fill copy - world bank documents
TRANSCRIPT
RESTRICTED
FIlL COPY Report No. PA-53
This report was prepared for use within the Bank and its affiliated organizations.They do not accept responsibility for its accuracy or completeness. The report maynot be published nor may it be quoted as representing their views.
INTERNATIONAL BANK FOR RECONSTRUCTION AND DEVELOPMENT
INTERNATIONAL DEVELOPMENT ASSOCIATION
SECOND NORTH SUMATRA ESTATES PROJECT
INDONESIA
May 12, 1970
Agriculture Projects Department
Pub
lic D
iscl
osur
e A
utho
rized
Pub
lic D
iscl
osur
e A
utho
rized
Pub
lic D
iscl
osur
e A
utho
rized
Pub
lic D
iscl
osur
e A
utho
rized
CURRENCY EQUIVALENTS
US$ 1 Rp 3781 &Upiah 3 US$ 0.0026
WEIGHTS AND MhASURES(Metric System)
1 hectare - 2.47 acres1 square kilometer (km2) - 0.386 square miles1 metric ton - 1,000 kilograms (kg) - 2,205 pounds1 kilometer (km) = 0.62 miles1 millimeter (m) - 0.04 inches
INITIALS AND ACRONYMS
FNP: Perusahan Negara Perkebunan(State-owned Estate Ehterprise),
RISPA: Research Institute of the Sumatran PlantersAssociation
PT: Perseroan Terbatas (Corporate entity operatingunder the Commercial Code)
JMO: Joint Marketing OfficeFFB: Fresh Fruit Bunches (oil palm)
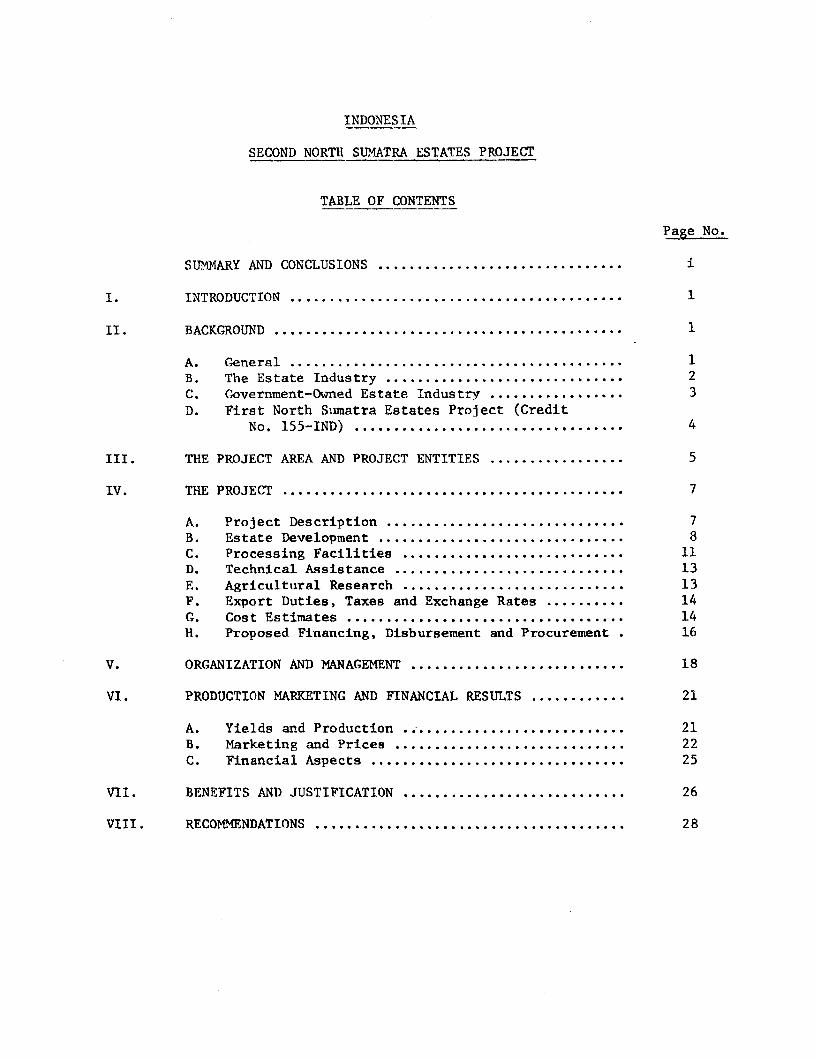
INDONESIA
SECOND NORTH SUMATRA ESTATES PROJECT
TABLE OF CONTENTS
Page No.
SUMMARY AND CONCLUSIONS ...... .........................
I. INTRODUCTION ..................... 1
II. BACKGROUND ..
A. General .,1B. The Estate Industry . ., 2C. Government-Owned Estate Industry .... ............. 3
D. First North Sumatra Estates Project (CreditNo. 155-IND) ... ,.. 4
III. THE PROJECT AREA AND PROJECT ENTITIES. 5
IV. THE PROJECT. 7
A. Project Description. 7B. Estate Development. 8C. Processing Facilities .11D. Technical Assistance .13E. Agricultural Research .13F. Export Duties, Taxes and Exchange Rates 14C. Cost Estimates .14H. Proposed Financing, Disbursement and Procurement . 16
V. ORGANIZATION AND MANAGEMENT .18
VI. PRODUCTION MARKETING AND FINANCIAL RESULTS .21
A. Yields and Production .21B. Marketing and Prices .22C. Financial Aspects .25
VII. BENEFITS AND JUSTIFICATION .. 26
VIII. RECOMMENDATIONS .28
ANNEXES
1. The Estate Industry
2. PNP IV and PNP VI Planted and Cultivable Areas
3. Planting Program
4. Plant Breeding and Planting Material
5. Foliar Analysis and the Fertilizer Investment Program
6. PNP IV Rubber Processing Facilities
7. PNP VI Oil Palm Processing Facilities
8. Project Cost Estimates
9. Disbursement Schedule
10. PNP IV and PNP VI Organization Chart
11. PNP IV and PNP VI Financial Statements
12. Yield Assumptions
13. Market Prospects for Palm Oil and Palm Kernels
14. Market Prospects for Natural Rubber
15. Projected Cash Flows and Operating Statements
16. Effect of the project on the Government's Budgetary Position
17. Economic Rate of Return Calculations and Sensitivity Analysis.
MAP
INDONESIA
SECOND NORTH SUMATRA ESTATES PROJECT
SUMMARY AND CONCLUSIONS
i. This report appraises a second project for the rehabilitation andexpansion of Government-owned estate groups in Indonesia. An IDA credit ofUS$17.0 million is proposed. The estate industry is one of Indonesia'slargest earners of foreign exchange, accounting for some 20% of exports interms of value. Since 1940 the industry has suffered severely, as havemost other sectors, from the political instability, corruption and extremeinflation that have been endemic in Indonesia until recently; and as aresult the contribution of the estates to the economy has declined. Involumetric terms estates now produce less than 50% of their production in1938, when they contributed 60% of exports. The fall in production reflectslow productivity as much as a decrease in the area under estates which hasdeclined by about 25%. The Government which took over in 1966 recognizesthe importance of the estates and in particular their ability to providemuch needed foreign exchange, and is taking measures both to rehabilitatethe estates which it owns, some 606,000 ha, and to create a climate in whichthe productivity of some 122,000 ha of foreign owned estates will improve.
ii. Two Government-owned estate groups in Sumatra, Perusahaan NegaraPerkebunan (PNP) IV and PNP VI, would be rehabilitated and expanded. Theformer comprises 18 estates with a total planted area of 29,300 ha of rub-ber which produced 18,000 tons of rubber in 1969. The latter is a group of7 estates growing 31,600 ha of oil palms and which in 1969 produced 70,000tons of palm oil and kernels. The project consists of planting or replant-ing some 12,000 ha of rubber and 8,000 ha of oil palms; bringing a further9,800 ha of immature rubber and 7,200 ha of immature oil palms into bear-ing; rehabilitating more than 19,000 ha of mature rubber, and 28,000 ha ofmature oil palms; and rehabilitating, replacing and expanding processingfacilities, estate transportation, buildings, workshop and agriculturalmachinery. The management of the two PNPs would be reorganized and strength-ened by the employment of advisers and inspectorate services.
iii. Project costs are estimated at US$31.7 million, of which aboutUS$17.0 million, or 54% would be the foreign exchange component. SomeUS$16.4 million of the proposed IDA credit would be onlent to the two PNPstogether with US$3.0 million of Government funds in the form of loans bear-ing interest at 12%, the Government's current lending rate to public sectorenterprises. The remainder of the credit would be used by Government toimprove agricultural and research facilities. The balance of project costswould be met by the PNPs from self-generated funds and by the Government.All goods to be financed from tne IDA credit would be procured through inter-national competitive bidding.
- ii -
iv. Most of the rubber and oil palm products produced under the proj-ect would be exported, although the local demand for palm oil is expectedto increase. At peak production in the early 1980's, net incremental annualforeign exchange earnings after expenditure on imported goods and serviceswould reach some US$14.0 million, and incremental reVenues accruing to theGovernment (from duties, taxes, and revenues) would reaeh some US$9.0 mil-lion. The estimated rates of return to the economy from planting and re-planting rubber and oil palm and carrying out fertilizer investment programsrange from about 12% to 30% at prices projected by the Bank's Economics De-partment for rubber and oil palm products on world markets.
v. The project would have similar characteristics to the First NorthSumatra Estates Project which is progressing satisfaetorily.
vi. The project is suitable for an IDA credit of US$17.0 million toIndonesia.
INDONESIA
SECOND NORTH SUMATRA ESTATES PROJECT
I. INTRODUCTION
1.01 In June 1969, approval was given for an IDA credit 1/ of US$16.0million to the Government of Indonesia to help finance the rehabilitationana development of two Governiment-owned estate groups in North Sumatra; Per-usahaan Negara Perkebunan Antan (PNP) V 2/, growing rubber, and PNP VII,growing oil palm. Fuller details of the First Estates Project are givenin paragraph 2.10.
1.02 The Government of Indonesia applied, in October 1969, for anotherIDA credit to finance part of the costs of rehabilitating and developingtwo more of the 28 Government-owned estate groups in Indonesia. A BankEconomic Mission to Indonesia in 1969 supported the priority given by Gov-ernment to this sector 3/ and in August/September 1969 Mr. Phillips of theBank's Resident Staff in Indonesia assisted the Government in preparing aproject for the rehabilitation and development of PNP IV, specializing inrubber, and PNP VI, specializing in oil palm, both in North Sumatra.
1.03 This report is based on the findings of an IDA appraisal mission,comprising Messrs. Wadsworth, Gold, Harris (FAO) and Bek-Nielson, Leach andWhiting (Consultants) which visited Indonesia in November/December 1969,and which was assisted by Mr. Phillips of the Bank's Resident Staff inIndonesia.
II. BACKGROUND
A. General
2.01 With its 3,000 islands and a total land surface of 1.9 millionkm2, Indonesia is the world's largest archipelago. Its population is about118 million and the population growth rate, which is increasing, is atpresent 2.4% per annum.
2.02 Indonesia's per capita gross domestic product is about US$80. Theislands of Java (population, 75 million) and Sumatra (population, 19 million)are the most important economically, followed by Sulawesi (population 8.5million) and Kalimantan (population 5 million). The economic developmentof the smaller islands is Just starting. Agriculture plays a dominant role
1/ President's Report No. P-709; Appraisal Report No. PA-19.
2/ Perusahaan Negara Perkebunan Antan V. State-owned Estate EnterpriseUnit V.
3/ Asia Department Report No. EAP-lOa of November 14, 1969 - CurrentEconomic Position and Prospects of Indonesia.
- 2 -
in the Indonesian economy, accounting for nearly h lf of the net domesticproduct, employing approximately 70% of the labor force, and contributingaround 75% of merchandise exports. The major export crop is rubber, whichis produced both by estates and smallholders, and which in 1968 accountedfor 27% of exports.
2.03 A war for independence, internal conflicts, nationalization ofmost foreign-owned enterprises, corruption, and a severe inflation havecurtailed economic development since World War 11. Agricultural exportsdeclined in the last decade and food imports increased.
2.04 The present Government took over in 1966 and has already succeeded,to a large extent, in stabilizing the currency; the rate of ±.flation wasbrought down from 85% in 1968 to 9% in 1969. Furthermore, the Governmenthas given the highest sector priority to agriculture, and particularly torice production in view of the major influence that the CU5pp7q of rice hason internal economic stabilization and the balance of paymen,s of the coun-try. An IDA credit of US$5.0 million to raise rice production through therehabilitation of irrigation works was made in 1969 (Credit No. 127-IND);the costs of this project have proved to be about three times the estimatesmade during appraisal, which was not preceded by a full feasibility study,on the other hand physical progress is satisfactory and the economic bene-fits of the project are ample to justify the increased expenditures. Afterrice, the Government is giving particular attention to the rehabilitationof estates, in order to increase foreign exchange earnings. An IDA creditof US$16.0 million was made in 1969 (Credit No. 155-IND) for the First NorthSumatra Estates Project; progress of this project is described in paras.2.10 through 2.15.
B. The Estate Industry
2.05 The background of the private and Government-owned estate industry,which was given in the First North Sumatra Estates Project appraisal report(Credit No. 155-IND), is detailed in Annex 1.
2.06 Over the last two years Government has taken positive steps to-wards stabilizing ownership, organization and management in the estate indus-try. The nationalized, previously Dutch-owned, estates are to remain underGovernment ownership and management. Some 90,000 ha of estates have beenreturned to their foreign owners -- Goodyear, Uni-Royal (American) andHarrisons and Crosfield (British) are some of the larger companies involved-- and are, and will continue to be managed by their owners. One estatecompany, SOCFIN (Belgian), has entered into a joint ownership and managementventure with Government for the 30,600 ha of rubber and oil palm which itpreviously owned outright.
- 3 -
C. Government-Owned Estate Industry
2.07 In 1969, Government-owned estates comprised a planted area of605,600 ha including some 224,500 ha of rubber and 80,500 ha of oil palm.Annex 1 contains further details.
2.08 While there have been improvements during the past three years,there is a long way to go before pre-war standards can be re-attained andsurpassed. This task would be formidable under any conditions, and whilethe economic, fiscal and political climates of Indonesia are improving,elements remain which constrain progress. Contacts abroad are being in-creasingly resumed, however, and substantial efforts are being made to up-grade research and to absorb modern techniques and management know-how.The Government, however, remains extremely short of cash and the relativelylarge investments needed to rehabilitate the industry must, therefore, con-tinue to come from abroad if the industry is to play its full part in theeconomy in the near future. To date, in addition to Credit 155-IND, otherfinancial assistance received by the Government estate industry has beenan Asian Development Bank credit of US$2.3 million, to rehabilitate some11,500 ha of oil palms on PNP II, and bi-lateral aid from the Federal Repub-lic of Germany for the supply of potash fertilizers.
2.09 Each PNP unit has a Board of Directors located on the estatesthemselves, though many important powers are reserved to the Minister ofAgriculture; these include appointment of senior staff; approval of budgetestimates and financial statements; approval of main lines of operations;and powers to give instructions to the Boards concerning the general dis-charge of their functions. The Minister exercises these powers throughthe Directorate General of Estates within the Ministry. These arrangementswere modified at the suggestion of IDA for PNP V and PNP VII, the two unitsfinanced under Credit 155-IND, and at that time it was thought that thesearrangements would serve as a model for a further degree of decentraliza-tion to be followed by other PNPs at a later date. For the proposed SecondNorth Sumatra Estates Project a further modification is suggested in thelight of experience gained, see para 5.04. It is anticipated that as bothprojects move ahead, they will fully demonstrate the advantages of furtherdecentralization based on more orthodox commercial principles. The Govern-ment is committed to placing its estate enterprises on a commercial basis,and has passed legislation (Government Regulation No. 12 of 1969) enablingPNP to move a stage further towards commercial autonomy by enabling them,as appropriate and when commercially viable, to be converted into a differ-ent type of enterprise - Perseroan Terbatas (PT) (see para 5.07). It ismandatory for PT to operate under the commercial code of Indonesia.
- 4 -
D. First North Sumatra Estates Pro4ect(Credit No. 155-IND)
The Protect
2.10 The project financed by Credit 155-IND is for the renabilitationand development of estate groups PNP V and PNP VII, growing respectivelyrubber and oil palms. Tne project involves planting or replanting 6,550ha of rubber and 13,670 ha of oil palms; bringing a further 7,070 ha ofimmature rubber and 5,750 ha of immature oil palms into bearing, rehabili-tating 9,660 ha of mature rubber and 23,990 ha of mature oil palms; andrehabilitating, replacing and expanding processing facilities, estate trans-portation, buildings, workshops and agricultural machinery. u-ortantly,the project involves the restructuring of the management of the two groupsand the provision of advisory and inspection services to assist management,as well as other technical assistance.
Comparison of Forecast and Actual Performance
2.11 The credit was signed in June 1969 but it did not become effectiveuntil December due to legal difficulties. In the meantime, however, therecruitment of management advisers and inspection services went ahead andcontracts have been signed between PNP V and N.V. Rubber Cultuur MaatschappijAmsterdam (RCMA), and between PNP VII and Societe Financiere des Caoutchoucs(SOCFIN) and Harrisons Fleming Advisory Services (HFAS). 1969 plantings andreplantings were as scheduled, and a total of 5,735 ha of rubber and oilpalms were established. The 1970 budgets and planting programs of the twoPNPs were reviewed by IDA in late 1969 and, following some changes, wereagreed with the Government. These provide for similar planting and replant-ing targets as envisaged at the time of appraisal. There has been no signi-ficant progress in other physical aspects of the project. It was agreed atthe time of appraisal that the procurement of new and replacement equipment,and the design and construction of new processing facilities would be pre-pared with the assistance of the management advisers and Inspection Services.
2.12 Terms of reference have been agreed between the Government and IDAfor the employment of oil palm and rubber plant breeding consultants, andqualified individuals and agencies have been approached. Terms of referencehave also been agreed for a survey of rubber smallholders in North Sumatra;for a survey of other Government-owned estates, and for studies of the mar-keting organization. Qualified consultants are now being contacted fcr thepurpose of carrying out these surveys and studies.
2.13 Insufficient data are available at this stage to compare actualwith forecast costs. In the Second Estates Project, however, higher laborcosts have been used as it appears that these may be increasing more rapidlythan originally forecast. To date, international procurement has been re-stricted to fertilizers, and no problems have arisen; US$212,000 have beendisbursed for the supply of fertilizers.
- 5 -
2.14 In compliance with terms of the Credit Agreement, new Boards ofDirectors have been appointed for PNP V and PNP VII, and a General Manager,Production Manager, and Commercial Manager have been appointed to eachestate group. All appointments to the Boards, and to management, were madefollowing consultation with IDA.
2.15 While the project is in a relatively early stage of development,the rapid progress made by Government and estate managements in the last sixmonths in implementing the terms of the Credit Agreement, and their adherenceto the project outline contained in the appraisal report justifies consider-able optimism for the future of the project.
III. THE PROJECT AREA AND PROJECT ENTITIES
General
3.01 The PNP IV and PNP VI groups of estates lie within the provinceof North Sumatra (see Map). PNP IV has 18 operational estates with a totalplanted area of about 29,300 ha of rubber, and 3 other estates which havebeen abandoned completely. PNP VI comprises 7 estates growing 31,600 ha ofoil palms and 570 ha of cocoa. Currently, PNP VI manages and finances thelosses of Karang Inoue estate of the PNP I group of estates located in theprovince of Atjeh. Government has agreed that such responsibility willterminate shortly and during negotiations assurances were obtained from theGovernment to this effect; such termination would be a condition of effec-tiveness of the proposed credit. Annex 1 provides information on all otherPNPs and Annex 2 details of each estate on PNP IV and PNP VI.
3.02 There are about 300,000 ha of estates in the province of NorthSumatra. Government owns about 197,000 ha of these, private Indonesianssome 40,000 ha, a Government/private joint venture 31,000 ha, and variouswell-known international companies the remainder. In addition, there aresome 200,000 ha of smallholder rubber, and substantial areas of virginjungle.
Climate and Soils
3.03 The mean temperature is 270 C, sunshine averages six hours dailyand annual rainfall ranges from 1,700 mm to 3,500 mm, and is well distri-buted. Soil types vary between PNP IV estates, but all are suitable forrubber cultivation. The soils of PNP VI estates are ideal for growing oilpalms, but four estates situated on alluvial flats adjacent to the SilauTua, Balai, Ular and Barumun rivers are affected by seasonal flooding, someof which is serious. The estuaries of these rivers have not been dredgedfor 30 years, and in this same period the maintenance of outlet drains tothe sea throughout the area has been almost non-existent, see para 4.14.
- 6 -
Location of PNP IV and PNP VI Estates and Communications
3.04 PNP IV. PNP IV group headquarters are at Gunung Pamela, about120 km from the provincial capital of Medan (see Map). Of the operatingestates 11, totalling about 23,000 ha are within a radius of 70 km fromGunung Pamela, and the remaining seven, about 6,000 ha, are located in theTapanuli district and lie between 350 and 400 km from headquarters. Metal-led roads, in poor-to-good condition, lInk PNP IV estates with Miecan, andthe port of Belawan. The production of the Gunung Pamela estates is movedan average of 130 km (range 86-168 km) to Be7awan by the State railwaySystem, which connects with all factories. In Tapanuli, however, presentproduction is sold ex-estate and the buyer is responsible for transportation,which is by road.
3.05 PNP VI. Group headquarters of PNP VI are at Pabatu, some 90 kmfrom Medan, and all but one of the seven estates are within a radius of 100km from headquarters. The remaining estate, Adjamu, is 326 km away. AllPNP VI estates are served by road, and with the exception of Adjamu, byrailway. Road communications with Adjamu are poor, however, in particularthe Rantau Prapat-Adjamu section, which is impassable in wet weather. Dur-ing negotiations assurances were obtained from Government that the RantauPrapat to Adjamu road and all other roads to be used by project estate trans-port for the carrying out of the pro4ect, would be improved and maintainedfor use by ordinary estate vehicles. The evacuation of produce from Adjamupresents a considerable problem, and at the moment it must be transportedto Belawan either by road, by sea or by sea to Tandjung Balai and then byroad or rail to Belawan. To overcome the problem provision is made underthe project for a seagoing palm oil barge to ply between Adjamu and Belawan.
3.06 All project imports and exports would be handled through NorthSumatra's sole major port -- Belawan. While the design capacity of Belawanis adequate to handle existing traffic of about 2,000 ship calls annually,the port infrastructure and shiD-servicing facilities are in poor condition,due to unsatisfactory maintenance and repair. Additionally, heavy siltingand some shortfall in maintenance dredging restrict shipping to freightersof about 15,000 tons, while bulk tankers of higher tonnage would be the mosteconomic means of exporting palm oil. In general, however, the port canhandle present traffic and its improvement is high on the list of Governmentrehabilitation projects. A Dutch consulting firm (NEDECO) has been commis-sioned to study port improvement requirements, including those needed forBelawan, and it is anticipated that action will be taken by the Governmentto implement recommendations made by the consultants, and that the portwill continue to be able to handle North Sumatra estate production. BothPNPs have experienced excessive delays in the port and rail handling of theirproduction and supplies, particularly the turn-around and availability ofrail tankers transporting liquid latex and palm oil from the estates toBelawan. During negotiations assurances were obtained from Government thatsteps would be taken to eliminate delays in handling PNP production and toeffect such improvements as are required to facilitate the export of projectproduction. A specific assurance on this issue was not obtained when Credit155-IND was negotiated since it was believed at that time that improvementswould take place more rapidly than has proved to be the case.
- 7 -
3.07 There is no road or rail link between North and South Sumatra,consequently air services are the only means of rapid transportation betweenMedan and Djakarta. Regular commercial air services connect Medan with otherSumatran towns, Dajakarta on the island of Java, and Penang (Malaysia).
Labor
3.08 The supply of labor in the project area is adequate and is wellable and prepared to work on estates. The majority of estates employ morelabor than required and an expansion in the labor force would not be re-quired to implement the project. If labor shortages should occur, workerscould be recruited from Java, without much difficulty, as in the past. Dueto severe inflation in the recent past the estates follow the general policyof paying a large proportion of wages in kind, such as rice, cloth and kero-sene. The present wage level for estate workers is Rp. 22.50 per day plusRp. 137.50 in kind, equivalent to just under US$0.42. This rate is very lowcompared with those in other countries with a major estate industry. TheGovernment is anxious to return to solely monetary wages, but this has notyet proved possible.
IV. TIIE PROJECT
A. Project Description
4.01 The Project is the rehabilitation and development over the fiveyears 1970 - 1974 of two groups of Government-owned estates, PNP IV andPNP VI, and involves:
- planting or replanting about 12,000 ha of rubber and8,000 ha of oil palms;
- bringing to maturity the above areas and about 9,800ha of immature rubber and 7,200 ha of immature oil palmsplanted prior to 1970-
- rehabilitating 19,400 ha of mature rubber and 28,100ha of mature oil palms by means of a fertilizer program;
- rehabilitating about 9,100 ha of mature oil palms,7,200 ha of immature oil palms and 300 ha of immaturerubber through special programs of weed and diseasecontrol, drainage and selective felling of uneconomicpalms;
- constructing a test laboratory, one new block rubberfactory, and converting an existing sheet factory toblock rubber production;
-8-
rehabilitating seven existing palm oil mills;
rehabilitating and expanding estate agriculturalequipment, transportation services and buildings;
rehabilitating existing estate roads and bridges;
providing machinery for land clearing, and upkeepof estate roads and drains;
- providing technical and management assistance, in-volving an estate and factory inspection service,technical and financial advisers and the purchaseof foliar (leaf) analysis services; and
- rehabilitation and improvement of RISPA after employ-ment of consultants to submit proposals for reorgani-zation and a long-term research and development program.
The physical and organizational components of the project would be similarto those of the First Estates Project, amended as necessary in the light ofexperience gained in carrying out the latter.
B. Estate Development
Planting Program
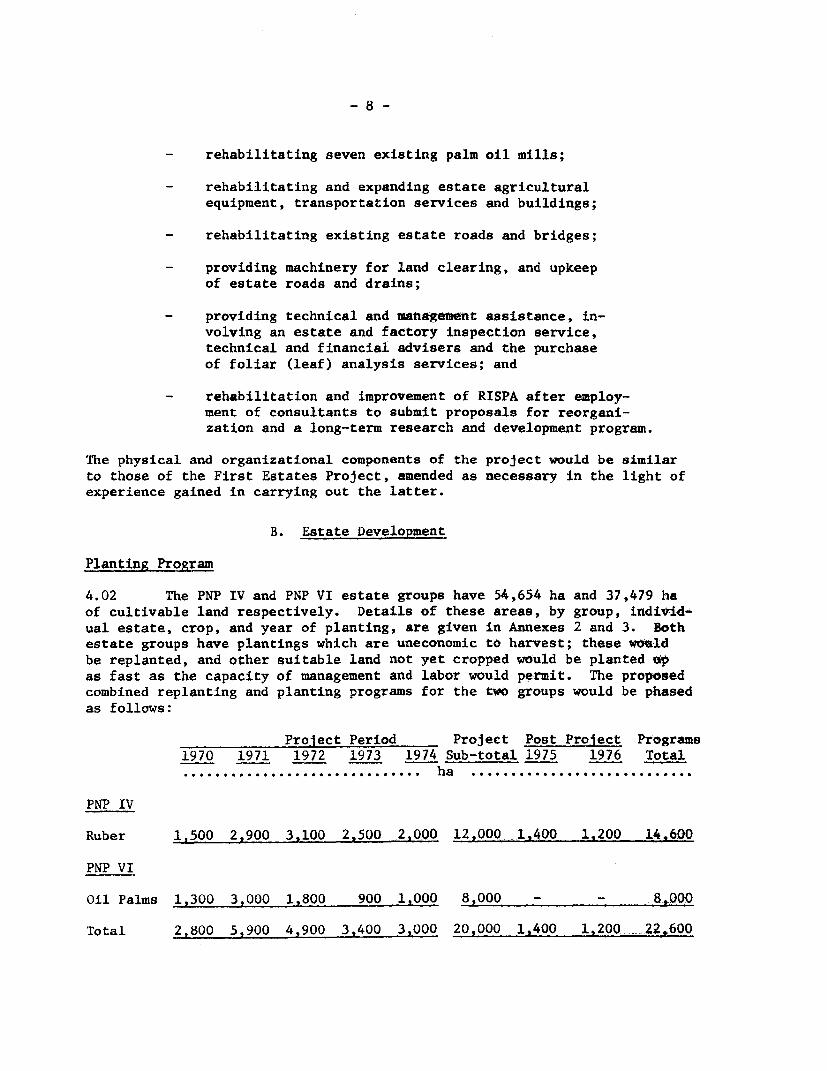
4.02 The PNP IV and PNP VI estate groups have 54,654 ha and 37,479 haof cultivable land respectively. Details of these areas, by group, individ-ual estate, crop, and year of planting, are given in Annexes 2 and 3. Bothestate groups have plantings which are uneconomic to harvest; these wouldbe replanted, and other suitable land not yet cropped would be planted upas fast as the capacity of management and labor would permit. The proposedcombined replanting and planting programs for the two groups would be phasedas follows:
Project Period Project Post Project Programs1970 1971 1972 1973 1974 Sub-total 1975 1976 Total.. . . .ha ............................
PNP IV
Ruber 1,500 2,900 3,100 2,500 2,000 12,000 1,400 1,200 14.600
PNP VI
Oil Palms 1,300 3,000 1,800 900 1,000 8,000 - - 8.000
Total 2,800 5,900 4,900 3,400 3,000 20,000 1,400 1,200 _22,600
4.03 The 14,600 ha PNP IV program would comprise replanting 9,400 hanow under rubber of between 25 and 50 years old, and planting up 3,900 haof jungle and 1,300 ha of land now occupied by illegal squatters but whichwould be recovered through compensating such squatters (see para 4.13).
4.04 The PNP VI program of 8,000 ha would include the replanting of2,100 ha of old and low yielding oil palms, and the planting with oil palmsof 500 ha in old rubber, 2,300 ha under jungle and 3,100 ha of vacant landto be recovered from illegal squatters (see para 4.13).
Routine Replanting
4.05 It is standard estate practice to use a 30-year replanting cyclefor oil palms, and a 25-year cycle for rubber. Replanting carried out underthe above programs would clear up the existing backlog of replanting. From1974 PNP VI would adopt a standard 30-year replanting cycle, and PNP IV a25-year cycle from 1976.
Planting Material
4.06 Both estate groups would produce their own supplies of high-yieldpotential planting material 1/. The only exception would be that for its1971 plantings PNP VI would have to import about half of its oil palm seedrequirements from Malaysia. Annex 4 gives details of the planting materialavailable and the plant breeding situation in Indonesia. In the First NorthSumatra Estates Project the Government undertook to implement suitable plantbreeding programs for all Government-owned estates in North Sumatra, and toappoint oil palm and rubber plant breeding consultants, acceptable to IDA,to oversee these programs. During negotiations, assurances were obtainedfrom the Government that all material used for project oil palm and rubberplanting programs from 1971 through 1974 would be subject to the recommen-dation of these plant breeding consultants. These plant breeding consult-ants are expected to be appointed shortly; and a condition of effectivenessof the proposed credit would be that the plant breeding consultants had beenappointed and were working in Indonesia.
Fertilizer Investment Program
4.07 Economic fertilizer programs can be determined only by scientificanalysis techniques, such as foliar (leaf) analysis which is described inAnnex 5. Foliar analysis services will not be available locally untilsometime during 1971, and provision is made in the project for obtaininganalysis services from abroad through contracts with suitable researchagencies. PNP VI made appropriate arrangements with a Malaysian agencyin 1969, and PNP IV will make similar arrangements in the latter half of1970. Consequently, scientifically based fertilizer programs will stsrtin 1970 in the case of PNP VI and in 1971 in that of PNP IV.
1/ PNP VI would produce oil palm seed from selected mother palms whichwould be pollinated artificially with pollen from selected male parents,
and PNP IV would obtain rubber seeds required for rootstocks from seedgardens, and bud wood from its bud wood nurseries.
- 10 -
4.08 The yields of all Indonesian estates, including those of PNP IVand PNP VI, are seriously depressed due to the lack for many years ofbalanced fertilizer applications. If maximum yield potential is to berealized mature areas on PNP IV and PNP VI must be properly fertilized asquickly as possible, although yield responses to the initial applicationswould not be significant until the second or third year following such ap-plications (see Annex 5). The cost of the initial applications is consider-ed a capital Item and it is proposed to finance them under the project.Thus fertilizer for application to mature PNP IV rubber would be financedin 1971 and 1972; and fertilizer for mature PNP VI oil palms in 1970 (somefoliar analysis results are available), 1971 and 1972. Fertilizer for im-mature areas 1/, which in estate accounting is normally regarded as a capitalitem, would be financed throughout the project period.
Special Rehabilitation
4.09 Many of the estates of PNP IV and PNP VI are in arrears with weed-ing programs, and this backlog of poor maintenance is adversely affectingrubber and oil palm growth in immature areas and yields in mature areas.Additionally, PNP VI is in arrears with disease control and drainage pro-grams and the selective felling of uneconomic oil palms. These programswould be brought up to date in 1970 and 1971, and this special rehabilita-tion would be included in the project. After 1971, the areas rehabilitatedin this way would be covered by routine annual maintenance programs.
Buildings
4.10 Cash shortages over many years have resulted in the wholly inade-quate maintenance of estate buildings, particularly of workers' housing.On many estates much of the workers' accommodation is sub-standard and shouldbe replaced. It is proposed to include in the project the cost of rehabili-tation, maintenance and replacement of estate housing. During the period1970 through 1974 provision has been made for PNP IV and PNP VI to replace125 and 850 double housing units respectively, and for each PNP to rehabili-tate about 50% of the remaining workers' housing units. No additional hous-ing would be required. General provisions have also been made for replace-ment and rehabilitation of staff housing, offices and other buildings.Annual plans for the replacement and rehabilitation of buildings would becarried out only after the Inspection Services had commented on the proposals(see para 5.12).
Vehicles and Equipment
4.11 All PNP IV produce is transported from field to processingfactories by road. PNP VI has an estate rail system, and only a smallproportion of road haulage takes place. The number of vehicles, locomo-
1/ The development period from planting or replanting until the treescome into bearing: 3-4 years for oil palms, 6-7 years for rubber.
- 11 -
tives and rolling stock on both PNPs is substantial, although efficientutilization is precluded due to age and consequent high repair incidence,shortage of spares, and poor organization. Other machinery and equipmentused by the estates, and which is generally in a state of disrepair, in-cludes wheeled and crawler tractors, road upkeep machinery, crop transportand general vehicles.
4.12 Under the project obsolete and irreparable equipment such aslocomotives, rolling stock, wheeled and crawler tractors, road graders,trucks and personnel vehicles (buses, cars, jeeps, and motorcycles) wouldbe replaced; and additional equipment purchased to handle the increasedproduction expected to be generated by the project. Requirements havebeen estimated on the basis of better utilization which would result fromimproved management, see Chapter V.
4.13 The PNP IV and PNP VI planting programs include some 4,400 hawhich are at present illegally occupied by squatters; Government regulationsrequire such squatters to be compensated in accordance with an agreed scalefor crops and housing which may be lost when the land is planted and projectcosts include compensation payable during the period 1970 through 1972.This would not be financed under the IDA credit. During negotiations assur-ances were obtained from the Government that such squatters would be removedin time to prevent any disruption of the agreed planting program.
4.14 Four of the PNP VI estates, and particularly Tanah Itam Ulu estate,are affected by seasonal flooding as river estuaries have not been dredgedand outlet drains to the sea have not been maintained for many years (seepara 3.03). To alleviate the flooding problems Government assurances wereobtained during negotiations that the blocked outlet drain to the sea whichcauses severe flooding at Tanah Itam Ulu estate would be rehabilitated notlater than June 30, 1971, and that other major outlet drains to the seaaffecting other PNP estates within the project would be rehabilitated andproperly maintained, see para 4.31.
C. Processing Facilities
PNP IV
4.15 The current PNP rubber crop of about 18,000 tons per annum is pro-cessed into sheet and crepe rubber 1/ by PNP IV factories and those of Indone-sian remillers, and into concentrated latex at a plant owned and operated bythe Goodyear Company. The 11 PNP IV plants, which are in a generally satis-factory condition, comprise five-sheet and crepe rubber plants, four-sheetrubber plants and two-crepe rubber plants; there are.also two additionalsheet-rubber plants which are only used for sheet drying during peak crop-
I/ The main characteristics of the various types of rubber produced aredescribed in Annex 6.
- 12 -
ping periods. In order to meet competition from synthetic rubbers, and toobtain the long-term marketing advantages of block rubber over sheet andcrepe rubber, the project provides for conversion of PNP IV factories toblock rubber manufacture as and when present facilities or arrangements be-come inadequate to deal with the crop harvested. At least three of the ex-isting sheet and crepe factories would be held in reserve following theintroduction of block rubber processing facilities.
4.16 PNP IV crops are expected to increase to about 47,000 tons by themid 1980's. To provide for the additional crop and conversion of existingfactories when crops exceed present capacity the prbject includes:
- the construction of a new block rubber factory atBandar Betsy;
- conversion to block rubber of an existing sheet rubberfactory at Bangun;
- establishment of a rubber testing laboratory at PNP IVheadquarters in 1970; and
- additional drying facilities at Bandar Negeri and SarangGiting.
During the following ten years to 1985 provision has been made for fo'tr m'orbfactories to be converted to block rubber production, the construction of anew block rubber plant at Hapesong and extension of plant capacity as andwhen required. Further details of existing plants and proposed investmentsare given in Annex 6.
4.17 After 1970 PNP IV processing should be adequate for all PNP IVcrops and the need for outside processing arrangements would be eliminatff8.During negotiations assurances were obtained from the Government that exist-ing and any future outside processing arrangements would be subject to theapproval of IDA and the Joint Marketing Office (JMO), see para 6.03.
PNP VI
4.18 The current PNP VI oil palm crop of about 300,000 tons of FFB perannum is processed in seven mills. The condition of four of the mills isgenerally satisfactory but the mills at Tindjowan (built in 1922 and re-habilitated in 1968), Pulu Radja (built in 1920), and Adjamu (built in1938) operate inefficiently due to poor layout and lack of equipment. Withthe exception of Tindjowan, all mills are operating far below rated capacity.Quality control checks acceptable internationally are carried out by RISPAlaboratories.
- 13 -
4.19 PNP VI crops are expected to increase to about 690,000 tons FFB by1979. Additional mill capacity would not be required but rehabilitation andadditional equipment is necessary to enable each mill to operate efficientlyat full rated capacity. The project provides for substantial rehabilitationand new equipment for the mills at Tindjowan, Pulu Radja and Adja"u, mach-inery spares, incinerators and conveyors for bunch waste disposal (a productof such disposal is valuable potash fertilizer), storage facilities, labora-tory equipment and rehabilitation and improvement of mill workshops. (Annex7 gives further details of existing mills and proposed investments.)
D. Technical Assistance
4.20 Reference has already been made to technical assistance for rubberand oil palm plant breeding programs being provided under Credit 155-IND(paras 2.12 and 4.06). Technical assistance would be provided under theproject to strengthen and up-date the management of both PNP IV and PNP VI(paras 5.06 thru 5.10).
E. Agricultural Research
4.21 The Research Institute of the Sumatran Planters' Association(RISPA) was established early in the century (under the name AVROS) toprovide a common research service for the estate sector, and soon developedworld-wide reputation for the quality of its work. RISPA remains theprincipal research center for rubber, palm oil and tea, but since theexpropriation of Dutch owned estates has been unable to maintain a satis-factory service. The main reasons for this have been shortages of fundsand of qualified staff. Consequently, the estate sector is receiving in-adequate research support, despite the efforts of individual estates toconduct their own research programs.
4.22 The Government recognizes the importance of RISPA and the devel-opment of agricultural research for all sectors. In April 1969 a cess wasintroduced for all export crops to finance research requirements and toprovide other essential services for the export crops sector. Equipmentfor soil and leaf analyses at RISPA is being provided under bilateral aidand IDA assistance has been made available under the First North SumatraEstates credit for periodic visits by foreign plant breeding experts, thetraining of Indonesian personnel, and the purchase of equipment.
4.23 An early improvement in the advisory and product testing servicesprovided by RISPA to the estate sector is considered essential. It is rotpossible to establish in detail RISPA's financial and man-power needs in theabsence of a long-term research and development program for the institute.The preparation of such a program is long overdue, but when the First EstatesProject was being appraised Government's intentions for the future of RISPAwere insufficiently clear to permit IDA to consider providing financial
- 14 -
assistance other than for the services described above. The situation isnow clear, and RISPA will be operated under Government auspices with appro-priate representation by the estates on its management body. Funds wouldbe provided under the project to employ consultants to prepare a researchand development program, and to recommend the organizational and financialarrangements, such as the level of a research cess, required to support it.An amount of US$200,000 would be provided from the proposed credit for thispurpose, and an additional US$400,000 for the procurement of any goods andservices shown by the studies to be urgently required and which could not befinanced readily from RISPA resources. It is estimated that Governmentcounterpart funds equivalent to US$400,000 also would be required. Assur-ances were obtained during negotiations that, to carry out preparation ofthe research and development program the Government and RISPA would employconsultants satisfactory to IDA, on terms and conditions satisfactory toIDA. Assurances were also obtained from the Government that the consultant'sfindings and recommendations would be submitted to IDA to enable agreemeatto be reached on their implementation.
F. Export Duties, Taxes and Exchange Rates
4.24 Export duties and taxes payable to Government by the PNPs amountto 15% of the fob proceeds of rubber and palm produce. The rate of exportduty is currently 10% and agricultural and other taxes account for a further5%. In addition a cess of Rp 1,000 (US$2.65) per ton of production io payableto the Provincial Government for infrastructure maintenance (see para. 7.03).All financial projections in this report are expressed in US dollars andconversions from rupiahs have been made at the rate of US$1 - Rp 378.
G. Cost Estimates
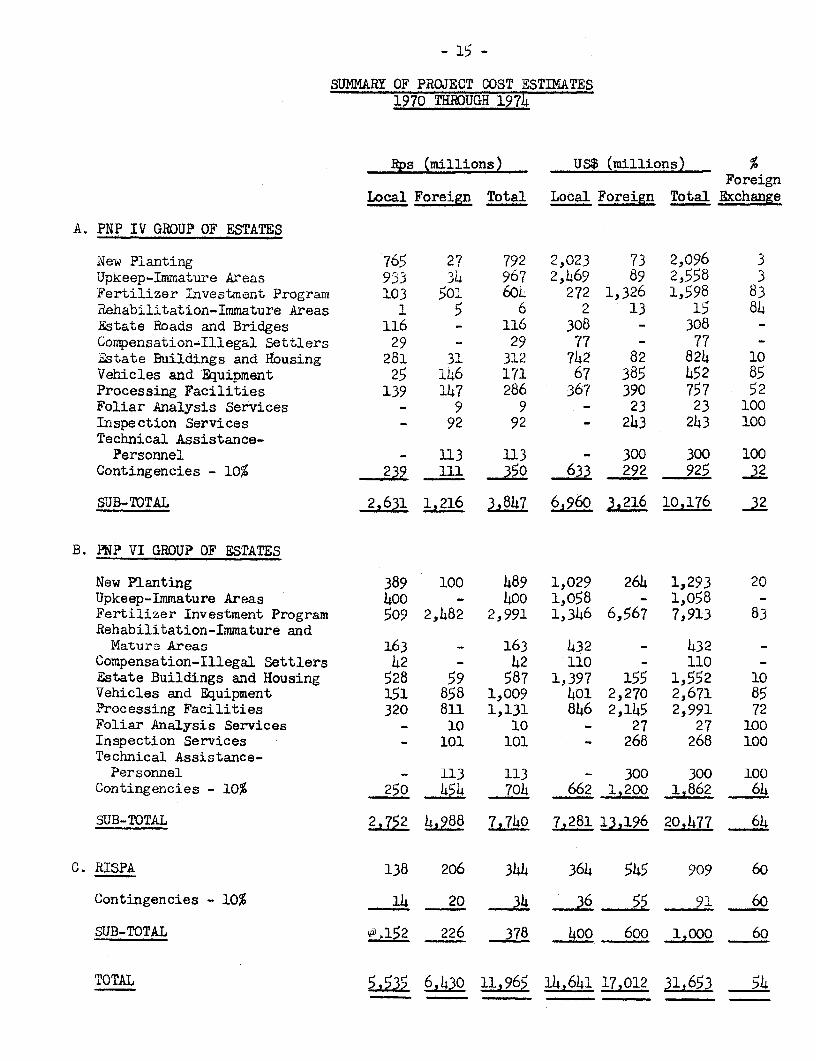
4.25 Total project costs are estimated at US$31.7 million, with aforeign exchange component of US$17.0 million. The following is a summaryof the cost estimates; further details are given in Annex 8.
- 15 -
SUMMARY OF PROJECT COST ESTIMATES1970 THROUGH 1974
Rps (millions) US$ (millions) %Foreign
Local Foreign Total Local Foreign Total Exchange
A. PNP IV GROUP OF ESTATES
New Planting 765 27 792 2,023 73 2,096 3Upkeep-Immature Areas 933 34 967 2,469 89 2,558 3Fertilizer investment Program 103 501 604 272 1,326 1,598 83Rehabilitation-Immature Areas 1 5 6 2 13 15 84Estate Roads and Bridges 116 - 116 308 - 308 _Compensation-Illegal Settlers 29 - 29 77 - 77 -Estate Buildings and Housing 281 31 312 742 82 824 10Vehicles and Equipment 25 146 171 67 385 452 85Processing Facilities 139 147 286 367 390 757 52Foliar Analysis Services - 9 9 - 23 23 100Inspection Services - 92 92 - 243 243 100Technical Assistance-Personnel - 113 113 - 300 300 100
Contingencies - 10% 239 111 350 633 292 925 32
SUB-TOTAL 2,631 1,216 3,847 6,960 3,216 10,176 32
B. PNP VI GROUP OF ESTATES
New Planting 389 100 489 1,029 264 1,293 20Upkeep-Immature Areas 400 - 400 1,058 - 1,058 -Fertilizer Investment Program 509 2,482 2,991 1,346 6,567 7,913 83Rehabilitation-Immature andMature Areas 163 - 163 432 - 432 -
Compensation-Illegal Settlers 42 - 42 110 - 110 -Estate Buildings and Housing 528 59 587 1,397 155 1,552 10Vehicles and Equipment 151 858 1,009 401 2,270 2,671 85Processing Facilities 320 811 1,131 846 2,145 2,991 72Foliar Analysis Services - 10 10 - 27 27 100Inspection Services - 101 101 - 268 268 100Technical Assistance-Personnel - 113 113 - 300 300 100
Contingencies - 10% 250 454 704 662 1,200 1,862 64
SUB-TOTAL 2,752 4,988 7,740 7,281 13,196 20,477 64
C. RISPA 138 206 344 364 545 909 60
Contingencies - 10% 14 20 34 36 55 9 60
SUB-TOTAL @,152 226 378 400 600 1,000 60
TOTAL L^L 6,430 11,965 14,641 17,012 31,653 54
- 16 -
4.26 Although the severe inflation experienced in Indonesia in recentyears has abated during the last twelve months, previous costs are not yeta reliable guide for establishing cost projections. Wherever possible,cost estimates have been calculated on the basis of man-day requirementswhich have then been compounded by the daily wage rate assumed. Increasesof 5% in the wage rate were made at the beginning of both 1969 and 1970,and in the cost projections it has been assumed that wages and salarieswould be increased by 5% per annum (compounded) for a further nine years,until 1979, and that thereafter the annual increase would be 1% for theremainder of the project life. Current daily wage rates are less than50% of those now being paid to estate labor in Malaysia, but the averageIndonesian worker's output is appreciably lower. Productivity improvementsare achievable, as shown by experience in Malaysia where despite increasinglabor costs, costs of production have fallen. Estimates for the rehabilita-tion and replacement of existing buildings, vehicles and equipment have beenarbitrarily assessed as it was not possible to appraise each item, and to'forecast the precise life left in many of the items would be difficult. Itemswould only be purchased, replaced or rehabilitated as required, and in accord-ance with annual budgets approved by PNP Boards which would incorporate thecomments of the Inspection Service (see para. 5.12). The Government hasgranted duty free privileges to projects financed with foreign aid, andthese arrangements would apply to PNP IV and PNP VI for goods required forthe project. A contingency provision of 10% has been applied to all coststhroughout the life of the project as increases have- only been provided forwages and salaries.
H. Proposed Financing, Disbursement and Procurement
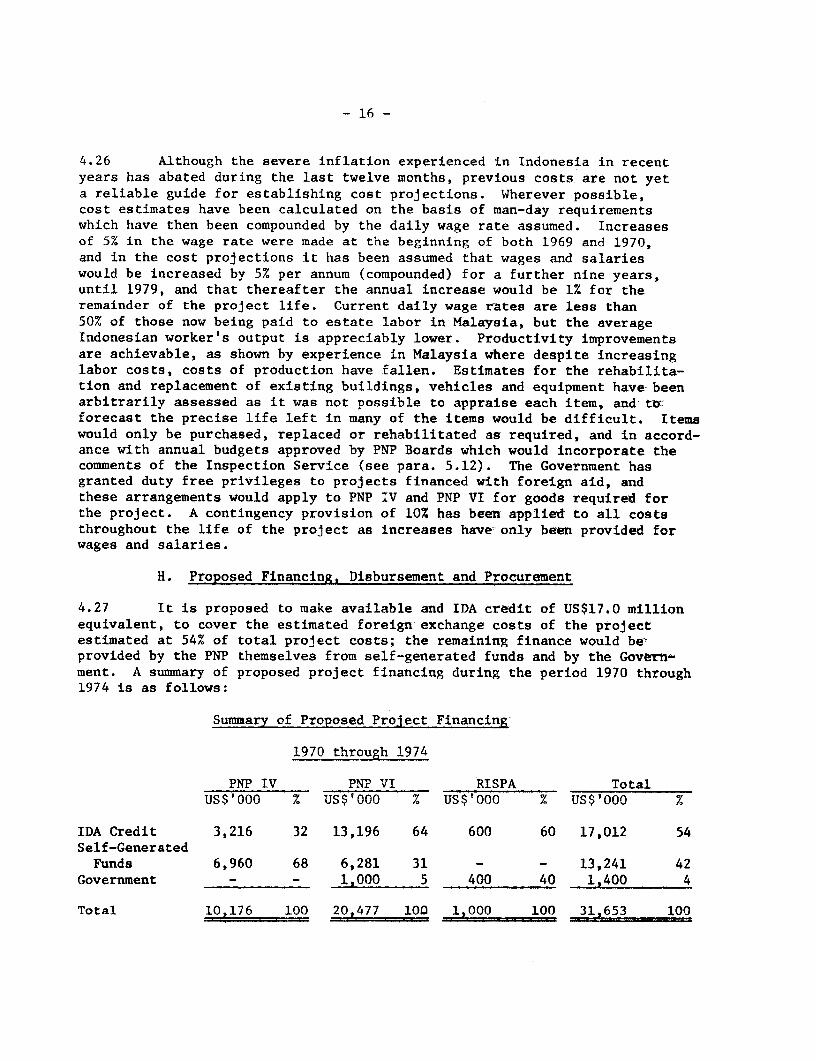
4.27 It is proposed to make available and IDA credit of US$17.0 millionequivalent, to cover the estimated foreign exchange costs of the projectestimated at 54% of total project costs; the remaining finance would bevprovided by the PNP themselves from self-generated funds and by the Govern-ment. A summary of proposed project financing during the period 1970 through1974 is as follows:
Summary of Proposed Project Financing
PNP IV PNP VI RISPA TotalUS$'000 % US$'000 % US$'000 % US$'000 %
IDA Credit 3,216 32 13,196 64 600 60 17,012 54Self-GeneratedFunds 6,960 68 6,281 31 - - 13,241 42
Government - - 1,000 5 400 40 1,400 4
Total 10,176 100 20,477 100 1,000 100 31,653 100
- 17 -
4.28 In addition to the US$1.0 million to be provided for PNP VI byGovernment during the period 1970 - 1974, a further US$2.0 million would berequired by PNP IV in 1975 and 1976 for replanting, processing facilitiesand renewal of fixed assets, which would increase the total Governmentcontribution for the two PNP to US$3.0 million. Government funds requiredfor both PNP IV and PNP VI would be amply covered by export duty andcorporation tax received from the PNP during the period 1970 - 1976 (seeAnnex 16).
4.29 The IDA credit be on-lent by the Government to the PNP. Boththe IDA credit and the direct Government contributions to PNP IV and PNP VIwould be lent under Subsidiary Loan Agreements, which would be similar tothose executed between the Government and the PNP financed under the FirstNorth Sumatra Estates project. The subsidiary loans would bear interest at12% per annum, the standard Government lending rate for all State enterprises.The term of the PNP IV subsidiary loan would be 16 years, including a 9 yeargrace period; the PNP VI loan would be for 13 years, with a grace period offive years. The terms of these sub-loans are largely determined by thecapacity of the PNP to meet loan interest and repayments, (see paras. 6.12through 6.14). During negotiations assurances were obtained from the Govern-ment that draft Subsidiary Loan Agreements would be submitted to IDA forapproval. Signature of the Subsidiary Loan Agreements would be a conditionof effectiveness of the proposed credit.
Procurement
4.30 During negotiations assurances were obtained from Governmentthat goods to be imported under the project, and to be financed by IDA,would be procured following international competitive bidding procedures,and that for all contracts in excess of US$50,000 draft tender documentswould be submitted to IDA for approval together with analyses of bids beforecontracts are awarded. The Inspection Services would assist the PNP toprepare bid documents and specifications and to evaluate tenders.
Disbursement
4.31 IDA funds would be disbursed against full CIF documentation forfertilizers and chemicals amounting to about US$8.5 million, processing andother machinery amounting to some US$2.8 million and transporation equip-ment totalling US$3.0 million. Disbursements would be made against foreignexchange payments for the purchase of foliar analysis and inspection servicesand the cash cost of employing technical assistance personnel would be re-imbursed in full. No disbursements would be made for goods and services forRISPA until the consultants' recommendations for the RISPA research programhave been discussed and agreed with IDA (see para. 4.23), or for Tanah ItamUlu estate until rehabilitation of the outlet drain has been completed (seepara. 4.14). A disbursement schedule is at Annex 9. Should any savings bemade the resultant balance of the IDA credit would be cancelled.
- 18 -
V. ORGANIZATION AND MANAGEMENT
5.01 Until recently, Government-owned estates have been isolated frominternational developments in estate technology and management, and theintroduction of modern crop production and processing techniques and manage-ment skills is urgently required. The first North Sumatra Estates Projectprovided for a restructuring of the Boards of Directors and managements ofthe two estate groups involved, as well as for a greater decentralizationof authority, appointment of expatriate management advisers, and employmentof foreign estate companies to make regular inspections of all estates.These arrangements were agreed by IDA as the existing day to day managementof the estates was regarded as generally satisfactory.
5.02 The revised directorate and management arrangements under thefirst North Sumatra Estates Project have only been in operation for a shortperiod. Generally they appear to be working well, and it is proposed thatsimilar arrangements should be introduced for PNP IV and PNP VI.
Boards of Directors
5.03 The Boards of Directors for PNP IV and PNP VI would have powerssimilar to the Boards of Directors of commercial companies, including fullauthority for hiring and dismissing managers and staff and for determiningand implementing all administrative, financial, technical and commercialpolicies and programs. Each Board would consist of a Chairman and at leastthree other members who would be appointed for an initial period of fiveyears by the President of Indonesia acting on the reconmendation of theMinister of Agriculture. In each case the Director General of Estates, ora senior member of his staff nominated by him, would serve as an ex-officiomember. The Director General is a civil servant responsible to the Ministerof Agriculture for all matters pertaining to the estate industry, as such hehas broad experience of PNP operations. The other members of the Boardswould be Indonesians with experience in estate business and management, bank-ing, commerce or some related field. The Boards would not be responsiblefor day to day management (see para. 5.04). During negotiations assuranceswere obtained from the Government that such new boards of Directors forPNP IV and PNP VI would be established, and that all appointments to theBoards would be subject to prior consultation with IDA. Establishment ofthe two Boards, and the filling of their positions would be a condition ofeffectiveness of the proposed credit.
Day to Day Management
5.04 Day to day management is now in the hands of the three Directorswho make up the existing Boards of Directors of PNP IV and PNP VI. Theseare, a First Director, Production Director and Commercial Director. Underthe project these directorships would be abolished, and their managementfunctions would be exercised respectively by a General Manager, ProductionManager and Commercial Manager appointed by the Minister of Agriculture onthe recommendations of the new Boards of Directors. This would be similarto the arrangements agreed by IDA for the First North Sumatra Estate Proj-
- 19 -
ect which appear to work well. A change under the second project would bethat the Director of Estates, or his representative, would be an ex-officiomember of the two Boards and would assist them in making managerial appoint-ments and, additionally, ensure close cooperation between the PNPs and theDirectorate of Estates. Initial appointments to the three key managerialpositions of PNP VI would be almost certainly the three present Directorsbut changes are considered desirable for PNP IV. Assurances were obtainedfrom the Government during negotiations that such managerial appointmentswould be made only after prior consultation with IDA, and appointment ofthe six managers would be a condition of effectiveness of the proposedcredit. Management organization below group level would remain unchanged.Managers of individual estates would be responsible to the group managersand the latter would be assisted at Head Office by a Department of Agronomyand Technology (reporting to the Production Manager) and a Department ofFinance, Commerce and General Affairs (reporting to the Commercial Manager).Marketing is organized through a Joint Marketing Office (see para. 6.03).An organization chart for the reorganized PNP IV and PNP VI is shown atAnnex 10.
5.05 Existing Government regulations for the dismissal of employeespreclude the effective operation of incentive payment schemes, which wouldimprove productivity, but might result in some redundancy. Increasedproductivity is essential for the success of the project and assuranceswere obtained from the Government that the Boards and Managements of PNP IVand PNP VI would be fully authorized to hire and dismiss project personnelas required. Assurances were also obtained from the Government that theexisting wage premium system in use by the PNPs would be improved and,wherever possible, future wage and salary increases would be linked toincentive payments systems.
5.06 In order to ensure the strengthening and consolidation of themanagement of PNP IV and PNP VI, assurances were obtained during negotia-tions that no changes would be made in the management responsibilities andstructure of the two PNPs without IDA's approval during the disbursementperiod of the proposed credit or without prior consultation with IDA there-after. IDA financing of the PNPs, and the introduction of foreign advisersand inspectors should lessen interference by the military in the affairsof these estate groups, which has, and still does occur, particularly inthe case of PNP IV. This assumption is based on the experience in caseswhere foreign companies have recovered the management control of theirestates.
5.07 The Government is presently considering a new form of corporateentity, Purusahaan Perseroan Terbatas (PT), for the operation of PNP estategroups and other Government-owned enterprises. Only profitable enterpr1seswould be converted to PT which mandatoriy would operate under the Commer-cial Code. In such cases share capital of the PT would be issued to theGovernment with the Minister of Finance making appointments to a Board ofManagement and a Supervisory Board.
- 20 -
Inspection Service
5.08 As in the case of the First Estates Project, PNP IV and PNP VImanagements would be assisted and strengthened by their each employing anexperienced plantation company or companies to provide an InspectionService for an initial period of at least five years. The service wouldentail at least semi-annual visits of highly experienced estate managers,accountants, agriculturists and engineers to each individual estate andfactory the purpose of which would be to review the operations of thepreceding six months, to compare performance with Board policy directivesand approved budgets, and to prepare proposals for future operations. TheInspection Service would also report on general standards of technical andfinancial management, and comment on draft annual budgets prior to theirapproval by the Board. The service would be directly responsible to thePNP Board and copies of its reports would be sent to the Minister of Agri-culture. During negotiations assurances were obtained from the Governmentthat an experienced plantation company or companies satisfactory to IDAwould be engaged by PNP IV and PNP VI for an initial period of about fiveyears to provide inspection services on terms and conditions satisfactoryto IDA; these appointments would be a condition of effectiveness of theproposed credit. Companies qualified to provide the necessary serviceswould need to have considerable first-hand experience of the developmentand management of rubber and oil palm plantations, including up-to-dateexperience of modern field and factory technology and of marketing. Theterms of reference of the inspection service would also provide for thein-service training of selected Indonesians who would subsequently assumethese duties, as well as for assistance to the PNP in the preparation oftender documents, and the analysis of bids, for goods and services to bepurchased under the project.
Management Advisers
5.09 PNP IV and PNP VI would each appoint a financial adviser for aninitial period of about two years. The adviser would assist and instructhis PNP in utilizing the mass of financial data that is now being producedand collated at all levels, but which is not being used for financial con-trol, and for making management decisions. The financial system now inuse was introduced by the former Dutch owners of the PNP but detailedanalysis of the material was carried out in the Netherlands; thus whilethe material is still being collected PNP financial personnel have inade-quate experience to make use of it. In addition, the adviser would reviewthe PNP financial management structure and assist in the revaluation ofassets necessitated by the severe inflation of past and recent years.
5.10 Each PNP would also engage for about a two year period an estatemanagement specialist to advise the General Manager in all aspects of estatemanagement, and an agricultural specialist to advise the Production Ma)sger,and train estate managers and field assistants in modern rubber and oil palmproduction practices. Close cooperation between advisers and Inspection
- 21 -
Service personnel would be essential, and for this reason assurances wereobtained from Government during negotiations that the companies providingthe Inspection Services would supply advisers under the same contract.
Accounts and Audit
5.11 Audited accounts of PNP IV and PNP VI for the periods ended Decem-ber 31, 1968 and 1969 are summarized in Annex 11. Audits are now carriedout by Government auditors, but these arrangements are not considered satis-factory and thus assurances were obtained from the Government during negotia-tions that independent auditors satisfactory to IDA, as in the case of theFirst Estates Project, would be appointed to audit the accounts of PNP IVand PNP VI, and that audited accounts would be submitted to IDA within fourmonths of the close of the financial year.
Annual Budgets
5.12 Annual budgets prepared by PNP IV and PNP VI would incorporatethe comments of the Inspection Services and would be approved by the res-pective Boards. Approval by IDA of the planting program included in theannual budget, and of any material changes made subsequently is considereddesirable and during negotiations assurances to this effect were obtainedfrom the Government. Assurances were also obtained that annual budgetsand any material changes made subsequently, would be submitted to IDA forcomment not later than 30 days prior to their adoption.
VI. PRODUCTION MARKETING AND FINANCIAL RESULTS
A. Yields and Production
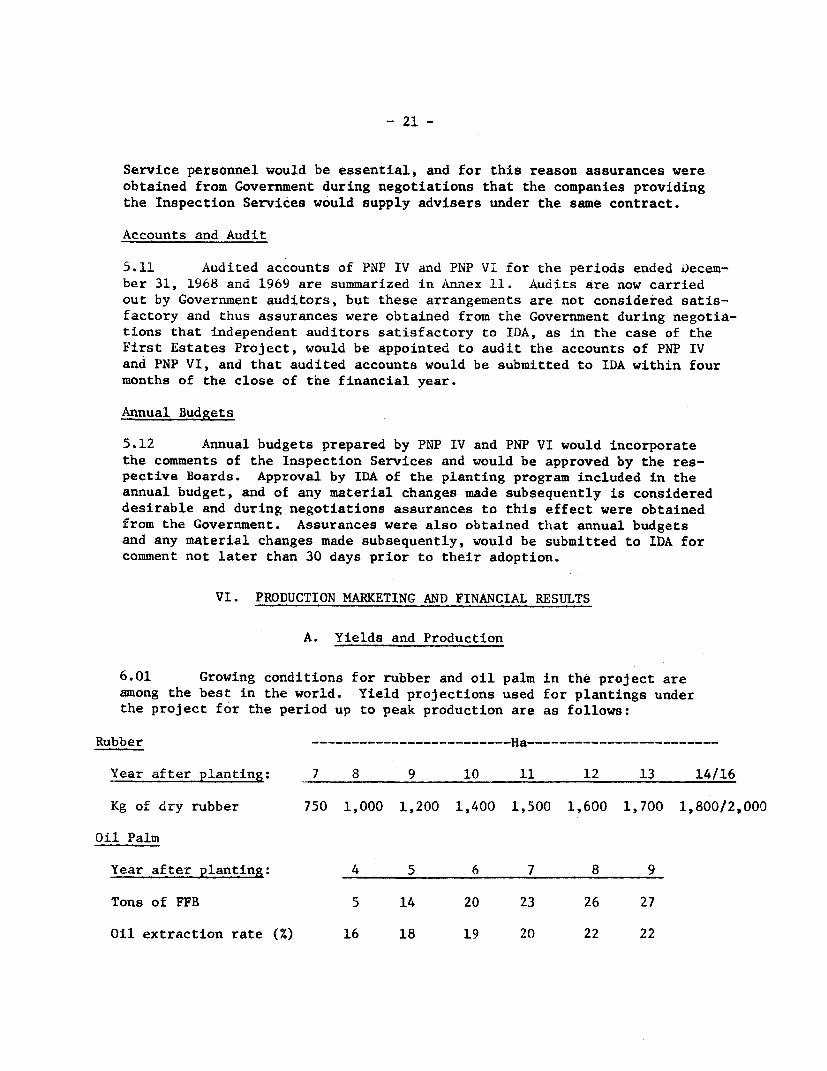
6.01 Growing conditions for rubber and oil palm in the project areamong the best in the world. Yield projections used for plantings underthe project for the period up to peak production are as follows:
Rubber ------------------- Ha------------------------
Year after planting: 7 8 9 10 11 12 13 14/16
Kg of dry rubber 750 1,000 1,200 1,400 1,500 1,600 1,700 1,800/2,000
Oil Palm
Year after planting: 4 5 6 7 8 9
Tons of FFB 5 14 20 23 26 27
Oil extraction rate (x) 16 18 19 20 22 22
- 22 -
Further details are given in Annex 12 together with the expected decline inyields after the years of peak production, and incremental yields from exist-ing mature areas as a result of the fertilizer investment program. Theyields used in project estimates are similar to those obtained in Malaysiaon soils classed as of average suitability for oil palm and rubber, andunder average management efficiency. Climatic conditions of project estatesare similar to Malaysia, soils tend to be superior and under the project,management should be equivalent.
6.02 Total annual production of PNP IV is estimated to rise from approxi-mately 18,000 tons of rubber in 1969 to a peak of abut 47,000 tons in 1985.For PNP VI annual production is estimated to rise from about 56,500 tons ofpalm oil and 13,500 tons of palm kernels in 1969 to a peak of nearly 146,000tons of palm oil and 30,000 tons of palm kernels in 1979. Peak incrementalproduction amounts to some 29,000 tons of rubber, 89,500 tons of palm oiland 16,500 tons of kernels.
B. Marketing and Prices
Joint Marketing Office
6.03 The nine PNP's in Atjeh and North Sumatra (PNP's I through IX)sell all export produce through a Joint Marketing Office (JMO) with head-quarters in Medan. The JMO is headed by a Managing Director appointed bythe Minister of Agriculture and control is vested in a Joint Board ofDirectors in which each of the nine PNP's is represented by its FirstDirector or General Manager. Separate committees comprising the directorsdirectly concerned with the marketing of each crop meet every fortnightand establish the JMO policy for that crop.
6.04 Most of the major rubber buyers are represented directly, or byagents, in Medan, and much of the dry rubber for export is marketed by JMOunder a local auction system. Buyers of concentrated latex are limited andsales are usually made under negotiated forward contracts. Palm oil andpalm kernels are sold by a system of continuous worldwide offers and bidscarried out directly between the JMO and purchasers. PNP produce isexported to East and West Europe, Japan, Pakistan and the USA.
6.05 Except for PNP V and PNP VII, local sales of rubber are madedirectly by the PNP's without proper bidding procedures, which is unsatis-factory. Under the first North Sumatra Estate project (Credit 155-IND) theGovernment agreed that all PNP V and PNP VII rubber for local sale wouldbe handled by the JMO using its standard procedures. Local palm oil salesare satisfactorily handled by JMO, prices being determined on the basis ofaverage prices obtained for recent exports, and at present all palm kernelsare exported. During negotiations assurances were obtained from Governmentthat rubber, palm oil and palm kernels produced by PNP IV and PNP VI wouldbe marketed by the JMO using its standard procedures.
- 23 -
6.06 In 1960 a jointly-owned selling agency company (Indoham) wasformed in Hamburg between the Government and German commodity trading andbusiness interests to handle all PNP produce sold in Germany and much ofthe PNP production sold elsewhere in Europe. The company maintains con-tacts with European buyers, submits buyers' offers to JMO for approval,deals with documentation, payment procedures and claims, and supplies salesrecommendations, marketing advice and information to the JMO. The Boardof Directors consists of one resident Indonesian transferred from JMO, anda representative of the German shareholders. Indoham receives 1% of theFOB sales it handles from which is paid total operating costs, includingthe salaries and expenses of the directors and a small locally recruitedstaff; any profit remaining is paid to the German shareholders. The JMOhas no other overseas agents or representation.
6.07 The JMO needs restructuring to give the PNP's strong and reliablemarketing services. Coordination between the JMO and the individual PNP'sis often weak and greater autonomy and flexibility is required for JMOoperations. The first North Sumatra Estates Project provided technicalassistance for consultants to carry out with JMO's assistance, a marketsurvey for oil palm and rubber products and to recommend the marketingmethods to be adopted; and consultants to advise the Managing Director onJMO's internal organization and procedures. The JMO would also retainmarketing consultants to give marketing advice as and when required. Invi-tations will shortly be circulated to a selected list of consultants. Theconsultants finally appointed and the terms and conditions of appointmentmust be satisfactory to IDA in accordance with assurances received underCredit 155-IND.
Market Prospects - Oil Palm Products
6.08 Current production of palm oil in Indonesia is about 175,000 tonsper annum of which more than 80% is exported, the remainder being used bylocal soap manufacturers. In addition to an increase in soap consumptionit is expected that demand for palm oil as an edible fat, in substitutionfor decreasing coconut oil supplies, will increase considerably as thereare no alternative local sources of edible oil other than palm oil. Assum-ing a continued population growth of 2.4% per annum, that annual per capitaconsumption of edible fats and oils remains at about 4 kg and that coconutoil cannot supply the increased demand, local sales of palm oil for ediblepurposes could increase to some 150,000 tons by 1980 plus approximately50,000 tons for soap manufacture, a total of 200,000 tons. By 1980 projectproduction would be approximately 146,000 tons and total Indonesian produc-tion might be in the region of about 400,000 tons. Under these assumptionsexports would therefore increase from their present level of 150,000 tonsto some 200,000 tons. While this is necessarily a somewhat speculativeprojection, it does indicate that oil palm development under this projectis unlikely to significantly affect world trade patterns in the long term.
- 24 -
6.09 Annex 13 examines market prospects for palm oil and kernels onthe world market. Until recently the growth rate in the supply of palmoil was low compared with other fats and oil amounting to only 1.3% duringthe 14 year period to 1967. New plantings, particularly in Malaysia, areexpected to increase the annual growth rate to more than 5% by 1970 andto raise the share of palm oil production in total fats and oils fromabout 3% in 1965/67 to 5% by 1980. Much of the additional world suppliesof palm oil will be exported and absorbed by the international market. Al-lowing for an expected decline in world market prices for nearly all majorfats and oils, and the need for palm oil to increase its share of totalusage, it is estimated that palm oil prices will fall by the mid-1970'sfrom the average 1969 price of US$181 cif per ton into a price range ofUS$155 - US$165 per ton cif; palm kernels are expected to range betweenUS$135 - US$138 per ton cif compared with an average price for 1969 ofUS$153 per ton cif. For the purpose of making economic and financialprojections in this report cif prices of palm oil are assumed to beUS$160 per ton and for palm kernels US$136 per ton.
Market Prospects - Rubber
6.10 Indonesia exports most of its rubber and will continue to do sofor the foreseeable future. Over the last 20 years annual net exports ofrubber from Indonesia have been fairly constant at nearly 700,000 tons butduring the same period world production has risen by more than 30% andIndonesia's share has fallen from 41% to 29%.
6.11 The market prospects and price trends for rubber are reviewedin Annex 14. During the years to 1975 consumption of both natural andsynthetic rubber in non-Centrally Planned countries is estimated to in-crease at 6.5% per annum compared with a rate of 6% per annum during thepast 20 years. Prices for natural rubber must become more competitive withprices of synthetic rubber if natural rubber is to retain its share of themarket. Polyisoprene, a synthetic rubber which is highly competitive withnatural rubber, costs about 21 US cents per lb to produce. A technicalbreakthrough which would reduce production costs is a possibility whichcannot be ignored, and the projected prices for natural rubber used inthis report allow for some reduction in the production costs of syntheticrubber. Consequently, it is assumed that the price of natural rubber wouldfall from an average price of 26.2 cents per lb in 1969, to an average ofabout 20 US cents per lb for 1970 to about 16 US cents per lb by 1975 andin subsequent years, as shown below:
1970 1971 1972 1973 1974 1975 onwards
US cents per lb cif New York 20 19 19 18 17 16
- 25 -
C. Financial Aspects
PNP IV
6.12 PNP IV would obtain a loan from Government of about US$5.2 million(of which proceeds of the IDA credit on-lent by Government would be US$3.2million) during the period 1970 through 1976; this would be adequate tocomplete the investment program described in paras. 4.01 and 4.02. There-after, self-generated funds would be sufficient to meet all operating costs,planting and other investment requirements and debt service, even if thepresent high rates of export duty and corporation tax continue. From 1980onwards up to US$1.0 million annually would be available for distributionto Government which would be increased to about US$2.0 million annuallyafter completion of debt service in 1985.
PNP VI
6.13 PNP VI would require a Government loan of about US$14.2 million(of which proceeds of the IDA credit on-lent by Government would be US$13.2million) during the project period 1970 through 1974. Self-generated fundsthereafter would be adequate to cover all operating costs, other invest-ment requirements and repayment of the Government loan which would commencein 1975. From 1976 onwards, an average US$2.0 million annually would beavailable for distribution to Government and this would increase to approxi-mately US$4.0 million annually in 1983 when debt service is completed.
6.14 PNP IV and PNP VI projected cash flows, operating statements, andreplanting costs and other capital expenditure after the project is completedare detailed in Annex 15. The Government onlending terms for PNP IV - 16years with a 9-year grace period - are softer than those for PNP VI, 13 years,including a grace period of 5 years. The terms of these sub-loans are largelydetermined by the draw-down periods, and the capacity of each PNP to meetloan interest and repayments. PNP IV requires loan funds from Governmentfrom 1970 through 1976, two years more than PNP VI, due to the replantingbacklog and other project requirements. During the first 10 years of theproject, immature areas of PNP IV would average more than 30% of the totalplanted area, compared with only 10% for PNP VI, which restricts self-generated funds and requires an extension of the Government loan repaymentand grace periods.
6.15 Annual financial rates of return on capital employed cannot becalculated for the PNPs as the real value of assets employed is not knowndue to the heavy inflation experienced in Indonesia in recent years. Arevaluation of assets would be undertaken as part of the project (see para.5.09). Calculation of the incremental financial rate of return to thePNPs from the project would have little value since it is not possible topredict, without wide margins of error, the financial performance of thetwo PNPs without the project. The financial rates of return to the Govern-ment, as the sole owner of the PNPs, from project activities would besimilar to the economic rates of return shown at para. 7.03.
- 26 -
Government
6.16 Annex 16 shows the effect of the PNP IV and PNP VI sub-projectson the Government's budgetary position and assumes that present rates ofexport duty and corporation tax would continue. Import duties and personaltaxation, however, are excluded. Throughout the project life both PNPswould provide a net source of income to the Government since, despite theneed for direct Government loans totalling US$3.0 million during the period1970 through 1976, these would be more than offset by tax revenues. Theestimated additional net income accruing to Government, assuming that thenet income expected in 1970 without the project remains constant, wouldrise from more than US$1.0 million in 1973 to about US$9 million annuallyfrom 1981 onwards. During the life of the project additional net incomeaccruing to Government is estimated at about US$175 million.
VII. BENEFITS AND JUSTIFICATION
7.01 The principal benefits of the project are:
- increased net foreign exchange earnings, rising froma current US$16 million per annum to about US$30 mil-lion by 1981. Insofar as this latter figure may notfully represent exports because of increased localconsumption of palm oil, it would represent foreignexchange savings from import substitution;
- increased budgetary support to the Government, risingfrom a current US$6.0 million per annum to about US$15.0million by 1981;
- improved management arrangements for two Govetnment-owned estate groups;
- maintenance of job opportunities at adequate wage ratesfor some 20,000 workers;
- improved research support both for the estate industryand for small farmers growing export crops; and
- a general improvement in the estate industry which couldhelp to stimulate new investment and reinvestment bythe private sector.
7.02 The project comprises a number of separate programs which aredistinct in terms of costs and benefits. Consequently, individual econemicrates of return have been calculated for each of these rather than anoverall rate of return for the project as a whole, or global rates ofreturn for each of the PNPs. Project benefits accrue both from new invest-ment and past investment which are considered sunk, such as estate infra-
- 27 -
structure and processing facilities. Sunk costs have not been taken intoaccount in calculating rates of return, but the costs of rehabilitating,replacing, and expanding estate infrastructure and processing facilitieshave been apportioned to the individual programs in accordance with theirrequirements.
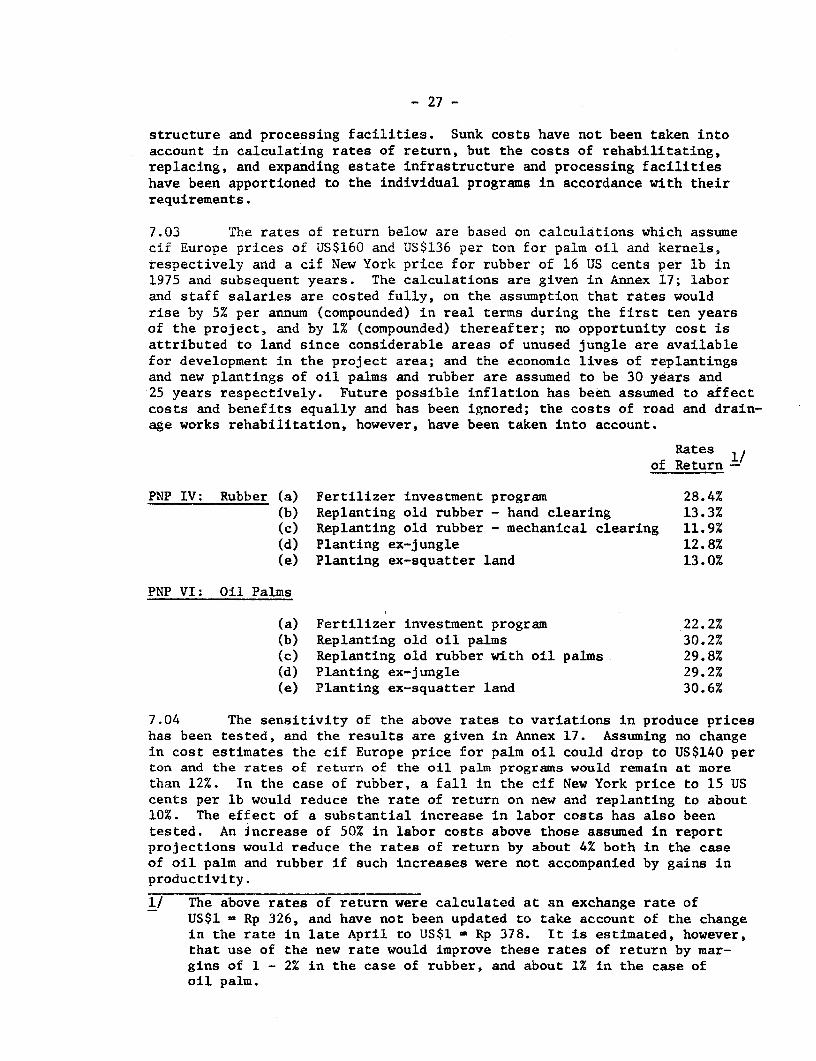
7.03 The rates of return below are based on calculations which assumecif Europe prices of US$160 and US$136 per ton for palm oil and kernels,respectively and a cif New York price for rubber of 16 US cents per lb in1975 and subsequent years. The calculations are given in Annex 17; laborand staff salaries are costed fully, on the assumption that rates wouldrise by 5% per annum (compounded) in real terms during the first ten yearsof the project, and by 1% (compounded) thereafter; no opportunity cost isattributed to land since considerable areas of unused jungle are availablefor development in the project area; and the economic lives of replantingsand new plantings of oil palms and rubber are assumed to be 30 years and25 years respectively. Future possible inflation has been assumed to affectcosts and benefits equally and has been ignored; the costs of road and drain-age works rehabilitation, however, have been taken into account.
Rates 1/of Return -
PNP IV: Rubber (a) Fertilizer investment program 28.4%(b) Replanting old rubber - hand clearing 13.3%(c) Replanting old rubber - mechanical clearing 11.9%(d) Planting ex-jungle 12.8%(e) Planting ex-squatter land 13.0%
PNP VI: Oil Palms
(a) Fertilizer investment program 22.2%(b) Replanting old oil palms 30.2%(c) Replanting old rubber with oil palms 29.8%(d) Planting ex-jungle 29.2%(e) Planting ex-squatter land 30.6%
7.04 The sensitivity of the above rates to variations in produce priceshas been tested, and the results are given in Annex 17. Assuming no changein cost estimates the cif Europe price for palm oil could drop to US$140 perton and the rates of return of the oil palm programs would remain at morethan 12%. In the case of rubber, a fall in the cif New York price to 15 UScents per lb would reduce the rate of return on new and replanting to about10%. The effect of a substantial increase in labor costs has also beentested. An increase of 50% in labor costs above those assumed in reportprojections would reduce the rates of return by about 4% both in the caseof oil palm and rubber if such increases were not accompanied by gains inproductivity.
1/ The above rates of return were calculated at an exchange rate ofUS$1 - Rp 326, and have not been updated to take account of the changein the rate in late April to US$1 - Rp 378. It is estimated, however,that use of the new rate would improve these rates of return by mar-gins of 1 - 2% in the case of rubber, and about 1% in the case ofoil palm.
- 28 -
VIII. RECOMMENDATIONS
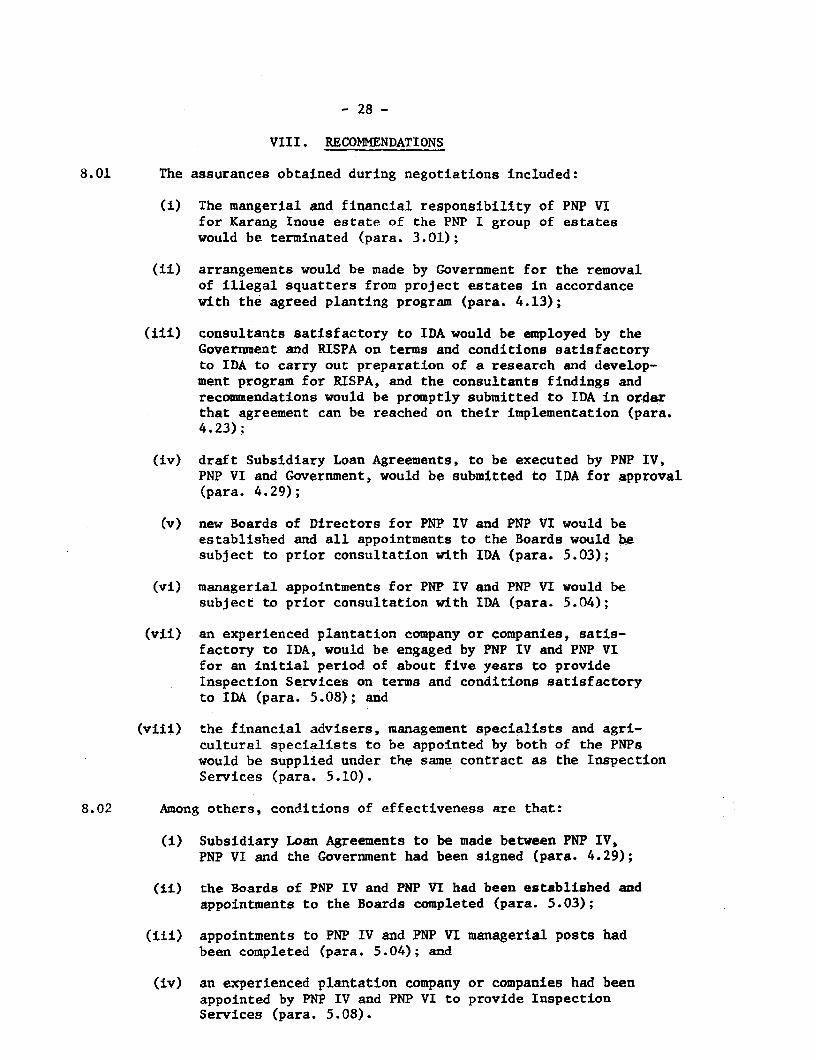
8.01 The assurances obtained during negotiations included:
(i) The mangerial and financial responsibility of PNP VIfor Karang Inoue estate of the PNP I group of estateswould be terminated (para. 3.01);
(ii) arrangements would be made by Government for the removalof illegal squatters from project estates in accordancewith the agreed planting program (para. 4.13);
(iii) consultants satisfactory to IDA would be employed by theGovernment and RISPA on terms and conditions satisfactoryto IDA to carry out preparation of a research and develop-ment program for RISPA, and the consultants findings andrecommendations would be promptly submitted to IDA in orderthat agreement can be reached on their implementation (para.4.23);
(iv) draft Subsidiary Loan Agreements, to be executed by PNP IV,PNP VI and Government, would be submitted to IDA for approval(para. 4.29);
(v) new Boards of Directors for PNP IV and PNP VI would beestablished and all appointments to the Boards would besubject to prior consultation with IDA (para. 5.03);
(vi) managerial appointments for PNP IV and PNP VI would besubject to prior consultation with IDA (para. 5.04);
(vii) an experienced plantation company or companies, satis-factory to IDA, would be engaged by PNP IV and PNP VIfor an initial period of about five years to provideInspection Services on terms and conditions satisfactoryto IDA (para. 5.08); and
(viii) the financial advisers, management specialists and agri-cultural specialists to be appointed by both of the PNPswould be supplied under the same contract as the InspectionServices (para. 5.10).
8.02 Among others, conditions of effectiveness are that:
(i) Subsidiary Loan Agreements to be made between PNP IV,PNP VI and the Government had been signed (para. 4.29);
(ii) the Boards of PNP IV and PNP VI had been established andappointments to the Boards completed (para. 5.03);
(iii) appointments to PNP IV and PNP VI managerial posts hadbeen completed (para. 5.04); and
(iv) an experienced plantation company or companies had beenappointed by PNP IV and PNP VI to provide InspectionServices (para. 5.08).
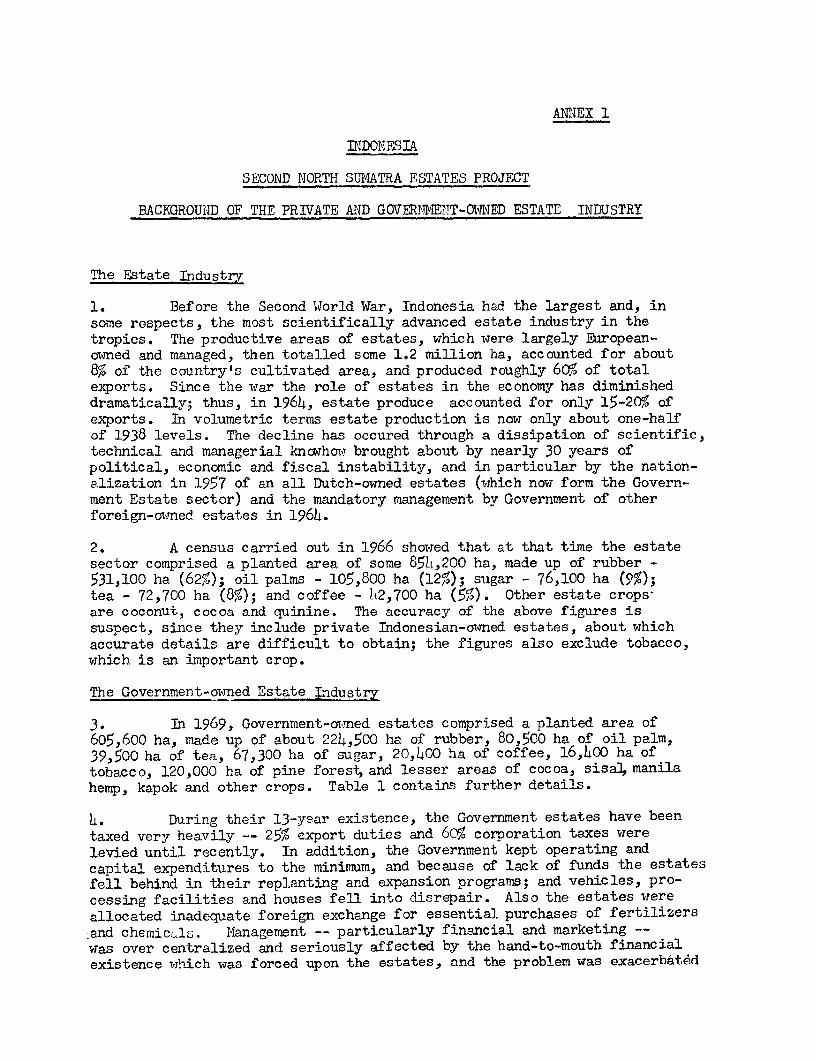
A1IEX 1
INDONRSIA
SECOND NORTH SUMATRA ESTATES PROJECT
BACKGROUIND OF THE PRIVATE AND GOVERNI0T -OIWNED ESTATE INDUWSTRY
The Estate Industry
1. Before the Second World War, Indonesia had the largest and, insome respects, the most scientifically advanced estate industry in thetropics. The productive areas of estates, which were largely European-owned and managed, then totalled some 1.2 million ha, accounted for about8% of the country's cultivated area, and produced roughly 60% of totalexports. Since the war the role of estates in the economy has diminisheddramatically; thus, in 1964, estate produce accounted for only 15-20% ofexports. In volumetric terms estate production is now only about one-halfof 1938 levels. The decline has occured through a dissipation of scientific,technical and managerial knowhow brought about by nearly 30 years ofpolitical, economic and fiscal instability, and in particular by the nation-alization in 1957 of an all Dutch-owned estates (which now form the Govern-ment Estate sector) and the mandatory management by Government of otherforeign-owned estates in 1964.
2. A census carried out in 1966 showed that at that time the estatesector comprised a planted area of some 854,200 ha, made up of rubber -531,100 ha (62%); oil palms - 105,800 ha (12%;); sugar - 76,100 ha (9%);tea - 72,700 ha (8%); and coffee - lt2,700 ha (51). Other estate crops-are coconut, cocoa and quinine. The accuracy of the above figures issuspect, since they include private Indonesian-omwned estates, about whichaccurate details are difficult to obtain; the figures also exclude tobacco,which is an important crop.
The Government-owmed Estate Industry
3. In 1969, Government-owned estates comprised a planted area of605,600 ha, made up of about 224,500 ha of rubber, 80,500 ha of oil palm,39,500 ha of tea, 67,300 ha of sugar, 20,400 ha of colfee, 16,hO0 ha oftobacco, 120,000 ha of pine forest, and lesser areas of cocoa, sisal, manilahemp, kapok and other crops. Table 1 contains further details.
4. During their 13-year existence, the Government estates have beentaxed very heavily -- 25% export duties and 6C% corporation taxes werelevied until recently. In addition, the Government kept operating andcapital expenditures to the minimum, and because of lack of funds the estatesfell behind in their replanting and expansion programs; and vehicles, pro-cessing facilities and houses fell into disrepair. Also the estates wereallocated inadequate foreign exchange for essential purchases of fertilizers-and chemicls. Management -- particularly financial and marketing --was over centralized and seriously affected by the hand-to-mouth financialexistence which was forced upon the estates, and the problem was exacerbatdd
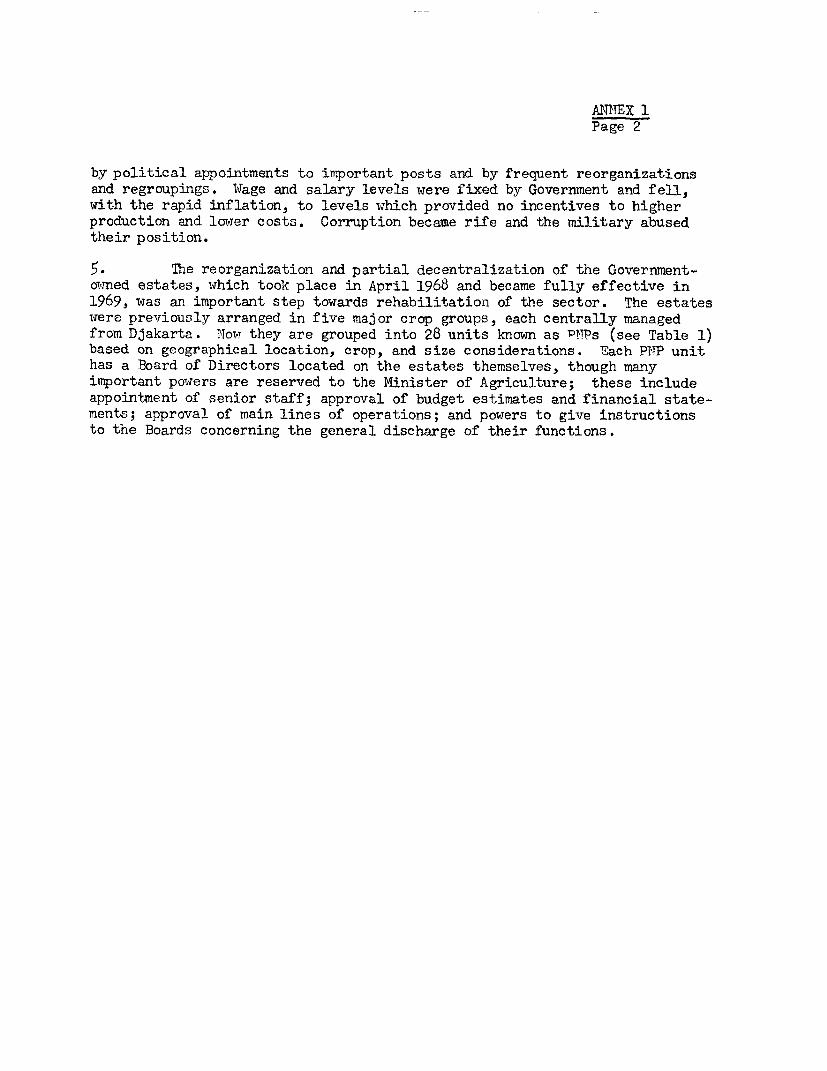
AN4NTEX 1Page 2
by political appointments to important posts and by frequent reorganizationsand regroupings. lWage and salary levels were fixed by Government and fell,with the rapid inflation, to levels which provided no incentives to higherproduction and lower costs. Corruption became rife and the military abusedtheir position.
5. The reorganization and partial decentralization of the Government-owned estates, which took place in April 1968 and became fully effective in1969, was an important step towards rehabilitation of the sector. The estateswere previously arranged in five major crop groups, each centrally managedfrom Djakarta. Now they are grouped into 28 units known as PFPs (see Table 1)based on geographical location, crop, and size considerations. Sach PlNTP unithas a Board of Directors located on the estates themselves, though manyimportant powers are reserved to the Minister of Agriculture; these includeappointment of senior staff; approval of budget estimates and financial state-ments; approval of main lines of operations; and powers to give instructionsto the Boards concerning the general discharge of their functions.
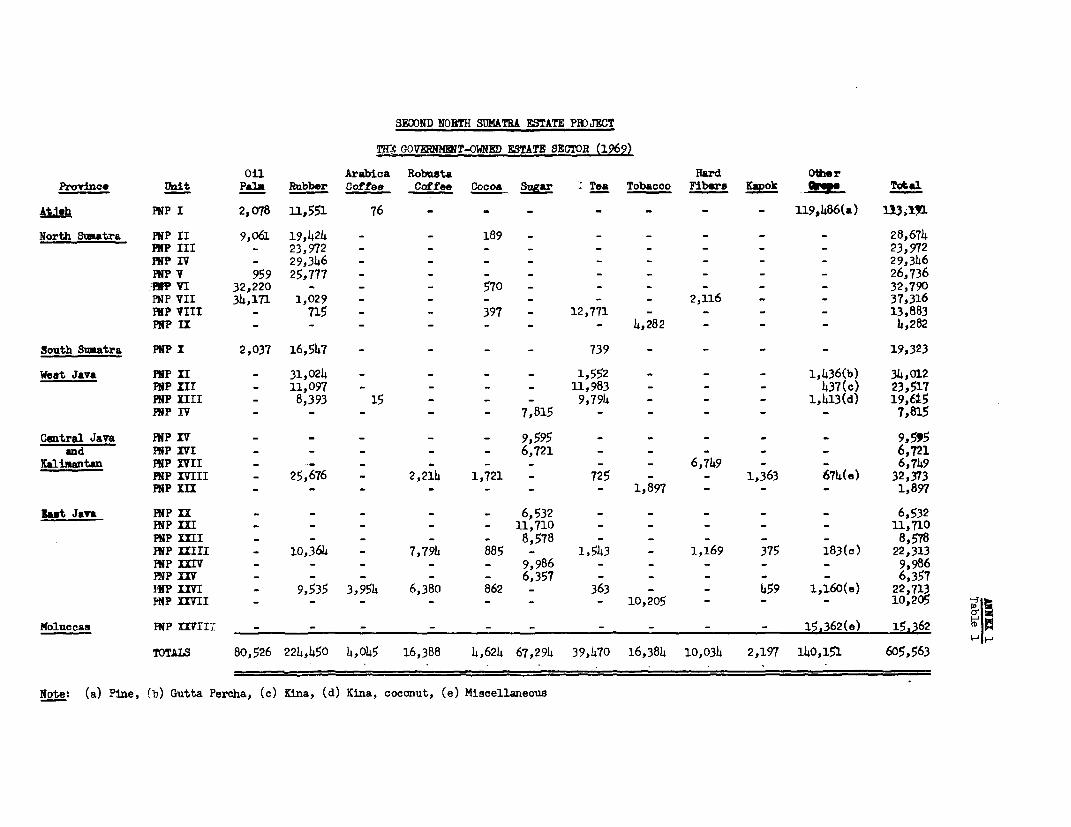
SECOND NORTH SUMATRA ESTATE PR)JECT
MX GOVERNKW T-OWNED ESTATE SECTOR (1969)
Oil Arabica Robtsta Hard Othe rProvince Unit Pala Rubber Coffee Coffee Cocoa Sugar Tea Tobacco Fibers Kaok Total
PNP I 2,078 11,551 76 - _ - _ _ _ _ 119,486(a) f13,13n
North Sumatra FNP II 9,0o6 19,424 - - 189 - - 28,674PNP III - 23,972 - - - - - 23,972PNP IV - 29,346 _- - - 29,346PNP V 959 25,777 - - _ _ _ _ _ _ - 26,736-FM VI 32,220 - - - 570 - 32,790PNP VII 34,171 1,029 - - - - - - 2,116 - - 37,316PNP VIII - 715 - - 397 - 12,771 - - - - 13,883PNP IT - - - - - - - 4,282 - - - 4,282
South Sumatra lNP x 2,037 16,547 - - _ _ 739 _- - 19,323
West Java NP xI - 31,024 - - 1,552 - _ _ 1,436(b) 34,012PNP III - 11,097 - - _ _ 11,983 - 437(c) 23,517PNP YIII - 8,393 15 - - - 9,794 - - - 1,413(d) 19,615PNP IV - - - - 7,815 - - - - - 7,815
Central Java PNP XV - - - - - 9,595 - - - - 9,595and PNP ZVI - 6,721 - _ _ _ - 6,721
Kalimantan PNP XVII - -- - - - - 6,749 - - 6,749PNP XVIII - 25,676 _ 2,214 1,721 - 725 - _ 1,363 674(e) 32,373PNP In - - - - - - 1,897 - - - 1,897
Ist Java NP X1 - - - - 6,532 - _ - - 6,532PNP I I - - - - 11,710 - - - - 11,710PNP M1I - - - - 8,578 - - - - 8,578RNP 1III1 - 10,364 - 7,794 885 - 1,543 - 1,169 375 183(c) 22,313PNP mv - - - - - 9,986 - - - - - 9,986FNP XV _ - _ - - 6,357 - - - 6,357imP 1XVI - 9,535 3,954 6,380 862 - 363 - - 459 1,160(e) 22,713IPNP YII - - - - - - - 10,205 - - _ 10,205
Molucesa NP Hiu1s - - - - - - - -- - 15,362(e) 15,362
TOTALS 80,526 224,450 4,045 16,388 4,624 67,294 39,470 16,384 10,034 2,197 140,151 605,563
Note: (a) Pine, (b) Gutta Percha, (c) Kina, (d) Kina, coconut, (e) Miscellaneows
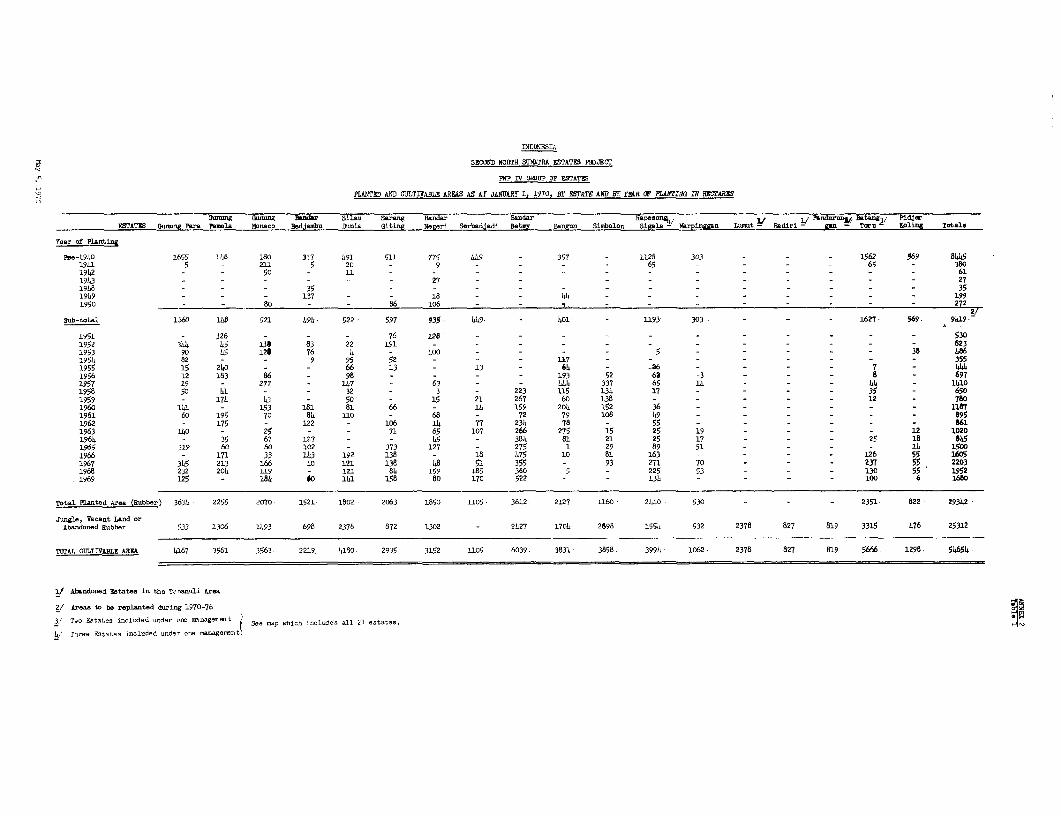
INDONESIA
SECOND NORTH SUMATRA ESTATES PRJECT
PK? IV OCUP OF ESTATES
PLANTED AND CULT1TABLE AREAS AS AT JA nART 1, 1970, BT ESTATE AN13 Br f R OF PLANDTZiG IN R6CTAR1S
Gaig Gunung Bandar Silau SaranBg Bandar Bandar Rapesong uy B% 1 Pandoronj, BtanEy1 Pidjwr
ESTATES Gunung Para Pamela Monaco Bedjambni Dunia Giting Negeri Serbadladi Betey Bangun Sinbolon Sigala = Marpinggan bunt - Badiri- 1/ n = Toru Kolirg Totale
Year of Planting
PMe -1940 1655 148 180 317 491 511 775 449 - 357 - 1128 303 - _ _ 1562 569 844519M1 5 - 211 5 20 - 9 - - - - 65 - _ _ _ 65 - 3801942 - - 50 - 11 - - - - - - - - - - - - 61
1943 - - _ _ - - 27 _ _ _ _ _ - 271948 35 - - 351949 - - 137 - 18 - - 44 - - - - - - - - 1991950 s8 -_ 86 1o6 - - -. - - - - - - - - 272
2/Sub-total 1.560 11.8 521 494 522 597 935- 449 - 401 - 1193 303 - - - 1627- 569. 9419.-
1951 - 326 - - - 76 128 - - - - - - - - - - - 530
1952 344 45 138 83 22 191 - - 8231953 90 45 126 76 4 - 100 - - - - 5 - - - - 38 486
1954 82 - - 9 95 52 - - - 117 - - - - - - - - 355
1955 15 21
40 - - 66 13 - 13 - 64 - _26 - - - - 7 - 444
1956 12 183 86 - 98 - _ 193 52 6 3 _ _ _ 8 - 6971957 19 - 277 - 147 - 63 - - 1.. 337 65 14 - - - 44 - 1110
1958 50 41 - - 32 - 3 - 223 115 134 17 - - - - 35 - 650
1959 - 174 43 - 50 - 15 21 267 60 138 - - - - - 12 - 780
1960 141 - 153 181 81 66 - 11 159 204 152 36 - _ _ _- - 11871961 60 195 70 84 110 - 68 - 72 79 108 49 _- - 895
1962 - 175 - 122 _ 106 14 77 234 78 - 55 _- - 8611963 1140 - 25 - - 71 65 107 266 275 15 25 19 - - _ - 12 1020
1964 - 35 67 127 - - 45 - 384 81 21 25 17 _ _ _ 25 18 8451965 319 60 60 102 - 373 127 - 275 1 29 89 51 _ _ - - 14 1500
1966 - 171 33 143 192 138 - 18 475 10 81 163 - - - - 126 55 1605
1967 3145 213 166 40 121 138 48 51 355 - 93 271 70 - 237 55 22031968 232 204 119 - 121 84 159 185 380 5 - 225 53 - - - 130 55 19521969 125 - 184 60 111 158 80 170 522 - - 134 - _ _ _ 100 6 1680
Total Planted Area (Rubber) 3634 2255. 2070 1521- 1802 2063 1850 1105- 3612 2127 1160 2440 530 - - - 2351- 822- 29342
Jungle, Vacant Land orAbandoned Rubber 533 1306 1493 698 2378 872 1302 - 2127 1704 2698 1554 532 2378 827 819 3315 476 25312
TOTAL CULTIVAELE AREA 4167 3561 3563 2219 1910 2935 3152 1105 6039. 3831 3858. 3994 1062 2378 827 819 5666. 1298 546541
1/ Abandoned Estates in the T -nanuli Area
2/ Arewe to be replanted during 1970-76
3 T/ T tat..es included under on- man.-t 3 S p hi.h includes all 21 estatoo.
4/ Three Estates included under one m .anagoennt
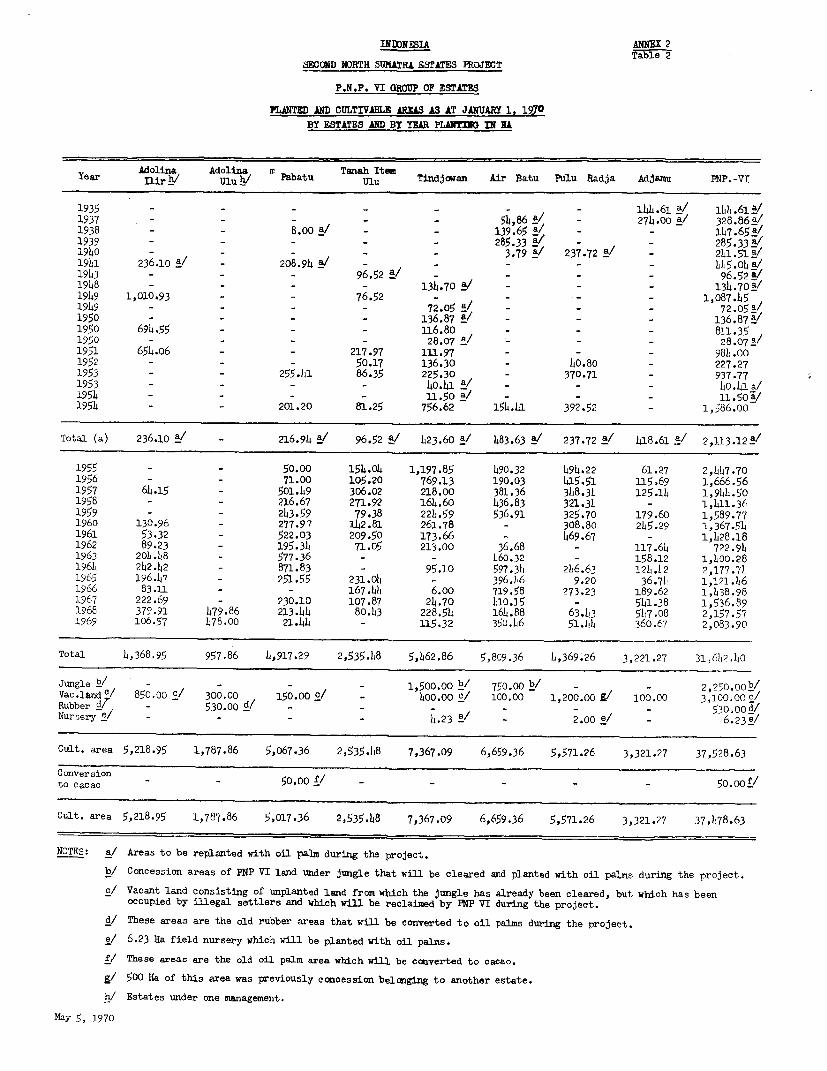
INDDN 3IA ANNEX 2Table 2
SECOND NORTH SUMATRL ESTATES PROJZCT
P.N.P. VI GROUP OF ESTATES
PLANTED AND CULTIVABLE RAS AS AT JANUARY 1, 1970BY ESTATES AND BY YEAR PLANTfN IN UL
Adolina Adolina m Tanah ItemYear nir h Ulu / PabatUl Tindjowan Air Bat Pulu Radja AdJau PNP. -VI
1935 - _ _ _ 1144.61 a/ 144.61 a/1937 - _ 54, 86 _/ 274.00 a/ 328.86 a/1938 - - 8.00 a/ _ _ 139.65 / - _ 12.65 a/1939 - _ - _ _ 285.33 a/ _ 285.33 _/1940 - - - _ _ 3.79 a/ 237.72 _ _ 2L41.51a1941 236.10 a/ 208.94 a/ - - 445.04 a/1943 - 96.52 a/ - - 96.52 /1948 - - - - 134.70 _/ - _ _ 134.70a/1949 1,010.93 _ _ 76.52 - - - - 1,087.451949 _- - 72.05 / - - - 72.05 a/1950 - - - - 136.87 a/ - - - 136.87_1950 694.55 - 116.80 - _ _ 811.351950 - _ _ - 28.07 a/ _ 28.07 a/1951 654.06 - - 217.97 111.97 - - - 984.001952 - _ _ 50.17 136.30 - 40.80 - 227.271953 - - 255.141 86.35 225.30 - 370.71 - 937.771953 - _ - -_40.41 a/ _ _- - 4.41 a/1954 - - - - 11.50 a - 11.50 a!1954 - - 201.20 81.25 756.62 154.441 392.52 - 1,586.00
Total (a) 236.10 a/ - 216.94 a/ 96.52 a/ 423.60 1/ 483.63 a/ 237-72 a/ 418.61 _ 2,113.12 a/
1955 - - 50.00 154.04 1,197.85 490.32 494.22 61.27 2,447.701956 - - 71.00 105.20 769.13 190.03 415.51 115.69 1,666.561957 64.15 - 501.49 306.02 218.00 381.36 348-34 125.14 1,944.501958 - - 216.67 271.92 164.60 436.83 321.34 - 1,411.361959 - - 243.59 79.38 224.59 536.91 325.70 179.60 1,589.771960 130.96 - 277.97 142.81 261.78 - 308.80 215.29 1,367.511961 53.32 - 522.03 209.50 173.66 - 469.67 - 1,428.281962 89.23 - 195.34 71.05 213.00 36.68 - 117.64 722.941963 204.148 - 577.36 - - 460.32 - 158.12 1,400.281964 242.42 - 871.83 - 95.10 597.34 246.63 12ZI.1!2 2,177.741965 196.47 - 251.55 231.04 _ 396.46 9.20 36.714 1,121.461966 83.11 - - 167.44 6.oo 719.58 273.23 189.62 1,438.981967 222.69 - 230.10 107.87 24.70 410.15 - 541.38 1,536.891968 379.91 479.86 213.44 80.43 228.54 164.88 63.43 51!7.08 2,157.571969 106.57 478.00 21.44 - I15.32 350.46 51.44 360.67 2,083.90
Total 4,368.95 957.86 4,917.29 2,535.48 5,462.86 5,809.36 4,369.26 3,221.27 31,612.40
Jungle b - -- 1,500.00 b/ 750.00 b/ - - 2,250.00b/Vac.land/ c 850.00 c/ 300.00 150.00W 1/ 400.00 c/ 100.00 1,200.00 K/ 100.00 3,100.00 c/Rubber d/ - 530.00 _ _ _ _ _ _ 530.dOd/Nursery e/ _ - - - 14.23 ! - 2.00 e/ - 6.23e/
Cult. area 5,218.95 1,787.86 5,o67.36 2,535.48 7,367.09 6,659.36 5,571.26 3,321.27 37,528-63
Conversion - - 50.oof - - - - - 5_. o0to cacao
Cult. area 5,218.95 1,787.86 5,017.36 2,535.48 7,367.09 6,659.36 5,571.26 3,321.27 37,478.63
NOTES: a/ Areas to be replanted with oil palm during the project.
b/ Concession areas of PNP VI land under jungle that will be cleared and planted with oil palms during the project.
c/ Vacant land consisting of unplanted land from which the jungle has already been cleared, but which has beenoccupied by illegal settlers and which will be reclaimed by PNP VI during the project.
d/ These areas are the old rubber areas that will be converted to oil palms during the project.
e/ 6.23 Ha field nursery which will be planted with oil palms.
f/ These areas are the old oil palm area which will be converted to cacao.
r/ 500 Ha of this area was previously concession belonging to another estate.
h/ Estates under one management.
May 5, 1970
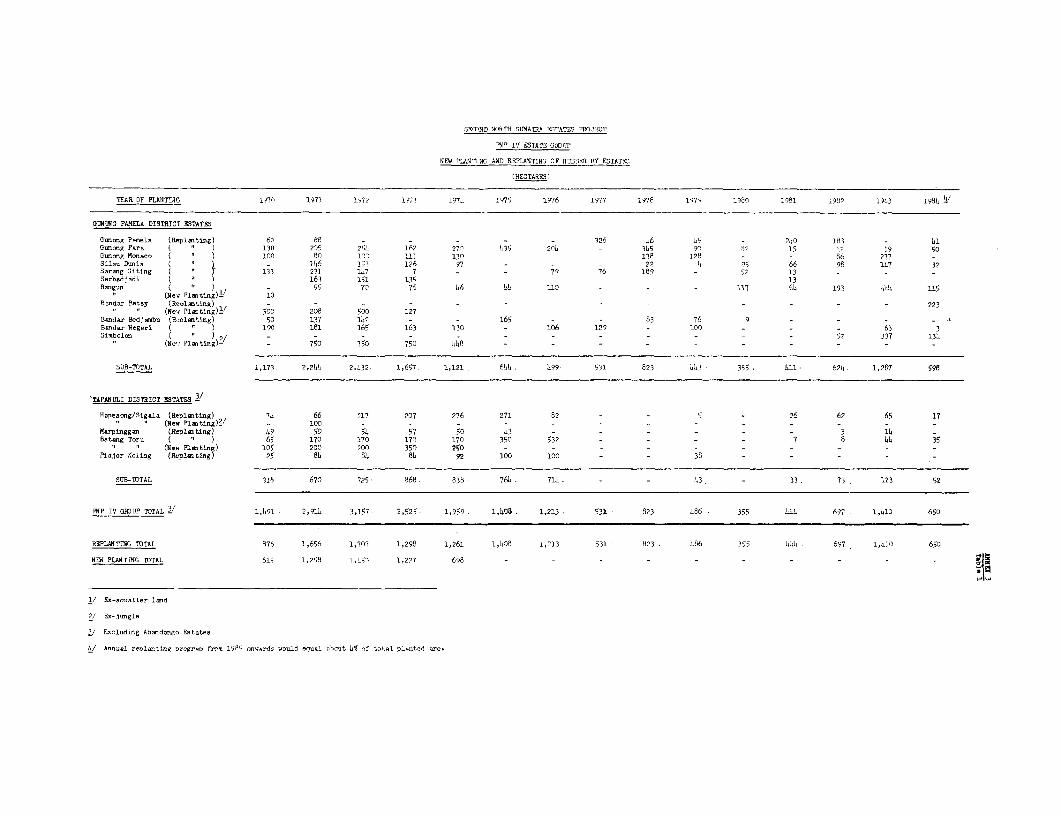
SECOND NORTH SUMATRA ESTATES PROJECT
PM' 1 ESTATE G, HOUP
NEW PLANTIW- AND REPLANTING OF RUBBER BY ESTATES
(HEC TARE3)
YEAR OF PLANTIAG 1970 1971 1970 1973 1971 1975 1976 1977 1978 1970 1980 1980 1982 1983 198
GUNUNG PAMELA DISTRICT ESTATES
G-on-g Pamela (Replanting) 60 68 - - - - - 326 06 45 - 940 183 - 41Gunong Pgra ( " 130 205 254 162 27S 435 204 - 345 90 d2 15 12 19 50Grmong Monaco ( ) 100 80 10? 111 130 138 128 - - 86 277 -SilO nia (D"i - 116 153 126 97 - - - 22 h 95 66 96 147 32Sarng Giting ( 133 231 147 7 - - 79 76 089 - - - -Serbdj.adi ( ' ) 163 050 135 13Bangue ( e 55 73 76 46 h4 110 - - - 117 64 193 444 115
"1 (New POating)1' 10Bandar Betsy (ReplRating) - - - - - - - - - - - - - - 223
"1 "1 (Meo Plaatig)'1 500 208 500 127Bandar Bedjambu (R-olating) 50 137 142 - - 165 - - 83 76 9 - -Bandar Negai ( 1) 90 181 165 163 130 - 106 129 - 100 _ - - 63 3Simbolon ( - - - - - - - - 52 337 134
(NRe Plesting)- - 750 750 750 08 - - - - - - - -
SUB-TOTAL 1,173 2,24h 2,032. 1,657. 1,121 644 499- 531 823 443 355. 810 624 1,287. 598
>TAPANRnI DISTRICT ESTATES
Hape-ong/Sigala (Replenting) 74 66 217 207 276 271 82 - - 5 - 26 60 65 1711 "~ (Ne.P. eatig)Z/ - 100 - - - - - - - - -
1arpinggan (Replaating) 49 50 54 57 50 43 - - - _ 3 14 -Batang Toru ( " ) 65 170 170 170 170 350 537 _ _ - _ 7 8 44 35
" (Na Planting) 105 200 200 350 250 - - - - -Pidjor- ifuli.g (NepoAm ting) 25 84 84 84 92 100 100 _ _ 38 _- - - -
SUB-TOTAL 318 670 725 868. 838 764. 7141 - - 43 - 33. 73 123 52
PNP IV SHDUP TOTAL 1,890 . 2,910 3,157 2,525. 1,959 . 1,408 . 1,213 . 531 823 486 . 355 444 697 . 1,b1O 650
REPLANTING TOTAL 876 1,656 1,707 1,298 1,261 1,408 1,213 531 823. o86 355 444 697 1,410 650
NEW PLANTING TOTAL 61S 1,208 0,4$7 1,2?7 698 - - - - - - - -
1/ Ex-sosatter land
7/ ER-jangle
3/ Excluding Abandongo Estates
8/ Annual re.. a- log t oigr-g s- frm 1985 o-wapds would equal 40o1t 45
of tot1 planted ares
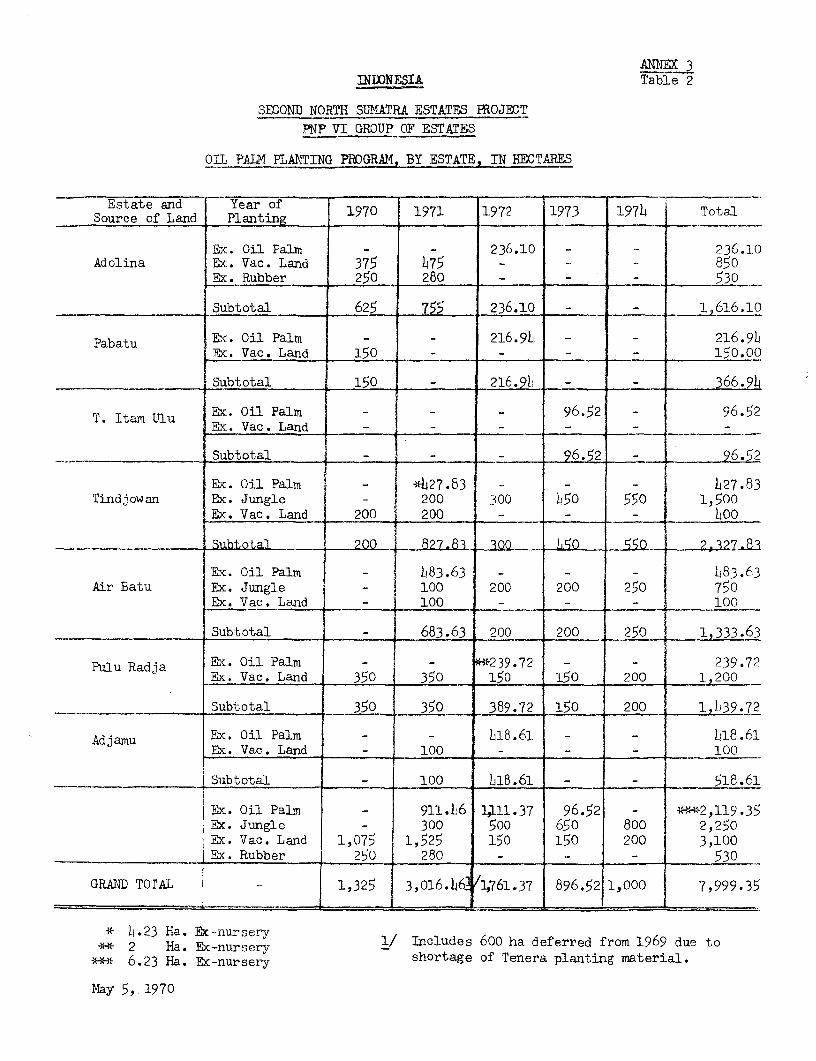
ANNE 3INDNESIA Table 2
SECOND NORTH SU1'ATRA ESTATES PROJECTPNP VI GROUP OF ESTATES
OIL PALM PLANTING PROGRAM, BY ESTATE. IN HECTARES
Estate and pleartiof 1970 1971 1972 1973 197T Total
Ex. Oil Palxa - - 236.10 - 236.10Adolina Ex. Vac. Land 375 475 _ _ 850
Ex. Rubber 250 280 _ - 530
Subtotal 625 755 236.10 - _ 1,616.10
Pabatu Ex. Oil Palm - - 216.94 - _ 216.9bEx. Vac. Land 150 _ - - _ 150.00
Subtotal 150 _ 2l6.91l - _ 366.9L
T. Itam Ulu Ex. Oil Palm - _ 96.52 96.52Ex. Vac. Land - -,
Subtotal - - _ _ 96.52 96.52
Ex. Oil Palm - *427.83 - - k27.83Tindj owan Ex. Jungle - 200 300 k50 550 1,500
Ex. Vac. Land 200 200 _ - - WOo
Su1btotal 200 827.cI _ 1 0 5. 2,327.83
Ex. Oil Palm _ k83.63 - - - k83.63Air Batu Ex. Jungle _ 100 200 200 250 750
Ex. Vac. Land - 100 - - - 100
Subtotal _ 683.63 200 200 250 1,333.63
Pulu Radja Ex. Oil Palm - - *239.72 - - 239.72Ex. Vac. Land 350 350 150 150 200 1,200
Subtotal 350 350 389.72 150 200 1,139.72
Adjamu Ex. Oil Palm - - 418.61 - - L,18.61Ex. Vac. Land 100 -- _ 100
Subtotal - 100 b18.61 - _ 518.61
Ex. Oil Palm - 911.L6 1111.37 96.52 - **-2,119.35Ex. Jungle - 300 500 650 800 2,250Ex. Vac. Land 1,075 1,525 150 150 200 3,100Ex. Rubber 250 280 - - - 530
GRAND TOTAL _ 1,325 3,016.A6 1,761.37 896.52 1,000 7,999.35
* 23 Ha. Ex-nursery 1/ Includes 600 ha deferred from 1969 due to*-2 Ha. Exc-nursery
**-* 6.23 Ha. Ex-nursery shortage of Tenera planting material.
May 5, 1970
ANNEX 4
INDONESIA
Second North Sumatra Estates Prolect
Plant Breeding and Planting Material
A. Plant Breeding
1. In the first North Sumatra Estates project, credit 155-IND, theGovernment agreed to implement plant breeding programs for all Governmentowned estates in North Sumatra and to appoint oil palm and rubber plantbreeding consultants acceptable to IDA to monitor such programs. As statedin the main report the choice of material for project oil palm and rubberplanting programs from 1971 through 1974 would be subject to approval bythe appointed plant breeding consultants. From 1975 onwards plantingmaterial would be chosen by the Boards of PNP IV and PNP VI on the recom-mendation of the plant breeders at the research centers and the InspectionService.
B. Planting Material: Oil Palms
2. The oil palm fruit comprises a kernel inside a hard shell,surrounded by a mass of oily flesh; individual fruits develop in bunchesof approximately 1,200 attached to a fibrous core. A healthy palm producesabout 10 bunches a year and on a mature palm the average bunch weight isabout 18 kilograms; the fruits represent approximately 78% of total bunchweight. Palm oil is extracted from the flesh and palm kernel oil from thekernel in separate processes. Plant breeders have aimed at reducing theproportion of shell in each fruit, which is the only non-oil bearing part,and have achieved this by crossing thick shelled (Dura) fruit, with fruitwith no shell (Pisifera 1/) to produce a thin shelled fruit (Tenera). Highyielding hybrid material with these characteristics is now generally avail-able throughout the world, including Indonesia, and technically is knownas D x P. PNP VI has not had adequate supplies of D x P planting materialand in recent years has used D x T (Dura x Tenera) seed which has a higherproportion of thick shelled fruit resulting in a lower proportion of oil,than D x P.
3. The plant breeding program to be implemented under credit 155-IND(see paragraph 1) will not produce sufficient high grade D x P material forproject plantings until 1972 and consequently:
1/ In theory Pisifera, with no shell, would be ideal planting material,but in practice, small fruit size, a high sterility rate and a verysmall proportion of kernel preclude its use.
ANNEX 4Page 2
- the 1970 planting program on PNP VI will be limited toavailable supplies of D x P material; and
- the 1971 program will be planted with local D x Pmaterial and material to be purchased from Malaysia.
Local supplies of high grade planting material would be sufficient to meetPNP VI requirements thereafter.
C. Planting Material: Rubber
4. The most common rubber varieties (clones) planted by PNP IV inrecent years are PR 107 and GT1, both classed as Grade One by the Rubber Re-search Institute of Malaya (RRIM), the acknowledged authority which classesonly four clones as Grade One. PR 107 and GT1 would continue to be theclones most commonly used for project plantings but the other Grade OneClones, RRIM 600 and PB 5/51 would also be used. A well known Sumatranclone, Avros 2037, about which little is known outside Indonesia but whichhas done well in Sumatra, is also included in the list of clones approvedfor large scale plantings.
5. There are a number of other potentially good clones availablein Sumatra but information is limited to yield data of doubtful value; andbefore a clone can be safely used for large scale plantings, attention mustalso be paid to soil conditions and wind damage and leaf disease characteris-tics. Use of the newer clones of high but improved potential would there-fore be limited to plots of 20 ha, and the advice of the plant breeders andInspection Service would be sought before any decision was taken to proceedto full scale planting.
ANNEX 5
INDONESIA
Second North Sumatra Estates ProjectFoliar Analysis and the Fertilizer Investment Program
for Mature Oil Palms and Rubber
1. Until a few years ago fertilizer policies for oil palm and rubberwere usually based on the following:
a) leaf sympetom which indicate the deficiency ofsome nutrients;
b) known nutrient status of different soil types;
c) fertilizer experiments; and
d) management experience.
2* Foliar analysis, in which the nutrient content of the leaf isdetermined in the laboratory and compared with established optimum levels,has become common practice in both rubber and oil palms in recent years asa means of determining deficiencies of major elements. Foliar analysisdoes not, however, provide an immediate and simple determination of thequantities of fertilizer required. At present, quantitative requirementsof fertilizer can only be determined from fertilizer trials, but foliaranalysis does provide a reasonable guide to the main chemical deficiencies.As more experience is gained, particularly by comparing fertilizer trialresults with determinations of leaf nutrient status made by foliar analysisof trees in the trials, foliar analysis can become a most useful aid indetermining fertilizer requirements.
3. Foliar analysis was used by PNP VI for the first time in 1969,and PNP lV will make similar arrangements in the latter half of 1970.Consequently fertilizer applications based on foliar analysis will startin 1970 for PNP VI and in 1971 for PNP IV. Significant responses frominitial applicatioas of fertilizers are not expected from either oil palmor rubber until 1973 1/ The effect on oil palm yields will be greaterwhere the palms are young; in the case of older palms, whose yield capa-cities are past their peak, the response would be lower. With maturerubber factors such as tapping policy and the maintenance of bark reservesare likely to have a gr :tey E&`ect ot yields than fertilizers, but it isestimated that the effect of a correct fertilizer policy would play asignificant and economic part in the recovery of rubber yields.
1/ Responses to the improved fertilizer program are expected after threeyears in the case of oil palms and two years in the case of rubber.
ANNEX 5Page 2
4. PNP IV and VI fertilizer policy in recent years has been un-systematic and inadequate. Visual symptoms of deficiencies in oil palmsare widespread and yields are depressed. Rubber appears to be less badlyaffected by the lack of nutrients, but the fertilizers that have beenapplied in the past might be depressing yields since the applications weremade on an ad hoc basis and probably were not balanced. Unless a scienti-fic program of nutrient requirement appraisal is instituted, and correctiveapplications made this situation cannot be improved.
5. In view of the delay in yield response to balanced fertilizerapplications which would start in 1970, and in view of the considerationsin the immediately preceding paragraph the application of fertilizer tomature rubber areas in 1971 and 1972 and to mature oil palm areas in 1970,1971 and 1972 would be considered as an investment item under the project.
6. It is not possible to determine in advance of a detailed ap-praisal of nutrient requirements the precise quantities or types offertilizer required for the investment program or thereafter. The follow-ing assumptions based on actual results of foliar analysis for oil palmand recent research and experience in Malaysia for rubber are made for thepurpose of projections in this report:
a) Rubber - An annual application costing about US$12 per hafor PNP IV mature rubber, except for the last five yearsof productive life (i.e. years 21 through 25) whenfertilizer would no longer be required or applied.Applications under the two year fertilizer investmentprogram would be of the same order of magnitude.
b) Oil Palm - An annual application of about US$35 per hashould be sufficient for PNP VI mature oil palms undernormal conditions, except for the last five years oftheir productive life (i.e. years 26 through 30) whenfertilizer is no longer required. For areas in theirprime, however, where natural nutrient reserves arebadly exhausted, applications under the three yearfertilizer investment program would have to be sub-stantially higher, at about US$100 per ha in 1970,US$87 per ha in 1971 and US$70 per ha in 1972.
The quoted costs contain the foreign exchange element only; in the projec-tions a further 20% has been added for local handling and transport costs.
ANNEX 6
INDONESIA
Secoud North Sumatra Estates Project
PNP IV Rubber Processing Facilities
PrinciAl_L pes of Rubber
1. With the exception of Bandar Betsy Estate all PNP IV crops arepresently being processed into ribbed smoked sheet and crepe rubber ineither PNP IV's own factories or those of remillers. Liquid latex fromBandar Betsy estate, which has no processing facilities, is being processedinto concentrated liquid latex by a nearby Goodyear factory; the lower gradesfrom Bandar Betsy are processed into crepe rubber by one of the other PNPIV factories. Further details of the main types of rubber are set out be-low:
(a) Concentrated Latex - The latex is preserved in liquid formby the addition of ammonia, which prevents coagulation, andis centrifuged until the dry rubber content (DRC) is in-creased from about 30% to 60%. The quality of concentratedlatex can be fully controlled to conform to technical spe-cifiestions.
(b) Ribbed Smoked Sheet (RSS) - The latex is coagulated by theaddition of acid. The coagulum is passed through rollersto remove water and the resulting sheets are smoked dried.Quality standards can be technically specified and controlled,but the normal, though less satisfactory, practise is to gradeRSS by visual appearance.
(c) Crepe - Either coagulated latex or scrap can be made into creperubber. The rubber is passed through heavy rollers running atdifferent speeds which work the rubber into a thin sheet witha crepe-like texture. The crepe is air dried at a lower tem-perature than smoked sheet. As with sheet, quality standardscan be technically specified and controlled but grading isnormally done visually. Crepe made from latex is a premiumrubber and usually sells at substantially higher prices thantop grade smoked sheet.
(d) Block rubbeis - A relatively new process in which eithercoagulated latex or scrap grades can be:
- treated with chemicals to improve and retain the bestproperties of natural rubber;
- dried quickly and cheaply;
ANNEX 6Page 2
- highly compacted into small bales for easier handling; and
- graded only to technical specifications;
all of which improve the competitiveness of natural rubber with syntheticrubbers.
2. The long term advantages of block rubber production over con-ventional rubbers are considerable and the project provides for the con-version of PNP IV factories to block rubber manufacture as and when presentfacilities or arrangements become inadequate to deal with the crop harvested.
Existing facilities and project investments
3. PNP IV has eleven fully operational factories with a daily totalcapacity of nearly 60 tons. These processing facilities, plus the facili-ties provided by Goodyear and remillers, serve the fifteen estates of PNPIV. Proposals for the rehabilitation of existing plant, and new factoryand machinery requirements to provide sufficient processing capacity forPNP IV projected crops are summarized on an area basis as follows:
(a) Gunong Pamela Area:
Each of the four estates in this area (Gunong Pamela, Gunong Para,Gunong Monaco and Bandar Bedjambu) has smoked sheet processing facilities andtwo also have a creping plant. With the exception of Bandar Bedjambu thefactories are well laid out, generally in good condition and able to provideprocessing facilities for area crops except cup lump until 1976. The GunongPara factory would be converted into a centralized block rubber plant in1975 at an estimated cost of US$305,000 and would serve all four estates; atthe same time the Bandar Bedjambu factory, which is in poor condition, wouldbe phased out of production and scrapped. The remaining two factories wouldbe held in reserve until Gunong Pamela is converted to block rubber product-ion in 1977, at a cost of US$184,000.
(b) Sarang Giting Area
The four estates in the area (Sarang Giting, Siliau Dunia, Serbad-jadi and Bandar Negeri) all possess sheet processing facilities but twofactories (Siliau Dunia and Serbadjadi) are used only for sheet dryingduring peak cropping periods. Sarnag Giting factory, which also hascreping facilities, and Bandar Negeri factory would be able to provideprocessing facilities for area crops until the mid-1970s although thegeneral condition of their plant is poor. Project costs include US$14,000in 1970 for improving smoking and drying facilities, and US$185,000 in 1976for conversion of the Sarang Giting factory to block rubber production atwhich time the Bandar Negeri factory would be placed in reserve.
(c) Bangun Area - This area comprises Bangun and Simbolan estates whichare served by a well laid out and equipped sheet and crepe processing plantat Bangun. The present processing facilities, together with surplus capa-city available at Gunong Pamela end Bandar Betsy, would be adequate for
ANNEX 6Page 3
area crops until 1973 when a new block rubber plant estimated at US$204,000would displace existing sheet production. The creping facilities would be
continued as required or placed in reserve.
(d) Bandar Betsy Estate
There are no processing facilities at this estate; latex iscurrently processed into concentrate under a contract with Goodyear andcup lump is usually processed at Gunong Para. The Goodyear contract, which
can be terminated by either party giving one month's notice, provides latex
processing facilities up to a maximum of 20,000 litres daily. By 1971,
Bandar Betsy crops are expected to be 502 higher than this and the projectprovides for the construction of a new block rubber plant in 1970 at an
estimated cost of US$313,000 and a doubling of capacity in 1976 costingUS$132,000.
(e) Hapesong Area
Each of the four estates in this area (Hapesong, Marpinggan, BatangToru and Pidjor Koling) have either sheet or crepe processing facilities.Although all factories and equipment are in generally poor condition the
facilities would be capable of processing area crops until 1976, when anew block rubber plant would be installed at an estimated cost of US$257,000.All existing factories would then be closed down.
(f) Quality Control Facilities
The estimates for block rubber plants include the basic laboratoryequipment required for quality control. A central laboratory would be es-tablished at PNP IV headquarters at an estimated cost of US$35,000 to ensurethat rubber produced by PNP IV factories meets Standard Indonesian Rubber(SIR) quality standards established byqGovernment. The laboratory staffwould work closely with RISPA, which would normally monitor SIR requirements,and be licensed to issue SIR certificates in respect of PNP IV production.
(g) Future Processing Requirements
PNP IV total crops are expected to peak at about 47,000 tons inthe late 1980s by which time additional daily capacity of approximately 100tons would be required. The estimates provide for expenditure of US$132,000in each of the years 1978, 1979, 1980 and 1982 and US$184,000 in 1985 forextension and conversion of existing plant as necessary.
(h) Rehabilitation of Existing Plant
During the years 1970 through 1974 essential rehabilitation of plantin existing PNP IV factories would cost an estimated US$191,000. ThereafterUS$24,000 per annum is provided for machinery upkeep and overseas and locallymanufactured spares.
ANNEX 6Page 4
4. Outside Processing Arrangements
PNP IV processing facilities would be sufficient for all PNP IVcrops and all outside processing arrangements would cease except when IDAagrees to their continuation. However, the situation may arise where mar-keting requirements would make alternative processing arrangements financial-ly attractive. For this reason the project estimates do not commit PNP IVto short term heavy capital costs for plant replacement as it may be advan-tageous to switch part of the crop temporarily to outside factories. Theswitch most likely to occur is for latex to be processed outside PNP IVinstead of into smoked sheet in project factories. Any outside processingarrangements for PNP IV rubber would be subject to tender following consul-tation and agreement with the JMO and IDA.
ANNEX 7
INDONESIA
Second North Sumatra Estates Prolect
PNP IV Oil Palm Processing Facilities
1. Details of the present status of individual mills and proposals fortheir rehabilitation and extension are as follows:
(a) Adolina (commissioned in 1956) - The lay out of the mill is sa-tisfactory but maintenance standards and management are poor. The ratedcapacity of the mill is 24 tons FFB per hour but only one of the two pro-duction lines is in operation and current throughput is less than 50%. Toenable the factory to achieve maximum capacity when required, the projectprovides for adequate spare parts to bring all machinery into efficientrunning order; the provision of a water treatment plant; and new palmkernel drying equipment. Total costs of these improvements are estimatedat $83,000.
(b) Pabatu (commissioned in 1939) - The layout of the mill is goodand standards of maintenance and management are fair. The mill is capableof a throughput of 36 tons FFB per hour but only one of the two productionlines can be used due to faulty hydraulic pumps and digestors, and currentthroughput is less than 50 percent. No increase in capacity will be re-quired to handle projected crops but to enable the factory to achieve maxi-mum throughput extra equipment will be required in the kernel recovery plant,oil purification station, and water treatment plant. Adequate spare partsfor existing machinery are required and also the replacement of two boilers.The total cost of improvements and spare parts is estimated at $292,000.
(c) Tanah Itam Ulu (commissioned before 1920 and rehabilitated in 1934)-Despite the age of this mill, the layout and maintenance and managementstandards are good. The mill is capable of a throughput of 11 tons FFB perhour which will be sufficient to process projected crops. Current through-put is nearly 50% below rated capacity. In order to bring the mill up tooptimum capacity, and to provide standby equipment, the project providesfor a new boiler; replacement of alternators, electric motors and switch-gear to convert the D.C. to A.C. power supply; extra equipment for thekernel recovery plant; and adequate spare parts to maintain all machineryin efficient working order. The total cost is estimated to be $147,000.
(d) TindJowan (commissioned in 1922 and rehabilitated in 1968) - Thelayout of this factory is unsuitable for efficient operation and must bere-designed. General management is fair but standards of maintenance arelow. Maximum capacity is 20 tons FFB per hour and current throughput isnear this level. Further extensions to provide sufficient capacity forfuture operations cannot be undertaken until the mill layout has beenreorganized and most of the machinery resited. The existing plant can beused during rehabilitation which would consist of the following:
ANNEX 7Page 2
- new buildings for the extraction plant and purificationstation;
- new cranes for unloading FFB, relocation of sterilizersand new strippers with automatic feeders;
- new presses and pressing station and relocation of pressesinstalled in 1968;
- new kernel extraction plant and new oil purification plant;
- new alternators and switchgear for conversion of the DC plantto AC and a new auxiliary diesel generating set;
- a new boiler and a new water treatment plant; and
- sufficient spare parts to ensure continuous and efficientrunning of the mill.
The total estimated cost is $831,000.
(e) Air Batu (commissioned in 1937) - The fruit reception lay outwill need modification but the remainder of the plant is satisfactory. Thestandard of maintenance is poor despite good general management. Maximumcapacity is 36 tons FFB per hour but one complete production line is outof action for want of spare parts and repairs and current throughput isless than 30% of rated capacity. To handle projected crops and to main-tain machinery in efficient working order, buildings and equipment mustbe extended, and fruit reception area modifications; a water treatmentplant; automatic bunch feeders to the strippers; kernel extraction plant;sludge recovery plant and spare parts are required. Total cost is estimatedat $183,000.
(f) Pulu Radja (commissioned in 1920 and rehabilitated in 1930) - Thelayout of this mill is unnecessarily complex and to increase operatingefficiency it will be redesigned. Management is fair although maintenancestandards are poor. The mill's rated capacity is 20 tons FFB per hour andcurrent throughput is some 60% of this. To increase efficiency and to caterfor increasing crops it will be necessary to:
- install aew crane building to improve fruit handlingeff ici` uy;
- install two new production lines incorporating reconditionedequipment from the existing factory;
- install a complete new kernel extraction plant;
- install a new oil purification plant;
ANNEX 7Page 3
- install a new boiler complete with automatic firing gear andwater treatment plant;
- install new electric motors and switchgear to convert fromDC power to AC; and
- provide adequate spare parts to ensure continuous andefficient running of the mill.
The total estimated cost of the above program is $591,000.
(g) Adjamu (commissioned in 1938) - The layout of the plant doesnot permit efficient operation and maintenance standards are low. Maximumthroughput is 12 tons FFB per hour but current capacity usage is less than40%. A serious defect is the lack of equipment for recovery of kernels.The kernel extraction rate for 1969 was less than 2%, compared with thePNP VI average of 4.3%; many unshelled kernels are burnt as fuel To in-crease efficiency and to enable the mill to handle projected crops theproject provides for:
- a new boiler and water treatment plant and a dieselgenerating set;
- a new oil extraction plant;
- a new kernel recovery plant;
- sufficient spares to maintain the mill in efficientworking order.
Total estimated costs are $452,000.
2. None of the mills have incinerators and conveyors for bunchwaste disposal and provision is made in the project for one at each mill.In addition to being the most efficient method of bunch waste disposal theincinerators would yield about 1,800 tons of muriate of potash annuallyfrom bunch waste, by 1978. The cost of obtaining this quantity of muriateof potash on the international market is approximately $140,000 in foreignexchange, compared with an estimated total cost of providing incineratorsand empty bunch conveyors of $235,000.
3. Total palum oi btoz,,e capacity on the estates is approximately24,000 tons, about 40" of production during 1969. Unfortunately, distri-bution of the storage tanks is such that some estates have surplus storagecapacity while others do not have the capacity to store six weeks produc-tion which is considered a minimum requirement. The project provides foran estimated expenditure of p55,000 for the construction of storage tanKson the Adolina and Tanah Itam Ulu estates.
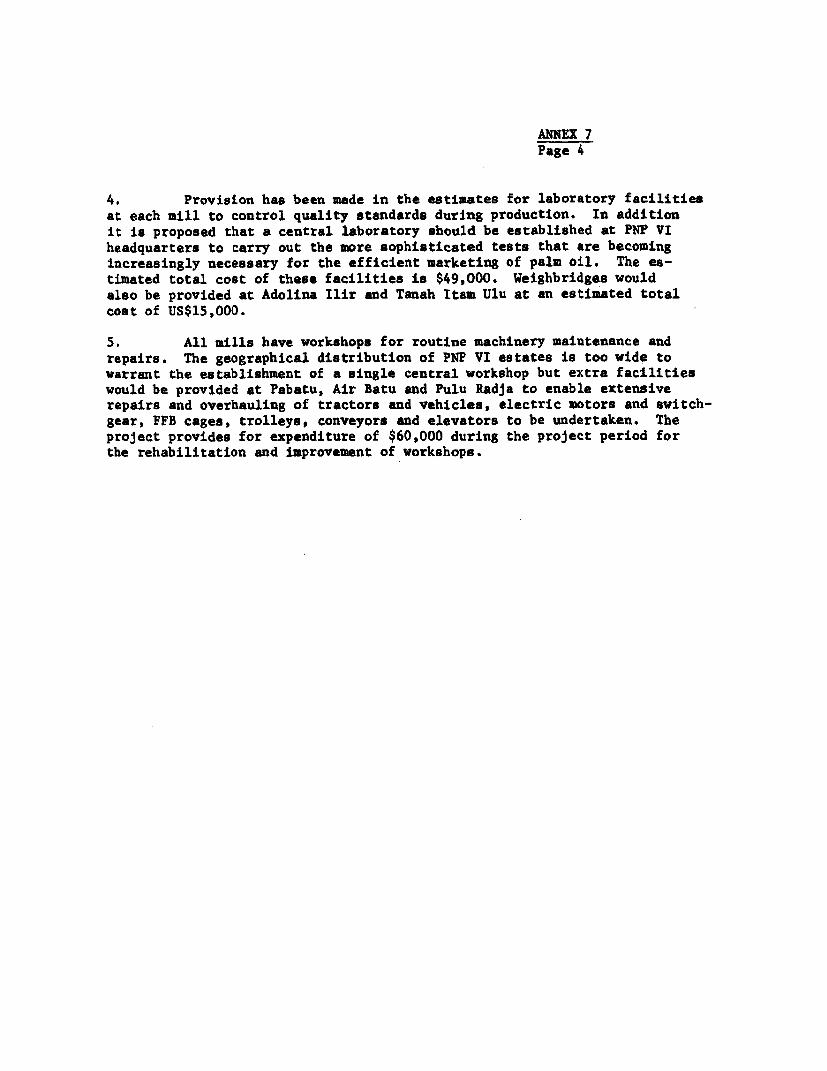
ANNEX 7Page 4
4. Provision has been made in the estimates for laboratory facilitiesat each mill to control quality standards durlng production. In additionit is proposed that a central laboratory should be established at PNP VIheadquarters to carry out the more sophisticated tests that are becomingincreasingly necessary for the efficient marketing of palm oil. The es-timated total cost of these facilities is $49,000. Weighbridges wouldalso be provided at Adolina Ilir and Tanah Itam Ulu at an estimated totalcost of US$15,000.
5. All mills have workshops for routine machinery maintenance andrepairs. The geographical distribution of PNP VI estates is too wide towarrant the establishment of a mingle central workshop but extra facilitieswould be provided at Pabatu, Air Batu and Pulu Radja to enable extensiverepairs and overhauling of tractors and vehicles, electric motors and switch-gear, FFB cages, trolleys, conveyors and elevators to be undertaken. Theproject provides for expenditure of $60,000 during the project period forthe rehabilitation and improvement of workshops.
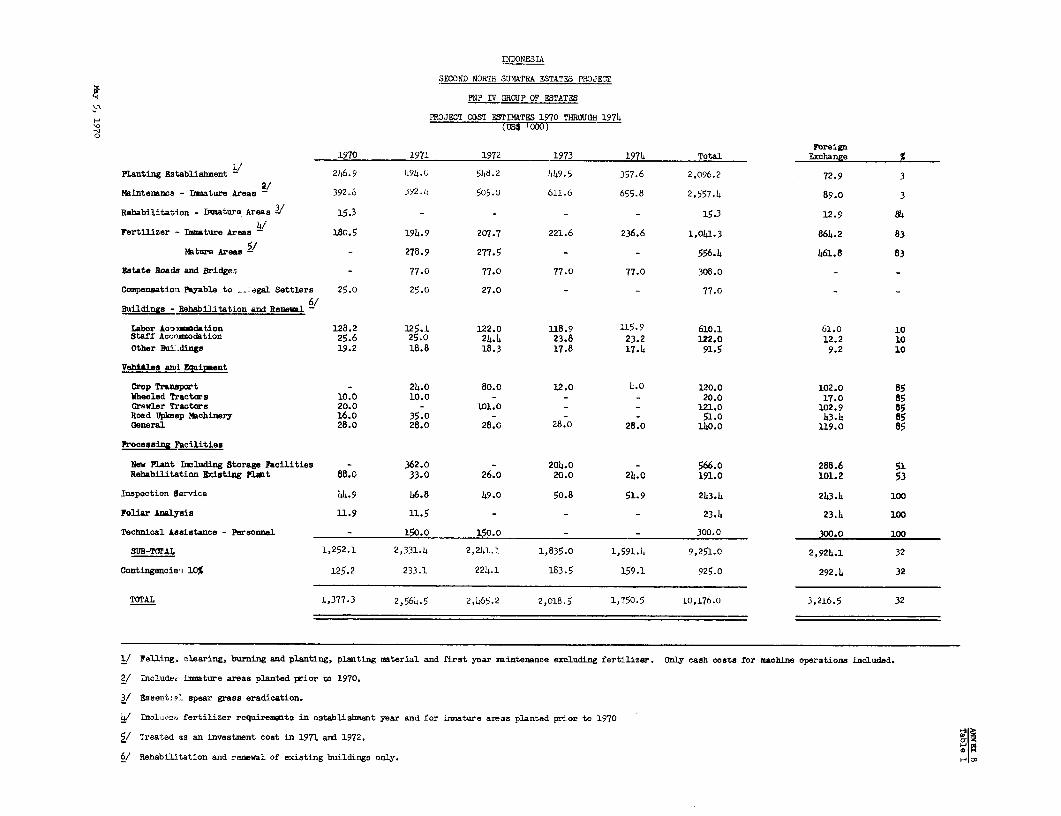
INDONESIA
SECOND NORTH SUMATRA ESTATES PROJECT
PNP IV GROUP OF FSTATES
PROJECT COST ESTIMATES 1970 THROUGH 1974'0 (US$ '000)
Foreiga1970 1971 1972 1973 1974 Total Exchange %
Planting Establishment 246.9 494.C 548.2 449.5 357.6 2,096.2 72.9 3
Maintenance - Imsature Areas 2/ 392.6 Y92.L4 505.0 611.6 655.8 2,557.4 89.0 3
Rebabilitation - Iasture Areas 2 15.3 - - - - 15.3 12.9 84
Fertilizer - Imature Areas 4 180.5 194.9 207.7 221.6 236.6 1,041.3 864.2 83
Mature Areas - - 278.9 277.5 - - 556.4 461.8 83
Estate Roads and Bridges - 77.0 77.0 77.0 77.0 30e.0 - -
Compensation Payable to -. agal Settlers 25.o 25.0 27.0 - - 77.0 -
Buildings - Rehabilitation and Renewal Y
labor Aco.inetdation 128.2 125.1 122.0 118.9 115.9 610.1 61.0 10Staff Accommodation 25.6 25.0 24.4 23.8 23.2 122.0 12.2 10Other Bit.dings 19.2 18.8 18.3 17.8 17.4 91.5 9.2 10
Vebi*les and F4uipunt
Crop Transport - 24.0 80.0 12.0 4.0 120.0 102.0 85Wheeled Tractors 10.0 10.0 - - - 20.0 17.0 85Crawler Tractors 20.0 - 101.0 - - 121.0 102.9 85Road Upkeep Nachinery 16.0 35.0 - - 51.0 43.4 85General 28.0 28.0 28.0 28.0 28.0 140.0 119.0 85
processina Facilities
New Plant Including Storage Facilities - 362.0 - 204.0 - 566.o 288.6 51Rehabilitation 3xisting Plat 88.0 33.0 26.0 20.0 24.0 191.0 101.2 53
Inspection Service 44.9 46.8 49.0 50.8 51.9 243.4 243.4 100
Foliar Analysis 11.9 11.5 - - - 23.4 23.4 100
Technieal Assistance - Personnel - 150.0 150.0 - - 300.0 300.0 100
SUB-TGTAL 1,252.1 2,331. 4 2,241.1 1,835.0 1,591.4 9,251.0 2,924.1 32
Contingencie s 10% 125.2 233.1 224.1 183.5 159.1 925.0 292.4 32
TOTAL 1,377.3 2,564.5 2,465.2 2,018.5 1,750.5 10,176.0 3,216.5 32
I/ Feling. clearing, burning and planting, planting material and first year meintenance excluding fertilizer. Only cash costs for machine operations included.
2/ Include.- ijeture areas planted prior to 1970.
3/ Essenrt i spear grass eradication.
4/ I uli 'el, fertilizer requirements in establishment year and for inmature areas planted prior to 1970
5/ Treated as an investment cost in 1971 and 1972.
6/ Rehabilitation and renewal of existing buildings only. H s
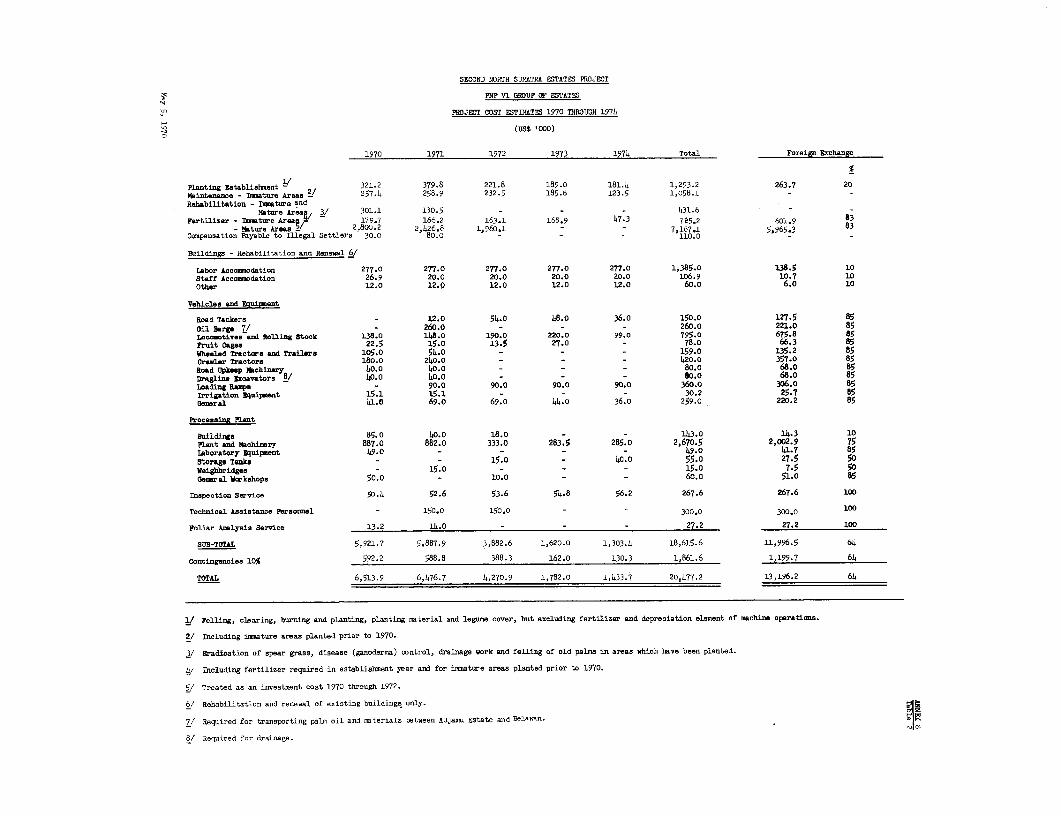
SECOND NORTH SUMATRA ESTATES PROJECT
P?NP VI GROUP OF ESTATES
PROJET COST ESTIMATES 1970 THROUGH 1974
(us$ '000)
1970 1971 1972 1973 197L Total Foreign Exchange
Planting Establishment - 321.2 379.8 221.8 189.0 181.4 1,293.2 263.7 20
Maintenance - Dasature Areas _/ 257.4 258.9 232.5 185.8 123.5 1,058.1 - -
Rehabilitation - Isuture andMature Areas 3/ 301.1 130.5 - - - 431.6
Fertilizer - Iature Areaa 4 179.7 166.2 163.1 168.9 47-3 725.2 601.9 83
- Mature Aresa - 2.800.2 2,426.8 1,960.1 - - 7,187.1 5,965.3 83
Compensation Payable to Illegal Settlers 30.0 80.0 - - 110.0 - -
Bluildings - Rehabilitation and Renewal 6/
Labor Accommodation 277.0 277.0 277.0 277.0 277.0 1,385.0 138.5 10
Staff Accomaodation 26.9 20.0 20.0 20.0 20.0 106.9 10.7 10
Other 12.0 12.0 12.0 12.0 12.0 60.0 6.o 10
Vehicles and Equipment
Read Tankers - 12.0 54.0 48.0 36.o 150.0 127.5 85
Oil argp _/ - 260.0 - - - 260.0 221.0 85
Locoootives and Rolling Stoek 138.0 1148.0 190.0 220.0 99.0 795.0 675.8 85
fruit Cages 22.5 15.0 13.5 27.0 - 78.0 66.3 85
Wheeled Tractors and Trailers 105.0 54.0 - - - 159.0 135.2 85
Crawler Tractors 180.0 240.0 - - - 420.0 357.0 85
Road Upksep MRchinery 40.0 40.0 - - - 80.0 68.o 85
Dragline Excavators 8/ 40.0 40.0 - - - 60.0 68.o 85Loading Rampe - 90.0 90.0 90.0 90.0 360.0 306.0 85
Irrigation Equipment 15.1 15.1 - - - 30.2 25.7 85Genral 41.0 69.0 69.0 44.0 36.o 259.0 220.2 85
Processing Plant
Buildings 85.0 40.0 18.0 - - 143.0 114.3 10
Plant and Machinery 887.0 882.0 333.0 283.5 285.0 2,670.5 2,002.9 75
Laboratory Bquipment 49.0 - - - - 49.0 41.7 85
Storage Tanks - - 15.0 - 40.0 55.0 27.5 50Weighbridges - 15.0 - - - 15.0 7.5 50aeneral Workshops 50.0 - 10.0 - - 60.0 51.0 85
Inpeetion Service 50.4 52.6 53.6 54.8 56.2 267.6 267.6 100
Technical Assistance Personnel - 150.0 150.0 - - 300.0 300.0 100
Poliar dialysis Service 13.2 14.0 - - 27.2 27.2 100
SUB-TOTAL 5,921.7 5,887.9 3,882.6 1,620.0 1,303.4 18,615.6 11,996.5 64
Contingencies 10% 592.2 588.8 388.3 162.0 130.3 1,861.6 1,199.7 64
TOTAL 6,513.9 6,476.7 4,270.9 1,782.0 1,433.7 20,477.2 13,196.2 64
1 Felling, clearing, burning and planting, planting material and legume cover, but excluding fertilizer and depreciation element of machine operations.
2/ Including immature areas planted prior to 1970.
3/ Eradication of spear grass, disease (ganoderma) control, drainage work and felling of old palms in areas which have been planted.
4/ Including fertilizer required in establishment year and for iccanture areas planted prior to 1970.
5/ Treated as an investment cost 1970 through 1972.
6/ Rehabilitation and renewal of exnsting buildings only.
7/ Required for transporting palm oil and materials between Adjamlu Estate and Belean.
8/ Required for drainage.
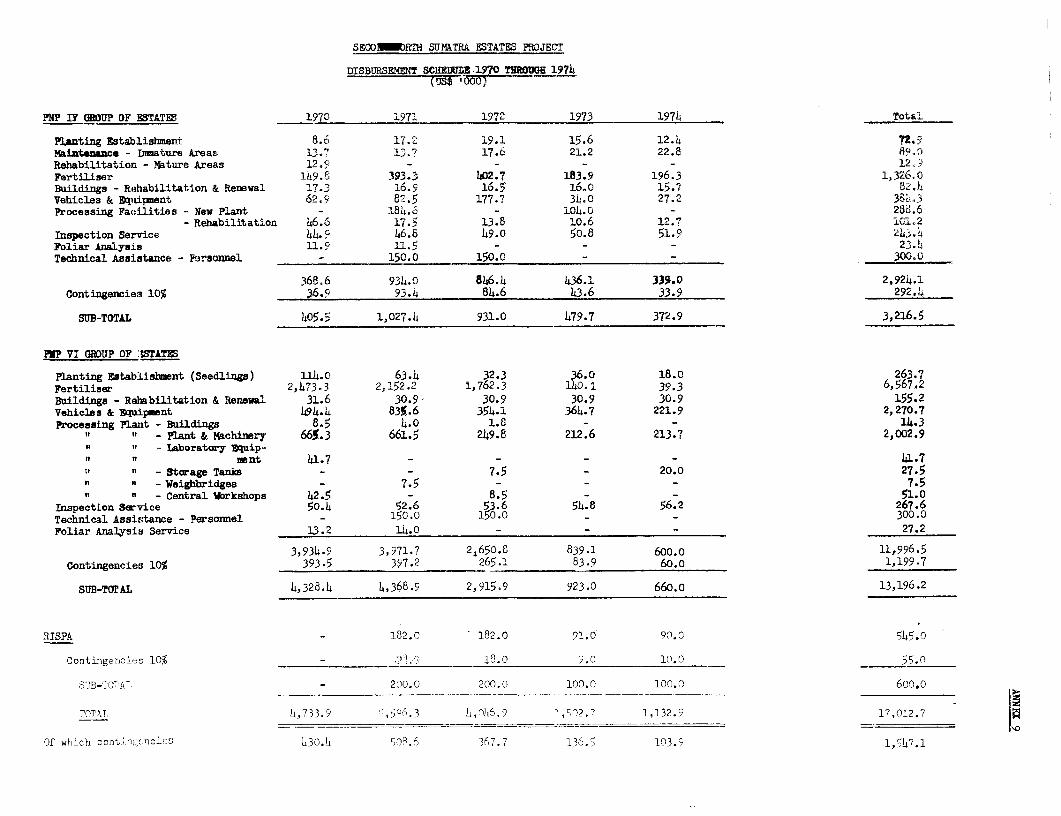
SEGOOMRTH SUMATRA ESTATES PROJECT
DISBURSEMENT SCHEDU HZ 70 THROW 1974(U5$ 100
PtlP IT OWUP OF ESTATE 1970 1972. 1972 1973 1974 Total
Planting Establishment 8.6 17.2 19.1 15.6 12.4 72.9Maintencse - Tmature Areas 13.7 ID.7 17.6 21.2 22.8 890,Rehabilitation - Mature Areas 12.9 - - - - 129Fertiliser 149.8 393.3 1402.7 183.9 196.3 1,326.0Buildings - Rehabilitation & Renewal 17.3 16.9 16.5 16.o 15.7 82,4Vehicles & Equipment 62.9 82.5 177.7 34.0 27.2 38s,.3Processing Facilities - New Plant - 184.6 - 104.0 - 288.6
- Rehabilitation 46.6 17.5 13.8 10.6 12.7 l10,2
Inspection Service 44.9 46.t6 49.o 50.8 51.9 243,!1Foliar Analysis 11.9 11.5 - - - 23.4Technical Assistance - Parsonnel - 150.0 150.0 - - 300,0
368.6 934.0 846.4 436.1 339.0 2,924.1
Contingencies 10% 36.9 93.4 84.6 143.6 33.9 292.4
SUB-TOTAL 4O05.5 1,027.4 931.0 479.7 372.9 3,216.5
P1P? VI aDUP OF :STATFS
Planting Establishnnt (Seedlings) 114.0 63.4 32.3 36.o 18.0 263.7Fertiliser 2,473.3 2,152.2 1,762.3 14o.i 39.3 6,567,2Buildings - Rehabilitation & Renewal 31.6 30.9, 30.9 30.9 30.9 155.2Vehicles & Uquipment 494.4 835.6 354.1 364.7 221.9 2,270.7Processing Plant - Buildings 8.5 4.0 1.8 - - 14 .3
" - Plant & Machinery 665.3 661.5 249.8 212.6 213.7 2,002.9L- Iaboratory Equip-
nmnt 41.7 - - - - 41.7
-Storage Tanks - - 7.5 _ 20.0 27.5n n - Weighbridges - 7.5 - - 7.5n n - Central Workshops 42.5 - 8.5 - - 51.0
Inspection Service 50.4 52.6 53.6 54.8 56.2 267.6Technical Assistance - Personnel - 150.0 150.0 - - 300.0
Foliar Analysis Service 13.2 14.0 - - - 27.2
3,934.9 3,971.7 2i650.8 839.1 11,996.5Contingencies 10% 393.5 397.2 265.1 83.9 60o0 1,199.7
SUB-TOTAL 4,328.4 4,368.9 2,915.9 923.0 66o.o 13,196.2
RISPA - 182.0 182.0 91.0 90.0 545.0
Contingencies 10% _ 18.0 9.0 10.0 55.0
SUB-TOTAI - 200.0 200.0 100.0 100.0 600o.
TOTAL [t,733.9 s,5o6.3 L, 06.9 1 ,02.27 1,132.9 17,012.7
Of which cont.rSngElcics 430.4 508.6 367.7 136.5 103.9 1,547.1
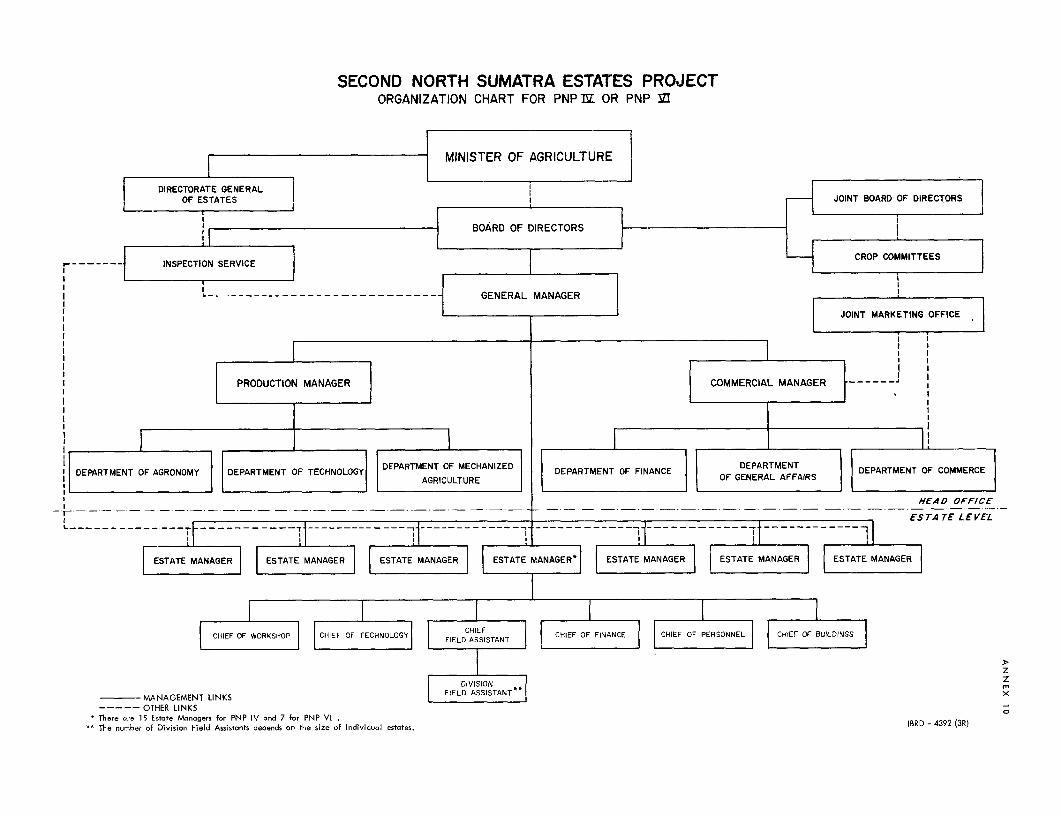
SECOND NORTH SUMATRA ESTATES PROJECTORGANIZATION CHART FOR PNP1 OR PNP I
F-- MINISTER OF AGRICULTURE
DIRECTORATE GENERAL l l
OF ESTATES l - JOINT BOARD OF DIRECTORS |
1, | ~~~~~~~~~~BOARD OF DIRECTORSt
------- F INSPECTION SERVICE
GENERAL MANAGER
JOINT MARKETING OFFICE
PRODUCTION MANAGER COMMERCIAL MANAGER - - - - - - I
DEPARTMENT OF MECHANI ~~~~~~~~DEPARTMENT DPRMN FCMEC
DEPARTMENT OF AGRONOMY DEPARTMENT OF TECHNOLOGY D AGRT TF MDEPARTMENT OF FINANCE OF GENERAL AFFAIRS DEPARTMENT OF COMMERCE
HEAD OFFICE
_.1 _ ._._ _._ ._._ _._ _._ ._ ._ ._ _ _ _ ._ ._ ._ _ .___ ___ _ _ _ _ _ _ _ _ _ _ _ _ _ _ _ ES. _LEE
L -- -- ---… - - - -- -- - -- - - -ESTATE MANAGER] ESTATE MANAGER] ESTATE MANAGER E E MANAGER ESTATE MANAGER ESTATE MANAGER ESTATE MANAGER
*CHIE OF -COG ----T a,5,1t , EsrTE ECHIEF
CHIEF OF WORKCHIEF CHIEF OF TECHNOLOGY FIELD ASSISTANT CHIEF OF FINANCE CHIEF OF PERSONNEL CHIEF OF BUILDINGS
zDIVI ION
MANAGEMENT LINKS FIELD ASSIAx…~--- OTHER LINKS
* There are 1S Lstate Managers for PNP IV and 7 for PNP VIThe number ol Division Field Assistants depends on the size of Individual estates. IBRD - 4392 (3R)
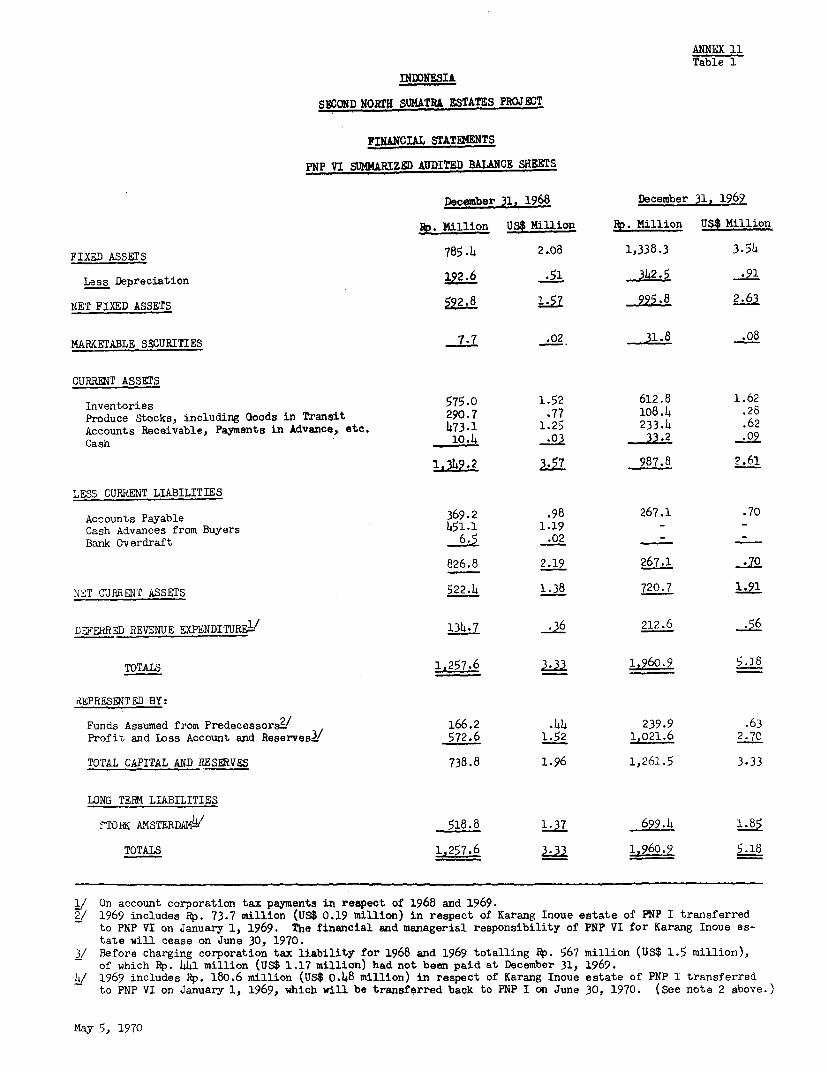
ANNEX 11Table 1
INDDNESIA
SECOND NORTH SUMATRA ESTATES PRCJSCT
FINANCIAL STATEMENTS
PNP VI SUMMARIZED AUDITED BALANCE SHEETS
Deceiber 31, 1968 December 31, 1969
Hp. Million US$ Million Hp. Million US$ Million
FIXED ASSETS 785.4 2.08 1,338.3 3-54
Less Depreciation 192.6 .51 342-5 .91
NET FIXED ASSETS 592.8 15 995.82.63
MARKETABLE SECURITIES 7.7 .02 31.8 .08
CURRENT ASSETS
Inventories 57. 1652 612.8 1.62Produce Stocks, including Goods in Transit 290.7 .77 108.4 .28Accounts Receivable, Payments in Advance, etc, 473.1 1.25 233.4 .62Cash 10.4~ .0 3 .09
1.349.2 L 987.8 2.61
LESS CURRENT LIABILITIES
Accounts Payable 369.2 .98 267.1 .70Cash Advances from Buyers 451.1 1.19 --Bank Overdraft 5 2 -
826.8 2.19 267.1 .70
NET CURRENT ASSETS 522.4 1.38 720.7 1.91
1DEFERRED REVENUE EXPENDITURE-/ 134.7 .36 212.6 .56
TOTALS 1,257.6 1,960.9 5.18
REPRESENTED BY:
Funds Assumed from Predecessorsw 166.2 .44 239.9 .63Profit and Loss Account and Reserves3/ 572.6 1.52 1,021.6 2.70
TOTAL CAPITAL AND RESERVES 738.8 1.96 1,261.5 3.33
LONG TER4 LIABILITIES
a'TORK AMSTERDAM I 518.8 1.37 699.4 1.85
TOTALS 1,257.6 i_ 1,960.9 5.18
1/ On account corporation tax payments in respect of 1968 and 1969.2/ 1969 includes ap. 73.7 million (US$ 0.19 million) in respect of Karang Inoue estate of PNP I transferred
to PNP VI on January 1, 1969. The financial and managerial responsibility of PNP VI for Karang Inoue es-tate will cease on June 30, 1970.
3/ Before charging corporation tax liability for 1968 and 1969 totalling Rp. 567 million (US$ 1.5 million),of which Rp. 441 million (US$ 1.17 million) had not been paid at December 31, 1969.
4/ 1969 includes Rp. 180.6 million (US$ 0.48 million) in respect of Karang Inoue estate of PNP I transferredto PNP VI on January 1, 1969, which will be transferred back to PNP I on June 30, 1970. (See note 2 above.)
May 5, 1970
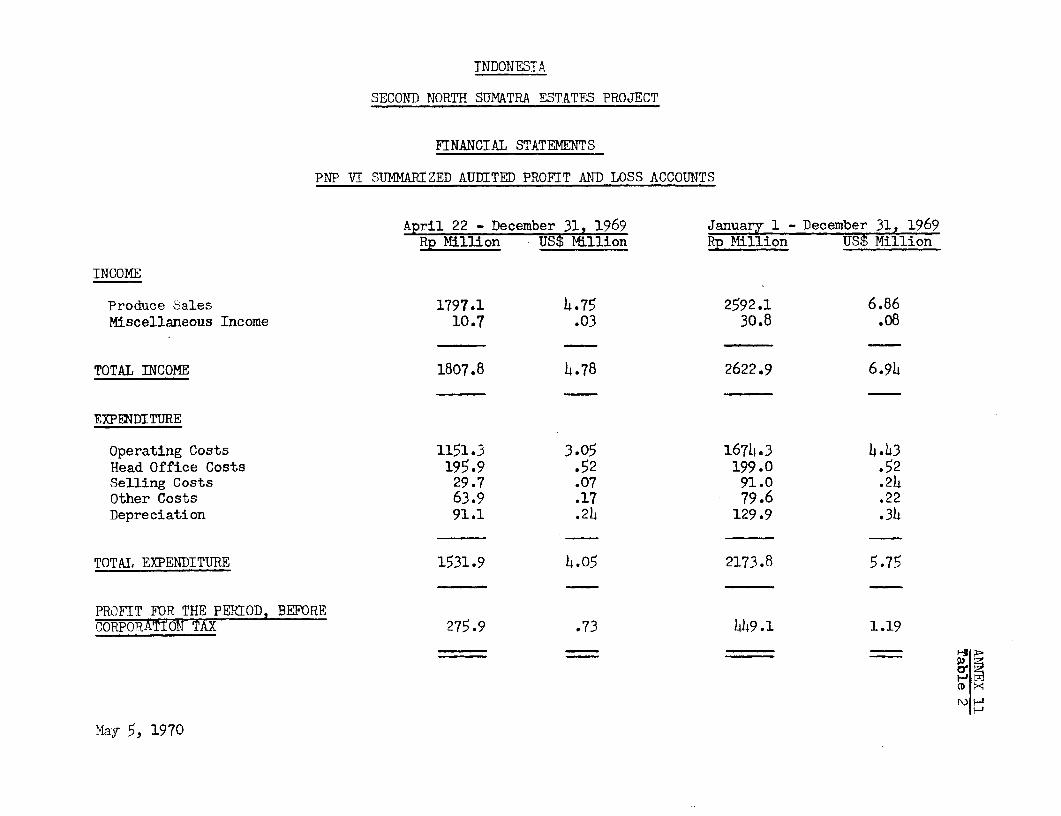
INDONESIA
SECOND NORTH SUMATRA ESTATES PROJECT
FINANCIAL STATEMENTS
PNP VI SUMMARIZED AUDITED PROFIT AND LOSS ACCOUNTS
April 22 - December 31, 1969 January 1 - December 31, 1969Rp Million US$ Million Rp Million US$ Million
INCOME
Produce bales 1797.1 4.75 2592.1 6.86Miscellaneous Income 10.7 .03 30.8 .08
TOTAL INCOME 1807.8 4.78 2622.9 6.94
EXPENDITURE
Operating Costs 1151.3 3.05 16714.3 4.3Head Office Costs 195.9 .52 199.0 .52Selling Costs 29.7 .07 91.0 .24Other Costs 63.9 .17 79.6 .22Depreciation 91.1 .24 129.9 .34
TOTAL EXPENDITURE 1531.9 4.05 2173.8 5.75
PROFIT FOR THE PERIOD, BEFORECORPORATION TAX 275.9 .73 449.1 1.19
a 1H
May 5, 1970
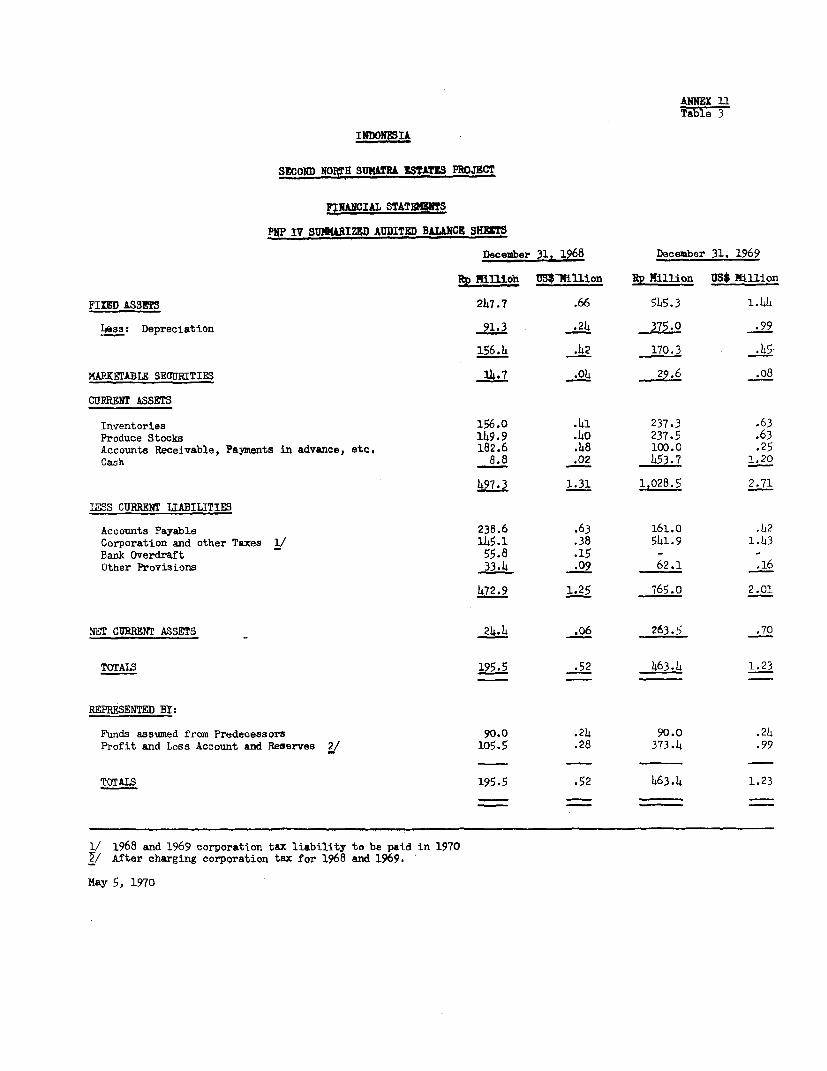
ANNEX 11Table 3
INDONESIA
SECOND NORTH SUXUL ESTATZU PROJECT
nINACIAL STATEffNTS
PNP IV SUMIlRIZED AUDITED BALWOR SHEETS
December 31, 1968 December 31, 1969
Rp Plfli6n US$1Million Rp Million US$ Million
FIED ASStTS 247.7 .66 545.3 1.44
less: Depreciation 91.3 .24 375.0 .99
156.4 .42 170.3 .45
MARKETABLE SECURITIES 14.7 .a4 29.6 .08
CURRENT ASSETS
Inventories 156.0 .41 237.3 .63Produce Stocks 149.9 .40 237.5 .63Accounts Receivable, Payments in advance, etc, 182.6 .48 100.0 .25Cash 8.8 .02 453.7 1.20
497.3 1.31 1,028.5 2.71
LESS CURRENT LIABILITIES
Accounts Payable 238.6 .63 161.0 .42Corporation and other Taxes 1/ 145.1 .38 541.9 1.43Bank Overdraft 55.8 .15 - -Other Provisions 33.4 .09 62.1 .16
472.9 1.25 765.0 2.01
NET CURRENT ASSETS 24.4 .o6 263.5 .70
TOTALS 195.5 .52 463.4 1.23
REPRESENTED BY:
Funds assumed from Predecessors 90.0 .24 90.0 .24Profit and Loss Account and Reserves 2/ 105.5 .28 373.4 .99
TOTALS 195.5 .52 463.4 1.23
1/ 1968 and 1969 corporation tax liability to be pald in 1970f/ After charging corporation tax for 1968 and 1969.
May 5, 1970
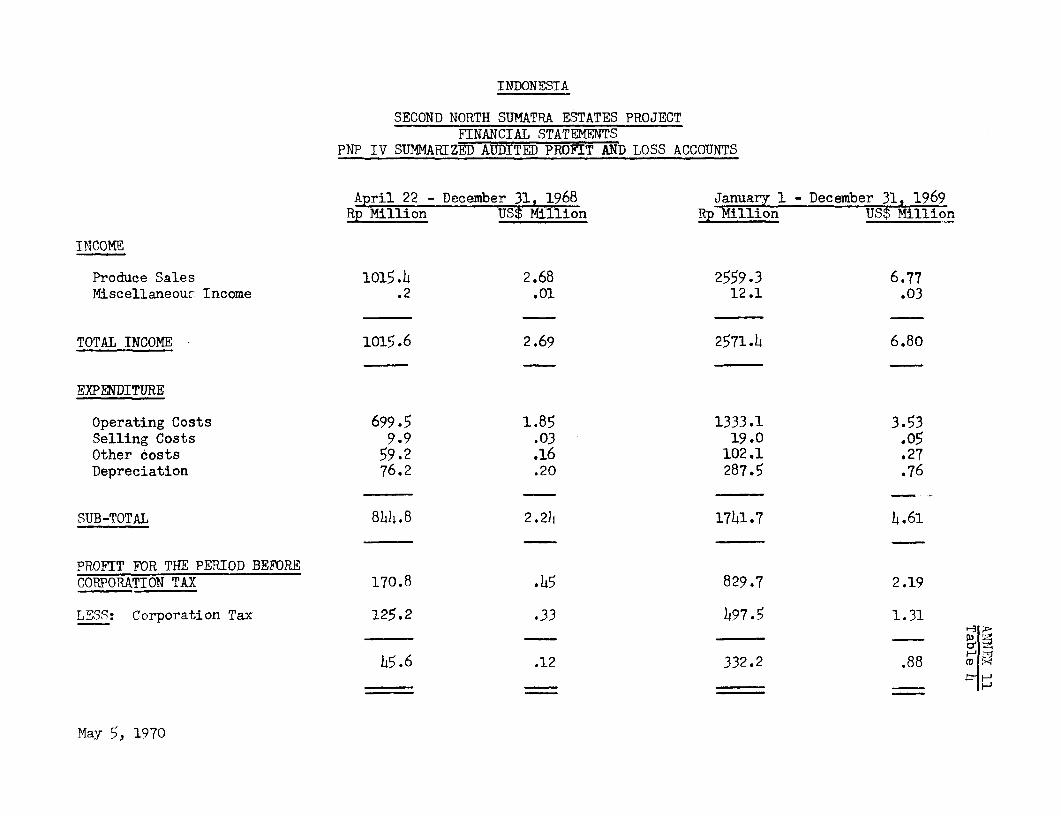
INDONESIA
SECOND NORTH SUMATRA ESTATES PROJECTFINANCIAL STATEMENTS
PNP IV SUMMARIZED AUDITED PROFIT AND LOSS ACCOUNTS
April 22 - December 31, 1968 January 1 - December 31, 1969Rp Million US$ Million Rp Million US$ Million
INCOME
Produce Sales o1l5.4 2.68 2559.3 6.77Miscellaneouc Income .2 .01 12.1 .03
TOTAL INCOME 1015.6 2.69 2571.4 6.80
EXPEDITURE
Operating Costs 699.5 1.85 1333.1 3.53Selling Costs 9.9 .03 19.0 .05Other costs 59.2 .16 102.1 .27Depreciation 76.2 .20 287.5 .76
SUB-TOTAL 8h.8 2.24 17b1.7 l.61
PROFIT FOR THE PERIOD BEFORECORPORATION TAX 170.8 .45 829.7 2.19
LESS: Corporation Tax 125.2 .33 h97.5 1.31
45.6 .12 332.2 .88 H .Myl1H
May 5, 1970
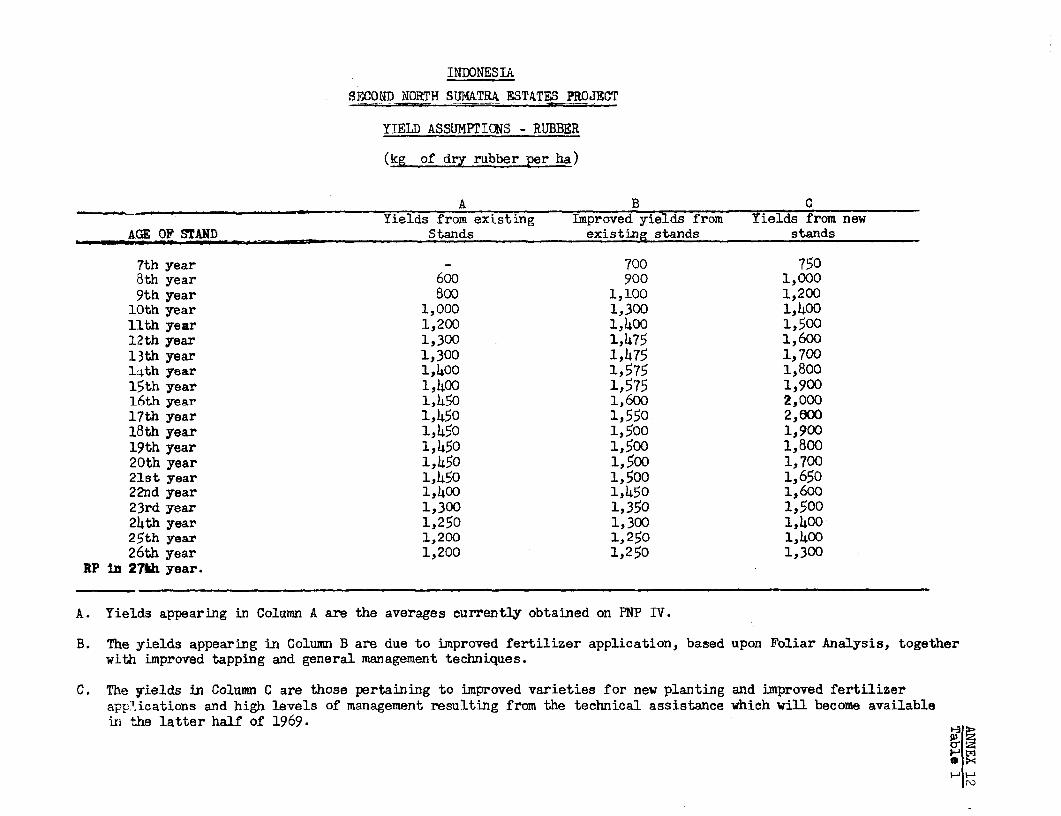
INDONESIA
BECONID NORTH SKIATRA ESTATES PROJECT
YIELD ASSUMPTIONS - RUBBER
(kg of dry rubber per ha)
A B CYields from existing Improved yields from Yields from new
AGE OF STAND Stands existing stands stands
7th year _ 700 7508th year 600 900 1,0009th year 800 1,100 1,20010th year 1,000 1,300 1,40011th year 1,200 1,400 1,50012th year 1,300 1,475 1,60013th year 1,300 1,h75 1,70014th year 1,400 1,575 1,80015th year 1,400 1,575 1,90016th year 1,450 1,600 2,00017th year 1,450 1,550 2,00018th year 1,450 1,500 1,90019th year 1,450 1,500 1,80020th year 1,450 1,500 1,70021st year 1,450 1,500 1,65022nd year 1,400 1,450 1,60023rd year 1,300 1,350 1,50024th year 1,250 1,300 1,40025th year 1,200 1,250 1,40026th year 1,200 1,250 1,300
RP in 27%h year.
A. Yields appearing in Column A are the averages currently obtained on PNP IV.
B. The yields appearing in Column B are due to improved fertilizer application, based upon Foliar Analysis, togetherwith improved tapping and general management techniques.
C. The yields in Column C are those pertaining to improved varieties for new planting and improved fertilizerappications and high levels of management resulting from the technical assistance which will become availablein the latter half of 1969.
0 Z
I-.
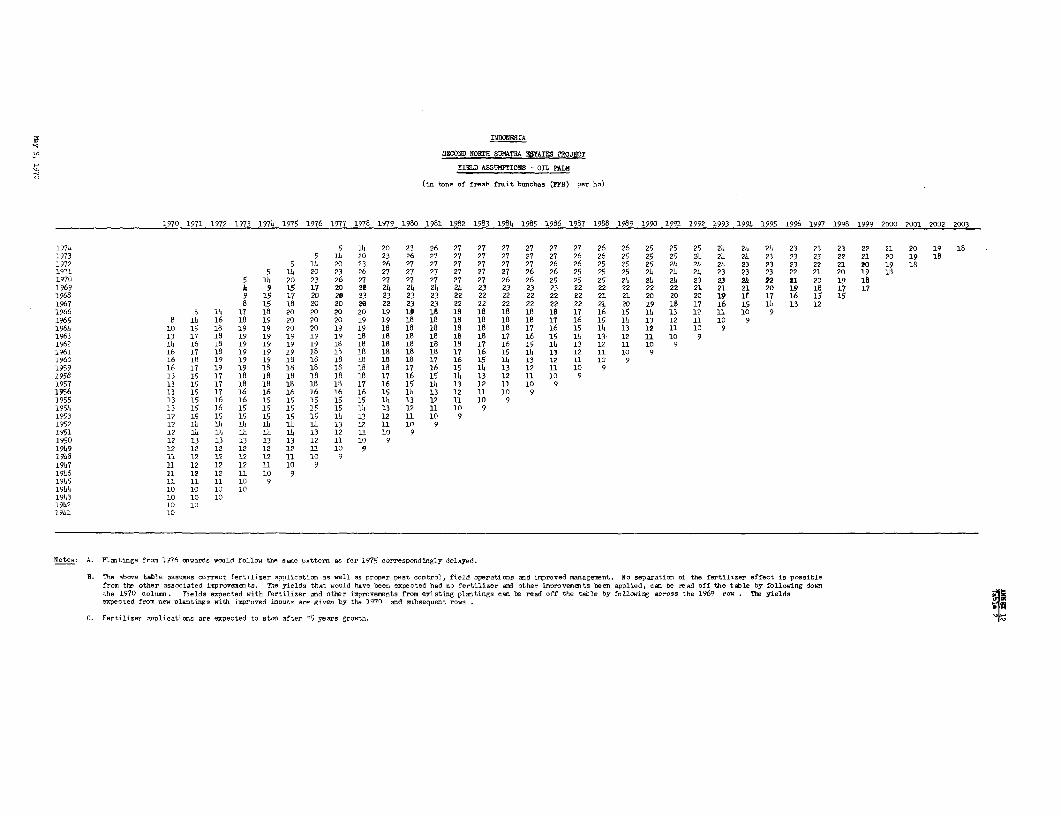
SECOND NORTH SUM&TRA £ST?ATS PROJIET
H ~~~~~~~~~~~~~~~~~~~~~~~~~~~YIELD ASSUMPTION4S - 0IL PALM
(in tose of fresh freAt hunches (7D'B) per ha)
1970 1971 1972 1)73 1974 1975 1976 1977 1979 1979 1990 1991 1992 1993 1984 1995 1966 1967 1989 1989 1990 1991 1992 1993 199% 1995 1996 1997 1998 1999 2900 2001 2002 2003
1921 5 14 20 23 26 27 27 27 27 27 27 26 26 25 25 25 21. 24. '24 23 23 23 22 21 20 19 iS1973 5 14. 22 23 26 27 27 27 27 U? 27 26 26 25 25 25 ?t 21. 21 23 23 23 22 21 20 19 281972 5 14. 20 23 26 27 27 27 27 27 27 26 26 25 25 25 20 Ut 20 23 23 23 22 21 20 19 1819)71 5 11. 20) 23 26 27 27 27 27 27 27 26 26 25 25 25 21. 24 21. 23 23 23 22 21 20 19 191973 5 14 20 23 26 27 27 23 27 27 27 26 26 25 25 25 21. Ut 24 23 23 25 22 21 20 19 iB1969 Ia 9 15 1? 20 20 24 24 24 2h 23 23 23 23 22 22 22 22 22 21. 21. 21 20 19 iS8 17 171968 9 15 17 20 20 23 23 23 23 22 22 22 22 22 82 21 21 20 20 20 19 it 1? i6 15 151967 8 15 18 20 20 26 22 23 23 22 22 22 22 22 22 21 20 19 lo 17 i6 15 lb 13 121966 9 lb, 17 18 20 20 20 20 19 10 is 18 is iS 18 iS 17 16 15 It 13 12 II. 10 91965 8 it 16 iS 19 20 20 20 19 19 18 18 18 18 18 iS 17 i6 15 it 13 12 ii 10 91964 10 iS 18 19 19 20 20 19 19 iS 18 18 18 18 18 17 16 iS it 13 12 ii 10 91963 13 17 is 19 19 19 19 19 18 18 18 18 18 18 17 i6 iS it 13 12 13. 10 91962 10 16 18 i9 19 19 19 i8 18 18 is 18 19 17 16 15 lb 13 12 U1 10 9:961 i6 17 18 19 09 19 18 iS 18 18 18 18 17 i6 iS lb. 13 12 11 10 919,60 16 19 19 19 19 18 19 iS 19 18 3.8 17 16 15 Ii, 13 12 U1 10 91959 16 17 19 19 18 18 19 18 19 18 17 26 25 it 13 12 11 10 91,958 13 15 17 i8 iS 18 iS 18 iS 17 i6 15 it 13 12 11 10 91957 13 15 17 io 18 i8 18 19 17 16 15 it 13 12 12 10 91956 13 15 1? 16 16 16 16 16 16 15 it 13 12 11 10 91955 13 15 16 16 15 15 15 iS 15 lt 13 12 ii 10 91954 13 15 16 15 iS 15 15 15 it4 13 12 11 10 91953 12 15 iS 15 15 15 15 it4 13 12 fl1 10 91952 12 it it it, IL it it 13 12 11 10 91951 12 it it it it it 13 12 11 10 91950 12 13 13 13 13 13 12 11 10 91949 12 12 12 12 12 12 11 10 9191.8 11 12 12 12 12 11 10 91947 11 12 12 12 11 10 9191.6 12 12 12 11 10 91915 11 11 11 10 9i94t 10 10 13 101943 10 10 101942 10 10lAIt 10
Notes: A. Pirtings from 1976 onwards would folios the sam patte- so for 1975 correspondingly delayed.
8. The shov table ssescorrect fertilizer application as well as proper pest control, field operations and improved e,anogesmt. Ko separation of the fertli..er effect to poseihiefrom the other associated imprormesnto. The yields that woold hove hee expected had no fertiliser and other improveemts been applied, cmn he mad off the table hy foUoeli.g downthe 1970 colcou. flelds expected with fertilizer and other improvenente froma existing plantings con~ be read off the tble hy falliono across the 1969 row . The yieldeexpected fre new Diantigs with improved ipots ore gien hy the 2979 and e,heeqoet rows
C. Fertilicer Apolicatiano are expected to ston after '5 years growth.
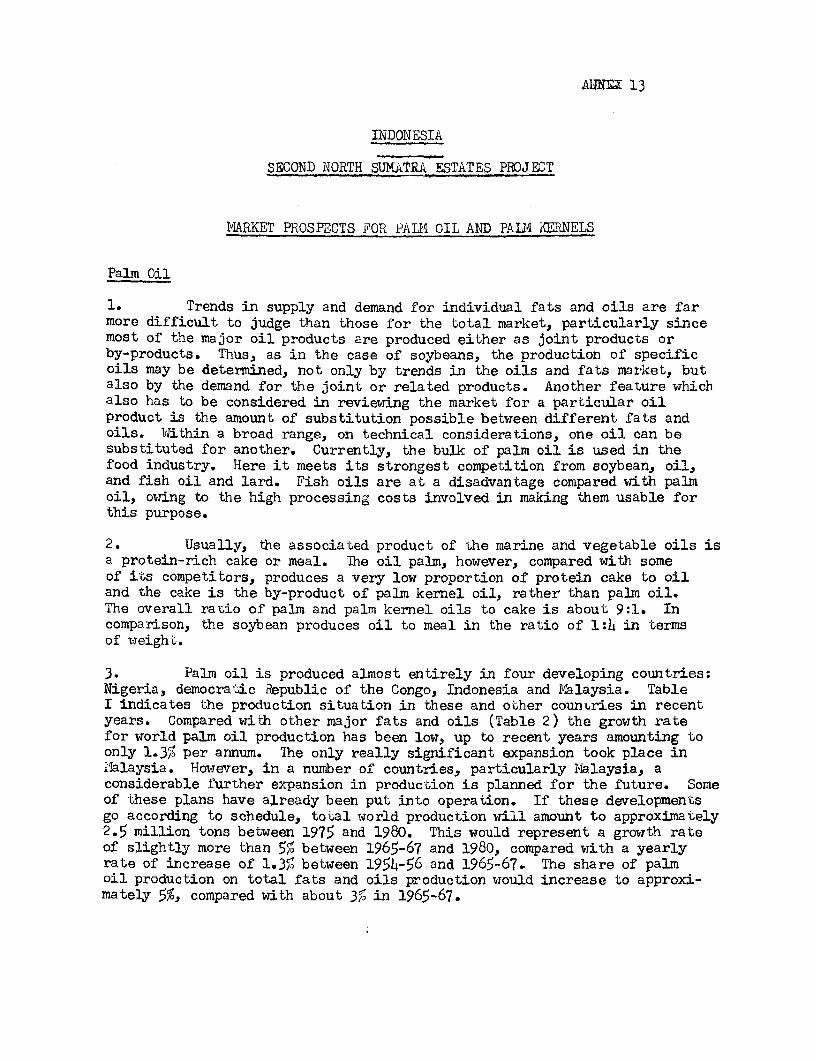
AQM31 13
INDONESIA
SECOND NORTH SUMATRA ESTATES PROJECT
MARKET PROSPi3CTS FOR PALI2 OIL AND PALM !MNELS
Palm Oil
1. Trends in supply and demand for individual fats and oils are farmore difficult to judge than those for the total market, particularly sincemost of the major oil products are produced either as joint products orby-products. Thus, as in the case of soybeans, the production of specificoils may be deternined, not only by trends in the oils and fats market, butalso by the demand for the joint or related products. Another feature whichalso has to be considered in reviewing the market for a particular oilproduct is the amount of substitution possible between different fats andoils. IWithin a broad range, on technical considerations, one oil can besubstituted for another. Currently, the bulk of palm oil is used in thefood industry. Here it meets its strongest competition from soybean, oil,and fish oil and lard. Fish oils are at a disadvantage compared with palmoil, owing to the high processing costs involved in making them usable forthis purpose.
2. Usually, the associated product of the marine and vegetable oils isa protein-rich cake or meal. The oil palm, however, compared with someof its competitors, produces a very low proportion of protein cake to oiland the cake is the by-product of palm kernel oil, rather than palm oil.The overall ratio of palm and palm kernel oils to cake is about 9:1. Incomparison, the soybean produces oil to meal in the ratio of 1:46 in termsof weight.
3. Palm oil is produced almost entirely in four developing countries:Nigeria, democratic Republic of the Congo, Indonesia and Malaysia. TableI indicates the production situation in these and other countri-es in recentyears. Compared with other major fats and oils (Table 2) the growth ratefor world palm oil production has been low, up to recent years amounting toonly 1.3% per annum. The only really significant expansion took place inIIalaysia. However, in a number of countries, particularly Malaysia, aconsiderable further expansion in production is planned for the future. Someof these plans have already been put into operation. If these developmen"Csgo according to schedule, total world production will amount to approximately2.5 million tons between 1975 and 1980. This would represent a growth rateof slightly more than 5%0 between 1965-67 and 1980, compared with a yearlyrate of increase of 1.3%J between 1954-56 and 1965-67. The share of palmoil production on total fats and oils production would increase to approxi-mately 5%, compared with about 3,5 in 1965-67.
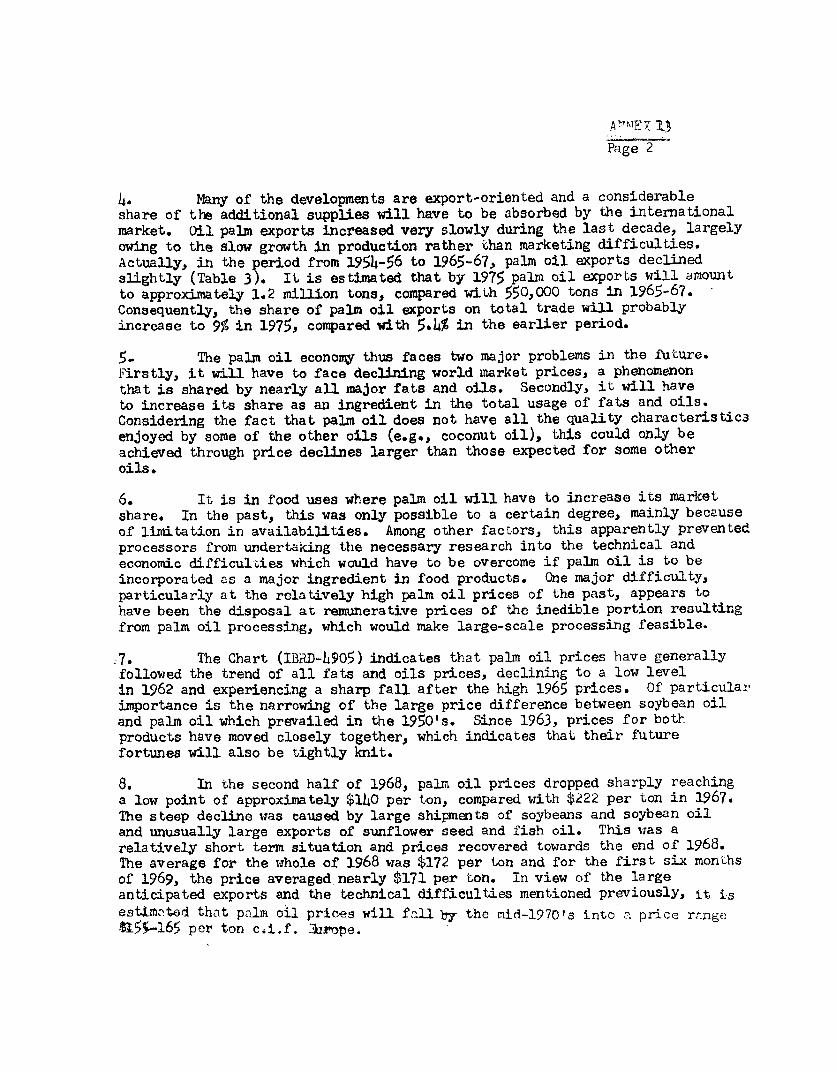
A6'TER 13Page 2
4. Many of the developments are export-oriented and a considerableshare of the additional supplies will have to be absorbed by the internationalmarket. Oil palm exports increased very slowly during the last decade, largelyowing to the slow growth in production rather than marketing difficulties.Actually, in the period from 1954-5 6 to 1965-67, palm oil exports declinedslightly (Table 3). It is estimated that by 1975 palm oil exports will amountto approximately 1.2 million tons, compared with 550,000 tons in 1965-67.Consequently, the share of palm oil exports on total trade will. probablyincrease to 9% in 1975, compared with 5.4% in the earlier period.
5. The palm oil economy thus faces two major problems in the fut-ure.Firstly, it will have to face declining world market prices, a phenomenonthat is shared by nearly all major fats and oils. Secondly, it will haveto increase its share as an ingredient in the total usage of fats and oils.Considering the fact that palm oil does not have all the quality characteristicsenjoyed by some of the other oils (e.g., coconut oil), this could only beachieved through price declines larger than those expected for some otheroils.
6. It is in food uses where palm oil will have to increase its marketshare. In the past, this was only possible to a certain degree, mainly becauseof limitation in availabilities. Among other factors, this apparently preventedprocessors from undertaking the necessary research into the technical andeconomic difficul-ies which would have to be overcome if palm oil is to beincorporated as a major ingredient in food products. One major difficulty,particularly at the relatively high palm oil prices of the past, appears tohave been the disposal at remunerative prices of the inedible portion resultingfrom palm oil processing, which would make large-scale processing feasible.
.7. The Chart (IBRD-h950) indicates that palm oil prices have generallyfollowed the trend of all fats and oils prices, declining to a low levelin 1962 and experiencing a sharp fall after the high 1965 prices. Of particularimportance is the narrowing of the large price difference between soybean oiland palm oil which prevailed in the 1950's. Since 1963, prices for bothproducts have moved closely together, which indicates that their futurefortunes will also be tightly knit.
8. In the second half of 1968, palm oil prices dropped sharply reachinga low point of approximately $140 per ton, compared with $222 per Lon in 1967.The steep decline was caused by large shipments of soybeans and soybean oiland unusually large exports of sunflower seed and fish oil. This wias arelatively short term situation and prices recovered towards the end of 1968.The average for the whole of 1968 was $172 per ton and for the first six monthsof 1969, the price averaged nearly $171 per ton. In view of the largeanticipated exports and the technical difficulties mentioned previously, it isestJl-tad that palm oil prices will fall 1by the mid-1970's into t price r.nge$15%-165 per ton c.i.f. 3irope.
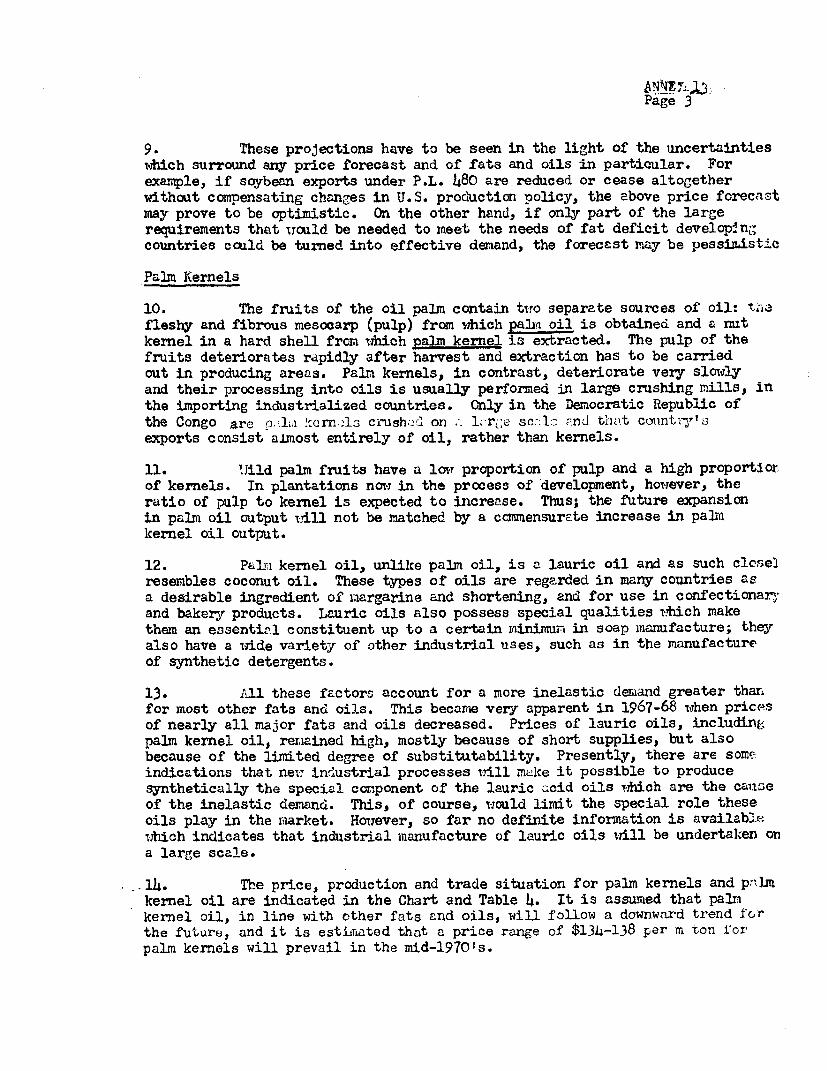
Page 3
9. These projections have to be seen in the light of the uncertaintiesdhich surround any price forecast and of fats and oils in particular. Forexample, if soybean exports under P.L. 480 are reduced or cease altogetherwithout compensating changes in U.S. production policy, the above price forecastmay prove to be optimistic. On the other hand, if only part of the largerequirements that wrculd be needed to meet the needs of fat deficit develop n-countries could be turned into effective denand, the forecast may be pessimistic
Palm IKernels
10. The fruits of the oil palm contain twto separate sources of oil: ti;-,afleshy and fibrous mesocarp (pulp) from 'which pam oil is obtained and a nutkernel in a hard shell from which Ralm kernel is extracted. The pulp of thefruits deteriorates rapidly after harvest and extraction has to be carriedout in producing areas. Palm kernels, in contrast, deteriorate very slowTlyand their processing into oils is usually performed in large crushing nills, inthe importing industrialized countries. Cnly in the Democratic Republic ofthe Congo are pli -,karn.~ls crushAd on (' 1.r,;; sc..l-. nd that cmintizrlsexports consist almost entirely of oil, rather than kernels.
11. U.ild palm fruits have a low proportion of pulp and a high proportiorof kernels. In plantations now in the process of development, how-rever, theratio of pulp to kernel is expected to increase. Thus; the future expansionin palm oil output vill not be matched by a ccmensurate increase in palmkernel oil output.
12. P&ln kernel oil, unlike palm oil, is a lauric oil and as such closeiresembles coconut oil. These types of oils are regarded in many countries asa desirable ingredient of margarine and shortening, and for use in confectiona.r.,and bakery products. Lauric oils also possess special qualities viich makethem an essential constituent up to a certain mainimun in soap manufacture; theyalso have a w-ride variety of other industrial uses, such as in the manufactureof synthetic detergents.
13. All these factors account for a more inelastic demand greater thanfor most other fats and oils. This becaie very apparent in 1967-68 when pricesof nearly all major fats and oils decreased. Prices of lauric oils, includingpalm kemel oil, renained high, mostly because of short supplies, but alsobecause of the limited degree of substitutability. Presently, there are someindications that net- ind'ustrial processes will imaIke it possible to producesynthetically the special conponent of the lauric vcid oils which are the caoseof the inelastic demand. This, of course, would limit the special role theseoils play in the market. Houever, so far no definite information is availab}e,which indicates that industrial manufacture of lauric oils will be undertaken ona large scale.
l14~. The price, production and trade situation for palm kernels and p".lmkernel oil are indicated in the Chart and Table 4. It is assmaed that palmkernel oil, in line with other fats and oils, will follow a downw-.Lrd trend fcrthe future, and it is estiirAated that a price range of $134-138 per m ton i'orpalm kernels will prevail in the mid-1970 1 s.
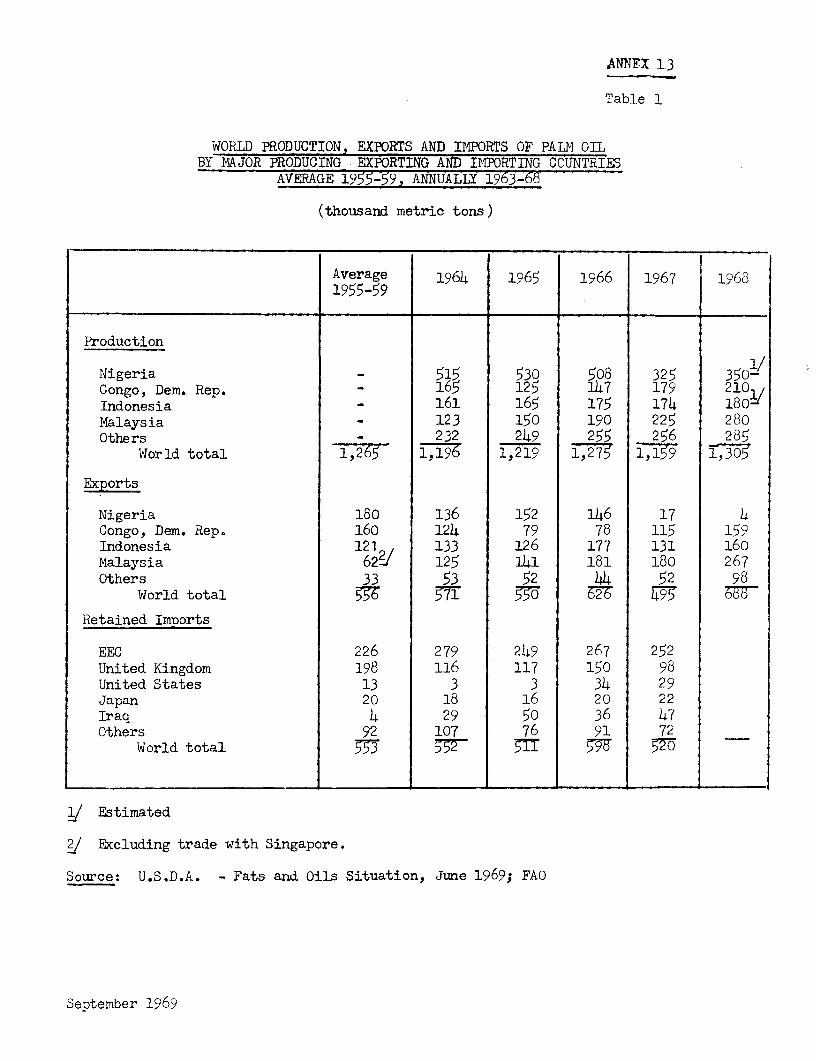
ANNEX 13
Table 1
WORLD PRODUCTION, EXPORTS AND IMPORTS OF PALM OILBY MAJOR PRODUCING EXPORTING AND IMTORTING COUNTRIES
AVERAGE 1955-59, ANNUALLY 1963-68
(thousand metric tons)
Average 1964 1965 1966 1967 19681955-59
Production
Nigeria 515 530 508 325 350-/Congo, Dem. Rep. - 165 125 147 179 210Indonesia - 161 165 175 174 180Malaysia - 123 150 190 225 280Others - 232 249 255 256 285
World total 1,265 1,197 1,219 1,275 1,159 1,305
iExports
Nigeria 180 136 152 146 17 4Congo, Dem. Rep. 160 124 79 78 115 159Indonesia 121 133 126 177 131 160Malaysia 622J 125 141 181 180 267Others 33 53 52 44 52 98
World total 7 71 76 26 7 0=
Retained Imports
EEC 226 279 249 267 252United Kingdom 198 116 117 150 98United States 13 3 3 34 29Japan 20 18 16 20 22Iraq 4 29 50 36 47Others 92 107 76 91 72
World total T53 -_ _ _ _
J Estimated
2/ Excluding trade with Singapore.
Source: U.S.D.A. - Fats and Oils Situation, June 1969; FAO
September 1969
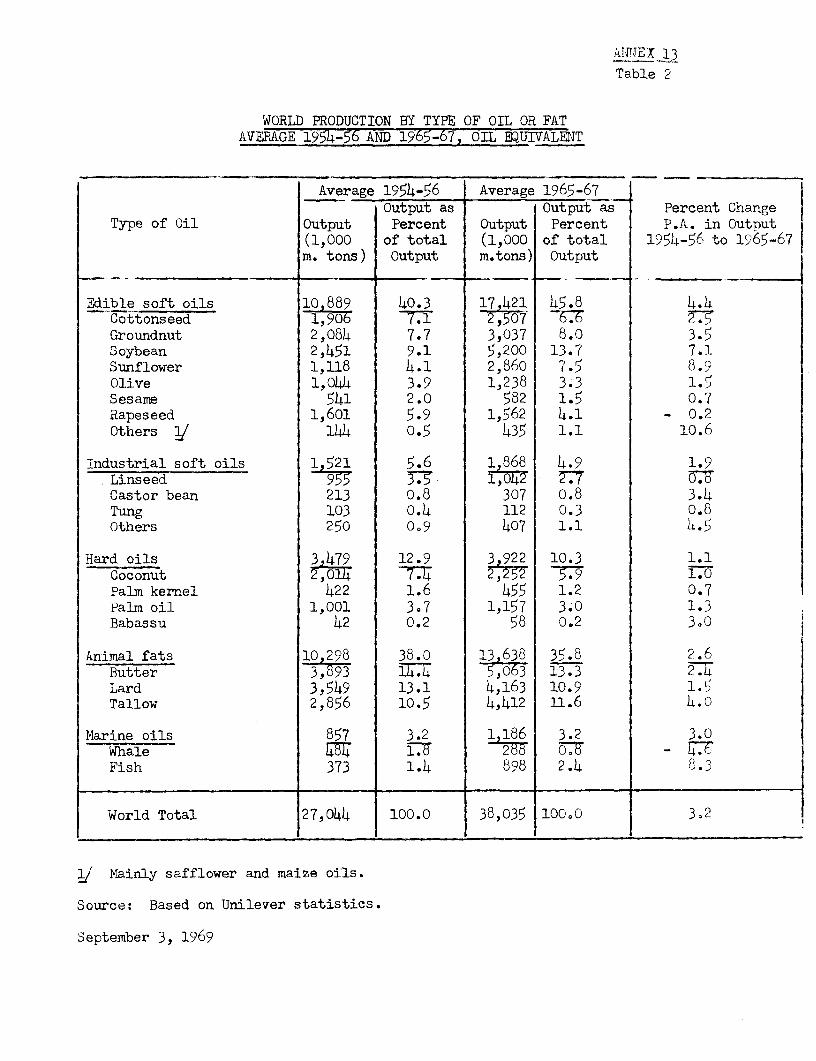
AJNEX 13
Table 2
WORLD PRODUCTION BY TYPE OF OIL OR FATAVERAGE 1954-56 AND 1965-67, OIL EQUIVALENT
Average 1954-56 Average 1965-67Output as Output as Percent Change
Type of Oil Output Percent Output Percent P.A. in Output(1,000 of total (1,000 of total 1954-56 to 1965-67m. tons) Output m.tons) Output
Edible soft oils 10 889 40.3 17 421 45.8 4.4Cottonseed 1,90 T7.1 ,7 T66 7;Groundnut 2,084 7.7 3,037 8.0 3.5Soybean 2,451 9.1 5,200 13.7 7.1Sunflower 1,118 4.1 2,860 7.5 8.9Olive 1,044 3.9 1,238 3.3 1.5Sesame 541 2.0 582 1.5 0.7Rapeseed 1,601 5.9 1,562 4.1 - 0.2Others 1/ 144 0.5 435 1.1 10.6
Industrial soft oils 1 521 5.6 1 868 4.9 1.9.Linseed '9X T75 1,042 :77 _7bCastor bean 213 0.8 307 0.8 3.4Tung 103 0.4 112 0.3 0.8Others 250 0.9 407 1.1 4.5
Hard oils 3 479 12.9 3 922 10.3 1.1Coconut 7.4 5.9 1.0Palm kernel 422 1.6 455 1.2 0.7Palm oil 1,001 307 1,157 3.0 1.3Babassu 42 0.2 58 0.2 30X
Animal fats 10 298 38.o 13 638 35.8 2.6
Butter 3,8 93 14.4 13.3 2Lard 3,549 13.1 4,163 10.9 1.5Tallow 2,856 10.5 4,412 11.6 4.0
Marine oils 857 3.2 1,186 3.2 3.0Whale 4 57 288 07 _ 7,Fish 373 1.4 898 2.4 8.3
World Total 27,044 100.0 38,035 100.0 3.2
1| Mainly safflower and maize oils.
Source: Based on Unilever statistics.
September 3, 1969
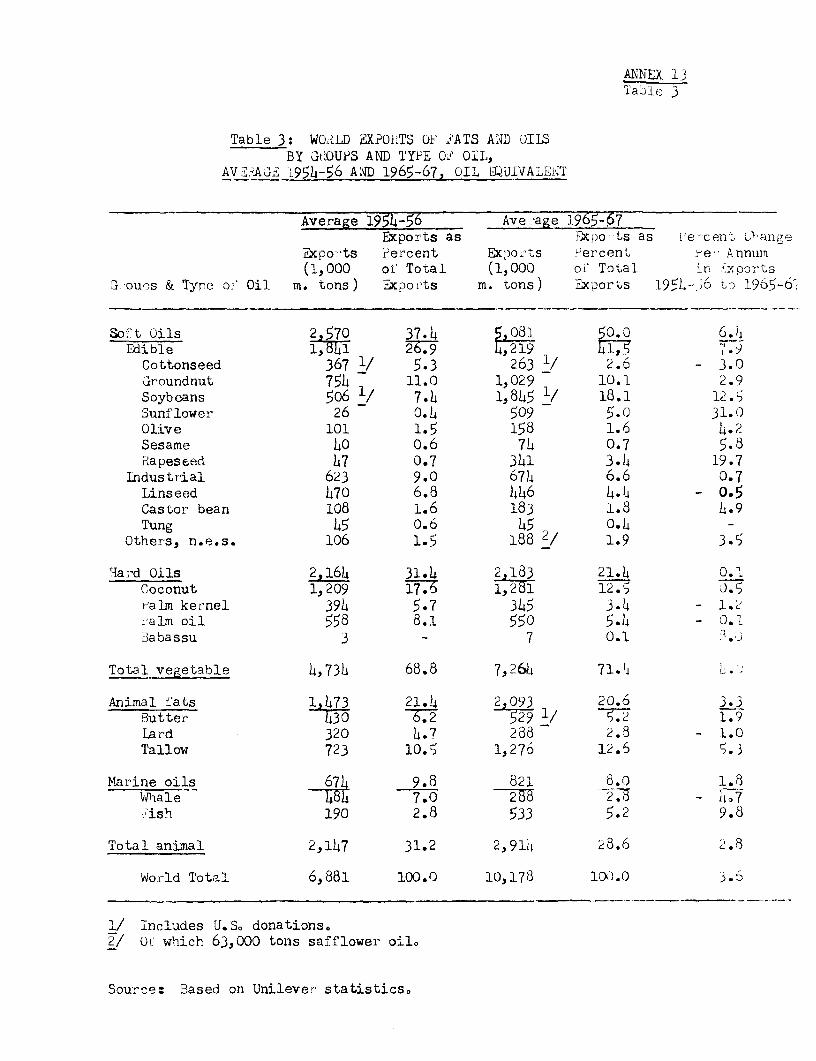
ANNEX1Tajle 3
Table 3: WO'?LD EXPO;'LTS OF 2ATS ANID OIISBY 't'.OUPS AND TYPE O,' OIL,
AVE,;A E 1954-56 AiN 1965-67, OIL 9QUIVALE T
Average 1954-56 Ave-age 1965-67Exports as icxpo ts as l-e-cenv 0}ange
Expo-ts Percent Expo.-ts percent i-e- Annumn(1,000 ol Total (1,000 of Total in exorots
n ouos & Tyce o, Oil m. tons) Exports m. tons) Exports 1954-,6 6 1965-6.
Soft Oils 2 570 37.4 5,081 50.0 6.J4Edible 26.79 1,219 4,.Cottonseed 367 1/ 5.3 263 l/ 2.6 - 3.0uroundnut 754 11.0 1,029 10.1 2.9Soybeans 506 1/ 7.4 1,845 1/ 18.1 12.5Sunflower 26 0.4 509 5.( 31.0Olive 101 1.5 158 1.6 14.2Sesame 40 0.6 714 0.7 5.8i{apeseed 47 0.7 341 3.1l 19.7
Industrial 623 9.0 6714 6.6 0.7Linseed 470 6.8 446 4.i4 - 0.5Castor bean 108 1.6 183 1.8 4.9Tung 45 o.6 45 0.4 -
Others, n.e.s. 106 1.5 188 2/ 1.9 3.5
Ha r.d Oils 2,164 31.4 2 183 21.4 0.Coconut 1,209 176 t; 12.5 o.5r-alm kernel 394 5.7 345 3.4 -1.r
ralm oil 558 8.1 550 5.14 _ 0.1Babassu 3 - 7 0.1
Total vegetable 4,734 68.8 7,266 71. 4 L.
Animal fats 1 473 21.4 2,093 20.6 3.3Butter 60 q529 1/ 5.2 1.9Lard 320 4.7 288 2.8 _ 1.0Tallow 723 10.5 1,276 12.6 5.3
Marine oils 674 9.8 821 8.o 1.8Whale 484 7.0 27 2. -Lt-7
'ish 190 2.8 533 5.2 9.8
Total animal 2,147 31.2 2,9114 28.6 2.3
World Total 6,881 100.0 10,178 100.0
1/ Includes U.S0 donations.2/ Ot which 63,000 tons safflower oilo
Source: Based on Unilever statistics.
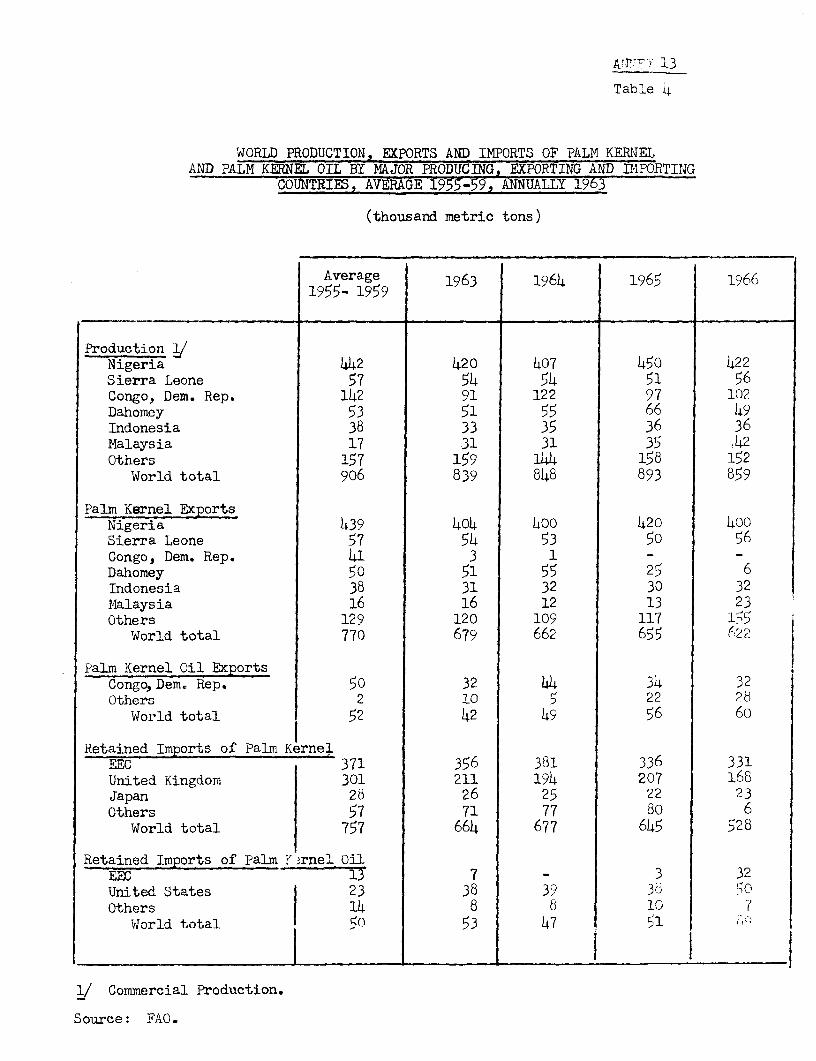
A'. 13
Table l
WORLD PRODUCTION, EXPORTS AND IMPORTS OF PALM KERNELAND PALM KERNEL OIL BY MAJOR PRODUCING, EXPORTING AND DvIPORTING
COUNTRIES, AVERAGE 1955-59, ANNUALLY 1963
(thousand metric tons)
Average 1963 1964 1965 19661955- 1959
Production /Nigeria 442 420 407 450 422Sierra Leone 57 54 54 51 56Congo, Dem. Rep. 142 91 122 97 102Dahomey 53 51 55 66 49Indonesia 38 33 35 36 36Malaysia 17 31 31 35 ,42Others 157 159 144 158 152
World total 906 839 848 893 859
Palm Kernel ExportsNigeria 439 404 400 420 400Sierra Leone 57 54 53 5o 56Congo, Dem. Rep. 41 3 1 - -
Dahomey 50 51 55 25 6Indonesia 38 31 32 30 32Malaysia 16 16 12 13 23Others 129 120 109 117 1`5
World total 770 679 662 655 (22!
Palm Kernel Oil ExportsCongo,Dem. Rep. 50 32 44 34 32Others 2 10 5 22 28
World total 52 42 49 56 60
Retained Imports of Palm Kerne.EEC 371 356 381 336 331United Kingdom 301 211 194 207 168Japan 28 26 25 22 23Others 57 71 77 80 6
World total 757 664 677 645 528
Retained Imports of Palm Y rnel OilEEBC ~13 7 _ 3 32United States 23 38 39 36 50Others 14 8 8 10 7
World total 5n 53 47 51
_ ~~~ _ _ _ _ I__ I _ _ IJ Commercial Production.
Source: FAO.
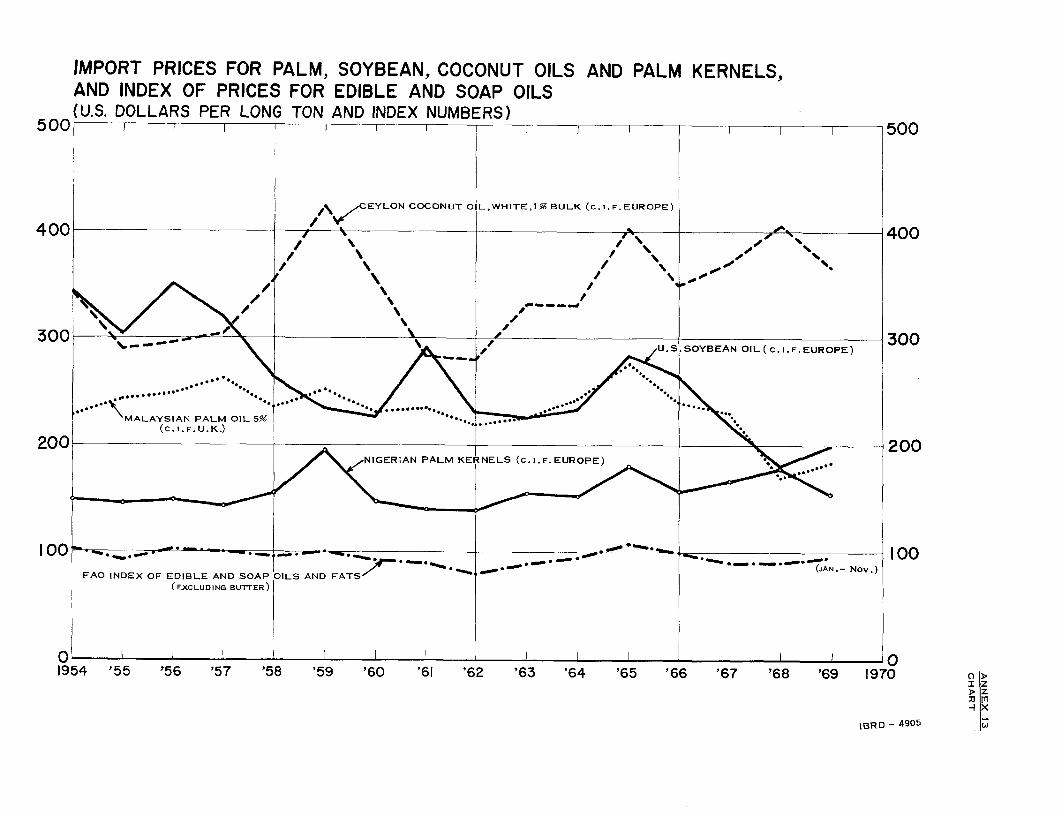
IMPORT PRICES FOR PALM, SOYBEAN, COCONUT OILS AND PALM KERNELS,AND INDEX OF PRICES FOR EDIBLE AND SOAP OILS(U.S. DOLLARS PER LONG TON AND INDEX NUMBERS)
500 1 -F -1 - - - - 500
400\ -CEYLON COCONUT OIL,WHITE, 1% BULK (C. I.F. EUROPE)
400 -t-,, " - 00400
300 \ />\ _U. SSOYBEAN OIL(C.I.F.EUROPE) 300
"'MALAYSIAN PALM OIL 59-*-.. ,.>(C.1. F. U.K.)x
200 200
100 ~ ~ ~ ~ ~ ~ ~ ~ ~ ~ ~ ~ *.~ .100
FAO INDEX OF EDIBLE AND SOAP OILS AND FATS ' ,(EXCLUDING BUTTER)
0 01954 '55 '56 '57 '58 '59 '60 '61 '62 '63 '64 '65 '66 '67 '68 '69 1970
IBRD - 4905
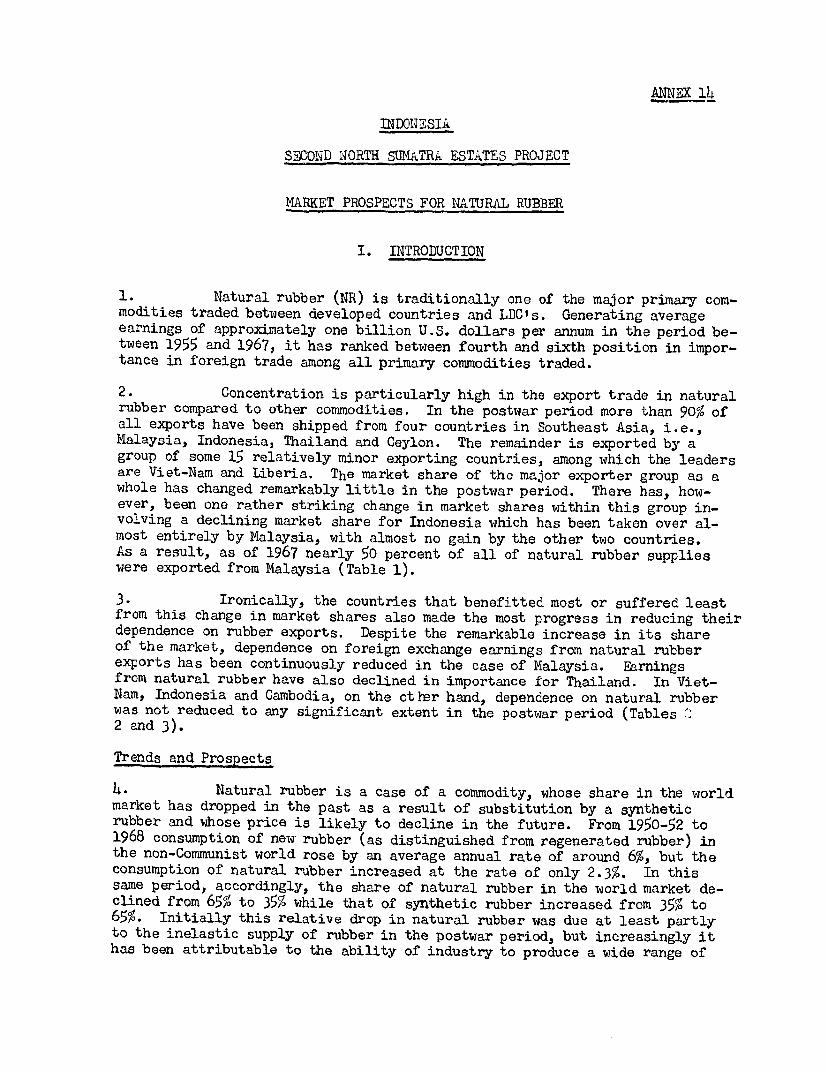
ANNEX 14
INDOWESIk
SECOND NORTH SUMATRA ESTiTES PROJECT
MARKET PROSPECTS FOR RATURAL RUBBER
I. INTRODUCTION
1. Natural rubber (NR) is traditionally one of the major primary com-modities traded between developed countries and LDC's. Generating averageearnings of approximately one billion U.S. dollars per annum in the period be-tween 1955 and 1967, it has ranked between fourth and sixth position in impor-tance in foreign trade among all primary commodities traded.
2. Concentration is particularly high in the export trade in naturalrubber compared to other commodities. In the postwar period more than 90% ofall exports have been shipped from four countries in Southeast Asia, i.e.,Malaysia, Indonesia, Thailand and Ceylon. The remainder is exported by agroup of some 15 relatively minor exporting countries, among which the leadersare Viet-Nam and Liberia. The market share of the major exporter group as awhole has changed remarkably little in the postwar period. There has, how-ever, been one rather striking change in market shares within this group in-volving a declining market share for Indonesia which has been taken over al-most entirely by Malaysia, with almost no gain by the other two countries.As a result, as of 1967 nearly 50 percent of all of natural rubber supplieswere exported from Malaysia (Table 1).
3. Ironically, the countries that benefitted most or suffered leastfrom this change in market shares also made the most progress in reducing theirdependence on rubber exports. Despite the remarkable increase in its shareof the market, dependence on foreign exchange earnings from natural rubberexports has been continuously reduced in the case of Malaysia. Earningsfrom natural rubber have also declined in importance for Thailand. In Viet-Nam, Indonesia and Cambodia, on the other hand, dependence on natural rubberwas not reduced to any significant extent in the postwar period (Tables2 and 3).
Trends and Prospects
4. Natural rubber is a case of a commodity, whose share in the worldmarket has dropped in the past as a result of substitution by a syntheticrubber and whose price is likely to decline in the future. From 1950-52 to1968 consumption of new rubber (as distinguished from regenerated rubber) inthe non-Communist world rose by an average annual rate of around 6%, but theconsumption of natural rubber increased at the rate of only 2.3%. In thissame period, accordingly, the share of natural rubber in the world market de-clined from 65% to 35% while that of synthetic rubber increased from 35% to65%. Initially this relative drop in natural rubber was due at least partlyto the inelastic supply of rubber in the postwar period, but increasingly ithas been attributable to the ability of industry to produce a wide range of
ANNEX 1-
synthetics at qualities and prices that proved attractive as compared twithnatural rubber.
5. The single most important market for rubber is the transportationequipment industry. Approximately 50p5 of all newf rubber is utilized in tiresand tire products. Also, aside from tires, automobiles average more than 100lb of rubber per car. Other "non'tire" uses include a uide variety of indus-trial and consumer goods. Since end products of rubber have a high incomeelasticity of demand, future world demand for rubber should a priori dependto a large extent on the future rate of income grorth and especially of growithin manufacturing output. This reasoning is supported by correlation analysisbetwyeen world manufacturing output and world rubber consumption which yieldsa coefficient (referred to hereafter as elasticity of deiaand) of 1.1 for theperiod 1951-1967.
6. Table 4 presents a view of the probable course of world demand fornew rubber to 1985 based on projections made in the Economics Department. Onthe basis of pro ections of GNP and projections of industrial output in theOECD countries 1 total world consumption outside the centrally planned countriesis expected to grow at just over 6.5,; per annum reaching a level of 8.7 millionlong tons per year around 1975. In addition, net imports of natural rubber intothe centrally planned countries are projected to reach 700,000 long tons as of1975. Of course, deviations in the gronfth rate of GNP in OECD countries fromthe assumed growth rates as projected would have an effect on the above picture,as wsould, too, a change in the amount of imports into the centrally plannedcountries, or a change in the assumed elasticity coefficient of demand 2/.The implications of a more pessimistic assumption in these determinants can bequantified by tald.ng as the growsth rate of GUP in CECD countries, the lower limitindicated above, i.e., 4.3, p.a. (rounded from 4.255), for the period of 1967to 1975. The corresponding growth rate of total new rubber consumption of 5.5r'p.at would then yield an estirate of total new rubber consumption in the worldas of 1975 of about 8.4 million long tons. Estimates of natural rubber importsinto the centrally planned countries range from 600,000 long tons, implyingthat any increase in consumption in these countries could be met by expandingoutput of their synthetic rubber industry to 850,000 long tons, which wouldreflect a technical relationship between tire production and natural rubberconsumption similar to that in the rest of the world. A medium projection oftotal nesr rubber consumpticn in the Pree 'Jorld, representing a growth rate of6.5 y p.a. would result in 8.7 million long tons as of 1975. Imports into thecentrally planned countries could be assumed at 700,000 long tons as of 1975.
1/ It wras assumed on the basis of available protections by OECDp that G1TP inall developed countries trould grotT at a range betwreen 4.3 to 4.6 p.a. andindustrial prociuction at a range betwjeen 4.8 and 5.8 p.a.
2/ It should be noted, howiever, that the elasticity coefficient of 1.1 holdremarkably strong over the last 16 years.
AENX 14Faoc 3
7. Potential production from already existing rubber plantings isexpected to increase to 3.5 million long tons in the mid-1970's (with furtherincreases to approximately 4.0 millicn long tons in 1980 and 1985 in the absenceof replantings as of 1969). Since it is expected that the centrally plannedcountries would import about 700,000 long tons as of 1975, approximately 2.8million long tons of natural rubber -ould be left for sale in the free worldmarket in the 1970's. If output proceeded at capacity level, therefore,natural rubber would have to retain its share of the grotuth in demand. Inessence, this means that between now and the mid-1970's natural rubber's shareof total rubber demand would have to decline more slowrly than in the periodbefore 1967. As a consequence it is expected that prices for natural rubberwould have to becor,me more competitive with prices of synthetic rubber.
8. Hatural rubber prices are likely to decline to about 16 U.S. centsper pound as of the mid-1970's (see chart). This forecast is based on ourassessment of what will happen to the cost price of synthetic rubber. Themajor development foreseen in synthetic rubber is cammercial production of thehighly competitive stereo-regular rubbers (i.e. polyisoprene and poly-butadiene)besides the more trnditional SBRf, and a decline in the price of raw materialinputs of such rubbers, except for polyisoprene. In assessing the prospectiveprice for butadiene-based synthetic rubber (SBR and PB) the major developmentanticipated is the change in the status of butadiene frcm being a productprimarily produced for synthetic rubber conversion to a by-product of anothermajor chemical proeuct, ethylene. In the case of polyisoprene, cost reductionin the raw material input is also foreseen, although as a result of expectedeconomics of scale rather than a change in status from major product to by-product. The proJected price of natural rubber is based on the assumption thatthe cost/price of PI will serve as a ceiling since protracted movements ofnatural rubber above that ceiling would lead to an acceleration of capacity inpolyisoprene.
9. Over the longer run-and in particular for the peTiod 1975-85 duringwhich new and replanted rubber would be maturing--it is believed that the priceof natural rubber may either decline somewThat nore, to a level say, of approxi-mately 12 U.S. cents per pound, c.i.f. New York or stay at 16 U.S. cents perpound. This prognosis is based on the assumption of further technological pro-gress in the synthetic rubber industry. In making a longer term forecast fornatural rubber, the key question is the possible further price developments inpolyisoprene, uhich from the standpoint of quality is the synthetic most likelyto make progress at the expense of natural rubber. There are presently researchefforts by the industry to adjust the petro-chemical production stream so as toderive isoprene, the major raw material inputs, as a by-product. The history ofsuccess in butadiene-based rubbers suggests that this aim may be achieved. Homw-ever, the present position is that an approach to such a technical breakthroughhas not yet been found. If a breakthrough were to be achieved, it is conceiva-ble that the price of polyisoprene would fall belouT 15 U.S. cents per pound,ccmpared to 21 U.S. cents as of 1968, and both polyisoprene and natural rubbermight be selling at a level in the order of 12 U.S. cents per pound. A situa-tion such as this is w¢ithin the realm of possibilities sonetime betwreen 1975 and1985. If isoprene cannot be produced as a by-product, however, prices forpolyisoprene and natural rubber miight continue at the projected 1975 level, inreal terms, for the period 197c5-1995. According to repeated industry statermentsat IRSG meetings, however, efficient producers of natural rubber opereting onreplanted high-yielding acreage should be able to produce rubber profitably atprices as lo;- as 12 U.S. cents per pound c.i.f. consuming countries.
ANNEX 14
-Page
10. The foregoing implicitly assumes that in the late 1970's and the
1980's all natural rubber produced at the suggested prices wrill be absorbed,
i.e., that price consi-lerations will outweigh any possible additional tech-
nical advantages that synthetic rubber may present to consumers. On the
other hand, if this assumption -iere considered to be too optimistic, the
question would arise whether it wTould be desirable to improve or even main-
tain the existing natural rubber capacity.
11. To test this proposition, prospective demand for new rubber in the1980's was compared iith natural rubber output that would materialize from aglobal 3I, replanting program in the natural rubber industry (see Table 4). Theproduction implications of such an ambitious program is shown in line 6 ofTable 4, indicating that the resulting output of natural rubber would in factbe substantially absorbed even if technical substitution against natural rubbercontinued regardless of price. Of course, if low prices for natural rubber,especially any w7ell below the future cost price of synthetic rubber resultingfrom newT plantings wyith high yieldin7 trees were to halt, or even reverse
substitution, then foreseeable supplies of natural rubber might not be sufficientto meet denand even i-ith an accelerated global rate in replanting. The probablemagnitude of the deficit is illustrated in line 5 of Table 4. In other words,the implicit natural rubber shortage seen in the 1950's w.Jould be repeated.
12. In this case new planting in addition to the program to improvethe cost competitiveness of natural rubber against synthetic rubber by replant-ing would be required. lioreover, it may be noted that it is far from certainat this point in time that a replanting rate of 3~, per annum could be achievedon a global basis. Even if it is achieved, completion of the program wouldrequire between 13 to 29 years. Such a long-term program would be subject toadjustment if the prospects for rubber change over time. The case for newplanting is further strengthened by the prospects for improvement in thecompetitive position of natural rubber through better preparation of the rawmaterial which wJould proceed alongside a planting program. Such improvementsinvolving production of newr formis of crude natural rubber such as "block rubber",raise the technical standards of natural rubber and make possible a redactionin the processin- costs of the rubber products manufacturer who is the decisivefactor in deciding the issues of substitution between natural and syntheticrubbers.
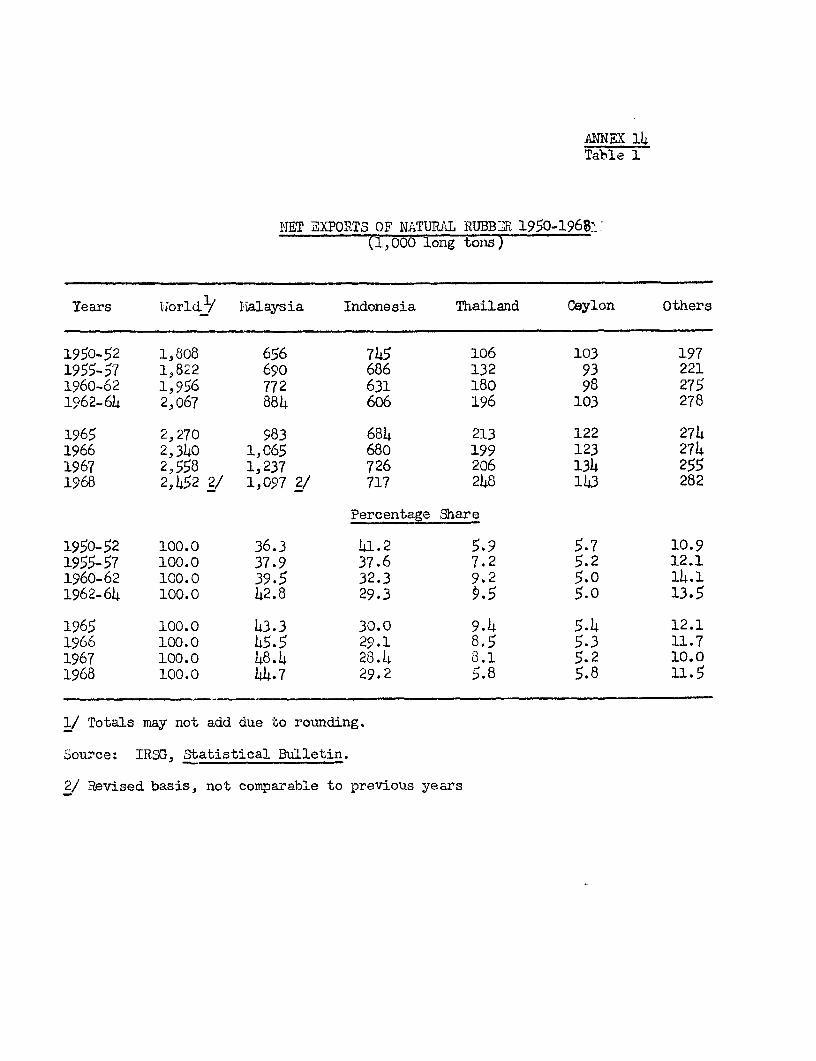
ANNEX 14Table 1
NET 3XPORTS OF NATURAL RUBBIR 1950-1968?(1,000 long tons)
Years WJorlL1/ Pialaysia Indonesia Thailand Ceylon Others
1950-52 1,808 656 745 106 103 1971955-57 1,822 69o 686 132 93 2211960-62 1,956 772 631 180 98 2751962-64 2,067 884 606 196 103 278
1965 2,270 983 684 213 122 2741966 2,340 1,065 680 199 123 2741967 2,558 1,237 726 206 134 2551968 2,452 2/ 1,097 2/ 717 248 143 282
Percentage Share
1950-52 100.0 36.3 41.2 5.9 5.7 10.91955-57 100.0 37.9 37.6 7.2 5.2 12.11960-62 100.0 39.5 32.3 9.2 5.0 14.11962-64 100.0 42.8 29.3 9.5 5.0 13.5
1965 100.0 43.3 30.0 9.4 5.4 12.11966 100.0 45.5 29.1 8.5 5.3 11.71967 100.0 48.4 28.4 8.1 5.2 10.01968 100.0 44.7 29.2 5.8 5.8 11.5
1/ Totals may not add due to rounding.
Source: IRSG, Statistical Bulletin.
2/ Revised basis, not comparable to previous years
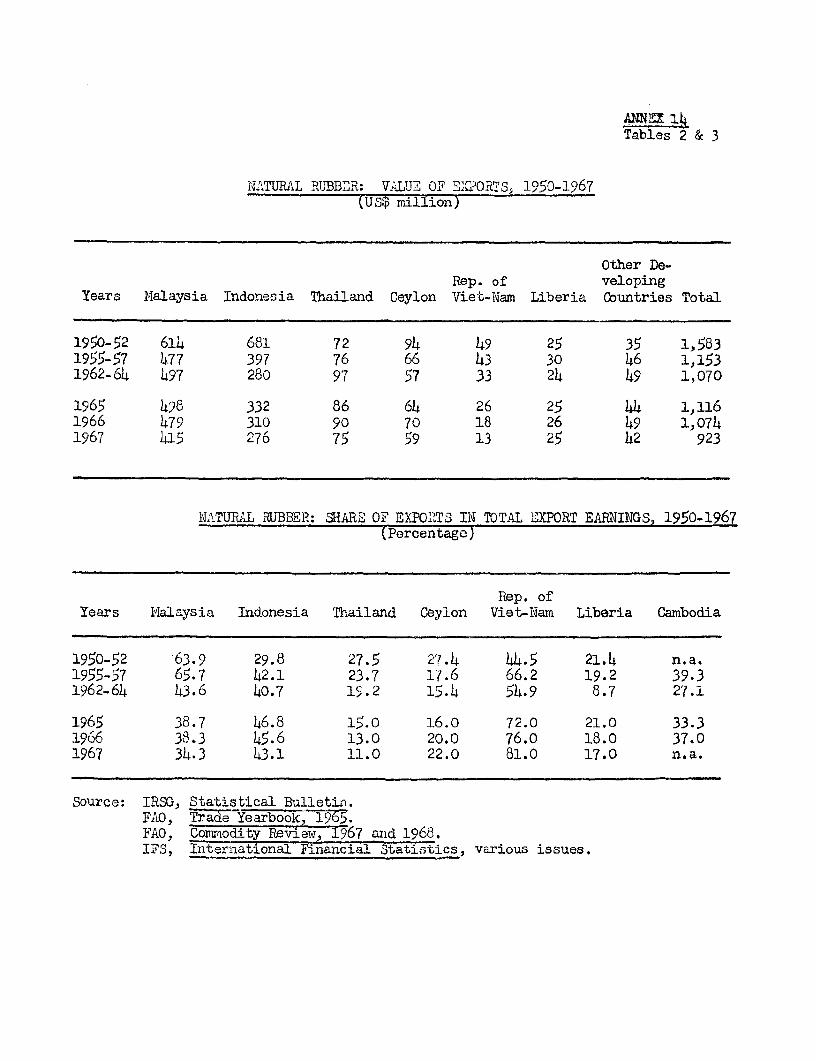
ANNg 1,LTables 2 & 3
N.MATUPLAL RUBDZR: VALUE OF EXPDORTS, 1950-1967(US$ million)
Other De-Rep. of veloping
Years Malaysia Indo-nesia Thailand Ceylon Viet-Nam Liberia Countries Total
1950-52 614 681 72 94 49 25 35 1,5831955-57 477 397 76 66 43 30 46 1,1531962-64 497 280 97 57 33 24 49 1,070
1965 4)8 332 86 64 26 25 44 1,1161966 479 310 90 70 18 26 49 1,0741967 415 276 75 59 13 25 42 923
N:1ATURAL RUBBE:R: SHARE OF EXPO.1T3 IN TOTAL E3XPORT EARNINGS, 1950-1967(Percentage)
Rep. ofYears Malaysia Indonesia Thailand Ceylon Viet-Nam Liberia Cambodia
1950-52 63.9 29.8 27.5 27.4 44.5 21.4 n.a.1955-57 65.7 42.1 23.7 17.6 66.2 19.2 39.31962-64 43.6 40.7 1c.2 15.4 54.9 8.7 27.1
1965 38.7 46.8 15.0 16.0 72.0 21.0 33.31966 38.3 45.6 13.0 20.0 76.0 18.0 37.01967 34.3 43.1 11.0 22.0 81.0 17.0 n.a.
Source: IRSG, Statistical Bulletin.FAO, Trade Yearbook1 .FAO, Commodity Review) 1967 and 1968.IFS, International F-inancial StatiaLis, various issues.
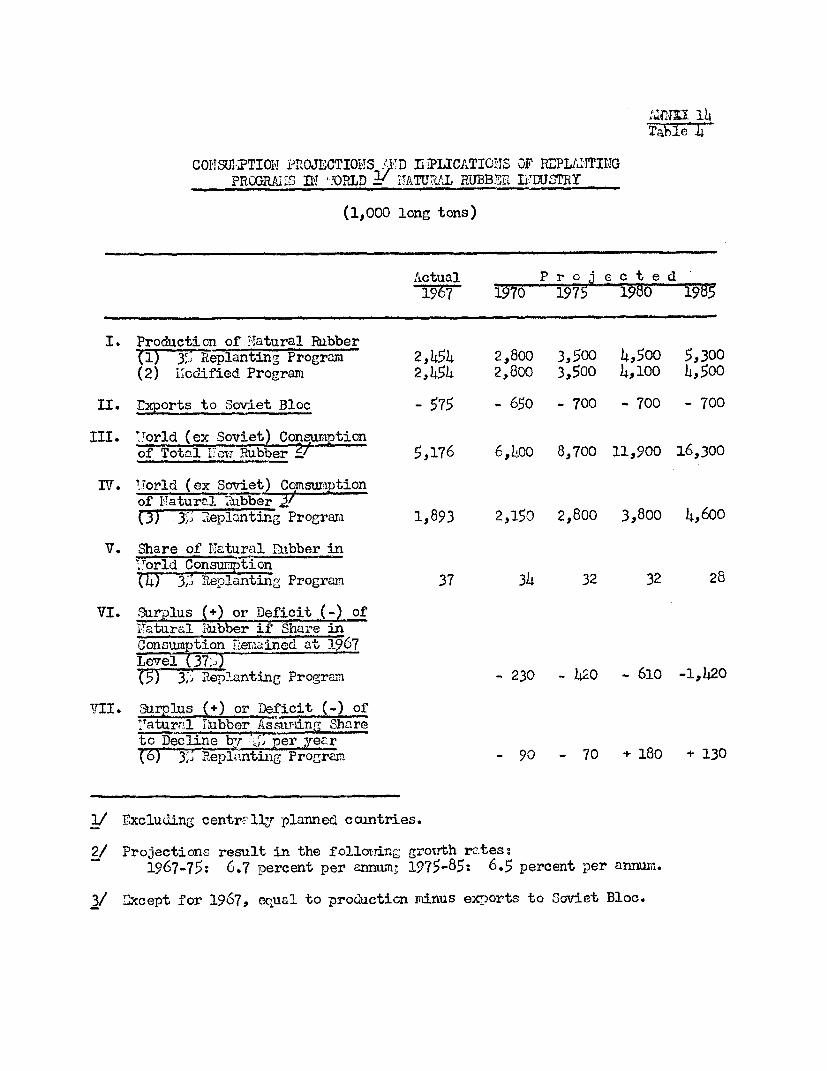
M1rN 14Table 14
COi1SUMiTION PIROJECTIOiKS''1 D IiThLICATICOJS OF RiPLILUTIUGPRCGRA;S Y ni -OD _ UATUI RUBBr. IZDUSTRY
(1,000 long tons)
Actual P r o e c t e di967 1970 1975 1950 19t5
I. Production of 1Ptatural Rubber(1) 3T. Replanting Program 2,454 2,800 3,500 4,500 5,300(2) !iedified Program 2,454 2,800 3,500 4,100 4,500
II. Exports to Soviet Bloc - 575 - 650 - 700 - 700 - 700
III. '!orld (ex Soviet) Consumptionof Total- Ru 5,176 eo 163000
IV. tTorld (ex Soviet) Comsumptionof ITatural :Fer 3t(3) 3; Progra,m 1,893 2,150 2,800 3,800 4,600
V. Share of NIatural aTEbber in',Torld Consumpt-ionT4T)3-,'.Replanting Progran 37 34 32 32 28
VI. Surplus (+) or Deficit (-) ofIY,atural IAabber if Share inConsumption Pe,ined at 1967Level (37.j)(5) 3. ;tepi.antinC Program - 230 - 420 - 610 -1,,420
JII. 3urplus (+) or Deficit (-) of,"atur-l Ruabber Assmaiing Shareto Decline b-r , per year(6) 3;. PReplonting Prog-ral - 90 - 70 + 180 t 130
1/ Excluding centr'lly planned ccuntries.
2/ Projections result in the follomring growth rates:1967-75: 6.7 percent per annmim 1975-85: 6.5 percent per annum.
3/ Except for 1967, equal to production minus exports to Soviet Bloc.
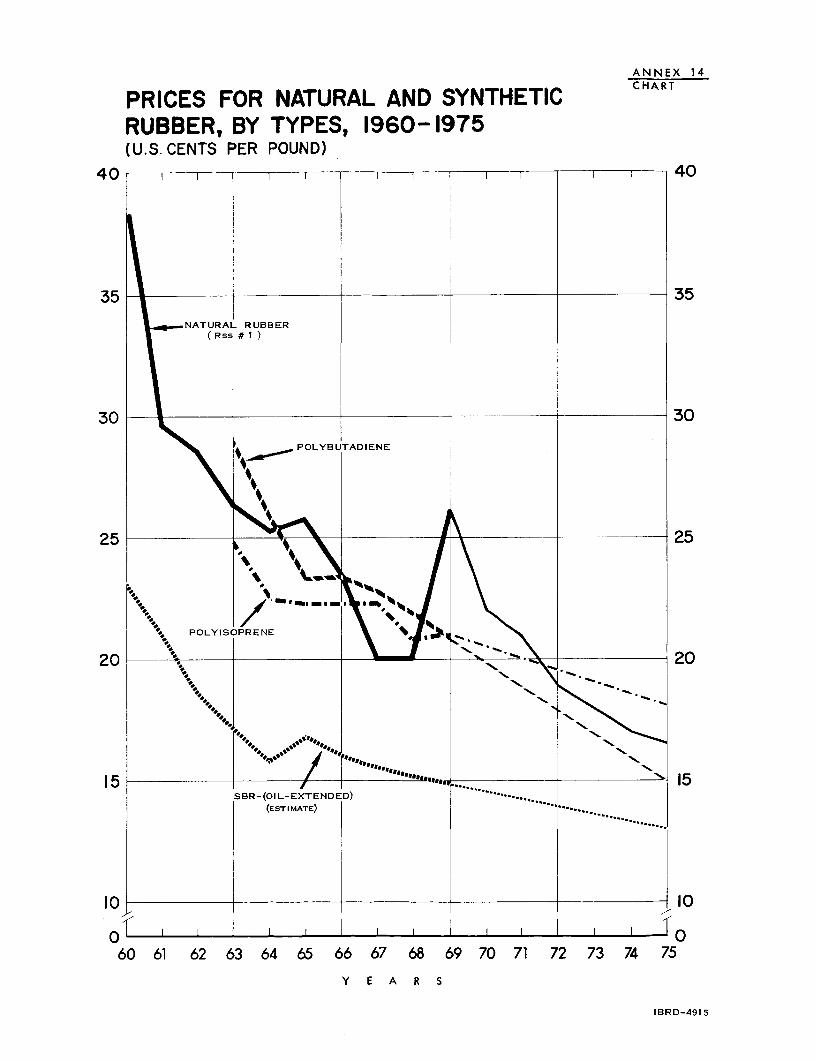
ANNEX 14
PRICES FOR NATURAL AND SYNTHETIC CHART
RUBBER, BY TYPES, 1960-1975(U.S. CENTS PER POUND)
40 I I I I I 40
35 35
NATURAL RUBBER(Rss# )
30 30
POLYBUTADIENE
25 9 t5
20 9 _ 8\. 0
15 \<....... ,,,,,e,...15SBR-(OIL-EXTENDE D> )
(E ST IMATrE) .... ',,,''
4
10 10o
60 61 62 63 64 65 66 67 68 69 70 71 72 73 74 75
Y E A R S
IBRD-491 5
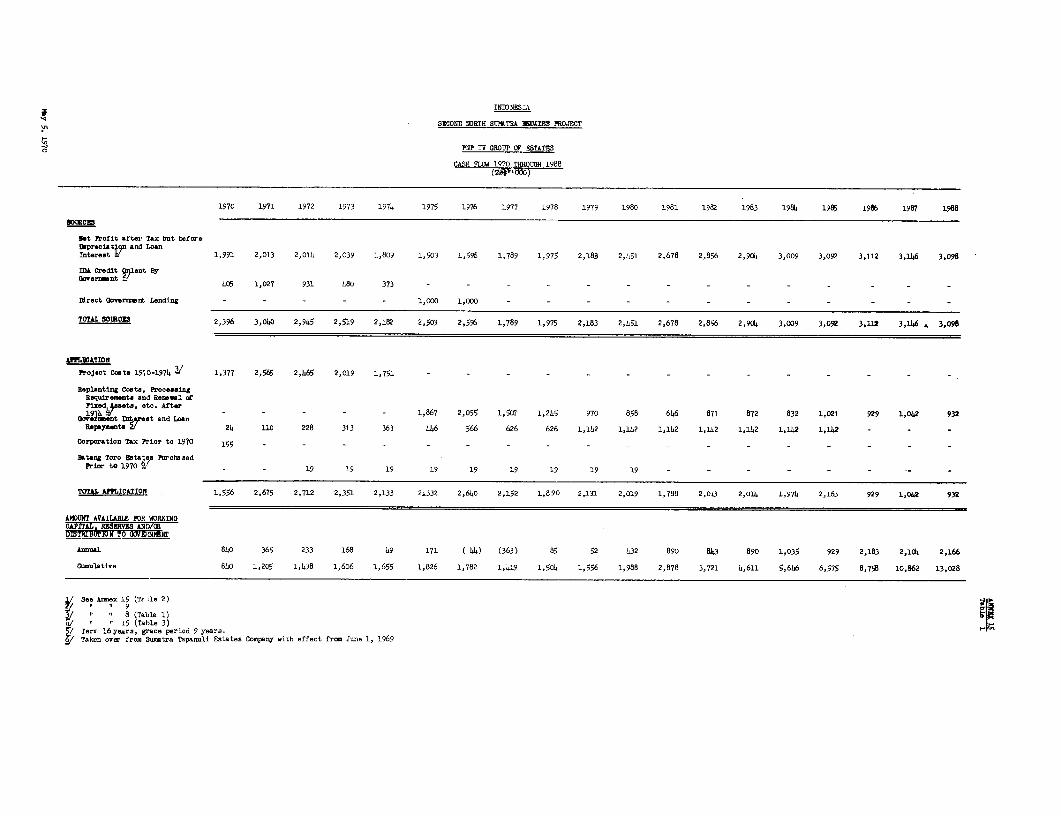
INMHNESIA
SECOND NifRTH SU1ATRi IESA PROJECT
PrNP IV GROUP OF ESTATES
CASH FLOW 1970 THROUGH 1988
1970 1971 1972 1973 1974 1975 1976 1977 1978 1979 1980 1981 1982 1983 1984 1985 1986 1987 1988
0URCHS
Not Profit after Tax but beforeDapraciatirn n LoanIntereat Y 1,991 2,013 2,014 2,039 1,809 1,503 1,556 1,789 1,975 2,183 2,451 2,678 2,856 2,904 3,009 3,092 3,112 3,146 3,098
ML Credit plaient By
Government - 405 1,027 931 480 373 - - _ - - - - - - - - - - -
Direct Uovernmrt Lending - - - - - 1,000 1,000 - - - - - -
TOTAL SOUCXS 2,396 3,040 2,945 2,519 2,182 2,503 2,5% 1,789 1,975 2,183 2,451 2,678 2,856 2,904 3,009 3,092 3,112 3,114 * 3,098
ProJect Co ta 19f0-1974 -/ 1,377 2,565 2,465 2,019 1,751 - - - - - - - -
Replanting Coats, ProcesingReoquireents and Rene_l ofF01ed4 5 eet, etc. Arter _ _ _ _ 1,867 2,055 1,507 1,245 970 858 646 871 872 832 1,021 929 1,042 932wovernent Intre.ft and LoanRepayments 5. 24 110 228 313 363 446 566 626 626 1,142 1,142 1,142 1,142 1,142 1,142 1,142 - - -
Corporation Tax Prior to 1970 155 - - - - - - - - - - - - - -
Batang Toro Ietages PorciwaedPrior tO 1970 ° - - 19 19 19 19 19 19 19 19 19 - - - -
TOT AMPLICATION 1,556 2,675 2,712 2,351 2,133 2,332 2,640 2,152 1,890 2,131 2,019 1,788 2,013 2,014 1,974 2,163 929 1,042 932
AIMUNT AVAIL&ILE FOR WORKINGCAPITAL. RIS3UV1S AND~/alDOlTlLBEdTN TO 4LVg.PNT
Annl 840 365 233 168 49 171 ( 44) (363) 85 52 432 890 8w3 890 1,035 929 2,183 2,104 2,166
Cumulative 840 1,205 1,438 1,606 1,655 1,826 1,782 1,419 1,504 1,556 1,988 2,878 3,721 4,611 5,646 6,575 8,75 10,862 13,028
See Annex 15 (T.e I 2)
8 (Table 1)15 (Table 3)
Term 16years, grace period 9 years.6/ Taken ovwr froe Sumatra Tapanuli Estates Company with effect froa June 1, 1969
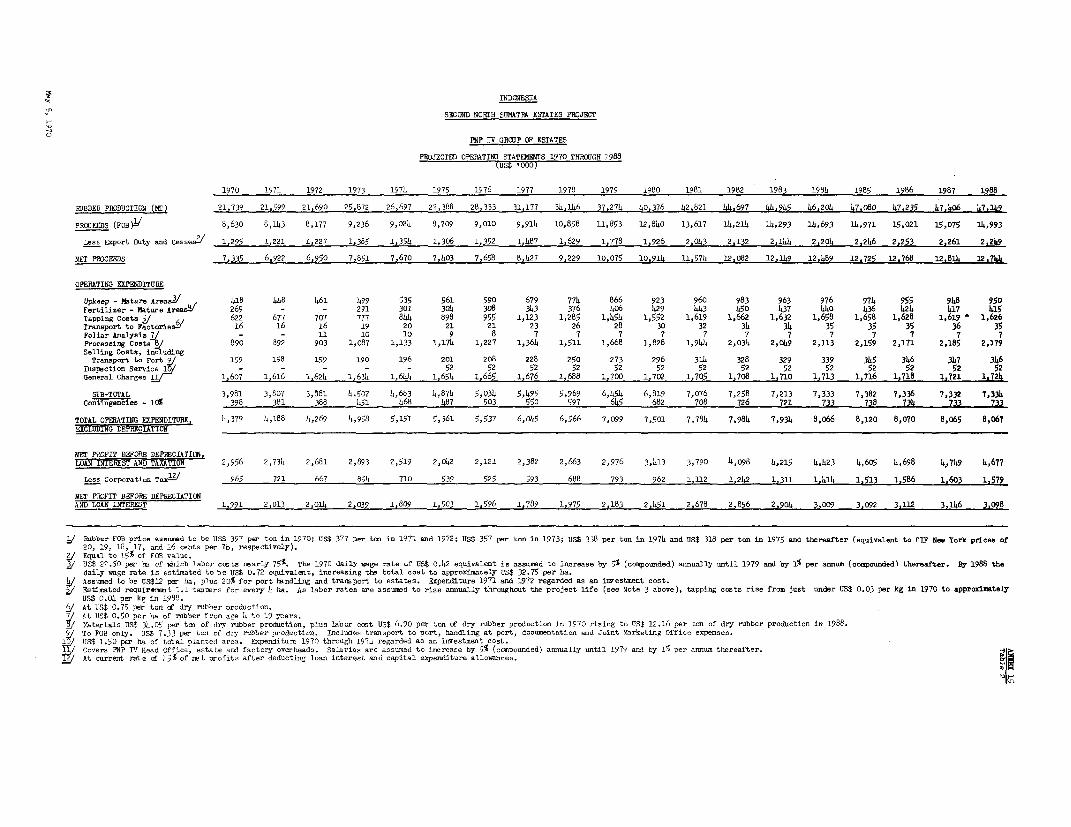
INDONESIA
SECOND NORTH SUMATRA ESTATES PROJECT
PNP IV GROUP OF ESTATES
PROJECTED OPERATING STATEMHETS 1970 THROUGH 1988(US$ '000)
1970 1971 1972 1973 1974 1975 1976 1977 1978 1979 1980 1981 1982 1983 1984 1985 1986 1987 1988
RUBBER PR8DUCTION (IC) 21,739 21,599 21,690 25,872 26,697 27,388 28,333 31,177 34,146 37.274 40,376 42,821 44,697 44,945 46,204 47,080 47,235 47.406 47.149
PROCEEDS (FOB) 8,630 8,143 8,177 9,236 9,024 8,709 9,010 9,914 10,858 11,853 12,840 13,617 14,214 14,293 14,693 14,971 15,021 15,075 14,993
Less Export Duty and Ce.ses2 /
1,295 1,221 1,227 1,385 1,354 1,306 1,352 1,487 1,629 1,778 1,926 2,043 2,132 2,144 2,204 2,246 2,253 2,261 2,249
NET PROCEEDS 7,335 6,922 6,950 7,851 7,670 7,403 7,658 8,427 9,229 10,075 lo,914 11,574 12,082 12,149 12,489 12.725 12,768 12.814 12.7i4
OPERATING EXPENDITUEE
Upkeep - Mature Area32/ 418 448 461 499 535 561 590 679 774 866 923 960 983 963 976 974 955 948 950
Fertilizer - Mature Areaa4/ 269 - - 291 301 304 308 343 376 406 429 443 450 437 440 436 424 417 415
Tapping Costs 5/ , 622 677 707 777 844 898 955 1,123 1,285 1,454 1,552 1,619 1,662 1,632 1,658 1,658 1,628 1,619 1,626
Transport to Factories 16 16 16 19 20 21 21 23 26 28 30 32 34 34 35 35 35 36 35
Foliar Analysis 7/ - - 11 10 10 9 8 7 7 7 7 7 7 7 7 7 7 7 7
Processing Costs e 890 892 903 1,087 1,133 1,174 1,227 1,364 1,511 1,668 1,828 1,944 2,034 2,049 2,113 2,159 2,171 2,185 2,179
Selling Costs, includingTransport to Port 2/ 159 158 159 190 196 201 208 228 250 273 296 314 328 329 339 345 346 347 346
Inspection Service I8 - - - - - 52 52 52 52 52 52 52 52 52 52 52 52 52 52
General Charges 11 1,607 1,616 1.624 1,634 1,644 1,654 1,665 1,676 1,688 1,700 1,702 1,705 1,708 1,710 1.713 1,716 1,718 1,721 1.72)4
SUB-TCrAL 3,981 3,807 3,881 4,507 4,683 4,874 5,034 5,495 5,969 6,454 6,819 7,076 7,258 7,213 7,333 7,382 7,336 7,332 7,334
Contingencies - 10% 398 381 388 451 468 487 503 550 597 645 682 708 726 721 733 738 734 733 733
TOTAL OPERATING EXPENDITURE, 4,379 4,188 4,269 4,958 5,151 5,361 5,537 6,045 6,566 7,099 7,501 7,784 7,984 7,934 8,066 8,120 8,070 8,065 8,067
EXCLUDING DEPRECIATION
NET PROFIT BBFORE DEPRECIATION.rO08 INTEREST AND TAXATION 2,956 2,734 2,681 2,893 2,519 2,042 2,121 2,382 2,663 2,976 3,413 3,790 4,o98 4,215 4,423 4,605 4,698 4,749 4,677
Lees Corporation TL2H/ 965 721 667 854 710 539 525 593 688 793 962 1,112 1,242 1,311 1,414 1,513 1,586 1,603 1,579
NET PROFIT BEFORE DEPRECIATIONA.D LOAN INTEREST 1,991 2,013 2,014 2,039 1,809 1,503 1,596 1,789 1,975 2,183 2,451 2,678 2,856 2,904 3,009 3,092 3,112 3,146 3.098
j¢/ Rubber FOB price a3sueod to be US$ 397 per ton in 1970; US$ 377 per ton in 1971 and 1972; 112$ 357 per ton in 1973; us$ 338 per ton in 1974 and 02S$ 318 per ton in 1975 and thereafter (equivalent to CI NRev York prices of
20, 19, 18, 17, and 16 cents per lb, respectively).g/ Equal to 15% of FOB value.
U us$ 22.50 per ha of which labor cste onearly 75%. The 1970 daily wage rate of US$ 0.42 equivalent is assumed to increase by s% (compounded) annually until 1979 and by 1% per annum (compounded) thereafter. By 1988 the
daily wage rate is estimated to be US$ 0.72 equivalmut, increasing the total cost to approximately us$ 32.75 per ha.
4/ Assumed to be US$12 pe ha, pIus 20% for port handling and tramaport to estates. Expenditure 1971 and 1972 regarded as an irvestment cost.
Estimated requiremmst 1.1 tappers for every 4 ha. As labor rates are assusad to rise arnnually throughout the project life (see Note 3 above), tapping costs rise from just under us$ 0.03 per kg in 1970 to approximately
us$ 0.04 per kg in 1988.4/ At US$ 0.75 per ton cf dry rubber orcduction.7 At US$ 0.50 per ha of rubber from age 4 to 19 years.
M/ Materials U.$ 34.05 per tcn of dry rubber production, plus labor cost US$ 6.90 per ton of dry rubber production in 1970 rising to US$ 12.16 per ten of dry robber production in 1988.
9 To FOb only. US$ 7.33 per ton of dry robber production. Includos transport to port, handling at port, documentation end Joint Marketing Office expenses.
/ us$ 1.50 per ha of total planted area. Expenditure 1970 through 1974 regarded as an investment cost.G. Corers PNP IV Read Office, estate and factory overheads. Salaries are assumed to increase by 5% (compounded) annually until 1979 and by 15 per annum thereafter.
n/At current rate of 45% of net profits after deducting loan interest and capital expenditure allowances.
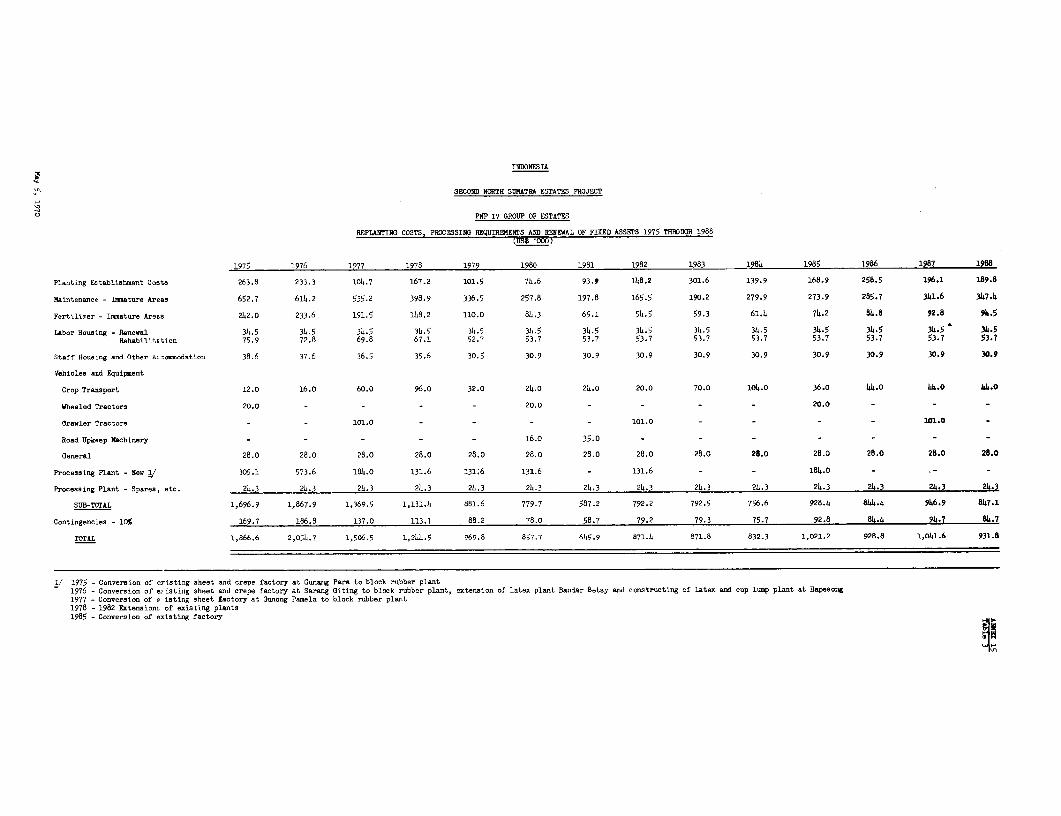
INDONESIA
'5 SECOND NORTH SUMATRA ESTATES PROJECT
o7 PNP IV GROUP OF ESTATES
REPLANTING COSTS, PROCESSING REQUIRYEENTS AND RENEWAL OF FIXED ASSETS 1975 THO0UGH 1988
(05$« '000)
1975 1976 1977 1978 1979 1980 1981 1982 1983 1984 1985 1986 1987 188
Planting Establishment Costs 263.8 233.3 104.7 167.2 101.5 74.6 93.9 148.2 301.6 139.9 168.9 258.5 196.1 189.8
Maintenance - Ineature Areas 652.7 614.2 535.2 398.9 336.5 257.8 197.8 165.5 190.2 279.9 273.9 285.7 341.6 347.4
Fertilieer - Immature Are&s 242.0 233.6 191.5 148.2 110.0 84.3 65.1 54.5 59.3 61.4 74.2 84.8 92.8 94.5
Labor Hous:ng - Renewal 34.5 34.5 34.5 34.5 34.5 34.5 34.5 34.5 34.5 34.5 34.5 34.5 34a5 34-5Rehabilltution 75,9 72.8 69.8 67.1 52.7 53.7 53.7 53.7 53.7 53.7 53.7 53.7 53.7 53.7
St.ff Housing and Other A-onsodation 38.6 37.6 36.5 35.6 30.5 30.9 30.9 30.9 30.9 30.9 30.9 30.9 30.9 30.9
Vehicles and Equipment
Crop Transport 12.0 16.0 60.0 96.0 32.0 24.0 24.0 20.0 70.0 104.0 36.o 44.0 44.0 44.0
Wheeled Tractors 20.0 - - - - 20.0 - - - - 20.0 - - -
Cr-wler Tractors - - 101.0 - - - - 101.0 - - - - 101.0
Road Upkeep Machinery - - - - - 16.0 35.0 - - - - - -
General 28.0 28.0 28.0 28.0 28.0 28.0 28.0 28.0 28.0 28.0 28.0 2B.0 28.0 28.0
Processing Plant - New 1/ 305.1 573.6 184.0 131.6 131.6 131.6 - 131.6 - - 184.0 - - -
Processing Plant - Spares, etc. 24.3 24.3 24.3 24.3 24.3 24.3 24.3 24.3 24.3 24.3 24.3 24.3 24.3 24.3
SUB-TOTAL 1,696.9 1,867.9 1,369.5 1,131.4 881.6 779.7 587.2 792.2 792.5 756.6 928.4 844.4 946.9 847.1
Contingencies - 10% 169.7 186.8 137.0 113.1 88.2 78.0 58.7 79.2 79.3 75.7 92.8 84.4 94.7 84.7
TOTAL 1,866.6 2,054.7 1,506.5 1,244.5 969.8 857.7 645.9 871.4 871.8 832.3 1,021.2 928.8 1,041.6 931.8
1/ 1975 - Conversion of eristing sheet and crepe factory at Gunang Para to block rubber plant1976 - Conversion of e: isting sheet and crepe factory at Sarang Giting to block rubber plant, extension of latex plant Bandar Betsy and constructing of latex and cup lump plant at Hapesong
1977 - Conversion of e isting sheet factory at Gunong Panela to block rubber plant1978 - 1982 Extensiont of existing plants1985 - Conversion of existing factory
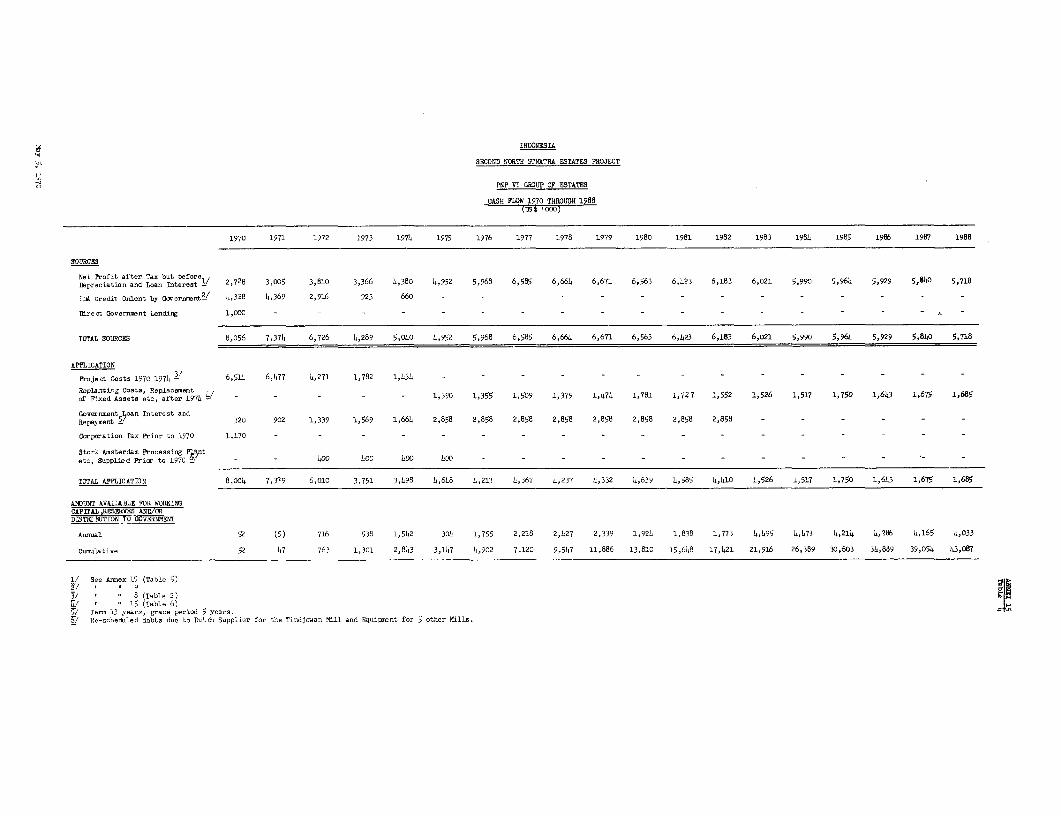
INDONESIA
SECOND NORTH SUMATRA ESTATES PROJECT
PNP VI GROUP OF ESTATES
CASH FLOW 1970 TRROUGR 1988(1'$ '000)
1970 1971 1972 1973 1974 1975 1976 1977 1978 1979 1980 1981 1982 1983 1984 1985 1986 1987 1988
SOURCES
Ret Profit after Tax hot beforeDepr.c1atio. and Loan Interest 1 2,728 3,005 3,810 3,366 4,380 4,952 5,968 6,585 6,664 6,671 6,563 6,423 6,183 6,021 5,990 5,964 5,929 5,140 5,718
IIA Credit Olent by Oorera,ent2/ 4,328 4,369 2,916 923 660 - - - - - - - - - - - -
Dire-t (ovcr nt Lending 1,000 - - - - - - - - - - _ - _ _ _ _
TOTAL SOURCES 8,056 7,374 6,726 4,289 5,040 4,952 5,968 6,585 6,664, 6,671 6,563 6
,423 6,183 6,o21 5,990 5,964 5,929 5,840 5,718
APPLICATION
Project Costs 1970-1974 3 6,591 6,477 4,271 1,782 1,434 - - - - - - - - - - -
Hopl-anZl13 Costs, Repiacoe.ntof Fr.ed Assets etc, after 1974/ 1,390 1,355 1,509 1,379 1,474 1,781 1,7 7 1,552 1,526 1,517 1,750 1,643 1,675 i,685
Gover-netOoaa Interest andRapayernt - 320 902 1,339 1,569 1,664 2,858 2,858 2,858 2,858 2,858 2,858 2,858 2,858 - -
Corporation Tax Prior to 1l70 1,170 - - - - - - - - - - - - -
Stork Ansterdam Processing PXnt
etc, Supplied Prior to 1970 L- - 1400 400 400 400 - - - - - - - - _ _ _
TOTAL APPLICATIDN 8,oo4 7,379 6,010 3,751 3,498 4,648 4,213 4,367 4,237 4,332 4,639 4,585 4,410 1,526 1,517 1,750 1,643 1,675 1,685
AMDUNT AVAILABLE FOR WORKINoCAPITAL RESERVES AND/ORDISTRIBUTION TO 30VERNMENT
Annual 52 (5) 716 538 1,542 304 1,755 2,218 2,427 2,339 1,924 1,838 1,773 4,495 1,473 4,214 4,286 4,165 4,033
Cumulti-ve 52 47 763 1,301 2,843 3,147 4,902 7,120 9,547 11,886 13,810 15,6
48
'17,421 21,916 26,389 30,603 34,889 39,054 43,087
1/ See Annex 1S (Table 519
3/ ' 't 8 (Table 2)i15 (Table 6)
5/ Tern 13 years, grace period 5 years.6/ Re-scheduled debta doe to Duth Supplier for the Tindjowan Mill and Equipmnt for 5 other Mills.
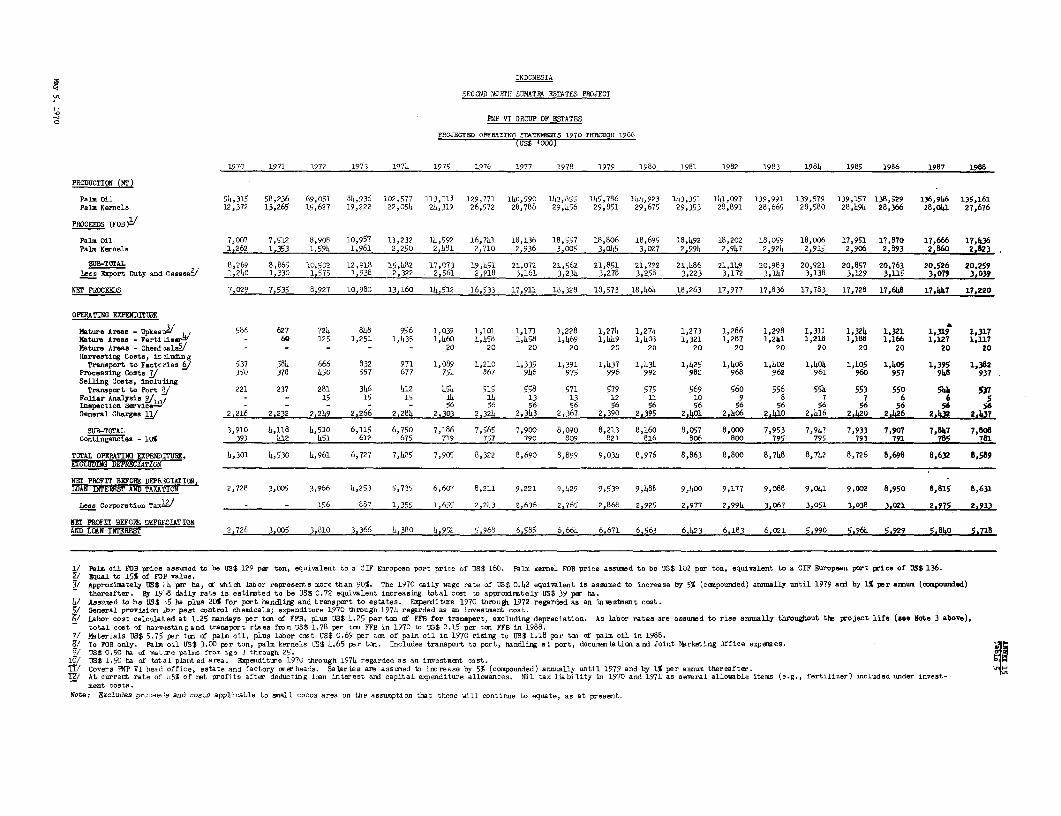
INDONESIA
2SECCND NORTH SUMATRi ESTATES PROTECT
PEP VI GROUP OF ESTATES
FEOoJGTSD8 oPSc'.IrnO CThEIfSET 1970 11180000 1986
1970 1971 1972 1973 1974 1975 1976 1977 1978 1979 1980 1981 1982 1983 1984 1985 1986 1987 1988
PRODUCTIOC (NT)
Palo Oil 54,315 58,236 69,051 8h,936 102,577 113,113 129,771 140,590 143,855 145,786 14)4,923 143,351 11.3,097 139,991 139,579 139,157 138,529 136,9946 135,161Palm Kernels 12,372 13,265 15,627 19,222 22,054 24,319 26,572 28,788 29,456 29,851 29,675 29,353 28,891 28,665 28,580 28,494 28,366 28,041 27,676
PROCEEDS (FOB
Pal, Oil 7,007 7,512 8,908 i0,957 13,232 14,592 16,741 18,136 18,557 18,806 18,695 18,492 18,202 18,059 18,006 17,951 17,870 17,666 17,436Palm Kernels 1,262 1,353 1,594 1,961 2,250 2,481 2,710 2,936 3,005 3,045 3,027 2,994 2,947 2,924 2,915 2,906 2,393 2,860 2;823
SUB-TOTAL 8,269 8.865 10,502 12,918 15,482 17,073 19,1451 21,072 21,562 21,851 21,772 21,486 21,149 20,983 20,921 20,857 20,763 20,526 20,259Less Export Duty and CesseeI 1,240 1,230 1,575 1,938 2,322 2,561 2,918 3,161 3,234 3,278 3,258 3,223 3,172 3,147 3,138 3,129 3,115 3,079 3,039
NET PROCEES 7,029 7,535 8,927 10,980 13,160 14,512 16,533 17,91a 18,328 18,573 18,464 18,263 17,977 17,836 17,783 17,728 17,648 17,447 17,220
OPERATING EXPENLDITURE
Mature Areas - Upkee;/ 586 627 724 848 956 1,039 1,101 1,171 1,228 1,274 1,274 1,273 1,286 1,298 1,311 1,324 1,321 1,319 1,317Mature Areas - FertiLjserW - 69 125 1,251 1,435 1,460 1,458 1,458 1,469 1,449 1,403 1,321 1,287 1,211 1,218 1,188 1,166 1,127 1,117Mature Areas - Chee,ia1e2/ - - - - - 20 20 20 20 20 20 20 20 20 20 20 20 20 20Harvesting Costa, irnu1ding
Transport to Factcrlee §#/ 537 584 666 832 971 1,089 1,210 1,335 1,391 1,437 1,434 1,425 1,408 1,402 1,404 1,405 1,405 1,395 1,382Processing Costa I/ 350 378 450 557 677 751 867 916 975 y96 992 982 968 962 961 960 957 910 937Selling Costs, including
Transport to Port 9/ 221 237 281 346 412 454 515 558 571 579 575 569 560 556 554 553 550 5411 537Foliar Analysis 2/1 - - 15 15 15 14 14 13 13 12 11 10 9 8 7 7 6 6 5IsSspectIon Gervlbc. - - - - 56 56 96 56 56 56 56 56 56 56 56 56 56 56General Charges Li/ 2,216 2,232 2,249 2,266 2,284 2,303 2,324 2,343 2,367 2,390 2,395 2,401 2,406 2,410 2,416 2,420 2,k426 2.3m 2,137
SUB-TOTAL 3,910 4,118 4,510 6,115 6,750 7,186 7,565 7,900 8,090 8,213 8,160 8,057 8,000 7,953 7,947 7,933 7,907 7,847 7,808Gontingencles - lo% 391 4L12 451 612 675 719 757 790 809 821 816 806 800 795 795 793 791 785 78l
TOTAL OPERATINa EXPENDIT7URE, 4,301 4,530 L,961 6,727 7,425 7,905 8,322 8,690 8,899 9,031 8,976 8,863 8,800 8,748 8,742 8,726 8,698 8,632 8,589ETCLUD7NG DEPRIATION-
NET PROFT! BEOB DEPI3CIAT IO.LOAN iTER133T AM TAnATION 2,728 3,005 3,966 4,253 5,735 6,607 8,211 9,221 9,429 9,539 9,488 9,400 9,177 9,088 9,041 9,002 8,950 8,815 8,633
Le-s Corporation Tas/ - - 156 887 1,355 1,655 2,243 2,636 2,765 2,868 2,925 2,977 2,994 3,067 3.051 3,038 3,021 2.S75 2,913
NET PROFIT BEFORE DEPRECIATIONATO LOAN IN'EREST 2,728 3,005 3,810 3,366 4,380 4,952 5,968 6,585 6,664 6,671 6,563 6,.423 6,183 6,021 5,990 5,964 5,929 5.840 5.718
1/ Palm oil FOB price assumed to be 71$ 129 per ton, equivalent to a CIF Earopean port price of US$ 160. Palm kemel FOB price assumed to be U3$ 102 per ton, equivalent to a CIF European port prioe of US$ 136.E/ Equal to 15% of FOP value.
3/ Approximately US$ S'4 Fpr ha, cf which labor represents more than 90%. The 1970 daily wage rate of US$ 0.42 equivalent is assumed to increase by 5% (compounded) annually until 1979 and by 1% per amnum (eompounded)thereafter . By 19 8 daily rate is estimated to be US$ 0.72 equivalent increasing total cost to approxdmately US$ 39 per ha.
W Asmxmed to be 11$ 5 ha plus 20% for port handling and transport to estates. Expenditure 1970 through 1972 regarded as an invstment eoat.5/ General provision .br pest oontrol chemicals; expenditure 1970 thomugh 1974 regarded as an investment cost.6/ Labor cost calculated at 1.25 nandays per ton of FFB, plus 0S$ 1.25 per ton of FF8 for transport, excluding depreciation. As labor rates are assumed to rise annually throughout the project life (see Note 3 above),
total cost of harvestingand transport rises fmom U8$ 1.78 per ton FFB in 1970 to US$ 2.15 per ten FFB in 1988.7/ Materials U0$ 5.75 per ton of palm oil, plus labor eost US$ 0.69 per ton of paln oil in 1970 rising to US$ 1.18 per tcn of palo oil in 1988.8/ To FOB only. Palm oil US$ 3.00 per ton, paom kernels US$ 4.65 per ton. Includes transport to port, handling at port, documentation and Joint Marketing Jffice expesmes.9/ US$ 0.50 ha of mature pals from age 3 through 25.
10/ US$ 1.50 ha of total planted aea. Expenditure 1970 through 1974 regarded as an investment cost. I'M1/ Covers PNF VI head office, estate and factory owrheads. Salaries are assumed to increase by 5% (compounded) annually until 1979 and by 1% per annum thereafter.1/ At current rate of a5% of rot profits after deducting loan interest and capital expenditure allowances. Nil tax liability in 1970 and 1971 an several allowable items (e.g., fertiliner) included under invest-
ment costs.Note: Excludes proc,eo' and costs applicable to snail cocoa area on the assumption that these will continue to equate, as at present.
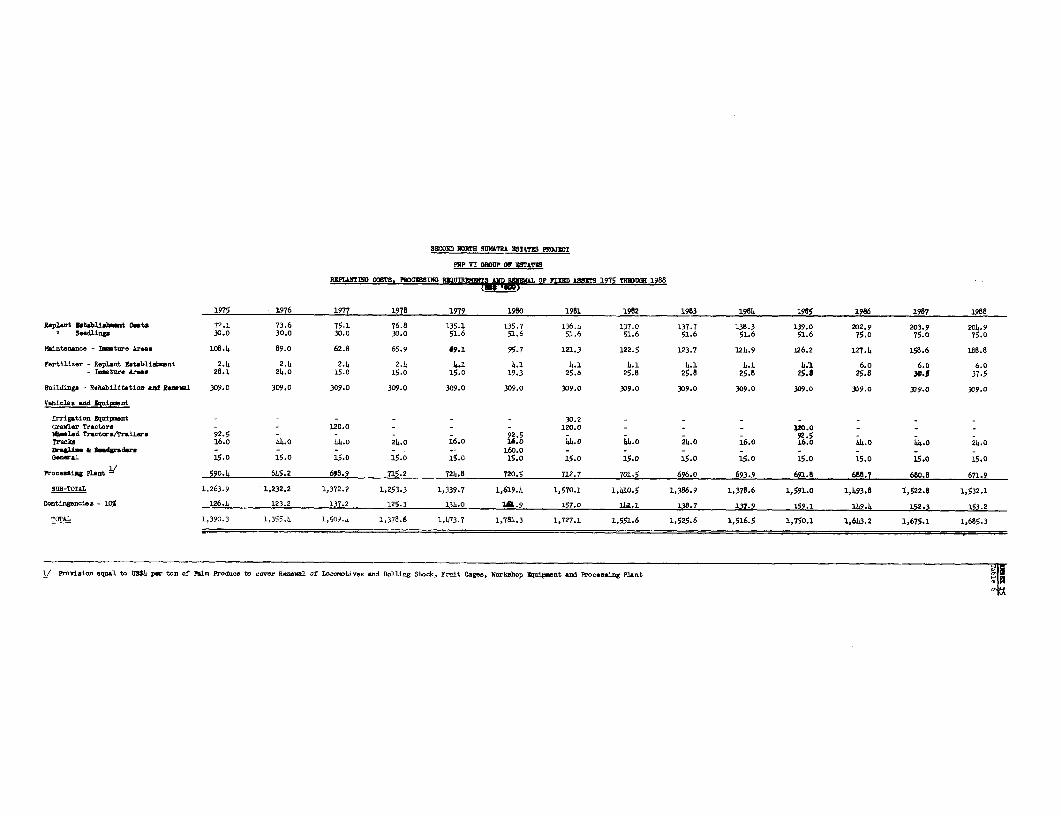
SWOID NOIRTH SMhTR ESTATES PROJRCT
PNP VI OFOOP OF 0 TAT
EXPLubINO OOSTS, PROCIN0( R20UnmSTGWAL 0F FIXD O SS!TS 1975 THIDOOH 1988
1975 1976 1977 1978 1979 1980 1981 1982 1983 1984 1985 1986 1987 3988
Replant Dtoblish_ent Oset 72.1 73.6 75.1 76.8 135.1 135.7 136.4 137.0 137.7 138.3 139.0 202.9 203.9 204.9Seedlings 30.0 30.0 30.0 30.0 51.6 51.6 51.6 51.6 51.6 51.6 51.6 75.0 75.0 75.0
Maintenance - Deutue Areae 108.4 89.0 62.8 65.9 d9.I 95.7 121.3 122.5 123.7 124.9 126.2 127.4 158.6 188.8
Fertili.er - Replant Rrtablise,nt 2.4 2.4 2.4 2.4 k.1 4.1 4.1 4.1 4.1 4.1 4.1 6.o 6.o 6.0- Ieture Araeo 28.1 24.0 15.0 15.0 15.0 19.3 25.8 25.8 25.8 25.8 25.8 25.8 30.J 37.5
Buildings - Rehabilitstion eDd Removl 309.0 309.0 309.0 309.0 309.0 309.0 309.0 309.0 309.0 309.0 309.0 309.0 309.0 309.0
Vehicles nd Squipewt
Irrigation BIqipuent - - - - - - 30.2 - - - - _- -Crawler Tractors - - 120.0 - - - 120.0 - - - 120.0eISI*d Tractw Ar,ralere 92.5 _- -_ 92.5 - - - - 925 5 4 2Trcks 16.0 44.0 44.0 24.0 16.0 16.0 44.0 414.0 24.0 16.0 16.0 44.0 44.0 24.0We1lim & edgedr - - - - - 160.0 - - - - - - - -feowal 15.0 15.0 15.0 15.0 15.0 15.0 15.0 15.0 15.0 15.0 15.0 15.0 15.0 15.0
Proce.siag Plant 50O.4 645.2 698.9 715.2 724.8 720.5 712.7 701.5 696.0 693.9 691.8 688.7 680.8 671.9
SUB-TOTAl 1,263.9 1,232.2 1,372.2 1,253.3 1,339.7 1,619.4 1,570.1 1,410.5 1,386.9 1,378.6 1,591.0 1,493.8 i,522.8 1,532.1
Oontingencies - 10% 126.4 123.2 137.2 125.3 134.0 1*.9 157.0 141L.1 138.7 137.9 159.1 149.4 152.3 153.2
TOTAL 1,390.3 1,355.4 1,509.4 1,379.6 1,473.7 1,781.3 1,727.1 1,551.6 1,525.6 1,516.5 1,750.1 1,643.2 1,675.1 1,685.3
1/ Provision equal to US$4 per ton of Pa1 P!roduce to cover Ren&kL1 of L oootives and Rolling Stock, Fruit Cages, Workshop Rcitp.nt and Processing P2ant ,FM
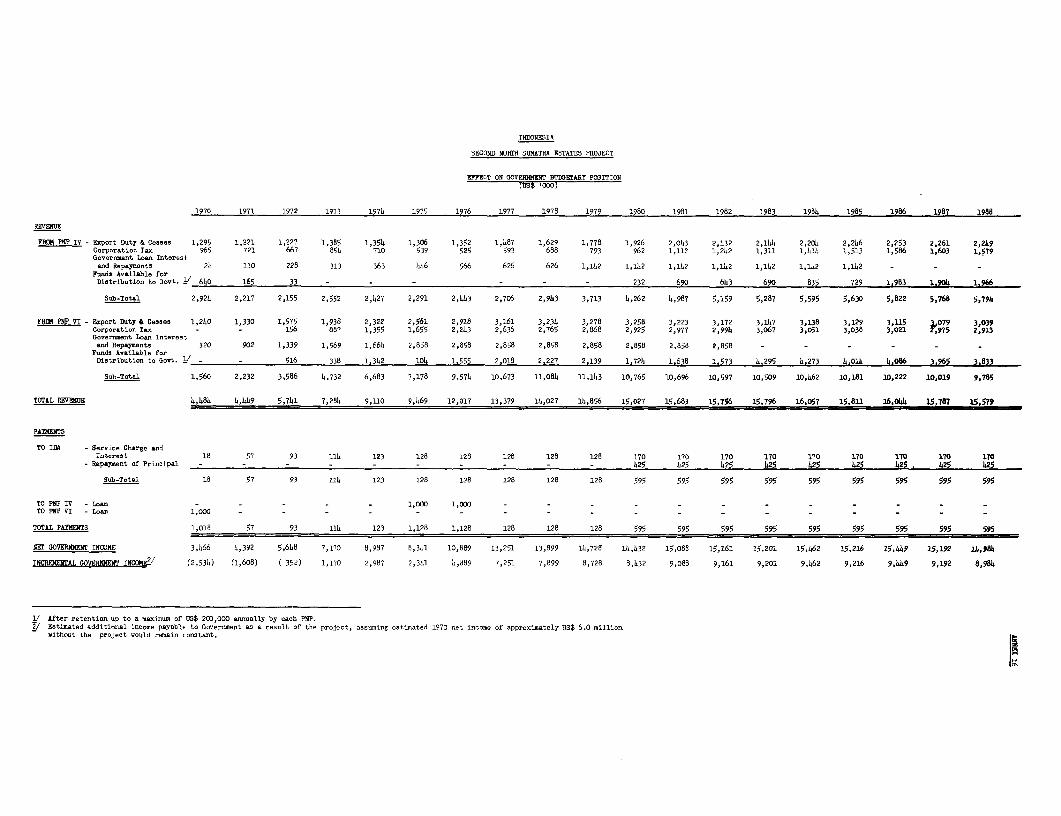
INDONESIA
SBCOND N08T3 SIUMlTRA ESTATES PROJECT
EFFECT ON OOVEmRMNr BUDOETART POSITION(US$ 'OCO)
1970 1971 1972 1973 1974 1975 1976 1977 1978 1979 1980 1981 1982 1983 1934 1985 1986 1987 1988
REVEIUE
FV PNP IV - Export Duty & Ceases 1,295 1,221 1,227 1,385 1,354 1,306 1,352 1,487 1,629 1,778 1,926 2,013 2,132 2,144 2,204 2,2b6 2,253 2,261 2,249Corporation Tax 965 721 667 85h 710 539 525 593 688 793 962 1,112 1,242 1,311 1,411 1,513 1,586 1,603 1,579Government Loan Interestand Repay.entt 24 110 228 313 363 446 566 626 626 1,142 1,142 1,142 1,142 1,112 1,182 1,1.42 - - _
Fuods Available forDi.trib.tion to Govt. 1 640 165 33 - _ - - - - 232 690 643 690 835 729 1,983 1904 1 96
Sub-Total 2,924 2,217 2,155 2,552 2,427 2,291 2,443 2,706 2,943 3,713 4,262 4,987 5,159 5,287 5,595 5,630 5,822 5,768 5,794
FRCE PNP VI - Export Duty & Ceases 1,240 1,330 1,575 1,938 2,322 2,561 2,918 3,161 3,231 3,278 3,258 3,223 3,172 3,147 3,138 3,129 3,115 1079 3,039Corporation Tax - - 156 887 1,355 1,655 2,243 2,636 2,765 2,868 2,925 2,977 2,994 3,067 3,051 3,038 3,021 2,975 2,913Government LOan Interest
nd Repay.entt 320 902 1,339 1,569 1,661 2,858 2,858 2,858 2,858 2,858 2,858 2,858 2,858 - - - - - -Foods Available for
Distribution to Govt. _ _ 516 338 1,342 101 1.555 2,018 2,227 2.139 1,724 1.638 1,573 4,295 4.273 41,o4 4,086 3.965 3.833
Sub-Total 1,560 2,232 3,586 4,732 6,683 7,178 9,574 10,673 11,084 11,143 10,765 10,696 10,597 10,509 10,462 10,181 10,222 10,019 9,785
TOTAL REUNIUE 4,484 4,449 5,741 7,284 9,110 9,469 12,017 13,379 14,027 14,856 15,027 15,683 15,756 15,796 16,057 15,811 16,044 15,787 15,579
PAW3NTS
TO I11 - Sereice Charge andItohreat 18 57 93 114 123 128 128 128 128 128 170 170 170 170 170 170 170 170 170
- Repaylent of Principal - - _ - - - - - - - 1,25 425 1,5 425 125 125 425 125 4425
S.b-Total 18 57 93 111 123 128 128 128 128 128 595 595 595 595 595 595 595 595 595
TO PNP IV -Loan - - - _ _ 1,000 1,O00 - - - _ _ _ _ _ _ _ _ _TO PNP VI -Lon 1,000 - - - - - -
TOAL PAIIEKTS 1,018 57 93 114 123 1,128 1,128 128 128 128 595 595 595 595 595 595 595 595 595
NFT GOVERIIMENT INOSME 3,b66 4,392 5,648 7,170 8,987 8,341 10,889 13,251 13,899 14,728 14,432 15,088 15,161 15,201 15,462 15,216 15,4419 15,292 2t,81O
INGREMENTAL GOv8E8mEr 1iww,E/ (2,531) (1,608) ( 352) 1,170 2,987 2,341 4,889 7,251 7,899 8,728 8,132 9,088 9,161 9,201 9,462 9,216 9,449 9,192 8,984
I/ After retention up to a maximum of 0S$ 200,000 annually by each PNP.2/ Estimated additional income payable to Government as a reoult of the project, a-snuing esti.ated 1970 ne. inc.se of approximately US$ 6.0 million
without the project iould remain co-stant.
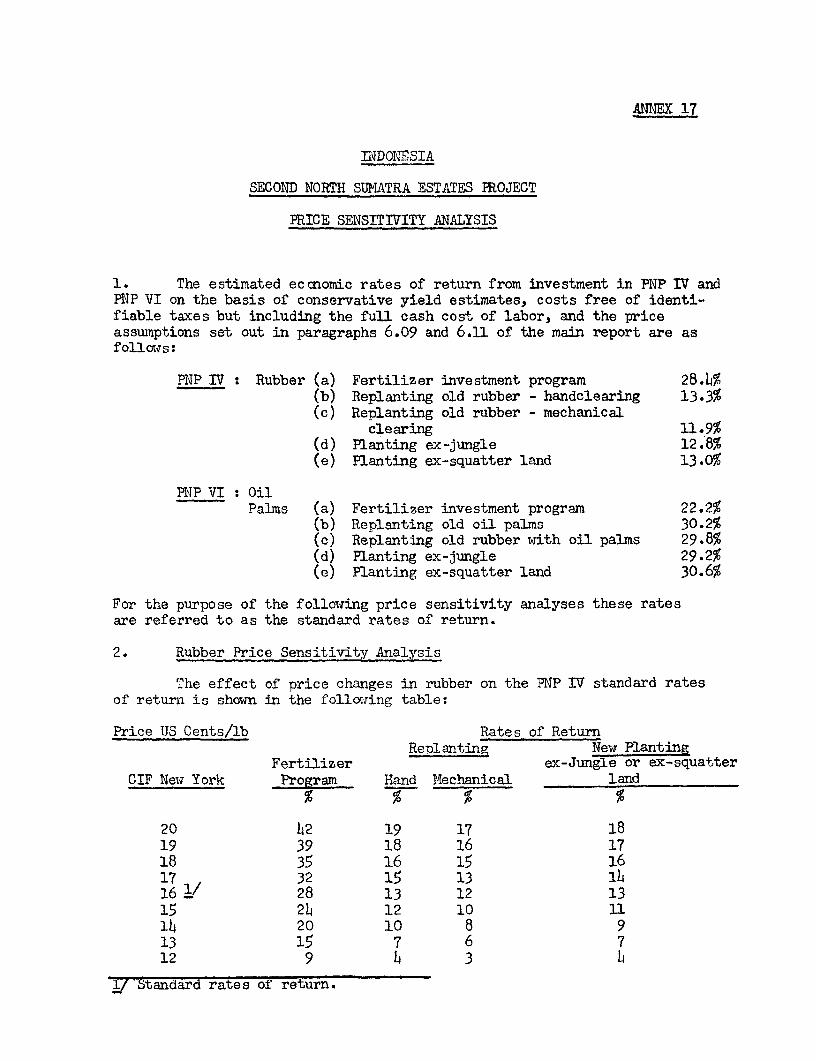
ANNEX 17
MIDONESIA
SECOND NORTH SUMATRA ESTATES PROJECT
PRICE SENSITIVITY ANALYSIS
1. The estimated economic rates of return from investment in PNP IV andPNP VI on the basis of conservative yield estimates, costs free of identi-fiable taxes but including the full cash cost of labor, and the priceassumptions set out in paragraphs 6.09 and 6.11 of the main report are asfollows:
PNP IV : Rubber (a) Fertilizer investment program 28.b%(b) Replanting old rubber - handclearing 13.3%(c) Replanting old rubber - mechanical
clearing 11.9%(d) Planting ex-jungle 12.8%(e) Planting ex-squatter land 13.0%
PNP VI : OilPalms (a) Fertilizer investment program 22.2%
(b) Replanting old oil palms 30.2%(c) Replanting old rubber with oil palms 29.8%fd) Planting ex-jungle 29.2%(e) Planting ex-squatter land 30.6%
For the purpose of the following price sensitivity analyses these ratesare referred to as the standard rates of return.
2. Rubber Price Sensitivity Analysis
The effect of price changes in rubber on the PNP IV standard ratesof return is shown in the following table:
Price US Cents/lb Rates of ReturnRenlanting New Planting
Fertilizer ex-Jungle or ex-squatterCIF New York Program Hand Mechanical land
20 L2 19 17 1819 39 18 16 1718 35 16 15 1617 32 15 13 lb16 1/ 28 13 12 1315 2b 12 10 1114 20 10 8 913 15 7 6 712 9 b 3 b
1/ Standard rates of return.
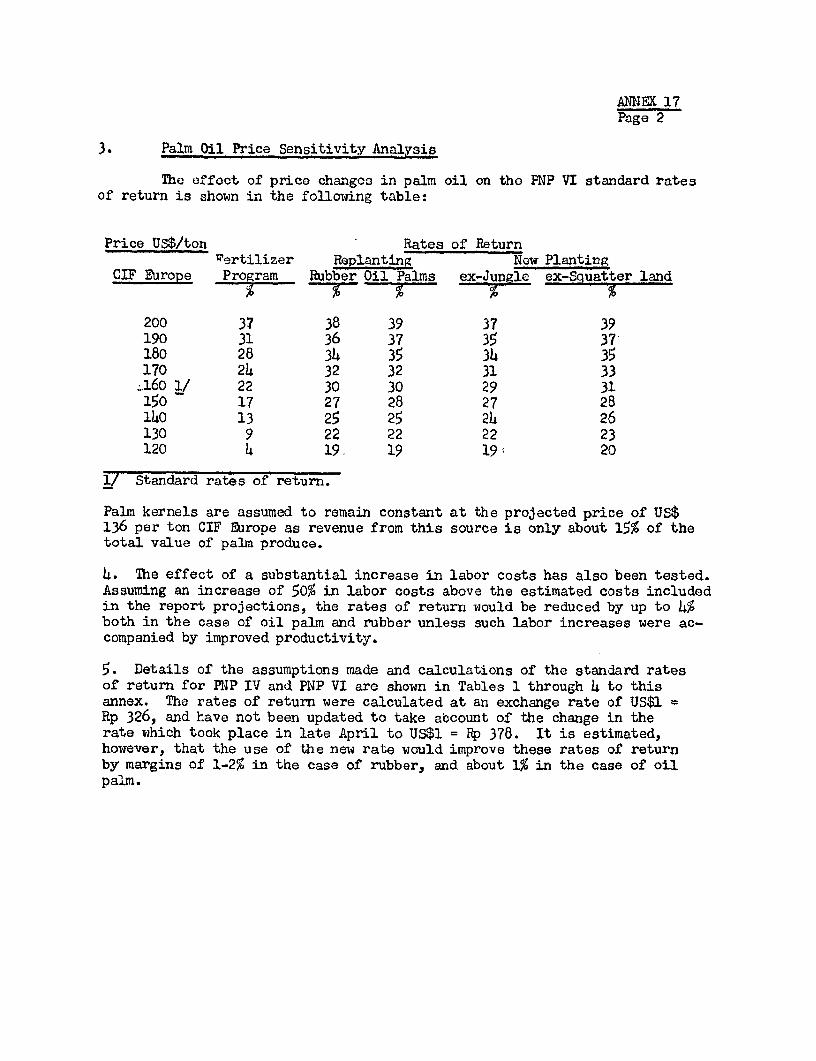
ANNEX 17Page 2
3. Palm Oil Price Sensitivity Analysis
The effect of prico changes in palm oil on tho PNP VI standard ratesof return is shown in the following table:
Price US$/ton Rates of ReturnWertilizer Replanting Now Plantirg
CIF Europe Program Rubber Oil Palms ex-Jungle e q er land
200 37 38 39 37 39190 31 36 37 35 37180 28 34 35 34 35170 24 32 32 31 33.160 1/ 22 30 30 29 31150 17 27 28 27 28140 13 25 25 24 26130 9 22 22 22 23120 4 19- 19 19' 20
_/ Standard rates of return.
Palm kernels are assumed to remain constant at the projected price of US$136 per ton CIF Erope as revenue from this source is only about 15% of thetotal value of palm produce.
4. The effect of a substantial increase in labor costs has also been tested.Assuming an increase of 50% in labor costs above the estimated costs includedin the report projections, the rates of return would be reduced by up to 4%both in the case of oil palm and rubber unless such labor increases were ac-companied by improved productivity.
5. Details of the assumptions made and calculations of the standard ratesof return for PNP IV and PNP VI are shown in Tables 1 through 4 to thisannex. The rates of return were calculated at an exchange rate of US$1 #Rp 326, and have not been updated to take account of the change in therate which took place in late April to US$1 = Rp 378. It is estimated,however, that the use of the new rate would improve these rates of returnby margins of 1-2% in the case of rubber, and about 1% in the case of oilpalm.
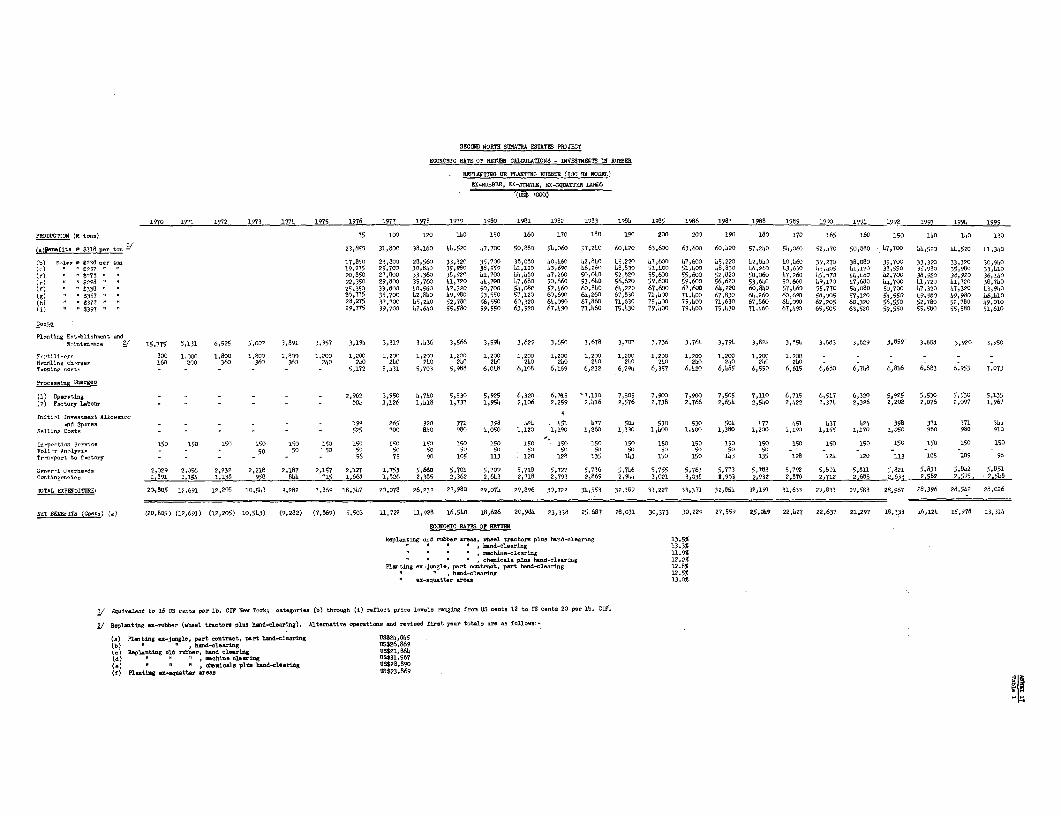
SfOalD NORTH Sl1OATA ESTATES FROJECT
BOONOMIC 70TE OF RETURN CALCULATIONS - rfVB0tMENTS IN R 11833R
RRPIANTINOG OR MARTIN0O RUBBER (100 8A MODEL)
EX-R BBRR, E1-JUN1G0E, EX-00A0TTXR LANL3
(00% '080)
1970 0971 1972 1973 1971 1975 1976 1977 1978 1979 1980 1980 1987 190 18954 1985 1986 1987 1988 1989 1990 1991 1992 1993 1994 1995
PRODC70000 (1 tons) 75 100 120 l1O 10 160 170 180 190 200 200 190 189 170 165 160 150 140 140 130
(0 78snflts * $118 per ton 23,850 31,8900 39,160 hb,520 47,700 50,880 5L,060 57,?b0 60,420 63,600 63,600 60,h20 57,2h0 54,060 52,h70 50,880 47,700 44,520 Lh,520 41,340
(b) 71- e 2138 per ton 17,850 23,800 27,560 33,320 35,700 38,080 h0,460 h2,810 hS,220 47,600 17,600 h5,220 427,8h0 .0,60 39,270 38,080 35,700 33,320 33,320 30,9h0
(') . V 3757 "$7 19,275 25,700 30,810 35,980 39,550 h1,l20 13,690 L6,060 48,830 01,100 80,400 48,830 h6,260 13,690 42-0,0 410120 38,550 350980 35,960 33,010(e) 5 e $075 r C 20,850 273800 33,360 38,920 h1,700 hh1,80 17,260 50,01.0 52,820 55,600 19,600 52,820 50,060 17,260 453,70 hh,h00 41.7 50 38,920 30,920 36,Ih0(r, ' "098 022,30 29,800 35.760 41,720 hh,790 17,680 50,660 53,640 56,620 59.600 599600 56,620 53,640 50.660 49,170 10,680 1.o,700 11,720 hl1720 38,740(f) " 1338 2C.350 33,800 .0,560 47,320 50,700 51,080 57,.60 60,81O 64,220 67,600 67,600 64,220 60,840 57,h60 55,770 54,080 50,700 17,320 17,320 13,910(g) .. $357 26,775 35,700 42,810 19,980 53,810 57,120 60,690 64,260 67,830 71,100 71,400 670830 61,260 60,690 58,305 57,120 53,553 19,980 h19,980 h6,1.10(h) 'S377 ' 28,275 37,700 459,20 52,780 56,550 60,320 60,090 67,860 71,630 75,1.00 75,100 71,630 67,860 61,790 62,205 60 320 56,50O 52,780 52,780 h9,010(i) '$ 397 29,775 39,700 T7,640 55,580 59,550 63,520 67,190 71,460 7M,30 79,100 79,.00 75,130 71,060 67,190 65,505 63,520 59,550 55,580 55,580 51,610
Costs
Plsnting E.t.blislh-,t andM-ictsnoocs f/ 15.7T5 8,131 6,529 1,907 3,891 3,357 3,190 3,317 3,.36 3,566 3,594 3,629 3,650 3,678 3,707 3,736 3,761 3,79h 3,82L 3,991 3,883 3,829 3,859 3,888 3,920 3,950
F"rtili.pr 800 1,o00 1e 1,800 ,000 0.900 0,700 1,200 1,20e 1,200 1,200 1,200 1,200 1,200 1,200 1,200 1,200 1,200 1,200 1.200 1,200 - - - - -Meodlo.g chOross 160 200 360 360 360 2O 00 2o 21O 2bO 70 40 240 210 210 2h0 210 210 210 2h1 2h0T.pplng co-t. _ - 5,172 1,131 5,703 5,988 6,048 6,108 6,169 6,232 6,291 6,357 6,120 6,485 6,559 6,619 6,680 6,748 6,816 6,883 6,953 7,073
Proce-ssng Charges
(1) Opre,tiag - - - - - 2,962 3,950 4,740 5,530 5,925 6,320 6,7s "7,110 7,505 7,900 7,900 7,505 7,110 6,715 6,517 6,320 5,925 5,530 5,530 5,135
(72) Fatory7 laborr _5 0,i26 1,418 1,737 1,954 7,106 2,259 2,b16 2,576 2,738 2,766 2,654 2,540 2,h22 2,371 2,326 2,202 2,076 2,097 1,967
CoitiOl rInestasot Alloowco.ad psPes 199 265 320 371 398 19L - 15l 177 90h 5930 190 501. 177 1.11 h37 12h 39b 371 371 30h
Selllng Costs - - - - - - 525 700 8h0 980 1,050 1,177 1,190 1,260 1,330 1,1.0 1,.00 1,380 1,200 1,190 1,110 1,170 1,050 980 9S0 910
Io.pectban s. rn ce O190 10 19O 110 lO 110 190 110 50 190 110 050 150 050 110 190 190 110 190 110 iSo 150 190 110 190 150Foll-r -n.Oy.i - _ _ 90 50 S0 90 90 0o 510 50 5n 5o 00 90 S0 50 00 S0 - - _ _ _Tr-o.ort to rfctry - _ _ _ _ 56 75 93 lo5 113 120 128 135 343 150 110 013 135 128 121 120 213 100 109 9B
GOner-1 0-erhe-ds 2,029 2,056 2,232 2,21e 2,187 2,197 2,127 1,753 5,660 5,701 5,709 5,718 1,727 9,736 5,746 5,755 9,763 5,773 9,783 5,792 9,831 5,811 5.821 5,831 5,841 5,851Cantiotgsnoser 01,891 1,15. 1,138 958 81. 715 1,668 1,826 2,385 2,362 2,613 2,718 2,793 2,869 2,944 3,021 3,038 9,983 2.932 2,876 7,712 2.689 2,3 6.982 2,195. 7.5h8
TDT7L EP8NDITURE: 20,809 12,691 12,205 10,543 9,282 7,869 18,3h7 20,078 26,237 27,980 29,071 29,896 30,722 31,553 32,389 33,227 33,371 32,861 32,191 31,633 79,833 29,583 289967 28,396 28,512 27,026
8Er B6ENEITS (Coaoa) (.5 (20,805) (12,691) (12,205) 10,543) (9,282) (7,8569) 5,503 11,722 11,928 16,540 18,626 20,960 23,338 25,687 28,031 30,373 30,229 27,559 25,049 22,427 22,637 21,297 18,733 16,124 15,978 13,311
EGONOMIC RATES OF RETlURN
fEplantong old robber a , onal tr-oloas pl-c h nd-lsarig 13.595 , bend-olsortog ~~~~~~~~~13.3%
'' v ao8bos-o sartng 310.9%ohl' iatla p3o, hamd-oleariag 12.2%
Plating ao-j,oglo part -atrot, part hand-IsOaing 12.98, h.d-o1aartog 12.5g
so-x_sqoattar areas 13.0%
1/ 6bqav.lrla to 06 00 c-ot. par lb. CI7 Nrw or-k; catagor-s. (b) throoagh (i) roflot prlc lols r-gig fro Um .. osnts 12 to 00 capt. 20 pse lb. CIF.
/ Rsp3nting na-robbsr (aheal tractors plwn bmd-clsoling). AltsenAtit oporati2ns and assiend first por totals aro as follo, -:_
(a) Pl. tig a-Jangle, part cntrast, Port bhnd-.ls-ring 0004.815(b) . , hapd-cls-rLiAg Eo$o6,869(o) R.9.otng old r-tb-r, hlnd clearIng 701821,861(d) -, ranhi.. c3a-ing US$31,567(a) * ainlo plOs hbnd-claaring b'SS28,890(f) Plsting -a-ott-r aras 1$23,869
ANNEX 17Table 1
INDONESIA
SECOND NORTH SUMATRA ESTATES PROJECT
ECONOMIC RATES OF RETURN CALCULATIONS - INVESTMENTS IN RUBBER
REPLANTING OR PLANTING RUBBER (100 HA MODEL)
The following assumptions were made for calculating the economicrates of return from replanting or planting rubber on PNP IV.
(1) Production
Estimated production from new plantings with regular fertilizerapplications (see Annex 12, Table 1).
(2) Benefits
On the basis of US$ 318 per ton equivalent to 16 US cents perlb cif New York; benefits have also been calculated at prices ranging from12 US cents to 20 US cents per lb.
(3) Costs
(a) Planting Establishment and Maintenance
First year costs include felling, clearing burning, plant-ing and general upkeep; the cost of using alternative clearingmethods of planting or replanting is also shown. During the im-mature period (6 years after planting) manday requirements forwfeeding, pest and disease control fertilizer application, etc., wouldfall from an estimated 156 mandays in the second year after plantingto 61 mandays in the sixth year after planting. From the seventhyear, when the rubber becomes mature, an estimated 36 mandays perannum would be required for maintenance, plus tractor costs.
(b) Fertilizer
Estimated costs are US$ 8 per ha (year 1), US$ 10 per ha(year 2), US$ 18 per ha (years 3 through 5) and US$ 12 per hathereafter, plus 20% for local handling and transportation costs.
(c) Tapping Costs
Requirements estimated at 1 tapper for 1 ha plus 10%spares. Annual cost increase reflects assumed rise in laborrates of 5% (compounded) during first ten years and 1% (compounded)thereafter.
ANNEX 17Table 1Page 2
(d) Processing Charges
Materials US$ 39.50 per ton of dry rubber plus laborcosts equal to US$ 10.72 per ton of dry rubber in 1976 risingto US$ 15.13 per ton of dry rubber in 1995.
(e) Capital Outlay for New Plant
Proportionate cost of new 1 ton/hour capacity blockrubber factory and subsequent spares and replacements on basisof production from 100 ha to estimated total factory throughput.
(f) Selling Charges
At US$ 7.00 per ton of dry rubber covering transportto port, port handling charges, documentation and JMO expenses.
(g) Inspection Services
US$ 1.50 per ha of total planted area.
(h) Foliar Analysis
Fifty US cents per ha aged between 3 and 20 years.
Ci) Transport to Factory
Seventy-five US cents per ton of dry rubber.
(j) General Overheads
PNP IV total overheads have been allocated on the basisof total immature area to total planted area until 1977, andthereafter, pro-rata to total planted area.
(4) Contingencies
W4ith the exception of wages and salaries no increases in costshave been assumed and a contingency provision of 104 has been added to allcosts (including wages and salaries) during the period 1970-1995.
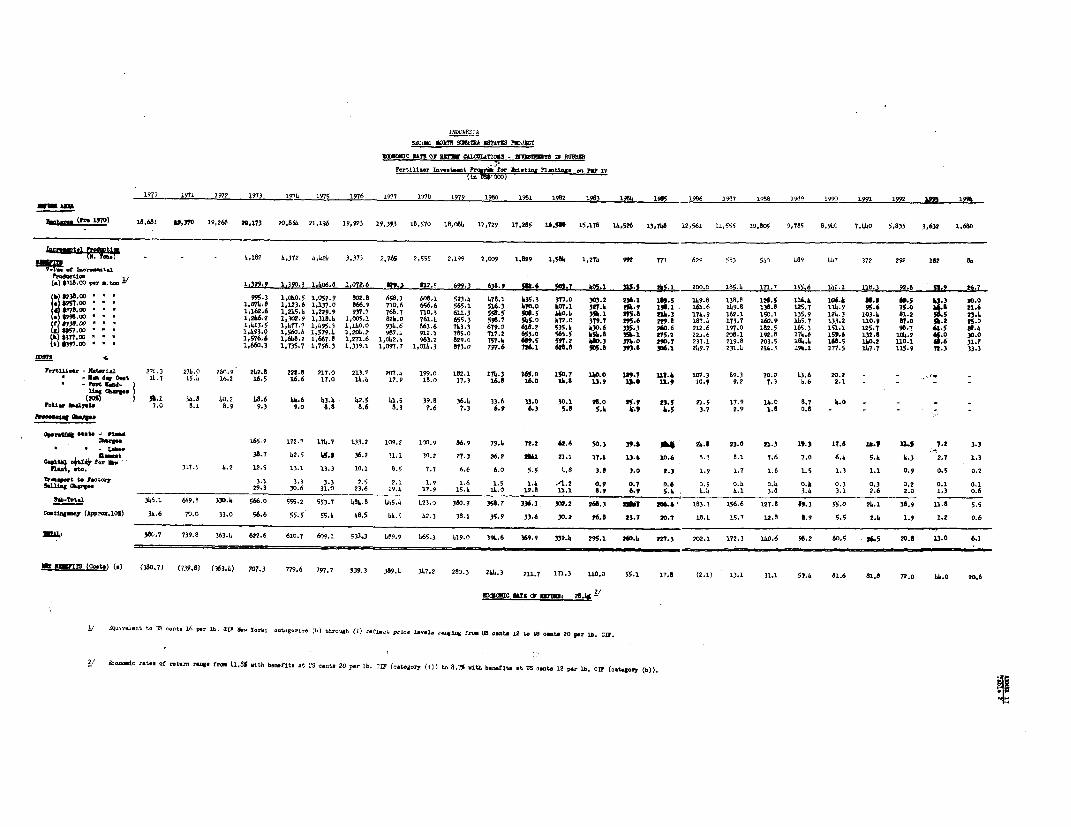
IY ONF891A
=*MNIC UTZ OT R aT o 08102877O1 - 31001IS DN R8UBER
9ert1l1o.r b,v.t.", PT'o. lE-t1 9tLota.-_o 71 28
197) 1571 1972 1973 1974 1975 1976 1977 1970 I9 1990 1981 1992 1963 1964 1968 19va 797 1989 1989 1990 1991 1992 IM3 1986
8 t (ft 1970) l1,68L A,370 19,268 28,173 20,66. 21,136 19,923 19,393 18,570 18,099 17,729 17,285 .6,50 15,178 16.526 13,746 12,561 11, 55 108,08 9,785 8,96O 7,4.0 5,835 3.632 1,68o
zu-t.1~~~~~~~~~~~~~~~~~~~~~~~~~~~~~~~~~~~~~~~~~~~~~~~~~~~~~~~~~~~~~~~~~~~~~~~~~~~~~~~~~~~~~~~~~~~~~~~~~~~~~~~~~~~~~~~~~~~
(M. Tom; 4I182 b,372 &,42b 3,373 2,765 2,555 2,199 3,009 1,829 1,58. 1,274 9m r7t 629 593 SbO 489 bb 372 292 182 ab
7;; of TOer_toL
(I3 $'18.00 P., I. t 1,329.8 1,390.3 1IA06.8 1.072.6 912.3 821.5 699.3 638.9 S.6 8E.7 188.1 W1.5 265.1. 200.0 185.4 IT.7 155.6 112.1 118.3 92.5 n .9 PA6.7
b*38.00 . . * 895.3 1,(10.5 1,052.9 802.8 658.1 608.1 523.b WA78.1 35.3 377.0 303.2 236.1 189.8 169.8 138.8 16.8 116. 106.. 0.4 46.5 6.3 20.0827.00 I 1,074.8 1,123.6 1,137.0 866.9 no.6 66.6 565.1 516.3 170.0 M7.1 327.1 "W.9 196.1 161.6 19.8 138.8 125.7 M11.9 95.6 75.0 a. n.64878.00 1,162.6 1,1258. 1,239.9 937.7 768.7 71O.3 611.3 81.85 50685 O.b1 3. 1 MA.8 214.3 17h.9 162.1 180.1 135.9 124.3 103.1 81.2 It.8 23.4
.38se.00 1,216.2 1,902.9 1,318.4 1,005.1 82h.0 761,4 655.3 5 4.7 88.0 172.0 379.7 29.6 229.8 187.1 173.7 160.9 115.7 133.2 110.9 87.0 8.2 25.02338.00 . . . 1,413.5 1,1T77.7 1,895.3 1,.16.0 931.6 863.6 743.3 679.0 618.2 535.1 630.6 335.3 260.6 212.6 197.0 182.5 165.3 151.1 125.7 98.7 41.5 28.1#328.00 1.1493.0 1,560.0 1,579.1. 1.201.2 997.1 912.1 785.2 717. 2 983.0 868.5 15.86. 35h.1 218.2 226.6 208.1 192.0 17h.6 159.6 130.8 104.2 ~ 8 3.
k)$377.00 . 1,576.6 1,648.2 1,667.8 1,271.6 1,0412.14 963.2 829.0 757.1. "69.° 597. 5 .3 376. 0 M. 27 237.1 219.8 203.5 18..4 168.5 Ih08.2 310.1 6 31.7)0397.00 * 1,660.3 1,735.7 1,756.3 1,339.1 1,097.7 1,016.3 873.0 797.6 726.1 628.8 505. 3M3.8 06.1 219.7 231.4 211.3 19k.1 177.5 117.7 115.9 78.3 33.3
b,ti!les. - lht .1 271.3 271.0 260.9 212.8 222.8 217.0 213.7 207.4 199.0 182.1 171.3 265.0 150.7 11..0 12.3 1J.1 107.3 89.3 70. 0 43.6 20.2 - =.6 r do.t 11.? 18.1 11.2 16.5 16.6 17.0 14.1 17.9 15.0 17.3 16.8 16.0 1h.8 13.9 u.8 11.9 l0.9 9.2 7.3 4.6 2. .
lis -. (208 ) *.1 51.8 10.2 1.6 1.1.6 43.4 42.5 41.5 39.8 36.4 33.6 33.0 30.1 26.0 88., 83.5 20.5 17.9 A. 0 8.7 6.0 . _
Y.11w 661y.8. 7.0 8.1 8.9 9.3 9.0 8.8 8.6 8.3 7.6 7.3 6.9 6.3 5.8 5.1 i.O 6.5 3.7 2.9 1.8 0.8 -
..- -
M-Mee. 165.2 172.7 174.7 133.2 109.2 100.9 86.9 79.1 72.2 62.6 50.3 39.a 04 24.8 23.0 n.3 19.3 17.8 l.? 23s 7.2 3-3-Lob.,
fLut 38.7 42.5 1.8. 36.2 31.1 30.2 27.3 26.2 A". 23.1 17.1 13.1 10.6 8.7 0.1 7.6 7.0 6.4 5.4 4,3 2.7 1.3
Cl t 1 317 5 4.2 12.5 13.1 13.3 10.1 8.5 7.7 6.6 6.O 5.5 1.8 3.8 3.0 2.3 1.9 1.7 1.6 1.5 1.3 I1. 0.9 0.8 0.2
T*..n to 7050t55 3.1 3.3 3.3 2.5 2.1 1.9 1.6 1.8 11.1 .. 2 0.9 0.7 0.6 0.s 0.h 0.14 0. 0.3 0.3 0.2 0.1 0.1selling 1h1w. 29.3 30.6 31.0 23.6 19.1 17.9 15.. 164.0 12.8 11.1 8.9 6.9 5.1 1.1 4.1 3.8 3.1 3.1 2.6 2.0 1.3 o.6
.b-Tot.1 346.1 669.8 330.1. 566.0 558.2 553.7 4,86.8 445.4 423.0 380.9 358.7 336.3 300.2 268.3 r1't 206.8 183.7 156.6 127.8 88.3 58.0 24.1 18.9 11.8 5.5
CtIogwot y (APP.n2.10%) 34.6 70.0 33.0 86.6 55.5 55.4 ,8.5 44.5 42.3 38.1 35.9 33.6 30.2 26.8 83.7 20.7 18.h 15.7 12.8 6.9 5.5 2.4 1.9 1.2 o.6
W38.7 739.8 363.4 622.6 610.7 679.1 533.3 189.9 465.3 1,9.0 394.6 369.9 332.4 295.1 260.4 . 27.3 202.1 172.3 140.6 986.2 60.5 t.5 20.6 13.0 6.1
M 8W1T5 (Coot.) (a) (38007) (739.8) (363.4) 707.3 779.6 797.7 539.3 389,4 317.2 280.3 21,4.3 211.7 171.3 110.0 85.1 17.8 (2.1) 13.1 31.1 87.1 81.6 81.8 72.0 1k.O 20.6
ILar1c UTZ rJ WM. 26.1$
1/ iquvloaJnt to 203 colts 16 pr lb. P Ib -ork, -8oro (b) throogh (i) ror1cs prVo 1-.-l. r-.lg Ir-. US o-t. 1.2 tO 03 C-ote 20 p-r lb. C17.
&/ 88orostc rat.. of st-rn rTAg fros 4.8.% 81th bnoit. at US .. st. 20 p.r lb. CI? (-.tqo-y (i) Wto 0.7n with beneit It 0S s-t. 12 p-r lb. C17 (cstgo-Y (b)).
ANNEX 17Table 2
INDONESIA
SECOND NORTH SUMATRA ESTATES PROJECT
ECONOMIC RATE OF RETURN CALCULATIONS - INVESTITS IN RUBBER
FERTILIZER INVESTMENT PROGRAM FOR EXISTING PLAMTINGS ON PNP IV
The follawing assumptions were made for calculating the economicrate of return from the proposed fertilizer investment program for existingplantations on PNP IV.
(1) Incremental Production
Estimated additional yield response to fertilizer application(see Annex 12, Table 1) from mature areas between 7 and 20 years old.
(2) Benefits
On the basis of US$ 318 per ton equivalent to 16 US cents perlb cif New York; benefits have also been calculated at pricesranging from12 US cents to 20 US cents per lb.
(3) Costs
(a) Fertilizer - Material
US$ 12 per ha, plus 20% for local handling and trans-portation costs, except for the last five years of productivelife (years 21 through 25);
(b) Fertilizer - Manday Cost
Labor requirements assumed to be 1.5 mandays per ha.
(c) Foliar Analysis
Costed at 50 US cents per ha of mature rubber between4 and 19 years old.
(d) Processing Charges
Materials US$ 39.50 per ton of dry rubber plus laborcosts equal to US$ 8.00 per ton of dry rubber in 1970 risingto US$ 1IJ.98 per ton of dry rubber in 1991.
ANNEX 17Table 2Page 2
(e) Capital Outlay for NewJ Plant
Provision is made in 1971 for a complete new blockrubber processing factory with 1 ton/hour capacity and sparesand replacements required in the following years. Day to daymaintenance spares are included in processing costs (see 3 (d)above).
(f) Transport to Factory
Costed at 75 US cents per ton of dry rubber.
(g) Selling Charges
At US$ 7.00 per ton of dry rubber covering transportto port, port handling charges, documentation and JMO expenses.
(4) Contingencies
With the exception of wages and salaries no increases in costshave been assumed and a contingency provision of 10% has been added to allcosts (including wages and salaries) during the period 1970-1994).
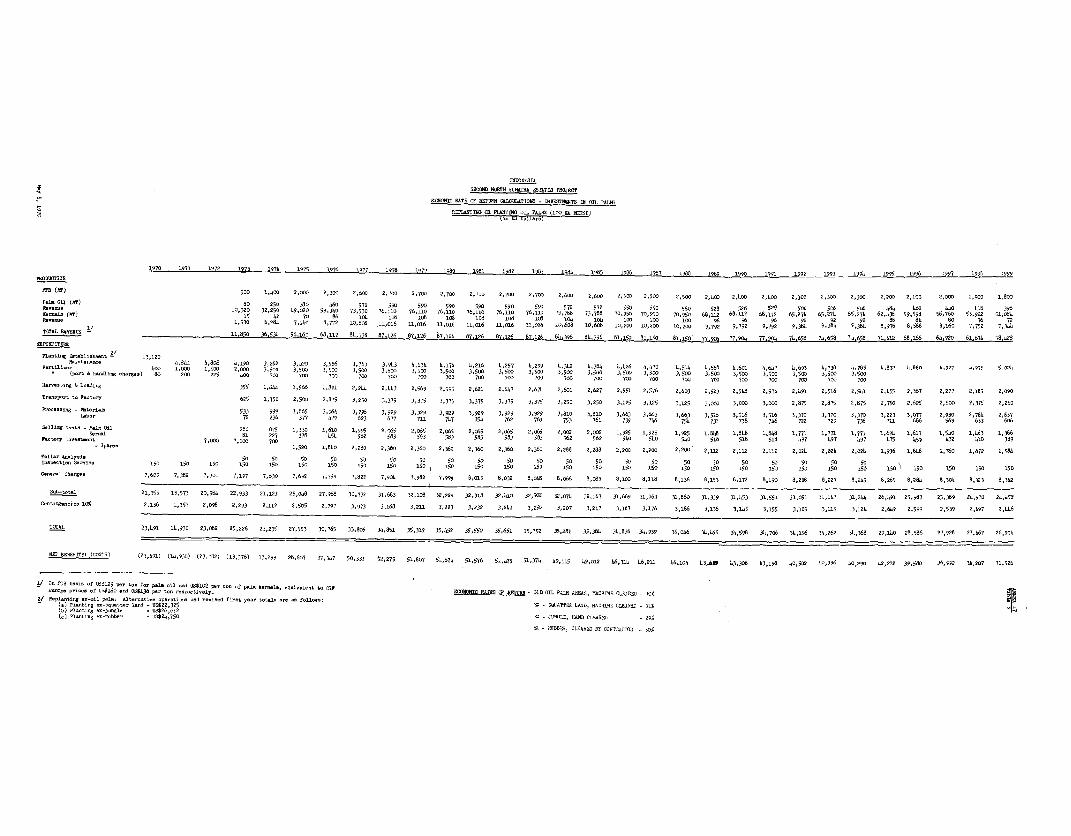
�M�
Sr.OM MMH SUM&M 4BUTFA PROA�"SR" OF MM ULDULVIONS - lm�
m Oll IALM
REPLANTM OR PAIM UDD " "-L)
�17. 1971 1972 l`?3 �97L 1975 i976 1�77 1981 1982 198, 19W 1911 1992 1193 1�94 1995 1996 �997 1995 1999
mm.10A
m (�) 500 1,40O 2,000 2,300 2,6. 2, 7W 2,7W 2,7. 217W 2,7. 2,7. �,6.� 2,6W 2,50I 2,5. 2,500 2,40O 2,tOO 2,4W 2,3. 2.30O 2,30. B, 2W B, 100 2,000 11900 1,800
F� - (M) B. 250 380 460 570 590 590 590 590 590 590 572 572 55o 550 550 525 526 528 506 5D6 5O6 484 L62 440 LaB 396
M= 10,320 32,25. 49,020 59,3to 73,53. 76,110 110 76,liO 76,UO 76,11- 76,110 73,786 73,786 70,M 70, R5� 95S , 68,112 65,274 65,274 62
&-.I. (W) 8 76, 70, 68 112 68,112 65,274 06 59,598 56,76o 53,92z 5i,.a
ft-- 15 42 7. 96 96 92 91 92 8R 80 72
1,530 4,28h 7,11,0 B, 2 10,6m 11, 11, " 108 11, Im 11, 1�8 ,'103 10, JO, 1.4 96 ",B 9"R 9"5 8" 7
77' ... 106 108 - 11 lw IOD 9,792 R, 792 9,792 7'
o16 016 ou Q16 016 016 608 608 ID'. .'BOO L., 4 976 5u 6. 7,752 �44
TCT� NVENUE 11.M 36.534 56.160 68.112 BL,138 67.126 87,126 87,126 67.1 77,904 77, N4 74,653 74,658 7�,658 71.412 68,166 64,920 61,67L 58,�23
EXPEMITU�.
R..iN F..bll.�.t 13,120
4^1 4,808 �'lqo 3,262 3,42-1 3,5d6 3,760 3. 943 4�134 4,176 4,216 4,257 4,299 4 342 4,354 4,426 4,47. 4,5" 4,55B 4,Wl 4,647 4,693 4 L 785 4,832 4,88. 4,927 4, �75 5,�2h
4. l'om 1,500 2,OOO 3, 5. 3,500 3, 5- 3,5 3.500 3,500 3,500 3,500 3,500 3,5GI 3 5W 3,500 3, 5W 3,500 3, 5w 3,500 3,500 3,50O 3,500 3 00 3 5w7388. 2m '25 7 7 7 7M 7 7 7
:5
4w SO Oo SO .0 w 7W 70O 7-0 7W 7. 7m 7w 7W 7w ?" 7W 7M 7W 7W
& L-dl, 355 �'04� i,566 1,391 2,2" 2'U7 2�569 2,595 2,621 2,60 2,674 2,6oi 2,627 2,551 2,576 2,6.3 2,523 2,5LB 2�574 2,491 2,516 2,541 2,455 2,367 2,277 2,185 2,090
T- �- 1. F-.� 625 1175O 2,50S 2,875 3,250 3, 375 3,375 3, 375 3,375 3,375 3,375 3,25. 3,250 3,115 3,125 3x5 3,000 3,000 3.000 2,875 2,875 2,675 2, 750 2,625 2,500 2,375 2,250
P- ... j� - 533 999 1,865 3,)64 3, 796 ), 229 3, 929 3,921 3,929 3, 929 3,929 3,810 3,010 3,663 3,663 3,663 3,5!6 3,516 3,516 3,370 3,370 31370 3, 272,3 3,077 2,9310 2,78L 2�6 7
72 B36 377 471 623 677 711 747 754 762 769 753 761 739 746 N, 731 738 746 722 729 736 1 686 569 633 6.6
.IILV 1-11 - 280 875 1, 330 1,610 1, �95 2, 165 2�065 2,065 2,065 2,065 2,06 2,002 2,002 1,925 1,925 1,925 1,848 1,80 1,848 1,771 1,7 1,771 1,69L 1,61? 1,540 1,463 i, 386
K, 7 3 5 71
81 22 76 464 562 583 583 5�) 583 533 583 562 562 54. 40 54O 5i8 518 518 497 497 497 475 45� 432 4iO 369
S'-. 1,520 1,84. 2,2BO 36. 2,360 2,360 1. 36. 360 2,36o 2,2aa 2, 288 " 2M 2,200 2,2M 2'U2 2,112 2.112 2,.24 2,024 2,024 1,936 1,846 i, 76. 1,672 i, 584
5. 50 5D 5- 50 5O 5- 5 50 50 50 50 50 50 50 50 50 50 5 50
�50 15. .50 a 'o 0 515" 150 i5o 150 15. ISO 0 150
15. 15� 15. 15. 150 15S 15. 150 15 150 50 L 0 �53 150 50 150 150 150 150 150
7,6I5 7,382 7,301 7,197 7,630 7,692 7,75� 7,822 7,90h 7,982 7,"g B.m5 8,032 5,.w 8,066 8,O63 8,1. 8,110 8,136 B.153 B,172 8.190 8,208 8,227 8,245 8,265 B'2a4 5,3-4 6,323 B,342
21,355 13,573 20,96L 22,933 21,123 25A8 27,968 31,732 31,683 32, 1M 32,22, 32,313 32,410 3B,5-2 32474 32,167 31,669 31,763 31,860 31,359 31,453 31.551 31,051 31,�17 31,244 26,491 25,�B7 25,359 Z4'm 24,458
10% 2.136 1,351 2,096 2,293 2,112 2,505 2,797 3073 3.168 312n 3,223 3,�32 312U 3,25- 3,207 3,217 3,167 3,176 3,L86 3,136 3,145 3,155 3,105 3'U5 3,124 2,649 2,599 2,539 2,L97 2,L66
TNIL 23,491 14,9311 23,062 25,226 23,235 27.553 30.765 33,8.5 34,851 35,319 35,452 35,550 35,652 35,752 35,282 35,38L 34,836 34,939 35�046 34,495 34,598 34,7-6 34,156 34,262 A.368 29,140 28.5B6 ??,926 27,467 26,904
(B3,01) (14,130) (23,"B21 �13,376) 13,2F' 28,607 37,30 5.,333 52,275 51,607 5L,674 51,576 51.,75 51,374 �9,115 41,O12 46,314 L6.211 46.104 U,*09 43,306 h3,198 4MM 1-01� 4-,29. 42,272 39,580 36,992 A,2.7 31.524
I/ 0- FOB b- -f U3$12? j - 0"102 f -q� .t t. CIF
- � '- �f "L'o �SU36 p- OID CIL Pl,:X AREAS, MACHn. CL&XRM - 309
21' �pl-ti� -- il ��- at-O.' . ..... f" Y.- '-t-l` f-u-' EX - IQUATT� LAN�, 31,1
I USWP11--, -lb�l "S$24:75.
- Wo
17 - XBB:�', cLEARM BY Sot4riAma 30�
AANNTEX 1 7
Table 3
I'DO'I2SIA
SECOND MORTH SUMATRA ESTATES PROJECT
ECONOGI4IC RATE OF RETURN CALCULATIONS - INVESTMENTS IM OIL PALMS
REPLATEIG OR PLANTING OIL PALMS (100 HA MODEL)
The following assumptions were made for calculating the economicrate of return from replanting or planting oil palms on PMP VI.
(1) Production
Estimated production from new plantings or replantingswith regular fertilizer applications, improved managementetc. (see Annex 12, Table 2). Palm oil extraction ratesassumed to increase from 16%o in the first year of productionto a maximum of 22% in the fifth year of production (seeparagraph 6.01 of the main report), and kernel extractionrates to increase from 3% to 4% during the same period.
(2) Revenue
On the basis of US$129 per ton for palm oil and US$102for palm kernels, equal to CIF Europe prices of US$160 per tonper ton and US$136 per ton respectively.
(3) Expenditure
(a) Planting Establishment
Includes manday and machinery requirements forfelling, stacking, burning, lining, holing andplanting, weeding and other upkeep. Variationin first year costs reflects alternative oper-ations, e.g. replanting oil palm, planting ex-squatter land, planting ex-jungle and plantingex-rubber.
(b) Planting maintenance
Manday and machine requirements for weeding, pestsand diseases, roads, bridges and railways, drainsand application of fertilizer. Manday requirementsare reduced by more than 50% when area becomesmature in the fourth year after planting.
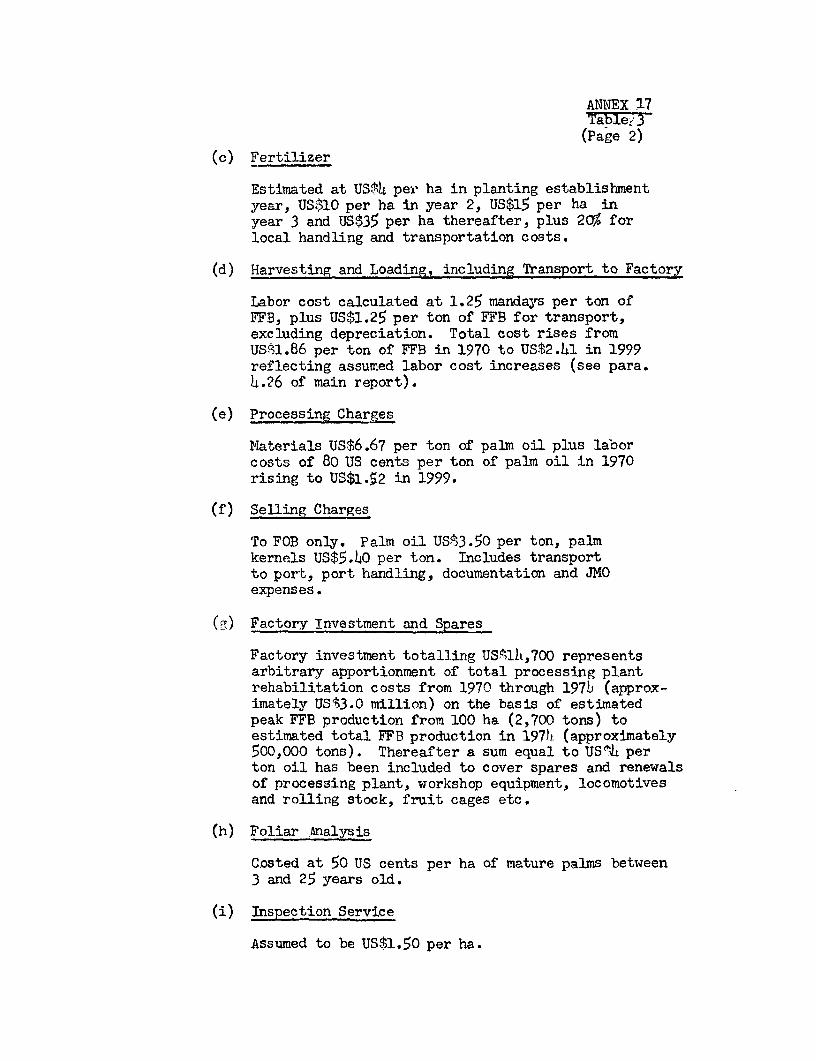
ANNEX 17Table, 3(Page 2)
(c) Fertilizer
Estimated at USW& per ha in planting establishmentyear, US$10 per ha in year 2, US$15 per ha inyear 3 and US$35 per ha thereafter, plus 20g forlocal handling and transportation costs.
(d) Harvesting and Loading, including Transport to Factory
Labor cost calculated at 1.25 mandays per ton ofFFB, plus US$1.25 per ton of FFB for transport,excluding depreciation. Total cost rises fromUS$1.86 per ton of FFB in 1970 to USt2.h1 in 1999reflecting assumed labor cost increases (see para.4.26 of main report).
(e) Processing Charges
Materials US$6.67 per ton of palm oil plus laborcosts of 80 US cents per ton of palm oil in 1970rising to US$1.52 in 1999.
(f) Selling Charges
To FOB only. Palm oil USt3 .50 per ton, palmkernels US$5.h0 per ton. Includes transportto port, port handling, documentation and JMOexpenses.
(g) Factory Investment and Spares
Factory investment totalling USt1li,700 representsarbitrary apportionment of total processing plantrehabilitation costs from 1970 through 1976 (approx-imately USt3.0 million) on the basis of estimatedpeak FFB production from 100 ha (2,700 tons) toestimated total FFB production in 1971, (approximately500,000 tons). Thereafter a sum equal to US*h perton oil has been included to cover spares and renewalsof processing plant, workshop equipment, locomotivesand rolling stock, fruit cages etc.
(h) Foliar Analysis
Costed at 50 US cents per ha of mature palms between3 and 25 years old.
(i) Inspection Service
Assumed to be US$t.50 per ha.
ANNEX 17Table 3(page 3)
(j) General Charges
Total general charges apportioned on the basis oftotal planted area. Annual increase in cost reflectssalary increments of 5% per annum (compounded)through 1979 and 1% (compounded) thereafter.
h. (h) Contingencies
With the exception of wages and salaries no increases incosts have been assumed and a contingency provision of 10%has been added to all costs (including wages and salaries)during the period 1970-1999.
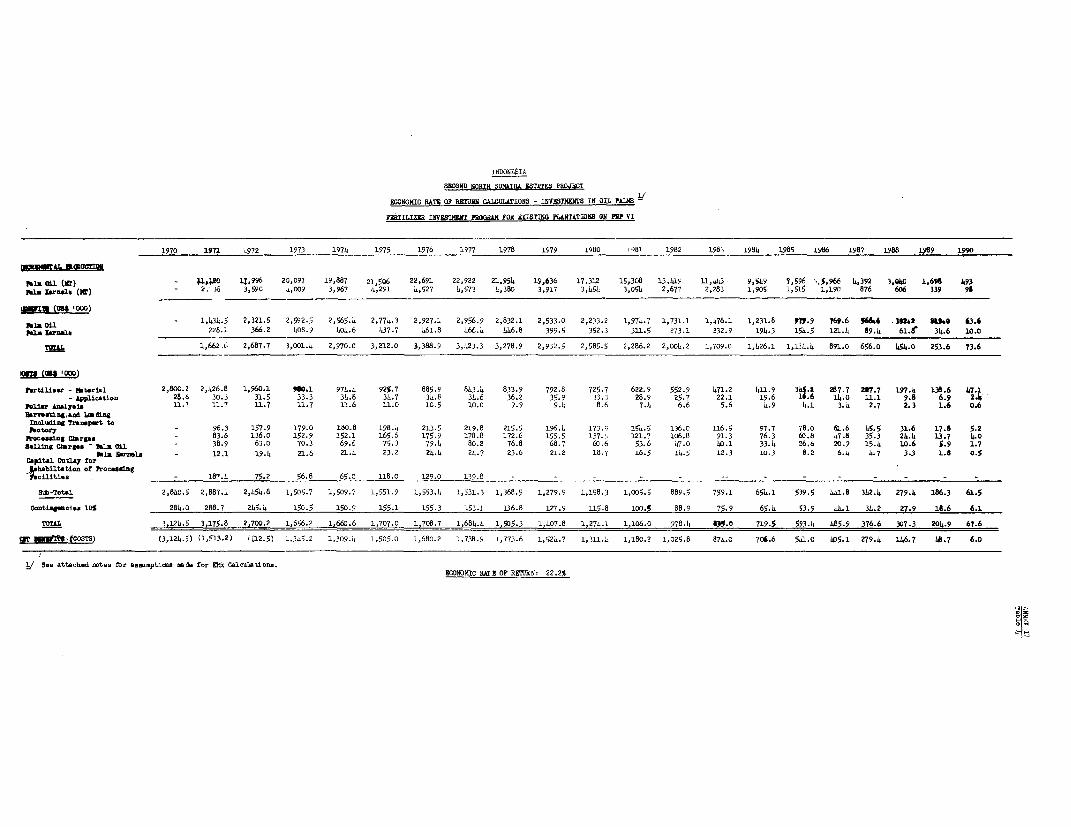
INDON8;IA
SICOND NORTHl SUW1T lSTATES PSOJECT
NGONOMIC HATO OF RETURN CALGIAiTIONS - INVEjSTl1T2S IN OIN PALNS 9
FiBTILIZER 2l8v0T8w PR2a0L0 ?OR RISTINO PLiTATIONS ON 9nr VI
1970 1971 i972 1973 1974 1975 1976 1977 1978 1979 1980 1I 81 1982 198 1984 1985 1986 1987 1988 1"96 1990
Ov~ Oil (It) _ 3~450 14,996 20,097 19,887 21,506 22,691 22,922 21,954 19,636 17,312 150308 13,41S 11,443 9,549 7,596 .5,966 4,392 3,02,0 1,696 493
ft = ~ ()~) - 2.' 136 3,590 c ,009 3,967 4,291 4,527 4,573 4,380 3,917 3,454 3,054 2,677 2,283 1,905 1,515 1,190 876 606 339 98
s 011 - 1,4,34.5 2,321.5 2,592.5 2,565.4 2,774.3 2,927.1 2,956.9 2,832.1 2,533.0 2,233.2 1,974.7 1,731.1 1,476.1 1,231.8 PV.9 16.6 O6M6 . Mt P. O 63.6
raIa 1i-I 228.1 366.2 408.9 404.6 437.7 461.8 466.6 446.8 399.5 352.3 311.5 273.1 232.9 194.3 154.5 121.4 89.4 61.8 34.6 10.0
TC5A. 1,662., 2,687.7 3,001.4 2,970.0 3,212.0 3,388.9 3,423.3 3,278.9 2,932.5 2,585.5 2,286.2 2,006.2 1,709.0 1,426.1 1,136.4 891.0 656.0 454.0 253.6 73.6
cm8 (gm100 DO
Fertilizer - ibt.ri.1 2,800.2 2,426.8 1,960.1 90.1 974.4 925.7 885.9 843.4 833.9 792.8 725.7 622.9 552.9 471.2 411.9 345.1 287.7 227.7 197.4 138.6 47.1
- ApLi atio. 28.6 30.3 31.5 33.3 34.8 34.7 34.6 34.6 36.2 35.9 33.3 28.9 25.7 22.1 19.6 16.6 14.0 11.1 9.8 6.9 2.4
Poliar AnLyai 11.7 11.7 11.7 11.7 11.6 11.0 10.5 10.0 9.9 9.4 8.6 7.4 6.6 5.6 4.9 4.1 3.6 2.7 2.3 1.6 o.6
bWrmsting,and LadingIncluding Tra.spart toFactory - 96.3 157.9 179.0 180.8 198.4 213.5 219.8 215.5 196.6 173.q 154.5 136.0 116.5 97.7 78.0 61.6 65.5 31.6 17.S 5.2
oocdag CSrps - 83.6 136.0 152.9 152.1 165.6 175.9 178.8 172.6 155.F 137.F 121.7 106.8 91.3 76.3 60.8 47.8 35.3 2464 13.7 4.0
S*wosming Glarps ~ Oil38.9 63.0 70.3 69.6 75.3 79.4 80.2 76.8 68.7 60.6 53.6 47.0 40.1 33.4 26.6 20.9 15.4 10.6 -i.9 1.7
1ios } 12.1 19.4 21.6 21.4 23.2 24.4 24.7 23.6 21.2 18.7 16.5 14.5 10.3 10.3 8.2 6.4 4.7 3.3 1.8 0.5
Capital Outlay forhabiltation of Proc0.85ngilitis - 187.4 75.2 56.8 65.C 118.0 129.0 139.8 - - - - - -- - - - - - - -
Sb -TotAl 2,840.:i 2,887.1 2,454.8 1,505.7 1,509.7 1,551.9 1,553.4 1,531.3 1,368.5 1,279.9 1,158.3 1,005.5 889.5 759.1 654.1 539.5 4b1.8 342.4 279.4 186.3 61.5
Contiumso.i. 10% 284.0 288.7 245.4 150.5 150.9 155.1 155.3 153.1 136.8 127.9 115.8 100.5 88.9 75.9 65.4 53.9 44.1 34.2 27.9 18.6 6.1
TOTAL 3,124.5 3,175.8 2,700.2 1,656.2 1,660.6 1,707.0 1,708.7 1,684.4 1,505.3 1,407.8 1,275.1 1,106.0 978.4 635.0 719.5 593.4 485.9 376.6 307.3 204.9 67.6
im MMDDfW f2-2OTSJ (3,124.5) (1,513.2) (412.5) 1,345.2 1,309.4 1,505.0 1,680.2 1,738.9 1,773.6 1,526.7 1,311.- 1,180.2 1.025.8 874.o 706.6 541.0 45.1 279.4 146.7 48.7 6.0
I/ S.. ottached Mt.. fbr *smarpti md. for E NMC1Rtion.2
800N3901C RAT! 0? REIU28,: 22.2S
ANNEX 17Table 4
INDONESIA
SECOND NORTH SUMATRA ESTATES PROJECT
ECONOMIC RATE OF RETURN CAICULATIONS
RTILIZER INVESTMENT PROGRAM FOR EXISTING
PLANTATIONS ON PNP VI
The followiing assumptions were made for calculating the economicratesof return from the proposed fertilizer investment program for existingplantations on PNP VI.
(1) Incremental Production
Estimated additional yield response to fertilizer application(see Annex 12, Table 2) from mature areas between h - 26 years old totalling23,335 ha. Palm oil extraction rate 22% except in 1971, kernel extractionrate approximately b.L%.
(2) Benefits
On the basis of US$ 129 per ton for palm oil and US$ 102 forpalm kernels, equal to cif Europe prices of US$ 160 per ton and US$ 136
per ton respectively.
(3) Costs
(a) Fertilizer - Material
Initial applications US$ 100 per ha in 1970, US.$ 87 perha in 1971, US$ 70 per ha in 1972 and US$ 35 per ha thereafter(see Annex 5) plus 20% for local handling and transportation costs.
(b) Fertilizer - Application
Manday requirements estimated at 2.5 per ha per annum.Manday costs assumed to increase from b9 US cents per day in 1970to 85 US cents per day by 1990 (see para 4.26 of the main report).
(c) Foliar Analysis
Costed at 50 US cents per ha of mature palms between3 and 25 years old.
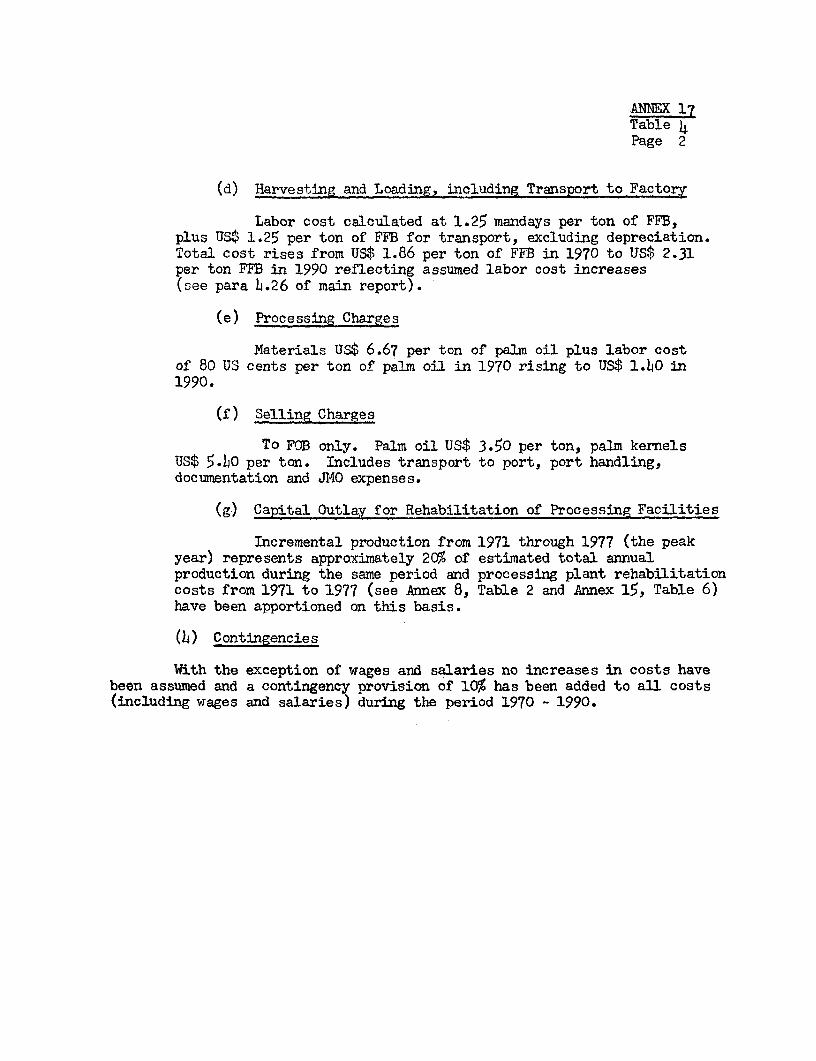
ANNEX 17Table 4Page 2
(d) Harvesting and Loading, including Transport to Factory
Labor cost calculated at 1.25 mandays per ton of FFB,plus US$ 1.25 per ton of FFB for transport, excluding depreciation.Total cost rises from US$ 1.86 per ton of FFB in 1970 to US$ 2.31per ton FFB in 1990 reflecting assumed labor cost increases(see para 4.26 of main report).
(e) Processing Charges
Materials Us$ 6.67 per ton of palm oil plus labor costof 80 US cents per ton of palm oil in 1970 rising to US$ 1.b0 in1990.
(f) Selling Charges
To FOB only. Palm oil US$ 3.50 per ton, palm kernelsUS$ 5.bO per ton. Includes transport to port, port handling,documentation and JMO expenses.
(g) Capital Outlay for Rehabilitation of Processing Facilities
Incremental production from 1971 through 1977 (the peakyear) represents approximately 2CF% of estimated total annualproduction during the same period and processing plant rehabilitationcosts from 1971 to 1977 (see Annex 8, Table 2 and Annex 15, Table 6)have been apportioned on this basis.
(4) Contingencies
With the exception of wages and salaries no increases in costs havebeen assumed and a contingency provision of 10% has been added to all costs(including wages and salaries) during the period 1970 - 1990.
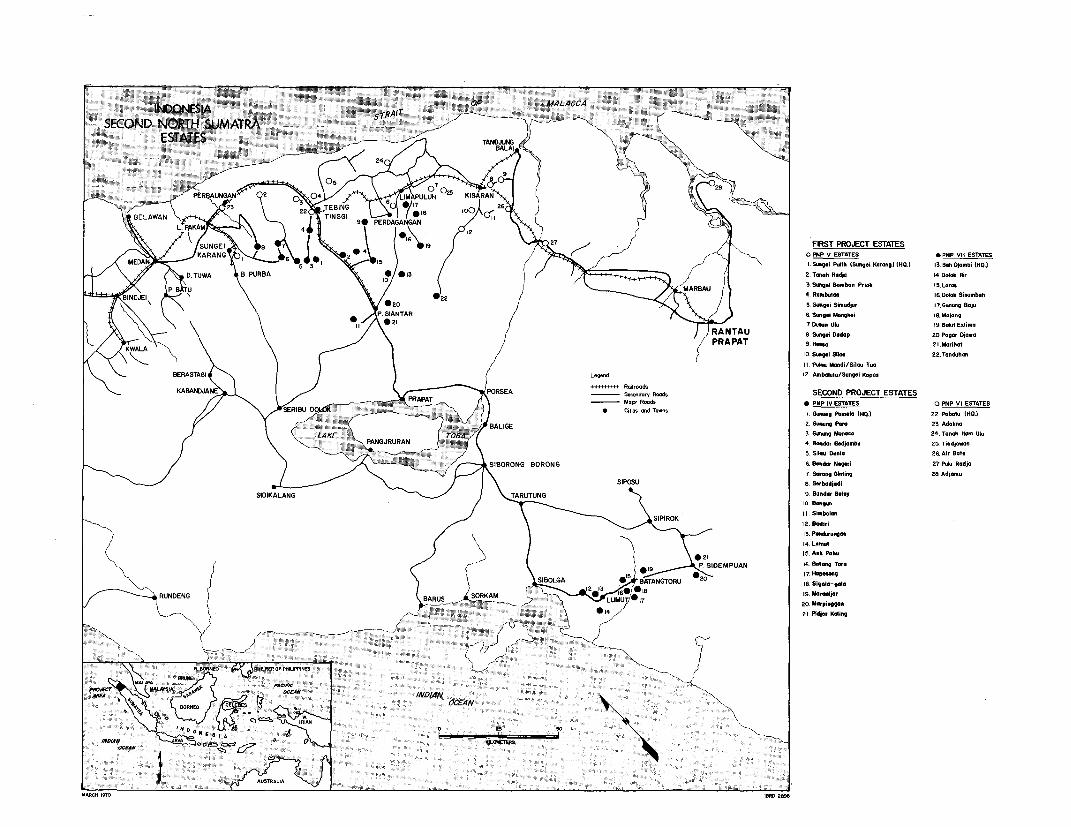
% / /:UNGEI) a d\ 1 t \ *t ( +?\27 > X < ~~~~~~~~~~~~~~~~~~FIRST PROJECT ESTATES
2KA R A N G N--S6\ 503 101 5 / g > /- / > < I.Susnr Pdih (SungdKoro l(HQ) *P"0PVETTESTATEE
4/ HgZ R%,D TUWA t B. PUR8A \65, * 13 g ) / / ,/r g 2. Tenab Rody 24.DR* IlSl
(t \ %20 / tRBAU / 3Eq|lilnml Pidl 16DdakSinumboh~~~~~~~~~~~~~~~~~~~~~~~~~~4.Rorbla 1200kSionbo
t \ \ C-C {WT U s _,G, B-k: Ex n~~~~~~~~~~~~~~~~~~~~~~~~~~~~~~~~~~~~~~~7255. bnI. oitElir
22 ING~~~~~~~~~~~~~~~~~~~~~~~~~~~~~~~~~~~~0 n.. Sls2.TRoa
9* PERDAGANGAN~~~~~~~~~~~~~~~~~~~~~~~~~~~~~IP00 osISla u
12BERASTAGI;\ Z / \ (/ Leg nd 12 Anbvlutu/S1.g-l/ KoKp
19 FIRAN DJA N<< t > ( -A P O R SE A _ onoor SECOND PROJECT ESTATES
14 04VIB W M~; B -~ m / ) - it, oda * PNP IV ESTATES 0Z PNP VI ESTATES
I 1. S-"i ~~~~~~~~~~~~~~~ Cls n TasP0i500g. .,. ((HQ. 22. Pil, D..b (HQ.)
3A2 SGunug Pana 23 AdoliS a
022 4,~~~~~~~~~~~~~~~~~~~~~~~~~~~ GRabt. MonnD4. Tnk Sin, Si
( \ ) j j ji, tUGURURAN (h^::;^- j>-0gl^0 t 4 B nder E dldmbu Zf Tindjoyron~~4. aradr Ddjamo 23TindOWO
PO 5 S / \ \iSIPOSUd6j5 bodjddi ze.Ss i2AD
SIDIKALANG~~~~~~~~IATA 6. STARUTUi Mgke I& Bun ds
NTAU 8.~~ Sgoid D.d.p 27. Pg10 RDi.oPRAPAT 9~~~~ Kam. Gstn 2 1 .Adhalt
S0. SarbdjoiSi-2T h.
$ W $ 1 A t ;4Lunu~~~~~~~~~~~~~~~~~~~~~~~~~~~~~~~~~~~~~~~~~~~~~~~~~~~~ABog,
I.I. MSIdn ftis . T.
BERA L.WM ~~~~~~~~~~~~~~~~~~~~~~~~~~~~~~~~~~~~~~~~~~~~~~~~~~~~~~~2. DAdbiri .g. K
\X\ / t t XSIBOLGA *15~~~~~~~~~~~~~~~~~~~~~~~~~~~~~~~~P SBDC MPU AN IA. Dabtng Tr
KABAN EA S-dry RUNDENGA6 1i SigEl R- ESla
MARCH 0972 19Ros 509