dietary fibers and human health - open research library
TRANSCRIPT
Dietary Fibers and Human Health
Megan A. McCrory
www.mdpi.com/journal/nutrients
Edited by
Printed Edition of the Special Issue Published in Nutrients
nutrients
Dietary Fibers and Human Health
Special Issue Editor Megan A. McCrory
MDPI • Basel • Beijing • Wuhan • Barcelona • Belgrade
Special Issue Editor
Megan A. McCrory
Boston University
USA
Editorial Office
MDPI AG
St. Alban-Anlage 66
Basel, Switzerland
This edition is a reprint of the Special Issue published online in the open access
journal Nutrients (ISSN 2072-6643) from 2016–2017/ (available at:
http://www.mdpi.com/journal/nutrients/special_issues/dietary_fibers).
For citation purposes, cite each article independently as indicated on the article
page online and as indicated below:
Author 1; Author 2. Article title. Journal Name Year, Article number, page range.
First Edition 2017
ISBN 978-3-03842-581-6 (Pbk) ISBN 978-3-03842-582-3 (PDF)
Articles in this volume are Open Access and distributed under the Creative Commons Attribution license (CC BY), which allows users to download, copy and build upon published articles even for commercial purposes, as long as the author and publisher are properly credited, which ensures maximum dissemination and a wider impact of our publications. The book taken as a whole is © 2017 MDPI, Basel, Switzerland, distributed under the terms and conditions of the Creative Commons license CC BY-NC-ND (http://creativecommons.org/licenses/by-nc-nd/4.0/).
iii
Table of Contents
About the Special Issue Editor ..................................................................................................................... vii
Preface to “Dietary Fibers and Human Health” ....................................................................................... ix
Chao Ding, Xiaolong Ge, Xueying Zhang, Hongliang Tian, Hongkan Wang, Lili Gu, Jianfeng Gong, Weiming Zhu and Ning Li
Efficacy of Synbiotics in Patients with Slow Transit Constipation: A Prospective Randomized Trial Reprinted from: Nutrients 2016, 8(10), 605; doi: 10.3390/nu8100605 ...................................................... 3
Marilia Carabotti, Bruno Annibale, Carola Severi and Edith Lahner
Role of Fiber in Symptomatic Uncomplicated Diverticular Disease: A Systematic Review
Reprinted from: Nutrients 2017, 9(2), 161; doi: 10.3390/nu9020161 ........................................................ 13
Danielle N. Cooper, Mary E. Kable, Maria L. Marco, Angela De Leon, Bret Rust, Julita E. Baker, William Horn, Dustin Burnett and Nancy L. Keim
The Effects of Moderate Whole Grain Consumption on Fasting Glucose and Lipids, Gastrointestinal Symptoms, and Microbiota
Reprinted from: Nutrients 2017, 9(2), 173; doi: 10.3390/nu9020173 ........................................................ 27
Sarina Pacifici, Jaehong Song, Cathy Zhang, Qiaoye Wang, Raymond P. Glahn, Nikolai Kolba and Elad Tako
Intra Amniotic Administration of Raffinose and Stachyose Affects the Intestinal Brush Border Functionality and Alters Gut Microflora Populations
Reprinted from: Nutrients 2017, 9(3), 304; doi: 10.3390/nu9030304 ........................................................ 48
Athanasios Koutsos, Maria Lima, Lorenza Conterno, Mattia Gasperotti, Martina Bianchi, Francesca Fava, Urska Vrhovsek, Julie A. Lovegrove and Kieran M. Tuohy
Effects of Commercial Apple Varieties on Human Gut Microbiota Composition and Metabolic
Output Using an In Vitro Colonic Model Reprinted from: Nutrients 2017, 9(6), 533; doi: 10.3390/nu9060533 ........................................................ 58
Sathish Sivaprakasam, Yangzom D. Bhutia, Sabarish Ramachandran and Vadivel Ganapathy
Cell-Surface and Nuclear Receptors in the Colon as Targets for Bacterial Metabolites and Its Relevance to Colon Health
Reprinted from: Nutrients 2017, 9(8), 856; doi: 10.3390/nu9080856 ........................................................ 81
Tahir Rasool Qamar, Fatima Syed, Muhammad Nasir, Habib Rehman, Muhammad Nauman Zahid, Rui Hai Liu and Sanaullah Iqbal
Novel Combination of Prebiotics Galacto-Oligosaccharides and Inulin-Inhibited Aberrant Crypt Foci Formation and Biomarkers of Colon Cancer in Wistar Rats
Reprinted from: Nutrients 2016, 8(8), 465; doi: 10.3390/nu8080465 ........................................................ 99
Rui Xu, Zhi Ding, Ping Zhao, Lingchao Tang, Xiaoli Tang and Shuomeng Xiao
The Effects of Early Post-Operative Soluble Dietary Fiber Enteral Nutrition for Colon Cancer
Reprinted from: Nutrients 2016, 8(9), 584; doi: 10.3390/nu8090584 ........................................................ 113
iv
Sandi L. Navarro, Marian L. Neuhouser, Ting-Yuan David Cheng, Lesley F. Tinker, James M. Shikany, Linda Snetselaar, Jessica A. Martinez, Ikuko Kato, Shirley A. A. Beresford, Robert S. Chapkin and Johanna W. Lampe
The Interaction between Dietary Fiber and Fat and Risk of Colorectal Cancer in the Women’s Health Initiative
Reprinted from: Nutrients 2016, 8(12), 779; doi: 10.3390/nu8120779 ...................................................... 121
Huawei Zeng, David P. Taussig, Wen-Hsing Cheng, LuAnn K. Johnson and Reza Hakkak
Butyrate Inhibits Cancerous HCT116 Colon Cell Proliferation but to a Lesser Extent in Noncancerous NCM460 Colon Cells
Reprinted from: Nutrients 2017, 9(1), 25; doi: 10.3390/nu9010025 .......................................................... 137
Samsu U. Nurdin, Richard K. Le Leu, Graeme P. Young, James C. R. Stangoulis, Claus T. Christophersen and Catherine A. Abbott
Analysis of the Anti-Cancer Effects of Cincau Extract (Premna oblongifolia Merr) and Other Types of Non-Digestible Fibre Using Faecal Fermentation Supernatants and Caco-2 Cells as
a Model of the Human Colon
Reprinted from: Nutrients 2017, 9(4), 355; doi: 10.3390/nu9040355 ........................................................ 150
Xue Li, Xiaxia Cai, Xiaotao Ma, Lulu Jing, Jiaojiao Gu, Lei Bao, Jun Li, Meihong Xu, Zhaofeng Zhang and Yong Li
Short- and Long-Term Effects of Wholegrain Oat Intake on Weight Management and Glucolipid Metabolism in Overweight Type-2 Diabetics: A Randomized Control Trial Reprinted from: Nutrients 2016, 8(9), 549; doi: 10.3390/nu8090549 ........................................................ 167
Chengquan Tan, Hongkui Wei, Xichen Zhao, Chuanhui Xu, Yuanfei Zhou and Jian Peng
Soluble Fiber with High Water-Binding Capacity, Swelling Capacity, and Fermentability Reduces Food Intake by Promoting Satiety Rather Than Satiation in Rats
Reprinted from: Nutrients 2016, 8(10), 615; doi: 10.3390/nu8100615 ...................................................... 181
Vicky A. Solah, Deborah A. Kerr, Wendy J. Hunt, Stuart K. Johnson, Carol J. Boushey, Edward J. Delp, Xingqiong Meng, Roland J. Gahler, Anthony P. James, Aqif S. Mukhtar, Haelee K. Fenton and Simon Wood
Effect of Fibre Supplementation on Body Weight and Composition, Frequency of Eating and Dietary Choice in Overweight Individuals
Reprinted from: Nutrients 2017, 9(2), 149; doi: 10.3390/nu9020149 ........................................................ 196
Liliana G. González-Rodríguez, José Miguel Perea Sánchez, Javier Aranceta-Bartrina, Ángel Gil, Marcela González-Gross, Lluis Serra-Majem, Gregorio Varela-Moreiras and Rosa M. Ortega Intake and Dietary Food Sources of Fibre in Spain: Differences with Regard to the Prevalence of Excess Body Weight and Abdominal Obesity in Adults of the ANIBES Study
Reprinted from: Nutrients 2017, 9(4), 326; doi: 10.3390/nu9040326 ........................................................ 210
Robert E. Steinert, Daniel Raederstorff and Thomas M. S. Wolever
Effect of Consuming Oat Bran Mixed in Water before a Meal on Glycemic Responses in Healthy Humans—A Pilot Study
Reprinted from: Nutrients 2016, 8(9), 524; doi: 10.3390/nu8090524 ........................................................ 235
v
Sebely Pal, Suleen Ho, Roland J. Gahler and Simon Wood
Effect on Insulin, Glucose and Lipids in Overweight/Obese Australian Adults of 12 Months Consumption of Two Different Fibre Supplements in a Randomised Trial Reprinted from: Nutrients 2017, 9(2), 91; doi: 10.3390/nu9020091 .......................................................... 242
Maria L. Stewart and J. Paul Zimmer
A High Fiber Cookie Made with Resistant Starch Type 4 Reduces Post-Prandial Glucose
and Insulin Responses in Healthy Adults
Reprinted from: Nutrients 2017, 9(3), 237; doi: 10.3390/nu9030237 ........................................................ 255
Akua F. Amankwaah, R. Drew Sayer, Amy J. Wright, Ningning Chen, Megan A. McCrory and Wayne W. Campbell
Effects of Higher Dietary Protein and Fiber Intakes at Breakfast on Postprandial Glucose, Insulin, and 24-h Interstitial Glucose in Overweight Adults
Reprinted from: Nutrients 2017, 9(4), 352; doi: 10.3390/nu9040352 ........................................................ 263
Rafaëlle M. A. van Gijssel, Kim V. E. Braun, Jessica C. Kiefte-de Jong, Vincent W. V. Jaddoe, Oscar H. Franco and Trudy Voortman
Associations between Dietary Fiber Intake in Infancy and Cardiometabolic Health at School Age: The Generation R Study
Reprinted from: Nutrients 2016, 8(9), 531; doi: 10.3390/nu8090531 ........................................................ 281
Parvin Mirmiran, Zahra Bahadoran, Sajad Khalili Moghadam, Azita Zadeh Vakili and Fereidoun Azizi
A Prospective Study of Different Types of Dietary Fiber and Risk of Cardiovascular Disease:
Tehran Lipid and Glucose Study
Reprinted from: Nutrients 2016, 8(11), 686; doi: 10.3390/nu8110686 ...................................................... 295
Eric Francelino Andrade, Andressa Ribeiro Veiga Lima, Ingrid Edwiges Nunes, Débora Ribeiro Orlando, Paula Novato Gondim, Márcio Gilberto Zangeronimo, Fernando Henrique Ferrari Alves and Luciano José Pereira
Exercise and Beta-Glucan Consumption (Saccharomyces cerevisiae) Improve the Metabolic Profile and Reduce the Atherogenic Index in Type 2 Diabetic Rats (HFD/STZ) Reprinted from: Nutrients 2016, 8(12), 792; doi: 10.3390/nu8120792 ...................................................... 307
Pilar Buil-Cosiales, Miguel Angel Martinez-Gonzalez, Miguel Ruiz-Canela, Javier Díez-Espino, Ana García-Arellano and Estefania Toledo
Consumption of Fruit or Fiber-Fruit Decreases the Risk of Cardiovascular Disease in a Mediterranean Young Cohort Reprinted from: Nutrients 2017, 9(3), 295; doi: 10.3390/nu9030295 ........................................................ 318
Isabel Halnes, Katherine J. Baines, Bronwyn S. Berthon, Lesley K. MacDonald-Wicks, Peter G. Gibson and Lisa G. Wood
Soluble Fibre Meal Challenge Reduces Airway Inflammation and Expression of GPR43 and
GPR41 in Asthma
Reprinted from: Nutrients 2017, 9(1), 57; doi: 10.3390/nu9010057 .......................................................... 333
Genelle Healey, Louise Brough, Rinki Murphy, Duncan Hedderley, Chrissie Butts and Jane Coad
Validity and Reproducibility of a Habitual Dietary Fibre Intake Short Food Frequency Questionnaire
Reprinted from: Nutrients 2016, 8(9), 558; doi: 10.3390/nu8090558 ........................................................ 347
vi
Lise Deroover, Joran Verspreet, Anja Luypaerts, Greet Vandermeulen, Christophe M. Courtin and Kristin Verbeke
Wheat Bran Does Not Affect Postprandial Plasma Short-Chain Fatty Acids from 13C-inulin
Fermentation in Healthy Subjects
Reprinted from: Nutrients 2017, 9(1), 83; doi: 10.3390/nu9010083 .......................................................... 354
Moul Dey
Toward a Personalized Approach in Prebiotics Research
Reprinted from: Nutrients 2017, 9(2), 92; doi: 10.3390/nu9020092 .......................................................... 368
Caleigh M. Sawicki, Kara A. Livingston, Martin Obin, Susan B. Roberts, Mei Chung and Nicola M. McKeown
Dietary Fiber and the Human Gut Microbiota: Application of Evidence Mapping Methodology
Reprinted from: Nutrients 2017, 9(2), 125; doi: 10.3390/nu9020125 ........................................................ 372
Sibylle Kranz, Kevin W. Dodd, Wen Yen Juan, LuAnn K. Johnson and Lisa Jahns
Whole Grains Contribute Only a Small Proportion of Dietary Fiber to the U.S. Diet Reprinted from: Nutrients 2017, 9(2), 153; doi: 10.3390/nu9020153 ........................................................ 393

vii
About the Special Issue Editor
Megan A. McCrory is a research associate professor in the Sargent College of Health and Rehabilitation Sciences in Boston University, USA. Prof. McCrory’s research and scholarly interests include: (1) Roles of eating patterns, dietary composition and their interaction effects on energy regulation; (2) Physiological and psychological factors influencing energy balance; (3) Improvement in dietary intake, physical activity
and body composition assessment methods.


ix
Preface to “Dietary Fibers and Human Health”
Research on the role dietary fibers in a vast array of health issues continues to evolve. This book contains some of the latest, cutting-edge research on dietary fiber in colon health; prevention and treatment of chronic diseases such as cancer, cardiovascular disease, and type 2 diabetes; weight management; dietary fiber intake and methodology is also covered. I would like to take the time to acknowledge the excellent work of the author contributors, and the people who contributed their time to review each paper, without whom this book would not be possible.
Megan A. McCrory
Special Issue Editor

nutrients
Article
Efficacy of Synbiotics in Patients with Slow TransitConstipation: A Prospective Randomized Trial
Chao Ding 1,†, Xiaolong Ge 1,†, Xueying Zhang 1, Hongliang Tian 1, Hongkan Wang 2, Lili Gu 1,
Jianfeng Gong 1,*, Weiming Zhu 1 and Ning Li 1,*
1 Department of General Surgery, Jinling Hospital, Medical School of Nanjing University,Nanjing 210002, China; [email protected] (C.D.); [email protected] (X.G.);[email protected] (X.Z.); [email protected] (H.T.); [email protected] (L.G.);[email protected] (W.Z.)
2 First Affiliated Hospital, School of Medicine, Zhejiang University, Hangzhou 310003, China;[email protected]
* Correspondence: [email protected] (J.G.); [email protected] (N.L.);Tel.: +86-25-8086-0036 (J.G.); +86-25-8086-0045 (N.L.)
† These authors contributed equally to this work.
Received: 27 August 2016; Accepted: 22 September 2016; Published: 28 September 2016
Abstract: Synbiotic intake may efficiently restore the balance of gut microbiota and improvegastrointestinal functions. The aim of the study was to evaluate the efficacy of a synbiotic in patientswith slow transit constipation. A total of 100 patients with slow transit constipation were randomizedto receive either a synbiotic or placebo twice daily for 12 weeks. The primary efficacy endpoints werethe clinical remission and improvement rates at weeks 4 and 12. Stool frequency and consistency,colonic transit time (CTT), evacuation and abdominal symptoms, patient assessment of constipationsymptoms, gastrointestinal quality-of-life index scores, satisfaction scores, and adverse events werealso monitored. The clinical remission rates reached 37.5% at week 4 and 45.8% at week 12 inthe treatment group, compared to 13.3% at week 4 and 16.7% at week 12 in the placebo group(p < 0.01 for both comparisons). Over 12 weeks, 64.6% of the patients who received the synbioticexperienced clinical improvement, compared to 29.2% of the patients in the placebo group (p < 0.01).During the intervention period, patients who were treated with the synbiotic exhibited increased stoolfrequency, improved stool consistency, decreased CTT, and improved constipation-related symptoms.This randomized, placebo-controlled trial suggested that dietary supplementation with a synbioticimproved evacuation-parameters-associated symptoms and colonic motility in patients with slowtransit constipation (STC).
Keywords: synbiotic; soluble dietary fiber; slow transit constipation; microbiota
1. Introduction
Chronic constipation has become a common, often long-term, functional gastrointestinal diseasethat influences the quality of life in patients worldwide [1]. According to the Rome III criteria forchronic constipation [2], almost 16% of all adults are affected by chronic constipation worldwide,and it is more prevalent and symptomatic in women and elderly people [3]. Constipation is definedas difficult or infrequent passage of stool, hardness of stool, or a feeling of incomplete evacuation [4].Clinically, constipation can always be categorized as normal transit constipation (NTC), slow transitconstipation (STC), pelvic floor dysfunction, or a defecatory disorder due to assessments of anorectalfunction and colonic transit time [5]. Among these, STC is the major category and is characterized bya decreased rate of colonic transit [5].
Nutrients 2016, 8, 605 1 www.mdpi.com/journal/nutrients
Nutrients 2016, 8, 605
The treatments for chronic constipation are varied, but remain challenging [6]. Most patientswith chronic constipation have used laxatives (osmotic or stimulant) or prokinetic agents to alleviatesymptoms empirically [7]. Although there is a wide range of medications, many patients are stilldissatisfied with their current treatments, according to the results of a long-term survey, due toinsufficient efficacy and some adverse effects [8]. Sajid et al. [9] reported that adverse events or sideeffects such as abdominal cramps, rash, excessive flatulence, and dizziness have occurred in constipatedpatients who used prucalopride, which is a new pharmacotherapy for chronic constipation. From ourclinical experience in constipation, laxatives or other agents could be efficient at the beginning ofchronic constipation, but they gradually become largely ineffective. Therefore, novel effective therapiesare still needed.
Probiotics are live microorganisms that may benefit human health, and are now used widelyto treat some diseases. Cui et al. [10] reported that Bifidobacteria intake could play a role in theremission of ulcerative colitis (UC) and that prebiotics, such as dietary fiber, are ingredients in foodthat may increase the functions of probiotics in the human body. Previous research has suggestedthat a sufficient intake of dietary fiber with prebiotic effects is necessary for patients with chronicconstipation [11–13]. Pectin, one typical kind of dietary fiber, is usually present in the cell walls offruits, vegetables, and legumes [14]. It is fermented by the intestinal microbiota in the gut and canstrongly stimulate the growth and activity of some bacteria, such as Bifidobacterium and Lactobacillus [14].Some reports have also shown that therapy with increasing dietary fiber intake, especially soluble fibers,was beneficial for individuals with chronic constipation [15]. Soluble dietary fiber, which includespectin, is physiologically important [16]. Pectin can be digested into short-chain fatty acids (SCFAs)by intestinal microbiota, which may have effects on motility [17]. Fukumoto et al. [18] reported thatSCFAs could stimulate the colon to release serotonin, which is an important factor in colonic motility.In addition, butyrate is used in treating various gastrointestinal motility disorders that are associatedwith the inhibition of colonic transit [17].
Currently, the combination of prebiotics and probiotics is called synbiotics, and it may havesynergistic effects [19]. Morelli et al. [20] suggested that microbiota composition could be modified bysynbiotics, which might play a role in gastrointestinal functions. This prospective, randomized studywas designed to measure the effects of a symbiotic consisting of Enterococci, Bifidobacteria, and Lactobacilli
triple viable bacteria (BIFICO) and pectin on slow transit constipation [10]. This was the first study toassess a specific synbiotic containing triple viable bacteria and pectin in individuals with constipation.
Our objective was to evaluate the clinical efficacy of synbiotic treatment in individuals withslow transit constipation. The primary aim was to assess clinical improvement and remission atweeks 4 and 12. The secondary aim was to assess the frequency of bowel movements, stool consistency,and colonic transit time. Other aims included the assessment of constipation-related symptoms, and thegastrointestinal quality-of-life index.
2. Materials and Methods
2.1. Ethical Issues
This study was registered in the Clinical Trials Database (ID: NCT02844426) and conducted atJinling Hospital, a teaching hospital of Nanjing University. The current study was approved by theEthical Committee of Jinling Hospital. All participants provided written informed consent.
2.2. Patients
Patients were eligible if they fulfilled the following criteria:Inclusion criteria: age ≥18 years; body mass index 18.5–25 kg/m2; chronic constipation was
diagnosed according to the Rome III criteria with two or fewer spontaneous, complete bowelmovements (SCBMs) per week for a minimum of 6 months [21]; colonic transit time (CTT) >48 h [22];mild-to-moderate constipation with a Wexner constipation scale score between 16 and 25 [23,24].
2
Nutrients 2016, 8, 605
Exclusion criteria: Megacolon, intestinal obstruction, inflammatory bowel disease, and cancer;secondary constipation (i.e., due to drugs, endocrine disorders, neurological disorders, metabolic disorders,psychological disorders or abdominal surgery); severe anterior rectocele or full thickness rectorectalintussusception according to defecography; pregnant or lactating women; infection with an entericpathogen; usage of antibiotics or proton pump inhibitors (PPIs); hepatic, renal, cardiovascular,respiratory or psychiatric disease; and other diseases or factors evaluated by the investigator whichcould influence intestinal transit or intestinal microbiota [24].
2.3. Study Design
A total of 100 patients were screened for eligibility to participate in our study. The sealed envelopemethod was used to randomize the participants into either the treatment group or the placebo group.After a week of non-interventional clinical observation, the treatment or placebo group blindly receivedthe synbiotic or placebo twice daily for 12 weeks. The synbiotic (BIFICOPEC) contained 0.63 g of bifidtriple viable capsules (BIFICO) [10] and 8 g of soluble dietary fiber (Pectin, provided by Ander Group inYantai, China) [24]. The placebo group was treated with digestible maltodextrin (CTFH pharmaceuticalcompany, Nanjing, China) by an experienced doctor. These constipated patients were advised toparticipate in a healthy lifestyle, including proper diet and exercise, and to avoid any other probioticsand dietary fiber during the study period. If patients did not have a bowel movement for 3 or moreconsecutive days, they were permitted to take up to 20 g of Macrogol 4000 powder (Forlax®, Ipsen,Paris, France). If ineffective, an enema could be used.
During the follow-up, patients were asked to keep daily diaries of their bowel symptoms,including stool consistency, as rated by the Bristol Stool Form Scale (BSFS). The trained physicians,who were blinded to the treatments, assessed the quality of life and constipation-related symptomsof all of the participants at weeks 4 and 12 via phone or e-mail. Adverse events were also monitoredduring follow-up.
2.4. Outcomes
The primary efficacy endpoints were as follows: (1) Clinical remission rate: the proportionof patients having an average of three or more spontaneous complete bowel movements (SCBMs)per week during the observation period of weeks 4 and 12; and (2) Clinical improvement rate:the proportion of patients with an average increase of one or more SCBMs per week comparedwith baseline at weeks 4 and 12.
The secondary efficacy endpoints were as follows: (1) Number of bowel movements withinone week [24]; (2) Stool consistency according to the BSFS: stool types 1 and 2 indicated constipation,types 3, 4, and 5 indicated a normal consistency, and types 6 and 7 indicated diarrhea [24];and (3) Colonic transit time (CTT), which was measured at baseline and at weeks 4 and 12 by theMetcalf method [22].
Other endpoints included the following: (1) The Patient Assessment of Constipation Symptoms(PAC-SYM) questionnaire was administered at baseline and at weeks 4 and 12. The questionnaire contained12 symptoms that were grouped into three subscales for stool, abdominal, and rectal symptoms. For theoverall scale and each subscale, the scores ranged from 0 (symptoms absent) to 4 (symptoms verysevere) [25]; (2) The Gastrointestinal Quality-of-Life Index (GIQLI) assessment, which was used toevaluate the quality of life in patients with gastrointestinal diseases, comprised 36 questions using a 5-pointLikert-type scale ranging from 0 to 4 (0, worst; 4, best) [26]; (3) The satisfaction scoresof constipated patients,which used a 5-point ordinal scale. The score ranged from 1 (extremely unsatisfied) to 5 (extremely satisfied);(4) For evacuation symptoms, patients recorded their perception of straining, lumpy hard stools, thesensation of incomplete evacuation, and the sensation of anorectal blockage according to a 5-point ordinalscale (1, none; 2, mild; 3, moderate; 4, severe; or 5, very severe); (5) Finally, abdominal symptoms werecategorized, patients recorded their symptoms of abdominal pain or cramps and bloating or flatulenceaccording to five classifications (1, none; 2, mild; 3, moderate; 4, severe; or 5, very severe).
3
Nutrients 2016, 8, 605
2.5. Safety Assessments
During treatment and follow-up, patients were advised to record adverse events in dailydiaries and to report adverse events immediately. Adverse events could include abdominal pain,flatulence, borborygmus, and other gastrointestinal symptoms.
2.6. Sample Size
The sample size was calculated based on the frequency of evacuation and the standard deviationof the difference as 0.8 between the groups [27]. Therefore, a total sample size of 100 (50 in each group)was sufficient to expect a 95% power with a two-sided significance level of 0.05.
2.7. Statistical Analysis
The results were analyzed with SPSS 19.0 (SPSS, Inc., Chicago, IL, USA). Continuous data werepresented as the mean ± standard deviation and categorical data were presented as n (%). Paired t testsor a repeated measures ANOVA were performed for continuous variables, and for categorical variables;Pearson’s chi-square test or the Fisher exact test was performed as appropriate. p values < 0.05 wereconsidered statistically significant for all comparisons.
3. Results
3.1. Baseline Characteristics
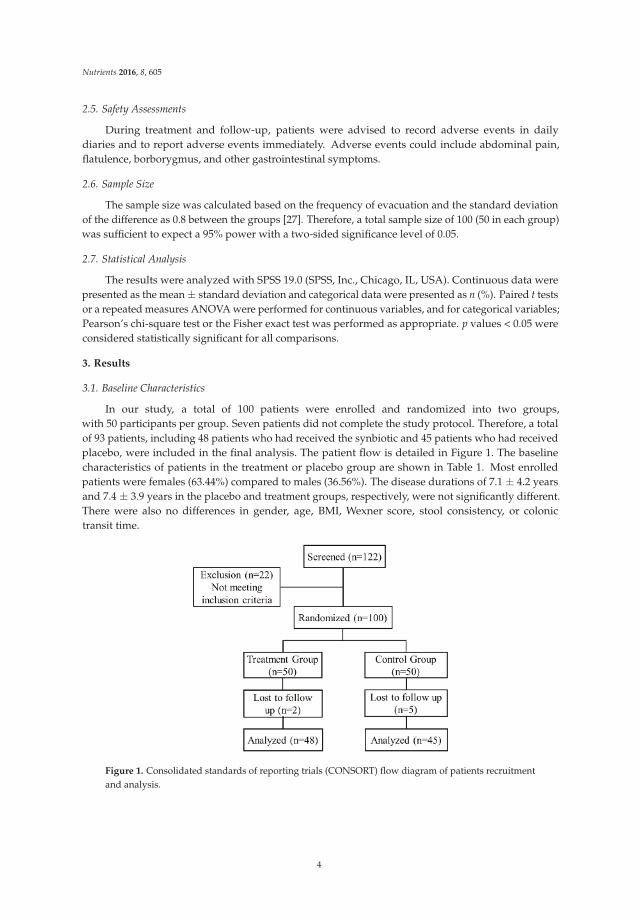
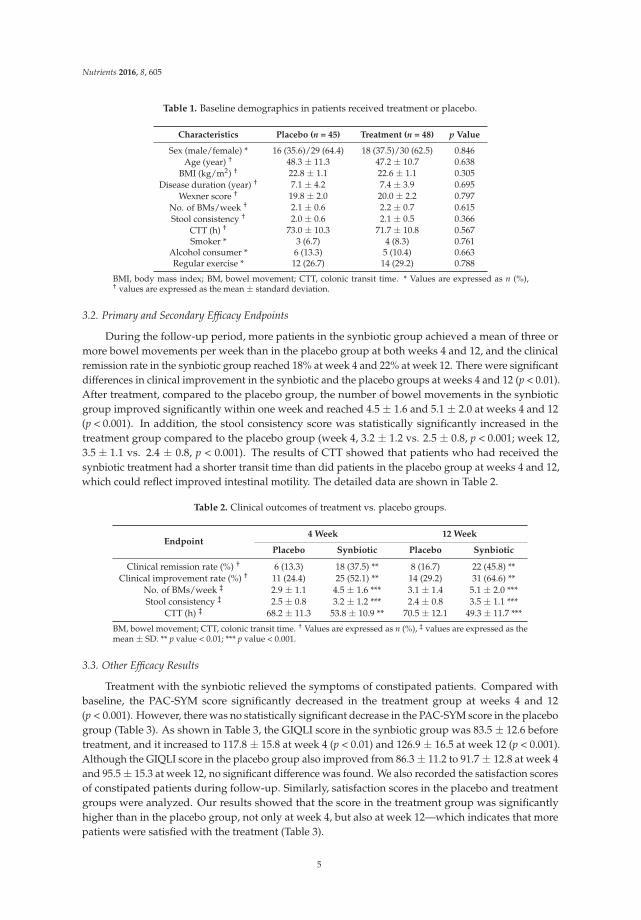
In our study, a total of 100 patients were enrolled and randomized into two groups,with 50 participants per group. Seven patients did not complete the study protocol. Therefore, a totalof 93 patients, including 48 patients who had received the synbiotic and 45 patients who had receivedplacebo, were included in the final analysis. The patient flow is detailed in Figure 1. The baselinecharacteristics of patients in the treatment or placebo group are shown in Table 1. Most enrolledpatients were females (63.44%) compared to males (36.56%). The disease durations of 7.1 ± 4.2 yearsand 7.4 ± 3.9 years in the placebo and treatment groups, respectively, were not significantly different.There were also no differences in gender, age, BMI, Wexner score, stool consistency, or colonictransit time.
Figure 1. Consolidated standards of reporting trials (CONSORT) flow diagram of patients recruitmentand analysis.
4
Nutrients 2016, 8, 605
Table 1. Baseline demographics in patients received treatment or placebo.
Characteristics Placebo (n = 45) Treatment (n = 48) p Value
Sex (male/female) * 16 (35.6)/29 (64.4) 18 (37.5)/30 (62.5) 0.846Age (year) † 48.3 ± 11.3 47.2 ± 10.7 0.638
BMI (kg/m2) † 22.8 ± 1.1 22.6 ± 1.1 0.305Disease duration (year) † 7.1 ± 4.2 7.4 ± 3.9 0.695
Wexner score † 19.8 ± 2.0 20.0 ± 2.2 0.797No. of BMs/week † 2.1 ± 0.6 2.2 ± 0.7 0.615Stool consistency † 2.0 ± 0.6 2.1 ± 0.5 0.366
CTT (h) † 73.0 ± 10.3 71.7 ± 10.8 0.567Smoker * 3 (6.7) 4 (8.3) 0.761
Alcohol consumer * 6 (13.3) 5 (10.4) 0.663Regular exercise * 12 (26.7) 14 (29.2) 0.788
BMI, body mass index; BM, bowel movement; CTT, colonic transit time. * Values are expressed as n (%),† values are expressed as the mean ± standard deviation.
3.2. Primary and Secondary Efficacy Endpoints
During the follow-up period, more patients in the synbiotic group achieved a mean of three ormore bowel movements per week than in the placebo group at both weeks 4 and 12, and the clinicalremission rate in the synbiotic group reached 18% at week 4 and 22% at week 12. There were significantdifferences in clinical improvement in the synbiotic and the placebo groups at weeks 4 and 12 (p < 0.01).After treatment, compared to the placebo group, the number of bowel movements in the synbioticgroup improved significantly within one week and reached 4.5 ± 1.6 and 5.1 ± 2.0 at weeks 4 and 12(p < 0.001). In addition, the stool consistency score was statistically significantly increased in thetreatment group compared to the placebo group (week 4, 3.2 ± 1.2 vs. 2.5 ± 0.8, p < 0.001; week 12,3.5 ± 1.1 vs. 2.4 ± 0.8, p < 0.001). The results of CTT showed that patients who had received thesynbiotic treatment had a shorter transit time than did patients in the placebo group at weeks 4 and 12,which could reflect improved intestinal motility. The detailed data are shown in Table 2.
Table 2. Clinical outcomes of treatment vs. placebo groups.
Endpoint4 Week 12 Week
Placebo Synbiotic Placebo Synbiotic
Clinical remission rate (%) † 6 (13.3) 18 (37.5) ** 8 (16.7) 22 (45.8) **Clinical improvement rate (%) † 11 (24.4) 25 (52.1) ** 14 (29.2) 31 (64.6) **
No. of BMs/week ‡ 2.9 ± 1.1 4.5 ± 1.6 *** 3.1 ± 1.4 5.1 ± 2.0 ***Stool consistency ‡ 2.5 ± 0.8 3.2 ± 1.2 *** 2.4 ± 0.8 3.5 ± 1.1 ***
CTT (h) ‡ 68.2 ± 11.3 53.8 ± 10.9 ** 70.5 ± 12.1 49.3 ± 11.7 ***
BM, bowel movement; CTT, colonic transit time. † Values are expressed as n (%), ‡ values are expressed as themean ± SD. ** p value < 0.01; *** p value < 0.001.
3.3. Other Efficacy Results
Treatment with the synbiotic relieved the symptoms of constipated patients. Compared withbaseline, the PAC-SYM score significantly decreased in the treatment group at weeks 4 and 12(p < 0.001). However, there was no statistically significant decrease in the PAC-SYM score in the placebogroup (Table 3). As shown in Table 3, the GIQLI score in the synbiotic group was 83.5 ± 12.6 beforetreatment, and it increased to 117.8 ± 15.8 at week 4 (p < 0.01) and 126.9 ± 16.5 at week 12 (p < 0.001).Although the GIQLI score in the placebo group also improved from 86.3 ± 11.2 to 91.7 ± 12.8 at week 4and 95.5 ± 15.3 at week 12, no significant difference was found. We also recorded the satisfaction scoresof constipated patients during follow-up. Similarly, satisfaction scores in the placebo and treatmentgroups were analyzed. Our results showed that the score in the treatment group was significantlyhigher than in the placebo group, not only at week 4, but also at week 12—which indicates that morepatients were satisfied with the treatment (Table 3).
5
Nutrients 2016, 8, 605
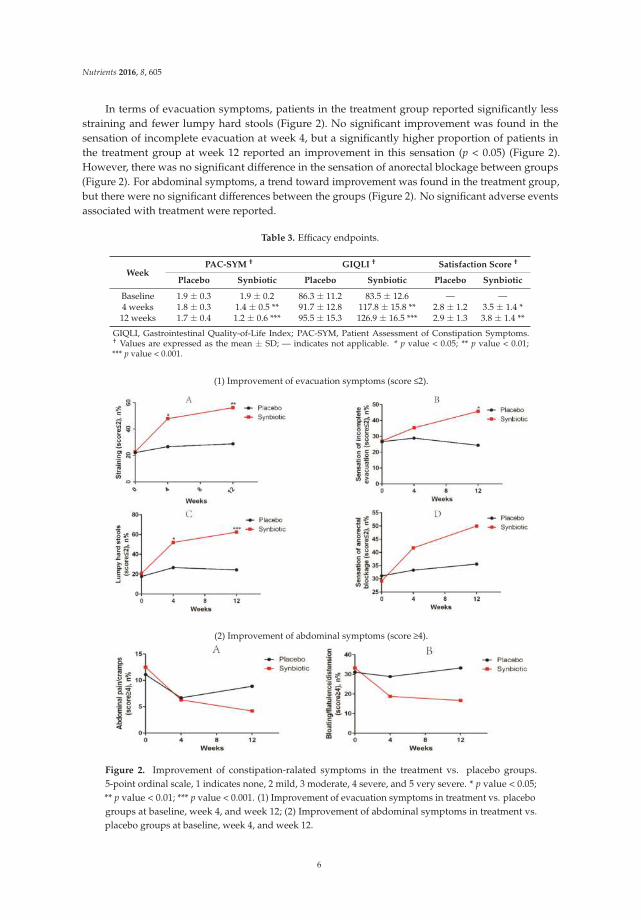
In terms of evacuation symptoms, patients in the treatment group reported significantly lessstraining and fewer lumpy hard stools (Figure 2). No significant improvement was found in thesensation of incomplete evacuation at week 4, but a significantly higher proportion of patients inthe treatment group at week 12 reported an improvement in this sensation (p < 0.05) (Figure 2).However, there was no significant difference in the sensation of anorectal blockage between groups(Figure 2). For abdominal symptoms, a trend toward improvement was found in the treatment group,but there were no significant differences between the groups (Figure 2). No significant adverse eventsassociated with treatment were reported.
Table 3. Efficacy endpoints.
WeekPAC-SYM † GIQLI † Satisfaction Score †
Placebo Synbiotic Placebo Synbiotic Placebo Synbiotic
Baseline 1.9 ± 0.3 1.9 ± 0.2 86.3 ± 11.2 83.5 ± 12.6 — —4 weeks 1.8 ± 0.3 1.4 ± 0.5 ** 91.7 ± 12.8 117.8 ± 15.8 ** 2.8 ± 1.2 3.5 ± 1.4 *12 weeks 1.7 ± 0.4 1.2 ± 0.6 *** 95.5 ± 15.3 126.9 ± 16.5 *** 2.9 ± 1.3 3.8 ± 1.4 **
GIQLI, Gastrointestinal Quality-of-Life Index; PAC-SYM, Patient Assessment of Constipation Symptoms.† Values are expressed as the mean ± SD; — indicates not applicable. * p value < 0.05; ** p value < 0.01;*** p value < 0.001.
(1) Improvement of evacuation symptoms (score 2).
(2) Improvement of abdominal symptoms (score 4).
Figure 2. Improvement of constipation-ralated symptoms in the treatment vs. placebo groups.5-point ordinal scale, 1 indicates none, 2 mild, 3 moderate, 4 severe, and 5 very severe. * p value < 0.05;** p value < 0.01; *** p value < 0.001. (1) Improvement of evacuation symptoms in treatment vs. placebogroups at baseline, week 4, and week 12; (2) Improvement of abdominal symptoms in treatment vs.placebo groups at baseline, week 4, and week 12.
6
Nutrients 2016, 8, 605
4. Discussion
This was a prospective randomized trial to evaluate the efficacy of a synbiotic (BIFICOPEC)comprised of probiotics (BIFICO) [10] and soluble dietary fiber (Pectin) in patients with slow transitconstipation who met the Rome III criteria. Our study found that 12 weeks of supplementation withprobiotics and soluble dietary fiber increased bowel movements, improved the PAC-SYM and GIQLIscores, relieved constipation-related symptoms, and decreased CTT. Finally, the clinical remission andclinical improvement rates reached 45.8% and 64.6%, respectively, at week 12 among patients withmild-to-moderate constipation. No serious treatment-related adverse events were observed during thefollow-up period.
Slow transit constipation, which is one type of chronic idiopathic constipation, has an importantpathophysiological feature of decreased colonic motility, which could be diagnosed by usingradiopaque markers, as occurred in this study [28]. Recently, many researchers have focusedon the relationship between intestinal microbiota and constipation and have demonstrated thatintestinal microbiota contribute to the pathophysiology of functional gastrointestinal disorders [29].Parthasarathy et al. [30] suggested that the profile of microbiota in the intestine was associated withcolonic transit, and genera from Firmicutes was related with faster colonic transit. Zhu et al. [31]reported that, compared with a control group, individuals in a constipation group had a distinctmicrobiome in the gut. Moreover, the Bristol Stool Scale classification has been widely used toreflect intestinal colon transit time in constipated patients. Vandeputte et al. [32] advised thatstool consistency, as evaluated using the Bristol Stool Scale, was strongly correlated with intestinalmicrobiota. These studies all suggest that gut microbiota contribute to the etiology in constipation.Our previous study [33] reported that the reestablishment of the whole intestinal flora with fecalmicrobiota transplantation could alleviate the symptoms of slow transit constipation, which mightprovide a basis for the considerable role of gut microbiota in constipation from the perspective ofclinical treatment.
Recently, emerging studies on the individual benefits of probiotics and prebiotics in the treatmentof chronic constipation have been reported. Ford et al. [19] reported a systematic review andmeta-analysis and showed that probiotics appeared to have beneficial effects in chronic idiopathicconstipation (CIC), but only a few RCTs were available for the analysis. Data from RCTs for prebioticsand synbiotics in individuals with CIC are also sparse. Some studies found that prebiotics had a positiveeffect in constipated patients. Christodoulides et al. [34] suggested that fiber was moderately effectivefor chronic idiopathic constipation in adults. Suares et al. [35] also reported that soluble fiber might bemore beneficial than insoluble fiber in constipated patients in alleviating straining, pain on defecation,improving stool consistency, and other constipation-related symptoms. In addition, research on thechanges in intestinal microbiota in individuals with constipation indicated that microbiota other thanLactobacillus and Bifidobacteria also changed, which might indicate the importance of stability andintegration of intestinal microbiota. Therefore, supplementation with both probiotics and prebiotics isbetter than treatment with probiotics or prebiotics alone.
Pectin is an important soluble dietary fiber that can be fermented by gut microbiota. The mostfamiliar and predominant structural element in pectin is formed by the “smooth” homogalacturonanregions and is composed predominantly of a homopolymer of partially methyl esterified (1–4)-linkedα-D-galacturonic acid (GalA) units [12]. The health benefits of pectin might include alterationsin the composition of intestinal microbiota and the production of short-chain fatty acids [36,37].Onumpai et al. [37] reported that pectin could stimulate the activity of Bifidobacterium and Lactobacillus.Recently, our team also found that fecal microbiota transplantation, in combination with soluble dietaryfiber, could improve the symptoms of patients with slow transit constipation, indicating that theregulation of intestinal microecology was associated with constipation [24]. The addition of pectin tothe treatment regimen further improved the symptoms in constipated patients. Therefore, pectin mayplay a beneficial role in constipation.
7
Nutrients 2016, 8, 605
In contrast, butyrate, which is a byproduct of pectin fermentation by certain microbiota,is necessary for colonic homeostasis and provides energy for intestinal epithelial cells [38]. We chosemaltodextrin as a placebo control because maltodextrin is an easily digested carbohydrate, but it is notfermented by intestinal microbiota; thus, it would not affect gut metabolism and microbial ecology [27].
In our study, we provided constipated patients with bifid triple viable capsules and pectinfor 12 weeks. Our results revealed an improvement in the number of bowel movements per week,stool consistency, and colonic transit time in constipated patients, which are related to intestinalmotility. Intestinal microbiota analysis has already shown that microbiota are associated withcolonic transit, stool frequency, and stool consistency in humans [30,32]. During the follow-up, wefound that the improvement in stool consistency was the most obvious effect, but a significantimprovement in the sensation of incomplete evacuation did not appear until three months aftertreatment initiation. Harder stools and decreased frequency are associated with a slower colonic transittime, while increased incomplete evacuation is related to outlet obstructive constipation [22]. So theefficacy of synbiotics in constipation might depend on the improvement of intestinal motility throughregulating intestinal microecology.
Because pharmacological interventions have limited efficacy and more side effects,traditional treatments have not been able to fully satisfy constipated patients [39]. Prucalopride is awidely used prokinetic agent, but adverse events such as abdominal cramps, headache, skin disorders,and drug dependence have been reported with its use [9]. During our treatment and follow-up,no serious adverse events occurred in the patients. It is found that constipated patients at our hospitalprefer to use prebiotics, probiotics, or synbiotics rather than some laxatives.
However, our pilot study does have several limitations. First, this was a single-center study,and the sample size of our trial was relatively small. A multicenter randomized controlled studyshould be performed to verify these findings. Second, our follow-up period was restricted to 12 weeks.The clinical efficacy of treatment for chronic constipation should be examined in a study with a longerfollow-up. Finally, we did not analyze the structural changes in the gut microbiota in constipatedpatients before and after treatment. Intestinal microbiota analysis might provide us a new perspectiveto explain the therapeutic mechanism underlying synbiotic treatment.
5. Conclusions
In conclusion, we found that 12 weeks of treatment with a synbiotic that contained pectinas a prebiotic and bifid triple viable capsule (BIFICO) as a probiotic was effective in increasingstool frequency, improving stool consistency, decreasing colonic transit time, and relievingconstipation-related symptoms. In addition, synbiotic treatment effectively improved the qualityof life in patients with mild-to-moderate constipation. Therefore, additional multicenter randomizedclinical trials are needed to confirm these results and assess the role of the regulation of gut microbiotain treatment of constipation.
Acknowledgments: This study was funded by the National Natural Science Foundation of China (81270006)and the National Gastroenterology Research Project (2015BAI13B07). The authors thank Huatong Liu from theAustralian National University for checking the entire manuscript for grammar and typographical errors.
Author Contributions: Ning Li, Weiming Zhu and Jianfeng Gong conceived and designed the study; Chao Ding,Xiaolong Ge, Xueying Zhang, and Hongliang Tian performed all required data collection for the study experiment;Hongkan Wang and Lili Gu analyzed the data; Xiaolong Ge and Chao Ding wrote the paper.
Conflicts of Interest: The authors declare no conflicts of interest.
References
1. Nelson, A.D.; Camilleri, M.; Chirapongsathorn, S.; Vijayvargiya, P.; Valentin, N.; Shin, A.; Erwin, P.J.;Wang, Z.; Murad, M.H. Comparison of efficacy of pharmacological treatments for chronic idiopathicconstipation: A systematic review and network meta-analysis. Gut 2016. [CrossRef] [PubMed]
8
Nutrients 2016, 8, 605
2. Higgins, P.D.; Johanson, J.F. Epidemiology of constipation in north america: A systematic review.Am. J. Gastroenterol. 2004, 99, 750–759. [CrossRef] [PubMed]
3. Mugie, S.M.; Benninga, M.A.; Di Lorenzo, C. Epidemiology of constipation in children and adults:A systematic review. Best Pract. Res. Clin. Gastroenterol. 2011, 25, 3–18. [CrossRef] [PubMed]
4. Rao, S.S.; Rattanakovit, K.; Patcharatrakul, T. Diagnosis and management of chronic constipation in adults.Nat. Rev. Gastroenterol. Hepatol. 2016, 13, 295–305. [CrossRef] [PubMed]
5. Bharucha, A.E.; Pemberton, J.H.; Locke, G.R., III. American gastroenterological association technical reviewon constipation. Gastroenterology 2013, 144, 218–238. [CrossRef] [PubMed]
6. American Gastroenterological Association; Bharucha, A.E.; Dorn, S.D.; Lembo, A.; Pressman, A.American gastroenterological association medical position statement on constipation. Gastroenterology
2013, 144, 211–217. [CrossRef] [PubMed]7. Ford, A.C.; Suares, N.C. Effect of laxatives and pharmacological therapies in chronic idiopathic constipation:
Systematic review and meta-analysis. Gut 2011, 60, 209–218. [CrossRef] [PubMed]8. Camilleri, M.; Kerstens, R.; Rykx, A.; Vandeplassche, L. A placebo-controlled trial of prucalopride for severe
chronic constipation. N. Engl. J. Med. 2008, 358, 2344–2354. [CrossRef] [PubMed]9. Sajid, M.S.; Hebbar, M.; Baig, M.K.; Li, A.; Philipose, Z. Use of prucalopride for chronic constipation:
A systematic review and meta-analysis of published randomized, controlled trials. J. Neurogastroenterol. Motil.
2016, 22, 412–422. [CrossRef] [PubMed]10. Cui, H.H.; Chen, C.L.; Wang, J.D.; Yang, Y.J.; Cun, Y.; Wu, J.B.; Liu, Y.H.; Dan, H.L.; Jian, Y.T.; Chen, X.Q.
Effects of probiotic on intestinal mucosa of patients with ulcerative colitis. World J. Gastroenterol. 2004, 10,1521–1525. [CrossRef] [PubMed]
11. Kaczmarczyk, M.M.; Miller, M.J.; Freund, G.G. The health benefits of dietary fiber: Beyond the usualsuspects of type 2 diabetes mellitus, cardiovascular disease and colon cancer. Metabolism 2012, 61, 1058–1066.[CrossRef] [PubMed]
12. Tian, L.; Bruggeman, G.; van den Berg, M.; Borewicz, K.; Scheurink, A.J.; Bruininx, E.; de Vos, P.; Smidt, H.;Schols, H.A.; Gruppen, H. Effects of pectin on fermentation characteristics, carbohydrate utilization andmicrobial community composition in the gastrointestinal tract of weaning pigs. Mol. Nutr. Food Res. 2016.[CrossRef] [PubMed]
13. Voderholzer, W.A.; Schatke, W.; Muhldorfer, B.E.; Klauser, A.G.; Birkner, B.; Muller-Lissner, S.A.Clinical response to dietary fiber treatment of chronic constipation. Am. J. Gastroenterol. 1997, 92, 95–98.[PubMed]
14. Tian, L.; Scholte, J.; Borewicz, K.; Bogert, B.V.; Smidt, H.; Scheurink, A.J.; Gruppen, H.; Schols, H.A. Effects ofpectin supplementation on the fermentation patterns of different structural carbohydrates in rats. Mol. Nutr.
Food Res. 2016. [CrossRef] [PubMed]15. Chan, A.O.; Leung, G.; Tong, T.; Wong, N.Y. Increasing dietary fiber intake in terms of kiwifruit improves
constipation in chinese patients. World J. Gastroenterol. 2007, 13, 4771–4775. [CrossRef] [PubMed]16. Eswaran, S.; Muir, J.; Chey, W.D. Fiber and functional gastrointestinal disorders. Am. J. Gastroenterol. 2013,
108, 718–727. [CrossRef] [PubMed]17. Soret, R.; Chevalier, J.; De Coppet, P.; Poupeau, G.; Derkinderen, P.; Segain, J.P.; Neunlist, M. Short-chain fatty
acids regulate the enteric neurons and control gastrointestinal motility in rats. Gastroenterology 2010, 138,1772–1782. [CrossRef] [PubMed]
18. Fukumoto, S.; Tatewaki, M.; Yamada, T.; Fujimiya, M.; Mantyh, C.; Voss, M.; Eubanks, S.; Harris, M.;Pappas, T.N.; Takahashi, T. Short-chain fatty acids stimulate colonic transit via intraluminal 5-ht release inrats. Am. J. Physiol. Regul. Integr. Comp. Physiol. 2003, 284, R1269–R1276. [CrossRef] [PubMed]
19. Ford, A.C.; Quigley, E.M.; Lacy, B.E.; Lembo, A.J.; Saito, Y.A.; Schiller, L.R.; Soffer, E.E.; Spiegel, B.M.;Moayyedi, P. Efficacy of prebiotics, probiotics, and synbiotics in irritable bowel syndrome and chronicidiopathic constipation: Systematic review and meta-analysis. Am. J. Gastroenterol. 2014, 109, 1547–1561.[CrossRef] [PubMed]
20. Morelli, L.; Zonenschain, D.; Callegari, M.L.; Grossi, E.; Maisano, F.; Fusillo, M. Assessment of a newsynbiotic preparation in healthy volunteers: Survival, persistence of probiotic strains and its effect on theindigenous flora. Nutr. J. 2003, 2, 11. [CrossRef] [PubMed]
21. Drossman, D.A. The functional gastrointestinal disorders and the rome iii process. Gastroenterology 2006, 130,1377–1390. [CrossRef] [PubMed]
9
Nutrients 2016, 8, 605
22. Emmanuel, A.; Cools, M.; Vandeplassche, L.; Kerstens, R. Prucalopride improves bowel function and colonictransit time in patients with chronic constipation: An integrated analysis. Am. J. Gastroenterol. 2014, 109,887–894. [CrossRef] [PubMed]
23. Agachan, F.; Chen, T.; Pfeifer, J.; Reissman, P.; Wexner, S.D. A constipation scoring system to simplifyevaluation and management of constipated patients. Dis. Colon Rectum 1996, 39, 681–685. [CrossRef][PubMed]
24. Ge, X.; Tian, H.; Ding, C.; Gu, L.; Wei, Y.; Gong, J.; Zhu, W.; Li, N.; Li, J. Fecal microbiota transplantationin combination with soluble dietary fiber for treatment of slow transit constipation: A pilot study.Arch. Med. Res. 2016, 47, 236–242. [CrossRef] [PubMed]
25. Frank, L.; Kleinman, L.; Farup, C.; Taylor, L.; Miner, P., Jr. Psychometric validation of a constipation symptomassessment questionnaire. Scand. J. Gastroenterol. 1999, 34, 870–877. [PubMed]
26. Eypasch, E.; Williams, J.I.; Wood-Dauphinee, S.; Ure, B.M.; Schmulling, C.; Neugebauer, E.; Troidl, H.Gastrointestinal quality of life index: Development, validation and application of a new instrument.Br. J. Surg. 1995, 82, 216–222. [CrossRef] [PubMed]
27. Waitzberg, D.L.; Logullo, L.C.; Bittencourt, A.F.; Torrinhas, R.S.; Shiroma, G.M.; Paulino, N.P.;Teixeira-da-Silva, M.L. Effect of synbiotic in constipated adult women—A randomized, double-blind,placebo-controlled study of clinical response. Clin. Nutr. 2013, 32, 27–33. [CrossRef] [PubMed]
28. Li, N.; Jiang, J.; Feng, X.; Ding, W.; Liu, J.; Li, J. Long-term follow-up of the jinling procedure for combinedslow-transit constipation and obstructive defecation. Dis. Colon Rectum 2013, 56, 103–112. [CrossRef][PubMed]
29. Drossman, D.A. Functional gastrointestinal disorders: History, pathophysiology, clinical features andRome IV. Gastroenterology 2016, 150, 1262–1279. [CrossRef] [PubMed]
30. Parthasarathy, G.; Chen, J.; Chen, X.F.; Chia, N.; O'Connor, H.M.; Wolf, P.G.; Gaskins, H.R.; Bharucha, A.E.Relationship between microbiota of the colonic mucosa vs feces and symptoms, colonic transit, and methaneproduction in female patients with chronic constipation. Gastroenterology 2016, 150, 367–379. [CrossRef][PubMed]
31. Zhu, L.; Liu, W.; Alkhouri, R.; Baker, R.D.; Bard, J.E.; Quigley, E.M.; Baker, S.S. Structural changes in the gutmicrobiome of constipated patients. Physiol. Genom. 2014, 46, 679–686. [CrossRef] [PubMed]
32. Vandeputte, D.; Falony, G.; Vieira-Silva, S.; Tito, R.Y.; Joossens, M.; Raes, J. Stool consistency is stronglyassociated with gut microbiota richness and composition, enterotypes and bacterial growth rates. Gut 2016,65, 57–62. [CrossRef] [PubMed]
33. Tian, H.; Ding, C.; Gong, J.; Ge, X.; McFarland, L.V.; Gu, L.; Wei, Y.; Chen, Q.; Zhu, W.; Li, J.; et al. Treatment ofslow transit constipation with fecal microbiota transplantation: A pilot study. J. Clin. Gastroenterol. 2016.[CrossRef] [PubMed]
34. Christodoulides, S.; Dimidi, E.; Fragkos, K.C.; Farmer, A.D.; Whelan, K.; Scott, S.M. Systematic reviewwith meta-analysis: Effect of fibre supplementation on chronic idiopathic constipation in adults.Aliment. Pharmacol. Ther. 2016, 44, 103–116. [CrossRef] [PubMed]
35. Suares, N.C.; Ford, A.C. Systematic review: The effects of fibre in the management of chronic idiopathicconstipation. Aliment. Pharmacol. Ther. 2011, 33, 895–901. [CrossRef] [PubMed]
36. Dongowski, G.; Lorenz, A.; Proll, J. The degree of methylation influences the degradation of pectin in theintestinal tract of rats and in vitro. J. Nutr. 2002, 132, 1935–1944. [PubMed]
37. Onumpai, C.; Kolida, S.; Bonnin, E.; Rastall, R.A. Microbial utilization and selectivity of pectin fractions withvarious structures. Appl. Environ. Microbiol. 2011, 77, 5747–5754. [CrossRef] [PubMed]
38. Wong, J.M.; de Souza, R.; Kendall, C.W.; Emam, A.; Jenkins, D.J. Colonic health: Fermentation and shortchain fatty acids. J. Clin. Gastroenterol. 2006, 40, 235–243. [CrossRef] [PubMed]
39. Muller-Lissner, S.; Tack, J.; Feng, Y.; Schenck, F.; Specht Gryp, R. Levels of satisfaction with current chronicconstipation treatment options in europe - an internet survey. Aliment. Pharmacol. Ther. 2013, 37, 137–145.[CrossRef] [PubMed]
© 2016 by the authors. Licensee MDPI, Basel, Switzerland. This article is an open accessarticle distributed under the terms and conditions of the Creative Commons Attribution(CC BY) license (http://creativecommons.org/licenses/by/4.0/).
10
nutrients
Review
Role of Fiber in Symptomatic UncomplicatedDiverticular Disease: A Systematic Review
Marilia Carabotti 1,2,*, Bruno Annibale 1, Carola Severi 2 and Edith Lahner 1
1 Medical-Surgical Department of Clinical Sciences and Translational Medicine, University Sapienza,Via di Grottarossa 1035, 00189 Rome, Italy; [email protected] (B.A.);[email protected] (E.L.)
2 Department of Internal Medicine and Medical Specialties, University Sapienza, Viale del Policlinico 155,00161 Rome, Italy; [email protected]
* Correspondence: [email protected]; Tel.: +39-06-49978377
Received: 23 December 2016; Accepted: 14 February 2017; Published: 20 February 2017
Abstract: Symptomatic uncomplicated diverticular disease (SUDD) is a syndrome characterized byrecurrent abdominal symptoms in patients with colonic diverticula. There is some evidence that ahigh-fiber diet or supplemental fibers may reduce symptoms in SUDD patients and a high-fiber dietis commonly suggested for these patients. This systematic review aims to update the evidence onthe efficacy of fiber treatment in SUDD, in terms of a reduction in symptoms and the preventionof acute diverticulitis. According to PRISMA, we identified studies on SUDD patients treated withfibers (PubMed and Scopus). The quality of these studies was evaluated by the Jadad scale. The mainoutcome measures were a reduction of abdominal symptoms and the prevention of acute diverticulitis.Nineteen studies were included, nine with dietary fiber and 10 with supplemental fiber, with a highheterogeneity concerning the quantity and quality of fibers employed. Single studies suggest thatfibers, both dietary and supplemental, could be beneficial in SUDD, even if the quality is very low,with just one study yielding an optimal score. The presence of substantial methodological limitations,the heterogeneity of the therapeutic regimens employed, and the lack of ad hoc designed studies, didnot permit a summary of the outcome measure. Thus, the benefit of dietary or supplemental fiber inSUDD patients still needs to be established.
Keywords: diverticular disease; dietary fiber; supplemental fiber; symptomatic uncomplicateddiverticular disease
1. Introduction
Colonic diverticula are common in Western countries, affecting up to 60% of subjects over70 years of age [1]. In about 80% of patients, colonic diverticula remain asymptomatic (diverticulosis),while approximately 20% of patients may develop abdominal symptoms (symptomatic uncomplicateddiverticular disease, SUDD) and, eventually, complications such as bouts of diverticulitis or bleeding [2].SUDD has been defined as a syndrome which is characterized by recurrent abdominal symptoms(i.e., abdominal pain and bloating resembling or overlapping those present in irritable bowelsyndrome), attributed to diverticula in the absence of macroscopically evident alterations, other thanthe presence of diverticula [3,4]. The impact of these complaints is variable, and the severity andfrequency of symptoms may range from mild and rare episodes, to a severe, chronic, recurrent disorder,impacting daily activities and the quality of life of patients [5,6]. About 4% of patients develop acutediverticulitis, an inflammatory process that may result in complications in about 15% of patients,with the development of abscesses, perforation, fistula, obstruction, or peritonitis [7]. A recurrence ofdiverticulitis after the first episode has been reported to occur in 15%–30% of patients [8,9].
Nutrients 2017, 9, 161 11 www.mdpi.com/journal/nutrients
Nutrients 2017, 9, 161
The main goals of managing SUDD are both the reduction of abdominal symptoms and theprevention of acute diverticulitis. Even if recommendations for the treatment of SUDD have beenissued by the medical societies of various countries [3,10–13], a standard therapeutic approach stillremains to be defined. Fibers have been suggested for the treatment of SUDD patients, but thetherapeutic benefit is not yet fully understood. Fibers might confer benefits by increasing fecal mass andregularizing bowel movements, as well as acting as prebiotics in the colon, favoring health-promotingspecies of the intestinal microbiota [14]. Fibers are defined as the edible parts of plants or theanalogous carbohydrates that are resistant to digestion and absorption in the human small intestine,with complete or partial fermentation in the colon [15]. Fiber intake may be achieved by consumingfruits, vegetables, and cereal grains (dietary fibers), and/or by diet supplementation with specificcommercial preparations containing fibers (supplemental fibers).
A previous systematic review assessed whether a high-fiber diet can improve symptoms orprevent complications of diverticular disease. Few studies were identified, and the authors concludedthat evidence for a therapeutic benefit of a high-fiber diet in the treatment of diverticular disease ispoor [16].
This systematic review aims to update the evidence on the efficacy of treatment with fiber inSUDD, in terms of the reduction of symptoms and the prevention of acute diverticulitis.
2. Methods
2.1. Study Selection
The search was conducted according to the PRISMA (Preferred Reporting Items for SystematicReviews and Meta-Analyses) guidelines [17]. The electronic databases PubMed MEDLINE(U.S. National Library of Medicine, Bethesda, MD, USA) and Scopus were systematically searchedaccording to the following search strategy, using the following MesH terms:
(((“diverticulum” [MeSH Terms] OR “diverticulum” [All Fields] OR “diverticulosis” [All Fields])OR diverticular [All Fields] OR (“diverticulum” [MeSH Terms] OR “diverticulum” [All Fields] OR“diverticula” [All Fields]) OR (“diverticulitis” [MeSH Terms] OR “diverticulitis” [All Fields])) AND((“colon” [MeSH Terms] OR “colon” [All Fields]) OR (“colon” [MeSH Terms] OR “colon” [All Fields] OR“colonic” [All Fields]) OR (“colon, sigmoid” [MeSH Terms] OR (“colon” [All Fields] AND “sigmoid”[All Fields]) OR “sigmoid colon” [All Fields] OR “sigmoid” [All Fields])) AND ((“dietary fiber”[MeSH Terms] OR (“dietary” [All Fields] AND “fiber” [All Fields]) OR “dietary fiber” [All Fields] OR“fiber” [All Fields]) OR fibre [All Fields] OR (“diet” [MeSH Terms] OR “diet” [All Fields] OR “dietary”[All Fields]) OR insoluble [All Fields] OR soluble [All Fields] OR (“fruit” [MeSH Terms] OR “fruit”[All Fields]) OR (“vegetables” [MeSH Terms] OR “vegetables” [All Fields] OR “vegetable” [All Fields]) OR(“(1-6)-alpha-glucomannan” [Supplement *] OR “(1-6)-alpha-glucomannan” [All Fields] OR “glucomannan”[All Fields]) OR (“starch” [MeSH Terms] OR “starch” [All Fields]) OR fructooligosaccharides [All Fields]OR bran [All Fields] OR (“inulin” [MeSH Terms] OR “inulin” [All Fields]) OR (“psyllium” [MeSH Terms]OR “psyllium” [All Fields]))) AND (“humans” [MeSH Terms] AND (English [lang] OR French[lang] OR German [lang] OR Italian [lang] OR Spanish [lang]) AND “adult” [MeSH Terms]) AND(“therapy” [Subheading] OR “therapy” [All Fields] OR “treatment” [All Fields] OR “therapeutics”[MeSH Terms] OR “therapeutics” [All Fields]) AND (“humans” [MeSH Terms] AND (English [lang]OR French [lang] OR German [lang] OR Italian [lang] OR Spanish [lang]) AND “adult” [MeSH Terms]).
The search strategy excluded reviews, meta-analyses, case reports, and animal studies.The following study types were included: randomized controlled trials (blinded and/or placebo-controlled), open randomized clinical trials, and non-randomized open studies. Pediatric subjectswere excluded from this review. No publication data restriction was imposed. Reports published inEnglish, German, French, Italian, and Spanish were considered.
12
Nutrients 2017, 9, 161
Clinical studies published up to 7 October 2016 were considered for inclusion in this review, if theydescribed in adults (>18 years) with SUDD, the efficacy of fiber treatment with respect to the baseline(i) on reduction or remission of abdominal symptoms; and/or (ii) on prevention of acute diverticulitis.
Potentially relevant articles were independently screened for eligibility in an un-blindedstandardized manner by the two reviewers (M.C., E.L.), initially by abstract, and then by full textwhen necessary, in order to determine whether they met the inclusion criteria. Reviews, letters, books,and/or editorials were excluded on the basis of the abstract and/or title; in other cases, the judgementof inclusion/exclusion was based on an evaluation of the full-text. Disagreement between reviewerswas resolved by discussion. The reference lists of the identified articles, as well as of the identifiedrelevant reviews, were manually searched for additional studies that may have been overlooked usinga computer-assisted search strategy.
2.2. Data Extraction
We developed a data extraction sheet, pilot-tested it on three randomly-selected included studies,and refined it accordingly. One review author (M.C.) extracted the data from the included studiesand the second author (E.L.) checked the extracted data. Disagreements were resolved by discussionbetween the two review authors. The following information was extracted from each included paper:(1) author and year of publication; (2) characteristics of fibers; (3) characteristics of study participants(number, mean age, and gender); (4) diagnosis of SUDD; (5) study type and treatment arms; (6) type ofintervention; (7) follow-up; (8) outcome measure (reduction of abdominal symptoms; occurrenceof acute diverticulitis); (9) efficacy of intervention; (10) adverse effects of fiber arms; (11) single ormultiple centers.
The diagnosis of SUDD was considered appropriate when patients with colonic diverticula hadrecurrent abdominal symptoms such as abdominal pain, which were eventually associated withbloating or bowel habit alteration [3]. Studies which did not completely fulfill this definition were notexcluded a priori, but the specific clinical settings were singularly extracted and described in detail.
For the purpose of this paper, dietary fibers were defined as the intake of food fibers in fruits,vegetables, and cereal grains. A high-fiber diet has been defined as at least a 30 g daily intake ofdietary fibers [18]. When indicated, the amount of daily fiber intake was extracted from each paper.Supplemental fibers were defined as diet supplementation with specific commercial preparationscontaining one or more types of fiber.
2.3. Statistical Analysis
Originally, a meta-analysis was planned in order to provide a numerical estimate of the overalleffect of interest, for which the outcome measure (effect size) comprised the proportion of patientswho showed a positive response to fiber treatment with respect to the baseline, or with respect tocontrols, defined as the reduction of abdominal symptoms and prevention of acute diverticulitis. Due tothe heterogeneity of the retrieved studies and their low quality, a meta-analysis was not consideredapplicable. The efficacy of the interventions reported in the retrieved studies was described in aqualitative manner.
2.4. Quality Assessment
The two reviewers evaluated the quality of all of the included studies, using the Jadad scalefor randomized controlled trials [19]. This scale awards a maximum of five points to each study.The considered categories are randomization, blinding of outcome assessment, description ofwithdrawals and dropouts, and description and appropriateness of randomization and blinding.A study can be awarded a maximum of one point for each category (Table S1). Discrepancies in thequality assessment were discussed and resolved by the two reviewers.
13
Nutrients 2017, 9, 161
3. Results
3.1. Search Results
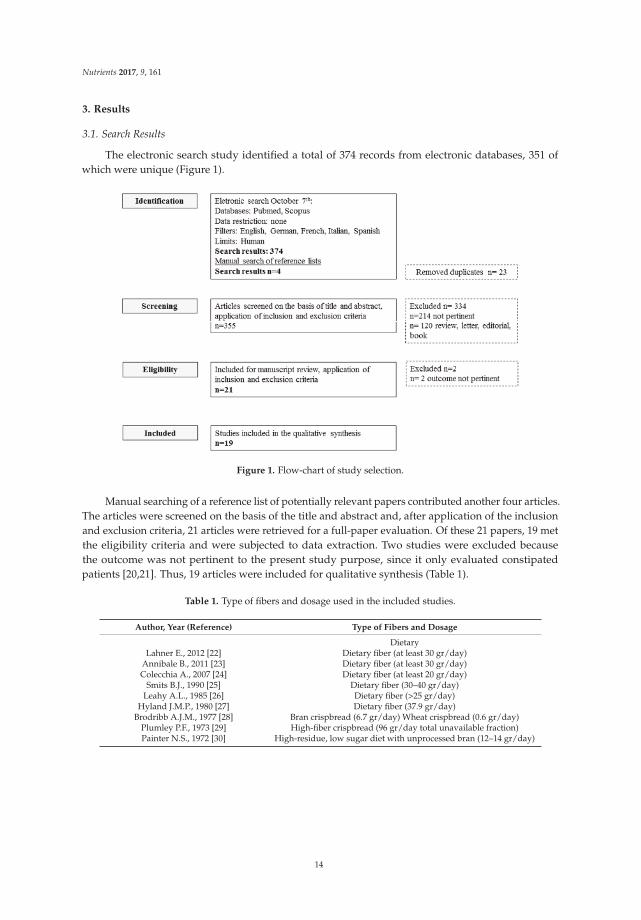
The electronic search study identified a total of 374 records from electronic databases, 351 ofwhich were unique (Figure 1).
Figure 1. Flow-chart of study selection.
Manual searching of a reference list of potentially relevant papers contributed another four articles.The articles were screened on the basis of the title and abstract and, after application of the inclusionand exclusion criteria, 21 articles were retrieved for a full-paper evaluation. Of these 21 papers, 19 metthe eligibility criteria and were subjected to data extraction. Two studies were excluded becausethe outcome was not pertinent to the present study purpose, since it only evaluated constipatedpatients [20,21]. Thus, 19 articles were included for qualitative synthesis (Table 1).
Table 1. Type of fibers and dosage used in the included studies.
Author, Year (Reference) Type of Fibers and Dosage
DietaryLahner E., 2012 [22] Dietary fiber (at least 30 gr/day)
Annibale B., 2011 [23] Dietary fiber (at least 30 gr/day)Colecchia A., 2007 [24] Dietary fiber (at least 20 gr/day)
Smits B.J., 1990 [25] Dietary fiber (30–40 gr/day)Leahy A.L., 1985 [26] Dietary fiber (>25 gr/day)
Hyland J.M.P., 1980 [27] Dietary fiber (37.9 gr/day)Brodribb A.J.M., 1977 [28] Bran crispbread (6.7 gr/day) Wheat crispbread (0.6 gr/day)
Plumley P.F., 1973 [29] High-fiber crispbread (96 gr/day total unavailable fraction)Painter N.S., 1972 [30] High-residue, low sugar diet with unprocessed bran (12–14 gr/day)
14
Nutrients 2017, 9, 161
Table 1. Cont.
Author, Year (Reference) Type of Fibers and Dosage
Supplemental
Lanas A., 2013 [31] Plantago ovata (7 gr/day)Latella G., 2003 [32] Glucomannan (4 gr/day)
Papi C., 1995 [33] Glucomannan (2 gr/day)Papi C., 1992 [34] Glucomannan (2 gr/day)
Thorburn H.A., 1992 [35] Ispaghula husk (7 gr/day)Ornstein M.H., 1981 [36] Bran (6.99 g/day) Ispaghula (9.04 gr/day)Eastwood M.A., 1978 [37] Bran (20 g/day) Isphaghula (2 sachets/day)Hodgson W.J.B., 1977 [38] Methylcellulose (1000 mg/day)Brodribb A.J.M., 1976 [39] Wheat bran (24 gr/day)
Taylor I., 1976 [40] High roughage diet with bran supplement Bran (18 gr/day)
3.2. Quality Assessment
Details of the quality assessment of the included studies are given in Supplementary Table S1(see Supplementary material). Of the 19 studies included, six achieved 0 points [26,27,35,36,39,40],three achieved 1 point [25,29,30], two achieved 2 points [28,38], seven achieved 3 points [22–24,31,33,34,36],and only one achieved 5 points [33], according to Jadad scale.
3.3. Characteristics of Included Studies
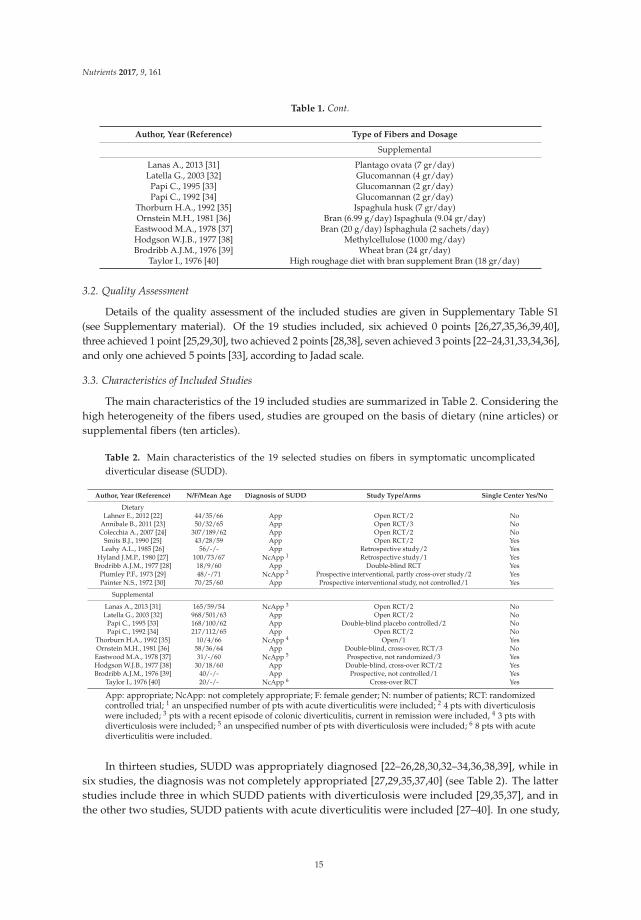
The main characteristics of the 19 included studies are summarized in Table 2. Considering thehigh heterogeneity of the fibers used, studies are grouped on the basis of dietary (nine articles) orsupplemental fibers (ten articles).
Table 2. Main characteristics of the 19 selected studies on fibers in symptomatic uncomplicateddiverticular disease (SUDD).
Author, Year (Reference) N/F/Mean Age Diagnosis of SUDD Study Type/Arms Single Center Yes/No
DietaryLahner E., 2012 [22] 44/35/66 App Open RCT/2 No
Annibale B., 2011 [23] 50/32/65 App Open RCT/3 NoColecchia A., 2007 [24] 307/189/62 App Open RCT/2 No
Smits B.J., 1990 [25] 43/28/59 App Open RCT/2 YesLeahy A.L., 1985 [26] 56/-/- App Retrospective study/2 Yes
Hyland J.M.P., 1980 [27] 100/73/67 NcApp 1 Retrospective study/1 YesBrodribb A.J.M., 1977 [28] 18/9/60 App Double-blind RCT Yes
Plumley P.F., 1973 [29] 48/-/71 NcApp 2 Prospective interventional, partly cross-over study/2 YesPainter N.S., 1972 [30] 70/25/60 App Prospective interventional study, not controlled/1 Yes
Supplemental
Lanas A., 2013 [31] 165/59/54 NcApp 3 Open RCT/2 NoLatella G., 2003 [32] 968/501/63 App Open RCT/2 No
Papi C., 1995 [33] 168/100/62 App Double-blind placebo controlled/2 NoPapi C., 1992 [34] 217/112/65 App Open RCT/2 No
Thorburn H.A., 1992 [35] 10/4/66 NcApp 4 Open/1 YesOrnstein M.H., 1981 [36] 58/36/64 App Double-blind, cross-over, RCT/3 NoEastwood M.A., 1978 [37] 31/-/60 NcApp 5 Prospective, not randomized/3 YesHodgson W.J.B., 1977 [38] 30/18/60 App Double-blind, cross-over RCT/2 YesBrodribb A.J.M., 1976 [39] 40/-/- App Prospective, not controlled/1 Yes
Taylor I., 1976 [40] 20/-/- NcApp 6 Cross-over RCT Yes
App: appropriate; NcApp: not completely appropriate; F: female gender; N: number of patients; RCT: randomizedcontrolled trial; 1 an unspecified number of pts with acute diverticulitis were included; 2 4 pts with diverticulosiswere included; 3 pts with a recent episode of colonic diverticulitis, current in remission were included, 4 3 pts withdiverticulosis were included; 5 an unspecified number of pts with diverticulosis were included; 6 8 pts with acutediverticulitis were included.
In thirteen studies, SUDD was appropriately diagnosed [22–26,28,30,32–34,36,38,39], while insix studies, the diagnosis was not completely appropriated [27,29,35,37,40] (see Table 2). The latterstudies include three in which SUDD patients with diverticulosis were included [29,35,37], and inthe other two studies, SUDD patients with acute diverticulitis were included [27–40]. In one study,
15
Nutrients 2017, 9, 161
patients who had reported a recent episode of colonic diverticulitis, but were currently in remission,were included [31].
3.4. Dietary Fiber
Articles concerning dietary fibers were performed over a period of 40 years, from 1972 to 2012,and only three of them were published in the last 10 years [22–24]. Six of these were single center studiesand three were multicenter studies [22–24]. Six studies were conducted in the United Kingdom [25–30]and three were completed in Italy [22–24].
An overall number of 736 patients with SUDD were investigated, for which the female genderwas slightly prevalent (n = 391), but in two articles [26–29], the gender of the patients was lacking.Patients had a mean age of 64 years, ranging from 59 to 71 years. In one study, the age of patients waslacking [26].
With regard to the study type, four were randomized controlled open trials [22–25], two wereretrospective studies [26,27], one was a double-blind RCT [28], one was a prospective partly cross-overstudy [29], and the remaining one was an un-controlled study [30].
With regard to the fibers used, in the majority of the studies, patients were treated with dietaryfibers [22–27], in two articles crispbread was used [28,29], and in the last study, a high residue, low sugarwith unprocessed bran was utilized [30]. In addition, the amount of dietary fiber utilized was variable,ranging from 20 [24] to 96 gr/day [29]. In five studies, a high-fiber diet was employed [22,23,25,27,29],but in the other studies, the dosage of fiber seemed to be lower than 30 gr daily [24,26,28,30].Unfortunately, it was not possible to assess the proportion of soluble or insoluble fibers for eachdietary regimen, since its exact composition was not reported.
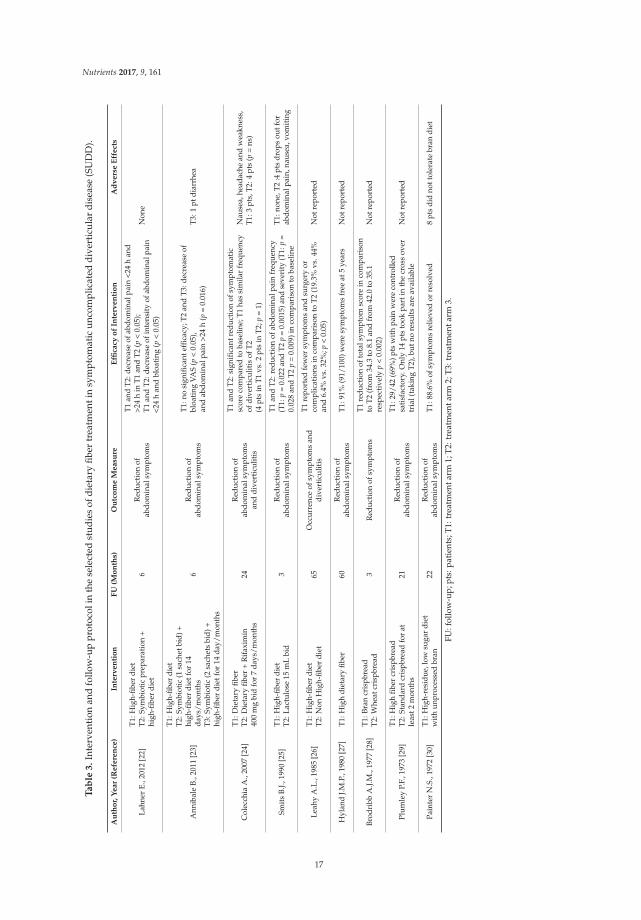
The follow-up protocol was very variable between studies, ranging from three [25–28] to65 months [27]. Also, the interventions were variable between studies: in four studies, the dietary fiberwas a control arm and was compared in two articles to symbiotic preparations [22,23], in another it wascompared to rifaximin [24], and in the last it was compared to lactulose [25]. In one study, a high-fiberdiet was compared to one which was not high in fiber [26], and in two studies, high-fiber crispbread wascompared to lower fiber crispbread [28,29]. One study used a high-fiber diet without a control arm [27],and the other study used a high-residue, low sugar diet with unprocessed bran [30]. With regard tothe outcome measures, seven articles assessed the reduction of abdominal symptoms [22,23,25,27–30],and two assessed the reduction of symptoms and/or complications.
Two of the most recent open RCT studies compared a high-fiber diet with the combined treatmentof a high-fiber diet and a symbiotic preparation [22,23]. In the first study, both treatments significantlyreduced abdominal pain [22], whereas in the second, the high-fiber diet alone did not improveabdominal symptoms, compared to the baseline [23]. Another open RCT study compared a high-fiberdiet with the combination of a high-fiber diet and rifaximin, and showed that both treatmentssignificantly improved abdominal symptoms, compared to the baseline [24]. The occurrence ofdiverticulitis was reduced during the administration of a high-fiber diet in comparison to one whichwas not high in fiber, at a follow-up of 65 months [26]. Another study showed a similar frequency ofdiverticulitis occurrence in both treatment arms, for both dietary fiber and dietary fiber plus rifaximin,after 24 months [24]. Table 3 summarizes the type of intervention, follow-up protocols, the outcomemeasure, and the efficacy of each intervention included in the selected studies.
16
Nutrients 2017, 9, 161
Ta
ble
3.
Inte
rven
tion
and
follo
w-u
ppr
otoc
olin
the
sele
cted
stud
ies
ofdi
etar
yfib
ertr
eatm
enti
nsy
mpt
omat
icun
com
plic
ated
dive
rtic
ular
dise
ase
(SU
DD
).
Au
tho
r,Y
ear
(Refe
ren
ce)
Inte
rven
tio
nF
U(M
on
ths)
Ou
tco
me
Measu
reE
ffica
cyo
fIn
terv
en
tio
nA
dv
ers
eE
ffect
s
Lahn
erE.
,201
2[2
2]T1
:Hig
h-fib
erdi
etT2
:Sym
biot
icpr
epar
atio
n+
high
-fibe
rdi
et6
Red
ucti
onof
abdo
min
alsy
mpt
oms
T1an
dT2
:dec
reas
eof
abdo
min
alpa
in<2
4h
and
>24
hin
T1an
dT2
(p<
0.05
);T1
and
T2:d
ecre
ase
ofin
tens
ity
ofab
dom
inal
pain
<24
han
dbl
oati
ng(p
<0.
05)
Non
e
Ann
ibal
eB.
,201
1[2
3]
T1:H
igh-
fiber
diet
T2:S
ymbi
otic
(1sa
chet
bid)
+hi
gh-fi
ber
diet
for
14da
ys/m
onth
sT3
:Sym
biot
ic(2
sach
ets
bid)
+hi
gh-fi
ber
diet
for
14da
y/m
onth
s
6R
educ
tion
ofab
dom
inal
sym
ptom
s
T1:n
osi
gnifi
cant
effic
acy;
T2
and
T3:
decr
ease
ofbl
oati
ngVA
S(p
<0.
05),
and
abdo
min
alpa
in>2
4h
(p=
0.01
6)T
3:1
ptdi
arrh
ea
Col
ecch
iaA
.,20
07[2
4]T1
:Die
tary
fiber
T2:D
ieta
ryfib
er+
Rif
axim
in40
0m
gbi
dfo
r7
days
/mon
ths
24R
educ
tion
ofab
dom
inal
sym
ptom
san
ddi
vert
icul
itis
T1an
dT2
:sig
nific
antr
educ
tion
ofsy
mpt
omat
icsc
ore
com
pare
dto
base
line;
T1ha
ssi
mila
rfr
eque
ncy
ofdi
vert
icul
itis
ofT2
(4pt
sin
T1vs
.2pt
sin
T2;
p=
1)
Nau
sea,
head
ache
and
wea
knes
s,T
1:3
pts,
T2:
4pt
s(p
=ns
)
Smit
sB.
J.,19
90[2
5]T1
:Hig
h-fib
erdi
etT2
:Lac
tulo
se15
mL
bid
3R
educ
tion
ofab
dom
inal
sym
ptom
s
T1an
dT2
:red
ucti
onof
abdo
min
alpa
infr
eque
ncy
(T1:
p=
0.02
2an
dT2
p=
0.00
15)a
ndse
veri
ty(T
1:p
=0.
028
and
T2p
=0.
009)
inco
mpa
riso
nto
base
line
T1:
none
,T2
:4pt
sdr
ops
outf
orab
dom
inal
pain
,nau
sea,
vom
iting
Leah
yA
.L.,
1985
[26]
T1:H
igh-
fiber
diet
T2:N
onH
igh-
fiber
diet
65O
ccur
renc
eof
sym
ptom
san
ddi
vert
icul
itis
T1re
port
edfe
wer
sym
ptom
san
dsu
rger
yor
com
plic
atio
nsin
com
pari
son
toT
2(1
9.3%
vs.4
4%an
d6.
4%vs
.32%
;p<
0.05
)N
otre
port
ed
Hyl
and
J.M.P
.,19
80[2
7]T1
:Hig
hdi
etar
yfib
er60
Red
ucti
onof
abdo
min
alsy
mpt
oms
T1:9
1%(9
1/10
0)w
ere
sym
ptom
sfr
eeat
5ye
ars
Not
repo
rted
Brod
ribb
A.J.
M.,
1977
[28]
T1:B
ran
cris
pbre
adT2
:Whe
atcr
ispb
read
3R
educ
tion
ofsy
mpt
oms
T1re
duct
ion
ofto
tals
ympt
omsc
ore
inco
mpa
riso
nto
T2(f
rom
34.3
to8.
1an
dfr
om42
.0to
35.1
resp
ecti
vely
p<
0.00
2)N
otre
port
ed
Plum
ley
P.F.
,197
3[2
9]T1
:Hig
hfib
ercr
ispb
read
T2:S
tand
ard
cris
pbre
adfo
rat
leas
t2m
onth
s21
Red
ucti
onof
abdo
min
alsy
mpt
oms
T1:2
9/42
(69%
)pts
wit
hpa
inw
ere
cont
rolle
dsa
tisf
acto
ry.O
nly
14pt
sto
okpa
rtin
the
cros
sov
ertr
ial(
taki
ngT2
),bu
tno
resu
lts
are
avai
labl
eN
otre
port
ed
Pain
ter
N.S
.,19
72[3
0]T1
:Hig
h-re
sidu
e,lo
wsu
gar
diet
wit
hun
proc
esse
dbr
an22
Red
ucti
onof
abdo
min
alsy
mpt
oms
T1:8
8.6%
ofsy
mpt
oms
relie
ved
orre
solv
ed8
pts
did
nott
oler
ate
bran
diet
FU:f
ollo
w-u
p;pt
s:pa
tien
ts;T
1:tr
eatm
enta
rm1;
T2:t
reat
men
tarm
2;T3
:tre
atm
enta
rm3.
17
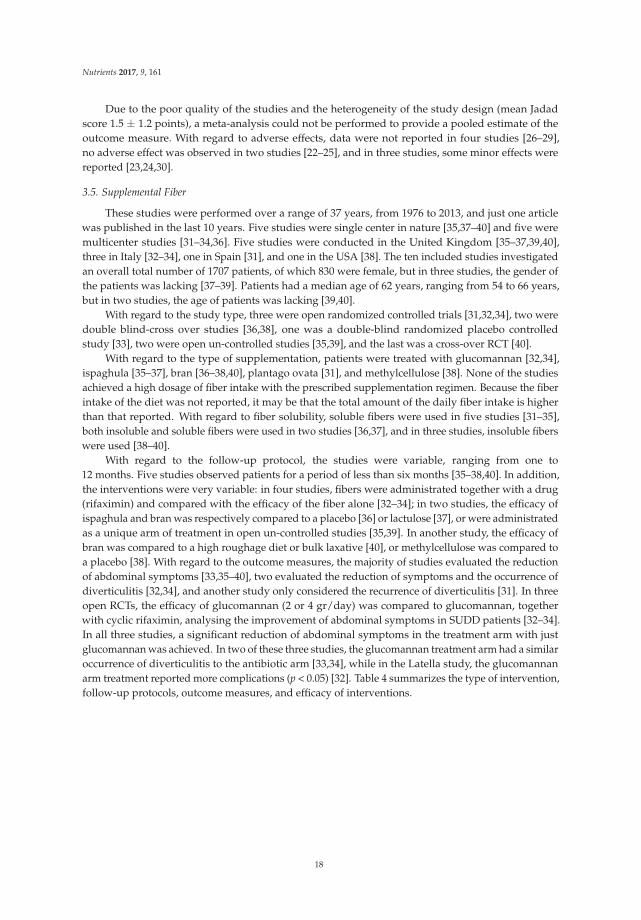
Nutrients 2017, 9, 161
Due to the poor quality of the studies and the heterogeneity of the study design (mean Jadadscore 1.5 ± 1.2 points), a meta-analysis could not be performed to provide a pooled estimate of theoutcome measure. With regard to adverse effects, data were not reported in four studies [26–29],no adverse effect was observed in two studies [22–25], and in three studies, some minor effects werereported [23,24,30].
3.5. Supplemental Fiber
These studies were performed over a range of 37 years, from 1976 to 2013, and just one articlewas published in the last 10 years. Five studies were single center in nature [35,37–40] and five weremulticenter studies [31–34,36]. Five studies were conducted in the United Kingdom [35–37,39,40],three in Italy [32–34], one in Spain [31], and one in the USA [38]. The ten included studies investigatedan overall total number of 1707 patients, of which 830 were female, but in three studies, the gender ofthe patients was lacking [37–39]. Patients had a median age of 62 years, ranging from 54 to 66 years,but in two studies, the age of patients was lacking [39,40].
With regard to the study type, three were open randomized controlled trials [31,32,34], two weredouble blind-cross over studies [36,38], one was a double-blind randomized placebo controlledstudy [33], two were open un-controlled studies [35,39], and the last was a cross-over RCT [40].
With regard to the type of supplementation, patients were treated with glucomannan [32,34],ispaghula [35–37], bran [36–38,40], plantago ovata [31], and methylcellulose [38]. None of the studiesachieved a high dosage of fiber intake with the prescribed supplementation regimen. Because the fiberintake of the diet was not reported, it may be that the total amount of the daily fiber intake is higherthan that reported. With regard to fiber solubility, soluble fibers were used in five studies [31–35],both insoluble and soluble fibers were used in two studies [36,37], and in three studies, insoluble fiberswere used [38–40].
With regard to the follow-up protocol, the studies were variable, ranging from one to12 months. Five studies observed patients for a period of less than six months [35–38,40]. In addition,the interventions were very variable: in four studies, fibers were administrated together with a drug(rifaximin) and compared with the efficacy of the fiber alone [32–34]; in two studies, the efficacy ofispaghula and bran was respectively compared to a placebo [36] or lactulose [37], or were administratedas a unique arm of treatment in open un-controlled studies [35,39]. In another study, the efficacy ofbran was compared to a high roughage diet or bulk laxative [40], or methylcellulose was compared toa placebo [38]. With regard to the outcome measures, the majority of studies evaluated the reductionof abdominal symptoms [33,35–40], two evaluated the reduction of symptoms and the occurrence ofdiverticulitis [32,34], and another study only considered the recurrence of diverticulitis [31]. In threeopen RCTs, the efficacy of glucomannan (2 or 4 gr/day) was compared to glucomannan, togetherwith cyclic rifaximin, analysing the improvement of abdominal symptoms in SUDD patients [32–34].In all three studies, a significant reduction of abdominal symptoms in the treatment arm with justglucomannan was achieved. In two of these three studies, the glucomannan treatment arm had a similaroccurrence of diverticulitis to the antibiotic arm [33,34], while in the Latella study, the glucomannanarm treatment reported more complications (p < 0.05) [32]. Table 4 summarizes the type of intervention,follow-up protocols, outcome measures, and efficacy of interventions.
18
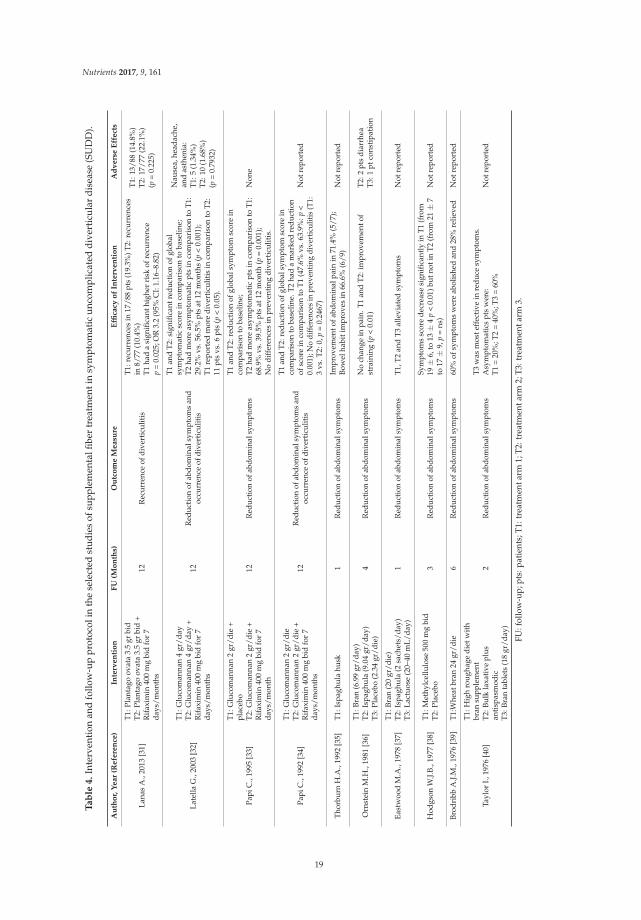
Nutrients 2017, 9, 161
Ta
ble
4.
Inte
rven
tion
and
follo
w-u
ppr
otoc
olin
the
sele
cted
stud
ies
ofsu
pple
men
talfi
ber
trea
tmen
tin
sym
ptom
atic
unco
mpl
icat
eddi
vert
icul
ardi
seas
e(S
UD
D).
Au
tho
r,Y
ear
(Refe
ren
ce)
Inte
rven
tio
nF
U(M
on
ths)
Ou
tco
me
Measu
reE
ffica
cyo
fIn
terv
en
tio
nA
dv
ers
eE
ffect
s
Lana
sA
.,20
13[3
1]
T1:P
lant
ago
ovat
a3.
5gr
bid
T2:P
lant
ago
ovat
a3.
5gr
bid
+R
ifax
imin
400
mg
bid
for
7da
ys/m
onth
s
12R
ecur
renc
eof
dive
rtic
ulit
is
T1:r
ecur
renc
esin
17/8
8pt
s(1
9.3%
)T2:
recu
rren
ces
in8/
77(1
0.4%
)T1
had
asi
gnifi
cant
high
erri
skof
recu
rren
cep
=0.
025;
OR
3.2
(95%
CI:
1.16
–8.8
2)
T1:
13/8
8(1
4.8%
)T
2:17
/77
(22.
1%)
(p=
0.22
5)
Late
llaG
.,20
03[3
2]
T1:G
luco
man
nan
4gr
/day
T2:G
luco
man
nan
4gr
/day
+R
ifax
imin
400
mg
bid
for
7da
ys/m
onth
s
12R
educ
tion
ofab
dom
inal
sym
ptom
san
doc
curr
ence
ofdi
vert
icul
itis
T1an
dT2
:sig
nific
antr
educ
tion
ofgl
obal
sym
ptom
atic
scor
ein
com
pari
son
toba
selin
e;T2
had
mor
eas
ympt
omat
icpt
sin
com
pari
son
toT
1:29
.2%
vs.5
6.5%
pts
at12
mon
ths
(p<
0.00
1);
T1re
port
edm
ore
dive
rtic
ulit
isin
com
pari
son
toT
2:11
pts
vs.6
pts
(p<
0.05
).
Nau
sea,
head
ache
,an
das
then
ia:
T1:
5(1
.34%
)T
2:10
(1.6
8%)
(p=
0.79
32)
Papi
C.,
1995
[33]
T1:G
luco
man
nan
2gr
/die
+pl
aceb
oT2
:Glu
com
anna
n2
gr/d
ie+
Rif
axim
in40
0m
gbi
dfo
r7
days
/mon
th
12R
educ
tion
ofab
dom
inal
sym
ptom
s
T1an
dT2
:red
ucti
onof
glob
alsy
mpt
omsc
ore
inco
mpa
riso
nto
base
line;
T2ha
dm
ore
asym
ptom
atic
pts
inco
mpa
riso
nto
T1:
68.9
%vs
.39.
5%pt
sat
12m
onth
(p=
0.00
1);
No
diff
eren
ces
inpr
even
ting
dive
rtic
ulit
is.
Non
e
Papi
C.,
1992
[34]
T1:G
luco
man
nan
2gr
/die
T2:G
luco
man
nan
2gr
/die
+R
ifax
imin
400
mg
bid
for
7da
ys/m
onth
s
12R
educ
tion
ofab
dom
inal
sym
ptom
san
doc
curr
ence
ofdi
vert
icul
itis
T1an
dT2
:red
ucti
onof
glob
alsy
mpt
omsc
ore
inco
mpa
riso
nto
base
line.
T2
had
am
arke
dre
duct
ion
ofsc
ore
inco
mpa
riso
nto
T1
(47.
6%vs
.63.
9%:p
<0.
001)
;No
diff
eren
ces
inpr
even
ting
dive
rtic
uliti
s(T
1:3
vs.T
2:0,
p=
0.24
67)
Not
repo
rted
Thor
burn
H.A
.,19
92[3
5]T1
:Isp
aghu
lahu
sk1
Red
ucti
onof
abdo
min
alsy
mpt
oms
Impr
ovem
ento
fabd
omin
alpa
inin
71.4
%(5
/7);
Bow
elha
biti
mpr
oves
in66
.6%
(6/9
)N
otre
port
ed
Orn
stei
nM
.H.,
1981
[36]
T1:B
ran
(6.9
9gr
/day
)T2
:Isp
aghu
la(9
.04
gr/d
ay)
T3:P
lace
bo(2
.34
gr/d
ie)
4R
educ
tion
ofab
dom
inal
sym
ptom
sN
och
ange
inpa
in.T
1an
dT
2:im
prov
emen
tof
stra
inin
g(p
<0.
01)
T2:
2pt
sdi
arrh
eaT
3:1
ptco
nsti
pati
on
East
woo
dM
.A.,
1978
[37]
T1:B
ran
(20
gr/d
ie)
T2:I
spag
hula
(2sa
chet
s/da
y)T3
:Lac
tuos
e(2
0–40
mL/
day)
1R
educ
tion
ofab
dom
inal
sym
ptom
sT1
,T2
and
T3
alle
viat
edsy
mpt
oms
Not
repo
rted
Hod
gson
W.J.
B.,1
977
[38]
T1:M
ethy
lcel
lulo
se50
0m
gbi
dT2
:Pla
cebo
3R
educ
tion
ofab
dom
inal
sym
ptom
sSy
mpt
oms
scor
ede
crea
sesi
gnifi
cant
lyin
T1
(fro
m19
±6,
to13
±4
p<
0.01
)but
noti
nT
2(f
rom
21±
7to
17±
9,p
=ns
)N
otre
port
ed
Brod
ribb
A.J.
M.,
1976
[39]
T1:W
heat
bran
24gr
/die
6R
educ
tion
ofab
dom
inal
sym
ptom
s60
%of
sym
ptom
sw
ere
abol
ishe
dan
d28
%re
lieve
dN
otre
port
ed
Tayl
orI.,
1976
[40]
T1:H
igh
roug
hage
diet
wit
hbr
ansu
pple
men
tT2
:Bul
kla
xati
vepl
usan
tisp
asm
odic
T3:B
ran
tabl
ets
(18
gr/d
ay)
2R
educ
tion
ofab
dom
inal
sym
ptom
sT3
was
mos
teff
ecti
vein
redu
cesy
mpt
oms.
Asy
mpt
omat
ics
pts
wer
e:T1
=20
%;T
2=
40%
;T3
=60
%N
otre
port
ed
FU:f
ollo
w-u
p;pt
s:pa
tien
ts;T
1:tr
eatm
enta
rm1;
T2:t
reat
men
tarm
2;T3
:tre
atm
enta
rm3.
19
Nutrients 2017, 9, 161
Also, due to the poor quality of the studies and their heterogeneity (mean Jadad score1.9 ± 1.8 points), a meta-analysis could not be performed.
On the basis of the heterogeneity of these papers, it was not possible to perform a sub-analysisassessing the differences between dietary and supplemental fibers, the effects of high- or low fiberdiet/supplementation, or the differences between soluble and insoluble fibers.
With regard to adverse effects, data were not reported in six studies [34,35,37–40], some minoradverse effects were reported in the fiber arm in three studies [31,32,36], and in another study, the onlydouble-blind randomized placebo controlled report, no adverse effects were observed [33].
4. Discussion
Dietary fibers are defined as the edible parts of plants or the analogous carbohydratesthat are resistant to digestion and absorption in the human small intestine, with complete orpartial fermentation in the colon [15]. Dietary fibers include non-starch polysaccharides, resistantoligosaccharides, and other carbohydrates, such as resistant starch and dextrins, and lignin [41,42].Non-starch polysaccharides can be further subdivided into soluble and insoluble fibers: soluble fibersdissolve in water-forming viscous gels, bypass the digestion of the small intestine, and are easilyfermented by the gut microbiota (i.e., pectins, gums, inulin-type fructans, and some hemicelluloses).In contrast, insoluble fibers are not water soluble, they do not form gels due to their water insolubility,and fermentation is severely limited (i.e., lignin, cellulose, and some hemicelluloses). The Academy ofNutrition and Dietetics declared that the adequate intake of fiber is 14 gr total per 1000 kcal, or 25 gr foradult women and 38 gr for adult men [18]. In Western countries, the daily fiber intake can change fromregion to region, and may change over the years. The mean intake of dietary fiber in the United Statesis 17 gr/day, with only 5% of the general population meeting the adequate intake [18]. In contrast,in a recent study evaluating the changes in food consumption and nutrient intake in a Mediterraneancohort, it has been observed that fiber intake has a baseline of 24.3 ± 9.4 gr/day; after 10 years, it wasobserved that fiber intake increased by 1.8 gr/day, thus augmenting over time [43]. Even if the healthbenefits of dietary fibers have long been appreciated, especially for their effect on cardiovasculardiseases, type II diabetes, glycemic control, and gastrointestinal conditions [14], these data underlinethat dietary habits in Western countries may be far from the recommended adequate intake.
With regard to the risk of developing colonic diverticula, it has been proposed that“fiber deficiency”, caused by the spreading of refined carbohydrates in the Western diet, may play animportant role. However, little evidence is available to substantiate this hypothesis [44,45], and morerecently, this concept has been reviewed. A colonoscopy-based, cross-sectional study on the dietaryrisk factors for diverticulosis found that a high fiber diet was even associated with a higher prevalenceof colonic diverticula [46]. The association with dietary fiber intake was dose-dependent and strongerwhen limited to cases with multiple diverticula. Although it has been suggested that a high-fiberdiet does not protect against the development of colonic diverticulosis, it may reduce the abdominalsymptoms related to diverticular disease.
Patients with SUDD may complain of chronic recurrent abdominal symptoms, and fibersmight confer benefits by increasing fecal mass and promoting the regularity of bowel movements.Another beneficial effect of fibers in the treatment of SUDD may be ascribed to their capabilityto act as prebiotics in the colon, by favoring health-promoting species of the intestinal microbiota,especially bifidobacteria and lactobacilli [14].
Diverticular disease is a complex, multifactorial disorder, in which the gut microbiota couldplay a key role. Recently, Barbara et al. reported that patients with diverticular disease showeddepletion of microbiota members with anti-inflammatory properties, including Clostridium clusterIV, Clostridium cluster IX, Fusobacterium, and Lactobacillaceae, with microbiota changes beingcorrelated with mucosal immune activation [47]. The gut microbiota, indeed, shifts rapidly in responseto dietary changes, particularly with fiber intake [48]. For this reason, high-fiber intake represents apromising treatment option in diverticular disease. In this condition, a high-fiber diet based on fruits,
20
Nutrients 2017, 9, 161
vegetables, and cereal grains may be difficult to achieve and should be supported with an adequatedietary counseling, and in a subset of patients, the use of supplemental fibers might be useful.
The beneficial effect on potential microbiota changes achieved with dietary fibers, based ondifferent amounts of soluble and insoluble fibers, or the supplementation of commercial fibers of thesame type, may be different and not necessarily comparable. However, it was not possible to performa sub-analysis assessing the differences between dietary or supplemental fibers, or between high- orlow-fiber diet/supplementation. Unfortunately, on the basis of these studies, it was not possible toassess differences between the effect of soluble or insoluble fibers, even if the relative amount mighthave influenced the outcome of treatment. In patients with irritable bowel syndrome, a condition thatmight be considered similar to SUDD, the effect of fibers appears to be limited to the soluble type [49].
In clinical practice, a high-fiber diet or fiber supplementation are commonly used in patientsaffected by diverticular disease, even if most recommendations are based on poor evidence. A previoussystematic review, performed in 2012, was restricted to the use of a high-fiber diet in diverticulardisease and only included controlled studies in the English language, reporting that high-qualityevidence for a high-fiber diet in the treatment of this condition is scarce [16].
The present systematic review represents an attempt to provide an updated measure of evidenceon the efficacy of dietary and supplemental fibers in SUDD, in terms of the reduction of abdominalsymptoms and the prevention of acute diverticulitis.
The research was updated until October 2016, considering randomized controlled trials(blinded and/or placebo-controlled), open randomized clinical trials, non-randomized open studies,and also taking into consideration papers in German, French, Italian, and Spanish. The selectedstudies, all of which came from Western countries with just one study from the USA, presented a highheterogeneity concerning the quantity and quality of the fibers employed, notwithstanding dietaryand supplemental fibers, which were evaluated separately. However, the quality of the studies wasvery low, with just one study yielding an optimal score [33]. Based on the available studies, it was notpossible to draw conclusions regarding the efficacy of fiber treatment in SUDD patients, neither interms of the reduction of abdominal symptoms, nor for the prevention of acute diverticulitis.
5. Conclusions
Single low quality studies suggest that fibers, both dietary and supplemental, could be beneficialin the treatment of SUDD. The presence of substantial methodological limitations, the heterogeneity oftherapeutic regimens employed, and the lack of ad hoc designed studies, do not permit a summaryof the outcome measures. Up to now, high-quality evidence on the efficacy of fiber treatmentfor the reduction of symptoms in SUDD and for the prevention of acute diverticulitis, is lacking.Thus, further, well-designed studies, specifically focusing on the efficacy of fibers in SUDD, dietary orsupplemental, are needed.
Supplementary Materials: The following are available online at http://www.mdpi.com/2072-6643/9/2/161/s1.
Acknowledgments: This study was in part supported by a Grant of University Sapienza, Roma 2014.
Author Contributions: Marilia Carabotti performed the data extraction and collection, and wrote the manuscript.Edith Lahner performed the data extraction, collection, and contributed to final revision of the manuscript.Carola Severi contributed to the critical revision of the manuscript. Bruno Annibale contributed to the conceptionand design of the study and to the final revision of the manuscript. All authors approved the final draft submitted.
Conflicts of Interest: The authors declare no conflict of interest.
References
1. Parra-Blanco, A. Colonic diverticular disease: Pathophysiology and clinical picture. Digestion 2006, 73
(Suppl. 1), 47–57. [CrossRef] [PubMed]2. Stollman, N.; Raskin, J.B. Diverticular disease of the colon. Lancet 2004, 363, 631–639. [CrossRef]
21
Nutrients 2017, 9, 161
3. Cuomo, R.; Barbara, G.; Pace, F.; Annese, V.; Bassotti, G.; Binda, G.A.; Casetti, T.; Colecchia, A.; Festi, D.;Fiocca, R.; et al. Italian consensus conference for colonic diverticulosis and diverticular disease. United Eur.
Gastroenterol. J. 2014, 2, 413–442. [CrossRef] [PubMed]4. Annibale, B.; Lahner, E.; Maconi, G.; Usai, P.; Marchi, S.; Bassotti, G.; Barbara, G.; Cuomo, R. Clinical features
of symptomatic uncomplicated diverticular disease: A multicenter Italian survey. Int. J. Colorectal Dis. 2012,27, 1151–1159. [CrossRef] [PubMed]
5. Bolster, L.T.; Papagrigoriadis, S. Diverticular disease has an impact on quality of life-results of a preliminarystudy. Colorectal Dis. 2003, 5, 320–323. [CrossRef] [PubMed]
6. Comparato, G.; Fanigliulo, L.; Aragona, G.; Cavestro, G.M.; Cavallaro, L.G.; Leandro, G.; Pilotto, A.; Nervi, G.;Soliani, P.; Sianesi, M.; et al. Quality of life in uncomplicated symptomatic diverticular disease: Is it anothergood reason for treatment? Dig. Dis. 2007, 25, 252–259. [CrossRef] [PubMed]
7. Shahedi, K.; Fuller, G.; Bolus, R.; Cohen, E.; Vu, M.; Shah, R.; Agarwal, N.; Kaneshiro, M.; Atia, M.; Sheen, V.;et al. Long-term risk of acute diverticulitis among patients with incidental diverticulosis found duringcolonoscopy. Clin. Gastroenterol. Hepatol. 2013, 11, 1609–1613. [CrossRef] [PubMed]
8. Anaya, D.A.; Flum, D.R. Risk of emergency colectomy and colostomy in patients with diverticular disease.Arch. Surg. 2005, 140, 681–685. [CrossRef] [PubMed]
9. Broderick-Villa, G.; Burchette, R.J.; Collins, J.C.; Abbas, M.A.; Haigh, P.I. Hospitalization for acutediverticulitis does not mandate routine elective colectomy. Arch. Surg. 2005, 140, 576–581. [CrossRef][PubMed]
10. Binda, G.A.; Cuomo, R.; Laghi, A.; Nascimbeni, R.; Serventi, A.; Bellini, D.; Gervaz, P.; Annibale, B.;Italian society of colon and rectal surgery. Practice parameters for the treatment of colonic diverticulardisease: Italian society of colon and rectal surgery (SICCR) guidelines. Tech. Coloproctol. 2015, 19, 615–626.[CrossRef] [PubMed]
11. Andersen, J.C.; Bundgaard, L.; Elbrønd, H.; Laurberg, S.; Walker, L.R.; Støvring, J.; Danish Surgical Society.Danish national guidelines for treatment of diverticular disease. Dan. Med. J. 2012, 59, C4453. [PubMed]
12. Pietrzak, A.; Bartnik, W.; Szczepkowski, M.; Krokowicz, P.; Dziki, A.; Reguła, J.; Wallner, G. Polishinterdisciplinary consensus on diagnostics and treatment of colonic diverticulosis (2015). Pol. Przegl. Chir.
2015, 87, 203–220. [CrossRef] [PubMed]13. Strate, L.L.; Peery, A.F.; Neumann, I. American gastroenterological association institute technical review on
the management of acute diverticulitis. Gastroenterology 2015, 149, 1950–1976. [CrossRef] [PubMed]14. Slavin, J. Fiber and prebiotics: Mechanisms and health benefits. Nutrients 2013, 5, 1417–1435. [CrossRef]
[PubMed]15. The Definition of Dietary Fiber. Available online: http://www.aaccnet.org/initiatives/definitions/
documents/dietaryfiber/dfdef.pdf (accessed on 16 February 2017).16. Ünlü, C.; Daniels, L.; Vrouenraets, B.C.; Boermeester, M.A. A systematic review of high-fibre dietary therapy
in diverticular disease. Int. J. Colorectal Dis. 2012, 27, 419–427. [CrossRef] [PubMed]17. Moher, D.; Liberati, A.; Tetzlaff, J.; Altman, D.G.; PRISMA Group. Preferred reporting items for systematic
reviews and meta-analyses: The PRISMA statement. PLoS Med. 2009, 6, e1000097. [CrossRef] [PubMed]18. Dahl, W.J.; Stewart, M.L. Position of the academy of nutrition and dietetics: Health implications of dietary
fiber. J. Acad. Nutr. Diet. 2015, 115, 1861–1870. [CrossRef] [PubMed]19. Jadad, A.R.; Moore, R.A.; Carroll, D.; Jenkinson, C.; Reynolds, D.J.; Gavaghan, D.J.; McQuay, H.J.
Assessing the quality of reports of randomized clinical trials: Is blinding necessary? Control Clin. Trials 1996,17, 1–12. [CrossRef]
20. Coste, T.; Rautureau, J.; Paraf, A. Treatment of constipation and colonic diverticulosis by bran. Med. Chir. Dig.
1978, 7, 631–634. [PubMed]21. Ewerth, S.; Ahlberg, J.; Holmström, B.; Persson, U.; Udén, R. Influence on symptoms and transit-time of
Vi-SiblinR in diverticular disease. Acta Chir. Scand. Suppl. 1980, 500, 49–50. [PubMed]22. Lahner, E.; Esposito, G.; Zullo, A.; Hassan, C.; Cannaviello, C.; Di Paolo, M.C.; Pallotta, L.; Garbagna, N.;
Grossi, E.; Annibale, B. High-fibre diet and Lactobacillus paracasei B21060 in symptomatic uncomplicateddiverticular disease. World J. Gastroenterol. 2012, 18, 5918–5924. [CrossRef] [PubMed]
23. Annibale, B.; Maconi, G.; Lahner, E.; De Giorgi, F.; Cuomo, R. Efficacy of Lactobacillus paracasei sub. paracasei
F19 on abdominal symptoms in patients with symptomatic uncomplicated diverticular disease: A pilotstudy. Minerva Gastroenterol. Dietol. 2011, 57, 13–22. [PubMed]
22
Nutrients 2017, 9, 161
24. Colecchia, A.; Vestito, A.; Pasqui, F.; Mazzella, G.; Roda, E.; Pistoia, F.; Brandimarte, G.; Festi, D. Efficacy oflong term cyclic administration of the poorly absorbed antibiotic Rifaximin in symptomatic, uncomplicatedcolonic diverticular disease. World J. Gastroenterol. 2007, 13, 264–269. [CrossRef] [PubMed]
25. Smits, B.J.; Whitehead, A.M.; Prescott, P. Lactulose in the treatment of symptomatic diverticular disease:A comparative study with high-fibre diet. Br. J. Clin. Pract. 1990, 4, 314–318.
26. Leahy, A.L.; Ellis, R.M.; Quill, D.S.; Peel, A.L. High fibre diet in symptomatic diverticular disease of thecolon. Ann. R. Coll. Surg. Engl. 1985, 67, 173–174. [PubMed]
27. Hyland, J.M.; Taylor, I. Does a high fibre diet prevent the complications of diverticular disease? Br. J. Surg.
1980, 67, 77–79. [CrossRef] [PubMed]28. Brodribb, A.J. Treatment of symptomatic diverticular disease with a high-fibre diet. Lancet 1977, 1, 664–666.
[CrossRef]29. Plumley, P.F.; Francis, B. Dietary management of diverticular disease. J. Am. Diet. Assoc. 1973, 63, 527–530.
[PubMed]30. Painter, N.S.; Almeida, A.Z.; Colebourne, K.W. Unprocessed bran in treatment of diverticular disease of the
colon. Br. Med. J. 1972, 2, 137–140. [CrossRef] [PubMed]31. Lanas, A.; Ponce, J.; Bignamini, A.; Mearin, F. One year intermittent rifaximin plus fibre supplementation vs.
fibre supplementation alone to prevent diverticulitis recurrence: A proof-of-concept study. Dig. Liver Dis.
2013, 45, 104–109. [CrossRef] [PubMed]32. Latella, G.; Pimpo, M.T.; Sottili, S.; Zippi, M.; Viscido, A.; Chiaramonte, M.; Frieri, G. Rifaximin improves
symptoms of acquired uncomplicated diverticular disease of the colon. Int. J. Colorectal Dis. 2003, 18, 55–62.[CrossRef] [PubMed]
33. Papi, C.; Ciaco, A.; Koch, M.; Capurso, L. Efficacy of rifaximin in the treatment of symptomatic diverticulardisease of the colon. A multicentre double-blind placebo-controlled trial. Aliment. Pharmacol. Ther. 1995, 9,33–39. [CrossRef] [PubMed]
34. Papi, C.; Ciaco, A.; Koch, M.; Capurso, L. Efficacy of rifaximin on symptoms of uncomplicated diverticulardisease of the colon. A pilot multicentre open trial. Diverticular Disease Study Group. Ital. J. Gastroenterol.
1992, 24, 452–456. [PubMed]35. Thorburn, H.A.; Carter, K.B.; Goldberg, J.A.; Finlay, I.G. Does ispaghula husk stimulate the entire colon in
diverticular disease? Gut 1992, 33, 352–356. [CrossRef] [PubMed]36. Ornstein, M.H.; Littlewood, E.R.; Baird, I.M.; Fowler, J.; North, W.R.; Cox, A.G. Are fibre supplements really
necessary in diverticular disease of the colon? A controlled clinical trial. Br. Med. J. 1981, 282, 1353–1356.[CrossRef]
37. Eastwood, M.A.; Smith, A.N.; Brydon, W.G.; Pritchard, J. Comparison of bran, ispaghula, and lactulose oncolon function in diverticular disease. Gut 1978, 19, 1144–1147. [CrossRef] [PubMed]
38. Hodgson, W.J. The placebo effect. Is it important in diverticular disease? Am. J. Gastroenterol. 1977, 67,157–162. [PubMed]
39. Brodribb, A.J.; Humphreys, D.M. Diverticular disease: Threee studies. Part II—Treatment with bran.Br. Med. J. 1976, 1, 425–428. [CrossRef] [PubMed]
40. Taylor, I.; Duthie, H.L. Bran tablets and diverticular disease. Br. Med. J. 1976, 1, 988–990. [CrossRef][PubMed]
41. Hamaker, B.R.; Tuncil, Y.E. A perspective on the complexity of dietary fiber structures and their potentialeffect on the gut microbiota. J. Mol. Biol. 2014, 426, 3838–3850. [CrossRef] [PubMed]
42. Jones, J.M. CODEX-aligned dietary fiber definitions help to bridge the ‘fiber gap’. Nutr. J. 2014, 13, 34.[CrossRef] [PubMed]
43. De la Fuente-Arrillaga, C.; Zazpe, I.; Santiago, S.; Bes-Rastrollo, M.; Ruiz-Canela, M.; Gea, A.;Martinez-Gonzalez, M.A. Beneficial changes in food consumption and nutrient intake after 10 years offollow-up in a Mediterranean cohort: The SUN project. BMC Public Health 2016, 16, 203. [CrossRef][PubMed]
44. Painter, N.S.; Burkitt, D.P. Diverticular disease of the colon: A deficiency disease of Western civilization.Br. Med. J. 1971, 2, 450–454. [CrossRef] [PubMed]
45. Korzenik, J.R. Case closed? Diverticulitis: Epidemiology and fiber. J. Clin. Gastroenterol. 2006, 40 (Suppl. 3),S112–S116. [CrossRef] [PubMed]
23
Nutrients 2017, 9, 161
46. Peery, A.F.; Barrett, P.R.; Park, D.; Rogers, A.J.; Galanko, J.A.; Martin, C.F.; Sandler, R.S. A high-fiber diet doesnot protect against asymptomatic diverticulosis. Gastroenterology 2012, 142, 266–272. [CrossRef] [PubMed]
47. Barbara, G.; Scaioli, E.; Barbaro, M.R.; Biagi, E.; Laghi, L.; Cremon, C.; Marasco, G.; Colecchia, A.; Picone, G.;Salfi, N.; et al. Gut microbiota, metabolome and immune signatures in patients with uncomplicateddiverticular disease. Gut 2016. [CrossRef] [PubMed]
48. David, L.A.; Maurice, C.F.; Carmody, R.N.; Gootenberg, D.B.; Button, J.E.; Wolfe, B.E.; Ling, A.V.; Devlin, A.S.;Varma, Y.; Fischbach, M.A.; et al. Diet rapidly and reproducibly alters the human gut microbiome. Nature
2014, 505, 559–563. [CrossRef] [PubMed]49. Moayyedi, P.; Quigley, E.M.; Lacy, B.E.; Lembo, A.J.; Saito, Y.A.; Schiller, L.R.; Soffer, E.E.; Spiegel, B.M.;
Ford, A.C. The effect of fiber supplementation on irritable bowel syndrome: A systematic review andmeta-analysis. Am. J. Gastroenterol. 2014, 109, 1367–1374. [CrossRef] [PubMed]
© 2017 by the authors. Licensee MDPI, Basel, Switzerland. This article is an open accessarticle distributed under the terms and conditions of the Creative Commons Attribution(CC BY) license (http://creativecommons.org/licenses/by/4.0/).
24
nutrients
Article
The Effects of Moderate Whole Grain Consumptionon Fasting Glucose and Lipids, GastrointestinalSymptoms, and Microbiota
Danielle N. Cooper 1, Mary E. Kable 2, Maria L. Marco 3, Angela De Leon 1, Bret Rust 1,2,
Julita E. Baker 1, William Horn 2, Dustin Burnett 2 and Nancy L. Keim 1,2,*
1 Department of Nutrition, University of California at Davis, 1 Shields Ave, Davis, CA 95616, USA;[email protected] (D.N.C.); [email protected] (A.D.L.); [email protected] (B.R.);[email protected] (J.E.B.)
2 Western Human Nutrition Research Center, USDA-ARS, 430 West Health Sciences Drive,Davis, CA 95616, USA; [email protected] (M.E.K.); [email protected] (W.H.);[email protected] (D.B.)
3 Food Science and Technology, University of California at Davis, 1 Shields Ave, Davis, CA 95616, USA;[email protected]
* Correspondence: [email protected]; Tel.: +1-530-752-4163
Received: 29 December 2016; Accepted: 16 February 2017; Published: 21 February 2017
Abstract: This study was designed to determine if providing wheat, corn, and rice as whole (WG) orrefined grains (RG) under free-living conditions will change parameters of health over a six-weekintervention in healthy, habitual non-WG consumers. Measurements of body composition, fecalmicrobiota, fasting blood glucose, total cholesterol, high density lipoprotein (HDL), low densitylipoprotein (LDL), and triglycerides were made at baseline and post intervention. Subjects weregiven adequate servings of either WG or RG products based on their caloric need and asked to keeprecords of grain consumption, bowel movements, and GI symptoms weekly. After six weeks, subjectsrepeated baseline testing. Significant decreases in total, LDL, and non-HDL cholesterol were seenafter the WG treatments but were not observed in the RG treatment. During Week 6, bowel movementfrequency increased with increased WG consumption. No significant differences in microbiota wereseen between baseline and post intervention, although, abundance of order Erysipelotrichales increasedin RG subjects who ate more than 50% of the RG market basket products. Increasing consumption ofWGs can alter parameters of health, but more research is needed to better elucidate the relationshipbetween the amount consumed and the health-related outcome.
Keywords: whole grains; maize; brown rice; whole wheat; fasting glucose; fasting blood lipids;microbiota; bowel movement frequency; gastrointestinal symptoms
1. Introduction
Grains are a staple of the average American diet and therefore changes to grain products,especially the level of refinement, can have a notable effect on Americans’ consumption of fiber,minerals, and vitamins [1]. The topic of whole grains has come to wider public attention since thepublication of the 2005 Dietary Guidelines for Americans, which recommends half of one’s daily grainintake (3–5 servings or 48–80 g for adults) should be in the form of whole grains [2]. However, there isstill a huge disparity between the recommended level of whole grain consumption and the actualamount of consumption in the US with most adults only consuming on average 9.76 g of whole grainsdaily, as reported by the 2009–2010 National Health and Nutrition Examination Survey (NHANES) [3].
Botanically, grains are defined as the caryopsis or dried fruit (also called corn) of a cerealplant [4]. True cereals include wheat (Triticum spp.), corn/maize (Zea mays), rice (Oryza spp.),
Nutrients 2017, 9, 173 25 www.mdpi.com/journal/nutrients
Nutrients 2017, 9, 173
oats (Avena spp.), and barley (Hordeum spp.), whereas the pseudocereals include foods such asamaranth (Amaranthus spp.), buckwheat (Fagopyrum esculentum) and quinoa (Chenopodium quinoa) [5].Grains are made up of three distinct components: the fibrous bran, the starchy endosperm, and thelipid containing germ. In addition to these three components, some grains, such as oats, grow withinan inedible husk which is removed prior to human consumption. Whole grains are defined as theintact edible portion of the fruit of the cereal plant or the ground, cracked, flaked, or rolled fruit solong as the original proportions of the bran, endosperm, and germ are present in nearly the sameproportions in the processed grain as were found in the intact grain [5,6].
Refined grains are grains that have been altered so that they are devoid of some, or all, of theirnaturally occurring germ and/or bran. In removing the germ, the shelf life of the grain is generallyimproved due to the absence of the lipid component of the germ that can become rancid [5]. Removal ofthe bran is often done to remove fibrous and potentially bitter components of the grain to improvethe hedonic experience of the consumer and lighten the color of the resulting grain product [7].Unfortunately, the removal of the bran and germ removes many bioactive components includingvitamins, minerals, antioxidants, phenolics, flavonoids, carotenoids and critically fiber, particularlyinsoluble fiber [4,8]. To ameliorate some of the losses in the refining process and increase consumptionof vitamins and minerals, enrichment or fortification is done with riboflavin, niacin, thiamin, folate,iron, and calcium, however nothing is done to increase the fiber level of refined grains [9].
In addition to not consuming enough whole grains, Americans are also not consuming enoughfiber. The 2009–2010 NHANES data reported adults were only consuming on average 17 g of fiberper day despite the recommendation to consume 25 to 38 g per day [3]. Consumption of more wholegrains has been suggested as an excellent way for Americans to bridge the fiber gap because manypalatability studies have shown that in moderate proportions substituting whole grains for refinedgrains does not change the “liking” of grain based foods [3,10].
Consumption of whole grains is associated with decreased risk of type 2 diabetes and majorchronic diseases, such as cardiovascular disease, and may even decrease the risk for some types ofcancers, such as colorectal cancer [4,11,12]. Alteration of glucose homeostasis [13–16] and reductionof total cholesterol and low density lipoprotein (LDL) have been somewhat inconsistently reportedin connection with increased whole grain consumption [12,13,17,18]. Beneficial alteration of the gutmicrobiota is often cited as a possible reason for health improvements seen with increased whole grainconsumption, although a relationship between the two is not always observed [8,13,14,19]. Fiber canbe mechanistically linked to all these health improvements and the content of fiber varies from grainto grain, which might explain some of the mixed reports. Another potential confounding variableis how much fiber subjects are consuming either prior to the dietary interventions or as part of theirbackground diet [20,21].
Our study was conducted to document biological changes that occur with increased whole grainconsumption. We hypothesized that compared to the subjects consuming refined grains the wholegrain consumers would have lower concentrations of fasting blood glucose, total cholesterol and LDL,increased bowel movement frequency, a shift to midrange fecal firmness, and increased abundance ofBacteroidetes. The three grains most commonly consumed in the United States, wheat, maize, and rice [1]were used in the grain interventions, which were provided in weekly “market baskets” containing anarray of either whole or refined grain foods. The number of servings per day provided to each subjectwas intended to be ~100% of the total grain recommendations for their maintenance calorie level.
We found that measures of fasting blood cholesterol significantly improved with the whole grainintervention. We also found that bowel movement frequency was significantly improved relativeto percent consumption of the whole grains, and blood glucose tended to decrease as well withincreased percent consumption of whole grains. Additionally, we observed increased abundance oforder Erysipelotrichales, with greater amounts of refined grain consumption.
26
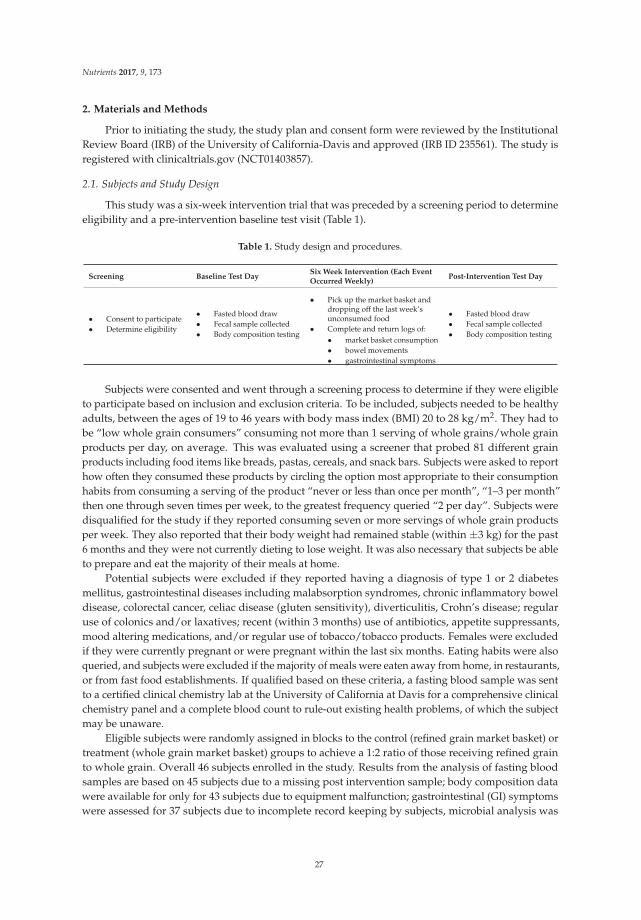
Nutrients 2017, 9, 173
2. Materials and Methods
Prior to initiating the study, the study plan and consent form were reviewed by the InstitutionalReview Board (IRB) of the University of California-Davis and approved (IRB ID 235561). The study isregistered with clinicaltrials.gov (NCT01403857).
2.1. Subjects and Study Design
This study was a six-week intervention trial that was preceded by a screening period to determineeligibility and a pre-intervention baseline test visit (Table 1).
Table 1. Study design and procedures.
Screening Baseline Test DaySix Week Intervention (Each EventOccurred Weekly)
Post-Intervention Test Day
• Consent to participate• Determine eligibility
• Fasted blood draw• Fecal sample collected• Body composition testing
• Pick up the market basket anddropping off the last week’sunconsumed food
• Complete and return logs of:• market basket consumption• bowel movements• gastrointestinal symptoms
• Fasted blood draw• Fecal sample collected• Body composition testing
Subjects were consented and went through a screening process to determine if they were eligibleto participate based on inclusion and exclusion criteria. To be included, subjects needed to be healthyadults, between the ages of 19 to 46 years with body mass index (BMI) 20 to 28 kg/m2. They had tobe “low whole grain consumers” consuming not more than 1 serving of whole grains/whole grainproducts per day, on average. This was evaluated using a screener that probed 81 different grainproducts including food items like breads, pastas, cereals, and snack bars. Subjects were asked to reporthow often they consumed these products by circling the option most appropriate to their consumptionhabits from consuming a serving of the product “never or less than once per month”, “1–3 per month”then one through seven times per week, to the greatest frequency queried “2 per day”. Subjects weredisqualified for the study if they reported consuming seven or more servings of whole grain productsper week. They also reported that their body weight had remained stable (within ±3 kg) for the past6 months and they were not currently dieting to lose weight. It was also necessary that subjects be ableto prepare and eat the majority of their meals at home.
Potential subjects were excluded if they reported having a diagnosis of type 1 or 2 diabetesmellitus, gastrointestinal diseases including malabsorption syndromes, chronic inflammatory boweldisease, colorectal cancer, celiac disease (gluten sensitivity), diverticulitis, Crohn’s disease; regularuse of colonics and/or laxatives; recent (within 3 months) use of antibiotics, appetite suppressants,mood altering medications, and/or regular use of tobacco/tobacco products. Females were excludedif they were currently pregnant or were pregnant within the last six months. Eating habits were alsoqueried, and subjects were excluded if the majority of meals were eaten away from home, in restaurants,or from fast food establishments. If qualified based on these criteria, a fasting blood sample was sentto a certified clinical chemistry lab at the University of California at Davis for a comprehensive clinicalchemistry panel and a complete blood count to rule-out existing health problems, of which the subjectmay be unaware.
Eligible subjects were randomly assigned in blocks to the control (refined grain market basket) ortreatment (whole grain market basket) groups to achieve a 1:2 ratio of those receiving refined grainto whole grain. Overall 46 subjects enrolled in the study. Results from the analysis of fasting bloodsamples are based on 45 subjects due to a missing post intervention sample; body composition datawere available for only for 43 subjects due to equipment malfunction; gastrointestinal (GI) symptomswere assessed for 37 subjects due to incomplete record keeping by subjects, microbial analysis was
27
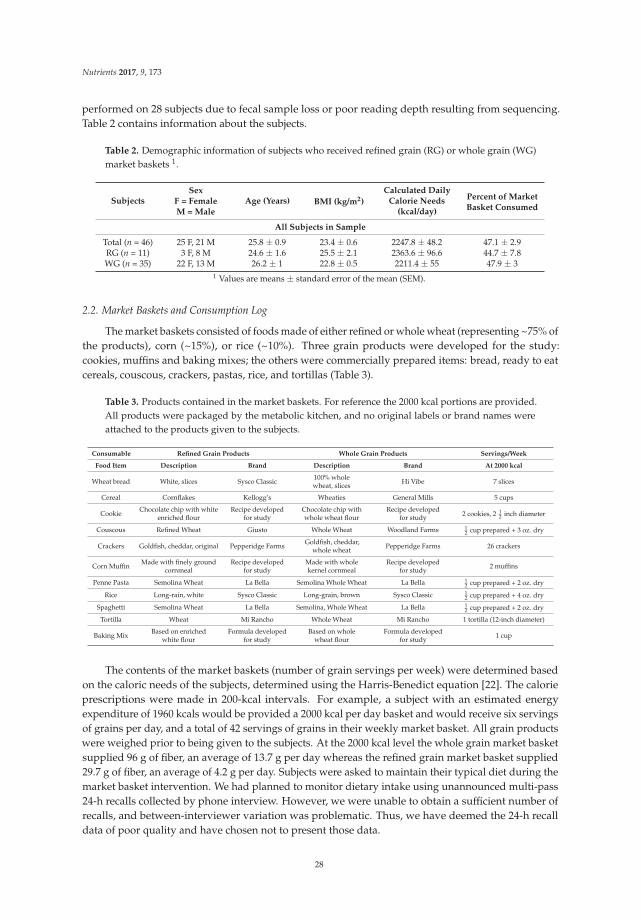
Nutrients 2017, 9, 173
performed on 28 subjects due to fecal sample loss or poor reading depth resulting from sequencing.Table 2 contains information about the subjects.
Table 2. Demographic information of subjects who received refined grain (RG) or whole grain (WG)market baskets 1.
SubjectsSex
Age (Years) BMI (kg/m2)
Calculated DailyCalorie Needs
(kcal/day)
Percent of MarketBasket Consumed
F = FemaleM = Male
All Subjects in Sample
Total (n = 46) 25 F, 21 M 25.8 ± 0.9 23.4 ± 0.6 2247.8 ± 48.2 47.1 ± 2.9RG (n = 11) 3 F, 8 M 24.6 ± 1.6 25.5 ± 2.1 2363.6 ± 96.6 44.7 ± 7.8WG (n = 35) 22 F, 13 M 26.2 ± 1 22.8 ± 0.5 2211.4 ± 55 47.9 ± 3
1 Values are means ± standard error of the mean (SEM).
2.2. Market Baskets and Consumption Log
The market baskets consisted of foods made of either refined or whole wheat (representing ~75% ofthe products), corn (~15%), or rice (~10%). Three grain products were developed for the study:cookies, muffins and baking mixes; the others were commercially prepared items: bread, ready to eatcereals, couscous, crackers, pastas, rice, and tortillas (Table 3).
Table 3. Products contained in the market baskets. For reference the 2000 kcal portions are provided.All products were packaged by the metabolic kitchen, and no original labels or brand names wereattached to the products given to the subjects.
Consumable Refined Grain Products Whole Grain Products Servings/Week
Food Item Description Brand Description Brand At 2000 kcal
Wheat bread White, slices Sysco Classic 100% wholewheat, slices Hi Vibe 7 slices
Cereal Cornflakes Kellogg’s Wheaties General Mills 5 cups
Cookie Chocolate chip with whiteenriched flour
Recipe developedfor study
Chocolate chip withwhole wheat flour
Recipe developedfor study 2 cookies, 2 1
2 inch diameter
Couscous Refined Wheat Giusto Whole Wheat Woodland Farms 12 cup prepared + 3 oz. dry
Crackers Goldfish, cheddar, original Pepperidge Farms Goldfish, cheddar,whole wheat Pepperidge Farms 26 crackers
Corn Muffin Made with finely groundcornmeal
Recipe developedfor study
Made with wholekernel cornmeal
Recipe developedfor study 2 muffins
Penne Pasta Semolina Wheat La Bella Semolina Whole Wheat La Bella 12 cup prepared + 2 oz. dry
Rice Long-rain, white Sysco Classic Long-grain, brown Sysco Classic 12 cup prepared + 4 oz. dry
Spaghetti Semolina Wheat La Bella Semolina, Whole Wheat La Bella 12 cup prepared + 2 oz. dry
Tortilla Wheat Mi Rancho Whole Wheat Mi Rancho 1 tortilla (12-inch diameter)
Baking Mix Based on enrichedwhite flour
Formula developedfor study
Based on wholewheat flour
Formula developedfor study 1 cup
The contents of the market baskets (number of grain servings per week) were determined basedon the caloric needs of the subjects, determined using the Harris-Benedict equation [22]. The calorieprescriptions were made in 200-kcal intervals. For example, a subject with an estimated energyexpenditure of 1960 kcals would be provided a 2000 kcal per day basket and would receive six servingsof grains per day, and a total of 42 servings of grains in their weekly market basket. All grain productswere weighed prior to being given to the subjects. At the 2000 kcal level the whole grain market basketsupplied 96 g of fiber, an average of 13.7 g per day whereas the refined grain market basket supplied29.7 g of fiber, an average of 4.2 g per day. Subjects were asked to maintain their typical diet during themarket basket intervention. We had planned to monitor dietary intake using unannounced multi-pass24-h recalls collected by phone interview. However, we were unable to obtain a sufficient number ofrecalls, and between-interviewer variation was problematic. Thus, we have deemed the 24-h recalldata of poor quality and have chosen not to present those data.
28
Nutrients 2017, 9, 173
Subjects were asked to record the type, amount, preparation, as well as date and time of thegrains used from the market basket. The grain products were pre-portioned for the subjects to increaseconvenience and help with record keeping in the log books (Figure A1). Subjects were not requiredto consume all grain products but where encouraged to replace what they would normally consumewith products from the provided market baskets whenever possible. The log data were comparedwith the disappearance data generated by weighing back the returned market basket containing theprepared or unprepared unused grain products. If there was a discrepancy between the log dataand what was returned in the market basket, in absence of a note from the subject explaining thediscrepancy, the weigh back data was deemed preferred and used in the consumption calculation.After the initial basket was picked up subjects returned once weekly to return their past week’s unusedfood, return their log books, and pick up materials for the following week. The intervention periodwas six weeks. The post-intervention test day was scheduled during the sixth week.
2.3. Body Composition
Subject’s body composition was determined using air displacement plethysmometry(BodPod, COSMED, USA, Inc., Concord, CA, USA) in conjunction with a calibrated digital scale(Scale-tronic model 6002, Wheaton, IL, USA). Height was determined by a wall-mounted stadiometer(Ayrton Stadiometer model S100, Prior Lake, MN, USA). Subjects were required to wear tight fittingclothing such as a bathing suits or compression shorts as well as swim caps prior to entering thechamber. Subjects were evaluated twice, once in the baseline period and once after the sixth week ofintervention, on both occasions they were tested after an overnight fast.
2.4. Clinical Parameters
Twelve-hour fasting blood samples were obtained by a licensed phlebotomist twice during thestudy. Whole blood was sent to the UC Davis Medical Center’s clinical laboratory for analysis ofglucose, lipids, cell counts, and iron status. The first collection occurred at baseline, the second occurredpost intervention.
2.5. Gastrointestinal Symptoms Log Book
GI symptom log books were distributed and collected weekly with the market baskets. The goalof the logs was to monitor GI tolerability of the market basket products. Subjects were asked to recordthe day and time of each bowel movement and rate the consistency of each bowel movement using theBristol stool scale [23]. There was also a short questionnaire in the log book that asked subjects to reflectover the past week when reporting their answers. The questions regarded frequency of experiencinggas, bloating, abdominal pain, nausea, or flatulence, and responses were recorded on a 5-point Likertscale [24]. There was a query about experiencing a change in stool and, if so, how they felt aboutthe change.
2.6. Fecal Collection
A single bowel movement was collected by the subject at baseline and then again post interventionusing a feces collection kit. The kit consisted of a plastic container lined with a ziplock bag,gloves, pens for labeling, and a hard-sided cooler with dry ice to keep their samples frozen untilthey could be delivered to the research center (WHNRC) for immediate storage at −20 C.
2.7. Gut Microbial Community Analysis
The composition of the fecal microbiota was determined by sequencing of bacterial 16S rRNAgenes. Comparisons of the fecal microbiota at baseline and post intervention were used to determinethe change in relative abundance of specific taxa. Bacterial DNA was extracted as previouslydescribed [25]. Briefly, approximately 200 mg of fecal material was placed in a 2 mL screw cap tube
29
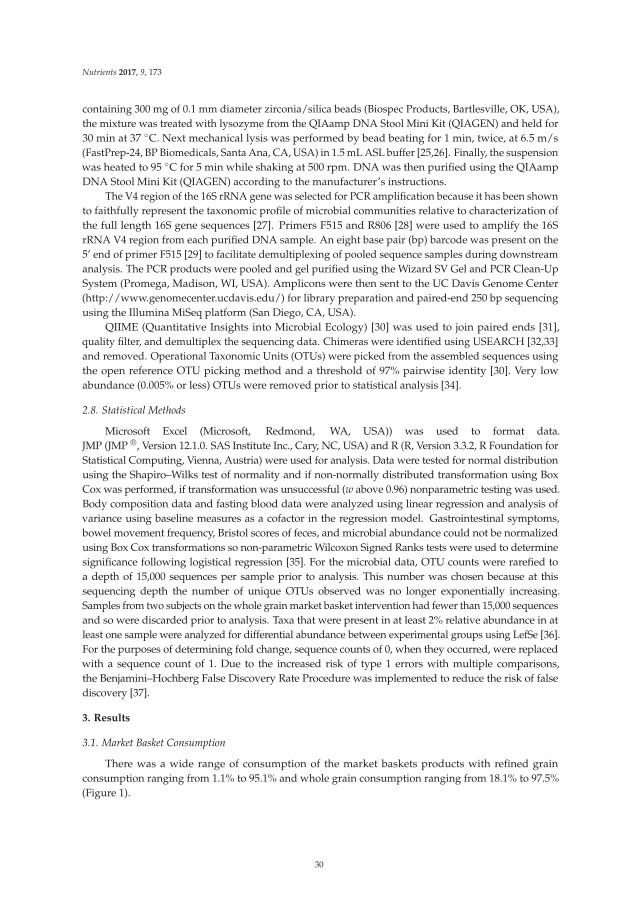
Nutrients 2017, 9, 173
containing 300 mg of 0.1 mm diameter zirconia/silica beads (Biospec Products, Bartlesville, OK, USA),the mixture was treated with lysozyme from the QIAamp DNA Stool Mini Kit (QIAGEN) and held for30 min at 37 C. Next mechanical lysis was performed by bead beating for 1 min, twice, at 6.5 m/s(FastPrep-24, BP Biomedicals, Santa Ana, CA, USA) in 1.5 mL ASL buffer [25,26]. Finally, the suspensionwas heated to 95 C for 5 min while shaking at 500 rpm. DNA was then purified using the QIAampDNA Stool Mini Kit (QIAGEN) according to the manufacturer’s instructions.
The V4 region of the 16S rRNA gene was selected for PCR amplification because it has been shownto faithfully represent the taxonomic profile of microbial communities relative to characterization ofthe full length 16S gene sequences [27]. Primers F515 and R806 [28] were used to amplify the 16SrRNA V4 region from each purified DNA sample. An eight base pair (bp) barcode was present on the5’ end of primer F515 [29] to facilitate demultiplexing of pooled sequence samples during downstreamanalysis. The PCR products were pooled and gel purified using the Wizard SV Gel and PCR Clean-UpSystem (Promega, Madison, WI, USA). Amplicons were then sent to the UC Davis Genome Center(http://www.genomecenter.ucdavis.edu/) for library preparation and paired-end 250 bp sequencingusing the Illumina MiSeq platform (San Diego, CA, USA).
QIIME (Quantitative Insights into Microbial Ecology) [30] was used to join paired ends [31],quality filter, and demultiplex the sequencing data. Chimeras were identified using USEARCH [32,33]and removed. Operational Taxonomic Units (OTUs) were picked from the assembled sequences usingthe open reference OTU picking method and a threshold of 97% pairwise identity [30]. Very lowabundance (0.005% or less) OTUs were removed prior to statistical analysis [34].
2.8. Statistical Methods
Microsoft Excel (Microsoft, Redmond, WA, USA)) was used to format data.JMP (JMP ®, Version 12.1.0. SAS Institute Inc., Cary, NC, USA) and R (R, Version 3.3.2, R Foundation forStatistical Computing, Vienna, Austria) were used for analysis. Data were tested for normal distributionusing the Shapiro–Wilks test of normality and if non-normally distributed transformation using BoxCox was performed, if transformation was unsuccessful (w above 0.96) nonparametric testing was used.Body composition data and fasting blood data were analyzed using linear regression and analysis ofvariance using baseline measures as a cofactor in the regression model. Gastrointestinal symptoms,bowel movement frequency, Bristol scores of feces, and microbial abundance could not be normalizedusing Box Cox transformations so non-parametric Wilcoxon Signed Ranks tests were used to determinesignificance following logistical regression [35]. For the microbial data, OTU counts were rarefied toa depth of 15,000 sequences per sample prior to analysis. This number was chosen because at thissequencing depth the number of unique OTUs observed was no longer exponentially increasing.Samples from two subjects on the whole grain market basket intervention had fewer than 15,000 sequencesand so were discarded prior to analysis. Taxa that were present in at least 2% relative abundance in atleast one sample were analyzed for differential abundance between experimental groups using LefSe [36].For the purposes of determining fold change, sequence counts of 0, when they occurred, were replacedwith a sequence count of 1. Due to the increased risk of type 1 errors with multiple comparisons,the Benjamini–Hochberg False Discovery Rate Procedure was implemented to reduce the risk of falsediscovery [37].
3. Results
3.1. Market Basket Consumption
There was a wide range of consumption of the market baskets products with refined grainconsumption ranging from 1.1% to 95.1% and whole grain consumption ranging from 18.1% to 97.5%(Figure 1).
30
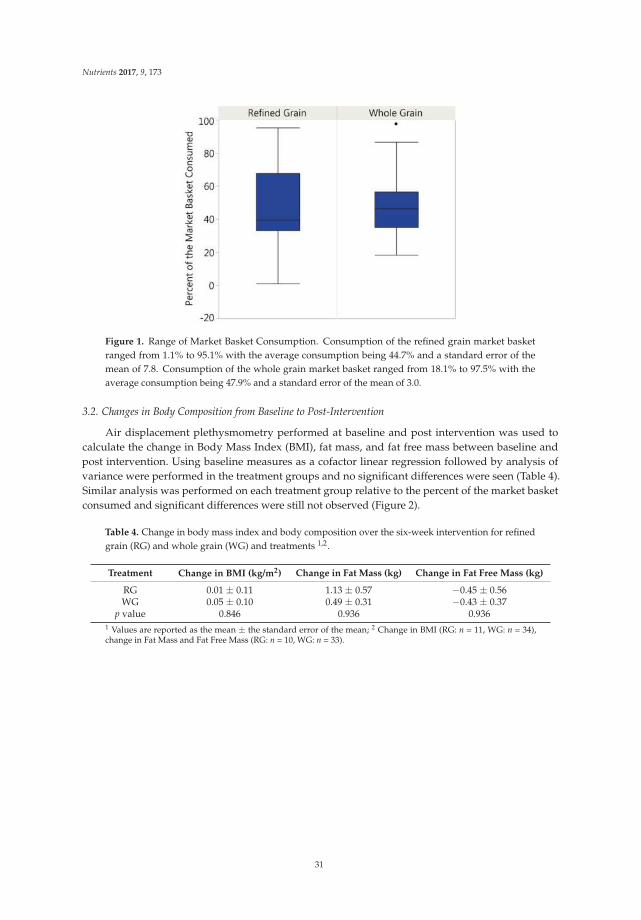
Nutrients 2017, 9, 173
Figure 1. Range of Market Basket Consumption. Consumption of the refined grain market basketranged from 1.1% to 95.1% with the average consumption being 44.7% and a standard error of themean of 7.8. Consumption of the whole grain market basket ranged from 18.1% to 97.5% with theaverage consumption being 47.9% and a standard error of the mean of 3.0.
3.2. Changes in Body Composition from Baseline to Post-Intervention
Air displacement plethysmometry performed at baseline and post intervention was used tocalculate the change in Body Mass Index (BMI), fat mass, and fat free mass between baseline andpost intervention. Using baseline measures as a cofactor linear regression followed by analysis ofvariance were performed in the treatment groups and no significant differences were seen (Table 4).Similar analysis was performed on each treatment group relative to the percent of the market basketconsumed and significant differences were still not observed (Figure 2).
Table 4. Change in body mass index and body composition over the six-week intervention for refinedgrain (RG) and whole grain (WG) and treatments 1,2.
Treatment Change in BMI (kg/m2) Change in Fat Mass (kg) Change in Fat Free Mass (kg)
RG 0.01 ± 0.11 1.13 ± 0.57 −0.45 ± 0.56WG 0.05 ± 0.10 0.49 ± 0.31 −0.43 ± 0.37
p value 0.846 0.936 0.9361 Values are reported as the mean ± the standard error of the mean; 2 Change in BMI (RG: n = 11, WG: n = 34),change in Fat Mass and Fat Free Mass (RG: n = 10, WG: n = 33).
31
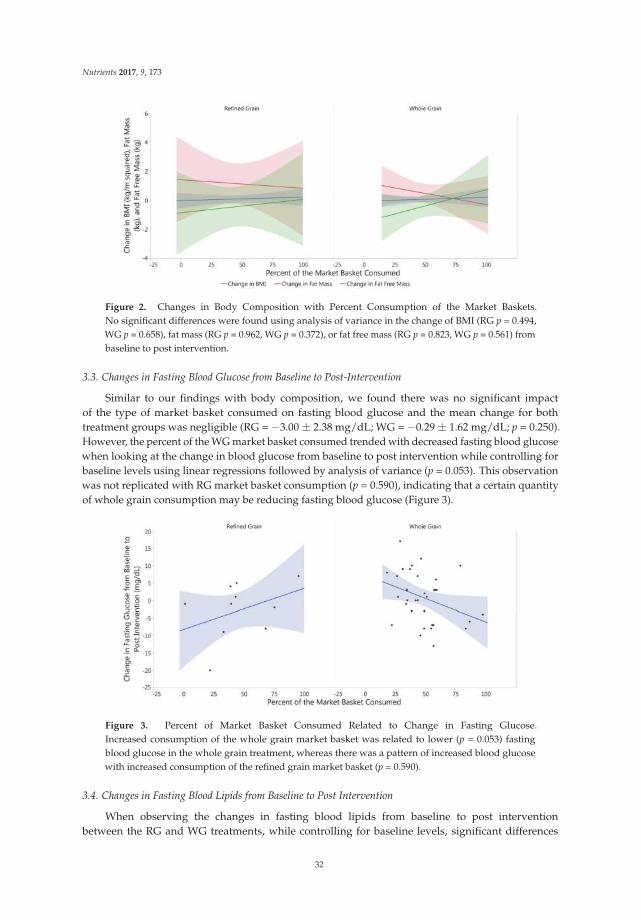
Nutrients 2017, 9, 173
Figure 2. Changes in Body Composition with Percent Consumption of the Market Baskets.No significant differences were found using analysis of variance in the change of BMI (RG p = 0.494,WG p = 0.658), fat mass (RG p = 0.962, WG p = 0.372), or fat free mass (RG p = 0.823, WG p = 0.561) frombaseline to post intervention.
3.3. Changes in Fasting Blood Glucose from Baseline to Post-Intervention
Similar to our findings with body composition, we found there was no significant impactof the type of market basket consumed on fasting blood glucose and the mean change for bothtreatment groups was negligible (RG = −3.00 ± 2.38 mg/dL; WG = −0.29 ± 1.62 mg/dL; p = 0.250).However, the percent of the WG market basket consumed trended with decreased fasting blood glucosewhen looking at the change in blood glucose from baseline to post intervention while controlling forbaseline levels using linear regressions followed by analysis of variance (p = 0.053). This observationwas not replicated with RG market basket consumption (p = 0.590), indicating that a certain quantityof whole grain consumption may be reducing fasting blood glucose (Figure 3).
Figure 3. Percent of Market Basket Consumed Related to Change in Fasting Glucose.Increased consumption of the whole grain market basket was related to lower (p = 0.053) fastingblood glucose in the whole grain treatment, whereas there was a pattern of increased blood glucosewith increased consumption of the refined grain market basket (p = 0.590).
3.4. Changes in Fasting Blood Lipids from Baseline to Post Intervention
When observing the changes in fasting blood lipids from baseline to post interventionbetween the RG and WG treatments, while controlling for baseline levels, significant differences
32
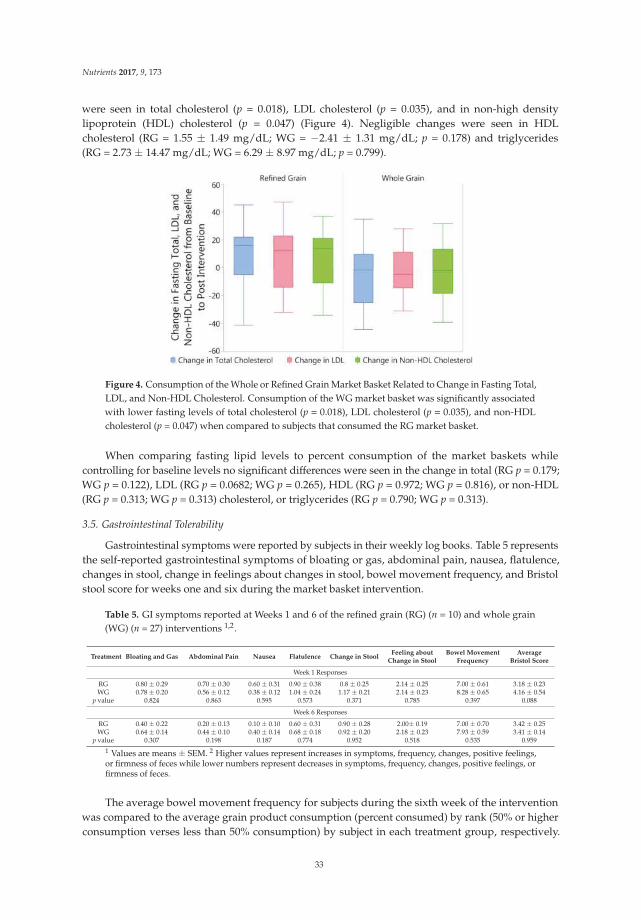
Nutrients 2017, 9, 173
were seen in total cholesterol (p = 0.018), LDL cholesterol (p = 0.035), and in non-high densitylipoprotein (HDL) cholesterol (p = 0.047) (Figure 4). Negligible changes were seen in HDLcholesterol (RG = 1.55 ± 1.49 mg/dL; WG = −2.41 ± 1.31 mg/dL; p = 0.178) and triglycerides(RG = 2.73 ± 14.47 mg/dL; WG = 6.29 ± 8.97 mg/dL; p = 0.799).
Figure 4. Consumption of the Whole or Refined Grain Market Basket Related to Change in Fasting Total,LDL, and Non-HDL Cholesterol. Consumption of the WG market basket was significantly associatedwith lower fasting levels of total cholesterol (p = 0.018), LDL cholesterol (p = 0.035), and non-HDLcholesterol (p = 0.047) when compared to subjects that consumed the RG market basket.
When comparing fasting lipid levels to percent consumption of the market baskets whilecontrolling for baseline levels no significant differences were seen in the change in total (RG p = 0.179;WG p = 0.122), LDL (RG p = 0.0682; WG p = 0.265), HDL (RG p = 0.972; WG p = 0.816), or non-HDL(RG p = 0.313; WG p = 0.313) cholesterol, or triglycerides (RG p = 0.790; WG p = 0.313).
3.5. Gastrointestinal Tolerability
Gastrointestinal symptoms were reported by subjects in their weekly log books. Table 5 representsthe self-reported gastrointestinal symptoms of bloating or gas, abdominal pain, nausea, flatulence,changes in stool, change in feelings about changes in stool, bowel movement frequency, and Bristolstool score for weeks one and six during the market basket intervention.
Table 5. GI symptoms reported at Weeks 1 and 6 of the refined grain (RG) (n = 10) and whole grain(WG) (n = 27) interventions 1,2.
Treatment Bloating and Gas Abdominal Pain Nausea Flatulence Change in StoolFeeling about
Change in StoolBowel Movement
FrequencyAverage
Bristol Score
Week 1 Responses
RG 0.80 ± 0.29 0.70 ± 0.30 0.60 ± 0.31 0.90 ± 0.38 0.8 ± 0.25 2.14 ± 0.25 7.00 ± 0.61 3.18 ± 0.23WG 0.78 ± 0.20 0.56 ± 0.12 0.38 ± 0.12 1.04 ± 0.24 1.17 ± 0.21 2.14 ± 0.23 8.28 ± 0.65 4.16 ± 0.54
p value 0.824 0.863 0.595 0.573 0.371 0.785 0.397 0.088
Week 6 Responses
RG 0.40 ± 0.22 0.20 ± 0.13 0.10 ± 0.10 0.60 ± 0.31 0.90 ± 0.28 2.00± 0.19 7.00 ± 0.70 3.42 ± 0.25WG 0.64 ± 0.14 0.44 ± 0.10 0.40 ± 0.14 0.68 ± 0.18 0.92 ± 0.20 2.18 ± 0.23 7.93 ± 0.59 3.41 ± 0.14
p value 0.307 0.198 0.187 0.774 0.952 0.518 0.535 0.959
1 Values are means ± SEM. 2 Higher values represent increases in symptoms, frequency, changes, positive feelings,or firmness of feces while lower numbers represent decreases in symptoms, frequency, changes, positive feelings, orfirmness of feces.
The average bowel movement frequency for subjects during the sixth week of the interventionwas compared to the average grain product consumption (percent consumed) by rank (50% or higherconsumption verses less than 50% consumption) by subject in each treatment group, respectively.
33
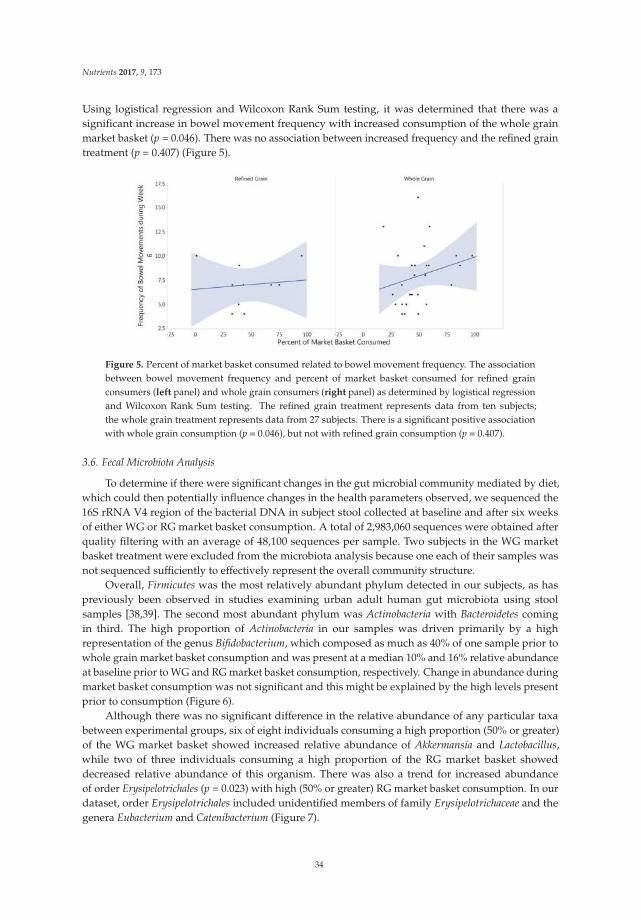
Nutrients 2017, 9, 173
Using logistical regression and Wilcoxon Rank Sum testing, it was determined that there was asignificant increase in bowel movement frequency with increased consumption of the whole grainmarket basket (p = 0.046). There was no association between increased frequency and the refined graintreatment (p = 0.407) (Figure 5).
Figure 5. Percent of market basket consumed related to bowel movement frequency. The associationbetween bowel movement frequency and percent of market basket consumed for refined grainconsumers (left panel) and whole grain consumers (right panel) as determined by logistical regressionand Wilcoxon Rank Sum testing. The refined grain treatment represents data from ten subjects;the whole grain treatment represents data from 27 subjects. There is a significant positive associationwith whole grain consumption (p = 0.046), but not with refined grain consumption (p = 0.407).
3.6. Fecal Microbiota Analysis
To determine if there were significant changes in the gut microbial community mediated by diet,which could then potentially influence changes in the health parameters observed, we sequenced the16S rRNA V4 region of the bacterial DNA in subject stool collected at baseline and after six weeksof either WG or RG market basket consumption. A total of 2,983,060 sequences were obtained afterquality filtering with an average of 48,100 sequences per sample. Two subjects in the WG marketbasket treatment were excluded from the microbiota analysis because one each of their samples wasnot sequenced sufficiently to effectively represent the overall community structure.
Overall, Firmicutes was the most relatively abundant phylum detected in our subjects, as haspreviously been observed in studies examining urban adult human gut microbiota using stoolsamples [38,39]. The second most abundant phylum was Actinobacteria with Bacteroidetes comingin third. The high proportion of Actinobacteria in our samples was driven primarily by a highrepresentation of the genus Bifidobacterium, which composed as much as 40% of one sample prior towhole grain market basket consumption and was present at a median 10% and 16% relative abundanceat baseline prior to WG and RG market basket consumption, respectively. Change in abundance duringmarket basket consumption was not significant and this might be explained by the high levels presentprior to consumption (Figure 6).
Although there was no significant difference in the relative abundance of any particular taxabetween experimental groups, six of eight individuals consuming a high proportion (50% or greater)of the WG market basket showed increased relative abundance of Akkermansia and Lactobacillus,while two of three individuals consuming a high proportion of the RG market basket showeddecreased relative abundance of this organism. There was also a trend for increased abundanceof order Erysipelotrichales (p = 0.023) with high (50% or greater) RG market basket consumption. In ourdataset, order Erysipelotrichales included unidentified members of family Erysipelotrichaceae and thegenera Eubacterium and Catenibacterium (Figure 7).
34
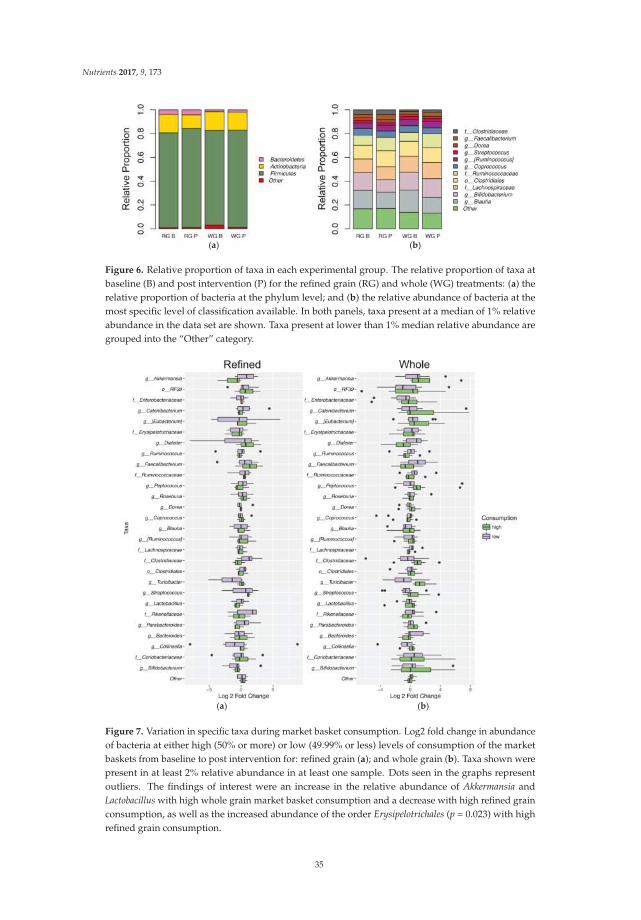
Nutrients 2017, 9, 173
(a) (b)
Figure 6. Relative proportion of taxa in each experimental group. The relative proportion of taxa atbaseline (B) and post intervention (P) for the refined grain (RG) and whole (WG) treatments: (a) therelative proportion of bacteria at the phylum level; and (b) the relative abundance of bacteria at themost specific level of classification available. In both panels, taxa present at a median of 1% relativeabundance in the data set are shown. Taxa present at lower than 1% median relative abundance aregrouped into the “Other” category.
(a) (b)
Figure 7. Variation in specific taxa during market basket consumption. Log2 fold change in abundanceof bacteria at either high (50% or more) or low (49.99% or less) levels of consumption of the marketbaskets from baseline to post intervention for: refined grain (a); and whole grain (b). Taxa shown werepresent in at least 2% relative abundance in at least one sample. Dots seen in the graphs representoutliers. The findings of interest were an increase in the relative abundance of Akkermansia andLactobacillus with high whole grain market basket consumption and a decrease with high refined grainconsumption, as well as the increased abundance of the order Erysipelotrichales (p = 0.023) with highrefined grain consumption.
35
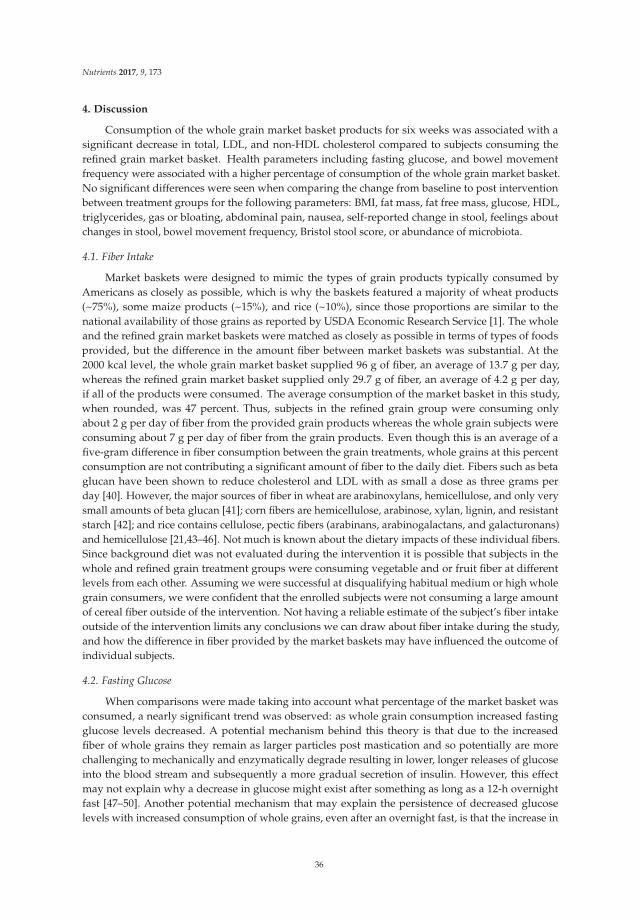
Nutrients 2017, 9, 173
4. Discussion
Consumption of the whole grain market basket products for six weeks was associated with asignificant decrease in total, LDL, and non-HDL cholesterol compared to subjects consuming therefined grain market basket. Health parameters including fasting glucose, and bowel movementfrequency were associated with a higher percentage of consumption of the whole grain market basket.No significant differences were seen when comparing the change from baseline to post interventionbetween treatment groups for the following parameters: BMI, fat mass, fat free mass, glucose, HDL,triglycerides, gas or bloating, abdominal pain, nausea, self-reported change in stool, feelings aboutchanges in stool, bowel movement frequency, Bristol stool score, or abundance of microbiota.
4.1. Fiber Intake
Market baskets were designed to mimic the types of grain products typically consumed byAmericans as closely as possible, which is why the baskets featured a majority of wheat products(~75%), some maize products (~15%), and rice (~10%), since those proportions are similar to thenational availability of those grains as reported by USDA Economic Research Service [1]. The wholeand the refined grain market baskets were matched as closely as possible in terms of types of foodsprovided, but the difference in the amount fiber between market baskets was substantial. At the2000 kcal level, the whole grain market basket supplied 96 g of fiber, an average of 13.7 g per day,whereas the refined grain market basket supplied only 29.7 g of fiber, an average of 4.2 g per day,if all of the products were consumed. The average consumption of the market basket in this study,when rounded, was 47 percent. Thus, subjects in the refined grain group were consuming onlyabout 2 g per day of fiber from the provided grain products whereas the whole grain subjects wereconsuming about 7 g per day of fiber from the grain products. Even though this is an average of afive-gram difference in fiber consumption between the grain treatments, whole grains at this percentconsumption are not contributing a significant amount of fiber to the daily diet. Fibers such as betaglucan have been shown to reduce cholesterol and LDL with as small a dose as three grams perday [40]. However, the major sources of fiber in wheat are arabinoxylans, hemicellulose, and only verysmall amounts of beta glucan [41]; corn fibers are hemicellulose, arabinose, xylan, lignin, and resistantstarch [42]; and rice contains cellulose, pectic fibers (arabinans, arabinogalactans, and galacturonans)and hemicellulose [21,43–46]. Not much is known about the dietary impacts of these individual fibers.Since background diet was not evaluated during the intervention it is possible that subjects in thewhole and refined grain treatment groups were consuming vegetable and or fruit fiber at differentlevels from each other. Assuming we were successful at disqualifying habitual medium or high wholegrain consumers, we were confident that the enrolled subjects were not consuming a large amountof cereal fiber outside of the intervention. Not having a reliable estimate of the subject’s fiber intakeoutside of the intervention limits any conclusions we can draw about fiber intake during the study,and how the difference in fiber provided by the market baskets may have influenced the outcome ofindividual subjects.
4.2. Fasting Glucose
When comparisons were made taking into account what percentage of the market basket wasconsumed, a nearly significant trend was observed: as whole grain consumption increased fastingglucose levels decreased. A potential mechanism behind this theory is that due to the increasedfiber of whole grains they remain as larger particles post mastication and so potentially are morechallenging to mechanically and enzymatically degrade resulting in lower, longer releases of glucoseinto the blood stream and subsequently a more gradual secretion of insulin. However, this effectmay not explain why a decrease in glucose might exist after something as long as a 12-h overnightfast [47–50]. Another potential mechanism that may explain the persistence of decreased glucoselevels with increased consumption of whole grains, even after an overnight fast, is that the increase in
36
Nutrients 2017, 9, 173
fiber from whole grains may alter metabolism in the microbiota increasing the production of shortchain fatty acids (SCFA) like propionate and acetate due to continued exposure to fiber from thewhole grains. Propionate is known to stimulate enteroendocrine L cells to increase the release ofglucagon-like peptide-1 (GLP-1) which increases the responsiveness of insulin to glucose as well asinhibiting gastric emptying [51–53]. In a human study, supplementation with propionate was shownto decrease glucose peaks and two-hour glucose area under the curve [54]. Acetate may be able toalter appetite and satiety signaling in the brain without use of gut hormone intermediaries, and hasbeen shown to reduce fasting glucose levels in humans [55,56]. Reduced blood glucose has beenseen postprandially in the literature with boiled barley, whole rye, whole wheat, and brown rice incomparison to refined grain interventions [46,57,58]. Fasting glucose has been shown to decrease withacute interventions of wheat bran in mice [50] and with acute interventions of whole wheat, whole oats,and whole barley in rats [59]. There is some literature suggesting that whole grains do not have aneffect on glycemic control. For example Ampatzoglou and colleagues showed no significant impact ofincreasing whole grain consumption from 24 or more grams per day to at least 80 g per day for sixweeks, on blood glucose [13]. Another study by Kristensen and colleagues compared acute wholegrain wheat and refined grain wheat consumption and failed to show significant differences in bloodglucose up to 180 min after feeding [60]. Since only a trend towards decreased glucose levels wasobserved in our study no strong conclusions can be drawn, but it is clear that future research will beneeded to definitively understand if beginning or increasing whole grain consumption may effectglycemic control, and if so why.
4.3. Blood Lipids
Fasting total, LDL, and non-HDL cholesterol decreased with consumption of the whole grainmarket basket, whereas no significant changes were seen with these lipids in the refined grain group.Whole grain consumption has been shown to improve lipid profiles [12]. In rats diets high in maizehave been shown to reduce LDL [61]. In humans diets rich in whole wheat have been shown to reducetotal cholesterol when given at a dosage of 48 g per day [15,19]. Most of the research on the lipidlowering effects of whole grains has been performed with oats, which are rich in beta glucan, a fiberthat has been clinically shown to lower cholesterol [40]. Oats were not featured in this study and whilewhole wheat contains very small amounts of beta glucan, maize and rice do not [21,41]. The currentunderstanding of this lipid lowering property of whole grains is that it is due to their increased fibercontent as compared to their refined grain counterparts [8,41].
Assuming whole grain intake replaces refined grain intake this diet alteration would be expectedto increase fiber intake, thereby initiating the following signaling cascade. Fiber increases the viscosityof the foodstuffs in the stomach which may delay gastric emptying and affect satiety signaling.In the duodenum the increased viscosity may also alter nutrient release from the chyme and thusaffect nutrient sensing, which could have far reaching consequences including lipid metabolism andprocessing [62]. The better established and accepted mechanism for increased fiber intake decreasingblood cholesterol levels is through sequestration of bile salts resulting in their loss in feces insteadof their reabsorption back into the intestine, which results in the body needing to use cholesterol tomanufacture more bile salts, thus decreasing blood cholesterol concentrations [58,63]. The existingliterature suggests that in some cases increasing whole grains consumption does not affect lipidlevels. This was seen in the previously discussed mixed increased whole grain consumption study byAmpatzoglou and colleagues [13]. Odes and colleagues also performed a study on humans using amixed grain fiber supplement providing 12.5 g of fiber daily for two or four weeks and found thatit had no effect on HDL or LDL cholesterol [64]. However, the findings of the current study indicatethat inclusion of a combination of whole grain wheat, corn and rice in the diet for six weeks led todecreased fasting total, LDL, and non-HDL cholesterol levels compared to consuming the refinedgrain counterparts.
37
Nutrients 2017, 9, 173
4.4. Fecal Frequency
While there was no difference in average bowel movement frequency across the six-weekintervention, there was there a significant difference in frequency with relation to percent of the wholegrain market basket consumed when looking at only the sixth week of intervention. Bowel movementfrequency increased significantly with increased whole grain consumption in Week 6 while there wasonly a slight, non-significant increase in the refined grain intervention. Whole grains have been shownto decrease intestinal transit time, thereby increasing bowel movement frequency [8,41,65,66]. In arecent review of 65 intervention studies, it was found that intake of wheat fiber, such as is found inwheat bran, a component of whole grain wheat, was shown to decrease transit time by about 45 minper gram of wheat fiber consumed, if the initial transit time was more than 48 h [67]. In a meta-analysisof 65 intervention studies utilizing cereal fibers from wheat, rye, corn, oats, barley, sorghum, and rice,investigators reported that, if the initial transit time was more than 48 h, cereal fiber reduced transittime by 30 min per gram consumed [68]. The mechanism for this is generally thought to be fecalbulking due to the increased fiber from increasing whole grain intake causing water retention in thefeces which improves transit time [8,69]. Consuming whole grain barley has been shown to increaseaverage fecal weight compared to the stool weight of refined grain consumers [65] and consumptionof a high fiber cereal made of wheat, corn, oats, and soybeans was shown to increase bowel movementfrequency compared to a similar low fiber cereal in humans [70]. It must be noted that bowel movementfrequency was self-reported in our study and was not measured pre-intervention at baseline. There wasalso a trend towards increased bowel movement frequency observed in the refined grain intervention,thus the validity of the increase should be interpreted with caution.
4.5. Microbiota
Increasing intake of whole grain wheat, maize, and barley have all been shown to alter thehuman gut microbiota, potentially through increasing the availability of fiber, but possibly due toother functional components in the whole grains such as polyphenols [14].
However, in this study no significant changes in microbial community composition were detectedwith consumption of the whole or refined grain market baskets. This is not necessarily surprising,given that in this pilot study subjects were free-living and the market basket comprised only about16% of their expected calorie intake at the average level of consumption.
Although no significant differences were detected between the whole and refined grain treatmentsthis does not empirically mean that there were not changes in the microbial community that weresimply unable to reach statistical significance with our small sample size. Additionally, it is possiblethat changes occurred in the metabolic pathways or activity of the microbiota over the course ofthis investigation that could be detected with metatranscriptomic, metabolomics, or proteomicanalysis [71]. For example, changes in the production of metabolic byproducts such as short chain fattyacids can occur without necessitating changes in bacterial composition [72–74]. Alterations in bacterialmetabolism can occur due to changes in pH, oxygen tension, or substrate availability, to name a few [75].
Based on studies seen in the literature it was expected that the increase in dietary fiber fromthe consumption of 50% of more of the whole grain market basket would initiate an increase in theabundance in Bifidobacterium [19,76–78]. At baseline, high levels of Actinobacteria were seen, largelydue to an enrichment of Bifidobacterium. Enrichment of Actinobacteria has previously been observed inexpectant mothers in the third trimester of pregnancy [79], however since subjects were excluded ifpregnant it is unclear to us why Actinobacteria was so abundant at baseline. It is possible that subjectswere consuming a significant amount of dietary fiber from a non-whole grain source prior to thestudy, which could have selectively enriched Bifidobacterium [80]. If this were the case, background dietvariability may have acted as a confounding factor obscuring the expected increase in the abundanceof Bifidobacterium. The average fiber intake for American adults is 17.0 g per day with grain products aswell as mixed dishes (containing grains) make up nearly half (46%) of the intake, whereas vegetablesaccount for 16%, snacks and sweets for 13% and fruits 12% [81].
38
Nutrients 2017, 9, 173
The trend towards increased relative abundance of Akkermansia and Lactobacillus with high wholegrain consumption seen in this study has been previously observed with a whole grain barley feedingstudy in rats [82]. Increases in the abundance of Lactobacillus have also been seen in humans after adiet rich in whole grain barley [83] and whole grain wheat [19]. While this trend was not significant,we feel it is a noteworthy observation since increases in Akkermansia are associated with reducedendotoxemia, improved inflammatory tone, and potentially weight loss [84–87]. Lactobacillus are oftentaken as probiotics due to their ability to exclude pathogenic bacteria and prevent or shorten episodesof diarrhea [88].
An increase in the abundance of the order Erysipelotrichales was seen in this study in the threeindividuals that consumed 50% or more of the refined grain market basket. Increased abundanceof Erysipelotrichales has also been reported in canines with a diet high in refined maize and low infiber [89], in mice with high fat diets [90], in mouse models of acute inflammatory colitis [91], and inhumans with Crohn’s disease [92]. Within the order Erysipelotrichales, the genera Eubacterium andCatenibacterium as well as unidentified members of family Erysipelotrichaceae were observed, althoughno significant differences were detected at the family or genus levels. Eubacterium has been seen inlower abundance in individuals with metabolic syndrome [93] and advanced colorectal adenoma [94].Catenibacterium has been observed to be enriched in individuals with end stage renal disease [95]and to be depleted in individuals with higher risk for cardiovascular disease [96]. Erysipelotrichaceae
has been observed as being enriched with obesity, Western-type diets, and increased host cholesterolmetabolites [97].
4.6. Limitations
A serious limitation of the study was the small sample size. The study enrolled 46 subjects butdue to technical problems with instrumentation and only partial cooperation of some of our researchvolunteers, we have missing data for some variables reported here. Most notably fecal samples fromonly 28 subjects were available for microbiota analysis. Of those 28 subjects used for the microbiotaanalysis the ratio of sexes was not balanced. There was a 1:2 ratio of females to males in the refinedgrain treatment and about a 3:1 ratio of females to males in the whole grain treatment. When observinggut microbiota there is enormous variation between subjects, and within subjects, so it is difficult todetect the signal above the noise, as it were, especially with a small population of subjects. Only havingone baseline and one post intervention blood draw and fecal collection was another limitation. Muchof the data were collected through self-report which introduces its own complexities and errors,especially when it concerns dietary record keeping, however pre-weighing and re-weighing the marketbaskets was used to improve the accuracy of those data. Background diet was attempted to be assessedwith phone interviews using the multi-pass 24 hour recall method, however subject cooperation wasextremely poor so the data collected were not considered to be representative of the usual diet intake.Due to this limitation, we cannot say with certainty that subjects did maintain their habitual diet,creating another possible source of error. Estimated fiber intake from the market basket productswas calculated, not determined directly by analysis, so it is possible that the quantity of grain fiberconsumed was erroneous. However, since those values were then averaged across the week and by allsubjects in the treatment group, this might improve the reliability of the estimations. Analysis wasdone for body composition, blood work, and GI symptoms using linear regression which can only beused to discover medium to large effects with a sample size as small as those utilized in this study;small changes many have occurred but would not have been detectable. This limits the ability toconclude with certainty that changes did not occur if no difference was detected in our analysis.
5. Conclusions
The results of this paper indicate that increasing the consumption of whole grains inhabitual low-whole grain consumers may significantly lower fasting measures of total, LDL,and non-HDL cholesterol.
39
Nutrients 2017, 9, 173
The trend towards decreased fasting glucose with increased whole grain consumption cametantalizingly close to significance, and was not seen when the same analysis was done with thosereceiving the refined grain intervention. Due to the tight regulation of blood glucose in healthyindividuals, it is not surprising that changes to fasting levels would be subtle and challenging to detectwithout large groups of homogenous subjects. The fact that a strong trend was seen indicates that atrue effect may be present and detectable with better study design.
The increase in bowel movement frequency seen with increased consumption of whole grainsduring the sixth week of the intervention is supported by existing literature and meta-analyses,however given that no baseline measurements were taken, the sample size was small (n = 37), the datarely solely on self-report, and that the same pattern was seen in the refined grain intervention thisfinding must be interpreted with some reservations.
Microbial analysis was conducted on 28 subjects, and we did not have the power needed to detectanything but very large changes in the microbial community. The only significant change seen wasan increase in abundance of the order Erysipelotrichales in the three individuals that consumed 50%or more of the refined grain market basket. This finding cannot reasonably be interpreted to say thatother changes to the microbiota were not occurring, since there was not enough power in the analysisto validate that inference. The microbial analysis performed in this study was exploratory and shouldnot be interpreted without the many caveats discussed above.
6. Future Research
Given the small sample size and limited sample collection, future research would be necessaryto definitively describe changes in health parameters seen with increased whole grain consumption.This study does indicate that whole grains may be an important food type for improving fastingcholesterol and glucose levels, as well as increasing bowel movement frequency. Due to the fact thatsome changes in health parameters only became apparent in subjects who consumed at least 50% ofthe whole grain market basket, another direction for future research would be to determine whatlevel of whole grain consumption affords the most beneficial health effects. Due to differences in thecomposition and level of fibers, vitamins, minerals, and digestibility of different grains, it would alsobe important to consider exactly which whole grains are being studied and whether they are similar tothe grains, and preparations of grains, seen in the population relevant to the study. Another possibledirection for future research would be to compare the whole grains typically consumed in the US(wheat, corn, and rice) to other sources of whole grains such as oats, barley, and rye for which moredefinitive health effects have been documented. Then, recommendations could be further refined toinclude not only the total quantity of whole grains, but also more specifically for the types of grainsconsumed based on the potential health benefit.
It is likely that the improvements seen from increasing whole grain consumption come from theincreases in fiber consumption, but future research is necessary to confirm this assertion and determineif other functional components of the whole grains contribute to health benefits. Regardless of howwhole grains exert their effects, increasing whole grain consumption can reduce the gap between therecommended consumption of fiber and current fiber intake in the US.
Acknowledgments: Funding was contributed by USDA-ARS intramural funds from projects 5306-51530-019 and2032-51530-022, as well as the University of California at Davis Henry A. Jastro Research Award (2012–2013).
Author Contributions: N.L.K., A.D.L., J.E.B. and B.R. conceived and designed the study; D.B. designed thesensory evaluation and market basket foods/recipes; A.D.L., B.R. and J.E.B. conducted the study visits; D.N.C.,M.E.K. and W.H. performed sample analyses; A.D.L., M.E.K. and D.N.C. analyzed the data; N.L.K. and M.L.M.contributed reagents/materials/analysis tools; and D.N.C., M.E.K. and N.L.K. wrote the paper.
Conflicts of Interest: The authors declare no conflict of interest.
40
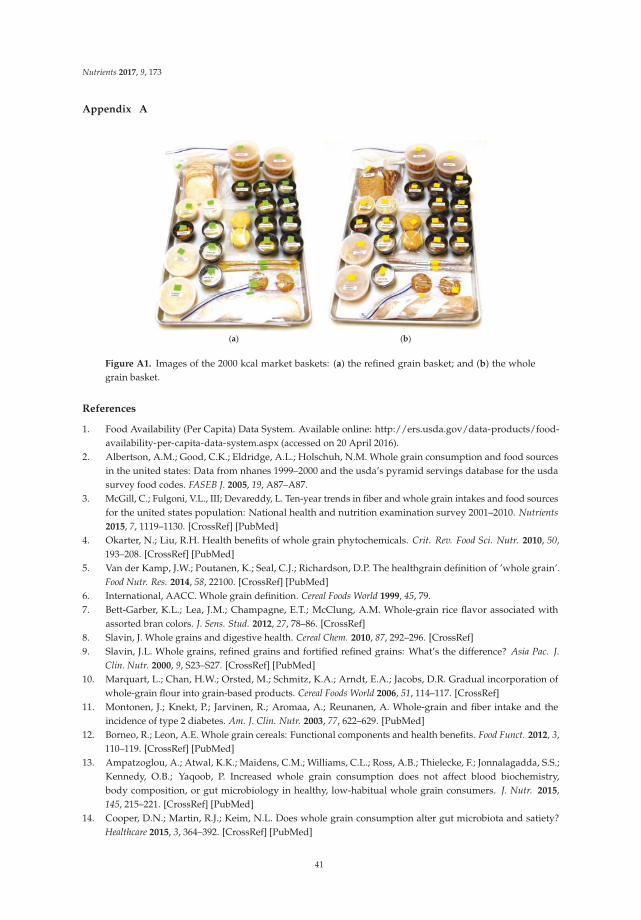
Nutrients 2017, 9, 173
Appendix A
(a) (b)
Figure A1. Images of the 2000 kcal market baskets: (a) the refined grain basket; and (b) the wholegrain basket.
References
1. Food Availability (Per Capita) Data System. Available online: http://ers.usda.gov/data-products/food-availability-per-capita-data-system.aspx (accessed on 20 April 2016).
2. Albertson, A.M.; Good, C.K.; Eldridge, A.L.; Holschuh, N.M. Whole grain consumption and food sourcesin the united states: Data from nhanes 1999–2000 and the usda’s pyramid servings database for the usdasurvey food codes. FASEB J. 2005, 19, A87–A87.
3. McGill, C.; Fulgoni, V.L., III; Devareddy, L. Ten-year trends in fiber and whole grain intakes and food sourcesfor the united states population: National health and nutrition examination survey 2001–2010. Nutrients
2015, 7, 1119–1130. [CrossRef] [PubMed]4. Okarter, N.; Liu, R.H. Health benefits of whole grain phytochemicals. Crit. Rev. Food Sci. Nutr. 2010, 50,
193–208. [CrossRef] [PubMed]5. Van der Kamp, J.W.; Poutanen, K.; Seal, C.J.; Richardson, D.P. The healthgrain definition of ’whole grain’.
Food Nutr. Res. 2014, 58, 22100. [CrossRef] [PubMed]6. International, AACC. Whole grain definition. Cereal Foods World 1999, 45, 79.7. Bett-Garber, K.L.; Lea, J.M.; Champagne, E.T.; McClung, A.M. Whole-grain rice flavor associated with
assorted bran colors. J. Sens. Stud. 2012, 27, 78–86. [CrossRef]8. Slavin, J. Whole grains and digestive health. Cereal Chem. 2010, 87, 292–296. [CrossRef]9. Slavin, J.L. Whole grains, refined grains and fortified refined grains: What’s the difference? Asia Pac. J.
Clin. Nutr. 2000, 9, S23–S27. [CrossRef] [PubMed]10. Marquart, L.; Chan, H.W.; Orsted, M.; Schmitz, K.A.; Arndt, E.A.; Jacobs, D.R. Gradual incorporation of
whole-grain flour into grain-based products. Cereal Foods World 2006, 51, 114–117. [CrossRef]11. Montonen, J.; Knekt, P.; Jarvinen, R.; Aromaa, A.; Reunanen, A. Whole-grain and fiber intake and the
incidence of type 2 diabetes. Am. J. Clin. Nutr. 2003, 77, 622–629. [PubMed]12. Borneo, R.; Leon, A.E. Whole grain cereals: Functional components and health benefits. Food Funct. 2012, 3,
110–119. [CrossRef] [PubMed]13. Ampatzoglou, A.; Atwal, K.K.; Maidens, C.M.; Williams, C.L.; Ross, A.B.; Thielecke, F.; Jonnalagadda, S.S.;
Kennedy, O.B.; Yaqoob, P. Increased whole grain consumption does not affect blood biochemistry,body composition, or gut microbiology in healthy, low-habitual whole grain consumers. J. Nutr. 2015,145, 215–221. [CrossRef] [PubMed]
14. Cooper, D.N.; Martin, R.J.; Keim, N.L. Does whole grain consumption alter gut microbiota and satiety?Healthcare 2015, 3, 364–392. [CrossRef] [PubMed]
41
Nutrients 2017, 9, 173
15. Jackson, K.H.; West, S.G.; Vanden Heuvel, J.P.; Jonnalagadda, S.S.; Ross, A.B.; Hill, A.M.; Grieger, J.A.;Lemieux, S.K.; Kris-Etherton, P.M. Effects of whole and refined grains in a weight-loss diet on markers ofmetabolic syndrome in individuals with increased waist circumference: A randomized controlled-feedingtrial. Am. J. Clin. Nutr. 2014, 100, 577–586. [CrossRef] [PubMed]
16. Modi, P. Benefits of low glycemic and high satiety index foods for obesity and diabetes control andmanagement. In Nutrients, Dietary Supplements, and Nutriceuticals; Cost Analysis Versus Clinical Benefits;Springer: New York, NY, USA, 2011; pp. 403–424.
17. Zhou, A.L.; Hergert, N.; Rompato, G.; Lefevre, M. Whole grain oats improve insulin sensitivity and plasmacholesterol profile and modify gut microbiota composition in C57BL/6J mice. J. Nutr. 2015, 145, 222–230.[CrossRef] [PubMed]
18. Rebello, C.J.; Greenway, F.L.; Finley, J.W. Whole grains and pulses: A comparison of the nutritional andhealth benefits. J. Agric. Food Chem. 2014, 62, 7029–7049. [CrossRef] [PubMed]
19. Costabile, A.; Klinder, A.; Fava, F.; Napolitano, A.; Foglian, V.; Leonard, C.; Gibson, G.R.; Tuohy, K.M.Whole-grain wheat breakfast cereal has a prebiotic effect on the human gut microbiota: A double-blind,placebo-controlled, crossover study. Br. J. Nutr. 2008, 99, 110–120. [CrossRef] [PubMed]
20. Raninen, K.; Lappi, J.; Mykkanen, H.; Poutanen, K. Dietary fiber type reflects physiological functionality:Comparison of grain fiber, inulin, and polydextrose. Nutr. Rev. 2011, 69, 9–21. [CrossRef] [PubMed]
21. Nyman, M.; Siljestrom, M.; Pedersen, B.; Knudsen, K.E.B.; Asp, N.G.; Johansson, C.G.; Eggum, B.O.Dietary fiber content and composition in 6 cereals at different extraction rates. Cereal Chem. 1984, 61,14–19.
22. Frankenfield, D.C.; Muth, E.R.; Rowe, W.A. The harris-benedict studies of human basal metabolism:History and limitations. J. Am. Diet. Assoc. 1998, 98, 439–445. [CrossRef]
23. Lewis, S.J.; Heaton, K.W. Stool form scale as a useful guide to intestinal transit time. Scand. J. Gastroenterol.
1997, 32, 920–924. [CrossRef] [PubMed]24. Ferguson, L.W. A study of the likert technique of attitude scale construction. J. Soc. Psychol. 1941, 13, 51–57.
[CrossRef]25. Hsieh, Y.-H.; Peterson, C.M.; Raggio, A.; Keenan, M.J.; Martin, R.J.; Ravussin, E.; Marco, M.L.
Impact of different fecal processing methods on assessments of bacterial diversity in the human intestine.Front. Microbiol. 2016, 7, 1–11. [CrossRef] [PubMed]
26. Salonen, A.; Nikkila, J.; Jalanka-Tuovinen, J.; Immonen, O.; Rajilic-Stojanovic, M.; Kekkonen, R.A.; Palva, A.;de Vos, W.M. Comparative analysis of fecal DNA extraction methods with phylogenetic microarray: Effectiverecovery of bacterial and archaeal DNA using mechanical cell lysis. J. Microbiol. Methods 2010, 81, 127–134.[CrossRef] [PubMed]
27. Wang, Q.; Garrity, G.M.; Tiedje, J.M.; Cole, J.R. Naive bayesian classifier for rapid assignment of rrnasequences into the new bacterial taxonomy. Appl. Environ. Microbiol. 2007, 73, 5261–5267. [CrossRef][PubMed]
28. Caporaso, J.G.; Lauber, C.L.; Walters, W.A.; Berg-Lyons, D.; Lozupone, C.A.; Turnbaugh, P.J.; Fierer, N.;Knight, R. Global patterns of 16S rRNA diversity at a depth of millions of sequences per sample. Proc. Natl.
Acad. Sci. USA 2011, 108, 4516–4522. [CrossRef] [PubMed]29. Hamady, M.; Walker, J.J.; Harris, J.K.; Gold, N.J.; Knight, R. Error-correcting barcoded primers for
pyrosequencing hundreds of samples in multiplex. Nat. Methods 2008, 5, 235–237. [CrossRef] [PubMed]30. Caporaso, J.G.; Kuczynski, J.; Stombaugh, J.; Bittinger, K.; Bushman, F.D.; Costello, E.K.; Fierer, N.; Pena, A.G.;
Goodrich, J.K.; Gordon, J.I.; et al. Qiime allows analysis of high-throughput community sequencing data.Nat. Methods 2010, 7, 335–336. [CrossRef] [PubMed]
31. Aronesty, E. Ea-utils: Command-Line Tools for Processing Biological Sequencing Data. Available online:https://github.com/ExpressionAnalysis/ea-utils (accessed on 17 April 2011).
32. Edgar, R.C.; Haas, B.J.; Clemente, J.C.; Quince, C.; Knight, R. Uchime improves sensitivity and speed ofchimera detection. Bioinformatics 2011, 27, 2194–2200. [CrossRef] [PubMed]
33. Edgar, R.C. Search and clustering orders of magnitude faster than blast. Bioinformatics 2010, 26, 2460–2461.[CrossRef] [PubMed]
34. Bokulich, N.A.; Subramanian, S.; Faith, J.J.; Gevers, D.; Gordon, J.I.; Knight, R.; Mills, D.A.; Caporaso, J.G.Quality-filtering vastly improves diversity estimates from illumina amplicon sequencing. Nat. Methods 2013,10, 57–59. [CrossRef] [PubMed]
42
Nutrients 2017, 9, 173
35. Wu, G.D.; Lewis, J.D.; Hoffmann, C.; Chen, Y.Y.; Knight, R.; Bittinger, K.; Hwang, J.; Chen, J.; Berkowsky, R.;Nessel, L.; et al. Sampling and pyrosequencing methods for characterizing bacterial communities in thehuman gut using 16s sequence tags. BMC Microbiol. 2010, 10, 206. [CrossRef] [PubMed]
36. Segata, N.; Izard, J.; Waldron, L.; Gevers, D.; Miropolsky, L.; Garrett, W.S.; Huttenhower, C.Metagenomic biomarker discovery and explanation. Genome Biol. 2011, 12, R60. [CrossRef] [PubMed]
37. Kwong, K.S.; Holland, B.; Cheung, S.H. A modified benjamini-hochberg multiple comparisons procedurefor controlling the false discovery rate. J. Stat. Plan. Inference 2002, 104, 351–362. [CrossRef]
38. De Filippo, C.; Cavalieri, D.; Di Paola, M.; Ramazzotti, M.; Poullet, J.B.; Massart, S.; Collini, S.; Pieraccini, G.;Lionetti, P. Impact of diet in shaping gut microbiota revealed by a comparative study in children from europeand rural africa. Proc. Natl. Acad. Sci. USA 2010, 107, 14691–14696. [CrossRef] [PubMed]
39. Mariat, D.; Firmesse, O.; Levenez, F.; Guimaraes, V.D.; Sokol, H.; Dore, J.; Corthier, G.; Furet, J.P.The firmicutes/bacteroidetes ratio of the human microbiota changes with age. BMC Microbiol. 2009, 9,123. [CrossRef] [PubMed]
40. Lange, E. Oats products as functional food. Zywnosc-Nauka Technol. Jakosc 2010, 17, 7–24. [CrossRef]41. Fardet, A. New hypotheses for the health-protective mechanisms of whole-grain cereals: What is beyond
fibre? Nutr. Res. Rev. 2010, 23, 65–134. [CrossRef] [PubMed]42. Bressani, R.; Breuner, M.; Ortiz, M.A. Acid-detergent and neutro-detergent fiber and mineral elements
content of maize and tortilla. Arch. Latinoam. Nutr. 1989, 39, 382–391. [PubMed]43. Sumczynski, D.; Bubelova, Z.; Fisera, M. Determination of chemical, insoluble dietary fibre, neutral-detergent
fibre and in vitro digestibility in rice types commercialized in Czech markets. J. Food Compos. Anal. 2015, 40,8–13. [CrossRef]
44. Lai, V.M.F.; Lu, S.; He, W.H.; Chen, H.H. Non-starch polysaccharide compositions of rice grains with respectto rice variety and degree of milling. Food Chem. 2007, 101, 1205–1210. [CrossRef]
45. Rose, D.J.; Patterson, J.A.; Hamaker, B.R. Structural differences among alkali-soluble arabinoxylans frommaize (Zea mays), rice (oryza sativa), and wheat (triticum aestivum) brans influence human fecal fermentationprofiles. J. Agric. Food Chem. 2010, 58, 493–499. [CrossRef] [PubMed]
46. Mohan, V.; Spiegelman, D.; Sudha, V.; Gayathri, R.; Hong, B.; Praseena, K.; Anjana, R.M.; Wedick, N.M.;Arumugam, K.; Malik, V.; et al. Effect of brown rice, white rice, and brown rice with legumes on blood glucoseand insulin responses in overweight Asian Indians: A randomized controlled trial. Diabetes Technol. Ther.
2014, 16, 317–325. [CrossRef] [PubMed]47. Tosh, S.M. Review of human studies investigating the post-prandial blood-glucose lowering ability of oat
and barley food products. Eur. J. Clin. Nutr. 2013, 67, 310–317. [CrossRef] [PubMed]48. Ranawana, V.; Clegg, M.E.; Shafat, A.; Henry, C.J. Postmastication digestion factors influence glycemic
variability in humans. Nutr. Res. 2011, 31, 452–459. [CrossRef] [PubMed]49. Bornhorst, G.M.; Stroebinger, N.; Rutherfurd, S.M.; Singh, R.P.; Moughan, P.J. Properties of gastric chyme
from pigs fed cooked brown or white rice. Food Biophys. 2013, 8, 12–23. [CrossRef]50. Oishi, K.; Yamamoto, S.; Itoh, N.; Nakao, R.; Yasumoto, Y.; Tanaka, K.; Kikuchi, Y.; Fukudome, S.; Okita, K.;
Takano-Ishikawa, Y. Wheat alkylresorcinols suppress high-fat, high-sucrose diet-induced obesity and glucoseintolerance by increasing insulin sensitivity and cholesterol excretion in male mice. J. Nutr. 2015, 145, 199–206.[CrossRef] [PubMed]
51. Arora, T.; Sharma, R.; Frost, G. Propionate. Anti-obesity and satiety enhancing factor? Appetite 2011, 56,511–515. [CrossRef] [PubMed]
52. Everard, A.; Cani, P.D. Gut microbiota and GLP-1. Rev. Endocr. Metab. Disord. 2014, 15, 189–196. [CrossRef][PubMed]
53. Chambers, E.S.; Viardot, A.; Psichas, A.; Morrison, D.J.; Murphy, K.G.; Sagen, E.K.; Varghese, Z.;MacDougall, K.; Preston, T. Effects of targeted delivery of propionate to the human colon on appetiteregulation, body weight maintenance and adiposity in overweight adult. BMJ 2014, 1–11. [CrossRef][PubMed]
54. Todesco, T.; Rao, A.V.; Bosello, O.; Jenkins, D.J.A. Propionate lowers blood-glucose and alterslipid-metabolism in healthy-subjects. Am. J. Clin. Nutr. 1991, 54, 860–865. [PubMed]
55. Frost, G.; Sleeth, M.L.; Sahuri-Arisoylu, M.; Lizarbe, B.; Cerdan, S.; Brody, L.; Anastasovska, J.; Ghourab, S.;Hankir, M.; Zhang, S.; et al. The short-chain fatty acid acetate reduces appetite via a central homeostaticmechanism. Nat. Commun. 2014, 5, 3611. [CrossRef] [PubMed]
43
Nutrients 2017, 9, 173
56. Venter, C.S.; Vorster, H.H.; Cummings, J.H. Effects of dietary propionate on carbohydrate andlipid-metabolism in healthy-volunteers. Am. J. Gastroenterol. 1990, 85, 549–553. [PubMed]
57. Johansson, E.V.; Nilsson, A.C.; Ostman, E.M.; Bjorck, I.M.E. Effects of indigestible carbohydrates in barley onglucose metabolism, appetite and voluntary food intake over 16 h in healthy adults. Nutr. J. 2013, 12, 46.[CrossRef] [PubMed]
58. McIntosh, G.H.; Noakes, M.; Royle, P.J.; Foster, P.R. Whole-grain rye and wheat foods and markers of bowelhealth in overweight middle-aged men. Am. J. Clin. Nutr. 2003, 77, 967–974. [PubMed]
59. Youn, M.; Csallany, A.S.; Gallaher, D.D. Whole grain consumption has a modest effect on the developmentof diabetes in the goto-kakisaki rat. Br. J. Nutr. 2012, 107, 192–201. [CrossRef] [PubMed]
60. Kristensen, M.; Jensen, M.G.; Riboldi, G.; Petronio, M.; Bugel, S.; Toubro, S.; Tetens, I.; Astrup, A.Wholegrain vs. Refined wheat bread and pasta. Effect on postprandial glycemia, appetite, and subsequentad libitum energy intake in young healthy adults. Appetite 2010, 54, 163–169. [CrossRef] [PubMed]
61. Cano, J.M.M.; Aguilar, A.C.; Hernandez, J.C. Lipid-lowering effect of maize-based traditional mexican foodon a metabolic syndrome model in rats. Lipids Health Dis. 2013, 12, 35. [CrossRef] [PubMed]
62. Mackie, A.; Bajka, B.; Rigby, N. Roles for dietary fibre in the upper gi tract: The importance of viscosity.Food Res. Int. 2016, 88, 234–238. [CrossRef]
63. Knudsen, K.E.B.; Laerke, H.N. Whole grain cereals and gut health. Agro Food Ind. Hi-Tech 2008, 19, 6–8.64. Odes, H.S.; Lazovski, H.; Stern, I.; Madar, Z. Double-blind trial of a high dietary fiber, mixed grain cereal in
patients with chronic constipation and hyperlipidemia. Nutr. Res. 1993, 13, 979–985. [CrossRef]65. Bird, A.R.; Vuaran, M.S.; King, R.A.; Noakes, M.; Keogh, J.; Morell, M.K.; Topping, D.L. Wholegrain foods
made from a novel high-amylose barley variety (himalaya 292) improve indices of bowel health in humansubjects. Br. J. Nutr. 2008, 99, 1032–1040. [CrossRef] [PubMed]
66. Kim, J.Y.; Son, B.K.; Lee, S.S. Effects of adlay, buckwheat, and barley on transit time and the antioxidativesystem in obesity induced rats. Nutr. Res. Pract. 2012, 6, 208–212. [CrossRef] [PubMed]
67. De Vries, J.; Miller, P.E.; Verbeke, K. Effects of cereal fiber on bowel function: A systematic review ofintervention trials. World J. Gastroenterol. 2015, 21, 8952–8963. [CrossRef] [PubMed]
68. De Vries, J.; Birkett, A.; Hulshof, T.; Verbeke, K.; Gibes, K. Effects of cereal, fruit and vegetable fibers onhuman fecal weight and transit time: A comprehensive review of intervention trials. Nutrients 2016, 8, 130.[CrossRef] [PubMed]
69. Slavin, J. Health aspects of dietary fibre. Fibre-Rich Wholegrain Foods Improv. Qual. 2013, 237, 61–75.70. Belobrajdic, D.P.; Bird, A.R. The potential role of phytochemicals in wholegrain cereals for the prevention of
type-2 diabetes. Nutr. J. 2013, 12, 62. [CrossRef] [PubMed]71. Coughlin, S.S. Toward a road map for global -omics: A primer on -omic technologies. Am. J. Epidemiol. 2014,
180, 1188–1195. [CrossRef] [PubMed]72. Scott, K.P.; Martin, J.C.; Duncan, S.H.; Flint, H.J. Prebiotic stimulation of human colonic butyrate-producing
bacteria and bifidobacteria, in vitro. Fems Microbiol. Ecol. 2014, 87, 30–40. [CrossRef] [PubMed]73. Mirande, C.; Kadlecikova, E.; Matulova, M.; Capek, P.; Bernalier-Donadille, A.; Forano, E.; Bera-Maillet, C.
Dietary fibre degradation and fermentation by two xylanolytic bacteria bacteroides xylanisolvens xb1at androseburia intestinalis xb6b4 from the human intestine. J. Appl. Microbiol. 2010, 109, 451–460. [PubMed]
74. Hamer, H.M.; De Preter, V.; Windey, K.; Verbeke, K. Functional analysis of colonic bacterial metabolism:Relevant to health? Am. J. Physiol.-Gastrointest. Liver Physiol. 2012, 302, G1–G9. [CrossRef] [PubMed]
75. Lozupone, C.A.; Stombaugh, J.I.; Gordon, J.I.; Jansson, J.K.; Knight, R. Diversity, stability and resilience ofthe human gut microbiota. Nature 2012, 489, 220–230. [CrossRef] [PubMed]
76. Bosscher, D.; Breynaert, A.; Pieters, L.; Hermans, N. Food-based strategies to modulate the composition ofthe intestinal microbiota and their associated health effects. J. Physiol. Pharmacol. 2009, 60, 5–11. [PubMed]
77. Cani, P.D.; Neyrinck, A.M.; Fava, F.; Knauf, C.; Burcelin, R.G.; Tuohy, K.M.; Gibson, G.R.; Delzenne, N.M.Selective increases of bifidobacteria in gut microflora improve high-fat-diet-induced diabetes in mice througha mechanism associated with endotoxaemia. Diabetologia 2007, 50, 2374–2383. [CrossRef] [PubMed]
78. Christensen, E.G.; Licht, T.R.; Kristensen, M.; Bahl, M.I. Bifidogenic effect of whole-grain wheat duringa 12-week energy-restricted dietary intervention in postmenopausal women. Eur. J. Clin. Nutr. 2013, 67,1316–1321. [CrossRef] [PubMed]
44
Nutrients 2017, 9, 173
79. Koren, O.; Goodrich, J.K.; Cullender, T.C.; Spor, A.; Laitinen, K.; Backhed, H.K.; Gonzalez, A.; Werner, J.J.;Angenent, L.T.; Knight, R.; et al. Host remodeling of the gut microbiome and metabolic changes duringpregnancy. Cell 2012, 150, 470–480. [CrossRef] [PubMed]
80. Gibson, G.R.; Probert, H.M.; Van Loo, J.; Rastall, R.A.; Roberfroid, M.B. Dietary modulation of the humancolonic microbiota: Updating the concept of prebiotics. Nutr. Res. Rev. 2004, 17, 259–275. [CrossRef][PubMed]
81. Mobley, A.R.; Jones, J.M.; Rodriguez, J.; Slavin, J.; Zelman, K.M. Identifying practical solutions to meetamerica’s fiber needs: Proceedings from the food & fiber summit. Nutrients 2014, 6, 2540–2551. [PubMed]
82. Zhong, Y.; Nyman, M.; Fak, F. Modulation of gut microbiota in rats fed high-fat diets by processingwhole-grain barley to barley malt. Mol. Nutr. Food Res. 2015, 59, 2066–2076. [CrossRef] [PubMed]
83. De Angelis, M.; Montemurno, E.; Vannini, L.; Cosola, C.; Cavallo, N.; Gozzi, G.; Maranzano, V.; Di Cagno, R.;Gobbetti, M.; Gesualdo, L. Effect of whole-grain barley on the human fecal microbiota and metabolome.Appl. Environ. Microbiol. 2015, 81, 7945–7956. [CrossRef] [PubMed]
84. Everard, A.; Belzer, C.; Geurts, L.; Ouwerkerk, J.P.; Druart, C.; Bindels, L.B.; Guiot, Y.; Derrien, M.;Muccioli, G.G.; Delzenne, N.M.; et al. Cross-talk between akkermansia muciniphila and intestinal epitheliumcontrols diet-induced obesity. Proc. Natl. Acad. Sci. USA 2013, 110, 9066–9071. [CrossRef] [PubMed]
85. Joyce, S.A.; Gahan, C.G.M. The gut microbiota and the metabolic health of the host. Curr. Opin. Gastroenterol.
2014, 30, 120–127. [CrossRef] [PubMed]86. Greer, R.L.; Dong, X.X.; Moraes, A.C.F.; Zielke, R.A.; Fernandes, G.R.; Peremyslova, E.; Vasquez-Perez, S.;
Schoenborn, A.A.; Gomes, E.P.; Pereira, A.C.; et al. Akkermansia muciniphila mediates negative effects ofifn gamma on glucose metabolism. Nat. Commun. 2016, 7, 13329. [CrossRef] [PubMed]
87. Remely, M.; Tesar, I.; Hippe, B.; Gnauer, S.; Rust, P.; Haslberger, A.G. Gut microbiota composition correlateswith changes in body fat content due to weight loss. Benef. Microbes 2015, 6, 431–439. [CrossRef] [PubMed]
88. Sarao, L.K.; Arora, M. Probiotics, prebiotics, and microencapsulation: A review. Crit. Rev. Food Sci. Nutr.
2017, 57, 344–371. [CrossRef] [PubMed]89. Hang, I.; Rinttila, T.; Zentek, J.; Kettunen, A.; Alaja, S.; Apajalahti, J.; Harmoinen, J.; de Vos, W.M.;
Spillmann, T. Effect of high contents of dietary animal-derived protein or carbohydrates on canine faecalmicrobiota. BMC Vet. Res. 2012, 8, 90. [CrossRef] [PubMed]
90. Magnusson, K.R.; Hauck, L.; Jeffrey, B.M.; Elias, V.; Humphrey, A.; Nath, R.; Perrone, A.; Bermudez, L.E.Relationships between diet-related changes in the gut microbiome and cognitive flexibility. Neuroscience
2015, 300, 128–140. [CrossRef] [PubMed]91. Schwab, C.; Berry, D.; Rauch, I.; Rennisch, I.; Ramesmayer, J.; Hainzl, E.; Heider, S.; Decker, T.; Kenner, L.;
Muller, M.; et al. Longitudinal study of murine microbiota activity and interactions with the host duringacute inflammation and recovery. ISME J. 2014, 8, 1101–1114. [CrossRef] [PubMed]
92. Gevers, D.; Kugathasan, S.; Denson, L.A.; Vazquez-Baeza, Y.; Van Treuren, W.; Ren, B.Y.; Schwager, E.;Knights, D.; Song, S.J.; Yassour, M.; et al. The treatment-naive microbiome in new-onset crohn’s disease.Cell Host Microbe 2014, 15, 382–392. [CrossRef] [PubMed]
93. Haro, C.; Garcia-Carpintero, S.; Alcala-Diaz, J.F.; Gomez-Delgado, F.; Delgado-Lista, J.; Perez-Martinez, P.;Zuniga, O.A.R.; Quintana-Navarro, G.M.; Landa, B.B.; Clemente, J.C.; et al. The gut microbial community inmetabolic syndrome patients is modified by diet. J. Nutr. Biochem. 2016, 27, 27–31. [CrossRef] [PubMed]
94. Chen, W.G.; Liu, F.L.; Ling, Z.X.; Tong, X.J.; Xiang, C. Human intestinal lumen and mucosa-associatedmicrobiota in patients with colorectal cancer. PLoS ONE 2012, 7, e39743. [CrossRef] [PubMed]
95. Vaziri, N.D.; Wong, J.; Pahl, M.; Piceno, Y.M.; Yuan, J.; DeSantis, T.Z.; Ni, Z.M.; Nguyen, T.H.; Andersen, G.L.Chronic kidney disease alters intestinal microbial flora. Kidney Int. 2013, 83, 308–315. [CrossRef] [PubMed]
96. Kelly, T.N.; Bazzano, L.A.; Ajami, N.J.; He, H.; Zhao, J.Y.; Petrosino, J.F.; Correa, A.; He, J. Gut microbiomeassociates with lifetime cardiovascular disease risk profile among bogalusa heart study participants. Circ. Res.
2016, 119, 956–964. [CrossRef] [PubMed]97. Kaakoush, N.O. Insights into the role of erysipelotrichaceae in the human host. Front. Cell. Infect. Microbiol.
2015, 5, 84. [CrossRef] [PubMed]
© 2017 by the authors. Licensee MDPI, Basel, Switzerland. This article is an open accessarticle distributed under the terms and conditions of the Creative Commons Attribution(CC BY) license (http://creativecommons.org/licenses/by/4.0/).
45
nutrients
Article
Intra Amniotic Administration of Raffinose andStachyose Affects the Intestinal Brush BorderFunctionality and Alters Gut Microflora Populations
Sarina Pacifici 1, Jaehong Song 2, Cathy Zhang 3, Qiaoye Wang 4, Raymond P. Glahn 5,
Nikolai Kolba 5 and Elad Tako 5,*
1 Department of Animal Sciences, Cornell University, Ithaca, NY 14853, USA; [email protected] Department of Biological Sciences, Cornell University, Ithaca, NY 14853, USA; [email protected] Division of Nutritional Sciences, Cornell University, Ithaca, NY 14853, USA; [email protected] Department of Food Science and Technology, Cornell University, Ithaca, NY 14853, USA; [email protected] USDA-ARS, Robert W. Holley Center for Agriculture and Health, Cornell University, Ithaca, NY 14853, USA;
[email protected] (R.P.G.); [email protected] (N.K.)* Correspondence: [email protected]; Tel.: +1-607-255-5434
Received: 10 January 2017; Accepted: 17 March 2017; Published: 19 March 2017
Abstract: This study investigates the effectiveness of two types of prebiotics—stachyose andraffinose—which are present in staple food crops that are widely consumed in regions where dietaryFe deficiency is a health concern. The hypothesis is that these prebiotics will improve Fe status,intestinal functionality, and increase health-promoting bacterial populations in vivo (Gallus gallus).By using the intra-amniotic administration procedure, prebiotic treatment solutions were injectedin ovo (day 17 of embryonic incubation) with varying concentrations of a 1.0 mL pure raffinoseor stachyose in 18 MΩ H2O. Four treatment groups (50, 100 mg·mL−1 raffinose or stachyose) andtwo controls (18 MΩ H2O and non-injected) were utilized. At hatch the cecum, small intestine,liver, and blood were collected for assessment of the relative abundance of the gut microflora,relative expression of Fe-related genes and brush border membrane functional genes, hepatic ferritinlevels, and hemoglobin levels, respectively. The prebiotic treatments increased the relative expressionof brush border membrane functionality proteins (p < 0.05), decreased the relative expression ofFe-related proteins (p < 0.05), and increased villus surface area. Raffinose and stachyose increased therelative abundance of probiotics (p < 0.05), and decreased that of pathogenic bacteria. Raffinose andstachyose beneficially affected the gut microflora, Fe bioavailability, and brush border membranefunctionality. Our investigations have led to a greater understanding of these prebiotics’ effects onintestinal health and mineral metabolism.
Keywords: raffinose; stachyose; brush border membrane; iron; prebiotics
1. Introduction
Iron (Fe) deficiency is the most common nutrient deficiency worldwide, affecting between 30%and 40% of the world’s population [1,2]. Those who suffer from this condition can experience fatigue,cognitive impairment, and death [3]. The prevalence of Fe deficiency in these geographical regions canbe attributed to the populations’ consumption of low-diversity plant-based diets including cereals andlegumes, which contain low amounts of bioavailable Fe as well as compounds such as polyphenolsthat further inhibit Fe absorption [4,5]. Dietary Fe deficiency and other dietary mineral deficienciesstem from a lack of essential nutrients in staple food crops, and thus health sectors have turned tovarious agricultural interventions as potential solutions. A form of intervention that shows greatpromise is biofortification. Biofortification refers to the use of traditional breeding practices to bring
Nutrients 2017, 9, 304 46 www.mdpi.com/journal/nutrients
Nutrients 2017, 9, 304
about significant increases in bioavailable micronutrients in the edible portions of food crops [6,7].Once biofortified, the seedlings of staple foods crops can be distributed to farmers who are alreadyexperienced in growing these particular crops. In fact, biofortified crops are found to have a multitudeof agronomic benefits for farmers due to their high micronutrient stores, including disease resistance,improved seed viability, greater seedling vigor, lower seeding rate requirements, and faster rootestablishment—all of which lead to increased productivity relative to the original seedlings [7].Another sustainable aspect of this solution is that once biofortified varieties are grown, they willnot continue to require government attention or funding [7].
However, a major challenge associated with biofortification of staple food crops—namely cerealgrains and legume seeds—in developing regions is that they contain factors such as polyphenolsand phytic acid that inhibit the absorption of Fe [8]. When these crops are biofortified viaconventional breeding, there is the potential for these inhibitory factors to increase along withFe [9–11]. Despite containing inhibitory factors, cereal grains and legumes also carry other substances,referred to as promoters, which have the potential to counteract the effects of these inhibitory factors.Thus, one prospective solution to the aforementioned dilemma is to increase the content of thesepromoter substances to counteract the negative effects of the inhibitory factors such as polyphenols [9].One of the most notable of these promoter substances is the prebiotic [9,12].
Prebiotics are polysaccharides that have been shown to enhance the growth and activitiesof probiotics, or beneficial gut microflora. These compounds are capable of surviving acidic andenzymatic digestion in the small intestine, and thus can be fermented by probiotics that reside in thecolon/cecum [6]. The fermentation of prebiotics by probiotics leads to the production of short-chainfatty acids, which lower intestinal pH, inhibiting the growth of potentially pathogenic bacterialpopulations and improving the absorption of minerals such as Fe [7]. Raffinose and stachyose werechosen as the prebiotics for investigation in this study, since they are found in high concentrations inlentils and chickpeas [8], which are staple crops consumed by populations in which Fe deficiency is ahealth concern [5]. Previously, we demonstrated the effects of the wheat prebiotics arabinoxylans andfructans on intestinal probiotics [12] as a potential approach to improving Fe bioavailability in staplefood crops and gut health.
In the current study, raffinose and stachyose effects were studied in vivo by utilizing the poultrymodel (Gallus gallus). The broiler chicken is a fast-growing animal with sensitivities to dietarydeficiencies of trace minerals such as Fe [13], and is very receptive to dietary manipulations [9,12–14].Additionally, there is >85% homology between gene sequences of human and chicken intestinal genessuch as DMT1, DcytB, ZnT1, and Ferroportin [15]. Thus, one objective of this study is to assess theeffects of intra-amniotic raffinose and stachyose administration on Fe status in vivo (Gallus gallus),an animal model that has been used to investigate the physiological effects of various nutritionalsolutions [16,17]. Specifically, the expression of Fe metabolism-related genes (DMT1, the major Feintestinal transporter; DcytB, Fe reductase; and Ferroportin, the major intestinal enterocyte Fe exporter),in the duodenum (the major Fe absorption site). The second objective in using this model is to assessthe effects of raffinose and stachyose on brush border membrane (BBM) development and functionalityusing biomarkers for BBM absorptive ability such as the relative expressions of aminopeptidase (AP),sucrase isomaltase (SI), and sodium glucose cotransporter-1 (SGLT1), as well as the surface areas of theintestinal villi. The third objective is to evaluate the effects of the intra-amniotic administrationof these prebiotics on intestinal bacterial populations by measuring the relative abundances ofprobiotic health-promoting populations bacteria such as Bifidobacterium and Lactobacillus versus thoseof potentially pathogenic bacteria such as E. coli and Clostridium.
The goal in investigating these effects is to determine whether raffinose and stachyose may becandidates for biofortification in staple food crops. If they demonstrate the ability to improve Fe status,BBM functionality, and intestinal bacterial populations, breeding lentils and chickpeas for increasedstachyose and raffinose content may potentially eliminate the need for exogenous Fe supplementationby increasing the bioavailability of Fe in these crops. The distribution of biofortified crop seedlings
47
Nutrients 2017, 9, 304
would serve as a sustainable means of combating malnutrition in developing regions where dietary Fedeficiency is common.
2. Materials and Methods
2.1. Animals and Design
Cornish cross-fertile broiler chicken eggs (n = 120) were obtained from a commercial hatchery(Moyer’s chicks, Quakertown, PA, USA). The eggs were incubated under optimal conditions at theCornell University Animal Science poultry farm incubator.
2.2. Intra-Amniotic Administration
All animal protocols were approved by Cornell University Institutional Animal Care and Usecommittee (ethic approval code: 2007-0129). Pure stachyose and raffinose in powder form wereseparately diluted in 18 MΩ H2O to determine the concentrations necessary to maintain an osmolarityvalue of less than 320 Osm to ensure that the chicken embryos would not be dehydrated upon injectionof the solution. This intra-amniotic administration procedure followed that of Tako et al. [12]. On day17 of embryonic incubation, eggs containing viable embryos were weighed and divided into 6 groups(n = 12) with an approximately equal weight distribution. The intra-amniotic treatment solution (1 mLper egg) was injected with a 21-gauge needle into the amniotic fluid, which was identified by candling.After injection, the injection sites were sealed with cellophane tape. The six groups were assigned asfollows: 1. 5% stachyose (in 18 MΩ H2O); 2. 10% stachyose (in 18 MΩ H2O); 3. 5% raffinose (in 18 MΩ
H2O); 4. 10% raffinose (in 18 MΩ H2O); 5. 18 MΩ H2O; 6. non-injected. Eggs were placed in hatchingbaskets such that each treatment was equally represented at each incubator location.
2.3. Tissue Collection
On the day of hatch (day 21), birds were euthanized by CO2 exposure. The small intestines,ceca, blood, and livers were quickly removed from the carcasses and placed in separate tubes forstorage. The samples were immediately frozen in liquid nitrogen and then stored in a −80 C freezeruntil analysis.
2.4. Isolation of Total RNA
Total RNA was extracted from 30 mg of small intestine (duodenal) tissue using Qiagen RNeasyMini Kit. RNA was quantified by absorbance at 260–280 nm. Integrity of the 28S and 18S rRNA wasverified by 1.5% agarose gel electrophoresis followed by ethidium bromide staining.
2.5. Gene Expression Analysis
As was previously described [9,12,13], RT-PCR was carried out with primers chosen from thefragments of chicken duodenal tissues. After the completion of PCR, the results were run under gelelectrophoresis on 2% agarose gel stained with ethidium bromide for separation of the target genes(DMT1, Ferroportin, DcytB, AP, SI, SGLT1). Quantity One 1D analysis software (Bio-Rad, Hercules,CA, USA) was utilized to quantify the resulting bands. Highly conserved tissue-specific 18S rRNAwas used as internal standard to normalize the results.
2.6. Bacterial Analysis
As was previously described [18–20], the contents of the ceca were placed into a sterile 50 mLtube containing 9 mL of sterile phosphate-buffered saline (PBS) and homogenized by vortexing withglass beads. Debris was removed by centrifugation. For DNA purification, the pellet was treated withlysozyme. The bacterial genomic DNA was isolated using a Wizard Genomic DNA purification kit.Primers for Lactobacillus, Bifidobacterium, Clostridium, and E. coli were designed according to previouslypublished data by Zhu et al. in 2002 [19]. The universal primers—which identify all known strains of
48
Nutrients 2017, 9, 304
bacteria in the intestine—were prepared with the invariant region in the 16S rRNA of bacteria, andwere used as internal standard to normalize the results. The DNA samples underwent PCR, and theamplified results were loaded on 2% agarose gel stained with ethidium bromide and underwentelectrophoresis for separation. Then, the bands were quantified using Quantity One 1-D analysissoftware (Bio-Rad, Hercules, CA, USA). Abundance of individual bacterial gene expression wasmeasured relative to the universal primer product, where the total bacteria equaled 100%.
2.7. Assessment of Liver Ferritin
As was previously described [9,14], the collected liver samples were treated similarly to theprocedures described in a previous study by Passaniti et al. in 1989 [21]. Approximately 0.25 gof liver sample was diluted into 0.5 mL of 50 mM Hepes buffer (pH 7.4) and homogenized onice using an UltraTurrax homogenizer at maximum speed (5000× g) for 2 min. Each homogenatewas subjected to heat treatment for 10 min at 75 C to aid isolation of ferritin. The samples wereimmediately cooled on ice for 30 min after heat treatment, centrifuged at 13,000× g for 30 min until aclear supernatant was obtained, and the pellet containing insoluble denatured proteins was discarded.Native polyacrylamide gel electrophoresis was utilized for separation technique. Six percent separatinggel and 5% stacking gel were prepared for the procedure. A constant 100 V voltage was administeredthroughout the process. The resulting gels were then treated with two specific stains: potassiumferricyanide (K3Fe(CN)6)—a stain specific for Fe—and Coomassie blue G-250 stain, specific for proteinin general. The Fe-stained bands represented ferritin levels, and were compared to the correspondingbands in the Coomasie-stained gel to calculate relative abundance of ferritin (ferritin-to-total-proteinratio). Gels were scanned by using the Bio-Rad densitometer and measured using the Quantity-One1-D analysis program (Bio-Rad, Hercules, CA, USA). Horse spleen ferritin was used as a standard tocalibrate ferritin/Fe concentrations. Ferritin saturation levels were measured by calculating relativepercentage of Fe present in the protein to the maximum number of Fe atoms that can be present permolecule of ferritin (approximately 4500 Fe atoms) [22].
2.8. Blood Analysis and Hb Measurements
Blood was collected using micro-hematocrit heparinized capillary tubes (Fisher Scientific,Waltham, MA, USA). Blood Hb concentrations were determined spectrophotometrically using thecyanmethemoglobin method (H7506-STD, Pointe Scientific Inc., Canton, MI, USA) following the kitmanufacturer's instructions.
2.9. Morphological Examination of the Intestinal Villi
As was previously described [17], intestinal samples (duodenal region as the main intestinalFe absorption site) at day of hatch from each treatment were fixed in fresh 4% (vol/vol) bufferedformaldehyde, dehydrated, cleared, and embedded in paraffin. Serial sections were cut at 5 µm andplaced on glass slides. Sections were deparaffinized in xylene, rehydrated in a graded alcohol series,stained with hematoxylin and eosin, and examined by light microscopy. Morphometric measurementsof villus height and width were performed with an Olympus light microscope using EPIX XCAPsoftware. Villus surface area was calculated from villus height and width at half height.
2.10. Goblet Cell Diameter
Morphometric measurements of goblet cell diameter were performed with an Olympus lightmicroscope using EPIX XCAP software.
49
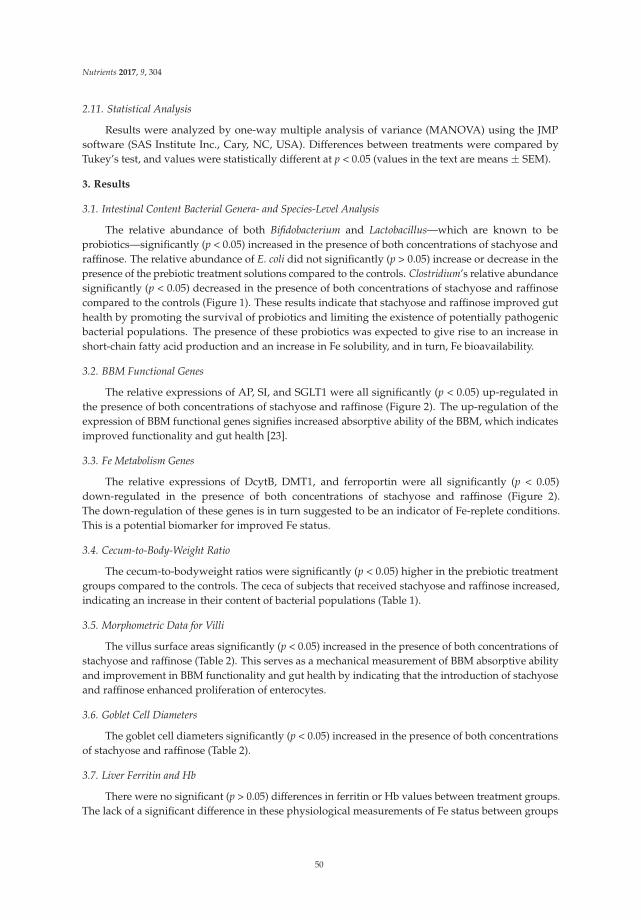
Nutrients 2017, 9, 304
2.11. Statistical Analysis
Results were analyzed by one-way multiple analysis of variance (MANOVA) using the JMPsoftware (SAS Institute Inc., Cary, NC, USA). Differences between treatments were compared byTukey’s test, and values were statistically different at p < 0.05 (values in the text are means ± SEM).
3. Results
3.1. Intestinal Content Bacterial Genera- and Species-Level Analysis
The relative abundance of both Bifidobacterium and Lactobacillus—which are known to beprobiotics—significantly (p < 0.05) increased in the presence of both concentrations of stachyose andraffinose. The relative abundance of E. coli did not significantly (p > 0.05) increase or decrease in thepresence of the prebiotic treatment solutions compared to the controls. Clostridium’s relative abundancesignificantly (p < 0.05) decreased in the presence of both concentrations of stachyose and raffinosecompared to the controls (Figure 1). These results indicate that stachyose and raffinose improved guthealth by promoting the survival of probiotics and limiting the existence of potentially pathogenicbacterial populations. The presence of these probiotics was expected to give rise to an increase inshort-chain fatty acid production and an increase in Fe solubility, and in turn, Fe bioavailability.
3.2. BBM Functional Genes
The relative expressions of AP, SI, and SGLT1 were all significantly (p < 0.05) up-regulated inthe presence of both concentrations of stachyose and raffinose (Figure 2). The up-regulation of theexpression of BBM functional genes signifies increased absorptive ability of the BBM, which indicatesimproved functionality and gut health [23].
3.3. Fe Metabolism Genes
The relative expressions of DcytB, DMT1, and ferroportin were all significantly (p < 0.05)down-regulated in the presence of both concentrations of stachyose and raffinose (Figure 2).The down-regulation of these genes is in turn suggested to be an indicator of Fe-replete conditions.This is a potential biomarker for improved Fe status.
3.4. Cecum-to-Body-Weight Ratio
The cecum-to-bodyweight ratios were significantly (p < 0.05) higher in the prebiotic treatmentgroups compared to the controls. The ceca of subjects that received stachyose and raffinose increased,indicating an increase in their content of bacterial populations (Table 1).
3.5. Morphometric Data for Villi
The villus surface areas significantly (p < 0.05) increased in the presence of both concentrations ofstachyose and raffinose (Table 2). This serves as a mechanical measurement of BBM absorptive abilityand improvement in BBM functionality and gut health by indicating that the introduction of stachyoseand raffinose enhanced proliferation of enterocytes.
3.6. Goblet Cell Diameters
The goblet cell diameters significantly (p < 0.05) increased in the presence of both concentrationsof stachyose and raffinose (Table 2).
3.7. Liver Ferritin and Hb
There were no significant (p > 0.05) differences in ferritin or Hb values between treatment groups.The lack of a significant difference in these physiological measurements of Fe status between groups
50
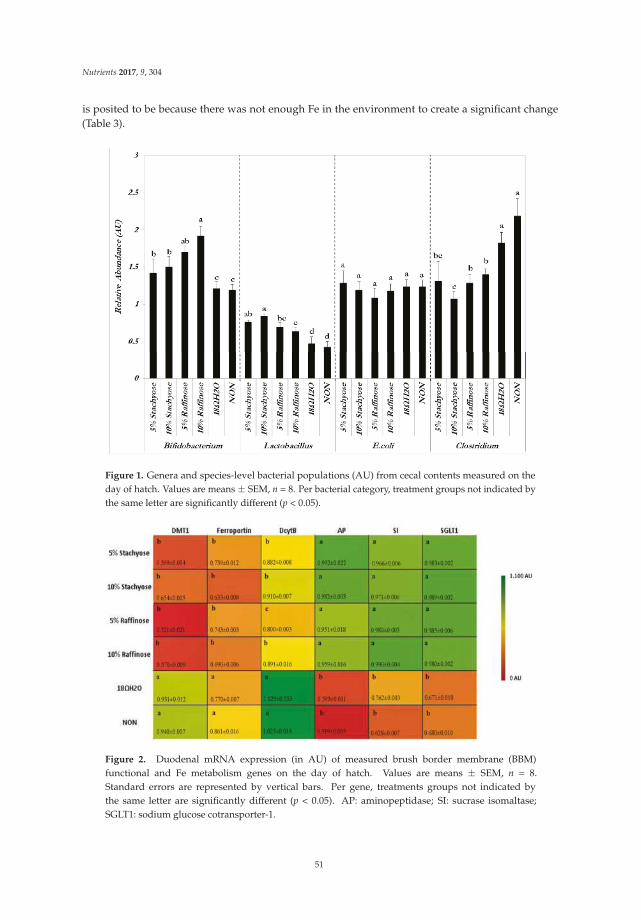
Nutrients 2017, 9, 304
is posited to be because there was not enough Fe in the environment to create a significant change(Table 3).
Figure 1. Genera and species-level bacterial populations (AU) from cecal contents measured on theday of hatch. Values are means ± SEM, n = 8. Per bacterial category, treatment groups not indicated bythe same letter are significantly different (p < 0.05).
Figure 2. Duodenal mRNA expression (in AU) of measured brush border membrane (BBM)functional and Fe metabolism genes on the day of hatch. Values are means ± SEM, n = 8.Standard errors are represented by vertical bars. Per gene, treatments groups not indicated bythe same letter are significantly different (p < 0.05). AP: aminopeptidase; SI: sucrase isomaltase;SGLT1: sodium glucose cotransporter-1.
51
Nutrients 2017, 9, 304
Table 1. Cecum-to-body weight ratio (%). Values are means ± SEM, n = 12. a,b Treatment groups notindicated by the same letter are significantly different (p < 0.05).
Treatment Group Cecum/Body Weight Ratio (%)
5% Stachyose 1.67 ± 0.21 a
10% Stachyose 1.63 ± 0.18 a
5% Raffinose 1.83 ± 0.20 a
10% Raffinose 1.55 ± 0.13 a
18ΩH2O 1.35 ± 0.08 b
Non-injected 1.22 ± 0.07 b
Table 2. Effect of intra-amniotic administration of experimental solutions on the duodenal smallintestinal villus surface area (mm2) and goblet cells diameter (µm). Values are means ± SEM, n = 6.a–e Treatment groups not indicated by the same letter are significantly different (p < 0.05).
Treatment Group Villus Surface Area (mm2) Goblet Cell Diameter (µm)
5% Stachyose 459.2 ± 32.09 a,b 18.2 ± 0.143 c
10% Stachyose 493.8 ± 10.31 a 19.1 ± 0.152 b
5% Raffinose 467.5 ± 35.55 a,b 22.5 ± 0.180 a
10% Raffinose 425.2 ± 24.04 b,c 19.5 ± 0.156 b
18ΩH2O 384.4 ± 14.16 c 15.4 ± 0.123 d
Non-injected 353.1 ± 13.24 c 13.2 ± 0.105 e
Table 3. Liver Ferritin protein amounts (AU) and blood hemoglobin (Hb) concentrations (g/dL).Values are means ± SEM, n = 10. a Treatment groups not indicated by the same letter are significantlydifferent (p < 0.05).
Treatment Group Ferritin (AU) Hb (g/dL)
5% Stachyose 0.48 ± 0.09 a 10.7 ± 0.54 a
10% Stachyose 0.48 ± 0.08 a 11.1 ± 0.55 a
5% Raffinose 0.47 ± 0.10 a 10.5 ± 0.68 a
10% Raffinose 0.48 ± 0.09 a 11.0 ± 0.56 a
18ΩH2O 0.47 ± 0.09 a 10.4 ± 0.42 a
Non-injected 0.47 ± 0.07 a 10.3 ± 0.65 a
4. Discussion
This study utilized the Gallus gallus model, as it is a fast growing animal with relatively highmineral requirements, and hence can develop deficiency considerably quickly [13]. Previous studieshave shown that intra-amniotic administration is useful for investigating the effects of specific nutrientsat particular stages of intestinal development [16,17,24]. According to Ludwiczek et al., intracellular Feconcentrations play a role in regulating Fe absorption into the enterocytes and are beneficial to bacteriawithin the cecum [25].
There was an increased abundance of both Lactobacillus (p < 0.05) and Bifidobacterium (p < 0.05),and a decrease in Clostridium in the cecal contents of the birds that received the prebiotic treatments.However, there were no significant differences for E. coli between the groups (p > 0.05), and likewisea lack of significant differences within and between the raffinose and stachyose groups (p > 0.05) ofsame bacterial species (Figure 1). As previously mentioned, Lactobacillus and Bifidobacterium are knownprobiotics, whereas Clostridium is a potentially pathogenic genus and E. coli can be either pathogenicor beneficial, depending on the strain [20,26,27]. Lactobacillus and Bifidobacterium both produce shortchain fatty acids (SCFA), potentially increasing Fe bioavailability and reducing the abundance ofpathogenic bacteria that utilize dietary Fe in the colon [28,29]. Other prebiotic compounds such asinulin have been shown to enhance the proliferation of selected beneficial colonic microflora [26,30].Bifidobacterium and Lactobacillus have an advantage over other intestinal microorganisms due to their
52
Nutrients 2017, 9, 304
β-1,2-glycosidase activity that allows them to break down prebiotics, resulting in their proliferationand possibly leading to greater SCFA production [18–20]. Therefore, it is reasonable to suspect thatthe intra-amniotic administration of stachyose and raffinose may improve Fe status by inducinga more efficient Fe uptake and intestinal transferring. In addition to the more efficient Fe uptake,the cecum-to-bodyweight ratios were higher in the prebiotic treatment groups versus the controlgroups (p < 0.05), indicating that the cecal content of chickens that received intra-amniotic prebioticsolutions was greater than those that did not. This observation is used as an indicator for a potentialincrease in cecal bacterial populations (Table 1) [12].
In addition, the expressions of duodenal (the major Fe absorption site) Fe metabolism-relatedproteins (DMT1, the major Fe intestinal transporter; DcytB, Fe reductase; and Ferroportin, the majorintestinal enterocyte Fe exporter), was decreased in treatment groups receiving the raffinose andstachyose solutions versus controls (p < 0.05) (Figure 2). These results are comparable to thoseof a previous study conducted on late-term broiler embryos and hatchlings, in which treatmentgroups with improved Fe status expressed significantly less Fe-related proteins [31]. The resultssuggest that the increased Fe bioavailability led to Fe-sufficient conditions, meaning an increase inFe metabolism-related transporters and enzymes were not required (as a compensatory mechanism).Furthermore, there was no significant differences (p > 0.05) between the two raffinose administeredgroups in DMT1 and ferroportin; whereas DcytB actually showed a significant decrease (p < 0.05)in the 10% versus 5% raffinose (Figure 2). One reasonable explanation is that SCFA produced frombacteria increases Fe3+ solubility, resulting in more bioavailable Fe that led to the decreased DcytBexpression [16].
The significant increase in the expression of the BBM functionality genes (AP, SI, SGLT1, p < 0.05)is in agreement with the morphometric measurements, indicating that intra-amniotic administrationof raffinose and stachyose improved BBM functionality and potentially enhanced the absorptive anddigestive capacity of the villi (Table 2). As is evident in the current study, it was previously suggestedthat dietary prebiotics increase probiotics’ butyrate production, which may lead to cellular (enterocyte)proliferation. It was also demonstrated that birds that received intra-amniotic administration ofcarbohydrates developed villi with greater surface areas compared to the untreated birds [32].Scholz-Ahrens et al. (2007) and Preidis et al. (2012) support these results by concluding that someof their respective prebiotics increase cellular proliferation, which causes the increase in villi surfacearea [33,34]. Additionally, we also measured an increase in goblet cell diameter, which suggests anincreased production of mucus that coats the intestinal lumen and effects bacterial composition andfunction [35,36].
Overall, the up-regulation of BBM functional proteins, down-regulation of Fe metabolism proteins,in addition to the increase in the relative abundance of beneficial probiotics, intestinal villi surfacearea, and goblet cell diameters, suggest that stachyose and raffinose are promising in their potentialfor improving Fe status and BBM functionality.
5. Conclusions
The current research validates the need for future studies that could incorporate these plantorigin prebiotics in long-term feeding trials. The potential breeding of staple food crops such as lentilsand chickpeas for increased stachyose and raffinose contents may serve as a sustainable means ofcombating malnutrition in developing regions, which is a strategy that has been proven effective inwheat [12]. This study served as a preliminary step to provide a greater understanding of the way thatvarious prebiotics can alleviate dietary deficiencies.
Author Contributions: E.T. led the research conceived and designed the experiment, wrote and edited themanuscript, N.K., S.P. and Q.W. collected and analyzed the data and wrote the initial draft of the paper. J.S., C.Z.and R.G. analyzed the data. All authors critically reviewed the final draft.
Conflicts of Interest: The authors declare no conflict of interest.
53
Nutrients 2017, 9, 304
Abbreviations
Fe ironHb hemoglobinDMT1 divalent metal transporter 1DcytB duodenal cytochrome BAP amino peptidaseSI sucrose isomaltaseSGLT-1 sodium glucose transporter 1BBM brush border membrane
References
1. World Health Organization. Iron Deficiency Anemia: Assessment, Prevention and Control: A Guide for Programme
Managers; World Health Organization: Geneva, Switzerland, 2001; pp. 15–21.2. World Health Organization. The Global Prevalence of Anaemia in 2011; World Health Organization:
Geneva, Switzerland, 2015; pp. 3–6.3. Pollitt, E.; Soemantri, A.G.; Yunis, F.; Scrimshaw, N.S. Cognitive effects of iron-deficiency Anaemia. Lancet
1985, 325, 158. [CrossRef]4. Johnson, C.R.; Thavarajah, D.; Combs, G.F.; Thavarajah, P. Lentil (Lens culinaris L.): A prebiotic-rich whole
food legume. Food Res. Int. 2013, 51, 107–113. [CrossRef]5. Dwivedi, S.; Sahrawat, K.; Puppala, N.; Ortiz, R. Plant prebiotics and human health: Biotechnology to breed
prebiotic-rich nutritious food crops. Electron. J. Biotechnol. 2014, 17, 238–245. [CrossRef]6. Nestel, P.; Bouis, H.E.; Meenakshi, J.V.; Pfeiffer, W. Biofortification of staple food crops. J. Nutr. 2006, 136,
1064–1067. [PubMed]7. Welch, R.M.; Graham, R.D. Breeding for micronutrients in staple food crops from a human nutrition
perspective. J. Exp. Bot. 2004, 55, 353–364. [CrossRef] [PubMed]8. Wiesinger, J.A.; Cichy, K.A.; Glahn, R.P.; Grusak, M.A.; Brick, M.A.; Thompson, H.J.; Tako, E. Demonstrating a
Nutritional Advantage to the Fast-Cooking Dry Bean ( Phaseolus vulgaris L.). J. Agric. Food Chem. 2016, 64,8592–8603. [CrossRef] [PubMed]
9. Tako, E.; Beebe, S.E.; Reed, S.; Hart, J.J.; Glahn, R.P. Polyphenolic compounds appear to limit the nutritionalbenefit of biofortified higher iron black bean (Phaseolus vulgaris L.). Nutr. J. 2014, 13, 1. [CrossRef] [PubMed]
10. Petry, N.; Egli, I.; Zeder, C.; Walczyk, T.; Hurrell, R. Polyphenols and phytic acid contribute to the low ironbioavailability from common beans in young women. J. Nutr. 2010, 140, 1977–1982. [CrossRef] [PubMed]
11. Petry, N.; Egli, I.; Gahutu, J.B.; Tugirimana, P.L.; Boy, E.; Hurrell, R. Phytic acid concentration influencesiron bioavailability from biofortified beans in Rwandese women with low iron status. J. Nutr. 2014, 144,1681–1687. [CrossRef] [PubMed]
12. Tako, E.; Glahn, R.P.; Knez, M.; Stangoulis, J.C. The effect of wheat prebiotics on the gut bacterial populationand iron status of iron deficient broiler chickens. Nutr. J. 2014, 13, 1. [CrossRef] [PubMed]
13. Tako, E.; Rutzke, M.A.; Glahn, R.P. Using the domestic chicken (Gallus gallus) as an in vivo model for ironbioavailability1. Poult. Sci. 2010, 89, 514–521. [CrossRef] [PubMed]
14. Tako, E.; Reed, S.M.; Budiman, J.; Hart, J.J.; Glahn, R.P. Higher iron pearl millet (Pennisetum glaucum L.)provides more absorbable iron that is limited by increased polyphenolic content. Nutr. J. 2015, 14, 1.[CrossRef] [PubMed]
15. Hillier, L.W.; Miller, W.; Birney, E.; Warren, W.; Hardison, R.C.; Ponting, C.P.; Bork, P.; Burt, D.W.;Groenen, M.A.M.; Delany, M.E.; et al. Sequence and comparative analysis of the chicken genome provideunique perspectives on vertebrate evolution. Nature 2004, 432, 695–716. [CrossRef] [PubMed]
16. Tako, E.; Glahn, R.P. Intra-amniotic administration and dietary inulin affect the iron status and intestinalfunctionality of iron-deficient broiler chickens. Poult. Sci. 2012, 91, 1361–1370. [CrossRef] [PubMed]
17. Tako, E.; Ferket, P.; Uni, Z. Changes in chicken intestinal zinc exporter mRNA expression and small intestinalfunctionality following intra-amniotic zinc-methionine administration. J. Nutr. Biochem. 2005, 16, 339–346.[CrossRef] [PubMed]
54
Nutrients 2017, 9, 304
18. Hartono, K.; Reed, S.; Ankrah, N.A.; Glahn, R.P.; Tako, E. Alterations in gut microflora populations andbrush border functionality following intra-amniotic daidzein administration. RSC Adv. 2015, 5, 6407–6412.[CrossRef]
19. Zhu, X.Y.; Zhong, T.; Pandya, Y.; Joerger, R.D. 16S rRNA-Based Analysis of Microbiota from the Cecum ofBroiler Chickens. Appl. Environ. Microbiol. 2002, 68, 124–137. [CrossRef] [PubMed]
20. Tako, E.; Glahn, R.P.; Welch, R.M.; Lei, X.; Yasuda, K.; Miller, D.D. Dietary inulin affects the expression ofintestinal enterocyte iron transporters, receptors and storage protein and alters the microbiota in the pigintestine. Br. J. Nutr. 2008, 99, 472–480. [CrossRef] [PubMed]
21. Passaniti, A.; Roth, T.F. Purification of chicken liver ferritin by two novel methods and structural comparisonwith horse spleen ferritin. Biochem. J. 1989, 258, 413–419. [CrossRef] [PubMed]
22. Mete, A.; van Zeeland, Y.R.A.; Vaandrager, A.B.; van Dijk, J.E.; Marx, J.J.M.; Dorrestein, G.M.Partial purification and characterization of ferritin from the liver and intestinal mucosa of chickens,turtledoves and mynahs. Avian Pathol. 2005, 34, 430–434. [CrossRef] [PubMed]
23. Reed, S.; Qin, X.; Ran-Ressler, R.; Brenna, J.; Glahn, R.; Tako, E. Dietary zinc deficiency affects blood linoleicacid: Dihomo-γ-linolenic acid (LA:DGLA) ratio; a sensitive physiological marker of zinc status in vivo(Gallus gallus). Nutrients 2014, 6, 1164–1180. [CrossRef] [PubMed]
24. Smirnov, A.; Tako, E.; Ferket, P.R.; Uni, Z. Mucin gene expression and mucin content in the chicken intestinalgoblet cells are affected by in ovo feeding of carbohydrates. Poult. Sci. 2006, 85, 669–673. [CrossRef][PubMed]
25. Ludwiczek, S.; Theurl, I.; Artner-Dworzak, E.; Chorney, M.; Weiss, G. Duodenal HFE expression and hepcidinlevels determine body iron homeostasis: Modulation by genetic diversity and dietary iron availability.J. Mol. Med. 2004, 82, 373–382. [CrossRef] [PubMed]
26. Gibson, G.; Beatty, E.; Wang, X.; Cummings, J.H. Selective stimulation of Bifidobacteria in the Human Colonby Oligofructose and Inulin. Gastroenterology 1995, 108, 975–982. [CrossRef]
27. Roberfroid, M.; Van Loot, J.; Gibson, G. The bifidogenic nature of chicory inulin and its hydrolysis products.J. Nutr. 1998, 128, 11–19. [PubMed]
28. Patterson, J.K.; Lei, X.G.; Miller, D.D. The pig as an experimental model for elucidating the mechanismsgoverning dietary influence on mineral absorption. Exp. Biol. Med. 2008, 233, 651–664. [CrossRef] [PubMed]
29. Gibson, G.R.; Rastall, R.A. Prebiotics: Development & Application; John Wiley & Sons: Chichester, UK; Hoboken,NJ, USA, 2006.
30. Tzortzis, G.; Goulas, A.K.; Gibson, G.R. Synthesis of prebiotic galactooligosaccharides using whole cellsof a novel strain, Bifidobacterium bifidum NCIMB 41171. Appl. Microbiol. Biotechnol. 2005, 68, 412–416.[CrossRef] [PubMed]
31. Tako, E.; Glahn, R.P. Iron status of the late term broiler (Gallus gallus) embryo and hatchling. Int. J. Poul. Sci.
2011, 10, 42–48. [CrossRef]32. Tako, E.; Ferket, P.R.; Uni, Z. Effects of in ovo feeding of carbohydrates and beta-hydroxy-beta-methylbutyrate
on the development of chicken intestine. Poult. Sci. 2004, 83, 2023–2028. [CrossRef] [PubMed]33. Scholz-Ahrens, K.; Ade, P.; Marten, B.; Weber, P.; Timm, W.; Acil, Y.; Gluer, C.; Schrezenmeir, J. Prebiotics,
probiotics, and synbiotics affect mineral absorption, bone mineral content, and bone structure. J. Nutr. 2007,137, 838S–846S. [PubMed]
34. Preidis, G.A.; Saulnier, D.M.; Blutt, S.E.; Mistretta, T.-A.; Riehle, K.P.; Major, A.M.; Venable, S.F.; Finegold, M.J.;Petrosino, J.F.; Conner, M.E.; et al. Probiotics stimulate enterocyte migration and microbial diversity in theneonatal mouse intestine. FASEB J. 2012, 26, 1960–1969. [CrossRef] [PubMed]
35. Ouwehand, A.C.; Derrien, M.; de Vos, W.; Tiihonen, K.; Rautonen, N. Prebiotics and other microbialsubstrates for gut functionality. Curr. Opin. Biotechnol. 2005, 16, 212–217. [CrossRef] [PubMed]
36. Deplancke, B.; Gaskins, H.R. Microbial modulation of innate defense: Goblet cells and the intestinal mucuslayer. Am. J. Clin. Nutr. 2001, 73, 1131S–1141S. [PubMed]
© 2017 by the authors. Licensee MDPI, Basel, Switzerland. This article is an open accessarticle distributed under the terms and conditions of the Creative Commons Attribution(CC BY) license (http://creativecommons.org/licenses/by/4.0/).
55
nutrients
Article
Effects of Commercial Apple Varieties on Human GutMicrobiota Composition and Metabolic Output Usingan In Vitro Colonic Model
Athanasios Koutsos 1,2,*, Maria Lima 2, Lorenza Conterno 2, Mattia Gasperotti 3, Martina Bianchi 2,
Francesca Fava 2, Urska Vrhovsek 3, Julie A. Lovegrove 1 and Kieran M. Tuohy 2
1 Hugh Sinclair Unit of Human Nutrition and the Institute for Cardiovascular and Metabolic Research (ICMR),Department of Food and Nutritional Sciences, University of Reading, Whiteknights, P.O. Box 226,Reading RG6 6AP, UK; [email protected]
2 Nutrition & Nutrigenomics Unit, Department of Food Quality and Nutrition, Research and Innovation Centre,Fondazione Edmund Mach (FEM), Via Mach 1, 38010 San Michele all’Adige, TN, Italy;[email protected] (M.L.); [email protected] (L.C.); [email protected] (M.B.);[email protected] (F.F.); [email protected] (K.M.T.)
3 Metabolomics Unit, Department of Food Quality and Nutrition, Research and Innovation Centre,Fondazione Edmund Mach (FEM), Via Mach 1, 38010 San Michele all’Adige, TN, Italy;[email protected] (M.G.); [email protected] (U.V.)
* Correspondence: [email protected]; Tel.: +44-118-378-7713
Received: 6 February 2017; Accepted: 15 May 2017; Published: 24 May 2017
Abstract: Apples are a rich source of polyphenols and fiber. A major proportion of apple polyphenolsescape absorption in the small intestine and together with non-digestible polysaccharides reachthe colon, where they can serve as substrates for bacterial fermentation. Animal studies suggesta synergistic interaction between apple polyphenols and the soluble fiber pectin; however, the effectsof whole apples on human gut microbiota are less extensively studied. Three commercial applevarieties—Renetta Canada, Golden Delicious and Pink Lady—were digested and fermentedin vitro using a batch culture colonic model (pH 5.5–6.0, 37 C) inoculated with feces from threehealthy donors. Inulin and cellulose were used as a readily and a poorly fermentable plant fiber,respectively. Fecal microbiota composition was measured by 16S rRNA gene Illumina MiSeqsequencing (V3-V4 region) and Fluorescence in Situ Hybridization. Short chain fatty acids (SCFAs) andpolyphenol microbial metabolites were determined. The three apple varieties significantly changedbacterial diversity, increased Actinobacteria relative abundance, acetate, propionate and total SCFAs(p < 0.05). Renetta Canada and Golden Delicious significantly decreased Bacteroidetes abundance andincreased Proteobacteria proportion and bifidobacteria population (p < 0.05). Renetta Canada alsoincreased Faecalibacterium prausnitzii, butyrate levels and polyphenol microbial metabolites (p < 0.05).Together, these data suggest that apples, particularly Renetta Canada, can induce substantial changesin microbiota composition and metabolic activity in vitro, which could be associated with potentialbenefits to human health. Human intervention studies are necessary to confirm these data andpotential beneficial effects.
Keywords: apples; polyphenols; proanthocyanidins; fiber; pectin; gut microbiota; in vitro batchculture fermentation; microbial metabolites; Illumina 16S rRNA gene sequencing; Fluorescence insitu hybridization (FISH)
1. Introduction
Evidence suggests that plant-derived dietary polyphenols and fiber possess health-promotingproperties [1]. Apples are among the most popular and frequently consumed fruits in the world and
Nutrients 2017, 9, 533 56 www.mdpi.com/journal/nutrients
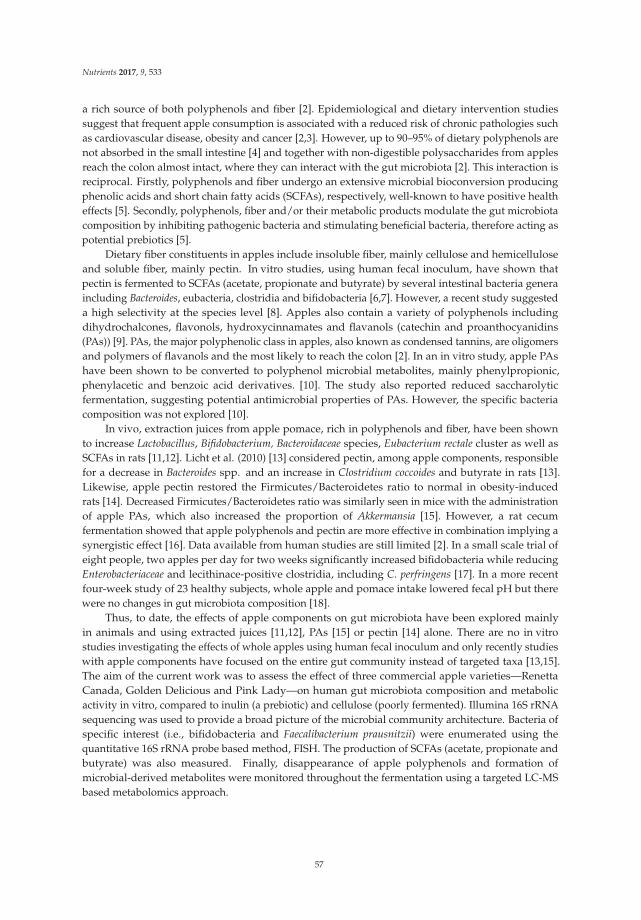
Nutrients 2017, 9, 533
a rich source of both polyphenols and fiber [2]. Epidemiological and dietary intervention studiessuggest that frequent apple consumption is associated with a reduced risk of chronic pathologies suchas cardiovascular disease, obesity and cancer [2,3]. However, up to 90–95% of dietary polyphenols arenot absorbed in the small intestine [4] and together with non-digestible polysaccharides from applesreach the colon almost intact, where they can interact with the gut microbiota [2]. This interaction isreciprocal. Firstly, polyphenols and fiber undergo an extensive microbial bioconversion producingphenolic acids and short chain fatty acids (SCFAs), respectively, well-known to have positive healtheffects [5]. Secondly, polyphenols, fiber and/or their metabolic products modulate the gut microbiotacomposition by inhibiting pathogenic bacteria and stimulating beneficial bacteria, therefore acting aspotential prebiotics [5].
Dietary fiber constituents in apples include insoluble fiber, mainly cellulose and hemicelluloseand soluble fiber, mainly pectin. In vitro studies, using human fecal inoculum, have shown thatpectin is fermented to SCFAs (acetate, propionate and butyrate) by several intestinal bacteria generaincluding Bacteroides, eubacteria, clostridia and bifidobacteria [6,7]. However, a recent study suggesteda high selectivity at the species level [8]. Apples also contain a variety of polyphenols includingdihydrochalcones, flavonols, hydroxycinnamates and flavanols (catechin and proanthocyanidins(PAs)) [9]. PAs, the major polyphenolic class in apples, also known as condensed tannins, are oligomersand polymers of flavanols and the most likely to reach the colon [2]. In an in vitro study, apple PAshave been shown to be converted to polyphenol microbial metabolites, mainly phenylpropionic,phenylacetic and benzoic acid derivatives. [10]. The study also reported reduced saccharolyticfermentation, suggesting potential antimicrobial properties of PAs. However, the specific bacteriacomposition was not explored [10].
In vivo, extraction juices from apple pomace, rich in polyphenols and fiber, have been shownto increase Lactobacillus, Bifidobacterium, Bacteroidaceae species, Eubacterium rectale cluster as well asSCFAs in rats [11,12]. Licht et al. (2010) [13] considered pectin, among apple components, responsiblefor a decrease in Bacteroides spp. and an increase in Clostridium coccoides and butyrate in rats [13].Likewise, apple pectin restored the Firmicutes/Bacteroidetes ratio to normal in obesity-inducedrats [14]. Decreased Firmicutes/Bacteroidetes ratio was similarly seen in mice with the administrationof apple PAs, which also increased the proportion of Akkermansia [15]. However, a rat cecumfermentation showed that apple polyphenols and pectin are more effective in combination implying asynergistic effect [16]. Data available from human studies are still limited [2]. In a small scale trial ofeight people, two apples per day for two weeks significantly increased bifidobacteria while reducingEnterobacteriaceae and lecithinace-positive clostridia, including C. perfringens [17]. In a more recentfour-week study of 23 healthy subjects, whole apple and pomace intake lowered fecal pH but therewere no changes in gut microbiota composition [18].
Thus, to date, the effects of apple components on gut microbiota have been explored mainlyin animals and using extracted juices [11,12], PAs [15] or pectin [14] alone. There are no in vitrostudies investigating the effects of whole apples using human fecal inoculum and only recently studieswith apple components have focused on the entire gut community instead of targeted taxa [13,15].The aim of the current work was to assess the effect of three commercial apple varieties—RenettaCanada, Golden Delicious and Pink Lady—on human gut microbiota composition and metabolicactivity in vitro, compared to inulin (a prebiotic) and cellulose (poorly fermented). Illumina 16S rRNAsequencing was used to provide a broad picture of the microbial community architecture. Bacteria ofspecific interest (i.e., bifidobacteria and Faecalibacterium prausnitzii) were enumerated using thequantitative 16S rRNA probe based method, FISH. The production of SCFAs (acetate, propionate andbutyrate) was also measured. Finally, disappearance of apple polyphenols and formation ofmicrobial-derived metabolites were monitored throughout the fermentation using a targeted LC-MSbased metabolomics approach.
57
Nutrients 2017, 9, 533
2. Materials and Methods
2.1. Fecal Donors
Fecal donors, two males and one female, were in good health and aged between 30 and 50.They had not received antibiotic treatment for at least 3 months prior to stool collection, had notknowingly consumed pre- or probiotic supplements prior to experiment, and had no history of boweldisorders. The three healthy donors were informed of the study aims and procedures and providedtheir verbal consent for their fecal matter to be used for the experiments, in compliance with the ethicsprocedures required at the University of Reading and Fondazione Edmund Mach.
2.2. Materials
Enzymes for the apples digestion and chemicals for the batch culture basal nutrient mediumwere purchased from Sigma-Aldrich (St. Louis, MO, USA) and Applichem (Darmstadt, Germany),unless otherwise stated. For the chemical standards of polyphenols and microbial metabolites aswell as the LC-MS reagents more information can be found in Vrhovsek et al. (2012) [19] andGasperotti et al. (2014) [20].
2.3. Apples and Controls
The three commercial apple varieties, Renetta Canada, Golden Delicious and Pink Lady werepurchased from a local shop in the Trentino region in north Italy. The apples’ macronutrient compositionwas analyzed by Campden BRI laboratories, UK, whereas the detailed polyphenol content wasmeasured in our laboratory in Fondazione Edmund Mach based on Vrhovsek et al. (2012) [19].Inulin (from dahlia tubers) and cellulose were used as a readily and a poorly fermentable plantfiber, respectively.
2.4. Preparation of Phospholipid Vesicles
A protocol was followed according to Mandalari et al. (2008) [21], with some modifications,for the preparation of the phospholipid vesicles and the simulation of the in vitro gastric andduodenal digestion as described below. Egg L-α-phosphatidylcholine (PC, lecithin grade 1, 99% purity,Lipid Products, Surrey, UK), 6.5 mL of a stock solution (127 mmol/L in chloroform/methanol),was placed into a round-bottom flask, and dried under rotary evaporation to make a thinphospholipid film. The lipid film was further dried overnight under vacuum to remove any remainingsolvent. Then, it was hydrated with the addition of 170 mL of warm saline (150 mmol/L NaCl, pH 2.5,at 37 C). The flask was flushed with argon to prevent oxidation and was placed in an orbital shaker(170 rpm, 37 C) for 30 min together with five 2 mm diameter glass beads. A PC nanoemulsion wasthen produced using a Branson Ultrasonics sonifier S-450 (Branson Ultrasonics, Danbury, CT, USA)equipped with a 13 mm titanium horn (30% of amplitude). The temperature of the liquid kept below60 C with ice.
2.5. In Vitro Gastric and Duodenal Digestion
A ratio of 4 g of apples for 12.4 mL gastric phase volume (acidic saline) considered appropriateafter preliminary experiments and according to Mandalari et al. (2008) [21]. Initially, 96 g of eachapple variety were grated with their skin and added to 146 mL of the sonicated and filtrated PC vesiclesuspension. The pH was adjusted to 2.5 using HCl and acidic saline (150 mmol/L NaCl, pH 2.5) wasadded to a total volume of 298 mL. Then, the PC vesicle suspension together with gastric pepsin andlipase were added so that the final concentrations were 2.4 mmol/L, 146 units/mL and 60 units/mL,respectively. The digestion was performed in an orbital shaker (170 rpm, 37 C) for 2 h. The in vitrogastric digestion was followed by duodenal digestion. The pH was raised to 6.5 using NaOH andthe following were added: 4 mmol/L sodium taurocholate, 4 mmol/L sodium glycodeoxycholate,
58
Nutrients 2017, 9, 533
11.7 mmol/L CaCl2, 0.73 mmol/L Bis-Tris buffer (pH 6.5), 5.9 units/mL α-chymotrypsin, 104 units/mLtrypsin, 3.2 µg/mL colipase, 54 units/mL pancreatic lipase and 25 units/mL alpha-amylase. The totalvolume of 340 mL was reached by the addition of saline (150 mmol/L NaCl, pH 6.5) and the finalPC concentration was 2.1 mmol/L. The duodenal digestion was performed for 1 h in the shakingincubator (170 rpm, 37 C). Then, samples were transferred to 1 kDa MWCO (molecular weight cutoff) cellulose dialysis tubing (Spectra/Por® 6, Spectrum Europe, Breda, Netherlands) and dialyzedovernight against NaCl (10 mmol/L) at 4 C to remove low molecular mass digestion products.The dialysis fluid was changed and dialysis continued for an additional 2 h. Finally, apples were frozenat −20 C and then freeze-dried until use. Inulin and cellulose (19.2 g each, equivalent with the drycontent of 96 g of apples) were also digested and dialyzed using the same protocol.
2.6. Fecal Batch-Culture Fermentation and Samples Collection
The fermentation profile of the three commercial apples, the prebiotic inulin and the poorlyfermented cellulose was determined using anaerobic, stirred, pH and temperature controlled fecalbatch cultures. Glass water-jacketed vessels (300 mL) were sterilized and filled aseptically with 180 mLof pre-sterilized basal nutrient medium according to Sanchez-Patan et al. 2012 [22]. The pH wasadjusted to 5.5–6.0 and kept between this range throughout the experiment with the automaticaddition of NaOH or HCI (0.5 M), to mimic the conditions located in the proximal region of thehuman large intestine. The medium was then gassed overnight with oxygen free nitrogen to maintainanaerobic conditions. The following day and before the inoculation, each of the 5 vessels was dosedwith 2 g of the appropriate substrate/treatment (inulin, cellulose, Renetta Canada, Golden Deliciousor Pink Lady) for a final concentration of 1% (w/v). Fresh human fecal samples were collected in ananaerobic jar and were processed within 1 h. Fecal slurry was prepared by homogenizing the feces inpre-reduced phosphate buffered saline (PBS). The temperature was set to 37 C using a circulatingwater-bath and the vessels were inoculated with 20 mL fecal slurry (10% w/v of fresh human feces)to a final concentration of 1% (w/v). Batch cultures were run under these controlled conditions fora period of 24 h, during which samples were collected at 4 time points (0, 5, 10 and 24 h) for FISH,SCFA, precursors polyphenols and polyphenol microbial metabolites. Pellets were stored at −80 Cfor DNA extraction. Fermentations were conducted in triplicate using three healthy fecal donors.
2.7. DNA Extraction, Amplification and Sequencing
DNA was extracted from each sample (available for 0, 10 and 24 h time points) usingthe FastDNA Spin Kit for Feces (MP Biomedicals, UK). Nucleic acid purity was tested onNanoDropTM 8000 Spectrophotometer (Thermo Fisher Scientific). Total genomic DNA was thensubjected to PCR amplification by targeting a ~460-bp fragment of the 16S rRNA variable regionV3-V4 using the specific bacterial primer set 341F (5′ CCTACGGGNGGCWGCAG 3′) and 806R(5′ GACTACNVGGGTWTCTAATCC 3′) with overhang Illumina adapters. PCR amplification of eachsample was carried out using 25 µL reactions with 1 µM of each primer, following the IlluminaMetagenomic Sequencing Library Preparation Protocol for 16S Ribosomal RNA Gene Amplicons.The PCR products were checked on 1.5% agarose gel and cleaned from free primers and primerdimer using the Agencourt AMPure XP system (Beckman Coulter, Brea, CA, USA) following themanufacturer’s instructions. Subsequently dual indices and Illumina sequencing adapters NexteraXT Index Primer (Illumina) were attached by 7 cycles PCR (16S Metagenomic Sequencing LibraryPreparation, Illumina). The final libraries, after purification by the Agencourt AMPure XP system(Beckman), were analyzed on a Typestation 2200 platform (Agilent Technologies, Santa Clara, CA, USA)and quantified using the Quant-IT PicoGreen dsDNA assay kit (Thermo Fisher Scientific) by theSynergy2 microplate reader (Biotek). Finally, all the libraries were pooled in an equimolar wayin a final amplicon library and analyzed on a Typestation 2200 platform (Agilent Technologies,Santa Clara, CA, USA). Barcoded library was sequenced on an Illumina® MiSeq (PE300) platform
59
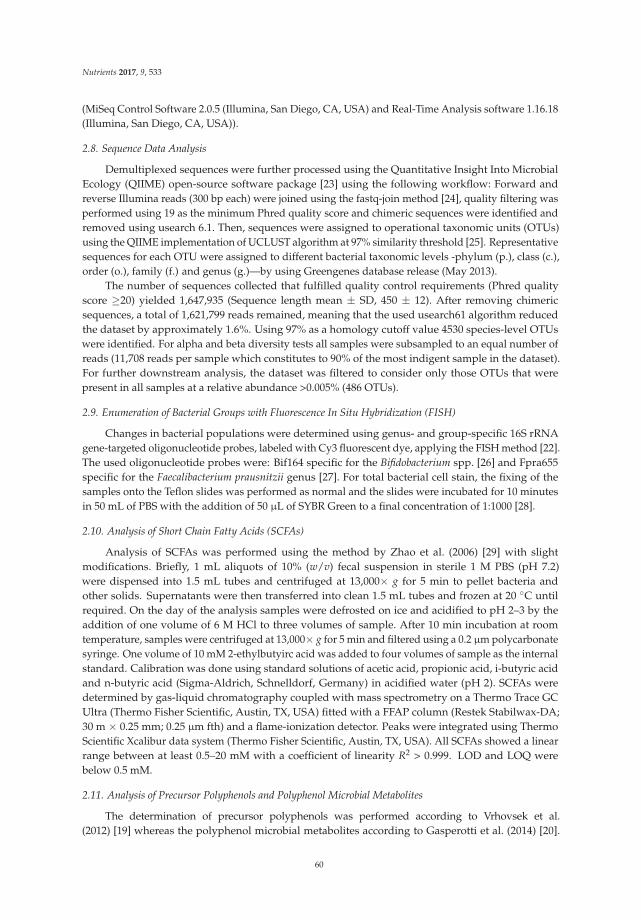
Nutrients 2017, 9, 533
(MiSeq Control Software 2.0.5 (Illumina, San Diego, CA, USA) and Real-Time Analysis software 1.16.18(Illumina, San Diego, CA, USA)).
2.8. Sequence Data Analysis
Demultiplexed sequences were further processed using the Quantitative Insight Into MicrobialEcology (QIIME) open-source software package [23] using the following workflow: Forward andreverse Illumina reads (300 bp each) were joined using the fastq-join method [24], quality filtering wasperformed using 19 as the minimum Phred quality score and chimeric sequences were identified andremoved using usearch 6.1. Then, sequences were assigned to operational taxonomic units (OTUs)using the QIIME implementation of UCLUST algorithm at 97% similarity threshold [25]. Representativesequences for each OTU were assigned to different bacterial taxonomic levels -phylum (p.), class (c.),order (o.), family (f.) and genus (g.)—by using Greengenes database release (May 2013).
The number of sequences collected that fulfilled quality control requirements (Phred qualityscore ≥20) yielded 1,647,935 (Sequence length mean ± SD, 450 ± 12). After removing chimericsequences, a total of 1,621,799 reads remained, meaning that the used usearch61 algorithm reducedthe dataset by approximately 1.6%. Using 97% as a homology cutoff value 4530 species-level OTUswere identified. For alpha and beta diversity tests all samples were subsampled to an equal number ofreads (11,708 reads per sample which constitutes to 90% of the most indigent sample in the dataset).For further downstream analysis, the dataset was filtered to consider only those OTUs that werepresent in all samples at a relative abundance >0.005% (486 OTUs).
2.9. Enumeration of Bacterial Groups with Fluorescence In Situ Hybridization (FISH)
Changes in bacterial populations were determined using genus- and group-specific 16S rRNAgene-targeted oligonucleotide probes, labeled with Cy3 fluorescent dye, applying the FISH method [22].The used oligonucleotide probes were: Bif164 specific for the Bifidobacterium spp. [26] and Fpra655specific for the Faecalibacterium prausnitzii genus [27]. For total bacterial cell stain, the fixing of thesamples onto the Teflon slides was performed as normal and the slides were incubated for 10 minutesin 50 mL of PBS with the addition of 50 µL of SYBR Green to a final concentration of 1:1000 [28].
2.10. Analysis of Short Chain Fatty Acids (SCFAs)
Analysis of SCFAs was performed using the method by Zhao et al. (2006) [29] with slightmodifications. Briefly, 1 mL aliquots of 10% (w/v) fecal suspension in sterile 1 M PBS (pH 7.2)were dispensed into 1.5 mL tubes and centrifuged at 13,000× g for 5 min to pellet bacteria andother solids. Supernatants were then transferred into clean 1.5 mL tubes and frozen at 20 C untilrequired. On the day of the analysis samples were defrosted on ice and acidified to pH 2–3 by theaddition of one volume of 6 M HCl to three volumes of sample. After 10 min incubation at roomtemperature, samples were centrifuged at 13,000× g for 5 min and filtered using a 0.2 µm polycarbonatesyringe. One volume of 10 mM 2-ethylbutyirc acid was added to four volumes of sample as the internalstandard. Calibration was done using standard solutions of acetic acid, propionic acid, i-butyric acidand n-butyric acid (Sigma-Aldrich, Schnelldorf, Germany) in acidified water (pH 2). SCFAs weredetermined by gas-liquid chromatography coupled with mass spectrometry on a Thermo Trace GCUltra (Thermo Fisher Scientific, Austin, TX, USA) fitted with a FFAP column (Restek Stabilwax-DA;30 m × 0.25 mm; 0.25 µm fth) and a flame-ionization detector. Peaks were integrated using ThermoScientific Xcalibur data system (Thermo Fisher Scientific, Austin, TX, USA). All SCFAs showed a linearrange between at least 0.5–20 mM with a coefficient of linearity R2 > 0.999. LOD and LOQ werebelow 0.5 mM.
2.11. Analysis of Precursor Polyphenols and Polyphenol Microbial Metabolites
The determination of precursor polyphenols was performed according to Vrhovsek et al.(2012) [19] whereas the polyphenol microbial metabolites according to Gasperotti et al. (2014) [20].
60
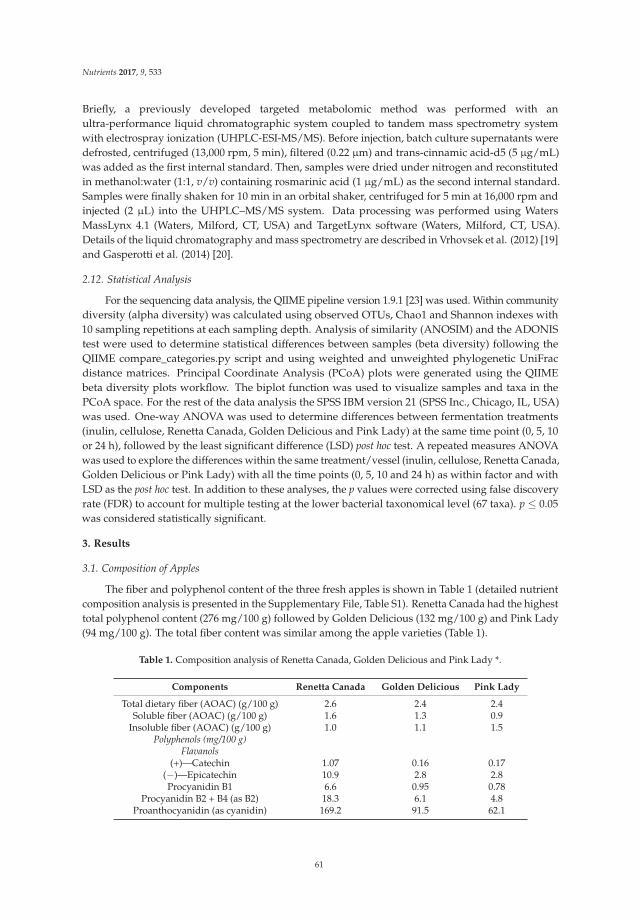
Nutrients 2017, 9, 533
Briefly, a previously developed targeted metabolomic method was performed with anultra-performance liquid chromatographic system coupled to tandem mass spectrometry systemwith electrospray ionization (UHPLC-ESI-MS/MS). Before injection, batch culture supernatants weredefrosted, centrifuged (13,000 rpm, 5 min), filtered (0.22 µm) and trans-cinnamic acid-d5 (5 µg/mL)was added as the first internal standard. Then, samples were dried under nitrogen and reconstitutedin methanol:water (1:1, v/v) containing rosmarinic acid (1 µg/mL) as the second internal standard.Samples were finally shaken for 10 min in an orbital shaker, centrifuged for 5 min at 16,000 rpm andinjected (2 µL) into the UHPLC–MS/MS system. Data processing was performed using WatersMassLynx 4.1 (Waters, Milford, CT, USA) and TargetLynx software (Waters, Milford, CT, USA).Details of the liquid chromatography and mass spectrometry are described in Vrhovsek et al. (2012) [19]and Gasperotti et al. (2014) [20].
2.12. Statistical Analysis
For the sequencing data analysis, the QIIME pipeline version 1.9.1 [23] was used. Within communitydiversity (alpha diversity) was calculated using observed OTUs, Chao1 and Shannon indexes with10 sampling repetitions at each sampling depth. Analysis of similarity (ANOSIM) and the ADONIStest were used to determine statistical differences between samples (beta diversity) following theQIIME compare_categories.py script and using weighted and unweighted phylogenetic UniFracdistance matrices. Principal Coordinate Analysis (PCoA) plots were generated using the QIIMEbeta diversity plots workflow. The biplot function was used to visualize samples and taxa in thePCoA space. For the rest of the data analysis the SPSS IBM version 21 (SPSS Inc., Chicago, IL, USA)was used. One-way ANOVA was used to determine differences between fermentation treatments(inulin, cellulose, Renetta Canada, Golden Delicious and Pink Lady) at the same time point (0, 5, 10or 24 h), followed by the least significant difference (LSD) post hoc test. A repeated measures ANOVAwas used to explore the differences within the same treatment/vessel (inulin, cellulose, Renetta Canada,Golden Delicious or Pink Lady) with all the time points (0, 5, 10 and 24 h) as within factor and withLSD as the post hoc test. In addition to these analyses, the p values were corrected using false discoveryrate (FDR) to account for multiple testing at the lower bacterial taxonomical level (67 taxa). p ≤ 0.05was considered statistically significant.
3. Results
3.1. Composition of Apples
The fiber and polyphenol content of the three fresh apples is shown in Table 1 (detailed nutrientcomposition analysis is presented in the Supplementary File, Table S1). Renetta Canada had the highesttotal polyphenol content (276 mg/100 g) followed by Golden Delicious (132 mg/100 g) and Pink Lady(94 mg/100 g). The total fiber content was similar among the apple varieties (Table 1).
Table 1. Composition analysis of Renetta Canada, Golden Delicious and Pink Lady *.
Components Renetta Canada Golden Delicious Pink Lady
Total dietary fiber (AOAC) (g/100 g) 2.6 2.4 2.4Soluble fiber (AOAC) (g/100 g) 1.6 1.3 0.9
Insoluble fiber (AOAC) (g/100 g) 1.0 1.1 1.5Polyphenols (mg/100 g)
Flavanols(+)—Catechin 1.07 0.16 0.17
(−)—Epicatechin 10.9 2.8 2.8Procyanidin B1 6.6 0.95 0.78
Procyanidin B2 + B4 (as B2) 18.3 6.1 4.8Proanthocyanidin (as cyanidin) 169.2 91.5 62.1
61
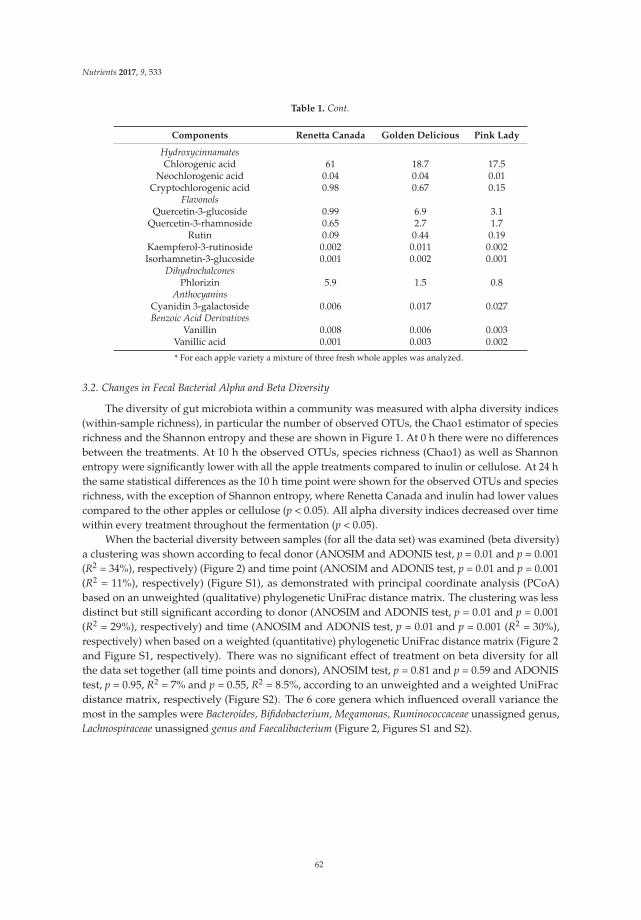
Nutrients 2017, 9, 533
Table 1. Cont.
Components Renetta Canada Golden Delicious Pink Lady
HydroxycinnamatesChlorogenic acid 61 18.7 17.5
Neochlorogenic acid 0.04 0.04 0.01Cryptochlorogenic acid 0.98 0.67 0.15
FlavonolsQuercetin-3-glucoside 0.99 6.9 3.1
Quercetin-3-rhamnoside 0.65 2.7 1.7Rutin 0.09 0.44 0.19
Kaempferol-3-rutinoside 0.002 0.011 0.002Isorhamnetin-3-glucoside 0.001 0.002 0.001
DihydrochalconesPhlorizin 5.9 1.5 0.8
AnthocyaninsCyanidin 3-galactoside 0.006 0.017 0.027Benzoic Acid Derivatives
Vanillin 0.008 0.006 0.003Vanillic acid 0.001 0.003 0.002
* For each apple variety a mixture of three fresh whole apples was analyzed.
3.2. Changes in Fecal Bacterial Alpha and Beta Diversity
The diversity of gut microbiota within a community was measured with alpha diversity indices(within-sample richness), in particular the number of observed OTUs, the Chao1 estimator of speciesrichness and the Shannon entropy and these are shown in Figure 1. At 0 h there were no differencesbetween the treatments. At 10 h the observed OTUs, species richness (Chao1) as well as Shannonentropy were significantly lower with all the apple treatments compared to inulin or cellulose. At 24 hthe same statistical differences as the 10 h time point were shown for the observed OTUs and speciesrichness, with the exception of Shannon entropy, where Renetta Canada and inulin had lower valuescompared to the other apples or cellulose (p < 0.05). All alpha diversity indices decreased over timewithin every treatment throughout the fermentation (p < 0.05).
When the bacterial diversity between samples (for all the data set) was examined (beta diversity)a clustering was shown according to fecal donor (ANOSIM and ADONIS test, p = 0.01 and p = 0.001(R2 = 34%), respectively) (Figure 2) and time point (ANOSIM and ADONIS test, p = 0.01 and p = 0.001(R2 = 11%), respectively) (Figure S1), as demonstrated with principal coordinate analysis (PCoA)based on an unweighted (qualitative) phylogenetic UniFrac distance matrix. The clustering was lessdistinct but still significant according to donor (ANOSIM and ADONIS test, p = 0.01 and p = 0.001(R2 = 29%), respectively) and time (ANOSIM and ADONIS test, p = 0.01 and p = 0.001 (R2 = 30%),respectively) when based on a weighted (quantitative) phylogenetic UniFrac distance matrix (Figure 2and Figure S1, respectively). There was no significant effect of treatment on beta diversity for allthe data set together (all time points and donors), ANOSIM test, p = 0.81 and p = 0.59 and ADONIStest, p = 0.95, R2 = 7% and p = 0.55, R2 = 8.5%, according to an unweighted and a weighted UniFracdistance matrix, respectively (Figure S2). The 6 core genera which influenced overall variance themost in the samples were Bacteroides, Bifidobacterium, Megamonas, Ruminococcaceae unassigned genus,Lachnospiraceae unassigned genus and Faecalibacterium (Figure 2, Figures S1 and S2).
62
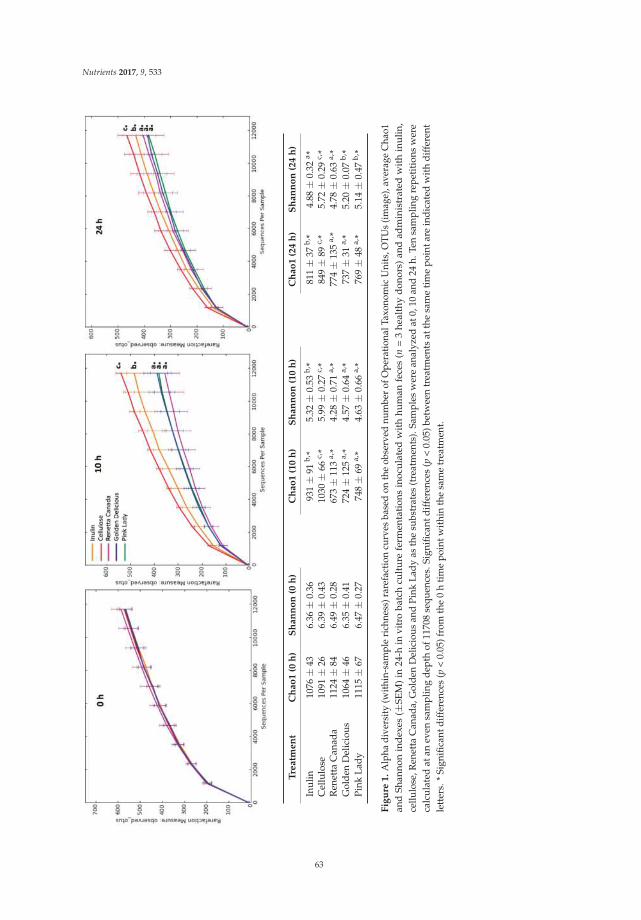
Nutrients 2017, 9, 533
Tre
atm
en
tC
ha
o1
(0h
)S
ha
nn
on
(0h
)C
ha
o1
(10
h)
Sh
an
no
n(1
0h
)C
ha
o1
(24
h)
Sh
an
no
n(2
4h
)
Inul
in10
76±
436.
36±
0.36
931±
91b,
*5.
32±
0.53
b,*
811±
37b,
*4.
88±
0.32
a *C
ellu
lose
1091
±26
6.39
±0.
4310
30±
66c,
*5.
99±
0.27
c,*
849±
89c,
*5.
72±
0.29
c,*
Ren
etta
Can
ada
1124
±84
6.49
±0.
2867
3±
113
a,*
4.28
±0.
71a,
*77
4±
135
a,*
4.78
±0.
63a,
*G
olde
nD
elic
ious
1064
±46
6.35
±0.
4172
4±
125
a,*
4.57
±0.
64a,
*73
7±
31a,
*5.
20±
0.07
b,*
Pink
Lady
1115
±67
6.47
±0.
2774
8±
69a,
*4.
63±
0.66
a,*
769±
48a,
*5.
14±
0.47
b,*
Fig
ure
1.
Alp
hadi
vers
ity(w
ithin
-sam
ple
rich
ness
)rar
efac
tion
curv
esba
sed
onth
eob
serv
ednu
mbe
rof
Ope
ratio
nalT
axon
omic
Uni
ts,O
TUs
(imag
e),a
vera
geC
hao1
and
Shan
non
ind
exes
(±SE
M)
in24
-hin
vitr
oba
tch
cult
ure
ferm
enta
tion
sin
ocu
late
dw
ith
hum
anfe
ces
(n=
3he
alth
yd
onor
s)an
dad
min
istr
ated
wit
hin
ulin
,ce
llulo
se,R
enet
taC
anad
a,G
olde
nD
elic
ious
and
Pink
Lady
asth
esu
bstr
ates
(tre
atm
ents
).Sa
mpl
esw
ere
anal
yzed
at0,
10an
d24
h.Te
nsa
mpl
ing
repe
titi
ons
wer
eca
lcul
ated
atan
even
sam
plin
gd
epth
of11
708
sequ
ence
s.Si
gnifi
cant
diff
eren
ces
(p<
0.05
)bet
wee
ntr
eatm
ents
atth
esa
me
tim
epo
inta
rein
dic
ated
wit
hd
iffer
ent
lett
ers.
*Si
gnifi
cant
diff
eren
ces
(p<
0.05
)fro
mth
e0
hti
me
poin
twit
hin
the
sam
etr
eatm
ent.
63
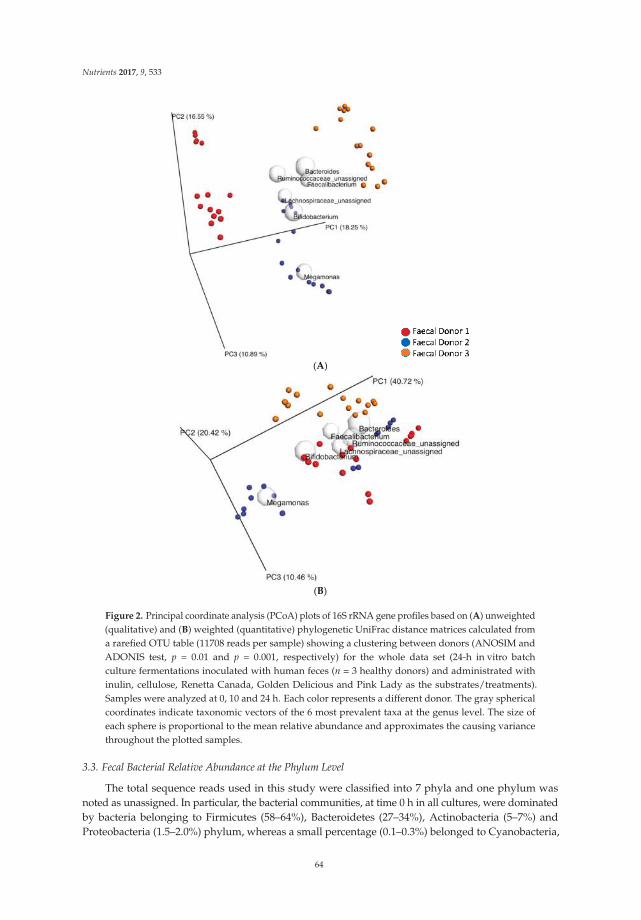
Nutrients 2017, 9, 533
(A)
(B)
Figure 2. Principal coordinate analysis (PCoA) plots of 16S rRNA gene profiles based on (A) unweighted(qualitative) and (B) weighted (quantitative) phylogenetic UniFrac distance matrices calculated froma rarefied OTU table (11708 reads per sample) showing a clustering between donors (ANOSIM andADONIS test, p = 0.01 and p = 0.001, respectively) for the whole data set (24-h in vitro batchculture fermentations inoculated with human feces (n = 3 healthy donors) and administrated withinulin, cellulose, Renetta Canada, Golden Delicious and Pink Lady as the substrates/treatments).Samples were analyzed at 0, 10 and 24 h. Each color represents a different donor. The gray sphericalcoordinates indicate taxonomic vectors of the 6 most prevalent taxa at the genus level. The size ofeach sphere is proportional to the mean relative abundance and approximates the causing variancethroughout the plotted samples.
3.3. Fecal Bacterial Relative Abundance at the Phylum Level
The total sequence reads used in this study were classified into 7 phyla and one phylum wasnoted as unassigned. In particular, the bacterial communities, at time 0 h in all cultures, were dominatedby bacteria belonging to Firmicutes (58–64%), Bacteroidetes (27–34%), Actinobacteria (5–7%) andProteobacteria (1.5–2.0%) phylum, whereas a small percentage (0.1–0.3%) belonged to Cyanobacteria,
64
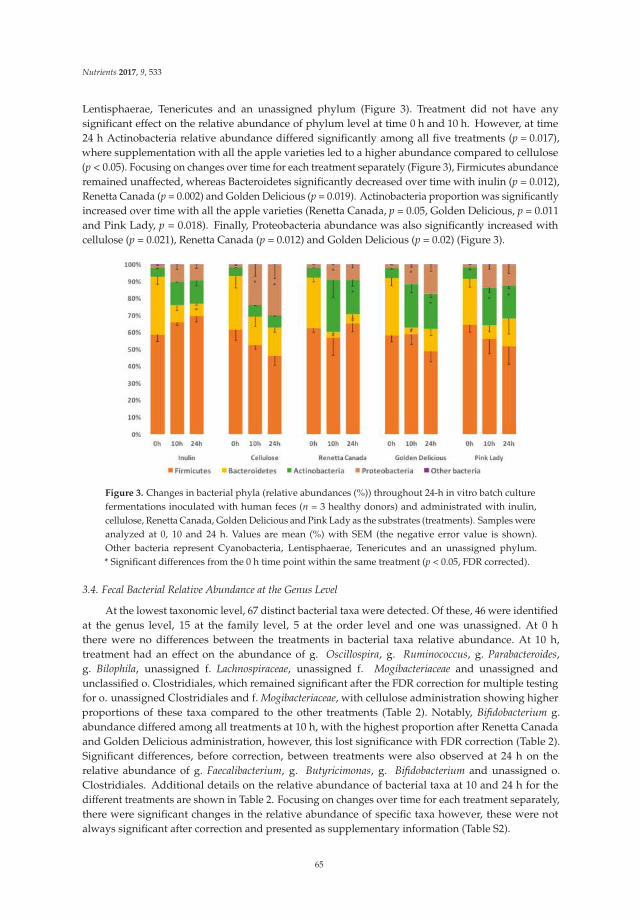
Nutrients 2017, 9, 533
Lentisphaerae, Tenericutes and an unassigned phylum (Figure 3). Treatment did not have anysignificant effect on the relative abundance of phylum level at time 0 h and 10 h. However, at time24 h Actinobacteria relative abundance differed significantly among all five treatments (p = 0.017),where supplementation with all the apple varieties led to a higher abundance compared to cellulose(p < 0.05). Focusing on changes over time for each treatment separately (Figure 3), Firmicutes abundanceremained unaffected, whereas Bacteroidetes significantly decreased over time with inulin (p = 0.012),Renetta Canada (p = 0.002) and Golden Delicious (p = 0.019). Actinobacteria proportion was significantlyincreased over time with all the apple varieties (Renetta Canada, p = 0.05, Golden Delicious, p = 0.011and Pink Lady, p = 0.018). Finally, Proteobacteria abundance was also significantly increased withcellulose (p = 0.021), Renetta Canada (p = 0.012) and Golden Delicious (p = 0.02) (Figure 3).
Figure 3. Changes in bacterial phyla (relative abundances (%)) throughout 24-h in vitro batch culturefermentations inoculated with human feces (n = 3 healthy donors) and administrated with inulin,cellulose, Renetta Canada, Golden Delicious and Pink Lady as the substrates (treatments). Samples wereanalyzed at 0, 10 and 24 h. Values are mean (%) with SEM (the negative error value is shown).Other bacteria represent Cyanobacteria, Lentisphaerae, Tenericutes and an unassigned phylum.* Significant differences from the 0 h time point within the same treatment (p < 0.05, FDR corrected).
3.4. Fecal Bacterial Relative Abundance at the Genus Level
At the lowest taxonomic level, 67 distinct bacterial taxa were detected. Of these, 46 were identifiedat the genus level, 15 at the family level, 5 at the order level and one was unassigned. At 0 hthere were no differences between the treatments in bacterial taxa relative abundance. At 10 h,treatment had an effect on the abundance of g. Oscillospira, g. Ruminococcus, g. Parabacteroides,g. Bilophila, unassigned f. Lachnospiraceae, unassigned f. Mogibacteriaceae and unassigned andunclassified o. Clostridiales, which remained significant after the FDR correction for multiple testingfor o. unassigned Clostridiales and f. Mogibacteriaceae, with cellulose administration showing higherproportions of these taxa compared to the other treatments (Table 2). Notably, Bifidobacterium g.abundance differed among all treatments at 10 h, with the highest proportion after Renetta Canadaand Golden Delicious administration, however, this lost significance with FDR correction (Table 2).Significant differences, before correction, between treatments were also observed at 24 h on therelative abundance of g. Faecalibacterium, g. Butyricimonas, g. Bifidobacterium and unassigned o.Clostridiales. Additional details on the relative abundance of bacterial taxa at 10 and 24 h for thedifferent treatments are shown in Table 2. Focusing on changes over time for each treatment separately,there were significant changes in the relative abundance of specific taxa however, these were notalways significant after correction and presented as supplementary information (Table S2).
65
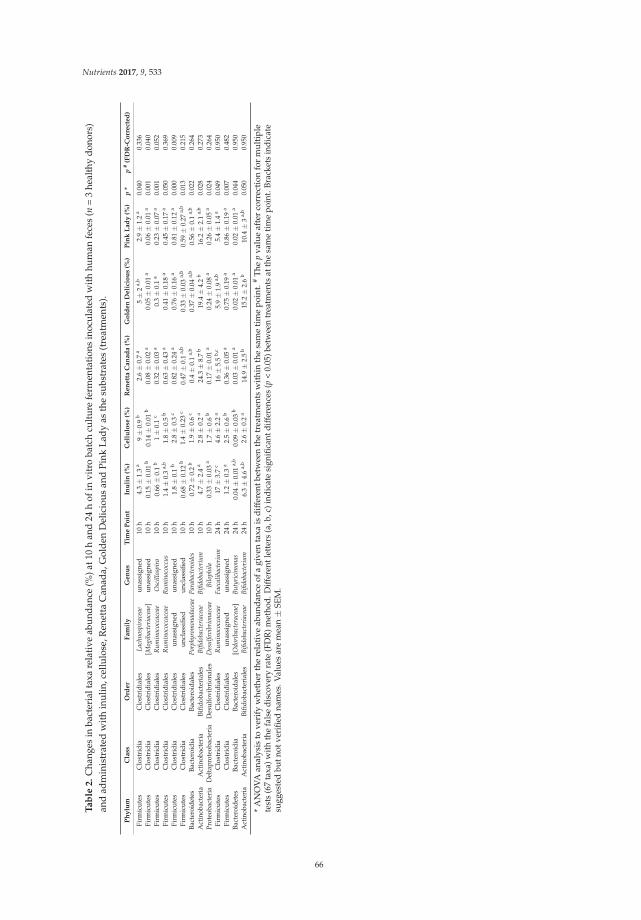
Nutrients 2017, 9, 533
Ta
ble
2.
Cha
nges
inba
cter
ialt
axa
rela
tive
abun
danc
e(%
)at1
0h
and
24h
ofin
vitr
oba
tch
cultu
refe
rmen
tatio
nsin
ocul
ated
with
hum
anfe
ces
(n=
3he
alth
ydo
nors
)an
dad
min
istr
ated
wit
hin
ulin
,cel
lulo
se,R
enet
taC
anad
a,G
olde
nD
elic
ious
and
Pink
Lady
asth
esu
bstr
ates
(tre
atm
ents
).
Ph
ylu
mC
lass
Ord
er
Fa
mil
yG
en
us
Tim
eP
oin
tIn
uli
n(%
)C
ell
ulo
se(%
)R
en
ett
aC
an
ad
a(%
)G
old
en
De
lici
ou
s(%
)P
ink
La
dy
(%)
p*
p#
(FD
R-C
orr
ect
ed
)
Firm
icut
esC
lost
ridi
aC
lost
ridi
ales
Lac
hnos
pira
ceae
unas
sign
ed10
h4.
3±
1.3
a9±
0.9
b2.
6±
0.7
a5±
2a,
b2.
9±
1.2
a0.
040
0.33
6Fi
rmic
utes
Clo
stri
dia
Clo
stri
dial
es[M
ogib
acte
riac
eae]
unas
sign
ed10
h0.
15±
0.01
b0.
14±
0.01
b0.
08±
0.02
a0.
05±
0.01
a0.
06±
0.01
a0.
001
0.04
0Fi
rmic
utes
Clo
stri
dia
Clo
stri
dial
esR
um
inoc
occa
ceae
Osc
illo
spir
a10
h0.
66±
0.1
b1±
0.1
c0.
32±
0.03
a0.
3±
0.1
a0.
23±
0.07
a0.
001
0.05
2Fi
rmic
utes
Clo
stri
dia
Clo
stri
dial
esR
um
inoc
occa
ceae
Ru
min
ococ
cus
10h
1.4±
0.3
a,b
1.8±
0.5
b0.
63±
0.43
a0.
41±
0.18
a0.
45±
0.17
a0.
050
0.36
9Fi
rmic
utes
Clo
stri
dia
Clo
stri
dial
esun
assi
gned
unas
sign
ed10
h1.
8±
0.1
b2.
8±
0.3
c0.
82±
0.24
a0.
76±
0.16
a0.
81±
0.12
a0.
000
0.00
9Fi
rmic
utes
Clo
stri
dia
Clo
stri
dial
esun
clas
sifie
dun
clas
sifie
d10
h0.
68±
0.12
b1.
4±
0.23
c0.
47±
0.1
a,b
0.33
±0.
03a,
b0.
59±
0.27
a,b
0.01
30.
215
Bact
eroi
dete
sBa
cter
oidi
aBa
cter
oida
les
Por
phyr
omon
adac
eae
Par
abac
tero
ides
10h
0.72
±0.
2b
1.9±
0.6
c0.
4±
0.1
a,b
0.37
±0.
04a,
b0.
56±
0.1
a,b
0.02
20.
264
Act
inob
acte
ria
Act
inob
acte
ria
Bifid
obac
teri
ales
Bifi
doba
cter
iace
aeB
ifido
bact
eriu
m10
h4.
7±
2.4
a2.
8±
0.2
a24
.3±
8.7
b19
.4±
4.2
b16
.2±
2.1
a,b
0.02
80.
273
Prot
eoba
cter
iaD
elta
prot
eoba
cter
iaD
esul
fovi
brio
nale
sD
esu
lfov
ibri
onac
eae
Bil
ophi
la10
h0.
33±
0.03
a1.
7±
0.6
b0.
17±
0.01
a0.
24±
0.08
a0.
26±
0.05
a0.
024
0.26
4Fi
rmic
utes
Clo
stri
dia
Clo
stri
dial
esR
um
inoc
occa
ceae
Fae
cali
bact
eriu
m24
h17
±3.
7c
4.6±
2.2
a16
±5.
5b,
c5.
9±
1.9
a,b
5.4±
1.4
a0.
049
0.95
0Fi
rmic
utes
Clo
stri
dia
Clo
stri
dial
esun
assi
gned
unas
sign
ed24
h1.
2±
0.3
a2.
5±
0.6
b0.
36±
0.05
a0.
75±
0.19
a0.
86±
0.19
a0.
007
0.48
2Ba
cter
oide
tes
Bact
eroi
dia
Bact
eroi
dale
s[O
dori
bact
erac
eae]
Bu
tyri
cim
onas
24h
0.04
±0.
01a,
b0.
09±
0.03
b0.
03±
0.01
a0.
02±
0.01
a0.
02±
0.01
a0.
044
0.95
0A
ctin
obac
teri
aA
ctin
obac
teri
aBi
fidob
acte
rial
esB
ifido
bact
eria
ceae
Bifi
doba
cter
ium
24h
6.3±
4.6
a,b
2.6±
0.2
a14
.9±
2.5
b15
.2±
2.6
b10
.4±
3a,
b0.
050
0.95
0
*A
NO
VA
anal
ysis
tove
rify
whe
ther
the
rela
tive
abun
dan
ceof
agi
ven
taxa
isd
iffer
entb
etw
een
the
trea
tmen
tsw
ithi
nth
esa
me
tim
epo
int.
#T
hep
valu
eaf
ter
corr
ecti
onfo
rm
ulti
ple
test
s(6
7ta
xa)w
ithth
efa
lse
disc
over
yra
te(F
DR
)met
hod.
Diff
eren
tlet
ters
(a,b
,c)i
ndic
ate
sign
ifica
ntdi
ffer
ence
s(p
<0.
05)b
etw
een
trea
tmen
tsat
the
sam
etim
epo
int.
Brac
kets
indi
cate
sugg
este
dbu
tnot
veri
fied
nam
es.V
alue
sar
em
ean±
SEM
.
66
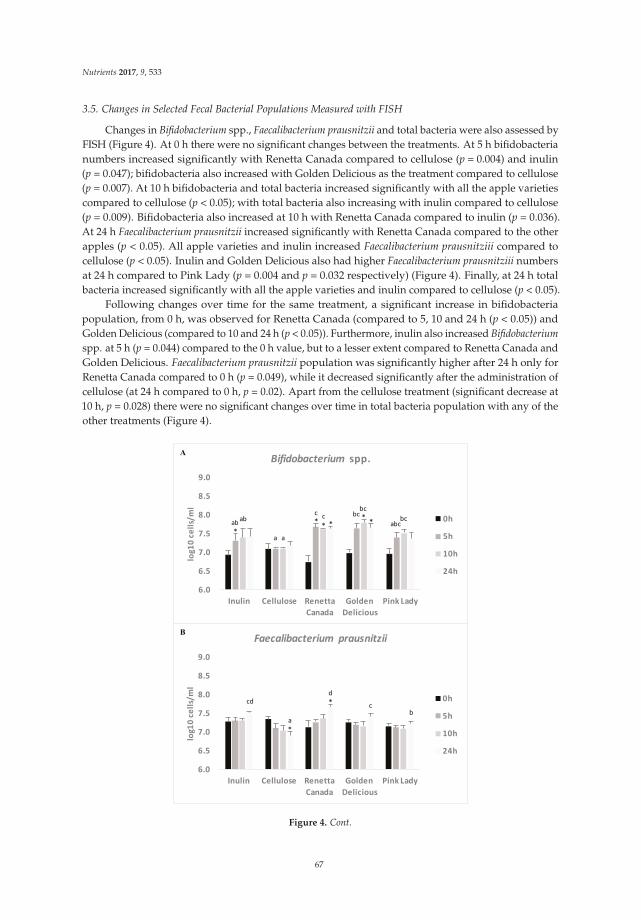
Nutrients 2017, 9, 533
3.5. Changes in Selected Fecal Bacterial Populations Measured with FISH
Changes in Bifidobacterium spp., Faecalibacterium prausnitzii and total bacteria were also assessed byFISH (Figure 4). At 0 h there were no significant changes between the treatments. At 5 h bifidobacterianumbers increased significantly with Renetta Canada compared to cellulose (p = 0.004) and inulin(p = 0.047); bifidobacteria also increased with Golden Delicious as the treatment compared to cellulose(p = 0.007). At 10 h bifidobacteria and total bacteria increased significantly with all the apple varietiescompared to cellulose (p < 0.05); with total bacteria also increasing with inulin compared to cellulose(p = 0.009). Bifidobacteria also increased at 10 h with Renetta Canada compared to inulin (p = 0.036).At 24 h Faecalibacterium prausnitzii increased significantly with Renetta Canada compared to the otherapples (p < 0.05). All apple varieties and inulin increased Faecalibacterium prausnitziii compared tocellulose (p < 0.05). Inulin and Golden Delicious also had higher Faecalibacterium prausnitziii numbersat 24 h compared to Pink Lady (p = 0.004 and p = 0.032 respectively) (Figure 4). Finally, at 24 h totalbacteria increased significantly with all the apple varieties and inulin compared to cellulose (p < 0.05).
Following changes over time for the same treatment, a significant increase in bifidobacteriapopulation, from 0 h, was observed for Renetta Canada (compared to 5, 10 and 24 h (p < 0.05)) andGolden Delicious (compared to 10 and 24 h (p < 0.05)). Furthermore, inulin also increased Bifidobacterium
spp. at 5 h (p = 0.044) compared to the 0 h value, but to a lesser extent compared to Renetta Canada andGolden Delicious. Faecalibacterium prausnitzii population was significantly higher after 24 h only forRenetta Canada compared to 0 h (p = 0.049), while it decreased significantly after the administration ofcellulose (at 24 h compared to 0 h, p = 0.02). Apart from the cellulose treatment (significant decrease at10 h, p = 0.028) there were no significant changes over time in total bacteria population with any of theother treatments (Figure 4).
6.0
6.5
7.0
7.5
8.0
8.5
9.0
Inulin Cellulose Renetta
Canada
Golden
Delicious
Pink Lady
log
10
ce
lls/
ml
Bifidobacterium spp.
0h
5h
10h
24h
bc
** *
**
*
abab
aa
bccc
abcbc
6.0
6.5
7.0
7.5
8.0
8.5
9.0
Inulin Cellulose Renetta
Canada
Golden
Delicious
Pink Lady
log
10
ce
lls/
ml
Faecalibacterium prausnitzii
0h
5h
10h
24h
*
*cd
a
d
cb
A
B
Figure 4. Cont.
67
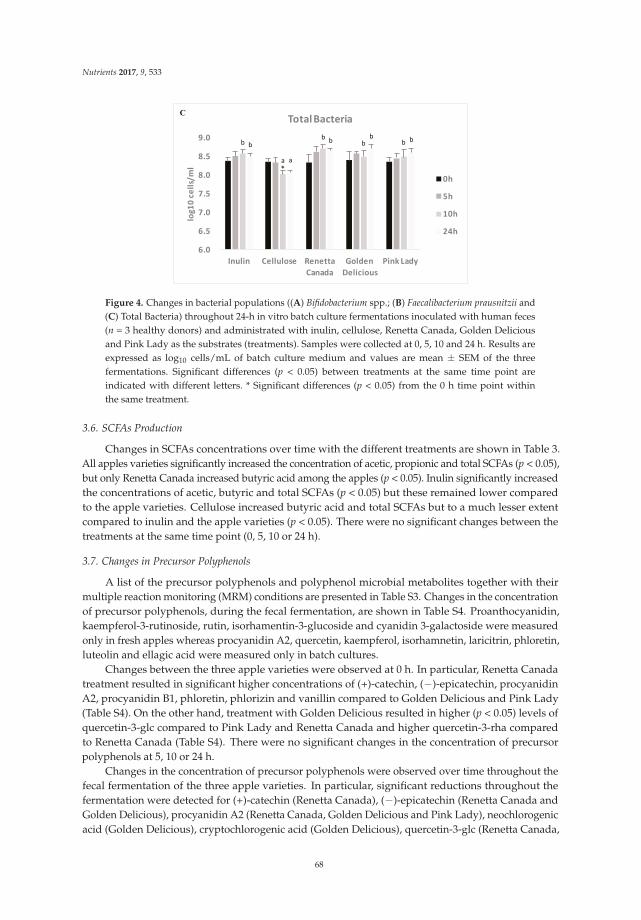
Nutrients 2017, 9, 533
6.0
6.5
7.0
7.5
8.0
8.5
9.0
Inulin Cellulose Renetta
Canada
Golden
Delicious
Pink Lady
log
10
ce
lls/
ml
Total Bacteria
0h
5h
10h
24h
*
aa
bb bb
bb
b b
C
Figure 4. Changes in bacterial populations ((A) Bifidobacterium spp.; (B) Faecalibacterium prausnitzii and(C) Total Bacteria) throughout 24-h in vitro batch culture fermentations inoculated with human feces(n = 3 healthy donors) and administrated with inulin, cellulose, Renetta Canada, Golden Deliciousand Pink Lady as the substrates (treatments). Samples were collected at 0, 5, 10 and 24 h. Results areexpressed as log10 cells/mL of batch culture medium and values are mean ± SEM of the threefermentations. Significant differences (p < 0.05) between treatments at the same time point areindicated with different letters. * Significant differences (p < 0.05) from the 0 h time point withinthe same treatment.
3.6. SCFAs Production
Changes in SCFAs concentrations over time with the different treatments are shown in Table 3.All apples varieties significantly increased the concentration of acetic, propionic and total SCFAs (p < 0.05),but only Renetta Canada increased butyric acid among the apples (p < 0.05). Inulin significantly increasedthe concentrations of acetic, butyric and total SCFAs (p < 0.05) but these remained lower comparedto the apple varieties. Cellulose increased butyric acid and total SCFAs but to a much lesser extentcompared to inulin and the apple varieties (p < 0.05). There were no significant changes between thetreatments at the same time point (0, 5, 10 or 24 h).
3.7. Changes in Precursor Polyphenols
A list of the precursor polyphenols and polyphenol microbial metabolites together with theirmultiple reaction monitoring (MRM) conditions are presented in Table S3. Changes in the concentrationof precursor polyphenols, during the fecal fermentation, are shown in Table S4. Proanthocyanidin,kaempferol-3-rutinoside, rutin, isorhamentin-3-glucoside and cyanidin 3-galactoside were measuredonly in fresh apples whereas procyanidin A2, quercetin, kaempferol, isorhamnetin, laricitrin, phloretin,luteolin and ellagic acid were measured only in batch cultures.
Changes between the three apple varieties were observed at 0 h. In particular, Renetta Canadatreatment resulted in significant higher concentrations of (+)-catechin, (−)-epicatechin, procyanidinA2, procyanidin B1, phloretin, phlorizin and vanillin compared to Golden Delicious and Pink Lady(Table S4). On the other hand, treatment with Golden Delicious resulted in higher (p < 0.05) levels ofquercetin-3-glc compared to Pink Lady and Renetta Canada and higher quercetin-3-rha comparedto Renetta Canada (Table S4). There were no significant changes in the concentration of precursorpolyphenols at 5, 10 or 24 h.
Changes in the concentration of precursor polyphenols were observed over time throughout thefecal fermentation of the three apple varieties. In particular, significant reductions throughout thefermentation were detected for (+)-catechin (Renetta Canada), (−)-epicatechin (Renetta Canada andGolden Delicious), procyanidin A2 (Renetta Canada, Golden Delicious and Pink Lady), neochlorogenicacid (Golden Delicious), cryptochlorogenic acid (Golden Delicious), quercetin-3-glc (Renetta Canada,
68
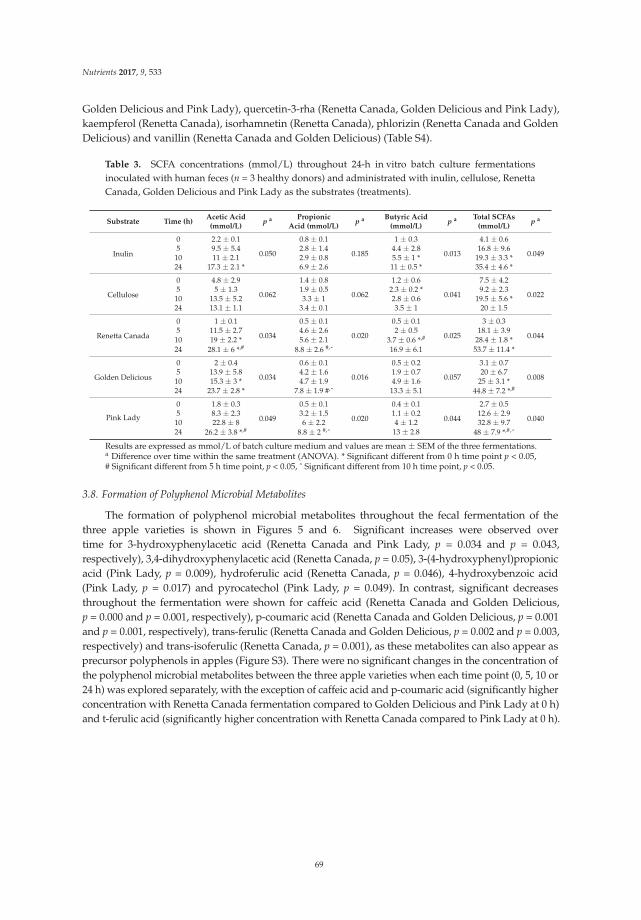
Nutrients 2017, 9, 533
Golden Delicious and Pink Lady), quercetin-3-rha (Renetta Canada, Golden Delicious and Pink Lady),kaempferol (Renetta Canada), isorhamnetin (Renetta Canada), phlorizin (Renetta Canada and GoldenDelicious) and vanillin (Renetta Canada and Golden Delicious) (Table S4).
Table 3. SCFA concentrations (mmol/L) throughout 24-h in vitro batch culture fermentationsinoculated with human feces (n = 3 healthy donors) and administrated with inulin, cellulose, RenettaCanada, Golden Delicious and Pink Lady as the substrates (treatments).
Substrate Time (h)Acetic Acid(mmol/L)
p a PropionicAcid (mmol/L)
p a Butyric Acid(mmol/L)
p a Total SCFAs(mmol/L)
p a
Inulin
0 2.2 ± 0.1
0.050
0.8 ± 0.1
0.185
1 ± 0.3
0.013
4.1 ± 0.6
0.0495 9.5 ± 5.4 2.8 ± 1.4 4.4 ± 2.8 16.8 ± 9.610 11 ± 2.1 2.9 ± 0.8 5.5 ± 1 * 19.3 ± 3.3 *24 17.3 ± 2.1 * 6.9 ± 2.6 11 ± 0.5 * 35.4 ± 4.6 *
Cellulose
0 4.8 ± 2.9
0.062
1.4 ± 0.8
0.062
1.2 ± 0.6
0.041
7.5 ± 4.2
0.0225 5 ± 1.3 1.9 ± 0.5 2.3 ± 0.2 * 9.2 ± 2.310 13.5 ± 5.2 3.3 ± 1 2.8 ± 0.6 19.5 ± 5.6 *24 13.1 ± 1.1 3.4 ± 0.1 3.5 ± 1 20 ± 1.5
Renetta Canada
0 1 ± 0.1
0.034
0.5 ± 0.1
0.020
0.5 ± 0.1
0.025
3 ± 0.3
0.0445 11.5 ± 2.7 4.6 ± 2.6 2 ± 0.5 18.1 ± 3.910 19 ± 2.2 * 5.6 ± 2.1 3.7 ± 0.6 *,# 28.4 ± 1.8 *24 28.1 ± 6 *,# 8.8 ± 2.6 #,ˆ 16.9 ± 6.1 53.7 ± 11.4 *
Golden Delicious
0 2 ± 0.4
0.034
0.6 ± 0.1
0.016
0.5 ± 0.2
0.057
3.1 ± 0.7
0.0085 13.9 ± 5.8 4.2 ± 1.6 1.9 ± 0.7 20 ± 6.710 15.3 ± 3 * 4.7 ± 1.9 4.9 ± 1.6 25 ± 3.1 *24 23.7 ± 2.8 * 7.8 ± 1.9 #,ˆ 13.3 ± 5.1 44.8 ± 7.2 *,#
Pink Lady
0 1.8 ± 0.3
0.049
0.5 ± 0.1
0.020
0.4 ± 0.1
0.044
2.7 ± 0.5
0.0405 8.3 ± 2.3 3.2 ± 1.5 1.1 ± 0.2 12.6 ± 2.910 22.8 ± 8 6 ± 2.2 4 ± 1.2 32.8 ± 9.724 26.2 ± 3.8 *,# 8.8 ± 2 #,ˆ 13 ± 2.8 48 ± 7.9 *,#,ˆ
Results are expressed as mmol/L of batch culture medium and values are mean ± SEM of the three fermentations.a Difference over time within the same treatment (ANOVA). * Significant different from 0 h time point p < 0.05,# Significant different from 5 h time point, p < 0.05, ˆ Significant different from 10 h time point, p < 0.05.
3.8. Formation of Polyphenol Microbial Metabolites
The formation of polyphenol microbial metabolites throughout the fecal fermentation of thethree apple varieties is shown in Figures 5 and 6. Significant increases were observed overtime for 3-hydroxyphenylacetic acid (Renetta Canada and Pink Lady, p = 0.034 and p = 0.043,respectively), 3,4-dihydroxyphenylacetic acid (Renetta Canada, p = 0.05), 3-(4-hydroxyphenyl)propionicacid (Pink Lady, p = 0.009), hydroferulic acid (Renetta Canada, p = 0.046), 4-hydroxybenzoic acid(Pink Lady, p = 0.017) and pyrocatechol (Pink Lady, p = 0.049). In contrast, significant decreasesthroughout the fermentation were shown for caffeic acid (Renetta Canada and Golden Delicious,p = 0.000 and p = 0.001, respectively), p-coumaric acid (Renetta Canada and Golden Delicious, p = 0.001and p = 0.001, respectively), trans-ferulic (Renetta Canada and Golden Delicious, p = 0.002 and p = 0.003,respectively) and trans-isoferulic (Renetta Canada, p = 0.001), as these metabolites can also appear asprecursor polyphenols in apples (Figure S3). There were no significant changes in the concentration ofthe polyphenol microbial metabolites between the three apple varieties when each time point (0, 5, 10 or24 h) was explored separately, with the exception of caffeic acid and p-coumaric acid (significantly higherconcentration with Renetta Canada fermentation compared to Golden Delicious and Pink Lady at 0 h)and t-ferulic acid (significantly higher concentration with Renetta Canada compared to Pink Lady at 0 h).
69
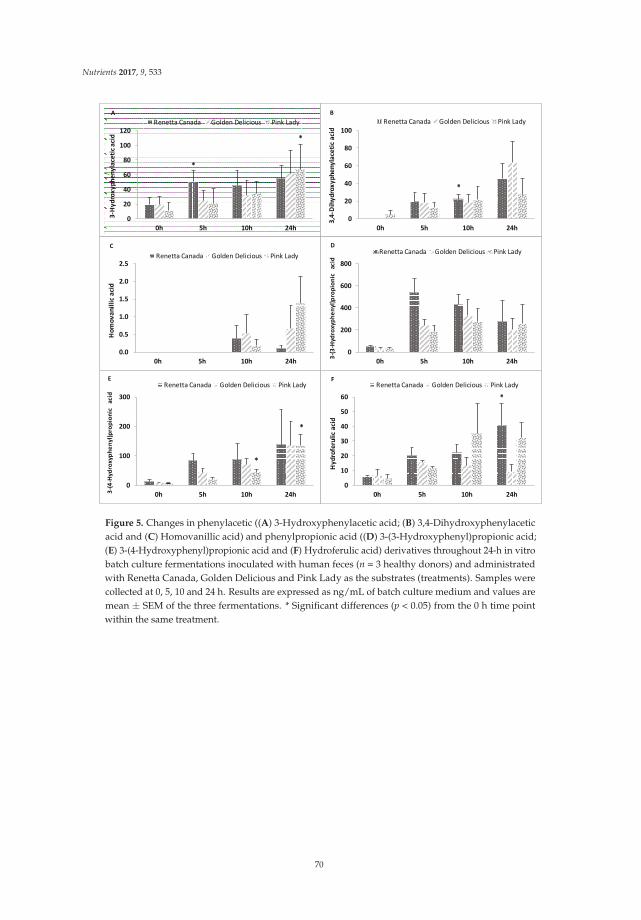
Nutrients 2017, 9, 533
0
20
40
60
80
100
120
0h 5h 10h 24h
3-H
yd
rox
yp
he
ny
lace
tic
aci
d
Renetta Canada Golden Delicious Pink Lady
*
*
0
20
40
60
80
100
0h 5h 10h 24h
3,4
-Dih
yd
rox
yp
he
ny
lace
tic
aci
d
Renetta Canada Golden Delicious Pink Lady
*
0.0
0.5
1.0
1.5
2.0
2.5
0h 5h 10h 24h
Ho
mo
va
nil
lic
aci
d
Renetta Canada Golden Delicious Pink Lady
C
0
200
400
600
800
0h 5h 10h 24h
3-(
3-H
ydro
xy
ph
en
yl)
pro
pio
nic
a
cid
Renetta Canada Golden Delicious Pink LadyD
0
100
200
300
0h 5h 10h 24h3-(
4-H
yd
rox
yph
en
yl)
pro
pio
nic
a
cid
Renetta Canada Golden Delicious Pink Lady
*
*
E
0
10
20
30
40
50
60
0h 5h 10h 24h
Hy
dro
feru
lic
aci
d
Renetta Canada Golden Delicious Pink Lady
*
F
Figure 5. Changes in phenylacetic ((A) 3-Hydroxyphenylacetic acid; (B) 3,4-Dihydroxyphenylaceticacid and (C) Homovanillic acid) and phenylpropionic acid ((D) 3-(3-Hydroxyphenyl)propionic acid;(E) 3-(4-Hydroxyphenyl)propionic acid and (F) Hydroferulic acid) derivatives throughout 24-h in vitrobatch culture fermentations inoculated with human feces (n = 3 healthy donors) and administratedwith Renetta Canada, Golden Delicious and Pink Lady as the substrates (treatments). Samples werecollected at 0, 5, 10 and 24 h. Results are expressed as ng/mL of batch culture medium and values aremean ± SEM of the three fermentations. * Significant differences (p < 0.05) from the 0 h time pointwithin the same treatment.
70
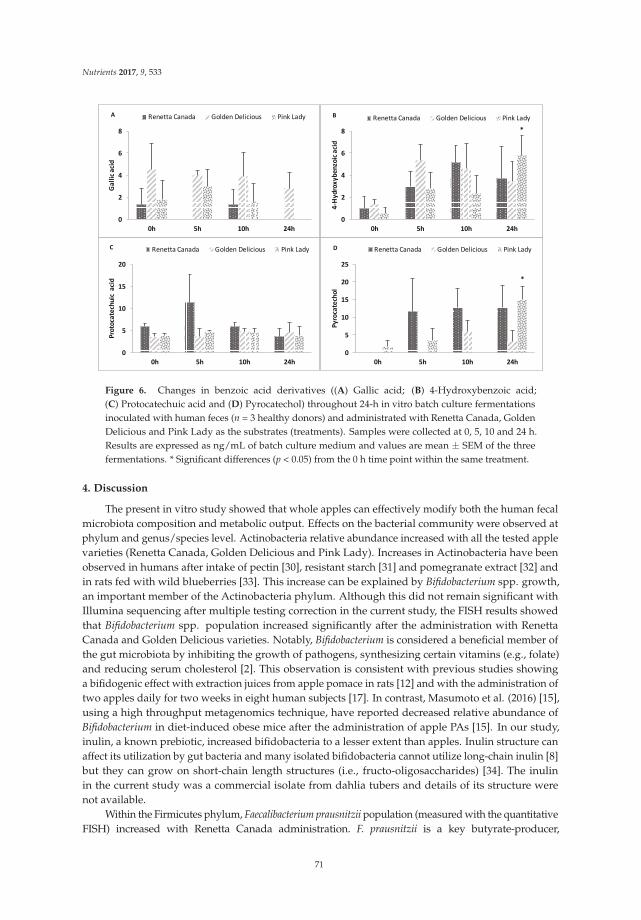
Nutrients 2017, 9, 533
0
2
4
6
8
0h 5h 10h 24h
Ga
llic
aci
dRenetta Canada Golden Delicious Pink LadyA
0
2
4
6
8
0h 5h 10h 24h
4-H
yd
rox
yb
en
zoic
aci
d
Renetta Canada Golden Delicious Pink Lady
*
B
0
5
10
15
20
0h 5h 10h 24h
Pro
toca
tech
uic
a
cid
Renetta Canada Golden Delicious Pink LadyC
0
5
10
15
20
25
0h 5h 10h 24h
Py
roca
tech
ol
Renetta Canada Golden Delicious Pink Lady
*
D
Figure 6. Changes in benzoic acid derivatives ((A) Gallic acid; (B) 4-Hydroxybenzoic acid;(C) Protocatechuic acid and (D) Pyrocatechol) throughout 24-h in vitro batch culture fermentationsinoculated with human feces (n = 3 healthy donors) and administrated with Renetta Canada, GoldenDelicious and Pink Lady as the substrates (treatments). Samples were collected at 0, 5, 10 and 24 h.Results are expressed as ng/mL of batch culture medium and values are mean ± SEM of the threefermentations. * Significant differences (p < 0.05) from the 0 h time point within the same treatment.
4. Discussion
The present in vitro study showed that whole apples can effectively modify both the human fecalmicrobiota composition and metabolic output. Effects on the bacterial community were observed atphylum and genus/species level. Actinobacteria relative abundance increased with all the tested applevarieties (Renetta Canada, Golden Delicious and Pink Lady). Increases in Actinobacteria have beenobserved in humans after intake of pectin [30], resistant starch [31] and pomegranate extract [32] andin rats fed with wild blueberries [33]. This increase can be explained by Bifidobacterium spp. growth,an important member of the Actinobacteria phylum. Although this did not remain significant withIllumina sequencing after multiple testing correction in the current study, the FISH results showedthat Bifidobacterium spp. population increased significantly after the administration with RenettaCanada and Golden Delicious varieties. Notably, Bifidobacterium is considered a beneficial member ofthe gut microbiota by inhibiting the growth of pathogens, synthesizing certain vitamins (e.g., folate)and reducing serum cholesterol [2]. This observation is consistent with previous studies showinga bifidogenic effect with extraction juices from apple pomace in rats [12] and with the administration oftwo apples daily for two weeks in eight human subjects [17]. In contrast, Masumoto et al. (2016) [15],using a high throughput metagenomics technique, have reported decreased relative abundance ofBifidobacterium in diet-induced obese mice after the administration of apple PAs [15]. In our study,inulin, a known prebiotic, increased bifidobacteria to a lesser extent than apples. Inulin structure canaffect its utilization by gut bacteria and many isolated bifidobacteria cannot utilize long-chain inulin [8]but they can grow on short-chain length structures (i.e., fructo-oligosaccharides) [34]. The inulinin the current study was a commercial isolate from dahlia tubers and details of its structure werenot available.
Within the Firmicutes phylum, Faecalibacterium prausnitzii population (measured with the quantitativeFISH) increased with Renetta Canada administration. F. prausnitzii is a key butyrate-producer,
71
Nutrients 2017, 9, 533
with anti-inflammatory properties, that may offer potential health benefits, especially in patientswith inflammatory bowel disease (IBD) [35,36]. Renetta Canada increased butyrate, a major energysource for the colonocytes, which is particularly beneficial to the gut mucosa [37]. In support of ourresults F. prausnitzii strains have been shown to utilize apple pectin for growth [8,38] and increasebutyrate concentration [13,39]. F. prausnitzii levels were unaffected by Golden Delicious and Pink Lady,and although the concentration of pectin was not determined, Renetta Canada had 19% and 44%higher soluble fiber content compared with Golden Delicious and Pink Lady, respectively. These datasuggest that at least for F. prausnitzii, pectin may have played a major role.
Bacteroidetes relative abundance decreased with inulin, Renetta Canada and Golden Delicious.Bacteroides is considered a dominant bacterial group in the large intestine and the main Bacteroidetesmember, along with the Prevotella. Licht et al. (2010) reported that both whole apples and isolatedpectin decreased Bacteroides spp. in rats compared to a control diet [13]. Moreover, Bacteroides has beenshown to decrease after the administration of other polyphenol sources, such as red wine [40] andcocoa [41] in rats, as well as with grape [42] and date extracts [43] in in vitro gut models inoculatedwith human feces. By contrast, Bacteroides species have been shown to increase with apple pomacejuice extracts [11] and PAs from Acacia angustissima [44] in rats, as well as with red wine in humans [45].
The proportion of Proteobacteria increased after the administration of Renetta Canada and GoldenDelicious but to a lesser extent compared to cellulose. However, an increase in Enterobacteriaceae family,a major member of Proteobacteria, was not observed. Enterobacteriaceae, includes numerous pathogenicbacteria genera, such as Escherichia, Salmonella and Yersinia and has been shown to increase in IBDpatients. Increased Proteobacteria with inulin [8], resistant starch [46] and de-alcoholized wine [45]has also been reported elsewhere.
Interestingly, the alpha diversity of gut microbiota, at the OTU level, was lower with the appletreatments compared to inulin or cellulose. This may indicate the selective nature of the applefermentations towards particular species. The beta diversify analysis showed a partitioning by donorand time, but not with treatment, which indicates that each individual possesses a specific startingpopulation of gut bacteria, a finding consistent with the previously described inter-individual variationin the intestinal microbiota [47,48]. However, despite the variability between donors, there were stilltreatment-associated changes in gut microbiota composition at phylum and at genus/species level.
In the present study, the conditions of the proximal colon were simulated by creatingan environment moderately acidic (pH 5.5–6.0) compared to a more neutral pH in the transverseand distal colon. The majority of the unabsorbed dietary carbohydrates are fermented in theproximal section producing SCFAs, leading to this reduced colonic pH, whereas in the distal sectioncarbohydrate fermentation is generally assumed to be low. The pH affects bacterial growth and SCFAproduction, especially among bacteria that utilize the same polysaccharides [8,49]. For example,suppression in Bacteroides spp. growth was observed at pH values below six [8]. On the other hand,F. prausnitzii is more low-pH tolerant [8]. Moreover, a lower pH tends to favor butyrate production [49].However, in our study, a significant increase in butyrate levels and F. prausnitzii population was onlyshown by Renetta Canada, indicating a treatment effect rather than a pH effect.
Pectin, the main soluble fiber found in apples, is extensively fermented by the gut microbiotato SCFAs, which are an important energy source for colonic health as well as for other tissues andorgans [2]. Apart from the aforementioned butyrate increase by Renetta Canada, all apples significantlyincreased propionate and mainly acetate. Increased SCFAs have been shown with apple pomacejuices [11,12]. Acetate serves as an energy source for the liver and peripheral tissues, but is alsoinvolved in the metabolic pathways of lipogenesis [50]. Pectin is known to produce relatively largeamounts of acetate [51], which can also be utilized by butyrate producers such as F. prausnitzii aspart of the cross feeding between bacteria [52]. A cross-feeding between Bifidobacterium strains andF. prausnitzii has been suggested, enhancing butyrate production [53]. Propionate on the other hand,may help to reduce hepatic cholesterol synthesis [54].
72
Nutrients 2017, 9, 533
The effects of polyphenols on health depend on their bioavailability. Flavanol monomers(i.e., catechin and epicatechin) are readily absorbed in the small intestine, while high molecularweight polyphenols, such as the polymeric PAs, reach the colon almost intact, where they aretransformed by the gut bacteria into a complex mixture of simple phenolic acids [55]. In the presentstudy, the degradation of precursor apple polyphenols started as early as 5 h of fermentation and wascomplete throughout the 24 h for most of the polyphenolic compounds. Renetta Canada fermentationresulted in higher degradation of precursor polyphenols due to their initial high concentration.
The formation of polyphenol microbial products represent potential beneficial bioactivemetabolites, not only locally in the gut but also systematically after their absorption in the colonand their appearance in the blood circulation. Renetta Canada was associated with the productionof 3,4-dihydroxyphenylacetic acid and hydroferulic acid, which both have shown to possessanti-inflammatory properties [56]. It has been proposed that 3,4-dihydroxyphenylacetic acid canarise from the microbial catabolism of dimeric PAs [57]. Moreover, microbial metabolites of chlorogenicacids such as dihydroferulic acid showed a high antioxidant activity in vitro [58]. These results are inline with the higher concentration of PAs and chlorogenic acid in Renetta Canada apples. Pink Ladywas associated with the formation of 3-(4-hydroxyphenyl)propionic acid and benzoic acid derivatives,in particular 4-hydroxybenzoic acid and pyrocatechol. Benzoic acids such as 4-hydroxybenzoic acidare considered to arise from beta oxidation of phenylpropionic acid derivatives and higher levelshave been found after the in vitro fermentation of grape seed flavanols [59]. Pyrocatechol may arisefrom the dehydroxylation of gallic acid [60], which has been identified as a microbial metabolite anda native compound [61]. In our study, gallic acid concentration remained unaffected throughout thefermentation. Finally, both Renetta Canada and Pink Lady apples increased 3-hydroxyphenylacetic acidconcentration. In vitro studies with human fecal inoculum are in line with the identified phenolic acids.In particular, PA catabolism has been associated with the production of 3-hydroxyphenylpropionicacid, 3-phenylpropionic acid, 4-hydroxyphenylpropionic acid and 4-hydroxyphenylacetic acid [62]as the main metabolites, whereas apples and apple components including isolated PAs formed3-(3,4-dihydroxyphenyl)propionic acid, 3-(3-hydroxyphenyl)propionic acid, 3-phenylpropionicacid, benzoic acid, 2-(3,4-dihydroxyphenyl)acetic acid and 2-(3-hydroxyphenyl)acetic acid [10].Furthermore, in human subjects, chocolate intake, a rich source of flavanols increased theurinary excretion of 3-hydroxyphenylpropionic acid, ferulic acid, 3,4-dihydroxyphenylacetic acid,3-hydroxyphenylacetic acid, vanillic acid and 3-hydroxybenzoic acid [63].
In this study, we demonstrated that whole apples could modify the gut microbiota compositionand affect the extent of degradation of soluble fiber and polyphenols through the production ofSCFAs and phenolic acids, with Renetta Canada variety showing the most beneficial effects. In vitrobatch culture models are a quick, simple and cost effective method of mimicking changes in gutmicrobiota numbers and metabolism [64], although they lack key metabolic functions, such as hostimmunological interactions, intestinal absorption and physiological components, such as epithelialmucosa, that exist in the human colon. The sample size (n = 3) is consistent with similar studiesinvestigating polyphenols extracts [22,59], prebiotics [65,66] and fruits [43,67], with observed changesconsistent with outcomes of human intervention studies [68]. Batch culture vessels contain a basalmedium with limited carbohydrate and protein sources, therefore changes in microbiota compositionand fermentation metabolites is known to be due to the added substrate, the apple varieties addedto the vessels, even with different starting bacterial populations. Finally, although, donors were ofsimilar age, with no gastrointestinal disorders, other characteristics that may affect gut microbiotacomposition such as diet, exercise and stress levels were not recorded and may have influenced theobserved results, and it is recommended that these are provided in future studies.
5. Conclusions
In conclusion, whole apples beneficially modulate the gut microbiota composition and metabolicoutput in vitro. Renetta Canada variety in particular may have positive consequences for human
73
Nutrients 2017, 9, 533
health by increasing bifidobacteria, Faecalibacterium prausnitzii population and producing SCFAs andpolyphenol microbial metabolites. It is recommended that the findings of this in vitro study should beconfirmed in human intervention trials.
Supplementary Materials: The following are available online at www.mdpi.com/2072-6643/9/5/533/s1,Figure S1: Principal coordinate analysis (PCoA) plots of 16S rRNA gene profiles based on (A) unweighted(qualitative) and (B) weighted (quantitative) phylogenetic UniFrac distance matrices, colored by time, Figure S2:Principal coordinate analysis (PCoA) plots of 16SrRNA gene profiles based on (A) unweighted (qualitative) and(B) weighted (quantitative) phylogenetic UniFrac distance matrices, colored by treatment, Figure S3: Changes incinnamic acid derivatives, Table S1: Composition analysis of Renetta Canada, Golden Delicious and Pink Lady,Table S2: Changes in bacterial taxa throughout 24-h in vitro batch culture fermentations inoculated with humanfeces (n = 3 healthy donors) and administrated with inulin, cellulose, Renetta Canada, Golden Delicious and PinkLady as the substrates, Table S3: Multiple Reaction Monitoring (MRM) conditions of precursor polyphenols andpolyphenol microbial metabolites, Table S4: Changes in precursor polyphenols throughout 24-h in vitro batchculture fermentations inoculated with human feces (n = 3 healthy donors) and administrated with inulin, cellulose,Renetta Canada, Golden Delicious and Pink Lady as the substrates.
Acknowledgments: This study was jointly funded by the University of Reading Research Endowment TrustFund, Reading, United Kingdom and Fondazione Edmund Mach, San Michele all’ Adige, Italy. We kindly thankDomenico Masuero and Evelyn Soini for measuring polyphenols in the three test apples and Silvia Carlin forhelping with the SCFA analysis.
Author Contributions: K.M.T., J.A.L., A.K. and M.L. conceived the research and designed the study. A.K. wrotethe manuscript. A.K. and M.L. performed the apple digestion and the in vitro batch cultures with the trainingof L.C. and F.F. A.K. performed the FISH analysis, the MiSeq Illumina sequencing data analysis and statisticalanalysis. A.K. performed the metabolites annotation, with the advice of L.C. and M.B. M.L. performed the SCFAanalysis. M.G., M.L. and U.V. performed the metabolomics polyphenol analysis in fermentation samples. K.M.T.and J.A.L. coordinated the overall project and provided funding. J.A.L. and K.M.T. reviewed and edited themanuscript and all authors approved the final version.
Conflicts of Interest: The authors declare no conflict of interest.
References
1. Wang, X.; Ouyang, Y.Y.; Liu, J.; Zhu, M.M.; Zhao, G.; Bao, W.; Hu, F.B. Fruit and vegetable consumptionand mortality from all causes, cardiovascular disease, and cancer: Systematic review and dose-responsemeta-analysis of prospective cohort studies. BMJ 2014, 349, 14. [CrossRef] [PubMed]
2. Koutsos, A.; Tuohy, K.M.; Lovegrove, J.A. Apples and cardiovascular health-is the gut microbiota a coreconsideration? Nutrients 2015, 7, 3959–3998. [CrossRef] [PubMed]
3. Gerhauser, C. Cancer chemopreventive potential of apples, apple juice, and apple components. Planta Med.
2008, 74, 1608–1624. [CrossRef] [PubMed]4. Monagas, M.; Urpi-Sarda, M.; Sanchez-Patan, F.; Llorach, R.; Garrido, I.; Gomez-Cordoves, C.; Andres-Lacueva, C.;
Bartolome, B. Insights into the metabolism and microbial biotransformation of dietary flavan-3-ols and thebioactivity of their metabolites. Food Funct. 2010, 1, 233–253. [CrossRef] [PubMed]
5. Ozdal, T.; Sela, D.A.; Xiao, J.B.; Boyacioglu, D.; Chen, F.; Capanoglu, E. The reciprocal interactions betweenpolyphenols and gut microbiota and effects on bioaccessibility. Nutrients 2016, 8, 36. [CrossRef] [PubMed]
6. Olano-Martin, E.; Gibson, G.R.; Rastall, R.A. Comparison of the in vitro bifidogenic properties of pectinsand pectic-oligosaccharides. J. Appl. Microbiol. 2002, 93, 505–511. [CrossRef] [PubMed]
7. Chen, J.; Liang, R.-H.; Liu, W.; Li, T.; Liu, C.-M.; Wu, S.-S.; Wang, Z.-J. Pectic-oligosaccharides prepared bydynamic high-pressure nnicrofluidization and their in vitro fermentation properties. Carbohydr. Polym. 2013,91, 175–182. [CrossRef] [PubMed]
8. Chung, W.S.F.; Walker, A.W.; Louis, P.; Parkhill, J.; Vermeiren, J.; Bosscher, D.; Duncan, S.H.; Flint, H.J.Modulation of the human gut microbiota by dietary fibres occurs at the species level. BMC Biol. 2016, 14, 13.[CrossRef] [PubMed]
9. Vrhovsek, U.; Rigo, A.; Tonon, D.; Mattivi, F. Quantitation of polyphenols in different apple varieties. J. Agric.
Food Chem. 2004, 52, 6532–6538. [CrossRef] [PubMed]10. Bazzocco, S.; Mattila, I.; Guyot, S.; Renard, C.M.G.C.; Aura, A.-M. Factors affecting the conversion of apple
polyphenols to phenolic acids and fruit matrix to short-chain fatty acids by human faecal microbiota in vitro.Eur. J. Nutr. 2008, 47, 442–452. [CrossRef] [PubMed]
74
Nutrients 2017, 9, 533
11. Sembries, S.; Dongowski, G.; Jacobasch, G.; Mehrlander, K.; Will, F.; Dietrich, H. Effects of dietary fibre-richjuice colloids from apple pomace extraction juices on intestinal fermentation products and microbiota in rats.Br. J. Nutr. 2003, 90, 607–615. [CrossRef] [PubMed]
12. Sembries, S.; Dongowski, G.; Mehrlaender, K.; Will, F.; Dietrich, H. Physiological effects of extraction juicesfrom apple, grape, and red beet pomaces in rats. J. Agric. Food Chem. 2006, 54, 10269–10280. [CrossRef][PubMed]
13. Licht, T.R.; Hansen, M.; Bergstrom, A.; Poulsen, M.; Krath, B.N.; Markowski, J.; Dragsted, L.O.; Wilcks, A.Effects of apples and specific apple components on the cecal environment of conventional rats: Role ofapple pectin. BMC Microbiol. 2010, 10. [CrossRef] [PubMed]
14. Jiang, T.; Gao, X.; Wu, C.; Tian, F.; Lei, Q.; Bi, J.; Xie, B.; Wang, H.Y.; Chen, S.; Wang, X. Apple-derived pectinmodulates gut microbiota, improves gut barrier function, and attenuates metabolic endotoxemia in rats withdiet-induced obesity. Nutrients 2016, 8, 126. [CrossRef] [PubMed]
15. Masumoto, S.; Terao, A.; Yamamoto, Y.; Mukai, T.; Miura, T.; Shoji, T. Non-absorbable apple procyanidinsprevent obesity associated with gut microbial and metabolomic changes. Sci. Rep. 2016, 6, 31208. [CrossRef][PubMed]
16. Aprikian, O.; Duclos, V.; Guyot, S.; Besson, C.; Manach, C.; Bernalier, A.; Morand, C.; Remesy, C.; Demigne, C.Apple pectin and a polyphenol-rich apple concentrate are more effective together than separately on cecalfermentations and plasma lipids in rats. J. Nutr. 2003, 133, 1860–1865. [PubMed]
17. Shinohara, K.; Ohashi, Y.; Kawasumi, K.; Terada, A.; Fujisawa, T. Effect of apple intake on fecal microbiotaand metabolites in humans. Anaerobe 2010, 16, 510–515. [CrossRef] [PubMed]
18. Ravn-Haren, G.; Dragsted, L.O.; Buch-Andersen, T.; Jensen, E.N.; Jensen, R.I.; Nemeth-Balogh, M.;Paulovicsova, B.; Bergstrom, A.; Wilcks, A.; Licht, T.R.; et al. Intake of whole apples or clear apple juice hascontrasting effects on plasma lipids in healthy volunteers. Eur. J. Nutr. 2012. [CrossRef] [PubMed]
19. Vrhovsek, U.; Masuero, D.; Gasperotti, M.; Franceschi, P.; Caputi, L.; Viola, R.; Mattivi, F. A versatile targetedmetabolomics method for the rapid quantification of multiple classes of phenolics in fruits and beverages.J. Agric. Food Chem. 2012, 60, 8831–8840. [CrossRef] [PubMed]
20. Gasperotti, M.; Masuero, D.; Guella, G.; Mattivi, F.; Vrhovsek, U. Development of a targeted method fortwenty-three metabolites related to polyphenol gut microbial metabolism in biological samples, using speand uhplc-esi-ms/ms. Talanta 2014, 128, 221–230. [CrossRef] [PubMed]
21. Mandalari, G.; Faulks, R.M.; Rich, G.T.; Lo Turco, V.; Picout, D.R.; Lo Curto, R.B.; Bisignano, G.; Dugo, P.;Dugo, G.; Waldron, K.W.; et al. Release of protein, lipid, and vitamin e from almond seeds during digestion.J. Agric. Food Chem. 2008, 56, 3409–3416. [CrossRef] [PubMed]
22. Sanchez-Patan, F.; Cueva, C.; Monagas, M.; Walton, G.E.; Gibson, G.R.; Quintanilla-Lopez, J.E.;Lebron-Aguilar, R.; Martin-Alvarez, P.J.; Moreno-Arribas, M.V.; Bartolome, B. In vitro fermentation ofa red wine extract by human gut microbiota: Changes in microbial groups and formation of phenolicmetabolites. J. Agric. Food Chem. 2012, 60, 2136–2147. [CrossRef] [PubMed]
23. Caporaso, J.G.; Kuczynski, J.; Stombaugh, J.; Bittinger, K.; Bushman, F.D.; Costello, E.K.; Fierer, N.; Pena, A.G.;Goodrich, J.K.; Gordon, J.I.; et al. Qiime allows analysis of high-throughput community sequencing data.Nat. Methods 2010, 7, 335–336. [CrossRef] [PubMed]
24. Aronesty, E. Comparison of sequencing utilitiy programs. Open Bioinform. J. 2013, 7, 1–8. [CrossRef]25. Edgar, R.C. Search and clustering orders of magnitude faster than blast. Bioinformatics 2010, 26, 2460–2461.
[CrossRef] [PubMed]26. Langendijk, P.S.; Schut, F.; Jansen, G.J.; Raangs, G.C.; Kamphuis, G.R.; Wilkinson, M.H.F.; Welling, G.W.
Quantitative fluorescence in-situ hybridization of Bifidobacterium spp. with genus-specific 16sribosomal-rna-targeted probes and its application in fecal samples. Appl. Environ. Microbiol. 1995, 61,3069–3075. [PubMed]
27. Hold, G.L.; Schwiertz, A.; Aminov, R.I.; Blaut, M.; Flint, H.J. Oligonucleotide probes that detect quantitativelysignificant groups of butyrate-producing bacteria in human feces. Appl. Environ. Microbiol. 2003, 69, 4320–4324.[CrossRef] [PubMed]
28. Daims, H.; Stoecker, K.; Wagner, M. Fluorescence In Situ Hybridization for the detection of prokaryotes.In Molecular Microbial Ecology; Osborn, A.M., Smith, C.J., Eds.; Taylor & Francis: New York, NY, USA, 2005.
75
Nutrients 2017, 9, 533
29. Zhao, G.H.; Nyman, M.; Jonsson, J.A. Rapid determination of short-chain fatty acids in colonic contentsand faeces of humans and rats by acidified water-extraction and direct-injection gas chromatography.Biomed. Chromatogr. 2006, 20, 674–682. [CrossRef] [PubMed]
30. Yang, J.; Martinez, I.; Walter, J.; Keshavarzian, A.; Rose, D.J. In vitro characterization of the impact of selecteddietary fibers on fecal microbiota composition and short chain fatty acid production. Anaerobe 2013, 23, 74–81.[CrossRef] [PubMed]
31. Martinez, I.; Kim, J.; Duffy, P.R.; Schlegel, V.L.; Walter, J. Resistant starches types 2 and 4 have differentialeffects on the composition of the fecal microbiota in human subjects. PLoS ONE 2010, 5, 11. [CrossRef][PubMed]
32. Li, Z.P.; Henning, S.M.; Lee, R.P.; Lu, Q.Y.; Summanen, P.H.; Thames, G.; Corbett, K.; Downes, J.; Tseng, C.H.;Finegold, S.M.; et al. Pomegranate extract induces ellagitannin metabolite formation and changes stoolmicrobiota in healthy volunteers. Food Funct. 2015, 6, 2487–2495. [CrossRef] [PubMed]
33. Lacombe, A.; Li, R.W.; Klimis-Zacas, D.; Kristo, A.S.; Tadepalli, S.; Krauss, E.; Young, R.; Wu, V.C.H.Lowbush wild blueberries have the potential to modify gut microbiota and xenobiotic metabolism in the ratcolon. PLoS ONE 2013, 8, 8. [CrossRef] [PubMed]
34. Rossi, M.; Corradini, C.; Amaretti, A.; Nicolini, M.; Pompei, A.; Zanoni, S.; Matteuzzi, D. Fermentationof fructooligosaccharides and inulin by bifidobacteria: A comparative study of pure and fecal cultures.Appl. Environ. Microbiol. 2005, 71, 6150–6158. [CrossRef] [PubMed]
35. Sokol, H.; Pigneur, B.; Watterlot, L.; Lakhdari, O.; Bermudez-Humaran, L.G.; Gratadoux, J.-J.; Blugeon, S.;Bridonneau, C.; Furet, J.-P.; Corthier, G.; et al. Faecalibacterium prausnitzii is an anti-inflammatorycommensal bacterium identified by gut microbiota analysis of crohn disease patients. Proc. Natl. Acad.
Sci. USA 2008, 105, 16731–16736. [CrossRef] [PubMed]36. Machiels, K.; Joossens, M.; Sabino, J.; De Preter, V.; Arijs, I.; Eeckhaut, V.; Ballet, V.; Claes, K.; Van Immerseel, F.;
Verbeke, K.; et al. A decrease of the butyrate-producing species roseburia hominis and faecalibacteriumprausnitzii defines dysbiosis in patients with ulcerative colitis. Gut 2014, 63, 1275–1283. [CrossRef] [PubMed]
37. Pryde, S.E.; Duncan, S.H.; Hold, G.L.; Stewart, C.S.; Flint, H.J. The microbiology of butyrate formation in thehuman colon. FEMS Microbiol. Lett. 2002, 217, 133–139. [CrossRef] [PubMed]
38. Lopez-Siles, M.; Khan, T.M.; Duncan, S.H.; Harmsen, H.J.M.; Garcia-Gil, L.J.; Flint, H.J.Cultured representatives of two major phylogroups of human colonic faecalibacterium prausnitzii canutilize pectin, uronic acids, and host-derived substrates for growth. Appl. Environ. Microbiol. 2012, 78,420–428. [CrossRef] [PubMed]
39. Waldecker, M.; Kautenburger, T.; Daumann, H.; Busch, C.; Schrenk, D. Inhibition of histone-deacetylaseactivity by short-chain fatty acids and some polyphenol metabolites formed in the colon. J. Nutr. Biochem.
2008, 19, 587–593. [CrossRef] [PubMed]40. Dolara, P.; Luceri, C.; de Filippo, C.; Femia, A.P.; Giovannelli, L.; Caderni, G.; Cecchini, C.; Silvi, S.;
Orpianesi, C.; Cresci, A. Red wine polyphenols influence carcinogenesis, intestinal microflora, oxidativedamage and gene expression profiles of colonic mucosa in f344 rats. Mutat. Res.-Fundam. Mol. Mech. Mutag.
2005, 591, 237–246. [CrossRef] [PubMed]41. Massot-Cladera, M.; Perez-Berezo, T.; Franch, A.; Castell, M.; Perez-Cano, F.J. Cocoa modulatory effect on rat
faecal microbiota and colonic crosstalk. Arch. Biochem. Biophys. 2012, 527, 105–112. [CrossRef] [PubMed]42. Kemperman, R.A.; Gross, G.; Mondot, S.; Possemiers, S.; Marzorati, M.; van de Wiele, T.; Dore, J.;
Vaughan, E.E. Impact of polyphenols from black tea and red wine/grape juice on a gut model microbiome.Food Res. Int. 2013, 53, 659–669. [CrossRef]
43. Eid, N.; Enani, S.; Walton, G.; Corona, G.; Costabile, A.; Gibson, G.; Rowland, I.; Spencer, J.P. The impact ofdate palm fruits and their component polyphenols, on gut microbial ecology, bacterial metabolites and coloncancer cell proliferation. J. Nutr. Sci. 2014, 3, e46. [CrossRef] [PubMed]
44. Smith, A.H.; Mackie, R.I. Effect of condensed tannins on bacterial diversity and metabolic activity in the ratgastrointestinal tract. Appl. Environ. Microbiol. 2004, 70, 1104–1115. [CrossRef] [PubMed]
76
Nutrients 2017, 9, 533
45. Isabel Queipo-Ortuno, M.; Boto-Ordonez, M.; Murri, M.; Miguel Gomez-Zumaquero, J.; Clemente-Postigo, M.;Estruch, R.; Cardona Diaz, F.; Andres-Lacueva, C.; Tinahones, F.J. Influence of red wine polyphenols andethanol on the gut microbiota ecology and biochemical biomarkers. Am. J. Clin. Nutr. 2012, 95, 1323–1334.[CrossRef] [PubMed]
46. Lyte, M.; Chapel, A.; Lyte, J.M.; Ai, Y.F.; Proctor, A.; Jane, J.L.; Phillips, G.J. Resistant starch alters themicrobiota-gut brain axis: Implications for dietary modulation of behavior. PLoS ONE 2016, 11, 22. [CrossRef][PubMed]
47. Walker, A.W.; Ince, J.; Duncan, S.H.; Webster, L.M.; Holtrop, G.; Ze, X.L.; Brown, D.; Stares, M.D.; Scott, P.;Bergerat, A.; et al. Dominant and diet-responsive groups of bacteria within the human colonic microbiota.ISME J. 2011, 5, 220–230. [CrossRef] [PubMed]
48. Salonen, A.; Lahti, L.; Salojarvi, J.; Holtrop, G.; Korpela, K.; Duncan, S.H.; Date, P.; Farquharson, F.;Johnstone, A.M.; Lobley, G.E.; et al. Impact of diet and individual variation on intestinal microbiotacomposition and fermentation products in obese men. ISME J. 2014, 8, 2218–2230. [CrossRef] [PubMed]
49. Walker, A.W.; Duncan, S.H.; McWilliam Leitch, E.C.; Child, M.W.; Flint, H.J. Ph and peptide supply canradically alter bacterial populations and short-chain fatty acid ratios within microbial communities from thehuman colon. Appl. Environ. Microbiol. 2005, 71, 3692–3700. [CrossRef] [PubMed]
50. Zambell, K.L.; Fitch, M.D.; Fleming, S.E. Acetate and butyrate are the major substrates for de novo lipogenesisin rat colonic epithelial cells. J. Nutr. 2003, 133, 3509–3515. [PubMed]
51. Onumpai, C.; Kolida, S.; Bonnin, E.; Rastall, R.A. Microbial utilization and selectivity of pectin fractions withvarious structures. Appl. Environ. Microbiol. 2011, 77, 5747–5754. [CrossRef] [PubMed]
52. Duncan, S.H.; Barcenilla, A.; Stewart, C.S.; Pryde, S.E.; Flint, H.J. Acetate utilization and butyrylcoenzyme a (coa): Acetate-coa transferase in butyrate-producing bacteria from the human large intestine.Appl. Environ. Microbiol. 2002, 68, 5186–5190. [CrossRef] [PubMed]
53. Rios-Covian, D.; Gueimonde, M.; Duncan, S.H.; Flint, H.J.; de los Reyes-Gavilan, C.G. Enhanced butyrateformation by cross-feeding between faecalibacterium prausnitzii and bifidobacterium adolescentis.FEMS Microbiol. Lett. 2015, 362. [CrossRef] [PubMed]
54. Cheng, H.H.; Lai, M.H. Fermentation of resistant rice starch produces propionate reducing serum andhepatic cholesterol in rats. J. Nutr. 2000, 130, 1991–1995. [PubMed]
55. Velderrain-Rodriguez, G.R.; Palafox-Carlos, H.; Wall-Medrano, A.; Ayala-Zavala, J.F.; Chen, C.Y.O.;Robles-Sanchez, M.; Astiazaran-Garcia, H.; Alvarez-Parrilla, E.; Gonzalez-Aguilar, G.A. Phenolic compounds:Their journey after intake. Food Funct. 2014, 5, 189–197. [CrossRef] [PubMed]
56. Larrosa, M.; Luceri, C.; Vivoli, E.; Pagliuca, C.; Lodovici, M.; Moneti, G.; Dolara, P. Polyphenol metabolitesfrom colonic microbiota exert anti-inflammatory activity on different inflammation models. Mol. Nutr.
Food Res. 2009, 53, 1044–1054. [CrossRef] [PubMed]57. Appeldoorn, M.M.; Vincken, J.P.; Aura, A.M.; Hollman, P.C.H.; Gruppen, H. Procyanidin dimers are
metabolized by human microbiota with 2-(3,4-dihydroxyphenyl)acetic acid and 5-(3,4-dihydroxyphenyl)-gamma-valerolactone as the major metabolites. J. Agric. Food Chem. 2009, 57, 1084–1092. [CrossRef] [PubMed]
58. Gomez-Ruiz, J.A.; Leake, D.S.; Ames, J.M. In vitro antioxidant activity of coffee compounds and theirmetabolites. J. Agric. Food Chem. 2007, 55, 6962–6969. [CrossRef] [PubMed]
59. Cueva, C.; Sanchez-Patan, F.; Monagas, M.; Walton, G.E.; Gibson, G.R.; Martin-Alvarez, P.J.; Bartolome, B.;Moreno-Arribas, M.V. In vitro fermentation of grape seed flavan-3-ol fractions by human faecal microbiota:Changes in microbial groups and phenolic metabolites. FEMS Microbiol. Ecol. 2013, 83, 792–805. [CrossRef][PubMed]
60. Selma, M.V.; Espin, J.C.; Tomas-Barberan, F.A. Interaction between phenolics and gut microbiota: Role inhuman health. J. Agric. Food Chem. 2009, 57, 6485–6501. [CrossRef] [PubMed]
61. Dall’Asta, M.; Calani, L.; Tedeschi, M.; Jechiu, L.; Brighenti, F.; Del Rio, D. Identification of microbialmetabolites derived from in vitro fecal fermentation of different polyphenolic food sources. Nutrition 2012,28, 197–203. [CrossRef] [PubMed]
62. Deprez, S.; Brezillon, C.; Rabot, S.; Philippe, C.; Mila, I.; Lapierre, C.; Scalbert, A. Polymeric proanthocyanidinsare catabolized by human colonic microflora into low-molecular-weight phenolic acids. J. Nutr. 2000, 130,2733–2738. [PubMed]
77
Nutrients 2017, 9, 533
63. Rios, L.Y.; Gonthier, M.P.; Remesy, C.; Mila, L.; Lapierre, C.; Lazarus, S.A.; Williamson, G.; Scalbert, A.Chocolate intake increases urinary excretion of polyphenol-derived phenolic acids in healthy human subjects.Am. J. Clin. Nutr. 2003, 77, 912–918. [PubMed]
64. Williams, C.F.; Walton, G.E.; Jiang, L.; Plummer, S.; Garaiova, I.; Gibson, G.R. Comparative analysis ofintestinal tract models. In Annual Review of Food Science and Technology; Doyle, M.P., Klaenhammer, T.R., Eds.;Annual Reviews: Palo Alto, CA, USA, 2015; Volume 6, pp. 329–350.
65. Johnson, L.P.; Walton, G.E.; Psichas, A.; Frost, G.S.; Gibson, G.R.; Barraclough, T.G. Prebiotics modulatethe effects of antibiotics on gut microbial diversity and functioning in vitro. Nutrients 2015, 7, 4480–4497.[CrossRef] [PubMed]
66. Rodrigues, D.; Walton, G.; Sousa, S.; Rocha-Santos, T.A.P.; Duarte, A.C.; Freitas, A.C.; Gomes, A.M.P.In vitro fermentation and prebiotic potential of selected extracts from seaweeds and mushrooms. LWT -Food
Sci. Technol. 2016, 73, 131–139. [CrossRef]67. Blatchford, P.; Stoklosinski, H.; Walton, G.; Swann, J.; Gibson, G.; Gearry, R.; Ansell, J. Kiwifruit fermentation
drives positive gut microbial and metabolic changes irrespective of initial microbiota composition.Bioact. Carbohydr. Diet. Fibre 2015, 6, 37–45. [CrossRef]
68. Walton, G.E.; van den Heuvel, E.; Kosters, M.H.W.; Rastall, R.A.; Tuohy, K.M.; Gibson, G.R. A randomisedcrossover study investigating the effects of galacto-oligosaccharides on the faecal microbiota in men andwomen over 50 years of age. Br. J. Nutr. 2012, 107, 1466–1475. [CrossRef] [PubMed]
© 2017 by the authors. Licensee MDPI, Basel, Switzerland. This article is an open accessarticle distributed under the terms and conditions of the Creative Commons Attribution(CC BY) license (http://creativecommons.org/licenses/by/4.0/).
78
nutrients
Review
Cell-Surface and Nuclear Receptors in the Colon asTargets for Bacterial Metabolites and Its Relevance toColon Health
Sathish Sivaprakasam, Yangzom D. Bhutia, Sabarish Ramachandran and Vadivel Ganapathy *
Department of Cell Biology and Biochemistry, Texas Tech University Health Sciences Center,Lubbock, TX 79430, USA; [email protected] (S.S.); [email protected] (Y.D.B.);[email protected] (S.R.)* Correspondence: [email protected]; Tel.: +1-806-743-2518
Received: 27 June 2017; Accepted: 5 August 2017; Published: 10 August 2017
Abstract: The symbiotic co-habitation of bacteria in the host colon is mutually beneficial toboth partners. While the host provides the place and food for the bacteria to colonize and live,the bacteria in turn help the host in energy and nutritional homeostasis, development andmaturation of the mucosal immune system, and protection against inflammation and carcinogenesis.In this review, we highlight the molecular mediators of the effective communication betweenthe bacteria and the host, focusing on selective metabolites from the bacteria that serve asmessengers to the host by acting through selective receptors in the host colon. These bacterialmetabolites include the short-chain fatty acids acetate, propionate, and butyrate, the tryptophandegradation products indole-3-aldehyde, indole-3-acetic, acid and indole-3-propionic acid, andderivatives of endogenous bile acids. The targets for these bacterial products in the host include thecell-surface G-protein-coupled receptors GPR41, GPR43, and GPR109A and the nuclear receptors arylhydrocarbon receptor (AhR), pregnane X receptor (PXR), and farnesoid X receptor (FXR). The chemicalcommunication between these bacterial metabolite messengers and the host targets collectively hasthe ability to impact metabolism, gene expression, and epigenetics in colonic epithelial cells aswell as in mucosal immune cells. The end result, for the most part, is the maintenance of optimalcolonic health.
Keywords: colonic bacteria; symbiotic relationship; bacterial metabolites; molecular targets;cell-surface receptors; nuclear receptors; immune tolerance; colitis; colon cancer
1. Introduction
Over millions of years, humans have co-evolved with microorganisms through co-habitation.Adult human harbors microflora that is equal or even greater than their human cells in number [1,2].These microorganisms colonize different parts of the body that are exposed to external environment,which include skin, oral cavity, airway lumen, intestinal tract, and vagina. Among these, the colonis the site where the microorganisms are most abundant, with bacteria as the principal component.There are 800–1000 different species of colonic bacteria under normal physiological conditions, but thepresence or absence of specific strains and the relative abundance of any given strain might varyfrom individual to individual, primarily influenced by the environmental factors such as the diet,air and water quality, medications, and mode of delivery (vaginal or Cesarean section) [3]. Because ofthe impact of multiple variables, the colonic bacteria might not remain the same even in a givenindividual over a long period of time. Despite these interpersonal variations, colonic bacteria arein general dominated by two phyla: Bacteroidetes and Firmicutes [4,5]. Normal microflora in thecolon elicit significant influence on the host, in the colon and in other organs. Recent studies have
Nutrients 2017, 9, 856 79 www.mdpi.com/journal/nutrients
Nutrients 2017, 9, 856
implicated colonic bacteria in brain function (gut-brain axis), liver function (gut-liver axis), mucosaland systemic immune function, diabetes (type 1 and type 2) (gut-pancreas axis), nutrition and obesity,and cardiovascular diseases [6–10]. This broad spectrum of biological impact of colonic bacteria onthe host is possible because of active communication between the two co-habitants. The impact ofcolonic bacteria on the host is not limited locally to the colon because of the changes the bacteriabring in terms of gene expression and biological function in colonic epithelial cells as well as mucosalimmune cells. The colon releases a wide variety of biologically active molecules into circulation inresponse to changes in the density and phylogenic makeup of the bacterial population; these activemolecules include hormones and cytokines that impact on the functions of distant organs including theliver, pancreas, and brain. Similarly, mucosal immune cells are also influenced in their behavior andfunction in response to colonic bacteria, which then travel to distant sites to modulate immune functionand disease processes [11,12]. Furthermore, colonic bacteria themselves elaborate different classes ofmetabolites, which enter the portal and systemic circulations to regulate the biology of cells and tissuesat distant sites through specific molecular targets that include enzymes and receptors [10,13,14].
Because of its close proximity to the bacteria, the colon is the most influenced organ as theresult of this co-habitation. The presence of bacteria in the colon is absolutely necessary for optimalcolonic health; normal bacteria in the colon offer protection against inflammation and cancer. As such,the beneficial effects of colonic bacteria are undeniable. Any imbalance in the normal density andphylogenetic composition in colonic bacteria, generally referred to as dysbiosis, is detrimental tocolonic health [15–18]. Inflammatory bowel diseases (IBD) are chronic inflammatory disorders ofthe intestinal tract that develop as a result of deregulation of the immune response toward theintestinal/colonic bacteria. In particular, there is a marked decrease in the colonization of Firmicutesand Bacteroidetes in the gut microbiota in association with IBD. Crohn’s disease and ulcerative colitisare the two major types of IBD, which are distinct diseases with different histological features andetiology that involve different immune cell types. Animal studies have shown that neither of thesediseases develops under germ-free conditions, indicating that the presence of bacteria is obligatoryfor the disease process [19,20]. The findings that normal bacteria are essential for colonic health andthat IBD does not develop in the absence of bacteria are not necessarily contradictory. The epithelialcells of the intestine/colon form an effective barrier between the bacteria and the host, and thecommunication between the two co-habitants occurs solely via chemical messengers to make sure thatthe mucosal immune system is not overly active in response to the bacterial antigens. However, if thebarrier function is compromised for any reason, the ability of the mucosal immune system to toleratethe bacteria is at risk [21–23]. What causes the breakdown of the barrier in IBD is not completelyunderstood, but changes in the normal bacterial phylogenetic composition are believed to be majordeterminants in the process. When the phylogenetic composition (i.e., dysbiosis) is altered in the colon,the chemical communication between the bacteria and the host also undergoes changes, thus initiatingthe inflammatory disease process. This phenomenon is also relevant to carcinogenesis in the colonbecause chronic inflammation as occurs in ulcerative colitis increases the risk of colorectal cancer [24].
2. Relationship between Microbiota and the Host: Parasitism, Commensalism, or Mutualism?
The relationship between the host and the microbiota could fall into three categories—parasitism,commensalism, and mutualism—depending on the specifics of the interaction. In parasitism, one ofthe co-habitants gets the benefits, while the other is harmed. In commensalism, one of the co-habitantsreaps the benefits, while the co-habitation is neither beneficial nor harmful to the other partner.In mutualism, both partners get the benefits from the co-existence. The relationship between thehost and the colonic bacteria falls under the third category, mutualism. The benefits to the bacteriaas a result of this co-habitation include the availability of the colonic lumen for colonization andproliferation and provision of the nutrients by the host necessary for survival and growth. The hostalso benefits from the relationship [25–27]. Colonic bacteria synthesize a variety of vitamins (folic acid,biotin, vitamin K, etc.) that are made available to the host. The principal fermentation products
80
Nutrients 2017, 9, 856
of bacterial metabolism, called short-chain fatty acids, that are present in normal colonic lumen atconcentrations as high as 100 mM serve as preferential metabolic fuel to colonic epithelial cells [28].These short-chain fatty acids also function as signaling molecules eliciting a broad range of biologicaleffects in colonic epithelium by targeting enzymes such histone deacetylases (HDACs), cell-surfacereceptors such as GPR109A and GPR43, and nuclear receptors such as AhR, PXR, FXR, and peroxisomeproliferator-activated receptors (PPARs) [29]. The end result of this mutually beneficial co-habitationis a symbiotic relationship between the two partners. Notwithstanding this overwhelming evidencefor mutualism between the host and colonic bacteria, too many investigators and published reportsstill continue to describe the relationship between the host and the bacteria as commensalism and thebacteria as commensals [30–32]. Surprisingly, the terms “commensalism” and “commensals” appeareven in publications that provide data in support of the mutually beneficial relationship between thehost and the colonic bacteria [25,30–32].
3. Bacterial Dysbiosis as a Cause of Colonic Diseases
Dysbiosis in the colon is a critical determinant in the pathogenesis of IBD. Research oncolitis induction in germ-free mice with introduction of specific strains of bacteria has shownthat microbial dysbiosis, rather than genetic factors, is the major factor for IBD pathogenesis.Many genetically-engineered mouse models that develop spontaneous colitis in the presence of bacteriain the colon are resistant to colitis when raised under germ-free conditions [33,34]. This suggeststhat the presence of bacteria in the intestinal tract is a critical requirement for IBD development.Most animal models of colitis show altered bacterial composition in the colon, providing evidence ofdysbiosis [16,35]. However, the link between dysbiosis and IBD is only associative, and the cause-effectrelationship has not yet been established beyond doubt. Nonetheless, administration of probiotics topatients with colonic inflammation has beneficial effects in terms of slowing or preventing progressionof the disease process [36–38]. As these probiotics tend to favor colonization of normal bacterial floraand suppress the growth of pathogenic bacteria in the colon, the preventive effects of probiotics suggesteffective reversal of the disease-associated dysbiosis and may actually point to a mechanistic model inwhich the dysbiosis is most likely the cause, rather than the result, of colonic inflammation [37,39,40].
4. Bacterial Metabolites with Impact on the Host: Relevance to Colitis and Colon Cancer
The communication between colonic bacteria and the host could be contact-dependent as well ascontact-independent. The phylogenetic composition of the microflora in colonic lumen is not exactlythe same as that of the microflora on the surface of the colonic epithelium. Which bacterial strainsadhere to the colonic epithelial cells depends on multiple factors such as the presence or absenceof cell-surface receptors for a given strain, ability of bacterial strains to traverse the thick mucinpresent on the luminal surface of the epithelial cell layer, as well as susceptibility of the bacterialstrains to the bactericidal and bacteriostatic actions of the various molecules secreted by the epithelialcells and mucosal immune cells. The physical contact followed by insertion of specific bacterialproteins into the epithelial cell membrane could elicit signaling changes in the epithelium as a meansof communication. Another mode of communication, probably more prevalent than the former,is through metabolites released into the lumen from live bacteria or from dead bacterial cells. The colonprovides a favorable environment for anaerobic microbial growth, resulting in fermentation by residentbacteria of dietary constituents that reach the colon. The microbiota population in the colon is highlyvariable depending on the intestinal physiology, substrate availability, oxygen tension, and pH [28].As a result, the microorganisms present in the colon are not the same all through the length of thelarge intestine. The phylogenetic composition of the bacteria is significantly different between theproximal colon and the distal colon [41]. As the metabolites elaborated by these bacteria depend onthe repertoire of metabolic pathways in a given strain of the bacteria, different regions of the colon areexposed to different bacterial metabolites and hence respond differently. Furthermore, the phylogeneticcomposition of the colonic bacteria varies from individual to individual and also in the same individual
81
Nutrients 2017, 9, 856
in health and disease; this again impacts the biological response of the host colon to the presence ofbacteria that could be significantly different on an individual basis and also depend on the healthstatus of the individual.
Among these bacterial metabolites responsible for communication between the bacteria and thehost, short-chain fatty acids (SCFAs) have received the most attention [42–45]. SCFAs are organic acidsconsisting of 2–4 carbon atoms. The principal components of SCFAs are acetate (C2), propionate (C3),and butyrate (C4). These fatty acids arise in the colon by bacterial fermentation of carbohydrates thatreach the colon either in the form of dietary fiber or due to ineffective digestion and absorption in thesmall intestine. The relative ratio of acetate, propionate, and butyrate in colon is 6:3:1, and the totalconcentration of these three SCFAs in colonic lumen is in the range of 50–100 mM. SCFAs serve asan important energy source for colonocytes. These fatty acids enter the colonic epithelium across thelumen–facing apical membrane by diffusion, anion-exchange, H+/SCFA− symport, and Na+/SCFA−
symport [46–49]. The relative contributions of each of these entry mechanisms might vary dependingon the luminal concentrations of SCFAs because of the marked differences in the substrate affinitiesfor the transport processes. Under physiological conditions with luminal concentrations of SCFAs inthe range of 50–100 mM, diffusion is probably the major entry mechanism. When the concentrationsdecrease due to changes in the dietary intake of fibers or due to dysbiosis under disease conditions,the carrier-mediated entry mechanisms probably play the major role. Irrespective of the entrymechanism, most of the SCFAs generated by the bacteria are absorbed in the colon, with only aminimal amount excreted in feces. The biological effects of SCFAs in the colon are not restrictedto their role as energy substrates for the epithelial cells. These bacterial metabolites promote waterand electrolyte absorption in the colon, thus providing protection against potential diarrheagenicdiseases [48]. They also modulate the mucosal immune system by helping the development of atolerant environment to facilitate the co-habitation of the bacteria and the host [50–52]. They aid in themaintenance of the mucosal barrier, thus preventing the direct exposure of systemic organs to colonicbacteria. SCFAs also suppress colonic inflammation and carcinogenesis [43,46,53–56].
As the cell-surface receptors for SCFAs are located on the lumen-facing apical membrane ofcolonic epithelial cells (see below), the luminal concentrations of these agonists are physiologicallyrelevant. SCFAs are low-affinity agonists for these receptors, and the normal luminal concentrationsof these bacterial metabolites are in the millimolar levels, sufficient to activate these receptorsfrom the luminal side. However, some of the molecular targets for these metabolites are eitherinside the cells (e.g., HDACs) or on the surface of the immune cells located in the lamina propria.Therefore, concentrations of these metabolites inside the colonic epithelial cells and in the laminapropria are relevant to impact these molecular targets. The intracellular target HDAC is inhibited bybutyrate and propionate at low micromolar concentrations. There are effective transport systems forSCFAs in the apical membrane of colonic epithelial cells (e.g., proton-coupled and sodium-coupledmonocarboxylate transporters) [47], thus making it very likely for these SCFAs to reach intracellularlevels sufficient to inhibit HDACs. Even though the luminal concentrations of SCFAs are in themillimolar range, it is unlikely that they reach lamina propria at significant levels to activate thecell-surface receptors present on the mucosal immune cells. These metabolites are present only atmicromolar levels in the portal blood [57], indicating that they undergo robust metabolism inside thecolonic epithelial cells. This raises the question as to the physiological relevance of these bacterialmetabolites to the activation of the cell-surface SCFA receptors in immune cells located in the laminapropria. With regard to this issue, it is important to note that colonic epithelial cells are highly ketogenic;they use acetate and butyrate to generate the ketone body β-hydroxybutyrate [58]. This ketone body isreleased from the cells into portal blood. As β-hydroxybutyrate is 3–4 times more potent than butyratein activating its receptor GPR109A, it can be speculated that the colon-derived ketone body is mostlikely involved in the activation of the SCFA receptor in mucosal immune cells.
Lactate is another bacterial metabolite that is important to colonic health but has received muchless attention than the SCFAs. Lactobacilli that generate lactate as a fermentation product form a
82
Nutrients 2017, 9, 856
significant constituent of normal bacterial flora in the colon. As such, in addition to the dietary sourcesof lactate from yogurt and other dairy products, bacterial metabolism constitutes an important sourceof lactate in the colonic lumen [36,59].
Bacterial metabolites arising from protein catabolism are receiving increasing attention in recentyears, particularly the metabolites resulting from tryptophan degradation [60,61]. This includesindole, indole-3-aldehyde, indole-3-acetic acid, and indole-3-propionic acid. These metabolites alsoelicit beneficial effects on the host colon; they suppress inflammation and carcinogenesis [14,62].Another important class of bacterial metabolites that impact on colonic health is the secondary bileacids [63]. Liver synthesizes two different bile acids, namely cholic acid and chenodeoxycholic acid,which are called primary bile acids. These bile acids are secreted into the bile and reach the smallintestine to facilitate the digestion and absorption of dietary fat. Almost 95% of these bile acids arereabsorbed in the ileum to undergo entero-hepatic circulation. The remaining bile acids reach thecolon where the resident bacteria metabolize them into secondary bile acids (deoxycholic acid andlithocholic acid). The bacteria-generated secondary bile acids get absorbed in the colon and enter theentero-hepatic circulation similar to the primary bile acids produced by the liver. Colonic bacteriaalso act on dietary lipids, generating metabolites such as conjugated linoleic and linolenic acidsand trimethylamine [64–66]. All these molecules have marked biological effects on the host colon.In addition to these metabolites, the bacterial cell-wall components such as lipopolysaccharide,peptidoglycans, and polysaccharide A also serve signaling molecules in the colon.
5. Molecular Targets for Bacterial Metabolites in the Host
Even though the beneficial effects of colonic bacteria and their metabolites on the host havebeen recognized for a long time, it was not until recently that we began to understand the molecularmechanisms that underlie this important biological phenomenon. This was true even in the case ofSCFAs for which there is a long history of investigations focusing on the role of these bacterialmetabolites as the molecular link between colonic bacteria and the host. Inhibition of histonedeacetylases (HDACs) by the SCFA butyrate is an exception; HDAC is probably the first moleculartarget discovered for bacterial metabolites in the colon to provide a mechanistic insight into thecommunication between colonic bacteria and the host [67]. HDACs are enzymes that modulate theepigenetics of the target cells, including the colonic epithelium. Butyrate is an inhibitor of HDAC1 andHDAC3, which belong to class I HDACs [68,69]. Propionate also possesses this inhibitory effect [68,69].There is overwhelming evidence in the literature for overexpression of HDACs in cancer and for thetherapeutic rationale and efficacy of HDAC inhibitors in cancer treatment [70,71]. As such, the biologicphenomenon of protection against colon carcinogenesis by SCFAs can be explained, at least in part, bythe functions of butyrate and propionate as inhibitors of HDACs. This also provided a mechanisticexplanation for the tumor-suppressive function of the Na+-coupled SCFA transporter SMCT1 (SLC5A8)in the colon [46]. HDACs being intracellular enzymes, entry of SCFAs from the lumen into colonicepithelial cells is a prerequisite for these bacterial metabolites to reach their molecular targets insidethe cells. As inhibition of HDACs causes tumor suppression, it is understandable why the transporterthat facilitates this process functions as a tumor suppressor.
In the past decade, we have witnessed a burgeoning of literature describing identification ofnew and novel molecular targets in the colon for bacterial metabolites [29,50,51,60,61]. These newdiscoveries have expanded our current understanding and knowledge of the molecular mechanismsas the basis of effective communication between the colonic bacteria and the host. The newly identifiedmolecular targets include the cell-surface G-protein-coupled receptors GPR109A, GPR43, GPR41,GPR 81, and GPR91, and the nuclear receptors AhR (aryl hydrocarbon receptor), PXR (pregnane Xreceptor), and FXR (farnesoid X receptor). Table 1 lists the bacterial metabolites and the correspondingendogenous metabolites that function as agonists for each of these molecular targets. There areadditional molecular targets for bacterial metabolites such as the receptors for bacterial cell-wallcomponents (TLR4 for lipopolysaccharide, NOD1/NOD2 for peptidoglycans, and TLR2 for
83
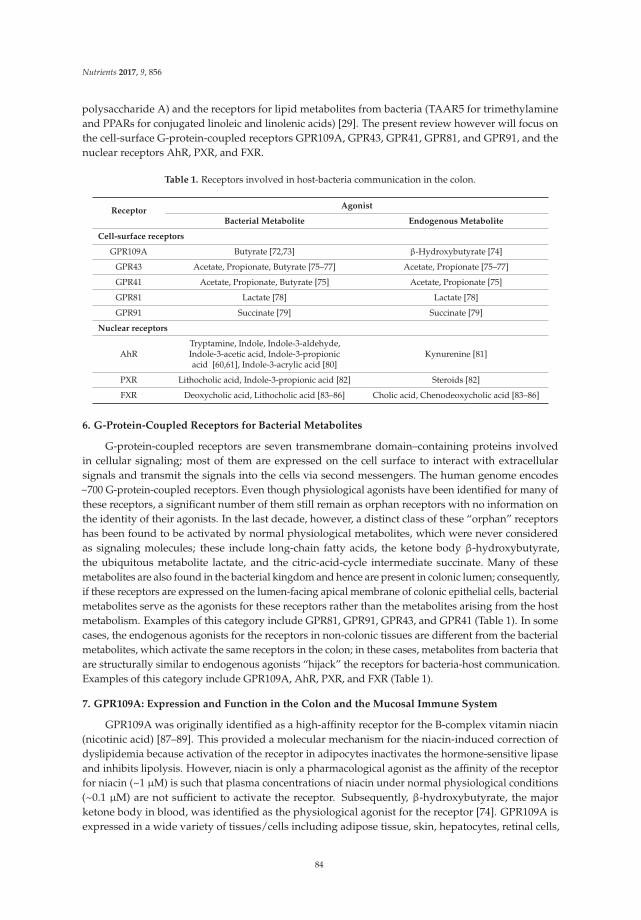
Nutrients 2017, 9, 856
polysaccharide A) and the receptors for lipid metabolites from bacteria (TAAR5 for trimethylamineand PPARs for conjugated linoleic and linolenic acids) [29]. The present review however will focus onthe cell-surface G-protein-coupled receptors GPR109A, GPR43, GPR41, GPR81, and GPR91, and thenuclear receptors AhR, PXR, and FXR.
Table 1. Receptors involved in host-bacteria communication in the colon.
ReceptorAgonist
Bacterial Metabolite Endogenous Metabolite
Cell-surface receptors
GPR109A Butyrate [72,73] β-Hydroxybutyrate [74]
GPR43 Acetate, Propionate, Butyrate [75–77] Acetate, Propionate [75–77]
GPR41 Acetate, Propionate, Butyrate [75] Acetate, Propionate [75]
GPR81 Lactate [78] Lactate [78]
GPR91 Succinate [79] Succinate [79]
Nuclear receptors
AhRTryptamine, Indole, Indole-3-aldehyde,Indole-3-acetic acid, Indole-3-propionicacid [60,61], Indole-3-acrylic acid [80]
Kynurenine [81]
PXR Lithocholic acid, Indole-3-propionic acid [82] Steroids [82]
FXR Deoxycholic acid, Lithocholic acid [83–86] Cholic acid, Chenodeoxycholic acid [83–86]
6. G-Protein-Coupled Receptors for Bacterial Metabolites
G-protein-coupled receptors are seven transmembrane domain–containing proteins involvedin cellular signaling; most of them are expressed on the cell surface to interact with extracellularsignals and transmit the signals into the cells via second messengers. The human genome encodes~700 G-protein-coupled receptors. Even though physiological agonists have been identified for many ofthese receptors, a significant number of them still remain as orphan receptors with no information onthe identity of their agonists. In the last decade, however, a distinct class of these “orphan” receptorshas been found to be activated by normal physiological metabolites, which were never consideredas signaling molecules; these include long-chain fatty acids, the ketone body β-hydroxybutyrate,the ubiquitous metabolite lactate, and the citric-acid-cycle intermediate succinate. Many of thesemetabolites are also found in the bacterial kingdom and hence are present in colonic lumen; consequently,if these receptors are expressed on the lumen-facing apical membrane of colonic epithelial cells, bacterialmetabolites serve as the agonists for these receptors rather than the metabolites arising from the hostmetabolism. Examples of this category include GPR81, GPR91, GPR43, and GPR41 (Table 1). In somecases, the endogenous agonists for the receptors in non-colonic tissues are different from the bacterialmetabolites, which activate the same receptors in the colon; in these cases, metabolites from bacteria thatare structurally similar to endogenous agonists “hijack” the receptors for bacteria-host communication.Examples of this category include GPR109A, AhR, PXR, and FXR (Table 1).
7. GPR109A: Expression and Function in the Colon and the Mucosal Immune System
GPR109A was originally identified as a high-affinity receptor for the B-complex vitamin niacin(nicotinic acid) [87–89]. This provided a molecular mechanism for the niacin-induced correction ofdyslipidemia because activation of the receptor in adipocytes inactivates the hormone-sensitive lipaseand inhibits lipolysis. However, niacin is only a pharmacological agonist as the affinity of the receptorfor niacin (~1 µM) is such that plasma concentrations of niacin under normal physiological conditions(~0.1 µM) are not sufficient to activate the receptor. Subsequently, β-hydroxybutyrate, the majorketone body in blood, was identified as the physiological agonist for the receptor [74]. GPR109A isexpressed in a wide variety of tissues/cells including adipose tissue, skin, hepatocytes, retinal cells,
84
Nutrients 2017, 9, 856
and bones; it is also highly expressed in immune cells such as macrophages and dendritic cells [90,91].Butyrate is the only known SCFA agonist for GPR109A, but it activates the receptor only with lowaffinity (EC50 value in low millimolar range) [72,73]. Acetate and propionate do not interact with thereceptor. The receptor is expressed in the intestinal tract, most robustly in the colon where butyrate ispresent at concentrations high enough to activate the receptor [72,73]. The expression is restricted tothe lumen-facing apical membrane of intestinal and colonic epithelial cells, thus having direct accessto butyrate in the lumen. As such, the bacterial metabolite butyrate appears to be the principal agonistfor GPR109A in the intestinal tract. Colonic bacteria regulate the expression of the receptor in thecolon; the expression is markedly reduced in germ-free mice, but the expression comes back to normalwhen the colon gets re-colonized [73].
Upon ligand binding, GPR109A couples through the Gi pathway in most tissues, resultingin decreased levels of cAMP inside the cells [87,88]. The receptor functions as a suppressor ofinflammation and carcinogenesis in the colon [72,92,93]. Deletion of the receptor in mice accelerates theprogression of colonic inflammation and colon cancer in multiple experimental model systems [92,93].The receptor is also expressed on mucosal immune cells, particularly in dendritic cells. Activation ofthe receptor in dendritic cells promotes the ability of these cells to convert naïve T cells intoimmunosuppressive Tregs and potentiates the production of the anti-inflammatory cytokine IL-10;Gpr109a-null mice have reduced number of Tregs in the colon, reduced levels of IL-10, and increasedlevels of the pro-inflammatory cytokine IL-17 [92,93]. Studies with NLRP6 knockout mice haveshown that increased Prevotellaceae and decreased IL-18 levels are associated with colitis [94].Gpr109a-null mice also show decreased IL-18 production and increased population of Prevotellaceae,both alterations leading to potentiation of experimentally induced colitis [92]. Recent studies showthat NLRP3-mediated inflammasome plays an important role in IL-18 secretion and regulation ofmicrobiota through GPR109A [93].
8. GPR43: Expression and Function in the Colon and the Mucosal Immune System
GPR43 was discovered in a cluster of four novel GPRs located in close proximity to CD22 onhuman chromosome 19 [95] and then cloned from mouse leukemia cells [96]. It has a widespreadexpression pattern, with most prominent expression in the adipose tissue, gastrointestinal tract,leukocytes and neutrophils [75]. The receptor is coupled to both Gq and Gi/o, leading to a decrease incAMP levels and the activation of phospholipase-C [50,75]. Studies with reporter mice have shownthat Gpr43 is highly expressed not only in colonic epithelial cells but also in immune cells present inthe colon lamina propria [76]. The receptor is activated by all three major SCFAs, acetate, propionate,and butyrate [77], which is in contrast to GPR109A that is activated solely by butyrate.
The exact biological role of GPR43 under normal physiological conditions remains controversialwith regard to whether the receptor suppresses or promotes inflammation and carcinogenesisin the colon. Several studies have demonstrated that the receptor plays a role in promotinginflammation and cancer [77,97–99]. GPR43 is expressed at higher levels in colorectal and gastriccancers and overexpression of the receptor in cancer cells potentiates their growth when xenografted innude mice [97]. The receptor has also been shown to induce neutrophil chemotaxis and promoteinflammation [77,98,99]. However, there are other reports that show the opposite; the receptorfunctions as a suppressor of colonic inflammation and carcinogenesis [55,100,101]. Tang et al. [100]have reported that GPR43 is silenced in colon cancer, both at the primary site and in metastatic spreads.Most colon cancer cells do not express the receptor, and when engineered to express the receptorectopically, the cells undergo apoptosis upon exposure to the receptor agonists propionate or butyrate.These studies strongly demonstrate a tumor-suppressive function for the receptor. Maslowski et al. [55]and Masui et al. [101] have shown that Gpr43- null mice are more susceptible to experimental colitis,indicating an anti-inflammatory role for the receptor. Our own studies [102] also corroborated thefunction of the receptor as a suppressor of inflammation and carcinogenesis. The anti-inflammatoryrole is further supported by the findings that Gpr43 blocks inflammasomes [93] and deletion of
85
Nutrients 2017, 9, 856
the receptor in mice leads to dysbiosis in colonic microflora and increased susceptibility to coloncancer [102].
In contrast to GPR109A, which is expressed only in colonic epithelial cells, GPR43 is expressed inepithelial cells and in enteroendocrine cells, particularly L-cells [103–105]. This has significant biologicalimplications. L-cells secrete two important gut hormones: glucagon-like peptide 1 and Peptide YY.Activation of GPR43 by SCFAs increases the secretion of both these gut hormones. As these hormonesimpact on the function of pancreas (insulin secretion) and brain (appetite control), SCFAs influence thebiology of distant organs via GPR43 expressed in the intestinal tract.
9. GPR41: Expression and Function in the Colon
GPR41 is also a receptor for SCFAs: all three SCFAs activate the receptor [50]. However, similar toGPR43, GPR41 is expressed in enteroendocrine cells, but unlike GPR43, GPR41 is not expressed incolonic epithelial cells [104–106]. Furthermore, unlike GPR109A and GPR43, GPR41 is also in entericneurons [107]. However, the intracellular signaling mechanism seems to be similar for all three SCFAreceptors, which involve a decrease intracellular levels of cAMP in response to receptor activation.Activation of GPR41 by SCFAs present in the colonic lumen is capable of altering secretion of guthormones to impact biology at distant organs. Studies have shown that activation of Gpr41 by SCFAsinduces secretion of glucagon-like peptide 1 and Peptide YY to alter insulin secretion and appetitecontrol [104,105].
10. GPR81 and GPR91: Expression and Function in the Colon
GPR81 is a cell-surface, G-protein-coupled receptor for the ubiquitous metabolite lactate [78]whereas GPR91, also present on cell-surface, is a G-protein-coupled receptor for the citric-acid cycleintermediate succinate [79]. Relatively less is known about the role of these receptors in the colon.Both these receptors are expressed in colonic epithelial cells and are likely to play a role in colonicbiology because lactate is a major metabolite generated by normal colonic bacteria, particularly byLactobacilli, and succinate is released by dead bacterial cells. The presence of these receptors inthe colon and their ligands in the colonic lumen strongly suggest a potential connection betweenthese receptors and colonic health. Further investigations are needed to understand the biologicalsignificance of these two receptors and their role in the communication between colonic bacteria andthe host.
11. Nuclear Receptors AhR, PXR, and FXR and Their Modulation by Bacterial Metabolites
There are bacterial metabolites other than the SCFAs that are also important for the communicationbetween the host and colonic bacteria and hence for optimal colonic health. These include tryptophanmetabolites and bile acids (Table 1). While the SCFAs elicit their biological effects on the colon byserving as agonists for the cell-surface G-protein-coupled receptors GPR109A, GPR43, and GPR41,tryptophan metabolites and bile acids impact colonic health by serving as the ligands for the nuclearreceptors AhR (aryl hydrocarbon receptor), PXR (pregnane X receptor), and FXR (farnesoid X receptor).Unlike the G-protein-coupled receptors, which regulate cellular function via changes in intracellularlevels of the second messengers such as cAMP and calcium, the nuclear receptors modulate cellularfunction by altering gene transcription as they all function as transcription factors. However, the abilityof these nuclear receptors to bind to their target genes is ligand-dependent; the receptors reside in thecytoplasm when not bound to their ligands, but in the presence of the ligands, the receptor-ligandcomplex translocates into the nucleus to act on the target genes.
AhR is expressed in colonic epithelial cells and functions as a suppressor of inflammationand carcinogenesis [62,108,109]. The bacterial metabolites that activate this receptor originate fromtryptophan catabolism; these include tryptamine, indole, indole-3-aldehyde, indole-3-acetic acid,and indole-3-propionic acid (Table 1). Activation of AhR by these metabolites occurs at dosesthat are relevant to their concentrations found in the colonic lumen under normal physiological
86
Nutrients 2017, 9, 856
conditions [60,61]. AhR has received considerable attention for its activation by xenobiotics as aprocess related to xenobiotic biotransformation and their subsequent elimination from the body.However, recent studies have identified the endogenous tryptophan metabolite kynurenine as thephysiological agonist for the receptor [81]. Kynurenine is a catabolic product of tryptophan inmammalian cells, generated by the intracellular enzyme indoleamine-2,3-dioxygenase-1 (IDO1);this enzyme is expressed at high levels in colonic epithelial cells. IDO1 is an immunosuppressiveenzyme [110] and its robust expression in the colon contributes to the tolerance of the colonic bacteriaby the host. Activation of AhR by kynurenine in the colon is obviously essential for the host-bacteriasymbiotic relationship. The tryptophan metabolites produced by the colonic bacteria also contribute tothis process via their ability to activate the same receptor. A more recent study has identified anothertryptophan metabolite, indole-3-acrylic acid, in colonic lumen that is generated by a specific bacterialspecies, Peptostreptococcus [80]. This metabolite is an agonist for AhR and is also a potent activatorof antioxidant machinery in cells [80]. Through these mechanisms, indole-3-acrylic acid promotesintestinal barrier function and attenuates inflammation.
PXR and FXR are also nuclear receptors and they are also activated by various xenobiotics.However, the endogenous agonists for these receptors are steroids and bile acids, respectively (Table 1).The bacterial metabolites that activate these receptors include the secondary bile acids deoxycholicacid and lithocholic acid and the tryptophan metabolite indole-3-propionic acid. The activation of boththese receptors elicits protective effects in the colon against inflammation and cancer [82–86].
12. Relevance of Dietary Fiber to the Production of Tryptophan Metabolites in Colon
Colonic bacteria generate tryptophan metabolites via protein metabolism. In contrast,the short-chain fatty acids are generated via fermentation of carbohydrates that reach the colon mostlyin the form of dietary fiber. However, the quantity and quality of dietary fiber can potentially impactthe generation of tryptophan metabolites because fiber as the source of carbon and energy is a majordeterminant of the composition of bacterial species in the colon. It has been documented that restrictionof sugar in the diet promotes expansion of Lactobacilli species that possess enzymatic machineryto generate selective tryptophan metabolites to activate AhR and stimulate IL22 production [14].This cytokine alters mucosal immune response in such a manner that it facilitates colonizationof selective bacterial species and at the same time prevents colonization of the fungus Candidaalbicans [14]. As such, alterations in dietary fiber intake have a major impact on the generation oftryptophan metabolites and possibly other metabolites as well.
13. Conclusions
The symbiotic relationship between colonic bacteria and the host is undeniable, and this mutuallybeneficial coexistence is made possible through effective communication between the two partners inthis co-habitation. The primary mode of this communication is chemical, mediated by specific bacterialmetabolites that elicit their biological effects on the host by activating selective molecular targetsin the host colon. Some of these molecular targets (GPR41, GPR43, GPR109A, GPR81, and GPR91)are located on the lumen-facing apical membrane of colonic epithelial cells where they have directaccess to bacterial metabolites generated in the lumen. Some are located intracellularly (e.g., HDACs,AhR, FXR, PXR, and PPARs), and there is evidence that the bacterial metabolites generated in thelumen enter the colonic epithelial cells, many of them via selective transporters expressed in the apicalmembrane of these cells. Mucosal immune cells present in the lamina propria also express the samemolecular targets as in colonic epithelial cells for these bacterial metabolites, but it is questionableif all of these metabolites reach lamina propria at concentrations sufficient to act on these targets inimmune cells. This question seems particularly appropriate for SCFAs because these metabolites areactively metabolized in colonic epithelial cells. This might not be an issue for tryptophan metabolites.Taken collectively, there is an overwhelming evidence for active dialogue between colonic bacteria andthe host with selective bacterial metabolites functioning as messengers. The end result of this chemical
87
Nutrients 2017, 9, 856
communication is the tolerance of colonic bacteria by the host immune system, which is obligatoryfor the symbiosis. A beneficial byproduct of this co-habitation and symbiosis is the maintenance ofoptimal colonic health with a decreased risk of colonic inflammation and carcinogenesis.
Acknowledgments: This work was supported by the National Institutes of Health grant CA190710 and by theWelch Endowed Chair in Biochemistry, Grant No. BI-0028, at the Texas Tech University Health Sciences Center.
Author Contributions: Sathish Sivaprakasam prepared the first draft of the review; Yangzom D. Bhutia andSabarish Ramachandran helped in the literature search and also worked on the first draft; Vadivel Ganapathycorrected, edited, and revised the first draft and prepared the final version.
Conflicts of Interest: The authors declare no conflict of interest.
References
1. Sender, R.; Fuchs, S.; Milo, R. Revised estimates for the number of human and bacterial cells in the body.PLoS Biol. 2016, 14, e1002533. [CrossRef] [PubMed]
2. Sender, R.; Fuchs, S.; Milo, R. Are we really vastly outnumbered? Revisiting the ratio of bacterial to host cellsin humans. Cell 2016, 164, 337–340. [CrossRef] [PubMed]
3. Lozupone, C.A.; Stombaugh, J.I.; Gordon, J.I.; Jansson, J.K.; Knight, R. Diversity and resilience of the humangut microbiota. Nature 2012, 489, 220–230. [CrossRef] [PubMed]
4. Qin, J.; Li, R.; Raes, J.; Arumugam, M.; Burgdorf, K.S.; Manichanh, C.; Nielsen, T.; Pons, N.; Levenez, F.;Yamada, T.; et al. A human gut microbial gene catalogue established by metagenomic sequencing. Nature
2010, 464, 59–65. [CrossRef] [PubMed]5. Arumugam, M.; Raes, J.; Pelletier, E.; Le Paslier, D.; Yamada, T.; Mende, D.R.; Fernandes, G.R.; Tap, J.;
Bruls, T.; Batto, J.M.; et al. Enterotypes of the human gut microbiome. Nature 2011, 473, 174–180. [CrossRef][PubMed]
6. Mu, C.; Yang, Y.; Zhu, W. Gut microbiota: The brain peacekeeper. Front. Microbiol. 2016, 7, 345. [CrossRef][PubMed]
7. Haque, T.R.; Barritt, A.S. Intestinal microbiota in liver disease. Best Pract. Res. Clin. Gastroenterol. 2016, 30,133–142. [CrossRef] [PubMed]
8. Leal-Lopes, C.; Velloso, F.J.; Campopiano, J.C.; Sogayar, M.C.; Correa, R.G. Roles of commensal microbiota inpancreas homeostasis and pancreatic pathologies. J. Diabetes Res. 2015, 2015, 284680. [CrossRef] [PubMed]
9. Khan, M.J.; Gerasimidis, K.; Edwards, C.A.; Shaikh, M.G. Role of gut microbiota in the aetiology of obesity:Proposed mechanisms and review of the literature. J. Obes. 2016, 2016, 7353642. [CrossRef] [PubMed]
10. Jonsson, A.L.; Backhed, F. Role of gut microbiota in atherosclerosis. Nat. Rev. Cardiol. 2017, 14, 79–87.[CrossRef] [PubMed]
11. Haghikia, A.; Jorg, S.; Duscha, A.; Berg, J.; Manzel, A.; Waschbisch, A.; Hammer, A.; Lee, D.H.; May, C.;Wilck, N.; et al. Dietary fatty acids directly impact central nervous system autoimmunity via thesmall intestine. Immunity 2015, 43, 817–829. [CrossRef] [PubMed]
12. Bhutia, Y.D.; Ganapathy, V. Short, but smart: SCFAs train T cells in the gut to fight autoimmunity in the brain.Immunity 2015, 43, 629–631. [CrossRef] [PubMed]
13. Rothhammer, V.; Mascanfroni, I.D.; Bunse, L.; Takenaka, M.C.; Kenison, J.E.; Mayo, L.; Chao, C.C.; Patel, B.;Yan, R.; Blain, M.; et al. Type I interferons and microbial metabolites of tryptophan modulate astrocyteactivity and central nervous system inflammation via the aryl hydrocarbon receptor. Nat. Med. 2016, 22,586–597. [CrossRef] [PubMed]
14. Zelante, T.; Iannitti, R.G.; Cunha, C.; De Luca, A.; Giovannini, G.; Pieraccini, G.; Zecchi, R.; D’Angelo, C.;Massi-Benedetti, C.; Fallarino, F.; et al. Tryptophan catabolites from microbiota engage aryl hydrocarbonreceptor and balance mucosal reactivity via interleukin-22. Immunity 2013, 39, 372–385. [CrossRef] [PubMed]
15. Ohland, C.L.; Jobin, C. Microbial activities and intestinal homeostasis: A delicate balance between healthand disease. Cell. Mol. Gastroenterol. Hepatol. 2015, 1, 28–40. [CrossRef] [PubMed]
16. Buttó, L.F.; Haller, D. Dysbiosis in intestinal inflammation: Cause or consequence. Int. J. Med. Microbiol.
2016, 306, 302–309. [CrossRef] [PubMed]17. Gao, Z.; Guo, B.; Gao, R.; Zhu, Q.; Qin, H. Microbiota disbiosis is associated with colorectal cancer.
Front. Microbiol. 2015, 6, 20. [CrossRef] [PubMed]
88
Nutrients 2017, 9, 856
18. Arthur, J.C.; Jobin, C. The struggle within: Microbial influences on colorectal cancer. Inflamm. Bowel Dis.
2011, 17, 396–409. [CrossRef] [PubMed]19. Sadlack, B.; Merz, H.; Schorle, H.; Schimpl, A.; Feller, A.C.; Horak, I. Ulcerative colitis-like disease with a
disrupted interleukin-2 gene. Cell 1993, 75, 253–261. [CrossRef]20. Madsen, K.L. Inflammatory bowel disease: Lessons from the IL-10 gene-deficient mouse. Clin. Investig. Med.
2001, 24, 250–257.21. Cani, P.D.; Everard, A. Talking microbes: When gut bacteria interact with diet and host organs. Mol. Nutr.
Food Res. 2016, 60, 58–66. [CrossRef] [PubMed]22. Velcich, A.; Yang, W.; Heyer, J.; Fragale, A.; Nicholas, C.; Viani, S.; Kucherlapati, R.; Lipkin, M.; Yang, K.;
Augenlicht, L. Colorectal cancer in mice genetically deficient in the mucin Muc2. Science 2002, 295, 1726–1729.[CrossRef] [PubMed]
23. Salim, S.Y.; Söderholm, J.D. Importance of disrupted intestinal barrier in inflammatory bowel diseases.Inflamm. Bowel Dis. 2011, 17, 362–381. [CrossRef] [PubMed]
24. Yashiro, M. Ulcerative colitis-associated colorectal cancer. World J. Gastroenterol. 2014, 20, 16389–16397.[CrossRef] [PubMed]
25. Mueller, C.; Macpherson, A.J. Layers of mutualism with commensal bacteria protect us fromintestinal inflammation. Gut 2006, 55, 276–284. [CrossRef] [PubMed]
26. Shapira, M. Gut microbiotas and host evolution: Scaling up symbiosis. Trends Ecol. Evol. 2016, 31, 539–549.[CrossRef] [PubMed]
27. Cogen, A.L.; Nizet, V.; Gallo, R.L. Skin microbiota: A source of disease or defence? Br. J. Dermatol. 2008, 158,442–455. [CrossRef] [PubMed]
28. Macfarlane, S.; Macfarlane, G.T. Regulation of short-chain fatty acid production. Proc. Nutr. Soc. 2003, 62,67–72. [CrossRef] [PubMed]
29. Bhutia, Y.D.; Ogura, J.; Sivaprakasam, S.; Ganapathy, V. Gut microbiome and colon cancer: Role of bacterialmetabolites and their molecular targets in the host. Curr. Colorectal Cancer Rep. 2017, 13, 111–118. [CrossRef]
30. Cario, E. Microbiota and innate immunity in intestinal inflammation and neoplasia. Curr. Opin. Gastroenterol.
2013, 29, 85–91. [CrossRef] [PubMed]31. Shanahan, F. The colonic microbiota in health and disease. Curr. Opin. Gastroenterol. 2013, 29, 49–54.
[CrossRef] [PubMed]32. Wang, X.; Huycke, M.M. Colorectal cancer: Role of commensal bacteria and bystander effects. Gut Microbes
2015, 6, 370–376. [CrossRef] [PubMed]33. Peloquin, J.M.; Nguyen, D.D. The microbiota and inflammatory bowel disease: Insights from animal models.
Anaerobe 2013, 24, 102–106. [CrossRef] [PubMed]34. Seksik, P.; Sokol, H.; Lepage, P.; Vasquez, N.; Manichanh, C.; Mangin, I.; Pochart, P.; Dore, J.;
Marteau, P. Review article: The role of bacteria in onset and perpetuation of inflammatory bowel disease.Aliment. Pharmacol. Ther. 2006, 24 (Suppl. 3), 11–18. [CrossRef] [PubMed]
35. Butto, L.F.; Schaubeck, M.; Haller, D. Mechanisms of microbe-host interaction in Crohn’s disease: Dysbiosis vs.pathobiont selection. Front. Immunol. 2015, 6, 555. [CrossRef] [PubMed]
36. De Moreno de LeBlanc, A.; Del Carmen, S.; Chatel, J.M.; Miyoshi, A.; Azevedo, V.; Langella, P.;Bermudez-Humaran, L.G.; LeBlanc, J.G. Current review of genetically modified lactic acid bacteria forthe prevention and treatment of colitis using murine models. Gasteroenterol. Res. Pract. 2015, 2015, 146972.[CrossRef] [PubMed]
37. Wasilewski, A.; Zielinska, M.; Storr, M.; Fichna, J. Beneficial effects of probiotics, prebiotics, synbiotics,and psychobiotics in inflammatory bowel disease. Inflamm. Bowel Dis. 2015, 21, 1674–1682. [CrossRef][PubMed]
38. Bellaguarda, E.; Chang, E.B. IBD and the gut microbiota—From bench to personalized medicine.Curr. Gastroenterol. Rep. 2015, 17, 15. [CrossRef] [PubMed]
39. Patel, R.; DuPont, H.L. New approaches for bacteriotherapy: Prebiotics, new-generation probiotics,and synbiotics. Clin. Infect. Dis. 2015, 60 (Suppl. 2), S108–S121. [CrossRef] [PubMed]
40. Grimm, V.; Riedel, C.U. Manipulation of the microbiota using probiotics. Adv. Exp. Med. Biol. 2016, 902,109–117. [PubMed]
89
Nutrients 2017, 9, 856
41. Stearns, J.C.; Lynch, M.D.; Senadheera, D.B.; Tenenbaum, H.C.; Goldberg, M.B.; Cvitkovitch, D.G.;Croitoru, K.; Moreno-Hagelsieb, G.; Neufeld, J.D. Bacterial biogeography of the human digestive tract.Sci. Rep. 2011, 1, 170. [CrossRef] [PubMed]
42. Vinolo, M.A.; Rodrigues, H.G.; Nachbar, R.T.; Curi, R. Regulation of inflammation by short-chain fatty acids.Nutrients 2011, 3, 858–876. [CrossRef] [PubMed]
43. Leonel, A.J.; Alvarez-Leite, J.I. Butyrate: Implications for intestinal function. Curr. Opin. Clin. Nutr.
Metab. Care 2012, 15, 474–479. [CrossRef] [PubMed]44. O’Keefe, S.J. Diet, microorganisms and their metabolites, and colon cancer. Nat. Rev. Gastroenterol. Hepatol.
2016, 13, 691–706. [CrossRef] [PubMed]45. Rios-Covian, D.; Ruas-Madeido, P.; Margolles, A.; Gueimonde, M.; de Los Reyes-Gavilan, C.G.; Salazar, N.
Intestinal short chain fatty acids and their link with diet and human health. Front. Microbiol. 2016, 7, 185.[CrossRef] [PubMed]
46. Gupta, N.; Martin, P.M.; Prasad, P.D.; Ganapathy, V. SLC5A8 (SMCT1)-mediated transport of butyrate formsthe basis for the tumor-suppressive function of the transporter. Life Sci. 2006, 78, 2419–2425. [CrossRef][PubMed]
47. Ganapathy, V.; Thangaraju, M.; Gopal, E.; Martin, P.M.; Itagaki, S.; Miyauchi, S.; Prasad, P.D. Sodium-coupledmonocarboxylate transporters in normal tissues and in cancer. AAPS J. 2008, 10, 193–199. [CrossRef][PubMed]
48. Binder, H.J. Role of colonic short-chain fatty acid transport in diarrhea. Annu. Rev. Physiol. 2010, 72, 297–313.[CrossRef] [PubMed]
49. Goncalves, P.; Martel, F. Butyrate and colorectal cancer: The role of butyrate transport. Curr. Drug Metab.
2013, 14, 994–1008. [CrossRef] [PubMed]50. Tazoe, H.; Otomo, Y.; Kaji, I.; Tanaka, R.; Karaki, S.I.; Kuwahara, A. Roles of short-chain fatty acids receptors,
GPR41 and GPR43 on colonic functions. J. Physiol. Pharmacol. 2008, 59 (Suppl. 2), 252–262.51. Ganapathy, V.; Thangaraju, M.; Prasad, P.D.; Martin, P.M.; Singh, N. Transporters and receptors for
short-chain fatty acids as the molecular link between colonic bacteria and the host. Curr. Opin. Pharmacol.
2013, 13, 869–874. [CrossRef] [PubMed]52. Tan, J.; McKenzie, C.; Potamitis, M.; Thorburn, A.N.; Mackay, C.R.; Macia, L. The role of short-chain fatty
acids in health and disease. Adv. Immunol. 2014, 121, 91–119. [PubMed]53. Arpaia, N.; Campbell, C.; Fan, X.; Dikiy, S.; van der Veeken, J.; deRoos, P.; Liu, H.; Cross, J.R.;
Pfeffer, K.; Coffer, P.J.; et al. Metabolites produced by commensal bacteria promote peripheral regulatoryT-cell generation. Nature 2013, 504, 451–455. [CrossRef] [PubMed]
54. Smith, P.M.; Howitt, M.R.; Panikov, N.; Michaud, M.; Gallini, C.A.; Bohlooly-Y, M.; Glickman, J.N.;Garrett, W.S. The microbial metabolites, short-chain fatty acids, regulate colonic Treg cell homeostasis.Science 2013, 341, 569–573. [CrossRef] [PubMed]
55. Maslowski, K.M.; Vieira, A.T.; Ng, A.; Kranich, J.; Sierro, F.; Yu, D.; Schilter, H.C.; Rolph, M.S.; Mackay, F.;Artis, D.; et al. Regulation of inflammatory responses by gut microbiota and chemoattractant receptor GPR43.Nature 2009, 461, 1282–1286. [CrossRef] [PubMed]
56. Sengupta, S.; Muir, J.G.; Gibson, P.R. Does butyrate protect from colorectal cancer? J. Gastroenterol. Hepatol.
2006, 21, 209–218. [CrossRef] [PubMed]57. Cummings, J.H.; Pomare, E.W.; Branch, W.J.; Naylor, C.P.; Macfarlane, G.T. Short chain fatty acids in human
large intestine, portal, hepatic and venous blood. Gut 1987, 28, 1221–1227. [CrossRef] [PubMed]58. Helenius, T.O.; Misiorek, J.O.; Nystrom, J.H.; Fortelius, L.E.; Habtezion, A.; Liao, J.; Asghar, M.N.; Zhang, H.;
Azhar, S.; Omary, M.B.; et al. Keratin 8 absence down-regulates colonocyte HMGCS2 and modulates colonicketogenesis and energy metabolism. Mol. Biol. Cell 2015, 26, 2298–2310. [CrossRef] [PubMed]
59. Pace, F.; Pace, M.; Quartarone, G. Probiotics in digestive diseases: Focus on Lactobacillus GG.Minerva Gastroenterol. Dietol. 2015, 61, 273–292. [PubMed]
60. Hubbard, T.D.; Murray, I.A.; Perdew, G.H. Indole and tryptophan metabolism: Endogenous and dietaryroutes to Ah receptor activation. Drug Metab. Dispos. 2015, 43, 1522–1535. [CrossRef] [PubMed]
61. Jin, U.H.; Lee, S.O.; Sridharan, G.; Lee, K.; Davidson, L.A.; Jayaraman, A.; Chapkin, R.S.; Alaniz, R.; Safe, S.Microbiome-derived tryptophan metabolites and their aryl hydrocarbon receptor-dependent agonist andantagonist activities. Mol. Pharmacol. 2014, 85, 777–788. [CrossRef] [PubMed]
90
Nutrients 2017, 9, 856
62. Díaz-Díaz, C.J.; Ronnekleiv-Kelly, S.M.; Nukaya, M.; Geiger, P.G.; Balbo, S.; Dator, R.; Megna, B.W.;Carney, P.R.; Bradfield, C.A.; Kennedy, G.D. The aryl hydrocarbon receptor is a repressor ofinflammation-associated colorectal tumorigenesis in mouse. Ann. Surg. 2016, 264, 429–436. [CrossRef][PubMed]
63. Ridlon, J.M.; Harris, S.C.; Bhowmik, S.; Kang, D.J.; Hylemon, P.B. Consequences of bile saltbiotransformations by intestinal bacteria. Gut Microbes 2016, 7, 22–39. [CrossRef] [PubMed]
64. Brown, J.M.; Hazen, S.L. The gut microbial endocrine organ: Bacterially derived signals drivingcardiometabolic diseases. Annu. Rev. Med. 2015, 66, 343–359. [CrossRef] [PubMed]
65. Wilson, A.; McLean, C.; Kim, R.B. Trimethylamine-N-oxide: A link between the gut microbiome, bile acidmetabolism, and atherosclerosis. Curr. Opin. Lipidol. 2016, 27, 148–154. [CrossRef] [PubMed]
66. Gorissen, L.; Leroy, F.; De Vuyst, L.; De Smet, S.; Raes, K. Bacterial production of conjugated linoleic andlinolenic acid in foods: A technological challenge. Crit. Rev. Food Sci. Nutr. 2015, 55, 1561–1574. [CrossRef][PubMed]
67. Davie, J.R. Inhibition of histone deacetylase activity by butyrate. J. Nutr. 2003, 133 (Suppl. 7), S2485–S2493.68. Thangaraju, M.; Gopal, E.; Martin, P.M.; Ananth, S.; Smith, S.B.; Prasad, P.D.; Sterneck, E.; Ganapathy, V.
SLC5A8 triggers tumor cell apoptosis through pyruvate-dependent inhibition of histone deacetylases.Cancer Res. 2006, 66, 11560–11564. [CrossRef] [PubMed]
69. Singh, N.; Thangaraju, M.; Prasad, P.D.; Martin, P.M.; Lambert, N.A.; Boettger, T.; Offermanns, S.;Ganapathy, V. Blockade of dendritic cell development by bacterial fermentation products butyrate andpropionate through a transporter (Slc5a8)-dependent inhibition of histone deacetylases. J. Biol. Chem. 2010,285, 27601–27608. [CrossRef] [PubMed]
70. Montezuma, D.; Henrique, R.M.; Jeronimo, C. Altered expression of histone deacetylases in cancer.Crit. Rev. Oncog. 2015, 20, 19–34. [CrossRef] [PubMed]
71. West, A.C.; Johnstone, R.W. New and emerging HDAC inhibitors for cancer treatment. J. Clin. Investig. 2014,124, 30–39. [CrossRef] [PubMed]
72. Thangaraju, M.; Cresci, G.A.; Liu, K.; Ananth, S.; Gnanaprakasam, J.P.; Browning, D.D.; Mellinger, J.D.;Smith, S.B.; Digby, G.J.; Lambert, N.A.; et al. GPR109A is a G-protein-coupled receptor for the bacterialfermentation product butyrate and functions as a tumor suppressor in colon. Cancer Res. 2009, 69, 2826–2832.[CrossRef] [PubMed]
73. Cresci, G.A.; Thangaraju, M.; Mellinger, J.D.; Liu, K.; Ganapathy, V. Colonic gene expression in conventionaland germ-free mice with a focus on the butyrate receptor GPR109A and the butyrate transporter SLC5A8.J. Gastrointest. Surg. 2010, 14, 449–461. [CrossRef] [PubMed]
74. Taggart, A.K.; Kero, J.; Gan, X.; Cai, T.Q.; Cheng, K.; Ippolito, M.; Ren, N.; Kaplan, R.; Wu, K.; Wu, T.J.; et al.(D)-β-hydroxybutyrate inhibits adipocyte lipolysis via the nicotinic acid receptor PUMA-G. J. Biol. Chem.
2005, 280, 26649–26652. [CrossRef] [PubMed]75. Brown, A.J.; Goldsworthy, S.M.; Barnes, A.A.; Eilert, M.M.; Tcheang, L.; Daniels, D.; Muir, A.I.;
Wigglesworth, M.J.; Kinghorn, I.; Fraser, N.J.; et al. The Orphan G protein-coupled receptors GPR41and GPR43 are activated by propionate and other short chain carboxylic acids. J. Biol. Chem. 2003, 278,11312–11319. [CrossRef] [PubMed]
76. Nøhr, M.K.; Pedersen, M.H.; Gille, A.; Egerod, K.L.; Engelstoft, M.S.; Husted, A.S.; Sichlau, R.M.;Grunddal, K.V.; Poulsen, S.S.; Han, S.; et al. GPR41/FFAR3 and GPR43/FFAR2 as cosensors for short-chainfatty acids in enteroendocrine cells vs. FFAR3 in enteric neurons and FFAR2 in enteric leukocytes.Endocrinology 2013, 154, 3552–3564. [CrossRef] [PubMed]
77. Le Poul, E.; Loison, C.; Struyf, S.; Springael, J.Y.; Lannoy, V.; Decobecq, M.E.; Brezillon, S.; Dupriez, V.;Vassart, G.; Van Damme, J.; et al. Functional characterization of human receptors for short chain fattyacids and their role in polymorphonuclear cell activation. J. Biol. Chem. 2003, 278, 25481–25489. [CrossRef][PubMed]
78. Liu, C.; Wu, J.; Zhu, J.; Kuei, C.; Yu, J.; Shelton, J.; Sutton, S.W.; Li, X.; Yun, S.J.; Mirzadegan, T.; et al. Lactateinhibits lipolysis in fat cells through activation of an orphan G-protein-coupled receptor. J. Biol. Chem. 2009,284, 2811–2822. [CrossRef] [PubMed]
79. He, W.; Miao, F.J.; Lin, D.C.; Schwandner, R.T.; Wang, Z.; Gao, J.; Chen, J.L.; Tian, H.; Ling, L. Citric acidcycle intermediates as ligands for orphan G-protein-coupled receptors. Nature 2004, 429, 188–193. [CrossRef][PubMed]
91
Nutrients 2017, 9, 856
80. Wlodarska, M.; Luo, C.; Kolde, R.; d’Hennezel, E.; Annand, J.W.; Heim, C.E.; Krastel, P.; Schmitt, E.K.;Omar, A.S.; Creasey, E.A.; et al. Indoleacrylic acid produced by commensal Peptostrreptococcus speciessuppresses inflammation. Cell Host Microbe 2017, 22, 25–37. [CrossRef] [PubMed]
81. Opitz, C.A.; Litzenburger, U.M.; Sahm, F.; Ott, M.; Tritschler, I.; Trump, S.; Schumacher, T.; Jestaedt, L.;Schrenk, D.; Weller, M.; et al. An endogenous tumour-promoting ligand of the human aryl hydrocarbonreceptor. Nature 2011, 478, 197–203. [CrossRef] [PubMed]
82. Cheng, J.; Shah, Y.M.; Gonzalez, F.J. Pregnane X receptor as a target for treatment of inflammatorybowel disorders. Trends Pharmacol. Sci. 2012, 33, 323–330. [CrossRef] [PubMed]
83. Cheng, J.; Fang, Z.Z.; Nagaoka, K.; Okamoto, M.; Qu, A.; Tanaka, N.; Kimura, S.; Gonzalez, F.J. Activation ofintestinal human pregnane X receptor protects against azoxymethane/dextran sulfate sodium-induced colitis.J. Pharmacol. Exp. Ther. 2014, 351, 559–567. [CrossRef] [PubMed]
84. Modica, S.; Murzilli, S.; Salvatore, L.; Schmidt, D.R.; Moschetta, A. Nuclear bile acid receptor FXR protectsagainst intestinal tumorigenesis. Cancer Res. 2008, 68, 9589–9594. [CrossRef] [PubMed]
85. Maran, R.R.; Thomas, A.; Roth, M.; Sheng, Z.; Esterly, N.; Pinson, D.; Gao, X.; Zhang, Y.; Ganapathy, V.;Gonzalez, F.J.; et al. Farnesoid X receptor deficiency in mice leads to increased intestinal epithelial cellproliferation and tumor development. J. Pharmacol. Exp. Ther. 2009, 328, 469–477. [CrossRef] [PubMed]
86. Stojancevic, M.; Stankov, K.; Mikov, M. The impact of farnesoid X receptor activation on intestinalpermeability in inflammatory bowel disease. Can. J. Gastroenterol. 2012, 26, 631–637. [CrossRef] [PubMed]
87. Tunaru, S.; Kero, J.; Schaub, A.; Wufka, C.; Blaukat, A.; Pfeffer, K.; Offermanns, S. PUMA-G and HM74are receptors for nicotinic acid and mediate its anti-lipolytic effect. Nat. Med. 2003, 9, 352–355. [CrossRef][PubMed]
88. Wise, A.; Foord, S.M.; Fraser, N.J.; Barnes, A.A.; Elshourbagy, N.; Eilert, M.; Ignar, D.M.; Murdock, P.R.;Steplewski, K.; Green, A.; et al. Molecular identification of high and low affinity receptors for nicotinic acid.J. Biol. Chem. 2003, 278, 9869–9874. [CrossRef] [PubMed]
89. Soga, T.; Kamohara, M.; Takasaki, J.; Matsumoto, S.; Saito, T.; Ohishi, T.; Hiyama, H.; Matsuo, A.;Matsushime, H.; Furuichi, K. Molecular identification of nicotinic acid receptor. Biochem. Biophys.
Res. Commun. 2003, 303, 364–369. [CrossRef]90. Gille, A.; Bodor, E.T.; Ahmed, K.; Offermanns, S. Nicotinic acid: Pharmacological effects and mechanisms
of action. Annu. Rev. Pharmacol. Toxicol. 2008, 48, 79–106. [CrossRef] [PubMed]91. Blad, C.C.; Ahmed, K.; IJzerman, A.P.; Offermanns, S. Biological and pharmacological roles of HCA receptors.
Adv. Pharmacol. 2011, 62, 219–250. [PubMed]92. Singh, N.; Gurav, A.; Sivaprakasam, S.; Brady, E.; Padia, R.; Shi, H.; Thangaraju, M.; Prasad, P.D.;
Manicassamy, S.; Munn, D.H.; et al. Activation of Gpr109a, receptor for niacin and the commensal metabolitebutyrate, suppresses colonic inflammation and carcinogenesis. Immunity 2014, 40, 128–139. [CrossRef][PubMed]
93. Macia, L.; Tan, J.; Vieira, A.T.; Leach, K.; Stanley, D.; Luong, S.; Maruya, M.; Ian McKenzie, C.; Hijikata, A.;Wong, C.; et al. Metabolite-sensing receptors GPR43 and GPR109A facilitate dietary fibre-induced guthomeostasis through regulation of the inflammasome. Nat. Commun. 2015, 6, 6734. [CrossRef] [PubMed]
94. Elinav, E.; Strowig, T.; Kau, A.L.; Henao-Mejia, J.; Thaiss, C.A.; Booth, C.J.; Peaper, D.R.; Bertin, J.;Eisenbarth, S.C.; Gordon, J.I.; et al. NLRP6 inflammasome regulates colonic microbial ecology and riskfor colitis. Cell 2011, 145, 745–757. [CrossRef] [PubMed]
95. Sawzdargo, M.; George, S.R.; Nguyen, T.; Xu, S.; Kolakowski, L.F.; O’Dowd, B.F. A cluster of four novelhuman G protein-coupled receptor genes occurring in close proximity to CD22 gene on chromosome 19q13.1.Biochem. Biophys. Res. Commun. 1997, 239, 543–547. [CrossRef] [PubMed]
96. Senga, T.; Iwamoto, S.; Yoshida, T.; Yokota, T.; Adachi, K.; Azuma, E.; Hamaguchi, M.; Iwamoto, T. LSSIG is anovel murine leukocyte-specific GPCR that is induced by the activation of STAT3. Blood 2003, 101, 1185–1187.[CrossRef] [PubMed]
97. Hatanaka, H.; Tsukui, M.; Takada, S.; Kurashina, K.; Choi, Y.L.; Soda, M.; Yamashita, Y.; Haruta, H.;Hamada, T.; Ueno, T.; et al. Identification of transforming activity of free fatty acid receptor 2 by retroviralexpression screening. Cancer Sci. 2010, 101, 54–59. [CrossRef] [PubMed]
98. Vinolo, M.A.; Ferguson, G.J.; Kulkarni, S.; Damoulakis, G.; Anderson, K.; Bohlooly, Y.M.; Stephens, L.;Hawkins, P.T.; Curi, R. SCFAs induce mouse neutrophil chemotaxis through the GPR43 receptor. PLoS ONE
2011, 6, e21205. [CrossRef] [PubMed]
92
Nutrients 2017, 9, 856
99. Sina, C.; Gavrilova, O.; Förster, M.; Till, A.; Derer, S.; Hildebrand, F.; Raabe, B.; Chalaris, A.; Scheller, J.;Rehmann, A.; et al. G protein-coupled receptor 43 is essential for neutrophil recruitment during intestinalinflammation. J. Immunol. 2009, 183, 7514–7522. [CrossRef] [PubMed]
100. Tang, Y.; Chen, Y.; Jiang, H.; Robbins, G.T.; Nie, D. G-protein-coupled receptor for short-chain fatty acidssuppresses colon cancer. Int. J. Cancer 2011, 128, 847–856. [CrossRef] [PubMed]
101. Masui, R.; Sasaki, M.; Funaki, Y.; Ogasawara, N.; Mizuno, M.; Iida, A.; Izawa, S.; Kondo, Y.; Ito, Y.;Tamura, Y.; et al. G protein-coupled receptor 43 moderates gut inflammation through cytokine regulationfrom mononuclear cells. Inflamm. Bowel Dis. 2013, 19, 2848–2856. [CrossRef] [PubMed]
102. Sivaprakasam, S.; Gurav, A.; Paschall, A.V.; Coe, G.L.; Chaudhary, K.; Cai, Y.; Kolhe, R.; Martin, P.;Browning, D.; Huang, L.; et al. An essential role of Ffar2 (Gpr43) in dietary fibre-mediated promotionof healthy composition of gut microbiota and suppression of intestinal carcinogenesis. Oncogenesis 2016, 5,e238. [CrossRef] [PubMed]
103. Psichas, A.; Sleeth, M.L.; Murphy, K.G.; Brooks, L.; Bewick, G.A.; Hanyaloglu, A.C.; Ghatei, M.A.; Bloom, S.R.;Frost, G. The short chain fatty acid propionate stimulates GLP-1 and PYY secretion via free fatty acid receptor2 in rodents. Int. J. Obes. 2015, 39, 424–429. [CrossRef] [PubMed]
104. Tolhurst, G.; Heffron, H.; Lam, Y.S.; Parker, H.E.; Habib, A.M.; Diakogiannaki, E.; Cameron, J.; Grosse, J.;Reimann, F.; Gribble, F.M. Short-chain fatty acids stimulate glucagon-like peptide-1 secretion via theG-protein-coupled receptor FFAR2. Diabetes 2012, 61, 364–371. [CrossRef] [PubMed]
105. Kaji, I.; Karaki, S.; Kuwahara, A. Short-chain fatty acid receptor and its contribution to glucagon-likepeptide-1 release. Digestion 2014, 89, 31–36. [CrossRef] [PubMed]
106. Tazoe, H.; Otomo, Y.; Karaki, S.; Kato, I.; Fukami, Y.; Terasaki, M.; Kuwahara, A. Expression of short-chainfatty acid receptor GPR41 in the human colon. Biomed. Res. 2009, 30, 149–156. [CrossRef] [PubMed]
107. Kimura, I.; Inoue, D.; Maeda, T.; Hara, T.; Ichimura, A.; Miyauchi, S.; Kobayashi, M.; Hirasawa, A.;Tsujimoto, G. Short-chain fatty acids and ketones directly regulate sympathetic nervous system via Gprotein-coupled receptor 41 (GPR41). Proc. Natl. Acad. Sci. USA 2011, 108, 8030–8035. [CrossRef] [PubMed]
108. Stockinger, B.; Di Meglio, P.; Gialitakis, M.; Duarte, J.H. The aryl hydrocarbon receptor: Multitasking in theimmune system. Annu. Rev. Immunol. 2014, 32, 403–432. [CrossRef] [PubMed]
109. Xie, G.; Raufman, J.P. Role of the aryl hydrocarbon receptor in colon neoplasia. Cancers 2015, 7, 1436–1446.[CrossRef] [PubMed]
110. Munn, D.H.; Mellor, A.L. IDO in the tumor microenvironment: Inflammation, counter-regulation,and tolerance. Trends Immunol. 2016, 37, 193–207. [CrossRef] [PubMed]
© 2017 by the authors. Licensee MDPI, Basel, Switzerland. This article is an open accessarticle distributed under the terms and conditions of the Creative Commons Attribution(CC BY) license (http://creativecommons.org/licenses/by/4.0/).
93


Section 2:
Cancer Prevention and Treatment

nutrients
Article
Novel Combination of PrebioticsGalacto-Oligosaccharides and Inulin-InhibitedAberrant Crypt Foci Formation and Biomarkersof Colon Cancer in Wistar Rats
Tahir Rasool Qamar 1, Fatima Syed 1, Muhammad Nasir 1, Habib Rehman 2,
Muhammad Nauman Zahid 3, Rui Hai Liu 4 and Sanaullah Iqbal 1,*
1 Department of Food Science and Human Nutrition, University of Veterinary & Animal Sciences,Lahore 54000, Punjab, Pakistan; [email protected] (T.R.Q.); [email protected] (F.S.);[email protected] (M.N.)
2 Department of Physiology, University of Veterinary & Animal Sciences, Lahore 54000, Punjab, Pakistan;[email protected]
3 Department of Population Medicine and Diagnostic Sciences, Cornell University, Ithaca, NY 14850, USA;[email protected]
4 Department of Food Science, Cornell University, Ithaca, NY 14850, USA; [email protected]* Correspondence: [email protected]; Tel.: +92-42-9921-1449 (ext. 283); Fax: +92-42-9921-1449
Received: 23 May 2016; Accepted: 20 July 2016; Published: 1 August 2016
Abstract: The selectivity and beneficial effects of prebiotics are mainly dependent on compositionand glycosidic linkage among monosaccharide units. This is the first study to use prebioticgalacto-oligosaccharides (GOS) that contains β-1,6 and β-1,3 glycosidic linkages and the novelcombination of GOS and inulin in cancer prevention. The objective of the present study is to explorethe role of novel GOS and inulin against various biomarkers of colorectal cancer (CRC) and theincidence of aberrant crypt foci (ACF) in a 1,2-dimethyl hydrazine dihydrochloride (DMH)-inducedrodent model. Prebiotic treatments of combined GOS and inulin (57 mg each), as well as individualdoses (GOS: 76–151 mg; inulin 114 mg), were given to DMH-treated animals for 16 weeks. Our datareveal the significant preventive effect of the GOS and inulin combination against the developmentof CRC. It was observed that inhibition of ACF formation (55.8%) was significantly (p ď 0.05)higher using the GOS and inulin combination than GOS (41.4%) and inulin (51.2%) treatmentsalone. This combination also rendered better results on short-chain fatty acids (SCFA) and bacterialenzymatic activities. Dose-dependent effects of prebiotic treatments were also observed on cecumand fecal bacterial enzymes and on SCFA. Thus, this study demonstrated that novel combination ofGOS and inulin exhibited stronger preventive activity than their individual treatments alone, and canbe a promising strategy for CRC chemoprevention.
Keywords: prebiotics; galacto-oligosaccharides; inulin; biomarkers; colon cancer
1. Introduction
Colorectal cancer (CRC) is one of the major causes of mortality in both genders amongcancer-related deaths worldwide. Being quite a complex process, many factors contribute to theonset of colon cancer and the major risk factors include family history, age, pre-carcinogens presentin the food chain and environment [1,2], inflammatory bowel diseases, low intake of vegetables,fruits and fibers, high consumption of red meat and processed meat [3,4], as well as hereditarygenetic factors [5]. Epidemiological studies suggest that high intake of fruits and vegetables inhuman diets has been linked to a lower risk of colon cancer. Excessive scientific and public concerns
Nutrients 2016, 8, 465 94 www.mdpi.com/journal/nutrients
Nutrients 2016, 8, 465
have been shown in earlier studies to identify naturally-occurring substances in food for CRCchemoprevention [6,7]. In chemoprevention, those natural or synthetic bioactive compounds are usedto prevent, delay, or reverse the formation of adenomas, as well as their progression into carcinomasthrough signal transduction pathways in tumor cells. Recently, prebiotics have gained much attentionas natural dietary ingredients which have the potential to maintain a healthy environment ingastrointestinal tract to improve intestinal functions and to prevent colon cancer [8].
Prebiotics are emerging as bioactive ingredients in foods and can positively influence thegastrointestinal microbiota and metabolism [9]. The beneficial bacteria residing in the colon causesfermentation of prebiotics to produce short chain fatty acids (SCFA), including acetate, propionate, andbutyrate, which are further involved in prevention of CRC [10,11]. Prebiotic galacto-oligosaccharides(GOS) are produced through transgalactosylation of lactose catalyzed by β-galactosidase (EC 3.2.1.23).During this process various products may be produced having β-1,3, β-1,4, or β-1,6 glycosidic linkagesdepending upon the source of the enzyme [12]. Previous studies have demonstrated that GOS havingdifferent glycosidic linkages have different health effects on the host [13], so glycosidic linkages usedbetween monosaccharide residues is of high importance in imparting health benefits.
The current study was performed to assess, for the first time, the combined effects of prebioticsGOS and inulin, as well as their individual effect on the various biomarkers of the initiation processof rat colon carcinogenesis. Several previously-performed experimental studies have shown thatadministration of prebiotics, probiotics [14], and synbiotics [15] provide protective and preventiveeffects against early biomarkers and tumor development in the colon of carcinogen-induced rats [16–18].Research on GOS’ role in colon cancer prevention is very limited to date. GOS used in previous studieshad β-1,4 as the primary glycosidic linkage [19,20] and no product with β-1,3 or β-1,6 linkages haveyet been used against any cancer treatment. To the best of our knowledge, this is the first time to useprebiotic GOS that contains β-1,6 and β-1,3 glycosidic linkages in a cancer prevention study.
Inulin-type prebiotics have been extensively studied for their potential benefits, and a largenumber of experimental studies have shown anti-carcinogenic effects of inulin this is the reason weadded inulin as the positive control in our experiment to compare GOS anti-carcinogenic effectswith inulin, as very limited data is available for the efficacy of GOS against CRC. No study isavailable on the combined effect of GOS and inulin against CRC prevention. The objectives of thepresent study were to investigate the preventive effects of inulin and GOS supplementation separatelyand in combination against the incidence of aberrant crypt foci (ACF) in a 1,2-dimethyl hydrazinedihydrochloride (DMH)-induced rodent model and to evaluate their effects on various biomarkers ofcolon cancer. Our study suggests that GOS had a dose-dependent preventive effect on biomarkers ofcolon cancer and the combined effect of GOS and inulin exhibited stronger preventive activity thantheir individual treatments alone.
2. Materials and Methods
2.1. Chemicals
All chemicals and reagents were analytical grade and were purchased form MerckChemicals (Darmstadt, Germany) unless otherwise stated. The DMH, m-nitrobenzoicacid, phenolphthalein-β-D-glucuronide, nitrophenyl-β-D-glucoside, and ortho-nitrophenyl-β-D-galactopyranoside (oNPG) were purchased from Sigma-Aldrich (St. Louis, MO, USA). The prebioticinulin extracted from chicory roots was purchased from Cargill® (Minneapolis, MN, USA).
2.2. Animals
Six-week old male Wister rats were purchased from the University of Agriculture,Faisalabad-Pakistan and were housed in temperature and humidity control room (22 ˘ 2 ˝C and55% ˘ 10%) under 12 h light and dark cycle. All rats received basal diet for one week acclimatization
95
Nutrients 2016, 8, 465
period before beginning the actual experiment. The experimental protocols used herein were approvedby the University Ethics Committee for Animal Research.
2.3. Experimental Design
Rats were randomly divided into seven groups (12 per group); G1 was control group fedon AIN-93G/M as basal diet [21]. G2 (DMH alone) was DMH control group fed on basal diet,and Groups G3–G7 were treatment groups. Treatments with prebiotic GOS were given to GroupsG3–G5. Group G6 was given inulin and Group G7 received combination of GOS and inulin along withbasal diet. Dose was calculated using the human equivalent dose (HED) equation: HED = animal dosein mg/kg ˆ (animal weight in kg/human weight in kg)0.33 [22]. Groups G3, G4, and G5 received76 mg (HED = 4 g), 114 mg (HED = 6 g), and 151 mg (HED = 8 g) GOS, respectively. Group G6received 114 mg (HED = 6 g) of inulin and group G7 was given combination of GOS and inulin(GOS 57 mg + inulin 57 mg) 114 mg (HED = 6 g). The doses of prebiotics were given orally throughtube feeding for a period of 16 weeks according to each group’s mean body weight at beginning ofexperiment and were adjusted at the end of each week according to body weight changes. In order tomake experimental conditions similar, groups G1 and G2 were administered the same amount of waterorally. After 16 weeks, all animals were sacrificed by injection of 45 mg/kg body weight of sodiumpentobarbital anesthesia.
2.4. Carcinogenic Injection
After acclimatization period of one week, respective groups were given prebiotics daily andafter completion of four weeks of prebiotics doses, groups G2–G7 received four subcutaneousinjections of DMH, 40 mg/kg body weight, twice a week for 2 weeks [23,24]. While G1, control groupreceived similar subcutaneous injections of Ethylenediaminetetraacetic acid (EDTA) solution of pH 6.0(DMH vehicle). All prebiotic doses were continued during DMH administration.
2.5. Preparation of Prebiotic GOS
The Escherichia coli BL21 (DE3) containing β-galactosidase (β-gal) gene from Lactobacillus reuteri
L103 was courtesy of Dietmar Haltrich, Food Biotechnology Laboratory, University of NaturalResources and Life Sciences, Vienna Austria and was used for β-gal production. The enzyme, β-gal wasproduced by following the procedure explained by Iqbal et al. [25] and enzyme activity was measuredfor oNPG and lactose. The crude cell extract of β-gal was used for the production of prebiotic GOSthrough transgalactosylation of lactose (250 g/L) prepared in 50 mM sodium phosphate buffer, pH 6.5at 37 ˝C. The reaction was carried out for 5 h and immediately stopped by heating at 95 ˝C for 5 min andstored at ´20 ˝C for further analysis. The Megazyme assay kits (Wicklow, Ireland) were used to analyzeglucose (GOPOD assay kit, K-GLUC), galactose and lactose (Lactose/Galactose assay kit, K-LACGAR)in the transgalactosylated mixture by following standard protocol given in the manual and GOS werecalculated by subtraction method. The maximum GOS were produced at 75% lactose conversion after5 h of reaction and the final mixture contained 30% GOS, 30% D-glucose, 15% D-galactose and 25%untransgalactosylated lactose. Furthermore, the mixture of GOS was composed of mainly disaccharide(allolactose) and tri-saccharides followed by tetra-saccharides. It was also observed that maximumGOS were produced at 5 h of lactose conversion and as the reaction continued, all GOS were convertedto monosaccharides, glucose, and galactose.
2.6. Measurement of Body Weight Changes
The body weight changes of rats were recorded weekly on weighing scale (Model No. SCL66110Olympia Plus Kent Scientific Corporation, Torrington, CT, USA).
96
Nutrients 2016, 8, 465
2.7. pH and Ammonia
The pH of cecal and fecal digesta were measured using a microelectrode and a pH/ION meter(Model No. HI 111, Hanna Instruments, Ann Arbor, MI, USA). The ammonia concentration wasdetermined by the method described by Lin and Visek [26].
2.8. Aberrant Crypt Foci (ACF) Analysis
After animals were sacrificed, the colon was carefully removed, opened longitudinally, and gentlyrinsed with saline to remove residual bowel contents followed by fixing flat in 10% buffered formalinfor 24 h at room temperature. The colon was divided into proximal (near the cecum), middle, and distalcolon (near the rectum). Methylene blue (0.2%) was used to stain all these three sections and ACFcounting was performed under light microscope. The total number of ACF per rat were calculated asthe sum of small, medium, and large ACF in colon [27].
2.9. Samples Collection and Enzyme Analysis
To ensure fresh fecal samples, before sacrificing animals fecal samples were collected by gentlysqueezing the rectal region of rats and cecum samples were collected after sacrificing each animal,which were processed immediately after collection. Azoreductase activity was determined accordingto the method described by Goldin and Gorbach [28] and for nitroreductase, β-glucuronidase,β-glucosidase, and azoreductase activities minor modifications were made in methods describedby Goldin and Gorbach [28].
2.9.1. Nitroreductase Assay
Cold pre-reduced (0.2 M; pH 7.8) Tris-HCl buffer was used to suspend fresh cecum and fecalsamples. Specimens were disrupted using spatula and were agitated by adding glass beads of 0.2-mmdiameter in a tightly stoppered tube for several minutes on a vortex mixer. The supernatant wascollected anaerobically by centrifuging the suspension at 500ˆ g for 10 min. This supernatant wasfurther processed for enzyme assay. The reaction was carried out anaerobically for 1 h at 30 ˝C(pH 7.8). The total volume of reaction mixture was 500 µL containing 0.08 M Tris-HCl buffer, 0.35 mMm-nitrobenzoic acid, 0.5 mM NADPH, 1 mM NADH and 200 µL fecal and cecum extracts. At theend of reaction 750 µL HCl of 1.2 N concentration was added in reaction mixture to stop chemicalprocess. To measure the amount of m-aminobenzoic acid produced, readings were taken at 550 nm.A standard curve was prepared by using the Bratton-Marshall reaction on known concentrations ofm-aminobenzoic acid.
2.9.2. β-Glucuronidase Assay
Fresh cecal and fecal samples were thawed in cold potassium phosphate buffer (0.1 M) havingpH 7.0. The cecal and fecal suspensions were homogenized in a pre-chilled homogenizer. The filtratewas sonicated for 30 s (six times) bursts at 4 ˝C and then supernatant was collected by centrifuging at500ˆ g for 15 min. The enzyme reaction was carried out using supernatant at 37 ˝C (pH 6.8), 500 µLwas the total volume of reaction mixture containing 0.02 M potassium phosphate buffer, 0.1 mMEDTA, 1 mM phenolphthalein-β-D-glucuronide, and 50 µL cecal and fecal extracts. At the end ofreaction 2.5 mL glycine buffer (0.2 M) having pH 10.4 containing NaCl (0.2 M) was added to stop thereaction. A standard curve of phenolphthalein was prepared for comparison to determine the amountof phenolphthalein released, all readings were taken at 540 nm.
2.9.3. β-Glucosidase Assay
The samples for β-glucosidase assay were prepared as described for the β-glucuronidase assay.Reaction was carried out at 37 ˝C (pH 7.0), 500 µL was the total volume of reaction mixture containing0.1 M potassium phosphate buffer, 1 mM nitrophenyl-β-D-glucoside and 100 µL cecal and fecal extracts.
97
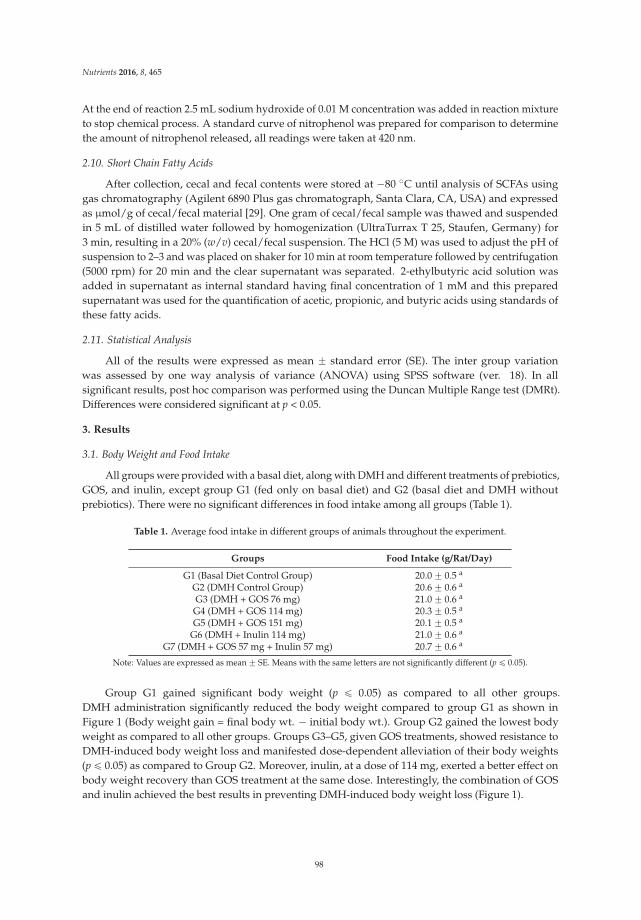
Nutrients 2016, 8, 465
At the end of reaction 2.5 mL sodium hydroxide of 0.01 M concentration was added in reaction mixtureto stop chemical process. A standard curve of nitrophenol was prepared for comparison to determinethe amount of nitrophenol released, all readings were taken at 420 nm.
2.10. Short Chain Fatty Acids
After collection, cecal and fecal contents were stored at ´80 ˝C until analysis of SCFAs usinggas chromatography (Agilent 6890 Plus gas chromatograph, Santa Clara, CA, USA) and expressedas µmol/g of cecal/fecal material [29]. One gram of cecal/fecal sample was thawed and suspendedin 5 mL of distilled water followed by homogenization (UltraTurrax T 25, Staufen, Germany) for3 min, resulting in a 20% (w/v) cecal/fecal suspension. The HCl (5 M) was used to adjust the pH ofsuspension to 2–3 and was placed on shaker for 10 min at room temperature followed by centrifugation(5000 rpm) for 20 min and the clear supernatant was separated. 2-ethylbutyric acid solution wasadded in supernatant as internal standard having final concentration of 1 mM and this preparedsupernatant was used for the quantification of acetic, propionic, and butyric acids using standards ofthese fatty acids.
2.11. Statistical Analysis
All of the results were expressed as mean ˘ standard error (SE). The inter group variationwas assessed by one way analysis of variance (ANOVA) using SPSS software (ver. 18). In allsignificant results, post hoc comparison was performed using the Duncan Multiple Range test (DMRt).Differences were considered significant at p < 0.05.
3. Results
3.1. Body Weight and Food Intake
All groups were provided with a basal diet, along with DMH and different treatments of prebiotics,GOS, and inulin, except group G1 (fed only on basal diet) and G2 (basal diet and DMH withoutprebiotics). There were no significant differences in food intake among all groups (Table 1).
Table 1. Average food intake in different groups of animals throughout the experiment.
Groups Food Intake (g/Rat/Day)
G1 (Basal Diet Control Group) 20.0 ˘ 0.5 a
G2 (DMH Control Group) 20.6 ˘ 0.6 a
G3 (DMH + GOS 76 mg) 21.0 ˘ 0.6 a
G4 (DMH + GOS 114 mg) 20.3 ˘ 0.5 a
G5 (DMH + GOS 151 mg) 20.1 ˘ 0.5 a
G6 (DMH + Inulin 114 mg) 21.0 ˘ 0.6 a
G7 (DMH + GOS 57 mg + Inulin 57 mg) 20.7 ˘ 0.6 a
Note: Values are expressed as mean ˘ SE. Means with the same letters are not significantly different (p ď 0.05).
Group G1 gained significant body weight (p ď 0.05) as compared to all other groups.DMH administration significantly reduced the body weight compared to group G1 as shown inFigure 1 (Body weight gain = final body wt. ´ initial body wt.). Group G2 gained the lowest bodyweight as compared to all other groups. Groups G3–G5, given GOS treatments, showed resistance toDMH-induced body weight loss and manifested dose-dependent alleviation of their body weights(p ď 0.05) as compared to Group G2. Moreover, inulin, at a dose of 114 mg, exerted a better effect onbody weight recovery than GOS treatment at the same dose. Interestingly, the combination of GOSand inulin achieved the best results in preventing DMH-induced body weight loss (Figure 1).
98
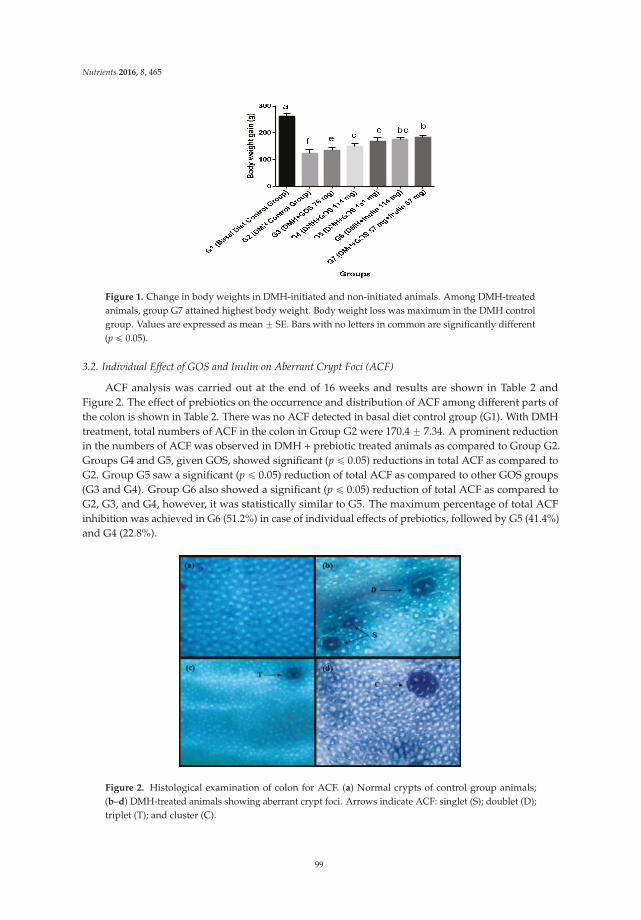
Nutrients 2016, 8, 465
Figure 1. Change in body weights in DMH-initiated and non-initiated animals. Among DMH-treatedanimals, group G7 attained highest body weight. Body weight loss was maximum in the DMH controlgroup. Values are expressed as mean ˘ SE. Bars with no letters in common are significantly different(p ď 0.05).
3.2. Individual Effect of GOS and Inulin on Aberrant Crypt Foci (ACF)
ACF analysis was carried out at the end of 16 weeks and results are shown in Table 2 andFigure 2. The effect of prebiotics on the occurrence and distribution of ACF among different parts ofthe colon is shown in Table 2. There was no ACF detected in basal diet control group (G1). With DMHtreatment, total numbers of ACF in the colon in Group G2 were 170.4 ˘ 7.34. A prominent reductionin the numbers of ACF was observed in DMH + prebiotic treated animals as compared to Group G2.Groups G4 and G5, given GOS, showed significant (p ď 0.05) reductions in total ACF as compared toG2. Group G5 saw a significant (p ď 0.05) reduction of total ACF as compared to other GOS groups(G3 and G4). Group G6 also showed a significant (p ď 0.05) reduction of total ACF as compared toG2, G3, and G4, however, it was statistically similar to G5. The maximum percentage of total ACFinhibition was achieved in G6 (51.2%) in case of individual effects of prebiotics, followed by G5 (41.4%)and G4 (22.8%).
Figure 2. Histological examination of colon for ACF. (a) Normal crypts of control group animals;(b–d) DMH-treated animals showing aberrant crypt foci. Arrows indicate ACF: singlet (S); doublet (D);triplet (T); and cluster (C).
99
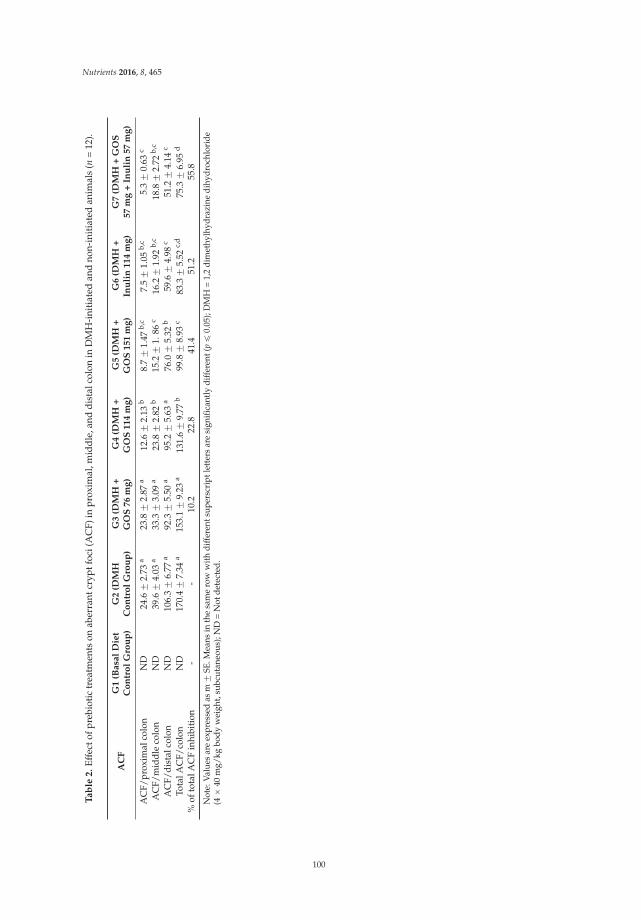
Nutrients 2016, 8, 465
Ta
ble
2.
Effe
ctof
preb
ioti
ctr
eatm
ents
onab
erra
ntcr
yptf
oci(
AC
F)in
prox
imal
,mid
dle,
and
dist
alco
lon
inD
MH
-ini
tiat
edan
dno
n-in
itia
ted
anim
als
(n=
12).
AC
FG
1(B
asa
lD
iet
Co
ntr
ol
Gro
up
)G
2(D
MH
Co
ntr
ol
Gro
up
)G
3(D
MH
+G
OS
76
mg
)G
4(D
MH
+G
OS
11
4m
g)
G5
(DM
H+
GO
S1
51
mg
)G
6(D
MH
+In
uli
n1
14
mg
)G
7(D
MH
+G
OS
57
mg
+In
uli
n5
7m
g)
AC
F/pr
oxim
alco
lon
ND
24.6
˘2.
73a
23.8
˘2.
87a
12.6
˘2.
13b
8.7
˘1.
47b,
c7.
5˘
1.05
b,c
5.3
˘0.
63c
AC
F/m
iddl
eco
lon
ND
39.6
˘4.
03a
33.3
˘3.
09a
23.8
˘2.
82b
15.2
˘1.
86c
16.2
˘1.
92b,
c18
.8˘
2.72
b,c
AC
F/di
stal
colo
nN
D10
6.3
˘6.
77a
92.3
˘5.
50a
95.2
˘5.
63a
76.0
˘5.
32b
59.6
˘4.
98c
51.2
˘4.
14c
Tota
lAC
F/co
lon
ND
170.
4˘
7.34
a15
3.1
˘9.
23a
131.
6˘
9.77
b99
.8˘
8.93
c83
.3˘
5.52
c,d
75.3
˘6.
95d
%of
tota
lAC
Fin
hibi
tion
--
10.2
22.8
41.4
51.2
55.8
Not
e:V
alue
sar
eex
pres
sed
asm
˘SE
.Mea
nsin
the
sam
ero
ww
ithdi
ffer
ents
uper
scri
ptle
tter
sar
esi
gnifi
cant
lydi
ffer
ent(
pď
0.05
);D
MH
=1,
2di
met
hylh
ydra
zine
dihy
droc
hlor
ide
(4ˆ
40m
g/kg
body
wei
ght,
subc
utan
eous
);N
D=
Not
dete
cted
.
100
Nutrients 2016, 8, 465
3.3. Combined Effect of Inulin and GOS on ACF
The combined effects of GOS and inulin showed much better results in ACF inhibition than theirindividual treatments. Group G7 showed a significant (p ď 0.05) reduction of ACF in all parts of colon(proximal, middle and distal). The combination of GOS and inulin treatment showed 55.8% inhibitionof ACF formation in animals, which is significantly (p ď 0.05) higher than the GOS treatment alone.
3.4. SCFA, pH, and Ammonia
Groups G3–G5, which were receiving GOS, showed significant (p ď 0.05) increases in cecumacetate levels as compared to Group G2, while groups G4 and G5 were higher (p ď 0.05) in cecumbutyrate, fecal acetate, and propionate levels, only G5 among GOS groups showed significant (p ď 0.05)higher concentrations of fecal butyrate compared to the DMH control (G2) group, as shown inTable 3. Inulin (G6) treatment showed significantly higher levels (p ď 0.05) of cecum and fecalacetate, propionate, and butyrate concentrations when compared with the DMH control group (G2).Interestingly, the combination of GOS and inulin treatment (G7) exhibited the highest cecum andfecal levels of acetate, propionate, and butyrate among all of the treatment groups. In addition toSCFA, pH and ammonia levels are also indicators of fermentation status. The fecal and cecal pH wasnot significantly altered among all groups (Table 3). Nevertheless, prebiotic treatments significantlyreduced (p ď 0.05) the ammonia levels in cecum and fecal overall. The combination of GOS and inulinsignificantly (p ď 0.05) reduced the levels of cecal and fecal ammonia than GOS groups alone at dosesof 114 mg and 76 mg, respectively.
3.5. Bacterial Enzymes
Overall, Group G2 showed higher levels of enzyme activities in cecum and fecal contents.Among those groups which were given GOS as treatments, G5 showed significantly (p ď 0.05)lower concentrations of β-glucoronidase, and both G4 and G5 showed significantly (p ď 0.05) lowerconcentrations of nitroreductase and azoreductase in cecum contents compared to G2. Regarding fecalcontent, G4 and G5 were able to significantly (p ď 0.05) reduce the concentrations of β-glucoronidase,nitroreductase, and azoreductase, while only G5 was able to reduce (p ď 0.05) the concentrationof β-glucosidase compared to G2. Group G6, which was given inulin, also showed significantly(p ď 0.05) lower concentrations of all enzymes in cecum and fecal contents as compared to DMH controlgroup (G2). We observed that combination treatment of GOS and inulin (G7) resulted in the lowestconcentrations of all enzymes in cecal and fecal samples, as shown in Table 4. Specifically, addition ofa GOS and inulin mixture in both cecum and feces reduced the activity of all enzymes more efficiently,compared to individual treatments of GOS and inulin.
101
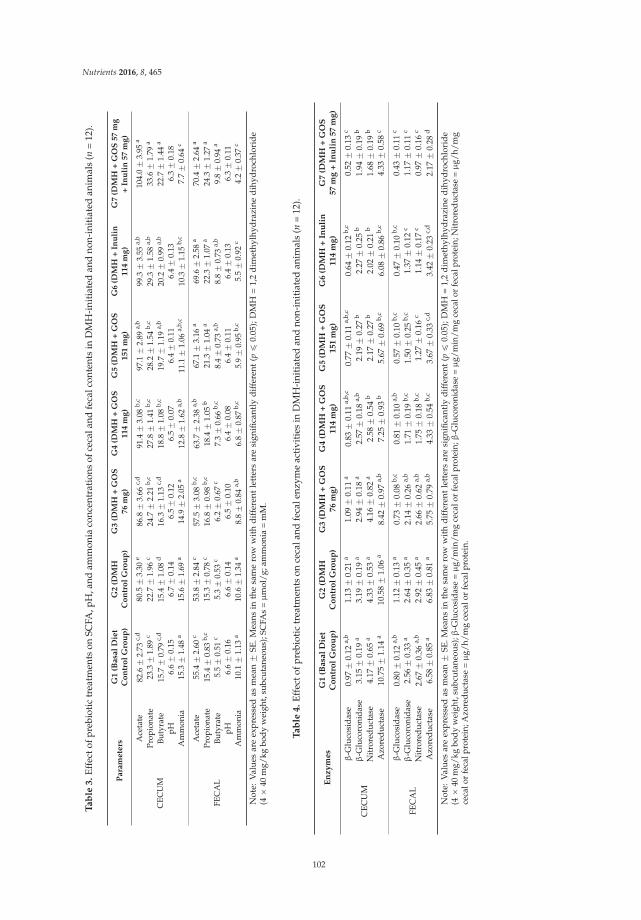
Nutrients 2016, 8, 465
Ta
ble
3.
Effe
ctof
preb
ioti
ctr
eatm
ents
onSC
FA,p
H,a
ndam
mon
iaco
ncen
trat
ions
ofce
cala
ndfe
calc
onte
nts
inD
MH
-ini
tiat
edan
dno
n-in
itia
ted
anim
als
(n=
12).
Pa
ram
ete
rsG
1(B
asa
lD
iet
Co
ntr
ol
Gro
up
)G
2(D
MH
Co
ntr
ol
Gro
up
)G
3(D
MH
+G
OS
76
mg
)G
4(D
MH
+G
OS
11
4m
g)
G5
(DM
H+
GO
S1
51
mg
)G
6(D
MH
+In
uli
n1
14
mg
)G
7(D
MH
+G
OS
57
mg
+In
uli
n5
7m
g)
CEC
UM
Ace
tate
82.6
˘2.
73c,
d80
.5˘
3.30
e86
.8˘
3.66
c,d
91.4
˘3.
08b,
c97
.1˘
2.89
a,b
99.3
˘3.
55a,
b10
4.0
˘3.
95a
Prop
iona
te23
.3˘
1.89
c22
.7˘
1.96
c24
.7˘
2.21
b,c
27.8
˘1.
41b,
c28
.2˘
1.54
b,c
29.3
˘1.
58a,
b33
.6˘
1.79
a
Buty
rate
15.7
˘0.
79c,
d15
.4˘
1.08
d16
.3˘
1.13
c,d
18.8
˘1.
08b,
c19
.7˘
1.19
a,b
20.2
˘0.
99a,
b22
.7˘
1.44
a
pH6.
6˘
0.15
6.7
˘0.
146.
5˘
0.12
6.5
˘0.
076.
4˘
0.11
6.4
˘0.
136.
3˘
0.18
Am
mon
ia15
.3˘
1.48
a15
.6˘
1.69
a14
.9˘
2.05
a12
.8˘
1.62
a,b
11.1
˘1.
06a,
b,c
10.3
˘1.
15b,
c7.
7˘
0.64
c
FEC
AL
Ace
tate
55.4
˘2.
60c
53.8
˘2.
84c
57.5
˘3.
08b,
c63
.7˘
2.38
a,b
67.1
˘3.
16a
69.6
˘2.
58a
70.4
˘2.
64a
Prop
iona
te15
.4˘
0.83
b,c
15.3
˘0.
78c
16.8
˘0.
98b,
c18
.4˘
1.05
b21
.3˘
1.04
a22
.3˘
1.07
a24
.3˘
1.27
a
Buty
rate
5.5
˘0.
51c
5.3
˘0.
53c
6.2
˘0.
67c
7.3
˘0.
66b,
c8.
4˘
0.73
a,b
8.8
˘0.
73a,
b9.
8˘
0.94
a
pH6.
6˘
0.16
6.6
˘0.
146.
5˘
0.10
6.4
˘0.
086.
4˘
0.11
6.4
˘0.
136.
3˘
0.11
Am
mon
ia10
.1˘
1.13
a10
.6˘
1.34
a8.
8˘
0.84
a,b
6.8
˘0.
87b,
c5.
9˘
0.95
b,c
5.5
˘0.
92c
4.2
˘0.
37c
Not
e:V
alu
esar
eex
pre
ssed
asm
ean
˘SE
.Mea
nsin
the
sam
ero
ww
ith
dif
fere
ntle
tter
sar
esi
gnifi
cant
lyd
iffe
rent
(pď
0.05
);D
MH
=1,
2d
imet
hylh
ydra
zine
dih
ydro
chlo
rid
e(4
ˆ40
mg/
kgbo
dyw
eigh
t,su
bcut
aneo
us);
SCFA
s=µ
mol
/g;a
mm
onia
=m
M.
Ta
ble
4.
Effe
ctof
preb
ioti
ctr
eatm
ents
once
cala
ndfe
cale
nzym
eac
tivi
ties
inD
MH
-ini
tiat
edan
dno
n-in
itia
ted
anim
als
(n=
12).
En
zy
mes
G1
(Basa
lD
iet
Co
ntr
ol
Gro
up
)G
2(D
MH
Co
ntr
ol
Gro
up
)G
3(D
MH
+G
OS
76
mg
)G
4(D
MH
+G
OS
114
mg
)G
5(D
MH
+G
OS
151
mg
)G
6(D
MH
+In
uli
n114
mg
)G
7(D
MH
+G
OS
57
mg
+In
uli
n57
mg
)
CEC
UM
β-G
luco
sida
se0.
97˘
0.12
a,b
1.13
˘0.
21a
1.09
˘0.
11a
0.83
˘0.
11a,
b,c
0.77
˘0.
11a,
b,c
0.64
˘0.
12b,
c0.
52˘
0.13
c
β-G
luco
roni
dase
3.15
˘0.
19a
3.19
˘0.
19a
2.94
˘0.
18a
2.57
˘0.
18a,
b2.
19˘
0.27
b2.
27˘
0.25
b1.
94˘
0.19
b
Nitr
ored
ucta
se4.
17˘
0.65
a4.
33˘
0.53
a4.
16˘
0.82
a2.
58˘
0.54
b2.
17˘
0.27
b2.
02˘
0.21
b1.
68˘
0.19
b
Azo
redu
ctas
e10
.75
˘1.
14a
10.5
8˘
1.06
a8.
42˘
0.97
a,b
7.25
˘0.
93b
5.67
˘0.
69b,
c6.
08˘
0.86
b,c
4.33
˘0.
58c
FEC
AL
β-G
luco
sida
se0.
80˘
0.12
a,b
1.12
˘0.
13a
0.73
˘0.
08b,
c0.
81˘
0.10
a,b
0.57
˘0.
10b,
c0.
47˘
0.10
b,c
0.43
˘0.
11c
β-G
luco
roni
dase
2.56
˘0.
33a
2.64
˘0.
35a
2.14
˘0.
26a,
b1.
71˘
0.19
b,c
1.50
˘0.
25b,
c1.
37˘
0.12
c1.
17˘
0.11
c
Nitr
ored
ucta
se2.
67˘
0.36
a,b
2.92
˘0.
45a
2.66
˘0.
62a,
b1.
75˘
0.18
b,c
1.27
˘0.
16c
1.14
˘0.
17c
0.97
˘0.
16c
Azo
redu
ctas
e6.
58˘
0.85
a6.
83˘
0.81
a5.
75˘
0.79
a,b
4.33
˘0.
54b,
c3.
67˘
0.33
c,d
3.42
˘0.
23c,
d2.
17˘
0.28
d
Not
e:V
alu
esar
eex
pre
ssed
asm
ean
˘SE
.Mea
nsin
the
sam
ero
ww
ith
dif
fere
ntle
tter
sar
esi
gnifi
cant
lyd
iffe
rent
(pď
0.05
);D
MH
=1,
2d
imet
hylh
ydra
zine
dih
ydro
chlo
rid
e(4
ˆ40
mg/
kgbo
dyw
eigh
t,su
bcut
aneo
us);β
-Glu
cosi
dase
=µ
g/m
in/m
gce
calo
rfe
calp
rote
in;β
-Glu
coro
nida
se=µ
g/m
in/m
gce
calo
rfe
calp
rote
in;N
itro
redu
ctas
e=µ
g/h/
mg
ceca
lor
feca
lpro
tein
;Azo
redu
ctas
e=µ
g/h/
mg
ceca
lor
feca
lpro
tein
.
102
Nutrients 2016, 8, 465
4. Discussion
CRC is one of the most common cancers and is the leading cause for morbidity and mortality,even in developed countries. Scientists have focused on various bioactive components in foods toevaluate their role in prevention of CRC. Our data demonstrate that the combination of GOS and inulinprovided a significant preventive effect against the development of CRC. Furthermore, the inhibition ofACF formation was significantly higher using this novel combination than inulin and GOS treatmentsalone. The results of current study also suggest that, in comparison to GOS or inulin individually indifferent doses, the combination of GOS and inulin rendered better resistance against DMH-inducedbody weight loss and showed higher levels of cecal and fecal SCFA (acetate, propionate, and butyrate).
ACF are pre-adenomatous morphological putative lesions within the colonic mucosa that maylead to progression to colon cancer. In the present study colon samples were collected after 16 weeks forACF analysis and, as reported in previous literature, this time period is sufficient for the developmentof ACF and to observe the effects of treatments. Our results indicated that various doses of prebioticssignificantly (p > 0.05) inhibited DMH-induced colonic ACF formation in rats. We also showed thatGOS inhibited ACF formation in rats in a dose-dependent manner; among all GOS groups, G5 had themaximum effect on ACF inhibition (55.8%), followed by G4 (41.4%) and G3 (22.8%) when compared tothe G2 group. Only one previous study [20] reported a high dose of commercial GOS (β-1,4 linkage),at 20% concentration in the diet, inhibited ACF formation. Interestingly, our results showed thatthe combination of prebiotics with both GOS and inulin (G7) had not only reduced the numberof ACF in the proximal, middle, and distal colon, but also altered the distribution of ACF in theentire colon (Table 2). This suggests that administration of prebiotics in combination is able to exert apronounced chemopreventive effect on preneoplastic ACF formation. Previous experimental studiesalso support our findings and suggest that prebiotics are effective enough to inhibit total ACF countschemically-induced in the colon [8,20,30–32]. As it is observed that inulin was better than GOS inreducing ACF counts, it might be due to inulin being slowly degraded and passing further along thecolon before being completely degraded in the upper parts of intestine [33]. Another reason might bethe monosaccharides in GOS which promote the growth of microbes without discriminating beneficialand harmful microbes. A previous study reported that inulin was able to inhibit 78.8% ACF formationin rats [30]. The reduced ACF counts in prebiotic-treated animals may be due to the modulation ofmicrobiota and increased concentrations of SCFAs, as these are important for normal development ofcolonic epithelial cells [16,31].
Those groups which were receiving prebiotics, particularly G5–G7, showed higher levelsof SCFA production and reductions in ammonia in cecal and fecal contents of rats (Table 3).The SCFA, especially acetate, propionate, and butyrate, are the major products of prebiotic anaerobicfermentation, which results in the lowering of colon pH and increasing the growth of beneficial bacteria,and ultimately attribute to the health benefits of prebiotics [34]. Among these SCFA, butyrate hasreceived much attention in colon cancer prevention with multiple roles, including intestinal barrierfunction, minerals absorption, cell growth and differentiation [35], as well as its immuno-modulatoryactivity through its histone deacetylase (HDAC) inhibitory activity on nuclear factor κB (NF-κB)and its expression in colon carcinoma cells [36]. The butyrigenic effect of prebiotic GOS and inulinis very much desirable and has been suggested to be a major contributor to prevent/inhibit coloncarcinogenesis [37]. Higher dietary protein can raise ammonia levels in the colon [38] and increaseCRC risk through enhancing colonocyte proliferation [26]. Prebiotic supplementation or increasedlevels of butyrate in the colon may reduce ammonia-mediated toxicity [39,40]. In the present study,significant (p > 0.05) reduction in ammonia and increase in SCFA’s production in cecum and fecalsamples (Table 3) during prebiotic treatments indicated a degree of shift from proteolytic activityto saccharolytic fermentation. This is particularly important in the distal colon where proteolyticfermentation predominates, leading to the accumulation of toxic metabolites. A previous studyusing prebiotic fructans was consistent with our results with lower levels of ammonia in theprebiotic-treated groups [8,40]. In our findings, high concentrations of dietary GOS (G5 151 mg,
103
Nutrients 2016, 8, 465
HED 8 g), inulin (G6 114 mg, HED 6 g), and GOS + inulin (G7, 57 mg each, HED 6 g) significantly(p > 0.05) enhanced the production of SCFA with reduction of ammonia and, interestingly, without achange in pH. Similar findings have been observed in earlier studies using prebiotics and probiotics incombination and ITF against CRC [8,16,32].
The gastrointestinal tract (GIT), particularly the colon, is considered a complex natural ecosystemoccupied by large number of micro-organisms. This microbiota is known to play a key role inthe well-being and health of the host [41]. The substances produced by colonic microflora havedifferent effects on the host, such as carcinogenic, genotoxic, tumor-promoting, and anti-carcinogenicactivities [15]. Enzymes, particularly β-glucuronidase, β-glucosidase, azoreductase, nitroreductase,7-β-dehydrogenase, and 7-β-dehydrolase, are involved in conversions of endogenous toxinsand genotoxic compounds [34]. It is proven that changes in concentrations of these bacterialenzymes is an indication of change in GIT microbiota [42] In our findings, the levels of enzymes(β-glucuronidase, β-glucosidase, azoreductase and nitroreductase) in cecal and fecal contents werelower in treatment groups. It is well documented that the higher levels of β-glucuronidase andβ-glucosidase are considered as biomarkers of colon cancer playing a significant role in coloncarcinogenesis and are involved in the carcinogenesis of neoplasms [28], as β-glucuronidase is involvedin restoration of the toxic properties of some xenobiotics in colon, its reduced level is taken as apositive effect for colon cancer prevention [43]. Higher levels of bacterial nitroreductase are consideredharmful as it is involved in the synthesis of nitrosamines in the colon produced by the interaction ofamines with the product of nitrate/nitrite reduction [43]. The decreased activity of β-glucosidase andβ-glucuronidase in the present study with prebiotic treatment may be due to the improved intestinalmicrobiota and many other in vivo factors like pH, ammonia production and substrate availability.Moreover, earlier in vivo studies have also documented that inulin and oligofructose supplementationin fecal bacterial cultures led to enhanced growth of bifidobacterium, having low β-glucuronidase andβ-glucosidase activity, and reduced growth of Escherichia coli and Clostridium sp. that are known tohave higher β-glucuronidase activity [30]. The previous study [30] using inulin and lactulose prebioticsalso found significantly (p ď 0.05) decreased activity of β-glucuronidase and β-glucosidase in animalsbelonging to the inulin + DMH group compared with the lactulose + DMH-treated group strengthensour findings.
5. Conclusions
In conclusion, this study reveals that GOS prebiotic treatment has a dose-dependentchemo-preventive effect against DMH-induced ACF formation and CRC-related bio-markers. A GOSdose of 8 g (HED) per day is more effective at producing these outcomes than lower doses of4 and 6 g per day. Novelty of the present study is utilization of GOS containing β-1,6 and β-1,3glycosidic linkages, which have never been used before in any cancer prevention study. A novelcombination of GOS and inulin exhibited stronger preventive activity than their individual treatmentsalone. As epidemiological data indicates increasing prevalence of CRC throughout the world, anddietary patterns are considered one of major risk factors, it time to focus on dietary strategies forchemoprevention of CRC. Results of the present study encourage inclusion of prebiotic combinationsin routine diet and can be a promising strategy for CRC chemoprevention. Further studies are neededto understand the mechanisms of action of different prebiotics containing a variety of linkages inCRC prevention.
Acknowledgments: We are really thankful to Dietmar Haltrich, Food Biotechnology Laboratory, University ofNatural Resources and Life Sciences, Vienna-Austria for providing us E. coli BL21 (DE3) containing β-galactosidase(β-gal) gene from Lactobacillus reuteri L103. Authors are very much thankful to Higher Education Commission,Islamabad—Pakistan for funding this study under project (112-25974-2AV1-346).
104
Nutrients 2016, 8, 465
Author Contributions: Tahir Rasool Qamar conceptualized, designed, and conducted all analyses. Fatima Syedhelped in performing efficacy study. Muhammad Nasir assisted in data collecting management. Habib-ur-Rehmancontributed to analysis design. Muhammad Nauman Zahid contributed to the study concept and design andinterpretation of the data. Rui Hai Liu helped in statistical analysis, and manuscript writing and Sanaullah Iqbalsupervised the study and helped in manuscript writing.
Conflicts of Interest: The author declares no conflict of interest.
References
1. Benson, A.L. Epidemiology, disease progression, and economic burden of colorectal cancer. J. Manag.
Care Pharm. 2007, 13, S5–S18. [CrossRef] [PubMed]2. Watson, A.J.; Collins, P.D. Colon cancer: A civilization disorder. Dig. Dis. 2011, 29, 222–228. [CrossRef]
[PubMed]3. Bastide, N.M.; Pierre, F.H.; Corpet, D.E. Heme iron from meat and risk of colorectal cancer: A meta-analysis
and a review of the mechanisms involved. Cancer Prev. Res. 2011, 4, 177–184. [CrossRef] [PubMed]4. Khan, N.; Afaq, F.; Mukhtar, H. Lifestyle as risk factor for cancer: Evidence from human studies. Cancer Lett.
2010, 293, 133–143. [CrossRef] [PubMed]5. Van Engeland, M.; Derks, S.; Smits, K.M.; Meijer, G.A.; Herman, J.G. Colorectal cancer epigenetics:
Complex simplicity. J. Clin. Oncol. 2011, 29, 1382–1391. [CrossRef] [PubMed]6. Poulsen, M.; Mortensen, A.; Binderup, M.L.; Langkilde, S.; Markowski, J.; Dragsted, L.O. The effect of apple
feeding on markers of colon carcinogenesis. Nutr. Cancer 2011, 63, 402–409. [CrossRef] [PubMed]7. Tarapore, R.S.; Siddiqui, I.A.; Mukhtar, H. Modulation of wnt/beta-catenin signaling pathway by bioactive
food components. Carcinogenesis 2012, 33, 483–491. [CrossRef] [PubMed]8. Fotiadis, C.I.; Stoidis, C.N.; Spyropoulos, B.G.; Zografos, E.D. Role of probiotics, prebiotics and synbiotics in
chemoprevention for colorectal cancer. World J. Gastroenterol. 2008, 14, 6453–6457. [CrossRef] [PubMed]9. Macfarlane, G.T.; Macfarlane, S. Fermentation in the human large intestine: Its physiologic consequences
and the potential contribution of prebiotics. J. Clin. Gastroenterol. 2011, 45, S120–S127. [CrossRef] [PubMed]10. Campbell, J.M.; Fahey, G.C., Jr.; Wolf, B.W. Selected indigestible oligosaccharides affect large bowel mass,
cecal and fecal short-chain fatty acids, pH and microflora in rats. J. Nutr. 1997, 127, 130–136. [PubMed]11. Ebert, M.N.; Beyer-Sehlmeyer, G.; Liegibel, U.M.; Kautenburger, T.; Becker, T.W.; Pool-Zobel, B.L.
Butyrate induces glutathione s-transferase in human colon cells and protects from genetic damage by4-hydroxy-2-nonenal. Nutr. Cancer 2001, 41, 156–164. [CrossRef] [PubMed]
12. Torres, D.P.M.; Gonçalves, M.d.P.F.; Teixeira, J.A.; Rodrigues, L.R. Galacto-oligosaccharides:Production, properties, applications, and significance as prebiotics. Compr. Rev. Food Sci. Food Saf. 2010, 9,438–454. [CrossRef]
13. Laparra, J.M.; Diez-Municio, M.; Herrero, M.; Moreno, F.J. Structural differences of prebiotic oligosaccharidesinfluence their capability to enhance iron absorption in deficient rats. Food Funct. 2014, 5, 2430–2437.[CrossRef] [PubMed]
14. Sivieri, K.; Spinardi-Barbisan, A.L.T.; Barbisan, L.F.; Bedani, R.; Pauly, N.D.; Carlos, I.Z.; Benzatti, F.;Vendramini, R.C.; Rossi, E.A. Probiotic Enterococcus faecium CRL 183 inhibit chemically induced colon cancerin male Wistar rats. Eur. Food Res. Technol. 2008, 228, 231–237. [CrossRef]
15. Gallaher, D.D.; Khil, J. The effect of synbiotics on colon carcinogenesis in rats. J. Nutr. 1999, 129, 1483S–1487S.[PubMed]
16. Femia, A.P.; Luceri, C.; Dolara, P.; Giannini, A.; Biggeri, A.; Salvadori, M.; Clune, Y.;Collins, K.J.; Paglierani, M.; Caderni, G. Antitumorigenic activity of the prebiotic inulin enriched witholigofructose in combination with the probiotics lactobacillus rhamnosus and bifidobacterium lactis onazoxymethane-induced colon carcinogenesis in rats. Carcinogenesis 2002, 23, 1953–1960. [CrossRef] [PubMed]
17. Pool-Zobel, B.; van Loo, J.; Rowland, I.; Roberfroid, M.B. Experimental evidences on the potential of prebioticfructans to reduce the risk of colon cancer. Br. J. Nutr. 2002, 87 (Suppl. S2), S273–S281. [CrossRef] [PubMed]
18. Reddy, B.S. Prevention of colon cancer by pre- and probiotics: Evidence from laboratory studies. Br. J. Nutr.
1998, 80, S219–S223. [PubMed]
105
Nutrients 2016, 8, 465
19. Wijnands, M.V.; Appel, M.J.; Hollanders, V.M.; Woutersen, R.A. A comparison of the effects of dietarycellulose and fermentable galacto-oligosaccharide, in a rat model of colorectal carcinogenesis: Fermentablefibre confers greater protection than non-fermentable fibre in both high and low fat backgrounds.Carcinogenesis 1999, 20, 651–656. [CrossRef] [PubMed]
20. Wijnands, M.V.; Schoterman, H.C.; Bruijntjes, J.B.; Hollanders, V.M.; Woutersen, R.A. Effect of dietarygalacto-oligosaccharides on azoxymethane-induced aberrant crypt foci and colorectal cancer in fischer344 rats. Carcinogenesis 2001, 22, 127–132. [CrossRef] [PubMed]
21. Reeves, P.G.; Rossow, K.L.; Lindlauf, J. Development and testing of the ain-93 purified diets for rodents:Results on growth, kidney calcification and bone mineralization in rats and mice. J. Nutr. 1993, 123,1923–1931. [PubMed]
22. Reagan-Shaw, S.; Nihal, M.; Ahmad, N. Dose translation from animal to human studies revisited. FASEB J.
2008, 22, 659–661. [CrossRef] [PubMed]23. Dias, M.C.; Spinardi-Barbisan, A.L.; Rodrigues, M.A.; de Camargo, J.L.; Teran, E.; Barbisan, L.F. Lack of
chemopreventive effects of ginger on colon carcinogenesis induced by 1,2-dimethylhydrazine in rats.Food Chem. Toxicol. 2006, 44, 877–884. [CrossRef] [PubMed]
24. Dias, M.C.; Vieiralves, N.F.; Gomes, M.I.; Salvadori, D.M.; Rodrigues, M.A.; Barbisan, L.F. Effects of lycopene,synbiotic and their association on early biomarkers of rat colon carcinogenesis. Food Chem. Toxicol. 2010, 48,772–780. [CrossRef] [PubMed]
25. Iqbal, S.; Nguyen, T.H.; Nguyen, T.T.; Maischberger, T.; Haltrich, D. Beta-galactosidasefrom Lactobacillus plantarum WCFS1: Biochemical characterization and formation of prebioticgalacto-oligosaccharides. Carbohydr. Res. 2010, 345, 1408–1416. [CrossRef] [PubMed]
26. Lin, H.C.; Visek, W.J. Large intestinal ph and ammonia in rats: Dietary fat and protein interactions. J. Nutr.
1991, 121, 832–843. [PubMed]27. Bird, R.P. Role of aberrant crypt foci in understanding the pathogenesis of colon cancer. Cancer Lett. 1995, 93,
55–71. [CrossRef]28. Goldin, B.R.; Gorbach, S.L. The relationship between diet and rat fecal bacterial enzymes implicated in colon
cancer. J. Natl. Cancer Inst. 1976, 57, 371–375. [PubMed]29. Zhao, G.; Nyman, M.; Åke Jönsson, J. Rapid determination of short-chain fatty acids in colonic contents
and faeces of humans and rats by acidified water-extraction and direct-injection gas chromatography.Biomed. Chromatogr. 2006, 20, 674–682. [CrossRef] [PubMed]
30. Verma, A.; Shukla, G. Administration of prebiotic inulin suppresses 1,2 dimethylhydrazine dihydrochlorideinduced procarcinogenic biomarkers fecal enzymes and preneoplastic lesions in early colon carcinogenesisin sprague dawley rats. J. Funct. Foods 2013, 5, 991–996. [CrossRef]
31. Aachary, A.A.; Gobinath, D.; Srinivasan, K.; Prapulla, S.G. Protective effect of xylooligosaccharides fromcorncob on 1,2-dimethylhydrazine induced colon cancer in rats. Bioact. Carbohydr. Diet. Fibre 2015, 5, 146–152.[CrossRef]
32. Pool-Zobel, B.L.; Sauer, J. Overview of experimental data on reduction of colorectal cancer risk by inulin-typefructans. J. Nutr. 2007, 137, 2580S–2584S. [PubMed]
33. Van de Wiele, T.; Boon, N.; Possemiers, S.; Jacobs, H.; Verstraete, W. Inulin-type fructans of longer degreeof polymerization exert more pronounced in vitro prebiotic effects. J. Appl. Microbiol. 2007, 102, 452–460.[CrossRef] [PubMed]
34. Macfarlane, G.T.; Macfarlane, S. Bacteria, colonic fermentation, and gastrointestinal health. J. AOAC Int.
2012, 95, 50–60. [CrossRef] [PubMed]35. Daly, K.; Cuff, M.A.; Fung, F.; Shirazi-Beechey, S.P. The importance of colonic butyrate transport to the
regulation of genes associated with colonic tissue homoeostasis. Biochem. Soc. Trans. 2005, 33, 733–735.[CrossRef] [PubMed]
36. Vinolo, M.A.; Rodrigues, H.G.; Nachbar, R.T.; Curi, R. Regulation of inflammation by short chain fatty acids.Nutrients 2011, 3, 858–876. [CrossRef] [PubMed]
37. Fung, K.Y.; Cosgrove, L.; Lockett, T.; Head, R.; Topping, D.L. A review of the potential mechanisms for thelowering of colorectal oncogenesis by butyrate. Br. J. Nutr. 2012, 108, 820–831. [CrossRef] [PubMed]
38. Lupton, J.R.; Marchant, L.J. Independent effects of fiber and protein on colonic luminal ammoniaconcentration. J. Nutr. 1989, 119, 235–241. [PubMed]
106
Nutrients 2016, 8, 465
39. De Preter, V.; Vanhoutte, T.; Huys, G.; Swings, J.; de Vuyst, L.; Rutgeerts, P.; Verbeke, K. Effects ofLactobacillus casei shirota, Bifidobacterium breve, and oligofructose-enriched inulin on colonic nitrogen-proteinmetabolism in healthy humans. Am. J. Physiol. Gastrointest. Liver Physiol. 2007, 292, G358–G368. [CrossRef][PubMed]
40. Geboes, K.P.; de Hertogh, G.; de Preter, V.; Luypaerts, A.; Bammens, B.; Evenepoel, P.; Ghoos, Y.; Geboes, K.;Rutgeerts, P.; Verbeke, K. The influence of inulin on the absorption of nitrogen and the production ofmetabolites of protein fermentation in the colon. Br. J. Nutr. 2006, 96, 1078–1086. [CrossRef] [PubMed]
41. Tappenden, K.A.; Deutsch, A.S. The physiological relevance of the intestinal microbiota—Contributions tohuman health. J. Am. Coll. Nutr. 2007, 26, 679S–683S. [CrossRef] [PubMed]
42. Klewicka, E.; Zdunczyk, Z.; Juskiewicz, J. Effect of lactobacillus fermented beetroot juice on compositionand activity of cecal microflora of rats. Eur. Food Res. Technol. 2009, 229, 153–157. [CrossRef]
43. Ayesh, R.; Weststrate, J.A.; Drewitt, P.N.; Hepburn, P.A. Safety evaluation of phytosterol esters. Part 5.Faecal short-chain fatty acid and microflora content, faecal bacterial enzyme activity and serum female sexhormones in healthy normolipidaemic volunteers consuming a controlled diet either with or without aphytosterol ester-enriched margarine. Food Chem. Toxicol. 1999, 37, 1127–1138. [PubMed]
© 2016 by the authors. Licensee MDPI, Basel, Switzerland. This article is an open accessarticle distributed under the terms and conditions of the Creative Commons Attribution(CC BY) license (http://creativecommons.org/licenses/by/4.0/).
107
nutrients
Article
The Effects of Early Post-Operative Soluble DietaryFiber Enteral Nutrition for Colon Cancer
Rui Xu, Zhi Ding, Ping Zhao, Lingchao Tang, Xiaoli Tang and Shuomeng Xiao *
Department of Gastrointestinal Surgery, Sichuan Cancer Hospital, Chengdu 610041, China;[email protected] (R.X.); [email protected] (Z.D.); [email protected] (P.Z.);[email protected] (L.T.); [email protected] (X.T.)* Correspondence: [email protected]; Tel.: +86-28-8542-0845
Received: 12 August 2016; Accepted: 13 September 2016; Published: 21 September 2016
Abstract: We examined colon cancer patients who received soluble dietary fiber enteral nutrition(SDFEN) to evaluate the feasibility and potential benefit of early SDFEN compared to EN.Sixty patients who were confirmed as having colon cancer with histologically and accepted radicalresection of colon cancer were randomized into an SDFEN group and an EN group. The postoperativecomplications, length of hospital stay (LOH), days for first fecal passage, and the differencein nutritional status, immune function and inflammatory reaction between pre-operation andpost-operation were all recorded. The statistical analyses were performed using the t-test and the chisquare test. Statistical significance was defined as p < 0.05. After the nutrition support, differencesin the levels of albumin, prealbumin and transferrin in each group were not statistically significant(p > 0.05); the levels of CD4+, IgA and IgM in the SDFEN group were higher than that of the ENgroup at seven days (p < 0.05); the levels of TNF-α and IL-6 in the SDFEN group were lower thanthat of the EN group at seven days (p < 0.05); and patients in the SDFEN group had a significantlyshorter first flatus time than the EN group (p < 0.05). Early post-operative SDFEN used in coloncancer patients was feasible and beneficial in immune function and reducing inflammatory reaction,gastrointestinal function and speeding up the recovery.
Keywords: colon cancer; dietary fiber; early enteral nutrition
1. Introduction
In the 21st century, cancer incidence and mortality has not reduced; moreover, it has even increasedyear by year. The total number of patients with colorectal cancer increased to 1.23 million globallyin 2008; it is ranked third in cancer incidence and fourth in mortality [1]. However, the incidence andmortality of colorectal cancer were ranked third and fifth, respectively [2] in China. Many studiesshowed that the incidence of malnutrition in patients with a malignant tumor was as high as31%–97% [3,4], especially for gastrointestinal cancer, so choosing a proper nutrition therapy forcolorectal cancer patients with malnutrition is necessary. Early enteral nutrition support is promotedafter gastrointestinal surgery, and there are many kinds of nutrient elements, such as probiotics,ω-3PUFA, Gln and fiber. We know that dietary fiber is a kind of nutrient, which is divided into solubledietary fiber and insoluble dietary fiber and can protect the intestinal barrier, modulate immunefunction, induce inflammatory response and postoperative complications [5,6]. SCFA is the mainsource of energy for intestinal epithelial cells and plays a key role in maintaining colonic healthand moderating cell growth and differentiation. This depends on the fermentation of dietary fiber.Soluble dietary fiber is fermented, but insoluble dietary fiber is difficult to ferment. The relationshipbetween dietary fiber and colon cancer prevention was studied widely, but there is little study aboutthe early postoperative application of soluble dietary fiber in colon cancer [7–9]. Thus, we decide to
Nutrients 2016, 8, 584 108 www.mdpi.com/journal/nutrients
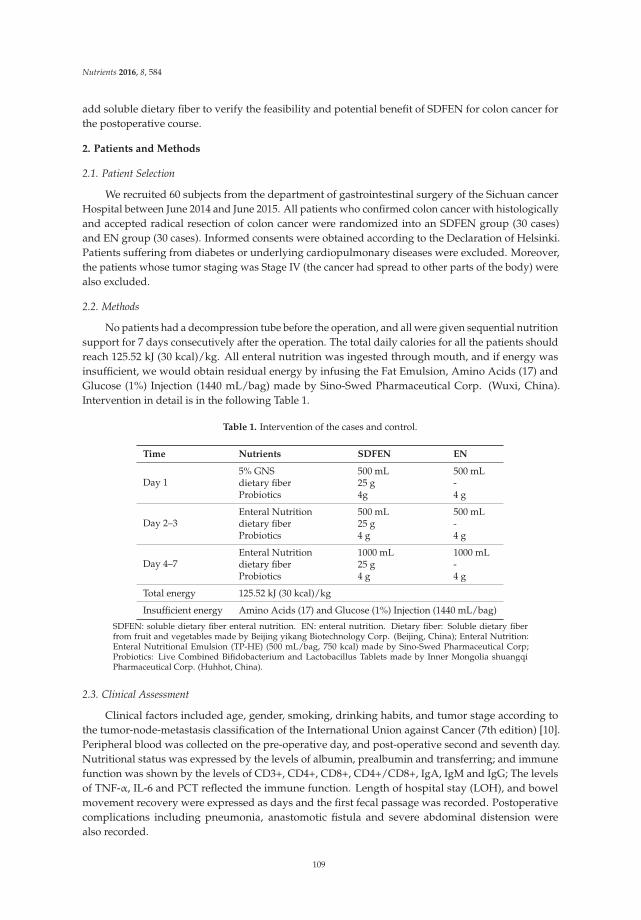
Nutrients 2016, 8, 584
add soluble dietary fiber to verify the feasibility and potential benefit of SDFEN for colon cancer forthe postoperative course.
2. Patients and Methods
2.1. Patient Selection
We recruited 60 subjects from the department of gastrointestinal surgery of the Sichuan cancerHospital between June 2014 and June 2015. All patients who confirmed colon cancer with histologicallyand accepted radical resection of colon cancer were randomized into an SDFEN group (30 cases)and EN group (30 cases). Informed consents were obtained according to the Declaration of Helsinki.Patients suffering from diabetes or underlying cardiopulmonary diseases were excluded. Moreover,the patients whose tumor staging was Stage IV (the cancer had spread to other parts of the body) werealso excluded.
2.2. Methods
No patients had a decompression tube before the operation, and all were given sequential nutritionsupport for 7 days consecutively after the operation. The total daily calories for all the patients shouldreach 125.52 kJ (30 kcal)/kg. All enteral nutrition was ingested through mouth, and if energy wasinsufficient, we would obtain residual energy by infusing the Fat Emulsion, Amino Acids (17) andGlucose (1%) Injection (1440 mL/bag) made by Sino-Swed Pharmaceutical Corp. (Wuxi, China).Intervention in detail is in the following Table 1.
Table 1. Intervention of the cases and control.
Time Nutrients SDFEN EN
Day 15% GNS 500 mL 500 mLdietary fiber 25 g -Probiotics 4g 4 g
Day 2–3Enteral Nutrition 500 mL 500 mLdietary fiber 25 g -Probiotics 4 g 4 g
Day 4–7Enteral Nutrition 1000 mL 1000 mLdietary fiber 25 g -Probiotics 4 g 4 g
Total energy 125.52 kJ (30 kcal)/kg
Insufficient energy Amino Acids (17) and Glucose (1%) Injection (1440 mL/bag)
SDFEN: soluble dietary fiber enteral nutrition. EN: enteral nutrition. Dietary fiber: Soluble dietary fiberfrom fruit and vegetables made by Beijing yikang Biotechnology Corp. (Beijing, China); Enteral Nutrition:Enteral Nutritional Emulsion (TP-HE) (500 mL/bag, 750 kcal) made by Sino-Swed Pharmaceutical Corp;Probiotics: Live Combined Bifidobacterium and Lactobacillus Tablets made by Inner Mongolia shuangqiPharmaceutical Corp. (Huhhot, China).
2.3. Clinical Assessment
Clinical factors included age, gender, smoking, drinking habits, and tumor stage according tothe tumor-node-metastasis classification of the International Union against Cancer (7th edition) [10].Peripheral blood was collected on the pre-operative day, and post-operative second and seventh day.Nutritional status was expressed by the levels of albumin, prealbumin and transferring; and immunefunction was shown by the levels of CD3+, CD4+, CD8+, CD4+/CD8+, IgA, IgM and IgG; The levelsof TNF-α, IL-6 and PCT reflected the immune function. Length of hospital stay (LOH), and bowelmovement recovery were expressed as days and the first fecal passage was recorded. Postoperativecomplications including pneumonia, anastomotic fistula and severe abdominal distension werealso recorded.
109
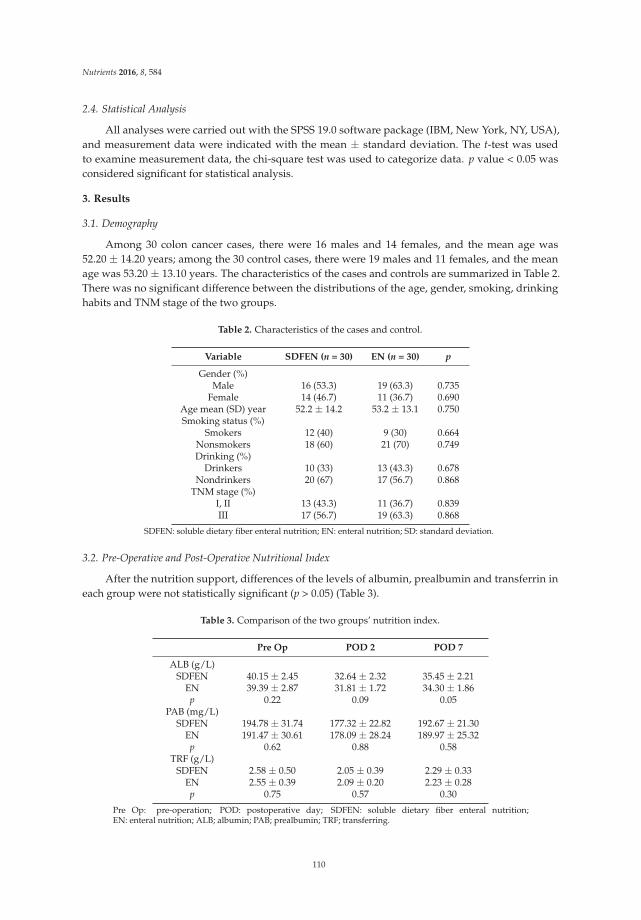
Nutrients 2016, 8, 584
2.4. Statistical Analysis
All analyses were carried out with the SPSS 19.0 software package (IBM, New York, NY, USA),and measurement data were indicated with the mean ± standard deviation. The t-test was usedto examine measurement data, the chi-square test was used to categorize data. p value < 0.05 wasconsidered significant for statistical analysis.
3. Results
3.1. Demography
Among 30 colon cancer cases, there were 16 males and 14 females, and the mean age was52.20 ± 14.20 years; among the 30 control cases, there were 19 males and 11 females, and the meanage was 53.20 ± 13.10 years. The characteristics of the cases and controls are summarized in Table 2.There was no significant difference between the distributions of the age, gender, smoking, drinkinghabits and TNM stage of the two groups.
Table 2. Characteristics of the cases and control.
Variable SDFEN (n = 30) EN (n = 30) p
Gender (%)Male 16 (53.3) 19 (63.3) 0.735
Female 14 (46.7) 11 (36.7) 0.690Age mean (SD) year 52.2 ± 14.2 53.2 ± 13.1 0.750Smoking status (%)
Smokers 12 (40) 9 (30) 0.664Nonsmokers 18 (60) 21 (70) 0.749Drinking (%)
Drinkers 10 (33) 13 (43.3) 0.678Nondrinkers 20 (67) 17 (56.7) 0.868
TNM stage (%)I, II 13 (43.3) 11 (36.7) 0.839III 17 (56.7) 19 (63.3) 0.868
SDFEN: soluble dietary fiber enteral nutrition; EN: enteral nutrition; SD: standard deviation.
3.2. Pre-Operative and Post-Operative Nutritional Index
After the nutrition support, differences of the levels of albumin, prealbumin and transferrin ineach group were not statistically significant (p > 0.05) (Table 3).
Table 3. Comparison of the two groups’ nutrition index.
Pre Op POD 2 POD 7
ALB (g/L)SDFEN 40.15 ± 2.45 32.64 ± 2.32 35.45 ± 2.21
EN 39.39 ± 2.87 31.81 ± 1.72 34.30 ± 1.86p 0.22 0.09 0.05
PAB (mg/L)SDFEN 194.78 ± 31.74 177.32 ± 22.82 192.67 ± 21.30
EN 191.47 ± 30.61 178.09 ± 28.24 189.97 ± 25.32p 0.62 0.88 0.58
TRF (g/L)SDFEN 2.58 ± 0.50 2.05 ± 0.39 2.29 ± 0.33
EN 2.55 ± 0.39 2.09 ± 0.20 2.23 ± 0.28p 0.75 0.57 0.30
Pre Op: pre-operation; POD: postoperative day; SDFEN: soluble dietary fiber enteral nutrition;EN: enteral nutrition; ALB; albumin; PAB; prealbumin; TRF; transferring.
110
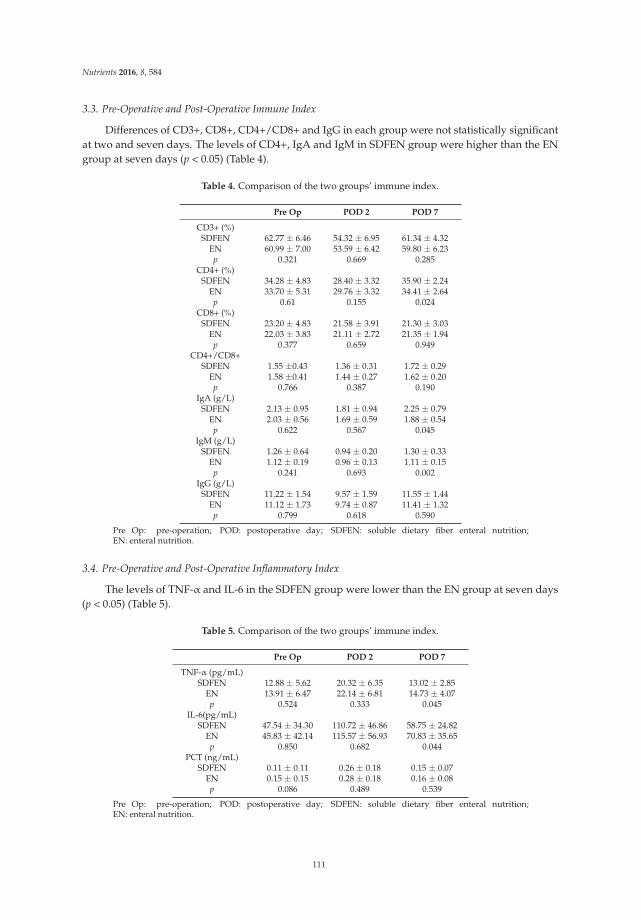
Nutrients 2016, 8, 584
3.3. Pre-Operative and Post-Operative Immune Index
Differences of CD3+, CD8+, CD4+/CD8+ and IgG in each group were not statistically significantat two and seven days. The levels of CD4+, IgA and IgM in SDFEN group were higher than the ENgroup at seven days (p < 0.05) (Table 4).
Table 4. Comparison of the two groups’ immune index.
Pre Op POD 2 POD 7
CD3+ (%)SDFEN 62.77 ± 6.46 54.32 ± 6.95 61.34 ± 4.32
EN 60.99 ± 7.00 53.59 ± 6.42 59.80 ± 6.23p 0.321 0.669 0.285
CD4+ (%)SDFEN 34.28 ± 4.83 28.40 ± 3.32 35.90 ± 2.24
EN 33.70 ± 5.31 29.76 ± 3.32 34.41 ± 2.64p 0.61 0.155 0.024
CD8+ (%)SDFEN 23.20 ± 4.83 21.58 ± 3.91 21.30 ± 3.03
EN 22.03 ± 3.83 21.11 ± 2.72 21.35 ± 1.94p 0.377 0.659 0.949
CD4+/CD8+SDFEN 1.55 ±0.43 1.36 ± 0.31 1.72 ± 0.29
EN 1.58 ±0.41 1.44 ± 0.27 1.62 ± 0.20p 0.766 0.387 0.190
IgA (g/L)SDFEN 2.13 ± 0.95 1.81 ± 0.94 2.25 ± 0.79
EN 2.03 ± 0.56 1.69 ± 0.59 1.88 ± 0.54p 0.622 0.567 0.045
IgM (g/L)SDFEN 1.26 ± 0.64 0.94 ± 0.20 1.30 ± 0.33
EN 1.12 ± 0.19 0.96 ± 0.13 1.11 ± 0.15p 0.241 0.693 0.002
IgG (g/L)SDFEN 11.22 ± 1.54 9.57 ± 1.59 11.55 ± 1.44
EN 11.12 ± 1.73 9.74 ± 0.87 11.41 ± 1.32p 0.799 0.618 0.590
Pre Op: pre-operation; POD: postoperative day; SDFEN: soluble dietary fiber enteral nutrition;EN: enteral nutrition.
3.4. Pre-Operative and Post-Operative Inflammatory Index
The levels of TNF-α and IL-6 in the SDFEN group were lower than the EN group at seven days(p < 0.05) (Table 5).
Table 5. Comparison of the two groups’ immune index.
Pre Op POD 2 POD 7
TNF-α (pg/mL)SDFEN 12.88 ± 5.62 20.32 ± 6.35 13.02 ± 2.85
EN 13.91 ± 6.47 22.14 ± 6.81 14.73 ± 4.07p 0.524 0.333 0.045
IL-6(pg/mL)SDFEN 47.54 ± 34.30 110.72 ± 46.86 58.75 ± 24.82
EN 45.83 ± 42.14 115.57 ± 56.93 70.83 ± 35.65p 0.850 0.682 0.044
PCT (ng/mL)SDFEN 0.11 ± 0.11 0.26 ± 0.18 0.15 ± 0.07
EN 0.15 ± 0.15 0.28 ± 0.18 0.16 ± 0.08p 0.086 0.489 0.539
Pre Op: pre-operation; POD: postoperative day; SDFEN: soluble dietary fiber enteral nutrition;EN: enteral nutrition.
111
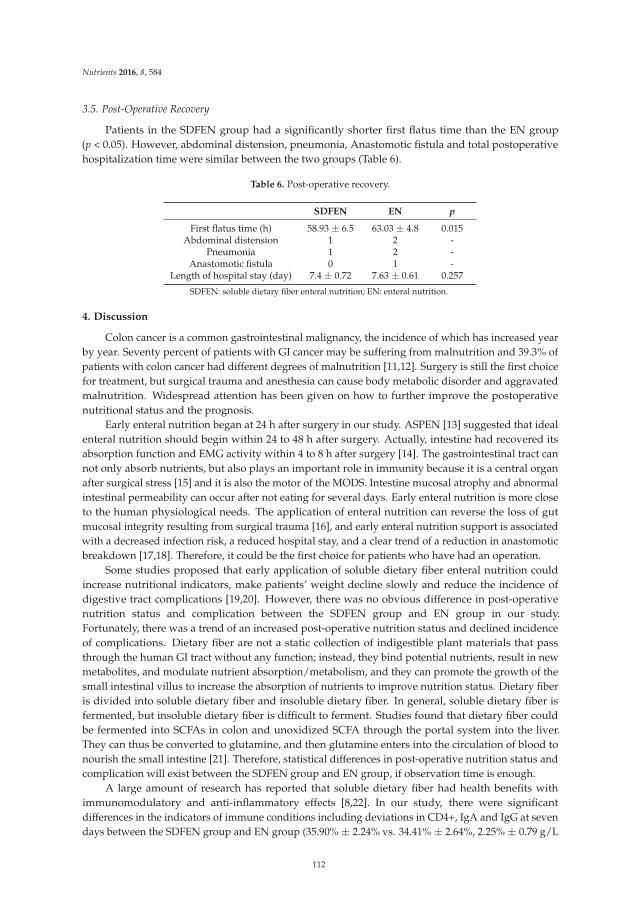
Nutrients 2016, 8, 584
3.5. Post-Operative Recovery
Patients in the SDFEN group had a significantly shorter first flatus time than the EN group(p < 0.05). However, abdominal distension, pneumonia, Anastomotic fistula and total postoperativehospitalization time were similar between the two groups (Table 6).
Table 6. Post-operative recovery.
SDFEN EN p
First flatus time (h) 58.93 ± 6.5 63.03 ± 4.8 0.015Abdominal distension 1 2 -
Pneumonia 1 2 -Anastomotic fistula 0 1 -
Length of hospital stay (day) 7.4 ± 0.72 7.63 ± 0.61 0.257
SDFEN: soluble dietary fiber enteral nutrition; EN: enteral nutrition.
4. Discussion
Colon cancer is a common gastrointestinal malignancy, the incidence of which has increased yearby year. Seventy percent of patients with GI cancer may be suffering from malnutrition and 39.3% ofpatients with colon cancer had different degrees of malnutrition [11,12]. Surgery is still the first choicefor treatment, but surgical trauma and anesthesia can cause body metabolic disorder and aggravatedmalnutrition. Widespread attention has been given on how to further improve the postoperativenutritional status and the prognosis.
Early enteral nutrition began at 24 h after surgery in our study. ASPEN [13] suggested that idealenteral nutrition should begin within 24 to 48 h after surgery. Actually, intestine had recovered itsabsorption function and EMG activity within 4 to 8 h after surgery [14]. The gastrointestinal tract cannot only absorb nutrients, but also plays an important role in immunity because it is a central organafter surgical stress [15] and it is also the motor of the MODS. Intestine mucosal atrophy and abnormalintestinal permeability can occur after not eating for several days. Early enteral nutrition is more closeto the human physiological needs. The application of enteral nutrition can reverse the loss of gutmucosal integrity resulting from surgical trauma [16], and early enteral nutrition support is associatedwith a decreased infection risk, a reduced hospital stay, and a clear trend of a reduction in anastomoticbreakdown [17,18]. Therefore, it could be the first choice for patients who have had an operation.
Some studies proposed that early application of soluble dietary fiber enteral nutrition couldincrease nutritional indicators, make patients’ weight decline slowly and reduce the incidence ofdigestive tract complications [19,20]. However, there was no obvious difference in post-operativenutrition status and complication between the SDFEN group and EN group in our study.Fortunately, there was a trend of an increased post-operative nutrition status and declined incidenceof complications. Dietary fiber are not a static collection of indigestible plant materials that passthrough the human GI tract without any function; instead, they bind potential nutrients, result in newmetabolites, and modulate nutrient absorption/metabolism, and they can promote the growth of thesmall intestinal villus to increase the absorption of nutrients to improve nutrition status. Dietary fiberis divided into soluble dietary fiber and insoluble dietary fiber. In general, soluble dietary fiber isfermented, but insoluble dietary fiber is difficult to ferment. Studies found that dietary fiber couldbe fermented into SCFAs in colon and unoxidized SCFA through the portal system into the liver.They can thus be converted to glutamine, and then glutamine enters into the circulation of blood tonourish the small intestine [21]. Therefore, statistical differences in post-operative nutrition status andcomplication will exist between the SDFEN group and EN group, if observation time is enough.
A large amount of research has reported that soluble dietary fiber had health benefits withimmunomodulatory and anti-inflammatory effects [8,22]. In our study, there were significantdifferences in the indicators of immune conditions including deviations in CD4+, IgA and IgG at sevendays between the SDFEN group and EN group (35.90% ± 2.24% vs. 34.41% ± 2.64%, 2.25% ± 0.79 g/L
112
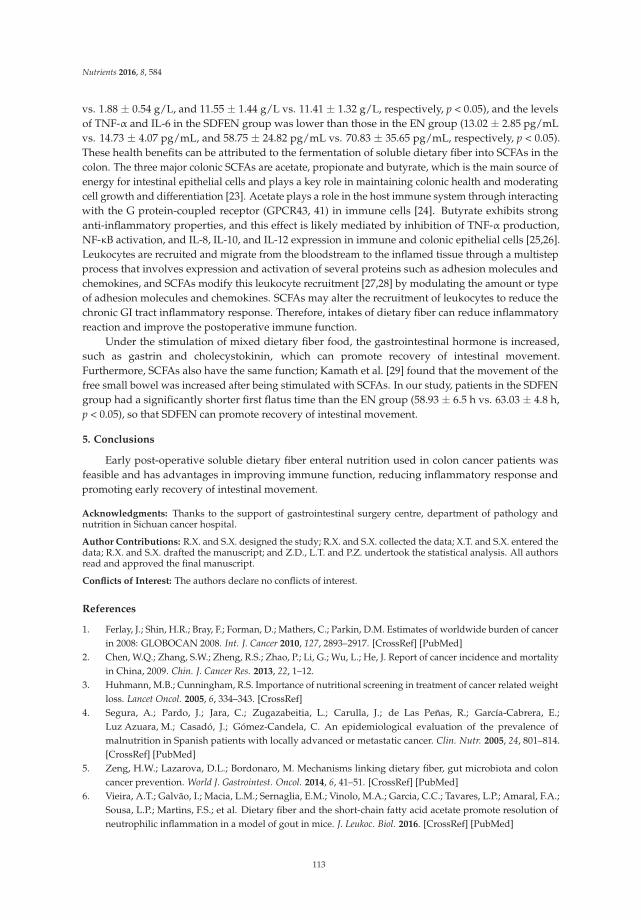
Nutrients 2016, 8, 584
vs. 1.88 ± 0.54 g/L, and 11.55 ± 1.44 g/L vs. 11.41 ± 1.32 g/L, respectively, p < 0.05), and the levelsof TNF-α and IL-6 in the SDFEN group was lower than those in the EN group (13.02 ± 2.85 pg/mLvs. 14.73 ± 4.07 pg/mL, and 58.75 ± 24.82 pg/mL vs. 70.83 ± 35.65 pg/mL, respectively, p < 0.05).These health benefits can be attributed to the fermentation of soluble dietary fiber into SCFAs in thecolon. The three major colonic SCFAs are acetate, propionate and butyrate, which is the main source ofenergy for intestinal epithelial cells and plays a key role in maintaining colonic health and moderatingcell growth and differentiation [23]. Acetate plays a role in the host immune system through interactingwith the G protein-coupled receptor (GPCR43, 41) in immune cells [24]. Butyrate exhibits stronganti-inflammatory properties, and this effect is likely mediated by inhibition of TNF-α production,NF-κB activation, and IL-8, IL-10, and IL-12 expression in immune and colonic epithelial cells [25,26].Leukocytes are recruited and migrate from the bloodstream to the inflamed tissue through a multistepprocess that involves expression and activation of several proteins such as adhesion molecules andchemokines, and SCFAs modify this leukocyte recruitment [27,28] by modulating the amount or typeof adhesion molecules and chemokines. SCFAs may alter the recruitment of leukocytes to reduce thechronic GI tract inflammatory response. Therefore, intakes of dietary fiber can reduce inflammatoryreaction and improve the postoperative immune function.
Under the stimulation of mixed dietary fiber food, the gastrointestinal hormone is increased,such as gastrin and cholecystokinin, which can promote recovery of intestinal movement.Furthermore, SCFAs also have the same function; Kamath et al. [29] found that the movement of thefree small bowel was increased after being stimulated with SCFAs. In our study, patients in the SDFENgroup had a significantly shorter first flatus time than the EN group (58.93 ± 6.5 h vs. 63.03 ± 4.8 h,p < 0.05), so that SDFEN can promote recovery of intestinal movement.
5. Conclusions
Early post-operative soluble dietary fiber enteral nutrition used in colon cancer patients wasfeasible and has advantages in improving immune function, reducing inflammatory response andpromoting early recovery of intestinal movement.
Acknowledgments: Thanks to the support of gastrointestinal surgery centre, department of pathology andnutrition in Sichuan cancer hospital.
Author Contributions: R.X. and S.X. designed the study; R.X. and S.X. collected the data; X.T. and S.X. entered thedata; R.X. and S.X. drafted the manuscript; and Z.D., L.T. and P.Z. undertook the statistical analysis. All authorsread and approved the final manuscript.
Conflicts of Interest: The authors declare no conflicts of interest.
References
1. Ferlay, J.; Shin, H.R.; Bray, F.; Forman, D.; Mathers, C.; Parkin, D.M. Estimates of worldwide burden of cancerin 2008: GLOBOCAN 2008. Int. J. Cancer 2010, 127, 2893–2917. [CrossRef] [PubMed]
2. Chen, W.Q.; Zhang, S.W.; Zheng, R.S.; Zhao, P.; Li, G.; Wu, L.; He, J. Report of cancer incidence and mortalityin China, 2009. Chin. J. Cancer Res. 2013, 22, 1–12.
3. Huhmann, M.B.; Cunningham, R.S. Importance of nutritional screening in treatment of cancer related weightloss. Lancet Oncol. 2005, 6, 334–343. [CrossRef]
4. Segura, A.; Pardo, J.; Jara, C.; Zugazabeitia, L.; Carulla, J.; de Las Peñas, R.; García-Cabrera, E.;Luz Azuara, M.; Casadó, J.; Gómez-Candela, C. An epidemiological evaluation of the prevalence ofmalnutrition in Spanish patients with locally advanced or metastatic cancer. Clin. Nutr. 2005, 24, 801–814.[CrossRef] [PubMed]
5. Zeng, H.W.; Lazarova, D.L.; Bordonaro, M. Mechanisms linking dietary fiber, gut microbiota and coloncancer prevention. World J. Gastrointest. Oncol. 2014, 6, 41–51. [CrossRef] [PubMed]
6. Vieira, A.T.; Galvão, I.; Macia, L.M.; Sernaglia, E.M.; Vinolo, M.A.; Garcia, C.C.; Tavares, L.P.; Amaral, F.A.;Sousa, L.P.; Martins, F.S.; et al. Dietary fiber and the short-chain fatty acid acetate promote resolution ofneutrophilic inflammation in a model of gout in mice. J. Leukoc. Biol. 2016. [CrossRef] [PubMed]
113
Nutrients 2016, 8, 584
7. Kaczmarczyk, M.M.; Miller, M.J.; Freund, G.G. The health benefis of dietary fiber: Beyond the usualsuspects of type 2 diabetes mellitus, cardiovascular disease and colon cancer. Metabolism 2012, 61, 1058–1066.[CrossRef] [PubMed]
8. Peters, U.; Sinha, R.; Chatterjee, N.; Subar, A.F.; Ziegler, R.G.; Kulldorff, M.; Bresalier, R.; Weissfeld, J.L.;Flood, A.; Schatzkin, A.; Hayes, R.B.; et al. Dietary fire and colorectal adenoma in a colorectal cancer earlydetection programme. Lancet 2003, 361, 1491–1495. [CrossRef]
9. Nomura, A.M.; Hankin, J.H.; Henderson, B.E.; Wilkens, L.R.; Murphy, S.P.; Pike, M.C.; Le Marchand, L.;Stram, D.O.; Monroe, K.R.; Kolonel, L.N. Dietary fier and colorectal cancer risk: The multiethnic cohortstudy. Cancer Causes Control 2007, 18, 753–764. [CrossRef] [PubMed]
10. Sobin, L.H.; Gospodarowicz, M.K.; Wittekind, C. TNM Classification of Malignant Tumors, 7th ed.;Wiley: New York, NY, USA, 2010.
11. Yang, Z.H.; Li, G.N. Clinical analysis of perioperative enteral nutrition in patients with gastrointestinaltumor. Appl. J. Gen. Prac. 2008, 6, 483–484.
12. Schwegler, I.; von Holzen, A.; Gutzwiller, J.P.; Schlumpf, R.; Mühlebach, S.; Stanga, Z. Nutritional risk is aclinical predictor of postoperative mortality and morbidity in surgery for colorectal cancer. Br. J. Surg. 2010,97, 92–97. [CrossRef] [PubMed]
13. McClave, S.A.; Martindale, R.G.; Vanek, V.W.; McCarthy, M.; Roberts, P.; Taylor, B.; Ochoa, J.B.; Napolitano, L.;Cresci, G. Guidelines for the provision and assessment of nutritionsupport therapyintheadult critically illpatient: Society of Critical Caremedicine (SCCM) and American Society for Parenteral and Enteral Nutrition(ASPEN). J. Parenter. Enter. Nutr. 2009, 33, 277–316. [CrossRef] [PubMed]
14. Sakurai, Y.; Kanaya, S.; Komori, Y.; Uyama, I. Is postoperative early enteral nutrition with regular ordisease-specific enteral formula really beneficial in patients undergoing esophagectomy? Esophagus 2009, 3,149–154. [CrossRef]
15. Wilmore, D.W.; Smith, R.J.; O’Dwyer, S.T.; Jacobs, D.O.; Ziegler, T.R.; Wang, X.D. The gut: A central organafter surgical stress. Surgery 1988, 104, 917–923. [PubMed]
16. Jiang, X.H.; Li, N.; Li, J.S. Intestinal permeability in patients after surgical trauma and effect of enteralnutrition versus parenteral nutrition. World J. Gastroenterol. 2003, 9, 1878–1880. [CrossRef] [PubMed]
17. Ochoa, J.B.; Caba, D. Advances in surgical nutrition. Surg. Clin. N. Am. 2006, 86, 1483–1493. [CrossRef][PubMed]
18. Fearon, K.C.; Ljungqvist, O.; Von Meyenfeldt, M.; Revhaug, A.; Dejong, C.H.; Lassen, K.; Nygren, J.; Hausel, J.;Soop, M.; Andersen, J.; et al. Enhanced recovery after surgery: A consensus review of clinical care for patientsundergoing colonic resection. Clin. Nutr. 2005, 24, 466–477. [CrossRef] [PubMed]
19. Yan, M.; Li, S.F.; Li, C.; Zhang, J.; Ji, F.; Xu, H.; Cao, W.H. Clinical studies on early post-operative enteralnutrition with dietary fibers for GI tumor. Parenter. Enter. Nutr. 2001, 8, 15–18.
20. Lu, J.; Zhao, Z.M.; Wang, F.; Ding, Y.P.; Ma, D.N.; Ye, X.L.; Song, X.L. High dietary fiber enteral nutritionimproves the nutritional status and tolerance in critically ill patients. Chin. J. Crit. Care Med. 2011, 5, 300–305.
21. Dosmoulin, F.; Caninoni, P.; Cozzone, P.J. Glutamate-glutamine metabolism in the perfused rat liver.13C NMR study using 13C-enriched acetate. FEBS Lett. 1985, 185, 29–32. [CrossRef]
22. Macfarlane, G.T.; Steed, H.; Macfarlane, S. Bacterial metabolism and health-related effects ofgalacto-oligosaccharides and other prebiotics. Appl. Microbiol. 2008, 104, 305–344. [CrossRef] [PubMed]
23. Macfarlane, G.T.; Macfarlane, S. Fermentation in the human large intestine: Its physiologic consequencesand the potential contribution of prebiotics. Clin. Gastroenterol. 2011, 45, S120–S127. [CrossRef] [PubMed]
24. Brown, A.J.; Goldsworthy, S.M.; Barnes, A.A.; Eilert, M.M.; Tcheang, L.; Daniels, D.; Muir, A.I.;Wigglesworth, M.J.; Kinghorn, I.; Fraser, N.J.; et al. The orphan G protein-coupled receptors GPR41 and GPR4are activated by propionate and other short chain carboxylic acids. J. Biol. Chem. 2003, 278, 11312–11319.[CrossRef] [PubMed]
25. Bailón, E.; Cueto-Sola, M.; Utrilla, P.; Rodríguez-Cabezas, M.E.; Garrido-Mesa, N.; Zarzuelo, A.; Xaus, J.;Gálvez, J.; Comalada, M. Butyrate in vitro immune-modulatory effects might be mediated through aproliferation-related induction of apoptosis. Immunobiology 2010, 215, 863–873. [CrossRef] [PubMed]
26. Lührs, H.; Gerke, T.; Müller, J.G.; Melcher, R.; Schauber, J.; Box-berge, F.; Scheppach, W.; Menzel, T.Butyrate inhibits NF-kappaB activation in lamina propria macrophages of patients with ulcerative colitis.Scand. J. Gastroenterol. 2002, 37, 458–466. [CrossRef] [PubMed]
114
Nutrients 2016, 8, 584
27. Maslowski, K.M.; Vieira, A.T.; Ng, A.; Kranich, J.; Sierro, F.; Yu, D.; Schilter, H.C.; Rolph, M.S.; Mackay, F.;Artis, D.; et al. Regulation of inflmmatory responses by gut microbiota and chemoattractant receptor GPR4.Nature 2009, 461, 1282–1286. [CrossRef] [PubMed]
28. Vinolo, M.A.; Rodrigues, H.G.; Hatanaka, E.; Hebeda, C.B.; Farsky, S.H.; Curi, R. Short-chain fatty acidsstimulate the migration of neutrophils to inflmmatory sites. Clin. Sci. 2009, 117, 331–338. [CrossRef][PubMed]
29. Kamath, P.S.; Hoepfner, M.T.; Phillips, S.F. Short-chain fatty acids stimulate ileal motility in humans.Gastroenterology 1988, 95, 1496–1502. [CrossRef]
© 2016 by the authors. Licensee MDPI, Basel, Switzerland. This article is an open accessarticle distributed under the terms and conditions of the Creative Commons Attribution(CC BY) license (http://creativecommons.org/licenses/by/4.0/).
115
nutrients
Article
The Interaction between Dietary Fiber and Fat andRisk of Colorectal Cancer in the Women’sHealth Initiative
Sandi L. Navarro 1,*, Marian L. Neuhouser 1,2, Ting-Yuan David Cheng 3, Lesley F. Tinker 1,
James M. Shikany 4, Linda Snetselaar 5, Jessica A. Martinez 6, Ikuko Kato 7,
Shirley A. A. Beresford 1,2, Robert S. Chapkin 8 and Johanna W. Lampe 1,2
1 Division of Public Health Sciences, Fred Hutchinson Cancer Research Center, Seattle, WA 98109, USA;[email protected] (M.L.N.); [email protected] (L.F.T.); [email protected] (S.A.A.B.);[email protected] (J.W.L.)
2 Department of Epidemiology, School of Public Health, University of Washington, Seattle, WA 98105, USA3 Division of Cancer Prevention and Population Sciences, Roswell Park Cancer Institute,
Buffalo, NY 14263, USA; [email protected] Division of Preventive Medicine, University of Alabama at Birmingham, Birmingham, AL 35294, USA;
[email protected] Department of Epidemiology, University of Iowa, Iowa City, IA 52242, USA; [email protected] Department of Nutritional Sciences, University of Arizona Cancer Center, Tucson, AZ 85724, USA;
[email protected] Department of Oncology and Pathology, Wayne State University, Detroit, MI 48201, USA;
[email protected] Program in Integrative Nutrition and Complex Diseases, Texas A&M University, College
Station, TX 77843, USA; [email protected]* Correspondence: [email protected]; Tel.: +1-206-667-6583
Received: 1 November 2016; Accepted: 25 November 2016; Published: 30 November 2016
Abstract: Combined intakes of specific dietary fiber and fat subtypes protect against colon cancer inanimal models. We evaluated associations between self-reported individual and combinations offiber (insoluble, soluble, and pectins, specifically) and fat (omega-6, omega-3, and docosahexaenoicacid (DHA) and eicosapentaenoic acid (EPA), specifically) and colorectal cancer (CRC) risk in theWomen’s Health Initiative prospective cohort (n = 134,017). During a mean 11.7 years (1993–2010),1952 incident CRC cases were identified. Cox regression models computed multivariate adjustedhazard ratios to estimate the association between dietary factors and CRC risk. Assessing fiber andfat individually, there was a modest trend for lower CRC risk with increasing intakes of total andinsoluble fiber (p-trend 0.09 and 0.08). An interaction (p = 0.01) was observed between soluble fiberand DHA + EPA, with protective effects of DHA + EPA with lower intakes of soluble fiber and anattenuation at higher intakes, however this association was no longer significant after correction formultiple testing. These results suggest a modest protective effect of higher fiber intake on CRC risk,but not in combination with dietary fat subtypes. Given the robust results in preclinical models andmixed results in observational studies, controlled dietary interventions with standardized intakes areneeded to better understand the interaction of specific fat and fiber subtypes on colon biology andultimately CRC susceptibility in humans.
Keywords: butyrate; colorectal cancer; DHA; EPA; fat; fiber; omega-3; pectin
1. Introduction
Colorectal cancer (CRC) is the third most common type of cancer in the U.S., accounting forroughly 8% of new cancer cases and 8% of all cancer deaths in 2015 [1]. Lifestyle factors such as
Nutrients 2016, 8, 779 116 www.mdpi.com/journal/nutrients
Nutrients 2016, 8, 779
diet, physical activity, and body weight contribute substantially to CRC, and it is generally heldthat risk could be greatly reduced through dietary modification [2]. Dietary fiber and fat are two ofthe most well-studied dietary components in this regard [3]. Although many case-control studieshave found inverse associations between fiber and fat intakes and CRC [4], data from epidemiologicstudies are mixed [4–25], possibly due to differences in intake assessment, the type of fiber or fatanalyzed, and residual confounding by other lifestyle and dietary factors. More recent studies haveattempted to control for dietary confounders such as folate, alcohol, and red meat consumption, yetthe contradictions in outcomes persist [7,15,26,27]. Finally, within the Women’s Health Initiative (WHI)Dietary Modification Trial, a low fat dietary pattern intervention which included a focus on increasingservings of whole grains, vegetables, and fruits, was found to have no significant benefit on CRCincidence over an average of 8.1 years [28].
There is a growing recognition that dietary exposures are complex with synergistic andantagonistic effects between different dietary components contributing to chronic disease risk.Interactions between dietary constituents and microbial metabolites may also partially explaindifferences in population-level study outcomes [29,30]. In contrast to the equivocal data fromobservational studies in humans—in which each dietary component is evaluated separately—strongevidence for a combined effect of the subtypes of fat and fiber in relation to reduced colon tumorigenesishas been demonstrated in preclinical animal models [31–35]. Gut bacteria ferment dietary fiber(e.g., pectins, a type of fermentable soluble fiber) to butyrate [36–49], a potent histone deacetylase(HDAC) inhibitor [29,30] associated with reduced CRC risk [50–52]. Omega 6 (n-6) polyunsaturatedfatty acids (PUFA), commonly found in refined vegetables oils, processed and fast foods, and redmeat, typical in Western diets [53], and omega 3 (n-3) PUFA in fish oils [54] are structural precursors ofeicosanoids; those derived from n-6 are mainly pro-inflammatory, whereas those produced from n-3tend to have opposing effects [55,56]. Given the strong correlation between inflammation and CRC [56],higher intakes of long-chain n-3 PUFA provide biologic validity for a chemoprotective effect [57].
Preclinical research suggests that the combined effects of n-3 PUFA in fish oils(e.g., docosahexaenoic acid (DHA) and eicosapentaenoic acid (EPA)) and butyrate from fermentablefiber (e.g., pectin) may work in concert to enhance the chemopreventive potential of either dietarycomponent alone, primarily by increasing apoptosis [31,33,34,58–62]. While other factors, such as lowdietary intakes of fiber and certain fatty acid subtypes, may contribute to the mixed results in humans,the lack of evaluation of the interaction between subtypes of dietary fat and fiber, i.e., pectins in solublefiber and marine-derived n-3 PUFA, may also explain why the chemoprotective effects of fiber and fathave not been consistently detected in prospective cohort studies. Therefore, our objectives for thisstudy were to determine the associations between the individual and combinations of subtypes offiber (soluble, and pectins specifically, which leads to the production of butyrate, vs. insoluble) and fat(n-3, and DHA + EPA, specifically, vs. n-6), and risk of CRC in the WHI.
2. Materials and Methods
2.1. Study Population
The WHI is a large prospective study focused on understanding preventive strategies formajor chronic diseases in postmenopausal women [63]. WHI includes both a multi-componentrandomized Clinical Trial (CT) and an Observational Study (OS). The CT (n = 68,132) was actuallythree overlapping randomized controlled trials evaluating combined hormone therapy or estrogenalone versus placebo (HRT), a low-fat dietary pattern versus comparison (Dietary Modification), andcalcium and vitamin D supplementation versus placebo (CaD), on the risk of breast and colorectalcancers, coronary heart disease, and osteoporotic fractures. The OS (n = 93,676) examines a broaderrange of lifestyle, health, and risk factors and risk of common chronic diseases in postmenopausalwomen initially interested in but ineligible for one or more of the clinical trials. Postmenopausal womenaged 50–79 years were recruited from the general population at 40 different Clinical Centers between
117
Nutrients 2016, 8, 779
1993 and 1998, with trial follow-up information and outcome data available through 2005, and post-trialfollow-up information and outcome data for these analyses available through September, 2010, the endof the first WHI Extension Study. All participants in the CT and OS were included in the presentanalysis except women who were randomized to the intervention arm of the Dietary Modification trial(n = 19,541). Further details on recruitment, study design, and baseline measures have been publishedelsewhere [63–66]. Institutional review board approval was obtained from all clinical sites, and womenprovided written informed consent prior to participation and for follow-up in the Extension period.The WHI ClinicalTrials.gov identifier is NCT00000611.
2.2. Data Collection and Dietary Assessment
Detailed information on demographic characteristics, medical, reproductive and familial CRChistory, and lifestyle factors were collected at baseline. Weight and height were assessed witha standardized protocol using a calibrated balance beam scale and stadiometer, respectively,and body mass index (BMI) was computed as weight in kg/height in m2. Physical activity wasassessed by computing average weekly metabolic equivalents of moderate and vigorous leisure-timephysical activity.
Dietary intake over the past three months was measured from the WHI food frequencyquestionnaire (FFQ) [67] using a standardized protocol at baseline for all women, and at year one forDietary Modification CT participants. Follow-up FFQs were completed in years two through ninefor a rotating proportion (33%) of Dietary Modification CT participants. The baseline FFQ data wereused for the current study. The FFQs contained 122 food and food group items, and 19 adjustmentquestions, the majority of which ask about food practices pertaining to types and amounts of addedfats (e.g., fat added at the table and in cooking), and three summary questions on food purchasing andpreparation methods [67]. The WHI nutrient database was derived from Nutrition Data Systems forResearch (NDS-R, version 2005, Nutrition Coordinating Center, University of Minnesota, Minneapolis,MN, USA). The database has over 140 nutrient values including total fat, total PUFA, n-6 and n-3PUFA, total DHA and EPA from food sources; and total, insoluble and soluble fiber, and pectins.
2.3. Colorectal Cancer Case Ascertainment
Clinical outcomes, including cancer diagnoses, were updated annually in the OS andsemi-annually in the CT until 2005 when the outcomes were thereafter reported annually using mail ortelephone questionnaires. Self-reports of CRC were verified by trained physician adjudicators at theClinical Centers who reviewed medical records and pathology reports [68]. All CRC diagnoses werethen confirmed by blinded review at the WHI Clinical Coordinating Center at the Fred HutchinsonCancer Research Center.
2.4. Statistical Analysis
Exclusions were made for women who reported history of colon or rectal cancers prior to baselineenrollment or who were missing these data (n = 946). Further exclusions were made for womenwith FFQs containing incomplete information, or data that suggested biologically implausible dailyenergy intakes of <2512 or >20,930 kJ (n = 4649), or extreme BMIs (<15 or >50 kg/m2; n = 2069).Finally, women who were missing data for smoking, physical activity, and education variables combined(n = 9), or were lost to follow up (n = 577), were excluded, leaving a sample of 134,017 for analysis.
Cox proportional hazards models were used to estimate hazard ratios (HR) and 95% confidenceintervals (95% CI) for the association of fiber (total, insoluble, soluble, and pectins) and fat (total,n-6, n-3, and DHA + EPA) intakes and CRC risk. Dietary variables were evaluated as separate maineffects, as quintiles of intake, using the lowest quintile as the reference group. Quintile assignments ofdietary variables from the baseline FFQ were calculated based on the distribution in non-cases. Tests fortrend were performed in a separate Cox model treating quintiles 1–5 as linear. Fat variables wereanalyzed both as g intake/day with energy adjusted in the models, and as % energy. As the results
118
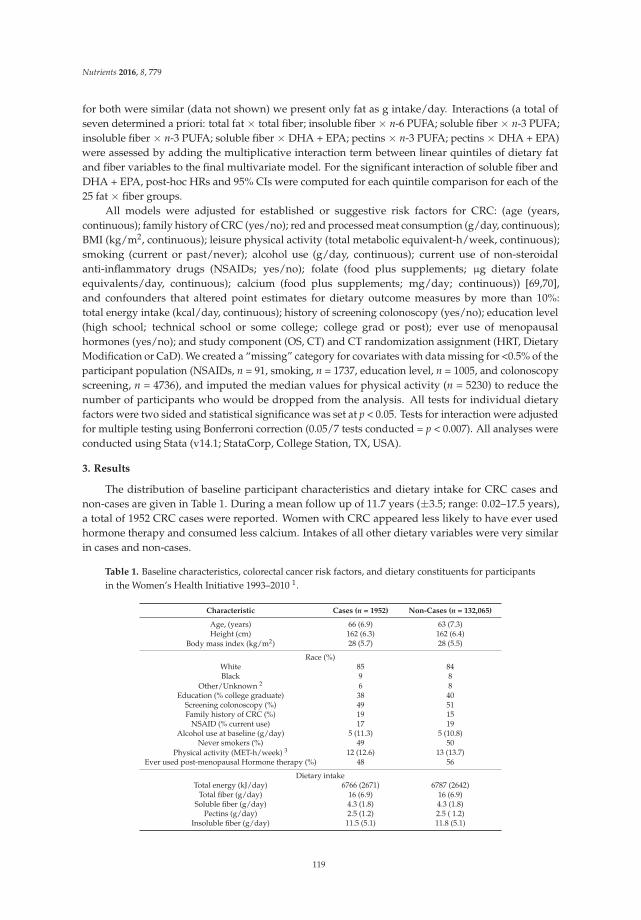
Nutrients 2016, 8, 779
for both were similar (data not shown) we present only fat as g intake/day. Interactions (a total ofseven determined a priori: total fat × total fiber; insoluble fiber × n-6 PUFA; soluble fiber × n-3 PUFA;insoluble fiber × n-3 PUFA; soluble fiber × DHA + EPA; pectins × n-3 PUFA; pectins × DHA + EPA)were assessed by adding the multiplicative interaction term between linear quintiles of dietary fatand fiber variables to the final multivariate model. For the significant interaction of soluble fiber andDHA + EPA, post-hoc HRs and 95% CIs were computed for each quintile comparison for each of the25 fat × fiber groups.
All models were adjusted for established or suggestive risk factors for CRC: (age (years,continuous); family history of CRC (yes/no); red and processed meat consumption (g/day, continuous);BMI (kg/m2, continuous); leisure physical activity (total metabolic equivalent-h/week, continuous);smoking (current or past/never); alcohol use (g/day, continuous); current use of non-steroidalanti-inflammatory drugs (NSAIDs; yes/no); folate (food plus supplements; µg dietary folateequivalents/day, continuous); calcium (food plus supplements; mg/day; continuous)) [69,70],and confounders that altered point estimates for dietary outcome measures by more than 10%:total energy intake (kcal/day, continuous); history of screening colonoscopy (yes/no); education level(high school; technical school or some college; college grad or post); ever use of menopausalhormones (yes/no); and study component (OS, CT) and CT randomization assignment (HRT, DietaryModification or CaD). We created a “missing” category for covariates with data missing for <0.5% of theparticipant population (NSAIDs, n = 91, smoking, n = 1737, education level, n = 1005, and colonoscopyscreening, n = 4736), and imputed the median values for physical activity (n = 5230) to reduce thenumber of participants who would be dropped from the analysis. All tests for individual dietaryfactors were two sided and statistical significance was set at p < 0.05. Tests for interaction were adjustedfor multiple testing using Bonferroni correction (0.05/7 tests conducted = p < 0.007). All analyses wereconducted using Stata (v14.1; StataCorp, College Station, TX, USA).
3. Results
The distribution of baseline participant characteristics and dietary intake for CRC cases andnon-cases are given in Table 1. During a mean follow up of 11.7 years (±3.5; range: 0.02–17.5 years),a total of 1952 CRC cases were reported. Women with CRC appeared less likely to have ever usedhormone therapy and consumed less calcium. Intakes of all other dietary variables were very similarin cases and non-cases.
Table 1. Baseline characteristics, colorectal cancer risk factors, and dietary constituents for participantsin the Women’s Health Initiative 1993–2010 1.
Characteristic Cases (n = 1952) Non-Cases (n = 132,065)
Age, (years) 66 (6.9) 63 (7.3)Height (cm) 162 (6.3) 162 (6.4)
Body mass index (kg/m2) 28 (5.7) 28 (5.5)
Race (%)White 85 84Black 9 8
Other/Unknown 2 6 8Education (% college graduate) 38 40
Screening colonoscopy (%) 49 51Family history of CRC (%) 19 15
NSAID (% current use) 17 19Alcohol use at baseline (g/day) 5 (11.3) 5 (10.8)
Never smokers (%) 49 50Physical activity (MET-h/week) 3 12 (12.6) 13 (13.7)
Ever used post-menopausal Hormone therapy (%) 48 56
Dietary intakeTotal energy (kJ/day) 6766 (2671) 6787 (2642)
Total fiber (g/day) 16 (6.9) 16 (6.9)Soluble fiber (g/day) 4.3 (1.8) 4.3 (1.8)
Pectins (g/day) 2.5 (1.2) 2.5 ( 1.2)Insoluble fiber (g/day) 11.5 (5.1) 11.8 (5.1)
119
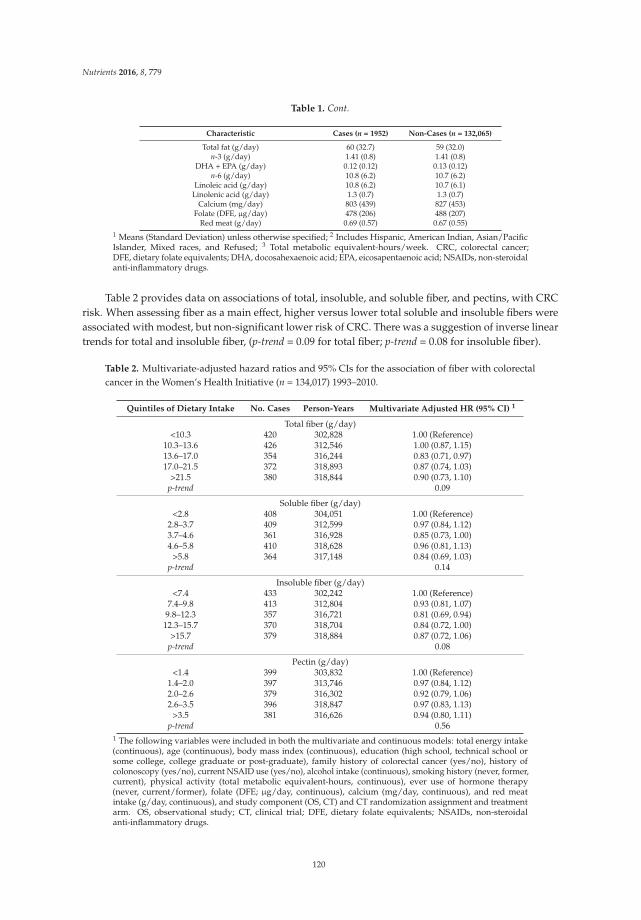
Nutrients 2016, 8, 779
Table 1. Cont.
Characteristic Cases (n = 1952) Non-Cases (n = 132,065)
Total fat (g/day) 60 (32.7) 59 (32.0)n-3 (g/day) 1.41 (0.8) 1.41 (0.8)
DHA + EPA (g/day) 0.12 (0.12) 0.13 (0.12)n-6 (g/day) 10.8 (6.2) 10.7 (6.2)
Linoleic acid (g/day) 10.8 (6.2) 10.7 (6.1)Linolenic acid (g/day) 1.3 (0.7) 1.3 (0.7)
Calcium (mg/day) 803 (439) 827 (453)Folate (DFE, µg/day) 478 (206) 488 (207)
Red meat (g/day) 0.69 (0.57) 0.67 (0.55)1 Means (Standard Deviation) unless otherwise specified; 2 Includes Hispanic, American Indian, Asian/PacificIslander, Mixed races, and Refused; 3 Total metabolic equivalent-hours/week. CRC, colorectal cancer;DFE, dietary folate equivalents; DHA, docosahexaenoic acid; EPA, eicosapentaenoic acid; NSAIDs, non-steroidalanti-inflammatory drugs.
Table 2 provides data on associations of total, insoluble, and soluble fiber, and pectins, with CRCrisk. When assessing fiber as a main effect, higher versus lower total soluble and insoluble fibers wereassociated with modest, but non-significant lower risk of CRC. There was a suggestion of inverse lineartrends for total and insoluble fiber, (p-trend = 0.09 for total fiber; p-trend = 0.08 for insoluble fiber).
Table 2. Multivariate-adjusted hazard ratios and 95% CIs for the association of fiber with colorectalcancer in the Women’s Health Initiative (n = 134,017) 1993–2010.
Quintiles of Dietary Intake No. Cases Person-Years Multivariate Adjusted HR (95% CI) 1
Total fiber (g/day)<10.3 420 302,828 1.00 (Reference)
10.3–13.6 426 312,546 1.00 (0.87, 1.15)13.6–17.0 354 316,244 0.83 (0.71, 0.97)17.0–21.5 372 318,893 0.87 (0.74, 1.03)
>21.5 380 318,844 0.90 (0.73, 1.10)p-trend 0.09
Soluble fiber (g/day)<2.8 408 304,051 1.00 (Reference)
2.8–3.7 409 312,599 0.97 (0.84, 1.12)3.7–4.6 361 316,928 0.85 (0.73, 1.00)4.6–5.8 410 318,628 0.96 (0.81, 1.13)
>5.8 364 317,148 0.84 (0.69, 1.03)p-trend 0.14
Insoluble fiber (g/day)<7.4 433 302,242 1.00 (Reference)
7.4–9.8 413 312,804 0.93 (0.81, 1.07)9.8–12.3 357 316,721 0.81 (0.69, 0.94)
12.3–15.7 370 318,704 0.84 (0.72, 1.00)>15.7 379 318,884 0.87 (0.72, 1.06)
p-trend 0.08
Pectin (g/day)<1.4 399 303,832 1.00 (Reference)
1.4–2.0 397 313,746 0.97 (0.84, 1.12)2.0–2.6 379 316,302 0.92 (0.79, 1.06)2.6–3.5 396 318,847 0.97 (0.83, 1.13)
>3.5 381 316,626 0.94 (0.80, 1.11)p-trend 0.56
1 The following variables were included in both the multivariate and continuous models: total energy intake(continuous), age (continuous), body mass index (continuous), education (high school, technical school orsome college, college graduate or post-graduate), family history of colorectal cancer (yes/no), history ofcolonoscopy (yes/no), current NSAID use (yes/no), alcohol intake (continuous), smoking history (never, former,current), physical activity (total metabolic equivalent-hours, continuous), ever use of hormone therapy(never, current/former), folate (DFE; µg/day, continuous), calcium (mg/day, continuous), and red meatintake (g/day, continuous), and study component (OS, CT) and CT randomization assignment and treatmentarm. OS, observational study; CT, clinical trial; DFE, dietary folate equivalents; NSAIDs, non-steroidalanti-inflammatory drugs.
120
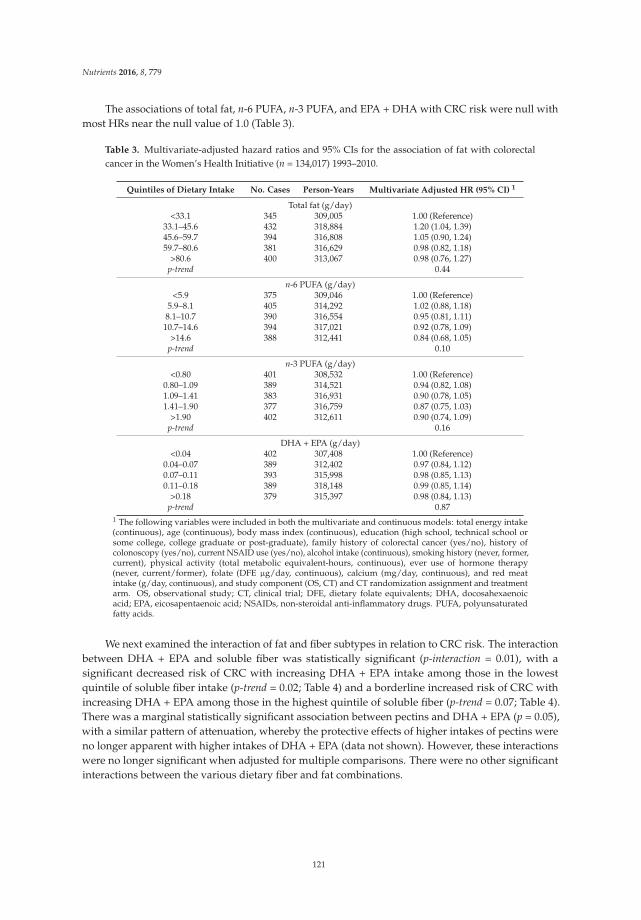
Nutrients 2016, 8, 779
The associations of total fat, n-6 PUFA, n-3 PUFA, and EPA + DHA with CRC risk were null withmost HRs near the null value of 1.0 (Table 3).
Table 3. Multivariate-adjusted hazard ratios and 95% CIs for the association of fat with colorectalcancer in the Women’s Health Initiative (n = 134,017) 1993–2010.
Quintiles of Dietary Intake No. Cases Person-Years Multivariate Adjusted HR (95% CI) 1
Total fat (g/day)<33.1 345 309,005 1.00 (Reference)
33.1–45.6 432 318,884 1.20 (1.04, 1.39)45.6–59.7 394 316,808 1.05 (0.90, 1.24)59.7–80.6 381 316,629 0.98 (0.82, 1.18)
>80.6 400 313,067 0.98 (0.76, 1.27)p-trend 0.44
n-6 PUFA (g/day)<5.9 375 309,046 1.00 (Reference)
5.9–8.1 405 314,292 1.02 (0.88, 1.18)8.1–10.7 390 316,554 0.95 (0.81, 1.11)
10.7–14.6 394 317,021 0.92 (0.78, 1.09)>14.6 388 312,441 0.84 (0.68, 1.05)
p-trend 0.10
n-3 PUFA (g/day)<0.80 401 308,532 1.00 (Reference)
0.80–1.09 389 314,521 0.94 (0.82, 1.08)1.09–1.41 383 316,931 0.90 (0.78, 1.05)1.41–1.90 377 316,759 0.87 (0.75, 1.03)
>1.90 402 312,611 0.90 (0.74, 1.09)p-trend 0.16
DHA + EPA (g/day)<0.04 402 307,408 1.00 (Reference)
0.04–0.07 389 312,402 0.97 (0.84, 1.12)0.07–0.11 393 315,998 0.98 (0.85, 1.13)0.11–0.18 389 318,148 0.99 (0.85, 1.14)
>0.18 379 315,397 0.98 (0.84, 1.13)p-trend 0.87
1 The following variables were included in both the multivariate and continuous models: total energy intake(continuous), age (continuous), body mass index (continuous), education (high school, technical school orsome college, college graduate or post-graduate), family history of colorectal cancer (yes/no), history ofcolonoscopy (yes/no), current NSAID use (yes/no), alcohol intake (continuous), smoking history (never, former,current), physical activity (total metabolic equivalent-hours, continuous), ever use of hormone therapy(never, current/former), folate (DFE µg/day, continuous), calcium (mg/day, continuous), and red meatintake (g/day, continuous), and study component (OS, CT) and CT randomization assignment and treatmentarm. OS, observational study; CT, clinical trial; DFE, dietary folate equivalents; DHA, docosahexaenoicacid; EPA, eicosapentaenoic acid; NSAIDs, non-steroidal anti-inflammatory drugs. PUFA, polyunsaturatedfatty acids.
We next examined the interaction of fat and fiber subtypes in relation to CRC risk. The interactionbetween DHA + EPA and soluble fiber was statistically significant (p-interaction = 0.01), with asignificant decreased risk of CRC with increasing DHA + EPA intake among those in the lowestquintile of soluble fiber intake (p-trend = 0.02; Table 4) and a borderline increased risk of CRC withincreasing DHA + EPA among those in the highest quintile of soluble fiber (p-trend = 0.07; Table 4).There was a marginal statistically significant association between pectins and DHA + EPA (p = 0.05),with a similar pattern of attenuation, whereby the protective effects of higher intakes of pectins wereno longer apparent with higher intakes of DHA + EPA (data not shown). However, these interactionswere no longer significant when adjusted for multiple comparisons. There were no other significantinteractions between the various dietary fiber and fat combinations.
121
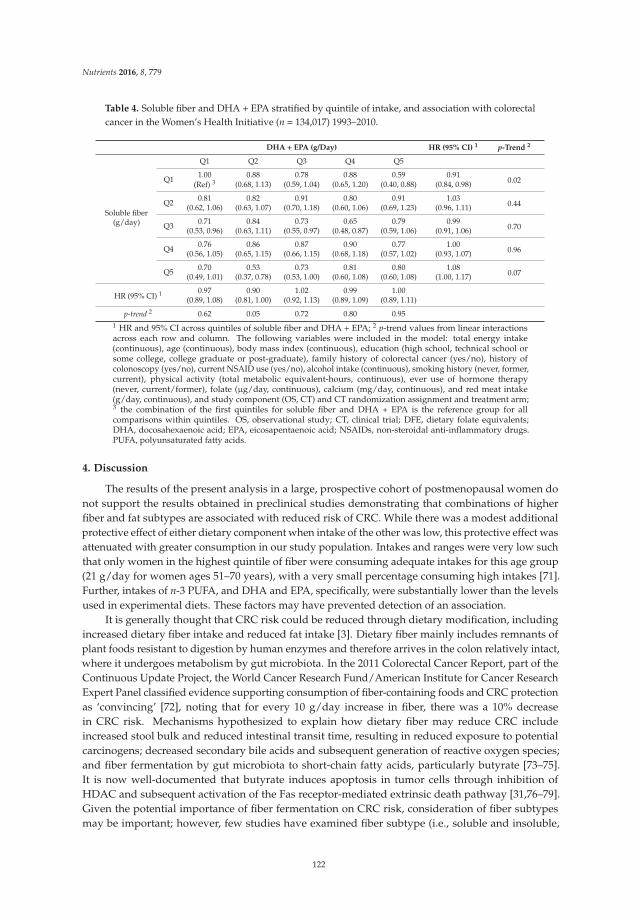
Nutrients 2016, 8, 779
Table 4. Soluble fiber and DHA + EPA stratified by quintile of intake, and association with colorectalcancer in the Women’s Health Initiative (n = 134,017) 1993–2010.
DHA + EPA (g/Day) HR (95% CI) 1 p-Trend 2
Soluble fiber(g/day)
Q1 Q2 Q3 Q4 Q5
Q11.00 0.88 0.78 0.88 0.59 0.91
0.02(Ref) 3 (0.68, 1.13) (0.59, 1.04) (0.65, 1.20) (0.40, 0.88) (0.84, 0.98)
Q20.81 0.82 0.91 0.80 0.91 1.03
0.44(0.62, 1.06) (0.63, 1.07) (0.70, 1.18) (0.60, 1.06) (0.69, 1.23) (0.96, 1.11)
Q30.71 0.84 0.73 0.65 0.79 0.99
0.70(0.53, 0.96) (0.63, 1.11) (0.55, 0.97) (0.48, 0.87) (0.59, 1.06) (0.91, 1.06)
Q40.76 0.86 0.87 0.90 0.77 1.00
0.96(0.56, 1.05) (0.65, 1.15) (0.66, 1.15) (0.68, 1.18) (0.57, 1.02) (0.93, 1.07)
Q50.70 0.53 0.73 0.81 0.80 1.08
0.07(0.49, 1.01) (0.37, 0.78) (0.53, 1.00) (0.60, 1.08) (0.60, 1.08) (1.00, 1.17)
HR (95% CI) 1 0.97 0.90 1.02 0.99 1.00(0.89, 1.08) (0.81, 1.00) (0.92, 1.13) (0.89, 1.09) (0.89, 1.11)
p-trend 2 0.62 0.05 0.72 0.80 0.951 HR and 95% CI across quintiles of soluble fiber and DHA + EPA; 2 p-trend values from linear interactionsacross each row and column. The following variables were included in the model: total energy intake(continuous), age (continuous), body mass index (continuous), education (high school, technical school orsome college, college graduate or post-graduate), family history of colorectal cancer (yes/no), history ofcolonoscopy (yes/no), current NSAID use (yes/no), alcohol intake (continuous), smoking history (never, former,current), physical activity (total metabolic equivalent-hours, continuous), ever use of hormone therapy(never, current/former), folate (µg/day, continuous), calcium (mg/day, continuous), and red meat intake(g/day, continuous), and study component (OS, CT) and CT randomization assignment and treatment arm;3 the combination of the first quintiles for soluble fiber and DHA + EPA is the reference group for allcomparisons within quintiles. OS, observational study; CT, clinical trial; DFE, dietary folate equivalents;DHA, docosahexaenoic acid; EPA, eicosapentaenoic acid; NSAIDs, non-steroidal anti-inflammatory drugs.PUFA, polyunsaturated fatty acids.
4. Discussion
The results of the present analysis in a large, prospective cohort of postmenopausal women donot support the results obtained in preclinical studies demonstrating that combinations of higherfiber and fat subtypes are associated with reduced risk of CRC. While there was a modest additionalprotective effect of either dietary component when intake of the other was low, this protective effect wasattenuated with greater consumption in our study population. Intakes and ranges were very low suchthat only women in the highest quintile of fiber were consuming adequate intakes for this age group(21 g/day for women ages 51–70 years), with a very small percentage consuming high intakes [71].Further, intakes of n-3 PUFA, and DHA and EPA, specifically, were substantially lower than the levelsused in experimental diets. These factors may have prevented detection of an association.
It is generally thought that CRC risk could be reduced through dietary modification, includingincreased dietary fiber intake and reduced fat intake [3]. Dietary fiber mainly includes remnants ofplant foods resistant to digestion by human enzymes and therefore arrives in the colon relatively intact,where it undergoes metabolism by gut microbiota. In the 2011 Colorectal Cancer Report, part of theContinuous Update Project, the World Cancer Research Fund/American Institute for Cancer ResearchExpert Panel classified evidence supporting consumption of fiber-containing foods and CRC protectionas ‘convincing’ [72], noting that for every 10 g/day increase in fiber, there was a 10% decreasein CRC risk. Mechanisms hypothesized to explain how dietary fiber may reduce CRC includeincreased stool bulk and reduced intestinal transit time, resulting in reduced exposure to potentialcarcinogens; decreased secondary bile acids and subsequent generation of reactive oxygen species;and fiber fermentation by gut microbiota to short-chain fatty acids, particularly butyrate [73–75].It is now well-documented that butyrate induces apoptosis in tumor cells through inhibition ofHDAC and subsequent activation of the Fas receptor-mediated extrinsic death pathway [31,76–79].Given the potential importance of fiber fermentation on CRC risk, consideration of fiber subtypesmay be important; however, few studies have examined fiber subtype (i.e., soluble and insoluble,
122
Nutrients 2016, 8, 779
or more and less fermentable), and associations are similar, with both null [9,10] and inverseassociations [80–83] reported.
When evaluating total fiber and subtypes in the present study, CRC risk was reduced for allquintiles of increased consumption and a marginal linear trend was observed; however, most quintilesdid not reach statistical significance. Inconsistencies across epidemiologic studies may be attributed inpart to lower overall fiber intakes and narrow ranges of fiber intakes in Western populations whichreduce statistical power [13]. Mean fiber intake in the U.S. is ~15 g/day [4]. Intakes at or above currentrecommended intakes (25 g/day for women and 38 g/day for men) [71] show robust protection againstCRC with relative risks ranging from 0.72 to 0.90 [4,6,26]. Only 10% of our study population reportedintakes of dietary fiber >25 g/day, thus our ability to detect a protective effect was compromised.
Overlaying the conflicting data observed with dietary fiber and CRC is a similar body ofinconsistent literature on the association between subtypes of fat, particularly n-3 PUFA, and CRCrisk. In addition to the anti-inflammatory effects promulgated by changes in the eicosanoid milieu,other putative actions of n-3 PUFA have been proposed. These include alterations in membranefluidity and lipid raft composition, which may affect receptor signaling involved in proliferationand apoptosis [84], and modulation of oxidative stress [57,85]. As with dietary fiber, laboratorydata consistently show reduced CRC risk with marine n-3 PUFA [58], while epidemiologic dataare less convincing. Whereas two meta-analyses reported reduced CRC risk with n-3 PUFA fromfish intake [86,87], two systematic reviews concluded that there is insufficient [15] or limited [7]evidence to suggest an association between long-chain n-3 PUFA intake and CRC risk. A more recentpublication reported no overall association between n-3 PUFA and CRC risk among 123,529 individuals;however, among women in the same cohort, n-3 PUFA intake after CRC diagnosis had a protectiveeffect on survival [88].
In the WHI population, we did not observe an association between any dietary fat subtypesand CRC risk. As with fiber, intakes of n-3 PUFA were very low; mean intakes were 1.4 g/day(range 0.1–10.4) for n-3, and 0.04 and 0.08 g/day (range 0–1.4 and 0–3.1, respectively) for EPA andDHA. While specific recommendations for n-3 PUFA intake have not been determined, the Food andNutrition Board of the Institute of Medicine established adequate intake levels for alpha-linolenicacid (ALA), the precursor of long-chain n-3 PUFA, of 1.1 g/day for women over the age of 19 [71].Only about half of our study population had intakes at that level. Furthermore, the Academy ofNutrition and Dietetics recommends a minimum intake of 0.5 g/day of combined EPA and DHA [89].Less than 2% of the women in our study cohort reached an intake level above 0.5 g/day.
Despite the inconsistent epidemiologic data for dietary fiber and fat, studies in preclinical animalmodels have shown that combinations of fiber and fat work synergistically to protect against coloncancer [58–62]. In a series of experiments, the effects of different types of fat (fish oil or corn oil;15 g/100 g) and fiber (pectin or cellulose; 6 g/100 g) diets were tested on tumorigenesis and variousother aspects of colonocyte physiology [58,90]. Both fish oil and pectin alone, relative to corn oiland cellulose feeding, resulted in a significantly lower proportion of animals with adenocarcinomas;however, the combination of fish oil and pectin led to an even greater reduction [58]. Additional workshowed changes to the re-dox environment within rat colonocytes with a concomitant reduction inDNA damage [35,59,91]. Serving as the primary energy source for colonic epithelial cells, butyrateinduces cellular reactive oxygen species (ROS) generation, creating a pro-oxidant environment [31].At the same time, long chain n-3 PUFA from fish oil (e.g., DHA) incorporated into cell membranes, aresusceptible to oxidation due to their high degree of unsaturation [33]. These physiological attributes ofbutyrate and DHA are relevant as lipid peroxidation can directly trigger the release of pro-apoptoticfactors from mitochondria into the cytosol, through a p53-independent, calcium-mediated cell deathpathway [33]. Given that butyrate independently induces apoptosis through an extrinsic, HDACinhibition-mediated pathway, the combination of dietary constituents, and subsequent effects onintrinsic apoptotic pathways, would be expected to exponentially increase apoptosis.
123
Nutrients 2016, 8, 779
Dietary fiber and fatty acids, in combination, and risk of CRC in humans has only recently begunto be evaluated. In a large cohort study (n = 96,354) of Seventh Day Adventists, risk of CRC wasreduced by 22% among all vegetarians combined compared to non-vegetarians, but protection wasgreatest among pescovegetarians who consume high amounts of both fiber and n-3 PUFA-containingfish (HR: 0.57; 95% CI: 0.40, 0.82) [92]. Furthermore, striking reciprocal changes in gut mucosal cancerrisk biomarkers, the microbiome, and the metabolome were reported after African Americans weregiven a high-fiber (primarily in the form of resistant starch, including pectin), low-fat diet and ruralAfricans were given a high-fat, low-fiber Western-style diet [93]. Significantly increased butyrateproduction and suppressed secondary bile acid synthesis were also noted after the diet exchange tohigh-fiber, low-fat intake in African Americans [93].
An analysis in the Rotterdam prospective cohort (n = 4967) lends support to the hypothesis thathigher intakes of fat and fiber are an important factor mediating the relationship between these dietaryvariables. An increased risk of CRC was observed with n-3 PUFA intake and dietary fiber intakes belowthe median, but not when fiber intakes were above [22]. It is noteworthy that the levels of fiber intakeswere markedly lower (mean 26 g/day) relative to the intakes among pescovegetarians in the SeventhDay Adventist population (mean 40 g/day) and the African American intervention participants(mean 55 g/day), but higher than the intakes in our population (mean 16 g/day). Adding to thecomplexity of the relationship, when evaluated by food sources of n-3 PUFA in the Rotterdam study,increased CRC risk was restricted to intake from non-marine sources which contain ALA; there was noassociation when n-3 PUFA from marine-derived (e.g., EPA and DHA) sources were evaluated [22].Contrary to these results, evaluation by n-3 PUFA source in a case-control study did not show anydifference between non-marine and marine sources and interaction with dietary fiber. In this instance,greater protection of n-3 PUFA was found among individuals with lower dietary fiber intakes althoughoverall intake was low (median 18.6 g/day) [94], consistent with our observation of the significantreduced risk of CRC among women with the lowest soluble fiber and highest DHA + EPA intakes.The authors speculated that high fiber intake may interfere with lipid absorption, offsetting potentialbeneficial effects of certain fatty acids [94].
While intakes in animal models do not directly translate to human intakes, the amount of fiberand fat used in preclinical experiments is comparable, as a proportion of intake, to what is currentlyrecommended for humans. For example, the amount of fiber in the rat diets was 6% by weight, which isapproximately equivalent to 30 g/day for humans [58]. This level of intake was only approached in thehighest quintile of total fiber intake (>21.5 g/day). Similarly, all rat diets contained fat at 15% by weightand 30% of energy, with fish oil comprising approximately 1%–5% [58]. Women in WHI consumed33% of their calories from fat on average, but less than 1% from n-3 PUFA and even less from combinedDHA and EPA from fish oil (highest quintile >0.18 g/day). In the VITamins And Lifestyle (VITAL)cohort (n = 68,109), individuals using fish oil supplements on 4+ days/week for 3+ years experienced49% lower CRC risk than non-users (HR = 0.51, 95% CI = 0.26–1.00; p-trend = 0.06) [17]. An averageserving of oily fish (e.g., salmon or mackerel) provides 1.5–3 g of marine fish oil [95]. Thus, it may bedifficult to achieve the levels of n-3 PUFA needed for a chemoprotective effect through diet alone.
Strengths of this study include the large, well-characterized prospective cohort. As CRC was one ofthe primary outcomes of WHI, incident cases were expertly adjudicated and confirmed. Additionally,detailed information was collected on a wide range of exposures, including diet, with reliabilitysubsequently assessed [65]. Finally, this is the largest prospective cohort to evaluate the interactions ofsubtypes of fiber and fat on CRC to date.
As with all observational studies, there are limitations. First, we relied on self-report via FFQto capture usual dietary intake, therefore we cannot rule out measurement error. FFQs are subject tolack of precision and inaccurate recall of dietary intake [96]. As dietary intakes were only assessed atbaseline, it is possible that diets changed over time. However, we performed a sensitivity analysis usingFFQ from women in the Dietary Modification comparison arm (the only group for which FFQ datafrom multiple time-points were collected) between years 0, 1, 3, 6, and 9, and found that correlations
124
Nutrients 2016, 8, 779
were 0.62 for fiber intake and 0.44 for total fat intake, suggesting that intake remained relatively stableduring the follow-up. The WHI FFQ has been shown to yield nutrient estimates that are similar tothose obtained from short-term dietary recall and recording methods, and test-retest reliability formost nutrients was high (e.g., FFQ estimates for total, saturated, and polyunsaturated fat variableswere all within 10% of those from food records and 24-h recalls, although dietary fiber was slightlyhigher ~17%, and information on fat and fiber subtypes was not evaluated) [67]. Our fiber exposurealso did not include the integration of dietary fiber supplement use, which is known to be higher withage and among women [97]. Lastly, measurement of the level of EPA/DHA incorporation in plasma orthe tissue level was not conducted. It is widely known that the biological activities of these compoundsdepend on their bioavailability [98] and FFQ estimates only provide a surrogate for exposure.
Finally, while we adjusted for several potential confounders, we did not directly evaluateantioxidant content of the diet. Because the combination of butyrate and n-3 PUFA drive apoptosis viaan oxidative-dependent mechanism, higher antioxidant intakes might antagonize this protective effect.In addition, there is some evidence that high antioxidants promote CRC in both preclinical [59,91]and epidemiologic [99–101] studies. Although mean intakes for several individual nutrients withantioxidant capacity (e.g., vitamins C, E, and beta-carotene) were very similar between cases andcontrols at baseline (<1% difference), total antioxidant capacity of dietary intakes was not considered.
5. Conclusions
In summary, at the levels of dietary intake consumed by women in WHI, we did not findevidence of a protective association between increased subtypes of fiber and fat intakes in combination,and reduced risk of CRC. Our results for fat and fiber separately are in agreement with what hasbeen reported previously, namely modest inverse associations with fiber, but no consistent trendsacross intakes. Given the biologic plausibility of a protective effect for fiber and n-3 PUFA, the robustresults from preclinical models, and the mixed results in observational studies, controlled feedingtrials with standardized intakes and consideration of the potential impact of the gut microbiome areurgently needed.
Acknowledgments: We acknowledge the WHI Investigator Group, short list: Program Office: (National Heart,Lung, and Blood Institute, Bethesda, Maryland); Jacques Rossouw, Shari Ludlam, Dale Burwen, Joan McGowan,Leslie Ford, and Nancy Geller; Clinical Coordinating Center: (Fred Hutchinson Cancer Research Center, Seattle,WA, USA) Garnet Anderson, Ross Prentice, Andrea LaCroix, and Charles Kooperberg; Investigators andAcademic Centers: (Brigham and Women’s Hospital, Harvard Medical School, Boston, MA, USA) JoAnn E.Manson; (MedStar Health Research Institute/Howard University, Washington, DC, USA) Barbara V. Howard;(Stanford Prevention Research Center, Stanford, CA, USA) Marcia L. Stefanick; (The Ohio State University,Columbus, OH, USA) Rebecca Jackson; (University of Arizona, Tucson/Phoenix, AZ, USA) Cynthia A. Thomson;(University at Buffalo, Buffalo, NY, USA) Jean Wactawski-Wende; (University of Florida, Gainesville/Jacksonville,FL, USA) Marian Limacher; (University of Iowa, Iowa City/Davenport, IA, USA) Robert Wallace; (University ofPittsburgh, Pittsburgh, PA, USA) Lewis Kuller; (Wake Forest University School of Medicine, Winston-Salem,NC, USA) Sally Shumaker. Women’s Health Initiative Memory Study: (Wake Forest University School ofMedicine, Winston-Salem, NC, USA) Sally Shumaker; WHI is supported by National Heart, Lung, and BloodInstitute, National Institutes of Health, U.S. Department of Health and Human Services through contracts,HHSN268201100046C (Fred Hutch), HHSN268201100001C (SUNY Buffalo), HHSN268201100002C (The Ohio StateUniversity), HHSN268201100003C (Stanford), HHSN268201100004C (Wake Forest), and HHSN271201100004C(WHI Memory Study), and grants P30 CA015704, R35 CA197707, and T32 CA09168.
Author Contributions: Author contributions: S.L.N., J.W.L., M.L.N., S.A.A.B., T.-Y.D.C., L.F.T. and R.S.C.conceived the study; S.L.N., T.-Y.D.C. and M.L.N. conducted the data analysis; S.L.N., M.L.N., T.-Y.D.C., R.S.C.and J.W.L. interpreted the results; S.L.N. wrote the manuscript; M.L.N., J.W.L., R.S.C., T.-Y.D.C., L.F.T., J.M.S., L.S.,J.A.M., I.K. and S.A.A.B. critically revised the manuscript.
Conflicts of Interest: The authors declare no conflict of interest.
References
1. American Cancer Society. Cancer Facts & Figures 2016; American Cancer Society: Atlanta, GA, USA, 2016.2. World Cancer Research Fund. Food, Nutrition, Physical Activity, and the Prevention of Cancer: A Global
Perspective; American Institute for Cancer Research: Washington, DC, USA, 2007.
125
Nutrients 2016, 8, 779
3. Perez-Cueto, F.J.; Verbeke, W. Consumer implications of the WCRF’s permanent update on colorectal cancer.Meat. Sci. 2012, 90, 977–978. [CrossRef] [PubMed]
4. Ben, Q.; Sun, Y.; Chai, R.; Qian, A.; Xu, B.; Yuan, Y. Dietary fiber intake reduces risk for colorectal adenoma:A meta-analysis. Gastroenterology 2014, 146, 689–699. [CrossRef] [PubMed]
5. Michels, K.B.; Fuchs, C.S.; Giovannucci, E.; Colditz, G.A.; Hunter, D.J.; Stampfer, M.J.; Willett, W.C.Fiber intake and incidence of colorectal cancer among 76,947 women and 47,279 men. Cancer Epidemiol.
Biomark. Prev. 2005, 14, 842–849. [CrossRef] [PubMed]6. Murphy, N.; Norat, T.; Ferrari, P.; Jenab, M.; Bueno-de-Mesquita, B.; Skeie, G.; Dahm, C.C.; Overvad, K.;
Olsen, A.; Tjonneland, A.; et al. Dietary fibre intake and risks of cancers of the colon and rectum in theeuropean prospective investigation into cancer and nutrition (epic). PLoS ONE 2012, 7, e39361. [CrossRef][PubMed]
7. Gerber, M. Omega-3 fatty acids and cancers: A systematic update review of epidemiological studies.Br. J. Nutr. 2012, 107, S228–S239. [CrossRef] [PubMed]
8. Kunzmann, A.T.; Coleman, H.G.; Huang, W.Y.; Kitahara, C.M.; Cantwell, M.M.; Berndt, S.I. Dietary fiberintake and risk of colorectal cancer and incident and recurrent adenoma in the prostate, lung, colorectal, andovarian cancer screening trial. Am. J. Clin. Nutr. 2015, 102, 881–890. [CrossRef] [PubMed]
9. Wakai, K.; Date, C.; Fukui, M.; Tamakoshi, K.; Watanabe, Y.; Hayakawa, N.; Kojima, M.; Kawado, M.;Suzuki, K.; Hashimoto, S.; et al. Dietary fiber and risk of colorectal cancer in the japan collaborative cohortstudy. Cancer Epidemiol. Biomark. Prev. 2007, 16, 668–675. [CrossRef] [PubMed]
10. Uchida, K.; Kono, S.; Yin, G.; Toyomura, K.; Nagano, J.; Mizoue, T.; Mibu, R.; Tanaka, M.; Kakeji, Y.;Maehara, Y.; et al. Dietary fiber, source foods and colorectal cancer risk: The fukuoka colorectal cancer study.Scand. J. Gastroenterol. 2010, 45, 1223–1231. [CrossRef] [PubMed]
11. Park, Y.; Hunter, D.J.; Spiegelman, D.; Bergkvist, L.; Berrino, F.; van den Brandt, P.A.; Buring, J.E.;Colditz, G.A.; Freudenheim, J.L.; Fuchs, C.S.; et al. Dietary fiber intake and risk of colorectal cancer:A pooled analysis of prospective cohort studies. JAMA 2005, 294, 2849–2857. [CrossRef] [PubMed]
12. Willett, W.C.; Stampfer, M.J.; Colditz, G.A.; Rosner, B.A.; Speizer, F.E. Relation of meat, fat, and fiber intaketo the risk of colon cancer in a prospective-study among women. N. Engl. J. Med. 1990, 323, 1664–1672.[CrossRef] [PubMed]
13. Schatzkin, A.; Mouw, T.; Park, Y.; Subar, A.F.; Kipnis, V.; Hollenbeck, A.; Leitzmann, M.F.; Thompson, F.E.Dietary fiber and whole-grain consumption in relation to colorectal cancer in the nih-aarp diet and healthstudy. Am. J. Clin. Nutr. 2007, 85, 1353–1360. [PubMed]
14. Fuchs, C.S.; Giovannucci, E.L.; Colditz, G.A.; Hunter, D.J.; Stampfer, M.J.; Rosner, B.; Speizer, F.E.; Willett, W.C.Dietary fiber and the risk of colorectal cancer and adenoma in women. N. Engl. J. Med. 1999, 340, 169–176.[CrossRef] [PubMed]
15. MacLean, C.H.; Newberry, S.J.; Mojica, W.A.; Khanna, P.; Issa, A.M.; Suttorp, M.J.; Lim, Y.W.; Traina, S.B.;Hilton, L.; Garland, R.; et al. Effects of omega-3 fatty acids on cancer risk: A systematic review. JAMA 2006,295, 403–415. [CrossRef] [PubMed]
16. Daniel, C.R.; McCullough, M.L.; Patel, R.C.; Jacobs, E.J.; Flanders, W.D.; Thun, M.J.; Calle, E.E. Dietary intakeof omega-6 and omega-3 fatty acids and risk of colorectal cancer in a prospective cohort of US men andwomen. Cancer Epidemiol. Biomark. Prev. 2009, 18, 516–525. [CrossRef] [PubMed]
17. Kantor, E.D.; Lampe, J.W.; Peters, U.; Vaughan, T.L.; White, E. Long-chain omega-3 polyunsaturated fattyacid intake and risk of colorectal cancer. Nutr. Cancer 2014, 66, 716–727. [CrossRef] [PubMed]
18. Ward, H.A.; Norat, T.; Overvad, K.; Dahm, C.C.; Bueno-de-Mesquita, H.B.; Jenab, M.; Fedirko, V.;van Duijnhoven, F.J.; Skeie, G.; Romaguera-Bosch, D.; et al. Pre-diagnostic meat and fibre intakes inrelation to colorectal cancer survival in the european prospective investigation into cancer and nutrition.Br. J. Nutr. 2016, 116, 316–325. [CrossRef] [PubMed]
19. Liu, L.; Wang, S.; Liu, J. Fiber consumption and all-cause, cardiovascular, and cancer mortalities: A systematicreview and meta-analysis of cohort studies. Mol. Nutr. Food Res. 2015, 59, 139–146. [CrossRef] [PubMed]
20. Hajishafiee, M.; Saneei, P.; Benisi-Kohansal, S.; Esmaillzadeh, A. Cereal fibre intake and risk of mortality fromall causes, cvd, cancer and inflammatory diseases: A systematic review and meta-analysis of prospectivecohort studies. Br. J. Nutr. 2016, 116, 343–352. [CrossRef] [PubMed]
126
Nutrients 2016, 8, 779
21. Song, M.; Chan, A.T.; Fuchs, C.S.; Ogino, S.; Hu, F.B.; Mozaffarian, D.; Ma, J.; Willett, W.C.; Giovannucci, E.L.;Wu, K. Dietary intake of fish, omega-3 and omega-6 fatty acids and risk of colorectal cancer: A prospectivestudy in U.S. Men and women. Int. J. Cancer 2014, 135, 2413–2423. [CrossRef] [PubMed]
22. Kraja, B.; Muka, T.; Ruiter, R.; de Keyser, C.E.; Hofman, A.; Franco, O.H.; Stricker, B.H.; Kiefte-de Jong, J.C.Dietary fiber intake modifies the positive association between n-3 pufa intake and colorectal cancer risk in aCaucasian population. J. Nutr. 2015, 145, 1709–1716. [CrossRef] [PubMed]
23. Trock, B.; Lanza, E.; Greenwald, P. Dietary fiber, vegetables, and colon cancer: Critical review andmeta-analyses of the epidemiologic evidence. J. Natl. Cancer Inst. 1990, 82, 650–661. [CrossRef] [PubMed]
24. Vargas, A.J.; Neuhouser, M.L.; George, S.M.; Thomson, C.A.; Ho, G.Y.; Rohan, T.E.; Kato, I.; Nassir, R.;Hou, L.; Manson, J.E. Diet quality and colorectal cancer risk in the women’s health initiative observationalstudy. Am. J. Epidemiol. 2016, 184, 23–32. [CrossRef] [PubMed]
25. Makarem, N.; Nicholson, J.M.; Bandera, E.V.; McKeown, N.M.; Parekh, N. Consumption of whole grainsand cereal fiber in relation to cancer risk: A systematic review of longitudinal studies. Nutr. Rev. 2016, 74,353–373. [CrossRef] [PubMed]
26. Aune, D.; Chan, D.S.; Lau, R.; Vieira, R.; Greenwood, D.C.; Kampman, E.; Norat, T. Dietary fibre, wholegrains, and risk of colorectal cancer: Systematic review and dose-response meta-analysis of prospectivestudies. BMJ 2011, 343, d6617. [CrossRef] [PubMed]
27. Aune, D.; Lau, R.; Chan, D.S.; Vieira, R.; Greenwood, D.C.; Kampman, E.; Norat, T. Nonlinear reductionin risk for colorectal cancer by fruit and vegetable intake based on meta-analysis of prospective studies.Gastroenterology 2011, 141, 106–118. [CrossRef] [PubMed]
28. Beresford, S.A.; Johnson, K.C.; Ritenbaugh, C.; Lasser, N.L.; Snetselaar, L.G.; Black, H.R.; Anderson, G.L.;Assaf, A.R.; Bassford, T.; Bowen, D.; et al. Low-fat dietary pattern and risk of colorectal cancer: The women’shealth initiative randomized controlled dietary modification trial. JAMA 2006, 295, 643–654. [CrossRef][PubMed]
29. Donohoe, D.R.; Bultman, S.J. Metaboloepigenetics: Interrelationships between energy metabolism andepigenetic control of gene expression. J. Cell. Physiol. 2012, 227, 3169–3177. [CrossRef] [PubMed]
30. Donohoe, D.R.; Garge, N.; Zhang, X.X.; Sun, W.; O’Connell, T.M.; Bunger, M.K.; Bultman, S.J. The microbiomeand butyrate regulate energy metabolism and autophagy in the mammalian colon. Cell Metab. 2011, 13,517–526. [CrossRef] [PubMed]
31. Kolar, S.; Barhoumi, R.; Jones, C.K.; Wesley, J.; Lupton, J.R.; Fan, Y.Y.; Chapkin, R.S. Interactive effects of fattyacid and butyrate-induced mitochondrial Ca(2)(+) loading and apoptosis in colonocytes. Cancer 2011, 117,5294–5303. [CrossRef] [PubMed]
32. Kansal, S.; Negi, A.K.; Bhatnagar, A.; Agnihotri, N. Ras signaling pathway in the chemopreventive action ofdifferent ratios of fish oil and corn oil in experimentally induced colon carcinogenesis. Nutr. Cancer 2012, 64,559–568. [CrossRef] [PubMed]
33. Kolar, S.S.; Barhoumi, R.; Callaway, E.S.; Fan, Y.Y.; Wang, N.; Lupton, J.R.; Chapkin, R.S. Synergy betweendocosahexaenoic acid and butyrate elicits p53-independent apoptosis via mitochondrial Ca(2+) accumulationin colonocytes. Am. J. Physiol. Gastrointest. Liver Physiol. 2007, 293, G935–G943. [CrossRef] [PubMed]
34. Kolar, S.S.; Barhoumi, R.; Lupton, J.R.; Chapkin, R.S. Docosahexaenoic acid and butyrate synergisticallyinduce colonocyte apoptosis by enhancing mitochondrial Ca2+ accumulation. Cancer Res. 2007, 67, 5561–5568.[CrossRef] [PubMed]
35. Ng, Y.; Barhoumi, R.; Tjalkens, R.B.; Fan, Y.Y.; Kolar, S.; Wang, N.; Lupton, J.R.; Chapkin, R.S. The role ofdocosahexaenoic acid in mediating mitochondrial membrane lipid oxidation and apoptosis in colonocytes.Carcinogenesis 2005, 26, 1914–1921. [CrossRef] [PubMed]
36. Hooda, S.; Boler, B.M.; Serao, M.C.; Brulc, J.M.; Staeger, M.A.; Boileau, T.W.; Dowd, S.E.; Fahey, G.C., Jr.;Swanson, K.S. 454 pyrosequencing reveals a shift in fecal microbiota of healthy adult men consumingpolydextrose or soluble corn fiber. J. Nutr. 2012, 142, 1259–1265. [CrossRef] [PubMed]
37. Ross, A.B.; Bruce, S.J.; Blondel-Lubrano, A.; Oguey-Araymon, S.; Beaumont, M.; Bourgeois, A.;Nielsen-Moennoz, C.; Vigo, M.; Fay, L.B.; Kochhar, S.; et al. A whole-grain cereal-rich diet increasesplasma betaine, and tends to decrease total and ldl-cholesterol compared with a refined-grain diet in healthysubjects. Br. J. Nutr. 2011, 105, 1492–1502. [CrossRef] [PubMed]
127
Nutrients 2016, 8, 779
38. Costabile, A.; Klinder, A.; Fava, F.; Napolitano, A.; Fogliano, V.; Leonard, C.; Gibson, G.R.; Tuohy, K.M.Whole-grain wheat breakfast cereal has a prebiotic effect on the human gut microbiota: A double-blind,placebo-controlled, crossover study. Br. J. Nutr. 2008, 99, 110–120. [CrossRef] [PubMed]
39. Finley, J.W.; Burrell, J.B.; Reeves, P.G. Pinto bean consumption changes scfa profiles in fecal fermentations,bacterial populations of the lower bowel, and lipid profiles in blood of humans. J. Nutr. 2007, 137, 2391–2398.[PubMed]
40. Smith, S.C.; Choy, R.; Johnson, S.K.; Hall, R.S.; Wildeboer-Veloo, A.C.; Welling, G.W. Lupin kernel fiberconsumption modifies fecal microbiota in healthy men as determined by rrna gene fluorescent in situhybridization. Eur. J. Nutr. 2006, 45, 335–341. [CrossRef] [PubMed]
41. Johnson, S.K.; Chua, V.; Hall, R.S.; Baxter, A.L. Lupin kernel fibre foods improve bowel function andbeneficially modify some putative faecal risk factors for colon cancer in men. Br. J. Nutr. 2006, 95, 372–378.[CrossRef] [PubMed]
42. Tuohy, K.M.; Kolida, S.; Lustenberger, A.M.; Gibson, G.R. The prebiotic effects of biscuits containing partiallyhydrolysed guar gum and fructo-oligosaccharides—A human volunteer study. Br. J. Nutr. 2001, 86, 341–348.[CrossRef] [PubMed]
43. Hylla, S.; Gostner, A.; Dusel, G.; Anger, H.; Bartram, H.P.; Christl, S.U.; Kasper, H.; Scheppach, W. Effects ofresistant starch on the colon in healthy volunteers: Possible implications for cancer prevention. Am. J.
Clin. Nutr. 1998, 67, 136–142. [PubMed]44. Arumugam, M.; Raes, J.; Pelletier, E.; Le Paslier, D.; Yamada, T.; Mende, D.R.; Fernandes, G.R.; Tap, J.;
Bruls, T.; Batto, J.M.; et al. Enterotypes of the human gut microbiome. Nature 2011, 473, 174–180. [CrossRef][PubMed]
45. Faust, K.; Raes, J. Microbial interactions: From networks to models. Nat. Rev. Microbiol. 2012, 10, 538–550.[CrossRef] [PubMed]
46. Faust, K.; Sathirapongsasuti, J.F.; Izard, J.; Segata, N.; Gevers, D.; Raes, J.; Huttenhower, C.Microbial co-occurrence relationships in the human microbiome. PLoS Comput. Biol. 2012, 8, e1002606.[CrossRef] [PubMed]
47. Lozupone, C.; Faust, K.; Raes, J.; Faith, J.J.; Frank, D.N.; Zaneveld, J.; Gordon, J.I.; Knight, R.Identifying genomic and metabolic features that can underline early successional and opportunistic lifestylesof human gut symbionts. Genome Res. 2012, 22, 1974–1984. [CrossRef] [PubMed]
48. Bolca, S.; van de Wiele, T.; Possemiers, S. Gut metabotypes govern health effects of dietary polyphenols.Curr. Opin. Biotechnol. 2013, 24, 220–225. [CrossRef] [PubMed]
49. Heinzmann, S.S.; Merrifield, C.A.; Rezzi, S.; Kochhar, S.; Lindon, J.C.; Holmes, E.; Nicholson, J.K. Stability androbustness of human metabolic phenotypes in response to sequential food challenges. J. Proteome Res. 2012,11, 643–655. [CrossRef] [PubMed]
50. Wang, T.; Cai, G.; Qiu, Y.; Fei, N.; Zhang, M.; Pang, X.; Jia, W.; Cai, S.; Zhao, L. Structural segregation of gutmicrobiota between colorectal cancer patients and healthy volunteers. ISME J. 2012, 6, 320–329. [CrossRef][PubMed]
51. Weir, T.L.; Manter, D.K.; Sheflin, A.M.; Barnett, B.A.; Heuberger, A.L.; Ryan, E.P. Stool microbiome andmetabolome differences between colorectal cancer patients and healthy adults. PLoS ONE 2013, 8, e70803.[CrossRef] [PubMed]
52. Wu, N.; Yang, X.; Zhang, R.; Li, J.; Xiao, X.; Hu, Y.; Chen, Y.; Yang, F.; Lu, N.; Wang, Z.; et al.Dysbiosis signature of fecal microbiota in colorectal cancer patients. Microb. Ecol. 2013, 66, 462–470.[CrossRef] [PubMed]
53. Simopoulos, A.P. Importance of the omega-6/omega-3 balance in health and disease: Evolutionary aspectsof diet. World Rev. Nutr. Diet. 2011, 102, 10–21. [PubMed]
54. Strobel, C.; Jahreis, G.; Kuhnt, K. Survey of n-3 and n-6 polyunsaturated fatty acids in fish and fish products.Lipids Health Dis. 2012, 11, 144. [CrossRef] [PubMed]
55. Skender, B.; Hyrslova Vaculova, A.; Hofmanova, J. Docosahexaenoic fatty acid (dha) in the regulation ofcolon cell growth and cell death: A review. Biomed. Pap. Med. Fac. Univ. Palacky Olomouc Czech. Repub. 2012,156, 186–199. [CrossRef] [PubMed]
56. Azer, S.A. Overview of molecular pathways in inflammatory bowel disease associated with colorectal cancerdevelopment. Eur. J. Gastroenterol. Hepatol. 2012, 25, 271–281. [CrossRef] [PubMed]
128
Nutrients 2016, 8, 779
57. Cockbain, A.J.; Toogood, G.J.; Hull, M.A. Omega-3 polyunsaturated fatty acids for the treatment andprevention of colorectal cancer. Gut 2012, 61, 135–149. [CrossRef] [PubMed]
58. Chang, W.C.; Chapkin, R.S.; Lupton, J.R. Predictive value of proliferation, differentiation and apoptosis asintermediate markers for colon tumorigenesis. Carcinogenesis 1997, 18, 721–730. [CrossRef] [PubMed]
59. Sanders, L.M.; Henderson, C.E.; Hong, M.Y.; Barhoumi, R.; Burghardt, R.C.; Wang, N.; Spinka, C.M.;Carroll, R.J.; Turner, N.D.; Chapkin, R.S.; et al. An increase in reactive oxygen species by dietary fish oilcoupled with the attenuation of antioxidant defenses by dietary pectin enhances rat colonocyte apoptosis.J. Nutr. 2004, 134, 3233–3238. [PubMed]
60. Vanamala, J.; Glagolenko, A.; Yang, P.; Carroll, R.J.; Murphy, M.E.; Newman, R.A.; Ford, J.R.; Braby, L.A.;Chapkin, R.S.; Turner, N.D.; et al. Dietary fish oil and pectin enhance colonocyte apoptosis in part throughsuppression of ppardelta/pge2 and elevation of pge3. Carcinogenesis 2008, 29, 790–796. [CrossRef] [PubMed]
61. Crim, K.C.; Sanders, L.M.; Hong, M.Y.; Taddeo, S.S.; Turner, N.D.; Chapkin, R.S.; Lupton, J.R. Upregulationof p21waf1/cip1 expression in vivo by butyrate administration can be chemoprotective or chemopromotivedepending on the lipid component of the diet. Carcinogenesis 2008, 29, 1415–1420. [CrossRef] [PubMed]
62. Cho, Y.; Kim, H.; Turner, N.D.; Mann, J.C.; Wei, J.; Taddeo, S.S.; Davidson, L.A.; Wang, N.; Vannucci, M.;Carroll, R.J.; et al. A chemoprotective fish oil- and pectin-containing diet temporally alters gene expressionprofiles in exfoliated rat colonocytes throughout oncogenesis. J. Nutr. 2011, 141, 1029–1035. [CrossRef][PubMed]
63. The Women’s Health Initiative Study Group. Design of the women’s health initiative clinical trial andobservational study. Control. Clin. Trials 1998, 19, 61–109.
64. Anderson, G.L.; Manson, J.; Wallace, R.; Lund, B.; Hall, D.; Davis, S.; Shumaker, S.; Wang, C.Y.; Stein, E.;Prentice, R.L. Implementation of the women’s health initiative study design. Ann. Epidemiol. 2003, 13, S5–S17.[CrossRef]
65. Langer, R.D.; White, E.; Lewis, C.E.; Kotchen, J.M.; Hendrix, S.L.; Trevisan, M. The women’s healthinitiative observational study: Baseline characteristics of participants and reliability of baseline measures.Ann. Epidemiol. 2003, 13, S107–S121. [CrossRef]
66. Hays, J.; Hunt, J.R.; Hubbell, F.A.; Anderson, G.L.; Limacher, M.; Allen, C.; Rossouw, J.E. The women’shealth initiative recruitment methods and results. Ann. Epidemiol. 2003, 13, S18–S77. [CrossRef]
67. Patterson, R.E.; Kristal, A.R.; Tinker, L.F.; Carter, R.A.; Bolton, M.P.; Agurs-Collins, T. Measurementcharacteristics of the women’s health initiative food frequency questionnaire. Ann. Epidemiol. 1999, 9,178–187. [CrossRef]
68. Curb, J.D.; McTiernan, A.; Heckbert, S.R.; Kooperberg, C.; Stanford, J.; Nevitt, M.; Johnson, K.C.;Proulx-Burns, L.; Pastore, L.; Criqui, M.; et al. Outcomes ascertainment and adjudication methods inthe women’s health initiative. Ann. Epidemiol. 2003, 13, S122–S128. [CrossRef]
69. Haggar, F.A.; Boushey, R.P. Colorectal cancer epidemiology: Incidence, mortality, survival, and risk factors.Clin. Colon Rectal Surg. 2009, 22, 191–197. [CrossRef] [PubMed]
70. Edwards, B.K.; Ward, E.; Kohler, B.A.; Eheman, C.; Zauber, A.G.; Anderson, R.N.; Jemal, A.; Schymura, M.J.;Lansdorp-Vogelaar, I.; Seeff, L.C.; et al. Annual report to the nation on the status of cancer, 1975–2006,featuring colorectal cancer trends and impact of interventions (risk factors, screening, and treatment) toreduce future rates. Cancer 2010, 116, 544–573. [CrossRef] [PubMed]
71. National Academy of Sciences-Institute of Medicine. Food and Nutrition Board. Dietary Reference Intakes for
Energy, Carbohydrate, Fiber, Fat, Fatty Acids, Cholesterol, Protein, and Amino Acids; National Academy Press:Washington, DC, USA, 2005.
72. American Institute For Cancer Research. Available online: http://www.Aicr.Org/continuous-update-project/colorectal-cancer.Html (accessed on 4 November 2016).
73. Bingham, S.A. Diet and large bowel cancer. J. R. Soc. Med. 1990, 83, 420–422. [PubMed]74. Young, G.P.; Hu, Y.; Le Leu, R.K.; Nyskohus, L. Dietary fibre and colorectal cancer: A model for
environment–gene interactions. Mol. Nutr. Food Res. 2005, 49, 571–584. [CrossRef] [PubMed]75. Slavin, J.L. Dietary fiber and body weight. Nutrition 2005, 21, 411–418. [CrossRef] [PubMed]76. Donohoe, D.R.; Collins, L.B.; Wali, A.; Bigler, R.; Sun, W.; Bultman, S.J. The warburg effect dictates the
mechanism of butyrate-mediated histone acetylation and cell proliferation. Mol. Cell 2012, 48, 612–626.[CrossRef] [PubMed]
129
Nutrients 2016, 8, 779
77. Bultman, S.J. Molecular pathways: Gene-environment interactions regulating dietary fiber induction ofproliferation and apoptosis via butyrate for cancer prevention. Clin. Cancer Res. 2014, 20, 799–803. [CrossRef][PubMed]
78. Triff, K.; Kim, E.; Chapkin, R.S. Chemoprotective epigenetic mechanisms in a colorectal cancer model:Modulation by n-3 pufa in combination with fermentable fiber. Curr. Pharmacol. Rep. 2015, 1, 11–20.[CrossRef] [PubMed]
79. Chapkin, R.S.; Seo, J.; McMurray, D.N.; Lupton, J.R. Mechanisms by which docosahexaenoic acid and relatedfatty acids reduce colon cancer risk and inflammatory disorders of the intestine. Chem. Phys. Lipids 2008, 153,14–23. [CrossRef] [PubMed]
80. Levi, F.; Pasche, C.; Lucchini, F.; la Vecchia, C. Dietary fibre and the risk of colorectal cancer. Eur. J. Cancer
2001, 37, 2091–2096. [CrossRef]81. Freudenheim, J.L.; Graham, S.; Horvath, P.J.; Marshall, J.R.; Haughey, B.P.; Wilkinson, G. Risks associated
with source of fiber and fiber components in cancer of the colon and rectum. Cancer Res. 1990, 50, 3295–3300.[PubMed]
82. Le Marchand, L.; Hankin, J.H.; Wilkens, L.R.; Kolonel, L.N.; Englyst, H.N.; Lyu, L.C. Dietary fiber andcolorectal cancer risk. Epidemiology 1997, 8, 658–665. [CrossRef] [PubMed]
83. Negri, E.; Franceschi, S.; Parpinel, M.; La Vecchia, C. Fiber intake and risk of colorectal cancer.Cancer Epidemiol. Biomark. Prev. 1998, 7, 667–671.
84. Turk, H.F.; Monk, J.M.; Fan, Y.Y.; Callaway, E.S.; Weeks, B.; Chapkin, R.S. Inhibitory effects of omega-3 fattyacids on injury-induced epidermal growth factor receptor transactivation contribute to delayed woundhealing. Am. J. Physiol. Cell Physiol. 2013, 304, C905–C917. [CrossRef] [PubMed]
85. Larsson, S.C.; Kumlin, M.; Ingelman-Sundberg, M.; Wolk, A. Dietary long-chain n-3 fatty acids for theprevention of cancer: A review of potential mechanisms. Am. J. Clin. Nutr. 2004, 79, 935–945. [PubMed]
86. Wu, S.; Feng, B.; Li, K.; Zhu, X.; Liang, S.; Liu, X.; Han, S.; Wang, B.; Wu, K.; Miao, D.; et al. Fish consumptionand colorectal cancer risk in humans: A systematic review and meta-analysis. Am. J. Med. 2012, 125, 551–559.[CrossRef] [PubMed]
87. Geelen, A.; Schouten, J.M.; Kamphuis, C.; Stam, B.E.; Burema, J.; Renkema, J.M.; Bakker, E.J.; van’t Veer, P.;Kampman, E. Fish consumption, n-3 fatty acids, and colorectal cancer: A meta-analysis of prospective cohortstudies. Am. J. Epidemiol. 2007, 166, 1116–1125. [CrossRef] [PubMed]
88. Song, M.; Zhang, X.; Meyerhardt, J.A.; Giovannucci, E.L.; Ogino, S.; Fuchs, C.S.; Chan, A.T. Marine omega-3polyunsaturated fatty acid intake and survival after colorectal cancer diagnosis. Gut 2016. [CrossRef][PubMed]
89. Vannice, G.; Rasmussen, H. Position of the academy of nutrition and dietetics: Dietary fatty acids for healthyadults. J. Acad. Nutr. Diet. 2014, 114, 136–153. [CrossRef] [PubMed]
90. Jiang, Y.H.; Lupton, J.R.; Chapkin, R.S. Dietary fat and fiber modulate the effect of carcinogen on colonicprotein kinase c lambda expression in rats. J. Nutr. 1997, 127, 1938–1943. [PubMed]
91. Fan, Y.Y.; Ran, Q.; Toyokuni, S.; Okazaki, Y.; Callaway, E.S.; Lupton, J.R.; Chapkin, R.S. Dietary fish oilpromotes colonic apoptosis and mitochondrial proton leak in oxidatively stressed mice. Cancer Prev. Res.
2011, 4, 1267–1274. [CrossRef] [PubMed]92. Orlich, M.J.; Singh, P.N.; Sabate, J.; Fan, J.; Sveen, L.; Bennett, H.; Knutsen, S.F.; Beeson, W.L.; Jaceldo-Siegl, K.;
Butler, T.L.; et al. Vegetarian dietary patterns and the risk of colorectal cancers. JAMA Intern. Med. 2015, 175,767–776. [CrossRef] [PubMed]
93. O’Keefe, S.J.; Li, J.V.; Lahti, L.; Ou, J.; Carbonero, F.; Mohammed, K.; Posma, J.M.; Kinross, J.; Wahl, E.;Ruder, E.; et al. Fat, fibre and cancer risk in African americans and rural Africans. Nat. Commun. 2015, 6,6342. [CrossRef] [PubMed]
94. Kato, I.; Majumdar, A.P.; Land, S.J.; Barnholtz-Sloan, J.S.; Severson, R.K. Dietary fatty acids, luminal modifiers,and risk of colorectal cancer. Int. J. Cancer 2010, 127, 942–951. [CrossRef] [PubMed]
95. US Department of Agriculture, Agriculture Research Services. Nutrient Intakes from Food: Mean AmountsConsumed per Individual, by Gender and Age. Available online: http://www.ars.usda.gov/ba/bhnrc/fsrg(accessed on 4 November 2016).
96. Kristal, A.R.; Shattuck, A.L.; Williams, A.E. Food Frequency Questionnaires for Diet Intervention Research.In Proceedings of the 17th National Nutrient Databank Conference, Baltimore, MD, USA, 7–10 June 1992.
130
Nutrients 2016, 8, 779
97. Satia-Abouta, J.; Kristal, A.R.; Patterson, R.E.; Littman, A.J.; Stratton, K.L.; White, E. Dietary supplement useand medical conditions: The vital study. Am. J. Prev. Med. 2003, 24, 43–51. [CrossRef]
98. Fasano, E.; Serini, S.; Cittadini, A.; Calviello, G. Long-chain n-3 pufa against breast and prostate cancer:Which are the appropriate doses for intervention studies in animals and humans? Crit. Rev. Food
Sci. Nutr. 2015. [CrossRef] [PubMed]99. Vece, M.M.; Agnoli, C.; Grioni, S.; Sieri, S.; Pala, V.; Pellegrini, N.; Frasca, G.; Tumino, R.; Mattiello, A.;
Panico, S.; et al. Dietary total antioxidant capacity and colorectal cancer in the italian epic cohort. PLoS ONE
2015, 10, e0142995. [CrossRef] [PubMed]100. La Vecchia, C.; Decarli, A.; Serafini, M.; Parpinel, M.; Bellocco, R.; Galeone, C.; Bosetti, C.; Zucchetto, A.;
Polesel, J.; Lagiou, P.; et al. Dietary total antioxidant capacity and colorectal cancer: A large case-controlstudy in italy. Int. J. Cancer 2013, 133, 1447–1451. [CrossRef] [PubMed]
101. Bjelakovic, G.; Nikolova, D.; Simonetti, R.G.; Gluud, C. Antioxidant supplements for prevention ofgastrointestinal cancers: A systematic review and meta-analysis. Lancet 2004, 364, 1219–1228. [CrossRef]
© 2016 by the authors. Licensee MDPI, Basel, Switzerland. This article is an open accessarticle distributed under the terms and conditions of the Creative Commons Attribution(CC BY) license (http://creativecommons.org/licenses/by/4.0/).
131
nutrients
Article
Butyrate Inhibits Cancerous HCT116 Colon CellProliferation but to a Lesser Extent in NoncancerousNCM460 Colon Cells
Huawei Zeng 1,*, David P. Taussig 1, Wen-Hsing Cheng 2, LuAnn K. Johnson 1 and
Reza Hakkak 3,4
1 United States Department of Agriculture, Agricultural Research Service,Grand Forks Human Nutrition Research Center, Grand Forks, ND 58203, USA;[email protected] (D.P.T.); [email protected] (L.K.J.)
2 Department of Food Science, Nutrition and Health Promotion, Mississippi State University,Starkville, MS 39762, USA; [email protected]
3 Departments of Dietetics and Nutrition, University of Arkansas for Medical Sciences,Little Rock, AR 72205, USA; [email protected]
4 Arkansas Children Research Institute, Little Rock, AR 72202, USA* Correspondence: [email protected]; Tel.: +1-701-795-8465
Received: 20 October 2016; Accepted: 23 December 2016; Published: 1 January 2017
Abstract: Butyrate, an intestinal microbiota metabolite of dietary fiber, exhibits chemopreventioneffects on colon cancer development. However, the mechanistic action of butyrate remains to bedetermined. We hypothesize that butyrate inhibits cancerous cell proliferation but to a lesser extentin noncancerous cells through regulating apoptosis and cellular-signaling pathways. We tested thishypothesis by exposing cancerous HCT116 or non-cancerous NCM460 colon cells to physiologicallyrelevant doses of butyrate. Cellular responses to butyrate were characterized by Western analysis,fluorescent microscopy, acetylation, and DNA fragmentation analyses. Butyrate inhibited cellproliferation, and led to an induction of apoptosis, genomic DNA fragmentation in HCT116 cells,but to a lesser extent in NCM460 cells. Although butyrate increased H3 histone deacetylationand p21 tumor suppressor expression in both cell types, p21 protein level was greater withintense expression around the nuclei in HCT116 cells when compared with that in NCM460 cells.Furthermore, butyrate treatment increased the phosphorylation of extracellular-regulated kinase 1/2(p-ERK1/2), a survival signal, in NCM460 cells while it decreased p-ERK1/2 in HCT116 cells. Takentogether, the activation of survival signaling in NCM460 cells and apoptotic potential in HCT116cells may confer the increased sensitivity of cancerous colon cells to butyrate in comparison withnoncancerous colon cells.
Keywords: apoptosis; butyrate; colon cancer; cell proliferation; microbiota
1. Introduction
Colon cancer is the third most frequently occurring cancer in men and women in the United States.In 2016 about 134,490 people are predicted to be diagnosed with colorectal cancer in the US, and itis likely that half the Western population will develop at least one colorectal tumor by the age of70 years [1,2]. It has been reported that high intake of dietary fiber and resistant starches reducesthe risk of colon cancer in human populations and animal models [3,4]. This effect may be relatedto butyrate, a short chain fatty acid (SCFA), which is produced in the colonic lumen by the bacterialfermentation of dietary fiber [3–6]. Colonic luminal SCFA concentration can reach 10 mmol/L whenhumans consume diets containing moderate levels of fiber [7,8]. Conceivably, there is continuous
Nutrients 2017, 9, 25 132 www.mdpi.com/journal/nutrients
Nutrients 2017, 9, 25
butyrate exposure in the colonic epithelium, and butyrate may exert several anticarcinogenic effectsthrough the modulation of colon cell proliferation and apoptosis [9–12].
A successful chemoprevention agent should have a minimal effect on normal cells but a stronginhibitory effect on cell proliferation and carcinogenic pathways in cancer cells. While much has beenstudied on the effect of butyrate on colon cancer cells, little is known about its effect on noncancerouscells, which is essential for understanding butyrate’s anticancer properties. Several studies haveshown that histone deacetylase (HDAC) activity represses transcriptional activity by condensing thechromatin package leading to an epigenetically mediated silencing of tumor suppressor genes likep21 [13,14]. Butyrate is an HDAC inhibitor (HDACi) and a potential anti-tumor agent. HDACi stronglyactivates the expression of the cyclin-dependent kinase inhibitor p21, a tumor suppressor [13,15].In addition, previous data have shown that the extracellular-regulated kinase 1/2 (ERK1/2) andmyelocytomatosis (c-Myc) signaling pathways are both required to drive cell cycle progression duringcell proliferation [16–18]; c-Myc may also modulate p21 expression [19,20]. To study the effects ofbutyrate on these signaling pathways related to colon cancer proliferation, two human colon cell lineswere employed in this study. The NCM460 colon cell line is an epithelial cell line which is noncancerousand derived from normal colon mucosa [21]. This cell line has not been infected or transfected with anygenetic information, and is widely used because there are few other noncancerous colon cell lines [21].Although there are several cancerous colon cell lines (e.g., HCT116, HT29, and Caco-2) available,most of these cell lines are derived from adenocarcinoma, and only the HCT116 cell line is derivedfrom carcinoma [22,23]. It is known that adenocarcinoma develops in glands whereas carcinomaoriginates in the epithelial tissue, and there are differences between colorectal carcinoma and advancedadenomas [24]. Given the fact that NCM460 and HCT116 cells were both originally derived from(male adult) colon epithelial tissues and are the same cell subtypes, we believe that NCM460 andHCT116 cells are the best cell-line pair to use in our present study.
In view of the critical role of butyrate in colon cancer prevention [3–6], we hypothesize thatbutyrate inhibits cancerous cell proliferation but to a lesser extent in noncancerous colon cells throughsignaling pathways regulating apoptosis and cellular survival [21,22]. Colon crypt cells divide rapidlyand travel to the top of the epithelium where they differentiate, proliferate, and undergo cell cycleprogression and apoptosis within 48 h. Thus, we focused on the effects of butyrate on colon cell growthand apoptosis for up to 48 h in the present study whereas signaling molecules were examined at earlytime points (e.g., 1.5 h) to limit the bystander effect.
2. Materials and Methods
2.1. Cell Cultures
HCT116 colorectal carcinoma cells were obtained from American Type Culture Collection andmaintained in Dulbecco’s Modified Eagle Medium (DMEM) (Invitrogen, Carlsbad, CA, USA) with 10%fetal bovine serum (FBS; Sigma Chemical Co., St. Louis, MO, USA). The nontransformed, noncancerouscolon NCM460 cells derived from human normal colon mucosa [21,25] were maintained in M3 Basemedium (INCELL Corp., San Antonio, TX, USA) with 10% FBS. Sodium butyrate (purity > 98.5%)was purchased from Sigma Chemical Corporation (St. Louis, MO, USA). Stock cells were passagedtwice weekly at ~<80% confluency in Ca-Mg-free Hanks’ balanced salt solution (Sigma Chemical Co.,St. Louis, MO, USA) containing 0.25% trypsin (Invitrogen) and 1 mmol/L ethylenediamine tetra-aceticacid (EDTA). Cell viability was determined by trypan blue exclusion based on hemocytometer countsand cells were incubated in a humidified chamber at 36.5 C with 5% CO2. Cultures were tested andfound to be mycoplasma free [26]. HCT116 cells at passages 22–40 and NCM460 cells at passages 34–50were used. Importantly, both HCT116 and NCM460 cell lines were grown in DMEM medium with10% FBS in all subsequent assays.
133
Nutrients 2017, 9, 25
2.2. Cell Count/Growth Assay
HCT116 and NCM460 cell lines were both cultured in DMEM medium with 10% FBS, harvestedwith 0.25% trypsin (Invitrogen) and 1 mmol/L EDTA, and resuspended in 1 mL medium. Cells werethen diluted 1:2 (or 1:4) in 0.2% trypan blue and counted in duplicate using a hemocytometer. At least200 cells per sample were counted.
2.3. Apoptosis Analysis
Apoptosis was analyzed using a Guava Nexin™ Kit (Guava Technologies, Inc.Hayward, CA, USA). HCT116 and NCM460 cell lines were tryspinized, and then suspendedin growth media (DMEM with 10% FBS). Annexin V is a calcium-dependent phospholipid bindingprotein with high affinity to phosphatidylserine (PS), which has translocated from the internalto external side of the cell membrane upon induction of apoptosis. The cell impermeant dye7-amino-actinomycin D (7-AAD) is included in the assay kit as an indicator of membrane structuralintegrity [27]. Therefore, [Annexin V (+), 7-AAD (−)] cells are in the early stages of apoptosis,and [Annexin V (+) and 7-AAD (+)] cells are in the late stages of apoptosis. At least 2000 single cellevents per sample were analyzed by the Guava PCA System (Hayward, CA, USA).
2.4. DNA Fragmentation Assay
Each DNA sample was extracted from about 1,000,000 cells by overnight incubation at 50–55 Cin a lysis buffer (50 mmol/L Tris-HCl, pH 8.0, 10 mmol/L EDTA, 150 mmol/L NaCl, 100 µg/mLproteinase K). These DNA samples were recovered by isopropanol precipitation, resuspended inTris-EDTA-RNase (6 units/mL), analyzed using 1.9% agarose gels, and visualized by ethidium bromidestaining. The intensity signals of genomic DNA fragmentation were analyzed by the UVP BioimagingSystems (Upland, CA, USA).
2.5. Western Blotting Analysis
After butyrate treatment for 1.5 or 15 h, adherent cells were scraped, pooled with the detachedcells in 5 mL media, and then these cells were collected by centrifugation at 350× g for 10 minat 4 C. At least four independent experimental cell sample sets were collected. The cell pellet(about 1,000,000 cells) was washed once in ice-cold PBS and lysed in a cell lysis buffer (20 mmol/LTris-HCT, pH 7.5, 150 mmol/L NaCl, 1 mmol/L Na2EDTA, 1 mmol/L EGTA, 1% Triton, 2.5 mmol/Lsodium pyrophosphate, 1 mmol/L Na3VO4, 1 µg/mL leupeptin, 1 mmol/L phenylmethylsulfonylfluoride) (Cell Signaling Technology, Inc., Danvers, MA, USA). After 15 s sonication, the cell lysatewas centrifuged at 14,000× g for 30 min at 4 C. The supernatant was designated as whole cell proteinextract and kept at −80 C. The protein concentration was quantified by the Bradford dye-bindingassay (Bio-Rad laboratories, Richmond, CA, USA). Protein extracts with equal amount (~40 µg) wereresolved over 4%–20% Tris-glycine gradient gels under denaturing and reducing conditions andelectroblotted onto polyvinylidene difluoride (PVDF) membranes (Invitrogen, Carlsbad, CA, USA).Membrane blots were blocked in phosphate-buffered saline (PBS)—0.05% Tween (v/v) supplementedwith 1% (wt/v) nonfat dry milk (BioRad, Hercules, CA, USA) overnight at 4 C. Membranes wereprobed with antibodies against c-Myc (Epitomics, Inc., Burlingame, CA, USA), phosphorylated ERK1/2(p-ERK1/2), ERK1/2, acetyl-Histone H3 (Lys9), and p21 antibodies (Cell Signaling Technology, Inc.,Danvers, MA, USA), and then incubated with an anti-mouse/rabbit (1:3000 dilution) horseradishperoxidase (HRP)-conjugated secondary antibody (Cell Signaling Technology, Inc., Danvers, MA, USA)in blocking solution for 1 h at room temperature. Blots were washed as above and proteins wereincubated with an ECL plus kit (Amersham Pharmacia Biotech, Piscataway, NJ, USA) and imaged bythe Molecular Dynamics Image-Quant system (Sunnyvale, CA, USA).
134
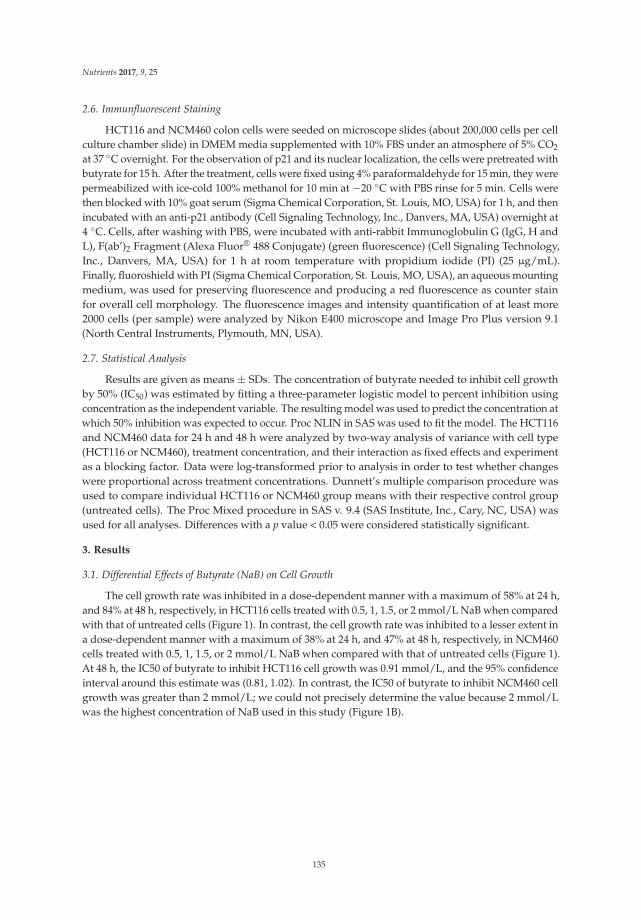
Nutrients 2017, 9, 25
2.6. Immunfluorescent Staining
HCT116 and NCM460 colon cells were seeded on microscope slides (about 200,000 cells per cellculture chamber slide) in DMEM media supplemented with 10% FBS under an atmosphere of 5% CO2
at 37 C overnight. For the observation of p21 and its nuclear localization, the cells were pretreated withbutyrate for 15 h. After the treatment, cells were fixed using 4% paraformaldehyde for 15 min, they werepermeabilized with ice-cold 100% methanol for 10 min at −20 C with PBS rinse for 5 min. Cells werethen blocked with 10% goat serum (Sigma Chemical Corporation, St. Louis, MO, USA) for 1 h, and thenincubated with an anti-p21 antibody (Cell Signaling Technology, Inc., Danvers, MA, USA) overnight at4 C. Cells, after washing with PBS, were incubated with anti-rabbit Immunoglobulin G (IgG, H andL), F(ab’)2 Fragment (Alexa Fluor® 488 Conjugate) (green fluorescence) (Cell Signaling Technology,Inc., Danvers, MA, USA) for 1 h at room temperature with propidium iodide (PI) (25 µg/mL).Finally, fluoroshield with PI (Sigma Chemical Corporation, St. Louis, MO, USA), an aqueous mountingmedium, was used for preserving fluorescence and producing a red fluorescence as counter stainfor overall cell morphology. The fluorescence images and intensity quantification of at least more2000 cells (per sample) were analyzed by Nikon E400 microscope and Image Pro Plus version 9.1(North Central Instruments, Plymouth, MN, USA).
2.7. Statistical Analysis
Results are given as means ± SDs. The concentration of butyrate needed to inhibit cell growthby 50% (IC50) was estimated by fitting a three-parameter logistic model to percent inhibition usingconcentration as the independent variable. The resulting model was used to predict the concentration atwhich 50% inhibition was expected to occur. Proc NLIN in SAS was used to fit the model. The HCT116and NCM460 data for 24 h and 48 h were analyzed by two-way analysis of variance with cell type(HCT116 or NCM460), treatment concentration, and their interaction as fixed effects and experimentas a blocking factor. Data were log-transformed prior to analysis in order to test whether changeswere proportional across treatment concentrations. Dunnett’s multiple comparison procedure wasused to compare individual HCT116 or NCM460 group means with their respective control group(untreated cells). The Proc Mixed procedure in SAS v. 9.4 (SAS Institute, Inc., Cary, NC, USA) wasused for all analyses. Differences with a p value < 0.05 were considered statistically significant.
3. Results
3.1. Differential Effects of Butyrate (NaB) on Cell Growth
The cell growth rate was inhibited in a dose-dependent manner with a maximum of 58% at 24 h,and 84% at 48 h, respectively, in HCT116 cells treated with 0.5, 1, 1.5, or 2 mmol/L NaB when comparedwith that of untreated cells (Figure 1). In contrast, the cell growth rate was inhibited to a lesser extent ina dose-dependent manner with a maximum of 38% at 24 h, and 47% at 48 h, respectively, in NCM460cells treated with 0.5, 1, 1.5, or 2 mmol/L NaB when compared with that of untreated cells (Figure 1).At 48 h, the IC50 of butyrate to inhibit HCT116 cell growth was 0.91 mmol/L, and the 95% confidenceinterval around this estimate was (0.81, 1.02). In contrast, the IC50 of butyrate to inhibit NCM460 cellgrowth was greater than 2 mmol/L; we could not precisely determine the value because 2 mmol/Lwas the highest concentration of NaB used in this study (Figure 1B).
135
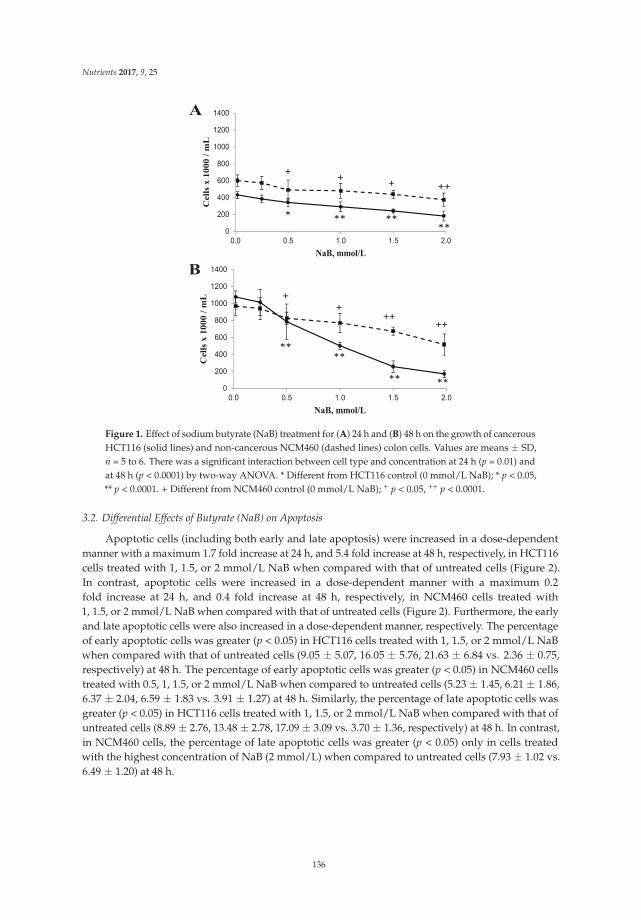
Nutrients 2017, 9, 25
A
++++
+
******
*
0
200
400
600
800
1000
1200
1400
0.0 0.5 1.0 1.5 2.0
Cell
s x
10
00
/ m
L
NaB, mmol/L
B
++++
+
+
****
**
**
0
200
400
600
800
1000
1200
1400
0.0 0.5 1.0 1.5 2.0
Cell
s x
10
00 /
mL
NaB, mmol/L
Figure 1. Effect of sodium butyrate (NaB) treatment for (A) 24 h and (B) 48 h on the growth of cancerousHCT116 (solid lines) and non-cancerous NCM460 (dashed lines) colon cells. Values are means ± SD,n = 5 to 6. There was a significant interaction between cell type and concentration at 24 h (p = 0.01) andat 48 h (p < 0.0001) by two-way ANOVA. * Different from HCT116 control (0 mmol/L NaB); * p < 0.05,** p < 0.0001. + Different from NCM460 control (0 mmol/L NaB); + p < 0.05, ++ p < 0.0001.
3.2. Differential Effects of Butyrate (NaB) on Apoptosis
Apoptotic cells (including both early and late apoptosis) were increased in a dose-dependentmanner with a maximum 1.7 fold increase at 24 h, and 5.4 fold increase at 48 h, respectively, in HCT116cells treated with 1, 1.5, or 2 mmol/L NaB when compared with that of untreated cells (Figure 2).In contrast, apoptotic cells were increased in a dose-dependent manner with a maximum 0.2fold increase at 24 h, and 0.4 fold increase at 48 h, respectively, in NCM460 cells treated with1, 1.5, or 2 mmol/L NaB when compared with that of untreated cells (Figure 2). Furthermore, the earlyand late apoptotic cells were also increased in a dose-dependent manner, respectively. The percentageof early apoptotic cells was greater (p < 0.05) in HCT116 cells treated with 1, 1.5, or 2 mmol/L NaBwhen compared with that of untreated cells (9.05 ± 5.07, 16.05 ± 5.76, 21.63 ± 6.84 vs. 2.36 ± 0.75,respectively) at 48 h. The percentage of early apoptotic cells was greater (p < 0.05) in NCM460 cellstreated with 0.5, 1, 1.5, or 2 mmol/L NaB when compared to untreated cells (5.23 ± 1.45, 6.21 ± 1.86,6.37 ± 2.04, 6.59 ± 1.83 vs. 3.91 ± 1.27) at 48 h. Similarly, the percentage of late apoptotic cells wasgreater (p < 0.05) in HCT116 cells treated with 1, 1.5, or 2 mmol/L NaB when compared with that ofuntreated cells (8.89 ± 2.76, 13.48 ± 2.78, 17.09 ± 3.09 vs. 3.70 ± 1.36, respectively) at 48 h. In contrast,in NCM460 cells, the percentage of late apoptotic cells was greater (p < 0.05) only in cells treatedwith the highest concentration of NaB (2 mmol/L) when compared to untreated cells (7.93 ± 1.02 vs.6.49 ± 1.20) at 48 h.
136
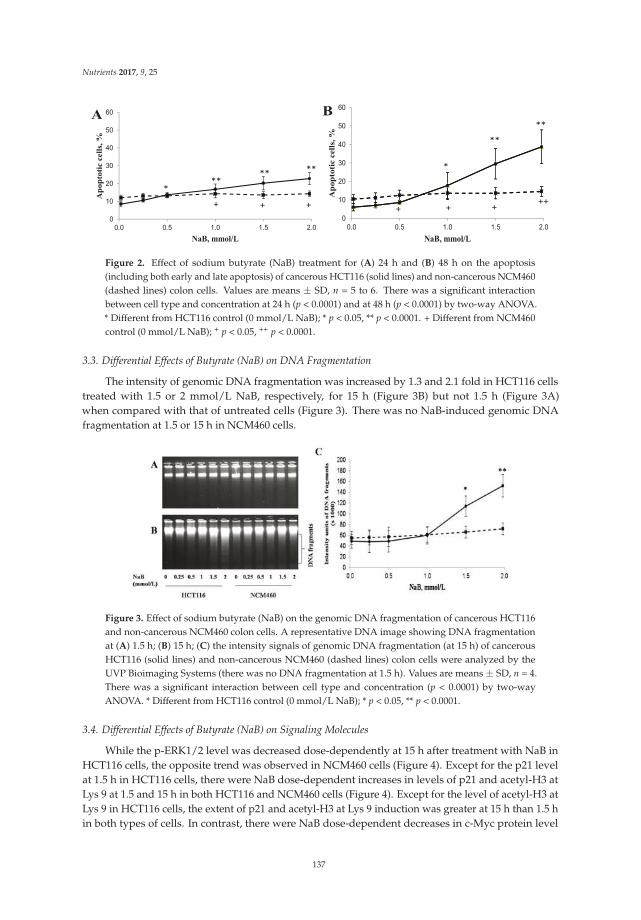
Nutrients 2017, 9, 25
A
++ +
****
***
0
10
20
30
40
50
60
0.0 0.5 1.0 1.5 2.0
Ap
op
toti
c c
ell
s, %
NaB, mmol/L
B
++++ +
**
**
*
0
10
20
30
40
50
60
0.0 0.5 1.0 1.5 2.0
Ap
op
toti
c c
ell
s, %
NaB, mmol/L
Figure 2. Effect of sodium butyrate (NaB) treatment for (A) 24 h and (B) 48 h on the apoptosis(including both early and late apoptosis) of cancerous HCT116 (solid lines) and non-cancerous NCM460(dashed lines) colon cells. Values are means ± SD, n = 5 to 6. There was a significant interactionbetween cell type and concentration at 24 h (p < 0.0001) and at 48 h (p < 0.0001) by two-way ANOVA.* Different from HCT116 control (0 mmol/L NaB); * p < 0.05, ** p < 0.0001. + Different from NCM460control (0 mmol/L NaB); + p < 0.05, ++ p < 0.0001.
3.3. Differential Effects of Butyrate (NaB) on DNA Fragmentation
The intensity of genomic DNA fragmentation was increased by 1.3 and 2.1 fold in HCT116 cellstreated with 1.5 or 2 mmol/L NaB, respectively, for 15 h (Figure 3B) but not 1.5 h (Figure 3A)when compared with that of untreated cells (Figure 3). There was no NaB-induced genomic DNAfragmentation at 1.5 or 15 h in NCM460 cells.
Figure 3. Effect of sodium butyrate (NaB) on the genomic DNA fragmentation of cancerous HCT116and non-cancerous NCM460 colon cells. A representative DNA image showing DNA fragmentationat (A) 1.5 h; (B) 15 h; (C) the intensity signals of genomic DNA fragmentation (at 15 h) of cancerousHCT116 (solid lines) and non-cancerous NCM460 (dashed lines) colon cells were analyzed by theUVP Bioimaging Systems (there was no DNA fragmentation at 1.5 h). Values are means ± SD, n = 4.There was a significant interaction between cell type and concentration (p < 0.0001) by two-wayANOVA. * Different from HCT116 control (0 mmol/L NaB); * p < 0.05, ** p < 0.0001.
3.4. Differential Effects of Butyrate (NaB) on Signaling Molecules
While the p-ERK1/2 level was decreased dose-dependently at 15 h after treatment with NaB inHCT116 cells, the opposite trend was observed in NCM460 cells (Figure 4). Except for the p21 levelat 1.5 h in HCT116 cells, there were NaB dose-dependent increases in levels of p21 and acetyl-H3 atLys 9 at 1.5 and 15 h in both HCT116 and NCM460 cells (Figure 4). Except for the level of acetyl-H3 atLys 9 in HCT116 cells, the extent of p21 and acetyl-H3 at Lys 9 induction was greater at 15 h than 1.5 hin both types of cells. In contrast, there were NaB dose-dependent decreases in c-Myc protein level
137
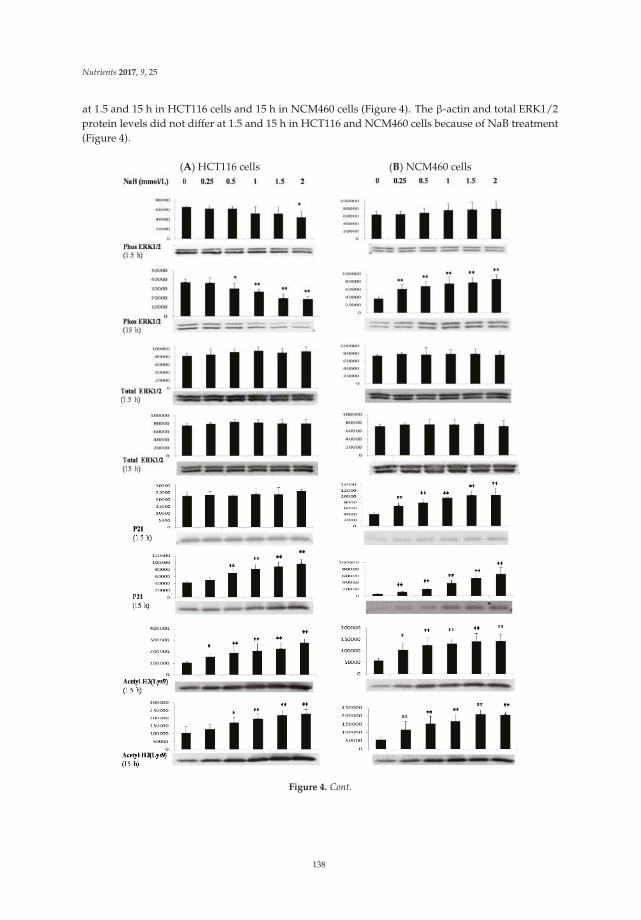
Nutrients 2017, 9, 25
at 1.5 and 15 h in HCT116 cells and 15 h in NCM460 cells (Figure 4). The β-actin and total ERK1/2protein levels did not differ at 1.5 and 15 h in HCT116 and NCM460 cells because of NaB treatment(Figure 4).
(A) HCT116 cells (B) NCM460 cells
Figure 4. Cont.
138
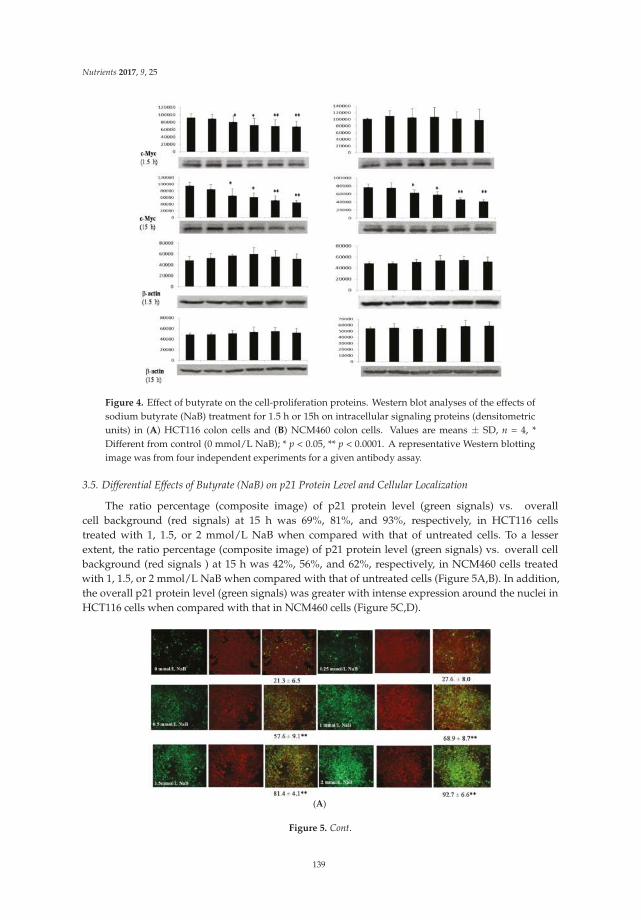
Nutrients 2017, 9, 25
Figure 4. Effect of butyrate on the cell-proliferation proteins. Western blot analyses of the effects ofsodium butyrate (NaB) treatment for 1.5 h or 15h on intracellular signaling proteins (densitometricunits) in (A) HCT116 colon cells and (B) NCM460 colon cells. Values are means ± SD, n = 4, *Different from control (0 mmol/L NaB); * p < 0.05, ** p < 0.0001. A representative Western blottingimage was from four independent experiments for a given antibody assay.
3.5. Differential Effects of Butyrate (NaB) on p21 Protein Level and Cellular Localization
The ratio percentage (composite image) of p21 protein level (green signals) vs. overallcell background (red signals) at 15 h was 69%, 81%, and 93%, respectively, in HCT116 cellstreated with 1, 1.5, or 2 mmol/L NaB when compared with that of untreated cells. To a lesserextent, the ratio percentage (composite image) of p21 protein level (green signals) vs. overall cellbackground (red signals ) at 15 h was 42%, 56%, and 62%, respectively, in NCM460 cells treatedwith 1, 1.5, or 2 mmol/L NaB when compared with that of untreated cells (Figure 5A,B). In addition,the overall p21 protein level (green signals) was greater with intense expression around the nuclei inHCT116 cells when compared with that in NCM460 cells (Figure 5C,D).
(A)
Figure 5. Cont.
139
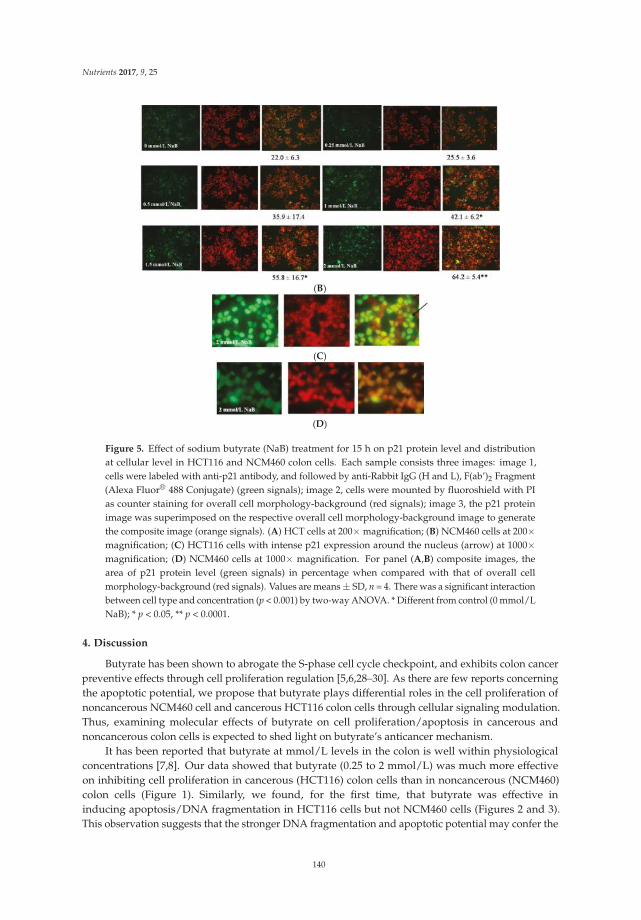
Nutrients 2017, 9, 25
(B)
(C)
(D)
Figure 5. Effect of sodium butyrate (NaB) treatment for 15 h on p21 protein level and distributionat cellular level in HCT116 and NCM460 colon cells. Each sample consists three images: image 1,cells were labeled with anti-p21 antibody, and followed by anti-Rabbit IgG (H and L), F(ab’)2 Fragment(Alexa Fluor® 488 Conjugate) (green signals); image 2, cells were mounted by fluoroshield with PIas counter staining for overall cell morphology-background (red signals); image 3, the p21 proteinimage was superimposed on the respective overall cell morphology-background image to generatethe composite image (orange signals). (A) HCT cells at 200× magnification; (B) NCM460 cells at 200×magnification; (C) HCT116 cells with intense p21 expression around the nucleus (arrow) at 1000×magnification; (D) NCM460 cells at 1000× magnification. For panel (A,B) composite images, thearea of p21 protein level (green signals) in percentage when compared with that of overall cellmorphology-background (red signals). Values are means ± SD, n = 4. There was a significant interactionbetween cell type and concentration (p < 0.001) by two-way ANOVA. * Different from control (0 mmol/LNaB); * p < 0.05, ** p < 0.0001.
4. Discussion
Butyrate has been shown to abrogate the S-phase cell cycle checkpoint, and exhibits colon cancerpreventive effects through cell proliferation regulation [5,6,28–30]. As there are few reports concerningthe apoptotic potential, we propose that butyrate plays differential roles in the cell proliferation ofnoncancerous NCM460 cell and cancerous HCT116 colon cells through cellular signaling modulation.Thus, examining molecular effects of butyrate on cell proliferation/apoptosis in cancerous andnoncancerous colon cells is expected to shed light on butyrate’s anticancer mechanism.
It has been reported that butyrate at mmol/L levels in the colon is well within physiologicalconcentrations [7,8]. Our data showed that butyrate (0.25 to 2 mmol/L) was much more effectiveon inhibiting cell proliferation in cancerous (HCT116) colon cells than in noncancerous (NCM460)colon cells (Figure 1). Similarly, we found, for the first time, that butyrate was effective ininducing apoptosis/DNA fragmentation in HCT116 cells but not NCM460 cells (Figures 2 and 3).This observation suggests that the stronger DNA fragmentation and apoptotic potential may confer the
140
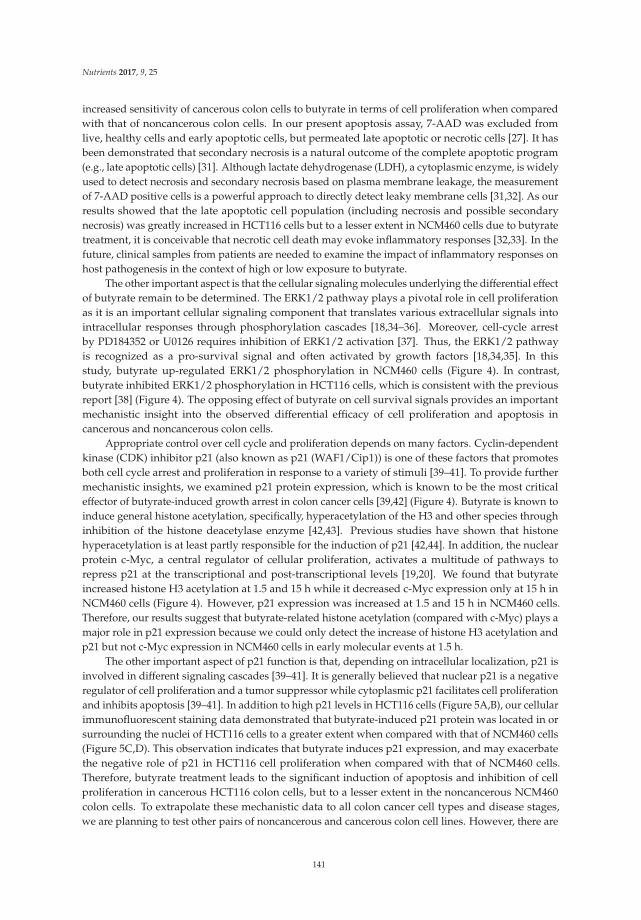
Nutrients 2017, 9, 25
increased sensitivity of cancerous colon cells to butyrate in terms of cell proliferation when comparedwith that of noncancerous colon cells. In our present apoptosis assay, 7-AAD was excluded fromlive, healthy cells and early apoptotic cells, but permeated late apoptotic or necrotic cells [27]. It hasbeen demonstrated that secondary necrosis is a natural outcome of the complete apoptotic program(e.g., late apoptotic cells) [31]. Although lactate dehydrogenase (LDH), a cytoplasmic enzyme, is widelyused to detect necrosis and secondary necrosis based on plasma membrane leakage, the measurementof 7-AAD positive cells is a powerful approach to directly detect leaky membrane cells [31,32]. As ourresults showed that the late apoptotic cell population (including necrosis and possible secondarynecrosis) was greatly increased in HCT116 cells but to a lesser extent in NCM460 cells due to butyratetreatment, it is conceivable that necrotic cell death may evoke inflammatory responses [32,33]. In thefuture, clinical samples from patients are needed to examine the impact of inflammatory responses onhost pathogenesis in the context of high or low exposure to butyrate.
The other important aspect is that the cellular signaling molecules underlying the differential effectof butyrate remain to be determined. The ERK1/2 pathway plays a pivotal role in cell proliferationas it is an important cellular signaling component that translates various extracellular signals intointracellular responses through phosphorylation cascades [18,34–36]. Moreover, cell-cycle arrestby PD184352 or U0126 requires inhibition of ERK1/2 activation [37]. Thus, the ERK1/2 pathwayis recognized as a pro-survival signal and often activated by growth factors [18,34,35]. In thisstudy, butyrate up-regulated ERK1/2 phosphorylation in NCM460 cells (Figure 4). In contrast,butyrate inhibited ERK1/2 phosphorylation in HCT116 cells, which is consistent with the previousreport [38] (Figure 4). The opposing effect of butyrate on cell survival signals provides an importantmechanistic insight into the observed differential efficacy of cell proliferation and apoptosis incancerous and noncancerous colon cells.
Appropriate control over cell cycle and proliferation depends on many factors. Cyclin-dependentkinase (CDK) inhibitor p21 (also known as p21 (WAF1/Cip1)) is one of these factors that promotesboth cell cycle arrest and proliferation in response to a variety of stimuli [39–41]. To provide furthermechanistic insights, we examined p21 protein expression, which is known to be the most criticaleffector of butyrate-induced growth arrest in colon cancer cells [39,42] (Figure 4). Butyrate is known toinduce general histone acetylation, specifically, hyperacetylation of the H3 and other species throughinhibition of the histone deacetylase enzyme [42,43]. Previous studies have shown that histonehyperacetylation is at least partly responsible for the induction of p21 [42,44]. In addition, the nuclearprotein c-Myc, a central regulator of cellular proliferation, activates a multitude of pathways torepress p21 at the transcriptional and post-transcriptional levels [19,20]. We found that butyrateincreased histone H3 acetylation at 1.5 and 15 h while it decreased c-Myc expression only at 15 h inNCM460 cells (Figure 4). However, p21 expression was increased at 1.5 and 15 h in NCM460 cells.Therefore, our results suggest that butyrate-related histone acetylation (compared with c-Myc) plays amajor role in p21 expression because we could only detect the increase of histone H3 acetylation andp21 but not c-Myc expression in NCM460 cells in early molecular events at 1.5 h.
The other important aspect of p21 function is that, depending on intracellular localization, p21 isinvolved in different signaling cascades [39–41]. It is generally believed that nuclear p21 is a negativeregulator of cell proliferation and a tumor suppressor while cytoplasmic p21 facilitates cell proliferationand inhibits apoptosis [39–41]. In addition to high p21 levels in HCT116 cells (Figure 5A,B), our cellularimmunofluorescent staining data demonstrated that butyrate-induced p21 protein was located in orsurrounding the nuclei of HCT116 cells to a greater extent when compared with that of NCM460 cells(Figure 5C,D). This observation indicates that butyrate induces p21 expression, and may exacerbatethe negative role of p21 in HCT116 cell proliferation when compared with that of NCM460 cells.Therefore, butyrate treatment leads to the significant induction of apoptosis and inhibition of cellproliferation in cancerous HCT116 colon cells, but to a lesser extent in the noncancerous NCM460colon cells. To extrapolate these mechanistic data to all colon cancer cell types and disease stages,we are planning to test other pairs of noncancerous and cancerous colon cell lines. However, there are
141
Nutrients 2017, 9, 25
very limited noncancerous colon cell lines available, which is a challenge. The other approach wouldbe to evaluate clinical samples from patients with possible high or low exposure to butyrate.
Colon carcinogenesis consists of initiation, promotion, and progression phases [45,46]. Suppressionof apoptosis and promotion of colonocyte proliferation are key cellular carcinogenic events as aconsequence of dysregulation of molecular signal cascades [46]. Taken together, our findings on thedifferential roles of butyrate in cell proliferation and the activation of ERK1/2, histone hyperacetylation,and c-Myc, p21 protein abundance and intracellular location in cancerous HCT116 and noncancerousNCM460 colon cells may, at least in part, account for the selective potential of butyrate’s anticancercolon cancer action.
Acknowledgments: We greatly appreciate Emily Fair, Mary Briske-Anderson, Brenda Skinner, Kay Keehr,Bryan Safratowich, and Laura Idso for the technical support. This work was funded by the US Department ofAgriculture, Agricultural Research Service, Research Project 3062-51000-050-00D.
Author Contributions: H.Z., W.-H.C. and R.H. conceived and designed the experiments; H.Z. and D.P.T.performed the experiments; H.Z. and L.K.J. analyzed the data; H.Z., W.-H.C. and R.H. wrote the paper.
Conflicts of Interest: The authors declare no conflict of interest.
References
1. American Cancer Society. Cancer Facts & Figures; American Cancer Society: Atlanta, GA, USA, 2016.2. Simon, K. Colorectal cancer development and advances in screening. J. Clin. Interv. Aging 2016, 11, 967–976.3. Perrin, P.; Pierre, F.; Patry, Y.; Champ, M.; Berreur, M.; Pradal, G.; Bornet, F.; Meflah, K.; Menanteau, J.
Only fibres promoting a stable butyrate producing colonic ecosystem decrease the rate of aberrant crypt fociin rats. Gut 2001, 48, 53–61. [CrossRef] [PubMed]
4. Zeng, H.; Lazarova, D.L.; Bordonaro, M. Mechanisms linking dietary fiber, gut microbiota and colon cancerprevention. World J. Gastrointest. Oncol. 2014, 6, 41–51. [CrossRef] [PubMed]
5. Lazarova, D.L.; Bordonaro, M. Vimentin, colon cancer progression and resistance to butyrate and otherHDACis. J. Cell. Mol. Med. 2016, 20, 989–993. [CrossRef] [PubMed]
6. Bultman, S.J. The microbiome and its potential as a cancer preventive intervention. Semin. Oncol. 2016, 43,97–106. [CrossRef] [PubMed]
7. Fleming, S.E.; O’Donnell, A.U.; Perman, J.A. Influence of frequent and long-term bean consumption oncolonic function and fermentation. Am. J. Clin. Nutr. 1985, 41, 909–918. [PubMed]
8. Fleming, S.E.; Marthinsen, D.; Kuhnlein, H. Colonic function and fermentation in men consuming highfiber diets. J. Nutr. 1983, 113, 2535–2544. [PubMed]
9. Leonel, A.J.; Alvarez-Leite, J.I. Butyrate: Implications for intestinal function. Curr. Opin. Clin. Nutr.
Metab. Care 2012, 15, 474–479. [CrossRef] [PubMed]10. Brown, D.G.; Rao, S.; Weir, T.L.; O’Malia, J.; Bazan, M.; Brown, R.J.; Ryan, E.P. Metabolomics and metabolic
pathway networks from human colorectal cancers, adjacent mucosa, and stool. Cancer Metab. 2016, 4, 11.[CrossRef] [PubMed]
11. Zeng, H.; Davis, C.D. Down-regulation of proliferating cell nuclear antigen gene expression occurs duringcell cycle arrest induced by human fecal water in colonic HT-29 cells. J. Nutr. 2003, 133, 2682–2687. [PubMed]
12. Hu, G.X.; Chen, G.R.; Xu, H.; Ge, R.S.; Lin, J. Activation of the AMP activated protein kinase by short-chainfatty acids is the main mechanism underlying the beneficial effect of a high fiber diet on the metabolicsyndrome. Med. Hypotheses 2010, 74, 123–126. [CrossRef] [PubMed]
13. Ocker, M.; Schneider-Stock, R. Histone deacetylase inhibitors: Signalling towards p21cip1/waf1. Int. J. Biochem.
Cell Biol. 2007, 39, 1367–1374. [CrossRef] [PubMed]14. Bi, G.; Jiang, G. The molecular mechanism of HDAC inhibitors in anticancer effects. Cell. Mol. Immunol. 2006,
3, 285–290. [PubMed]15. Chen, H.P.; Zhao, Y.T.; Zhao, T.C. Histone deacetylases and mechanisms of regulation of gene expression.
Crit. Rev. Oncog. 2015, 20, 35–47. [CrossRef] [PubMed]16. Jones, S.M.; Kazlauskas, A. Growth-factor-dependent mitogenesis requires two distinct phases of signalling.
Nat. Cell Biol. 2001, 3, 165–172. [CrossRef] [PubMed]
142
Nutrients 2017, 9, 25
17. Karslioglu, E.; Kleinberger, J.W.; Salim, F.G.; Cox, A.E.; Takane, K.K.; Scott, D.K.; Stewart, A.F. cMyc is aprincipal upstream driver of beta-cell proliferation in rat insulinoma cell lines and is an effective mediator ofhuman beta-cell replication. Mol. Endocrinol. 2011, 25, 1760–1772. [CrossRef] [PubMed]
18. Sun, Y.; Liu, W.Z.; Liu, T.; Feng, X.; Yang, N.; Zhou, H.F. Signaling pathway of MAPK/ERK in cellproliferation, differentiation, migration, senescence and apoptosis. J. Recept. Signal Transduct. Res. 2015, 35,600–604. [CrossRef] [PubMed]
19. Gartel, A.L.; Ye, X.; Goufman, E.; Shianov, P.; Hay, N.; Najmabadi, F.; Tyner, A.L. Myc represses thep21(WAF1/CIP1) promoter and interacts with Sp1/Sp3. Proc. Natl. Acad. Sci. USA 2001, 98, 4510–4515.[CrossRef] [PubMed]
20. Wang, Z.; Liu, M.; Zhu, H.; Zhang, W.; He, S.; Hu, C.; Quan, L.; Bai, J.; Xu, N. Suppression of p21 by c-Mycthrough members of miR-17 family at the post-transcriptional level. Int. J. Oncol. 2010, 37, 1315–1321.[PubMed]
21. Moyer, M.P.; Manzano, L.A.; Merriman, R.L.; Stauffer, J.S.; Tanzer, L.R. NCM460, a normal human colonmucosal epithelial cell line. In Vitro Cell. Dev. Biol. Anim. 1996, 32, 315–317. [CrossRef] [PubMed]
22. Brattain, M.G.; Fine, W.D.; Khaled, F.M.; Thompson, J.; Brattain, D.E. Heterogeneity of malignant cells froma human colonic carcinoma. Cancer Res. 1981, 41, 1751–1756. [PubMed]
23. Megna, B.W.; Carney, P.R.; Nukaya, M.; Geiger, P.; Kennedy, G.D. Indole-3-carbinol induces tumor cell death:Function follows form. J. Surg. Res. 2016, 204, 47–54. [CrossRef] [PubMed]
24. De Meij, T.G.; Larbi, I.B.; van der Schee, M.P.; Lentferink, Y.E.; Paff, T.; Terhaar Sive Droste, J.S.; Mulder, C.J.;van Bodegraven, A.A.; de Boer, N.K. Electronic nose can discriminate colorectal carcinoma and advancedadenomas by fecal volatile biomarker analysis: Proof of principle study. Int. J. Cancer 2014, 134, 1132–1138.[CrossRef] [PubMed]
25. Zhao, D.; Keates, A.C.; Kuhnt-Moore, S.; Moyer, M.P.; Kelly, C.P.; Pothoulakis, C. Signal transductionpathways mediating neurotensin-stimulated interleukin-8 expression in human colonocytes. J. Biol. Chem.
2001, 276, 44464–44471. [CrossRef] [PubMed]26. Chen, T.R. In situ detection of mycoplasma contamination in cell cultures by fluorescent Hoechst 33258 stain.
Exp. Cell Res. 1977, 104, 255–262. [CrossRef]27. Schmid, I.; Krall, W.J.; Uittenbogaart, C.H.; Braun, J.; Giorgi, J.V. Dead cell discrimination with
7-amino-actinomycin D in combination with dual color immunofluorescence in single laser flow cytometry.Cytometry 1992, 13, 204–208. [CrossRef] [PubMed]
28. Zeng, H.; Briske-Anderson, M. Prolonged butyrate treatment inhibits the migration and invasion potentialof HT1080 tumor cells. J. Nutr. 2005, 135, 291–295. [PubMed]
29. Saldanha, S.N.; Kala, R.; Tollefsbol, T.O. Molecular mechanisms for inhibition of colon cancer cells bycombined epigenetic-modulating epigallocatechin gallate and sodium butyrate. Exp. Cell Res. 2014, 324,40–53. [CrossRef] [PubMed]
30. Gospodinov, A.; Popova, S.; Vassileva, I.; Anachkova, B. The inhibitor of histone deacetylases sodiumbutyrate enhances the cytotoxicity of mitomycin C. Mol. Cancer Ther. 2012, 11, 2116–2126. [CrossRef][PubMed]
31. Silva, M.T. Secondary necrosis: The natural outcome of the complete apoptotic program. FEBS Lett. 2010,584, 4491–4499. [CrossRef] [PubMed]
32. Chan, F.K.; Moriwaki, K.; De Rosa, M.J. Detection of necrosis by release of lactate dehydrogenase activity.Methods Mol. Biol. 2013, 979, 65–70. [PubMed]
33. Kono, H.; Rock, K.L. How dying cells alert the immune system to danger. Nat. Rev. Immunol. 2008, 8,279–289. [CrossRef] [PubMed]
34. Meloche, S.; Pouysségur, J. The ERK1/2 mitogen-activated protein kinase pathway as a master regulator ofthe G1- to S-phase transition. Oncogene 2007, 26, 3227–3239. [CrossRef] [PubMed]
35. Xia, Z.; Dickens, M.; Raingeaud, J.; Davis, R.J.; Greenberg, M.E. Opposing effects of ERK and JNK-p38 MAPkinases on apoptosis. Science 1995, 270, 1326–1331. [CrossRef] [PubMed]
36. Park, J.I. Growth arrest signaling of the Raf/MEK/ERK pathway in cancer. Front. Biol. (Beijing) 2014, 9,95–103. [CrossRef] [PubMed]
37. Squires, M.S.; Nixon, P.M.; Cook, S.J. Cell-cycle arrest by PD184352 requires inhibition of extracellularsignal-regulated kinases (ERK) 1/2 but not ERK5/BMK1. Biochem. J. 2002, 366, 673–680. [CrossRef][PubMed]
143
Nutrients 2017, 9, 25
38. Davido, D.J.; Richter, F.; Boxberger, F.; Stahl, A.; Menzel, T.; Lührs, H.; Löffler, S.; Dusel, G.; Rapp, U.R.;Scheppach, W. Butyrate and propionate downregulate ERK phosphorylation in HT-29 colon carcinoma cellsprior to differentiation. Eur. J. Cancer Prev. 2001, 10, 313–321. [CrossRef] [PubMed]
39. Karimian, A.; Ahmadi, Y.; Yousefi, B. Multiple functions of p21 in cell cycle, apoptosis and transcriptionalregulation after DNA damage. DNA Repair 2016, 42, 63–71. [CrossRef] [PubMed]
40. Romanov, V.S.; Pospelov, V.A.; Pospelova, T.V. Cyclin-dependent kinase inhibitor p21(Waf1):Contemporary view on its role in senescence and oncogenesis. Biochemistry (Mosc.) 2012, 77, 575–584.[CrossRef] [PubMed]
41. Parveen, A.; Akash, M.S.; Rehman, K.; Kyunn, W.W. Dual Role of p21 in the Progression of Cancer and ItsTreatment. Crit. Rev. Eukaryot. Gene Expr. 2016, 26, 49–62. [CrossRef] [PubMed]
42. Archer, S.Y.; Meng, S.; Shei, A.; Hodin, R.A. p21(WAF1) is required for butyrate-mediated growth inhibitionof human colon cancer cells. Proc. Natl. Acad. Sci. USA 1998, 95, 6791–6796. [CrossRef] [PubMed]
43. Pham, T.X.; Lee, J. Dietary regulation of histone acetylases and deacetylases for the prevention of metabolicdiseases. Nutrients 2012, 4, 1868–1886. [CrossRef] [PubMed]
44. Nian, H.; Delage, B.; Pinto, J.T.; Dashwood, R.H. Allyl mercaptan, a garlic-derived organosulfur compound,inhibits histone deacetylase and enhances Sp3 binding on the P21WAF1 promoter. Carcinogenesis 2008, 29,1816–1824. [CrossRef] [PubMed]
45. Gatenby, R.A.; Vincent, T.L. An evolutionary model of carcinogenesis. Cancer Res. 2003, 63, 6212–6220.[PubMed]
46. Rajamanickam, S.; Agarwal, R. Natural products and colon cancer: Current status and future prospects.Drug Dev. Res. 2008, 69, 460–471. [CrossRef] [PubMed]
© 2017 by the authors. Licensee MDPI, Basel, Switzerland. This article is an open accessarticle distributed under the terms and conditions of the Creative Commons Attribution(CC BY) license (http://creativecommons.org/licenses/by/4.0/).
144
nutrients
Article
Analysis of the Anti-Cancer Effects of CincauExtract (Premna oblongifolia Merr) and Other Typesof Non-Digestible Fibre Using Faecal FermentationSupernatants and Caco-2 Cells as a Model of theHuman Colon
Samsu U. Nurdin 1,2,3, Richard K. Le Leu 3,4, Graeme P. Young 3, James C. R. Stangoulis 1,
Claus T. Christophersen 4,5 and Catherine A. Abbott 1,3,*1 School of Biological Sciences, Flinders University, Adelaide, SA 5042, Australia;
[email protected] (S.U.N.); [email protected] (J.C.R.S.)2 Department of Agricultural Product Technology, Lampung University, Bandar Lampung 35145, Indonesia3 Flinders Centre for Innovation in Cancer, Adelaide, SA 5042, Australia; [email protected] (R.K.L.L.);
[email protected] (G.P.Y.)4 CSIRO Food and Nutrition, Adelaide, SA 5000, Australia; [email protected] School of Medical and Health Sciences, Edith Cowan University, Joondalup, WA 6027, Australia* Correspondence: [email protected]; Tel.: +61-8-8201-2078
Received: 15 December 2016; Accepted: 29 March 2017; Published: 3 April 2017
Abstract: Green cincau (Premna oblongifolia Merr) is an Indonesian food plant with a high dietaryfibre content. Research has shown that dietary fibre mixtures may be more beneficial for colorectalcancer prevention than a single dietary fibre type. The aim of this study was to investigate theeffects of green cincau extract on short chain fatty acid (SCFA) production in anaerobic batch culturesinoculated with human faecal slurries and to compare these to results obtained using different dietaryfibre types (pectin, inulin, and cellulose), singly and in combination. Furthermore, fermentationsupernatants (FSs) were evaluated in Caco-2 cells for their effect on cell viability, differentiation,and apoptosis. Cincau increased total SCFA concentration by increasing acetate and propionate,but not butyrate concentration. FSs from all dietary fibre sources, including cincau, reduced Caco-2cell viability. However, the effects of all FSs on cell viability, cell differentiation, and apoptosis werenot simply explainable by their butyrate content. In conclusion, products of fermentation of cincauextracts induced cell death, but further work is required to understand the mechanism of action.This study demonstrates for the first time that this Indonesian traditional source of dietary fibre maybe protective against colorectal cancer.
Keywords: dietary fibre; colorectal cancer; fermentation; cincau; short chain fatty acids
1. Introduction
Colorectal cancer (CRC) incidence is rising significantly in most countries due to increasingprosperity [1]. Compounds such as short chain fatty acids (SCFAs), which are produced by bacterialfermentation of undigested dietary fibre, are capable of inhibiting cancer in vitro and in vivo [2–6].The type of dietary fibre consumed influences the proportion and distribution of SCFAs in thegastrointestinal tract [7–10]. Rapidly fermentable dietary fibre is fermented in the proximal colon andresults in increased SCFA levels in this region of the gut; conversely, slow fermentable dietary fibrewill reach the distal colon and modulate SCFA production at this site [7,11].
Many researchers have shown mixtures of multiple dietary fibre types are more beneficial thana single dietary fibre [7,12–14]. Rats administered diets containing guar gum or pectin produced low
Nutrients 2017, 9, 355 145 www.mdpi.com/journal/nutrients
Nutrients 2017, 9, 355
proportions of butyrate in comparison to rats fed mixtures of both [12,13]. Compared with control orwheat bran diets alone, diets containing a combination of wheat bran and resistant starch producedhigher wet and dry output, a lower pH and ammonia, as well as lower levels of phenol [13]. An in vitrofermentation study showed that a combination of Raftilose (oligofructose) and guar gum results inhigher total SCFAs than individual guar gum [14]. Following 24 h culture, the SCFA productionrate from individual Raftilose or guar gum fermentation decreased, but when these fibres werecombined, the production rate kept increasing, indicating that a combination of fibre sources maybe more beneficial.
The inulin-type compound fructan has also been well studied for its ability to protect againstcolorectal cancer when included in the diet [15–18]. In combination with lycopene and probiotics,inulin induced apoptosis, and inhibited cell proliferation and aberrant crypt formation (ACF)in rat colon when the chemical 1,2-dimethylhydrazine (DMH) was used to induce cancer [19].Inulin intake reduced CRC levels in rats fed a high lipid diet or chemical-induced CRC throughdecreasing enzyme activity and bile acid concentration [20,21]. The dietary fibre pectin is fermentableby human faecal bacteria and produces high proportions of acetic acid in vitro and in vivo [22].Fermentation supernatant from incubation of human faecal slurry with apple pectin was found to berich in butyrate and inhibited histone deacetylase in nucleus extracted from tumour cell lines [23].
Green cincau (Premna oblongifolia Merr) is a tropical plant belonging to the Verbenaceae familywhich is a traditional food source in Indonesia. Extracts from green leaf of the cincau plant containabout 20% pectin and have free radical scavenging activity [24]. Research on cincau extracts indicatesthey have the ability to induce cell-mediated immune responses in vitro [25]. As a dietary fibre,cincau extracts have laxative properties and can effectively induce the growth of lactic acid producingbacteria in the colon [26]. This study aimed to compare the efficacy of cincau extracts as a traditionalsource of dietary fibre with other dietary fibre combinations known to be protective against CRC.Our study found that, when fermented, cincau extracts were able to reduce Caco-2 cell viability, but themechanism was unclear. In addition, this study found that when two different dietary fibres werecombined, the benefits were not always additive.
2. Materials and Methods
2.1. Green Cincau Extracts
Green cincau leaves (Premna oblongifolia Merr.) were collected from traditional farmers in Indonesia.The fresh leaves were dried in an oven at 50 C (water content around 12%), ground into fine powder,and imported into Australia using an AQIS permit (IP07024278). To prepare extracts for this study, 5 gof dried cincau leaf powder was placed in a glass beaker, then boiled water was added until the finalvolume was 100 mL, and the mixture was stirred for 5 min at maximum speed. The mixture was thenfiltered and allowed to set at room temperature [24]. The resulting jelly like extract was then freezedried (Dynavac) and ground with mortar and pestle before use. Table 1 shows the freeze dried cincauextract composition as determined by CSIRO analytical tests (Adelaide, South Australia), as describedin Belobrajdic [27]. A modification of the AOACI Method 994.13 [28] was used to determine dietaryfibre composition as soluble and insoluble non-starch polysaccharides (NSPs) [27].
146
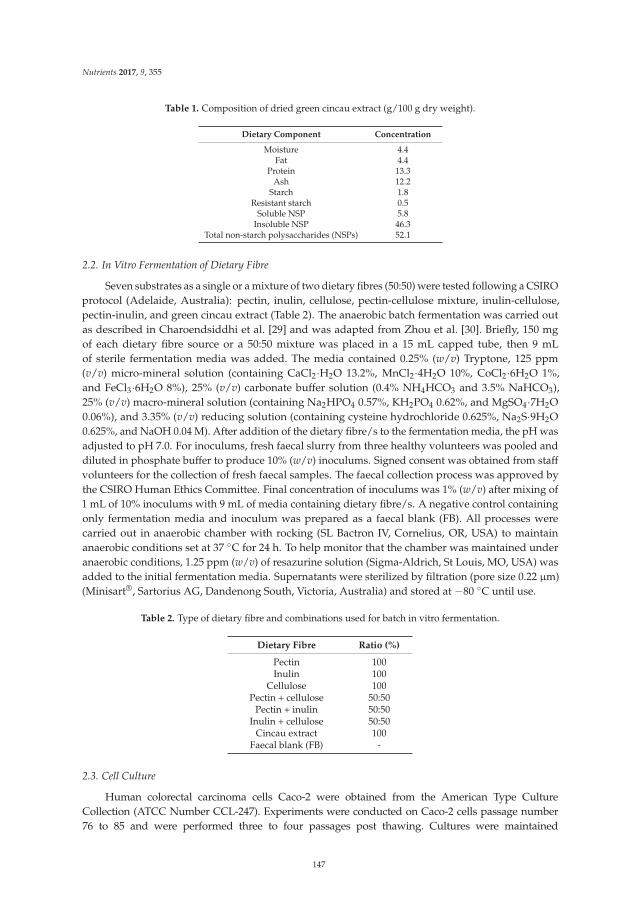
Nutrients 2017, 9, 355
Table 1. Composition of dried green cincau extract (g/100 g dry weight).
Dietary Component Concentration
Moisture 4.4Fat 4.4
Protein 13.3Ash 12.2
Starch 1.8Resistant starch 0.5
Soluble NSP 5.8Insoluble NSP 46.3
Total non-starch polysaccharides (NSPs) 52.1
2.2. In Vitro Fermentation of Dietary Fibre
Seven substrates as a single or a mixture of two dietary fibres (50:50) were tested following a CSIROprotocol (Adelaide, Australia): pectin, inulin, cellulose, pectin-cellulose mixture, inulin-cellulose,pectin-inulin, and green cincau extract (Table 2). The anaerobic batch fermentation was carried outas described in Charoendsiddhi et al. [29] and was adapted from Zhou et al. [30]. Briefly, 150 mgof each dietary fibre source or a 50:50 mixture was placed in a 15 mL capped tube, then 9 mLof sterile fermentation media was added. The media contained 0.25% (w/v) Tryptone, 125 ppm(v/v) micro-mineral solution (containing CaCl2·H2O 13.2%, MnCl2·4H2O 10%, CoCl2·6H2O 1%,and FeCl3·6H2O 8%), 25% (v/v) carbonate buffer solution (0.4% NH4HCO3 and 3.5% NaHCO3),25% (v/v) macro-mineral solution (containing Na2HPO4 0.57%, KH2PO4 0.62%, and MgSO4·7H2O0.06%), and 3.35% (v/v) reducing solution (containing cysteine hydrochloride 0.625%, Na2S·9H2O0.625%, and NaOH 0.04 M). After addition of the dietary fibre/s to the fermentation media, the pH wasadjusted to pH 7.0. For inoculums, fresh faecal slurry from three healthy volunteers was pooled anddiluted in phosphate buffer to produce 10% (w/v) inoculums. Signed consent was obtained from staffvolunteers for the collection of fresh faecal samples. The faecal collection process was approved bythe CSIRO Human Ethics Committee. Final concentration of inoculums was 1% (w/v) after mixing of1 mL of 10% inoculums with 9 mL of media containing dietary fibre/s. A negative control containingonly fermentation media and inoculum was prepared as a faecal blank (FB). All processes werecarried out in anaerobic chamber with rocking (SL Bactron IV, Cornelius, OR, USA) to maintainanaerobic conditions set at 37 C for 24 h. To help monitor that the chamber was maintained underanaerobic conditions, 1.25 ppm (w/v) of resazurine solution (Sigma-Aldrich, St Louis, MO, USA) wasadded to the initial fermentation media. Supernatants were sterilized by filtration (pore size 0.22 µm)(Minisart®, Sartorius AG, Dandenong South, Victoria, Australia) and stored at −80 C until use.
Table 2. Type of dietary fibre and combinations used for batch in vitro fermentation.
Dietary Fibre Ratio (%)
Pectin 100Inulin 100
Cellulose 100Pectin + cellulose 50:50
Pectin + inulin 50:50Inulin + cellulose 50:50
Cincau extract 100Faecal blank (FB) -
2.3. Cell Culture
Human colorectal carcinoma cells Caco-2 were obtained from the American Type CultureCollection (ATCC Number CCL-247). Experiments were conducted on Caco-2 cells passage number76 to 85 and were performed three to four passages post thawing. Cultures were maintained
147
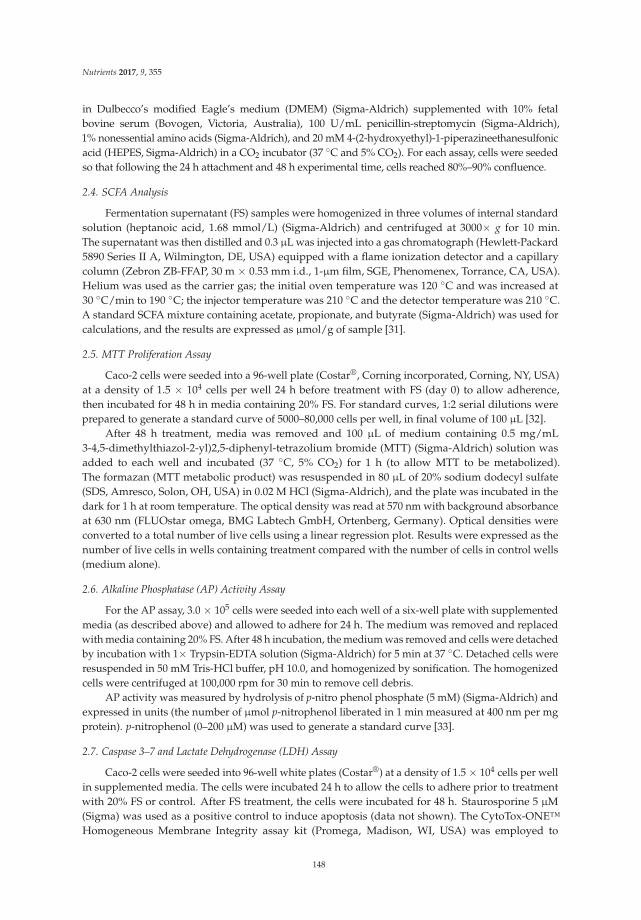
Nutrients 2017, 9, 355
in Dulbecco’s modified Eagle’s medium (DMEM) (Sigma-Aldrich) supplemented with 10% fetalbovine serum (Bovogen, Victoria, Australia), 100 U/mL penicillin-streptomycin (Sigma-Aldrich),1% nonessential amino acids (Sigma-Aldrich), and 20 mM 4-(2-hydroxyethyl)-1-piperazineethanesulfonicacid (HEPES, Sigma-Aldrich) in a CO2 incubator (37 C and 5% CO2). For each assay, cells were seededso that following the 24 h attachment and 48 h experimental time, cells reached 80%–90% confluence.
2.4. SCFA Analysis
Fermentation supernatant (FS) samples were homogenized in three volumes of internal standardsolution (heptanoic acid, 1.68 mmol/L) (Sigma-Aldrich) and centrifuged at 3000× g for 10 min.The supernatant was then distilled and 0.3 µL was injected into a gas chromatograph (Hewlett-Packard5890 Series II A, Wilmington, DE, USA) equipped with a flame ionization detector and a capillarycolumn (Zebron ZB-FFAP, 30 m × 0.53 mm i.d., 1-µm film, SGE, Phenomenex, Torrance, CA, USA).Helium was used as the carrier gas; the initial oven temperature was 120 C and was increased at30 C/min to 190 C; the injector temperature was 210 C and the detector temperature was 210 C.A standard SCFA mixture containing acetate, propionate, and butyrate (Sigma-Aldrich) was used forcalculations, and the results are expressed as µmol/g of sample [31].
2.5. MTT Proliferation Assay
Caco-2 cells were seeded into a 96-well plate (Costar®, Corning incorporated, Corning, NY, USA)at a density of 1.5 × 10⁴ cells per well 24 h before treatment with FS (day 0) to allow adherence,then incubated for 48 h in media containing 20% FS. For standard curves, 1:2 serial dilutions wereprepared to generate a standard curve of 5000–80,000 cells per well, in final volume of 100 µL [32].
After 48 h treatment, media was removed and 100 µL of medium containing 0.5 mg/mL3-4,5-dimethylthiazol-2-yl)2,5-diphenyl-tetrazolium bromide (MTT) (Sigma-Aldrich) solution wasadded to each well and incubated (37 C, 5% CO2) for 1 h (to allow MTT to be metabolized).The formazan (MTT metabolic product) was resuspended in 80 µL of 20% sodium dodecyl sulfate(SDS, Amresco, Solon, OH, USA) in 0.02 M HCl (Sigma-Aldrich), and the plate was incubated in thedark for 1 h at room temperature. The optical density was read at 570 nm with background absorbanceat 630 nm (FLUOstar omega, BMG Labtech GmbH, Ortenberg, Germany). Optical densities wereconverted to a total number of live cells using a linear regression plot. Results were expressed as thenumber of live cells in wells containing treatment compared with the number of cells in control wells(medium alone).
2.6. Alkaline Phosphatase (AP) Activity Assay
For the AP assay, 3.0 × 10⁵ cells were seeded into each well of a six-well plate with supplementedmedia (as described above) and allowed to adhere for 24 h. The medium was removed and replacedwith media containing 20% FS. After 48 h incubation, the medium was removed and cells were detachedby incubation with 1× Trypsin-EDTA solution (Sigma-Aldrich) for 5 min at 37 C. Detached cells wereresuspended in 50 mM Tris-HCl buffer, pH 10.0, and homogenized by sonification. The homogenizedcells were centrifuged at 100,000 rpm for 30 min to remove cell debris.
AP activity was measured by hydrolysis of p-nitro phenol phosphate (5 mM) (Sigma-Aldrich) andexpressed in units (the number of µmol p-nitrophenol liberated in 1 min measured at 400 nm per mgprotein). p-nitrophenol (0–200 µM) was used to generate a standard curve [33].
2.7. Caspase 3–7 and Lactate Dehydrogenase (LDH) Assay
Caco-2 cells were seeded into 96-well white plates (Costar®) at a density of 1.5 × 10⁴ cells per wellin supplemented media. The cells were incubated 24 h to allow the cells to adhere prior to treatmentwith 20% FS or control. After FS treatment, the cells were incubated for 48 h. Staurosporine 5 µM(Sigma) was used as a positive control to induce apoptosis (data not shown). The CytoTox-ONE™Homogeneous Membrane Integrity assay kit (Promega, Madison, WI, USA) was employed to
148
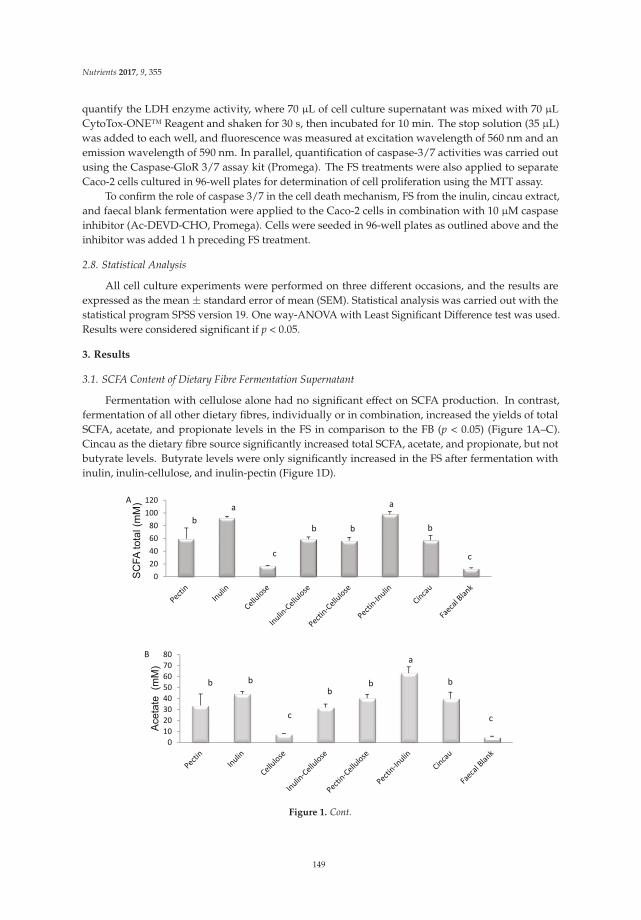
Nutrients 2017, 9, 355
quantify the LDH enzyme activity, where 70 µL of cell culture supernatant was mixed with 70 µLCytoTox-ONE™ Reagent and shaken for 30 s, then incubated for 10 min. The stop solution (35 µL)was added to each well, and fluorescence was measured at excitation wavelength of 560 nm and anemission wavelength of 590 nm. In parallel, quantification of caspase-3/7 activities was carried outusing the Caspase-GloR 3/7 assay kit (Promega). The FS treatments were also applied to separateCaco-2 cells cultured in 96-well plates for determination of cell proliferation using the MTT assay.
To confirm the role of caspase 3/7 in the cell death mechanism, FS from the inulin, cincau extract,and faecal blank fermentation were applied to the Caco-2 cells in combination with 10 µM caspaseinhibitor (Ac-DEVD-CHO, Promega). Cells were seeded in 96-well plates as outlined above and theinhibitor was added 1 h preceding FS treatment.
2.8. Statistical Analysis
All cell culture experiments were performed on three different occasions, and the results areexpressed as the mean ± standard error of mean (SEM). Statistical analysis was carried out with thestatistical program SPSS version 19. One way-ANOVA with Least Significant Difference test was used.Results were considered significant if p < 0.05.
3. Results
3.1. SCFA Content of Dietary Fibre Fermentation Supernatant
Fermentation with cellulose alone had no significant effect on SCFA production. In contrast,fermentation of all other dietary fibres, individually or in combination, increased the yields of totalSCFA, acetate, and propionate levels in the FS in comparison to the FB (p < 0.05) (Figure 1A–C).Cincau as the dietary fibre source significantly increased total SCFA, acetate, and propionate, but notbutyrate levels. Butyrate levels were only significantly increased in the FS after fermentation withinulin, inulin-cellulose, and inulin-pectin (Figure 1D).
0
20
40
60
80
100
120
SC
FA
to
tal (m
M)A
b
a
c
b b b
a
c
0
10
20
30
40
50
60
70
80
Ace
tate
(m
M)
B
b b
c
bb
a
c
b
Figure 1. Cont.
149
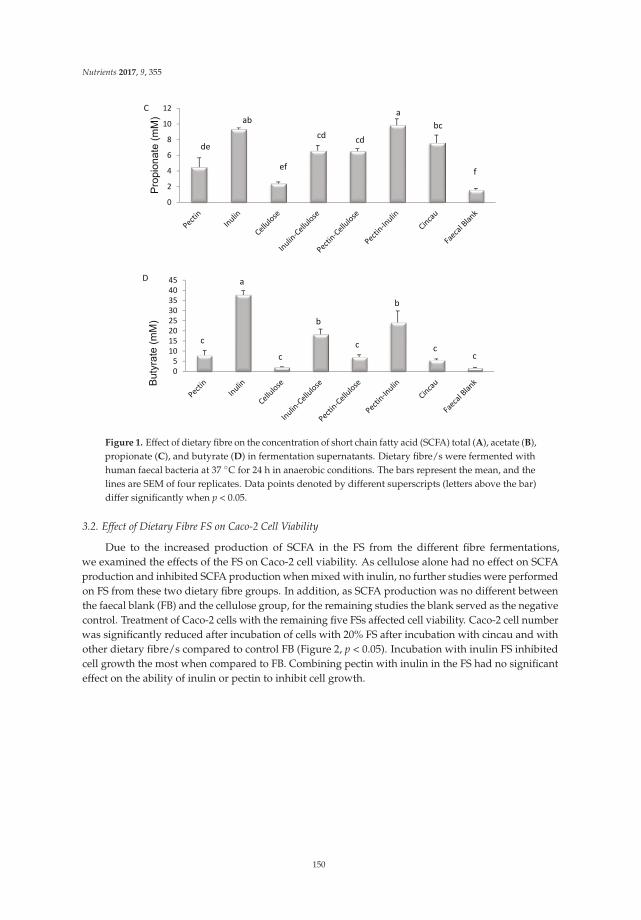
Nutrients 2017, 9, 355
0
2
4
6
8
10
12
Pro
pio
na
te (
mM
)
C
de
ab
ef
cdcd
a
bc
f
0
5
10
15
20
25
30
35
40
45
Bu
tyra
te (
mM
)
D
c
c
c cc
a
b
b
Figure 1. Effect of dietary fibre on the concentration of short chain fatty acid (SCFA) total (A), acetate (B),propionate (C), and butyrate (D) in fermentation supernatants. Dietary fibre/s were fermented withhuman faecal bacteria at 37 C for 24 h in anaerobic conditions. The bars represent the mean, and thelines are SEM of four replicates. Data points denoted by different superscripts (letters above the bar)differ significantly when p < 0.05.
3.2. Effect of Dietary Fibre FS on Caco-2 Cell Viability
Due to the increased production of SCFA in the FS from the different fibre fermentations,we examined the effects of the FS on Caco-2 cell viability. As cellulose alone had no effect on SCFAproduction and inhibited SCFA production when mixed with inulin, no further studies were performedon FS from these two dietary fibre groups. In addition, as SCFA production was no different betweenthe faecal blank (FB) and the cellulose group, for the remaining studies the blank served as the negativecontrol. Treatment of Caco-2 cells with the remaining five FSs affected cell viability. Caco-2 cell numberwas significantly reduced after incubation of cells with 20% FS after incubation with cincau and withother dietary fibre/s compared to control FB (Figure 2, p < 0.05). Incubation with inulin FS inhibitedcell growth the most when compared to FB. Combining pectin with inulin in the FS had no significanteffect on the ability of inulin or pectin to inhibit cell growth.
150
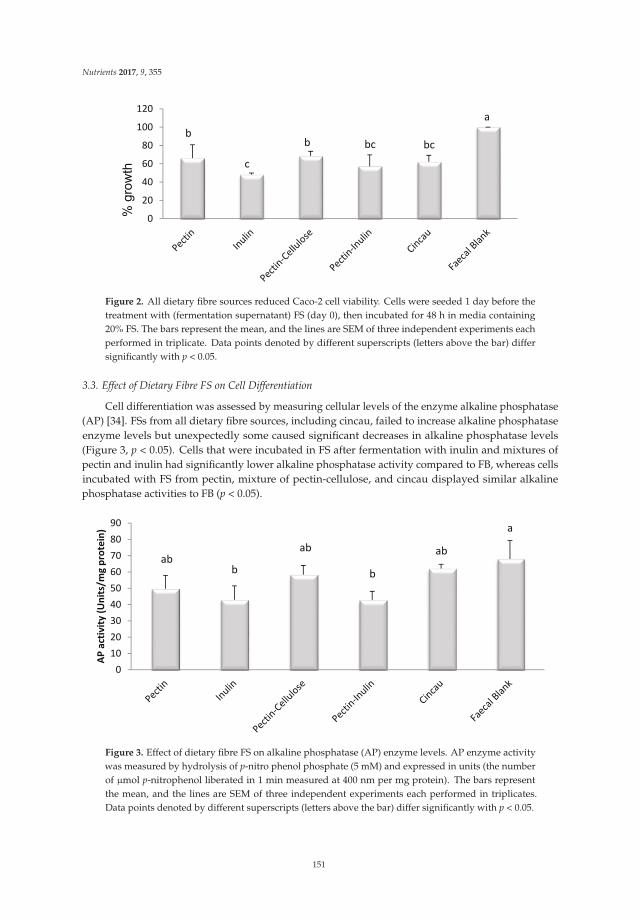
Nutrients 2017, 9, 355
0
20
40
60
80
100
120
% g
row
thb
c
b bc bc
a
Figure 2. All dietary fibre sources reduced Caco-2 cell viability. Cells were seeded 1 day before thetreatment with (fermentation supernatant) FS (day 0), then incubated for 48 h in media containing20% FS. The bars represent the mean, and the lines are SEM of three independent experiments eachperformed in triplicate. Data points denoted by different superscripts (letters above the bar) differsignificantly with p < 0.05.
3.3. Effect of Dietary Fibre FS on Cell Differentiation
Cell differentiation was assessed by measuring cellular levels of the enzyme alkaline phosphatase(AP) [34]. FSs from all dietary fibre sources, including cincau, failed to increase alkaline phosphataseenzyme levels but unexpectedly some caused significant decreases in alkaline phosphatase levels(Figure 3, p < 0.05). Cells that were incubated in FS after fermentation with inulin and mixtures ofpectin and inulin had significantly lower alkaline phosphatase activity compared to FB, whereas cellsincubated with FS from pectin, mixture of pectin-cellulose, and cincau displayed similar alkalinephosphatase activities to FB (p < 0.05).
0
10
20
30
40
50
60
70
80
90
AP
act
ivit
y (
Un
its/
mg
pro
tein
)
abb
ab ab
b
a
Figure 3. Effect of dietary fibre FS on alkaline phosphatase (AP) enzyme levels. AP enzyme activitywas measured by hydrolysis of p-nitro phenol phosphate (5 mM) and expressed in units (the numberof µmol p-nitrophenol liberated in 1 min measured at 400 nm per mg protein). The bars representthe mean, and the lines are SEM of three independent experiments each performed in triplicates.Data points denoted by different superscripts (letters above the bar) differ significantly with p < 0.05.
151
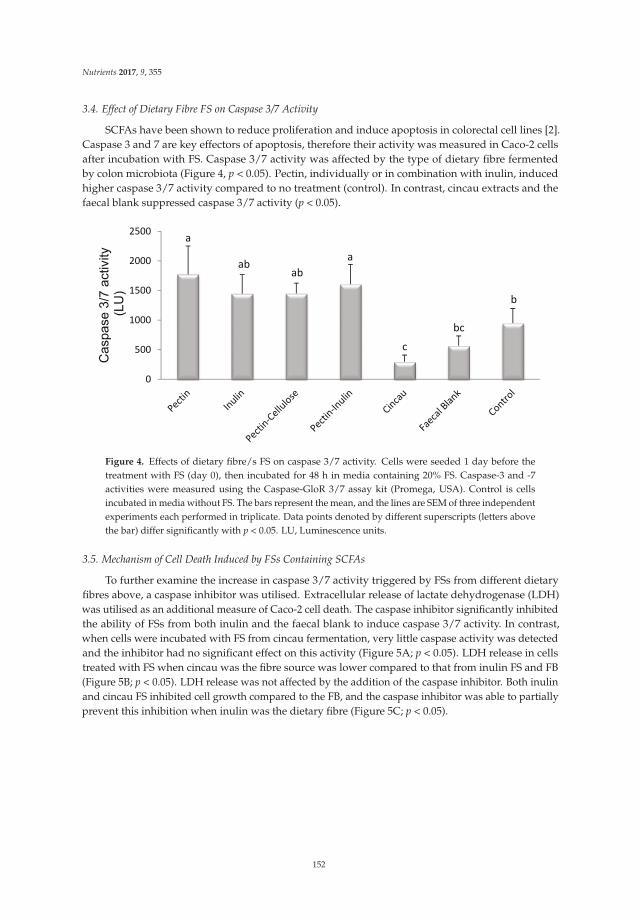
Nutrients 2017, 9, 355
3.4. Effect of Dietary Fibre FS on Caspase 3/7 Activity
SCFAs have been shown to reduce proliferation and induce apoptosis in colorectal cell lines [2].Caspase 3 and 7 are key effectors of apoptosis, therefore their activity was measured in Caco-2 cellsafter incubation with FS. Caspase 3/7 activity was affected by the type of dietary fibre fermentedby colon microbiota (Figure 4, p < 0.05). Pectin, individually or in combination with inulin, inducedhigher caspase 3/7 activity compared to no treatment (control). In contrast, cincau extracts and thefaecal blank suppressed caspase 3/7 activity (p < 0.05).
0
500
1000
1500
2000
2500
Caspase 3
/7 a
ctivity
(LU
)
a
abab
a
c
bc
b
Figure 4. Effects of dietary fibre/s FS on caspase 3/7 activity. Cells were seeded 1 day before thetreatment with FS (day 0), then incubated for 48 h in media containing 20% FS. Caspase-3 and -7activities were measured using the Caspase-GloR 3/7 assay kit (Promega, USA). Control is cellsincubated in media without FS. The bars represent the mean, and the lines are SEM of three independentexperiments each performed in triplicate. Data points denoted by different superscripts (letters abovethe bar) differ significantly with p < 0.05. LU, Luminescence units.
3.5. Mechanism of Cell Death Induced by FSs Containing SCFAs
To further examine the increase in caspase 3/7 activity triggered by FSs from different dietaryfibres above, a caspase inhibitor was utilised. Extracellular release of lactate dehydrogenase (LDH)was utilised as an additional measure of Caco-2 cell death. The caspase inhibitor significantly inhibitedthe ability of FSs from both inulin and the faecal blank to induce caspase 3/7 activity. In contrast,when cells were incubated with FS from cincau fermentation, very little caspase activity was detectedand the inhibitor had no significant effect on this activity (Figure 5A; p < 0.05). LDH release in cellstreated with FS when cincau was the fibre source was lower compared to that from inulin FS and FB(Figure 5B; p < 0.05). LDH release was not affected by the addition of the caspase inhibitor. Both inulinand cincau FS inhibited cell growth compared to the FB, and the caspase inhibitor was able to partiallyprevent this inhibition when inulin was the dietary fibre (Figure 5C; p < 0.05).
152
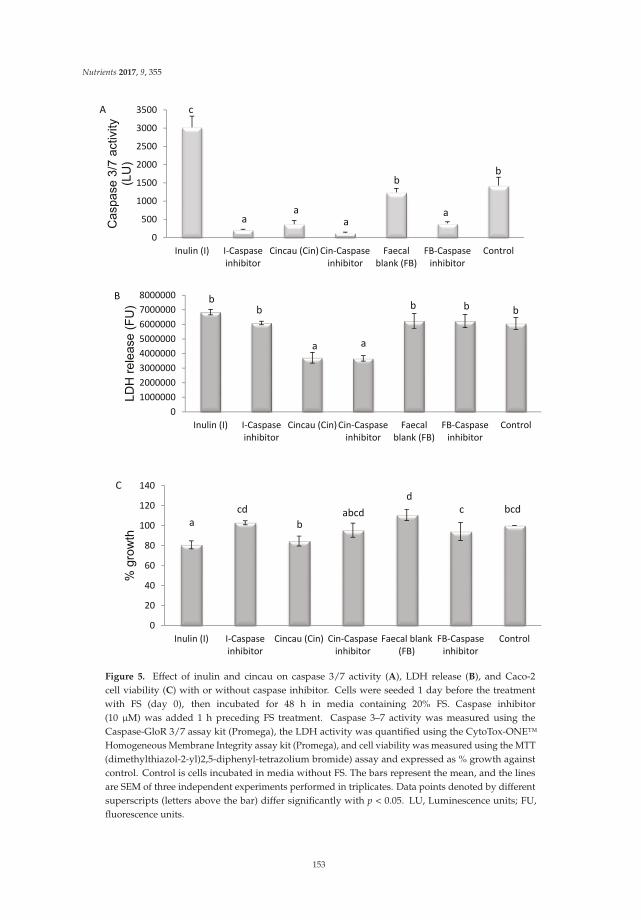
Nutrients 2017, 9, 355
0
500
1000
1500
2000
2500
3000
3500
Inulin (I) I-Caspase
inhibitor
Cincau (Cin) Cin-Caspase
inhibitor
Faecal
blank (FB)
FB-Caspase
inhibitor
Control
Caspase 3
/7 a
ctivity
(LU
)
c
aa a
a
bb
A
0
1000000
2000000
3000000
4000000
5000000
6000000
7000000
8000000
Inulin (I) I-Caspase
inhibitor
Cincau (Cin) Cin-Caspase
inhibitor
Faecal
blank (FB)
FB-Caspase
inhibitor
Control
LD
H r
ele
ase (
FU
)
bb
a a
b b b
B
0
20
40
60
80
100
120
140
Inulin (I) I-Caspase
inhibitor
Cincau (Cin) Cin-Caspase
inhibitor
Faecal blank
(FB)
FB-Caspase
inhibitor
Control
% g
row
th
a
cd
babcd
d
c bcd
C
Figure 5. Effect of inulin and cincau on caspase 3/7 activity (A), LDH release (B), and Caco-2cell viability (C) with or without caspase inhibitor. Cells were seeded 1 day before the treatmentwith FS (day 0), then incubated for 48 h in media containing 20% FS. Caspase inhibitor(10 µM) was added 1 h preceding FS treatment. Caspase 3–7 activity was measured using theCaspase-GloR 3/7 assay kit (Promega), the LDH activity was quantified using the CytoTox-ONE™Homogeneous Membrane Integrity assay kit (Promega), and cell viability was measured using the MTT(dimethylthiazol-2-yl)2,5-diphenyl-tetrazolium bromide) assay and expressed as % growth againstcontrol. Control is cells incubated in media without FS. The bars represent the mean, and the linesare SEM of three independent experiments performed in triplicates. Data points denoted by differentsuperscripts (letters above the bar) differ significantly with p < 0.05. LU, Luminescence units; FU,fluorescence units.
153
Nutrients 2017, 9, 355
4. Discussion
This work demonstrates for the first time that green cincau, a traditional food that is indigenousto Indonesia, can be fermented to produce SCFAs which, when tested on colon cancer cells, can inhibitcell growth in vitro. In particular, cincau fermentation resulted in increased acetate and propionateproduction as assessed by their concentrations, but not butyrate. Furthermore, this study demonstratesthat pectin and inulin alone, or in combination, had the greatest influence on individual and total SCFAproduction after fermentation by gut microbiota. Inulin produced the highest concentration of butyrateamong the dietary fibres tested. Butyrate levels in FS from cellulose and pectin increased significantlyif these dietary fibres were mixed with inulin. Inulin is known to stimulate butyrate-producingbacteria (Roseburia intestinalis, Eubacterium rectale, Anaerostipes caccae), which in turn leads to higherconcentrations and proportions of butyrate [35].
The concentration of total SCFA, acetate, and butyrate produced in culture from the cincau extractwas very similar to that produced when pectin or pectin-cellulose was added as the dietary fibre.Cellulose is a non-fermentable fibre and as a result has little effect on SCFA concentrations. Given thatcincau extracts are known to contain 20% pectin [24], the increases in SCFA concentrations observedmay be produced by the fermentation of the pectin component of this extract. However, when analysedthese hot water extracts contained 5.8% soluble NSPs and 46.3% insoluble NSPs, thus it appears thatthe heating, cooling, and freeze drying process may have modified chemical and physical propertiesof the non-starch polysaccharides including pectin to form insoluble NSPs [36]. These now insolubleNSPs may also contribute to SCFA production during the in vitro fermentation.
SCFAs, and particularly butyrate, are well known for their ability to inhibit proliferationand induce apoptosis of colorectal cancer cells [2,3], but in this study high levels of butyratein FS did not always affect cell viability. The butyrate content in pectin-inulin FS was nearlytwo-fold higher than pectin alone FS, while the propionate and acetate content from pectin-inulinFS was nearly double of pectin FS, however, the effect on Caco-2 cell growth when cultured inmedia containing these fermentation supernatants was no different. This indicates that butyrateor combinations of butyrate with propionate or acetate are not the main factors in fermentationsupernatant that affect cell growth, and that non-SCFA compounds also contained in the FS may beinvolved [33]. Interestingly, cincau extract and pectin-cellulose FSs which had lower concentrations oftotal or individual SCFAs than pectin-inulin FS, inhibited Caco- 2 cell growth to the same extent aspectin-inulin FS.
Cell differentiation is one of the mechanisms by which SCFAs act in order to slow cancercell growth [37]. This process requires cells to enter G1/G0 phase arrest, and cell proliferationis then inhibited [38]. Our results indicate that FS from pectin, inulin, pectin-cellulose mixture,pectin-inulin mixture, or cincau extract do not induce alkaline phosphatase, a marker of celldifferentiation. Surprisingly, FS from blank (FB) induced higher alkaline phosphatase levels thanpectin, inulin, or pectin-inulin, even though all of these dietary fibre FSs had high SCFA concentrations.There are some possibilities to explain these observations. First, the effect of butyrate on celldifferentiation is dose dependent. It was previously observed that butyrate induced cell differentiationof Caco-2 cells at a concentration of 0.1 mM, but when the butyrate level was increased to 5 mM,activity of this enzyme decreased [39]. In the present study, the inulin and pectin-inulin FSs contained37.7 and 24.2 mM of butyrate, respectively. When 20% of these FSs were added to the media, the finalconcentration of butyrate in the media would be 7.5 and 4.8 mM, respectively, whereas the finalconcentration of butyrate in media containing pectin, pectin-cellulose, and cincau was only 1.6, 1.4,and 1.1 mM, respectively. It is suggested that high levels of butyrate in inulin and pectin-inulin FSsmay have led to the downregulation of AP activity. However, this explanation is not likely, as theblank (FB) which contains very little SCFA, elicited higher AP levels. Therefore, a second possibilityneeds to be considered to rationally explain the effects of FB. Previous researchers have also found thatFB had an effect that was unexplainable by SCFA content in FS [16,33,40]. For example, Sauer et al.found that metabolic activity of HT-29 cells was increased by 15% by FB supplementation, with levels
154
Nutrients 2017, 9, 355
increasing similarly to those from inulin FS [16]. Moreover, these authors also found that FB enhancedgene expression of GSTA4, but inulin FS or SCFA mixture had no effects on this gene. GSTA4 isa gene encoding a glutathione S-transferase belonging to the alpha class 4 that has high catalyticefficiency with 4-hydroxyalkenals and other cytotoxic and mutagenic products of radical reactionsand lipid peroxidation [41]. Taking this into account, data from this study indicate that the effect ofFSs from dietary fibre on cell differentiation may depend on several factors including SCFA patternand unidentified products formed during the fermentation process or that originally exist in the freshfaecal sample as a source of inoculums.
The ability of pectin, inulin, pectin-inulin, and pectin-cellulose FSs to induce apoptosis wasconfirmed by their ability to increase caspase 3/7 activity compared to control (Figure 4; p < 0.05).In contrast, cincau and FB, when compared to control, decreased levels of caspase 3/7. Previous researchhas shown that inulin induced apoptosis in HT-29 cells [42] or in a colon cancer rat model [43].Our results support that inulin or pectin-inulin FSs are able to induce apoptosis through caspases,as caspase 3/7 activity increased in Caco-2 cells incubated with these FSs (Figure 4, p < 0.05).
Pectin or pectin-cellulose mixtures also increased caspase 3/7 activity (Figure 4, p < 0.05), and thismay support a role for pectin via its increase in SCFAs as a dietary fibre that can affect the apoptosisprocess. Butyrate or other SCFAs produced by the fermentation of pectin may be able to inhibit histonedeacetylase activity in order to induce gene transcription of caspase 3 and induce apoptosis [6,44–46].
Butyrate is the most potent SCFA for modulating colorectal cancer growth, including the inductionof apoptosis [6,47]. However, our data indicate that modulation of apoptosis is not always dependanton butyrate content. The effect of FSs on caspase 3/7 activity was also unexplainable by total SCFAcontent of FS. Therefore, some factors other than SCFAs might be involved in modulating caspase 3/7activity [23,42].
FSs from inulin, cincau, and FB were chosen to further elucidate the role of caspase 3/7 oncell death using the caspase inhibitor (Ac-DEVD-CHO) before the application of FS. LDH is anaccurate method to assay cell death with membrane damage such as necrosis, while the MTTassay can measure differences in cell viability, but it cannot tell whether cells are being killed viaapoptosis or necrosis [45]. The FS from inulin induced cell death through a caspase 3/7-dependentpathway, as the release of caspase 3/7 could be inhibited by the addition of the caspase inhibitor,and this led to an observed increase in Caco-2 cell viability. Cincau extract FS suppressed Caco-2cell growth compared to FB (Figure 5C, p < 0.05), but the mechanism appeared to be different tothat observed with inulin. Compared to FB, cincau did not induce caspase 3/7 activity (Figure 5A,p < 0.05), and indeed less LDH was released from cells treated with either cincau or cincau andcaspase inhibitor (Figure 5B, p < 0.05), suggesting that cincau could protect cells from necrotic celldeath. However, these cells were less viable than the control cells. Previously, Huang et al. [48] foundthat Solanum nigrum Linn leaf extract, rich in polyphenols and anthocyanidin, caused cell death dueto the induction of autophagy and apoptosis. Acetone and ethyl acetate extracts from Eupatorium
odoratum induced autophagic cell death in MCF-7 and Vero cell lines [49]. Cincau was extractedfrom green cincau leaves (Premna oblongifolia Merr.). The extract contains alkaloids, saponins, phenolhydroquinones, molisch, benedict, and tannins [50]. Supernatants collected after the non-digestiblefraction of cooked common bean (Phaseolus vulgaris L.), when fermented with gut microbes, were ableto induce apoptosis of HT-29 colon cells, and this was thought to be due to the participation of otherphenolic fatty acid derivatives and biopeptides and not the SCFA contained in the supernates [51]Therefore, it may be possible that the phytochemical compounds from cincau or cincau fermentationinduce autophagic cell death which cannot be measured by either the caspase or LDH assay, but wouldbe worth investigating in future studies.
Our research implies that the beneficial effects of mixed dietary fibre as experienced in mosthuman diets will depend on how each dietary fibre consumed interacts with the colon microbiota,and suggests the important role of unidentified compounds produced during fermentation by gutmicrobes in modulation of the effect of dietary fibre on CRC carcinogenesis. Furthermore, for the first
155
Nutrients 2017, 9, 355
time we show that Green cincau, a traditional Indonesian food, is not only able to inhibit colon cancercell growth, but by an apoptosis-independent pathway. Further work should be conducted to assessthe ability of this novel traditional dietary fibre as a chemopreventative.
Acknowledgments: This work was partially funded by an anonymous Philanthropic grant toGraeme P. Young (G.P.Y.) and by a Ph.D. scholarship from the Indonesian government to support Samsu U.Nurdin (S.U.N.). We would also like to thank Samsul Rizal from the University of Lampung, Indonesia forsupplying the green cincau.
Author Contributions: S.U.N., R.K.L.L., G.P.Y., J.C.R.S. and C.A.A. all contributed to the design of this study.S.U.N. conducted all of the research and analysed all data. C.T.C. and R.K.L.L. helped S.U.N with setting up thein vitro fermentation and the SCFA measurements. S.U.N., R.K.L.L., G.P.Y. and C.A.A. contributed to the writingof the paper.
Conflicts of Interest: The authors declare no conflicts of interest.
References
1. Center, M.M.; Jemal, A.; Ward, E. International trends in colorectal cancer incidence rates. Cancer Epidemiol.
Biomarkers Prev. 2009, 18, 1688–1694. [CrossRef] [PubMed]2. Fung, K.Y.; Cosgrove, L.; Lockett, T.; Head, R.; Topping, D.L. A review of the potential mechanisms for the
lowering of colorectal oncogenesis by butyrate. Br. J. Nutr. 2012, 108, 820–831. [CrossRef] [PubMed]3. Encarnacao, J.C.; Abrantes, A.M.; Pires, A.S.; Botelho, M.F. Revisit dietary fiber on colorectal cancer:
Butyrate and its role on prevention and treatment. Cancer Metastasis Rev. 2015, 34, 465–478. [CrossRef][PubMed]
4. Scharlau, D.; Borowicki, A.; Habermann, N.; Hofmann, T.; Klenow, S.; Miene, C.; Munjal, U.; Stein, K.;Glei, M. Mechanisms of primary cancer prevention by butyrate and other products formed during gutflora-mediated fermentation of dietary fibre. Mutat. Res. 2009, 682, 39–53. [CrossRef] [PubMed]
5. Whitehead, R.H.; Young, G.P.; Bhathal, P.S. Effects of short chain fatty acids on a new human colon carcinomacell line (lim1215). Gut 1986, 27, 1457–1463. [CrossRef] [PubMed]
6. Medina, V.; Edmonds, B.; Young, G.P.; James, R.; Appleton, S.; Zalewski, P.D. Induction of caspase-3 proteaseactivity and apoptosis by butyrate and trichostatin a (inhibitors of histone deacetylase): Dependence onprotein synthesis and synergy with a mitochondrial/cytochrome c-dependent pathway. Cancer Res. 1997, 57,3697–3707. [PubMed]
7. Juskiewicz, J.; Zdunczyk, Z. Effects of cellulose, carboxymethylcellulose and inulin fed to rats as singlesupplements or in combinations on their caecal parameters. Comp. Biochem. Phys. A 2004, 139, 513–519.[CrossRef] [PubMed]
8. Pompei, A.; Cordisco, L.; Raimondi, S.; Amaretti, A.; Pagnoni, U.M.; Matteuzzi, D.; Rossi, M. In vitrocomparison of the prebiotic effects of two inulin-type fructans. Anaerobe 2008, 14, 280–286. [CrossRef][PubMed]
9. Nilsson, U.; Nyman, M.; Ahrne, S.; Sullivan, E.O.; Fitzgerald, G. Bifidobacterium lactis bb-12 and lactobacillussalivarius ucc500 modify carboxylic acid formation in the hindgut of rats given pectin, inulin, and lactitol.J. Nutr. 2006, 136, 2175–2180. [PubMed]
10. McIntyre, A.; Young, G.P.; Taranto, T.; Gibson, P.R.; Ward, P.B. Different fibers have different regional effectson luminal contents of rat colon. Gastroenterology 1991, 101, 1274–1281. [CrossRef]
11. Pluske, J.R.; Durmic, Z.; Pethick, D.W.; Mullan, B.P.; Hampson, D.J. Confirmation of the role of rapidlyfermentable carbohydrates in the expression of swine dysentery in pigs after experimental infection. J. Nutr.
1998, 128, 1737–1744. [PubMed]12. Henningsson, A.M.; Bjorck, I.M.; Nyman, E.M. Combinations of indigestible carbohydrates affect short-chain
fatty acid formation in the hindgut of rats. J. Nutr. 2002, 132, 3098–3104. [PubMed]13. Muir, J.G.; Yeow, E.G.; Keogh, J.; Pizzey, C.; Bird, A.R.; Sharpe, K.; O’Dea, K.; Macrae, F.A. Combining wheat
bran with resistant starch has more beneficial effects on fecal indexes than does wheat bran alone. Am. J.
Clin. Nutr. 2004, 79, 1020–1028. [PubMed]14. Khan, K.M.; Edwards, C.A. In vitro fermentation characteristics of a mixture of raftilose and guar gum by
human faecal bacteria. Eur. J. Nutr. 2005, 44, 371–376. [CrossRef] [PubMed]
156
Nutrients 2017, 9, 355
15. Pool-Zobel, B.L. Inulin-type fructans and reduction in colon cancer risk: Review of experimental and humandata. Br. J. Nutr. 2005, 93, S73–S90. [CrossRef] [PubMed]
16. Pool-Zobel, B.L.; Sauer, J. Overview of experimental data on reduction of colorectal cancer risk by inulin-typefructans. J. Nutr. 2007, 137, 2580s–2584s. [PubMed]
17. Qamar, T.R.; Syed, F.; Nasir, M.; Rehman, H.; Zahid, M.N.; Liu, R.H.; Iqbal, S. Novel combination of prebioticsgalacto-oligosaccharides and inulin-inhibited aberrant crypt foci formation and biomarkers of colon cancerin wistar rats. Nutrients 2016, 8. [CrossRef] [PubMed]
18. Wu, W.T.; Yang, L.C.; Chen, H.L. Effects of konjac glucomannan, inulin and cellulose on acute colonicresponses to genotoxic azoxymethane. Food Chem. 2014, 155, 304–310. [CrossRef] [PubMed]
19. Dias, M.C.; Vieiralves, N.F.; Gomes, M.I.; Salvadori, D.M.; Rodrigues, M.A.; Barbisan, L.F. Effects of lycopene,synbiotic and their association on early biomarkers of rat colon carcinogenesis. Food Chem. Toxicol. 2010, 48,772–780. [CrossRef] [PubMed]
20. Wu, W.T.; Chen, H.L. Effects of konjac glucomannan on putative risk factors for colon carcinogenesis in ratsfed a high-fat diet. J. Agric. Food Chem. 2011, 59, 989–994. [CrossRef] [PubMed]
21. Bertkova, I.; Hijova, E.; Chmelarova, A.; Mojzisova, G.; Petrasova, D.; Strojny, L.; Bomba, A.; Zitnan, R.The effect of probiotic microorganisms and bioactive compounds on chemically induced carcinogenesis inrats. Neoplasma 2010, 57, 422–428. [CrossRef] [PubMed]
22. Rao, C.V.; Chou, D.; Simi, B.; Ku, H.; Reddy, B.S. Prevention of colonic aberrant crypt foci and modulation oflarge bowel microbial activity by dietary coffee fiber, inulin and pectin. Carcinogenesis 1998, 19, 1815–1819.[CrossRef] [PubMed]
23. Waldecker, M.; Kautenburger, T.; Daumann, H.; Veeriah, S.; Will, F.; Dietrich, H.; Pool-Zobel, B.L.; Schrenk, D.Histone-deacetylase inhibition and butyrate formation: Fecal slurry incubations with apple pectin and applejuice extracts. Nutrition 2008, 24, 366–374. [CrossRef] [PubMed]
24. Nurdin, S.U.; Zuidar, S.A.; Suharyono. Dried extract from green cincau leaves as potential fibre sources forfood enrichment. Afr. Crop. Sci. J. 2005, 7, 655–658.
25. Nurdin, S.U.; Hwang, J.K.; Hung, P. Effect of green cincau leaf (Premna oblongifolia merr.) water extracts oncytokines production in whole cell culture of mouse splenocytes. Indo Food Nutr. Prog. 2003, 10, 70–74.
26. Nurdin, S.U. Evaluation of laxative effect and fermentability of gel forming component of green cincauleaves (Premna oblongifolia merr.). Teknologi dan Industri Pangan 2007, 18, 10–16.
27. Belobrajdic, D.P.; Hino, S.; Kondo, T.; Jobling, S.A.; Morell, M.K.; Topping, D.L.; Morita, T.; Bird, A.R.High wholegrain barley beta-glucan lowers food intake but does not alter small intestinal macronutrientdigestibility in ileorectostomised rats. Int. J. Food Sci. Nutr. 2016, 67, 678–685. [CrossRef] [PubMed]
28. Association of Official Analytical Chemists (AOAC). Official Methods of Analysis, Method 994.13, Supplement
Total Dietary Fibre (Determined as Neutral Sugar Residues, Uronic Acid Residues and Klason Lignin); AOAC:Arlington, VA, USA, 1995.
29. Charoensiddhi, S.; Conlon, M.A.; Vuaran, M.S.; Franco, C.M.M.; Zhang, W. Impact of extraction processeson prebiotic potential of the brown seaweed ecklonia radiata by in vitro human gut bacteria fermentation.J. Funct. Foods 2016, 24, 221–230. [CrossRef]
30. Zhou, Z.; Cao, X.; Zhou, J.Y.H. Effect of resistant starch structure on short-chain fatty acids production byhuman gut microbiota fermentation in vitro. Starch Stärke 2013, 65, 509–516. [CrossRef]
31. Le Leu, R.K.; Brown, I.L.; Hu, Y.; Bird, A.R.; Jackson, M.; Esterman, A.; Young, G.P. A synbiotic combinationof resistant starch and bifidobacterium lactis facilitates apoptotic deletion of carcinogen-damaged cells in ratcolon. J. Nutr. 2005, 135, 996–1001. [PubMed]
32. Young, F.M.; Phungtamdet, W.; Sanderson, B.J. Modification of mtt assay conditions to examine the cytotoxiceffects of amitraz on the human lymphoblastoid cell line, wil2ns. Toxicol. In Vitro 2005, 19, 1051–1059.[CrossRef] [PubMed]
33. Beyer-Sehlmeyer, G.; Glei, M.; Hartmann, E.; Hughes, R.; Persin, C.; Bohm, V.; Rowland, I.; Schubert, R.;Jahreis, G.; Pool-Zobel, B.L. Butyrate is only one of several growth inhibitors produced during gutflora-mediated fermentation of dietary fibre sources. Br. J. Nutr. 2003, 90, 1057–1070. [CrossRef] [PubMed]
34. Matsumoto, H.; Erickson, R.H.; Gum, J.R.; Yoshioka, M.; Gum, E.; Kim, Y.S. Biosynthesis ofalkaline-phosphatase during differentiation of the human colon cancer cell-line caco-2. Gastroenterology 1990,98, 1199–1207. [CrossRef]
157
Nutrients 2017, 9, 355
35. Van den Abbeele, P.; Gerard, P.; Rabot, S.; Bruneau, A.; El Aidy, S.; Derrien, M.; Kleerebezem, M.;Zoetendal, E.G.; Smidt, H.; Verstraete, W.; et al. Arabinoxylans and inulin differentially modulate themucosal and luminal gut microbiota and mucin-degradation in humanized rats. Environ. Microbiol. 2011, 13,2667–2680. [CrossRef] [PubMed]
36. Lovegrove, A.; Edwards, C.H.; De Noni, I.; Patel, H.; El, S.N.; Grassby, T.; Zielke, C.; Ulmius, M.; Nilsson, L.;Butterworth, P.J.; et al. Role of polysaccharides in food, digestion, and health. Crit. Rev. Food Sci. Nutr. 2017,57, 237–253. [CrossRef] [PubMed]
37. Lanneau, D.; de Thonel, A.; Maurel, S.; Didelot, C.; Garrido, C. Apoptosis versus cell differentiation: Role ofheat shock proteins hsp90, hsp70 and hsp27. Prion 2007, 1, 53–60. [CrossRef] [PubMed]
38. Ding, Q.M.; Ko, T.C.; Evers, B.M. Caco-2 intestinal cell differentiation is associated with g(1) arrest andsuppression of cdk2 and cdk4. Am. J. Physiol. 1998, 275, C1193–C1200. [PubMed]
39. Orchel, A.; Dzierzewicz, Z.; Parfiniewicz, B.; Weglarz, L.; Wilczok, T. Butyrate-induced differentiation ofcolon cancer cells is pkc and jnk dependent. Dig. Dis. Sci. 2005, 50, 490–498. [CrossRef] [PubMed]
40. Kiefer, J.; Beyer-Sehlmeyer, G.; Pool-Zobel, B.L. Mixtures of scfa, composed according to physiologicallyavailable concentrations in the gut lumen, modulate histone acetylation in human ht29 colon cancer cells.Br. J. Nutr. 2006, 96, 803–810. [CrossRef] [PubMed]
41. Hubatsch, I.; Ridderstrom, M.; Mannervik, B. Human glutathione transferase a4-4: An alpha class enzymewith high catalytic efficiency in the conjugation of 4-hydroxynonenal and other genotoxic products of lipidperoxidation. Biochem. J. 1998, 330 Pt 1, 175–179. [CrossRef] [PubMed]
42. Munjal, U.; Glei, M.; Pool-Zobel, B.L.; Scharlau, D. Fermentation products of inulin-type fructans reduceproliferation and induce apoptosis in human colon tumour cells of different stages of carcinogenesis.Br. J. Nutr. 2009, 102, 663–671. [CrossRef] [PubMed]
43. Hughes, R.; Rowland, I.R. Stimulation of apoptosis by two prebiotic chicory fructans in the rat colon.Carcinogenesis 2001, 22, 43–47. [CrossRef] [PubMed]
44. Anh, T.D.; Ahn, M.Y.; Kim, S.A.; Yoon, J.H.; Ahn, S.G. The histone deacetylase inhibitor, trichostatin a,induces g2/m phase arrest and apoptosis in yd-10b oral squamous carcinoma cells. Oncol. Rep. 2012, 27,455–460. [PubMed]
45. Hwang, J.J.; Kim, Y.S.; Kim, M.J.; Jang, S.J.; Lee, J.H.; Choi, J.; Ro, S.; Hyun, Y.L.; Lee, J.S.; Kim, C.S. A novelhistone deacetylase inhibitor, cg0006, induces cell death through both extrinsic and intrinsic apoptoticpathways. Anti-Cancer Drug 2009, 20, 815–821. [CrossRef] [PubMed]
46. Wallace, D.M.; Donovan, M.; Cotter, T.G. Histone deacetylase activity regulates apaf-1 and caspase 3expression in the developing mouse retina. Investig. Ophth. Vis. Sci. 2006, 47, 2765–2772. [CrossRef][PubMed]
47. Matthews, G.M.; Howarth, G.S.; Butler, R.N. Short-chain fatty acids induce apoptosis in colon cancer cellsassociated with changes to intracellular redox state and glucose metabolism. Chemotherapy 2012, 58, 102–109.[CrossRef] [PubMed]
48. Huang, H.C.; Syu, K.Y.; Lin, J.K. Chemical composition of solanum nigrum linn extract and induction ofautophagy by leaf water extract and its major flavonoids in au565 breast cancer cells. J. Agric. Food Chem.
2010, 58, 8699–8708. [CrossRef] [PubMed]49. Harun, F.B.; Jamalullail, S.M.S.S.; Yin, K.B.; Othman, Z.; Tilwari, A.; Balaram, P. Autophagic cell death is
induced by acetone and ethyl acetate extracts from eupatorium odoratum in vitro: Effects on mcf-7 and verocell lines. Sci. World J. 2012, 2012, 1–9. [CrossRef] [PubMed]
50. Aryudhani, N. Mechanism of Antitumor Activity of Powdered Leaf Green Grass Jelly(Premna blongifolia merr.) in Mice Transplanted c3h Breast Tumor Cells. Master’s Thesis, BogorAgricultural University, Bogor, Indonesia, 2011.
51. Cruz-Bravo, R.K.; Guevara-Gonzalez, R.G.; Ramos-Gomez, M.; Oomah, B.D.; Wiersma, P.; Campos-Vega, R.;Loarca-Pina, G. The fermented non-digestible fraction of common bean (Phaseolus vulgaris L.) triggers cellcycle arrest and apoptosis in human colon adenocarcinoma cells. Genes Nutr. 2014, 9, 359. [CrossRef][PubMed]
© 2017 by the authors. Licensee MDPI, Basel, Switzerland. This article is an open accessarticle distributed under the terms and conditions of the Creative Commons Attribution(CC BY) license (http://creativecommons.org/licenses/by/4.0/).
158
nutrients
Article
Short- and Long-Term Effects of Wholegrain OatIntake on Weight Management and GlucolipidMetabolism in Overweight Type-2 Diabetics:A Randomized Control Trial
Xue Li 1,2, Xiaxia Cai 1,3, Xiaotao Ma 1,4, Lulu Jing 1, Jiaojiao Gu 1, Lei Bao 1,5, Jun Li 6,
Meihong Xu 1, Zhaofeng Zhang 1 and Yong Li 1,*1 Department of Nutrition and Food Hygiene, School of Public Health, Peking University,
Beijing 100191, China; [email protected] (X.L.); [email protected] (X.C.); [email protected] (X.M.);[email protected] (L.J.); [email protected] (J.G.); [email protected] (L.B.);[email protected] (M.X.); [email protected] (Z.Z.)
2 Centre for Population Health Sciences, University of Edinburgh, Edinburgh EH8 9AG, UK3 Department of Nutrition and Food Hygiene, School of Public Health, Capital Medical University,
Beijing 100191, China4 Department of Clinical Nutrition, China-Japan Friendship Hospital, Peking University, Beijing 100191, China5 Department of Clinical Nutrition, International Hospital, Peking University, Beijing 100191, China6 The 153 Hospital of People’s Liberation Army, Zhengzhou 450001, China; [email protected]* Correspondence: [email protected]; Tel./Fax: +86-10-8280-1177
Received: 21 June 2016; Accepted: 1 September 2016; Published: 7 September 2016
Abstract: Glycemic control and weight reduction are primary goals for the management of overweightand obese type 2 diabetes mellitus (T2DM). Effective management cannot be achieved without anappropriate diet. Our study aimed to evaluate the short- and long-term effects of oat intake anddevelop a reasonable dietary plan for overweight T2DM patients. A randomized control trial, registeredunder ClinicalTrials.gov (Identification code: NCT01495052), was carried out among adult T2DMpatients. A subgroup of 298 overweight subjects was selected and received a 30-day centralizedintervention and 1-year free-living follow-up. Participants were randomly allocated to one of thefollowing four groups. The usual care group (n = 60) received no intervention; the healthy diet group(n = 79) received a low-fat and high-fiber diet (“healthy diet”); the 50 g-oats group (n = 80) and 100 g-oatsgroup (n = 79) received the “healthy diet” with the same amount of cereals replaced by 50 g and 100 goats respectively. Anthropometric, blood glycemic and lipid variables were measured. For the 30-dayintervention, significant differences in the changes of FPG (fasting plasma glucose), PPG (postprandialplasma glucose), HbA1c (glycosylated hemoglobin), HOMA-IR (homeostasis model assessment ofinsulin resistance), TC (total cholesterol), TG (total triglycerides), and LDL-c (low-density lipoproteincholesterol) were observed among the four groups. Compared to the healthy diet group, the 50 g-oatsgroup had a bigger reduction in PPG (mean difference (MD): −1.04 mmol/L; 95% CI: −2.03, −0.05)and TC (MD: −0.24 mmol/L; 95% CI: −0.47, −0.01); the 100 g-oats group had a bigger reduction inPPG (MD: −1.48 mmol/L; 95% CI: −2.57, −0.39), HOMA-IR (MD: −1.77 mU·mol/L2; 95% CI: −3.49,−0.05), TC (MD: −0.33 mmol/L; 95% CI: −0.56, −0.10) and LDL-c (MD: −0.22 mmol/L; 95% CI: −0.41,−0.03). In the 1-year follow-up, greater effects in reducing weight (MD: −0.89 kg; 95% CI: −1.56, −0.22),HbA1c (MD: −0.64%; 95% CI: −1.19, −0.09) and TG (MD: −0.70 mmol/L; 95% CI: −1.11, −0.29) wereobserved in the 100 g-oats group. In conclusion, short- and long-term oat intake had significant effectson controlling hyperglycemia, lowering blood lipid and reducing weight. Our study provided somesupportive evidence for recommending oat as a good whole grain selection for overweight diabetics.
Keywords: type 2 diabetes; obesity; whole grain; oats; fiber
Nutrients 2016, 8, 549 159 www.mdpi.com/journal/nutrients
Nutrients 2016, 8, 549
1. Introduction
Type 2 diabetes (T2DM) and obesity are both major global health problems, which have beenlinked with an increased risk of life-threatening comorbidities and enormous economic burdens [1,2].Epidemiological studies report that most of the patients with T2DM are overweight or obese and,similarly, a significant number of obese individuals have diabetes [3]. This parallel prevalenceindicates a strong association between T2DM and obesity. It has been further estimated that every1 kilogram increase in body weight is associated with a 9% relative increase in diabetes prevalence [4].Identification of this association has changed the primary goal of diabetes management in obese andoverweight T2DM patients, and now controlling the blood glucose and reducing weight are bothpromoted [5].
Effective management of diabetes cannot be achieved without an appropriate diet, especially fortype 2 diabetics who are overweight or obese. The recommended diet for controlling diabetes shouldbe rich in dietary fiber, preferably provided by nature and less processed whole grains [6]. A Harvardstudy of health professionals found that high intake of whole grains was associated with lowerincidence of T2DM [7] and therefore its benefit could be an important part of a diet which can help toimprove diabetic control.
Wholegrain foods can be found in a variety of cereals, but the content and solubility offiber can vary significantly [8]. People with diabetes are often advised to select a good sourceof whole grains. Oat, with the advantage of having a high concentration of β-glucan, can beused for the management of diabetes [9]. The effects of oat intake have been investigated inseveral aspects [10–12]. Soluble fiber from oats has been found to be effective in lowering totalcholesterol and low-density lipoprotein (5%–10% reduction with 3 g β-glucan intake per day), andthus oat and oat-products have already been recommended to patients with hyperlipidemia [13].Besides, it has been suggested that oat intake can improve insulin response and decrease postprandialhyperglycemia [11,14]. Although these effects have been supported in many studies, others failedto replicate these. In particular, the effects of oat intake on fasting glucose concentration and weightcontrol remain conflicting [11,14]. Therefore, further work is needed to determine whether oat intakehas the reported benefits and whether these benefits could be observed similarly in specific populations,particularly in overweight T2DM patients.
To develop a reasonable dietary plan, which includes wholegrain oats, a randomized controltrail was conducted among adults with T2DM in Baotou, Inner Mongolia, China. This study aimedto compare the short- and long-term integrative effects of oat intake with a low-fat and high-fiberdiet (“healthy diet”) on weight management, blood glucose control and lipid-profile improvement inoverweight T2DM patients.
2. Methods
2.1. Participants
A subgroup of 298 subjects, meeting the Chinese criteria of overweight (body massindex ≥ 24 kg/m2), was selected from 445 adult patients with T2DM, who had participated in the30-day centralized management of a dietary program and the 1-year free-living follow-up in Baotou,China. The sample size of the original study was calculated based on an estimated standard deviation(SD) of 2.7 mmol/L in HbA1c. A total of 420 participants were required to detect a difference of0.80 SD of HbA1c with 90% power and allowing for 10% missing data. Individuals who were heavysmokers (smoking more than or equal to 25 cigarettes per day) or heavy drinkers (drinking more than25 mL alcohol per day), or had recent changes (less than 3 months) in diet and physical activities,or had severe cardiovascular, renal or hepatic complications, mental illness or other serious diseases,or recently accepted glucocorticoid treatment, or had already been eating oats or oat products aspart of their diet, were excluded. At the end of recruitment, a total of 445 individuals were includedand randomized, of which 298 overweight participants were selected for this subgroup analysis.
160
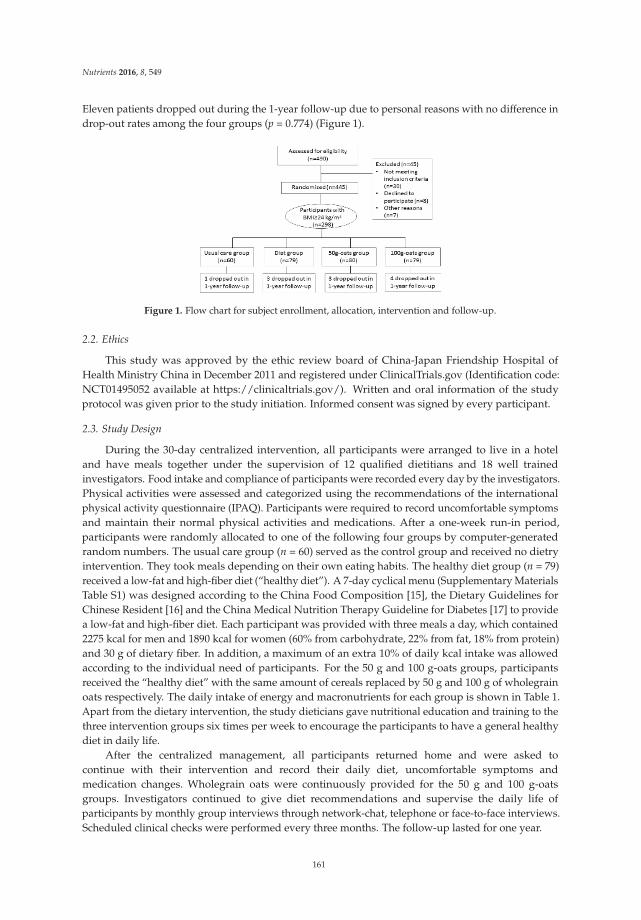
Nutrients 2016, 8, 549
Eleven patients dropped out during the 1-year follow-up due to personal reasons with no difference indrop-out rates among the four groups (p = 0.774) (Figure 1).
Figure 1. Flow chart for subject enrollment, allocation, intervention and follow-up.
2.2. Ethics
This study was approved by the ethic review board of China-Japan Friendship Hospital ofHealth Ministry China in December 2011 and registered under ClinicalTrials.gov (Identification code:NCT01495052 available at https://clinicaltrials.gov/). Written and oral information of the studyprotocol was given prior to the study initiation. Informed consent was signed by every participant.
2.3. Study Design
During the 30-day centralized intervention, all participants were arranged to live in a hoteland have meals together under the supervision of 12 qualified dietitians and 18 well trainedinvestigators. Food intake and compliance of participants were recorded every day by the investigators.Physical activities were assessed and categorized using the recommendations of the internationalphysical activity questionnaire (IPAQ). Participants were required to record uncomfortable symptomsand maintain their normal physical activities and medications. After a one-week run-in period,participants were randomly allocated to one of the following four groups by computer-generatedrandom numbers. The usual care group (n = 60) served as the control group and received no dietryintervention. They took meals depending on their own eating habits. The healthy diet group (n = 79)received a low-fat and high-fiber diet (“healthy diet”). A 7-day cyclical menu (Supplementary MaterialsTable S1) was designed according to the China Food Composition [15], the Dietary Guidelines forChinese Resident [16] and the China Medical Nutrition Therapy Guideline for Diabetes [17] to providea low-fat and high-fiber diet. Each participant was provided with three meals a day, which contained2275 kcal for men and 1890 kcal for women (60% from carbohydrate, 22% from fat, 18% from protein)and 30 g of dietary fiber. In addition, a maximum of an extra 10% of daily kcal intake was allowedaccording to the individual need of participants. For the 50 g and 100 g-oats groups, participantsreceived the “healthy diet” with the same amount of cereals replaced by 50 g and 100 g of wholegrainoats respectively. The daily intake of energy and macronutrients for each group is shown in Table 1.Apart from the dietary intervention, the study dieticians gave nutritional education and training to thethree intervention groups six times per week to encourage the participants to have a general healthydiet in daily life.
After the centralized management, all participants returned home and were asked tocontinue with their intervention and record their daily diet, uncomfortable symptoms andmedication changes. Wholegrain oats were continuously provided for the 50 g and 100 g-oatsgroups. Investigators continued to give diet recommendations and supervise the daily life ofparticipants by monthly group interviews through network-chat, telephone or face-to-face interviews.Scheduled clinical checks were performed every three months. The follow-up lasted for one year.
161
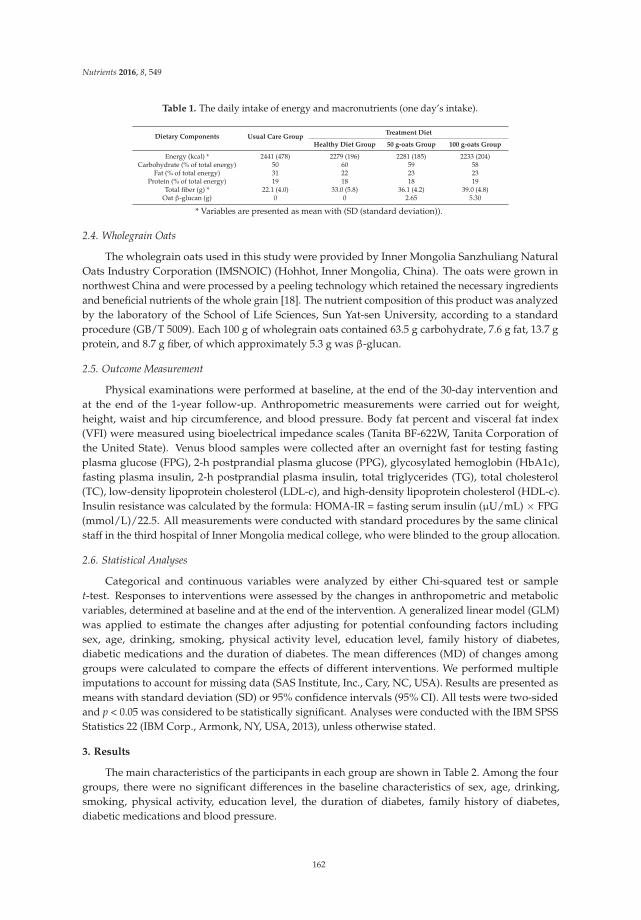
Nutrients 2016, 8, 549
Table 1. The daily intake of energy and macronutrients (one day’s intake).
Dietary Components Usual Care GroupTreatment Diet
Healthy Diet Group 50 g-oats Group 100 g-oats Group
Energy (kcal) * 2441 (478) 2279 (196) 2281 (185) 2233 (204)Carbohydrate (% of total energy) 50 60 59 58
Fat (% of total energy) 31 22 23 23Protein (% of total energy) 19 18 18 19
Total fiber (g) * 22.1 (4.0) 33.0 (5.8) 36.1 (4.2) 39.0 (4.8)Oat β-glucan (g) 0 0 2.65 5.30
* Variables are presented as mean with (SD (standard deviation)).
2.4. Wholegrain Oats
The wholegrain oats used in this study were provided by Inner Mongolia Sanzhuliang NaturalOats Industry Corporation (IMSNOIC) (Hohhot, Inner Mongolia, China). The oats were grown innorthwest China and were processed by a peeling technology which retained the necessary ingredientsand beneficial nutrients of the whole grain [18]. The nutrient composition of this product was analyzedby the laboratory of the School of Life Sciences, Sun Yat-sen University, according to a standardprocedure (GB/T 5009). Each 100 g of wholegrain oats contained 63.5 g carbohydrate, 7.6 g fat, 13.7 gprotein, and 8.7 g fiber, of which approximately 5.3 g was β-glucan.
2.5. Outcome Measurement
Physical examinations were performed at baseline, at the end of the 30-day intervention andat the end of the 1-year follow-up. Anthropometric measurements were carried out for weight,height, waist and hip circumference, and blood pressure. Body fat percent and visceral fat index(VFI) were measured using bioelectrical impedance scales (Tanita BF-622W, Tanita Corporation ofthe United State). Venus blood samples were collected after an overnight fast for testing fastingplasma glucose (FPG), 2-h postprandial plasma glucose (PPG), glycosylated hemoglobin (HbA1c),fasting plasma insulin, 2-h postprandial plasma insulin, total triglycerides (TG), total cholesterol(TC), low-density lipoprotein cholesterol (LDL-c), and high-density lipoprotein cholesterol (HDL-c).Insulin resistance was calculated by the formula: HOMA-IR = fasting serum insulin (µU/mL) × FPG(mmol/L)/22.5. All measurements were conducted with standard procedures by the same clinicalstaff in the third hospital of Inner Mongolia medical college, who were blinded to the group allocation.
2.6. Statistical Analyses
Categorical and continuous variables were analyzed by either Chi-squared test or samplet-test. Responses to interventions were assessed by the changes in anthropometric and metabolicvariables, determined at baseline and at the end of the intervention. A generalized linear model (GLM)was applied to estimate the changes after adjusting for potential confounding factors includingsex, age, drinking, smoking, physical activity level, education level, family history of diabetes,diabetic medications and the duration of diabetes. The mean differences (MD) of changes amonggroups were calculated to compare the effects of different interventions. We performed multipleimputations to account for missing data (SAS Institute, Inc., Cary, NC, USA). Results are presented asmeans with standard deviation (SD) or 95% confidence intervals (95% CI). All tests were two-sidedand p < 0.05 was considered to be statistically significant. Analyses were conducted with the IBM SPSSStatistics 22 (IBM Corp., Armonk, NY, USA, 2013), unless otherwise stated.
3. Results
The main characteristics of the participants in each group are shown in Table 2. Among the fourgroups, there were no significant differences in the baseline characteristics of sex, age, drinking,smoking, physical activity, education level, the duration of diabetes, family history of diabetes,diabetic medications and blood pressure.
162
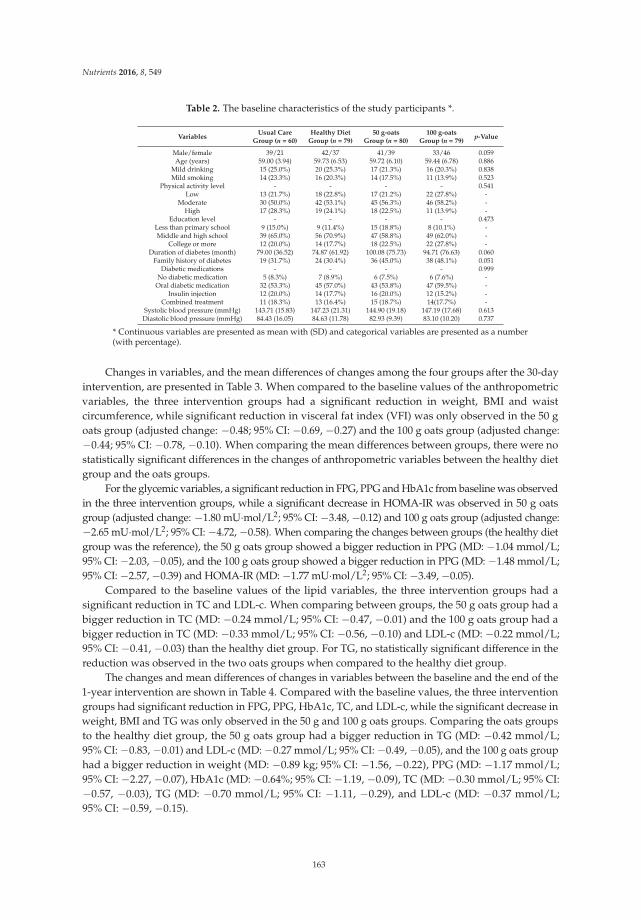
Nutrients 2016, 8, 549
Table 2. The baseline characteristics of the study participants *.
VariablesUsual Care
Group (n = 60)Healthy Diet
Group (n = 79)50 g-oats
Group (n = 80)100 g-oats
Group (n = 79)p-Value
Male/female 39/21 42/37 41/39 33/46 0.059Age (years) 59.00 (3.94) 59.73 (6.53) 59.72 (6.10) 59.44 (6.78) 0.886
Mild drinking 15 (25.0%) 20 (25.3%) 17 (21.3%) 16 (20.3%) 0.838Mild smoking 14 (23.3%) 16 (20.3%) 14 (17.5%) 11 (13.9%) 0.523
Physical activity level - - - - 0.541Low 13 (21.7%) 18 (22.8%) 17 (21.2%) 22 (27.8%) -
Moderate 30 (50.0%) 42 (53.1%) 45 (56.3%) 46 (58.2%) -High 17 (28.3%) 19 (24.1%) 18 (22.5%) 11 (13.9%) -
Education level - - - - 0.473Less than primary school 9 (15.0%) 9 (11.4%) 15 (18.8%) 8 (10.1%) -Middle and high school 39 (65.0%) 56 (70.9%) 47 (58.8%) 49 (62.0%) -
College or more 12 (20.0%) 14 (17.7%) 18 (22.5%) 22 (27.8%) -Duration of diabetes (month) 79.00 (36.52) 74.87 (61.92) 100.08 (75.73) 94.71 (76.63) 0.060
Family history of diabetes 19 (31.7%) 24 (30.4%) 36 (45.0%) 38 (48.1%) 0.051Diabetic medications - - - - 0.999
No diabetic medication 5 (8.3%) 7 (8.9%) 6 (7.5%) 6 (7.6%) -Oral diabetic medication 32 (53.3%) 45 (57.0%) 43 (53.8%) 47 (59.5%) -
Insulin injection 12 (20.0%) 14 (17.7%) 16 (20.0%) 12 (15.2%) -Combined treatment 11 (18.3%) 13 (16.4%) 15 (18.7%) 14(17.7%) -
Systolic blood pressure (mmHg) 143.71 (15.83) 147.23 (21.31) 144.90 (19.18) 147.19 (17.68) 0.613Diastolic blood pressure (mmHg) 84.43 (16.05) 84.63 (11.78) 82.93 (9.39) 83.10 (10.20) 0.737
* Continuous variables are presented as mean with (SD) and categorical variables are presented as a number(with percentage).
Changes in variables, and the mean differences of changes among the four groups after the 30-dayintervention, are presented in Table 3. When compared to the baseline values of the anthropometricvariables, the three intervention groups had a significant reduction in weight, BMI and waistcircumference, while significant reduction in visceral fat index (VFI) was only observed in the 50 goats group (adjusted change: −0.48; 95% CI: −0.69, −0.27) and the 100 g oats group (adjusted change:−0.44; 95% CI: −0.78, −0.10). When comparing the mean differences between groups, there were nostatistically significant differences in the changes of anthropometric variables between the healthy dietgroup and the oats groups.
For the glycemic variables, a significant reduction in FPG, PPG and HbA1c from baseline was observedin the three intervention groups, while a significant decrease in HOMA-IR was observed in 50 g oatsgroup (adjusted change: −1.80 mU·mol/L2; 95% CI: −3.48, −0.12) and 100 g oats group (adjusted change:−2.65 mU·mol/L2; 95% CI: −4.72, −0.58). When comparing the changes between groups (the healthy dietgroup was the reference), the 50 g oats group showed a bigger reduction in PPG (MD: −1.04 mmol/L;95% CI: −2.03, −0.05), and the 100 g oats group showed a bigger reduction in PPG (MD: −1.48 mmol/L;95% CI: −2.57, −0.39) and HOMA-IR (MD: −1.77 mU·mol/L2; 95% CI: −3.49, −0.05).
Compared to the baseline values of the lipid variables, the three intervention groups had asignificant reduction in TC and LDL-c. When comparing between groups, the 50 g oats group had abigger reduction in TC (MD: −0.24 mmol/L; 95% CI: −0.47, −0.01) and the 100 g oats group had abigger reduction in TC (MD: −0.33 mmol/L; 95% CI: −0.56, −0.10) and LDL-c (MD: −0.22 mmol/L;95% CI: −0.41, −0.03) than the healthy diet group. For TG, no statistically significant difference in thereduction was observed in the two oats groups when compared to the healthy diet group.
The changes and mean differences of changes in variables between the baseline and the end of the1-year intervention are shown in Table 4. Compared with the baseline values, the three interventiongroups had significant reduction in FPG, PPG, HbA1c, TC, and LDL-c, while the significant decrease inweight, BMI and TG was only observed in the 50 g and 100 g oats groups. Comparing the oats groupsto the healthy diet group, the 50 g oats group had a bigger reduction in TG (MD: −0.42 mmol/L;95% CI: −0.83, −0.01) and LDL-c (MD: −0.27 mmol/L; 95% CI: −0.49, −0.05), and the 100 g oats grouphad a bigger reduction in weight (MD: −0.89 kg; 95% CI: −1.56, −0.22), PPG (MD: −1.17 mmol/L;95% CI: −2.27, −0.07), HbA1c (MD: −0.64%; 95% CI: −1.19, −0.09), TC (MD: −0.30 mmol/L; 95% CI:−0.57, −0.03), TG (MD: −0.70 mmol/L; 95% CI: −1.11, −0.29), and LDL-c (MD: −0.37 mmol/L;95% CI: −0.59, −0.15).
163
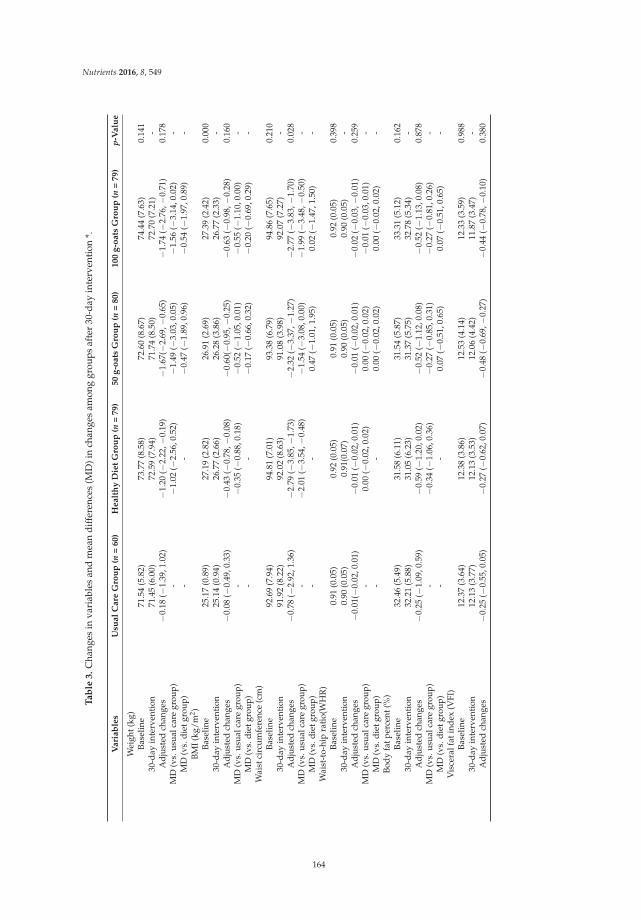
Nutrients 2016, 8, 549
Ta
ble
3.
Cha
nges
inva
riab
les
and
mea
ndi
ffer
ence
s(M
D)i
nch
ange
sam
ong
grou
psaf
ter
30-d
ayin
terv
enti
on*.
Vari
ab
les
Usu
al
Care
Gro
up
(n=
60)
Healt
hy
Die
tG
rou
p(n
=79)
50
g-o
ats
Gro
up
(n=
80)
100
g-o
ats
Gro
up
(n=
79)
p-V
alu
e
Wei
ght(
kg)
Base
line
71.5
4(5
.82)
73.7
7(8
.58)
72.6
0(8
.67)
74.4
4(7
.63)
0.14
130
-day
inte
rven
tion
71.4
5(6
.00)
72.5
9(7
.94)
71.7
4(8
.50)
72.7
0(7
.21)
-A
djus
ted
chan
ges
−0.
18(−
1.39
,1.0
2)−
1.20
(−2.
22,−
0.19
)−
1.67
(−2.
69,−
0.65
)−
1.74
(−2.
76,−
0.71
)0.
178
MD
(vs.
usua
lcar
egr
oup)
-−
1.02
(−2.
56,0
.52)
−1.
49(−
3.03
,0.0
5)−
1.56
(−3.
14,0
.02)
-M
D(v
s.di
etgr
oup)
--
−0.
47(−
1.89
,0.9
6)−
0.54
(−1.
97,0
.89)
-BM
I(kg
/m2 )
Base
line
25.1
7(0
.89)
27.1
9(2
.82)
26.9
1(2
.69)
27.3
9(2
.42)
0.00
030
-day
inte
rven
tion
25.1
4(0
.94)
26.7
7(2
.66)
26.2
8(3
.86)
26.7
7(2
.33)
-A
djus
ted
chan
ges
−0.
08(−
0.49
,0.3
3)−
0.43
(−0.
78,−
0.08
)−
0.60
(−0.
95,−
0.25
)−
0.63
(−0.
98,−
0.28
)0.
160
MD
(vs.
usua
lcar
egr
oup)
-−
0.35
(−0.
88,0
.18)
−0.
52(−
1.05
,0.0
1)−
0.55
(−1.
10,0
.00)
-M
D(v
s.di
etgr
oup)
--
−0.
17(−
0.66
,0.3
2)−
0.20
(−0.
69,0
.29)
-W
aist
circ
umfe
renc
e(c
m)
Base
line
92.6
9(7
.94)
94.8
1(7
.01)
93.3
8(6
.79)
94.8
6(7
.65)
0.21
030
-day
inte
rven
tion
91.9
2(8
.22)
92.0
2(8
.63)
91.0
8(3
.98)
92.0
7(7
.27)
-A
djus
ted
chan
ges
−0.
78(−
2.92
,1.3
6)−
2.79
(−3.
85,−
1.73
)−
2.32
(−3.
37,−
1.27
)−
2.77
(−3.
83,−
1.70
)0.
028
MD
(vs.
usua
lcar
egr
oup)
-−
2.01
(−3.
54,−
0.48
)−
1.54
(−3.
08,0
.00)
−1.
99(−
3.48
,−0.
50)
-M
D(v
s.di
etgr
oup)
--
0.47
(−1.
01,1
.95)
0.02
(−1.
47,1
.50)
-W
aist
-to-
hip
rati
o(W
HR
)Ba
selin
e0.
91(0
.05)
0.92
(0.0
5)0.
91(0
.05)
0.92
(0.0
5)0.
398
30-d
ayin
terv
enti
on0.
90(0
.05)
0.91
(0.0
7)0.
90(0
.05)
0.90
(0.0
5)-
Adj
uste
dch
ange
s−
0.01
(−0.
02,0
.01)
−0.
01(−
0.02
,0.0
1)−
0.01
(−0.
02,0
.01)
−0.
02(−
0.03
,−0.
01)
0.25
9M
D(v
s.us
ualc
are
grou
p)-
0.00
(−0.
02,0
.02)
0.00
(−0.
02,0
.02)
−0.
01(−
0.03
,0.0
1)-
MD
(vs.
diet
grou
p)-
-0.
00(−
0.02
,0.0
2)0.
00(−
0.02
,0.0
2)-
Body
fatp
erce
nt(%
)Ba
selin
e32
.46
(5.4
9)31
.58
(6.1
1)31
.54
(5.8
7)33
.31
(5.1
2)0.
162
30-d
ayin
terv
enti
on32
.21
(5.8
8)31
.05
(6.2
3)31
.37
(5.7
5)32
.78
(5.3
4)-
Adj
uste
dch
ange
s−
0.25
(−1.
09,0
.59)
−0.
59(−
1.20
,0.0
2)−
0.52
(−1.
12,0
.08)
−0.
52(−
1.13
,0.0
8)0.
878
MD
(vs.
usua
lcar
egr
oup)
-−
0.34
(−1.
06,0
.36)
−0.
27(−
0.85
,0.3
1)−
0.27
(−0.
81,0
.26)
-M
D(v
s.di
etgr
oup)
--
0.07
(−0.
51,0
.65)
0.07
(−0.
51,0
.65)
-V
isce
ralf
atin
dex
(VFI
)Ba
selin
e12
.37
(3.6
4)12
.38
(3.8
6)12
.53
(4.1
4)12
.33
(3.5
9)0.
988
30-d
ayin
terv
enti
on12
.13
(3.7
7)12
.13
(3.5
3)12
.06
(4.4
2)11
.87
(3.4
7)-
Adj
uste
dch
ange
s−
0.25
(−0.
55,0
.05)
−0.
27(−
0.62
,0.0
7)−
0.48
(−0.
69,−
0.27
)−
0.44
(−0.
78,−
0.10
)0.
380
164
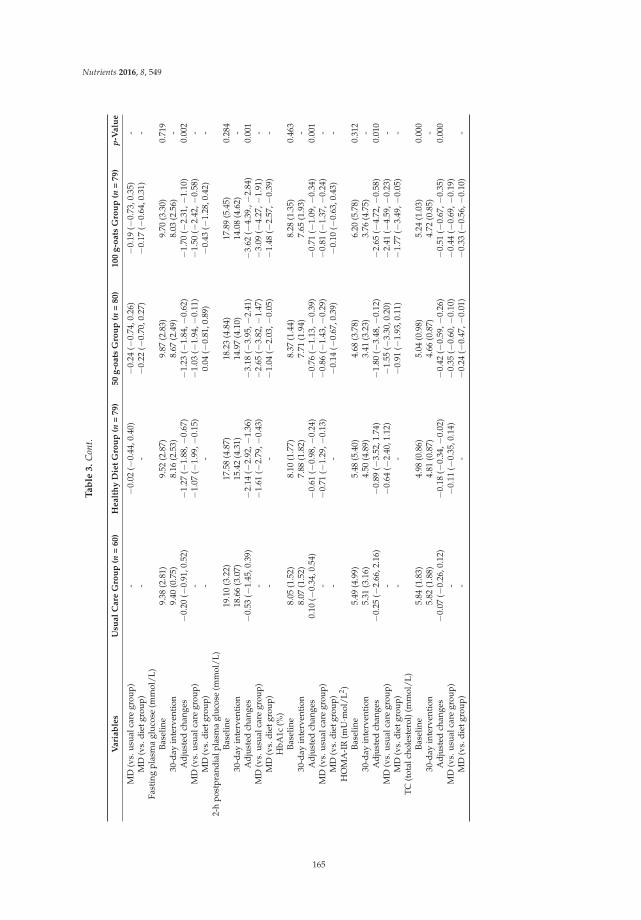
Nutrients 2016, 8, 549
Ta
ble
3.
Con
t.
Vari
ab
les
Usu
al
Care
Gro
up
(n=
60)
Healt
hy
Die
tG
rou
p(n
=79)
50
g-o
ats
Gro
up
(n=
80)
100
g-o
ats
Gro
up
(n=
79)
p-V
alu
e
MD
(vs.
usua
lcar
egr
oup)
-−
0.02
(−0.
44,0
.40)
−0.
24(−
0.74
,0.2
6)−
0.19
(−0.
73,0
.35)
-M
D(v
s.di
etgr
oup)
--
−0.
22(−
0.70
,0.2
7)−
0.17
(−0.
64,0
.31)
-Fa
stin
gpl
asm
agl
ucos
e(m
mol
/L)
Base
line
9.38
(2.8
1)9.
52(2
.87)
9.87
(2.8
3)9.
70(3
.30)
0.71
930
-day
inte
rven
tion
9.40
(0.7
5)8.
16(2
.53)
8.67
(2.4
9)8.
03(2
.56)
-A
djus
ted
chan
ges
−0.
20(−
0.91
,0.5
2)−
1.27
(−1.
88,−
0.67
)−
1.23
(−1.
84,−
0.62
)−
1.70
(−2.
31,−
1.10
)0.
002
MD
(vs.
usua
lcar
egr
oup)
-−
1.07
(−1.
99,−
0.15
)−
1.03
(−1.
94,−
0.11
)−
1.50
(−2.
42,−
0.58
)-
MD
(vs.
diet
grou
p)-
-0.
04(−
0.81
,0.8
9)−
0.43
(−1.
28,0
.42)
-2-
hpo
stpr
andi
alpl
asm
agl
ucos
e(m
mol
/L)
Base
line
19.1
0(3
.22)
17.5
8(4
.87)
18.2
3(4
.84)
17.8
9(5
.45)
0.28
430
-day
inte
rven
tion
18.6
6(3
.07)
15.4
2(4
.31)
14.9
7(4
.10)
14.0
8(4
.62)
-A
djus
ted
chan
ges
−0.
53(−
1.45
,0.3
9)−
2.14
(−2.
92,−
1.36
)−
3.18
(−3.
95,−
2.41
)−
3.62
(−4.
39.,−
2.84
)0.
001
MD
(vs.
usua
lcar
egr
oup)
-−
1.61
(−2.
79,−
0.43
)−
2.65
(−3.
82,−
1.47
)−
3.09
(−4.
27,−
1.91
)-
MD
(vs.
diet
grou
p)-
-−
1.04
(−2.
03,−
0.05
)−
1.48
(−2.
57,−
0.39
)-
HbA
1c(%
)Ba
selin
e8.
05(1
.52)
8.10
(1.7
7)8.
37(1
.44)
8.28
(1.3
5)0.
463
30-d
ayin
terv
enti
on8.
07(1
.52)
7.88
(1.8
2)7.
71(1
.94)
7.65
(1.9
3)-
Adj
uste
dch
ange
s0.
10(−
0.34
,0.5
4)−
0.61
(−0.
98,−
0.24
)−
0.76
(−1.
13,−
0.39
)−
0.71
(−1.
09,−
0.34
)0.
001
MD
(vs.
usua
lcar
egr
oup)
-−
0.71
(−1.
29,−
0.13
)−
0.86
(−1.
43,−
0.29
)−
0.81
(−1.
37,−
0.24
)-
MD
(vs.
diet
grou
p)-
-−
0.14
(−0.
67,0
.39)
−0.
10(−
0.63
,0.4
3)-
HO
MA
-IR
(mU·m
ol/L
2 )Ba
selin
e5.
49(4
.99)
5.48
(5.4
0)4.
68(3
.78)
6.20
(5.7
8)0.
312
30-d
ayin
terv
enti
on5.
31(3
.16)
4.50
(4.8
9)3.
41(3
.23)
3.76
(4.7
5)-
Adj
uste
dch
ange
s−
0.25
(−2.
66,2
.16)
−0.
89(−
3.52
,1.7
4)−
1.80
(−3.
48,−
0.12
)−
2.65
(−4.
72,−
0.58
)0.
010
MD
(vs.
usua
lcar
egr
oup)
-−
0.64
(−2.
40,1
.12)
−1.
55(−
3.30
,0.2
0)−
2.41
(−4.
59,−
0.23
)-
MD
(vs.
diet
grou
p)-
-−
0.91
(−1.
93,0
.11)
−1.
77(−
3.49
,−0.
05)
-TC
(tot
alch
oles
tero
l)(m
mol
/L)
Base
line
5.84
(1.8
3)4.
98(0
.86)
5.04
(0.9
8)5.
24(1
.03)
0.00
030
-day
inte
rven
tion
5.82
(1.8
8)4.
81(0
.87)
4.66
(0.8
7)4.
72(0
.85)
-A
djus
ted
chan
ges
−0.
07(−
0.26
,0.1
2)−
0.18
(−0.
34,−
0.02
)−
0.42
(−0.
59,−
0.26
)−
0.51
(−0.
67,−
0.35
)0.
000
MD
(vs.
usua
lcar
egr
oup)
-−
0.11
(−0.
35,0
.14)
−0.
35(−
0.60
,−0.
10)
−0.
44(−
0.69
,−0.
19)
MD
(vs.
diet
grou
p)-
-−
0.24
(−0.
47,−
0.01
)−
0.33
(−0.
56,−
0.10
)-
165
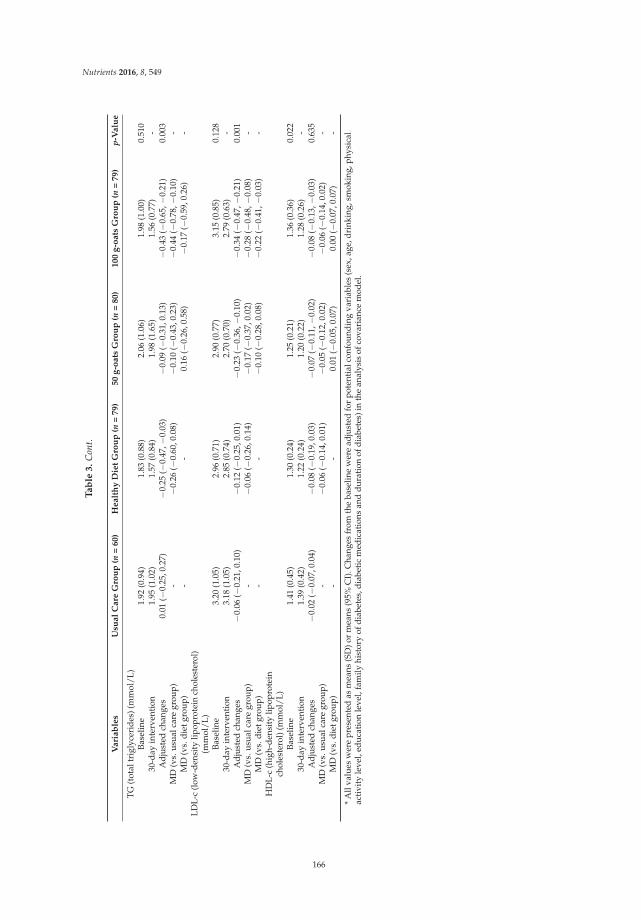
Nutrients 2016, 8, 549
Ta
ble
3.
Con
t.
Vari
ab
les
Usu
al
Care
Gro
up
(n=
60)
Healt
hy
Die
tG
rou
p(n
=79)
50
g-o
ats
Gro
up
(n=
80)
100
g-o
ats
Gro
up
(n=
79)
p-V
alu
e
TG
(tot
altr
igly
ceri
des)
(mm
ol/L
)Ba
selin
e1.
92(0
.94)
1.83
(0.8
8)2.
06(1
.06)
1.98
(1.0
0)0.
510
30-d
ayin
terv
enti
on1.
95(1
.02)
1.57
(0.8
4)1.
98(1
.65)
1.56
(0.7
7)-
Adj
uste
dch
ange
s0.
01(−
0.25
,0.2
7)−
0.25
(−0.
47,−
0.03
)−
0.09
(−0.
31,0
.13)
−0.
43(−
0.65
,−0.
21)
0.00
3M
D(v
s.us
ualc
are
grou
p)-
−0.
26(−
0.60
,0.0
8)−
0.10
(−0.
43,0
.23)
−0.
44(−
0.78
,−0.
10)
-M
D(v
s.di
etgr
oup)
--
0.16
(−0.
26,0
.58)
−0.
17(−
0.59
,0.2
6)-
LDL-
c(l
ow-d
ensi
tylip
opro
tein
chol
este
rol)
(mm
ol/L
)Ba
selin
e3.
20(1
.05)
2.96
(0.7
1)2.
90(0
.77)
3.15
(0.8
5)0.
128
30-d
ayin
terv
enti
on3.
18(1
.05)
2.85
(0.7
4)2.
70(0
.70)
2.79
(0.6
3)-
Adj
uste
dch
ange
s−
0.06
(−0.
21,0
.10)
−0.
12(−
0.25
,0.0
1)−
0.23
(−0.
36,−
0.10
)−
0.34
(−0.
47,−
0.21
)0.
001
MD
(vs.
usua
lcar
egr
oup)
-−
0.06
(−0.
26,0
.14)
−0.
17(−
0.37
,0.0
2)−
0.28
(−0.
48,−
0.08
)-
MD
(vs.
diet
grou
p)-
-−
0.10
(−0.
28,0
.08)
−0.
22(−
0.41
,−0.
03)
-H
DL-
c(h
igh-
dens
ity
lipop
rote
inch
oles
tero
l)(m
mol
/L)
Base
line
1.41
(0.4
5)1.
30(0
.24)
1.25
(0.2
1)1.
36(0
.36)
0.02
230
-day
inte
rven
tion
1.39
(0.4
2)1.
22(0
.24)
1.20
(0.2
2)1.
28(0
.26)
-A
djus
ted
chan
ges
−0.
02(−
0.07
,0.0
4)−
0.08
(−0.
19,0
.03)
−0.
07(−
0.11
,−0.
02)
−0.
08(−
0.13
,−0.
03)
0.63
5M
D(v
s.us
ualc
are
grou
p)-
−0.
06(−
0.14
,0.0
1)−
0.05
(−0.
12,0
.02)
−0.
06(−
0.14
,0.0
2)-
MD
(vs.
diet
grou
p)-
-0.
01(−
0.05
,0.0
7)0.
00(−
0.07
,0.0
7)-
*A
llva
lues
wer
epr
esen
ted
asm
eans
(SD
)or
mea
ns(9
5%C
I).C
hang
esfr
omth
eba
selin
ew
ere
adju
sted
for
pote
ntia
lcon
foun
ding
vari
able
s(s
ex,a
ge,d
rink
ing,
smok
ing,
phys
ical
acti
vity
leve
l,ed
ucat
ion
leve
l,fa
mily
hist
ory
ofdi
abet
es,d
iabe
tic
med
icat
ions
and
dura
tion
ofdi
abet
es)i
nth
ean
alys
isof
cova
rian
cem
odel
.
166
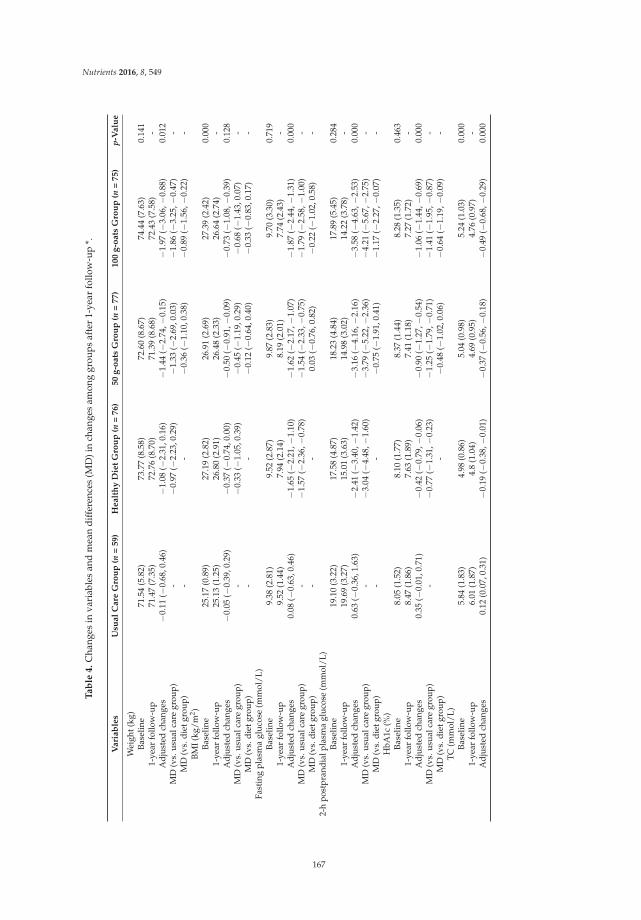
Nutrients 2016, 8, 549
Ta
ble
4.
Cha
nges
inva
riab
les
and
mea
ndi
ffer
ence
s(M
D)i
nch
ange
sam
ong
grou
psaf
ter
1-ye
arfo
llow
-up
*.
Vari
ab
les
Usu
al
Care
Gro
up
(n=
59)
Healt
hy
Die
tG
rou
p(n
=76)
50
g-o
ats
Gro
up
(n=
77)
100
g-o
ats
Gro
up
(n=
75)
p-V
alu
e
Wei
ght(
kg)
Base
line
71.5
4(5
.82)
73.7
7(8
.58)
72.6
0(8
.67)
74.4
4(7
.63)
0.14
11-
year
follo
w-u
p71
.47
(7.3
5)72
.76
(8.7
0)71
.39
(8.6
8)72
.43
(7.5
8)-
Adj
uste
dch
ange
s−
0.11
(−0.
68,0
.46)
−1.
08(−
2.31
,0.1
6)−
1.44
(−2.
74,−
0.15
)−
1.97
(−3.
06,−
0.88
)0.
012
MD
(vs.
usua
lcar
egr
oup)
-−
0.97
(−2.
23,0
.29)
−1.
33(−
2.69
,0.0
3)−
1.86
(−3.
25,−
0.47
)-
MD
(vs.
diet
grou
p)-
-−
0.36
(−1.
10,0
.38)
−0.
89(−
1.56
,−0.
22)
-BM
I(kg
/m2 )
Base
line
25.1
7(0
.89)
27.1
9(2
.82)
26.9
1(2
.69)
27.3
9(2
.42)
0.00
01-
year
follo
w-u
p25
.13
(1.2
5)26
.80
(2.9
1)26
.48
(2.3
3)26
.64
(2.7
4)-
Adj
uste
dch
ange
s−
0.05
(−0.
39,0
.29)
−0.
37(−
0.74
,0.0
0)−
0.50
(−0.
91,−
0.09
)−
0.73
(−1.
08,−
0.39
)0.
128
MD
(vs.
usua
lcar
egr
oup)
-−
0.33
(−1.
05,0
.39)
−0.
45(−
1.19
,0.2
9)−
0.68
(−1.
43,0
.07)
-M
D(v
s.di
etgr
oup)
--
−0.
12(−
0.64
,0.4
0)−
0.33
(−0.
83,0
.17)
-Fa
stin
gpl
asm
agl
ucos
e(m
mol
/L)
Base
line
9.38
(2.8
1)9.
52(2
.87)
9.87
(2.8
3)9.
70(3
.30)
0.71
91-
year
follo
w-u
p9.
52(1
.44)
7.94
(2.1
4)8.
19(2
.01)
7.74
(2.4
3)-
Adj
uste
dch
ange
s0.
08(−
0.63
,0.4
6)−
1.65
(−2.
21,−
1.10
)−
1.62
(−2.
17,−
1.07
)−
1.87
(−2.
44,−
1.31
)0.
000
MD
(vs.
usua
lcar
egr
oup)
-−
1.57
(−2.
36,−
0.78
)−
1.54
(−2.
33,−
0.75
)−
1.79
(−2.
58,−
1.00
)-
MD
(vs.
diet
grou
p)-
-0.
03(−
0.76
,0.8
2)−
0.22
(−1.
02,0
.58)
-2-
hpo
stpr
andi
alpl
asm
agl
ucos
e(m
mol
/L)
Base
line
19.1
0(3
.22)
17.5
8(4
.87)
18.2
3(4
.84)
17.8
9(5
.45)
0.28
41-
year
follo
w-u
p19
.69
(3.2
7)15
.01
(3.6
3)14
.98
(3.0
2)14
.22
(3.7
8)-
Adj
uste
dch
ange
s0.
63(−
0.36
,1.6
3)−
2.41
(−3.
40,−
1.42
)−
3.16
(−4.
16,−
2.16
)−
3.58
(−4.
63,−
2.53
)0.
000
MD
(vs.
usua
lcar
egr
oup)
-−
3.04
(−4.
48,−
1.60
)−
3.79
(−5.
22,−
2.36
)−
4.21
(−5.
67,−
2.75
)-
MD
(vs.
diet
grou
p)-
-−
0.75
(−1.
91,0
.41)
−1.
17(−
2.27
,−0.
07)
-H
bA1c
(%)
Base
line
8.05
(1.5
2)8.
10(1
.77)
8.37
(1.4
4)8.
28(1
.35)
0.46
31-
year
follo
w-u
p8.
47(1
.86)
7.63
(1.8
9)7.
41(1
.18)
7.27
(1.7
2)-
Adj
uste
dch
ange
s0.
35(−
0.01
,0.7
1)−
0.42
(−0.
79,−
0.06
)−
0.90
(−1.
27,−
0.54
)−
1.06
(−1.
44,−
0.69
)0.
000
MD
(vs.
usua
lcar
egr
oup)
-−
0.77
(−1.
31,−
0.23
)−
1.25
(−1.
79,−
0.71
)−
1.41
(−1.
95,−
0.87
)-
MD
(vs.
diet
grou
p)-
−0.
48(−
1.02
,0.0
6)−
0.64
(−1.
19,−
0.09
)-
TC
(mm
ol/L
)Ba
selin
e5.
84(1
.83)
4.98
(0.8
6)5.
04(0
.98)
5.24
(1.0
3)0.
000
1-ye
arfo
llow
-up
6.01
(1.8
7)4.
8(1
.04)
4.69
(0.9
5)4.
76(0
.97)
-A
djus
ted
chan
ges
0.12
(0.0
7,0.
31)
−0.
19(−
0.38
,−0.
01)
−0.
37(−
0.56
,−0.
18)
−0.
49(−
0.68
,−0.
29)
0.00
0
167
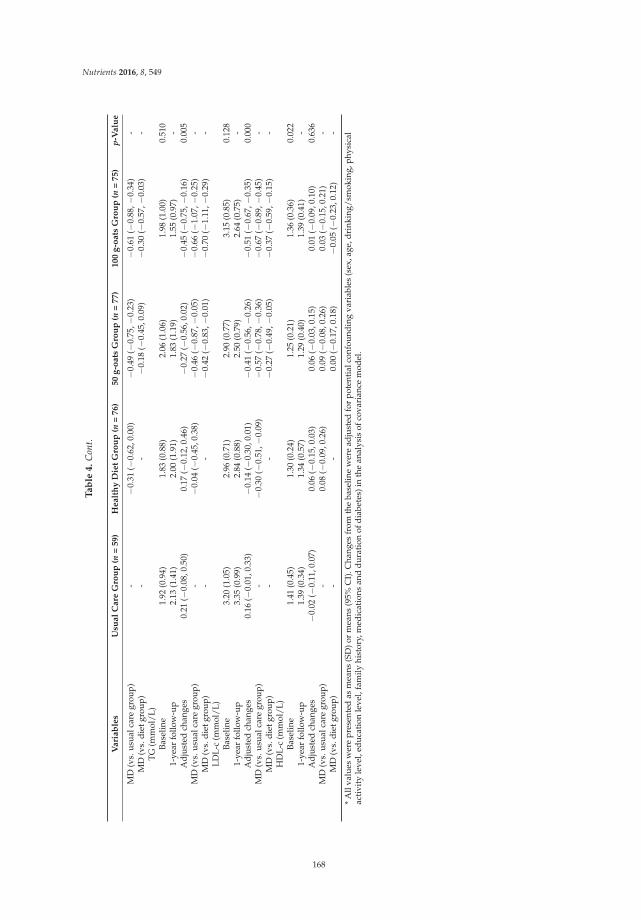
Nutrients 2016, 8, 549
Ta
ble
4.
Con
t.
Vari
ab
les
Usu
al
Care
Gro
up
(n=
59)
Healt
hy
Die
tG
rou
p(n
=76)
50
g-o
ats
Gro
up
(n=
77)
100
g-o
ats
Gro
up
(n=
75)
p-V
alu
e
MD
(vs.
usua
lcar
egr
oup)
-−
0.31
(−0.
62,0
.00)
−0.
49(−
0.75
,−0.
23)
−0.
61(−
0.88
,−0.
34)
-M
D(v
s.di
etgr
oup)
--
−0.
18(−
0.45
,0.0
9)−
0.30
(−0.
57,−
0.03
)-
TG(m
mol
/L)
Base
line
1.92
(0.9
4)1.
83(0
.88)
2.06
(1.0
6)1.
98(1
.00)
0.51
01-
year
follo
w-u
p2.
13(1
.41)
2.00
(1.9
1)1.
83(1
.19)
1.55
(0.9
7)-
Adj
uste
dch
ange
s0.
21(−
0.08
,0.5
0)0.
17(−
0.12
,0.4
6)−
0.27
(−0.
56,0
.02)
−0.
45(−
0.75
,−0.
16)
0.00
5M
D(v
s.us
ualc
are
grou
p)-
−0.
04(−
0.45
,0.3
8)−
0.46
(−0.
87,−
0.05
)−
0.66
(−1.
07,−
0.25
)-
MD
(vs.
diet
grou
p)-
-−
0.42
(−0.
83,−
0.01
)−
0.70
(−1.
11,−
0.29
)-
LDL-
c(m
mol
/L)
Base
line
3.20
(1.0
5)2.
96(0
.71)
2.90
(0.7
7)3.
15(0
.85)
0.12
81-
year
follo
w-u
p3.
35(0
.99)
2.84
(0.8
8)2.
50(0
.79)
2.64
(0.7
5)-
Adj
uste
dch
ange
s0.
16( −
0.01
,0.3
3)−
0.14
(−0.
30,0
.01)
−0.
41(−
0.56
,−0.
26)
−0.
51(−
0.67
,−0.
35)
0.00
0M
D(v
s.us
ualc
are
grou
p)-
−0.
30(−
0.51
,−0.
09)
−0.
57(−
0.78
,−0.
36)
−0.
67(−
0.89
,−0.
45)
-M
D(v
s.di
etgr
oup)
--
−0.
27(−
0.49
,−0.
05)
−0.
37(−
0.59
,−0.
15)
-H
DL-
c(m
mol
/L)
Base
line
1.41
(0.4
5)1.
30(0
.24)
1.25
(0.2
1)1.
36(0
.36)
0.02
21-
year
follo
w-u
p1.
39(0
.34)
1.34
(0.5
7)1.
29(0
.40)
1.39
(0.4
1)-
Adj
uste
dch
ange
s−
0.02
(−0.
11,0
.07)
0.06
(−0.
15,0
.03)
0.06
(−0.
03,0
.15)
0.01
(−0.
09,0
.10)
0.63
6M
D(v
s.us
ualc
are
grou
p)-
0.08
(−0.
09,0
.26)
0.09
(−0.
08,0
.26)
0.03
(−0.
15,0
.21)
-M
D(v
s.di
etgr
oup)
--
0.00
(−0.
17,0
.18)
−0.
05(−
0.23
,0.1
2)-
*A
llva
lues
wer
epr
esen
ted
asm
eans
(SD
)or
mea
ns(9
5%C
I).C
hang
esfr
omth
eba
selin
ew
ere
adju
sted
for
pote
ntia
lcon
foun
ding
vari
able
s(s
ex,a
ge,d
rink
ing/
smok
ing,
phys
ical
acti
vity
leve
l,ed
ucat
ion
leve
l,fa
mily
hist
ory,
med
icat
ions
and
dura
tion
ofdi
abet
es)i
nth
ean
alys
isof
cova
rian
cem
odel
.
168
Nutrients 2016, 8, 549
4. Discussion
The present study showed that a low-fat and high-fiber diet (“healthy diet”) had beneficialeffects on glucolipid metabolism in overweight T2DM patients, and these effects were more evidentwhen combined with oat intake. In particular, the combination of short-term (30 days) oat intakewith the “healthy diet” had greater effects on lowering the PPG, HOMA-IR, TC and LDL-c than thatof merely having a low-fat and high-fiber diet. The 1-year follow-up showed that the reduction ofPPG, HOMA-IR, TC and LDL-c can be maintained for long time, and significantly greater effects indecreasing weight, HbA1c and TG were observed.
The primary finding of this study was the significant effect of oat intake on hyperglycemia control.A growing number of studies have suggested that oats and oat-enriched products can significantlydecrease the postprandial hyperglycemia [11,14]. Consistently, our study provided supportive evidencefor the PPG lowering effect of oat intake in overweight T2DM patients. Although the mechanism oflowering PPG has not been fully understood, at least parts of the contribution could be attributed to theproperty of oat β-glucan. Oat β-glucan can increase the viscosity in the intestine, slow the absorptionof carbohydrates, and thus reduce the PPG [19,20]. Research findings on the FPG lowering effects of oatintake are less consistent. A few human trials and diabetic mice laboratory studies have found that oatintake can significantly decrease the FPG concertation [14,21,22], but this finding was not supportedby the majority of randomized control trials (RCTs) [11]. Although a subgroup analysis of high qualityRCTs in a meta-analysis indicated that oat intake can slightly lower FPG concentration in the long-termintervention [11], our study did not find any FPG lowering effect that could be attributed to eithershort-term or long-term oat intake. The long-term oat intake had a significant effect in reducing HbA1c,but short-term oat intake did not. This finding is not totally unexpected. Considering that HbA1clevels usually reflect the blood glucose levels for the period of 8–12 weeks, the duration of a 30-dayintervention may not be long enough to have significant changes in HbA1c, whereas a significantreduction in HbA1c could be shown in the longer 1-year follow-up. So far, a few studies have evaluatedthe effect of oat intake on HOMA-IR. A meta-analysis of three RCTs reported that oat intake had noeffect on the improvement of HOMA-IR [11]. In contrast, our study suggested a significant effect ondecreasing HOMA-IR. Our finding was consistent with a recent published RCT, which suggestedoats consumption can significantly decrease the HOMA-IR index [23]. These varying results may bepartly due to the different characteristics of study populations, probably because overweight andobese T2DM patients are likely to result in more severe insulin resistance, and insulin resistance ismore likely to be modifiable in this population [24].
Furthermore, this study confirmed the serum lipid lowering effect of oat intake in overweightT2DM patients. The effect of oat intake on lowering TC and LDL-c has been supported in mostpublished studies [10,13]. The main controversy is the magnitude of the effect. In some studies,the reduction of TC and LDL-c could be more than 10% [25,26], while in others, the reduction was lessthan 5% [27,28]. In our study, the decrease of TC and LDL-c was around 10%. However, the effectsize in this study was not comparable with others, considering the study population, the dose of oatsand oat processing were different from other studies. Comparing the duration of the intervention,the long-term oat intake had a significant effect on the reduction of TG. The mechanism of serumlipid-lowering effect also seems to be related to the increased viscosity attributed to the oat β-glucan,which can lead to the reduction in cholesterol absorption [20].
Another finding which is important for overweight T2DM patients is the weight loss effectof long-term oat intake. During the 30-day intervention, the three intervention groups had asignificant decrease in body weight and the weight reduction was similar among the three diet groups.However, during the 1-year follow-up, the 100 g oats group had a significantly greater decrease inweight than the healthy diet group. Considering that oat intake was combined with the “healthy diet”,it is possible that the moderate weight-reducing effect of a short-term (30 days) oat intake was coveredup by the weight reduction due to the low-fat and high-fiber diet; or the duration of a 30-day oatintake was too short to have changes on weight. The bigger weight reduction observed in the 1-year
169
Nutrients 2016, 8, 549
oat intake was unlikely to be caused by the poorly controlled blood glucose level, since a significantreduction in FPG, PPG and HbA1c was also observed. The weight reduction effect is probably relatedto the oat β-glucan, which may enhance the viscosity of meals, decrease the starch digestion andreduce the food intake by increasing satiety [29]. In addition to our studies, a few other studies alsoindicated a weigh-reducing effect of oats in certain populations [23,29,30], but these findings were notconsistently in agreement, as some studies found no decrease in weight [12,25,31]. Further research isneeded to verify the weight-reducing effect of oat intake.
The predominant effect of oats on diabetic management is most likely to be attributed to thebioactivity of β-glucan. Although, compared to other cereals, wholegrain oats have distinct bioactivecomposition in lipids and phenolics, the most significant difference is in the high content of β-glucan,especially when considering that the effective dose of the other two components is not likely to beachieved through 50 g or 100 g wholegrain oats consumption [30,31]. As mentioned above, β-glucanhas been reported to increase the intestinal viscosity, decrease the absorption of carbohydrates andlipids, and reduce food intake to control hyperglycemia, lower lipid and reduce weight. In addition,another important role of β-glucan involves the impact on gut microbiota. Specifically, the bacterialmetabolism of β-glucan can increase the production of short-chain fatty acids and drive the release ofbioactive compounds, which may interact with host biology to affect the risk of obesity and associateddisorders [32,33]. Oat β-glucan has been shown to decrease the protein fermentation and thus reducethe detrimental metabolites produced [34]. Furthermore, the fermentation of β-glucan has also beenreported to increase the diversity of gut microbiota, which is a potential benefit, considering that thereduced microbiota diversity is associated with obesity [35,36]. Studies exploring the mechanismsbehind the health benefits of β-glucan and gut microbiota may provide more evidence to encouragean increase in oat intake and to maximize the health benefits derived from oats.
Strengths and limitations of the study design should be noted. In the first phase, a 30-daycentralized management of intervention was designed to improve the compliance of participants.Potential dietary confounding factors for assessing the effects of oat intake were homogenized amonggroups by providing a general “healthy diet” to the intervention groups of oat intake and usinga healthy diet group as the reference group. To estimate the beneficial effects due to the “healthydiet”, a usual care group, with no dietry intervention, was established as a control group. To provideinformation for recommending a proper dose of daily oat intake (or oat β-glucan), we designedtwo intervention groups with different doses (50 g and 100 g) of oat intake. Considering that theduration of a 30-day intervention is probably too short for some variables, such as HbAc1 and weight,to have significant changes, a 1-year follow-up was designed to investigate the long-term changesof the variables and to determine if the significant changes observed in the 30-day interventioncould be maintained for a long time. However, in this subgroup analysis, we only reported thatthe anthropometric and blood biochemical variables, cardiovascular events and other diabeticcomplications were not presented, which led us to consider that the duration of a 1-year interventionwas relatively short for evaluating the diabetic complications. Another limitation was that the subjectswere not fully blinded because of the different taste of oats and other cereals. Furthermore, the benefitsof oat intake were assessed in comparison to an already healthy diet, and as discussed above, it ispossible that the moderate beneficial effects of oat intake were covered up or magnified by the healthyreference diet. However, in either case, it should be emphasized that the whole grain oat intake shouldbe recommended with a healthy diet.
5. Conclusions
In conclusion, our study provided some supportive evidence that oats can be a good selection ofwhole grains for overweight diabetics, but further larger scale studies are needed to evaluate thesefindings further.
170
Nutrients 2016, 8, 549
Supplementary Materials: The following is available online at http://www.mdpi.com/2072-6643/8/9/549/s1,Table S1: A sample menus of the general healthy diet provided for intervention groups (average consumptionper day).
Acknowledgments: The authors would like to thank the Beijing Nutrition Society for the consistent supportin the field study and data collection herein. The authors would also like to thank the Third Hospital of InnerMongolia Medical College for helping with the clinical examinations.
Author Contributions: Y.L. conceived the idea for the study. X.L. performed the statistical analysis and draftedthe manuscript. All authors participated in the design of the study, study supervision, data collection andinterpretation, revised and approved the final version of the manuscript.
Conflicts of Interest: The authors declare no conflict of interest. This study was sponsored by the InnerMongolia Sanzhuliang Natural Oats Industry Corporation (IMSNOIC). The sponsor had no impact on theresults and manuscript.
References
1. Series, W.T. Obesity: Preventing and managing the global epidemic. Report of a WHO consultation.World Health Organ. Tech. Rep. Ser. 2000, 894, 1–253.
2. NCD Risk Factor Collaboration. Effects of diabetes definition on global surveillance of diabetesprevalence and diagnosis: A pooled analysis of 96 population-based studies with 331,288 participants.Lancet Diabetes Endocrinol. 2015, 3, 624–637.
3. Yaturu, S. Obesity and type 2 diabetes. J. Diabetes Mellit. 2011, 1, 79–95. [CrossRef]4. Mokdad, A.H.; Ford, E.S.; Bowman, B.A.; Nelson, D.E.; Engelgau, M.M.; Vinicor, F.; Marks, J.S.
Diabetes trends in the U.S.: 1990–1998. Diabetes Care 2000, 23, 1278–1283. [CrossRef] [PubMed]5. American Diabetes Association. Standards of medical care in diabetes-2015 abridged for primary care
providers. Clin. Diabetes 2015, 33, 97–111.6. American Diabetes Association. Evidence-based nutrition principles and recommendations for the treatment
and prevention of diabetes and related complications. Diabetes Care 2002, 25, 202–212.7. Fung, T.T.; Hu, F.B.; Pereira, M.A.; Liu, S.; Stampfer, M.J.; Colditz, G.A.; Willett, W.C. Whole-grain intake and
the risk of type 2 diabetes: A prospective study in men. Am. J. Clin. Nutr. 2002, 76, 535–540. [PubMed]8. Brennan, C.S.; Cleary, L.J. The potential use of cereal (1→3,1→4)-β-D-glucans as functional food ingredients.
J. Cereal Sci. 2005, 42, 1–13. [CrossRef]9. Clemens, R.; van Klinken, B.J. Oats, more than just a whole grain: An introduction. Br. J. Nutr. 2014,
112 (Suppl. S2), S1–S3. [CrossRef] [PubMed]10. Whitehead, A.; Beck, E.J.; Tosh, S.; Wolever, T.M. Cholesterol-lowering effects of oat beta-glucan:
A meta-analysis of randomized controlled trials. Am. J. Clin. Nutr. 2014, 100, 1413–1421. [CrossRef][PubMed]
11. Bao, L.; Cai, X.; Xu, M.; Li, Y. Effect of oat intake on glycaemic control and insulin sensitivity: A meta-analysisof randomised controlled trials. Br. J. Nutr. 2014, 112, 457–466. [CrossRef] [PubMed]
12. Saltzman, E.; Das, S.K.; Lichtenstein, A.H.; Dallal, G.E.; Corrales, A.; Schaefer, E.J.; Greenberg, A.S.;Roberts, S.B. An oat-containing hypocaloric diet reduces systolic blood pressure and improves lipid profilebeyond effects of weight loss in men and women. J. Nutr. 2001, 131, 1465–1470. [PubMed]
13. Othman, R.A.; Moghadasian, M.H.; Jones, P.J. Cholesterol-lowering effects of oat beta-glucan. Nutr. Rev.
2011, 69, 299–309. [CrossRef] [PubMed]14. Shen, X.L.; Zhao, T.; Zhou, Y.; Shi, X.; Zou, Y.; Zhao, G. Effect of oat beta-glucan intake on glycaemic control
and insulin sensitivity of diabetic patients: A meta-analysis of randomized controlled trials. Nutrients
2016, 8, 39. [CrossRef] [PubMed]15. Institute of Nutrition and Food Safety. China CDC 2005 China Food Composition; Peking University Medical
Press: Beijing, China, 2005.16. Chinese Nutrition Society. Dietary Guidelines for Chinese Residents; Tibet People’s Publishing House:
Lhasa, China, 2010.17. Chinese Diabetes Society. China Medical Nutrition Therapy Guideline for Diabetes. Available online:
http://www.cdschina.org/news_show.jsp?id=509.html (accessed on 16 October 2012).18. Sun, Z. Process for Dehulling Oats without Removing Plumules. CN101264459 17 September 2008.
171
Nutrients 2016, 8, 549
19. Hlebowicz, J. Postprandial blood glucose response in relation to gastric emptying and satiety in healthysubjects. Appetite 2009, 53, 249–252. [CrossRef] [PubMed]
20. Wang, Q.; Ellis, P.R. Oat beta-glucan: Physico-chemical characteristics in relation to its blood-glucose andcholesterol-lowering properties. Br. J. Nutr. 2014, 112 (Suppl. S2), S4–S13. [CrossRef] [PubMed]
21. Pick, M.E.; Hawrysh, Z.J.; Gee, M.I.; Toth, E.; Garg, M.L.; Hardin, R.T. Oat bran concentrate bread productsimprove long-term control of diabetes: A pilot study. J. Am. Diet. Assoc. 1996, 96, 1254–1261. [CrossRef]
22. Shen, R.L.; Cai, F.L.; Dong, J.L.; Hu, X.Z. Hypoglycemic effects and biochemical mechanisms of oat productson streptozotocin-induced diabetic mice. J. Agric. Food Chem. 2011, 59, 8895–8900. [CrossRef] [PubMed]
23. Schuster, J.; Beninca, G.; Vitorazzi, R.; Morelo Dal Bosco, S. Effects of oats on lipid profile, insulin resistanceand weight loss. Nutr. Hosp. 2015, 32, 2111–2116. [PubMed]
24. Qatanani, M.; Lazar, M.A. Mechanisms of obesity-associated insulin resistance: Many choices on the menu.Genes Dev. 2007, 21, 1443–1455. [CrossRef] [PubMed]
25. Charlton, K.E.; Tapsell, L.C.; Batterham, M.J.; O’Shea, J.; Thorne, R.; Beck, E.; Tosh, S.M. Effect of6 weeks’ consumption of beta-glucan-rich oat products on cholesterol levels in mildly hypercholesterolaemicoverweight adults. Br. J. Nutr. 2012, 107, 1037–1047. [CrossRef] [PubMed]
26. Ma, X.; Gu, J.; Zhang, Z.; Jing, L.; Xu, M.; Dai, X.; Jiang, Y.; Li, Y.; Bao, L.; Cai, X.; et al. Effects of avena nuda l.On metabolic control and cardiovascular disease risk among Chinese patients with diabetes and meetingmetabolic syndrome criteria: Secondary analysis of a randomized clinical trial. Eur. J. Clin. Nutr. 2013, 67,1291–1297. [CrossRef] [PubMed]
27. Torronen, R.; Kansanen, L.; Uusitupa, M.; Hanninen, O.; Myllymaki, O.; Harkonen, H.; Malkki, Y. Effects ofan oat bran concentrate on serum lipids in free-living men with mild to moderate hypercholesterolaemia.Eur. J. Clin. Nutr. 1992, 46, 621–627. [PubMed]
28. Kerckhoffs, D.A.; Hornstra, G.; Mensink, R.P. Cholesterol-lowering effect of beta-glucan from oat bran inmildly hypercholesterolemic subjects may decrease when beta-glucan is incorporated into bread and cookies.Am. J. Clin. Nutr. 2003, 78, 221–227. [PubMed]
29. Lyly, M.; Liukkonen, K.H.; Salmenkallio-Marttila, M.; Karhunen, L.; Poutanen, K.; Lahteenmaki, L. Fibre inbeverages can enhance perceived satiety. Eur. J. Nutr. 2009, 48, 251–258. [CrossRef] [PubMed]
30. Rose, D.J. Impact of whole grains on the gut microbiota: The next frontier for oats? Br. J. Nutr. 2014,112 (Suppl. S2), S44–S49. [CrossRef] [PubMed]
31. Viscidi, K.A.; Dougherty, M.P.; Briggs, J.; Camire, M.E. Complex phenolic compounds reduce lipid oxidationin extruded oat cereals. Food Sci. Technol. 2004, 37, 789–796. [CrossRef]
32. El Khoury, D.; Cuda, C.; Luhovyy, B.L.; Anderson, G.H. Beta glucan: Health benefits in obesity and metabolicsyndrome. J. Nutr. Metab. 2012, 2012, 851362. [CrossRef] [PubMed]
33. Den Besten, G.; van Eunen, K.; Groen, A.K.; Venema, K.; Reijngoud, D.J.; Bakker, B.M. The role of short-chainfatty acids in the interplay between diet, gut microbiota, and host energy metabolism. J. Lipid Res. 2013, 54,2325–2340. [CrossRef] [PubMed]
34. Ross, A.B.; Pere-Trepat, E.; Montoliu, I.; Martin, F.P.; Collino, S.; Moco, S.; Godin, J.P.; Cleroux, M.; Guy, P.A.;Breton, I.; et al. A whole-grain-rich diet reduces urinary excretion of markers of protein catabolism and gutmicrobiota metabolism in healthy men after one week. J. Nutr. 2013, 143, 766–773. [CrossRef] [PubMed]
35. Martinez, I.; Lattimer, J.M.; Hubach, K.L.; Case, J.A.; Yang, J.; Weber, C.G.; Louk, J.A.; Rose, D.J.;Kyureghian, G.; Peterson, D.A.; et al. Gut microbiome composition is linked to whole grain-inducedimmunological improvements. ISME J. 2013, 7, 269–280. [CrossRef] [PubMed]
36. De Vos, W.M.; de Vos, E.A. Role of the intestinal microbiome in health and disease: From correlation tocausation. Nutr. Rev. 2012, 70 (Suppl. S1), S45–S56. [CrossRef] [PubMed]
© 2016 by the authors. Licensee MDPI, Basel, Switzerland. This article is an open accessarticle distributed under the terms and conditions of the Creative Commons Attribution(CC BY) license (http://creativecommons.org/licenses/by/4.0/).
172

nutrients
Article
Soluble Fiber with High Water-Binding Capacity,Swelling Capacity, and Fermentability Reduces FoodIntake by Promoting Satiety Rather Than Satiationin Rats
Chengquan Tan 1, Hongkui Wei 1, Xichen Zhao 1, Chuanhui Xu 1, Yuanfei Zhou 1,* and
Jian Peng 1,2,*
1 Department of Animal Nutrition and Feed Science, College of Animal Science and Technology,Huazhong Agricultural University, Wuhan 430070, China; [email protected] (C.T.);[email protected] (H.W.); [email protected] (X.Z.); [email protected] (C.X.)
2 The Cooperative Innovation Center for Sustainable Pig Production, Wuhan 430070, China* Correspondence: [email protected] (Y.Z.); [email protected] (J.P.);
Tel.: +86-27-8728-0122 (Y.Z.); +86-27-8728-6912 (J.P.)
Received: 31 July 2016; Accepted: 26 September 2016; Published: 2 October 2016
Abstract: To understand whether soluble fiber (SF) with high water-binding capacity (WBC),swelling capacity (SC) and fermentability reduces food intake and whether it does so by promotingsatiety or satiation or both, we investigated the effects of different SFs with these properties on thefood intake in rats. Thirty-two male Sprague-Dawley rats were randomized to four equal groupsand fed the control diet or diet containing 2% konjac flour (KF), pregelatinized waxy maize starch(PWMS) plus guar gum (PG), and PWMS starch plus xanthan gum (PX) for three weeks, with themeasured values of SF, WBC, and SC in the four diets following the order of PG > KF > PX > control.Food intake, body weight, meal pattern, behavioral satiety sequence, and short-chain fatty acids(SCFAs) in cecal content were evaluated. KF and PG groups reduced the food intake, mainly due tothe decreased feeding behavior and increased satiety, as indicated by decreased meal numbers andincreased inter-meal intervals. Additionally, KF and PG groups increased concentrations of acetateacid, propionate acid, and SCFAs in the cecal contents. Our results indicate that SF with high WBC,SC, and fermentability reduces food intake—probably by promoting a feeling of satiety in rats todecrease their feeding behavior.
Keywords: guar gum; water binding capacity; meal pattern; food intake; satiety
1. Introduction
Satiation and satiety are part of the body’s appetite control system involved in limiting foodintake. Satiation is reflected in meal size and meal duration, while satiety is reflected in meal numberand inter-meal intervals [1]. Modulation of food intake by consuming foods with a high satiety orsatiation value may be one of the approaches to help reduce obesity. The efficacy by which differenttypes of dietary fibers promote satiety or satiation is varied [2,3]. This issue can be explored first byusing laboratory animals due to the advantages of a complete control over the diet, facile collection ofgut samples, and systematic observation of behaviors.
Growing evidence showed that the physicochemical properties of dietary fiber such as viscosity,water-binding capacity, and fermentability may contribute to decrease the food intake in humanbeings and rodents [3–5]. Viscous fibers increase chewing activity and saliva production in themouth [6], which could result in early satiation and reduced food intake [7,8]. However, dietaryfiber with high water-binding capacity may increase gastric distension by expanding their volume
Nutrients 2016, 8, 615 173 www.mdpi.com/journal/nutrients
Nutrients 2016, 8, 615
up to eight-fold in the stomach [9], which will increase feelings of satiety [10], probably via afferentvagal signals of fullness [6]. Moreover, a delay in gastric emptying accompanied by an increase ingastric distension is often associated with enhanced satiety between meals [11]. In addition, dietaryfiber is also fermented by intestinal microbiota, contributing to the increase of short-chain fatty acids(SCFAs). Furthermore, SCFAs could stimulate the release of satiety-related peptides, such as peptidetyrosine-tyrosine (PYY) and glucagon-like peptide-1 (GLP-1) from entero-endocrine cells, which maypromote feelings of satiety [12].
Konjac flour (KF) is a water soluble, viscous dietary fiber with a high water-binding capacity(15.5 mL H2O/g) [13,14]. KF mainly contains konjac glucomannan (KGM), which is composed ofβ-1,4-linked D-mannosyl and D-glucosyl residues at a molar ratio of 1.6:1.0 as the main chain with asmall number of branches through β-1,3 mannosyl units [15]. KGM is considered a functional fiber offood ingredient and has been consumed in the form of rubbery jelly, noodles, and other food productsby humans in Asia for centuries [16]. KGM has been known to be helpful in lowering cholesterollevels, reducing weight in human beings [17], and modifying intestinal microbial metabolism insows [18,19]. Our previous study indicated that dietary inclusion of KF with higher water-bindingcapacity (1.97 vs. 1.78 g/g) and swelling capacity (2.14 vs. 1.62 mL/g) than inclusion of wheat branpromoted the satiety of gestating sow [20]. However, the tuber is usually grown in Asian countriesand the resources for commercial production are limited, suggesting the necessity to develop noveldietary fibers with functional properties similar to those of KF, as well as similar effects on food intakereduction by promoting satiety or satiation.
Pregelatinized waxy maize starch, a fermentable resistant starch composed mainly of highlybranched amorphous amylopectin, has many specific food attributes [21]. Dietary supplementationwith modified waxy maize starch lowers glucose-dependent insulinotropic polypeptides and hasbeneficial implications in weight management [22]. Guar and xanthan gums with high viscosity andhydrating properties are used as stabilizer and thickener in various food products [23,24]. A previousstudy reported that the digesta viscosity of subjects was increased after consuming cookies containing2.5% guar gum alone for 42 days, without any effect on their food intake [3]. The consumption ofbeverages enriched with dietary fibers and xanthan gum (0.22%) for one week also had no influenceon the appetite sensations in healthy men [25]. Our previous results showed that the combined fibermaterials (pregelatinized waxy maize starch plus guar gum (PG) and pregelatinized waxy maize starchplus xanthan gum (PX)) had higher or similar water-binding capacity or swelling capacity than theKF [26]. Therefore, we hypothesized that the combination of pregelatinized waxy maize starch withguar gum or xanthan gum inclusion in diet may have a similar effect to that of KF on physicochemicalproperties (water-binding capacity and swelling capacity) and fermentability, as well as food intakereduction by promoting satiety or satiation. The objective of the present study was to investigatewhether dietary fibers with high water-binding capacity, swelling capacity, and fermentability reducefood intake by promoting satiety or satiation as well as the mechanism underlying it by evaluatingtheir effects on plasma concentrations of GLP-1 and PYY, SCFAs in cecal contents, meal pattern, feedingbehavior, food intake, and body weight in rats.
2. Experimental Section
2.1. Animals and Diets
A total of 32 male Sprague-Dawley rats (average initial body weight of 377.10 ± 3.43 g; 10 weeksof age) (Hunan SJA Laboratory Animal Co., Ltd., Changsha, China) were housed individually instandard cages that allowed recording of food intake. The cages were placed in a temperature-andhumidity-controlled room (21 ± 2 C, 55% ± 10% humidity) with a 12:12 light/dark cycle (lights off at8:30 p.m.). The animals were acclimatized for one week with the control diet fed prior to the experiment.Rats were given free access to water and food. All the experiment protocols were approved by theanimal care and use committee of Huazhong Agriculture University and were in accordance with the
174
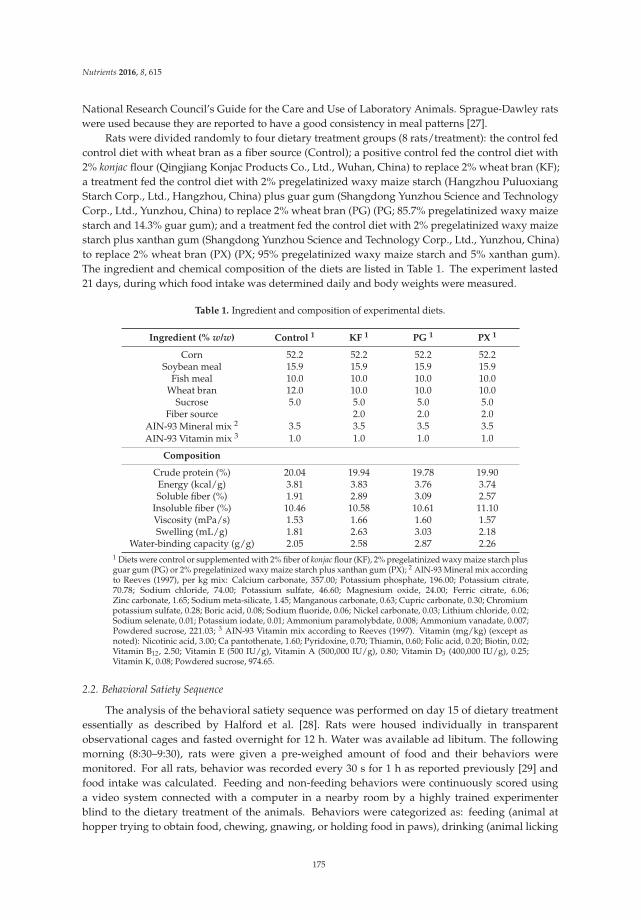
Nutrients 2016, 8, 615
National Research Council’s Guide for the Care and Use of Laboratory Animals. Sprague-Dawley ratswere used because they are reported to have a good consistency in meal patterns [27].
Rats were divided randomly to four dietary treatment groups (8 rats/treatment): the control fedcontrol diet with wheat bran as a fiber source (Control); a positive control fed the control diet with2% konjac flour (Qingjiang Konjac Products Co., Ltd., Wuhan, China) to replace 2% wheat bran (KF);a treatment fed the control diet with 2% pregelatinized waxy maize starch (Hangzhou PuluoxiangStarch Corp., Ltd., Hangzhou, China) plus guar gum (Shangdong Yunzhou Science and TechnologyCorp., Ltd., Yunzhou, China) to replace 2% wheat bran (PG) (PG; 85.7% pregelatinized waxy maizestarch and 14.3% guar gum); and a treatment fed the control diet with 2% pregelatinized waxy maizestarch plus xanthan gum (Shangdong Yunzhou Science and Technology Corp., Ltd., Yunzhou, China)to replace 2% wheat bran (PX) (PX; 95% pregelatinized waxy maize starch and 5% xanthan gum).The ingredient and chemical composition of the diets are listed in Table 1. The experiment lasted21 days, during which food intake was determined daily and body weights were measured.
Table 1. Ingredient and composition of experimental diets.
Ingredient (% w/w) Control 1 KF 1 PG 1 PX 1
Corn 52.2 52.2 52.2 52.2Soybean meal 15.9 15.9 15.9 15.9
Fish meal 10.0 10.0 10.0 10.0Wheat bran 12.0 10.0 10.0 10.0
Sucrose 5.0 5.0 5.0 5.0Fiber source 2.0 2.0 2.0
AIN-93 Mineral mix 2 3.5 3.5 3.5 3.5AIN-93 Vitamin mix 3 1.0 1.0 1.0 1.0
Composition
Crude protein (%) 20.04 19.94 19.78 19.90Energy (kcal/g) 3.81 3.83 3.76 3.74Soluble fiber (%) 1.91 2.89 3.09 2.57
Insoluble fiber (%) 10.46 10.58 10.61 11.10Viscosity (mPa/s) 1.53 1.66 1.60 1.57Swelling (mL/g) 1.81 2.63 3.03 2.18
Water-binding capacity (g/g) 2.05 2.58 2.87 2.261 Diets were control or supplemented with 2% fiber of konjac flour (KF), 2% pregelatinized waxy maize starch plusguar gum (PG) or 2% pregelatinized waxy maize starch plus xanthan gum (PX); 2 AIN-93 Mineral mix accordingto Reeves (1997), per kg mix: Calcium carbonate, 357.00; Potassium phosphate, 196.00; Potassium citrate,70.78; Sodium chloride, 74.00; Potassium sulfate, 46.60; Magnesium oxide, 24.00; Ferric citrate, 6.06;Zinc carbonate, 1.65; Sodium meta-silicate, 1.45; Manganous carbonate, 0.63; Cupric carbonate, 0.30; Chromiumpotassium sulfate, 0.28; Boric acid, 0.08; Sodium fluoride, 0.06; Nickel carbonate, 0.03; Lithium chloride, 0.02;Sodium selenate, 0.01; Potassium iodate, 0.01; Ammonium paramolybdate, 0.008; Ammonium vanadate, 0.007;Powdered sucrose, 221.03; 3 AIN-93 Vitamin mix according to Reeves (1997). Vitamin (mg/kg) (except asnoted): Nicotinic acid, 3.00; Ca pantothenate, 1.60; Pyridoxine, 0.70; Thiamin, 0.60; Folic acid, 0.20; Biotin, 0.02;Vitamin B12, 2.50; Vitamin E (500 IU/g), Vitamin A (500,000 IU/g), 0.80; Vitamin D3 (400,000 IU/g), 0.25;Vitamin K, 0.08; Powdered sucrose, 974.65.
2.2. Behavioral Satiety Sequence
The analysis of the behavioral satiety sequence was performed on day 15 of dietary treatmentessentially as described by Halford et al. [28]. Rats were housed individually in transparentobservational cages and fasted overnight for 12 h. Water was available ad libitum. The followingmorning (8:30–9:30), rats were given a pre-weighed amount of food and their behaviors weremonitored. For all rats, behavior was recorded every 30 s for 1 h as reported previously [29] andfood intake was calculated. Feeding and non-feeding behaviors were continuously scored usinga video system connected with a computer in a nearby room by a highly trained experimenterblind to the dietary treatment of the animals. Behaviors were categorized as: feeding (animal athopper trying to obtain food, chewing, gnawing, or holding food in paws), drinking (animal licking
175
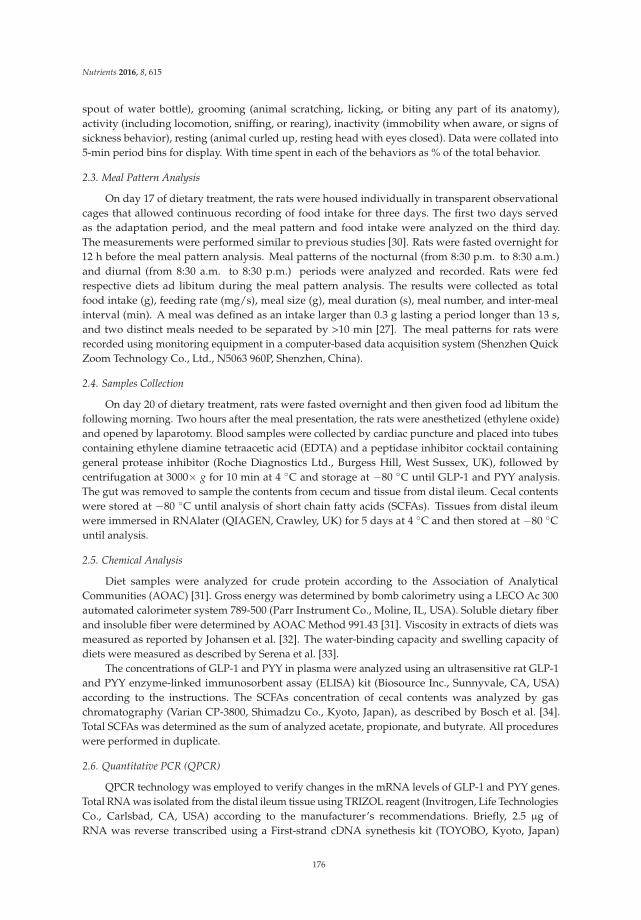
Nutrients 2016, 8, 615
spout of water bottle), grooming (animal scratching, licking, or biting any part of its anatomy),activity (including locomotion, sniffing, or rearing), inactivity (immobility when aware, or signs ofsickness behavior), resting (animal curled up, resting head with eyes closed). Data were collated into5-min period bins for display. With time spent in each of the behaviors as % of the total behavior.
2.3. Meal Pattern Analysis
On day 17 of dietary treatment, the rats were housed individually in transparent observationalcages that allowed continuous recording of food intake for three days. The first two days servedas the adaptation period, and the meal pattern and food intake were analyzed on the third day.The measurements were performed similar to previous studies [30]. Rats were fasted overnight for12 h before the meal pattern analysis. Meal patterns of the nocturnal (from 8:30 p.m. to 8:30 a.m.)and diurnal (from 8:30 a.m. to 8:30 p.m.) periods were analyzed and recorded. Rats were fedrespective diets ad libitum during the meal pattern analysis. The results were collected as totalfood intake (g), feeding rate (mg/s), meal size (g), meal duration (s), meal number, and inter-mealinterval (min). A meal was defined as an intake larger than 0.3 g lasting a period longer than 13 s,and two distinct meals needed to be separated by >10 min [27]. The meal patterns for rats wererecorded using monitoring equipment in a computer-based data acquisition system (Shenzhen QuickZoom Technology Co., Ltd., N5063 960P, Shenzhen, China).
2.4. Samples Collection
On day 20 of dietary treatment, rats were fasted overnight and then given food ad libitum thefollowing morning. Two hours after the meal presentation, the rats were anesthetized (ethylene oxide)and opened by laparotomy. Blood samples were collected by cardiac puncture and placed into tubescontaining ethylene diamine tetraacetic acid (EDTA) and a peptidase inhibitor cocktail containinggeneral protease inhibitor (Roche Diagnostics Ltd., Burgess Hill, West Sussex, UK), followed bycentrifugation at 3000× g for 10 min at 4 C and storage at −80 C until GLP-1 and PYY analysis.The gut was removed to sample the contents from cecum and tissue from distal ileum. Cecal contentswere stored at −80 C until analysis of short chain fatty acids (SCFAs). Tissues from distal ileumwere immersed in RNAlater (QIAGEN, Crawley, UK) for 5 days at 4 C and then stored at −80 Cuntil analysis.
2.5. Chemical Analysis
Diet samples were analyzed for crude protein according to the Association of AnalyticalCommunities (AOAC) [31]. Gross energy was determined by bomb calorimetry using a LECO Ac 300automated calorimeter system 789-500 (Parr Instrument Co., Moline, IL, USA). Soluble dietary fiberand insoluble fiber were determined by AOAC Method 991.43 [31]. Viscosity in extracts of diets wasmeasured as reported by Johansen et al. [32]. The water-binding capacity and swelling capacity ofdiets were measured as described by Serena et al. [33].
The concentrations of GLP-1 and PYY in plasma were analyzed using an ultrasensitive rat GLP-1and PYY enzyme-linked immunosorbent assay (ELISA) kit (Biosource Inc., Sunnyvale, CA, USA)according to the instructions. The SCFAs concentration of cecal contents was analyzed by gaschromatography (Varian CP-3800, Shimadzu Co., Kyoto, Japan), as described by Bosch et al. [34].Total SCFAs was determined as the sum of analyzed acetate, propionate, and butyrate. All procedureswere performed in duplicate.
2.6. Quantitative PCR (QPCR)
QPCR technology was employed to verify changes in the mRNA levels of GLP-1 and PYY genes.Total RNA was isolated from the distal ileum tissue using TRIZOL reagent (Invitrogen, Life TechnologiesCo., Carlsbad, CA, USA) according to the manufacturer’s recommendations. Briefly, 2.5 µg ofRNA was reverse transcribed using a First-strand cDNA synethesis kit (TOYOBO, Kyoto, Japan)
176
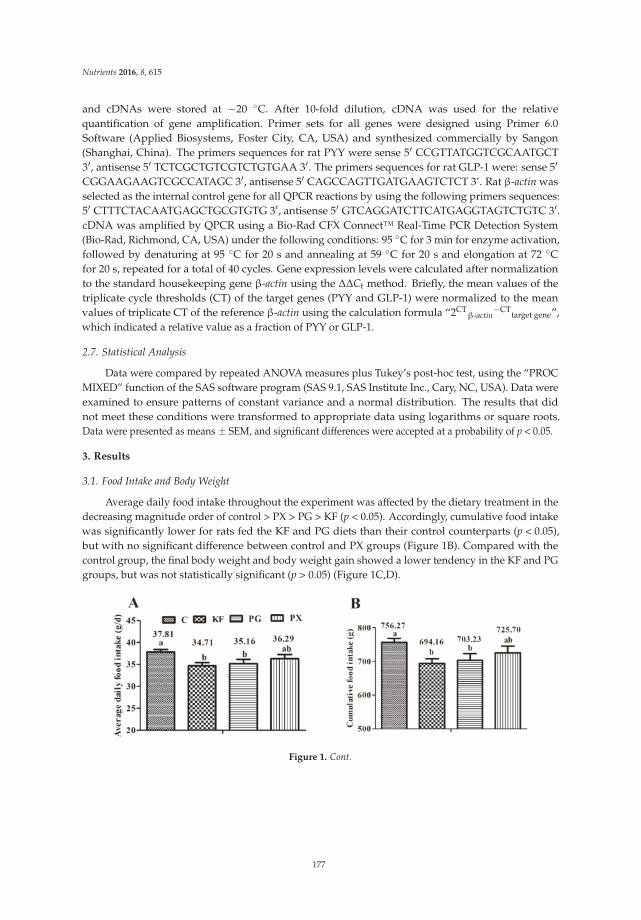
Nutrients 2016, 8, 615
and cDNAs were stored at −20 C. After 10-fold dilution, cDNA was used for the relativequantification of gene amplification. Primer sets for all genes were designed using Primer 6.0Software (Applied Biosystems, Foster City, CA, USA) and synthesized commercially by Sangon(Shanghai, China). The primers sequences for rat PYY were sense 5′ CCGTTATGGTCGCAATGCT3′, antisense 5′ TCTCGCTGTCGTCTGTGAA 3′. The primers sequences for rat GLP-1 were: sense 5′
CGGAAGAAGTCGCCATAGC 3′, antisense 5′ CAGCCAGTTGATGAAGTCTCT 3’. Rat β-actin wasselected as the internal control gene for all QPCR reactions by using the following primers sequences:5′ CTTTCTACAATGAGCTGCGTGTG 3′, antisense 5′ GTCAGGATCTTCATGAGGTAGTCTGTC 3′.cDNA was amplified by QPCR using a Bio-Rad CFX Connect™ Real-Time PCR Detection System(Bio-Rad, Richmond, CA, USA) under the following conditions: 95 C for 3 min for enzyme activation,followed by denaturing at 95 C for 20 s and annealing at 59 C for 20 s and elongation at 72 Cfor 20 s, repeated for a total of 40 cycles. Gene expression levels were calculated after normalizationto the standard housekeeping gene β-actin using the ∆∆Ct method. Briefly, the mean values of thetriplicate cycle thresholds (CT) of the target genes (PYY and GLP-1) were normalized to the meanvalues of triplicate CT of the reference β-actin using the calculation formula “2CT
β-actin−CT
target gene”,which indicated a relative value as a fraction of PYY or GLP-1.
2.7. Statistical Analysis
Data were compared by repeated ANOVA measures plus Tukey’s post-hoc test, using the “PROCMIXED” function of the SAS software program (SAS 9.1, SAS Institute Inc., Cary, NC, USA). Data wereexamined to ensure patterns of constant variance and a normal distribution. The results that didnot meet these conditions were transformed to appropriate data using logarithms or square roots.Data were presented as means ± SEM, and significant differences were accepted at a probability of p < 0.05.
3. Results
3.1. Food Intake and Body Weight
Average daily food intake throughout the experiment was affected by the dietary treatment in thedecreasing magnitude order of control > PX > PG > KF (p < 0.05). Accordingly, cumulative food intakewas significantly lower for rats fed the KF and PG diets than their control counterparts (p < 0.05),but with no significant difference between control and PX groups (Figure 1B). Compared with thecontrol group, the final body weight and body weight gain showed a lower tendency in the KF and PGgroups, but was not statistically significant (p > 0.05) (Figure 1C,D).
Figure 1. Cont.
177
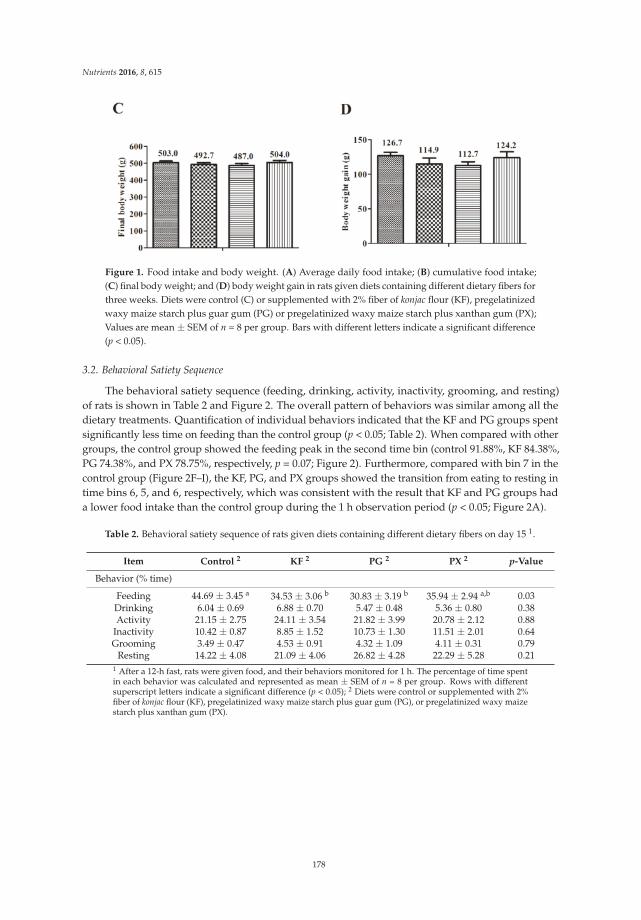
Nutrients 2016, 8, 615
Figure 1. Food intake and body weight. (A) Average daily food intake; (B) cumulative food intake;(C) final body weight; and (D) body weight gain in rats given diets containing different dietary fibers forthree weeks. Diets were control (C) or supplemented with 2% fiber of konjac flour (KF), pregelatinizedwaxy maize starch plus guar gum (PG) or pregelatinized waxy maize starch plus xanthan gum (PX);Values are mean ± SEM of n = 8 per group. Bars with different letters indicate a significant difference(p < 0.05).
3.2. Behavioral Satiety Sequence
The behavioral satiety sequence (feeding, drinking, activity, inactivity, grooming, and resting)of rats is shown in Table 2 and Figure 2. The overall pattern of behaviors was similar among all thedietary treatments. Quantification of individual behaviors indicated that the KF and PG groups spentsignificantly less time on feeding than the control group (p < 0.05; Table 2). When compared with othergroups, the control group showed the feeding peak in the second time bin (control 91.88%, KF 84.38%,PG 74.38%, and PX 78.75%, respectively, p = 0.07; Figure 2). Furthermore, compared with bin 7 in thecontrol group (Figure 2F–I), the KF, PG, and PX groups showed the transition from eating to resting intime bins 6, 5, and 6, respectively, which was consistent with the result that KF and PG groups hada lower food intake than the control group during the 1 h observation period (p < 0.05; Figure 2A).
Table 2. Behavioral satiety sequence of rats given diets containing different dietary fibers on day 15 1.
Item Control 2 KF 2 PG 2 PX 2 p-Value
Behavior (% time)
Feeding 44.69 ± 3.45 a 34.53 ± 3.06 b 30.83 ± 3.19 b 35.94 ± 2.94 a,b 0.03Drinking 6.04 ± 0.69 6.88 ± 0.70 5.47 ± 0.48 5.36 ± 0.80 0.38Activity 21.15 ± 2.75 24.11 ± 3.54 21.82 ± 3.99 20.78 ± 2.12 0.88
Inactivity 10.42 ± 0.87 8.85 ± 1.52 10.73 ± 1.30 11.51 ± 2.01 0.64Grooming 3.49 ± 0.47 4.53 ± 0.91 4.32 ± 1.09 4.11 ± 0.31 0.79
Resting 14.22 ± 4.08 21.09 ± 4.06 26.82 ± 4.28 22.29 ± 5.28 0.211 After a 12-h fast, rats were given food, and their behaviors monitored for 1 h. The percentage of time spentin each behavior was calculated and represented as mean ± SEM of n = 8 per group. Rows with differentsuperscript letters indicate a significant difference (p < 0.05); 2 Diets were control or supplemented with 2%fiber of konjac flour (KF), pregelatinized waxy maize starch plus guar gum (PG), or pregelatinized waxy maizestarch plus xanthan gum (PX).
178
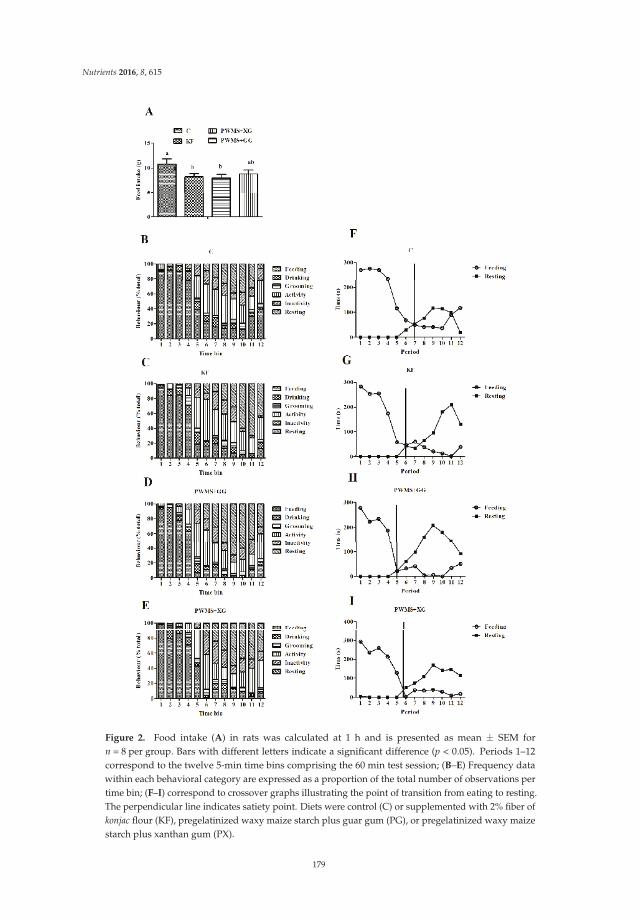
Nutrients 2016, 8, 615
Figure 2. Food intake (A) in rats was calculated at 1 h and is presented as mean ± SEM forn = 8 per group. Bars with different letters indicate a significant difference (p < 0.05). Periods 1–12correspond to the twelve 5-min time bins comprising the 60 min test session; (B–E) Frequency datawithin each behavioral category are expressed as a proportion of the total number of observations pertime bin; (F–I) correspond to crossover graphs illustrating the point of transition from eating to resting.The perpendicular line indicates satiety point. Diets were control (C) or supplemented with 2% fiber ofkonjac flour (KF), pregelatinized waxy maize starch plus guar gum (PG), or pregelatinized waxy maizestarch plus xanthan gum (PX).
179
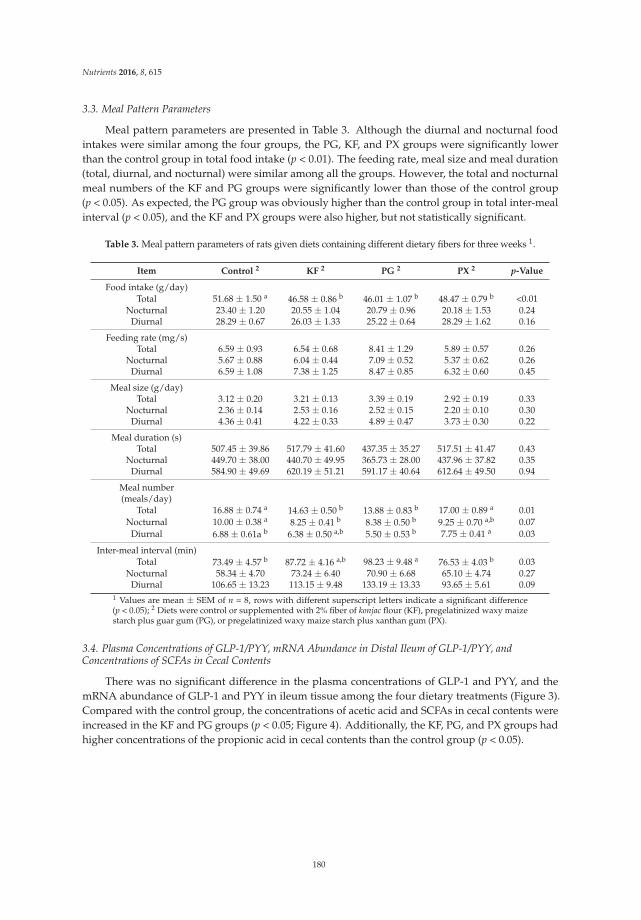
Nutrients 2016, 8, 615
3.3. Meal Pattern Parameters
Meal pattern parameters are presented in Table 3. Although the diurnal and nocturnal foodintakes were similar among the four groups, the PG, KF, and PX groups were significantly lowerthan the control group in total food intake (p < 0.01). The feeding rate, meal size and meal duration(total, diurnal, and nocturnal) were similar among all the groups. However, the total and nocturnalmeal numbers of the KF and PG groups were significantly lower than those of the control group(p < 0.05). As expected, the PG group was obviously higher than the control group in total inter-mealinterval (p < 0.05), and the KF and PX groups were also higher, but not statistically significant.
Table 3. Meal pattern parameters of rats given diets containing different dietary fibers for three weeks 1.
Item Control 2 KF 2 PG 2 PX 2 p-Value
Food intake (g/day)Total 51.68 ± 1.50 a 46.58 ± 0.86 b 46.01 ± 1.07 b 48.47 ± 0.79 b <0.01
Nocturnal 23.40 ± 1.20 20.55 ± 1.04 20.79 ± 0.96 20.18 ± 1.53 0.24Diurnal 28.29 ± 0.67 26.03 ± 1.33 25.22 ± 0.64 28.29 ± 1.62 0.16
Feeding rate (mg/s)Total 6.59 ± 0.93 6.54 ± 0.68 8.41 ± 1.29 5.89 ± 0.57 0.26
Nocturnal 5.67 ± 0.88 6.04 ± 0.44 7.09 ± 0.52 5.37 ± 0.62 0.26Diurnal 6.59 ± 1.08 7.38 ± 1.25 8.47 ± 0.85 6.32 ± 0.60 0.45
Meal size (g/day)Total 3.12 ± 0.20 3.21 ± 0.13 3.39 ± 0.19 2.92 ± 0.19 0.33
Nocturnal 2.36 ± 0.14 2.53 ± 0.16 2.52 ± 0.15 2.20 ± 0.10 0.30Diurnal 4.36 ± 0.41 4.22 ± 0.33 4.89 ± 0.47 3.73 ± 0.30 0.22
Meal duration (s)Total 507.45 ± 39.86 517.79 ± 41.60 437.35 ± 35.27 517.51 ± 41.47 0.43
Nocturnal 449.70 ± 38.00 440.70 ± 49.95 365.73 ± 28.00 437.96 ± 37.82 0.35Diurnal 584.90 ± 49.69 620.19 ± 51.21 591.17 ± 40.64 612.64 ± 49.50 0.94
Meal number(meals/day)
Total 16.88 ± 0.74 a 14.63 ± 0.50 b 13.88 ± 0.83 b 17.00 ± 0.89 a 0.01Nocturnal 10.00 ± 0.38 a 8.25 ± 0.41 b 8.38 ± 0.50 b 9.25 ± 0.70 a,b 0.07
Diurnal 6.88 ± 0.61a b 6.38 ± 0.50 a,b 5.50 ± 0.53 b 7.75 ± 0.41 a 0.03
Inter-meal interval (min)Total 73.49 ± 4.57 b 87.72 ± 4.16 a,b 98.23 ± 9.48 a 76.53 ± 4.03 b 0.03
Nocturnal 58.34 ± 4.70 73.24 ± 6.40 70.90 ± 6.68 65.10 ± 4.74 0.27Diurnal 106.65 ± 13.23 113.15 ± 9.48 133.19 ± 13.33 93.65 ± 5.61 0.09
1 Values are mean ± SEM of n = 8, rows with different superscript letters indicate a significant difference(p < 0.05); 2 Diets were control or supplemented with 2% fiber of konjac flour (KF), pregelatinized waxy maizestarch plus guar gum (PG), or pregelatinized waxy maize starch plus xanthan gum (PX).
3.4. Plasma Concentrations of GLP-1/PYY, mRNA Abundance in Distal Ileum of GLP-1/PYY, andConcentrations of SCFAs in Cecal Contents
There was no significant difference in the plasma concentrations of GLP-1 and PYY, and themRNA abundance of GLP-1 and PYY in ileum tissue among the four dietary treatments (Figure 3).Compared with the control group, the concentrations of acetic acid and SCFAs in cecal contents wereincreased in the KF and PG groups (p < 0.05; Figure 4). Additionally, the KF, PG, and PX groups hadhigher concentrations of the propionic acid in cecal contents than the control group (p < 0.05).
180
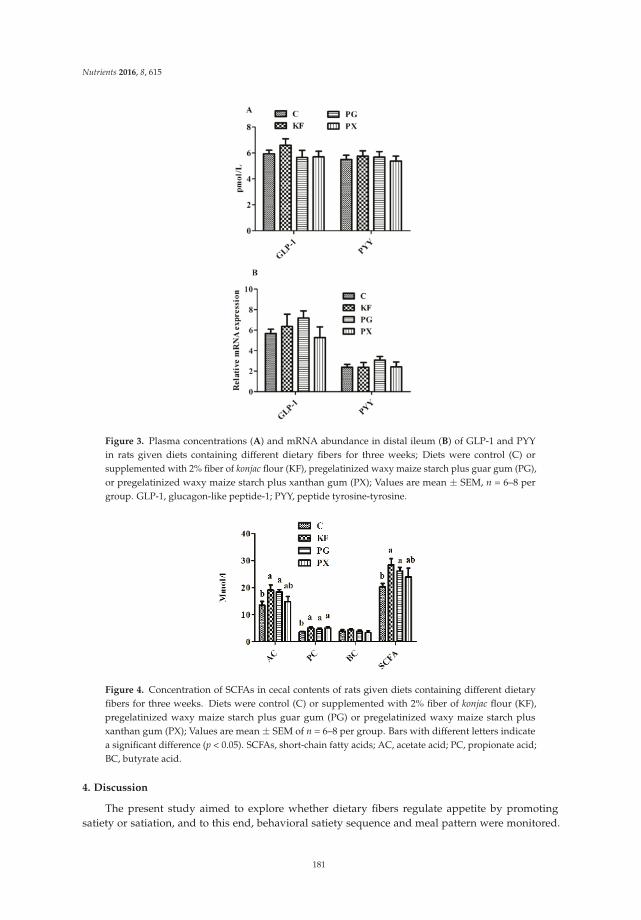
Nutrients 2016, 8, 615
Figure 3. Plasma concentrations (A) and mRNA abundance in distal ileum (B) of GLP-1 and PYYin rats given diets containing different dietary fibers for three weeks; Diets were control (C) orsupplemented with 2% fiber of konjac flour (KF), pregelatinized waxy maize starch plus guar gum (PG),or pregelatinized waxy maize starch plus xanthan gum (PX); Values are mean ± SEM, n = 6–8 pergroup. GLP-1, glucagon-like peptide-1; PYY, peptide tyrosine-tyrosine.
Figure 4. Concentration of SCFAs in cecal contents of rats given diets containing different dietaryfibers for three weeks. Diets were control (C) or supplemented with 2% fiber of konjac flour (KF),pregelatinized waxy maize starch plus guar gum (PG) or pregelatinized waxy maize starch plusxanthan gum (PX); Values are mean ± SEM of n = 6–8 per group. Bars with different letters indicatea significant difference (p < 0.05). SCFAs, short-chain fatty acids; AC, acetate acid; PC, propionate acid;BC, butyrate acid.
4. Discussion
The present study aimed to explore whether dietary fibers regulate appetite by promotingsatiety or satiation, and to this end, behavioral satiety sequence and meal pattern were monitored.
181
Nutrients 2016, 8, 615
Detailed analysis of the behavioral satiety sequence revealed that the overall pattern of the behavioralresponse to fast-induced food intake in rats was normal. However, we observed a decrease inshort-term (1 h) food intake, accompanied by reduced feeding behavior in rats fed the KF and PGdiets. Furthermore, the transition from eating to resting occurred in early time bins in the PG, PX,and KF groups, indicating that satiety was induced in the three groups [35]. To our knowledge, this isprobably the first report so far about a detailed analysis of the behavioral satiety sequence followingdietary fiber treatments in rats.
The present results are consistent with our previous study in that supplementation of KF reducedthe non-feeding oral behavior and promoted the satiety of sows [20]. In the current study, there wasno significant difference in the feeding rates of rats among all the dietary treatments. Based on theassociation of taste and flavor aversions with a decrease in feeding rate [36], the consistent feeding ratesindicated that dietary fiber supplementation did not produce a significant effect on food palatability,implying that the changes in the meal pattern observed here might be attributed to physiologicalfactors rather than changes in diet palatability or flavor.
In the present study, dietary supplementation of KF and PG reduced the total food intake, mainlydue to the increased satiety, as indicated by decreased meal numbers and increased inter-meal intervals.This is in agreement with a previous study that reported the suppression of food intake 2 h afterthe administration of the mixture of guar gum and fructo-oligosaccharide, due to decreased mealnumbers and increased inter-meal intervals [37]. It is worth noting that the current result contrastedwith a most recent study about diets supplemented with guar gum or fructo-oligosaccharide alone [30].Although both of them reduced the food intake immediately after dietary fiber ingestion, the result wasmainly attributed to a decrease of meal size and meal duration but not meal number and inter-mealintervals, indicating that the decrease in food intake is associated with increased satiation rather thansatiety. In the current study, the rats consumed such a high proportion of their daily intake during thelight phase, probably due to their 12-h fast overnight before the meal pattern analysis.
Pregelatinized waxy maize starch and fructo-oligosaccharide are highly fermentable fibers [38,39],and guar gum is a viscous fiber with high water-binding capacity [3]. This suggests that the combinationof fibers with different physicochemical properties may affect the physiological processes (satiation orsatiety) of appetite regulation. In the present study, dietary treatments were similar in insoluble fiberand viscosity, but their soluble fiber, water-binding capacity, and swelling capacity followed thesequence of PG > KF > PX > control.
The addition of a small amount of hydrocolloids resulted in a large enhancement in water-bindingcapacity and swelling capacity of starch pastes, but a reduction of syneresis in starch gels, indicatingthat the magnitude of such changes in paste rheology and texture depends on the type of starch andgum used [40,41]. The current results (PG group with highest water-binding capacity and swellingcapacity) could be explained by a previous study which showed that the most pronounced effect hasbeen the retardation of gelation kinetics of waxy maize starch plus the guar gum, rather than thecombination with other gums [42].
Gelatinized waxy maize starch was subjected to different time and temperature conditions ofstorage to obtain samples with different extents of amylopectin retrogradation. Increased retrogradationextents reduced the enzyme susceptibilities to pancreatic alpha amylase and amyloglucosidase at37 C [43]. The pregelatinized starch produced more satiety than the raw potato starch, probablybecause this starch was digested too slowly to increase the postprandial blood glucose concentrationsto any appreciable extent [44,45].
Soluble fiber with high water-binding capacity and viscosity may slow gastric emptying and smallbowel transit [46,47], and several of the aforementioned signals generated in the gastrointestinal tractcooperate to promote satiety by activating vagal afferents and/or by acting directly on the brain [48,49].Thus, the increased satiety by dietary supplementation of KF and PG is associated with decreased foodintake in rats, which may be attributed to the high water-binding capacity and swelling capacity inthose diets.
182
Nutrients 2016, 8, 615
In the current study, supplementation of KF and PG significantly increased the concentrations ofacetic acid, propionate acid, and SCFAs in the cecal content of rats. A number of factors—includingchemical structure, particle size, surface area, and solubility of the fiber—affect the fermentation inthe gut and the nature of the SCFAs produced [50,51]. Carbohydrates containing glucomannan oralpha-galacturonic acid residues are generally more susceptible to fermentation [51]. A comparison ofkonjac gum, guar gum, xanthan gum, and pectin in human fecal inoculum in a 48-h static fermentationculture system showed that all the gums increased the SCFAs level, and konjac and guar gum hadthe strongest acid-reducing ability among gum dietary fibers [52]. Resistant starch is completelydegraded in the large bowel, and thus long-term consumption of fermentable fiber could producesatiety benefits [53].
It has been suggested that SCFAs stimulate the production and secretion of satiety-relatedhormones, such as GLP-1 and PYY, possibly via G-protein coupled receptors [54]. However, in thecurrent study, dietary treatments did not alter the GLP-1 and PYY either in plasma concentration ormRNA abundance in distal ileum two hours after feeding, which is not consistent with a previousreport that dietary supplementation of fructooligosaccharide increased the plasma concentration ofPYY in the fasted state of rats [37]. It can be inferred that dietary fiber effect on satiety hormones(GLP-1/PYY) is associated with fed or fasted state. PYY and GLP-1 are both synthesized and releasedfrom L-cells located in the small intestine and large intestine [55]. They showed no increased expressionhere in distal ileum, probably due to an overall increase in L-cell number along the enlarged intestines,which was not detectable here since the real time PCR method measures expression per mg tissue.Slowly digestible starch inclusion in pig diet decreased distal ileum SCFAs transporter mRNAabundance [56]. This is why we selected the distal ileum for anatomical analysis.
The SCFAs produced via bacterial fermentation directly suppresses appetite via central hypothalamicmechanisms in rodents [57]. Recent findings from human study suggest that propionate production mayplay an important role in attenuating reward-based eating behavior via striatal pathways, independentof changes in plasma PYY and GLP-1 [58]. It is well known that SCFAs serve as an additional energysource, especially at the moment when glucose absorption is decreasing (or completed) in the smallintestine, which helps to stabilize glucose levels in blood [59,60]. Delayed postprandial glucosetransient declines could delay the onset of the ensuing meal and induce inter-meal satiety [61].
In the current study, dietary treatments had no effect on final body weight and body weight gainin the rats. At 10 weeks of age, the tested rats were young adults. The adult rats might continue to gainbody mass at a slower rate, but the juvenile rapid growth phase ceased [62]. Therefore, the similarityin the body weight gain of rats among all the dietary treatments can be explained from the analysis ofshort-term effects.
The slight but not significant variation in feeding behavior, meal number, and SCFAs yield in PXgroup may result in an overall reduction trend but not in notable changes in food intake, probablydue to the reason that the PX diet did not reach the level of KF and PG diets in the physicochemicalproperties (water-binding capacity and swelling capacity) and fermentability (SCFAs), thus it couldnot produce a significant effect on the satiety and food intake in rats.
In the current study, the daily dosage of soluble fiber per kilogram of body weightin rats was 1.4 g/kg (35 g (daily food intake) × 2% (dosage)/0.5 kg (body weight) =1.4 g/kg body weight). Based on the dose translation formula (Human equivalent doses(mg/kg) = Animal dose (mg/kg) × (Animal Km/Human Km)) from animal to human studiesrevisited [63,64], the corresponding soluble fiber dose for humans was estimated to be 0.23 g/kg(1.4 g/kg (Animal dose) × 6 (Animal Km)/37 (Human Km) = 0.23 g/kg), which means the solublefiber dose for a 60 kg person is 13.8 g (0.23 g/kg × 60 kg = 13.8 g). Further work is required to translatethe findings to humans.
183
Nutrients 2016, 8, 615
5. Conclusions
KF and PG reduce the food intake, probably by promoting the satiety, which was supported bydecreased meal numbers and increased inter-meal intervals, but without a reduction in body weightgain. Additionally, dietary soluble fibers with high levels of physicochemical properties (water-bindingcapacity and swelling capacity) and fermentability (SCFAs) have a more significant effect on foodintake, meal pattern, and feeding behavior in rats.
Author Contributions: All authors contributed to the paper in the following ways: conception and design of thestudy (J.P., Y.F.Z.), acquisition of data (C.Q.T., X.C.Z., C.H.X.), analysis and interpretation of the data (J.P., C.Q.T.,H.K.W.), drafting the article (C.Q.T.), and final approval (J.P., C.Q.T., Y.F.Z.).
Conflicts of Interest: The authors declare no conflict of interest.
References
1. Raghad, A.; Hala, G.; Mohamad, A.; Omar, O. Meal pattern of male rats maintained on amino acidsupplemented diets: The effect of tryptophan, lysine, arginine, proline and threonine. Nutrients 2014,6, 2509–2522.
2. Schroeder, N.; Marquart, L.F.; Gallaher, D.D. The role of viscosity and fermentability of dietary fibers onsatiety- and adiposity-related hormones in rats. Nutrients 2013, 5, 2093–2113. [CrossRef] [PubMed]
3. Wanders, A.J.; Jonathan, M.C.; van den Borne, J.J.; Mars, M.; Schols, H.A.; Feskens, E.J.; de Graaf, C.The effects of bulking, viscous and gel-forming dietary fibres on satiation. Br. J. Nutr. 2013, 109, 1330–1337.[CrossRef] [PubMed]
4. Bortolotti, M.; Levorato, M.; Lugli, A.; Mazzero, G. Effect of a balanced mixture of dietary fibers on gastricemptying, intestinal transit and body weight. Ann. Nutr. Metab. 2008, 52, 221–226. [CrossRef] [PubMed]
5. Rendon-Huerta, J.A.; Juarez-Flores, B.; Pinos-Rodriguez, J.M.; Aguirre-Rivera, J.R.; Delgado-Portales, R.E.Effects of different sources of fructans on body weight, blood metabolites and fecal bacteria in normal andobese non-diabetic and diabetic rats. Plant Foods Hum. Nutr. 2012, 67, 64–70. [CrossRef] [PubMed]
6. Howarth, N.C.; Saltzman, E.; Roberts, S.B. Dietary fiber and weight regulation. Nutr. Rev. 2001, 59, 129–139.[CrossRef] [PubMed]
7. Li, J.; Zhang, N.; Hu, L.; Li, Z.; Li, R.; Li, C.; Wang, S. Improvement in chewing activity reduces energy intakein one meal and modulates plasma gut hormone concentrations in obese and lean young Chinese men. Am. J.
Clin. Nutr. 2011, 94, 709–716. [CrossRef] [PubMed]8. Zijlstra, N.; Mars, M.; de Wijk, R.A.; Westerterp-Plantenga, M.S.; de Graaf, C. The effect of viscosity on ad
libitum food intake. Int. J. Obes. 2008, 32, 676–683. [CrossRef] [PubMed]9. Dabin, B. Fibres for fertility: The inclusion of raw fibre in sow diets has many positive effects. In Feed Mix;
Misset International: Doetinchem, The Netherlands, 2006; pp. 18–21.10. Bergmann, J.F.; Chassany, O.; Petit, A.; Triki, R.; Caulin, C.; Segrestaa, J.M. Correlation between echographic
gastric emptying and appetite: Influence of psyllium. Gut 1992, 33, 1042–1043. [CrossRef] [PubMed]11. Phillips, R.J.; Powley, T.L. Tension and stretch receptors in gastrointestinal smooth muscle: Re-evaluating
vagal mechanoreceptor electrophysiology. Brain Res. Brain Res. Rev. 2000, 34, 1–26. [CrossRef]12. Heijboer, A.C.; Pijl, H.; van den Hoek, A.M.; Havekes, L.M.; Romijn, J.A.; Corssmit, E.P.M. Gut-brain axis:
Regulation of glucose metabolism. J. Neuroendocrinol. 2006, 18, 883–894. [CrossRef] [PubMed]13. Silva, E.; Birkenhake, M.; Scholten, E.; Sagis, L.M.C.; Linden, E.V.D. Controlling rheology and structure of
sweet potato starch noodles with high broccoli powder content by hydrocolloids. Food Hydrocoll. 2013, 30,42–52. [CrossRef]
14. Sun, H.Q.; Zhou, Y.F.; Tan, C.Q.; Zheng, L.F.; Peng, J.; Jiang, S.W. Effects of konjac flour inclusion in gestationdiets on the nutrient digestibility, lactation feed intake and reproductive performance of sows. Animal 2014,8, 1089–1094. [CrossRef] [PubMed]
15. Katsuraya, K.; Okuyama, K.; Hatanaka, K.; Oshima, R.; Sato, T.; Matsuzaki, K. Constitution of konjacglucomannan: Chemical analysis and 13 C NMR spectroscopy. Carbohydr. Polym. 2003, 53, 183–189. [CrossRef]
16. Chua, M.; Baldwin, T.C.; Hocking, T.J.; Chan, K. Traditional uses and potential health benefits ofAmorphophallus konjac K. Koch ex NEBr. J. Ethnopharmacol. 2010, 128, 268–278. [CrossRef] [PubMed]
184
Nutrients 2016, 8, 615
17. Shah, B.R.; Li, B.; Wang, L.; Liu, S.; Li, Y.; Wei, X.; Jin, W.; Li, Z. Health benefits of konjac glucomannan withspecial focus on diabetes. Bioact. Carbohydr. Diet. Fibre 2015, 5, 179–187. [CrossRef]
18. Tan, C.Q.; Wei, H.K.; Sun, H.Q.; Long, G.; Ao, J.T.; Jiang, S.W.; Peng, J. Effects of supplementing sow dietsduring two gestations with konjac flour and Saccharomyces boulardii on constipation in peripartal period,lactation feed intake and piglet performance. Anim. Feed Sci. Technol. 2015, 210, 254–262. [CrossRef]
19. Tan, C.Q.; Wei, H.K.; Ao, J.T.; Long, G.; Peng, J. Inclusion of konjac flour in the gestation diet changes the gutmicrobiota, alleviates oxidative stress, and improves insulin sensitivity in sows. Appl. Environ. Microbiol.
2016, 82, 5899–5909. [CrossRef] [PubMed]20. Sun, H.; Tan, C.; Wei, H.; Zou, Y.; Long, G.; Ao, J.; Xue, H.; Jiang, S.; Peng, J. Effects of different amounts
of konjac flour inclusion in gestation diets on physio-chemical properties of diets, postprandial satiety inpregnant sows, lactation feed intake of sows and piglet performance. Anim. Reprod. Sci. 2015, 152, 55–64.[CrossRef] [PubMed]
21. Copeland, L.; Blazek, J.; Salman, H.; Tang, M.C.M. Form and functionality of starch. Food Hydrocoll. 2009, 23,1527–1534. [CrossRef]
22. Shimotoyodome, A.; Suzuki, J.; Kameo, Y.; Hase, T. Dietary supplementation with hydroxypropyl-distarchphosphate from waxy maize starch increases resting energy expenditure by lowering the postprandialglucose-dependent insulinotropic polypeptide response in human subjects. Br. J. Nutr. 2011, 106, 96–104.[CrossRef] [PubMed]
23. Fuongfuchat, A.; Seetapan, N.; Makmoon, T.; Pongjaruwat, W.; Methacanon, P.; Gamonpilas, C. Linear andnon-linear viscoelastic behaviors of crosslinked tapioca starch/polysaccharide systems. J. Food Eng. 2012,109, 571–578. [CrossRef]
24. Mandala, I.G.; Bayas, E. Xanthan effect on swelling, solubility and viscosity of wheat starch dispersions.Food Hydrocoll. 2004, 18, 191–201. [CrossRef]
25. Paquet, É.; Bédard, A.; Lemieux, S.; Turgeon, S.L. Effects of apple juice-based beverages enriched with dietaryfibres and xanthan gum on the glycemic response and appetite sensations in healthy men. Bioact. Carbohydr.
Diet. Fibre 2014, 4, 39–47. [CrossRef]26. Tan, C.Q.; Wei, H.K.; Zhao, X.C.; Xu, C.H.; Peng, J. Effects of Water Binding Capacity and Swelling
Capacity of Soluble Fibers on Physicochemical Properties of Gastrointestinal Digesta and Food Intakein Rats. Food Nutr. Res. 2015, in press.
27. Glendinning, J.I.; Smith, J.C. Consistency of meal patterns in laboratory rats. Physiol. Behav. 1994, 56, 7–16.[CrossRef]
28. Halford, J.C.; Wanninayake, S.C.; Blundell, J.E. Behavioral satiety sequence (BSS) for the diagnosis of drugaction on food intake. Pharmacol. Biochem. Behav. 1998, 61, 159–168. [CrossRef]
29. Lira, L.A.; Almeida, L.C.A.; Silva, A.A.M.D.; Cavalcante, T.C.F.; Melo, D.D.C.B.D.; Souza, J.A.D.;Campina, R.C.F.; Souza, S.L.D. Perinatal undernutrition increases meal size and neuronal activation ofthe nucleus of the solitary tract in response to feeding stimulation in adult rats. Int. J. Dev. Neurosci. 2014, 38,23–29. [CrossRef] [PubMed]
30. Hadri, Z.; Chaumontet, C.; Fromentin, G.; Even, P.C.; Darcel, N.; Bouras, A.D.; Tome, D.; Rasoamanana, R.Long term ingestion of a preload containing fructo-oligosaccharide or guar gum decreases fat mass but notfood intake in mice. Physiol. Behav. 2015, 147, 198–204. [CrossRef] [PubMed]
31. Association of Official Analytical Chemists. Official Methods of Analysis, 16th ed.; AOAC International:Arlington, VA, USA, 1999.
32. Johansen, H.N.; Bach Knudsen, K.E.; Wood, P.J.; Fulcher, R.G. Physico-Chemical Properties and theDegradation of Oat Bran Polysaccharides in the Gut of Pigs. J. Sci. Food Agric. 1997, 73, 81–92. [CrossRef]
33. Serena, A.; Jorgensen, H.; Knudsen, K.E.B. Digestion of carbohydrates and utilization of energy in sowsfed diets with contrasting levels and physicochemical properties of dietary fiber. J. Anim. Sci. 2008, 86,2208–2216. [CrossRef] [PubMed]
34. Bosch, G.; Pellikaan, W.F.; Rutten, P.G.P.; van der Poel, A.F.B.; Verstegen, M.W.A.; Hendriks, W.H.Comparative in vitro fermentation activity in the canine distal gastrointestinal tract and fermentationkinetics of fiber sources. J. Anim. Sci. 2008, 86, 2979–2989. [CrossRef] [PubMed]
35. Orozco-Solis, R.; Lopes-de-Souza, S.; Barbosa Matos, R.J.; Grit, I.; Le-Bloch, J.; Nguyen, P.;Manhaes-de-Castro, R.; Bolanos-Jimenez, F. Perinatal undernutrition-induced obesity is independent of thedevelopmental programming of feeding. Physiol. Behav. 2009, 96, 481–492. [CrossRef] [PubMed]
185
Nutrients 2016, 8, 615
36. Labouré, H.; Saux, S.; Nicolaidis, S. Effects of food texture change on metabolic parameters: Short- andlong-term feeding patterns and body weight. Am. J. Physiol. Regul. Integr. Comp. Physiol. 2001, 280, R780–R789.[PubMed]
37. Rasoamanana, R.; Even, P.C.; Darcel, N.; Tomé, D.; Fromentin, G. Dietary fibers reduce food intake bysatiation without conditioned taste aversion in mice. Physiol. Behav. 2013, 17, 13–19. [CrossRef] [PubMed]
38. Alles, M.S.; de Roos, N.M.; Bakx, J.C.; van de Lisdonk, E.; Zock, P.L.; Hautvast, G.A. Consumption offructooligosaccharides does not favorably affect blood glucose and serum lipid concentrations in patientswith type 2 diabetes. Am. J. Clin. Nutr. 1999, 69, 64–69. [PubMed]
39. Da Silva, C.S.; Bosch, G.; Bolhuis, J.E.; Stappers, L.J.N.; van Hees, H.M.J.; Gerrits, W.J.J.; Kemp, B. Effects ofalginate and resistant starch on feeding patterns, behaviour and performance in ad libitum-fed growing pigs.Animal 2014, 8, 1917–1927. [CrossRef] [PubMed]
40. Eidam, D.C.D.; Kuhn, K.; Stute, R. Formation of Maize Starch Gels Selectively Regulated by the Additionof Hydrocolloids. Starch Stärke 1995, 47, 378–384. [CrossRef]
41. Sudhakar, V.; Singhal, R.S.; Kulkarni, P.R. Effect of salts on interactions of starch with guar gum.Food Hydrocoll. 1996, 10, 329–334. [CrossRef]
42. Biliaderis, C.G.; Arvanitoyannis, I.; Izydorczyk, M.S.; Prokopowich, D.J. Effect of Hydrocolloids onGelatinization and Structure Formation in Concentrated Waxy Maize and Wheat Starch Gels. Starch Stärke
1997, 49, 278–283. [CrossRef]43. Eerlingen, R.C.; Jacobs, H.; Delcour, J.A. Enzyme-resistant starch. V. Effect of retrogradation of waxy maize
starch on enzyme susceptibility. Cereal Chem. 1994, 71, 351–355.44. Liljeberg, H.G.; Akerberg, A.K.; Björck, I.M. Effect of the glycemic index and content of indigestible
carbohydrates of cereal-based breakfast meals on glucose tolerance at lunch in healthy subjects. Am. J.
Clin. Nutr. 1999, 69, 647–655. [PubMed]45. Raben, A.; Tagliabue, A.; Christensen, N.J.; Madsen, J.; Holst, J.J.; Astrup, A. Resistant starch: The effect on
postprandial glycemia, hormonal response, and satiety. Am. J. Clin. Nutr. 1994, 60, 544–551. [PubMed]46. Burton-Freeman, B. Dietary fiber and energy regulation. J. Nutr. 2000, 130, 272S–275S. [PubMed]47. Kristensen, M.; Jensen, M.G. Dietary fibres in the regulation of appetite and food intake. Importance of viscosity.
Appetite 2011, 56, 65–70. [CrossRef] [PubMed]48. Moran, T.H.; Ladenheim, E.E.; Schwartz, G.J. Within-meal gut feedback signaling. Int. J. Obes. Relat.
Metab. Disord. 2001, 25, S39–S41. [CrossRef] [PubMed]49. Schwartz, G. Integrative capacity of the caudal brainstem in the control of food intake. Philos. Trans. R. Soc.
B Biol. Sci. 2006, 361, 1275–1280. [CrossRef] [PubMed]50. Blackwood, A.D.; Salter, J.; Dettmar, P.W.; Chaplin, M.F. Dietary fibre, physicochemical properties and their
relationship to health. J. R. Soc. Promot. Health 2000, 120, 242–247. [CrossRef] [PubMed]51. Slavin, J.; Savarino, V.; Paredes-Diaz, A.; Fotopoulos, G. A review of the role of soluble fiber in health with
specific reference to wheat dextrin. J. Int. Med. Res. 2009, 37, 1–17. [CrossRef] [PubMed]52. Fiszman, S.; Varela, P. The role of gums in satiety/satiation. A review. Food Hydrocoll. 2013, 32, 147–154.
[CrossRef]53. Yang, H.-F.; Chen, H.-L. Utilization of Gum Dietary Fibers by the Human Fecal Inoculum in the Static
Fermentation Culture System. Taiwan J. Agric. Chem. Food Sci. 2008, 46, 183–189.54. Tilg, H.; Moschen, A.R. Microbiota and diabetes: An evolving relationship. Gut 2014, 63, 1513–1521.
[CrossRef] [PubMed]55. Del, P.A.; Iadevaia, M.; Loguercio, C. The role of gut hormones in controlling the food intake: What is their
role in emerging diseases? Endocrinol. Nutr. 2012, 59, 197–206.56. Woodward, A.D.; Regmi, P.R.; Gänzle, M.G.; van Kempen, T.A.; Zijlstra, R.T. Slowly digestible starch
influences mRNA abundance of glucose and short-chain fatty acid transporters in the porcine distalintestinal tract. J. Anim. Sci. 2012, 90, 80–82. [CrossRef] [PubMed]
57. Frost, G.; Sleeth, M.L.; Sahuri-Arisoylu, M.; Lizarbe, B.; Cerdan, S.; Brody, L.; Anastasovska, J.; Ghourab, S.;Hankir, M.; Shuai, Z. The short-chain fatty acid acetate reduces appetite via a central homeostatic mechanism.Nat. Commun. 2014, 5, 3611. [CrossRef] [PubMed]
58. Byrne, C.S.; Chambers, E.S.; Alhabeeb, H.; Chhina, N.; Morrison, D.J.; Preston, T.; Tedford, C.; Fitzpatrick, J.;Irani, C.; Busza, A. Increased colonic propionate reduces anticipatory reward responses in the humanstriatum to high-energy foods123. Am. J. Clin. Nutr. 2016, 188, 724–732.
186
Nutrients 2016, 8, 615
59. Higgins, J.A. Resistant starch: Metabolic effects and potential health benefits. J. AOAC Int. 2004, 87, 761–768.[CrossRef] [PubMed]
60. Leeuw, J.A.D.; Jongbloed, A.W.; Spoolder, H.A.M.; Verstegen, M.W.A. Effects of hindgut fermentation ofnon-starch polysaccharides on the stability of blood glucose and insulin levels and physical activity inempty sows. Livest. Prod. Sci. 2005, 96, 165–174. [CrossRef]
61. De Leeuw, J.A.; Jongbloed AWVerstegen, M.W. Dietary Fiber Stabilizes Blood Glucose and Insulin Levelsand Reduces Physical Activity in Sows (Sus scrofa). J. Nutr. 2004, 134, 1481–1486. [PubMed]
62. Sengupta, P. The Laboratory Rat: Relating Its Age With Human’s. Int. J. Prev. Med. 2013, 4, 624–630.[PubMed]
63. Food and Drug Administration. Guidance for Industry: Estimating the Maximum Safe Starting Dose in Initial
Clinical Trials for Therapeutics in Adult Healthy Volunteers; Food and Drug Administration: Washington, DC,USA, 2005.
64. Reagan-Shaw, S.; Nihal, M.; Ahmad, N. Dose translation from animal to human studies revisited. FASEB J.
2008, 22, 659–661. [CrossRef] [PubMed]
© 2016 by the authors. Licensee MDPI, Basel, Switzerland. This article is an open accessarticle distributed under the terms and conditions of the Creative Commons Attribution(CC BY) license (http://creativecommons.org/licenses/by/4.0/).
187
nutrients
Article
Effect of Fibre Supplementation on Body Weight andComposition, Frequency of Eating and Dietary Choicein Overweight Individuals
Vicky A. Solah 1,*, Deborah A. Kerr 1, Wendy J. Hunt 1, Stuart K. Johnson 1, Carol J. Boushey 2,
Edward J. Delp 3, Xingqiong Meng 4, Roland J. Gahler 5, Anthony P. James 1,6,
Aqif S. Mukhtar 1,7, Haelee K. Fenton 1 and Simon Wood 1,8,9
1 School of Public Health, Faculty of Health Sciences, Curtin University, Perth WA 6845, Australia;[email protected] (D.A.K.); [email protected] (W.J.H.); [email protected] (S.K.J.);[email protected] (A.P.J.); [email protected] (A.S.M.); [email protected] (H.K.F.);[email protected] (S.W.)
2 Epidemiology Program, University of Hawaii Cancer Center, Honolulu, HI 96813, USA;[email protected]
3 Video and Image Processing Laboratory, School of Electrical and Computer Engineering, Purdue University,West Lafayette, IN 47907, USA; [email protected]
4 Flinders Centre for Innovation in Cancer, School of Medicine, Flinders University, Adelaide 5001, Australia;[email protected]
5 Factors Group R & D, Burnaby, BC V3N4S9, Canada; [email protected] Curtin Health Innovation Research Institute, Faculty of Health Sciences, Curtin University,
Perth WA 6845, Australia7 Centre for Population Health Research, Faculty of Health Sciences, Curtin University,
Perth WA 6845, Australia8 InovoBiologic Inc., Calgary, AB Y2N4Y7, Canada9 Food, Nutrition and Health Program, University of British Columbia, Vancouver, BC V6T1Z4, Canada* Correspondence: [email protected]; Tel.: +61-8-9266-2771; Fax: +61-8-9266-2958
Received: 12 December 2016; Accepted: 13 February 2017; Published: 16 February 2017
Abstract: Fibre supplementation can potentially reduce energy intake and contribute to weightloss. The mechanism may be reduced frequency of eating, resulting in reduced food consumption.The objective of this research was to determine the effectiveness of fibre supplementation withPolyGlycopleX® (PGX®), on body weight and composition, frequency of eating and dietary intake in118 overweight adults. In a three-arm, parallel, blind, randomised controlled trial participants wererandomised to one of three groups; 4.5 g PGX as softgels (PGXS), 5 g PGX granules (PGXG) or 5 g riceflour (RF) control. Prior to supplementation and at 12 weeks, participants captured before and afterimages of all food and beverages consumed within 4 days using a mobile food record app (mFR).The mFR images were analysed for food group serving sizes and number of eating occasions. In thePGXG group, per-protocol analysis showed there was a significant reduction in waist circumference(2.5 cm; p = 0.003). Subgroup analysis showed that PGXG supplementation at the recommended doseresulted in a reduction in body weight (−1.4 ± 0.10 kg, p < 0.01), body mass index (BMI) reduction(−0.5 ± 0.10, p < 0.01), reduced number of eating occasions (−1.4 ± 1.2, p < 0.01) and a reducedintake of grain food (−1.52 ± 1.84 serves, p = 0.019). PGXG at the recommended dose resulted in areduction in weight and BMI which was significantly greater than that for RF (p = 0.001). These resultsdemonstrate the potential benefits of PGX fibre in controlling frequency of eating and in weight loss.
Keywords: fibre; weight; waist circumference; frequency; eating; PolyGlycopleX® (PGX)
Nutrients 2017, 9, 149 188 www.mdpi.com/journal/nutrients
Nutrients 2017, 9, 149
1. Introduction
The burden of chronic disease in many countries is increasing concomitant with the percentageof the population with a high body mass index (BMI) [1]. Providing tools to improve the healthinessof the food environment and assisting people to make healthy food choices are important in theprevention of excessive weight gain [1].
Dietary pattern evidence has shown that higher dietary quality i.e. consumption of mainly wholegrains, vegetables, fruit, nuts, legumes, seafood, plant protein and low-fat dairy leads to markedreductions in all-cause, cardiovascular disease and cancer mortality [2,3]. Similarly, a healthy dietarypattern which includes consumption of fruits, vegetables, grains, combined with a lower intake ofsweets, red meat and processed meat, lowers the risk of developing colorectal cancer [4].
Evidence supports the role of dietary fibre in improving metabolic health. A higher intake of fibreis associated with increased satiety and reduced energy intake and therefore may be important inobesity management [5–11].
Total fibre is the sum of both dietary fibre (complete, intrinsic non-digestible plant carbohydrates,lignin) and functional fibres (non-digestible carbohydrates that have been isolated but still havebeneficial physiological effects) [12]. What constitutes a ‘beneficial physiological effect’ and the level ofevidence required for this to be substantiated remains unspecified [13]. Solubility or the ability of a fibreto dissolve in water will affect water holding capacity, viscosity and fermentability [11]. The propertiesof fibre that are associated with appetite, energy intake and body weight include solubility [11].Solubility remains a common classification technique, although it has been suggested that fibres shouldbe categorised according to functional properties such as viscosity and fermentability [14], since not allfibre is equal in delivering a beneficial physiological effect.
PolyGlycopleX (PGX) is a commercial functional fibre complex, manufactured by a proprietaryprocess (EnviroSimplex®) from three dietary fibres: konjac glucomannan, sodium alginate, and xanthangum [9]. PGX is a soluble viscous non-starch polysaccharide complex that has been identified ascontributing to improved satiety, lipidaemia and glycaemia [8–10,15,16].
In the modern food environment both portion size and frequency of eating have increased inthe population [17]. Mattes [17] has suggested that increased frequency of eating is a major factorin weight gain and is linked to the increased energy intake and rising BMI trends. In addition tofrequency of eating, the types and amount of food and beverages consumed at an eating occasionmay influence energy intake. Aljuraiban et al. [18] suggest that modifying eating behaviour throughmore frequent meals of low energy density and high nutrient quality may be an important approachto controlling obesity.
A challenge for understanding the contribution of dietary factors is our ability to measure diet.This is even more difficult in overweight and obese participants who are more prone to misreportingor underreporting their energy intake [19,20]. In addition, details such as time of eating is importantin examining eating frequency and are difficult to accurately capture with paper-based methods.Advancement in technology has made available new image-based food recording systems such asthose using a mobile food record app (mFR) [21–25]. Among the advantages of mFRs is the provisionof real-time data capture which allows for the extraction of information from the images on the timingand location of the eating occasion, without relying on individuals to report these details [22,23].Thus the mFR app allows for more accurate capture of time of eating while reducing the burden to theparticipant of reporting food consumption [23,24]. A unique aspect of this study was the use of themFR to capture frequency of eating and dietary intake.
The objective of this research was to determine the effectiveness of diet supplementation withthe viscous and gel-forming fibre, PolyGlycopleX (PGX), on body weight and composition and todetermine if frequency of eating and diet can explain subsequent changes in 118 overweight adults.
189
Nutrients 2017, 9, 149
2. Materials and Methods
2.1. Study Design
A three-arm, parallel, blind, randomised control trial was conducted to determine whether PGXsupplementation would promote weight loss and reduce waist circumference and BMI, change dietarypatterns and reduce the frequency of eating or number of eating occasions. Participants (118 in total)were divided between three groups, 4.5 g PGX as softgels (PGXS), 5 g PGX granules (PGXG) and 5 grice flour (RF) control, (Figure 1) and were assessed at baseline and 12 weeks. This trial was registeredwith the Australian New Zealand Clinical Trials Registry (reference ACTRN12614000701628).
The food images sent via the mFR were stored by a participant identification number (ID) only.No personal information was stored with the images. The research was conducted in accordancewith the principles proposed by the Australian Association for Research in Education (AARE),the Australian Vice-Chancellor’s Committee (AVCC) and the National Health and Medical ResearchCouncil (NHMRC). The study was conducted in accordance with the Declaration of Helsinkiand ethics approval was granted by the Human Research Ethics Committee, Curtin University(reference HR170/2014).
2.2. Study Participants
Participants, aged 25–70 years and with BMI 25–35 kg/m2 were recruited through advertisementson Curtin University radio, as well as email communication systems. Individuals that expressed interestwere screened for eligibility by completing a screening questionnaire. Participants were excluded ifthey were: (a) pregnant; (b) unable to complete the 12-week study; (c) undertaking extreme forms ofexercise or dieting; (d) unable to attend the study centre; or (e) had an allergy to any food ingredientused in the study; (f) had previous or current renal, liver or respiratory failure; (g) had previous gastricor weight-loss surgery; (h) had any malabsorption conditions or (i) had current or recent dietary fibresupplementation. The participant flow diagram (Figure 1) lists the reasons for exclusion. Once assessedas eligible, further details of the study were provided and informed consent obtained.
2.3. Baseline Assessments
Participants who met the selection criteria had height, weight and waist circumferenceanthropometric measurements taken at baseline. A portable stadiometer was used to measure height;weight was measured using a pre-calibrated digital scale and waist was measured as described byNorton and Olds [26]. To electronically record food consumption, iPods with mFR application installedwere given to the participants, who were asked to keep a 4-day mFR at baseline and during the twelfthweek of the study.
Before beginning their baseline image-based 4-day food record, all participants received a30-minute interactive training session by a single researcher who conducted individual or smallgroup training sessions using PowerPoint slides on how to connect the iPod to the Wi-Fi and howto use the mFR app. Training sessions were held at Curtin University in a room with Wi-Fi access.The inclusion of a fiducial marker (a checkerboard pattern of known shape, size and colour) in all foodrecord images gave a known reference of dimension and markings to assist with food identificationand portion size estimation [25]. During training, participants were able to practice taking before andafter images using food models. Collected food record images were automatically uploaded fromthe iPod touch, when in Wi-Fi range. The iPods were coded with the participant ID ensuring eachimage was tagged with the participant ID, date and time of eating occasion. Participant ID was usedto identify the images on the server. The server was accessible by researchers only via password.
Prior to the commencement of supplementation and during the twelfth week of the study,participants took before and after images of all foods and drinks (excluding water) consumed overfour consecutive days. Food consumption during the entire study was ad libitum.
190
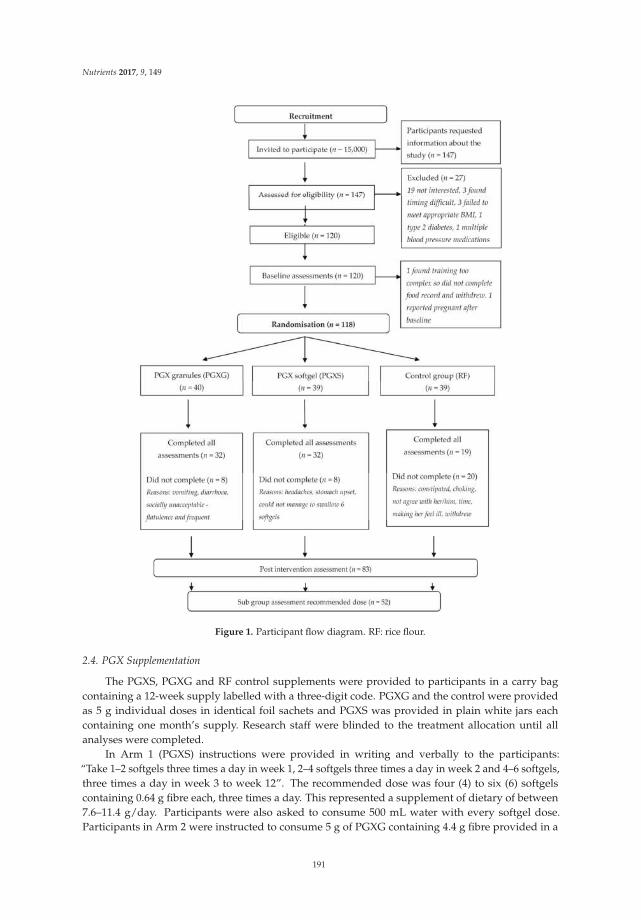
Nutrients 2017, 9, 149
Figure 1. Participant flow diagram. RF: rice flour.
2.4. PGX Supplementation
The PGXS, PGXG and RF control supplements were provided to participants in a carry bagcontaining a 12-week supply labelled with a three-digit code. PGXG and the control were providedas 5 g individual doses in identical foil sachets and PGXS was provided in plain white jars eachcontaining one month’s supply. Research staff were blinded to the treatment allocation until allanalyses were completed.
In Arm 1 (PGXS) instructions were provided in writing and verbally to the participants:“Take 1–2 softgels three times a day in week 1, 2–4 softgels three times a day in week 2 and 4–6 softgels,three times a day in week 3 to week 12”. The recommended dose was four (4) to six (6) softgelscontaining 0.64 g fibre each, three times a day. This represented a supplement of dietary of between7.6–11.4 g/day. Participants were also asked to consume 500 mL water with every softgel dose.Participants in Arm 2 were instructed to consume 5 g of PGXG containing 4.4 g fibre provided in a
191
Nutrients 2017, 9, 149
single dose foil sachet taken three times a day just before or with meals over the 12-week interventionperiod. This represented a supplement of dietary fibre of 12.2 g/day. Those in Arm 3 were providedwith 5 g of RF containing 4 g fibre in the same dose format as the PGXG, representing 12 g fibre/day.RF was selected due to its neutral taste and hypoallergenicity, and it has a similar dietary fibre content,energy, colour and texture to PGX [7]. The recommended dose was 1 sachet, three times per day.Directions were “Stir 1 sachet into your meal or in a drink and consume immediately. You mustconsume 500mL of water each time you take a sachet.” Participants were also advised that “If you haveany discomfort, reduce the dose to 1 sachet a day for week 1, 2 sachets for week 2 and 3 sachets week 3to week 12. Contact the researcher to discuss any issues.” Participants were informed of the importanceof consuming water with the supplement as well as the possible gastrointestinal effects of fibre such asdiarrhoea, bloating and flatulence as described in research by Kacinik et al. [7]. All participants wereinstructed to record their daily sachet or softgel intake and report in person to the researcher at the endof week 12 of the intervention.
2.5. Post-Intervention Assessments
At the end of the 12-week intervention period, measurement of participants’ height, weight andwaist circumference were repeated, along with the 4-day mFR being repeated during week 12. At theend of the 12-week intervention, during the final meeting participants reported the number of doses tothe interviewer and data were recorded in participant files.
2.6. Dietary Analysis
A researcher reviewed the 4-day food record images and as needed, confirmed the content ofimages with participants. Eating occasions were defined as all food and beverages (except water)and were taken from the image metadata and any additional notes supplied by the participant.Eating occasions were categorised as beverage only, food only, single item, food and beverage or fibreonly. The images of fibre also allowed dose of fibre taken to be determined. Analysis was conducted tomeasure any change in eating occasions from baseline to study week 12.
Images were analysed and eating occasions, types of foods and serving sizes were entered into adatabase specifically designed to capture the number of eating occasions and food groups according tothe Australian Guide to Healthy Eating food group serves (vegetables, fruit, grain (cereal) foods, mostlywholegrain and/or high cereal fibre varieties, lean meats and poultry, fish, eggs, tofu, nuts and seedsand legumes/beans, milk, yoghurt cheese and/or alternatives, mostly reduced fat) (NHMRC 2013)plus junk food (Table 1).
The primary outcome variables measured at baseline and at the end of the intervention were:changes in weight, waist circumference and BMI; eating occasions and foods consumed each dayclassified as serves of junk food (energy-dense nutrient poor), grain (cereal), meat, dairy, fruits andvegetables for the three intervention groups. Within each intervention group, participants were furthercategorised into fibre dose compliance level and number of eating occasions and the primary outcomesfor this subgroup were also evaluated.
2.7. Statistical Analysis
Per-protocol analyses were performed and reported. The distribution of all outcome variables,weight, waist and BMI were checked by construction of histograms to check normality. A mixed effectmodel with clustering of participants’ ID and robust variance-covariance estimation were used toassess outcome variables. For per-protocol analysis, only those who completed the study at week12 were included and missing values were not imputed. Further analysis of subgroups by actualdose consumed was performed and reported. All tests were two tailed and a p value < 0.05 wasregarded as statistically significant. All analyses were performed using Stata MP 14.1 (Stata Corp.,College Station, TX, USA).
192
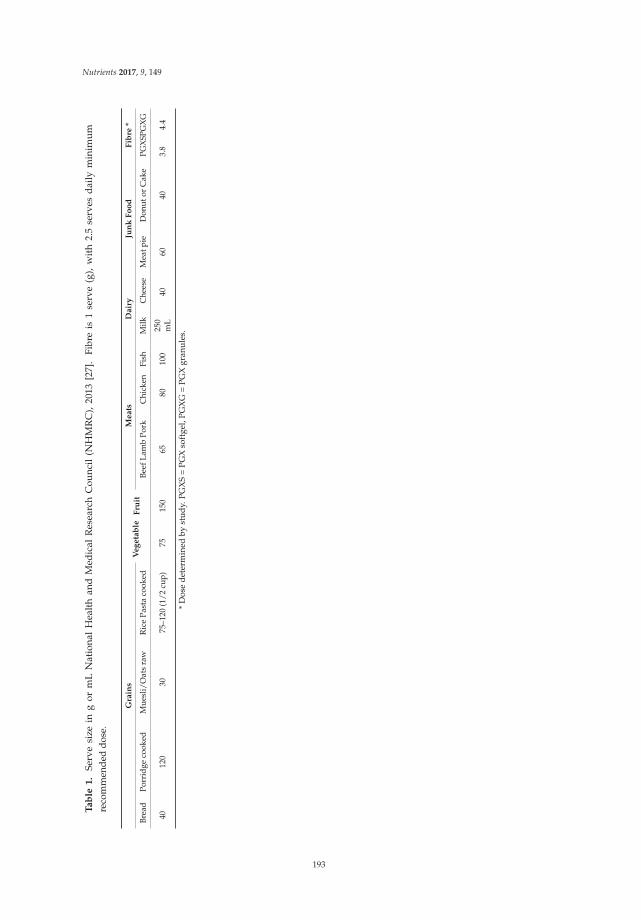
Nutrients 2017, 9, 149
Ta
ble
1.
Serv
esi
zein
gor
mL
Nat
iona
lH
ealt
han
dM
edic
alR
esea
rch
Cou
ncil
(NH
MR
C),
2013
[27]
.Fi
bre
is1
serv
e(g
),w
ith
2.5
serv
esd
aily
min
imu
mre
com
men
ded
dose
.
Gra
ins
Ve
ge
tab
leF
ruit
Me
ats
Da
iry
Jun
kF
oo
dF
ibre
*
Brea
dPo
rrid
geco
oked
Mue
sli/
Oat
sra
wR
ice
Past
aco
oked
Beef
Lam
bPo
rkC
hick
enFi
shM
ilkC
hees
eM
eatp
ieD
onut
orC
ake
PGX
SPG
XG
4012
030
75–1
20(1
/2cu
p)75
150
6580
100
250
mL
4060
403.
84.
4
*D
ose
dete
rmin
edby
stud
y.PG
XS
=PG
Xso
ftge
l,PG
XG
=PG
Xgr
anul
es.
193
Nutrients 2017, 9, 149
3. Results
3.1. Baseline Characteristics
3.1.1. Per-Protocol Analysis
Baseline measurements showing of all recruited participant characteristics according to treatmentgroup are shown in Table 2. There were 92 females and 28 males, evenly distributed across thethree treatment groups. In total 83 of the 118 participants (63% retention) completed the 12-weekstudy. Greater attrition was observed in the first two weeks of the supplementation for participantswho reported stomach upsets and diarrhoea after PGXG consumption (attrition = 6); who reporteddiarrhoea, headaches, difficulty swallowing recommended PGXS dose (attrition = 6) and during thefirst six weeks of supplementation in the RF group (attrition = 15) due to constipation and feeling ill.
Baseline data (Table 2) shows the characteristics of study participants randomised (n = 118) andshows that at baseline there were no significant differences (p > 0.05) in age, height, weight, waistcircumference, BMI and food group servings across three groups. At baseline PGXS participants hadsimilar baseline frequency of eating (number of eating occasions) to the PGXG and RF participants butthose allocated to the PGXG intervention had a significantly greater number of eating occasions perday than those allocated to the RF intervention (p = 0.04) (Table 2).
Table 2. Characteristics of all recruited study participants randomised at baseline (n = 120)comparing groups.
All Participants PGXS (n = 40) PGXG (n = 40) RF (n = 40)
Men 9 10 9Women 31 30 31
Mean ± SDAge (years) 42.2 ± 16.0 46.5 ± 14.0 43.3 ± 16.8Height (cm) 167.4 ± 9.1 167.3 ± 9.0 166.4 ± 7.9Weight (kg) 82.7 ± 16.8 80.9 ± 16.6 81.3 ± 17.7Waist (cm) 89.8 ± 12.8 90.7 ± 12.1 88.4 ± 14.3
Body Mass Index (BMI, kg/m2) 29.4 ± 4.8 28.7 ± 4.4 29.2 ± 4.8Eating occasions per day 5.4 ± 2.8 6.3 ± 2.0 4.8 ± 2.1
Food group servings (mean daily serves ± SD)Fruit (150 g) 0.8 ± 0.8 1.0 ± 1.0 1.1 ± 1.2
Vegetable (75 g) 2.4 ± 1.5 2.6 ± 1.4 2.5 ± 1.1Grain (cereal) (40 g bread, 75–120 g cooked rice, pasta etc. or 500 kJ) 3.8 ± 1.8 4.3 ± 2.2 4 .0 ± 1.5
Dairy (250 mL milk, 40 g cheese or 500–600 kJ) 1.3 ± 0.9 1.6 ± 0.8 1.3 ± 0.8Junk food (60 g meat pie or hot chips, 40 g donut or cake) 3.5 ± 1.9 3.1 ± 1.6 3.0 ± 1.7
Meat (65 g meat, 100 g fish or 500–699 kJ) 1.0 ± 0.7 1.6 ± 0.8 1.4 ± 0.7Alcohol (150 mL) 0.5 ± 0.8 0.4 ± 0.5 0.1 ± 0.2
PGXS = PGX softgel, PGXG = PGX granules, RF = Rice Flour. SD = Standard Deviation.
3.1.2. Subgroup Analysis
Baseline measurements according to treatment group showing participant characteristics of allwho consumed the recommended dose of fibre supplements are shown in Table 3. Baseline data(Table 3) shows the characteristics of study participants (n = 54) and shows that at baseline therewere no significant differences (p > 0.05) in weight, waist circumference and BMI across three groups.PGXG and RF intervention sub-group numbers of eating occasions per day were not significantlydifferent to each other or to the baseline group but the PGXS subgroup number of eating occasionswas 7.4 times per day (Table 3).
194
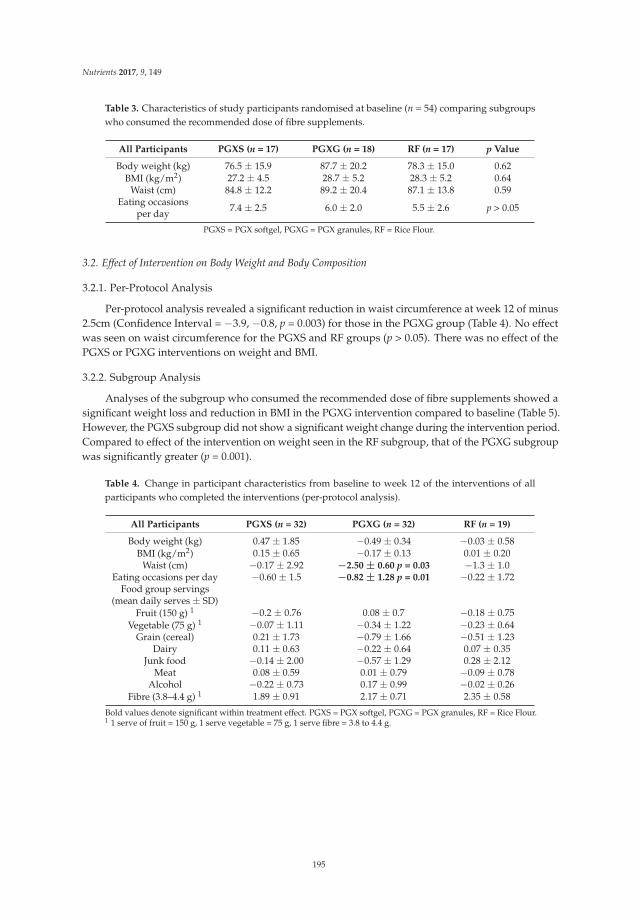
Nutrients 2017, 9, 149
Table 3. Characteristics of study participants randomised at baseline (n = 54) comparing subgroupswho consumed the recommended dose of fibre supplements.
All Participants PGXS (n = 17) PGXG (n = 18) RF (n = 17) p Value
Body weight (kg) 76.5 ± 15.9 87.7 ± 20.2 78.3 ± 15.0 0.62BMI (kg/m2) 27.2 ± 4.5 28.7 ± 5.2 28.3 ± 5.2 0.64
Waist (cm) 84.8 ± 12.2 89.2 ± 20.4 87.1 ± 13.8 0.59Eating occasions
per day 7.4 ± 2.5 6.0 ± 2.0 5.5 ± 2.6 p > 0.05
PGXS = PGX softgel, PGXG = PGX granules, RF = Rice Flour.
3.2. Effect of Intervention on Body Weight and Body Composition
3.2.1. Per-Protocol Analysis
Per-protocol analysis revealed a significant reduction in waist circumference at week 12 of minus2.5cm (Confidence Interval = −3.9, −0.8, p = 0.003) for those in the PGXG group (Table 4). No effectwas seen on waist circumference for the PGXS and RF groups (p > 0.05). There was no effect of thePGXS or PGXG interventions on weight and BMI.
3.2.2. Subgroup Analysis
Analyses of the subgroup who consumed the recommended dose of fibre supplements showed asignificant weight loss and reduction in BMI in the PGXG intervention compared to baseline (Table 5).However, the PGXS subgroup did not show a significant weight change during the intervention period.Compared to effect of the intervention on weight seen in the RF subgroup, that of the PGXG subgroupwas significantly greater (p = 0.001).
Table 4. Change in participant characteristics from baseline to week 12 of the interventions of allparticipants who completed the interventions (per-protocol analysis).
All Participants PGXS (n = 32) PGXG (n = 32) RF (n = 19)
Body weight (kg) 0.47 ± 1.85 −0.49 ± 0.34 −0.03 ± 0.58BMI (kg/m2) 0.15 ± 0.65 −0.17 ± 0.13 0.01 ± 0.20
Waist (cm) −0.17 ± 2.92 −2.50 ± 0.60 p = 0.03 −1.3 ± 1.0Eating occasions per day −0.60 ± 1.5 −0.82 ± 1.28 p = 0.01 −0.22 ± 1.72
Food group servings(mean daily serves ± SD)
Fruit (150 g) 1 −0.2 ± 0.76 0.08 ± 0.7 −0.18 ± 0.75Vegetable (75 g) 1 −0.07 ± 1.11 −0.34 ± 1.22 −0.23 ± 0.64
Grain (cereal) 0.21 ± 1.73 −0.79 ± 1.66 −0.51 ± 1.23Dairy 0.11 ± 0.63 −0.22 ± 0.64 0.07 ± 0.35
Junk food −0.14 ± 2.00 −0.57 ± 1.29 0.28 ± 2.12Meat 0.08 ± 0.59 0.01 ± 0.79 −0.09 ± 0.78
Alcohol −0.22 ± 0.73 0.17 ± 0.99 −0.02 ± 0.26Fibre (3.8–4.4 g) 1 1.89 ± 0.91 2.17 ± 0.71 2.35 ± 0.58
Bold values denote significant within treatment effect. PGXS = PGX softgel, PGXG = PGX granules, RF = Rice Flour.1 1 serve of fruit = 150 g, 1 serve vegetable = 75 g, 1 serve fibre = 3.8 to 4.4 g.
195
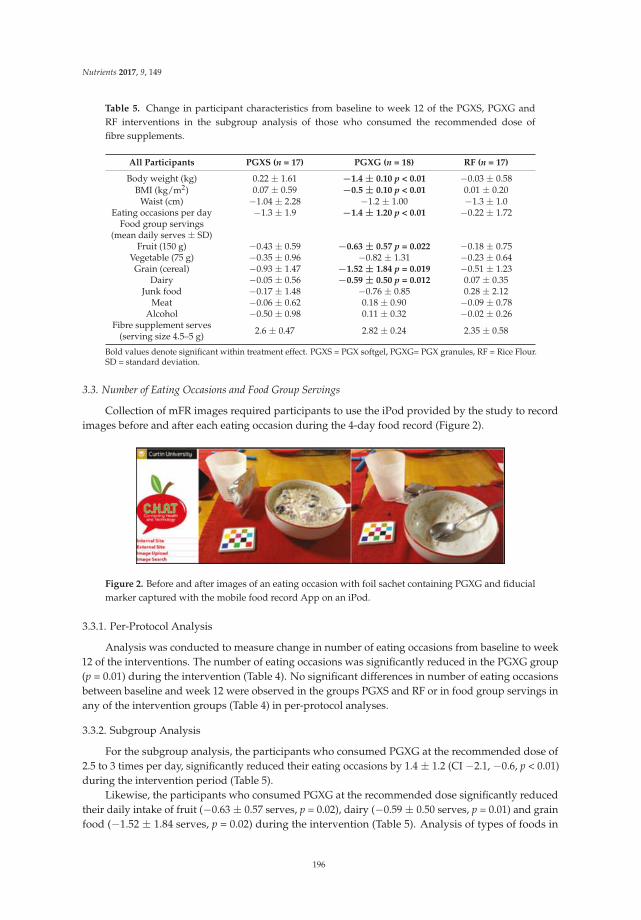
Nutrients 2017, 9, 149
Table 5. Change in participant characteristics from baseline to week 12 of the PGXS, PGXG andRF interventions in the subgroup analysis of those who consumed the recommended dose offibre supplements.
All Participants PGXS (n = 17) PGXG (n = 18) RF (n = 17)
Body weight (kg) 0.22 ± 1.61 −1.4 ± 0.10 p < 0.01 −0.03 ± 0.58BMI (kg/m2) 0.07 ± 0.59 −0.5 ± 0.10 p < 0.01 0.01 ± 0.20
Waist (cm) −1.04 ± 2.28 −1.2 ± 1.00 −1.3 ± 1.0Eating occasions per day −1.3 ± 1.9 −1.4 ± 1.20 p < 0.01 −0.22 ± 1.72
Food group servings(mean daily serves ± SD)
Fruit (150 g) −0.43 ± 0.59 −0.63 ± 0.57 p = 0.022 −0.18 ± 0.75Vegetable (75 g) −0.35 ± 0.96 −0.82 ± 1.31 −0.23 ± 0.64Grain (cereal) −0.93 ± 1.47 −1.52 ± 1.84 p = 0.019 −0.51 ± 1.23
Dairy −0.05 ± 0.56 −0.59 ± 0.50 p = 0.012 0.07 ± 0.35Junk food −0.17 ± 1.48 −0.76 ± 0.85 0.28 ± 2.12
Meat −0.06 ± 0.62 0.18 ± 0.90 −0.09 ± 0.78Alcohol −0.50 ± 0.98 0.11 ± 0.32 −0.02 ± 0.26
Fibre supplement serves(serving size 4.5–5 g) 2.6 ± 0.47 2.82 ± 0.24 2.35 ± 0.58
Bold values denote significant within treatment effect. PGXS = PGX softgel, PGXG= PGX granules, RF = Rice Flour.SD = standard deviation.
3.3. Number of Eating Occasions and Food Group Servings
Collection of mFR images required participants to use the iPod provided by the study to recordimages before and after each eating occasion during the 4-day food record (Figure 2).
Figure 2. Before and after images of an eating occasion with foil sachet containing PGXG and fiducialmarker captured with the mobile food record App on an iPod.
3.3.1. Per-Protocol Analysis
Analysis was conducted to measure change in number of eating occasions from baseline to week12 of the interventions. The number of eating occasions was significantly reduced in the PGXG group(p = 0.01) during the intervention (Table 4). No significant differences in number of eating occasionsbetween baseline and week 12 were observed in the groups PGXS and RF or in food group servings inany of the intervention groups (Table 4) in per-protocol analyses.
3.3.2. Subgroup Analysis
For the subgroup analysis, the participants who consumed PGXG at the recommended dose of2.5 to 3 times per day, significantly reduced their eating occasions by 1.4 ± 1.2 (CI −2.1, −0.6, p < 0.01)during the intervention period (Table 5).
Likewise, the participants who consumed PGXG at the recommended dose significantly reducedtheir daily intake of fruit (−0.63 ± 0.57 serves, p = 0.02), dairy (−0.59 ± 0.50 serves, p = 0.01) and grainfood (−1.52 ± 1.84 serves, p = 0.02) during the intervention (Table 5). Analysis of types of foods in
196
Nutrients 2017, 9, 149
the mFR showed that 1.6 to 2 serves of the grain food consumed at baseline were white bread forthese participants. This consumption of white bread for the PGXG group also dropped significantly to0.74 serves per day at 12 weeks of intervention.
3.4. Adverse Events
Adverse effects reported by the participants were mild and agreed with common reportedreactions to increased fibre, for example those reported by Kacinik et al. (2011) [7] where for PGXsupplementation, 30.9 % of participants reported diarrhoea, bloating and flatulence whereas for riceflour consumption 7.8% reported constipation.
4. Discussion
This 12 week randomised controlled study showed that when consumed at the recommendeddose (subgroup), the PGXG intervention gave a reduction in BMI and body weight, the number ofeating occasions per day and consumption of servings of grain food.
The weight loss and BMI reduction observed for the PGXG intervention is most likely a result ofcompliance to the recommended dose, resulting in 64% of participants who consumed PGXG at therecommended dose losing weight and reducing BMI. The average 1.4-kg weight loss found in our studyof overweight adults for the PGX per-protocol intervention is in agreement with previous researchby Lyon et al. [28] who found a weight loss in women of 1.6 kg with 12 weeks PGX supplementation.Pal et al. [29] reported obese adults on 12-week supplementation of both artificially sweetened andflavoured PGX and psyllium lost weight (1.6 kg and 1.1 kg respectively).
On an individual basis, the highest weight loss in the PGXS group (per-protocol) was 4.4 kg, witha waist circumference decrease of 5.5 cm. However, in this group a weight gain of 6.3 kg and waistcircumference increase was 9.6 cm was also recorded in one participant. This high variance in change inweight and waist circumference resulted in a non-significant weight loss for this group. Data collectedby personal communication at the 6-week visit showed five participants in the PGXS group reportingthat they expected PGXS to be a “magic bullet” for weight loss, which was an unexpected issuethat requires consideration in future research. Protocol in future research may involve education ofparticipants on using PGX to control appetite.
The significant reduction in waist circumference observed in the present study for PGXGper-protocol group of 2.5 cm was similar in magnitude to that reported in a study by Reimer et al. [8]where PGX consumption over 14 weeks resulted in a significant reduction of 1.96 cm in waistcircumference. The significant reduction in BMI of 0.5 observed in the present study for PGXGsub-group was in contrast to Reimer [8] who found no significant differences in BMI comparedto baseline.
The findings from our study that PGXS and PGXG consumption (per-protocol groups) did notaffect weight is similar to research on PGX consumption by Kacinik et al. [7] who reported no significantdifferences in weight loss between PGX and the placebo groups in a study involving a low-calorie dietof 1000 kcal/day for both treatments. There was also no weight loss recorded in a three-week study byReimer et al. [30] where PGX was pre-mixed with breakfast cereal and consumed with yogurt. In ourstudy participants were not on an energy restricted diet nor were the PGX and RF doses mixed withother products.
The use of the mFR allowed our research to determine level of compliance to the recommendeddose of the PGXG subgroup by reviewing the images collected. The mFR image analysis of the foodseaten, serving sizes and number of eating occasions per day enabled important information about thedietary pattern of the overweight participants to be collected. The reduced number of eating occasionsfound with the PGXG subgroup, translated into reduced consumption of grain food of 1.52 serves(p = 0.019), mainly being a reduction in consumption of white bread.
Research by Kerr et al. [23] reported a reduction in consumption of energy-dense nutrient-poor(EDNP) foods as a result of tailored dietary feedback using the mFR. In the present study there was
197
Nutrients 2017, 9, 149
a non-significant reduction in junk food consumption of 0.57 in the PGXG per-protocol group and0.76 serves in the PGXG subgroup. Pollard et al. [31] also found overweight people were more likelythan those who were a healthy weight to decrease their intake grain food when trying to lose weight,supporting the reduced grain food trend found in this research. Small reductions in conscious ormindful energy intake can improve weight gain [32] and the choice to reduce grain food intake foundin this research may have been the contributor to weight loss. Although we observed a reduction indaily intake of fruit and dairy, which is not desirable based on dietary guidelines [27], the magnitudeof this change was minor.
Data from the mFR showed participants in all groups, other than the PGXG subgroup, appearedto make no changes to their eating pattern, as after 12 weeks of intervention, food group servingswere not significantly different to baseline. This finding is supported by previous studies [32–34]where it was reported that humans tend to consume a consistent weight or volume of food from dayto day. While participants reported feeling full in previous PGXS and PGXG research [9,10,35,36],most participants in this study did not appear to use appetite to change their eating patterns, except inthe PGXG subgroup who consumed the recommended dose, most likely resulting reduced appetiteand reduced food intake.
Dietary feedback using the mFR indicated a reduction of 1 serve white bread, each day, which mayhave been a contributor to the reduction of 40 g in weight daily in the PGXG per-protocol group [27].In a previous study, a reduction of 31.5 g carbohydrate per day was recorded at 12 weeks after PGXsupplementation using a 3-day food and drink diary [29]. The 3-day food and drink diary does notprovided details on type carbohydrates foods, whereas the mFR reports provided detail of types offoods and serving sizes. Dietary intake records collected using the mFR can reduce the bias found inauto-assessment [24].
In the present study, PGXG was taken with 500 mL water immediately before or with a meal.The PGXG was mixed in the water, in juice or mixed into the meal. The mechanism for weight loss inthe PGXG sub-group in the present study may have been as a result of reducing dietary energy densityof the meals with which it was consumed by increasing the fibre and water content of meals whilemaintaining the volume of food eaten [37,38]. Decreasing dietary energy density has been shown to beuseful in long-term weight loss [39].
The detailed dietary feedback from the mFR enabled this research to determine weight loss waspossible when PGXG at the recommended dose was consumed and the reduction in the numberof eating occasions may be part of the mechanism for this effect. Previous research indicates that apossible mechanism behind the appetite and body weight reduction effects of PGX may be relatedto circulating gut hormones [30]. Reimer et al. [30] reported increased peptide YY, which can slowgastric emptying and decreased ghrelin (an appetite stimulant) on consumption of PGX. More work isrequired to confirm the physiological mechanisms controlling these effects of PGX.
The detailed dietary feedback from the mFR enabled this research to more accurately determinefood group changes after 12 weeks. The reason the PGXS, and PGXG per-protocol groups did notreduce their weight may be because they did not reduce the number of eating occasions or changetheir daily intake of the foods and continued to consume the amount and type of food usually eaten.In addition, research by Polidori et al. [40] reports that weight loss leads to increased appetite, andappetite increases by approximately 100 kcal/day per kg of lost weight. The reason fibre such as PGXGhelps some individuals in the control of appetite and not others requires more research.
Limitation
Meals and consumption of test products were self-administered; the possibility of non-compliancecould not be avoided. In the current study misreporting of intake may have occurred due to participantsnot taking images of all food and beverages consumed. In addition, the assessment of food groupserves by a trained analyst may not be sensitive enough to detect changes in dietary intake.
198
Nutrients 2017, 9, 149
5. Conclusions
Supplementation with PGX at the recommended dose resulted in a reduction in body weight (kg),BMI (kg/m2), reduced frequency of eating and reduced intake of white bread. The weight loss andBMI reduction from baseline to 12 weeks was significantly greater for PGXG at the recommendeddose than for the RF treatment. Dietary assessment using the mFR provided detailed informationenabling accurate analysis of the number of eating occasions and changes to food group servingsper day. Further research on reducing the frequency eating of specific foods, such as junk food iswarranted. These results demonstrate the potential benefits of PGX fibre in controlling frequency ofeating and in weight loss.
Acknowledgments: PGX® and PolyGlycopleX® are registered trademarks of InovoBiologic Inc.,Calgary, AB, Canada. Financial support for the submitted work was provided by Factors Group, AustraliaPty Ltd. RJG owns the Factors Group of Companies, which retains an interest in PGX. SW receives consulting feesfrom InovoBiologic Inc.
Author Contributions: V.A.S., D.A.K., W.J.H., X.M., S.K.J. and S.W. designed and conducted the research;C.J.B., D.A.K. and E.J.D. developed the mFR part of this research; R.J.G. critically reviewed the study design;X.M., V.A.S., A.S.M. and D.A.K. analysed the data; V.A.S., D.A.K., W.J.K., S.K.J., C.J.B., E.J.D., X.M., A.P.J., A.S.M.,H.K.F. and S.W. wrote the paper; all authors read and approved the final manuscript.
Conflicts of Interest: The authors declare no conflict of interest.
References
1. Swinburn, B.; Kraak, V.; Rutter, H.; Vandevijvere, S.; Lobstein, T.; Sacks, G.; Gomes, F.; Marsh, T.;Magnusson, R. Strengthening of accountability systems to create healthy food environments and reduceglobal obesity. Lancet 2015, 385, 2534–2545. [CrossRef]
2. Liese, A.D.; Krebs-Smith, S.M.; Subar, A.F.; George, S.M.; Harmon, B.E.; Neuhouser, M.L.; Boushey, C.J.;Schap, T.E.; Reedy, J. The Dietary Patterns Methods Project: Synthesis of findings across cohorts and relevanceto dietary guidance. J. Nutr. 2015, 145, 393–402. [CrossRef] [PubMed]
3. Reedy, J.; Krebs-Smith, S.M.; Miller, P.E.; Liese, A.D.; Kahle, L.L.; Park, Y.; Subar, A.F. Higher diet quality isassociated with decreased risk of all-cause, cardiovascular disease, and cancer mortality among older adults.J. Nutr. 2014, 144, 881–889. [CrossRef] [PubMed]
4. Tayyem, R.F.; Bawadi, H.A.; Shehadah, I.; Agraib, L.M.; AbuMweis, S.S.; Al-Jaberi, T.; Al-Nusairr, M.;Bani-Hani, K.E.; Heath, D.D. Dietary patterns and colorectal cancer. Clin. Nutr. 2016, in press. [CrossRef][PubMed]
5. Delzenne, N.M.; Cani, P.D. A place for dietary fiber in the management of the metabolic syndrome. Curr. Opin.
Clin. Nutr. Metab. Care 2005, 8, 636–640. [CrossRef] [PubMed]6. Kristensen, M.; Jensen, M.G. Dietary fibres in the regulation of appetite and food intake. Importance of
viscosity. Appetite 2011, 56, 65–70. [CrossRef] [PubMed]7. Kacinik, V.; Lyon, M.; Purnama, M.; Reimer, R.A.; Gahler, R.; Green, T.J.; Wood, S. Effect of PGX, a novel
functional fibre supplement, on subjective ratings of appetite in overweight and obese women consuming a3-day structured, low-calorie diet. Nutr. Diabetes 2011, 1, 1–8. [CrossRef] [PubMed]
8. Reimer, R.A.; Yamaguchi, H.; Eller, L.K.; Lyon, M.R.; Gahler, R.J.; Kacinik, V.; Juneja, P.; Wood, S. Changes invisceral adiposity and serum cholesterol with a novel viscous polysaccharide in Japanese adults withabdominal obesity. Obesity 2013, 21, E379–E387. [PubMed]
9. Solah, V.; Brand-Miller, J.; Atkinson, F.; Gahler, R.; Kacinik, V.; Lyon, M.; Wood, S. Dose-response effect of anovel functional fibre, PolyGlycopleX, PGX, on satiety. Appetite 2014, 77, 72–76. [CrossRef] [PubMed]
10. Solah, V.A.; O’Mara-Wallace, B.; Meng, X.; Gahler, R.J.; Kerr, D.A.; James, A.P.; Fenton, H.K.; Johnson, S.K.;Wood, S. Consumption of the Soluble Dietary Fibre Complex PolyGlycopleX® Reduces Glycaemia andIncreases Satiety of a Standard Meal Postprandially. Nutrients 2016, 8, 268. [CrossRef] [PubMed]
11. Wanders, A.J.; Van Den Borne, J.J.G.C.; De Graaf, C.; Hulshof, T.; Jonathan, M.C.; Kristensen, M.; Mars, M.;Schols, H.A.; Feskens, E.J.M. Effects of dietary fibre on subjective appetite, energy intake and body weight:A systematic review of randomized controlled trials. Obes. Rev. 2011, 12, 724–739. [CrossRef] [PubMed]
12. Slavin, J.; Green, H. Dietary fibre and satiety. Nutr. Bull. 2007, 32, 32–42. [CrossRef]
199
Nutrients 2017, 9, 149
13. Mann, J.I.; Cummings, J.H. Possible implications for health of the different definitions of dietary fibre.Nutr. Metab. Cardiovasc. Dis. 2009, 19, 226–229. [CrossRef] [PubMed]
14. Slavin, J.L. Dietary fibre and body weight. Nutrition 2005, 21, 411–418. [CrossRef] [PubMed]15. Brand-Miller, J.C.; Atkinson, F.S.; Gahler, R.J.; Kacinik, V.; Lyon, M.R; Wood, S. Effects of PGX, a novel
functional fibre, on acute and delayed postprandial glycaemia. Eur. J. Clin. Nutr. 2010, 64, 1488–1493.[CrossRef] [PubMed]
16. Brand-Miller, J.C.; Atkinson, F.S.; Gahler, R.J.; Kacinik, V.; Lyon, M.R.; Wood, S. Effects of added PGX®, anovel functional fibre, on the glycaemic index of starchy foods. Br. J. Nutr. 2012, 108, 245–248. [CrossRef][PubMed]
17. Mattes, R. Energy intake and obesity: Ingestive frequency outweighs portion size. Physiol. Behav. 2015, 134,110–118. [CrossRef] [PubMed]
18. Aljuraiban, G.S.; Chan, Q.; Griep, L.M.O.; Brown, I.J.; Daviglus, M.L.; Stamler, J.; Van Horn, L.; Elliott, P.;Frost, G.S.; INTERMAP Research Group. The impact of eating frequency and time of intake on nutrientquality and Body Mass Index: The INTERMAP Study, a Population-Based Study. J. Acad. Nutr. Diet. 2015,115, 528–536. [CrossRef] [PubMed]
19. Thompson, F.E.; Subar, A.F. Dietary Assessment Methodology. In Nutrition in the Prevention and Treatment of
Disease, 3rd ed.; Coulston, A.M., Boushey, C.J., Ferruzzi, M.G., Eds.; Elsevier Academic Press: San Diego, CA,USA, 2013.
20. Meng, X.; Kerr, D.A.; Zhu, K.; Devine, A.; Solah, V.A.; Wright, J.; Binns, C.W.; Prince, R.L. Under-reporting ofenergy intake in elderly Australian women is associated with a higher body mass index. J. Nutr. Health Aging
2013, 17, 112–118. [CrossRef] [PubMed]21. Bosch, M.; Zhu, F.; Khanna, N.; Boushey, C.J.; Delp, E.J. Combining global and local features for food
identification in dietary assessment. IEEE Trans. Image Process. 2011, 2011, 1789–1792. [PubMed]22. Harray, A.J.; Boushey, C.J.; Pollard, C.M.; Delp, E.J.; Ahmad, Z.; Dhaliwal, S.S.; Mukhtar, S.A.; Kerr, D.A.
A novel dietary assessment method to measure a healthy and sustainable diet using the Mobile Food Record:Protocol and methodology. Nutrients 2015, 7, 5375–5395. [CrossRef] [PubMed]
23. Kerr, D.A.; Pollard, C.M.; Howat, P.; Delp, E.J.; Pickering, M.; Kerr, K.R.; Dhaliwal, S.S.; Pratt, I.S.;Wright, J.; Boushey, C.J. Connecting Health and Technology (CHAT): Protocol of a randomized controlledtrial to improve nutrition behaviours using mobile devices and tailored text messaging in young adults.BMC Public Health 2012, 12, 477. [CrossRef] [PubMed]
24. Kerr, D.A.; Harray, A.J.; Pollard, C.M.; Dhaliwal, S.S.; Delp, E.J.; Howat, P.A.; Pickering, M.R.; Ahmad, Z.;Meng, X.; Pratt, I.S.; et al. The connecting health and technology study: A 6-month randomized controlledtrial to improve nutrition behaviours using a mobile food record and text messaging support in youngadults. Int. J. Behav. Nutr. Phys. Act. 2016, 13, 52. [CrossRef] [PubMed]
25. Zhu, F.; Bosch, M.; Khanna, N.; Boushey, C.J.; Delp, E.J. Multiple hypotheses image segmentation andclassification with application to dietary assessment. IEEE J. Biomed. Health Inform. 2015, 19, 377–388.[CrossRef] [PubMed]
26. Norton, K.; Olds, T. Anthropometrica; University of New South Wales Press: Sydney, Australia, 2000.27. National Health and Medical Research Council. Eat for Health. Australian Dietary Guidelines
Summary. Canberra: Australian Government, Department of Health and Ageing. 2013.Available online: http://www.nhmrc.gov.au/_files_nhmrc/publications/attachments/n55a_australian_dietary_guidelines_susumma_131014.pdf (accessed on 2 February 2015).
28. Lyon, M.; Wood, S.; Pelletier, X.; Donazzolo, Y.; Gahler, R.; Bellisle, F. Effects of a 3-month supplementationwith a novel soluble highly viscous polysaccharide on anthropometry and blood lipids in nondietingoverweight or obese adults. J. Hum. Nutr. Diet. 2011, 24, 351–359. [CrossRef] [PubMed]
29. Pal, S.; Ho, S.; Gahler, R.J.; Wood, S. Effect on body weight and composition in overweight/obese Australianadults over 12 months consumption of two different types of fibre supplementation in a randomized trial.Nutr. Metab. 2016, 13, 82. [CrossRef] [PubMed]
30. Reimer, R.A.; Pelletier, X.; Carabin, I.G.; Lyon, M.; Gahler, R.; Parnell, J.A.; Woods, S. Increased plasma PYYlevels following supplementation with functional fiber PolyGlycopleX in healthy adults. Eur. J. Clin. Nutr.
2010, 64, 1186–1191. [CrossRef] [PubMed]
200
Nutrients 2017, 9, 149
31. Pollard, C.M.; Pulker, C.; Meng, X.; Denham, F.; Solah, V.; Scott, J.A.; Kerr, D.A. Cereal foods consumptiontrends and factors associated with changing intake, among Western Australian adults, 1995 to 2012. FASEB J.
2016, 30, 409.32. Hill, J.O. Can a small-changes approach help address the obesity epidemic? A report of the Joint Task Force
of the American Society for Nutrition, Institute of Food Technologists, and International Food InformationCouncil. Am. J. Clin. Nutr. 2009, 89, 477–484. [CrossRef] [PubMed]
33. Bell, E.A.; Castellanos, V.H.; Pelkman, C.L.; Thorwart, M.L.; Rolls, B.J. Energy density of foods affects energyintake in normal-weight women. Am. J. Clin. Nutr. 1998, 67, 412–420.
34. Bell, E.A.; Rolls, B.J. Energy density of foods affects energy intake across multiple levels of fat content in leanand obese women. Am. J. Clin. Nutr. 2001, 73, 1010–1018. [PubMed]
35. Solah, V.A.; Meng, X.; Wood, S.; Gahler, R.J.; Kerr, D.A.; James, A.P.; Pal, S.; Fenton, H.K.; Johnson, S.K.Effect of training on the reliability of satiety evaluation and use of trained panellists to determine the satietyeffect of dietary fibre: A randomised controlled trial. PLoS ONE 2015, 10, e012. [CrossRef] [PubMed]
36. Yong, M.K.; Solah, V.A.; Johnson, S.K.; Meng, X.; Kerr, D.A.; James, A.P.; Fenton, H.K.; Gahler, R.J.; Wood, S.Effects of a viscous-fibre supplemented evening meal and the following un-supplemented breakfast onpost-prandial satiety responses in healthy women. Physiol. Behav. 2016, 154, 34–39. [CrossRef] [PubMed]
37. Rolls, B.J.; Castellanos, V.H.; Halford, J.C.; Kilara, A.; Panyam, D.; Pelkman, C.L.; Smith, G.P.; Thorwart, M.L.Volume of food consumed affects satiety in men. Am. J. Clin. Nutr. 1998, 67, 1170–1177. [PubMed]
38. Rolls, B.J. The relationship between dietary energy density and energy intake. Physiol. Behav. 2009, 97,609–615. [CrossRef] [PubMed]
39. Ello-Martin, J.A.; Roe, L.S.; Ledikwe, J.H.; Beach, A.M.; Rolls, B.J. Dietary energy density in the treatment ofobesity: A year-long trial comparing 2 weight-loss diets. Am. J. Clin. Nutr. 2007, 85, 1465–1477. [PubMed]
40. Polidori, D.; Sanghvi, A.; Seeley, R.J.; Hall, K.D. How strongly does appetite counter weight loss?Quantification of the feedback control of human energy intake. Obesity 2016, 24, 2289–2295. [CrossRef][PubMed]
© 2017 by the authors. Licensee MDPI, Basel, Switzerland. This article is an open accessarticle distributed under the terms and conditions of the Creative Commons Attribution(CC BY) license (http://creativecommons.org/licenses/by/4.0/).
201
nutrients
Article
Intake and Dietary Food Sources of Fibre in Spain:Differences with Regard to the Prevalence of ExcessBody Weight and Abdominal Obesity in Adults ofthe ANIBES Study
Liliana G. González-Rodríguez 1,2, José Miguel Perea Sánchez 1,2, Javier Aranceta-Bartrina 3,4,
Ángel Gil 4,5, Marcela González-Gross 4,6, Lluis Serra-Majem 4,7, Gregorio Varela-Moreiras 8,9
and Rosa M. Ortega 2,10,*
1 Department of Nutrition and Dietetics, Faculty of Health Sciences, University Alfonso X El Sabio,Madrid 28691, Spain; [email protected] (L.G.G.-R.); [email protected] (J.M.P.S.)
2 VALORNUT Research Group, Department of Nutrition, Faculty of Pharmacy, Complutense University,Madrid 28040, Spain
3 Department of Preventive Medicine and Public Health, University of Navarra,Pamplona, Navarra 31008, Spain; [email protected]
4 Biomedical Research Networking Center for Physiopathology of Obesity and Nutrition (CIBEROBN),Carlos III Health Institute, Madrid 28029, Spain; [email protected] (A.G.);[email protected] (M.G.-G.); [email protected] (L.S.-M.)
5 Department of Biochemistry and Molecular Biology II and Institute of Nutrition and Food Sciences,University of Granada, Granada 18100, Spain
6 ImFINE Research Group, Department of Health and Human Performance, Technical University of Madrid,Madrid 28040, Spain
7 Research Institute of Biomedical and Health Sciences, University of Las Palmas de Gran Canaria,Faculty of Health Sciences, c/Doctor Pasteur s/n Trasera del Hospital, Las Palmas de Gran Canaria,35016 Las Palmas, Spain
8 Department of Pharmaceutical and Health Sciences, Faculty of Pharmacy, CEU San Pablo University,Madrid 28668, Spain; [email protected]
9 Spanish Nutrition Foundation (FEN), Madrid 28010, Spain10 Department of Nutrition, Faculty of Pharmacy, Madrid Complutense University, Madrid 28040, Spain* Correspondence: [email protected]; Tel.: +34-913-941-837; Fax: +34-913-941-810
Received: 8 December 2016; Accepted: 21 March 2017; Published: 25 March 2017
Abstract: The aim was to study the intake and food sources of fibre in a representative sampleof Spanish adults and to analyse its association with excess body weight and abdominal obesity.A sample of 1655 adults (18–64 years) from the ANIBES (“Anthropometric data, macronutrients andmicronutrients intake, practice of physical activity, socioeconomic data and lifestyles”) cross-sectionalstudy was analysed. Fibre intake and dietary food sources were determined by using a three-daydietary record. Misreporters were identified using the protocol of the European Food Safety Authority.Mean (standard deviation) fibre intake was 12.59 (5.66) g/day in the whole sample and 15.88 (6.29) g/dayin the plausible reporters. Mean fibre intake, both in the whole sample and the plausible reporters, wasbelow the adequate intake established by European Food Safety Authority (EFSA) and the Instituteof Medicine of the United States (IOM). Main fibre dietary food sources were grains, followed byvegetables, fruits, and pulses. In the whole sample, considering sex, and after adjusting for age andphysical activity, mean (standard error) fibre intake (adjusted by energy intake) was higher in subjectswho had normal weight (NW) 13.40 (0.184) g/day, without abdominal obesity 13.56 (0.192) g/day orwithout excess body weight and/or abdominal obesity 13.56 (0.207) g/day compared to those whowere overweight (OW) 12.31 (0.195) g/day, p < 0.001 or obese (OB) 11.83 (0.266) g/day, p < 0.001,with abdominal obesity 12.09 (0.157) g/day, p < 0.001 or with excess body weight and/or abdominalobesity 12.22 (0.148) g/day, p < 0.001. There were no significant differences in relation with the fibre
Nutrients 2017, 9, 326 202 www.mdpi.com/journal/nutrients
Nutrients 2017, 9, 326
intake according to the body mass index (BMI), presence or absence of abdominal obesity or excessbody weight and/or abdominal obesity in the plausible reporters. Fibre from afternoon snacks washigher in subjects with NW (6.92%) and without abdominal obesity (6.97%) or without excess bodyweight and/or abdominal obesity (7.20%), than those with OW (5.30%), p < 0.05 or OB (4.79%),p < 0.05, with abdominal obesity (5.18%), p < 0.01, or with excess body weight and/or abdominalobesity (5.21%), p < 0.01, in the whole sample. Conversely, these differences were not observed in theplausible reporters. The present study demonstrates an insufficient fibre intake both in the wholesample and in the plausible reporters and confirms its association with excess body weight andabdominal obesity only when the whole sample was considered.
Keywords: fibre; food sources; obesity; abdominal obesity; misreporting; adults; Spain; ANIBES
1. Introduction
In recent decades, there has been a significant increase in the prevalence of overweight (OW)and obesity (OB) in children and adults, in both developed and developing countries [1]. Excess bodyweight increases the risk of developing various diseases, such as cardiovascular disease, type 2 diabetes,some types of cancers, musculoskeletal disorders, and neurodegenerative diseases, which have animportant health and social impact [1–3].
Diet and physical activity are the main factors that influence the development of OW and OB [1,4].In this respect, several studies have shown that the intake of dietary fibre may have a positive effect onbody weight control; however, the available results are inconsistent [5–8]. There are several possiblemechanisms to explain the anti-obesogenic effect of dietary fibre. Among the most documentedmechanisms is the one that refers to the benefits of the fibre capacity (mainly soluble fibre) to formviscous gels that delay the gastric emptying, which helps, on the one hand, to increase the satietysensation and consequently reduces energy intake [9] and, secondly, to control the postprandialglycaemia by delaying the intestinal absorption [10]. Another possible mechanism is associatedwith short-chain fatty acid produced during fermentation of fibre in the gastrointestinal tract [11]since it has been shown that this can contribute to regulating the secretion of some gastrointestinalhormones, such as glucagon-like peptide-1 (GLP-1), involved in satiety, and ghrelin, involved inappetite control [12,13], and to increase the oxidation of fatty acids and energy expenditure and toregulate glucose metabolism [11].
In addition, there are few recent studies regarding the intake of fibre in a representative Spanishadults sample and none of these studies have analysed the relation between the fibre intake, fibre fromdifferent meals of the day and food sources and the problematic of excess body weight and abdominalobesity [14,15]. Additionally, it is the first Spanish study that takes into account the dietary misreportingof the participants.
Therefore, the aim of the present work was to study the intake and dietary food sources of fibre ina representative sample of the Spanish adults from the ANIBES (“Anthropometric data, macronutrientsand micronutrients intake, practice of physical activity, socioeconomic data and lifestyles”) studyand to analyse the differences in fibre intake between people with different body weight and withor without abdominal obesity. The present work shows the analysed data for the total sample andplausible reporters of the study.
2. Materials and Methods
2.1. Study Design and Sampling Procedure
The complete design, protocol, and methodology of the ANIBES study have been alreadydescribed in detail elsewhere [16,17]. In summary, the ANIBES study was carried out to analyse
203
Nutrients 2017, 9, 326
anthropometric data, physical activity, intake of food and beverages, and dietary habits in the Spanishpopulation (9–75 years old, n = 2009). The participants were randomly selected from the Northeast,East, Southwest, North-Central, Barcelona, Madrid, Balearic, and Canary Islands areas of Spain,including rural, semi-urban and urban populations [16,17]. The present study is focused on 1655 adults(779 men and 858 women) with ages ranging 18–64.
The following exclusion criteria were applied:
• Those individuals living in an institutional setting (e.g., colleges, nursing homes, hospitals,and others);
• Individuals following a therapeutic diet owing to recent surgery or taking any medical prescriptions;• Potential participants with a transitory illness (i.e., flu, gastroenteritis) at the time of the
fieldwork; and• Individuals employed in areas related to consumer science, marketing, or the media [16,17].
The fieldwork for the ANIBES study was carried out from mid-September 2013 to mid-November2013. The final protocol was approved by the Ethical Committee for Clinical Research of the Region ofMadrid (Spain) (code FEN 2013/31, May 2013). All participants were informed of the protocol andrisks and benefits of their participation in the study and a written informed consent was obtained fromall the study’s participants.
2.2. Anthropometric Data
Weight, height, and waist circumference (WC) were measured by trained interviewers followingstandardized procedures [18]. Weight was measured once with a Seca® model 804 weighingscale (Medizinische Messsysteme und Waagen seit 1840, Hamburg, Germany; range: 70–205 cm,precision: 1 mm). Height was assessed in triplicate using a Seca® model 206 stadiometer (MedizinischeMesssysteme und Waagen seit 1840, Hamburg, Germany; range: 0.1–150 kg, precision: 100 g). WC wasmeasured in triplicate using a Seca® 201 tape measure (Seca, Hamburg, Germany; range: 0–150 cm,precision: 1 mm).
Excess body weight was assessed using the body mass index (BMI) and abdominal obesityby the waist to height ratio (WHtR). BMI was calculated as weight (kg)/height (m)2 andWHtR as WC (cm)/height (cm). Participants were classified into the following categories usingthe BMI: underweight (UW) (BMI <18.5 kg/m2), normal weight (NW) (BMI 18.5–24.9 kg/m2),OW (BMI 25–29.9 kg/m2), and OB (BMI ≥30 kg/m2), based on the World Health Organizationclassification [19], and using the WHtR respondents were classified into two categories:“non-abdominal obesity” (WHtR <0.5) and those with “abdominal obesity” (WHtR ≥0.5) [20–23].BMI and WHtR were combined into one category called “excess body weight and/or abdominalobesity” (BMI ≥25 kg/m2 and/or WHtR ≥0.5) for subsequent analysis [19,21–23].
2.3. Physical Activity
To obtain physical activity data of the studied participants, a detailed interview using theInternational Physical Activity Questionnaire (IPAQ) for adults was performed [24]. In addition,different physical activity measurements were obtained with an accelerometer ActiGraph (model GT3xand GT3x+; ActiGraph, Pensacola, FL, USA) in a subsample of 167 adults. Individuals were askedto wear the ActiGraph on a belt above the right hip, for three consecutive full days. This previousinformation was used to validate the physical activity questionnaire administered to the whole sample.
There were calculated the following indicators of physical activity in the participants of thepresent study:
• Total physical activity expressed as minutes of activity per week;• Time spent in vigorous physical activity expressed as minutes of activity per week.
204
Nutrients 2017, 9, 326
Subjects were classified into two levels of physical activity based on two questions of the IPAQ [24]:“Sedentary activity level” as those subjects who have performed less than 30 min per day of
physical activity of daily life and less than 2 h per week of structured physical exercise.“Active activity level” as those subjects who have performed at least 30 min per day of physical
activity of daily life or have performed at least 2 h per week of structured physical exercise.
2.4. Food and Beverage Record
Study participants were provided with a tablet device (Samsung Galaxy Tab 2 7.0,Samsung Electronics, Suwon, South Korea) and trained in how to record information by takingphotos of all food and beverages consumed during the three days of the study, both at home andoutside the home. Photos had to be taken before beginning to eat and drink, and again after finishing,so as to record the actual intake. Additionally, a brief description of meals (including the type of food),recipes, brands, and the use of dietary supplements were recorded using the device.
Energy and fibre intake were calculated from food consumption records using VD-FEN 2.1software (Dietary Evaluation Programme, Spanish Nutrition Foundation, Madrid, Spain) which wasnewly developed for the ANIBES study by the Spanish Nutrition Foundation and is based mainlyon Spanish food composition tables [25], with several expansions and updates. Data obtained fromfood manufacturers and nutritional information provided on food labels were also included. A foodphotographic atlas was also used to assist in assigning gram weights to serving sizes [26].
The present study was focused on the intake of fibre expressed in grams per day (g/day)raw (before the energy intake adjustment) and after the energy intake adjustment by the residualmethods [27,28] and the intake of fibre expressed in grams per 1000 kcal per day. The mean intake offibre of the studied participants was compared with the adequate intake set out by European FoodSafety Authority (EFSA): 25 g/day in adults [29], and by the Institute of Medicine of the United States(IOM): 38 g/day for men and 25 g/day for women of 19–50 years and 30 g/day for men and 21 g/dayfor women of 51–70 years (14 g/1000 kcal/day) [30].
Once fibre intake has been established, the percentage of fibre from each one of the meal times(breakfast, mid-morning snack, lunch, afternoon snack, and dinner) was calculated.
The contribution of each food to total fibre intake has been calculated by adding the amount offibre provided by each specific food and dividing by the total intake of fibre, all multiplied by 100 [31].
2.5. Evaluation of Misreporting
The assessment of dietary intake based on self-reported or self-recorded data by the study subjectsis often prone to bias. One of the main sources of error is misreporting, including both under- andover-reporting, which are often influenced by age, sex, and other individual characteristics, includingBMI [32]. The magnitude of misreporting of the intake of food may lead to biased interpretation ofthe results. In the present study the protocol of the EFSA was used to identify misreporters [33,34].This method is based mainly on the Goldberg [35] and Black [36,37] work. This method evaluates thereported energy intake (EIrep) against the presumed energy requirements. EIrep is expressed as amultiple of the mean basal metabolic rate estimated (BMRest) (from formulas), and it is compared withthe presumed energy expenditure of the studied population. Then the ratio EIrep:BMRest is referredto as the physical activity levels (PAL) [33,34]. The PAL is established for adults (≥18 years) in threelevels: low, 1.4; moderate, 1.6; and vigorous, 1.8. Additionally, the protocol indicates that analysesshould be performed at two levels, group and individual. The group level determines the overall biasto the reported energy intake, and the individual level shows the rate of under and over reporters.The BMRest was calculated using the Schöfield equations [38]. Misreporting cut-offs at group andindividual levels for the ANIBES study has been described in a previous paper [39]. Subjects wereclassified into two categories:
205
Nutrients 2017, 9, 326
“Plausible reporters” as those subjects with estimated values of the ratio EIrep:BMRest rangingbetween calculated lower cut-off and upper cut-off values for the studied population allocated to thedifferent category of physical activity [33,34].
“Misreporters” as those subjects with estimated values of EIrep:BMRest below the calculatedlower cut-off value (under-reporters) and those subjects with estimated values of EIrep:BMRest abovethe upper calculated cut -off value (over-reporters) [33,34].
In the present study, the results are showed in the total sample (before the exclusion of thenon-plausible reporters) and in the plausible reporters.
2.6. Statistical Analysis
Descriptive data were presented as mean and standard deviation (SD), median and interquartilerange (IQR) (both without any adjustment), and frequencies (%) stratified by sex, BMI, presence ofabdominal obesity, and excess body weight and/or abdominal obesity. The normality of the data andequality of the variances were tested using the Kolmogorov–Smirnov and Levene’s test, respectively.
The statistical differences of the studied quantitative variables by sex were assessed usingStudent’s t-test when data were normally distributed, and using the Mann–Whitney test, otherwise.A two-way ANOVA test was used to assess the differences within the studied variables using sexand the variables of BMI, abdominal obesity or excess body weight and/or abdominal obesity.Two-way ANOVA main effects for BMI, abdominal obesity, and excess body weight and/or abdominalobesity were obtained. The Bonferroni post hoc test for comparison for more than two groups was used.A two-way ANCOVA test was used to assess the differences within the studied variables using theprevious ANOVA model taking into account the age and the physical activity (PA) of the participantsas covariates to control their influence on the dependent variable. Two-way ANCOVA main effectsand interactions were analysed and they are only reported in the text as estimated marginal meansand the standard error (SE) when a significant inverse trend, significant changes, or an interaction withsex were observed. The level of significance was set at p < 0.05. All calculations were performed usingIBM SPSS version 22.0 (IBM Corp., Armonk, NY, USA).
3. Results
3.1. Study Population
A sample of 1655 adults (48.2% men and 51.8% women) with ages ranging from 18 to 64 years wasstudied. In total, 26.16% (n = 433) (36.4% men and 63.5% women) of the studied adults were classifiedas plausible reporters. Table 1 shows the anthropometric and physical activity data of the wholesample and of the plausible reporters. The combined prevalence of OW and OB in the whole samplewas 55.70% and 32.80% in the plausible reporters. The prevalence of abdominal obesity was 58.40%and 39.3% and the presence of excess body weight and/or abdominal obesity was 63.93% and 42.7%in the whole sample and in the plausible reporters, respectively. A 44.40% of the whole sample and44.3% of the plausible reporters were sedentary.
3.2. Fibre Intake and Dietary Food Sources in the Whole Sample and in the Plausible Reporters and by Sex
Mean dietary fibre intake (raw) was 12.59 (SD 5.66) g/day, and adjusted by energy was12.59 (SD 4.91) g/day, while the intake of fibre expressed as grams per 1000 kcal per day was7.05 (SD 2.81) in the whole sample (Table 2). Fibre intake (raw) was significantly lower in women thanin men, but when it was adjusted by energy intake or when was expressed as grams per 1000 kcal perday, it was significantly lower in men than in women in the whole sample (Table 2). Meanwhile, in thegroup of plausible reporters, the mean dietary fibre (raw) was 15.88 (SD 6.29) g/day, and it was alsosignificantly lower in women than in men, however, there were no statistically significant differences inrelation with the fibre intake adjusted by the energy intake or expressed as g/1000 kcal/day (Table 2).Lunch and dinner contributed the highest proportions of fibre to the total daily intake in the whole
206
Nutrients 2017, 9, 326
sample and in the plausible reporters (75.85% and 70.59%, respectively). It is noteworthy that thefibre from breakfast was quite low in the whole sample (13.04%) as well as in the plausible reporters(14.27%). The proportion of fibre from breakfast and afternoon snacks was higher in women and fromdinner in men in the whole sample. No significant differences were observed regarding the fibre fromthe different meals in the plausible reporters (Table 2).
The main food sources of fibre in the whole studied population and in the plausible reporterswere grains (39.13% and 39.14%), vegetables (24.17% and 20.99%), fruits (16.60% and 18.51%),pulses (9.28% and 9.14%), ready-to-eat-meals (4.50% and 4.99%), sauces and condiments (2.18% and1.97%), appetizers (1.53% and 2.30%), sugars and sweets (0.67% and 1.15%), non-alcoholic beverages(0.49% and 0.53%), dairy products (0.39% and 0.28%), and supplements and meal replacers (0.14% and0.09%, respectively).
3.3. Fibre Intake and Dietary Food Sources in the Whole Sample and in the Plausible Reporters by Body MassIndex Classification
Considering the whole sample, the fibre intake (raw) was higher in subjects who had NWcompared to those who had OW or OB, taking into account sex and after adjusting for the age and PA(Table 3). When the interaction of sex by BMI was analysed, it was noted that the intake of fibre (raw)was slightly different according to sex. Men who presented NW 14.83 (SE 0.327) g/day had a higherintake compared to those who had OW 12.45 (SE 0.304) g/day (p < 0.001) or OB 11.67 (SE 0.413) g/day(p < 0.001). While women who were UW 14.52 (SE 1.077) g/day had a higher intake than those withOW 11.48 (SE 0.335) g/day (p < 0.05) or OB 11.33 (SE 0.455) g/day (p < 0.05).
Fibre intake adjusted by energy intake (considering sex) was similar for the different groups ofBMI in the whole sample (Table 3). However, after adjusting for the age and the PA, it was observedthat subjects with NW 13.29 (SE 0.183) g/day had a higher intake than subjects with OW 12.26(SE 0.194) g/day (p < 0.001) or OB 11.79 (SE 0.265) g/day (p < 0.001). Analysing the interactionof sex at different levels of BMI, these differences were observed only in men. Thus, men whopresented NW 13.46 (SE 0.279) g/day had a higher intake in comparison with those who had OW 11.81(SE 0.260) g/day (p < 0.001) or OB 11.33 (SE 0.353) g/day (p < 0.001).
The intake of fibre per 1000 kcal per day (considering sex) was similar for the different groupsof BMI in the whole sample (Table 3). However, after adjusting for the age and the PA, it wasobserved that subjects with NW 7.35 (SE 0.104) g/1000 kcal/day had a higher intake than subjectswith OW 6.92 (SE 0.110) g/1000 kcal/day (p < 0.05) or OB 6.68 (SE 0.151) g/1000 kcal/day (p < 0.01).
No significant differences were observed regarding the fibre intake (raw, adjusted by the energyintake and expressed as grams per 1000 kcal/day) according with the BMI in the plausible reporters,considering sex and after adjusting for the age and the PA (Table 3).
The proportion of fibre from the lunch was higher in individuals with OW than those with NWtaking into account sex, but this difference disappeared when an adjustment for age and PA wasperformed. Fibre from the afternoon snack was higher in individuals with NW than those with OWor OB (taking into account sex and even after adjusting for age and PA) (Table 3). While fibre fromdinner was lower (after adjusting for the age and PA) in individuals who had OW 27.50% (SE 0.581)compared to those with OB 30.27% (SE 0.795) (p < 0.05). However, the proportion of fibre from thedifferent meals was similar according the BMI in the plausible reporters (Table 3).
Regarding the fibre food sources according to the BMI in the whole sample, we observed that fibrefrom breakfast cereals and cereal bars was higher in individuals with NW than those with OW and fibrefrom vegetables was higher in individuals with OB than those with NW, but these differences disappearedwhen an adjustment for age and PA was performed (Table S1). Fibre from fruits (taking into accountsex and after adjusting for the age and PA) was significantly higher in individuals with NW 18.36%(SE 0.574%) compared to subjects with OW 15.16% (SE 0.605%) (p < 0.01). In analysing the interactionof sex, it was observed that only in men, the fibre from fruits was higher in those with NW 18.50%(SE 0.881%) than those with OW 14.01% (SE 0.819%) (p < 0.001) or OB 12.92% (SE 1.094%) (p < 0.001).
207
Nutrients 2017, 9, 326
After excluding misreporters, we observed that fibre from grains and flours was higher in subjectswith NW than those subjects with OW, but this difference disappeared when an adjustment for ageand PA was performed (Table S2). Fibre from pasta (taking into account sex and after adjusting forage and PA) was significantly higher individuals with UW 10.83 (SE 2.231%) compared to subjectswith NW 4.72% (0.383%) (p < 0.05) or OW 4.59% (0.580%) (p < 0.05). In analysing the interaction of sex,it was observed that only in men, the fibre from pasta was higher in those with UW 17.98% (SE 4.207%)than in those with NW 4.71% (SE 0.616%) (p < 0.05) or OW 4.62% (SE 0.835%) (p < 0.05).
3.4. Fibre Intake and Dietary Food Sources in the Whole Sample and in the Plausible Reporters by the Presenceof Abdominal Obesity Determined by the Waist to Height Ratio
Having into account the whole sample, fibre intake (raw) was higher in subjects withoutabdominal obesity (taking into account sex and even after adjusting for the age and PA) thanthose with abdominal obesity (Table 4). In analysing the interaction of sex was found that fibreintake in both men and women without abdominal obesity was higher 15.14 (SE 0.337) g/day and12.76 (SE 0.276) g/day than those subjects with abdominal obesity 12.04 (SE 0.244) g/day (p < 0.001)and 11.47 (SE 0.264) g/day (p < 0.01), respectively.
Fibre intake (adjusted by energy intake) considering the sex of the participants was similarindependently of the presence or absence of abdominal obesity in the whole sample (Table 4).However, after adjusting for the age and PA, subjects without abdominal obesity 13.43 (SE 0.191)g/day had significantly higher intake than subjects with abdominal obesity 12.05 (SE 0.157) g/day(p < 0.001). In analysing the interaction of sex was found that fibre intake in both men and womenwithout abdominal obesity was higher 13.63 (SE 0.288) g/day and 13.24 (SE 0.236) g/day that those withabdominal obesity 11.57 (SE 0.208) g/day (p < 0.001) and 12.52 (SE 0.226) g/day (p < 0.05), respectively.
The intake of fibre per 1000 kcal per day (considering sex) was similar regardless the presence orabsence of abdominal obesity in the whole sample (Table 4). However, after adjusting for the age andthe PA, it was observed that the subjects without abdominal obesity 7.44 (SE 0.109) g/1000 kcal/dayhad a higher intake than subjects with abdominal obesity 6.79 (SE 0.089) g/1000 kcal/day (p < 0.001).An interaction of sex was found and it was observed that fibre intake only in men without abdominalobesity was higher 7.36 (SE 0.164) g/1000 kcal/day than in those men with abdominal obesity6.40 (SE 0.119) g/1000 kcal/day (p < 0.001).
Nevertheless, no significant differences were observed regarding the fibre intake (raw, adjusted bythe energy intake and expressed as grams per 1000 kcal/day) according with the presence or absence ofabdominal obesity, considering sex and after adjusting for the age and the PA in the plausible reporters(Table 4).
Fibre from the mid-morning snack was higher in subjects without abdominal obesity than insubjects with abdominal obesity in the whole sample, but this difference disappeared when anadjustment for age and PA was performed (Table 4).
Considering sex and after adjusting for age and PA, the proportion of fibre from lunch was higherin subjects with abdominal obesity than those without abdominal obesity. In contrast, fibre from theafternoon snack was higher in individuals without abdominal obesity unlike those with abdominalobesity (Table 4). The proportion of fibre from the different meals was similar according the presenceor absence of abdominal obesity in the plausible reporters (Table 4).
Concerning the fibre food sources according to the presence or absence of abdominal obesity in thewhole sample, we observed that fibre from grains, breakfast cereals, and cereal bars, ready-to-eat meals,and sauces and condiments was higher in individuals without abdominal obesity than those withabdominal obesity and fibre from vegetables was higher in individuals with abdominal obesity thanthose subjects without abdominal obesity, but all of these differences disappeared when an adjustmentfor age and PA was performed (Table S3). We only found that fibre from bread (taking into account sexand after adjusting for the age and PA) was higher in subjects with abdominal obesity than those whodid not have this problem (Table S3). Similarly, after adjusting for the age and the PA, it was observed
208
Nutrients 2017, 9, 326
that the fibre from pasta was higher in individuals with abdominal obesity 6.73% (SE 0.272%) unlikethose participants without abdominal obesity 5.68% (SE 0.332%) (p < 0.05). In contrast, the fibre fromfruits (taking into account sex and after adjusting for the age and PA) was higher in subjects withoutabdominal obesity 18.46% (SE 0.600%) than in subjects with abdominal obesity 15.46% (SE 0.491%)(p < 0.001). However, when the interaction with sex was analysed (Table S3), the previous resultonly was observed in men without abdominal obesity 19.15% (SE 0.902%) compared to those withabdominal obesity 13.78% (SE 0.654%) (p < 0.001). In relation to the group of sugars and sweets andspecifically chocolates, individuals without abdominal obesity had a higher intake than subjects withabdominal obesity (Table S3).
In the plausible reporters, we observed that fibre from pasta was higher in subjects withoutabdominal obesity than those with abdominal obesity, but this difference disappeared when anadjustment for age and PA was performed (Table S4). Fibre from ready-to-eat-meals (taking intoaccount sex and after adjusting for age and PA) was significantly higher in individuals with abdominalobesity 6.39% (SE 0.585%) compared to subjects without abdominal obesity 4.02% (0.484%) (p < 0.01).
3.5. Fibre Intake and Dietary Food Sources in the Whole Sample and in the Plausible Reporters by the Presenceof Excess Body Weight and/or Abdominal Obesity Using the Body Mass Index and Waist to Height Ratio
Fibre intake (raw) was higher in individuals without excess body weight and/or abdominalobesity in the whole sample (taking into account sex and after adjusting for the age and PA) (Table 5).An interaction of sex was found and it was observed that fibre intake in both men and women withoutexcess body weight and/or abdominal obesity was higher 15.22 (SE 0.371) g/day and 12.81 (SE 0.291)g/day than in those who had excess body weight and/or abdominal obesity 12.28 (SE 0.232) g/day(p < 0.001) and 11.55 (SE 0.252) g/day (p < 0.01), respectively.
Fibre intake (adjusted by energy intake) considering sex was similar according to the presenceor absence of excess body weight and/or abdominal obesity in the whole sample (Table 5).However, after adjusting for the age and PA, it was found that subjects without excess body weightand/or abdominal obesity 13.43 (SE 0.206) g/day had significantly higher intake than subjects withexcess body weight and/or abdominal obesity 12.18 (SE 0.148) g/day (p < 0.001). An interaction ofsex was found and it was observed that fibre intake only in men without excess body weight and/orabdominal obesity was higher 13.68 (SE 0.317) g/day than in those men with excess body weightand/or abdominal obesity 11.74 (SE 0.198) g/day (p < 0.001).
The intake of fibre per 1000 kcal per day (considering sex) was similar regardless the presence orabsence of excess body weight and/or abdominal obesity in the whole sample (Table 5). However, afteradjusting for the age and the PA, it was observed that the subjects without excess body weight and/orabdominal obesity 7.43 (SE 0.117) g/1000 kcal/day had a higher intake than subjects with excess bodyweight and/or abdominal obesity 6.86 (SE 0.084) g/1000 kcal/day (p < 0.001). An interaction of sexwas found and it was observed that fibre intake only in men without excess body weight and/orabdominal obesity was higher 7.36 (SE 0.180) g/1000 kcal/day than in those men with excess bodyweight and/or abdominal obesity 6.48 (SE 0.113) g/1000 kcal/day (p < 0.001).
No significant differences were observed regarding the fibre intake (raw, adjusted by the energyintake and expressed as grams per 1000 kcal/day) according with the presence or absence of excessbody weight and/or abdominal obesity in the plausible reporters, considering sex and after adjustingfor the age and the PA (Table 5).
Considering the sex and after adjusting for the age and the PA, the proportion of fibre from lunchwas higher in subjects with excess body weight and/or abdominal obesity than those who did nothave excess body weight and/or abdominal obesity. In contrast, the fibre from the afternoon snack washigher in individuals who had no excess body weight and/or abdominal obesity, unlike those withexcess body weight and/or abdominal obesity (Table 5). The proportion of fibre from the differentmeals was similar according the presence or absence of excessive body weight and/or abdominalobesity in the plausible reporters (Table 5).
209
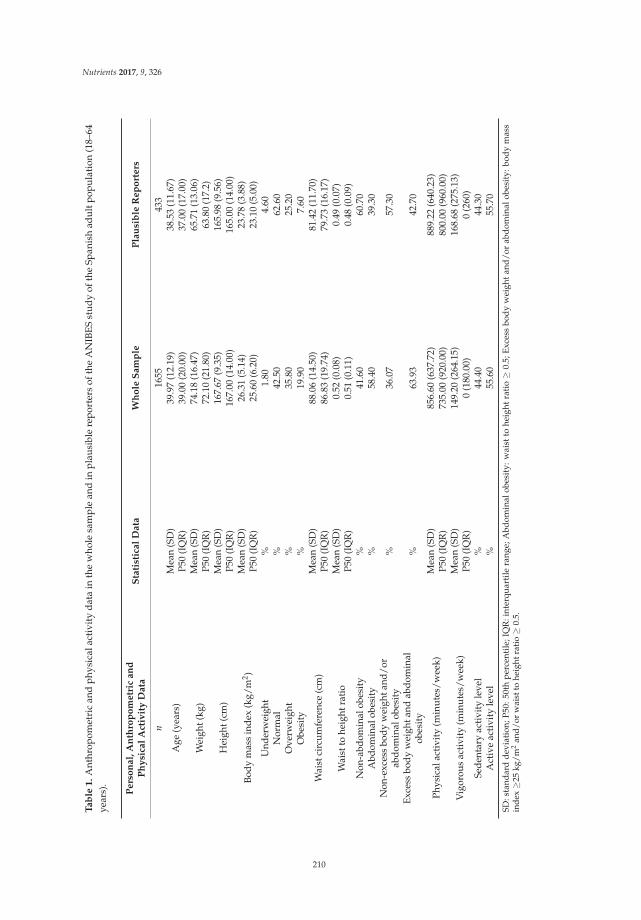
Nutrients 2017, 9, 326
Ta
ble
1.
Ant
hrop
omet
ric
and
phys
ical
acti
vity
dat
ain
the
who
lesa
mpl
ean
din
plau
sibl
ere
port
ers
ofth
eA
NIB
ES
stu
dy
ofth
eSp
anis
had
ult
popu
lati
on(1
8–64
year
s).
Pe
rso
na
l,A
nth
rop
om
etr
ica
nd
Ph
ysi
cal
Act
ivit
yD
ata
Sta
tist
ica
lD
ata
Wh
ole
Sa
mp
leP
lau
sib
leR
ep
ort
ers
n16
5543
3
Age
(yea
rs)
Mea
n(S
D)
39.9
7(1
2.19
)38
.53
(11.
67)
P50
(IQ
R)
39.0
0(2
0.00
)37
.00
(17.
00)
Wei
ght(
kg)
Mea
n(S
D)
74.1
8(1
6.47
)65
.71
(13.
06)
P50
(IQ
R)
72.1
0(2
1.80
)63
.80
(17.
2)
Hei
ght(
cm)
Mea
n(S
D)
167.
67(9
.35)
165.
98(9
.56)
P50
(IQ
R)
167.
00(1
4.00
)16
5.00
(14.
00)
Body
mas
sin
dex
(kg/
m2 )
Mea
n(S
D)
26.3
1(5
.14)
23.7
8(3
.88)
P50
(IQ
R)
25.6
0(6
.20)
23.1
0(5
.00)
Und
erw
eigh
t%
1.80
4.60
Nor
mal
%42
.50
62.6
0O
verw
eigh
t%
35.8
025
.20
Obe
sity
%19
.90
7.60
Wai
stci
rcum
fere
nce
(cm
)M
ean
(SD
)88
.06
(14.
50)
81.4
2(1
1.70
)P5
0(I
QR
)86
.83
(19.
74)
79.7
3(1
6.17
)
Wai
stto
heig
htra
tio
Mea
n(S
D)
0.52
(0.0
8)0.
49(0
.07)
P50
(IQ
R)
0.51
(0.1
1)0.
48(0
.09)
Non
-abd
omin
alob
esit
y%
41.6
060
.70
Abd
omin
alob
esit
y%
58.4
039
.30
Non
-exc
ess
body
wei
ghta
nd/o
rab
dom
inal
obes
ity
%36
.07
57.3
0
Exce
ssbo
dyw
eigh
tand
abdo
min
alob
esit
y%
63.9
342
.70
Phys
ical
acti
vity
(min
utes
/wee
k)M
ean
(SD
)85
6.60
(637
.72)
889.
22(6
40.2
3)P5
0(I
QR
)73
5.00
(920
.00)
800.
00(9
60.0
0)
Vig
orou
sac
tivi
ty(m
inut
es/w
eek)
Mea
n(S
D)
149.
20(2
64.1
5)16
8.68
(275
.13)
P50
(IQ
R)
0(1
80.0
0)0
(260
)Se
dent
ary
acti
vity
leve
l%
44.4
044
.30
Act
ive
acti
vity
leve
l%
55.6
055
.70
SD:s
tand
ard
dev
iati
on;P
50:
50th
per
cent
ile;I
QR
:int
erqu
arti
lera
nge;
Abd
omin
alob
esit
y:w
aist
tohe
ight
rati
o≥
0.5;
Exc
ess
bod
yw
eigh
tan
d/
orab
dom
inal
obes
ity:
bod
ym
ass
inde
x≥
25kg
/m2
and/
orw
aist
tohe
ight
rati
o≥
0.5.
210
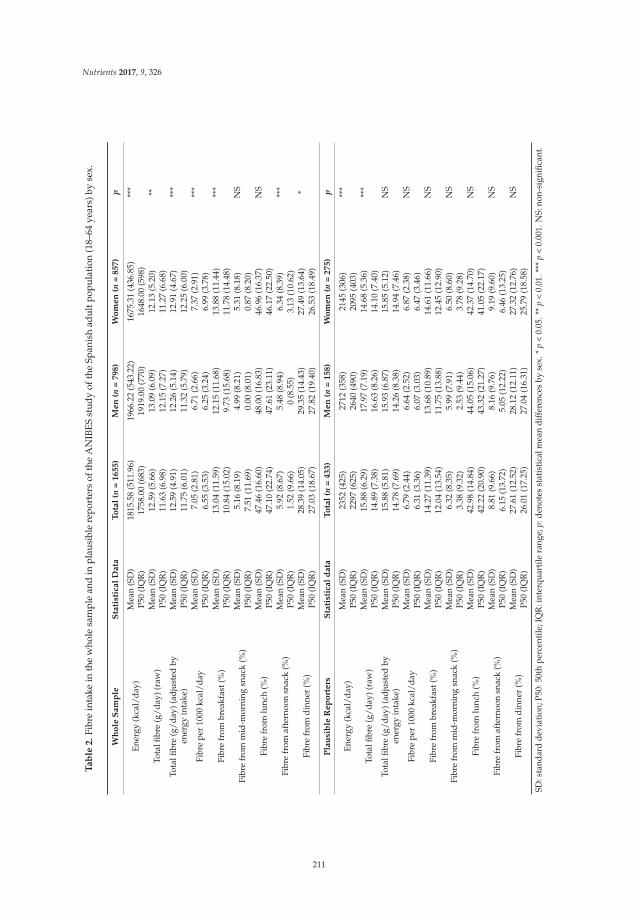
Nutrients 2017, 9, 326
Ta
ble
2.
Fibr
ein
take
inth
ew
hole
sam
ple
and
inpl
ausi
ble
repo
rter
sof
the
AN
IBES
stud
yof
the
Span
ish
adul
tpop
ulat
ion
(18–
64ye
ars)
byse
x.
Wh
ole
Sam
ple
Sta
tist
ical
Data
To
tal
(n=
1655)
Men
(n=
798)
Wo
men
(n=
857)
p
Ener
gy(k
cal/
day)
Mea
n(S
D)
1815
.58
(511
.96)
1966
.22
(543
.22)
1675
.31
(436
.85)
***
P50
(IQ
R)
1758
.00
(683
)19
19.0
0(7
70)
1648
.00
(598
)
Tota
lfibr
e(g
/day
)(ra
w)
Mea
n(S
D)
12.5
9(5
.66)
13.0
9(6
.09)
12.1
3(5
.20)
**P5
0(I
QR
)11
.63
(6.9
8)12
.15
(7.2
7)11
.27
(6.6
8)To
talfi
bre
(g/d
ay)(
adju
sted
byen
ergy
inta
ke)
Mea
n(S
D)
12.5
9(4
.91)
12.2
6(5
.14)
12.9
1(4
.67)
***
P50
(IQ
R)
11.7
5(6
.01)
11.3
2(5
.79)
12.2
5(6
.00)
Fibr
epe
r10
00kc
al/d
ayM
ean
(SD
)7.
05(2
.81)
6.71
(2.6
6)7.
37(2
.91)
***
P50
(IQ
R)
6.55
(3.5
3)6.
25(3
.24)
6.99
(3.7
8)
Fibr
efr
ombr
eakf
ast(
%)
Mea
n(S
D)
13.0
4(1
1.59
)12
.15
(11.
68)
13.8
8(1
1.44
)**
*P5
0(I
QR
)10
.84
(15.
02)
9.73
(15.
68)
11.7
8(1
4.48
)
Fibr
efr
omm
id-m
orni
ngsn
ack
(%)
Mea
n(S
D)
5.16
(8.1
9)4.
99(8
.21)
5.31
(8.1
8)N
SP5
0(I
QR
)7.
51(1
1.69
)0.
00(8
.01)
0.87
(8.2
0)
Fibr
efr
omlu
nch
(%)
Mea
n(S
D)
47.4
6(1
6.60
)48
.00
(16.
83)
46.9
6(1
6.37
)N
SP5
0(I
QR
)47
.10
(22.
74)
47.6
1(2
3.11
)46
.17
(22.
50)
Fibr
efr
omaf
tern
oon
snac
k(%
)M
ean
(SD
)5.
92(8
.67)
5.48
(8.9
4)6.
34(8
.39)
***
P50
(IQ
R)
1.52
(9.6
6)0
(8.5
5)3.
13(1
0.62
)
Fibr
efr
omdi
nner
(%)
Mea
n(S
D)
28.3
9(1
4.05
)29
.35
(14.
43)
27.4
9(1
3.64
)*
P50
(IQ
R)
27.0
3(1
8.67
)27
.82
(19.
40)
26.5
3(1
8.49
)
Pla
usi
ble
Rep
ort
ers
Sta
tist
ical
data
To
tal
(n=
433)
Men
(n=
158)
Wo
men
(n=
275)
p
Ener
gy(k
cal/
day)
Mea
n(S
D)
2352
(425
)27
12(3
58)
2145
(306
)**
*P5
0(I
QR
)22
97(6
25)
2640
(490
)20
95(4
03)
Tota
lfibr
e(g
/day
)(ra
w)
Mea
n(S
D)
15.8
8(6
.29)
17.9
7(7
.19)
14.6
8(5
.36)
***
P50
(IQ
R)
14.8
9(7
.38)
16.6
3(8
.26)
14.1
0(7
.40)
Tota
lfibr
e(g
/day
)(ad
just
edby
ener
gyin
take
)M
ean
(SD
)15
.88
(5.8
1)15
.93
(6.8
7)15
.85
(5.1
2)N
SP5
0(I
QR
)14
.78
(7.6
9)14
.26
(8.3
8)14
.94
(7.4
6)
Fibr
epe
r10
00kc
al/d
ayM
ean
(SD
)6.
79(2
.44)
6.64
(2.5
2)6.
87(2
.38)
NS
P50
(IQ
R)
6.31
(3.3
6)6.
07(3
.03)
6.47
(3.4
6)
Fibr
efr
ombr
eakf
ast(
%)
Mea
n(S
D)
14.2
7(1
1.39
)13
.68
(10.
89)
14.6
1(1
1.66
)N
SP5
0(I
QR
)12
.04
(13.
54)
11.7
5(1
3.88
)12
.45
(12.
90)
Fibr
efr
omm
id-m
orni
ngsn
ack
(%)
Mea
n(S
D)
6.32
(8.3
5)5.
99(7
.91)
6.50
(8.6
0)N
SP5
0(I
QR
)3.
38(9
.32)
2.53
(9.4
4)3.
78(9
.28)
Fibr
efr
omlu
nch
(%)
Mea
n(S
D)
42.9
8(1
4.84
)44
.05
(15.
06)
42.3
7(1
4.70
)N
SP5
0(I
QR
)42
.22
(20.
90)
43.3
2(2
1.27
)41
.05
(22.
17)
Fibr
efr
omaf
tern
oon
snac
k(%
)M
ean
(SD
)8.
81(9
.66)
8.16
(9.7
6)9.
19(9
.60)
NS
P50
(IQ
R)
6.15
(13.
72)
5.05
(12.
22)
6.46
(13.
25)
Fibr
efr
omdi
nner
(%)
Mea
n(S
D)
27.6
1(1
2.52
)28
.12
(12.
11)
27.3
2(1
2.76
)N
SP5
0(I
QR
)26
.01
(17.
25)
27.0
4(1
6.31
)25
.79
(18.
58)
SD:s
tand
ard
devi
atio
n;P5
0:50
thpe
rcen
tile
;IQ
R:i
nter
quar
tile
rang
e;p:
deno
tes
stat
isti
calm
ean
diff
eren
ces
byse
x.*
p<
0.05
.**
p<
0.01
.***
p<
0.00
1.N
S:no
n-si
gnifi
cant
.
211
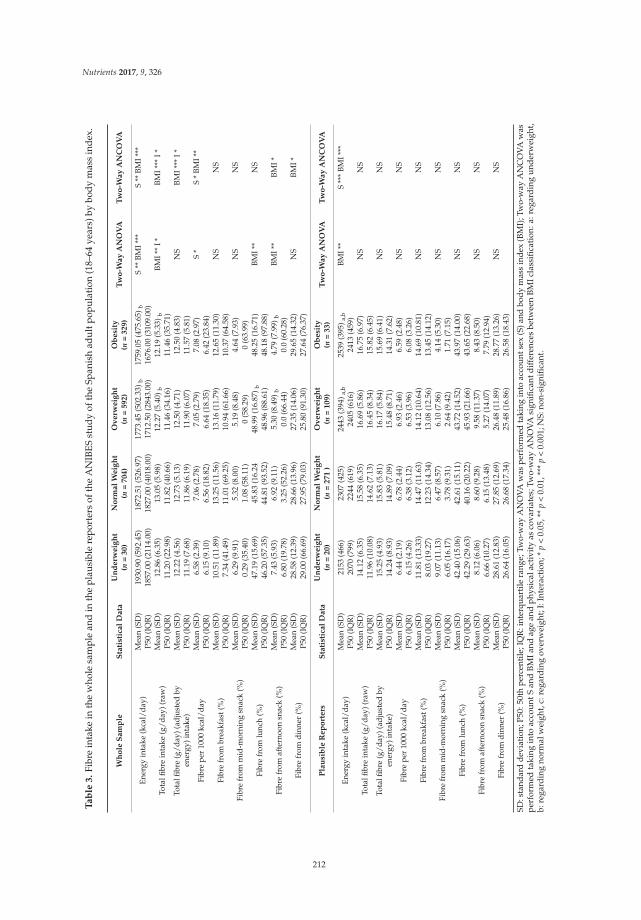
Nutrients 2017, 9, 326
Ta
ble
3.
Fibr
ein
take
inth
ew
hole
sam
ple
and
inth
epl
ausi
ble
repo
rter
sof
the
AN
IBES
stud
yof
the
Span
ish
adul
tpop
ulat
ion
(18–
64ye
ars)
bybo
dym
ass
inde
x.
Wh
ole
Sa
mp
leS
tati
stic
al
Da
taU
nd
erw
eig
ht
(n=
30
)N
orm
al
We
igh
t(n
=7
04
)O
ve
rwe
igh
t(n
=5
92
)O
be
sity
(n=
32
9)
Tw
o-W
ay
AN
OV
AT
wo
-Wa
yA
NC
OV
A
Ener
gyin
take
(kca
l/da
y)M
ean
(SD
)19
30.9
0(5
92.4
5)18
72.5
1(5
26.9
7)17
73.4
5(5
02.3
3)b
1759
.05
(475
.65)
bS
**BM
I***
S**
BMI*
**P5
0(I
QR
)18
57.0
0(2
114.
00)
1827
.00
(401
8.00
)17
12.5
0(2
843.
00)
1676
.00
(310
9.00
)
Tota
lfibr
ein
take
(g/d
ay)(
raw
)M
ean
(SD
)12
.86
(6.3
5)13
.05
(5.9
8)12
.27
(5.4
0)b
12.1
9(5
.33)
bBM
I**
I*BM
I***
I*P5
0(I
QR
)11
.20
(22.
98)
11.8
2(4
0.66
)11
.46
(34.
16)
11.4
6(3
5.71
)To
talfi
bre
(g/d
ay)(
adju
sted
byen
ergy
)int
ake)
Mea
n(S
D)
12.2
2(4
.56)
12.7
3(5
.13)
12.5
0(4
.71)
12.5
0(4
.83)
NS
BMI*
**I*
P50
(IQ
R)
11.1
9(7
.68)
11.8
6(6
.19)
11.9
0(6
.07)
11.5
7(5
.81)
Fibr
epe
r10
00kc
al/d
ayM
ean
(SD
)6.
58(2
.39)
7.06
(2.7
8)7.
05(2
.79)
7.08
(2.9
7)S
*S
*BM
I**
P50
(IQ
R)
6.15
(9.1
0)6.
56(1
8.82
)6.
64(1
8.35
)6.
42(2
3.84
)
Fibr
efr
ombr
eakf
ast(
%)
Mea
n(S
D)
10.5
1(1
1.89
)13
.25
(11.
56)
13.1
6(1
1.79
)12
.65
(11.
30)
NS
NS
P50
(IQ
R)
7.34
(41.
49)
11.0
1(6
9.25
)10
.94
(61.
66)
10.3
7(6
4.58
)
Fibr
efr
omm
id-m
orni
ngsn
ack
(%)
Mea
n(S
D)
6.29
(9.9
1)5.
32(8
.00)
5.19
(8.4
8)4.
64(7
.93)
NS
NS
P50
(IQ
R)
0.29
(35.
40)
1.08
(58.
11)
0(5
8.29
)0
(63.
99)
Fibr
efr
omlu
nch
(%)
Mea
n(S
D)
47.1
9(1
5.69
)45
.83
(16.
2448
.99
(16.
87) b
48.2
5(1
6.71
)BM
I**
NS
P50
(IQ
R)
46.2
0(5
7.35
)44
.81
(93.
52)
48.9
6(8
8.61
)48
.18
(97.
88)
Fibr
efr
omaf
tern
oon
snac
k(%
)M
ean
(SD
)7.
43(5
.93)
6.92
(9.1
1)5.
30(8
.49)
b4.
79(7
.99)
bBM
I**
BMI*
P50
(IQ
R)
6.80
(19.
78)
3.25
(52.
26)
0.0
(66.
44)
0.0
(60.
28)
Fibr
efr
omdi
nner
(%)
Mea
n(S
D)
28.5
8(1
2.39
)28
.66
(13.
96)
27.3
5(1
4.06
)29
.65
(14.
32)
NS
BMI*
P50
(IQ
R)
29.0
0(6
6.69
)27
.95
(79.
03)
25.8
0(9
1.30
)27
.64
(76.
37)
Pla
usi
ble
Re
po
rte
rsS
tati
stic
al
Da
taU
nd
erw
eig
ht
(n=
20
)N
orm
al
We
igh
t(n
=2
71
)O
ve
rwe
igh
t(n
=1
09
)O
be
sity
(n=
33
)T
wo
-Wa
yA
NO
VA
Tw
o-W
ay
AN
CO
VA
Ener
gyin
take
(kca
l/da
y)M
ean
(SD
)21
53(4
66)
2307
(425
)24
43(3
94) a
,b25
39(3
95) a
,bBM
I**
S**
*BM
I***
P50
(IQ
R)
2070
(799
)22
44(6
19)
2405
(616
)24
13(4
59)
Tota
lfibr
ein
take
(g/d
ay)(
raw
)M
ean
(SD
)14
.12
(6.3
5)15
.58
(6.3
5)16
.69
(5.8
6)16
.75
(6.9
7)N
SN
SP5
0(I
QR
)11
.96
(10.
08)
14.6
2(7
.13)
16.4
5(8
.34)
15.8
2(6
.45)
Tota
lfibr
e(g
/day
)(ad
just
edby
ener
gy)i
ntak
e)M
ean
(SD
)15
.25
(4.9
3)15
.83
(5.8
1)16
.17
(5.8
4)15
.69
(6.4
1)N
SN
SP5
0(I
QR
)14
.24
(8.9
3)14
.89
(7.0
9)15
.48
(8.7
1)14
.31
(7.6
2)
Fibr
epe
r10
00kc
al/d
ayM
ean
(SD
)6.
44(2
.19)
6.78
(2.4
4)6.
93(2
.46)
6.59
(2.4
8)N
SN
SP5
0(I
QR
)6.
15(4
.26)
6.38
(3.1
2)6.
53(3
.96)
6.08
(3.2
6)
Fibr
efr
ombr
eakf
ast(
%)
Mea
n(S
D)
11.8
1(1
3.33
)14
.47
(11.
63)
14.1
2(1
0.64
)14
.69
(10.
81)
NS
NS
P50
(IQ
R)
8.03
(19.
27)
12.2
3(1
4.34
)13
.08
(12.
56)
13.4
5(1
4.12
)
Fibr
efr
omm
id-m
orni
ngsn
ack
(%)
Mea
n(S
D)
9.07
(11.
13)
6.47
(8.5
7)6.
10(7
.86)
4.14
(5.3
0)N
SN
SP5
0(I
QR
)6.
05(1
6.17
)3.
78(9
.31)
2.64
(9.4
2)1.
71(7
.15)
Fibr
efr
omlu
nch
(%)
Mea
n(S
D)
42.4
0(1
5.06
)42
.61
(15.
11)
43.7
2(1
4.52
)43
.97
(14.
00)
NS
NS
P50
(IQ
R)
42.2
9(2
9.63
)40
.16
(20.
22)
45.9
3(2
1.66
)43
.65
(22.
68)
Fibr
efr
omaf
tern
oon
snac
k(%
)M
ean
(SD
)8.
12(6
.06)
8.60
(9.2
8)9.
58(1
1.37
)8.
43(8
.50)
NS
NS
P50
(IQ
R)
6.66
(10.
27)
6.15
(13.
48)
5.27
(14.
07)
7.79
(12.
94)
Fibr
efr
omdi
nner
(%)
Mea
n(S
D)
28.6
1(1
2.83
)27
.85
(12.
69)
26.4
8(1
1.89
)28
.77
(13.
26)
NS
NS
P50
(IQ
R)
26.6
4(1
6.05
)26
.68
(17.
34)
25.4
8(1
6.86
)26
.58
(18.
43)
SD:s
tand
ard
devi
atio
n;P5
0:50
thpe
rcen
tile;
IQR
:int
erqu
artil
era
nge;
Two-
way
AN
OVA
was
perf
orm
edta
king
into
acco
unts
ex(S
)and
body
mas
sin
dex
(BM
I);T
wo-
way
AN
CO
VAw
aspe
rfor
med
taki
ngin
toac
coun
tSan
dBM
Iand
age
and
phys
ical
acti
vity
asco
vari
ates
;Tw
o-w
ayA
NO
VAsi
gnifi
cant
diff
eren
ces
betw
een
BMIc
lass
ifica
tion
:a:r
egar
ding
unde
rwei
ght,
b:re
gard
ing
norm
alw
eigh
t,c:
rega
rdin
gov
erw
eigh
t;I:
Inte
ract
ion;
*p
<0.
05,*
*p
<0.
01,*
**p
<0.
001;
NS:
non-
sign
ifica
nt.
212
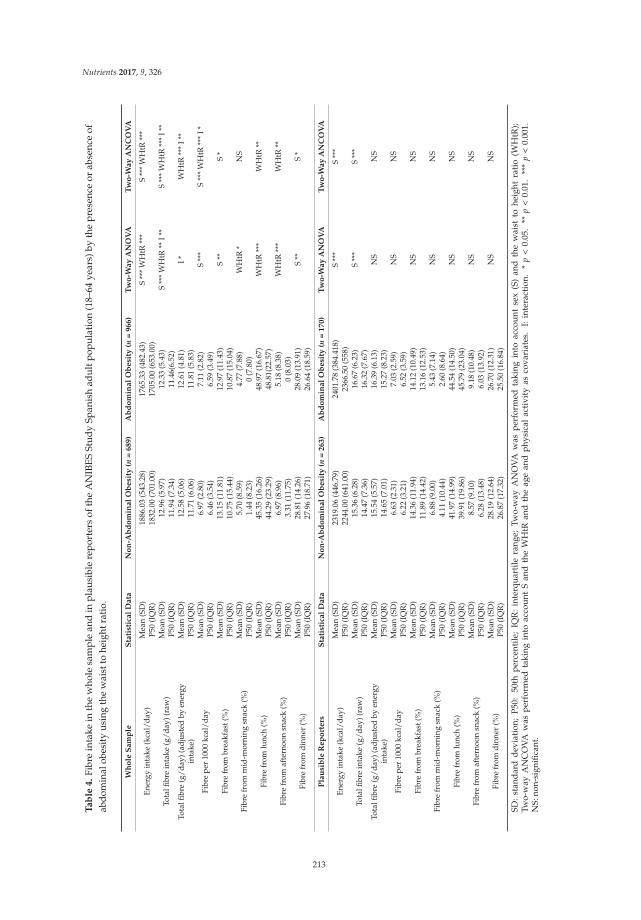
Nutrients 2017, 9, 326
Ta
ble
4.
Fibr
ein
take
inth
ew
hole
sam
ple
and
inp
lau
sibl
ere
por
ters
ofth
eA
NIB
ES
Stu
dy
Span
ish
adu
ltp
opu
lati
on(1
8–64
year
s)by
the
pre
senc
eor
abse
nce
ofab
dom
inal
obes
ity
usin
gth
ew
aist
tohe
ight
rati
o.
Wh
ole
Sa
mp
leS
tati
stic
al
Da
taN
on
-Ab
do
min
al
Ob
esi
ty(n
=6
89
)A
bd
om
ina
lO
be
sity
(n=
96
6)
Tw
o-W
ay
AN
OV
AT
wo
-Wa
yA
NC
OV
A
Ener
gyin
take
(kca
l/da
y)M
ean
(SD
)18
86.0
3(5
43.2
8)17
65.3
3(4
82.4
3)S
***
WH
tR**
*S
***
WH
tR**
*P5
0(I
QR
)18
32.0
0(7
01.0
0)17
05.0
0(6
53.0
0)
Tota
lfibr
ein
take
(g/d
ay)(
raw
)M
ean
(SD
)12
.96
(5.9
7)12
.33
(5.4
3)S
***
WH
tR**
I**
S**
*W
HtR
***
I**
P50
(IQ
R)
11.9
4(7
.34)
11.4
6(6.
52)
Tota
lfibr
e(g
/day
)(ad
just
edby
ener
gyin
take
)M
ean
(SD
)12
.58
(5.0
6)12
.61
(4.8
1)I*
WH
tR**
*I*
*P5
0(I
QR
)11
.71
(6.0
6)11
.81
(5.8
3)
Fibr
epe
r10
00kc
al/d
ayM
ean
(SD
)6.
97(2
.80)
7.11
(2.8
2)S
***
S**
*W
HtR
***
I*P5
0(I
QR
)6.
46(3
.54)
6.59
(3.4
9)
Fibr
efr
ombr
eakf
ast(
%)
Mea
n(S
D)
13.1
5(1
1.81
)12
.97
(11.
43)
S**
S*
P50
(IQ
R)
10.7
5(1
5.44
)10
.87
(15.
04)
Fibr
efr
omm
id-m
orni
ngsn
ack
(%)
Mea
n(S
D)
5.70
(8.5
9)4.
77(7
.88)
WH
tR*
NS
P50
(IQ
R)
1.44
(8.2
3)0
(7.8
0)
Fibr
efr
omlu
nch
(%)
Mea
n(S
D)
45.3
5(1
6.26
)48
.97
(16.
67)
WH
tR**
*W
HtR
**P5
0(I
QR
)44
.29
(23.
29)
48.8
1(22
.57)
Fibr
efr
omaf
tern
oon
snac
k(%
)M
ean
(SD
)6.
97(8
.96)
5.18
(8.3
8)W
HtR
***
WH
tR**
P50
(IQ
R)
3.31
(11.
75)
0(8
.03)
Fibr
efr
omdi
nner
(%)
Mea
n(S
D)
28.8
1(1
4.26
)28
.09
(13.
91)
S**
S*
P50
(IQ
R)
27.9
6(1
8.71
)26
.64
(18.
59)
Pla
usi
ble
Re
po
rte
rsS
tati
stic
al
Da
taN
on
-Ab
do
min
al
Ob
esi
ty(n
=2
63
)A
bd
om
ina
lO
be
sity
(n=
17
0)
Tw
o-W
ay
AN
OV
AT
wo
-Wa
yA
NC
OV
A
Ener
gyin
take
(kca
l/da
y)M
ean
(SD
)23
19.0
6(4
46.7
9)24
01.7
8(3
84.4
18)
S**
*S
***
P50
(IQ
R)
2244
.00
(641
.00)
2366
.50
(558
)
Tota
lfibr
ein
take
(g/d
ay)(
raw
)M
ean
(SD
)15
.36
(6.2
8)16
.67
(6.2
3)S
***
S**
*P5
0(I
QR
)14
.47
(7.3
6)16
.32
(7.6
7)To
talfi
bre
(g/d
ay)(
adju
sted
byen
ergy
inta
ke)
Mea
n(S
D)
15.5
4(5
.57)
16.3
9(6
.13)
NS
NS
P50
(IQ
R)
14.6
5(7
.01)
15.2
7(8
.23)
Fibr
epe
r10
00kc
al/d
ayM
ean
(SD
)6.
63(2
.31)
7.03
(2.5
9)N
SN
SP5
0(I
QR
)6.
22(3
.21)
6.52
(3.5
9)
Fibr
efr
ombr
eakf
ast(
%)
Mea
n(S
D)
14.3
6(1
1.94
)14
.12
(10.
49)
NS
NS
P50
(IQ
R)
11.8
9(1
4.42
)13
.16
(12.
53)
Fibr
efr
omm
id-m
orni
ngsn
ack
(%)
Mea
n(S
D)
6.88
(9.0
0)5.
43(7
.14)
NS
NS
P50
(IQ
R)
4.11
(10.
44)
2.60
(8.6
4)
Fibr
efr
omlu
nch
(%)
Mea
n(S
D)
41.9
7(1
4.99
)44
.54
(14.
50)
NS
NS
P50
(IQ
R)
39.9
1(1
9.86
)45
.79
(23.
04)
Fibr
efr
omaf
tern
oon
snac
k(%
)M
ean
(SD
)8.
57(9
.10)
9.18
(10.
48)
NS
NS
P50
(IQ
R)
6.28
(13.
48)
6.03
(13.
92)
Fibr
efr
omdi
nner
(%)
Mea
n(S
D)
28.1
9(1
2.64
)26
.70
(12.
31)
NS
NS
P50
(IQ
R)
26.8
7(1
7.32
)25
.50
(16.
84)
SD:
stan
dar
dd
evia
tion
;P
50:
50th
per
cent
ile;
IQR
:in
terq
uar
tile
rang
e;Tw
o-w
ayA
NO
VA
was
per
form
edta
king
into
acco
unt
sex
(S)
and
the
wai
stto
heig
htra
tio
(WH
tR);
Two-
way
AN
CO
VA
was
per
form
edta
king
into
acco
unt
San
dth
eW
HtR
and
the
age
and
phy
sica
lac
tivi
tyas
cova
riat
es.
I:in
tera
ctio
n.*
p<
0.05
.**
p<
0.01
.**
*p
<0.
001.
NS:
non-
sign
ifica
nt.
213
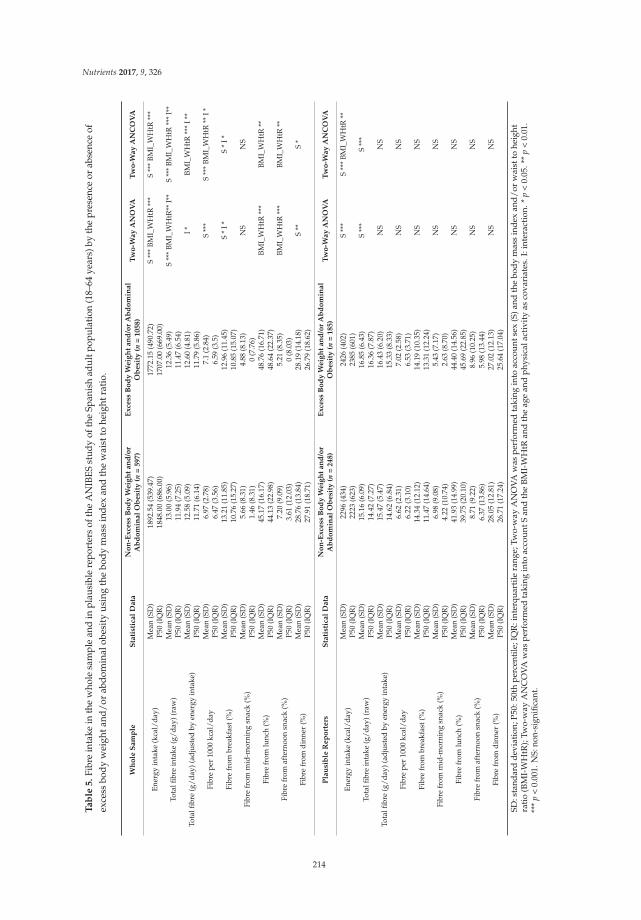
Nutrients 2017, 9, 326
Ta
ble
5.
Fibr
ein
take
inth
ew
hole
sam
ple
and
inpl
ausi
ble
repo
rter
sof
the
AN
IBES
stud
yof
the
Span
ish
adul
tpop
ulat
ion
(18–
64ye
ars)
byth
epr
esen
ceor
abse
nce
ofex
cess
body
wei
ghta
nd/o
rab
dom
inal
obes
ity
usin
gth
ebo
dym
ass
inde
xan
dth
ew
aist
tohe
ight
rati
o.
Wh
ole
Sa
mp
leS
tati
stic
al
Da
taN
on
-Ex
cess
Bo
dy
We
igh
ta
nd
/or
Ab
do
min
al
Ob
esi
ty(n
=5
97
)E
xce
ssB
od
yW
eig
ht
an
d/o
rA
bd
om
ina
lO
be
sity
(n=
10
58
)T
wo
-Wa
yA
NO
VA
Tw
o-W
ay
AN
CO
VA
Ener
gyin
take
(kca
l/da
y)M
ean
(SD
)18
92.5
4(5
39.4
7)17
72.1
5(4
90.7
2)S
***
BMI_
WH
tR**
*S
***
BMI_
WH
tR**
*P5
0(I
QR
)18
48.0
0(6
86.0
0)17
07.0
0(6
69.0
0)
Tota
lfibr
ein
take
(g/d
ay)(
raw
)M
ean
(SD
)13
.00
(5.9
6)12
.36
(5.4
9)S
***
BMI_
WH
tR**
I**
S**
*BM
I_W
HtR
***
I**
P50
(IQ
R)
11.9
4(7
.25)
11.4
7(6
.54)
Tota
lfibr
e(g
/day
)(ad
just
edby
ener
gyin
take
)M
ean
(SD
)12
.58
(5.0
9)12
.60
(4.8
1)I*
BMI_
WH
tR**
*I*
*P5
0(I
QR
)11
.71
(6.1
4)11
.79
(5.8
6)
Fibr
epe
r10
00kc
al/d
ayM
ean
(SD
)6.
97(2
.78)
7.1
(2.8
4)S
***
S**
*BM
I_W
HtR
**I*
P50
(IQ
R)
6.47
(3.5
6)6.
59(3
.5)
Fibr
efr
ombr
eakf
ast(
%)
Mea
n(S
D)
13.2
1(1
1.85
)12
.96
(11.
45)
S*
I*S
*I*
P50
(IQ
R)
10.7
6(1
5.27
)10
.85
(15.
07)
Fibr
efr
omm
id-m
orni
ngsn
ack
(%)
Mea
n(S
D)
5.66
(8.3
1)4.
88(8
.13)
NS
NS
P50
(IQ
R)
1.46
(8.3
1)0
(7.7
6)
Fibr
efr
omlu
nch
(%)
Mea
n(S
D)
45.1
7(1
6.17
)48
.76
(16.
71)
BMI_
WH
tR**
*BM
I_W
HtR
**P5
0(I
QR
)44
.13
(22.
98)
48.6
4(2
2.37
)
Fibr
efr
omaf
tern
oon
snac
k(%
)M
ean
(SD
)7.
20(9
.09)
5.21
(8.3
5)BM
I_W
HtR
***
BMI_
WH
tR**
P50
(IQ
R)
3.61
(12.
03)
0(8
.03)
Fibr
efr
omdi
nner
(%)
Mea
n(S
D)
28.7
6(1
3.84
)28
.19
(14.
18)
S**
S*
P50
(IQ
R)
27.9
1(1
8.71
)26
.79
(18.
62)
Pla
usi
ble
Re
po
rte
rsS
tati
stic
al
Da
taN
on
-Ex
cess
Bo
dy
We
igh
ta
nd
/or
Ab
do
min
al
Ob
esi
ty(n
=2
48
)E
xce
ssB
od
yW
eig
ht
an
d/o
rA
bd
om
ina
lO
be
sity
(n=
18
5)
Tw
o-W
ay
AN
OV
AT
wo
-Wa
yA
NC
OV
A
Ener
gyin
take
(kca
l/da
y)M
ean
(SD
)22
96(4
34)
2426
(402
)S
***
S**
*BM
I_W
HtR
**P5
0(I
QR
)22
23(6
23)
2385
(601
)
Tota
lfibr
ein
take
(g/d
ay)(
raw
)M
ean
(SD
)15
.16
(6.0
9)16
.85
(6.4
3)S
***
S**
*P5
0(I
QR
)14
.42
(7.2
7)16
.36
(7.8
7)
Tota
lfibr
e(g
/day
)(ad
just
edby
ener
gyin
take
)M
ean
(SD
)15
.47
(5.4
7)16
.43
(6.2
0)N
SN
SP5
0(I
QR
)14
.62
(6.8
4)15
.33
(8.3
3)
Fibr
epe
r10
00kc
al/d
ayM
ean
(SD
)6.
62(2
.31)
7.02
(2.5
8)N
SN
SP5
0(I
QR
)6.
22(3
.10)
6.53
(3.7
1)
Fibr
efr
ombr
eakf
ast(
%)
Mea
n(S
D)
14.3
4(1
2.12
)14
.19
(10.
35)
NS
NS
P50
(IQ
R)
11.4
7(1
4.64
)13
.31
(12.
24)
Fibr
efr
omm
id-m
orni
ngsn
ack
(%)
Mea
n(S
D)
6.98
(9.0
8)5.
43(7
.17)
NS
NS
P50
(IQ
R)
4.22
(10.
74)
2.63
(8.7
0)
Fibr
efr
omlu
nch
(%)
Mea
n(S
D)
41.9
3(1
4.99
)44
.40
(14.
56)
NS
NS
P50
(IQ
R)
39.7
5(2
0.10
)45
.69
(22.
85)
Fibr
efr
omaf
tern
oon
snac
k(%
)M
ean
(SD
)8.
71(9
.22)
8.96
(10.
25)
NS
NS
P50
(IQ
R)
6.37
(13.
86)
5.98
(13.
44)
Fibr
efr
omdi
nner
(%)
Mea
n(S
D)
28.0
5(1
2.81
)27
.02
(12.
13)
NS
NS
P50
(IQ
R)
26.7
1(1
7.24
)25
.64
(17.
04)
SD:s
tand
ard
dev
iati
on;P
50:5
0th
perc
enti
le;I
QR
:int
erqu
arti
lera
nge;
Two-
way
AN
OV
Aw
aspe
rfor
med
taki
ngin
toac
coun
tsex
(S)a
ndth
ebo
dy
mas
sin
dex
and
/or
wai
stto
heig
htra
tio
(BM
I-W
HtR
);Tw
o-w
ayA
NC
OV
Aw
aspe
rfor
med
taki
ngin
toac
coun
tSan
dth
eB
MI-
WH
tRan
dth
eag
ean
dph
ysic
alac
tivi
tyas
cova
riat
es.I
:int
erac
tion
.*p
<0.
05.*
*p
<0.
01.
***
p<
0.00
1.N
S:no
n-si
gnifi
cant
.
214
Nutrients 2017, 9, 326
Relating to the fibre food sources, according to the presence or absence of excess body weightand/or abdominal obesity in the whole sample, we found that fibre from grains, breakfast cereals,and cereal bars, chocolates, ready-to-eat meals, sauces, and condiments, was higher in individualswithout excess body weight and/or abdominal obesity than those with excess body weight and/orabdominal obesity, and fibre from vegetables was higher in individuals with excess body weightand/or abdominal obesity than those subjects without excess body weight and/or abdominal obesity,but all these differences disappeared when an adjustment for age and PA was performed (Table S5).Fibre from bread (taking into account sex and after adjusting for the age and PA) was higher insubjects who had excess body weight and/or abdominal obesity than in those who did not havethis problematic (Table S5). Similarly, after adjusting for the age and the PA, it was observed that thefibre from the pasta was higher in individuals with excess body weight and/or abdominal obesity6.65% (SE 0.256%) as opposed to those without it 5.63% (SE 0.358%) (p < 0.05). In contrast, fibre fromfruits (taking into account sex and after adjusting for the age and PA) was higher in subjects withoutexcess body weight and/or abdominal obesity 19.06% (SE 0.644%) than in subjects with excess bodyweight and/or abdominal obesity 15.45% (SE 0.462%) (p < 0.001). However, when analysing theinteraction with sex (Table S5), this result was only observed in men without excess body weightand/or abdominal obesity 20.12% (SE 0.990%) compared to those with excess body weight and/orabdominal obesity 13.87% (SE 0.619%) (p < 0.001).
In the plausible reporters, we observed that fibre from the groups of grains and flours, pasta andjuices and nectars was higher in subjects without excess body weight and/or abdominal obesity thanthose with excess body weight and/or abdominal obesity, but these differences disappeared whenan adjustment for age and PA was performed (Table S6). Taking into account sex and after adjustingfor age and PA, fibre from fruits was significantly higher in individuals without excess body weightand/or abdominal obesity 20.2% (SE 1.042%) compared to subjects with excess body weight and/orabdominal obesity 16.9% (1.144%) (p < 0.05). Conversely, the fibre from ready-to-eat-meals was higherin those subjects with excess body weight and/or abdominal obesity 6.41 (SE 0.558%) than thosewithout excess body weight and/or abdominal obesity 3.81% (SE 0.508%) (p < 0.01).
4. Discussion
The present study provides updated information on fibre intake and dietary sources and theirassociation with the condition of excess body weight and abdominal obesity in a representative sampleof the Spanish adult population. It is highlighted the ANIBES is the first national diet and nutritionsurvey in Spain that has taken into account the plausible reporters in the analysis of the data, based onwell-harmonised procedures [33,34].
A great proportion of participants of the whole sample and of the plausible reporters had OWor OB, which is in concordance with other studies performed in the Spanish population [40,41].Nonetheless, it is highlighted the prevalence of OW or OB was lower in the plausible reporters incomparison with the whole sample. When comparing our results with the FANPE study (carried outin 2009 on a representative sample of the Spanish population), we found that the combined prevalenceof OW and OB of the study (47.80%) was lower than that observed in our study in the whole sample(55.70%) and higher than that observed in the plausible reporters (32.80%) [41], while the combinedprevalence observed in the ENPE study, conducted in 2014–2015, also in Spain, was higher (60.9%)than that observed in the present study both in the whole sample and in the plausible reporters [40].
Some studies have indicated that the WHtR is a better predictor of metabolic syndrome orcardiovascular disease and mortality than the WC or BMI [21,23]. Possibly, the most importantadvantage of using the WHtR resides in the fact that this ratio takes into account the height ofthe subject, which avoids the overestimation or underestimation of individuals who have a highor low height [21,23,42]. In our study, the mean WHtR in the whole sample was 0.52 (SD 0.08)and 0.49 (SD 0.07) in the plausible reporters. These values are in line to those indicated by theFANPE and ENPE studies [40,43]. Using this parameter, 58.4% of the whole sample and 39.30%
215
Nutrients 2017, 9, 326
of the plausible reporters had abdominal obesity, lower than those indicated in the DARIOS Study(conducted in 2013 in Spanish population), in which 89% of men and 77% of women had abdominalobesity [44]. Moreover, when the presence of excess body weight and/or the presence of abdominalobesity were examined, it was found that 63.93% of the whole sample and 42.70% of the plausiblereporters had one or both of these problems.
Furthermore, we found that a high proportion of the studied population was sedentary, which hasbeen already discussed in detail in a previous paper [45].
The mean dietary fibre intakes (raw, adjusted by energy intake and expressed in grams per1000 kcal per day) both in the whole sample and in the plausible reporters were very similar and werelower in comparison with the observed in other studies performed in population with similar agesand characteristics [14,15,46,47]. When comparing the results of our study with those observed by theENIDE study (carried out in a representative sample of the Spanish population aged 18 to 64 yearsin 2011), the fibre intake of the participants of our study was lower than the results of such study(men: 20.94 (SD 11.38) g/day and women: 18.85 (SD 10.06) g/day) [14]. Likewise, the mean fibreintakes shown in other study also performed in Spain 20.2 (SD 7.8) g/day and in a study carriedout in Irish population 25.7 (SD 8.1) g/day were higher than that observed in our study [15,46].However, our results were more similar to those observed in the National Health and NutritionExamination Survey (NHANES 2009–2010) performed in United States adults aged 19 years and olderwhere the fibre intake was 17.0 g/day [47].
The mean intake of fibre (raw) both in men and women was below the adequate intake establishedby the EFSA and IOM [29,30] in the whole sample and in the plausible reporters. This situation wasclose to the results shown in various studies performing in similar population [14,46,48,49].
We observed only in the whole sample that the fibre intake after adjusting for energy intakeand the fibre per 1000 kcal per day were significantly higher in women than in men. This may beexplained because women are usually more concerned about following healthy eating habits and tendto include more healthy foods in their diet compared to men [50]. The analysis of the source of dailyfibre intake depending on the different meals throughout the day, revealed that nearly half came fromlunch (47.46% and 42.98%) and almost a third from dinner (28.39% and 27.61%) in the whole sampleand plausible reporters, respectively. It is noteworthy that the fibre from breakfast was too low in thewhole sample (13.04%) and in the plausible reporters (14.27%). The number of frequency of meals perday, including snacks, has been positively related to the intake of various nutrients including the fibreintake [51]. In our study, the mid-morning and afternoon snacks provided the 11.08% and the 15.13%of the daily fibre in the whole sample and in the plausible reporters, respectively. In contrast to ourresults, the 2001–2010 NHANES study observed that most of the daily fibre came from dinner (37% foradults 19–50 years) [52]. Furthermore, the pattern of fibre intake from the different meals of the daydiffers according to sex. The proportion of fibre from breakfast and afternoon snacks was higher inwomen and from dinner in men only in the whole sample. These differences in the pattern of fibreintake are probably due to the differences in the food choices made by the subjects at each meal of theday [52]. A better contribution of fibre from breakfast or afternoon snack, with respect to other meals,could help to reduce appetite and food intake at subsequent meals [6,9]. This could be related to thebetter situation observed in women compared to men in connection with the presence of excess bodyweight and abdominal obesity described in a previous paper in more detail for the ANIBES Spanishadult population [53].
Regarding dietary sources of fibre, the main sources in the studied sample were grains, followedby vegetables, fruits, and pulses and were very similar in both studied samples. Similar food groupswere identified as the major contributors in the Belgian population [49]. Unlike our study, themain sources of fibre in the ENIDE study were fruits (30%), followed by legumes and nuts (26%),cereals (22%), and vegetables (14%) [14]. Differences were also observed when compared to the resultsof the 2001–2010 NHANES study, where it was observed that the main sources were the vegetables,followed by cereals and fruits [52].
216
Nutrients 2017, 9, 326
Some studies performed on populations from the United States [5], the Netherlands [4],and Spain [54] have observed an inverse association between fibre intake and BMI. In accordance withthis, in our study, taking into account sex, and after adjusting for the age and physical activity of theparticipants, fibre intake (raw, adjusted by energy intake and expressed as grams per 1000 kcal per day)was different according to the BMI only in the whole sample. Participants with NW had a significantlyhigher intake of fibre (raw and expressed as grams per 1000 kcal per day) than those subjects withOW or OB. However, the differences on fibre intake adjusted by the energy intake only were observedin the male sex, where men with NW had a greater intake than those who had OW or OB, which isconsistent with what is stated in the study conducted in the Dutch population, where they have foundan inverse association between fibre intake and BMI only in men [4]. Moreover, the pattern of fibreintake in the different meals during the day varied depending on the body weight situation only in thewhole sample. Specifically, we found that the percentage of fibre that comes from the afternoon snackwas higher in individuals with NW than those with OW or OB, while the fibre from dinner was higherin individuals who had OB than those who had OW. The difference found regarding the contributionof fibre from the afternoon snack according to BMI, as previously mentioned, could be related, on theone hand, to the fact that a higher fibre content may favour a reduced appetite which, in turn, can helpto take in less food at subsequent meals, in this case during dinner, thus balancing the daily energyintake [6,9]. On the other hand, this also could be explained due to an afternoon snack that contains ahigher amount of fibre, which could also include healthier foods with a lower content of energy or fat.
An inverse relation between dietary fibre from cereals and fruits and body weight gain hasbeen described in a study performed in male adults (40–75 years old) from the United States [55].Although the fibre from grains was the most important fibre food source in the present study, there wereno significant differences according to BMI in the whole sample. Conversely, we found that the intakeof fibre coming from fruits was higher in men with NW compared to those who had OW or OB inthe whole sample. These differences may be explained due to fruits that are rich in soluble fibre,which may help control appetite, or because people who consume fruits and vegetables regularly alsotend to have a healthier lifestyle [9,49].
We only observed in the men of the group of plausible reporters that fibre from pasta was higherin those with UW than in those with NW or OW. This may be due to subjects who have an excessivebody weight try to control their weight by the reduction of carbohydrates of the diet reducing theintake of this type of food.
When the data were analysed according to the presence or absence of abdominal obesity usingthe WHtR, we found that the intake of fibre (raw, adjusted by energy intake and express per 1000 kcalper day) only in the whole sample was higher in those subjects without abdominal obesity. In thismanner, it becomes clear that the fibre intake may help to avoid the appearance of abdominal obesity,which has also been described in a study performed in Chinese adults that observed subjects with alower WHtR had a higher fibre intake [56].
On the other hand, the pattern of fibre intake in the different meals during the day varieddepending on the presence or absence of abdominal obesity only in the whole sample. The proportionof fibre from lunch was higher in the participants with abdominal obesity compared to their normalcounterparts, which could be due to the style of eating in Spain, since in general, lunch is characterizedby the presence of an abundant amount of foods like cereals, pulses and vegetables that provide agreat amount of fibre, respect to other meals of the day. This type of lunch is largely respected by thegeneral population regardless of individual food habits. However, in relation to the snack and dinner,in Spain is observed that there is a much more marked difference in the composition depending onthe food habits of each person. On the other hand, the proportion of fibre from afternoon snacks washigher in individuals without abdominal obesity than in those who had this problem. This findingsuggests that a higher intake of fibre in the afternoon could have a beneficial effect in relation to theabdominal accumulation of body fat and not only with respect to the body weight situation describedpreviously. Nevertheless, further studies are needed to clarify this aspect.
217
Nutrients 2017, 9, 326
Some studies have indicated that the consumption of whole grain foods seems to have benefitsregarding weight control and abdominal adiposity, emphasizing that the consumption of whole grainproducts seems to have not promote weight gain, while refined-grain products are directly associatedwith the excess of weight and abdominal fat [7,57]. In our study, the contribution to the intake offibre from bread and pasta was higher only in subjects with abdominal obesity of the whole sample.However, the information about the type of bread or pasta consumed by the population was notavailable in our study. Moreover, various studies have found an inverse association between dietaryfibre from fruits and the WC, insulin resistance, and metabolic syndrome [58–60]. In line with this,in our study, the fibre from fruits was higher only in men of the whole sample without abdominalobesity than in those with this problem. This difference, as previously noted, could be explainedbecause of the beneficial effect of soluble fibre on the reduction of the appetite or due to a healthierlifestyle [9,49]. A similar trend was also observed in relation to the group of sugars and sweets and,in particular, with the subgroup of chocolates. However, because the food groups disaggregated byfood items have not been analysed, it was not possible to give an explanation. However, it is assumedthat this difference may be due to participants without abdominal obesity selecting and consumingsome type of chocolate or similar healthier product with a higher content of fibre, unlike the groupwho has abdominal obesity.
We only observed in the group of plausible reporters that fibre from ready-to-eat-meals was higherin individuals with abdominal obesity compared to subjects without abdominal obesity, which isaccording with following an unhealthy diet rich in ready-to-eat-meals, which is common in individualswith obesity.
Likewise, when analysing the excess body weight and abdominal obesity individually, it wasconfirmed that there was a greater fibre intake in subjects without excess body weight and abdominalobesity compared with those who had one or two of these problems only in the whole sample.
It is noted that the fibre from the afternoon snack seems to play a major role in the body weightsituation and abdominal obesity. Even when considering the presence or absence of both problems inthe same individual, we also found that those subjects in the whole sample with excess body weightor abdominal obesity had a lower proportion of fibre from the afternoon snack and higher fromlunch than their counterparts. This suggests that, probably, the meal of the day in which the fibre isconsumed is of relevance to obtaining the benefits of the fibre in relation to excess body weight orabdominal obesity.
In relation to the dietary fibre sources according to the excess body weight and/or abdominalobesity, we found a consistent tendency when the sources were analysed according to the excessbody weight and abdominal obesity separately. A higher proportion of fibre from bread and pasta(in men and woman), and less from fruit (only in men), is associated with excess body weight and/orabdominal obesity in comparison with subjects with NW and without abdominal obesity.
As in the whole sample, in the plausible reporters we also observed that fibre from fruits wassignificantly higher in individuals without excess body weight and/or abdominal obesity comparedto subjects with excess body weight and/or abdominal obesity. However, only in the plausiblereporters, the fibre from ready-to-eat-meals was higher in those subjects with excess body weightand/or abdominal obesity than those without excess body weight and/or abdominal obesity, which isconsistent with the results when the fibre dietary sources were analysed according to the presence orabsence of abdominal obesity individually.
A limitation of our study was the inability to analyse the types of fibre (soluble and insoluble) andthe food groups disaggregated by food items, since such information was not available. Nonetheless,this did not represent an impediment to achieve the aim of our work that was to study the intakeand dietary food sources of fibre and analyse the differences in the fibre intake between peoplewith different body weight situations, and with or without abdominal obesity. In contrast, the mainstrengths of our study include the methodological design used in the ANIBES study, such as thefact that all anthropometric data were measured and they were not self-reported by the participants,
218
Nutrients 2017, 9, 326
which improves the validity of the study, and the possibility of extrapolating our results to the Spanishpopulation because it was conducted in a representative sample. It is important to highlight that thisis the first Spanish study at national level that analyses the data for the whole population and theplausible reporters.
The findings regarding the association between diet and the health outcomes analysed in thepresent study should be interpreted with caution given the discrepancy observed between bothsamples. Further studies considering different methods to address misreporting are needed to confirmthe association between the fibre intake and the excess body weight and/or abdominal obesity. At thesame time, the information derived from our study can be useful in designing nutrition interventionstrategies to increase the intake of fibre in our country that it was low both in the whole sample and inthe plausible reporters, which in turn could prevent and control some health problems such as excessbody weight and abdominal obesity.
5. Conclusions
The present study demonstrates an insufficient fibre intake among the Spanish adult population,both in the whole sample and in the plausible reporters. The main dietary sources were grains, followedby vegetables, fruits, and pulses for both samples. This study observed an association between the fibreintake and excess body weight and abdominal obesity in the whole sample but not in the plausiblereporters. Further studies are needed to confirm the association between the fibre intake and the excessbody weight and/or abdominal obesity. Nonetheless, it is advisable to increase the intake of foods richin fibre in order to prevent diseases related with a low intake.
Supplementary Materials: The following are available online at www.mdpi.com/1999-4907/9/04/325/s1,Table S1: Dietary food sources of total fibre (%) in the whole sample of the ANIBES study of the Spanish adultpopulation (18–64 years) by body mass index., Table S2: Dietary food sources of total fibre (%) in the plausiblereporters of the ANIBES study of the Spanish adult population (18–64 years) by body mass index, Table S3: Dietaryfood sources of total fibre (%) in the whole sample of the ANIBES Study Spanish adult population (18–64 years)by the presence or absence of abdominal obesity using the waist to height ratio, Table S4: Dietary food sourcesof total fibre (%) in the plausible reporters of the ANIBES Study Spanish adult population (18–64 years) by thepresence or absence of abdominal obesity using the waist to height ratio, Table S5: Dietary food sources of totalfibre (%) in the whole sample of the ANIBES study of the Spanish adult population (18–64 years) by the presenceor absence of excess body weight and/or abdominal obesity using the body mass index and the waist to heightratio, Table S6: Dietary food sources of total fibre (%) in the plausible reporters of the ANIBES study of the Spanishadult population (18–64 years) by the presence or absence of excess body weight and/or abdominal obesity usingthe body mass index and the waist to height ratio.
Acknowledgments: The authors would like to thank Coca-Cola Iberia and IPSOS for its support and technicaladvice, particularly Rafael Urrialde and Javier Ruiz.
Author Contributions: L.G.G.-R., J.M.P.S and R.M.O. analysed the data. L.G.G.-R. also drafted and wrote themanuscript. J.M.P.S and R.M.O. contributed to the analysis and wrote the manuscript. J.A.-B., A.G., R.M.O.,M.G.-G., and L.S.-M. are members of the Scientific Advisory Board of the ANIBES study and were responsiblefor careful review of the protocol, design, and methodology. These authors provided continuous scientificadvice for the study and for the interpretation of results. These authors also critically reviewed the manuscript.G.V.-M., Principal Investigator of the ANIBES study, was responsible for the design, protocol, methodology,and follow-up checks of the study. All authors approved the final version of the manuscript.
Conflicts of Interest: The ANIBES study was financially supported by a grant from Coca Cola Iberia through anagreement with the Spanish Nutrition Foundation (FEN). The funding sponsors had no role in the design of thestudy, in the collection, analyses, or interpretation of the data; in the writing of the manuscript, and in the decisionto publish the results. The authors declare no conflict of interest.
Abbreviations
ANIBES Anthropometric data, macronutrients and micronutrients intake, practice of physical activity, socioeconomic data and lifestylesBMI Body Mass IndexEFSA European Food Safety AuthorityGLP-1 Glucagon-like peptide-1IOM Institute of Medicine of the United States
219
Nutrients 2017, 9, 326
IPAQ International Physical Activity QuestionnaireNHANES National Health and Nutrition Examination SurveyNW Normal weightOB ObesityOW OverweightPA Physical activityUW UnderweightWC Waist circumferenceWHtR Waist to height ratio
1. Tucker, L.A.; Thomas, K.S. Increasing Total Fiber Intake Reduces Risk of Weight and Fat Gains in Women.J. Nutr. 2009, 139, 576–581. [CrossRef] [PubMed]
2. Buil-Cosiales, P.; Toledo, E.; Salas-Salvado, J.; Zazpe, I.; Farras, M.; Basterra-Gortari, F.J.; Diez-Espino, J.;Estruch, R.; Corella, D.; Ros, E.; et al. Association between Dietary Fibre Intake and Fruit, Vegetable OrWhole-Grain Consumption and the Risk of CVD: Results from the PREvencion Con DIeta MEDiterranea(PREDIMED) Trial. Br. J. Nutr. 2016, 116, 534–546. [CrossRef] [PubMed]
3. Lin, Y.; Huybrechts, I.; Vereecken, C.; Mouratidou, T.; Valtuena, J.; Kersting, M.; Gonzalez-Gross, M.; Bolca, S.;Warnberg, J.; Cuenca-Garcia, M.; et al. Dietary Fiber Intake and its Association with Indicators of Adiposityand Serum Biomarkers in European Adolescents: The HELENA Study. Eur. J. Nutr. 2015, 54, 771–782.[CrossRef] [PubMed]
4. Van de Vijver, L.P.; van den Bosch, L.M.; van den Brandt, P.A.; Goldbohm, R.A. Whole-Grain Consumption,Dietary Fibre Intake and Body Mass Index in the Netherlands Cohort Study. Eur. J. Clin. Nutr. 2009, 63,31–38. [CrossRef] [PubMed]
5. King, D.E.; Mainous, A.G., 3rd; Lambourne, C.A. Trends in Dietary Fiber Intake in the United States,1999–2008. J. Acad. Nutr. Diet. 2012, 112, 642–648. [CrossRef] [PubMed]
6. Hamedani, A.; Akhavan, T.; Samra, R.A.; Anderson, G.H. Reduced Energy Intake at Breakfast is NotCompensated for at Lunch if a High-Insoluble-Fiber Cereal Replaces a Low-Fiber Cereal. Am. J. Clin. Nutr.
2009, 89, 1343–1349. [CrossRef] [PubMed]7. Serra-Majem, L.; Bautista-Castano, I. Relationship between Bread and Obesity. Br. J. Nutr. 2015, 113, S29–S35.
[CrossRef] [PubMed]8. Slavin, J.L. Dietary Fiber and Body Weight. Nutrition 2005, 21, 411–418. [CrossRef] [PubMed]9. Guess, N.D.; Dornhorst, A.; Oliver, N.; Bell, J.D.; Thomas, E.L.; Frost, G.S. A Randomized Controlled Trial:
The Effect of Inulin on Weight Management and Ectopic Fat in Subjects with Prediabetes. Nutr. Metab. (Lond.)
2015, 12, 36. [CrossRef] [PubMed]10. Lupton, J.R. Sugar and Fiber Intake and Type of Adiposity: Are they Related? Am. J. Clin. Nutr. 2009, 90,
1119–1120. [CrossRef] [PubMed]11. Barczynska, R.; Bandurska, K.; Slizewska, K.; Litwin, M.; Szalecki, M.; Libudzisz, Z.; Kapusniak, J.
Intestinal Microbiota, Obesity and Prebiotics. Pol. J. Microbiol. 2015, 64, 93–100. [PubMed]12. Sleeth, M.L.; Thompson, E.L.; Ford, H.E.; Zac-Varghese, S.E.; Frost, G. Free Fatty Acid Receptor 2 and
Nutrient Sensing: A Proposed Role for Fibre, Fermentable Carbohydrates and Short-Chain Fatty Acids inAppetite Regulation. Nutr. Res. Rev. 2010, 23, 135–145. [CrossRef] [PubMed]
13. St-Pierre, D.H.; Rabasa-Lhoret, R.; Lavoie, M.E.; Karelis, A.D.; Strychar, I.; Doucet, E.; Coderre, L. Fiber IntakePredicts Ghrelin Levels in Overweight and Obese Postmenopausal Women. Eur. J. Endocrinol. 2009, 161,65–72. [CrossRef] [PubMed]
14. Agencia Española de Seguridad Alimentaria y Nutrición (AESAN). Evaluación Nutricional De La DietaEspañola. I Energía Y Macronutrientes. Sobre Datos De La Encuesta Nacional De Ingesta Dietética (ENIDE),2011. Available online: http://www.Aesan.Msc.Es/AESAN/Docs/Docs/Notas_prensa/Presentacion_ENIDE.Pdf (accessed on 15 February 2016).
15. Moreno Franco, B.; Leon Latre, M.; Andres Esteban, E.M.; Ordovas, J.M.; Casasnovas, J.A.; Penalvo, J.L.Soluble and Insoluble Dietary Fibre Intake and Risk Factors for Metabolic Syndrome and CardiovascularDisease in Middle-Aged Adults: The AWHS Cohort. Nutr. Hosp. 2014, 30, 1279–1288. [PubMed]
16. Ruiz, E.; Avila, J.M.; Castillo, A.; Valero, T.; del Pozo, S.; Rodriguez, P.; Bartrina, J.A.; Gil, A.;Gonzalez-Gross, M.; Ortega, R.M.; et al. The ANIBES Study on Energy Balance in Spain: Design, Protocoland Methodology. Nutrients 2015, 7, 970–998. [CrossRef] [PubMed]
220
Nutrients 2017, 9, 326
17. Moreiras, G.V.; Avila, J.M.; Ruiz, E. Energy Balance, a New Paradigm and Methodological Issues:The ANIBES Study in Spain. Nutr. Hosp. 2015, 31, 101–112.
18. Marfell-Jones, M.; Olds, T.; Stewart, A.; Carter, L. International Standards for Anthropometric Assessment;International Society for the Advancement of Kinanthropometry: Potchefstroom, South Africa, 2006;pp. 1–137.
19. WHO. Obesity: Preventing and Managing the Global Epidemic. Report of a WHO Consultation. World Health.
Organ. Tech. Rep. Ser. 2000, 894, 1–253.20. Srinivasan, S.R.; Wang, R.; Chen, W.; Wei, C.Y.; Xu, J.; Berenson, G.S. Utility of Waist-to-Height Ratio in
Detecting Central Obesity and Related Adverse Cardiovascular Risk Profile among Normal Weight YoungerAdults (from the Bogalusa Heart Study). Am. J. Cardiol. 2009, 104, 721–724. [CrossRef] [PubMed]
21. Browning, L.M.; Hsieh, S.D.; Ashwell, M. A Systematic Review of Waist-to-Height Ratio as a Screening Toolfor the Prediction of Cardiovascular Disease and Diabetes: 0.5 could be a Suitable Global Boundary Value.Nutr. Res. Rev. 2010, 23, 247–269. [CrossRef] [PubMed]
22. Ashwell, M.; Hsieh, S.D. Six Reasons Why the Waist-to-Height Ratio is a Rapid and Effective Global Indicatorfor Health Risks of Obesity and how its use could Simplify the International Public Health Message onObesity. Int. J. Food Sci. Nutr. 2005, 56, 303–307. [CrossRef] [PubMed]
23. Schneider, H.J.; Friedrich, N.; Klotsche, J.; Pieper, L.; Nauck, M.; John, U.; Dorr, M.; Felix, S.; Lehnert, H.;Pittrow, D.; et al. The Predictive Value of Different Measures of Obesity for Incident Cardiovascular Eventsand Mortality. J. Clin. Endocrinol. Metable 2010, 95, 1777–1785. [CrossRef] [PubMed]
24. Craig, C.L.; Marshall, A.L.; Sjostrom, M.; Bauman, A.E.; Booth, M.L.; Ainsworth, B.E.; Pratt, M.; Ekelund, U.;Yngve, A.; Sallis, J.F.; et al. International Physical Activity Questionnaire: 12-Country Reliability and Validity.Med. Sci. Sports Exerc. 2003, 35, 1381–1395. [CrossRef] [PubMed]
25. Moreiras, O.; Carbajal, A.; Cabrera, L.; Cuadrado, C. Tablas De Composición De Alimentos/Guía De Prácticas,16th ed.; Ediciones Pirámide: Madrid, Spain, 2013.
26. Hercberg, S.; Deheeger, M.; Preziosi, P. Portions Alimentaires. Manuel Photos Pour L’estimation Des Quantités.
SUVIMAX; Polytechnica: Paris, France, 1994.27. Willett, W.; Stampfer, M.J. Total Energy Intake: Implications for Epidemiologic Analyses. Am. J. Epidemiol.
1986, 124, 17–27. [CrossRef] [PubMed]28. Willett, W.C.; Sampson, L.; Stampfer, M.J.; Rosner, B.; Bain, C.; Witschi, J.; Hennekens, C.H.; Speizer, F.E.
Reproducibility and Validity of a Semiquantitative Food Frequency Questionnaire. Am. J. Epidemiol. 1985,122, 51–65. [CrossRef] [PubMed]
29. EFSA Panel on Dietetic Products, Nutrition, and Allergies (NDA). Scientific Opinion on Dietary ReferenceValues for Carbohydrates and Dietary Fibre. EFSA J. 2010, 8, 1462.
30. Institute of Medicine. Reference Intakes for Energy, Carbohydrate, Fiber, Fat, Fatty Acids, Cholesterol, Protein and
Aminoacids; The National Academies Press: Washington, DC, USA, 2005.31. Krebs-Smith, S.M.; Kott, P.S.; Guenther, P.M. Mean Proportion and Population Proportion: Two Answers to
the Same Question? J. Am. Diet. Assoc. 1989, 89, 671–676. [PubMed]32. Rhee, J.J.; Sampson, L.; Cho, E.; Hughes, M.D.; Hu, F.B.; Willett, W.C. Comparison of Methods to Account
for Implausible Reporting of Energy Intake in Epidemiologic Studies. Am. J. Epidemiol. 2015, 181, 225–233.[CrossRef] [PubMed]
33. Ambrus, Á.; Horváth, Z.; Farkas, Z.; Dorogházi, E.; Cseh, J.; Petrova, S.; Dimitrov, P.; Duleva, V.; Rangelova, L.;Chikova-Iscener, E. Pilot Study in the View of a Pan-European Dietary survey—Adolescents, Adults andElderly. EFSA Support. Publ. 2013, EN-485, 1–85.
34. European Food Safety Authority (EFSA). Example of a Protocol for Identification of Misreporting(Under- and Over-Reporting of Energy Intake) Based on the PILOT-PANEU Project. EFSA J. 2013, 11,1–17. Available online: http://www.efsa.europa.eu/sites/default/files/efsa_rep/blobserver_assets/3944A-8-2-1.pdf (Accessed on 1 March 2017).
35. Goldberg, G.R.; Black, A.E.; Jebb, S.A.; Cole, T.J.; Murgatroyd, P.R.; Coward, W.A.; Prentice, A.M.Critical Evaluation of Energy Intake Data using Fundamental Principles of Energy Physiology: 1. Derivationof Cut-Off Limits to Identify Under-Recording. Eur. J. Clin. Nutr. 1991, 45, 569–581. [PubMed]
36. Black, A.E. Critical Evaluation of Energy Intake using the Goldberg Cut-Off for Energy Intake:Basal MetabolicRate. A Practical Guide to its Calculation, use and Limitations. Int. J. Obes. Relat. Metab. Disord. 2000, 24,1119–1130. [CrossRef] [PubMed]
221
Nutrients 2017, 9, 326
37. Black, A.E. The Sensitivity and Specificity of the Goldberg Cut-Off for EI:BMR for Identifying Diet Reportsof Poor Validity. Eur. J. Clin. Nutr. 2000, 54, 395–404. [CrossRef] [PubMed]
38. Schofield, W.N. Predicting Basal Metabolic Rate, New Standards and Review of Previous Work. Hum. Nutr.
Clin. Nutr. 1985, 39, 5–41. [PubMed]39. Olza, J.; Aranceta-Bartrina, J.; Gonzalez-Gross, M.; Ortega, R.M.; Serra-Majem, L.; Varela-Moreiras, G.;
Gil, A. Reported Dietary Intake, Disparity between the Reported Consumption and the Level Needed forAdequacy and Food Sources of Calcium, Phosphorus, Magnesium and Vitamin D in the Spanish Population:Findings from the ANIBES Study Dagger. Nutrients 2017. [CrossRef] [PubMed]
40. Aranceta-Bartrina, J.; Perez-Rodrigo, C.; Alberdi-Aresti, G.; Ramos-Carrera, N.; Lazaro-Masedo, S.Prevalence of General Obesity and Abdominal Obesity in the Spanish Adult Population (Aged 25–64Years) 2014–2015: The ENPE Study. Rev. Esp. Cardiol. (Engl. Ed.) 2016, 69, 579–587. [CrossRef] [PubMed]
41. Ortega Anta, R.M.; Lopez-Solaber, A.M.; Perez-Farinos, N. Associated Factors of Obesity in SpanishRepresentative Samples. Nutr. Hosp. 2013, 28, 56–62. [PubMed]
42. Ashwell, M.; Gunn, P.; Gibson, S. Waist-to-Height Ratio is a Better Screening Tool than Waist Circumferenceand BMI for Adult Cardiometabolic Risk Factors: Systematic Review and Meta-Analysis. Obes. Rev. 2012, 13,275–286. [CrossRef] [PubMed]
43. Navia, B.; Aparicio, A.; Perea, J.M.; Perez-Farinos, N.; Villar-Villalba, C.; Labrado, E.; Ortega, R.M.Sodium Intake may Promote Weight Gain; Results of the FANPE Study in a Representative Sample ofthe Adult Spanish Population. Nutr. Hosp. 2014, 29, 1283–1289. [PubMed]
44. Felix-Redondo, F.J.; Grau, M.; Baena-Diez, J.M.; Degano, I.R.; de Leon, A.C.; Guembe, M.J.; Alzamora, M.T.;Vega-Alonso, T.; Robles, N.R.; Ortiz, H.; et al. Prevalence of Obesity and Associated Cardiovascular Risk:The DARIOS Study. BMC Public Health 2013, 13, 542. [CrossRef] [PubMed]
45. Mielgo-Ayuso, J.; Aparicio-Ugarriza, R.; Castillo, A.; Ruiz, E.; Avila, J.M.; Aranceta-Batrina, J.; Gil, A.;Ortega, R.M.; Serra-Majem, L.; Varela-Moreiras, G.; et al. Physical Activity Patterns of the Spanish Populationare mostly Determined by Sex and Age: Findings in the ANIBES Study. PLoS ONE 2016, 11, e0149969.[CrossRef] [PubMed]
46. Galvin, M.A.; Kiely, M.; Harrington, K.E.; Robson, P.J.; Moore, R.; Flynn, A. The North/South Ireland FoodConsumption Survey: The Dietary Fibre Intake of Irish Adults. Public Health Nutr. 2001, 4, 1061–1068.[CrossRef] [PubMed]
47. Reicks, M.; Jonnalagadda, S.; Albertson, A.M.; Joshi, N. Total Dietary Fiber Intakes in the US Population areRelated to Whole Grain Consumption: Results from the National Health and Nutrition Examination Survey2009 to 2010. Nutr. Res. 2014, 34, 226–234. [CrossRef] [PubMed]
48. McGill, C.R.; Birkett, A.; Fulgonii Iii, V.L. Healthy Eating Index-2010 and Food Groups Consumed by USAdults Who Meet Or Exceed Fiber Intake Recommendations NHANES 2001–2010. Food Nutr. Res. 2016, 60,29977. [CrossRef] [PubMed]
49. Lin, Y.; Huybrechts, I.; Vandevijvere, S.; Bolca, S.; De Keyzer, W.; De Vriese, S.; Polet, A.; De Neve, M.;Van Oyen, H.; Van Camp, J.; et al. Fibre Intake among the Belgian Population by Sex-Age and Sex-EducationGroups and its Association with BMI and Waist Circumference. Br. J. Nutr. 2011, 105, 1692–1703. [CrossRef][PubMed]
50. Grunert, K.G.; Wills, J.M.; Fernandez-Celemin, L. Nutrition Knowledge, and use and Understanding ofNutrition Information on Food Labels among Consumers in the UK. Appetite 2010, 55, 177–189. [CrossRef][PubMed]
51. Kerver, J.M.; Yang, E.J.; Obayashi, S.; Bianchi, L.; Song, W.O. Meal and Snack Patterns are Associated withDietary Intake of Energy and Nutrients in US Adults. J. Am. Diet. Assoc. 2006, 106, 46–53. [CrossRef][PubMed]
52. McGill, C.R.; Fulgoni, V.L., 3rd; Devareddy, L. Ten-Year Trends in Fiber and Whole Grain Intakes and FoodSources for the United States Population: National Health and Nutrition Examination Survey 2001–2010.Nutrients 2015, 7, 1119–1130. [CrossRef] [PubMed]
53. Lopez-Sobaler, A.M.; Aparicio, A.; Aranceta-Bartrina, J.; Gil, A.; Gonzalez-Gross, M.; Serra-Majem, L.;Varela-Moreiras, G.; Ortega, R.M. Overweight and General and Abdominal Obesity in a RepresentativeSample of Spanish Adults: Findings from the ANIBES Study. Biomed. Res. Int. 2016, 2016, 8341487. [CrossRef][PubMed]
222
Nutrients 2017, 9, 326
54. Bes-Rastrollo, M.; Martinez-Gonzalez, M.A.; Sanchez-Villegas, A.; de la Fuente Arrillaga, C.; Martinez, J.A.Association of Fiber Intake and Fruit/Vegetable Consumption with Weight Gain in a MediterraneanPopulation. Nutrition 2006, 22, 504–511. [CrossRef] [PubMed]
55. Koh-Banerjee, P.; Franz, M.; Sampson, L.; Liu, S.; Jacobs, D.R., Jr.; Spiegelman, D.; Willett, W.; Rimm, E.Changes in Whole-Grain, Bran, and Cereal Fiber Consumption in Relation to 8-Y Weight Gain among Men.Am. J. Clin. Nutr. 2004, 80, 1237–1245. [PubMed]
56. Thompson, A.L.; Adair, L.; Gordon-Larsen, P.; Zhang, B.; Popkin, B. Environmental, Dietary, and BehavioralFactors Distinguish Chinese Adults with High Waist-to-Height Ratio with and without Inflammation. J. Nutr.
2015, 145, 1335–1344. [CrossRef] [PubMed]57. Liu, S.; Willett, W.C.; Manson, J.E.; Hu, F.B.; Rosner, B.; Colditz, G. Relation between Changes in Intakes of
Dietary Fiber and Grain Products and Changes in Weight and Development of Obesity among Middle-AgedWomen. Am. J. Clin. Nutr. 2003, 78, 920–927. [PubMed]
58. Du, H.; van der, A.D.L.; Boshuizen, H.C.; Forouhi, N.G.; Wareham, N.J.; Halkjaer, J.; Tjonneland, A.;Overvad, K.; Jakobsen, M.U.; Boeing, H.; et al. Dietary Fiber and Subsequent Changes in Body Weightand Waist Circumference in European Men and Women. Am. J. Clin. Nutr. 2010, 91, 329–336. [CrossRef][PubMed]
59. Hosseinpour-Niazi, S.; Mirmiran, P.; Mirzaei, S.; Azizi, F. Cereal, Fruit and Vegetable Fibre Intake and theRisk of the Metabolic Syndrome: A Prospective Study in the Tehran Lipid and Glucose Study. J. Hum.
Nutr. Diet. 2015, 28, 236–245. [CrossRef] [PubMed]60. McKeown, N.M.; Meigs, J.B.; Liu, S.; Saltzman, E.; Wilson, P.W.; Jacques, P.F. Carbohydrate Nutrition,
Insulin Resistance, and the Prevalence of the Metabolic Syndrome in the Framingham Offspring Cohort.Diabetes Care 2004, 27, 538–546. [CrossRef] [PubMed]
© 2017 by the authors. Licensee MDPI, Basel, Switzerland. This article is an open accessarticle distributed under the terms and conditions of the Creative Commons Attribution(CC BY) license (http://creativecommons.org/licenses/by/4.0/).
223
nutrients
Article
Effect of Consuming Oat Bran Mixed in Water beforea Meal on Glycemic Responses in HealthyHumans—A Pilot Study
Robert E. Steinert 1,*, Daniel Raederstorff 1 and Thomas M. S. Wolever 2
1 DSM Nutritional Products Ltd., R & D Human Nutrition and Health, Basel 4057, Switzerland;[email protected]
2 Glycemic Index Laboratories, Inc., Toronto, ON M5C 2N8, Canada; [email protected]* Correspondence: [email protected]
Received: 23 June 2016; Accepted: 19 August 2016; Published: 26 August 2016
Abstract: Background: Viscous dietary fibers including oat β-glucan are one of the most effectiveclasses of functional food ingredients for reducing postprandial blood glucose. The mechanismof action is thought to be via an increase in viscosity of the stomach contents that delays gastricemptying and reduces mixing of food with digestive enzymes, which, in turn, retards glucoseabsorption. Previous studies suggest that taking viscous fibers separate from a meal may not beeffective in reducing postprandial glycemia. Methods: We aimed to re-assess the effect of consuminga preload of a commercially available oat-bran (4.5, 13.6 or 27.3 g) containing 22% of high molecularweight oat β-glucan (O22 (OatWell®22)) mixed in water before a test-meal of white bread on glycemicresponses in 10 healthy humans. Results: We found a significant effect of dose on blood glucose areaunder the curve (AUC) (p = 0.006) with AUC after 27.3 g of O22 being significantly lower than whitebread only. Linear regression analysis showed that each gram of oat β-glucan reduced glucose AUCby 4.35% ± 1.20% (r = 0.507, p = 0.0008, n = 40) and peak rise by 6.57% ± 1.49% (r = 0.582, p < 0.0001).Conclusion: These data suggest the use of oat bran as nutritional preload strategy in the managementof postprandial glycemia.
Keywords: postprandial glycemia; dietary fibre; blood glucose; type 2 diabetes mellitus; preload
1. Introduction
In current obesogenic societies with many people having mild or moderate hyperglycemia,postprandial blood glucose patterns account for the majority of variability of overall glycemiccontrol [1,2]. This is not surprising considering that most individuals spend perhaps only aboutthree to four hours before breakfast in a truly fasted state [1,3]. Dietary means to lower postprandialglycemic responses are, thus, urgently needed for the prevention of Type 2 Diabetes mellitus (T2DM).Viscous dietary fibers including high molecular weight (HMW) oat β-glucan are one of the mosteffective classes of functional food ingredients for reducing postprandial glucose [4]. The mechanism ofaction is thought to be their ability to increase the viscosity of the contents of the upper gastrointestinal(GI) tract and, hence, slow gastric emptying (GE) [5]. The rate of GE has a substantial impact onpostprandial glycemia by determining glucose absorption and incretin hormone secretion [6,7].In addition, an increase in viscosity of GI contents reduces the rate of digestion of starch by pancreaticamylase and the rate of absorption of glucose in the small intestine by increasing the thickness of theunstirred water layer [5].
Previous studies suggest that taking viscous fibers separate from a main meal may not beeffective in reducing postprandial glycemia [8,9]. One potential solution to this problem may beto consume, before eating, a fiber “preload”, which develops viscosity slowly, so that it can be
Nutrients 2016, 8, 524 224 www.mdpi.com/journal/nutrients
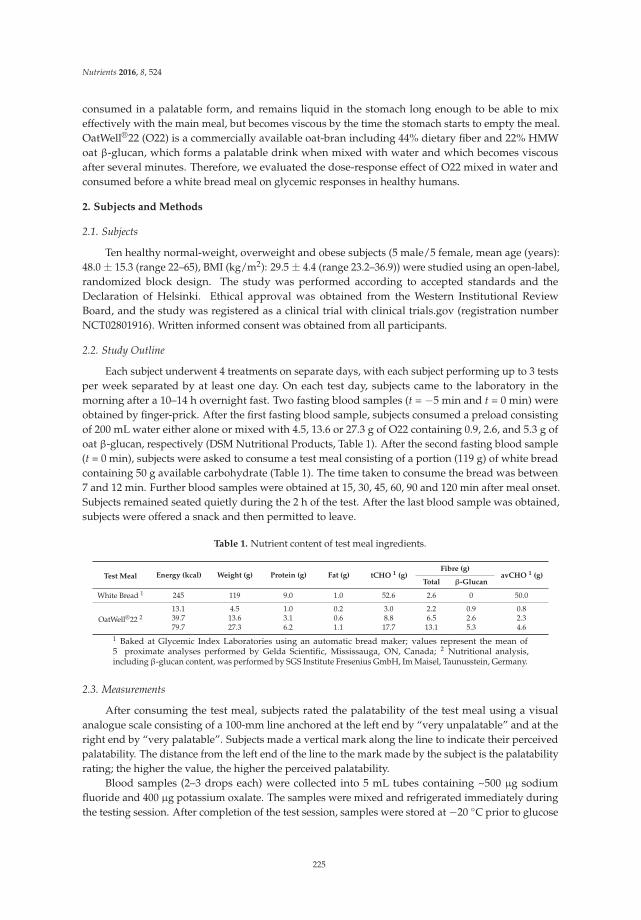
Nutrients 2016, 8, 524
consumed in a palatable form, and remains liquid in the stomach long enough to be able to mixeffectively with the main meal, but becomes viscous by the time the stomach starts to empty the meal.OatWell®22 (O22) is a commercially available oat-bran including 44% dietary fiber and 22% HMWoat β-glucan, which forms a palatable drink when mixed with water and which becomes viscousafter several minutes. Therefore, we evaluated the dose-response effect of O22 mixed in water andconsumed before a white bread meal on glycemic responses in healthy humans.
2. Subjects and Methods
2.1. Subjects
Ten healthy normal-weight, overweight and obese subjects (5 male/5 female, mean age (years):48.0 ± 15.3 (range 22–65), BMI (kg/m2): 29.5 ± 4.4 (range 23.2–36.9)) were studied using an open-label,randomized block design. The study was performed according to accepted standards and theDeclaration of Helsinki. Ethical approval was obtained from the Western Institutional ReviewBoard, and the study was registered as a clinical trial with clinical trials.gov (registration numberNCT02801916). Written informed consent was obtained from all participants.
2.2. Study Outline
Each subject underwent 4 treatments on separate days, with each subject performing up to 3 testsper week separated by at least one day. On each test day, subjects came to the laboratory in themorning after a 10–14 h overnight fast. Two fasting blood samples (t = −5 min and t = 0 min) wereobtained by finger-prick. After the first fasting blood sample, subjects consumed a preload consistingof 200 mL water either alone or mixed with 4.5, 13.6 or 27.3 g of O22 containing 0.9, 2.6, and 5.3 g ofoat β-glucan, respectively (DSM Nutritional Products, Table 1). After the second fasting blood sample(t = 0 min), subjects were asked to consume a test meal consisting of a portion (119 g) of white breadcontaining 50 g available carbohydrate (Table 1). The time taken to consume the bread was between7 and 12 min. Further blood samples were obtained at 15, 30, 45, 60, 90 and 120 min after meal onset.Subjects remained seated quietly during the 2 h of the test. After the last blood sample was obtained,subjects were offered a snack and then permitted to leave.
Table 1. Nutrient content of test meal ingredients.
Test Meal Energy (kcal) Weight (g) Protein (g) Fat (g) tCHO 1 (g)Fibre (g)
avCHO 1 (g)Total β-Glucan
White Bread 1 245 119 9.0 1.0 52.6 2.6 0 50.0
OatWell®22 213.1 4.5 1.0 0.2 3.0 2.2 0.9 0.839.7 13.6 3.1 0.6 8.8 6.5 2.6 2.379.7 27.3 6.2 1.1 17.7 13.1 5.3 4.6
1 Baked at Glycemic Index Laboratories using an automatic bread maker; values represent the mean of5 proximate analyses performed by Gelda Scientific, Mississauga, ON, Canada; 2 Nutritional analysis,including β-glucan content, was performed by SGS Institute Fresenius GmbH, Im Maisel, Taunusstein, Germany.
2.3. Measurements
After consuming the test meal, subjects rated the palatability of the test meal using a visualanalogue scale consisting of a 100-mm line anchored at the left end by “very unpalatable” and at theright end by “very palatable”. Subjects made a vertical mark along the line to indicate their perceivedpalatability. The distance from the left end of the line to the mark made by the subject is the palatabilityrating; the higher the value, the higher the perceived palatability.
Blood samples (2–3 drops each) were collected into 5 mL tubes containing ~500 µg sodiumfluoride and 400 µg potassium oxalate. The samples were mixed and refrigerated immediately duringthe testing session. After completion of the test session, samples were stored at −20 C prior to glucose
225
Nutrients 2016, 8, 524
analysis. Blood glucose analysis, using a YSI (Yellow Spring Instruments, Yellow Springs, OH, USA)analyzer, took place within five days of collection.
2.4. Data and Statistical Analysis
The primary endpoint was incremental area under the blood glucose curve (AUC) which wascalculated using the trapezoid rule, ignoring area beneath the baseline. Baseline blood glucose wascalculated as mean of values obtained at t = −5 min and t = 0 min. AUC and peak rise wereanalyzed using repeated-measures analysis of variance (RMANOVA) examining for the main effectsof treatment dose. In case of significant heterogeneity, differences among different doses were testedusing Tukey’s test to adjust for multiple comparisons. AUC and peak rises for each dose of O22 wereexpressed relative to the AUC or peak rise after the test of white bread alone taken by the same subject.The glycemic response of 1 subject with a relative response after the 13.6 g dose of 2.55 × SD abovethe mean was considered to be an outlier and the data removed; the values were replaced usinga procedure described by Snedecor and Cochran [10], and the error degrees of freedom in RMANOVAreduced by one. Blood glucose concentrations at each time were subjected to RMANOVA examiningfor the main effects of time and treatment and the time × treatment interaction; after demonstratinga highly significant time × treatment interaction (p = 1.2 × 10⁻¹⁷), blood glucose concentrationsat each time were subjected to RMANOVA followed by Tukey’s test, as described above for AUC.Differences were considered to be statistically significant if 2-tailed p < 0.05.
3. Results
There were significant differences in blood glucose concentration among doses at 15 (p = 0.0015),30 (p < 0.0001), 45 (p = 0.0003) and 120 min (p = 0.0004). At 15 min, blood glucose concentration after27.3 g was significantly lower than those after 0 g and 4.5 g. At 30 min, blood glucose after the 27.3 gdose was significantly lower than after 13.6 g, which, in turn, was significantly lower than the 0 and4.5 g doses. At 45 min blood glucose concentration after 27.3 g of O22 was significantly lower thanthose after the 0, 4.5 and 13.6 g doses. At 120 min, blood glucose after 27.3 g of O22 was significantlyhigher than that after the 0 and 4.5 g doses (Figure 1A). There was a significant effect of dose on bloodglucose AUC (p = 0.006) with AUC after 27.3 g of O22 (141 ± 21 mmol × min/L) being significantlylower than both the 4.5 g and 0 g doses (174 ± 1 7 and 185 ± 18 mmol × min/L, respectively) and theAUC after 13.6 g being intermediate (167 ± 19 mmol × min/L). When AUC was expressed relativeto that of bread alone, the relative responses for the 4.5, 13.6 and 27.3 g doses of O22, respectively,were 95.0% ± 4.1%, 90.3% ± 4.7% and 76.3% ± 7.7% with the only significant reduction being seenwith the highest dose. However, linear regression analysis showed that each gram of oat β-glucanreduced glucose AUC by 4.35% ± 1.20% (r = 0.507, p = 0.0008, n = 40; Figure 1B). There was alsoa significant effect of dose for blood glucose peak rise (p < 0.0001) with the peak rise after 27.3 gof O22, 1.96 ± 0.29 mmol/L, being significantly lower than that after all the other doses (3.07 ± 0.25,2.83 ± 0.30 and 2.72 ± 0.30 g for the 0, 4.5 and 13.6 g doses of O22, respectively). When peak rise wasexpressed relative to that for bread alone, the relative responses for the 4.5, 13.6 and 27.3 g doses of O22,respectively, were 92.5% ± 6.8%, 88.5% ± 7.2% and 63.8% ± 7.1% with the only significant reductionbeing seen with the highest dose. However, linear regression analysis showed that each gram of oatβ-glucan reduced glucose peak rise by 6.57% ± 1.49% (r = 0.582, p < 0.0001, n = 40; Figure 1C).
There was a significant main effect of dose on palatability, with all 3 doses of O22 rated as beingless palatable than white bread alone (palatability in mm: 71 ± 7 for white bread alone; 38 ± 9 for4.5 g O22; 33 ± 10 for 13.6 g O22; 31 ± 9 for 27.3 g O22; p = 0.0003). Although palatability tended todecrease as the dose increased, this difference was not significant. There was no significant relationshipbetween palatability and glucose AUC (expressed as % of that after white bread) for 4.5 g (r = 0.439,p = 0.20, n = 10), 13.6 g (r = 0.502, p = 0.14, n = 10) or 27.3 g (r = 0.398, p = 0.25, n = 10) doses of O22.
No adverse effects were observed.
226
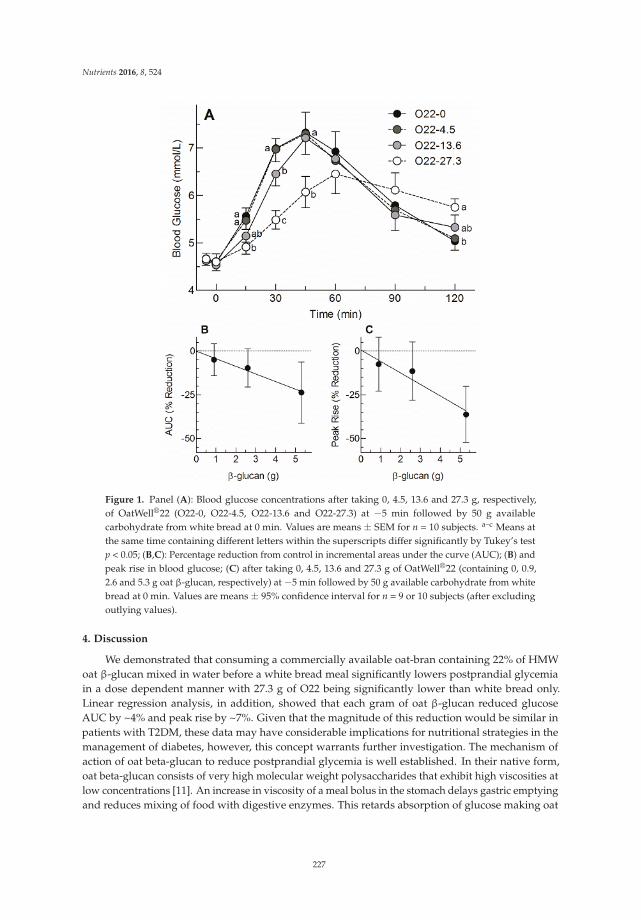
Nutrients 2016, 8, 524
Figure 1. Panel (A): Blood glucose concentrations after taking 0, 4.5, 13.6 and 27.3 g, respectively,of OatWell®22 (O22-0, O22-4.5, O22-13.6 and O22-27.3) at −5 min followed by 50 g availablecarbohydrate from white bread at 0 min. Values are means ± SEM for n = 10 subjects. a–c Means atthe same time containing different letters within the superscripts differ significantly by Tukey’s testp < 0.05; (B,C): Percentage reduction from control in incremental areas under the curve (AUC); (B) andpeak rise in blood glucose; (C) after taking 0, 4.5, 13.6 and 27.3 g of OatWell®22 (containing 0, 0.9,2.6 and 5.3 g oat β-glucan, respectively) at −5 min followed by 50 g available carbohydrate from whitebread at 0 min. Values are means ± 95% confidence interval for n = 9 or 10 subjects (after excludingoutlying values).
4. Discussion
We demonstrated that consuming a commercially available oat-bran containing 22% of HMWoat β-glucan mixed in water before a white bread meal significantly lowers postprandial glycemiain a dose dependent manner with 27.3 g of O22 being significantly lower than white bread only.Linear regression analysis, in addition, showed that each gram of oat β-glucan reduced glucoseAUC by ~4% and peak rise by ~7%. Given that the magnitude of this reduction would be similar inpatients with T2DM, these data may have considerable implications for nutritional strategies in themanagement of diabetes, however, this concept warrants further investigation. The mechanism ofaction of oat beta-glucan to reduce postprandial glycemia is well established. In their native form,oat beta-glucan consists of very high molecular weight polysaccharides that exhibit high viscosities atlow concentrations [11]. An increase in viscosity of a meal bolus in the stomach delays gastric emptyingand reduces mixing of food with digestive enzymes. This retards absorption of glucose making oat
227
Nutrients 2016, 8, 524
β-glucan one of the most effective classes of functional food ingredients to reduce postprandial bloodglucose and insulin responses [4,5].
Previous studies have suggested that taking viscous fibers, such as psyllium or guar gum,separate from a main meal may not be effective in reducing postprandial glycemia [12,13]. In contrast,the concept of a “preload” that refers to administration of a small load of nutrient at a fixed intervalbefore a main meal to lower postprandial blood glucose via the slowing of GE has been confirmedseveral times [14–16]. While in the classical sense of the preload concept, the slowing of GE is relatedprimarily to a nutrient-induced neuroendocrine feedback [14–16], the present findings suggest that thepreload concept also applies to fibers such as oat beta-glucan that delay GE via increases in meal bolusviscosity. It requires consideration, however, that the oat bran also contained about 20% protein thatmay have contributed to the slowing of GE via neuroendocrine feedbacks. In addition, the proteinmay have lowered postprandial blood glucose independently of the preload effect because a reductionin postprandial blood glucose was observed also in studies with protein ingested simultaneouslywith carbohydrate-rich meals [17]. The discrepancy between the current results and those of previousinvestigations mentioned above suggests that proper control of method of administration of the preloadsuch as timing (i.e., interval between preload administration and meal onset) and the physicochemicalproperties of the fiber at meal onset, as well as other macronutritional components, are important.Ideally the fiber preload remains liquid in the stomach long enough to be able to mix effectively withthe meal, but becomes viscous by the time the stomach starts to empty the meal.
The present results are in line with the health claim that has previously been evaluated by theEuropean Food Safety Authority (EFSA) and authorized by the European commission for β-glucansfrom oats and barley and reduction of postprandial glycemia [18]. The conditions of use state that inorder to obtain the claimed effect, 4 g of beta-glucans for each 30 g of available carbohydrates shouldbe consumed per meal. Our results further indicate that lower doses of HMW oat β-glucan may besufficient to impact postprandial glycemia when consumed in a suitable manner (e.g., several smallerdoses/day, correct timing/preload paradigm). This approach is in line with a recent systematic reviewby Tosh et al. [4], including 119 treatments from 34 publications that finds that the efficacy of oatand barley β-glucan in lowering postprandial blood glucose is more strongly related to β-glucancontent alone than to the ratio of β-glucan/available carbohydrate. In addition, when authors actuallycalculated a ratio, 4 g of β-glucan per meal were found to be sufficient to reduce post-prandial bloodglucose in a clinical relevant amount for meals with up to 80 g of available carbohydrate.
A limitation of this pilot trial that requires consideration is that it was not powered to detectsmall differences seen with the lower doses used here (i.e., 4.5 and 13.6 g). We only found a significanteffect with 27.3 g of O22, however, the results show that the expected reduction in AUC and peakrise for the 13.6 g dose were 11.3% and 17.1%, respectively. Therefore, based on the results of thisstudy, 27 subjects would be required to have 80% power to detect an 11.3% reduction in AUC and14 subjects to detect a 17.1% reduction in peak rise. The additional energy intake associated with an oatbran preload should also be considered if using such a strategy over the long term, althoughsubjectsusually tend to compensateat least in part, for extra energy by eating less at a subsequent ad libitummeal. There is good evidence for particularly viscous fibers to reduce appetite and eating. For example,a recent systematic review including 58 original studies by Wanders et al. [19] reports a reduction inappetite perception by 7.4% over a 4 h time interval when dietary fiber is added as part of a preload.Similarly, a recent meta-analysis including 6 human studies shows that polydextrose fiber as partof a mid-morning preload reduces energy intake at a subsequent ad libitum meal at lunch time by12.5% [20]. Finally, there is evidence from epidemiological studies that show associations betweenhigh fiber intakes and weight loss [21,22].
In conclusion, consuming O22 mixed in water before a meal reduces glycemic responsein a dose-dependent manner with each gram of oat β-glucan reducing glucose AUC byabout 4%. This suggests the use of O22 as a nutritional preload strategy in the management ofpostprandial glycemia.
228
Nutrients 2016, 8, 524
Author Contributions: Robert E. Steinert, Thomas M. S. Wolever and Daniel Raederstorff conceptualizedthe study. Thomas M. S. Wolever conducted the experiments and statistical analysis. Robert E. Steinert,Thomas M. S. Wolever and Daniel Raederstorff interpreted the data. Robert E. Steinert and Thomas M. S. Woleverdrafted the manuscript. All authors reviewed and approved the manuscript.
Conflicts of Interest: The authors declare no conflict of interest. Robert E. Steinert and Daniel Raederstorff areemployees of DSM Nutritional Products, Basel, Switzerland. Thomas M. S. Wolever is part owner, President andMedical Director of Glycemic Index Laboratories, Inc. (GI Labs) and his wife is also a part owner and ChiefFinancial Officer of GI Labs.
References
1. Monnier, L.; Lapinski, H.; Colette, C. Contributions of fasting and postprandial plasma glucose incrementsto the overall diurnal hyperglycemia of type 2 diabetic patients: Variations with increasing levels of HbA(1c).Diabetes Care 2003, 26, 881–885. [CrossRef] [PubMed]
2. Peter, R.; Dunseath, G.; Luzio, S.D.; Owens, D.R. Estimates of the relative and absolute diurnal contributionsof fasting and post-prandial plasma glucose over a range of hyperglycaemia in type 2 diabetes. Diabetes Metab.
2013, 39, 337–342. [CrossRef] [PubMed]3. Monnier, L.; Colette, C.; Owens, D. Postprandial and basal glucose in type 2 diabetes: Assessment and
respective impacts. Diabetes Technol. Ther. 2011, 13, S25–S32. [CrossRef] [PubMed]4. Tosh, S.M. Review of human studies investigating the post-prandial blood-glucose lowering ability of oat
and barley food products. Eur. J. Clin. Nutr. 2013, 67, 310–317. [CrossRef] [PubMed]5. Würsch, P.; Pi-Sunyer, F.X. The role of viscous soluble fiber in the metabolic control of diabetes: A review
with special emphasis on cereals rich in beta-glucan. Diabetes Care 1997, 20, 1774–1780. [CrossRef] [PubMed]6. Horowitz, M.; Edelbroek, M.A.; Wishart, J.M.; Straathof, J.W. Relationship between oral glucose tolerance
and gastric emptying in normal healthy subjects. Diabetologia 1993, 36, 857–862. [CrossRef] [PubMed]7. Marathe, C.S.; Rayner, C.K.; Jones, K.L.; Horowitz, M. Relationships between gastric emptying,
postprandial glycemia, and incretin hormones. Diabetes Care 2013, 36, 1396–1405. [CrossRef] [PubMed]8. Fuessl, S.; Adrian, T.E.; Bacarese-Hamilton, A.J.; Bloom, S.R. Guar in NIDD: Effect of different modes of
administration on plasma glucose and insulin responses to a starch meal. Pract. Diabetes Int. 1986, 3, 258–260.[CrossRef]
9. Jenkins, D.J.; Nineham, R.; Craddock, C.; Craig-McFeely, P.; Donaldson, K.; Leigh, T.; Snook, J. Fibre indiabetes. Lancet 1979, 1, 434–435. [CrossRef]
10. Snedecor, G.W.; Cochran, W.G. Statistical Methods, 7th ed.; Iowa State University Press: Ames, IA, USA, 1980.11. Ren, Y.; Ellis, P.R.; Sutherland, I.W.; Ross-Murphy, S.B. Dilute and semi-dilute solution properties of
an exopolysaccharide from Escherichia coli strain S61. Carbohydr. Polym. 2003, 52, 189–195. [CrossRef]12. Wolever, T.M.; Vuksan, V.; Eshuis, H.; Spadafora, P.; Peterson, R.D.; Chao, E.S.; Storey, M.L.; Jenkins, D.J.
Effect of method of administration of psyllium on glycemic response and carbohydrate digestibility. J. Am.
Coll. Nutr. 1991, 10, 364–371. [CrossRef] [PubMed]13. Cohen, M.; Leong, V.W.; Salmon, E.; Martin, F.I. Role of guar and dietary fibre in the management of diabetes
mellitus. Med. J. Aust. 1980, 1, 59–61. [PubMed]14. Gentilcore, D.; Chaikomin, R.; Jones, K.L.; Russo, A.; Feinle-Bisset, C.; Wishart, J.M.; Rayner, C.K.;
Horowitz, M. Effects of fat on gastric emptying of and the glycemic, insulin, and incretin responses toa carbohydrate meal in type 2 diabetes. J. Clin. Endocrinol. Metab. 2006, 91, 2062–2067. [CrossRef] [PubMed]
15. Ma, J.; Stevens, J.E.; Cukier, K.; Maddox, A.F.; Wishart, J.M.; Jones, K.L.; Clifton, P.M.; Horowitz, M.;Rayner, C.K. Effects of a protein preload on gastric emptying, glycemia, and gut hormones aftera carbohydrate meal in diet-controlled type 2 diabetes. Diabetes Care 2009, 32, 1600–1602. [CrossRef][PubMed]
16. Ma, J.; Jesudason, D.R.; Stevens, J.E.; Keogh, J.B.; Jones, K.L.; Clifton, P.M.; Horowitz, M.; Rayner, C.K.Sustained effects of a protein “preload” on glycaemia and gastric emptying over 4 weeks in patients withtype 2 diabetes: A randomized clinical trial. Diabetes Res. Clin. Pract. 2015, 108, e31–e34. [CrossRef][PubMed]
17. Lan-Pidhainy, X.; Wolever, T.M.S. The hypoglycemic effect of fat and protein is not attenuated by insulinresistance. Am. J. Clin. Nutr. 2010, 91, 98–105. [CrossRef] [PubMed]
229
Nutrients 2016, 8, 524
18. Panel on Dietetic Products, Nutrition and Allergies (NDA). Scientific Opinion on the substantiation of healthclaims related to beta-glucans from oats and barley and maintenance of normal blood LDL-cholesterolconcentrations (ID 1236, 1299), increase in satiety leading to a reduction in energy intake (ID 851, 852),reduction of post-prandial glycaemic responses (ID 821, 824), and “digestive function” (ID 850) pursuant toArticle 13(1) of Regulation (EC) No 1924/2006. EFSA J. 2011, 9. [CrossRef]
19. Wanders, A.J.; van den Borne, J.J.G.C.; de Graaf, C.; Hulshof, T.; Jonathan, M.C.; Kristensen, M.; Mars, M.;Schols, H.A.; Feskens, E.J.M. Effects of dietary fibre on subjective appetite, energy intake and body weight:A systematic review of randomized controlled trials. Obes. Rev. Off. J. Int. Assoc. Study Obes. 2011, 12,724–739. [CrossRef] [PubMed]
20. Ibarra, A.; Astbury, N.M.; Olli, K.; Alhoniemi, E.; Tiihonen, K. Effect of polydextrose on subjective feelings ofappetite during the satiation and satiety periods: A systematic review and meta-analysis. Nutrients 2016, 8.[CrossRef] [PubMed]
21. Howarth, N.C.; Saltzman, E.; Roberts, S.B. Dietary fiber and weight regulation. Nutr. Rev. 2001, 59, 129–139.[CrossRef] [PubMed]
22. Alfieri, M.A.; Pomerleau, J.; Grace, D.M.; Anderson, L. Fiber intake of normal weight, moderately obese andseverely obese subjects. Obes. Res. 1995, 3, 541–547. [CrossRef] [PubMed]
© 2016 by the authors. Licensee MDPI, Basel, Switzerland. This article is an open accessarticle distributed under the terms and conditions of the Creative Commons Attribution(CC BY) license (http://creativecommons.org/licenses/by/4.0/).
230
nutrients
Article
Effect on Insulin, Glucose and Lipids inOverweight/Obese Australian Adults of 12 MonthsConsumption of Two Different Fibre Supplements ina Randomised Trial
Sebely Pal 1,*, Suleen Ho 1, Roland J. Gahler 2 and Simon Wood 3
1 School of Public Health, Curtin University, Perth 6845, Australia; [email protected] Factors Group Research, Burnaby, BC V3N 4S9, Canada; [email protected] Food, Nutrition and Health Program, University of British Columbia, Vancouver, BC V6T 1Z4, Canada;
[email protected]* Correspondence: [email protected]; Tel.: +61-8-9266-4755
Received: 30 September 2016; Accepted: 16 January 2017; Published: 29 January 2017
Abstract: Higher fibre intakes are associated with risk reduction for chronic diseases. This studyinvestigated the effects of supplementation with PolyGlycopleX® (PGX), a complexed polysaccharide,on insulin, glucose and lipids in overweight and obese individuals. In this double-blind 12 monthsstudy, participants were randomised into three groups: control (rice flour); PGX or psyllium (PSY).Participants followed their usual lifestyle and diet but consumed 5 g of their supplement before meals.Insulin was significantly lower in the PGX and PSY groups compared to control at 3 and 6 monthsand in the PSY group compared to control at 12 months. Serum glucose was significantly lower in thePGX group at 3 months compared to control. Total cholesterol was significantly lower in the PGX andPSY groups compared to control at 3 and 6 months. High density lipoprotein (HDL) cholesterol wassignificantly increased in the PGX group compared to control at 12 months. low density lipoprotein(LDL) cholesterol was significantly lower in the PGX group at 3 and 6 months compared to controland in the PSY group at 3 months compared to control. A simple strategy of fibre supplementationmay offer an effective solution to glucose, insulin and lipid management without the need for othernutrient modification.
Keywords: obesity; PGX; psyllium; cholesterol; insulin
1. Introduction
Previous studies have consistently shown that higher fibre intakes are correlated with lower bodyweight, body mass index (BMI), waist circumference [1,2] and improved plasma lipid profiles [3–12],glycaemia and insulinaemia [13], indicating benefits and risk reduction for metabolic syndrome,cardiovascular disease (CVD) and type 2 diabetes.
While the benefits of a high fibre diet are well known, increasing fruit and vegetable intake tomeet the recommended intake of fibre is difficult for many [14]. Present estimations of dietary fibreintake in Australian, Canadian, European and American adults is approximately 15–25 g/day [3,15],which is below the current recommendations for adults in Australia, Canada, Europe and the USAof 25–30 g/day [16]. Therefore, fibre supplements can provide a cost effective and easy alternativemethod for increasing the fibre content of a diet without the need for other major nutrient modifications.
PolyGlycopleX (PGX) has been shown to have lipid lowering effects in healthy subjects [17]as well as in overweight and obese adults [18]. In a clinical trial with healthy subjects, 25 malesand 29 females, mean age of 31.6 ± 10.5 years entered the study [17] and consumed 2.5 g of PGXtwice a day as part of two main meals (breakfast and/or lunch, and/or dinner) for the first seven
Nutrients 2017, 9, 91 231 www.mdpi.com/journal/nutrients
Nutrients 2017, 9, 91
days, followed by 5 g PGX for the last 14 days of the study. The control product was a skimmedmilk powder. PGX’s effects on decreasing total and low density lipoprotein (LDL) cholesterol levelsin the study concur with similar reports in the literature [19]. Studies are required to investigate ifthese benefits are sustainable over a longer duration and also in those who are overweight/obese.Another study with 29 overweight and obese adults, ages 20–65 with a BMI between 25–36 kg/m2,consuming 5 g of PGX in 500 mL of water 5–10 min before each meal, 2–3 times a day for 14 daysshowed a significant reduction of total cholesterol (TC) and LDL levels of 19% and 25% respectively,compared to baseline [18]. However, the supplement was combined with advice for healthy eating,weight loss and exercise so it is difficult to evaluate the effect of the fibre alone on lipids. This was nota randomised controlled trial as there was no control group in this study. Recent human studies haveshown that the addition of 2.5 to 5 g of PGX with a meal is highly effective in reducing postprandialglycaemia, lowering the glycaemic index of food [20] and modifying satiety hormones in healthyadults [21]. However, these studies have some limitations; they were acute or short term, mostlyconducted in healthy, normal weight participants or combined with lifestyle changes.
Psyllium has been evaluated in various human studies for effects on glucose and insulinhomeostasis, body weight, body composition and appetite as well as lipids and lipoproteins [22–30].Psyllium was reviewed in 2012 for its effect on metabolic syndrome [31]. The authors concludedthat “Collectively, research to date does support the notion that the consumption of psyllium mayprovide benefits to many components of the metabolic syndrome”. Psyllium fibre decreased fatabsorption in overweight and obese men, but had no effect on postprandial glucose and insulinconcentrations [32]. In another study, simply adding a psyllium fibre supplement to a normal diet(10.2 g/day) was sufficient to see improvements in TC and LDL cholesterol but not fasting glucoseor insulin concentrations when compared to the control group [22]. However, a meta-analysis [33]found that in type 2 diabetes patients, psyllium fibre significantly improved fasting blood glucose,proportional to loss of glycaemic control.
Apart from these few studies, limited research is available on the effect of PGX fibre on bloodinsulin, glucose and lipids. Randomised controlled clinical trials are required to verify whether PGXcan be used for improving insulin, glucose and lipids in the long term and whether this fibre type isbetter than other soluble fibres, such as psyllium. Therefore the aim of this study was to investigatethe effect of PGX on insulin, glucose and lipid concentrations. Given the effect of PGX on total andLDL cholesterol in healthy weight participants and its considerably higher viscosity, we hypothesisethat PGX will have a greater health outcome than psyllium in overweight and obese individuals.
2. Materials and Methods
2.1. Subjects
Overweight and obese individuals with a body mass index (BMI) between 25–47 kg/m2 and agedbetween 19 and 68 years, were recruited from the community in Perth, Australia (via newspaper andradio). Potential participants were screened by telephone or online questionnaire and attended CurtinUniversity to assess suitability for the study, at which time the details of the study were explained.Exclusion criteria included smoking, lipid lowering medication, use of steroids and other agentsthat may influence lipid metabolism, use of warfarin, diabetes mellitus, hypo- and hyperthyroidism,cardiovascular events within the last 6 months, psychological unsuitability, major systemic diseases,gastrointestinal problems, proteinuria, liver, renal failure, weight fluctuations over the past 6months, vegetarianism and participation in any other clinical trials within the last 6 months.This study was approved by and conducted in accordance with the ethical standards of CurtinHuman Research Ethics Committee. Written consent was obtained from all participants. ANZCTRnumber: ACTRN12611000415909.
232
Nutrients 2017, 9, 91
2.2. Study Design
This study is part of a larger trial, which was a randomised, double blind, parallel designstudy over a 52 week period. Study participants were randomised by the trial sponsors using aWeb site (http://www.randomization.com) to one of the three groups (three randomly permutedblocks): the control group who consumed the placebo with their usual diet; the psyllium supplementgroup (PSY) who consumed a psyllium supplement with their usual diet and a PGX supplementgroup (PGX) who consumed a PGX supplement with their usual diet. Psyllium is a soluble fibreand PolyGlycopleX (PGX) is a novel, highly viscous functional non-starch polysaccharide complex,with developing viscosity, manufactured from konjac (glucomannan), sodium alginate and xanthangum by a proprietary process (EnviroSimplex®). The fibre supplementation consisted of either 5 gof psyllium (a proprietary psyllium product with the trade name PgxSyl™) (InovoBiologic, Inc.,Calgary, AB, Canada) or 5 g of PGX (InovoBiologic, Inc., Calgary, AB, Canada). Placebo consisted of5 g rice flour. All supplements were artificially sweetened and flavoured. The rice flour provided anappropriate placebo due to its low energy and fibre content and similarity in texture and appearanceto the psyllium and PGX supplement. Participants were instructed to take either 5 g of the fibresupplements or placebo, mixed with a minimum of 250 mL water followed by a further 250 mLwater, three times daily, 5–10 min before breakfast, lunch and dinner. Extra water was allowed tobe taken ad libitum during or after the meal if desired and subjects were encouraged to do this.The supplement packages (control, PGX and psyllium) were from a single batch provided by themanufacturer, and appeared identical so that the research assistants and participants were blindedto the type of supplement being consumed. Packages consisted of 5 g doses of the control, PGX orpsyllium and were only marked by the participant ID, with the group allocation only known to thetrial sponsors to ensure blinding. Quantities of rice flour and psyllium were determined by input,with the amounts weighed and checked by the dispensing and blending department while PGX wasanalysed according to USP Monograph FCC9 3rd Sup 2015 [34]. All identifiable information fromparticipants was coded to ensure privacy.
The subjects attended a briefing session on how to consume the supplement, complete foodrecords and comply with the study protocol as previously reported [35]. Briefly, the dietary intakeover the course of the trial was monitored through the completion of 3-day food diaries at baseline,12, 26 and 52 weeks. All participants in the control and the fibre supplement groups were asked tomaintain their usual dietary intake for the duration of the study. To monitor compliance, all participantswere required to complete a diary to record their supplement consumption and asked to return boththe empty and unused sachets of the supplements at their visits.
2.3. Anthropometry and Body Composition
Measures of body weight, height, waist and hip circumference were undertaken at baseline,3, 6 and 12 months. Body weight (HBF-514, Omron, Kyoto, Japan) was recorded in light clothingwithout shoes. Height was measured to the nearest 0.1 cm using a stadiometer without shoes.Waist circumference was measured in the standing position at the narrowest area between thelateral lower rib and the iliac crest. Hip measurement was taken at the largest circumference ofthe lower abdomen.
2.4. Diet and Physical Activity
Participants completed 3-day food and drink diaries at baseline, 3, 6 and 12 months to monitorfor changes in food intake. Data were analysed with Foodworks 7 Professional (Xyris Software,Brisbane, Australia), based on data from the AUSNUT database. Participants also completed theInternational Physical Activity Questionnaire (IPAQ) at the same time points.
233
Nutrients 2017, 9, 91
2.5. Measurements of Lipids, Glucose and Insulin Levels
Participants attended clinical rooms at Curtin University Bentley, after a 10–12 h fast, for baselinemeasurements. Fasting blood samples (20 mL) were drawn by venipuncture. The collection of fastingblood samples was repeated at 3, 6 and 12 months. Serum tubes were allowed to clot and blood sampleswere centrifuged at 2500 rpm at 4 C for 10 min using a Hettich Rottina 48R centrifuge. Serum andplasma were then aliquoted and samples stored at −80 C and analysed after study completion.
Serum triglyceride and total cholesterol was measured by enzymatic colorimetric kits(TRACE Scientific Ltd., Melbourne, Australia). Serum HDL cholesterol was determined afterprecipitation of apoB (apolipoprotein B)-containing lipoproteins with phosphotungstic acid andMgCl2 (magnesium chloride); the supernatant containing the HDL cholesterol was determined byenzymatic colorimetry (TRACE Scientific Ltd., Melbourne, Australia). Serum LDL cholesterol wasdetermined by using the Friedewald equation [36]. Non-esterified fatty acid (NEFA) was determinedusing WAKO NEFA C kit (Osaka, Japan). ApoB was analysed using an ELISA kit obtained fromMabtech AB (Nacka Strand, Stockholm, Sweden).
Plasma glucose concentrations were measured using the Randox glucose GOD-PAP kit(Antrim, UK), according to the manufacturer’s instructions. Plasma insulin was measured by anELISA kit (Alpha Diagnostics International, San Antonio, TX, USA). HOMA2-IR (homeostasis modelassessment of insulin resistance) was used to assess insulin resistance from fasting glucose and insulinconcentrations using a computer model [37].
2.6. Statistical Analysis
A sample size of 24 subjects per group was predicted to provide sufficient power (80%) to detecta 3% difference in weight before and after treatment within a group. We recruited a total of 53 subjectsper group to accommodate for 50% dropouts. Calculations were based on an average mean weight of80 kg and a standard deviation of 5% within a group on all eligible subjects. Statistical analysis wasundertaken using SPSS 22 for Windows (SPSS Inc., Chicago, IL, USA). Data were expressed as mean(±SD or SEM) and assessed for normality to ensure that the assumptions of the analysis were met.Baseline differences between groups were analysed with one-way ANOVA. The data were analysedusing general linear models with baseline value covariates. If significant between–groups effects werepresent, post hoc comparisons between the treatment groups was made using the least significantdifference (LSD) method. Statistical significance was considered at p < 0.05. Intention–to–treat analysiswas also carried out with missing data replaced with the last observation carried forward.
3. Results
3.1. Participants
The 159 participants (19 to 68 years) who met the eligibility criteria were randomised to one ofthree groups (Control, PSY, PGX) by assignment of an ID number and the corresponding numberedsupplement. Participant flow through the study can be seen in Figure 1. Although the PGX group hadthe highest attrition rate, it was generally due to factors unrelated to the study. A total of 127 participants(54 male, 73 female) completed at least 3 months of the study and were included in the analysis (45 inControl (24 male), 43 in PSY (15 male) and 39 in PGX (15 male)). Thirty-two participants withdrewbefore 3 months and were excluded from analysis due to non-compliance, unrelated health issues,minor adverse effects and personal reasons. A total of 108 participants at 6 months (38 in Control, 39 inPSY and 31 in PGX) and 93 participants at 12 months (32 in Control, 36 in PSY and 25 in PGX) wereanalysed. Results for intention–to–treat analysis for the primary outcome variables can be found insupplementary files.
234
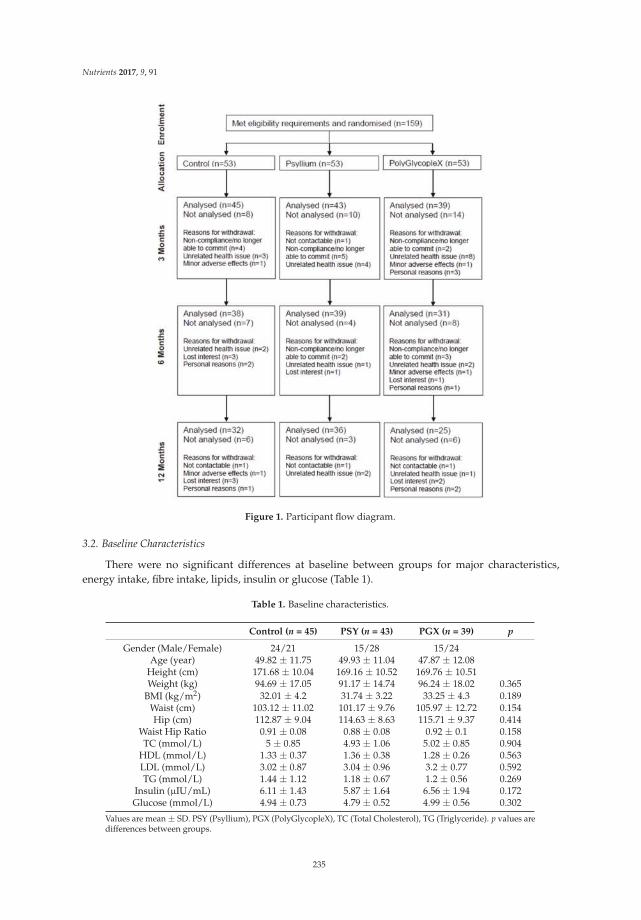
Nutrients 2017, 9, 91
Figure 1. Participant flow diagram.
3.2. Baseline Characteristics
There were no significant differences at baseline between groups for major characteristics,energy intake, fibre intake, lipids, insulin or glucose (Table 1).
Table 1. Baseline characteristics.
Control (n = 45) PSY (n = 43) PGX (n = 39) p
Gender (Male/Female) 24/21 15/28 15/24Age (year) 49.82 ± 11.75 49.93 ± 11.04 47.87 ± 12.08
Height (cm) 171.68 ± 10.04 169.16 ± 10.52 169.76 ± 10.51Weight (kg) 94.69 ± 17.05 91.17 ± 14.74 96.24 ± 18.02 0.365
BMI (kg/m2) 32.01 ± 4.2 31.74 ± 3.22 33.25 ± 4.3 0.189Waist (cm) 103.12 ± 11.02 101.17 ± 9.76 105.97 ± 12.72 0.154Hip (cm) 112.87 ± 9.04 114.63 ± 8.63 115.71 ± 9.37 0.414
Waist Hip Ratio 0.91 ± 0.08 0.88 ± 0.08 0.92 ± 0.1 0.158TC (mmol/L) 5 ± 0.85 4.93 ± 1.06 5.02 ± 0.85 0.904
HDL (mmol/L) 1.33 ± 0.37 1.36 ± 0.38 1.28 ± 0.26 0.563LDL (mmol/L) 3.02 ± 0.87 3.04 ± 0.96 3.2 ± 0.77 0.592TG (mmol/L) 1.44 ± 1.12 1.18 ± 0.67 1.2 ± 0.56 0.269
Insulin (µIU/mL) 6.11 ± 1.43 5.87 ± 1.64 6.56 ± 1.94 0.172Glucose (mmol/L) 4.94 ± 0.73 4.79 ± 0.52 4.99 ± 0.56 0.302
Values are mean ± SD. PSY (Psyllium), PGX (PolyGlycopleX), TC (Total Cholesterol), TG (Triglyceride). p values aredifferences between groups.
235
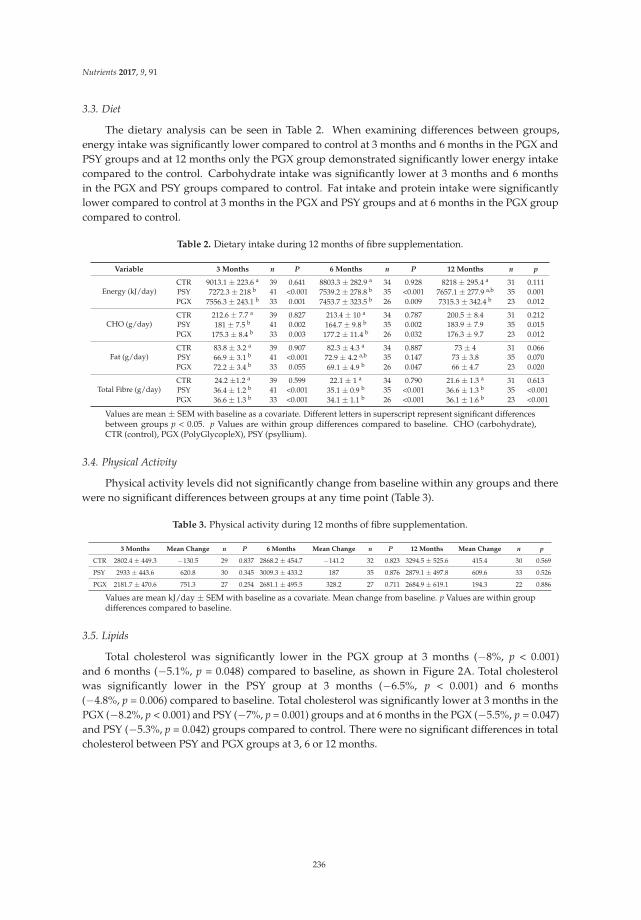
Nutrients 2017, 9, 91
3.3. Diet
The dietary analysis can be seen in Table 2. When examining differences between groups,energy intake was significantly lower compared to control at 3 months and 6 months in the PGX andPSY groups and at 12 months only the PGX group demonstrated significantly lower energy intakecompared to the control. Carbohydrate intake was significantly lower at 3 months and 6 monthsin the PGX and PSY groups compared to control. Fat intake and protein intake were significantlylower compared to control at 3 months in the PGX and PSY groups and at 6 months in the PGX groupcompared to control.
Table 2. Dietary intake during 12 months of fibre supplementation.
Variable 3 Months n P 6 Months n P 12 Months n p
Energy (kJ/day)CTR 9013.1 ± 223.6 a 39 0.641 8803.3 ± 282.9 a 34 0.928 8218 ± 295.4 a 31 0.111PSY 7272.3 ± 218 b 41 <0.001 7539.2 ± 278.8 b 35 <0.001 7657.1 ± 277.9 a,b 35 0.001PGX 7556.3 ± 243.1 b 33 0.001 7453.7 ± 323.5 b 26 0.009 7315.3 ± 342.4 b 23 0.012
CHO (g/day)CTR 212.6 ± 7.7 a 39 0.827 213.4 ± 10 a 34 0.787 200.5 ± 8.4 31 0.212PSY 181 ± 7.5 b 41 0.002 164.7 ± 9.8 b 35 0.002 183.9 ± 7.9 35 0.015PGX 175.3 ± 8.4 b 33 0.003 177.2 ± 11.4 b 26 0.032 176.3 ± 9.7 23 0.012
Fat (g/day)CTR 83.8 ± 3.2 a 39 0.907 82.3 ± 4.3 a 34 0.887 73 ± 4 31 0.066PSY 66.9 ± 3.1 b 41 <0.001 72.9 ± 4.2 a,b 35 0.147 73 ± 3.8 35 0.070PGX 72.2 ± 3.4 b 33 0.055 69.1 ± 4.9 b 26 0.047 66 ± 4.7 23 0.020
Total Fibre (g/day)CTR 24.2 ±1.2 a 39 0.599 22.1 ± 1 a 34 0.790 21.6 ± 1.3 a 31 0.613PSY 36.4 ± 1.2 b 41 <0.001 35.1 ± 0.9 b 35 <0.001 36.6 ± 1.3 b 35 <0.001PGX 36.6 ± 1.3 b 33 <0.001 34.1 ± 1.1 b 26 <0.001 36.1 ± 1.6 b 23 <0.001
Values are mean ± SEM with baseline as a covariate. Different letters in superscript represent significant differencesbetween groups p < 0.05. p Values are within group differences compared to baseline. CHO (carbohydrate),CTR (control), PGX (PolyGlycopleX), PSY (psyllium).
3.4. Physical Activity
Physical activity levels did not significantly change from baseline within any groups and therewere no significant differences between groups at any time point (Table 3).
Table 3. Physical activity during 12 months of fibre supplementation.
3 Months Mean Change n P 6 Months Mean Change n P 12 Months Mean Change n p
CTR 2802.4 ± 449.3 −130.5 29 0.837 2868.2 ± 454.7 −141.2 32 0.823 3294.5 ± 525.6 415.4 30 0.569
PSY 2933 ± 443.6 620.8 30 0.345 3009.3 ± 433.2 187 35 0.876 2879.1 ± 497.8 609.6 33 0.526
PGX 2181.7 ± 470.6 751.3 27 0.254 2681.1 ± 495.5 328.2 27 0.711 2684.9 ± 619.1 194.3 22 0.886
Values are mean kJ/day ± SEM with baseline as a covariate. Mean change from baseline. p Values are within groupdifferences compared to baseline.
3.5. Lipids
Total cholesterol was significantly lower in the PGX group at 3 months (−8%, p < 0.001)and 6 months (−5.1%, p = 0.048) compared to baseline, as shown in Figure 2A. Total cholesterolwas significantly lower in the PSY group at 3 months (−6.5%, p < 0.001) and 6 months(−4.8%, p = 0.006) compared to baseline. Total cholesterol was significantly lower at 3 months in thePGX (−8.2%, p < 0.001) and PSY (−7%, p = 0.001) groups and at 6 months in the PGX (−5.5%, p = 0.047)and PSY (−5.3%, p = 0.042) groups compared to control. There were no significant differences in totalcholesterol between PSY and PGX groups at 3, 6 or 12 months.
236
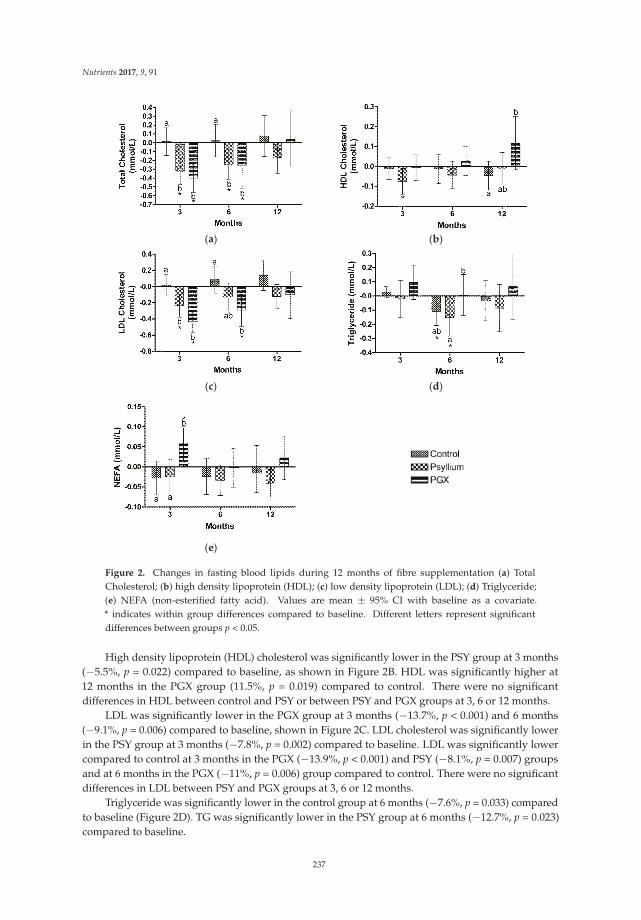
Nutrients 2017, 9, 91
(a) (b)
(c) (d)
(e)
Figure 2. Changes in fasting blood lipids during 12 months of fibre supplementation (a) TotalCholesterol; (b) high density lipoprotein (HDL); (c) low density lipoprotein (LDL); (d) Triglyceride;(e) NEFA (non-esterified fatty acid). Values are mean ± 95% CI with baseline as a covariate.* indicates within group differences compared to baseline. Different letters represent significantdifferences between groups p < 0.05.
High density lipoprotein (HDL) cholesterol was significantly lower in the PSY group at 3 months(−5.5%, p = 0.022) compared to baseline, as shown in Figure 2B. HDL was significantly higher at12 months in the PGX group (11.5%, p = 0.019) compared to control. There were no significantdifferences in HDL between control and PSY or between PSY and PGX groups at 3, 6 or 12 months.
LDL was significantly lower in the PGX group at 3 months (−13.7%, p < 0.001) and 6 months(−9.1%, p = 0.006) compared to baseline, shown in Figure 2C. LDL cholesterol was significantly lowerin the PSY group at 3 months (−7.8%, p = 0.002) compared to baseline. LDL was significantly lowercompared to control at 3 months in the PGX (−13.9%, p < 0.001) and PSY (−8.1%, p = 0.007) groupsand at 6 months in the PGX (−11%, p = 0.006) group compared to control. There were no significantdifferences in LDL between PSY and PGX groups at 3, 6 or 12 months.
Triglyceride was significantly lower in the control group at 6 months (−7.6%, p = 0.033) comparedto baseline (Figure 2D). TG was significantly lower in the PSY group at 6 months (−12.7%, p = 0.023)compared to baseline.
237
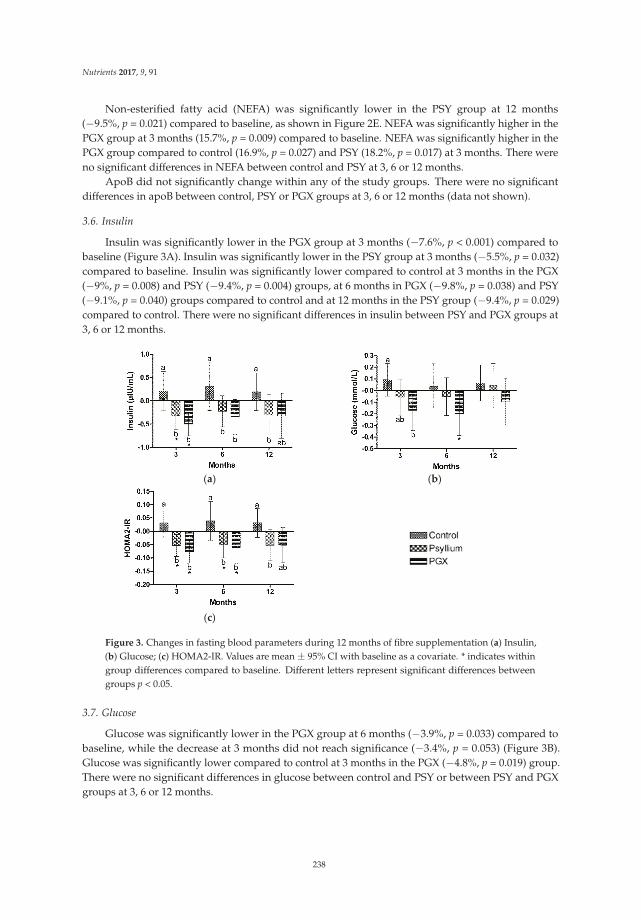
Nutrients 2017, 9, 91
Non-esterified fatty acid (NEFA) was significantly lower in the PSY group at 12 months(−9.5%, p = 0.021) compared to baseline, as shown in Figure 2E. NEFA was significantly higher in thePGX group at 3 months (15.7%, p = 0.009) compared to baseline. NEFA was significantly higher in thePGX group compared to control (16.9%, p = 0.027) and PSY (18.2%, p = 0.017) at 3 months. There wereno significant differences in NEFA between control and PSY at 3, 6 or 12 months.
ApoB did not significantly change within any of the study groups. There were no significantdifferences in apoB between control, PSY or PGX groups at 3, 6 or 12 months (data not shown).
3.6. Insulin
Insulin was significantly lower in the PGX group at 3 months (−7.6%, p < 0.001) compared tobaseline (Figure 3A). Insulin was significantly lower in the PSY group at 3 months (−5.5%, p = 0.032)compared to baseline. Insulin was significantly lower compared to control at 3 months in the PGX(−9%, p = 0.008) and PSY (−9.4%, p = 0.004) groups, at 6 months in PGX (−9.8%, p = 0.038) and PSY(−9.1%, p = 0.040) groups compared to control and at 12 months in the PSY group (−9.4%, p = 0.029)compared to control. There were no significant differences in insulin between PSY and PGX groups at3, 6 or 12 months.
(a) (b)
(c)
Figure 3. Changes in fasting blood parameters during 12 months of fibre supplementation (a) Insulin,(b) Glucose; (c) HOMA2-IR. Values are mean ± 95% CI with baseline as a covariate. * indicates withingroup differences compared to baseline. Different letters represent significant differences betweengroups p < 0.05.
3.7. Glucose
Glucose was significantly lower in the PGX group at 6 months (−3.9%, p = 0.033) compared tobaseline, while the decrease at 3 months did not reach significance (−3.4%, p = 0.053) (Figure 3B).Glucose was significantly lower compared to control at 3 months in the PGX (−4.8%, p = 0.019) group.There were no significant differences in glucose between control and PSY or between PSY and PGXgroups at 3, 6 or 12 months.
238
Nutrients 2017, 9, 91
3.8. Homeostasis Model Assessment of Insulin Resistance
The HOMA2-IR score was significantly lower in the PGX group at 3 months (−9%, p = 0.001)and 6 months (−7.3%, p = 0.039) compared to baseline (Figure 3C). HOMA2-IR was significantlylower in the PSY group at 3 months (−7%, p = 0.011) and 6 months (−6.7%, p = 0.037) comparedto baseline. HOMA2-IR was significantly lower compared to control at 3 months in the PGX(−10.8%, p = 0.005) and PSY (−10.8%, p = 0.001) groups, at 6 months in PGX (−11.9%, p = 0.033)and PSY (−11.9%, p = 0.018) groups compared to control and at 12 months in the PSY group(−11%, p = 0.011) compared to control. There was a trend for HOMA2-IR to be lower in the PGXgroup compared to control at 12 months but this was not significant (−8.5%, p = 0.068). There were nosignificant differences in HOMA2-IR score between PSY and PGX groups at 3, 6 or 12 months.
3.9. Adverse Events
Minor adverse events were gastrointestinal related (e.g., flatulence, diarrhoea) with four withdrawingfrom the study, two in the PGX group and two in the control group. The PSY supplement was bettertolerated and participants did not report any adverse effects.
4. Discussion
Previous epidemiological and cohort studies have consistently revealed that higher fibre intakesare correlated with lower body weight, BMI, waist circumference [1,2], and improved plasma lipidprofiles [3–12], glycaemia and insulinaemia [13], indicating the benefits and risk reduction for themetabolic syndrome, CVD and type 2 diabetes. Given that individuals find it difficult to eat the requiredamounts of fibre by increasing fruit and vegetable intake, it was hypothesised that fibre supplementscan provide similar health benefits compared with increased dietary fibre intake. Therefore, this studyinvestigated the effects of 15 g of PGX or psyllium compared to control (rice flour) supplementationfor one year on lipids, insulin and glucose. Specifically, both the PGX and PSY groups demonstratedsignificant reductions at 3 months in fasting concentrations of total cholesterol by 8.2% and 7%respectively, LDL cholesterol by 13.9% and 8.1% respectively, insulin by 9% and 9.4% respectively andHOMA2-IR score by 11.9%, compared to control group. Only the PGX intervention improved fastingglucose and HDL cholesterol during the study.
Our results herein are supported by recent human and animal studies which suggest that psylliumfibre supplementation may provide cardiovascular benefits [22,31]. The effect of PGX on decreasingtotal and LDL cholesterol levels in this study concurs with similar reports in the literature describingthe effects of viscous dietary fibre on lowering serum cholesterol levels. Carabin et al. [17] conducteda clinical trial with healthy subjects, 25 males and 29 females, mean age of 31.6 ± 10.5 years whoconsumed 2.5 g of PGX packaged with cereal and yoghurt twice a day as part of two main meals(breakfast and/or lunch, and/or dinner), for the first seven days, followed by 5 g PGX twice a day forthe last 14 days of the study. The control product was a skimmed milk powder. Investigators observedsignificantly lower total and LDL cholesterol in the test group compared to the control group at day 8(9.4% vs. 3.3% for total and 10.4% vs. 2.5% for LDL cholesterol, respectively) and at day 22 (14.1% vs.8.3% for total and 16.6% vs. 8.2% for LDL cholesterol, respectively). The differences between groupswas similar to the magnitude observed in our study. Reimer et al. [38] observed the effects of 14 weeksof short-term PGX supplementation in adults with abdominal obesity and also observed significantreductions in total and LDL cholesterol. In a pre-post study by Lyon & Reichert [18], 29 overweightand obese adults with a BMI between 25–36 kg/m2, consumed 5 g of PGX in 500 mL of water 5–10 minbefore each meal, 2–3 times a day for 14 days and showed a significant reduction of total cholesteroland LDL cholesterol levels of 19% and 25% respectively, compared to baseline. As the supplementintervention in this latter study was combined with lifestyle changes, the decreases in cholesterollevels were greater than those observed in our current study. Although neither of the studies describedabove reported changes in HDL after PGX supplementation, we only observed this effect at 12 months,
239
Nutrients 2017, 9, 91
indicating a possible long term effect that has not been demonstrated previously. When looking at theeffect of psyllium, another study [22] also found that simply adding a psyllium fibre supplement toa normal diet (10.2 g/day) was sufficient to see improvements in total cholesterol (−21%) and LDLcholesterol (−22%) at 12 weeks compared to control. Similar findings for psyllium have also beenreported in various meta-analyses [39].
Animal studies have demonstrated a beneficial effect of PGX supplementation on glucose controland fasting insulin [40]. While many human studies have examined the short-term postprandialglucose response to PGX supplementation [20,41,42], few have looked at the long term effects.Lyon & Reichert [18] assessed changes to fasting insulin and glucose in their study. The PGX andlifestyle intervention caused a 6.96% reduction in fasting glucose and a 27.26% reduction in fastinginsulin which is in agreement with our PGX intervention findings. Psyllium has been previouslyshown to improve glucose and insulin response [31,33]. In a study by Ziai et al. [23], psyllium wastaken in combination with medication and a significant reduction in fasting glucose was observed.Gibb et al. [33] reported that psyllium improved glycaemic control proportional to loss of glycaemiccontrol, which may explain why our non-diabetic psyllium group did not demonstrate any significantimprovements to fasting blood glucose concentrations.
Due to its high viscosity, PGX swells in the stomach and increases feelings of fullness [23,42–45].Psyllium has also been shown to increase fullness [29] but has a far lower viscosity than PGX [18].This characteristic may have caused participants to decrease their food intake, which then lead tosignificant weight loss [46]. The changes to blood lipids and insulin observed are likely due to thechanges in dietary intake and weight loss observed as well as the possible effect of PGX slowing gastricemptying and absorption of nutrients in the small intestine [47].
When comparing the PGX and PSY groups in the current study, there were no significantdifferences between them except for a lower concentration of TG at 3 months in the PSY groupcompared to the PGX group. However, when examining differences compared to control, HDLcholesterol was significantly higher in the PGX group at 12 months but not in the PSY group. LDLcholesterol was significantly lower in the PGX group at 3 and 6 months compared to control whereasLDL cholesterol was only significantly lower in the PSY group at 3 months compared to control.Glucose was significantly lower in the PGX group at 3 months but not in the PSY group. Intent-to-treatanalysis was carried out but the outcome results were no different from the results presented. In thisregard, the PGX group performed better overall than the PSY group and elicited more health benefitsover the 12 months intervention period.
One of the strengths of this study was the duration, with a 12 months intervention period.Comparable studies have only been conducted for 14 weeks. This allowed us to investigate the longterm effects of the fibre supplements, especially weight maintenance. This was a double-blinded studyand supplements were packed in identical foil sachets. Investigators were not aware which participantswere taking which supplement; however, due to the different characteristics of the supplements,participants may have been able to guess if they were taking a fibre supplement or the control, which isa limitation. The intervention was not combined with any other lifestyle modification advice, thus itwould be simple for consumers to incorporate into their lifestyle or there could be added benefitsif the supplements were combined with healthy lifestyle advice. Other study limitations includethe use of a generally healthy population. We did not specifically recruit participants with elevatedlipid, insulin or glucose concentrations which would have limited our ability to detect significantimprovements. The majority of participants were women and hormonal changes over the 12 monthsmay have impacted on lipids levels.
5. Conclusions
It is thought the high viscosity of PGX caused participants to decrease their food intake, which thenlead to significant weight loss, lipid, insulin, and glucose reductions. Taking a fibre supplement beforemeals was a relatively easy task for people to incorporate into their daily routine and would be a simple
240
Nutrients 2017, 9, 91
intervention to implement. We observed similar results between PGX and PSY supplements whencompared to the control group, however the PGX supplement was superior in terms of increased HDLcholesterol and decreased fasting blood glucose. Therefore, regular consumption of a PolyGlycopleXor a psyllium supplement is a simple and effective method to improve blood lipids, insulin andglucose control in overweight or obese people and may lead to risk reduction for metabolic syndrome,CVD and type 2 diabetes.
Supplementary Materials: The following are available online at http://www.mdpi.com/2072-6643/9/2/091/s1,Table S1: Lipids, Glucose and Insulin levels during 12 months of fibre supplementation (intention to treat analysis).
Acknowledgments: PGX®, PolyGlycopleX® and EnviroSimplex® are registered trademarks of InovoBiologic Inc.,Calgary, AB, Canada. The proprietary Psyllium product (PgxSyl™) (PSY) was formulated by InovoBiologic Inc.We thank Michael Lyon, MD for helping with the design of this study. We thank all the participants for their timeand contributions to this study.
Author Contributions: S.P., S.W. and R.J.G. designed research; S.H. (and Jenny McKay) conducted research;S.H. analysed data; S.P., S.H., S.W. and R.J.G. wrote the paper; S.P. and S.H. had primary responsibility for finalcontent. All authors read and approved the final manuscript.
Conflicts of Interest: R.J.G. owns the Factors Group of Companies, which retains an interest in PGX®. S.W. receivesconsulting fees from InovoBiologic Inc. Funding: Financial support for the submitted work from Factors GroupAustralia Pty Ltd., which had no role in data collection, analysis and interpretation.
References
1. Du, H.; van der, A.D.L.; Boshuizen, H.C.; Forouhi, N.G.; Wareham, N.J.; Halkjaer, J.; Tjonneland, A.;Overvad, K.; Jakobsen, M.U.; Boeing, H.; et al. Dietary fiber and subsequent changes in body weight andwaist circumference in European men and women. Am. J. Clin. Nutr. 2010, 91, 329–336. [CrossRef] [PubMed]
2. Newby, P.K.; Maras, J.; Bakun, P.; Muller, D.; Ferrucci, L.; Tucker, K.L. Intake of whole grains, refined grains,and cereal fiber measured with 7-D diet records and associations with risk factors for chronic disease. Am. J.
Clin. Nutr. 2007, 86, 1745–1753. [PubMed]3. National Health and Medical Research Council. Australian Dietary Guidelines; National Health and Medical
Research Council: Canberra, Australia, 2013.4. Wu, H.; Dwyer, K.M.; Fan, Z.; Shircore, A.; Fan, J.; Dwyer, J.H. Dietary fiber and progression of atherosclerosis:
The Los Angeles Atherosclerosis Study. Am. J. Clin. Nutr. 2003, 78, 1085–1091. [PubMed]5. Lairon, D. Macronutrient intake and modulation on chylomicron production and clearance. Atheroscler. Suppl.
2008, 9, 45–48. [CrossRef] [PubMed]6. Kan, H.; Stevens, J.; Heiss, G.; Klein, R.; Rose, K.M.; London, S.J. Dietary fiber intake and retinal vascular
caliber in the atherosclerosis risk in communities study. Am. J. Clin. Nutr. 2007, 86, 1626–1632. [PubMed]7. Lairon, D.; Arnault, N.; Bertrais, S.; Planells, R.; Clero, E.; Hercberg, S.; Boutron-Ruault, M.C. Dietary fiber
intake and risk factors for cardiovascular disease in French adults. Am. J. Clin. Nutr. 2005, 82, 1185–1194.[PubMed]
8. Venn, B.J.; Mann, J.I. Cereal grains, legumes and diabetes. Eur. J. Clin. Nutr. 2004, 58, 1443–1461. [CrossRef][PubMed]
9. Weickert, M.O.; Pfeiffer, A.F. Metabolic effects of dietary fiber consumption and prevention of diabetes.J. Nutr. 2008, 138, 439–442. [PubMed]
10. McKeown, N.M.; Meigs, J.B.; Liu, S.; Wilson, P.W.; Jacques, P.F. Whole-grain intake is favorably associatedwith metabolic risk factors for type 2 diabetes and cardiovascular disease in the Framingham OffspringStudy. Am. J. Clin. Nutr. 2002, 76, 390–398. [PubMed]
11. Pittler, M.H.; Ernst, E. Guar gum for body weight reduction: Meta-analysis of randomized trials. Am. J. Med.
2001, 110, 724–730. [CrossRef]12. Brown, L.; Rosner, B.; Willett, W.W.; Sacks, F.M. Cholesterol-lowering effects of dietary fiber: A meta-analysis.
Am. J. Clin. Nutr. 1999, 69, 30–42. [PubMed]13. Ludwig, D.S.; Pereira, M.A.; Kroenke, C.H.; Hilner, J.E.; Van Horn, L.; Slattery, M.L.; Jacobs, D.R., Jr. Dietary
fiber, weight gain, and cardiovascular disease risk factors in young adults. JAMA 1999, 282, 1539–1546.[CrossRef] [PubMed]
241
Nutrients 2017, 9, 91
14. Clemens, R.; Kranz, S.; Mobley, A.; Nicklas, R.; Raimondi, M.; Rodriguez, J.; Slavin, J.; Jacobs, D.J.Filling America’s Fiber Intake Gap: Summary of a Roundtable to Probe Realistic Solutions with a Focus onGrain-Based Foods. J. Nutr. 2012, 142, 1390S–1401S. [CrossRef] [PubMed]
15. US Department of Agriculture; US Department of Health and Human Services. Dietary Guidelines for
Americans; US Government Printing Office: Washington, DC, USA, 2005.16. Marlett, J.A.; McBurney, M.I.; Slavin, J.L. Position of the American Dietetic Association: Health implications
of dietary fiber. J. Am. Diet. Assoc. 2002, 102, 993–1000. [CrossRef]17. Carabin, I.G.; Lyon, M.R.; Wood, S.; Pelletier, X.; Donazzolo, Y.; Burdock, G.A. Supplementation of the
diet with the functional fiber PolyGlycoplex is well tolerated by healthy subjects in a clinical trial. Nutr. J.
2009, 8, 9. [CrossRef] [PubMed]18. Lyon, M.R.; Reichert, R.G. The effect of a novel viscous polysaccharide along with lifestyle changes on
short-term weight loss and associated risk factors in overweight and obese adults: an observationalretrospective clinical program analysis. Altern. Med. Rev. 2010, 15, 68–75. [PubMed]
19. Food and Nutrition Board of the Institute of Medicine of the National Academies. Dietary, functional, andtotal fiber. In Dietary Reference Intakes for Energy, Carbohydrate, Fiber, Fat, Fatty Acids, Cholesterol, Protein, and
Amino Acids; Spears, G.E., Ed.; The National Academies Press: Washington, DC, USA, 2005; pp. 339–421.20. Jenkins, A.L.; Kacinik, V.; Lyon, M.; Wolever, T.M. Effect of adding the novel fiber, PGX®, to commonly
consumed foods on glycemic response, glycemic index and GRIP: A simple and effective strategy forreducing post prandial blood glucose levels—A randomized, controlled trial. Nutr. J. 2010, 9, 58. [CrossRef][PubMed]
21. Reimer, R.A.; Pelletier, X.; Carabin, I.G.; Lyon, M.; Gahler, R.; Parnell, J.A.; Wood, S. Increased plasma PYYlevels following supplementation with the functional fiber PolyGlycopleX in healthy adults. Eur. J. Clin. Nutr.
2010, 64, 1186–1191. [CrossRef] [PubMed]22. Pal, S.; Khossousi, A.; Binns, C.; Dhaliwal, S.; Ellis, V. The effect of a fibre supplement compared to a healthy
diet on body composition, lipids, glucose, insulin and other metabolic syndrome risk factors in overweightand obese individuals. Br. J. Nutr. 2011, 105, 90–100. [CrossRef] [PubMed]
23. Ziai, S.; Larijani, B.; Akhoondzadeh, S.; Fakhrzadeh, H.; Dastpak, A.; Bandarian, F.; Rezai, A.; Badi, H.;Emami, T. Psyllium decreased serum glucose and glycosylated hemoglobin significantly in diabeticoutpatients. J. Ethnopharmacol. 2005, 102, 202–207. [CrossRef] [PubMed]
24. Karhunen, L.; Juvonen, K.; Flander, S.; Liukkonen, K.; Lahteenmaki, L.; Siloaho, M.; Laaksonen, D.; Herzig, K.;Uusitupa, M.; Poutanen, K. A psyllium fiber-enriched meal strongly attenuates postprandial gastrointestinalpeptide release in healthy young adults. J. Nutr. 2010, 140, 737–744. [CrossRef] [PubMed]
25. Anderson, J.; Allgood, L.; Lawrence, A.; Altringer, L.; Jerdack, G.; Hengehold, D.; Morel, J.Cholesterol-lowering effects of psyllium intake adjuctive to diet therapy in men and women withhypercholesterolemia: Meta-analysis of 8 controlled trials. Am. J. Clin. Nutr. 2000, 71, 472–479. [PubMed]
26. Rodriguez-Moran, M.; Guerrero-Romero, F.; Lazcano-Burciaga, G. Lipid- and glucose-lowering efficacy ofPlantago. Psyllium in type II diabetes. J. Diabetes Complic. 1998, 12, 273–278. [CrossRef]
27. Vuksan, V.; Jenkins, A.L.; Rogovik, A.L.; Fairgrieve, C.; Jovanovski, E.; Leiter, L. Viscosity rather than quantityof dietary fibre predicts cholesterol-lowering effect in healthy individuals. Br. J. Nutr. 2011, 106, 1349–1352.[CrossRef] [PubMed]
28. Tai, E.; Fok, A.; Chu, R.; Tan, C. A study to assess the effect of dietary supplementation with soluble fibre(Minolest) on lipid levels in normal subjects with hypercholesterolaemia. Ann. Acad. Med. Singapore 1999, 28,209–213. [PubMed]
29. Turnbull, W.; Thomas, H. The effect of a Plantago ovata seed containing preparation on appetite variables,nutrient and energy intake. Int. J. Obes. Relat. Metab. Disord. 1995, 19, 338–342. [PubMed]
30. Delargy, H.; O’Sullivan, K.; Fletcher, R.; Blundell, J. Effects of amount and type of dietary fibre (soluble andinsoluble) on short-term control of appetite. Int. J. Food Sci. Nutr. 1997, 48, 67–77. [CrossRef] [PubMed]
31. Pal, S.; Radavelli-Bagatini, S. Effects of psyllium on metabolic syndrome risk factors. Obes. Rev. 2012, 13,1034–1047. [CrossRef] [PubMed]
32. Khossousi, A.; Binns, C.W.; Dhaliwal, S.S.; Pal, S. The acute effects of psyllium on postprandial lipaemia andthermogenesis in overweight and obese men. Br. J. Nutr. 2008, 99, 1068–1075. [CrossRef] [PubMed]
242
Nutrients 2017, 9, 91
33. Gibb, R.; McRorie, J.; Russel, D.; Hasselblad, V.; D’Alessio, D. Psyllium fiber improves glycemic controlproportional to loss of glycemic control: A meta-analysis of data in euglycemic subjects, patients at risk oftype 2 diabetes mellitus, and patients being treated for type 2 diabetes mellitus. Am. J. Clin. Nutr. 2015, 102,1604–1614. [CrossRef] [PubMed]
34. US Pharmacopeia. Food Chemicals Codex (FCC), 9th ed.; US Pharmacopeia: Rockville, MD, USA, 2015.35. Pal, S.; Ellis, V.; Dhaliwal, S. Effects of whey protein isolate on body composition, lipids, insulin and glucose
in overweight and obese individuals. Br. J. Nutr. 2010, 104, 716–723. [CrossRef] [PubMed]36. Bairaktari, E.; Hatzidimou, K.; Tzallas, C.; Vini, M.; Katsaraki, A.; Tselepis, A.; Elisaf, M.; Tsolas, O.
Estimation of LDL cholesterol based on the Friedewald formula and on apo B levels. Clin. Biochem.
2000, 33, 549–555. [CrossRef]37. Wallace, T.M.; Levy, J.C.; Matthews, D.R. Use and abuse of HOMA modeling. Diabetes Care 2004, 27,
1487–1495. [CrossRef] [PubMed]38. Reimer, R.A.; Yamaguchi, H.; Eller, L.K.; Lyon, M.R.; Gahler, R.J.; Kacinik, V.; Juneja, P.; Wood, S. Changes in
visceral adiposity and serum cholesterol with a novel viscous polysaccharide in Japanese adults withabdominal obesity. Obesity 2013, 21, E379–E387. [PubMed]
39. Bernstein, A.; Titgemeier, B.; Kirkpatrick, K.; Golubic, M.; Roizen, M. Major cereal grain fibers and psylliumin relation to cardiovascular health. Nutrients 2013, 5, 1471–1487. [CrossRef] [PubMed]
40. Grover, G.J.; Koetzner, L.; Wicks, J.; Gahler, R.J.; Lyon, M.R.; Reimer, R.A.; Wood, S. Effects of the solublefiber complex PolyGlycopleX® on glucose homeostasis and body weight in young Zucker diabetic rats.Front. Pharmacol. 2011, 2, 47. [CrossRef] [PubMed]
41. Brand-Miller, J.C.; Atkinson, F.S.; Gahler, R.J.; Kacinik, V.; Lyon, M.R.; Wood, S. Effects of PGX, a novelfunctional fibre, on acute and delayed postprandial glycaemia. Eur. J. Clin. Nutr. 2010, 64, 1488–1493.[CrossRef] [PubMed]
42. Solah, V.A.; Brand-Miller, J.C.; Atkinson, F.S.; Gahler, R.J.; Kacinik, V.; Lyon, M.R.; Wood, S. Dose-responseeffect of a novel functional fibre, PolyGlycopleX®, PGX®, on satiety. Appetite 2014, 77C, 72–76. [CrossRef][PubMed]
43. Vuksan, V.; Panahi, S.; Lyon, M.; Rogovik, A.L.; Jenkins, A.L.; Leiter, L.A. Viscosity of fiber preloads affectsfood intake in adolescents. Nutr. Metab. Cardiovasc. Dis. 2009, 19, 498–503. [CrossRef] [PubMed]
44. Yong, M.; Solah, V.; Johnson, S.; Meng, X.; Kerr, D.; James, A.; Fenton, H.; Gahler, R.J.; Wood, S. Effects of aviscous-fibre supplemented evening meal and the following un-supplemented breakfast on post-prandialsatiety responses in healthy women. Physiol. Behav. 2016, 154, 34–39. [CrossRef] [PubMed]
45. Kacinik, V.; Lyon, M.R.; Purnama, M.; Reimer, R.A.; Gahler, R.J.; Green, T.J.; Wood, S. Effect of PGX, a novelfunctional fibre supplement, on subjective ratings of appetite in overweight and obese women consuming a3-day structured, low-calorie diet. Nutr. Diab. 2011, 1, e22. [CrossRef] [PubMed]
46. Pal, S.; Ho, S.; Gahler, R.; Wood, S. Effect on body weight and composition in overweight/obese Australianadults over 12 months consumption of two different types of fiber supplementation in a randomized trial.Nutr. Metab. 2016, 13, 82. [CrossRef] [PubMed]
47. Matulka, R.A.; Lyon, M.R.; Wood, S.; Ann Marone, P.; Merkel, D.J.; Burdock, G.A. The safety of PolyGlycopleX(PGX) as shown in a 90-day rodent feeding study. Nutr. J. 2009, 8, 1. [CrossRef] [PubMed]
© 2017 by the authors. Licensee MDPI, Basel, Switzerland. This article is an open accessarticle distributed under the terms and conditions of the Creative Commons Attribution(CC BY) license (http://creativecommons.org/licenses/by/4.0/).
243
nutrients
Article
A High Fiber Cookie Made with Resistant StarchType 4 Reduces Post-Prandial Glucose and InsulinResponses in Healthy Adults
Maria L. Stewart * and J. Paul Zimmer
Global Nutrition R & D, Ingredion Incorporated, 10 Finderne Ave, Bridgewater, NJ 08807, USA;[email protected]* Correspondence: [email protected]; Tel.: +1-908-685-5470
Received: 6 January 2017; Accepted: 28 February 2017; Published: 5 March 2017
Abstract: Distarch phosphate is a resistant starch type 4 (RS4) containing phosphodiester cross-linkswithin and between starch molecules. This study examined the glycemic effects of VERSAFIBE1490™ resistant starch, a distarch phosphate derived from potato, containing 90% total dietary fiber(TDF, AOAC 991.43 method). In this double-blind, randomized, placebo-controlled, cross-over study,28 healthy adults consumed a cookie containing 24 g fiber from distarch phosphate (fiber cookie)or a control cookie containing 0.5 g fiber that was matched for fat, protein, and total carbohydratecontent. Intravenous blood glucose, intravenous blood insulin, and capillary glucose were measuredfor two hours after cookie consumption. The fiber cookie reduced the post-prandial blood glucoseincremental area under the curve from 0 to 120 minutes (iAUC0-120min) by 44% (p = 0.004) andreduced the maximum glucose concentration (Cmax0-120min) by 8% (p = 0.001) versus the controlcookie. Consumption of the fiber cookie resulted in a significant 46% reduction of the post-prandialserum insulin iAUC0-120min (p < 0.001) and a 23% reduction in Cmax0-120min (p = 0.007) versus thecontrol cookie. This study shows that distarch phosphate RS4 can be incorporated into a cookie andsignificantly reduce post-prandial glucose and insulin responses in healthy adults.
Keywords: resistant starch type 4; dietary fiber; post-prandial; blood glucose; insulin;capillary glucose; glycemic response
1. Introduction
Resistant starch (RS) is a complex carbohydrate (glucose polymer) that resists digestionand absorption in the small intestine. Resistant starches are classified into five types:RS1 (physically inaccessible starches), RS2 (granular starches with B- or C-polymorph),RS3 (retrograded starches), RS4 (chemically modified starches), and RS5 (amylose-lipid complexes) [1].Resistant starch type 4 is a unique class of resistant starch due to the diversity of chemical modificationsthat decrease digestibility. Common chemical modifications include cross-linking, substitution, andpyrodextrinization [2].
Resistant starch, in general, is known for improving physiological endpoints such as improvingbowel function [3] and controlling glycemia [4]. In these reviews, all sources of RS are combined.However, it has been documented that different RSs exert different physiological effects. In a studyusing a porcine model, RS3 increased fecal nitrogen excretion compared to RS2 [5]. The composition ofthe human gut microbiota was affected in different manners, depending on the type of RS consumed(RS2 vs. RS4) [6]. Given these differences, clinical trials on specific resistant starch preparations arenecessary to confirm the beneficial physiological effects.
As noted previously, RS4 includes starches that have a variety of chemical modifications to reducedigestibility. VERSAFIBE™ 1490 resistant starch is a distarch phosphate derived from potato that has
Nutrients 2017, 9, 237 244 www.mdpi.com/journal/nutrients
Nutrients 2017, 9, 237
been modified using phosphorus oxychloride [7]. Distarch phosphate is resistant to digestion due tothe presence of diester phosphate crosslinks within and between starch molecules. Phosphated distarchphosphate is a similar type of RS4 with additional monophosphate esters, although the monophosphateesters do not substantially affect digestibility [8,9].
Resistant starch type 4, specifically distarch phosphate and phosphate distarch phosphate, isa relatively new form of resistant starch, with the earliest clinical trials on phosphated distarchphosphate published in 2010. The evidence on phosphated distarch phosphate RS4, albeit limited,supports improvement of metabolic endpoints such as reduced post-prandial glucose responseand reduced serum lipids, after the ingredient is consumed [10–13]. To date, only one studyexamined post-prandial blood glucose response to distarch phosphate (consumed in a beverage) [14].The aforementioned study demonstrated that distarch phosphate did not contribute to thepost-prandial glycemic response, and this effect needed to be confirmed when the ingredient isincorporated into a solid, baked food with mixed nutrients. The present study assessed the acute,post-prandial glycemic and insulinemic response to a cookie containing RS4 in the form of distarchphosphate (VERSAFIBE 1490 resistant starch) in healthy adults. This is the first clinical study toexamine these outcomes in a solid food containing distarch phosphate RS4.
2. Materials and Methods
2.1. Study Subjects
This study was conducted in accordance with the ethical principles outlined in the Declarationof Helsinki and approved by the Institutional Review Board (IRB Services, Aurora, ON, Canada).Clinical study visits were held at a clinical research facility (KGK Synergize, London, Ontario,Canada). Healthy subjects were recruited to participate in this study. Subjects that met the inclusioncriteria (18 years of age or older, body mass index (BMI) 18.0–29.9 kg/m2, fasting glucose ≤6.0 mmol/L;if female, not of childbearing potential (e.g., taking oral contraceptives, past hysterectomy)) andexclusion criteria (diagnosed metabolic or chronic diseases (e.g., type-2 diabetes); cancer diagnosisor treatment within 5 years; gastrointestinal problems; bowel cleansing during prior week;current medications to control blood glucose; blood cholesterol and/or blood pressure; smoker; use ofmedical marijuana; alcohol or drug abuse treatment in past 12 months; allergy or sensitivity to studyproducts; blood donation in prior 2 months; if female, currently pregnant, currently breastfeeding,or planning to become pregnant) were qualified to participate in the study. Subjects providedinformed consent and were randomly assigned to a treatment order at the time of enrollment:“control cookie-fiber cookie” or “fiber cookie-control cookie”. A senior staff member not involved in thestudy procedures generated two randomization lists—one list for males and one list for females—bywww.randomization.com. Fourteen male participants were randomized into seven blocks by utilizinga randomization seed 10,087 and fourteen female participants were randomized into seven blocksby utilizing a randomization seed 11,065. A total of twenty-eight subjects were enrolled in the study.Subject flow through the study is described in Figure 1.
245
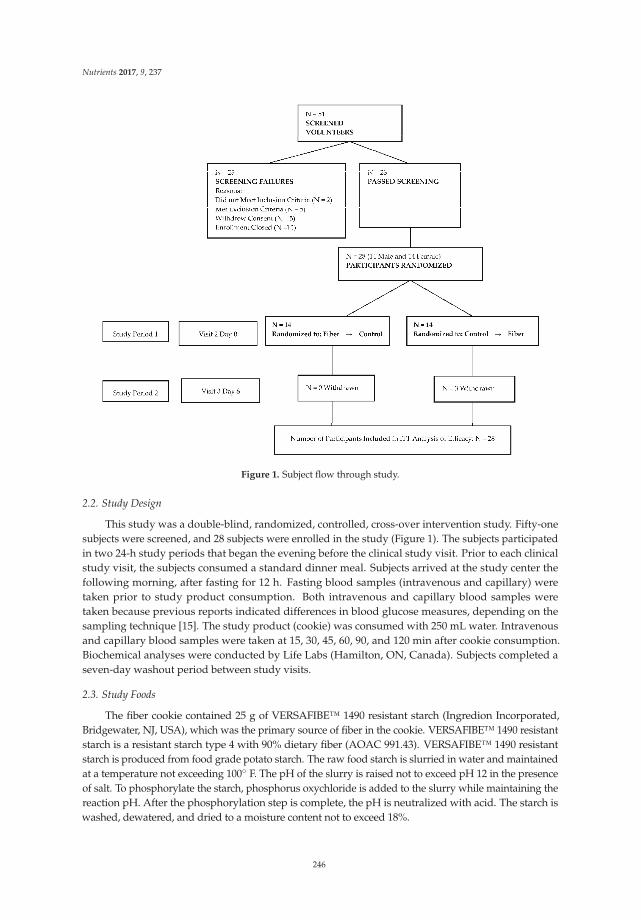
Nutrients 2017, 9, 237
Figure 1. Subject flow through study.
2.2. Study Design
This study was a double-blind, randomized, controlled, cross-over intervention study. Fifty-onesubjects were screened, and 28 subjects were enrolled in the study (Figure 1). The subjects participatedin two 24-h study periods that began the evening before the clinical study visit. Prior to each clinicalstudy visit, the subjects consumed a standard dinner meal. Subjects arrived at the study center thefollowing morning, after fasting for 12 h. Fasting blood samples (intravenous and capillary) weretaken prior to study product consumption. Both intravenous and capillary blood samples weretaken because previous reports indicated differences in blood glucose measures, depending on thesampling technique [15]. The study product (cookie) was consumed with 250 mL water. Intravenousand capillary blood samples were taken at 15, 30, 45, 60, 90, and 120 min after cookie consumption.Biochemical analyses were conducted by Life Labs (Hamilton, ON, Canada). Subjects completed aseven-day washout period between study visits.
2.3. Study Foods
The fiber cookie contained 25 g of VERSAFIBE™ 1490 resistant starch (Ingredion Incorporated,Bridgewater, NJ, USA), which was the primary source of fiber in the cookie. VERSAFIBE™ 1490 resistantstarch is a resistant starch type 4 with 90% dietary fiber (AOAC 991.43). VERSAFIBE™ 1490 resistantstarch is produced from food grade potato starch. The raw food starch is slurried in water and maintainedat a temperature not exceeding 100 F. The pH of the slurry is raised not to exceed pH 12 in the presenceof salt. To phosphorylate the starch, phosphorus oxychloride is added to the slurry while maintaining thereaction pH. After the phosphorylation step is complete, the pH is neutralized with acid. The starch iswashed, dewatered, and dried to a moisture content not to exceed 18%.
246
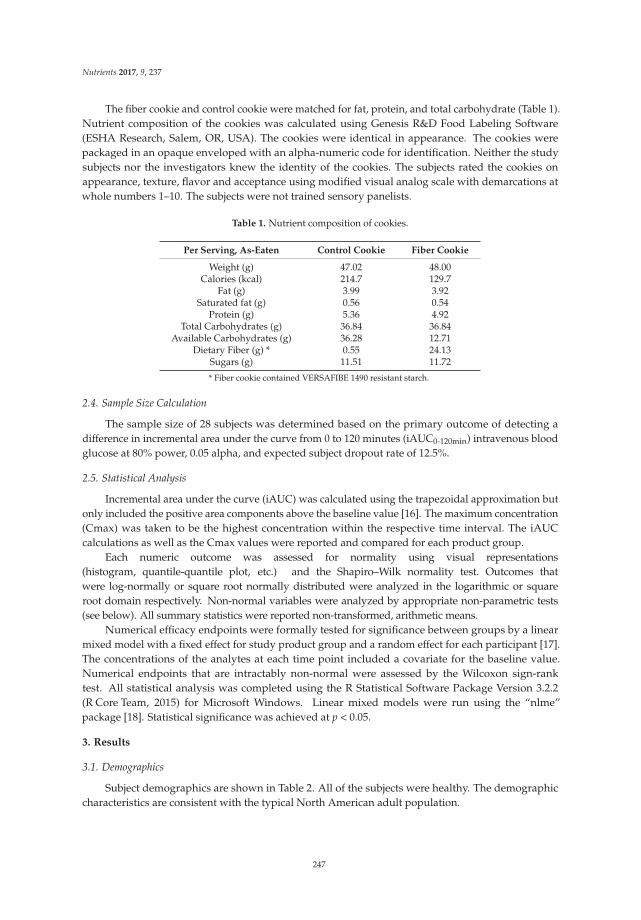
Nutrients 2017, 9, 237
The fiber cookie and control cookie were matched for fat, protein, and total carbohydrate (Table 1).Nutrient composition of the cookies was calculated using Genesis R&D Food Labeling Software(ESHA Research, Salem, OR, USA). The cookies were identical in appearance. The cookies werepackaged in an opaque enveloped with an alpha-numeric code for identification. Neither the studysubjects nor the investigators knew the identity of the cookies. The subjects rated the cookies onappearance, texture, flavor and acceptance using modified visual analog scale with demarcations atwhole numbers 1–10. The subjects were not trained sensory panelists.
Table 1. Nutrient composition of cookies.
Per Serving, As-Eaten Control Cookie Fiber Cookie
Weight (g) 47.02 48.00Calories (kcal) 214.7 129.7
Fat (g) 3.99 3.92Saturated fat (g) 0.56 0.54
Protein (g) 5.36 4.92Total Carbohydrates (g) 36.84 36.84
Available Carbohydrates (g) 36.28 12.71Dietary Fiber (g) * 0.55 24.13
Sugars (g) 11.51 11.72
* Fiber cookie contained VERSAFIBE 1490 resistant starch.
2.4. Sample Size Calculation
The sample size of 28 subjects was determined based on the primary outcome of detecting adifference in incremental area under the curve from 0 to 120 minutes (iAUC0-120min) intravenous bloodglucose at 80% power, 0.05 alpha, and expected subject dropout rate of 12.5%.
2.5. Statistical Analysis
Incremental area under the curve (iAUC) was calculated using the trapezoidal approximation butonly included the positive area components above the baseline value [16]. The maximum concentration(Cmax) was taken to be the highest concentration within the respective time interval. The iAUCcalculations as well as the Cmax values were reported and compared for each product group.
Each numeric outcome was assessed for normality using visual representations(histogram, quantile-quantile plot, etc.) and the Shapiro–Wilk normality test. Outcomes thatwere log-normally or square root normally distributed were analyzed in the logarithmic or squareroot domain respectively. Non-normal variables were analyzed by appropriate non-parametric tests(see below). All summary statistics were reported non-transformed, arithmetic means.
Numerical efficacy endpoints were formally tested for significance between groups by a linearmixed model with a fixed effect for study product group and a random effect for each participant [17].The concentrations of the analytes at each time point included a covariate for the baseline value.Numerical endpoints that are intractably non-normal were assessed by the Wilcoxon sign-ranktest. All statistical analysis was completed using the R Statistical Software Package Version 3.2.2(R Core Team, 2015) for Microsoft Windows. Linear mixed models were run using the “nlme”package [18]. Statistical significance was achieved at p < 0.05.
3. Results
3.1. Demographics
Subject demographics are shown in Table 2. All of the subjects were healthy. The demographiccharacteristics are consistent with the typical North American adult population.
247
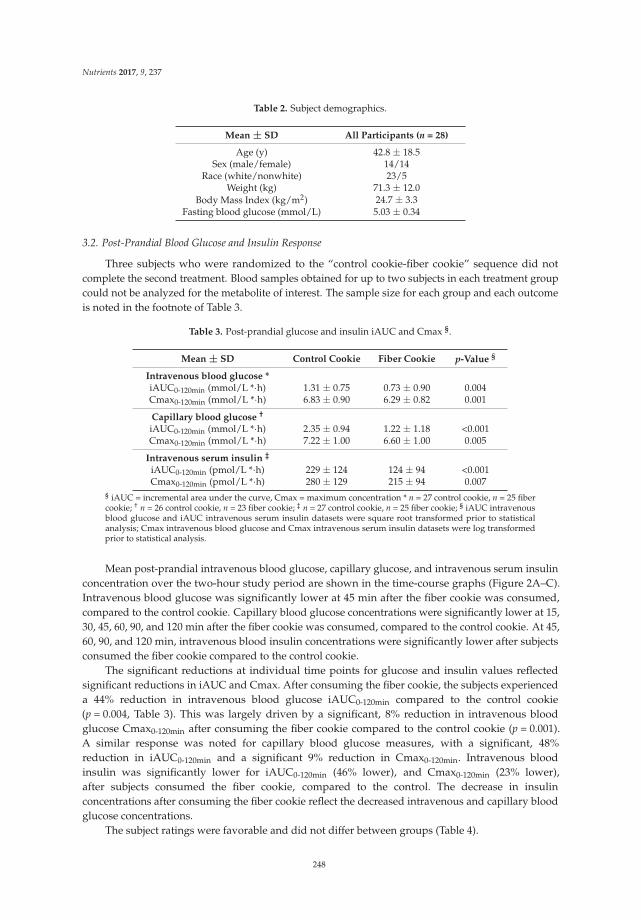
Nutrients 2017, 9, 237
Table 2. Subject demographics.
Mean ± SD All Participants (n = 28)
Age (y) 42.8 ± 18.5Sex (male/female) 14/14
Race (white/nonwhite) 23/5Weight (kg) 71.3 ± 12.0
Body Mass Index (kg/m2) 24.7 ± 3.3Fasting blood glucose (mmol/L) 5.03 ± 0.34
3.2. Post-Prandial Blood Glucose and Insulin Response
Three subjects who were randomized to the “control cookie-fiber cookie” sequence did notcomplete the second treatment. Blood samples obtained for up to two subjects in each treatment groupcould not be analyzed for the metabolite of interest. The sample size for each group and each outcomeis noted in the footnote of Table 3.
Table 3. Post-prandial glucose and insulin iAUC and Cmax §.
Mean ± SD Control Cookie Fiber Cookie p-Value §
Intravenous blood glucose *iAUC0-120min (mmol/L *·h) 1.31 ± 0.75 0.73 ± 0.90 0.004Cmax0-120min (mmol/L *·h) 6.83 ± 0.90 6.29 ± 0.82 0.001
Capillary blood glucose †
iAUC0-120min (mmol/L *·h) 2.35 ± 0.94 1.22 ± 1.18 <0.001Cmax0-120min (mmol/L *·h) 7.22 ± 1.00 6.60 ± 1.00 0.005
Intravenous serum insulin ‡
iAUC0-120min (pmol/L *·h) 229 ± 124 124 ± 94 <0.001Cmax0-120min (pmol/L *·h) 280 ± 129 215 ± 94 0.007
§ iAUC = incremental area under the curve, Cmax = maximum concentration * n = 27 control cookie, n = 25 fibercookie; † n = 26 control cookie, n = 23 fiber cookie; ‡ n = 27 control cookie, n = 25 fiber cookie; § iAUC intravenousblood glucose and iAUC intravenous serum insulin datasets were square root transformed prior to statisticalanalysis; Cmax intravenous blood glucose and Cmax intravenous serum insulin datasets were log transformedprior to statistical analysis.
Mean post-prandial intravenous blood glucose, capillary glucose, and intravenous serum insulinconcentration over the two-hour study period are shown in the time-course graphs (Figure 2A–C).Intravenous blood glucose was significantly lower at 45 min after the fiber cookie was consumed,compared to the control cookie. Capillary blood glucose concentrations were significantly lower at 15,30, 45, 60, 90, and 120 min after the fiber cookie was consumed, compared to the control cookie. At 45,60, 90, and 120 min, intravenous blood insulin concentrations were significantly lower after subjectsconsumed the fiber cookie compared to the control cookie.
The significant reductions at individual time points for glucose and insulin values reflectedsignificant reductions in iAUC and Cmax. After consuming the fiber cookie, the subjects experienceda 44% reduction in intravenous blood glucose iAUC0-120min compared to the control cookie(p = 0.004, Table 3). This was largely driven by a significant, 8% reduction in intravenous bloodglucose Cmax0-120min after consuming the fiber cookie compared to the control cookie (p = 0.001).A similar response was noted for capillary blood glucose measures, with a significant, 48%reduction in iAUC0-120min and a significant 9% reduction in Cmax0-120min. Intravenous bloodinsulin was significantly lower for iAUC0-120min (46% lower), and Cmax0-120min (23% lower),after subjects consumed the fiber cookie, compared to the control. The decrease in insulinconcentrations after consuming the fiber cookie reflect the decreased intravenous and capillary bloodglucose concentrations.
The subject ratings were favorable and did not differ between groups (Table 4).
248
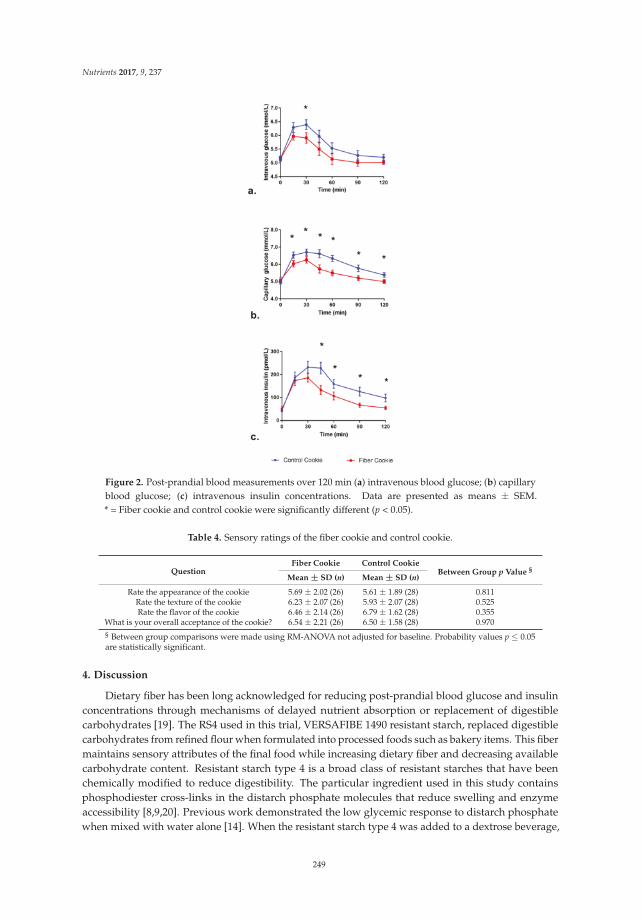
Nutrients 2017, 9, 237
Figure 2. Post-prandial blood measurements over 120 min (a) intravenous blood glucose; (b) capillaryblood glucose; (c) intravenous insulin concentrations. Data are presented as means ± SEM.* = Fiber cookie and control cookie were significantly different (p < 0.05).
Table 4. Sensory ratings of the fiber cookie and control cookie.
QuestionFiber Cookie Control Cookie
Between Group p Value §
Mean ± SD (n) Mean ± SD (n)
Rate the appearance of the cookie 5.69 ± 2.02 (26) 5.61 ± 1.89 (28) 0.811Rate the texture of the cookie 6.23 ± 2.07 (26) 5.93 ± 2.07 (28) 0.525Rate the flavor of the cookie 6.46 ± 2.14 (26) 6.79 ± 1.62 (28) 0.355
What is your overall acceptance of the cookie? 6.54 ± 2.21 (26) 6.50 ± 1.58 (28) 0.970§ Between group comparisons were made using RM-ANOVA not adjusted for baseline. Probability values p ≤ 0.05are statistically significant.
4. Discussion
Dietary fiber has been long acknowledged for reducing post-prandial blood glucose and insulinconcentrations through mechanisms of delayed nutrient absorption or replacement of digestiblecarbohydrates [19]. The RS4 used in this trial, VERSAFIBE 1490 resistant starch, replaced digestiblecarbohydrates from refined flour when formulated into processed foods such as bakery items. This fibermaintains sensory attributes of the final food while increasing dietary fiber and decreasing availablecarbohydrate content. Resistant starch type 4 is a broad class of resistant starches that have beenchemically modified to reduce digestibility. The particular ingredient used in this study containsphosphodiester cross-links in the distarch phosphate molecules that reduce swelling and enzymeaccessibility [8,9,20]. Previous work demonstrated the low glycemic response to distarch phosphatewhen mixed with water alone [14]. When the resistant starch type 4 was added to a dextrose beverage,
249
Nutrients 2017, 9, 237
the glycemic response was the same as the dextrose beverage alone. This demonstrates that the RS4does not affect bioavailability of other carbohydrates, and the changes in post-prandial glycemicresponse are due to the nondigestible nature of the carbohydrate. The dietary fiber content is consistentwhen analyzed with both AOAC method 991.43 and AOAC method 2009.01, which indicates thatthe RS4 is heat-stable and resistant to prolong enzymatic digestion (unpublished data). We expectthe RS4 content and dietary fiber content to be similar in the ingredient as well as the final foodproduct (cookie).
Resistant starch type 4 may exert additional mechanisms to reduce post-prandial glycemicresponse, in addition to strictly replacing available carbohydrate. In a study where the treatmentswere matched for available carbohydrate, the RS4 treatment, phosphated distarch phosphate, resultedin significantly lower blood glucose iAUC0-120min, peak blood glucose, blood insulin iAUC0-120min andpeak insulin in healthy adults [10]. Additional research is needed to further define the mechanismsby which RS4 lowers post-prandial blood glucose response when treatments are matched foravailable carbohydrate.
The iAUC0-120min and Cmax0-120min for blood glucose were significantly lower after subjectsconsumed the fiber cookie compared to the control cookie, regardless of the sampling method. As notedby previous researchers, the absolute blood glucose values differ when measured intravenously orthrough capillary sampling [15]. When individual time points were compared, the capillary samplingmethod yielded significantly lower values after the fiber cookie was consumed at 45, 60, 90, and 120 min,whereas the intravenous sampling method yielded significantly different blood glucose values at45 min, only. This can be attributed to the larger variability in blood glucose values when intravenoussampling was used. Previous researchers also noted this phenomenon [15]. Intravenous insuliniAUC0-120min and Cmax were lower after the subjects consumed the fiber cookie compared to thecontrol cookie, which corresponds to the observed changes in blood glucose.
Resistant starch type 4, such as distarch phosphate, has functional properties that allow it toreplace refined grain flour in product formulations. As a result, the available carbohydrates in a foodcan be reduced while maintaining the same sensory properties [2]. This provides the opportunityto formulate desirable foods with added health benefits such as improved post-prandial bloodglucose management.
Reduced post-prandial glycemic response is a beneficial health effect for healthy individuals aswell as individuals with compromised carbohydrate metabolism (e.g., pre-diabetes, Type-2 diabetes).The results from this study demonstrate how replacing refined flour with RS4 in a baked good (cookie)reduces post-prandial glucose and insulin response in healthy adults. Further research is warranted inindividuals with compromised carbohydrate metabolism.
Acknowledgments: This study was funded by Ingredion Incorporated.
Author Contributions: J.P.Z. conceived and designed the experiments; M.L.S. and J.P.Z. wrote the paper.
Conflicts of Interest: M.L.S. and J.P.Z. are employees of Ingredion Incorporated.
References
1. Birt, D.F.; Boylston, T.; Hendrich, S.; Jane, J.L.; Hollis, J.; Li, L.; McClelland, J.; Moore, S.; Phillips, G.J.;Rowling, M.; et al. Resistant starch: Promise for improving human health. Adv. Nutr. 2013, 4, 587–601.[CrossRef] [PubMed]
2. Maningat, C.C.; Seib, P.A. Rs4-Type Resistant Starch: Chemistry, Functionality and Health Benefits.In Resistant Starch: Sources, Applications and Health Benefits; Shi, Y.C., Maningat, C.C., Eds.; John Wiley & Sons:Hoboken, NJ, USA, 2013; pp. 43–77.
3. Shen, D.; Bai, H.; Li, Z.; Yu, Y.; Zhang, H.; Chen, L. Positive effects of resistant starch supplementation onbowel function in healthy adults: A systematic review and meta-analysis of randomized controlled trials.Int. J. Food Sci. Nutr. 2017, 68, 149–157. [CrossRef] [PubMed]
250
Nutrients 2017, 9, 237
4. Bindels, L.B.; Walter, J.; Ramer-Tait, A.E. Resistant starches for the management of metabolic diseases.Curr. Opin. Clin. Nutr. Metab. Care 2015, 18, 559–565. [CrossRef] [PubMed]
5. Heijnen, M.-L.A.; Beynen, A.C. Consumption of retrograded (rs3) but not uncooked (rs2) resistant starchshifts nitrogen excretion from urine to feces in cannulated piglets. J. Nutr. 1997, 127, 1828–1832. [PubMed]
6. Martínez, I.; Kim, J.H.; Duffy, P.R.; Schlegel, V.L.; Walter, J. Resistant starches types 2 and 4 have differentialeffects on the composition of the fecal microbiota in human subjects. PLoS ONE 2010, 5, e15046. [CrossRef][PubMed]
7. IngredionIncorporated. Technical Specifications: Versafibe 1490 tm Resistant Starch. Available online:http://www.ingredion.us/content/dam/ingredion/technical-documents/na/VERSAFIBE%201490%20%20%2006400400%20%20%20Technical%20Specification.pdf (accessed on 15 December 2016).
8. Woo, K.S.; Seib, P.A. Cross-linked resistant starch: Preparation and properties. Cereal Chem. 2002, 79, 819–825.[CrossRef]
9. Sang, Y.J.; Seib, P.A.; Herrera, A.I.; Prakash, O.; Shi, Y.-C. Effects of alkaline treatment on the structure ofphosphorylated wheat starch and its digestibility. Food Chem. 2010, 118, 323–327. [CrossRef]
10. Al-Tamimi, E.K.; Seib, P.A.; Snyder, B.S.; Haub, M.D. Consumption of cross-linked resistant starch (rs4(xl))on glucose and insulin responses in humans. J. Nutr. Metab. 2010. [CrossRef] [PubMed]
11. Haub, M.D.; Hubach, K.L.; Al-Tamimi, E.K.; Ornelas, S.; Seib, P.A. Different types of resistant starch elicitdifferent glucose reponses in humans. J. Nutr. Metab. 2010. [CrossRef] [PubMed]
12. Nichenametla, S.N.; Weidauer, L.A.; Wey, H.E.; Beare, T.M.; Specker, B.L.; Dey, M. Resistant starch type4-enriched diet lowered blood cholesterols and improved body composition in a double blind controlledcross-over intervention. Mol. Nutr. Food Res. 2014, 58, 1365–1369. [CrossRef] [PubMed]
13. Upadhyaya, B.; McCormack, L.; Fardin-Kia, A.R.; Juenemann, R.; Nichenametla, S.; Clapper, J.; Specker, B.;Dey, M. Impact of dietary resistant starch type 4 on human gut microbiota and immunometabolic functions.Sci. Rep. 2016, 6, 28797. [CrossRef] [PubMed]
14. Haub, M.D.; Louk, J.A.; Lopez, T.C. Novel resistant potato starches on glycemia and satiety in humans.J. Nutr. Metab. 2012, 2012, 478043. [CrossRef] [PubMed]
15. Wolever, T.M.; Vorster, H.H.; Bjorck, I.; Brand-Miller, J.; Brighenti, F.; Mann, J.I.; Ramdath, D.D.; Granfeldt, Y.;Holt, S.; Perry, T.L.; et al. Determination of the glycaemic index of foods: Interlaboratory study. Eur. J.
Clin. Nutr. 2003, 57, 475–482. [CrossRef] [PubMed]16. Wolever, T.M. Effect of blood sampling schedule and method of calculating the area under the curve on
validity and precision of glycaemic index values. Br. J. Nutr. 2004, 91, 295–301. [CrossRef] [PubMed]17. Cnaan, A.; Laird, N.M.; Slasor, P. Using the general linear mixed model to analyse unbalanced repeated
measures and longitudinal data. Stat. Med. 1997, 16, 2349–2380. [CrossRef]18. Pinheiro, J.; Bates, D.; DebRoy, S.; Sarkar, D.; R Core Team. Nlme: Linear and Nonlinear Mixed Effects Models;
R Foundation: Vienna, Austria, 2015.19. Medicine, I.O. Dietary, Functional, and Total Fiber. In Dietary Reference Intakes for Energy, Carbohydrate, Fiber,
Fat, Fatty Acids, Cholesterol, Protein, and Amino Acids; National Academies Press: Washington, DC, USA, 2005;pp. 339–421.
20. Janzen, J.G. Digestibility of starch and phosphate starches by pancreatin. Starke 1969, 21, 231–235. [CrossRef]
© 2017 by the authors. Licensee MDPI, Basel, Switzerland. This article is an open accessarticle distributed under the terms and conditions of the Creative Commons Attribution(CC BY) license (http://creativecommons.org/licenses/by/4.0/).
251
nutrients
Article
Effects of Higher Dietary Protein and Fiber Intakes atBreakfast on Postprandial Glucose, Insulin, and 24-hInterstitial Glucose in Overweight Adults
Akua F. Amankwaah 1,2, R. Drew Sayer 3, Amy J. Wright 1, Ningning Chen 4, Megan A. McCrory 5
and Wayne W. Campbell 1,*
1 Department of Nutrition Science, Purdue University, West Lafayette, IN 47907, USA;[email protected] (A.F.A.); [email protected] (A.J.W.)
2 Department of Public Health Sciences, College of Health Science, California Baptist University,Riverside, CA 92504, USA
3 Anschutz Health and Wellness Center, University of Colorado—Denver | Anschutz Medical Campus,Aurora, CO 80045, USA; [email protected]
4 Department of Statistics, Purdue University, West Lafayette, IN 47907, USA; [email protected] Department of Health Sciences, College of Health & Rehabilitation Sciences: Sargent College,
Boston University, Boston, MA 02215, USA; [email protected]* Correspondence: [email protected]; Tel.: +1-765-494-8236; Fax: +1-765-494-0674
Received: 11 February 2017; Accepted: 30 March 2017; Published: 2 April 2017
Abstract: Dietary protein and fiber independently influence insulin-mediated glucose control.However, potential additive effects are not well-known. Men and women (n = 20; age: 26 ± 5 years;body mass index: 26.1 ± 0.2 kg/m2; mean ± standard deviation) consumed normal proteinand fiber (NPNF; NP = 12.5 g, NF = 2 g), normal protein and high fiber (NPHF; NP = 12.5 g,HF = 8 g), high protein and normal fiber (HPNF; HP = 25 g, NF = 2 g), or high protein andfiber (HPHF; HP = 25 g, HF = 8 g) breakfast treatments during four 2-week interventions in arandomized crossover fashion. On the last day of each intervention, meal tolerance tests werecompleted to assess postprandial (every 60 min for 240 min) serum glucose and insulin concentrations.Continuous glucose monitoring was used to measure 24-h interstitial glucose during five days ofthe second week of each intervention. Repeated-measures ANOVA was applied for data analyses.The HPHF treatment did not affect postprandial glucose and insulin responses or 24-h glucosetotal area under the curve (AUC). Higher fiber intake reduced 240-min insulin AUC. Doubling theamount of protein from 12.5 g to 25 g/meal and quadrupling fiber from 2 to 8 g/meal at breakfastwas not an effective strategy for modulating insulin-mediated glucose responses in these young,overweight adults.
Keywords: dietary protein; dietary fiber; breakfast; overweight; continuous glucose monitoring;meal tolerance test
1. Introduction
Type 2 diabetes (T2D) is a chronic metabolic disease that is impacted by insulin resistance, glucoseintolerance, and dyslipidemia [1–3]. Dietary factors that influence blood glucose control may modifythese metabolic abnormalities [3–6]. Total dietary energy intake and macronutrient composition arewell-known to modulate glycemia [4,7]. Restricting energy intake and the resultant reductions inbody weight improves these modifiable risk factors for T2D [8–10]. Nevertheless, maintaining energyrestriction and weight loss over the long-term is challenging [11]. Manipulating dietary macronutrientcomposition without restricting energy has also been shown to be an effective dietary strategy forprevention of T2D [12,13].
Nutrients 2017, 9, 352 252 www.mdpi.com/journal/nutrients
Nutrients 2017, 9, 352
The quantity and quality of carbohydrate and protein in a mixed meal modulate postprandialglucose and insulin concentrations, with the total amount and the type of carbohydrate consumedbeing the major contributors to postprandial glucose concentration [14–16]. An increased amountof digestible/metabolizable carbohydrate consumed is associated with higher postprandialglycemia [17–19], which increases the risk of developing T2D [20,21]. On the other hand, a higheramount of complex/indigestible carbohydrates, such as soluble, viscous, and gel-forming fibers [22–24]may attenuate postprandial glucose concentrations [25–29]. Among different forms of solublefibers, psyllium fiber is known to consistently attenuate fasting and postprandial glucose andinsulin [30,31] and distinctly exert a laxation effect when consumed with meals [32]. Dietary proteinappears to stimulate insulin secretion in people with normal glucose tolerance and T2D [33–35]and this insulinotropic effect of protein is related to secretagogue amino acids, such as arginineand leucine [33]. Eggs are a complete protein source with a relatively high leucine content [36].Evidence supporting a glucose lowering effect of eggs is inconclusive [37–39]. Experimental evidencesupports metabolic effects of protein and fiber in blunting postprandial and long-term glucoseresponses independently [7,12,13,35,40]. However, the extent to which the effects of protein andfiber intakes on postprandial glucose when co-consumed may be additive are uncertain, particularlyin overweight individuals, who may be at risk of developing T2D.
While traditional meal tolerance tests adequately assess the impact of meals/diets on postprandialglucose and insulin responses, this method does not support the assessment of daylong glucose control.Continuous glucose monitoring (CGM) is an emerging technique that is used to determine the 24-hpattern of interstitial glucose concentrations in community-dwelling individuals [41,42]. The CGMtechnique may be preferred to inpatient meal tolerance tests to track the impact of dietary intake ondaylong glucose responses, particularly when the impact of self-selected dietary intake on glycemiais of interest. By using this approach, the suggested extended favorable effects of protein and fiberintakes on daylong glucose control can be assessed.
We conducted a randomized controlled crossover trial to assess the independent and combinedeffects of normal versus higher egg-based protein and fiber intakes at breakfast on postprandialglycemic and insulinemic responses as well as 24-h glucose patterns with CGM. The study focusedon breakfast because the typical intakes of protein and fiber at this meal are lower than at lunchand dinner [43]. In addition, some previous studies suggest that higher protein [13,44,45] orfiber [46,47] intake at breakfast, particularly protein, may have favorable metabolic benefits byenhancing insulin-mediated glucose disposal due to increased insulin secretion. We hypothesizedthat co-consumption of higher quantities of egg-based protein and fiber at breakfast would lowerpostprandial glucose and 24-h glucose responses.
2. Materials and Methods
2.1. Participants
Overweight male and female adults were recruited from the Greater Lafayette, Indiana, USA,area through advertisement to participate in the study. The inclusion criteria for selection of participantswere: age 21–45 years; body mass index (BMI) 25–29.9 kg/m2; females with regular menstrual cycles;non-smoking; not taking medications or dietary/herbal supplements known to affect energy regulationor appetite; not pregnant or lactating within the past 1 year or planning a pregnancy; weight stable(±3 kg) for the past 3 months; not following a vigorous exercise regimen or weight loss programwithin the past 6 months; no acute illness; not diabetic (fasting blood glucose ≤126 mg/dL (7 mmol/L);not severely claustrophobic; willing to eat study foods; and not skipping breakfast >2 day/week.Eligible individuals were approved by the study physician to participate based on routine bloodchemistry assessments. All participants gave written informed consent and the study had approvalfrom the Purdue University Biomedical Institutional Review Board. Figure 1 shows participants’flow through the study. Baseline participant characteristics were not statistically different (p > 0.05)
253
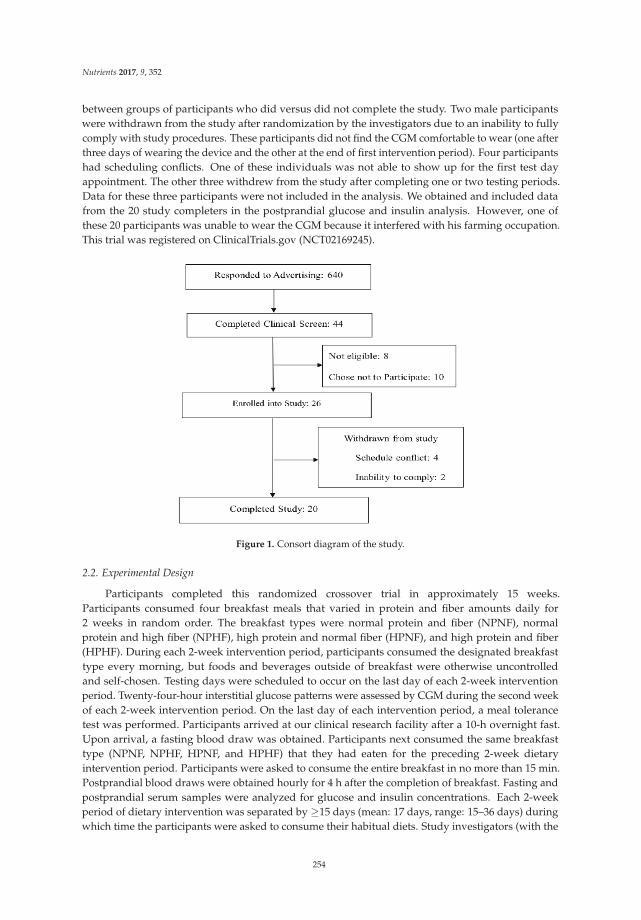
Nutrients 2017, 9, 352
between groups of participants who did versus did not complete the study. Two male participantswere withdrawn from the study after randomization by the investigators due to an inability to fullycomply with study procedures. These participants did not find the CGM comfortable to wear (one afterthree days of wearing the device and the other at the end of first intervention period). Four participantshad scheduling conflicts. One of these individuals was not able to show up for the first test dayappointment. The other three withdrew from the study after completing one or two testing periods.Data for these three participants were not included in the analysis. We obtained and included datafrom the 20 study completers in the postprandial glucose and insulin analysis. However, one ofthese 20 participants was unable to wear the CGM because it interfered with his farming occupation.This trial was registered on ClinicalTrials.gov (NCT02169245).
Figure 1. Consort diagram of the study.
2.2. Experimental Design
Participants completed this randomized crossover trial in approximately 15 weeks.Participants consumed four breakfast meals that varied in protein and fiber amounts daily for2 weeks in random order. The breakfast types were normal protein and fiber (NPNF), normalprotein and high fiber (NPHF), high protein and normal fiber (HPNF), and high protein and fiber(HPHF). During each 2-week intervention period, participants consumed the designated breakfasttype every morning, but foods and beverages outside of breakfast were otherwise uncontrolledand self-chosen. Testing days were scheduled to occur on the last day of each 2-week interventionperiod. Twenty-four-hour interstitial glucose patterns were assessed by CGM during the second weekof each 2-week intervention period. On the last day of each intervention period, a meal tolerancetest was performed. Participants arrived at our clinical research facility after a 10-h overnight fast.Upon arrival, a fasting blood draw was obtained. Participants next consumed the same breakfasttype (NPNF, NPHF, HPNF, and HPHF) that they had eaten for the preceding 2-week dietaryintervention period. Participants were asked to consume the entire breakfast in no more than 15 min.Postprandial blood draws were obtained hourly for 4 h after the completion of breakfast. Fasting andpostprandial serum samples were analyzed for glucose and insulin concentrations. Each 2-weekperiod of dietary intervention was separated by ≥15 days (mean: 17 days, range: 15–36 days) duringwhich time the participants were asked to consume their habitual diets. Study investigators (with the
254
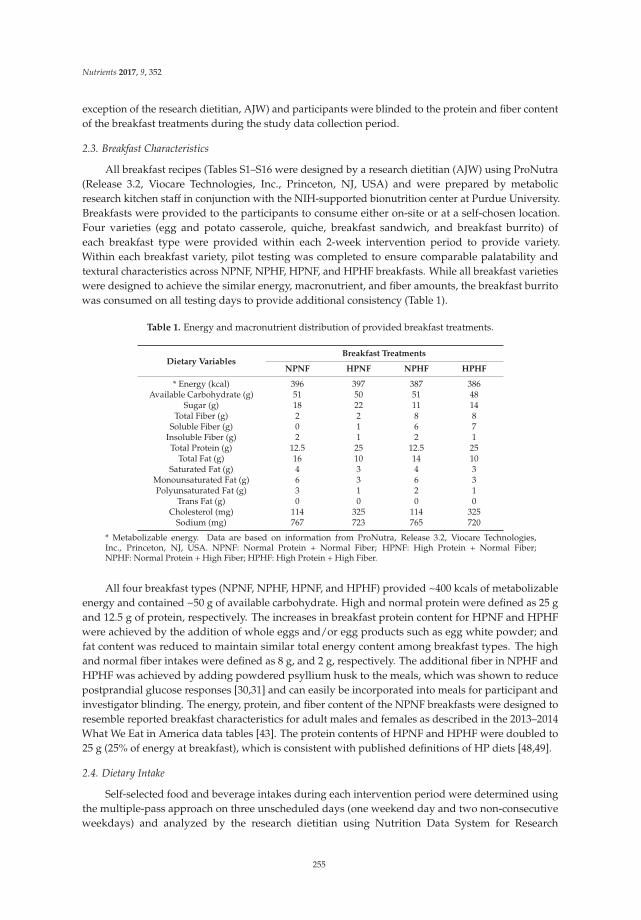
Nutrients 2017, 9, 352
exception of the research dietitian, AJW) and participants were blinded to the protein and fiber contentof the breakfast treatments during the study data collection period.
2.3. Breakfast Characteristics
All breakfast recipes (Tables S1–S16 were designed by a research dietitian (AJW) using ProNutra(Release 3.2, Viocare Technologies, Inc., Princeton, NJ, USA) and were prepared by metabolicresearch kitchen staff in conjunction with the NIH-supported bionutrition center at Purdue University.Breakfasts were provided to the participants to consume either on-site or at a self-chosen location.Four varieties (egg and potato casserole, quiche, breakfast sandwich, and breakfast burrito) ofeach breakfast type were provided within each 2-week intervention period to provide variety.Within each breakfast variety, pilot testing was completed to ensure comparable palatability andtextural characteristics across NPNF, NPHF, HPNF, and HPHF breakfasts. While all breakfast varietieswere designed to achieve the similar energy, macronutrient, and fiber amounts, the breakfast burritowas consumed on all testing days to provide additional consistency (Table 1).
Table 1. Energy and macronutrient distribution of provided breakfast treatments.
Dietary VariablesBreakfast Treatments
NPNF HPNF NPHF HPHF
* Energy (kcal) 396 397 387 386Available Carbohydrate (g) 51 50 51 48
Sugar (g) 18 22 11 14Total Fiber (g) 2 2 8 8
Soluble Fiber (g) 0 1 6 7Insoluble Fiber (g) 2 1 2 1Total Protein (g) 12.5 25 12.5 25
Total Fat (g) 16 10 14 10Saturated Fat (g) 4 3 4 3
Monounsaturated Fat (g) 6 3 6 3Polyunsaturated Fat (g) 3 1 2 1
Trans Fat (g) 0 0 0 0Cholesterol (mg) 114 325 114 325
Sodium (mg) 767 723 765 720
* Metabolizable energy. Data are based on information from ProNutra, Release 3.2, Viocare Technologies,Inc., Princeton, NJ, USA. NPNF: Normal Protein + Normal Fiber; HPNF: High Protein + Normal Fiber;NPHF: Normal Protein + High Fiber; HPHF: High Protein + High Fiber.
All four breakfast types (NPNF, NPHF, HPNF, and HPHF) provided ~400 kcals of metabolizableenergy and contained ~50 g of available carbohydrate. High and normal protein were defined as 25 gand 12.5 g of protein, respectively. The increases in breakfast protein content for HPNF and HPHFwere achieved by the addition of whole eggs and/or egg products such as egg white powder; andfat content was reduced to maintain similar total energy content among breakfast types. The highand normal fiber intakes were defined as 8 g, and 2 g, respectively. The additional fiber in NPHF andHPHF was achieved by adding powdered psyllium husk to the meals, which was shown to reducepostprandial glucose responses [30,31] and can easily be incorporated into meals for participant andinvestigator blinding. The energy, protein, and fiber content of the NPNF breakfasts were designed toresemble reported breakfast characteristics for adult males and females as described in the 2013–2014What We Eat in America data tables [43]. The protein contents of HPNF and HPHF were doubled to25 g (25% of energy at breakfast), which is consistent with published definitions of HP diets [48,49].
2.4. Dietary Intake
Self-selected food and beverage intakes during each intervention period were determined usingthe multiple-pass approach on three unscheduled days (one weekend day and two non-consecutiveweekdays) and analyzed by the research dietitian using Nutrition Data System for Research
255
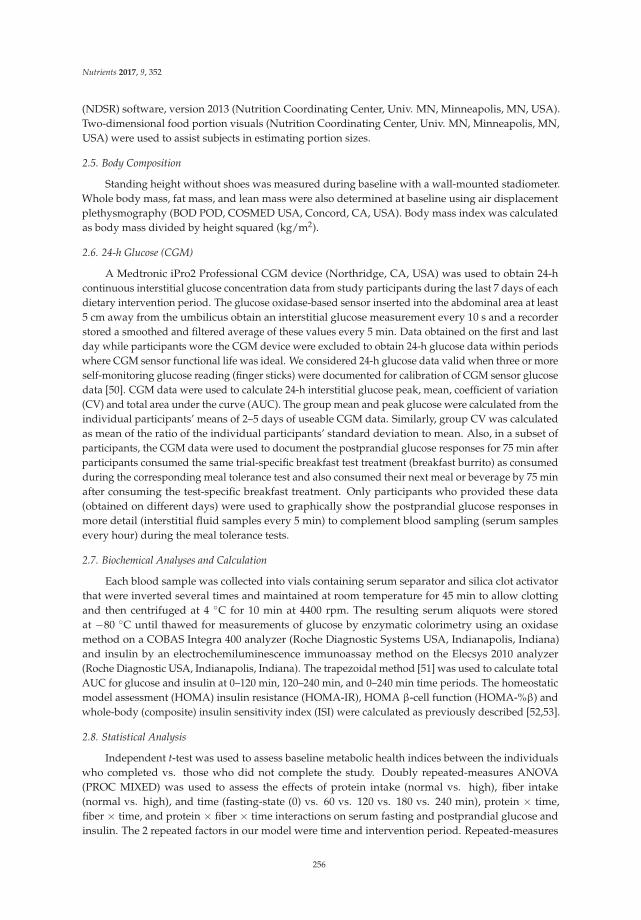
Nutrients 2017, 9, 352
(NDSR) software, version 2013 (Nutrition Coordinating Center, Univ. MN, Minneapolis, MN, USA).Two-dimensional food portion visuals (Nutrition Coordinating Center, Univ. MN, Minneapolis, MN,USA) were used to assist subjects in estimating portion sizes.
2.5. Body Composition
Standing height without shoes was measured during baseline with a wall-mounted stadiometer.Whole body mass, fat mass, and lean mass were also determined at baseline using air displacementplethysmography (BOD POD, COSMED USA, Concord, CA, USA). Body mass index was calculatedas body mass divided by height squared (kg/m2).
2.6. 24-h Glucose (CGM)
A Medtronic iPro2 Professional CGM device (Northridge, CA, USA) was used to obtain 24-hcontinuous interstitial glucose concentration data from study participants during the last 7 days of eachdietary intervention period. The glucose oxidase-based sensor inserted into the abdominal area at least5 cm away from the umbilicus obtain an interstitial glucose measurement every 10 s and a recorderstored a smoothed and filtered average of these values every 5 min. Data obtained on the first and lastday while participants wore the CGM device were excluded to obtain 24-h glucose data within periodswhere CGM sensor functional life was ideal. We considered 24-h glucose data valid when three or moreself-monitoring glucose reading (finger sticks) were documented for calibration of CGM sensor glucosedata [50]. CGM data were used to calculate 24-h interstitial glucose peak, mean, coefficient of variation(CV) and total area under the curve (AUC). The group mean and peak glucose were calculated from theindividual participants’ means of 2–5 days of useable CGM data. Similarly, group CV was calculatedas mean of the ratio of the individual participants’ standard deviation to mean. Also, in a subset ofparticipants, the CGM data were used to document the postprandial glucose responses for 75 min afterparticipants consumed the same trial-specific breakfast test treatment (breakfast burrito) as consumedduring the corresponding meal tolerance test and also consumed their next meal or beverage by 75 minafter consuming the test-specific breakfast treatment. Only participants who provided these data(obtained on different days) were used to graphically show the postprandial glucose responses inmore detail (interstitial fluid samples every 5 min) to complement blood sampling (serum samplesevery hour) during the meal tolerance tests.
2.7. Biochemical Analyses and Calculation
Each blood sample was collected into vials containing serum separator and silica clot activatorthat were inverted several times and maintained at room temperature for 45 min to allow clottingand then centrifuged at 4 C for 10 min at 4400 rpm. The resulting serum aliquots were storedat −80 C until thawed for measurements of glucose by enzymatic colorimetry using an oxidasemethod on a COBAS Integra 400 analyzer (Roche Diagnostic Systems USA, Indianapolis, Indiana)and insulin by an electrochemiluminescence immunoassay method on the Elecsys 2010 analyzer(Roche Diagnostic USA, Indianapolis, Indiana). The trapezoidal method [51] was used to calculate totalAUC for glucose and insulin at 0–120 min, 120–240 min, and 0–240 min time periods. The homeostaticmodel assessment (HOMA) insulin resistance (HOMA-IR), HOMA β-cell function (HOMA-%β) andwhole-body (composite) insulin sensitivity index (ISI) were calculated as previously described [52,53].
2.8. Statistical Analysis
Independent t-test was used to assess baseline metabolic health indices between the individualswho completed vs. those who did not complete the study. Doubly repeated-measures ANOVA(PROC MIXED) was used to assess the effects of protein intake (normal vs. high), fiber intake(normal vs. high), and time (fasting-state (0) vs. 60 vs. 120 vs. 180 vs. 240 min), protein × time,fiber × time, and protein × fiber × time interactions on serum fasting and postprandial glucose andinsulin. The 2 repeated factors in our model were time and intervention period. Repeated-measures
256
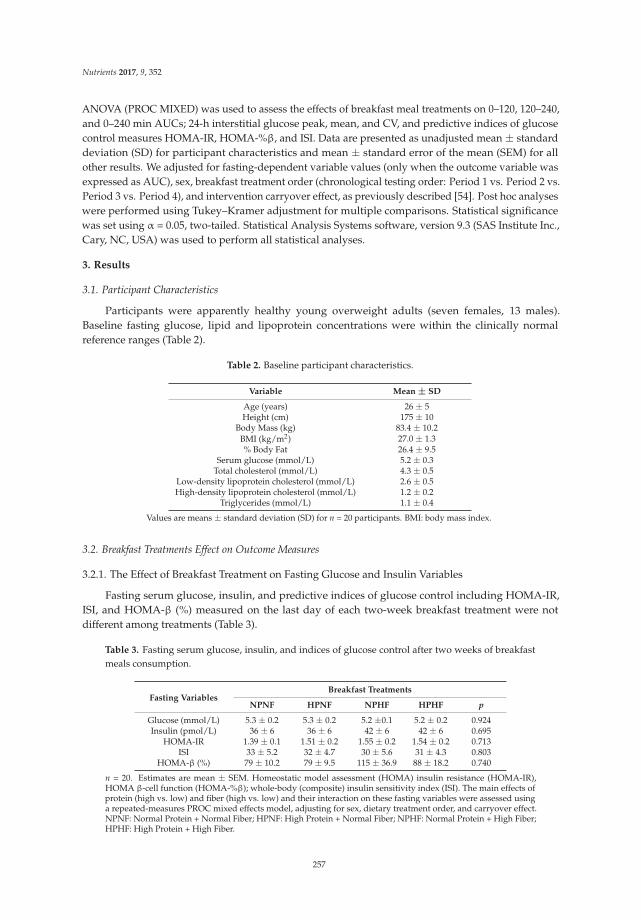
Nutrients 2017, 9, 352
ANOVA (PROC MIXED) was used to assess the effects of breakfast meal treatments on 0–120, 120–240,and 0–240 min AUCs; 24-h interstitial glucose peak, mean, and CV, and predictive indices of glucosecontrol measures HOMA-IR, HOMA-%β, and ISI. Data are presented as unadjusted mean ± standarddeviation (SD) for participant characteristics and mean ± standard error of the mean (SEM) for allother results. We adjusted for fasting-dependent variable values (only when the outcome variable wasexpressed as AUC), sex, breakfast treatment order (chronological testing order: Period 1 vs. Period 2 vs.Period 3 vs. Period 4), and intervention carryover effect, as previously described [54]. Post hoc analyseswere performed using Tukey–Kramer adjustment for multiple comparisons. Statistical significancewas set using α = 0.05, two-tailed. Statistical Analysis Systems software, version 9.3 (SAS Institute Inc.,Cary, NC, USA) was used to perform all statistical analyses.
3. Results
3.1. Participant Characteristics
Participants were apparently healthy young overweight adults (seven females, 13 males).Baseline fasting glucose, lipid and lipoprotein concentrations were within the clinically normalreference ranges (Table 2).
Table 2. Baseline participant characteristics.
Variable Mean ± SD
Age (years) 26 ± 5Height (cm) 175 ± 10
Body Mass (kg) 83.4 ± 10.2BMI (kg/m2) 27.0 ± 1.3% Body Fat 26.4 ± 9.5
Serum glucose (mmol/L) 5.2 ± 0.3Total cholesterol (mmol/L) 4.3 ± 0.5
Low-density lipoprotein cholesterol (mmol/L) 2.6 ± 0.5High-density lipoprotein cholesterol (mmol/L) 1.2 ± 0.2
Triglycerides (mmol/L) 1.1 ± 0.4
Values are means ± standard deviation (SD) for n = 20 participants. BMI: body mass index.
3.2. Breakfast Treatments Effect on Outcome Measures
3.2.1. The Effect of Breakfast Treatment on Fasting Glucose and Insulin Variables
Fasting serum glucose, insulin, and predictive indices of glucose control including HOMA-IR,ISI, and HOMA-β (%) measured on the last day of each two-week breakfast treatment were notdifferent among treatments (Table 3).
Table 3. Fasting serum glucose, insulin, and indices of glucose control after two weeks of breakfastmeals consumption.
Fasting VariablesBreakfast Treatments
NPNF HPNF NPHF HPHF p
Glucose (mmol/L) 5.3 ± 0.2 5.3 ± 0.2 5.2 ±0.1 5.2 ± 0.2 0.924Insulin (pmol/L) 36 ± 6 36 ± 6 42 ± 6 42 ± 6 0.695
HOMA-IR 1.39 ± 0.1 1.51 ± 0.2 1.55 ± 0.2 1.54 ± 0.2 0.713ISI 33 ± 5.2 32 ± 4.7 30 ± 5.6 31 ± 4.3 0.803
HOMA-β (%) 79 ± 10.2 79 ± 9.5 115 ± 36.9 88 ± 18.2 0.740
n = 20. Estimates are mean ± SEM. Homeostatic model assessment (HOMA) insulin resistance (HOMA-IR),HOMA β-cell function (HOMA-%β); whole-body (composite) insulin sensitivity index (ISI). The main effects ofprotein (high vs. low) and fiber (high vs. low) and their interaction on these fasting variables were assessed usinga repeated-measures PROC mixed effects model, adjusting for sex, dietary treatment order, and carryover effect.NPNF: Normal Protein + Normal Fiber; HPNF: High Protein + Normal Fiber; NPHF: Normal Protein + High Fiber;HPHF: High Protein + High Fiber.
257
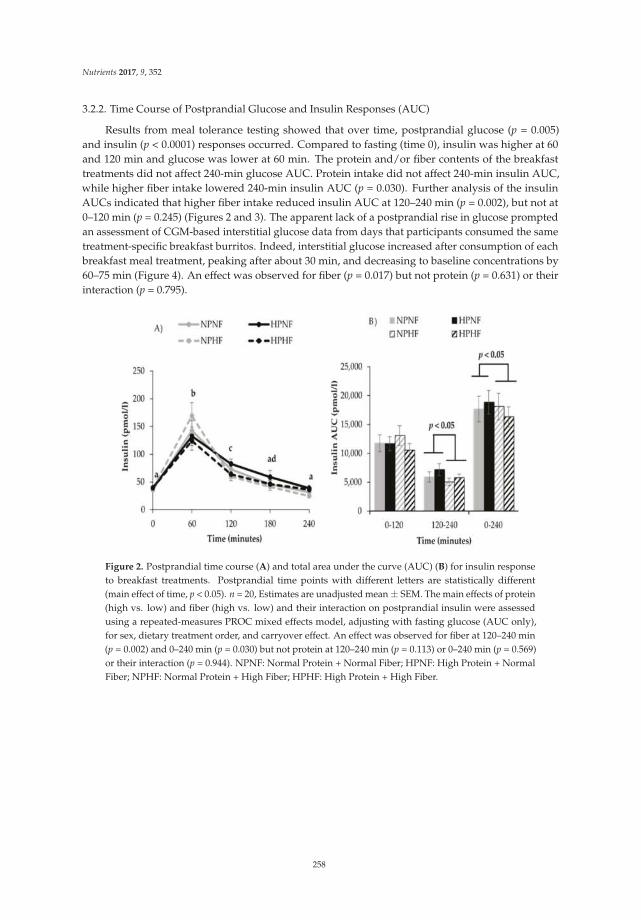
Nutrients 2017, 9, 352
3.2.2. Time Course of Postprandial Glucose and Insulin Responses (AUC)
Results from meal tolerance testing showed that over time, postprandial glucose (p = 0.005)and insulin (p < 0.0001) responses occurred. Compared to fasting (time 0), insulin was higher at 60and 120 min and glucose was lower at 60 min. The protein and/or fiber contents of the breakfasttreatments did not affect 240-min glucose AUC. Protein intake did not affect 240-min insulin AUC,while higher fiber intake lowered 240-min insulin AUC (p = 0.030). Further analysis of the insulinAUCs indicated that higher fiber intake reduced insulin AUC at 120–240 min (p = 0.002), but not at0–120 min (p = 0.245) (Figures 2 and 3). The apparent lack of a postprandial rise in glucose promptedan assessment of CGM-based interstitial glucose data from days that participants consumed the sametreatment-specific breakfast burritos. Indeed, interstitial glucose increased after consumption of eachbreakfast meal treatment, peaking after about 30 min, and decreasing to baseline concentrations by60–75 min (Figure 4). An effect was observed for fiber (p = 0.017) but not protein (p = 0.631) or theirinteraction (p = 0.795).
Figure 2. Postprandial time course (A) and total area under the curve (AUC) (B) for insulin responseto breakfast treatments. Postprandial time points with different letters are statistically different(main effect of time, p < 0.05). n = 20, Estimates are unadjusted mean ± SEM. The main effects of protein(high vs. low) and fiber (high vs. low) and their interaction on postprandial insulin were assessedusing a repeated-measures PROC mixed effects model, adjusting with fasting glucose (AUC only),for sex, dietary treatment order, and carryover effect. An effect was observed for fiber at 120–240 min(p = 0.002) and 0–240 min (p = 0.030) but not protein at 120–240 min (p = 0.113) or 0–240 min (p = 0.569)or their interaction (p = 0.944). NPNF: Normal Protein + Normal Fiber; HPNF: High Protein + NormalFiber; NPHF: Normal Protein + High Fiber; HPHF: High Protein + High Fiber.
258
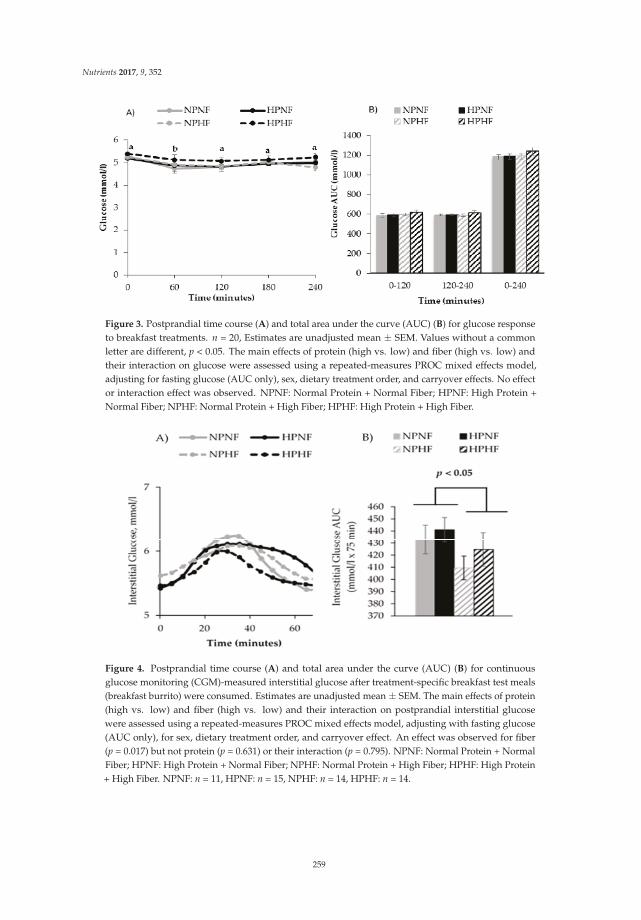
Nutrients 2017, 9, 352
Figure 3. Postprandial time course (A) and total area under the curve (AUC) (B) for glucose responseto breakfast treatments. n = 20, Estimates are unadjusted mean ± SEM. Values without a commonletter are different, p < 0.05. The main effects of protein (high vs. low) and fiber (high vs. low) andtheir interaction on glucose were assessed using a repeated-measures PROC mixed effects model,adjusting for fasting glucose (AUC only), sex, dietary treatment order, and carryover effects. No effector interaction effect was observed. NPNF: Normal Protein + Normal Fiber; HPNF: High Protein +Normal Fiber; NPHF: Normal Protein + High Fiber; HPHF: High Protein + High Fiber.
Figure 4. Postprandial time course (A) and total area under the curve (AUC) (B) for continuousglucose monitoring (CGM)-measured interstitial glucose after treatment-specific breakfast test meals(breakfast burrito) were consumed. Estimates are unadjusted mean ± SEM. The main effects of protein(high vs. low) and fiber (high vs. low) and their interaction on postprandial interstitial glucosewere assessed using a repeated-measures PROC mixed effects model, adjusting with fasting glucose(AUC only), for sex, dietary treatment order, and carryover effect. An effect was observed for fiber(p = 0.017) but not protein (p = 0.631) or their interaction (p = 0.795). NPNF: Normal Protein + NormalFiber; HPNF: High Protein + Normal Fiber; NPHF: Normal Protein + High Fiber; HPHF: High Protein+ High Fiber. NPNF: n = 11, HPNF: n = 15, NPHF: n = 14, HPHF: n = 14.
259
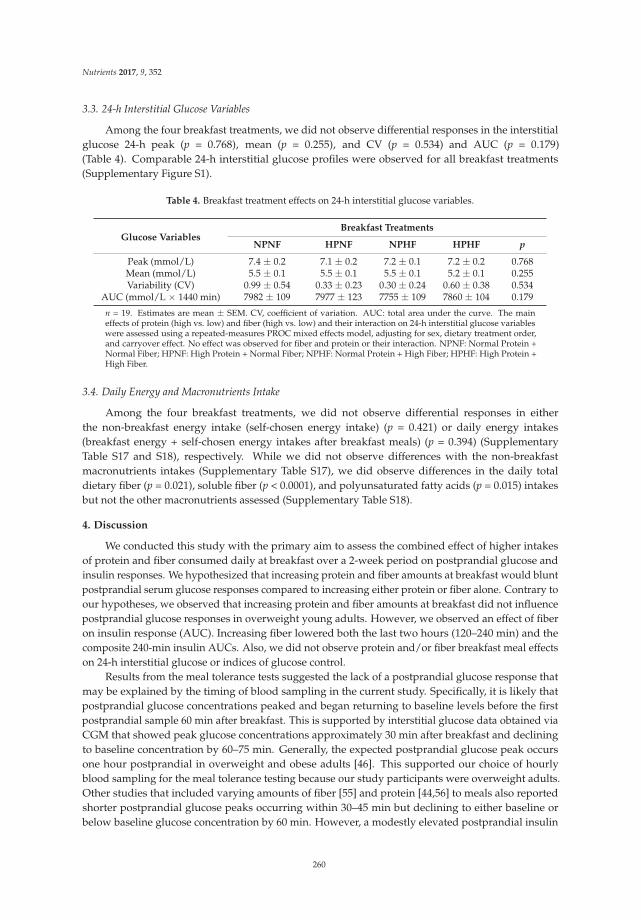
Nutrients 2017, 9, 352
3.3. 24-h Interstitial Glucose Variables
Among the four breakfast treatments, we did not observe differential responses in the interstitialglucose 24-h peak (p = 0.768), mean (p = 0.255), and CV (p = 0.534) and AUC (p = 0.179)(Table 4). Comparable 24-h interstitial glucose profiles were observed for all breakfast treatments(Supplementary Figure S1).
Table 4. Breakfast treatment effects on 24-h interstitial glucose variables.
Glucose VariablesBreakfast Treatments
NPNF HPNF NPHF HPHF p
Peak (mmol/L) 7.4 ± 0.2 7.1 ± 0.2 7.2 ± 0.1 7.2 ± 0.2 0.768Mean (mmol/L) 5.5 ± 0.1 5.5 ± 0.1 5.5 ± 0.1 5.2 ± 0.1 0.255Variability (CV) 0.99 ± 0.54 0.33 ± 0.23 0.30 ± 0.24 0.60 ± 0.38 0.534
AUC (mmol/L × 1440 min) 7982 ± 109 7977 ± 123 7755 ± 109 7860 ± 104 0.179
n = 19. Estimates are mean ± SEM. CV, coefficient of variation. AUC: total area under the curve. The maineffects of protein (high vs. low) and fiber (high vs. low) and their interaction on 24-h interstitial glucose variableswere assessed using a repeated-measures PROC mixed effects model, adjusting for sex, dietary treatment order,and carryover effect. No effect was observed for fiber and protein or their interaction. NPNF: Normal Protein +Normal Fiber; HPNF: High Protein + Normal Fiber; NPHF: Normal Protein + High Fiber; HPHF: High Protein +High Fiber.
3.4. Daily Energy and Macronutrients Intake
Among the four breakfast treatments, we did not observe differential responses in eitherthe non-breakfast energy intake (self-chosen energy intake) (p = 0.421) or daily energy intakes(breakfast energy + self-chosen energy intakes after breakfast meals) (p = 0.394) (SupplementaryTable S17 and S18), respectively. While we did not observe differences with the non-breakfastmacronutrients intakes (Supplementary Table S17), we did observe differences in the daily totaldietary fiber (p = 0.021), soluble fiber (p < 0.0001), and polyunsaturated fatty acids (p = 0.015) intakesbut not the other macronutrients assessed (Supplementary Table S18).
4. Discussion
We conducted this study with the primary aim to assess the combined effect of higher intakesof protein and fiber consumed daily at breakfast over a 2-week period on postprandial glucose andinsulin responses. We hypothesized that increasing protein and fiber amounts at breakfast would bluntpostprandial serum glucose responses compared to increasing either protein or fiber alone. Contrary toour hypotheses, we observed that increasing protein and fiber amounts at breakfast did not influencepostprandial glucose responses in overweight young adults. However, we observed an effect of fiberon insulin response (AUC). Increasing fiber lowered both the last two hours (120–240 min) and thecomposite 240-min insulin AUCs. Also, we did not observe protein and/or fiber breakfast meal effectson 24-h interstitial glucose or indices of glucose control.
Results from the meal tolerance tests suggested the lack of a postprandial glucose response thatmay be explained by the timing of blood sampling in the current study. Specifically, it is likely thatpostprandial glucose concentrations peaked and began returning to baseline levels before the firstpostprandial sample 60 min after breakfast. This is supported by interstitial glucose data obtained viaCGM that showed peak glucose concentrations approximately 30 min after breakfast and decliningto baseline concentration by 60–75 min. Generally, the expected postprandial glucose peak occursone hour postprandial in overweight and obese adults [46]. This supported our choice of hourlyblood sampling for the meal tolerance testing because our study participants were overweight adults.Other studies that included varying amounts of fiber [55] and protein [44,56] to meals also reportedshorter postprandial glucose peaks occurring within 30–45 min but declining to either baseline orbelow baseline glucose concentration by 60 min. However, a modestly elevated postprandial insulin
260
Nutrients 2017, 9, 352
at 60 min was concurrently reported by those studies with meal tolerance testing. Our results areconsistent with such studies. We observed that glucose concentration 60 min after breakfast wasslightly, but statistically, lower than the fasting serum glucose concentration. Our results, together withothers, suggest that future studies must always use frequent blood sampling (15-min interval withinthe first hour of feeding), particularly when both fiber and protein amounts are varied in test meals,to possibly avoid missing important data points within the first hour after feeding.
Studies assessing whether the consumption of higher amounts of protein and fiber simultaneouslywould better attenuate postprandial glucose response compared to when either protein or fiber isincreased and consumed separately are lacking. To our knowledge, only one study assessed theeffects of a moderate protein (from egg source) and high fiber (whole grains) breakfast treatment(protein = 20 g, fiber = 7 g, carbohydrates = 45 g) compared with a refined rice cereal breakfast(protein = 10 g, fiber = 1 g, carbohydrate = 55 g) [57]. Bonnema et al. [57] reported an attenuationof 3.5-h AUC glucose with the moderate protein and high fiber breakfast. Results of insulin AUCwere not reported. Of note, the difference in carbohydrate content of those breakfasts may explainthe glucose results as opposed to the combined effect of protein and fiber. In contrast, one previousstudy [58] systematically assessed the individual and combined effects of low vs. high glycemic index(GI) and protein breakfast treatments on postprandial insulin and glucose responses. Makris et al. [58]found that combining higher amounts of protein and low GI simultaneously did not have an effecton postprandial insulin and glucose responses. However, intake of higher amounts of the low GIbreakfast meal attenuated postprandial insulin and glucose responses. We also did not observe anadditive effect with intake of higher amounts of protein and fiber on postprandial insulin and glucose.Collectively, the expected favorable additive effect with increasing the amount of protein and eitherlow GI carbohydrates or fiber from whole grains sources and fiber per se on postprandial insulin andglucose responses is inconclusive.
Our results partially supported the favorable metabolic effects established for soluble viscousfibers. The 6-g difference between the normal fiber (2 g) and high fiber (8 g) breakfast treatmentswas achieved by adding psyllium husk powder, which is known as a soluble fiber. We observedthat increasing soluble fiber intake attenuated the postprandial insulin response. Other studiesnoted that increasing soluble fiber when a meal had greater amounts of high glycemic indexfoods/metabolizable carbohydrate content attenuated postprandial glucose [55,59] and insulin [55]responses. The lowering of insulin with increasing dietary fiber intake that was observed in ourstudy is consistent with previous findings [27,55,60]. Reducing postprandial insulin with higherfiber intakes has beneficial metabolic effects in healthy overweight individuals who are at risk ofdeveloping hyperinsulinemia, an early abnormality preceding the development of type 2 diabetes.Insulin resistance with concurrent compensatory hyperinsulinemia is a major feature that underliesthe development of metabolic morbidities, particularly, type 2 diabetes [61]. This compensatoryelevation of insulin secretion is usually needed to achieve a normal postprandial glucose responsein overweight and obese individuals [62] after a meal. Intervention strategies that alleviate the needfor elevated insulin secretion for glucose clearance are beneficial. While dietary interventions thatvary dietary macronutrient composition without inducing weight lost do not consistently improveinsulin resistance, manipulating the dietary macronutrient content has been documented to impactthe insulin resistance-induced hyperinsulinemia [46]. Therefore, increasing dietary fiber supportedimprovement in insulin sensitivity (lower insulin concentration to normalize blood glucose) aspreviously established [24,47].
In addition to assessing postprandial glucose and insulin responses by meal tolerance testing,our study design allowed us to evaluate potential “second meal effects” with CGM. Jenkins et al. [63]defined second meal effects as an effect of a first meal on the postprandial glucose response after eatingthe second meal. Consuming higher amounts of fiber and protein were previously shown to elicit“second meal effects” by reducing postprandial glucose responses following a second meal [64–67].Other studies also reported an attenuation of daylong glucose (lunch and dinner meals) with intake of
261
Nutrients 2017, 9, 352
low GI foods [68]. Assessing such a prolonged effect of consuming a breakfast with controlled proteinand fiber amounts on subsequent and uncontrolled meals was an important and novel aim of thecurrent study. However, 24-h interstitial glucose variables, including AUC, were not influenced bythe 4 breakfast treatments used in the current study, which suggests a lack of a “second meal effect”.Our results may be due to the observed large variability between participants’ self-selected intake afterthe breakfast meal (Tables S17 and S18). Our findings could also suggest that the inclusion of fiberin multiple meals across the day may be needed with the intake of a typical Western diet to improvedaily glycemic control.
One limitation of the study was that the lack of provision of a standard meal the night before theacute measurement to metabolically stabilize our study participants may have confounded our studyoutcomes. Previous studies suggest a residual effect from dinner meals may impact the next morningglucose profile [68] particularly with high fiber intake. Another limitation was the fact that we couldnot match sugar, MUFA, PUFA, and total fat, across normal vs. the high breakfast treatment mealsalthough these nutrients may influence our results. However, the magnitude of the differences in theamounts of the afore-mentioned nutrients between the normal vs. high protein and fiber breakfasttreatments where not numerically substantial. Lastly, our study findings are only generalizable tooverweight young adults. A strength of this study is that both researchers and study participantswere blinded to the study dietary treatment. This potentially eliminates any biases with our dietarymanipulation that may influence our study outcomes. Another strength is that the 2-week dietaryacclimation period before our postprandial responses were assessed allowed us to determine theprolonged effects of consumption of protein and fiber breakfasts beyond a single meal.
5. Conclusions
In conclusion, consumption of a breakfast meal with both higher protein and fiber content didnot differentially influence postprandial glucose response and 24-h glucose peak and AUC comparedto the other three breakfast treatments. However, increasing fiber had an attenuation effect on thepostprandial insulin response. Therefore, doubling the amount of protein from 12.5 g to 25 g/meal andquadrupling fiber from 2 to 8 g/meal simultaneously at breakfast may not be an effective therapeuticstrategy to improve insulin and glucose responses acutely; however, higher fiber intake at breakfastmay be effective for lowering the postprandial insulin response in healthy overweight, young adults.
Supplementary Materials: The following are available online at www.mdpi.com/2072-6643/9/4/352/s1,Figure S1: 24-hour time course interstitial glucose from CGM to breakfast treatments and self-selected intakesafter provided breakfast. n = 19, Estimates are unadjusted means. NPNF: Normal Protein + Normal Fiber;HPNF: High Protein + Normal Fiber; NPHF: Normal Protein + High Fiber; HPHF: High Protein + High Fiber,Table S1: NPNF breakfast burrito recipe, Table S2: HPNF breakfast burrito recipe, Table S3: NPHF breakfastburrito recipe, Table S4: HPHF breakfast burrito recipe, Table S5: NPNF breakfast sandwich recipe, Table S6:NPHP breakfast sandwich recipe, Table S7: NPHF breakfast sandwich recipe, Table S8: HPHF breakfast sandwichrecipe, Table S9: NPNF breakfast casserole recipe, Table S10: HPNF breakfast casserole recipe, Table S11:NPHF breakfast casserole recipe, Table S12: HPHF breakfast casserole recipe, Table S13: NPNF breakfastquiche recipe, Table S14: HPNF breakfast quiche recipe, Table S15: NPHF breakfast quiche recipe, Table S16:HPHF breakfast quiche recipe: Table S17: Non-breakfast energy and macronutrient distribution, Table S18: Dailyenergy and macronutrient distribution.
Acknowledgments: Funding: American Egg Board/Egg Nutrition Center; NIH Indiana Clinical and TranslationalSciences Institute, Clinical Research Center (Grant #UL1TR001108); USDA 2011-38420-20038. Financial supportershad no role in the design and conduct of the study or collection, analysis, and interpretation of the data. We arealso grateful for Doug Maish EMS-P, CCRC for his assistance with clinical testing and Gerald W. Wehr (MD),IU School of Medicine-West Lafayette, our study physician.
Author Contributions: M.A.M., W.W.C., and R.D.S. designed the research project; A.F.A. and R.D.S. conductedthe research; A.J.W. designed the intervention diets; N.C. conducted statistical analysis; A.F.A. and W.W.C. wrotethe manuscript; A.F.A., W.W.W., M.A.M. have primary responsibility for the final content. All authors takeresponsibility for the final content of the manuscript.
Conflicts of Interest: The authors declare no conflict of interest. The funding sponsors had no role in the designof the study; in the collection, analyses, or interpretation of data; in the writing of the manuscript, and in thedecision to publish the results.
262
Nutrients 2017, 9, 352
References
1. Geiss, L.S.; Pan, L.; Cadwell, B.; Gregg, E.W.; Benjamin, S.M.; Engelgau, M.M. Changes in Incidence ofDiabetes in U.S. Adults, 1997–2003. Am. J. Prev. Med. 2006, 30, 371–377. [CrossRef] [PubMed]
2. Cowie, C.C.; Rust, K.F.; Byrd-Holt, D.D.; Eberhardt, M.S.; Flegal, K.M.; Engelgau, M.M.; Saydah, S.H.;Williams, D.E.; Geiss, L.S.; Gregg, E.W. Prevalence of diabetes and impaired fasting glucose in adults inthe U.S. population: National Health And Nutrition Examination Survey 1999–2002. Diabetes Care 2006, 29,1263–1268. [CrossRef] [PubMed]
3. Eckel, R.H.; Kahn, R.; Robertson, R.M.; Rizza, R.A. Preventing Cardiovascular Disease and Diabetes: A Callto Action From the American Diabetes Association and the American Heart Association. Circulation 2006,113, 2943–2946. [CrossRef] [PubMed]
4. Thomas, T.; Pfeiffer, A.F. Foods for the prevention of diabetes: How do they work? Diabetes Metab. Res. Rev.
2012, 28, 25–49. [CrossRef] [PubMed]5. Salas-Salvado, J.; Martinez-Gonzalez, M.A.; Bullo, M.; Ros, E. The role of diet in the prevention of type 2
diabetes. Nutr. Metab. Cardiovasc. Dis. 2011, 21, B32–B48. [CrossRef] [PubMed]6. Wyness, L. Understanding the role of diet in type 2 diabetes prevention. Br. J. Community Nurs. 2009, 14,
374–379. [CrossRef] [PubMed]7. Wheeler, M.L.; Dunbar, S.A.; Jaacks, L.M.; Karmally, W.; Mayer-Davis, E.J.; Wylie-Rosett, J.; Yancy, W.S., Jr.
Macronutrients, food groups, and eating patterns in the management of diabetes: A systematic review of theliterature, 2010. Diabetes Care 2012, 35, 434–445. [CrossRef] [PubMed]
8. Most, J.; Tosti, V.; Redman, L.M.; Fontana, L. Calorie restriction in humans: An update. Ageing Res. Rev. 2016.[CrossRef] [PubMed]
9. Omodei, D.; Fontana, L. Calorie restriction and prevention of age-associated chronic disease. FEBS Lett.
2011, 585, 1537–1542. [CrossRef] [PubMed]10. Cox, K.L.; Burke, V.; Morton, A.R.; Beilin, L.J.; Puddey, I.B. Independent and additive effects of energy
restriction and exercise on glucose and insulin concentrations in sedentary overweight men. Am. J. Clin. Nutr.
2004, 80, 308–316. [PubMed]11. Heymsfield, S.B.; Harp, J.B.; Reitman, M.L.; Beetsch, J.W.; Schoeller, D.A.; Erondu, N.; Pietrobelli, A. Why do
obese patients not lose more weight when treated with low-calorie diets? A mechanistic perspective. Am. J.
Clin. Nutr. 2007, 85, 346–354. [PubMed]12. Blom, W.A.; Lluch, A.; Stafleu, A.; Vinoy, S.; Holst, J.J.; Schaafsma, G. Effect of a high-protein breakfast on
the postprandial ghrelin response. Am. J. Clin. Nutr. 2006, 83, 211–220. [PubMed]13. Erdmann, J.; Topsch, R.; Lippl, F.; Gussmann, P.; Schusdziarra, V. Postprandial response of plasma ghrelin
levels to various test meals in relation to food intake, plasma insulin, and glucose. J. Clin. Endocr. Metab.
2004, 89, 3048–3054. [CrossRef] [PubMed]14. Sheard, N.F.; Clark, N.G.; Brand-Miller, J.C.; Franz, M.J.; Pi-Sunyer, F.X.; Mayer-Davis, E.; Kulkarni, K.;
Geil, P. Dietary carbohydrate (amount and type) in the prevention and management of diabetes: A statementby the american diabetes association. Diabetes Care 2004, 27, 2266–2271. [CrossRef] [PubMed]
15. Franc, S.; Dardari, D.; Peschard, C.; Riveline, J.-P.; Biedzinski, M.; Boucherie, B.; Petit, C.; Requeda, E.;Mistretta, F.; Varroud-Vial, M.; Charpentier, G. Can Postprandial Blood Glucose Excursion Be Predicted inType 2 Diabetes? Diabetes Care 2010, 33, 1913–1918. [CrossRef] [PubMed]
16. AlEssa, H.B.; Bhupathiraju, S.N.; Malik, V.S.; Wedick, N.M.; Campos, H.; Rosner, B.; Willett, W.C.; Hu, F.B.Carbohydrate quality and quantity and risk of type 2 diabetes in US women. Am. J. Clin. Nutr. 2015, 102,1543–1553. [CrossRef] [PubMed]
17. Gross, L.S.; Li, L.; Ford, E.S.; Liu, S. Increased consumption of refined carbohydrates and the epidemic oftype 2 diabetes in the United States: An ecologic assessment. Am. J. Clin. Nutr. 2004, 79, 774–779. [PubMed]
18. Hu, F.B. Are refined carbohydrates worse than saturated fat? Am. J. Clin. Nutr. 2010, 91, 1541–1542.[CrossRef] [PubMed]
19. Liu, S. Intake of Refined Carbohydrates and Whole Grain Foods in Relation to Risk of Type 2 DiabetesMellitus and Coronary Heart Disease. J. Am. Coll. Nutr. 2002, 21, 298–306. [CrossRef] [PubMed]
263
Nutrients 2017, 9, 352
20. Lichtenstein, A.H.; Appel, L.J.; Brands, M.; Carnethon, M.; Daniels, S.; Franch, H.A.; Franklin, B.;Kris-Etherton, P.; Harris, W.S.; Howard, B.; et al. Diet and Lifestyle Recommendations Revision 2006:A Scientific Statement From the American Heart Association Nutrition Committee. Circulation 2006, 114,82–96. [CrossRef] [PubMed]
21. Beulens, J.W.J.; de Bruijne, L.M.; Stolk, R.P.; Peeters, P.H.M.; Bots, M.L.; Grobbee, D.E.; van der Schouw, Y.T.High Dietary Glycemic Load and Glycemic Index Increase Risk of Cardiovascular Disease AmongMiddle-Aged Women: A Population-Based Follow-Up Study. J. Am. Coll. Cardiol. 2007, 50, 14–21. [CrossRef][PubMed]
22. McRorie, J.W. Evidence-Based Approach to Fiber Supplements and Clinically Meaningful Health Benefits,Part 1: What to Look for and How to Recommend an Effective Fiber Therapy. Nutr. Today 2015, 50, 82–89.[CrossRef] [PubMed]
23. Chutkan, R.; Fahey, G.; Wright, W.L.; McRorie, J. Viscous versus nonviscous soluble fiber supplements:Mechanisms and evidence for fiber-specific health benefits. J. Am. Acad. Nurse Pract. 2012, 24, 476–487.[CrossRef] [PubMed]
24. Jenkins, D.J.; Wolever, T.M.; Leeds, A.R.; Gassull, M.A.; Haisman, P.; Dilawari, J.; Goff, D.V.; Metz, G.L.;Alberti, K.G. Dietary fibres, fibre analogues, and glucose tolerance: Importance of viscosity. Br. Med. J. 1978,1, 1392–1394. [CrossRef] [PubMed]
25. Jenkins, D.J.A.; Kendall, C.W.C.; Vuksan, V.; Vidgen, E.; Parker, T.; Faulkner, D.; Mehling, C.C.; Garsetti, M.;Testolin, G.; Cunnane, S.C.; et al. Soluble fiber intake at a dose approved by the US Food and DrugAdministration for a claim of health benefits: Serum lipid risk factors for cardiovascular disease assessed ina randomized controlled crossover trial. Am. J. Clin. Nutr. 2002, 75, 834–839. [PubMed]
26. Dall’Alba, V.; Silva, F.M.; Antonio, J.P.; Steemburgo, T.; Royer, C.P.; Almeida, J.C.; Gross, J.L.; Azevedo, M.J.Improvement of the metabolic syndrome profile by soluble fibre–guar gum–in patients with type 2 diabetes:A randomised clinical trial. Br. J. Nutr. 2013, 110, 1601–1610. [CrossRef] [PubMed]
27. Cicero, A.G.; Derosa, G.; Bove, M.; Imola, F.; Borghi, C.; Gaddi, A. Psyllium improves dyslipidaemia,hyperglycaemia and hypertension, while guar gum reduces body weight more rapidly in patients affectedby metabolic syndrome following an AHA Step 2 diet. Mediterr. J. Nutr. Metab. 2010, 3, 47–54. [CrossRef]
28. Gunness, P.; Gidley, M.J. Mechanisms underlying the cholesterol-lowering properties of soluble dietary fibrepolysaccharides. Food Funct. 2010, 1, 149–155. [CrossRef] [PubMed]
29. Wolever, T.M.; Tosh, S.M.; Gibbs, A.L.; Brand-Miller, J.; Duncan, A.M.; Hart, V.; Lamarche, B.; Thomson, B.A.;Duss, R.; Wood, P.J. Physicochemical properties of oat beta-glucan influence its ability to reduce serum LDLcholesterol in humans: A randomized clinical trial. Am. J. Clin. Nutr. 2010, 92, 723–732. [CrossRef] [PubMed]
30. Gibb, R.D.; McRorie, J.W.; Russell, D.A.; Hasselblad, V.; D’Alessio, D.A. Psyllium fiber improves glycemiccontrol proportional to loss of glycemic control: A meta-analysis of data in euglycemic subjects, patients atrisk of type 2 diabetes mellitus, and patients being treated for type 2 diabetes mellitus. Am. J. Clin. Nutr.
2015, 102, 1604–1614. [CrossRef] [PubMed]31. Pal, S.; Radavelli-Bagatini, S. Effects of psyllium on metabolic syndrome risk factors. Obes. Rev. 2012, 13,
1034–1047. [CrossRef] [PubMed]32. McRorie, J.W. Evidence-Based Approach to Fiber Supplements and Clinically Meaningful Health Benefits,
Part 2: What to Look for and How to Recommend an Effective Fiber Therapy. Nutr. Today 2015, 50, 90–97.[CrossRef] [PubMed]
33. Layman, D.K.; Baum, J.I. Dietary Protein Impact on Glycemic Control during Weight Loss. J. Nutr. 2004, 134,968S–973S. [PubMed]
34. Salehi, A.; Gunnerud, U.; Muhammed, S.J.; Östman, E.; Holst, J.J.; Björck, I.; Rorsman, P. The insulinogeniceffect of whey protein is partially mediated by a direct effect of amino acids and GIP on β-cells. Nutr. Metab.
2012, 9, 48. [CrossRef] [PubMed]35. Nuttall, F.Q.; Gannon, M.C. Metabolic response of people with type 2 diabetes to a high protein diet.
Nutr. Metab. (Lond.) 2004, 1, 6. [CrossRef] [PubMed]36. Norton, L.E.; Wilson, G.J.; Layman, D.K.; Moulton, C.J.; Garlick, P.J. Leucine content of dietary proteins
is a determinant of postprandial skeletal muscle protein synthesis in adult rats. Nutr. Metab. 2012, 9, 67.[CrossRef] [PubMed]
37. Djoussé, L.; Gaziano, J.M.; Buring, J.E.; Lee, I.M. Egg Consumption and Risk of Type 2 Diabetes in Men andWomen. Diabetes Care 2009, 32, 295–300. [CrossRef] [PubMed]
264
Nutrients 2017, 9, 352
38. Virtanen, J.K.; Mursu, J.; Tuomainen, T.-P.; Virtanen, H.E.K.; Voutilainen, S. Egg consumption and risk ofincident type 2 diabetes in men: The Kuopio Ischaemic Heart Disease Risk Factor Study. Am. J. Clin. Nutr.
2015, 101, 1088–1096. [CrossRef] [PubMed]39. Blesso, C.N.; Andersen, C.J.; Barona, J.; Volek, J.S.; Fernandez, M.L. Whole egg consumption improves
lipoprotein profiles and insulin sensitivity to a greater extent than yolk-free egg substitute in individualswith metabolic syndrome. Metabolism 2013, 62, 400–410. [CrossRef] [PubMed]
40. Livesey, G.; Tagami, H. Interventions to lower the glycemic response to carbohydrate foods with alow-viscosity fiber (resistant maltodextrin): Meta-analysis of randomized controlled trials. Am. J. Clin. Nutr.
2009, 89, 114–125. [CrossRef] [PubMed]41. Bell, K.J.; Smart, C.E.; Steil, G.M.; Brand-Miller, J.C.; King, B.; Wolpert, H.A. Impact of Fat, Protein,
and Glycemic Index on Postprandial Glucose Control in Type 1 Diabetes: Implications for Intensive DiabetesManagement in the Continuous Glucose Monitoring Era. Diabetes Care 2015, 38, 1008–1015. [CrossRef][PubMed]
42. Baek, Y.H.; Jin, H.Y.; Lee, K.A.; Kang, S.M.; Kim, W.J.; Kim, M.G.; Park, J.H.; Chae, S.W.; Baek, H.S.; Park, T.S.The Correlation and Accuracy of Glucose Levels between Interstitial Fluid and Venous Plasma by ContinuousGlucose Monitoring System. Korean Diabetes J. 2010, 34, 350–358. [CrossRef] [PubMed]
43. United States Department of Agriculture Agricultural Research Service. What We Eat in America, NHANES
Service; United States Department of Agriculture Agricultural Research Service: Washington, DC, USA,2011–2012. Available online: https://www.ars.usda.gov/northeast-area/beltsville-md/beltsville-human-nutrition-research-center/food-surveys-research-group/docs/wweia-data-tables/ (accessed on31 March 2017).
44. Rains, T.M.; Leidy, H.J.; Sanoshy, K.D.; Lawless, A.L.; Maki, K.C. A randomized, controlled, crossover trial toassess the acute appetitive and metabolic effects of sausage and egg-based convenience breakfast meals inoverweight premenopausal women. J. Nutr. 2015, 14, 17. [CrossRef] [PubMed]
45. Park, Y.-M.; Heden, T.D.; Liu, Y.; Nyhoff, L.M.; Thyfault, J.P.; Leidy, H.J.; Kanaley, J.A. A High-ProteinBreakfast Induces Greater Insulin and Glucose-Dependent Insulinotropic Peptide Responses to a SubsequentLunch Meal in Individuals with Type 2 Diabetes. J. Nutr. 2015, 145, 452–458. [CrossRef] [PubMed]
46. Jenkins, A.L.; Jenkins, D.J.A.; Wolever, T.M.S.; Rogovik, A.L.; Jovanovski, E.; Božikov, V.; Rahelic, D.;Vuksan, V. Comparable Postprandial Glucose Reductions with Viscous Fiber Blend Enriched Biscuitsin Healthy Subjects and Patients with Diabetes Mellitus: Acute Randomized Controlled Clinical Trial.Croat. Med. J. 2008, 49, 772–782. [CrossRef] [PubMed]
47. Wolever, T.M.S.; Campbell, J.E.; Geleva, D.; Anderson, G.H. High-Fiber Cereal Reduces Postprandial InsulinResponses in Hyperinsulinemic but not Normoinsulinemic Subjects. Diabetes Care 2004, 27, 1281–1285.[CrossRef] [PubMed]
48. Halton, T.L.; Hu, F.B. The effects of high protein diets on thermogenesis, satiety and weight loss: A criticalreview. J. Am. Coll. Nutr. 2004, 23, 373–385. [CrossRef] [PubMed]
49. Kim, J.E.; O’Connor, L.E.; Sands, L.P.; Slebodnik, M.B.; Campbell, W.W. Effects of dietary protein intakeon body composition changes after weight loss in older adults: A systematic review and meta-analysis.Nutr. Rev. 2016, 74, 210–224. [CrossRef] [PubMed]
50. Medtronic. A Practical Guide to Continuous Glucose Monitoring; Medtronic: North Ryde, Australia, 2011.51. Potteiger, J.A.; Jacobsen, D.J.; Donnelly, J.E. A comparison of methods for analyzing glucose and insulin areas
under the curve following nine months of exercise in overweight adults. Int. J. Obes. Relat. Metab. Disord.
2002, 26, 87–89. [CrossRef] [PubMed]52. Matthews, D.R.; Hosker, J.P.; Rudenski, A.S.; Naylor, B.A.; Treacher, D.F.; Turner, R.C. Homeostasis model
assessment: Insulin resistance and beta-cell function from fasting plasma glucose and insulin concentrationsin man. Diabetologia 1985, 28, 412–419. [CrossRef] [PubMed]
53. Matsuda, M.; DeFronzo, R.A. Insulin sensitivity indices obtained from oral glucose tolerance testing:Comparison with the euglycemic insulin clamp. Diabetes Care 1999, 22, 1462–1470. [CrossRef] [PubMed]
54. Sayer, R.D.; Amankwaah, A.F.; Tamer, G.G.; Chen, N.; Wright, A.J.; Tregellas, J.R.; Cornier, M.-A.;Kareken, D.A.; Talavage, T.M.; McCrory, M.A.; et al. Effects of Dietary Protein and Fiber at Breakfast onAppetite, ad Libitum Energy Intake at Lunch, and Neural Responses to Visual Food Stimuli in OverweightAdults. Nutrients 2016, 8, 21. [CrossRef] [PubMed]
265
Nutrients 2017, 9, 352
55. Potter, J.G.; Coffman, K.P.; Reid, R.L.; Krall, J.M.; Albrink, M.J. Effect of Test Meals of Varying Dietary FiberContent on Plasma-Insulin and Glucose Response. Am. J. Clin. Nutr. 1981, 34, 328–334. [PubMed]
56. Acheson, K.J.; Blondel-Lubrano, A.; Oguey-Araymon, S.; Beaumont, M.; Emady-Azar, S.;Ammon-Zufferey, C.; Monnard, I.; Pinaud, S.; Nielsen-Moennoz, C.; Bovetto, L. Protein choicestargeting thermogenesis and metabolism. Am. J. Clin. Nutr. 2011, 93, 525–534. [CrossRef] [PubMed]
57. Bonnema, A.L.; Altschwager, D.K.; Thomas, W.; Slavin, J.L. The effects of the combination of egg and fiber onappetite, glycemic response and food intake in normal weight adults—A randomized, controlled, crossovertrial. Int. J. Food Sci. Nutr. 2016, 67, 723–731. [CrossRef] [PubMed]
58. Makris, A.P.; Borradaile, K.E.; Oliver, T.L.; Cassim, N.G.; Rosenbaum, D.L.; Boden, G.H.; Homko, C.J.;Foster, G.D. The Individual and Combined Effects of Glycemic Index and Protein on Glycemic Response,Hunger, and Energy Intake. Obesity 2011, 19, 2365–2373. [CrossRef] [PubMed]
59. Aller, R.; de Luis, D.A.; Izaola, O.; La Calle, F.; del Olmo, L.; Fernandez, L.; Arranz, T.; Hernandez, J.M.G.Effect of soluble fiber intake in lipid and glucose leves in healthy subjects: A randomized clinical trial.Diabetes Res. Clin. Pract. 2004, 65, 7–11. [CrossRef] [PubMed]
60. Karhunen, L.J.; Juvonen, K.R.; Flander, S.M.; Liukkonen, K.H.; Lahteenmaki, L.; Siloaho, M.; Laaksonen, D.E.;Herzig, K.H.; Uusitupa, M.I.; Poutanen, K.S. A Psyllium Fiber-Enriched Meal Strongly AttenuatesPostprandial Gastrointestinal Peptide Release in Healthy Young Adults. J. Nutr. 2010, 140, 737–744.[CrossRef] [PubMed]
61. Reaven, G.M. The insulin resistance syndrome: Definition and dietary approaches to treatment.Annu. Rev. Nutr. 2005, 25, 391–406. [CrossRef] [PubMed]
62. Kn, F. Metabolic Regulation, 3rd ed.; Blackwell Publishing: Hoboken, NJ, USA, 2010.63. Jenkins, D.J.A.; Wolever, T.M.S.; Nineham, R.; Sarson, D.L.; Bloom, S.R.; Ahern, J.; Alberti, K.G.M.M.;
Hockaday, T.D.R. Improved glucose tolerance four hours after taking guar with glucose. Diabetologia 1980,19, 21–24. [CrossRef] [PubMed]
64. O’Connor, L.E.; Campbell, W.W. A novel fiber composite ingredient incorporated into a beverage and barblunts postprandial serum glucose and insulin responses: A randomized controlled trial. Nutr. Res. 2016, 36,253–261. [CrossRef] [PubMed]
65. Chen, M.J.; Jovanovic, A.; Taylor, R. Utilizing the Second-Meal Effect in Type 2 Diabetes: Practical Use of aSoya-Yogurt Snack. Diabetes Care 2010, 33, 2552–2554. [CrossRef] [PubMed]
66. Clark, C.A.; Gardiner, J.; McBurney, M.I.; Anderson, S.; Weatherspoon, L.J.; Henry, D.N.; Hord, N.G. Effects ofbreakfast meal composition on second meal metabolic responses in adults with type 2 diabetes mellitus. Eur.
J. Clin. Nutr. 2006, 60, 1122–1129. [CrossRef] [PubMed]67. Jovanovic, A.; Gerrard, J.; Taylor, R. The Second-Meal Phenomenon in Type 2 Diabetes. Diabetes Care 2009,
32, 1199–1201. [CrossRef] [PubMed]68. Nilsson, A.C.; Östman, E.M.; Granfeldt, Y.; Björck, I.M.E. Effect of cereal test breakfasts differing in glycemic
index and content of indigestible carbohydrates on daylong glucose tolerance in healthy subjects. Am. J.
Clin. Nutr. 2008, 87, 645–654. [PubMed]
© 2017 by the authors. Licensee MDPI, Basel, Switzerland. This article is an open accessarticle distributed under the terms and conditions of the Creative Commons Attribution(CC BY) license (http://creativecommons.org/licenses/by/4.0/).
266
nutrients
Article
Associations between Dietary Fiber Intake inInfancy and Cardiometabolic Health at School Age:The Generation R Study
Rafaëlle M. A. van Gijssel 1,2,†, Kim V. E. Braun 1,†, Jessica C. Kiefte-de Jong 1,3,
Vincent W. V. Jaddoe 1,2,4, Oscar H. Franco 1 and Trudy Voortman 1,*
1 The Department of Epidemiology, Erasmus MC, University Medical Center, Office Na-2909, P.O. Box 2040,Rotterdam 3000 CA, The Netherlands; [email protected] (R.M.A.v.G.);[email protected] (K.V.E.B.); [email protected] (J.C.K.-d.J.);[email protected] (V.W.V.J.); [email protected] (O.H.F.)
2 The Generation R Study Group, Erasmus MC, University Medical Center,Rotterdam 3000 CA, The Netherlands
3 Department of Global Public Health, Leiden University, The Hague 3595 DG, The Netherlands4 The Department of Pediatrics, Erasmus MC, University Medical Center,
Rotterdam 3000 CA, The Netherlands* Correspondence: [email protected]; Tel.: +31-10-704-3536; Fax: +31-10-704-4657† These authors contributed equally to this work.
Received: 17 June 2016; Accepted: 23 August 2016; Published: 30 August 2016
Abstract: Dietary fiber (DF) intake may be beneficial for cardiometabolic health.However, whether this already occurs in early childhood is unclear. We investigated associationsbetween DF intake in infancy and cardiometabolic health in childhood among 2032 childrenparticipating in a population-based cohort in The Netherlands. Information on DF intake at amedian age of 12.9 months was collected using a food-frequency questionnaire. DF was adjustedfor energy intake using the residual method. At age 6 years, body fat percentage, high-densitylipoprotein (HDL)-cholesterol, insulin, triglycerides, and blood pressure were assessed and expressedin age- and sex-specific standard deviation scores (SDS). These five factors were combined into acardiometabolic risk factor score. In models adjusted for several parental and child covariates, ahigher DF intake was associated with a lower cardiometabolic risk factor score. When we examinedindividual cardiometabolic factors, we observed that a 1 g/day higher energy-adjusted DF intakewas associated with 0.026 SDS higher HDL-cholesterol (95% CI 0.009, 0.042), and 0.020 SDS lowertriglycerides (95% CI −0.037, −0.003), but not with body fat, insulin, or blood pressure. Results weresimilar for DF with and without adjustment for energy intake. Our findings suggest that higher DFintake in infancy may be associated with better cardiometabolic health in later childhood.
Keywords: body fat; blood pressure; cohort; dietary fiber; early childhood; HDL-C; insulin; triglyceride
1. Introduction
Several studies suggest that dietary fiber (DF) is beneficial for various aspects of cardiometabolichealth in adults, such as lower insulin and cholesterol concentrations, and a lower blood pressure [1,2].High DF intake has been proposed to lower cardiometabolic risk through lower absorption ofcholesterol and fat, improved glucose and insulin metabolism after meals, or via increased satiety anda subsequent lower energy intake [3]. However, many of the cardiometabolic health consequences inadulthood are preceded by abnormalities that might begin in childhood [4]. For example, overweightoften already occurs in early childhood and is associated with a higher risk of overweight, type 2diabetes, hypertension, dyslipidemia, and atherosclerosis in later life [4,5]. Small changes in other
Nutrients 2016, 8, 531 267 www.mdpi.com/journal/nutrients
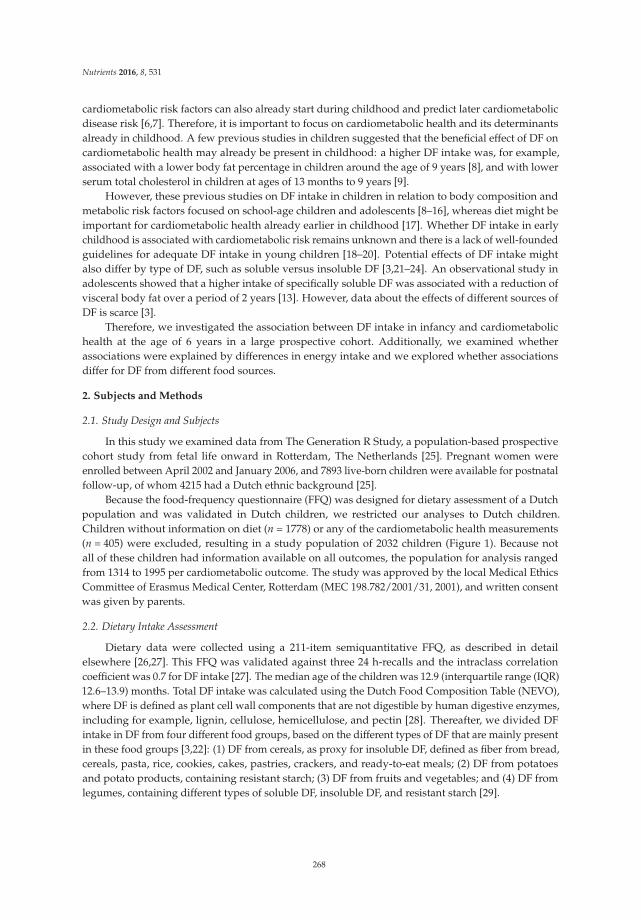
Nutrients 2016, 8, 531
cardiometabolic risk factors can also already start during childhood and predict later cardiometabolicdisease risk [6,7]. Therefore, it is important to focus on cardiometabolic health and its determinantsalready in childhood. A few previous studies in children suggested that the beneficial effect of DF oncardiometabolic health may already be present in childhood: a higher DF intake was, for example,associated with a lower body fat percentage in children around the age of 9 years [8], and with lowerserum total cholesterol in children at ages of 13 months to 9 years [9].
However, these previous studies on DF intake in children in relation to body composition andmetabolic risk factors focused on school-age children and adolescents [8–16], whereas diet might beimportant for cardiometabolic health already earlier in childhood [17]. Whether DF intake in earlychildhood is associated with cardiometabolic risk remains unknown and there is a lack of well-foundedguidelines for adequate DF intake in young children [18–20]. Potential effects of DF intake mightalso differ by type of DF, such as soluble versus insoluble DF [3,21–24]. An observational study inadolescents showed that a higher intake of specifically soluble DF was associated with a reduction ofvisceral body fat over a period of 2 years [13]. However, data about the effects of different sources ofDF is scarce [3].
Therefore, we investigated the association between DF intake in infancy and cardiometabolichealth at the age of 6 years in a large prospective cohort. Additionally, we examined whetherassociations were explained by differences in energy intake and we explored whether associationsdiffer for DF from different food sources.
2. Subjects and Methods
2.1. Study Design and Subjects
In this study we examined data from The Generation R Study, a population-based prospectivecohort study from fetal life onward in Rotterdam, The Netherlands [25]. Pregnant women wereenrolled between April 2002 and January 2006, and 7893 live-born children were available for postnatalfollow-up, of whom 4215 had a Dutch ethnic background [25].
Because the food-frequency questionnaire (FFQ) was designed for dietary assessment of a Dutchpopulation and was validated in Dutch children, we restricted our analyses to Dutch children.Children without information on diet (n = 1778) or any of the cardiometabolic health measurements(n = 405) were excluded, resulting in a study population of 2032 children (Figure 1). Because notall of these children had information available on all outcomes, the population for analysis rangedfrom 1314 to 1995 per cardiometabolic outcome. The study was approved by the local Medical EthicsCommittee of Erasmus Medical Center, Rotterdam (MEC 198.782/2001/31, 2001), and written consentwas given by parents.
2.2. Dietary Intake Assessment
Dietary data were collected using a 211-item semiquantitative FFQ, as described in detailelsewhere [26,27]. This FFQ was validated against three 24 h-recalls and the intraclass correlationcoefficient was 0.7 for DF intake [27]. The median age of the children was 12.9 (interquartile range (IQR)12.6–13.9) months. Total DF intake was calculated using the Dutch Food Composition Table (NEVO),where DF is defined as plant cell wall components that are not digestible by human digestive enzymes,including for example, lignin, cellulose, hemicellulose, and pectin [28]. Thereafter, we divided DFintake in DF from four different food groups, based on the different types of DF that are mainly presentin these food groups [3,22]: (1) DF from cereals, as proxy for insoluble DF, defined as fiber from bread,cereals, pasta, rice, cookies, cakes, pastries, crackers, and ready-to-eat meals; (2) DF from potatoesand potato products, containing resistant starch; (3) DF from fruits and vegetables; and (4) DF fromlegumes, containing different types of soluble DF, insoluble DF, and resistant starch [29].
268
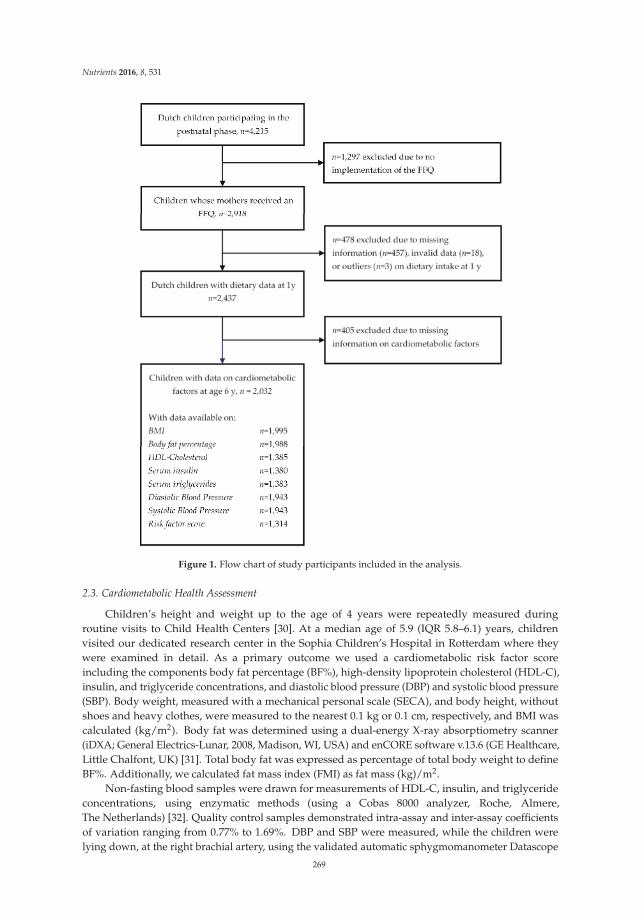
Nutrients 2016, 8, 531
Figure 1. Flow chart of study participants included in the analysis.
2.3. Cardiometabolic Health Assessment
Children’s height and weight up to the age of 4 years were repeatedly measured duringroutine visits to Child Health Centers [30]. At a median age of 5.9 (IQR 5.8–6.1) years, childrenvisited our dedicated research center in the Sophia Children’s Hospital in Rotterdam where theywere examined in detail. As a primary outcome we used a cardiometabolic risk factor scoreincluding the components body fat percentage (BF%), high-density lipoprotein cholesterol (HDL-C),insulin, and triglyceride concentrations, and diastolic blood pressure (DBP) and systolic blood pressure(SBP). Body weight, measured with a mechanical personal scale (SECA), and body height, withoutshoes and heavy clothes, were measured to the nearest 0.1 kg or 0.1 cm, respectively, and BMI wascalculated (kg/m2). Body fat was determined using a dual-energy X-ray absorptiometry scanner(iDXA; General Electrics-Lunar, 2008, Madison, WI, USA) and enCORE software v.13.6 (GE Healthcare,Little Chalfont, UK) [31]. Total body fat was expressed as percentage of total body weight to defineBF%. Additionally, we calculated fat mass index (FMI) as fat mass (kg)/m2.
Non-fasting blood samples were drawn for measurements of HDL-C, insulin, and triglycerideconcentrations, using enzymatic methods (using a Cobas 8000 analyzer, Roche, Almere,The Netherlands) [32]. Quality control samples demonstrated intra-assay and inter-assay coefficientsof variation ranging from 0.77% to 1.69%. DBP and SBP were measured, while the children werelying down, at the right brachial artery, using the validated automatic sphygmomanometer Datascope
269
Nutrients 2016, 8, 531
Accutorr Plus™ (Paramus, NJ, USA) [33]. Measurements were repeated four times with 1 min intervalsand we used the mean of DBP and the mean of SBP of the last three measurements.
For all outcomes we calculated age- and sex-specific standard deviation scores (SDS) on the basisof our study population. Outliers, defined as the SDS ≥ |3.29| [34], were excluded (n = 0–7 peroutcome). Individual cardiometabolic outcomes were combined into a continuous cardiometabolicrisk factor score as described elsewhere [17,35]. This score included the sum of age- and sex-specificSD scores of BF%, the inverse of HDL-C, insulin, triglycerides, SBP, and DBP and was transformedinto an SD score. A higher score is indicative of a less favorable cardiometabolic profile.
2.4. Covariates
Maternal age, household income, educational levels of both parents, and proxies for mother’spre-pregnancy cardiometabolic health (i.e., hypercholesterolemia, diabetes mellitus, or hypertension)were obtained with a questionnaire at enrolment in the study. Educational level of both parents wasassessed with the same questionnaire and highest finished education was categorized into: no highereducation; one parent with higher education; or both parents finished higher education, with highereducation defined as higher vocational training, a Bachelor’s degree, or university degree [36].
Maternal height and weight were measured at the research center at enrollment in thestudy, and BMI was calculated. Information about smoking, alcohol intake, and folic acidsupplementation during pregnancy, as markers of health-conscious behavior of the mother,was obtained with questionnaires during pregnancy [27]. Information about pregnancy complications(i.e., gestational hypertension, preeclampsia, or gestational diabetes mellitus) was retrieved frommedical records.
Medical records and hospital registries were used to collect information about child’s sex,birth weight and gestational age. Sex- and gestational age-specific z-scores for birth weight werecalculated using reference data [37]. Information about receiving breastfeeding at 4 months and timingof introduction of fruit and vegetables was collected with postnatal questionnaires [27].
A food-based diet score for preschool children was used to assess overall diet quality [27] andmacronutrient intakes and glycemic load of the diet were calculated [38] from data obtained withthe FFQ. Information about receiving dietary supplements (e.g., vitamins and mineral supplements)as a proxy of health-conscious behavior, was retrieved using the FFQ. Information about averagescreen time as proxy for sedentary behavior and about time spent walking or bicycling to school andplaying outside as proxies for physical activity, and smoking in the household (categorized into never;less than once per week; or once per week or more) was obtained with a questionnaire at the child’sage of 6 years.
2.5. Statistical Analysis
To explore whether potential associations of DF intake with cardiometabolic health wereexplained by energy intake, we examined both absolute DF (i.e., not adjusted for energy intake)and energy-adjusted DF intake. DF was adjusted for energy intake using the residual method [39].Insulin was root-transformed, to obtain a normal distribution. Potential nonlinearity of the associationswas assessed using natural cubic spline models with two to four degrees of freedom [40]. Because therewere no indications for nonlinear associations for any of the outcomes (all p > 0.05), we assessed allassociations using linear regression analyses only. In these models, we analyzed total DF intake andDF intake from different sources (per 1 g/day) and the cardiometabolic risk factor score and individualcardiometabolic health components at the age of 6 years.
In the crude model, we included child’s age at FFQ and sex. To identify potential dietaryconfounders, we first examined correlations of DF intake with intake of total protein, vegetableprotein, animal protein, fat, polyunsaturated fatty acids, monounsaturated fatty acids, saturated fattyacids, carbohydrates, glycemic load, and the diet quality score. We observed a strong correlationfor energy intake, glycemic load, and the diet score with DF intakes, and therefore included thesevariables in the analyses. To avoid overadjustment, the diet quality score and glycemic load were
270
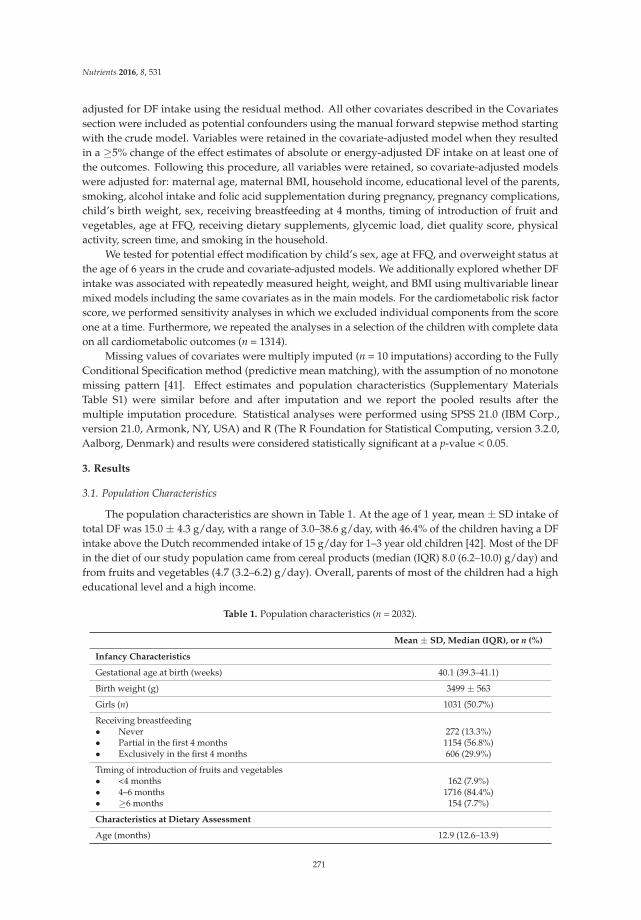
Nutrients 2016, 8, 531
adjusted for DF intake using the residual method. All other covariates described in the Covariatessection were included as potential confounders using the manual forward stepwise method startingwith the crude model. Variables were retained in the covariate-adjusted model when they resultedin a ≥5% change of the effect estimates of absolute or energy-adjusted DF intake on at least one ofthe outcomes. Following this procedure, all variables were retained, so covariate-adjusted modelswere adjusted for: maternal age, maternal BMI, household income, educational level of the parents,smoking, alcohol intake and folic acid supplementation during pregnancy, pregnancy complications,child’s birth weight, sex, receiving breastfeeding at 4 months, timing of introduction of fruit andvegetables, age at FFQ, receiving dietary supplements, glycemic load, diet quality score, physicalactivity, screen time, and smoking in the household.
We tested for potential effect modification by child’s sex, age at FFQ, and overweight status atthe age of 6 years in the crude and covariate-adjusted models. We additionally explored whether DFintake was associated with repeatedly measured height, weight, and BMI using multivariable linearmixed models including the same covariates as in the main models. For the cardiometabolic risk factorscore, we performed sensitivity analyses in which we excluded individual components from the scoreone at a time. Furthermore, we repeated the analyses in a selection of the children with complete dataon all cardiometabolic outcomes (n = 1314).
Missing values of covariates were multiply imputed (n = 10 imputations) according to the FullyConditional Specification method (predictive mean matching), with the assumption of no monotonemissing pattern [41]. Effect estimates and population characteristics (Supplementary MaterialsTable S1) were similar before and after imputation and we report the pooled results after themultiple imputation procedure. Statistical analyses were performed using SPSS 21.0 (IBM Corp.,version 21.0, Armonk, NY, USA) and R (The R Foundation for Statistical Computing, version 3.2.0,Aalborg, Denmark) and results were considered statistically significant at a p-value < 0.05.
3. Results
3.1. Population Characteristics
The population characteristics are shown in Table 1. At the age of 1 year, mean ± SD intake oftotal DF was 15.0 ± 4.3 g/day, with a range of 3.0–38.6 g/day, with 46.4% of the children having a DFintake above the Dutch recommended intake of 15 g/day for 1–3 year old children [42]. Most of the DFin the diet of our study population came from cereal products (median (IQR) 8.0 (6.2–10.0) g/day) andfrom fruits and vegetables (4.7 (3.2–6.2) g/day). Overall, parents of most of the children had a higheducational level and a high income.
Table 1. Population characteristics (n = 2032).
Mean ± SD, Median (IQR), or n (%)
Infancy Characteristics
Gestational age at birth (weeks) 40.1 (39.3–41.1)
Birth weight (g) 3499 ± 563
Girls (n) 1031 (50.7%)
Receiving breastfeeding• Never 272 (13.3%)• Partial in the first 4 months 1154 (56.8%)• Exclusively in the first 4 months 606 (29.9%)
Timing of introduction of fruits and vegetables• <4 months 162 (7.9%)• 4–6 months 1716 (84.4%)• ≥6 months 154 (7.7%)
Characteristics at Dietary Assessment
Age (months) 12.9 (12.6–13.9)
271
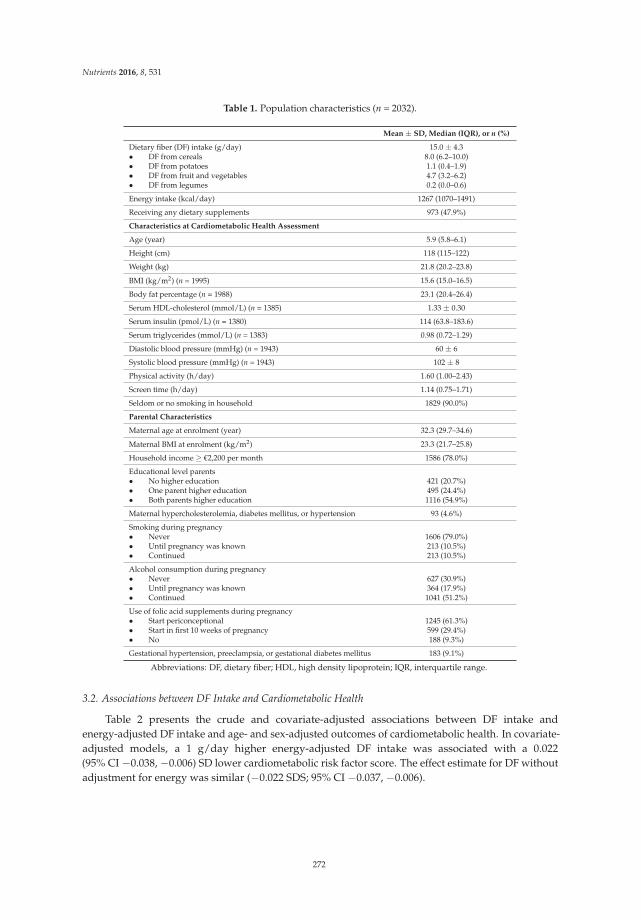
Nutrients 2016, 8, 531
Table 1. Population characteristics (n = 2032).
Mean ± SD, Median (IQR), or n (%)
Dietary fiber (DF) intake (g/day) 15.0 ± 4.3• DF from cereals 8.0 (6.2–10.0)• DF from potatoes 1.1 (0.4–1.9)• DF from fruit and vegetables 4.7 (3.2–6.2)• DF from legumes 0.2 (0.0–0.6)
Energy intake (kcal/day) 1267 (1070–1491)
Receiving any dietary supplements 973 (47.9%)
Characteristics at Cardiometabolic Health Assessment
Age (year) 5.9 (5.8–6.1)
Height (cm) 118 (115–122)
Weight (kg) 21.8 (20.2–23.8)
BMI (kg/m2) (n = 1995) 15.6 (15.0–16.5)
Body fat percentage (n = 1988) 23.1 (20.4–26.4)
Serum HDL-cholesterol (mmol/L) (n = 1385) 1.33 ± 0.30
Serum insulin (pmol/L) (n = 1380) 114 (63.8–183.6)
Serum triglycerides (mmol/L) (n = 1383) 0.98 (0.72–1.29)
Diastolic blood pressure (mmHg) (n = 1943) 60 ± 6
Systolic blood pressure (mmHg) (n = 1943) 102 ± 8
Physical activity (h/day) 1.60 (1.00–2.43)
Screen time (h/day) 1.14 (0.75–1.71)
Seldom or no smoking in household 1829 (90.0%)
Parental Characteristics
Maternal age at enrolment (year) 32.3 (29.7–34.6)
Maternal BMI at enrolment (kg/m2) 23.3 (21.7–25.8)
Household income ≥ €2,200 per month 1586 (78.0%)
Educational level parents• No higher education 421 (20.7%)• One parent higher education 495 (24.4%)• Both parents higher education 1116 (54.9%)
Maternal hypercholesterolemia, diabetes mellitus, or hypertension 93 (4.6%)
Smoking during pregnancy• Never 1606 (79.0%)• Until pregnancy was known 213 (10.5%)• Continued 213 (10.5%)
Alcohol consumption during pregnancy• Never 627 (30.9%)• Until pregnancy was known 364 (17.9%)• Continued 1041 (51.2%)
Use of folic acid supplements during pregnancy• Start periconceptional 1245 (61.3%)• Start in first 10 weeks of pregnancy 599 (29.4%)• No 188 (9.3%)
Gestational hypertension, preeclampsia, or gestational diabetes mellitus 183 (9.1%)
Abbreviations: DF, dietary fiber; HDL, high density lipoprotein; IQR, interquartile range.
3.2. Associations between DF Intake and Cardiometabolic Health
Table 2 presents the crude and covariate-adjusted associations between DF intake andenergy-adjusted DF intake and age- and sex-adjusted outcomes of cardiometabolic health. In covariate-adjusted models, a 1 g/day higher energy-adjusted DF intake was associated with a 0.022(95% CI −0.038, −0.006) SD lower cardiometabolic risk factor score. The effect estimate for DF withoutadjustment for energy was similar (−0.022 SDS; 95% CI −0.037, −0.006).
272
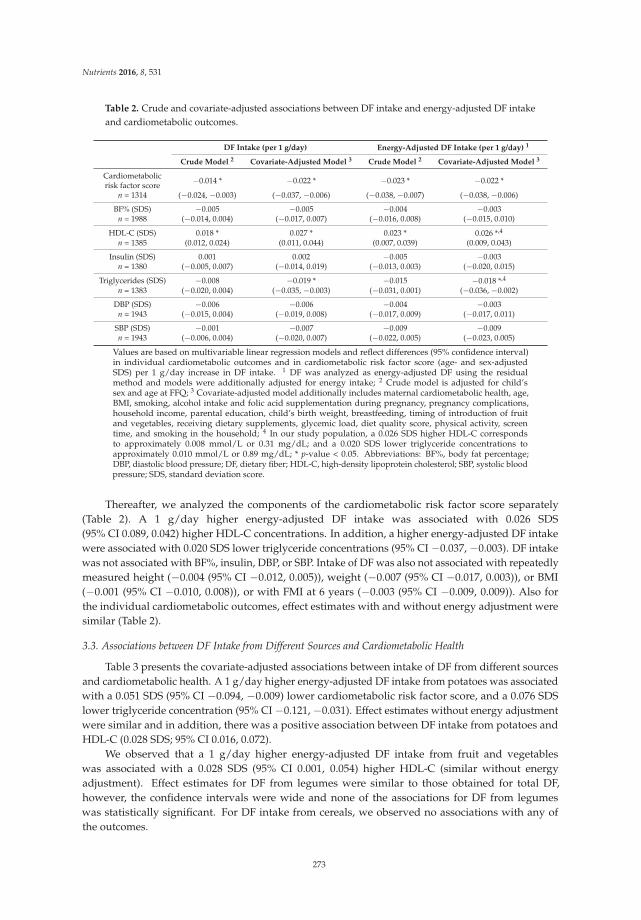
Nutrients 2016, 8, 531
Table 2. Crude and covariate-adjusted associations between DF intake and energy-adjusted DF intakeand cardiometabolic outcomes.
DF Intake (per 1 g/day) Energy-Adjusted DF Intake (per 1 g/day) 1
Crude Model 2 Covariate-Adjusted Model 3 Crude Model 2 Covariate-Adjusted Model 3
Cardiometabolicrisk factor score −0.014 * −0.022 * −0.023 * −0.022 *
n = 1314 (−0.024, −0.003) (−0.037, −0.006) (−0.038, −0.007) (−0.038, −0.006)
BF% (SDS) −0.005 −0.005 −0.004 −0.003n = 1988 (−0.014, 0.004) (−0.017, 0.007) (−0.016, 0.008) (−0.015, 0.010)
HDL-C (SDS) 0.018 * 0.027 * 0.023 * 0.026 *,4
n = 1385 (0.012, 0.024) (0.011, 0.044) (0.007, 0.039) (0.009, 0.043)
Insulin (SDS) 0.001 0.002 −0.005 −0.003n = 1380 (−0.005, 0.007) (−0.014, 0.019) (−0.013, 0.003) (−0.020, 0.015)
Triglycerides (SDS) −0.008 −0.019 * −0.015 −0.018 *,4
n = 1383 (−0.020, 0.004) (−0.035, −0.003) (−0.031, 0.001) (−0.036, −0.002)
DBP (SDS) −0.006 −0.006 −0.004 −0.003n = 1943 (−0.015, 0.004) (−0.019, 0.008) (−0.017, 0.009) (−0.017, 0.011)
SBP (SDS) −0.001 −0.007 −0.009 −0.009n = 1943 (−0.006, 0.004) (−0.020, 0.007) (−0.022, 0.005) (−0.023, 0.005)
Values are based on multivariable linear regression models and reflect differences (95% confidence interval)in individual cardiometabolic outcomes and in cardiometabolic risk factor score (age- and sex-adjustedSDS) per 1 g/day increase in DF intake. 1 DF was analyzed as energy-adjusted DF using the residualmethod and models were additionally adjusted for energy intake; 2 Crude model is adjusted for child’ssex and age at FFQ; 3 Covariate-adjusted model additionally includes maternal cardiometabolic health, age,BMI, smoking, alcohol intake and folic acid supplementation during pregnancy, pregnancy complications,household income, parental education, child’s birth weight, breastfeeding, timing of introduction of fruitand vegetables, receiving dietary supplements, glycemic load, diet quality score, physical activity, screentime, and smoking in the household; 4 In our study population, a 0.026 SDS higher HDL-C correspondsto approximately 0.008 mmol/L or 0.31 mg/dL; and a 0.020 SDS lower triglyceride concentrations toapproximately 0.010 mmol/L or 0.89 mg/dL; * p-value < 0.05. Abbreviations: BF%, body fat percentage;DBP, diastolic blood pressure; DF, dietary fiber; HDL-C, high-density lipoprotein cholesterol; SBP, systolic bloodpressure; SDS, standard deviation score.
Thereafter, we analyzed the components of the cardiometabolic risk factor score separately(Table 2). A 1 g/day higher energy-adjusted DF intake was associated with 0.026 SDS(95% CI 0.089, 0.042) higher HDL-C concentrations. In addition, a higher energy-adjusted DF intakewere associated with 0.020 SDS lower triglyceride concentrations (95% CI −0.037, −0.003). DF intakewas not associated with BF%, insulin, DBP, or SBP. Intake of DF was also not associated with repeatedlymeasured height (−0.004 (95% CI −0.012, 0.005)), weight (−0.007 (95% CI −0.017, 0.003)), or BMI(−0.001 (95% CI −0.010, 0.008)), or with FMI at 6 years (−0.003 (95% CI −0.009, 0.009)). Also forthe individual cardiometabolic outcomes, effect estimates with and without energy adjustment weresimilar (Table 2).
3.3. Associations between DF Intake from Different Sources and Cardiometabolic Health
Table 3 presents the covariate-adjusted associations between intake of DF from different sourcesand cardiometabolic health. A 1 g/day higher energy-adjusted DF intake from potatoes was associatedwith a 0.051 SDS (95% CI −0.094, −0.009) lower cardiometabolic risk factor score, and a 0.076 SDSlower triglyceride concentration (95% CI −0.121, −0.031). Effect estimates without energy adjustmentwere similar and in addition, there was a positive association between DF intake from potatoes andHDL-C (0.028 SDS; 95% CI 0.016, 0.072).
We observed that a 1 g/day higher energy-adjusted DF intake from fruit and vegetableswas associated with a 0.028 SDS (95% CI 0.001, 0.054) higher HDL-C (similar without energyadjustment). Effect estimates for DF from legumes were similar to those obtained for total DF,however, the confidence intervals were wide and none of the associations for DF from legumeswas statistically significant. For DF intake from cereals, we observed no associations with any ofthe outcomes.
273
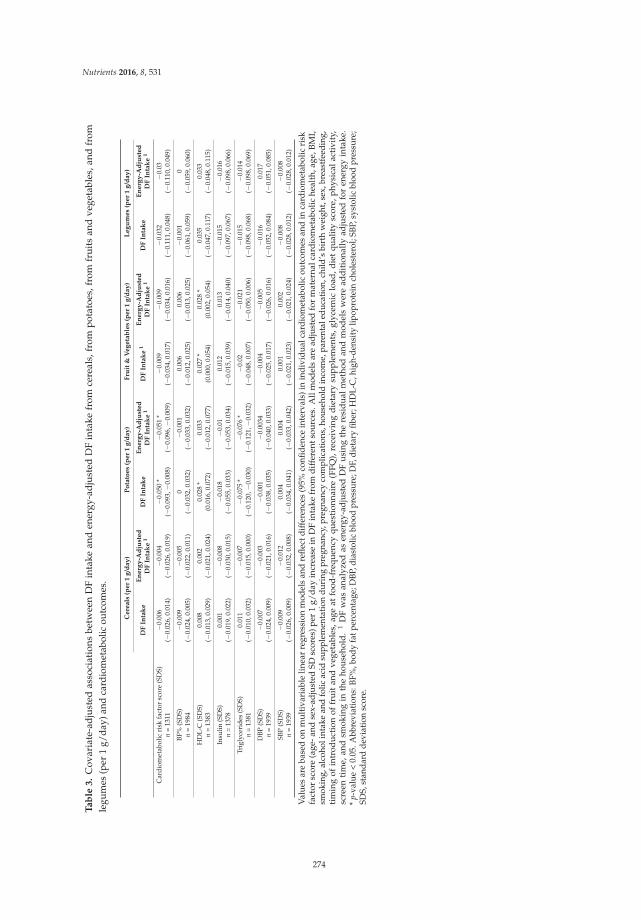
Nutrients 2016, 8, 531
Ta
ble
3.
Cov
aria
te-a
dju
sted
asso
ciat
ions
betw
een
DF
inta
kean
den
ergy
-ad
just
edD
Fin
take
from
cere
als,
from
pot
atoe
s,fr
omfr
uit
san
dve
geta
bles
,and
from
legu
mes
(per
1g/
day)
and
card
iom
etab
olic
outc
omes
.
Ce
rea
ls(p
er
1g
/da
y)
Po
tato
es
(pe
r1
g/d
ay
)F
ruit
&V
eg
eta
ble
s(p
er
1g
/da
y)
Le
gu
me
s(p
er
1g
/da
y)
DF
Inta
ke
En
erg
y-A
dju
ste
dD
FIn
tak
e1
DF
Inta
ke
En
erg
y-A
dju
ste
dD
FIn
tak
e1
DF
Inta
ke
1E
ne
rgy
-Ad
just
ed
DF
Inta
ke
1D
FIn
tak
eE
ne
rgy
-Ad
just
ed
DF
Inta
ke
1
Car
diom
etab
olic
risk
fact
orsc
ore
(SD
S)−
0.00
6−
0.00
4−
0.05
0*
−0.
051
*−
0.00
9−
0.00
9−
0.03
2−
0.03
n=
1311
(−0.
026,
0.01
4)(−
0.02
6,0.
019)
(−0.
093,−
0.00
8)(−
0.09
6,−
0.00
9)(−
0.03
4,0.
017)
(−0.
034,
0.01
6)(−
0.11
1,0.
048)
(−0.
110,
0.04
9)
BF%
(SD
S)−
0.00
9−
0.00
50
−0.
001
0.00
60.
006
−0.
001
0n
=19
84(−
0.02
4,0.
005)
(−0.
022,
0.01
1)(−
0.03
2,0.
032)
(−0.
033,
0.03
2)(−
0.01
2,0.
025)
(−0.
013,
0.02
5)(−
0.06
1,0.
059)
(−0.
059,
0.06
0)
HD
L-C
(SD
S)0.
008
0.00
20.
028
*0.
033
0.02
7*
0.02
8*
0.03
50.
033
n=
1383
(−0.
013,
0.02
9)(−
0.02
1,0.
024)
(0.0
16,0
.072
)(−
0.01
2,0.
077)
(0.0
00,0
.054
)(0
.002
,0.0
54)
(−0.
047,
0.11
7)(−
0.04
8,0.
115)
Insu
lin(S
DS)
0.00
1−
0.00
8−
0.01
8−
0.01
0.01
20.
013
−0.
015
−0.
016
n=
1378
(−0.
019,
0.02
2)(−
0.03
0,0.
015)
(−0.
055,
0.03
3)(−
0.05
3,0.
034)
(−0.
015,
0.03
9)(−
0.01
4,0.
040)
(−0.
097,
0.06
7)(−
0.09
8,0.
066)
Trig
lyce
ride
s(S
DS)
0.01
1−
0.00
7−
0.07
5*
−0.
076
*−
0.02
−0.
021
−0.
015
−0.
014
n=
1381
(−0.
010,
0.03
2)(−
0.01
5,0.
000)
(−0.
120,−
0.03
0)(−
0.12
1,−
0.03
2)(−
0.04
8,0.
007)
(−0.
050,
0.00
6)(−
0.09
8,0.
068)
(−0.
098,
0.06
9)
DBP
(SD
S)−
0.00
7−
0.00
3−
0.00
1−
0.00
34−
0.00
4−
0.00
5−
0.01
60.
017
n=
1939
(−0.
024,
0.00
9)(−
0.02
1,0.
016)
(−0.
038,
0.03
5)(−
0.04
0,0.
033)
(−0.
025,
0.01
7)(−
0.02
6,0.
016)
(−0.
052,
0.08
4)(−
0.05
1,0.
085)
SBP
(SD
S)−
0.00
9−
0.01
20.
004
0.00
40.
001
0.00
2−
0.00
8−
0.00
8n
=19
39(−
0.02
6,0.
009)
(−0.
032,
0.00
8)(−
0.03
4,0.
041)
(−0.
033,
0.04
2)(−
0.02
1,0.
023)
(−0.
021,
0.02
4)(−
0.02
8,0.
012)
(−0.
028,
0.01
2)
Val
ues
are
base
don
mul
tiva
riab
lelin
ear
regr
essi
onm
odel
san
dre
flect
diff
eren
ces
(95%
confi
den
cein
terv
als)
inin
div
idua
lcar
dio
met
abol
icou
tcom
esan
din
card
iom
etab
olic
risk
fact
orsc
ore
(age
-and
sex-
adju
sted
SDsc
ores
)per
1g/
day
incr
ease
inD
Fin
take
from
dif
fere
ntso
urc
es.A
llm
odel
sar
ead
just
edfo
rm
ater
nalc
ard
iom
etab
olic
heal
th,a
ge,B
MI,
smok
ing,
alco
holi
ntak
ean
dfo
licac
idsu
pple
men
tatio
ndu
ring
preg
nanc
y,pr
egna
ncy
com
plic
atio
ns,h
ouse
hold
inco
me,
pare
ntal
educ
atio
n,ch
ild’s
birt
hw
eigh
t,se
x,br
east
feed
ing,
tim
ing
ofin
trod
uct
ion
offr
uit
and
vege
tabl
es,a
geat
food
-fre
quen
cyqu
esti
onna
ire
(FFQ
),re
ceiv
ing
die
tary
sup
ple
men
ts,g
lyce
mic
load
,die
tqu
alit
ysc
ore,
phy
sica
lact
ivit
y,sc
reen
tim
e,an
dsm
okin
gin
the
hou
seho
ld.
1D
Fw
asan
alyz
edas
ener
gy-a
dju
sted
DF
usi
ngth
ere
sid
ual
met
hod
and
mod
els
wer
ead
dit
iona
llyad
just
edfo
ren
ergy
inta
ke.
*p-
valu
e<
0.05
.Abb
revi
atio
ns:B
F%,b
ody
fatp
erce
ntag
e;D
BP,d
iast
olic
bloo
dpr
essu
re;D
F,di
etar
yfib
er;H
DL-
C,h
igh-
dens
itylip
opro
tein
chol
este
rol;
SBP,
syst
olic
bloo
dpr
essu
re;
SDS,
stan
dard
devi
atio
nsc
ore.
274
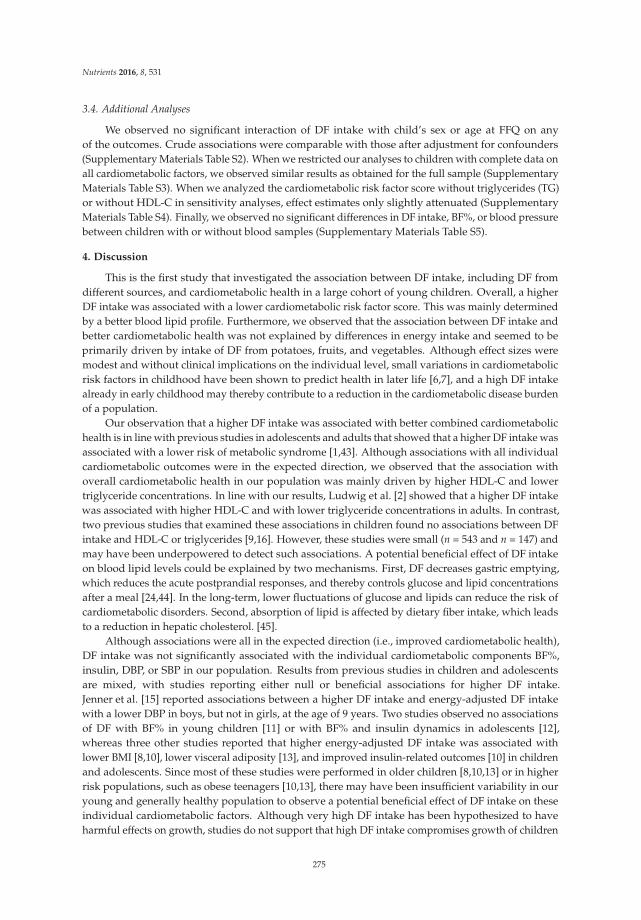
Nutrients 2016, 8, 531
3.4. Additional Analyses
We observed no significant interaction of DF intake with child’s sex or age at FFQ on anyof the outcomes. Crude associations were comparable with those after adjustment for confounders(Supplementary Materials Table S2). When we restricted our analyses to children with complete data onall cardiometabolic factors, we observed similar results as obtained for the full sample (SupplementaryMaterials Table S3). When we analyzed the cardiometabolic risk factor score without triglycerides (TG)or without HDL-C in sensitivity analyses, effect estimates only slightly attenuated (SupplementaryMaterials Table S4). Finally, we observed no significant differences in DF intake, BF%, or blood pressurebetween children with or without blood samples (Supplementary Materials Table S5).
4. Discussion
This is the first study that investigated the association between DF intake, including DF fromdifferent sources, and cardiometabolic health in a large cohort of young children. Overall, a higherDF intake was associated with a lower cardiometabolic risk factor score. This was mainly determinedby a better blood lipid profile. Furthermore, we observed that the association between DF intake andbetter cardiometabolic health was not explained by differences in energy intake and seemed to beprimarily driven by intake of DF from potatoes, fruits, and vegetables. Although effect sizes weremodest and without clinical implications on the individual level, small variations in cardiometabolicrisk factors in childhood have been shown to predict health in later life [6,7], and a high DF intakealready in early childhood may thereby contribute to a reduction in the cardiometabolic disease burdenof a population.
Our observation that a higher DF intake was associated with better combined cardiometabolichealth is in line with previous studies in adolescents and adults that showed that a higher DF intake wasassociated with a lower risk of metabolic syndrome [1,43]. Although associations with all individualcardiometabolic outcomes were in the expected direction, we observed that the association withoverall cardiometabolic health in our population was mainly driven by higher HDL-C and lowertriglyceride concentrations. In line with our results, Ludwig et al. [2] showed that a higher DF intakewas associated with higher HDL-C and with lower triglyceride concentrations in adults. In contrast,two previous studies that examined these associations in children found no associations between DFintake and HDL-C or triglycerides [9,16]. However, these studies were small (n = 543 and n = 147) andmay have been underpowered to detect such associations. A potential beneficial effect of DF intakeon blood lipid levels could be explained by two mechanisms. First, DF decreases gastric emptying,which reduces the acute postprandial responses, and thereby controls glucose and lipid concentrationsafter a meal [24,44]. In the long-term, lower fluctuations of glucose and lipids can reduce the risk ofcardiometabolic disorders. Second, absorption of lipid is affected by dietary fiber intake, which leadsto a reduction in hepatic cholesterol. [45].
Although associations were all in the expected direction (i.e., improved cardiometabolic health),DF intake was not significantly associated with the individual cardiometabolic components BF%,insulin, DBP, or SBP in our population. Results from previous studies in children and adolescentsare mixed, with studies reporting either null or beneficial associations for higher DF intake.Jenner et al. [15] reported associations between a higher DF intake and energy-adjusted DF intakewith a lower DBP in boys, but not in girls, at the age of 9 years. Two studies observed no associationsof DF with BF% in young children [11] or with BF% and insulin dynamics in adolescents [12],whereas three other studies reported that higher energy-adjusted DF intake was associated withlower BMI [8,10], lower visceral adiposity [13], and improved insulin-related outcomes [10] in childrenand adolescents. Since most of these studies were performed in older children [8,10,13] or in higherrisk populations, such as obese teenagers [10,13], there may have been insufficient variability in ouryoung and generally healthy population to observe a potential beneficial effect of DF intake on theseindividual cardiometabolic factors. Although very high DF intake has been hypothesized to haveharmful effects on growth, studies do not support that high DF intake compromises growth of children
275
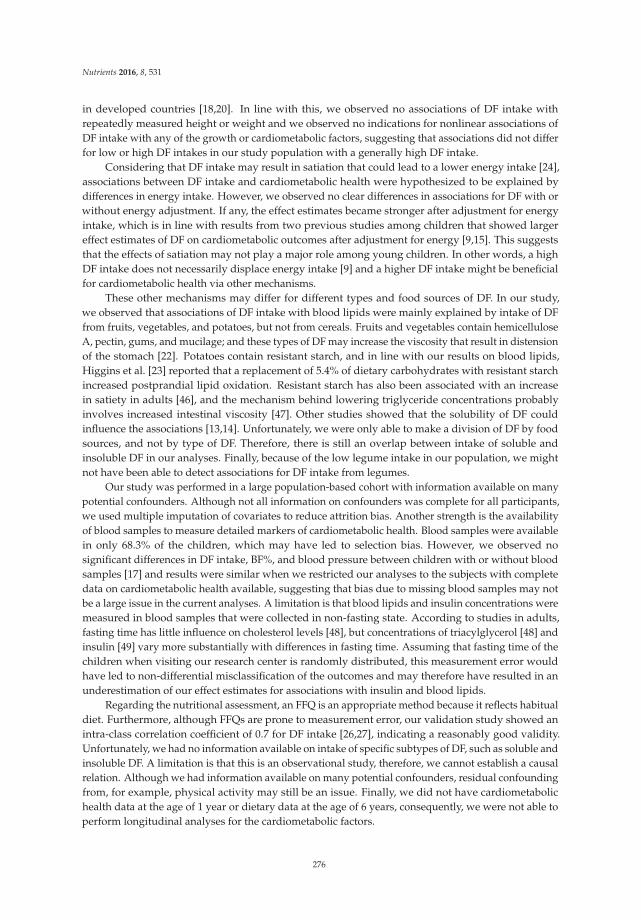
Nutrients 2016, 8, 531
in developed countries [18,20]. In line with this, we observed no associations of DF intake withrepeatedly measured height or weight and we observed no indications for nonlinear associations ofDF intake with any of the growth or cardiometabolic factors, suggesting that associations did not differfor low or high DF intakes in our study population with a generally high DF intake.
Considering that DF intake may result in satiation that could lead to a lower energy intake [24],associations between DF intake and cardiometabolic health were hypothesized to be explained bydifferences in energy intake. However, we observed no clear differences in associations for DF with orwithout energy adjustment. If any, the effect estimates became stronger after adjustment for energyintake, which is in line with results from two previous studies among children that showed largereffect estimates of DF on cardiometabolic outcomes after adjustment for energy [9,15]. This suggeststhat the effects of satiation may not play a major role among young children. In other words, a highDF intake does not necessarily displace energy intake [9] and a higher DF intake might be beneficialfor cardiometabolic health via other mechanisms.
These other mechanisms may differ for different types and food sources of DF. In our study,we observed that associations of DF intake with blood lipids were mainly explained by intake of DFfrom fruits, vegetables, and potatoes, but not from cereals. Fruits and vegetables contain hemicelluloseA, pectin, gums, and mucilage; and these types of DF may increase the viscosity that result in distensionof the stomach [22]. Potatoes contain resistant starch, and in line with our results on blood lipids,Higgins et al. [23] reported that a replacement of 5.4% of dietary carbohydrates with resistant starchincreased postprandial lipid oxidation. Resistant starch has also been associated with an increasein satiety in adults [46], and the mechanism behind lowering triglyceride concentrations probablyinvolves increased intestinal viscosity [47]. Other studies showed that the solubility of DF couldinfluence the associations [13,14]. Unfortunately, we were only able to make a division of DF by foodsources, and not by type of DF. Therefore, there is still an overlap between intake of soluble andinsoluble DF in our analyses. Finally, because of the low legume intake in our population, we mightnot have been able to detect associations for DF intake from legumes.
Our study was performed in a large population-based cohort with information available on manypotential confounders. Although not all information on confounders was complete for all participants,we used multiple imputation of covariates to reduce attrition bias. Another strength is the availabilityof blood samples to measure detailed markers of cardiometabolic health. Blood samples were availablein only 68.3% of the children, which may have led to selection bias. However, we observed nosignificant differences in DF intake, BF%, and blood pressure between children with or without bloodsamples [17] and results were similar when we restricted our analyses to the subjects with completedata on cardiometabolic health available, suggesting that bias due to missing blood samples may notbe a large issue in the current analyses. A limitation is that blood lipids and insulin concentrations weremeasured in blood samples that were collected in non-fasting state. According to studies in adults,fasting time has little influence on cholesterol levels [48], but concentrations of triacylglycerol [48] andinsulin [49] vary more substantially with differences in fasting time. Assuming that fasting time of thechildren when visiting our research center is randomly distributed, this measurement error wouldhave led to non-differential misclassification of the outcomes and may therefore have resulted in anunderestimation of our effect estimates for associations with insulin and blood lipids.
Regarding the nutritional assessment, an FFQ is an appropriate method because it reflects habitualdiet. Furthermore, although FFQs are prone to measurement error, our validation study showed anintra-class correlation coefficient of 0.7 for DF intake [26,27], indicating a reasonably good validity.Unfortunately, we had no information available on intake of specific subtypes of DF, such as soluble andinsoluble DF. A limitation is that this is an observational study, therefore, we cannot establish a causalrelation. Although we had information available on many potential confounders, residual confoundingfrom, for example, physical activity may still be an issue. Finally, we did not have cardiometabolichealth data at the age of 1 year or dietary data at the age of 6 years, consequently, we were not able toperform longitudinal analyses for the cardiometabolic factors.
276
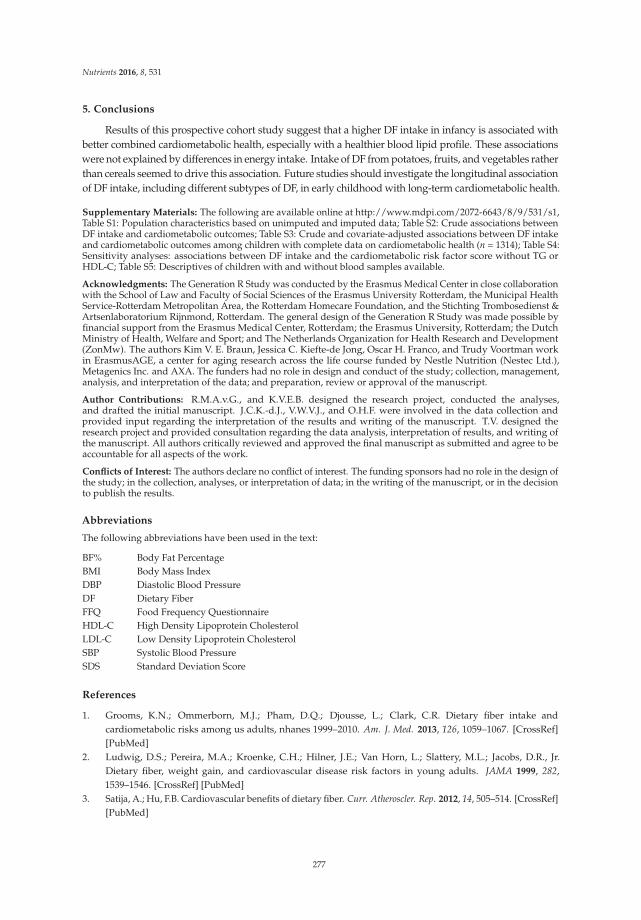
Nutrients 2016, 8, 531
5. Conclusions
Results of this prospective cohort study suggest that a higher DF intake in infancy is associated withbetter combined cardiometabolic health, especially with a healthier blood lipid profile. These associationswere not explained by differences in energy intake. Intake of DF from potatoes, fruits, and vegetables ratherthan cereals seemed to drive this association. Future studies should investigate the longitudinal associationof DF intake, including different subtypes of DF, in early childhood with long-term cardiometabolic health.
Supplementary Materials: The following are available online at http://www.mdpi.com/2072-6643/8/9/531/s1,Table S1: Population characteristics based on unimputed and imputed data; Table S2: Crude associations betweenDF intake and cardiometabolic outcomes; Table S3: Crude and covariate-adjusted associations between DF intakeand cardiometabolic outcomes among children with complete data on cardiometabolic health (n = 1314); Table S4:Sensitivity analyses: associations between DF intake and the cardiometabolic risk factor score without TG orHDL-C; Table S5: Descriptives of children with and without blood samples available.
Acknowledgments: The Generation R Study was conducted by the Erasmus Medical Center in close collaborationwith the School of Law and Faculty of Social Sciences of the Erasmus University Rotterdam, the Municipal HealthService-Rotterdam Metropolitan Area, the Rotterdam Homecare Foundation, and the Stichting Trombosedienst &Artsenlaboratorium Rijnmond, Rotterdam. The general design of the Generation R Study was made possible byfinancial support from the Erasmus Medical Center, Rotterdam; the Erasmus University, Rotterdam; the DutchMinistry of Health, Welfare and Sport; and The Netherlands Organization for Health Research and Development(ZonMw). The authors Kim V. E. Braun, Jessica C. Kiefte-de Jong, Oscar H. Franco, and Trudy Voortman workin ErasmusAGE, a center for aging research across the life course funded by Nestle Nutrition (Nestec Ltd.),Metagenics Inc. and AXA. The funders had no role in design and conduct of the study; collection, management,analysis, and interpretation of the data; and preparation, review or approval of the manuscript.
Author Contributions: R.M.A.v.G., and K.V.E.B. designed the research project, conducted the analyses,and drafted the initial manuscript. J.C.K.-d.J., V.W.V.J., and O.H.F. were involved in the data collection andprovided input regarding the interpretation of the results and writing of the manuscript. T.V. designed theresearch project and provided consultation regarding the data analysis, interpretation of results, and writing ofthe manuscript. All authors critically reviewed and approved the final manuscript as submitted and agree to beaccountable for all aspects of the work.
Conflicts of Interest: The authors declare no conflict of interest. The funding sponsors had no role in the design ofthe study; in the collection, analyses, or interpretation of data; in the writing of the manuscript, or in the decisionto publish the results.
Abbreviations
The following abbreviations have been used in the text:
BF% Body Fat PercentageBMI Body Mass IndexDBP Diastolic Blood PressureDF Dietary FiberFFQ Food Frequency QuestionnaireHDL-C High Density Lipoprotein CholesterolLDL-C Low Density Lipoprotein CholesterolSBP Systolic Blood PressureSDS Standard Deviation Score
References
1. Grooms, K.N.; Ommerborn, M.J.; Pham, D.Q.; Djousse, L.; Clark, C.R. Dietary fiber intake andcardiometabolic risks among us adults, nhanes 1999–2010. Am. J. Med. 2013, 126, 1059–1067. [CrossRef][PubMed]
2. Ludwig, D.S.; Pereira, M.A.; Kroenke, C.H.; Hilner, J.E.; Van Horn, L.; Slattery, M.L.; Jacobs, D.R., Jr.Dietary fiber, weight gain, and cardiovascular disease risk factors in young adults. JAMA 1999, 282,1539–1546. [CrossRef] [PubMed]
3. Satija, A.; Hu, F.B. Cardiovascular benefits of dietary fiber. Curr. Atheroscler. Rep. 2012, 14, 505–514. [CrossRef][PubMed]
277
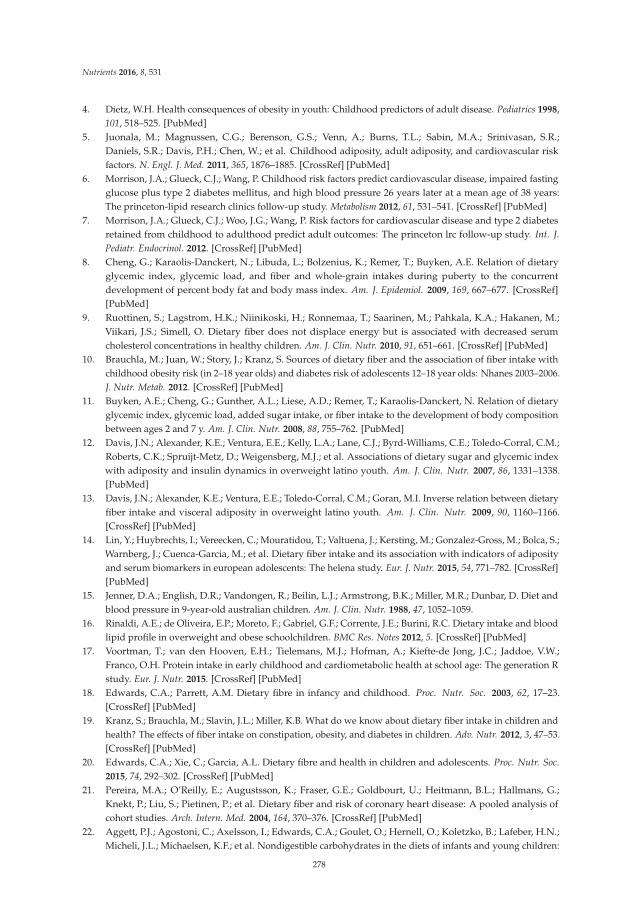
Nutrients 2016, 8, 531
4. Dietz, W.H. Health consequences of obesity in youth: Childhood predictors of adult disease. Pediatrics 1998,101, 518–525. [PubMed]
5. Juonala, M.; Magnussen, C.G.; Berenson, G.S.; Venn, A.; Burns, T.L.; Sabin, M.A.; Srinivasan, S.R.;Daniels, S.R.; Davis, P.H.; Chen, W.; et al. Childhood adiposity, adult adiposity, and cardiovascular riskfactors. N. Engl. J. Med. 2011, 365, 1876–1885. [CrossRef] [PubMed]
6. Morrison, J.A.; Glueck, C.J.; Wang, P. Childhood risk factors predict cardiovascular disease, impaired fastingglucose plus type 2 diabetes mellitus, and high blood pressure 26 years later at a mean age of 38 years:The princeton-lipid research clinics follow-up study. Metabolism 2012, 61, 531–541. [CrossRef] [PubMed]
7. Morrison, J.A.; Glueck, C.J.; Woo, J.G.; Wang, P. Risk factors for cardiovascular disease and type 2 diabetesretained from childhood to adulthood predict adult outcomes: The princeton lrc follow-up study. Int. J.
Pediatr. Endocrinol. 2012. [CrossRef] [PubMed]8. Cheng, G.; Karaolis-Danckert, N.; Libuda, L.; Bolzenius, K.; Remer, T.; Buyken, A.E. Relation of dietary
glycemic index, glycemic load, and fiber and whole-grain intakes during puberty to the concurrentdevelopment of percent body fat and body mass index. Am. J. Epidemiol. 2009, 169, 667–677. [CrossRef][PubMed]
9. Ruottinen, S.; Lagstrom, H.K.; Niinikoski, H.; Ronnemaa, T.; Saarinen, M.; Pahkala, K.A.; Hakanen, M.;Viikari, J.S.; Simell, O. Dietary fiber does not displace energy but is associated with decreased serumcholesterol concentrations in healthy children. Am. J. Clin. Nutr. 2010, 91, 651–661. [CrossRef] [PubMed]
10. Brauchla, M.; Juan, W.; Story, J.; Kranz, S. Sources of dietary fiber and the association of fiber intake withchildhood obesity risk (in 2–18 year olds) and diabetes risk of adolescents 12–18 year olds: Nhanes 2003–2006.J. Nutr. Metab. 2012. [CrossRef] [PubMed]
11. Buyken, A.E.; Cheng, G.; Gunther, A.L.; Liese, A.D.; Remer, T.; Karaolis-Danckert, N. Relation of dietaryglycemic index, glycemic load, added sugar intake, or fiber intake to the development of body compositionbetween ages 2 and 7 y. Am. J. Clin. Nutr. 2008, 88, 755–762. [PubMed]
12. Davis, J.N.; Alexander, K.E.; Ventura, E.E.; Kelly, L.A.; Lane, C.J.; Byrd-Williams, C.E.; Toledo-Corral, C.M.;Roberts, C.K.; Spruijt-Metz, D.; Weigensberg, M.J.; et al. Associations of dietary sugar and glycemic indexwith adiposity and insulin dynamics in overweight latino youth. Am. J. Clin. Nutr. 2007, 86, 1331–1338.[PubMed]
13. Davis, J.N.; Alexander, K.E.; Ventura, E.E.; Toledo-Corral, C.M.; Goran, M.I. Inverse relation between dietaryfiber intake and visceral adiposity in overweight latino youth. Am. J. Clin. Nutr. 2009, 90, 1160–1166.[CrossRef] [PubMed]
14. Lin, Y.; Huybrechts, I.; Vereecken, C.; Mouratidou, T.; Valtuena, J.; Kersting, M.; Gonzalez-Gross, M.; Bolca, S.;Warnberg, J.; Cuenca-Garcia, M.; et al. Dietary fiber intake and its association with indicators of adiposityand serum biomarkers in european adolescents: The helena study. Eur. J. Nutr. 2015, 54, 771–782. [CrossRef][PubMed]
15. Jenner, D.A.; English, D.R.; Vandongen, R.; Beilin, L.J.; Armstrong, B.K.; Miller, M.R.; Dunbar, D. Diet andblood pressure in 9-year-old australian children. Am. J. Clin. Nutr. 1988, 47, 1052–1059.
16. Rinaldi, A.E.; de Oliveira, E.P.; Moreto, F.; Gabriel, G.F.; Corrente, J.E.; Burini, R.C. Dietary intake and bloodlipid profile in overweight and obese schoolchildren. BMC Res. Notes 2012, 5. [CrossRef] [PubMed]
17. Voortman, T.; van den Hooven, E.H.; Tielemans, M.J.; Hofman, A.; Kiefte-de Jong, J.C.; Jaddoe, V.W.;Franco, O.H. Protein intake in early childhood and cardiometabolic health at school age: The generation Rstudy. Eur. J. Nutr. 2015. [CrossRef] [PubMed]
18. Edwards, C.A.; Parrett, A.M. Dietary fibre in infancy and childhood. Proc. Nutr. Soc. 2003, 62, 17–23.[CrossRef] [PubMed]
19. Kranz, S.; Brauchla, M.; Slavin, J.L.; Miller, K.B. What do we know about dietary fiber intake in children andhealth? The effects of fiber intake on constipation, obesity, and diabetes in children. Adv. Nutr. 2012, 3, 47–53.[CrossRef] [PubMed]
20. Edwards, C.A.; Xie, C.; Garcia, A.L. Dietary fibre and health in children and adolescents. Proc. Nutr. Soc.
2015, 74, 292–302. [CrossRef] [PubMed]21. Pereira, M.A.; O’Reilly, E.; Augustsson, K.; Fraser, G.E.; Goldbourt, U.; Heitmann, B.L.; Hallmans, G.;
Knekt, P.; Liu, S.; Pietinen, P.; et al. Dietary fiber and risk of coronary heart disease: A pooled analysis ofcohort studies. Arch. Intern. Med. 2004, 164, 370–376. [CrossRef] [PubMed]
22. Aggett, P.J.; Agostoni, C.; Axelsson, I.; Edwards, C.A.; Goulet, O.; Hernell, O.; Koletzko, B.; Lafeber, H.N.;Micheli, J.L.; Michaelsen, K.F.; et al. Nondigestible carbohydrates in the diets of infants and young children:
278
Nutrients 2016, 8, 531
A commentary by the espghan committee on nutrition. J. Pediatr. Gastroenterol. Nutr. 2003, 36, 329–337.[CrossRef] [PubMed]
23. Higgins, J.A.; Higbee, D.R.; Donahoo, W.T.; Brown, I.L.; Bell, M.L.; Bessesen, D.H. Resistant starchconsumption promotes lipid oxidation. Nutr. Metab. 2004, 1. [CrossRef] [PubMed]
24. Slavin, J.L. Dietary fiber and body weight. Nutrition 2005, 21, 411–418. [CrossRef] [PubMed]25. Jaddoe, V.W.; van Duijn, C.M.; Franco, O.H.; van der Heijden, A.J.; van Iizendoorn, M.H.; de Jongste, J.C.;
van der Lugt, A.; Mackenbach, J.P.; Moll, H.A.; Raat, H.; et al. The generation r study: Design and cohortupdate 2012. Eur. J. Epidemiol. 2012, 27, 739–756. [CrossRef] [PubMed]
26. Kiefte-de Jong, J.C.; de Vries, J.H.; Bleeker, S.E.; Jaddoe, V.W.; Hofman, A.; Raat, H.; Moll, H.A.Socio-demographic and lifestyle determinants of ‘western-like’ and ‘health conscious’ dietary patternsin toddlers. Br. J. Nutr. 2013, 109, 137–147. [CrossRef] [PubMed]
27. Voortman, T.; Kiefte-de Jong, J.C.; Geelen, A.; Villamor, E.; Moll, H.A.; de Jongste, J.C.; Raat, H.; Hofman, A.;Jaddoe, V.W.; Franco, O.H.; et al. The development of a diet quality score for preschool children and itsvalidation and determinants in the generation R study. J. Nutr. 2015, 145, 306–314. [CrossRef] [PubMed]
28. Westenbrink, S.; Jansen-van der Vliet, M.; Brants, H.A.M.; van der Heijden, L.J.M.; Hulshof, K.F.A.M.;Langius, J.A.E.; van Oosten, H.M.; Pruissen-Boskaljon, J.C. Nevo-Table 2006. Dutch Food Composition Table
2006; The NEVO Foundation and the Dutch Nutrition Centre: The Hague, The Netherlands, 2006.29. Bouchenak, M.; Lamri-Senhadji, M. Nutritional quality of legumes, and their role in cardiometabolic risk
prevention: A review. J. Med. Food 2013, 16, 185–198. [CrossRef] [PubMed]30. Braun, K.V.; Erler, N.S.; Kiefte-de Jong, J.C.; Jaddoe, V.W.; van den Hooven, E.H.; Franco, O.H.; Voortman, T.
Dietary intake of protein in early childhood is associated with growth. J. Nutr. 2016. in press.31. Voortman, T.; Braun, K.V.; Kiefte-de Jong, J.C.; Jaddoe, V.W.; Franco, O.H.; van den Hooven, E.H. Protein
intake in early childhood and body composition at the age of 6 years: The generation r study. Int. J. Obes.
2016, 40, 1018–1025. [CrossRef] [PubMed]32. Kruithof, C.J.; Kooijman, M.N.; van Duijn, C.M.; Franco, O.H.; de Jongste, J.C.; Klaver, C.C.; Mackenbach, J.P.;
Moll, H.A.; Raat, H.; Rings, E.H.; et al. The generation R study: Biobank update 2015. Eur. J. Epidemiol. 2014,29, 911–927. [CrossRef] [PubMed]
33. Wong, S.N.; Tz Sung, R.Y.; Leung, L.C. Validation of three oscillometric blood pressure devices againstauscultatory mercury sphygmomanometer in children. Blood Press. Monit. 2006, 11, 281–291. [CrossRef][PubMed]
34. Field, A. Discovering Statistics Using IBM SPSS Statistics; SAGE Publications Ltd.: London, UK, 2013;pp. 176–180.
35. Eisenmann, J.C. On the use of a continuous metabolic syndrome score in pediatric research.Cardiovasc. Diabetol. 2008, 7. [CrossRef] [PubMed]
36. Statistics Netherlands. Dutch Standard Classification of Education 2003 (Standaard Onderwijsindeling 2003);Statistics Netherlands (Centraal Bureau voor de Statistiek): Den Haag/Heerlen, The Netherlands, 2003.
37. Niklasson, A.; Ericson, A.; Fryer, J.G.; Karlberg, J.; Lawrence, C.; Karlberg, P. An update of the swedishreference standards for weight, length and head circumference at birth for given gestational age (1977–1981).Acta Paediatr. Scand. 1991, 80, 756–762. [CrossRef] [PubMed]
38. Kocevska, D.; Voortman, T.; Dashti, H.S.; van den Hooven, E.H.; Ghassabian, A.; Rijlaarsdam, J.; Schneider, N.;Feskens, E.J.; Jaddoe, V.W.; Tiemeier, H.; et al. Macronutrient intakes in infancy are associated with sleepduration in toddlerhood. J. Nutr. 2016, 146, 1250–1256. [CrossRef] [PubMed]
39. Willett, W.C.; Howe, G.R.; Kushi, L.H. Adjustment for total energy intake in epidemiologic studies. Am. J.
Clin. Nutr. 1997, 65, 1220S–1228S. [PubMed]40. Hastie, T.J. Generalized Additive Models. Chapter 7 of Statistical Models in S; Wadsworth & Brooks/Cole:
Pacific Grove, CA, USA, 1992.41. Sterne, J.A.; White, I.R.; Carlin, J.B.; Spratt, M.; Royston, P.; Kenward, M.G.; Wood, A.M.; Carpenter, J.R.
Multiple imputation for missing data in epidemiological and clinical research: Potential and pitfalls. BMJ
2009, 338. [CrossRef] [PubMed]42. Health Council of The Netherlands. Guideline for Dietary Fiber Intake; Health Council of The Netherlands:
The Hague, The Netherlands, 2006; pp. 1–90.
279
Nutrients 2016, 8, 531
43. Carlson, J.J.; Eisenmann, J.C.; Norman, G.J.; Ortiz, K.A.; Young, P.C. Dietary fiber and nutrient density areinversely associated with the metabolic syndrome in us adolescents. J. Am. Diet. Assoc. 2011, 111, 1688–1695.[CrossRef] [PubMed]
44. Heaton, K.W. Food fibre as an obstacle to energy intake. Lancet 1973, 2, 1418–1421. [CrossRef]45. Fernandez, M.L. Soluble fiber and nondigestible carbohydrate effects on plasma lipids and cardiovascular
risk. Curr. Opin. Lipidol. 2001, 12, 35–40. [CrossRef] [PubMed]46. Willis, H.J.; Eldridge, A.L.; Beiseigel, J.; Thomas, W.; Slavin, J.L. Greater satiety response with resistant starch
and corn bran in human subjects. Nutr. Res. 2009, 29, 100–105. [CrossRef] [PubMed]47. Lattimer, J.M.; Haub, M.D. Effect of dietary fiber and its components on metabolic health. Nutrients 2010, 2,
1266–1289. [CrossRef] [PubMed]48. Sidhu, D.; Naugler, C. Fasting time and lipid levels in a community-based population: A cross-sectional
study. Arch. Intern. Med. 2012, 172, 1707–1710. [CrossRef] [PubMed]49. Hancox, R.J.; Landhuis, C.E. Correlation between measures of insulin resistance in fasting and non-fasting
blood. Diabetol. Metab. Syndr. 2011, 3, 23. [CrossRef] [PubMed]
© 2016 by the authors. Licensee MDPI, Basel, Switzerland. This article is an open accessarticle distributed under the terms and conditions of the Creative Commons Attribution(CC BY) license (http://creativecommons.org/licenses/by/4.0/).
280
nutrients
Article
A Prospective Study of Different Types of DietaryFiber and Risk of Cardiovascular Disease:Tehran Lipid and Glucose Study
Parvin Mirmiran 1, Zahra Bahadoran 1,*, Sajad Khalili Moghadam 1, Azita Zadeh Vakili 2
and Fereidoun Azizi 3,*
1 Nutrition and Endocrine Research Center, Student Research Committee, Research Institute for EndocrineSciences, Shahid Beheshti University of Medical Sciences, No. 24, Shahid-Erabi St., Yeman St., Velenjak,Tehran 19395-4763, Iran; [email protected] (P.M.); [email protected] (S.K.M.)
2 Cellular and Molecular Endocrine Research Center, Obesity Research Center,Research Institute for Endocrine Sciences, Shahid Beheshti University of Medical Sciences, No. 24,Shahid-Erabi St., Yeman St., Velenjak, Tehran 19395-4763, Iran; [email protected]
3 Endocrine Research Center, Research Institute for Endocrine Sciences, Shahid Beheshti University of MedicalSciences, No. 24, Shahid-Erabi St., Yeman St., Velenjak, Tehran 19395-4763, Iran
* Correspondence: [email protected] (Z.B.); [email protected] (F.A.);Tel.: +98-21-224-32-500 (Z.B. & F.A.); Fax: +98-21-224-16-264 (Z.B. & F.A.) or +98-21-224-02-463 (Z.B. & F.A.)
Received: 2 August 2016; Accepted: 12 October 2016; Published: 7 November 2016
Abstract: Background and aim: This study was designed to examine the hypothesis that dietaryof intake different types of fiber could modify the risk of cardiovascular disease (CVD) in a largeprospective cohort among Iranian adults. Methods: In 2006–2008, we used a validated food frequencyquestionnaire to assess dietary fiber intake among 2295 health professionals with no previoushistory of heart disease. Subjects were subsequently followed until 2012 for incidence of CVDevents. Multivariate Cox proportional hazard regression models, adjusted for potential confounderswere used to estimate the risk of CVD across tertiles of total dietary fiber and different types offiber. Linear regression models were also used to indicate the association of dietary fiber intakeswith changes of cardiovascular risk factors during the follow-up. Results: Mean age of participants(42.8% men) was 38.2 ± 13.4, at baseline. Mean (SD) dietary intake of total fiber was 23.4 (8.9)g/day. After adjustment for cardiovascular risk score and dietary confounders, a significant inverseassociation was observed between intakes of total, soluble and insoluble dietary fiber and CVDrisk, in the highest compared to the lowest tertiles (HR = 0.39, 95% CI = 0.18–0.83, HR = 0.19,95% CI = 0.09–0.41, and HR = 0.31, 95% CI = 0.14–0.69, respectively). Inverse relations were observedbetween risk of CVD and dietary fiber from legumes, fruits and vegetables; however, dietary fiberintake from grain and nut sources was not related to risk of CVD. Conclusion: Our findings confirmedthat higher intakes of dietary fiber from different sources is associated with CVD events and modifyits major risk-related factors.
Keywords: coronary heart disease; dietary fiber; soluble fiber; insoluble fiber
1. Introduction
Dietary fiber, by its impact on the glycemic response and other aspects of metabolism, may alsohave important effects on cardiometabolic pathways [1]. An increasing number of studies have reporteda reduced risk of cardiovascular disease (CVD) following regular diets high in fiber. Based on findingsfrom epidemiologic studies regarding the protective effects of fiber intakes, the Dietary ReferenceIntakes (DRI) recommended consumption of dietary fiber is 14 g/1000 kcal, or 25 and 38 g/day foradult women and men, respectively [2]. Consuming a diet rich in high-fiber foods is also a critical
Nutrients 2016, 8, 686 281 www.mdpi.com/journal/nutrients
Nutrients 2016, 8, 686
component of the American Heart Association’s strategy and other dietary recommendations forcardiovascular disease risk reduction in the general population [3,4].
It has been proposed that dietary fiber could modify underlying CVD risk factors includinglipid and lipoprotein metabolism, insulin homeostasis, inflammatory markers and coagulation, andalso improve insulin sensitivity, thereby reducing the risk of CVD mortality [5–7]. Although studiesshowed beneficial effects of soluble, gel-forming fiber on cardiometabolic risk factors, food sources ofmainly insoluble fibers, primarily contributed by cereal products, have been the fiber most consistentlyassociated with lower risk of CVD [5]. Findings of some investigations also suggest that the roleof dietary fiber is more dependent on its types and sources, rather than the amount of intake [8,9].Different types or sources of dietary fiber may induce different physiological effects; soluble fiber isresponsible for the cholesterol-lowering effect of dietary fiber whereas insoluble fiber interacts withintestinal absorption of foods and contributes to reduction in clotting factors [10,11].
To examine the hypothesis that a greater intake of dietary fiber reduces risk of CVD, and differentdietary fiber may lead to different CVD outcomes, we used prospective data from the Tehran Lipid andGlucose Study over a 6-year period to assess the relationship between total dietary fiber, soluble andinsoluble fiber, and different fiber sources on the risk of CVD among Iranian adults.
2. Methods
2.1. Study Population
This study was conducted within the framework of the Tehran Lipid and Glucose Study(TLGS), an ongoing community-based prospective study being conducted to investigate and preventnon-communicable diseases in a representative sample in the district 13 of Tehran, the capital city ofIran [12]. During the third phase of the TLGS (2006–2008), of a total of 12,523 subjects who completedthe examinations, 4920 were randomly selected for completing the dietary assessment based ontheir age and sex. The randomization was performed because of cost and complexity of dietary datacollection in large populations and also the fact that this process is time-consuming. Finally, the dietarydata for 3462 subjects who agreed to participate and completed the food frequency questionnaire(FFQ) were available. The characteristics of participants who completed the validated FFQ weresimilar to those of the total population in the third phase of TLGS [13]. For the purpose of the currentstudy, among subjects aged ≥19 years, we recruited 2927 adult men and women, with complete data(demographics, anthropometrics, biochemicals). Participants were excluded from the final analysisif they had under- or over-reported energy intakes (<800 kcal/day or >4200 kcal/day, respectively),or were on specific diets (n = 563). Participants were also excluded if they had history of CVD atbaseline examination (n = 88). The remaining participants (n = 2276) were followed until March 2012,for a mean duration of 4.7 years from the baseline examination. Participants who had left the study(n = 17) were also excluded and final analyses was conducted on data of 2259 adults (Figure 1).
Written informed consents were obtained from all participants. The study protocol, based onthe ethical guidelines of the 1975 Declaration of Helsinki, was approved (ethics committee number:57ECRIES94/02/15) by the Ethics Research Council of the Research Institute for Endocrine Sciences,Shahid Beheshti University of Medical Sciences.
2.2. Demographic and Anthropometric Measures
Demographics, anthropometrics and biochemical measures were assessed both at baseline(2006–2008) and again at the follow-up examination (2010–2012). Trained interviewers collectedinformation including demographic data, medical history, medication use and smoking habits,using pretested questionnaires. Weight was measured to the nearest 100 g using digital scales,while the subjects were minimally clothed, without shoes. Height was measured to the nearest 0.5 cm,in a standing position without shoes, using a tape meter. Body mass index was calculated as weight(kg) divided by square of the height (m2). Waist circumference was measured to the nearest 0.1 cm,
282
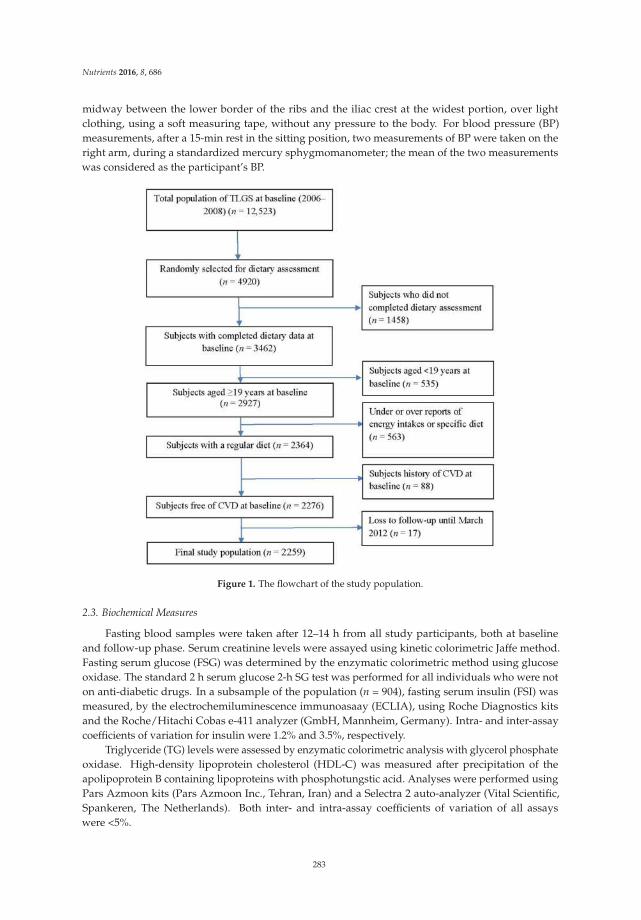
Nutrients 2016, 8, 686
midway between the lower border of the ribs and the iliac crest at the widest portion, over lightclothing, using a soft measuring tape, without any pressure to the body. For blood pressure (BP)measurements, after a 15-min rest in the sitting position, two measurements of BP were taken on theright arm, during a standardized mercury sphygmomanometer; the mean of the two measurementswas considered as the participant’s BP.
Figure 1. The flowchart of the study population.
2.3. Biochemical Measures
Fasting blood samples were taken after 12–14 h from all study participants, both at baselineand follow-up phase. Serum creatinine levels were assayed using kinetic colorimetric Jaffe method.Fasting serum glucose (FSG) was determined by the enzymatic colorimetric method using glucoseoxidase. The standard 2 h serum glucose 2-h SG test was performed for all individuals who were noton anti-diabetic drugs. In a subsample of the population (n = 904), fasting serum insulin (FSI) wasmeasured, by the electrochemiluminescence immunoasaay (ECLIA), using Roche Diagnostics kitsand the Roche/Hitachi Cobas e-411 analyzer (GmbH, Mannheim, Germany). Intra- and inter-assaycoefficients of variation for insulin were 1.2% and 3.5%, respectively.
Triglyceride (TG) levels were assessed by enzymatic colorimetric analysis with glycerol phosphateoxidase. High-density lipoprotein cholesterol (HDL-C) was measured after precipitation of theapolipoprotein B containing lipoproteins with phosphotungstic acid. Analyses were performed usingPars Azmoon kits (Pars Azmoon Inc., Tehran, Iran) and a Selectra 2 auto-analyzer (Vital Scientific,Spankeren, The Netherlands). Both inter- and intra-assay coefficients of variation of all assayswere <5%.
283
Nutrients 2016, 8, 686
2.4. Dietary Assessment
A 168-item food frequency questionnaire (FFQ) was used at the first examination to assess typicalfood intakes over the previous year. The validity and reliability of the FFQ had previously beenassessed in a random sample, by comparing the data from two FFQs, completed 1 year apart andcomparing the data from the FFQs and 12 dietary recalls, respectively; the validity and reliability ofthe FFQ for total dietary fat were acceptable; correlation coefficients between the FFQ and multiple24 recalls were 0.59 and 0.38 and those between the two FFQs were 0.43 and 0.42 in male and femalesubjects, respectively [14]. Study of the reliability, comparative validity and stability of dietary patternsderived from the FFQ also showed that there was a reasonable reliability and validity of the dietarypatterns among the population over time [15]. Trained dietitians asked participants to designate theirintake frequency for each food item consumed during the past year on a daily, weekly, or monthlybasis. Portion sizes of consumed foods reported in household measures were then converted to grams.Energy and nutrient content of foods and beverages were analyzed using the US Department ofAgriculture Food Composition Table (FCT) because the Iranian FCT is incomplete, and has limiteddata on nutrient content of raw foods and beverages [13]. Finally, dietary intakes of participants,including dietary energy and energy density, macronutrients, and micronutrients were determined.In addition to calculating total dietary fiber from all foods, soluble and insoluble dietary fiber intakeswere separately calculated. Additionally, we computed dietary fiber from different sources includingcereal (traditional breads including barbari, taftoon, sangak, lavash, baguette breads, white rice,and barley), legumes (soya, cowpea, chickpea, broad bean, red bean, white bean, lentil, and splitpea), nuts (almond, pistachio, walnut, hazelnut, and peanut), vegetables (green leafy vegetables, roots,starchy vegetables, and other vegetables including cucumber, tomato, scallion, zucchini, eggplant,cauliflower, onion, and garlic) and fruits (cantaloupe, melon watermelon, pear, apricot, cherries, apple,peach, nectarines, figs, grapes, kiwi, grapefruit, tangerine, pomegranate, strawberry, banana, lemons)as well.
2.5. Definition of Terms
History of cardiovascular disease was defined as previous ischemic heart disease and/orcerebrovascular accidents. Family history of premature cardiovascular disease reflected any priordiagnosis of cardiovascular disease in first-degree female relatives, aged <65 years, or first-degreemale relatives, aged <55 years. Diabetes was defined as fasting serum glucose ≥126, 2 h serumglucose ≥200 or anti-diabetic medications [16]. Hypertension (HTN) was considered as systolicBP ≥140 mmHg or systolic BP ≥90 mmHg or current use of antihypertensive medications [17].Homeostatic model assessment of insulin resistance was defined as follows: HOMA-IR = fasting insulin(µU/mL) × fasting glucose (mmol/L)/22.5; this index has been developed as a simple, inexpensive,and validated alternative tool for assessment of insulin resistance in epidemiological studies [18,19].Insulin resistance was defined as HOMA-IR ≥3.2 [20].
2.6. Definition of Outcome in Our Study
Details of the collection of cardiovascular outcome data have been described elsewhere [21].Briefly, each participant was followed up for any medical event annually by phone calls. Information ofany medical condition or event was collected by a trained nurse, a trained physician and by utilizationof data from medical files. The collected data were evaluated and confirmed by an outcome committeeconsisting of an internist, an endocrinologist, a cardiologist, an epidemiologist and other experts.CHD were included cases of definite myocardial infarction (MI) (diagnostic ECG and biomarkers),probable MI (positive ECG findings plus cardiac symptoms or signs plus missing biomarkers orpositive ECG findings plus equivocal biomarkers), and angiographic proven CHD. Cardiovasculardisease was defined as any CHD events, stroke (a new neurological deficit that lasted ≥24 h), or CVDdeath (definite fatal MI, definite fatal CHD, and definite fatal stroke) [22]. The CVD risk score wascalculated according to the sex-specific “general CVD” algorithms were derived that incorporated age,total cholesterol, HDL-C, SBP, treatment for HTN, smoking, and diabetes status [23].
284
Nutrients 2016, 8, 686
2.7. Statistical Methods
Dietary intakes of fiber and other nutrients were adjusted for total energy intake, according toresiduals methods [24]. Mean (SD) values and the frequencies (%) of baseline characteristics of theparticipants, with and without CVD event were compared using independent t test or chi squaretest, respectively.
Linear associations of baseline intakes of total and different types of dietary fiber with changesof serum lipids, blood pressure and insulin levels during the follow-up period were estimated usinglinear regression models with adjustment of age, sex, and BMI.
A univariate analysis was performed for potential confounding variables including CVD riskscore, dietary intake of total fats (% of energy), sodium (mg/1000 kcal), and vitamin C (mg/1000 kcal);variables with PE < 0.2 in the univariate analyses were selected for the final multivariable models.Adjustment of CVD risk score, as a continuous potential risk factor of CVD, improve the stability ofour models in the case of a limited number of events during the study follow-up.
To determine whether the associations of soluble and insoluble fiber intake are independent ofeach other, we adjusted the models in the presence of each type of the fiber. Similarly, the analyses offiber from each different source were adjusted for fiber from all of the other sources.
Cox proportional hazard regression was used to assess the hazard ratios (HRs) of dietary fiberintakes for CVD. Time to event was defined by time of censoring or having event, whichever camefirst. The proportional hazards assumption was tested. We censored participants at the time ofother causes of death, leaving the district or being in the study until March 2012 without event. Theenergy-adjusted amount of dietary fiber and its different types was categorized into tertiles, and thefirst tertile was given as a reference. Two Cox proportional hazard regression models were defined;model 1 was adjusted for CVD risk score and model 2 was further adjusted for dietary intakes oftotal fats, sodium and vitamin C. To assess the overall trends of HRs across tertiles of dietary fiberintakes, the median of each tertile was used as a continuous variable in Cox proportional hazardregression models.
All analyses were performed using IBM SPSS for Windows version 19 and STATA version 12 SE(StataCorp LP, College Station, TX, USA), with a two-tailed p value < 0.05 being considered significant.
3. Results
Mean age of participants (42.8% men) was 38.2 ± 13.4, at baseline. Mean (SD) dietary intakeof total fiber was 23.4 (8.9) g/day. Legumes (35.8%), fruits (30.4%), vegetables (27.8%), and grains(24.0%) had greater contributions to total intakes of dietary fiber, respectively. During the average4.7 ± 1.4 year of follow-up, 57 participants experienced CVD events; of which the more common eventswere angiographic proven CVD (40.4%), definite MI (24.6%), unstable angina (12.2%) and stroke (8.8%).
The distributions of the major known CVD risk factors and some biochemical values for theparticipants who had a CVD event and for those who did not are shown in Table 1. Higher prevalenceof diabetes (14.3 vs. 3.9, p = 0.002) and HTN (43.9 vs. 8.3, p = 0.001), as well as higher rate ofmedications, including lipid-lowering drugs, anti-hypertensive drugs and aspirin, was observed insubjects with CVD events, compared to the rest of the cohort. Compared with non-CVD subjects, CVDpatients were more likely to be older, and had higher BMI, waist circumference, blood pressure,serum creatinine, FPG, TG, TG/HDL-C ratio and CVD risk score at baseline (p for all < 0.05).Compared to non-CVD subjects, CVD patients had also higher intakes of dietary carbohydrate andlower intake of mono-unsaturated fatty acids and fiber (p for all < 0.05).
Results of linear regression showed a significant association between grain fiber intake andbaseline CVD risk score (β = 0.05, 95% CI = 0.02–0.08) as well as changes of HOMA-IR (β = 0.04,95% CI = 0.01–0.08) during the study follow-up. Legume fiber was associated with baseline CVDrisk score (β = −0.14, 95% CI = −0.23, −0.04) and changes of HDL-C (β = 0.64, 95% CI = 0.19–1.08).Furthermore, dietary fiber from vegetables (β = −0.24, 95% CI = −0.34, −0.15), nuts (β = −0.23,95% CI = −0.33, −0.13), fruits (β = −0.18, 95% CI = −0.28, −0.08) was inversely related to CVD
285
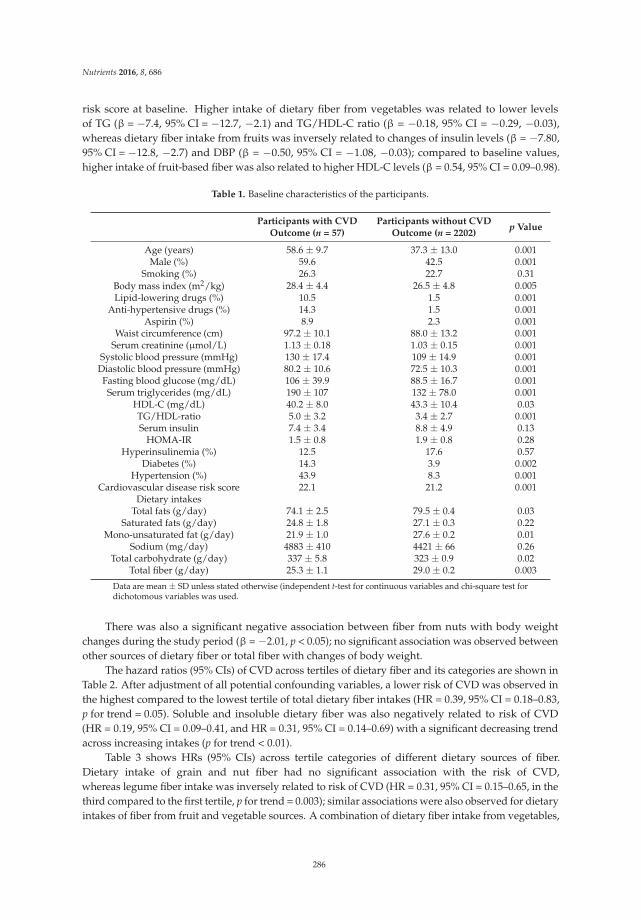
Nutrients 2016, 8, 686
risk score at baseline. Higher intake of dietary fiber from vegetables was related to lower levelsof TG (β = −7.4, 95% CI = −12.7, −2.1) and TG/HDL-C ratio (β = −0.18, 95% CI = −0.29, −0.03),whereas dietary fiber intake from fruits was inversely related to changes of insulin levels (β = −7.80,95% CI = −12.8, −2.7) and DBP (β = −0.50, 95% CI = −1.08, −0.03); compared to baseline values,higher intake of fruit-based fiber was also related to higher HDL-C levels (β = 0.54, 95% CI = 0.09–0.98).
Table 1. Baseline characteristics of the participants.
Participants with CVDOutcome (n = 57)
Participants without CVDOutcome (n = 2202)
p Value
Age (years) 58.6 ± 9.7 37.3 ± 13.0 0.001Male (%) 59.6 42.5 0.001
Smoking (%) 26.3 22.7 0.31Body mass index (m2/kg) 28.4 ± 4.4 26.5 ± 4.8 0.005Lipid-lowering drugs (%) 10.5 1.5 0.001
Anti-hypertensive drugs (%) 14.3 1.5 0.001Aspirin (%) 8.9 2.3 0.001
Waist circumference (cm) 97.2 ± 10.1 88.0 ± 13.2 0.001Serum creatinine (µmol/L) 1.13 ± 0.18 1.03 ± 0.15 0.001
Systolic blood pressure (mmHg) 130 ± 17.4 109 ± 14.9 0.001Diastolic blood pressure (mmHg) 80.2 ± 10.6 72.5 ± 10.3 0.001Fasting blood glucose (mg/dL) 106 ± 39.9 88.5 ± 16.7 0.001Serum triglycerides (mg/dL) 190 ± 107 132 ± 78.0 0.001
HDL-C (mg/dL) 40.2 ± 8.0 43.3 ± 10.4 0.03TG/HDL-ratio 5.0 ± 3.2 3.4 ± 2.7 0.001Serum insulin 7.4 ± 3.4 8.8 ± 4.9 0.13
HOMA-IR 1.5 ± 0.8 1.9 ± 0.8 0.28Hyperinsulinemia (%) 12.5 17.6 0.57
Diabetes (%) 14.3 3.9 0.002Hypertension (%) 43.9 8.3 0.001
Cardiovascular disease risk score 22.1 21.2 0.001Dietary intakes
Total fats (g/day) 74.1 ± 2.5 79.5 ± 0.4 0.03Saturated fats (g/day) 24.8 ± 1.8 27.1 ± 0.3 0.22
Mono-unsaturated fat (g/day) 21.9 ± 1.0 27.6 ± 0.2 0.01Sodium (mg/day) 4883 ± 410 4421 ± 66 0.26
Total carbohydrate (g/day) 337 ± 5.8 323 ± 0.9 0.02Total fiber (g/day) 25.3 ± 1.1 29.0 ± 0.2 0.003
Data are mean ± SD unless stated otherwise (independent t-test for continuous variables and chi-square test fordichotomous variables was used.
There was also a significant negative association between fiber from nuts with body weightchanges during the study period (β = −2.01, p < 0.05); no significant association was observed betweenother sources of dietary fiber or total fiber with changes of body weight.
The hazard ratios (95% CIs) of CVD across tertiles of dietary fiber and its categories are shown inTable 2. After adjustment of all potential confounding variables, a lower risk of CVD was observed inthe highest compared to the lowest tertile of total dietary fiber intakes (HR = 0.39, 95% CI = 0.18–0.83,p for trend = 0.05). Soluble and insoluble dietary fiber was also negatively related to risk of CVD(HR = 0.19, 95% CI = 0.09–0.41, and HR = 0.31, 95% CI = 0.14–0.69) with a significant decreasing trendacross increasing intakes (p for trend < 0.01).
Table 3 shows HRs (95% CIs) across tertile categories of different dietary sources of fiber.Dietary intake of grain and nut fiber had no significant association with the risk of CVD,whereas legume fiber intake was inversely related to risk of CVD (HR = 0.31, 95% CI = 0.15–0.65, in thethird compared to the first tertile, p for trend = 0.003); similar associations were also observed for dietaryintakes of fiber from fruit and vegetable sources. A combination of dietary fiber intake from vegetables,
286
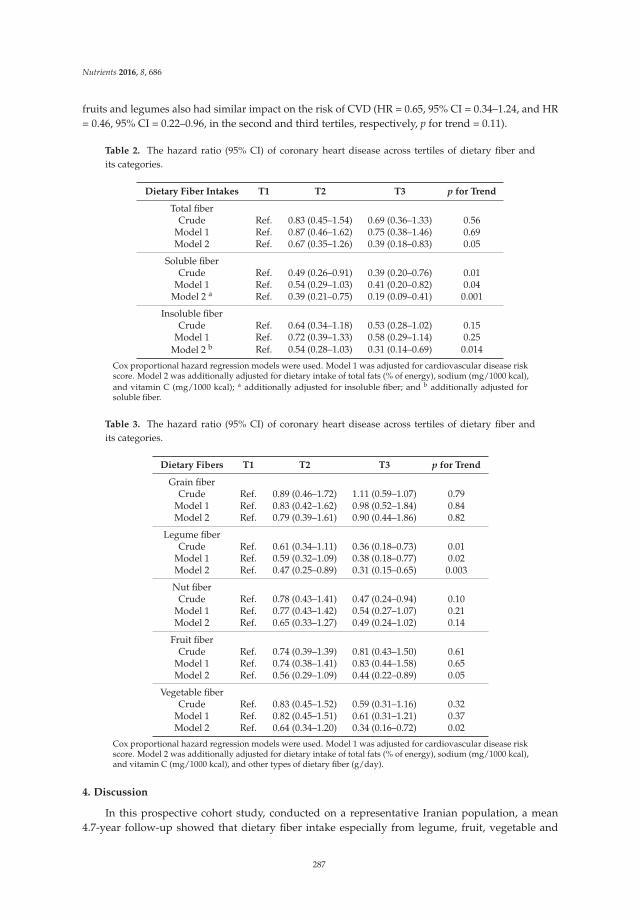
Nutrients 2016, 8, 686
fruits and legumes also had similar impact on the risk of CVD (HR = 0.65, 95% CI = 0.34–1.24, and HR= 0.46, 95% CI = 0.22–0.96, in the second and third tertiles, respectively, p for trend = 0.11).
Table 2. The hazard ratio (95% CI) of coronary heart disease across tertiles of dietary fiber andits categories.
Dietary Fiber Intakes T1 T2 T3 p for Trend
Total fiberCrude Ref. 0.83 (0.45–1.54) 0.69 (0.36–1.33) 0.56
Model 1 Ref. 0.87 (0.46–1.62) 0.75 (0.38–1.46) 0.69Model 2 Ref. 0.67 (0.35–1.26) 0.39 (0.18–0.83) 0.05
Soluble fiberCrude Ref. 0.49 (0.26–0.91) 0.39 (0.20–0.76) 0.01
Model 1 Ref. 0.54 (0.29–1.03) 0.41 (0.20–0.82) 0.04Model 2 a Ref. 0.39 (0.21–0.75) 0.19 (0.09–0.41) 0.001
Insoluble fiberCrude Ref. 0.64 (0.34–1.18) 0.53 (0.28–1.02) 0.15
Model 1 Ref. 0.72 (0.39–1.33) 0.58 (0.29–1.14) 0.25Model 2 b Ref. 0.54 (0.28–1.03) 0.31 (0.14–0.69) 0.014
Cox proportional hazard regression models were used. Model 1 was adjusted for cardiovascular disease riskscore. Model 2 was additionally adjusted for dietary intake of total fats (% of energy), sodium (mg/1000 kcal),and vitamin C (mg/1000 kcal); a additionally adjusted for insoluble fiber; and b additionally adjusted forsoluble fiber.
Table 3. The hazard ratio (95% CI) of coronary heart disease across tertiles of dietary fiber andits categories.
Dietary Fibers T1 T2 T3 p for Trend
Grain fiberCrude Ref. 0.89 (0.46–1.72) 1.11 (0.59–1.07) 0.79
Model 1 Ref. 0.83 (0.42–1.62) 0.98 (0.52–1.84) 0.84Model 2 Ref. 0.79 (0.39–1.61) 0.90 (0.44–1.86) 0.82
Legume fiberCrude Ref. 0.61 (0.34–1.11) 0.36 (0.18–0.73) 0.01
Model 1 Ref. 0.59 (0.32–1.09) 0.38 (0.18–0.77) 0.02Model 2 Ref. 0.47 (0.25–0.89) 0.31 (0.15–0.65) 0.003
Nut fiberCrude Ref. 0.78 (0.43–1.41) 0.47 (0.24–0.94) 0.10
Model 1 Ref. 0.77 (0.43–1.42) 0.54 (0.27–1.07) 0.21Model 2 Ref. 0.65 (0.33–1.27) 0.49 (0.24–1.02) 0.14
Fruit fiberCrude Ref. 0.74 (0.39–1.39) 0.81 (0.43–1.50) 0.61
Model 1 Ref. 0.74 (0.38–1.41) 0.83 (0.44–1.58) 0.65Model 2 Ref. 0.56 (0.29–1.09) 0.44 (0.22–0.89) 0.05
Vegetable fiberCrude Ref. 0.83 (0.45–1.52) 0.59 (0.31–1.16) 0.32
Model 1 Ref. 0.82 (0.45–1.51) 0.61 (0.31–1.21) 0.37Model 2 Ref. 0.64 (0.34–1.20) 0.34 (0.16–0.72) 0.02
Cox proportional hazard regression models were used. Model 1 was adjusted for cardiovascular disease riskscore. Model 2 was additionally adjusted for dietary intake of total fats (% of energy), sodium (mg/1000 kcal),and vitamin C (mg/1000 kcal), and other types of dietary fiber (g/day).
4. Discussion
In this prospective cohort study, conducted on a representative Iranian population, a mean4.7-year follow-up showed that dietary fiber intake especially from legume, fruit, vegetable and
287
Nutrients 2016, 8, 686
nut sources had protective effect against the development of CVD events. Following adjustment ofmultiple CVD risk factors and dietary variables, most negative trends in the current study remainedstatistically significant.
Beneficial effects of vegetable fiber in reduced risk of CVD, in our study, could be related todecreased TG and TG to HDL-C ratio during the study follow-up. Lower risk of CVD across increasingintakes of dietary fiber from fruit sources could also be attributed to its inverse association with insulinlevels and DBP as well as positive association with HDL-C. Lack of the beneficial effects of grainfiber on the risk of CVD may be explained by its positive relation with CVD risk score at baselineand its association with increased insulin resistance index during the study follow-up. It should benoted that in our study, high intakes of refined grains such as white rice and white breads had majorcontributions to dietary intakes of grain fiber, whereas the protective effects of grain fiber, reported insome previous studies, were mainly related to whole grains intake [11]. Aside from chance and biases,another explanation is that other characteristics of refined grains such as high-glycemic index nature,rather than fiber per se, may be responsible for the associations observed.
In a 6-year follow-up study among adult men, higher fiber intake (28.9 vs. 12.4 g/day) wasinversely related to risk of total myocardial infarction by 0.41 (RR = 0.59, 95% CI = 0.46–0.76); the inverseassociation was strongest for fatal myocardial infarction (RR = 0.45, 95% CI = 0.28–0.72) [25]. Each 10-gincrease in total dietary fiber corresponded to an RR for total myocardial infarction of 0.81 (95% CI,0.70–0.93); among the three main food contributors to total fiber intake, cereal fiber had a stronger effecton the reduced risk of total myocardial infarction (RR = 0.71, 95% CI = 0.55–0.91 for each 10-g increasein cereal fiber/day) [25]. In another prospective cohort of elderly men, only cereal fiber consumptionwas associated with lower incident total stroke and ischemic stroke, whereas neither fruit fiber intakenor vegetable fiber intake were associated with incident CVD; compared to cereal fiber from othersources, fiber from dark breads including wheat, rye, and pumpernickel were associated with a lowerrisk of CVD (HR = 0.76, 95% CI = 0.64–0.90) [26].
Findings of a recent meta-analysis of 22 prospective cohorts showed that total dietary fiber intakewas inversely associated with risk of CVD (Risk ratio = 0.91 per 7 g/day, 95% CI = 0.88 to 0.94) and CVD(Risk ratio = 0.91, 95% CI = 0.87–0.94); insoluble fiber and fiber from cereal and vegetable sources wereinversely associated with the incident CVD and CVD, whereas fruit fiber intake was only inverselyassociated with risk of CVD [27]. No clear differences in the effect of dietary fiber intake from variousfood groups on CVD mortality have been observed in a cohort of adult men, although every additional10 g/day intake of dietary total fiber reduced CVD mortality by 17% (95% CI = 2%–30%) and all-causemortality by 9% (95% CI = 0%–18%) [28] (Table 4). The cardioprotective effect of dietary fiber has beenfound to be stronger for cereal fiber than for fruit or vegetable fiber [29]. In a cross-sectional studyconducted on adult men and women, higher intakes of total fiber and insoluble fiber were inverselyrelated to systolic blood pressure [30].
In our previous study, we showed that higher intake of total dietary fiber reduced the risk ofmetabolic syndrome by 47% (OR = 0.53, 95% CI = 0.39–0.74, p for trend < 0.05); soluble and insolublefiber intakes were also related to lower risk of metabolic syndrome (OR = 0.60, 95% CI = 0.43–0.84,and OR = 0.51, 95% CI = 0.35–0.72). Similar findings were also observed for dietary fiber from fruits,cereals and legumes sources but not for vegetable and nut fiber [9]. In the National Health and NutritionExamination Survey, dietary fiber intake was related to a low and intermediate lifetime CVD risk andthere was a significant inverse linear association between dietary fiber intake and log-transformedC-reactive protein [31].
Some differences between our findings and those of other cohorts may be related to differentdietary habits and dietary patterns; previous studies among Iranians demonstrated some majordietary patterns including traditional dietary pattern with higher load of white rice, traditional breads,vegetables, full-fat dairy products, hydrogenated fats, legumes, dried fruits and nuts; the healthydietary pattern was related to a higher load of vegetables and fruits, whereas the Western pattern hadhigher load of fast foods, salty snacks, sweets, mayonnaise, and soft drinks [32,33]. Lack of significantassociations between fiber from grains and nuts may be related to types of these food groups consumed
288
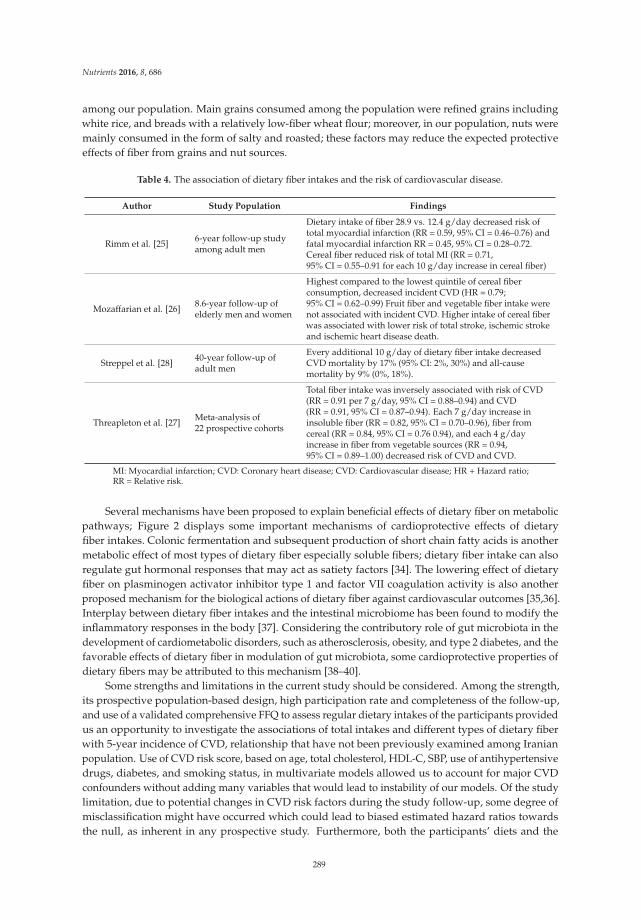
Nutrients 2016, 8, 686
among our population. Main grains consumed among the population were refined grains includingwhite rice, and breads with a relatively low-fiber wheat flour; moreover, in our population, nuts weremainly consumed in the form of salty and roasted; these factors may reduce the expected protectiveeffects of fiber from grains and nut sources.
Table 4. The association of dietary fiber intakes and the risk of cardiovascular disease.
Author Study Population Findings
Rimm et al. [25] 6-year follow-up studyamong adult men
Dietary intake of fiber 28.9 vs. 12.4 g/day decreased risk oftotal myocardial infarction (RR = 0.59, 95% CI = 0.46–0.76) andfatal myocardial infarction RR = 0.45, 95% CI = 0.28–0.72.Cereal fiber reduced risk of total MI (RR = 0.71,95% CI = 0.55–0.91 for each 10 g/day increase in cereal fiber)
Mozaffarian et al. [26] 8.6-year follow-up ofelderly men and women
Highest compared to the lowest quintile of cereal fiberconsumption, decreased incident CVD (HR = 0.79;95% CI = 0.62–0.99) Fruit fiber and vegetable fiber intake werenot associated with incident CVD. Higher intake of cereal fiberwas associated with lower risk of total stroke, ischemic strokeand ischemic heart disease death.
Streppel et al. [28] 40-year follow-up ofadult men
Every additional 10 g/day of dietary fiber intake decreasedCVD mortality by 17% (95% CI: 2%, 30%) and all-causemortality by 9% (0%, 18%).
Threapleton et al. [27] Meta-analysis of22 prospective cohorts
Total fiber intake was inversely associated with risk of CVD(RR = 0.91 per 7 g/day, 95% CI = 0.88–0.94) and CVD(RR = 0.91, 95% CI = 0.87–0.94). Each 7 g/day increase ininsoluble fiber (RR = 0.82, 95% CI = 0.70–0.96), fiber fromcereal (RR = 0.84, 95% CI = 0.76 0.94), and each 4 g/dayincrease in fiber from vegetable sources (RR = 0.94,95% CI = 0.89–1.00) decreased risk of CVD and CVD.
MI: Myocardial infarction; CVD: Coronary heart disease; CVD: Cardiovascular disease; HR + Hazard ratio;RR = Relative risk.
Several mechanisms have been proposed to explain beneficial effects of dietary fiber on metabolicpathways; Figure 2 displays some important mechanisms of cardioprotective effects of dietaryfiber intakes. Colonic fermentation and subsequent production of short chain fatty acids is anothermetabolic effect of most types of dietary fiber especially soluble fibers; dietary fiber intake can alsoregulate gut hormonal responses that may act as satiety factors [34]. The lowering effect of dietaryfiber on plasminogen activator inhibitor type 1 and factor VII coagulation activity is also anotherproposed mechanism for the biological actions of dietary fiber against cardiovascular outcomes [35,36].Interplay between dietary fiber intakes and the intestinal microbiome has been found to modify theinflammatory responses in the body [37]. Considering the contributory role of gut microbiota in thedevelopment of cardiometabolic disorders, such as atherosclerosis, obesity, and type 2 diabetes, and thefavorable effects of dietary fiber in modulation of gut microbiota, some cardioprotective properties ofdietary fibers may be attributed to this mechanism [38–40].
Some strengths and limitations in the current study should be considered. Among the strength,its prospective population-based design, high participation rate and completeness of the follow-up,and use of a validated comprehensive FFQ to assess regular dietary intakes of the participants providedus an opportunity to investigate the associations of total intakes and different types of dietary fiberwith 5-year incidence of CVD, relationship that have not been previously examined among Iranianpopulation. Use of CVD risk score, based on age, total cholesterol, HDL-C, SBP, use of antihypertensivedrugs, diabetes, and smoking status, in multivariate models allowed us to account for major CVDconfounders without adding many variables that would lead to instability of our models. Of the studylimitation, due to potential changes in CVD risk factors during the study follow-up, some degree ofmisclassification might have occurred which could lead to biased estimated hazard ratios towardsthe null, as inherent in any prospective study. Furthermore, both the participants’ diets and the
289
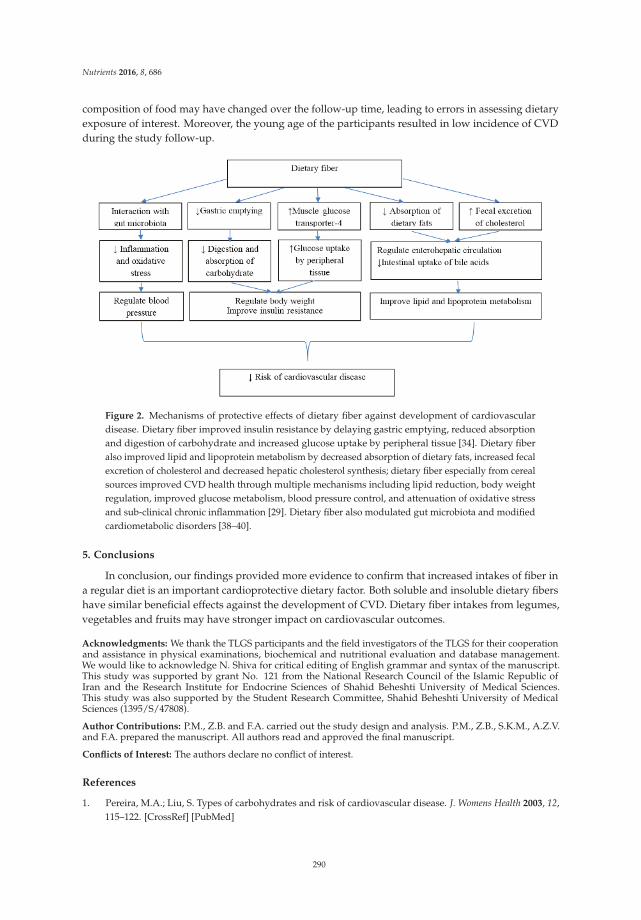
Nutrients 2016, 8, 686
composition of food may have changed over the follow-up time, leading to errors in assessing dietaryexposure of interest. Moreover, the young age of the participants resulted in low incidence of CVDduring the study follow-up.
Figure 2. Mechanisms of protective effects of dietary fiber against development of cardiovasculardisease. Dietary fiber improved insulin resistance by delaying gastric emptying, reduced absorptionand digestion of carbohydrate and increased glucose uptake by peripheral tissue [34]. Dietary fiberalso improved lipid and lipoprotein metabolism by decreased absorption of dietary fats, increased fecalexcretion of cholesterol and decreased hepatic cholesterol synthesis; dietary fiber especially from cerealsources improved CVD health through multiple mechanisms including lipid reduction, body weightregulation, improved glucose metabolism, blood pressure control, and attenuation of oxidative stressand sub-clinical chronic inflammation [29]. Dietary fiber also modulated gut microbiota and modifiedcardiometabolic disorders [38–40].
5. Conclusions
In conclusion, our findings provided more evidence to confirm that increased intakes of fiber ina regular diet is an important cardioprotective dietary factor. Both soluble and insoluble dietary fibershave similar beneficial effects against the development of CVD. Dietary fiber intakes from legumes,vegetables and fruits may have stronger impact on cardiovascular outcomes.
Acknowledgments: We thank the TLGS participants and the field investigators of the TLGS for their cooperationand assistance in physical examinations, biochemical and nutritional evaluation and database management.We would like to acknowledge N. Shiva for critical editing of English grammar and syntax of the manuscript.This study was supported by grant No. 121 from the National Research Council of the Islamic Republic ofIran and the Research Institute for Endocrine Sciences of Shahid Beheshti University of Medical Sciences.This study was also supported by the Student Research Committee, Shahid Beheshti University of MedicalSciences (1395/S/47808).
Author Contributions: P.M., Z.B. and F.A. carried out the study design and analysis. P.M., Z.B., S.K.M., A.Z.V.and F.A. prepared the manuscript. All authors read and approved the final manuscript.
Conflicts of Interest: The authors declare no conflict of interest.
References
1. Pereira, M.A.; Liu, S. Types of carbohydrates and risk of cardiovascular disease. J. Womens Health 2003, 12,115–122. [CrossRef] [PubMed]
290
Nutrients 2016, 8, 686
2. Slavin, J.L. Position of the American Dietetic Association: Health implications of dietary fiber. J. Am.
Diet. Assoc. 2008, 108, 1716–1731. [PubMed]3. Lichtenstein, A.H.; Appel, L.J.; Brands, M.; Carnethon, M.; Daniels, S.; Franch, H.A.; Appel, L.J.; Brands, M.;
Carnethon, M.; Daniels, S.; et al. Diet and lifestyle recommendations revision 2006: A scientific statementfrom the American Heart Association Nutrition Committee. Circulation 2006, 114, 82–96. [CrossRef][PubMed]
4. Eilat-Adar, S.; Sinai, T.; Yosefy, C.; Henkin, Y. Nutritional recommendations for cardiovascular diseaseprevention. Nutrients 2013, 5, 3646–3683. [CrossRef] [PubMed]
5. Erkkila, A.T.; Lichtenstein, A.H. Fiber and cardiovascular disease risk: How strong is the evidence?J. Cardiovasc. Nurs. 2006, 21, 3–8. [CrossRef] [PubMed]
6. Eshak, E.S.; Iso, H.; Date, C.; Kikuchi, S.; Watanabe, Y.; Wada, Y.; Wakai, K.; Tamakoshi, A.; JACC StudyGroup. Dietary fiber intake is associated with reduced risk of mortality from cardiovascular disease amongJapanese men and women. J. Nutr. 2010, 140, 1445–1453. [CrossRef] [PubMed]
7. Kokubo, Y.; Iso, H.; Saito, I.; Yamagishi, K.; Ishihara, J.; Inoue, M.; Tsugane, S.; JPHC Study Group.Dietary fiber intake and risk of cardiovascular disease in the Japanese population: The Japan Public HealthCenter-based study cohort. Eur. J. Clin. Nutr. 2011, 65, 1233–1241. [CrossRef] [PubMed]
8. McKeown, N.M.; Meigs, J.B.; Liu, S.; Saltzman, E.; Wilson, P.W.; Jacques, P.F. Carbohydrate nutrition, insulinresistance, and the prevalence of the metabolic syndrome in the Framingham Offspring Cohort. Diabetes Care
2004, 27, 538–546. [CrossRef] [PubMed]9. Hosseinpour, S.M.P.; Sohrab, G.; Hosseini-Esfahani, F.; Azizi, F. Inverse association between fruit, legume,
and cereal fiber and the risk of metabolic syndrome: Tehran Lipid and Glucose Study. Diabetes Res. Clin. Pract.
2011, 94, 276–283. [CrossRef] [PubMed]10. Brown, L.; Rosner, B.; Willett, W.W.; Sacks, F.M. Cholesterol-lowering effects of dietary fiber: A meta-analysis.
Am. J. Clin. Nutr. 1999, 69, 30–42. [PubMed]11. Liu, S.; Buring, J.E.; Sesso, H.D.; Rimm, E.B.; Willett, W.C.; Manson, J.E. A prospective study of dietary fiber
intake and risk of cardiovascular disease among women. J. Am. Coll. Cardiol. 2002, 39, 49–56. [CrossRef]12. Azizi, F.; Rahmani, M.; Emami, H.; Mirmiran, P.; Hajipour, R.; Madjid, M.; Ghanbili, J.; Ghanbarian, A.;
Mehrabi, Y.; Saadat, N.; et al. Cardiovascular risk factors in an Iranian urban population: Tehran lipid andglucose study (phase 1). Soz. Praventivmed. 2002, 47, 408–426. [CrossRef] [PubMed]
13. Hosseini-Esfahani, F.; Jessri, M.; Mirmiran, P.; Bastan, S.; Azizi, F. Adherence to dietary recommendationsand risk of metabolic syndrome: Tehran Lipid and Glucose Study. Metab. Clin. Exp. 2010, 59, 1833–1842.[CrossRef] [PubMed]
14. Mirmiran, P.; Esfahani, F.H.; Mehrabi, Y.; Hedayati, M.; Azizi, F. Reliability and relative validity of an FFQ fornutrients in the Tehran lipid and glucose study. Public Health Nutr. 2010, 13, 654–662. [CrossRef] [PubMed]
15. Panagiotakos, D.B.; Pitsavos, C.; Skoumas, Y.; Stefanadis, C. The Association between Food Patterns and theMetabolic Syndrome Using Principal Components Analysis: The ATTICA Study. J. Am. Diet. Assoc. 2007,107, 979–987. [CrossRef] [PubMed]
16. American Diabetes Association. Standards of medical care in diabetes—2014. Diabetes Care 2014, 37, S14–S80.17. Chobanian, A.V.; Bakris, G.L.; Black, H.R.; Cushman, W.C.; Green, L.A.; Izzo, J.L., Jr.; Jones, D.W.;
Materson, B.J.; Oparil, S.; Wright, J.T., Jr.; et al. The Seventh Report of the Joint National Committeeon Prevention, Detection, Evaluation, and Treatment of High Blood Pressure: The JNC 7 report. JAMA 2003,289, 2560–2572. [CrossRef] [PubMed]
18. Borai, A.; Livingstone, C.; Kaddam, I.; Ferns, G. Selection of the appropriate method for the assessment ofinsulin resistance. BMC Med. Res. Methodol. 2011, 11, 158. [CrossRef] [PubMed]
19. Muniyappa, R.; Lee, S.; Chen, H.; Quon, M.J. Current approaches for assessing insulin sensitivity andresistance in vivo: Advantages, limitations, and appropriate usage. Am. J. Physiol. Endocrinol. Metab. 2008,94, E15–E26. [CrossRef] [PubMed]
20. Enzevaei, A.; Salehpour, S.; Tohidi, M.; Saharkhiz, N. Subclinical hypothyroidism and insulin resistance inpolycystic ovary syndrome: Is there a relationship? Iran. J. Reprod. Med. 2014, 12, 481–486. [PubMed]
21. Hadaegh, F.; Harati, H.; Ghanbarian, A.; Azizi, F. Association of total cholesterol versus other serum lipidparameters with the short-term prediction of cardiovascular outcomes: Tehran Lipid and Glucose Study.Eur. J. Cardiovasc. Prev. Rehabil. 2006, 13, 571–577. [CrossRef] [PubMed]
291
Nutrients 2016, 8, 686
22. Nejat, A.; Mirbolouk, M.; Mohebi, R.; Hasheminia, M.; Tohidi, M.; Saadat, N.; Azizi, F.; Hadaegh, F.Changes in lipid measures and incident coronary heart disease: Tehran Lipid & Glucose Study. Clin. Biochem.
2014, 47, 1239–1244. [PubMed]23. D’Agostino, R.B., Sr.; Vasan, R.S.; Pencina, M.J.; Wolf, P.A.; Cobain, M.; Massaro, J.M.; Kannel, W.B.
General cardiovascular risk profile for use in primary care: The Framingham Heart Study. Circulation
2008, 117, 743–753. [CrossRef] [PubMed]24. Yilmaz, B.; Sahin, K.; Bilen, H.; Bahcecioglu, I.H.; Bilir, B.; Ashraf, S.; Halazun, K.J.; Kucuk, O. Carotenoids and
non-alcoholic fatty liver disease. Hepatobiliary Surg. Nutr. 2015, 4, 161–171. [PubMed]25. Rimm, E.B.; Ascherio, A.; Giovannucci, E.; Spiegelman, D.; Stampfer, M.J.; Willett, W.C. Vegetable, fruit,
and cereal fiber intake and risk of coronary heart disease among men. JAMA 1996, 275, 447–451. [CrossRef][PubMed]
26. Mozaffarian, D.; Kumanyika, S.K.; Lemaitre, R.N.; Olson, J.L.; Burke, G.L.; Siscovick, D.S. Cereal, fruit,and vegetable fiber intake and the risk of cardiovascular disease in elderly individuals. JAMA 2003, 289,1659–1666. [CrossRef] [PubMed]
27. Threapleton, D.E.; Greenwood, D.C.; Evans, C.E.; Cleghorn, C.L.; Nykjaer, C.; Woodhead, C.; Cade, J.E.;Gale, C.P.; Burley, V.J. Dietary fibre intake and risk of cardiovascular disease: Systematic review andmeta-analysis. BMJ 2013, 347, f6879. [CrossRef] [PubMed]
28. Streppel, M.T.; Ocké, M.C.; Boshuizen, H.C.; Kok, F.J.; Kromhout, D. Dietary fiber intake in relation tocoronary heart disease and all-cause mortality over 40 years: The Zutphen Study. Am. J. Clin. Nutr. 2008, 88,1119–1125. [PubMed]
29. Satija, A.; Hu, F.B. Cardiovascular benefits of dietary fiber. Curr. Atheroscler. Rep. 2012, 14, 505–514. [CrossRef][PubMed]
30. Aljuraiban, G.S.; Griep, L.M.; Chan, Q.; Daviglus, M.L.; Stamler, J.; Van Horn, L.; Elliott, P.; Frost, G.S.Total, insoluble and soluble dietary fibre intake in relation to blood pressure: The INTERMAP Study.Br. J. Nutr. 2015, 114, 1480–1486. [CrossRef] [PubMed]
31. Ning, H.; Van Horn, L.; Shay, C.M.; Lloyd-Jones, D.M. Associations of Dietary Fiber Intake with Long-TermPredicted Cardiovascular Disease Risk and C-Reactive Protein Levels (from the National Health andNutrition Examination Survey Data. Am. J. Cardiol. 2014, 113, 287–291. [CrossRef] [PubMed]
32. Doostvandi, T.; Bahadoran, Z.; Mozaffari-Khosravi, H.; Mirmiran, P.; Azizi, F. Food intake patterns areassociated with the risk of impaired glucose and insulin homeostasis: A prospective approach in the TehranLipid and Glucose Study. Public Health Nutr. 2016, 19, 2467–2474. [CrossRef] [PubMed]
33. Moslehi, N.; Hosseini-Esfahani, F.; Hosseinpanah, F.; Mirmiran, P.; Azizi, F. Patterns of food consumptionand risk of type 2 diabetes in an Iranian population: A nested case–control study. Nutr. Diet. 2016, 73,169–176. [CrossRef]
34. Weickert, M.O.; Pfeiffer, A.F.H. Metabolic Effects of Dietary Fiber Consumption and Prevention of Diabetes.J. Nutr. 2008, 138, 439–442. [PubMed]
35. Anderson, J.W.; Tietyen-Clark, J. Dietary fiber: Hyperlipidemia, hypertension, and coronary heart disease.Am. J. Gastroenterol. 1986, 81, 907–919. [PubMed]
36. Anderson, J.W.; Chen, W.J. Plant fiber. Carbohydrate and lipid metabolism. Am. J. Clin. Nutr. 1979, 32,346–363. [PubMed]
37. Kuo, S.M. The interplay between fiber and the intestinal microbiome in the inflammatory response. Adv. Nutr.
2013, 4, 16–28. [CrossRef] [PubMed]38. Miele, L.; Giorgio, V.; Alberelli, M.A.; De Candia, E.; Gasbarrini, A.; Grieco, A. Impact of Gut Microbiota on
Obesity, Diabetes, and Cardiovascular Disease Risk. Curr. Cardiol. Rep. 2015, 17, 120. [CrossRef] [PubMed]39. Hamaker, B.R.; Tuncil, Y.E. A perspective on the complexity of dietary fiber structures and their potential
effect on the gut microbiota. J. Mol. Biol. 2014, 426, 3838–3850. [CrossRef] [PubMed]40. Parnell, J.A.; Reimer, R.A. Prebiotic fiber modulation of the gut microbiota improves risk factors for obesity
and the metabolic syndrome. Gut Microbes 2012, 3, 29–34. [CrossRef] [PubMed]
© 2016 by the authors. Licensee MDPI, Basel, Switzerland. This article is an open accessarticle distributed under the terms and conditions of the Creative Commons Attribution(CC BY) license (http://creativecommons.org/licenses/by/4.0/).
292
nutrients
Article
Exercise and Beta-Glucan Consumption(Saccharomyces cerevisiae) Improve the MetabolicProfile and Reduce the Atherogenic Index in Type 2Diabetic Rats (HFD/STZ)
Eric Francelino Andrade 1,*, Andressa Ribeiro Veiga Lima 2, Ingrid Edwiges Nunes 3,
Débora Ribeiro Orlando 4, Paula Novato Gondim 1, Márcio Gilberto Zangeronimo 1,
Fernando Henrique Ferrari Alves 2 and Luciano José Pereira 2
1 Department of Veterinary Medicine, Federal University of Lavras, Mail Box 3037, Lavras 37200-000, Brazil;[email protected] (P.N.G.); [email protected] (M.G.Z.)
2 Department of Health Sciences, Federal University of Lavras, Mail Box 3037, Lavras 37200-000, Brazil;[email protected] (A.R.V.L.); [email protected] (F.H.F.A.);[email protected] (L.J.P.)
3 Department of Animal Sciences, Federal University of Lavras, Mail Box 3037, Lavras 37200-000, Brazil;[email protected]
4 Department of Agricultural Sciences, Federal University of Jequitinhonha and Mucuri Valleys,Rua Vereador João Narciso, 1380—Bairro Cachoeira, Unaí 3861-000, Brazil; [email protected]
* Correspondence: [email protected]; Tel.: +55-35-99187-2385
Received: 22 September 2016; Accepted: 29 November 2016; Published: 17 December 2016
Abstract: Physical activity and the ingestion of dietary fiber are non-drug alternatives commonlyused as adjuvants to glycemic control in diabetic individuals. Among these fibers, we can highlightbeta-glucans. However, few studies have compared isolated and synergic effects of physicalexercise and beta-glucan ingestion, especially in type 2 diabetic rats. Therefore, we evaluatedthe effects beta-glucan (Saccharomyces cerevisiae) consumption, associated or not to exercise, onmetabolic parameters of diabetic Wistar rats. The diabetes mellitus (DM) was induced by high-fatdiet (HFD) associated with a low dose of streptozotocin (STZ—35 mg/kg). Trained groups weresubmitted to eight weeks of exercise in aquatic environment. In the last 28 days of experiment,animals received 30 mg/kg/day of beta-glucan by gavage. Isolated use of beta-glucan decreasedglucose levels in fasting, Glycated hemoglobin (HbA1c), triglycerides (TAG), total cholesterol (TC),low-density lipoprotein (LDL-C), the atherogenic index of plasma. Exercise alone also decreasedblood glucose levels, HbA1c, and renal lesions. An additive effect for reducing the atherogenic indexof plasma and renal lesions was observed when both treatments were combined. It was concludedthat both beta-glucan and exercise improved metabolic parameters in type 2 (HFD/STZ) diabetic rats.
Keywords: dietary fibers; glycemic control; metabolic profile
1. Introduction
Diabetes mellitus (DM) is a metabolic disorder characterized by chronic hyperglycemia, causedby the absence or reduction in insulin production (type 1 DM) as well as the resistance to the actionof this hormone, featuring type 2 DM [1]. About 90% of DM cases are of type 2, and this fact isassociated with increased incidence of obesity and obesity in the general population, especially indeveloping nations [2,3]. In addition, DM may predispose to diseases, such as retinopathy, nephropathy,neuropathy and heart disease, further aggravating the health condition of patients [2,4].
Nutrients 2016, 8, 792 293 www.mdpi.com/journal/nutrients
Nutrients 2016, 8, 792
Glycemic control in diabetic patients can be achieved through the use of exogenous insulinand/oral hypoglycemic drugs [5]. However, the interaction between medications could cause sideeffects, and does not prevent the diseases associated with DM, making necessary the search fornon-pharmacological alternatives to assist in the maintenance of blood sugar levels [4,6]. In thissense, the practice of physical exercise and diet therapy has been recommended as a treatment ortherapeutic adjuvant [7]. Physical exercise increases the uptake and utilization of circulating glucoseand improves insulin sensitivity [8]. The ingestion of some dietary fibers has also been reported toshow antihyperglycemic action—mainly by reducing the absorption of carbohydrates and lipids in theintestine. Among these fibers, we can highlight beta-glucans that are polysaccharides found in thecomposition of cereal, fungi, bacteria and some grass cell walls [9].
The chemical structure of beta-glucan varies according to its origin [10]. Beta-glucans found inplants and cereals are linear and have branchings with β-1,3/1,4-type glycosidic linkages (soluble withlow molecular weight), while those found in yeasts and fungi have β-1,3/1,6-type glycosidiclinkages (insoluble with high molecular weight) [11]. These conformations make beta-glucansexhibit distinct physicochemical characteristics, such as molecular mass and solubility [12,13].Cereal beta-glucans are reported to show metabolic potential, while those from fungi and yeastincrease immune response [10,14,15]. Although fungi beta-glucans are recognized to modulate theimmune response [16], recent studies from our group have also demonstrated interesting metaboliceffects of yeast beta-glucans (Saccharomyces cereviseae) [10,17,18].
Considering the previously known effects of both exercise and the beta-glucan on glycemic controland metabolism, it is necessary to investigate the concomitant action of these agents in the treatmentof type DM. In addition, there is a shortage of studies evaluating such effects in type 2 diabetesmodel. Thus, the present study aimed to evaluate the effects of beta-glucan (Saccharomyces cerevisiae),associated or not to physical exercise, on the metabolic parameters of type 2 diabetic rats (HFD/STZ).
2. Materials and Methods
2.1. Animals
This study was approved by the Ethics Committee on Animal Use of Federal University of Lavras(CEUA protocol 002/2015). The animals were kept in accordance with the Guide to the Care and Useof Experimental Animals (1993). The number of animals per group was kept at a minimum for ethicalreasons but still enough to reach statistical significance. Thus, a power calculation test was performedto determine the sample size. The sample size was determined to provide 80% power to recognizea significant difference of 20% among groups and a standard deviation of 15% with a 95% confidenceinterval (α = 0.05).
We used adult male Wistar rats (Rattus norvegicus albinos)—from the Animal Laboratory ofthe Federal University of Lavras (UFLA). Animals weighed 195.0 ± 15.7 g at the beginning ofthe study. Initially, rats were submitted to seven days of acclimatization in polypropylene boxes(dimensions 41 cm × 34 cm × 17.5 cm), containing wood shavings (for absorbing urine and water).Six animals were placed in each box. Throughout the experimental period, the rodents remained undercontrolled temperature (22 ± 2 C), humidity (45% ± 15%) and luminosity (12–12 h light-dark cycle)conditions. High-fat diet and water were provided ad libitum throughout the experiment.
2.2. Induction of Diabetes Mellitus
At the end of the acclimatization period, all animals were submitted to type 2 diabetes inductionprotocol as described by Wang et al. [19]. The animals received high-fat diet (HFD—25% fat,48% carbohydrates and 20% protein) for 28 days. Then, a low dose of streptozotocin (dissolvedin citrate buffer—pH = 4.5) was injected intraperitoneally (STZ—35 mg/kg). Blood glucose levelswere measured 48 h after STZ injection. Rats with blood glucose levels above 200 mg/dL [19] wereconsidered diabetic. This model mimic advanced stages of type 2 diabetes in humans [19,20]. Rats that
294
Nutrients 2016, 8, 792
did not reach these glucose values were excluded from the experiment. Glycemia was checked weeklyto ensure that diabetes was not reversed.
After diabetes induction, animals were randomly divided into four groups containing six animalseach. A completely randomized experimental design in a 2 × 2 factorial scheme was used: with orwithout exercise and with or without beta-glucan.
2.3. Physical Training
After an acclimatization period, an adaptation to the aquatic environment was performed.Animals undergoing physical training remained for two hours daily, during seven days, in apolyethylene tank with a total capacity of 300 L, containing five centimeters of water at a temperatureof approximately 32 ± 2 C. The purpose of this acclimatization was to reduce stress against the aquaticenvironment, without causing, however, changes arising from the physical training [21].
In the following week, animals were submitted to progressive swimming sessions with timeincrements. This phase consisted of swimming without load, in 50 cm of water (in order to avoid animaltail contact with the bottom of the tank), where the animals swam 10 min in the first day, increasing10 min daily until the end of six days, when each animal was swimming for 60 uninterrupted minuteswithout load [22].
In the subsequent eight weeks, the animals swam for 60 min daily, five times a week witha load of 5% of their body weight. This load causes improvement in the animals’ endurance capacity,characterizing moderate intensity aerobic exercise [22]. After training sessions, we dried the animalswith absorbent towels, before returning them to their cages [21].
2.4. Administration of Beta-Glucans
Simultaneously with training, in the last 28 days of the experiment, the animals inbeta-glucan groups received a experimental solution and controls received saline—both by gavage.Beta-glucan solutions that contained 30 mg/kg of powder diluted in 0.3 mL saline solutionprepared daily.
Beta-glucan used in the present study were derived from yeast Saccharomyces cerevisiae,with structural β-1,3/1,6 conformation. The beta-glucan powder presented the following composition:β-glucans—Min. 60.0%; Crude Protein—Max. 8.0%; pH (solution 2%) 4.0–7.0; Ash—Max. 10.0 g/100 g.Distribution of particle size: mean—41 µm; <20 µm 19%; 20–50 µm 43%; 50–100 µm 28%; 100–200 µm10%; >200 µm 0%; Fluidity (seconds)—70.2; Angle of repose (degrees) 31.2; Compressibility 37%;Water retention capacity (mean) 7.4; and Solubility rate in water 7.9. The solutions were alwaysadministered daily in the morning. In animals under physical training, gavage was always performedwith a minimum of 45 min before exercise, as described in previous studies [21,23].
2.5. Collection of Biological Material and Assessment of the Atherogenic Index of Plasma
At the end of the experimental period (eight weeks), the animals fasted for eight hours.Euthanasia was conducted by cardiac puncture under anesthesia (sodium thiopental 50 mg/kgip). Glycated hemoglobin (HbA1c) and other blood biochemical parameters such as glucose,triacylglycerols (TAG), high density lipoprotein (HDL-C) and total cholesterol (TC) were determinedusing commercial kits (Labtest Diagnostica®, Belo Horizonte, Brazil and Gold analyzes diagnoses®,Belo Horizonte, Brazil) as described by Amr and Abeer [24]. The low-density lipoprotein (LDL) +very-low-density lipoprotein cholesterol (VLDL-C) levels of each animal were obtained by using thefollowing equation: total cholesterol − HDL-C = LDL + VLDL-C [25]. Additionally, the animals’atherogenic index of plasma was calculated using the equation: log (TG)/(HDL-C), which is used asa significant predictor of atherosclerosis [26]. This index was used because type 2 diabetes increasesone’s chances of developing atherosclerosis [27].
295
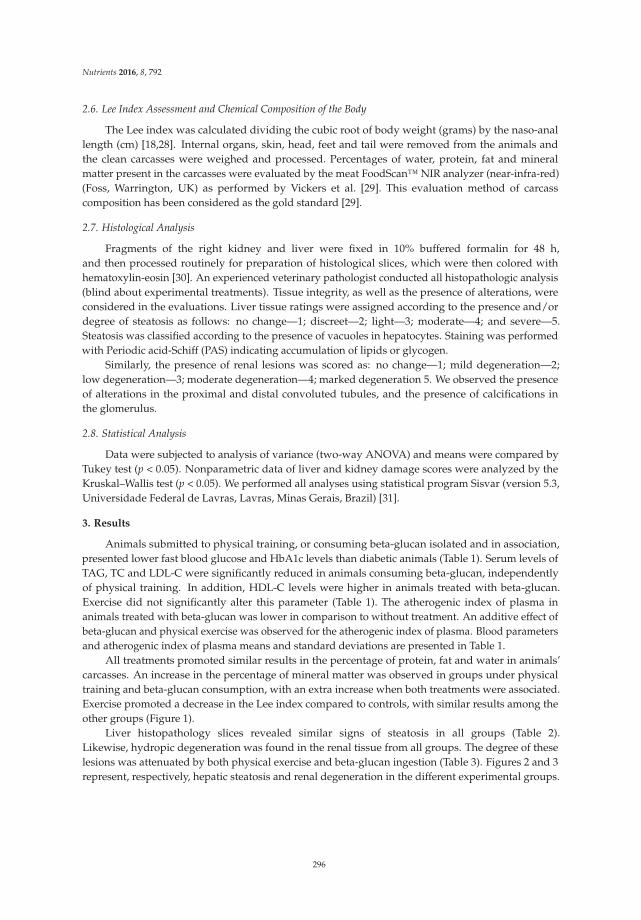
Nutrients 2016, 8, 792
2.6. Lee Index Assessment and Chemical Composition of the Body
The Lee index was calculated dividing the cubic root of body weight (grams) by the naso-anallength (cm) [18,28]. Internal organs, skin, head, feet and tail were removed from the animals andthe clean carcasses were weighed and processed. Percentages of water, protein, fat and mineralmatter present in the carcasses were evaluated by the meat FoodScan™ NIR analyzer (near-infra-red)(Foss, Warrington, UK) as performed by Vickers et al. [29]. This evaluation method of carcasscomposition has been considered as the gold standard [29].
2.7. Histological Analysis
Fragments of the right kidney and liver were fixed in 10% buffered formalin for 48 h,and then processed routinely for preparation of histological slices, which were then colored withhematoxylin-eosin [30]. An experienced veterinary pathologist conducted all histopathologic analysis(blind about experimental treatments). Tissue integrity, as well as the presence of alterations, wereconsidered in the evaluations. Liver tissue ratings were assigned according to the presence and/ordegree of steatosis as follows: no change—1; discreet—2; light—3; moderate—4; and severe—5.Steatosis was classified according to the presence of vacuoles in hepatocytes. Staining was performedwith Periodic acid-Schiff (PAS) indicating accumulation of lipids or glycogen.
Similarly, the presence of renal lesions was scored as: no change—1; mild degeneration—2;low degeneration—3; moderate degeneration—4; marked degeneration 5. We observed the presenceof alterations in the proximal and distal convoluted tubules, and the presence of calcifications inthe glomerulus.
2.8. Statistical Analysis
Data were subjected to analysis of variance (two-way ANOVA) and means were compared byTukey test (p < 0.05). Nonparametric data of liver and kidney damage scores were analyzed by theKruskal–Wallis test (p < 0.05). We performed all analyses using statistical program Sisvar (version 5.3,Universidade Federal de Lavras, Lavras, Minas Gerais, Brazil) [31].
3. Results
Animals submitted to physical training, or consuming beta-glucan isolated and in association,presented lower fast blood glucose and HbA1c levels than diabetic animals (Table 1). Serum levels ofTAG, TC and LDL-C were significantly reduced in animals consuming beta-glucan, independentlyof physical training. In addition, HDL-C levels were higher in animals treated with beta-glucan.Exercise did not significantly alter this parameter (Table 1). The atherogenic index of plasma inanimals treated with beta-glucan was lower in comparison to without treatment. An additive effect ofbeta-glucan and physical exercise was observed for the atherogenic index of plasma. Blood parametersand atherogenic index of plasma means and standard deviations are presented in Table 1.
All treatments promoted similar results in the percentage of protein, fat and water in animals’carcasses. An increase in the percentage of mineral matter was observed in groups under physicaltraining and beta-glucan consumption, with an extra increase when both treatments were associated.Exercise promoted a decrease in the Lee index compared to controls, with similar results among theother groups (Figure 1).
Liver histopathology slices revealed similar signs of steatosis in all groups (Table 2).Likewise, hydropic degeneration was found in the renal tissue from all groups. The degree of theselesions was attenuated by both physical exercise and beta-glucan ingestion (Table 3). Figures 2 and 3represent, respectively, hepatic steatosis and renal degeneration in the different experimental groups.
296
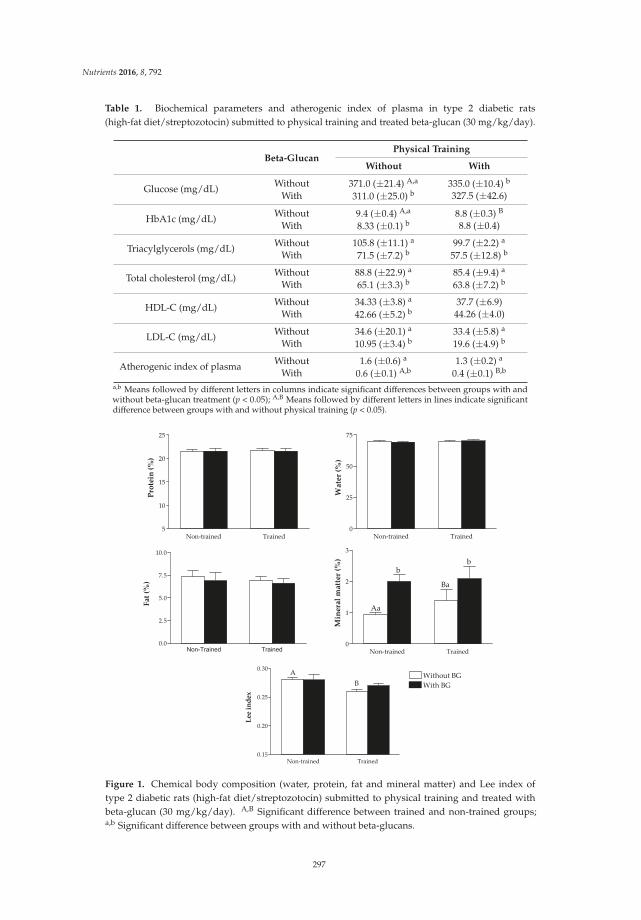
Nutrients 2016, 8, 792
Table 1. Biochemical parameters and atherogenic index of plasma in type 2 diabetic rats(high-fat diet/streptozotocin) submitted to physical training and treated beta-glucan (30 mg/kg/day).
Beta-GlucanPhysical Training
Without With
Glucose (mg/dL) Without 371.0 (±21.4) A,a 335.0 (±10.4) b
With 311.0 (±25.0) b 327.5 (±42.6)
HbA1c (mg/dL) Without 9.4 (±0.4) A,a 8.8 (±0.3) B
With 8.33 (±0.1) b 8.8 (±0.4)
Triacylglycerols (mg/dL) Without 105.8 (±11.1) a 99.7 (±2.2) a
With 71.5 (±7.2) b 57.5 (±12.8) b
Total cholesterol (mg/dL) Without 88.8 (±22.9) a 85.4 (±9.4) a
With 65.1 (±3.3) b 63.8 (±7.2) b
HDL-C (mg/dL) Without 34.33 (±3.8) a 37.7 (±6.9)With 42.66 (±5.2) b 44.26 (±4.0)
LDL-C (mg/dL) Without 34.6 (±20.1) a 33.4 (±5.8) a
With 10.95 (±3.4) b 19.6 (±4.9) b
Atherogenic index of plasma Without 1.6 (±0.6) a 1.3 (±0.2) a
With 0.6 (±0.1) A,b 0.4 (±0.1) B,b
a,b Means followed by different letters in columns indicate significant differences between groups with andwithout beta-glucan treatment (p < 0.05); A,B Means followed by different letters in lines indicate significantdifference between groups with and without physical training (p < 0.05).
Non trained Trained5
10
15
20
25
Protein(%)
Non trained Trained0
25
50
75
Water(%)
Non-Trained Trained
0.0
2.5
5.0
7.5
10.0
Fat(%)
Non trained Trained0
1
2
3
Aa
b
Ba
b
Mineralmatter(%)
Non trained Trained0.15
0.20
0.25
0.30Without BG
With BG
A
B
Leeindex
Figure 1. Chemical body composition (water, protein, fat and mineral matter) and Lee index oftype 2 diabetic rats (high-fat diet/streptozotocin) submitted to physical training and treated withbeta-glucan (30 mg/kg/day). A,B Significant difference between trained and non-trained groups;a,b Significant difference between groups with and without beta-glucans.
297
Nutrients 2016, 8, 792
Table 2. Degree of hepatic steatosis in type 2 diabetic rats (HFD/STZ) submitted to physical trainingand/or treated with beta-glucans (30 mg/kg/day).
GroupScore of Steatosis
* ** *** **** *****
A 0 3 0 3 0B 1 3 2 0 0C 2 3 0 1 0D 1 5 0 0 0
* No change. ** Discreet Degeneration; *** Mild degeneration; **** Moderate degeneration;***** Marked degeneration; A: diabetes mellitus; B: diabetes mellitus + beta-glucan; C: diabetes mellitus + exercise;D: diabetes mellitus + beta-glucan + exercise.
Figure 2. Histological representation (hematoxylin and eosin—20×) of degrees of hepatic steatosisin type 2 diabetic rats (HFD/STZ) submitted to physical training and/or treated with beta-glucans(30 mg/kg/day). (A) diabetes mellitus; (B) diabetes mellitus + beta-glucan; (C) diabetes mellitus + exercise;(D) diabetes mellitus + beta-glucan + exercise.
Table 3. Degree of renal degeneration in type 2 diabetic rats (HFD/STZ) submitted to physical trainingand/or treated with beta-glucans (30 mg/kg/day).
Score of Renal Degeneration
Group * ** *** **** *****
A 0 0 0 2 4B 0 0 0 6 0C 0 0 1 5 0
D # 0 0 1 5 0
* No change; ** Discreet Degeneration; *** Mild degeneration; **** Moderate degeneration;***** Marked degeneration; # Difference compared to the DM group; A: diabetes mellitus;B: diabetes mellitus + beta-glucan; C: diabetes mellitus + exercise; D: diabetes mellitus + beta-glucan + exercise.
298
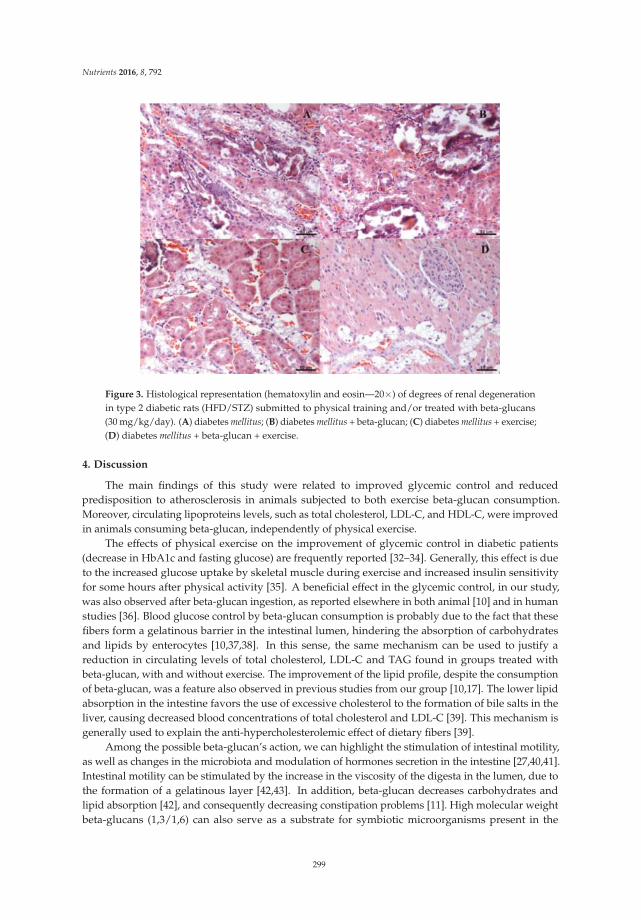
Nutrients 2016, 8, 792
Figure 3. Histological representation (hematoxylin and eosin—20×) of degrees of renal degenerationin type 2 diabetic rats (HFD/STZ) submitted to physical training and/or treated with beta-glucans(30 mg/kg/day). (A) diabetes mellitus; (B) diabetes mellitus + beta-glucan; (C) diabetes mellitus + exercise;(D) diabetes mellitus + beta-glucan + exercise.
4. Discussion
The main findings of this study were related to improved glycemic control and reducedpredisposition to atherosclerosis in animals subjected to both exercise beta-glucan consumption.Moreover, circulating lipoproteins levels, such as total cholesterol, LDL-C, and HDL-C, were improvedin animals consuming beta-glucan, independently of physical exercise.
The effects of physical exercise on the improvement of glycemic control in diabetic patients(decrease in HbA1c and fasting glucose) are frequently reported [32–34]. Generally, this effect is dueto the increased glucose uptake by skeletal muscle during exercise and increased insulin sensitivityfor some hours after physical activity [35]. A beneficial effect in the glycemic control, in our study,was also observed after beta-glucan ingestion, as reported elsewhere in both animal [10] and in humanstudies [36]. Blood glucose control by beta-glucan consumption is probably due to the fact that thesefibers form a gelatinous barrier in the intestinal lumen, hindering the absorption of carbohydratesand lipids by enterocytes [10,37,38]. In this sense, the same mechanism can be used to justify areduction in circulating levels of total cholesterol, LDL-C and TAG found in groups treated withbeta-glucan, with and without exercise. The improvement of the lipid profile, despite the consumptionof beta-glucan, was a feature also observed in previous studies from our group [10,17]. The lower lipidabsorption in the intestine favors the use of excessive cholesterol to the formation of bile salts in theliver, causing decreased blood concentrations of total cholesterol and LDL-C [39]. This mechanism isgenerally used to explain the anti-hypercholesterolemic effect of dietary fibers [39].
Among the possible beta-glucan’s action, we can highlight the stimulation of intestinal motility,as well as changes in the microbiota and modulation of hormones secretion in the intestine [27,40,41].Intestinal motility can be stimulated by the increase in the viscosity of the digesta in the lumen, due tothe formation of a gelatinous layer [42,43]. In addition, beta-glucan decreases carbohydrates andlipid absorption [42], and consequently decreasing constipation problems [11]. High molecular weightbeta-glucans (1,3/1,6) can also serve as a substrate for symbiotic microorganisms present in the
299
Nutrients 2016, 8, 792
intestine, increasing IgA and lysozyme secretion, and, as a consequence, immune resistance [40].Another mechanism related to the functional effect of beta-glucans is satiety, mediated bygastrointestinal hormones [41]. Beta-glucans modulate the secretion of ghrelin and peptide YY, in orderto inhibit hunger, acting indirectly in glycemic and lipidemic control [44].
In this study, we did not observe reduction of circulating lipids in trained animals. This maybe related to the training time or duration of exercise sessions. Moura et al. [45] also found similarlevels of HDL-C, LDL-C and TAG in diabetic rats (induced by alloxan) and subjected to 44 days oftraining, compared to sedentary diabetic rats. Another study demonstrated that twelve weeks ofaquatic training decreased cholesterol levels and TAG in diabetic Zucker rats [46]. However, in thepresent study, no significant differences were observed in circulating lipids in animals submitted tophysical training, and the atherosclerotic plasma index was reduced when there was an association ofexercise and beta-glucan consumption. This additive effect may be related to improvement of the lipidprofile provided by the dietary fiber [47], and to the recognized cardiovascular benefits of exercise [48].
Liver and renal lesions observed in all groups are consistent with those observed in type 2 diabetes,where circulating lipid levels promote increased fat deposition both in the liver and kidney [49,50].However, even with the benefits observed with beta-glucan consumption or exercise, no changeswere found in the degree of steatosis in any treatment. Beta-glucan consumption did not significantlyalter steatosis either in a recent study of our group that investigated the effects of these fibers in ratssubmitted to high-fat diet [18]. On the other hand, it was observed that, in Sprague–Dawley rats,hepatic steatosis was reversed after eight weeks of treadmill exercise associated with restrictive diet(low-fat) [51]. Thus, it is possible that, in this study, steatosis was not attenuated because the animalswere consuming a high-fat diet throughout the experimental period.
Regarding the effects of exercise, with or without the beta-glucan on the attenuation of renallesions, it can be considered two mechanisms. The first one involves the reduction in lipotoxicityagainst moderate exercise [52], since the oxidative stress observed in diabetic patients is one of thefactors that predispose to kidney damage [53]. The second one, more likely to explain the results ofthe present study, is the fact that exercise in moderate intensity promotes improvement in glycemiccontrol, which consequently reduces the generation of advanced glycation-end products (AGE) [54].Thus, the higher the blood glucose levels, the higher the formation of AGE that attack the kidney tissueand cause diabetic nephropathy [55].
Results of the present research show very promising effects of beta-glucan ingestion for glucosecontrol. Complimentary studies are encouraged, evaluating insulin/leptin levels and inflammatoryand cardiovascular parameters as well. The improvement of metabolic parameters in animals thatconsumed beta-glucans may be related to a decrease in the absorption of nutrients that increase plasmalevels of glucose and lipids [37,39]. These changes were not as evident in animals subjected to exercise,possibly due to high-fat diet maintenance for the entire period.
5. Conclusions
Both exercise and beta-glucan consumption alone improved glycemic control in diabetic rats.In the present study, the combination of exercise and beta-glucans improved the atherosclerotic indexand decreased renal lesions when compared to the isolated use of the treatments.
Acknowledgments: The authors thank the Coordination of Improvement of Higher Education Personnel (CAPES),the Research Foundation of the State of Minas Gerais (FAPEMIG), the National Council for Research andTechnological Development (CNPq), and the Federal University of Lavras (UFLA), Brazil.
Author Contributions: E.F.A., L.J.P. and M.G.Z. conceptualized the study. E.F.A., A.R.V.L., P.N.G. and I.E.N.conducted the experiments. D.R.O. performed histopathologic analysis. M.G.Z. contributed to statistical analysis.E.F.A., F.H.F.A., and L.J.P. were involved in writing and editing the manuscript. All authors participated in thedesign of the study, study supervision, data interpretation, and revision and approval of the final version ofthe manuscript.
Conflicts of Interest: The authors declare no conflict of interest.
300
Nutrients 2016, 8, 792
References
1. Forbes, J.M.; Cooper, M.E. Mechanisms of diabetic complications. Physiol. Rev. 2013, 93, 137–188. [CrossRef][PubMed]
2. Chen, L.; Magliano, D.J.; Zimmet, P.Z. The worldwide epidemiology of type 2 diabetes mellitus—Presentand future perspectives. Nat. Rev. Endocrinol. 2012, 8, 228–236. [CrossRef] [PubMed]
3. Kahn, S.E.; Cooper, M.E.; del Prato, S. Pathophysiology and treatment of type 2 diabetes: Perspectives on thepast, present, and future. Lancet (Lond. Engl.) 2014, 383, 1068–1083. [CrossRef]
4. Atkinson, M.A.; Eisenbarth, G.S.; Michels, A.W. Type 1 diabetes. Lancet 2014, 383, 69–82. [CrossRef]5. American Diabetes Association. Standards of medical care in diabetes—2015 abridged for primary care providers.
Clin. Diabetes 2015, 33, 97–111.6. Teixeira-Lemos, E.; Nunes, S.; Teixeira, F.; Reis, F. Regular physical exercise training assists in preventing
type 2 diabetes development: Focus on its antioxidant and anti-inflammatory properties. Cardiovasc. Diabetol.
2011, 10, 12. [CrossRef] [PubMed]7. Stevens, J.W.; Khunti, K.; Harvey, R.; Johnson, M.; Preston, L.; Woods, H.B.; Davies, M.; Goyder, E.
Preventing the progression to type 2 diabetes mellitus in adults at high risk: A systematic review andnetwork meta-analysis of lifestyle, pharmacological and surgical interventions. Diabetes Res. Clin. Pract.
2015, 107, 320–331. [CrossRef] [PubMed]8. Thompson, D.; Karpe, F.; Lafontan, M.; Frayn, K. Physical activity and exercise in the regulation of human
adipose tissue physiology. Physiol. Rev. 2012, 92, 157–191. [CrossRef] [PubMed]9. Samuelsen, A.B.C.; Schrezenmeir, J.; Knutsen, S.H. Effects of orally administered yeast-derived beta-glucans:
A review. Mol. Nutr. Food Res. 2014, 58, 183–193. [CrossRef] [PubMed]10. De Oliveira Silva, V.; Lobato, R.V.; Andrade, E.F.; de Macedo, C.G.; Napimoga, J.T.C.; Napimoga, M.H.;
Messora, M.R.; Murata, R.M.; Pereira, L.J. β-Glucans (Saccharomyces cereviseae) Reduce Glucose Levels andAttenuate Alveolar Bone Loss in Diabetic Rats with Periodontal Disease. PLoS ONE 2015, 10, e0134742.
11. Rahar, S.; Swami, G.; Nagpal, N.; Nagpal, M.A.; Singh, G.S. Preparation, characterization, and biologicalproperties of β-glucans. J. Adv. Pharm. Technol. Res. 2011, 2, 94–103. [CrossRef] [PubMed]
12. Sonck, E.; Stuyven, E.; Goddeeris, B.; Cox, E. The effect of beta-glucans on porcine leukocytes.Vet. Immunol. Immunopathol. 2010, 135, 199–207. [CrossRef] [PubMed]
13. Mantovani, M.S.; Bellini, M.F.; Angeli, J.P.F.; Oliveira, R.J.; Silva, A.F.; Ribeiro, L.R. Beta-Glucans in promotinghealth: Prevention against mutation and cancer. Mutat. Res. 2008, 658, 154–161. [CrossRef] [PubMed]
14. Andrade, E.F.; Lobato, R.V.; Araújo, T.V.; Zangerônimo, M.G.; Sousa, R.V.; Pereira, L.J. Effect of beta-glucansin the control of blood glucose levels of diabetic patients: A systematic review. Nutr. Hosp. 2014, 31, 170–177.
15. Akramiene, D.; Kondrotas, A.; Didziapetriene, J.; Kevelaitis, E. Effects of beta-glucans on the immune system.Medicina (Kaunas) 2007, 43, 597–606. [PubMed]
16. Stier, H.; Ebbeskotte, V.; Gruenwald, J. Immune-modulatory effects of dietary Yeast Beta-1,3/1,6-D-glucan.Nutr. J. 2014, 13, 38. [CrossRef] [PubMed]
17. Lobato, R.V.; de Silva, V.O.; Andrade, E.F.; Orlando, D.R.; Zangeronimo, M.G.; de Sousa, R.V.;Pereira, L.J. Metabolic effects of β-glucans (Saccharomyces cerevisae) per os administration in rats withstreptozotocin-induced diabetes. Nutr. Hosp. 2015, 32, 256–264.
18. De Araújo, T.V.; Andrade, E.F.; Lobato, R.V.; Orlando, D.R.; Gomes, N.F.; de Sousa, R.V.; Zangeronimo, M.G.;Pereira, L.J. Effects of beta-glucans ingestion (Saccharomyces cerevisiae) on metabolism of rats receivinghigh-fat diet. J. Anim. Physiol. Anim. Nutr. (Berl) 2016. [CrossRef] [PubMed]
19. Wang, L.; Duan, G.; Lu, Y.; Pang, S.; Huang, X.; Jiang, Q.; Dang, N. The effect of simvastatin on glucosehomeostasis in streptozotocin induced type 2 diabetic rats. J. Diabetes Res. 2013, 2013, 274986. [CrossRef][PubMed]
20. Skovsø, S. Modeling type 2 diabetes in rats using high-fat diet and streptozotocin. J. Diabetes Investig. 2014, 5,349–358. [CrossRef] [PubMed]
21. Rambo, L.M.; Ribeiro, L.R.; Oliveira, M.S.; Furian, A.F.; Lima, F.D.; Souza, M.A.; Silva, L.F.A.; Retamoso, L.T.;Corte, C.L.D.; Puntel, G.O.; et al. Additive anticonvulsant effects of creatine supplementation and physicalexercise against pentylenetetrazol-induced seizures. Neurochem. Int. 2009, 55, 333–340. [CrossRef] [PubMed]
301
Nutrients 2016, 8, 792
22. Gobatto, C.A.; de Mello, M.A.; Sibuya, C.Y.; de Azevedo, J.R.; dos Santos, L.A.; Kokubun, E. Maximal lactatesteady state in rats submitted to swimming exercise. Comp. Biochem. Physiol. A Mol. Integr. Physiol. 2001, 130,21–27. [CrossRef]
23. Andrade, E.F.; Lobato, R.V.; de Araújo, T.V.; Orlando, D.R.; da Costa, D.V.; de Oliveira Silva, V.; Rogatto, G.P.;Zangeronimo, M.G.; Rosa, P.V.; Pereira, L.J. Adaptation to physical training in rats orally supplementedwith glycerol. Can. J. Physiol. Pharmacol. 2015, 93, 63–69. [CrossRef] [PubMed]
24. Amr, A.R.; Abeer, E.E.-K. Hypolipideimic and Hypocholestermic Effect of Pine Nuts in Rats Fed High Fat,Cholesterol-Diet. World Appl. Sci. J. 2011, 15, 1667–1677.
25. Martinez-flores, H.E.; Kil, Y. Effect of high fiber products on blood lipids and lipoproteins in hamsters.Nutr. Res. 2004, 24, 85–93. [CrossRef]
26. Hemmati, M.; Zohoori, E.; Mehrpour, O.; Karamian, M.; Asghari, S.; Zarban, A.; Nasouti, R. Anti-atherogenicpotential of jujube, saffron and barberry: Anti-diabetic and antioxidant actions. EXCLI J. 2015, 14, 908–915.[PubMed]
27. Gleissner, C.A.; Galkina, E.; Nadler, J.L.; Ley, K. Mechanisms by which diabetes increases cardiovascular disease.Drug Discov. Today Dis. Mech. 2007, 4, 131–140. [CrossRef] [PubMed]
28. Lee, M.O. Determination of the surface area of the white rat with its application to the expression ofmetabolic results. Am. J. Physiol. 1929, 89, 24–33.
29. Vickers, S.P.; Cheetham, S.; Headland, K.; Dickinson, K.; Grempler, R.; Mayoux, E.; Mark, M.; Klein, T.Combination of the sodium-glucose cotransporter-2 inhibitor empagliflozin with orlistat or sibutraminefurther improves the body-weight reduction and glucose homeostasis of obese rats fed a cafeteria diet.Diabetes Metab. Syndr. Obes. Targets Ther. 2014, 7, 265–275. [CrossRef] [PubMed]
30. Andrade, E.F.; Lobato, R.V.; Araújo, T.V.; Orlando, D.R.; Gomes, N.F.; Alvarenga, R.R.; Rogatto, G.P.;Zangeronimo, M.G.; Pereira, L.J. Metabolic effects of glycerol supplementation and aerobic physical trainingon Wistar rats. Can. J. Physiol. Pharmacol. 2014, 92, 744–751. [CrossRef] [PubMed]
31. Ferreira, D.F. Sisvar: A computer statistical analysis system. Ciênc. Agrotec. 2011, 35, 1039–1042.32. Hall, K.E.; McDonald, M.W.; Grisé, K.N.; Campos, O.A.; Noble, E.G.; Melling, C.W.J. The role of resistance
and aerobic exercise training on insulin sensitivity measures in STZ-induced Type 1 diabetic rodents.Metabolism 2013, 62, 1485–1494. [CrossRef] [PubMed]
33. Ghiasi, R.; Ghadiri Soufi, F.; Somi, M.H.; Mohaddes, G.; Mirzaie Bavil, F.; Naderi, R.; Alipour, M.R.Swim Training Improves HOMA-IR in Type 2 Diabetes Induced by High Fat Diet and Low Dose ofStreptozotocin in Male Rats. Adv. Pharm. Bull. 2015, 5, 379–384. [CrossRef] [PubMed]
34. Silveira, A.P.S.; Bentes, C.M.; Costa, P.B.; Simão, R.; Silva, F.C.; Silva, R.P.; Novaes, J.S. Acute effects ofdifferent intensities of resistance training on glycemic fluctuations in patients with type 1 diabetes mellitus.Res. Sports Med. 2014, 22, 75–87. [CrossRef] [PubMed]
35. Borghouts, L.B.; Keizer, H.A. Exercise and insulin sensitivity: A review. Int. J. Sports Med. 2000, 21, 1–12.[CrossRef] [PubMed]
36. He, L.; Zhao, J.; Huang, Y.; Li, Y. The difference between oats and beta-glucan extract intake inthe management of HbA1c, fasting glucose and insulin sensitivity: A meta-analysis of randomizedcontrolled trials. Food Funct. 2016, 7, 1413–1428. [CrossRef] [PubMed]
37. Tappy, L.; Gügolz, E.; Würsch, P. Effects of breakfast cereals containing various amounts of beta-glucan fiberson plasma glucose and insulin responses in NIDDM subjects. Diabetes Care 1996, 19, 831–834. [CrossRef][PubMed]
38. Choi, J.S.; Kim, H.; Jung, M.H.; Hong, S.; Song, J. Consumption of barley beta-glucan ameliorates fatty liverand insulin resistance in mice fed a high-fat diet. Mol. Nutr. Food Res. 2010, 54, 1004–1013. [CrossRef][PubMed]
39. Rideout, T.C.; Harding, S.V.; Jones, P.J.; Fan, M.Z. Guar gum and similar soluble fibers in the regulation ofcholesterol metabolism: Current understandings and future research priorities. Vasc. Health Risk Manag.
2008, 4, 1023–1033. [CrossRef] [PubMed]40. Raa, J. Immune modulation by non-digestible and non-absorbable beta-1,3/1,6-glucan. Microb. Ecol.
Health Dis. 2015, 26, 27824. [CrossRef] [PubMed]41. Rebello, C.J.; Burton, J.; Heiman, M.; Greenway, F.L. Gastrointestinal microbiome modulator improves
glucose tolerance in overweight and obese subjects: A randomized controlled pilot trial. J. Diabetes Complicat.
2015, 29, 1272–1276. [CrossRef] [PubMed]
302
Nutrients 2016, 8, 792
42. Reyna, N.Y.; Cano, C.; Bermúdez, V.J.; Medina, M.T.; Souki, A.J.; Ambard, M.; Nuñez, M.; Ferrer, M.A.;Inglett, G.E. Sweeteners and beta-glucans improve metabolic and anthropometrics variables in wellcontrolled type 2 diabetic patients. Am. J. Ther. 2003, 10, 438–443. [CrossRef] [PubMed]
43. Battilana, P.; Ornstein, K.; Minehira, K.; Schwarz, J.M.; Acheson, K.; Schneiter, P.; Burri, J.; Jéquier, E.; Tappy, L.Mechanisms of action of beta-glucan in postprandial glucose metabolism in healthy men. Eur. J. Clin. Nutr.
2001, 55, 327–333. [CrossRef] [PubMed]44. Vitaglione, P.; Lumaga, R.B.; Stanzione, A.; Scalfi, L.; Fogliano, V. β-Glucan-enriched bread reduces energy
intake and modifies plasma ghrelin and peptide YY concentrations in the short term. Appetite 2009, 53,338–344. [CrossRef] [PubMed]
45. Moura, L.P.; Puga, G.M.; Beck, W.R.; Teixeira, I.P.; Ghezzi, A.C.; Silva, G.A.; Mello, M.A.R. Exercise andspirulina control non-alcoholic hepatic steatosis and lipid profile in diabetic Wistar rats. Lipids Health Dis.
2011, 10, 2–7. [CrossRef] [PubMed]46. De Lemos, E.T.; Pinto, R.; Oliveira, J.; Garrido, P.; Sereno, J.; Mascarenhas-Melo, F.; Páscoa-Pinheiro, J.;
Teixeira, F.; Reis, F. Differential effects of acute (extenuating) and chronic (training) exercise on inflammationand oxidative stress status in an animal model of type 2 diabetes mellitus. Mediat. Inflamm. 2011, 2011, 253061.
47. Bays, H.E.; Evans, J.L.; Maki, K.C.; Evans, M.; Maquet, V.; Cooper, R.; Anderson, J.W. Chitin-glucan fibereffects on oxidized low-density lipoprotein: A randomized controlled trial. Eur. J. Clin. Nutr. 2013, 67, 2–7.[CrossRef] [PubMed]
48. Roberts, C.K.; Chen, A.K.; Barnard, R.J. Effect of a short-term diet and exercise intervention in youth onatherosclerotic risk factors. Atherosclerosis 2007, 191, 98–106. [CrossRef] [PubMed]
49. Alsaad, K.O.; Herzenberg, A.M. Distinguishing diabetic nephropathy from other causes of glomerulosclerosis:An update. J. Clin. Pathol. 2007, 60, 18–26. [CrossRef] [PubMed]
50. Birkenfeld, A.L.; Shulman, G.I. Nonalcoholic fatty liver disease, hepatic insulin resistance, and type 2 Diabetes.Hepatology 2014, 59, 713–723. [CrossRef] [PubMed]
51. Gauthier, M.-S.; Couturier, K.; Latour, J.-G.; Lavoie, J.-M. Concurrent exercise prevents high-fat-diet-inducedmacrovesicular hepatic steatosis. J. Appl. Physiol. 2003, 94, 2127–2134. [CrossRef] [PubMed]
52. Ghosh, S.; Khazaei, M.; Moien-Afshari, F.; Ang, L.S.; Granville, D.J.; Verchere, C.B.; Dunn, S.R.; McCue, P.;Mizisin, A.; Sharma, K.; et al. Moderate exercise attenuates caspase-3 activity, oxidative stress, and inhibitsprogression of diabetic renal disease in db/db mice. Am. J. Physiol. Renal Physiol. 2009, 296, 700–708.[CrossRef] [PubMed]
53. Tanaka, Y.; Kume, S.; Araki, S.; Isshiki, K.; Chin-Kanasaki, M.; Sakaguchi, M.; Sugimoto, T.; Koya, D.;Haneda, M.; Kashiwagi, A.; et al. Fenofibrate, a PPARα agonist, has renoprotective effects in mice byenhancing renal lipolysis. Kidney Int. 2011, 79, 871–882. [CrossRef] [PubMed]
54. Boor, P.; Celec, P.; Behuliak, M.; Grancic, P.; Kebis, A.; Kukan, M.; Pronayová, N.; Liptaj, T.; Ostendorf, T.;Šebeková, K. Regular moderate exercise reduces advanced glycation and ameliorates early diabeticnephropathy in obese Zucker rats. Metabolism 2009, 58, 1669–1677. [CrossRef] [PubMed]
55. Yamagishi, S.-I.; Matsui, T. Advanced glycation end products, oxidative stress and diabetic nephropathy.Oxid. Med. Cell. Longev. 2010, 3, 101–108. [CrossRef] [PubMed]
© 2016 by the authors. Licensee MDPI, Basel, Switzerland. This article is an open accessarticle distributed under the terms and conditions of the Creative Commons Attribution(CC BY) license (http://creativecommons.org/licenses/by/4.0/).
303
nutrients
Article
Consumption of Fruit or Fiber-Fruit Decreases theRisk of Cardiovascular Disease in a MediterraneanYoung Cohort
Pilar Buil-Cosiales 1,2,3, Miguel Angel Martinez-Gonzalez 2,3,4,5, Miguel Ruiz-Canela 2,3,4,
Javier Díez-Espino 1,2,3, Ana García-Arellano 6 and Estefania Toledo 2,3,4,*
1 Atención Primaria, Servicio Navarro de Salud-Osasunbidea, 08010 Navarra, Spain;[email protected] (P.B.-C.); [email protected] (J.D.-E.)
2 Centro de Investigación Biomédica en Red Fisiopatología de la Obesidad y Nutrición (CIBERobn),Instituto de Salud Carlos III, 28029 Madrid, Spain; [email protected] (M.A.M.-G.);[email protected] (M.R.C.)
3 IdiSNA, Navarra Institute for Health Research, 31008 Pamplona, Navarra, Spain4 Department of Preventive Medicine and Public Health, University of Navarra, 31008 Pamplona,
Navarra, Spain5 Department of Nutrition, Harvard School of Public Health, Boston, MA 02115, USA6 Department of Emergency, Complejo Hospitalario de Navarra Servicio Navarro de Salud-Osasunbidea,
31008 Pamplona, Navarra, Spain; [email protected]* Correspondence: [email protected] or [email protected]; Tel.: +34-948-425600 (ext. 806224)
Received: 3 January 2017; Accepted: 10 March 2017; Published: 17 March 2017
Abstract: Fiber and fiber-rich foods have been inversely associated with cardiovascular disease(CVD), but the evidence is scarce in young and Mediterranean cohorts. We used Cox regressionmodels to assess the association between quintiles of total fiber and fiber from different sources,and the risk of CVD adjusted for the principal confounding factors in a Mediterranean cohort ofyoung adults, the SUN (Seguimiento Universidad de Navarra, Follow-up) cohort. After a medianfollow-up of 10.3 years, we observed 112 cases of CVD among 17,007 participants (61% female,mean age 38 years). We observed an inverse association between fiber intake and CVD events(p for trend = 0.024) and also between the highest quintile of fruit consumption (hazard ratio (HR)0.51, 95% confidence interval (CI) 0.27–0.95) or whole grains consumption (HR 0.43 95% CI 0.20–0.93)and CVD compared to the lowest quintile, and also a HR of 0.58 (95% CI 0.37–0.90) for the participantswho ate at least 175 g/day of fruit. Only the participants in the highest quintile of fruit-derivedfiber intake had a significantly lower risk of CVD (HR 0.52, 95% CI 0.28–0.97). The participants whoate at least one serving per week of cruciferous vegetables had a lower risk than those who didnot (HR 0.52, 95% CI 0.30–0.89). In conclusion, high fruit consumption, whole grain consumption,or consumption of at least one serving/week of cruciferous vegetables may be protective againstCVD in young Mediterranean populations.
Keywords: fiber; fruit; vegetables; cardiovascular disease; legumes; whole grains
1. Introduction
Cardiovascular disease (CVD) is the leading cause of morbidity and mortality in developedcountries [1,2] and its prevalence is increasing in developing countries. Lifestyles are the mostimportant determinants of CVD, among which nutritional habits play an important role.
Higher dietary fiber intake has been recognized to be inversely associated with coronary heartdisease (CHD) [3] and stroke [4]. Nevertheless, studies that have assessed the association between fiberintake and CVD in Mediterranean countries are scarce. It is also noteworthy that the foods that mainly
Nutrients 2017, 9, 295 304 www.mdpi.com/journal/nutrients
Nutrients 2017, 9, 295
contribute to the high intake of fiber—namely fruits, vegetables, legumes, and whole grains—haveother micronutrients that have been postulated to be even more important for the prevention ofCVD [5,6].
Fruits and vegetables are a heterogeneous food group with different contents of vitamins,minerals, and other bioactive phytochemicals [7]. There are not many studies that have evaluated theassociation between specific fruits or vegetables or groups of them, and it is unclear which fruit orvegetable subgroup may be the most protective against CVD. Also, fruits and vegetables consumed indifferent regions differ, and this could explain the differences observed in their reported effects [8].
Epidemiologic studies that have analyzed the relationship between fruit and vegetableconsumption, which represent the principal source of fiber in Mediterranean countries, and CHDfound inconsistent results. A meta-analysis published in 2015 [8], that analyzed 23 studies assessingthis relationship, found an inverse association but showed heterogeneity with geographical differences.Concretely, an inverse association between fruit and vegetable consumption and CHD was observedonly in Western countries. In addition, only one of the included studies had been conducted in aMediterranean country [9] and this latter study found no significant association of fruit and vegetableconsumption with the risk of CHD. More recently, two studies [10,11] conducted within the PREDIMEDtrial (PREvención con DIeta MEDiterránea) that recruited older participants in the Mediterranean areafound an inverse association between fruit consumption and cardiovascular mortality, but not withnon-fatal CVD. Albeit there are cohort studies and even a meta-analysis [12] that have observed aninverse association between fruits and vegetables and stroke, none of the included studies had beenconducted in Mediterranean countries.
On the other hand, legumes and whole grains are also good sources of dietary fiber, and bothhave been suggested to be protective against CVD [13–15]. There is a wide body of evidence regardingthe inverse association between whole grains and the risk of cardiovascular risk factors, such as type 2diabetes [16,17], dyslipidaemia [18,19], high blood pressure [20], and obesity [17], but the research ontheir association with CVD clinical hard end-points is not large. A meta-analysis [21] included onlynine publications that assessed the relationship between whole grains and CVD and found an inverseassociation. Six out of the nine studies had been conducted in the US, and only one in a Mediterraneancountry, and this latter study only reported on cardiovascular mortality. Even less are the studies whichhave assessed the relationship between legume consumption and the risk of CVD events [19,22,23].
Additionally, most of the studies have been conducted in aged adults and older people, and nonein young adults. Therefore, we analyzed the association between fiber-rich foods and CVD in aMediterranean cohort of young adults in order to advance in the knowledge of this relationship.
2. Materials and Methods
The SUN (Seguimiento Universidad de Navarra, Follow-up) project is a prospective,multipurpose, dynamic cohort of university graduates conducted in Spain. As a dynamic cohort,the recruitment of the participants is permanently open. Methodological aspects of this cohorthave been published in detail previously [24]. Briefly, the cohort began in December 1999 andthe recruitment of participants is permanently open. Information is gathered biennially by mailedquestionnaires. Several validation studies of this self-reported information have been conducted,including anthropometric data [25], physical activity [26], the diagnosis of hypertension [27] and thespecific criteria used for metabolic syndrome definition [28], all of them supporting the quality of thecollected information.
For the present study, we included 22,476 subjects recruited before March 2013, so that theycould have at least one follow-up questionnaire by the time of the last update of the dataset(December 2015). For the current analysis, we excluded 2113 participants with an energy intakeout of sex specific predefined limits (>4000 kcal/day and <800 kcal/day for men and >3500 kcal/dayand <500 kcal/day for women) [29]. We also excluded 947 participants who had prevalentcardiovascular disease at baseline and 2409 subjects with no follow-up information. After exclusions,
305
Nutrients 2017, 9, 295
the final sample population included a total of 17,007 participants. The retention in the cohortwas 88%.
The study was approved by the Institutional Review Board of the University of Navarraon 30 August 2001. Voluntary completion of the first questionnaire was considered to implyinformed consent.
Dietary intake was assessed through a validated 136-item semi-quantitative food-frequencyquestionnaire [30,31], which showed an intra-class correlation coefficient of 0.71 for fruits and 0.82for vegetables.
Each item in the questionnaire included a typical portion size. Daily food consumption was estimatedby multiplying the portion size by the consumption frequency for each item (nine options rangingfrom never or almost never to six times per day). Nutrient intake was estimated using Spanish foodcomposition tables. We defined moderate alcohol consumption between 5 and 25 g/day for women andbetween 10 and 50 g/day for men. Based on the dietary information collected with the food-frequencyquestionnaire we calculated a score of adherence to the traditional Mediterranean diet [13].
Incidence of cardiovascular events, defined as non-fatal myocardial infarction, non-fatal strokereported by participants on a follow-up questionnaire, or deaths due to cardiovascular disease, was theprimary endpoint. An expert panel of physicians, blinded to the information on diet, anthropometricindexes, and risk factors, reviewed medical records of participants and adjudicated events applyinguniversal criteria for myocardial infarction and clinical criteria for the other outcomes. A non-fatalstroke was defined as a focal neurological deficit of sudden onset and vascular mechanism lasting >24 h.Cases of fatal stroke were documented if there was evidence of a cerebrovascular mechanism. Deathswere reported to our research team by the participants’ next of kin, work associates, and postalauthorities. For participants lost to follow-up, we consulted the National Death Index every sixmonths to identify deceased cohort members and to obtain their cause of death. Cases of fatal CHD orstroke reported by families or postal authorities were confirmed by a review of medical records withpermission of the next of kin.
Statistical Analysis
Participants were categorized in quintiles of fiber, fruits, vegetables, legumes, or whole grainconsumption. We used the residuals method to adjust the assessed foods for total energy intake.
Baseline characteristics are presented according to quintiles of baseline consumption of fruit andvegetables, as mean (SD) for quantitative traits, and percentage for categorical variables.
We used Cox regression models to assess the relationship between quintiles of baseline fiber,fruit, vegetables, legumes, or whole grains consumption and the subsequent incidence of CVD duringfollow-up. Hazard ratios (HRs) and their 95% confidence intervals (95% CIs) were calculated using thefirst quintile as the reference category. We used age as the underlying time variable. Entry time wasdefined as the date of completion of the first questionnaire and exit time as the date of CVD, the dateof the completion of the last questionnaire, or date of death, whichever occurred first.
In addition, we analyzed specific subgroups of fruit and vegetables. The definition of compositegroups was based on a report by Joshipura et al. [32] which we adapted to our Food FrequencyQuestionnaire (FFQ) and to the usual habits of the Spanish population. The fruits and vegetablesincluded in each subgroup are presented in Table 1.
Three multivariable models were constructed to adjust for the known or suspected predictorsof CVD. First, we adjusted only for sex. In the second model, we adjusted additionally formarital status (married, single, widowed, separated, others), highest attained educational level(five categories), family history of CHD (dichotomous), type 2 diabetes (dichotomous), high bloodpressure (dichotomous), dyslipidemia (dichotomous), smoking status (four categories), total energyintake (kcal/day), body mass index (kg/m2), alcohol intake (three categories), and use ofcholesterol-lowering drugs. We also fitted a third model with additional adjustments for nutritionalvariables: olive oil (g/day) for all the groups and vegetables (g/day), legumes (g/day), and whole
306
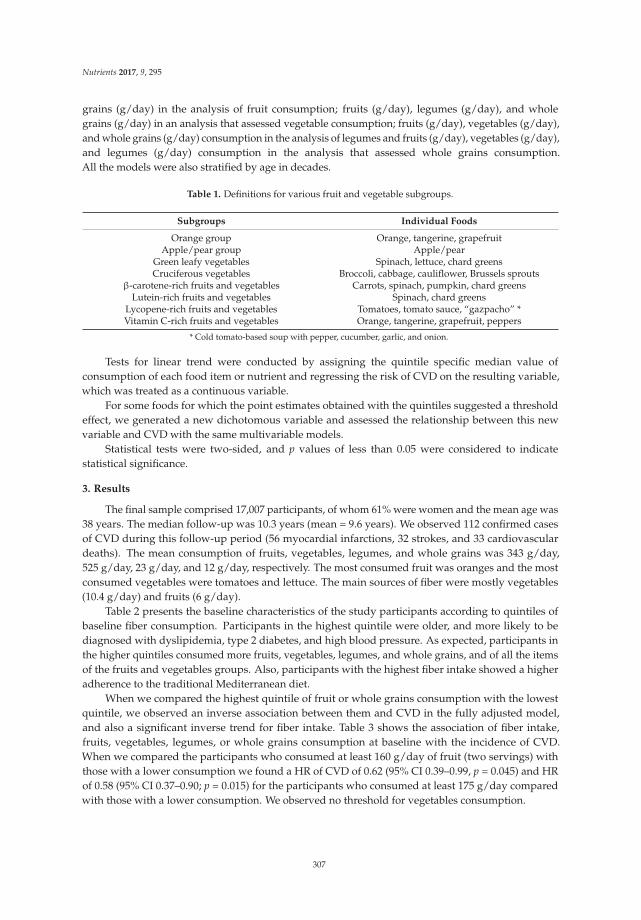
Nutrients 2017, 9, 295
grains (g/day) in the analysis of fruit consumption; fruits (g/day), legumes (g/day), and wholegrains (g/day) in an analysis that assessed vegetable consumption; fruits (g/day), vegetables (g/day),and whole grains (g/day) consumption in the analysis of legumes and fruits (g/day), vegetables (g/day),and legumes (g/day) consumption in the analysis that assessed whole grains consumption.All the models were also stratified by age in decades.
Table 1. Definitions for various fruit and vegetable subgroups.
Subgroups Individual Foods
Orange group Orange, tangerine, grapefruitApple/pear group Apple/pear
Green leafy vegetables Spinach, lettuce, chard greensCruciferous vegetables Broccoli, cabbage, cauliflower, Brussels sprouts
β-carotene-rich fruits and vegetables Carrots, spinach, pumpkin, chard greensLutein-rich fruits and vegetables Spinach, chard greens
Lycopene-rich fruits and vegetables Tomatoes, tomato sauce, “gazpacho” *Vitamin C-rich fruits and vegetables Orange, tangerine, grapefruit, peppers
* Cold tomato-based soup with pepper, cucumber, garlic, and onion.
Tests for linear trend were conducted by assigning the quintile specific median value ofconsumption of each food item or nutrient and regressing the risk of CVD on the resulting variable,which was treated as a continuous variable.
For some foods for which the point estimates obtained with the quintiles suggested a thresholdeffect, we generated a new dichotomous variable and assessed the relationship between this newvariable and CVD with the same multivariable models.
Statistical tests were two-sided, and p values of less than 0.05 were considered to indicatestatistical significance.
3. Results
The final sample comprised 17,007 participants, of whom 61% were women and the mean age was38 years. The median follow-up was 10.3 years (mean = 9.6 years). We observed 112 confirmed casesof CVD during this follow-up period (56 myocardial infarctions, 32 strokes, and 33 cardiovasculardeaths). The mean consumption of fruits, vegetables, legumes, and whole grains was 343 g/day,525 g/day, 23 g/day, and 12 g/day, respectively. The most consumed fruit was oranges and the mostconsumed vegetables were tomatoes and lettuce. The main sources of fiber were mostly vegetables(10.4 g/day) and fruits (6 g/day).
Table 2 presents the baseline characteristics of the study participants according to quintiles ofbaseline fiber consumption. Participants in the highest quintile were older, and more likely to bediagnosed with dyslipidemia, type 2 diabetes, and high blood pressure. As expected, participants inthe higher quintiles consumed more fruits, vegetables, legumes, and whole grains, and of all the itemsof the fruits and vegetables groups. Also, participants with the highest fiber intake showed a higheradherence to the traditional Mediterranean diet.
When we compared the highest quintile of fruit or whole grains consumption with the lowestquintile, we observed an inverse association between them and CVD in the fully adjusted model,and also a significant inverse trend for fiber intake. Table 3 shows the association of fiber intake,fruits, vegetables, legumes, or whole grains consumption at baseline with the incidence of CVD.When we compared the participants who consumed at least 160 g/day of fruit (two servings) withthose with a lower consumption we found a HR of CVD of 0.62 (95% CI 0.39–0.99, p = 0.045) and HRof 0.58 (95% CI 0.37–0.90; p = 0.015) for the participants who consumed at least 175 g/day comparedwith those with a lower consumption. We observed no threshold for vegetables consumption.
307
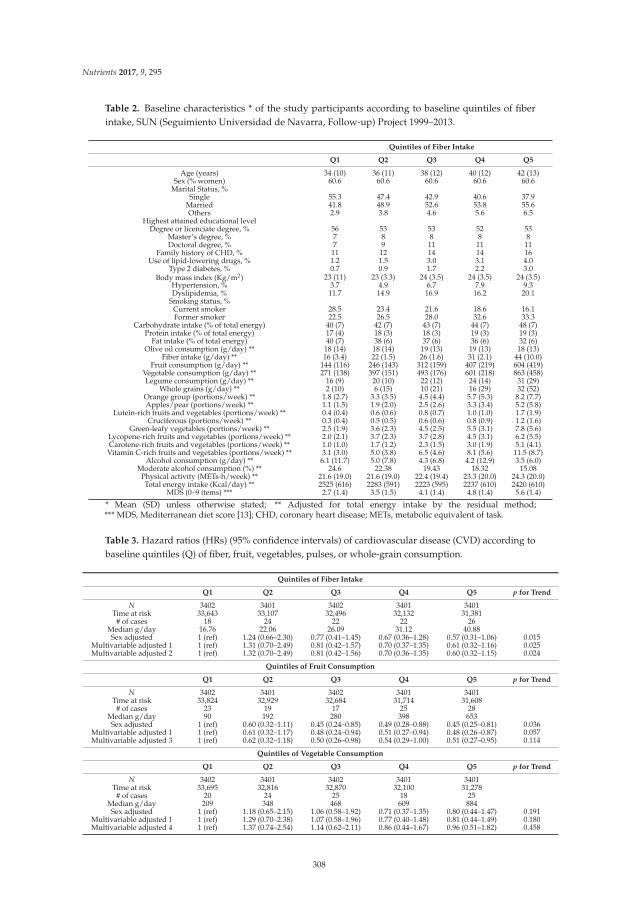
Nutrients 2017, 9, 295
Table 2. Baseline characteristics * of the study participants according to baseline quintiles of fiberintake, SUN (Seguimiento Universidad de Navarra, Follow-up) Project 1999–2013.
Quintiles of Fiber Intake
Q1 Q2 Q3 Q4 Q5
Age (years) 34 (10) 36 (11) 38 (12) 40 (12) 42 (13)Sex (% women) 60.6 60.6 60.6 60.6 60.6
Marital Status, %Single 55.3 47.4 42.9 40.6 37.9
Married 41.8 48.9 52.6 53.8 55.6Others 2.9 3.8 4.6 5.6 6.5
Highest attained educational levelDegree or licenciate degree, % 56 53 53 52 53
Master’s degree, % 7 8 8 8 8Doctoral degree, % 7 9 11 11 11
Family history of CHD, % 11 12 14 14 16Use of lipid-lowering drugs, % 1.2 1.5 3.0 3.1 4.0
Type 2 diabetes, % 0.7 0.9 1.7 2.2 3.0Body mass index (Kg/m2) 23 (11) 23 (3.3) 24 (3.5) 24 (3.5) 24 (3.5)
Hypertension, % 3.7 4.9 6.7 7.9 9.3Dyslipidemia, % 11.7 14.9 16.9 16.2 20.1
Smoking status, %Current smoker 28.5 23.4 21.6 18.6 16.1Former smoker 22.5 26.5 28.0 32.6 33.3
Carbohydrate intake (% of total energy) 40 (7) 42 (7) 43 (7) 44 (7) 48 (7)Protein intake (% of total energy) 17 (4) 18 (3) 18 (3) 19 (3) 19 (3)
Fat intake (% of total energy) 40 (7) 38 (6) 37 (6) 36 (6) 32 (6)Olive oil consumption (g/day) ** 18 (14) 18 (14) 19 (13) 19 (13) 18 (13)
Fiber intake (g/day) ** 16 (3.4) 22 (1.5) 26 (1.6) 31 (2.1) 44 (10.0)Fruit consumption (g/day) ** 144 (116) 246 (143) 312 (159) 407 (219) 604 (419)
Vegetable consumption (g/day) ** 271 (138) 397 (151) 493 (176) 601 (218) 863 (458)Legume consumption (g/day) ** 16 (9) 20 (10) 22 (12) 24 (14) 31 (29)
Whole grains (g/day) ** 2 (10) 6 (15) 10 (21) 16 (29) 32 (52)Orange group (portions/week) ** 1.8 (2.7) 3.3 (3.5) 4.5 (4.4) 5.7 (5.3) 8.2 (7.7)Apples/pear (portions/week) ** 1.1 (1.5) 1.9 (2.0) 2.5 (2.6) 3.3 (3.4) 5.2 (5.8)
Lutein-rich fruits and vegetables (portions/week) ** 0.4 (0.4) 0.6 (0.6) 0.8 (0.7) 1.0 (1.0) 1.7 (1.9)Cruciferous (portions/week) ** 0.3 (0.4) 0.5 (0.5) 0.6 (0.6) 0.8 (0.9) 1.2 (1.6)
Green-leafy vegetables (portions/week) ** 2.5 (1.9) 3.6 (2.3) 4.5 (2.5) 5.5 (3.1) 7.8 (5.6)Lycopene-rich fruits and vegetables (portions/week) ** 2.0 (2.1) 3.7 (2.3) 3.7 (2.8) 4.5 (3.1) 6.2 (5.5)Carotene-rich fruits and vegetables (portions/week) ** 1.0 (1.0) 1.7 (1.2) 2.3 (1.5) 3.0 (1.9) 5.1 (4.1)
Vitamin C-rich fruits and vegetables (portions/week) ** 3.1 (3.0) 5.0 (3.8) 6.5 (4.6) 8.1 (5.6) 11.5 (8.7)Alcohol consumption (g/day) ** 6.1 (11.7) 5.0 (7.8) 4.3 (6.8) 4.2 (12.9) 3.5 (6.0)
Moderate alcohol consumption (%) ** 24.6 22.38 19.43 18.32 15.08Physical activity (METs-h/week) ** 21.6 (19.0) 21.6 (19.0) 22.4 (19.4) 23.3 (20.0) 24.3 (20.0)Total energy intake (Kcal/day) ** 2525 (616) 2283 (591) 2223 (595) 2237 (610) 2420 (610)
MDS (0–9 items) *** 2.7 (1.4) 3.5 (1.5) 4.1 (1.4) 4.8 (1.4) 5.6 (1.4)
* Mean (SD) unless otherwise stated; ** Adjusted for total energy intake by the residual method;*** MDS, Mediterranean diet score [13]; CHD, coronary heart disease; METs, metabolic equivalent of task.
Table 3. Hazard ratios (HRs) (95% confidence intervals) of cardiovascular disease (CVD) according tobaseline quintiles (Q) of fiber, fruit, vegetables, pulses, or whole-grain consumption.
Quintiles of Fiber Intake
Q1 Q2 Q3 Q4 Q5 p for Trend
N 3402 3401 3402 3401 3401Time at risk 33,643 33,107 32,496 32,132 31,381
# of cases 18 24 22 22 26Median g/day 16.76 22.06 26.09 31.12 40.88Sex adjusted 1 (ref) 1.24 (0.66–2.30) 0.77 (0.41–1.45) 0.67 (0.36–1.28) 0.57 (0.31–1.06) 0.015
Multivariable adjusted 1 1 (ref) 1.31 (0.70–2.49) 0.81 (0.42–1.57) 0.70 (0.37–1.35) 0.61 (0.32–1.16) 0.025Multivariable adjusted 2 1 (ref) 1.32 (0.70–2.49) 0.81 (0.42–1.56) 0.70 (0.36–1.35) 0.60 (0.32–1.15) 0.024
Quintiles of Fruit Consumption
Q1 Q2 Q3 Q4 Q5 p for Trend
N 3402 3401 3402 3401 3401Time at risk 33,824 32,929 32,684 31,714 31,608
# of cases 23 19 17 25 28Median g/day 90 192 280 398 653Sex adjusted 1 (ref) 0.60 (0.32–1.11) 0.45 (0.24–0.85) 0.49 (0.28–0.88) 0.45 (0.25–0.81) 0.036
Multivariable adjusted 1 1 (ref) 0.61 (0.32–1.17) 0.48 (0.24–0.94) 0.51 (0.27–0.94) 0.48 (0.26–0.87) 0.057Multivariable adjusted 3 1 (ref) 0.62 (0.32–1.18) 0.50 (0.26–0.98) 0.54 (0.29–1.00) 0.51 (0.27–0.95) 0.114
Quintiles of Vegetable Consumption
Q1 Q2 Q3 Q4 Q5 p for Trend
N 3402 3401 3402 3401 3401Time at risk 33,695 32,816 32,870 32,100 31,278
# of cases 20 24 25 18 25Median g/day 209 348 468 609 884Sex adjusted 1 (ref) 1.18 (0.65–2.15) 1.06 (0.58–1.92) 0.71 (0.37–1.35) 0.80 (0.44–1.47) 0.191
Multivariable adjusted 1 1 (ref) 1.29 (0.70–2.38) 1.07 (0.58–1.96) 0.77 (0.40–1.48) 0.81 (0.44–1.49) 0.180Multivariable adjusted 4 1 (ref) 1.37 (0.74–2.54) 1.14 (0.62–2.11) 0.86 (0.44–1.67) 0.96 (0.51–1.82) 0.458
308
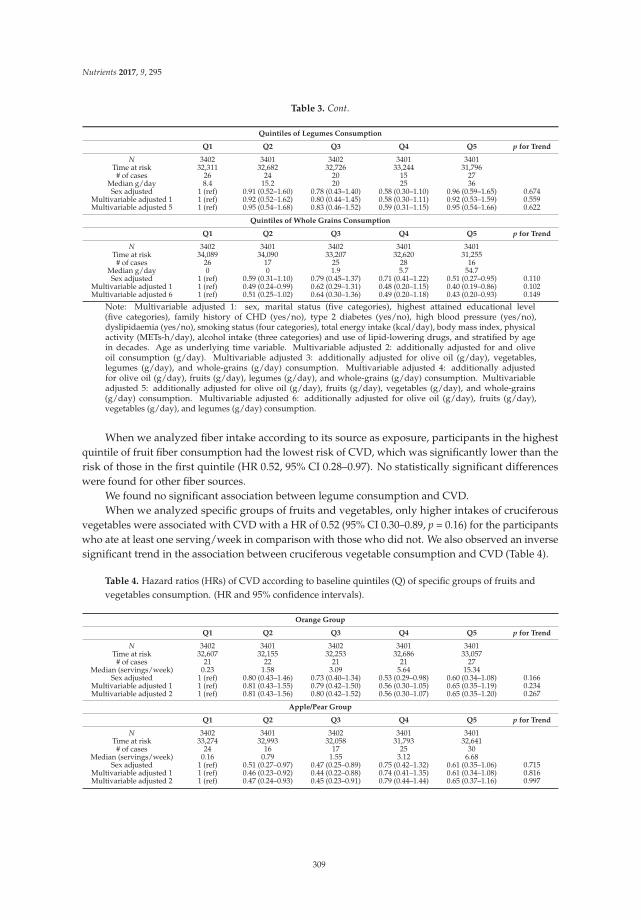
Nutrients 2017, 9, 295
Table 3. Cont.
Quintiles of Legumes Consumption
Q1 Q2 Q3 Q4 Q5 p for Trend
N 3402 3401 3402 3401 3401Time at risk 32,311 32,682 32,726 33,244 31,796
# of cases 26 24 20 15 27Median g/day 8.4 15.2 20 25 36Sex adjusted 1 (ref) 0.91 (0.52–1.60) 0.78 (0.43–1.40) 0.58 (0.30–1.10) 0.96 (0.59–1.65) 0.674
Multivariable adjusted 1 1 (ref) 0.92 (0.52–1.62) 0.80 (0.44–1.45) 0.58 (0.30–1.11) 0.92 (0.53–1.59) 0.559Multivariable adjusted 5 1 (ref) 0.95 (0.54–1.68) 0.83 (0.46–1.52) 0.59 (0.31–1.15) 0.95 (0.54–1.66) 0.622
Quintiles of Whole Grains Consumption
Q1 Q2 Q3 Q4 Q5 p for Trend
N 3402 3401 3402 3401 3401Time at risk 34,089 34,090 33,207 32,620 31,255
# of cases 26 17 25 28 16Median g/day 0 0 1.9 5.7 54.7Sex adjusted 1 (ref) 0.59 (0.31–1.10) 0.79 (0.45–1.37) 0.71 (0.41–1.22) 0.51 (0.27–0.95) 0.110
Multivariable adjusted 1 1 (ref) 0.49 (0.24–0.99) 0.62 (0.29–1.31) 0.48 (0.20–1.15) 0.40 (0.19–0.86) 0.102Multivariable adjusted 6 1 (ref) 0.51 (0.25–1.02) 0.64 (0.30–1.36) 0.49 (0.20–1.18) 0.43 (0.20–0.93) 0.149
Note: Multivariable adjusted 1: sex, marital status (five categories), highest attained educational level(five categories), family history of CHD (yes/no), type 2 diabetes (yes/no), high blood pressure (yes/no),dyslipidaemia (yes/no), smoking status (four categories), total energy intake (kcal/day), body mass index, physicalactivity (METs-h/day), alcohol intake (three categories) and use of lipid-lowering drugs, and stratified by agein decades. Age as underlying time variable. Multivariable adjusted 2: additionally adjusted for and oliveoil consumption (g/day). Multivariable adjusted 3: additionally adjusted for olive oil (g/day), vegetables,legumes (g/day), and whole-grains (g/day) consumption. Multivariable adjusted 4: additionally adjustedfor olive oil (g/day), fruits (g/day), legumes (g/day), and whole-grains (g/day) consumption. Multivariableadjusted 5: additionally adjusted for olive oil (g/day), fruits (g/day), vegetables (g/day), and whole-grains(g/day) consumption. Multivariable adjusted 6: additionally adjusted for olive oil (g/day), fruits (g/day),vegetables (g/day), and legumes (g/day) consumption.
When we analyzed fiber intake according to its source as exposure, participants in the highestquintile of fruit fiber consumption had the lowest risk of CVD, which was significantly lower than therisk of those in the first quintile (HR 0.52, 95% CI 0.28–0.97). No statistically significant differenceswere found for other fiber sources.
We found no significant association between legume consumption and CVD.When we analyzed specific groups of fruits and vegetables, only higher intakes of cruciferous
vegetables were associated with CVD with a HR of 0.52 (95% CI 0.30–0.89, p = 0.16) for the participantswho ate at least one serving/week in comparison with those who did not. We also observed an inversesignificant trend in the association between cruciferous vegetable consumption and CVD (Table 4).
Table 4. Hazard ratios (HRs) of CVD according to baseline quintiles (Q) of specific groups of fruits andvegetables consumption. (HR and 95% confidence intervals).
Orange Group
Q1 Q2 Q3 Q4 Q5 p for Trend
N 3402 3401 3402 3401 3401Time at risk 32,607 32,155 32,253 32,686 33,057
# of cases 21 22 21 21 27Median (servings/week) 0.23 1.58 3.09 5.64 15.34
Sex adjusted 1 (ref) 0.80 (0.43–1.46) 0.73 (0.40–1.34) 0.53 (0.29–0.98) 0.60 (0.34–1.08) 0.166Multivariable adjusted 1 1 (ref) 0.81 (0.43–1.55) 0.79 (0.42–1.50) 0.56 (0.30–1.05) 0.65 (0.35–1.19) 0.234Multivariable adjusted 2 1 (ref) 0.81 (0.43–1.56) 0.80 (0.42–1.52) 0.56 (0.30–1.07) 0.65 (0.35–1.20) 0.267
Apple/Pear Group
Q1 Q2 Q3 Q4 Q5 p for Trend
N 3402 3401 3402 3401 3401Time at risk 33,274 32,993 32,058 31,793 32,641
# of cases 24 16 17 25 30Median (servings/week) 0.16 0.79 1.55 3.12 6.68
Sex adjusted 1 (ref) 0.51 (0.27–0.97) 0.47 (0.25–0.89) 0.75 (0.42–1.32) 0.61 (0.35–1.06) 0.715Multivariable adjusted 1 1 (ref) 0.46 (0.23–0.92) 0.44 (0.22–0.88) 0.74 (0.41–1.35) 0.61 (0.34–1.08) 0.816Multivariable adjusted 2 1 (ref) 0.47 (0.24–0.93) 0.45 (0.23–0.91) 0.79 (0.44–1.44) 0.65 (0.37–1.16) 0.997
309
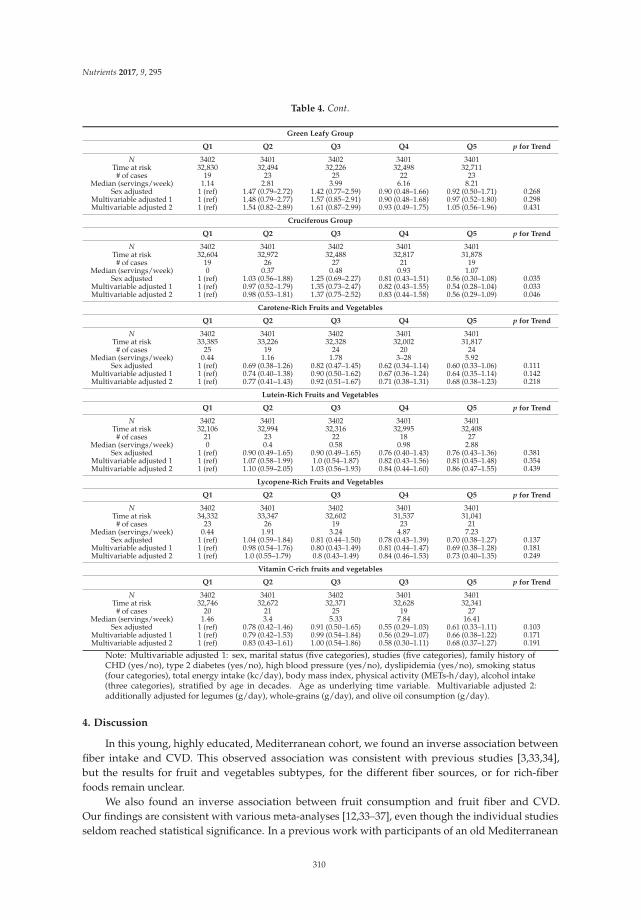
Nutrients 2017, 9, 295
Table 4. Cont.
Green Leafy Group
Q1 Q2 Q3 Q4 Q5 p for Trend
N 3402 3401 3402 3401 3401Time at risk 32,830 32,494 32,226 32,498 32,711
# of cases 19 23 25 22 23Median (servings/week) 1.14 2.81 3.99 6.16 8.21
Sex adjusted 1 (ref) 1.47 (0.79–2.72) 1.42 (0.77–2.59) 0.90 (0.48–1.66) 0.92 (0.50–1.71) 0.268Multivariable adjusted 1 1 (ref) 1.48 (0.79–2.77) 1.57 (0.85–2.91) 0.90 (0.48–1.68) 0.97 (0.52–1.80) 0.298Multivariable adjusted 2 1 (ref) 1.54 (0.82–2.89) 1.61 (0.87–2.99) 0.93 (0.49–1.75) 1.05 (0.56–1.96) 0.431
Cruciferous Group
Q1 Q2 Q3 Q4 Q5 p for Trend
N 3402 3401 3402 3401 3401Time at risk 32,604 32,972 32,488 32,817 31,878
# of cases 19 26 27 21 19Median (servings/week) 0 0.37 0.48 0.93 1.07
Sex adjusted 1 (ref) 1.03 (0.56–1.88) 1.25 (0.69–2.27) 0.81 (0.43–1.51) 0.56 (0.30–1.08) 0.035Multivariable adjusted 1 1 (ref) 0.97 (0.52–1.79) 1.35 (0.73–2.47) 0.82 (0.43–1.55) 0.54 (0.28–1.04) 0.033Multivariable adjusted 2 1 (ref) 0.98 (0.53–1.81) 1.37 (0.75–2.52) 0.83 (0.44–1.58) 0.56 (0.29–1.09) 0.046
Carotene-Rich Fruits and Vegetables
Q1 Q2 Q3 Q4 Q5 p for Trend
N 3402 3401 3402 3401 3401Time at risk 33,385 33,226 32,328 32,002 31,817
# of cases 25 19 24 20 24Median (servings/week) 0.44 1.16 1.78 3–28 5.92
Sex adjusted 1 (ref) 0.69 (0.38–1.26) 0.82 (0.47–1.45) 0.62 (0.34–1.14) 0.60 (0.33–1.06) 0.111Multivariable adjusted 1 1 (ref) 0.74 (0.40–1.38) 0.90 (0.50–1.62) 0.67 (0.36–1.24) 0.64 (0.35–1.14) 0.142Multivariable adjusted 2 1 (ref) 0.77 (0.41–1.43) 0.92 (0.51–1.67) 0.71 (0.38–1.31) 0.68 (0.38–1.23) 0.218
Lutein-Rich Fruits and Vegetables
Q1 Q2 Q3 Q4 Q5 p for Trend
N 3402 3401 3402 3401 3401Time at risk 32,106 32,994 32,316 32,995 32,408
# of cases 21 23 22 18 27Median (servings/week) 0 0.4 0.58 0.98 2.88
Sex adjusted 1 (ref) 0.90 (0.49–1.65) 0.90 (0.49–1.65) 0.76 (0.40–1.43) 0.76 (0.43–1.36) 0.381Multivariable adjusted 1 1 (ref) 1.07 (0.58–1.99) 1.0 (0.54–1.87) 0.82 (0.43–1.56) 0.81 (0.45–1.48) 0.354Multivariable adjusted 2 1 (ref) 1.10 (0.59–2.05) 1.03 (0.56–1.93) 0.84 (0.44–1.60) 0.86 (0.47–1.55) 0.439
Lycopene-Rich Fruits and Vegetables
Q1 Q2 Q3 Q4 Q5 p for Trend
N 3402 3401 3402 3401 3401Time at risk 34,332 33,347 32,602 31,537 31,041
# of cases 23 26 19 23 21Median (servings/week) 0.44 1.91 3.24 4.87 7.23
Sex adjusted 1 (ref) 1.04 (0.59–1.84) 0.81 (0.44–1.50) 0.78 (0.43–1.39) 0.70 (0.38–1.27) 0.137Multivariable adjusted 1 1 (ref) 0.98 (0.54–1.76) 0.80 (0.43–1.49) 0.81 (0.44–1.47) 0.69 (0.38–1.28) 0.181Multivariable adjusted 2 1 (ref) 1.0 (0.55–1.79) 0.8 (0.43–1.49) 0.84 (0.46–1.53) 0.73 (0.40–1.35) 0.249
Vitamin C-rich fruits and vegetables
Q1 Q2 Q3 Q3 Q5 p for Trend
N 3402 3401 3402 3401 3401Time at risk 32,746 32,672 32,371 32,628 32,341
# of cases 20 21 25 19 27Median (servings/week) 1.46 3.4 5.33 7.84 16.41
Sex adjusted 1 (ref) 0.78 (0.42–1.46) 0.91 (0.50–1.65) 0.55 (0.29–1.03) 0.61 (0.33–1.11) 0.103Multivariable adjusted 1 1 (ref) 0.79 (0.42–1.53) 0.99 (0.54–1.84) 0.56 (0.29–1.07) 0.66 (0.38–1.22) 0.171Multivariable adjusted 2 1 (ref) 0.83 (0.43–1.61) 1.00 (0.54–1.86) 0.58 (0.30–1.11) 0.68 (0.37–1.27) 0.191
Note: Multivariable adjusted 1: sex, marital status (five categories), studies (five categories), family history ofCHD (yes/no), type 2 diabetes (yes/no), high blood pressure (yes/no), dyslipidemia (yes/no), smoking status(four categories), total energy intake (kc/day), body mass index, physical activity (METs-h/day), alcohol intake(three categories), stratified by age in decades. Age as underlying time variable. Multivariable adjusted 2:additionally adjusted for legumes (g/day), whole-grains (g/day), and olive oil consumption (g/day).
4. Discussion
In this young, highly educated, Mediterranean cohort, we found an inverse association betweenfiber intake and CVD. This observed association was consistent with previous studies [3,33,34],but the results for fruit and vegetables subtypes, for the different fiber sources, or for rich-fiberfoods remain unclear.
We also found an inverse association between fruit consumption and fruit fiber and CVD.Our findings are consistent with various meta-analyses [12,33–37], even though the individual studiesseldom reached statistical significance. In a previous work with participants of an old Mediterranean
310
Nutrients 2017, 9, 295
cohort [11], our results suggested that higher fruit consumption was likely to be inversely associatedwith the future occurrence of CVD, but the results were no longer statistically significant in themultivariable analysis. The EPIC study (European Prospective Investigation into Cancer and Nutrition)that included participants from several Mediterranean countries did not find an association betweenfruit consumption and cardiovascular mortality either [38]. A meta-analysis [33] found a marginallysignificant inverse association for each 4 g/day greater intake of fiber fruit with CVD (HR 0.96(95% CI 0.93–1.00)), but another meta-analysis that included one further publication [3] found a clearlydecreased risk of 8% (95% CI 2%–14%) for CHD. None of these meta-analyses included studies withMediterranean populations. In our work, we also found that consumptions of at least two portions aday of fruit (160 g/day) could be protective against CVD, and higher consumptions did not appear toprovide additional protection.
We found no significant association with vegetable consumption nor with fiber from vegetables.Similarly, a recent meta-analysis [3] did not find a statistically significant association between vegetablefiber and CVD. It is also noteworthy that in our study vegetable consumption was very high(mean 525 g/day) and the median of the first quintile was already 209 g/day. Lack of variability in alower range of vegetable consumption may have precluded us from finding significant associations.In addition, the number of observed cases was low, as expected in this educated, slim, and youngMediterranean cohort. The statistical power of our study would be sufficient only to detect relativerisks between extreme quintiles in the range of 0.40–0.55, but not other relative risks closer to thenull. However, we expected to find strong associations, on the basis of a previous case-control studyconducted by our group [39].
Fruit and vegetables are rich sources of fiber, but they also provide antioxidants, vitamin K, folate,and other phytochemicals—some of them have other micronutrients, thus leading to heterogeneitybetween the different types. Therefore, some classifications have been suggested according thesedifferences. Nevertheless, studies that have assessed the association between a food or group andCVD are scarce. Oude Griep et al. [40] found no significant association between different varieties offruits and vegetables and CHD or stroke, but found a strong correlation between the different fruitvarieties and total fruit intake (0.72), and a less strong correlation between the different vegetablesvarieties and total vegetable consumption (0.53). Their results suggest that the quantity of fruitand vegetable consumption may be more relevant than their variety for the prevention of CVD.In a different classification according to the color of vegetables, the same authors [41,42] found asignificant protective association with stroke only for white fruits and vegetables; no significantassociation was observed for CHD. In our analysis, we found an inverse association betweencruciferous vegetable consumption and CVD, where eating at least one serving of cruciferousvegetables per week could reduce the risk of CVD by 48%. Our results differ from other studies thatfound no association between cruciferous vegetables and stroke [12] or CHD [32,43], but are consistentwith our results from a previous study on an old Mediterranean cohort [11]. Bendinelli [9] analyzedthe association between fruit and vegetable consumption and CHD in a Mediterranean cohort ofwomen, and found an inverse association with green leafy vegetables, which was consistent with otherstudies [32,44,45], but did not report the results for cruciferous vegetables alone. Cruciferous vegetablescontain sulforaphane [7], the most widely studied and best characterized isothiocyanate [46] which isa long-acting antioxidant, but also has anti-inflammatory activity by inhibition of cytokine production.The relationship between sulforaphane and the atherosclerosis process seems to be clear [46]. In animalmodels, sulforaphane has shown an inverse association with hypertension, diabetes, and diabetescomplications [47,48].
A higher consumption of legumes did not have any association with the risk of CVD in our cohort.Legumes are high in vegetable proteins and dietary fiber, and have a low glycemic index. To ourknowledge, only Bazzano et al. [49] and Wang et al. [50] reported an inverse association between theconsumption of legumes and CVD, with tangible benefits observed for the consumption of legumesat least four times per week. A recently published meta-analysis [51] found an inverse association
311
Nutrients 2017, 9, 295
between legume consumption and CHD (HR 0.90 CI 95% 0.84–0.97). Additionally, the authors of thislatter meta-analysis also found a marginally significant association between legume consumption andCVD (HR 0.94 CI 95% 0.89–1.00). Our participants had a high legume consumption (median in thefifth quintile: 36 g/day) and a priori we expected to find a risk reduction. Legumes are an importantfood in the Mediterranean diet and Trichopoulou et al. [13] found that the observed inverse associationbetween adherence to the Mediterranean diet and cardiovascular mortality was toned down whenlegumes were taken out from their score. Another meta-analysis [52] conducted with 20 studies thatanalyzed the association between adherence to the Mediterranean diet or its individual componentsand CVD also found an inverse association between legume consumption and CVD (HR 0.90 CI 95%0.83–0.98). Our results are similar in the magnitude and the direction of the association, but wedid not achieve statistical significance. Again, the low number of cases could explain this result.Moreover, there are important differences in composition across legumes in macronutrients [53](specifically in their protein content), fiber content, micronutrients, and phytochemicals, which couldalso explain the differences across different cohorts. Additionally, there are differences in the way theyare cooked in the different Mediterranean countries, which could also contribute to the diverse resultsin the different studies.
We found an inverse association between whole grain consumption and risk of CVD (HR forthe fifth vs. first quintile of 0.43 (95% CI 0.20–0.93)). Our study is consistent with a meta-analysisof ten cohort studies [21] that found an inverse association between whole grain consumption andrisk of CHD, stroke, and CVD, with no evidence of linearity and with a stronger risk reduction fromno consumption up to 50 g/day than with higher intakes. Most of the studies included in the lastmeta-analysis were from USA, only one of the included cohorts originating from a Mediterraneansetting, and even then, only cardiovascular mortality was assessed. We found no association betweenwhole grain consumption and CVD in a cohort with older Mediterranean participants [11].
Different plant foods, including fruits, vegetables, and whole grains among others, have theirdistinctive phytochemical contents. These distinctive phytochemicals have different biochemicalproperties, such as molecular size and solubility [5]. All these properties will affect the interactions betweenthe various biochemicals and thus their antioxidant or anti-inflammatory effect. Also, different plant-basedfoods contain different fiber types. Eating a wide variety of fruits, vegetables, whole grains, and otherplant foods and following a health dietary pattern—like the Mediterranean diet—has been postulated asbeing more important for CVD prevention than eating isolated food items [54]. A recent meta-analysishas shed light on this association [52], finding that some of the individual components did not achievesignificance, but that the overall diet decreased CVD disease rates.
We acknowledge that our study may have some limitations. First, our participants have a higheducational level, and are young and predominantly females, potentially limiting the generalizabilityof our results. However, the high educational level of our participants enhances the quality oftheir self-reported information and increases the internal validity of our results. In addition, lack ofrepresentativeness does not preclude from finding associations valid for other populations [55]. In fact,there are no biological mechanisms that suggest that our observed associations may no longer holdfor other populations. Finally, literature on the covered topic in middle-aged cohort was previouslyabsent. Second, the use of a validated FFQ does not rule out the existence of an information bias,but it has good or reasonable correlation coefficients for the considered exposures. Since the possiblemeasurement error in the assessment of diet is expected to be non-differential, it would presumablybias our results towards the null value. Third, the absence of repeated measurements may havealso led to a misclassification bias, because our participants may have experienced changes in theirconsumption along the follow-up. Fourth, we might have missed some CVD events. Nevertheless,all of our participants are university graduates, who are highly educated and highly motivated,and more than half of them are health professionals, thereby reducing the risk of underreporting.Additionally, we regularly consulted the National Death Index. Fifth, the incidence of CVD was lowin our cohort. Thus, we may have low statistical power to assess associations, especially in adjusted
312
Nutrients 2017, 9, 295
models. Nevertheless, it is noteworthy that the point estimates hardly changed with successiveadjustment and that the point estimates point towards the a priori expected association based onthe available literature. Finally, observing significant associations may have been hindered by aconsiderably high consumption of healthy foods in the lowest quintiles, compared to other availablestudies. High consumption of the considered food items may show protective effects when comparedto really low consumptions, but may show no additional protection beyond moderate consumptions.
The major strengths of the current study include its prospective design, its relatively large sampleand long-term follow-up, and its high retention rate. Another potential strength is the use of a validatedFFQ, with good correlations with the analyzed foods. Moreover, we adjusted the models for a widearray of potential confounders, in an attempt to control for potential confounders.
In conclusion, consumptions of at least two servings/day of fruit, and one serving/weekof cruciferous vegetables or whole grains may be protective against CVD in youngMediterranean populations.
Acknowledgments: The authors are indebted to the participants of the SUN study for their continued cooperationand participation. We are also grateful to the members of the Department of Nutrition of the HarvardSchool of Public Health (Willett WC, Hu FB, and Ascherio A) who helped us to design the SUN study.We also thank the other members of the SUN Group: Alonso A, Barrio López MT, Basterra-Gortari FJ,Benito Corchón S, Bes-Rastrollo M, Beunza JJ, Carlos Chillerón S, Carmona L, Cervantes S, de Irala Estévez J,de la Rosa PA, Delgado Rodríguez M, Donat Vargas CL, Donázar M, Fernández Montero A, Galbete Ciáurriz C,García López M, Gea A, Goñi Ochandorena E, Guillén Grima F, Hernández A, Lahortiga F, Llorca J,López del Burgo C, Marí Sanchís A, Martí del Moral A, Martín Calvo N, Martínez JA, Núñez-Córdoba JM,Pimenta AM, Ramallal R, Ruiz Zambrana A, Sánchez Adán D, Sayón Orea C, Toledo Atucha J, Vázquez Ruiz Z,and Zazpe García I. The SUN Project has received funding from the Spanish Government-Instituto de SaludCarlos III, and the European Regional Development Fund (FEDER) (RD 06/0045, CIBER-OBN, Grants PI10/02658,PI10/02293, PI13/00615, PI14/01668, PI14/01798, PI14/01764, and G03/140), the Navarra Regional Government(45/2011, 122/2014), and the University of Navarra.
Author Contributions: M.A.M.-G. and M.R.-C. conceived and designed the experiments; J.D.-E. and A.G.-A.contributed to data collection; P.B.-C. and E.T. analyzed the data and wrote the paper. All authors have revisedthe manuscript critically for important intellectual content and have given final approval of the version tobe published.
Conflicts of Interest: The authors declare no conflict of interest.
References
1. Mozaffarian, D.; Benjamin, E.J.; Go, A.S.; Arnett, D.K.; Blaha, M.J.; Cushman, M.; Das, S.H.; De Ferranti, S.;Despres, J.D.; Fullerton, H.J.; et al. Heart Disease and Stroke Statistics—2016 Update. Circulation 2016, 133,e38–e360. [CrossRef] [PubMed]
2. World Health Organization. Global Health Observatory (GHO) data. World Health Statistics 2016:
Monitoring health for the SDGs. Available online: http://www.who.int/gho/publications/world_health_statistics/2016/en/ (accessed on 16 March 2017).
3. Wu, Y.; Qian, Y.; Pan, Y.; Li, P.; Yang, J.; Ye, X.; Xu, G. Association between dietary fiber intake and risk ofcoronary heart disease: A meta-analysis. Clin. Nutr. 2015, 34, 603–611. [CrossRef] [PubMed]
4. Wang, S.; Moustaid-Moussa, N.; Chen, L.; Mo, H.; Shastri, A.; Su, R.; Bapak, P.; KWun, J.; Shen, C.L.Novel insights of dietary polyphenols and obesity. J. Nutr. Biochem. 2014, 25, 1–18. [CrossRef] [PubMed]
5. Liu, R.H. Health-promoting components of fruits and vegetables in the Diet. Adv. Nutr. 2013, 4, 384S–392S.[CrossRef] [PubMed]
6. Liu, R.H. Potential synergy of phytochemicals in cancer prevention: Mechanism of action. J. Nutr. 2004, 134,3479S–3485S. [PubMed]
7. Rodriguez-Casado, A. The health potential of fruits and vegetables phytochemicals: Notable examples.Crit. Rev. Food Sci. Nutr. 2014. [CrossRef] [PubMed]
8. Gan, Y.; Tong, X.; Li, L.; Cao, S.; Yin, X.; Gao, C.; Merath, C.; Li, W.; Jin, Z.; Chen, Y.; et al. Consumption offruit and vegetable and risk of coronary heart disease: A meta-analysis of prospective cohort studies.Int. J. Cardiol. 2015, 183, 129–137. [CrossRef] [PubMed]
313
Nutrients 2017, 9, 295
9. Bendinelli, B.; Masala, G.; Saieva, C.; Salvini, S.; Calonico, C.; Sacerdote, C.; Agnoli, C.; Grioni, S.; Frasca, G.;Mattiello, A.; et al. Fruit, vegetables, and olive oil and risk of coronary heart disease in Italian women:The EPICOR Study. Am. J. Clin. Nutr. 2011, 93, 275–283. [CrossRef] [PubMed]
10. Buil-Cosiales, P.; Zazpe, I.; Toledo, E.E.; Corella, D.; Salas-Salvadó, J.; Diez-Espino, J.; Ros, E.;Fernandez-Creuet Navajas, J.; Santos-Lozano, J.M.; Aros, F.; et al. Dietary Fiber intake and all-causemortality in the Prevencio (PREDIMED) study Mediterra. Am. J. Clin. Nutr. 2014, 100, 1498–1507. [CrossRef][PubMed]
11. Buil-Cosiales, P.; Toledo, E.; Salas-Salvadó, J.; Zazpe, I.; Farràs, M.; Basterra-Gortari, F.J.; Diez-Espino, J.;Estruch, R.; Corella, D.; Ros, E.; et al. Association between dietary fibre intake and fruit, vegetable orwhole-grain consumption and the risk of CVD: Results from the PREvención con DIeta MEDiterránea(PREDIMED) trial. Br. J. Nutr. 2016, 1, 1–13. [CrossRef] [PubMed]
12. Hu, D.; Huang, J.; Wang, Y.; Zhang, D.; Qu, Y. Fruits and vegetables consumption and risk of stroke:A meta-analysis of prospective cohort studies. Stroke 2014, 45, 1613–1619. [CrossRef] [PubMed]
13. Trichopoulou, A.; Bamia, C.; Trichopoulos, D. Anatomy of health effects of Mediterranean diet: Greek EPICprospective cohort study. BMJ 2009, 338, b2337. [CrossRef] [PubMed]
14. Nagura, J.; Iso, H.; Watanabe, Y.; Maruyama, K.; Date, C.; Toyoshima, H.; Yamamoto, A.; Kikuchi, S.;Koizumi, A.; Kondal, T.; et al. Fruit, vegetable and bean intake and mortality from cardiovascular diseaseamong Japanese men and women: The JACC Study. Br. J. Nutr. 2009, 102, 285–292. [CrossRef] [PubMed]
15. Flight, I.; Clifton, P. Cereal grains and legumes in the prevention of coronary heart disease and stroke:A review of the literature. Eur. J. Clin. Nutr. 2006, 60, 1145–1159. [CrossRef] [PubMed]
16. De Munter, J.S.L.; Hu, F.B.; Spiegelman, D.; Franz, M.; Van Dam, R.M. Whole grain, bran, and germ intakeand risk of type 2 diabetes: A prospective cohort study and systematic review. PLoS Med. 2007, 4, 1385–1395.[CrossRef] [PubMed]
17. Ye, E.; Chacko, S.; Chou, E.; Kugizaki, M.; Liu, S. Greater whole-grain intake is associated with lower risk oftype 2 diabetes, cardiovascular disease, and weight gain. J. Nutr. 2012, 142, 1304–1313. [CrossRef] [PubMed]
18. Leinonen, K.S.; Poutanen, K.S.; Mykkänen, H.M. Rye bread decreases serum total and LDL cholesterol inmen with moderately elevated serum cholesterol. J. Nutr. 2000, 130, 164–170. [PubMed]
19. Ha, V.; Sievenpiper, J.L.; de Souza, R.J.; Jayalath, V.H.; Mirrahimi, A.; Agarwal, A.; Chiavaroli, L.; Mejia, S.B.;Sacks, F.H.; Di Buono, M.; et al. Effect of dietary pulse intake on established therapeutic review andmeta-analysis of randomized controlled trials. Can. Med. Assoc. J. 2014, 186, 252–262. [CrossRef] [PubMed]
20. Kirwan, J.P.; Malin, S.K.; Scelsi, A.R.; Kullman, E.L.; Navaneethan, S.D.; Haus, J.M.; Fillion, J.; Godin, J.P.;Kochher, S.; Ross, A.B. A whole grain diet reduces cardiovascular risk factors in overweight and obese adults:A randomized controlled trial. J. Nutr. 2016, 146, 2244–2251. [CrossRef] [PubMed]
21. Aune, D.; Keum, N.; Giovannucci, E.; Fadnes, L.T.; Boffetta, P.; Greenwood, D.C.; Tonstad, S.; Vatten, L.J.;Riboli, E.; Narat, T. Whole grain consumption and risk of cardiovascular disease, cancer, and all cause andcause specific mortality: Systematic review and dose-response meta-analysis of prospective studies. BMJ
2016, 353, i2716. [CrossRef] [PubMed]22. Bouchenak, M.; Lamri-Senhadji, M. Nutritional quality of legumes, and their role in cardiometabolic risk
prevention: A review. J. Med. Food 2013, 16, 1–14. [CrossRef] [PubMed]23. Hosseinpour-Niazi, S.; Mirmiran, P.; Amiri, Z.; Hosseini-Esfahani, F.; Shakeri, N.; Azizi, F. Legume intake is
inversely associated with metabolic syndrome in adults. Arch. Iran. Med. 2012, 15, 538–544. [PubMed]24. Seguí-Gómez, M.; de la Fuente, C.; Vázquez, Z.; de Irala, J.; Martínez-González, M.A. Cohort profile: The
“Seguimiento Universidad de Navarra” (SUN) study. Int. J. Epidemiol. 2006, 35, 1417–1422. [CrossRef][PubMed]
25. The British Geriatrics Society. Fit for Frailty-Consensus Best Practice Guidance for the Care of OlderPeople Living in Community and Outpatient Settings-a Report from the British Geriatrics Society 2014.Available online: http://www.bgs.org.uk/campaigns/fff/fff_full.pdf (accessed on 15 March 2017).
26. Eguaras, S.; Toledo, E.; Hernández-Hernández, A.; Cervantes, S.; Martínez-González, M.A. Better adherenceto the mediterranean diet could mitigate the adverse consequences of obesity on cardiovascular disease:The SUN prospective cohort. Nutrients 2015, 7, 9154–9162. [CrossRef] [PubMed]
27. Alonso, A.; Beunza, J.J.; Delgado-Rodríguez, M.; Martínez-González, M.A. Validation of self reporteddiagnosis of hypertension in a cohort of university graduates in Spain. BMC Public Health 2005, 5, 94.[CrossRef] [PubMed]
314
Nutrients 2017, 9, 295
28. Fernandez-Montero, A.; Beunza, J.J.; Bes-Rastrollo, M.; Barrio, M.T.; de la Fuente-Arrillaga, C.;Moreno-Galarraga, L.; Martinez-Gonzalez, M.A. Validacion de los componentes del sindrome metabolicoautodeclarados en un estudio de cohortes. Gac. Sanit. 2011, 25, 303–307. (In Spanish) [CrossRef] [PubMed]
29. Willett, W.C. Implications of total energy intake for epidemiologic analyses. In Nutritional Epidemiology,3rd ed.; Willett, W.C., Ed.; Oxford University Press: New York, NY, USA, 2013.
30. Martin-Moreno, J.M.; Boyle, P.; Gorgojo, L.; Maisonneuve, P.; Fernandez-Rodriguez, J.C.; Salvini, S.;Willet, W.C. Development and validation of a food frequency questionnaire in Spain. Int. J. Epidemiol.
1993, 22, 512–519. [CrossRef] [PubMed]31. Fernández-Ballart, J.D.; Piñol, J.L.; Zazpe, I.; Corella, D.; Carrasco, P.; Toledo, E.; Perez-Bauer, M.;
Fernandez-Gonzalez, M.A.; Salas-Salvado, J.; Martin-Moreno, J.M. Relative validity of a semi-quantitativefood-frequency questionnaire in an elderly Mediterranean population of Spain. Br. J. Nutr. 2010, 103,1808–1816. [CrossRef] [PubMed]
32. Joshipura, K.J.; Hu, F.B.; Manson, J.E.; Stampfer, M.J.; Rimm, E.B.; Speizer, F.E.; Colditz, G.; Ascherio, A.;Rossner, B.; Spiegelman, D.; et al. The effect of fruit and vegetable intake on risk for coronary heart disease.Ann. Intern. Med. 2001, 134, 1106–1114. [CrossRef] [PubMed]
33. Threapleton, D.E.; Greenwood, D.C.; Evans, C.E.L.; Cleghorn, C.L.; Nykjaer, C.; Woodhead, C.; Cade, J.E.;Gale, C.P.; Burley, V.J. Dietary fibre intake and risk of cardiovascular disease: Systematic review andmeta-analysis. BMJ 2013, 347, f6879. [CrossRef] [PubMed]
34. Dauchet, L.; Amouyel, P.; Hercberg, S.; Dallongeville, J. Fruit and vegetable consumption and risk of coronaryheart disease: A meta-analysis of cohort studies. J. Nutr. 2006, 136, 2588–2593. [PubMed]
35. Chen, G.-C.C.; Lv, D.-B.B.; Pang, Z.; Dong, J.-Y.Y.; Liu, Q.-F.F. Dietary fiber intake and stroke risk:A meta-analysis of prospective cohort studies. Eur. J. Clin. Nutr. 2013, 67, 96–100. [CrossRef] [PubMed]
36. He, F.J.; Nowson, C.A.; MacGregor, G.A. Fruit and vegetable consumption and stroke: Meta-analysis ofcohort studies. Lancet 2006, 367, 320–326. [CrossRef]
37. Dauchet, L.; Amouyel, P.; Dallongeville, J. Fruit and vegetable consumption and risk of stroke:A meta-analysis of cohort studies. Neurology 2005, 65, 1193–1197. [CrossRef] [PubMed]
38. Leenders, M.; Sluijs, I.; Ros, M.M.; Boshuizen, H.C.; Siersema, P.D.; Ferrari, P.; Weikert, C.; Tjonneland, A.;Olsen, D.; Boutron-Ruault, M.C. Fruit and vegetable consumption and mortality European prospectiveinvestigation into cancer and nutrition. Am. J. Epidemiol. 2013. [CrossRef] [PubMed]
39. Martínez-González, M.A.; Fernández-Jarne, E.; Martínez-Losa, E.; Prado-Santamaría, M.;Brugarolas-Brufau, C.; Serrano-Martinez, M. Role of fibre and fruit in the Mediterranean diet toprotect against myocardial infarction: A case-control study in Spain. Eur. J. Clin. Nutr. 2002, 56, 715–722.[CrossRef] [PubMed]
40. Oude Griep, L.M.; Verschuren, W.M.; Kromhout, D.; Ocké, M.C.; Geleijnse, J.M. Variety in fruit and vegetableconsumption and 10-year incidence of CHD and stroke. Public Health Nutr. 2012, 1–7. [CrossRef] [PubMed]
41. Oude Griep, L.M.; Verschuren, W.M.M.; Kromhout, D.; Ocké, M.C.; Geleijnse, J.M. Colors of fruit andvegetables and 10-year incidence of stroke. Stroke 2011, 42, 3190–3195. [CrossRef] [PubMed]
42. Oude Griep, L.M.; Monique Verschuren, W.M.; Kromhout, D.; Ocké, M.C.; Geleijnse, J.M. Colours of fruitand vegetables and 10-year incidence of CHD. Br. J. Nutr. 2011, 106, 1562–1569. [CrossRef] [PubMed]
43. Bhupathiraju, S.N.; Wedick, N.M.; Pan, A.; Manson, J.E.; Rexrode, K.M.; Willett, W.C.; Rimm, E.B.; Hu, F.B.Quantity and variety in fruit and vegetable intake and risk of coronary heart disease. Am. J. Clin. Nutr. 2013.[CrossRef] [PubMed]
44. Joshipura, K.J.; Ascherio, A.; Manson, J.E.; Stampfer, M.J.; Rimm, E.B.; Speizer, F.E.; Mennkens, C.H.;Spiegelmam, D.; Willet, W.C. Fruit and vegetable intake in relation to risk of ischemic stroke. JAMA 1999,282, 1233–1239. [CrossRef] [PubMed]
45. Pollock, R.L. The effect of green leafy and cruciferous vegetable intake on the incidence of cardiovasculardisease: A meta-analysis. JRSM Cardiovasc. Dis. 2016, 5, 1–9. [CrossRef] [PubMed]
46. Bai, Y.; Wang, X.; Zhao, S.; Ma, C.; Cui, J.; Zheng, Y. Sulforaphane Protects against Cardiovascular Diseasevia Nrf2 Activation. Oxid. Med. Cell. Longev. 2015. [CrossRef] [PubMed]
47. Bahadoran, Z.; Mirmiran, P.; Hosseinpanah, F.; Rajab, A.; Asghari, G.; Azizi, F. Broccoli sprouts powdercould improve serum triglyceride and oxidized LDL/LDL-cholesterol ratio in type 2 diabetic patients:A randomized double-blind placebo-controlled clinical trial. Diabetes Res. Clin. Pract. 2012, 96, 348–354.[CrossRef] [PubMed]
315
Nutrients 2017, 9, 295
48. Bahadoran, Z.; Tohidi, M.; Nazeri, P.; Mehran, M.; Azizi, F.; Mirmiran, P. Effect of broccoli sprouts on insulinresistance in type 2 diabetic patients: A randomized double-blind clinical trial. Int. J. Food Sci. Nutr. 2012, 63,767–771. [CrossRef] [PubMed]
49. Bazzano, L.A.; He, J.; Ogden, L.G.; Loria, C.; Vupputuri, S.; Myers, L.; Whelton, P.K. Legume Consumptionand Risk of Coronary Heart Disease in US Men and Women. Arch. Intern. Med. 2001, 161, 2573. [CrossRef][PubMed]
50. Wang, J.-B.; Fan, J.-H.; Dawsey, S.M.; Sinha, R.; Freedman, N.D.; Taylor, P.R.; Qiao, Y-L.; Abnet, C.C.Dietary components and risk of total, cancer and cardiovascular disease mortality in the Linxian NutritionIntervention Trials cohort in China. Sci. Rep. 2016, 6, 22619. [CrossRef] [PubMed]
51. Marventano, S.; Izquierdo Pulido, M.; Sánchez-González, C.; Godos, J.; Speciani, A.; Galvano, F.; Grosso, G.Legume consumption and CVD risk: A systematic review and meta-analysis. Public Health Nutr. 2017, 20,245–254. [CrossRef] [PubMed]
52. Grosso, G.; Marventano, S.; Yang, J.; Micek, A.; Pajak, A.; Scalfi, L.; Galvano, F.; Kales, S.N. A comprehensivemeta-analysis on evidence of Mediterranean diet and cardiovascular disease: Are individual componentsequal? Crit. Rev. Food Sci. Nutr. 2015. [CrossRef] [PubMed]
53. Ros, E.; Hu, F.B. Consumption of plant seeds and cardiovascular health: Epidemiological and clinical trialevidence. Circulation 2013, 128, 553–565. [CrossRef] [PubMed]
54. Martínez-González, M.A.; Gea, A. Mediterranean diet: The whole is more than the sum of its parts.Br. J. Nutr. 2012, 108, 577–578. [CrossRef] [PubMed]
55. Rothman, K.J. Six persistent research misconceptions. J. Gen. Intern. Med. 2014, 29, 1060–1064. [CrossRef][PubMed]
© 2017 by the authors. Licensee MDPI, Basel, Switzerland. This article is an open accessarticle distributed under the terms and conditions of the Creative Commons Attribution(CC BY) license (http://creativecommons.org/licenses/by/4.0/).
316

Section 6:
Other Health Outcomes

nutrients
Article
Soluble Fibre Meal Challenge Reduces AirwayInflammation and Expression of GPR43 and GPR41in Asthma
Isabel Halnes 1, Katherine J. Baines 1, Bronwyn S. Berthon 1, Lesley K. MacDonald-Wicks 2,
Peter G. Gibson 1 and Lisa G. Wood 1,*
1 Centre for Healthy Lungs, Hunter Medical Research Institute, University of Newcastle,Callaghan, NSW 2308, Australia; [email protected] (I.H.);[email protected] (K.J.B.); [email protected] (B.S.B.);[email protected] (P.G.G.)
2 School of Health Sciences, University of Newcastle, Callaghan, NSW 2305, Australia;[email protected]
* Correspondence: [email protected]; Tel.: +61-240-420-147
Received: 16 November 2016; Accepted: 27 December 2016; Published: 10 January 2017
Abstract: Short chain fatty acids (SCFAs) are produced following the fermentation of soluble fibre bygut bacteria. In animal models, both dietary fibre and SCFAs have demonstrated anti-inflammatoryeffects via the activation of free fatty acid receptors, such as G protein-coupled receptor 41 and 43(GPR41 and GPR43). This pilot study examined the acute effect of a single dose of soluble fibreon airway inflammation—including changes in gene expression of free fatty acid receptors—inasthma. Adults with stable asthma consumed a soluble fibre meal (n = 17) containing 3.5 g inulinand probiotics, or a control meal (n = 12) of simple carbohydrates. Exhaled nitric oxide (eNO) wasmeasured and induced sputum was collected at 0 and 4 h for differential cell counts, measurementof interleukin-8 (IL-8) protein concentration, and GPR41 and GPR43 gene expression. At 4 h aftermeal consumption, airway inflammation biomarkers, including sputum total cell count, neutrophils,macrophages, lymphocytes, sputum IL-8, and eNO significantly decreased compared to baselinein the soluble fibre group only. This corresponded with upregulated GPR41 and GPR43 sputumgene expression and improved lung function in the soluble fibre group alone. Soluble fibre hasacute anti-inflammatory effects in asthmatic airways. Long-term effects of soluble fibre as ananti-inflammatory therapy in asthma warrants further investigation.
Keywords: asthma; prebiotics; G-protein coupled receptor; inflammation; short chain fatty acids
1. Introduction
Asthma is a chronic inflammatory disease of the airways, affecting approximately 300 millionpeople worldwide [1]. In Australia, over two million people are affected [2]. Glucocorticoids are themainstay of asthma management [3]. However, treatment can predispose individuals to long-termside effects (e.g., osteoporosis, hypertension, insulin resistance, neuropsychiatric effects), and somepatients respond poorly [3]. Thus, new ways to treat inflammation in asthma are urgently needed.
While asthma has a significant genetic component, environmental factors also play a role.Epidemiological studies report increased asthma risk with consumption of westernized diets [4–7],which are often high in fat and processed foods, and low in fibre. Dietary fibres are complexcarbohydrates found in plant-based foods and are classified based on their solubility in water [8].Insoluble fibres (e.g., cellulose) are biologically inert substances that assist in the alleviation ofconstipation by promoting bowel movements [8]. Soluble fibres such as oligosaccharides and
Nutrients 2017, 9, 57 317 www.mdpi.com/journal/nutrients
Nutrients 2017, 9, 57
fructans (e.g., inulin) act as substrates for fermentation by intestinal microbes [9]. Partial digestion ofsoluble fibre produces short chain fatty acids (SCFAs), primarily acetate, propionate and butyrate [9].Butyrate is the preferred fuel source for colonocytes, propionate is mainly metabolized by the liver,while acetate is the main SCFA to enter the circulation where it can act on immune cells and peripheraltissues and potentially elicit anti-inflammatory effects [9,10].
Recently, we reported that fibre intake was inversely associated with lung function andeosinophilic airway inflammation [11,12]. One mechanism potentially linking dietary fibre intake andinflammatory responses, involves the activation of the free fatty acid receptors, G protein-coupledreceptor 41 and 43 (GPR41 and GPR43). These are cell surface receptors that are activated by SCFAson cells of the gastrointestinal tract, as well as immune cells (e.g., eosinophils and neutrophils) andadipocytes [13]. To date, there are no human intervention trials that have assessed how dietary fibre—inparticular soluble fibre—can impact airway inflammation. Airway inflammation can be assessed insubjects with asthma by collecting induced sputum (which enables quantification of inflammatory cells)and the use of molecular techniques to measure gene expression to examine mechanistic pathways [14].Furthermore, sputum can be induced serially, in a safe manner to assess changes in inflammation [15].
We hypothesised that increased intake of soluble fibre would reduce airway inflammation inasthma via activation of free fatty acid receptors. Therefore, in this pilot study, we aimed to investigatethe effects of an acute soluble fibre challenge on airway inflammation and free fatty acid receptoractivity in asthma.
2. Materials and Methods
2.1. Subjects
Twenty-nine subjects with stable asthma, aged ≥18 years and with a body mass index (BMI)between 18 and 30 kg/m2 were recruited from the John Hunter Hospital Asthma Clinic, NSW, Australia,from existing study volunteer databases and by advertisement. A subset of data from these participantshas previously been reported [16]. Asthma stability was confirmed, defined as no exacerbation,respiratory tract infection, or oral corticosteroids in the past four weeks. Asthma control wasassessed using the seven-item Asthma Control Questionnaire (ACQ-7) [17]. Clinical asthma pattern(intermittent, mild, moderate, or severe persistent) was determined according to the Global Initiativefor Asthma (GINA) guidelines [18]. Subjects were excluded from the study if they were current smokersor had any respiratory-related illness other than asthma on presentation. This trial was conducted atthe Hunter Medical Research Institute, Newcastle, Australia according to the guidelines laid downin the Declaration of Helsinki, and all procedures involving human subjects were approved by theHunter New England Human Research Ethics Committee (HREC) (06/10/25/5.03, 11/06/15/4.02)and registered with the University of Newcastle HREC. Written informed consent was obtained fromall subjects. The trial was registered with the Australian and New Zealand Clinical Trials Registry(number ACTRN12607000236493) prior to the study commencing.
2.2. Study Design
All subjects fasted for 12 h, withheld short acting β2-agonist medications (for 12 h) and long actingβ2-agonist medications (for 24 h), and underwent exhaled nitric oxide (eNO, Ecomedics CLD 88sp,Ecomedics, Duernten, Switzerland), spirometry, and hypertonic saline challenge with combinedsputum induction, and then consumed the study meal (soluble fibre n = 17, control n = 12)within 15 min. Four hours after meal consumption, eNO, spirometry, and sputum induction wererepeated. The soluble fibre meal consisted of commercial probiotic yoghurt (Vaalia, low fat, 175 g),containing 806 kJ, the soluble fibre inulin (3.5 g), and the probiotics Lactobacillus acidophilus strainLA5, Bifidobacterium lactis strain Bb12, and Lactobacillus rhamnosus strain GG, each at a concentrationof ≥108 colony forming units. The control meal consisted of an isocaloric meal of 200 g plainmashed potato.
318
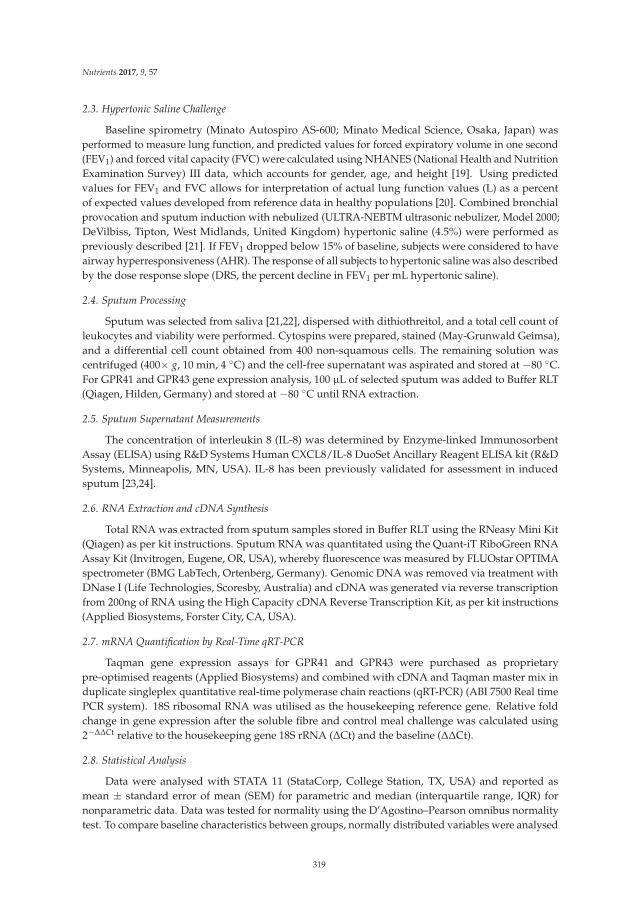
Nutrients 2017, 9, 57
2.3. Hypertonic Saline Challenge
Baseline spirometry (Minato Autospiro AS-600; Minato Medical Science, Osaka, Japan) wasperformed to measure lung function, and predicted values for forced expiratory volume in one second(FEV1) and forced vital capacity (FVC) were calculated using NHANES (National Health and NutritionExamination Survey) III data, which accounts for gender, age, and height [19]. Using predictedvalues for FEV1 and FVC allows for interpretation of actual lung function values (L) as a percentof expected values developed from reference data in healthy populations [20]. Combined bronchialprovocation and sputum induction with nebulized (ULTRA-NEBTM ultrasonic nebulizer, Model 2000;DeVilbiss, Tipton, West Midlands, United Kingdom) hypertonic saline (4.5%) were performed aspreviously described [21]. If FEV1 dropped below 15% of baseline, subjects were considered to haveairway hyperresponsiveness (AHR). The response of all subjects to hypertonic saline was also describedby the dose response slope (DRS, the percent decline in FEV1 per mL hypertonic saline).
2.4. Sputum Processing
Sputum was selected from saliva [21,22], dispersed with dithiothreitol, and a total cell count ofleukocytes and viability were performed. Cytospins were prepared, stained (May-Grunwald Geimsa),and a differential cell count obtained from 400 non-squamous cells. The remaining solution wascentrifuged (400× g, 10 min, 4 C) and the cell-free supernatant was aspirated and stored at −80 C.For GPR41 and GPR43 gene expression analysis, 100 µL of selected sputum was added to Buffer RLT(Qiagen, Hilden, Germany) and stored at −80 C until RNA extraction.
2.5. Sputum Supernatant Measurements
The concentration of interleukin 8 (IL-8) was determined by Enzyme-linked ImmunosorbentAssay (ELISA) using R&D Systems Human CXCL8/IL-8 DuoSet Ancillary Reagent ELISA kit (R&DSystems, Minneapolis, MN, USA). IL-8 has been previously validated for assessment in inducedsputum [23,24].
2.6. RNA Extraction and cDNA Synthesis
Total RNA was extracted from sputum samples stored in Buffer RLT using the RNeasy Mini Kit(Qiagen) as per kit instructions. Sputum RNA was quantitated using the Quant-iT RiboGreen RNAAssay Kit (Invitrogen, Eugene, OR, USA), whereby fluorescence was measured by FLUOstar OPTIMAspectrometer (BMG LabTech, Ortenberg, Germany). Genomic DNA was removed via treatment withDNase I (Life Technologies, Scoresby, Australia) and cDNA was generated via reverse transcriptionfrom 200ng of RNA using the High Capacity cDNA Reverse Transcription Kit, as per kit instructions(Applied Biosystems, Forster City, CA, USA).
2.7. mRNA Quantification by Real-Time qRT-PCR
Taqman gene expression assays for GPR41 and GPR43 were purchased as proprietarypre-optimised reagents (Applied Biosystems) and combined with cDNA and Taqman master mix induplicate singleplex quantitative real-time polymerase chain reactions (qRT-PCR) (ABI 7500 Real timePCR system). 18S ribosomal RNA was utilised as the housekeeping reference gene. Relative foldchange in gene expression after the soluble fibre and control meal challenge was calculated using2−∆∆Ct relative to the housekeeping gene 18S rRNA (∆Ct) and the baseline (∆∆Ct).
2.8. Statistical Analysis
Data were analysed with STATA 11 (StataCorp, College Station, TX, USA) and reported asmean ± standard error of mean (SEM) for parametric and median (interquartile range, IQR) fornonparametric data. Data was tested for normality using the D’Agostino–Pearson omnibus normalitytest. To compare baseline characteristics between groups, normally distributed variables were analysed
319
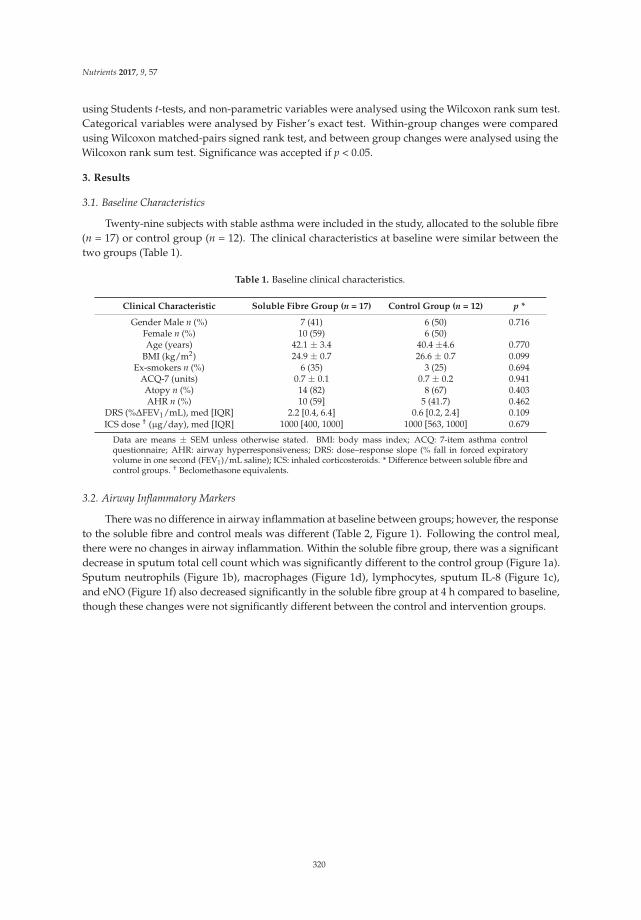
Nutrients 2017, 9, 57
using Students t-tests, and non-parametric variables were analysed using the Wilcoxon rank sum test.Categorical variables were analysed by Fisher’s exact test. Within-group changes were comparedusing Wilcoxon matched-pairs signed rank test, and between group changes were analysed using theWilcoxon rank sum test. Significance was accepted if p < 0.05.
3. Results
3.1. Baseline Characteristics
Twenty-nine subjects with stable asthma were included in the study, allocated to the soluble fibre(n = 17) or control group (n = 12). The clinical characteristics at baseline were similar between thetwo groups (Table 1).
Table 1. Baseline clinical characteristics.
Clinical Characteristic Soluble Fibre Group (n = 17) Control Group (n = 12) p *
Gender Male n (%) 7 (41) 6 (50) 0.716Female n (%) 10 (59) 6 (50)Age (years) 42.1 ± 3.4 40.4 ±4.6 0.770
BMI (kg/m2) 24.9 ± 0.7 26.6 ± 0.7 0.099Ex-smokers n (%) 6 (35) 3 (25) 0.694
ACQ-7 (units) 0.7 ± 0.1 0.7 ± 0.2 0.941Atopy n (%) 14 (82) 8 (67) 0.403AHR n (%) 10 (59] 5 (41.7) 0.462
DRS (%∆FEV1/mL), med [IQR] 2.2 [0.4, 6.4] 0.6 [0.2, 2.4] 0.109ICS dose † (µg/day), med [IQR] 1000 [400, 1000] 1000 [563, 1000] 0.679
Data are means ± SEM unless otherwise stated. BMI: body mass index; ACQ: 7-item asthma controlquestionnaire; AHR: airway hyperresponsiveness; DRS: dose–response slope (% fall in forced expiratoryvolume in one second (FEV1)/mL saline); ICS: inhaled corticosteroids. * Difference between soluble fibre andcontrol groups. † Beclomethasone equivalents.
3.2. Airway Inflammatory Markers
There was no difference in airway inflammation at baseline between groups; however, the responseto the soluble fibre and control meals was different (Table 2, Figure 1). Following the control meal,there were no changes in airway inflammation. Within the soluble fibre group, there was a significantdecrease in sputum total cell count which was significantly different to the control group (Figure 1a).Sputum neutrophils (Figure 1b), macrophages (Figure 1d), lymphocytes, sputum IL-8 (Figure 1c),and eNO (Figure 1f) also decreased significantly in the soluble fibre group at 4 h compared to baseline,though these changes were not significantly different between the control and intervention groups.
320
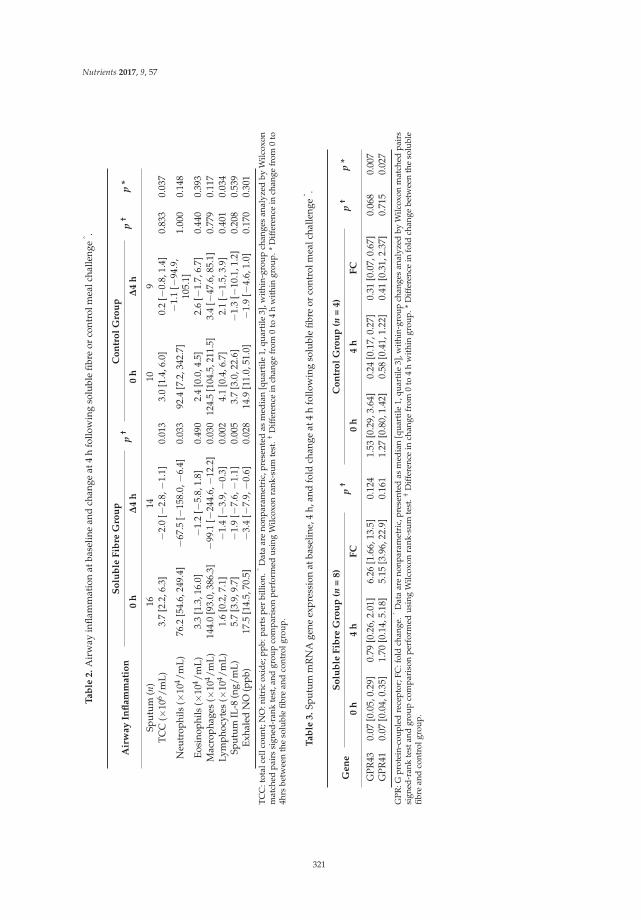
Nutrients 2017, 9, 57
Ta
ble
2.
Air
way
infla
mm
atio
nat
base
line
and
chan
geat
4h
follo
win
gso
lubl
efib
reor
cont
rolm
ealc
halle
nge
ˆ .
Air
wa
yIn
fla
mm
ati
on
So
lub
leF
ibre
Gro
up
p†
Co
ntr
ol
Gro
up
p†
p*
0h
∆4
h0
h∆
4h
Sput
um(n
)16
1410
9TC
C(×
106 /m
L)3.
7[2
.2,6
.3]
−2.
0[−
2.8,−
1.1]
0.01
33.
0[1
.4,6
.0]
0.2
[−0.
8,1.
4]0.
833
0.03
7
Neu
trop
hils
(×10
4 /mL)
76.2
[54.
6,24
9.4]
−67
.5[−
158.
0,−
6.4]
0.03
392
.4[7
.2,3
42.7
]−
1.1
[−94
.9,
105.
1]1.
000
0.14
8
Eosi
noph
ils(×
104 /m
L)3.
3[1
.3,1
6.0]
−1.
2[−
5.8,
1.8]
0.49
02.
4[0
.0,4
.5]
2.6
[−1.
7,6.
7]0.
440
0.39
3M
acro
phag
es(×
104 /m
L)14
4.0
[93.
0,38
6.3]
−99
.1[−
244.
6,−
12.2
]0.
030
124.
5[1
04.5
,211
.5]
3.4
[−47
.6,8
5.1]
0.77
90.
117
Lym
phoc
ytes
(×10
4 /mL)
1.6
[0.2
,7.1
]−
1.4
[−3.
9,−
0.3]
0.00
24.
1[0
.4,6
.7]
2.1
[−1.
5,3.
9]0.
401
0.03
4Sp
utum
IL-8
(ng/
mL)
5.7
[3.9
,9.7
]−
1.9
[−7.
6,−
1.1]
0.00
53.
7[3
.0,2
2.6]
−1.
3[−
10.1
,1.2
]0.
208
0.53
9Ex
hale
dN
O(p
pb)
17.5
[14.
5,70
.5]
−3.
4[−
7.9,−
0.6]
0.02
814
.9[1
1.0,
51.0
]−
1.9
[−4.
6,1.
0]0.
170
0.30
1
TC
C:t
otal
cell
coun
t;N
O:n
itri
cox
ide;
ppb:
part
spe
rbi
llion
.ˆD
ata
are
nonp
aram
etri
c,pr
esen
ted
asm
edia
n[q
uart
ile1,
quar
tile
3],w
ithi
n-gr
oup
chan
ges
anal
yzed
byW
ilcox
onm
atch
edpa
irs
sign
ed-r
ank
test
,and
grou
pco
mpa
riso
npe
rfor
med
usin
gW
ilcox
onra
nk-s
umte
st.†
Diff
eren
cein
chan
gefr
om0
to4
hw
ithin
grou
p.*
Diff
eren
cein
chan
gefr
om0
to4h
rsbe
twee
nth
eso
lubl
efib
rean
dco
ntro
lgro
up.
Ta
ble
3.
Sput
umm
RN
Age
neex
pres
sion
atba
selin
e,4
h,an
dfo
ldch
ange
at4
hfo
llow
ing
solu
ble
fibre
orco
ntro
lmea
lcha
lleng
eˆ .
Ge
ne
So
lub
leF
ibre
Gro
up
(n=
8)
p†
Co
ntr
ol
Gro
up
(n=
4)
p†
p*
0h
4h
FC
0h
4h
FC
GPR
430.
07[0
.05,
0.29
]0.
79[0
.26,
2.01
]6.
26[1
.66,
13.5
]0.
124
1.53
[0.2
9,3.
64]
0.24
[0.1
7,0.
27]
0.31
[0.0
7,0.
67]
0.06
80.
007
GPR
410.
07[0
.04,
0.35
]1.
70[0
.14,
5.18
]5.
15[3
.96,
22.9
]0.
161
1.27
[0.8
0,1.
42]
0.58
[0.4
1,1.
22]
0.41
[0.3
1,2.
37]
0.71
50.
027
GPR
:Gpr
otei
n-co
uple
dre
cept
or;F
C:f
old
chan
ge.ˆ
Dat
aar
eno
npar
amet
ric,
pres
ente
das
med
ian
[qua
rtile
1,qu
artil
e3]
,with
in-g
roup
chan
ges
anal
yzed
byW
ilcox
onm
atch
edpa
irs
sign
ed-r
ank
test
and
grou
pco
mpa
riso
npe
rfor
med
usin
gW
ilcox
onra
nk-s
umte
st.†
Diff
eren
cein
chan
gefr
om0
to4
hw
ithin
grou
p.*
Diff
eren
cein
fold
chan
gebe
twee
nth
eso
lubl
efib
rean
dco
ntro
lgro
up.
321
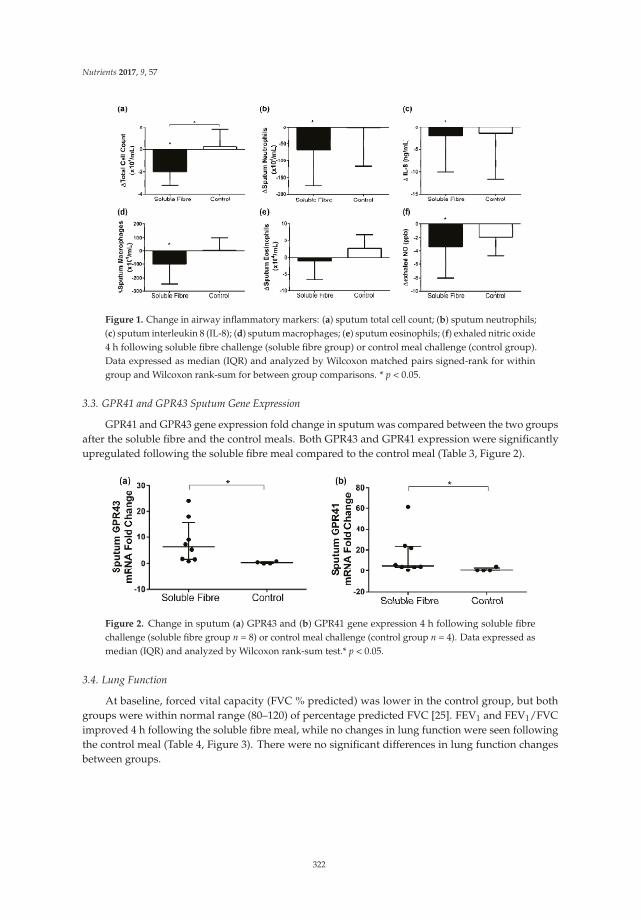
Nutrients 2017, 9, 57
Figure 1. Change in airway inflammatory markers: (a) sputum total cell count; (b) sputum neutrophils;(c) sputum interleukin 8 (IL-8); (d) sputum macrophages; (e) sputum eosinophils; (f) exhaled nitric oxide4 h following soluble fibre challenge (soluble fibre group) or control meal challenge (control group).Data expressed as median (IQR) and analyzed by Wilcoxon matched pairs signed-rank for withingroup and Wilcoxon rank-sum for between group comparisons. * p < 0.05.
3.3. GPR41 and GPR43 Sputum Gene Expression
GPR41 and GPR43 gene expression fold change in sputum was compared between the two groupsafter the soluble fibre and the control meals. Both GPR43 and GPR41 expression were significantlyupregulated following the soluble fibre meal compared to the control meal (Table 3, Figure 2).
Figure 2. Change in sputum (a) GPR43 and (b) GPR41 gene expression 4 h following soluble fibrechallenge (soluble fibre group n = 8) or control meal challenge (control group n = 4). Data expressed asmedian (IQR) and analyzed by Wilcoxon rank-sum test.* p < 0.05.
3.4. Lung Function
At baseline, forced vital capacity (FVC % predicted) was lower in the control group, but bothgroups were within normal range (80–120) of percentage predicted FVC [25]. FEV1 and FEV1/FVCimproved 4 h following the soluble fibre meal, while no changes in lung function were seen followingthe control meal (Table 4, Figure 3). There were no significant differences in lung function changesbetween groups.
322
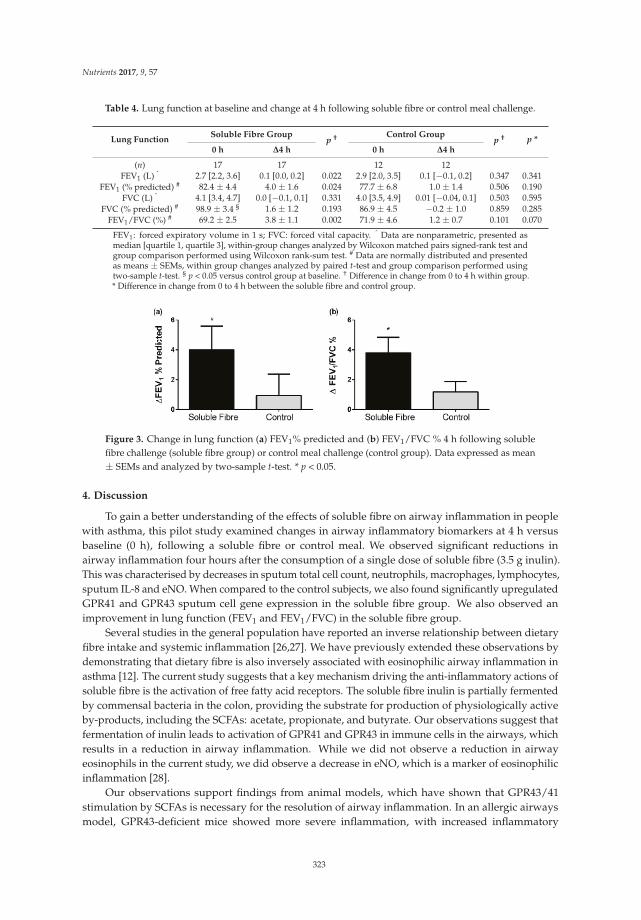
Nutrients 2017, 9, 57
Table 4. Lung function at baseline and change at 4 h following soluble fibre or control meal challenge.
Lung FunctionSoluble Fibre Group
p † Control Groupp † p *
0 h ∆4 h 0 h ∆4 h
(n) 17 17 12 12FEV1 (L) ˆ 2.7 [2.2, 3.6] 0.1 [0.0, 0.2] 0.022 2.9 [2.0, 3.5] 0.1 [−0.1, 0.2] 0.347 0.341
FEV1 (% predicted) # 82.4 ± 4.4 4.0 ± 1.6 0.024 77.7 ± 6.8 1.0 ± 1.4 0.506 0.190FVC (L) ˆ 4.1 [3.4, 4.7] 0.0 [−0.1, 0.1] 0.331 4.0 [3.5, 4.9] 0.01 [−0.04, 0.1] 0.503 0.595
FVC (% predicted) # 98.9 ± 3.4 § 1.6 ± 1.2 0.193 86.9 ± 4.5 −0.2 ± 1.0 0.859 0.285FEV1/FVC (%) # 69.2 ± 2.5 3.8 ± 1.1 0.002 71.9 ± 4.6 1.2 ± 0.7 0.101 0.070
FEV1: forced expiratory volume in 1 s; FVC: forced vital capacity. ˆ Data are nonparametric, presented asmedian [quartile 1, quartile 3], within-group changes analyzed by Wilcoxon matched pairs signed-rank test andgroup comparison performed using Wilcoxon rank-sum test. # Data are normally distributed and presentedas means ± SEMs, within group changes analyzed by paired t-test and group comparison performed usingtwo-sample t-test. § p < 0.05 versus control group at baseline. † Difference in change from 0 to 4 h within group.* Difference in change from 0 to 4 h between the soluble fibre and control group.
Figure 3. Change in lung function (a) FEV1% predicted and (b) FEV1/FVC % 4 h following solublefibre challenge (soluble fibre group) or control meal challenge (control group). Data expressed as mean± SEMs and analyzed by two-sample t-test. * p < 0.05.
4. Discussion
To gain a better understanding of the effects of soluble fibre on airway inflammation in peoplewith asthma, this pilot study examined changes in airway inflammatory biomarkers at 4 h versusbaseline (0 h), following a soluble fibre or control meal. We observed significant reductions inairway inflammation four hours after the consumption of a single dose of soluble fibre (3.5 g inulin).This was characterised by decreases in sputum total cell count, neutrophils, macrophages, lymphocytes,sputum IL-8 and eNO. When compared to the control subjects, we also found significantly upregulatedGPR41 and GPR43 sputum cell gene expression in the soluble fibre group. We also observed animprovement in lung function (FEV1 and FEV1/FVC) in the soluble fibre group.
Several studies in the general population have reported an inverse relationship between dietaryfibre intake and systemic inflammation [26,27]. We have previously extended these observations bydemonstrating that dietary fibre is also inversely associated with eosinophilic airway inflammation inasthma [12]. The current study suggests that a key mechanism driving the anti-inflammatory actions ofsoluble fibre is the activation of free fatty acid receptors. The soluble fibre inulin is partially fermentedby commensal bacteria in the colon, providing the substrate for production of physiologically activeby-products, including the SCFAs: acetate, propionate, and butyrate. Our observations suggest thatfermentation of inulin leads to activation of GPR41 and GPR43 in immune cells in the airways, whichresults in a reduction in airway inflammation. While we did not observe a reduction in airwayeosinophils in the current study, we did observe a decrease in eNO, which is a marker of eosinophilicinflammation [28].
Our observations support findings from animal models, which have shown that GPR43/41stimulation by SCFAs is necessary for the resolution of airway inflammation. In an allergic airwaysmodel, GPR43-deficient mice showed more severe inflammation, with increased inflammatory
323
Nutrients 2017, 9, 57
cell numbers in the lung lining fluid and higher levels of eosinophil peroxidase activity andinflammatory cells in lung tissue [29]. In another study in mice with allergic airways disease [30],a fibre-rich diet changed the composition of the gut microbiota by increasing proportions of theBacteroidaceae and Bifidobacteriaceae families, which are potent fermenters of soluble fibre intoSCFA. Increased circulating SCFA levels were observed and airway inflammation was attenuated,with dendritic cells having an impaired ability to activate Th2 effector cells in the lung [30].Consequently, in mice fed either a high fibre diet or directly administered with acetate or propionatein their drinking water, airway inflammation could not be sustained; after an allergen challenge,cellular infiltration (eosinophils), IL-4, IL-5, IL-13, and IL-17A levels were reduced in the lungs andAHR improved. The effects were dependent on GPR41, but not GPR43. This highlights the importanceof measuring both free fatty acid receptors in order to understand their anti-inflammatory actions.
This is the first study to examine the effects of SCFAs on inflammation in human airways.The majority of previous studies in humans that have looked at the role of SCFAs have examined gutinflammation, predominantly ulcerative colitis where sodium butyrate is administered either orally(using capsules with slow release coating to release butyrate into the colon), or through enemas [10].We are interested in the effects of SCFAs on inflammation in peripheral tissues, in particular thelungs [31]. Certainly, it has previously been shown that soluble fibre can affect inflammation in thecirculation. In a randomized, double-blind, placebo-controlled crossover study on inflammationand gut microbiota following soluble fibre supplementation, improvements in the composition andmetabolic activity of gut microbiota—such as increased production of butyrate—was seen after twoand four weeks [32]. In addition, significant reductions in circulating pro-inflammatory mediatorssuch as tumour necrosis factor-alpha (TNF-α), IL-6, and IL-8 were observed [32]. We sought to extendour investigations to the airways, and have shown that a single dose of soluble fibre can modulateairway inflammation. This was associated with an improvement in lung function, and hence appearsto be clinically important.
The single meal challenge design that we employed mimics many previous studies thathave shown that a single meal high in carbohydrates and/or fat causes postprandial systemicinflammation [33]. We have also previously shown that a single high fat mixed meal increasesairway inflammation within 4 h [16]. This is biologically plausible, as it is known that at 4 h afterthe consumption of inulin, the SCFAs acetate, propionate, and butyrate are all elevated compared tobaseline in plasma [34]. Nonetheless, a clinical trial of longer duration is warranted to determine whatclinical effects would occur with chronic supplementation.
As the importance of SCFAs in human health is being increasingly recognized, further researchis required to assess changes that occur in circulating SCFA levels and inflammation following theintake of various types of soluble fibres. In addition, research is also needed to determine the optimaldelivery form for increasing circulating SCFAs. In animal studies, SCFAs are often administereddirectly through the drinking water of animals, however oral delivery of SCFA is not optimal forhumans, as the majority of acetate delivered orally is oxidized, with plasma levels only remainingelevated for 60 min [35]. Hence, supplementation with soluble fibre (as we have done in this study) isa useful strategy to increase circulating SCFA levels [34].
From our study, we are unable to determine whether SCFA reach the lungs, and this isan important area for future research. Previous animal studies have shown that SCFA are not detectablein lung tissue following soluble fibre supplementation [30]. Hence, it appears likely that effects of SCFAon immune function initially occur systemically. Supporting this hypothesis, it has been reported thatmice treated with propionate have altered haematopoiesis in bone marrow, characterised by changesin the types of dendritic cell (DC) precursors generated, which have greater phagocytic ability butreduced ability to promote Th2 responses once in the lungs [30].
A limitation of this study is the small sample size; however, this was adequate for us todemonstrate, for the first time, that soluble fibre can reduce airway inflammation in people withasthma. Another potential limitation is the short duration of the study, as the soluble fibre was
324
Nutrients 2017, 9, 57
delivered as a single meal. Nonetheless, the chronic effects of soluble fibre on airway inflammation inasthma are likely to be even greater, as in addition to activation of free fatty acid receptors, gut microbialchanges will also be induced, which further enhance SCFA production [36]. Hence, long-term studiesof soluble fibre supplementation are warranted.
5. Conclusions
In summary, we have shown that a single dose of soluble fibre was able to significantly reduceairway inflammation in stable asthma. The long-term benefits of increasing soluble fibre intakeare likely to have a greater impact on inflammation, as soluble fibre also enhances the growthof SCFA-producing gut bacteria, which will further enhance the production of beneficial SCFAs.Supplementing with a prebiotic such as inulin has the potential to be widely accepted and adopted,and could potentially reduce the amount of inhaled glucocorticoids required for treatment. As such,this approach provides a less costly strategy for managing asthma, as well as lowering the risk ofasthma patients experiencing adverse side effects due to pharmacological treatment.
Acknowledgments: The authors would like to acknowledge the research participants and the HMRI RespiratoryResearch clinical team including Amber Smith, Joanne Smart, Hayley Scott and the laboratory team includingBridgette Donati, Michelle Gleeson, Kellie Fakes and Naomi Fibbens for assistance with collection, processing andanalysis of samples. This trial was supported by a National Health and Medical Research Council of AustraliaProject Grant and a Hunter Medical Research Institute project grant sponsored by the Piggott family.
Author Contributions: I.H. conducted the laboratory work and statistical analysis and contributed to draftingthe manuscript, K.J.B. contributed to the conception and design of the study, analysis, interpretation of dataand revising the manuscript, B.S.B. contributed to the data acquisition, interpretation of data and revising themanuscript, P.G.G. contributed to the conception and design of the study, analysis, interpretation of data andrevising the manuscript, L.K.M.-W. contributed to the study design, interpretation of data and revising themanuscript, L.G.W. had overall responsibility for the conception and design of the study, analysis, interpretationof data, revising the manuscript and obtaining funding for the work.
Conflicts of Interest: The authors declare no conflict of interest.
References
1. Masoli, M.; Fabian, D.; Holt, S.; Beasley, R. Global initiative for asthma (GINA) program. The global burdenof asthma: Executive summary of the GINA dissemination committee report. Allergy 2004, 59, 469–478.[CrossRef] [PubMed]
2. Australian Centre for Asthma Monitoring. Asthma in Australia 2011. In AIHW Asthma Series No. 4. Cat. No.
ACM 22; Australian Institute of Health and Welfare (AIHW): Canberra, Australia, 2011.3. Barnes, P.J.; Adcock, I.M. Glucocorticoid resistance in inflammatory diseases. Lancet 2009, 373, 1905–1917.
[CrossRef]4. Wickens, K.; Barry, D.; Friezema, A.; Rhodius, R.; Bone, N.; Purdie, G.; Crane, J. Fast foods—Are they a risk
factor for asthma? Allergy 2005, 60, 1537–1541. [CrossRef] [PubMed]5. Hijazi, N.; Abalkhail, B.; Seaton, A. Diet and childhood asthma in a society in transition: A study in urban
and rural Saudi Arabia. Thorax 2000, 55, 775–779. [CrossRef] [PubMed]6. Carey, O.J.; Cookson, J.B.; Britton, J.; Tattersfield, A.E. The effect of lifestyle on wheeze, atopy, and bronchial
hyperreactivity in Asian and white children. Am. J. Respir. Crit. Care Med. 1996, 154, 537–540. [CrossRef][PubMed]
7. Huang, S.-L.; Pan, W.-H. Dietary fats and asthma in teenagers: Analyses of the first Nutrition and HealthSurvey in Taiwan (NAHSIT). Clin. Exp. Allergy 2001, 31, 1875–1880. [CrossRef] [PubMed]
8. Rolfes, S.R.; Pinna, K.; Whitney, E. Understanding Normal and Clinical Nutrition, 8th ed.; Wadsworth:Belmont, CA, USA, 2009.
9. Ganapathy, V.; Thangaraju, M.; Prasad, P.D.; Martin, P.M.; Singh, N. Transporters and receptors forshort-chain fatty acids as the molecular link between colonic bacteria and the host. Curr. Opin. Pharmacol.
2013, 13, 869–874. [CrossRef] [PubMed]10. Vinolo, M.A.R.; Rodrigues, H.G.; Nachbar, R.T.; Curi, R. Regulation of Inflammation by Short Chain Fatty
Acids. Nutrients 2011, 3, 858–876. [CrossRef] [PubMed]
325
Nutrients 2017, 9, 57
11. Root, M.M.; Houser, S.M.; Anderson, J.J.; Dawson, H.R. Healthy Eating Index 2005 and selectedmacronutrients are correlated with improved lung function in humans. Nutr. Res. 2014, 34, 277–284.[CrossRef] [PubMed]
12. Berthon, B.S.; Macdonald-Wicks, L.K.; Gibson, P.G.; Wood, L.G. Investigation of the association betweendietary intake, disease severity and airway inflammation in asthma. Respirology 2013, 18, 447–454. [CrossRef][PubMed]
13. Brown, A.J.; Goldsworthy, S.M.; Barnes, A.A.; Eilert, M.M.; Tcheang, L.; Daniels, D.; Muir, A.I.;Wigglesworth, M.J.; Kinghorn, I.; Fraser, N.J.; et al. The Orphan G protein-coupled receptors GPR41and GPR43 are activated by propionate and other short chain carboxylic acids. J. Biol. Chem. 2003, 278,11312–11319. [CrossRef] [PubMed]
14. Baines, K.J.; Simpson, J.L.; Wood, L.G.; Scott, R.J.; Gibson, P.G. Transcriptional phenotypes of asthma definedby gene expression profiling of induced sputum samples. J. Allergy Clin. Immunol. 2011, 127, 153–160.[CrossRef] [PubMed]
15. Fahy, J.V.; Liu, J.; Wong, H.; Boushey, H.A. Analysis of cellular and biochemical constituents of inducedsputum after allergen challenge: A method for studying allergic airway inflammation. J. Allergy Clin. Immunol.
1994, 93, 1031–1039. [CrossRef]16. Wood, L.G.; Garg, M.L.; Gibson, P.G. A high fat challenge increases airway inflammation and impairs
bronchodilator recovery in asthma. J. Allergy Clin. Immunol. 2011, 127, 1133–1140. [CrossRef] [PubMed]17. Juniper, E.F.; Bousquet, J.; Abetz, L.; Bateman, E.D. Identifying ‘well-controlled’ and ‘not well-controlled’
asthma using the Asthma Control Questionnaire. Respir. Med. 2006, 100, 616–621. [CrossRef] [PubMed]18. Global Initiative for Asthma (GINA). Global Strategy for Asthma Management and Prevention 2012 (Update).
Available online: http://wwwginasthmaorg (accessed on 30 July 2012).19. Hankinson, J.; Odencrantz, J.; Fedan, K. Spirometric reference values from a sample of the general U.S.
population. Am. J. Respir. Crit. Care Med. 1999, 159, 179–187. [CrossRef] [PubMed]20. Stanojevic, S.; Wade, A.; Stocks, J. Reference values for lung function: Past, present and future. Eur. Respir. J.
2010, 36, 12–19. [CrossRef] [PubMed]21. Gibson, P.G.; Wlodarczyk, J.W.; Hensley, M.J.; Gleeson, M.; Henry, R.L.; Cripps, A.W.;
Clancy, R.L. Epidemiological Association of Airway Inflammation with Asthma Symptoms and AirwayHyperresponsiveness in Childhood. Am. J. Respir. Crit. Care Med. 1998, 158, 36–41. [CrossRef] [PubMed]
22. Gibson, P.G.; Henry, R.L.; Thomas, P. Noninvasive assessment of airway inflammation in children: Inducedsputum, exhaled nitric oxide, and breath condensate. Eur. Respir. J. 2000, 16, 1008–1015. [PubMed]
23. Simpson, J.L.; Scott, R.J.; Boyle, M.J.; Gibson, P.G. Differential proteolytic enzyme activity in eosinophilic andneutrophilic asthma. Am. J. Respir. Crit. Care Med. 2005, 172, 559–565. [CrossRef] [PubMed]
24. Wood, L.G.; Garg, M.L.; Simpson, J.L.; Mori, T.A.; Croft, K.D.; Wark, P.A.B.; Gibson, P.G. Induced Sputum8-Isoprostane Concentrations in Inflammatory Airway Diseases. Am. J. Respir. Crit. Care Med. 2005, 171,426–430. [CrossRef] [PubMed]
25. Altalag, A.; Road, J.; Wilcox, P. Pulmonary Function Tests in Clinical Practice; Springer: London, UK, 2009.26. Ma, Y.; Griffith, J.A.; Chasan-Taber, L.; Olendzki, B.C.; Jackson, E.; Stanek, E.J.; Li, W.; Pagoto, S.L.;
Hafner, A.R.; Ockene, I.S. Association between dietary fiber and serum C-reactive protein. Am. J. Clin. Nutr.
2006, 83, 760–766. [PubMed]27. Ajani, U.A.; Ford, E.S.; Mokdad, A.H. Dietary fiber and C-reactive protein: Findings from national health
and nutrition examination survey data. J. Nutr. 2004, 134, 1181–1185. [PubMed]28. Taylor, D.R.; Pijnenburg, M.W.; Smith, A.D.; Jongste, J.C.D. Exhaled nitric oxide measurements:
Clinical application and interpretation. Thorax 2006, 61, 817–827. [CrossRef] [PubMed]29. Maslowski, K.M.; Vieira, A.T.; Ng, A.; Kranich, J.; Sierro, F.; Yu, D.; Schilter, H.C.; Rolph, M.S.; Mackay, F.;
Artis, D.; et al. Regulation of inflammatory responses by gut microbiota and chemoattractant receptor GPR43.Nature 2009, 461, 1282–1286. [CrossRef] [PubMed]
30. Trompette, A.; Gollwitzer, E.S.; Yadava, K.; Sichelstiel, A.K.; Sprenger, N.; Ngom-Bru, C.; Blanchard, C.;Junt, T.; Nicod, L.P.; Harris, N.L.; et al. Gut microbiota metabolism of dietary fiber influences allergic airwaydisease and hematopoiesis. Nat. Med. 2014, 20, 159–166. [CrossRef] [PubMed]
31. De Filippo, C.; Cavalieri, D.; Di Paola, M.; Ramazzotti, M.; Poullet, J.B.; Massart, S.; Collini, S.; Pieraccini, G.;Lionetti, P. Impact of diet in shaping gut microbiota revealed by a comparative study in children from Europeand rural Africa. Proc. Natl. Acad. Sci. USA 2010, 107, 14691–14696. [CrossRef] [PubMed]
326
Nutrients 2017, 9, 57
32. Macfarlane, S.; Cleary, S.; Bahrami, B.; Reynolds, N.; Macfarlane, G.T. Synbiotic consumption changes themetabolism and composition of the gut microbiota in older people and modifies inflammatory processes:A randomised, double-blind, placebo-controlled crossover study. Aliment. Pharmacol. Ther. 2013, 38, 804–816.[CrossRef] [PubMed]
33. Nappo, F.; Esposito, K.; Cioffi, M.; Giugliano, G.; Molinari, A.M.; Paolisso, G.; Marfella, R.; Giugliano, D.Postprandial endothelial activation in healthy subjects and in Type 2 diabetic patients: Role of fat andcarbohydrate meals. J. Am. Coll. Cardiol. 2002, 39, 1145–1150. [CrossRef]
34. Tarini, J.; Wolever, T.M. The fermentable fibre inulin increases postprandial serum short-chain fatty acids andreduces free-fatty acids and ghrelin in healthy subjects. Appl. Physiol. Nutr. Metab. 2010, 35, 9–16. [CrossRef][PubMed]
35. Smith, G.I.; Jeukendrup, A.E.; Ball, D. Sodium acetate induces a metabolic alkalosis but not the increasein fatty acid oxidation observed following bicarbonate ingestion in humans. J. Nutr. 2007, 137, 1750–1756.[PubMed]
36. Roberfroid, M.B. Introducing inulin-type fructans. Br. J. Nutr. 2005, 93, S13–S25. [CrossRef] [PubMed]
© 2017 by the authors. Licensee MDPI, Basel, Switzerland. This article is an open accessarticle distributed under the terms and conditions of the Creative Commons Attribution(CC BY) license (http://creativecommons.org/licenses/by/4.0/).
327
nutrients
Communication
Validity and Reproducibility of a Habitual DietaryFibre Intake Short Food Frequency Questionnaire
Genelle Healey 1,2,*, Louise Brough 1, Rinki Murphy 3, Duncan Hedderley 2, Chrissie Butts 2 and
Jane Coad 1
1 Massey Institute of Food Science and Technology, School of Food and Nutrition, Massey University,Palmerston North 4442, New Zealand; [email protected] (L.B.); [email protected] (J.C.)
2 Food, Nutrition and Health, The New Zealand Institute for Plant & Food Research Limited,Palmerston North 4442, New Zealand; [email protected] (D.H.);[email protected] (C.B.)
3 Faculty of Medical and Health Sciences, The University of Auckland, Auckland 1023, New Zealand;[email protected]
* Correspondence: [email protected]; Tel.: +64-6-355-6108
Received: 22 July 2016; Accepted: 5 September 2016; Published: 10 September 2016
Abstract: Low dietary fibre intake has been associated with poorer health outcomes, therefore havingthe ability to be able to quickly assess an individual’s dietary fibre intake would prove usefulin clinical practice and for research purposes. Current dietary assessment methods such as foodrecords and food frequency questionnaires are time-consuming and burdensome, and there arepresently no published short dietary fibre intake questionnaires that can quantify an individual’stotal habitual dietary fibre intake and classify individuals as low, moderate or high habitual dietaryfibre consumers. Therefore, we aimed to develop and validate a habitual dietary fibre intake shortfood frequency questionnaire (DFI-FFQ) which can quickly and accurately classify individualsbased on their habitual dietary fibre intake. In this study the DFI-FFQ was validated against theMonash University comprehensive nutrition assessment questionnaire (CNAQ). Fifty-two healthy,normal weight male (n = 17) and female (n = 35) participants, aged between 21 and 61 years,completed the DFI-FFQ twice and the CNAQ once. All eligible participants completed the study,however the data from 46% of the participants were excluded from analysis secondary to misreporting.The DFI-FFQ cannot accurately quantify total habitual dietary fibre intakes, however, it is a quick,valid and reproducible tool in classifying individuals based on their habitual dietary fibre intakes.
Keywords: dietary fibre; short food frequency questionnaire; validation
1. Introduction
Dietary fibre are non-digestible plant polysaccharides found in high amounts in fruits,vegetables, breads and cereals, legumes and nuts and seeds. Dietary fibre has been shown tohave important implications on human health, including preventing and alleviating constipation,reducing gastrointestinal cancer incidence and blood glucose levels, lowering blood cholesterol levelsand blood pressure, and beneficially modulating gut microbiota [1]. It is also possible that the efficacyof a dietary intervention is altered as a result of the influence habitual dietary fibre intake has on gutmicrobiota responsiveness and host outcomes. Therefore, being able to quickly assess an individual’shabitual dietary fibre intake and classify individuals based on their dietary fibre intakes will proveuseful in clinical practice and in nutrition and health research. Dietary assessment methods suchas diet records and food frequency questionnaires have inherent limitations such as being difficultto complete accurately, time-consuming and may not accurately assess a person’s habitual diet [2].A small number of dietary fibre assessment questionnaires have been developed, however these
Nutrients 2016, 8, 558 328 www.mdpi.com/journal/nutrients
Nutrients 2016, 8, 558
questionnaires assess general dietary behaviours, do not estimate total dietary fibre amounts, and/ordo not classify individuals based on habitual dietary fibre intakes [3–6]. Therefore, the primary aimof this study was to determine whether a newly developed dietary fibre intake short food frequencyquestionnaire (DFI-FFQ) can accurately classify individuals based on their habitual dietary fibre intakeand the secondary aim of the study was to determine whether the DFI-FFQ can accurately quantifytotal habitual dietary fibre intakes.
2. Methods
2.1. Subjects
Participants were recruited via email and poster advertisement in multiple locations aroundPalmerston North, New Zealand. A diverse cross-section of the population was targeted to helpensure a good representation of the New Zealand population was recruited. Sixty-eight individualsprovided informed consent to participate in this study, of which fifty-two healthy participants metthe inclusion criteria (aged >19 and <65 years, healthy, BMI >18.5 and <30 kg/m2, no significantweight loss or weight gain within the past year, no significant dietary change within the pastyear, not pregnant or breastfeeding, no food intolerances which cause gastrointestinal symptoms(i.e., lactose intolerance, gluten sensitivity), no adverse gastrointestinal symptoms, non-smoker andnot high alcohol consumers). Participants completed the DFI-FFQ twice, at least 2 weeks apart, and thecomprehensive nutrition assessment questionnaire (CNAQ) once. The DFI-FFQ was completed initially,followed by the CNAQ, and lastly the repeated DFI-FFQ was completed. The CNAQ and DFI-FFQwere both completed online. An energy intake: basal metabolic rate (EI:BMR) of <1.1 and >2.19 wasused to exclude participants who appeared to have over- or under-reported using the CNAQ [7].Ethical approval was obtained from the Massey University Human Ethics Committee (Southern A,Application 15/34).
2.2. Development of the DFI-FFQ
The DFI-FFQ (Figure S1) was designed to quickly and accurately classify individuals as low,moderate or high habitual dietary fibre consumers and quantify an individual’s habitual dietaryfibre intake (g/day). The DFI-FFQ consists of five high dietary fibre containing food groups(vegetables, fruits, breads and cereals, nuts and seeds and legumes) which account for 73.5% ofthe dietary fibre in a typical New Zealand diet [8]. Examples of what one serve is equivalent to, for eachfood group, is detailed within the DFI-FFQ. The frequency of consumption for the average number ofserves consumed over the past year, was given as follows: Never, <1/month, 1–3/month, 1/week,2–4/week, 5–6/week, 1/day, 2/day, 3/day, 4/day, 5/day and 6+/day.
2.3. DFI-FFQ Scoring Sheet
A scoring sheet was developed to quantify the amount of dietary fibre consumed and toclassify individuals as low, moderate and high dietary fibre consumers. FoodWorks version 7.0.3016(Xyris Software Pty Ltd., Brisbane, Queensland, Australia) was used to quantify the average amount ofdietary fibre provided by the five food groups for each frequency of consumption. An individual’s totaldietary fibre intake was calculated by adding together the average amount of dietary fibre consumedfrom each food group in relation to the number of serves consumed.
2.4. Dietary Fibre Classification
The cut-offs used to classify individuals based on their dietary fibre intakes are outlined in Table 1.The high dietary fibre intake cut-offs were selected to reflect the New Zealand Ministry of Healthrecommended dietary fibre intake guidelines; >25 g/day for females and >30 g/day for males [9].The low dietary fibre intake cut-offs were selected as the median dietary fibre intake in New Zealandwas 17.5 g/day for females and 22.1 g/day for males, which are below recommended amounts [8].
329
Nutrients 2016, 8, 558
Similar cut-offs have been used previously however the specific cut-offs used in this study weremodified to be applicable to a New Zealand population [3].
Table 1. The dietary fibre intake cut-offs used to classify individuals as low, moderate and high dietaryfibre consumers.
Females Males
Low <18 g/day <22 g/dayModerate 18–24.9 g/day 22–29.9 g/day
High ≥25 g/day ≥30 g/day
2.5. Dietary Assessment Method Used for Comparison
The Monash University online CNAQ was used for comparison with the DFI-FFQ. The 297-itemfood frequency questionnaire has been shown to be valid in assessing habitual dietary intakes whencompared to four 7-day food records, each completed three months apart [10].
2.6. Statistical Analysis
We aimed to recruit enough participants to ensure that correlations over 0.7 would be statisticallysignificant and that the assumptions of chi-squared tests would not be over stretched. The relationshipbetween results of the DFI-FFQ when compared to the CNAQ was determined using Spearmancorrelation, Pearson correlation, Bland-Altman plot, chi-squared test and linear weighted kappascore. Test-retest repeatability was assessed using Pearson correlation, Bland-Altman plot andCronbach’s alpha. T-tests were used to determine whether there were any differences in dietaryfibre intakes between the DFI-FFQ and CNAQ and the repeated DFI-FFQ. A p value of < 0.05 isconsidered significant. Statistical analysis was carried out using GenStat 17th edition (VSNi Ltd., HemelHempstead, UK), Minitab 16th edition (Cronbach’s alpha) (Minitab Inc., State College, PA, USA) andthe calculator at http://vassarstats.net/kappa.html (kappa score) [11].
3. Results
All eligible participants (n = 52) completed the study. The data from 28 participants (54%) wereused as the data from 24 participants (46%) were excluded from the analysis secondary to likelymisreporting on the CNAQ; with 18 participants (34.5%) having over-reported and six participants(11.5%) having under-reported their energy intakes. The group mean EI:BMR was 2.8 (SD 4.7) priorto exclusion and reduced to 1.6 (SD 0.3) after exclusion. Participant characteristics, total dietaryfibre intakes and classifications determined by the DFI-FFQ and CNAQ are summarised in Table 2.The median dietary fibre intake in New Zealand (20.3 g/day) [8] is similar to the average dietary fibreintake of the study cohort, with dietary fibre intakes from both groups being below the New Zealandrecommended dietary fibre intake guidelines [9]. The DFI-FFQ took on average 3.5 min to complete incomparison to the estimated completion time of 20–40 min for the CNAQ.
When comparing the DFI-FFQ to the CNAQ for dietary fibre classification, exact agreementoccurred 79% of the time and gross misclassification occurred 7% of the time (Table 3). There was asignificant difference in dietary fibre intakes between the DFI-FFQ and CNAQ (CNAQ was on average5 g/day higher than the DFI-FFQ). The two dietary assessment methods were however correlated(Pearson correlation 0.65, Spearman correlation 0.53). A chi-squared test indicated an associationbetween the classifications based on the DFI-FFQ and CNAQ (p = 0.002) and the linear weightedkappa score showed good agreement [12] (Table 4). The Bland-Altman plot is available within theSupplementary information (Figure S2A).
330
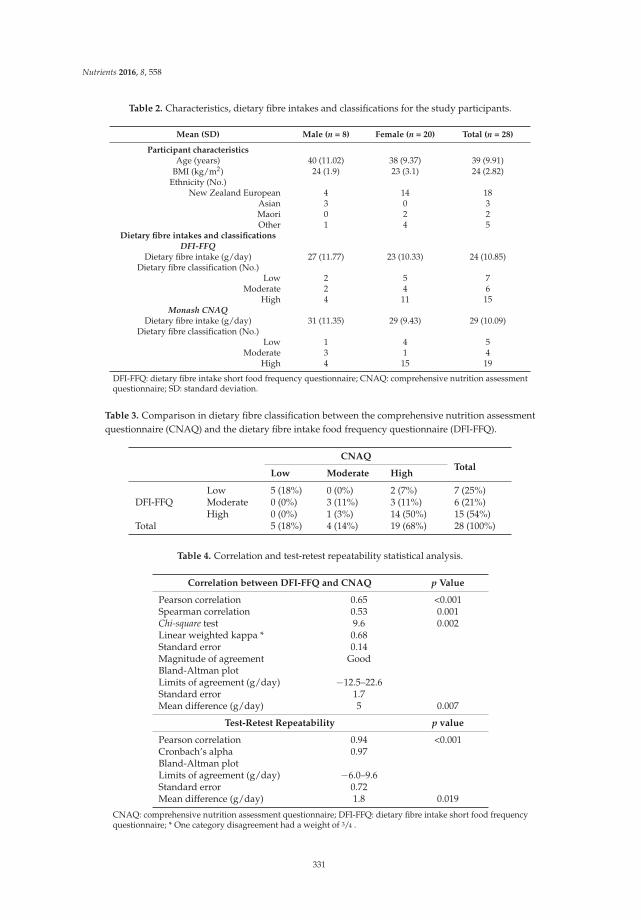
Nutrients 2016, 8, 558
Table 2. Characteristics, dietary fibre intakes and classifications for the study participants.
Mean (SD) Male (n = 8) Female (n = 20) Total (n = 28)
Participant characteristicsAge (years) 40 (11.02) 38 (9.37) 39 (9.91)
BMI (kg/m2) 24 (1.9) 23 (3.1) 24 (2.82)Ethnicity (No.)
New Zealand European 4 14 18Asian 3 0 3Maori 0 2 2Other 1 4 5
Dietary fibre intakes and classificationsDFI-FFQ
Dietary fibre intake (g/day) 27 (11.77) 23 (10.33) 24 (10.85)Dietary fibre classification (No.)
Low 2 5 7Moderate 2 4 6
High 4 11 15Monash CNAQ
Dietary fibre intake (g/day) 31 (11.35) 29 (9.43) 29 (10.09)Dietary fibre classification (No.)
Low 1 4 5Moderate 3 1 4
High 4 15 19
DFI-FFQ: dietary fibre intake short food frequency questionnaire; CNAQ: comprehensive nutrition assessmentquestionnaire; SD: standard deviation.
Table 3. Comparison in dietary fibre classification between the comprehensive nutrition assessmentquestionnaire (CNAQ) and the dietary fibre intake food frequency questionnaire (DFI-FFQ).
CNAQTotal
Low Moderate High
DFI-FFQLow 5 (18%) 0 (0%) 2 (7%) 7 (25%)Moderate 0 (0%) 3 (11%) 3 (11%) 6 (21%)High 0 (0%) 1 (3%) 14 (50%) 15 (54%)
Total 5 (18%) 4 (14%) 19 (68%) 28 (100%)
Table 4. Correlation and test-retest repeatability statistical analysis.
Correlation between DFI-FFQ and CNAQ p Value
Pearson correlation 0.65 <0.001Spearman correlation 0.53 0.001Chi-square test 9.6 0.002Linear weighted kappa * 0.68Standard error 0.14Magnitude of agreement GoodBland-Altman plotLimits of agreement (g/day) −12.5–22.6Standard error 1.7Mean difference (g/day) 5 0.007
Test-Retest Repeatability p value
Pearson correlation 0.94 <0.001Cronbach’s alpha 0.97Bland-Altman plotLimits of agreement (g/day) −6.0–9.6Standard error 0.72Mean difference (g/day) 1.8 0.019
CNAQ: comprehensive nutrition assessment questionnaire; DFI-FFQ: dietary fibre intake short food frequencyquestionnaire; * One category disagreement had a weight of 3/4 .
331
Nutrients 2016, 8, 558
Pearson correlation (0.94) and Cronbach’s alpha (0.97) showed that the repeated DFI-FFQcorrelated. The estimated dietary fibre intake from the second DFI-FFQ was significantly lower thanthe first DFI-FFQ by 1.8 g/day (Table 4). The Bland-Altman plot is available within the Supplementaryinformation (Figure S2B).
4. Discussion
Presently, there are no known short dietary fibre intake questionnaires that are able to classifyindividuals based on their habitual dietary fibre intake. Having the ability to be able to quickly andaccurately classify an individual based on their dietary fibre intake will prove useful as low dietaryfibre intakes have been associated with poorer health outcomes [13]. This study has shown that theDFI-FFQ can accurately classifying individuals based on their habitual dietary fibre intakes.
There was however, a significant difference in habitual dietary fibre intakes between the repeatedDFI-FFQs and the DFI-FFQ and CNAQ, which suggests the DFI-FFQ might not accurately quantifytotal habitual dietary fibre intakes. Research has shown that large food item FFQs overestimate fruitand vegetable consumption, which may help explain the higher dietary fibre intakes determinedfrom the CNAQ [14]. The addition of other dietary fibre contributing food groups, such as cakes andmuffins, pies and pastries and biscuits, to the DFI-FFQ may have helped to improve the questionnaire’saccuracy in quantifying total habitual dietary fibre intakes as these food groups collectively contribute6.3% of the dietary fibre in a typical New Zealand diet [8]. Another reason why the DFI-FFQ may nothave been able to accurately quantify total habitual dietary fibre intakes may be related to the servingsize examples provided. The examples provided did not include all possible foods within a particularfood group and relied on participants to use their own judgement regarding the number of servesconsumed for foods that were not specifically listed.
There are a handful of short questionnaires that have been developed to assess dietary fibre intakeshowever these questionnaires assess general dietary behaviours [4–6], do not estimate total dietaryfibre amounts [4–6], and/or do not classify individuals based on habitual dietary fibre intakes [3–6].The DFI-FFQ is novel as it can accurately classify individuals based on habitual dietary fibre intake.Unlike previously developed questionnaires, the DFI-FFQ was validated against an FFQ which assessesdietary intake over the past year, providing a more accurate account of long term rather than currentdietary fibre intakes. Additionally, some of the questionnaires were validated using fairly homogenouspopulations, such as factory workers [3] and patients [5], making these questionnaires less useful inmore diverse populations, such as in this study.
When comparing the study cohorts average dietary fibre intake to the Adult Nutrition Surveydata [8] it appeared the study cohort has a similar dietary fibre intake to the New Zealand population.Therefore, the DFI-FFQ is a valid tool for classifying individuals based on their habitual dietaryfibre intakes in New Zealand. In countries where dietary fibre intakes are distinctly different fromNew Zealand, the DFI-FFQ may need to be re-validated in these populations.
Forty-six percent of participants were excluded from the study secondary to misreporting onthe CNAQ, which reduced the data available for analysis. A known limitation of FFQs is the highrate of misreporting, however the rate of misreporting in this study was much higher than previouslyreported [15]. It may therefore be useful to compare the DFI-FFQ to another dietary assessment method(i.e., 3- or 7-day diet records, or shorter validated FFQ) to confirm these results. The sample size forthis study was small however a sufficient number of participants were recruited based on the samplesize calculations, even after exclusion for misreporting. Additionally, other dietary questionnairevalidation studies have similarly small participant numbers [16,17]. Despite the limitations discussed,we believe the DFI-FFQ will be a valuable tool in research and clinical practice as it is quick to complete(3.5 min on average), has low respondent burden and is a valid and reproducible method of classifyingindividuals based on their habitual dietary fibre intakes.
332
Nutrients 2016, 8, 558
5. Conclusions
The DFI-FFQ has been shown to be a quick, valid and reproducible tool in classifying individualsbased on their habitual dietary fibre intakes. The DFI-FFQ cannot however, accurately estimate totalhabitual dietary fibre intakes.
Author Contributions: G.H. was involved in the conception, study design, recruitment, conducting the study,and writing and editing the manuscript. J.C., C.B., R.M. and L.B. were involved in the conception, study designand editing of the manuscript. D.H. conducted the statistical analysis and was involved in editing the manuscript.All authors read and approved the manuscript.
Acknowledgments: The authors would like to take the opportunity to thank the individuals who participatedin this study. The study was supported by the Foods for Health programme (C11X1312). The funds for theFoods for Health programme were provided to a number of collaborating New Zealand organisations, includingThe New Zealand Institute for Plant & Food Research Limited, by the Ministry of Business, Innovation andEmployment, New Zealand Government.
Conflicts of Interest: The authors declare no conflict of interest.
References
1. Fuller, S.; Beck, E.; Salman, H.; Tapsell, L. New horizons for the study of dietary fiber and health: A review.Plant Foods Hum. Nutr. 2016, 71, 1–12. [CrossRef] [PubMed]
2. Thompson, F.E.; Subar, A.F. Dietary assessment methodology. In Nutrition in the Prevention and Treatment of
Disease, 2nd ed.; Coulston, A.M., Boushey, C.J., Eds.; Elsevier: London, UK, 2008; pp. 3–39.3. Roe, L.; Strong, C.; Whiteside, C.; Neil, A.; Mant, D. Dietary intervention in primary care: Validity of the
DINE method for diet assessment. Fam. Pract. 1994, 11, 375–381. [CrossRef] [PubMed]4. Wright, J.L.; Scott, J.A. The fat and fibre barometer, a short food behaviour questionnaire:
Reliability, relative validity and utility. Aust. J. Nutr. Diet. 2000, 57, 33–39.5. Shannon, J.; Kristal, A.R.; Curry, S.J.; Beresford, S.A. Application of a behavioral approach to measuring
dietary change: The fat- and fiber-related diet behavior questionnaire. Cancer Epidemiol. Biomark. Prev. 1997,6, 355–361.
6. Svilaas, A.; Strom, E.C.; Svilaas, T.; Borgejordet, A.; Thoresen, M.; Ose, L. Reproducibility and validity of ashort food questionnaire for the assessment of dietary habits. Nutr. Metab. Cardiovasc. Dis. 2002, 12, 60–70.[PubMed]
7. Black, A.E. Critical evaluation of energy intake using the Goldberg cut-off for energy intake: Basal metabolicrate. A practical guide to its calculation, use and limitations. Int. J. Obes. 2000, 24, 1119–1130. [CrossRef]
8. Ministry of Health. A Focus on Nutrition Key Findings of the 2008/09 New Zealand Adult NutritionSurvey. Available online: https://www.health.govt.nz/system/files/documents/publications/a-focus-on-nutrition-v2.pdf (accessed on 15 July 2016).
9. Ministry of Health; Department of Health and Ageing. Nutrient Reference Values for Australia andNew Zealand. Available online: http://www.health.govt.nz/publication/nutrient-reference-values-australia-and-new-zealand (accessed on 15 July 2016).
10. Barrett, J.S.; Gibson, P.R. Development and validation of a comprehensive semi-quantitative food frequencyquestionnaire that includes FODMAP intake and glycemic index. J. Am. Diet. Assoc. 2010, 110, 1469–1476.[CrossRef] [PubMed]
11. Kappa as a Measure of Concordance in Categorical Sorting. Available online: http://vassarstats.net/kappa.html (accessed on 15 July 2016).
12. Masson, L.F.; McNeill, G.; Tomany, J.O.; Simpson, J.A.; Peace, H.S.; Wei, L.; Grubb, D.A.; Bolton-Smith, C.Statistical approaches for assessing the relative validity of a food-frequency questionnaire: Use of correlationcoefficients and the kappa statistic. Public Health Nutr. 2003, 6, 313–321. [CrossRef] [PubMed]
13. Buil-Cosiales, P.; Zazpe, I.; Toledo, E.; Corella, D.; Salas-Salvadó, J.; Diez-Espino, J.; Ros, E.; Navajas, J.F.C.;Santos-Lozano, J.M.; Arós, F.; et al. Fiber intake and all-cause mortality in the Prevención con DietaMediterránea (PREDIMED) study. Am. J. Clin. Nutr. 2014, 100, 1498–1507. [CrossRef] [PubMed]
14. Krebs-Smith, S.M.; Heimendinger, J.; Subar, A.F.; Patterson, B.H.; Pivonka, E. Using food frequencyquestionnaires to estimate fruit and vegetable intake: Association between the number of questions andtotal intakes. J. Nutr. Educ. 1995, 27, 80–85. [CrossRef]
333
Nutrients 2016, 8, 558
15. Molag, M.L.; De Vries, J.H.; Ocke, M.C.; Dagnelie, P.C.; Van Den Brandt, P.A.; Jansen, M.C.;van Staveren, W.A.; van’t Veer, P. Design characteristics of food frequency questionnaires in relation to theirvalidity. Am. J. Epidemiol. 2007, 166, 1468–1478. [CrossRef] [PubMed]
16. O’Reilly, S.; McCann, L. Development and validation of the Diet Quality Tool for use in cardiovasculardisease prevention settings. Aust. J. Prim. Health 2012, 18, 138–147. [CrossRef] [PubMed]
17. Spoon, M.; Devereux, P.; Benedict, J.; Leontos, C.; Constantino, N.; Christy, D.; Snow, G. Usefulness of thefood habits questionnaire in a worksite setting. J. Nutr. Educ. Behav. 2002, 34, 268–272. [CrossRef]
© 2016 by the authors. Licensee MDPI, Basel, Switzerland. This article is an open accessarticle distributed under the terms and conditions of the Creative Commons Attribution(CC BY) license (http://creativecommons.org/licenses/by/4.0/).
334
nutrients
Article
Wheat Bran Does Not Affect Postprandial PlasmaShort-Chain Fatty Acids from 13C-inulinFermentation in Healthy Subjects
Lise Deroover 1, Joran Verspreet 2,3, Anja Luypaerts 1, Greet Vandermeulen 1,
Christophe M. Courtin 2,3 and Kristin Verbeke 1,3,*
1 Translational Research in Gastrointestinal Disorders, KU Leuven, Leuven 3000, Belgium;[email protected] (L.D.); [email protected] (A.L.);[email protected] (G.V.)
2 Centre for Food and Microbial Technology, KU Leuven, Leuven 3000, Belgium;[email protected] (J.V.); [email protected] (C.M.C.)
3 Leuven Food Science and Nutrition Research Centre, KU Leuven, Leuven 3000, Belgium* Correspondence: [email protected]; Tel.: +32-163-301-50; Fax: +32-163-307-23
Received: 14 December 2016; Accepted: 17 January 2017; Published: 20 January 2017
Abstract: Wheat bran (WB) is a constituent of whole grain products with beneficial effects for humanhealth. Within the human colon, such insoluble particles may be colonized by specific microbialteams which can stimulate cross-feeding, leading to a more efficient carbohydrate fermentationand an increased butyrate production. We investigated the extent to which WB fractions withdifferent properties affect the fermentation of other carbohydrates in the colon. Ten healthy subjectsperformed four test days, during which they consumed a standard breakfast supplemented with 10 g13C-inulin. A total of 20 g of a WB fraction (unmodified WB, wheat bran with a reduced particle size(WB RPS), or de-starched pericarp-enriched wheat bran (PE WB)) was also added to the breakfast,except for one test day, which served as a control. Blood samples were collected at regular timepoints for 14 h, in order to measure 13C-labeled short-chain fatty acid (SCFA; acetate, propionateand butyrate) concentrations. Fermentation of 13C-inulin resulted in increased plasma SCFA forabout 8 h, suggesting that a sustained increase in plasma SCFA can be achieved by administeringa moderate dose of carbohydrates, three times per day. However, the addition of a single dose ofa WB fraction did not further increase the 13C-SCFA concentrations in plasma, nor did it stimulatecross-feeding (Wilcoxon signed ranks test).
Keywords: colonic fermentation; short-chain fatty acids; wheat bran; inulin
1. Introduction
The short-chain fatty acids (SCFA) acetate, propionate, and butyrate, constitute a major class ofbacterial metabolites that are derived from colonic carbohydrate fermentation. They are increasinglyconsidered as signaling molecules with a beneficial impact on gut and systemic health [1,2].Indeed, besides serving as energy substrates for the colonocytes, SCFA influence the expressionof many genes by acting as inhibitors of histone deacetylases, and affect metabolic processes throughthe activation of G-protein coupled receptors (GPR41 and GPR43, later renamed as free fatty acidreceptor (FFAR)-3 and (FFAR)-2). Several studies have indicated that SCFA, and in particular butyrate,improve the intestinal barrier function and reduce inflammation by inhibiting NFκB activation [3,4].In addition, SCFA that enter the systemic circulation modulate energy homeostasis, and peripheralglucose and lipid metabolism [4–6]. Furthermore, SCFA regulate immune function by affecting T celldifferentiation into effector and regulatory T cells (Treg) [7], and colonic Treg cell homeostasis [8].
Nutrients 2017, 9, 83 335 www.mdpi.com/journal/nutrients
Nutrients 2017, 9, 83
As a consequence, strategies that target the microbiota to improve health often aim at increasingsaccharolytic fermentation. The production of colonic SCFA may be stimulated by modulating theintestinal microbiota and increasing the numbers of acetate and butyrate producing bacteria viaadministration of probiotics. Many probiotics are selected strains of lactobacilli or bifidobacteria [9],which are known lactate and acetate producers. In addition, there is a growing interest in the useof butyrate producing bacteria, such as Faecalibacterium prausnitzii and Butyrcicoccus pullicaecorum,as probiotics [10–13].
An alternative strategy for increasing SCFA production is to stimulate the indigenous saccharolyticbacterial population by administration of prebiotics or fermentable dietary fibers [14]. The best studiedprebiotic substrates are inulin-type fructans (comprising oligofructose), galacto-oligosaccharides,xylo-oligosaccharides, and arabinoxylanoligosaccharides. In vitro fermentation studies with fecalinocula indicate that the amount and proportion of SCFA produced, depends on the type of fermentablesubstrate [15]. For example, inulin-type fructans induce a relatively high proportion of acetate,whereas resistant starch favors butyrate production [16].
Here, we applied a third strategy for modulating the entire intestinal ecosystem, which involvesthe administration of disperse insoluble particles that act as platforms on which the bacteria canadhere, grow, and interact. We hypothesize that these particles facilitate the exchange of microbialnutrients and metabolites, resulting in a more complete carbohydrate fermentation and increasedcross-feeding. For example, the production of butyrate requires collaboration between primarydegraders, such as bifidobacteria, that produce acetate and lactate, and butyrate producing bacteria,such as Faecalibacterium and Roseburia, that convert acetate into butyrate [17,18]. This interactionmay be facilitated if both species adhere to the dietary platforms. Wheat bran (WB) was selectedas an interesting dietary component for this purpose, as bacterial communities attached to WBthat was incubated in vitro with human fecal inocula, were found to be dominated by Clostridium
cluster XIVa bacteria, known as butyrate producers [19]. In addition, WB can be easily technicallymodified to control its physical properties. In this study, we evaluated the impact of three WB fractionsthat differed in particle size and tissue composition, on the fermentation of a readily fermentablecarbohydrate (13C-inulin) in healthy subjects. Concentrations of 13C-SCFA were measured in plasmaas an indication of carbohydrate fermentation and the relative proportions of acetate, propionate, andbutyrate, were considered as a marker of cross-feeding.
2. Materials and Methods
2.1. WB Fractions
2.1.1. Unmodified WB
Commercial WB with a particle size of 1690 µm was obtained from Dossche Mills(Deinze, Belgium) and was used without further modification. Its chemical composition (amounts ofdietary fiber, starch, protein, lipid, and ash) was analysed as previously described [20–22].
2.1.2. Wheat Bran with Reduced Particle Size (WB RPS)
The unmodified commercial WB mentioned above was milled in a Cyclotec 1093 Sample mill(FOSS, Höganäs, Sweden), as described previously [22], in order to obtain WB particles with an averagesize of 150 µm.
2.1.3. Destarched Pericarp-Enriched Wheat Bran (PE WB)
PE WB was ascertained from Fugeia N.V. (Leuven, Belgium) and was obtained after an amylaseand xylanase treatment of untreated WB, as described by Swennen et al. [23]. Subsequently, the PEWB was reduced in particle size to about 280 µm, using the same method as mentioned above.
336
Nutrients 2017, 9, 83
2.2. Fermentable Substrate
Highly 13C-enriched inulin with an atom percent (AP) beyond 97% was purchased from Isolife(Wageningen, The Netherlands) and was mixed with unlabeled native inulin (Fibruline instant,Cosucra Groupe Warcoing SA, Warcoing, Belgium; AP 0.98%), to form a homogeneous mixturewith an AP of 1.93%.
2.3. Study Population
Ten healthy men and woman, aged between 18 and 65 years, were recruited to participate in thestudy. All subjects had a body mass index (BMI) between 18 and 27 kg/m2 and a regular diet definedas three meals per day, on at least five days per week. Exclusion criteria were the use of antibiotics,prebiotics and probiotics, in the month preceding the study and during the study, consumption ofa low calorie diet or another special diet in the month prior to the study, the use of medication thatcould affect the gastrointestinal tract in the two weeks before the start of the study and during thestudy, abdominal surgery in the past (except for appendectomy), chronic gastrointestinal diseases,blood donation in the three months prior to the study, hemoglobin (Hb) levels below reference values,and for woman, pregnancy or breast feeding. Subjects that had participated in a clinical trial involvingradiation exposure in the year prior to the study were also excluded. The study protocol conformed tothe Declaration of Helsinki and was approved by the Ethics Committee of the University of Leuven(Belgian Registration Number: B322201423101). All participants signed written informed consent.The study has been registered at ClinicalTrials.gov (clinical trial number: NCT02422537).
2.4. Study Design
Each subject performed four test days, with at least one week in between each test. During thethree days prior to each test day, subjects were instructed to consume a low fiber diet, consistingof a maximum of one piece of fruit per day, white bread instead of wholegrain products,and no more than 100 g vegetables per day. They were also asked to avoid alcohol consumption.On the evening prior to the test day, the subjects consumed a completely digestible and non-fermentablemeal (lasagna), eventually supplemented with white bread. After an overnight fast, the subjectspresented themselves at the laboratory and provided two basal breath samples for the measurementof 13CO2 and 14CO2. A catheter (BD, Erembodegem, Belgium) was placed into an antecubital veinin the forearm to collect all blood samples during the test day. After collection of a basal bloodsample, a standard breakfast was administered to the subjects. The breakfast consisted of 250 g low-fatyoghurt labeled with inulin-14C-carboxylic acid (74 kBq, Perkin Elmer, Boston, MA, USA), a markerfor oro-cecal transit time (OCTT), and 10 g of 13C-labeled inulin, which served as a model fermentablesubstrate. The OCTT was defined as the time that elapses between the intake of the meal, and thearrival in the colon, which is reflected by the appearance of 14CO2 in the breath. Depending on thetest day, the breakfast was further supplemented with 20 g of one of the three WB fractions, or nosupplement on the control test day. The participants were blind to the order of the different WBfractions and control tests, which were randomized using online software [24]. Breath samples werecollected every 20 min, up to 14 h after consumption of the breakfast. Blood samples were collectedevery hour during the first 4 h, every 40 min from 4 h to 10 h, and again every hour from 10 h to 14 h.A light digestible meal was offered to the subjects 4 h and 8 h after consumption of the breakfast. Waterwas offered ad libitum during the whole test day. The course of a test day is represented in Figure 1.
337
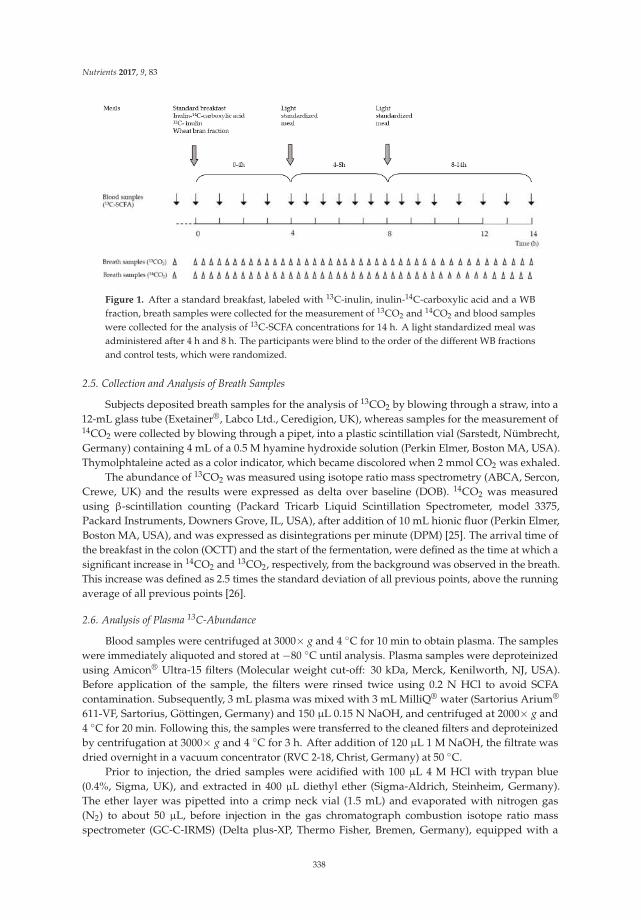
Nutrients 2017, 9, 83
Figure 1. After a standard breakfast, labeled with 13C-inulin, inulin-14C-carboxylic acid and a WBfraction, breath samples were collected for the measurement of 13CO2 and 14CO2 and blood sampleswere collected for the analysis of 13C-SCFA concentrations for 14 h. A light standardized meal wasadministered after 4 h and 8 h. The participants were blind to the order of the different WB fractionsand control tests, which were randomized.
2.5. Collection and Analysis of Breath Samples
Subjects deposited breath samples for the analysis of 13CO2 by blowing through a straw, into a12-mL glass tube (Exetainer®, Labco Ltd., Ceredigion, UK), whereas samples for the measurement of14CO2 were collected by blowing through a pipet, into a plastic scintillation vial (Sarstedt, Nümbrecht,Germany) containing 4 mL of a 0.5 M hyamine hydroxide solution (Perkin Elmer, Boston MA, USA).Thymolphtaleine acted as a color indicator, which became discolored when 2 mmol CO2 was exhaled.
The abundance of 13CO2 was measured using isotope ratio mass spectrometry (ABCA, Sercon,Crewe, UK) and the results were expressed as delta over baseline (DOB). 14CO2 was measuredusing β-scintillation counting (Packard Tricarb Liquid Scintillation Spectrometer, model 3375,Packard Instruments, Downers Grove, IL, USA), after addition of 10 mL hionic fluor (Perkin Elmer,Boston MA, USA), and was expressed as disintegrations per minute (DPM) [25]. The arrival time ofthe breakfast in the colon (OCTT) and the start of the fermentation, were defined as the time at which asignificant increase in 14CO2 and 13CO2, respectively, from the background was observed in the breath.This increase was defined as 2.5 times the standard deviation of all previous points, above the runningaverage of all previous points [26].
2.6. Analysis of Plasma 13C-Abundance
Blood samples were centrifuged at 3000× g and 4 C for 10 min to obtain plasma. The sampleswere immediately aliquoted and stored at −80 C until analysis. Plasma samples were deproteinizedusing Amicon® Ultra-15 filters (Molecular weight cut-off: 30 kDa, Merck, Kenilworth, NJ, USA).Before application of the sample, the filters were rinsed twice using 0.2 N HCl to avoid SCFAcontamination. Subsequently, 3 mL plasma was mixed with 3 mL MilliQ® water (Sartorius Arium®
611-VF, Sartorius, Göttingen, Germany) and 150 µL 0.15 N NaOH, and centrifuged at 2000× g and4 C for 20 min. Following this, the samples were transferred to the cleaned filters and deproteinizedby centrifugation at 3000× g and 4 C for 3 h. After addition of 120 µL 1 M NaOH, the filtrate wasdried overnight in a vacuum concentrator (RVC 2-18, Christ, Germany) at 50 C.
Prior to injection, the dried samples were acidified with 100 µL 4 M HCl with trypan blue(0.4%, Sigma, UK), and extracted in 400 µL diethyl ether (Sigma-Aldrich, Steinheim, Germany).The ether layer was pipetted into a crimp neck vial (1.5 mL) and evaporated with nitrogen gas(N2) to about 50 µL, before injection in the gas chromatograph combustion isotope ratio massspectrometer (GC-C-IRMS) (Delta plus-XP, Thermo Fisher, Bremen, Germany), equipped with a
338
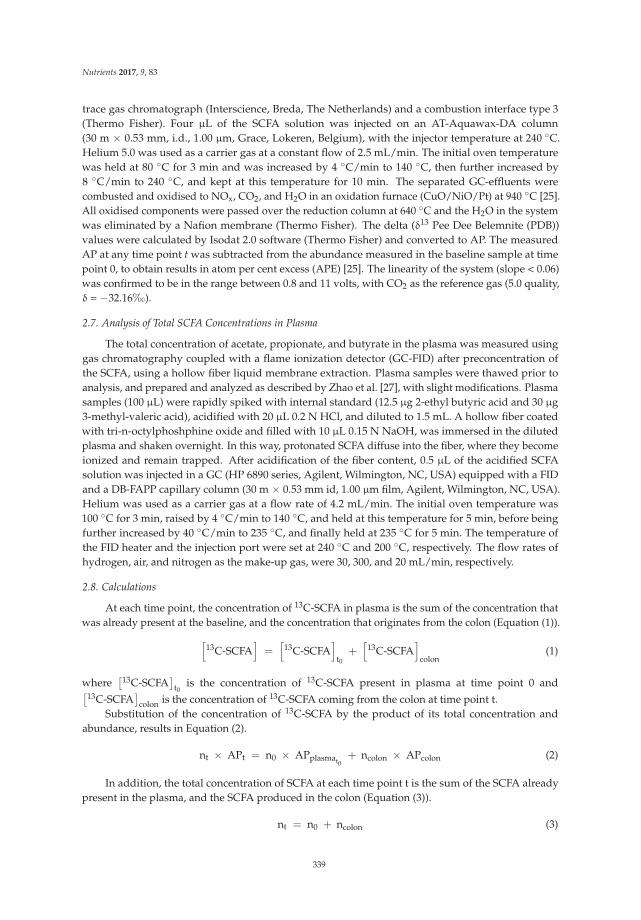
Nutrients 2017, 9, 83
trace gas chromatograph (Interscience, Breda, The Netherlands) and a combustion interface type 3(Thermo Fisher). Four µL of the SCFA solution was injected on an AT-Aquawax-DA column(30 m × 0.53 mm, i.d., 1.00 µm, Grace, Lokeren, Belgium), with the injector temperature at 240 C.Helium 5.0 was used as a carrier gas at a constant flow of 2.5 mL/min. The initial oven temperaturewas held at 80 C for 3 min and was increased by 4 C/min to 140 C, then further increased by8 C/min to 240 C, and kept at this temperature for 10 min. The separated GC-effluents werecombusted and oxidised to NOx, CO2, and H2O in an oxidation furnace (CuO/NiO/Pt) at 940 C [25].All oxidised components were passed over the reduction column at 640 C and the H2O in the systemwas eliminated by a Nafion membrane (Thermo Fisher). The delta (δ13 Pee Dee Belemnite (PDB))values were calculated by Isodat 2.0 software (Thermo Fisher) and converted to AP. The measuredAP at any time point t was subtracted from the abundance measured in the baseline sample at timepoint 0, to obtain results in atom per cent excess (APE) [25]. The linearity of the system (slope < 0.06)was confirmed to be in the range between 0.8 and 11 volts, with CO2 as the reference gas (5.0 quality,δ = −32.16‰).
2.7. Analysis of Total SCFA Concentrations in Plasma
The total concentration of acetate, propionate, and butyrate in the plasma was measured usinggas chromatography coupled with a flame ionization detector (GC-FID) after preconcentration ofthe SCFA, using a hollow fiber liquid membrane extraction. Plasma samples were thawed prior toanalysis, and prepared and analyzed as described by Zhao et al. [27], with slight modifications. Plasmasamples (100 µL) were rapidly spiked with internal standard (12.5 µg 2-ethyl butyric acid and 30 µg3-methyl-valeric acid), acidified with 20 µL 0.2 N HCl, and diluted to 1.5 mL. A hollow fiber coatedwith tri-n-octylphoshphine oxide and filled with 10 µL 0.15 N NaOH, was immersed in the dilutedplasma and shaken overnight. In this way, protonated SCFA diffuse into the fiber, where they becomeionized and remain trapped. After acidification of the fiber content, 0.5 µL of the acidified SCFAsolution was injected in a GC (HP 6890 series, Agilent, Wilmington, NC, USA) equipped with a FIDand a DB-FAPP capillary column (30 m × 0.53 mm id, 1.00 µm film, Agilent, Wilmington, NC, USA).Helium was used as a carrier gas at a flow rate of 4.2 mL/min. The initial oven temperature was100 C for 3 min, raised by 4 C/min to 140 C, and held at this temperature for 5 min, before beingfurther increased by 40 C/min to 235 C, and finally held at 235 C for 5 min. The temperature ofthe FID heater and the injection port were set at 240 C and 200 C, respectively. The flow rates ofhydrogen, air, and nitrogen as the make-up gas, were 30, 300, and 20 mL/min, respectively.
2.8. Calculations
At each time point, the concentration of 13C-SCFA in plasma is the sum of the concentration thatwas already present at the baseline, and the concentration that originates from the colon (Equation (1)).
[
13C-SCFA]
=
[
13C-SCFA]
t0+
[
13C-SCFA]
colon(1)
where[13C-SCFA
]
t0is the concentration of 13C-SCFA present in plasma at time point 0 and
[13C-SCFA]
colon is the concentration of 13C-SCFA coming from the colon at time point t.Substitution of the concentration of 13C-SCFA by the product of its total concentration and
abundance, results in Equation (2).
nt × APt = n0 × APplasmat0+ ncolon × APcolon (2)
In addition, the total concentration of SCFA at each time point t is the sum of the SCFA alreadypresent in the plasma, and the SCFA produced in the colon (Equation (3)).
nt = n0 + ncolon (3)
339
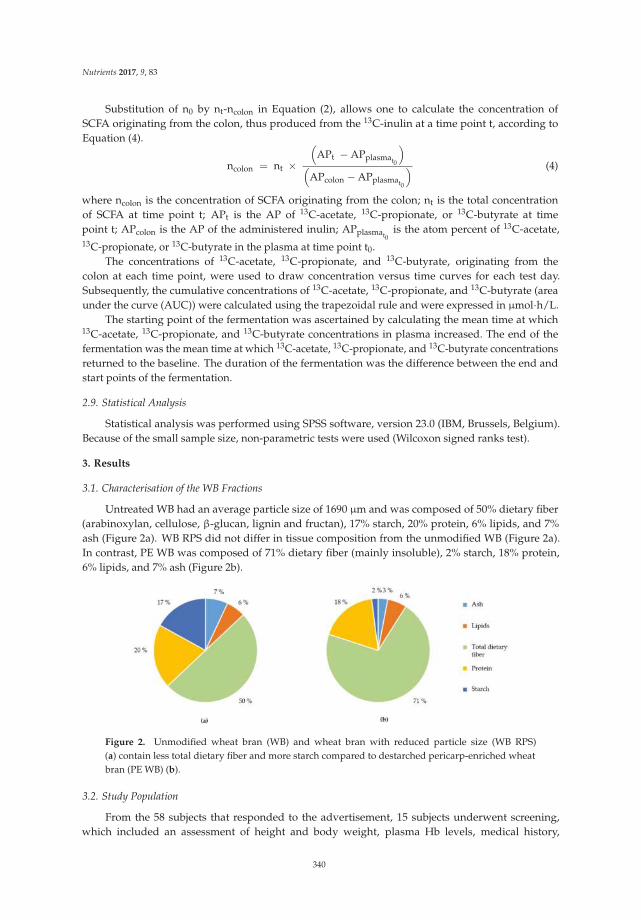
Nutrients 2017, 9, 83
Substitution of n0 by nt-ncolon in Equation (2), allows one to calculate the concentration ofSCFA originating from the colon, thus produced from the 13C-inulin at a time point t, according toEquation (4).
ncolon = nt ×
(
APt − APplasmat0
)
(
APcolon − APplasmat0
) (4)
where ncolon is the concentration of SCFA originating from the colon; nt is the total concentrationof SCFA at time point t; APt is the AP of 13C-acetate, 13C-propionate, or 13C-butyrate at timepoint t; APcolon is the AP of the administered inulin; APplasmat0
is the atom percent of 13C-acetate,13C-propionate, or 13C-butyrate in the plasma at time point t0.
The concentrations of 13C-acetate, 13C-propionate, and 13C-butyrate, originating from thecolon at each time point, were used to draw concentration versus time curves for each test day.Subsequently, the cumulative concentrations of 13C-acetate, 13C-propionate, and 13C-butyrate (areaunder the curve (AUC)) were calculated using the trapezoidal rule and were expressed in µmol·h/L.
The starting point of the fermentation was ascertained by calculating the mean time at which13C-acetate, 13C-propionate, and 13C-butyrate concentrations in plasma increased. The end of thefermentation was the mean time at which 13C-acetate, 13C-propionate, and 13C-butyrate concentrationsreturned to the baseline. The duration of the fermentation was the difference between the end andstart points of the fermentation.
2.9. Statistical Analysis
Statistical analysis was performed using SPSS software, version 23.0 (IBM, Brussels, Belgium).Because of the small sample size, non-parametric tests were used (Wilcoxon signed ranks test).
3. Results
3.1. Characterisation of the WB Fractions
Untreated WB had an average particle size of 1690 µm and was composed of 50% dietary fiber(arabinoxylan, cellulose, β-glucan, lignin and fructan), 17% starch, 20% protein, 6% lipids, and 7%ash (Figure 2a). WB RPS did not differ in tissue composition from the unmodified WB (Figure 2a).In contrast, PE WB was composed of 71% dietary fiber (mainly insoluble), 2% starch, 18% protein,6% lipids, and 7% ash (Figure 2b).
Figure 2. Unmodified wheat bran (WB) and wheat bran with reduced particle size (WB RPS)(a) contain less total dietary fiber and more starch compared to destarched pericarp-enriched wheatbran (PE WB) (b).
3.2. Study Population
From the 58 subjects that responded to the advertisement, 15 subjects underwent screening,which included an assessment of height and body weight, plasma Hb levels, medical history,
340
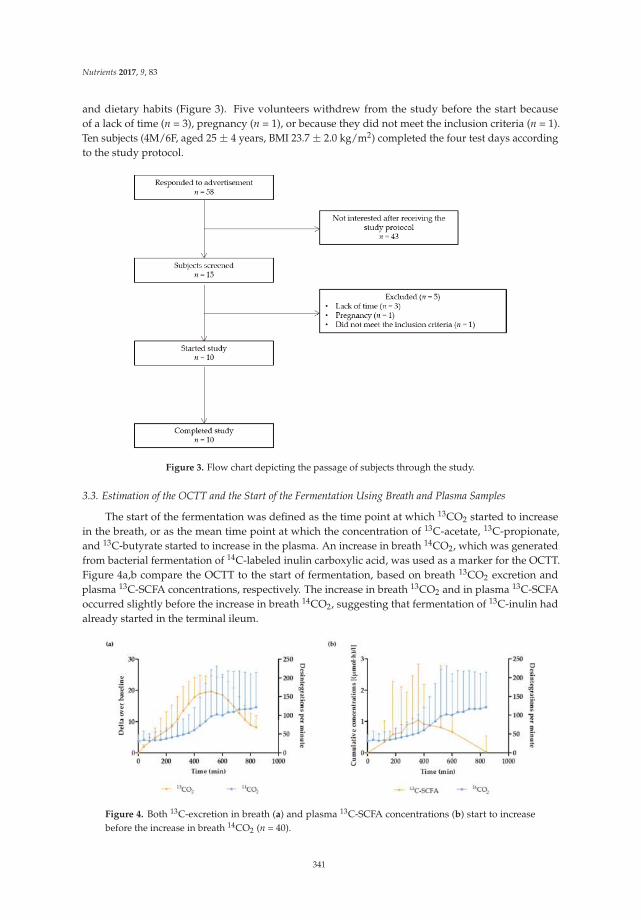
Nutrients 2017, 9, 83
and dietary habits (Figure 3). Five volunteers withdrew from the study before the start becauseof a lack of time (n = 3), pregnancy (n = 1), or because they did not meet the inclusion criteria (n = 1).Ten subjects (4M/6F, aged 25 ± 4 years, BMI 23.7 ± 2.0 kg/m2) completed the four test days accordingto the study protocol.
Figure 3. Flow chart depicting the passage of subjects through the study.
3.3. Estimation of the OCTT and the Start of the Fermentation Using Breath and Plasma Samples
The start of the fermentation was defined as the time point at which 13CO2 started to increasein the breath, or as the mean time point at which the concentration of 13C-acetate, 13C-propionate,and 13C-butyrate started to increase in the plasma. An increase in breath 14CO2, which was generatedfrom bacterial fermentation of 14C-labeled inulin carboxylic acid, was used as a marker for the OCTT.Figure 4a,b compare the OCTT to the start of fermentation, based on breath 13CO2 excretion andplasma 13C-SCFA concentrations, respectively. The increase in breath 13CO2 and in plasma 13C-SCFAoccurred slightly before the increase in breath 14CO2, suggesting that fermentation of 13C-inulin hadalready started in the terminal ileum.
Figure 4. Both 13C-excretion in breath (a) and plasma 13C-SCFA concentrations (b) start to increasebefore the increase in breath 14CO2 (n = 40).
341
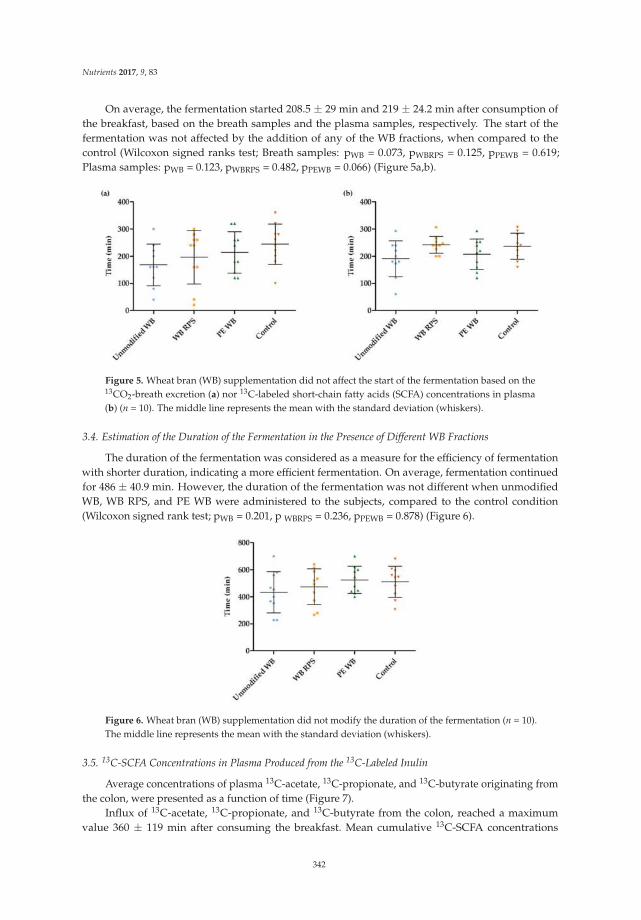
Nutrients 2017, 9, 83
On average, the fermentation started 208.5 ± 29 min and 219 ± 24.2 min after consumption ofthe breakfast, based on the breath samples and the plasma samples, respectively. The start of thefermentation was not affected by the addition of any of the WB fractions, when compared to thecontrol (Wilcoxon signed ranks test; Breath samples: pWB = 0.073, pWBRPS = 0.125, pPEWB = 0.619;Plasma samples: pWB = 0.123, pWBRPS = 0.482, pPEWB = 0.066) (Figure 5a,b).
Figure 5. Wheat bran (WB) supplementation did not affect the start of the fermentation based on the13CO2-breath excretion (a) nor 13C-labeled short-chain fatty acids (SCFA) concentrations in plasma(b) (n = 10). The middle line represents the mean with the standard deviation (whiskers).
3.4. Estimation of the Duration of the Fermentation in the Presence of Different WB Fractions
The duration of the fermentation was considered as a measure for the efficiency of fermentationwith shorter duration, indicating a more efficient fermentation. On average, fermentation continuedfor 486 ± 40.9 min. However, the duration of the fermentation was not different when unmodifiedWB, WB RPS, and PE WB were administered to the subjects, compared to the control condition(Wilcoxon signed rank test; pWB = 0.201, p WBRPS = 0.236, pPEWB = 0.878) (Figure 6).
Figure 6. Wheat bran (WB) supplementation did not modify the duration of the fermentation (n = 10).The middle line represents the mean with the standard deviation (whiskers).
3.5. 13C-SCFA Concentrations in Plasma Produced from the 13C-Labeled Inulin
Average concentrations of plasma 13C-acetate, 13C-propionate, and 13C-butyrate originating fromthe colon, were presented as a function of time (Figure 7).
Influx of 13C-acetate, 13C-propionate, and 13C-butyrate from the colon, reached a maximumvalue 360 ± 119 min after consuming the breakfast. Mean cumulative 13C-SCFA concentrations
342
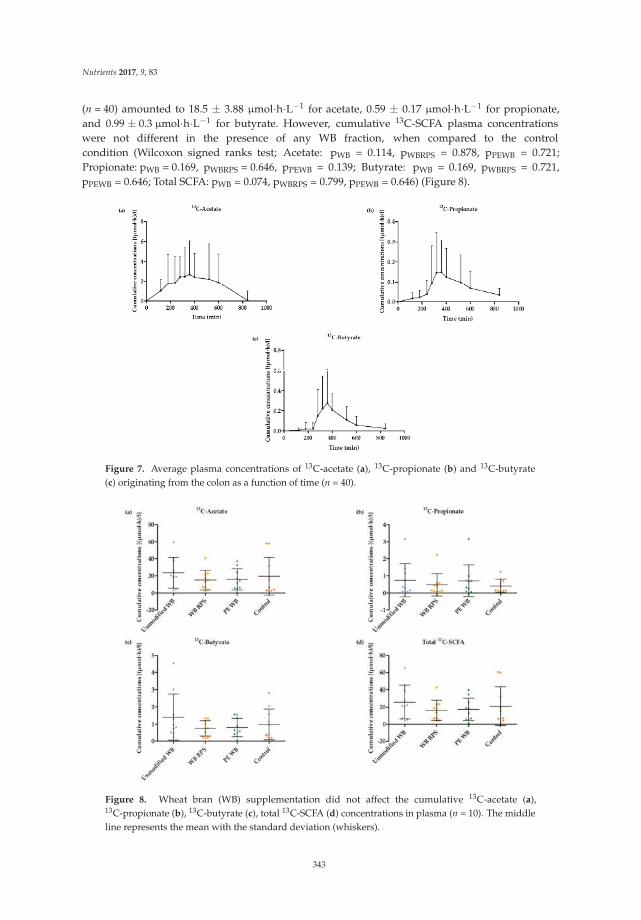
Nutrients 2017, 9, 83
(n = 40) amounted to 18.5 ± 3.88 µmol·h·L−1 for acetate, 0.59 ± 0.17 µmol·h·L−1 for propionate,and 0.99 ± 0.3 µmol·h·L−1 for butyrate. However, cumulative 13C-SCFA plasma concentrationswere not different in the presence of any WB fraction, when compared to the controlcondition (Wilcoxon signed ranks test; Acetate: pWB = 0.114, pWBRPS = 0.878, pPEWB = 0.721;Propionate: pWB = 0.169, pWBRPS = 0.646, pPEWB = 0.139; Butyrate: pWB = 0.169, pWBRPS = 0.721,pPEWB = 0.646; Total SCFA: pWB = 0.074, pWBRPS = 0.799, pPEWB = 0.646) (Figure 8).
Figure 7. Average plasma concentrations of 13C-acetate (a), 13C-propionate (b) and 13C-butyrate(c) originating from the colon as a function of time (n = 40).
Figure 8. Wheat bran (WB) supplementation did not affect the cumulative 13C-acetate (a),13C-propionate (b), 13C-butyrate (c), total 13C-SCFA (d) concentrations in plasma (n = 10). The middleline represents the mean with the standard deviation (whiskers).
343
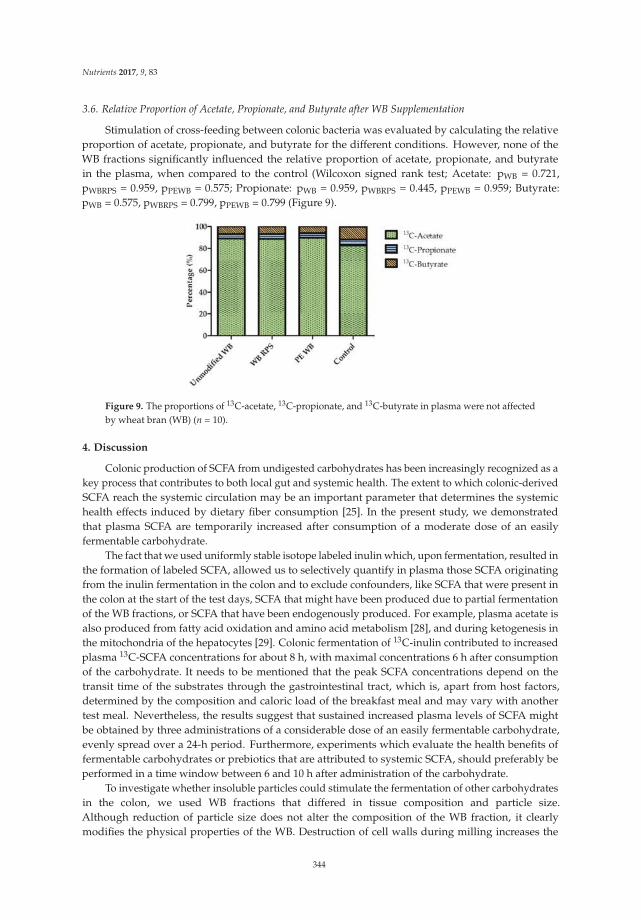
Nutrients 2017, 9, 83
3.6. Relative Proportion of Acetate, Propionate, and Butyrate after WB Supplementation
Stimulation of cross-feeding between colonic bacteria was evaluated by calculating the relativeproportion of acetate, propionate, and butyrate for the different conditions. However, none of theWB fractions significantly influenced the relative proportion of acetate, propionate, and butyratein the plasma, when compared to the control (Wilcoxon signed rank test; Acetate: pWB = 0.721,pWBRPS = 0.959, pPEWB = 0.575; Propionate: pWB = 0.959, pWBRPS = 0.445, pPEWB = 0.959; Butyrate:pWB = 0.575, pWBRPS = 0.799, pPEWB = 0.799 (Figure 9).
Figure 9. The proportions of 13C-acetate, 13C-propionate, and 13C-butyrate in plasma were not affectedby wheat bran (WB) (n = 10).
4. Discussion
Colonic production of SCFA from undigested carbohydrates has been increasingly recognized as akey process that contributes to both local gut and systemic health. The extent to which colonic-derivedSCFA reach the systemic circulation may be an important parameter that determines the systemichealth effects induced by dietary fiber consumption [25]. In the present study, we demonstratedthat plasma SCFA are temporarily increased after consumption of a moderate dose of an easilyfermentable carbohydrate.
The fact that we used uniformly stable isotope labeled inulin which, upon fermentation, resulted inthe formation of labeled SCFA, allowed us to selectively quantify in plasma those SCFA originatingfrom the inulin fermentation in the colon and to exclude confounders, like SCFA that were present inthe colon at the start of the test days, SCFA that might have been produced due to partial fermentationof the WB fractions, or SCFA that have been endogenously produced. For example, plasma acetate isalso produced from fatty acid oxidation and amino acid metabolism [28], and during ketogenesis inthe mitochondria of the hepatocytes [29]. Colonic fermentation of 13C-inulin contributed to increasedplasma 13C-SCFA concentrations for about 8 h, with maximal concentrations 6 h after consumptionof the carbohydrate. It needs to be mentioned that the peak SCFA concentrations depend on thetransit time of the substrates through the gastrointestinal tract, which is, apart from host factors,determined by the composition and caloric load of the breakfast meal and may vary with anothertest meal. Nevertheless, the results suggest that sustained increased plasma levels of SCFA mightbe obtained by three administrations of a considerable dose of an easily fermentable carbohydrate,evenly spread over a 24-h period. Furthermore, experiments which evaluate the health benefits offermentable carbohydrates or prebiotics that are attributed to systemic SCFA, should preferably beperformed in a time window between 6 and 10 h after administration of the carbohydrate.
To investigate whether insoluble particles could stimulate the fermentation of other carbohydratesin the colon, we used WB fractions that differed in tissue composition and particle size.Although reduction of particle size does not alter the composition of the WB fraction, it clearlymodifies the physical properties of the WB. Destruction of cell walls during milling increases the
344
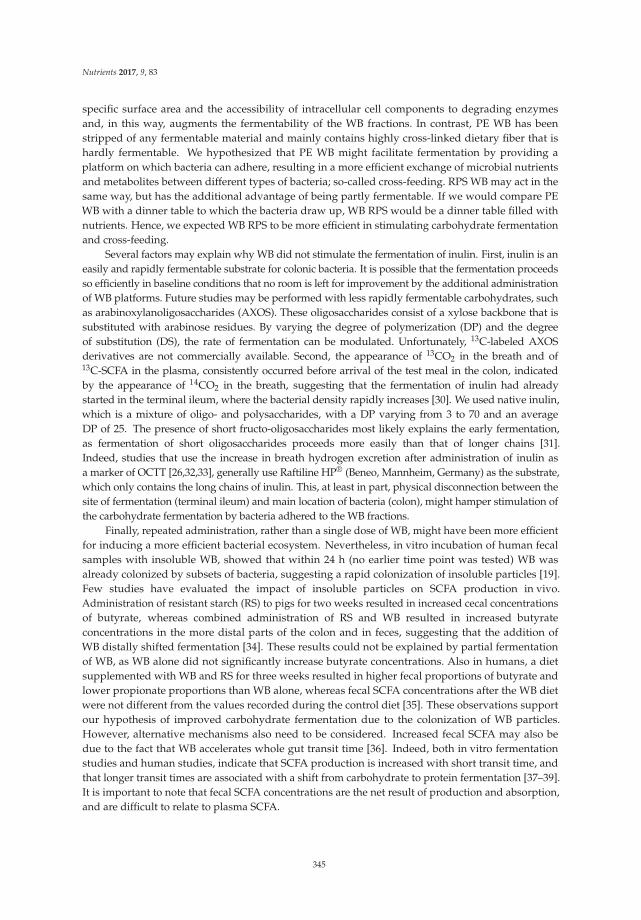
Nutrients 2017, 9, 83
specific surface area and the accessibility of intracellular cell components to degrading enzymesand, in this way, augments the fermentability of the WB fractions. In contrast, PE WB has beenstripped of any fermentable material and mainly contains highly cross-linked dietary fiber that ishardly fermentable. We hypothesized that PE WB might facilitate fermentation by providing aplatform on which bacteria can adhere, resulting in a more efficient exchange of microbial nutrientsand metabolites between different types of bacteria; so-called cross-feeding. RPS WB may act in thesame way, but has the additional advantage of being partly fermentable. If we would compare PEWB with a dinner table to which the bacteria draw up, WB RPS would be a dinner table filled withnutrients. Hence, we expected WB RPS to be more efficient in stimulating carbohydrate fermentationand cross-feeding.
Several factors may explain why WB did not stimulate the fermentation of inulin. First, inulin is aneasily and rapidly fermentable substrate for colonic bacteria. It is possible that the fermentation proceedsso efficiently in baseline conditions that no room is left for improvement by the additional administrationof WB platforms. Future studies may be performed with less rapidly fermentable carbohydrates, suchas arabinoxylanoligosaccharides (AXOS). These oligosaccharides consist of a xylose backbone that issubstituted with arabinose residues. By varying the degree of polymerization (DP) and the degreeof substitution (DS), the rate of fermentation can be modulated. Unfortunately, 13C-labeled AXOSderivatives are not commercially available. Second, the appearance of 13CO2 in the breath and of13C-SCFA in the plasma, consistently occurred before arrival of the test meal in the colon, indicatedby the appearance of 14CO2 in the breath, suggesting that the fermentation of inulin had alreadystarted in the terminal ileum, where the bacterial density rapidly increases [30]. We used native inulin,which is a mixture of oligo- and polysaccharides, with a DP varying from 3 to 70 and an averageDP of 25. The presence of short fructo-oligosaccharides most likely explains the early fermentation,as fermentation of short oligosaccharides proceeds more easily than that of longer chains [31].Indeed, studies that use the increase in breath hydrogen excretion after administration of inulin asa marker of OCTT [26,32,33], generally use Raftiline HP® (Beneo, Mannheim, Germany) as the substrate,which only contains the long chains of inulin. This, at least in part, physical disconnection between thesite of fermentation (terminal ileum) and main location of bacteria (colon), might hamper stimulation ofthe carbohydrate fermentation by bacteria adhered to the WB fractions.
Finally, repeated administration, rather than a single dose of WB, might have been more efficientfor inducing a more efficient bacterial ecosystem. Nevertheless, in vitro incubation of human fecalsamples with insoluble WB, showed that within 24 h (no earlier time point was tested) WB wasalready colonized by subsets of bacteria, suggesting a rapid colonization of insoluble particles [19].Few studies have evaluated the impact of insoluble particles on SCFA production in vivo.Administration of resistant starch (RS) to pigs for two weeks resulted in increased cecal concentrationsof butyrate, whereas combined administration of RS and WB resulted in increased butyrateconcentrations in the more distal parts of the colon and in feces, suggesting that the addition ofWB distally shifted fermentation [34]. These results could not be explained by partial fermentationof WB, as WB alone did not significantly increase butyrate concentrations. Also in humans, a dietsupplemented with WB and RS for three weeks resulted in higher fecal proportions of butyrate andlower propionate proportions than WB alone, whereas fecal SCFA concentrations after the WB dietwere not different from the values recorded during the control diet [35]. These observations supportour hypothesis of improved carbohydrate fermentation due to the colonization of WB particles.However, alternative mechanisms also need to be considered. Increased fecal SCFA may also bedue to the fact that WB accelerates whole gut transit time [36]. Indeed, both in vitro fermentationstudies and human studies, indicate that SCFA production is increased with short transit time, andthat longer transit times are associated with a shift from carbohydrate to protein fermentation [37–39].It is important to note that fecal SCFA concentrations are the net result of production and absorption,and are difficult to relate to plasma SCFA.
345
Nutrients 2017, 9, 83
Finally, we observed large inter- and intra-individual variations in plasma SCFA concentrations,which may have hampered detection of subtle changes in plasma SCFA due to WB intervention.Such large variations have also been reported in previous studies measuring SCFA [40–42] and maybe due to variability in intestinal microbiota composition, colonic SCFA absorption and metabolism,and SCFA metabolism in the liver.
5. Conclusions
In this study, we showed that fermentation of a readily fermentable substrate results in increasedplasma SCFA for about 8 h, suggesting that a sustained increase in plasma SCFA concentrations canbe achieved when a moderate dose of fermentable carbohydrate is administered three times per day.Nevertheless, the addition of a single dose of different WB fractions did not further increase either thefermentation of the readily fermentable inulin, or cross-feeding between gut bacteria.
Acknowledgments: This research was conducted in the framework of an SBO-IWT project entitled “BRANDING:Cereal bran-based dispersions for gut health” and is supported by the “Vlaams Agentschap Innoveren enOndernemen” (Vlaio, former IWT or “Agentschap voor Innovatie door Wetenschap en Technologie”).
Author Contributions: L.D. and K.V. conceived and designed the experiments and wrote the paper; L.D., A.L.and G.V. performed the experiments and analyzed the data; J.V. and C.M.C. provided the wheat bran fractionsand contributed to the revision of the manuscript.
Conflicts of Interest: The authors declare no conflict of interest.
References
1. Den Besten, G.; van Eunen, K.; Groen, A.K.; Venema, K.; Reijngoud, D.J.; Bakker, B.M. The role of short-chainfatty acids in the interplay between diet, gut microbiota, and host energy metabolism. J. Lipid Res. 2013, 54,2325–2340. [CrossRef] [PubMed]
2. Macfarlane, G.T.; Macfarlane, S. Bacteria, colonic fermentation, and gastrointestinal health. J. AOAC Int.
2012, 95, 50–60. [CrossRef] [PubMed]3. Hamer, H.M.; Jonkers, D.; Venema, K.; Vanhoutvin, S.; Troost, F.J.; Brummer, R.J. Review article: The role of
butyrate on colonic function. Aliment. Pharmacol. Ther. 2008, 27, 104–119. [CrossRef] [PubMed]4. Macfarlane, G.T.; Macfarlane, S. Fermentation in the human large intestine: Its physiologic consequences
and the potential contribution of prebiotics. J. Clin. Gastroenterol. 2011, 45, S120–S127. [CrossRef] [PubMed]5. Canfora, E.E.; Jocken, J.W.; Blaak, E.E. Short-chain fatty acids in control of body weight and insulin sensitivity.
Nat. Rev. Endocrinol. 2015, 11, 577–591. [CrossRef] [PubMed]6. Hong, Y.H.; Nishimura, Y.; Hishikawa, D.; Tsuzuki, H.; Miyahara, H.; Gotoh, C.; Choi, K.C.; Feng, D.D.;
Chen, C.; Lee, H.G.; et al. Acetate and propionate short chain fatty acids stimulate adipogenesis via GPCR43.Endocrinology 2005, 146, 5092–5099. [CrossRef] [PubMed]
7. Park, J.; Kim, M.; Kang, S.G.; Jannasch, A.H.; Cooper, B.; Patterson, J.; Kim, C.H. Short-chain fatty acidsinduce both effector and regulatory T cells by suppression of histone deacetylases and regulation of themtor-s6k pathway. Mucosal. Immunol. 2015, 8, 80–93. [CrossRef] [PubMed]
8. Smith, P.M.; Howitt, M.R.; Panikov, N.; Michaud, M.; Gallini, C.A.; Bohlooly, Y.M.; Glickman, J.N.;Garrett, W.S. The microbial metabolites, short-chain fatty acids, regulate colonic Treg cell homeostasis.Science 2013, 341, 569–573. [CrossRef] [PubMed]
9. Floch, M.H.; Hong-Curtiss, J. Probiotics and functional foods in gastrointestinal disorders. Curr. Treat.
Opt. Gastroenterol. 2002, 5, 311–321. [CrossRef]10. Marteau, P. Butyrate-producing bacteria as pharmabiotics for inflammatory bowel disease. Gut 2013, 62,
1673. [CrossRef] [PubMed]11. Eeckhaut, V.; Ducatelle, R.; Sas, B.; Vermeire, S.; Van Immerseel, F. Progress towards butyrate-producing
pharmabiotics: Butyricicoccus pullicaecorum capsule and efficacy in TNBS models in comparison withtherapeutics. Gut 2014, 63, 367. [CrossRef] [PubMed]
12. Eeckhaut, V.; Machiels, K.; Perrier, C.; Romero, C.; Maes, S.; Flahou, B.; Steppe, M.; Haesebrouck, F.; Sas, B.;Ducatelle, R.; et al. Butyricicoccus pullicaecorum in inflammatory bowel disease. Gut 2013, 62, 1745–1752.[CrossRef] [PubMed]
346
Nutrients 2017, 9, 83
13. Miquel, S.; Martin, R.; Rossi, O.; Bermudez-Humaran, L.G.; Chatel, J.M.; Sokol, H.; Thomas, M.; Wells, J.M.;Langella, P. Faecalibacterium prausnitzii and human intestinal health. Curr. Opin. Microbiol. 2013, 16,255–261. [CrossRef] [PubMed]
14. Gibson, G.; Scott, K.; Rastal, R.A.; Kieran, M.T.; Hotchkiss, A.; Dubert-Ferrandon, A.; Gareau, M.; Eileen, M.F.;Saulnier, D.; Loh, G.; et al. Dietary prebiotics: Current status and new definition. Food Sci. Technol. Bull. 2010,7, 1–19. [CrossRef]
15. Velázquez, M.; Davies, C.; Marett, R.; Slavin, J.L.; Feirtag, J.M. Effect of oligosaccharides and fibre substituteson short-chain fatty acid production by human faecal microflora. Anaerobe 2000, 6, 87–92. [CrossRef]
16. Brouns, F.; Kettlitz, B.; Arrigoni, E. Resistant starch and “the butyrate revolution”. Trends Food Sci. Technol.
2002, 13, 251–261. [CrossRef]17. Moens, F.; Weckx, S.; De Vuyst, L. Bifidobacterial inulin-type fructan degradation capacity determines
cross-feeding interactions between bifidobacteria and faecalibacterium prausnitzii. Int. J. Food Microbiol.
2016, 231, 76–85. [CrossRef] [PubMed]18. Riviere, A.; Gagnon, M.; Weckx, S.; Roy, D.; De Vuyst, L. Mutual cross-feeding interactions between
bifidobacterium longum subsp. Longum NCC2705 and eubacterium rectale ATCC 33656 explain thebifidogenic and butyrogenic effects of arabinoxylan oligosaccharides. Appl. Environ. Microbiol. 2015, 81,7767–7781. [CrossRef] [PubMed]
19. Leitch, E.C.; Walker, A.W.; Duncan, S.H.; Holtrop, G.; Flint, H.J. Selective colonization of insoluble substratesby human faecal bacteria. Environ. Microbiol. 2007, 9, 667–679. [CrossRef] [PubMed]
20. Courtin, C.M.; Van den Broeck, H.; Delcour, J.A. Determination of reducing end sugar residues in oligo- andpolysaccharides by gas-liquid chromatography. J. Chromatogr. A 2000, 866, 97–104. [CrossRef]
21. Gerits, L.R.; Pareyt, B.; Delcour, J.A. Single run hplc separation coupled to evaporative light scatteringdetection unravels wheat flour endogenous lipid redistribution during bread dough making. LWT-Food Sci.
Technol. 2013, 53, 426–433. [CrossRef]22. Jacobs, P.J.; Hemdane, S.; Dornez, E.; Delcour, J.A.; Courtin, C.M. Study of hydration properties of wheat
bran as a function of particle size. Food Chem. 2015, 179, 296–304. [CrossRef] [PubMed]23. Swennen, K.; Courtin, C.M.; Lindemans, G.C.J.E.; Delcour, J.A. Large-scale production and characterisation
of wheat bran arabinoxylooligosaccharides. J. Sci. Food Agric. 2006, 86, 1722–1731. [CrossRef]24. Urbaniak, G.U.; Plous, S. Research Randomizer. Available online: http://www.randomizer.org (accessed on
10 January 2015).25. Boets, E.; Deroover, L.; Houben, E.; Vermeulen, K.; Gomand, S.V.; Delcour, J.A.; Verbeke, K. Quantification of
in vivo colonic short chain fatty acid production from inulin. Nutrients 2015, 7, 8916–8929. [CrossRef][PubMed]
26. Verbeke, K.; de Preter, V.; Geboes, K.; Daems, T.; van den Mooter, G.; Evenepoel, P.; Rutgeerts, P. In vivoevaluation of a colonic delivery system using isotope techniques. Aliment. Pharmacol. Ther. 2005, 21, 187–194.[CrossRef] [PubMed]
27. Zhao, G.; Liu, J.F.; Nyman, M.; Jonsson, J.A. Determination of short-chain fatty acids in serum by hollow fibersupported liquid membrane extraction coupled with gas chromatography. J. Chromatogr. B Anal. Technol.
Biomed. Life Sci. 2007, 846, 202–208. [CrossRef] [PubMed]28. Layden, B.T.; Angueira, A.R.; Brodsky, M.; Durai, V.; Lowe, W.L., Jr. Short chain fatty acids and their
receptors: New metabolic targets. Transl. Res. 2013, 161, 131–140. [CrossRef] [PubMed]29. Yamashita, H.; Kaneyuki, T.; Tagawa, K. Production of acetate in the liver and its utilization in peripheral
tissues. Biochim. Biophys. Acta 2001, 1532, 79–87. [CrossRef]30. Sartor, R.B. Microbial influences in inflammatory bowel diseases. Gastroenterology 2008, 134, 577–594.
[CrossRef] [PubMed]31. Van der Meulen, R.; Makras, L.; Verbrugghe, K.; Adriany, T.; De Vuyst, L. In vitro kinetic analysis
of oligofructose consumption by Bacteroides and Bifidobacterium spp. Indicates different degradationmechanisms. Appl. Environ. Microbiol. 2006, 72, 1006–1012. [CrossRef] [PubMed]
32. Geboes, K.P.; Luypaerts, A.; Rutgeerts, P.; Verbeke, K. Inulin is an ideal substrate for a hydrogen breath testto measure the orocaecal transit time. Aliment. Pharmacol. Ther. 2003, 18, 721–729. [CrossRef] [PubMed]
33. Schneider, A.R.; Jepp, K.; Murczynski, L.; Biniek, U.; Stein, J. The inulin hydrogen breath test accuratelyreflects orocaecal transit time. Eur. J. Clin. Investig. 2007, 37, 802–807. [CrossRef] [PubMed]
347
Nutrients 2017, 9, 83
34. Govers, M.J.; Gannon, N.J.; Dunshea, F.R.; Gibson, P.R.; Muir, J.G. Wheat bran affects the site of fermentationof resistant starch and luminal indexes related to colon cancer risk: A study in pigs. Gut 1999, 45, 840–847.[CrossRef] [PubMed]
35. Muir, J.G.; Yeow, E.G.; Keogh, J.; Pizzey, C.; Bird, A.R.; Sharpe, K.; O’Dea, K.; Macrae, F.A. Combining wheatbran with resistant starch has more beneficial effects on fecal indexes than does wheat bran alone. Am. J.
Clin. Nutr. 2004, 79, 1020–1028. [PubMed]36. De Vries, J.; Miller, P.E.; Verbeke, K. Effects of cereal fiber on bowel function: A systematic review of
intervention trials. World J. Gastroenterol. 2015, 21, 8952–8963. [CrossRef] [PubMed]37. Lewis, S.J.; Heaton, K.W. Increasing butyrate concentration in the distal colon by accelerating intestinal
transit. Gut 1997, 41, 245–251. [CrossRef] [PubMed]38. Macfarlane, G.T.; Macfarlane, S.; Gibson, G.R. Validation of a three-stage compound continuous culture
system for investigating the effect of retention time on the ecology and metabolism of bacteria in the humancolon. Microb. Ecol. 1998, 35, 180–187. [CrossRef] [PubMed]
39. Roager, H.M.; Hansen, L.B.; Bahl, M.I.; Frandsen, H.L.; Carvalho, V.; Gobel, R.J.; Dalgaard, M.D.; Plichta, D.R.;Sparholt, M.H.; Vestergaard, H.; et al. Colonic transit time is related to bacterial metabolism and mucosalturnover in the gut. Nat. Microbiol. 2016, 1, 16093. [CrossRef] [PubMed]
40. Bloemen, J.G.; Venema, K.; van de Poll, M.C.; Olde Damink, S.W.; Buurman, W.A.; Dejong, C.H. Short chainfatty acids exchange across the gut and liver in humans measured at surgery. Clin. Nutr. 2009, 28, 657–661.[CrossRef] [PubMed]
41. Boets, E.; Gomand, S.V.; Deroover, L.; Preston, T.; Vermeulen, K.; De Preter, V.; Hamer, H.; Van den Mooter, G.;De Vuyst, L.; Courtin, C.M.; et al. Systemic availability and metabolism of colonic-derived short-chain fattyacids in healthy subjects—A stable isotope study. J. Physiol. 2017, 595, 541–555. [CrossRef] [PubMed]
42. Peters, S.G.; Pomare, E.W.; Fisher, C.A. Portal and peripheral blood short chain fatty acid concentrationsafter caecal lactulose instillation at surgery. Gut 1992, 33, 1249–1252. [CrossRef] [PubMed]
© 2017 by the authors. Licensee MDPI, Basel, Switzerland. This article is an open accessarticle distributed under the terms and conditions of the Creative Commons Attribution(CC BY) license (http://creativecommons.org/licenses/by/4.0/).
348
nutrients
Commentary
Toward a Personalized Approach inPrebiotics Research
Moul Dey
Department of Health and Nutritional Sciences, Box 2203, South Dakota State University, Brookings, SD 57007,USA; [email protected]; Tel.: +1-605-688-4050
Received: 14 December 2016; Accepted: 20 January 2017; Published: 26 January 2017
Abstract: Recent characterization of the human microbiome and its influences on health have led todramatic conceptual shifts in dietary bioactives research. Prebiotic foods that include many dietaryfibers and resistant starches are perceived as beneficial for maintaining a healthy gut microbiota.This article brings forward some current perspectives in prebiotic research to discuss why reporting ofindividual variations in response to interventions will be important to discern suitability of prebioticsas a disease prevention tool.
Keywords: prebiotics; disease prevention; dietary bioactives; resistant starch type 4;intervention response variability
The ancient Greek physician Hippocrates perceived food as the key player in the maintenance ofhealth, not just as a fuel to run the human body. Since then, scientists have probed deeper into therole of diet in nutrient absorption and bodily function. In the late 1800s, scientists began isolatingmicroorganisms from different parts of the human body including from the digestive tract. Some ofthese organisms were considered harmful and others beneficial. However, the concept of the humanmicrobiome and its critical role in human health and diseases is more recent, emerging in the 21stcentury after the advent of next generation sequencing. Mapping microbiome diversity has unlockedmany mysteries—but also triggered new questions. The answers to many such questions still eludeus, including a very basic but pressing question, “what diet is ideal for a healthy gut microbiome?”It remains unknown if there is an ideal gut microbiome that can be considered “healthy”, nor do weknow of one ideal diet that can positively manipulate the microbiome of people of all ages across theglobe. Furthermore, a plethora of contradictory research findings on what dietary component may ormay not be healthy frequently confuse the public. Not too long ago, dietary fat used to be our worstenemy. With time, that spot was taken over by dietary sugars. Another example is soy, with its manyknown health benefits and a host of negative side effects [1]. While the reasons behind contradictorynutritional research are multi-faceted, one contributing factor may be researchers designing studieslike modern medical research that predominantly aims for disease-specific diagnostic and therapeuticavenues. Scientists prioritize collective outcomes with high statistical significance. While thesebenchmarks are a sign of a successful clinical trial, individual responses to the dietary treatment areoften ignored. For example, recently Zeevi et al. reported widespread and high interpersonal variabilityin post-prandial glucose response among healthy participants to common dietary components [2]. It ispossible that researchers in dietary intervention studies frequently encounter similar variations, butthey are under-reported.
Prebiotics are selectively fermented dietary ingredients such as resistant starches and some dietaryfibers that change the composition and/or activity of the gastrointestinal microbiota, thus conferringbenefits to the host’s health [3]. While this newer type of functional food is increasingly popular,a recent systematic review of six prebiotic trials published before 6 November 2015 suggests thatmore randomized controlled trials are needed to support their clinical use [4]. More recently our
Nutrients 2017, 9, 92 349 www.mdpi.com/journal/nutrients
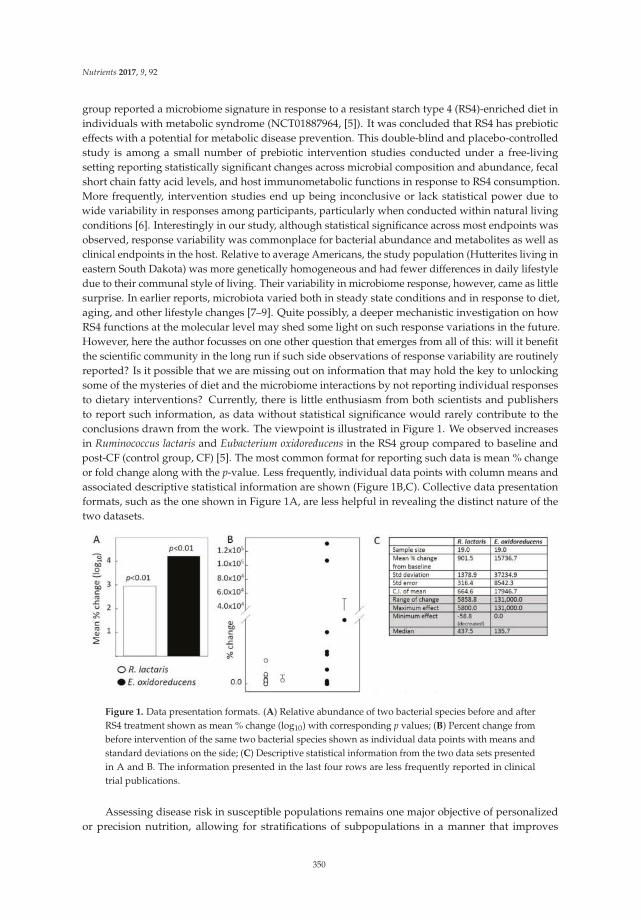
Nutrients 2017, 9, 92
group reported a microbiome signature in response to a resistant starch type 4 (RS4)-enriched diet inindividuals with metabolic syndrome (NCT01887964, [5]). It was concluded that RS4 has prebioticeffects with a potential for metabolic disease prevention. This double-blind and placebo-controlledstudy is among a small number of prebiotic intervention studies conducted under a free-livingsetting reporting statistically significant changes across microbial composition and abundance, fecalshort chain fatty acid levels, and host immunometabolic functions in response to RS4 consumption.More frequently, intervention studies end up being inconclusive or lack statistical power due towide variability in responses among participants, particularly when conducted within natural livingconditions [6]. Interestingly in our study, although statistical significance across most endpoints wasobserved, response variability was commonplace for bacterial abundance and metabolites as well asclinical endpoints in the host. Relative to average Americans, the study population (Hutterites living ineastern South Dakota) was more genetically homogeneous and had fewer differences in daily lifestyledue to their communal style of living. Their variability in microbiome response, however, came as littlesurprise. In earlier reports, microbiota varied both in steady state conditions and in response to diet,aging, and other lifestyle changes [7–9]. Quite possibly, a deeper mechanistic investigation on howRS4 functions at the molecular level may shed some light on such response variations in the future.However, here the author focusses on one other question that emerges from all of this: will it benefitthe scientific community in the long run if such side observations of response variability are routinelyreported? Is it possible that we are missing out on information that may hold the key to unlockingsome of the mysteries of diet and the microbiome interactions by not reporting individual responsesto dietary interventions? Currently, there is little enthusiasm from both scientists and publishersto report such information, as data without statistical significance would rarely contribute to theconclusions drawn from the work. The viewpoint is illustrated in Figure 1. We observed increasesin Ruminococcus lactaris and Eubacterium oxidoreducens in the RS4 group compared to baseline andpost-CF (control group, CF) [5]. The most common format for reporting such data is mean % changeor fold change along with the p-value. Less frequently, individual data points with column means andassociated descriptive statistical information are shown (Figure 1B,C). Collective data presentationformats, such as the one shown in Figure 1A, are less helpful in revealing the distinct nature of thetwo datasets.
Figure 1. Data presentation formats. (A) Relative abundance of two bacterial species before and afterRS4 treatment shown as mean % change (log10) with corresponding p values; (B) Percent change frombefore intervention of the same two bacterial species shown as individual data points with means andstandard deviations on the side; (C) Descriptive statistical information from the two data sets presentedin A and B. The information presented in the last four rows are less frequently reported in clinicaltrial publications.
Assessing disease risk in susceptible populations remains one major objective of personalizedor precision nutrition, allowing for stratifications of subpopulations in a manner that improves
350
Nutrients 2017, 9, 92
the accuracy and cost-effectiveness of interventions and follow-ups. In addition, early prognosisand/or diagnosis may facilitate prophylactic treatment that would otherwise be unsuitable for alarger population. In this context, Zeevi et al. has proposed a machine-learning algorithm approachthat integrates multiple features based on a preexisting large cohort data set to predict, for example,glycemic response to real-life meals [2]. While they have reported feasibility, cost-effectiveness of suchan approach has not been determined. It must be taken into consideration that no one outcome alone,such as glycemic response, determines the overall health outcome of an individual. For example,being able to predict glycemic response may attenuate the risk of type 2 diabetes, but will nothelp with the prognosis of hyperlipidemia, heart disease, or cancer. Therefore, many large-scaleendeavors, such as those reported by Zeevi et al., will be necessary to predict multiple clinicalend-points or intermediate biomarkers before personalized overall health risk determination followedby preventive intervention is possible. For similar reasons, personalized microbiome profiling, whiledeemed promising as a tool for disease risk stratification, is not ready for translation to a clinicalsetting. It is only proposed that a predictive microbiome modeling system with more sophisticatedreadouts integrating multiple aspects of gut microbiota (composition, abundance, metagenomics,meta-transcriptomic, metabolomics, etc.) should be incorporated [10]. In addition, microbiome-basedbiomarkers for personalized prognostic, diagnostic, and treatment may vary by geographic locations,lifestyle, and many other factors. Therefore, while personalized microbiome profiling may be usefulfor predicting and mitigating disease, it will take a huge scientific undertaking before it is ready forthe clinical setting.
In the past few decades, there has been a surge in metabolic diseases that affect quality of life andpose a substantial medical and economic burden on society. There is a growing interest in preventivemeasures to modify the risk of metabolic diseases, with diet proposed as a major player in public healthpromotion. Decades of generalized nutritional recommendations do not seem to be mitigating themetabolic health crisis, although at present there is no alternate to an overall healthy diet and regularphysical activity recommendation for long-term health maintenance. Mounting evidence suggests amore personalized approach is required for health promotion through disease prevention and thatsuch personalization cannot entirely rely on human genomic variations in case of complex metabolicdiseases. Even taking into account the huge undertaking discussed above, current knowledge about themicrobiome suggests that integrating microbiome profiling into patient care will likely allow for a faster,more accurate, and less invasive clinical decision-making processes. In this context, prebiotics willbe critical components of personally tailored dietary interventions aimed at altering the microbiometo a more beneficial configuration for disease prevention. While the benefits of dietary fibers, manyof which have prebiotic properties, are well-known, their mechanisms of action mostly remain amystery. Without the knowledge of structure-function relationships between various prebiotics andmicrobial species as well as further consideration of the bilateral relationship of the microbiome andthe host, personalized and effective use of prebiotics for disease prevention will be difficult. Large-scalecharacterization of the nutrition-microbiome-host metabolism axis will help delineate the integration ofprebiotics in personalized diets for prevention of multi-factorial metabolic diseases. One caveat towardsuch effort is that disease prevention trials typically focus on intermediate outcomes because long-termfollow-up of a large enough population, that will both adhere to the intervention as well as providesufficient statistical power to detect differences, is technically difficult and prohibitively expensive.Regrettably, intermediate outcome measures do not always reflect the true preventive potential of anintervention as reported from the Look AHEAD (Action for Health in Diabetes) trial [11].
Looking to the future, it will be critical to consider the collective effects that are statisticallysignificant, as well as individual response variations, for harnessing the many potential health benefitsof prebiotics. Encouraging the scientific community to report variations observed in clinical trials,even if such observations may not meaningfully contribute to the main conclusions of the currentstudy, will be important. Such data may be presented in formats that allow more holistic visualizationof study results, including but not limited to, effect sizes, percentile ranking, minimum and maximum
351
Nutrients 2017, 9, 92
values, outliers, means, and medians. A recent commentary in Nature Methods discussed similar datapresentation approaches in lieu of sample-to-sample variability and irreproducibility of scientific data,particularly in biomedical disciplines [12]. In addition to that, the author believes, this may also providean opportunity to build on the vast repertoire of individual response variations that may not otherwisebe possible for any one research study to capture. How such data may precisely inform clinical studydesigns and/or results in the future will depend on effective systematic reviews and meta-analysisoutcome from the growing body of such data sets. Nevertheless, the author is hopeful that theinformation generated will facilitate better predictability of microbial and/or host-physiologicalresponse behavior in the direction of early prognosis and prevention.
Acknowledgments: The author’s laboratory is currently supported by USDA National Institute of Food andAgriculture Hatch grant [1004817] as well as state and industry grants. No funding was directly utilized towardpreparation of this manuscript.
Conflicts of Interest: The author declares no conflict of interest.
References
1. Messina, M. Soy and Health Update: Evaluation of the Clinical and Epidemiologic Literature. Nutrients
2016, 8, 754. [CrossRef] [PubMed]2. Zeevi, D.; Korem, T.; Zmora, N.; Israeli, D.; Rothschild, D.; Weinberger, A.; Ben-Yacov, O.; Lador, D.;
Avnit-Sagi, T.; Lotan-Pompan, M.; et al. Personalized Nutrition by Prediction of Glycemic Responses. Cell
2015, 163, 1079–1094. [CrossRef] [PubMed]3. Roberfroid, M.; Gibson, G.R.; Hoyles, L.; McCartney, A.L.; Rastall, R.; Rowland, I.; Wolvers, D.; Watzl, B.;
Szajewska, H.; Stahl, B.; et al. Prebiotic effects: Metabolic and health benefits. Br. J. Nutr. 2010, 104, S1–S63.[CrossRef] [PubMed]
4. Fernandes, R.; do Rosario, V.A.; Mocellin, M.C.; Kuntz, M.G.; Trindade, E.B. Effects of inulin-type fructans,galacto-oligosaccharides and related synbiotics on inflammatory markers in adult patients with overweightor obesity: A systematic review. Clin. Nutr. 2016. [CrossRef] [PubMed]
5. Upadhyaya, B.; McCormack, L.; Fardin-Kia, A.R.; Juenemann, R.; Clapper, J.; Specker, B.; Dey, M. Impact ofdietary resistant starch type 4 on human gut microbiota and immunometabolic functions. Sci. Rep. 2016, 6,28797. [CrossRef] [PubMed]
6. Satija, A.; Yu, E.; Willett, W.C.; Hu, F.B. Understanding nutritional epidemiology and its role in policy.Adv. Nutr. 2015, 6, 5–18. [CrossRef] [PubMed]
7. Eckburg, P.B.; Bik, E.M.; Bernstein, C.N.; Purdom, E.; Dethlefsen, L.; Sargent, M.; Gill, S.R.; Nelson, K.E.;Relman, D.A. Diversity of the Human Intestinal Microbial Flora. Science 2005, 308, 1635–1638. [CrossRef][PubMed]
8. Claesson, M.J.; Jeffery, I.B.; Conde, S.; Power, S.E.; O’Connor, E.M.; Cusack, S.; Harris, H.M.; Coakley, M.;Lakshminarayanan, B.; O’Sullivan, O.; et al. Gut microbiota composition correlates with diet and health inthe elderly. Nature 2012, 488, 178–184. [CrossRef] [PubMed]
9. Carmody, R.N.; Gerber, G.K.; Luevano, J.M., Jr.; Gatti, D.M.; Somes, L.; Svenson, K.L.; Turnbaugh, P.J.Diet dominates host genotype in shaping the murine gut microbiota. Cell Host Microbe 2015, 17, 72–84.[CrossRef] [PubMed]
10. Zmora, N.; Zeevi, D.; Korem, T.; Segal, E.; Elinav, E. Taking it Personally: Personalized Utilization of theHuman Microbiome in Health and Disease. Cell Host Microbe 2016, 19, 12–20. [CrossRef] [PubMed]
11. Look, A.R.G.; Wing, R.R.; Bolin, P.; Brancati, F.L.; Bray, G.A.; Clark, J.M.; Coday, M.; Crow, R.S.; Curtis, J.M.;Egan, C.M.; et al. Cardiovascular effects of intensive lifestyle intervention in type 2 diabetes. N. Engl. J. Med.
2013, 369, 145–154.12. Halsey, L.G.; Curran-Everett, D.; Vowler, S.L.; Drummond, G.B. The fickle p value generates irreproducible
results. Nat. Methods 2015, 12, 179–185. [CrossRef] [PubMed]
© 2017 by the author. Licensee MDPI, Basel, Switzerland. This article is an open accessarticle distributed under the terms and conditions of the Creative Commons Attribution(CC BY) license (http://creativecommons.org/licenses/by/4.0/).
352
nutrients
Article
Dietary Fiber and the Human Gut Microbiota:Application of Evidence Mapping Methodology
Caleigh M. Sawicki 1,2, Kara A. Livingston 1, Martin Obin 3, Susan B. Roberts 4, Mei Chung 5
and Nicola M. McKeown 1,2,*
1 Nutritional Epidemiology, Jean Mayer USDA Human Nutrition Research Center on Aging at Tufts University,Boston, MA 02111, USA; [email protected] (C.M.S.); [email protected] (K.A.L.)
2 Friedman School of Nutrition Science and Policy, Tufts University, Boston, MA 02111, USA3 Nutrition & Genomics Laboratory, Jean Mayer USDA Human Nutrition Research Center on Aging at
Tufts University, Boston, MA 02111, USA; [email protected] Energy Metabolism Laboratory, Jean Mayer USDA Human Nutrition Research Center on Aging at
Tufts University, Boston, MA 02111, USA; [email protected] Nutrition/Infection Unit, Department of Public Health and Community Medicine,
Tufts University School of Medicine, Boston, MA 02111, USA; [email protected]* Correspondence: [email protected]; Tel.: +1-617-556-3008
Received: 15 December 2016; Accepted: 4 February 2017; Published: 10 February 2017
Abstract: Interest is rapidly growing around the role of the human gut microbiota in facilitatingbeneficial health effects associated with consumption of dietary fiber. An evidence map of currentresearch activity in this area was created using a newly developed database of dietary fiber interventionstudies in humans to identify studies with the following broad outcomes: (1) modulation of colonicmicroflora; and/or (2) colonic fermentation/short-chain fatty acid concentration. Study designcharacteristics, fiber exposures, and outcome categories were summarized. A sub-analysis describedoligosaccharides and bacterial composition in greater detail. One hundred eighty-eight relevantstudies were identified. The fiber categories represented by the most studies were oligosaccharides(20%), resistant starch (16%), and chemically synthesized fibers (15%). Short-chain fatty acidconcentration (47%) and bacterial composition (88%) were the most frequently studied outcomes.Whole-diet interventions, measures of bacterial activity, and studies in metabolically at-risk subjectswere identified as potential gaps in the evidence. This evidence map efficiently captured the variabilityin characteristics of expanding research on dietary fiber, gut microbiota, and physiological healthbenefits, and identified areas that may benefit from further research. We hope that this evidence mapwill provide a resource for researchers to direct new intervention studies and meta-analyses.
Keywords: dietary fiber; gut microbiota; evidence map; colonic fermentation; oligosaccharides;resistant starch; cereal fiber; Bifidobacteria; Lactobacilli
1. Introduction
According to the 2009 Codex Alimentarius definition of dietary fiber, which aims to unifythe definition among all countries, dietary fiber includes all carbohydrate polymers of three ormore monomeric units that resist digestion in the small intestine [1,2]. A further stipulation of thisdefinition is that isolated or chemically synthesized fibers need to show a physiological health benefit.Epidemiological evidence consistently shows that higher intake of dietary fiber is associated witha reduced risk of chronic diseases, such as cardiovascular disease (CVD), type 2 diabetes, and cancer [3].However, new research is interested in the role of the gut microbiota with respect to observed beneficialeffects [4,5].
Nutrients 2017, 9, 125 353 www.mdpi.com/journal/nutrients
Nutrients 2017, 9, 125
Research on the human gut microbiota, sometimes referred to as the “forgotten organ” [6], hasexponentially increased over the past decade with recent advances in technology. There has beengrowing evidence that the microbiota not only produces metabolites that can influence host physiology,but these metabolites also play an integral role in the host immune system and metabolism througha complex array of chemical interactions and signaling pathways [7–9]. These interactions can greatlyimpact host health and risk of disease [7,10], and the microbiota have been linked to numerousdiseases such as irritable bowel syndrome (IBS), asthma, allergy, metabolic syndrome, diabetes, obesity,cardiovascular disease, and colorectal cancer [11].
A number of factors can cause the composition of the microbiota to shift, including changes indiet [10]. Consumption of dietary fiber has been shown to influence the gut microbiota by alteringbacterial fermentation, colony size, and species composition [12]. Non-digestible carbohydrates are theprimary energy source for most gut microbes and, therefore, can directly impact those species thatheavily depend on that substrate [13]. There can also be indirect impacts through cross-feeding, wheresome types of microbes depend on the by-products, or metabolites, of other types of microbes [14,15].In addition to substrate availability, the magnitude and diversity of the microbiota are also greatlyinfluenced by other aspects of the gut environment, including pH, host secretions, and transittime [11,12,16–19]. While certain dietary components play an important role in the gut environment,products of microbial fermentation can also have an influence [10,20]. For example, consumption offermentable dietary fiber will provide substrates for microbial activity but will also increase theconcentrations of fermentation products, such as short-chain fatty acids (SCFAs). A buildup of SCFAssubsequently lowers the colonic pH, which can then have dramatic effects on the composition of themicrobiota [16,20,21]. Therefore, the relationship between diet, the gut microbiota, microbial activity,and gut physiology is complex.
The distribution of different strains or species of bacteria within the gut will determine themetabolic profile of the microbiota, which could have potential physiologic effects on health [10].SCFAs, such as butyrate, acetate, and propionate produced by the fermentation of dietary fibers,may play a role in energy homeostasis, immune function, and host-microbe signaling [7,22,23],and prevention of diseases, such as bowel disease, colon cancer, and metabolic syndrome [20,24–26].Therefore, fiber-induced modulation of the gut microbiota has gained interest for its potential impacton health and disease [27]. However, it is not well understood how and to what extent these changesmay happen in a predictable way [28]. The first step toward answering these questions is to gather andsummarize the current literature on dietary fiber and the gut microbiota, which can be done effectivelyusing evidence mapping.
Evidence mapping is a new technique being applied in nutritional epidemiology to review andcharacterize the published research on a broad topic of interest, allowing for the identification ofgaps and prioritizing new research questions [29–31]. Evidence maps may be considered as the firstfew steps in a systematic review but are generally more comprehensive in the scope of the researchquestion [31,32]. Instead of a specific, targeted question, an evidence map aims to determine theresearch “landscape” of the topic area. Evidence mapping can provide a context for systematic reviewsand meta-analyses by presenting a wide range of study designs and methods being utilized in thearea of interest [29]. While systematic reviews are the method of choice for synthesizing study results,evidence mapping is a more efficient methodology for visualizing the evidence and is a particularlyuseful technique in fast-paced or rapidly growing areas of research, such as the human gut microbiota.
Our objective was to describe existing research on dietary fiber intake and the gut microbiota.Through the creation of an evidence map, we identify potential gaps in the research and highlightareas where new hypotheses may be addressed in future studies. Furthermore, we extended ourevidence mapping to summarize broad study findings in a focused area regarding the effects of theoligosaccharide interventions on the gut microbial composition. In doing so, we demonstrate howthis evidence map can be used as a platform to build on the existing evidence by answering thefollowing two questions: (1) Can we identify specific gut microbial species that are modulated by
354
Nutrients 2017, 9, 125
dietary fiber? (2) Is there evidence that modulation of the gut microbiota is correlated with fermentationor physiological effects on host health?
2. Materials and Methods
Evidence mapping involves three major steps: (1) clearly defining a topic area and setting criteriaaround the questions of interest; (2) systematically searching for and selecting relevant studies basedon pre-defined criteria, such as study design and outcomes of interest and, thereby, creating a “map” ofavailable evidence; and (3) reporting on study characteristics and the extent of existing research [30–32].
To develop the dietary fiber and human gut microbiota evidence map, we utilized a newlydeveloped Dietary Fiber Database (Version 3.0), containing data on published dietary fiberinterventions [33]. The database, housed in the Systematic Review Data Repository (SRDR) [34],contains descriptive data extracted from dietary fiber intervention studies that were identified bya systematic literature search. It includes all human studies published from 1946 to May 2016 thatexamined the effect of dietary fiber on at least one of nine pre-defined physiological health outcomes.For the complete list of the inclusion/exclusion criteria, including the nine health outcomes, refer toSupplementary Materials Table S1.
The database includes two specific outcomes related to the gut microbiota: (1) modulation ofcolonic microflora; and (2) colonic fermentation/short-chain fatty acid concentration. Keywords usedto identify these specific outcomes in the development of the database are provided in theSupplementary Methods. Our evidence map is comprised of all publications in the database reportingon at least one of these two outcomes.
Descriptive analyses were performed to examine the range of study designs, fiber interventions,and types of outcomes examined. Because evidence mapping is meant to capture the wider landscapeof evidence and is, therefore, more inclusive and less homogenous than is usually required fora meta-analysis, results are specifically not represented. Due to the large variety of fiber interventionsidentified, fiber intervention exposures were grouped into categories according to structure or source,depending on how they were described in the original publication. If the same fiber intervention wasgiven at different doses within the same study, that fiber type was only counted once for that study.
Microbiota outcomes identified by the database were examined in more detail and werere-classified into three categories: (1) fermentation, which included measures of SCFAs, breath markers(such as H2 and CH4), bacterial enzyme activity and metabolites, bile acid metabolism, and fiberdigestibility (measured by fecal recovery); (2) bacterial composition, which included relative orabsolute bacterial counts; and (3) colonic and fecal pH.
Weighted scatter plots were used to visualize the available evidence on different fiber types byoutcome groups and sample size. Each bubble in the plot represents a single publication with the sizeof the bubble corresponding to the study sample size. Publications may be represented more than oncethroughout the plot if multiple fiber interventions or outcomes were reported but are not repeatedwithin any single cross-sectional area.
To further explore the information captured in this evidence map, we isolated publications on thetop most reported fiber type, oligosaccharides. We examined oligosaccharides in relation to bacterialcomposition and extracted more detailed information on the study characteristics, bacterial strainsand/or species identified in the publication and the direction of change in strain/species frequency(increased, decreased, or remained the same) in response to the fiber intervention.
3. Results
A total of 188 distinct studies with at least one outcome related to the gut microbiota wereidentified in the Dietary Fiber Database (Version 3.0). The study design and population characteristicsof these studies are summarized in Table 1.
355
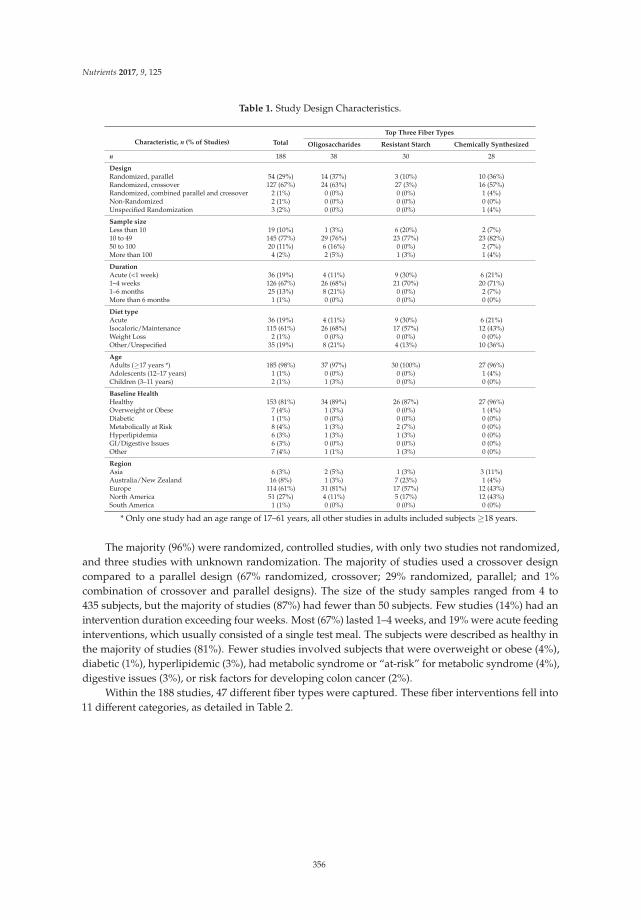
Nutrients 2017, 9, 125
Table 1. Study Design Characteristics.
Characteristic, n (% of Studies) Total
Top Three Fiber Types
Oligosaccharides Resistant Starch Chemically Synthesized
n 188 38 30 28
DesignRandomized, parallel 54 (29%) 14 (37%) 3 (10%) 10 (36%)Randomized, crossover 127 (67%) 24 (63%) 27 (3%) 16 (57%)Randomized, combined parallel and crossover 2 (1%) 0 (0%) 0 (0%) 1 (4%)Non-Randomized 2 (1%) 0 (0%) 0 (0%) 0 (0%)Unspecified Randomization 3 (2%) 0 (0%) 0 (0%) 1 (4%)
Sample sizeLess than 10 19 (10%) 1 (3%) 6 (20%) 2 (7%)10 to 49 145 (77%) 29 (76%) 23 (77%) 23 (82%)50 to 100 20 (11%) 6 (16%) 0 (0%) 2 (7%)More than 100 4 (2%) 2 (5%) 1 (3%) 1 (4%)
DurationAcute (<1 week) 36 (19%) 4 (11%) 9 (30%) 6 (21%)1–4 weeks 126 (67%) 26 (68%) 21 (70%) 20 (71%)1–6 months 25 (13%) 8 (21%) 0 (0%) 2 (7%)More than 6 months 1 (1%) 0 (0%) 0 (0%) 0 (0%)
Diet typeAcute 36 (19%) 4 (11%) 9 (30%) 6 (21%)Isocaloric/Maintenance 115 (61%) 26 (68%) 17 (57%) 12 (43%)Weight Loss 2 (1%) 0 (0%) 0 (0%) 0 (0%)Other/Unspecified 35 (19%) 8 (21%) 4 (13%) 10 (36%)
AgeAdults (≥17 years *) 185 (98%) 37 (97%) 30 (100%) 27 (96%)Adolescents (12–17 years) 1 (1%) 0 (0%) 0 (0%) 1 (4%)Children (3–11 years) 2 (1%) 1 (3%) 0 (0%) 0 (0%)
Baseline HealthHealthy 153 (81%) 34 (89%) 26 (87%) 27 (96%)Overweight or Obese 7 (4%) 1 (3%) 0 (0%) 1 (4%)Diabetic 1 (1%) 0 (0%) 0 (0%) 0 (0%)Metabolically at Risk 8 (4%) 1 (3%) 2 (7%) 0 (0%)Hyperlipidemia 6 (3%) 1 (3%) 1 (3%) 0 (0%)GI/Digestive Issues 6 (3%) 0 (0%) 0 (0%) 0 (0%)Other 7 (4%) 1 (1%) 1 (3%) 0 (0%)
RegionAsia 6 (3%) 2 (5%) 1 (3%) 3 (11%)Australia/New Zealand 16 (8%) 1 (3%) 7 (23%) 1 (4%)Europe 114 (61%) 31 (81%) 17 (57%) 12 (43%)North America 51 (27%) 4 (11%) 5 (17%) 12 (43%)South America 1 (1%) 0 (0%) 0 (0%) 0 (0%)
* Only one study had an age range of 17–61 years, all other studies in adults included subjects ≥18 years.
The majority (96%) were randomized, controlled studies, with only two studies not randomized,and three studies with unknown randomization. The majority of studies used a crossover designcompared to a parallel design (67% randomized, crossover; 29% randomized, parallel; and 1%combination of crossover and parallel designs). The size of the study samples ranged from 4 to435 subjects, but the majority of studies (87%) had fewer than 50 subjects. Few studies (14%) had anintervention duration exceeding four weeks. Most (67%) lasted 1–4 weeks, and 19% were acute feedinginterventions, which usually consisted of a single test meal. The subjects were described as healthy inthe majority of studies (81%). Fewer studies involved subjects that were overweight or obese (4%),diabetic (1%), hyperlipidemic (3%), had metabolic syndrome or “at-risk” for metabolic syndrome (4%),digestive issues (3%), or risk factors for developing colon cancer (2%).
Within the 188 studies, 47 different fiber types were captured. These fiber interventions fell into11 different categories, as detailed in Table 2.
356
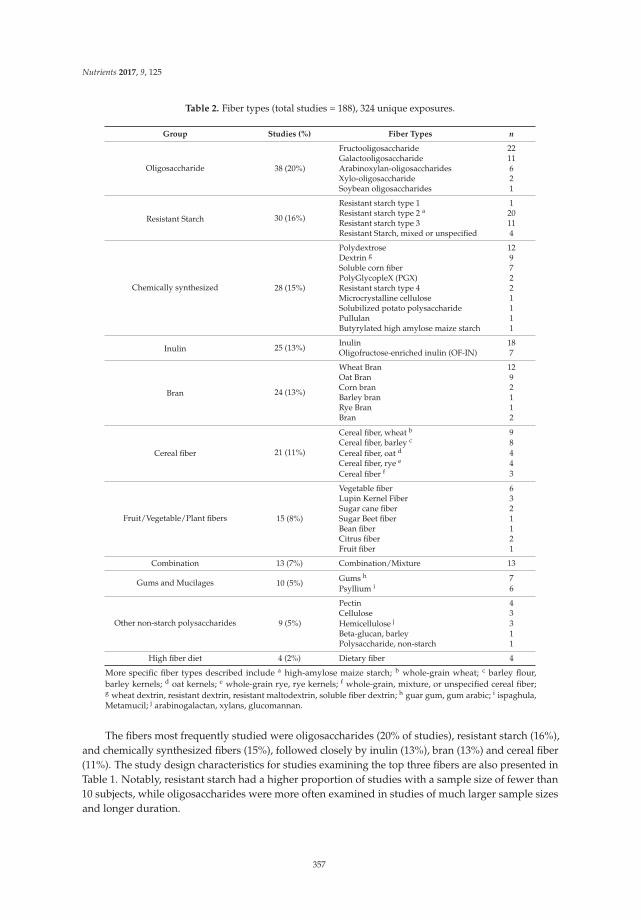
Nutrients 2017, 9, 125
Table 2. Fiber types (total studies = 188), 324 unique exposures.
Group Studies (%) Fiber Types n
Oligosaccharide 38 (20%)
Fructooligosaccharide 22Galactooligosaccharide 11Arabinoxylan-oligosaccharides 6Xylo-oligosaccharide 2Soybean oligosaccharides 1
Resistant Starch 30 (16%)
Resistant starch type 1 1Resistant starch type 2 a 20Resistant starch type 3 11Resistant Starch, mixed or unspecified 4
Chemically synthesized 28 (15%)
Polydextrose 12Dextrin g 9Soluble corn fiber 7PolyGlycopleX (PGX) 2Resistant starch type 4 2Microcrystalline cellulose 1Solubilized potato polysaccharide 1Pullulan 1Butyrylated high amylose maize starch 1
Inulin 25 (13%)Inulin 18Oligofructose-enriched inulin (OF-IN) 7
Bran 24 (13%)
Wheat Bran 12Oat Bran 9Corn bran 2Barley bran 1Rye Bran 1Bran 2
Cereal fiber 21 (11%)
Cereal fiber, wheat b 9Cereal fiber, barley c 8Cereal fiber, oat d 4Cereal fiber, rye e 4Cereal fiber f 3
Fruit/Vegetable/Plant fibers 15 (8%)
Vegetable fiber 6Lupin Kernel Fiber 3Sugar cane fiber 2Sugar Beet fiber 1Bean fiber 1Citrus fiber 2Fruit fiber 1
Combination 13 (7%) Combination/Mixture 13
Gums and Mucilages 10 (5%) Gums h 7Psyllium i 6
Other non-starch polysaccharides 9 (5%)
Pectin 4Cellulose 3Hemicellulose j 3Beta-glucan, barley 1Polysaccharide, non-starch 1
High fiber diet 4 (2%) Dietary fiber 4
More specific fiber types described include a high-amylose maize starch; b whole-grain wheat; c barley flour,barley kernels; d oat kernels; e whole-grain rye, rye kernels; f whole-grain, mixture, or unspecified cereal fiber;g wheat dextrin, resistant dextrin, resistant maltodextrin, soluble fiber dextrin; h guar gum, gum arabic; i ispaghula,Metamucil; j arabinogalactan, xylans, glucomannan.
The fibers most frequently studied were oligosaccharides (20% of studies), resistant starch (16%),and chemically synthesized fibers (15%), followed closely by inulin (13%), bran (13%) and cereal fiber(11%). The study design characteristics for studies examining the top three fibers are also presented inTable 1. Notably, resistant starch had a higher proportion of studies with a sample size of fewer than10 subjects, while oligosaccharides were more often examined in studies of much larger sample sizesand longer duration.
357
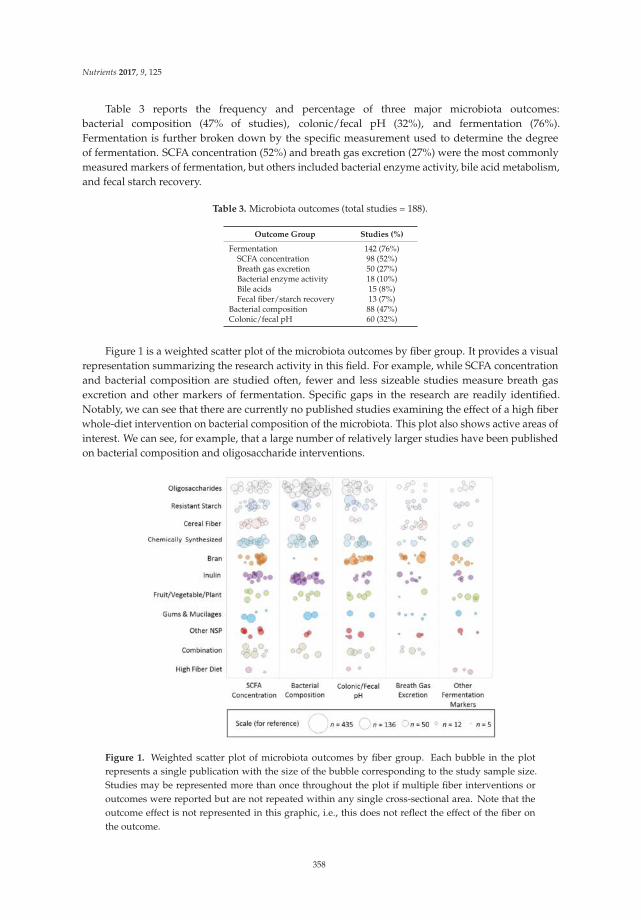
Nutrients 2017, 9, 125
Table 3 reports the frequency and percentage of three major microbiota outcomes:bacterial composition (47% of studies), colonic/fecal pH (32%), and fermentation (76%).Fermentation is further broken down by the specific measurement used to determine the degreeof fermentation. SCFA concentration (52%) and breath gas excretion (27%) were the most commonlymeasured markers of fermentation, but others included bacterial enzyme activity, bile acid metabolism,and fecal starch recovery.
Table 3. Microbiota outcomes (total studies = 188).
Outcome Group Studies (%)
Fermentation 142 (76%)SCFA concentration 98 (52%)Breath gas excretion 50 (27%)Bacterial enzyme activity 18 (10%)Bile acids 15 (8%)Fecal fiber/starch recovery 13 (7%)
Bacterial composition 88 (47%)Colonic/fecal pH 60 (32%)
Figure 1 is a weighted scatter plot of the microbiota outcomes by fiber group. It provides a visualrepresentation summarizing the research activity in this field. For example, while SCFA concentrationand bacterial composition are studied often, fewer and less sizeable studies measure breath gasexcretion and other markers of fermentation. Specific gaps in the research are readily identified.Notably, we can see that there are currently no published studies examining the effect of a high fiberwhole-diet intervention on bacterial composition of the microbiota. This plot also shows active areas ofinterest. We can see, for example, that a large number of relatively larger studies have been publishedon bacterial composition and oligosaccharide interventions.
Figure 1. Weighted scatter plot of microbiota outcomes by fiber group. Each bubble in the plotrepresents a single publication with the size of the bubble corresponding to the study sample size.Studies may be represented more than once throughout the plot if multiple fiber interventions oroutcomes were reported but are not repeated within any single cross-sectional area. Note that theoutcome effect is not represented in this graphic, i.e., this does not reflect the effect of the fiber onthe outcome.
358
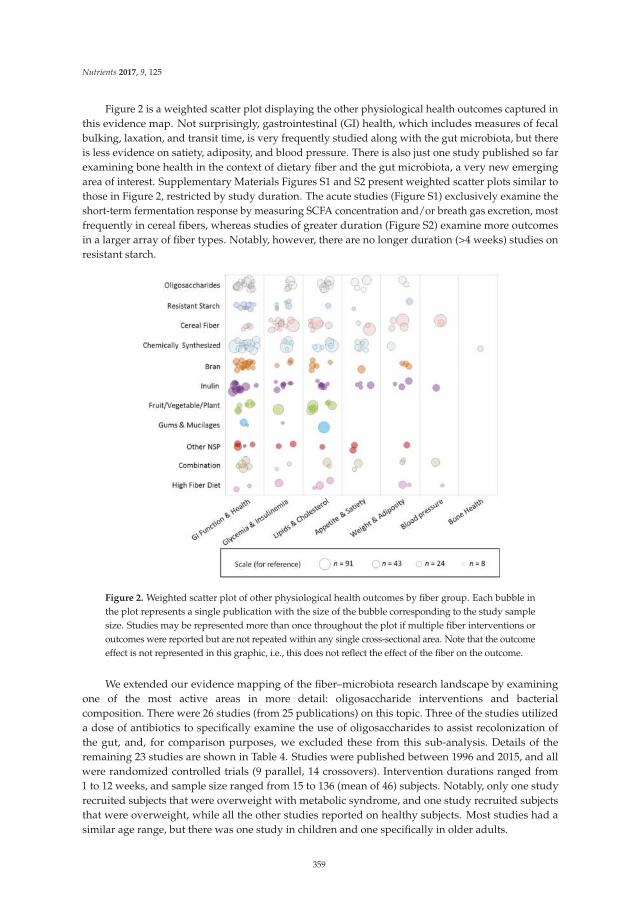
Nutrients 2017, 9, 125
Figure 2 is a weighted scatter plot displaying the other physiological health outcomes captured inthis evidence map. Not surprisingly, gastrointestinal (GI) health, which includes measures of fecalbulking, laxation, and transit time, is very frequently studied along with the gut microbiota, but thereis less evidence on satiety, adiposity, and blood pressure. There is also just one study published so farexamining bone health in the context of dietary fiber and the gut microbiota, a very new emergingarea of interest. Supplementary Materials Figures S1 and S2 present weighted scatter plots similar tothose in Figure 2, restricted by study duration. The acute studies (Figure S1) exclusively examine theshort-term fermentation response by measuring SCFA concentration and/or breath gas excretion, mostfrequently in cereal fibers, whereas studies of greater duration (Figure S2) examine more outcomesin a larger array of fiber types. Notably, however, there are no longer duration (>4 weeks) studies onresistant starch.
Figure 2. Weighted scatter plot of other physiological health outcomes by fiber group. Each bubble inthe plot represents a single publication with the size of the bubble corresponding to the study samplesize. Studies may be represented more than once throughout the plot if multiple fiber interventions oroutcomes were reported but are not repeated within any single cross-sectional area. Note that the outcomeeffect is not represented in this graphic, i.e., this does not reflect the effect of the fiber on the outcome.
We extended our evidence mapping of the fiber–microbiota research landscape by examiningone of the most active areas in more detail: oligosaccharide interventions and bacterialcomposition. There were 26 studies (from 25 publications) on this topic. Three of the studies utilizeda dose of antibiotics to specifically examine the use of oligosaccharides to assist recolonization ofthe gut, and, for comparison purposes, we excluded these from this sub-analysis. Details of theremaining 23 studies are shown in Table 4. Studies were published between 1996 and 2015, and allwere randomized controlled trials (9 parallel, 14 crossovers). Intervention durations ranged from1 to 12 weeks, and sample size ranged from 15 to 136 (mean of 46) subjects. Notably, only one studyrecruited subjects that were overweight with metabolic syndrome, and one study recruited subjectsthat were overweight, while all the other studies reported on healthy subjects. Most studies had asimilar age range, but there was one study in children and one specifically in older adults.
359
Nutrients 2017, 9, 125
Among these 23 studies, there are 26 fiber interventions: eight fructooligosaccharides (FOS),nine galactooligosaccharides (GOS), six arabinoxylan-oligosaccharides (AX-OS), two xylo-oligosaccharide(XOS), and one soybean oligosaccharide. All but one study found a bifidogenic effect of oligosaccharides,with doses as small as 1.4 g/day (XOS) and a range of treatment forms, including tablets,beverages, and whole foods. Many studies also examined oligosaccharide impacts on Lactobacilli orLactobacillus–Enterococcus frequency, with 19 studies reporting no effect, three reporting a positive effect,and one reporting a negative effect. Few publications reported decreases in bacterial strains/species,but among those that did, it was most often Bacteroides, with four studies finding a significant decreasein response to a GOS intervention. However, two intervention studies found no effect of GOS onBacteroides, five interventions using other oligosaccharides also found no effect, and one XOS interventionfound a significant increase in Baceroides fragilis. There were a number of other strains/species reported;however, it is important to note that some studies used targeted culturing techniques, whereas othersused DNA sequencing to attempt to identify all species present.
Table 5 summarizes the other physiological outcomes examined within these studies. Ten out ofthe 26 interventions also significantly increased markers of fermentation, but only one interventionhad a significant effect on fecal bulking, and only two had significant effects on transit time. Of theother physiologic outcomes examined in these studies, most were related to GI health. Only a fewstudies measured lipids, glucose, or insulin, and of those that did, only one study found a significanteffect on total cholesterol and insulin.
360
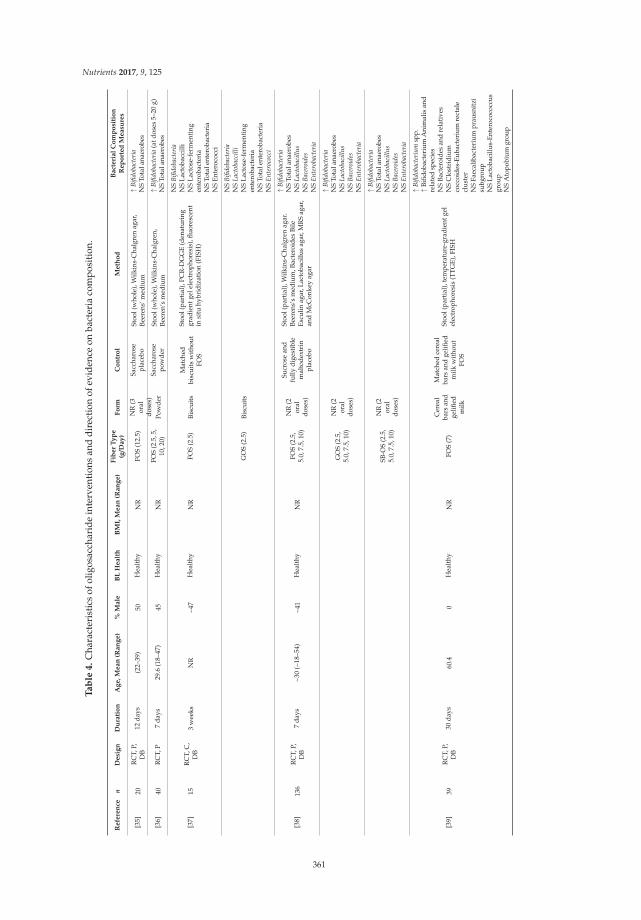
Nutrients 2017, 9, 125
Ta
ble
4.
Cha
ract
eris
tics
ofol
igos
acch
arid
ein
terv
enti
ons
and
dire
ctio
nof
evid
ence
onba
cter
iaco
mpo
siti
on.
Re
fere
nce
nD
esi
gn
Du
rati
on
Ag
e,
Me
an
(Ra
ng
e)
%M
ale
BL
He
alt
hB
MI,
Me
an
(Ra
ng
e)
Fib
er
Ty
pe
(g/D
ay
)F
orm
Co
ntr
ol
Me
tho
dB
act
eri
al
Co
mp
osi
tio
nR
ep
ort
ed
Me
asu
res
[35]
20R
CT,
P,D
B12
days
(22–
39)
50H
ealt
hyN
RFO
S(1
2.5)
NR
(3or
aldo
ses)
Sacc
haro
sepl
aceb
oSt
ool(
who
le),
Wilk
ins-
Cha
lgre
nag
ar,
Beer
ens’
med
ium
↑B
ifido
bact
eria
NS
Tota
lana
erob
es
[36]
40R
CT,
P7
days
29.6
(18–
47)
45H
ealt
hyN
RFO
S(2
.5,5
,10
,20)
Pow
der
Sacc
haro
sepo
wde
rSt
ool(
who
le),
Wilk
ins-
Cha
lgre
n,Be
eren
’sm
ediu
m↑
Bifi
doba
cter
ia(a
tdos
es5–
20g)
NS
Tota
lana
erob
es
[37]
15R
CT,
C,
DB
3w
eeks
NR
~47
Hea
lthy
NR
FOS
(2.5
)Bi
scui
tsM
atch
edbi
scui
tsw
itho
utFO
S
Stoo
l(pa
rtia
l),P
CR
-DG
GE
(den
atur
ing
grad
ient
gele
lect
roph
ores
is),
fluor
esce
ntin
situ
hybr
idiz
atio
n(F
ISH
)
NS
Bifi
doba
cter
iaN
SLa
ctob
acci
lliN
SLa
ctos
e-fe
rmen
ting
ente
roba
cter
iaN
STo
tale
nter
obac
teri
aN
SEn
tero
cocc
i
GO
S(2
.5)
Bisc
uits
NS
Bifi
doba
cter
iaN
SL
acto
bacc
illi
NS
Lact
ose-
ferm
enti
ngen
tero
bact
eria
NS
Tota
lent
erob
acte
ria
NS
En
tero
cocc
i
[38]
136
RC
T,P,
DB
7da
ys~3
0(~
18–5
4)~4
1H
ealt
hyN
RFO
S(2
.5,
5.0,
7.5,
10)
NR
(2or
aldo
ses)
Sucr
ose
and
fully
dige
stib
lem
alto
dext
rin
plac
ebo
Stoo
l(pa
rtia
l),W
ilkin
s-C
halg
ren
agar
.Be
eren
s’s
med
ium
,Bac
tero
ides
Bile
Escu
linag
ar,L
acto
baci
llus
agar
,MR
Sag
ar,
and
McC
onke
yag
ar
↑B
ifido
bact
eria
NS
Tota
lana
erob
esN
SL
acto
baci
llu
sN
SB
acer
oide
sN
SE
nte
roba
cter
ia
GO
S(2
.5,
5.0,
7.5,
10)
NR
(2or
aldo
ses)
↑B
ifido
bact
eria
NS
Tota
lana
erob
esN
SL
acto
baci
llu
sN
SB
acer
oide
sN
SE
nte
roba
cter
ia
SB-O
S(2
.5,
5.0,
7.5,
10)
NR
(2or
aldo
ses)
↑B
ifido
bact
eria
NS
Tota
lana
erob
esN
SL
acto
baci
llu
sN
SB
acer
oide
sN
SE
nte
roba
cter
ia
[39]
39R
CT,
P,D
B30
days
60.4
0H
ealt
hyN
RFO
S(7
)
Cer
eal
bars
and
gelifi
edm
ilk
Mat
ched
cere
alba
rsan
dge
lified
milk
wit
hout
FOS
Stoo
l(pa
rtia
l),t
empe
ratu
re-g
radi
entg
elel
ectr
opho
resi
s(T
TG
E),F
ISH
↑B
ifido
bact
eriu
msp
p.↑
Bifid
obac
teri
umA
nim
alis
and
rela
ted
spec
ies
NS
Bact
eroi
des
and
rela
tive
sN
SC
lost
ridi
umco
ccoi
des-
Euba
cter
ium
rect
ale
clus
ter
NS
Faec
alib
acte
rium
prau
snit
zisu
bgro
upN
SLa
ctob
acill
us-E
nter
ococ
occu
sgr
oup
NS
Ato
pobi
umgr
oup
361
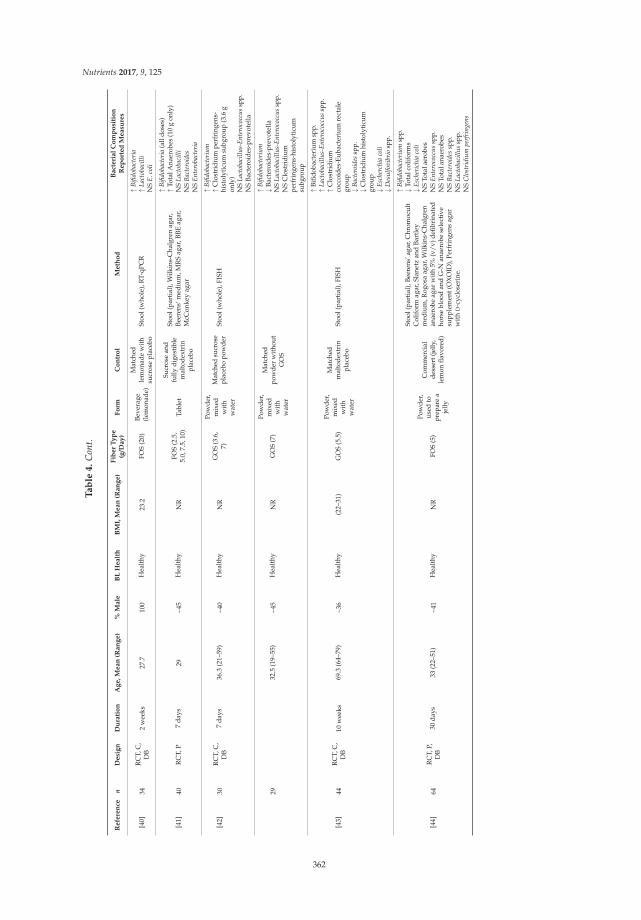
Nutrients 2017, 9, 125
Ta
ble
4.
Con
t.
Re
fere
nce
nD
esi
gn
Du
rati
on
Ag
e,
Me
an
(Ra
ng
e)
%M
ale
BL
He
alt
hB
MI,
Me
an
(Ra
ng
e)
Fib
er
Ty
pe
(g/D
ay
)F
orm
Co
ntr
ol
Me
tho
dB
act
eri
al
Co
mp
osi
tio
nR
ep
ort
ed
Me
asu
res
[40]
34R
CT,
C,
DB
2w
eeks
27.7
100
Hea
lthy
23.2
FOS
(20)
Beve
rage
(lem
onad
e)
Mat
ched
lem
onad
ew
ith
sucr
ose
plac
ebo
Stoo
l(w
hole
),R
T-qP
CR
↑B
ifido
bact
eria
↑L
acto
baci
lli
NS
E.c
oli
[41]
40R
CT,
P7
days
29~4
5H
ealt
hyN
RFO
S(2
.5,
5.0,
7.5,
10)
Tabl
et
Sucr
ose
and
fully
dige
stib
lem
alto
dext
rin
plac
ebo
Stoo
l(pa
rtia
l),W
ilkin
s-C
halg
ren
agar
,Be
eren
s‘m
ediu
m,M
RS
agar
,BBE
agar
,M
cCon
key
agar
↑B
ifido
bact
eria
(all
dose
s)↑
Tota
lAna
erob
es(1
0g
only
)N
SL
acto
baci
lli
NS
Bac
tero
ides
NS
En
tero
bact
eria
[42]
30R
CT,
C,
DB
7da
ys36
.3(2
1–59
)~4
0H
ealt
hyN
RG
OS
(3.6
,7)
Pow
der,
mix
edw
ith
wat
er
Mat
ched
sucr
ose
plac
ebo
pow
der
Stoo
l(w
hole
),FI
SH
↑B
ifido
bact
eriu
m↑
Clo
stri
dium
perf
ring
ens-
hist
olyt
icum
subg
roup
(3.6
gon
ly)
NS
Lac
toba
cill
us-
En
tero
cocc
us
spp.
NS
Bact
eroi
des-
prev
otel
la
2932
.5(1
9–55
)~4
5H
ealt
hyN
RG
OS
(7)
Pow
der,
mix
edw
ith
wat
er
Mat
ched
pow
der
wit
hout
GO
S
↑B
ifido
bact
eriu
m↓
Bact
eroi
des-
prev
otel
laN
SL
acto
baci
llu
s-E
nte
roco
ccu
ssp
p.N
SC
lost
ridi
umpe
rfri
ngen
s-hi
stol
ytic
umsu
bgro
up
[43]
44R
CT,
C,
DB
10w
eeks
69.3
(64–
79)
~36
Hea
lthy
(22–
31)
GO
S(5
.5)
Pow
der,
mix
edw
ith
wat
er
Mat
ched
mal
tode
xtri
npl
aceb
oSt
ool(
part
ial)
,FIS
H
↑Bi
fidob
acte
rium
spp.
↑L
acto
baci
llu
s-E
nte
roco
ccu
ssp
p.↑
Clo
stri
dium
cocc
oide
s-Eu
bact
eriu
mre
ctal
egr
oup
↓B
acte
roid
essp
p.↓
Clo
stri
dium
hist
olyt
icum
grou
p↓
Esc
herc
hia
coli
↓D
esu
lfov
ibri
osp
p.
[44]
64R
CT,
P,D
B30
days
33(2
2–51
)~4
1H
ealt
hyN
RFO
S(5
)
Pow
der,
used
topr
epar
ea
jelly
Com
mer
cial
dess
ert(
jelly
,le
mon
flavo
red)
Stoo
l(pa
rtia
l),B
eere
ns’a
gar,
Chr
omoc
ult
Col
ifor
mag
ar,S
lane
tzan
dBa
rtle
ym
ediu
m,R
ogos
aag
ar,W
ilkin
s-C
halg
ren
anae
robe
agar
wit
h5%
(v/v
)defi
brin
ated
hors
ebl
ood
and
G-N
anae
robe
sele
ctiv
esu
pple
men
t(O
XO
ID),
Perf
ring
ens
agar
wit
hD
-cyc
lose
rine
.
↑B
ifido
bact
eriu
msp
p.↓
Tota
lcol
ifor
ms
↓E
sche
rich
iaco
liN
STo
tala
erob
esN
SE
nte
roco
ccu
ssp
p.N
STo
tala
naer
obes
NS
Bac
tero
ides
spp.
NS
Lac
toba
cill
us
spp.
NS
Clo
stri
diu
mpe
rfri
nge
ns
362
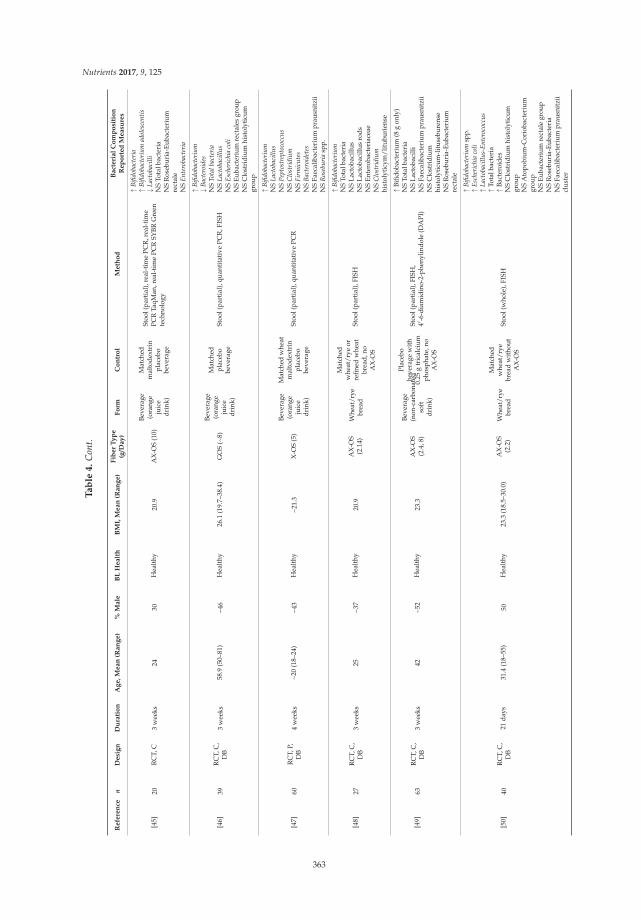
Nutrients 2017, 9, 125
Ta
ble
4.
Con
t.
Re
fere
nce
nD
esi
gn
Du
rati
on
Ag
e,
Me
an
(Ra
ng
e)
%M
ale
BL
He
alt
hB
MI,
Me
an
(Ra
ng
e)
Fib
er
Ty
pe
(g/D
ay
)F
orm
Co
ntr
ol
Me
tho
dB
act
eri
al
Co
mp
osi
tio
nR
ep
ort
ed
Me
asu
res
[45]
20R
CT,
C3
wee
ks24
30H
ealt
hy20
.9A
X-O
S(1
0)
Beve
rage
(ora
nge
juic
edr
ink)
Mat
ched
mal
tode
xtri
npl
aceb
obe
vera
ge
Stoo
l(pa
rtia
l),r
eal-
tim
ePC
R,r
eal-
tim
ePC
RTa
qMan
,rea
l-ti
me
PCR
SYBR
Gre
ente
chno
logy
↑B
ifido
bact
eria
↑B
ifido
bact
eriu
mad
oles
cen
tis
↓L
acto
baci
lli
NS
Tota
lbac
teri
aN
SR
oseb
uria
-Eub
acte
rium
rect
ale
NS
En
tero
bact
eria
[46]
39R
CT,
C,
DB
3w
eeks
58.9
(50–
81)
~46
Hea
lthy
26.1
(19.
7–38
.4)
GO
S(~
8)
Beve
rage
(ora
nge
juic
edr
ink)
Mat
ched
plac
ebo
beve
rage
Stoo
l(pa
rtia
l),q
uant
itat
ive
PCR
,FIS
H
↑B
ifido
bact
eriu
m↓
Bac
tero
ides
NS
Tota
lba
cter
iaN
SL
acto
baci
llu
sN
SE
sche
rich
iaco
liN
SEu
bact
eriu
mre
ctal
esgr
oup
NS
Clo
stri
dium
hist
olyt
icum
grou
p
[47]
60R
CT,
P,D
B4
wee
ks~2
0(1
8–24
)~4
3H
ealt
hy~2
1.3
X-O
S(5
)
Beve
rage
(ora
nge
juic
edr
ink)
Mat
ched
whe
atm
alto
dext
rin
plac
ebo
beve
rage
Stoo
l(pa
rtia
l),q
uant
itat
ive
PCR
↑B
ifido
bact
eriu
mN
SL
acto
baci
llu
sN
SP
epto
stre
ptoc
occu
sN
SC
lost
ridi
um
NS
Fir
mic
ute
sN
SB
acte
roid
etes
NS
Faec
alib
acte
rium
prau
snit
zii
NS
Ros
ebu
ria
spp.
[48]
27R
CT,
C,
DB
3w
eeks
25~3
7H
ealt
hy20
.9A
X-O
S(2
.14)
Whe
at/r
yebr
ead
Mat
ched
whe
at/r
yeor
refin
edw
heat
brea
d,no
AX
-OS
Stoo
l(pa
rtia
l),F
ISH
↑B
ifido
bact
eriu
mN
STo
talb
acte
ria
NS
Lact
obac
illus
NS
Lact
obac
illus
rods
NS
Ente
roba
cter
iace
aeN
SC
lost
ridi
um
hist
olyt
icym
/lit
ubur
iens
e
[49]
63R
CT,
C,
DB
3w
eeks
42~5
2H
ealt
hy23
.3A
X-O
S(2
.4,8
)
Beve
rage
(non
-car
bona
ted
soft
drin
k)
Plac
ebo
beve
rage
wit
h0.
25g
tric
alci
umph
osph
ate,
noA
X-O
S
Stoo
l(pa
rtia
l),F
ISH
,4′
-6-d
iam
idin
o-2-
phen
ylin
dole
(DA
PI)
↑Bi
fidob
acte
rium
(8g
only
)N
STo
talb
acte
ria
NS
Lact
obac
illi
NS
Faec
alib
acte
rium
prau
snit
zii
NS
Clo
stri
dium
hist
olyt
icum
-lit
useb
uren
seN
SR
oseb
uria
-Eub
acte
rium
rect
ale
[50]
40R
CT,
C,
DB
21da
ys31
.4(1
8–55
)50
Hea
lthy
23.3
(18.
5–30
.0)
AX
-OS
(2.2
)W
heat
/rye
brea
d
Mat
ched
whe
at/r
yebr
ead
wit
hout
AX
-OS
Stoo
l(w
hole
),FI
SH
↑B
ifido
bact
eriu
msp
p.↑
Esc
heri
chia
coli
↑L
acto
baci
llu
s-E
nte
roco
ccu
s↑
Tota
lbac
teri
a↑
Bact
eroi
des
NS
Clo
stri
dium
hist
olyt
icum
grou
pN
SA
topo
bium
-Cor
ioba
cter
ium
grou
pN
SEu
bact
eriu
mre
ctal
egr
oup
NS
Ros
ebur
ia-E
ubac
teri
aN
SFa
ecal
ibac
teri
umpr
ausn
itzi
icl
uste
r
363
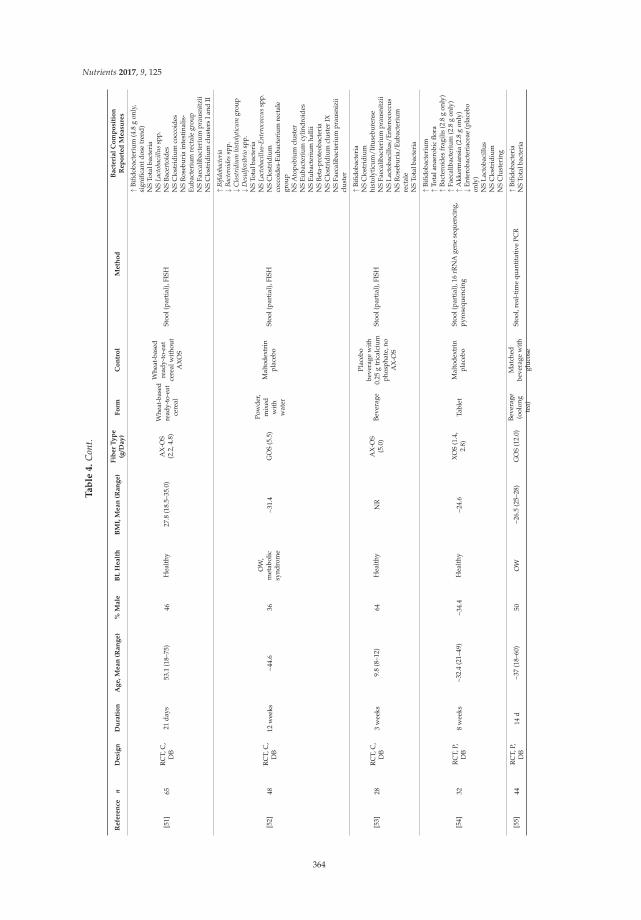
Nutrients 2017, 9, 125
Ta
ble
4.
Con
t.
Re
fere
nce
nD
esi
gn
Du
rati
on
Ag
e,
Me
an
(Ra
ng
e)
%M
ale
BL
He
alt
hB
MI,
Me
an
(Ra
ng
e)
Fib
er
Ty
pe
(g/D
ay
)F
orm
Co
ntr
ol
Me
tho
dB
act
eri
al
Co
mp
osi
tio
nR
ep
ort
ed
Me
asu
res
[51]
65R
CT,
C,
DB
21da
ys53
.1(1
8–75
)46
Hea
lthy
27.8
(18.
5–35
.0)
AX
-OS
(2.2
,4.8
)
Whe
at-b
ased
read
y-to
-eat
cere
al
Whe
at-b
ased
read
y-to
-eat
cere
alw
itho
utA
XO
S
Stoo
l(pa
rtia
l),F
ISH
↑Bi
fidob
acte
rium
(4.8
gon
ly,
sign
ifica
ntdo
setr
end)
NS
Tota
lbac
teri
aN
SL
acto
baci
llu
ssp
p.N
SBa
cert
oide
sN
SC
lost
ridi
umco
ccoi
des
NS
Ros
ebur
iain
test
inal
is-
Euba
cter
ium
rect
ale
grou
pN
SFa
ecal
ibac
teri
umpr
ausn
itzi
iN
SC
lost
ridi
umcl
uste
rsIa
ndII
[52]
48R
CT,
C,
DB
12w
eeks
~44.
636
OW
,m
etab
olic
synd
rom
e~3
1.4
GO
S(5
.5)
Pow
der,
mix
edw
ith
wat
er
Mal
tode
xtri
npl
aceb
oSt
ool(
part
ial)
,FIS
H
↑B
ifido
bact
eria
↓B
acte
roid
essp
p.↓
Clo
stri
diu
mhi
stol
ytic
um
grou
p↓
Des
ulf
ovib
rio
spp.
NS
Tota
lbac
teri
aN
SL
acto
baci
llu
s-E
nte
roco
ccu
ssp
p.N
SC
lost
ridi
umco
ccoi
des-
Euba
cter
ium
rect
ale
grou
pN
SA
topo
bium
clus
ter
NS
Euba
cter
ium
cylin
droi
des
NS
Euba
cter
ium
halli
iN
SBe
ta-p
rote
obac
teri
aN
SC
lost
ridi
umcl
uste
rIX
NS
Faec
alib
acte
rium
prau
sniz
iicl
uste
r
[53]
28R
CT,
C,
DB
3w
eeks
9.8
(8–1
2)64
Hea
lthy
NR
AX
-OS
(5.0
)Be
vera
ge
Plac
ebo
beve
rage
wit
h0.
25g
tric
alci
umph
osph
ate,
noA
X-O
S
Stoo
l(pa
rtia
l),F
ISH
↑Bi
fidob
acte
ria
NS
Clo
stri
dium
hist
olyt
icum
/lit
useb
uren
seN
SFa
ecal
ibac
teri
umpr
ausn
itzi
iN
SLa
ctob
acill
us/E
nter
ococ
cus
NS
Ros
ebur
ia/E
ubac
teri
umre
ctal
eN
STo
talb
acte
ria
[54]
32R
CT,
P,D
B8
wee
ks~3
2.4
(21–
49)
~34.
4H
ealt
hy~2
4.6
XO
S(1
.4,
2.8)
Tabl
etM
alto
dext
rin
plac
ebo
Stoo
l(pa
rtia
l),1
6rR
NA
gene
sequ
enci
ng,
pyro
sequ
enci
ng
↑Bi
fidob
acte
rium
↑To
tala
naer
obic
flora
↑Ba
cter
oide
sfr
agili
s(2
.8g
only
)↑
Faec
alib
acte
rium
(2.8
gon
ly)
↑A
kker
man
sia
(2.8
gon
ly)
↓En
tero
bact
eria
ceae
(pla
cebo
only
)N
SLa
ctob
acill
usN
SC
lost
ridi
umN
SC
lust
erin
g
[55]
44R
CT,
P,D
B14
d~3
7(1
8–60
)50
OW
~26.
5(2
5–28
)G
OS
(12.
0)Be
vera
ge(o
olon
gte
a)
Mat
ched
beve
rage
wit
hgl
ucos
e
Stoo
l,re
al-t
ime
quan
tita
tive
PCR
↑Bi
fidob
acte
ria
NS
Tota
lbac
teri
a
364
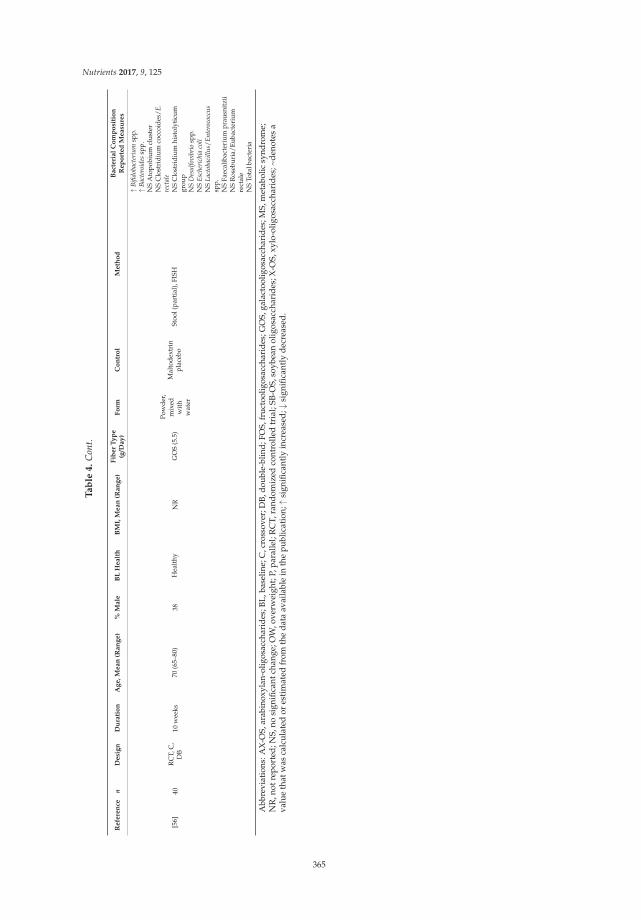
Nutrients 2017, 9, 125
Ta
ble
4.
Con
t.
Re
fere
nce
nD
esi
gn
Du
rati
on
Ag
e,
Me
an
(Ra
ng
e)
%M
ale
BL
He
alt
hB
MI,
Me
an
(Ra
ng
e)
Fib
er
Ty
pe
(g/D
ay
)F
orm
Co
ntr
ol
Me
tho
dB
act
eri
al
Co
mp
osi
tio
nR
ep
ort
ed
Me
asu
res
[56]
40R
CT,
C,
DB
10w
eeks
70(6
5–80
)38
Hea
lthy
NR
GO
S(5
.5)
Pow
der,
mix
edw
ith
wat
er
Mal
tode
xtri
npl
aceb
oSt
ool(
part
ial)
,FIS
H
↑B
ifido
bact
eriu
msp
p.↑
Bac
tero
ides
spp.
NS
Ato
pobi
umcl
uste
rN
SC
lost
ridi
umco
ccoi
des/
E.
rect
ale
NS
Clo
stri
dium
hist
olyt
icum
grou
pN
SD
esu
lfov
ibri
osp
p.N
SE
sche
rich
iaco
liN
SL
acto
baci
llu
s/E
nte
roco
ccu
ssp
p.N
SFa
ecal
ibac
teri
umpr
ausn
itzi
iN
SR
oseb
uria
/Eub
acte
rium
rect
ale
NS
Tota
lbac
teri
a
Abb
revi
atio
ns:A
X-O
S,ar
abin
oxyl
an-o
ligos
acch
arid
es;B
L,ba
selin
e;C
,cro
ssov
er;D
B,do
uble
-blin
d;FO
S,fr
ucto
olig
osac
char
ides
;GO
S,ga
lact
oolig
osac
char
ides
;MS,
met
abol
icsy
ndro
me;
NR
,not
repo
rted
;NS,
nosi
gnifi
cant
chan
ge;O
W,o
verw
eigh
t;P,
para
llel;
RC
T,ra
ndom
ized
cont
rolle
dtr
ial;
SB-O
S,so
ybea
nol
igos
acch
arid
es;X
-OS,
xylo
-olig
osac
char
ides
;~de
note
sa
valu
eth
atw
asca
lcul
ated
ores
tim
ated
from
the
data
avai
labl
ein
the
publ
icat
ion;
↑si
gnifi
cant
lyin
crea
sed;
↓si
gnifi
cant
lyde
crea
sed.
365
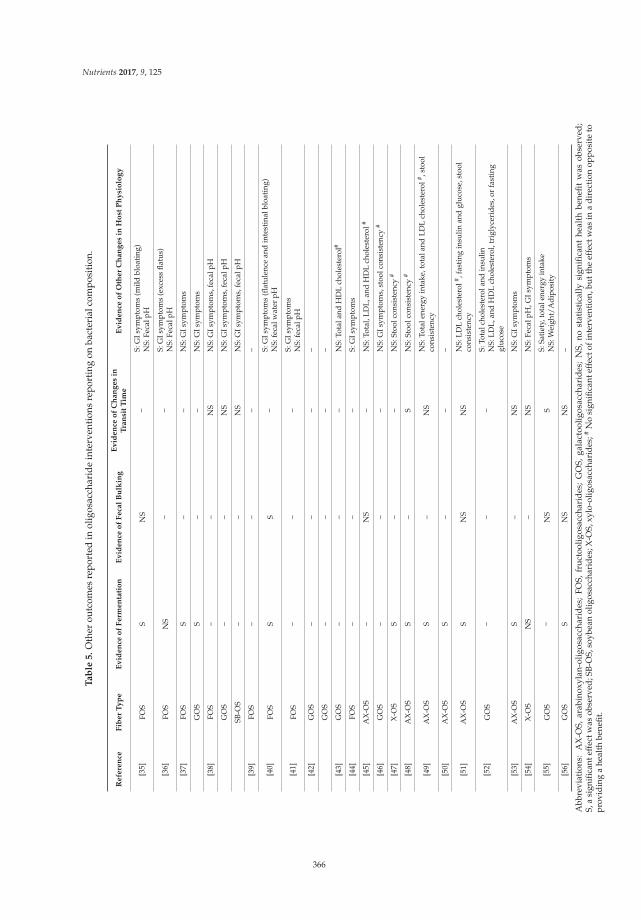
Nutrients 2017, 9, 125
Ta
ble
5.
Oth
erou
tcom
esre
port
edin
olig
osac
char
ide
inte
rven
tion
sre
port
ing
onba
cter
ialc
ompo
siti
on.
Refe
ren
ceF
iber
Ty
pe
Ev
iden
ceo
fF
erm
en
tati
on
Ev
iden
ceo
fF
eca
lB
ulk
ing
Ev
iden
ceo
fC
han
ges
inT
ran
sit
Tim
eE
vid
en
ceo
fO
ther
Ch
an
ges
inH
ost
Ph
ysi
olo
gy
[35]
FOS
SN
S–
S:G
Isym
ptom
s(m
ildbl
oati
ng)
NS:
Feca
lpH
[36]
FOS
NS
––
S:G
Isym
ptom
s(e
xces
sfla
tus)
NS:
Feca
lpH
[37]
FOS
S–
–N
S:G
Isym
ptom
s
GO
SS
––
NS:
GIs
ympt
oms
[38]
FOS
––
NS
NS:
GIs
ympt
oms,
feca
lpH
GO
S–
–N
SN
S:G
Isym
ptom
s,fe
calp
H
SB-O
S–
–N
SN
S:G
Isym
ptom
s,fe
calp
H
[39]
FOS
––
––
[40]
FOS
SS
–S:
GIs
ympt
oms
(flat
ulen
cean
din
test
inal
bloa
ting
)N
S:fe
calw
ater
pH
[41]
FOS
––
–S:
GIs
ympt
oms
NS:
feca
lpH
[42]
GO
S–
––
–
GO
S–
––
–
[43]
GO
S–
––
NS:
Tota
land
HD
Lch
oles
tero
l#
[44]
FOS
––
–S:
GIs
ympt
oms
[45]
AX
-OS
–N
S–
NS:
Tota
l,LD
L,an
dH
DL
chol
este
rol#
[46]
GO
S–
––
NS:
GIs
ympt
oms,
stoo
lcon
sist
ency
#
[47]
X-O
SS
––
NS:
Stoo
lcon
sist
ency
#
[48]
AX
-OS
S–
SN
S:St
oolc
onsi
sten
cy#
[49]
AX
-OS
S–
NS
NS:
Tota
lene
rgy
inta
ke,t
otal
and
LDL
chol
este
rol# ,s
tool
cons
iste
ncy
[50]
AX
-OS
S–
––
[51]
AX
-OS
SN
SN
SN
S:LD
Lch
oles
tero
l# ,fas
ting
insu
linan
dgl
ucos
e,st
ool
cons
iste
ncy
[52]
GO
S–
––
S:To
talc
hole
ster
olan
din
sulin
NS:
LDL,
and
HD
Lch
oles
tero
l,tr
igly
ceri
des,
orfa
stin
ggl
ucos
e
[53]
AX
-OS
S–
NS
NS:
GIs
ympt
oms
[54]
X-O
SN
S–
NS
NS:
Feca
lpH
,GIs
ympt
oms
[55]
GO
S–
NS
SS:
Sati
ety,
tota
lene
rgy
inta
keN
S:W
eigh
t/A
dipo
sity
[56]
GO
SS
NS
NS
–
Abb
revi
atio
ns:
AX
-OS,
arab
inox
ylan
-olig
osac
char
ides
;FO
S,fr
uct
oolig
osac
char
ides
;G
OS,
gala
ctoo
ligos
acch
arid
es;
NS,
nost
atis
tica
llysi
gnifi
cant
heal
thbe
nefi
tw
asob
serv
ed;
S,a
sign
ifica
ntef
fect
was
obse
rved
;SB
-OS,
soyb
ean
olig
osac
char
ides
;X-O
S,xy
lo-o
ligos
acch
arid
es;#
No
sign
ifica
ntef
fect
ofin
terv
enti
on,b
utth
eef
fect
was
ina
dir
ecti
onop
posi
teto
prov
idin
ga
heal
thbe
nefit
.
366
Nutrients 2017, 9, 125
4. Discussion
Observational/epidemiologic evidence shows that diets higher in fiber are associated withreduced risk of certain chronic diseases, such as heart disease, diabetes, and obesity [3,57], and thesemay be related to the effect of dietary fiber on the gut microbiota [4,5]. However, the present evidencemap reveals that there is insufficient data from well-controlled dietary fiber interventions that studythe gut microbiota in relation to intermediate risk factors of cardiometabolic disease or in relation tochronic conditions such as obesity. In fact, we found little evidence on the intersection of dietary fiber,the microbiota, and adiposity. Much of the current literature has shown positive effects of dietary fiberon gut function or beneficial bacterial species, or positive effects of dietary fiber on specific healthoutcomes, but few seem to be directly measuring these outcomes together, to provide evidence of adietary fiber-modulated gut microbiota and health outcome [58,59].
Over the last 25 years, there has been a rapid increase in interest on dietary fiber and themicrobiota, particularly with respect to prebiotics, such as oligosaccharides and inulin, as well aschemically synthesized fibers such as Polydextrose (PDX), soluble corn fiber, and PolyGlycopleX(PGX). From this map, we can see that the most actively researched fibers are oligosaccharides,resistant starch, and chemically synthesized fibers, followed closely by inulin, bran, and cereal fiber(Table 2), and the most common measures of the gut microbiota are SCFA concentration and bacterialcomposition (Table 3). The fiber and outcome most frequently studied together were oligosaccharidesand bacterial composition, and we, therefore, examined these studies in more detail in summarizingour evidence map.
Oligosaccharides are short-chain saccharide polymers, generally made up of 3–10 carbohydratemonomers [60,61], and are known for their prebiotic activity. Prebiotics are defined as non-digestiblefoods that, when metabolized, alter the composition and/or activity of the microbiota in a such away that promotes the health of the host [4,62,63]. Randomized controlled trials have consistentlyshown that oligosaccharides, and FOS in particular, increase Bifidobacterium (Table 4), a genus ofoligosaccharide fermenting gut bacteria that may be beneficial to human health [64–66]. Despite theconsiderable number of studies showing this bifidogenic effect, few have actually examined directrelationships of this modulation of the gut microbiota to other physiological health outcomes. In oursub-analysis on oligosaccharides, we found that only five [43,45,51–53] of the 26 oligosaccharideinterventions measuring bacterial composition also measured changes in lipids, and only two [51,52]measured glucose and insulin response. Additionally, only one study [52] found a small statisticallysignificant beneficial effect on total cholesterol and insulin, while the rest found no beneficial effect.These findings are consistent with reviews by McRorie et al. [67–70], which conclude that clinicalevidence does not support a link between soluble, non-viscous, readily fermentable fibers (such asoligosaccharides) and physiological health benefits on cholesterol, glycemic control, or laxation.Rather, these benefits are attributed to the physical properties of soluble, viscous/gel-forming fibersthat are not readily fermented (such as beta glucan and raw guar gum).
However, readily-fermented fiber types, such as oligosaccharides and resistant starch, may haveother important physiologic effects via the metabolites produced from microbial fermentation.The most studied products of fermentation are SCFAs, mainly butyrate, propionate, and acetate [25].Up to 95% of SCFAs are absorbed by the colonocytes of the large intestine [20], and recent evidence hasshown that they may play a role in health and prevention of disease, such as bowel disease, colon cancer,and metabolic syndrome [20,24–26]. SCFAs have been shown to affect gut health, immune function,energy metabolism, stimulation of the sympathetic nervous system, and serotonin release [4,7,20].
This evidence map also highlights areas where evidence is lacking. For instance, high-fiber dietinterventions, where total dietary fiber was increased from a variety of sources, have the leastnumber of publications. As more emphasis is put on the importance of dietary patterns rather thanindividual foods or food components [71], more whole-diet intervention studies need to be conductedto understand how these relationships among diet, the gut microbiota, and health work in the contextof a whole diet. With respect to microbiota outcomes, fewer studies have measured bacterial enzyme
367
Nutrients 2017, 9, 125
activity, which may be more important than simply measuring changes in the bacterial compositionbecause some strains or species may alter their function, and, therefore, their metabolites, in response tochanges in the gut environment rather than their absolute number. Well-controlled human interventiontrials incorporating “next generation” metagenomics, meta-transcriptomics and metabolomics willbe vital to further understanding these changes in microbial activity. In addition, the microbiotacomposition or activity may be altered in people with chronic diseases such as obesity [58], and futureresearch should consider whether diet may have differential effects depending on underlying healthstatus. Based on this evidence map, the majority of fiber research on the gut microbiota was conductedin healthy adults (81%).
The definition of fiber has been a moving target, and fibers, being one of the most heterogeneousgroups of associated molecules, have been categorized in many different contexts, including bysource, structure, or physical properties (solubility, fermentability, etc.). Further, fibers may bedelivered/consumed as isolated supplements, but they are more often consumed intact in whole foods(such as in raw fruits and vegetables), or in processed foods (including processes such as cooking,milling, and baking). The food matrix is important to consider because other components of the food,such as phytochemicals, may provide synergistic effects [72,73], and the degree of processing can alterthe structure and physical attributes of the fiber [70]. All of these factors contribute to the type andextent of microbial utilization [28]. Therefore, it is important for future studies to describe the dietaryfiber intervention in as much detail as possible, and, where applicable, define the characteristics of thefibers being studied.
Creating an updatable evidence map of microbiota-related outcomes allows researchers to obtaina more global view of the research landscape, including its history, current trajectory, and specificareas or research questions lacking data or consensus. Since the Dietary Fiber Database used for thisevidence map captures literature going back to 1946, it is important to note that the literature in thedatabase often represents evolving knowledge about particular fiber types. This is both a strength andlimitation of the database and the evidence mapping process overall, and it highlights the importanceof reviewing the totality of available evidence. For instance, bran is well represented in the evidencemap, and although the effect of bran on the microbiota was of interest in earlier publications, it is nowwell-established that insoluble bran is not very readily fermented and may have less of an effect on themicrobiota. Instead, interest has shifted toward more fermentable fibers such as the prebiotics andchemically synthesized fibers.
Unlike systematic reviews, which generally address a narrower, focused question with extensivequality analysis and risk of bias assessment, the primary goal of evidence mapping is to identifypatterns and provide a broader context within which systematic reviews may occur. As such, in Tables 4and 5, we did not provide information on effect size of the significance, as this information was notreported in the published fiber database [33]. Furthermore, because of the complex nature of dietaryfiber and the size of the literature on dietary fiber, the database which this evidence map is based onhas some inherent limitations, which are detailed in a separate publication [33]. Notably, the databasewas limited to publications in PubMed, and studies were only included if there was a well-defineddietary fiber intervention with a concurrent control. Further, because this database was designed tospecifically capture certain health outcomes, other publications of interest to microbiota research maynot be represented.
A major strength of this evidence map is that it is a cost effective way of summarizing thedata on dietary fiber and the gut microbiota. For instance, the data presented in Tables 4 and 5may be used to guide future work, such as a meta-analysis, which would provide more specificinformation to quantify statistical significance. We were able to use a previously created database inorder to efficiently identify potentially relevant literature. Although we closely reviewed the subsetof relevant literature identified via the database, we saved significant resources in conducting initial,broad searches which would inevitably yield a large amount of irrelevant literature to screen through.The result is a‘useful platform to visualize the current evidence, which can be used to summarize the
368
Nutrients 2017, 9, 125
volume of existing research, generate new hypotheses, direct systematic reviews and meta-analyses,and can be continually updated.
5. Conclusions
In conclusion, this evidence map summarizes the existing literature on dietary fiber interventionsand the human gut microbiota. This is a rapidly growing area of interest, but well-controlled humaninterventions are needed to support the associations being seen in animal and observational studies.We hope that this evidence map will provide a resource for researchers to direct new interventionstudies and meta-analyses.
Supplementary Materials: The following are available online at http://www.mdpi.com/2072-6643/9/2/125/s1,Table S1: Inclusion/Exclusion Criteria. Supplementary Methods. Figure S1: Acute studies: weighted scatter plotof other microbiota outcomes by fiber group presents weighted scatter. The acute studies exclusively examine theshort-term fermentation response by measuring SCFA concentration and/or breath gas excretion, most frequentlyin cereal fibers. Figure S2: Longer duration studies: weighted scatter plot of other microbiota outcomes by fibergroup. Studies of greater duration examine more outcomes in a larger array of fiber types. Notably, however,there are no longer duration (>4 weeks) studies on resistant starch.
Acknowledgments: Funding support provided by a research grant from the International Life Science Institute,North America Branch, Technical Committee on Carbohydrates and from the USDA Agricultural Research Service(agreement 58-1950-0-014). We acknowledge Katherine Rancaño for her assistance with the tables.
Author Contributions: N.M.M. and M.C. designed research; C.M.S. and K.A.L. conducted research; M.C.,S.B.R. and M.O. provided expertise on the following areas: evidence mapping methodology, dietary fibers,and gut microbiota; C.M.S. and K.A.L. analyzed data; C.M.S. and N.M.M. wrote paper; and N.M.M. had primaryresponsibility for final content. All authors have read and approved the final manuscript.
Conflicts of Interest: N.M.M. is supported in part by a research grant from the General Mills Bell Institute ofHealth and Nutrition and an unrestricted gift from Proctor and Gamble. C.M.S., K.A.L., M.O., S.B.R. and M.C.declare no conflicts of interest.
References
1. Codex Alimentarius Commission. Codex Alimentarius Commission Report of the 30th Session of the Codex
Committee on Nutrition and Foods for Special Dietary Uses; Codex Alimentarius Commission: Cape Town,South Africa, 2008.
2. Jones, J.M. CODEX-aligned dietary fiber definitions help to bridge the “fiber gap”. Nutr. J. 2014, 13, 34.[CrossRef] [PubMed]
3. Dahl, W.J.; Stewart, M.L. Position of the Academy of Nutrition and Dietetics: Health implications ofdietary fiber. J. Acad. Nutr. Diet. 2015, 115, 1861–1870. [CrossRef] [PubMed]
4. Slavin, J. Fiber and prebiotics: Mechanisms and health benefits. Nutrients 2013, 5, 1417–1435. [CrossRef][PubMed]
5. Conlon, M.A.; Bird, A.R. The impact of diet and lifestyle on gut microbiota and human health. Nutrients
2014, 7, 17–44. [CrossRef] [PubMed]6. O’Hara, A.M.; Shanahan, F. The gut flora as a forgotten organ. EMBO Rep. 2006, 7, 688–693. [CrossRef]
[PubMed]7. Nicholson, J.K.; Holmes, E.; Kinross, J.; Burcelin, R.; Gibson, G.; Jia, W.; Pettersson, S. Host-gut microbiota
metabolic interactions. Science 2012, 336, 1262–1267. [CrossRef] [PubMed]8. Hooper, L.V.; Littman, D.R.; Macpherson, A.J. Interactions between the microbiota and the immune system.
Science 2012, 336, 1268–1273. [CrossRef] [PubMed]9. Clemente, J.C.; Ursell, L.K.; Parfrey, L.W.; Knight, R. The impact of the gut microbiota on human health:
An integrative view. Cell 2012, 148, 1258–1270. [CrossRef] [PubMed]10. Flint, H.J.; Duncan, S.H.; Scott, K.P.; Louis, P. Links between diet, gut microbiota composition and gut metabolism.
Proc. Nutr. Soc. 2015, 74, 13–22. [CrossRef] [PubMed]11. Blumberg, R.; Powrie, F. Microbiota, disease, and back to health: A metastable journey. Sci. Transl. Med. 2012,
4, 137rv7. [CrossRef] [PubMed]12. Flint, H.J. The impact of nutrition on the human microbiome. Nutr. Rev. 2012, 70 (Suppl. 1), S10–S13.
[CrossRef] [PubMed]
369
Nutrients 2017, 9, 125
13. David, L.A.; Maurice, C.F.; Carmody, R.N.; Gootenberg, D.B.; Button, J.E.; Wolfe, B.E.; Ling, A.V.; Devlin, A.S.;Varma, Y.; Fischbach, M.A.; et al. Diet rapidly and reproducibly alters the human gut microbiome. Nature
2014, 505, 559–563. [CrossRef] [PubMed]14. Belenguer, A.; Duncan, S.H.; Calder, A.G.; Holtrop, G.; Louis, P.; Lobley, G.E.; Flint, H.J. Two routes of
metabolic cross-feeding between Bifidobacterium adolescentis and butyrate-producing anaerobes from thehuman gut. Appl. Environ. Microbiol. 2006, 72, 3593–3599. [CrossRef] [PubMed]
15. Falony, G.; Vlachou, A.; Verbrugghe, K.; De Vuyst, L. Cross-feeding between Bifidobacterium longum
BB536 and acetate-converting, butyrate-producing colon bacteria during growth on oligofructose.Appl. Environ. Microbiol. 2006, 72, 7835–7841. [CrossRef] [PubMed]
16. El Oufir, L.; Flourié, B.; Bruley des Varannes, S.; Barry, J.L.; Cloarec, D.; Bornet, F.; Galmiche, J.P.Relations between transit time, fermentation products, and hydrogen consuming flora in healthy humans.Gut 1996, 38, 870–877. [CrossRef] [PubMed]
17. Stephen, A.M.; Wiggins, H.S.; Cummings, J.H. Effect of changing transit time on colonic microbial metabolismin man. Gut 1987, 28, 601–609. [CrossRef] [PubMed]
18. Lewis, S.J.; Heaton, K.W. Increasing butyrate concentration in the distal colon by accelerating intestinal transit.Gut 1997, 41, 245–251. [CrossRef] [PubMed]
19. Graf, D.; Di Cagno, R.; Fåk, F.; Flint, H.J.; Nyman, M.; Saarela, M.; Watzl, B. Contribution of diet to thecomposition of the human gut microbiota. Microb. Ecol. Health Dis. 2015, 26, 26164. [CrossRef] [PubMed]
20. Den Besten, G.; van Eunen, K.; Groen, A.K.; Venema, K.; Reijngoud, D.-J.; Bakker, B.M. The role of short-chainfatty acids in the interplay between diet, gut microbiota, and host energy metabolism. J. Lipid Res. 2013, 54,2325–2340. [CrossRef] [PubMed]
21. Duncan, S.H.; Louis, P.; Thomson, J.M.; Flint, H.J. The role of pH in determining the species composition ofthe human colonic microbiota. Environ. Microbiol. 2009, 11, 2112–2122. [CrossRef] [PubMed]
22. Samuel, B.S.; Shaito, A.; Motoike, T.; Rey, F.E.; Backhed, F.; Manchester, J.K.; Hammer, R.E.; Williams, S.C.;Crowley, J.; Yanagisawa, M.; et al. Effects of the gut microbiota on host adiposity are modulated by theshort-chain fatty-acid binding G protein-coupled receptor, Gpr41. Proc. Natl. Acad. Sci. USA 2008, 105,16767–16772. [CrossRef] [PubMed]
23. Wong, J.M.W.; de Souza, R.; Kendall, C.W.C.; Emam, A.; Jenkins, D.J.A. Colonic health: Fermentation andshort chain fatty acids. J. Clin. Gastroenterol. 2006, 40, 235–243. [CrossRef] [PubMed]
24. Tan, J.; McKenzie, C.; Potamitis, M.; Thorburn, A.N.; Mackay, C.R.; Macia, L. The role of short-chain fattyacids in health and disease. Adv. Immunol. 2014, 121, 91–119. [PubMed]
25. Birt, D.F.; Boylston, T.; Hendrich, S.; Jane, J.-L.; Hollis, J.; Li, L.; McClelland, J.; Moore, S.; Phillips, G.J.;Rowling, M.; et al. Resistant starch: Promise for improving human health. Adv. Nutr. Int. Rev. J. 2013, 4,587–601. [CrossRef] [PubMed]
26. Hamer, H.M.; Jonkers, D.; Venema, K.; Vanhoutvin, S.; Troost, F.J.; Brummer, R.-J. Review article: The role ofbutyrate on colonic function. Aliment. Pharmacol. Ther. 2008, 27, 104–119. [CrossRef] [PubMed]
27. Flint, H.J.; Scott, K.P.; Louis, P.; Duncan, S.H. The role of the gut microbiota in nutrition and health. Nat. Rev.
Gastroenterol. Hepatol. 2012, 9, 577–589. [CrossRef] [PubMed]28. Hamaker, B.R.; Tuncil, Y.E. A perspective on the complexity of dietary fiber structures and their potential
effect on the gut microbiota. J. Mol. Biol. 2014, 426, 3838–3850. [CrossRef] [PubMed]29. Althuis, M.D.; Weed, D.L. Evidence mapping: Methodologic foundations and application to intervention
and observational research on sugar-sweetened beverages and health outcomes. Am. J. Clin. Nutr. 2013, 98,755–768. [CrossRef] [PubMed]
30. Bragge, P.; Clavisi, O.; Turner, T.; Tavender, E.; Collie, A.; Gruen, R.L. The global evidence mapping initiative:Scoping research in broad topic areas. BMC Med. Res. Methodol. 2011, 11, 92. [CrossRef] [PubMed]
31. Hetrick, S.E.; Parker, A.G.; Callahan, P.; Purcell, R. Evidence mapping: Illustrating an emerging methodologyto improve evidence-based practice in youth mental health. J. Eval. Clin. Pract. 2010, 16, 1025–1030.[CrossRef] [PubMed]
32. Wang, D.D.; Shams-White, M.; Bright, O.J.M.; Parrott, J.S.; Chung, M. Creating a literature database oflow-calorie sweeteners and health studies: Evidence mapping. BMC Med. Res. Methodol. 2016, 16, 1.[CrossRef] [PubMed]
370
Nutrients 2017, 9, 125
33. Livingston, K.A.; Chung, M.; Sawicki, C.M.; Lyle, B.J.; Wang, D.D.; Roberts, S.B.; McKeown, N.M.Development of a publicly available, comprehensive database of fiber and health outcomes: Rationale andmethods. PLoS ONE 2016, 11, e0156961. [CrossRef] [PubMed]
34. McKeown, N.M.; Chung, M.; Livingston, K.A.; Sawicki, C.M.; Wang, D.D.; Blakeley, C.; Jia, Y.; Baruch, N.;Karlsen, M.; Brown, C. Project: Diet-Related Fibers and Human Health Outcomes, Version 1 (Retired Version).Available online: http://srdr.ahrq.gov/projects/564 (accessed on 7 September 2015).
35. Bouhnik, Y.; Flourié, B.; Riottot, M.; Bisetti, N.; Gailing, M.F.; Guibert, A.; Bornet, F.; Rambaud, J.C.Effects of fructo-oligosaccharides ingestion on fecal bifidobacteria and selected metabolic indexes of coloncarcinogenesis in healthy humans. Nutr. Cancer 1996, 26, 21–29. [CrossRef] [PubMed]
36. Bouhnik, Y.; Vahedi, K.; Achour, L.; Attar, A.; Salfati, J.; Pochart, P.; Marteau, P.; Flourié, B.;Bornet, F.; Rambaud, J.C. Short-chain fructo-oligosaccharide administration dose-dependently increasesfecal bifidobacteria in healthy humans. J. Nutr. 1999, 129, 113–116. [PubMed]
37. Tannock, G.W.; Munro, K.; Bibiloni, R.; Simon, M.A.; Hargreaves, P.; Gopal, P.; Harmsen, H.; Welling, G.Impact of consumption of oligosaccharide-containing biscuits on the fecal microbiota of humans.Appl. Environ. Microbiol. 2004, 70, 2129–2136. [CrossRef] [PubMed]
38. Bouhnik, Y.; Raskine, L.; Simoneau, G.; Vicaut, E.; Neut, C.; Flourié, B.; Brouns, F.; Bornet, F.R. The capacityof nondigestible carbohydrates to stimulate fecal bifidobacteria in healthy humans: A double-blind,randomized, placebo-controlled, parallel-group, dose-response relation study. Am. J. Clin. Nutr. 2004,80, 1658–1664. [PubMed]
39. Clavel, T.; Fallani, M.; Lepage, P.; Levenez, F.; Mathey, J.; Rochet, V.; Sérézat, M.; Sutren, M.; Henderson, G.;Bennetau-Pelissero, C.; et al. Isoflavones and functional foods alter the dominant intestinal microbiota inpostmenopausal women. J. Nutr. 2005, 135, 2786–2792. [PubMed]
40. Ten Bruggencate, S.J.M.; Bovee-Oudenhoven, I.M.J.; Lettink-Wissink, M.L.G.; Katan, M.B.; van der Meer, R.Dietary fructooligosaccharides affect intestinal barrier function in healthy men. J. Nutr. 2006, 136, 70–74.[PubMed]
41. Bouhnik, Y.; Raskine, L.; Simoneau, G.; Paineau, D.; Bornet, F. The capacity of short-chain fructo-oligosaccharidesto stimulate faecal bifidobacteria: A dose-response relationship study in healthy humans. Nutr. J. 2006, 5, 8.[CrossRef] [PubMed]
42. Depeint, F.; Tzortzis, G.; Vulevic, J.; I’anson, K.; Gibson, G.R. Prebiotic evaluation of a novelgalactooligosaccharide mixture produced by the enzymatic activity of Bifidobacterium bifidum NCIMB 41171,in healthy humans: A randomized, double-blind, crossover, placebo-controlled intervention study. Am. J.
Clin. Nutr. 2008, 87, 785–791. [PubMed]43. Vulevic, J.; Drakoularakou, A.; Yaqoob, P.; Tzortzis, G.; Gibson, G.R. Modulation of the fecal microflora profile
and immune function by a novel trans-galactooligosaccharide mixture (B-GOS) in healthy elderly volunteers.Am. J. Clin. Nutr. 2008, 88, 1438–1446. [PubMed]
44. Mitsou, E.K.; Turunen, K.; Anapliotis, P.; Zisi, D.; Spiliotis, V.; Kyriacou, A. Impact of a jelly containingshort-chain fructo-oligosaccharides and Sideritis euboea extract on human faecal microbiota. Int. J.
Food Microbiol. 2009, 135, 112–117. [CrossRef] [PubMed]45. Cloetens, L.; Broekaert, W.F.; Delaedt, Y.; Ollevier, F.; Courtin, C.M.; Delcour, J.A.; Rutgeerts, P.; Verbeke, K.
Tolerance of arabinoxylan-oligosaccharides and their prebiotic activity in healthy subjects: A randomised,placebo-controlled cross-over study. Br. J. Nutr. 2010, 103, 703–713. [CrossRef] [PubMed]
46. Walton, G.E.; van den Heuvel, E.G.H.M.; Kosters, M.H.W.; Rastall, R.A.; Tuohy, K.M.; Gibson, G.R.A randomised crossover study investigating the effects of galacto-oligosaccharides on the faecal microbiotain men and women over 50 years of age. Br. J. Nutr. 2012, 107, 1466–1475. [CrossRef] [PubMed]
47. Lecerf, J.-M.; Dépeint, F.; Clerc, E.; Dugenet, Y.; Niamba, C.N.; Rhazi, L.; Cayzeele, A.; Abdelnour, G.;Jaruga, A.; Younes, H.; et al. Xylo-oligosaccharide (XOS) in combination with inulin modulates both theintestinal environment and immune status in healthy subjects, while XOS alone only shows prebiotic properties.Br. J. Nutr. 2012, 108, 1847–1858. [CrossRef] [PubMed]
48. Damen, B.; Cloetens, L.; Broekaert, W.F.; François, I.; Lescroart, O.; Trogh, I.; Arnaut, F.; Welling, G.W.;Wijffels, J.; Delcour, J.A.; et al. Consumption of breads containing in situ-produced arabinoxylanoligosaccharides alters gastrointestinal effects in healthy volunteers. J. Nutr. 2012, 142, 470–477. [CrossRef][PubMed]
371
Nutrients 2017, 9, 125
49. François, I.E.J.A.; Lescroart, O.; Veraverbeke, W.S.; Marzorati, M.; Possemiers, S.; Evenepoel, P.; Hamer, H.;Houben, E.; Windey, K.; Welling, G.W.; et al. Effects of a wheat bran extract containing arabinoxylanoligosaccharides on gastrointestinal health parameters in healthy adult human volunteers: A double-blind,randomised, placebo-controlled, cross-over trial. Br. J. Nutr. 2012, 108, 2229–2242. [CrossRef] [PubMed]
50. Walton, G.E.; Lu, C.; Trogh, I.; Arnaut, F.; Gibson, G.R. A randomised, double-blind, placebo controlledcross-over study to determine the gastrointestinal effects of consumption of arabinoxylan-oligosaccharidesenriched bread in healthy volunteers. Nutr. J. 2012, 11, 36. [CrossRef] [PubMed]
51. Maki, K.C.; Gibson, G.R.; Dickmann, R.S.; Kendall, C.W.C.; Chen, C.-Y.O.; Costabile, A.; Comelli, E.M.;McKay, D.L.; Almeida, N.G.; Jenkins, D.; et al. Digestive and physiologic effects of a wheat bran extract,arabino-xylan-oligosaccharide, in breakfast cereal. Nutrition 2012, 28, 1115–1121. [CrossRef] [PubMed]
52. Vulevic, J.; Juric, A.; Tzortzis, G.; Gibson, G.R. A mixture of trans-galactooligosaccharides reduces markers ofmetabolic syndrome and modulates the fecal microbiota and immune function of overweight adults. J. Nutr.
2013, 143, 324–331. [CrossRef] [PubMed]53. François, I.E.J.A.; Lescroart, O.; Veraverbeke, W.S.; Marzorati, M.; Possemiers, S.; Hamer, H.;
Windey, K.; Welling, G.W.; Delcour, J.A.; Courtin, C.M.; et al. Effects of wheat bran extract containingarabinoxylan oligosaccharides on gastrointestinal parameters in healthy preadolescent children. J. Pediatr.
Gastroenterol. Nutr. 2014, 58, 647–653. [CrossRef] [PubMed]54. Finegold, S.M.; Li, Z.; Summanen, P.H.; Downes, J.; Thames, G.; Corbett, K.; Dowd, S.; Krak, M.; Heber, D.
Xylooligosaccharide increases bifidobacteria but not lactobacilli in human gut microbiota. Food Funct. 2014,5, 436–445. [CrossRef] [PubMed]
55. Morel, F.B.; Dai, Q.; Ni, J.; Thomas, D.; Parnet, P.; Fança-Berthon, P. α-Galacto-oligosaccharidesdose-dependently reduce appetite and decrease inflammation in overweight adults. J. Nutr. 2015, 145,2052–2059. [CrossRef] [PubMed]
56. Vulevic, J.; Juric, A.; Walton, G.E.; Claus, S.P.; Tzortzis, G.; Toward, R.E.; Gibson, G.R. Influence ofgalacto-oligosaccharide mixture (B-GOS) on gut microbiota, immune parameters and metabonomics inelderly persons. Br. J. Nutr. 2015, 114, 586–595. [CrossRef] [PubMed]
57. Hur, I.Y.; Reicks, M. Relationship between whole-grain intake, chronic disease risk indicators, and weightstatus among adolescents in the National Health and Nutrition Examination Survey, 1999–2004. J. Acad.
Nutr. Diet. 2012, 112, 46–55. [CrossRef] [PubMed]58. Ley, R.E.; Bäckhed, F.; Turnbaugh, P.; Lozupone, C.A.; Knight, R.D.; Gordon, J.I. Obesity alters gut
microbial ecology. Proc. Natl. Acad. Sci. USA 2005, 102, 11070–11075. [CrossRef] [PubMed]59. Kalliomäki, M.; Collado, M.C.; Salminen, S.; Isolauri, E. Early differences in fecal microbiota composition in
children may predict overweight. Am. J. Clin. Nutr. 2008, 87, 534–538. [PubMed]60. Carbohydrates in Human Nutrition. Report of a Joint FAO/WHO Expert Consultation; Food and Agriculture
Organization, World Health Organization (FAO/WHO): Rome, Italy, 1997; pp. 1–140.61. American Association of Cereal Chemists (AACC). The Definition of Dietary Fiber. Report of the Dietary
Fiber Definition Committee to the Board of Directors of the American Association of Cereal Chemists.Cereal Foods World 2001, 46, 112–126.
62. Valcheva, R.; Dieleman, L.A. Prebiotics: Definition and protective mechanisms. Best Pract. Res. Clin. Gastroenterol.
2016, 30, 27–37. [CrossRef] [PubMed]63. Bindels, L.B.; Delzenne, N.M.; Cani, P.D.; Walter, J. Towards a more comprehensive concept for prebiotics.
Nat. Rev. Gastroenterol. Hepatol. 2015, 12, 303–310. [CrossRef] [PubMed]64. Cummings, J.H.; Antoine, J.-M.; Azpiroz, F.; Bourdet-Sicard, R.; Brandtzaeg, P.; Calder, P.C.; Gibson, G.R.;
Guarner, F.; Isolauri, E.; Pannemans, D.; et al. PASSCLAIM—Gut health and immunity. Eur. J. Nutr. 2004, 43
(Suppl. 2), II118–II173. [CrossRef] [PubMed]65. Meyer, D. Inunlin, gut microbes, and health. In Dietary Fiber and Health; Cho, S.S., Almeida, N., Eds.;
CRC Press Taylor & Francis Group: Boca Raton, FL, USA, 2012; pp. 169–183.66. Tojo, R.; Suárez, A.; Clemente, M.G.; de los Reyes-Gavilán, C.G.; Margolles, A.; Gueimonde, M.;
Ruas-Madiedo, P. Intestinal microbiota in health and disease: Role of bifidobacteria in gut homeostasis.World J. Gastroenterol. 2014, 20, 15163–15176. [CrossRef] [PubMed]
67. McRorie, J.W. Evidence-based approach to fiber supplements and clinically meaningful health benefits, part1: What to look for and how to recommend an effective fiber therapy. Nutr. Today 2015, 50, 82–89. [CrossRef][PubMed]
372
Nutrients 2017, 9, 125
68. McRorie, J.W. Evidence-based approach to fiber supplements and clinically meaningful health benefits,part 2: What to look for and how to recommend an effective fiber therapy. Nutr. Today 2015, 50, 90–97.[CrossRef] [PubMed]
69. Mcrorie, J.W.; Fahey, G.C. A review of gastrointestinal physiology and the mechanisms underlying the healthbenefits of dietary fiber: Matching an effective fiber with specific patient needs. Clin. Nurs. Stud. 2013, 1,82–92. [CrossRef]
70. McRorie, J.W.; McKeown, N.M. Understanding the physics of functional fibers in the gastrointestinal tract:An evidence-based approach to resolving enduring misconceptions about insoluble and soluble fiber. J. Acad.
Nutr. Diet. 2017, 17, 251–264. [CrossRef] [PubMed]71. 2015–2020 Dietary Guidelines—Health.gov. Available online: https://health.gov/dietaryguidelines/2015/
guidelines/ (accessed on 15 December 2016).72. Okarter, N.; Liu, R.H. Health benefits of whole grain phytochemicals. Crit. Rev. Food Sci. Nutr. 2010, 50,
193–208. [CrossRef] [PubMed]73. Vitaglione, P.; Mennella, I.; Ferracane, R.; Rivellese, A.A.; Giacco, R.; Ercolini, D.; Gibbons, S.M.; La Storia, A.;
Gilbert, J.A.; Jonnalagadda, S.; et al. Whole-grain wheat consumption reduces inflammation in a randomizedcontrolled trial on overweight and obese subjects with unhealthy dietary and lifestyle behaviors: Role ofpolyphenols bound to cereal dietary fiber. Am. J. Clin. Nutr. 2015, 101, 251–261. [CrossRef] [PubMed]
© 2017 by the authors. Licensee MDPI, Basel, Switzerland. This article is an open accessarticle distributed under the terms and conditions of the Creative Commons Attribution(CC BY) license (http://creativecommons.org/licenses/by/4.0/).
373
nutrients
Article
Whole Grains Contribute Only a Small Proportion ofDietary Fiber to the U.S. Diet
Sibylle Kranz 1,*, Kevin W. Dodd 2, Wen Yen Juan 3, LuAnn K. Johnson 4 and Lisa Jahns 4
1 Department of Kinesiology, University of Virginia, Charlottesville, VA 22904, USA2 National Cancer Institute, Bethesda, MD 20892, USA; [email protected] Nutrition Assessment and Evaluation, Office of Nutrition and Food Labeling, Center for Food and Applied
Nutrition, United States Food and Drug Administration, College Park, MD 20740, USA;[email protected]
4 United States Department of Agriculture, Agricultural Research Service, Grand Forks Human NutritionResearch Center, Grand Forks, ND 58203, USA; [email protected] (L.K.J.);[email protected] (L.J.)
* Correspondence: [email protected]; Tel.: +1-434-924-7904
Received: 14 December 2016; Accepted: 14 February 2017; Published: 17 February 2017
Abstract: Dietary fiber (DF), found in whole fruits, vegetables, and whole grains (WG), is considereda nutrient of concern in the US diet and increased consumption is recommended. The present studywas designed to highlight this critical importance of the difference between WG, high-fiber WG,and sources of fiber that are not from WG. The study is based on the two-day diets reportedconsumed by the nationally representative sample of Americans participating in What We EatIn America, the dietary component of the National Health and Nutrition Examination Survey from2003–2010. Foods consumed were classified into tertiles of DF and WG and the contribution of fiberby differing levels of WG content were examined. Foods containing high amounts of WG and DFonly contributed about 7% of total fiber intake. Overall, grain-based foods contributed 54.5% of allDF consumed. Approximately 39% of DF came from grain foods that contained no WG, rather thesefoods contained refined grains, which contain only small amounts of DF but are consumed in largequantities. All WG-containing foods combined contributed a total of 15.3% of DF in the Americandiet. Thus, public health messaging needs to be changed to specifically encourage consumption ofWG foods with high levels of DF to address both recommendations.
Keywords: whole grain intake; dietary fiber; nutrition monitoring; Dietary Guidelines for Americans;healthy diet; sources of dietary fiber
1. Introduction
1.1. Dietary Fiber
Dietary fiber (DF), which occurs in whole fruits, vegetables, and whole grains (WG), is considereda nutrient of concern in the US diet and increased consumption is recommended. [1] In the UK,recommendations are 30 g/day for adults [2]. The recommended DF intake in the US is at least 14 g offiber per 1000 kcal of total energy consumed, which translates to roughly 19 g per day for children1–3 years old to between 25–35 g per day for adults [3]. Although intake increased slightly amongsome Americans over a 10-year period [4], fiber intake is low in the American diet with less than 3%of the population meeting recommendations [5,6]; most Americans consume very low amounts [7].As fiber intake is inversely associated with body weight [8–12], cardiovascular disease (CVD) riskfactors [13–15], some cancers, and potentially type 2 diabetes and other chronic diseases [16,17], it isimportant to increase consumption to improve population health. The greatest source of fiber in thediet is vegetables (22%), followed by mixed dishes (12%), yeast breads (12%), and fruits (11%) [4].
Nutrients 2017, 9, 153 374 www.mdpi.com/journal/nutrients
Nutrients 2017, 9, 153
1.2. Whole Grains
One of the sources of dietary fiber, WG, has also been associated with decreased risks of obesity,type 2 diabetes, and CVD [18–20]. The World Health Organization recommends consuming WG aspart of a healthy diet [21]. Many countries and organizations also have recommendations for WGintake, although intake guidelines vary substantially [22]. WG were first introduced as a food group forrecommended intake in the Dietary Guidelines for Americans (DGA) 2005 and have been maintainedas part of the USDA Healthy US-Style Food Patterns as a food group to be recommended in the2015–2020 DGA [23,24]. The 2015–2020 DGA provides food-based guidance and recommends thatAmericans consume at least one-half of their daily suggested total grains as WG, which is equivalentto at least 3 oz. equivalents per day for many individuals consuming more than 1600 calories perday. However, nationally representative intake data suggest that only 2%–7% of Americans meetthis recommendation [25,26]. The greatest sources of WG in the diet of adults are yeast breads (27%),ready-to-eat (RTE) cereals (23%), and pastas, cooked cereal and rice (21%) [4]. However, those foodsources are not generally 100% WG. The American diet does not include many foods that are 100%WG, but rather foods that contain some small proportion of WG, such as breads, cereals, or pastrymade with some WG flour. The US Food and Drug Administration classification of WG is limitedto those products which retain all of the main biological components of the grain (germ, endosperm,and bran) in the same relative proportion as in the intact grain [27], which is not necessary related tothe amount of dietary fiber. Therefore, the “whole grain”-containing foods recommended by the DGAencompass a wide variety of foods, ranging from those with proportionally low to those with veryhigh amounts of dietary fiber, depending upon the type of grain.
1.3. Significance
DGA recommendations focus on increasing the consumption of WG [28,29] to half of all consumedgrains, however, due to the large variation of dietary fiber content in WG foods (g/100 g), it is importantto differentiate between high fiber and low fiber WG foods. The present study was designed to highlightthis critical importance of the difference between WG, high-fiber WG, and sources of fiber that are notfrom WG. A previous analysis using the 2009–2010 National Health and Nutrition Examination Survey(NHANES) found that fiber consumption was related to WG consumption [30]; however, the samplewas small (only one NHANES wave), which limited the amounts of food that were included in theanalysis. Due to the high number of foods in the US food supply that use the words “whole grain” inseveral locations on food packaging for marketing purposes, a timely research question is: “what arethe food sources of DF consumed by the American population, and what proportion of dietary fiber iscontributed by WG?” To answer this question, we pooled data from 8 years of NHANES surveys inthe US, from 2003–2004 to 2009–2010 and examined the relationships between WG foods and DF fromthese foods.
2. Materials and Methods
2.1. Data Set
The study is based on the two-day diets reported consumed by the nationally representativesample of Americans participating in What We Eat In America (WWEIA), the dietary componentof NHANES, and is reflected in oz. equivalent of the MyPlate “whole grains” food group [31].NHANES is a nationally representative, cross-sectional survey of the non-institutionalized civilianU.S. population and is conducted by the National Center for Health Statistics, Centers for DiseasesControl and Prevention. Details of both WWEIA and NHANES can be found elsewhere [32]. In short,participants completed two interviewer-assisted 24-h recalls; day one recalls were administeredin-person and day two recalls were conducted over the phone. Primary caregivers reported proxyintake for children less than six years old and assisted children ages 6–11 years; individuals age 12 and
375
Nutrients 2017, 9, 153
older self-reported their previous day’s food intake. All dietary interviews were conducted by trainedinterviewers using the U.S. Department of Agriculture’s Automated Multiple-Pass Method [33].
For this study, total grain, WG, and DF intakes were estimated using day one dietary intakedata collected from 34,391 individuals aged 2 years and older participating in the WWEIA, NHANES2003–2004, 2005–2006, 2007–2008, and 2009–2010 continuing surveys.
WG were defined as grains that include the entire grain kernel—the bran, germ, and endosperm.WG values were obtained for all reported foods in all survey years using the MyPyramid EquivalentsDatabase (MPED), 2.0 for USDA Survey Food Codes, 2003–2004 (MPED 2.0) and the Center forNutrition Policy and Promotion Addendum to MPED 2.0 [34,35]. At the time of analysis, the newMPED including the Equivalents database for NHANES 2009–2010 was not available, thus the authorsgenerated a proxy food list to identify the food codes containing WG. Since only a small proportionof Americans meet the WG or the DF dietary guidance, consumption patterns were not based on theintake level of the individuals but conducted on the food level, to help explain why so many Americanshave insufficient amounts of WG and DF in their diets. Foods containing WG were categorized asdescribed below. Dietary fiber intake values were obtained from the USDA Food and NutritionDatabase for Dietary Studies (FNDDS) version 2.0 and version 4.1 [36].
2.2. Study Variables
Four categories of dietary fiber density food (no, low, medium, or high dietary fiber) and fivecategories of WG food (not a grain food, a grain food with no WG, a grain food with low amounts ofWG, a grain food with medium amounts of WG, and a grain food with high amounts of WG) wereestablished. The dietary fiber and WG categories “low, medium, and high” were established basedon unweighted tertiles of dietary fiber density (g/100 g of food) and of WG density (oz. equivalents/100 g of food) of all food codes in the FNDDS that were reported consumed at least once in day onedietary intake data. As this research focuses on WG and fiber intake, foods not containing grains werenot included in analysis beyond the description of their contribution to total fiber intake.
To maintain the nationally representative character of the data, the calculation of the proportionof foods consumed in each of the fiber (low, medium, high) and WG (no grains, no WG, low WG,medium WG, and high WG) categories in the total population and the male and female population of2–18 years old and 19–85 years old were computed using survey sample weights. All analyses wereperformed using SAS, version 9.3 (SAS Institute, Cary, NC, USA). It is important to point out thatthis analysis was conducted to identify the foods available to the consumer based on their WG andDF content and their contribution to average usual intake, not to any particular individual’s dietaryintake. This approach was chosen to highlight the complexity of access to high-fiber foods in the USfood supply.
3. Results
The number of survey respondents and their socio-economic characteristics are reflected in Table 1.Approximately 50% of the sample were males, more individuals were Non-Hispanic white and morehad higher than high school education, which is reflective of the US census data. The educational levelsof individuals 18 years and younger are not reported here, as they are likely still in school and theirterminal degrees are not known. A greater proportion of younger individuals was from low-incomefamilies while the majority of the adult population was from medium or high income households.
376
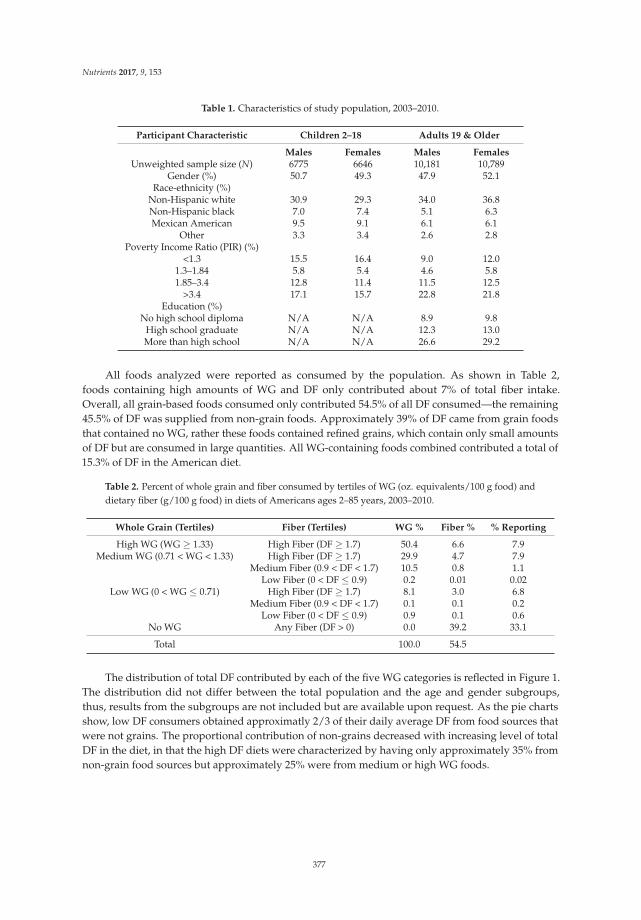
Nutrients 2017, 9, 153
Table 1. Characteristics of study population, 2003–2010.
Participant Characteristic Children 2–18 Adults 19 & Older
Males Females Males FemalesUnweighted sample size (N) 6775 6646 10,181 10,789
Gender (%) 50.7 49.3 47.9 52.1Race-ethnicity (%)
Non-Hispanic white 30.9 29.3 34.0 36.8Non-Hispanic black 7.0 7.4 5.1 6.3Mexican American 9.5 9.1 6.1 6.1
Other 3.3 3.4 2.6 2.8Poverty Income Ratio (PIR) (%)
<1.3 15.5 16.4 9.0 12.01.3–1.84 5.8 5.4 4.6 5.81.85–3.4 12.8 11.4 11.5 12.5
>3.4 17.1 15.7 22.8 21.8Education (%)
No high school diploma N/A N/A 8.9 9.8High school graduate N/A N/A 12.3 13.0More than high school N/A N/A 26.6 29.2
All foods analyzed were reported as consumed by the population. As shown in Table 2,foods containing high amounts of WG and DF only contributed about 7% of total fiber intake.Overall, all grain-based foods consumed only contributed 54.5% of all DF consumed—the remaining45.5% of DF was supplied from non-grain foods. Approximately 39% of DF came from grain foodsthat contained no WG, rather these foods contained refined grains, which contain only small amountsof DF but are consumed in large quantities. All WG-containing foods combined contributed a total of15.3% of DF in the American diet.
Table 2. Percent of whole grain and fiber consumed by tertiles of WG (oz. equivalents/100 g food) anddietary fiber (g/100 g food) in diets of Americans ages 2–85 years, 2003–2010.
Whole Grain (Tertiles) Fiber (Tertiles) WG % Fiber % % Reporting
High WG (WG ≥ 1.33) High Fiber (DF ≥ 1.7) 50.4 6.6 7.9Medium WG (0.71 < WG < 1.33) High Fiber (DF ≥ 1.7) 29.9 4.7 7.9
Medium Fiber (0.9 < DF < 1.7) 10.5 0.8 1.1Low Fiber (0 < DF ≤ 0.9) 0.2 0.01 0.02
Low WG (0 < WG ≤ 0.71) High Fiber (DF ≥ 1.7) 8.1 3.0 6.8Medium Fiber (0.9 < DF < 1.7) 0.1 0.1 0.2
Low Fiber (0 < DF ≤ 0.9) 0.9 0.1 0.6No WG Any Fiber (DF > 0) 0.0 39.2 33.1
Total 100.0 54.5
The distribution of total DF contributed by each of the five WG categories is reflected in Figure 1.The distribution did not differ between the total population and the age and gender subgroups,thus, results from the subgroups are not included but are available upon request. As the pie chartsshow, low DF consumers obtained approximatly 2/3 of their daily average DF from food sources thatwere not grains. The proportional contribution of non-grains decreased with increasing level of totalDF in the diet, in that the high DF diets were characterized by having only approximately 35% fromnon-grain food sources but approximately 25% were from medium or high WG foods.
377
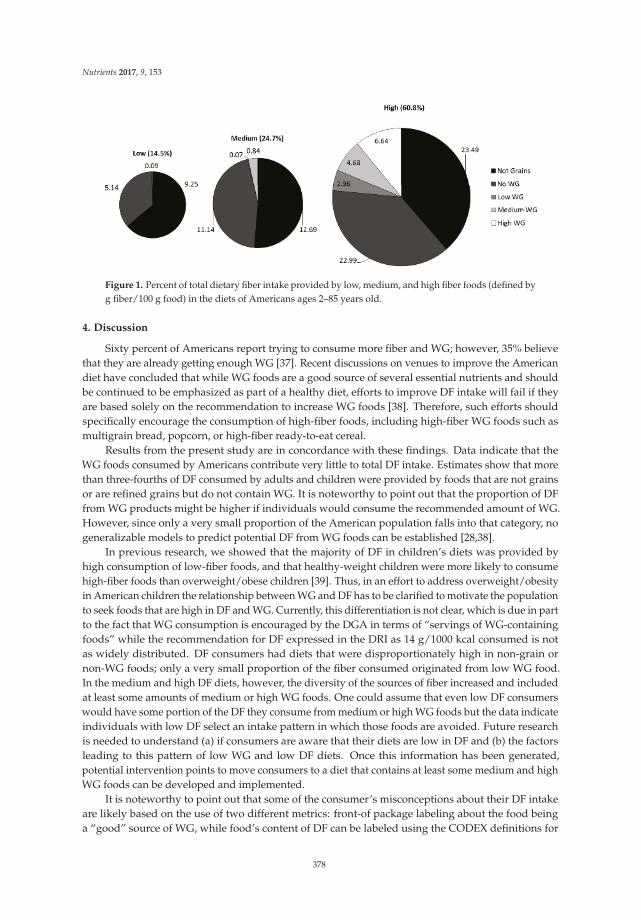
Nutrients 2017, 9, 153
Figure 1. Percent of total dietary fiber intake provided by low, medium, and high fiber foods (defined byg fiber/100 g food) in the diets of Americans ages 2–85 years old.
4. Discussion
Sixty percent of Americans report trying to consume more fiber and WG; however, 35% believethat they are already getting enough WG [37]. Recent discussions on venues to improve the Americandiet have concluded that while WG foods are a good source of several essential nutrients and shouldbe continued to be emphasized as part of a healthy diet, efforts to improve DF intake will fail if theyare based solely on the recommendation to increase WG foods [38]. Therefore, such efforts shouldspecifically encourage the consumption of high-fiber foods, including high-fiber WG foods such asmultigrain bread, popcorn, or high-fiber ready-to-eat cereal.
Results from the present study are in concordance with these findings. Data indicate that theWG foods consumed by Americans contribute very little to total DF intake. Estimates show that morethan three-fourths of DF consumed by adults and children were provided by foods that are not grainsor are refined grains but do not contain WG. It is noteworthy to point out that the proportion of DFfrom WG products might be higher if individuals would consume the recommended amount of WG.However, since only a very small proportion of the American population falls into that category, nogeneralizable models to predict potential DF from WG foods can be established [28,38].
In previous research, we showed that the majority of DF in children’s diets was provided byhigh consumption of low-fiber foods, and that healthy-weight children were more likely to consumehigh-fiber foods than overweight/obese children [39]. Thus, in an effort to address overweight/obesityin American children the relationship between WG and DF has to be clarified to motivate the populationto seek foods that are high in DF and WG. Currently, this differentiation is not clear, which is due in partto the fact that WG consumption is encouraged by the DGA in terms of “servings of WG-containingfoods” while the recommendation for DF expressed in the DRI as 14 g/1000 kcal consumed is notas widely distributed. DF consumers had diets that were disproportionately high in non-grain ornon-WG foods; only a very small proportion of the fiber consumed originated from low WG food.In the medium and high DF diets, however, the diversity of the sources of fiber increased and includedat least some amounts of medium or high WG foods. One could assume that even low DF consumerswould have some portion of the DF they consume from medium or high WG foods but the data indicateindividuals with low DF select an intake pattern in which those foods are avoided. Future researchis needed to understand (a) if consumers are aware that their diets are low in DF and (b) the factorsleading to this pattern of low WG and low DF diets. Once this information has been generated,potential intervention points to move consumers to a diet that contains at least some medium and highWG foods can be developed and implemented.
It is noteworthy to point out that some of the consumer’s misconceptions about their DF intakeare likely based on the use of two different metrics: front-of package labeling about the food beinga “good” source of WG, while food’s content of DF can be labeled using the CODEX definitions for
378
Nutrients 2017, 9, 153
nutrient claims (“high” in fiber (must contain 6 g DF/100 g of food, or 3 g DF per 100 kcal fromthe food, or 20% of dietary reference values delivered in one serving). To eliminate this confusion,packages would have to be labeled with two statements: one concerning the level of WG in the productand another to address the amount of DF in the food.
As all studies based on the NHANES, this study too has several limitations. First, our analysiswas based on self-reported dietary intake records, which may include biased reporting and may not bereflective of the rapidly changing U.S. food supply. Many more high-fiber foods may be available inthe American food supply but if they were not reported by the participants of NHANES, they were notincluded in this analysis. Our approach, therefore, may well underestimate the number of high WG,high-fiber foods in the marketplace. Also, the food industry has responded to the recommendation toconsume more dietary fiber by reformulating food products and adding WG, fiber, or both. Currently itis not possible to differentiate between naturally occurring fibers and fiber added to products, such aswheat bran added to breads. Furthermore, the food supply now also includes different, new, types offiber, which are found in foods in varying proportions and which may have disparate health effects.
Despite the limitations, the strengths of this study include the large, nationally representativesample and the use of four NHANES waves, which increases the variety and number of foods includedin the analysis. Also, unlike other researchers who categorize consumers by their level of WG orDF intake, we focused on a food-based analysis to help explain the high proportion of Americansnot meeting the intake guidelines. Although this effort requires the establishing of a different set ofcut points, it allows the data-driven analysis, thus enhancing our understanding of the populationintake patterns. In this particular instance, the methodology specifically developed for this projectto optimally estimate WG and DF intake sources moves the field beyond other studies, which werelimited by describing intakes in pre-established groups of people who meet or fail to meet the intakerecommendations [40]. Based on the study presented here, public health efforts to change the intakebehavior of those who do not meet the WG and DF intake recommendations can be developed.
5. Conclusions
The Dietary Guidelines for Americans include the recommendation to consume at least 50%of grains from WG and the DRI stipulate that a healthy diet contain 14 g of DF per 1000 kcalconsumed. Most Americans don’t meet either recommendation. The data presented here show that theWG products consumed by Americans are very low in dietary fiber, thus, public health messagingneeds to be changed to encourage consumption of WG foods with high levels of DF to addressboth recommendations.
Acknowledgments: Financial support was provided by the USDA/Agricultural Research Service,(USDA 3062-51000-051-00D) and The Kellogg Citizenship Fund.
Author Contributions: S.K. conceived of this study and led all analysis and the writing of publications andpresentation materials, L.J. and W.J. significantly contributed to the conceptualization of the design, K.D. ledthe statistical analysis, and L.K.J. conducted all programming involved in this study. All authors have read andagreed to the final version of this manuscript.
Conflicts of Interest: The authors declare no conflict of interest. The funding sponsors had no role in the designof the study; in the collection, analyses, or interpretation of data; in the writing of the manuscript, and in thedecision to publish the results.
References
1. U.S. Department of Health and Human Services; U.S. Department of Agriculture. 2015–2020 Dietary
Guidelines for Americans, 8th ed.2015. Available online: https://health.gov/dietaryguidelines/2015/guidelines/ (accessed on 13 December 2016).
2. NHS. How to Get More Fibre into Your Diet. Available online: http://www.nhs.uk/Livewell/Goodfood/Pages/how-to-get-more-fibre-into-your-diet.aspx/ (accessed on 13 January 2017).
379
Nutrients 2017, 9, 153
3. Institute of Medicine of the National Academy of Sciences. Dietary Reference Intakes for
Energy, Carbohydrate, Fiber, Fat, Fatty Acids, Cholesterol, Protein, and Amino Acids (Macronutrients);National Academy Press: Washington, DC, USA, 2002.
4. McGill, C.; Fulgoni, V.L., III; Devareddy, L. Ten-year trends in fiber and whole grain intakes and food sourcesfor the United States population: National Health and Nutrition Examination Survey 2001–2010. Nutrients
2015, 7, 1119. [CrossRef] [PubMed]5. Keast, D.R.; Fulgoni, V.L.; Nicklas, T.A.; O’Neil, C.E. Food sources of energy and nutrients among children in
the United States: National Health and Nutrition Examination Survey 2003–2006. Nutrients 2013, 5, 283–301.[CrossRef] [PubMed]
6. O’Neil, C.E.; Keast, D.R.; Fulgoni, V.L.; Nicklas, T.A. Food sources of energy and nutrients among adults inthe US: NHANES 2003–2006. Nutrients 2012, 4, 2097–2120. [CrossRef] [PubMed]
7. Lin, B.H.; Yen, S.T. The U.S. Grain Consumption Landscape: Who Eats Grain, in What Form, Where, and HowMuch? Economic Research Report Number 50. United States Department of Agriculture, Departmentof Economic Research Service, 2007–2011. Available online: http://purl.umn.edu/55967 (accessed on13 December 2016).
8. Gropper, S.S.; Acosta, P.B. The therapeutic effect of fiber in treating obesity. J. Am. Coll. Nutr. 1987, 6, 533–535.[CrossRef] [PubMed]
9. Johnson, L.; Mander, A.P.; Jones, L.R.; Emmett, P.M.; Jebb, S.A. Energy-dense, low-fiber, high-fat dietarypattern is associated with increased fatness in childhood. Am. J. Clin. Nutr. 2008, 87, 846–854. [PubMed]
10. Slavin, J.L. Dietary fiber and body weight. Nutrition 2005, 21, 411–418. [CrossRef] [PubMed]11. Howarth, N.C.; Huang, T.T.; Roberts, S.B.; McCrory, M.A. Dietary fiber and fat are associated with excess
weight in young and middle-aged US adults. J. Am. Diet. Assoc. 2005, 105, 1365–1372. [CrossRef] [PubMed]12. Du, H.; van der, A.D.; Boshuizen, H.C.; Forouhi, N.G.; Wareham, N.J.; Halkjaer, J.; Tjonneland, A.;
Overvad, K.; Jakobsen, M.U.; Boeing, H.; et al. Dietary fiber and subsequent changes in body weightand waist circumference in European men and women. Am. J. Clin. Nutr. 2010, 91, 329–336. [CrossRef][PubMed]
13. Overby, N.C.; Sonestedt, E.; Laaksonen, D.E.; Birgisdottir, B.E. Dietary fiber and the glycemic index:A background paper for the Nordic nutrition recommendations 2012. Food. Nutr. Res. 2013, 57. [CrossRef][PubMed]
14. Johansson-Persson, A.; Ulmius, M.; Cloetens, L.; Karhu, T.; Herzig, K.H.; Onning, G. A high intake ofdietary fiber influences C-reactive protein and fibrinogen, but not glucose and lipid metabolism, in mildlyhypercholesterolemic subjects. Eur. J. Nutr. 2014, 53, 39–48. [CrossRef] [PubMed]
15. Slavin, J. Fiber and prebiotics: Mechanisms and health benefits. Nutrients 2013, 5, 1417–1435. [CrossRef][PubMed]
16. Kranz, S.; Brauchla, M.; Slavin, J.L.; Miller, K.B. What do we know about dietary fiber intake in children andhealth? The effects of fiber intake on constipation, obesity, and diabetes in children. Adv. Nutr. 2012, 3, 47–53.[CrossRef] [PubMed]
17. Kaczmarczyk, M.M.; Miller, M.J.; Freund, G.G. The health benefits of dietary fiber: Beyond the usualsuspects of type 2 diabetes mellitus, cardiovascular disease and colon cancer. Metabolism 2012, 61, 1058–1066.[CrossRef] [PubMed]
18. Anderson, J.W.; Baird, P.; Davis, R.H., Jr.; Ferreri, S.; Knudtson, M.; Koraym, A.; Waters, V.; Williams, C.L.Health benefits of dietary fiber. Nutr. Rev. 2009, 67, 188–205. [CrossRef] [PubMed]
19. Jonnalagadda, S.S.; Harnack, L.; Hai Liu, R.; McKeown, N.; Seal, C.; Liu, S.; Fahey, G.C. Putting the wholegrain puzzle together: Health benefits associated with whole grains—Summary of American society fornutrition 2010 satellite symposium. J. Nutr. 2011, 141, 1011S–1022S. [CrossRef] [PubMed]
20. Cho, S.S.; Qi, L.; Fahey, G.C.; Klurfeld, D.M. Consumption of cereal fiber, mixtures of whole grain and bran,and whole grains and risk reduction in type 2 diabetes, obesity, and cardiovascular disease. Am. J. Clin. Nutr.
2013, 98, 594–619. [CrossRef] [PubMed]21. World Health Organization. Healthy Diet Fact Sheet n394. Available online: http://www.who.int/
mediacentre/factsheets/fs394/en/ (accessed on 13 January 2017).22. Oldways Trust. Whole Grain Guidelines Worldwide. Available online: http://wholegrainscouncil.org/
whole-grains-101/how-much-enough/whole-grain-guidelines-worldwide (accessed on 13 January 2017).
380
Nutrients 2017, 9, 153
23. U.S. Department of Health and Human Services; U.S. Department of Agriculture. Dietary Guidelines
for Americans 2005. Available online: https://www.cnpp.usda.gov/dietary-guidelines-2005 (accessed on13 December 2016).
24. U.S. Department of Agriculture; U.S. Department of Health and Human Services. Dietary Guidelinesfor Americans 2010. Available online: https://www.cnpp.usda.gov/dietary-guidelines-2010 (accessed on13 December 2016).
25. Krebs-Smith, S.M.; Guenther, P.M.; Subar, A.F.; Kirkpatrick, S.I.; Dodd, K.W. Americans do not meet federaldietary recommendations. J. Nutr. 2010, 140, 1832–1838. [CrossRef] [PubMed]
26. O’Neil, C.E.; Nicklas, T.A.; Zanovec, M.; Cho, S. Whole-grain consumption is associated with diet qualityand nutrient intake in adults: The National Health and Nutrition Examination Survey, 1999–2004. J. Am.
Diet. Assoc. 2010, 110, 1461–1468. [CrossRef] [PubMed]27. Food and Drug Administration. Draft Guideline: Whole Grains Label Statements, Guidance for Industry and FDA
Staff ; Food and Drug Administration: College Park, MD, USA, 2006.28. Clemens, R.; Kranz, S.; Mobley, A.R.; Nicklas, T.A.; Raimondi, M.P.; Rodriguez, J.C.; Slavin, J.L.; Warshaw, H.
Filling America’s fiber intake gap: Summary of a roundtable to probe realistic solutions with a focus ongrain-based foods. J. Nutr. 2012, 142, 1390s–1401s. [CrossRef] [PubMed]
29. Nicklas, T.A.; O’Neil, C.E.; Liska, D.J.; Almeida, N.G.; Fulgoni, V.L., III. Modeling dietary fiber intakes in USadults: Implications for public policy. Food Nutr. Sci. 2011, 2, 925–931. [CrossRef]
30. Reicks, M.; Jonnalagadda, S.; Albertson, A.M.; Joshi, N. Total dietary fiber intakes in the US population arerelated to whole grain consumption: Results from the national health and nutrition examination survey 2009to 2010. Nutr. Res. 2014, 34, 226–234. [CrossRef] [PubMed]
31. U.S. Department of Agriculture. ChooseMyPlate.gov. Available online: https://www.choosemyplate.gov/(accessed on 13 December 2016).
32. Centers for Disease Control and Prevention; National Center for Health Statistics. National Healthand Nutrition Examination Survey (NHANES). Available online: https://www.cdc.gov/nchs/nhanes/(accessed on 13 December 2016).
33. Moshfegh, A.J.; Rhodes, D.G.; Baer, D.J.; Murayi, T.; Clemens, J.C.; Rumpler, W.V.; Paul, D.R.; Sebastian, R.S.;Kuczynski, K.J.; Ingwersen, L.A.; et al. The US Department of Agriculture Automated Multiple-Pass Methodreduces bias in the collection of energy intakes. Am. J. Clin. Nutr. 2008, 88, 324–332. [PubMed]
34. Bowman, S.A.; Friday, J.E.; Moshfegh, A. MyPyramid Equivalents Database, 2.0 for USDA Survey Foods2003–2004. Available online: https://www.ars.usda.gov/northeast-area/beltsville-md/beltsville-human-nutrition-research-center/food-surveys-research-group/docs/mped-databases-for-downloading/(accessed on 26 February 2017).
35. Center for Nutrition Policy and Promotion. CNPP 03-04 Fruit Database. Available online:https://www.cnpp.usda.gov/healthy-eating-index-support-files-03-04 (accessed on 16 February 2017).
36. Food and Nutrient Database for Dietary Studies. Available online: https://www.ars.usda.gov/northeast-area/beltsville-md/beltsville-human-nutrition-research-center/food-surveys-research-group/docs/fndds/ (accessed on 16 February 2017).
37. International Food Information Council. 2016 Food and Health Survey. Available online:http://www.foodinsight.org/sites/default/files/2016-Food-and-Health-Survey-Report_%20FINAL_0.pdf (accessed on 13 December 2016).
38. Mobley, A.R.; Slavin, J.L.; Hornick, B.A. The future of grain foods recommendations in dietary guidance.J. Nutr. 2013, 143, 1527S–1532S. [CrossRef] [PubMed]
39. Brauchla, M.; Juan, W.; Story, J.; Kranz, S. Sources of dietary fiber and the association of fiber intake withchildhood obesity risk (in 2–18 years old) and diabetes risk of adolescents 12–18 years old: NHANES2003–2006. J. Nutr. Metab. 2012, 2012. [CrossRef] [PubMed]
40. Hur, I.Y.; Reicks, M. Relationship between whole-grain intake, chronic disease risk indicators, and weightstatus among adolescents in the National Health and Nutrition Examination Survey, 1999–2004. J. Am.
Diet. Assoc. 2012, 112, 46–55. [CrossRef] [PubMed]
© 2017 by the authors. Licensee MDPI, Basel, Switzerland. This article is an open accessarticle distributed under the terms and conditions of the Creative Commons Attribution(CC BY) license (http://creativecommons.org/licenses/by/4.0/).
381
MDPI AG
St. Alban-Anlage 66
4052 Basel, Switzerland
Tel. +41 61 683 77 34
Fax +41 61 302 89 18
http://www.mdpi.com
Nutrients Editorial Office
E-mail: [email protected]
http://www.mdpi.com/journal/nutrients


MDPI AG
St. Alban-Anlage 66
4052 Basel
Switzerland
Tel: +41 61 683 77 34
Fax: +41 61 302 89 18
www.mdpi.com ISBN 978-3-03842-582-3