comparison of dietary assessment methods in a low-fat dietary intervention program
TRANSCRIPT
This article was downloaded by: [FDA Library]On: 14 December 2013, At: 13:19Publisher: RoutledgeInforma Ltd Registered in England and Wales Registered Number: 1072954 Registered office: Mortimer House,37-41 Mortimer Street, London W1T 3JH, UK
Nutrition and CancerPublication details, including instructions for authors and subscription information:http://www.tandfonline.com/loi/hnuc20
Comparison of Dietary Assessment Methods in a Low-Fat Dietary Intervention ProgramMichael S. Simon , Samir Lababidi , Zora Djuric , Virginia Uhley , Janice Depper , CyndiKresge , David M. Klurfeld & Lance K. HeilbrunPublished online: 18 Nov 2009.
To cite this article: Michael S. Simon , Samir Lababidi , Zora Djuric , Virginia Uhley , Janice Depper , Cyndi Kresge , David M.Klurfeld & Lance K. Heilbrun (2001) Comparison of Dietary Assessment Methods in a Low-Fat Dietary Intervention Program,Nutrition and Cancer, 40:2, 108-117, DOI: 10.1207/S15327914NC402_6
To link to this article: http://dx.doi.org/10.1207/S15327914NC402_6
PLEASE SCROLL DOWN FOR ARTICLE
Taylor & Francis makes every effort to ensure the accuracy of all the information (the “Content”) containedin the publications on our platform. However, Taylor & Francis, our agents, and our licensors make norepresentations or warranties whatsoever as to the accuracy, completeness, or suitability for any purpose of theContent. Any opinions and views expressed in this publication are the opinions and views of the authors, andare not the views of or endorsed by Taylor & Francis. The accuracy of the Content should not be relied upon andshould be independently verified with primary sources of information. Taylor and Francis shall not be liable forany losses, actions, claims, proceedings, demands, costs, expenses, damages, and other liabilities whatsoeveror howsoever caused arising directly or indirectly in connection with, in relation to or arising out of the use ofthe Content.
This article may be used for research, teaching, and private study purposes. Any substantial or systematicreproduction, redistribution, reselling, loan, sub-licensing, systematic supply, or distribution in anyform to anyone is expressly forbidden. Terms & Conditions of access and use can be found at http://www.tandfonline.com/page/terms-and-conditions

Comparison of Dietary Assessment Methods in aLow-Fat Dietary Intervention Program
Michael S. Simon, Samir Lababidi, Zora Djuric, Virginia Uhley,Janice Depper, Cyndi Kresge, David M. Klurfeld, and Lance K. Heilbrun
Abstract: The food frequency questionnaire (FFQ) is com-monly utilized for assessment of dietary fat intake, but its va-lidity among individuals following a low-fat diet is unclear.We evaluated the agreement of nutrient estimates derivedfrom FFQ, 24-h recall, and 3-day food records obtainedfrom 104 participants in a randomized trial of a low-fat di-etary intervention for women at elevated breast cancer risk.Comparisons were made for total calories, percent caloriesfrom fat, and total fat after 1 yr. Correlation was assessedusing standard methods based on a null hypothesis of noagreement between instruments as well as by a methodologybased on a null hypothesis that the instruments should be inagreement. With the use of standard methods, FFQ esti-mates for women on the low-fat diet were significantly cor-related to records only for percent calories from fat (r =0.39), whereas recall and record estimates were signifi-cantly correlated for all three dietary variables. Using thenew method, we found no significant correlation betweenFFQ and either recalls or records for women following alow-fat diet but significant correlation between recall andrecord estimates for total calories (r = 0.67). Traditionalcorrelation testing may overestimate the extent of agreementin dietary instruments among women on a low-fat diet. Wefound empirical support for the nontraditional method.
Introduction
The food frequency questionnaire (FFQ) is the most com-monly utilized instrument for assessment of nutrient intake(1–4) and is currently being used in a number of studies thathave evaluated the association between dietary fat intakeand breast cancer risk (5–10). Numerous previous analyseshave been conducted verifying the validity of FFQs. How-ever, these studies tested the FFQ only among “average” in-dividuals consuming a “usual” American diet (2,11,12).Therefore, the validity of the FFQ as a method of choice for
assessment of fat intake for individuals on a low-fat diet orfor individuals at high risk for cancer is unclear (3,13,14).
Several years ago, the Breast Cancer Prevention Program(BCPP), a two-arm randomized trial of a low-fat dietary in-tervention vs. usual diet in women who were at an elevatedrisk for breast cancer (based on family history, mammo-graphic abnormality, or prior breast biopsies), was com-pleted at our institution (15). Several biomarkers of cancerrisk were quantified, and risk factor and dietary question-naires were administered to the participants (16,17). Dietarydata were collected by registered dietitians at baseline, 3-mointervals, and at 1 yr after randomization using three dietarycollection instruments, which included the Harvard FFQ(12), 3-day food records, and 24-h recalls. The extensive di-etary data collected through the BCPP provides a good re-source with which to address questions regarding dietaryinstrument validity.
The purpose of this study was to compare dietary intakesreported by FFQ, 24-h food recall, and 3-day food recordamong women at an elevated risk for breast cancer on a low-fat dietary intervention as well as for similar women on anonintervention or usual American diet. In this report, weassess the agreement among the three dietary instruments forintakes of total energy, total fat, and percent energy from fat.Given the inconsistency in the literature regarding an associa-tion between dietary fat and breast cancer risk (13,18,19) andthe fact that the results of two large prospective studies areprimarily based on FFQ data (7,10), we believed that it wasimportant to explore the validity of the FFQ among womenwho are most likely to be affected by the results of these stud-ies (i.e., women at an elevated risk for breast cancer). We uti-lized a unique methodology to address the issue of instrumentagreement based on the null hypothesis that the dietary instru-ments should be in agreement, since they measure the sameintakes. Therefore, statistical tests are conducted to detect“significant lack of correlation” instead of “significant corre-lation” (20). This methodology was presented by Hebert and
NUTRITION AND CANCER, 40(2), 108–117Copyright © 2001, Lawrence Erlbaum Associates, Inc.
M. S. Simon, S. Lababidi, Z. Djuric, J. Depper, C. Kresge, and L. K. Heilbrun are affiliated with the Division of Hematology and Oncology, KarmanosCancer Institute at Wayne State University School of Medicine, Detroit, MI 48201. V. Uhley is affiliated with the General Clinical Research Center at theUniversity of Michigan Hospital, Ann Arbor, MI 48109. D. M. Klurfeld is affiliated with the Department of Nutrition and Food Science, Wayne StateUniversity, Detroit, MI 48202.
Dow
nloa
ded
by [
FDA
Lib
rary
] at
13:
19 1
4 D
ecem
ber
2013
Miller in 1991 (20), but, to the best of our knowledge, it hasnot been widely used in dietary research.
Methods
Breast Cancer Prevention Program
Data for this study were collected from participants in theBCPP, which was initiated in 1987 at Harper Hospital, an af-filiate of the Karmanos Cancer Institute and Wayne StateUniversity (15). The program was a randomized interven-tion trial of a low-fat diet (15% of total energy) vs. non-intervention (usual diet) for women at an elevated risk forbreast cancer. Eligible subjects had to meet at least one ofthe following three entry criteria: 1) a first-degree relativewith a history of breast cancer, 2) a P2 or DY Wolfe mam-mographic pattern (21), or 3) a prior breast biopsy demon-strating epithelial hyperplasia with or without atypia. Onlywomen with fat intakes �30% energy from fat, as deter-mined by screening with 3-day food records, were eligiblefor the study. Women were recruited from the BCPP atHarper Hospital as well as the Hospital Corporation ofAmerica Wesley Hospital (Wichita, KS). Participants in thelow-fat diet group were counseled by registered dietitians tofollow a low-fat eating plan, developed by the Nutrition Co-ordinating Center (NCC) at the University of Minnesota andby the American Health Foundation (22). The women on theusual diet consumed ~36% of calories from fat at baseline,and the low-fat group received intensive education to lowerfat consumption to ~15% of the caloric intake.
Data reported here are from 104 women �18 yr of age en-rolled at the two geographic sites that constitute our studycohort subset. Originally, 194 women were randomized andenrolled into the clinical trial (137 from Detroit and 57 fromWichita), of whom 114 provided baseline data and com-pleted postintervention FFQs at 1 yr. Four subjects were ex-cluded because of unreliable dietary data [lack of recall of ameal(s)], and an additional six subjects were excluded be-cause of incomplete FFQ results at 1 yr.
Dietary Assessment
Semiquantitative FFQ: The FFQ was self-administeredby the respondents during a BCPP clinic visit for low-fat andnonintervention women at baseline and at 1 yr after random-ization (12). Respondents reported how often, on average,they consumed each food or beverage, as the number of timesper day, week, or month during the preceding year. Data werecollected for a list of 116 commonly consumed “important”foods and beverages, including usual serving sizes. Otherdata collected included information on supplemental vita-mins, type of supplemental fats, type of fat used for frying orbaking, whether visible fat on meat was consumed, quantityof added bran, frequency of added sugar, type of cooking oil,type of cold breakfast cereal, how often 12 common foodswere changed over the past 10 yr, and frequency of fried
foods. The FFQs were analyzed at the Channing Laboratoryat the Harvard Medical School.
Food records and recalls: Food records were used toassess dietary intake at baseline and 3-mo intervals, alternat-ing Sunday/Monday/Tuesday with Thursday/Friday/Satur-day, to give a more representative sampling of days. If a foodrecord was not received within 2 wk of the assigned date, thesubject was contacted. Dietary data that could not be col-lected within 30 days of the assigned date were consideredmissing.
Food recalls were collected by registered dietitians at 3-mo intervals (except baseline) by appointment or by tele-phone. The majority of food recalls were collected at apreviously scheduled clinic visit that occurred on Tuesdaysand were conducted over the telephone if the subject missedthe clinic appointment. The subjects were aware that threerecalls would be conducted during the course of the studyyear but were not specifically informed of the clinic visits atwhich they would occur. This method allowed for the addedadvantage of face-to-face probing of foods eaten and the useof food models, although it did not allow for completely un-announced recalls.
The two dietitians who collected dietary data weretrained and certified at the NCC for dietary data collectionand dietary intervention. The dietary records and recallswere subsequently sent to the NCC and analyzed for nutri-tional content by the University of Minnesota Nutrition DataSystem software using Food Database version 14 (23). Nu-trient intake data were received on magnetic tape within 3mo. Our previous work (15) showed that mean total fat andtotal caloric intakes collected by food records were stable3–12 mo after randomization, indicating that a food record at1 yr should provide a reasonable comparison to estimates ofintake derived from a 1-yr FFQ.
Statistical Analysis
Our goal was to assess the validity of the FFQ comparedwith food recall and food record data, all collected after 1 yron a randomized dietary intervention study. Comparisonswere made for total caloric intake, percent calories from fat,and total fat in grams. Instrument agreement for FFQ vs.food recall, FFQ vs. food record, and food recall vs. foodrecord was reported as Pearson correlation coefficients (CCs)and 95% confidence intervals. Interinstrument correlationwas assessed using standard methods based on a null hy-pothesis of no agreement between dietary instruments. Wealso performed a new hypothesis testing procedure for theCC (�) based on the approach suggested by Hebert andMiller (20) but with a null hypothesis of Ho: � = 0.7. Thisnull hypothesis was based on past work indicating that mostvalidation studies of dietary instruments declare “agree-ment” between any two instruments whenever the corre-sponding CC lies in the interval 0.5–0.7 (1). Additionalsupport for the use of CC = 0.7 as a benchmark can also be
Vol. 40, No. 2 109
Dow
nloa
ded
by [
FDA
Lib
rary
] at
13:
19 1
4 D
ecem
ber
2013
found in the recent work of Fung et al. (24). The choice of0.7 is only an estimate of what we as well as others believedto be a reasonable estimate of correlation between two di-etary instruments.
To perform this new hypothesis testing procedure, threesteps were involved (25). First, to satisfy the assumption ofnormality, we had to transform the variables (FFQ, food rec-ord, and food recall) using the natural logarithm. Second, weused the Fisher’s Z transformation (Z-r) on the logarith-mically transformed variable from Step 1, where r is the cor-responding CC for a given pair of dietary instruments. TheZ-r transformation is necessary for calculation of the confi-dence limits for the CC. Finally, we performed the statisticalcomparisons between Z-r from Step 2 vs. the null hypothesisvalue z = 0.7. We present two versions of (null) hypothesistesting results: the Ho: � = 0 “traditional CC testing,” andthe Ho: � = 0.7 “nontraditional CC testing” based on thework of Hebert and Miller (20). In “traditional” CC hypothe-sis testing, rejection of the null hypothesis Ho: � = 0 wouldimply that the sample CC was significantly different (P �
0.05) from zero. That can be interpreted as agreement of thetwo dietary instruments, even if the sample CC were ratherlow. In the “nontraditional” CC hypothesis testing, rejectionof the null hypothesis Ho: � = 0.7 would indicate that thesample CC was significantly different from (and lower than)0.7. We also modified our application of the work of Hebertand Miller by computing one-sided, rather than two-sided, Pvalues. The detailed statistical rationale for this modificationwill be reported separately.
Because we chose � = 0.7 as representing a minimumlevel of agreement, rejecting Ho here means that the two di-etary instruments are “not in agreement.” Failing to rejectthat Ho means that we cannot reject the (null) hypothesisthat their (true, unknown) CC = 0.7 and that they are, thus,“in agreement.” Hence, in this statistical testing approach, P� 0.05 indicates evidence of statistically significant agree-ment in the two dietary instruments, which is the opposite ofthe traditional approach.
To examine whether the extent of agreement of a givenpair of dietary instruments differed statistically by diet arm(low-fat vs. nonintervention), we used regression models.Intake calculated from one instrument was regressed on in-take calculated from the other instrument, with a binary vari-able denoting diet arm as a second predictor, along with thecross product of those two terms to model their interactioneffect. Statistical significance of the interaction term (P �
0.05) was taken as evidence that the relationship of dietaryintake measured by the two instruments differed by studyarm in an important way. In that event, dietary agreementthen depended significantly on diet arm.
Results
Table 1 shows the demographic and risk factor character-istics of the BCPP study cohort at the time of randomizationby diet group. The mean age of the 104 participants was 46
yr; ~90% were white, 70% were married, 77% had completedmore than high school, and 77% were working full- or part-time. There were no statistically significant differences in de-mographic characteristics by diet group, except for maritalstatus. There were notably fewer separated women on thelow-fat diet and more divorced women on the low-fat diet.
In terms of risk factor eligibility, family history of breastcancer (in a 1st-degree relative) accounted for 72% of allparticipants. About 55% of the women had a P2 or DYmammographic pattern. Only 36 women (35%) were knownto have had a prior breast biopsy, and �10% of those had epi-thelial hyperplasia with or without atypia (data not shown).There was only one significant difference in risk factor eligi-bility by diet group: fewer women on the low-fat diet hadmore than one first-degree relative with a history of breastcancer.
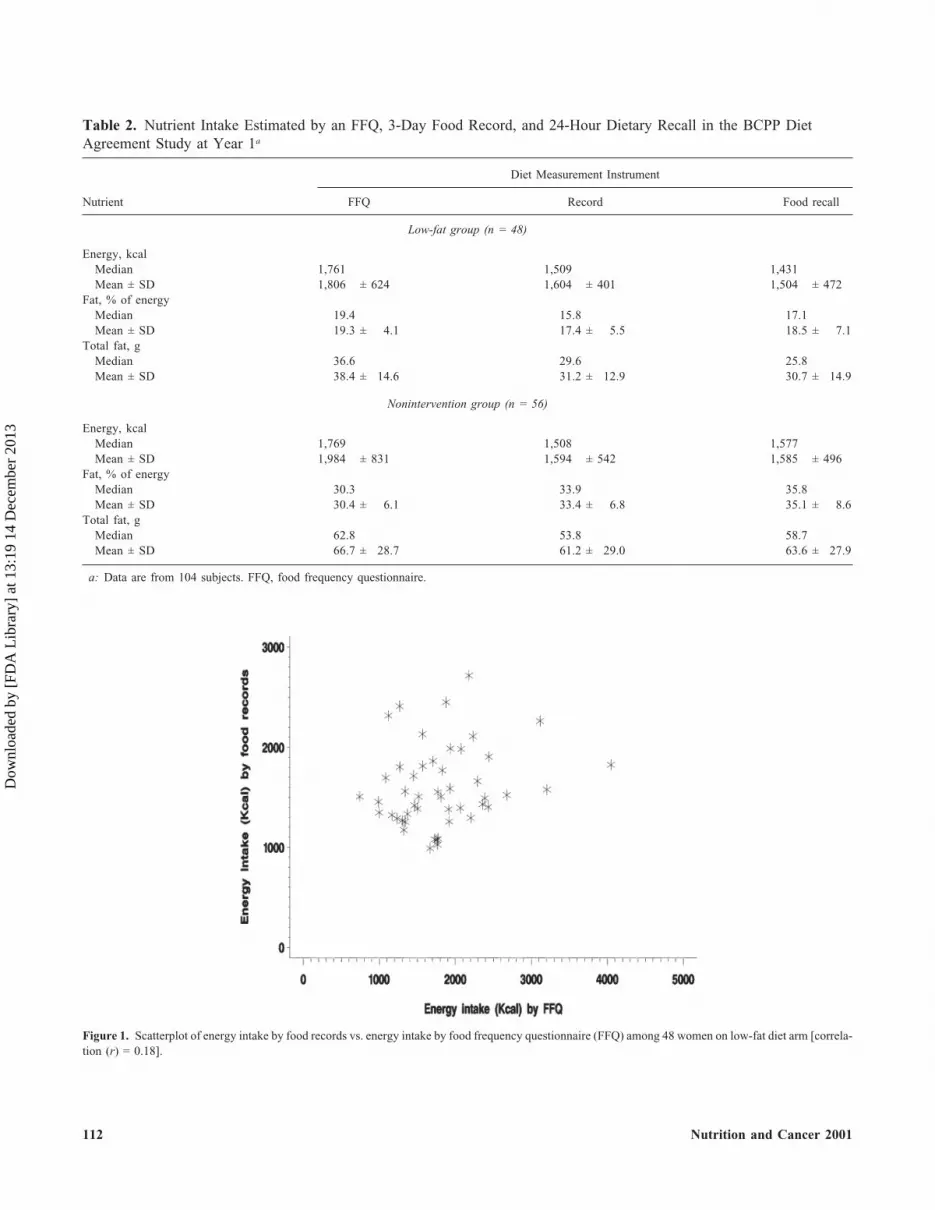
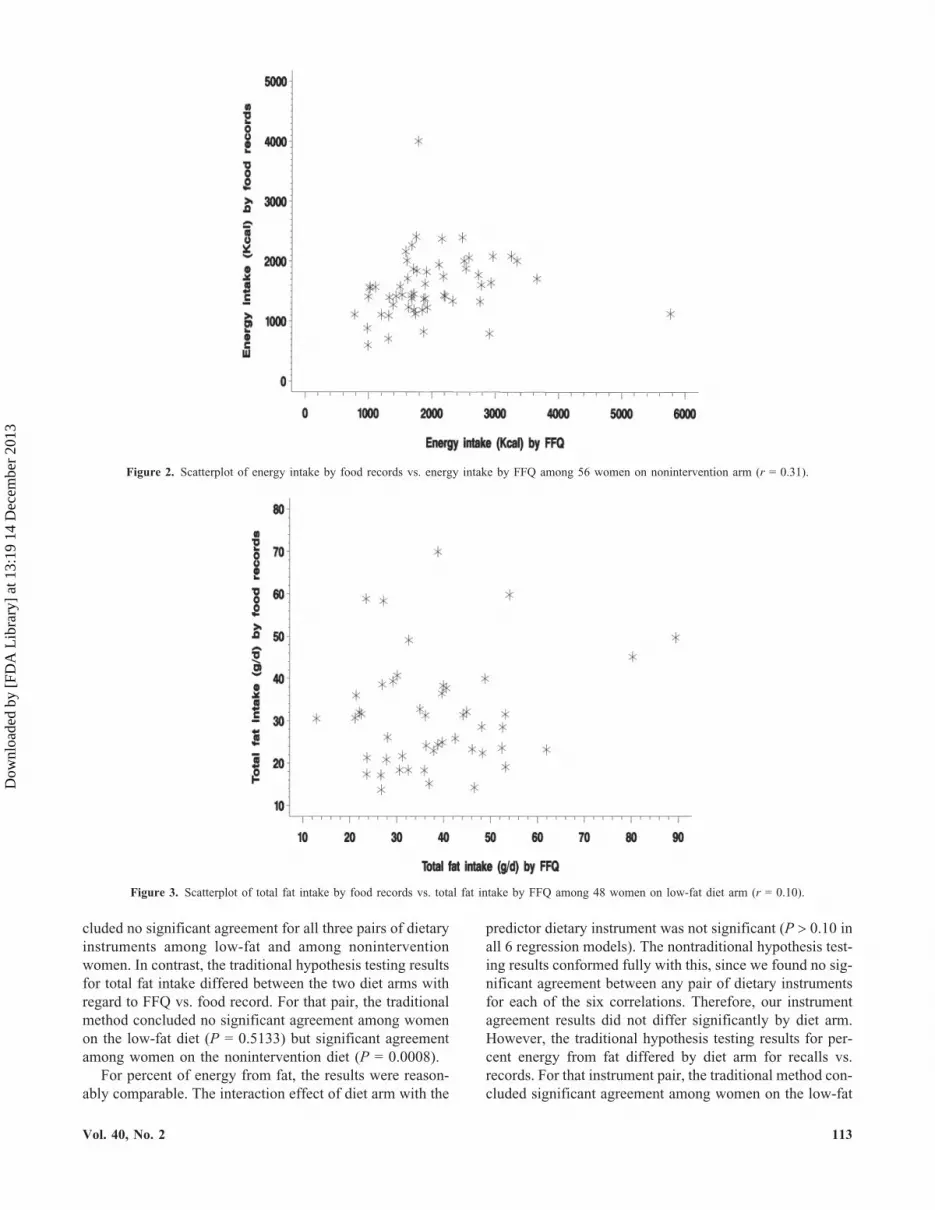
Table 2 shows the median and mean nutrient intakes oftotal energy, percent energy from fat, and total fat (in grams)estimated by an FFQ, food record, and food recall for partic-ipants in the BCPP at 1 yr. Overall, the energy intakes forwomen on the low-fat and nonintervention diets were simi-lar, and the fat intake for the low-fat group was roughly halfthat of the nonintervention cohort. For the most part, nutrientestimates from the FFQ were greater than those from recordsor recalls, except for percent energy from fat in the non-intervention diet group, for which a lower estimate was de-rived from the FFQ than from the other instruments. Fortotal energy, mean intakes estimated by the FFQ were within13% of the food records and 20% of the food recalls for thelow-fat diet group and within 25% of the food records andrecalls for the nonintervention group. The energy intake ofthe 48 women on the low-fat diet, as measured by FFQ, wassomewhat higher (and more variable) than that measured byfood records (Fig. 1). A similar pattern was observed for thewomen on the nonintervention diet (Fig. 2).
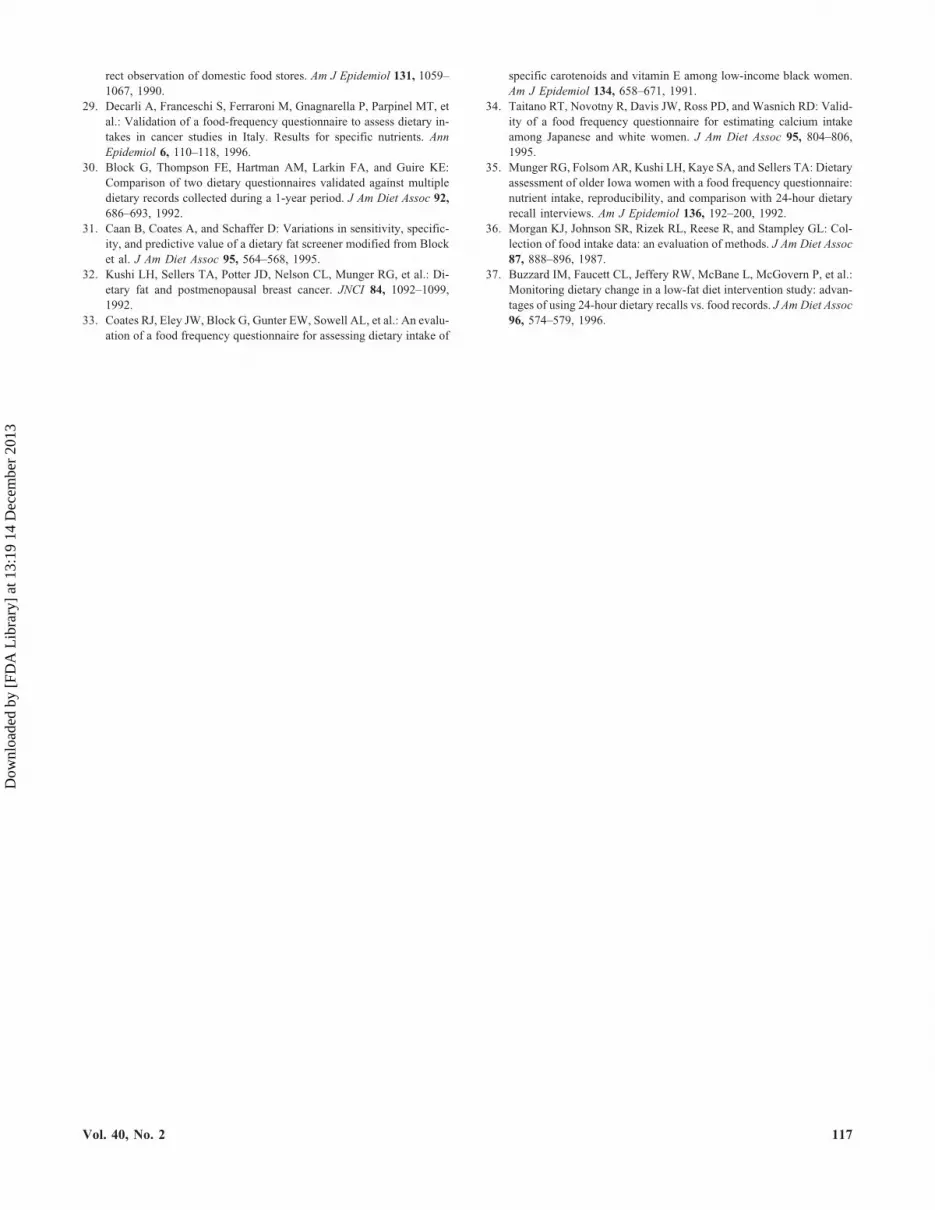
For percent of energy from fat, mean intakes estimated bythe FFQ were within 11% of the food records and 4% of thefood recalls for the low-fat group and within 9% of the foodrecords and 13% of the food recalls for the noninterventiongroup. For total fat, mean intakes estimated by the FFQ werewithin 23% of the food records and 25% of the food recallsfor the low-fat group and within 9% of the food records and5% of the food recalls for the nonintervention group. Fat in-take of the women on the low-fat diet, as measured by FFQ,was somewhat higher than that measured by food records(Fig. 3), but the two instruments had similar variability. Wefound a similar pattern among the nonintervention women(Fig. 4).
Table 3 lists the CCs (along with their 95% confidenceintervals) between nutrient intake estimates from FFQ vs.food record, FFQ vs. food recall, and record vs. recall. Cor-relations are listed for total energy, percent energy from fat,and total fat. We present the Ho: � = 0 traditional hypothesistest as well as a Ho: � = 0.7 nontraditional hypothesis testbased on the work of Hebert and Miller (20). Hypothesistesting by the traditional method showed nine instances ofagreement between food recall and food record or between
110 Nutrition and Cancer 2001
Dow
nloa
ded
by [
FDA
Lib
rary
] at
13:
19 1
4 D
ecem
ber
2013

FFQ and food record across the three nutrient measures.However, the assessment using the hypothesis Ho: � = 0.7showed only one instance of agreement, which was betweenfood recall and food record for total calories in the low-fatdiet group. The traditional method approach did not showany examples of statistically significant agreement betweenFFQ and food recall, and the nontraditional approach did notshow any examples of statistically significant agreement be-tween FFQ and either of the other two dietary measurementinstruments.
To explore the potential diet arm dependence of thesefindings, we fit regression models for each of the three pairsof dietary instruments. Because correlation does not distin-
guish between independent and dependent variable, we fiteach regression model twice, after exchanging the two dietinstruments’ roles as independent and dependent variables.This generated six regression models for each nutrient (3pairs of dietary instruments × 2 choices of dependent vari-able for each pair).
For fat intake, the interaction effect of diet arm with thepredictor (independent) dietary instrument was not signifi-cant (P � 0.35 in all 6 models). Therefore, the relationship offat intake estimates from any pair of dietary instrumentsshould not differ in a statistically important way by diet arm.This finding conforms fully to the nontraditional hypothesistesting results for total fat intake (Table 3), since we con-
Vol. 40, No. 2 111
Table 1. Demographic and Risk Factor Characteristics of our BCPP Study Cohort Subset by Diet Groupa
Low-Fat Diet(n = 48)
Usual Diet(n = 56) P Valueb
Age, yr (mean ± SD) 46.0 ± 10.0 46.1 ± 9.3 0.881c
Age, yr 1.000�35 7 (15) 8 (14)
35–50 25 (52) 29 (52)�51 16 (33) 19 (34)
Race/ethnicity 0.646Caucasian 43 (91) 48 (87)African-American 4 (9) 5 (9)Hispanic 0 (0) 2 (4)
Marital status 0.025Single 5 (11) 7 (13)Married 35 (76) 36 (65)Divorced 3 (7) 0 (0)Separated 1 (2) 10 (18)Widowed 2 (4) 2 (4)
Education 0.843Grade 7–9 1 (2) 0 (0)Grade 10–12 1 (2) 1 (2)High school graduate 11 (24) 9 (16)Some college 15 (33) 23 (42)College graduate 7 (15) 10 (18)Some graduate school 6 (13) 5 (9)Graduate degree 5 (11) 7 (13)
Employment 0.721Working full-time 25 (54) 27 (49)Working part-time 11 (24) 15 (27)Homemaker 5 (11) 10 (18)Retired 3 (7) 2 (4)Unemployed 2 (4) 1 (2)
Family history of breast cancer 0.040No affected 1st-degree relative 16 (35) 12 (22)1 affected 1st-degree relative 28 (61) 32 (58)
�1 affected 1st-degree relative 2 (4) 11 (20)Prior breast biopsy 0.589
None 27 (59) 38 (69)1 8 (17) 7 (13)
�1 11 (24) 10 (18)Mammographic pattern 0.327
Normal 19 (40) 28 (50)P2/DY 29 (60) 28 (50)
a: Data are from a total of 104 subjects. Effective sample size was �104 for some characteristics because of occasional missing data. Values represent numberof subjects, with percentage in parentheses, unless otherwise noted. Percentage is from distribution of women across categories of that characteristic.BCPP, Breast Cancer Prevention Program.
b: From Fisher’s exact test (2-sided), unless stated otherwise.c: From Wilcoxon rank sum test.
Dow
nloa
ded
by [
FDA
Lib
rary
] at
13:
19 1
4 D
ecem
ber
2013
112 Nutrition and Cancer 2001
Table 2. Nutrient Intake Estimated by an FFQ, 3-Day Food Record, and 24-Hour Dietary Recall in the BCPP DietAgreement Study at Year 1a
Diet Measurement Instrument
Nutrient FFQ Record Food recall
Low-fat group (n = 48)
Energy, kcalMedian 1,761 1,509 1,431Mean ± SD 1,806 ± 624 1,604 ± 401 1,504 ± 472
Fat, % of energyMedian 19.4 15.8 17.1Mean ± SD 19.3 ± 4.1 17.4 ± 5.5 18.5 ± 7.1
Total fat, gMedian 36.6 29.6 25.8Mean ± SD 38.4 ± 14.6 31.2 ± 12.9 30.7 ± 14.9
Nonintervention group (n = 56)
Energy, kcalMedian 1,769 1,508 1,577Mean ± SD 1,984 ± 831 1,594 ± 542 1,585 ± 496
Fat, % of energyMedian 30.3 33.9 35.8Mean ± SD 30.4 ± 6.1 33.4 ± 6.8 35.1 ± 8.6
Total fat, gMedian 62.8 53.8 58.7Mean ± SD 66.7 ± 28.7 61.2 ± 29.0 63.6 ± 27.9
a: Data are from 104 subjects. FFQ, food frequency questionnaire.
Figure 1. Scatterplot of energy intake by food records vs. energy intake by food frequency questionnaire (FFQ) among 48 women on low-fat diet arm [correla-tion (r) = 0.18].
Dow
nloa
ded
by [
FDA
Lib
rary
] at
13:
19 1
4 D
ecem
ber
2013
cluded no significant agreement for all three pairs of dietaryinstruments among low-fat and among noninterventionwomen. In contrast, the traditional hypothesis testing resultsfor total fat intake differed between the two diet arms withregard to FFQ vs. food record. For that pair, the traditionalmethod concluded no significant agreement among womenon the low-fat diet (P = 0.5133) but significant agreementamong women on the nonintervention diet (P = 0.0008).
For percent of energy from fat, the results were reason-ably comparable. The interaction effect of diet arm with the
predictor dietary instrument was not significant (P � 0.10 inall 6 regression models). The nontraditional hypothesis test-ing results conformed fully with this, since we found no sig-nificant agreement between any pair of dietary instrumentsfor each of the six correlations. Therefore, our instrumentagreement results did not differ significantly by diet arm.However, the traditional hypothesis testing results for per-cent energy from fat differed by diet arm for recalls vs.records. For that instrument pair, the traditional method con-cluded significant agreement among women on the low-fat
Vol. 40, No. 2 113
Figure 2. Scatterplot of energy intake by food records vs. energy intake by FFQ among 56 women on nonintervention arm (r = 0.31).
Figure 3. Scatterplot of total fat intake by food records vs. total fat intake by FFQ among 48 women on low-fat diet arm (r = 0.10).
Dow
nloa
ded
by [
FDA
Lib
rary
] at
13:
19 1
4 D
ecem
ber
2013

diet (P = 0.0110) but not for women on the noninterventiondiet (P = 0.5053). This again contradicts the finding of anonsignificant interaction effect in all six regression modelsand, taken together, lends empirical support to the nontradi-tional hypothesis testing approach as the preferred method.
For energy intake, we found no significant interaction ef-fect of diet arm with the predictor dietary instrument forFFQ/recall modeling or for FFQ/record modeling (P � 0.14for all 4 models). Therefore, our conclusions of no signifi-cant agreement of those pairs of instruments should hold forboth diet arms. The nontraditional hypothesis testing resultsshowed that for all four relevant correlations. However, thetraditional method declared no significant agreement of FFQand records among women on the low-fat diet (P = 0.2257)but significant agreement among women on the noninter-vention diet (P = 0.0221), thus contradicting the regressionmodeling results.
Finally, for recalls vs. food records, the regression model-ing revealed a nonsignificant interaction effect (P = 0.6901)of diet arm and energy intake by recall as the predictor in-strument. However, when energy intake from food recordswas the predictor, the analogous interaction effect was sig-nificant (P = 0.0386). Because at least one of the two rele-
114 Nutrition and Cancer 2001
Figure 4. Scatterplot of total fat intake by food records vs. total fat intakeby FFQ among 56 women on nonintervention arm (r = 0.43).
Table 3. Results of Dietary Comparisons for the FFQ, Food Record, and Food Recall at Year 1 Using Two HypothesisTesting Procedures in Our BCPP Study Cohort Subseta
Hypothesis Testing Procedures
CC (95% CI)Ho: � = 0
(traditional)Ho: � = 0.7b
(nontraditional)
Low-Fat Group (n = 48)
Energy (kcal)FFQ/recall 0.26 (�0.02 to 0.51) 0.0727 �0.0001FFQ/record 0.18 (�0.11 to 0.44) 0.2257 �0.0001Recall/record 0.67 (0.48 to 0.80) 0.0001c 0.3615c
Fat (% of energy)FFQ/recall �0.01 (�0.29 to 0.28) 0.9540 �0.0001FFQ/record 0.39 (0.12 to 0.60) 0.0066c 0.0010Recall/record 0.36 (0.09 to 0.59) 0.0110c 0.0006
Total fat (g)FFQ/recall 0.09 (�0.20 to 0.36) 0.5492 �0.0001FFQ/record 0.10 (�0.19 to 0.37) 0.5133 �0.0001Recall/record 0.44 (0.18 to 0.64) 0.0018c 0.0039
Nonintervention group (n = 56)
Energy (kcal)FFQ/recall 0.06 (�0.20 to 0.32) 0.6493 �0.0001FFQ/record 0.31 (0.05 to 0.53) 0.0221c �0.0001Recall/record 0.52 (0.30 to 0.69) 0.0001c 0.0187
Fat (% of energy)FFQ/recall 0.10 (�0.17 to 0.36) 0.4560 �0.0001FFQ/record 0.44 (0.20 to 0.63) 0.0008c 0.0018Recall/record 0.09 (�0.18 to 0.35) 0.5053 �0.0001
Total fat (g)FFQ/recall 0.06 (�0.20 to 0.32) 0.6372 �0.0001FFQ/record 0.43 (0.19 to 0.63) 0.0008c 0.0017Recall/record 0.38 (0.13 to 0.58) 0.0042c 0.0003
a: Cohort subset consisted of 104 subjects. CC, Pearson correlation coefficient; CI, confidence interval.b: Based on a correlation coefficient of 0.7 as indicative of maximum agreement between dietary instruments (1,20).c: Statistically significant “in agreement” by this method of CC hypothesis testing.
Dow
nloa
ded
by [
FDA
Lib
rary
] at
13:
19 1
4 D
ecem
ber
2013

vant regression models had a significant interaction term, itsuggested that the recall vs. record energy intake agreement(yes/no) conclusions should differ by diet arm. The tradi-tional hypothesis testing method contradicts this, since itconcluded that there was significant agreement on each dietarm (P = 0.0001 for either). However, the nontraditional hy-pothesis testing method did identify the pattern indicated bythe regression modeling: significant recall/record energy in-take agreement among women on the low-fat diet (Fig. 5)but not among women on the nonintervention diet (Fig. 6).This unexpected observation lends further empirical supportto the nontraditional hypothesis testing method for assessingdietary agreement.
Discussion
The purpose of this study was to investigate the FFQ asan accurate tool for assessment of dietary intake amongwomen at an elevated risk for breast cancer who were partic-ipating in a low-fat vs. nonintervention dietary interventionprogram. The FFQ is the most commonly utilized instru-ment for assessment of dietary fat intake (1–4). It has beenused for several retrospective and prospective analyses ofdiet and cancer (5–9) and is the main diet comparison in-strument being used for the Women’s Health Initiative (10).Because many prior validation studies have used as their ref-erence population healthy individuals consuming a usualAmerican diet (11,12,26–34), we believed that it would beworthwhile to evaluate data derived from women at highrisk for breast cancer, since these women are the likely tar-gets for other cancer-prevention efforts.
The work described here is unique, in that we used amethodology to address the issue of instrument agreement
that has not been utilized in other settings. Prior validationwork has been, for the most part, based on a null hypothesisof “no agreement” between dietary instruments (10–12,26,27,29,30,32). It was our belief that since different dietary in-take instruments are supposed to measure roughly the samefood intake, it was more appropriate to test a null hypothesisof instrument agreement, as was proposed by Hebert andMiller in 1991 (20). Although Hebert and Miller used a nullhypothesis CC of 0.95 (Ho: � = 0.95), we believed that wastoo stringent and that 0.7 (Ho: � = 0.7) was more consistentwith prior diet agreement studies reported in the literature(1). The methodology that we utilized was first presented in1991 but, to the best of our knowledge, has not been widelyused by others in dietary research.
In our data set, nutrient intake as estimated by FFQ wasgreater than that measured by food record or recall. This isconsistent with some validation studies (27,29,30), but oth-ers showed lower mean nutrient intake levels from FFQ thanfrom records and/or recalls (10–12,26,35). By traditional hy-pothesis testing methods, our data substantiated the goodcorrelation between food records and recalls seen in the lit-erature (36) but showed significant correlation between FFQand 3-day food record data mainly in the noninterventiondiet group, indicating that the FFQ may not be as valuableamong women consuming a low-fat diet. In addition, utiliz-ing a variant of the methodology of Hebert and Miller (20),the FFQ did not correlate with any of the other measurementmethods. This is in contrast to the majority of other pub-lished validation studies where the FFQ did correlate withother measures of intake (10–12,26,27,29,30,35). Through aformal analysis (regression modeling with interaction effecttesting), we have identified those instances where dietary in-strument agreement (yes/no) should be consistent (or should
Vol. 40, No. 2 115
Figure 5. Scatterplot of energy intake by 24-h recalls vs. energy intake byfood records among 48 women on low-fat diet arm (r = 0.67).
Figure 6. Scatterplot of energy intake by 24-h recalls vs. energy intake byfood records among 56 women on nonintervention arm (r = 0.52).
Dow
nloa
ded
by [
FDA
Lib
rary
] at
13:
19 1
4 D
ecem
ber
2013

differ) between the two diet arms (low-fat diet vs. non-intervention). That work also provided empirical support infavor of the nontraditional method of CC hypothesis testing(our variant of the method of Hebert and Miller) for assess-ing dietary instrument agreement.
Although this study was unique, in that we were able tocompare measurements recorded by FFQ with food recordand food recall data among women on low-fat as well asusual diets, there are a number of potential weaknesses. In-herent in all studies measuring dietary intake by whatevermethodology, there is always the possibility of adherencebias. Because our recalls were not completely unannounced,this was a possibility here. Also, there was a relatively smallsample size in each diet group, and the use of the Ho: � = 0.7may not be universally accepted as the standard on which tobase the validation of the FFQ. In addition, we comparedFFQ results with results obtained from a 3-day food recordand 24-h dietary recall derived at one time point. Although itmay have been better to compare FFQ with the mean of mul-tiple recalls or food records, our previous published data in-dicate the stability of the food record data 3–12 mo afterrandomization (15), and our unpublished data indicate com-parable stability of the 24-h recall data. One other study hasshown the potential value of multiple 24-h dietary recalls inassessing food intake (37).
We conclude that traditional correlation testing may over-estimate the extent of agreement in dietary instrumentsamong women on a low-fat diet. Despite its convenience,the FFQ does not appear to be a useful surrogate for foodrecords or recalls in our study population.
Acknowledgments and Notes
This work was done at the Karmanos Cancer Institute at Wayne StateUniversity (Detroit, MI). This research was supported in part by the Mari-lyn J. Smith Fund, Harper-Grace Hospitals, the Wesley Foundation, Na-tional Cancer Institute Contract CN-55423, Karmanos Cancer InstituteCore Grant CA-22453, and the United Foundation of Detroit. Addresscorrespondence to M. S. Simon, Harper Hospital - 513 Hudson, 3990 JohnR. St., Detroit, MI 48201. E-mail: [email protected].
Submitted 16 November 2000; accepted in final form 23 April 2001.
References
1. Willett WC: Nutritional Epidemiology. New York: Oxford UniversityPress, 1990.
2. Block G and Subar AF: Estimates of nutrient intake from a food fre-quency questionnaire: the 1987 National Health Interview Survey. JAm Diet Assoc 92, 969–977, 1992.
3. Zulkifli SN and Yu SM: The food frequency method for dietary assess-ment. J Am Diet Assoc 92, 681–685, 1992.
4. Kushi LH: Gaps in epidemiologic research methods: design consider-ations for studies that use food-frequency questionnaires. Am J ClinNutr 59, 180S–184S, 1994.
5. Rohan TE, McMichael AJ, and Baghurst PA: A population-basedcase-control study of diet and breast cancer in Australia. Am J Epi-demiol 128, 478–489, 1988.
6. Howe GR, Hirohata T, Hislop G, Iscovich JM, Yuan JM, et al.: Dietaryfactors and risk of breast cancer: combined analysis of 12 case-controlstudies. JNCI 82, 561–569, 1990.
7. Willett WC, Hunter DJ, Stampfer MJ, Colditz G, Manson JE, et al.: Di-etary fat and fiber in relation to risk of breast cancer. JAMA 268,2037–2044, 1992.
8. Hunter DJ, Spiegelman D, Adami H, Beeson L, and Van Den BrantPA: Cohort studies of fat intake and the risk of breast cancer—a pooledanalysis. N Engl J Med 334, 356–361, 1996.
9. Wolk A, Bergstrom R, Hunter D, Willett W, Ljung H, et al.: A pro-spective study of association of monounsaturated fat and other types offat with risk of breast cancer. Arch Intern Med 158, 41–45, 1998.
10. Patterson RE, Kristal AR, Tinker LF, Carter RA, Bolton MP, et al.:Measurement characteristics of the Women’s Health Initiative foodfrequency questionnaire. Ann Epidemiol 9, 178–187, 1999.
11. Willett WC, Sampson L, Stampfer MJ, Rosner B, Bain C, et al.:Reproducibility and validity of a semiquantitative food frequencyquestionnaire. Am J Epidemiol 122, 51–65, 1985.
12. Willett WC, Reynolds RD, Cottrell-Hoehner S, Sampson L, andBrowne ML: Validation of a semiquantitative food frequency ques-tionnaire: comparison with a 1-year diet record. J Am Diet Assoc 87,43–47, 1987.
13. Wynder EL, Cohen LA, Rose DP, and Stellman SD: Dietary fat andbreast cancer: where do we stand on the evidence? J Clin Epidemiol47, 217–222, 1994.
14. Wynder EL, Cohen LA, Muscat JE, Winters B, Dwyer JT, et al.: Breastcancer: weighing the evidence for a promoting role of dietary fat. JNCI89, 766–775, 1997.
15. Simon MS, Heilbrun LK, Boomer A, Kresge C, Depper J, et al.: A ran-domized trial of a low-fat dietary intervention in women at high risk forbreast cancer. Nutr Cancer 27, 136–142, 1997.
16. Djuric Z, Heilbrun LK, Reading BA, Boomer A, Valeriote FA, et al.:Effects of a low-fat diet on levels of oxidative damage to DNA in hu-man peripheral nucleated blood cells. JNCI 83, 766–769, 1991.
17. Ensley J, Weaver D, Benitez P, An T, Maciorowski Z, et al.: Dietarymodulation of abnormal DNA histograms from breast aspirates of pa-tients at high risk for developing breast cancer. Int J Cancer Mol Biol1, 45–51, 1994.
18. Hankin JH: Role of nutrition in women’s health: diet and breast cancer.J Am Diet Assoc 93, 994–999, 1993.
19. Willett W: Response to Wynder et al.’s paper on dietary fat and breastcancer. J Clin Epidemiol 47, 223–226, 1994.
20. Hebert JR and Miller DR: The inappropriateness of conventional useof the correlation coefficient in assessing validity and reliability of di-etary assessment methods. Eur J Epidemiol 7, 339–343, 1991.
21. Funkhauser E, Waterboro FW, and Cole P: Mammographic patternsand breast cancer risk: a meta-analysis. Breast Dis 6, 277–284, 1993.
22. Buzzard IM, Asp EH, Chlebowski RT, Boyar AP, Jeffery RW, et al.:Diet intervention methods to reduce fat intake: nutrient and food groupcomposition of self-selected low-fat diets. J Am Diet Assoc 90, 42–50,1990.
23. Dennis B, Ernst N, Hjortland M, Tillotson J, and Grambsch V: TheNHLBI nutrition data system. J Am Diet Assoc 77, 641–647, 1980.
24. Fung TT, Rimm EB, Spiegelman D, Rifai N, Tofler GH, et al.: Associ-ation between dietary patterns and plasma biomarkers of obesity andcardiovascular disease risk. Am J Clin Nutr 73, 61–67, 2001.
25. Snedecor GW and Cochran WG: Statistical Methods, 7th ed. Ames,IA: Iowa State University Press, 1980.
26. Block G, Woods M, Potosky A, and Clifford C: Validation of a self-administered diet history questionnaire using multiple diet records. JClin Epidemiol 43, 1327–1335, 1990.
27. Jain M, Howe GR, and Rohan T: Dietary assessment in epidemiology:comparison of a food frequency and a diet history questionnaire with a7-day food record. Am J Epidemiol 143, 953–960, 1996.
28. Horwath CC and Worsley A: Assessment of the validity of a food fre-quency questionnaire as a measure of food use by comparison with di-
116 Nutrition and Cancer 2001
Dow
nloa
ded
by [
FDA
Lib
rary
] at
13:
19 1
4 D
ecem
ber
2013
rect observation of domestic food stores. Am J Epidemiol 131, 1059–1067, 1990.
29. Decarli A, Franceschi S, Ferraroni M, Gnagnarella P, Parpinel MT, etal.: Validation of a food-frequency questionnaire to assess dietary in-takes in cancer studies in Italy. Results for specific nutrients. AnnEpidemiol 6, 110–118, 1996.
30. Block G, Thompson FE, Hartman AM, Larkin FA, and Guire KE:Comparison of two dietary questionnaires validated against multipledietary records collected during a 1-year period. J Am Diet Assoc 92,686–693, 1992.
31. Caan B, Coates A, and Schaffer D: Variations in sensitivity, specific-ity, and predictive value of a dietary fat screener modified from Blocket al. J Am Diet Assoc 95, 564–568, 1995.
32. Kushi LH, Sellers TA, Potter JD, Nelson CL, Munger RG, et al.: Di-etary fat and postmenopausal breast cancer. JNCI 84, 1092–1099,1992.
33. Coates RJ, Eley JW, Block G, Gunter EW, Sowell AL, et al.: An evalu-ation of a food frequency questionnaire for assessing dietary intake of
specific carotenoids and vitamin E among low-income black women.Am J Epidemiol 134, 658–671, 1991.
34. Taitano RT, Novotny R, Davis JW, Ross PD, and Wasnich RD: Valid-ity of a food frequency questionnaire for estimating calcium intakeamong Japanese and white women. J Am Diet Assoc 95, 804–806,1995.
35. Munger RG, Folsom AR, Kushi LH, Kaye SA, and Sellers TA: Dietaryassessment of older Iowa women with a food frequency questionnaire:nutrient intake, reproducibility, and comparison with 24-hour dietaryrecall interviews. Am J Epidemiol 136, 192–200, 1992.
36. Morgan KJ, Johnson SR, Rizek RL, Reese R, and Stampley GL: Col-lection of food intake data: an evaluation of methods. J Am Diet Assoc87, 888–896, 1987.
37. Buzzard IM, Faucett CL, Jeffery RW, McBane L, McGovern P, et al.:Monitoring dietary change in a low-fat diet intervention study: advan-tages of using 24-hour dietary recalls vs. food records. J Am Diet Assoc96, 574–579, 1996.
Vol. 40, No. 2 117
Dow
nloa
ded
by [
FDA
Lib
rary
] at
13:
19 1
4 D
ecem
ber
2013