diagnostics of the tropical tropopause layer from in-situ observations and ccm data
TRANSCRIPT
ACPD9, 11659–11698, 2009
Diagnostics of theTTL
E. Palazzi et al.
Title Page
Abstract Introduction
Conclusions References
Tables Figures
J I
J I
Back Close
Full Screen / Esc
Printer-friendly Version
Interactive Discussion
Atmos. Chem. Phys. Discuss., 9, 11659–11698, 2009www.atmos-chem-phys-discuss.net/9/11659/2009/© Author(s) 2009. This work is distributed underthe Creative Commons Attribution 3.0 License.
AtmosphericChemistry
and PhysicsDiscussions
This discussion paper is/has been under review for the journal Atmospheric Chemistryand Physics (ACP). Please refer to the corresponding final paper in ACP if available.
Diagnostics of the Tropical TropopauseLayer from in-situ observations and CCMdataE. Palazzi1, F. Fierli1, F. Cairo1, C. Cagnazzo2, G. Di Donfrancesco3,E. Manzini2,4, F. Ravegnani1, C. Schiller5, F. D’Amato6, and C. M. Volk7,*
1ISAC-Institute for Atmospheric Sciences and Climate, National Research Council, Italy2CMCC-Centro Euro-Mediterraneo per i Cambiamenti Climatici, Italy3ENEA-Ente Nuove Tecnologie Energia e Ambiente, Rome, Italy4INGV-Istituto Nazionale di Geofisica e Vulcanologia, Italy5FZJ, Forschungzentrum Julich, GMBH, Germany6INOA-CNR, Istituto Nazionale di Ottica Applicata, Italy7J.W. Goethe University, Frankfurt, Germany*now at: Department of Physics, University of Wuppertal, Germany
Received: 24 April 2009 – Accepted: 6 May 2009 – Published: 12 May 2009
Correspondence to: E. Palazzi ([email protected])
Published by Copernicus Publications on behalf of the European Geosciences Union.
11659
ACPD9, 11659–11698, 2009
Diagnostics of theTTL
E. Palazzi et al.
Title Page
Abstract Introduction
Conclusions References
Tables Figures
J I
J I
Back Close
Full Screen / Esc
Printer-friendly Version
Interactive Discussion
Abstract
A suite of diagnostics is applied to in-situ aircraft measurements and one Chemistry-Climate Model (CCM) data to characterize the vertical structure of the TropicalTropopause Layer (TTL). The diagnostics are based on the vertical tracers profiles,relative vertical tracers gradients, and tracer-tracer relationships in the tropical Upper5
Troposphere/Lower Stratosphere (UT/LS), using tropopause coordinates.Observations come from the four tropical campaigns performed from 1998 to 2006
with the research aircraft Geophysica and have been directly compared to the output ofthe ECHAM5/MESSy CCM. The model vertical resolution in the TTL allows for appro-priate comparison with high-resolution aircraft observations and the diagnostics used10
highlight common TTL features between the model and the observational data.The analysis of the vertical profiles of water vapour, ozone, and nitrous oxide, in
both the observations and the model, shows that concentration mixing ratios exhibita strong gradient change across the tropical tropopause, due to the role of this latteras a transport barrier and that transition between the tropospheric and stratospheric15
regimes occurs within a finite layer. The use of relative vertical ozone gradients, inaddition to the vertical profiles, helps to highlight the region where this transition occursand allows to give an estimate of its thickness. The analysis of the CO-O3 and H2O-O3 scatter plots and of the Probability Distribution Function (PDF) of the H2O-O3 paircompletes this picture as it allows to better distinguish tropospheric and stratospheric20
regimes that can be identified, first, by their differing chemical composition.The joint analysis and comparison of observed and modelled data allows us to eval-
uate the capability of the model in reproducing the observed vertical structure of theTTL and its variability, and also to assess whether observations from particular regionson a monthly timescale can be representative of the fine scale mean structure of the25
Tropical Tropopause Layer.
11660
ACPD9, 11659–11698, 2009
Diagnostics of theTTL
E. Palazzi et al.
Title Page
Abstract Introduction
Conclusions References
Tables Figures
J I
J I
Back Close
Full Screen / Esc
Printer-friendly Version
Interactive Discussion
1 Introduction
The extreme dryness of the stratosphere was used by Brewer (1949) to deduce thatair entered the stratosphere primarily in the tropics, within the so called TropicalTropopause Layer (TTL) (Fueglistaler et al., 2005). This transition layer has proper-ties both of the troposphere and the stratosphere and, in the tropics, may extend over5
several kilometers vertically encompassing the tropopause. The TTL is of interest notonly because of being the interface between two very different dynamical regimes butalso because it acts as a gate to the stratosphere for atmospheric tracers such aswater vapour and other short lived substances, which both play an important role forstratospheric chemistry and climate (Holton et al., 1995).10
The ascending branch of the Brewer-Dobson circulation transports the mass upwardin the tropics from the upper troposphere driving the vertical stratospheric motion. Thestratospheric Brewer-Dobson circulation is also key to the “atmospheric tape recorder”signals in water vapour and other compounds like CO2 (Andrews et al., 1999; Park etal., 2007) and CO (Schoeberl et al., 2006). The tape recorder is the name given to15
the slow upward movement of trace gases into the tropical stratosphere and appar-ently all that is required for a tape recorder is a trace gas that varies in concentrationwith time near the tropical tropopause. The tape recorder in water vapour, in particu-lar, was validated by Mote et al. (1996) using measurements from the satellite-borneMicrowave Limb Sounder (MLS) and Halogen Occultation Experiment (HALOE) instru-20
ments, showing that air transported upward retains a memory for tropical tropopauseconditions for at least 18 months, as it is advected upward by the large scale circu-lation. The seasonal variation of water vapour in the tropical lower stratosphere, infact, is clearly tied to seasonality in tropical tropopause temperatures, which are corre-lated with the seasonal variability of “freeze-drying” process in the upper troposphere25
and tropical tropopause region (Randel et al., 2001). Freeze-drying mechanism is re-sponsible for the low water vapour values in the lower stratosphere, since air passingthrough the tropical tropopause has its water vapour mixing ratio reduced to the ice
11661
ACPD9, 11659–11698, 2009
Diagnostics of theTTL
E. Palazzi et al.
Title Page
Abstract Introduction
Conclusions References
Tables Figures
J I
J I
Back Close
Full Screen / Esc
Printer-friendly Version
Interactive Discussion
saturation value at or near the tropopause.The processes that contribute to the unique properties of the TTL, identified as the
zone where the properties of both troposphere and stratosphere can be observed,are subject of long debates and studies, focusing on the use of both observationaland model data (Fueglistaler et al., 2009). In-situ observations in the Upper Tropo-5
sphere/Lower Stratosphere (UT/LS) are unique in terms of accuracy, sensitivity, andresolution but they are sparse for season and regions. Satellite observations, on theother hand, guarantee an extensive geographical coverage and measurement conti-nuity, and can provide a global picture of the lower and middle stratosphere, but theirtypical resolution cannot describe the required detailed vertical structure of the TTL.10
These sets of observations have been intensively used to study the TTL processesand can be exploited also to correctly estimate the capability of current Chemical Cir-culation Models (CCMs) to reproduce the structure of the TTL. In a recent study, forexample, Gettelman and Birner (2007) have discussed the capability of two CCMs indescribing the key structural features of the TTL including the mean state and the vari-15
ability of temperature, ozone, clouds, and thermal structure. They concluded that theTTL features must be largely regulated by the large scale processes, since the TTLstructure seemed not altered by sub-grid scale processes such as convection.
The validation of CCMs with observational data sets from in-situ or remote sensingmeasurements can be improved using diagnostics that are able to reveal peculiar fea-20
tures in the tropical UT/LS tracers distribution. These diagnostics are key indicatorsof whether the contributions of dynamics and chemistry to the tropical tropopause re-gion are correctly represented in the models, and have been used by several authorsto perform comparisons between models and measurements, e.g. in the extratropics.For instance, Pan et al. (2007) showed that the tracers distribution and mixing across25
the extratropical UT/LS is highlighted when moving from geometric altitude coordinatesinto tropopause-referenced coordinates or in tracer-tracer space.
In this paper, we perform a joint analysis of the in-situ high-resolution measurementsperformed on-board the research aircraft Geophysica during the four tropical cam-
11662
ACPD9, 11659–11698, 2009
Diagnostics of theTTL
E. Palazzi et al.
Title Page
Abstract Introduction
Conclusions References
Tables Figures
J I
J I
Back Close
Full Screen / Esc
Printer-friendly Version
Interactive Discussion
paigns – APE-THESEO (February–March 1999, Seychelles), TROCCINOX (January–February 2005, Brazil), SCOUT-Darwin (November–December 2005, Australia), andSCOUT-AMMA (August 2006, West-Africa), and the ECHAM5/MESSy CCM. A set ofdiagnostics, which have been successfully applied in the extratropical tropopause re-gion (Pan et al., 2007; Hegglin et al., 2009), are here applied to observational and5
model data in the Tropical Tropopause Layer, to highlight some features of the TTLvertical structure and its regional/temporal variability. The diagnostics are based onthe analysis of the vertical profiles of water vapour, ozone, and nitrous oxide and ofthe relative vertical ozone gradients, in a tropopause-referenced coordinate, and onCO-O3 and H2O-O3 correlations.10
The aircraft measurements performed during the tropical campaigns include obser-vation of a wide number of chemical species in the whole TTL height, in peculiar re-gions and seasons. So, these observations are actually used to characterize the TTLvertical variability of different species like water vapour, O3, N2O, and CO. This anal-ysis is applied on a straightforward way to the model data, encouraging in this way15
a comparison between the model and the observations. The comparison betweenthe ECHAM5/MESSy CCM and the in-situ dataset aims at estimating how the verticalstructure of the tropical transition layer and its variability can be inferred from the jointanalysis of observed and modelled data through the application of the specific afore-mentioned diagnostics. Moreover, the comparison aims at evaluating how the simu-20
lations reproduce the observed vertical structure of the TTL and assessing to whichextent observations from different time periods and locations can be considered asrepresentative of the whole TTL fine scale mean structure.
The paper will be arranged as follows. Section 2 presents the observations andthe main characteristics of the model run. Section 3 describes the methodology used25
to compare the observations and the ECHAM5/MESSy data. The diagnostics used,such as tropopause coordinates, tracer-tracer correlations, and relative vertical tracergradients are described. Section 4 provides a direct comparison of the measuredand modelled vertical tracers profiles and the relative vertical ozone gradient around
11663
ACPD9, 11659–11698, 2009
Diagnostics of theTTL
E. Palazzi et al.
Title Page
Abstract Introduction
Conclusions References
Tables Figures
J I
J I
Back Close
Full Screen / Esc
Printer-friendly Version
Interactive Discussion
the tropical tropopause. In Sect. 5, we focus on the analysis of CO-O3 and H2O-O3correlations in the TTL, for both the model and the observations. Section 6 gives themain conclusions of this work.
2 Description of the campaigns and the model data
2.1 The measurement campaigns5
The experimental data presented in this paper were obtained during four tropical mea-surement campaigns performed at different times and locations with the high-altitudeM55 Geophysica aircraft. APE-THESEO (Airborne Platform for Earth observation –contribution to the Third European Stratospheric Experiment on Ozone) was performedfrom 15 February to 15 March, 1999, in the Seychelles (Stefanutti et al., 2004). TROC-10
CINOX (TROpical Convection, Cirrus and Nitrogen Oxides Experiment) was carriedout in January and February 2005 in Brazil (ACP special issue “TROCCINOX-Tropicalconvection and its impact on the troposphere and lower stratosphere”). SCOUT-Darwin(Stratospheric-Climate Links with Emphasis on the Upper Troposphere and LowerStratosphere) took place in Australia, in November–December 2005 (Vaughan et al.,15
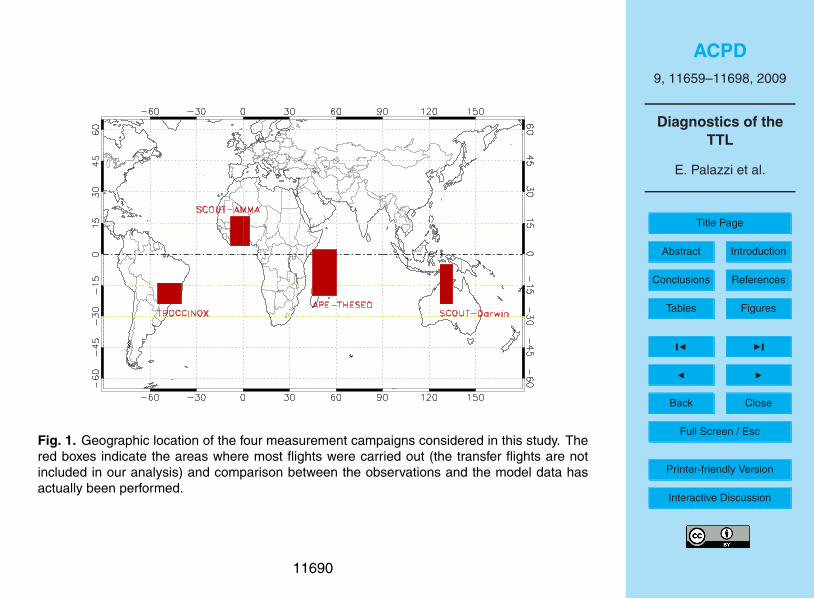
2008). SCOUT-AMMA (African Monsoon Multidisciplinary Analyses) was performed inAugust 2006 in Burkina Faso, West Africa (Law et al., 2009). The red boxes in Fig. 1 in-dicate the regions where the aircraft flights planned in the frame of the four campaignstook place (the measurements taken during the transfer flights have not been includedin our analysis).20
The scientific objectives of the campaigns were to study chemical processes andtransport into the TTL and across the tropopause. In particular, all the campaigns fo-cused on the analysis of such processes in deep convective systems, such as thecontinental convection over Brazil during TROCCINOX (Chaboureau et al., 2006),the isolated “Hector” storms over the Northern Australian archipelago during SCOUT-25
Darwin (Brunner et al., 2009) and the African monsoon during SCOUT-AMMA. Con-
11664
ACPD9, 11659–11698, 2009
Diagnostics of theTTL
E. Palazzi et al.
Title Page
Abstract Introduction
Conclusions References
Tables Figures
J I
J I
Back Close
Full Screen / Esc
Printer-friendly Version
Interactive Discussion
sequently, all the campaigns included a fraction of flights useful to study the impactof convection on the mean chemical structure of the upper troposphere. Therefore,a bias toward convectively influenced observations can be expected, markedly in theSCOUT-Darwin campaign and to a lesser extent in the SCOUT-AMMA and TROCCI-NOX campaigns. Direct convection events can for example alter the water budget at the5
tropical tropopause, leading to a moistening of the lower stratosphere at least locally(Chaboureau et al., 2006; Corti et al., 2008). APE-THESEO measurements, which tookplace during a relatively quiescent period, can be considered the less-convectively in-fluenced dataset. In our analysis, no filters have been applied on the observations toremove the impact of the small-scale transport processes related to convective activity.10
Table 1 lists the instruments used on board the aircraft Geophysica for the measure-ment of the atmospheric compounds considered in our study.
2.2 Numerical model
The atmospheric chemistry general circulation model used in our study consists ofECHAM5 (Roeckner et al., 2003, 2006) coupled with the Modular Earth Submodel15
System, MESSy. This model includes a comprehensive representation of clouds, ra-diation, multiphase chemistry and emission-deposition processes (Jockel et al., 2006).The model computes the atmospheric dynamics up to wavenumber 42 using a trian-gular truncation (T42), which allows to predict the prognostic variables every 15 min.The associated quadratic Gaussian grid, where physical and chemical parameteriza-20
tions are calculated, is of approximately 2.8◦ in latitude and longitude (Roeckner et al.,2006). The vertical grid resolves the atmosphere with 90 vertical layers reaching up to0.01 hPa (∼80 km altitude). The mean layer thickness in the lower and middle strato-sphere is about 700 m, which allows for a resolution high enough to internally generatethe quasi-biennial oscillation (QBO), as shown by Giorgetta et al. (2006). The vertical25
resolution in the tropopause region is higher, about 500 m (6–10 hPa).Further general description of the model setup can be found in Jockel et al. (2006);
the radiation scheme is accurately described in Cagnazzo et al. (2007) and information11665
ACPD9, 11659–11698, 2009
Diagnostics of theTTL
E. Palazzi et al.
Title Page
Abstract Introduction
Conclusions References
Tables Figures
J I
J I
Back Close
Full Screen / Esc
Printer-friendly Version
Interactive Discussion
about coupling of ECHAM5 with MESSy can be found in Jockel et al. (2005) (see alsohttp://www.messy-interface.org/).
The cloud microphysics scheme implemented in the CCM is described in Lohmannand Roeckner (1996) and includes phase changes between the water components(condensation/evaporation, deposition/sublimation, and freezing/melting) and precipi-5
tation processes (autoconversion, accretion, and aggregation). Moreover, the evapo-ration of rain and the melting of snow are considered as well as the sedimentation ofcloud ice.
The simulation presented here is a three year run, forced with climatological seasurface temperatures (SSTs), so the effect of El Nino or La Nina are not included. The10
model is not forced through nudging on dynamical variables towards atmospheric anal-yses and hence it performs a free run both in the troposphere and in the stratosphere.
For the representation of natural and anthropogenic emissions and the boundaryconditions for the chemical species considered in this study, we refer to the detaileddescription by Kerkweg et al. (2006). We have used 3-D fields of the chemical and dy-15
namical variables taken at 12:00 UTC every day, in the height range between 300 hPaand 10 hPa.
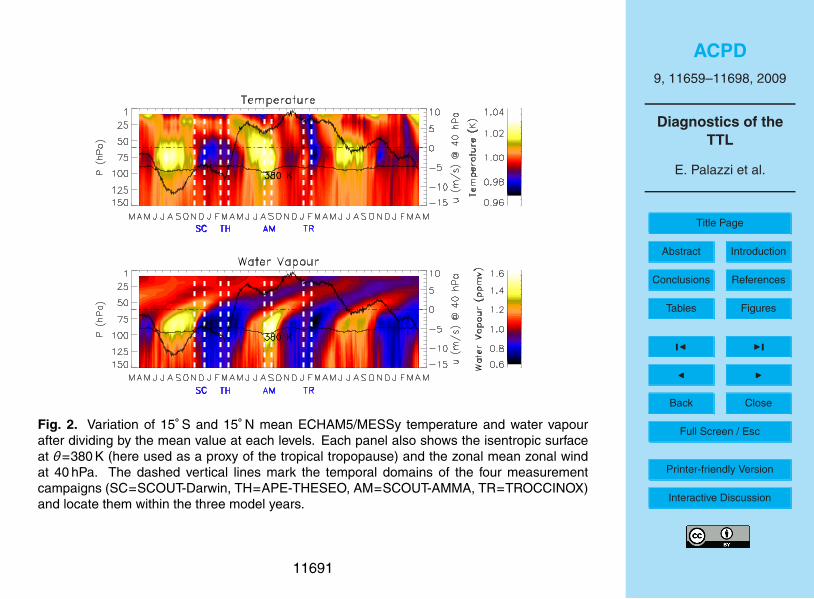
Figure 2 shows the variation of the model monthly mean temperature (top) and watervapour (bottom), averaged between 15◦ S and 15◦ N. The monthly means are dividedby the time mean value at each level. The isentropic surface at θ=380 K (here used20
as a proxy of the tropical tropopause), the zonal mean zonal wind at 40 hPa, and thetemporal location of the four measurement campaigns (SC=SCOUT-Darwin, TH=APE-THESEO, AM=SCOUT-AMMA, TR=TROCCINOX) considered in this study are alsoshown.
Figure 2 clearly shows the presence of a tape recorder signal in the25
ECHAM5/MESSy water vapour. H2O follows an annual cycle between about 150 and100 hPa that propagates upward in the whole domain under analysis. Minima of H2O atthe tropopause are found in the NH winter (corresponding to APE-THESEO, TROCCI-NOX, SCOUT-Darwin temporal and spatial domains) while the maxima occur in the NH
11666
ACPD9, 11659–11698, 2009
Diagnostics of theTTL
E. Palazzi et al.
Title Page
Abstract Introduction
Conclusions References
Tables Figures
J I
J I
Back Close
Full Screen / Esc
Printer-friendly Version
Interactive Discussion
summer (SCOUT-AMMA), when the temperatures at the tropopause are lowest andhighest, respectively. In Sect. 4.2 it will be shown that this seasonal variability in watervapour is seen in the observational data as well, and agrees with the one reproducedby the model. Nevertheless, the temperature profiles measured during the four aircraftcampaigns will not be discussed in this paper.5
The simulated H2O tape recorder can be compared to the MLS water vapour shownin the paper by Liu et al. (2007) (Fig. 1a). At 100 hPa the greater (lower) than one watervapour values roughly span from June to November (November to June) for both MLSand ECHAM5/MESSy. At 70 hPa the agreement between MLS and the model is stillconsistent, with a one-month phase shift. At 50 hPa, on the other hand, the MLS water10
vapour greater (lower) than one values span from September to May (May to Septem-ber), while for ECHAM5/MESSy from September to March (March to September). Thecomparison between the MLS and ECHAM5/MESSy water vapour tape recorder givesan overall good agreement in the lowermost stratosphere (pressure <70 hPa), while aphase shift of approximately two months appears at 50 hPa.15
The ECHAM5/MESSy water vapour tape recorder is also in agreement with the re-sults obtained by Lelieveld et al. (2007), who compared the ECHAM5/MESSy1 modelwith realistic tropospheric nudging for the period 1996–2005 to the HALOE watervapour observations.
3 Methodology20
The exchange of chemical constituents between the upper troposphere and the lowerstratosphere takes place across the tropopause, which is often marked by an abrupttransition in the values of atmospheric concentration of compounds such as watervapour, ozone, and various nitrogen oxides. However, observations of temperature,winds, and atmospheric trace gases suggest that the transition from troposphere to25
stratosphere occurs in a layer, rather than at a sharp tropopause. In the tropics thislayer is known as the Tropical Tropopause Layer (Fueglistaler et al., 2009). The TTL
11667
ACPD9, 11659–11698, 2009
Diagnostics of theTTL
E. Palazzi et al.
Title Page
Abstract Introduction
Conclusions References
Tables Figures
J I
J I
Back Close
Full Screen / Esc
Printer-friendly Version
Interactive Discussion
can be qualitatively defined as the region where the tropospheric convection effect re-mains but no longer dominates the setting of the temperature structure which – as inthe stratosphere – is mainly affected by radiative processes (Thuburn and Craig, 2002).However, the TTL is currently not well or consistently defined, leading to various defini-tions of its vertical boundaries and thickness (Gettelman and Forster, 2002; Highwood5
and Hoskins, 1998; Sherwood and Dessler, 2001; Folkins et al., 1999; Vomel et al.,2002).
In this study, a tropopause coordinate (i.e., using vertical profiles of a variable of in-terest relative to the tropopause height or pressure) is used rather than the geometricaltitude or pressure as the vertical coordinate, since it highlights the characteristics of10
tracers transition across the tropopause and the climatological features of the chemicaldistribution in the UT/LS, minimizing the effects of geophysical and meteorological vari-ability (Pan et al., 2007). The tropopause-referenced vertical profiles of chemical trac-ers are indeed more compact than if they were plotted in geometric altitude/pressure orpotential temperature coordinates, and reveal the sharp gradient change between tro-15
pospheric and stratospheric mixing ratios (Pan et al., 2004; Hoor et al., 2004; Hegglinet al., 2006, and references therein).
In addition, the tropopause coordinate system facilitates the identification and repre-sentation in Chemistry-Climate Models of the specific structure of a given tracer acrossthe tropopause and within the TTL, allowing for a direct comparison between model20
data and measurements and for process-oriented validations of CCMs.By convection of the World Meteorological Organization (WMO), the tropopause is
defined as the lowest level at which the temperature lapse rate becomes less than2 K km−1, provided that the average lapse rate between this level and all higher levelswithin 2 km does not exceed 2 K km−1 (WMO, 1957). This conventional thermal defi-25
nition of the tropopause has been used throughout the present paper. Nevertheless,it is known that the tropical tropopause corresponds roughly to the isentropic surfaceθ≈380 K (in the annual mean), a definition that enhances the quasi-material behaviourof the tropopause. The use of θ=380 K as a proxy for the tropical tropopause as been
11668
ACPD9, 11659–11698, 2009
Diagnostics of theTTL
E. Palazzi et al.
Title Page
Abstract Introduction
Conclusions References
Tables Figures
J I
J I
Back Close
Full Screen / Esc
Printer-friendly Version
Interactive Discussion
done in Sect. 2.2, Fig. 2.Following the recent work by Hegglin et al. (2009), a relatively new approach is used
here for the representation of the vertical structure of the TTL based on chemical trac-ers: the use of relative vertical tracer gradients (the ratio between the vertical tracergradients and the tracer concentrations), plotted in tropopause coordinates, which are5
equivalent to the vertical gradients of the logarithm of the tracers concentration (Randelet al., 2007). This formulation is particularly useful to identify the vertical distribution ofthe layers where tracers characterized by strong gradients across the tropopause showhigh variability and allows to give a measure of the TTL thickness. The analysis of thetracers relative vertical gradients can be applied also to model-measurement compar-10
isons to test the capability of CCMs to capture the ensemble of dynamical and chemicalprocesses that determine the transition in tracer distributions across the tropopausetransition region.
To characterize the chemical transition across the tropopause, use can also be doneof the theory of relationships between a tropospheric and a stratospheric tracer. Until15
now, this approach has been widely applied in the extra-tropics (Pan et al., 2007; Heg-glin et al., 2009) to derive the extratropical tropopause layer depth using CO-O3 andH2O-O3 correlations. In an atmosphere with ideally no mixing between troposphereand stratosphere (i.e., where the tropopause would act as a perfectly impermeablebarrier to vertical transport) the correlation between a tropospheric and a stratospheric20
tracer would have the typical “L” shape predicted from the theory (Plumb, 2007), witha nearly linear relationship between the tracer mixing ratios for both the troposphericand stratospheric branches. This shape is likely expected in the tropics, at least forthe H2O-O3 pair, since cross-tropopause mixing is small and upward motion fromthe troposphere to the stratosphere is associated with dehydration at the tropopause25
(Brewer, 1949). Nevertheless, Pan et al. (2007) showed that, in the extra-tropics, thecorrelations between the stratospheric O3 and the tropospheric CO or H2O move fromthe linearity an exhibit a curvature, which is associated to the importance of mixingand stratosphere-troposphere exchange mechanisms that lead to the erosion of the
11669
ACPD9, 11659–11698, 2009
Diagnostics of theTTL
E. Palazzi et al.
Title Page
Abstract Introduction
Conclusions References
Tables Figures
J I
J I
Back Close
Full Screen / Esc
Printer-friendly Version
Interactive Discussion
sharp transition between tropospheric and stratospheric regimes. This diagnostic fa-cilitates the understanding of a finite chemical transition layer that encompasses thetropopause, with partly tropospheric, partly stratospheric character and allows to de-rive the transition region depth (Hegglin et al., 2009).
In this paper, the theory of the correlation between a tropospheric and a stratospheric5
tracer is applied to the TTL, and used to identify the chemical transition across the trop-ical tropopause, using both the H2O-O3 and CO-O3 relationships. Since the structurefound in the form of tracer-tracer scatterplots can strongly reflect sampling (Hegglinand Shepherd, 2007), the use of joint probability density functions (PDFs) is in somecircumstances preferable: an example of such an approach is shown for the H2O-O310
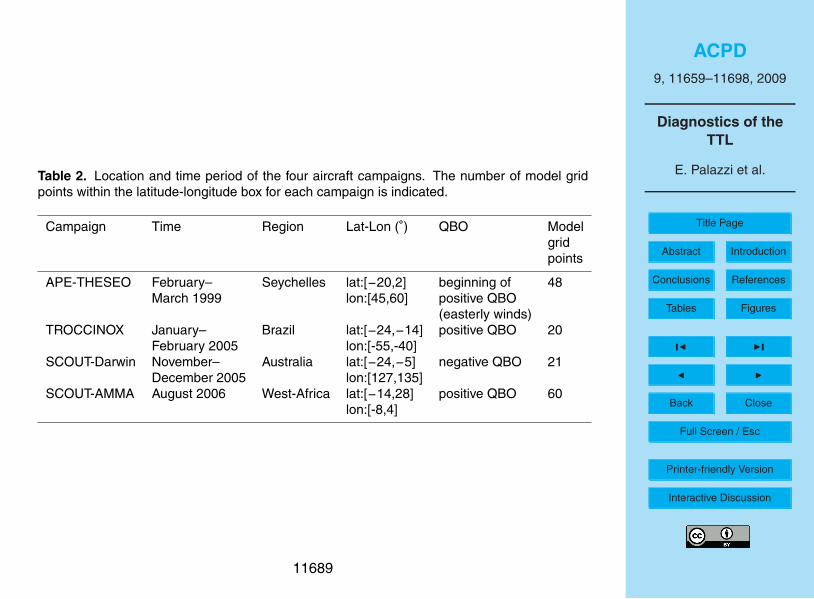
correlation.Table 2 specifies the latitudinal and longitudinal domain and the temporal collocation
of each measurement campaign analyzed in this study, and indicates the number ofmodel grid points within each box. The phase of the QBO at 40 hPa relative to eachcampaign time period is also reported.15
For the observations, the chemicals concentrations measured during the Geophysicaflights (one flight per day) have been averaged within the geographical box (see alsoFig. 1) and through the duration (about one month) of each campaign, in order to obtaina unique profile representative of the observations for a selected region, month, andQBO phase.20
For the model as well, one unique averaged vertical profile for each species hasbeen considered for each of the three model years. However, in this paper, we havenot focused on the model interannual variability and the observed mean vertical profileof each species has been compared to the modelled one using the criterion of matchingthe observed QBO phase with the QBO internally generated by the model.25
11670
ACPD9, 11659–11698, 2009
Diagnostics of theTTL
E. Palazzi et al.
Title Page
Abstract Introduction
Conclusions References
Tables Figures
J I
J I
Back Close
Full Screen / Esc
Printer-friendly Version
Interactive Discussion
4 Measured versus modelled vertical profiles
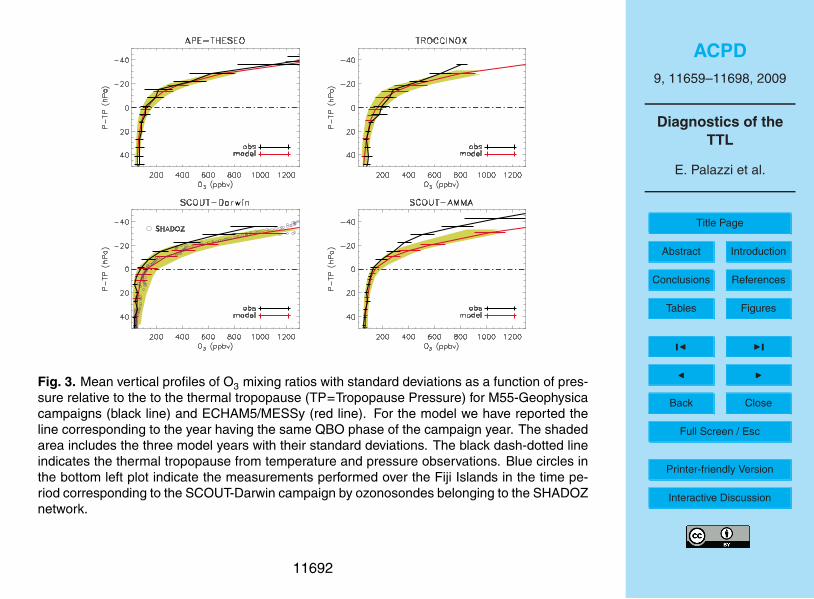
In this section, we analyze the mean vertical behaviour of ozone (Fig. 3a and 4), watervapour (Fig. 5), and nitrous oxide (Fig. 6) from each campaign observations (blacklines) and the model data (red lines). The shaded green area includes the mean verticaltracers profiles (or the relative tracers gradients in Fig. 4) from the three model years,5
and the black dash-dotted line indicates the thermal tropopause calculated from theobservations. The tropopause calculated from the model temperature and pressurevalues is not shown. Each panel in Figs. 3a, b, 5, and 6 corresponds to the region andtime period of each campaign.
4.1 Ozone10
Ozone is a tracer frequently used for studies of the TTL and troposphere-stratosphereexchange in general (e.g. Folkins et al., 1999), due to the fact that it is much moreabundant in the stratosphere than in the troposphere.
In both the modelled and observed vertical profiles shown in Fig. 3, an upper tropo-spheric regime, characterized by nearly constant and less than 100 ppbv ozone mixing15
ratios, a transition zone between about −15 and 15 hPa in which air starts to assumesome of the chemical characteristics of the stratosphere, and a lower stratosphericregime where ozone concentrations strongly increase with height due to photochemicalproduction, are observed. Though these three regimes in the ozone vertical behaviourare visible in both the modelled and the observed ozone profiles, some differences20
occur between them, that are in part related to the specificity of each campaign.During SCOUT-Darwin (bottom left panel) and SCOUT-AMMA (bottom right panel),
for instance, the model profiles are characterized, respectively, by higher ozone mix-ing ratios then those observed throughout the entire vertical range considered and inthe lower stratosphere, while the model-measurements agreement can be considered25
satisfactory in the case of APE-THESEO and TROCCINOX campaigns.SCOUT-Darwin took place during the pre-monsoon season, characterized by vigor-
11671
ACPD9, 11659–11698, 2009
Diagnostics of theTTL
E. Palazzi et al.
Title Page
Abstract Introduction
Conclusions References
Tables Figures
J I
J I
Back Close
Full Screen / Esc
Printer-friendly Version
Interactive Discussion
ous convection including the development of a mesoscale system known as “Hector”(Brunner et al., 2009). Therefore, convection occurred during this campaign, and thelower observed ozone mixing ratios (compared to the ones measured during the othercampaigns) in the upper troposphere can be interpreted as a consequence of convec-tive detrainment of ozone-poor low-level air. Moreover, since in the tropical boundary5
layer over the oceans net ozone destruction occurs, local transport patterns with en-hanced meridional transport of air from Pacific Equator and the occurrence of deepconvection can be invoked together to explain the ozone reduction in the lower strato-sphere. We also report in the bottom left panel of Fig. 3, the ozone mixing ratiosmeasured over the Fiji Islands (18.13◦ S, 178.40◦ E) in the time period corresponding10
to the SCOUT-Darwin campaign by the ozonosondes belonging to the SHADOZ net-work (Thompson and Witte, 1999). It can be noticed that ECHAM5/MESSy agrees wellwith the SHADOZ data since these latter are much less influenced by local convectionand by the “Hector” system that the aircraft measurements.
With regard to SCOUT-AMMA, the observational strategy followed during this cam-15
paign led to a fraction of observations (about 30%) influenced by local convection,that should explain the low ozone values in the lowermost stratosphere. The analysescarried out so far on the SCOUT-AMMA measurement database have shown that allobservations constitute an ensemble adequate and representative of the mean aver-age conditions of the TTL of that region during August 2006 (Law et al., 2009).20
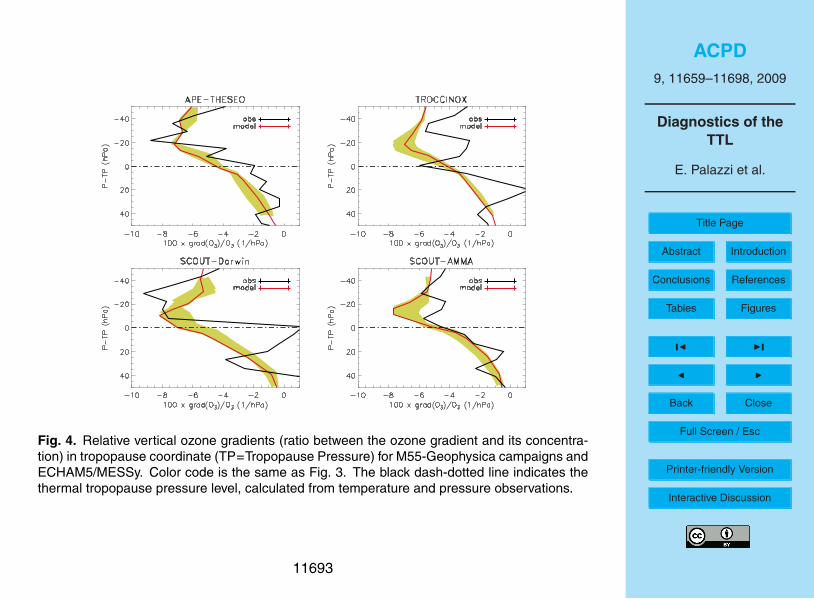
In Fig. 4, the observed and modelled ozone relative vertical gradients, expressed intropopause coordinates (see Sect. 3) are shown, the color notation being the sameas in Fig. 3. The modelled gradients shown in Fig. 4 have the same general verti-cal structure in the different geographical and temporal domains considered, which ischaracterized by a minimum located from 10 to 20 hPa above the thermal tropopause25
that marks the beginning of stratospheric ozone increasing concentrations and a localmaximum located from 5 to 10 hPa below the thermal tropopause. In between lies theregion that can be actually considered the transition between tropospheric and strato-spheric regimes and that is no more than 30 hPa-thick (from 15 to 30 hPa, depending
11672
ACPD9, 11659–11698, 2009
Diagnostics of theTTL
E. Palazzi et al.
Title Page
Abstract Introduction
Conclusions References
Tables Figures
J I
J I
Back Close
Full Screen / Esc
Printer-friendly Version
Interactive Discussion
on the campaign).The observations generally confirm the picture illustrated by the model, though
they are much more scattered due to local effects, especially duing SCOUT-Darwinand TROCCINOX. For APE-THESEO and SCOUT-AMMA, a satisfactory model-measurements agreement is found.5
The vertical tracer gradients approach has been used by Hegglin et al. (2009) tosupply a measure of the extratropical tropopause transition layer depth using the verti-cal gradients of CO and O3 mixing ratios from the limb-viewing Atmospheric ChemistryExperiment-Fourier Transform Spectrometer (ACE-FTS). ACE-FTS has provided accu-rate measurements of numerous chemical species with high vertical resolution (better10
than 1 km) in the UT/LS.
4.2 Water vapour
Water vapour is one of the key tracers for troposphere-stratosphere exchange that ledBrewer (1949) to conclude that air enters the stratosphere primarily in the tropics (seeSect. 1). In general, tropical water vapour concentration vertical profiles are charac-15
terized by large H2O values in the troposphere, a region with a pronounced tracergradient with very low concentrations near the tropical tropopause, and smaller valuesin the lower stratosphere compared to the tropospheric mixing ratios. Very low valuesof the water vapour mixing ratio, in fact, extend upward from the minimum, which is onlya few part per million by volume and far lower than typical tropospheric values, within a20
few kilometers of the tropical tropopause. The increase of water vapour concentrationsabove the minimum at tropopause levels can be due to in-mixing of stratosphericallyolder air masses with increased water concentrations (due to oxidized methane), and,to a lesser degree, to in-situ methane oxidation or sporadic overshooting convection.
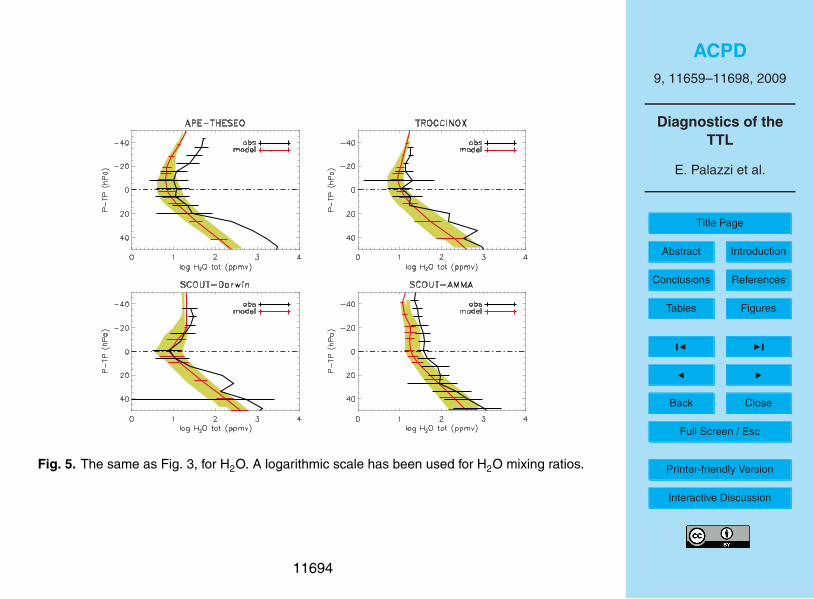
These distinct features in the TTL water vapour distribution are in the main found in25
both the modelled and observed water vapour mixing ratio vertical profiles shown inFig. 5. For each campaign analyzed, the modelled water vapour mixing ratios agreewell with the observed ones, both above and below the tropopause. At the tropopause,
11673
ACPD9, 11659–11698, 2009
Diagnostics of theTTL
E. Palazzi et al.
Title Page
Abstract Introduction
Conclusions References
Tables Figures
J I
J I
Back Close
Full Screen / Esc
Printer-friendly Version
Interactive Discussion
the dehydration mechanism can be considered to be well captured by the model, evenif a dry bias of about −1.5 ppmv can be identified in the model with respect to theobservations in the case of SCOUT-AMMA (bottom right). For the other campaigns, thedifferences between the modelled and observed H2O mixing ratios at the tropopauseare less significant and, anyhow, they are included in the interannual variability of the5
three model years (shaded area) and in the standard deviations of the observations.Lelieveld et al. (2007) compared results from the ECHAM5/MESSy1 CCM to satelliteHALOE water vapour observations for the period 1996–2005 and, based on a modelevaluation between 30◦ S and 30◦ N latitude, they found a dry bias in the model of about−0.5 ppmv in the 100 hPa–75 hPa region.10
In general, the largest differences between the observed and modelled water vapourvertical profiles arise in the upper troposphere where, as expected, higher H2O con-centrations are observed in convectively influenced regions. See, for instance, theobserved H2O peak at 20 hPa below the tropopause during SCOUT-Darwin. This isalso confirmed by the high variability of the measured profiles, and a likely sampling15
bias of air masses which are influenced by local convection.As mentioned above, convection can also occasionally enhance water vapour mix-
ing ratios in the lowermost stratosphere. During the SCOUT-Darwin campaign, forinstance, overshoot was measured during several flights (Corti et al., 2008), leading tothe high H2O mixing ratios between −40 and −20 hPa shown in Fig. 5.20
Figure 5 also shows that the tropopause (dash-dotted line) is dryer during the NHwinter (APE-THESEO, SCOUT-Darwin and TROCCINOX campaigns) while it is moisterduring the NH summer (SCOUT-AMMA). It has been already pointed out in Sect. 1 andshown in Fig. 2, in fact, that a likely implication of the freeze-drying basic mechanismoccurring at or near the tropopause and responsible for the low water vapour values in25
the lowermost stratosphere, is that H2O mixing ratios of air entering the tropical strato-sphere should vary seasonally in phase with the annual cycle of tropical tropopausetemperature.
11674
ACPD9, 11659–11698, 2009
Diagnostics of theTTL
E. Palazzi et al.
Title Page
Abstract Introduction
Conclusions References
Tables Figures
J I
J I
Back Close
Full Screen / Esc
Printer-friendly Version
Interactive Discussion
4.3 Nitrous oxide
N2O is a tracer that has a tropospheric source and a stratospheric sink, which makesit a chemical species of interest for TTL studies. In fact, it is destroyed by O(1D) onlyat altitudes well above the tropopause and air with low N2O values in the upper part ofthe TTL therefore is expected to have some stratospherically older origin.5
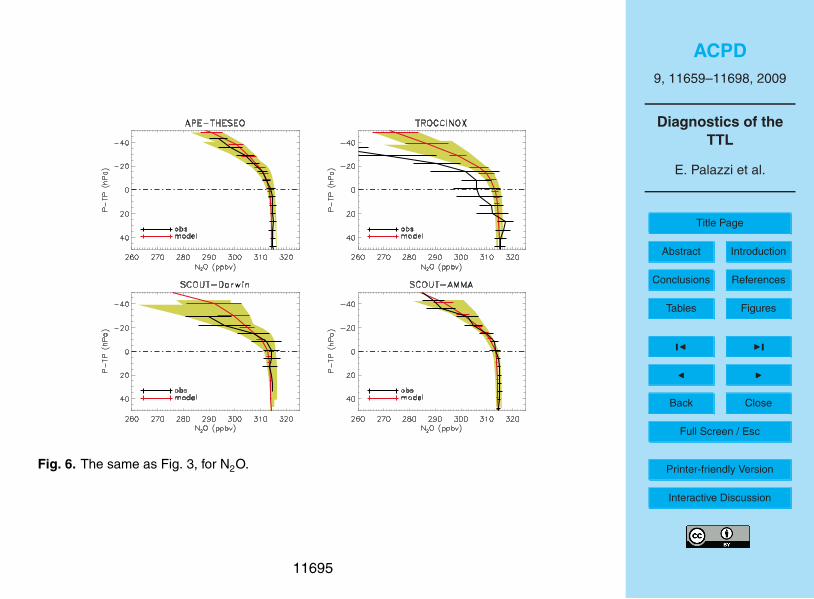
The measured and modelled vertical profiles of N2O in Fig. 6 show, in general, nearlyuniform tropospheric concentrations and a decrease from the tropopause level upward.N2O is observed to have its largest stratospheric mixing ratios immediately above thetropical thermal tropopause, matching tropospheric values. The profiles shown in Fig. 6moreover suggest that in-mixing of stratospheric air masses with low N2O concentra-10
tions is rare below the tropopause. The tropospheric value for N2O has increased ofabout 1 ppb/yr between 1999 and 2006 (updated from Prinn et al., 2000). However,since the model does not include the actual tropospheric growth rates, the observedN2O mixing ratios in the upper troposphere are generally higher then the simulatedones (not shown). The observed mean profiles have been scaled with a factor for each15
campaign, such that tropospheric observed values match those of the model.The best model-measurements agreement is found for APE-THESEO (located in
the inner tropics, see Fig. 1) and for SCOUT-AMMA. Because of the location at aboutthe edge of the tropical pipe, the observations during TROCCINOX show a decreaseof N2O at lower altitudes (Konopka et al., 2007). During SCOUT-Darwin, the negative20
phase of the QBO, denoting occurrence of westerly winds, led to a less intense dynam-ical barrier in the subtropics (Shuckburgh et al., 2001), leading to increased meridionaltransport and, again, layers of low N2O mixing ratios. In the case of TROCCINOX and,despite the sparseness of observations of SCOUT-Darwin, moreover, the N2O gradi-ent above the tropopause is sharper in the observations than in the model. Moreover,25
both observations and model data, show a higher variability compared to the other twocampaigns, as denoted by the larger standard deviations.
11675
ACPD9, 11659–11698, 2009
Diagnostics of theTTL
E. Palazzi et al.
Title Page
Abstract Introduction
Conclusions References
Tables Figures
J I
J I
Back Close
Full Screen / Esc
Printer-friendly Version
Interactive Discussion
5 Tracer-tracer correlations in the TTL
In this section, the TTL morphology is investigated from the perspective of chemicalcomposition through the use of tracer-tracer correlations. Working in the tracer-tracerspace is useful to reveal characteristic tracer features of different air masses due tospecific dynamical and transport processes. In the extratropics, this approach has5
been widely used to derive the transition layer depth in terms of the distance betweenits top and bottom from the thermal or dynamical tropopause (Pan et al., 2007; Hegglinet al., 2009). However, only few applications to the TTL can be found in literature (e.g.,Hegglin et al., 2009).
As mentioned in Sect. 3, the correlations in the tropics are expected to have the10
classical “L” shape, due to the small cross-tropopause mixing and slow ascent of theair parcels.
In particular, the relationships between the pairs CO-O3 and H2O-O3 will be investi-gated (Figs. 7 and 8, respectively) using the tracer mixing ratios measured during thefour tropical Geophysica campaigns and the ones reproduced by ECHAM5/MESSy.15
The model data include all the point collocated within the four red boxes shown inFig. 1.
The tracer-tracer correlation points in Figs. 7 and 8 have been colored according to12 hPa-thick pressure intervals defined a priori. The PDF of the H2O-O3 correlation isalso shown exemplary for the region and time period of the SCOUT-Darwin campaign20
(Fig. 9).
5.1 CO vs. O3
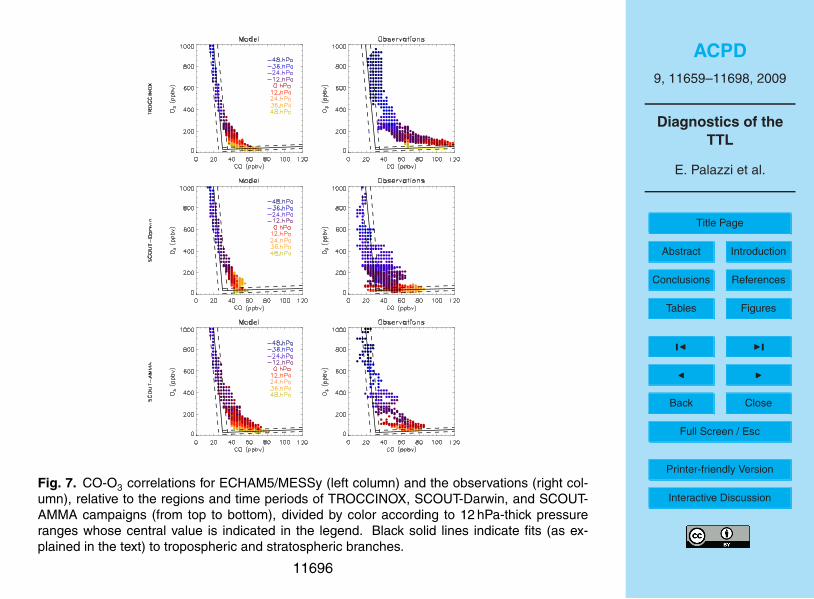
Figure 7 shows the correlation of CO with O3 for ECHAM5/MESSy (left column) and theobservations from only three of the four campaigns considered in this study (TROC-CINOX, SCOUT-Darwin and SCOUT-AMMA, in the right column from the top to the25
bottom), since CO data were not measured during APE-THESEO.In general, the CO-O3 relationships shown in Fig. 7, rather then the “L” shape ob-
11676
ACPD9, 11659–11698, 2009
Diagnostics of theTTL
E. Palazzi et al.
Title Page
Abstract Introduction
Conclusions References
Tables Figures
J I
J I
Back Close
Full Screen / Esc
Printer-friendly Version
Interactive Discussion
served in the extratropical UT/LS, form a smoother curve. This is mainly due to thechemical lifetime of CO, which is comparable to the transport timescales on whichtroposphere-to-stratosphere transport occurs and makes CO a “pure” transport tracer.
The black solid lines in Fig. 7 represent the empirical stratospheric and troposphericCO-O3 relationships, derived using data points with CO<30 ppbv for stratospheric and5
O3<70 ppbv for tropospheric. CO decreases from a range of tropospheric concentra-tions depending on the campaign, towards its stratospheric steady value of around30 ppbv, reached at about 10–15 hPa above the tropopause.
Overall agreement is found in the case of SCOUT-AMMA between the modelled(bottom left panel) and observed (bottom righ panel) CO-O3 correlation. The transition10
region between tropospheric and stratospheric regimes, in fact, is characterized bysimilar ozone mixing ratios (from ∼80 ppbv to ∼450 ppbv) and CO mixing ratios (from∼30 ppbv to ∼80 ppbv). For TROCCINOX (first row panels) and SCOUT-Darwin cam-paigns (middle panels), on the contrary, some differences between the model and theobservations can be noticed. The transition region for both these campaigns, as de-15
duced from the model data, occurs for a smaller range of O3 values (from ∼90 ppbv to∼350 ppbv) as well as of CO values (from ∼30 ppbv to ∼60 ppbv) than those emergingfrom the observations. The structure of the transition region inferred from TROCCINOXobservations, for instance, shows the clear impact of in-mixing from mid-latitudes (dueto the fact that this campaign was performed close to the subtropics), which alters and20
shifts the overall CO-O3 scatter plot: it lies nearly completely outside the empirical no-mixing lines and is characterized by higher values of CO (from ∼30 ppbv to >120 ppbv)and typically stratospheric O3 mixing ratios.
5.2 H2O vs. O3
Figure 8 shows the correlation of H2O with O3 for ECHAM5/MESSy (left column) and25
the observations from the four campaigns analyzed (APE-THESEO, TROCCINOX,SCOUT-Darwin and SCOUT-AMMA, in the right column from the top to the bottom).
In spite of inter-campaigns differences, H2O-O3 correlations have the theoretical11677
ACPD9, 11659–11698, 2009
Diagnostics of theTTL
E. Palazzi et al.
Title Page
Abstract Introduction
Conclusions References
Tables Figures
J I
J I
Back Close
Full Screen / Esc
Printer-friendly Version
Interactive Discussion
tropical “L” shape, that results from the small cross-tropopause mixing and small as-cent of air parcels that experience dehydration at tropopause levels. H2O is a less puretracer than CO. Moreover, the transition between the tropospheric and the stratosphericbranches occurs at lower H2O mixing ratios during winter (APE-THESEO, TROCCI-NOX, SCOUT-Darwin campaigns) than during summer (SCOUT-AMMA campaign),5
reflecting the seasonal cycle in tropopause temperatures (lower temperatures duringwinter). The transition occurs around the thermal tropopause or slightly below and in-volves a layer which is no more than 25–30 hPa thick, depending on the specificity ofeach campaign.
For SCOUT-AMMA (bottom panels in Fig. 8), both model data and the measure-10
ments lie on well separated tropospheric and stratospheric branches with a relativelynarrow transition zone in between (∼15 hPa thick). From a chemical point of view thetransition region includes H2O mixing ratios from about 2 to 5 ppmv (model) and 3 to7 ppmv (observations), in agreement with the ECHAM5/MESSy dry bias discussed inSect. 4.2, and O3 mixing ratios less then 200 ppbv, in both the model and the observa-15
tions.For the other three campaigns, besides the evidence of dehydration mechanism at
tropopause levels, which is a common feature in both the modelled and observed H2O-O3 scatter plots, situation is more complicated that for SCOUT-AMMA. For SCOUT-Darwin, for instance, the scatter plot shows a noticeable region of mixing (for H2O20
mixing ratios >4 ppmv) in the model, and a less extended region of mixing with morecoherent hydrated layers around 12 and 24 hPa above the tropopause in the observa-tions.
Figure 9 shows the two-dimensional PDFs of H2O-O3 pairs calculated from themodel (left) and the observations relative to the SCOUT-Darwin campaign area and25
time period. Use of probability density functions in this context has demonstrated to bevery useful to provide a detailed picture of key aspects of transport across the tropicaltropopause (e.g. Sparling, 2000). The data were binned into H2O and O3 bins withwidths of 0.1 ppmv and 25 ppbv, respectively, and normalized with respect to the total
11678
ACPD9, 11659–11698, 2009
Diagnostics of theTTL
E. Palazzi et al.
Title Page
Abstract Introduction
Conclusions References
Tables Figures
J I
J I
Back Close
Full Screen / Esc
Printer-friendly Version
Interactive Discussion
number of measurements used in the evaluation. Three well separated regimes arevisible in both the observed and modelled H2O-O3 PDFs. The tropospheric regime ischaracterized by a nearly constant O3 value and variable H2O mixing ratios, while thestratospheric regime is characterized by a nearly constant H2O value and variable O3mixing ratios. In between, a region where the probability to have chemical character-5
istics of both the troposphere and the stratosphere is higher than in the two branches,separately. This is particularly well visible in the plot obtained from the measurements.
Maxima in the joint PDFs indicate the regions where mixing is favoured and irre-versible homogenization likely occurs, similar to maxima found in 1-D PDFs of strato-spheric tracers, which indicate the presence of the well mixed regions; minima in the10
joint PDFs occur likely in the two separated branches, indicating that mixing in these re-gions is limited, similar to the minima found in 1-D PDFs of stratospheric tracers, whichindicate the presence of mixing barriers (Sparling, 2000; Neu et al., 2003; Hegglin andShepherd, 2007).
The example shown in Fig. 9 supports the fact that the PDF approach is helpful to as-15
sess the statistical relevance of the observational sampling; for instance, the hydratedlayers above the tropopause visible in the observations during the SCOUT-Darwin cam-paign (Fig. 8, third row on the right) are not visible in the joint PDF shown in the toppanel of Fig. 9. This implies that the fraction of measurements influenced by convectionin the lower stratosphere are negligible and do not impact on the statistical properties20
of the H2O-O3 correlation.
6 Conclusions
The TTL is a region of interest because of being the interface between the very dif-ferent dynamical and chemical tropospheric and stratospheric regimes and because itdetermines the entry of atmospheric tracers such as water vapour and the short-lived25
substances in the stratosphere.A decade of observational activity in the tropical UT/LS with high resolution in-situ in-
11679
ACPD9, 11659–11698, 2009
Diagnostics of theTTL
E. Palazzi et al.
Title Page
Abstract Introduction
Conclusions References
Tables Figures
J I
J I
Back Close
Full Screen / Esc
Printer-friendly Version
Interactive Discussion
struments on board stratospheric research aircrafts has built up a considerable datasetthat allows to partially overcome the drawback due to the spatial and temporal sparse-ness of such kind of data, making use of appropriate diagnostics that capture the keyaspects of TTL transport and interrelationships between different species.
A good representation of the TTL in Chemistry Climate Models is a challenge, due5
to the difficulty of understand and correctly simulate the TTL radiative, chemical anddynamical processes and their connections. The vertical resolution of CCMs is oftennot adequate to capture the small-scale variability of the tracer fields and processes inthis relatively thin layer, and the horizontal resolution can also be a limit, since convec-tion that transport compounds from the emission sources to the upper troposphere is10
parameterized.In this paper, a suite of specific diagnostics have been applied to the in-situ high-
resolution measurements performed on board the aircraft Geophysica during the fourtropical campaigns (APE-THESEO, TROCCINOX, SCOUT-Darwin, SCOUT-AMMA)and to the ECHAM5/MESSy CCM data. These diagnostics consist of the vertical mix-15
ing ratio profiles and relative gradients of selected compounds (ozone, water vapour,and nitrous oxide), an on tracer-tracer correlations (CO-O3, H2O-O3), all expressedin tropopause coordinates. They corroborate the existence of a tropical tropopausetransition region and allow to characterize it in terms of chemical vertical distribution,thickness, and variability. They moreover facilitate comparisons of observational and20
model data (Pan et al., 2007) and provide a suite of tools for testing the ability of CCMsto simulate the TTL structure.
The analysis of the O3, H2O, and N2O vertical profiles and the ozone relative ver-tical gradient in tropopause coordinates has revealed, in fact, the existence of a finitetropical transition layer about the tropopause (the TTL) having characteristics of both25
the troposphere and the stratosphere. The transition between the two regimes oc-curs within this layer where the aforementioned species exhibit their greatest gradientchanges (see Figs. 3, 4, 5, 6). The TTL encompasses the thermal tropopause thatacts as a barrier to vertical mixing. The ozone relative vertical gradient, in particular,
11680
ACPD9, 11659–11698, 2009
Diagnostics of theTTL
E. Palazzi et al.
Title Page
Abstract Introduction
Conclusions References
Tables Figures
J I
J I
Back Close
Full Screen / Esc
Printer-friendly Version
Interactive Discussion
has allowed to deduce that the transition between the tropospheric and stratosphericregimes occurs within a region that extends from where the gradient exhibits a localmaximum (from about 5 hPa to 10 hPa below the tropopause) to where the gradientsexhibits a minimum and ozone concentrations start to increase (from about 10 hPa to20 hPa above the tropopause) towards their stratospheric values.5
The existence of a region where the tropospheric and stratospheric regimes in chem-icals distribution co-exist is enhanced using the correlation between a tropospheric(typically CO or H2O) and a stratospheric (typically O3) tracer. In the tropics, a clas-sical L shape is found in the H2O-O3 correlation, where vertical transport acrossthe tropopause in mainly upward into the overworld and the low temperatures at the10
tropopause determine the dehydration of air entering the stratosphere. On the otherhand, the CO-O3 correlation has a smoother shape than the H2O-O3 relationship ,because CO is a purer tracer for transport than H2O in this region (the chemical life-time of CO is comparable to the transport timescales characterizing troposphere-to-stratosphere transport).15
Depending on the location in the tropics and on the season, the TTL derived fromH2O-O3 extends roughly from −20 to 20 hPa (P-TP coordinate), being thinner in sum-mer than in winter. The TTL derived from CO-O3 is in general thinner than the onederived from the H2O-O3 pair, confirming the results of Hegglin et al. (2009).
The comparison between ECHAM5/MESSy and the aircraft observations has shown20
that the CCM is able to reproduce the differences among the different campaigns re-lated to the peculiar regions and seasons (see, for instance, Fig. 2 and Fig. 5), thougha free running simulation without dynamical nudging has been used and observationshave not been filtered to remove the impact of small scale and local processes (suchas convection) on the measured mixing ratios of the target species.25
Even if restricted to a single CCM and the M55 observational dataset, the analy-ses performed in this paper show that the use of specific diagnostics for the analysisof different datasets can highlight the average features of the TTL vertical structureand allow to roughly estimate the TTL thickness. Until now, the extratropical transition
11681
ACPD9, 11659–11698, 2009
Diagnostics of theTTL
E. Palazzi et al.
Title Page
Abstract Introduction
Conclusions References
Tables Figures
J I
J I
Back Close
Full Screen / Esc
Printer-friendly Version
Interactive Discussion
region has been diagnosed using such tools mainly applied to satellite data, and theextratropical UT/LS depth has been derived from both the vertical tracer gradients andthe tracer-tracer correlations, but few applications can be found in the literature con-cerning the TTL. The suite of diagnostics presented in this paper can contribute to giverepresentativeness to geographically sparse or limited in-situ observations, and can be5
profitably applied to satellite data, as extensively done in the extra-tropics, and to CCMdata.
Acknowledgements. Authors would like to thank M. I. Hegglin for providing very useful sug-gestions. Authors acknowledge the partial support of the EC SCOUT-O3 Integrated Project(505390-GOCE-CT-2004). Chiara Cagnazzo and Elisa Manzini acknowledge the partial sup-10
port of Centro Euro-Mediterraneo per i Cambiamenti Climatici. The model simulation wereperformed at ECMWF, under the Special Project on Middle Atmosphere Modelling.
References
Andrews, A. E., Boering, K. A., Daube, B. C., Wofsy, S. C., Hintsa, E. J., Weinstock, E. M., andBui, T. P.: Empirical age spectra for the lower tropical stratosphere from in situ observations15
of CO2: Implications for stratospheric transport, J. Geophys. Res., 104(D21), 26581–2659,1999. 11661
Brewer, A. W.: Evidence for a world circulation provided by the measurements of helium andwater vapour distribution in the stratosphere, Q. J. Roy. Meteorol. Soc., 75, 351–363, 1949.11661, 11669, 1167320
Brunner, D., Siegmund, P., May, P. T., Chappel, L., Schiller, C., Muller, R., Peter, T., Fueglistaler,S., MacKenzie, A. R., Fix, A., Schlager, H., Allen, G., Fjaeraa, A. M., Streibel, M., and Harris,N. R. P.: The SCOUT-O3 Darwin Aircraft Campaign: rationale and meteorology, Atmos.Chem. Phys., 9, 93–117, 2009,http://www.atmos-chem-phys.net/9/93/2009/. 11664, 1167225
Cagnazzo, C., Manzini, E., Giorgetta, M. A., Forster, P. M. De F., and Morcrette, J. J.: Impactof an improved shortwave radiation scheme in the MAECHAM5 General Circulation Model,Atmos. Chem. Phys., 7, 2503–2515, 2007,http://www.atmos-chem-phys.net/7/2503/2007/. 11665
11682
ACPD9, 11659–11698, 2009
Diagnostics of theTTL
E. Palazzi et al.
Title Page
Abstract Introduction
Conclusions References
Tables Figures
J I
J I
Back Close
Full Screen / Esc
Printer-friendly Version
Interactive Discussion
Chaboureau, J.-P., Cammas, J.-P., Duron, J., Mascart, P. J., Sitnikov, N. M., and Voessing,H.-J.: A numerical study of tropical cross-tropopause transport by convective overshoots,Atmos. Chem. Phys., 7, 1731–1740, 2007,http://www.atmos-chem-phys.net/7/1731/2007/. 11664, 11665
Corti, T., Luo, B. P., de Reus, M., Brunner, D., Cairo, F., Mahoney, M. J., Martucci, G., Matthey,5
R., Mitev, V., dos Santos, F. H., Schiller, C., Shur, G., Sitnikov, N. M., Spelten, N., Voessing,H. J., Borrmann, S., and Peter, T.: Unprecedented evidence for deep convection hydrat-ing the tropical stratosphere, Geophys. Res. Lett., 35, L10810, doi:10.1029/2008GL033641,2008. 11665, 11674
Folkins, I., Loewenstein, M., Podolske, J., Oltmans, S. J., and Proffitt, M.: A barrier to vertical10
mixing at 14 km in the tropics: Evidence from ozonesondes and aircraft measurements, J.Geophys. Res., 104(D18), 22095–22102, 1999. 11668, 11671
Fueglistaler, S., Bonazzola, M., Haynes, P., and Peter, Th.: Stratospheric water vapor predictedfrom the Lagrangian temperature history of air entering the stratosphere in the tropics, J.Geophys. Res., 110, D08107, doi:10.1029/2004JD005516, 2005. 1166115
Fueglistaler, S., Dessler, A. E., Dunkerton, T. J., Folkins, I., Fu, Q., and Mote, P. W.: Tropicaltropopause layer, Rev. Geophys., 47, RG1004, doi:10.1029/2008RG000267, 2009. 11662,11667
Gettelman, A. and Forster, P. M. de F.: A climatology of the tropical tropopause layer, J. Meteo-rol. Soc. Jpn., 80, 911–924, 2002. 1166820
Gettelman, A. and Birner, T.: Insights into Tropical Tropopause Layer processes using globalmodels, J. Geophys. Res., 112, D23104, doi:10.1029/2007JD008945, 2007. 11662
Giorgetta, M. A., Manzini, E., Roeckner, E., Esch, M., and Bengtsson, L.: Climatology andForcing of the Quasi-Biennial Oscillation in the MAECHAM5 Model, J. Climate, 19(6), 3882–3901, 2006. 1166525
Hegglin, M. I., Brunner, D., Peter, T., Hoor, P., Fischer, H., Staehelin, J., Krebsbach, M., Schiller,C., Parchatka, U., and Weers, U.: Measurements of NO, NOy, N2O, and O3 during SPURT:implications for transport and chemistry in the lowermost stratosphere, Atmos. Chem. Phys.,6, 1331–1350, 2006,http://www.atmos-chem-phys.net/6/1331/2006/. 1166830
Hegglin, M. I. and Shepherd, T. G.: O3-N2O correlations from the Atmospheric Chemistry Ex-periment: Revisiting a diagnostic of transport and chemistry in the stratosphere, J. Geophys.Res., 112, D19301, doi:10.1029/2006JD008281, 2007. 11670, 11679
11683
ACPD9, 11659–11698, 2009
Diagnostics of theTTL
E. Palazzi et al.
Title Page
Abstract Introduction
Conclusions References
Tables Figures
J I
J I
Back Close
Full Screen / Esc
Printer-friendly Version
Interactive Discussion
Hegglin, M. I., Boone, C. D., Manney, G. L., and Walker, K. A.: A global view of the extratropicaltropopause transition layer from Atmospheric Chemistry Experiment Fourier Transform Spec-trometer O3, H2O, and CO, J. Geophys. Res., 114, D00B11, doi:10.1029/2008JD009984,2009. 11663, 11669, 11670, 11673, 11676, 11681
Highwood, E. J. and Hoskins, B. J.: The tropical tropopause, Q. J. Roy. Meteorol. Soc.,5
124(549), 1579–1604, 1998. 11668Holton, J., Haynes, P., McIntyre, M., Douglass, A., Rood, R., and Pfister L.: Stratosphere-
Troposphere Exchange, Rev. Geophys., 33(4), 403–439, 1995. 11661Hoor, P., Gurk, C., Brunner, D., Hegglin, M. I., Wernli, H., and Fischer, H.: Seasonality and
extent of extratropical TST derived from in-situ CO measurements during SPURT, Atmos.10
Chem. Phys., 4, 1427–1442, 2004,http://www.atmos-chem-phys.net/4/1427/2004/. 11668
Jockel, P., Sander, R., Kerkweg, A., Tost, H., and Lelieveld, J.: Technical Note: The ModularEarth Submodel System (MESSy) – a new approach towards Earth System Modeling, At-mos. Chem. Phys., 5, 433–444, 2005,15
http://www.atmos-chem-phys.net/5/433/2005/. 11666Jockel, P., Tost, H., Pozzer, A., Bruhl, C., Buchholz, J., Ganzeveld, L., Hoor, P., Kerk-
weg, A., Lawrence, M. G., Sander, R., Steil, B., Stiller, G., Tanarhte, M., Taraborrelli, D.,van Aardenne, J., and Lelieveld, J.: The atmospheric chemistry general circulation modelECHAM5/MESSy1: consistent simulation of ozone from the surface to the mesosphere, At-20
mos. Chem. Phys., 6, 5067–5104, 2006,http://www.atmos-chem-phys.net/6/5067/2006/. 11665
Kerkweg, A., Sander, R., Tost, H., and Jockel, P.: Technical note: Implementation of prescribed(OFFLEM), calculated (ONLEM), and pseudo-emissions (TNUDGE) of chemical species inthe Modular Earth Submodel System (MESSy), Atmos. Chem. Phys., 6, 3603–3609, 2006,25
http://www.atmos-chem-phys.net/6/3603/2006/. 11666Konopka, P., Gunther, G., Muller, R., dos Santos, F. H. S., Schiller, C., Ravegnani, F., Ulanovsky,
A., Schlager, H., Volk, C. M., Viciani, S., Pan, L. L., McKenna, D.-S., and Riese, M.: Contribu-tion of mixing to upward transport across the tropical tropopause layer (TTL), Atmos. Chem.Phys., 7, 3285–3308, 2007,30
http://www.atmos-chem-phys.net/7/3285/2007/. 11675Kyro, E., Kivi, R., Turunen, T., Aulamo, H., Rudakov, V. V., Khattatov, V. V., MacKenzie, A.
R., Chipperfield, M. P., Lee, A. M., Stefanutti, L., and Ravegnani, F.: Ozone measurements
11684
ACPD9, 11659–11698, 2009
Diagnostics of theTTL
E. Palazzi et al.
Title Page
Abstract Introduction
Conclusions References
Tables Figures
J I
J I
Back Close
Full Screen / Esc
Printer-friendly Version
Interactive Discussion
during the Airborne Polar Experiment: Aircraft instrument validation; isentropic trends; andhemispheric fields prior to the 1997 Arctic ozone depletion, J. Geophys. Res., 105, 14599–14611, 2000. 11688
Lelieveld, J., Bruhl, C., Jockel, P., Steil, B., Crutzen, P. J., Fischer, H., Giorgetta, M. A., Hoor, P.,Lawrence, M. G., Sausen, R., and Tost, H.: Stratospheric dryness: model simulations and5
satellite observations, Atmos. Chem. Phys., 7, 1313–1332, 2007,http://www.atmos-chem-phys.net/7/1313/2007/. 11667, 11674
Liu, C., Zipser, E., Garrett, T., Jiang, J. H., and Su, H.: How do the water vapor and car-bon monoxide tape recorders start near the tropical tropopause?, Geophys. Res. Lett., 34,L09804, doi:10.1029/2006GL029234, 2007. 1166710
Lohmann, U. and Roeckner, E: Design and performance of a new cloud microphysics schemedeveloped for the ECHAM general circulation model, Clim. Dynam., 12(8), 557–572, 1996.11666
Mote, P., Rosenlof, W. K., Mclntyre, M., Carr, E., Gille, J., Holton, J., Kinnersley, J., Pumphrey,H., Russell III, J. M., and Waters, J.: An atmospheric tape recorder: The imprint of tropical15
tropopause temperatures on stratospheric water vapor, J. Geophys. Res., 101, 3989–4006,1996. 11661
Neu, J. L., Sparling, L. C., and Plumb, R. A.: Variability of the subtropical “edges” in the strato-sphere, J. Geophys. Res., 108(D15), 4482, doi:10.1029/2002JD002706, 2003. 11679
Pan, L. L., Randel, W. J., Gary, B. L., Mahoney, M. J., and Hintsa, E. J.: Definitions and20
sharpness of the extratropical tropopause: A trace gas perspective, J. Geophys. Res., 109,D23103, doi:10.1029/2004JD004982, 2004. 11668
Pan, L. L., Wei, J. C., Kinnison, D. E., Garcia, R. R., Wuebbles, D. J., and Brasseur, J. P: A setof diagnostics for evaluating chemistry-climate models in the extratropical tropopause region,J. Geophys. Res., 112, D09316, doi:10.1029/2006JD007792, 2007. 11662, 11663, 11668,25
11669, 11676, 11680Park, S., Jimenez, R., Daube, B. C., Pfister, L., Conway, T. J., Gottlieb, E. W., Chow, V. Y.,
Curran, D. J., Matross, D. M., Bright, A., Atlas, E. L., Bui, T. P., Gao, R.-S., Twohy, C. H., andWofsy, S. C.: The CO2 tracer clock for the Tropical Tropopause Layer, Atmos. Chem. Phys.,7, 3989–4000, 2007,30
http://www.atmos-chem-phys.net/7/3989/2007/. 11661Plumb, R. A.: Tracer-tracer relationships in the stratosphere, Rev. Geophys., 45, RG4005,
doi:10.1029/2005RG000179, 2007. 11669
11685
ACPD9, 11659–11698, 2009
Diagnostics of theTTL
E. Palazzi et al.
Title Page
Abstract Introduction
Conclusions References
Tables Figures
J I
J I
Back Close
Full Screen / Esc
Printer-friendly Version
Interactive Discussion
Prinn, R. G., Weiss, R. F., Fraser, P. J., Simmonds, P. G., Cunnold, D. M., Alyea, F. N.,O’Doherty, S., Salameh, P., Miller, B. R., Huang, J., Wang, R. H. J., Hartley, D. E., Harth,C., Steele, L. P., Sturrock, G., Midgley, P. M., and McCulloch, A.: A history of chemicallyand radiatively important gases in air deduced from ALE/GAGE/AGAGE, J. Geophys. Res.,105(D14), 17751–17792, 2000. 116755
Randel, W. J., Wu, F., Gettelman, A., Russell III, J. M., Zawodny, J. M., and Oltmans, S. J.:Seasonal variation of water vapor in the lower stratosphere observed in Halogen OccultationExperiment data, J. Geophys. Res., 106(D13), 14313–14325, 2001. 11661
Randel, W. J., Park, M., Wu, F., and Livesey, N.: A Large Annual Cycle in Ozone above theTropical Tropopause Linked to the Brewer-Dobson Circulation, J. Atmos. Sci., 64, 4479–10
4488, 2007. 11669Roeckner, E., Bauml, G., Bonaventura, L., Brokopf, R., Esch, M., Giorgetta, M., Hagemann,
S., Kirchner, I., Kornblueh, L., Manzini, E., Rhodin, A., Schlese, U., Schulzweida, U.,and Tompkins, A.: The atmospheric general circulation model ECHAM5. PART I: Modeldescription, Max Planck Institute for Meteorology, MPI-Report 349, online available at:15
http://www.mpimet.mpg.de/fileadmin/models/echam/mpi report 349.pdf, 2003. 11665Roeckner, E., Brokopf, R., Esch, M., Giorgetta, M., Hagemann, S., Kornblueh, S., Manzini,
E., Schlese U., and Schulzweida, U.: Sensitivity of Simulated Climate to Horizontal andVertical Resolution in the ECHAM5 Atmosphere Model, J. Climate, 19(16), 3771–3791,doi:10.1175/JCLI3831.1, 2006. 1166520
Sherwood, S. C. and Dessler, A. E.: A model for transport across the tropical tropopause, J.Atmos. Sci., 58, 765–779, 2001. 11668
Schoeberl, M. R., Duncan, B. N., Douglass, A. R., Waters, J., Livesey, N., Read, W.,and Filipiak, M.: The carbon monoxide tape recorder, Geophys. Res. Lett., 33, L12811,doi:10.1029/2006GL026178, 2006. 1166125
Shuckburgh, E., Norton, W., Iwi, A., and Haynes, P.: Influence of the quasi-biennial oscillationon isentropic transport and mixing in the tropics and subtropics, J. Geophys. Res., 106(D13),14327–14337, 2001. 11675
Sparling, L. C.: Statistical perspectives on stratospheric transport, Rev. Geophys., 38(3), 417–436, 2000. 11678, 1167930
Stefanutti, L., Mackenzie, A. R., Santacesaria, V., Adriani, A., Balestri, S., Borrmann, S., Khat-tov, V., Mazzinghi, P., Mitev, V., Rudakov, V., Schiller, C., Toci, G., Volk, C. M., Yushkov, V.,Flentje, H., Kiemle, C., Redaelli, G., Carslaw, K. S., Noon, K., and Peter, Th.: The APE-
11686
ACPD9, 11659–11698, 2009
Diagnostics of theTTL
E. Palazzi et al.
Title Page
Abstract Introduction
Conclusions References
Tables Figures
J I
J I
Back Close
Full Screen / Esc
Printer-friendly Version
Interactive Discussion
THESEO Tropical Campaign: An Overview, J. Atmos. Chem., 48(1), 1–33, 2004. 11664Thompson, A. M. and Witte, J. C.: SHADOZ (Southern Hemisphere Additional Ozonesondes):
A new data set for the earth science community, Earth Observer, 11(4), 27–30, 1999. 11672Thuburn, J. and Craig, G. C.: On the temperature structure of the tropical substratosphere, J.
Geophys. Res., 107(D2), 4017, doi:10.1029/2001JD000448, 2002. 116685
Vaughan, G., Schiller, C., MacKenzie, A. R., Bower, K., Peter, T., Schlager, H., Harris N. R.P., and May, P. T.: SCOUT-O3/ACTIVE: High-altitude aircraft measurements around deeptropical convection, B. Am. Meteorol. Soc., 89(5), 647–662, 2008. 11664
Viciani, S., D’Amato, F., Mazzinghi, P., Castagnoli, F., Toci, G., and Werle, P. A.: Cryogenicallyoperated laser diode spectrometer for airborne measurement of stratospheric trace gases,10
Appl. Phys. B, 90(3–4), 581–592, 2008. 11688Volk, C. M., Riediger, O., Strunk, M., Schmidt, U., Ravegnani, F., Ulanovsky, A., and Rudakov,
V.: In situ Tracer Measurements in the Tropical Tropopause Region During APE-THESEO,Eur. Comm. Air Pollut. Res. Report 73, 661–664, 2000. 11688
Vomel, H., Oltmans, S. J., Johnson, B. J., Hasebe, F., Shiotani, M., Fujiwara, M., Nishi, N.,15
Agama, M., Cornejo, J., Paredes, F., and Enriquez, H.: Balloon-borne observations of watervapor and ozone in the tropical upper troposphere and lower stratosphere, J. Geophys. Res.,107(D14), 4210, doi:10.1029/2001JD000707, 2002. 11668
World Meteorological Organisation (WMO): Definition of the tropopause, WMO Bull., 6, p. 136,1957. 1166820
Yushkov V., Oulanovsky, A., Lechenuk, N., Rudakov, I., Arshinov, K., Tikhonov, F., Stefanutti,L., Ravegnani, F., Bonafe, U., and Georgiadis, T.: A chemilumineschent Analyser for strato-spheric Measurements of the Ozone Concentration (FOZAN), J. Atmos. Ocean. Tech., 16,1345–1350, 1999. 11688
Zoger, M., Afchine, A., Eicke, N., Gerhards, M.-T., Klein, E., McKenna, D. S., Morschel, U.,25
Schmidt, U., Tan, V., Tuitjer, F., Woyke, T., and Schiller, C.: Fast in situ stratospheric hygrom-eters: A new family of balloon-borne and airborne Lyman α photofragment fluorescencehygrometers, J. Geophys. Res., 104(D1), 1807–1816, doi:10.1029/1998JD100025, 1999.
11688
11687
ACPD9, 11659–11698, 2009
Diagnostics of theTTL
E. Palazzi et al.
Title Page
Abstract Introduction
Conclusions References
Tables Figures
J I
J I
Back Close
Full Screen / Esc
Printer-friendly Version
Interactive Discussion
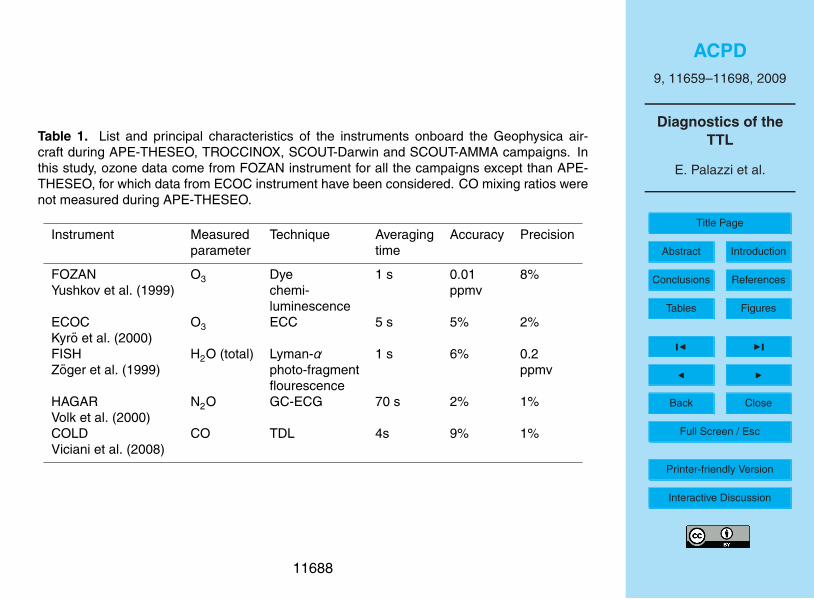
Table 1. List and principal characteristics of the instruments onboard the Geophysica air-craft during APE-THESEO, TROCCINOX, SCOUT-Darwin and SCOUT-AMMA campaigns. Inthis study, ozone data come from FOZAN instrument for all the campaigns except than APE-THESEO, for which data from ECOC instrument have been considered. CO mixing ratios werenot measured during APE-THESEO.
Instrument Measured Technique Averaging Accuracy Precisionparameter time
FOZAN O3 Dye 1 s 0.01 8%Yushkov et al. (1999) chemi- ppmv
luminescenceECOC O3 ECC 5 s 5% 2%Kyro et al. (2000)FISH H2O (total) Lyman-α 1 s 6% 0.2Zoger et al. (1999) photo-fragment ppmv
flourescenceHAGAR N2O GC-ECG 70 s 2% 1%Volk et al. (2000)COLD CO TDL 4s 9% 1%Viciani et al. (2008)
11688
ACPD9, 11659–11698, 2009
Diagnostics of theTTL
E. Palazzi et al.
Title Page
Abstract Introduction
Conclusions References
Tables Figures
J I
J I
Back Close
Full Screen / Esc
Printer-friendly Version
Interactive Discussion
Table 2. Location and time period of the four aircraft campaigns. The number of model gridpoints within the latitude-longitude box for each campaign is indicated.
Campaign Time Region Lat-Lon (◦) QBO Modelgridpoints
APE-THESEO February– Seychelles lat:[−20,2] beginning of 48March 1999 lon:[45,60] positive QBO
(easterly winds)TROCCINOX January– Brazil lat:[−24,−14] positive QBO 20
February 2005 lon:[-55,-40]SCOUT-Darwin November– Australia lat:[−24,−5] negative QBO 21
December 2005 lon:[127,135]SCOUT-AMMA August 2006 West-Africa lat:[−14,28] positive QBO 60
lon:[-8,4]
11689
ACPD9, 11659–11698, 2009
Diagnostics of theTTL
E. Palazzi et al.
Title Page
Abstract Introduction
Conclusions References
Tables Figures
J I
J I
Back Close
Full Screen / Esc
Printer-friendly Version
Interactive Discussion
Fig. 1. Geographic location of the four measurement campaigns considered in this study. Thered boxes indicate the areas where most flights were carried out (the transfer flights are notincluded in our analysis) and comparison between the observations and the model data hasactually been performed.
11690
ACPD9, 11659–11698, 2009
Diagnostics of theTTL
E. Palazzi et al.
Title Page
Abstract Introduction
Conclusions References
Tables Figures
J I
J I
Back Close
Full Screen / Esc
Printer-friendly Version
Interactive Discussion
Fig. 2. Variation of 15◦ S and 15◦ N mean ECHAM5/MESSy temperature and water vapourafter dividing by the mean value at each levels. Each panel also shows the isentropic surfaceat θ=380 K (here used as a proxy of the tropical tropopause) and the zonal mean zonal windat 40 hPa. The dashed vertical lines mark the temporal domains of the four measurementcampaigns (SC=SCOUT-Darwin, TH=APE-THESEO, AM=SCOUT-AMMA, TR=TROCCINOX)and locate them within the three model years.
11691
ACPD9, 11659–11698, 2009
Diagnostics of theTTL
E. Palazzi et al.
Title Page
Abstract Introduction
Conclusions References
Tables Figures
J I
J I
Back Close
Full Screen / Esc
Printer-friendly Version
Interactive Discussion
Fig. 3. Mean vertical profiles of O3 mixing ratios with standard deviations as a function of pres-sure relative to the to the thermal tropopause (TP=Tropopause Pressure) for M55-Geophysicacampaigns (black line) and ECHAM5/MESSy (red line). For the model we have reported theline corresponding to the year having the same QBO phase of the campaign year. The shadedarea includes the three model years with their standard deviations. The black dash-dotted lineindicates the thermal tropopause from temperature and pressure observations. Blue circles inthe bottom left plot indicate the measurements performed over the Fiji Islands in the time pe-riod corresponding to the SCOUT-Darwin campaign by ozonosondes belonging to the SHADOZnetwork.
11692
ACPD9, 11659–11698, 2009
Diagnostics of theTTL
E. Palazzi et al.
Title Page
Abstract Introduction
Conclusions References
Tables Figures
J I
J I
Back Close
Full Screen / Esc
Printer-friendly Version
Interactive Discussion
Fig. 4. Relative vertical ozone gradients (ratio between the ozone gradient and its concentra-tion) in tropopause coordinate (TP=Tropopause Pressure) for M55-Geophysica campaigns andECHAM5/MESSy. Color code is the same as Fig. 3. The black dash-dotted line indicates thethermal tropopause pressure level, calculated from temperature and pressure observations.
11693
ACPD9, 11659–11698, 2009
Diagnostics of theTTL
E. Palazzi et al.
Title Page
Abstract Introduction
Conclusions References
Tables Figures
J I
J I
Back Close
Full Screen / Esc
Printer-friendly Version
Interactive Discussion
Fig. 5. The same as Fig. 3, for H2O. A logarithmic scale has been used for H2O mixing ratios.
11694
ACPD9, 11659–11698, 2009
Diagnostics of theTTL
E. Palazzi et al.
Title Page
Abstract Introduction
Conclusions References
Tables Figures
J I
J I
Back Close
Full Screen / Esc
Printer-friendly Version
Interactive Discussion
Fig. 6. The same as Fig. 3, for N2O.
11695
ACPD9, 11659–11698, 2009
Diagnostics of theTTL
E. Palazzi et al.
Title Page
Abstract Introduction
Conclusions References
Tables Figures
J I
J I
Back Close
Full Screen / Esc
Printer-friendly Version
Interactive DiscussionFig. 7. CO-O3 correlations for ECHAM5/MESSy (left column) and the observations (right col-umn), relative to the regions and time periods of TROCCINOX, SCOUT-Darwin, and SCOUT-AMMA campaigns (from top to bottom), divided by color according to 12 hPa-thick pressureranges whose central value is indicated in the legend. Black solid lines indicate fits (as ex-plained in the text) to tropospheric and stratospheric branches.
11696
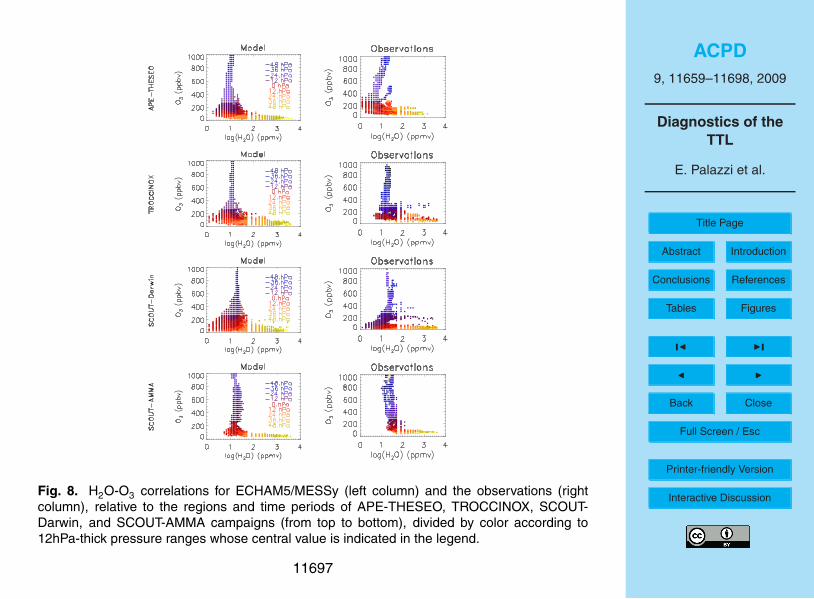
ACPD9, 11659–11698, 2009
Diagnostics of theTTL
E. Palazzi et al.
Title Page
Abstract Introduction
Conclusions References
Tables Figures
J I
J I
Back Close
Full Screen / Esc
Printer-friendly Version
Interactive DiscussionFig. 8. H2O-O3 correlations for ECHAM5/MESSy (left column) and the observations (rightcolumn), relative to the regions and time periods of APE-THESEO, TROCCINOX, SCOUT-Darwin, and SCOUT-AMMA campaigns (from top to bottom), divided by color according to12hPa-thick pressure ranges whose central value is indicated in the legend.
11697
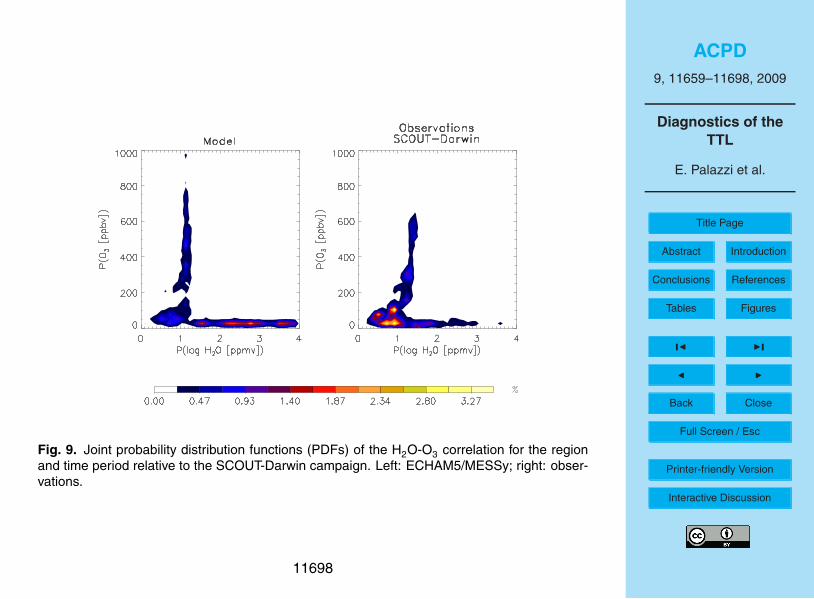
ACPD9, 11659–11698, 2009
Diagnostics of theTTL
E. Palazzi et al.
Title Page
Abstract Introduction
Conclusions References
Tables Figures
J I
J I
Back Close
Full Screen / Esc
Printer-friendly Version
Interactive Discussion
Fig. 9. Joint probability distribution functions (PDFs) of the H2O-O3 correlation for the regionand time period relative to the SCOUT-Darwin campaign. Left: ECHAM5/MESSy; right: obser-vations.
11698