development of solar arrays for argentine satellite missions
TRANSCRIPT
Aerospace Science and Technology 26 (2013) 38–52
Contents lists available at SciVerse ScienceDirect
Aerospace Science and Technology
www.elsevier.com/locate/aescte
Development of solar arrays for Argentine satellite missions
M. Alurralde a, M. Barrera a,b, C.G. Bolzi a, C.J. Bruno a, P. Cabot c, E. Carella c, J. Di Santo a, J.C. Durán a,∗,D. Fernández Slezak a, J. Fernández Vázquez a, A. Filevich a, C.D. Franciulli a, J.A. García a,1, E.M. Godfrin a,L. González a, V. Goldbeck d, A. Iglesias e, M.G. Martínez Bogado a,b, E. Mezzabolta a, A. Moglioni c,S. Muñoz a, C. Nigri a,1, S.L. Nigro a, J.I. Pérez a, J. Plá a,b, I. Prario a,1, M.C. Raffo Calderón e, D. Raggio a,C. Rinaldi a, S.E. Rodríguez a, H. Socolovsky a,1, M.J.L. Tamasi a,b
a Gerencia Investigación y Aplicaciones, CAC, CNEA, Av. General Paz 1499, 1650 San Martín, Provincia de Buenos Aires, Argentinab Consejo Nacional de Investigaciones Científicas y Técnicas (CONICET), Argentinac Departamento Ensayos No Destructivos y Estructurales, CAC, CNEA, Argentinad Departamento Materiales, CAC, CNEA, Argentinae Gerencia Química, CAC, CNEA, Argentina
a r t i c l e i n f o a b s t r a c t
Article history:Received 9 June 2010Received in revised form 15 December 2011Accepted 13 February 2012Available online 20 February 2012
Keywords:PV arraySpace solar cellsRadiation damage
This paper presents the development of solar arrays for Argentine satellite missions performed withinthe frame of cooperation agreements between the Argentine National Atomic Energy Commission (CNEA)and the Argentine National Commission for Space Activities (CONAE). Relevant issues such as simulationand design, solar cells characterisation, set up of soldering and bonding processes, radiation damage anddevelopment of testing techniques, are reviewed. A chamber for testing solar cells and other devices in asimulated space environment, and the integration and tests of two engineering models for qualificationof space technology processes are described. The requirements and solar array design for 3 missions,Aquarius/SAC-D and SAOCOM 1A and 1B, are presented. Finally, the flight model for the SAC-D mission,which was launched on 10 June 2011, is outlined, and telemetry data analysis from the first stages of themission is presented.
© 2012 Elsevier Masson SAS. All rights reserved.
1. Introduction
By the end of 1995, the Solar Energy Department (DES) of theNational Atomic Energy Commission (CNEA) began activities re-lated with solar cells and solar arrays for space applications. Tothis end, CNEA and the National Commission for Space Activities(CONAE) signed a cooperation agreement which led to a first ex-periment: Argentine Solar Cells in Space, on board of the Argentinesatellite SAC-A (Satellite for Scientific Applications – A) launchedby the end of 1998 [9].
After this experiment, CNEA and CONAE signed new coopera-tion agreements for the development of the solar arrays for threeArgentine missions:
– SAOCOM 1A and 1B missions for Earth observation. Thesesatellites are part of a future constellation, SIASGE [22],planned for monitoring natural and man-made disasters, as
* Corresponding author.E-mail address: [email protected] (J.C. Durán).
1 PhD student.
1270-9638/$ – see front matter © 2012 Elsevier Masson SAS. All rights reserved.doi:10.1016/j.ast.2012.02.012
well as harvests, natural resources, and soil moisture. Thisproject is a joint venture with the Italian Space Agency (ASI).
– Aquarius/SAC-D mission, for scientific research and Earthobservation. CONAE and the USA National Aeronautics andSpace Administration, NASA, have jointly developed the SAC-D/Aquarius [21]. The scientific objective is to conduct obser-vations of the Earth in order to obtain new information onclimate by measuring sea surface salinity. SAC-D must alsoidentify hot spots on the ground surface to allow the map-ping of fire risk, and perform measurements of soil humidityto prevent floodings (early warning).
In this paper we describe the development of the technologiesfor the integration and testing of solar arrays for space applica-tions. Particularly, the integration and testing of two engineeringmodels are shown. It should be remarked that NASA and ESA(European Space Agency) documents [23,28] have been taken asreferences for these developments.
The main activities performed on flight components were car-ried out in a clean room – Class 10,000 (according to FED-STD-209D), shown in Fig. 1. Other development work has been carriedout in different facilities belonging to the Tandar Accelerator Labo-ratory, CNEA.

M. Alurralde et al. / Aerospace Science and Technology 26 (2013) 38–52 39
Fig. 1. Solar Array Integration Laboratory, clean room – Class 10,000.
Further activities related with simulation and characterisationof III–V solar cells, beyond the scope of this paper, are presentedelsewhere [7,26].
2. Solar array design and simulation
A solar array is composed by strings of solar cells connected inseries. The number of cells in each string depends on the operat-ing voltage required. Strings are connected in parallel conformingmodules, which are the commutable units handled by the regula-tor.
The sizing of a solar array for satellite missions can be achievedby means of theoretical simulations of the power subsystems, tak-ing into account the mission’s requirements and, in a detailed way,the consumption profile of the satellite. To this end two modelsand their corresponding computational codes have been devel-oped.
The first code allows classifying the cells and calculates thetotal current–voltage (I–V ) curve of a solar array by adding nu-merically (in series or in parallel) the I–V curves of each com-ponent (solar cells, diodes, wires, etc.). Unlike usual models [8,10,14,25] which use theoretical equations for the simulation of theI–V curve of the cells and do not take into account the deviationin the electrical characteristics of the cells, this code does not re-quire any model for the electrical characteristics, only a set of I–Vvalues defining the curve for each component. If available it mayuse the actual (measured) I–V curves of the solar cells that willbe integrated into the solar panel, or theoretical values randomlygenerated using mean values and standard deviations provided bythe solar cells manufacturer. The code allows to classify the cellsby: short circuit current (Isc), voltage at maximum power point(V mpp), maximum power point (Pmpp), open circuit voltage (V oc),current at maximum power point (Impp), or current at a fixed volt-age (Ifv).
The second code simulates the power subsystem, which con-sists of a solar array, batteries, and regulator. The aim of the simu-lation code is to obtain the temporal evolution of several importantparameters during the mission’s (beginning of life (BOL), end oflife (EOL) or at intermediate states). At each step (time = t), thecode takes into account the intensity of the solar radiation and thesatellite position, calculates the solar radiation incidence angle andgenerates the array I–V curve. Then, using the satellite consump-tion and the state of charge of the battery at t , the subroutine
which simulates the regulator defines the number of modules ofthe solar array that should be on (part of the modules may beshort-circuited to avoid overcharge of the batteries). Finally, thecurrent provided by the solar array and the batteries, and the newstate of charge of the battery at (t + �t) are calculated. The simu-lation is performed with a typical time step of 1 minute.
The main input information for the simulation code is:
(i) I–V curves of modules, previously calculated for normal inci-dence at several operating temperatures;
(ii) charge and discharge curves of batteries for several operatingtemperatures;
(iii) regulator thresholds;(iv) the consumption profile;(v) orbit information (type, altitude, inclination, eclipses duration,
etc.).
Factors associated with radiation damage, incidence angle, Sun–Earth distance and operation temperature are considered.
The simulation code was written in Fortran 90, using an object-oriented design.
The models developed have been applied for designing the so-lar arrays and predicting the power subsystems performance forSAOCOM and SAC-D missions. Energy needs for the satellites andavailable solar array area led to choose InGaP/GaAs/Ge advancedtriple junction (ATJ) solar cells from Emcore [16], with a minimumaverage efficiency of 27.5% (28 ◦C, AM0), and an area of 27.5 cm2.
2.1. SAOCOM mission
The SAOCOM 1A satellite will describe a Sun-synchronousfrozen orbit at approximately 620 km height, with an inclinationof 98◦ and an orbital hour LTAN 6:12 AM. The orbital period willbe 98 minutes, with variable eclipse periods during 4 months eachyear at northern latitudes, and a maximum duration of 19 min-utes on December. For the solar array parallel to the orbit plane(normal mode of operation), the angle of incidence of the solar ra-diation on the solar cells will vary between 31◦ (December), 15◦(June) and 4◦ (March and September).
The main instrument of the satellite will be an approximately35 m2 radar antenna. The high power requirement of the satel-lite is associated to the operation of this antenna and also withmanoeuvres of the satellite (rotations) for observation at different
40 M. Alurralde et al. / Aerospace Science and Technology 26 (2013) 38–52
directions. The satellite will have a base consumption of about1.4 kW and a maximum consumption of approximately 4.9 kWduring antenna operations. The mean power requirement willstrongly depend on the number of observations per day and theduration of each observation. The available area for the solar ar-ray is approximately 13 m2 and the battery will be composed ofLi-ion cells with a nominal voltage of 50 V and a capacity of 128Ah at EOL. The maximum depth of discharge (DOD) has been rec-ommended not to exceed 20% to optimise the battery lifetime.
For the design and simulation presented below, the followingmission requirement has been considered:
• The power generation at EOL (5 years) shall be of at least1900 W orbital mean value with one generation module failed,and during worst-case illumination condition.
The solar array will be integrated with ATJ solar cells, each onebridged by a silicon bypass diode, provided by Emcore. The solarcells will be interconnected in strings with one blocking diode ineach string. The number of cells per string is determined by theoperating voltage defined by the battery. Assuming a mean state ofcharge (SOC) of 90%, which defines an operating voltage of 61.4 V,and taking into account the electrical characteristics of the solarcells, the number of cells interconnected in series for each stringshould be 32.
Using the code for the interconnection of cells and the cellcurves obtained from the electrical parameters (Isc , V oc , Impp andV mpp) of 2700 solar cells at 28 ◦C (data supplied by the manufac-turer) as input, the I–V curves of the modules were generated forthe following operating conditions:
(i) EOL (5 years), using the equivalent 1 MeV electron fluencesestimated for the mission and their corresponding degradationfactors;
(ii) 70 ◦C operating temperature, using the temperature coeffi-cients for the electrical parameters from Ref. [16];
(iii) normal incidence of solar radiation. A further factor associatedwith actual incidence angles of the solar radiation is consid-ered (see Table 3).
The following factors have also been considered for the simula-tion:
(a) a random experimental error on Isc and Impp , to consider ad-ditional mismatch factors associated with measurement errorsduring the classification procedure;
(b) a series resistance of 0.37 � for the strings and 0.15 � for themodules, associated with wires and connectors.
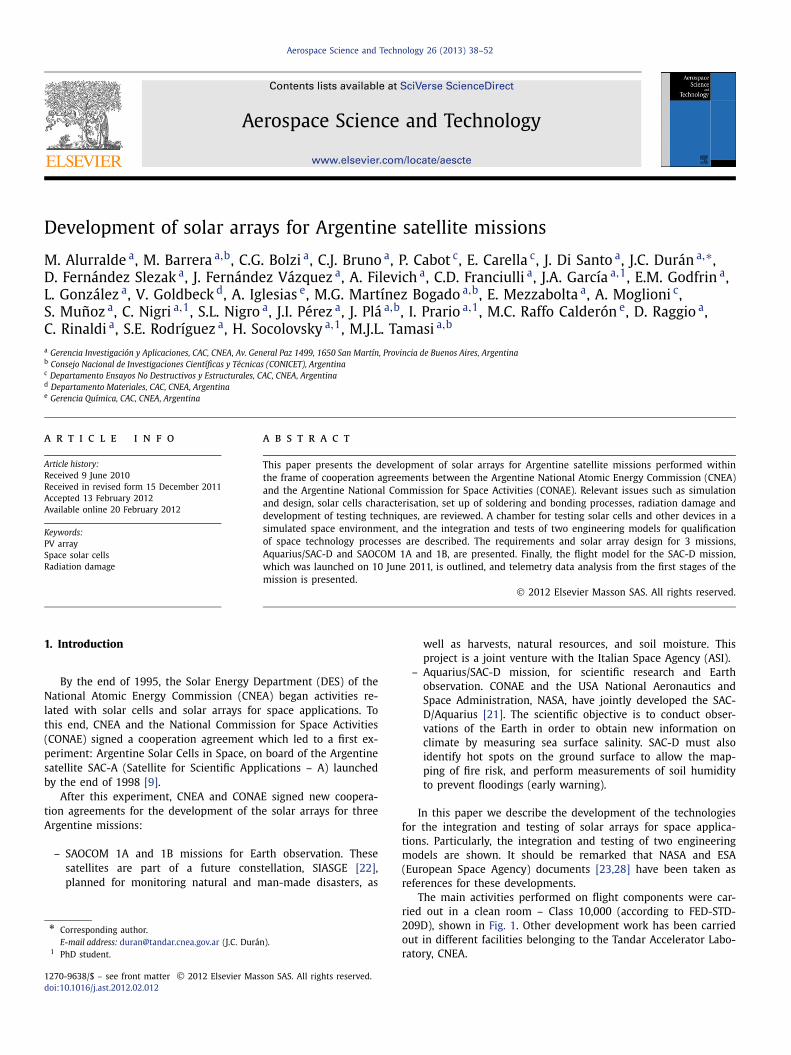
Fig. 2 shows a typical I–V curve for a mean module at EOLand 70 ◦C. It should be mentioned that this curve represents theI–V values generated by the module in the bus bar of the satellite,because it includes losses in blocking diodes, wires and connectors.
Three solar arrays were generated using different classificationcriteria for the solar cells: Impp , Isc and Pmpp . Table 1 shows themean power at EOL and 70 ◦C obtained for each case. The maxi-mum power is obtained using the Impp classification criterion, eventhough the difference of the results using different classificationcriteria is less than 2%.
The influence of the experimental errors during the classifica-tion procedure on the expected power generation was also anal-ysed. A random error of 2%, 4% and 6% was introduced in Isc andImpp for each cell. As experimental errors in voltage measurementsare usually much lower than in current measurements they havenot been included in the simulations. Table 2 shows an example ofthe variation of the electrical characteristics of a module at BOL
Fig. 2. Typical I–V curve for a 5 strings module and 32 cells per string, at EOL and70 ◦C.
Table 1Electrical characteristics of the mean module obtained using dif-ferent classification criteria.
Classification criteria Power at Pmpp [W]
Impp 3268Isc 3241Pmpp 3232
Table 2Influence of the simulated experimental errors on the electrical parameters of onemodule. Percentage differences are shown in parentheses.
Error V oc [V] Isc [A] Pmpp [W] V mpp [V] Impp [A]
0% 83.42 2.379 165.0 73.62 2.2412% 83.43 2.396 164.0 73.73 2.224
(0.01%) (0.7%) (−0.6%) (0.2%) (−0.8%)
4% 83.44 2.418 163.0 73.93 2.205(0.02%) (1.6%) (−1.2%) (0.4%) (−1.6%)
6% 83.45 2.432 160.9 74.11 2.171(0.03%) (2.2%) (−2.5%) (0.7%) (−3.1%)
and 28 ◦C, as a function of the experimental errors considered.These results are similar for other operating conditions and couldbe summarised as follows:
– Impp and Pmpp decrease less than half the experimental errorconsidered;
– Isc increases less than half the experimental error considered;– V oc and V mpp are almost independent on the error.
In order to estimate the number of strings needed to satisfy thepower requirements of the mission, the I–V curve for the meanmodule has been obtained for the worst case: EOL (5 years) andmaximum duration of eclipses (December 21st), which also corre-sponds to the maximum angle of incidence of the solar radiation.
Taking into account that the I–V curve of the module has beenobtained for normal incidence of a solar radiation of 1367 W/m2,the factors associated with: (i) non-normal incidence, (ii) the vari-ation of the solar radiation during the year, and (iii) the eclipses,should be added. Moreover, an additional degradation factor asso-ciated to damage due to UV and micrometeorites has also beenintroduced.
Using the factors shown in Table 3 and considering a batteryvoltage of 61.4 V, the orbital mean power generation for the meanmodule (5 strings) is about 94 W for the worst case. Taking into
M. Alurralde et al. / Aerospace Science and Technology 26 (2013) 38–52 41
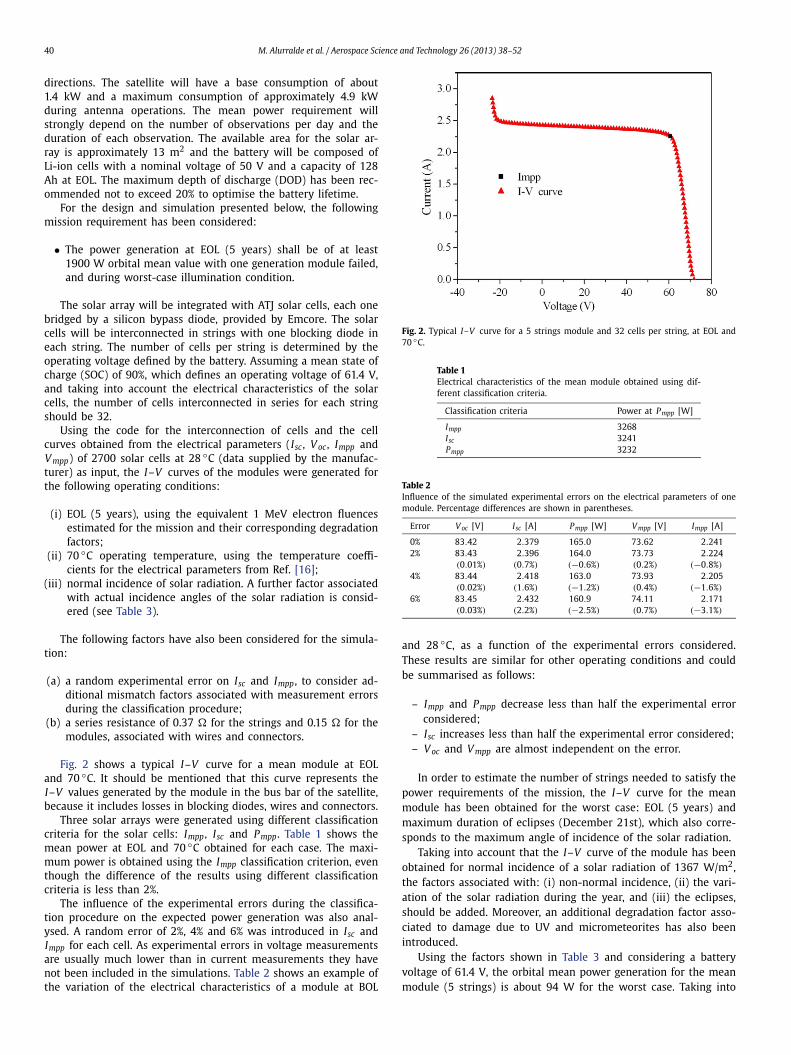
Fig. 3. Consumption, array generation and SOC on December 20th to 22nd (worst case) for the SAOCOM 1A.
Table 3Factors for the estimation of the mean module power generationin December at EOL.
Distance Sun–Earth 1.029Solar radiation incidence angle (31◦) 0.857Rate of illumination 0.796UV + micrometeorites 0.980
Total 0.688
account a mean power requirement of 1900 W a minimum of 101strings are needed.
Power subsystem simulations were performed using 112 strings,the maximum number compatible with the available area. As anexample Fig. 3 shows power consumption, solar array generation,and the state of charge (SOC) for the worst case (EOL, December20th to 22nd, as part of a simulation beginning on December 18thand extending over 75 orbits), performing only one antenna oper-ation per orbit. For the consumption profile used, the maximumDOD is under 18% (reached on December 20th), with a mean DODless than 7%, with the full-power demand satisfied [19].
These results show that the solar array and the battery capacityare appropriate for the consumption considered.
2.2. Aquarius/SAC-D mission
SAC-D mission has a similar profile to that of the SAOCOMmission: the orbit is Sun-synchronous, frozen at approximately657 km height, with an inclination of 98◦ and an orbital hour of6 PM for the ascending node. The orbital period is 98 minutes,with variable eclipse periods during 4 months each year at south-ern latitudes with a maximum duration of 19 minutes on June. Forthe solar array parallel to the orbit plane (normal mode of opera-tion), the incidence angle of the solar radiation on the solar cells
varies between 31◦ (June), 15◦ (December) and a minimum of 4◦(March and September). The main instrument of the satellite is theAquarius (Band-L radiometer), which measures the ocean salinityand Argentine soil humidity. The area of the solar array is about9 m2, and the battery is also in this case composed of Li-ion cellswith a capacity of 65 Ah at EOL.
The main requirements for the Aquarius/SAC-D mission were asfollows:
• The Service Platform being capable of providing at least1320 W of orbital average power at EOL (5 years).
• A solar array able to generate during daylight time a minimumpower of 1600 W after 3 years mission, with a Sun pointingangle of 31.4◦ in the worst-case season, and having lost onemodule.
• When exposed to the wide energy spectra of electrons andprotons in the space environment for a 5 years mission, thesolar cells short circuit current, open circuit voltage and peakpower should not be degraded more than 1%, 6% and 7%, re-spectively.
For SAC-D, three different string configurations (with 18, 19 and20 cells) were analysed at EOL, and two operating temperatures(53 ◦C – cold case, and 83 ◦C – hot case). From the point of view ofthe power generation a configuration with 18 cells per string wasrecommended. It should be mentioned that during the hot statethe operating voltage could marginally shift to the right side of themaximum power point in the I–V curve. However, detailed calcu-lations have shown that this configuration fulfil safely the powerrequirements of the mission [18].
Design and power subsystem estimations were carried outas described in Section 2.1 and led to the following configura-tion: 2584 cells distributed on 143 strings, each string contain-ing 18 cells interconnected in series. Strings were arranged in

42 M. Alurralde et al. / Aerospace Science and Technology 26 (2013) 38–52
21 modules of 6 strings, 1 of 7 strings and 2 of 20 strings. Ta-ble 4 shows the electrical characteristics of the modules simulatedusing the I–V curves measured for each cell at normalised con-ditions (AM0, 1367 W/m2, 28 ◦C, and normal incidence of radia-tion).
3. Experimental simulation of in-orbit conditions
3.1. Radiation damage
A satellite in a low Earth orbit (LEO) works in a radiation “un-friendly” environment. Inside the inner Van Allen belt there existsisotropic proton and electron irradiation, but most part of the dam-age is due to protons with energies ranging from a few keV tohundreds of MeV. In addition the satellite is unprotected from cos-mic radiation hitting with all kinds of energetic ions.
Table 4Electrical characteristics of the modules simulated using the cell I–V curves mea-sured at normalised conditions.
Module V oc [V] Isc [A] P [A] V mpp [V] Impp [A]
1 46.9 2.90 106 39.0 2.722 47.1 2.92 109 39.5 2.743 46.9 2.91 107 39.0 2.744 46.9 2.91 106 38.8 2.735 46.8 2.91 106 38.9 2.736 46.9 3.38 125 39.2 3.197 46.9 2.90 106 38.9 2.738 46.7 2.91 106 39.0 2.739 46.9 2.92 108 39.5 2.74
10 46.8 2.91 106 38.8 2.7311 47.0 2.91 107 39.1 2.7412 47.0 2.92 109 39.6 2.7413 46.6 2.87 106 39.0 2.7114 46.5 2.89 105 38.9 2.7115 46.7 2.91 106 39.0 2.7316 46.4 2.91 105 38.7 2.7217 46.7 2.88 106 39.1 2.7218 46.5 2.90 106 39.1 2.7219 46.8 2.41 89 39.3 2.2720 46.4 2.43 89 39.0 2.2821 46.7 2.89 107 39.1 2.7322 46.7 2.90 106 38.9 2.7223 46.6 2.92 106 39.0 2.7324 46.6 2.89 107 39.2 2.72
To consider this situation a chamber was built for testing so-lar cells by cycling the temperature of sample coupons within theexpected in-orbit temperature range. At the same time the cellsunder test are irradiated by a proton beam featuring a space-likespectrum with variable incidence angles to approach the isotropicspace flux. Ion beams are delivered to the test chamber by theTandar 20 MV Tandem Van de Graaff Accelerator. This facility issomewhat similar to that described in Ref. [17], but our upper en-ergy limit for protons is at present 25 MeV, suitable for irradiatingsamples with 100 to 150 μm thick cover glasses. Attached to thechamber a solar simulator based on a 1 kW Xe lamp (SciencetechSS 1 kW) allows illuminating the samples with a space-like photonflux.
Fig. 4 shows a picture of the facility. The size of the access lid(on top of the chamber) is 760 mm in diameter, while the ionbeam enters through a 5′′ diameter port. The ion optics was de-signed to produce an ion beam of about this size on the targetholder. Appropriate shielding collimators were installed to preventnuclear reaction activation of the stainless steel beam line. Thechamber can be lined with aluminium sheet with the same pur-pose. Some new features have been added, for example the beamline was modified to include a proton energy degrading system.This degrader allows fast modification of the beam energy in orderto simulate the space proton spectrum, and also, it allows defo-cussing the beam to produce irradiation over bigger areas.
In order to improve the dose uniformity a beam sweeping sys-tem was developed, consisting in two dipolar magnets (steerers)oriented along the X and Y axes. The magnets are fed by two tri-angular current waveforms with incongruent periods and used todeflect the beam, which is swept over the target surface. The re-sulting beam intensity uniformity is better than 5% over the wholetarget area.
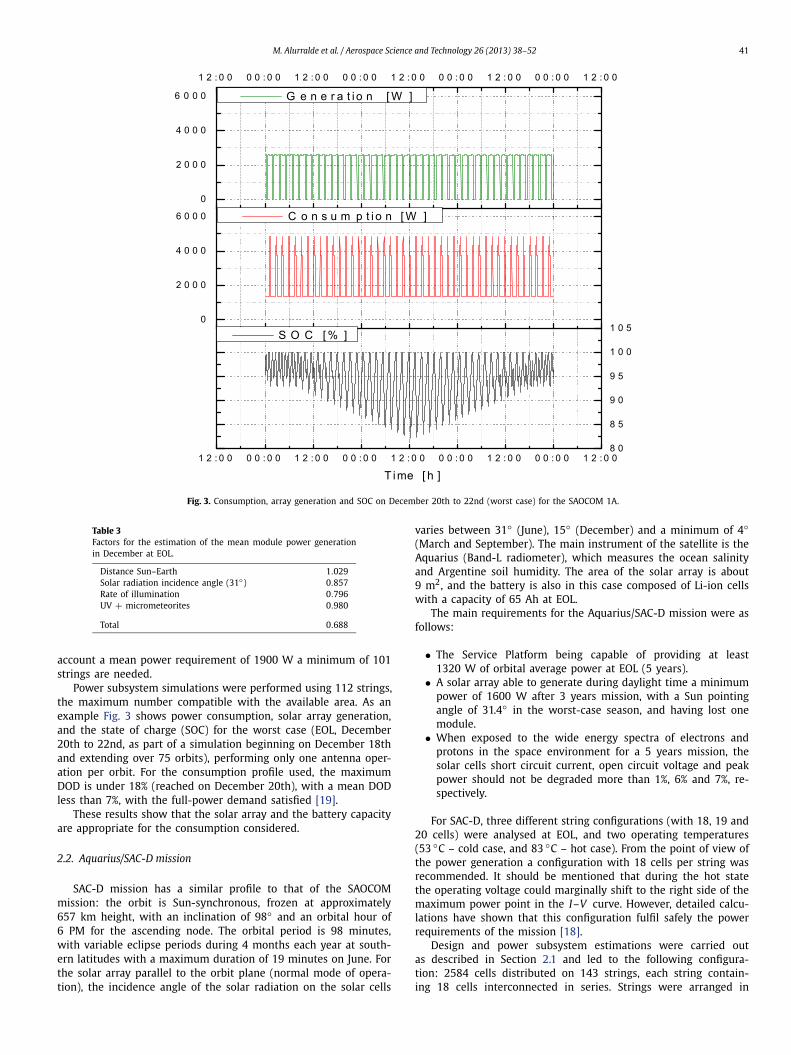
A 9-Faraday cup (FC) array, or Multiple Faraday Cup (MFC), wasdeveloped to measure the beam intensity and to determine its uni-formity. Data are collected in a personal computer installed in theaccelerator control room. Fig. 5 shows the results of a first irra-diation test [4]. In this example the two segments reaching valuesclose to 120 pA indicate an unexpected increase of the current andpoor uniformity due to beam instabilities. It can be seen that theMFC array is able to give a clear indication of the beam shape anduniformity at the irradiation area.
Fig. 4. 76-cm vacuum chamber installed on one of the Tandar accelerator beam lines.
M. Alurralde et al. / Aerospace Science and Technology 26 (2013) 38–52 43
Fig. 5. Sequential measurements of beam currents for the 9 Faraday cups of the MFC array. Each symbol represents the average of twenty individual measurements on eachFC, the errors bars correspond to their standard deviation. The solid curve is the average of the current measured by the 9 FCs.
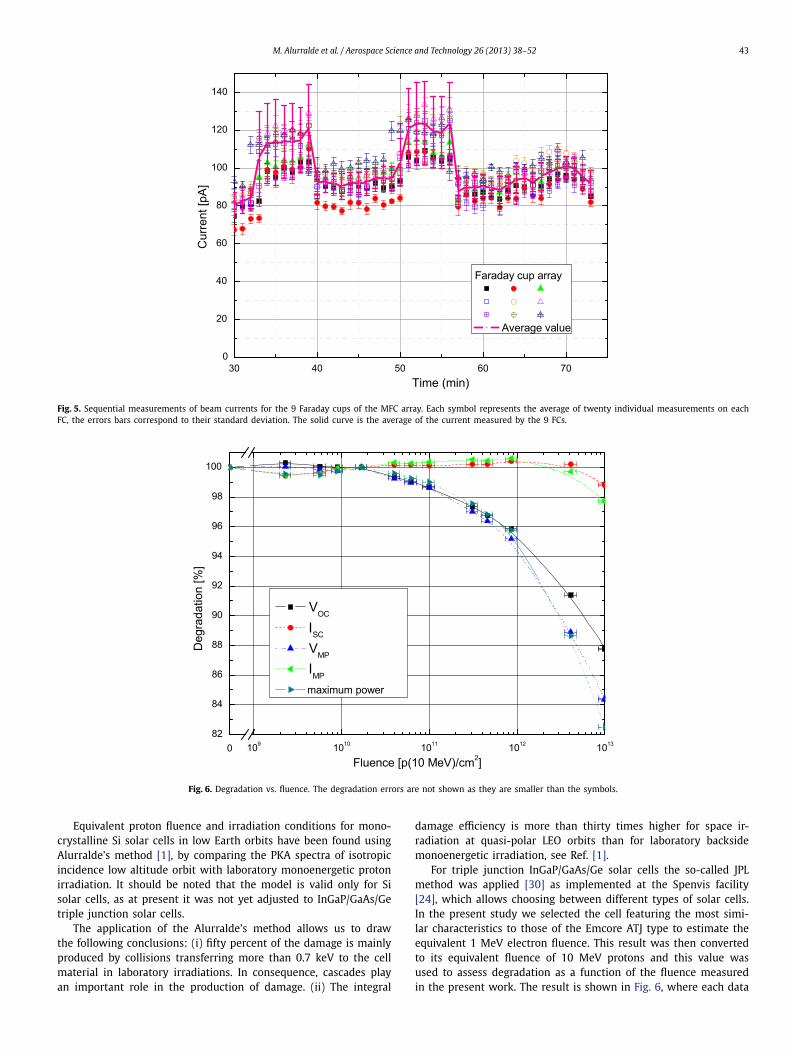
Fig. 6. Degradation vs. fluence. The degradation errors are not shown as they are smaller than the symbols.
Equivalent proton fluence and irradiation conditions for mono-crystalline Si solar cells in low Earth orbits have been found usingAlurralde’s method [1], by comparing the PKA spectra of isotropicincidence low altitude orbit with laboratory monoenergetic protonirradiation. It should be noted that the model is valid only for Sisolar cells, as at present it was not yet adjusted to InGaP/GaAs/Getriple junction solar cells.
The application of the Alurralde’s method allows us to drawthe following conclusions: (i) fifty percent of the damage is mainlyproduced by collisions transferring more than 0.7 keV to the cellmaterial in laboratory irradiations. In consequence, cascades playan important role in the production of damage. (ii) The integral
damage efficiency is more than thirty times higher for space ir-radiation at quasi-polar LEO orbits than for laboratory backsidemonoenergetic irradiation, see Ref. [1].
For triple junction InGaP/GaAs/Ge solar cells the so-called JPLmethod was applied [30] as implemented at the Spenvis facility[24], which allows choosing between different types of solar cells.In the present study we selected the cell featuring the most simi-lar characteristics to those of the Emcore ATJ type to estimate theequivalent 1 MeV electron fluence. This result was then convertedto its equivalent fluence of 10 MeV protons and this value wasused to assess degradation as a function of the fluence measuredin the present work. The result is shown in Fig. 6, where each data

44 M. Alurralde et al. / Aerospace Science and Technology 26 (2013) 38–52
point was extracted from the I–V curve measured using the four-point method and a Model 2602 Keithley SMU, using the solar sim-ulator for illumination. This study was performed “in situ”, haltingthe irradiation at selected fluencies to perform the measurements.The estimated errors in the degradation are smaller than the sizeof the symbols used in Fig. 6. All irradiations were made using thesample holder with controlled temperature at 30 ◦C. From Fig. 5 a15% error in fluence was adopted. Other particular topics on radi-ation damage studies performed are presented elsewhere [1,3,4,6,17,31].
3.2. Thermal cycling
Due to pass through eclipses, changes of orientation with re-spect to the Sun, and eventual shadowing, the solar panels in satel-lites are continuously subjected to thermal cycling between ex-treme temperatures, which can reach −100 ◦C and +100 ◦C. Thesetemperature changes are relatively slow as cooling and heating areessentially due to absorption of thermal radiation from the Sunand, respectively, to radiative emission to space from the panel sur-face.
Several devices have been built to test solar cells and electroniccomponents under similar thermal conditions to those found inthe space environment, but being able to induce much faster tem-perature excursions.
One of them consists of a sample holder attached to a coldplate with circulating LN2. At the same time a resistive heat sourcecan be activated so that different temperature profiles can beachieved in the holder. By alternating or combining cooling andheating sources, the thermal cycles found in space applications canbe simulated by this device, which works either in a controlled at-mosphere plastic chamber, where cycling periods of the order of20 min were performed [5].
A similar method for heating/cooling was used in a sampleholder installed in the in-line 76-cm vacuum chamber, where slowvacuum cycling was performed on solar sensors under specifiedtemperature ramps.
In order to run a larger number of thermal cycles a fast ther-mal shock device was built, using a specially designed LN2 nozzleand 350 ◦C heat guns under automated control. Fast cycling wasachieved by removing the honeycomb and supporting the solar cellstrings only by a thin carbon fibre substrate covered with a Kaptonfilm. The reduction in the associated thermal mass allowed veryfast cycling (of the order of 2 min) within the same temperatureinterval.
Using this device, over 3000 thermal vacuum cycles were per-formed between −100 ◦C and +100 ◦C on a substring of 16 ATJsolar cells integrated at CNEA in a dry nitrogen gas atmosphere at1 atm pressure, and other sample, with 18 flight cells, was success-fully qualified by 5000 thermal cycles between −50 ◦C and +80 ◦C.These tests allowed validating the developed bonding techniques,interconnector integrity, welding, soldering, and bonding processes,both for cells and coverglasses. The number of cycles performedwas comparable with the number expected in the whole mis-sion lifetime. All these fast cycling tests have been performed indry nitrogen gas atmosphere, at a pressure slightly higher than1 atm.
The solar cells are mounted according to developed integrationprocedures (see Fig. 7). This picture has been obtained during vi-sual inspection after the first 2000 thermal shocks. Observe the by-pass diodes welded on the cell corners, and the 4 surface mountedPt100 temperature sensors. Temperature measured by Pt100 sensorsand bidirectional electric continuity using a square wave currentof about 0.45 A peak are permanently monitored and recorded us-ing an 8-channel data logger with 1 s sample time. This checks theintegrity of the bypass diode connections. The control of electrical
Fig. 7. Coupon containing 18 series-connected Emcore ATJ cells on a carbon fibreskin of the honeycomb.
Table 5Summary of the result of a thermal cycling test performed on a 4-cell coupon.
Component Before test After test
Interconnectors OK OKCurrent collectors OK OKSCAs OK 2 cracked glassPt100, cables OK OKSoldering OK OKSubstrate OK OK
continuity has shown no noticeable degradation in the differenttests performed, and visual inspections at regular intervals duringthe long tests have shown only minimal chippings on coverglasses.Preliminary results were presented in [4], and a sample of thermalcycling results is summarised in Table 5.
4. Processes for solar array integration
4.1. Interconnectors
For the interconnection of cells metallic tabs are commonlyused. Silver-plated molybdenum and Kovar were selected as thebase material. Mo and kovar are used due to their high resistanceto fatigue. Moreover, the first material is non-magnetic. Intercon-nector fabrication from Mo and Kovar sheets is performed in threestages: sheet electroplating, cutting, and forming. Two electroplat-ing processes were developed for both materials. Results are eval-uated by optical and SEM observations. Besides, a testing machinewas developed in order to assess the fatigue resistance of inter-connectors, this machine produces an alternating displacement of±50 μm, emulating the effect of the thermal cycling suffered inorbit. Test results show that interconnectors made using with thisprocedure withstand more than 100,000 cycles.
Devices for cutting and conforming appropriate interconnectorsfor the chosen solar cells were developed and constructed. Ther-mal cycling tests made on coupons assembled with Kovar-platedinterconnectors showed good behaviour after more than 10,000 cy-cles. This type of interconnectors was used for (i) the integrationof one of the two strings of the second engineering model madeto undergo the set of tests described below, (ii) for the Engineer-ing Qualification Model (EQM), and (iii) for the SAC-D mission [4]Flight Model (FM).

M. Alurralde et al. / Aerospace Science and Technology 26 (2013) 38–52 45
Fig. 8. (a) Welding system. (b) Soldering process.
4.2. Welding and soldering joints
4.2.1. Front side weldingThe welding for solar cells interconnection must guarantee
an adequate electrical contact and enough strength to resist thestresses commonly produced at the launch and during in-orbit op-eration.
The resistance, parallel-gap welding technique was selected forwelding the silver-plated Kovar interconnectors to the front sideof ATJ Emcore solar cells [11–13,20,27,29]. The system used forwelding consisted of a programmable DC power supply (ModelDC 25) and a parallel-gap welding head (Model 86A/EZ) madeby Unitek Co. (Fig. 8a). It allows programming the welding cy-cles, number of pulses, pulse amplitude, pulse time, modes ofcurrent flow, weld force, magnitude/time, etc. Optimum pro-cess parameters were identified in order to both, assuring sta-ble welding conditions, and producing joints of high integrity.Previously to welding the surface condition of contacts waschecked.
Pull tests at 45◦ angle were performed for assessing weld-ing quality and strength. All tests were carried out using a smallmotor driven machine specifically designed and constructed withthis purpose. In the case of the 45◦ tests all pulling strength re-sults satisfied a requirement of 350 g established in this labora-tory.
To allow comparison with data supplied by Emcore, weldingpull tests were conducted at 0◦ pull angle. Tests at 0◦ performedon about 250 cells in the frame of the SAC-D FM integrationshowed a Gaussian-like distribution centred at 985 g [4]. Resultsare shown in Fig. 9.
The standard deviation σ was about 240 g , therefore 68% of thetested samples gave results between 745 and 1225 g . The mini-mum value registered was approximately 400 g , higher than theacceptable minimum. For the welding of joint-interconnecting Si-bypass diodes, the mean value obtained for traction tests was700 g .
4.2.2. Back side solderingSoldering is a reliable, established process, which has been suc-
cessfully used well for past arrays [29]. For this work, it was ver-
Fig. 9. Distribution of results of pull tests.
ified that the welding made to the smoother cell contact surfaceswere very much stronger than those made to the rougher backside cell surface. Moreover, measurements showed that the rough-ness of the back side of the cell is almost five times greater thanthat of the front side. It was proved that higher electrode pressuressomewhat improve welding strength; however, the presence of thecoverglass adhesive hinders the increase of that pressure. Becauseof this, soldering was chosen for the interconnections on the backside (Fig. 8b).
The joints were made with a programmable reflow Unitek sys-tem with controlled temperature profile and solder preforms con-sisting of a Sn/Pb/Ag alloy. The principal parameters of the systemwere thermode type and force, temperature and time.
The quality of welding and soldering processes was assured byverifying the actual power or temperature profiles during the pro-cesses, and through periodic pulling tests and visual inspection ofimprints.
46 M. Alurralde et al. / Aerospace Science and Technology 26 (2013) 38–52
4.3. Bonding
Solar cells in space applications are protected by coverglassesfrom UV exposure and from low energy charged particles. A 100-μm coverglass is mounted onto each cell.
Activities related to bonding techniques can be listed as:
• bonding coverglasses to cells,• bonding stringed cells to substrate,• bonding buses to substrate,• bonding cables and electronic devices to substrate.
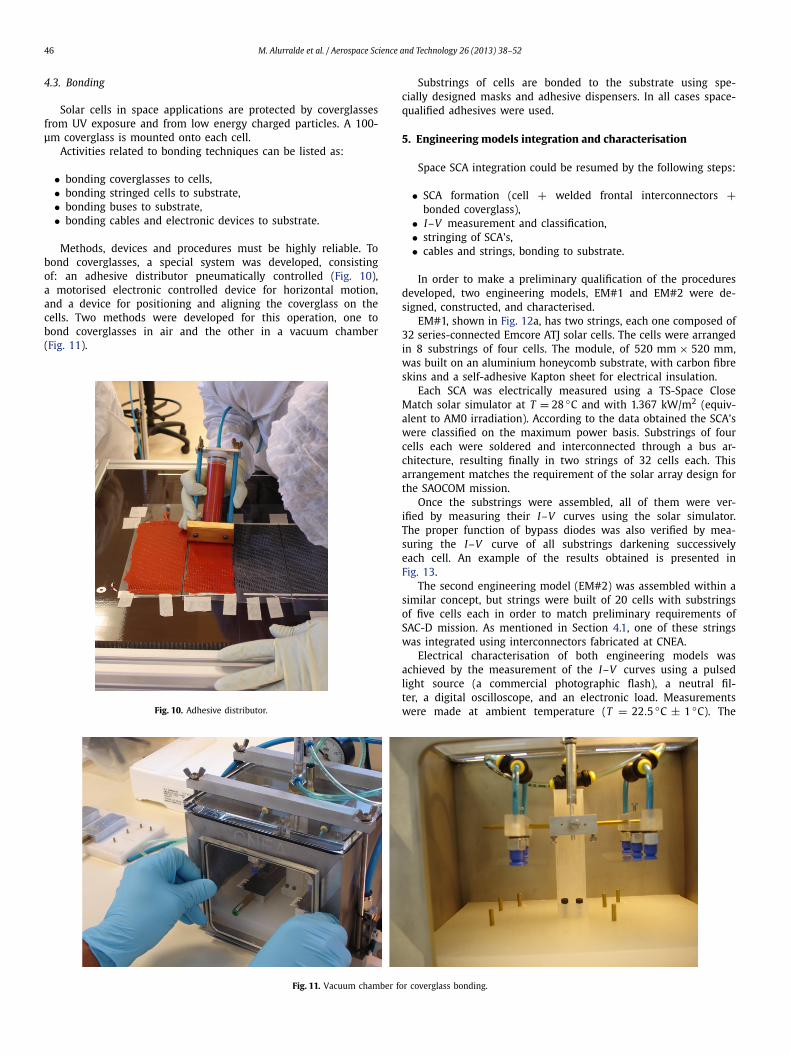
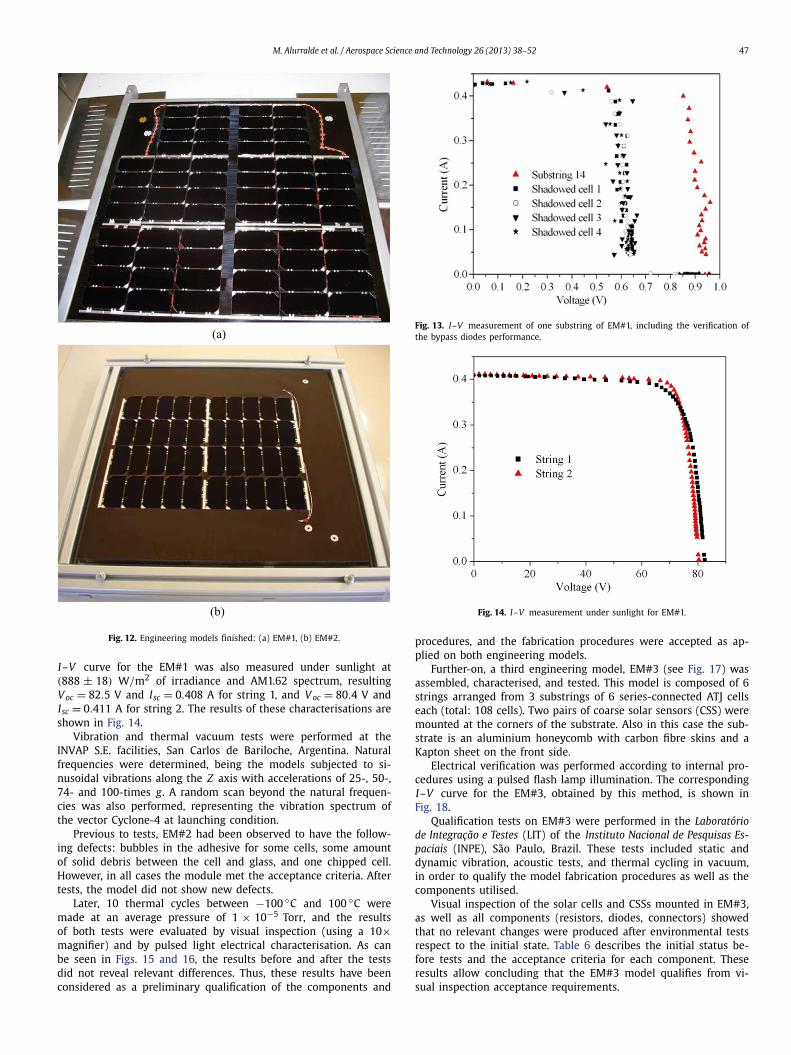
Methods, devices and procedures must be highly reliable. Tobond coverglasses, a special system was developed, consistingof: an adhesive distributor pneumatically controlled (Fig. 10),a motorised electronic controlled device for horizontal motion,and a device for positioning and aligning the coverglass on thecells. Two methods were developed for this operation, one tobond coverglasses in air and the other in a vacuum chamber(Fig. 11).
Fig. 10. Adhesive distributor.
Substrings of cells are bonded to the substrate using spe-cially designed masks and adhesive dispensers. In all cases space-qualified adhesives were used.
5. Engineering models integration and characterisation
Space SCA integration could be resumed by the following steps:
• SCA formation (cell + welded frontal interconnectors +bonded coverglass),
• I–V measurement and classification,• stringing of SCA’s,• cables and strings, bonding to substrate.
In order to make a preliminary qualification of the proceduresdeveloped, two engineering models, EM#1 and EM#2 were de-signed, constructed, and characterised.
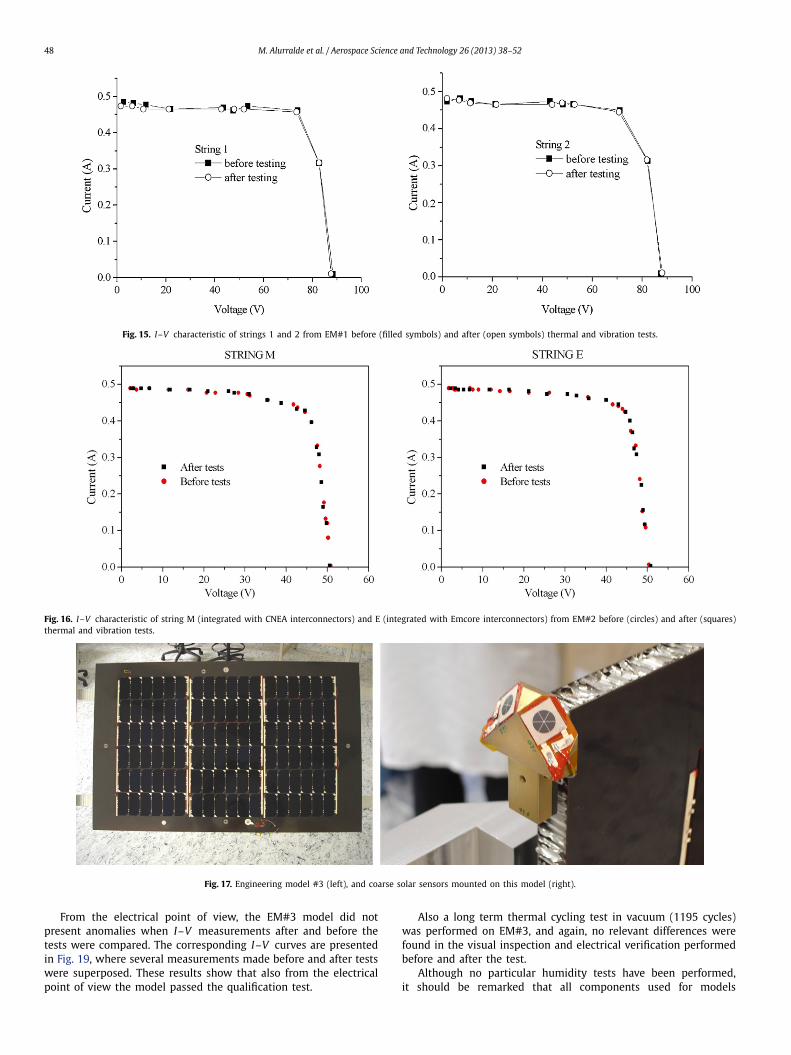
EM#1, shown in Fig. 12a, has two strings, each one composed of32 series-connected Emcore ATJ solar cells. The cells were arrangedin 8 substrings of four cells. The module, of 520 mm × 520 mm,was built on an aluminium honeycomb substrate, with carbon fibreskins and a self-adhesive Kapton sheet for electrical insulation.
Each SCA was electrically measured using a TS-Space CloseMatch solar simulator at T = 28 ◦C and with 1.367 kW/m2 (equiv-alent to AM0 irradiation). According to the data obtained the SCA’swere classified on the maximum power basis. Substrings of fourcells each were soldered and interconnected through a bus ar-chitecture, resulting finally in two strings of 32 cells each. Thisarrangement matches the requirement of the solar array design forthe SAOCOM mission.
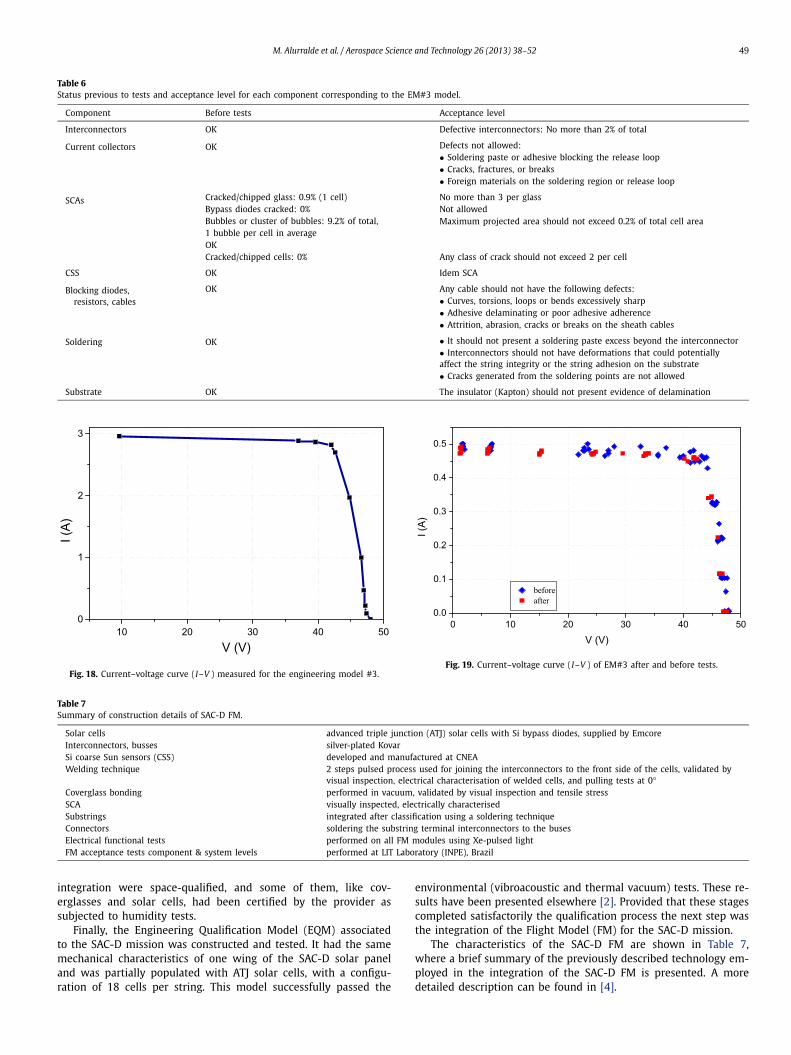
Once the substrings were assembled, all of them were ver-ified by measuring their I–V curves using the solar simulator.The proper function of bypass diodes was also verified by mea-suring the I–V curve of all substrings darkening successivelyeach cell. An example of the results obtained is presented inFig. 13.
The second engineering model (EM#2) was assembled within asimilar concept, but strings were built of 20 cells with substringsof five cells each in order to match preliminary requirements ofSAC-D mission. As mentioned in Section 4.1, one of these stringswas integrated using interconnectors fabricated at CNEA.
Electrical characterisation of both engineering models wasachieved by the measurement of the I–V curves using a pulsedlight source (a commercial photographic flash), a neutral fil-ter, a digital oscilloscope, and an electronic load. Measurementswere made at ambient temperature (T = 22.5 ◦C ± 1 ◦C). The
Fig. 11. Vacuum chamber for coverglass bonding.
M. Alurralde et al. / Aerospace Science and Technology 26 (2013) 38–52 47
Fig. 12. Engineering models finished: (a) EM#1, (b) EM#2.
I–V curve for the EM#1 was also measured under sunlight at(888 ± 18) W/m2 of irradiance and AM1.62 spectrum, resultingV oc = 82.5 V and Isc = 0.408 A for string 1, and V oc = 80.4 V andIsc = 0.411 A for string 2. The results of these characterisations areshown in Fig. 14.
Vibration and thermal vacuum tests were performed at theINVAP S.E. facilities, San Carlos de Bariloche, Argentina. Naturalfrequencies were determined, being the models subjected to si-nusoidal vibrations along the Z axis with accelerations of 25-, 50-,74- and 100-times g . A random scan beyond the natural frequen-cies was also performed, representing the vibration spectrum ofthe vector Cyclone-4 at launching condition.
Previous to tests, EM#2 had been observed to have the follow-ing defects: bubbles in the adhesive for some cells, some amountof solid debris between the cell and glass, and one chipped cell.However, in all cases the module met the acceptance criteria. Aftertests, the model did not show new defects.
Later, 10 thermal cycles between −100 ◦C and 100 ◦C weremade at an average pressure of 1 × 10⁻⁵ Torr, and the resultsof both tests were evaluated by visual inspection (using a 10×magnifier) and by pulsed light electrical characterisation. As canbe seen in Figs. 15 and 16, the results before and after the testsdid not reveal relevant differences. Thus, these results have beenconsidered as a preliminary qualification of the components and
Fig. 13. I–V measurement of one substring of EM#1, including the verification ofthe bypass diodes performance.
Fig. 14. I–V measurement under sunlight for EM#1.
procedures, and the fabrication procedures were accepted as ap-plied on both engineering models.
Further-on, a third engineering model, EM#3 (see Fig. 17) wasassembled, characterised, and tested. This model is composed of 6strings arranged from 3 substrings of 6 series-connected ATJ cellseach (total: 108 cells). Two pairs of coarse solar sensors (CSS) weremounted at the corners of the substrate. Also in this case the sub-strate is an aluminium honeycomb with carbon fibre skins and aKapton sheet on the front side.
Electrical verification was performed according to internal pro-cedures using a pulsed flash lamp illumination. The correspondingI–V curve for the EM#3, obtained by this method, is shown inFig. 18.
Qualification tests on EM#3 were performed in the Laboratóriode Integração e Testes (LIT) of the Instituto Nacional de Pesquisas Es-paciais (INPE), São Paulo, Brazil. These tests included static anddynamic vibration, acoustic tests, and thermal cycling in vacuum,in order to qualify the model fabrication procedures as well as thecomponents utilised.
Visual inspection of the solar cells and CSSs mounted in EM#3,as well as all components (resistors, diodes, connectors) showedthat no relevant changes were produced after environmental testsrespect to the initial state. Table 6 describes the initial status be-fore tests and the acceptance criteria for each component. Theseresults allow concluding that the EM#3 model qualifies from vi-sual inspection acceptance requirements.
48 M. Alurralde et al. / Aerospace Science and Technology 26 (2013) 38–52
Fig. 15. I–V characteristic of strings 1 and 2 from EM#1 before (filled symbols) and after (open symbols) thermal and vibration tests.
Fig. 16. I–V characteristic of string M (integrated with CNEA interconnectors) and E (integrated with Emcore interconnectors) from EM#2 before (circles) and after (squares)thermal and vibration tests.
Fig. 17. Engineering model #3 (left), and coarse solar sensors mounted on this model (right).
From the electrical point of view, the EM#3 model did notpresent anomalies when I–V measurements after and before thetests were compared. The corresponding I–V curves are presentedin Fig. 19, where several measurements made before and after testswere superposed. These results show that also from the electricalpoint of view the model passed the qualification test.
Also a long term thermal cycling test in vacuum (1195 cycles)was performed on EM#3, and again, no relevant differences werefound in the visual inspection and electrical verification performedbefore and after the test.
Although no particular humidity tests have been performed,it should be remarked that all components used for models
M. Alurralde et al. / Aerospace Science and Technology 26 (2013) 38–52 49
Table 6Status previous to tests and acceptance level for each component corresponding to the EM#3 model.
Component Before tests Acceptance level
Interconnectors OK Defective interconnectors: No more than 2% of total
Current collectors OK Defects not allowed:• Soldering paste or adhesive blocking the release loop• Cracks, fractures, or breaks• Foreign materials on the soldering region or release loop
SCAs Cracked/chipped glass: 0.9% (1 cell) No more than 3 per glassBypass diodes cracked: 0% Not allowedBubbles or cluster of bubbles: 9.2% of total, Maximum projected area should not exceed 0.2% of total cell area1 bubble per cell in averageOKCracked/chipped cells: 0% Any class of crack should not exceed 2 per cell
CSS OK Idem SCA
Blocking diodes,resistors, cables
OK Any cable should not have the following defects:• Curves, torsions, loops or bends excessively sharp• Adhesive delaminating or poor adhesive adherence• Attrition, abrasion, cracks or breaks on the sheath cables
Soldering OK • It should not present a soldering paste excess beyond the interconnector• Interconnectors should not have deformations that could potentiallyaffect the string integrity or the string adhesion on the substrate• Cracks generated from the soldering points are not allowed
Substrate OK The insulator (Kapton) should not present evidence of delamination
Fig. 18. Current–voltage curve (I–V ) measured for the engineering model #3.Fig. 19. Current–voltage curve (I–V ) of EM#3 after and before tests.
Table 7Summary of construction details of SAC-D FM.
Solar cells advanced triple junction (ATJ) solar cells with Si bypass diodes, supplied by EmcoreInterconnectors, busses silver-plated KovarSi coarse Sun sensors (CSS) developed and manufactured at CNEAWelding technique 2 steps pulsed process used for joining the interconnectors to the front side of the cells, validated by
visual inspection, electrical characterisation of welded cells, and pulling tests at 0◦Coverglass bonding performed in vacuum, validated by visual inspection and tensile stressSCA visually inspected, electrically characterisedSubstrings integrated after classification using a soldering techniqueConnectors soldering the substring terminal interconnectors to the busesElectrical functional tests performed on all FM modules using Xe-pulsed lightFM acceptance tests component & system levels performed at LIT Laboratory (INPE), Brazil
integration were space-qualified, and some of them, like cov-erglasses and solar cells, had been certified by the provider assubjected to humidity tests.
Finally, the Engineering Qualification Model (EQM) associatedto the SAC-D mission was constructed and tested. It had the samemechanical characteristics of one wing of the SAC-D solar paneland was partially populated with ATJ solar cells, with a configu-ration of 18 cells per string. This model successfully passed the
environmental (vibroacoustic and thermal vacuum) tests. These re-sults have been presented elsewhere [2]. Provided that these stagescompleted satisfactorily the qualification process the next step wasthe integration of the Flight Model (FM) for the SAC-D mission.
The characteristics of the SAC-D FM are shown in Table 7,where a brief summary of the previously described technology em-ployed in the integration of the SAC-D FM is presented. A moredetailed description can be found in [4].
50 M. Alurralde et al. / Aerospace Science and Technology 26 (2013) 38–52
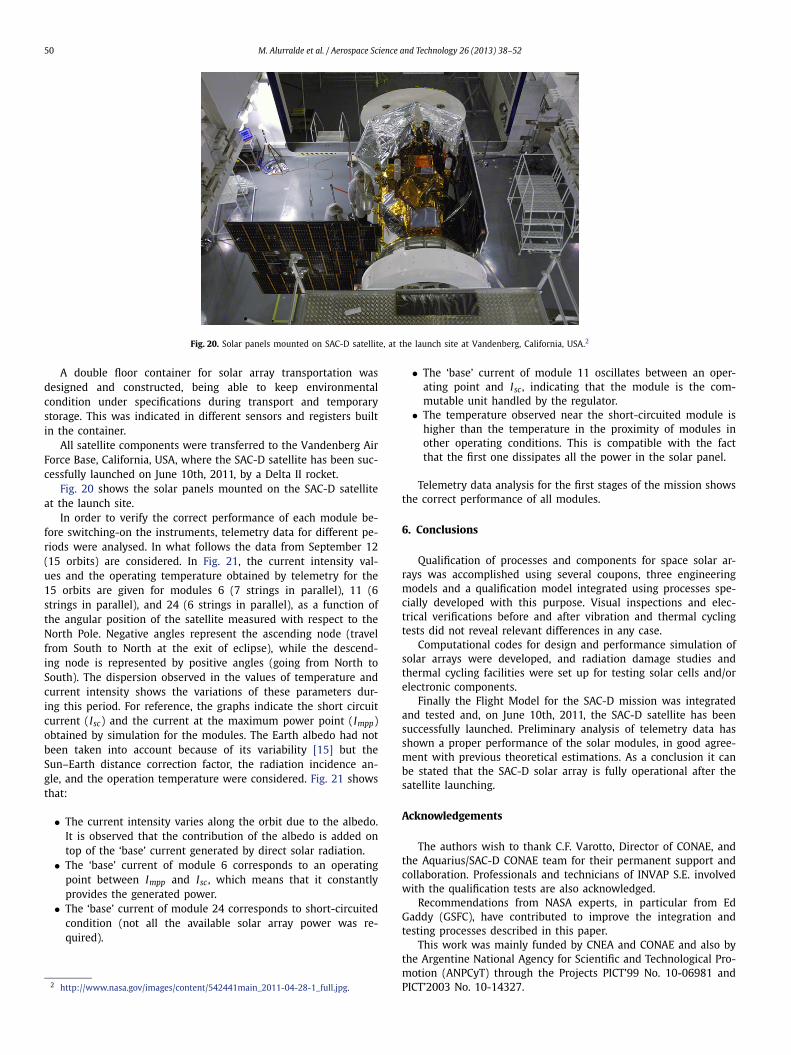
Fig. 20. Solar panels mounted on SAC-D satellite, at the launch site at Vandenberg, California, USA.2
A double floor container for solar array transportation wasdesigned and constructed, being able to keep environmentalcondition under specifications during transport and temporarystorage. This was indicated in different sensors and registers builtin the container.
All satellite components were transferred to the Vandenberg AirForce Base, California, USA, where the SAC-D satellite has been suc-cessfully launched on June 10th, 2011, by a Delta II rocket.
Fig. 20 shows the solar panels mounted on the SAC-D satelliteat the launch site.
In order to verify the correct performance of each module be-fore switching-on the instruments, telemetry data for different pe-riods were analysed. In what follows the data from September 12(15 orbits) are considered. In Fig. 21, the current intensity val-ues and the operating temperature obtained by telemetry for the15 orbits are given for modules 6 (7 strings in parallel), 11 (6strings in parallel), and 24 (6 strings in parallel), as a function ofthe angular position of the satellite measured with respect to theNorth Pole. Negative angles represent the ascending node (travelfrom South to North at the exit of eclipse), while the descend-ing node is represented by positive angles (going from North toSouth). The dispersion observed in the values of temperature andcurrent intensity shows the variations of these parameters dur-ing this period. For reference, the graphs indicate the short circuitcurrent (Isc) and the current at the maximum power point (Impp)obtained by simulation for the modules. The Earth albedo had notbeen taken into account because of its variability [15] but theSun–Earth distance correction factor, the radiation incidence an-gle, and the operation temperature were considered. Fig. 21 showsthat:
• The current intensity varies along the orbit due to the albedo.It is observed that the contribution of the albedo is added ontop of the ‘base’ current generated by direct solar radiation.
• The ‘base’ current of module 6 corresponds to an operatingpoint between Impp and Isc , which means that it constantlyprovides the generated power.
• The ‘base’ current of module 24 corresponds to short-circuitedcondition (not all the available solar array power was re-quired).
2 http://www.nasa.gov/images/content/542441main_2011-04-28-1_full.jpg.
• The ‘base’ current of module 11 oscillates between an oper-ating point and Isc , indicating that the module is the com-mutable unit handled by the regulator.
• The temperature observed near the short-circuited module ishigher than the temperature in the proximity of modules inother operating conditions. This is compatible with the factthat the first one dissipates all the power in the solar panel.
Telemetry data analysis for the first stages of the mission showsthe correct performance of all modules.
6. Conclusions
Qualification of processes and components for space solar ar-rays was accomplished using several coupons, three engineeringmodels and a qualification model integrated using processes spe-cially developed with this purpose. Visual inspections and elec-trical verifications before and after vibration and thermal cyclingtests did not reveal relevant differences in any case.
Computational codes for design and performance simulation ofsolar arrays were developed, and radiation damage studies andthermal cycling facilities were set up for testing solar cells and/orelectronic components.
Finally the Flight Model for the SAC-D mission was integratedand tested and, on June 10th, 2011, the SAC-D satellite has beensuccessfully launched. Preliminary analysis of telemetry data hasshown a proper performance of the solar modules, in good agree-ment with previous theoretical estimations. As a conclusion it canbe stated that the SAC-D solar array is fully operational after thesatellite launching.
Acknowledgements
The authors wish to thank C.F. Varotto, Director of CONAE, andthe Aquarius/SAC-D CONAE team for their permanent support andcollaboration. Professionals and technicians of INVAP S.E. involvedwith the qualification tests are also acknowledged.
Recommendations from NASA experts, in particular from EdGaddy (GSFC), have contributed to improve the integration andtesting processes described in this paper.
This work was mainly funded by CNEA and CONAE and also bythe Argentine National Agency for Scientific and Technological Pro-motion (ANPCyT) through the Projects PICT’99 No. 10-06981 andPICT’2003 No. 10-14327.

M. Alurralde et al. / Aerospace Science and Technology 26 (2013) 38–52 51
Fig. 21. Current (red squares) generated by modules 6 (a), 24 (b), and 11 (c), and temperature (cyan crosses) on orbits for 12 September 2011. For reference, simulated Isc
(blue circles) and Impp (green triangles) are indicated. (For interpretation of the references to color in this figure legend, the reader is referred to the web version of thisarticle.)
52 M. Alurralde et al. / Aerospace Science and Technology 26 (2013) 38–52
References
[1] M. Alurralde, Method using the primary knock-on atom spectrum to char-acterize electrical degradation of monocrystalline silicon solar cells by spaceprotons, Journal of Applied Physics 95 (2004) 3391.
[2] M. Alurralde, M. Barrera, C.G. Bolzi, C.J. Bruno, P. Cabot, E. Carella, J. Di Santo,J.C. Durán, J. Fernández Vázquez, A. Filevich, C.D. Franciulli, E.M. Godfrin,V. Goldbeck, L. González, A. Iglesias, M.G. Martínez Bogado, E. Mezzabolta,A. Moglioni, S. Muñoz, C. Nigri, S.L. Nigro, J. Plá, I. Prario, M.C. Raffo Calderón,D. Raggio, C. Rinaldi, S.E. Rodríguez, H. Socolovsky, M.J.L. Tamasi, Solar arrayqualification models for Aquarius/SAC-D satellite mission, in: Proceedings ofthe 23rd European Photovoltaic Solar Energy Conference, Valencia, Spain, 2008,p. 785.
[3] M. Alurralde, M. Barrera, C.G. Bolzi, C.J. Bruno, P. Cabot, E. Carella, J. Di Santo,J.C. Durán, J. Fernández Vázquez, A. Filevich, C.D. Franciulli, E.M. Godfrin,V. Goldbeck, A. Iglesias, M.G. Martínez Bogado, E. Mezzabolta, A. Moglioni, C.Nigri, S.L. Nigro, F. Palumbo, J. Plá, I. Prario, M.C. Raffo Calderón, S.E. Rodríguez,H. Socolovsky, M.J.L. Tamasi, A. Vertanessian, Advances in the development ofphotovoltaics for space applications in Argentina, in: Proceedings of the 22ndEuropean Photovoltaic Solar Energy Conference, Milan, Italy, 2007, p. 687.
[4] M. Alurralde, M. Barrera, C.G. Bolzi, C.J. Bruno, P. Cabot, E. Carella, J. DiSanto, J.C. Durán, J. Fernández Vázquez, A. Filevich, E.M. Godfrin, V. Goldbeck,L. González, A. Iglesias, M.G. Martínez Bogado, E. Mezzabolta, A. Moglioni,S. Muñoz, C. Nigri, S.L. Nigro, J. Plá, I. Prario, M.C. Raffo Calderón, D. Rag-gio, C. Rinaldi, S.E. Rodríguez, H. Socolovsky, M.J.L. Tamasi, A. Vertanessian,Flight models for the Aquarius/SAC-D satellite mission, in: Proceedings of the24th European Photovoltaic Solar Energy Conference, Hamburg, Germany, 2009,p. 695.
[5] M. Alurralde, M. Barrera, C.G. Bolzi, C.J. Bruno, J.C. Durán, J. Fernández Vázquez,A. Filevich, E.M. Godfrin, V. Goldbeck, A. Iglesias, M.G. Martínez Bogado, E.Mezzabolta, S.L. Nigro, J. Plá, I. Prario, M.C. Raffo Calderón, S.E. Rodríguez,M.J.L. Tamasi, A. Vertanessian, F. Antonuccio, P. Cabot, E. Carella, J. Di Santo,C.D. Franciulli, A. Moglioni, G. Berbeglia, D. Fernández Slezack, Developmentof photovoltaic modules for space applications in Argentina, in: Proceedingsof the 20th European Photovoltaic Solar Energy Conference, Barcelona, Spain,2005, p. 538.
[6] M. Alurralde, M.J.L. Tamasi, C.J. Bruno, M.G. Martínez Bogado, J. Plá, J. Fernán-dez Vázquez, J. Durán, J. Schuff, A.A. Burlon, P. Stoliar, A.J. Kreiner, Experimentaland theoretical radiation damage studies on crystalline silicon solar cells, SolarEnergy Materials and Solar Cells 82 (2004) 531.
[7] M. Barrera, J. García, H. Socolovsky, F. Rubinelli, E. Godfrin, J. Plá, Activities onsimulation and characterization of multi-junction solar cells for space appli-cations in Argentina, in: Proceedings of the 23rd European Photovoltaic SolarEnergy Conference, Valencia, Spain, 2008, p. 781.
[8] E.V. den Berg, M. Kronn, Algorithms and performance of a space dedicated so-lar array modeling tool, in: 6th Space Power Conference, 2002, p. 527.
[9] C.G. Bolzi, C.J. Bruno, J.C. Durán, E.M. Godfrin, M.G. Martínez Bogado, L.M.Merino, J.C. Plá, M.J.L. Tamasi, M. Barrera, First experiment of Argentine solarcells in space: modules fabrication, characterisation, and telemetry data analy-sis from SAC-A satellite, Solar Energy Materials and Solar Cells 73 (2002) 269.
[10] A. Capel, P. Chapoulie, S. Zimmerman, E. Snachís, Dynamic performance simu-lation of a spacecraft power system, in: 6th European Space Power Conference,2002, p. 327.
[11] L.G. Chidester, D.R. Lott, Advances in solar cell welding technology, in: 16thPhotovoltaic Specialists Conference, San Diego, USA, 1982, pp. 51–56.
[12] C.L. Chu, Weldability of GaAs solar cells on either GaAs or Ge substrates, in:28th Photovoltaic Specialists Conference, Las Vegas, USA, 1988, pp. 968–973.
[13] C.L. Chu, P. Iles, Control parallel gap welding for solar cells, in: 38th ElectronicsComponents Conference, Los Angeles, USA, 1988, pp. 40–44.
[14] G. Colombo, U. Grasselli, A. De Luca, A. Spizzichino, S. Falzini, Satellite powersystem simulation, Acta Astronautica 40 (1) (1997) 41.
[15] Earth’s thermal environment, extracted from Thermal Environments, JPL D-8160, http://www.tak2000.com/data/planets/earth.htm.
[16] Emcore photovoltaics, http://www.emcore.com/product/photovoltaic.php.[17] A. Filevich, C.J. Bruno, J. Fernández Vázquez, M. Alurralde, I. Prario, M.J.L.
Tamasi, M.G. Martínez Bogado, J.C. Plá, J. Durán, J. Schuff, A. Burlon, P. Sto-liar, D. Minsky, A.J. Kreiner, R. Mayer, A compact portable set up for in situsolar cells degradation studies, IEEE Transactions on Nuclear Science 50 (2003)2380.
[18] E.M. Godfrin, J.C. Durán, D. Fernández Slezak, G. Berbeglia, Design and sim-ulation of the power subsystems for two Argentine satellites, in: Proceedingsof the 22nd European Photovoltaic Solar Energy Conference, Milan, Italy, 2007,p. 692.
[19] E.M. Godfrin, S.E. Rodríguez, J.C. Durán, Power subsystem simulation for SAO-COM mission, in: Proceedings of the 26th European Photovoltaic Solar EnergyConference, Hamburg, Germany, 2011, p. 789.
[20] P.T. Houldcroft, Welding Process Technology, Cambridge University Press, NewYork, 1977.
[21] http://aquarius.nasa.gov/index.html, http://aquarius.nasa.gov/pdfs/overview.pdf.[22] http://www.conae.gov.ar/prensa/siasge.html.[23] http://www.ecss.nl/forums/ecss/dispatch.cgi/home/showFile/100439/
d20070919074956/No/ecss-e-20-08B-Draft4%2813September2007%29.pdf.[24] http://www.spenvis.oma.be/.[25] D.L. King, J.K. Dudley, W.E. Boyson, PVSIM©: A simulation program for photo-
voltaic cells, modules, and arrays, in: 25th Photovoltaic Specialists Conference,1996, p. 1295.
[26] J. Plá, M. Barrera, F. Rubinelli, Influence of the InGaP window layer on the op-tical and electrical performance of GaAs solar cells, Semiconductor Science andTechnology 22 (2007) 1122.
[27] J.W. Slemmons, The Microworld of Joining Technology, American Welding Soci-ety, New York, 1969.
[28] Solar array design, development, and evaluation for in house spacecraft,Directive No. 563-PG-8700.2.2A, NASA Procedures and Guidelines, 2004,http://standards.gsfc.nasa.gov/gsfc-std/gsfc-std-1000/gsfc-std-1000-b.1.pdf.
[29] E.J. Stofel, E.R. Browne, R.A. Meese, G.J. Vendura, Welded solar cell intercon-nection, in: 16th Photovoltaic Specialists Conference, San Diego, USA, 1982,pp. 45–50.
[30] H.Y. Tada, J.R. Carter Jr., B.E. Anspaugh, R.G. Downing, Solar Cell RadiationHandbook, JPL Publication 82-69, 1982.
[31] M.J.L. Tamasi, M. Alurralde, I. Prario, A. Filevich, R. Mayer, J.C. Durán, M.G.Martínez Bogado, J. Plá, C.J. Bruno, J. Fernández Vázquez, Comparison of elec-tron and proton radiation damage in solar cells for space uses, in: Proceedingsof the 19th European Photovoltaic Solar Energy Conference, Paris, France, 2004,p. 3719.