development of soft armor conditioning protocols for nij
TRANSCRIPT

NISTIR 7627
Development of Soft ArmorConditioning Protocols for NIJStandard–0101.06: Analytical
Results
Amanda L. Forster, Kirk D. Rice, Michael A. Riley,
Guillaume H. R. Messin, Sylvain Petit, Cyril Clerici, Marie-Cecile
Vigoroux, Pierre Pintus, Gale Holmes, and Joannie Chin


NISTIR 7627
Development of Soft ArmorConditioning Protocols for NIJStandard–0101.06: Analytical
Results
Amanda L. Forster, Guillaume H. R. Messin, Pierre Pintus,
Michael A. Riley, and Kirk D. RiceOffice of Law Enforcement Standards
Electronics and Electrical Engineering Laboratory
Gale A. HolmesPolymers Division
Materials Science and Engineering Laboratory
Joannie Chin, Sylvain Petit, Cyril Clerici, Marie-Cecile VigorouxMaterials and Construction Research Division
Building and Fire Research Laboratory
September 24, 2009
U.S. Department of CommerceGary Locke, Secretary
National Institute of Standards and TechnologyPatrick D. Gallagher, Director


Abstract
This publication details the four major phases of analytical developmentwork, coupled with several additional side studies, undertaken by the Officeof Law Enforcement Standards in writing the Flexible Armor ConditioningProtocol in NIJ Standard–0101.06. This protocol partially fulfills a require-ment to develop a revised performance standard for body armor to address anumber of concerns, one of which was the ability of the armor to withstandenvironmental and wear conditions that an armor might see over its life-time. This document details how the protocol was shortened from 9 weeksin the first phase of development to 10 days, as it appears in the currentversion of the standard. All major classes of ballistic materials were testedin the protocol development. The conditions selected are found to be quitedetrimental to armors of a design that previously had problems in the field,but are not detrimental to armors of known good design. It is importantto note that the protocol does not represent an exact period of time in thefield, but efforts to correlate the protocol to a period of time in the field arethe subject of future research.
v

Development of Soft Armor Conditioning Protocols for NIJ
Standard–0101.06: Analytical Results
This page intentionally left blank.
vi
Acknowledgments
Financial support for this research effort was provided by the National Insti-tute of Justice under Interagency Agreement Number 2003-IJ-R-029. Theirsupport is gratefully acknowledged.
vii
Development of Soft Armor Conditioning Protocols for NIJ
Standard–0101.06: Analytical Results
This page intentionally left blank.
viii

Disclaimer
Certain commercial equipment, instruments, or materials are identified inthis paper in order to specify the experimental procedure adequately. Suchidentification is not intended to imply recommendation or endorsement bythe National Institute of Standards and Technology, nor is it intended toimply that the materials or equipment identified are necessarily the bestavailable for this purpose.
ix

Development of Soft Armor Conditioning Protocols for NIJ
Standard–0101.06: Analytical Results
This page intentionally left blank.
x
Contents
1 Introduction 1
1.1 Background . . . . . . . . . . . . . . . . . . . . . . . . . . . . 2
1.2 Theoretical Approach . . . . . . . . . . . . . . . . . . . . . . 3
1.2.1 Definition of Wear Environment . . . . . . . . . . . . 3
1.2.2 Selection of Temperature . . . . . . . . . . . . . . . . 5
1.2.3 Selection of Relative Humidity . . . . . . . . . . . . . 6
1.2.4 Simulation of Mechanical Wear . . . . . . . . . . . . . 8
2 Experimental 11
2.1 Extracted Yarn Tensile Testing . . . . . . . . . . . . . . . . . 11
2.2 Fourier Transform Infrared Analysis . . . . . . . . . . . . . . 12
2.3 Moisture Sorption Analysis . . . . . . . . . . . . . . . . . . . 12
2.4 Dynamic Mechanical Thermal Analysis . . . . . . . . . . . . . 12
3 Conditioning Protocol Development 15
3.1 Phase I . . . . . . . . . . . . . . . . . . . . . . . . . . . . . . 15
3.1.1 Sample Description . . . . . . . . . . . . . . . . . . . . 15
3.1.2 Experimental Conditions . . . . . . . . . . . . . . . . 16
3.1.3 Analytical Results . . . . . . . . . . . . . . . . . . . . 17
3.2 Phase I Summary . . . . . . . . . . . . . . . . . . . . . . . . . 23
3.3 Phase II . . . . . . . . . . . . . . . . . . . . . . . . . . . . . . 24
3.3.1 Sample Description . . . . . . . . . . . . . . . . . . . . 24
3.3.2 Experimental Conditions . . . . . . . . . . . . . . . . 24
3.3.3 Analytical Results . . . . . . . . . . . . . . . . . . . . 25
3.3.4 Ballistic Results from Phase I and Phase II Testing . . 26
3.4 Phase II Summary . . . . . . . . . . . . . . . . . . . . . . . . 26
3.5 Phase III . . . . . . . . . . . . . . . . . . . . . . . . . . . . . 26
3.5.1 Experimental Conditions . . . . . . . . . . . . . . . . 30
3.5.2 Sample Description . . . . . . . . . . . . . . . . . . . . 30
3.5.3 Analytical Results . . . . . . . . . . . . . . . . . . . . 31
3.5.4 Ballistic Results from Phase III Testing . . . . . . . . 36
3.6 Phase III Summary . . . . . . . . . . . . . . . . . . . . . . . . 36
3.7 Phase IV . . . . . . . . . . . . . . . . . . . . . . . . . . . . . 36
3.7.1 Sample Description . . . . . . . . . . . . . . . . . . . . 36
3.7.2 Analytical Results . . . . . . . . . . . . . . . . . . . . 37
3.8 Important Observations From Other Studies . . . . . . . . . . 38
3.9 Phase IV Summary . . . . . . . . . . . . . . . . . . . . . . . . 39
xi

Development of Soft Armor Conditioning Protocols for NIJ
Standard–0101.06: Analytical Results
4 Conclusions and Future Work 41
5 References 43
xii
List of Tables
1.1 “Rule of Thumb” for Kinetics of Chemical Reactions. . . . . 4
3.1 Rank Ordering of PPTA Infrared Bands; 1=greatest change;4=least change. . . . . . . . . . . . . . . . . . . . . . . . . . . 23
xiii

Development of Soft Armor Conditioning Protocols for NIJ
Standard–0101.06: Analytical Results
This page intentionally left blank.
xiv

List of Figures
1.1 Dynamic Temperature Ramp Results for Common BallisticFibers. . . . . . . . . . . . . . . . . . . . . . . . . . . . . . . . 5
1.2 Representative Vehicle Temperature and Relative HumidityData. . . . . . . . . . . . . . . . . . . . . . . . . . . . . . . . 6
1.3 Moisture Sorption Data for PPTA (cyclic conditions). . . . . 71.4 Moisture Sorption Data for PBO (cyclic conditions). . . . . . 81.5 Moisture Sorption Data for PBO (constant conditions). . . . 91.6 Moisture Sorption Data for PPTA (constant conditions). . . . 10
3.1 Phase I Protocol Cycle. . . . . . . . . . . . . . . . . . . . . . 163.2 Phase I Breaking Strength Retention for PBO. . . . . . . . . 183.3 Phase I Breaking Strength Retention for PPTA. . . . . . . . 193.4 Phase I FTIR Difference Spectra for PBO. . . . . . . . . . . . 203.5 Phase I FTIR Difference Spectra for PPTA (full scale). . . . 213.6 Phase I FTIR Difference Spectra for PPTA (expanded scale). 223.7 Phase II Protocol Cycle. . . . . . . . . . . . . . . . . . . . . . 253.8 Phase II Breaking Strength Retention for PPTA and PBO
(all conditions). . . . . . . . . . . . . . . . . . . . . . . . . . . 273.9 Phase II Breaking Strength Retention for PPTA and PBO (T
& RH only). . . . . . . . . . . . . . . . . . . . . . . . . . . . . 283.10 Phase II Breaking Strength Retention for PPTA and PBO
(tumbling only). . . . . . . . . . . . . . . . . . . . . . . . . . 293.11 Phase III Breaking Strength Retention for PPTA and PBO
(all conditions). . . . . . . . . . . . . . . . . . . . . . . . . . . 323.12 Phase III Breaking Strength Retention for PPTA and PBO
(T & RH only). . . . . . . . . . . . . . . . . . . . . . . . . . . 333.13 Phase III Breaking Strength Retention for PPTA and PBO
(tumbling only). . . . . . . . . . . . . . . . . . . . . . . . . . 343.14 Phase III Reduction in Key Infrared Bands. . . . . . . . . . . 353.15 Phase IV Breaking Strength Retention for PPTA and PBO
(all conditions). . . . . . . . . . . . . . . . . . . . . . . . . . . 373.16 Analysis of Potential for Condensation at 70 ◦C and 90 %
Relative Humidity. . . . . . . . . . . . . . . . . . . . . . . . . 393.17 Analysis of Potential for Condensation at 65 ◦C and 80 %
Relative Humidity. . . . . . . . . . . . . . . . . . . . . . . . . 40
xv

Development of Soft Armor Conditioning Protocols for NIJ
Standard–0101.06: Analytical Results
This page intentionally left blank.
xvi

1 Introduction
In response to the 2003 US Attorney General’s initiative to examine failuresof soft body armor containing the material poly(p-phenylene-2,6-benzobis-oxazole), or PBO, the National Institute of Justice (NIJ) determined thata significant revision of the performance standard for ballistic body armorwas required. One area that had not previously been examined was thelong term, or field performance of body armor. Historically, the NationalInstitute of Standards and Technology’s (NIST) Office of Law EnforcementStandards (OLES) has been NIJ’s technical partner in the development ofperformance standards for body armor. OLES and NIST had also workedclosely with NIJ to examine the issues with PBO in the field and pub-lished several papers [1, 2, 3] and reports documenting the degradation ofPBO fiber with exposure to elevated conditions of moisture and tempera-ture. Once the issues with PBO fibers became clear, NIJ issued “NIJ BodyArmor Standard Advisory Notice # 01-2005” to inform the community ofbody armor end users about the degradation issues with PBO. Concurrently,NIJ issued the “NIJ 2005 Interim Requirements for Bullet-Resistant BodyArmor,” requiring manufacturers to state that their armor did not containany material listed on an NIJ Standard Advisory Notice (e.g., PBO), andrequiring that the armor “will maintain ballistic performance (consistentwith its originally declared threat level) over its declared warranty period.”Subsequently, NIJ turned to OLES to develop a revised performance stan-dard for body armor to address a number of concerns, one of which was theability of the armor to withstand environmental and wear conditions that anarmor might see over its lifetime. This document describes the developmentof a soft armor conditioning protocol to address this requirement.
Previous work published at NIST documented a detailed examination ofthe failure of an officer’s PBO armor in the field [4]. Two key observationsfrom this study were that yarns extracted from the officer’s armor showeda 32 % reduction in tensile strength when compared with yarns extractedfrom new armor, and that infrared spectroscopy analysis of yarns from theofficer’s vest showed evidence of degradation in the molecular structure ofPBO. Further studies at NIST examined degradation of PBO armors un-der controlled laboratory conditions. A crucial finding from these studieswas that PBO fibers degrade when exposed to elevated moisture and tem-perature, but are stable when exposed to elevated temperature in a dry
1

Development of Soft Armor Conditioning Protocols for NIJ
Standard–0101.06: Analytical Results
environment [5]. Studies [6, 7] also showed that PBO yarns were vulnera-ble to degradation by mechanical wear, showing classical fatigue behavior.Findings from all of this fundamental research formed the basis of the theorybehind the soft armor conditioning protocol.
The primary goals of the soft armor conditioning protocol for use in NIJStandard–0101.06 are to develop a test protocol that would have caught theproblems with PBO-based soft body armor before they appeared in the fieldand to ensure that the protocol will neither under- nor over- expose armorwith respect to the environment that armor is expected to encounter duringits lifetime. It quickly became clear that relating this protocol to an exactperiod of time in the field would be impossible. Body armor is made upof many different materials, all of which show different rates of degrada-tion with exposure to a given set of conditions. To date, very little workhas been published on artificial or accelerated aging of fibers used in bodyarmor. Work is currently underway at NIST to develop the relationshipbetween exposure at conditions of low temperature to conditions at hightemperature. Currently, including the aspect of mechanical wear in this re-lationship still remains a challenge. Because of this ongoing work and thechallenges involved in developing correlations between field and laboratoryaging, this protocol will not predict the service life of body armor. Cur-rently, the soft armor conditioning protocol in NIJ Standard–0101.06 canbe considered a “challenge test” for armor that provides an indication as towhether or not the armor will withstand use in the field. This represents amajor change from previous versions of the ballistic body armor standard,which gave no consideration to long term performance.
1.1 Background
Historically, there have been several efforts to assign an expected service lifeto body armor. Two studies are typically cited, one undertaken by DuPontin the mid-1980s [8] and one undertaken by NIST (then the National Bureauof Standards, NBS) published in 1986 [9]. The DuPont study indicatedthat a reduction in ballistic performance as measured by ballistic limit, orV50 testing, was seen after 3 to 5 years of use, but that a reduction inperformance was better correlated to heavy use than to the age of the poly(p-phenylene terephthalamide), or PPTA, armor. As a result of this study,DuPont recommended that armor be replaced after 5 years, which causedsome controversy in the law enforcement community [8, 10, 11, 12, 13, 14].The NBS study examined 24 sets of 10 year old armor of the same 100% woven PPTA design, manufactured at the same time and distributed tovarious law enforcement agencies. The sample set of armors was distributedacross various climates and saw various levels of wear, encompassing a rangefrom never issued to heavily worn. The author concluded that armor storedunder warehouse conditions maintained its full ballistic performance for atleast 10 years, and perhaps indefinitely. The author also concluded thatlight to moderate wear may improve ballistic performance, and that heavywear might slightly reduce ballistic performance. It is important to note that
2
1. Introduction
the limited sample size of this study makes it difficult to draw meaningfulconclusions about the long term performance of armor in the field [9].
In more recent years, several body armor manufacturers have undertakenprograms to examine the performance of fielded PBO armor by retrievingvests from the field, assigning a wear rating to the vests, and then conductingballistic limit testing on the vests. Two reports, one from Armor HoldingsProduct Division [15] and one from DHB Armor Group [16] were both pub-lished in 2004. Both reports concluded that there was some loss in ballisticperformance with both age and wear of the armor, although the methodsused to report the data make it difficult to draw meaningful conclusionsabout the results. Both armor manufacturers indicated that they felt thatused armor still had an adequate margin of safety. A study was also un-dertaken between 2001 and 2005 by the Technical Support Working Group(TSWG) to examine the effect of environmental conditions on armor per-formance by exposing shoot packs of various ballistic materials to elevatedconditions of moisture and temperature. TSWG operates as a program el-ement under the Department of Defense Combating Terrorism TechnicalSupport Office (CTTSO) and they serve as “the national inter-agency re-search and development program for combating terrorism requirements athome and abroad.” Unfortunately, due to problems with controlling theexposure conditions used in this study, the results were inconclusive. Afterreviewing the limited body of work that had been conducted on armor ser-vice life prediction, it was determined that there was little available to drawon for the development of the soft armor conditioning protocol.
1.2 Theoretical Approach
1.2.1 Definition of Wear Environment
In an effort to better tailor a revision of NIJ Standard–0101.04 to the needsof the end user community, NIJ issued a Request for Information (RFI)to the armor community, including manufacturers and end users, in thefall of 2005. The RFI stated that “. . . NIJ is interested, though not exclu-sively, in operational requirements and testing methodologies that address:Validation of used armor performance; Non-destructive testing/monitoringmethods for used armor to ensure ongoing performance; Improved require-ments and testing protocols for new armor (e.g., blunt trauma, multi-shotimpacts, contact shots); Numbers and sizes of samples to be tested; Long-term performance of armor; Artificial armor aging protocols to replicatefield use; Quality control and conformity assessments. . . ” In reviewing theresponses to this request, several respondents were contacted. One of these,Mine Safety Appliance (MSA), had a long history in the production and ser-vice life prediction of other types of safety equipment. In January 2006, ameeting between MSA and NIST was held to discuss armor aging, in whichseveral approaches were discussed. In this discussion, it was suggested thatarmor should be robust enough to withstand conditions typically seen dur-ing wear and those seen during transit. Based on the previously publishedguidelines for armor replacement, a typical service life was defined as 5 years,
3

Development of Soft Armor Conditioning Protocols for NIJ
Standard–0101.06: Analytical Results
Temperature Exposure◦C ◦F h weeks
35 95 10,000 59.5
45 113 5000 29.8
55 131 2500 14.8
65 149 1250 7.44
75 167 625 3.72
Table 1.1: “Rule of Thumb” for Kinetics of Chemical Reactions.
and a typical wear environment was defined as near body temperature andhumidities near complete saturation (due to perspiration of the wearer). Ifone defines a typical work schedule as 8 h per day, 5 d per week, 50 weeksper year, this works out to 2000 h of wear per year. If one then expects thetypical lifetime of a vest to be 5 years, then that corresponds to 10,000 h ofservice at the wear conditions. These simple assumptions provided a start-ing point for the development of the protocol. To maintain the independenceof NIST and NIJ, no further input was sought from MSA after these initialmeetings in the protocol development [17].
A “rule of thumb” in chemical kinetics [18] often applied to acceleratedaging of materials is for every 10 ◦C increase in temperature, one can expect
a doubling in the rate of reaction. Application of this guideline to the definedwear temperature of 35 ◦C, results in 10,000 h of aging in approximately8 weeks at 65 ◦C, as shown in Table 1.1. It is important to note thatthis “rule of thumb” applies to certain reactions that occur in solution anddoes not directly translate to reactions of degradation in the solid state.Additionally, body armor is made up of many different types of materials,all of which can be assumed to degrade at different rates. So, while thetemperature 65 ◦C was chosen to accelerate degradation in the armor basedon assumptions of a 5 year service life, it definitely cannot be said to predictarmor service life because we do not know the exact relationship betweentemperature and degradation rate for ballistic materials.
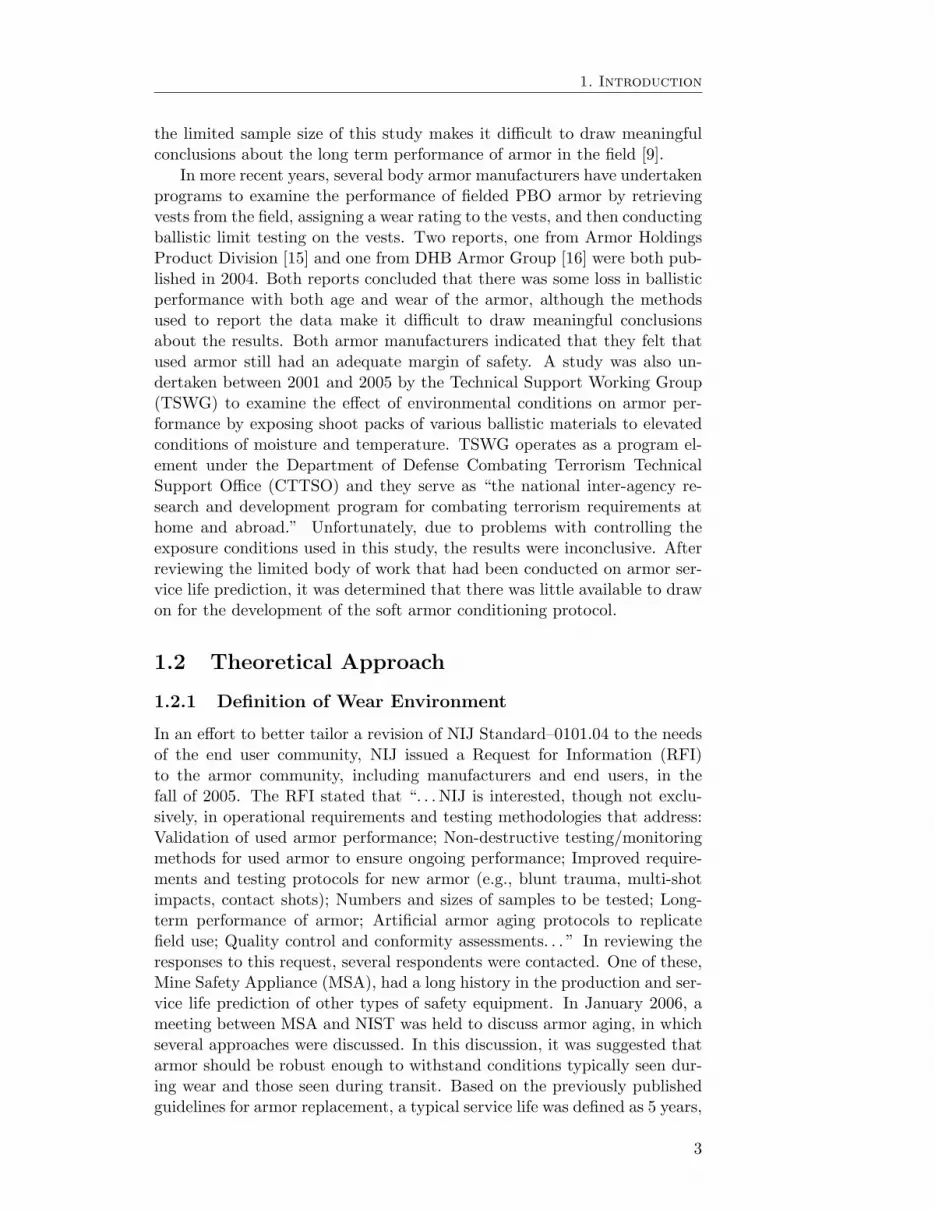
When attempting to apply the “Rule of Thumb” to accelerated agingkinetics of materials, it is important to keep in mind that elevated tempera-tures may induce new mechanisms of degradation, rather than acceleratingmechanisms of lower-temperature degradation. For example, if temperatureis increased to the point that a material would melt or burn, different chem-ical reactions will occur, and the results of the accelerated study will not bemeaningful. To avoid this potential problem, dynamic mechanical thermalanalysis (DMTA) was performed on representative fiber samples from themajor material classes of body armor prior to temperature selection. A dy-namic temperature ramp at a constant frequency of 1 Hz was performed onfiber samples of PPTA, PBO, and ultrahigh molecular weight polyethylene(UHMWPE). These results are presented in Figure 1.1. This analysis re-vealed that temperatures exceeding 80 ◦C might be too high due to changes
4
1. Introduction
Temperature (°C)
40 60 80 100
E' (P
a)
1e+8
1e+9
1e+10
1e+11
1e+12
PBO
PPTA
UHMWPE
Figure 1.1: Dynamic Temperature Ramp Results for Common BallisticFibers.
in the molecular structure of the UHMWPE fibers above this temperature,however the PPTA and PBO fibers remain essentially unchanged in the tem-perature range studied. In the UHMWPE system, 80 ◦C is in the range ofthe α
′-relaxation temperature, which is the temperature at which molecularmotion within the polymer begins to increase, resulting in a decrease in themodulus of the polymer [19]. DSM Dyneema, a manufacturer of UHMWPEfiber for ballistic applications, published results of an artificial aging study in2007 indicating that an Arrhenius relationship existed for UHMWPE fibersbetween 35 ◦C (the same as our reference base temperature) and 65 ◦C [20].Therefore, it was determined that limiting our experiments to temperaturesbelow 70 ◦C would allow us to avoid introducing new mechanisms of degra-dation in the fibers during our studies.
1.2.2 Selection of Temperature
Questions also arose regarding the exposure of armor to a temperature of65 ◦C—(e.g., is this condition unreasonable in the environment in whichbody armor will be used?). Anecdotal evidence that officers commonlystore armor in the trunks of their cars was frequently brought up duringdiscussions of the armor wear environment. Additionally, armor is typi-cally delivered across the country in trucks. However, the temperature andrelative humidity inside a vehicle can vary widely depending on season, ge-ographical region of the country, and location inside the vehicle. In order
5
Development of Soft Armor Conditioning Protocols for NIJ
Standard–0101.06: Analytical Results
max temperature 67 °C
Time (d)
0 5 10 15 20
Tem
pera
ture
(°C
)
10
20
30
40
50
60
70
80
Rela
tive H
um
idit
y (
%)
0
20
40
60
80
100
Temperature
Relative Humidity
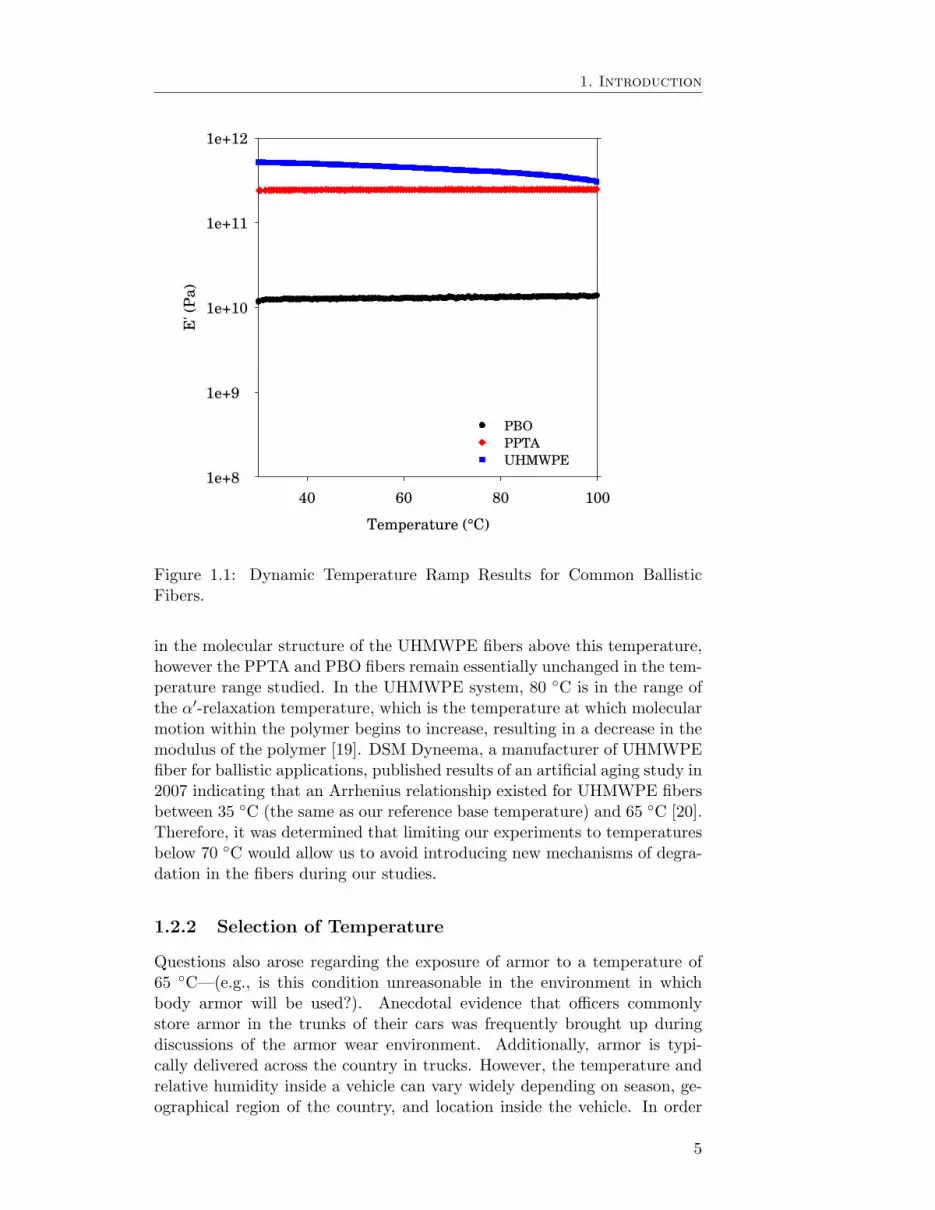
Figure 1.2: Representative Vehicle Temperature and Relative HumidityData.
to answer this question, cooperation was sought from NIJ’s Body ArmorTechnology Working Group (TWG), which is made up of law enforcementand corrections officers who have interest or expertise in ballistics and bodyarmor. Small, inexpensive universal serial bus (USB)-readable temperatureand relative humidity data loggers were purchased and distributed to vol-unteers from the TWG from across the United States. These were placedinside actual police vehicles throughout different seasons and the data wereexamined periodically. The same data recorders were also placed insideOLES staff members’ personal vehicles during the summer of 2006 in Mary-land. A high temperature of 67 ◦C was obtained in July 2006 from thestudy of OLES staff member vehicles. Readings around 63 ◦C were alsoobtained in California and Illinois during the summer of 2007. An exampleof representative vehicle data is shown in Figure 1.2.
1.2.3 Selection of Relative Humidity
Another parameter that must be selected is the relative humidity used inthe exposure conditions. One of the participants in the TWG vehicle con-ditions study, independent of the NIST study, obtained permission to haveofficers wear an environmental sensor on the outside of their armor. Relative
6
1. Introduction
Time (min)
0 2000 4000 6000 8000
Mois
ture
Con
ten
t (m
ass
%)
0
2
4
6
8
Tem
pera
ture
(°C
)
Rela
tive H
um
idit
y (
%)
20
40
60
80
100
Moisture
Content (%)
Temperature (°C)
Relative
Humidity (RH)(%)
90% RH
65 °C
90% RH
35 °C
21% RH
35 °C
Figure 1.3: Moisture Sorption Data for PPTA (cyclic conditions).
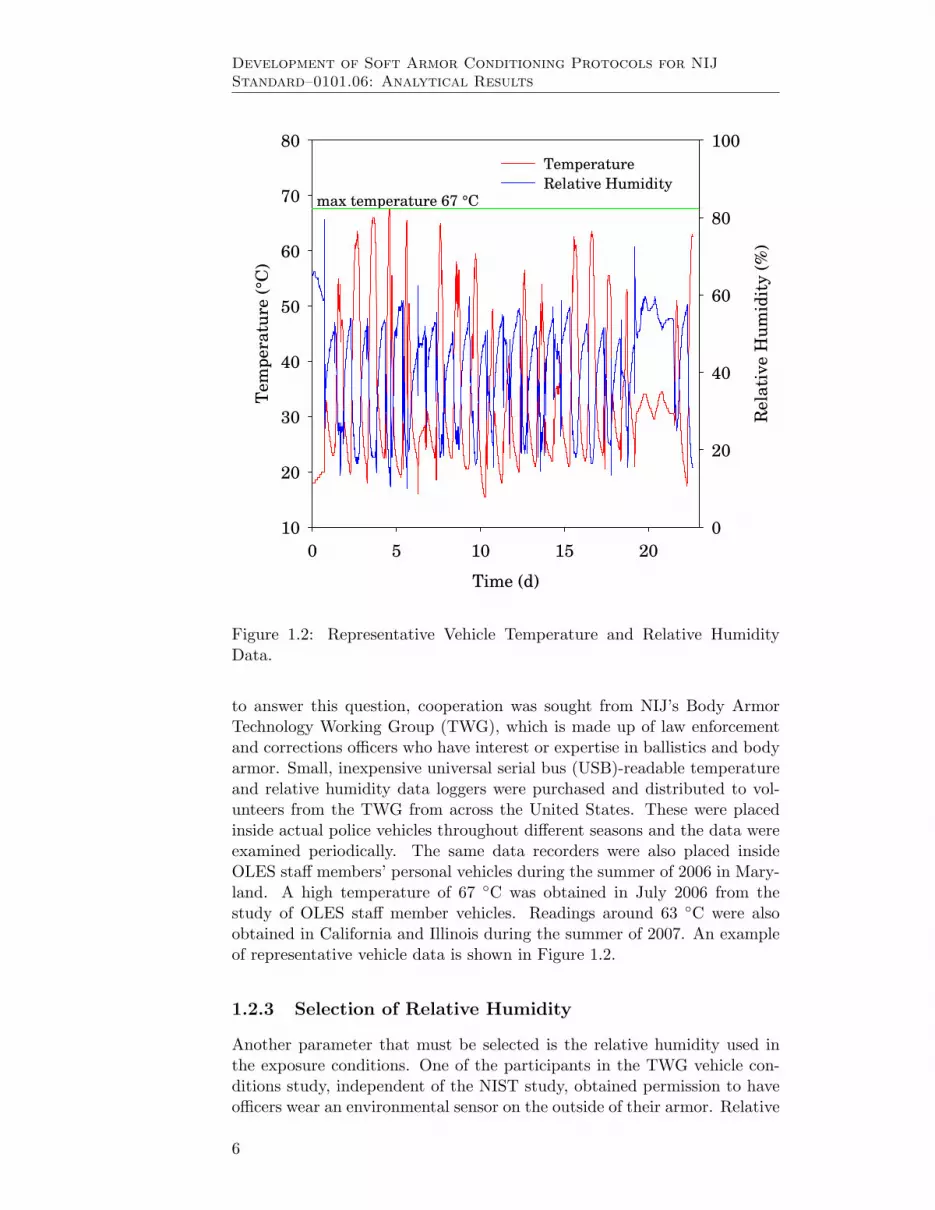
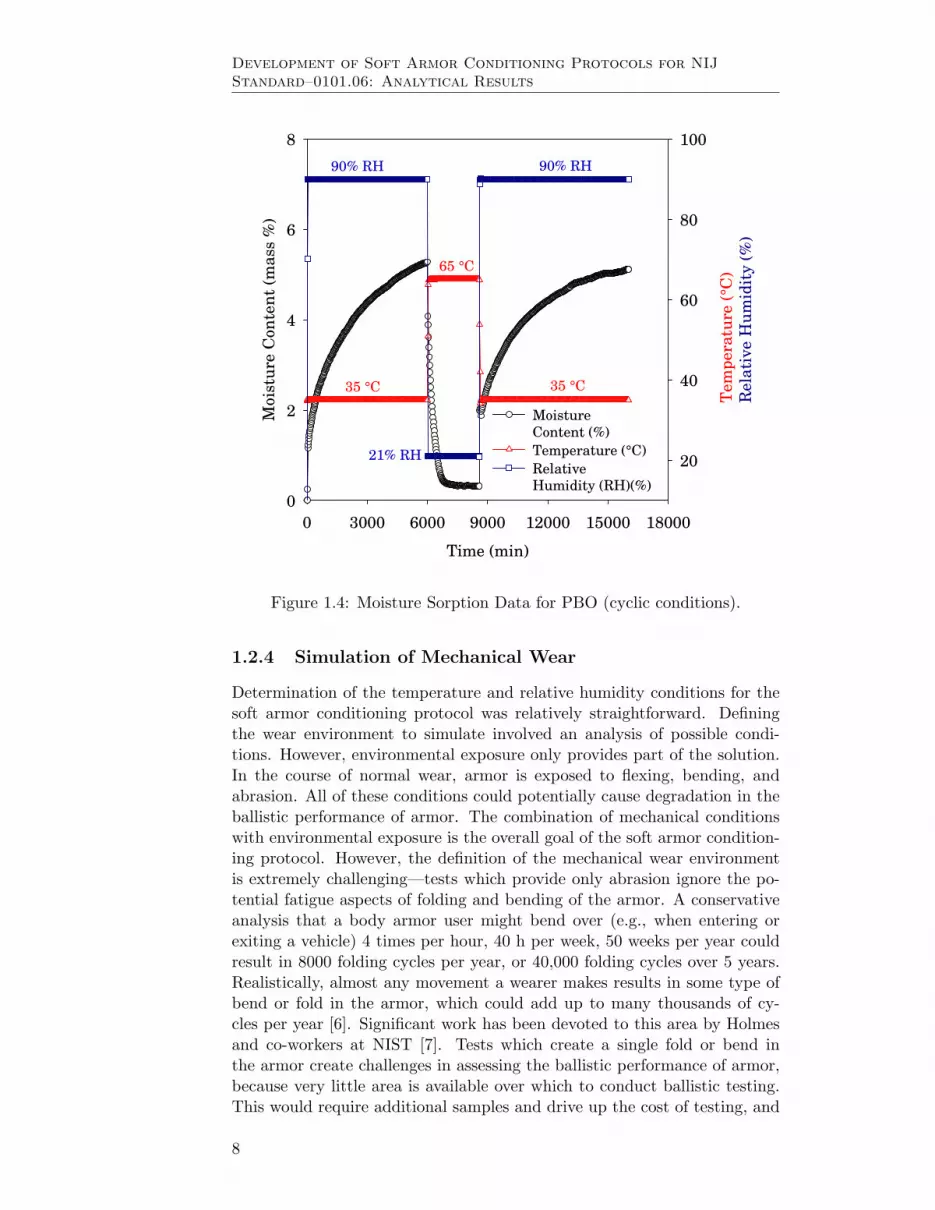
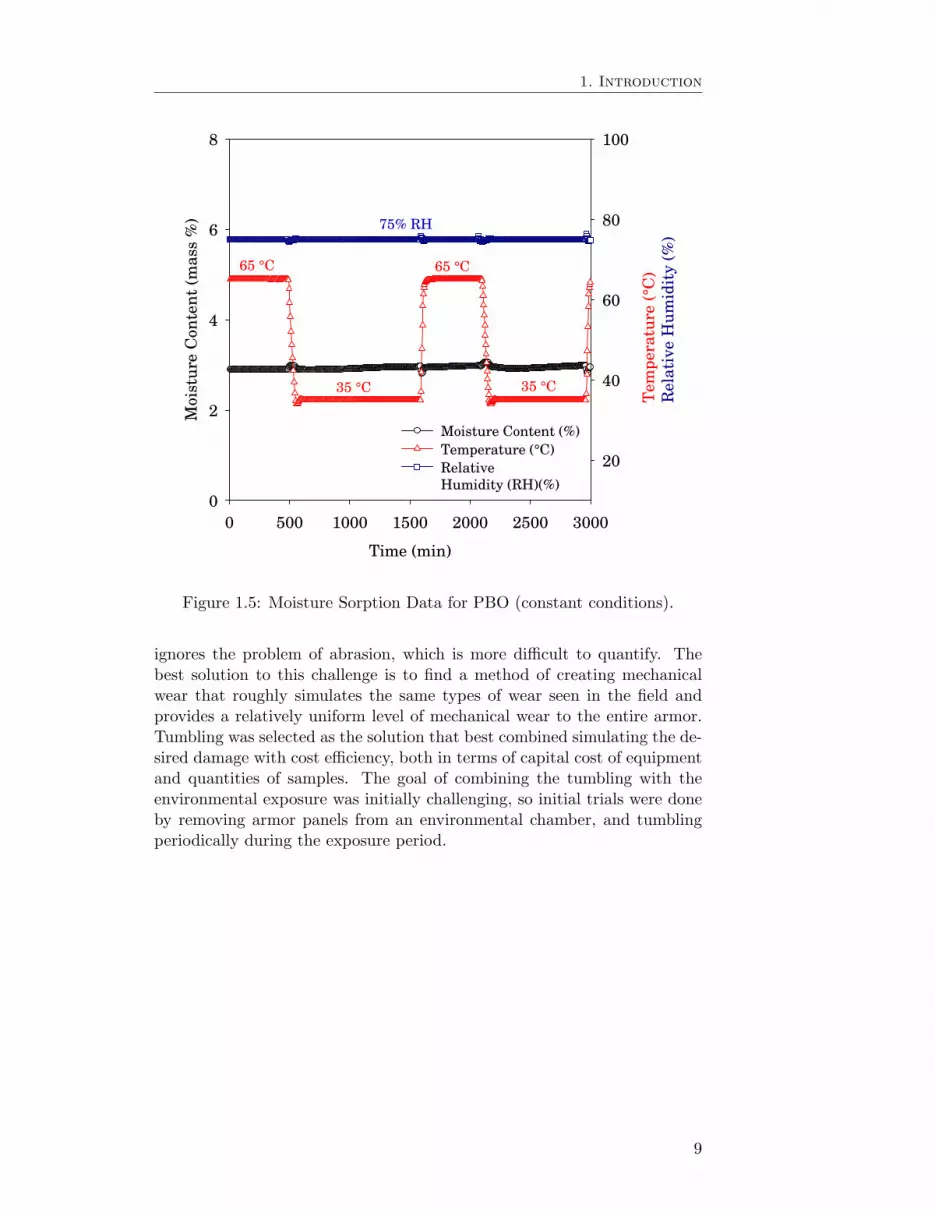
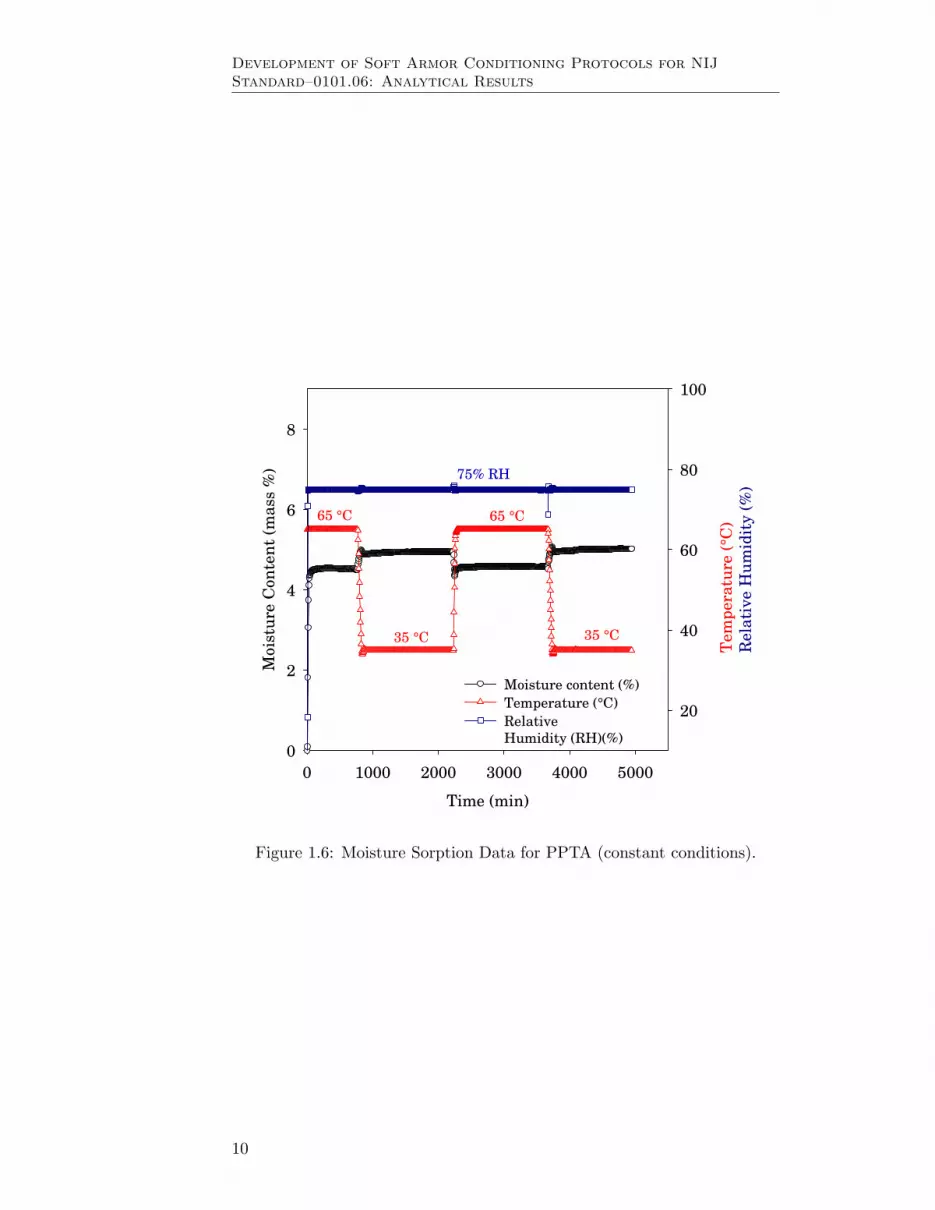
humidities and temperatures outside of the armor are probably close to, butpossibly slightly lower than, those seen within the armor. The maximumtemperature seen during this study was 41 ◦C and the maximum relativehumidity seen was 76 %. Initially, the protocol was envisoned as a cyclicaltemperature and relative humidity exposure, with a low temperature con-dition of 35 ◦C, 90 % relative humidity. In an effort to maintain consistentconditions at an elevated temperature of 65 ◦C, high temperature relativehumidities were envisoned as 21 %, which corresponds to the same quantityof water per gram of dry air (0.032 gram water per gram dry air). How-ever, prior to beginning testing, a moisture sorption study was undertakento examine the moisture uptake by the fiber at the two conditions of tem-perature and relative humidity. In changing conditions from 35 ◦C, 90 %relative humidity to 65 ◦C, 21 % relative humidity, a large desorption wasobserved in both PPTA (Fig. 1.3) and PBO (Fig. 1.4) fibers. This indicatedthat the moisture content in the air around the fiber was actually the wrongvariable to control—it was more important to attempt to maintain a con-stant moisture content in the fiber, where the degradation reactions wouldoccur. After examining several conditions, it was determined that 75 % rel-ative humidity at both 35 ◦C and 65 ◦C would result in an approximatelyequal moisture content, as observed for PBO (Fig. 1.5) and PPTA (Fig. 1.6)fibers, so this relative humidity was selected for the initial trials.
7
Development of Soft Armor Conditioning Protocols for NIJ
Standard–0101.06: Analytical Results
Time (min)
0 3000 6000 9000 12000 15000 18000
Mois
ture
Con
ten
t (m
ass
%)
0
2
4
6
8
Tem
pera
ture
(°C
)
Rela
tive H
um
idit
y (
%)
20
40
60
80
100
Moisture
Content (%)
Temperature (°C)
Relative
Humidity (RH)(%)
90% RH
65 °C
90% RH
35 °C
21% RH
35 °C
Figure 1.4: Moisture Sorption Data for PBO (cyclic conditions).
1.2.4 Simulation of Mechanical Wear
Determination of the temperature and relative humidity conditions for thesoft armor conditioning protocol was relatively straightforward. Definingthe wear environment to simulate involved an analysis of possible condi-tions. However, environmental exposure only provides part of the solution.In the course of normal wear, armor is exposed to flexing, bending, andabrasion. All of these conditions could potentially cause degradation in theballistic performance of armor. The combination of mechanical conditionswith environmental exposure is the overall goal of the soft armor condition-ing protocol. However, the definition of the mechanical wear environmentis extremely challenging—tests which provide only abrasion ignore the po-tential fatigue aspects of folding and bending of the armor. A conservativeanalysis that a body armor user might bend over (e.g., when entering orexiting a vehicle) 4 times per hour, 40 h per week, 50 weeks per year couldresult in 8000 folding cycles per year, or 40,000 folding cycles over 5 years.Realistically, almost any movement a wearer makes results in some type ofbend or fold in the armor, which could add up to many thousands of cy-cles per year [6]. Significant work has been devoted to this area by Holmesand co-workers at NIST [7]. Tests which create a single fold or bend inthe armor create challenges in assessing the ballistic performance of armor,because very little area is available over which to conduct ballistic testing.This would require additional samples and drive up the cost of testing, and
8
1. Introduction
Time (min)
0 500 1000 1500 2000 2500 3000
Mois
ture
Con
ten
t (m
ass
%)
0
2
4
6
8
Tem
pera
ture
(°C
)
Rela
tive H
um
idit
y (
%)
20
40
60
80
100
Moisture Content (%)
Temperature (°C)
Relative
Humidity (RH)(%)
75% RH
65 °C
35 °C 35 °C
65 °C
Figure 1.5: Moisture Sorption Data for PBO (constant conditions).
ignores the problem of abrasion, which is more difficult to quantify. Thebest solution to this challenge is to find a method of creating mechanicalwear that roughly simulates the same types of wear seen in the field andprovides a relatively uniform level of mechanical wear to the entire armor.Tumbling was selected as the solution that best combined simulating the de-sired damage with cost efficiency, both in terms of capital cost of equipmentand quantities of samples. The goal of combining the tumbling with theenvironmental exposure was initially challenging, so initial trials were doneby removing armor panels from an environmental chamber, and tumblingperiodically during the exposure period.
9
Development of Soft Armor Conditioning Protocols for NIJ
Standard–0101.06: Analytical Results
Time (min)
0 1000 2000 3000 4000 5000
Mois
ture
Con
ten
t (m
ass
%)
0
2
4
6
8
Tem
pera
ture
(°C
)
Rela
tive H
um
idit
y (
%)
20
40
60
80
100
Moisture content (%)
Temperature (°C)
Relative
Humidity (RH)(%)
75% RH
65 °C
35 °C 35 °C
65 °C
Figure 1.6: Moisture Sorption Data for PPTA (constant conditions).
10

2 Experimental
A combination of analytical and ballistic characterization techniques wereused throughout the development of the soft armor conditioning protocol inan effort to learn as much as possible from each trial. The two analyticaltechniques that were most commonly used were tensile testing and Fouriertransform infrared analysis (FTIR) of yarns extracted from test armor pan-els. Other analytical techniques that were used include dynamic mechanicalthermal analysis (DMTA) and moisture sorption analysis (MSA). Ballistictesting was limited to two techniques—perforation/backface signature (P-BFS) testing and ballistic limit (V50) analysis.
2.1 Extracted Yarn Tensile Testing
To obtain yarn mechanical properties, tensile testing of yarns was carriedout in accordance with ASTM D2256-02,“Standard Test Method for TensileProperties of Yarn by the Single-Strand Method,” using an Instron Model4482 test frame equipped with a 91 kg (200 lb) load cell, and pneumaticyarn and cord grips (Instron model 2714-006). The jaw separation was7.9 cm (3.1 in) and the cross-head speed was 2.3 cm/min (0.9 in/min).In this study, yarns were nominally 38.1 cm (15 in) long, and given 60twists1 on a custom-designed yarn twisting device. This level of twist wasmaintained on the yarns as they were inserted into the pneumatic yarn andchord grips. Strain measurements were made with an Instron non-contactingType 3 video extensometer in conjunction with black foam markers placedapproximately 2.5 cm apart in the gage section of the yarn. Ten to twelvereplicates from each vest were tested to failure. The standard uncertainty ofthese measurements is typically 3 %, however the error bars generated forplots presented herein are based on the relative standard deviation of theyarn breaking strength, which is in some cases higher than 3 %.
1This twist level is within the range recommended by ASTM D2256-02, and was ex-perimentally verified prior to beginning experiments.
11
Development of Soft Armor Conditioning Protocols for NIJ
Standard–0101.06: Analytical Results
2.2 Fourier Transform Infrared Analysis
Infrared analysis was carried out using a Nicolet Nexus Fourier TransformInfrared (FTIR) Spectrometer equipped with a mercury-cadmium-telluride(MCT) detector and a SensIR Durascope attenuated total reflectance (ATR)accessory or a Bruker Vertex 80 FTIR, also equipped with a Smiths Detec-tion Durascope ATR accessory. Air dried by passage through a standardFTIR purge gas generator was used as the purge gas. Consistent pressureon the yarns was applied using the force monitor on the Durascope. FTIRspectra were recorded at a resolution of 4 cm−1 between 4000 cm−1 and700 cm−1 and averaged over 128 scans. Three different locations on eachyarn were analyzed. Spectral analysis, including spectral subtraction, wascarried out using a custom software program developed in the Building andFire Research Laboratory’s Polymeric Materials Group at NIST. All spectrawere baseline corrected and normalized using the aromatic C-H deformationpeak at 848 cm−1 for PBO and 820 cm−1 for Kevlar. Standard uncertaintiesassociated with this measurement are typically 4 cm−1 in wavenumber and1 % in peak intensity.
2.3 Moisture Sorption Analysis
Moisture absorbed by the yarn specimens during the temperature/humidityexposure period was measured using a Hiden IGAsorp Moisture SorptionAnalyzer. The IGAsorp software monitors the temporal changes in themass of a specimen subjected to prescribed temperature and relative hu-midity conditions, and calculates equilibrium parameters via curve fitting.Specimens for sorption analysis were prepared by disassembling between5 mg and 7 mg of yarn into individual filaments to prevent capillarity ef-fects from dominating the sorption process. Prior to beginning a sorptionexperiment, specimens were dried in the moisture sorption analyzer at ≈ 0% relative humidity and the prescribed temperature at which the sorptionexperiment would be carried out. Moisture uptake was measured at 50 ◦Cand 60 % relative humidity as well as at 60 ◦C and 37 % relative humidity.The water sorption isotherm was generated using the isothermal mappermode at 40 ◦C within a range of 0 % relative humidity to 95 % relative hu-midity. Results are the average of two specimens. The standard uncertaintyof these measurements is typically 0.02 % mass fraction.
2.4 Dynamic Mechanical Thermal Analysis
Dynamic Mechanical Thermal Analysis (DMTA) was performed using a TAInstruments RSA III DMTA. Dynamic temperature ramp measurementswere generated by loading a single fiber into film/fiber tension clamps, andapplying a preload of approximately 1 g force to the sample. The measure-ment was performed in a strain controlled mode with a strain of 0.1 % at afrequency of 1 Hz. The temperature was increased from 30 ◦C to 110 ◦C ata ramp rate of 3 ◦C/min. For the RSA III, the manufacturer-stated relative
12
2. Experimental
standard uncertainty [21] in the force measurement is typically ± 0.0002 g,and the standard uncertainty in the temperature scale is typically ± 0.5 ◦C.
13

Development of Soft Armor Conditioning Protocols for NIJ
Standard–0101.06: Analytical Results
This page intentionally left blank.
14
3 Conditioning Protocol
Development
Multiple phases of development were conducted, all utilizing slightly differ-ent methods and equipment configurations. Each phase of development willbe presented separately in this document to better describe the developmentof the soft armor conditioning protocol.
3.1 Phase I
Initial experiments were performed using separate tumbling and environ-mental exposure steps. This allowed for “proof of concept” of tumbling asa mechanism to provide mechanical wear, and also allowed for explorationof potential environmental conditions.
3.1.1 Sample Description
Two types of test armors were used in the first phase of protocol develop-ment. One sample armor was constructed of 20 layers of plain woven 500denier PBO, with 26 yarns per inch in the horizontal direction and 26 yarnsper inch in the vertical direction. The layers of fabric were stitched togetherin two packs of 10 layers each with a 2.54 cm (1 in) diagonal quilt stitchto form the ballistic package. This ballistic package was then encased ina stitched moisture-permeable fabric cover and inserted into a lightweightpoly-cotton carrier to form an armor panel. The other sample armor wasconstructed of 25 layers of plain woven 500 denier PPTA, with 24 yarns inthe horizontal direction and 24 yarns in the vertical direction. The layersof fabric were stitched together in one package with a 3.18 cm (1.25 in) di-agonal quilt stitch to form the ballistic package. This ballistic package wasthen encased in a standard water-repellent treated nylon fabric cover andinserted into a medium-weight poly-cotton carrier to form an armor panel1.All armors were manufactured specifically for this study. The PBO armorsamples were designed to be NIJ Standard–0101.04 Level IIA compliant.
1The definitions of panel and armor panel used in this document are intended to beconsistent with the definitions of these terms as described in Section 3 of NIJ Standard–0101.06 [22].
15
Development of Soft Armor Conditioning Protocols for NIJ
Standard–0101.06: Analytical Results
Hour
0 5 10 15 20 25
Tem
pera
ture
(°C
)
0
20
40
60
80
100
Rela
tive H
um
idit
y (
%)
0
20
40
60
80
100
Temperature
Relative Humidity
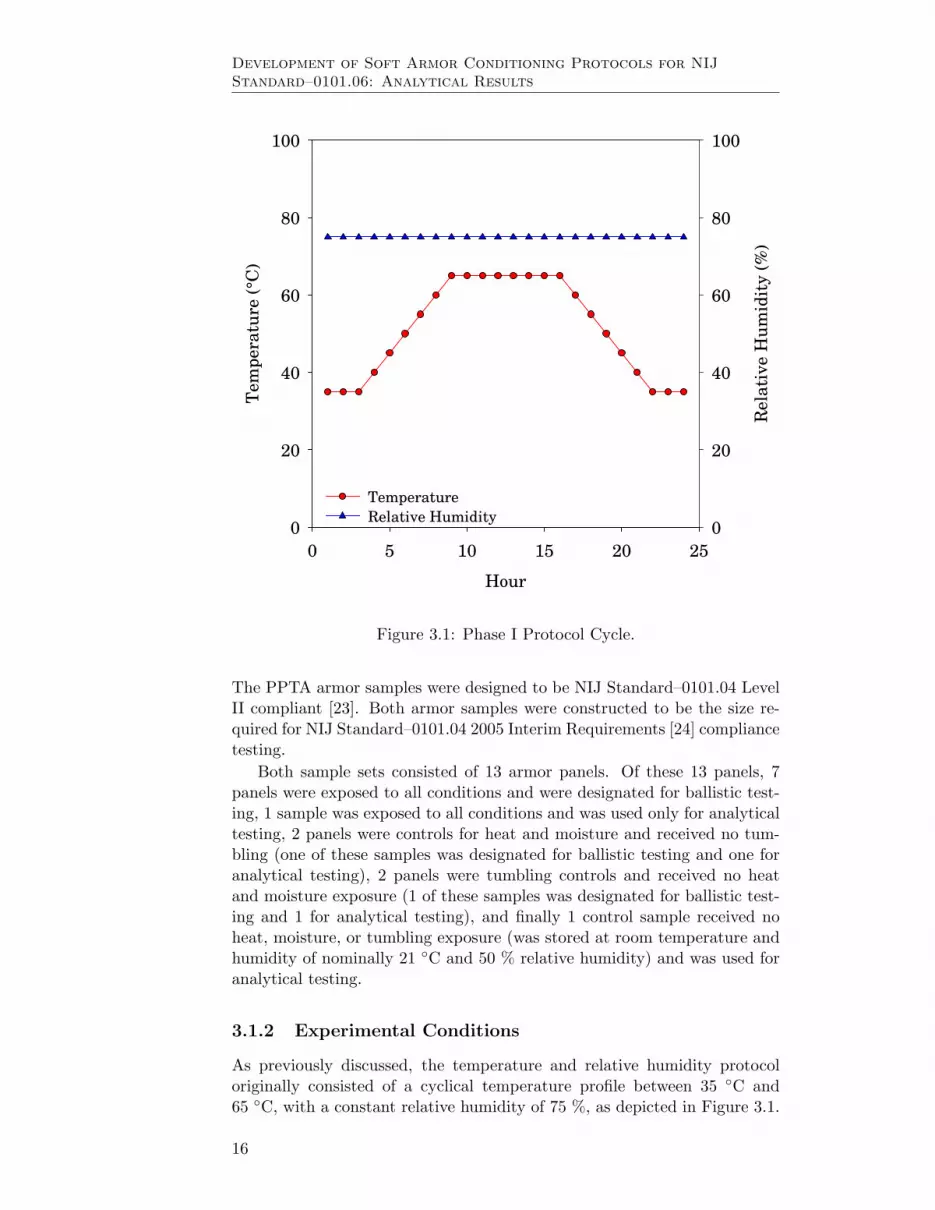
Figure 3.1: Phase I Protocol Cycle.
The PPTA armor samples were designed to be NIJ Standard–0101.04 LevelII compliant [23]. Both armor samples were constructed to be the size re-quired for NIJ Standard–0101.04 2005 Interim Requirements [24] compliancetesting.
Both sample sets consisted of 13 armor panels. Of these 13 panels, 7panels were exposed to all conditions and were designated for ballistic test-ing, 1 sample was exposed to all conditions and was used only for analyticaltesting, 2 panels were controls for heat and moisture and received no tum-bling (one of these samples was designated for ballistic testing and one foranalytical testing), 2 panels were tumbling controls and received no heatand moisture exposure (1 of these samples was designated for ballistic test-ing and 1 for analytical testing), and finally 1 control sample received noheat, moisture, or tumbling exposure (was stored at room temperature andhumidity of nominally 21 ◦C and 50 % relative humidity) and was used foranalytical testing.
3.1.2 Experimental Conditions
As previously discussed, the temperature and relative humidity protocoloriginally consisted of a cyclical temperature profile between 35 ◦C and65 ◦C, with a constant relative humidity of 75 %, as depicted in Figure 3.1.
16

3. Conditioning Protocol Development
Environmental exposures of the PPTA and PBO samples were conductedin two separate chambers. Vests were hung vertically in the humidity cham-ber for the environmental portion of the exposures and removed at desig-nated times for tumbling in a standard home clothes dryer (with the heatingelement disabled). The chamber was returned to room temperature and hu-midity before removing the armor for tumbling to avoid the formation of acondensing atmosphere in the chamber. Samples were extracted from armordesignated for analytical testing after it was removed from the chamber fortumbling. Extractions were performed after the tumbling was completed.An estimate of the total number of revolutions of the armor for the firstphase is 194,400 total revolutions, based on 3 h of tumbling, 3 d per week,for 9 weeks. The rotation speed of the standard home clothes dryer wasmeasured at nominally 4.19 rad/s (40 revolutions per minute) using a lasertachometer.
3.1.3 Analytical Results
Relative tensile strengths of yarns extracted from the PBO armor panelsare depicted in Figure 3.2. This figure shows the reduction of ultimatetensile strength, plotted as percent strength retention, of the PBO armor asa function of exposure time. After 9 weeks, armor exposed to heat, moisture,and tumbling had a tensile strength retention of approximately 62 %. This iscomparable to the value that was observed in the back panel of a PBO armorthat was defeated in the field, and the value that was ultimately reached after6 months of aging in a previous study [4]. An interesting observation is thatthe armor panel that was exposed to only heat and moisture had essentiallythe same tensile strength retention. The armor panel that was only exposedto tumbling had only a reduction in tensile strength of approximately 8 %.This indicates that the tumbling did not produce enough mechanical damageor did not happen frequently enough in the protocol to accelerate the effectsof the heat and moisture exposure.
Relative tensile strengths of yarns extracted from the PPTA armor pan-els are depicted in Figure 3.3. This figure shows the reduction of ultimatetensile strength, plotted as percent strength retention, of the PPTA armoras a function of exposure time. After 9 weeks, the armor exhibits essentiallyno change in tensile strength and was apparently unaffected by the exposureprotocol.
In previous studies [4, 5], it has been shown that oxazole ring openingis a major indicator of hydrolysis in PBO. Oxazole ring opening in previousstudies is identified by the loss of peaks attributed to the vibrations associ-ated with the benzoxazole ring at 1496 cm−1, 1362 cm−1, 1056 cm−1, and914 cm−1, and by the formation of a peak at 1650 cm−1 attributed to anamide carbonyl or carboxylic acid, which are potential products of oxazolering opening. Infrared difference spectra of PBO taken over the course ofthe exposure study are shown in Figure 3.4. The difference spectra showthe chemical changes occurring in PBO as a function of exposure time.
The difference spectra show marked reductions in the peaks at 1492 cm−1,1361 cm−1, 1056 cm−1, and 914 cm−1, all of which are attributed to oxazole
17

Development of Soft Armor Conditioning Protocols for NIJ
Standard–0101.06: Analytical Results
Conditioning Time (d)
0 10 20 30 40 50 60 70
Bre
ak
ing S
tren
gth
Rete
nti
on
(%
)
40
60
80
100
PBO (all conditions)
Benchmark reduction
PBO (tumbling only)
PBO (T&RH only)
Figure 3.2: Phase I Breaking Strength Retention for PBO. The error barsrepresent the relative standard deviation of the mean yarn breaking strength.Points are offset horizontally for clarity.
18

3. Conditioning Protocol Development
Conditioning Time (d)
-10 0 10 20 30 40 50 60
Ten
sile
Str
en
gth
Rete
nti
on
(%
)
40
60
80
100
120
PPTA
PPTA (tumble only)
PPTA (T&RH)
Benchmark reduction
Figure 3.3: Phase I Breaking Strength Retention for PPTA. The error barsrepresent the relative standard deviation of the mean yarn breaking strength.Points are offset horizontally for clarity.
19

Development of Soft Armor Conditioning Protocols for NIJ
Standard–0101.06: Analytical Results
Wavenumber (cm-1
)
80010001200140016001800
Abso
rban
ce
-0.10
-0.05
0.00
0.05
0.10week 1
week 4
week 8
1056 cm-1
and 914 cm-1
benzoxazole ring
opening
1361 cm-1
benzoxazole
ring opening
1492 cm-1
benzoxazole
ring opening
*
* *
starred peaks (*) are attributed to
loss of skeletal vibration from conjugated benzoxazole ring system
carbonyl expected
at 1647 cm-1
but
very weak for
carbonyl
Figure 3.4: Phase I FTIR Difference Spectra for PBO.
ring opening. As previously mentioned, standard uncertainties associatedwith this measurement are typically 4 cm−1 in wavenumber and 1 % in peakintensity, so the slight shift in wavenumbers for the difference spectra maybe due to variations in the individual spectra used to create the differencespectrum. However, we do not see a large peak at 1650 cm−1 to indicate theformation of an amide carbonyl or carboxylic acid as expected. A possibleexplanation is that this product is leaving the system, possibly due to theabrasion created during tumbling, or that this product was extracted bymoisture.
The infrared subtraction spectra of PPTA yarns extracted from bodyarmor panels following environmental exposure are shown in Figure 3.5 andFigure 3.6. The body armor panels were divided into four groups–one groupwas subjected to tumbling alone, one to temperature/moisture exposurealone, one to temperature/moisture combined with tumbling (designated as“all”), and one group was sealed in plastic bags at room temperature ofnominally 22 ◦C to serve as controls.
Infrared analysis and spectral subtraction revealed that all of the con-ditions, even the control conditions, resulted in some degree of PPTA hy-drolysis. The difference spectra in Figure 3.5 and Figure 3.6 shows negativepeaks with positions corresponding to the original amide I peak at 1640cm−1 and amide II peak at 1513 cm−1 . A new (positive) broad peak is
20

3. Conditioning Protocol Development
Wavenumber (cm-1
)
1000150020002500300035004000
Abso
rban
ce
-0.30
-0.20
-0.10
0.00
0.10
0.20
PPTA control
PPTA (T&RH only)
PPTA (all conditions )
PPTA (tumble only)
3400 cm-1
3320 cm-1
Figure 3.5: Phase I FTIR Difference Spectra for PPTA (full scale).
21

Development of Soft Armor Conditioning Protocols for NIJ
Standard–0101.06: Analytical Results
Wavenumber (cm-1
)
800100012001400160018002000
Abso
rban
ce
-0.30
-0.20
-0.10
0.00
0.10
0.20
PPTA control
PPTA (T&RH only)
PPTA (all conditions)
PPTA (tumble only)
1560 cm-1
1420 cm-1
1627 cm-1
Amide I
1513 cm-1
Amide II
Figure 3.6: Phase I FTIR Difference Spectra for PPTA (expanded scale).
22

3. Conditioning Protocol Development
Infrared Band T&RH Tumble(cm−1) All Only Only Control
3320 3 1 2 4
1627 2 1 4 3
1513 3 1 2 4
1560 2 (tie) 2 (tie) 1 3
1420 2 3 (tie) 1 3 (tie)
Table 3.1: Rank Ordering of PPTA Infrared Bands; 1=greatest change;4=least change.
observed at 3400 cm−1, which is attributed to a combination of amine N-Hstretching and carboxylic acid OH stretching. New peaks are also observedat 1570 cm−1 and 1420 cm−1 that are attributed to carboxylate ion stretch-ing. This evidence points to the hydrolysis of the main chain amide groupto amine and carboxylic acid.
It is puzzling why even the control panels that were not subjected to anyenvironmental stresses also underwent hydrolysis, albeit to a lesser extent.It is likely that as long as moisture is present, hydrolytic reactions in thePPTAs can occur.
In an attempt to determine which environmental conditioning treatmentcaused the most hydrolytic damage, intensities of the difference bands wereexamined and rank-ordered. A tabulation of the major difference bands(except for the bands at 3400 cm−1 which were too close to distinguish) andtheir intensity rankings is given in Table 3.1 below.
No clear or consistent pattern can be found in the above table; theintensity rank order differs for each infrared band. Since the tensile strengthsof the yarns extracted from the environmentally conditioned panels did notexhibit any changes over the course of the conditioning treatments, it ispossible that these chemical changes are beneath the threshold necessary toinfluence mechanical properties and may fall within the standard deviationsof the infrared measurements.
3.2 Phase I Summary
This phase of development showed that it was possible to develop a protocolof elevated temperature and relative humidity that would cause damage toPBO armor after 9 weeks of exposure, but would not cause similar damagein PPTA armor in this time period. However, the 8 week exposure time wasdeemed too long for practical implementation in the new NIJ Standard–0101.06. After this first phase, it was determined that the duration of theprotocol must be reduced. Reduction of the time required to complete theprotocol was the primary goal for Phase II.
23
Development of Soft Armor Conditioning Protocols for NIJ
Standard–0101.06: Analytical Results
3.3 Phase II
As was the case in Phase I, in order to meet the timetable for development ofthe conditioning protocol, initial exposures were performed using separatetumbling and environmental exposure for Phase II. This allowed for “proofof concept” of tumbling as a mechanism to provide mechanical wear, andalso allowed for further exploration of potential environmental conditions.
3.3.1 Sample Description
Three sets of armors were used in the second phase of protocol development.Two woven armors were the same as those discussed in the Phase I testing.The additional armor was a nonwoven armor, constructed of 30 sheets ofunidirectional (UD) laminated UHMWPE fibers. In a UD layer, all fibersare laid parallel, in the same plane. In this study, the sheets of UHMWPEarmors were made of 4 layers of fibers, with the orientation of fibers in eachlayer at 90 ◦ to the direction of the fibers in the adjacent layers (0 ◦, 90 ◦, 0 ◦,90 ◦). The sheets of UHMWPE were stitched together in three places at thetop of the vest and one place at the bottom of the vest. Phase II also usedtwo chambers and two sample sets. Chamber 1 contained 15 panels of PBOarmor and 6 panels of UHMWPE armor. The PBO panels were tested asfollows—in chamber 1, one of the PBO samples was a control and was notexposed to any heat, humidity, or tumbling exposure. Three panels wereexposed to only tumbling (two of these were for ballistic testing and onewas for analytical testing), two panels were exposed to only temperatureand relative humidity (one of these was used for ballistic testing and onefor analytical testing), 8 panels were exposed to all conditions and weredesignated for ballistic testing, and 1 sample was exposed to all conditionsand was only tested analytically. All six of the UHMWPE panels weretested ballistically. The results of the ballistic testing will be the subject ofa separate publication.
Chamber 2 consisted of 15 panels of PPTA armor and 5 panels ofUHMWPE armor. The PPTA panels were used as follows—in chamber2, one of the PPTA samples was a control and was not exposed to anyheat, humidity, or tumbling exposure. Three panels were exposed to onlytumbling (two of these were for ballistic testing and one was for analyticaltesting), two panels were exposed to only temperature and relative humid-ity (one of these was for ballistic testing and one was for analytical testing),8 panels were exposed to all conditions and were designated for ballistictesting, and 1 sample was exposed to all conditions and was used only foranalytical testing. All five of the UHMWPE panels were for ballistic testing.
3.3.2 Experimental Conditions
In an effort to shorten the time required to achieve the target degradationfrom Phase I, the temperature and relative humidity protocol was adjustedto allow for two cycles within a 24 h time period with a temperature profilebetween 35 ◦C and 65 ◦C, with a constant relative humidity of 75 % except
24

3. Conditioning Protocol Development
Hour
0 5 10 15 20 25
Tem
pera
ture
(°C
)
0
20
40
60
80
100
Rela
tive H
um
idit
y (
%)
0
20
40
60
80
100
Temperature
Relative Humidity
Figure 3.7: Phase II Protocol Cycle.
on the cooling parts of the cycle to avoid condensation, where the relativehumidity was dropped to 65 % as depicted in Figure 3.7.
Environmental exposures of the PPTA and PBO samples were conductedin two separate chambers. Vests were hung vertically in the humidity cham-ber for the environmental portion of the exposures and removed periodicallyfor tumbling in a standard home clothes dryer (with the heating elementdisabled). The chamber was returned to room temperature and humiditybefore removing armor for tumbling to avoid the formation of a condensingatmosphere in the chamber. Samples were extracted from armor designatedfor analytical testing when it was removed from the chamber for tumbling.An estimate of the total number of revolutions of the armor for the firstphase is 115,200 total revolutions, based on 2 h of tumbling, 2 d per week,for 6 weeks. The rotation speed of the standard home clothes dryer was mea-sured at nominally 4.19 rad/s (40 rpm) using a laser tachometer. The loadin each individual tumbler was increased in an effort to increase mechanicaldamage caused by tumbling.
3.3.3 Analytical Results
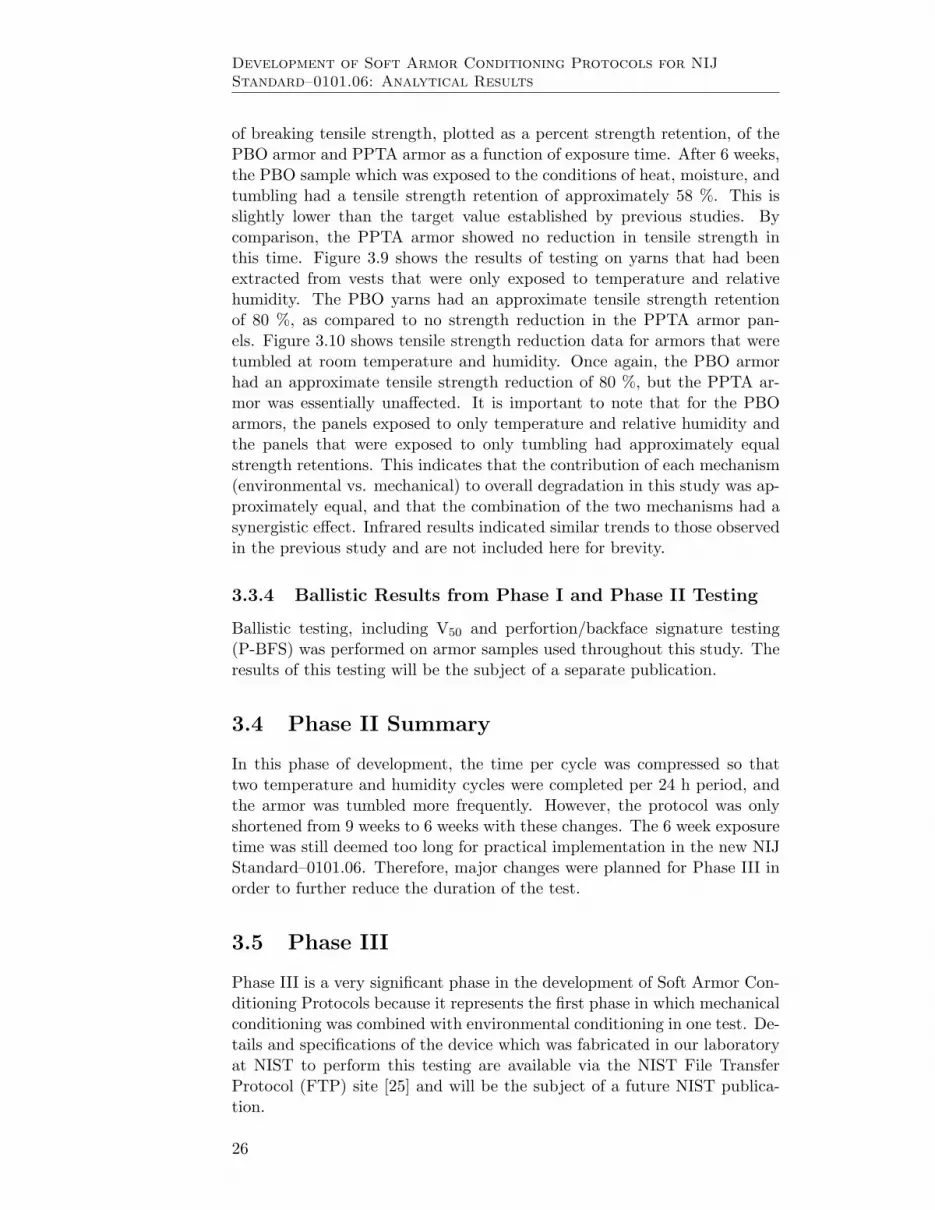
Tensile breaking strength testing of yarns extracted from the armor panelsare depicted in Figures 3.8 through 3.10. Figure 3.8 shows the reduction
25
Development of Soft Armor Conditioning Protocols for NIJ
Standard–0101.06: Analytical Results
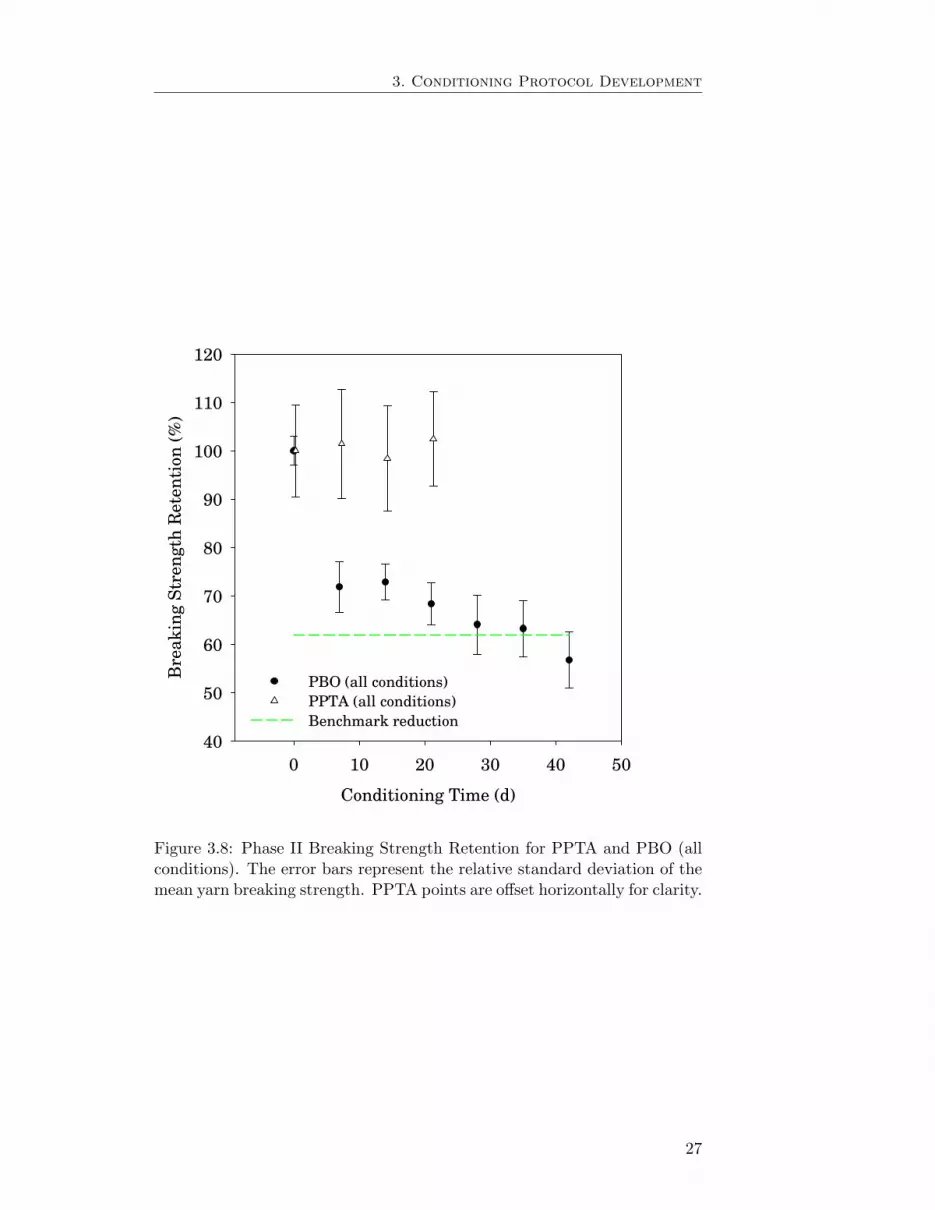
of breaking tensile strength, plotted as a percent strength retention, of thePBO armor and PPTA armor as a function of exposure time. After 6 weeks,the PBO sample which was exposed to the conditions of heat, moisture, andtumbling had a tensile strength retention of approximately 58 %. This isslightly lower than the target value established by previous studies. Bycomparison, the PPTA armor showed no reduction in tensile strength inthis time. Figure 3.9 shows the results of testing on yarns that had beenextracted from vests that were only exposed to temperature and relativehumidity. The PBO yarns had an approximate tensile strength retentionof 80 %, as compared to no strength reduction in the PPTA armor pan-els. Figure 3.10 shows tensile strength reduction data for armors that weretumbled at room temperature and humidity. Once again, the PBO armorhad an approximate tensile strength reduction of 80 %, but the PPTA ar-mor was essentially unaffected. It is important to note that for the PBOarmors, the panels exposed to only temperature and relative humidity andthe panels that were exposed to only tumbling had approximately equalstrength retentions. This indicates that the contribution of each mechanism(environmental vs. mechanical) to overall degradation in this study was ap-proximately equal, and that the combination of the two mechanisms had asynergistic effect. Infrared results indicated similar trends to those observedin the previous study and are not included here for brevity.
3.3.4 Ballistic Results from Phase I and Phase II Testing
Ballistic testing, including V50 and perfortion/backface signature testing(P-BFS) was performed on armor samples used throughout this study. Theresults of this testing will be the subject of a separate publication.
3.4 Phase II Summary
In this phase of development, the time per cycle was compressed so thattwo temperature and humidity cycles were completed per 24 h period, andthe armor was tumbled more frequently. However, the protocol was onlyshortened from 9 weeks to 6 weeks with these changes. The 6 week exposuretime was still deemed too long for practical implementation in the new NIJStandard–0101.06. Therefore, major changes were planned for Phase III inorder to further reduce the duration of the test.
3.5 Phase III
Phase III is a very significant phase in the development of Soft Armor Con-ditioning Protocols because it represents the first phase in which mechanicalconditioning was combined with environmental conditioning in one test. De-tails and specifications of the device which was fabricated in our laboratoryat NIST to perform this testing are available via the NIST File TransferProtocol (FTP) site [25] and will be the subject of a future NIST publica-tion.
26
3. Conditioning Protocol Development
Conditioning Time (d)
0 10 20 30 40 50
Bre
ak
ing S
tren
gth
Rete
nti
on
(%
)
40
50
60
70
80
90
100
110
120
PBO (all conditions)
PPTA (all conditions)
Benchmark reduction
Figure 3.8: Phase II Breaking Strength Retention for PPTA and PBO (allconditions). The error bars represent the relative standard deviation of themean yarn breaking strength. PPTA points are offset horizontally for clarity.
27
Development of Soft Armor Conditioning Protocols for NIJ
Standard–0101.06: Analytical Results
Conditioning Time (d)
0 10 20 30 40 50
Bre
ak
ing S
tren
gth
Rete
nti
on
(%
)
50
60
70
80
90
100
110
120Benchmark reduction
PBO (T&RH only)
PPTA (T&RH only)
Figure 3.9: Phase II Breaking Strength Retention for PPTA and PBO (T& RH only). The error bars represent the relative standard deviation ofthe mean yarn breaking strength. PPTA points are offset horizontally forclarity.
28

3. Conditioning Protocol Development
Conditioning time (d)
0 10 20 30 40 50
Bre
ak
ing S
tren
gth
Rete
nti
on
(%
)
50
60
70
80
90
100
110
120
Benchmark reduction
PBO (tumble only)
PPTA (tumble only)
Figure 3.10: Phase II Breaking Strength Retention for PPTA and PBO(tumbling only). The error bars represent the relative standard deviation ofthe mean yarn breaking strength. PPTA points are offset horizontally forclarity.
29

Development of Soft Armor Conditioning Protocols for NIJ
Standard–0101.06: Analytical Results
3.5.1 Experimental Conditions
In an effort to accelerate the degradation achieved in Phases I and II, thetemperature and relative humidity protocol were adjusted to a constantcondition of 70 ◦C and 90 % relative humidity. The rationale behind thischange was to shorten the test protocol by spending all of the conditioningtime at the high heat, high relative humidity condition instead of cyclingbetween two conditions. At this point in the development, it was determinedthat 8 armors would be tumbled at a time, so efforts were made to try to keeptumbler loads as close to 8 armors, or 16 armor panels, as possible. Tumblingwas performed at 0.523 rad/s (5 rpm) continuously throughout the exposure.A specific time interval for exposure was not set at the beginning of thestudy, the intention was to track the chemical and physical degradation ofthe armor to determine when the target reduction in tensile strength hadbeen obtained.
3.5.2 Sample Description
Three types of armors were used in the third phase of protocol develop-ment. The two woven sample armors were the same as those discussed inthe Phase I and Phase II testing. A new set of armor was obtained forPhase III, also constructed of 30 sheets of UD laminated UHMWPE fibers,as described previously. There was no stitching of the sheets of UHMWPE.After ballistic testing was completed, it was discovered that these sampleshad been fabricated incorrectly. Instead of cutting each sheet of the materialseparately in order to achieve the correct 0◦, 90◦, 0◦, 90◦ orientation, thematerial was rolled out in a back and forth direction and all layers were cutout at once. Additionally, the layers were not aligned properly and portionsof layers were missing from all of the armor panels that were manufacturedin this way. This construction problem was determined to affect the ballisticproperties of the material that were measured after conditioning, as will bediscussed in a future publication. One environmental chamber in which atumbler had been installed was used in Phase III with two sets of samples.The first sample set consisted of 6 PBO armor panels, 7 UHMWPE armorpanels, and 6 PPTA armor panels. One of each type of armor panel wasexposed to only temperature and relative humidity and used for analyticaltesting. One of the PBO armor panels and one of the PPTA armor panelsthat were exposed to all conditions were used for analytical testing. The re-maining armor panels (4 PBO, 4 PPTA, and 6 UHMWPE) were designatedfor ballistic testing. The chamber was programmed at constant conditionsof 70 ◦C and 90 % relative humidity, with a constant tumbling speed of 0.52rad/s (5 rpm). A separate second set of testing was performed to obtainarmors that had only been exposed to mechanical conditioning. In this test,5 PBO panels, 6 UHMWPE panels, and 5 PPTA panels were tumbled atroom temperature and humidity at 0.52 rad/s (5 rpm).
30

3. Conditioning Protocol Development
3.5.3 Analytical Results
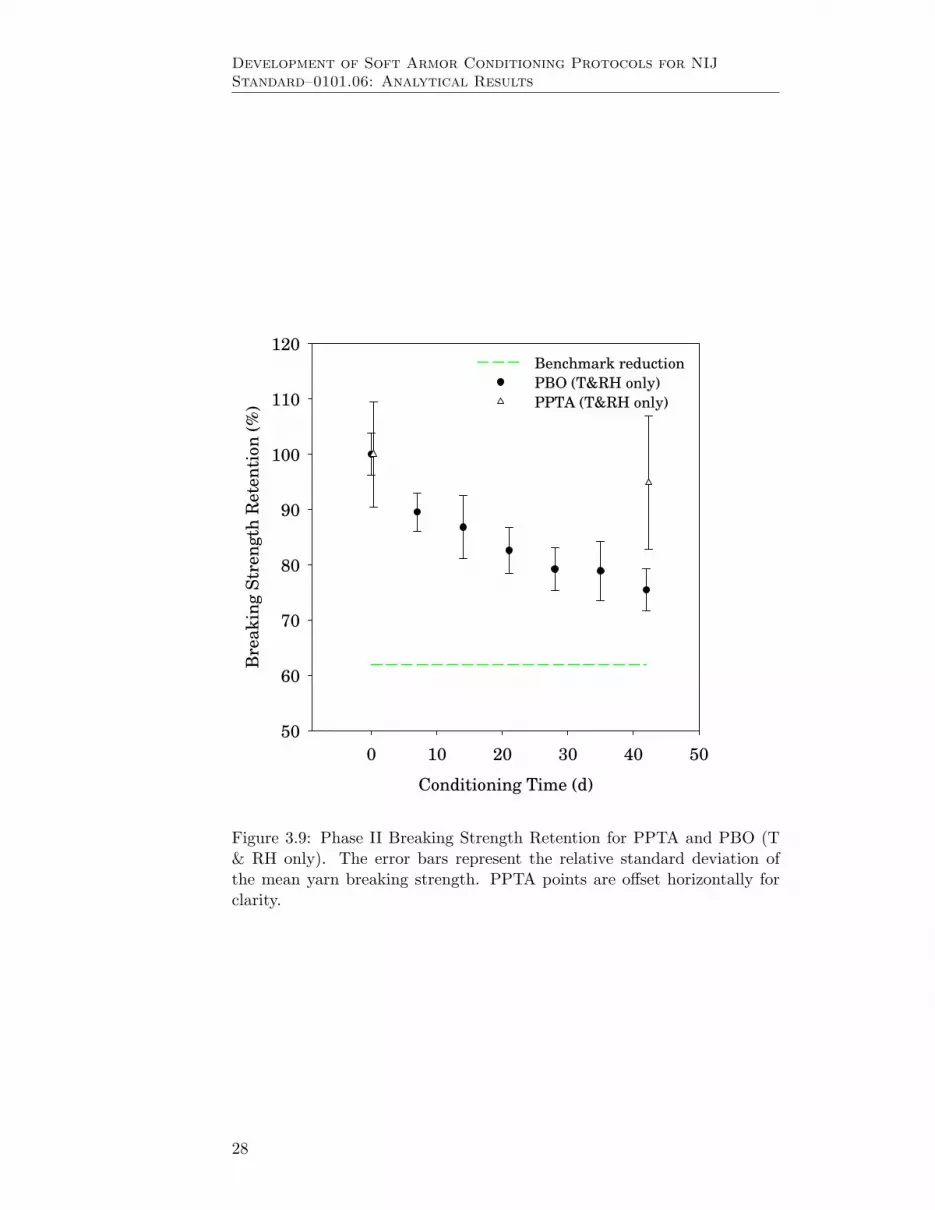
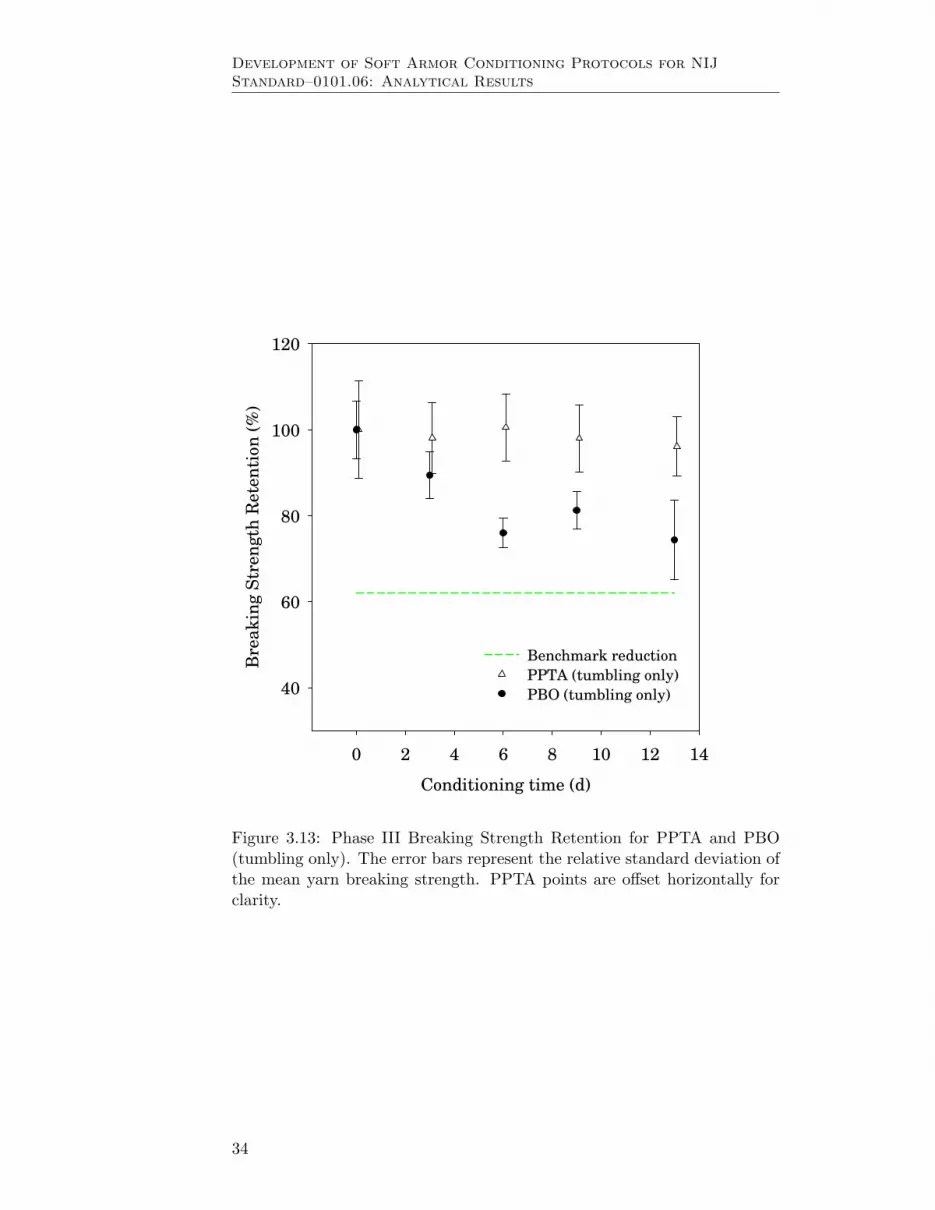
Tensile breaking strength testing of yarns extracted from the PBO andPPTA armor panels are depicted in Figure 3.11 through Figure 3.13. Fig-ure 3.11 shows the reduction of ultimate tensile strength, plotted as a percentstrength retention, of the PBO and PPTA armors exposed to all conditionsas a function of exposure time. After 10 d, the PBO sample that was exposedto the conditions of heat, moisture, and tumbling had a tensile strength re-tention of approximately 62 %, though we continued the test until day 13.In this phase, for the first time, there was an indication of strength loss inthe PPTA armor. Samples that were exposed to all conditions had a tensilestrength retention of approximately 88 % after 13 days of exposure. Fig-ure 3.12 compares the PBO and PPTA armor panels that were exposed toonly temperature and relative humidity. The PBO armor panels had a ten-sile strength retention of approximately 77 % and the PPTA armor panelshad a tensile strength retention of 90 %. Figure 3.13 shows panels that wereexposed to only tumbling. The PBO armor panels had a tensile strengthretention of approximately 78 % and the PPTA armor panels showed no re-duction in tensile strength. There are a few conclusions that can be drawnfrom these results. The first is that for PBO, the test combining environ-mental exposure and tumbling still had approximately equal contributionsof each mechanisms (environmental vs. mechanical) to overall degradationof the material. In the case of the PPTA armor, it is puzzling that therewas a slight reduction in tensile strength in the samples that were only ex-posed to temperature and relative humidity. A possible explanation is thatthe armor could have been more sensitive to the slightly higher temperatureand relative humidity in this study, which could have also been responsiblefor the slight reduction in strength observed in the armor exposed to allconditions.
Results from infrared analysis of yarns extracted from the PBO armorpanels are depicted in Figure 3.14. Similar to the infrared analysis presentedin Phases I and II of the study, these results show an overall reduction inthe peak absorbance at 1606 cm−1, 1302 cm−1, 1257 cm−1, 1136 cm−1, 1036cm−1, and 909 cm−1, which are typically associated with the benzoxazoleand an increase in the peak absorbance at 1635 cm−1, which is associatedwith carbonyl formation after opening of the benzoxazole ring. These twotrends, taken together, indicate that hydrolysis was achieved in the PBOsamples. One may note in Figure 3.14 that there is not a trend indicatinga steady decline in absorbance for the benzoxazole ring. There is a sharpdecline between day 0 and day 3, then at day 8, there was an apparentincrease in the absorbance of the benzoxazole peak. This may be attributedto differences in the samples removed from the armor for testing on thedifferent days, or may be due to the continual mechanical damage occurringin the system due to tumbling. This tumbling may abrade the degraded layerof material and expose fresh material underneath, which would lead to anapparent increase in the absorbance of the benzoxazole peak as referencedto the data obtained on day 3. Analysis of the PPTA samples indicatedsimilar trends to those seen in previous phases of the study.
31

Development of Soft Armor Conditioning Protocols for NIJ
Standard–0101.06: Analytical Results
Conditioning time (d)
0 2 4 6 8 10 12
Bre
ak
ing S
tren
gth
Rete
nti
on
(%
)
40
60
80
100
PBO (all conditions)
PPTA (all conditions)
Benchmark reduction
Figure 3.11: Phase III Breaking Strength Retention for PPTA and PBO(all conditions). The error bars represent the relative standard deviation ofthe mean yarn breaking strength. PPTA points are offset horizontally forclarity.
32
3. Conditioning Protocol Development
Conditioning time (d)
0 2 4 6 8 10 12 14
Bre
ak
ing S
tren
gth
Rete
nti
on
(%
)
40
60
80
100
120
Benchmark reduction
PPTA (T&RH only)
PBO (T&RH only)
Figure 3.12: Phase III Breaking Strength Retention for PPTA and PBO (T& RH only). The error bars represent the relative standard deviation ofthe mean yarn breaking strength. PPTA points are offset horizontally forclarity.
33
Development of Soft Armor Conditioning Protocols for NIJ
Standard–0101.06: Analytical Results
Conditioning time (d)
0 2 4 6 8 10 12 14
Bre
ak
ing S
tren
gth
Rete
nti
on
(%
)
40
60
80
100
120
Benchmark reduction
PPTA (tumbling only)
PBO (tumbling only)
Figure 3.13: Phase III Breaking Strength Retention for PPTA and PBO(tumbling only). The error bars represent the relative standard deviation ofthe mean yarn breaking strength. PPTA points are offset horizontally forclarity.
34

3. Conditioning Protocol Development
Conditioning Time (d)
0 2 4 6 8 10 12 14
Peak
Abso
rban
ce
-0.5
-0.4
-0.3
-0.2
-0.1
0.0
0.1
1635 cm-1
1606 cm-1
1302 cm-1
1257 cm-1
1136 cm-1
1036 cm-1
909 cm-1
Figure 3.14: Phase III Reduction in Key Infrared Bands.
35

Development of Soft Armor Conditioning Protocols for NIJ
Standard–0101.06: Analytical Results
3.5.4 Ballistic Results from Phase III Testing
Ballistic testing, including V50 and perforation/backface signature testing(P-BFS) was performed on armor samples used throughout this study. Aspreviously indicated, the results of this testing will be the subject of a sep-arate publication.
3.6 Phase III Summary
Major changes to the protocol occurred in Phase III. The concept of cyclicalconditions of temperature and relative humidity exposure were abandonedin favor of a constant high heat, high relative humidity condition. Thetumbling and environmental exposure were combined into one test withthe development of a custom-built tumbler inside of the humidity chamber.While the test presented in Phase III ran for 13 days, the target degradationwas achieved before the end of the test. Therefore, it was determined thatthe changes made in Phase III allowed the exposure time to be reduced toa much more practical 10 days. The 10 d test was deemed acceptable forpractical implementation into NIJ Standard–0101.06.
3.7 Phase IV
The Phase IV study was designed to verify the conditions selected in PhaseIII, and verify that 10 d was the appropriate period of time for the test.Conditions of exposure remained the same in this phase as in Phase III.
3.7.1 Sample Description
Three sets of armor samples were used in the fourth phase of protocol devel-opment. Two of the armors were the same woven armors as those discussedin the Phase I, Phase II, and Phase III testing. A new set of armor wasobtained for Phase IV. This armor model consisted of 18 layers of four plieseach of UD PPTA fiber, crossplied at 0◦, 90◦, 0◦, 90◦ sandwiched betweenthermoplastic film inside of a nylon armor panel cover. The panel coverseams were heat-sealed and the interior surface of the panel covers werecoated for water repellency. There was no stitching of the sheets of UDPPTA. Phase IV used one environmental chamber in which a tumbler hadbeen installed, and one sample set. This sample set consisted of 5 PBOarmor panels, 6 UD PPTA armor panels, and 5 woven PPTA armor panels.One of the PBO armor panels and one of the PPTA armor panels which wereexposed to all conditions were used for analytical testing. The remainingarmor panels (4 PBO, 4 woven PPTA, and 6 UD PPTA) were used for bal-listic testing. The chamber was maintained at constant conditions of 70 ◦Cand 90 % relative humidity, with a constant tumbling speed of 0.52 rad/s(5 rpm).
36
3. Conditioning Protocol Development
Conditioning Time (d)
0 2 4 6 8 10 12
Str
en
gth
Rete
nti
on
(%
)
40
60
80
100
PPTA
PBO
Benchmark reduction
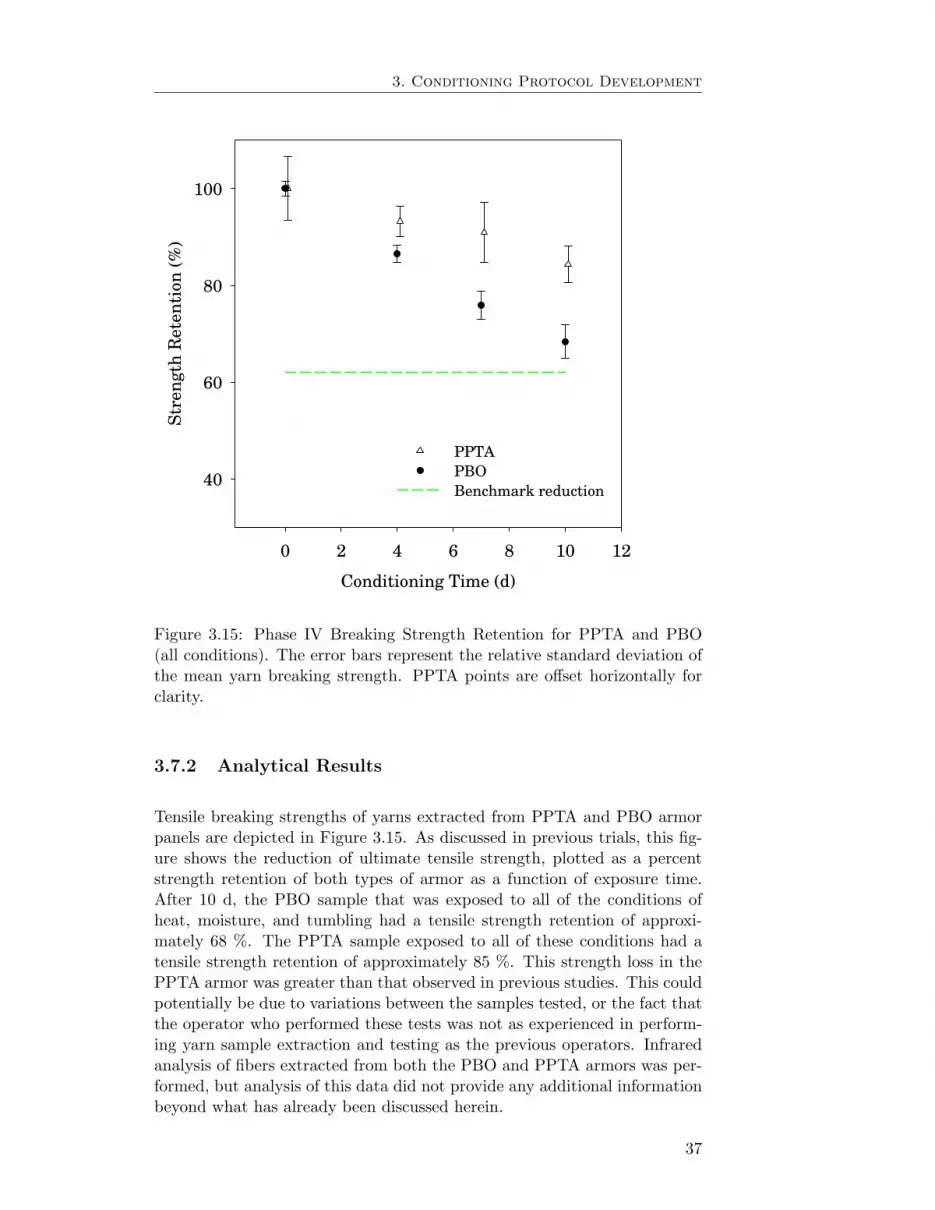
Figure 3.15: Phase IV Breaking Strength Retention for PPTA and PBO(all conditions). The error bars represent the relative standard deviation ofthe mean yarn breaking strength. PPTA points are offset horizontally forclarity.
3.7.2 Analytical Results
Tensile breaking strengths of yarns extracted from PPTA and PBO armorpanels are depicted in Figure 3.15. As discussed in previous trials, this fig-ure shows the reduction of ultimate tensile strength, plotted as a percentstrength retention of both types of armor as a function of exposure time.After 10 d, the PBO sample that was exposed to all of the conditions ofheat, moisture, and tumbling had a tensile strength retention of approxi-mately 68 %. The PPTA sample exposed to all of these conditions had atensile strength retention of approximately 85 %. This strength loss in thePPTA armor was greater than that observed in previous studies. This couldpotentially be due to variations between the samples tested, or the fact thatthe operator who performed these tests was not as experienced in perform-ing yarn sample extraction and testing as the previous operators. Infraredanalysis of fibers extracted from both the PBO and PPTA armors was per-formed, but analysis of this data did not provide any additional informationbeyond what has already been discussed herein.
37
Development of Soft Armor Conditioning Protocols for NIJ
Standard–0101.06: Analytical Results
3.8 Important Observations From Other Studies
Some of the studies performed in development of the Flexible Armor Con-ditioning Protocol did not result in a full analysis appropriate for treatmentwithin this document. Some of these observations may be important andthey will be summarized below. A set of armor was received that had beenenclosed in a heat-sealed panel-covering material, but supplied without ar-mor carriers. Some prior work had been performed to evaluate the effect oftumbling with or without a carrier, but only with armors that were encasedin sewn panel-covering materials. In these trials, there was no discernibledifference between the armors tumbled with and without the carriers. Basedon the results of these previous studies, the heat-sealed armors were placedin the tumbler without carriers. However, within a few days, the edges ofthe heat-sealed panel-covering material started to peel away from the mainbody of the panel cover. This caused the remaining panel cover to separateand exposed the ballistic package to the tumbler. This experience was oneof the factors that led to the decision that all armors would be tested in aspecified, generic carrier in NIJ Standard–0101.06.
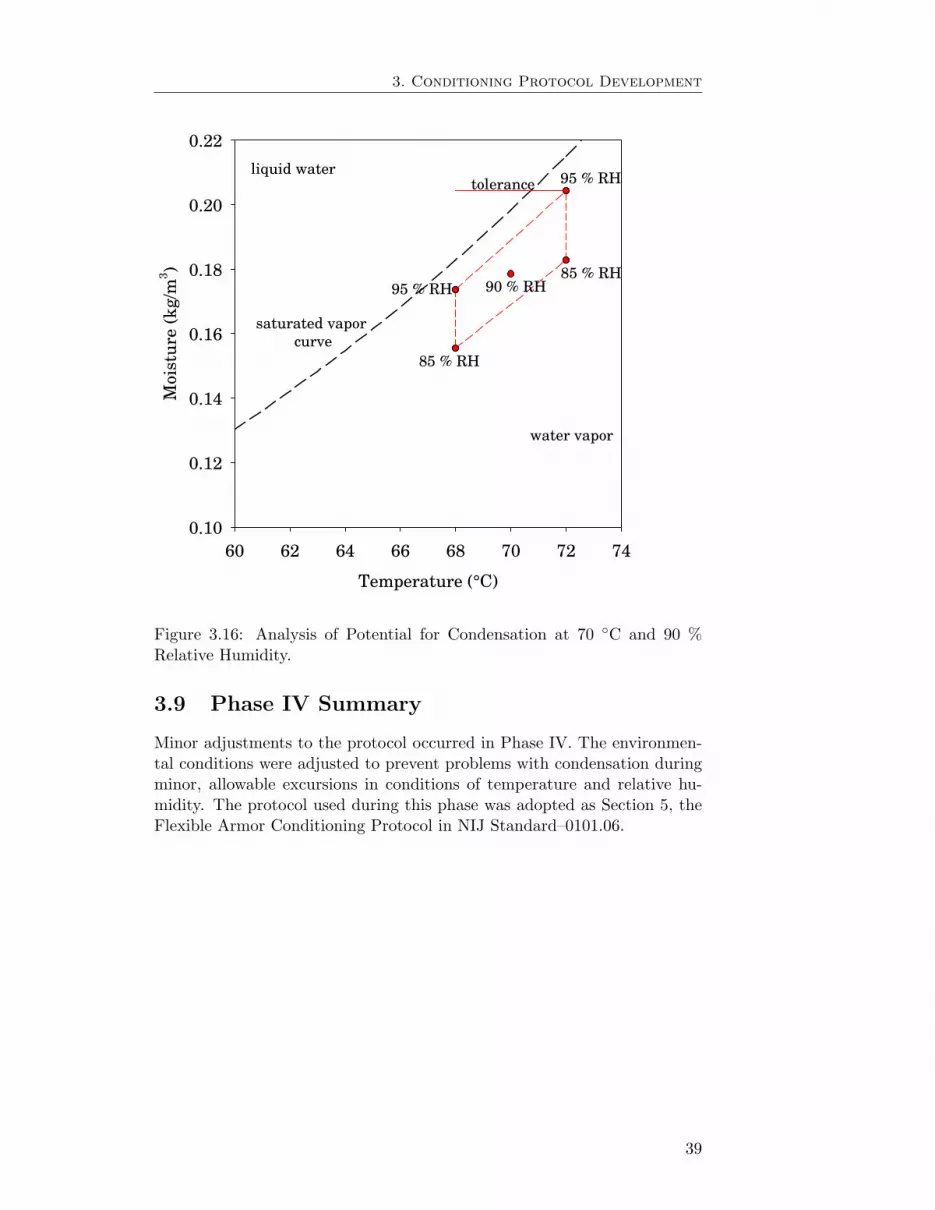
After the completion of Phase IV testing, a concern was raised that,even within the specified tolerances of relative humidity and temperature, acondensing atmosphere could be achieved within the tumbler. In responseto this concern, the saturated vapor curve for water vapor was examinedin relation to the specified conditions. Figure 3.16 shows this analysis forconditions of 70 ◦C and 90 % relative humidity, with tolerances of ± 2 ◦Cand ± 5 % relative humidity. It was discovered from this analysis that ifthe temperature dropped from the upper limit of 72 ◦C to the lower limitof 68 ◦C, while maintaining the relative humidity at 95 %, condensationwould indeed occur in the chamber by the time the temperature droppednear 70 ◦C, the specified temperature (as indicated by the tolerance barcrossing the saturated vapor curve to transition from vapor to liquid wa-ter). Reexamination of possible conditions lead to the decision to reduceboth the temperature and humidity specified in the protocol. The temper-ature was reduced to 65 ◦C and the relative humidity was reduced to 80 %.These conditions were selected based on the vehicle data study which hadindicated that temperatures of 65 ◦C were not unreasonable with respect tothe potential operating environment of the armor, and the previous workperformed at 65 ◦C. The relative humidity was reduced to 80 % in an effortto avoid the issues with condensation. Figure 3.17 shows the tolerance asso-ciated with a drop from the upper limit of 67 ◦C to the lower limit of 63 ◦C,while maintaing the relative humidity at 85 %. In this case, the tolerancedoes not touch the saturated vapor curve until the temperature drops verynear 63 ◦C, so condensation is much less likely with these revised condi-tions. These changes were included in the soft armor conditioning protocolreleased in NIJ Standard–0101.06 in July 2008.
38
3. Conditioning Protocol Development
Temperature (°C)
60 62 64 66 68 70 72 74
Mois
ture
(k
g/m
3)
0.10
0.12
0.14
0.16
0.18
0.20
0.22
saturated vapor
curve
85 % RH
95 % RH
90 % RH95 % RH85 % RH
tolerance
water vapor
liquid water
Figure 3.16: Analysis of Potential for Condensation at 70 ◦C and 90 %Relative Humidity.
3.9 Phase IV Summary
Minor adjustments to the protocol occurred in Phase IV. The environmen-tal conditions were adjusted to prevent problems with condensation duringminor, allowable excursions in conditions of temperature and relative hu-midity. The protocol used during this phase was adopted as Section 5, theFlexible Armor Conditioning Protocol in NIJ Standard–0101.06.
39

Development of Soft Armor Conditioning Protocols for NIJ
Standard–0101.06: Analytical Results
Temperature (°C)
60 62 64 66 68 70 72 74
Mois
ture
(k
g/m
3)
0.10
0.12
0.14
0.16
0.18
0.20
0.22
saturated
vapor curve
85 % RH
75 % RH80 % RH
75 % RH
85 % RH
toleranceliquid water
water vapor
Figure 3.17: Analysis of Potential for Condensation at 65 ◦C and 80 %Relative Humidity.
40
4 Conclusions and Future Work
After four major phases of development work, the Flexible Armor Condi-tioning Protocol in NIJ Standard–0101.06 (as it appears at the time of thispublication) was finalized. The duration of the protocol was shortened from9 weeks in the first efforts to 10 d. All major classes of materials were tested,and the conditions selected are found to be quite detrimental to PBO ar-mors of designs that previously had exhibited problems in the field. Theconditions have not been found to be excessively detrimental to other com-monly used types of armor. However, the protocol does not represent anexact period of time in the field.
Current and future work will attempt to validate this protocol to reflecta period of field service for armor. Two major efforts will work to createthis validation. The first of these is an extensive study to examine theaging properties of most of the ballistic fibers used in body armor, whichwill attempt to determine the correlation between natural aging and accel-erated (elevated temperature and relative humidity) aging. Methods willbe explored to better correlate artificial mechanical damage to actual wear.Additionally, a large study to examine the physical and ballistic propertiesof fielded armor is currently being planned and initial work on this projectis underway. As opportunities arise, more studies to examine fielded armorin support of the validation of this protocol will be performed.
41
Development of Soft Armor Conditioning Protocols for NIJ
Standard–0101.06: Analytical Results
This page intentionally left blank.
42

5 References
[1] NIJ. Status report to the Attorney General of body armor safety ini-tiative testing and activities. NIJ Special Report, 2004.
[2] NIJ. Supplement I: Status report to the Attorney General of bodyarmor safety initiative testing and activities. NIJ Special Report, 2004.
[3] NIJ. Third status report to the Attorney General on body armor safetyinitative testing and activities. NIJ Special Report, 2005.
[4] J. Chin, E. Byrd, A.L. Forster, X. Gu, T. Nguyen, S. Scierka, L. Sung,P. Stutzman, J. Sieber, and K. Rice. Chemical and Physical Character-ization of Poly (p-phenylene-2,6-benzobisoxazole) Fibers Used in BodyArmor. NISTIR 7237, 2006.
[5] J. Chin, E. Byrd, C. Clerici, M. Oudina, L. Sung, A.L. Forster, andK. Rice. Chemical and Physical Characterization of Poly (p-phenylene-2,6-benzobisoxazole) Fibers Used in Body Armor: Temperature andHumidity Aging. NISTIR 7373, 2007.
[6] A.L. Forster, J.W. Chin, and M. Gundlach. Effect of bending andmechanical damage on the physical properties of poly(p-phenylene-2,6-benzobisoxazole)(PBO) fiber. Abstracts of Papers of the American
Chemical Society, 231:274–POLY, 2006.
[7] G.A. Holmes, J-H Kim, D.L. Ho, and W.G. McDonough. The Role ofFolding in the Degradation of Ballistic Fibers. Polymer Composites, inpress, 2009.
[8] T.E. Bachner. Rational Replacement Policy–A Recommendation to theLaw Enforcement Community, October 1985.
[9] D.E. Frank. Ballistic Tests of Used Soft Body Armor. NBSIR 86-3444,1986.
[10] National Institute of Justice. Response to DuPont’s Rational Replace-ment Policy, 1985.
[11] DuPont Kevlar Survivor’s Club. Personal body armor facts book. Tech-nical report, 1989.
43
Development of Soft Armor Conditioning Protocols for NIJ
Standard–0101.06: Analytical Results
[12] Police body armor standards and testing Volume I: Report. Congress
of the United States Office of Technology Assessment, 1992.
[13] Police body armor standards and testing Volume II: Appendixes.Congress of the United States Office of Technology Assessment, 1992.
[14] E. Hoffman. Soft Body Armor. Police Product News, 1986.
[15] Armor Holdings. Interim Report on Body Armor Testing: Investiga-tions and Actions. Technical report, 2004.
[16] DHB Armor Group. DHB Armor Group Armor Safety Report. Tech-nical report, 2004.
[17] Z.N. Frund. Response to Request for Information: Artificial Aging ofArmor, November 2005.
[18] H.S. Fogler. Elements of Chemical Reaction Engineering. Prentice HallInternational Series in the Physical and Chemical Engineering Sciences.Prentice Hall, Englewood Cliffs, New Jersey, 2nd edition, 1992.
[19] F.J. Stadler, J. Kaschta, and H. Munstedt. Dynamic-mechanical be-havior of polyethylenes and ethene-/alpha-olefin-co-polymers. Part I.alpha’-relaxation. Polymer, 46:10311–10320, 2005.
[20] S. Chabba, M. van Es, E.J. van Klinken, M.J. Jongedijk, D. Vanek,P. Gijsman, and A.C.L.M. van der Waals. Accelerated aging study ofultra high molecular weight polyethylene yarn and unidirectional com-posites for ballistic applications. Journal of Materials Science, 42:2891–2893, 2007.
[21] Rheometrics Series User Manual. RSA III Manufacturer’s Specifica-tions. TA Instruments, New Castle, DE, pn902-30027 edition, 2003.
[22] Ballistic resistance of personal body armor. NIJ Standard–0101.06,2008.
[23] Ballistic resistance of personal body armor. NIJ Standard–0101.04,2000.
[24] Ballistic resistance of personal body armor. NIJ Standard–0101.04 In-
terim Requirements, 2005.
[25] M. Riley. Environmental Conditioning Tumbler Reference Design,ftp://ftp.nist.gov/pub/bfrl/riley/NIJ 010106/Tumbler/, 2009.
44