development of a prototype of a gis-based web site to assist the control of chagas disease in (2002)
TRANSCRIPT

Copyright City University Virtual Library
City University, London
Department of Information Science
DEVELOPMENT OF A PROTOTYPE OF A GIS-BASED WEB
SITE TO ASSIST THE CONTROL OF CHAGAS DISEASE IN
COLOMBIA.
Maria Cristina Arciniegas Lopez
MSc in Geographic Information
September 2002

2
I ABSTRACT
Chagas disease affects between 16 - 18 million people, with a further 100
million people at risk in South America. To effectively tackle the Disease, control
actions to prevent its spreading or possible reinfestation are needed.
Therefore, in Colombia, in 1998 a National Program of Control of Chagas
Disease and Children’s Cardiopathy was carried out in nine States. This Program
surveyed information about house quality and triatomine presence as well as
took serological test. However, all this surveyed information does not have any
worth if some kind of access to them is given.
In order to overcome this problem a prototype web site was implemented. With
this prototype, the local health authorities in Colombia may count on with a tool
that allows them to query and georeference on political maps all these
information. Moreover, being an Internet based tool, it offers the possibility to
be accessed at any time in any place.
3
II ACKNOWLEDGES
I wish to acknowledge my particular indebtedness to Diarmid Campbell for his
endless patience and support throughout my time studying in London. Also, I
wish to thank Jo Wood for his extraordinary lectures and his invaluable advices
throughout my master course but specially during the dissertation stage.
I owe many thanks to my husband to be Pedro Hernandez for his love, endless
support and encouragement to pursue my dreams. I should also like to thank
my mother Esther Lopez, my brothers Fausto and Gustavo Arciniegas and all
my family in Colombia, for their affection and moral support.

4
III TABLE OF CONTENTS
I ABSTRACT ......................................................................................2
III TABLE OF CONTENTS.....................................................................4
IV LIST OF FIGURES ...........................................................................7
V LIST OF TABLES..............................................................................8
1 INTRODUCTION .............................................................................9
2 AIMS AND OBJECTIVES................................................................10
3 SCOPE AND DEFINITION..............................................................11
4 BACKGROUND AND RESEARCH CONTEXT ....................................12
4.1 CHAGAS DISEASE......................................................................... 12
4.1.1 Transmission of Chagas disease.............................................. 13
4.1.2 What Type of Lesions the parasite causes................................ 15
4.1.3 Risk ...................................................................................... 15
4.1.4 Control of Chagas Disease ...................................................... 16
4.2 TECHNOLOGICAL ELEMENTS NEEDED TO BUILD A GIS-BASED WEB
SITE 18
4.2.1 Geographic Information GI and Geographic Information System
GIS 19
4.2.2 Connective Elements: Web Server, Web Browser and Internet .. 20
4.2.3 Programming Technologies..................................................... 21
4.2.4 Data Repositories................................................................... 22
4.3 GIS IN HEALTH SECTOR................................................................ 23
4.3.1 Health GIS in United Kingdom................................................. 23
4.3.2 Health GIS in South America and Caribbean Zone..................... 24
5 METHODOLOGY............................................................................26
5.1 PLANNING STAGE ........................................................................ 28

5
5.2 ANALYSIS AND DESIGN STAGE...................................................... 30
5.2.1 Analysis ................................................................................ 30
5.2.1.1 Descriptive information about Chagas Diseases..................... 31
5.2.1.2 Georeferenced information.................................................. 37
5.2.2 Design .................................................................................. 39
5.2.2.1 Architectural design ............................................................ 39
5.2.2.2 Information Design............................................................. 42
5.2.2.3 Data Structure Design......................................................... 43
5.2.2.4 Interface Design................................................................. 48
5.3 IMPLEMENTATION STAGE............................................................. 51
5.3.1.1 Home Page ........................................................................ 51
5.3.1.2 Query Data Form Page........................................................ 52
5.3.1.3 Display Form Page.............................................................. 54
5.3.1.4 User Connection From Page ................................................ 56
5.3.1.5 Management Data Form Page.............................................. 56
5.3.1.6 Control Map Display Page.................................................... 57
6 THE PROTOTYPE APPLICATION IN ACTION.................................58
6.1 GEOGRAPHIC DATA...................................................................... 58
6.2 CONTROL PRIORITY INDEX MAP ................................................... 60
6.3 WEB SITE .................................................................................... 61
6.4 STRENGTHS AND WEAKNESS ........................................................ 66
7 FINDINGS AND IMPROVEMENTS .................................................67
7.1 FINDINGS.................................................................................... 67
7.2 IMPROVEMENTS .......................................................................... 67
8 CONCLUSIONS .............................................................................69
9 REFERENCES ................................................................................71
9.1 REFERENCES ............................................................................... 71
9.2 WEB SITES .................................................................................. 71
APPENDIX A: CHAGAS_STYLE_SHEET.CSS FILE CODE.......................73

6
APPENDIX B: INDEX.HTML FILE CODE .............................................75
APPENDIX C: QUERY_DATA_FORM.PHP FILE CODE........................77
APPENDIX D: DISPLAY.PHP FILE CODE.............................................79
APPENDIX E: USER_CONNECTION_FORM.PHP FILE CODE ..............82
APPENDIX F: DATA_MANAGEMENT_TOOL.PHP.................................83
APPENDIX G: CONTROL_MAP_DISPLAY.PHP....................................85

7
IV LIST OF FIGURES
FIGURE 1 PRESENCE OF CHAGAS DISEASE IN SOUTH AMERICA .................... 13
FIGURE 2 CYCLE OF THE T. CRUZI IN HUMANS AND MAMMALS ................... 14
FIGURE 3 RHODINUS PROLIXUS TRIATOMINE ........................................ 14
FIGURE 4 COMPONENTS PROPOSED FOR THE APPLICATION ........................ 18
FIGURE 5 PROCESS OF PROTOTYPE DEVELOPMENT .................................. 28
FIGURE 6 PROTOTYPING PLAN.......................................................... 29
FIGURE 7 REQUIREMENT SELECTION FLOW CHART.................................. 30
FIGURE 8 POLITICAL MAP OF COLOMBIA.............................................. 37
FIGURE 9 PROTOTYPE'S ARCHITECTURAL DESIGN.................................... 40
FIGURE 10 PROTOTYPE'S PURE WEB STRUCTURE .................................... 43
FIGURE 11 ER MODEL FOR THE PROTOTYPE'S DATABASE.......................... 44
FIGURE 12 EXAMPLE OF AN ARCIMS INTERFACE ..................................... 49
FIGURE 13 TWO INTERFACES IN THE PROTOTYPE ................................... 50
FIGURE 14 LINKING SHP FILE TO A MSACCESS TABLE .............................. 59
FIGURE 15 CLASSIFIED SHP FILE........................................................ 59
FIGURE 16 PROTOTYPE HOME PAGE .................................................. 62
FIGURE 17 QUERY SYSTEM INTERFACE ................................................ 63
FIGURE 18 DISPLAY'S RESULT INTERFACE ............................................ 64
FIGURE 19 USER'S AUTHENTICATION INTERFACE.................................... 64
FIGURE 20 DATA MANAGEMENT TOOL INTERFACE ................................... 65
FIGURE 21 CONTROL PRIORITY INDEX MAP INTERFACE............................. 65

8
V LIST OF TABLES
TABLE 1 SEROLOGICAL FILE'S STRUCTURE ............................................ 32
TABLE 2 HOUSE QUALITY FILE'S STRUCTURE ......................................... 34
TABLE 3 TRIATOMINE PRESENCE FILE'S STRUCTURE................................. 36
TABLE 4 POPULATION FILE'S STRUCTURE ............................................. 36
TABLE 5 NBI FILE'S STRUCTURE........................................................ 37
TABLE 6 ENTITIES IN THE ER MODEL ................................................. 47
TABLE 7 LEVELS OF CPI ................................................................. 60
TABLE 8 TOTAL COMPONENTS OF HQI................................................ 61
TABLE 9 WEIGHTS FOR THE ROOF TYPE............................................... 61

9
1 INTRODUCTION
This report describes the development of a prototype of a gis-based web site to
assist the control of Chagas disease in Colombia. This project was conceived
during the development of the project “A comparison of targeting strategies for
Chagas disease control in the Andean Region”, funded by the Welcome Trust
Foundation and co-ordinated by London School of Hygiene and Tropical
Medicine (LSHTM) and several Universities in Colombia. The idea was born due
to the necessity to have a tool allows to amalgamate and map the vast amount
of information generated by the Welcome Trust project and previous projects
carried out by the Ministry of Health in Colombia.
Within the development of the prototype are applied two revolutionary
concepts: Internet and geography information system GIS. The union of these
two offers the possibility to have access throughout the web to maps and
descriptive information about a specific topic. Many solutions to public maps
and data base information on the Web can be found, however this report
mainly addresses an off-line map solution. This solution may not have all GIs
oriented tools offer by a map server solution, however it is a solution that fits to
the developing country needs where in many occasion economical factors like
availability of financial resources overwhelms functionality and usefulness.

10
2 AIMS AND OBJECTIVES
To develop a Website based on information managed on the project “A
comparison of targeting strategies for Chagas disease control in the Andean
Region”. This would provide potential users (Health Offices at the States and
Municipality levels in the affected States of Colombia) with a useful tool that
informs them about the risk of Chagas disease within their own regions, and
helps them to make decisions about how to most effectively control the
disease.
At a practical level, the objectives contributing to this aim are:
1. Easy access to project information such as maps of administrative
boundaries and village locations, raw survey data on disease risk, and the
results of predictive risk maps generated during the project.
2. Let users make queries involving variables such as population, poverty and
risk of the disease.
3. Define processes that allow users to manipulate different themes to create
new maps.
4. Grant privilege to some users to submit new surveillance data to update the
database.
5. Create processes to validate new data before they are added to the
database.

11
3 SCOPE AND DEFINITION
The Welcome Trust project in which the prototype project idea was born, aims
to produce control maps for Chagas disease in the Andean Region of Colombia,
as well as, to generate strategies based on information surveyed by local
research centres. The type of information already collected varies from
geolocation, population, and poverty to quality of the houses in surveyed
villages. This information joins with control and boundaries map could offer a
new vision of the Chagas disease cannot be seen in a written report and paper
maps.
Although, if they do not have a tool allows people know about the findings and
surveyed information on the project, the foreseeable destination for this
invaluable information might be a place on shelves in states offices, rather than
being made directly accessible to the local Ministry of Health Offices. Where,
control activities are currently carry out.
As a prototype development, this project will design a Web Site that allows the
people who work at the secretaries of health of some municipalities in Colombia
to make queries and display maps related with Chagas Disease, in order to
support them in the decision making process. In consequence, this information
will allow the authorities to be informed about the risk of Chagas disease and
help them to take the best control decisions possible. This means that this
information will be taken into account to design the most effective strategies to
control the disease.
However, this project will not only implement a series of specific functions on a
Web site. The parallel aim is to serve as a pilot project to demonstrate the
usefulness and effectiveness of this kind of tool. The unseen aim is to generate
a full project to size up the prototype, and let the health authorities in Colombia
have a starting point in the control of Chagas diseases.

12
4 BACKGROUND AND RESEARCH CONTEXT
To undertake the development of a Web site prototype project, the first step is
to think about all key components need to be assembled in order to create a
meaningful, useful and well worthy site. Summarizing, the implementation
involves handling information about Chagas disease, which can be either
georeferenced information like risk maps or descriptive information like
serological test data. Therefore, to manage these two kinds of input
information, the proposed web site has to be based on GIS principles mixed
with technological components, which can vary from web server, database
management system, map base, map server to a programming language.
Each technical element has a specific role within the implementation process;
their sensible selection is a crucial factor in the success or failure of the project.
For each these elements must be defined a clear selection criterion according to
available hardware and software resources, within the context in which the
web site will be working in.
This chapter describes Chagas disease principles, GIS and GI theory, the
architecture of web site implementation and the front line of the gis-based web
site in health area.
4.1 CHAGAS DISEASE
It is a chronic and incurable parasitic infection wide spread in South American.
Current, WHO estimates its affects between 16 - 18 million people, with a
further 100 million people at risk. This represents an average prevalence of
about 4% of the total population of Latin America, although in some areas the
local prevalence may exceed 75%.

13
Figure 1 Presence of chagas disease in South America
The disease is more prevalence in the open savanna like regions of Central and
South America, such as the llanos in Venezuela and Colombia, the ‘norte chico’
of Chile, the cerrados and caatinga of Brazil, and the chaco of northern
Argentina, southern Bolivia and western Paraguay, as it is seen in Figure 1.
Presence Chagas disease in South America.
4.1.1 Transmission of Chagas disease
The disease is caused by a flagellate protozoan parasite, Trypanosoma cruzi,
transmitted to humans in the faeces of its triatomine bug vectors. The bugs
acquire the infection by feeding on an infection mammal but then retain the
infection for life. The domestic cycle results from human-vector contact,
involving the colonization of artificial places to live by the triatomines like
houses, dog, cats and some rodents, and a series of social and ecological
modifications in the environment Pinto(1992). As it is depicted in Figure 2, the
parasite that lives in the vector, is transmitted to humans and domestic

14
mammals by the vector’s faeces producing an acute stage, which appears
shortly after the infection, or asymptomatic chronic stage, which appears after
a silent period that may last several years.
Figure 2 Cycle of the T. Cruzi in Humans and Mammals
Amongst the 60 species of triatomine that can be considered as potential
vectors, the Rhodinus Prolixus (Figure 3) is the main domestic vector of Chagas
Disease in Colombia.
Figure 3 Rhodinus Prolixus Triatomine
In Colombia it is found in silvatic habitats such a palm tree crowns, as well as in
houses. This triatomine can complete its egg to adult development in 3-4
months and can reach very high population densities in houses – over 9.000
individuals were collected from a single house in Santander, Colombia.
A part of Vectorial transmission, exist the possibility to acquire the infection
through blood transfusion from an infected blood donors. However, all
information handles to produce the web site is focused on the Vectorial form,
therefore this second type will not be further addressed.

15
4.1.2 What Type of Lesions the parasite causes
Infection can be fatal, and often leads to severely debilitating lesions of the vital
organs – especially the heart and intestinal tract. Since the infection is
incurable – except during its earliest stags – and vaccines are unavailable,
control relies heavily on elimination of domestic populations of the insect
vectors.
Chagas disease shows acute and chronic stages. The acute stage of the disease
is generally seen in children, and is characterized by fever, swelling of lymph
glands, enlargement of the liver and spleen, or local inflammation at the site of
infection. The lesions of the chronic phase irreversible affect internal organs
namely the heart, oesophagus and the colon and the peripheral nervous
system. Patients at this stage become progressively more ill and ultimately die,
usually from heart failure.
The WHO statistics shows that after several years of an asymptomatic period,
27% of those infected develop cardiac symptoms which may lead to sudden
death, 6% develop digestive damage mainly megaviscera, and 3% will present
peripheral nervous involvement.
4.1.3 Risk
The risk of infection with Chagas Disease is directly related to the poverty. The
parasite finds a favourable habitat in crevices in the walls and roofs of poor
houses constructed with mud, stones or wood in rural areas or in the peripheral
urban slums. All these characteristics are observed in Central and South
America as result of their economical and social problems, making the disease
in high percentage a consequence of poor live conditions.

16
According to Pinto(1992), social and political development of endemic region is
sufficient to achieve control of Chagas Disease. Thus, the Control mainly relies
on three different strategies:
1. The systematic elimination of domestic vector population (by using
insecticides of long residual action).
2. Housing improvements
3. Control of transfusional Chagas disease.
Following these statement Latin-American governments sponsored by
international organizations established transmission control programs in order
to control the disease and indirectly bring the people in rural and suburban
areas better life conditions in terms of housing and health care. Looking at the
statistics an estimated 45,000 deaths per year was attributed to Chagas'
Disease-associated pathogenesis before the transmission control programs were
implemented WHO (2002).
4.1.4 Control of Chagas Disease
Until the 80s, the real scale of the Chagas disease problem in Colombia was
unknown, and there were not any policy concerning the disease. Control
activities were very sporadic, although small-scale control with insecticides were
carried out in highly endemic regions, and limited serological surveys were
undertaken.
However, based on information surveyed by national programs effective
control programmes have been implemented in the Southern Cone, basically by
spraying houses with insecticides, identifying low and medium risk for
monitoring and control to avoid possible reinfestations and stop the disease
spreading. Consequently, after some years of controlled spraying, countries
such as Argentina have succeeded in decreasing Chagas disease to a very low
level.

17
Due to the successful seen in Argentina, the Colombian Ministry of Health and
WHO launched the Andean Countries Initiative for Vectorial Control of Chagas
disease in 1997. Countries like Venezuela, Ecuador, Peru, Bolivia and Chile met
in Bogotá-Colombia in order to prepare draft of national action plans. After
this meeting, the delegates considered to launch a multinational programme to
halt the transmission of Chagas disease, primarily by eliminating vectors and
controlling the national blood transfusion systems.
To comply with the international commitment, Colombia started in 1998 the
National Program of Control of Chagas Disease and Children’s Cardiopathy in
nine states (covering 45% of the area). It aimed at the interruption of disease
transmission by vectorial routes, mainly through the application of residual
insecticides in domiciles and screening proactive blood donors. This included a
national project to survey information about zones of high risk, and to identify
social conditions in these areas.
The National Vector Control Program has been generating invaluable
information not only about the presence of Chagas disease, but also about
quality of life of the people who live in the surveyed areas. These have been
the raw material for the Welcome Trust project which main aim is to synthesise
and produce a predictive control map. With this map the local health
authorities in Colombia will count on a tool to base theirs decision about where
and how attack the Chagas disease spreading.
Analysing Chagas disease scenario in Colombia including National Vector
Control Program and the Welcome Trust project as an information backbones,
many ideas can rise about how everything can be articulated.
Stepping in that direction the idea of having an Internet site arose. This site
might a powerful tool that make available of the information surveyed and
generated maps. Thus, taking into account all factors from social,

18
environmental to economical might influence the spread of the Chagas disease,
is easy to realize that all them have a special feature of being associated with a
position on a map. Therefore, many conclusions can be revealed if all these
features are putting altogether in a map, even better in a map based web site
that allows the user takes advantage of georeferenced factor.
4.2 TECHNOLOGICAL ELEMENTS NEEDED TO BUILD A GIS-
BASED WEB SITE
From the technological point of view the web site “application”1 is designed
following client-server model where a client makes requests to the server and
the server deals with these requests sending relevance answers.
Figure 4 Components proposed for the application
Figure 4 shows all components proposed for the client-server application.
According to the figure a user needs a browser, which acts as client to the
server system. Through the browser the user accesses the web sever that hosts
the application, in this case a side server application written in PhP language.
The PhP application established the connection with the database and the
1 Now on, the GIS-BASED WEB SITE will be called application in order to avoid repetition.
DATA REPOSITORIES
INTERNETDATA BASE
Descriptive information
Geographic Information
G.I BASE Maps and Images
Server Side
Application
(PhP)
Make Request
Result Sent
Browser
Client
Web Server
19
geographic base to extract and send a set of information according to user’s
requests.
These requests involve querying and displaying of geographic and descriptive
information in such a way that allows users gain new insights into all stored
information about Chagas disease. The whole interchange between the web
browser and the server takes place over Internet allowing many users access
the application and data at the same time.
The next sections delineate components’ roles into the application’s architecture
scheme.
4.2.1 Geographic Information GI and Geographic Information System
GIS
Every time we look at surround us is inevitable to observe that almost
everything has a geographic position associated with, a position which every
object on earth is directly or indirectly associated. This kind of information
known as Geographic Information offers a wide range of possibilities to
manipulate the existed information in order to extract unseen information.
Many examples can be mentioned to depict the GI usefulness. Looking at
hospital and city maps, it is possible to know which is the closest hospital to
certain zone or which area has not medical presence. Embracing other kind of
activities, with a borough map classifies according to post code zones and with
the address of all borough residents is easy to create a dot density map which
depicts the population density assigning X number of dots per Y number of
people. Even better, during the outbreak of a disease with a postcode zone
map and the address of all positive patients is very likely to produce a new map
where postcode zone are classified by low, medium and high risk.
Almost every single activity can be associated with the use of GI. However, in
all examples mentioned, to produce new maps by hand is time-consuming task,

20
which also demand human and economical resources. During the sixties, in
order to overcome this kind of drawback a system to identify nation’s land
resources was developed in Canada. It was named Canada Geographic
Information System CGIS and it is known as the first Geographic Information
System GIS.
GIS is a special class of information systems that keeps track not only of
events, activities, and things, but also of where these events, activities and
things happen or exist Longley(2001). The use of GIS overcame the problem
to manipulate vast amount of GI and data, speeded up the time of produce
maps and delivered new tools like zoom, pan, buffer, overlap and network
analysis.
Some of distinguishing GIS features and principles are being used to design an
application, which offers the user certain functionalities at the moment to
manipulate GI about Chagas disease. Hence, the application must have the
capability to link maps with health data and displaying the results. Expecting
the prototype application points out how similar tools could enable local health
authorities in different parts of Colombia to access up-to-date information about
control programs of Chagas disease.
To achieve this aim, the application should be easily delivered to users, being in
this part of the puzzle where Internet is the optimal solution since it has
become the society’s mechanism of information exchange.
4.2.2 Connective Elements: Web Server, Web Browser and Internet
There are two essential components in the client-sever model, the web server
and the web client. The former is a piece of software installed and configured in
the host machine that is in charge of reading client’s requests, determining if it
should fulfil them or not; web servers can be found free of charge or full price
in the market place, offering different features and tools. The latter software,
better known as browser makes requests for web pages or application objects

21
in the server. Nowadays, browsers come along with the operating system
installed on the Pcs.
In order to communicate server with client and make the information available
for everybody, the use of Internet arises as a solution. Internet is the largest
computer network composed of millions of computers, which each has its own
unique network address to identify itself to the other computers. Even in
Colombia, a developing country, figures about computers having accesses to
Internet are increasing daily. In the counter, there are more people willing to
connect to the global network, including governmental offices. Therefore, it is
not difficult to find in a tiny town at least one computer with Internet connexion
within the local authority office. In contrast with an Intranet or LAN that needs
to be built, all Internet applications are ready to be used.
To sum up, the client server model and Internet meet the requirements for an
easy delivered application available for everybody.
4.2.3 Programming Technologies
The programming technologies deliver different angles and tools to build any-
purpose application e.g. standalone, multi- user or web site applications. The
application to be built belongs to web site class. Web programming
technologies can be grouped into two basic groups: client-side and server-side.
On the one hand, client-side technologies, in which applications almost run on
the web client side. Among them, plug-ins, java applets, activex controls and
javascript and VBSscript applications. On the other hand, server-side
technologies, in which applications are executed on the server, like java
servelets, active server pages and php applications
Therefore, either of them has to be selected in order to build the application.
The choice has to take into account, which one is more suitable according to
the application’s requirements.

22
4.2.4 Data Repositories
The application’s scenario involves storing and updating of GI and alphanumeric
information, therefore there must exist two different repositories for each type.
Storing GI can be done in different ways depend upon how this information will
treat and the class of Internet GIS to be build. If the development stage is
leading a 100% Internet GIS, a special kind of software called in general Map
Server will be need. In this option, the Map Server offers the way to storage,
update and manipulate GI. In contrast, if the application leads to handling off
line produced GI, the generated maps will be storage in a specific folder into
the web server space.
In relation to descriptive information, there are many structures to storage and
handle it, but the most widely used is the Entity Model EM. The design of EM
model involves various steep. The first steep is to define an entity model where
the entities are key objects into the context of the reality that wants to be
modelled. For example, if the reality is a Bank, the entities might be
costumers, accounts, transactions or employees. All these entities must be
completely identified within a unique key. Thus, for an account is key is its
number, for an employee is employee code and so on.
The second steep is to define all relationship among entities. These relations
are described according to how many entities one entity is related to. For the
bank case, one customer might have more than one account so the relationship
is described as one to many relationship degree (1-m), all customers in the
banks might do many transactions during a day being the relationship many to
many. However, one bank branch has only one manager and a manager can
be manager of only one branch, so the relationship degree is one to one (1-1).
The third steep is to generate the EM itself, drawing the relationship between
entities into a diagram. Four steep is to generate the Relational Model RM
where the entities are converted into tables and the relationships into inherited
keys to the tables pointed by the “many” in the relationship notation. For

23
example, in the ideal case of a costumer can only have one account the
relationship is 1-m, therefore account table inherits customer identification from
the customer table in the RM.
To implement RM there are software tools known as Relational Data Base
System Manager RDBSM. The complexity and prices of the RDBSM are directly
related, varying from simple low price tools like access, moving up more
expensive and elaborate ones like Sybase and Informix, to tools like Oracle that
can handle tetra bytes of information but with high market prices.
RDBSM for the prototype has to combine reliability, low prices with a high
performance on handling vast amount of information and maps.
4.3 GIS IN HEALTH SECTOR
GIS has becoming one of the key technologies in health globalisation. During
the last two decades, it has evolved as a powerful tool for understanding spatial
relationships between various phenomena. GIS has been opening new windows
into the character and mobility of virus, revealing previously unseen
relationships between diseases, demographics and the environment, and
enabling researchers to develop and test new hypotheses regarding their
interaction. Besides, with the rapidly spreading of Internet, which allows much
more people the access to the information, GIS has ample its usefulness.
4.3.1 Health GIS in United Kingdom
Among all new development of GIS-based Internet application, one is an
outstanding achievement. It is attempt to improve the overall health of
people and to help reduce the existing health inequalities in England by
government agencies through a co-operative working.

24
The Multi-Agency Internet Geographic Information Service (MAIGIS) project is a
3-yr pilot project funded by the Public Health Development Fund to establish an
interactive map-based web site for sharing health and health related data for
the West Midlands Region (http://maigis.wmpho.org.uk). Data sets within the
MAIGIS project follow three broad themes of health, socio-economic and
environmental information. Data are made available by different organisations
and shared using geography as the linking theme. MAIGIS (2002).
MAIGIS is a well design application that allows user to gain a deep insight
about key aspect of the health sector in West Midlands’s area. This application
was developed in ARC IMS, ESRI software that acts as a map server allowing
users make queries linking various health variables online. Besides it offers all
tools proper to GIS like zoom, pan, theme overlaps or on-off theme.
4.3.2 Health GIS in South America and Caribbean Zone
The Universidad de Guatemala has been developed a project that is focused on
two vector-borne diseases of significant public health and economic importance
within the region: Malaria and Chagas Disease. It consists in the development
of a georeferenced database, which will be used to identify appropriate
interventions for given areas, target resources to those areas at greatest need,
and foster regional cooperation and collaboration. Guatemala(2002).
Neither specific information about the GIS tool to be developed nor any URL
address of the tool was found, however it could be established the system
tends to be a tool, which allows sharing health GI, tracking health inspections,
makes disaster planning and response, management and preparedness. The
project delivers to the health employees, a GIs based web site where they can
see pertinent data represented spatially and perform spatial queries. The
different levels within the health department’s structure like inspectors, specific
project managers and even elected officials, who need real time information,
might find the system an irreplaceable tool within their daily basis.

25
Generally speaking, in Brazil where the chagas disease was more spread
affecting millions of people, the use of GIS, particular Internet based GIS, was
seen as a panacea for the lacking of information about the researches carried
out and for fresh information about the control actions taken within different
States affected by the Disease.
The undertaking of all these kinds of projects is shown how is increasing the
public awareness of GI use. Day to day GI has became a key part in the
development of Information System. Therefore, GIS is slowly taking the place
of the traditional Information System that only manages alphanumeric of
descriptive information, enriching the decision-making process by adding of
georeferenced information. Even more, taking advantage of the role that
Internet is playing into human’s communication processes, the limits of GI and
GIS use and spreading seem does not have any barriers.
All these good attempts have been a useful starting point for to think about a
similar project to manage Chagas disease information in Colombia. However, it
have to bear in mind the economical limitations that the Country is having
today, in order to state a feasible solution that can be running as soon as
possible without involving a considerable investment of money.

26
5 METHODOLOGY
Web site development is a challenging endeavour that has similar implications
of building software, therefore its development, which ever is its purpose, has
to undertaken under the principles of software engineering.
Software engineering is an engineering discipline whose goal is the cost-
effective development of software system. Hence, software engineering
process has become vital tools at the time to develop a software system
avoiding in many cases that project lasts many years or costs much more than
originally predicted. The key relies on planning, and the software engineering
delivers some techniques and methods to control the complexity inherent in any
software system development. These methods have been developing and
constantly perfecting in an attempt to help minimize problems and provide a
framework to manage the project.
Although, the Proposal states the software life cycle or waterfall method as a
methodology to be followed, the choice was changed to software prototyping
due to:
● Waterfall model is based on an inflexible partitioning of the project into
these distinct stages. It means any change into the user’s requirements can
be fatal and intermediate software products cannot be realised.
● The aim of the project is to build a prototype instead of full size software
system. Although, waterfall methodology can be applied, software
engineering offers a specific methodology in which efforts are made to build
a prototype as a first step to the implementation of the whole system.
When the idea of having a web site system was born, many questions about
what have to be in, functionality, scope, users or usefulness arose. It is almost
impossible to predict how the system will work, what user operations should be

27
automated or if it will have the expected impact. In these cases is where
system prototype is a decisive tool.
A prototype is an initial version of a software system which is used to
demonstrate concepts, try out design options and, generally, to find out more
about the problem and its possible solutions. Rapid develop of the prototype is
essential so that costs are controlled and users can experiment with the
prototype early in the software process Sommerville(2001).
One of the most chaotic parts within the development process of mainstream
software is the definition of user’s requirements. It is not rare to find out
misunderstandings between users and software developers at late stages of the
process like evaluation or even worst installation. Prototype developments
allow users to experiment to see how the system supports their work. During
the use of the prototype, users might get new ideas for requirements and can
find areas of strength and weakness within it.
Analysing the prototype’s performance is possible to state whether the
mainstream system will be well worth or its development will be just a waste of
time, human and financial resources. Furthermore, a software prototyping
might help to demonstrate the feasibility and usefulness of the application,
which in this specific project is the pursed aim.
The process model for prototype development comprises four stages: planning,
analysis and design, implementation and evaluation. Their interactions are
depicted in Figure 5. on the next page.
The process starts with planning stage that establishes a clearly problem
definition. Questions like what for the prototype is, or which are user’s
requirements are solved generating a prototyping plan. After, the analysis and
design phase is conducted based on the prototyping plan. At this stage
objectives and users requirements are translated into system’s functionality

28
specifications, which will be foundations to carry out the system’s design. This
design should depict how the prototype will achieve the proposed objectives
and requirements. Additionally, the design will reflect the limitations and
constraints of the prototype.
Figure 5 Process of prototype development
Having a clearly prototype’s outline definition, the implementation stage can be
undertaken. This is the phase where software developers join hands in order
to build the prototype itself. Therefore, this stage will generate an executable
prototype it is ready to be tested and evaluated.
Finally, a decisive evaluation stage is carried out. It aims to test and evaluate
the built prototype in terms of functionality and usefulness, as well as to
discover its possible weakness or magnifying its strengths. The next sections in
this chapter will consider how each stage was carried out during the
development of the gis-based web site.
5.1 PLANNING STAGE
This phase involved a close interaction with the project’s sponsorships and end-
users through talks with the former and interviews and emails with the latter.
Everybody knew what in terms of application’s functionality wanted but it was
Establish Prototype Objectives
Define Prototype
Functionality
Develop
Prototype
Evaluate Prototype
Prototyping
Plan
Outline
Definition
Executable
Prototype
Evaluation
Report
ANALYSIS AND DESIGN
PLANNING STAGE
IMPLEMENTATION STAGE
EVALUATION STAGE

29
necessary to put all ideas together in order to pursue a single objective that
satisfied everybody. Therefore, the aim was to define a complete, detailed
problem definition that stated the key issues without proposing solutions.
The whole process started with the aim and specific objectives definitions as
well as a scope for the project (see chapters 5 and 6). Many ideas arose out
during brainstorm process with the leader of the project but each one was
considered according to its practically and feasibility. Clearly, the project was
constrained by the three-month time available for its development.
Consequently, the project was focused on developing a prototype that could be
used to depict the possible usefulness of a mainstream application.
Figure 6 Prototyping Plan
Figure 6 describes the prototyping plan defined for the development of the gis-
based web site project. The input data for the development process is the
project’s definition, in this case is a prototype system aims to demonstrate the
feasibility and usefulness of the application as is stated in the figure. Based on
it, the prototype will be built in the implementation state. As soon as the
System Adequate
Prototype’s development (3 months)
Prototype aims to demonstrate the feasibility and usefulness of the application
Use prototype
system
NoYesProject rejectedSystem deliver project
Reusable components

30
prototype is ready, the evaluation state will be undertaken in order to ascertain
the real worth of the application. The evaluation process involves the use of
prototype by end users; them in conjunction with the managerial level will be in
charge of to determine whether start delivering or reject the system.
5.2 ANALYSIS AND DESIGN STAGE
In this stage was decided first, the functionality of the prototype, what to put
into and more importantly, what leave out of the prototype system, and
second, the description of the structure of the software to be implemented. The
former tasks encapsulate the analysis stage and the latter ones the design
stage.
5.2.1 Analysis
During this stage was clearly defined what functionalities the prototype will
have, according to the needs of end-users in the research centre groups and
local health authorities in Colombia. Here, it was important to emphasize the
time constraint, in order to prioritise requirements. The Figure 7 shows a flow
Figure 7 Requirement Selection Flow chart
No
Prototype‘s system requirements ● Internet based system that offers some GIS features. ● To georeference information available in order to reflect it in
maps. ● See maps and information linked. ● Maps with information about serology, house quality and
triatomine presence and related with population, poverty and altitude and land use images.
● Update the database. ● Generate new maps.
User’s requirements
Indispensable and Feasible
Rejected Requirements ● Pan and zoom and tools. ● Switch on/ off layers ● Overlap two thematic
layers. Yes

31
Chart followed to select which user’s needs were translated into system
requirements. Besides, it depicts the system requirements to be implemented
and which users’ needs were rejected because they were unfeasible or required
too much time to be implemented.
All system requirements defined accomplish two features, one they are feasible
in terms of implementation time and well worthy in terms of adding valuable
functionality to the system.
Other task involved during the analysis stage was identified which sort of
information will be manipulated by the system. As it was stated before, the
system will be involved with two different kind of information. Descriptive
information about Chagas disease and concerned subjects and geoferenced
information or digital maps about Colombia and surveyed zones.
5.2.1.1 Descriptive information about Chagas Diseases
The National Program in Colombia through local research Centres in Santander,
Cundinamarca and Antioquia states collected information by carrying out survey
and blood tests in endemic areas in certain regions of theses states. The houses
to be visited were chosen in a draw: The surveys’ results generated some files
that contained information about:
● Serological Test: Adults and children from villages visited were appointed at
the local schools in order to determine whether they are infected or not. It
was carried out analysing theirs blood tests using ELISA techniques. Within
the Chagas disease’s control is important to know which children (under 12
years of age) are already infected in order to undertake the disease’s
treatment in early stage. The results of these actions are compiled in a
serological file that contains approximately 42.000 records. Table 1 shows
the serological file’s structure.

32
FIELD NAME DESCRIPTION
State Name of the state in which the municipality is located.
Region Name of the region, in which the states were divided into,
by the Research Centre.
Municipality Name of the municipality in which the village is located.
Village Name of the village in which the patient lives.
Patient Age Years of age of the patient
Gender Gender of the patient. 1 male, 0 female, 3 undefined
Result Result of the Elisa test carried out over the patient. The
positive result represented by 1 shows the presence of the
parasite, 0 otherwise.
Name Name of the Patient
Bugs Result of the question. Does the patient know the bugs? 1
yes, 0 no.
Research Centre
Name
Name of the Research Centre that analysed the blood
sample.
Table 1 Serological file's structure
● House Quality
The house’s quality is a crucial factor within the prevalence of Chagas Disease.
There are some house’s features more likely to give the right livening conditions
for the triatomines. It signified, that a house with mud walls, straw roof,
without plastering and with animals living is more likely to have triatomines
living in that one with brick walls, plastered, zinc roof, tile floor and without
animals living in. Additionally, this file stores the information about presence of
triatomines inside as well as outside parts in the surveyed houses.
Based on the survey conducted about houses’ quality and triatomine presence,
the house quality file was created showing the structure depicted in the Table
2.

33
FIELD NAME DESCRIPTION
State Name of the state in which the municipality is located.
Region Name of the region in which the states were divided into,
by the Research Centre.
Municipality Name of the municipality in which the village is located.
Village Name of the village in which the patient lives.
House Id Id assigned to each house participating in the survey.
Date Survey’s date
Head Household
Name
Name of the head of the household.
Time of
Residence
Number of years living in this municipality
Spraying Answer to the question. Has your house been sprayed for
the last 6 months?. 1 yes, 2 no, 3 does not know, 9 not
answered. For each answer there is a column the file
Sort of spraying 1 does not know, 2 domestic, 3 official programme, 4 both,
9 not answered. For each type there is a column on the file.
Number of
household
How many people live in the house
Type of wall
materials
Answer to the question: With which material are the house’s
walls built? 1 adobe, 2 barheque, 3 brick, 4 wood, 5
tinplate, 6 tapia pisada, 7 without wall, 8 others, 9 mud. For
each type there is a column on the file.
Plastered Answer to the question: Have the house’s walls been
plastered?. 1 has done, 2 partially done, 3 has not done.
For each type there is a column on the file.
Roof Answer to the question: With which material is the house’s
roof built? 1 zinc, 2 palm, 3 mud tile, 3 eternity (type of
tile), 5 straw, 6 wood, 7 others, 8 mixture. For each type
there is a column on the file.
Floor Answer to the question: With which material is the house’s

34
floor built?. 1 ground, 2 concrete, 3 tile, 4 others, 9 not
answered. For each type there is a column on the file.
House’s front Approximate measurement in meters of the front of the
house.
House’s depth Approximate measurement in meters of the depth of the
house.
House’s area Approximate measurement in square meters of the house’s
area.
Type of annexe Answer to the question: Which type of annexe has the
house got?. 1 attic, 2 chicken coop, 3 granary, 4 others, 5
none. For each type there is a column on the file.
Animals Answer to the question: Are there animals are living in the
house?. 1 yes, 2 no, 9 not answered.
Type of living in
animals
Answer to the question: Which type of animals are living in
the house?. 1 dog, 2 cat, 3 hens, 4 pork. For each type
there is a column on the file.
Bug knowledge Answer to the question: Do you know the bug?. 1 yes, 2 no,
0 does not know, 9 not answered.
Seen bug in Answer to the question: Have you seen the bug inside the
house?. 1 yes, 2 no, 0 does not know, 9 not answered.
Places inside the
house
Answer to the question: In which place inside the house
have you seen the bug?. 1. bedroom, 2 roof, 3 attic, 4
walls, 5 others. For each type there is a column on the file.
See bug outside Answer to the question: Have you seen the bug outside the
house?. 1 yes, 2 no, 0 does not know, 9 not answered.
Places outside
the house
Answer to the question: In which place outside the house
have you seen the bug?. 1 chicken coop, 2 granary. For
each type there is a column on the file.
Research Centre
Name
Name of the Research Centre that analysed the blood
sample.
Table 2 House quality file's structure

35
● Collection of triatomines
This data shows the real presence of triatomine inside and outside the houses.
Plastic containers were left in the houses where the house quality survey was
carried out. In the case of any household found a bug it would be kept in the
plastic containers. When the time for keeping the container is over, it has to be
sent it up to the Research Centre’s offices in order to carry out some DNA
analysis over the bugs. After, all required analyses were conducted at the
respective Research Centre, a triatomines’s presence file was generated to
reflect the results with the structure showing in Table 3.
FIELD NAME DESCRIPTION
State Name of the state in which the municipality is located.
Region Name of the region, in which the states were divided into,
by the Research Centre.
Municipality Name of the municipality in which the village is located.
Village Name of the village in which the patient lives.
House Id Id assigned to each house participating in the survey.
Head Household
Name
Name of the head of the household.
Specie sent Triatomine specie sent: Pgeniculata, Rcolombu, Rpallences,
Rprolixus, Tdimidiata, RPS, Tvenosa. For each type there is
a column on the file
Presence of adult
triatomine
Answer to the question: Are there adult bugs in the house?.
1 yes, 2 no, ND indeterminate
Amount of adults Amount of adult bugs found inside the house.
Presence of
nymph triatomine
Answer to the question: Are there nymph bugs in the
house?. 1 yes, 2 no, ND indeterminate
Amount of
nymph
Amount of nymph bugs found inside the house.
Positives Answer to the question: Were there infected bugs into the
sample sent?. 1 yes, 2, no, ND indeterminate

36
Amount of
Positive bugs
Number of bugs infected by the parasite
Parasite Species of Trypanosoma identified among the infected
triatomine. TC Tcruzi, TR T rangeli, TCTR T cruzi and T
rangeli, TSP indeterminate Trypanosoma.
Research Centre
Name
Name of the Research Centre that analysed the blood
sample.
Table 3 Triatomine presence file's structure
● Population
In 1993, a general census was carried in Colombia, being the last official
information about the Colombian population. This information is distributed by
the National Office of Statistics (DANE acronym in Spanish). To have a figure
about population in Colombia, some information was extracted and compiled
into a single file. Its structure is showed in Table 4.
FIELD NAME DESCRIPTION
State Name of the state in which the municipality is located.
Municipality Name of the municipality in which the village is located.
Women Numbers of women in the municipality
Men Number of men in the municipality
Total men in
town
Total men in the urban area in the municipality.
Total woman in
rural area
Total women in rural area in the municipality
Total population Total population in the municipality
Table 4 Population file's structure
● Poverty
In Colombia the poverty is measured according to the percentage of dissatisfied
basic need (NBI acronym in Spanish). It means if a certain state shows a high
NBI, its habitants are living under the level of subsistence. It is due to many of

37
theirs basic needs like decent house, education or basic public utilities, are not
being satisfied. DANE provides this information consolidated by state level. The
structure of NBI file is shown in Table 5.
FIELD NAME DESCRIPTION
State Name of the state
Index of
dissatisfied basic
need
Index used in Colombia to measure in which percentage the
basic needs for living are dissatisfied.
Table 5 NBI file's structure
5.2.1.2 Georeferenced information
Colombia is divided into 32 states as is shown in Figure 8. Each state is made
up to municipalities and each municipality is composed of villages. The number
of municipalities and villages vary in number from state to state.
Figure 8 Political Map of Colombia
Santander State

38
For the project’s development, there are available in shp format, state map of
Colombia, municipality map of Santander and village Map of Florida2
Municipality. If the system would want to be implemented for whole Colombia,
it will be necessary to have shp format maps of every state, every municipality
(approx 1200) and every village (unknown amount). This option is almost
impossible because even in some municipalities the local authorities do not
have paper maps of the villages in theirs jurisdiction. Therefore, it would be a
utopia think about digital map of every single village in Colombia. However, if
the project will be broke into stages covering certain number of states.
Besides shp format maps, there is a classified land use image of 1 kilometre of
resolution for whole South America available. Due to the image’s extension is
whole South America, when it is overlapped with any state, and viewing in a
more detail scale, the image looks like a bit map rather than smooth
classification map.
Finally, there is a one-band altitude image for the north part of Colombia,
including the Santander state, with which the prototype will be tested. With
this image occurs the problem stated before. The resolution is not enough to
work with state level maps. This problem will be sorted out with a more
precision scale image but it will imply the investment of a decent amount of
money buying it. Nevertheless, the two images were downloaded for free
saving a great amount of money.
In summary, there is some descriptive information about the disease although
there is not georeferenced. However, it might be done linking them with the
digital maps available, offering the possibility to see unseen relations between
the variables stated.
2 This municipality belongs to Santander State

39
5.2.2 Design
The system design process partitions the requirements to either hardware or
software systems. It establishes an overall system architecture. A software
design is a description of the structure of the software to be implemented, the
data which is part of the system, the interfaces between system components
and, sometimes, the algorithms used Sommerville(2001).
Besides, due to the project’s nature, development of a web site, is important to
determine what the site will look, like, both structurally and graphically, and
how it will work are developed. Here, it is necessary to bear in mind that user’s
interface and web page are almost synonymous, because through some web
pages the user will interact with the system. This stage was broken into some
sub stages: Architectural design, information design, data structure design and
interface design.
5.2.2.1 Architectural design
As a result of the analysis stage, two constrains were established to the
development of the prototype’s project. First, financial resources, there is no
money to buy software or hire new staff and second, there are only three
months available for the development. These two constrains were had into
account during the analysis stage, hence they must have into account at this
stage as well.
In Chapter 8, through the Figure 4 Components proposed for the
application was articulated possible components for a GIs based web site
prototype. Therefore, it is time to express this proposed model in terms of real
components. Based on the Prototype‘s system requirements and design
principles, the following elements were selected in order to create an
architectural design for the prototype, shown in Figure 9.
● Hardware System: this is element was not reflected in Figure 4 because
of the machine where the system will be running on, have already been

40
bought. The machine presents workstation standard features. Nothing can
be done in respect of the hardware aspect.
Figure 9 Prototype's architectural design
● Client Browser: it might any among, Netscape, Explorer, Mosaic and so.
Nobody can control with which browser the user will be connected.
However, the web site must be designed and implemented bearing in mind
that some browser’s versions do not accept certain html tags or they might
not work well with some scrip languages and do not accept activex controls
or plug-ins. Therefore, the web site should be as much general as possible.
● Web Server: All web server packages may exhibit different responsiveness
on equivalent hardware. Different kinds of web server can be found in the
market vary from less powerful but ease of administration like Microsoft
solution (Internet information server) to high performance solutions but little
complicated administration like Apache, prices varying with the number of
functionalities incorporated.
For the project, Apache was the option selected due to its powerful
administrative capabilities, its image handling performance and because it is
DATA REPOSITORIES
INTERNET MySql DATA BASE
IMAGE BASE
FOLDER IN THE WEB SERVER’S
ROOT
PhP Server Side
Application
Make Request
Result Sent
Any Client Browser
Apache Web Server
41
a free software with strong technical support through the Web. There are
different versions of Apache, therefore the appropriate version that runs
over the host machine’s operating system should be downloaded from
www.apache.org web site.
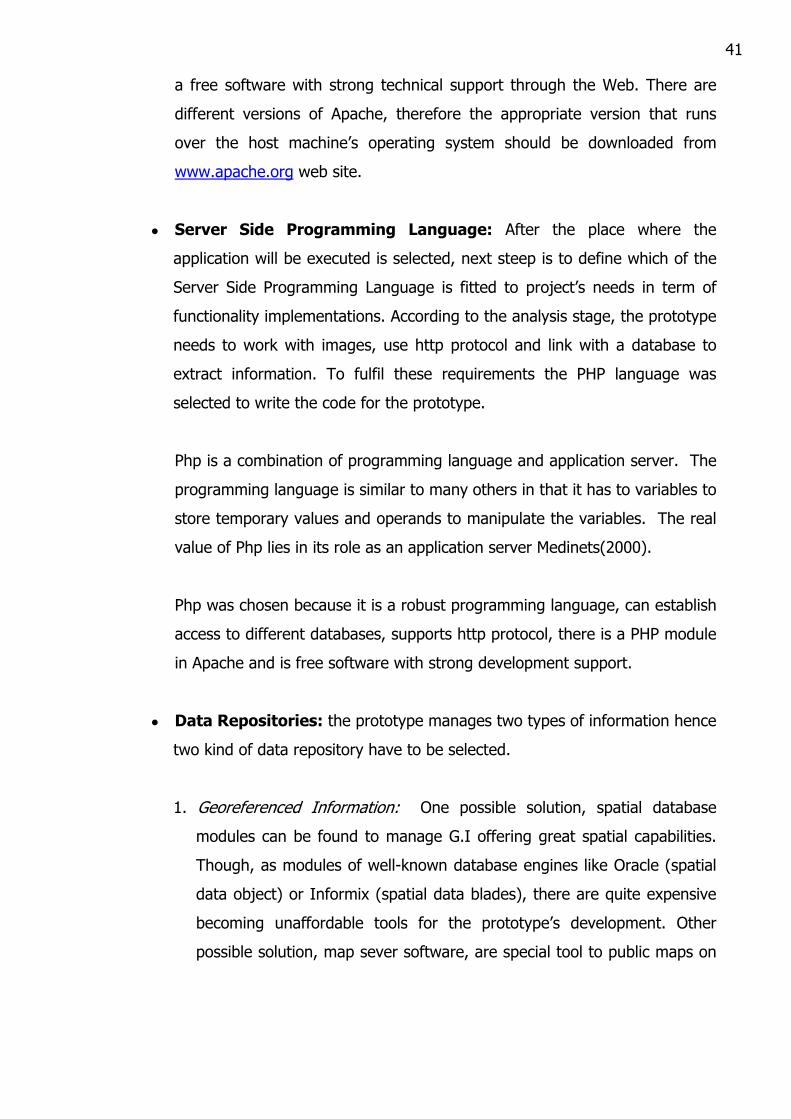
● Server Side Programming Language: After the place where the
application will be executed is selected, next steep is to define which of the
Server Side Programming Language is fitted to project’s needs in term of
functionality implementations. According to the analysis stage, the prototype
needs to work with images, use http protocol and link with a database to
extract information. To fulfil these requirements the PHP language was
selected to write the code for the prototype.
Php is a combination of programming language and application server. The
programming language is similar to many others in that it has to variables to
store temporary values and operands to manipulate the variables. The real
value of Php lies in its role as an application server Medinets(2000).
Php was chosen because it is a robust programming language, can establish
access to different databases, supports http protocol, there is a PHP module
in Apache and is free software with strong development support.
● Data Repositories: the prototype manages two types of information hence
two kind of data repository have to be selected.
1. Georeferenced Information: One possible solution, spatial database
modules can be found to manage G.I offering great spatial capabilities.
Though, as modules of well-known database engines like Oracle (spatial
data object) or Informix (spatial data blades), there are quite expensive
becoming unaffordable tools for the prototype’s development. Other
possible solution, map sever software, are special tool to public maps on

42
Internet and make queries, however its price varies from £3.200 to
£16.000 Longley(2001) being unaffordable software as well.
To manage GI the proposed solution is a series of map images created
off-line according to all possible queries results; the images will be
stored in a special folder in the Server’s root space. The complete
process will be elaborated in Chapter 6 item 6.1 GEOGRAPHIC DATA .
2. Descriptive Information: Many database engines to handle information
can be found. As any piece of software, theirs prices varies directly with
the number of theirs capabilities rising up to thousand of pounds for the
powerful ones. Names like Oracle, Informix, Sybase or Access can be
identified as the more known and used. However, free database engine
MySql was selected for the project. Based on Structure Query Language
Standard SQL, easy connection with PhP and its widely development
support, were the decisive features for the decision. After the PHP
installation on the Web server, some features have to be configured in
some PHP variable created for the MySql management.
5.2.2.2 Information Design
Information design describes the organization of information which provides
clarity, meaning, and context for the information Mok(1996). It involves taking
data like text, pictures, multimedia elements, and programming elements in
order to organize them, in a way that is meaningful and hopefully useful. As it
seen, there is two sorts of elements should be organized and mixed, they are
the normal design elements and programming elements. The former expresses
graphically the web site’s intentions and the latter adds capability to do
something according to the scope of the web site.
Particularly, the prototype in this project is more oriented towards programming
elements than aesthetical ones. Although, the design is focused on
programming elements some actions like Cascade Style Sheet CSS layouts are
applied to care about the web site presentation.

43
Figure 10 Prototype's pure web structure
According to the hypertext theory in Powell(1998), the developed prototype
web site structure can be classified into Pure Web Category, where a collection
of documents seems to have no discernible structure. Figure 10 depicts pure
web structure designed for web site prototype, showing with normal line two-
direction relationship and dotted line one-direction relationship. Among the
advantages of this model are the information can be accessed quickly,
because every page can be accessed through the rest, and the fact of this kind
of site provides a great deal of expressiveness.
However, its detractors argue that this design may cause the users lost focus
making difficult for them to form a mental map of the site. Nevertheless, this
module structure fits perfect to the prototype, due to its lack of logic flow to
access the information by the users and they can not get lost because there is a
navigation bar allows them to move with the overall site.
5.2.2.3 Data Structure Design
The data structure design corresponds to the logical design of the database will
store the descriptive information about Chagas disease within the project.
Analysing the information available for the project, some alterations were made
into the given files, in order to create an efficient database structure that avoids
duplication of data in the future database and to offer low response times.
Prototype Home Page
Query Data Form Result Display
Form
User Connection Form
More About Chagas Disease
Control Map Display
Management Data Form

44
The EM for the prototype’s database is depicted in the Figure 11.
Figure 11 ER Model for the prototype's database
A detailed explanation about all entities included in the ER model is stated in
the Table 6 (shown below).
TABLE NAME TABLE DESCRIPTION
States To store state’s identification and name, and research centre in
charge of survey in it.
Municipalities To store municipality’s identification and name, and
identification of the state that the municipality belongs to.
Villages To store village’s identification and name, and identification of
the municipality that the village belongs to
Population Information about population given by municipality level.

45
NBI Information about NBI index given by state level.
Control_map_d
ata
Amalgamated information about infection, presence triatomine,
house and real triatomine presence indexes3. Indexes necessary
to calculate the risk unit about chagas disease for each state,
municipal or village.
Research_centr
es
To store information about all research centres in Colombia,
which participated into the National Program.
Con_serology_s
tates
To store amalgamated information about serological test result
by state. It includes state identification, number of positive
patients, number of negative patients, total of people surveyed
and year of the survey.
Con_serology_
mun
To store amalgamated information about serological test result
by municipality. It includes municipality identification, number
of positive patients, number of negative patients, total of people
surveyed and year of the survey.
Serology To store all the information about serological tests applied. This
information is given by village level and contains village
identification, name, gender and gender of the patient, result of
the blood test and date of the survey.
Gen_inf_houses To store general information about the houses surveyed by
village level. This information includes: village identification,
number of surveyed houses, average area per house, average
households per house, average annexe number per house,
number of houses with annexe, average area per house,
average perimeter per annexe, number of houses with domestic
animals, number of houses have been spaying during the last 6
months, number of house with domestic spray, number of
house with official spray, number of houses with both official
and domestic spray, number of houses without spray and year
of the survey.
3 How calculate these indexes are explained in detail in 6.2 CONTROL INDEX MAP section.

46
House_interior_
features
To store general information about the interior features of the
surveyed houses, given by village level. This information
includes: village identification, number of house with zinc roof,
number of houses with palm roof, number of house with clay
tile roof, number of houses with eternity4 roof, number of
houses with straw roof, wood roof, number of houses with
other types of roof, number of houses with soiled floor, number
of houses with concrete floor, number of houses with tile floor,
number of houses with other types of floor and year of the
survey.
House_walls To store information about type of material that surveyed
house’s walls are made, given by village level. This information
includes: village identification, number of houses with brick
walls, number of houses with barheque5 walls, number of
houses with block walls, number of houses with wood walls,
number of house with thin plate, number of house with tapia
pisada walls, number of houses without walls, number of
houses with clay walls, number of houses with totally plastered
walls, number of houses with partially plastered walls, number
of houses without plastered walls, and year of sample.
Triatomine_spe
cies
To store information about type of triatomine species found in
the surveyed houses and sent back to the research centre
offices; the information is given by village level. This
information includes: village identification, number of surveyed
houses, number of Pgeniculata triatomine sent, number of
rcolomb triatomine sent, number of rpallaences triatomine sent,
number of rprolixus triatomine sent, number of tdimidiata
triatomine sent, number of tvenosa triatomine sent, number of
4 Thing concrete tile used to build roofs. 5 Special type of material made with clay and water, used in poor areas to build houses
(barheque and tapia pisada have similar features).

47
rps triatomine sent and year of the survey.
Triatomine_pre
sence
To store information about presence of the triatomine with the
surveyed houses, by village level. This information includes
number of houses surveyed, number of houses where the
triatomine was seen inside, number of houses where the
triatomine was seen in the bedroom, number of houses where
the triatomine was seen in the roof, number of houses where
the triatomine was seen in the attic, number of houses where
the triatomine was seen in the walls, number of houses where
the triatomine was seen in others parts inside, number of
houses where the triatomine was seen outside, number of
houses where the triatomine was seen in the chicken coop,
number of houses where the triatomine was seen in the granary
and year of the survey.
Table 6 Entities in the ER Model
The following were the arrangements made to design the database structure:
● Three entities were created to States, municipalities and villages to describe
the general information of each one. It means that table’s only need to have
the parent’s identification, and through sql statements the rest of
information might be accessed.
● In the state entity was created a field called Research centre, to avoid the
repetition of its information in every single entity that describes the surveyed
information. Now, with the state’s name or code is possible to know which
research centre carried out the surveyed for this specific zone.
● A year sample field was added for almost every table in order to allow the
system to make multi-temporal analysis, although there is only information
for one survey year. This feature will facilitate to add the information when
more surveys would be carried out.

48
● The id field join with the year sample formed a compound primary key for
the population, serology, con_serology_mun, con_serology_states,
tratomine_presence, house_walls, house_interior_features,
triatomine_species, gen_inf_house, NBI and control_index_map entities.
● There are three amalgamated tables to handle the control index map query
and the serology by municipality and state queries. These tables were
created due to the high complexity presented by the sql statement to query
serology information and to create the indexes for the control map. The
queries were made almost manually, dividing the main sql query into
intermediated queries that created new tables with the results. All these
new tables were joined in a single table. After the process all intermediate
table were delete leaving only the tables generated. This was the specific
case for Control_map_data, Con_serology_states and Con_serology_mun
tables.
● During the survey, all information about house quality and triatomine
presence were stored in one file. It generated a 50 column file that may
make slow response time for the queries willing to extract their information.
For this reason this file was broken into four entities: general information
about the houses, triatomine presence, walls and interior features in the
houses. Having the files separated facilitates the process of making queries
and may produce quickest time’s response.
5.2.2.4 Interface Design
The first idea was to created a similar interface to any of the map sever
software in the marketplace. These interfaces almost offer a layout where the
map is displayed in a frame and the map utilities like pan, zoom or identify
bottom are displayed like kind of tool bars next to the map frame. A map server
interface is shown in the Figure 12. However, the idea was dismissed because
the aim of the prototype is to build an inexpensive Internet tool that offers
some GIS capabilities rather than built map server software that already exists.

49
Figure 12 Example of an ArcIms interface
Hence, the web site prototype should not have a unique interface. The interface
has to vary depending upon functionality offers by the specific web page where
the user is. However, this functionality can be classified in 3 interface
categories:
● Information display interface: Page uses to display information and
available links; the home page and control map display are examples of this
type of interface. Although, control map display interface displays
descriptive information as well as GI information result of a internal query.
● Input data interface. Pages where some variable values are asked in
order to make queries or execute some actions based on them. Examples:
● Result display interface: These pages display the results of queries or
actions taken. If the interface is query type, it displays the result of a query
made thought an Input data interface. This result is made up two parts, GI
part where descriptive variables are georeferenced and the consolidated
value variables used to produce the map; example, query data interface. In
contrast, if the interface is action taken, it displays other interface related in
Typical Gis features
On-off layer tool

50
some how with the previous interface thorough the variable values typed in.
Example of this type, user’s authentication interface.
Examples of input data and result display interface categories are depicted on
the Figure 13.
Figure 13 Two interfaces in the prototype
Moreover, all web pages appear to keep the same style. This feature is
achieved introducing the Cascading Style Sheet concept. CSS defines how
elements are displayed, just like the font tag and the colour attribute in HTML.
Styles are normally saved in files external to the HTML documents. These
External style sheets enable the web site designer to change the appearance
and layout of all the pages in the Web, just by editing a single CSS document.
CSS is a breakthrough in Web design because it allows developers to control
the style and layout of multiple Web pages all at once. The Web developer can
define a style for each HTML element and apply it to as many Web pages as
he/she wants. To make a global change, simply change the style, and all
elements in the Web are updated automatically CSS(2002).
For the development stage, a CSS external file was created and linked to each
web page. This file contains the web site’s style in terms of heading, font, list

51
element or paragraph format. With Using CSS is definitely true that lot of work
can be saved.
In addition with the style, there is an important element in all pages. It is t the
navigation bar that allows users to navigate throughout the web site and reach
every page available, avoiding the user gets lost.
5.3 IMPLEMENTATION STAGE
The first steep within the Implementation stage was a four-week process of
Php language learning. During this process the learning curve behaved like an
exponential curve, with slow progress during the first week but good progress
during the following three weeks. Due to its similarity with C language, the php
syntax is easy to learn, although as a result of being embedded in html tags the
debugging process is complicated and time consuming. Any php syntax error
impedes web page being displayed, when there is a php syntax error,everything
stops working.
The second steep was to start writing the php code base on the functionality
described in the analysis stage and the web site structure generated in the
design stage. The following sections describe the most striking part of code
written.
5.3.1.1 Home Page
The home page is the simplest one, having only html tags. However, there are
two code blocks all pages have in common:
● The code to link the CSS file called chagas_style_sheet.css that defines the
unique stile of the web site. The html code to link a html page with a CCS
is depicted on the next paragraph . The whole CSS code is shown on the
Appendix A chagas_style_sheet.css file code.
<head> <link rel="stylesheet" type="text/css"

52
href="http://www.student.city.ac.uk/~at705/php/chagas_style_sheet.css" /> <title> Chagas GIS </title> </head>
The code has to be located in the head section of the html code and has to
make reference to the CSS file’s location on the web server.
● The navigation bar code allows the user to access all pages in the web site
do not care in which page he/se is.
<h5> <a href="http://www.student.city.ac.uk/~at705/">Home</a> | <a href="http://www.student.city.ac.uk/~at705/php/query_data_form.php">Query System</a> | <a href="http://www.student.city.ac.uk/~at705/php/user_connection_form.php"> Data Managment Tool</a> | <a href="http://www.student.city.ac.uk/~at705/php/control_map_display.php">Control Priority Index Map</a> | <a href="http://www.who.int/tdr/diseases/chagas/default.htm">About Chagas Disease</a>| </h5> The code composes of <a href> </a> tags referencing all pages want to be
accessed, notice that the navigation bar uses <h5></h5> heading style
redefined in the CSS file. Refer to Appendix B Index.Html File Code to see
whole home page code.
5.3.1.2 Query Data Form Page
Query Data Form Page allows the user to make queries about test, house,
quality or triatomine presence variables, in either all states or specific state and
for a specific surveyed year.
Apart from the main variable selection, the user has to select the target zone.
Here, the code search into states table into the database in order to see for
which states information is available. This functionality cannot be achieved with
html tags; hence the following php code was written to create a dynamic pull
down menu based on state table.
<td width = 100% > <p class="margin"><b>Target zone: </b> <?php $db = mysql_connect("localhost", "at705", "m0d13");

53
if ($db) { mysql_select_db("at705",$db); $sql = "SELECT name FROM states ORDER BY name"; $result = mysql_query($sql,$db); echo "<select name= name size = 1>"; echo "<option value =\"all states\">All States</option>"; while ($row = mysql_fetch_array($result)) { $name = $row["name"]; echo "<option value=\"$name\">$name</option>"; } echo "</select>"; } else { echo "Unable to connect to database!"; } ?> </p> </td> However, the first row of the pull down menu is all states option that it is not in
the states table. Nevertheless, this option allows querying the information
consolidated by all states instead of by a single state. Other important feature
of this piece of code is the connection with the database established by the
following instruction.
$db = mysql_connect("localhost", "at705", "m0d13");
The php variable to manage the database connection is named localhost,
at705 is the database name and m0d13 is a valid user password. After, the
database connection is successfully established the SQL is executed in order to
fetch the relevant data to fill the pull down menu. This set of instructions is
depicted in the next piece of code.
$sql = "SELECT name FROM states ORDER BY name"; $result = mysql_query($sql,$db);
In the event of an updating action over the state table, the pull down menu will
show automatically the new records. After, the variable and the target zone are
selected, it is necessary to specify a base map that will serve as a background
for the Chagas disease data results. Finally, the user has to select the year for
which the information is wanted. The code to achieve the year selection is
similar to the pull down men varying only in the sql statement. Following code

54
depicted the sql statement written, using con_serology_mun table in instead of
states table.
$sql = "SELECT DISTINCTROW year_sample FROM con_serology_mun ORDER BY year_sample"; $result = mysql_query($sql,$db);
Refer to Appendix C query_data_form.php File Code to see the whole code.
5.3.1.3 Display Form Page
Display form page in conjunction with the Query Data Form Page are the most
important parts of prototype because it is in these two pages where the main
functionality is shown. After the selection of the main variable (house quality,
blood test or triatomine presence), target zone, base map and year values, the
next step is to call the display.php that is in charge of making the query, based
on the information stipulated
The first step is to make the query with all stipulated information. This is
achieved by the following code.
if ($infection_var == 'blood') { if ($name == "all states") { } } else { $sql =
"SELECT municipality_name, number_positive, number_neative, total_sampled, states.name,round(((100*number_neative)/total_sampled),2) as negatives,
round(((100*number_positive)/total_sampled),2) as positives FROM municipalities, con_serology_mun, states WHERE ((municipalities.municipality_id = con_serology_mun.municipality_id) and (municipalities.state_id = states.state_id) and (states.name = '$name')and
(con_serology_mun.year_sample = '$year')) ORDER BY $sort_var"; ); } This sql statement makes a query over municipalities, states and
con_seology_mun tables. The query displays the municipality name, number of
positive, calculate positive %, number of negative, calculate negative % and

55
total of sampled. The, all information will be displayed for a specific year and
ordered by an specific variable.
To overcome the possibility to turn on-off layers, a link to different base maps
is made available. It allows the user to see the same query with different base
maps as background. Therefore, poverty, altitude, land use, NBI or population
are available as background for any query made. This particular functionality is
achieved with the following php code.
echo("<tr><th><table border=0 width=100%><tr><td align=center><a href=\"http://www.student.city.ac.uk/~at705/php/display.php?sort_var=municipality_name&year=$year&name=$name&base_map=alt&infection_var=$infection_var\">Altitud</a></td><td align=center><a href=\"http://www.student.city.ac.uk/~at705/php/display.php?sort_var=municipality_name&year=$year&name=$name&base_map=land&infection_var=$infection_var\">Land Cover</a></td><td align=center><a href=\"http://www.student.city.ac.uk/~at705/php/display.php?sort_var=municipality_name&year=$year&name=$name&base_map=pop&infection_var=$infection_var\">Census</a></td></tr></table></th><th
The code might look a bit complicated but in reality is very simple. The principle
is based on call the display.php page itself varying the map base variable
depending on the link chosen and passing all the parameters used to make the
query at the first time. Other functionality that display.php offers, is the
possibility to arrange the query’s result by state name, percentage of positive,
percentage of negatives or total people sampled. This functionality is based on
the same principle followed to change the base map background.
A particular form to handle the maps was created. It consists in select the
image to be displayed according to the target zone and base map selected.
The map name is automatically generated by the php code. The code for this
task is shown below.
if ($name == "all states") { $image_name = "all_states_".$infection_var."_".$base_map.".jpg";

56
To show the data result for any query, the php code generates a table that will
contain on the left side the map and on the right side, the data. The data will
be expanded automatically according to the number of rows on the query
result. The following code shows how the php code creates the display result
table.
$result = mysql_query($sql,$db); $num_records = mysql_num_rows($result); echo("<tr><td valign=top rowspan=\"$num_records\">"); echo("<img src=\"http://www.student.city.ac.uk/~at705/images/blood/$image_name\" width=\"365\" height=\"483\"></td>"); while ($row = mysql_fetch_array($result)) { $s_name = $row["municipality_name"]; $positive = $row["number_positive"]; $negative = $row["number_neative"]; $total = $row["total_sampled"]; $p_negative = $row["negatives"]; $p_positive = $row["positives"]; echo("<td align = left><a href=\"http://www.student.city.ac.uk/~at705/php/municipality.php\">$s_name</a></td><td align = center>$positive</td><td align = center>$p_positive</td><td align = center>$negative</td><td align = center>$p_negative</td><td align=center>$total</td></tr>\n"); } All functionalities implemented on this page, is the proposed way to emulate
GIS capabilities on the prototype. Refer to Appendix D to see the whole
display.php file code.
5.3.1.4 User Connection Form Page
This page allow to right users to connect to the data management tool. A right
user is who has a valid user name and password. This special kind of user can
access the database structure in order to modify the records. Not everybody
can have a user name and a password, there is a privilege reserved to the
people in charge to updating process on the database. Refer to Appendix E to
see the whole user_connetion_form.php file code.
5.3.1.5 Management Data Form Page
Once, user name and the password have been typed, they need to be
validated in order to get access to the management data form. The php code

57
to validate this information is a simple sql statement joins with a If loop. The
php code is shown below.
$sql = "SELECT user_name, user_pass FROM users WHERE ((user_name= '$user') and (user_pass='$pass'))"; $result = mysql_query($sql,$db); $num_records = mysql_num_rows($result); if ($num_records == 0) echo "User or password invalid. Use the <b>Data Managment Tool</b> option on the navigation bar"; else {} The else block of instructions seen empty in the above, but it is used to show
all the available tables in the database. Next php code are the else block
instructions.
else { $sql = "SHOW tables"; $result = mysql_query($sql,$db); echo "<select name= Tables_in_at705 size = 7>"; while ($row = mysql_fetch_array($result)) { $name = $row["Tables_in_at705"]; echo "<option value=\"$name\">$name</option>"; }
This code will fill a fixed size list with all tables available on the data base. The
code to select one specific task as edit, add or delete, was not developed. It
might be part of a future development stage. Refer to Appendix F to see the
whole management_data_form.php code file.
5.3.1.6 Control Map Display Page
Map control is the option that amalgamates the stored information about
serology, house quality and triatomine presence. This page has a similar logical
structure with the display page. The difference varies on the sql statement
made to query the information. The sql statement is shown below.
$sql = "SELECT name, infection_index, presene_triatomine_index, house_index, real_triatomine_presence_indez FROM states, control_map_data
WHERE (states.state_id = control_map_data.state_id) ORDER BY name";

58
Like display.php, the control_map_display.php shows a table with two columns,
one for the risk map and the other for the information about all risk indexes.
Refer to Appendix G to see the whole control_map_display.php file code.
The evaluation stage is omitted in this section because all Chapter 6 is
dedicated to explain the prototype in action, including an analysis of its
strengths and weakness.
6 THE PROTOTYPE APPLICATION IN ACTION
This chapter describes three important features about the prototype. First, how
prepared the geographic data to be used and linked with other data; Second,
how should be the process to create the control priority index map and third,
how the prototype is currently working.
6.1 GEOGRAPHIC DATA
The geographic data (or GI) in conjunction with the descriptive information
about serology, house quality and triatomine presence, are raw material to the
prototype’s functionality. To fit it with the proposed solution where there is not
specialize software to handle GI, it was necessary to design a specific procedure
to handle GI. The GI acquisition for the prototype is an off-line process that
uses Arcview shp files link to an MsAccess database in order to generate the
maps used in the display interface. It is composed of the following steps.
1. The Ms access database has to have the same structure of the MySql
database designed to the prototype. Using MsAccess, a sql statement is created
based on the asked-query. After, the sql statement is executed and a results
table is generated. Here, it is necessary that the MsAccess table has a join field
with the shp file. It may be the municipality_id or state_id depended on the
kind of target zone has been selected.

59
2. In Arcview, a connection with the database in MsAccess is established in
order to gain access to the created table. With the join tool in Arcview, the
attributes table of the shp file with the MsAccess table are linked through the
common field as it seen on Figure 14.
Figure 14 Linking shp file to a MsAccess table
3. After the linking step, the shp is classified according to a specific field on
the MsAccess table. A classified map by NBI index is shown on the Figure 15.
Figure 15 classified shp file

60
4. The finally step is to export this image as a jpg file. Here, it is necessary
to have care about the image name. The notation for the image name is
image_name = "all_states_".$infection_var."_".$base_map.".jpg" or
image_name = $name."_".$infection_var."_".$base_map.".jpg";
Where, $infection_var can be blood, house or triatomine, and $base map can
be land, population, poverty or altitude.
6.2 CONTROL PRIORITY INDEX MAP
The data to elaborate the control priority index map is made up of the
calculation of some indexes. They are infection index II , triatomine presence
index TPI, house quality index HQI and real triatomine presence index RTPI.
The risk level name as Control Priority Index, for any municipality is calculated
through the following formula.
CPI = (II x 0.5) + (HQI x 0.2) + (PT x 0.1) + (RTPI x 0.2)
To classify a municipality according to risk presented, three levels of CPI were
established. These values are shown on the Table 7.
LEVEL OF RISK CPI RANGE
Low 0 – 30
Medium 31 – 60
High 61 –100
Table 7 Levels of CPI
However, to calculate the CPI, first, the II, TPI, HQI and RTPI indexes need
to be calculated. Here, it is the most complicated part of the process. Each
index has its own values to weight all variables defined as possible risk factors.
An example of some values to calculate HQI are depicted on the Table over
the page .

61
Component Weight (in Risk Unit)
Walls and plaster 35
Roof 35
Floor 5
Annexes 10
Presence of Animal 5
Density of people living on the house 10
Table 8 Total components of HQI
Each component will take a value according to information = surveyed during
the National Program. For example, for each roof typed found there a specific
has to be assigned. If the roof is made up straw or palm its contribution with
the risk will be weighted with 35 risk units, on the other hand if the roof is
made up with wood, its contribution will only be 10 risk units . The list of
values for roof component are shown o the Table 9.
Type of roof Weight (in Risk Unit)
Straw and palm 35
Mud tile 20
Wood 10
Other types 0
Table 9 Weights for the roof type
According to the Table 9, a house with palm roof will get more unit risk than a
house that has a thin plate roof.
6.3 WEB SITE
To describe the currently prototype’s functionality, it is necessary to have in
mind some details about the data and the functionality already implemented.
● The prototype only works with serology variable option.

62
● About target zone variable, the prototype can only make queries for all
states and for Santander state. (it is due to maps and data availability).
● As it is warned on the query system page, poverty as a base map is only
available for all states target zone.
● In the display page, all base map options are working to Santander state
target zone.
● In the display page, only poverty and census base map options are working
to all states target zone.
● The user name and password in the user’s authentication page are cristina
and cristi02 respectively.
● Finally, the submit and clear buttons on the data management tool are not
implemented.
The prototype can be accessed through the temporal URL
www.student.city.ac.uk/~at705. This Internet address retrieves the prototype’s
home page shows on the Figure 16.
Figure 16 Prototype Home Page

63
The home page has some figures about the disease and offers links to all pages
available on the web site as well other links to external pages related. Query
system link retrieves a form to make queries; data management retrieves the
form that allows right users a connection with the database management tool;
and control priority index map retrieves the control map with its associated
information. The navigation bar can be used instead to access the same pages.
If the query system link is selected, the query system interface appears as it
depicted on the Figure 17.
Figure 17 Query system interface
To make any query select the values to type of infection variable, target zone,
base map and a surveyed year. After, all variable values are selected, click on
the submit button. According to selected values, the display interface shows the
query’s results as it is shown on Figure 18 over the page.
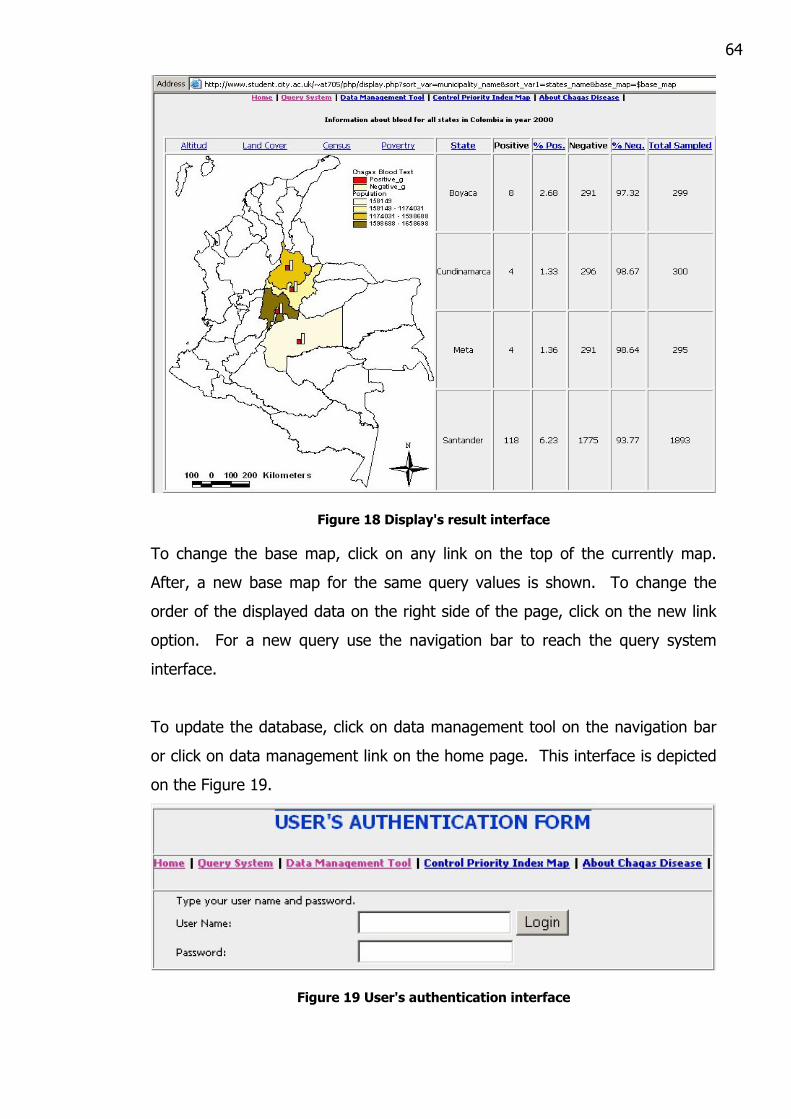
64
Figure 18 Display's result interface
To change the base map, click on any link on the top of the currently map.
After, a new base map for the same query values is shown. To change the
order of the displayed data on the right side of the page, click on the new link
option. For a new query use the navigation bar to reach the query system
interface.
To update the database, click on data management tool on the navigation bar
or click on data management link on the home page. This interface is depicted
on the Figure 19.
Figure 19 User's authentication interface
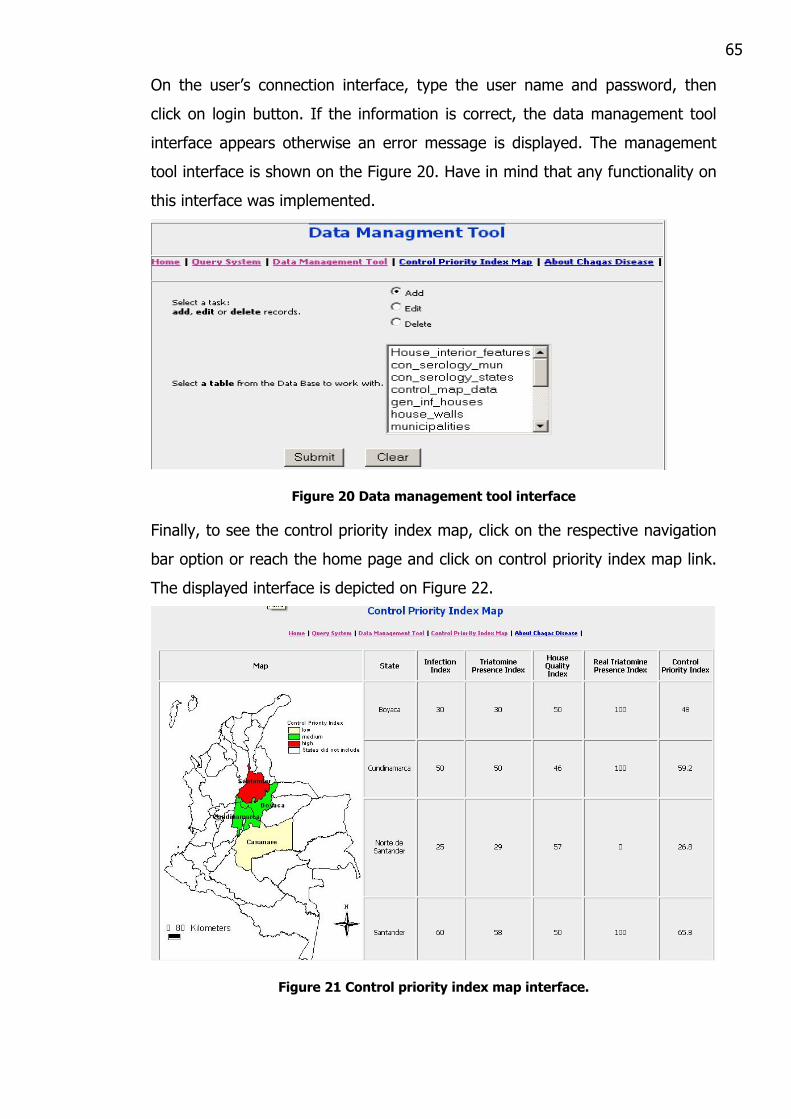
65
On the user’s connection interface, type the user name and password, then
click on login button. If the information is correct, the data management tool
interface appears otherwise an error message is displayed. The management
tool interface is shown on the Figure 20. Have in mind that any functionality on
this interface was implemented.
Figure 20 Data management tool interface
Finally, to see the control priority index map, click on the respective navigation
bar option or reach the home page and click on control priority index map link.
The displayed interface is depicted on Figure 22.
Figure 21 Control priority index map interface.

66
So far, all interfaces altogether constitute the prototype’s functionality and can
be shown as a example of what may be done.
6.4 STRENGTHS AND WEAKNESS
To establish what the prototype’s strengths are, it is necessary to think about
how much useful it might be for the potential users. So far, the local health
authorities in Colombia have not tool a part from the digital files resulted from
the surveys and later analyses carried out. With the prototype, they may count
on with a tool that allows them to query and georeference on political maps all
these information. The decision making process is easier to carry out when all
information needed is graphically displayed and linked. Moreover, being an
Internet based tool it offers the possibility to be accessed at any time in any
place.
As a prototype the tool is in constant improvement stage, therefore it is not
right to establish the lacking of any kind of functionality as a weakness.
However, the GI acquisition process must be improved. It is almost manual and
time-consuming process. Besides, it needs a considerable number of
predefined maps.
A further factor to consider is the consolidated tables like con_serology_mun or
con_serology_state. They are the result of off line queries. In the case of a
database update, these changes will be automatically reflected on the input
tables (con_serology_mun or con_serology_state) rather than on the
consolidate tables, that will need to be generated again.
The main strength of the development project itself is related to the discovery
of what things should be improved or what things need a crucial change.

67
7 FINDINGS AND IMPROVEMENTS
The followings two sections are a compilation of findings and improvements
reached after carried out the whole prototype’s development project.
7.1 FINDINGS
The web site might look like simple but an important amount of code is needed
to produce the prototype’s functionality. Although, the development time
seemed to be short, a couple of key things were done in order to demonstrate
how much important GI might be when is related to descriptive information.
Even more, when it can be used during the decision making process.
Moreover, factors like the possible influence of altitude or particular vegetation
type on the number of positive people in a specific region can be easily
detected on the prototype’s display result interface. These two basic but
meaningful details depicts how much useful GI may be in health sector.
7.2 IMPROVEMENTS
As it is expected for a prototype development, many improvements need to be
done. First of all, it is necessary to add the functionality for the other two main
variables house quality and triatomine presence. Second, as it was stated on
the strengths and weakness section is important to rewrite the sql statement
used to create the serological query and to create the index control map.
Therefore, instead of using off-line sql statements to create the
con_serology_mun, con_serology_state and control_map_data tables, it will be
convenient to use on line queries. In this way, all off line sub queries needed to
generate these tables can be executed online using make a table query option
available on the sql syntax. This kind of query will allow to have amalgamated
tables up to date, showing instantly all changes made to the database. In
respect to the database, it is necessary to add all the functionality for the tool

68
management form. This new functionality allows the right users to keep up to
date the database and hence, the information depicted on the web site.
GI information is input data to the prototype and invaluable asset for the user.
Hence, all process related with GI have to be carefully planned and done. As it
was seen in previous 6.2 geographic data section, the GI designed process has
some drawbacks. First, it is a time consuming off line process that does not
reflect changes made to the database into the generated maps and second, as
a result of its design the process needs a massive number stored images.
The first disadvantage can be solved establishing a connection between Arcview
and MySql instead of use Arcview and MsAccess. It can be done using the
MyODBC module available within MySql database. The second one does not
seem as a real disadvantage due to the maps can not need much space.
Many new and unthinkable functionalities can be added to the prototype.,
however, the more useful would be to create a completely online process to
generate the index control map. An index control map process that generates
the indexes for each main variable and allows the user to weight and combine
all variables in a single table. This table will be used as input data to create
the control index map.
It is not difficult to imagine how many lives could be saved if a local authority in
a tiny village in Colombia would know exactly in which direction oriented the
control action of Chagas disease, thanks to a online control map that depicts
the low, medium and high risk zones.

69
8 CONCLUSIONS
Nowadays, it is a well-known fact that GI might mark the difference between a
well-oriented and wrong decision. When GI and descriptive data are available,
the uncertainty about taken the right or wrong decision can be reduced. To
reach this stage it is necessary to have a tool that allows this information’s
availability at any time.
As a way to solve this situation a prototype was developed. The prototype has
the essential features to display GI and query its related data. Besides, as it
was built almost with free software, its cost about developer software is almost
nil.
However, some GIs features like zoom, pan, layers overlap and online map
creation are not present. If these are indispensable features to the health
authorities in Colombia, this prototype lost its validity and must be replaced by
any map server application. Map server applications include Autodesk Map
Guide, Esri ArcIms, Intergraph GeoMedia Web Map and Map Info Map Xtreme
can deliver all these functionality and more. However, according to
Longley(2001), the cost of these kind of Internet GIS varies from £3.200 to
£16.000, for small to medium sized systems, to well beyond for large
multifunction multi-user systems. Having the price as a constraint, this is a
utopian solution.
Searching for information about Gis Internet software a third solution called
MapServer, was located. It achieved the two sought features, Internet GIs
tools and free of cost. According to information found in its home page (
http://mapserver.gis.umn.edu/home.html ), “MapServer is not a full-featured
GIS system, however, provide enough core functionality to support a wide
variety of web applications. Beyond browsing GIS data, MapServer allows users
to create "geographic image maps", that is, maps that can direct users to
content”.

70
Although, MapServer is seen as the optimal solution for the Chagas disease-
displaying problem, there is still one fact in favour of the prototype solution. It
is related to user’s behaviour.
Map server solutions like ArcIms, Autodesk or Map Server itself can deliver
unbelievable GIs features, however, there are still complicated tools to use by a
user who does not anything about GIS. Therefore, the percentage of the users
that used all these GIs tools is low. The user is limited to make simple queries
and manually analyse the result displayed. This lack of simplicity on the map
server solution converts the prototype’s simplicity in its main strength.
Simplicity is the feature needed in a tool that will be used by people with
different levels of education and Gis understandings. The most important
feature to have is the tool delivers the essential GI and descriptive data that
may help to make well-oriented decisions about Chagas disease control actions.

71
9 REFERENCES
9.1 REFERENCES
Carter John, Carter(2000), “Database Design and Programming – Database
Process”, McGraw Hill. London.
Gordon, V.S. and Bieman, J.M. Gordon and Bieman(1995). “Rapid prototyping:
lessons learned”. IEEE software, 12(1), 85-95. (Ch. 8).
Longley P A, GoodChild M F, Maguire D J, and Rind D W, Longley(2001),
“Geographic Information System and Science”.
Medinets David, Medinets(2000) “PHP 3. Programming Browser-based
Applications”. McGraw Hill. United States of America.
Mok, C. Mok(1996) “Designing Business”, Adobe Press, San Jose, CA.
Powell Thomas A., Powell(1998), “Web Site Engineering”, Prentice Hall. Upper
Saddle River.
Schofield C.J., Schofield(1994), “ TRIATOMINE Biology & Control”. London.
Sommerville Ian, Sommerville(2001), “Software Engineering”, 6th Edition,
Pearson Education Limited, Harlow. England, 172-191 (Ch.8)
9.2 WEB SITES
W3Schools.com, CSS(2002). “CSS Tutorial”, http://www.w3schools.com/css,
(accessed 24/09/2002).

72
Fiedler Kendall, Fiedler Stephanie. Fiedler(2002). “Internet GIs Solution For
Bermuda's Environmental Health Department “.
www.gita.org/members_only/downloads/kendell.pdf, (accessed 15/09/2002).
London School of Hygiene and Tropical Medicine, “A comparison of targeting
strategies for Chagas disease control in the Andean Region”, LSHTM(2002)
.http://www.lshtm.ac.uk/itd/units/dcvbu/research/colombia_menu.htm,
(accessed 15/09/2002).
Multi-Agency Internet Geographic Information Service (MAIGIS), MAIGIS
(2002) http://maigis.wmpho.org.uk (accessed 15/09/2002).
Pinto Dias J. C., Pinto(1992), “Epidemiology of Chagas Disease”,
http:dbbm.fiocruz.br/tropcical/chagas/chapter4.html, (accessed 22/07/2002).
Universidad del Valle de Guatemala Project, Guatemala(2002).
http://cc.cdc.uvg.edu.gt/MAIN/program%20review/GEOGRAFIC.htm, (accessed
15/09/2002).
WHO - World Health Organisations, “Infectious Diseases Home, Chagas”,
WHO(2002), http://www.who.int/health_topics/chagas_disease/en/, (accessed
22/07/2002) .

73
APPENDIX A: CHAGAS_STYLE_SHEET.CSS FILE CODE
body {background-color: EEEEEE}
h1 {color: #0033cc; text-align: center; text-decoration: overline; font-family: tahoma;font-size:
150%}
h2 {color: #0066cc; text-align: center;font-family: tahoma;font-size: 130%}
h3 {color: #0099cc; text-align: center;font-family: tahoma;font-size: 120%}
h4 {text-align: left; font-family: tahoma; font-size: 80%}
h5 {text-align: center;font-family: tahoma;font-size: 80%}
p {text-indent: 0cm;font-family: tahoma;font-size: 80%}
p.margin {margin-left: 0.5cm; margin-right: 0cm}
td {padding-left: 0cm;padding-right: 0cm;padding-top: 0cm}
ul.disc
{
list-style-type: disc
}
ul.circle
{
list-style-type: circle
}
ul.square
{
list-style-type: square
}
ul.none
{
list-style-type: none
}
img.normal
{
height: auto;
width: auto
}
img.big

74
{
height: 80px;
width: 100px
}
img.small
{
height: 252px;
width: 438px
}
a:link {color: #0000cc}
a:visited {color: #cc3399}
a:hover {color: #FF00FF}
a:active {color: #0000FF}

75
APPENDIX B: INDEX.HTML FILE CODE
<html> <head> <link rel="stylesheet" type="text/css" href="http://www.student.city.ac.uk/~at705/php/chagas_style_sheet.css" /> <title> Chagas GIS </title> </head> <body> <table border="1" width=80%> <tr> <td align = center> <h1>CHAGAS DISEASE - COLOMBIA</h1> </td> </tr> <tr> <td align = center> <h5> <a href="http://www.student.city.ac.uk/~at705/">Home</a> | <a href="http://www.student.city.ac.uk/~at705/php/query_data_form.php">Query System</a> | <a href="http://www.student.city.ac.uk/~at705/php/user_connection_form.php">Data Management Tool</a> | <a href="http://www.student.city.ac.uk/~at705/php/control_map_display.php">Control Priority Index Map</a> | <a href="http://www.who.int/tdr/diseases/chagas/default.htm">About Chagas Disease</a> | </h5> </td> </tr> <tr> <td><table border= 0 width=100%> <tr> <td> <table> <tr>
<td><h5>What is Chagas Disease? </h5><p class="margin">It is a chronic and incurable parasitic infection wide spread in South American. Current WHO estimates, its affects between 16 - 18 million people and with a further 100 million people at risk. This represents an average prevalence of about 4% of the total population of Latin America, although in some rural areas the local prevalence may exceed 75%. </p>
</td> <td valign=top rowspan=3><IMG class="small" SRC="http://www.student.city.ac.uk/~at705/images/chagas_presence.gif" WIDTH=520 HEIGHT=316</td> <td align = left> <p> The following links are part of a <b>Prototype Project</b> that allows you to query and display maps and relevant information about the presence of Chagas Disease in Colombia. </p>
<ul class="disc"> <li><h4><a ref="http://www.student.city.ac.uk/~at705/php/query_data_form.php"> <b>Query System</b></a></h4>
<li><h4><a ef="http://www.student.city.ac.uk/~at705/php/user_connection_form.php"> <b>Data Management</b></a></h4>

76
<li><h4><a href="http://www.student.city.ac.uk/~at705/php/control_map_display.php"> <b>Control Priority Index Map</b></a></h4> </ul> </td> </tr> </table> </td> </tr> <tr> <td align = center><H2> USEFUL LINKS </H2></td></tr> <tr> <td align = left> <p class="margin"> <a href=
"http://www.lshtm.ac.uk/itd/units/dcvbu/research/comparisontarget_venuzela&colombia.htm"> A comparison of targeting strategies for Chagas disease control</a><br /> <a href="http://maigis.wmpho.org.uk/">MAIGIS - health related data for the West Midlands
Region</a><br /> <a href="http://www.cdc.gov/ncidod/eid/vol8no7/01-0454.htm">Ecologic Niche Modelling for Chagas disease, Mexico</a><br />
</p> </td> </tr> </table> </td> </tr> </table> </body> </html>

77
APPENDIX C: QUERY_DATA_FORM.PHP FILE CODE <html> <head> <link rel="stylesheet" type="text/css" href="http://www.student.city.ac.uk/~at705/php/chagas_style_sheet.css" /> </head> <body > <table border="1" cellpadding="0" cellspacing="0"> <form method = "POST" action ="http://www.student.city.ac.uk/~at705/php/display.php?sort_var=municipality_name&sort_var1=states_name&base_map=$base_map" > <tr> <td center><h1>Query System</h1> </td> </tr> <tr ><td align =center width = 100% > <h5> <a href="http://www.student.city.ac.uk/~at705/">Home</a> | <a href="http://www.student.city.ac.uk/~at705/php/query_data_form.php">Query System</a> | <a href="http://www.student.city.ac.uk/~at705/php/user_connection_form.php">Data Management Tool</a> | <a href="http://www.student.city.ac.uk/~at705/php/control_map_display.php">Control Priority Index Map</a> | <a href="http://www.who.int/tdr/diseases/chagas/default.htm">About Chagas Disease</a> | </h5> </td> </tr> <tr> <td width = 100% > <p class="margin"><b>To make a query select: </b><br> Any of <b>three infection variables</b>, a target geographic zone :<br> <b>state</b> or <b>all states</b>,a specific <b>year</b> and a <b>base map</b> to be used as background. </p> </td> </tr> <tr> <td width = 100% > <p class="margin"><b>Type of infection variable: </b> <br> <input TYPE="radio" NAME="infection_var" VALUE="blood" checked>Blood Test <br> <input TYPE="radio" NAME="infection_var" VALUE="house">House Quality <br> <input TYPE="radio" NAME="infection_var" VALUE="bugs">Triatomine Presence<br> </p> </td> </tr> <tr> <td width = 100% > <p class="margin"><b>Target zone: </b> <?php $db = mysql_connect("localhost", "at705", "m0d13"); if ($db) { mysql_select_db("at705",$db); $sql = "SELECT name FROM states ORDER BY name"; $result = mysql_query($sql,$db);

78
echo "<select name= name size = 1>"; echo "<option value =\"all states\">All States</option>"; while ($row = mysql_fetch_array($result)) { $name = $row["name"]; echo "<option value=\"$name\">$name</option>"; } echo "</select>"; } else { echo "Unable to connect to database!"; } ?> </p> </td> <tr> <td width = 100% > <p class="margin"><b>Base Map to display the query result on: </b><br> <input type="radio" name="base_map" value="alt" >Altitude<br> <input type="radio" name="base_map" value="land">Land Cover<br> <input type="radio" name="base_map" value="pop" checked>Census 1993<br> <input type="radio" name="base_map" value="prov">Index of Poverty 1993 (just for All States)<br> </p> </td> </tr> <tr bgcolor=EEEEEE> <td width = 100% > <p class="margin"><b>Choose the year to be queried ?</b> <?php if ($db) { $sql = "SELECT DISTINCTROW year_sample FROM con_serology_mun ORDER BY year_sample"; $result = mysql_query($sql,$db); echo "<select name= year size = 1>"; while ($row = mysql_fetch_array($result)) { $year_i = $row["year_sample"]; echo "<option value=\"$year_i\">$year_i</option>"; } echo "</select>"; } else { echo "Unable to connect"; } ?> </p> </td> </tr> <tr> <td width = 100% align= center> <br> <input type="submit" name="Submit" value="Submit">       <input type="reset" value=" Clear "> <br> <br> </td> </tr> </table> </form> </body> </html>

79
APPENDIX D: DISPLAY.PHP FILE CODE <html> <head> <link rel="stylesheet" type="text/css" href="http://www.student.city.ac.uk/~at705/php/chagas_style_sheet.css" /> <title> Chagas GIS </title> </head> <body> <table > <tr> <td align = center width = 100% ><h1>Query System Result</h1> </td> </tr> <tr><td align =center width = 100% > <h5> <a href="http://www.student.city.ac.uk/~at705/">Home</a> | <a href="http://www.student.city.ac.uk/~at705/php/query_data_form.php">Query System</a> | <a href="http://www.student.city.ac.uk/~at705/php/user_connection_form.php">Data Management Tool</a> | <a href="http://www.student.city.ac.uk/~at705/php/control_map_display.php">Control Priority Index Map</a> | <a href="http://www.who.int/tdr/diseases/chagas/default.htm">About Chagas Disease</a> | </h5> </td> </tr> <tr><td width = 100%> <?php $db = mysql_connect("localhost", "at705", "m0d13"); if (! $db) { echo "Unable to connect to database!"; } else { mysql_select_db("at705",$db); echo("<h5>Information about $infection_var for $name in Colombia in year $year</h5>\n"); echo("<p><table border=1>\n"); if ($infection_var == 'blood') { if ($name == "all states") { $image_name = "all_states_".$infection_var."_".$base_map.".jpg"; $sql = "SELECT name as states_name, number_positive, number_negative, total_sampled, round(((100*number_negative)/total_sampled),2) as negatives, round(((100*number_positive)/total_sampled),2) as positives FROM con_serology_states, states, municipalities WHERE ((states.state_id = con_serology_states.state_id) and (municipalities.state_id = states.state_id) and (con_serology_states.year_sample = '$year')) GROUP BY states_name ORDER BY '$sort_var1'"; $result = mysql_query($sql,$db); $num_records = mysql_num_rows($result);

80
echo("<th><table border=0 width = 100%><tr><td align=center><a href=\"http://www.student.city.ac.uk/~at705/php/display.php?sort_var1=states_name&year=$year&name=$name&base_map=alt&infection_var=$infection_var\">Altitud</a></td><td align=center><a href=\"http://www.student.city.ac.uk/~at705/php/display.php?sort_var1=states_name&year=$year&name=$name&base_map=land&infection_var=$infection_var\">Land Cover</a></td><td align=center><a href=\"http://www.student.city.ac.uk/~at705/php/display.php?sort_var1=states_name&year=$year&name=$name&base_map=pop&infection_var=$infection_var\">Census</a></td><td align=center><a href=\"http://www.student.city.ac.uk/~at705/php/display.php?sort_var1=states_name&year=$year&name=$name&base_map=prov&infection_var=$infection_var\">Povertry</a></td></tr></table></th><th><a href=\"http://www.student.city.ac.uk/~at705/php/display.php?sort_var1=states_name&year=$year&name=$name&base_map=$base_map&infection_var=$infection_var\">State</a></th><th>Positive</th><th><a href=\"http://www.student.city.ac.uk/~at705/php/display.php?sort_var1=positives&year=$year&name=$name&base_map=$base_map&infection_var=$infection_var\">% Pos.</a></th><th>Negative</th><th><a href=\"http://www.student.city.ac.uk/~at705/php/display.php?sort_var1=negatives&year=$year&name=$name&base_map=$base_map&infection_var=$infection_var\">% Neg.</a></th><th><a href=\"http://www.student.city.ac.uk/~at705/php/display.php?sort_var1=total_sampled&year=$year&name=$name&base_map=$base_map&infection_var=$infection_var\">Total Sampled</a></th></tr>\n"); echo("<tr><td valign=top rowspan=\"$num_records\">"); echo("<img src=\"http://www.student.city.ac.uk/~at705/images/blood/$image_name\" width=\"371\" height=\"507\"></td>"); while ($row = mysql_fetch_array($result)) { $s_name = $row["states_name"]; $positive = $row["number_positive"]; $negative = $row["number_negative"]; $total = $row["total_sampled"]; $p_negative = $row["negatives"]; $p_positive = $row["positives"]; echo("<td align = center>$s_name</td><td align = center>$positive</td><td align = center>$p_positive</td><td align = center>$negative</td><td align = center>$p_negative</td><td align=center>$total</td></tr>\n"); } } else { $sql = "SELECT municipality_name, number_positive, number_neative, total_sampled, states.name,round(((100*number_neative)/total_sampled),2) as negatives, round(((100*number_positive)/total_sampled),2) as positives FROM municipalities, con_serology_mun, states WHERE ((municipalities.municipality_id = con_serology_mun.municipality_id) and (municipalities.state_id = states.state_id) and (states.name = '$name')and (con_serology_mun.year_sample = '$year')) ORDER BY $sort_var"; echo("<tr><th><table border=0 width=100%><tr><td align=center><a href=\"http://www.student.city.ac.uk/~at705/php/display.php?sort_var=municipality_name&year=$year&name=$name&base_map=alt&infection_var=$infection_var\">Altitud</a></td><td align=center><a href=\"http://www.student.city.ac.uk/~at705/php/display.php?sort_var=municipality_name&year=$year&name=$name&base_map=land&infection_var=$infection_var\">Land Cover</a></td><td align=center><a href=\"http://www.student.city.ac.uk/~at705/php/display.php?sort_var=municipality_name&year=$year&name=$name&base_map=pop&infection_var=$infection_var\">Census</a></td><

81
/tr></table></th><th><a href=\"http://www.student.city.ac.uk/~at705/php/display.php?sort_var=municipality_name&year=$year&name=$name&base_map=$base_map&infection_var=$infection_var\">Municipality</a></th><th>Positives</th><th><a href=\"http://www.student.city.ac.uk/~at705/php/display.php?sort_var=positives&year=$year&name=$name&base_map=$base_map&infection_var=$infection_var\">%Pos.</a></th><th>Negatives</th><th><a href=\"http://www.student.city.ac.uk/~at705/php/display.php?sort_var=negatives&year=$year&name=$name&base_map=$base_map&infection_var=$infection_var\">%Neg.</a></th><th><a href=\"http://www.student.city.ac.uk/~at705/php/display.php?sort_var=total_sampled&year=$year&name=$name&base_map=$base_map&infection_var=$infection_var\">Total Sampled</a></th></tr>\n"); $image_name = $name."_".$infection_var."_".$base_map.".jpg"; $result = mysql_query($sql,$db); $num_records = mysql_num_rows($result); echo("<tr><td valign=top rowspan=\"$num_records\">"); echo("<img src=\"http://www.student.city.ac.uk/~at705/images/blood/$image_name\" width=\"365\" height=\"483\"></td>"); while ($row = mysql_fetch_array($result)) { $s_name = $row["municipality_name"]; $positive = $row["number_positive"]; $negative = $row["number_neative"]; $total = $row["total_sampled"]; $p_negative = $row["negatives"]; $p_positive = $row["positives"]; echo("<td align = left><a href=\"http://www.student.city.ac.uk/~at705/php/municipality.php\">$s_name</a></td><td align = center>$positive</td><td align = center>$p_positive</td><td align = center>$negative</td><td align = center>$p_negative</td><td align=center>$total</td></tr>\n"); } } } echo("</table>\n"); echo("</p>"); } ?> <br> </td> </tr> </table> </body> </html>

82
APPENDIX E: USER_CONNECTION_FORM.PHP FILE CODE
<html> <head> <link rel="stylesheet" type="text/css" href="http://www.student.city.ac.uk/~at705/php/chagas_style_sheet.css" /> <title>Admin connection form</title> </head> <body > <table border="1" cellpadding="0" cellspacing="0"> <tr> <td width = 100%> </td> </tr> <form method = "POST" action ="http://www.student.city.ac.uk/~at705/php/data_management_tool.php"> <tr> <td align = center><h1><b>USER'S AUTHENTICATION FORM</b></h1> </td> </tr> <tr><td align =center width = 100% > <h5> <a href="http://www.student.city.ac.uk/~at705/">Home</a> | <a href="http://www.student.city.ac.uk/~at705/php/query_data_form.php">Query System</a> | <a href="http://www.student.city.ac.uk/~at705/php/user_connection_form.php">Data Management Tool</a> | <a href="http://www.student.city.ac.uk/~at705/php/control_map_display.php">Control Priority Index Map</a> | <a href="http://www.who.int/tdr/diseases/chagas/default.htm">About Chagas Disease</a> | </h5> </td> </tr> <tr> <td width = 100% > <table> <tr> <td><p class="margin">Type your user name and password.</p></font> </td> </tr> <tr><td><p class="margin">User Name:</p></td> <td><input name="user" value="" size=20 maxlength=20 ></td><td align =center><input type="submit" value="Login"></td> </tr> <tr> <td><p class="margin">Password:</p></td><td><input type="password" name="pass" size=20></td><td></td> </tr> </td> </table> </tr> </table> </form> </body> </html>
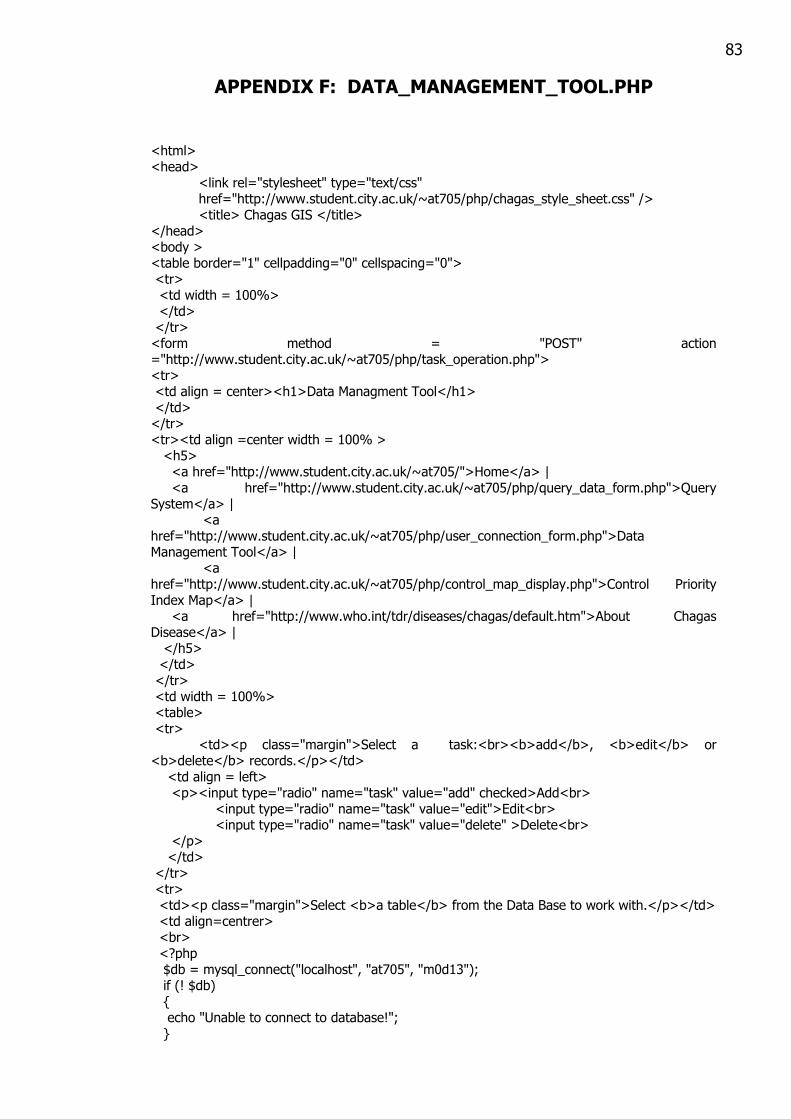
83
APPENDIX F: DATA_MANAGEMENT_TOOL.PHP
<html> <head> <link rel="stylesheet" type="text/css" href="http://www.student.city.ac.uk/~at705/php/chagas_style_sheet.css" /> <title> Chagas GIS </title> </head> <body > <table border="1" cellpadding="0" cellspacing="0"> <tr> <td width = 100%> </td> </tr> <form method = "POST" action ="http://www.student.city.ac.uk/~at705/php/task_operation.php"> <tr> <td align = center><h1>Data Managment Tool</h1> </td> </tr> <tr><td align =center width = 100% > <h5> <a href="http://www.student.city.ac.uk/~at705/">Home</a> | <a href="http://www.student.city.ac.uk/~at705/php/query_data_form.php">Query System</a> | <a href="http://www.student.city.ac.uk/~at705/php/user_connection_form.php">Data Management Tool</a> | <a href="http://www.student.city.ac.uk/~at705/php/control_map_display.php">Control Priority Index Map</a> | <a href="http://www.who.int/tdr/diseases/chagas/default.htm">About Chagas Disease</a> | </h5> </td> </tr> <td width = 100%> <table> <tr> <td><p class="margin">Select a task:<br><b>add</b>, <b>edit</b> or <b>delete</b> records.</p></td> <td align = left> <p><input type="radio" name="task" value="add" checked>Add<br> <input type="radio" name="task" value="edit">Edit<br> <input type="radio" name="task" value="delete" >Delete<br> </p> </td> </tr> <tr> <td><p class="margin">Select <b>a table</b> from the Data Base to work with.</p></td> <td align=centrer> <br> <?php $db = mysql_connect("localhost", "at705", "m0d13"); if (! $db) { echo "Unable to connect to database!"; }

84
else { mysql_select_db("at705",$db); $sql = "SELECT user_name, user_pass FROM users WHERE ((user_name= '$user') and (user_pass='$pass'))"; $result = mysql_query($sql,$db); $num_records = mysql_num_rows($result); if ($num_records == 0) echo "User or password invalid. Use the <b>Data Management Tool</b> option on the navigation bar"; else { $sql = "SHOW tables"; $result = mysql_query($sql,$db); echo "<select name= Tables_in_at705 size = 7>"; while ($row = mysql_fetch_array($result)) { $name = $row["Tables_in_at705"]; echo "<option value=\"$name\">$name</option>"; } echo "</select>"; } } ?> </td> </tr> <tr align = center> <td colspan = "2"> <br> <input type="submit" name="Submit" value="Submit">       <input type="reset" value=" Clear "> <br> </td> </tr> </table> </tr> </table> </form> </body> </html>

85
APPENDIX G: CONTROL_MAP_DISPLAY.PHP
<html> <head> <link rel="stylesheet" type="text/css" href="http://www.student.city.ac.uk/~at705/php/chagas_style_sheet.css" /> <title> Chagas GIS </title> </head> <body> <table> <tr> <td align = center width = 100% ><h1>Control Priority Index Map</h1> </td> </tr> <tr><td align =center width = 100% > <h5> <a href="http://www.student.city.ac.uk/~at705/">Home</a> | <a href="http://www.student.city.ac.uk/~at705/php/query_data_form.php">Query System</a> | <a href="http://www.student.city.ac.uk/~at705/php/user_connection_form.php">Data Management Tool</a> | <a href="http://www.student.city.ac.uk/~at705/php/control_map_display.php">Control Priority Index Map</a> | <a href="http://www.who.int/tdr/diseases/chagas/default.htm">About Chagas Disease</a> | </h5> </td> </tr> <tr> <td width = 100% > <?php $db = mysql_connect("localhost", "at705", "m0d13"); if (! $db) { echo "Unable to connect to database!"; } else { mysql_select_db("at705",$db); echo("<p><table border=1 cellpadding=4>\n"); $image_name = "control_index_map_colombia.jpg"; echo("<tr><th>Map</th><th>State</th><th>Infection Index </th><th>Triatomine Presence Index</th><th>House Quality Index</th><th>Real Triatomine Presence Index</th><th>Control Priority Index</th></tr>\n"); $sql = "SELECT name, infection_index, presene_triatomine_index, house_index, real_triatomine_presence_indez FROM states, control_map_data WHERE (states.state_id = control_map_data.state_id) ORDER BY name"; $result = mysql_query($sql,$db); $num_records = mysql_num_rows($result); echo("<tr><td align = center rowspan=\"$num_records\">"); echo("<img src=\"http://www.student.city.ac.uk/~at705/images/$image_name\" width=\"356\" height=\"495\"></td>"); while ($row = mysql_fetch_array($result)) { $s_name = $row["name"]; $infection = $row["infection_index"];
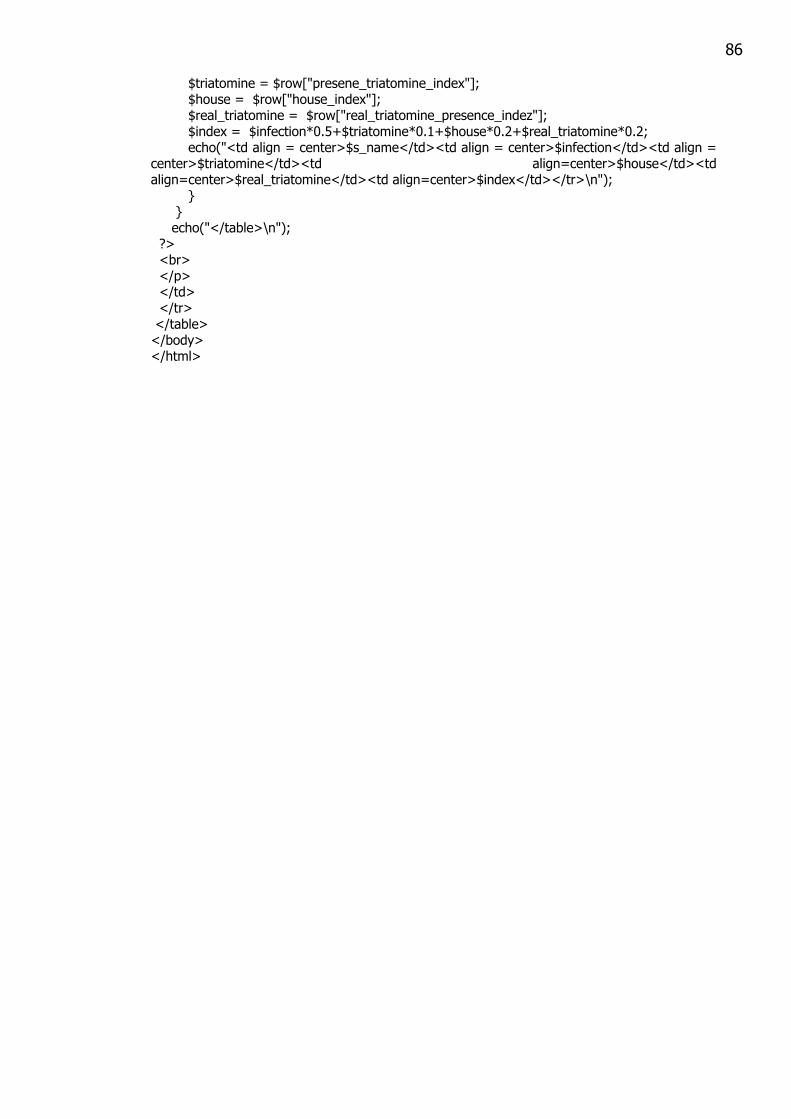
86
$triatomine = $row["presene_triatomine_index"]; $house = $row["house_index"]; $real_triatomine = $row["real_triatomine_presence_indez"]; $index = $infection*0.5+$triatomine*0.1+$house*0.2+$real_triatomine*0.2; echo("<td align = center>$s_name</td><td align = center>$infection</td><td align = center>$triatomine</td><td align=center>$house</td><td align=center>$real_triatomine</td><td align=center>$index</td></tr>\n"); } } echo("</table>\n"); ?> <br> </p> </td> </tr> </table> </body> </html>