development of a irsn code for dust mobilisation problems in iter
TRANSCRIPT

D
J
a
b
c
d
a
KIFSSD
1
a(gdta(tpjatpHcEe
0d
Fusion Engineering and Design 85 (2010) 2274–2281
Contents lists available at ScienceDirect
Fusion Engineering and Design
journa l homepage: www.e lsev ier .com/ locate / fusengdes
evelopment of a IRSN code for dust mobilisation problems in ITER
.R. García-Cascalesa,∗, F. Vera-Garcíaa, J. Zueco-Jordána, A. Bentaibb, N. Meynetb, J. Vendelc, D. Perraultd
Thermal and Fluid Engineering Department, Technical University of Cartagena, 30202 Cartagena, Murcia, SpainInstitut de Radioprotection et Sûreté Nucléaire (IRSN)/DSR, BP17, 92262 Fontenay-aux-Roses Cedex, FranceIRSN/DSU, BP68, 91192 Gif-sur-Yvette Cedex, FranceIRSN/DSU, 550 rue de la tramontane, 30 402 Villeneuve lez Avignon, France
r t i c l e i n f o
eywords:TERusionafetycenariosust mobilisation
a b s t r a c t
The analysis of accident scenarios in the ITER Fusion facility such as loss of vacuum accidents (LOVA) oringress of coolant accidents (ICE) is of primary importance in order to evaluate pressure loads generatedby a potential dust explosion or mobilisation. Thus the DUST code for simulation of dust mobilisation hasbeen developed in close collaboration between IRSN (France) and the Technical University of Cartagena(Spain), on the basis of the CAST3M code developed at the Commissariat à l’Energie Atomique (CEA,France). A high dilute model for the analysis of particle and gas mixtures has been implemented in the
code. This type of mixtures is expected in the case of a LOVA inside ITER. The code will permit the analysisof dust spatial distribution, remobilisation and entrainment, and explosion. Special attention is paid tothe study of the closure relationships which characterise the physical phenomena involved in this sort ofproblems and a model based on the force balance has been implemented as well. The implementation ofthe adhesion/re-suspension model is carefully described. To test the code qualitatively, two benchmarkshave been studied taking into account the influence of different parameters. Some conclusions are finally drawn.. Introduction
The analysis of accident scenarios in the ITER Fusion facility suchs loss of vacuum accidents (LOVA) or ingress of coolant accidentsICE) is of primary importance in order to evaluate pressure loadsenerated by a potential dust explosion or mobilisation. In the lastecade many models have been developed for the analysis of mix-ures of gas and particles. Most of them lay between two differentpproximations: Eulerian–Eulerian (E–E) or Eulerian–LagrangianE–L) approximations. Eulerian methods treat solid phase as a con-inuum (like a fluid), they are not suitable for large and heavyarticles [1]. Instead, in the Lagrangian approximations, the tra-
ectories of individual particles are pursued and can be applied tony particle size. Particle-to-wall interaction and particle to par-icle interaction can be taken into account based on the physicalroperties of the materials concerned. According to Kosinski and
offmann [2], in the E–L approach, the particles are tracked in theomputational domain which is physically more correct than the–E models. It makes much easier the implementation of phenom-na like particle–particle and particle–wall interactions, and some∗ Corresponding author. Tel.: +34 968325991; fax: +34 968325999.E-mail address: [email protected] (J.R. García-Cascales).
920-3796/$ – see front matter © 2010 Elsevier B.V. All rights reserved.oi:10.1016/j.fusengdes.2010.09.014
© 2010 Elsevier B.V. All rights reserved.
particle–fluid interactions (like the lift force, for example). The useof an E–E approach, while economical and suited to dense mixtureswith two-way coupling requires good phenomenological models,usually based on kinetic theories for granular flows.
During the last years the authors have been extending success-fully several approximate Riemann solvers such as AUSM+up, Roe,and van Leer Hanel solvers to analyse this sort of problems. In thecase of the solid phase some extended versions of the AUSM+ orRusanov schemes have been used [3]. Thus, the DUST code forsimulation of dust mobilisation has been developed in close col-laboration between IRSN (France) and the Technical University ofCartagena (Spain), on the basis of the CAST3M code developedat the Commissariat à l’Energie Atomique (CEA, France). A highdilute model for the analysis of particle and gas mixtures has beenimplemented in the code. This type of mixtures is that expectedin the case of a LOVA inside ITER. The code permits the analy-sis of dust spatial distribution, remobilisation and entrainment,and explosion to be carried out. Some assumptions such as par-ticle incompressibility and a negligible effect of pressure on the
solid phase make the model quite appealing from the mathemati-cal point of view as the systems of equations that characterise thebehaviour of the phases are decoupled. The code allows multidi-mensional problems in unstructured grids to be studied. It is basedon an Eulerian–Eulerian finite volume approximation where the
ineeri
n[
tdfpFtmbotaalaCwchirbac
aa
2
aAcCdDfFFgmnnNPQrRRRTTuVz˛����ω˝
J.R. García-Cascales et al. / Fusion Eng
umerical fluxes at each element interface are evaluated explicitly3].
In this paper, the different models considered to characterisehe physical phenomena taking place in this kind problems areescribed. In the study of re-suspension of particles from a sur-ace when a turbulent flow passes by and interacts with thesearticles three theories are considered in the existing literature:orce balance, momentum balance, or an energy balance. The firstwo approximations consider the forces acting on a particle by
eans of either the force or the momentum balance; the interactionetween fluid and particle is enough to provoke the re-entrainmentf the particle. The third approximation is based on the energyransferred to a particle by the fluid which is balanced with thedhesion energy of the particle to the surface. Unlike, the otherpproaches, this model considers the particle oscillating in an equi-ibrium position so the particle leaves the well where it is when theccumulated energy accumulated exceeds the adhesion potential.onsidering the Eulerian nature of the approach followed in thisork and that the energy balance means considering the statisti-
al nature of the process, only the forces involved in the processesave been included in the balance equations. Despite the difficulty
n the characterisation of the different physical phenomena, theesults obtained are satisfactory enough for the type of problemseing analysed. It should be remarked that this is not a force bal-nce method as that found in Lagrangian models (i.e. FZK – Gasflowode).
Some numerical benchmarks used for the validation of the codere considered. Numerical results are shown and some conclusionnd ideas for future works are finally drawn.
. Nomenclature
effective contact surface areaprojected area; Hamaker constant
m, cp specific heatsD drag coefficient
diametergas-particle drag force
s sliding friction factorforce
d drag forceacceleration of gravityparticle massnumber of particles per unit volume
p number of particlesu Nusselt numberr Prandtl number
interfacial convective heat transferdistance
adh ratio of adherencem average ratio between two particlese Reynolds number
interaction termtemperaturevelocityvolumedistancevolume fraction; intrinsic adhesivenesssurface energy or heat specific ratio depending on the case
kinematic viscositydensityparticle concentrationrotationspin parameterng and Design 85 (2010) 2274–2281 2275
Subscripts and superscriptsA adhesionb buoyantC cohesivef frictiong gas phasen normalJKR Johnson, Kendall and Robertsp solid phase (particles)r relativeT totalvdW van der WaalsW wall
3. Closure laws
The Eulerian approach considered in this work is characterisedby the set of conservation equations of mass, momentum, andenergy of each phase
∂
∂t(˛�g) + �∇.(˛�g �ug) = 0
∂
∂t(˛�g �ug) + �∇.(˛�g ⊗ �ug + ˛pg) = pg
�∇.˛ + ˛�g �g + �Fd + �Flift
∂
∂t(˛�gEg) + �∇.(˛�g �ugHg + ˛pg) = −pg
∂˛
∂t+ ˛�g �ug · �g
+(�Fd + �Flift)�ur + Qg
∂
∂t((1 − ˛)�p �up) �∇.((1 − ˛)�p �up) = 0
∂
∂t((1 − ˛)�p �up) �∇.((1 − ˛)�p �up ⊗ �up + (1 − ˛)pp) = −pg
�∇.˛
+(1 − ˛)(�p − �g)�g − �Fd − �Flift + �Fadh − �Fwf
∂
∂t((1 − ˛)�pEp) �∇.((1 − ˛)�p �upEp + (1 − ˛)pp) = −pg
∂˛
∂t+(1 − ˛)(�p − �g)�up · �g − (�Fd + �Flift)�ur − Qg
where �g is the gravity vector, Eg and Ep are the total internal energyof the gas and the solid phases.
Different equations have to be considered in order to close theproblem. These correlations accounts for many physical phenom-ena such as gravity, viscous, and non-viscous friction, lift, buoyancy,and so on. In them, other interactions such heat transfer, energygeneration, and phase change could also be included. When re-entrainment and re-suspension are present, special care must betaken. Some approximations to characterise these processes areintroduced in what follows.
3.1. Re-entrainment models
In the study of re-suspension of particles from a surface whena turbulent flow passes by and interacts with these particles threetheories are considered:
• Force balance• Momentum balance• Energy balance
The first two approximations consider the forces acting on aparticle by means of either the force or the momentum balance;the interaction between fluid and particle is enough to provoke the
re-entrainment of the particle. The third approximation is based onthe energy transferred to a particle by the fluid which is balancedwith the adhesion energy of the particle to the surface. Unlike, theother approaches, this model considers the particle oscillating inan equilibrium position so the particle leaves the well where it is
2276 J.R. García-Cascales et al. / Fusion Engineeri
Ft
wp
cfbtetb
3
mtcceda
3tc
–f
F
wCu
F
a
C
�up
chsa
ig. 1. Forces acting on a single sphere at rest on a wall with a steady, fully developedurbulent flow.
hen the accumulated energy accumulated exceeds the adhesionotential.
In the case of the force balance, two types of forces are basi-ally considered: aerodynamic and attractive forces. Aerodynamicorces are mainly drag and lift forces. Lift forces elevate the particley introducing it in the fluid stream. Attractive forces instead, tryo avoid re-entrainment. The model followed in this work consid-rs the different forces acting on the particles in such a way thathey are included in the balance equations which characterise theehaviour of the gas and particle mixture.
.1.1. Force balance modelThis model is rather utilised due to its simplicity. The approxi-
ations based on this model consider that particle re-entrainmentakes place depending on the resultant force from the force balanceonsidered on this particle. In order to describe it rigorously, let usonsider the forces acting on a particle such as that in Fig. 1. Therexist horizontal and normal forces: horizontal forces are the fluid-rag force and the frictional force. The normal forces to the wall aredhesion, gravitational, buoyant and lift forces.
.1.1.1. Drag force. Several approaches are available in the code forhe drag interaction between the phases (in them spherical parti-les are supposed):
A simple relationship was proposed by Otterman and Levine [4]this is used in the shock tube analysis carried out in [5]. Thus, the
orce per unit volume is given by:
d = − �
mD (1)
here D, the drag force acting on a particle is, D =D(1/8)�d2
p�g(�ug − �up)|�ug − �up| and then the drag force pernit volume can be written as
�d = �
mCD
18
�d2p�g(�ug − �up)|�ug − �up| (2)
nd the drag coefficient is given by:
D = 0.48 + 28 Re−0.85 (3)
/m is the number of particles per unit volume in the control vol-me, �, the particle concentration (kg/m3) and m, the mass of aarticle.
Eq. (3) may be used for Re between 10 and 103 (although oneould go further). For low Re, Stokes law may be adopted and forigher Re, up to 105, Newton’s law could be considered. Other pos-ible expressions and more interesting aspects on their ranges ofpplicability may be found in [6–8].
ng and Design 85 (2010) 2274–2281
3.1.1.2. Lift forces. Lift forces acting on a particle are due to particlerotation [8]. This rotation may be caused by velocity gradient ormay be imposed from other sources such as particle contact andrebound from another surface. Several models can be considered:
Saffman force is due to pressure distribution developed on aparticle due to the rotation induced by a velocity gradient:
�FSaffman = 1.61d2p(g�g)1/2|ωc |1/2((�ug − �up) × �ωc (4)
where �ωc = �∇ × �ug . According to De los Reyes Castelo [9], Saffmanforce overestimates lift near the walls – there the use of Goren forceis proposed. In Dust code, the correction proposed by McLaughlinhas been implemented. It was suggested in [8]:
Flift Saffman
FSaffman=
⎧⎨⎩
(1 − 0.3314ˇ1/2) exp(
−Rer
10
)+ 0.3314ˇ1/2 Re ≤ 40
0.0524(ˇ Rer)1/2 Rer > 40
(5)
where Rer is the Reynolds number based on the relative velocitybetween the solids and the gas, the parameter ˇ:
ˇ = dp
2|�up − �ug | |ωc |0.005 < ˇ < 0 (6)
Magnus force is due to rotation of the particle.
�FMagnus = 12
�g |�ug − �up|CLRA
((�ug − �up) × �ωr
| �ωr |
)(7)
where A is the area projected by the particle, | �ωr | = | �ωp − (1/2) �∇ ×�ug |, �ωp = �∇ × �up, and CLR = min(0.5 and 0.5 ). The spin parameteris given by ˝ = dp| �ωr |/2|�ug − �up|.
These expressions have also been taken from [8].Finally, the expression of the lift force should be expressed as a
force per unit volume to be included in the initial system of con-servation equations
�Flift = − �
m(�FMagnus + �FSoffman)
3.1.1.3. Adhesion forces. Particle adhesion is caused by surface andfield forces (such as van der Waals, electrostatic, and/or magneticforces), material bridges between particles surfaces (water bridge –wetness), and interlocking. An interesting state of the art on adhe-sion forces and the interaction between these forces in ultrafineparticles may be found in [10].
3.1.1.3.1. van der Waals forces. The London–van der Waalsforces are molecular forces associated to the atomic structure ofthe molecules. They are responsible for the adhesion and cohe-sion between particles. Different expressions may be found in theexisting literature depending on the surfaces considered.
• Force between a spherical particle and a flat wall is given by
Fpw = Adp
12Z2(8)
where A is the Hamaker constant [11]. In Cabrejos and Klinzing[12], A is not given for a specific material and the value proposedis 10−12 erg.
• Force between two spheres with the same diameter [11]:
Fpp = Adp
24Z2(9)
There are expressions which take into account the deformationof particles and surfaces or their roughness [8,11]. Values of theHamaker constant can be found in the existing literature for sev-eral materials [8]. Li et al. [13] provide an expression for theHamaker constant, A of a solid interacting with a medium. Some

ineering and Design 85 (2010) 2274–2281 2277
bm
F
wt
R
Spf[
cip
F
Scf
F
w
i
F
ieip
otlvbbtmo
R
J.R. García-Cascales et al. / Fusion Eng
authors like Reed propose theoretical models for the estimationof the adhesion forces [14]. The most popular estimate is thatgiven by Johnson, Kendall and Robert [15], known as JKR model[9]. They suggest that the adhesion force is the result of the combi-nation of the elastic, potential, and surface energies. So, the forcenecessary to take a particle from the surface is given by
FAJKR = 32
y�rp (10)
where � is the surface energy per surface unit, whose value isunknown for most surfaces. It is obtained by considering experi-mental data.
3.1.1.3.2. Cohesion force. This force is related to the interactionetween particles. It makes particles stay stuck together. In [9] a JKRodel is proposed:
CJKR32
y�Rm (11)
here Rm is the average ratio between two particles, assuminghem spherical:
m = rp1rp2
rp1 + rp2(12)
elf-adhesive or cohesive forces must be considered when a bed ofarticles is studied. These are mainly caused by the van der Waalsorces and their effect depends on the particles size and geometry11].
Two types of interaction may be considered [11]; firstly, theohesion force between a particle and a planar bed of particles –.e., for a tetrahedral configuration the cohesion force between aarticle and the other three is
Cps = 3(FvdW pp · cos �) ≈ FvdW pw = A
12Z2dp (13)
econdly, the interaction between two layers of particles. In thisase, the layers are considered as two flat parallel surfaces, and theorce per unit surface (N/m2) may be calculated as:
Css = A
6�Z3(N/m2) (14)
here z is the distance between surfaces.In this case, the interaction between particles that are initially
n contact is approximated by
Cps = Adp
24Z2(N/m2) (15)
3.1.1.3.3. Practical implementation. In an Eulerian approach, its not possible to know how many particles are in contact as thexact position of each particle is not known; the only availablenformation is the position of the element being studied and thearticle concentration in it.
To estimate the value of the adhesion forces between particles –r between particles and walls, it is necessary to establish a criteriono decide if the adhesion forces must be considered or not. To do so,et us assume a uniform distribution of the particle in each contrololume and let us introduce a ratio to characterise the proximityetween particles and call it adherence ratio (Radh) so it is definedy the relation between Vele
p , the maximum volume occupied byhe particles of an element if all of them are in contact with the
aximum separation between them (see Fig. 2) and Vele the volumef the element:
adh = Velep
Vele(16)
Fig. 2. General control volume.
This Velep volume can be calculated as the volume of a cube with
side equal to the particle diameter times the number of particles(Fig. 2), so
Velep = np · d3
p (17)
where spherical particles with a diameter dp are assumed.Let us relate the number of particle np with the particle concen-
tration � in a control volume by considering that the concentrationis
� = mp
Vele= npVp�p
Vele(18)
where mp is the mass of all the particles, Vele is the volume of theelement, np is the number of particles, �p is the particle density,and Vp is the volume of a particle.
Assuming spherical particles, the volume of a particle is Vp =1/6�d3
p . So, substituting in the previous equation:
� = n�pVp
Vele= n�p�d3�p
6Vele(19)
re-grouping the different terms, the following expression isobtained for the number of particles the element inside the controlvolume:
np = 6�Vele
�d3p�p
(20)
substituting np in (3) the following expression for the ratio definedin Eq. (2) is obtained
Radh = Velep
Vele= 6
�
�
�p(21)
Finally, the criterion defined to decide if adhesion forces are ofapplication is
if Radh ≥ 1 ⇒ Feleadh
= np
2Fadh pp
if Radh < 1 ⇒{
if Radh > ı ⇒ Feleadh
= np
2Fadh pp
if Radh < ı ⇒ Feleadh
= 0
(22)
where ı is a threshold value, below which the particles are so farone from another that adhesion is not possible (in the preliminarycalculation carried out in this work ı has had a value of 0.5).
For the calculation of the adhesion force between particles andthe wall, we should multiply the adhesion force acting on a particle
by the number of particles influenced by the action of the wall,Fadh pw . Assuming a uniform distribution of particles in a controlvolume which is in contact with a wall as is depicted in Fig. 3, anexpression for the number of particles in contact with a wall, n′p canbe derived.

2278 J.R. García-Cascales et al. / Fusion Engineering and Design 85 (2010) 2274–2281
a
�
sta
S
Tm
n
Tta
F
wpc
3a
F
w
3
g
F
wct0
TT
F
Simulated slice
30mm 30mm
Air jet hole
Ø1mm 6.5mm
[7,8]:Viscous wall friction has been neglected in the case of the gas
phase. Wall heat transfer, Virtual and Basset forces, and electro-static forces have not been considered in this model.
Fig. 3. Control volume next to the wall.
If we consider the particle concentration definition (Eq. (19))nd make the following approximation:
= mp
Vele= npVp�p
Vele≈ npVp�p
Sele(23)
o SeleW is the surface of the control volume in contact with the wallhat is being considered in the analysis, �p is the particle density,nd Spw is the surface projected by a particle near the wall:
pw = �
4d2
p (24)
hus, the number of particles in contact with the wall is approxi-ated by
pw = 4�
� · SeleW
�pd2p
(25)
he adhesion force of a particle to a wall must be multiplied byhe number of particles adhered to the wall, npw , to obtain thedherence force to the wall of the control volume.
adh pw = npw · Fadh pw (26)
here Fadh pw could be calculated by using any of the expressionsresented above (van der Waals or JKR forces). Its direction will behosen arbitrarily opposite to the particle movement.
.1.1.4. Buoyant and gravity force. The buoyancy and gravity effectsre considered by means of
�b = �g(�p − �g) (27)
here �p is the particle density and �g is the gas density.
.1.1.5. Wall friction.3.1.1.5.1. Solid phase. The frictional force for the solid phase is
iven by the following expression
f = fsFn (28)
here fs is the coefficient of sliding friction [11]. It is an empiricoefficient which depends on the particle, the wall material, andhe surface roughness [9], in our calculation an arbitrary value of.37 has been considered.
Fn is the normal component of the forces acting on the particles.
his will depend on the force balance considered in our model.aking into account the forces presented in previous sections:n = (�Fd + �FSaffman + �FMagnus + �Fadh pp + �Fadh wp + �Fb + �Fg + �FE) · �n
(29)
Graphite dust, Ø4μm
Fig. 4. Dust dispersion tube geometry [12].
in 3D
�Ff = fsFn
⎛⎝0, − upt1√
u2pt1 + u2
pt2
, − upt2√u2
pt1 + u2pt2
⎞⎠ ¯̄T (30)
where ¯̄T is the rotation matrix corresponding to the local frame-work.
3.1.2. Other interactions3.1.2.1. Interfacial heat transfer. Regarding the interfacial heattransfer, the model use by Miura and Glass [5] may be used. Sothat the heat flux per unit volume is given by:
Qg = �
m�dpgCpg Pr−1 Nu(Tg − Tp) (31)
where the Nusselt number is given by the expression suggestedby Otterman and Levine [4] Nu = 2 + 0.6 Pr1/3 re1/2 and Pr is the gasPrandtl.
And the gas viscosity is given byg = 1.71 × 10⁻⁵(Tg/273)0.77 N s/m2. m is the particle massassuming it spherical. Other expression have been implemented
Fig. 5. Grid considered in the calculations (left) and initial state (right).

J.R. García-Cascales et al. / Fusion Engineering and Design 85 (2010) 2274–2281 2279
10−3
4
m
••
o
4
mdw
Fig. 6. Evolution of particle concentration at different times: 5 × 10⁻⁴, 3 ×
. Numerical results
The following tests have been used to study qualitatively theobilisation of particles and test the model presented above:
3D dust dispersion tube with air injection.2D mobilisation problem at Bise facility.
In what follows these tests are briefly described and the resultsbtained with the model are presented and commented.
.1. 3D dust dispersion tube with air injection
This experiment was designed by the FZK to study the dustobilisation provoked by air injected through the holes of a cylin-
rical tube situated at the bottom of another one of bigger diameterhere a dust layer has been situated [16].
, 7.5 × 10⁻³, 1.4 × 10⁻², 2.25 × 10⁻², 3.3 × 10⁻², 4.55 × 10⁻² and 6 × 10⁻² s.
4.1.1. Problem specificationsA schematic view of the experimental facility is depicted in Fig. 4.Geometrical parameters:
• Bigger tube inner diameter = 150 mm.• Smaller tube inner/external diameter = 12/14 mm.• Graphite dust parameters: dp = 4 × 10⁻⁶ m.• The closest distance between the two tubes: 6.5 mm.
Injection
• Injection hole diameter: 1 mm.• Interval between holes: 30 mm.
• Injection duration: 130 ms.4.1.2. Initial and boundary conditionsPressure in the bigger tube is pb = 0.6 bar, pressure in the smaller
tube ps = 21 bar and particle density �p = 2450 kg/m3.
2280 J.R. García-Cascales et al. / Fusion Engineeri
40 cm
12 cm
7 cm
12 cm
4 cm
18 cm
22 cm
�ptibh
4
oolt
itOvfd0hta
4
iCc
4
wdflt
52 cm
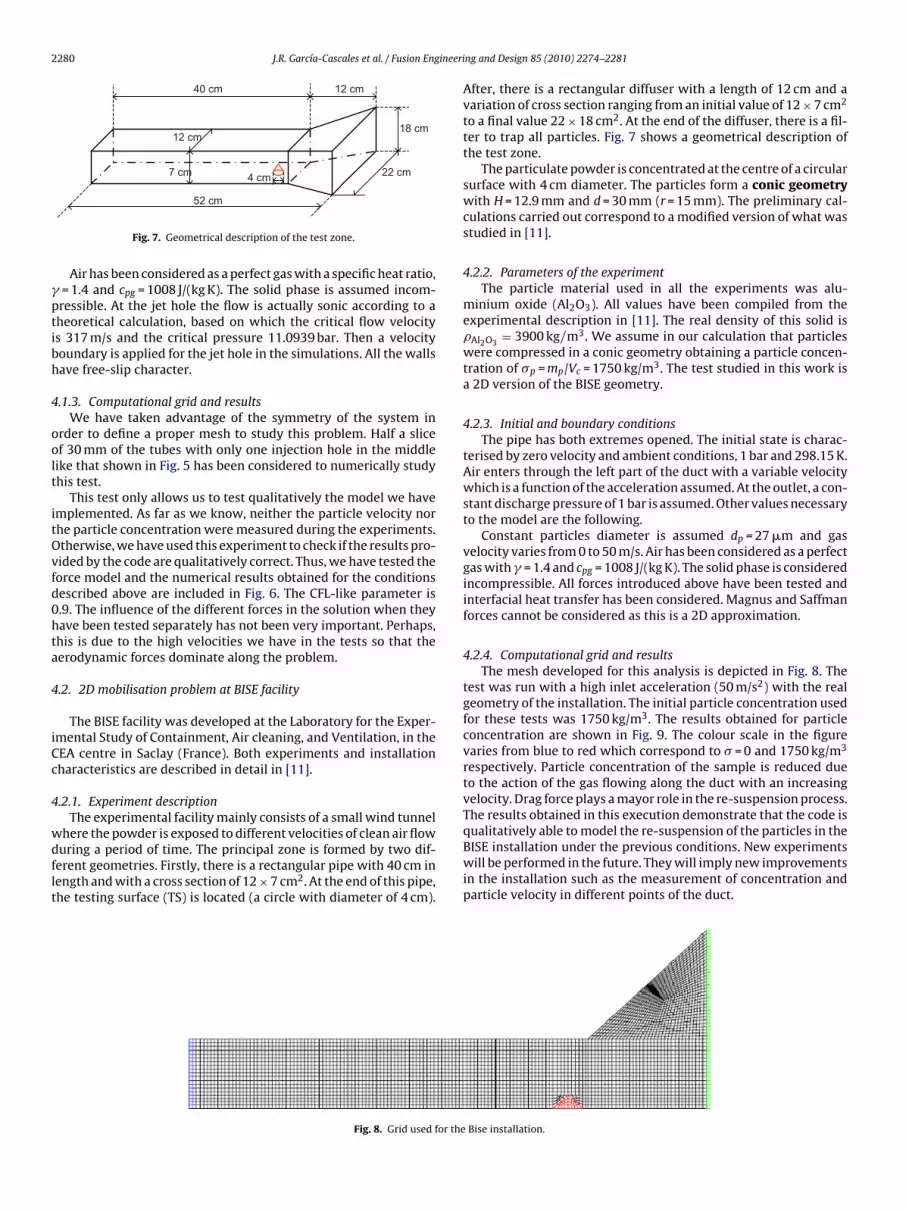
Fig. 7. Geometrical description of the test zone.
Air has been considered as a perfect gas with a specific heat ratio,= 1.4 and cpg = 1008 J/(kg K). The solid phase is assumed incom-ressible. At the jet hole the flow is actually sonic according to aheoretical calculation, based on which the critical flow velocitys 317 m/s and the critical pressure 11.0939 bar. Then a velocityoundary is applied for the jet hole in the simulations. All the wallsave free-slip character.
.1.3. Computational grid and resultsWe have taken advantage of the symmetry of the system in
rder to define a proper mesh to study this problem. Half a slicef 30 mm of the tubes with only one injection hole in the middleike that shown in Fig. 5 has been considered to numerically studyhis test.
This test only allows us to test qualitatively the model we havemplemented. As far as we know, neither the particle velocity norhe particle concentration were measured during the experiments.therwise, we have used this experiment to check if the results pro-ided by the code are qualitatively correct. Thus, we have tested theorce model and the numerical results obtained for the conditionsescribed above are included in Fig. 6. The CFL-like parameter is.9. The influence of the different forces in the solution when theyave been tested separately has not been very important. Perhaps,his is due to the high velocities we have in the tests so that theerodynamic forces dominate along the problem.
.2. 2D mobilisation problem at BISE facility
The BISE facility was developed at the Laboratory for the Exper-mental Study of Containment, Air cleaning, and Ventilation, in theEA centre in Saclay (France). Both experiments and installationharacteristics are described in detail in [11].
.2.1. Experiment descriptionThe experimental facility mainly consists of a small wind tunnel
here the powder is exposed to different velocities of clean air flowuring a period of time. The principal zone is formed by two dif-erent geometries. Firstly, there is a rectangular pipe with 40 cm inength and with a cross section of 12 × 7 cm2. At the end of this pipe,he testing surface (TS) is located (a circle with diameter of 4 cm).
Fig. 8. Grid used for the
ng and Design 85 (2010) 2274–2281
After, there is a rectangular diffuser with a length of 12 cm and avariation of cross section ranging from an initial value of 12 × 7 cm2
to a final value 22 × 18 cm2. At the end of the diffuser, there is a fil-ter to trap all particles. Fig. 7 shows a geometrical description ofthe test zone.
The particulate powder is concentrated at the centre of a circularsurface with 4 cm diameter. The particles form a conic geometrywith H = 12.9 mm and d = 30 mm (r = 15 mm). The preliminary cal-culations carried out correspond to a modified version of what wasstudied in [11].
4.2.2. Parameters of the experimentThe particle material used in all the experiments was alu-
minium oxide (Al2O3). All values have been compiled from theexperimental description in [11]. The real density of this solid is�Al2O3
= 3900 kg/m3. We assume in our calculation that particleswere compressed in a conic geometry obtaining a particle concen-tration of �p = mp/Vc = 1750 kg/m3. The test studied in this work isa 2D version of the BISE geometry.
4.2.3. Initial and boundary conditionsThe pipe has both extremes opened. The initial state is charac-
terised by zero velocity and ambient conditions, 1 bar and 298.15 K.Air enters through the left part of the duct with a variable velocitywhich is a function of the acceleration assumed. At the outlet, a con-stant discharge pressure of 1 bar is assumed. Other values necessaryto the model are the following.
Constant particles diameter is assumed dp = 27 �m and gasvelocity varies from 0 to 50 m/s. Air has been considered as a perfectgas with � = 1.4 and cpg = 1008 J/(kg K). The solid phase is consideredincompressible. All forces introduced above have been tested andinterfacial heat transfer has been considered. Magnus and Saffmanforces cannot be considered as this is a 2D approximation.
4.2.4. Computational grid and resultsThe mesh developed for this analysis is depicted in Fig. 8. The
test was run with a high inlet acceleration (50 m/s2) with the realgeometry of the installation. The initial particle concentration usedfor these tests was 1750 kg/m3. The results obtained for particleconcentration are shown in Fig. 9. The colour scale in the figurevaries from blue to red which correspond to � = 0 and 1750 kg/m3
respectively. Particle concentration of the sample is reduced dueto the action of the gas flowing along the duct with an increasingvelocity. Drag force plays a mayor role in the re-suspension process.The results obtained in this execution demonstrate that the code is
qualitatively able to model the re-suspension of the particles in theBISE installation under the previous conditions. New experimentswill be performed in the future. They will imply new improvementsin the installation such as the measurement of concentration andparticle velocity in different points of the duct.Bise installation.

J.R. García-Cascales et al. / Fusion Engineering and Design 85 (2010) 2274–2281 2281
erime
5
hb(dAhitDfbittftbhttdtltmtsadn
[
[
[
[
[
Fig. 9. Numerical results obtained for the BISE exp
. Conclusion and future work
In this work, the DUST code for simulation of dust mobilisationas been introduced. This has been developed in close collaborationetween IRSN (France) and the Technical University of CartagenaSpain). It has been carried out on the basis of the CAST3M codeeveloped at the Commissariat à l’Energie Atomique (CEA, France).high dilute model for the analysis of particle and gas mixtures
as been implemented in the code. This let us study LOVA accidentnside ITER. The code permits the analysis of dust spatial distribu-ion, remobilisation and entrainment, and explosion to be done.ifferent models for re-entrainment, adhesion, and electrostatic
orces have been studied. Adhesion forces between particles andetween particles and a wall have been included in the model. Its
mplementation is just a first rough approximation. The inclusion ofhe random nature of the arrangement of the particle in each con-rol volume will be looked into in the near future Aerodynamicsorces have been reviewed: Magnus and Saffman forces have beenested and added to the model. Particle friction with walls has alsoeen considered. Other forces as gravitational and buoyant forcesave been considered as well. Special attention has been paid toheir implementation inside the DUST code. A qualitative valida-ion of the model has been carried out by means of the experimenteveloped by the FZK in the framework of a collaboration work withhe EFDA [16]. Preliminary calculations of the mobilisation prob-ems performed in BISE facility have been done. New experimentalests must been developed to better validate the re-entrainment
odel developed and the future improvements. Variables like par-
icle concentration and velocity should be measured to do so. Apecial effort should be made in the near future in order to designnd develop new experiment for the sake of validation. The futureevelopments will try to include the possibility of analysing lami-ar and turbulent viscous flows.[
[
nt at different times t = 0, 15, 33, 51, 69 and 87 ms.
References
[1] T. Tanaka, Y. Tsuji, Numerical Simulation of Gas–Solid Two-phase Flow in aVertical Pipe: On the Effect of Inter-particle Collision, FED-Vol. 121, Gas–SolidFlows, ASME, 1991.
[2] P. Kosinski, A.C. Hoffmann, An Eulerian–Lagrangian model for dense particleclouds, Comput. Fluids 36 (2007) 714–723.
[3] J.R. García-Cascales, J. Mulas-Pérez, H. Paillère, Extension of some numericalschemes to the analysis of gas and particle mixtures, Int. J. Numer. Methods FL56 (2008) 845–875.
[4] B. Otterman, A. Levine, Analysis of gas–solid particles in shock tubes, AIAA J. 12(1974) 579–580.
[5] H. Miura, I.I. Glass, On dusty-gas shock tube, Proc. R. Soc. Lond. 382 (1982)373–388.
[6] L. Combe, Hérard, Un schéma volumes-finis pour la simulation d’un modéle bi-fluide d’écoulements diphasiques compressibles gaz–solide, Rev. Europ. Élém.Finis 6 (1997) 197–231.
[7] X. Rogue, G. Rodríguez, J.F. Hass, R. Saurel, Experimental and numerical inves-tigation of the shock-induced fluidization of a particles bed, Shock Waves 8(1998) 29–45.
[8] C.T. Crowe, M. Sommerfeld, Y. Tsuji, Multiphase Flow with Droplets and Parti-cles, CRC Press LLC, Boca Raton, FL, USA, 1998.
[9] A. De los Reyes Castelo, Estudio de los mecanismos de transporte de aerosolesen el sistema primario de centrales nucleares de agua ligera en caso de acci-dente grave, Ph.D. Thesis, Universidad Politécnica de Madrid, 1997.
10] J. Tomas, Adhesion of ultrafine particles – a micromechanical approach, Chem.Eng. Sci. 62 (2006) 1997–2010.
11] L. Alloul-Marmor, Reentrainement par ecoulement d’air d’une contaminationparticulaire deposee sur une surface application au cas d’un “tas” de poudre,Ph.D. Thesis, Université Paris XII, 2002.
12] F.J. Cabrejos, G.E. Kinzing, Incipient motion of solid particles in horizontal pneu-matic conveying, Powder Technol. 73 (1992) 51–61.
13] H. Li, R. Hong, Z. Wang, Fluidizing ultrafine powders with circulating fluidizedbed, Chem. Eng. Sci. 54 (1999) 5609–5615.
14] J. Reed, The adhesion of small particles to a surface, in: K.L. Mittal (Ed.), Particleson Surfaces 2 Detection, Adhesion, and Removal, Plenum Press, New York, 1989,
pp. 3–17.15] K.L. Johnson, K. Kendall, A.D. Roberts, Surface energy and the contact of elasticsolids, Proc. R. Soc. Lond. A 324 (1971) 301–313.
16] J.R. García-Cascales, H. Paillère, Z. Xu, J.R. Travis, G. Necker, Review of Analyticaland Experimental Test Cases for Dust Mobilization Modeling, RAPPORT DM2SSFME/LTMF/RT/07-005/A, 2007.