local resources mobilisation towards sustainable - amazon s3
TRANSCRIPT

LOCAL RESOURCES MOBILISATION TOWARDS SUSTAINABLE
SOLID WASTE MANAGEMENT IN TANZANIA: A CASE OF KINONDONI
MUNICIPALITY, DAR ES SALAAM CITY
TILOTWA WILSON BABYEBONELA
A THESIS SUBMITTED IN FULFILMENT OF THE REQUIREMENTS
FOR THE DEGREE OF DOCTOR OF PHILOSOPHY OF THE OPEN
UNIVERSITY OF TANZANIA
2013

ii
CERTIFICATION
The undersigned certifies that he has read and hereby recommends for examination
by the Open University of Tanzania a thesis titled: Local Resources Mobilization
Towards Sustainable Solid Waste Management in Tanzania: A Case of Kinondoni
Municipality, Dar es Salaam City in fulfilment of the requirements for the Degree
of Doctor of Philosophy of the Open University of Tanzania.
……………………………………………………
Professor A. G. Kyessi
Supervisor
Date…………………………………………….

iii
COPYRIGHT
This thesis is a copyright material protected under the Berne Convention, the
Copyright Act of 1999 and other international and national enactments, in that
behalf, on intellectual property. It may not be reproduced by any means, in full or in
part, except for short extracts in fair dealing, for research or private study, critical
scholarly review or research or discourse with an acknowledgement, without written
permission of the Directorate of Postgraduate Studies, on behalf of both the author
and the Open University of Tanzania.
iv
DECLARATION
I, Tilotwa Wilson Babyebonela, do hereby declare to the Senate of the Open
University of Tanzania that this thesis is a result of my original work and has never
been submitted for a degree award at any other University.
Signature…………………………………………..
Date…………………………………..

v
DEDICATION
Dedicated to the Dar es Salaam City Council; Kinondoni Municipal Council; all
residents of Kawe, Sinza and Hanna Nassif Wards; UN-Habitat workers; Institute of
Social Work workers; my friends; and all my family members.

vi
ACKNOWLEDGEMENTS
This thesis report could not have been what it is today without the support received
from several institutions and some particular individuals who contributed in one way
or another towards completion of this research. May I express my sincere gratitude
and appreciation to the Open University of Tanzania for accepting my proposal
which culminated to this dissertation.
I am extremely indebted to my supervisor Prof. Dr. Alphonce Gabriel Kyessi for his
tutorials, guidance and competent assistance that led to the production of this thesis.
Also, I am highly indebted to Prof. Dr. Anna Kajumulo Tibaijuka, the then UN-
Under Secretary General and Executive Director of UN-Habitat and all relevant
focal points including Dr. Xing Zhang, and Mr. Phillemon Mutashubirwa for
supporting this study.
My sincere appreciation to Dr. James Kisoza, Dr. B. Ndoloi, Dr. Jumanne Kalwani,
Mr. Elias Chinamo, Eng. Maximillian Kabairuka, Mr. Gerase Kamugisha and all
other friends for their academic and moral support. I am grateful to the staff and
management of the Institute of Social Work and Rubeta Trust for their moral and
logistical support that created a superb working environment throughout my study. I
would also, like to thank my research assistants: Mr. Deus Jovin Kahangwa, Miss
Adrophina Salvatory, Mr. Fidelis Wamara, Mr. Jumanne R. Njechele, and Mr.
Dickson N. Gatahya; without forgetting all involved respondents in the public and
private offices, Wards, Mitaa (hamlets) and informal organizations I managed to
visit. In relation to this, I am particularly grateful to the interviewed informants,

vii
community leaders and focus groups in some of the informal and formal settlements
for their tireless support during information gathering and data collection. I would
like to extend my utmost thanks to my family members for their total support and
understanding particularly my wife Mrs Praxeda Kokugonza Babyebonela who had
to barely manage with little financial resources and all relatives who offered me a lot
of backing throughout the period I was conducting the research and writing this
thesis. I further recognize with gratitude all contributions from my children
particularly Lillian Abella, Leticia Atugonza, Gilbert Rwegasira, Geresson
Mutabazi, Millen Katulebe, Philemon Mugelezi and Levina Kemigisha for their
contributions, moral and practical support during this study.
Lastly, I also extend my sincere appreciation to my parents who missed a great deal
of my assistance during the whole period of this study, and all other individuals who
assisted me in one way or another towards accomplishment of this research up to a
readable and applied document.

viii
ABSTRACT
This study dealt with Local Resources Mobilization towards Sustainable Solid Waste
Management in Tanzania: A Case of Kinondoni Municipality, Dar es Salaam City. It
was motivated by the fact that, regardless of various programmes which have been
initiated in order to address the challenges of urban solid waste management, scanty
literature exists on the relevance of bottom-up approach in local resource
mobilization towards sustainable solid waste management. In order to fill this gap a
new study was conducted in Kinondoni Municipality Council. I effect, the study
revealed that top-down approach alone is not capable of mobilizing enough
resources for facilitating sustainable solid waste management. Hence, the need for
integrating both top-down and bottom-up approaches to solid waste management,
where local community participation as a key dimension, was confirmed and
recommended by the study. To this end, the study provides policy recommendations
on five key issues, namely: institutionalising the policy framework for local
resources mobilization, networking and mobilisation of local actors, supplementing
conventional approach in municipal service provision, effective solid waste
management cost recovery, and compliance with the waste hierarchy principle in
contracts design. It is expected that, the study findings can inform decision-makers,
practitioners, academicians, local community workers, the private sector, industries,
development partners and other beneficiaries on the relevance of local resources
mobilisation towards sustainable solid waste management.

ix
TABLE OF CONTENTS
CERTIFICATION ..................................................................................................... ii
COPYRIGHT ............................................................................................................iii
DECLARATION ....................................................................................................... iv
DEDICATION ............................................................................................................ v
ACKNOWLEDGEMENTS ..................................................................................... vi
ABSTRACT .............................................................................................................viii
TABLE OF CONTENTS ......................................................................................... ix
LIST OF FIGURES ................................................................................................ xix
LIST OF TABLES .................................................................................................. xix
LIST OF PLATES ................................................................................................. xxii
LIST OF ACRONYMS ........................................................................................xxiii
LIST OF ACRONYMS ........................................................................................xxiii
CHAPTER ONE ........................................................................................................ 1
1.0 INTRODUCTION AND STATEMENT OF THE PROBLEM ....................... 1
1.1 Introduction ................................................................................................................................. 1
1.2 Background to the Study ......................................................................................................... 1
1.2.1 Definition of Solid Waste and Solid Waste Management ................................. 1
1.2.2 Global Responses to the Challenges of Solid Waste Management ................... 2
1.2.3 Regional Responses to the Challenge of Solid Waste Management ................. 3
1.2.4 National Responses to the Challenge of Solid Waste Management .................. 5
1.3 Statement of the Problem ........................................................................................................ 6
1.4 Objectives of the Study ........................................................................................................... 6
1.5 Research Questions................................................................................................................... 7

x
1.6 Significance of the Study ........................................................................................................ 8
1.7 Organization of the Thesis ...................................................................................................... 8
CHAPTER TWO ....................................................................................................... 9
2.0 LITERATURE REVIEW ON RESOURCES MOBILIZATION ................... 9
FOR URBAN SOLID WASTE MANAGEMENT ........................................ 9
2.1 Introduction ................................................................................................................................. 9
2.2 Decentralization and Local Resources Mobilization ...................................................... 9
2.2.1 The Logic of Decentralisation ........................................................................................... 9
2.2.2 Local Resources Mobilization ......................................................................... 11
2.2.3 The Concept of Community Participation in Local Resources
Mobilization ..................................................................................................... 12
2.3 Solid Waste Management Practices at Global, Regional and National Levels .... 14
2.3.1 Global Responses to Solid Waste Management .............................................. 14
2.3.2 Regional Responses to Local Resource Mobilization for SWM ..................... 18
2.3.3 Tanzanian Government’s Response to Solid Waste Management .................. 38
2.3.4 Community Participation in Morogoro Municipality, Tanzania ..................... 40
2.4 Economic Aspects of Resource Mobilization for Solid Waste Management ...... 43
2.5 Need for Local Resources Mobilization for Solid Waste Management................. 46
2.6 Theoretical Frameworks for Local Resource Mobilization ....................................... 48
2.6.1 Institutional Economic Theory ........................................................................ 48
2.6.2 Principal-Agent Theory ................................................................................... 50
2.6.3 Social Capital Theory ...................................................................................... 53
2.6.4 Collective Action Theory ................................................................................. 55
2.6.5 Market Processes Theory ................................................................................. 57

xi
2.7 Conceptualizing Local Resources Mobilization ........................................................... 60
2.7.1 Legal Factors .................................................................................................... 60
2.7.2 Organizational Factors ..................................................................................... 62
2.7.3 Institutional Factors ......................................................................................... 62
2.7.4 Technological Factors ...................................................................................... 62
2.7.5 Spatial Factors .................................................................................................. 63
2.7.6 Financial Factors .............................................................................................. 63
2.8 Summary ................................................................................................................................. 64
CHAPTER THREE ................................................................................................. 67
3.0 RESEARCH METHODOLOGY ..................................................................... 67
3.1 Introduction.............................................................................................................................. 67
3.2 Research Strategy .................................................................................................................... 67
3.3 Research Design and Process .............................................................................................. 68
3.3.1 Research Design................................................................................................................... 68
3.3.2 Research Process .............................................................................................. 69
3.4 Selection of the Study Area ................................................................................................ 71
3.4.1 Criteria for Choosing a Given Type of a Case Study ...................................... 72
3.4.2 Framework Used to Select Study Sub-Cases ................................................... 73
3.4.3 Justification of the Selected Case Studies ........................................................ 76
3.5 Sample design and Smallest Unit of Analysis .............................................................. 78
3.5.1 Sample Design ................................................................................................. 78
3.5.2 Units of Analysis.............................................................................................. 79
3.6 Case study Protocol ............................................................................................................... 80
3.6.1 Overview of the in-Depth Case Study ............................................................. 80
xii
3.6.2 Sources of Data ................................................................................................ 81
3.6.3 Data Collection Methods ................................................................................. 81
3.6.4 Data Analysis Procedure .................................................................................. 87
3.7 Limitations to the Study ........................................................................................................ 89
CHAPTER FOUR .................................................................................................... 92
4.0 PERFORMANCE OF SOLID WASTE MANAGEMENT IN
KINONDONI .................................................................................................. 92
4.1 Introduction ............................................................................................................................... 92
4.2 Profile of Kinondoni Municipality ..................................................................................... 92
4.2.1 Kinondoni Municipality Administrative Set-up .............................................. 93
4.2.2 Demography ..................................................................................................... 95
4.2.3 Spatial Factors .................................................................................................. 95
4.2.4 Other Municipal Infrastructure Services .......................................................... 98
4.2.5 History of Solid waste Management in Kinondoni Municipality .................. 100
4.3 Performance of Solid Waste Management in Kinondoni Municipality ................ 104
4.3.1 Solid Waste Generation and Collection Rate in Kinondoni Municipality ..... 105
4.3.2 Waste Recycling, Composting and Dumping Ratios ..................................... 108
4.3.3 Residents’ Satisfaction in Solid Waste Management .................................... 109
4.4 Local Resources Mobilization Strategies Towards Sustainable SWM ................. 111
4.4.1 Insufficiency of Financial Resources ........................................................... 111
4.4.2 Lack of on-site Storage Facilities .................................................................. 112
4.4.3 Inefficient use of Bin System ......................................................................... 112
4.4.4 Enclosures Systems ........................................................................................ 113
4.4.5 Inadequacy of Trailers on Collection Points .................................................. 113

xiii
4.4.6 Inadequacy of Trained Personnel/Human Resources .................................... 114
4.4.7 Inadequacy of Working Equipment/Tools ..................................................... 115
4.4.8 Emergency of Grassroots Institutions in Solid Waste Management.............. 116
4.4.9 Does the Kinondoni legal Framework Guide Local Resources
Mobilization? ........................................................................................................... 120
4.5 Key Actors Involved in Solid Waste Management in Kinondoni ......................... 124
4.5.1 Intra-Organizational Arrangements for SWM System in Kinondoni ............ 124
4.5.2 Performance of Informal Actors in Solid Waste Management ...................... 128
4.5.3 Actors Involved in Solid Waste Sorting in Kinondoni .................................. 131
4.6 Constraints and Potentials Facing SWM in Kinondoni ........................................... 132
4.6.1 Constraints Facing Solid Waste Management in the Study Area .................. 133
4.6.2 Challenges Facing solid Waste Management in the Study Area ................... 140
4.6.3 Challenges encountered by individual scavengers......................................... 145
4.6.4 Challenges Encountered by Middlemen in SWM ......................................... 146
4.6.5 Potentials of Better Solid Waste Management in Kinondoni ........................ 146
4.7 Summary and Conclusions............................................................................................... 148
CHAPTER FIVE ................................................................................................... 150
5.0 LOCAL RESOURCES MOBILIZATION THROUGH PUBLIC-
PRIVATE PARTNERSHIP: THE CASE OF KAWE WARD ............... 150
5.1 Introduction............................................................................................................................ 150
5.2 Profile of Kawe Ward ......................................................................................................... 150
5.2.1 Location of Kawe Ward................................................................................................... 150
5.2.2 Kawe Ward administrative Set-up ................................................................................ 150
5.2.3 Socio-economic Profile of Kawe Ward ...................................................................... 153

xiv
5.2.4 Infrastructure profile of Kawe Ward .............................................................. 154
5.3 Performance of Solid Waste Management Services in Kawe Ward ...................... 154
5.3.1 Solid Waste Generation and Collection Rates per Day ................................. 154
5.3.2 Waste Recycling, Composting and Dumping ratios per Day ........................ 155
5.3.3 Residents’ Satisfaction in Solid Waste Management Services ...................... 156
5.4 Actors involved in Local Resources Mobilization and Their Roles .................... 157
5.5 Local Resources Mobilization Strategies .................................................................... 158
5.5.1 Institutional Factors ....................................................................................... 158
5.5.2 Organizational Factors ................................................................................... 158
5.5.3 Spatial Factors ................................................................................................ 159
5.5.4 Financial Factors ............................................................................................ 159
5.5.5 Legal Factors .................................................................................................. 161
5.5.6 Technological Factors .................................................................................... 163
5.6 Constraints and Potentials Facing Solid Waste Management Services .............. 165
5.7 Summary of Major Findings From Kawe Ward ........................................................ 166
CHAPTER SIX ...................................................................................................... 169
6.0 LOCAL RESOURCES MOBILIZATION THROUGH INFORMAL
COMMUNITY BASED ORGANIZATIONS: THE CASE OF SINZA
WARD ........................................................................................................... 169
6.1 Introduction ............................................................................................................................. 169
6.2 Profile of Sinza Ward ........................................................................................................... 169
6.2.1 Location of Sinza Ward ................................................................................. 169
6.2.2 Socio-economic Profile of Sinza Ward .......................................................... 169
6.2.3 Infrastructure Profile of Sinza Ward .............................................................. 170
xv
6.3 Performance of Solid Waste Management Services ................................................... 172
6.3.1 Solid Waste Generation and Collection per Day ........................................... 172
6.3.2 Waste recycling, Composting and Dumping Ratios per Day ........................ 172
6.3.3 Residents Satisfaction in Solid Waste Management Services ....................... 173
6.4 Actors Involved in Local Resources Mobilization in Sinza Ward ........................ 174
6.5 Local resources Mobilization Strategies in Sinza Ward ........................................... 174
6.5.1 Financial Factors ............................................................................................ 174
6.5.2 Organisational Factors ................................................................................... 176
6.5.3 Spatial factors ................................................................................................. 178
6.5.4 Institutional Factors ....................................................................................... 178
6.5.5 Technological Factors .................................................................................... 179
6.5.6 Legal Factors .................................................................................................. 180
6.6 Potentials Facing Local Resources Mobilization in Sinza Ward ........................... 181
6.7 Summary of Major Findings from Sinza Ward ........................................................... 183
CHAPTER SEVEN ................................................................................................ 185
7.0 LOCAL RESOURCES MOBILISATION THROUGH FORMAL NON-
GOVERNMENTAL ORGANIZATIONS: THE CASE OF HANNA
NASSIF WARD ............................................................................................ 185
7.1 Introduction............................................................................................................................ 185
7.2 Profile of Hanna Nassif Ward .......................................................................................... 185
7.2.1 Location of Hanna Nassif Ward .................................................................... 185
7.2.2 Socio-economic Profile of Hanna Nassif Ward ............................................. 187
7.2.3 Infrastructure Profile of Hanna Nassif Ward ................................................. 188
7.3 Performance of Solid Waste Management Services .................................................. 188

xvi
7.3.1 Solid Waste Generation and Collection Rate per Day ................................... 188
7.3.2 Waste recycling, Composting and Dumping Ratios per Day ........................ 188
7.3.3 Residents’ Satisfaction in Solid Waste Management Services ...................... 190
7.4 Actors Involved In Local Resources Mobilization in Hanna Nassif Ward ......... 191
7.5 Local resources Mobilization Strategies in Hanna Nassif Ward ............................ 192
7.5.1 Financial Factors ................................................................................................................ 192
7.5.2 Organizational Factors ................................................................................... 195
7.5.3 Spatial Factors ................................................................................................ 196
7.5.4 Institutional Factors ....................................................................................... 196
7.5.5 Technological Factors .................................................................................... 197
7.5.6 Legal Factors .................................................................................................. 198
7.6 Constraints and Potentials Facing LRM in Hanna Nassif Ward ............................ 199
7.7 Summary of Major Findings From Hanna Nassif Ward .......................................... 199
CHAPTER EIGHT ................................................................................................ 203
8.0 CROSS-CASE ANALYSIS AND SYNTHESIS OF THE FINDINGS ON
LOCAL RESOURCE MOBILIZATION IN KINONDONI .................... 203
8.1 Introduction ............................................................................................................................. 203
8.2 Performance of Solid Waste Management Services in the Study Area ............... 203
8.2.1 Effectiveness of Solid Waste Management Services in the Study Area ........ 203
8.2.2 Waste Recycling, Composting and Dumping Ratios per Day ....................... 205
8.2.3 Satisfaction Levels With Solid Waste Management Services ....................... 206
8.3 Actors Involved in Local Resources Mobilization ..................................................... 207
8.4 Local Resource Mobilization Strategies For Sustainable SWM services ............. 209
8.5 Constraints Facing Local Resources Mobilization in SSWM services ................. 211

xvii
8.5.1 Inadequacy of Local Resource Mobilization ................................................. 211
8.5.2 Poor Coordination of a Solid Waste Management System ........................... 212
8.5.3 Inadequacy of Private Sector Monitoring ...................................................... 212
8.5.4 Lack of an Appropriate Solid Waste Management Policy Framework ......... 212
8.5.5 Inadequacy of Proper Technology for Supporting Recycling Activities ....... 213
8.5.6 Unavailability of Land for Disposal Sites ...................................................... 213
8.5.7 Polluters with Poor Purchasing Power ........................................................... 213
8.5.8 Neglect of the Wastes Hierarchy Principle in Contracts Design ................... 214
8.6 Potentials for Local Resources Mobilization ............................................................... 214
8.6.1 Availability of Labour-Based Technology .................................................... 214
8.6.2 Willingness to Pay for Solid Waste Management Services ........................... 215
8.6.3 Relatively Favourable Policy and Legal Environment .................................. 215
8.6.4 Local Political Support .................................................................................. 216
8.6.5 Progressive Compliance with the Wastes Hierarchy Principle ...................... 216
8.6.6 Promotion of Self-Employment Creation ...................................................... 217
8.7 Summary .................................................................................................................................. 217
CHAPTER NINE ................................................................................................... 219
9.0 CONCLUSIONS, POLICY IMPLICATIONS AND
RECOMMENDATIONS ............................................................................. 219
9.1 Introduction ............................................................................................................................. 219
9.2 Conclusions ............................................................................................................................. 219
9.3 Policy Implication Issues .................................................................................................... 221
9.3.1 Policy Framework for Local Resources Mobilization ................................... 222
9.3.2 Networking and Mobilisation of Local Actors .............................................. 222

xviii
9.3.3 Supplementing Conventional Approach with Bottom up Approach .................. 223
9.3.4 Solid Waste Management Cost Recovery ...................................................... 224
9.3.5 Compliance with the Waste Hierarchy Principle in Contracts Design .......... 224
9.4 Policy Recommendations ................................................................................................... 225
9.4.1 Institutionalization of Policy Framework ...................................................... 225
9.4.2 Mobilising Grass Roots Actors Towards Local Resources Mobilization ...... 225
9.4.3 Supplementing Conventional Approach With Bottom up Approach ................ 226
9.4.4 Establishment of an Efficient System of Cost Recovery ............................... 226
9.4.5 Compliance with the Wastes Hierarchy Principle in Contracts Design ........ 228
9.5 Areas for Further Research ................................................................................................. 228
REFERENCES ....................................................................................................... 230
APPENDECES ............................................................................................................................ 250

xix
LIST OF TABLES
Table 2.1: Global Trends of Urban Population and MSW Growth from 2012-25 ..... 16
Table 3.1: Conditions for Wards Inclusion in the Detailed Study .................................. 74
Table 3.2: Weighting Matrix ...................................................................................................... 75
Table 3.3: Selected Case Study Areas ..................................................................................... 76
Table 3.4: Magnitude of Sample Selection in the Study Area ......................................... 79
Table 3.5: Focus Group Discussions (FGD) ......................................................................... 82
Table 4.1: Kinondoni Municipality Projected Population From 2002 to 2010 ........... 95
Table 4.2: Amount of Solid Waste Generated per day in Kinondoni .......................... 105
Table 4.3: Kinondoni Municipality SWM Budget Allocations ..................................... 111
Table 4.4: Level of Staff Deployment at KMH and WMD ........................................... 114
Table 4.5: Level of KMC and POs-SWM Working Equipments and Tools .............. 116
Table 4.6: Stakeholders Involved in SWM in Kinondoni Municipality ..................... 124
Table 4.7: Functions of Different Actors in SWM in Kinondoni Municipality ...... 126
Table 4.8: Comparison of CBOs and Informal Collectors in Kinondoni.................... 127
Table 4.9: Roles of Waste Management Department: At Ward Levels ...................... 128
Table 4.10: Scavengers Income Schedule per Weight and Pieces ........................... 130
Table 4.11: Population Density Distribution and Physical Expansion in
Kinondoni .................................................................................................................. 133
Table 4.12: List of Major Constraints Facing Re-Cycling Activities in
Kinondoni .................................................................................................................. 140
Table 4.13: Priorities Set by Kinondoni Municipality for Effective use of
Available Technology and Solid Waste Management ................................. 147

xx
Table 5.1: Kawe Ward population Growth as at 2002 and Projections
2004/2010 .................................................................................................................. 152
Table 5.2: Actors and Their Roles in LRM for SWM in Kawe Ward ......................... 157
Table 5.3: Kawe Ward Revenue Report (2007/08 and 2008/09) .................................. 160
Table 6.1: Sinza Ward Population 2002 to 2010 ............................................................... 170
Table 6.2: Local Resources Mobilization Capacity in the Study Area ........................ 175
Table 7.1: KIWODET Trends of Revenue Collected from SWC............................... 192
Table 7.2: Level of Satisfaction by the Solid Waste Management Services ........... 193
Table 7.3: Level of Willingness to Pay for Solid Wastes Management Services .... 194
Table 7.4: Hanna Nassif Ward Revenue Report for 2007/08 and 2008/09 ................ 194
Table 8.1: Effectiveness of Solid Waste Management Services in Kinondoni ......... 204
Table 8.2: Waste Recycling, Composting and Dumping Ratios per Day ............... 205
Table 8.3: Satisfaction Level of SWM services in Kinondoni Municipality ............. 207
Table 8.4: Actors Involved in Local Resources Mobilization Towards SSWM .... 208
Table 8.5: Local Resource Mobilization Strategies in Three Kinondoni Wards ...... 210

xxi
LIST OF FIGURES
Figure 2.1: The Basic Reasons for Stakeholder’s Participation ....................................... 13
Figure 2.2: Municipal Dynamics Towards Sustainable SWM Approach ...................... 45
Figure 2.3: Conceptual Framework .......................................................................................... 61
Figure 3.1: The Research Process ............................................................................................. 70
Figure 3.2: Location of Kinondoni Municipality in Dar es Salaam City ....................... 77
Figure 3.3: Kinondoni Municipality Wards Administrative Boundaries ....................... 77
Figure 4.1: Top-level Kinondoni Administrative Set-up .................................................... 94
Figure 4.2: Kinondoni Municipality Spatial Expansion From 1970s-2010s .............. 96
Figure 4.3: Infrastructure Conditions in Kinondoni Municipality .................................. 99
Figure 4.4: Wastes Collected by Municipality Versus Contractors in Kinondoni
(2000-2007) .............................................................................................................. 107
Figure 4.5: Waste Generated Versus Collected in Kinondoni (2000 – 2007) ............ 107
Figure 4.6: Residents’ Satisfaction in Solid Waste Management Services ................. 110
Figure 4.7: Kinondoni Municipal Council Waste Management Structure .................. 117
Figure 4.8: Administrative Links Between Municipal and Lowest Community
Levels ......................................................................................................................... 119
Figure 6.1: Sinza Ward Administrative Boundaries and Mitaa ............................... 171
Figure 5.1: Administrative Structure of Kawe Ward ....................................................... 152
Figure 5.2: Kawe Ward Administrative Boundaries and Mitaa .................................... 153
Figure 7.1: Hanna Nassif Ward Administrative Boundaries and Mitaa .................... 186
Figure 7.2: Informal Property Development in Hanna Nassif Ward .......................... 187
Figure 7.3: Organization Chart of Kisutu Women Development Trust ...................... 195

xxii
LIST OF PLATES
Plate 4.1: Voluntary Primary Dumpsite in an Informal Settlement at
Kwa Kopa ................................................................................................................... 97
Plate 4.2: Uncollected solid Waste Being Burnt Along a Grave Yard in
Kijitonyama .............................................................................................................. 106
Plate 4.3: Youths Sorting Re-usable Items at Mwenge Trailer Collection
Point ............................................................................................................................ 130
Plate 4.4: Packed plastic Bottles in sacks for Sale at Mzimuni in Kawe Ward ....... 131
Plate 4.5: Scrap Metal Dealer Loading Materials for Sale to a Recycling
Factory ....................................................................................................................... 132
Plate 4.6: Crude Solid Waste at One of the Informal Dumpsite in Tandale ............. 143
Plate 4.7: Solid waste Dumped in Nalung’ombe River in Tandale Ward ................. 144
Plate 4.8: People Busy Sorting Re-usable Materials at Kigogo Darajani .................. 145
Plate 5.1: Labour Based Solid Waste Collection in Kawe Ward ................................. 164
Plate 5.2: Solid Waste Collection Point at Mzimuni in Kawe Ward .......................... 164
Plate 5.3: Waste Dumping at Mbezi Valley River at Ukwamani in Kawe ............... 166
Plate 6.1: A Meeting of the Informal Management and Leadership of SCEMG .... 178
Plate 6.2: Pull/push Carts Awaiting Daily Trailer from the Dumpsite ................ 179

xxiii
LIST OF ACRONYMS
4Rs : Wastes Re-use, Re-cycling, Cost Recovery, and Reduction
CIUP : Community Infrastructure Upgrading Programme
CBOs : Community Based Organizations
DDC : Dar es Salaam Development Corporation
EIA : Environmental Impact Assessment
ERC : Environmental Research Consultancy
HWDA : Hanna Nassif Women Development Association
IDWE : Infections Diseases Week Findings
ISWM : Integrated Solid Waste Management
ISWMS : Integrated Solid Waste Management System
KIMWODA : Kinondoni Moscow Women Development Association
KMC : Kinondoni Municipal Council
KIWODET : Kisutu Women Development Trust
LEAT : Lawyers’ Environmental Action Team
LGA’s : Local Government Authorities
LGR : Local Government Reform
LGRF : Local Government Reform Programme
LRM : Local Resources Mobilisation
MDG’s : Millennium Development Goals
MSWMS : Municipal Solid Waste Management Systems
NEMC : National Environmental Management Council
NGOs : Non- Governmental Organizations
NSGRP : National Strategy for Growth and Reduction of Poverty

xxiv
OECD : Organization for Economic Cooperation and Development
PPP : Public - Private Partnership
PHDR : Poverty and Human Development Report
REPOA : Research on Poverty Alleviation
RAS : Rapid Appraisal Survey
SCEMG : Sinza Community Environmental Management Group
SRRUC : Shanghai Resources Recovery and Utilization Company
SSWM : Sustainable Solid Waste Management
SIMSM : Screening, Incentives, Monitoring and Sanction Mechanisms
SUDP : Strategic Urban Development Program
SWC : Solid Waste Collection
SWM : Solid Wastes Management
SWMS : Solid Waste Management Systems
TANGO : Tanzania Association of Non-Governmental Organizations
TECA : Tanzania Environmental Cleanliness Association
TZS : Tanzania Shillings
UN-CHS : United Nations Centre for Human Settlements
UN- Habitat : United Nations Human Settlements Program
UNEP : United Nations Environmental Program
USEPA : United States Environmental Protection Agency
WCED : World Commission on Environmental and Development

1
CHAPTER ONE
1.0 INTRODUCTION AND STATEMENT OF THE PROBLEM
1.1 Introduction
Municipal solid waste management is multi-disciplinary embracing both natural and
social sciences. This is a community economic development study scoped to
investigate socio- economic issues on integrated municipal solid waste management
with various stakeholders in formal and informal settlements in Kinondoni
Municipality, Dar es Salaam City, Tanzania. Thus, this chapter defines the nature
and scope of the problem of solid waste management as it was addressed by the
researcher in the study area. In this case the following issues are discussed:
background to the study, statement of the problem, objectives of the study, research
questions, significance of the study, and organization of the thesis.
1.2 Background to the Study
1.2.1 Definition of Solid Waste and Solid Waste Management
The history and tradition of humanity teaches us that the completion of various
human activities always generates both prime-products and by-products. The
challenge of managing by-products from human activities is inseparably connected
with the history of urbanization and the related population growth. Prior to Neolithic
time, that is about 10,000 B.C., when the human race was mostly nomadic, the
natural decomposition of by-products from human activities was the normal way of
getting rid of wastes, the phenomenon which can be referred to as the natural cycle
of by-products management (Tibaijuka, 1998; Kironde, 1999).

2
However, the urbanization process stopped the natural cycle of solid waste
management (SWM) for the following reasons: as time passed populations
increased, cities emerged, urban settlements expanded and the related economic
activities grew bigger day after day. As a consequence, improperly managed solid
waste posed a risk to human health and the environment. For these reasons, the
natural cycle of by-products management failed, eventually, conventional methods
of by-products management had to be introduced by human beings in order to
alleviate these problems. By-products from human beings activities are also called
wastes, and they can be in a solid, liquid or gaseous state (ibid).
Thus, in general term solid waste management refers to collection, transfer,
treatment, recycling, resources recovery and disposal off solid wastes in urban areas.
In this case, the goal is to protect public health, promote hygiene, recover materials,
reduce the quantity and avoid wastes eye sores, decrease emissions and residuals,
and prevent the diseases such as typhoid fever and dysentery (Rwegasira, et al,
1996; Kironde, 1999).
1.2.2 Global Responses to the Challenges of Solid Waste Management
The challenge of solid waste management has featured in the agenda of many
international organizations for a long time, with a view of promoting shared
regulations and measures. These initiatives include the World summit on sustainable
development (WSSD); the Millennium development goals (MDG); the G8 summit
initiative on 3R’s; the Kyoto Protocol on global climate change; and the Basel
convention. Essentially, all of these initiatives emphasized the application of an

3
integrated approach to solid waste management, which entails the waste hierarchy
principle. They aim at building a global recycling-oriented society through
promoting the 3R’s, namely: reducing, re-using, and re-cycling solid wastes (ibid).
1.2.3 Regional Responses to the Challenge of Solid Waste Management
Rapid urbanization in underdeveloped countries has increased pressure on urban
infrastructure hence resulting into poor urban service delivery including uncollected
solid wastes in most urban allocations in developing countries including Tanzania
(Tibaijuka, 1998). However, at this juncture the question is: Why put more emphasis
on local resources mobilization (LRM) towards sustainable solid waste
management? This is because; municipal services provision including SWM is an
expensive undertaking which requires ample resources: such as awareness, finance,
personnel, equipment (Kironde, 1999; Majani, 2000; Kyessi, 2002; Tibaijuka, 2007).
Also it requires an efficient management system if the focus is on sustainable
development (ibid).
Some of the academicians reveal that, there exists a wide array of environmental
problems which are associated with inadequate urban management and resources
mobilization capacity (institutional capacity) of cities in the developing world
especially in Africa (Stren, 1986; Fekade, 1994; UNCHS, 1996; Kyessi, 2002:3).
However, the central characteristic problem of urban services insufficiency is not
only the scale of population growth, but includes many other challenges. They
include: growing urban poverty, poor national economic performance, insufficiency
of conventional approaches and concepts, economics of infrastructure ignored,
4
neglected grass roots institutions, poor governance of resources, and a growing gap
between demand and supply of municipal infrastructure services (Kombe W.J. 1994;
Majani, 2002; Kyessi, 2002:3-37).
In developing countries, for example in Tanzania, municipal authorities serve only a
limited part of the urban population, and in many cases, refuse collection is restricted
to high income areas where the elites and senior government officials reside. In some
cases even those living in decent housing areas are living next to mountains of heaps
of garbage lying uncollected (Zurbrugg, 2000; Mwakalinga, 2005). The majority of
the people especially in slum areas remain without waste collection services. These
are the low income earners living in poor conditions in informal settlements (ibid).
Citing the 1996 Global Report on Human Settlements, Ogu (2000:103) notes that
between one third and one half of the solid waste generated within most cities in low
and middle income countries, remain uncollected. These usually end up at illegal
dumpsites, along streets, on open spaces and on hazard waste land. The proportion of
solid waste collected and disposed off is less than 40% in Karachi (Pakistan) and
60% in Jakarta (Indonesia) (Ogu, 2000:103).
The situation is worse in informal settlements in sub-Saharan Africa including Dar es
Salaam City in Tanzania; where 50% of wastes generated are collected. Even the
collected wastes are crudely dumped (Mwakalinga, 2005; Msangi, 2005; Kalwani,
2009). Zerbock (2003) asserts that the main reasons for such situation emanates
from rapid urbanization, complex interrelationship of financial and management
constraints, including inadequate financial resources, insufficient and poorly
5
maintained equipment, insufficient and inadequate qualified human resources,
inappropriate management systems, corruption and mismanagement, and
unwillingness of the residents to pay for refuse collection charges.
To this end, Dar es Salaam City in Tanzania and its three municipalities (i.e.
Kinondoni, Ilala, and Temeke) is not exceptional (Mwakalinga, 2005; Tibaijuka,
2007). However, as one of the prime solution at recent years, there has been
increased awareness by the central and local governments that local community
development and related problems are best handled by locally based agencies
(Kyessi, 2002: 36/37; Msangi, 2005).
1.2.4 National Responses to the Challenge of Solid Waste Management
Recent national responses to the challenge of solid waste management manifest
themselves through the national environmental policy of 1997 and the national
environmental management Act of 2004. These instruments are briefly discussed
below. The National Environmental Policy was issued by the government of
Tanzania in 1997. The policy outlines the six key environmental concerns as land
degradation, deforestation, environmental pollution, loss of wildlife habitat and
biodiversity, deterioration of aquatic and terrestrial ecosystems, and lack of
accessible good quality water.
In so far as solid waste management is concerned, environmental pollution is very
relevant. And the Environmental Management Act was enacted by the Tanzanian
Parliament in 2004. Furthermore, the Act provides for the establishment of a

6
National Environment Management Council to coordinate environmental
management issues at the national level. The Act also requires the appointment of
sectoral, regional and district environmental coordinators, who in one way or another
must address the problem of environmental pollution.
1.3 Statement of the Problem
Diminishing municipal and state resources coupled with inadequate urban
management capacity and insufficiency of conventional approaches which have
rendered it impossible to provide effective and efficient solid waste management in
urban areas in developing countries and the need for local resources mobilization
constitute the statement of the problem. Based on the background to the study it is
clear that, regardless of various programmes which have been initiated globally,
regionally and nationally in order to address the challenge of urban solid waste
management, scanty literature exist on the tapping of bottom-up approaches in local
resource mobilization towards sustainable solid waste management. Hence, it has
been important to employ this study in order to alleviate the prevailing problem.
1.4 Objectives of the Study
The overall objective of this study was to explore the potentiality of the various
modes of local resources mobilization toward the design of a framework that can
meaningfully form the development of an integrated solid waste management
(ISWM) in Kinondoni Municipality. Specifically, the study sought:
a) To assess the performance of solid waste management system in Kinondoni
Municipality;

7
b) To describe and asses the strategies used in local resources mobilization for solid
waste management that exists in Kinondoni Municipality;
c) To identify types and roles of actors involved in local resources mobilization for
solid waste management in Kinondoni Municipality;
d) To determine constraints and potentials in local resources mobilization; and
e) To propose policy recommendations based on the research findings on various
strategies of local resources mobilization for solid waste management in urban
areas.
1.5 Research Questions
The main research question was: What is the potentiality of the various modes of
local resources mobilization toward the design of a framework that can meaningfully
form the development of an integrated solid waste management in Kinondoni
Municipality? From this main question the following sub-questions were derived:
a) What is the performance of local resources mobilization in Kinondoni?
b) Why and how local resources are mobilised for solid waste management?
c) Who are the actors involved in local resources mobilization for solid waste
management in Kinondoni Municipality and what are their roles?
d) What are the constraints and potentials facing various strategies of local
resources mobilization for solid waste management?
e) What are the policy implications based on the research findings on various
strategies of local resources mobilization for solid waste management in urban
areas?

8
1.6 Significance of the Study
The findings of this research are intended to build up knowledge which shows that
without local resources mobilization it is difficult to have sustainable solid waste
management in urban areas, particularly in poor societies. Thus, the study findings
are intended to inform decision-makers, practitioners, academicians, local
community workers, the private sector, industries, development partners and other
beneficiaries on the relevance of mobilising local resources towards sustainable solid
waste management.
1.7 Organization of the Thesis
This study was organized in nine chapters. Chapter one an introduction and the
research issue. Chapter two presents a review of literature that is relevant to urban
solid waste management. Chapter three defines the research methodology. Chapter
four presents the performance of solid waste management in Kinondoni
Municipality. Chapter five discusses the performance of solid waste management
through public-private-partnerships. Chapter six looks at the performance of solid
waste management through informal community based organization (CBOs).
Chapter seven examines the performance of solid waste management through formal
non-governmental organizations (NGOs). Chapter eight unleashes a cross-cutting
analysis of solid waste management in Sinza, Kawe and Hanna Nassif Wards.
Finally, chapter nine reveals conclusions, policy implications and recommendations.

9
CHAPTER TWO
2.0 LITERATURE REVIEW ON RESOURCES MOBILIZATION
FOR URBAN SOLID WASTE MANAGEMENT
2.1 Introduction
This chapter explores the relevant literature in order to identify and assess the issues
and challenges pertaining to local resources mobilization toward sustainable solid
waste management in Kinondoni Municipality, in Dar es Salaam City, Tanzania.
Specifically, the following issues are addressed: solid waste management practices at
Global, Regional and National levels; contextual issues in resources mobilization for
solid waste management; theoretical frameworks for local resource mobilisation; and
conceptualising local resource mobilisation for solid waste management.
2.2 Decentralization and Local Resources Mobilization
2.2.1 The Logic of Decentralisation
Decentralization can be discussed in terms of deconcentration, privatization, and
partnerships. Deconcentration involves the transfer of authority for specific decision-
making, financial and management functions by administrative means to different
levels under the same jurisdictional authority of the central government. This is the
least extensive type of administrative decentralization and the most common found
in developing countries. General deconcentration occurs to the extent that a variety
of tasks are deconcentrated to a horizontally integrated administrative system.
Functional deconcentration occurs to the extent that specific tasks are deconcentrated
to the field units of a particular ministry or agency (Mukandala, R.S.1998). Thus,

10
privatization occurs when planning and administrative responsibility or other public
functions are transferred from government to voluntary, private, or non-government
institutions. In some cases, governments may transfer to "parallel organizations"
such as national industrial and trade associations, professional or ecclesiastical
organizations, political parties, or cooperatives - the right to license, regulate or
supervise their members in performing functions that were previously controlled by
the government. In other cases, governments may shift responsibility for producing
goods or supplying services to private organizations, a process often called
privatization (ibid).
Partnership entails transferring the responsibility for planning and delivery of
services to CSOs. Decentralization measures applied to CSOs go beyond the local
government level, reaching that part of the system of governance that is outside the
various levels of the public administration and delegated agencies. At this level,
partnership arrangements may involve a leading NGO, or an intermediary agent of a
more complex nature, say an association established under private law, in which
local common interest groups and associations, the NGOs operating in the area and
representatives of local governments join together as members with equal rights
(ibid).
Decentralization has some benefits to local communities. These benefits range from
expected improvement in locative efficiency, welfare and equity to increased
participation, accountability and responsiveness on the part of local authorities
(Robinson, 2003). Other benefits include facilitation of democratic participation by

11
empowering grassroots actors to channel their inputs into the national development
efforts, ensure that people explore their real needs such as local resources
mobilization towards sustainable solid waste management and develop interest in
seeing that they are realized, proper efficiency and effectiveness, improve service
delivery, reduce conflicts, facilitate access to decision points, increase representation
and enhance democracy (Kyessi, 2002:74).
2.2.2 Local Resources Mobilization
Resources mobilization refers to an expansion of relations with the resource
providers, and the skills, knowledge and capacity for proper use of the same
resources. It denotes the process that achieves the mission of the organization or an
institution through mobilization of knowledge for human use of skills, equipments,
services, etc. Thus, it refers, not to fund-raising only, but also includes other
resources as well as the correct and maximum use of the available resources (Peter
Berman, 1996; UNDP, 2002).
However, according to TANGO (2005) and Mwakalinga (2005), local resource
means any contribution from within the local community that assists the
implementation of an activity, project or program. They include a wide range of
financial and non-financial contributions from local community members, including
individual citizens, institutions, organizations, businesses, government authorities,
etc.
Local resources as defined earlier, could imply many things including human
resources (labour), intellectual and institutional capacity. The human resource base

12
varies according to culture as well as economic and historical factors. The natural
resources that a country is endowed with also differ enormously, and their use
depends, inter alia, on the prevailing technologies (ILO, 1993; UNDP, 2002).
Hence, this study refers to local resources mobilization as a process whereby
individuals or local organizations such as CBOs/NGOs facilitates, collects and
manage any kind of contributions from within the local community that assists the
implementation of an activity, project or program. These local resources include a
wide range of financial and non-financial contributions from local community
members, including individual citizens, institutions, organizations, businesses,
government authorities, etc. (TANGO, 2005). However, in the context of effective
and efficient local resources mobilization towards sustainable SWM it can smoothly
be attained when the unfolding of local community initiatives is routinely supported
by the local authorities and all other relevant actors, based upon the local human and
material resources. Local authorities are responsible for enabling the people in their
respective jurisdictions to participate in planning and execution of development
programmes in their areas (UNDP, 2002).
2.2.3 The Concept of Community Participation in Local Resources Mobilization
Participation is a process whereby stakeholders exercise influence over public
decisions, and share control over resources and institutions that affect their lives,
thereby providing a check on the power of the government (UNDP, 1994; Ruwa,
2001; TANGO, 2005). In the context of the good governance, participation is
focused on the empowerment of citizens and addressing the interplay between the
13
broad range of civic societies, actors and actions. It occurs at various levels: at
grassroots, through local and civic institutions; at the regional and national levels,
through their flexible and decentralized forms of government, and also in the private
sector (ibid). The principle of participation derives from an acceptance that people
are at the heart of development. They are not only the ultimate beneficiaries of
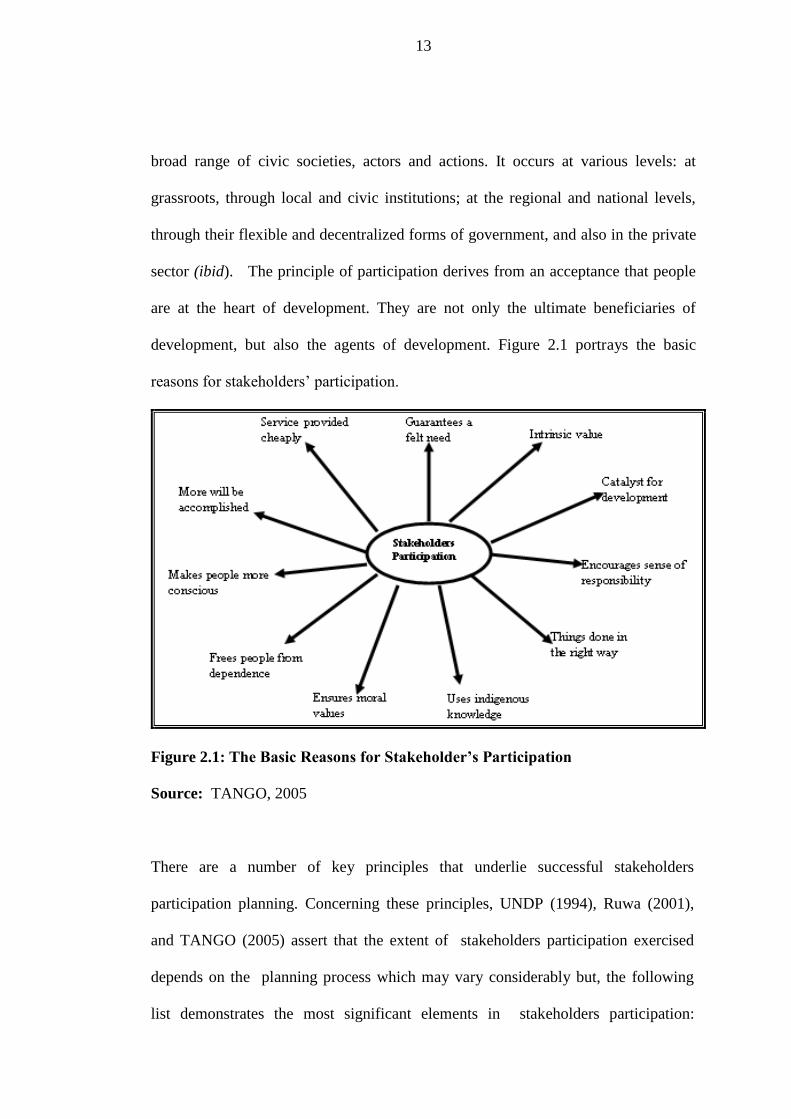
development, but also the agents of development. Figure 2.1 portrays the basic
reasons for stakeholders’ participation.
Figure 2.1: The Basic Reasons for Stakeholder’s Participation
Source: TANGO, 2005
There are a number of key principles that underlie successful stakeholders
participation planning. Concerning these principles, UNDP (1994), Ruwa (2001),
and TANGO (2005) assert that the extent of stakeholders participation exercised
depends on the planning process which may vary considerably but, the following
list demonstrates the most significant elements in stakeholders participation:

14
information giving (e.g. public presentations); information gathering (for example,
opinion surveys), discussion and negotiation in planning processes, power-sharing
and participatory decision-making (e.g. participatory budgeting).
In short, the involvement of local communities helps the identification of problems
and also planning of the layout of the disposal infrastructure itself. The knowledge
and resources of local stakeholders provide invaluable benefits that may be
measured in terms of cost-effectiveness and increased sustainability. These
principles, if not adhered to, may undermine the planning process and the potential
benefits of working with local stakeholders will be lost. These principles are the
following: consensus, inclusiveness, transparency, accountability, and decisiveness
(ibid).
2.3 Solid Waste Management Practices at Global, Regional and National Levels
2.3.1 Global Responses to Solid Waste Management
Available literature indicates that, the amount of municipal solid waste (MSW), one
of the most important by-products of an urban lifestyle, is growing faster than the
rate of urbanization. For example, in 2002 there were 2.9 billion urban residents who
generated about 0.64 kg of MSW per person per day, an equivalent of 0.68 billion
tones per year. Ten years later, which is in 2012, estimates show that these amounts
have increased to about 3 billion residents generating 1.2 kg per person per day, an
equivalent of 1.3 billion tones per year. The rise of urban population from 2.9 billion
residents in 2002 to about 3 billion residents in 2012 is the reason for the related rise
in MSW generation which has increased from 0.64 kg per person per day in 2002 to
1.2 kg per person per day in 2012. In this regard, it is estimated that, by 2025 this

15
population will likely increase to 4.3 billion urban residents generating about 1.42 kg
per capita per day of municipal solid waste. This is an equivalent of 2.2 billion tones
per year (Daniel Hoornweg and Perinaz Bhada-Tata, 2012; World Bank, 2012).
Table 2.1 summarizes these realities.
From Table 2.1, it follows that, there is a strong correlation between urban solid
waste generation rates and population growth. Apart from population growth, MSW
generation rate is also correlated with national gross domestic product (GDP) and
illiteracy level. The correlation is in the form of a linear model, which assumes a
linear relationship between the amount of municipal solid waste generation and its
contributing factors, namely: population, GDP per capita, and illiteracy rate.
On the other hand, poorly managed waste has an enormous impact on health, local
and global environment, and economy. Improperly managed waste usually results in
down-stream costs higher than what it would have cost to manage the waste properly
in the first place. The global nature of MSW includes its contribution to green house
gases (GHG) emissions, e.g. the methane from the organic fraction of the waste
stream, and the increasingly global linkages of products, urban practices, and the
recycling industry. Thus, improving urban SWM services is one of the most effective
ways to strengthen overall municipal management and is usually a prerequisite for
other, more complicated, municipal services. Accordingly, various global actors
have repeatedly sought to remedial interventions toward a better SWM practices.

16
This section examines the key global responses to the challenge of solid waste management.
Table 2.1: Global Trends of Urban Population and MSW Growth from 2012-25
Source: Daniel Hoornweg and Perinaz Bhada-Tata, 2012
Region
Current MSW Data (2012) Projected MSW Data (2025)
Urban
Population
(millions)
Urban MSW
Generation Per
Capita
(kg/capita/day)
Total
Urban
MSW
Generation
(tons/day)
Total Urban
MSW
Uncollected
(tons/day)
Urban
Population
(millions)
Urban MSW
Generation Per
Capita
(kg/capita/day)
Total
Urban
MSW
Generation
(tons/day)
Total Urban
MSW
Uncollected
(tons/day)
Africa 260 0.65 169,119 91,324 518 0.85 441,840 238,594
East Asia and Pacific 777 0.95 738,958 206,908 1,229 1.5 1,865,379 522,306
Eastern and Central Asia 227 1.1 254,389 55,966 239 1.5 354,810 78,058
Latin America and the Caribbean 399 1.1 437,545 96,260 466 1.6 728,392 160,246
Middle East and North Africa 162 1.1 173,545 26,032 257 1.43 369,320 55,398
Organisation for Economic Co-
operation and Development
729 2.2 1,566,286 31,326 842 2.1 1,742,417 34,848
South Asia 426 0.45 192,410 67,344 734 0.77 567,545 198,641
Total 2,980 1.2 3,532,252 575,159 4,285 1.4 6,069,703 128,8091
17
(a) The Basel Convention
The Basel Convention was on the Control of Transboundary Movements of
Hazardous Wastes and their disposal which was an international treaty that was
designed to reduce the movements of hazardous wastes between nations and
specifically to prevent transfer of hazardous wastes from developed to less
developed countries. The Basel Convention entered into force on 5th
May 1992.
(b) World summit on sustainable development
In June 1992, the United Nations Conference on Environment and Development
(UNCED), known as the “Earth Summit,” was held and adopted a global action plan
called “Agenda 21” for international activities in environment protection. Ten years
later, in August 2002, the World Summit on Social Development was held to review
the action plan and to discuss new challenges. As far as solid waste management is
concerned, the key challenges identified included developing integrated solid waste
management, placing utmost priority on waste prevention and minimization, re-use
and recycling, and the application of environmentally sound disposal facilities.
Another challenge identified was the promotion of waste prevention and
minimizations by encouraging the production of re-usable consumer goods and
biodegradable products. Hence, the WSSD emphasized the application of an
integrated approach to solid waste management, which entails the waste hierarchy
principle.
(c) Millennium development goals
The millennium development goals (MDG) were adopted by the United Nations
General Assembly in 2000. They include the endeavour “to ensure environmental

18
sustainability.” This is the seventh goal. Within the same goal the world targeted to
integrate the principles of sustainable development into country policies and
programmes; reverse the loss of environmental resources; and achieve significant
improvement in the lives of at least 100 million slum dwellers by 2020.
(d) The G8 summit initiative on 3R’s
In June 2004, the G8 Summit launched the “3R Initiative”. This initiative aimed at
building a global recycling-oriented society through promoting the three R’s,
namely: reduce, re-use, and re-cycle. As far as foreign aid to third world countries is
concerned, cooperation in areas such as capacity development, raising public
awareness, and the implementation of recycling projects is being sought through this
initiative.
(e) The Kyoto protocol on global climate change
The Kyoto Protocol is a protocol to the United Nations Framework Convention on
Climate Change (UNFCCC). It is an international environmental treaty with the goal
of achieving the stabilization of greenhouse gas concentrations in the atmosphere at
a level that would prevent dangerous anthropogenic interference with the climate
system. The Protocol came into force in February 2005. In the field of solid waste
management, two approaches have attracted increasing attention. They are the
recovery of methane (CH4) gas from landfill sites and recapturing energy from
organic wastes.
2.3.2 Regional Responses to Local Resource Mobilization for SWM
This section describes the relevant experiences of innovative practices dealing with
the improvement of waste management in urban poor settlements in various parts of

19
the third world countries. The projects chosen are organized along the following
dimensions: project background and context, implementation arrangement, technical
solutions, operational organization, financing, and analysis and synthesis of the
project.
(a) Solid waste management through cooperative union in Rosario City,
Argentina
This case study has been extracted from Samol et al (2005:46-51). According to this
source, the purpose of the project was the improvement of hygiene and
environmental infrastructure in neglected districts, in combination with measures for
income generation and support for local initiatives and micro-enterprises. In 1999,
with GTZ support, a cooperative was established to carry out domestic refuse
collection, cleaning ditches and open sewer ducts, lawn mowing; and
complementary environmental education on behalf of the city. Settlements with
approximately 11,000 inhabitants were being served by the cooperative.
(i) Background and context
Argentina has undergone significant restructuring in the course of the last decades,
and has privatized almost all state-owned enterprises in the process. Basic services
and environmental management have been increasingly given over to private
companies. On the one hand, this has provided more opportunities for local
entrepreneurs; on the other hand, competition in the cities is harsh and often favours
big international firms with large capital assets.
In many Argentinean cities, waste management simply means refuse collection,
whereas integrated approaches to waste management planning are hardly known.
20
Even city administrations have little experience in this field, and therefore the
privatization of services is generally limited to refuse collection and transportation.
Private companies are not expected to offer intricate waste management solutions
designed for specific local situations or settlement structures. In many cases
"standard" solutions, copied from industrialized countries, do not yield the desired
results. In addition, bidding procedures are mainly dominated by large,
internationally active companies because of the very high initial costs for vehicles
etc.
The city administration of the city of Rosario, an industrial and commercial centre of
supra-regional importance, has contracted two private international firms for refuse
collection, urban hygiene, and street cleaning in all six districts of the city. The
problems of these different districts are, however, more complex than the solutions
either company has so far presented. In large parts of Rosario, refuse collection is
organized as a retrieval system. Inhabitants leave plastic bags with domestic refuse
outside their homes on a daily basis. It is collected and loaded onto refuse trucks, so-
called "compactors", and then disposed off on dumps without further treatment. In
poorer districts, with built environments of medium density and various degrees of
consolidation, the compactors cannot access streets that are unpaved or too narrow.
Residents must therefore, bring their refuse to containers installed by the refuse
disposal company.
Apart from the extra effort involved in this system, it is dependant in part on the
residents themselves. Peripheral settlements especially have therefore, encountered a

21
variety of problems affecting urban hygiene. Container sites are frequently filthy and
often the inhabitants do not appreciate the importance of dealing with their refuse
properly. In most cases they are not directly aware of the negative consequences
poor refuse management can have.
Informal refuse scavenging further exacerbates the problem: scavengers collect
plastic bags and other waste materials in the commercial centers of the city, and
bring them back to their homes on the periphery for separation and recycling.
Because what remains of the garbage is often inadequately disposed of, peripheral
housing areas frequently produce extremely large amounts of refuse in spite of
relatively low population densities. Consequently numerous small dumping grounds
eventually develop around peripheral settlements, and open drainage canals are
commonly fouled up.
The city administration had not been able to develop appropriate refuse management
solutions in cooperation with residents and private firms. Particularly poorer
population groups have limited possibilities to make their voice heard in decision
making processes on solid waste management or settlement development.
(ii) Implementation
Communal waste management in Rosario is a joint project of the city administration
of Rosario and the GTZ. The project began with an educational trip to Bolivia for
employees of Rosario's environmental authority. They visited micro-enterprises for
refuse collection in peripheral areas difficult to access with trucks because of their
adverse topography. Drawing experience from this trip, it was decided to adapt the

22
Bolivian example and apply it to a poorly serviced district of Rosario as a pilot
project. A group was already involved in hygiene education as part of an
employment generation program in that district, and, in addition, the employment
office was actively supporting micro-enterprises there, with construction projects,
carpentry, sewing work etc.
When the employment generation program ended, the group was encouraged to take
in refuse collection and the improvement of urban hygiene in the district. They were
advised to start a business in order to ensure the sustainability of their activities.
With the help of the GTZ, the group organized themselves into a cooperative. The
cooperatives now offers services were ranging from domestic refuse collection
(using an adapted system), to street and sewage canal cleaning, as well as lawn
mowing. The contract with the company originally in charge of waste disposal in the
area was canceled. It remains responsible only for transporting containers to the
dumping grounds. The district chosen for the pilot project is a poor residential area
located in on the periphery most of its inhabitants work in the informal sector, some
of them as collectors of recyclable material. In order to give the pilot project a good
chance of succeeding, it was not implemented in the poorest districts of the city.
Instead, a settlement was chosen where there had already been experience of
working with inhabitants who then later formed themselves into a cooperative.
(iii) Technical solutions
Refuse collection is managed as a pick-up system. Members of the cooperative
collect refuse bags at front doors and load them onto a special handcart that they
push through the district, and in this way, even unpaved footpaths are accessible. At

23
the same time, streets and open sewage canals are cleared of refuse. Personal
contacts between residents and refuse collectors make it easy to arrange which time
of a day garbage bags should left outside. This helps to avoid them being rummaged
through by stray dogs, which spread their contents and leave it for the wind to
scatter. The collected refuse is taken from the handcart and loaded into containers -
in this case, large open topped movable skips (also known as “dumpsters”) - at
collection points located at the edge of the district. From here, private disposal
companies take it to the dump in trucks. The cooperative is responsible for the
maintenance and hygiene of the collection points.
(iv) Operational organization
The project's goal was to create a micro-enterprise that could be officially contracted
by the city administration. A contractual arrangement was used that did not require a
new round of public bidding. The founders of the cooperative had previously been
involved in an 18 month employment generation program. Their tasks included
educating the residents in the field of urban hygiene and organizing one-off cleaning
up actions in some public places of the district. Preliminary investigations to
determine the size of the project area and for the founding of the cooperative
company were taken over by the GTZ's Communal Waste Management Project
Rosario.
The utility and probable cost-effectiveness of the enterprise were checked by the
city's employment office. After the company had been established, a contract was
signed between the cooperative and the city's environmental authority – the
commissioning institution in the field of waste management. Training for the
24
cooperative's original members was financed within the framework of a supra-
regional GTZ project. Internal task allocation was managed by the members
themselves. The GTZ supported the preparation of cost estimates and a business plan
for services.
(v) Financing
The inhabitants of Rosario pay a property tax dependent on the size and location of
their plot. This tax is used to finance communal services and is also charged in
"informal" areas of the city. No extra charges are made for refuse collection, which
is directly financed through the city budget. The cooperative's basic equipment was
financed through an interest-free GTZ loan (3,000 US$), repayable within three
years. Wheelbarrows, uniforms and tools were purchased with this money. After
only 18 months of work, 50% of the loan had been repaid. The provincial
government of Santa Fe awarded an additional US$ 2,500. The city's environmental
authority is the contract partner.
(vi) Analysis and synthesis of the project
Spatial aspects: Spatially, the types of settlements in question were characterized as
peripheral settlements with medium population densities, various degrees of
consolidation and poor vehicle access. Rosario City had the inhabitants of 1,005,000
in 1999.
Organizational Set-up: Organizationally, the project was comprised of a cooperative
of 12 residents of the affected settlements; the municipality; and GTZ. The
cooperative of 12 residents were the implementers; GTZ provided advisory

25
assistance especially on organizational and financial issues; and the municipality
supported the founding of the cooperative and awarded it a contract.
Technological support: Technologically, refuse collection was being done with
handcarts and subsequent unloading to larger removable containers at central
collection points; transport to municipal dump by private contractors with motorized
vehicles. These private contractors also dealt with cleaning and maintenance of
container sites; cleaning of sewage ditches; complementary environmental education
of users.
Financial resources: Financially, financing of initial investment costs for basic
equipment came from GTZ loan repayable over three years and a subsidy by the
provincial government; and cost recovery was made through property tax as raised
by the municipality.
Lessons learnt: A residents' poll taken 18 months after the cooperative's business
started operating confirmed that the project was able to improve general living
conditions and hygiene in the district. The members of the cooperative are residents
of the area, and therefore there is a close relationship between refuse collectors and
other inhabitants, which facilitates environmental education and awareness. It is
argued that conventional refuse collection might not usually have this advantage.
And in fact, this small cooperative enterprise offered the city administration a system
of waste management especially designed to meet the district's needs. At the
moment, however, the arrangement means that the city has additional costs and
additional administration work, because a suitable form of contract has yet to be

26
worked out. The rules of competition prohibited a long-term contract, so the
agreement had to be renewed on a monthly basis: this hindered the optimization of
the technical processes. Under these circumstances, the cooperative was unable to
make long-range plans or, for example, invest in a van.
While the city administration profited from the advantages of a small local enterprise
and its benefits to the community, the cooperative received little recognition in other
respects. Its members were not allowed to join the union of sanitation workers, and
its economic significance was seen as minimal compared to that of the large,
internationally organized companies. This resulted in a high level of dependence on
the city administration, and encouraged paternalism and the exercise of influence.
An important factor in the city administration's role in waste management was the
design of its bid invitations. These openly favoured large private firms in spite of the
fact that the cooperatives specialized services were unquestionably competitive. The
competitiveness and profitability of the cooperative would, however, be improved if
the area they serviced was bigger, and the technical equipment and the number of
people employed were optimized. But pragmatism, i.e. doing what can be done
under the circumstances, is inherent to such small and flexible projects.
(b) Solid Waste Management through CBOs in Qanater City near Cairo, Egypt
This case study has been extracted from UN-Habitat (2010) and Samol et al
(2005:44-47). According to this source, the purpose of this project was the
establishment of a solid waste management system operated by a community
development organization in collaboration with the city administration. In 1997 was
the beginning of technical cooperation in the context of the UNDP-LIFE programme

27
with support by GTZ; and 1999 was the end of support through the GTZ. The
inhabitants as of 1999 were as follows: City (10,800,000) and Metropolitan Area
(15,000,000).
(i) Background and context
The German contribution to the UNDP/LIFE project (Local Initiative Facility for the
Urban Environment) consists of supporting waste management initiatives in different
locations of the urban area of Cairo and Fayum. Geziret El Sheir is the most
successful project area to date. The settlement is located on an island in the Nile
about 30 km north of Cairo. The island officially belongs to Qanater City, a small
town within the catchments area of the Egyptian capital. Its inhabitants are socially
diverse. Although the majority of its 7,300 residents have a low income, only one
tenth of families live in extreme poverty.
Because the island is located outside of the actual city, municipal refuse disposal
services are sporadic or non-existent. Residents disposed of their garbage on the
banks of the river. During high tide, the contents of cesspits flooded into houses and
public open spaces. This appalling situation affected all the five peri-urban
settlements of Geziret El Sheir equally, and caused illness and high child mortality
rates.
The project is linked to a local community development organization (CDA). CDAs
are legally authorized to take responsibility for a variety of tasks in their district,
although their work does not usually extend beyond social activities and charity. The
political-administrative system in Egypt is extremely centralized and city

28
administrations have hardly any leeway for policy development. Elected
representatives at the city level consider themselves lobbyists for their own
constituency, and show little interest in issues concerning the living conditions of
poorer sections of the population. Before the project started, Geziret El Sheir had
therefore been excluded from public waste management services in spite of the city
administration's formal responsibility.
(ii) Implementation
The technical cooperation project was implemented in four relatively small areas
(Kohafa/Fayum, Qanater City, Kassabgy/Gizeh and Boulaq el Dakrour/Gizeh) over a
period of two and a half years. It aimed at establishing decentralized systems of
refuse management in urban poor settlements by mobilizing young volunteers and
cooperating with existing community associations. The most successful project was
in Qanater City, where it was possible to establish both a refuse disposal system and
a sewage management system on the island of Geziret El Sheir. This case study
presents only measures pertaining to the project in Qanater City. Its implementation
was based on the following components: mobilization of the local Community
Development Association (CDA); activation and education of volunteers for
mobilizing the population; financing of a small refuse truck and a pumping vehicle
for feces disposal; participative development of organizational and financial
concepts in cooperation with the city administration.
Twice a week, public employees collect domestic refuse from specific locations and
transfer it to the municipal dumping grounds with a CDA truck. According to the
estimates of those responsible, approximately 80% of the population is actively
29
involved in refuse collection and reliably pays the fees charged.
(iii) Technical solutions
Refuse disposal is handled through a drop-off system: rubbish bags are brought to
collection points located near to the houses. A remodeled pickup truck then takes the
refuse to the authorized dumping grounds. Distances are kept short by using small
vehicles with the ability to maneuver in the narrow streets of the settlement. A CDA
pumping vehicle empties private latrines for the normal fee for such services.
(iv) Operational organization
The project is innovative especially because it is based on a division of labor that
involves a range of stakeholders. Empowering the local CDA (Community
Development Association) is of central importance for mobilizing the population. As
a quasi state-controlled CBO, the CDA is as much the local executing organization
as its project counterpart. The input of the group of young volunteers makes a
substantial contribution to the project's success. They work as mediators for the
population, by collecting fees (whilst selling plastic rubbish bags door-to door) and
motivating residents to get involved. A total of 32 youths regularly participate in the
different project areas. In this way, loyalties and personal inter-dependencies are
fostered, and the problem of corruption is virtually eliminated from the fee collection
process.
Ultimately the system is based on cooperation with the city administration, which
pays the refuse truck workers whilst being relieved of its (formal) street cleaning
obligation. The cooperation of the city administration was achieved through

30
intensive discussions, which also involved local politicians, in what is called local-
local dialogue, a conceptual element of UNDP/LIFE's project approach. In all, the
following stakeholders became seamlessly integrated: the city administration and
political representatives; the local CDA; youth volunteers for carrying out awareness
campaigns, fee collection, and encouraging local participatory data collection and
surveys; and the inhabitants.
(v) Financing
The refuse truck and latrine clearing vehicle were financed by the GTZ. The CDA
organized a secure parking place. The city administration provides the project with
four workers to collect refuse bags. In addition to their slim wages, the CDA pays
them a bonus of EUR 3.00 per month. The CDA employs one manager for
organizing refuse collection, and an additional supervisor is employed by the city
administration. The project was as of March 2000 relatively well staffed.
Contributions made by the CDA are financed by a fee of EUR 0.6 charged per
household per month. It is collected by volunteers by way of "selling" refuse bags.
The fees cover operating expenses as well as the bonuses for public employees.
These revenues are large enough to pay for maintenance and vehicle replacement,
and even cover approximately 50% of the garbage truck's amortization costs.
Financial sustainability is therefore at least partially secured. These financial
provisions are unusually high by Egyptian standards, but stem from the conscious
recognition of the advantages the project brings. In return for its “accommodation”,
the city administration is released from formal street cleaning duties, which are now
organized by the CDA and carried out by residents.

31
(vi) Analysis and synthesis of the project
Spatial aspects: This type of settlement was characterized as peri-urban settlement;
the average population density was 500 to 700 inhabitants per hectare; and it
approximately had 7,300 inhabitants.
Institutions involved: Organizationally, there were international and bilateral
organizations (GTZ/UNDP); the city administration of Qanater City; CDA
(Community Development Association); and volunteers from the districts.
Technology adopted: Technologically, the project was characterized by door-to-
door collection of refuse in plastic bags (pick-up retrieval system) and transport to
central collection points; and transport of refuse from collection points to municipal
dump by a pick-up truck remodeled for this purpose.
Financial support: Financially, the financing of initial investment costs came
through the GTZ; and the financing of recurrent operational costs and approximately
50% of vehicle amortization costs came through user fees collected by the CDA.
Lessons learnt: Under this project, the operational organization facilitated an
effective local resource mobilization framework. The GTZ contributed to the UNDP
/LIFE program by helping local CDAs (Community Development Associations)
become competent waste management operators, working with local volunteers and
with the city administration. The project was successful, because it offered
advantages to all stakeholders, namely: relief for the city administration; the solution
of sanitation problems for the residents; and for the CDA, a strengthened local
32
community. Because of the strategic capabilities of the project's approach, the CDA
became involved in a number of its own projects and has successfully acquired
financial support from other international donors. At other GTZ project locations in
Egypt, alliances between other kinds of stakeholders also worked successfully: for
example, in Kassabgy (Gizah), private companies were involved, and in Kohafa
(Gizah), there was cooperation with an international NGO, CARE.
(c) Waste management through PPP in Cotonou City, Benin
This case study has been extracted from UNEP (2005) Samol et al (2005:48-51).
The purpose of the project was to put in place, waste disposal and recycling
measures in a cooperation between a local NGO, private refuse collectors and the
municipality. To this end, in 1993 a system of domestic waste collection was
initiated. However, in 1995 the NGO Développement Communautaire et
Assaisissement du Millieu (DCAM) took over waste disposal and separation for
recycling; and in 1999 to 2000 recycling activities (plastic, biodegradable waste,
compressed paper briquettes) were established and put in operation. In 1999
Cotonou City had the following inhabitants: City (500,000) and Metropolitan Area
(approx. 1,000,000).
(i) Background and context
Cotonou is Benin's most important seaport, and also the country's economic and
industrial center. Democratic reforms together with economic restructuring resulted
in relatively high economic growth at the beginning of the 1990's. However,
economic imbalances within the population increased. Many Benin City
administrations, handicapped by a lack of resources, were unable to provide urban

33
inhabitants with basic services. NGOs, such as the Organization Confessionelle de
Development (OCD), attempted to bridge the resulting gap. OCD is financed by the
country's protestant church and administers a hospital (Centre de Santé de Bethesda)
in the St. Rita quarter.
The hygiene situation in this urban area is extremely precarious and was held
responsible not only for the general population's poor state of health but is also
regarded as an obstacle to overall development. Rotting refuse on public streets
polluted the air and caused infections and the breakout of epidemics.
(ii) Implementation
As early as 1993, a door-to-door system of domestic refuse collection was
established with approximately US$ 115,000 of French development aid. Part of this
money was also used to improve the necessary infrastructure and for the construction
of a landfill. This funding enabled the OCD to found an initiative called
Développement Communautaire et Assaisissement du Millieu (DCAM) to take over
waste management tasks. DCAM organized door-to-door collection, contracting
about 20 refuse collectors, supplying them with the necessary carts, supervising their
work and arranging transport to the refuse disposal site.
They were partially financed through subscription fees and recruited workers from
the area. After the initial funding was exhausted, DCAM continued collecting refuse,
but could no longer afford to transport it the dump, which meant that refuse had to be
stored on the settlement's periphery. A grant from the Protestant Development
Service (EZE) in 1997 was aimed at helping restore the project's independence.

34
Working together with representatives from the town quarter and the local
administration, residents were to be made more aware and more involved.
Extending the refuse collection system was to generate new employment.
Educational measures were an important part of the program. The refuse collection
system in the St. Rita town quarter was established successfully and because it was
able to sustain itself through fees, it could be partially privatized. Each former
employee was assigned a certain area of the settlement and managed it
independently. Former employees now also collect fees, and, after subtracting
DCAM licensing charges and credit repayments for the pushcarts, are allowed to
keep the fees as profit. DCAM still monitors the work, in addition to distributing
licenses and administering small reserve accounts for the refuse collectors, in case an
old pushcart needs to be replaced. While the first phase of the project was mainly
concerned with setting up a collection system, the focus has shifted towards refuse
separation and reuse of recyclables. The capacity for separating plastic, paper, waste
oil and biodegradable waste is now established. The notable success of these
measures has resulted in a contract between the city administration of Cotonou and
DCAM that covers all the refuse collected in the community. 400 cubic meters of
refuse are sorted daily by more than 100 people and then transferred to different
institutions for further processing. Costs are borne by the city administration.
(iii) Technical solutions
Transporting domestic refuse on pushcarts through unpaved, sometimes muddy
streets proved to be difficult. The high cost of its subsequent transfer to central
separation points or refuse dumps was another problem. DCAM therefore tried to

35
reduce the amount of unsorted refuse by promoting separation in households. The
following materials are collected separately: paper, plastic, metal, glass, organic
substances, and – for environmental reasons – batteries. Because of the large
amounts of refuse that still reaches the central separation point unsorted, the use of
future investment in equipment such as wheel loaders, sieve drums and conveyor
belts is being considered. Appropriate methods for disposing of the remaining refuse
are being examined.
Hazardous waste from the local hospital was treated in a small waste incinerator
until its use was found to carry environmental and health risks. A contract was
therefore signed with the largest hospital in the city, which has a modern incinerator
where waste from other hospitals was also being handled. DCAM now collects
refuse from hospitals across the whole city.
(iv) Operational organization
DCAM took up work in 1995. Its connection to church institutions through the OCD
created a relationship of trust and thus simplified the lead-in to the work. Awareness-
raising activities and environmental education were conducted at the level of
residents and schools, and also at the level of the local authorities. Without the local
district representatives' ready and willing support for DCAM's work, the project
would never have materialized. Participation in the project is voluntary and linked to
the payment of fees. An average of over 60% of all households has subscribed to
DCAM's refuse collection services, although the number of subscribing households
varies between settlements, and ranges from 30% to nearly 90%. Almost 80% of
participating households pay their monthly fees of 1000 FCFA, or US$ 1.4 regularly.

36
DCAM has evolved into a highly professional NGO in its field with close to 130
employees.
(v) Financing
Transportation to the refuse dump is extremely costly because of the distances
involved, the vehicles required, their gasoline consumption and their maintenance. It
was impossible to cover these costs in the first phase of the project. About US$
1,750 were needed to transport the monthly load of then 1,300 m3 of refuse to the
dump. Now that DCAM separates all the refuse collected by communal agencies in
its processing center about 25 km outside the city, the city administration has taken
over transportation costs, and even pays US$ 10 per cubic meter for separation and
processing.
Recently, however, Cotonou city administration has exhibited a bad attitude towards
payment. It has not honored its obligations for months. Only a storm of protest from
workers could make it do so. Additional funds are generated through the sale of
recyclables and secondary raw materials (metals, bones, compost, plastic chips,
plastic agglomerates, fuel briquettes, etc.). Within a year of its inception, the project
is expected to be self-financing. This not only implies an increase in efficiency and
an expansion of the project area, but above all, developing a market for recycled raw
materials. Furthermore, economic independence is a precondition for possible future
privatization in favor of current workers.
(vi) Analysis and synthesis of the project
Spatial aspects: This type of settlement was characterized as formal peripheral with
low building density, located in an area prone to flooding.
37
Institutional and stakeholders aspects: Organizationally, there was a local NGO in
cooperation with the city administration and with support from the Protestant
Development Service (Evangelische Zentralstelle für Entwicklungshilfe - EZE).
Technological aspects: Technologically, the project entailed door-to-door domestic
refuse collection with handcarts by individual private collectors; further
transportation to dumpsite by the NGO; refuse separation and sorting at household
level; and central refuse sorting and marketing of recycled material.
Financial aspects: Financially, the operational cost of refuse collection was financed
through subscriber fees; and refuse separation and sorting was covered by a
municipal subsidy.
Lessons learnt: The population has proven its willingness to pay a cost-covering
fee for refuse collection after they have been adequately informed. For
organizational reasons, local self-help groups were unable to take over waste
management as originally planned. It seems necessary therefore, to revert to a central
institution, like DCAM. Such an institution was not, however, work itself as a local
refuse collector, but, after an initial testing period, its activities were to be privatized.
In this way, the NGO could continue to operate in the educational field, and extend
the project to cover other districts. Recycling of waste materials has demonstrated
that financially self supporting structures are possible and attractive enough to be
extended to other districts or even cities. Dissemination of the concept is the
responsibility of the NGO.

38
2.3.3 Tanzanian Government’s Response to Solid Waste Management
The various national responses to the challenge of solid waste management in
Tanzania manifest themselves through the national environmental policy of 1997,
the national environmental management Act of 2004, and other related interventions.
These instruments and their impact at a national level are briefly discussed under this
section.
(a) National environmental policy
The National environmental policy was issued by the government of Tanzania in
1997. The policy outlines the six key environmental concerns as land degradation,
deforestation, environmental pollution, loss of wildlife habitat and biodiversity,
deterioration of aquatic and terrestrial ecosystems, and lack of accessible good
quality water. In so far as SWM is concerned, environmental pollution is very
relevant. To this end, the National environment policy (NEP) recognizes the
indispensable role of local governments in achieving its policy objectives. This is
because most local authorities are better placed to receive local concerns and
implement ways to create sustainable conditions.
(b) The environmental management Act
The environmental management Act was enacted by the Tanzanian Parliament in
2004. The Act provides for the establishment of a National environment
management council to coordinate environmental management issues at the national
level. The Act also requires the appointment of sectoral, regional and district
environmental coordinators, who in one way or another must address the problem of
environmental pollution. The role of the National Environment Management Council

39
(NEMC) is to act as the leading technical advisory, co-coordinating and regulatory
agency, which is responsible for protection of environment and sustainable use of
natural resources.
(c) MKUKUTA and public-private partnership frameworks
In 2010 Tanzania launched the National Strategy for Growth and Reduction of
Poverty (NSGRP II), popularly known as MKUKUTA in Kiswahili. It includes an
operational target with respect to the effectiveness of solid waste management, as
measured by the ratio of collected waste versus generated waste in urban centers.
According to the document, this ratio should increase from 47 per cent in 2008 to 85
percent in 2015. To this end, among other strategies, the government of Tanzania is
committed to do the following: sensitizing key actors on public-private
partnership(PPP) policy (2009) and PPP Act (2010); developing a guiding document
for PPP implementation including in infrastructure sectors; capacity development for
institutions engaging in PPP; expanding space for public private dialogue; ensuring
that PPP is also pro-poor through development of inclusive markets; making markets
work for the poor; and putting in place investment incentives and systems to
encourage investment by domestic private sector participation in all sectors (URT,
2010:78, 101-103).
(d) The status of solid waste management in Tanzania
Despite of the above mentioned policy and legal interventions, literature indicates
that, solid waste management problem is now surfacing with great intensity in cities,
towns and rural areas in Tanzania. This implies that, urban authorities in Tanzania
have failed to fulfil their duties in this regard. In most urban areas, only a fraction of

40
the waste generated daily is collected and disposed of by the authorities. In Dar es
Salaam, Mwanza, Mbeya, Tanga Cities and other municicipalities and town in the
country, it is estimated that only 20% to 30% of the urban solid waste generated was
collected and disposed off. Thus, on the average, more than 60% of the solid waste
was left uncollected in most urban centres (Magoma et al., 2005; DCC, 2007;
Kalwani, 2009).
2.3.4 Community Participation in Morogoro Municipality, Tanzania
This case study has been extracted from Kalwani (2009: 136-169). The Morogoro
Municipality has already moved from conventional to participatory approaches in
SWM. Thus, this case study on local resources mobilization for solid waste
management was concluded by examining how participatory approaches are
conducted with a focus on the existing organizational, legal, coordination, and
resource and benefit factors. During the 1980s and 1990s, solid waste management
under conventional approach was engulfed by various inefficiencies due to various
reasons.
The Morogoro Municipal Council was then the sole provider of municipal solid
waste services but was overwhelmed by rapid urbanization. As a result, much of the
generated solid wastes remained uncollected or haphazardly dumped thus, polluting
the municipal environment. For example, it is reported that, in 1998 the
municipality generated roughly 3,300 tons of solid wastes per annum. It managed to
collect only 30% of the solid wastes and it was dumped at Tungi estate quarry. And
after that these wastes was burn and decomposed in an open air. As a result smoke

41
and offensive smell polluted the environment. Finally, the municipal environment
became a source of various diseases to residents in the neighbourhood.
Faced by these challenges, early 1990s the Morogoro Municipality embarked on
environmental planning management practice as a participatory approach to SWM. It
was dubbed “Mpango wa Udhibiti wa Taka Ngumu Morogoro” (MUTAMO) in
2005. The purpose was to strengthen local capacity to plan, coordinate, and manage
urban development and growth with emphasis on improved multi-sectoral
coordination and community-based participation. This is to say that, the programme
was intended to promote community participation in municipal solid wastes service
provision through enterprising community based organizations. The organizational,
legal, coordination, resource and benefit aspects relating to MUTAMO are
summarized below.
Organizationally, community involvement in municipal solid wastes management
was promoted. It involved distribution of roles and responsibilities to different
stakeholders; coordination and supervision of such roles by the municipal authority.
Their organogram linked generators, collectors and supervisors of municipal solid
wastes in Morogoro Municipality. In this program, households were the principal
generators and sweepers of municipal solid wastes at primary level. They had to pay
a solid wastes collection service user charge to CBOs for collecting the solid wastes
to secondary/transfer stations. CBOs were supposed to originate from the community
which provides the same service. CBOs were contracted by the municipal authority
essentially to discharge the service. The municipal authority had to supervise and
reinforce municipal SWM activities according to the existing policy and public

42
health laws. It had to liaise with Wards leadership as part of the Municipal
Government. Moreover, the municipal authority had to collect and transfer solid
wastes from secondary collection points to the municipal dumpsite for final disposal.
The assumption was that if the three parties discharged their responsibilities
efficiently, sustainable SWM could be realized.
Legally, MUTAMO was guided by two legal instruments, namely, the
Environmental Management Act of 2004 which was intended to enforce the National
Environmental Policy and the by-Laws for CBOs engaged in SWM. The Morogoro
Municipal Council enacted a by-law effecting the formation of CBOs in Wards.
Registered community groups acquired a legal recognition to bid for municipal
contracts for solid wastes service provision in Wards. They were empowered to
collect solid wastes service user charges directly from households. Ward executive
officers were directed to recognize the CBOs’ role and oversee their selection and
performance in mitaa. Coordinationally, MUTAMO entailed vertical and horizontal
links in social, economic, technical and political aspects related to SWM in
Morogoro Municipality. And for the purpose of making this program a success,
MUTAMO entailed various strategies for LRM in terms of the following areas:
external financial and technical assistance; internal financial sources; revenue
collection; human resources; physical resources; land/space; and transportation of
solid wastes.
In light of the above discussion, Kalwani (2009) managed to assess benefits of
participatory SWM strategy. He concluded that, the local community especially in
informal settlements gained very limited benefits. On the other hand, though at

43
small scale, the local government had its solid wastes collection service shared with
the local communities as a result of which some form of cost recovery was achieved.
Furthermore, Kalwani (2009) notes that, substantive cost recovery was hindered by
the municipal local government for not utilizing optimally the surrounding wide
stakeholder institutions. Moreover, he observed that, the municipal government
failed to employ modern technology included in 4Rs in order to increase cost
recovery opportunities.
2.4 Economic Aspects of Resource Mobilization for Solid Waste Management
Fiscally, solid waste management is a continuing challenge throughout the world
(Kironde, 1999; Mwasumbi, 2003; Msangi, 2005; Tibaijuka, 2007). Tackling the
problem of municipal solid waste management in a country like Tanzania where
financial resources are severely scarce is very difficult.
The cost of municipal solid waste management is too huge; the money which could
have been invested in other development activities for future income generations
may end up paying municipal infrastructure services only. This is due to the fact that
solid municipal solid waste management is a mult-disciplinary activity that requires
proper integration and co-ordination, which involves several expertise’s, for
example, civil, environmental and mechanical engineers, chemists, land use
planners, and politicians to mention few. These different disciplines should be well
co-coordinated towards sustainable solid waste management to succeed.
Kyessi (2002:6) argues that, incomes of the poor can be increased if provided with
better infrastructure services including solid waste management and which allows
44
every household member to devote more time for income earning through the same
activity. Then, such poor people can be able to afford paying for the user service
charges. However, this presupposes the presence of solid waste service provision in a
competitive market situation. The competition in solid waste service provision may
lead to low prices or affordable user service charges. However, this is possible
where appropriate regulatory mechanisms prevails e.g. proper quality and quantity of
services provided to protect consumers and the investors prevail (World Bank,
1994). When such conditions hold in a competitive market situation, they may lead
to local resources mobilization for sustainable solid waste management in urban
areas.
According to the above discussions, Figure 2.2 below shows an approach to SWM
that takes into account the dynamics of environmental, social, and economic
infrastructure service provision in general through integrated or multiple
stakeholders’ participation in urban areas. Generally, this approach is for the
provision of sustainable social service originated in a market oriented situation in
informal settlements’ communities in urban areas. Briefly, it entails a causation-
analysis on how sustainable social services provision in general can be achieved in
informal settlements. This approach involves capital investment/costs level,
integrated/multiple stakeholders participation level, and accrued revenue quasi
proper planning in both cases i.e. at local communities/households as well as solid
waste management actors such as contractors and Kinondoni Municipal Authority
itself.

45
Figure 2.2: Municipal Dynamics Towards Sustainable SWM Approach
Source: Own construct
The approach above provides linkages of dynamics in local resources mobilization
towards sustainable solid waste management, particularly in informal settlements in
urban areas. It shows how capital /cost level of investments in solid waste
management may facilitate affordability which results into the local community
activity effectiveness hence smooth cost recovery of municipal infrastructure
services provision. It further links with the amount of revenues collected by the
actors which may constitute municipal infrastructure services provision reliability
and hence local resources mobilization for sustainable solid waste management.
Thus, for developing countries like Tanzania, the question of willingness to pay is an
important policy and relevant research problem that demands attention. Indeed,

46
rapid reconnaissance surveys of what consumers actually already pay for services
need to be carried out. Results of several studies do point to the conclusion that
when dealing with a settlement, conducting a relatively simple household survey can
yield reliable sustainable SWM, the way the community is organized plus
participation are the main two inevitable qualities which every community must
posses.
2.5 Need for Local Resources Mobilization for Solid Waste Management
Local resources mobilization towards sustainable SWM emanates from cultural
revitalization which demands enhancement of local communities’ involvement in
their socio-economic development through generation of a sense of self-confidence
and mutual trust. This leads to more participative democracy, more responsible
citizenship, increased social and economic effectiveness, creative technological
change, and more sustainable poverty reduction (UNDP, 2002; TANGO, 2005;
Tibaijuka, 2009)
An active culture is both a heritage and a development project, because it gives more
meaning and direction (Oxfam GB, 2002:11; ILO, 2003). Development is the
process by which vulnerabilities are reduced and local community capacities are
increased. If equality and equity are the goals of development, then interventions
must address the causes of peoples’ weaknesses and recognize their source of
strength, and understand the dynamic relationships between them. So, no one
develops any one else; people and societies develop themselves, with or without
external agencies (Goldsmith, quoted in Moore, 1995). However, these local

47
communities’ dynamics need to be continuously assessed, monitored, and evaluated
in order to see how or at what degree they meet a wider pattern of socio-economic
development (ibid).
However, the vexed question is: what are the benefits of local resources
mobilization for solid waste management? Effective and efficient SWM is reflected
in both environmental and economic aspects, i.e. minimization of environmental and
health risks are an implicit result in maximization of economic and social benefits.
This situation manifests in the activities of sorting and sanitary disposal and
recycling. Efficiency in the balancing of these costs and benefits is an integral
ingredient of local communities’ socio-economic development. This efficiency
normally emanates from strong institutional capacities which effectively accomplish
the objectives of environmental cleanliness on the one hand, and generates economic
activities such as recycling on the other, and which eventually creates self-
employment for cities local communities and assists concerted efforts to alleviate
urban poverty.
In summary, Chinamo (2003) conceded important benefits for involving local
communities in solid waste management as follows:
i) Provision of efficient and effective services in their localities;
ii) Possibilities of lower costs through introduction of commercial principles;
iii) Pay greater attention to customer satisfaction;
iv) Easily drawing on local and international experience;
v) Easily extension of services to the disadvantaged and low income
communities in urban areas;

48
vi) Creation of employment through private companies, NGO’s, CBO’s and/or
individuals;
vii) Improved primary solid waste collection, cleanliness in the neighborhoods,
living conditions and productivity; and
viii) Reduced incidences of diseases that are transmitted by flies and other
insects.
2.6 Theoretical Frameworks for Local Resource Mobilization
In light of this understanding and the preceding literature review, what follows,
therefore, is a description of the central elements of some theoretical and conceptual
models that were used as interpretive guides for supporting and explaining local
resources mobilization towards sustainable solid waste management in the area of
study.
2.6.1 Institutional Economic Theory
The first interpretive framework that informed this study was the institutional
economic theory. The central premises entailed by this theory were discussed below
and finally its application to integrated solid waste management systems was
highlighted.
The institutional economic theory considers the processes by which structures,
including schemes; rules, norms, and routines, become established as authoritative
guidelines for social behavior. It inquires into how these elements are created,
diffused, adopted, and adapted over space and time; and how they fall into decline
and disuse. Although the ostensible subject is stability and order in social life, the

49
theory attends not only to consensus and conformity but also to conflict and change
in social structures (Oliver, 1991; Majani, 2000).
Institutions by definition connote stability but are subject to change processes, both
incremental and discontinuous. Majani 2000 and Kalwani, 2009 shed light on the
meaning of “institutions” by asserting that, the new institutionalism in organization
theory and sociology comprises a rejection of rational-actor models, an interest in
institutions as independent variables, a turn toward cognitive and cultural
explanations, and an interest in properties of supra-individual units of analysis that
cannot be reduced to aggregations or direct consequences of individuals’ attributes
or motives.
According to this theory, the social structures mentioned above are both imposed on
and upheld by the actors (e.g. an individual, an organization, etc.) behaviour.
Concerning this matter, one cognitively oriented view is that a given institution is
encoded into an actor through a socialization process. When internalized, it
transforms to a script of a patterned behaviour. When the actor behaves according to
the script, the institution is enacted.
In this manner, institutions are continuously reproduced. The enactment of an
institution externalizes or objectifies it. In this way, other actors can see that the
institution is in play, and a new round of socialization starts. After some time, the
institution and the resulting patterned behaviour becomes sediment and taken for
granted. Then, it might be difficult for the actors even to realize that their behaviour
is in fact partly controlled by an institution. Acting in accordance with the institution

50
is viewed as rational by those who share the institution (ibid).
The relevance of this theory to local resources mobilization towards sustainable
solid waste management stems from the fact that, it furnished a researcher with a
convenient framework within which the following questions could be answered
satisfactorily: What are the normative, evaluative and existential beliefs that guide
SWM? Which institutional actors participate in LRM towards sustainable SWM? To
what extent is LRM towards sustainable SWM institutionalised?
2.6.2 Principal-Agent Theory
The second interpretive framework that informed this study was the principal-agent
theory. The central premises entailed by this theory were discussed below and finally
its application to integrated solid waste management system was highlighted.
The principal-agent theory defines an organization as a system that is comprised of
networks of overlapping or nested relationships between principals and agents.
These chains of delegation and accountability between principals and their agents are
the key to the division of labor and development of specialization within an
organization. According to this theory, delegation entails one actor (called a
principal) voluntarily giving over one’s authority to perform certain responsibilities
to another actor (called an agent), where the latter voluntarily accepts the
responsibilities and is expected to act on behalf of and in the best interest of the
principal.
Principal-agent relationships are inherent in many social interactions. For example,
labour (employer and employees), franchises (franchisor and franchisee), regulation

51
(regulator and regulated company), investors (shareholders and executives), courts
(clients and lawyer), medicine (patients and doctors) and markets (buyers and
sellers) entail principal-agent relationships.
These relationships have many things in common. The first is a contract concluded
on the basis of a free and informed consent on either side. It can be oral or written.
This contract defines the rights and duties of each party. The second common
element in all principal/agent relationships is that they entail accountability.
Accountability is the agent’s obligation to report to the principal, to explain, to
justify, to answer questions about how resources have been used, and to what effect.
In this case, the principal is called the forum of accountability and has veto power
over the agent’s decisions and actions (Thompson, 2007).
And the third common element in all principal/agent relationships is that they entail
propensity toward corruption of power through bribes involving the agent. Simply
stated, a bribe is a payment, made by a third party to an agent, in which the agent
explicitly or implicitly agrees to take an action that is contrary to his duty as defined
by the agent’s principal and is thus in the interest of, not the principal, but the third
party. Thus, in order to check the propensity toward corruption on the part of the
agent there must exist an accountability mechanism as a necessary check on the
corruption of power, including fraud, manipulation and the like (ibid).
Under such accountability mechanism, the principal-agent theory suggests a number
of ways by which some of the principal/agent problems can be mitigated.
Specifically, there are four main mechanisms by which principals can mitigate

52
principal/agent problems. The first is selection/screening, by which the principal
carefully vets the agent to ensure to the greatest degree possible that the agent has
preferences and goals similar to those held by the principal. Second, the principal
can design an incentive structure that ties the performance of the agent to the agent's
compensation. This implies the third mechanism, namely, the careful monitoring of
the agent's performance.
Finally, the principal can design sanctions that impose some penalty on the agent for
poor performance. Sanctions are, of course, the flip side of incentives. Incentives are
the carrot, while sanctions are the stick. While none of these possible solutions are
costless, they can provide the principal greater discretion over the performance of the
agent. An assessor can use the presence, or absence of selection/screening,
incentives, monitoring, and sanction mechanisms to evaluate the principal/agent
relationships that exist in any given organization as they pertain to the effectiveness
and efficiency of the organization or system. The mechanisms of selection/screening,
incentives, monitoring, and sanction mechanisms can be remembers through an
acronym “SIMSM” (Kiewiet and McCubbins, 1991).
The relevance of this theory to SWM stems from the fact that, it furnished a
researcher with a convenient framework within which the following questions could
be answered satisfactorily: Who are the principals and agents within a typical SWM
system? What problems do arise from the agents’ side in the principal/agent
equation? And to what extent do organisations participating in SWM control the
propensity to corruption of power on the part of agents through selection/screening,
incentives, monitoring, and sanction mechanisms?

53
2.6.3 Social Capital Theory
The third interpretive framework which informed this study was the social capital
theory. The central premises entailed by this theory were discussed below and
finally its application to ISWMS was highlighted.
The social capital theory implicitly existed ever since small communities formed and
humans interacted with the expectation of reciprocation and trust. However, the
theory in its present form was popularized by authors such as Fekade (1994) and
Majani (2000). Within its present form, it can be discussed under the following sub-
headings: the social capital construct; dimensions, levels, types, determinants,
benefits and downsides of social capital.
The social capital construct entails the value of social networks, bonding similar
people and bridging between diverse people, with norms of reciprocity. It has been
defined differently by different authors. One of the best definitions is the following:
social capital is the sum of the actual and potential resources embedded within,
available through, and derived from the network of relationships possessed by an
individual or social unit. Social capital thus, comprises both the network and the
assets that may be mobilized through that network' (Nahapiet and Ghoshal 1998).
Social capital has many dimensions. For example, according to Nahapiet and
Ghoshal (1998), social capital can be seen in terms of five dimensions. The first
dimension is networks, that is, lateral associations that vary in density and size, and
occur among both individuals and groups. The second dimension is reciprocity, that
54
is, expectation that in short or long term kindness and services will be returned. The
third dimension is trust, that is, willingness to take initiatives (or risk) in a social
context based on assumption that others will respond as expected.
The fourth dimension is social norms, that is, the unwritten shared values that direct
behaviours and interactions. And the fifth dimension is personal and collective
efficacy, that is, the active and willing engagement of citizens within participative
community. These five dimensions manifest themselves in various combinations and
shape the interaction amongst the members of a group, organization, community,
society or simply network and can be studied through various perspectives.
However, there are different levels at which social capital is located, such as the
individual, the informal social group, the formal organization, the community, the
ethnic group and even the nation. There are divergent views in the literature; some
authors posit social capital at the individual level, some the community level and
others have a more dynamic views. Some state that social capital exists within levels
or scales as one feels belonging to family, community, profession, country, etc,
simultaneously. Supporters of these views argue that social capital's sources lie in
the social structure within which the actor is located.
The relevance of this theory to SWM stems from the fact that, it furnished a
researcher with a convenient framework within which the following questions could
be answered satisfactorily: To what extent can inter-personal trust assist in
revitalizing SWM? What types of social capital can be mobilized at a micro
(individual), meso (group) and macro (societal) levels toward sustainable SWM?

55
2.6.4 Collective Action Theory
The fourth interpretive framework which informed this study was the collective
action theory. The central premises entailed by this theory were discussed below and
finally its application to solid waste management was highlighted. The collective
action theory asserts that the motivation for collective action ultimately depends on
whether stakeholders foresee net benefits from taking part in a common project. This
is to say that, people agree to cooperate in order to do something that none of them
thinks is more easily done independently. When the cooperation is successful, all
parties improve their position by virtue of the cooperation. Thus, two or more
persons cooperate because somehow their interaction results in a product that is
greater than it would have been if they had acted independently. Such a product is
called a common human good (Samuelson, 1954).
Thus, the fundamental construct in the collective action theory is the concept of
human goods. A human good is anything which contributes, either directly or
indirectly, to human flourishing, which entails the fulfillment of positive human
potentialities. Along with the products generated by the market, human goods
include such disparate items as friendship, love and conviviality; the exercise of the
imagination; the acquisition of knowledge and understanding; the development and
application of complex skills and capacities; the aesthetic appreciation of nature, and
engagement in activities which are seen as productive of other goods. Thus although
economic goods are properly so called, there is no reason to restrict the class of
human goods to these alone. Nor is there any reason to believe that the relative value
of different kinds of human goods can be expressed or measured in monetary terms

56
(Gleason, 1997).
The theory asserts that human goods exist as a spectrum ranging from private goods
to public goods. Private goods tend to be excludable and rivalries in consumption.
For example, a piece of cake, once consumed, cannot be enjoyed by others. On the
other hand, public goods are non-rivalries and non-excludable in consumption.
Private goods are best provided by the market while public goods are best provided
by the government. And within a state, the demarcation between private and public
goods is a policy matter which is determined politically (ibid).
According to this theory, regardless of the trait of individual rationality which is
inherent in each group member, collective action may fail due to collective
irrationality. This failure is likely to ensue if any of the following two reasons exists.
The first reason is group size. The theory suggests that group size influenced
collective action in three ways: larger groups would be less likely to achieve
collective action at all, the overall level of collective provision would be lower for
larger groups that did achieve collective action, and the degree of sub-optimality in
collective provision would increase with group size. (Olson, 1965).
The second reason for collective action failure is group heterogeneity, that is, the
absence of homogeneity in terms of endowments, political, wealth, cultural, racial,
and economic dimensions. According to the theory, homogeneity may also have a
bearing on collective action. Sharing important social, cultural, or economic
characteristics may increase the predictability of interactions. Predictability may in

57
turn provide a basis for trust. Even if trust does not arise from predictability, for
instance, if members of a homogeneous group consider themselves to be predictably
opportunistic, common traits suggest common interests. In this case, whether it
promotes trust or reflects common interests, homogeneity may facilitate collective
action (ibid).
The relevance of this theory to SWM stems from the fact that, it furnished a
researcher with a convenient framework within which the following questions could
be answered satisfactorily: Which SWM services can be treated as public goods?
Which SWM services can be treated as private goods? How can the problem of free-
riding public services with respect to SWM be addressed? What are the conditions
under which collective action towards effective and efficient solid waste
management services may fail?
2.6.5 Market Processes Theory
The fifth interpretive framework which informed this study was the market processes
theory. The central premises entailed by this theory were discussed below and finally
its application to solid waste management was highlighted.
According to the market processes theory, a market is a set up where two or more
parties engage in exchange of goods, services and information. And where the two
parties involved in a transaction are called seller and buyer. And the market process
entails economic competition where sellers compete for buyers in accordance with
the laws of demand and supply. This competition goes on until when a market is at
equilibrium point (Menger, 1950).

58
According to the theory, for a market to exist the following conditions must be
satisfied: buyers and sellers must engage in voluntary exchanges, as price takers; the
good or service must be homogeneous across sellers such that there is a possibility
for a buyer to switch to an alternative seller; the goods or services must be a true
private goods, that is rivalries and excludable; there must be a relatively open entry
and exit into the market; buyers and sellers must have access to complete
information; and the government or some other alternative organization must
provide for contract compliance to ensure that property rights are respected
(Gleason, 1997).
According to the market processes theory, market failure is a concept describing a
scenario in which the allocation of goods and services by a free market is inefficient.
Such inefficiencies are often associated with information asymmetries, non-
competitive markets, principal–agent problems, externalities, or public goods.
Market outcomes are termed efficient if the same level of total benefits which they
generate cannot be obtained at lower cost or, alternatively, if greater benefits cannot
be generated at the same level of costs.
In either case, the resulting total benefits must exceed total costs if the outcomes are
to be deemed efficient. Efficiency, thus, is like a contest among different ways of
doing a job. If the market can accomplish the job at a lower cost than can other non-
market arrangements, or can do a better job for the same costs, then the market is
relatively efficient. On the other hand, if non-market arrangements can accomplish
the task at lower cost, or can do it better for the same cost, then the market is, in this
respect, relatively inefficient (ibid).

59
Specifically, the market can fail to exist if these conditions are not satisfied. This is
to say that, markets can fail if: only one seller provides a good or service (monopoly)
or one buyer seeks a good or service (monopsony); buyers or sellers, or both, are
compelled by the state or some other agency to enter into non-voluntary exchanges;
a good or service is so unique that only one seller offers it or only one buyer seeks it;
government (or some other agent) restricts exit and entry into the market; the buyers
or sellers are prevented from gathering information about alternative exchanges;
contracts are ignored or if private property conventions are not upheld by the state or
some other agency; when natural monopoly exists because the good is not sub
tractable or excludable or both; and when there are many hierarchies, that is
bureaucracies and complex organizations, where non-market decision systems
establish priorities for allocation (ibid).
When markets fail, governments must step in. This is to say that, market failures of
various sorts provide the principal rationale for attempted non-market remedies.
However, in both cases, the failures, whether market or non-market, can and should
be evaluated in terms of the same criteria of success, namely: allocative efficiency.
Thus, non-market remedies fail to the extent they, too, result in outcomes that depart
from the efficiency goals by which market outcomes are judged to fail. Thus, the
theory of market processes represents a normative framework on the basis of which
one can identify instances where the level of societal welfare produced by market
processes alone can be further improved through non-market organizations (Kirzner,
1963). The relevance of this theory to SWM stems from the fact that, it furnished a
researcher with a convenient framework within which the following questions could

60
be answered satisfactorily: If SWM services are treated as private goods, under what
conditions would perfect market exist? What remedial actions can be taken by
stakeholders of solid waste management when market failure happens?
2.7 Conceptualizing Local Resources Mobilization
In light of the above literature review, the following conceptual framework was
formulated as a tool for guiding the present research. It highlights parameters to be
examined, the key variables and their relationships with reference to the study
problem. The framework highlights six independent variables entailed by the
research process. These six independent variables are: legal factors, institutional
factors, spatial factors, technological factors, financial factors, and organizational
factors. Figure 2.3 shows their conceptual relationships to local resource
mobilization.
The conceptual framework below shows two types of variables, namely: local
resource mobilization towards sustainable solid waste management (SSWM) as the
dependent variable, and on the other hand, the following six independent variables:
legal, institutional, spatial, technological, financial and organizational factors. They
are described briefly in Figure 2.3.
2.7.1 Legal Factors
Legal factors refer to constitutional provisions, statutes, regulations and by-laws
which are required to control individual and institutional behaviours in relation to
municipal solid waste management transactions. They also, define stakeholders’
different responsibilities, accountabilities, rights, and regulate environmental

61
management. However, rules and norms, by-laws, culture, and attitudes of mind can
have negative or positive impact on the sustainability of municipal solid waste
management depending on the prevailing socio-economic situation in the local
community (TANGO, 2005; Msangi, 2005; Kalwani, 2009).
Figure 2.3: Conceptual Framework
Source: Own construct

62
2.7.2 Organizational Factors
Organisational factors refer to instruments such as written constitution, goals,
objectives, values, procedures, rules, regulations, policies and other norms which are
needed for facilitating the governance of an organization toward an effective and
efficient municipal solid waste management. Such an organisation can be registered
by an authority that is recognised by the laws of the land or otherwise. When
registered an organisation is said to be formal, while it is referred to as informal if
unregistered. In either case, the said organisational factors are required to facilitate
community participation in solid waste management. They are needed for enhancing
regular flow of linkages within an organization and other partners (Msangi, 2005;
Kalwani, 2009).
2.7.3 Institutional Factors
Institutional factors entail instruments such as written constitution, goals, objectives,
values, procedures, rules, regulations, and norms which are needed for facilitating
the governance of a formal organization toward an effective and efficient municipal
solid waste management. Such an organisation must have been registered by an
authority that is recognised by the laws of the land. Such instruments are required to
facilitate ccommunity participation in SWM. They are needed for enhancing regular
flow of linkages within an organization and other partners (Fekade, 1994; Majani,
2000; Kisoza, 2007; and Kalwani, 2009).
2.7.4 Technological Factors
Technological factors refer to all the tools and ideas available for extending the
natural, physical and mental reach of human kind. A central theme in technology is

63
the practical application of new ideas. This theme is better clarified by the following
distinction between science and technology. Science is the quest for more or less
abstract knowledge, whereas technology is the application of organised knowledge
to solve problems in society (Kreitner, 1986; Wangwe, 1993; Kyessi, 2002). Within
the present study area the relevant technology include: push/pull carts, wheel
barrows, buckets, trucks, landfills, and capital intensive vehicles. Other important
requirements are data collection instruments such as regular household surveys and
census and regular researches.
2.7.5 Spatial Factors
Spatial factors are physical factors that pertain to solid waste management. They
include the availability of enough planned land and considerations of distance from
the collection points to the official disposal dumpsites; accessible roads for
transportation of solid wastes; enough space for solid waste sorting at source;
enough paths in informal settlements for the use of push/pull, and wheel barrows. To
this end, land is required by residents as capital for various MSWM activities
including temporary dumpsites, for the purpose of infrastructure development and
for construction of recycling industries or factories, however, the cost of capital have
to be mobilized (Kyessi, 2002; UN-Habitat, 2007).
2.7.6 Financial Factors
Financial factors refer to resources in the form of cash which may arise from
community contributions through self-help initiatives, internal and external
donations, user service fees, and subsidies from central and local governments.
64
2.8 Summary
The above literature review has revealed diverse experiences on solid waste
management across the world. On one hand, it has been revealed that, the
convectional approach has not been able to mobilize adequate resources for effective
and efficient solid waste management in situations of urbanization under poverty.
On the other hand, it appears that, local resources mobilization toward sustainable
solid waste management in poor urban settlements is an alternative approach which
gives some hope of greater success. It seems to be the case due to the following
reasons:
Organizationally, the following four themes emerge from the above literature
review: Firstly, participation of residents in target districts is a decisive factor in
initiating and operating the systems. A sense of identification and ownership is in
particular necessary in those cases which are depending on the input of residents.
Also, in case of waste management and sanitation, the value of local ownership
cannot be undermined.
Secondly, modern types of organization, such as clubs, CBOs, and associations,
usually provide a more effective basis for organizing waste management than
traditional forms (councils of elders, clans, caste groups etc.). The best example, are
NGOs in Benin where such modern organizational structures are existing.
Thirdly, it should be noted that all participants are suitably trained thus; actors are
able to negotiate and cooperate. Referring to positive responses for example, visiting
projects can play a highly motivating role in local resources mobilization towards

65
sustainable solid waste management. Because, in all tested regional countries of sub-
Saharan Africa successful projects have usually established vertical and horizontal
linkages to other groups and state authorities.
Financially, the following two key themes emerge from the above case studies:
Firstly, some successful projects finance their running expenses through fees, but the
ways they are raised vary greatly. Directly linking payments to usage is an
exception. Indirect payments, through taxes or other fees, are more common. And,
none of the project examples has secured complete cost recovery. Secondly,
willingness to pay mainly depends on the extent of resident’s participation and their
identification with the system. Benefits are not appreciated until they are
experienced at the individual level. In this case, for example, functional sewage
system is often only felt by the community as a whole until individual sanitary
linkages provides an immediate personal improvement.
Technologically, it appears that successful technical systems meet the following
fundamental criteria: Firstly, they provide services comparable to conventional
systems, but at a lower price, or provide higher quality at the same price. Secondly,
they are adapted to the level of technical expertise and organizational capabilities of
the inhabitants and other project stakeholders. Thus, equipment and installations
must be easy to maintain. Finally, the larger the project area (or envisaged project
area), the more systematic and rational the technical solutions should be. In this way
therefore, practical experience is a prerequisite for the successful application of
technical systems or their use in different situations.

66
These global experiences can possibly be emulated in Tanzania in a way that
influences local communities to participate fully in municipal solid waste
management for their livelihood and betterment of the environment.
Thus, within the Tanzanian context, there is a need for examining on how efficiency
and effectiveness of solid waste management can be improved through local
resources mobilization. Such an examination should seek to show how various
dimensions of local resource pool would contribute to effective solid waste
management. These dimensions include: physical, financial, social, economic, legal,
institutional, spatial, political, cultural and other resources.

67
CHAPTER THREE
3.0 RESEARCH METHODOLOGY
3.1 Introduction
This chapter provides the research methodology which was used to conduct the
present study. To this end, the following issues are discussed: research strategy;
design and process; location and description of the study area; population and
sampling procedure; methods of data collection; methods of data analysis and
presentation; and limitations of the study.
3.2 Research Strategy
According to Yin (1994:15) and Saunders et al (2000), there are five research
strategies in the social sciences. These are experiments, surveys, archival analysis,
histories and case studies. However, due to the nature of this study, two theories
were employed that is, theory testing approach which entails deductive reasoning
and a theory building approach which entails inductive reasoning. In theory building
the research begun with observations and used inductive reasoning to derive at
relevant data. Also, this theory attempted to uncover an attribute that was common to
all observations. This form of theory building entails asking whether the
observations in a particular case had a more general factor, or how the observations
fitted into a pattern or background to this study.
On the other hand, a theory testing approach used relevant theoretical propositions to
guide which observations to make from the general case to particular cases. Such
combination of theories, observations, inductive and deductive reasoning had to
provide a positive test of which strategy was adequate and fitted to reach abductive
68
reasoning. Following, these facts a multi-case strategy has been adopted
supplemented with abductive reasoning.
3.3 Research Design and Process
3.3.1 Research Design
A research design is a decision matrix which responds to the aspects of what, where,
which, when, how much, and by what means as they pertain to a research problem.
Specifically, this roadmap answers the following questions: What is the study about?
Why is the study being made? Where will the study be carried out? What type of
data is required? Where can the required data are found? What periods of time will
the study include? What will be the sample design? What techniques of data
collection will be used? How will the data be analyzed? And, in what style will the
report be prepared? In short, we can divide the research design to include:
philosophical assumptions; approaches; strategies; methods; time horizons;
techniques and procedures (Kothari, 2004; Saunders et al, 2000).
Based on this understanding, and in light of the nature of the data required by the
research problem under study, this research adopted a mixed research paradigm.
That is, it predominantly collected qualitative data which was then complimented by
the quantitative data. The qualitative paradigm was used in data collection in order to
fully capture narrative facts concerning SWM constraints and opportunities in the
study area. Since the case study design allows the subject matter to be studied in all
its dimensions and ramifications, for this study, the mixed research paradigm was
aligned with multiple case study design.

69
3.3.2 Research Process
A research process consists of a series of actions or steps necessary to effectively
carry out research and the desired sequencing of these steps. For an ideal research
process, these steps are as follows: formulating the research problem; extensive
literature survey; developing the hypothesis; preparing the research design;
determining sample design; collecting the data; execution of the project; analysis of
data; hypothesis testing; generalization and interpretation; and preparation of the
report (Yin, 2001).
Accordingly, this research started with the identification of the research problem,
which largely also depended on the author’s background and research motivation,
followed by the formulation of research objectives and questions based on the
comprehensive theories and concepts applied in this research.
Then rapid appraisal survey (RAS) was employed under which it was done in
two stages: stage one was about general study for the municipality and stage two
was about in-depth study in selected sub-cases. Based on the above logistic a
conceptual framework was developed to which the study was anchored. This was
followed by preparation of the research process. Case study areas were then selected
plus live and dormant actors, by using developed selection criteria, and the
reconnaissance survey was conducted including setting interviews criteria, sample
selection criteria, and finding base maps and updating them. This was done after
identification of the methods of data collection and data analysis techniques. Finally,
summary and conclusions, recommendations, operational policy implications, and
areas for further studies were drawn.

70
In short, the research process of this study which represents the whole master plan is
provided under Figure 3.1.
Figure 3.1: The Research Process
Source: Own construct

71
3.4 Selection of the Study Area
Minyoi (2007:22) asserts that identification of sub-cases logically enables the
researcher to gain access and establish relations with potential stakeholders which
would likely result in the refinement of the research parameters. Thus, in order to
ensure research validity and reliability, proper unit of analysis, construct validity,
dependability and triangulation, three sub-cases were identified based on the
following modes of local resource mobilisation: public- private partnership, local
community participation and formal non-governmental organization.
Through a RAS, public - private partnership (PPP) was spotted in Kawe Ward. The
franchising system in Dar es Salaam City was established in 1993/1994 under DCC
solid waste management and disposal by-laws, which was geared towards improving
City’s environment. By then Kinondoni Municipality adopted this system and Kawe
Ward was one of first to practice the same. Thus, this study picked Kawe Ward in
order to examine the long experience of public - private partnership in solid waste
management. However, apart from employing PPP under selection criteria was also
the poorest Ward in regard to effective and efficient local resources mobilization
towards sustainable SWM in Kinondoni Municipality.
Through a RAS, local community participation was spotted in Sinza Ward. It has
been clear that the direct involvement of citizens in environmental management is
one of the most effective ways for ensuring that improvements in environmental
quality occur (Word Bank, 1997). Instruments to achieve this include information
disclosure; support to formal and informal organizations etc. (ibid). Based on these

72
facts Sinza Ward seemed to be a rich case for examination of level of community
participation through informal organizations in solid waste management.
Finally, through a RAS, formal non-governmental organization was spotted in
Hanna Nassif Ward. This Ward is the founder of formal NGOs in solid waste
management in Dar es Salaam City hence in Kinondoni Municipality. This approach
was adopted since 1990s in the area of study thus; this was a rich case to draw its
experience. The manner in which RAS was conducted for the purpose of selecting
these sub-cases is discussed below.
3.4.1 Criteria for Choosing a Given Type of a Case Study
Yin (2008) argues that, the selection of sub-cases should follow either literal
replication criteria and/or theoretical replication criteria. Literal replication entails
choosing cases that have similar settings and are expected to achieve similar results.
The theoretical replication approach is used when cases have different settings and
are expected to achieve different results. This means that, each case must be
carefully selected so that it either predicts similar results (a literal replication) or
predicts contrasting results but for predictable reasons (a theoretical replication).
Predictable reasons would entail predefined theoretical propositions that provide
examples of polar types, where the two poles subscribe to competing theories
(Peterson, 1998).
More precisely, this implies that, within a multiple case design, each site or case
should be considered as an experiment in itself, where subsequent sites are used
either to confirm or refute previous findings. Sites should therefore, be selected if

73
they are expected to yield similar results (literal replication) or on the contrary, if
they are expected to yield completely opposite results (theoretical replication)
according to the theory. Thus, cases may be chosen to replicate previous cases or
extend emergent theory, or they may be chosen to confirm or falsify at least one set
of competing theoretical propositions and hence provide grounds for the researcher
to side with one of the predefined theoretical poles (Eisenhardt, 1989).
In the present study, the cases of Kawe, Sinza and Hanna Nassif were chosen based
on the assumption that they are similar, and hence constitute paradigm cases or
typical cases in so far as PPP as a strategy for LRM towards SSWM is concerned.
On the other hand, the Kindondoni Municipality, when viewed as an actor before the
introduction of PPP in 1994, constitutes a polar type relative to the cases of Kawe,
Sinza and Hanna Nassif Wards which are on the opposite pole.
3.4.2 Framework Used to Select Study Sub-Cases
Based on the nature of this study, the researcher decided to adopt both literal and
theoretical replication strategies of data collection and analysis. To this end, for the
purpose of making a rational choice of Wards which constitute polar sub-cases
within Kinondoni Municipality, a RAS tool was designed and employed.
Following Kyessi (2002:120) and Msangi (2005) a number of selection criteria for
this purpose were designed. These are elimination and/or inclusion criterion.
According to Flyvbjerg (1999) and Patton (1987), in the selection of a case, one
must consider information rich cases that will generate enough information/data
and where a researcher can learn a great deal about the problems under

74
investigation. In light of this understanding, four conditions had to be fulfilled by a
Ward in order for it to be selected for further detailed study. The conditions carried
different weights ranging from 2 to 10 points as shown in Table 3.1 below. The
conditions are as follows: presence of organised system of solid waste management;
absence of organised system of solid waste management; solid waste management
fees/rates established; and presence of computerised data on households.
Table 3.1: Conditions for Wards Inclusion in the Detailed Study
No. Criteria Points
1. Presence of organised spatial system of solid waste
management
10
2. Presence of computerised data on house hold 6
3. Solid waste management fees/rates established 4
4. Absence of organized actors in solid waste management 2
Source: Own construct
These criteria were used to implement a RAS in all twenty urban Wards of
Kinondoni Municipality. The ultimate scores for each Ward were computed, and
they are summarised in Table 3.2.
From the weighting matrix above, three Wards scored the maximum points of 21
each. These were Kawe, Sinza and Hanna Nassif. Four Wards scored 15 points
each. Five Wards scored 18 points each. Four Wards scored 12 points each. The
rest scored 10 points each. Due to resources constraints and for the purpose of
facilitating literal replication logic, the first three Wards in the first quartile were
chosen for further investigation. These are Kawe, Sinza and Hanna Nassif Wards.
The purpose was to make a comparative analysis on how the following modes of

75
LRM impact the effectiveness and efficiency of SWM in the municipality: public-
private partnership (PPP) through contracts, CBO participation and formal non-
governmental organizations. Table 3.3 below shows the alignment between the
selected Wards and the modes of LRM to be investigated in each Ward.
Table 3.2: Weighting Matrix
No. Ward Name Weighting per condition
1 2 3 4 Total
1. Kawe 10 6 3 2 21
2. Sinza 10 6 3 2 21
3. Hanna-Nassif 10 6 3 2 21
4. Mwananyamala 10 0 3 2 15
5. Manzese 10 0 3 2 15
6. Msasani 10 0 3 2 15
7. Makurumla 10 0 3 2 15
8. Ubungo 10 6 0 2 18
9. Mikocheni 10 6 0 2 18
10. Makumbusho 10 6 0 2 18
11. Mabibo 10 6 0 2 18
12. Kinondoni 10 6 0 2 18
13. Tandale 10 0 0 2 12
14. Ndugumbi 10 0 0 2 12
15. Kimara 10 0 0 2 12
16. Kijitonyama 10 0 0 2 12
17. Mzimuni 10 0 0 0 10
18. Makuburi 10 0 0 0 10
19. Mburahati 10 0 0 0 10
20. Kigogo 10 0 0 0 10
Source: Own construct

76
Table 3.3: Selected Case Study Areas
No. Ward Mode of LRM Remarks/Purpose
1. Sinza Local community
participation
(NGOs / CBOs)
Sinza Ward was a rich case for examination of the
level of community participation in resources
mobilization and informal organizations in solid
waste management since 1997.
2. Kawe Public and
private
partnership
The purpose was to examine the long experience of
public -private partnership in resource mobilization
for solid waste management which existed since
1994.
3. Hanna
Nassif
Formal
NGOs/CBOs
Hanna Nassif Ward was the founder of formal
NGOs in solid waste management in Dar es Salaam
City since 1990s by using locally mobilized
resources.
Source: Own construct
3.4.3 Justification of the Selected Case Studies
The three sub-cases are conceptually distinct and stand-alone, yet related in the
following manner: The Sinza case study provided an answer to the question of what
are the potentialities of local community participation towards maximum
implementation of the principles of ISWM in Kinondoni Municipality? The Kawe
case study provided an answer to the question of what are the potentialities of PPP
towards maximum implementation of the principles of ISWM in Kinondoni
Municipality? And the Hanna Nassif case study provided an answer to the question
of what are the potentialities of formal NGOs towards maximum implementation of
the principles of ISWM in Kinondoni Municipality? Thus, for this purpose Figure 3.2
and 3.3 below provides the location of Kinondoni Municipality in Dar es Salaam
City and selected sub-cases in the study area.

77
Figure 3.2: Location of Kinondoni Municipality in Dar es Salaam City
Source: DCC, 2007
Figure 3.3: Kinondoni Municipality Wards Administrative Boundaries
Source: Kinondoni Municipal Council, 2008

78
3.5 Sample design and Smallest Unit of Analysis
3.5.1 Sample Design
A sample is a small number of respondents who are chosen to be true
representatives of the population from a selected study area. Thus, a sample is a
selection of some parts of the population on the basis of which judgment is made;
small enough for convenient data collection; and large enough to be truly
representative of the population from which it had been selected (Kothari, 2004).
On the other hand, sampling procedures are those techniques used to choose
respondents and the study area (ibid).
Thus, for the purpose of this study two steps were executed in sampling the
respondents within the limits of the study areas, namely, Kawe, Sinza and Hanna
Nassif Wards, as already selected through RAS.
Firstly, various stakeholders in SWM were classified into six categories. These are
individuals having experience in the private contracting of SWM services;
individuals having long experience in re-cycling factories/industries; and
individuals having some professionalism in SWM. Other categories are individuals
from CBOs/NGOs members who are SWM service consumer and/or providers;
individuals who are heads of households which are part and parcel of the study
area; and individuals who scavengers in the study area.
Secondly, for each class, various sources were used to estimate the possible
maximum sub-population. And thirdly, following Kothari (2004) who asserts that a
sample must be around 5% of the total population, at least 5% for each of the

79
possible sub-populations were attended for data collection either through
questionnaires, interviews or focus discussion groups. Table 3.4 shows the results
of this sampling procedure.
Table 3.4: Magnitude of Sample Selection in the Study Area
S/N Type of
Sample Key
characteristics of
respondents
Possible
maximum
sub-
population
Number
intervie
wed/que
stionnair
es
Remarks on
Possible
maximum sub-
population
1. Existing and
former
private
contractors
Those with long
experience in SWC
in the area of study
280 14 Based on
questionnaires
2. Existing and
former re-
cycling
factories
Those with long
experience on re-
cycling
320 16 Based on
questionnaires
3. Existing &
retired key
informants
Professionals in
SWM 780 39 Based on
interviews and
questionnaires 4. Formal &
informal
focus groups
Majority of
CBOs/NGOs
members
720 36 Based on
interview with
Social Welfare
Office at
Kinondoni
Municipality 5. Head of
Households Residents in the
area of study 2400 410 Based on
Tanzania’s 2002
census 6. Scavengers Conducting
SWM/SWC
activities in the
area of study
2000 120 Based on
physical
observations and
personal
discussions Totals 635
Source: Field work, 2008
3.5.2 Units of Analysis
A unit of analysis is defined as the addressed key factor a researcher sets out to
investigate and comes back in the end of the study with evaluated knowledge about it
80
(Kyessi, 2002). This study treated a neighbourhood of households where SWM was
carried out by residents in collaboration with all relevant actors for effective and
efficient SWM services as a unit of study. This decision was significant due to the
fact that it would allow the exploration of various aspects relating to community
participation in SWM through households, individual professionals with long
experience in LRM and SWM, recycling industries/factories, organizations
(contractors) engaged in SWM in the study area. This decision included all mandated
authorities/institutions in SWM, international organizations involved in SWM, and
other formal and informal actors (scavengers) who were part and parcel of SWM in
Kinondoni Municipality.
3.6 Case study Protocol
Case study protocols contain the instruments and the procedures and general rules
that should be followed to control the contextual environment of the studies.
Controlling the contextual environment is an important consideration in the design
and application of qualitative research approaches in case study research designs.
For this research therefore, a case study protocol was developed in order to increase
the reliability of the study. It also, became the guide for carrying out the
investigation efficiently. It was considered that the essential components of a
protocol are: an overview of the in-depth case study; data sources; data collection
methods; and data analysis procedures; and a guide for case study report (Yin, 1994).
3.6.1 Overview of the in-Depth Case Study
It was decided by the researcher that for every in-depth case study a brief overview
showing details on demographics, infrastructure, and population should be presented

81
first. These overviews pertain to the following in-depth cases studies: Kinondoni
Municipality as whole prior to the advent of PPP in 1994 on one hand, and on the
other hand, Kawe, Sinza and Hanna Nassif Wards after the advent of PPP.
3.6.2 Sources of Data
For the purpose of facilitating the above impact analysis, the following sources of
data were used: documentation (memoranda, written reports, articles in the mass
media, environmental legislation especially on solid waste, contract specifications
between agents and the municipality, and addenda); archival records (organizational
records, maps and charts of the geographical characteristics of Kinondoni and
relevant neighborhood maps, formal studies or evaluations, newspaper clippings and
commentaries in the mass media, minutes of meetings, letters administrative
documents); questionnaires (closed and open questions); direct observations (site
visit to the landfill in Kinondoni/routine visits to the city), and participants-
observations (being residents in Kinondoni Municipality).
3.6.3 Data Collection Methods
Data for this study was collected through four methods, namely, documentary
review, questionnaires, interviews, focused discussion groups and physical
observations. The relevant tools in question are briefly discussed in subsequent
sections.
(a) Field observation
Field observation was considered as one of the main sources of information from
the study area. Through observation, ongoing activities including solid waste
management were documented.

82
(b) Focus group discussions
These were carefully planned discussions designed to obtain perceptions on local
resources mobilization towards sustainable SWM in Kinondoni Municipality and
elsewhere in Tanzania. The researcher was responsible for taking field notes
during the discussions which were guided by predefined questions. Some
questions were closed while others were open-ended. The participants included
CBOs/NGOs leaders, individual academicians who were competent in SWM
particularly those at the Ardhi University, and some private operators in the same
field. Table 3.5 below depicts focus group observations.
Table 3.5: Focus Group Discussions (FGD)
SN Group
category
Number
of
members
Remarks
1. CBO/NGOs
leaders
10 Lack of enough resources and SWM
decentralization
2. Faith Based
leaders
4 Inaccessibility of SWC points; less collective
interests and patriotism; and remote political
willingness
3. Ward level
political leaders
6 Lack of community awareness and
involvement; and unnecessary ideological
differences
4. Environmental
experts
6 Ineffective laws on SWM; poor
infrastructure; and centrally selection of Pos
5. Long
experience Pos
10 Incapacity of LGA to manage SWs; long
dumpsites distance; lack of modern
technology; and some of the re-cycling
factories are invisible or in the back yards.
Source: Field work, 2008
(c) Interviews and questionnaires
The in-depth case study questions form the heart of the protocol. This is a set of
substantive questions reflecting the actual inquiry (Yin 1994). For this reason,
several interview questions were developed based upon the concepts in the
theoretical framework and the research questions. These interview questions, given

83
in Appendix 1.10 of this thesis, were used in all in-depth cases for data collection
purposes. Specific respondents included the Kinondoni Municipal Director, key
municipal solid waste management officers, relevant Wards Executive Officers,
Mitaa Chairpersons, and some selected stakeholders. In concretizing the collected
information the key informants were identified from UN-Habitat Dar es Salaam
office, ILO Dar es Salaam office, DCC, KMC, and CBOs/NGOs. Table 3.6
summarises the key respondents.
Table 3.6: Key Informants Interviewed
No Key informants No. inter-
viewed
Remarks
1. UN-Habitat (Tanzania) 1 Programme Manager
2. ILO- Dar es Salaam Office 1 Resource Department Officer
3. NEMC Officials 2 Legal Department Officials
4. Local Government Leaders
(DCC)
5 SWM Department Officials and
Accountant
5. KMC Officials 2 KMC Director and Accountant
6. KMH and WMD Officials 4 SWM Department and
Operations Officers
7. LGR Official 1 LGR Manager
8. Kawe; Hanna Nassif and
Sinza Wards Officials
15 All WEOs and Mitaa Leaders
9. Kawe Ward Contractors 2 Private Operators’ Managers
10. Sinza CBOs Officials 2 Two Chairpersons
11. KIWODET Officials 2 Chairperson and Secretary
12. Umbrella NGO Officials 1 Program Manager
13. OUT Lecturer 3 PhD in Environment
14 Totals 39 Informal Facilitators
Source: Field work, 2008
For convenience, the interview protocol was divided into two different types of
questionnaires. One type was sent to the top management of the private firms and the
other type sent to Kinondoni Municipality. These questionnaires were divided into
six main categories, namely the hierarchy principle; the polluter pays principle, the

84
continuity principle, and effectiveness, efficiency, and efficacy principles. Some
questions addressed to the management of contractors differ from those addressed to
the representative of the municipality. The questions relating to the continuity of the
service, for example, only concern the municipal authorities. All questionnaires
started with closed questions to make the respondent comfortable at the beginning.
Open questions concluded both questionnaires.
Questionnaire submitted to the Kinondoni Municipalit; the questionnaire submitted
to the municipality started with some questions concerning the hierarchy principle.
The quantity of waste collected in m³/day or in tons/day was enquired about. These
figures provided important information on the application of the hierarchy principle
in the management of solid waste in the municipality. As the amount of waste
generated depends on the number of inhabitants, the socio-economic situation, the
level of public awareness, etc., this quantity was to be compared with the most
probable quantity of waste generated in the city.
Questions were also raised about awareness campaigns after contracting-out. Even a
well designed contract without an awareness campaign might result in mutual
disadvantages for both the principal (municipality) and the agent (the private sector).
One way to find out if the hierarchy principle is respected is through the presence of
the recycling and/or composting industry in the city irrespective of whether it is
formal or informal. Furthermore, the presence of a weighbridge is very relevant to
acquiring accurate information on the quantity of waste being disposed off. There
were questions to capture such types of information.
85
The second section embraced the polluter pays principle. There were questions about
how the solid waste services are financed, and the level of tax recovery. If the
beneficiaries did not bear the cost of the service, there would be no incentive from
their side to minimize the quantity of waste which has to be ultimately disposed into
a landfill. Since not all citizens have the same economic situation in a given city, one
of the questions asked relates to the fees the citizens are charged in order to ascertain
whether this amount is the same for all citizens or not.
The third section concerned the principle of continuity/sustainability. It is a fact that
solid waste services must be rendered in a continuous manner. This means that even
if a private firm provides the service, the municipality legally responsible for the
service must ensure the continuity of the service. The conditions known as the
“5Ms” have to be fulfilled to ensure the continuity of the solid waste service:
efficient management, sufficient manpower, sufficient money, reliable machines and
material. The municipality managers involved were questioned in order to verify
whether all these “5Ms” can be mobilized in a very short-term period or not.
Therefore, the municipality was asked whether it is delivering the service in some of
the other municipalities of the city or not, in order to ensure that some “5Ms” are
available. Furthermore, managers were asked if they can ensure continuity about the
private firms after the municipality go out of solid waste management business.
The fourth section dealt with the aspect of effectiveness. Due to the key
characteristics of solid waste as public goods, it was relevant to recognize as to
whether every Ward somehow benefited from the basic services provided at a
satisfactory level. Thus, in order to ascertain the degree of efficacy relating to SWM
86
services, another question concerned the degree of satisfaction in the community.
And the next section concerned efficiency. One of the arguments put forward when
contracting-out solid waste services in a given city concerns the efficiency of the
private sector in comparison to public administration. Hence, a question about the
cost of the service before and after contracting out to the municipality was raised.
Questionnaires applied to contractors; like the questionnaire applied to the
municipality, the questionnaire applied to contractors started with some questions
concerning the hierarchy principle. A question was posed concerning the quantity of
waste collected in m³/day or in tons/day in order to create internal validity. The
private firms were also asked if this quantity is variable over the year. Questions
about awareness campaigns prior to contracting-out were also posed to the private
entrepreneurs. The existence of the recycling and/or composting industry in the city
had to be established, as this determines whether the hierarchy principle is respected
or not. Furthermore, the presence of a weighbridge was very relevant, as it facilitated
the gathering of accurate information concerning the quantity of waste disposed off.
Another question concerned the basis for payment in the private sector: lump sum or
according to quantity of waste disposed off. Incentives to establish the hierarchy
principle could obviously be better in achieving about the use of lump sum charge,
rather than one which is calculated according to the quantity of waste disposed off,
or by setting different prices for different types of waste with lower price for
recyclable and treatable waste. The question whether the contract specifications take
into account the treatment of waste, such as recycling or composting, was also raised
in this context.
87
Another important issue of contracting-out was the accessibility of areas. It was
relevant to establish whether the contract specifications take into account the specific
characteristics of the municipality, such as road conditions, accessibility to the
landfill, etc. Very often, municipalities use standard contracts, set up by the central
government; although these are well-designed, they do not take into consideration
the key features of a given city, such as its road conditions.
The questionnaire comprehensively tackled the issues of market failure due to
asymmetric information. To capture this aspect, the exact quantity of waste collected
and disposed off, any relevant addenda, and so forth were inquired into. Regarding
asymmetric information and inter-organizational relationships, the following main
patterns were elucidated: the frequency of transactions resulting from the
relationships between principal (municipality) and agents (contractors); and the
degree of accuracy of the information prior to and following the contract.
Furthermore, a question concerning the private enterprise’s interest in an extension
of the contract was raised. If this question was answered positively, this would be
interpreted to mean that the private contractors were satisfied with their cooperation
with the municipality. Towards the end of the questionnaires, there were some open
questions relating to the incorporation of waste treatment in contracting-out, or
whether parties believe that contracting-out automatically results in a conflict of
interest with the hierarchy principle.
3.6.4 Data Analysis Procedure
For the purpose of systematic in-depth case study analyses and syntheses the pre-
defined research questions were provided for guidance after a context-specific

88
modification. These questions were: What is the performance of local resource
mobilization towards sustainable solid waste management? Who are the actors
involved in local resources mobilization towards sustainable solid waste
management and what are their roles? What are the constraints and challenges in
local resources mobilization towards sustainable solid waste management? And how
are the motives and practical aspects entailed by local resources mobilization
towards sustainable solid waste management?
In order to assess the performance of local resources mobilization towards
sustainable solid waste management as mandated by the first question, compliance
with the following principles were to be checked: the waste hierarchy principle; the
effectiveness principle; the efficacy principle; and the sustainability principle. In
order to answer these performance related questions, the procedure below was
adopted.
From a quantitative aspect, in order to make this compliance audit a success,
compliance with the hierarchy principle was checked through two ratios. These were
the percentage of re-cycled wastes versus land-filled waste and the percentage of
composted wastes versus land-filled wastes. In order to determine some notable
improvements the ratios were compared across time and across the four case studies.
Compliance with the hierarchy principle was also checked by qualitative data,
through the mode of payments. In principle, if the contractors are paid per quantity
of solid wastes disposed off in bulk regardless of the differences in biodegradable,
reusable, recyclable and inert wastes, then, there can be no incentive for them to

89
encourage wastes minimization awareness campaigns, re-cycling initiatives, and
composting of wastes. Also, quantitatively, the polluter pays principle was checked
through two ratios. These are percentage of actual recovered cost versus percentage
of total investment cost and percentage of subsidies from central government versus
percentage of total investment cost. These two ratios allow one to determine the
relative sustainability of the SWM system.
Thereafter, quantitatively effectiveness was checked through three ratios. These are
total wastes generated versus total wastes collected; the population provided with
collection services versus total population; households provided with collection
services versus total households and length of paved streets regularly cleaned versus
total length of paved streets. Finally, quantitatively, efficiency was checked by using
three ratios. These are costs under municipal administration versus costs of private
sector, total cost versus population served and total cost versus households served.
The above computations and comparisons were done in two stages. In the first stage,
an intra-case search for patterns was executed along with the above defined
analytical questions. In the second stage the analysis consisted of a cross-case search
for similarities and dissimilarities along with the same questions as it was the case
for a case by case analysis. In this way, convergences and divergences between case
studies were identified.
3.7 Limitations to the Study
The study was intended to cover the whole of Kinondoni Municipality in Dar es
Salaam City, Tanzania. However, due to time and resource limitations, only three

90
Wards out of twenty urban Wards had to be studied in detail. Obviously, this was a
small sample for the study. A number of innovations were employed to compensate
for this limitation.
First, a RAS was used in order to be able to pick the most typical cases. And
secondly, a multiple case study design was employed, so as to allow analytical
generalisations to be applied to the rest of seventeen Wards in Kinondoni
Municipality. The RAS was a method applied in the twenty urban Wards in order to
obtain useful information that could enable the selection of cases for detailed study.
This method was very useful.
Actually, the multiple case study design was intended to bring in the rich experience
and knowledge using the same variables in different types of solid waste
management practices and settings with a view of identifying similarities and
differences in the process. To this end, both quantitative and qualitative data
collection methods were used in a way that equalised the fluid spots of each
individual method.
Thus, due to the analytical selection process used to pick sub-cases, the sub-case
studies picked stand for distinct types of solid waste management practices and
settings, in this way it allowed analytical generalisations to be applied to the rest of
seventeen Wards in Kinondoni Municipality.
Finally, the scatteredness of information made the study difficult. Key information
on various issues were scattered in different locations and offices which were not

91
readily accessible as and when one wants. Thus, too much time was needed to
search this information/data. For this reason, five assistants were employed to
facilitate this exercise effectively and efficiently.

92
CHAPTER FOUR
4.0 PERFORMANCE OF SOLID WASTE MANAGEMENT IN KINONDONI
4.1 Introduction
This chapter documents the performance of solid waste management in Kinondoni
Municipality prior to the advent of public-private partnerships. Thus, the chapter
identifies the actors along with challenges and opportunities they face and enjoy
respectively, in local resources mobilization towards sustainable solid waste
management. Also, it elaborate spatial and population growth in the municipal,
combined with unrealistic institutional structure for solid waste management, lack
of enough resources, lack of practical legal policies, and how inefficient local
organizational development has affected the status of municipal services particularly
in solid waste management. Generally, this chapter shows that solid waste
management problems were increasing over time with the increase in population.
4.2 Profile of Kinondoni Municipality
Government Notice No. 4 of the year 2000 issued by the President’s Office,
Regional Administration and Local Government established the Kinondoni
Municipal Council (KMC) as an autonomous body. The move was part of the on
going Local Government Reforms in the country at that time. The municipality is
bordered by the Indian Ocean to the Northeast, Ilala Municipal to the South,
Bagamoyo District to the North, Kibaha District to the West and Kisarawe District to
the Southwest. The municipality was well linked by roads and other communication
networks to the rest of the city and other parts of the country. Major road links were
Morogoro Road, Bagamoyo Road, Kawawa Road, Mandela Road and Sam Nujoma

93
Road.
Kinondoni Municipality experiences a modified type of equatorial climate – it is
generally hot and humid throughout the year with an average temperature of 290C.
The hottest season is from October to March while it is relatively cool between May
and August with temperatures around 250C. There are two rain seasons - short rains
fall from October to December and long rains between March and May. The average
annual rainfall is 1300mm. Humidity is around 96% in the mornings and 67% in the
afternoons. The climate is also influenced by the Southwest monsoon winds from
April to October and Northeast monsoon winds between November and March.
It was revealed that, about 360,000 residents of Kinondoni Municipality were
employed in both private and public sectors. Out of these, 95% were employed in the
private sector while the rest 5% were employed in the public sector. A working force
of about 200,000 people was self-employed (KMC, 2008). The majority of the
residents were involved in petty business, fisheries, livestock keeping and agriculture
including horticulture. Only 3% of the working force was engaged in subsistence
agriculture in the peri-urban areas. There were no big farms but small plots ranging
from 2.5 to 6 acres. Others make small gardens around their houses in which various
vegetables and root crops like cassava and sweet potatoes were grown for family
food and the surplus for income generating (ibid).
4.2.1 Kinondoni Municipality Administrative Set-up
The Kinondoni Municipality comprised of four (4) divisions namely: Magomeni,
Kinondoni, Kibamba and Kawe. These divisions were then divided into twenty
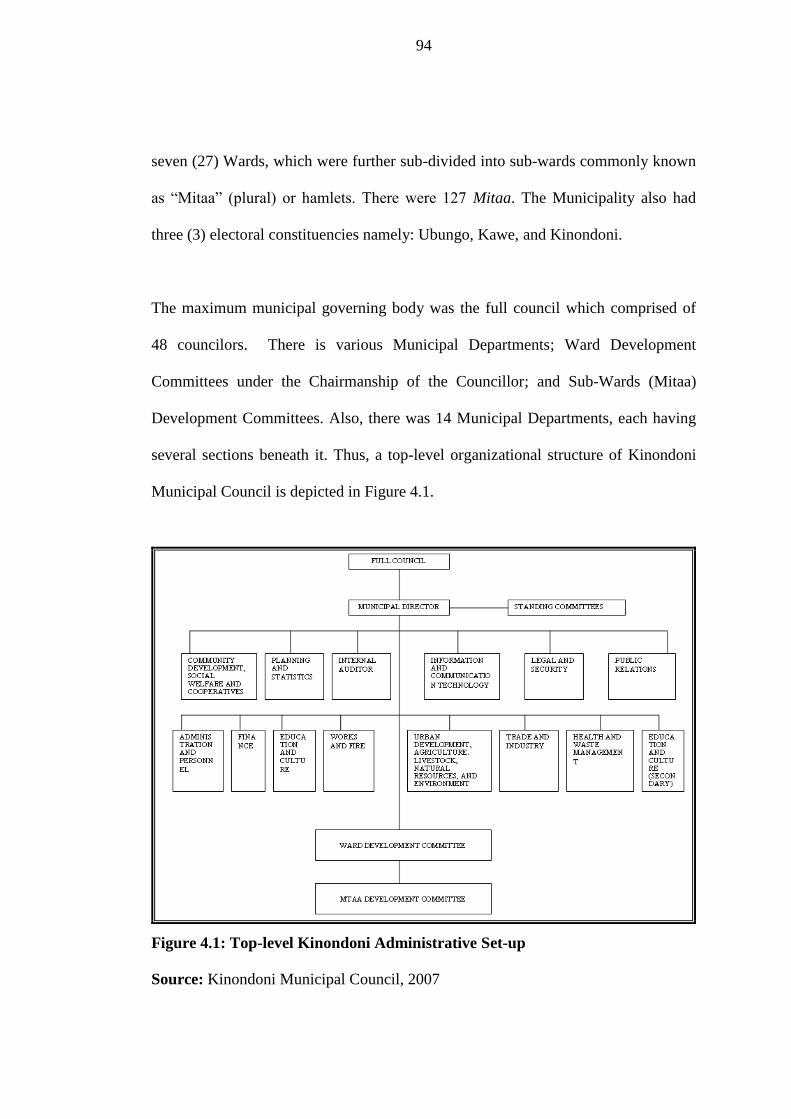
94
seven (27) Wards, which were further sub-divided into sub-wards commonly known
as “Mitaa” (plural) or hamlets. There were 127 Mitaa. The Municipality also had
three (3) electoral constituencies namely: Ubungo, Kawe, and Kinondoni.
The maximum municipal governing body was the full council which comprised of
48 councilors. There is various Municipal Departments; Ward Development
Committees under the Chairmanship of the Councillor; and Sub-Wards (Mitaa)
Development Committees. Also, there was 14 Municipal Departments, each having
several sections beneath it. Thus, a top-level organizational structure of Kinondoni
Municipal Council is depicted in Figure 4.1.
Figure 4.1: Top-level Kinondoni Administrative Set-up
Source: Kinondoni Municipal Council, 2007

95
4.2.2 Demography
In the 2002 census, the district with the largest population in Tanzania was
Kinondoni with a population of 1,083,913. There was enormous increase of
population in Kinondoni District (now KMC) from 627,416 in 1988 to 1,083,913 in
2002 which was an average annual growth rate of about 4.1% (URT, 2002). Table
4.1 below portrays projected population from 2002 to 2010 for KMC based on year
2002, at a growth rate of 4.1%.
Table 4.1: Kinondoni Municipality Projected Population From 2002 to 2010
Years 2002 2004 2006 2008 2010
Total 1,083,913 1,179,985 1,278,727 1,385,732 1,501,692
Source: URT 2002, 2006.
The trend of population increase like in KMC was a resource for supply of labour,
hence an important parameter for socio-economic development. However, the
growth of population increases demand for food, municipal services such as water
and sanitation, energy, solid and liquid management, etc. Without a matching
supply of essential municipal services provision, environmental destruction would
normally be a logical outcome.
4.2.3 Spatial Factors
The total area of Dar es Salaam City was about 1,800 sq kilometres, comprising
1,393 square kilometres of land mass of which Kinondoni Municipality constitutes
531 square kilometres of the whole land mass area (URT/DCC, 2002). Apart from

96
such endowment, informal settlements were found in the heart of Kinondoni
Municipality, and therefore are part and parcel of the urban fabric.
The informal settlements were found right from the inner of KMC, actually within
half a kilometre radius such as along Msimbazi Valley and Nalung’ombe River in
Magomeni Ward, Kigogo, Hanna Nassif, Ali Maua, Tandale, Ndugumbi, Manzese
etc. Figure 4.2 portrays Kinondoni Municipality sequential spatial growth from
1970s to 2010.
Figure 4.2: Kinondoni Municipality Spatial Expansion From 1970s-2010s
Source: Info Bridge, 2011

97
It is always obvious that rapid spatial expansion would render difficulties in the
proper solid waste management services in Kinondoni Municipality. Also, basic
infrastructure almost in all settlements was either inadequate or not available due to
municipal uncoordinated development. Kinondoni Municipality expansion continued
to take place regardless of efforts to provide infrastructure and amenities. The rate of
urban growth and population increase outpaced the local authority’s capacity to
render necessary services. At the time of the study, many of the social services that
were erected in the past did not seem to be improved nor extended to cater for the
ever increasing municipal population. However, within these informal settlements,
although in some rare cases, private individuals located some of the services such as
solid waste primary dumps for community use, in order to ameliorate the scarcity of
land for infrastructure. This was noted during this study in Mwananyamala Ward,
around Kwa Kopa (see Plate 4.1).
Plate 4.1: Voluntary Primary Dumpsite in an Informal Settlement at Kwa Kopa
Source: Photo by author, 2008

98
It was revealed that, during this study KMC had no sustainable official dumpsite
though solid wastes was collected and transported either to Pugu-Kinyamwezi,
about 25 kilometres from the City centre or at Kigogo temporary official dumpsite,
about 8 kilometres from the City centre. But, all in all the problem of affordability
due to long distances for waste disposal was still unsolvable. However, the state of
underdevelopment in terms of spatial factors such as lack of land in the City centre
which emanated from poor planning, solid wastes service distance, poor types of
equipment and tools etc. circumscribe the limits of resources available towards
sustainable solid waste management.
4.2.4 Other Municipal Infrastructure Services
Physical observations revealed that the infrastructure condition in Kinondoni
Municipality in terms of technical plus social services such as roads, drainage
system, electricity, water supply, health, education and safety was absent or poor.
Many parts of the settlements had no clear roads or footpath networks (about 50%);
the drainage system was not well defined (about 50%), and where available were
mainly natural drains. While many households used pit latrines or septic tanks (on
site sanitation), and the solid waste management service was still poor. The same
was observed by Kyessi (2002). Generally, solid wastes were burnt or left
uncollected in many parts of Kinondoni Municipality. Figure 4.3 below portrays
types of infrastructure including SWC; roads; footpaths; drainage and sanitation in
real prevailing situation.
Furthermore, it was observed that informal settlements in Kinondoni Municipality
has a high housing density, poor availability of solid waste management services

99
and with the highest population. A cross-examination of poor infrastructure
conditions in these informal settlements was dominant in Kinondoni Municipality as
earlier noted; this being due to low awareness levels on the health hazards likely to
be caused by dirty environment, less affordability levels and likewise low
educational levels of the residents. But, generally the authority only had no capacity
to alleviate the prevailing situation.
SWC
Roads
Footpaths
Drainage
Sanitation
0% 20% 40% 60% 80% 100%
Key:
Figure 4.3: Infrastructure Conditions in Kinondoni Municipality
Source: Field work, 2008
Good Fair Poor Not Available

100
4.2.5 History of Solid waste Management in Kinondoni Municipality
(a) Urbanization and its impact on solid waste management
It was reported from KMC in (2007) that, before the advent of privatization in 1994,
the Dar es Salaam City Council (DCC) was the only authority responsible for
provision of public services, including primary waste collection, temporary storage
and transportation to disposal sites, streets’ sweeping, manage the disposal sites, and
sometimes recycle the waste. To perform these activities efficiently, the DCC was
required to have a robust budget for funding SWM activities, adequate personnel and
equipment for execution of these activities, etc. City residents, developers, business
operators, etc, as waste generators, relied on the DCC as the sole provider of SWM
services in return to taxes they paid to the government.
However, in the early 1990’s, population growth in the City was extremely high due
to a number of factors. One of the factors was the introduction of economic
structural adjustment policies in the mid 1980’s. At this point in time, Tanzania
turned from a socialist economy to the market economy. This policy, attracted
foreign investors who concentrated their investments mainly in Dar es Salaam City,
which attracted an influx of job seekers. This situation did not go parallel with the
provision of public social services that could, among other things, provide sufficient
mechanism for efficient management of domestic solid wastes. This high number of
population led to an increased waste generation rate, greater number of squatter areas
and more people without access to the official waste collection system (KMC, 2007).
From the above report it was obvious that, while operating in such a situation under
the guidance of conventional approaches, the DCC failed to provide efficient and

101
reliable SWM services to the growing city population. The Council was capable of
collecting only between 30 and 60 tones that is 2%-4%, of the then total waste
generated per day in the city (Halla and Majani, 1999b, UCLAS, 2003). For this and
other reasons there was a need for devising alternative methods of SWM (ibid).
(b) The advent of private sector in solid waste management
According to Majani (2000), the involvement of the private sector in solid waste
management was initiated under the Global Sustainable City Development
Programme (GSCDP). Several Cities, including DSM, were part of this sustainable
Cities network in which the GSCDP was promoting demonstration projects world-
wide. The Sustainable DSM City Project (SDP) was started in January 1992
(UNCHS, 1994). In 1993 the Sustainable DSM Project (SDP) introduced the
Environmental Planning and Management (EPM) process with the overall aim of
supporting the DSM City Council in promotion of new partnerships among public,
private, and community sectors to develop sustainable solutions to priority
environmental issues (UNCHS, 1994). And one of the priority issues was solid waste
management.
The SDP, through the EPM process, provides municipal authorities and their
partners in the public, private, and community sector with an improved
environmental planning and management capacity. The focus of the SDP in solid
waste management was to support DSM municipalities to prioritize their most
critical problems in solid waste management, and in so doing to bring together in
working groups in particular those who were affected by the problem, those who

102
create problem, and those who had an institutional responsibility to manage the
problem (Halla and Majani, 1999a). Before the intervention of the SDP in 1992 the
first City consultation on environmental issues was held in August 1992 involving
more than 200 participants, represented a cross-section of institutions in the public,
private and community sector (Chinamo, 2003). The participants were exposed to an
analysis of nine critical City environmental issues, some of them were: solid waste
management; unplanned and un-serviced settlements; liquid waste management;
managing City transportation and air quality; managing open spaces, etc.
A series of City mini-consultations were held and working groups established for
each environmental issue under the overall supervision of the Sustainable Dar es
Salaam City project. The working group on solid waste management adopted a five-
point strategy involving the following: launching of an emergency city clean-up
campaign; privatization of solid waste management services; encouraging
community participation in solid waste management; encouraging recycling and
composting; better management of disposal sites (Halla and Majani 1999a; DCC,
2001; Chinamo, 2003).
(c) Phase one of solid waste management privatization in 1994
Phase one started in 1994 with 10 City Wards at the City centre, after competitive
bidding Multinet Africa Limited won the tender to collect waste (Halla and
Majani,1999a, Majani, 2000; DCC, 2001; Chinamo, 2003). The contractor was
empowered to collect solid waste collection charges directly from the service
recipients. The contractor has to arrange for the necessary facilities for solid waste

103
collection. The contractor started to operate in September 1994 (Halla and Majani,
1997).
DCC enacted by-laws along with privatization, to cover the solid waste collection
services. In the beginning the contractor performed well, collecting up to 75 percent
of the solid waste generated daily in the 10 Wards. But later, this rate dropped due to
contractual problems. The number of Wards served dropped to 5 and only 15 percent
of waste was collected. The main reason was the non-payment from the recipients as
they had previously received the free service from DCC (Majani, 2000).
(d) Phase two of solid waste management privatization in 1996
In 1996 four organizations entered to make a total of five organizations, contracted
to serve four Wards (DCC, 2001). These four new organizations started their work
with morale and commitment and the daily solid waste collection rates increased in
these Wards, as waste heaps along streets and open spaces and market places
significantly reduced. Like the first contractor these additional four organizations
faced the same problem of insufficient collection charge from the residents (Majani,
2000). This was due to inadequate cooperation from the DCC in enforcement of by-
laws and public awareness creation. As a result the performance levels of the
organizations dropped, including the first contractor i.e. Multinet who once again
had to withdraw from providing services in the five Wards of the city centre.
(e) Phase three of solid waste management privatization in 1998/1999
Experience gained in the previous two phase’s strengthened institutional
arrangements in favour of SWM strategy, and an independent department of SWM

104
was established in the DCC. The number of private organizations contracted to
provide solid waste collection service increased to 65 (i.e. local company and
community groups). Privatization covers 44 out of 73 wards in the city. After the
private sector has been accepted to provide service, Communities Based
Organizations (CBOs) were also empowered by various stakeholders to implement
solid waste management.
The City and Municipal authorities, in collaboration with agencies such as ILO,
UNDP/LIFE, WHO, UNIDO, DANIDA, HABITAT, and CARE International have
been providing technical and other support to the CBOs (ibid). For example UNCHS
(Habitat) collaborated with ILO, UNDP and United Nations Volunteers on the
implementation of the programme in urban low-income (UNCHS, 1994). However,
it was further reported that, some international organizations support the solid waste
management organizations in different ways. For example, ILO supported the
implementation of solid waste management activities by focusing mainly on
promoting employment opportunities and income generating activities within the
sector (ibid). These activities in turn contributed to the improvement of solid waste
management and environmental cleanliness. Thus, from this background one could
draw different conclusions on the involvement of private sector in solid waste
management service in Dar es Salaam City, hence in Kinondoni Municipality.
4.3 Performance of Solid Waste Management in Kinondoni Municipality
Urban solid waste management in Tanzania in general, and in Kinondoni
Municipality in particular, had always been a serious environmental problem and a

105
challenge for many years for a number of reasons. In order to put this contention in
perspective, this section addresses this issue in the following sub-sections.
4.3.1 Solid Waste Generation and Collection Rate in Kinondoni Municipality
The ratio of wastes collected versus wastes generated is a good measure of the
effectiveness of SWM services. If the ratio is 100% then we have the maximum
possible effectiveness. As far as Kinondoni Municipality before PPP is concerned,
that is before 1994 the ratio of wastes collected versus wastes generated was 10%
out of 1480 tones (Majani, 2000). Furthermore, the study revealed that, by 2007
Kinondoni Municipality was generating about 2,026 tons of waste per day from
various waste streams as shown in the Table 4.2.
Table 4.2: Amount of Solid Waste Generated per day in Kinondoni
No. Waste stream Amount generated (tones per day)
1. Kitchen waste 646
2. Paper waste 94
3. Textile waste 11
4. Plastic waste 83
5. Glass waste 52
6. scrap metal waste 41
7. Grass waste 444
8. Leather and rubber waste 21
9. Soil and ceramics waste 11
10. Other solid wastes 670
Total 2,026
Source: Field work, 2008

106
It was estimated that out of 2026 tonnes of solid wastes generated per day only 1155
tones (57%) was collected, whereby 608 tones (30%) was taken to official disposal
sites. The rest was recycled, and re-used, composted, disposed onsite, burnt and
indiscriminately thrown away haphazardly even in grave yards (see Plate 4.2).
Plate 4.2: Uncollected solid Waste Being Burnt Along a Grave Yard in Kijitonyama
Source: Photo by author, 2008
It was further learnt that the Kinondoni Municipality has poor information/data
management system which contributes to a complicated process of settings for
modern waste storage, suitable routes assignment for SWM waste equipment and
tools etc., almost everywhere. The researcher further, was informed by Kinondoni
Municipal SWM Department that in order to cope with the daily SWM and
sanitation in the municipality, they had to launch a campaign for all stakeholders to
come together to find a lasting solution to SWM problems, specifically at each
Ward level. However, this campaign had no much output so far. In this regard,
Figure 4.4 compares the efficiency of the municipal versus contractors in terms of
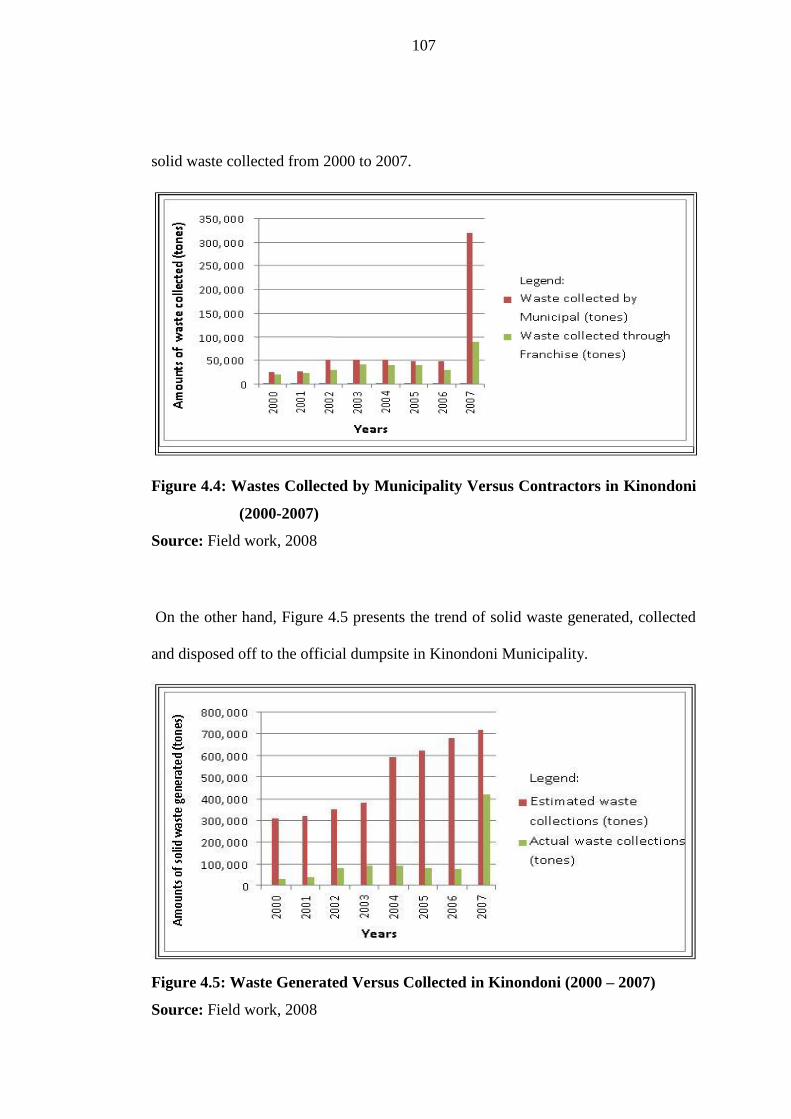
107
solid waste collected from 2000 to 2007.
Figure 4.4: Wastes Collected by Municipality Versus Contractors in Kinondoni
(2000-2007)
Source: Field work, 2008
On the other hand, Figure 4.5 presents the trend of solid waste generated, collected
and disposed off to the official dumpsite in Kinondoni Municipality.
Figure 4.5: Waste Generated Versus Collected in Kinondoni (2000 – 2007)
Source: Field work, 2008

108
4.3.2 Waste Recycling, Composting and Dumping Ratios
This study conducted a compliance audit with respect to the wastes hierarchy
principle. According to this principle, in designing waste management strategies,
preference should be given to those methods which are more environmentally sound.
The study was guided by the assumption that, the wastes hierarchy entails a five-step
order of priority in which waste prevention has the highest priority being followed
by re-use, recycling, recovery and waste disposal as the last option. From a
quantitative aspect, in order to make this compliance audit a success, compliance
with the hierarchy principle was checked through two ratios. These were the
percentage of recycled wastes versus land-filled wastes and the percentage of
composted wastes versus land-filled wastes.
In order to compute these ratios an extensive documentary review was employed.
Available literature (Kironde, 1999) showed that the first dumpsite which was
established after independence was located at Tabata. The Tabata dump site was
established in year 1965, at that time Tabata was the outskirt of the city and no
settlement patterns assumed to gain the proximity say of 200m from site. All waste
collected in the city of Dar es Salaam was dumped here. In September 1991 the site
was moved from Tabata to Vingunguti.
According to Ngiloi (1992), the composition of domestic solid waste dumped at
Vingunguti dumpsite in February 1992 was largely comprised of organic materials.
Specifically, its composition by percentage in brackets was as follows: vegetable/
putrescible (62.5%); paper (6.2%); glass (0.3%); metal (1.2%); textiles (1.2%);

109
plastic and rubber (1.8%); bones (0.3%); and inert matter, sand, ash, stones, pottery
(27.3%). This data set implies that re-use, re-cycling and composting were rarely
performed prior to dumping.
The researcher further confirmed that, at the dump site a large number of individual
scavengers privately sorted out waste components like plastics, foam plastics,
metals, waste wood etc. Recycling at domestic level was only sometimes done in
terms of discarded consumer goods like fans, refrigerators, furniture and wood.
Materials like glasses, plastics and metals were hardly recycled. Waste from the
Kariakoo market was sometimes given to farmers where they used it as raw
compost. Industrial waste was recycled on small amounts for examples plastics like
polyvinyl chloride (PVC). Tins were used as lamps, doors and wall covers. Paper
bags and cuttings were reused for manufacturing toilet paper. Car wrecks were
sometimes used as spare part pools and steel iron parts for blast furnace plants
(Ngiloi, 1992). When all these findings are coupled with findings from the field, the
general conclusion reached by the researcher was that, in 1992, the percentage of
recycled waste versus land-filled waste was 1.4% while the percentage of composted
waste versus land-filled waste was 1.1%. From these findings logically implies that
by 1992; the Kinondoni Municipality was not complied with the waste hierarchy
principle.
4.3.3 Residents’ Satisfaction in Solid Waste Management
It is believed that when the households feel that are receiving a good service, in
waste management this leads to an improvement in participation also in paying
collection fees. Since the residents are happy to receive a good service and discover

110
that their payments are used directly for the service, they might support the system
and wish to continue with the service. According to Kaseva (1994) one survey was
made in early, 1990s asking about 120 households if they are satisfied with the
SWM service they receive. In order to test this satisfaction the following question
was posed: If you receive SWM services what is your opinion of the service
provided? The possible alternative responses were: very satisfied; reasonably
satisfying; needs improvement; don’t know; and no service received. The findings
on the degree of satisfaction from SWM services in Kinondoni Municipality before
PPP were as follows: about 2 (1.1%) out of 120 households the answer was very
satisfying; about 13 (10.4%) out of 120 households the answer was reasonably
satisfying; about 28 (22.9%) out of 120 households the answer was needs
improvement; about 1 (0.4%) out of 120 households the answer was don’t know; and
about 79 (65.2%) out of 120 households the answer was no service received. Figure
4.6 depicts these details visually.
Figure 4.6: Residents’ Satisfaction in Solid Waste Management Services
Source: Field work, 2008

111
4.4 Local Resources Mobilization Strategies Towards Sustainable SWM
This study established that, there were several problems facing Kinondoni
Municipality efforts toward resources mobilization for sustainable SWM as
summarized below:
4.4.1 Insufficiency of Financial Resources
It was revealed that Kinondoni Municipality obtains subsidies from the central
government and collects levies from several ventures including incinerations,
markets, sign boards, recreation rooms and grounds etc. In some instances it sought
assistance from reputable donors such as the World Bank, ILO and UN-Habitat.
Sometimes the use of locally available resources was adopted. Table 4.3 shows the
percentage of municipal budget which has been allocated for SWM from 20005/06
to 2009/10.
Table 4.3: Kinondoni Municipality SWM Budget Allocations
Financia
l Years
Total KMC Actual
Budget/Collection
Amount
Demanded for
MSWM
Amount
Demande
d in %age
Amounts
Allocated for
MSWM
Amount
Allocate
d in
%age
Dema
nded
in
%age
2005/06 11,981,772,250.78 768,396,920.00 6.41% 474,233,712.85 3.95 61.7
2006/07 14,814,207,753.99 858,376,000.00 5.79% 684,300,000.00 4.62 79.7
2007/08 20,570,542,455.63 988,637,000.00 11.80% 672,765,800.00 3.27 68.0
2008/09 16,621,381,678.31 2,527,558,000.00 15.20% 1,153,952,475.00 6.94 45.6
2009/10 23,636,377,183.46 3,616,700,000.00 15.30% 1,512,000,000.00 6.39 41.8
Totals 87,624,281,322.17 8,919,945,493.00 10.17% 5,586,500,150.00 6.37 62.6
Source: KMC, 2010
From Table 4.3 above it was clear that, the amount allocated for SWM in Kinondoni
Municipality was almost doubled as much from 3.95% in fiscal year 2005/06 to

112
6.39%. However, there was an increasing gap between the actual amounts demanded
for SWM from 6.41% in fiscal year 2005/06 to 15.30%. One of the informants
revealed that this deficit was due to the tendency of non-prioritising SWM at
municipal level leading to uncollected wastes at the local levels.
4.4.2 Lack of on-site Storage Facilities
The study revealed that vital facilities such as on-site storage are considered as one
of the biggest problems in Kinondoni Municipality’s popular market places. These
market places include Tandale, Kinondoni, Mwenge, Kawe, and Mwananyamala.
The drainage system either did not exist or were almost obsolete, while collection of
garbage was haphazardly done, leaving huge pileups of stinking filth everywhere.
All these market places in those days were sure candidates of health hazards such as
cholera; the situation was even worse when it rains. The storage volume which is
necessary to provide for either public or domestic wastes is a function of the
generation of waste, population size and frequency of collection. The availability of
whatever storage whether plastic buckets and bins with lids or depots and fixed
storage bins, would be effective and efficient depending on the type or style of SWM
put in place. Though by small degree, the research further revealed that, solid waste
collection on site in the study area undergoes some phases or processes prior to the
final collection.
4.4.3 Inefficient use of Bin System
These included open metal bins, i.e. dust bins with lids and empty oil drums without
lids - common types of on-site storage in the municipality. Bins of various sizes were
located along the roads and sometimes around apartment blocks, to serve as final

113
storage prior to collection. It was reported that frequency on the use of these
available bins was very minimal (i.e. may range between once to thrice per week)
due to little local communities awareness for the use of them. However, other
problems with these bin systems apart from their limitations in number and small
volumes to hold all the refuse produced within the collection period of five to seven
days, most of them were not equipped with tight closing lids to prevent stench, flies
and rats, and some of the bins are made of unsuitable materials and only few storage
sites have concrete floors.
4.4.4 Enclosures Systems
During this study one could find only a few enclosures in Kinondoni Municipality
built of bricks but some without roofs. The study further, found out that in most
settlements in Kinondoni they commonly used containers made of galvanized steel
with lids particularly along the main roads, and discarded drums mostly without lids.
This system could be effective and efficient if all enclosures are engulfed and roofed.
4.4.5 Inadequacy of Trailers on Collection Points
The key municipal SWM officer reported that about fourteen out of twenty urban
Wards in Kinondoni Municipal Council were using trailers as modern collection
points. The system was feasible and acceptable to almost all local communities
though it was betrayed and affected by inconsistency of collection vehicles. Users of
this service informed the researcher that sometimes it could take as long as some
weeks before wastes are collected. Some communities had to create another (see
Plate 4.1) informal dumpsite in the affected areas. When the relevant authority was
contacted, it claimed that this happened due to lack of enough tractors to follow

114
those trailers daily and even the available ones are ramshackle.
4.4.6 Inadequacy of Trained Personnel/Human Resources
This study was informed that Kinondoni Municipal Health and Waste Management
Department (KMH and WMD) was organized into four sections – solid waste
management, liquid waste management, pollution control, and disposal management.
During this study, however, the Waste Management Department had only thirty
employees instead of the required one hundred and sixty two; so there was a
shortage of 132 employees, see Table 4.4.
Table 4.4: Level of Staff Deployment at KMH and WMD
S/N Position/Job title Number of personnel Required Available Surplus Shortage
1. Municipal waste
management officer 1 1 0 0
2. Solid waste disposal
operations officer 1 1 0 0
3. Solid waste management
officer 1 1 0 0
4. Asst. SWM officer-control
of refuse collection trailers 1 1 0 0
5. Asst. SWM officer-major
roads cleaning 1 0 0 1
6. Waste management
officer-coordination of
working group plans
1 1 0 0
7. Liquid waste management
officer 1 0 0 1
8. Wards waste management
officers 27 10 0 17
9. Settlements/Mitaa waste
management officers 113 0 0 113
10. Secretary 1 1 0 0 11. Office attendant 1 1 0 0
12. Drivers 10 10 0 0
13. Cleansing attendants 3 3 0 0
14. Total 162 30 0 132
Source: Field work, 2008

115
The personnel status in Kinondoni Municipal Health and Wastes Management
Department revealed that there was a shortage of one assistant SWM officer
responsible for major roads cleaning, one liquid waste management officer,
seventeen wards waste management officers, and one hundred and thirteen mitaa
waste management officers. In total the municipal suffered a shortage of one
hundred and thirty two officers. However, key informant’s reported that SWM was
a big problem in Kinondoni Municipality because almost all private operators and
the municipality itself have been facing a very huge deficit in terms of human and
financial resources, and physical equipment and tools for efficient SWM.
4.4.7 Inadequacy of Working Equipment/Tools
As one of the dependable resources in SWM, Table 4.5 summarizes the status of
SWM working equipment and tools as recorded during the study. It was noted that,
one category of the equipments are trailers which, under normal circumstances, were
to service informal settlements.
Kinondoni Municipality had a very serious problem in SWM working tools and
equipments. Table 4.5 reveals that there was a huge shortage in the area of vehicles
and machines including trailers, tractors, bulldozers, tipper trucks, road sweeper
machines, and grass cutting machines, open drains cleaning machines, tree pruning
and sets of cleaning tools. All these resources above are the heart of effective and
efficient SWM everywhere.

116
Table 4.5: Level of KMC and POs-SWM Working Equipments and Tools
Sections Types of working
tools
Requi
red
tools
Availabl
e tools
Surpl
us
tools
Shortage
of tools
Municipal
wastes
management
office
Computer with
printers
4 2 0 2
Photocopier 1 0 0 1
Monitoring vehicle 3 0 0 3
KMC and
POs refuse
collection and
transportation
Refuse trucks 54 14 0 40
Trailers 54 27 0 27
Tractors 4 0 0 4
Radio call system 1 0 0 1
Final disposal
and wastes
reduction
Tipper trucks 2 0 0 2
Bulldozers 2 0 0 2
4WD pick-up
vehicle
1 0 0 1
Main
roads/streets
cleansing
Road sweeper
machines
4 0 0 4
Grass cutting
machines
27 0 0 27
Open drains
cleaning machines
27 0 0 27
Tree cutting
saw/pruning tools
27 0 0 27
Sets of cleansing
tools
27 0 0 27
Source: Field work, 2008
4.4.8 Emergency of Grassroots Institutions in Solid Waste Management
The study established that the traditional organisational structure for KMC virtually
excludes NGOs, CBOs and other grassroots institutions. This observation was
applied to both to solid waste management services and other services provisioning
such as water supply, sanitation, liquid water management, and so on. This reality
was substantiated in Figure 4.7.

117
Figure 4.7: Kinondoni Municipal Council Waste Management Structure
Source: KMC, 2008
However, literature reviewed indicated that NGOs and CBOs are small-scale settings
for meaningful political participation that can contribute to the cumulative processes
of decision making at grass root levels. It was further suggested that, grass root
institutions, such as NGOs and CBO, can build independent organizations in a way
that can help pluralize the institutional landscape and strengthen societies. Moreover,

118
it was insisted that such grass root institutions can reinforce popular demands and
empower community members to assemble to take collective development actions
(Dimond, 1988; Bretton, 1990; Semboja and Therkilden, 1995; Kyessi, 2002).
This line of thinking was supported by empirical evidence from KMC where a
number of grass root institutions, such as NGOs and CBO, were already making a
valuable contribution in SWM by filling the gaps left by the municipality. Such grass
root institutions included KIWODET, Informal Youth Groups, Lyhene Sanitary and
Waste wise Solution (Po), Kawe Environmental Group (Po), and Mkunguni Group
“2003”(Po).
Thus, what was needed was an approach acknowledging the substantial role of the
grassroots actors (At the Designated Ten Cells Level) which are playing at the
lowest level in the informal settlements in community socio-economic development.
Indeed, it was logical to conclude that, formal and informal institutional or
organizational linkages carry heavy weight as it is the first and foremost in
stimulating mutual and moral supportive mechanisms in order to tap the resources
from both institutions for the purpose of sustainable local community socio-
economic development.
However, from the literature review it was found that, Kyessi (2002) had already
proposed the administrative linkages between municipal and lowest community
levels for smooth local resources mobilization towards sustainable SWM in urban
areas as portrayed in Figure 4.8.

119
The top is concerned about
enhanced links with local
communities in LRM
for SWC services
Key:
Directives and minimum interaction
rep. = Elected housing cluster representative
Informal interaction
Strong interaction at the horizontal level
Figure 4.8: Administrative Links Between Municipal and Lowest Community
Levels
Source: Adopted from Kyessi, 2002:36
Ward level
Ward executive officer
SWM officer etc
Municipal
level
Expected ward and LRM
agents to assist in SWC
and basic services issues. Mitaa and designated Ten
Cell leaders in LRM
administration recognized
by local community
Flow of directions from
tax collection and
development levy etc.
Mitaa leaders’ level.
Traditional LRM
statutory links exist
Community/Mtaa Level
Mtaa leaders CBO leaders
Ten cell
leaders
Area rep Ten cell
leaders
Area rep Ten cell
leaders
Area rep

120
4.4.9 Does the Kinondoni legal Framework Guide Local Resources Mobilization?
The study established that, SWM in Kinondoni Municipality was guided by the
Kinondoni Municipal Commission By-Laws of 2000 (Waste Management and
Refuse Collection Fees). The by-laws prescribe the obligations of the residents as
beneficiaries, service providers as private firms and authority as Municipal Council
for managing solid wastes. The beneficiaries provide and maintain receptacles for
domestic refuse to the satisfaction of the Municipal Council. They collect refuse
from premises in receptacle placed strategically or as directed by the council and pay
refuse collection charges (RCC) as directed from time to time by the council
(Kinondoni Municipal By-Laws, 2000).
The franchise system had been adopted by the Kinondoni Municipality, where
private contractors, community based organizations (CBOs) and non-governmental
organizations (NGOs) had entered into contractual agreements with the authority in
solid waste management. Contractors had been mandated to collect user fees from all
persons who receive SWM services. The fees are different from place to place
depending on the income level of the community. For example, fees for Oyseterbay,
Mikocheni and Sinza are different. These rates are negotiated in community
meetings. Generally speaking, the communities in KMC are receptive to the
principle of pay as you pollute. This meant that, the service providers are exclusively
responsible for management of solid wastes within their area of jurisdiction, and they
pay a dumping fee of TZS 1500= per trip per tone as set out by the authority (ibid).
All franchisees are mandated by the Kinondoni Municipal Council to collect RCC
from residents, and take legal action against residents who refuse to pay collection

121
fees. However the prosecution role given to them was perceived as an obstacle to
their performance, since this activity would not dedicate their time for service
provision and prosecution of resident. In turn, service delivery was done mostly in
high and middle income residential areas with good payments records. This left poor
areas to be served by informal waste collectors. Although informal waste collectors
provide service at a relatively cheaper price, they dispose waste illegally at open
spaces, in drains and there was no control of where they dump the wastes. On the
other hand, the Municipal Council was responsible for coordinating waste collection
and disposal arrangements and had the mandate to take legal action against by-laws
defaulters.
There were many legislations concerning solid waste management at that time in
Kinondoni Municipality to discipline and enforce the public behaviour regarding
solid waste management, although there was some pieces which were already
outdated and inappropriate for the actual conditions for the municipality life. The
existed legislations were enforced by the Municipality Environmental Health Officer
(MEHO) assisted by health assistants and municipal lawyers, apart from other staff
members under the MSWM department.
However, the continuing poor SWM had caused environmental degradation in many
parts of the urban areas. Thus, imposing a fine on somebody living in an area not
serviced by collection service for throwing garbage’s in open public places was
almost absurd. As a result, solid wastes were indiscriminately disposed of in open
spaces as well as in water draining channels on the seashore and in vacant public and

122
private plots and after all were very few people who were fined. Consequently,
those who were fined but did not comply, were to be taken to court, but the court
procedures were very bureaucratic and lengthy and decision in the case could take
more than one year. This was a very bad picture, but not only from the environment
point of view, but also from psychological side because, when laws are disobeyed
and nothing happens the government plus relevant institutions are deeply eroded. In
trying to curve the above challenges Environmental Management Act
(Implementation SWM Regulations) was enacted in 2009 and came into force in the
same year. In this Act there has been an improvement in administration and
institutional arrangements plus duties of LGAs in relation to solid waste disposal.
The proposed punishment was that for the defaulters or anybody caught polluting
the City would had to pay a fine amounting to TZS 50.000/= (US$ 42) or be jailed
for three years. Under this pilot project Dar es Salaam City residents and all
authorities were urged to take measures in preserving the City to enable it attract
more tourists as one of the local resources mobilization. Actually, the overall solid
waste management was still chaotic in many streets of Kinondoni Municipality, and
service provision was poor because of low capacity of Kinondoni Municipal Council
plus the contracted private companies.
It was further revealed that, under the guidance of the same legislation efforts had
been employed by Kinondoni Municipality for suitable SWM but in vain as follows:
allowance of public-private partnership through private contractors; encouragement
of community participation in SWM through CBOs/NGOs such as Kisutu Women
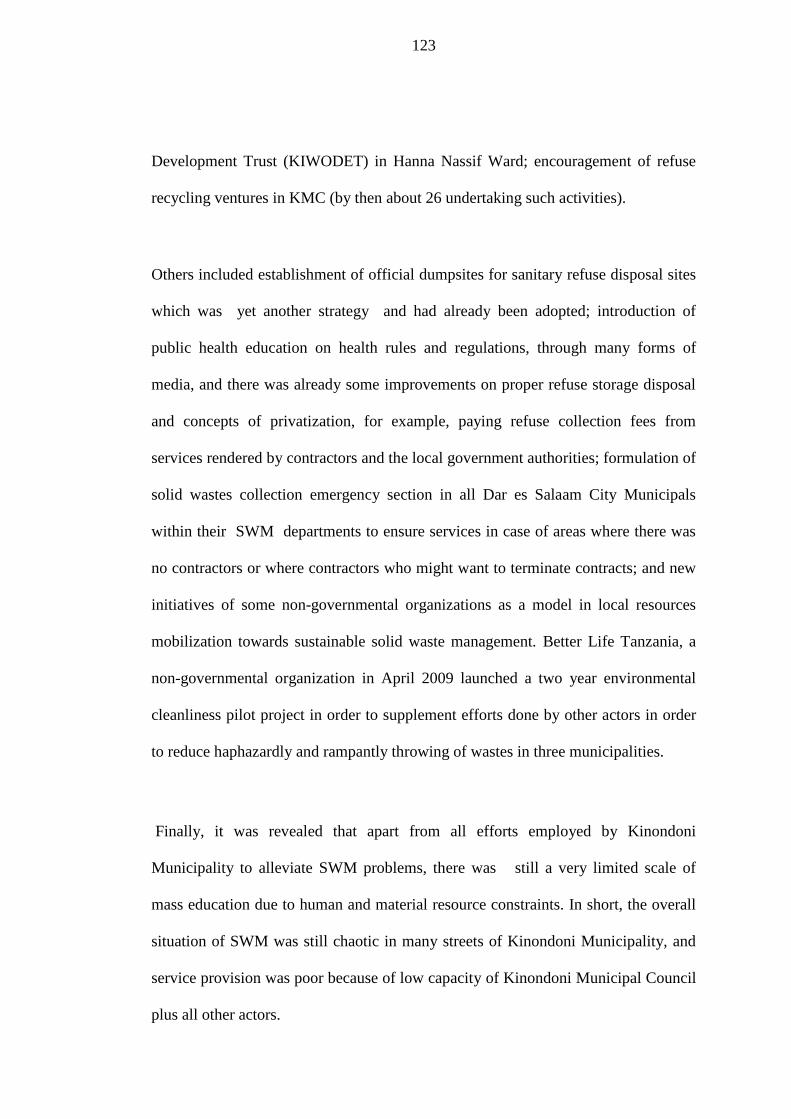
123
Development Trust (KIWODET) in Hanna Nassif Ward; encouragement of refuse
recycling ventures in KMC (by then about 26 undertaking such activities).
Others included establishment of official dumpsites for sanitary refuse disposal sites
which was yet another strategy and had already been adopted; introduction of
public health education on health rules and regulations, through many forms of
media, and there was already some improvements on proper refuse storage disposal
and concepts of privatization, for example, paying refuse collection fees from
services rendered by contractors and the local government authorities; formulation of
solid wastes collection emergency section in all Dar es Salaam City Municipals
within their SWM departments to ensure services in case of areas where there was
no contractors or where contractors who might want to terminate contracts; and new
initiatives of some non-governmental organizations as a model in local resources
mobilization towards sustainable solid waste management. Better Life Tanzania, a
non-governmental organization in April 2009 launched a two year environmental
cleanliness pilot project in order to supplement efforts done by other actors in order
to reduce haphazardly and rampantly throwing of wastes in three municipalities.
Finally, it was revealed that apart from all efforts employed by Kinondoni
Municipality to alleviate SWM problems, there was still a very limited scale of
mass education due to human and material resource constraints. In short, the overall
situation of SWM was still chaotic in many streets of Kinondoni Municipality, and
service provision was poor because of low capacity of Kinondoni Municipal Council
plus all other actors.

124
4.5 Key Actors Involved in Solid Waste Management in Kinondoni
This study established a number of issues about key actors in Kinondoni
Municipality. These issues are summarised.
4.5.1 Intra-Organizational Arrangements for SWM System in Kinondoni
The study revealed that SWM was largely managed by Kinondoni Municipality and
narrowly influenced by other actors’ through the performance of various functions
as indicated in Table 4.6:
Table 4.6: Stakeholders Involved in SWM in Kinondoni Municipality
Stakeholders Functions, Responsibility and Roles
City Council Formulating and supervising city policies,
regulations and strategies; supervision of private
firms; secondary waste collection in public and
institutional area.
Municipal Council Formulating and supervising municipal policies,
regulations and strategies; supervision of private
firms; secondary waste collection in public and
institutional area.
Private
Firms(see Appendix 1.2)
Collecting and disposing waste; charging fee;
Informal Collectors (informal
CBOs/NGOs, individual youths
&scavengers)
Collecting and disposing waste; charging fee;
Central Government Formulating national policies, laws, regulations
and strategies
NEMC Implementing national policies, laws, regulations
and strategies
Development Partners Providing technical and financial support to
national policies, laws, regulations and strategies
Source: Kinondoni Municipality, 2007

125
From Table 4.6, it was evident that integrated or multiple stakeholders participation
in local resources mobilization towards sustainable SWM in Kinondoni Municipal
was still lacking. This was because, the involved actors in SWM in the study area
only ranging from the City Council as a coordinator, the municipality as a manager,
contactors and rest of the CBOs/NGOs and individual scavengers as solid waste
collectors. The integrated or multiple stakeholders participation could include all
central government agencies or ministries such as Ministry of Land, Housing, and
Human Settlement Development; Communication; Infrastructure Development etc.
Also, local development partners, private engineers, environmentalists, lawyers to
mention few should not left out and so on. However, it was revealed that some of
these functions are just on papers. Practically, for example, promotion, facilitation
and supervision of contractors were still weak. There was no proper schedule for
daily routine supervision due to inadequate staffs plus transport facilities and laxity.
Also, there was lack of enforcement of waste management legislation and by laws
and collection of appropriate waste management charges. Finally, local community
mobilization towards proper SWM almost did not exist. Furthermore, Table 4.7
provides detailed elaborations on the functions of different actors in SWM in
Kinondoni Municipal Council.
Generally speaking, it was evident that intra-organization arrangement for local
resources mobilization towards sustainable SWM was still weak. For example, to
perceive informal solid waste collectors as illegal operators while their role was very
important for the same activity was very unfair. From Table 4.8 summarises the
situation.

126
Table 4.7: Functions of Different Actors in SWM in Kinondoni Municipality
Institution
Department
Responsibilities
City
Council
Waste
Management
Coordination of cross-cutting issues in waste
management activities provided by the three
municipalities
Advise City Council and Municipalities, on legal,
financial, environment, landfill and disposal on matters
concerning city waste management
Liaison with various waste management agencies and
undertake research on waste management.
Collection of solid waste from main roads, open spaces,
government institutions such as hospitals, state house,
schools etc.
Municipal
Council
Waste
Department
Collection, transportation and disposal of solid waste
Street sweeping
Promote, facilitate and supervise the privatization of solid
waste collection services
Enforcement of waste management legislation and by
laws
Collection of appropriate waste management charges
WDC Ward
Executive
Officers
Mobilize and coordinate the community towards proper
waste management operations
Ensure that waste collection charges are efficiently
collected in the ward
Enforce the relevant waste management legislation and
by laws.
Mtaa Mtaa
Executive
Officer
Enforce the relevant waste management legislation and
by laws.
Source: Kinondoni Municipality, 2007

127
Table 4.8: Comparison of CBOs and Informal Collectors in Kinondoni
Criterion CBO/Private Collectors Informal Collectors
Relationship to local
government
Contractual (legally binding) No formal relationship;
perceived by Kinondoni
Municipality as illegal.
Ownership CBO: Community Private:
Limited ownership
Mostly, single owner
Organizational
structure
CBO: Single stage hierarchy
management/members Private:
Management/employees
Owner operated
Structure of solid
waste management
system
Not applicable Not applicable
Collection schedule Rigid, cost conscious, Flexible to suit customer’s
convenience
Fee structure Based on municipal rates,
charged monthly
Charged per collection, fee
negotiable, accepts
alternative payment
arrangements (barter, credit,
micro-payment etc.)
Secondary collection Bound to provide secondary
collection services
No secondary collection;
illegal dumping.
Recruitment of
clients
CBO’s and private constrained
by lack of legal provision
Based upon social relations
Equipment Primary collection: bicycles,
pushcarts and trolleys; secondary
collection: hired trucks
Primary collection: bicycles,
pushcarts and trolleys. No
secondary collection
Capital Small capital resources Micro capital resources
Expenses Includes secondary collection
costs, operating costs, taxes etc.
Avoid extra costs because of
illegal status.
Source: Kinondoni Municipality, 2007

128
Furthermore, it was revealed that only nine Wards were run by qualified waste
management officers in the study area. From this fact, however, it was clear that
these roles at the Ward levels were just on papers. It was further revealed that even
those Wards with such officers their performance in local resources mobilization
towards sustainable SWM was very weak. Table 4.9 elaborates the said roles of
waste management at the Ward levels in Kinondoni Municipality.
Table 4.9: Roles of Waste Management Department: At Ward Levels
S/N Section Roles 1. Ward
Executive
Office
Mobilize and coordinate the community towards proper waste
management operations
Ensure that refuse collection charges are efficiently collected
in the ward
Enforce the relevant waste management legislation’s and by-
laws
Coordinate with Health Personnel at ward/street level on
health related matter.
2. Ward Health
Officers
Supervision of health matters in the ward
Reports weekly or sometimes daily to the WEOs actions to be
employed in case any unethical health cases
3. Mitaa/Hamlets
Leaders
They attend health problems as directed by WEOs
Source: Ward Executive Officers, 2008
4.5.2 Performance of Informal Actors in Solid Waste Management
The study established that, the shortage of SWM equipments in Kinondoni
Municipality and in the whole City has turned into a fortune to many unemployed
youths who were informally collecting wastes from residential areas and in some
business premises which were not easily attended by contractors. This was done by

129
youths relatively at a meagre fee ranging from TZS 600/= (0.5 US$) up to TZS
1000/= (0.98 US$) per trip by using simple local pull/push carts. These wastes were
then dumped at the relevant nearby designated waste collection points.
One of the Kinondoni Municipality officials admitted that the management was all
aware about the SWM activities done by the youths in the informal and sometimes
formal settlements, but it did not cost the authority any money to pay them. Instead,
depending on informal arrangements the youths could pay around TZS 5000/=
(4.2=US$) as a retaining fee to the waste collection point caretaker for the site
management purpose. The author further learnt that these youths were able to earn
income ranging between TZS 6000/= (4.8=US$) up to TZS 10,000/= (9.2= US$) per
day.
The overall observations and discussions with these self-employed youths in
Kinondoni Municipality revealed about 12 up to 15 youths were working in the
temporary or informal dumpsite per day. These youths went on to inform the
researcher that they normally took solid wastes sorting and sold them to the owners
of crush factories. Meanwhile the glass bottles for example, were washed and
cleaned and sold to Kariakoo shopkeepers, who in turn were re-selling them at a
profit. It was obvious that despite making money out of solid wastes sorting, most of
these youths were exposed to several risks because they did not had any protective
gear; sorting was done by using bare hands and worse they did not even wear gum
boots to protect their feet (see Plate 4.3).

130
Plate 4.3: Youths Sorting Re-usable Items at Mwenge Trailer Collection Point
Source: Photo by author, 2008
The data below shows the contribution of scavenging activities in reducing solid
wastes around streets over a period of five years, i.e. from 2004 to 2008; and the
dominant items are scrap metal and plastic bottles.
Table 4.10: Scavengers Income Schedule per Weight and Pieces
Source: Fieldwork, 2008
Year Weight in kgs Picies Income (in TZS in Millions)
2004 504,000 0 84.4
2005 738,000 216,000 148.6
2006 1,072,080 251,290 229.2
2007 1,934,200 493,130 430.8
2008 2,875,240 703,370 637.1
Total 7,123,520 1,663,790 1,530.1

131
4.5.3 Actors Involved in Solid Waste Sorting in Kinondoni
The study confirmed that, in Kinondoni Municipality, there were no solid wastes
sorting at source at household’s level in the area of study. Sorting was mainly done
by scavengers who moved from one place to another, collecting re-usable items,
which they sold directly or through middlemen to the public and to the industries
that had to sprung up for industrial recycling of wastes. Recycling, and in this case
scavenging, took place at five points: at generation; at collection during discharge; at
storage; at illegal dumping sites; and at final disposal sites.
Plate 4.4: Packed plastic Bottles in sacks for Sale at Mzimuni in Kawe Ward
Source: Photo by author, 2008

132
Informal actors in Kinondoni Municipality played an important role in local
resources mobilization towards sustainable SWM. Plate 4.4 above, and Plate 4.5
below, shows the role of scavengers in particular, youths and level of re-cycling in
local resources mobilization towards sustainable SWM in the study area.
Plate 4.5: Scrap Metal Dealer Loading Materials for Sale to a Recycling Factory
Source: Photo by author, 2008
4.6 Constraints and Potentials Facing SWM in Kinondoni
A number of constraints and potentials face SWM in Kinondoni Municipality.
Constraints manifest themselves both in terms of internal weaknesses and external
challenges/threats. Similarly, opportunities manifest themselves both in terms of
internal strengths and external opportunities. This section briefly discusses these
dimensions.

133
4.6.1 Constraints Facing Solid Waste Management in the Study Area
(a) Rapid population growth and physical expansion
According to Mwaipopo (2005), the rapid growth rate of Kinondoni Municipality is
about 4.2% annually and it becomes the 3rd
fastest growing in Africa after Bamako
in Mali and Lagos in Nigeria, and the 9th
fastest growing in the world. Like in the
case of many developing countries, this is due to its consequent attraction of rural
migrants. Kombe (1994) noted that about 70% of the urban population in Tanzania
was a product of rural urban migration without an exception of Kinondoni
Municipality. It was estimated that about 80,000 people migrate to Kinondoni
Municipality every year (Mwaipopo, 2005). The main reasons for migration would
seem to be rural-urban wage discrepancy, job opportunities and better social and
physical amenities in urban areas (Kironde, 1999). Table 4.11 below shows
Kinondoni Municipality population density distribution and physical expansion.
Table 4.11: Population Density Distribution and Physical Expansion in
Kinondoni
Zone Population density Wards
1. More than 200 persons per
hectare
Kinondoni, Hanna Nasif, Kijitonyama,
Tandale, Manzese, Makurumla Mburahati,
Ndugumbi
2. 100-200 persons per hectare Makumbusho, Mwananyamala, Magomeni
Mzimuni, Kigogo
3. 50-100 persons per hectare Mikocheni, Msasani, Makaburini, Mabibo,
Sinza
4. Less than 50 persons per
hectare
Ubungo, Kawe, Kimara, Goba, Mbweni,
Bunju, Kibamba, Kunduchi,Mbezi
Source: KMC, 2008

134
In Kinondoni Municipality, plot subdivisions differed from place to place in both
planned and unplanned settlements. For example, planned areas like Msasani and
Mbezi, which were low-density areas range between 12002 and 2000m
2. Plot sizes
for areas like Sinza ranges between 4002 and 800m
2. In areas like Manzese Ward,
Hannanasif, Mlalakuwa, Kawe, Mzizima, Tegeta centre area, Kimara, Kigogo,
Magomeni etc. plot sizes were not more than 200m2. These areas lack basic services
and public utilities including piped water, access roads, storm water drainage
channels and SWM services; however poor land survey results into insufficient
surveyed plots for housing development (KMC, 2009). Moreover, due to poor
accessibility in almost all informal settlements SWM was seriously still lacking.
(b) Weak coordination among solid waste management institutions
There was a weak coordination among solid waste management institutions in the
area of study. Because, the multiple-stakeholders approach this is so central to social
and economic development and for that matter to the integration of sustainable
socio-economic development was still lacking. Normally it requires appropriate
coordination, cooperation and political willingness among all relevant organs of the
governments (central and local governments) and the society in general. It is
necessary to recognize the existing institutional arrangements and consider ways and
means by which coordination and cooperation between institutionally distinct bodies
with over lapping mandates might be enhanced and their purpose and functions
constructively arranged. At the same time a dedicated and strong political
willingness is inevitable, and solid waste management must be treated as a cross-
cutting issue among our responsible institutions and communities at large.

135
Many philosophers argue that a successful execution of any development policy
depends on the existence of a conducive institutional and legal frame work for its
implementation and availability of adequate resources and coordination of all actors
and stakeholders involved and interested in socio-economic community
development (Kessy, 2005:77). In addition, there is also lack of clear connectedness
and networks between communities’ local organizations, actors and the communities
themselves. The nature of relationships between these three domains is the vital
aspect of social capital. There are many different types of connection between
groups or institutions, such as trading of goods, exchange of information, mutual
help, and provision of loans, communal celebrations including prayers, marriages
and funerals. These might be long established and so not responsive to current
conditions, or subject to regular update (Pretty and Ward, 2001:172-5; Kessy,
2005:74).
Connectedness, therefore, is manifested in different groups at the local level from
guilds and mutual aid societies, to sport clubs and credit groups, to forest, fishery or
pest management groups and to literary societies and mother and toddler groups.
High social capital implies likelihood of multiple memberships of organizations and
links between these groups. It is possible to imagine a context with large numbers of
organizations, but each protecting its own interests with little cross contact (ibid).
(c) Inadequacy of capacity building in solid waste management
There are varying perceptions on the meaning of capacity building. In the narrowest
sense capacity building includes training of human resources while in the broader

136
perspective entails institutional development and the society as a whole (TANGO,
2005). Capacity in this case, must suffice the ability to achieve performance in solid
waste management, through better production of outputs and outcomes and hence
high quality of living environment. All in all, capacity building as such seeks to
improve the performance of all elements that forms CBO’s/NGO’s and the entire
whole community members. Capacity building, therefore, for local resources
mobilization for sustainable SWM must be systematically wider, and involve
community planned and concerted efforts to achieve both CBO’s/NGO’s
performance through purposeful reflection and enrich all community members
(ibid).
In particular capacity building is inadequate in local resources mobilization for
SWM in terms of knowledge, skills, resources, commitments and social corporate
responsibility. Communities like those of Sinza, Kawe, and Hanna -Nassif Wards
you may find that they lack mission and vision pertaining to sustainable local
resources mobilization for sustainable SWM. At policy level adequate capacity
building must involve improvement of the rules of governance along with
regulations and practices that foster development of community members, all
relevant institutions and the environment in which these institutions operate.
In this regard therefore, capacity building represents a broader perspective to
include the creation of a conducive internal and external environment within which
communities operate and function; and which represent human resources training
and development, particularly only for CBO’s/NGO’s team management and
leadership.

137
(d) Poor community participation in solid waste management
Community participation according to UNCHS (1996) means the voluntary and
democratic involvement of a certain community (people) in contributing to the
execution of a project, then enjoying the benefits derived there from common
decision-making, particularly in respect with setting and formulation of objectives
and goals and preparation of the implementation plan. Participation, therefore, is
seen as an indispensable attribute in resolving community felt needs, and achieving
the stated objectives and goals. This is particularly practical, because under normal
circumstances the public sector does not have enough or sufficient resources of
whatsoever. Consequently, in order to enhance the project ownership, beneficiaries’
participation is necessary. However, at a larger existent Kinondoni Municipality was
still condoning conventional approach in local resources mobilization towards
sustainable solid waste solid waste management.
Effective and efficient community participation, which was still lacking in KMC in
local resources mobilization towards sustainable SWM, was, therefore, a
prerequisite for socio-community economic development in the area of study. Thus,
local community participation may involve contribution of labour, money or
material things in order to operate and maintain the project. It also involves
contribution of ideas and sharing responsibilities in local resources mobilization
towards sustainable SWM. Community participation in this context is seen as both a
voluntary and democratic right of any community member.
In order to promote community participation for local resources mobilization
towards sustainable SWM in Kinondoni Municipality, the researcher suggested the

138
proper use of community mobilization techniques. Community mobilization
techniques are the skills used to stimulate people and let them get engaged into a
public or community activity. In this context therefore, politicians in particular, at all
levels are urged to assist in instilling the culture of dislike of filth and throwing away
solid wastes indiscriminately, into local communities’ minds. We need immediate
change in our local communities’ mind sets towards sustainable environmental
cleanliness. It is obvious that it is wrong to assume sweepingly that people may
change and hate filth before enhancement of their psychological state and
behaviours towards local resources mobilization for sustainable SWM.
(e) Inequality and increasing poverty among the residents
To a greater extent, the increasing number of residents particularly in informal
settlements which was due to the pressure arising from rural urban migration of
unskilled labour and also low speed in growth of job opportunities, had contributed
a lot to the increase of the rate of inequality and poverty among residents in
Kinondoni Municipality. Generally in Dar es Salaam City, in 1991 the rate of
inequality stood at 0.30; in 2001 stood at 0.36; but in 2007 stood at 0.34 (URT,
2006/7).
Major determinants of inequality in this municipal basically were in four categories,
i.e. differences in wealth due to big income gaps, differences in attitudes and ability,
differences in household composition, and discrimination and less government
support particularly in the area of municipal service delivery. One of the principles
of measuring inequality states that “if ones income distribution is achieved from
139
another by constructing a sequence of regressive transfers, then the former
distribution must be deemed more unequal than the latter” because under this system
incomes are transferred from the poor to the richer individuals instead of being vice
versa (Kyessi, 2002).
(f) Inadequate solid waste re-cycling activities
There were also some constrains in solid waste recycling activities in the area of
study. Under normal circumstances, recycling provide benefits for the original
owner or dealer of the solid wastes as well as all people performing various steps
from retrieval, recovery to re-use in order to compensate them for their time and
efforts. In order to achieve this objective the government, municipalities or private
sectors was to create incentives of the owners or dealers and all other people
participating in the recycling trends and processes. There was a tendency that as the
income of the community raises it becomes difficult to convince the people to deal
with recycling activities unless the government or municipals have strict by laws
concerning recycling goals.
However, informants from 16 interviewed factories reported that sorting at source at
the original generations of solid wastes in Kinondoni Municipality was not done
properly in order to make the dealer decide to choose disposal over storages, and
there was wrong traditional attitudes towards scavengers as the public did not
perceive solid waste as economic materials. More constrains are summarized under
Table 4.12.

140
Table 4.12: List of Major Constraints Facing Re-Cycling Activities in
Kinondoni
Serial No Major constraints Responses
1. Electric power from TANESCO is of a lower voltage than
required by the machines
50%
2. Tax rate is high; needs to be reduced in order to encourage
higher production
26%
3. Workers strikes affects production, leading to low quality
and quantity of goods
17%
4. Tanzania's available enabling infrastructure do not favour
industrial production
17%
5. Government policy on the scraps collection is contradictory 73%
6. There is shortage of iron sheets in the market, and we are
planning to export them
47%
7. Poor infrastructures in the industrial sector 19%
8. Generation of the type of waste needed is becoming less;
only assorted materials and Kart are available
14%
9. The products made out of available kart has less market in
Tanzania so we plan to export to Zambia
9%
10. There is a small market for steel products: i.e. iron bars,
iron sheets - looking for markets outside
7%
11. Workers strikes decreases the morale of re-cycling
activities
3%
12. Competition from other factories is stiff
13. Failure to process unfinished goods to finished goods so
that we have value-added
1%
14. Change of technology necessitates also changing the
machines
3%
15. The materials collected by scavengers is not enough
causing shortages of materials
9%
Source: Field data, 2008/09
4.6.2 Challenges Facing solid Waste Management in the Study Area
(a) Negative cleanliness habit
Local resources mobilization towards sustainable solid waste management cannot
succeed if solid waste producers are not sensitized on the question of cleanliness;
thus, it had to be inculcated in people’s mindset otherwise the whole exercise would
become fruitless. The study urged the community to be sensitized in order to realize

141
that SWM was everybody’s duty and not the duty of some other organ (e.g. local
authorities). In this regard therefore, the inherent attitude that local governments
should take care of the environment was to be changed; communities would achieve
this through self-help/self-reliance.
(b) Increased plastic wrappings
The researcher observed that the increased use of plastic wrapping bags in the shops;
markets and supermarkets pose a big problem in SWM since these plastics do not
undergo decomposition.
(c) Lack of appropriate information and data base
A lot of information about SWM was still scattered apart from lack of a central
database. If such information and data was properly maintained and managed, they
would be useful in planning for solid waste management systems. Data showing how
many people, households, shops, hotels, markets, public institutions, waste
generated, and income tax, prevalent diseases (endemic and epidemic) should be
available for each hamlet (mtaa). Lack of such data was misleading the allocation of
the meagre resources available.
(d) Existence of gender roles
Genuine development is achieved by each person being given same opportunity and
being treated fairly, age, creed, religion and justly regardless of sex and socio-
economic status (UNDP, 2002; TANGO, 2005). As it is the case in many developing
countries including Tanzania, women are disadvantaged by traditions, laws and
policies. Their access to employment and business opportunities, living conditions,
involvement in development programmes, time control, and human and material

142
resources are limited for them, without an exception of Kinondoni Municipality.
Thus, the issue here of gender dimension in SWM was also very important. The
researcher emphasized that those problems of SWM cut across the whole society
regardless gender; therefore, involving everybody in planning for SWM from the
point of generation to disposal was recommended. The case of KIWODET in
Kinondoni Municipality was a good example.
(e) Low level of political willingness
Since many decisions are endorsed by politicians, it was important that the
politicians were sensitized on SWM so that they could understand their role in
matters of the environment and public health. A local government leader should,
among other things, be chosen on the merit of his ability to facilitate SWM in his/her
area. The case of Sinza Ward where almost all local government leaders, the Ward
Councillor, and Member of the Parliament gave assistance to solid waste
management was to be emulated.
(f) Partial involvement of private operators in solid waste management
To improve efficiency, effectiveness and accountability, the private sector should be
involved as sole agents through clear contracts with municipalities. In that respect
the Municipal Authorities should in turn only assume a supervisory role (act as a
watchdog and client) that should represent the people. The contractor either, should
be allowed to collect revenue and be paid a reasonable commission that is
administration costs plus profits by the Municipal Authorities.
(g) Lack of comprehensive & sustainable solid waste management programmes
This study underscored the importance of proper use of resources allocated to

143
SWM to be directly managed by SWM departments. In order to have a sustainable
SWM programmes, the money generated from the services should be managed by
the environmental department itself.
(h) Factual environmental degradation caused by resources deficits
A cross examination of the whole Dar es Salaam City during rapid settlement
appraisal, however, with much attention to Kinondoni Municipality it was revealed
that waste collection was relatively effective in some urban Wards like Sinza,
Kijitonyama, part of Makumbusho and Mikocheni, part of Kawe particularly in
Makongo Juu and part of Msasani particularly in Oyster Bay and Masaki. These are
settlements which were relatively inhabited by relatively high income earners. In
these areas contractors were assured of being paid service charges because of
people’s awareness of the health hazards likely to be caused by a dirty environment.
Plate 4.6: Crude Solid Waste at One of the Informal Dumpsite in Tandale
Source: Photo by author, 2008

144
It was also revealed that solid wastes are dumped directly into rivers particularly
during the night and consequently pollutes water that is used for horticulture and
domestic purposes. This was noted along Nalung’ombe River in Tandale Ward, as
seen in Plate 4.7.
Plate 4.7: Solid waste Dumped in Nalung’ombe River in Tandale Ward
Source: Photo by author, 2008
Further, investigation revealed that in Kinondoni Municipality informal/temporary
dumpsites still exist. One of the informal dumpsite caretakers (names withheld)
informed the author that there were informal arrangements where KMH and WMD
had allowed informal/temporary dumping of waste in those areas. These types of
informal dumpsites were noted in almost every Ward in Kinondoni Municipality as
portrayed in the following plates.
However, apart from all these challenges, it was learnt that these informal dumpsites
were a source of living for local communities as some people sort re-usable materials
for sale, before these materials are collected and directly transported either by Pos or

145
the municipality to a dumpsite for further treatment.
Plate 4.8: People Busy Sorting Re-usable Materials at Kigogo Darajani
Source: Photo by author, 2008
4.6.3 Challenges encountered by individual scavengers
The informal collectors (scavengers) could have been doing better in reducing solid
wastes around the streets if their activities were not hampered by the following
major challenges:
i) Lack of protective gear to protect themselves from sharp materials, various
communicable diseases and unpleasant smell.
ii) Fluctuation of demand of waste causing very low prices of some of the
collected items.
iii) Weather conditions such as the hot sun and heavy rainfalls affect the
scavenging business
iv) Illegal solid wastes dumping practices for example dumping in river
valleys and grave yards create a sense of immorality and questionable

146
human behaviour.
4.6.4 Challenges Encountered by Middlemen in SWM
Middlemen have at least reported about five problems facing them while conducting
their businesses, as follows:
i) Lack of enough capital to buy raw materials at times.
ii) Lack of a direct market since some of the buyers or recyclable dealers are
still operating their businesses informally and sometimes in their back
yards or closed areas.
iii) Absence of protective gear and as a result they get infected with long term
coughing and other respiratory diseases, low security at the disposal sites.
In view of all this, the law of survival for the fittest or of the jungle was the order of
the day.
4.6.5 Potentials of Better Solid Waste Management in Kinondoni
Despite the existence of ineffective and inefficient SWM in the area of study there
were potentials of improvement. Specifically, the Kinondoni Municipality had put in
place a special plan of action program which would address these constraints. This
plan entails a number of priorities as summarized in Table 4.13.
Apart from these priorities, Kinondoni Municipality had adopted techniques (see
Appendix 1.8) and streamlined roles of the actors to be involved (see Appendix
1.9). Furthermore, the study revealed that there was an envisaged programme in the
area of study to install machines for recycling organic solid waste in big markets. It

147
was claimed that these machines would be efficient, and one machine could recycle
about 10 to 15 tones of waste per hour. These machines would recycle organic
wastes into other commercial products which would be used to produce other
commodities. The remaining wastes could be used to produce biogas and fertilizers
to be used by farmers. It was further revealed that apart from using bulk waste in
agricultural activities, it may also be used to make a briquette which is a substitute
of charcoal fuel and reduce deforestations and create employment to many youths.
Generally, this move could minimize the cost of solid waste management in the
study area especially in the big markets.
Table 4.13: Priorities Set by Kinondoni Municipality for Effective use of
Available Technology and Solid Waste Management
SWM Problems
Strategies
1. Poor waste disposal services (Absence
of a proper disposal/final treatment
facility, absence of proper equipment
for final treatment operations)
Construction of a Sanitary Landfill in
Kisopwa and supply of necessary
equipment for final disposal operations.
2. Increased fatalistic attitude of the public
towards proper waste management
Population lacking information on
waste management programmes
Weak private sector participation
Promotion of more public cooperation
through awareness creation programmes
3. Insufficient fleet of vehicles and other
equipment for the provision of waste
management services
Insufficient clear systems and
technologies as applied for waste
collection and transportation
Supply of standard equipment/tools for
streets/roads sweeping, refuse collection
and transportation (trucks, sweeping
machines etc)
Establishment of waste management
information system (WMIS)
4. Insufficient technology for intermediate
waste treatment and or recycling
Insufficient market for recyclables
Organization of intermediate treatment and
recycling activities programmes
5. Poor waste water management Construction and rehabilitation of storm
water drainage
Rehabilitation and expansion of public
sewerage system
Capacitating cesspit emptying services
Source: Field work, 2008

148
4.7 Summary and Conclusions
This chapter presented findings of studies, which were carried out in Kinondoni
Municipality to assess pre-privatization of solid waste management and disposal.
From these findings, it was the case that, due to rapid population growth, solid waste
generation was inversely proportional to solid waste collection in 1993, where, about
10% out of 1480 tones of solid waste generated was collected. According to the
theory of collective action, this observation was warranted since the large the group
the lower the allocative efficiency of a collective action initiative. However, various
fieldwork studies which were conducted after 1994 indicated that as a result of
privatization of solid waste management activities in the study area, solid waste
management had improved from at about 12% in 1994 in DCC to 40% out of 1500
tones of the total solid waste generated in the Kinondoni Municipality daily
(KMC,2008).
Theoretically speaking, this improvement in SWM was attributed to local resources
mobilization through private sector participation in solid waste management in the
City. This was the case since; private sector participation entails delegation of
powers to lower entities, where such delegation narrows the group enjoying the
goods allocated through a collective action initiative. According to the collective
action theory, the smaller the group the higher the allocative efficiency of a
collective action initiative.
However, the studies consulted hitherto did not clearly tell the researcher specific
operational and institutional arrangements which had been put in place since 1994
and that had warranted these improvements. For example, answers to the following

149
questions were not yet clear: What is the impact of contracting-out companies as a
strategy of LRM towards sustainable solid waste management? What is the impact
of formal NGOs involvement in SWM as a strategy of LRM towards sustainable solid
waste management? And, what is the impact of informal CBOs involvement in SWM
as a strategy of LRM towards sustainable solid waste management?
These and the previously stated research questions are answered case-wise in chapter
five, six and seven respectively. And finally, chapter eight was a cross case analysis
and synthesis that could allow this study to put together key emerging trends that
would help the whole community in answering the above questions.

150
CHAPTER FIVE
5.0 LOCAL RESOURCES MOBILIZATION THROUGH PUBLIC- PRIVATE
PARTNERSHIP: THE CASE OF KAWE WARD
5.1 Introduction
This chapter addresses the following issues: administrative profile of Kawe Ward;
socio-economic and infrastructure profile of Kawe Ward; the influence of PPP in
Kawe Ward; the privatization process and framework in Kawe Ward; benefits of
PPP in Kawe Ward; LRM towards sustainable solid waste management in Kawe;
challenges facing private operators in Kawe Ward; and the lessons learnt from Kawe
Ward.
5.2 Profile of Kawe Ward
5.2.1 Location of Kawe Ward
Kawe Ward is located in the Northeast of the KMC headquarters, and bordered by
Goba Ward to the North, Indian Ocean to the East and Kimara Ward to the West. In
the South it is bordered by Mikocheni, Kijitonyama and Ubungo Wards. It
constituted about 26,490 households and habited with a population of about 94,166
people (URT, 2002). In this regard, demographically Kawe Ward population growth
was as indicated in the Table 5.1.
5.2.2 Kawe Ward administrative Set-up
Kawe Ward is divided into six administrative settlements (Ukwamani, Mlalakuwa,
Mzimuni, Mbezi Juu, Makongo and Changanyikeni) as potrayed in Figure 5.2
below. The Ward administration was comprised of five departments including

151
Health, Education, Property Tax, Community Development, and Agriculture and
Livestock Development as portrayed in Figure 5.1 below. Overall, permanent
employees in Kawe were supposed to be nine, but during this study they were only
eight, because of the absence of a Ward Waste Management Officer. There was also,
a Ward Development Committee (WDC) which was the highest decision-making
body in the Ward. Members of the committee included the Chairperson who was the
Ward Councillor and who represented the Ward in KMC, Chairpersons of the
settlements/mitaa areas (for urban authorities), Chairpersons of village councils
within the Ward, invited persons from CBO’s/NGO’s, and other Civic Groups in the
Ward involved with promotion of local development and member of the District
Council who was a resident in that Ward.
Other members included Councillors of Urban Authorities resident in the Ward and
Women Representatives in KMC. In any case, the Ward Executive Secretary (WEO)
was the secretary to the Ward. The settlements/mitaa administrative units were co-
coordinated by the WDC which linked them to the Council of elected Ward
Councillors as well as the Member of Parliament for Kawe constituency which was
under Kinondoni Municipality. Sections 14A (1) and (2) of the Local Government,
Urban Authorities Act of 1982 gave the mandate to WDC governments to formulate
and submit to the urban authority (in this case KMC), proposals for the making of
by-laws related to the affairs of the Ward including SWM. It also, implemented
directives of the Municipal Council including implementation of policies. WDC
further drew powers and mandate to perform its roles from the Local Government
(Urban Authorities Act of 1982) which among others establishes WDCs. However,

152
the administrative structure was similar across all the KMC Wards.
Table 5.1: Kawe Ward population Growth as at 2002 and Projections 2004/2010
Mitaa names 2002 2004 2006 2008 2010
Mzimuni 28,966 31,177 32,372 33,455 34,377
Ukwamani 14,775 15,883 16,449 16,956 17,377
Mbezi Juu 18,355 18,902 19,546 20,112 20,600
Makongo 8,453 9,345 9,701 10,037 10,326
Mlalakuwa 7,973 8,911 9,212 9,484 9,720
Changanyikeni 15,623 16,123 16,652 17,219 17,808
Totals 94,166 100,332 103,938 107,265 110,196
Source: URT, 2002, 2006, 2008
Ward Councilor
Ward Executive Officer
Health Education Works Community Agriculture/Livestock
Department Department Development Department
Figure 5.1: Administrative Structure of Kawe Ward
Source: Kawe Ward Office, 2008

153
Figure 5.2: Kawe Ward Administrative Boundaries and Mitaa
Source: Kinondoni Municipality and field work, 2008
5.2.3 Socio-economic Profile of Kawe Ward
The majority of local communities in Kawe Ward had low incomes, with major
activities of the households including street vendors who earned Tshs. 30,000/= per
month (REPOA, 2003). These constituted about 38.4% private business income,
28.78% rental houses income; 28.7% self-employment; 27.10% Mama/Baba Lishe
(informal restaurants); 19.8% civil servants; 19.4% small scale agriculture; 11.5%
masonry; and fishing was about 4.7%. Generally, about 12.5% of the total local
community members could not read or write while about 70% had primary

154
education, which resulted in poor level of income due to lack of formal knowledge
and skills (ibid). The area was mostly unplanned with fewer planned settlements;
and ethnically it was relatively heterogeneous with different ethnic groups mostly
migrants from other regions.
5.2.4 Infrastructure profile of Kawe Ward
In regard of infrastructure conditions, the following facts were applied: many parts
of the settlements had no clear roads (i.e. estimated at about 40%); no clear footpaths
(i.e. estimated at about 54%); the drainage system was not well defined (i.e.
estimated at about 60%); and big part of the settlements sanitation was characterized
by liquid water and pit latrines (i.e. also estimated at about 57%). In order to
mitigate the situation particularly in the informal settlements, Kinondoni
Municipality had begun to allow private provision of municipal services, both to
enhance efficiency and to ease the strain on authority finances. So, the following
findings and discussions was to dwell on how public-private partnership (PPP)
strived to contribute to LRM toward sustainable SWM in the study area.
5.3 Performance of Solid Waste Management Services in Kawe Ward
5.3.1 Solid Waste Generation and Collection Rates per Day
The ratio of waste collected versus waste generated is a good measure of the
effectiveness of SWM services. If the ratio is 100% then we have the maximum
possible effectiveness. As far as Kawe Ward was concerned, the field data collected
during this study in 2008 showed that the collected solid wastes was about 54 tones
(33.3%) out of 162 tones of solid waste generated per day. This meant that more
than (66.7%) of the residents were not getting SWM services as required by the

155
equity principle.
5.3.2 Waste Recycling, Composting and Dumping ratios per Day
This study conducted a compliance audit with respect to the wastes hierarchy
principle. According to this principle, in designing wastes management strategies,
preference should be given to those methods which are more environmentally sound.
The study was guided by the assumption that, the wastes hierarchy entails a five-step
order of priority in which wastes prevention has the highest priority being followed
by re-use, recycling, recovery and wastes disposal as the last option.
From a quantitative aspect, in order to make this compliance audit a success,
compliance with the wastes hierarchy principle was checked through two ratios.
These were the percentage of recycled wastes versus land-filled wastes and the
percentage of composted wastes versus land-filled wastes.
The quantitative findings from the field were as follows: the total of recycled in
terms of tones was about 2.6 (1.6%); and the amount of composted wastes was about
2.1 tones (1.3%) of land-filled wastes. Due to the demands of the wastes hierarchy
principle, the bigger the ratios the more the principle is complied with. Thus, in this
case it was revealed that the level of compliance with the wastes hierarchy principle
was still negligible.
In regard to qualitative perspectives, compliance with the wastes hierarchy principle
was checked by examination of the modes of payments which are made by various
solid waste management service providers. For the waste hierarchy principle to be
complied with there should be different price tags for biodegradable wastes, re-

156
usable wastes, recyclable wastes, and inert wastes respectively. But, if the
contractors are paid per quantity of solid waste disposed off in bulk, regardless of the
differences in these waste types, then, there could be no incentive for them to
encourage wastes minimization awareness campaigns, recycling initiatives, and
wastes treatment.
An examination of the contracts between Kinondoni Municipality Council and solid
waste management service providers showed that the mode of payment to service
providers was based on the quantity of solid waste disposed off in bulk, regardless of
the differences in these waste types. Specifically, the contracts were pegged against
the “Waste Management and Refuse Collection Fees” as amended by the Kinondoni
Municipal Council in 2004. Thus, these refuse collection charge rates were contrary
to the demands of the wastes hierarchy principle.
5.3.3 Residents’ Satisfaction in Solid Waste Management Services
During this study a survey was conducted asking the 186 households if they are
satisfied with the SWM service they received. In order to test this satisfaction the
following question was posed: If you receive SWM services what is your opinion of
the service provided? The possible alternative responses were: very satisfied;
reasonably satisfying; needs improvement; don’t know; and no service received. The
findings on the degree of satisfaction from SWM services in Kawe Ward were as
follows: 9 (5.2%) out of 186 households the answer was very satisfying; 66 (35.5%)
out of 186 households the answer was reasonably satisfying; 45 (24%) out of 186
households the answer was needs improvement; about 4 (1.9%) out of 186
households the answer was don’t know; and about 62 (33.4%) out of 186 households

157
the answer was no service received.
5.4 Actors involved in Local Resources Mobilization and Their Roles
The study revealed that by July 2008, there were 42 private operators (Pos)
contracted by Kinondoni Municipal Council to manage solid wastes in the
municipality. In this regard therefore, institutional actors and their roles are
summarized in Table 5.2.
Table 5.2: Actors and Their Roles in LRM for SWM in Kawe Ward
Actor Resources Inputs
Households
Members
Collection Of Solid Wastes; Payment Of Fees; Waste Containers;
Human Resources.
Informal
Youth Groups
Local Pull/Push Carts; Labour; Transportation Of Wastes To Collection
Points Or To Informal Primary Dumpsites.
Lyhene
Sanitary And
Waste Wise
Solution (PO)
Human Resource For Collecting Solid Wastes In Mbezi Juu, Makongo,
And Mlalakuwa Settlements And Transporting Them To The Official
Dumpsites; And At The End Of The Month The Mobize/Collects
Service Charges From Each Household.
Kawe
Environmental
Group (Po)
Human Resource For Collecting Solid Wastes In Ukwamani, Mzimuni,
And Changanyikeni Settlements And Transporting Them To The
Official Dumpsites. And At The End Of The Month The
Mobize/Collects Service Charges From Each Household.
Mkunguni
Group
“2003”(Po)
Human Resource For Collecting Solid Wastes In Mlalakuwa Settlement
And Transporting Them To The Official Dumpsites. And At The End
Of The Month The Mobize/Collects Service Charges From Each
Household.
Kmc Supplies Tractors For Pulling Trailers From Mzimuni And Mlalakuwa
Collection Points To Official Dumpsites
Mtaa Leaders Coordinates Various Actors In Swm In A Way That Makes The Process
Organised.
Source: Own construct, 2009

158
The actors involved in PPP engagement at Kawe Ward like in any other Wards in
Kinondoni Municipal Council, operate in accordance with the “Public Procurement
Act No.4 of 2001 revised in 2004”, through open tendering.
5.5 Local Resources Mobilization Strategies
The study of LRM was guided by six variables, namely: institutional factors,
organizational factors, spatial factors, financial factors, legal factors and
technological factors. Against these variables, the findings on the existed local
resource mobilisation strategies in Kawe Ward were presented below.
5.5.1 Institutional Factors
By July 2008, there were 42 private operators (Pos) contracted by Kinondoni
Municipal Council to manage solid wastes in the municipality. They include: Lyhene
Sanitary and Waste wise Solution, Kawe Environmental Group, Mkunguni Group
“2003” and KMC. Apart from KMC and Lyhene Sanitary and Waste wise Solution,
the rest of the actors were informal actors, meaning that they did not had formal
registration. As such they lacked legal recognition by the government.
5.5.2 Organizational Factors
The study revealed that, formal community participation through grass root
institutions for municipal SWM services did not exist in Kawe Ward, though at low
level in order to enhance regular flow of linkages within that local community and
other relevant partners. It was discovered that, leadership skills, management skills,
ability to define and manage different roles and responsibilities, structure and

159
procedures, accountability and transparency in partnership agreements, appropriate
empowerment, and conflict resolution skills were still very low.
5.5.3 Spatial Factors
The study revealed that, spatial factors in Kawe Ward were mostly characterized by
unplanned settlements and dense population in the biggest part of it. More than 70%
of housing in Kawe Ward comprised informal settlements, most of which were
rapidly getting dense. As a result, there was an increasing blockage of access roads
and paths. No land had been provided for temporary dumpsites; thus, solid wastes
were indiscriminately dumped into streets/ paths. Due to lack of accessible roads
big trucks could not get through to collect solid wastes instead a wide range of solid
waste collection was serviced by push/pull carts.
5.5.4 Financial Factors
The study established that, since December 2004, SWM services in Kawe Ward
particularly in Mlalakuwa settlements had been provided by Pos i.e. Mkunguni
Group “2003” to during the study. Financially, Mkunguni Group “2003” charged
TZS 1.500/= (equivalent to US$ 1.35) per month, per household instead of the
municipal fixed rate of TZS 2000/= (equivalent to US$ 1.80) per month, per
household. This figure had to be agreed upon after some negotiations between the
Mtaa leaders and the Pos following the resident’s request. For example, Mlalakuwa
Mtaa leaders were supposed to ensure that Pos were rendering the services at the
standard agreed and without any contractual default. In their routine task, the Mtaa
leaders were obliged to sensitize local residents to keep their environment clean in
order to avert epidemics.

160
On the other hand, Mtaa leaders met Pos particularly when they suspect that local
residents were reluctant to pay service charges or any other dues. Similarly, in the
year 2008, a SWM service in Mbezi Juu Mtaa was contracted to a private actor, one
known as M/s Iyhane Sanitary and Waste-wise Solution Supplies. Contractually, the
Po was supposed to provide SWM services, while households were responsible to
pay TZS 2000/= (equivalent to US$ 1.80) per month for the services rendered.
However, data availed from Kinondoni Municipality there were other revenue
collection sources such as traders, institutions and informal sectors. Table 5.3 shows
Kawe Ward revenue collection in fiscal year 2007/08 and 2008/09.
Table 5.3: Kawe Ward Revenue Report (2007/08 and 2008/09)
Revenue collection from
SWM
2007/08(TZS in Millions) 2008/09 (in TZS in
Millions)
Shops 19.5 12.2
Restaurants 5.6 3.4
Hotels 7.9 5.5
Other businesses 1.8 1.3
Households 32.7 34.7
Institutions 4.5 3.2
Informal sector 5.9 7.9
Total 77.9 68.2
Source: KMC, 2010
The Kinondoni Municipality informed the researcher that the reasons for the notable
shortfalls include development of informal SWM sector, weak patriotism, growing
number of defaulters, and poor enforcement of by-laws. Regarding resources such
as supply of labour in SWM, youths render such services which supplement local
residents’ involvement or participation in the study area. Other resources like space

161
and modern equipment for effective and efficient SWM was still a challenge.
During this study neither allocation nor physical financial resources had been put
aside for SWM services in Kawe Ward in Kinondoni Municipality.
5.5.5 Legal Factors
The study showed that, the contracts issued to Pos also provided for them do and
don’ts which the contractors were ought to observe. For instance, the contracts
required Pos to collect, transport and dispose solid waste to approved sites; clean
and remove sand from all streets within their areas of operation; clean open drains;
remove dead animals from the relevant streets and roads; and to collect refuse
collection charges as specified under the waste management and refuse collection
by-law (2000). Under item one to nine of the terms and conditions of the contract
(refer Appendix 4.1) among other things, the Pos were required to do the following:
i) Provide to Kinondoni Municipal Council a schedule of the time table for
services provision.
ii) Collect refuse collection charges as specified under the waste management
and refuse collection fees by-law 2000.
iii) Pay 5% of the collection fee to Mtaa leaders if they used such money to
assist in the collection of refuse. The percentage was due only when the
Mtaa leaders collect service charges from the residents and hand these
over to the Pos.
iv) Properly discharge solid waste in officially designated disposal facilities
during official hours of operations.
v) Pay dumping fees as directed by Kinondoni Municipal Council.

162
vi) Pos were not allowed to sub-let or purport to assign any part of the
contract to any other person.
vii) Neither the Pos nor their servants could hold themselves as being the
servants or agents of Kinondoni Municipal Council. Furthermore, the
Pos were neither allowed to enter into any contract on behalf of
Kinondoni Municipal Council, nor were they allowed to make, vary,
discharge or waive any by-laws or regulation.
In addition to the above, items ten and eleven of the terms and conditions of the
contract described situations where the contract given to a Po could be terminated.
These included the following:
ii) Failure to collect solid wastes present in the contractor’s area of
operation;
iii) Presence of informal waste dumps or accumulations of waste in areas
where solid waste collection should be provided by the contractor;
iv) Presence of litter or refuse in an area that should have been cleaned;
v) Presence of solid waste on the ground near a transfer station;
vi) Presence of any solid materials in a drain that should have been
cleaned;
vii) Scattering or leakage of waste from any waste collection vehicle;
viii) Improper handling of hazardous waste; incorrect or inadequate record-
keeping by the contractor; inadequate or inappropriate responses to
viable complaints;
ix) Unsafe work practice and traffic violation;

163
x) Discharge/disposal of solid waste in an unauthorized area;
xi) Failure to perform a substantial part of the service for a period of one
week;
xii) Inability of the contractor to satisfy customers;
xiii) Unreliable service frequency;
xiv) Lack of working equipments and poor performance of the contractor;
and
xv) Poor or lack of provision and use of health and safety gears for
workers.
Other important requirements specified in the terms of contract were stated under
items fourteen and fifteen to include submission of weekly, monthly, quarterly and
yearly reports by the Pos to Kinondoni Municipal Council. These reports could be
authenticated by the contractors and Mtaa leaders on their correctness. The last
condition seemed to give Mtaa leaders an opportunity to check and monitor the
performance of the Pos in order to check adherence to the contractual obligations;
but during the study it was found that this was not happening.
5.5.6 Technological Factors
It was established that, Kawe Ward had limited vehicular access to inner settlements
for sustainable SWM. This was due to lack of easily passable roads and the
unplanned houses in many settlements. Although heavy vehicles such as lorries and
trailers were used in SWC from the collection points along the main roads, pull/push
carts were very useful to bring solid wastes from the inner households to collection
points (see Plate 5.1 and 5.2). This was practically done under informal
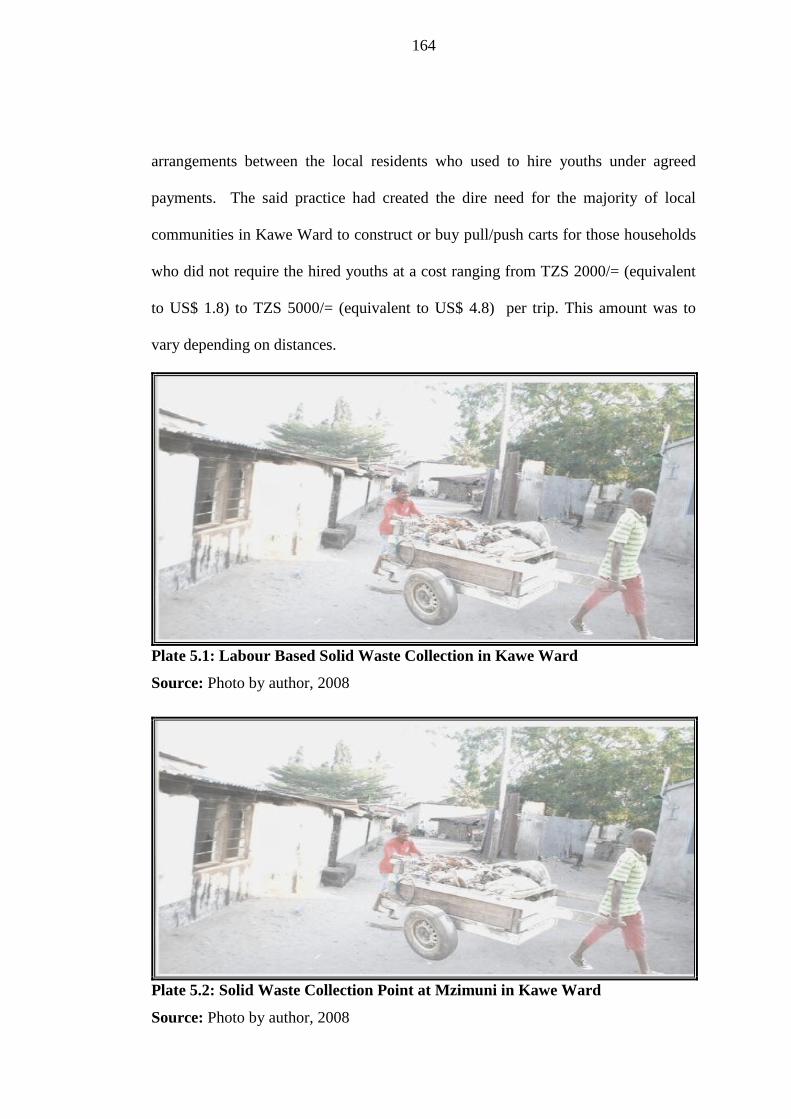
164
arrangements between the local residents who used to hire youths under agreed
payments. The said practice had created the dire need for the majority of local
communities in Kawe Ward to construct or buy pull/push carts for those households
who did not require the hired youths at a cost ranging from TZS 2000/= (equivalent
to US$ 1.8) to TZS 5000/= (equivalent to US$ 4.8) per trip. This amount was to
vary depending on distances.
Plate 5.1: Labour Based Solid Waste Collection in Kawe Ward
Source: Photo by author, 2008
Plate 5.2: Solid Waste Collection Point at Mzimuni in Kawe Ward
Source: Photo by author, 2008

165
5.6 Constraints and Potentials Facing Solid Waste Management Services
Generally, the estimated generation of solid wastes in Kawe Ward was around 162
tones per day, but only about 38 tones (23.4%) was collected per day; franchising
was about 31.7 tones (19.6%) and Kinondoni Municipality about 7.1 tones (4.4%)
per day. However, like in every aspect of SWM sector in urban areas in Tanzania,
PPP in Kawe Ward was facing the following challenges and potentials:
i) There was lack of awareness on the part of local community leaders and their
local residents about the provisions of solid waste by-laws and contents of
PPP operators and Kinondoni Municipal Council contracts.
ii) The role of residents who were ultimate service users to monitor performance
of PPP was marginalised due to lack of clear laws governing their operations
at the grassroots level which lessens cooperation from the local community.
iii) Accountability was lacking coupled with poor information flow and link
between PPP operators, Ward and Mtaa institutions on matters pertaining to
monitoring and regulating some settings which suggested the existence of
corruption.
iv) Varying political ideologies undermined the common good through
reluctance of opposition parties to take part in many developmental activities
including payment of waste management services, hence restraining efforts
to improve services provision.
v) Undue political interference and poor governance practice exercised by
Kinondoni Municipal Council politicians through ad-hoc decisions and
working on rumours against PPP operators did not augur well with good
governance principles and undermined enforcement of the rule of law.

166
vi) Unsatisfactory services provided by informal actors particularly youths who
had the upper hand from the grass roots, Mtaa and Ward leaders simply due
to their minimal charges (50 kg bag charged at TZS 200/= (equivalent to US$
0.2); small plastic bags of less than 15 kg charged at TZS 100/= (equivalent
to US$ 0.1) but against low quality service.
vii) Dumpsites were very far away, leading youths to dump waste before they
arrive at the official disposal sites; e.g. along Mbezi River Valley (see Plate
5.3).
viii) Failure by Kinondoni Municipal Council to decentralize by-laws and even
to translate the existing ones into Kiswahili had left such laws in English,
which cannot be understood by the majority.
Plate 5.3: Waste Dumping at Mbezi Valley River at Ukwamani in Kawe
Source: Photo by author, 2008
5.7 Summary of Major Findings From Kawe Ward
The principal findings based on the study of local resource mobilisation towards
sustainable solid waste management in Kawe Ward were in five folds as follows:

167
Firstly, in terms of effectiveness, the study showed that 38 tones (23.4%) was solid
waste collected out of 162 tones of solid wastes generated. Before the advent of PPP
in 1994, this ratio for Kinondoni Municipality was only 10% out of 1480 tones per
day. In terms of wastes recycling, composting and dumping ratios as indicators of
compliance with the waste hierarchy principle, the study showed that the percentage
of recycled wastes versus land-filled wastes was about 2.6 tones (1.6%) and 2.1
tones (1.3%). These findings showed a tremendous improvement between 1994 and
2008. For the whole of Kinondoni Municipality before the advent of PPP in 1994
these ratios were 2.3 tones (1.4%) and 1.7 (1.1%) respectively.
However, the wastes hierarchy principle was found to be violated by the modes of
payments which are made to various solid waste management service providers in
the three cases. This was the case because; the service providers were paid per
quantity of solid waste disposed off in bulk regardless of the differences in these
waste types. This means that, there is no incentive for them to encourage wastes
minimization awareness campaigns, recycling initiatives, and wastes treatment.
Secondly, it was further found that the actors involved in local resource mobilization
towards sustainable solid waste management, in Kawe Ward clearly are contractors,
NGOs, CBOs, WEO, Mtaa leaders, households and individual scavengers. In effect,
it was logical to conclude that, the process of private sector participation has created
employment, both formally and informally.
Thirdly, in respect to local resources mobilization strategies towards sustainable
solid waste management, the study confirmed that, in this Ward: policies, laws and

168
regulations prefer bottom-up approach to SWM and encourage the formation of
various CSOs; informal and formal CBOs and contractors as formal organizations;
good planning of settlements, good distribution of waste collection points, and good
accessibility of waste collection points. In addition to the above strategies, it was
found that local contractors are urged to own capital based and not labour-based
technology, though finances are acquired through user fee collections, and subsidy
based on public taxation.
Fourthly, local resource mobilization towards sustainable solid waste management
faces a number of constraints. These include: inadequacy of local resource
mobilization; poor coordination of a solid waste management system; inadequacy of
private sector monitoring; lack of a solid waste management policy framework for
involvement of the informal sector; lack of proper technology for supporting
recycling activities; unavailability of land for disposal sites; polluters with poor
purchasing power; and neglection of the waste hierarchy principle in contracts
design.
Lastly, potentials facing local resource mobilizations towards sustainable solid waste
management, in the area of study before and after the advent of PPP in 1994 are:
availability of labour-based technology; willingness to pay for solid waste
management services; relatively favourable policy and legal environment; local
political support; progressive compliance with the waste hierarchy principle; and
promotion of self-employment creation.

169
CHAPTER SIX
6.0 LOCAL RESOURCES MOBILIZATION THROUGH INFORMAL
COMMUNITY BASED ORGANIZATIONS: THE CASE OF SINZA WARD
6.1 Introduction
This chapter addresses the following issues: administrative profile of Sinza Ward;
socio-economic and infrastructure profile of Sinza Ward; waste sampling frequency;
types of solid waste mostly produced by households in Sinza Ward; methods of
disposal of solid wastes in Sinza Ward; methods of solid waste storage in Sinza
Ward; cost recovery in solid waste collection in the study area; SWM fees, service
rating and quality in Sinza Ward; determinants of SWM service quality in Sinza
Ward; local resources mobilization and use; constraints and potentials facing SWM
in Sinza Ward; and lessons learnt from Sinza Ward.
6.2 Profile of Sinza Ward
6.2.1 Location of Sinza Ward
Sinza Ward is located in the Southeast and about five kilometers from Kinondoni
Municipality headquarters. It is bordered by Kijitonyama and Manzese Wards in the
Southeast, Ubungo Ward in West and Kawe Ward in Northeast. The Ward was
divided into five settlements and it was relatively well planned, except some few
parts of Sinza Block “E” Sinza Block “D”; and Sinza Block “C”.
6.2.2 Socio-economic Profile of Sinza Ward
The major economic activities undertaken by respondents in Sinza Ward were highly
varied. Analysis of the economic activities indicated that 38% of the people were

170
engaged in private business, 18% were house-wives, and about 10% were either
government, or parastatal employees. About 9% were employed in the private sector,
while the remaining 25% were either day workers or wage earners. Respondents
were further asked to identify their religious faith/affiliation. It turned out that 99%
respondents answered this question, among which 66% were Christians, and about
33% were Moslems. One respondent decided to abstain.
Table 6.1: Sinza Ward Population 2002 to 2010
Mitaa names 2002 2004 2006 2008 2010
Sinza A 5,877 6,082 6,269 6,436 6,590
Sinza B 5,585 5,785 5,972 6,129 6,270
Sinza C 10,492 10,898 11,255 11,567 11,848
Sinza D 4,318 4,468 4,603 4,722 4,810
Sinza E 3,887 4,024 4,146 4,268 4,350
Total 36,323 37,730 39,015 40,158 41,153
Source: URT (2002 and 2006)
Demographically, Sinza Ward was not very densely populated; it had only a total of
40,676 people. Table 6.1 clarifies the situation. And Figure 6.1 below depicts Sinza
Ward administrative boundaries. (URT, 2008)
6.2.3 Infrastructure Profile of Sinza Ward
The institutional and spatial conditions and households participation in SWM in
Sinza was an interesting case. Physical observation revealed that infrastructure was
relatively good. Also, a number of community based organizations (CBOs) had
emerged in dealing with solid waste management activities in urban areas. One of

171
the CBOs’ major goals was to improve the environment through physical solid
waste management engagement for the purpose of self-employment creation. The
community members were the solid wastes generators and it was their responsibility
therefore, to mobilize resources towards sustainable solid waste management
services through payment of fee service charges. Thus, if local community members
were willing to participate in SWM through payment of collection charges in real
terms our municipalities would remain clean and attractive.
Figure 6.1: Sinza Ward Administrative Boundaries and Mitaa
Source: Kinondoni Municipal Council and field work, 2008

172
6.3 Performance of Solid Waste Management Services
6.3.1 Solid Waste Generation and Collection per Day
The ratio of wastes collected versus wastes generated is a good measure of the
effectiveness of SWM services. If the ratio is 100% then we have the maximum
possible effectiveness. As far as Sinza Ward was concerned, the field data collected
during this study in 2008 showed that solid wastes collected was about 43 tones
(41.2%) out of 105 of solid wastes generated per day. This implied that about
(58.8%) of the citizens were not getting SWM services as required by the equity
principle.
6.3.2 Waste recycling, Composting and Dumping Ratios per Day
This study conducted a compliance audit with respect to the wastes hierarchy
principle. According to this principle, in designing wastes management strategies,
preference should be given to those methods which are more environmentally sound.
The study was guided by the assumption that, the wastes hierarchy principle entails a
five-step order of priority in which wastes prevention has the highest priority being
followed by re-use, recycling, recovery and wastes disposal as the last option.
From a quantitative aspect, in order to make this compliance audit a success,
compliance with the wastes hierarchy principle was checked through two ratios.
These were the percentage of recycled wastes versus land-filled wastes and the
percentage of composted wastes versus land-filled wastes. The quantitative findings
from the field were as follows: the percentage of recycled wastes versus land-filled
wastes was about 1.8 tones (1.7%) of solid wastes; and the percentage of composted
wastes versus land-filled wastes was about 1.6 tones (1.5%) of solid wastes. Due to

173
the demands of the wastes hierarchy principle, the bigger the ratios the more the
principle is complied with. Thus, in this case it was revealed that the level of
compliance with the wastes hierarchy principle was still negligible.
In case of qualitative perspective, compliance with the wastes hierarchy principle
was checked by examining the modes of payments which are made by various solid
waste management service providers. For the wastes hierarchy principle to be
complied with there should be different price tags for biodegradable wastes, re-
usable wastes, recyclable wastes, and inert wastes respectively. But, if the
contractors are paid per quantity of solid wastes disposed off in bulk, regardless of
the differences in these waste types, then, there can be no incentive for them to
encourage wastes minimization awareness campaigns, recycling initiatives, and
wastes treatment.
Thus, an examination of the contracts between Kinondoni Municipality Council and
solid waste management service providers showed that the mode of payment to
service providers was based on the quantity of solid wastes disposed off in bulk
regardless of the differences in these waste types. Specifically, the contracts were
pegged against the “Waste Management and Refuse Collection Fees” as amended by
the Kinondoni Municipal Council in 2004. In this case, these refuse collection
charge rates were contrary to the demands of the wastes hierarchy principle.
6.3.3 Residents Satisfaction in Solid Waste Management Services
During this study a survey was conducted asking 410 households if they were
satisfied with the SWM service they received. In order to test this satisfaction the

174
following question was posed: If you receive SWM services what is your opinion of
the service provided? The possible alternative responses were: very satisfied;
reasonably satisfying; needs improvement; don’t know; and no service received. The
findings on the degree of satisfaction from SWM services in Sinza Ward were as
follows: 25 (6.1%) out of 410 households the answer was very satisfying; 149
(36.4%) out of 410 households the answer was reasonably satisfying; 102 (24.9%)
out of 410 households the answer was needs improvement; 9 (2.4%) out of 410
households the answer was don’t know; and 124 (30.2%) out of 410 households the
answer was no service received.
6.4 Actors Involved in Local Resources Mobilization in Sinza Ward
The field study revealed that, in Sinza Ward key actors involved in solid waste
management included informal youth groups, individual scavengers, Mtaa leaders,
and the Kinondoni Municipality. The dominant youth group was known as Sinza
Community Environmental Management Group (SCEMG)).
6.5 Local resources Mobilization Strategies in Sinza Ward
6.5.1 Financial Factors
It was learnt from the research field that no single hamlet had formal budget or
financial planning for local socio-economic development in the area of study.
Furthermore, the researcher found that LRM capacity towards sustainable SWM in
the area of study included push/pull carts, availability of land for secondary dump
site, and human resources. However, in addition to the above resources informal
youths, cash contribution from trustees, political support from mitaa leaders,

175
counsellor and Member of Parliament, equipments such as trailers from the
municipal, and volunteerism from good Samaritans, were summarised in Table 6.2.
Table 6.2: Local Resources Mobilization Capacity in the Study Area
No. List of
contributo
rs
Types of local resources contributed/pledged for effective and
efficient SWM
Push
/pull
carts
Lan
d
Human
resource
Cash Political
support
Equip-
ments
Volunteeris
m
1. SCEMG
Trustees
++ +
++ ++
+++ + +++
2. KMC + ++ + ++ + ++ +
3. Mitaa
leaders
+ + ++ + +++ + ++
4. Researcher
meeting
++ + + ++ +++ ++ +++
5. Member of
Parliament
++ + + ++ +++ + +++
6. Residents + + + ++ ++ + ++
7. Informal
youths
++ + +++ + +++ ++ +++
Key: += minimum: + += moderate: + + += high
Source: Field work, 2008
It was further reported that SCEMG members apart from charging a negotiable or
small fee from local households or residents compared to the amount charged by
private operators, still each youth earned up to TZS 15.000/= (US$ 13.6) net per
day. The survey of Sinza Ward indicated that the surrounding environment looked
relatively cleaner every day than those days when they used to employ private
operators.

176
The informal group ( i.e. SCEMG) chairperson reported that in order to maintain
SWM tools and to sustain excellent services in Sinza area the pull/push carts
owners including trustees and other providers decided to rent each push cart at the
value of TZS 5.000/= (US$ 5.4) per day. These rental charges were surrendered to
owners daily. When youths were probed on how much they saved per day, they
confirmed that they managed to pay for rent, garbage collection and daily meals
only.
6.5.2 Organisational Factors
It was found by the researcher that an informal local community based organization
(CBO) called Sinza Community Environmental Management Group (SCEMG)) in
Sinza Ward played a very important role towards the success of LRM towards
sustainable SWM. This informal group was recognized by the Sinza Ward local
government since 2002. SCEMG had about 47 active members (40 men and 7
women) under own informal management and leadership. About other 13 youths had
their own push/pull carts, and their activities had changed into a vibrant and lucrative
business.
It was further reported by informants that about 210 household heads that some of
the trustees had decided to support this informal SWM youth group as one ways of
local community participation because of main two reasons: to create self-
employment for these local youths particularly for those standard seven leavers; and
to reduce the burden and liabilities of hazardous health emanating from poor SWM
in Sinza Ward. This meant that, the SWM project at Sinza Block “C”, Block “D”

177
and Block “E” was implemented under the supervision of informal CBO known as
Sinza Community Environmental Management Group. Thus, community
organization was linked with Ward and Mitaa leaders who were playing an active
role during meetings of sensitization and mobilization of resources.
It was observed further that good linkage with external institutions such as regular
communication with the MSWM and a good educational background of the CBO
management and leaders add to the productivity of the project hence relatively
sustainable. The linkage with and use of grassroots (at least ten cell leaders)
especially in LRM with appropriate, timely and vigour information dissemination to
local communities are most likely to enhance participation in sustainable SWM
projects.
Other important links played by this informal local organization included regular
consultations with Sinza Ward Waste Management Officer, and the Kinondoni
Municipal Health and Waste Management Department. These links assisted to build
trust among SWM service users or stakeholders in general including tenants to
participate and contribute both tangible and intangible resources even though the
community organization had not been statutorily recognized. It was further noted
that regular and stable links with other service users or stakeholders build
community participation of local residents to contribute to the SWM project.
Moreover, such links assist to bring in resources and skills which are not obtainable
within the community such as technical expertise, and training.

178
Plate 6.1: A Meeting of the Informal Management and Leadership of SCEMG
Source: Photo by author, 2008
6.5.3 Spatial factors
The institutional and spatial conditions and households participation in SWM in
Sinza was an interesting case. The researcher physical observation revealed that
infrastructure was relatively good and settlements were planned. Thus, waste
collection points were easily accessible both by vehicles and push/pull carts. For
these reasons, Sinza Ward was relatively cleaner.
6.5.4 Institutional Factors
The study informants revealed that, there was a very low level of institutional set-up
that could allow an effective and efficient inter-organisational collaboration towards
a reasonable initiative for better performance in SWM. As indicated above, most of
the existing groups were informal youth organisations that made a living through the

179
provision of SWM services.
6.5.5 Technological Factors
In collecting solid wastes the majority of people used push/pull carts which were
made of wood or metal, and/or transport vehicles. While heavy vehicles such as
lorries and trailers were used in SWC mainly from the collection points, and youths
pull/push carts were very useful to transfer solid wastes from the less accessible
households though most of the settlements in Sinza Ward were relatively well
planned. However, the challenge was that most of the youths pull/push carts were
collecting solid wastes without any protective gear such as groves, gum boots, rain
coats etc. Plate 6.2 below shows push/pull carts loaded with solid waste materials at
an official collection point at Sinza “C” awaiting the trailer.
Plate 6.2: Pull/push Carts Awaiting Daily Trailer from the Dumpsite
Source: Photo by author, 2008

180
6.5.6 Legal Factors
This study established that SWM project in Sinza Ward was implemented under the
supervision of unregistered or informal CBO since year 2002. This was done after an
establishment of the three autonomous Municipalities in year 2000; where
Kinondoni Municipality took immediate measures to amend the 1994 Dar es Salaam
City Council SWM by-laws. The intention was to remedy the shortcomings existing
in the by-laws of 1994 such as the control of informal activities pertaining to SWM
as well as meeting the current demands and situations which include terms or
duration of PPP operators, collection of revenue from clients, quality of services
rendered and so forth. Then Kinondoni Municipality Solicitor was installed to
ensure implementation of these new by-laws. The main objective of these new by-
laws among other things was to enable a simple and quick privatization process and
effective implementation of SWM in the municipality.
However, the study informants revealed that these by-laws in question were poorly
administered as there was no strong and proper machinery to enforce them for
instance, to arrest people who are throwing waste products into the street, and
footpaths, or along the Municipal roads as it was sometimes happening in Sinza
Ward. The study established further that, under these by-laws the households and
commercial waste producers are liable, among other things, to provide adequate
receptacles or refuse storage. They further prohibit the throwing or depositing of
waste on the streets or on open spaces which were not designated as collection
points. They empower the Municipal Councils to make offenders pay for causing the
problem. There were enough legislations concerning SWM at this time in Kinondoni
181
Municipality to discipline and enforce the public behaviour, although there were
some pieces which were already outdated and inappropriate of the actual conditions
for the Municipal life such as in Sinza Ward.
The study further established that, relatively unlike in other case studies in Sinza
Ward there was an impressive situation which did not allow conflicting interests
between the central government, local government and politicians in implementing
and enforcing these by-laws pertaining to SWM. Because such SWM by-laws
implementation laxity could imply that there was no clear demarcation of powers
between these multiple-stakeholders in enforcing and instituting the prevailing by-
laws particularly, in SWM in the area of study.
6.6 Potentials Facing Local Resources Mobilization in Sinza Ward
As KMC reported earlier out of 105 tones of solid wastes generated per day, about
41.2% was collected; this was among the best performances in SWM in Kinondoni
Municipal Council. The reason was that Sinza was endowed with about five major
factors, which include: good political will and support, the presence of mixed
income groups, majority of houses were occupied by the owners, accessibility, and
availability of the trailers. These potentials are expanded in the following sections.
Political will and support: The study informants reported that community gets
support from ten cells and Mitaa leaders; councillor and the Member of the
Parliament. This support had a positive impact on solid waste collection because
these leaders were recognized and respected by the local community. Their

182
involvement in sensitizing and mobilizing the local community to pay service user
charges and remove solid waste out of their premises simplified SWM in that
Ward.
The presence of mixed income groups: The majority of people Sinza Ward were
either high or medium income groups; and it would seem like when high income
groups support any project or operation, some community members tend to get more
confidence in the whole operation.
Many houses are occupied by landlords: The study informants further, reported that
the majority of the houses were occupied by the owners, i.e. it was estimated that
about more than 65% of the houses in Sinza Ward were occupied by the owners.
This proportion was enough to form a strong social capital, and made it easy to team
up to contribute and monitor SWM operations daily.
Presence of local knowledge and know-how: As it has been said before, the majority
of Sinza Ward local residents were educated and had a strong sense of community
participation particularly when a social problem like SWM faces them.
Accessibility and availability of SWC facilities: It was further reported by KMC that
more than 85% of Sinza Ward was a planned settlement which gave advantage to
solid waste collectors because they could go round easily due to good roads. Sinza
was one of ten Wards which were run by Waste Management Officers plus a standby
daily trailer from Kinondoni Municipal Council.

183
6.7 Summary of Major Findings from Sinza Ward
The principal findings based on the study of local resource mobilisation towards
sustainable solid waste management in Sinza Ward were in five folds as follows:
Firstly, in terms of effectiveness, the study showed that the ratio of wastes collected
versus wastes generated was 41.2%. Before the advent of PPP in 1994, this ratio for
DCC was only 10% out of 1480 tones per day. In terms of wastes recycling,
composting and dumping ratios as indicators of compliance with the wastes
hierarchy principle, the study showed that the percentage of recycled wastes versus
land-filled wastes and the percentage of composted wastes versus land-filled wastes
were 1.8 tones (1.7%) and 1.6 tones (1.5%) respectively. These findings showed a
tremendous improvement between 1994 and 2008. For the whole of Kinondoni
Municipality before the advent of PPP in 1994 these ratios were 2.3 tones (1.4%)
and 1.7 tones (1.1%) respectively. These findings too showed a tremendous
improvement between 1994 and 2008.
However, the wastes hierarchy principle was found to be violated by the modes of
payments which are made by various solid waste management service providers in
the three cases. This was the case because; the service providers were paid per
quantity of solid wastes disposed off in bulk regardless of the differences in these
waste types. This meant that, there was no incentive for them to encourage wastes
minimization awareness campaigns, recycling initiatives, and wastes treatment.
Secondly, concerning the actors involved in local resource mobilization towards
sustainable solid waste management, the study showed that, the solid waste
management activities in this Ward, clearly involved contractors, NGOs, CBOs,

184
WEO, Mtaa leaders, households and individual scavengers. In effect, it was logical
to conclude that, the process of private sector participation had created employment,
both formally and informally.
Thirdly, in regard to local resources mobilization strategies towards sustainable solid
waste management, the study confirmed that, in this Ward: policies, laws and
regulations prefer bottom-up approach to SWM and encourage the formation of
various CBOs; good planning of settlements; good distribution of waste collection
points; good accessibility of waste collection points; local contractors own capital
based technology and not labour-based technology.
Fourthly, it was learnt that, the quest for resources mobilization towards sustainable
SWM faces a number of constraints. These include: inadequacy of local resource
mobilization; poor coordination of a solid waste management system; inadequacy of
private sector monitoring; lack of a solid waste management policy framework for
involvement of the informal sector; lack of proper technology for supporting
recycling activities; unavailability of land for disposal sites; polluters with poor
purchasing power; and neglection of the wastes hierarchy principle in contracts
design.
Lastly, it was learnt that in Sinza Ward before and after the advent of PPP in 1994
the quest for resources mobilization towards sustainable SWM faces a number of
potentials. These are: availability of labour-based technology; willingness to pay for
solid waste management services; relatively favourable policy and legal
environment; local political support; progressive compliance with the wastes
hierarchy principle; and promotion of self-employment creation.

185
CHAPTER SEVEN
7.0 LOCAL RESOURCES MOBILISATION THROUGH FORMAL NON-
GOVERNMENTAL ORGANIZATIONS: THE CASE OF HANNA NASSIF
WARD
7.1 Introduction
This chapter addresses the following issues: administrative profile of Hanna Nassif
Ward; socio-economic and infrastructure profile of Hanna Nassif Ward; Kisutu
Women Development Trust in Hanna Nassif Ward; organization and institution
factors in Hanna Nassif Ward; technological factors in local resources mobilization
by KIWODET; residents’ satisfaction in SWM performed by KIWODET;
constraints and potentials facing SWM; and lessons learnt from Hanna Nassif Ward.
7.2 Profile of Hanna Nassif Ward
7.2.1 Location of Hanna Nassif Ward
Hanna Nassif Ward is situated about four kilometres to the Northwest of the Dar es
Salaam City centre and almost one kilometre from Kinondoni Municipality
headquarters. This Ward was divided into three sub-wards: Kisutu, Mkunguni, and
Hanna Nassif (see Figure 7.1). The Ward bordered a high income residential area to
the Northeast, the Msimbazi creek to the East and a planned residential area to the
South. The main prominent physical feature in the Ward is the Msimbazi valley to
the East part of the Hanna Nassif sub-ward/settlement. The valley delineates the
Hanna Nassif settlement from the City centre and the neighbouring Upanga
residential area. The valley was rapidly being invaded by property developers (see
Figure 7.2), a move which had negative impacts on solid waste management since

186
there were neither defined neither roads nor good footpaths.
Figure 7.1: Hanna Nassif Ward Administrative Boundaries and Mitaa
Source: Kinondoni Municipality, 2008

187
Figure 7.2: Informal Property Development in Hanna Nassif Ward
Source: Kinondoni Municipality, 2009
7.2.2 Socio-economic Profile of Hanna Nassif Ward
The Ward was highly consolidated and densely populated. The Ward area was about
2.04 square kilometres with a population of around 37,000 people, 8,382 households,
and 3,149 buildings. In general socio-economic profile of this Ward was moderate.

188
7.2.3 Infrastructure Profile of Hanna Nassif Ward
Infrastructure conditions of Hanna Nassif Ward were not very attractive. About
98% of Hana Nassif and Mkunguni residents were still living in unsurveyed area
because land or accommodation was cheap and the area was closer to work places.
Because of this, WAT Human Settlements Trust (an NGO) was working in the area
to ensure that land was surveyed and owners got title deeds. Generation of domestic
solid waste in Hanna Nassif Ward was about 74 tones but actual collection was only
about 47.2% per day. Physical observation revealed that about 30% of most of
infrastructure such as roads, sanitation, and drainage systems were absent or poor.
This case was presented by findings generated from Kisutu Women Development
Trust (KIWODET), which was based in Hanna Nassif Ward, located within
Kinondoni Municipality in Dar es Salaam City.
7.3 Performance of Solid Waste Management Services
7.3.1 Solid Waste Generation and Collection Rate per Day
The ratio of wastes collected versus wastes generated is a good measure of the
effectiveness of SWM services. If the ratio is 100% then we have the maximum
possible effectiveness. As far as Hanna Nassif Ward was concerned, the field data
collected during this study in 2008 showed that the ratio of wastes collected versus
wastes generated was about 32 tones (43.5%). This meant that about 56.5% of the
residents were not getting SWM services as required by the equity principle.
7.3.2 Waste recycling, Composting and Dumping Ratios per Day
This study conducted a compliance audit with respect to the wastes hierarchy
principle. According to this principle, in designing wastes management strategies,

189
preference should be given to those methods which are more environmentally sound.
The study was guided by the assumption that, the wastes hierarchy principle entails a
five-step order of priority in which wastes prevention has the highest priority being
followed by re-use, recycling, recovery and wastes disposal as the last option.
From a quantitative aspect, in order to make this compliance audit a success,
compliance with the wastes hierarchy principle was checked through two ratios.
These were the percentage of recycled wastes versus land-filled wastes and the
percentage of composted wastes versus land-filled wastes.
The quantitative findings from the field were as follows: the percentage of recycled
wastes versus land-filled wastes was about 1.4 tones (1.9%); and the percentage of
composted wastes versus land-filled wastes was about 1.2 tones (1.6%). Due to the
demands of the wastes hierarchy principle, the bigger the ratios the more the
principle is complied with. In this case it was revealed that the level of compliance
with the wastes hierarchy principle was still negligible.
In case of qualitative perspectives, compliance with the wastes hierarchy principle
was checked through examination of modes of payments which were made to
various solid waste management service providers. For the wastes hierarchy
principle to be complied with there should be different price tags for biodegradable
wastes, re-usable wastes, recyclable wastes, and inert wastes respectively. But, if the
contractors are paid per quantity of solid wastes disposed off in bulk regardless of
the differences in these waste types, then, there could be no incentive for them to

190
encourage wastes minimization awareness campaigns, recycling initiatives, and
wastes treatment.
An examination of the contracts between Kinondoni Municipality Council and solid
waste management service providers showed that the mode of payment to service
providers was based on the quantity of solid wastes disposed off in bulk, regardless
of the differences in these waste types. Specifically, the contracts were pegged
against the “Waste Management and Refuse Collection Fees” as amended by the
Kinondoni Municipal Council in 2004. These refuse collection charge rates were
contrary to the demands of the wastes hierarchy principle.
7.3.3 Residents’ Satisfaction in Solid Waste Management Services
During this study a survey was conducted asking 112 households if they were
satisfied with the SWM service they receive. In order to test this satisfaction the
following question was posed: If you receive SWM services what is your opinion of
the service provided? The possible alternative responses were: very satisfied;
reasonably satisfying; needs improvement; don’t know; and no service received. The
findings on the degree of satisfaction from SWM services in Hanna Nassif Ward
were as follows: about 9 (7.3%) out of 112 households the answer was very
satisfying; about 42 (37.6%) out of 112 households the answer was reasonably
satisfying; about 23 (20.1%) out of 112 households the answer was needs
improvement; about 4 (3.6%) out of 112 households the answer was don’t know;
and about 35 (31.4%) out of 112 households the answer was no service received.

191
7.4 Actors Involved In Local Resources Mobilization in Hanna Nassif Ward
The study established that, Hanna Nassif Ward was most endowed with experienced
formal organizations in Kinondoni Municipality. But predominantly, it was served
by two organizations; one a CBO called Kinondoni Moscow Women Development
Association (KIMWODA) and another was an NGO called Kisutu Women
Development Trust (KIWODET). KIMWODA was established in 1994, by a group
of 10 women as a voluntary organization to deal with SWM in Hanna Nassif Ward.
At the time of its establishment, each household made its own private arrangements
to dispose off its waste, either by engaging an informal collector {most of whom
were children} or by burying, burning or dumping their waste. As a result of these
practices, the settlement was littered with waste. KIMWODA took up the challenge
of collecting waste in the settlement on a voluntary basis. Later it was officially
appointed by the DCC to collect waste in Hanna Nassif Ward, which compelled it to
register as a trading entity in 1995.
Later it was observed that most of the members were kin relatives of the founding
members and that entry was not open to community members as was the case with
community based organizations. Thus, KIMWODA was no longer operating as a
CBO but as an NGO, because its members who were engaged in various aspects of
SWM were paid wages and its relationship with the community was that of provider
and consumer. Nonetheless, in performing its functions, KIMWODA collaborates
with other actors in SWM such as the waste pickers, informal collectors and other
community based organizations, particularly on the aspect of waste recovery. These
actors were collecting wastes on behalf of KIMWODA on payment basis and also

192
supplied recyclable materials. With that experience, KIMWODA changed its
activities to HIV/AIDS. On the other hand, Kisutu Women Development Trust
(KIWODET) was a women’s group operating as a community based organization in
Hanna Nassif Ward. It was registered in June 1998 as an NGO and started venturing
into SWM as one of their prospective areas. Majani (2000) attributes the
development of this kind of non-governmental organization on the initial success of
KIMWODA, which was the first grass root organization in Hanna Nassif Ward.
Thus, at the time of this study, KIWODET’s main activity was SWM. It also
undertook waste recovery of about twelve materials such as glass, plastic, beer cans,
papers, etc. More details on how KIWODET was operating are described in the
ensuring sections.
7.5 Local resources Mobilization Strategies in Hanna Nassif Ward
7.5.1 Financial Factors
KIWODET got money through user fee collections. Table 7.1 displays the trends of
funds accrued from SWM for the period between 2002 and 2008.
Table 7.1: KIWODET Trends of Revenue Collected from SWC
Financial year Expected amount in
TZS in Millions
Actual amount
collected in TZS
in Millions
Uncollected in TZS
in Millions
2003/4 13.8 9.1 4.7
2004/5 15.2 8.6 6.6
2005/6 17.6 12.1 5.5
2006/7 19.1 13.0 6.1
2007/8 21.6 16.1 5.4
Total revenue 87.3 58.9 28.4
Source: KIWODET, 2008/09

193
The figures in Table 7.1 were calculated based on total number of households in the
settlement multiplied by TZS 1000/=. However, when total revenue collected was
compared to cost of SWM services there was little economic viability of providing
SWM by KIWODET in Hanna Nassif Ward. This was because an interrelationship
triad or three closely elements that was capital cost, service levels, and the accrued
revenue in SWM service delivery did not exist (Fox, 1994 and Kyessi, 2002:7). This
was happening when Hanna Nassif Ward was considered to be a medium income
group and therefore households served by KIWODET were supposed to pay TZS
1000/= per month as waste collection charges (see Appendix 6). KIWODET had
been able to mobilize other local resources such as personnel, labour through youths,
vehicles and trailers, and enhancement of residents’ awareness about SWM. It was
further observed that only about 20% of the households in the areas served by
KIWODET pay collection charges, although the majority of the residents were still
complaining about the uncollected wastes (see Table 7.2).
Table 7.2: Level of Satisfaction by the Solid Waste Management Services
Rating No. of
Households
% Respondents comments
Excellent SWC
services
10 10 SWC actors are very active and
with a lot of commitment
Very Good SWC
services
16 16 The environment is relatively clean
compared to KMC services
Good SWC services 18 18 Actors are moderately active
although fails to collect service
charges in time
Fair SWC services 32 32 Actors are not active enough as
they do not appear regularly
Poor SWC services 24 24 Actors are almost dormant because
they fail to render services
regularly
Total 100 100 -
Source: Field work, 2008/09

194
The local government leaders were praised by the KIWODET management for
being instrumental in mobilizing residents to pay for SWM services; however, they
were still urged to put more effort in enforcing the by-laws related to the collection
of charges. Table 7.3 displays the level of residents’ willingness to pay for SWM in
ranges between TZS 500/= to 3000/= per month.
Table 7.3: Level of Willingness to Pay for Solid Wastes Management Services
Range of
willingness to
pay in TZS
No of
Househol
ds
% Respondents comments
500/= to750/= 19 19 Affordable but, actors lacks close follow
ups 750/= to 1000/= 23 23 Affordable but, actors lacks close follow
ups 1000/= to 1500/= 21 21 Allow instalments payment per day/ week
1500/= to 2000/= 14 14 Affordable for high income earners
2000/= to 2500/= 11 11 Affordable for high income earners 2500= to 3000= 8 8 Let businessmen rates be reduced from
Tshs.5000= & above to this range. 3000= and above 4 4 Absolutely not affordable
- 100 100 -
Source: Field work, 2008/09
In view of the above level of willingness to pay for SWM (see Table 7.3), Table 7.4
portrays municipal revenue collection in fiscal year 2007/08 and 2008/09 in Hanna
Nassif Ward.
Table 7.4: Hanna Nassif Ward Revenue Report for 2007/08 and 2008/09
Revenue collection sources 2007/08 (in TZS in
Millions) 2008/09 (in TZS in
Millions)
Shops 4.4 6.2
Restaurants 2.8 3,3
Hotels 1.2 1.1
Other businesses 1.9 1.1
Households 8.6 4.5
Institutions 4.7 6.9
Informal sector 1.7 1.0
Total 25.3 24.1
Source: KMC, 2010

195
Like in any other in-depth case study the advanced reasons for shortfalls included
underdevelopment of the informal SWM sector, weak patriotism, growing number
of defaulters, and poor by-laws enforcement (KMC, 2008).
7.5.2 Organizational Factors
This research established that, KIWODET was one of the founder organisations as
key role-players in solid waste management in the study area. It had about
(KIWODET) 20 women members led by a chairperson. During this study, it was
run by seven active members, experienced and committed members including
chairperson, secretary, cashier, and four collection zone supervisors plus twelve
employees (see Figure 7.3).
Figure 7.3: Organization Chart of Kisutu Women Development Trust
Source: Kisutu Women Development Trust, 2009
Zone Three
SWM Supervisor
Chairperson
Secretary
Zone One
SWM Supervisor
Cashier
Zone Two
SWM Supervisor
All Twelve Solid Wastes Collection Employees
Zone Four
SWM Supervisor
196
KIWODET developed from local community members and it was therefore, easy to
display a peer group organization with a hierarchy which draws a distinction
between ordinary members and those who hold administrative positions in addition
to their membership. Also, KIWODET had good relationship with local government
authorities, because she enjoys political support and reliable SWM tenders from
Kinondoni Municipal Council. During this study KIWODET was vulnerable to
either partnership or corporate taxation, because it was run as any other private
operator in SWM activities.
7.5.3 Spatial Factors
It was established that, Hanna Nassif was one of the major informal settlements in
Kinondoni Municipality. During the rainy season the settlement did not experience
too much flooding due to its relatively good drainage channels. Also, the settlement
had basic infrastructure including community access roads, SWM and other services.
During this study it was found out that about 22.2 tones out of 74 tones (30%) of
crude solid wastes was normally dumped in Msimbazi Valley, about 33.3 tones
out of 74 tones (45%) was stored in containers (e.g. plastic bags or dust bins or at
KIWODET open space and later collected and disposed off in trucks or push carts),
and about 18.5 tones out of 74 tones (25%) was thrown in open pits or burnt.
7.5.4 Institutional Factors
KIWODET was formed as a formal group which was officially registered in 1999
with the purpose of undertaking activities which would generate income, and SWM
was one prospective area of its operations. Thus, it was recognised by the

197
government. At the period of the study, KIWODET and Mazingira Group were
contracted by KMC to collect solid waste in Hanna Nassif, Kisutu, and Mkunguni
sub-wards.
7.5.5 Technological Factors
The researcher established that push/pull carts are used and are able to negotiate
through narrow roads and footpaths where lorries could not go. Generally,
KIWODET had no enough collection points where solid wastes could be sorted out.
Table7.5: Types of the Equipments used by KIWODET
Type Required Available Deficit Remarks
Office space 1 1 0 Inadequate space
Computers 2 0 2 Adequate
Gum boots 25 12 13 Inadequate
Gears 50 24 26 Inadequate
Trailers 4 2 2 Inadequate
Tractors 2 1 1 Inadequate
Trucks 4 1 3 Inadequate
Push carts 25 12 13 Inadequate
Cell phones 7 2 5 Inadequate
Wheel barrows 25 6 19 Inadequate
Source: Kisutu Women Development Trust, 2008
However, it was observed that some of the KIWODET members performed SWM
activities without some protective gears such as folks, gum boots, groves, face
masks, and proper garments (see Plate 7.1). In addition, SWC was done manually
by using plastic buckets, shovels and worn out locally made basket wickers
(matenga) in order to reduce costs of operations. This study revealed that there
were inadequate financial resources to acquire appropriate SWC gears (see Table
7.1).

198
Plate 7.1: A woman Using Bear hands to Clean a Street in Hanna Nassif
Source: Photo by author, 2008.
7.5.6 Legal Factors
Given that KIWODET was a formal organisation it follows that it had a constitution,
by-laws and other documented norms of conduct. Due to the organization status, it
was recognised by the government and this recognition bestows trust on KIWODET
in the eyes of its other customers.

199
7.6 Constraints and Potentials Facing LRM in Hanna Nassif Ward
KIWODET was performing well financially apart from failure to pay solid waste
collection fees by some residents, though their best clients included popular
institutions such as the United Nations and Swaziland Embassy, plus the
municipality itself.
Apart from the fact that KIWODET’s main activity was SWM, it also undertook
waste recovery and recycling materials such as glass bottles, plastic bottles and
containers, beer cans etc. Upon retrieval, the materials were stored until enough
quantities had been collected to justify hiring a truck to transport the materials to the
selling points. The main buyer of the recyclables was Tanpack industries in
Mikocheni area. KIWODET used push carts, wheel barrows and sometimes sacks in
order to carry these materials. The cost of hiring a truck ranged between Tshs.
40.000/= to TZS 60.000/= (or equivalent to USD 33.0 to 50.0). To ease its
operations, KIWODET had constructed a collection point in front of their office
where municipal trailers were stationed (see Plate 7.2) before wastes are deposited
at the former Kigogo dumpsite.
7.7 Summary of Major Findings From Hanna Nassif Ward
The principal findings based on the study of local resource mobilisation towards
solid waste management in Hanna Nassif Ward were in five folds as follows:
Firstly, in terms of effectiveness, the study showed that the ratio of wastes collected
versus wastes generated was 43.5%. Before the advent of PPP in 1994, this ratio for
DCC was only 10% out of 1480 tones per day. In terms of wastes recycling,
composting and dumping ratios as indicators of compliance with the wastes

200
hierarchy principle, the study showed that the percentage of recycled wastes versus
land-filled wastes and the percentage of composted wastes versus land-filled wastes
were 1.4 tones (1.9%) and 1.2 tones (1.6%) respectively. These findings showed a
tremendous improvement between 1994 and 2008. For the whole of Kinondoni
Municipality before the advent of PPP in 1994 these ratios were 2.3 tones (1.4%)
and 1.7 tones (1.1%) respectively.
Plate 7.2: Stationed Trailers Near KIWODET Offices
Source: Photo by author, 2008.
However, the wastes hierarchy principle was found to be violated by the modes of
payments which were made by various solid waste management service providers in
the three cases. This was the case because; the service providers were paid per
quantity of solid wastes disposed off in bulk, regardless of the differences in these
waste types. This meant that, there was no incentive for them to encourage wastes
minimization awareness campaigns, recycling initiatives, and wastes treatment.

201
Secondly, in case of the actors involved in local resource mobilization towards
sustainable solid waste management, the study showed that, solid waste management
activities in this Ward, clearly involved contractors, NGOs, CBOs, WEO, Mtaa
leaders, households and individual scavengers. In effect, it was logical to conclude
that, the process of private sector participation had created employment, both wise
formally and informally.
Thirdly, in regard to local resources mobilization strategies towards sustainable solid
waste management, the study confirmed that, in this Ward: policies, laws and
regulations prefer bottom-up approach to SWM and encourage the formation of
various CSOs such as CBOs and NGOs; good planning of settlements, good
distribution and good accessibility of waste collection points.
Fourthly, the study revealed that the quest for resources mobilization towards
sustainable SWM faces a number of constraints. These included: inadequacy of local
resource mobilization; poor coordination of a solid waste management system;
inadequacy of private sector monitoring; lack of a solid waste management policy
framework for involvement of the informal sector; lack of proper technology for
supporting recycling activities; unavailability of land for disposal sites; polluters
with poor purchasing power; and neglection of the wastes hierarchy principle in
contracts design.
Lastly, regarding potentials for local resource mobilization towards sustainable solid
waste management, the study of Hanna Nassif Ward before and after the advent of
PPP in 1994, revealed that the quest for resources mobilization towards sustainable

202
SWM faced a number of potentials. These were: availability of labour-based
technology; willingness to pay for solid waste management services; relatively
favourable policy and legal environment; local political support; progressive
compliance with the wastes hierarchy principle; and promotion of self-employment
creation.

203
CHAPTER EIGHT
8.0 CROSS-CASE ANALYSIS AND SYNTHESIS OF THE FINDINGS ON
LOCAL RESOURCE MOBILIZATION IN KINONDONI
8.1 Introduction
This chapter summarizes the key observations on local resources mobilization
towards sustainable solid waste management as made in the preceding four case
studies, namely: Kinondoni Municipality as a whole on one hand, and on the other,
Sinza, Kawe and Hanna Nassif Wards. The aim was to compare and contrast the
emerging constraints and potentials with respect to solid waste management
processes in urban areas. It is organized into the following sub-sections: assessment
of solid waste management services performance; actors involved in local resources
mobilization towards sustainable solid waste management and their roles; and
constraints and challenges facing local resources mobilization towards sustainable
solid waste management.
8.2 Performance of Solid Waste Management Services in the Study Area
The cross-case analysis of the Kinondoni Municipality prior to 1994 on one hand,
and on the other hand, Sinza, Kawe and Hanna Nassif Wards after 1994, reveals that
public-private partnership (PPP) as a strategy of local resources mobilization
towards sustainable solid waste management has similar and different impacts on
these case studies as summarized below along various dimensions.
8.2.1 Effectiveness of Solid Waste Management Services in the Study Area
Effectiveness entails the principle that, the waste management model applied would
lead to the safe removal of all wastes. The ratio of wastes collected versus wastes

204
generated is a good measure of this variable. If the ratio is 100% then we have the
maximum possible effectiveness. The Table below compared and contrasted the
effectiveness of Kawe, Sinza, and Hanna Nassif Wards on one hand, and on the
other hand, the effectiveness of SWM in Kinondoni Municipality before PPP.
Table 8.1: Effectiveness of Solid Waste Management Services in Kinondoni
Parameter
Case studies
Kinondoni
Municipality
before PPP
(1994)
Kawe after
PPP
(Contractors
and Informal
CBOs)
Sinza after
PPP
(Informal
CBOs)
Hanna
Nassif
after PPP
(Formal
NGO)
Ratio of
wastes
collected
versus wastes
generated per
day
10% out of
1480 tones
23.4% out of
162 tones
41.2% out of
105 tones
43.5% out
of 74 tones
Source: Data for Sinza, Kawe and Hanna Nassif Computed from field (2008); and
Data for Kinondoni Municipality before PPP extracted from KMC (2007)
From this Table, it was obvious that, effectiveness before the advent of PPP was
very poor but was improved thereafter. This had been a result of emergency cleanup
campaigns, privatization, community involvement, improved disposal sites
management and development of wastes recycling. Thus, the performance of these
innovativeness proved more effectiveness in enhancing solid waste management in
Kinondoni Municipality than the previous conventional approaches.
On the other hand, the following differences within different modes of PPP were
noted: Hanna Nassif which mostly served by formal NGO ranked the highest in the
effectiveness of SWM services whereas Sinza which was mostly served by informal

205
CBOs ranked the second, and Kawe which was served by contractors and informal
CBOs ranked the last one.
8.2.2 Waste Recycling, Composting and Dumping Ratios per Day
This study conducted a compliance audit with respect to the waste hierarchy
principle across the four case studies. The quantitative findings from the field were
indicated in Table 8.2.
Table 8.2: Waste Recycling, Composting and Dumping Ratios per Day
Parameter
Case studies
Kinondoni
Municipality
before PPP
(1994)
Kawe after
PPP
(Contractors
and Informal
CBOs)
Sinza after
PPP
(Informal
CBOs)
Hanna
Nassif after
PPP (Formal
NGO)
Percentage of
wastes
recycled
versus land-
filled wastes
1.4% out of 2.3
tones
1.6% out of 2.6
tones
1.7% out of
1.8 tones
1.9% out of
1.4 tones
Percentage of
wastes
composted
versus land-
filled wastes
1.1% out of
1.7 tones
1.3% out of 2.1
tones
1.5% out of
1.6 tones
1.6% out of
1.2 tones
Source: Data for Sinza, Kawe and Hanna Nassif Computed from field (2008); and
Data for Kinondoni Municipality before PPP extracted from KMC (2007)
Based on the demands of wastes hierarchy principle, it is clear that, the bigger the
ratios the more the principle is complied with. Thus, revealed findings in these four
case studies it was clear that the level of compliance with the wastes hierarchy
principle had been progressively improving from 1994 to the present. Also, the
findings revealed that, the best improvements had also been registered under formal
NGOs in Hanna Nassif, which was followed by informal CBOs in Sinza and finally

206
informal CBOs and contractors in Kawe Ward.
On the other hand, from a qualitative perspective, compliance with the wastes
hierarchy principle was checked by examining the modes of payments which were
made to various solid waste management service providers in the three cases. It was
concluded that, in all Wards i.e. Kawe, Sinza and Hanna Nassif, the service
providers were paid per quantity of solid waste disposed off in bulk, regardless of the
differences in these waste types, meant that, there was no incentive for them to
encourage wastes minimization awareness campaigns, recycling initiatives, and
wastes treatment. From these conclusions, it followed that, these practices were
contrary to the demands of the wastes hierarchy principle.
8.2.3 Satisfaction Levels With Solid Waste Management Services
Various households’ surveyed asked if they were satisfied for the service. In order to
test this satisfaction the following question was posed by different surveyors across
time: If you receive SWM services what is your opinion of the service provided? The
possible alternative responses were: very satisfied; reasonably satisfying; needs
improvement; don’t know; and no service received. The Table below presented the
results from the households’ responses for four different surveys.
From this Table 8.3 it followed that Kawe, Sinza and Hanna Nassif Wards were
similar in the sense that comparably they all had higher degrees of satisfaction. They
were different from Kinondoni Municipality before PPP which had relatively lower
degrees of satisfaction. This implied that the introduction of PPP has had a bigger
impact on SWM services than it was the case before.

207
Table 8.3: Satisfaction Level of SWM services in Kinondoni Municipality
Degree of
satisfaction of
the areas
covered
Case Studies
Kinondoni
Municipality
before PPP
Kawe after
PPP
(Contractors
and Informal
CBOs)
Sinza after
PPP
(Informal
CBOs)
Hanna Nassif
after PPP
(Formal
NGO)
Very
satisfying
1.1% out of
120
households
5.2% out of
186
households
6.1% out of
410
households
7.3% out of
112
households
Reasonably
satisfying
10.4% out of
120
households
35.5% out of
186
households
36.4% out of
410
households
37.6% out of
112
households
Needs
improvement
22.9% out of
120
households
24% out of
186
households
24.9% out of
410
households
20.1% out of
112
households
Don’t know 0.4% out of
120
households
1.9% out of
186
households
2.4% out of
410
households
3.6% out of
112
households
No service
received
65.2% out of
120
households
33.4% out of
186
households
30.2% out of
410
households
31.4% out of
112
households
Total 100%
households
100%
households
100%
households
100%
households
Source: Data for Sinza, Kawe and Hanna Nassif Computed from field (2008); and
Data for Kinondoni Municipality before PPP extracted from KMC (2007)
On the other hand, the following differences within different modes of PPP were
noted: Hanna Nassif which mostly served by formal NGO ranked the highest in
satisfaction whereas Sinza which was mostly served by informal CBOs ranked the
second, and Kawe which was served by contractors and informal CBOs ranked the
last one. These findings supported similar findings on the effectiveness of SWM
services as discussed above under section 8.2.1.
8.3 Actors Involved in Local Resources Mobilization
The cross-case analysis of the Kinondoni Municipality prior to 1994 on one hand,
and on the other hand, Sinza, Kawe and Hanna Nassif Wards after 1994, revealed

208
that PPP as a strategy of local resources mobilization toward sustainable solid waste
management (SSWM) had increased the number of role players in solid waste
management as shown in Table 8.4.
Table 8.4: Actors Involved in Local Resources Mobilization Towards SSWM
Types of actors
present
Case Studies
Kinondoni
Municipality
before PPP
Kawe after
PPP
(Contractors
and informal
CBOs)
Sinza after
PPP
(informal
CBOs)
Hanna
Nassif
after PPP
(formal
NGO)
City Council Yes Yes Yes Yes
Municipality
Council
Yes Yes Yes Yes
Contractors No Yes Yes Yes
NGOs No Yes Yes Yes
CBOs No Yes Yes Yes
WEO No Yes Yes Yes
Mtaa leaders No Yes Yes Yes
Housholds Yes Yes Yes Yes
Individuals Yes Yes Yes Yes
Source: Field work, 2008
Prior to 1994 only the City Council and Municipal Councils were providing solid
waste management. But, according to the Table above, it was obvious that, other
actors such as NGOs and CBOs had joined the struggle. In effect, it was logical to
conclude that, the process of PPP had created employments, both formally and
informally. At the same time it had promoted local participation in a way that
respects human dignity. Furthermore, this synthesis showed that there were some
similarities and differences between contractors and civil society organizations
(CSOs). The differences were as follows: the local contractors paid tax to the
government while CSOs did not. The local contractors owned the collection vehicles

209
and equipment for the service, while the majority of the CSOs hired collection
vehicles. The similarities were as follows: both the local contractors and CSOs were
required to collect wastes and transfer to the disposal sites. Both the local contractors
and CSOs received their payments from the residents, and got paid for the Council
duty such as sweeping the streets. There were no differences for the contract
duration for both the contractors and the CSOs. It was found in the literature that the
local contractors mostly served in the high income areas while CSOs mostly served
in low income areas.
However, in a few areas some of the local contractors served in low income areas
and some CSOs served in high income areas and both performed very well. This
indicated that the arrangements of the company or the CSOs were very important in
performing the job. For the sustainability of the private sector the Municipality could
also consider this opportunity. Indeed, the payment which the contractors and CSOs
received from the Municipality for streets sweeping provided an incentive to take on
contract in low income areas as well high income areas to subsidize the running cost
of the service provided.
8.4 Local Resource Mobilization Strategies For Sustainable SWM services
In light of the four case studies of Kinondoni Municipality before the emergency of
PPP, Sinza, Kawe, and Hanna Nassif Wards, which had been covered in the
preceding four chapters, this section sought to compare and contrast the emerging
issues with respect to SWM services. To this end, the Table below used the key
research variables to highlight the key similarities and differences that had arisen
from the four case studies.

210
Table 8.5: Local Resource Mobilization Strategies in Three Kinondoni Wards
No.
Issue /
Resource
Case Studies
Kinondoni
Municipality
before PPP
Kawe after PPP
(Contractors
and Informal
CBOs)
Hanna Nassif
after PPP
(Formal NGO)
Sinza after PPP
(Informal
CBOs)
1. Legal
factors
Policies, laws
and regulations
preferred a top-
down approach
to SWM
Policies, laws
and regulations
prefer bottom-up
approach to
SWM and
encourage the
formation of
various CSOs
Policies, laws
and regulations
prefer bottom-up
approach to
SWM and
encourage the
formation of
various CSOs
Policies, laws
and regulations
prefer bottom-
up approach to
SWM and
encourage the
formation of
various CSOs
2. Organisati
onal
factors
Only Municipal
Councils
existed as
formal
organizations
Municipal
councils as
formal
organizations,
informal CBOs
and contractors
as formal
organizations
Municipal
councils, and
contractors and
NGOs as formal
organizations
Municipal
councils as
formal
organizations,
and informal
CBOs
3. Spatial
factors
Poor planning
of settlements,
poor
distribution of
waste collection
points, and poor
accessibility of
waste collection
points.
Good planning of
settlements, good
distribution of
waste collection
points, and good
accessibility of
waste collection
points.
Better planning
of settlements,
better
distribution of
waste collection
points, and
better
accessibility of
waste collection
points.
Best planning of
settlements, best
distribution of
waste collection
points, and best
accessibility of
waste collection
points.
4. Technolog
ical factors
Municipal
council owned
capital based
technology but
not labor-based
technology
Local contractors
own capital based
technology and
not labor-based
technology, and
the majority of
the CSOs hire
capital based
technology and
own labor-based
technology
The majority of
the CSOs hire
capital based
technology and
own labor-based
technology
The majority of
the CSOs hire
capital based
technology and
own labor-based
technology
5. Financial
factors
Finances
mainly acquired
through public
taxation.
Finances
acquired through
user fee
collections; and
subsidy based on
public taxation.
Finances
acquired through
user fee
collections; and
subsidy based on
public taxation.
Finances
acquired through
user fee
collections; and
subsidy based on
public taxation.
Source: Own construct

211
In general, the study had shown that, the provision of Municipal services by
Municipal Authorities alone could not be sustainable. It had been made clear that,
until early 1990s the Dar es Salaam City Council collected less than 10% out of 1480
tones of the total refuse generated in the City per day, where, limited public-sector
resources accounted for such low performance. However, a few years later, the
promotion of participatory and partnership arrangements whereby local groups
formulated strategies and prepared action plans to address critical environmental
issues proved to be innovative ways of improving solid waste management in the
City. The performance of these innovative ways had proved more effectiveness in
enhancing solid waste management in Kinondoni Municipality than the previous
conventional approaches. The changing trends in legal, organizational, institutional,
spatial, technological and financial factors as well as the effectiveness and
satisfaction levels reflected in Table 8.5 above were cases in support of this line of
thinking.
8.5 Constraints Facing Local Resources Mobilization in SSWM services
The cross-case analysis of the case study of Kinondoni Municipality prior to 1994 on
one hand, and on the other hand, the case studies of Sinza, Kawe and Hanna Nassif
Wards after 1994, revealed that the quest for resources mobilization towards
sustainable SWM faced a number of constraints and potentials. The evidence
gathered from the four case studies was summarized below.
8.5.1 Inadequacy of Local Resource Mobilization
The adequacy of local resource mobilization faced the following constraints: lack of
appropriate mechanism for collecting refuse charges, lack of funds to replace the

212
ageing fleet of vehicles and other equipments, inadequate funds for equipment
maintenance and repair, and lack of a sustainable programme for establishment of
local community-based organizations.
8.5.2 Poor Coordination of a Solid Waste Management System
The selection of technologies faced the following constraints: insufficient clear
systems and technologies as applied for solid waste storage at households and
primary collection, insufficient linkages between primary collection and
transportation to secondary collection, and unspecified vehicle types for refuse
collection systems in different areas.
8.5.3 Inadequacy of Private Sector Monitoring
Private sector participation faced the following constraints: poor community
orientation and contractors over-reliance on the Municipal Council’s enforcement of
legislation, lack of contractor’s operational experience in SWM and inappropriate
equipment base, inadequate enforcement of the existing legislation/by-laws, and
lack of adequate technical and financial capacity for both Municipal Council and
contractors themselves.
8.5.4 Lack of an Appropriate Solid Waste Management Policy Framework
The involvement of local community groups and the informal sector faced the
following constraints: unclear policy on involvement of the popular sector in SWM,
remote awareness of local community involvement in SWM, and poor infrastructure
to support local community involvement in SWM.

213
8.5.5 Inadequacy of Proper Technology for Supporting Recycling Activities
Waste recycling faced the following constraints: current SWM streams including
recycling points were lacking policy to support the intended or planned strategies,
recycling market was not yet identified, and recycling business was still in shambles
and unstable, extra work load on the local community, and insufficient funds and
lack of new technology.
8.5.6 Unavailability of Land for Disposal Sites
Management of disposal sites faced the following constraints: very minimal supports
to acquire new and realistic sites, poor planning of the land use hence poor
accessibility, irresponsibility of local communities, and persistent insufficiency of
funds.
8.5.7 Polluters with Poor Purchasing Power
Another key challenge faced solid waste management was poor purchasing power on
the part of the polluters, as a result of which the polluter pays principle could not be
complied with across the whole community. In terms of economic power, the
Kinondoni Municipality was comprised of different categories of residents. Most of
the residents had no steady incomes. This meant that, contractors and other solid
waste stakeholders who had decided to invest in this sector were unable to recover
their invested money. Cost recovery was almost impossible, and as such
entrepreneurs had no incentive to continue investing in the sector for quite sometime.
In the long run, this constraint opened a door for solid waste services market failure.

214
8.5.8 Neglect of the Wastes Hierarchy Principle in Contracts Design
The study established that, in Kinondoni Municipality, the service providers were
paid per quantity of solid waste disposed off in bulk, regardless of the differences in
these waste types, meaning that, there was no incentive for them to encourage wastes
minimization awareness campaigns, recycling initiatives, and wastes treatment.
From these conclusions, it followed that, these practices were contrary to the
demands of the wastes hierarchy principle. And such an abnormality was contrary to
the principles of sustainable solid waste management.
8.6 Potentials for Local Resources Mobilization
8.6.1 Availability of Labour-Based Technology
The chief potential for local resource mobilisation was found to be the discretion in
the choice of technology at the local level. At this level technology can be either
labour-based or capital-based. In labour-based technology, human labour is mainly
used for the operations. This is to say that, labuor-based technology aims at applying
a labour-equipment mix that gives priority to labour, where, labour is supplemented
with light equipment where necessary for reasons of quality or cost. It refers to the
optimum and flexible use of local labour and locally available materials, skills and
capacities, supported by the use of appropriate equipment, where technically and
economically feasible.
On the other hand, in capital based technology, machinery is mainly used for
operations. This is to say that, capital based technology aims at applying a labour-
equipment mix that gives priority to equipment, where, equipment is supplemented
with light labour where necessary for reasons of quality or cost.

215
In solid waste management, labour-based technology makes optimal use of local
resources such as local material, and tools and light equipment that are locally
produced. Thus, the Kinondoni Municipality could consider the use of labour-based
technology in solid waste management instead of capital based technology. In effect,
the choice of technology for solid waste management would influence employment
parameters since it had a marked influence on the number and location of
employment. Also, it could determine who was able to participate in a given solid
waste management project.
8.6.2 Willingness to Pay for Solid Waste Management Services
The cross-case study showed that, middle and upper class families were the main
generators of solid wastes. At the same time, it showed that, they were willing and
capable to pay the user fees in accordance with the pay as you pollute principle.
Thus, based on the market processes theory, in such segments of Kinondoni
Municipality, entrepreneurs had an incentive to continue investing in solid waste
management due to the prospects of profit making. That is to say, in these areas cost
recovery is possible.
8.6.3 Relatively Favourable Policy and Legal Environment
Both at municipal and national levels, the study revealed that, the existing legal
framework supports a bottom up approach to solid waste management. Specifically,
in 2010, the Government of Tanzania launched the National Strategy for Growth and
Reduction of Poverty (NSGRP II), popularly known as MKUKUTA in Kiswahili.
This strategy included an operational target with respect to the effectiveness of solid

216
waste management, as measured by the ratio of collected wastes versus generated
wastes in urban centers. According to the document, this ratio would increase from
47 per cent in 2008 to 85 percent in 2015. To this end, among other strategies, the
Government of Tanzania was committed to do the following: sensitizing key actors
on public-private partnership(PPP) policy (2009) and PPP Act (2010); developing a
guiding document for PPP implementation including in infrastructure sectors;
capacity development for institutions engaging in PPP; expanding space for public
private dialogue; ensuring that PPP was also pro-poor through development of
inclusive markets; making markets work for the poor; and putting in place
investment incentives and systems to encourage investment by domestic private
sector participation in all sectors.
8.6.4 Local Political Support
The researcher confirmed that, at the grass roots level Mtaa leaders had shown a
positive attitude toward solid waste management through PPP. They were ready to
help as and when they were consulted by solid waste management services
providers. This spirit facilitates the establishment of horizontal and vertical linkages.
In turn, going by the institutional economic theory, such linkages were important in
the creation of synergetic relationships toward sustainable solid waste management.
8.6.5 Progressive Compliance with the Wastes Hierarchy Principle
According to the wastes hierarchy principle, in designing wastes management
strategies, preference should be given to those methods which are more
environmentally sound, where the preferences can be determined in terms of the

217
wastes hierarchy that entails a five-step order of priority in which wastes prevention
has the highest priority being followed by re-use, recycling, recovery and waste
disposal as the last option. The study confirmed that, between 1994 and 2008, there
had been a progressive compliance with this principle, where the compliance was an
indicator of the relative effectiveness of PPP when compared to conventional top-
down approach to solid waste management. With improvements in wastes recycling
and re-use rates the researcher was sure that, solid waste management would be
more environmentally sustainable in the future.
8.6.6 Promotion of Self-Employment Creation
The researcher established that, prior to 1994 only the City Council and Municipal
Councils were providing solid waste management services. But, according to the
Table above, it was obvious that, other actors such as NGOs and CBOs had joined
the struggle. In effect, it was logical to conclude that, the process of PPP had created
employment, both formally and informally. At the same time bottom-up approach to
solid waste management had promoted local participation in a way that respects
human dignity by promoting self-actualisation amongst various solid waste
stakeholders.
8.7 Summary
This chapter has discussed the following issues: solid waste management services
performance; actors involved in local resources mobilization towards sustainable
solid waste management and their roles; and the constraints and potentials facing
local resources mobilization towards sustainable solid waste management. In effect,

218
the key similarities and differences of the four case studies as previously discussed in
chapter four, five, six and seven have been brought together. Finally, relevant
conclusions have been drawn. These conclusions have a number of policy
implications which are discussed in the next chapter.

219
CHAPTER NINE
9.0 CONCLUSIONS, POLICY IMPLICATIONS AND
RECOMMENDATIONS
9.1 Introduction
The principal objectives of this study were: to describe and analyse the performance
of solid waste management in Kinondoni Municipality; to assess the motives and
practical aspects of local resources mobilization towards solid waste management in
Kinondoni Municipality; to identify the actors involved and their roles in local
resources mobilization for solid waste management; to determine constraints and
potentials of local resources mobilization towards sustainable solid waste
management; and to make policy recommendations based on the research findings
on local resources mobilization for sustainable solid waste management in urban
areas. Against this background, this chapter closes the study by providing
conclusions, policy implication issues, the related policy recommendations, and
suggestions on future research prospects.
9.2 Conclusions
The study on local resource mobilization towards solid waste management in
Kinondoni Municipality before and after the advent of PPP in 1994, revealed that,
the following claims were true: for example various strategies of local resources
mobilization had a huge potentiality toward the design of a framework that could
meaningfully inform the development of an integrated and sustainable solid waste
management in Kinondoni Municipality.

220
This claim was premised on a number of potentialities for local resource
mobilisation which form the grounds on which the claim stood. In light of the above
findings, it was clear that, the quest for resources mobilization towards sustainable
solid waste management faced a number of potentials, namely: the availability of
labour-based technology; willingness to pay for solid waste management services;
relatively favourable policy and legal environment toward bottom-up approach to
solid waste management; local political support; progressive compliance with the
wastes hierarchy principle; and promotion of self-employment creation.
These adduced grounds were warranted by a number of similar solid waste
management initiatives which were pursued through a bottom-up approach, as the
literature review indicated. This review highlighted such solid waste management
initiatives as, solid waste management through Cooperative Union in Rosario City,
Argentina; solid waste management through CBOs in Qanater City near Cairo,
Egypt; and solid waste management through PPP in Contonou City, Benin. In all
these initiatives, it was evident that the above said potentialities were, in most cases,
a sign of relativity in sustainable solid waste management services.
These warrants were backed by the past experience as could be supported from a
number of theories which underpinned this study. For example, the institutional
economic theory states that, acting in accordance with the institution is viewed as
rational by those who share the institution. Thus, the legal, organizational and
institutional frameworks that existed in Kinondoni Municipality were a reason for
individual and collective rationality.

221
However, this conclusion could not permanently survive a number of objections if
some key constraints on local resource mobilisation, as the study indicated, were not
addressed properly. These constraints included: inadequacy of local resource
mobilization skills; poor coordination of a solid waste management system;
inadequacy of private sector monitoring; lack of a solid waste management policy
framework for involvement of the informal sector; lack of proper technology for
supporting recycling activities; unavailability of land for disposal sites; polluters
with poor purchasing power; and neglection of the waste hierarchy principle in
contracts design.
Failure to address properly these objections through policy, legal and administrative
mechanisms, they would definitely curtail the above conclusion for obvious reasons.
For example, if the fact that the polluter pays principle was not adhered too due to
poor economic statuses of the polluters implied that, entrepreneurs would soon
refrain from investing in solid waste management sector, since there was no profit
incentive for them to invest there. This was how the market processes theory teached
the researcher. On the other hand, if the Municipal Council failed to monitor
contractors properly, the latter would soon shirk. As a result of poor monitoring and
evaluation by the Municipal Council (principal), contractors (agents) would leave
streets full of wastes. This was what the principal-agent theory teached the
researcher.
9.3 Policy Implication Issues
In light of the above mentioned research findings and conclusion, the following were
issues for policy recommendations: policy framework for local resources
222
mobilization, networking and mobilisation of local actors, supplementing
conventional approach in municipal service provision, solid waste management cost
recovery, and compliance with the wastes hierarchy principle in contracts design.
Clarifications on each of the policy issue were given below.
9.3.1 Policy Framework for Local Resources Mobilization
The study found that, there was no policy for local resource mobilisation toward
solid waste management in Kinondoni Municipality. The absence of such a policy
was a constraint on local resource mobilisation toward solid waste management. In
principle, a policy is a statement, verbal, written or implied, of those principles and
rules that are set by a collective action institution as guidelines to the institution’s
actions. It is a predetermined course of action established as a guide towards
accepted objectives of the institution. Accordingly, a policy on local resource
mobilization toward solid waste management would enable the various stakeholders
to rely properly to the national objectives with respect to solid waste management.
Thus, it was a high time for Tanzania to enact a policy for SWM.
9.3.2 Networking and Mobilisation of Local Actors
The researcher established that, although the actors on solid waste management
sector had tremendously increased between 1994 and 2008, they were still not well
networked, both vertically and horizontally. However, according to this study, it was
found that, stakeholders’ participation in local resources mobilization towards
sustainable SWM in urban areas in Tanzania was a recent phenomenon. In the past,
that was prior to 1994, solid waste collection projects were planned, implemented

223
and operated in a top-down approach by the state organs which finally became
unable to run these activities effectively. The study further revealed that, after the
advent of PPP in 1994, a bottom-up approach was introduced, as a result of which, a
broad stakeholders’ participation emerged and tremendous improvements were
registered in solid waste management. Thus, there was a need to create a policy that
puts more emphasis on local community networking and mobilisation toward a fuller
participation in local resource mobilisation towards sustainable SWM.
9.3.3 Supplementing Conventional Approach with Bottom up Approach
The study found that, the conventional approach to solid waste management showed
some disabilities which could be traced back through the following factors: inability
of the local authorities to pick up all the waste, lack of financial resources, lack of
skill, increasing throw-away mentality, improper disposal facilities, lack of proper
legislation, improper organizational structure of the waste management authority,
and the lack of public participation.
On the other hand, it was revealed that the introduction of PPP after 1994 brought
about tremendous improvements in solid waste performance, especially in those
areas where the economic status of the residents favours the polluter pays principle.
Under PPP, the use of available labour based technology and tapping into actor’s
knowledge and skills promoted local resources mobilization towards sustainable
solid waste management. Thus, there was a need to produce a policy which would
ensure that the convectional system of solid waste management was supplemented
by the bottom-up approach.
224
9.3.4 Solid Waste Management Cost Recovery
This study found that, in most of the areas where solid waste management services
had been privatised, almost all entrepreneurs had no incentive of continuing to invest
in the sector due to lack of investment cost recovery and profit making. Apparently,
this problem based on the fact that some of the residents could not afford to comply
with the polluter pays principle. There was a need to promote resources
independence through a focused policy framework. Such a policy would seek to
promote self-reliance in terms of an empowerment program that entails a well-
balanced capital formation structure, coordination in the mobilization and use of
resources in the domestic market, and organic development from a simple to
complex structure.
9.3.5 Compliance with the Waste Hierarchy Principle in Contracts Design
Also, the study found that, the contractors were paid per quantity of solid wastes
disposed off in bulk, regardless of the differences in the different types of wastes,
namely: biodegradable, recyclable, reusable and inert wastes. This meant that, there
was no incentive for the contractors to encourage wastes minimization awareness
campaigns, recycling initiatives, and waste treatment. From these conclusions, it was
obvious that, these practices were contrary to the demands of the wastes hierarchy
principle. Such abnormality was contrary to the principles of sustainable solid waste
management. Thus, there was a need to put in place a policy, according to which,
the collected volumes of biodegradable, recyclable, reusable and inert wastes are
paid at different rates in such a way that collected biodegradable, recyclable,
reusable are paid at lower rates than the rate at which inert wastes are paid.

225
9.4 Policy Recommendations
In light of the above mentioned research findings, conclusion and issues for policy
recommendations, key policy recommendations were hereby given on the following
issues: policy framework for local resources mobilization, networking and
mobilisation of local actors, supplementing conventional approach in municipal
service provision, solid waste management cost recovery, and compliance with the
waste hierarchy principle in contracts design. Clarifications on each of the policy
recommendation were given below.
9.4.1 Institutionalization of Policy Framework
The study established that, there were weaknesses in SWM laws, by-laws and
contracts enforcement. Thus, it was recommended that, in order to succeed in
SWM our related norms, rules, regulations and by-laws must be institutionalised,
and hence, meaningful, effective, simple, and brief. It was important to note that all
current versions were almost passive hence the need to review the contents with a
view to reducing them and focusing on priority concerns of key actors. This study
proposed that it was high time to popularize these by-laws; however, this had to be
done after translating all of them into the national language, that is Kiswahili and
making them available at the local communities.
9.4.2 Mobilising Grass Roots Actors Towards Local Resources Mobilization
The study established that, deliberate and effective involvement of grass roots
institutions, that is from designated solid waste management (Ten cell leader up to
Ward Development Committee leaders), helps to address many operational

226
problems including streamlining dispute resolutions at Ward, Mtaa and Ten Cell
levels by directly involving private operators and service users as well as
empowering or giving key actors the mandate they deserve. However, it was
observed that, the prevailing procedures and practice did not give enough powers to
the local community leaders either to select efficient private operators or resolve
conflicts between service users and private operators. Thus, it was recommended
that a policy would be put in place so as to facilitate the formation, coordination and
empowerment of local institutions towards solid waste management.
9.4.3 Supplementing Conventional Approach With Bottom up Approach
The study established that, the top-down approach to solid waste management had a
number of drawbacks which could be remedied or solved through a bottom-up
approach. It was also confirmed that, the bottom-up approach to solid waste
management could not solve all problems relating to waste management. In other
words, the two approaches were complimentary to each other. In this regard, the
following policy was recommended: the municipality would not intervene in solid
waste management, if the lower entities alone could accomplish that task unless it is
otherwise.
9.4.4 Establishment of an Efficient System of Cost Recovery
The study established that, the polluter pays principle was not fully adhered too due
to fluctuating income levels amongst the residents who were supposed to pay for the
pollution they cause. As a result, the entrepreneurs in the waste management sector
did not always gain a profit incentive for them to stay in that activity. This was the

227
case because, in most cases, it was impossible for them to recover their investment
cost. From these observations, one conclusion followed that: although the
sustainability of waste management systems requires the establishment of an
effective and efficient cost recovery framework, this condition did not hold in the
study area.
Thus, it was recommended that, the following policy should be formulated so as to
promote efficient cost recovery: fees that reflect affordability and related
consumption that leads to waste should be developed. For households, this typically
meant setting the tariff based on one of the following: size of property, category of
neighborhood (by income) and related property tax, water consumption billings, and
electricity consumption billings. In order to discourage excessive waste generation,
waste generators that regularly produce large quantities should be charged based on
the size of their containers.
The policy should also make it necessary to collect money through a wide variety of
sources. These sources of revenues could be formalized: penalties for littering,
clandestine dumping and other solid waste infractions; license fees from
collectors/haulers of special categories of solid waste (e.g., construction/demolition
debris, medical waste, bulky waste); share of gross revenues from collectors/haulers
having a franchise (i.e., zonal monopoly) for waste collection; revenues from sale of
recyclables (e.g., secondary materials), recovered resources (e.g., compost), and
energy (e.g., steam, electricity) from treatment and disposal facilities; revenues from
sale of avoided or reduced emissions (e.g., methane expressed as carbon dioxide

228
equivalent green house gas); tipping fees from individuals, private establishments,
and waste haulers at transfer, treatment, and disposal facilities; and landfill or
general environmental taxes.
9.4.5 Compliance with the Wastes Hierarchy Principle in Contracts Design
The study established that, the process of contract design did not comply with the
wastes hierarchy principle, which demands that organic wastes should be treated
instead of being sent to the landfill. This happens because; contractors were paid
based on the weight of the waste they transport regardless of the differences in
organic and inert types of wastes. Thus, it was recommended that, the following
policy should be put in place: contractors remuneration, in case a single contractor
who was collecting, transporting and managing the landfill, had to reflect the
hierarchy principle in accordance with the following formula: the price of transport
(per tone) of recycling material and/or organic material to the treatment facilities
would be greater than the price of transport (per tone) of inert material to the
landfill.
9.5 Areas for Further Research
This study had also identified two areas for further research in order to complement
findings from the local resources mobilization. The following questions would need
to be addressed sooner than later.
i) What kind of legal actions and framework should municipalities/towns
depend on to ensure smooth local resources mobilization towards
sustainable solid waste management compliance in developing countries?

229
ii) What level of self-employment creation would involve each
household/local resident in sorting solid waste at source before they
dispose them, pack them into bags, or throw them into collection pits or
dumpsites, in developing countries.

230
REFERENCES
Ame, A. (1993). “Recycling of Solid Waste in Dar es Salaam City.”Unpublished
Report at the Department of Environmental Engineering, Ardhi Institute; Pg
9.
Anecetus H. E. and Magoma F. J. (2005). Status Policy; Legal and Institutional
Framework for Solid Waste Management in Tanzania.Unpublished; Pg 12-
21, Institute; Pg 9-16.
Armstrong, A (1987). “Master Plans for Dar es Salaam, Tanzania”, Habitat
International, Volume 11, No. 2 pp. 133-145
Bandawe, B. (2008). The Guardian News Paper of 12th
July, 2008.ISSN 0856-5422,
ISSUE No. 4137.
Bansal, P. (2005). “Evolving sustainably: Longitudinal study of corporate
sustainable development,” Strategic Management Journal, 26(3):197–218
Bartone, C. R., (2001). “Summary of the strategic Planning Guide to Municipal
Solid Waste Management”, World Bank. Based on Convention
Environmental Sound Management of Wastes (URT, 2003).
Beede D. N. and Bloom D. E., (1995), Economic of the generation and management
of municipal solid waste. NBER working paper series no. 5116, 96 p.
Bennet, J.W. and Tumin, M. M. (1948). Social Life (New York: Knopf).
Bikkenin, N.B. (1980). Socialist Ideology. Translated from the Russian by Yuri
Sviridow. Designed by Inna Borisova. Progress Publisher in Moscow;
Pg120-124.
Bojo, J. P. (1991). “Economics and Land Degradation,” AMBIO, Vol. 20, No 2;
Unpublished; Pg 75-79.

231
Brannen, J, (1992). Mixing methods: qualitative and quantitative research.
Aldershot, England; Avebury; Pg 12.
Brehm, John, and W Rahn. (1997). 'Individual-Level Evidence for the Causes and
Consequences of Social Capital.' American Journal of Political Science 41:
999 - 1023.
Bretton, C. (1990). Private Sector Participation in Municipal Solid Waste Service
Experience in Latin America. A Paper Presented to EPA Conference on
Municipal Solid Was Management. Solutions for the 1990s’. Washington,
DC.
Brewerton P. and Millward L. (2001). Organizational Research Methods, London:
Sage Publications.
Bromley, D. B. (1986). The case-study method in psychology and relate- disciplines.
Chichester: John Wiley & Sons.
Bryman, A. (1998). Social Research Methods, Oxford: Oxford UniversityPress;
p.94.
Bryson, J., Henry, N., Keeble, D. and Martin, R (eds), (1999). The Economic
Geography Reader, Chichester, John Wiley & Sons Ltd.
Burt, Ronald. (1992). Structural Holes: The Social Structure of Competition.
Cambridge: Harvard University Press.
Burton, J. (1983). Picking Losers….? The Political Economy of Industrial Policy.
London, the Institute of Economic Affairs. Pg. 33.
Cavaye, A.L.M. (1996). Case Study Research: A multi-faceted research approach
for IS. Information Systems Journal, 6: 227-242.

232
Changu A.S and Mandara G.R.R. (1994). The Use of Technology in Alleviating
Poverty in Tanzania; REPOA Social Paper 6; Pg 174-186.
Cheema G.S. and Rondinelli D.A. (1983). “Decentralization and Implementation in
Developing Countries.” London.Pg 18
Chinamo, E.B.M. (2006). The Status of Solid Waste Management in Tanzania Urban
Local Authorities. A Paper Presented during the Urban Forum at Karimjee
Hall, in Dar es Salaam.Unpublished; Pg 3-13.
Choguill, C.L (1999). “Community Infrastructure for Low Income Cities: The
Potential for Progressive Improvement”, in: Habitat International,
Volume 23, No.2, pp 289-301.
Coffing R. and Hutchison T. (1974). Needs Analysis Methodology, Amherst
University of Massachusetts; Pg 57-65.
Costanza, R. (2003). A vision of the future of science: Reintegrating the study of
humans and the rest of nature. Futures, 35, 651–671.
Creswell,J.W.(1994). Research design: Qualitative and quantitative
Approaches. London: Sage Publications
Daly, H. (1996). Toward some operational principles of sustainable development.
Ecological Economics, 2, 1–6.
Daniel Hoornweg and Perinaz Bhada-Tata. (2012). What a Waste: A Global Review
of Solid Waste Management. World Bank.
DCC (2004). Environmental Impact Assessment for Proposed Sanitary Landfill at
Pugu-Kinyamwezi, Dar es Salaam (Unpublished)
Doorn M, R. J. and Barlaz M. A., (1995). Estimate global methane emissions from
landfills and open dumps – Project summary. USEPA-EPA/600/ST-

233
95/019,3P.
Drawer, S.(1982). The Transfer of Construction Technique to Developing Countries.
The Role of Expatriate, Architects, Consultants and Contractors, LCHS
Sweden; Pg 91-106.
Dreyfus and Robison, R. (1982).Beyond Structuralism Hermeneuticcs. Harvester
Press Brighton.
Durban Metro (1999). A Paper Presented at UN-habitat Forum about the Major
Causes of Environmental Degradation. Unpublished.
Editor, (2008). The Daily News Paper, June 18th
2008. ISSN 0856-3812. No.9573,p.
3.
Eisenhardt, K. M. (1989). Building theories from case study research. Academy of
Management Review, 14(4), 532-550.
Environmental Sanitation Review (1984). “Recycling of Solid Waste” ENSIC No.
13-14.
Fekade, W. (1994). Local Determinants of Development Sustainability. A Study of
Rural Development Projects in Tanzania. Research Series No 7. Faculty of
Spatial Planning University of Dortmund in Germany; Pg 47-73.
Flybjeg, B. (1999). Case Study Research and Narratology, Course Document,
UCLAS, Dar es Salaam, Tanzania.
Frederickson, J.W. (1983). ‘Strategic Process Research: Questions and
Recommendations’, Academy of Management Review, 8(4), 565-75.
Friedman, J. (1992). “Empowerment: The Politics of Alternative Development.”
Cambridge, Oxford: Blackwell.
Furedy C., (1994), Solid wastes in the waste economy: socio-cultural aspects.

234
Vietnam Environmental Training Program. Publication series report no. 3.
Furedy, C. (1992). Garbage: Exploring Non-Conventional Options in Asia Cities,
Environment and Urbanization, Vol. 4, No. 2. Pg 18-26.
Fox W.F. (1994). Strategic Opinion for Urban Infrastructure Management.Urban
Management Program. UNDP/UNCHS/World Bank. Washngton DC.UMP
18.
Gibbs, A. (1997). “Focus Groups”, Social Research Update, Issue Nineteen.
Department of Sociology, University of Surrey Press.
Gill, J. and Johnson, P. (1997). Research Methods for Managers: 2nd
Edition,
London: Paul Chapman.
Gleason, G. (1997). Administration: The Public Sector in Transition. Ekaterinburg:
Urals Division of the Russian Academy of Science. Gleason, G.,
Administration: The public sector in Transition, Ekaterinburg: Urals
Division of the Russian Academy of Sciences, 1997.
Halla, F. and Majani, B. (1999b).“Innovative Ways for Solid Waste Management
in Dar es Salaam: Towards Stakeholder Partnership”, Habitat
International, Volume 3, pp. 351- 361
Imparato et al (2003). A Paper on Essentials of Community Participation.
Presented at TANGO Annual Meeting in Dar es Salaam. Unpublished.
International Labour Organization (1993). Environment and Natural
Resources for Community Development. ILO Publications.
John W. et al (1993). Community Participation Vs Human Development.
Southern New Humpshire Univrsity, Fuculty of Community Eaconomic
Development.Pg 251.

235
Kaare, S. (2002). “The Role of Privatisation in Providing the Poor Access to Social
Services”: The Case of Solid Waste Collection in Dar es Salaam Tanzania”
in Research on Poverty Alleviation, Mkuki na Nyota Publishers LTD. Dar
es Salaam.
Kalwani, J.D. (2009). Community Participation in Municipal Solid Waste
Management in Informal Settlements: Morogoro Municipality, Tanzania.
Unpublished PhD Thesis, University of Dar es Salaam,
Tanzania.Unpublished Report, Dar es Salaam; Pg 4-19.
Kasseva, M.E. (1996). Waste Recycling and Resources Recovery: A Sustainable
Approach Towards Urban Solid Waste Management. In: Rwegasira, et al.
(Eds). (1996). Legal and Administrative Aspect of SWM. Proceeding and
Papers from the Training Workshop on SWM held in Dododma: 25th –30th
November 1996; UCLAS and NEMC.
Kassenga, G. R M and Mashauri, D. (1996). “Solid Waste Management in Dar es
Salaam. Unpublished Report, Dar es Salaam; Pg 4-19.
Kiewiet, D.R. and McCubbins (1991). M.D., The Logic of Delegation:
Congressional Parties and the Appropriations Process. Chicago: The
University of Chicago Press.
Kinondoni Municipal Council (2008). Profile of Kinondoni Municipality, in Dar es
Salaam.
Kironde, J.M.L. (1999). Policy and Economic Considerations in SWM in Tanzania:
The Governance of Solid Waste Recycling: Unpublished Paper Prepared for
the Workshop on Recycling and Safe Solid Waste Disposal for Municipal

236
Areas in Tanzania, Dar es Salaam 6th
-8th
September 1999; Pg 4-9 and Pg
12- 22.
Kirzner, Israel M (1963). Market Theory and the Price System, Princeton N.J.: Van
Nostrand Company.
Kisoza, L.J.A. (2007). The Role of Local Institutions in the Management of Agro-
Pastoral and Pastoral Systems: A Case Study of Mkata Plains, Kilosa
District and Ngorongoro Conservation Area. A Thesis Submitted in
Fulfilment of the Requirements for the Degree of Doctor of Philosophy
of the Sokoine University of Agriculture; Unpublished; Pg 14-19.
Kombe, W.J. (1994). The Demise of the Public Land Management and the
Emergenceof the Normal Land Market in Tanzania. A case of Dar es Salaam
City, Habitat International, Vol 18, No 1, Pg 23-43.
Kothari, C.R. (2004). Research Methodology, Method and Techniques, 2ndEditions
Wishwa Rreakashan, New Delhi, India; Pg 42 – 58.
Kyessi, A.G. (2002). Community Participation in Urban Infrastructure Provision;
Servicing Informal Settlements in Dar es Salaam, Tanzania: Spring Research
Series No 33, Faculty of Spatial Planning University of Dortmund, Germany;
Pg 231-389.
Kyessi, A.G. (2003). Community - Based Urban Water Management in Fringe
Neighborhoods: The case of Dar es Salaam, Tanzania. Institute of Human
Settlements. UCLAS/ University of Dar es Salaam/UN- Habitat.
Unpublished; Pg 1-6.
L. Giusti, (2009). “A review of waste management practices and their impact on
human health,” in Waste Management. Pg 2227–2239

237
Lerise, F (1998a). “Privatisation of Urban services and Decentralisation in
Tanzania: Decentralisation as an Effective Strategy for Efficient and
Accountable Municipal Management in Tanzania”, A Report Prepared
for UN-Habitat, Nairobi.
Lia L. (2003). Using Focus Groups in Research; Continuum; the Tower Building,
II York Road; MPG Books Ltd; Great Britain; Pg 12-Pg 53.
Liviga A.J (1999). "Decentralized Authority and Capacity for Environmental
Management" A Draft Report to the Institutional and Legal Framework
for Environmental Management Project (ILFEMP)
Lockhart (1987). A Paper Presented at the Non Governmental Organization World
Forum on the Them of Development Economics, Unpublished.
Ludwig von Bertalanffy (1972). “The history and status of general systems theory,”
Academy of Management Journal, 15:411.
Lunderquist, J. (1999). “Tools of Scientific Thinking”. KTH, Stockholm.
Lundq, V. J. (1993). Water Supply and Waste Disposal Strategies for Maars Ambio
22, Focus Publications Ltd; Pg. 442-448.
Lupala, J.M. (1995). “Potentials of Community Based Organizations for Sustainable
Informal Housing Upgrading in Tanzania. The Case Study of Hanna Nassif
Pilot Project in Dar es Salaam City.” Msc. Thesis, Katholieke University
Lauven.
Lyby, E,T.J.and Nkya, T. (1991). “Employment Generation in Urban Works
Programs in Tanzania.” For UNDP and ILO, Dar es Salaam.
Maclaren Virginia (2005). Introduction to Integrated Waste Management, Integrated
Waste Management in Cambodia, Laos and Vietnam: Theory and Practice.

238
Science and Technics Publishing House: Hanoi.
Magimbi, S. (1995). The Conflict between the State and the Grassroots Based
Institutions in Tanzania’s Rural Development. In Magimbi, S. and Foster, P.
(Eds). The Tanzanian Peasantry: Further Studies. Avebury Adershot; Pg18.
Magoma; Majani; Magigi and Mbuya (2005). SWM in the City of Dar es Salaam.
Improving Management Capacity of SWM, through Policy Support in the
City of Dar es Salaam; August 2005, Dar es Salaam, Tanzania; Pg 22-37.
Majani B.B.K.(2000). Institutionalizing Environmental Planning and Management:
The Institutional Economics of Solid Waste Management in Tanzania:
Spring Research Series No 28; Faculty of Spatial Planning; University of
Dortmund, Germany; Pg 1-17; Pg 27-117 and Pg 197-230.
Mang’anya, (2007). The Guardian of August 23rd
, 2007, ISSN 0856-5422; ISSUE
No.3972. Manus, C. (1995). “Dar es Salaam Privatised Refuse Collection
System.” Unpublished Report Submitted to Dar es Salaam City Council; Pg
39-42.
Marcuse, P. (1992). “Why Conversional Self-Help Projects Won’t Work.” In: Mathe
Kosta (ed), Beyond Self-Help Housing. Profil Verlag, Miinchen, Pg 15-21.
Martin , M. (1993). Solid Waste Management in Third World Countries. Pg 69-70.
Unpublished. Maslow, Abraham H. Motivation and personality (3rd edition).
New York: Harper Collins Publishers, 1970.
Max , M. A. O. (1991). The Development of Local Government in Tanzania.
Education Publishers and Distributors Ltd. Dar es Salaam.
Mayo, A.W (2003). “A Recycling of Metals in Tanzania Industries, I.E.T,” Annual
Seminar Proceedings, held in Arusha, December, 2003.

239
McDougal, F.R. (2001a:43). Life Cycle Inventory Tools: Supporting the
Development of Sustainable Solid Waste Management Systems. Corporate
Environmental Energy, 8(2):142-147.
Mehta, M. and Pathak P. (1998). Financing of Urban Services in India: A Case for
Appropriate Pricingand Cost Recovery, in Habitat International, Vol. 22,
No. 4, pp. 487-502
Menger, C. (1950). Principles of Economics, Free Press, Glencoe, Illinois.
Mero, (2008). The Need for CDM Projects. The Guardian News Paper; ISSN 0856-
5422; Issue No: 4137 of Tuesday, March 4th
, 2008.
Meshack, M.V. and Sheuya, S.A. (2001). Trekking the Path of Urban Community
Based Organizations in Tanzania. The Case of Five CBOs in Dar es Salaam.
Dar es Salaam. University Press; Pg 5-21.
Mghweno, J. (1999). “Tanzania Surveyed Plots Program.” In: Payne G.K. (ed).
Low- Income Housing in Developing Countries.” The Role of Sites and
Services and Squatter Upgrading, John Wiley and Sons Ltd. Chichester,UK,
Pg 109- 124.
Minyoi, M.K. (2007). A Research Proposal for Thesis Registration for A Doctorate
Degree. Effectiveness of Plan-Making and Implementation on Urban
Development: The Case of Gaborone City in Botswana. Unpublished; Pg 22.
Mike, L. (1984). Organizational Management. Copyright printed in 1988. Published
by D.C.Health and Company. Published Simultaneously in Canada. Printed
in USA. Internatonal Standard Book Number: 0-669- 09223-1
Miles, M. B. and Huberman, A.M. (1994). Qualitative Data Analysis. SAGE,
London.

240
Mitnick, B.M. (1994). Hazards of Agency. A paper presented during the
proceedings of the American Political Science Association, The New
York Hilton, September 1-4, 1994.
Mniwasa and Shauri, V (2001). Village Titling and Its Legal Ramifications in the
Development of Rural Land Tenure in Tanzania, LLM Thesis,
University of Dar es Salaam.
Moningka Laura (2000). Factors Favouring the Sustainability of Community
Participation. A Literature Review. UWEP Occasional Paper.
Morgan, D.L. (1988). Focus Groups as Qualitative Research. SAGE. London.
Msangi, E.D. (2005). Enhancement of Municipal Service Delivery in Ubarn
Tanzania: Privatization and Emerging Opportunities and Regulatory
Challenges. Cases of SWM in Kawe Ward and Liquid Waste Management
by Truck Operators at Maji Machafu-Mikocheni, Dar es Salaam.
Unpublished; Pg 39-61.
Mugenda, O. and Mugenda, A. (1999). Research Methods; Quantitative and
Qualitative Approaches. African Centre for Technology Studies (ACTS)
Press, Nairobi, pp 233.
Mukandala, R.S (1998). "Decentralization and Democratization in Tanzania".
Occasional Paper No. 46, University of Iowa.
Murdoch, James C., and Todd Sandler. 1997. “The Voluntary Provision of a Pure
Public Good: The Case of Reduced CFC Emissions and the Montreal
Protocol.” Journal of Public Economics 63(2): 331–49.
Musto S. (1985). Endogenous Development: A Myth or A Path? Problems of
Economic Self- reliance in the European Periphery, Berlin: EADI Book
241
Series No.5. Germany Development Institute. Pg 5.
Mwaipopo, L. (2005). Global Rapid Population Growth and Physical Expansioon.
A Seminar Paper Presented in Dar es Salaam. Unpublished.
Mwakalinga, V. (2005).”GIS Application in Cordinating Integrated Urban
Development: The Case of SWC System in Dar es Salaam City”.
Unpublished Bsc.Dissertation, UCLS, University of Dar es Salaam.
Mwasumbi, A. (2003). Access to Privatized Solid Waste Collection by the Urban
Poor in Dar es Salaam in Tanzania. University of Waterloo, Ontario,
Canada, 2003, A PhD Thesis. Unpublished; Pg 153 – 176.
Nahapiet, J. and Ghoshal, S. (1998). "Social capital, intellectual capital, and the
organizational advantage." Academy of Management Review 23:
242.New York, 1952.
Ngeethe, N. (1998). "The Politics of Decentralization through Decentralization in
Kenya. Policy and Practice with Emphasis on District focus for Rural
Development"Occasional Paper No. 45. University of Iowa-
International Programmes.
Ngiloi, A. O. (1992). Study of Solid Waste Management in the City of Dar es
Salaam. Unpublished M Sc Thesis, University of Dar es Salaam.
Nkonoki S.R.(1999). Environment, Technology and Development. Development
Studies. The Open University of Tanzania. First Edition. Pg 39-63.
Nkya, T.J. (1996). “Planning in Practice and Democracy in Tanzania.” PhD.
Dissrtation, Royal Danish Accademy, Copenhagen.
North D, C. (1990). “Institutional Change and Economic Performance.”Cambridge
University Press.

242
Nyangech, N. G. (2001). Management of Solid and Liquid Wastes.African Research
Foundation, Nairobi Printers Ltd, Kenya; Pg 4-9
Oakley, P. et al (1991). Projects With People: The Practice of Participation in Rural
Development, Geneva: ILO Publications, Pg 12.
O'Connell, April and Vincent O'Connell (1992). Choice and growth: The
psychology of holistic growth, adjustment, and creativity. Englewood
Cliffs, NJ: Prentice Hall.
Ofong (2004). Health Problems Resulted from Improper Handling and Disposal of
Solid Wastes in Developing Countries. Unpublished.
Ogburn, W. F. (1929). “The Changing Family,” Publications of the American
Sociological Society, 23(1929): 124-133.
Ogu, L. (2000). Economic and Social Waste Management in the Developing World.
The Centre for Social and Economic Research on Global Environment.
University of Califonia.
Ojeda-Benitez S., Armijo de Vega C. And Ramirez-Barret E., (2003).
Characterization and quantification of household solid wastes in a
Mexican city. Resources, Conservation and Recycling 39,211-222.
Olson, M. (1965). “The Logic of Collective Action: Public Goods and the Theory of
Groups.” Harvard University Press. Cambridge.
Oliver. et al (1991). Projects With People: The Practice of Participation in Rural
Development, Geneva: ILO Publications, Pg 12.
Ostrom, E. (1990). “Governing the Commons: The Evolution of Institutions for
Collective Action.” Cambridge University Press. Cambridge.
Oxfam, GB (2002). Urban Vulnerability. Prospective from South Africa. A Periperi

243
Publication. Chapter Two.Pg 48.Paper Contributed by the (ICC)World
Business Council for Sustainable Development (WBCSD).
Patton, M.Q. (1987). How to Use Qualitative Methods in Evaluation. SAGE
Publications, London.Pg 51-52.
Patton, M.Q. (1990). Qualitative Evaluation and Research Methods. Sage
Publications, Newbury Park, California.
Pearce, et al. (1994). Economic and Social Waste Management in the Developing
World. The Centre for Social and Economic Research on Global
Environment. University of Birmingham. ISSN 0967-8875.
Peterson, M.F. (1998). ‘Embedded Organisational Events: The Units of Process in
Organisation Science’, Organisation Science 9(1).
Peter Berman (1996). A Paper on Development and Implementation of Resources
Mobilization Strategy in September, 1996 at the International Health
Economics Department of Population at Harvard School of Public Health in
U.S.A. Unpublished.
Puttick, Elizabeth (1997). "A new typology and sociological model of religion based
on the needs and values model of Abraham Maslow." Journal of Beliefs and
Values. November, 1997.
Ramanchadran, A. (1990). “Responsibilities and Capabilities for the Management
of Human Settlements.” UNCHS, Nairobi.
Research and Analysis Working Group (2003). Poverty and Human Development
Report 2005. Dar es Salaam Mkuki na Nyota Publishers.
Research on Poverty Alleviation (2003). Economic Policy and Rural Poverty in
Tanzania. A Survey of Three Regions. Report No.02.1.Mkuki na Nyota

244
Publishers.
Research on Poverty Alleviation (2009). Economic Policy and Rural Poverty in
Tanzania. A Survey of Three Regions on the Assessment and Evaluation of
LGRP.
Robbins, S.P. (2003). Organizational Behavior, 10th
Edition. New Delhi: Prentice
Hall of India Private Limited, India.
Robert Kreitner (1986). Management, 3rd
Edition. Boston: Houghton Mifflin
Company, USA.
Robinson, M. (2003). Participation, Local Governance and Decentralization Service
Delivery. Unpublished Workshop Paper, Santiago.
Rwegasira, et al., (1996). Legal and Administrative Aspects of Social Waste
Management. Proceeding and Papers from the Training Workshop on SWM
for Officers Responsible for Municipal Solid Waste Management Held in
Dodoma: 25-30 November 1996. UCLAS and NEMC. Unipublished.
Rwegoshora, H.M.M. (2006). A guide to social research. Dar es Salaa: Mkuki na
Nyota Publishers Ltd, Tanzania.
Samwelson, Paul A. (Theory of Public Expenditure). The Pure Theory of Public
Expenditure. The review of Economic and Statistics, Volume 36, Issue 4
(Nov. 1954) Pg 387-389.
Saunders, M. and Thornhill A. (2000). Research Methods for Business Students,
2nd
Edition, Harlow: Pearson Education.
Saunders, M., Lewis, P. and Thornhill, A. (2000). Research methods for business
students. 2nd edition. Harlow: Pearson Education.
Schübeler, P (1996). “Participation and Partnership in Urban Infrastructure

245
Management”, Urban Management Programme, World Bank,
Washington, DC.
Semboja, J. and Therkilden, O. (Eds) (1995). “Service Provision under Stress in East
Africa.” Centre for Development Research. Copenhagen.
Sheuya, S. (1997). Employment-Intensive Upgrading of Urban Unplanned
Settlements by Communities-Practices and Opportunities in Dar es Salaam,
Tanzania.
Smith, D. J. (1990). Integrated Waste Management-Systems. Are the Only Solution.
Power Engineering, 94(7): 18-25.
Spangenberg, J.H. and Bonniot, O. (1998). Sustainability Indicators: A Compass on
the Road Towards Sustainability, Wuppertal, Wuppertal Institute for
Climate, Environment, Energy. Stackelberg, H. V., The Theory of the
Market Economy, Oxford University Press, Sternners and Bourdeau
(1995).A Paper on the Consequences of Poor Solid Waste Management.
Presented at UN-Habitat Forum. Unpublished.
Sumner, W. G. and Keller, A. G. (1927). The Science of Society (4 Vol.; New
Haven, Cann.: Yale University Press).
Suzuki, H., Dastur, A., Moffatt, S., Yabuki, N., & Maruyama, H. (2010). Eco2 cities:
Ecological cities as economic Cities. Washington, DC: The World Bank.
Tanzania of Non-Governmental Organizations (2005). Organizational Development
Manual;Sustain Your NGO, Volume 11 (Governance and Management);
Colour Print (T) Ltd; in Dar es Salaam, Pg 1-12.
Tanzania of Non-Governmental Organizations (2007). Report on Pilot Participatory
Service Delivery Assessment on Agriculture, Health, Gender and

246
HIV/AIDS in Kilosa and Same Districts. Pg 41
Tchobanoglous, G. T., Eliassen, R.H (1977). Solid wastes: Engineering principles
and management issues, 1977
The National Environmental Act, (1993). Edition 2002 No. 19. Principal
Legislation. Printed by the Governmental Printer, Dar es Salaam. Pg 9-13.
Tibaijuka, A. K (1998). “The Social Service Crisis of the 1990s: Strategies for
Sustainable Systems in Tanzania,” Proceedings of the Second Convocation
Seminar of the University of Dar es Salaam: 3rd
–4th April
, 1991, Nkrumah
Hall, University of Dar es Salaam
Tibaijuka, A. K (2007). “The Social Service Crisis of the 2000s: Strategies for
Sustainable Solid Waste Management Systems in Tanzania. Unpublished.
Thompson, A. (2007). Principal Problems: UN Weapons Inspections in Iraq and
Beyond. A paper presented at the Annual National Conference of the
Midwest Political Science Association, Chicago, April 12-15, 2007.
Turner, R.K (1997). “Municipal Solid Waste Management: an Economic
Perspective”, in A.D. Bradshaw, et al., (eds.) (1997), The Treatment and
Handling of Wastes, Chapman Hall, London, pp. 83-102..
UNDP, (1997). Decentralized Governance Programme: Strengthening Capacity for
PeopleCentered Development, Management Development and Governance
Division, Bureau for Development Policy, September 1997.
UNEP (1992). Basel Convention on the Control of Transboundary Movements of
Hazardous Wastes and their Disposal, Basel: Switzerland.
UNEP(2005). Solid Waste Managtement. Volume II: Regional Overviews and
Information Sources.

247
United Republic of Tanzania (2006). Kinondoni Municipality Population
Projections.
United Nations Centre for Human Settlement (1996). An Urbanizing World: Global
Report on Human Settlements. Oxfords University Press.
United Nations Centre for Human Settlement (1996). Managing the Sustainable
Growth and Development of Dar es Salaam: Progress Report.
UNCHS,Nairobi.
United Nations Centre for Human Settlement (2001). Cities in A Globalising World:
Global Report on Human Settlements 2001, Earthscan Publications Ltd.
London and Sterling, VA.
United Nations Centre for Human Settlement (2001b). The State of the World’s
Cities 2001, UN-Habitat, Nairobi Past/Present/Future Prospects. Earth Print;
UK. Pg 29
United Nations Development Program (1997). Developing World Survey of 151
Cities on Solid Wastes Management. UNDP Publications.
United Nations-Habitat (2010). Solid Waste Management in the World’s Cities:
Water and Sanitation in the World’s Cities.
United Nations Development Program (2002). Chapter 1: Sustainable Development:
The Local Context Document(s) 3 of 4.United Nations Commission for
Sustainable Development. International Conference on Freshwater. Bonn,
Germany, 3-5 December 2002. Discussion.
United Republic of Tanzania (2002). Tanzania Census, 25th
August to 4th
September
2002.Volume II, Mkuki na Nyota, Dar es Salaam; Pg 30.
United Republic of Tanzania (1992). Environmental Management Acts No. 7 and 8.

248
United Republic of Tanzania (1993). The National Environmental Act, 1993
(Edition 2002) No. 19 of 1983) (Principal Legislation Printed by the
Governmental Printer, Dar es Salaam; Pg 9-13).
United Republic of Tanzania, (2002) and (2008). Population data/census.
Government Printer.
United Republic of Tanzania (1996). Local Government Reform Agenda 1996-
2000;Government Printers, Dar es Salaam; Pg 5-17
United Republic of Tanzania (2005). National Strategy for Growth and Reduction of
Poverty.Vice Presidents Office; Pg 46
United Republic of Tanzania (2006). Local Government Fiscal Review. Prime
Ministers Office- Regional Administration and Local Government; Pg 37.
United Republic of Tanzania (2006). Population and Housing Census. Government
Printer, Dar es Salaam; Pg 12-39.
United Republic of Tanzania(1997). The National Environmental Policy.
Government Printer, Dar es Salaam; Pg 9.
Wangwe, S. (1993). Technology and Development, Economics and Social Research
Foundation Publications.
Wolf, C. Jr. (1986). Markets or Governments: Choosing Between Imperfect
Alternatives, Santa Monica, CA: The Rand Corporation.
World Bank (1994). World Development Report, 1994. Infrastructure for
Development. Oxford University Press for the World Bank.Oxford.
World Bank (1995).Africa: A Frame Work for Integrated. Coastal Zone
Management Land Water and Natural Habitats; Unpublished; Pg 69-76.
World Bank (1996). World Resources 1996-1997, Oxford University Press, New

249
York World Bank (1997), World Resources, International Institute for
Environment and Development in Collaboration with United Nations
Environment Programme, New York.
World Bank. (2005). Empowering People By Transforming Institutions: Social
Development in World Bank Operations. Social Development Department.
World Health Organization (1971). Environmental Expert Committee. Geneva,
Unpublished; Pg 16-21.
Yin, R. K. (2003). Case Study Research; Design and Methods. Third Edition; Sage
Publication Ltd; MSA; Pg 25-39.
Zeleke, Befekadu (2003). African Local Government Action Forum (ALGAF 111);
Gender Relations Paper. Unpublished.

250
APPENDECES
Appendix 1: Rapid Settlement (Mitaa) Appraisal (Survey) in Kinondoni
Municipal in Dar es salaam- 2008
1. Informal Settlements Typology
Tools used for settlements typology were two, that is, physical observations and
checklist questions as per the study variables and indicators for analyzing informal
settlements. Typology for selection of in-depth case studies was as follows:
1.1 Solid Waste Management Services System Existing
Description Yardstick Score points
On site collection exist Routine collection 8
Informal collection Occasional collection 3
Crude dumping No collection system at all 0
Source: Own construct, 2007
1.2 Presence of Institutions Dealing with SWC
Community groups available (at grass roots)
and others(annotate them) e.g CBOs; NGOs;
& others(list them)
Formal score points:7
Informal score points:2
None score points: 0
Source: Modified from Kyessi, 1999
1.3 Presence (PPP) Involved in SWM at Ward Levels
PPP services plus Municipal
Sole PPP
PPP plus CBOs/NGOs
PPP plus others(list them)
Available PPP+KMC score points:6
Sole PPP score points 4
PPP +CBOs/NGOs score points 3
Occassional (all the above) points 2
PPP+ others score point 1
None at all score points: 0
Source: Own construct, 2007

251
1.4 Presence of Permanent Disposal Dumpsites
Types of SWC dumping Score points
Official permanent dumpsites Score points:5
Temporary dumpsites Score points:2
Crude dumpsite Score points: 0
Source: Own construct, 2007
1.5 State of the Environmental Surroundings/Neighborhood
Stages Clarification Score points
The infancy Stage Relatively clean environment with small
solid waste piles
Score point:4
The booming stage Scattered piles of solid waste accumulation Score points:2
The saturation stage Visible solid waste accumulation piles and
filthy smell
Score points:1
Source: Modified from Kyessi, 1999
1.6 Economic Status of Mitaa/Settlements
Main indicators Level of incomes
Status of settlement based on presence of economic
activities
Status of settlement based on Municipal services
provision
Status of settlement based on types of houses & all
related services
Mixed income score points: 3
Medium income score points: 2
Low income score point: 1
Source: Modified from Kyessi, 1999
Key:
Low Income: Less than one U$D per day
Medium Income: More than one but more than five U$D per day.

252
Mixed Income: Five U$D and above per day.
1.7 Physical Development and Types of Settlements
Main indicators and score points
Presence of planned houses/roads etc: score points: 2
Presence of mixed houses(planned & unplanned houses: score point: 1
Presence of unplanned settlement/houses: score point: 0
Source: Modified from Kyessi, 1999
1.8 Level of Economic & Social Development
Main indicators Level of assessment
Accessable roads/water/schools/electricity etc Score points: 2
Mixiture of the above infrastructure/services Score point: 1
Poor/no roads/service water etc Score point: 0
Source: Own construct, 2007
1.9 Selection Table
Names of
urban Ward
Names of Mitaa Index numbers &Weighing matrix
1.1 1.2 1.3 1.4 1.5 1.6 1.7 1.8 Total
score
1. Makurumla 1. Kimamba 3 2 3 2 1 2 1 1 15
2. Mianzini 3 2 3 2 1 1 1 1 14
3. Kwa Jogoo 3 2 3 2 1 1 1 1 14
4. Mburahati Kwa
Jogoo
3 2 3 2 1 1 1 1 14
5. Kilimahewa 3 2 3 2 1 1 1 1 14
6. Sisi Kwa Sisi 3 2 3 2 1 2 1 1 15
7. Kagera
Mikoroshoni
3 2 3 2 4 1 1 1 17
8. Kagera 3 2 3 2 4 2 1 1 18
Grand total 24 16 24 16 14 11 8 8 121
2. Ndugumbi
1 Ndugumbi
Vigaeni
8 2 3 4 2 1 1 1 22
2. Makanya 8 2 3 4 2 1 1 1 22
3. Kagera
Mikoroshoni
8 2 3 4 2 1 1 1 22
4. Mpakani 8 2 3 4 2 1 1 1 22
Grand total 32 8 12 16 8 4 4 4 88

253
Names of
urban Ward
Names of Mitaa Index numbers &Weighing matrix
1.1 1.2 1.3 1.4 1.5 1.6 1.7 1.8 Total
score
2. Pakacha 3 2 2 1 2 1 1 1 13
3. Kwa Pakacha 3 2 2 1 1 1 1 1 12
4. Muharitani 3 2 0 1 1 1 1 1 10
5. Mtogole 3 2 0 1 2 2 1 1 12
6. Mkunduge 3 2 0 1 1 1 1 1 10
7. Kwa Tumbo 3 2 0 1 1 1 1 1 10
Grand total 26 19 6 8 10 9 8 7 93
4.
Mwananyamala
1. Mwinjuma 3 2 6 2 1 1 1 1 17
2. Kambangwa 8 2 6 2 2 2 1 1 24
3. Msisiri “B” 3 2 6 2 2 2 1 1 20
4. Msisiri”A” 3 7 6 2 2 2 1 1 24
5. Bwawani 3 7 6 2 2 2 1 1 29
6. Kwa Kopa 8 7 6 2 1 2 1 1 23
7.
Msisiri”B”Inst.
Pop
3 7 6 2 2 2 1 1 24
Grand total 31 34 42 14 12 13 7 7 161
5. Msasani 1. Makangira 8 2 6 2 4 3 1 1 27
2. Mikoroshini 8 2 6 0 1 2 1 1 21
3. Bonde la Mpunga 8 2 6 0 1 1 1 1 22
4. Masaki 8 2 6 2 4 3 2 2 29
5. OysterBay 8 2 6 2 4 3 2 2 29
Grand total 40 10 30 6 14 12 7 7 128

254
Selection Table (continues)
Names
of urban
Ward
Names of Mitaa 1.1 1.2 1.3 1.4 1.5 1.6 1.7 1.8 Total
score
6.
Kinondon
i
1. Kinondoni Mjini 8 2 6 2 4 3 2 2 29
2. Kinondoni Shamba 8 2 6 0 1 2 1 1 21
3. Kumbukumbu 8 2 6 0 1 1 1 1 20
4. Ada Etate 8 2 6 2 4 3 2 2 29
Grand total 32 8 24 4 10 9 6 6 99
7.
Mzimuni
1. Makumbusho 8 2 3 2 2 1 1 1 20
2. Idirisa 3 2 3 2 2 1 1 1 15
3. Mwinyi Mkuu 3 2 3 2 2 1 1 1 15
4. Mtambani 3 2 3 2 2 1 1 1 15
Grand total 17 8 12 8 8 4 4 4 65
8.
Kigogo
1. Kigogo Mbuyuni 3 0 0 5 1 2 1 0 12
2. Kigogo Kati 3 0 0 5 1 2 1 0 12
3. Kigogo Mkwajuni 3 0 0 5 1 1 1 0 11
Grand total 9 0 0 15 3 5 3 0 35
9.
Mabibo
1. Mabibo 8 2 3 2 2 3 1 1 22
2. Jitegemee 8 2 3 2 2 3 1 1 22
3. Kanuni 3 2 3 2 2 3 1 1 17
4.Azimio 8 2 3 2 2 3 1 1 22
5. Matokeo 3 2 3 2 2 3 1 1 17
Grand total 30 10 15 10 10 15 5 5 100
10.
Manzese
1. Kilimani 8 2 6 2 2 2 1 1 24
2. Mvuleni 8 2 6 2 2 2 1 1 24
3. Mnazi Mmja 3 2 6 2 2 2 1 1 19
4. Uzuri 3 2 6 2 2 2 1 1 19
5. Muungano 8 2 6 2 2 2 1 1 24
6. Midizini 3 2 6 2 2 2 1 1 19
Grand total 33 12 36 12 12 12 6 6 129
11.
Ubungo
1. Ubungo N.H.C 3 2 3 2 2 2 1 2 17
2. Ubungo Kisiwani 3 2 3 2 2 2 1 0 15
3. Ubungo Kibo 8 2 3 2 2 2 1 2 22
4. Ubungo Msewe 3 2 3 2 2 2 1 0 15
5. Chuo Kikuu 8 2 3 2 2 2 1 2 22
6. Chuo Kikuu Inst. Pop. 8 2 3 2 2 2 1 2 22
Grand total 33 12 18 12 12 12 6 8 113

255
Selection Table (continues)
Names of urban
Ward
Names of Mitaa 1.1 1.2 1.3 1.4 1.5 1.6 1.7 1.8 Total
score
12. Kawe 1. Mzimuni 8 7 6 2 1 1 1 1 27
2. Ukwamani 8 7 6 2 1 1 1 1 27
3. Mbezi Juu 8 2 6 4 3 2 1 1 27
4. Makongo 8 2 6 4 3 1 1 1 26
5. Mlalakuwa 8 2 6 2 3 1 1 1 24
6. Changanyikeni-
Mbuyuni
8 2 6 2 2 1 1 2 24
7.Changanyikeni-
Kati
8 2 6 2 2 1 1 2 24
8. Changanyikeni 8 2 6 2 2 1 1 2 24
9. Lugalo 8 2 6 4 3 1 1 2 27
10. Mbezi Juu
Inst.Pop.
8 2 6 2 3 2 1 1 25
11. Changanyikeni
Inst.Pop.
8 2 6 2 1 1 1 2 23
Grand total 88 32 66 28 24 13 11 16 278
13. Makuburi 1. Mwongozo 3 2 2 2 1 1 1 1 13
2. Kibangu 3 2 2 2 1 1 1 1 13
3. Makoka 3 2 2 2 1 1 1 1 13
Grand total 9 6 6 6 3 3 3 3 39
14. Mburahati 1. Mburahati Barafu 3 2 2 2 1 1 1 1 13
2. Kisiwani 3 2 2 2 1 1 1 1 13
3. Mburahati N.H.C 3 2 2 2 1 1 1 1 13
Grand total 9 6 6 6 3 3 3 3 39
15 Makumbusho 1. Kisiwani 8 2 2 2 2 1 1 2 20
2. Mchangani 8 2 2 2 2 2 1 2 21
3. Minazini 8 2 2 2 2 2 1 2 21
4. Makumbusho 8 2 2 2 2 2 2 2 22
5. Mbuyuni 8 2 2 2 2 2 1 2 21
Grand total 40 10 10 10 10 9 6 10 105
16. Sinza 1. Sinza”C” 8 7 6 2 4 3 2 2 34
2. Sinza “A” 8 7 6 2 4 3 2 2 34
3. Sinza “B” 8 7 6 2 4 3 2 2 34
4. Sinza Block”E” 8 7 6 2 4 3 1 2 33
5. Sinza Block”D” 8 7 6 2 4 3 1 2 33
Grand total 40 35 30 10 20 15 8 10 168
17. Kijitonyama 1. Bwawani 3 7 2 2 2 2 1 2 21
2. Ali-Maua”A” 3 7 2 2 2 2 0 2 20
3.Ali-Maua”B” 3 7 2 2 2 2 1 2 21
4. Kijitonyama 8 7 2 2 2 3 1 2 27
5. Mpakani”A” 8 7 2 2 2 3 1 2 30
6. Mpakani”B” 8 7 2 2 2 3 1 2 30
7. Mwenge 8 7 2 2 2 3 1 2 28
Grand total 38 49 14 14 14 18 6 14 167

256
Selection Table (continues)
Names of
urban
Ward
Names of Mitaa 1.1 1.2 1.3 1.
4
1.5 1.6 1.7 1.
8
Total
score
18. Kimara 1. Kimara
Matangini
3 2 2 2 2 2 0 1 14
2. King’ongo 3 2 2 2 2 2 0 1 14
3. Kimara-Baruti 3 2 2 2 2 2 0 1 14
4. Baruti 3 2 2 2 2 2 0 1 14
5. Mavurunza 3 2 2 2 2 2 0 1 14
6. Kimara “B” 3 2 2 2 2 2 0 1 14
Grand total 31 12 12 12 12 12 0 6 84
19.
Mikocheni
1. Regent Estate 8 2 2 2 2 3 1 1 21
2. Mikocheni”A” 8 2 2 2 2 3 1 1 21
3. Mikocheni”B” 8 2 2 2 2 3 1 1 21
4. Regent Estate
Inst.Pop.
8 2 2 2 2 3 1 1 21
5. Mikocheni “B”
Inst. Pop
8 2 2 2 2 3 1 1 21
Grand total 40 10 10 10 10 15 5 5 105
20.
Hananasif
1. Hananasif 8 7 12 12 8 9 10 10 76
2. Mkunguni 8 7 8 8 8 6 7 6 58
3. Kisutu 8 7 6 6 6 4 6 7 50
Grand total 24 21 26 26 22 19 23 23 184
Source: Field work, 2007

257
Appendix 2.1: KMC-2008 (List of Urban Wards Contractors) and their
Capacity
S/N Name of
Wards
Mitaa/Service Area Code
no.
Contractors
Name
No. of Trucks (6-
8m3 )
1. Magomeni Makuti “A”& “B”,
Idirisa, Dosi, Suna
1 No
Contractor
NIL
2. Ndugumbi The Whole Ward 2 Sweet corner
Envirocare
1
3. Mzimuni Mtambani,Makumbush
o, Idirisa Mwinyimkuu
3 Sweet corner
Envirocare
2
4. Manzese Uzuri, Muungano,
Mvuleni &Midizini
4 A No
Contractor
Nil
Kilimani 4B No
Contractor
Nil
Mnazi Mmoja 4C Kurasini
Construction
Co Ltd
2
5. Sinza Sinza Block “A” &” B” 5A Kimangele
Enterprises
2
Sinza Block “C” 5B No
Contractor
Nil
Sinza Block” D” &”E” 5C No
Contractor
Nil
6. Makurumla Kwajogoo,Kilimahewa
& Mianzini
6A TTM Group 2
Sisi kwa sisi 6B SIMAYE
Group
1
Kimamba & Kagera 6C No
Contractor
Nil
7. Ubungo Ubungo NHC 7A No
Contractor
Nil
Ubungo Kisiwani 7B Umoja wa
Wazee
Kinondoni
1
Msewe,Kibo & Chuo
Kikuu
7C No
Contractor
Nil
8. Kimara Kimara Matangini,
Kimara” B”, Kimara
Baruti, & Mavurunza
8A NIMA
Enterprises
3
Baruti 8B JASIKA
Enterprises
1
9. Kigogo The Whole Ward 9 No
Contractor
Nil
10. Mabibo Matokeo & Kanuni 10A No
Contractor
Nil
Mabibo & Jitegemee 10B Tropical Eng.
Ser.& Co.
2
11. Makuburi Kibangu,Makoka
&Mwongozo
11 Tropical
Eng.Ser. &
Co
2
12. Kinondoni The Whole Ward 12 Kinondoni
Enviro
(KENS)
2

258
S/N Name of
Wards
Mitaa/Service Area Code
no.
Contractors
Name
No. of Trucks (6-
8m3 )
13. Hanna-Nissif The Whole Ward 13ªA
13B
Kisutu
Women
Trust Fund
(KIWODET)
Mazingira
Group
3
1
14. Msasani Bonde la
Mpunga,Makangira &
Mikoroshini
14A CLN
Electrical &
General
Construction
Ltd
1
Osterbay &Masaki 14B 1994
Environment
al Protection
(Mazingira)
3
15. Mikocheni Regent Estate,
Mikocheni “A”&”B”
15 Lyoto and
Company
Ltd
3
16. Tandale The Whole Ward 16 No
Contractor
Nil
17. Kijitonyama The Whole Ward 17A No
Contractor
Nil
The Whole Ward 17B No
Contractor
Nil
The Whole Ward 17C No
Contractor
Nil
18. Mwananyamal
a
Kambangwa &
Mwinyijuma
18A Kinondoni
Environment
alists
(KENS)
1
Msisiri “A” &”B” 18B No
Contractor
Nil
Bwawani 18C No
Contractor
Nil
Kwa Kopa 18D No
Contractor
Nil
19. Makumbusho The Whole Ward 19 Mazingira
Makumbusho
Group
4
20. Kawe Ukwamani 20A No
Contractor
Nil
Mzimuni 20B No
Contractor
Nil
Mbezi Chini 20C No
Contractor
Nil
Mbezi Juu 20D IYHANE
Sanitary &
Supplies
1
Mlalakuwa 20E Mkunguni
Group
“2003”
1
Makongo 20F No
Contractor
Nil
Source: Kinondoni Municipality, 2008

259
Appendix 2.2: Estimates of Acquired Local Materials in Quantity and Values
from Individual Scavengers from year 2004 to 2008
Year Materials Tons %
Value in
TZS1,000 %
2004-
2008 Containers 550,000 9.6 383,250 8.0
2004-
2008
Other
Plastics 1,390,000 24.3 754,700 15.8
2004-
2008
Plastic
Bottles 2,257,000 39.4 1,416,450 29.6
2004-
2008
Plastic
Buckets 1,530,000 26.7 2,227,300 46.6
Sub-Grand
Total 5,727,000 100.0 4,781,700 100.0
2004 All materials 920,000 16.1 168,400 3.5
2005 All materials 857,000 15.0 155,800 3.3
2006 All materials 1,130,000 19.7 188,800 3.9
2007 All materials 1,290,000 22.5 197,300 4.1
2008 All materials 1,530,000 26.7 4,071,400 85.1
Sub-Grand
Total 5,727,000 100.0 4,781,700 100.0
Source: Field work, 2008/09

260
Appendix 2.3: Estimates of Acquired Local Materials in Quantity and Values
from Agents in year 2004 to 2008
Year Materials Tons %
Value in
TZS.Millions In % age
2004-2008
Assorted
waste 7,197 0.1 413,650 0.0
2004-2008 Billets 739,540 11.6 1,964,438 11.5
2004-2008
Brown
Waste 9,563 0.2 16,914 0.1
2004-2008 Codri Roll 729,640 11.5 182,818 10.7
2004-2008
Hot roll
Coils 720,595 11.3 188,758 11.0
2004-2008 Kart waste 8,057 0.1 1,140 0.1
2004-2008 Steel Scraps 4,134,905 65.0 1,138,731 66.5
2004-2008 White waste 7,546 0.1 1,991 0.1
Sub-Grand
Total 6,357,043 100.0 1,711,990 100.0
2004
All
materials 1,271,927 20.0 200,883 11.7
2005
All
materials 1,537,210 24.2 284,527 16.6
2006
All
materials 1,687,415 26.5 331,295 19.4
2007
All
materials 1,012,638 15.9 488,024 28.5
2008
All
materials 847,853 13.3 407,259 23.8
Sub-Grand
Total 6,357,043 100.0 1,711,990 100.0
Source: Field work, 2008/09

261
Appendix 3.1: Trends of Estimates of SW Generated & Actual Amount
Collected in Tones per day in Terms of Wards in KMC from 2000-2007
S/N Name of Wards
Estimates
of SW
generated
per day
Actual
amount
of SW
collected
per day
SW
collected
per day in
percentage
wise
Remarks/reasons
for rise & falls in
SW collections
per day
1. Tandale 95.0 38.0 40.0% Trailer available
2. Msasani 95.0 74.4 78.3% Trailer available
3. Kawe 162.0 38.0 23.4% Trailer available
4. Kunduchi 88.0 30.0 34.0% Other means
5. Mwananyamala 114.0 18.0 15.7% Trailer available
6. Kinondoni 55.0 46.0 23.6% Trailer available
7. Magomeni 36.0 16.3 45.3% Trailer available
8. Ndugumbi 38.0 32.0 84.2% Trailer available
9. Makurumla 114.0 55.0 48.2% Trailer available
10. Mabibo 85.0 53.2 62.6% Trailer available
11. Manzese 131.4 52.0 30.9% Trailer available
12. Ubungo 85.0 38.0 44.7% Trailer available
13. Mzimuni 51.4 46.3 90.0% Trailer available
14. Sinza 105.0 48.6 46.3% Trailer available
15. Mburahati 101.0 27.8 39.4% Trailer available
16. Kigogo 32.4 21.0 41.7% Within di/site
17. Makuburi 42.0 27.0 64.3% Other means
18. Hannanasifu 74.0 45.0 60.8% Trailer available
19. Mikocheni 84.0 52.0 61.8% Other means
20. Kijitonyama 101.0 39.8 38.3% Trailer available
21. Makumbusho 108.5 25.8 59.4% Trailer available
22. Kimara 101.0 40.0 38.6% Other means
23. Bunju 32.4 13.0 40.1% Other means
24. Mbweni 11.4 5.5 40.7% Other means
25. Kibamba 25.0 9.8 39.2% Other means
26. Mbezi 30.5 12.0 39.4% Other means
27. Goba 38.0 15.0 39.5% Other means
28. Total 2,026 1,155 57.0% Almost
collection
Key: Within di/site= within disposal site
Source: Field work, 2008
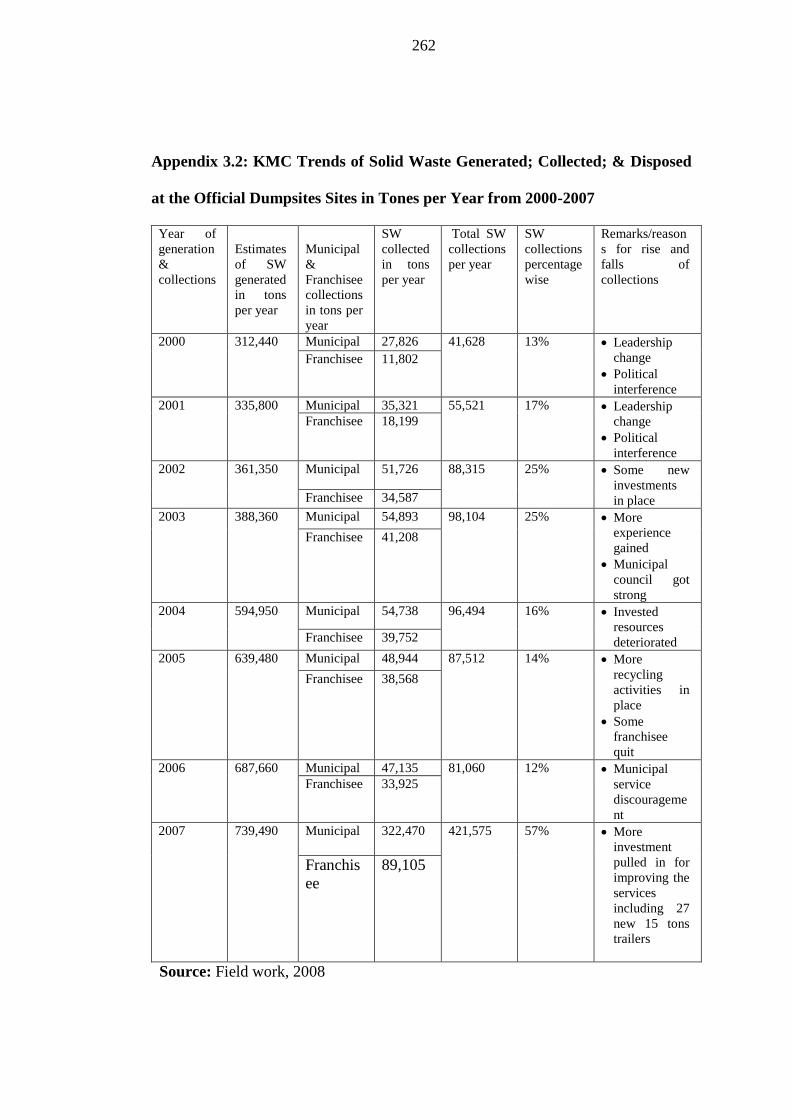
262
Appendix 3.2: KMC Trends of Solid Waste Generated; Collected; & Disposed
at the Official Dumpsites Sites in Tones per Year from 2000-2007
Year of
generation
&
collections
Estimates
of SW
generated
in tons
per year
Municipal
&
Franchisee
collections
in tons per
year
SW
collected
in tons
per year
Total SW
collections
per year
SW
collections
percentage
wise
Remarks/reason
s for rise and
falls of
collections
2000 312,440 Municipal 27,826 41,628 13% Leadership
change
Political
interference
Franchisee 11,802
2001 335,800 Municipal 35,321 55,521 17% Leadership
change
Political
interference
Franchisee 18,199
2002 361,350 Municipal 51,726 88,315 25% Some new
investments
in place Franchisee 34,587
2003 388,360 Municipal 54,893 98,104 25% More
experience
gained
Municipal
council got
strong
Franchisee 41,208
2004 594,950 Municipal 54,738 96,494 16% Invested
resources
deteriorated Franchisee 39,752
2005 639,480 Municipal 48,944 87,512 14% More
recycling
activities in
place
Some
franchisee
quit
Franchisee 38,568
2006 687,660 Municipal 47,135 81,060 12% Municipal
service
discourageme
nt
Franchisee 33,925
2007 739,490 Municipal 322,470 421,575 57% More
investment
pulled in for
improving the
services
including 27
new 15 tons
trailers
Franchis
ee
89,105
Source: Field work, 2008

263
Appendix 3.3: Waste generation and collection in Dar es Salaam City from
1993 to 2007
Years Generation per day in
tones
Collection
per day in
tones
% of collected
wastes
1993 1480 148 10
1994 1500 185 12
1995 1620 230 14
1996 1772 260 15
1997 1850 300 16
1998 1980 380 20
1999 2144 454 21
2000 2200 354 16
2001 2130 476 21
2002 2400 719 30
2003 2600 792 30
2004 3091 849 27
2005 3156 900 28
2006 1554 404 26
2007 3350 906 37
Source: Field work, 2008

264
Appendix 4.1: Contracts between KMC and Private Contractors
(a). Contract document:
KINONDONI MUNICIPAL COUNCIL
CONTRACT NO...............................................................................
AN AGREEMENT FOR REFUSE COLLECTION AND DISPOSAL
THIS CONTRACT is made this ………………………. day of
………………………. BETWEEN the Kinondoni Municipal Council of P.O. Box
31902 Dar es Salaam (hereinafter called “the Authority”) of the one part.
AND
M/S ………………………………………………………………………….of P.O.
Box …………………………Dar es Salaam (hereinafter called “The Contractor”) of
other part:
WHEREAS:
1. The Authority is desirous to privatize cleansing services, Refuse collection
and disposal within the Kinondoni Municipality;

265
AND WHEREAS
2. The contractor has tendered bids to perform such said services in areas
specified under Appendix ‘B’ on the terms and conditions contained in this
Agreement;
WHEREFORE
3. The Authority has agreed to engage the contractor to carry out the services
stipulated in the contract.
NOW THEREFORE THE PARTIES have agreed as follows:-
1. Interpretation:
In this contract, words and expressions shall have the same meaning as are
assigned to them except where the context otherwise requires.
2. The following documents shall form and are to be read and construed as part
of the contract for the performance of services by the contractor.
(a) Condition of the contract
(b) Service specifications- Appendix ‘A’
(c) Schedule of services
(d) Vehicles and equipments for performing services
(e) Area of operation – Appendix ‘B’
3. The contractor undertakes to diligently and promptly perform the services in
accordance with the provision of contract and to the satisfaction of the
Authority and in particular shall perform the following obligations:-
i. To collect, transport and dispose or dump solid waste into approved
sites.

266
ii. To cleanse and remove sand from all streets within its area of
operation
iii. To clean open drains
iv. To remove dead animals from the relevant streets and roads, and
v. To collect refuse collection charges directly from the residents or
trade facilities, in accordance with the specified rate chargeable as
indicated in Schedules I – V of the Kinondoni Municipal
Commission (Waste Management and Refuse Collection) By-laws,
2000
4. In consideration of and in reciprocal for the contractor’s undertaking herein,
the Authority authorizes the contractor to collect and appropriate to itself the
Refuse Collection charges, in a manner and in respect of the areas set out in
the contract.
5. The contract shall be deemed to have commenced on the ……… day of May
2003 and shall remain in force for a period of two years from the
commencement date, unless sooner terminated and is renewable for a further
term in accordance with terms and conditions to be determined by the
parties.
IN WITNESS WHEREOF the parties have caused to agreement this
………………………………… day of ………………………… be executed the
day and years first before.

267
SIGNED and DELIVERED by
the said ............................................................................................................
MUNICIPAL MAYOR
And.................................................................................................................................
MUNICIPAL DIRECTOR
For and on behalf of the
KINONDONI MUNICIPAL COUNCIL
This …………………day of ……………..
.....................................................................
In presence of
Signature
…………………………….............................................................................
Name..........................................................................................................................
Designation: MUNICIPAL SOLICITOR
KINONDONI MUNICIPAL COUNCIL
Postal Address Box 31902
DAR ES SALAAM.

268
SIGNED and DELIVERED by
the said ………………………… …………………………………
…………………………………... CONTRACTOR
For and on behalf
………………………………………
………………………………………
………………………………………
This …………………day of ……………..................................
In presence of
Signature………………………………….
Name: …………………………………….
Designation: ………………………………
Postal Address: …………………………..
Source: KMC, 2007
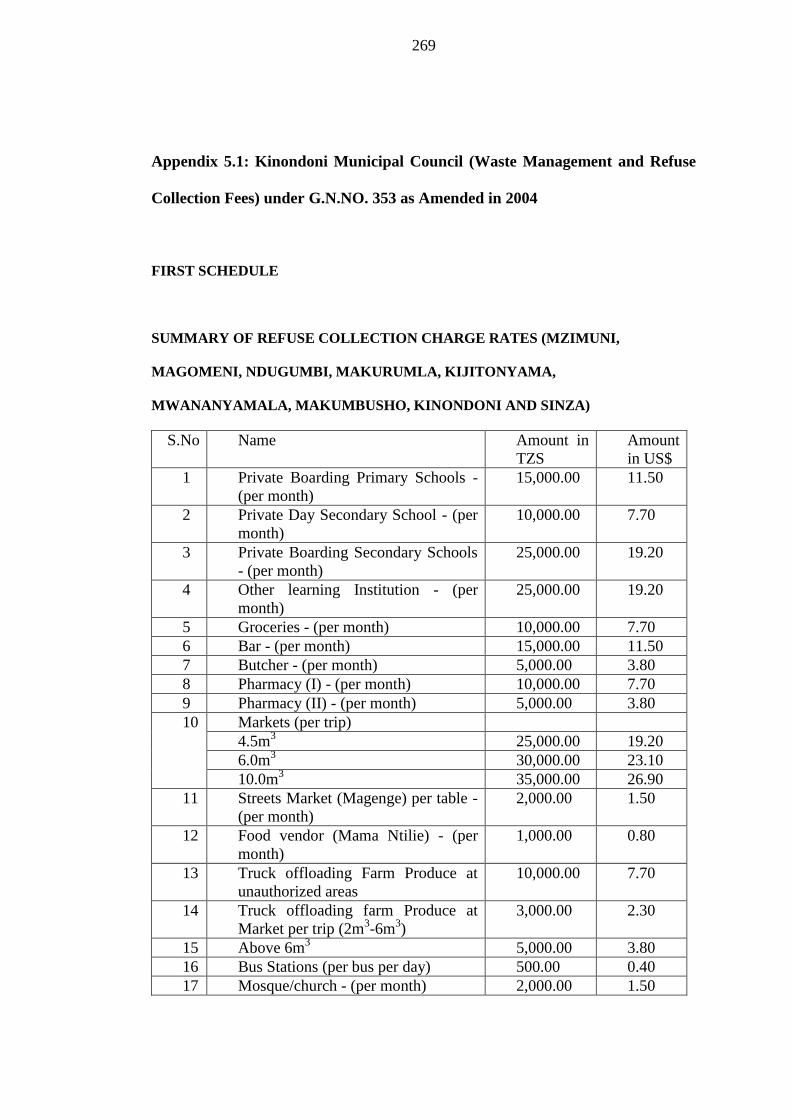
269
Appendix 5.1: Kinondoni Municipal Council (Waste Management and Refuse
Collection Fees) under G.N.NO. 353 as Amended in 2004
FIRST SCHEDULE
SUMMARY OF REFUSE COLLECTION CHARGE RATES (MZIMUNI,
MAGOMENI, NDUGUMBI, MAKURUMLA, KIJITONYAMA,
MWANANYAMALA, MAKUMBUSHO, KINONDONI AND SINZA)
S.No Name Amount in
TZS
Amount
in US$
1 Private Boarding Primary Schools -
(per month)
15,000.00 11.50
2 Private Day Secondary School - (per
month)
10,000.00 7.70
3 Private Boarding Secondary Schools
- (per month)
25,000.00 19.20
4 Other learning Institution - (per
month)
25,000.00 19.20
5 Groceries - (per month) 10,000.00 7.70
6 Bar - (per month) 15,000.00 11.50
7 Butcher - (per month) 5,000.00 3.80
8 Pharmacy (I) - (per month) 10,000.00 7.70
9 Pharmacy (II) - (per month) 5,000.00 3.80
10 Markets (per trip)
4.5m3 25,000.00 19.20
6.0m3 30,000.00 23.10
10.0m3 35,000.00 26.90
11 Streets Market (Magenge) per table -
(per month)
2,000.00 1.50
12 Food vendor (Mama Ntilie) - (per
month)
1,000.00 0.80
13 Truck offloading Farm Produce at
unauthorized areas
10,000.00 7.70
14 Truck offloading farm Produce at
Market per trip (2m3-6m
3)
3,000.00 2.30
15 Above 6m3 5,000.00 3.80
16 Bus Stations (per bus per day) 500.00 0.40
17 Mosque/church - (per month) 2,000.00 1.50

270
FIRST SCHEDULE – (continues)
S.No Name Amount in
TZS
Amount
in USD
18 Small business (informal) –
Sector - (per month)
1,000.00 0.80
19 Informal dry cleaner, tailors -
(per month)
1,000.00 0.80
20 Informal Carpenter - (per month) 1,500.00 1.20
21 Shoe makers - (per month) 500.00 0.40
22 Electronic gadgets repair - (per
month)
2,000.00 1.50
23 Street Barbers - (per month) 1,000.00 0.80
24 Saloon (licensed) - (per month) 5,000.00 3.80
25 Petrol Stations - (per month) 30,000.00 23.10
26 Kerosine station - (per month) 3,000.00 2.30
27 Ware house (per trip) 30,000.00 23.10
28 Charcoal stores - (per month) 2,000.00 1.50
29 Hotels
Rooms 01-10 per month 15,000.00 11.50
Rooms 11-20 per month 30,000.00 23.10
Rooms 21-30 per month 50,000.00 38.50
Rooms 31-50 per month 75,000.00 57.70
Rooms 51-100 per month 100,000.00 76.90
Rooms 101 – above per month 200,000.00 153.90
30 Offices
Staffs 01-10 per month 10,000.00 7.70
Staffs 11-20 per month 20,000.00 15.40
Staffs 21-30 per month 30,000.00 23.10
Staffs 31-50 per month 40,000.00 30.80
Staffs 51-100 per month 50,000.00 38.50
Staffs 101 – above per month 100,000.00 76.90
31 Bundle Waste per month 200,000.00 153.90
32 Construction Waste per trip 25,000.00 19.20
33 Garage per month 5,000.00 3.90

271
SECOND SCHEDULE
SUMMARY OF REFUSE COLLECTION CHARGE RATES (TANDALE,
MANZESE, MBURAHATI, HANNASIF, KIGOGO, MABIBO AND
MAKUBURI)
S.No Name Amount in TZS Amount in
USD
1 Residential areas per household
(per month)
500.00 0.40
2 Commercial, Industrial &
Institution
3 Tea Room (per month) 5,000.00 3.90
4 Cafe (per month) 5,000.00 3.90
5 Ice Parlour (per month) 10,000.00 7.70
6 Restaurant (per month) 10,000.00 7.70
7 Guest House (per month) 10,000.00 7.70
8 Dispensary (domestic waste) (per
month)
5,000.00 3.90
9 Health centre (domestic waste)
(per month)
10,000.00 7.70
10 Hospital (domestic waste) (per
month)
30,000.00 23.10
11 Sawing mills (per trip)
4.5m3 25,000.00 19.20
6.0m3 30,000.00 23.10
10.0m3 35,000.00 26.90

272
SECOND SCHEDULE – (continues)
S.No Name Amount in
TZS
Amount
in USD
12 Furniture making (per month) 20,000.00 15.40
13 Metal workshops (per month) 20,000.00 15.40
14 Industries (light waste) (per trip)
4.5m3 25,000.00 19.20
6.0m3 30,000.00 23.10
10.0m3 35,000.00 26.90
15 Industries (heavy waste per ton) 5,000.00 3.90
16 Wholesale shops (general) - (per
month)
10,000.00 7.70
17 Retail shop (food and other items) -
(per month)
5,000.00 3.90
18 Retail shops (other commodities) -
(per month)
10,000.00 7.70
19 Private Day Primary Schools - (per
month)
10,000.00 7.70
20 Private Boarding Primary Schools -
(per month)
15,000.00 11.50
21 Private Day Secondary Schools -
(per month)
10,000.00 7.70
22 Private Boarding Secondary Schools
- (per month)
25,000.00 19.20
23 Institution - (per month) 25,000.00 19.20
24 Groceries - (per month) 10,000.00 7.70
25 Bar - (per month) 15,000.00 11.50
26 Butcher - (per month) 5,000.00 3.90
27 Pharmacy (I) - (per month) 10,000.00 7.70
28 Pharmacy (II) - (per month) 5,000.00 3.90
29 Markets (per trip)
4.5m3 25,000.00 19.20
6.0m3 30,000.00 23.10
10.0m3 35,000.00 26.90
Source: KMC, 2008

273
Appendix 6.1: List of Questionnaire Forms
Private Contractors for SWM in KMC Questionnaire Form No.1
Name of Ward
Name of Respondent/Title/Company
Nationality
Name of Interviewer/Date
1. For how long have you been involved in solid waste collection?
2. i) Why did you decide to engage in Municipal in solid waste collection
services?
ii) What motivated you?
3. i) What services were you providing before engaging in solid waste
collection?
ii) And which areas did you serve?
4. What are contractual arrangements between you and the Municipality i.e. do
and don’ts?
5. i) What are your obligations to the residents/communities under your area of
services?
ii) And what are the obligations of the residents/communities under your area
of services?
6. i) Which areas are you serving-(names, total coverage and population)?
ii) Why and who defined it?
7. i) Who are your main customers?
ii) And how do you contact them?

274
8. What are the main types of solid wastes common in your area(s) of
operation? .
9. How do you collect solid waste in your area/neighborhoods?
10. What is your organization/company
a) capacity in terms of; i) People ii) Equipment iii) Skill iv) Company Setup
(etc)
b) What are the capacity gaps?
11. With your current level of equipments how much waste you are able to
collect per day/ week/month (percentage of the total)? How do you handle
these solid wastes from your area of services?
12. a) How much do you charge the households and other businesses in your area
of services?
b) Trends of revenues/funds accrued in the past five years in your business
area/areas.
Financial year Amount Accrued
2003/4
2004/5
2005/6
2006/7
2007/8
13. How do you fix waste collection and disposal rates i.e. service charges?
14. How do you rate customers’ acceptance of your services and their
willingness to pay for the services you are rendering?
15. How do you rate residents/community cooperation and participation in your
area of solid waste collection services?

275
16. Are you aware that solid waste is one of the local economic resources? If
(Yes) how? If (Not) why?
17. That being the case then, what should be done to improve community
participation in local resources mobilization for solid waste collection? Do
you also perform capacity building programs in your area of business? (i) If
(Yes) How? (ii) If (No), Why?
18. How information on solid waste is collected and stored. If there are any
inadequacy; How and Why
19.Information/data on how resources/revenues accrued and are used/spent in
the last five years
Financial Year Activities/Benefits
2003/4
2004/5
2005/6
2006/7
2007/8
20.What are major strengths, weaknesses and opportunities of your contract with the
Municipality in local resources mobilization for solid waste collection? What are the
overall constraints and challenges/problems or envisaged by you in local resources
mobilization for solid waste collection? What should be done to improve/ prevent
this situation?
21. Any other general comments/opinion regarding issues on towards local resources
mobilization for sustainable solid waste collection in your area/areas of business.

276
Households Questionnaire Form No.2
1. Questionnaire No. [ ] 1(a) Name of Enumerator___________Code:
[ ] (For official use only)
2. Name of Ward: Code of Ward: [ ]
3. Name of Respondent:. Title: Title Code: [ ]
4. Marital Status:1. Married 2.Not Married 3. Separated 4. Divorced [ ]
5. Gender 1. Male 2. Female [ ]
6. Age [ ]
7. Nationality 1. Tanzanian 2. Non Tanzanian: Mention
8. Name of Interviewer:
9. Date of Interview: [dd/mm/year][ / / ] .For how long have you been living
here?[rounded up years][ ]
10. Are you living in your own family house or a rented house/room? 1= Own
family house 2= Rented house 3= Rented room(s) [ ]
11. How big is your family? [ ]
12. What economic activities are you undertaking in where you live? [To be coded
later.
13. In the course of undertaking various economic activities, what type of waste are
you mostly producing? [To be coded later 21 (a)][ ]
14. How do you handle/treat these household wastes? [To be coded later 13(a)]
15. Are there any solid wastes services being provided by private
operator/CBOs/NGOs? Contracted by the Municipal Council) in your area?
14(a) Yes=1 2.No 3= don’t know [ ]

277
16. For how long have the private operators CBOs/NGOs been involved in solid
waste? Collection and management in your area/ settlement? [in months?
Years?
17. How do you rate private operator’s performance in your area regarding solid
waste?
Collection in terms of activity? I) Extremely active ii) Very active iii) Moderate
activeIV) Not active v) Dormant VI) Don’t Know
18. Then, how and Why? [To be coded later 17.(a) [ ]
19. How did you learn about the presence and operation of the private contractors/
CBOs/NGO in solid waste collection and disposal in your settlement?[To be
coded later 18(a)[ ]
20. How were you involved in the process of engaging CBOs/NGOs/Private
Company in solid waste collection? If no, Why? [To be coded later 19(a) [
]
21. Are you aware of any services of private operators/ CBOs/NGOs who are
providing solid waste collection and disposal in your settlement without any
Municipal contract/ registration? 1=Yes; 2= No; 3= Don’t Know 20(a)
22. If (Yes), in what way? [To be coded later] 21(a [ ]
23. And how much do you pay such nature of operator(s) compared to the registered
ones (private company/CBOs/NGOs) for the same services
Daily/weekly/monthly? .(a)1=Daily, 2=Weekly 3= Monthly (b) How
much? TZS.____________
24. Is there any individual people providing the same services in your area?
Without registration from the Municipal? 1=Yes; 2=No; 3=Don’t Know

278
25. If, they exist how they do handle/treat these solid wastes in your
area/settlement? To be coded later
25a [ ].These individuals, they do really charge anything for the services they
provide or free of charge? 1= Yes, they charge; 2= They don’t, free 3=
Sometime free/charge 4=Don’t Know
26.What are your opinion regarding the amount you pay to the private operators(s)/
CBOs/ NGOs for the services you are rendered? 1=Too high and unaffordable,
2=moderate and affordable or 3=low
26a and how and why? [to be coded after analysis} 26b [ ]
27. If you do not use services of the private operator(s) /CBO/NGO/non-registered
individuals. Then, why? To be coded later
28. How do you rate the quality of services offered and why? To be coded later
29. What is your main reservation about private operators/ CBOs/NGOs/non-
registered? Individuals (if any) engaged in solid waste collection in your area?
To be coded later
30. How do you assess the quality of Municipal services provided by
private/CBOs/NGOs/non p registered individuals(if any) in terms of frequency,
reliability, fees, capacity – equipments, finances, staffs etc as compared to the
period when they were provided by the government agencies(municipals)? To be
coded later
31. Are you willing to continue paying for services delivered by the private
operator(s)/CBOs/NGOs/non-registered individuals (if any)?1=Yes ; 2=No If yes
or no, give reasons?

279
32. What are your opinions if, such services will be provided by the community
itself from your area/settlement? To be coded later
33. Currently, how do you handle/treat solid wastes which absolutely you know
that, are qualifying for economic re-uses at your place/area?
[To be coded later 32(a)]
34. Are you aware that solid wastes are one of the economic resources? 1=Yes;
2=No [ ] (a) If yes, how? (b) If no why?
35. In your own opinion, do you think community participation in local?
Resources mobilization for solid waste collection in your area fail because of
lack of empowerment? 1=Yes; 2=No; 3=Don’t Know 4=Not Sure
36. If (Yes); what kind of empowerment do the communities urgently need in your
area? [To be coded later 36 (a) If (Not); what other reasons can you advance
for this failure? [To be coded later 36 (b)] [ ]
37. What are your suggestions, on what can community do to effect a
reliable/sustainable local resources (waste qualifying for economic re-use)
mobilization for solid waste management in your area?[To be coded later
37(a)]
38. What type of incentives is required in order to ensure that local
communities/households are sorting out solid waste at source or before they
pack them to the dumpsite? [To be coded later 38 (a)]
39. Any other personal comments/opinion regarding issues on towards local
resources mobilization for sustainable solid waste collection in your
area/areas? [To be coded later 39(a)] [ ]

280
Solid Waste Recyclist Factories Questionnaire Form No. 3
1. Factory particulars:
What types (kind) of solid waste materials do you mostly use in your recycling
process? Solid waste materials used to be categorized and coded later: Wastemat1:
Wastematl2 [ ] Wastematl3 [ Wastematl4 [ ]. How do you acquire these
solid waste materials in most cases (e.g. from individual scavengers or agents)? How
acquired 1= Individuals scavengers; 2=Agents; [ ] If agents; what kind of those
agents (e.g. CBO’s/Coy’s etc)? [Two sources to be exhaustively broken down and
coded later] Source: Individuals: 1=Boy; 2=Girl; 3=Grownup woman; 4=Grownup
man
5= etc. Agents: 11= Company; 12= CBO/IGA; 13=Schools [ ] Why did you
choose to use such kind of resources of solid waste materials? Whymater1
Whymater2:[reasons of use to be coded later] [ ]
2. Estimated quantity and sources in the past five years
Years Estimated Acquired Materials Weight/ Quantity and
Buying Prices
2004
Material List Weight (Kgs) or Pcs
Price in T.Shs 1=Individual scav.
2= Agents
materl matweigh matpcs matprice
matsourc
1. _______________ [ ] [ ] [ ]

281
[ ]
2.etc
2005 1. _______________ [ ] [ ] [ ]
[ ]
2.etc
2006 1. _______________ [ ] [ ] [ ]
[ ]
2.etc
2007 1. _______________ [ ] [ ] [ ]
[ ]
2.etc
2008 1. _______________ [ ] [ ] [ ]
[ ]
2. etc
3. Trends of revenues/funds accrued from recycling business in the past five years
Financial Year
Finyear
Amount Accrued
Amtaccru
2003/4 TZS__________________
2004/5 TZS__________________
2005/6 TZS_________________
2006/7 TZS_________________
2007/8 TZS________________

282
Do you also perform capacity building programs in your area of business (material
collection for recycling)? If (Yes), Capbuild: 1= Yes 2=No [ ] If yes,
How? How build: [to be coded} later] How? iii) If (No), Why? Notbuild2 [ to be
coded later][ ] Notbuild1: Why?
4. What are the capacity gaps as per the following schedule?
Items
Capacity_gaps
(1=Adequate
2=
Gaps/Deficit )
Quantify Capacity
gaps/Deficit,
i.e. No, kgs, tons
etc.
Personnel
Skills/knowledge
Equipments
Company set up
Production
Storage
Transportation
Marketing
Acquisition of raw materials (etc)
5. Information/data on how resources/revenues accrued are used/spent in the last five
years.
Activity/Benefits: [Benefits to be coded later after analysis] [ ]
283
Financial Year
Finyears
Activity/Benefits
Benefits: Briefly explain benefits herein below
2003/4
2004/5
2005/6
2006/7
2007/8
If there is inadequacy in terms of solid waste materials (raw materials) for recycling
business, then
Is there inadequacy? Inadequt: 1=Yes; 2=No [ ] If yes, why?
Why_inad [to be coded later] [ ] Briefly explain why: Inadequat1.
What constraints and challenges do you face in your recycling business and how are
you prepared to solve them? What constraints/challenges do you face? [to be coded
later] Constraint1: [ ] Constraint2: [ ] Constraint3 [ ]
Constraint4 [ ]
6. Any other suggestions/ comments/ opinion regarding acquisition of recycling
business raw materials and so on.
Source: Own construct, 2007