determinants of yield gap in small-scale apple farms in balochistan, pakistan
TRANSCRIPT
This article was downloaded by: [Ghulam Murtaza]On: 18 April 2015, At: 22:33Publisher: Taylor & FrancisInforma Ltd Registered in England and Wales Registered Number: 1072954 Registeredoffice: Mortimer House, 37-41 Mortimer Street, London W1T 3JH, UK
Click for updates
Journal of Crop ImprovementPublication details, including instructions for authors andsubscription information:http://www.tandfonline.com/loi/wcim20
Determinants of Yield Gap in Small-scaleApple Farms in Balochistan, PakistanGhulam Murtazaa & Gopal Bahadur Thapab
a Regional and Rural Development Planning, School of Environment,Resources and Development, Asian Institute of Technology,Pathumthani, Thailandb AgLEARN Project, School of Environment, Resources andDevelopment, Asian Institute of Technology, Pathumthani, ThailandPublished online: 16 Apr 2015.
To cite this article: Ghulam Murtaza & Gopal Bahadur Thapa (2015) Determinants of Yield Gap inSmall-scale Apple Farms in Balochistan, Pakistan, Journal of Crop Improvement, 29:2, 196-227, DOI:10.1080/15427528.2014.994054
To link to this article: http://dx.doi.org/10.1080/15427528.2014.994054
PLEASE SCROLL DOWN FOR ARTICLE
Taylor & Francis makes every effort to ensure the accuracy of all the information (the“Content”) contained in the publications on our platform. However, Taylor & Francis,our agents, and our licensors make no representations or warranties whatsoever as tothe accuracy, completeness, or suitability for any purpose of the Content. Any opinionsand views expressed in this publication are the opinions and views of the authors,and are not the views of or endorsed by Taylor & Francis. The accuracy of the Contentshould not be relied upon and should be independently verified with primary sourcesof information. Taylor and Francis shall not be liable for any losses, actions, claims,proceedings, demands, costs, expenses, damages, and other liabilities whatsoever orhowsoever caused arising directly or indirectly in connection with, in relation to or arisingout of the use of the Content.
This article may be used for research, teaching, and private study purposes. Anysubstantial or systematic reproduction, redistribution, reselling, loan, sub-licensing,systematic supply, or distribution in any form to anyone is expressly forbidden. Terms &

Conditions of access and use can be found at http://www.tandfonline.com/page/terms-and-conditions
Dow
nloa
ded
by [
Ghu
lam
Mur
taza
] at
22:
33 1
8 A
pril
2015
Journal of Crop Improvement, 29:196–227, 2015Copyright © Taylor & Francis Group, LLCISSN: 1542-7528 print/1542-7536 onlineDOI: 10.1080/15427528.2014.994054
Determinants of Yield Gap in Small-scale AppleFarms in Balochistan, Pakistan
GHULAM MURTAZA1 and GOPAL BAHADUR THAPA2
1Regional and Rural Development Planning, School of Environment, Resources andDevelopment, Asian Institute of Technology, Pathumthani, Thailand
2AgLEARN Project, School of Environment, Resources and Development, Asian Institute ofTechnology, Pathumthani, Thailand
Amid declining yield of apple (Malus domestica) in Balochistan,this study analyzed yield gaps of commonly grown varieties ‘Katja’(Malus domestica ’Katy’) and Red Delicious (Malus domestica‘Borkh’) grown at experimental station and in farmers’ fields usingdata collected through a survey of 181 officially designated smallfarmers in Mastung district in Balochistan, Pakistan. The aver-age actual yields of commonly grown Katja and Red Deliciousapple in farmers’ fields were below one-third of the experimentalstation yields, leading to an average experimental-station basedyield gap (YGE) of about 14,593 and 15,942 kg hectare−1, respec-tively. A significant variation in the yields of both varieties wasalso found within farmers’ fields. The average yield gaps betweenthe model-farmer (farmer with highest yield) and common farmeryields (YGM) were 4960 and 7288 kg hectare−1 for Katja and RedDelicious, respectively. Yield gap indexes (YGI) were also developedto calculate yield variability between experimental station andcurrent farmers’ yield (YGIE), and also within farmers’ yield vari-ability (YGIM). The mean YGIE was 69.3%, whereas the mean YGIM
was 46.5%, indicating the possibility of increasing yield by 53.5%.Farmer’s experience in apple farming, household labor force size,tree density, soil suitability, weed management, access to credit andextension services, and attendance of training on apple farming
Received 22 October 2014; accepted 28 November 2014.Address correspondence to Ghulam Murtaza, Regional and Rural Development Planning,
School of Environment, Resources and Development, Asian Institute of Technology, 58 Street9, Km. 42, Paholyothin Highway Klong Luang, Pathumthani 12120, P.O. Box 4, Thailand.E-mail: [email protected]
Color versions of one or more of the figures in the article can be found online at www.tandfonline.com/wcim.
196
Dow
nloa
ded
by [
Ghu
lam
Mur
taza
] at
22:
33 1
8 A
pril
2015
Determinants of Yield Gap in Small-Scale Apple Farms 197
had significantly influenced apple yield gap. Landholding size andcontract apple marketing system were other factors significantlyexpanding the yield gap. Addressing constraints to farmers’ accessto yield-improving resources and farm management would be avital step towards significant productivity improvements in applefarming.
KEYWORDS apple, farm management, potential yield, socio-economic determinants, yield constraints, yield-improvingresources
INTRODUCTION
Balochistan is the leading apple-producing province of Pakistan, accountingfor 92% of the total area (102,200 hectares) under apple and 83% of thetotal production in fiscal year (FY) 2011/12 (Government of Pakistan 2013).By virtue of favorable temperate climatic condition and suitable soil, appleproduced in this province is well known for its unique taste and quality.Balochistan supplies a major proportion of the production to other provincesas well as to other countries. Total production of apple in the country was598,804 tons, of which 497,600 tons (83.1%) were contributed by Balochistanprovince in FY 2011/12. Of this total production, only 1573 tons worth40 million rupees ($ 477,000) were exported to foreign countries (GoP 2013).The volume of export accounted for only less than 1% of the total production.
Farmers in Balochistan have been engaged in apple production for sev-eral decades as they see good economic benefit from this enterprise. Thearea under apple has increased from 11,200 ha in 1987/88 to 102,000 ha in2011/12. As a result, the production has also increased from 105,000 tons to497,600 tons during the same period, witnessing that apple yield has declinedfrom 9.38 tons/ha in 1987/88 to 4.88 tons/ha in 2011/12 (Governmentof Balochistan 2013). Despite this trend, a recent study revealed a wideinter-district variation in the yield as well as technical efficiency of appleproduction (Murtaza 2010). Therefore, it is plausible to assume that such vari-ation in apple yield is present at the farm-household level as well. However,so far no empirical study has been undertaken on this aspect.
The analysis of yield gap, which is derived from the analysis of differ-ence between potential and actual yield, can be used as a tool to explorefactors that influence such gaps and would help identify interventions tobe made to increase crop yield. The extent of gap between the actual andpotential yields indicates farmers’ resource base and technical ability in agiven environment and is important for agricultural policy development andresource planning (Angulo et al. 2012). At the same time, it offers an impor-tant insight into the performance of agriculture sector and the potential for
Dow
nloa
ded
by [
Ghu
lam
Mur
taza
] at
22:
33 1
8 A
pril
2015
198 G. Murtaza and G. B. Thapa
yield growth that can be exploited by agricultural investments and polices(Yengoh and Ardö 2014). Though the yield gaps have narrowed down insome areas of developing countries, in most areas farmers’ yields are stillbelow one-third of the local experimental station yields (Huang et al. 2002).Actual yields in farmers’ fields ranged from 20% to 80% of potential yieldsfor almost all of important crops of the world with no evidence of exceedingthis threshold to date (Lobell et al. 2009).
While the factors influencing yield gaps between experimental sta-tions and farmers’ fields are fairly well understood (Gomez et al. 1979;Balasubramanian et al. 2000; Bhatia et al. 2006; Singh et al. 2009; Mondal2011; Pala et al. 2011), factors determining yield gaps among farmers’ fieldscannot be generalized based on the findings of studies conducted in spe-cific locations as biophysical and socio-economic conditions vary from onelocation to another. Local-level analysis of biophysical and socio-economicconstraints to crop production/yield can guide the development of carefullytargeted responses that are adapted to local realities (Lobell et al. 2009).Addressing any location-specific yield-gap problem entails seeking location-specific factors explaining the gap between farmers’ fields and experimentalstations as well as within farmers’ fields.
Cognizant of such research gap, this study firstly aims at apple yieldgaps between a local experimental station and farmers’ fields and also gapwithin farmers’ fields. This is followed by analyses of factors explaining yieldgaps between the experimental station and farmers’ fields and within farmers’fields. Findings of this study may make important contributions to policiesfor improving apple yield in Balochistan as well as in other areas with sim-ilar biophysical and institutional conditions. The findings also contribute tostudies on crop yield gap.
MATERIALS AND METHODS
Study Area
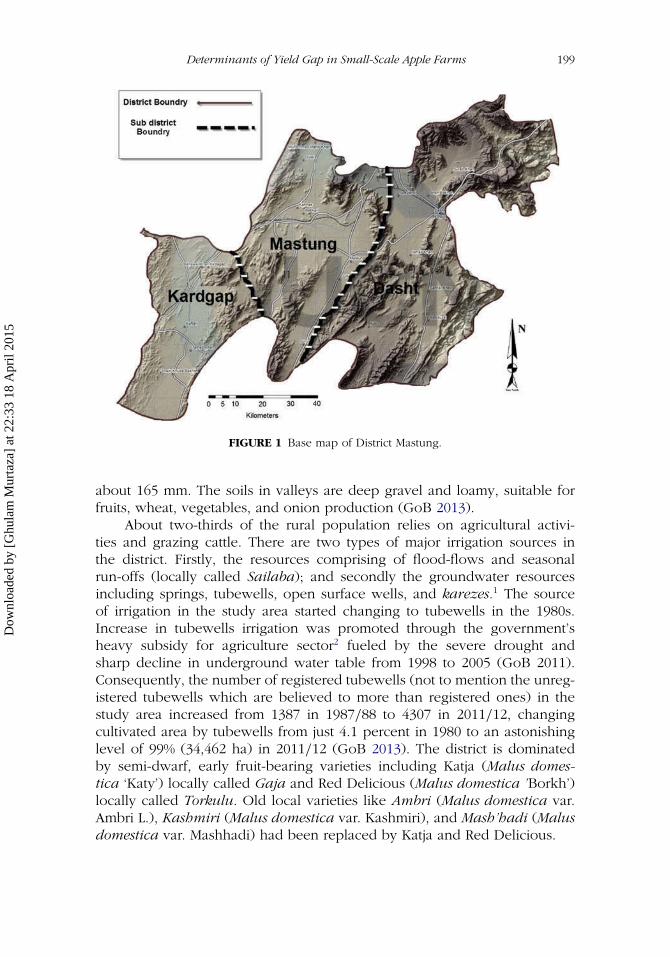
The research was carried out in Mastung district in north of Balochistan(Figure 1), which is located at 29◦48′N and 66◦50′60E and has an averagealtitude of 1701 meters. The district is one of the leading apple-producingdistricts of the province (GoB 2011). In 2010/11, Mastung ranked secondin terms of area (7630 ha) and third in production (43,152 tons) of applein the province (GoB 2013). Covering an area of 5,896 km2, the district ismountainous and its climate is characterized by dry-hot summers and coolwinters, with an annual average minimum temperature of 3.6C◦ and averagemaximum temperature of 28.4C◦. There is a wide variation between dayand night temperatures, which is considered to be necessary for good appleyields. Rainfall is scarce and most of it occurs in winter from November toMarch, during which snow also falls. The annual average rainfall amounts to
Dow
nloa
ded
by [
Ghu
lam
Mur
taza
] at
22:
33 1
8 A
pril
2015
Determinants of Yield Gap in Small-Scale Apple Farms 199
FIGURE 1 Base map of District Mastung.
about 165 mm. The soils in valleys are deep gravel and loamy, suitable forfruits, wheat, vegetables, and onion production (GoB 2013).
About two-thirds of the rural population relies on agricultural activi-ties and grazing cattle. There are two types of major irrigation sources inthe district. Firstly, the resources comprising of flood-flows and seasonalrun-offs (locally called Sailaba); and secondly the groundwater resourcesincluding springs, tubewells, open surface wells, and karezes.1 The sourceof irrigation in the study area started changing to tubewells in the 1980s.Increase in tubewells irrigation was promoted through the government’sheavy subsidy for agriculture sector2 fueled by the severe drought andsharp decline in underground water table from 1998 to 2005 (GoB 2011).Consequently, the number of registered tubewells (not to mention the unreg-istered tubewells which are believed to more than registered ones) in thestudy area increased from 1387 in 1987/88 to 4307 in 2011/12, changingcultivated area by tubewells from just 4.1 percent in 1980 to an astonishinglevel of 99% (34,462 ha) in 2011/12 (GoB 2013). The district is dominatedby semi-dwarf, early fruit-bearing varieties including Katja (Malus domes-tica ‘Katy’) locally called Gaja and Red Delicious (Malus domestica ’Borkh’)locally called Torkulu. Old local varieties like Ambri (Malus domestica var.Ambri L.), Kashmiri (Malus domestica var. Kashmiri), and Mash’hadi (Malusdomestica var. Mashhadi) had been replaced by Katja and Red Delicious.
Dow
nloa
ded
by [
Ghu
lam
Mur
taza
] at
22:
33 1
8 A
pril
2015
200 G. Murtaza and G. B. Thapa
The male members of the household primarily carry out agriculturaldecisions and agricultural labor, while women and children are involved inagriculture by helping out in the fields and/or at home. Large farmers employtenants for agricultural activities with the cultivated area under personal own-ership. Hired labor in Mastung mainly is comprised of Afghan refugees andseasonal migrated labor from eastern plan-areas of the province who areready to work at very cheap rates. Meanwhile, improvements in the trans-port network facilitated an upsurge in the cultivation of high-value fruitsand vegetables that are mostly supplied to major cities including Karachi,Faisalabad, and Lahore. Total length of roads in the study area increasedfrom 252 km in 1993/94 to 839 km in 2010/11 (GoB 2011), but these lengthsmainly include three national highways passing through the district. The dis-trict yet lacks paved farms to market roads, making it difficult the supply ofinputs to the farms and supplying farm produce to the market.
As in other districts under its jurisdiction, the government of Balochistanhas provided agricultural extension services in Mastung district as well.The organizational structure of agricultural extension services in the dis-trict comprised of 138 agricultural extension staff including several extensionofficers and subject matter specialists at the district-level office, and exten-sion workers at the union council-level. The primary objective of theagricultural extension department is to enhance agricultural production byadvising farmers on land preparation, irrigation methods, and pest controlthrough trainings, visits, and awareness campaigns. The Agricultural ResearchInstitute (ARI) Quetta, which provided information to the first author onapple production in its experimental farms, is located about 25 km north ofthe Mastung district.
Data Collection
District Mastung is administratively sub-divided into three Tehsils,3 namely,Mastung, Dasht, and Kardgap. Each Tehsil has been further divided intoUnion Councils (UCs) locally called Patwar-halqa.4 Altogether there are13 UCs in three Tehsils. In view of poor security situation, particularly inKardgap Tehsil, the field survey was carried out in six UCs of Mastung andDasht Tehsils. A sample size of 194 was determined at the confidence level(z) of 95% using the method developed by Arkin and Colton (1963). A multi-stage random sampling technique was used to identify farm households to besurveyed. Firstly, six UCs with relatively high intensity of apple farming wereselected in consultation with the concerned Patwaris.5 Then, 110 householdsfrom 18 selected villages of Mastung Tehsil and 84 households from 10 vil-lages of Dasht Tehsil were randomly surveyed. However, 13 householdswere not included in the analysis because of incomplete information.
A reconnaissance was conducted in June 2010 to get the first author,who supervised the survey, acquainted with the study area and to collect
Dow
nloa
ded
by [
Ghu
lam
Mur
taza
] at
22:
33 1
8 A
pril
2015
Determinants of Yield Gap in Small-Scale Apple Farms 201
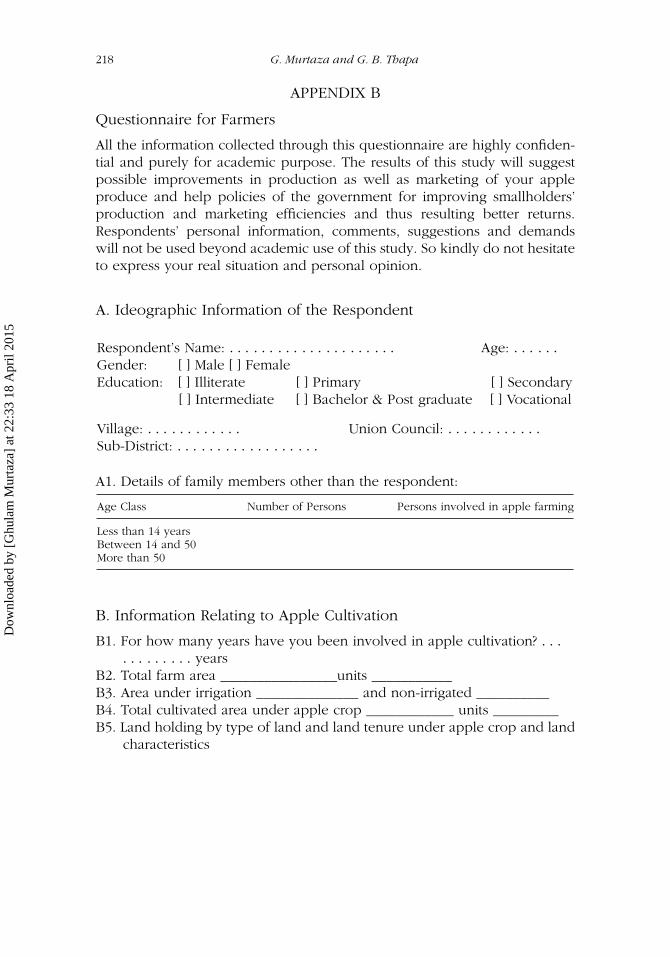
information required for designing the research. The questionnaire com-prised questions related to landholding size, area, and production by varietyof apple, amount and cost of inputs used, and access to credit and exten-sion services. The questionnaires were administered to the heads of farmhouseholds. All the respondents were male because of the strict tribal soci-ety where only men handled production and marketing-related activitiesand women perform household activities and were not allowed to inter-view. The survey was administered by the first author with the assistance ofthree Patwaris (in charge of a Patwar-halqa) who were trained by the firstauthor for four days on how to deliver questions to get the required infor-mation. The original English version of the questionnaire was translated intothe national language (Urdu). The data collecting assistants were directedto deliver the questions to the respondents in local language (Brahui) soas to make it more understandable. Before the interviews, the structureof the questionnaire was pre-tested on 15 farmers from the study area tocheck possible flaws and inconsistencies, after which the ambiguous andunclear questions were revised so as to get as much information as respon-dents wanted to share. The household survey was conducted from mid-Mayto late-August 2011, which was also the starting period of apple market-ing. A structured questionnaire was also constructed to collect informationfrom the experimental station. The questionnaire included questions onarea and production by variety of apple, amount and cost of inputs, andcrop-management practices (see Appendix).
Supplementary primary information was also collected before going inthe field through semi-structured personal interviews from key informantsincluding the District Agriculture Officer (DAO), extension officers, soil sci-entists, and senior research officers working with the Agricultural ResearchInstitute at Quetta, and the manager of the Agriculture Development Bankand from the regional office of the Water and Power Development Authority(WAPDA). These interviews helped the researcher in getting knowledge ofagriculture activities in the study area, common varieties grown in districtand in constructing questionnaire relating farmers’ problems, demands, andsuggestions to improve apple production in the study area, and their accessto agricultural development resources and electricity tariff.
The State Bank of Pakistan considers farmers in Balochistan with land-holdings up to 32 acre (or about 13 ha) as marginal farmers (State Bankof Pakistan 2010). According to the latest agricultural census, 84% of farmsin the province do not exceed 10.12 ha (25 acre) (GoP 2013). In view ofsmallholders confronting production and marketing problems in developingcountries (Thapa 2009; Thapa and Gaiha 2011), this research focused on offi-cially defined small farmers. However, they were classified into three groups:lower-, medium- and upper-small farmers as there was a wide variation intheir landholding size. Farmers were classified according to landholdings as:
Dow
nloa
ded
by [
Ghu
lam
Mur
taza
] at
22:
33 1
8 A
pril
2015
202 G. Murtaza and G. B. Thapa
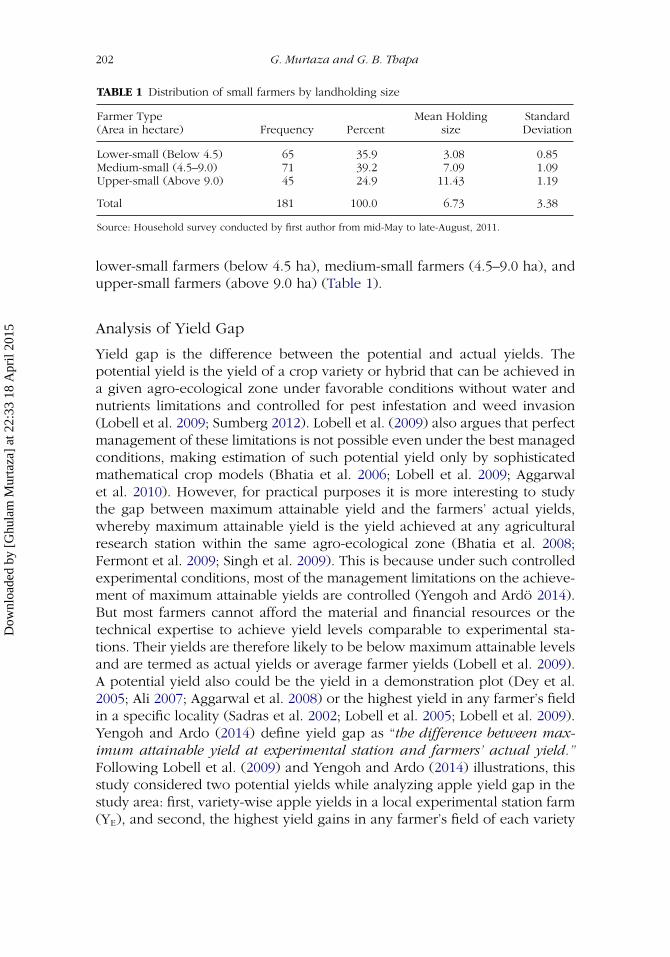
TABLE 1 Distribution of small farmers by landholding size
Farmer Type(Area in hectare) Frequency Percent
Mean Holdingsize
StandardDeviation
Lower-small (Below 4.5) 65 35.9 3.08 0.85Medium-small (4.5–9.0) 71 39.2 7.09 1.09Upper-small (Above 9.0) 45 24.9 11.43 1.19
Total 181 100.0 6.73 3.38
Source: Household survey conducted by first author from mid-May to late-August, 2011.
lower-small farmers (below 4.5 ha), medium-small farmers (4.5–9.0 ha), andupper-small farmers (above 9.0 ha) (Table 1).
Analysis of Yield Gap
Yield gap is the difference between the potential and actual yields. Thepotential yield is the yield of a crop variety or hybrid that can be achieved ina given agro-ecological zone under favorable conditions without water andnutrients limitations and controlled for pest infestation and weed invasion(Lobell et al. 2009; Sumberg 2012). Lobell et al. (2009) also argues that perfectmanagement of these limitations is not possible even under the best managedconditions, making estimation of such potential yield only by sophisticatedmathematical crop models (Bhatia et al. 2006; Lobell et al. 2009; Aggarwalet al. 2010). However, for practical purposes it is more interesting to studythe gap between maximum attainable yield and the farmers’ actual yields,whereby maximum attainable yield is the yield achieved at any agriculturalresearch station within the same agro-ecological zone (Bhatia et al. 2008;Fermont et al. 2009; Singh et al. 2009). This is because under such controlledexperimental conditions, most of the management limitations on the achieve-ment of maximum attainable yields are controlled (Yengoh and Ardö 2014).But most farmers cannot afford the material and financial resources or thetechnical expertise to achieve yield levels comparable to experimental sta-tions. Their yields are therefore likely to be below maximum attainable levelsand are termed as actual yields or average farmer yields (Lobell et al. 2009).A potential yield also could be the yield in a demonstration plot (Dey et al.2005; Ali 2007; Aggarwal et al. 2008) or the highest yield in any farmer’s fieldin a specific locality (Sadras et al. 2002; Lobell et al. 2005; Lobell et al. 2009).Yengoh and Ardo (2014) define yield gap as “the difference between max-imum attainable yield at experimental station and farmers’ actual yield.”Following Lobell et al. (2009) and Yengoh and Ardo (2014) illustrations, thisstudy considered two potential yields while analyzing apple yield gap in thestudy area: first, variety-wise apple yields in a local experimental station farm(YE), and second, the highest yield gains in any farmer’s field of each variety
Dow
nloa
ded
by [
Ghu
lam
Mur
taza
] at
22:
33 1
8 A
pril
2015
Determinants of Yield Gap in Small-Scale Apple Farms 203
in the selected sample, hereafter referred to as the model-farmer yield (YM).The reason behind focusing model-farmers based yield gap (YGM) is that,being based on farmers’ ground realities, the findings of analysis of YGM
bear more policy relevance than any experimental field- or simulation-basedanalysis in answering why there is variation among sample farmer yieldseven with same varietal and bio-physical characteristics. The yield gaps werecalculated as follows:
YGE = (Experimental station yield
)-(Common-farmer actual yields
)(1)
YGM = (Model-farmer yield
)-(Common-farmer actual yields
)(2)
For the analysis of factors influencing yield gap, both types of yield gap wereconverted into a 0–100 transformation, termed as yield-gap index (YGI), suchthat the higher the YGI the wider the yield gap and vice versa. The formulaused to construct YGI is as follows:
YGIE =[
YGE
Yield Experimental
]× 100 (3)
YGIM =[
YGM
Yield Model farm
]× 100 (4)
The YGIs were classified into groups with equal intervals. The average indexand variability (standard deviation) were also analyzed by variety of appleand by farmer groups.
Factors Influencing YGM: Model Specification
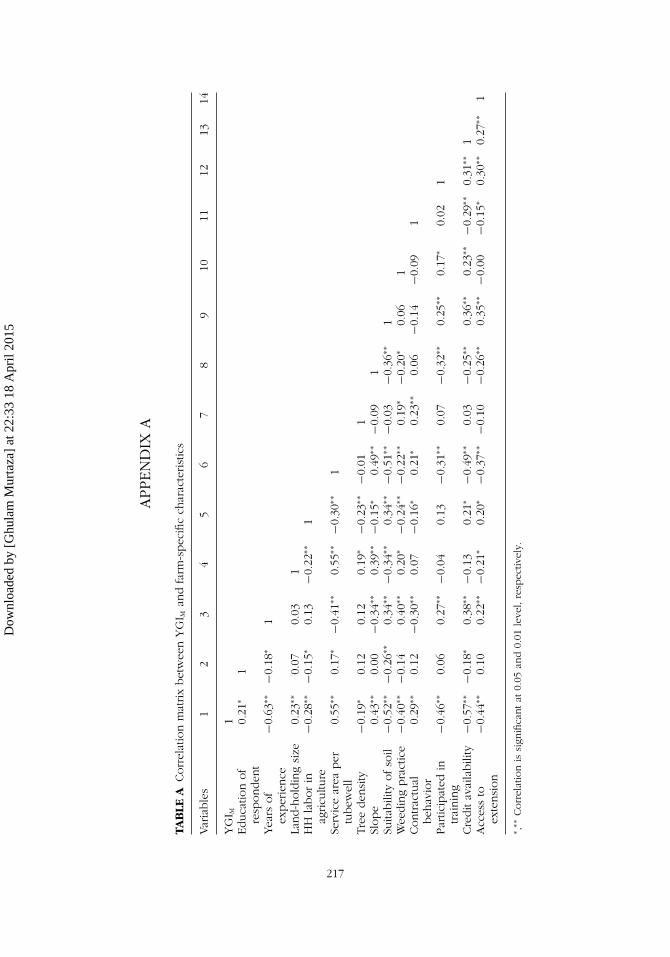
Where biophysical constraints are less of an important factor in determin-ing within farmers yield gap, issues of farmers’ socioeconomic differences,farm management practices, and access to institutional services, along withagricultural policies, are believed to contribute to low crop productiv-ity. To identify variables significantly associated with yield gap betweenthe model and common farmers (YGIM), we first analyzed Pearson andSpearman’s correlation coefficients to determine the variables to be includedin the regression model (see Appendix). As the YGIM index scores weretruncated (bound) at 0 and 100, the truncated regression analyses were car-ried out as a second step to determine the association between level of yieldgap and explanatory factors. Truncated estimates are theoretically superiorto ordinary least squares (OLS) estimates when dealing with the truncated
Dow
nloa
ded
by [
Ghu
lam
Mur
taza
] at
22:
33 1
8 A
pril
2015
204 G. Murtaza and G. B. Thapa
data. The use of OLS models on such data makes the estimates biased andinefficient (Simar and Wilson 2007).
To motivate our empirical model, we assumed:
y∗i = β0 +
∑m
k = 1βk Zki + ei, (5)
such that,
yi ={
100 if RHS ≥ 100y∗
i if 0 < RHS < 1000 if RHS ≤ 0
(6)
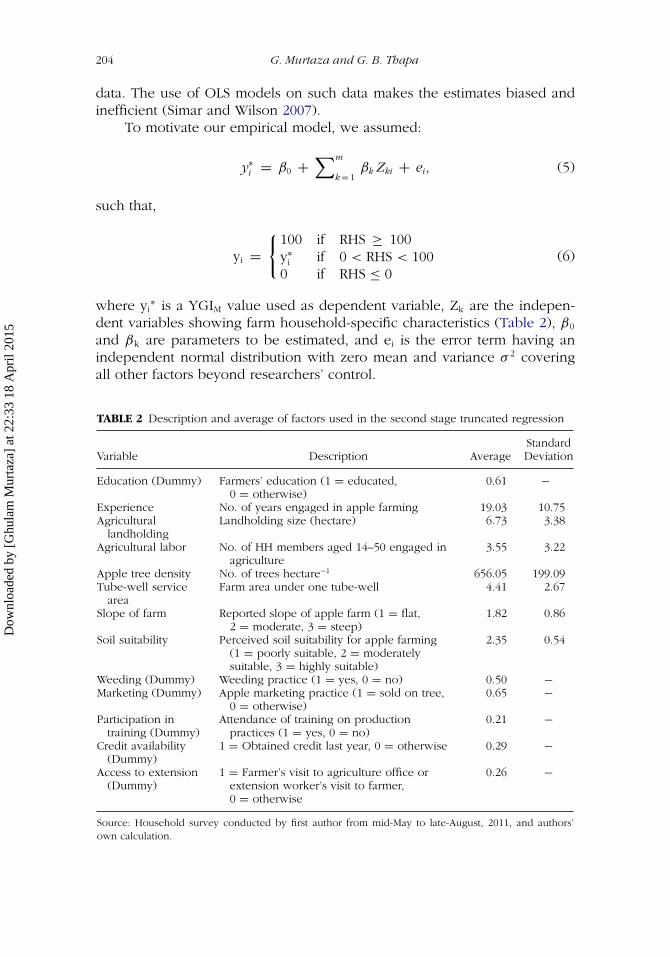
where yi∗ is a YGIM value used as dependent variable, Zk are the indepen-
dent variables showing farm household-specific characteristics (Table 2), β0
and βk are parameters to be estimated, and ei is the error term having anindependent normal distribution with zero mean and variance σ 2 coveringall other factors beyond researchers’ control.
TABLE 2 Description and average of factors used in the second stage truncated regression
Variable Description AverageStandardDeviation
Education (Dummy) Farmers’ education (1 = educated,0 = otherwise)
0.61 −Experience No. of years engaged in apple farming 19.03 10.75Agricultural
landholdingLandholding size (hectare) 6.73 3.38
Agricultural labor No. of HH members aged 14–50 engaged inagriculture
3.55 3.22
Apple tree density No. of trees hectare−1 656.05 199.09Tube-well service
areaFarm area under one tube-well 4.41 2.67
Slope of farm Reported slope of apple farm (1 = flat,2 = moderate, 3 = steep)
1.82 0.86
Soil suitability Perceived soil suitability for apple farming(1 = poorly suitable, 2 = moderatelysuitable, 3 = highly suitable)
2.35 0.54
Weeding (Dummy) Weeding practice (1 = yes, 0 = no) 0.50 −Marketing (Dummy) Apple marketing practice (1 = sold on tree,
0 = otherwise)0.65 −
Participation intraining (Dummy)
Attendance of training on productionpractices (1 = yes, 0 = no)
0.21 −Credit availability
(Dummy)1 = Obtained credit last year, 0 = otherwise 0.29 −
Access to extension(Dummy)
1 = Farmer’s visit to agriculture office orextension worker’s visit to farmer,0 = otherwise
0.26 −
Source: Household survey conducted by first author from mid-May to late-August, 2011, and authors’own calculation.
Dow
nloa
ded
by [
Ghu
lam
Mur
taza
] at
22:
33 1
8 A
pril
2015
Determinants of Yield Gap in Small-Scale Apple Farms 205
RESULTS
Farmers’ Characteristics and Farming Practices
There was wide variation in apple farmers’ socio-economic characteristics,farming practices, and access to institutional services. The average age ofrespondents, who in most instances were household heads, was nearly48 years, significantly different (p < 0.01) within farmer groups. More thanone-third of respondents were illiterate,6 followed by one-fourth having onlyup to eight years of formal schooling. The average duration of experience inapple farming was about 19 years, significantly different (p < 0.01) withinfarmer groups. Agriculture being the mainstay of lower-smallholders, theratio of household labor availability was highest (p < 0.01) for this group offarmers with an average of 4.6 compared with 3.1 and 2.8 for medium- andupper-smallholders, respectively.
The average landholding sizes of the lower-, medium-, and upper-smallfarmers were 3.06, 7.07, and 11.43 hectares, respectively. Apple was plantedon average 2.34, 3.76, and 5.93 hectares of land, accounting for about 78%,54%, and 47% of total landholdings of the these farmer groups, respectively.Farms in the study area were diverse relative to variety of apple grown. Oldlocal varieties of Mash’hadi, Ambri, and Kashmiri had been replaced bysemi-dwarf, early fruit-bearing varieties like Katja and Red Delicious. Almostall (181 out of 194) randomly sampled households were growing either Katjaor Red Delicious varieties. Katja was the most popular variety, grown bythree-fifths of the respondents because of relatively short period for fruitmaturity and attractive color. Red Delicious was the second popular variety.The slope of land where orchards were located and suitability of soil forapple were assessed separately by farmers’ perception on these aspects byusing the Likert scale. Scaling for the slope of orchard land ranged from 1(flat land) to 3 (steep land/high slope). Average index for suitability was1.81, indicating that many orchards were located on flat to moderate-slopinglands. In the same way, scaling for the soil suitability for apple farmingranged from 1 (less-suitable for apple farming) to 3 (highly-suitable). Averageindex for suitability was 2.35 showing that on average farmers perceive theirorchard soils as moderate to highlysuitable for apple farming either by theirindigenous knowledge and/or they had tested the soil from soil scientist.
The average apple tree density was about 656 trees ha−1, rangingfrom 159 to 1235 trees ha−1. All farmers were using tubewells for irri-gating orchards after drying up of Karezes. The upper-small farmers hadinstalled 3-6 tubewells on their orchards farms by virtue of their higherearnings and easy access to institutional credit; whereas some lower-smallfarmers had to buy half to one-third of the required water from fellow farm-ers who had installed tubewells. Water reached orchard mostly by earthenchannels/courses thereby wasting a considerable amount of it.
Dow
nloa
ded
by [
Ghu
lam
Mur
taza
] at
22:
33 1
8 A
pril
2015
206 G. Murtaza and G. B. Thapa
Yield Gap
YIELD GAP BETWEEN THE EXPERIMENTAL STATION AND FARMERS’ FIELDS
(YGE)
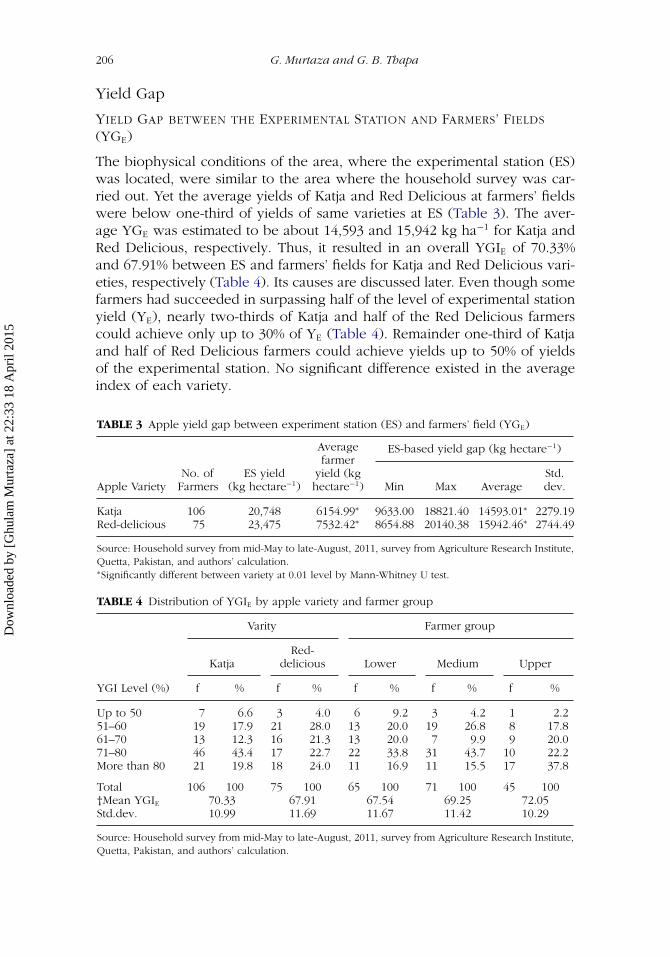
The biophysical conditions of the area, where the experimental station (ES)was located, were similar to the area where the household survey was car-ried out. Yet the average yields of Katja and Red Delicious at farmers’ fieldswere below one-third of yields of same varieties at ES (Table 3). The aver-age YGE was estimated to be about 14,593 and 15,942 kg ha−1 for Katja andRed Delicious, respectively. Thus, it resulted in an overall YGIE of 70.33%and 67.91% between ES and farmers’ fields for Katja and Red Delicious vari-eties, respectively (Table 4). Its causes are discussed later. Even though somefarmers had succeeded in surpassing half of the level of experimental stationyield (YE), nearly two-thirds of Katja and half of the Red Delicious farmerscould achieve only up to 30% of YE (Table 4). Remainder one-third of Katjaand half of Red Delicious farmers could achieve yields up to 50% of yieldsof the experimental station. No significant difference existed in the averageindex of each variety.
TABLE 3 Apple yield gap between experiment station (ES) and farmers’ field (YGE)
ES-based yield gap (kg hectare−1)
Apple VarietyNo. ofFarmers
ES yield(kg hectare−1)
Averagefarmer
yield (kghectare−1) Min Max Average
Std.dev.
Katja 106 20,748 6154.99∗ 9633.00 18821.40 14593.01∗ 2279.19Red-delicious 75 23,475 7532.42∗ 8654.88 20140.38 15942.46∗ 2744.49
Source: Household survey from mid-May to late-August, 2011, survey from Agriculture Research Institute,Quetta, Pakistan, and authors’ calculation.∗Significantly different between variety at 0.01 level by Mann-Whitney U test.
TABLE 4 Distribution of YGIE by apple variety and farmer group
Varity Farmer group
KatjaRed-
delicious Lower Medium Upper
YGI Level (%) f % f % f % f % f %
Up to 50 7 6.6 3 4.0 6 9.2 3 4.2 1 2.251–60 19 17.9 21 28.0 13 20.0 19 26.8 8 17.861–70 13 12.3 16 21.3 13 20.0 7 9.9 9 20.071–80 46 43.4 17 22.7 22 33.8 31 43.7 10 22.2More than 80 21 19.8 18 24.0 11 16.9 11 15.5 17 37.8
Total 106 100 75 100 65 100 71 100 45 100†Mean YGIE 70.33 67.91 67.54 69.25 72.05Std.dev. 10.99 11.69 11.67 11.42 10.29
Source: Household survey from mid-May to late-August, 2011, survey from Agriculture Research Institute,Quetta, Pakistan, and authors’ calculation.
Dow
nloa
ded
by [
Ghu
lam
Mur
taza
] at
22:
33 1
8 A
pril
2015
Determinants of Yield Gap in Small-Scale Apple Farms 207
Significant differences (p < 0.05) were found in the YGIE betweenlower- and upper-small farmer groups, indicating that there might be somefactors other than varietal and biophysical differences that caused significantvariation in yields among farmer groups. There was a tendency towards sig-nificantly decreasing yield with increasing landholding size (Table 4). This isconsistent with the classical theory of Schultz (1964) that revealed an inverserelationship between holding size and productivity. Slightly more than half oflower-small and nearly two-thirds of medium- and upper-small farmers hadapple yields below 30% of ES yields. Remainder nearly half of lower smalland more than one-third of both medium- and upper-small apple growerscould not exceed 50% of potential yield (YE).
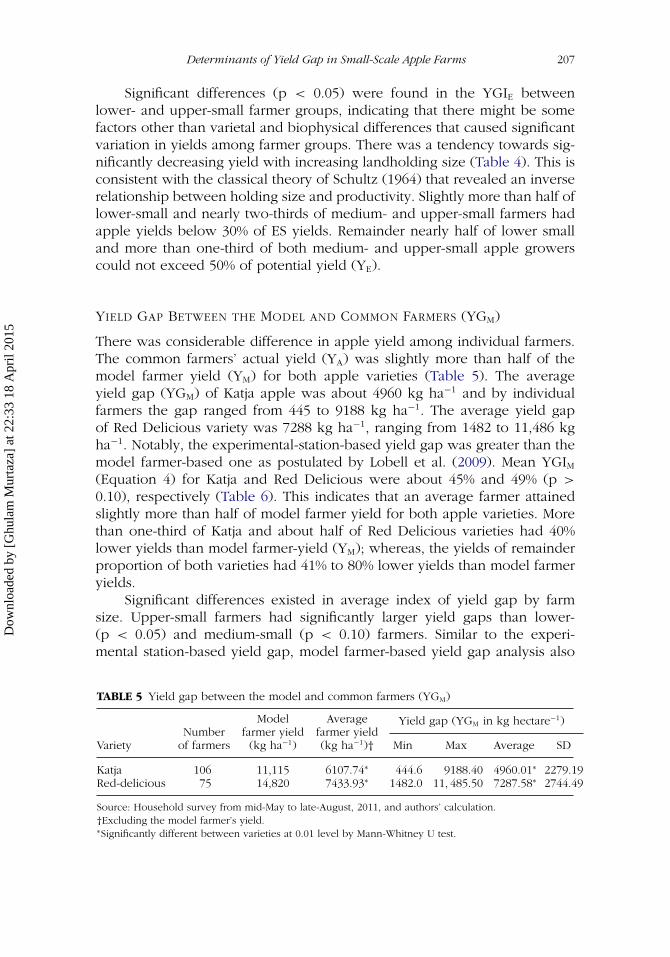
YIELD GAP BETWEEN THE MODEL AND COMMON FARMERS (YGM)
There was considerable difference in apple yield among individual farmers.The common farmers’ actual yield (YA) was slightly more than half of themodel farmer yield (YM) for both apple varieties (Table 5). The averageyield gap (YGM) of Katja apple was about 4960 kg ha−1 and by individualfarmers the gap ranged from 445 to 9188 kg ha−1. The average yield gapof Red Delicious variety was 7288 kg ha−1, ranging from 1482 to 11,486 kgha−1. Notably, the experimental-station-based yield gap was greater than themodel farmer-based one as postulated by Lobell et al. (2009). Mean YGIM(Equation 4) for Katja and Red Delicious were about 45% and 49% (p >
0.10), respectively (Table 6). This indicates that an average farmer attainedslightly more than half of model farmer yield for both apple varieties. Morethan one-third of Katja and about half of Red Delicious varieties had 40%lower yields than model farmer-yield (YM); whereas, the yields of remainderproportion of both varieties had 41% to 80% lower yields than model farmeryields.
Significant differences existed in average index of yield gap by farmsize. Upper-small farmers had significantly larger yield gaps than lower-(p < 0.05) and medium-small (p < 0.10) farmers. Similar to the experi-mental station-based yield gap, model farmer-based yield gap analysis also
TABLE 5 Yield gap between the model and common farmers (YGM)
Yield gap (YGM in kg hectare−1)
VarietyNumber
of farmers
Modelfarmer yield(kg ha−1)
Averagefarmer yield(kg ha−1)† Min Max Average SD
Katja 106 11,115 6107.74∗ 444.6 9188.40 4960.01∗ 2279.19Red-delicious 75 14,820 7433.93∗ 1482.0 11, 485.50 7287.58∗ 2744.49
Source: Household survey from mid-May to late-August, 2011, and authors’ calculation.†Excluding the model farmer’s yield.∗Significantly different between varieties at 0.01 level by Mann-Whitney U test.
Dow
nloa
ded
by [
Ghu
lam
Mur
taza
] at
22:
33 1
8 A
pril
2015
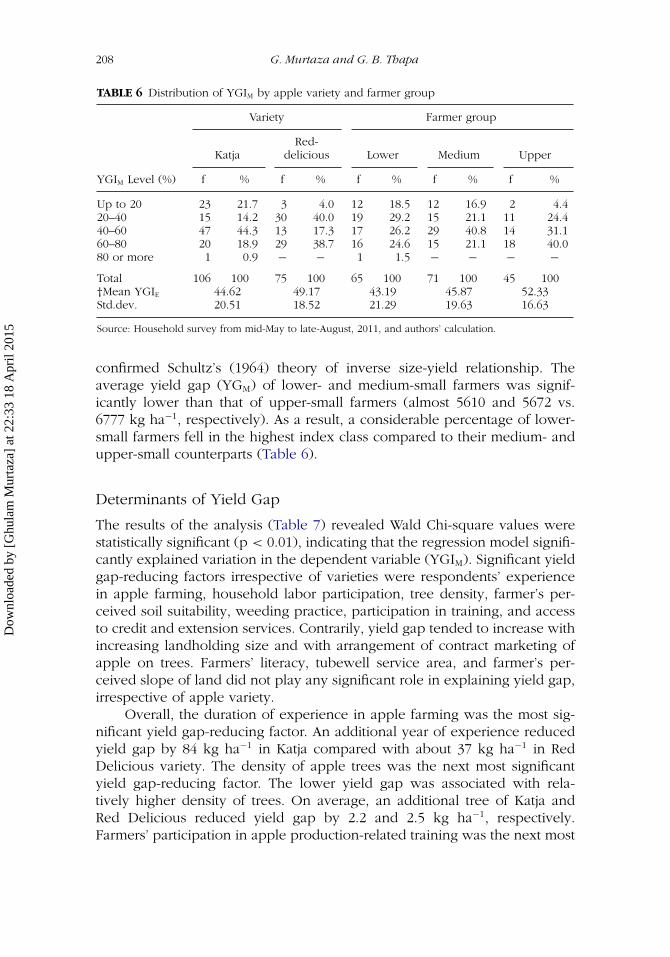
208 G. Murtaza and G. B. Thapa
TABLE 6 Distribution of YGIM by apple variety and farmer group
Variety Farmer group
KatjaRed-
delicious Lower Medium Upper
YGIM Level (%) f % f % f % f % f %
Up to 20 23 21.7 3 4.0 12 18.5 12 16.9 2 4.420–40 15 14.2 30 40.0 19 29.2 15 21.1 11 24.440–60 47 44.3 13 17.3 17 26.2 29 40.8 14 31.160–80 20 18.9 29 38.7 16 24.6 15 21.1 18 40.080 or more 1 0.9 − − 1 1.5 − − − −Total 106 100 75 100 65 100 71 100 45 100†Mean YGIE 44.62 49.17 43.19 45.87 52.33Std.dev. 20.51 18.52 21.29 19.63 16.63
Source: Household survey from mid-May to late-August, 2011, and authors’ calculation.
confirmed Schultz’s (1964) theory of inverse size-yield relationship. Theaverage yield gap (YGM) of lower- and medium-small farmers was signif-icantly lower than that of upper-small farmers (almost 5610 and 5672 vs.6777 kg ha−1, respectively). As a result, a considerable percentage of lower-small farmers fell in the highest index class compared to their medium- andupper-small counterparts (Table 6).
Determinants of Yield Gap
The results of the analysis (Table 7) revealed Wald Chi-square values werestatistically significant (p < 0.01), indicating that the regression model signifi-cantly explained variation in the dependent variable (YGIM). Significant yieldgap-reducing factors irrespective of varieties were respondents’ experiencein apple farming, household labor participation, tree density, farmer’s per-ceived soil suitability, weeding practice, participation in training, and accessto credit and extension services. Contrarily, yield gap tended to increase withincreasing landholding size and with arrangement of contract marketing ofapple on trees. Farmers’ literacy, tubewell service area, and farmer’s per-ceived slope of land did not play any significant role in explaining yield gap,irrespective of apple variety.
Overall, the duration of experience in apple farming was the most sig-nificant yield gap-reducing factor. An additional year of experience reducedyield gap by 84 kg ha−1 in Katja compared with about 37 kg ha−1 in RedDelicious variety. The density of apple trees was the next most significantyield gap-reducing factor. The lower yield gap was associated with rela-tively higher density of trees. On average, an additional tree of Katja andRed Delicious reduced yield gap by 2.2 and 2.5 kg ha−1, respectively.Farmers’ participation in apple production-related training was the next most
Dow
nloa
ded
by [
Ghu
lam
Mur
taza
] at
22:
33 1
8 A
pril
2015
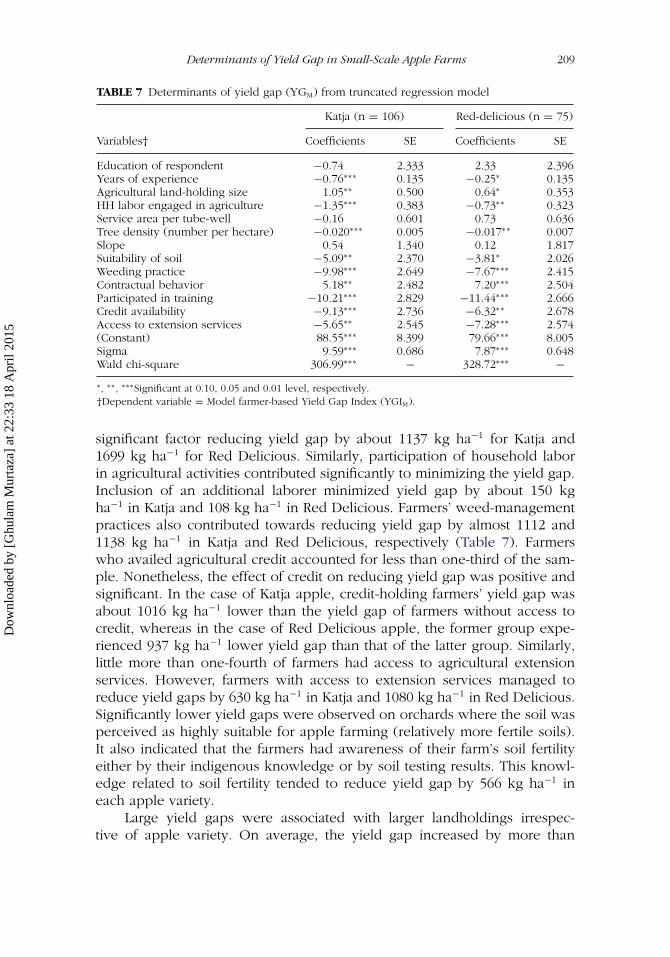
Determinants of Yield Gap in Small-Scale Apple Farms 209
TABLE 7 Determinants of yield gap (YGM) from truncated regression model
Katja (n = 106) Red-delicious (n = 75)
Variables† Coefficients SE Coefficients SE
Education of respondent −0.74 2.333 2.33 2.396Years of experience −0.76∗∗∗ 0.135 −0.25∗ 0.135Agricultural land-holding size 1.05∗∗ 0.500 0.64∗ 0.353HH labor engaged in agriculture −1.35∗∗∗ 0.383 −0.73∗∗ 0.323Service area per tube-well −0.16 0.601 0.73 0.636Tree density (number per hectare) −0.020∗∗∗ 0.005 −0.017∗∗ 0.007Slope 0.54 1.340 0.12 1.817Suitability of soil −5.09∗∗ 2.370 −3.81∗ 2.026Weeding practice −9.98∗∗∗ 2.649 −7.67∗∗∗ 2.415Contractual behavior 5.18∗∗ 2.482 7.20∗∗∗ 2.504Participated in training −10.21∗∗∗ 2.829 −11.44∗∗∗ 2.666Credit availability −9.13∗∗∗ 2.736 −6.32∗∗ 2.678Access to extension services −5.65∗∗ 2.545 −7.28∗∗∗ 2.574(Constant) 88.55∗∗∗ 8.399 79.66∗∗∗ 8.005Sigma 9.59∗∗∗ 0.686 7.87∗∗∗ 0.648Wald chi-square 306.99∗∗∗ − 328.72∗∗∗ −∗, ∗∗, ∗∗∗Significant at 0.10, 0.05 and 0.01 level, respectively.†Dependent variable = Model farmer-based Yield Gap Index (YGIM).
significant factor reducing yield gap by about 1137 kg ha−1 for Katja and1699 kg ha−1 for Red Delicious. Similarly, participation of household laborin agricultural activities contributed significantly to minimizing the yield gap.Inclusion of an additional laborer minimized yield gap by about 150 kgha−1 in Katja and 108 kg ha−1 in Red Delicious. Farmers’ weed-managementpractices also contributed towards reducing yield gap by almost 1112 and1138 kg ha−1 in Katja and Red Delicious, respectively (Table 7). Farmerswho availed agricultural credit accounted for less than one-third of the sam-ple. Nonetheless, the effect of credit on reducing yield gap was positive andsignificant. In the case of Katja apple, credit-holding farmers’ yield gap wasabout 1016 kg ha−1 lower than the yield gap of farmers without access tocredit, whereas in the case of Red Delicious apple, the former group expe-rienced 937 kg ha−1 lower yield gap than that of the latter group. Similarly,little more than one-fourth of farmers had access to agricultural extensionservices. However, farmers with access to extension services managed toreduce yield gaps by 630 kg ha−1 in Katja and 1080 kg ha−1 in Red Delicious.Significantly lower yield gaps were observed on orchards where the soil wasperceived as highly suitable for apple farming (relatively more fertile soils).It also indicated that the farmers had awareness of their farm’s soil fertilityeither by their indigenous knowledge or by soil testing results. This knowl-edge related to soil fertility tended to reduce yield gap by 566 kg ha−1 ineach apple variety.
Large yield gaps were associated with larger landholdings irrespec-tive of apple variety. On average, the yield gap increased by more than
Dow
nloa
ded
by [
Ghu
lam
Mur
taza
] at
22:
33 1
8 A
pril
2015
210 G. Murtaza and G. B. Thapa
47 kg and 37 kg for Katja and Red Delicious, respectively, with an incre-ment in landholding of one unit. While almost two-thirds of apple orchardswere under pre-harvest contractual arrangement, thereby transferring allpre-harvest orchard-management responsibilities to the contractors, orchardsunder contractual arrangement experienced significantly higher yield gap of578 kg for Katja and 1071 kg for Red Delicious.
DISCUSSION
The results of the analysis revealed that yields of both varieties of apple wereless than one-third of the maximum potential yields achieved at experimentalstation farms. Even if better performing farmers’ yields were considered, stillthe maximum yields were slightly more than half of the maximum potentialyields at experimental farms. This finding is consistent with the findings ofstudies undertaken elsewhere (Lobell et al. 2009). This was explained by thefact that apples at experimental farms were produced in a highly controlledenvironment, with adequate and timely water supply, application of requiredamounts of balanced nutrients mix, and insecticides and herbicides using thegenerous funding support from government. In contrast, the farmers’ couldnot irrigate apple orchards adequately because of energy crises, and werenot able to apply required amounts of fertilizer, pesticides, and herbicidesbecause of multiple financial issues.
Interestingly, this study also found a wide yield gap within farmers’fields, though they enjoyed similar climatic and soil conditions. The anal-ysis of factors influencing the variation in yield gap within farmers’ fieldsrevealed an inverse size-yield relationship, implying that there was a ten-dency towards increasing yield gap with the increasing landholding size,which was attributed to an inverse relationship between landholding sizeand apple yield. This finding is consistent with the findings of the stud-ies conducted elsewhere (Niroula and Thapa 2007; Ünal 2008; Sial et al.2012; Aneani and Ofori-Frimpong 2013). The inverse size-yield relationshipis attributed to the fact that small farmers could take care of apple orchardsproperly by virtue of availability of higher household labor per unit of land.In the study area, for example, lower-, medium-, and upper-small farmershad labor-land ratios of 0.64, 0.19, and 0.10, respectively. Moreover, farm-household members are better motivated about taking care of orchards thanhired laborers, as they are the sole beneficiaries of benefits accruing fromtheir hard work. Likewise, in other parts of Pakistan (Kiani 2008; Sial et al.2012), small landholders used more on-farm inputs per unit of land thanlarge landholders. As apple was their economic mainstay, any decrease inapple yield would make lower-small landholders vulnerable to economichardship and food insecurity. Therefore, they took care of their orchardsvery diligently and used inputs available at their disposal to the extent it was
Dow
nloa
ded
by [
Ghu
lam
Mur
taza
] at
22:
33 1
8 A
pril
2015
Determinants of Yield Gap in Small-Scale Apple Farms 211
possible. This is why the yields of both varieties of apple increased withdecreasing landholding size.
The experience in apple farming also played a very significant posi-tive role in influencing the yield gap, irrespective of variety. The yield gapdecreased with increasing experience in apple farming. This was becauseof the fact that the more experienced farmers could use their accumu-lated knowledge on pest control, orchard management, and land fertilizationgained through the trial-and-error process across a long period of time thanthe farmers who did not have experience in managing apple orchards fora long time. Moreover, experienced farmers were more likely to participatein trainings, avail credit, frequently visit agricultural extension office, andperform marketing operations by themselves, thereby reducing yield gapsubstantially (see Appendix A).
Plant population, the term typically used in agronomy for plant densityand measured as the number of plants per m2, also affects the yield potentialat a given location because maximum dry matter accumulation rates occurwhen the spatial density of plants allows rapid leaf canopy developmentto intercept all incoming solar radiation as early as possible in the growingseason (Lobell et al. 2009).
The tendency towards decreasing yield gaps in both varieties of applesignificantly with increasing tree density was a clear indication of increasingyield with increasing tree density. This was somewhat contrary to the generalbelief that crop yield decreases with increasing plant/tree density because ofhigh competition between plants/trees for nutrients available in the soil. Thehigh tree density provided earlier canopy cover, which controlled the growthof weeds, reduced water evaporation, and improved water-holding capacity(WHC) of soil, thereby increasing crop yield (de Bie 2004; Fermont et al.2009). High tree density also contributes to natural pollination of trees (Jasraet al. 2001). This does not mean that the yield continues to increase infinitelywith increasing tree density. In our study, yields of both varieties of appledeclined in orchards with tree density higher than 867 ha−1.
Farmers’ participation in agricultural trainings and access to agricultureextension services had also significantly positively influenced the yield gapas proven by the tendency towards decreasing yield gaps with participationin training and access to extension services. Training sessions attended byfarmers and extension services provided to farmers helped transfer knowl-edge and technologies to farmers, which ultimately contributed to increasingapple yield and decreasing the yield gap. However, because of lack of suchtrainings only one-fifth of farmers in the study areas had participated inany training on apple farming conducted by the Balochistan Rural SupportProgram (BRSP) and District Agricultural Office. Similarly, only one-fourthof farmers had access to agricultural extension services, almost all claimingthat extension workers never visited their farms. Rather farmers themselvesconsulted extension officials in times of need.
Dow
nloa
ded
by [
Ghu
lam
Mur
taza
] at
22:
33 1
8 A
pril
2015
212 G. Murtaza and G. B. Thapa
The positive association of weed management with yield gap was plau-sible as proper and timely weed management allowed apple trees to useavailable soil nutrients in an effective way and at the same time helped con-trol pests, resulting in healthy trees and better yields as proven by the studiesof de-Bie (2004), Fermont et al. (2009), and Aneani and Ofori-Frimpong(2013). Weeding was performed manually using mostly household labor orby grazing cattle. Some of the farmers used herbicides to control weeds.Besides, the hoeing of orchards before the flowering season helped controlweeds.
The importance of farmers’ perceived soil suitability for apple farmingin bridging yield gap is well exemplified by the strong response of the soil toits water-holding capacity (WHC, i.e., irrigation constraints) and fertilization(nutrient constraints), as also argued by Fermont et al. (2009). It was alsoan indication of farmers’ knowledge of their farm soil. Moreover, flat landplots were perceived more suitable than sloping land plots by the farmers(r = -0.36, p = 0.01: see table in Appendix). It signified that farmers’ in ourstudy area were well aware of the general fact that apple was a drought-prone crop, thus their perception of soil suitability mainly focused on itsWHC because of energy crises (electric load shedding of about 16 hours aday), shortage of rainfall, and continuous drop in water table.
Regarding the significant positive role of credit in reducing yield gap,this could happen as farmers’ access to the formal credit enabled them toadopt new technology needed for increasing crop yield (Mahmood et al.2009). However, unlike in the Punjab province of Pakistan where severalfinancial institutions were providing credit to farmers (Hussain and Thapa2012), none of the surveyed farmers had access to formal credit. Only slightlymore than one-fourth of them could get credit from informal sources, includ-ing relatives, fellow farmers, apple buyers, and commission agents. Notably,Zarai Taraqqiati Bank (Agriculture Development Bank) had not providedany credit for agricultural operations for the reason that it could not recoverthe provided credit effectively.
Like in many Asian countries (Miyata et al. 2009; Thapa and Gaiha 2011),farmers in the study area were selling apple on tree as early as the floweringseason. After that the responsibility of orchard management was transferredto the buyers, who could not take care of the orchards as effectively asfarmers for the practical reason that they were far away from the orchards.On the farmers’ side, there was neither any additional incentive nor any bind-ing condition for taking care of orchards. As a result, the yield of apple underthe pre-harvest selling system was lower than the alternative selling system(self-marketing). This explains why the result of the analysis revealed a sig-nificant negative relationship between the practice of selling apple on treesand yield. Reportedly, the contractors applied two to six extensive sprays ofpesticides to control pests and getting fruit color, decreasing the population
Dow
nloa
ded
by [
Ghu
lam
Mur
taza
] at
22:
33 1
8 A
pril
2015
Determinants of Yield Gap in Small-Scale Apple Farms 213
of natural pollinating insects. It was also coupled with the contractor’s prac-tice of growing vegetables under the trees for security and to recover theirexpenses, thus lowering the crop yield. This finding contradicts with that ofMiyata et al. (2009).
CONCLUSION
This paper aimed at analyzing yield gap of apple orchards in a resource-scarce region of Balochistan plateau, Pakistan, and then at identifying thefactors affecting yield gaps. The paper also discussed socio-economic struc-ture, production practices, potentials, and problems of smallholder applegrowers in the study area. The finding that there was a significant gapbetween the yields of apple grown in the Research Center farm and farm-ers’ fields was not a big surprise as proven by several other studies citedabove. Being grown in a controlled environment with the application ofadequate amounts of needed inputs, yields of both varieties of apple grownin the government-supported Research Center farm were significantly higherthan those of apple grown in farmers’ fields. Because of the shortage ofresources, common farmers in the study area could hardly avail an adequateamount of needed inputs and take care of orchards in an effective way.Therefore, it is unrealistic to expect farmers to achieve the level of yield ofthe Research Center so as to bridge the yield gap completely. However, it ispossible to narrow down the yield gap by enabling farmers to improve appleyield through necessary support. This can be done by diffusing technologyat the experiment station to farmers’ fields through an efficient exten-sion service mechanism, on-farm demonstrations, and by arranging timelytrainings.
The interesting finding of this study is that, despite similar biophysi-cal conditions, there was a significant gap in yields of apple grown in modeland common farmers’ fields. The overall model farmer-based yield gap index(YGIM) within apple producers was 46.5%, indicating that there was a pos-sibility of improving common farmers’ apple yield by 53.5%. Because theyield gap was in farmers’ situations, ideally it should be possible to nar-row down the gap significantly through necessary interventions based onthe factors determined to be influencing the yield gap. The analysis of fac-tors influencing the yield gap between the model and common farmers’fields indicated that adequate labor, credit and extension services, experiencein apple farming, weeding of orchard, farmers’ capacity building throughappropriate training, and optimum density of apple trees were needed toenable common farmers to increase apple yields, thereby reducing the yieldgap. The findings also indicated the need for improving apple orchard man-agement under the contract marketing system. The District Extension Office
Dow
nloa
ded
by [
Ghu
lam
Mur
taza
] at
22:
33 1
8 A
pril
2015
214 G. Murtaza and G. B. Thapa
should play a lead role in addressing such needs directly as well as indirectlythrough advisory services.
NOTES
1. Local term used for farmers’ community-based underground water channels constructed as aseries of wells connected by underground tunnels delivering water to the surface without pumping.
2. By this way, the orchard’s farmers pay flat rates of only Rs. 4000 as monthly tariff per tubewellirrespective of energy consumed.
3. Local term used for a sub-district in Pakistan.4. Local term used for a Union Council, an administrative area lower than sub-district in Pakistan.5. Local term used for the officer keeping land record at Union Council level in Pakistan.6. A literate person is defined by Pakistan’s Ministry of Education as, “one who can read a
newspaper and write a simple letter in any language” (Latif 2009).
REFERENCES
Aggarwal, P. K., K. B. Hebbar, M. V. Venugopalan, S. Rani, A. Bala, A. Biswal, andS. P. Wani. 2008. Quantification of yield gaps in rain-fed rice, wheat, cotton andmustard in India. Andhra Pradesh, India: International Crops Research Institutefor the Semi-Arid Tropics.
Aggarwal, P. K., S. N. Kumar, and H. Pathak. 2010. Impacts of climate change ongrowth and yield of rice and wheat in the Upper Ganga Basin. New Delhi, India:Indian Agricultural Research Institute (IARI).
Ali, N. 2007. Allocative efficiency of rice farmers: study of West Bengal. New Dehli,India: Concept Publishing Co.
Aneani, F., and K. Ofori-Frimpong. 2013. An analysis of yield gap and some factorsof cocoa (theobroma cacao) yields in Ghana. Sustainable Agric. Res. 2:117–127.
Angulo, C., M. Becker, and R. Wassmann. 2012. Yield gap analysis and assessmentof climate-induced yield trends of irrigated rice in selected provinces of thePhilippines. J. Agric. Rural Develop. Tropic Subtropics 113:61–68.
Arkin, H., and R. Colton. 1963. Tables for statisticians. New York, NY: Barnes &Noble.
Balasubramanian, V., M. Bell, and M. Sombilla. 2000. Yield, profit, and knowl-edge gaps in rice farming: Causes and development of mitigation measures.In Bridging the Rice Yield Gap in the Asia-Pacific Region, edited by M. K.Papademetriou, F. J. Dent, and E. M. Herath, 163–177. RAP Publication: 2000/16.Bangkok, Thailand: FAO Regional Office for Asia and the Pacific.
Bhatia, V. S., P. Singh, S. P. Wani, G. S. Chauhan, A. V. R. Rao, A. K. Mishra, and K.Srinivas. 2008. Analysis of potential yields and yield gaps of rainfed soybean inIndia using CROPGRO-Soybean model. Agric. Forest Meteorol. 148:1252–1265.
Bhatia, V. S., P. Singh, S. P. Wani, A. V. R. K. Rao, and K. Srinivas. 2006. Yield gapanalysis of soybean, groundnut, pigeonpea and chickpea in India using simu-lation modeling. Andhra Pradesh, India: International Crops Research Institutefor the Semi-Arid Tropics (ICRISAT).
Dow
nloa
ded
by [
Ghu
lam
Mur
taza
] at
22:
33 1
8 A
pril
2015
Determinants of Yield Gap in Small-Scale Apple Farms 215
de Bie, C. A. J. M. 2004. The yield gap of mango in Phrao, Thailand, as investigatedthrough comparative performance evaluation. Scientia Horticulturae 102:37–52.
Dey, M. M., F. Alam, M. Weimin, S. Piumsombun, R. Bhatta, L. T. C. Dung, and F. J.Paraguas. 2005. Constraints to increased yields in carp farming: implications forfuture genetic research: Chapter 5. In Carp Genetic Resources for Aquaculturein Asia, edited by D. J. Penman, M. V. Gupta, and M. M. Dey, pp. 152. Penang,Malaysia: WorldFish Center.
Fermont, A. M., P. J. A. van Asten, P. Tittonell, M. T. van Wijk, and K. E. Giller.2009. Closing the Cassava yield gap: An analysis from smallholder farms in EastAfrica. Field Crops Res. 112:24–36.
Government of Balochistan. 2011. Mastung-District Development Profile 2011.Balochistan, Pakistan: Planning & Development Department, Government ofBalochistan, Quetta in Collaboration with UNICEF.
Government of Balochistan. 2013. Development Satatistics of Balochistan 2011-12. Balochistan, Pakistan: Bureau of Statistics, Planning and Development,Government of Balochistan, Pakistan, Quetta.
Gomez, K. A., R. W. Herdt, R. Barker, and S. K. De Datta. 1979. A methodologyfor identifying constraints to high rice yields on farmers’ fields. In Farm-LevelConstraints to High Rice Yields in Asia: 1974-77 , edited by International RiceResearch Institute (IRRI), pp. 27–47. Los Banos, Philippines: IRRI.
Government of Balochistan. 2013. Agricultural statistics of Pakistan. Islamabad,Pakistan: Federal Bureau of Statistics, Government of Pakistan.
Huang, J., C. Pray, and S. Rozelle. 2002. Enhancing the crops to feed the poor.Nature 418:678–684.
Hussain, A., and G. B. Thapa. 2012. Smallholders’ access to agricultural credit inPakistan. Food Security 4:73–85.
Jasra, A. W., S. Ashfaq, and M. A. Kasi. 2001. Apple Pollination Problems inBalochistan, Pakistan. Int. J. Agric. Biol. 3:210–213.
Kiani, A. K. 2008. Farm size and productivity in Pakistan. Eur. J. Social Sci. 7:42–52.Latif, A. 2009. A Critical Analysis of School Enrollment and Literacy Rates of Girls
and Women in Pakistan. Educational Studies 45:424–439.Lobell, D. B., K. G. Cassman, and C. B. Field. 2009. Crop yield gaps: their importance,
magnitudes, and causes. Ann. Rev. Environ. Res. 34:179–204.Lobell, D. B., J. I. Ortiz-Monasterio, G. P. Asner, R. L. Naylor, and W. P. Falcon. 2005.
Combining field surveys, remote sensing, and regression trees to understandyield variations in an irrigated wheat landscape. Agron. J . 97:241–49.
Mahmood, N., M. Khalid, and S. Kouser. 2009. Role of agriculture credit in thegrowth of livestock sector: A case study of Faisalabad. Pak.Vet. J . 29:81–84.
Miyata, S., N. Minot, and D. Hu. 2009. Impact of Contract farming on income:linking small farmers, packers, and supermarkets in China. World Develop.37:1781–1790.
Mondal, M. H. 2011. Causes of yield gaps and strategeis for minimizing the gaps indifferent crops of Bangladesh. Bangladesh J. Agril. Res. 36:469–476.
Murtaza, G. 2010. Technical efficiency of horticulture farms in Balochistan, Pakistan:A stochastic production frontier analysis. Master Research studies project report,no. RD-10-03, Asian Institute of Technology, Bangkok, Thailand.
Dow
nloa
ded
by [
Ghu
lam
Mur
taza
] at
22:
33 1
8 A
pril
2015
216 G. Murtaza and G. B. Thapa
Niroula, G. S., and G. B. Thapa. 2007. Impacts of land fragmentation on input use,crop yield and production efficiency in the mountains of Nepal. Land Degrad.Develop. 18:237–248.
Pala, M., T. Oweis, B. Benli, E. De Pauw, M. El Mourid, M. Karrou, M. Jamal, andN. Zencirci. 2011. Assessment of wheat yield gap in the Mediterranean: casestudies from Morocco, Syria and Turkey. Aleppo, Syria: International Center forAgricultural Research in the Dry Areas (ICARDA).
Sadras, V., D. Roget, and G. O’Leary. 2002. On-farm assessment of environmentaland management constraints to wheat yield and efficiency in the use of rainfallin the Mallee. Austr. J. Agric. Res. 53:587–98.
State Bank of Pakistan. 2010. Document of definitions, annual report-statisticalsupplement. Karachi, Pakistan: Agricultural Credit Department, State Bank ofPakistan.
Sial, M. H., S. Iqbal, and A. D. Sheikh. 2012. Farm size—Productivity relationship:Recent evidence from Central Punjab. Pak. Econ. Social Rev. 50:139–162.
Simar, L., and P. W. Wilson. 2007. Estimation and inference in two-stage, semi-parametric models of production processes. J. Econo. 136:31–64.
Singh, P., P. K. Aggarwal, V. S. Bhatia, M. V. R. Murty, M. Pala, T. Oweis, B. Benli, K.P. C. Rao, and S. P. Wani. 2009. Yield gap analysis: Modelling of Achievableyields at farm level. In Rainfed Agriculture: Unlocking the Potential, editedby S. P. Wani, J. Rockstorm, and T. Oweis, pp. 81–123. Wallingford, UK: CABInternational,
Sumberg, J. 2012. Mind the (yield) gap(s). Food Security 4:509–518.Thapa, G. 2009. Smallholder farming in transforming economies of Asia and
the Pacific: challenges and opportunities. Rome, Italy: International Fund forAgricultural Development (IFAD). Discussion Paper prepared for the side eventorganized during the Thirty-third session of IFAD’s Governing Council.
Thapa, G., and Gaiha, R. 2011. Smallholder Farming in Asia and the Pacific:Challenges and Opportunities. Paper presented at the IFAD Conference on NewDirections for Smallholder Agriculture, 24–25 January 2011, International Fundfor Agricultural Development (IFAD), Rome, Italy.
Ünal, F. G. 2008. Small is beautiful: evidence of an inverse relationship between farmsize and yield in Turkey. New York, NY: The Levy Economics Institute of BardCollege.
Yengoh, G., and J. Ardö. 2014. Crop yield gaps in Cameroon. AMBIO 43:175–190.Dow
nloa
ded
by [
Ghu
lam
Mur
taza
] at
22:
33 1
8 A
pril
2015
APPEN
DIX
A
TAB
LEA
Corr
elat
ion
mat
rix
bet
wee
nY
GI M
and
farm
-spec
ific
char
acte
rist
ics
Var
iable
s1
23
45
67
89
1011
1213
14
YG
I M1
Educa
tion
of
resp
onden
t0.
21∗
1
Yea
rsof
exper
ience
−0.6
3∗∗−0
.18∗
1
Land-h
old
ing
size
0.23
∗∗0.
070.
031
HH
labor
inag
ricu
lture
−0.2
8∗∗−0
.15∗
0.13
−0.2
2∗∗1
Serv
ice
area
per
tubew
ell
0.55
∗∗0.
17∗
−0.4
1∗∗0.
55∗∗
−0.3
0∗∗1
Tre
eden
sity
−0.1
9∗0.
120.
120.
19∗
−0.2
3∗∗−0
.01
1Sl
ope
0.43
∗∗0.
00−0
.34∗∗
0.39
∗∗−0
.15∗
0.49
∗∗−0
.09
1Su
itabili
tyofso
il−0
.52∗∗
−0.2
6∗∗0.
34∗∗
−0.3
4∗∗0.
34∗∗
−0.5
1∗∗−0
.03
−0.3
6∗∗1
Wee
din
gpra
ctic
e−0
.40∗∗
−0.1
40.
40∗∗
0.20
∗−0
.24∗∗
−0.2
2∗∗0.
19∗
−0.2
0∗0.
061
Contrac
tual
beh
avio
r0.
29∗∗
0.12
−0.3
0∗∗0.
07−0
.16∗
0.21
∗0.
23∗∗
0.06
−0.1
4−0
.09
1
Par
ticip
ated
intrai
nin
g−0
.46∗∗
0.06
0.27
∗∗−0
.04
0.13
−0.3
1∗∗0.
07−0
.32∗∗
0.25
∗∗0.
17∗
0.02
1
Cre
dit
avai
labili
ty−0
.57∗∗
−0.1
8∗0.
38∗∗
−0.1
30.
21∗
−0.4
9∗∗0.
03−0
.25∗∗
0.36
∗∗0.
23∗∗
−0.2
9∗∗0.
31∗∗
1A
cces
sto
exte
nsi
on
−0.4
4∗∗0.
100.
22∗∗
−0.2
1∗0.
20∗
−0.3
7∗∗−0
.10
−0.2
6∗∗0.
35∗∗
−0.0
0−0
.15∗
0.30
∗∗0.
27∗∗
1
∗ ,∗∗
Corr
elat
ion
issi
gnifi
cantat
0.05
and
0.01
leve
l,re
spec
tivel
y.
217
Dow
nloa
ded
by [
Ghu
lam
Mur
taza
] at
22:
33 1
8 A
pril
2015
218 G. Murtaza and G. B. Thapa
APPENDIX B
Questionnaire for Farmers
All the information collected through this questionnaire are highly confiden-tial and purely for academic purpose. The results of this study will suggestpossible improvements in production as well as marketing of your appleproduce and help policies of the government for improving smallholders’production and marketing efficiencies and thus resulting better returns.Respondents’ personal information, comments, suggestions and demandswill not be used beyond academic use of this study. So kindly do not hesitateto express your real situation and personal opinion.
A. Ideographic Information of the Respondent
Respondent’s Name: . . . . . . . . . . . . . . . . . . . . . Age: . . . . . .
Gender: [ ] Male [ ] FemaleEducation: [ ] Illiterate [ ] Primary [ ] Secondary
[ ] Intermediate [ ] Bachelor & Post graduate [ ] Vocational
Village: . . . . . . . . . . . . Union Council: . . . . . . . . . . . .
Sub-District: . . . . . . . . . . . . . . . . . .
A1. Details of family members other than the respondent:
Age Class Number of Persons Persons involved in apple farming
Less than 14 yearsBetween 14 and 50More than 50
B. Information Relating to Apple Cultivation
B1. For how many years have you been involved in apple cultivation? . . .
. . . . . . . . . yearsB2. Total farm area ________________units ___________B3. Area under irrigation ______________ and non-irrigated __________B4. Total cultivated area under apple crop ____________ units _________B5. Land holding by type of land and land tenure under apple crop and land
characteristics
Dow
nloa
ded
by [
Ghu
lam
Mur
taza
] at
22:
33 1
8 A
pril
2015
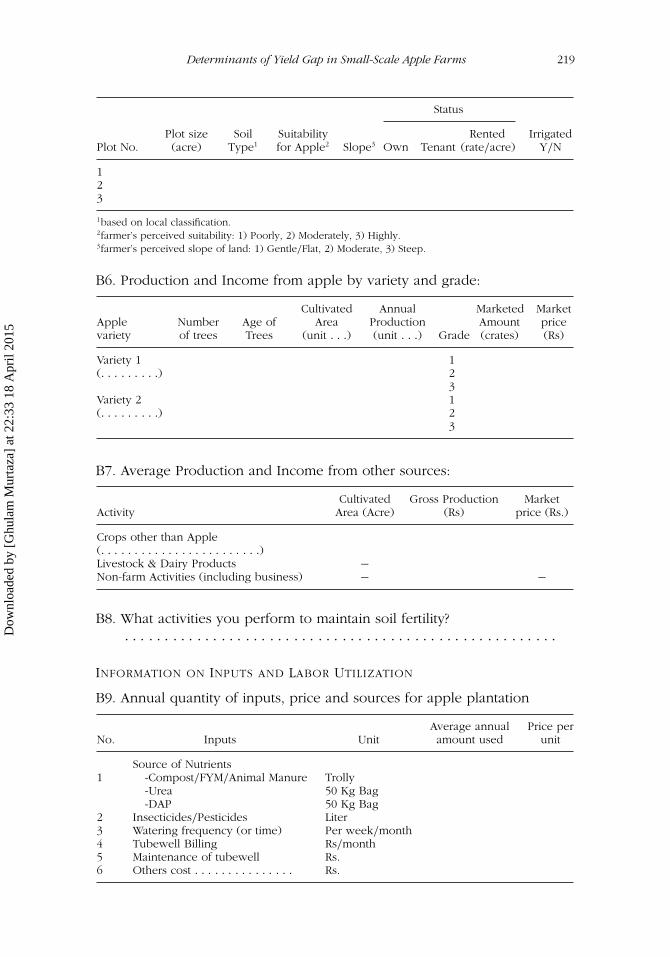
Determinants of Yield Gap in Small-Scale Apple Farms 219
Status
Plot No.Plot size(acre)
SoilType1
Suitabilityfor Apple2 Slope3 Own Tenant
Rented(rate/acre)
IrrigatedY/N
123
1based on local classification.2farmer’s perceived suitability: 1) Poorly, 2) Moderately, 3) Highly.3farmer’s perceived slope of land: 1) Gentle/Flat, 2) Moderate, 3) Steep.
B6. Production and Income from apple by variety and grade:
Applevariety
Numberof trees
Age ofTrees
CultivatedArea
(unit . . .)
AnnualProduction(unit . . .) Grade
MarketedAmount(crates)
Marketprice(Rs)
Variety 1(. . . . . . . . .)
123
Variety 2(. . . . . . . . .)
123
B7. Average Production and Income from other sources:
ActivityCultivated
Area (Acre)Gross Production
(Rs)Market
price (Rs.)
Crops other than Apple(. . . . . . . . . . . . . . . . . . . . . . . .)Livestock & Dairy Products −Non-farm Activities (including business) − −
B8. What activities you perform to maintain soil fertility?. . . . . . . . . . . . . . . . . . . . . . . . . . . . . . . . . . . . . . . . . . . . . . . . . . . . . .
INFORMATION ON INPUTS AND LABOR UTILIZATION
B9. Annual quantity of inputs, price and sources for apple plantation
No. Inputs UnitAverage annualamount used
Price perunit
Source of Nutrients1 -Compost/FYM/Animal Manure Trolly
-Urea 50 Kg Bag-DAP 50 Kg Bag
2 Insecticides/Pesticides Liter3 Watering frequency (or time) Per week/month4 Tubewell Billing Rs/month5 Maintenance of tubewell Rs.6 Others cost . . . . . . . . . . . . . . . Rs.
Dow
nloa
ded
by [
Ghu
lam
Mur
taza
] at
22:
33 1
8 A
pril
2015
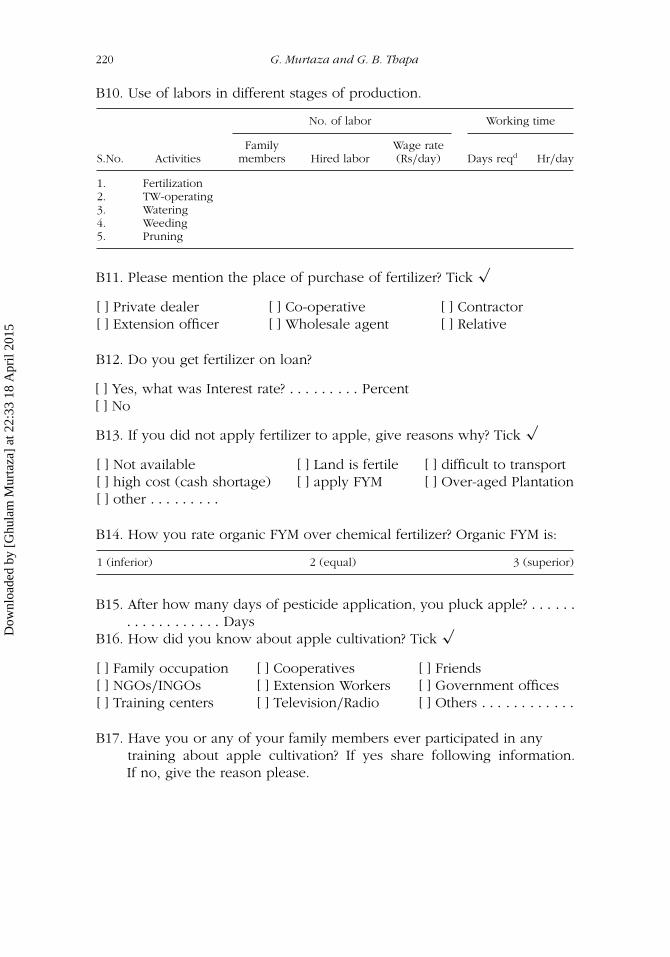
220 G. Murtaza and G. B. Thapa
B10. Use of labors in different stages of production.
No. of labor Working time
S.No. ActivitiesFamily
members Hired laborWage rate(Rs/day) Days reqd Hr/day
1. Fertilization2. TW-operating3. Watering4. Weeding5. Pruning
B11. Please mention the place of purchase of fertilizer? Tick√
[ ] Private dealer [ ] Co-operative [ ] Contractor[ ] Extension officer [ ] Wholesale agent [ ] Relative
B12. Do you get fertilizer on loan?
[ ] Yes, what was Interest rate? . . . . . . . . . Percent[ ] No
B13. If you did not apply fertilizer to apple, give reasons why? Tick√
[ ] Not available [ ] Land is fertile [ ] difficult to transport[ ] high cost (cash shortage) [ ] apply FYM [ ] Over-aged Plantation[ ] other . . . . . . . . .
B14. How you rate organic FYM over chemical fertilizer? Organic FYM is:
1 (inferior) 2 (equal) 3 (superior)
B15. After how many days of pesticide application, you pluck apple? . . . . . .
. . . . . . . . . . . . DaysB16. How did you know about apple cultivation? Tick
√
[ ] Family occupation [ ] Cooperatives [ ] Friends[ ] NGOs/INGOs [ ] Extension Workers [ ] Government offices[ ] Training centers [ ] Television/Radio [ ] Others . . . . . . . . . . . .
B17. Have you or any of your family members ever participated in anytraining about apple cultivation? If yes share following information.If no, give the reason please.
Dow
nloa
ded
by [
Ghu
lam
Mur
taza
] at
22:
33 1
8 A
pril
2015
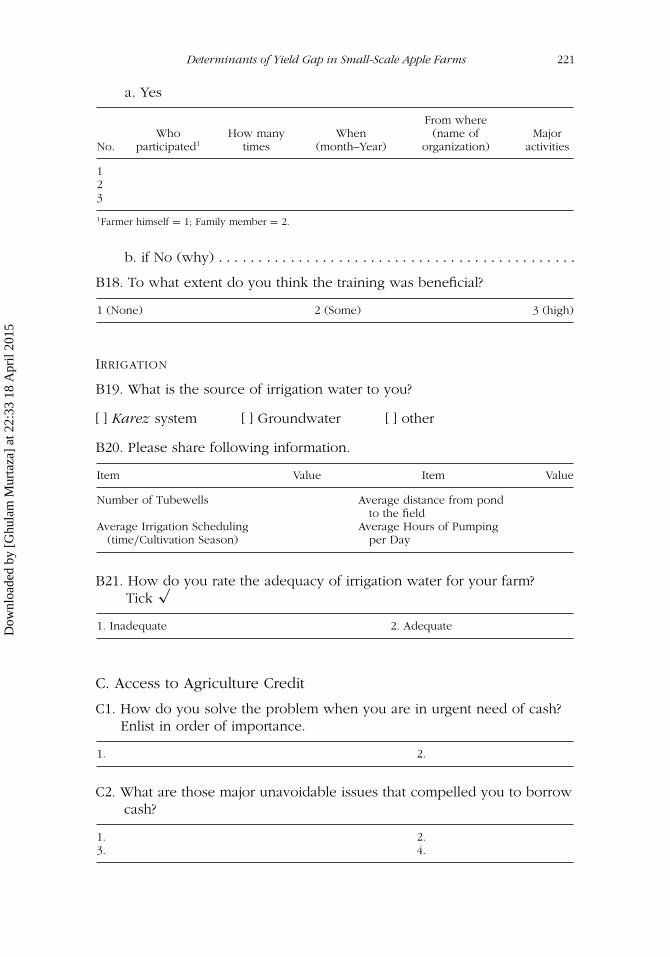
Determinants of Yield Gap in Small-Scale Apple Farms 221
a. Yes
No.Who
participated1How many
timesWhen
(month–Year)
From where(name of
organization)Major
activities
123
1Farmer himself = 1; Family member = 2.
b. if No (why) . . . . . . . . . . . . . . . . . . . . . . . . . . . . . . . . . . . . . . . . . . . . .
B18. To what extent do you think the training was beneficial?
1 (None) 2 (Some) 3 (high)
IRRIGATION
B19. What is the source of irrigation water to you?
[ ] Karez system [ ] Groundwater [ ] other
B20. Please share following information.
Item Value Item Value
Number of Tubewells Average distance from pondto the field
Average Irrigation Scheduling(time/Cultivation Season)
Average Hours of Pumpingper Day
B21. How do you rate the adequacy of irrigation water for your farm?Tick
√
1. Inadequate 2. Adequate
C. Access to Agriculture Credit
C1. How do you solve the problem when you are in urgent need of cash?Enlist in order of importance.
1. 2.
C2. What are those major unavoidable issues that compelled you to borrowcash?
1. 2.3. 4.
Dow
nloa
ded
by [
Ghu
lam
Mur
taza
] at
22:
33 1
8 A
pril
2015
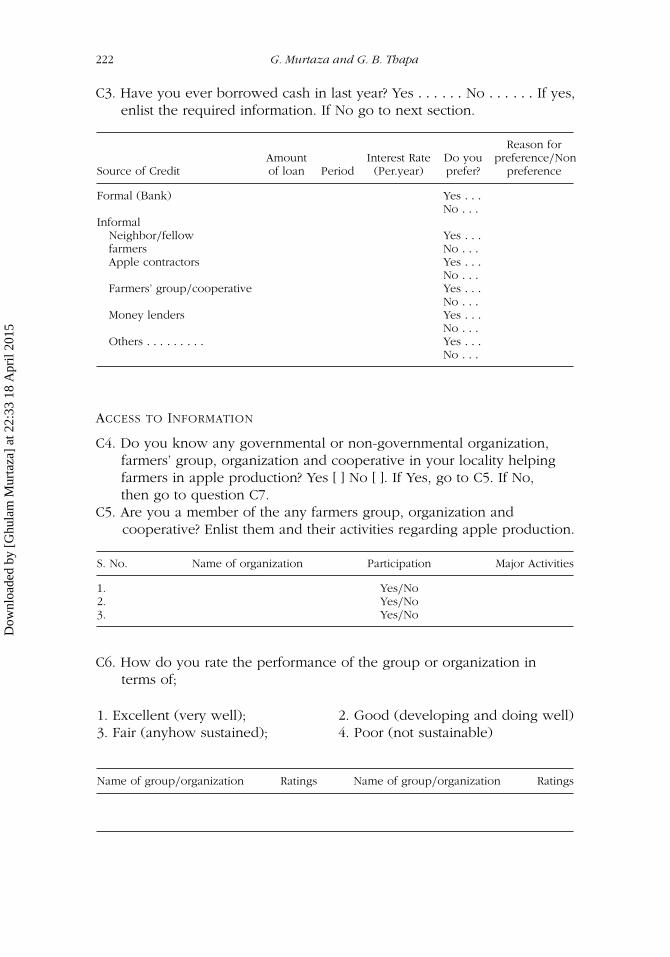
222 G. Murtaza and G. B. Thapa
C3. Have you ever borrowed cash in last year? Yes . . . . . . No . . . . . . If yes,enlist the required information. If No go to next section.
Source of CreditAmountof loan Period
Interest Rate(Per.year)
Do youprefer?
Reason forpreference/Non
preference
Formal (Bank) Yes . . .No . . .
InformalNeighbor/fellow Yes . . .farmers No . . .Apple contractors Yes . . .
No . . .Farmers’ group/cooperative Yes . . .
No . . .Money lenders Yes . . .
No . . .Others . . . . . . . . . Yes . . .
No . . .
ACCESS TO INFORMATION
C4. Do you know any governmental or non-governmental organization,farmers’ group, organization and cooperative in your locality helpingfarmers in apple production? Yes [ ] No [ ]. If Yes, go to C5. If No,then go to question C7.
C5. Are you a member of the any farmers group, organization andcooperative? Enlist them and their activities regarding apple production.
S. No. Name of organization Participation Major Activities
1. Yes/No2. Yes/No3. Yes/No
C6. How do you rate the performance of the group or organization interms of;
1. Excellent (very well); 2. Good (developing and doing well)3. Fair (anyhow sustained); 4. Poor (not sustainable)
Name of group/organization Ratings Name of group/organization Ratings
Dow
nloa
ded
by [
Ghu
lam
Mur
taza
] at
22:
33 1
8 A
pril
2015
Determinants of Yield Gap in Small-Scale Apple Farms 223
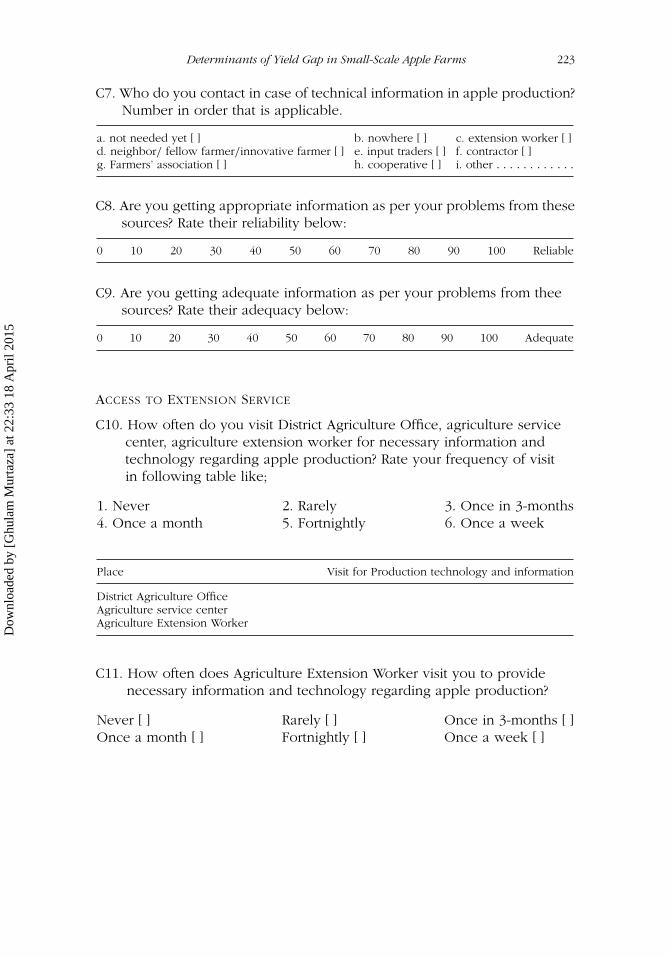
C7. Who do you contact in case of technical information in apple production?Number in order that is applicable.
a. not needed yet [ ] b. nowhere [ ] c. extension worker [ ]d. neighbor/ fellow farmer/innovative farmer [ ] e. input traders [ ] f. contractor [ ]g. Farmers’ association [ ] h. cooperative [ ] i. other . . . . . . . . . . . .
C8. Are you getting appropriate information as per your problems from thesesources? Rate their reliability below:
0 10 20 30 40 50 60 70 80 90 100 Reliable
C9. Are you getting adequate information as per your problems from theesources? Rate their adequacy below:
0 10 20 30 40 50 60 70 80 90 100 Adequate
ACCESS TO EXTENSION SERVICE
C10. How often do you visit District Agriculture Office, agriculture servicecenter, agriculture extension worker for necessary information andtechnology regarding apple production? Rate your frequency of visitin following table like;
1. Never 2. Rarely 3. Once in 3-months4. Once a month 5. Fortnightly 6. Once a week
Place Visit for Production technology and information
District Agriculture OfficeAgriculture service centerAgriculture Extension Worker
C11. How often does Agriculture Extension Worker visit you to providenecessary information and technology regarding apple production?
Never [ ] Rarely [ ] Once in 3-months [ ]Once a month [ ] Fortnightly [ ] Once a week [ ]
Dow
nloa
ded
by [
Ghu
lam
Mur
taza
] at
22:
33 1
8 A
pril
2015
224 G. Murtaza and G. B. Thapa
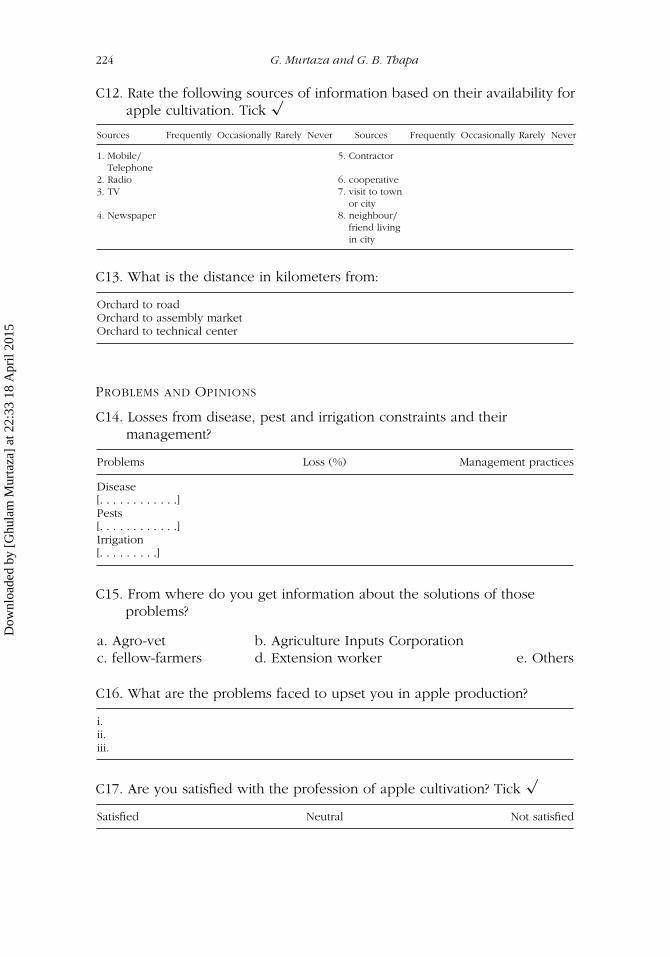
C12. Rate the following sources of information based on their availability forapple cultivation. Tick
√
Sources Frequently Occasionally Rarely Never Sources Frequently Occasionally Rarely Never
1. Mobile/
Telephone5. Contractor
2. Radio 6. cooperative3. TV 7. visit to town
or city4. Newspaper 8. neighbour/
friend livingin city
C13. What is the distance in kilometers from:
Orchard to roadOrchard to assembly marketOrchard to technical center
PROBLEMS AND OPINIONS
C14. Losses from disease, pest and irrigation constraints and theirmanagement?
Problems Loss (%) Management practices
Disease[. . . . . . . . . . . .]Pests[. . . . . . . . . . . .]Irrigation[. . . . . . . . .]
C15. From where do you get information about the solutions of thoseproblems?
a. Agro-vet b. Agriculture Inputs Corporationc. fellow-farmers d. Extension worker e. Others
C16. What are the problems faced to upset you in apple production?
i.ii.iii.
C17. Are you satisfied with the profession of apple cultivation? Tick√
Satisfied Neutral Not satisfied
Dow
nloa
ded
by [
Ghu
lam
Mur
taza
] at
22:
33 1
8 A
pril
2015
Determinants of Yield Gap in Small-Scale Apple Farms 225
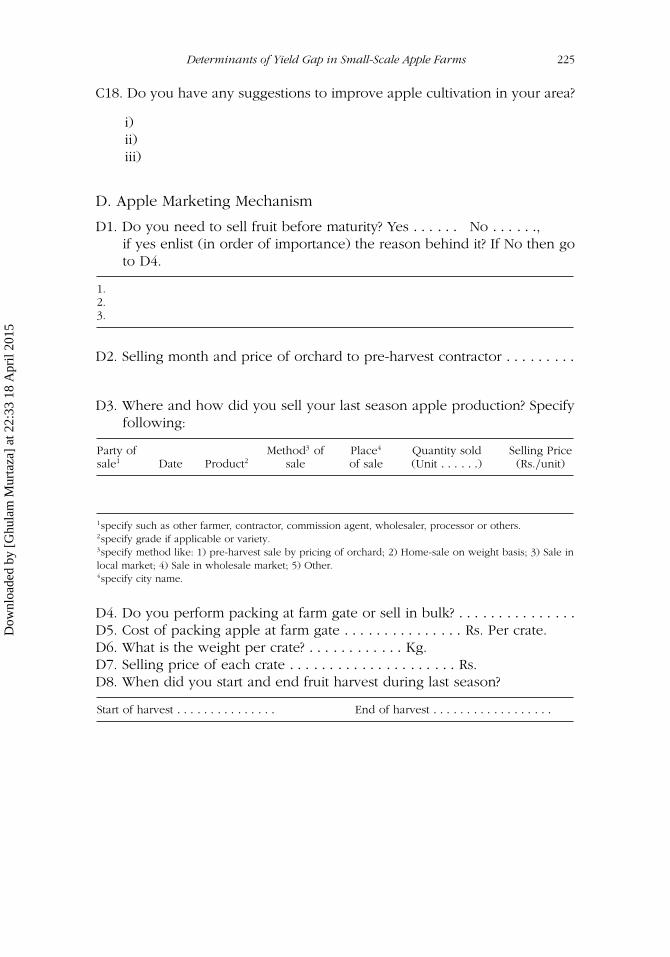
C18. Do you have any suggestions to improve apple cultivation in your area?
i)ii)iii)
D. Apple Marketing Mechanism
D1. Do you need to sell fruit before maturity? Yes . . . . . . No . . . . . .,if yes enlist (in order of importance) the reason behind it? If No then goto D4.
1.2.3.
D2. Selling month and price of orchard to pre-harvest contractor . . . . . . . . .
D3. Where and how did you sell your last season apple production? Specifyfollowing:
Party ofsale1 Date Product2
Method3 ofsale
Place4
of saleQuantity sold(Unit . . . . . .)
Selling Price(Rs./unit)
1specify such as other farmer, contractor, commission agent, wholesaler, processor or others.2specify grade if applicable or variety.3specify method like: 1) pre-harvest sale by pricing of orchard; 2) Home-sale on weight basis; 3) Sale inlocal market; 4) Sale in wholesale market; 5) Other.4specify city name.
D4. Do you perform packing at farm gate or sell in bulk? . . . . . . . . . . . . . . .
D5. Cost of packing apple at farm gate . . . . . . . . . . . . . . . Rs. Per crate.D6. What is the weight per crate? . . . . . . . . . . . . Kg.D7. Selling price of each crate . . . . . . . . . . . . . . . . . . . . . Rs.D8. When did you start and end fruit harvest during last season?
Start of harvest . . . . . . . . . . . . . . . End of harvest . . . . . . . . . . . . . . . . . .
Dow
nloa
ded
by [
Ghu
lam
Mur
taza
] at
22:
33 1
8 A
pril
2015
226 G. Murtaza and G. B. Thapa
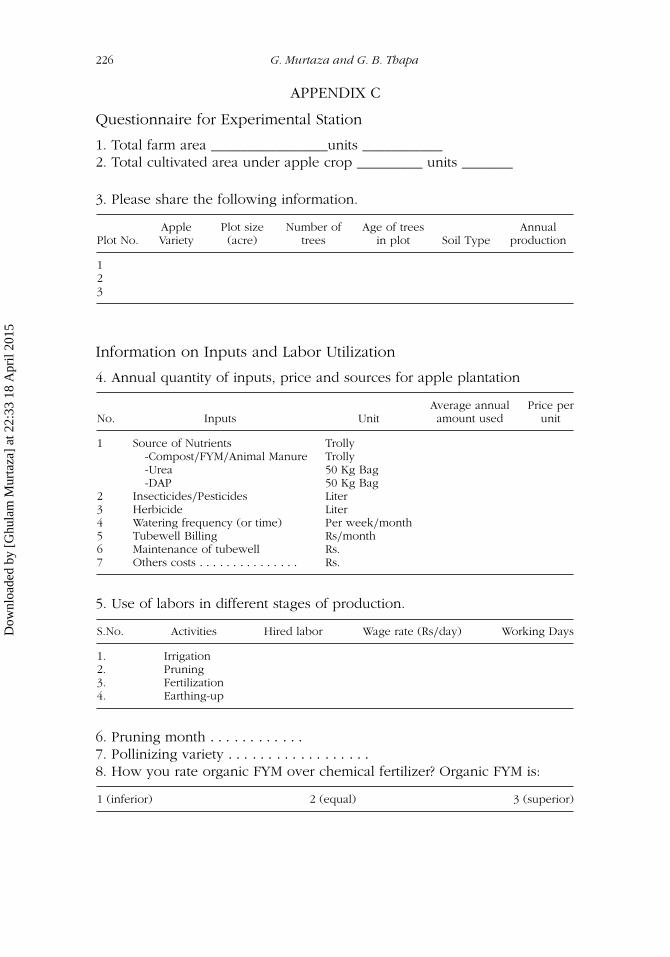
APPENDIX C
Questionnaire for Experimental Station
1. Total farm area ________________units ___________2. Total cultivated area under apple crop _________ units _______
3. Please share the following information.
Plot No.AppleVariety
Plot size(acre)
Number oftrees
Age of treesin plot Soil Type
Annualproduction
123
Information on Inputs and Labor Utilization
4. Annual quantity of inputs, price and sources for apple plantation
No. Inputs UnitAverage annualamount used
Price perunit
1 Source of Nutrients Trolly-Compost/FYM/Animal Manure Trolly-Urea 50 Kg Bag-DAP 50 Kg Bag
2 Insecticides/Pesticides Liter3 Herbicide Liter4 Watering frequency (or time) Per week/month5 Tubewell Billing Rs/month6 Maintenance of tubewell Rs.7 Others costs . . . . . . . . . . . . . . . Rs.
5. Use of labors in different stages of production.
S.No. Activities Hired labor Wage rate (Rs/day) Working Days
1. Irrigation2. Pruning3. Fertilization4. Earthing-up
6. Pruning month . . . . . . . . . . . .
7. Pollinizing variety . . . . . . . . . . . . . . . . . .
8. How you rate organic FYM over chemical fertilizer? Organic FYM is:
1 (inferior) 2 (equal) 3 (superior)
Dow
nloa
ded
by [
Ghu
lam
Mur
taza
] at
22:
33 1
8 A
pril
2015
Determinants of Yield Gap in Small-Scale Apple Farms 227
9. Please share following information
Item Value
Average Irrigation schedule(time/cultivation season)Irrigation amount (depth)
10. What activities you perform to maintain soil fertility?. . . . . . . . . . . . . . . . . . . . . . . . . . . . . . . . . . . . . . . . . . . . . . . . . . . . . . . . .
11. What activities you perform to improve production?. . . . . . . . . . . . . . . . . . . . . . . . . . . . . . . . . . . . . . . . . . . . . . . . . . . . . . . . .
12. How often farmers visit here for necessary information and technologyregarding apple production? Rate your frequency of visit in following;
1. Never . . . . . . . . . 2. Rarely . . . . . . . . . 3. Once in 3-months . . . . . .
4. Once a month . . . . . . 5. Fortnightly . . . . . . 6. Once a week . . . . . . . . .
Problems and Opinions
13. What are the problems faced to upset apple production?
i.ii.iii.
14. What are policies, strategies, programs or activity having positive impactson apple production?
1.2.
Dow
nloa
ded
by [
Ghu
lam
Mur
taza
] at
22:
33 1
8 A
pril
2015