decentralized evaluation - wfp document storage & index
TRANSCRIPT
Decentralized Evaluation
Dec
entr
ali
zed
ev
alu
ati
on
fo
r ev
iden
ce-b
ase
d d
ecis
ion
ma
kin
g
Evaluation of the School Meals Programme in Malawi with financial
support from United States Department of Agriculture (USDA)
2016 to 2018
Evaluation Report Volume II
Prepared by
Nyasha Tirivayi, Team Leader
Augustine Kamlongera, Senior Evaluator; Sonila M. Tomini, Senior Evaluator; Wondimagegn
Tesfaye, Evaluator; Rumbidzai Ndoro, Evaluator;
Francesco Iacoella, Evaluator; Alexander Hunns, Evaluator
February 2019
WFP Malawi
Evaluation Manager: Grace Makhalira
Decentralized Evaluation
Acknowledgements
The evaluation team is grateful for all the support and assistance received from staff at the World Food
Programme (WFP) Malawi Country Office notably Grace Makhalira, Mietek Maj, Bernard Owadi, Chalizamudzi
Matola, Martin Mphangwe, Polycarp Chigwenembe, Annie Mlangeni, Jason Nyirenda, field monitoring
assistants in the districts, as well as all other WFP staff who facilitated evaluation activities. We are also grateful
for the support received from the Regional Bureau, especially from Derek Nyasulu, Shamiso Shirichena and
Grace Igweta We extend particular gratitude to Innocent Njera who tirelessly facilitated our logistics needs and
our search for schools which met our survey criteria. The evaluation team is indebted to Dr Augustine
Kamlongera and Dr Paul Kamlongera of Communication Development Initiative and the entire team of
enumerators who worked ceaselessly through long days and high temperatures to collect data. We also thank
respondents of our data collection activities, the Evaluation Reference Group, MoEST staff and implementing
partners- World Vision Malawi, Save the Children, Association of Early Childhood Development in Malawi
(AECDM) and Creative Centre for Community Social Mobilization (CRECCOM) for giving us their time,
information and thoughts.
Disclaimer
The opinions expressed in this report are those of the Evaluation Team, and do not necessarily reflect those of
the World Food Programme. Responsibility for the opinions expressed in this report rests solely with the
authors. Publication of this document does not imply endorsement by WFP of the opinions expressed.
The designation employed and the presentation of material in maps do no imply the expression of any opinion
whatsoever on the part of WFP concerning the legal or constitutional status of any country, territory or sea
area, or concerning the delimitation of frontiers.
Table of Contents
ANNEX 1: MAPS ...................................................................................................................................................... 3
ANNEX 2:RESULTS FRAMEWORK ......................................................................................................................... 5
PART B : PERFORMANCE MANAGEMENT PLAN ......................................................................................................................... 6
PART C : MCGOVERN-DOLE THEORY OF CHANGE ..................................................................................................................... 6
ANNEX 3: EVALUATION MATRIX ......................................................................................................................... 9
A4.1 EVALUATION CRITERIA, QUESTIONS AND MATRIX ...................................................................................................... 16
A4.2 DATA COLLECTION METHODS AND TOOLS ................................................................................................................ 18
A4.3 AVAILABILITY AND RELIABILITY OF PROGRAMME DOCUMENTS AND EXISTING DATA ............................................ 19
A4.4 DATA COLLECTED, SAMPLING STRATEGY AND SAMPLE SIZE ........................................................................................ 19
A4.5 DATA MANAGEMENT AND VALIDITY ......................................................................................................................... 22
A4.6 TRIANGULATION ..................................................................................................................................................... 22
A4.7 DATA ANALYSIS ...................................................................................................................................................... 22
A4.8 GENDER RESPONSIVENESS OF DATA COLLECTION AND ANALYSIS................................................................................ 25
A4.9 LIMITATIONS .......................................................................................................................................................... 25
A4.10 ENSURING QUALITY AND ETHICAL SAFEGUARDS ...................................................................................................... 26
ANNEX 5: WFP’S THEORY OF CHANGE ..............................................................................................................28
ANNEX 6: DETAILED FINDINGS ON IMPACT .....................................................................................................28
ANNEX 7: ACHIEVEMENT OF PERFORMANCE INDICATORS ..........................................................................46
ANNEX 8: GENDER AND PROTECTION RECOMMENDATIONS .......................................................................51
ANNEX 9: DOCUMENTS REVIEWED ....................................................................................................................53
ANNEX 10: MISSION SCHEDULE .........................................................................................................................58
ANNEX 11: STAKEHOLDERS INTERVIEWED.......................................................................................................60
ANNEX 12: DATA COLLECTION TOOLS ..............................................................................................................62
ANNEX 13: BIBLIOGRAPHY ....................................................................................................................................... 140
ANNEX 14: TERMS OF REFERENCE .................................................................................................................... 142
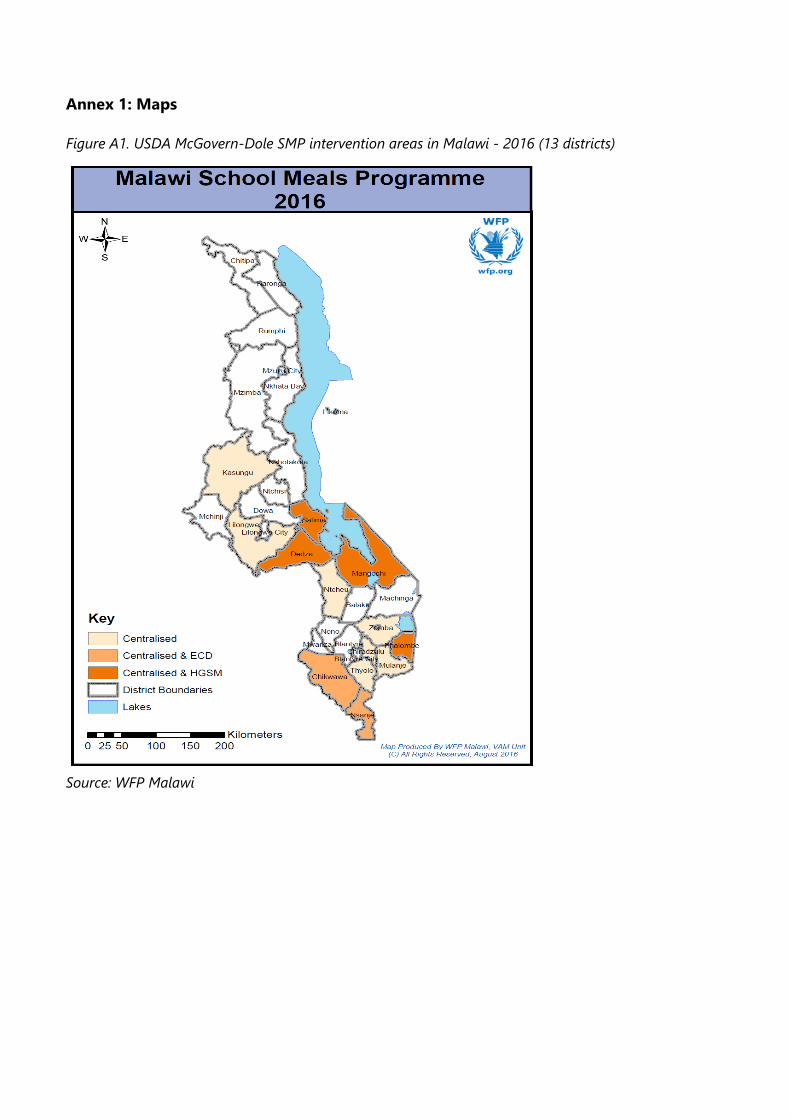
Annex 1: Maps
Figure A1. USDA McGovern-Dole SMP intervention areas in Malawi - 2016 (13 districts)
Source: WFP Malawi
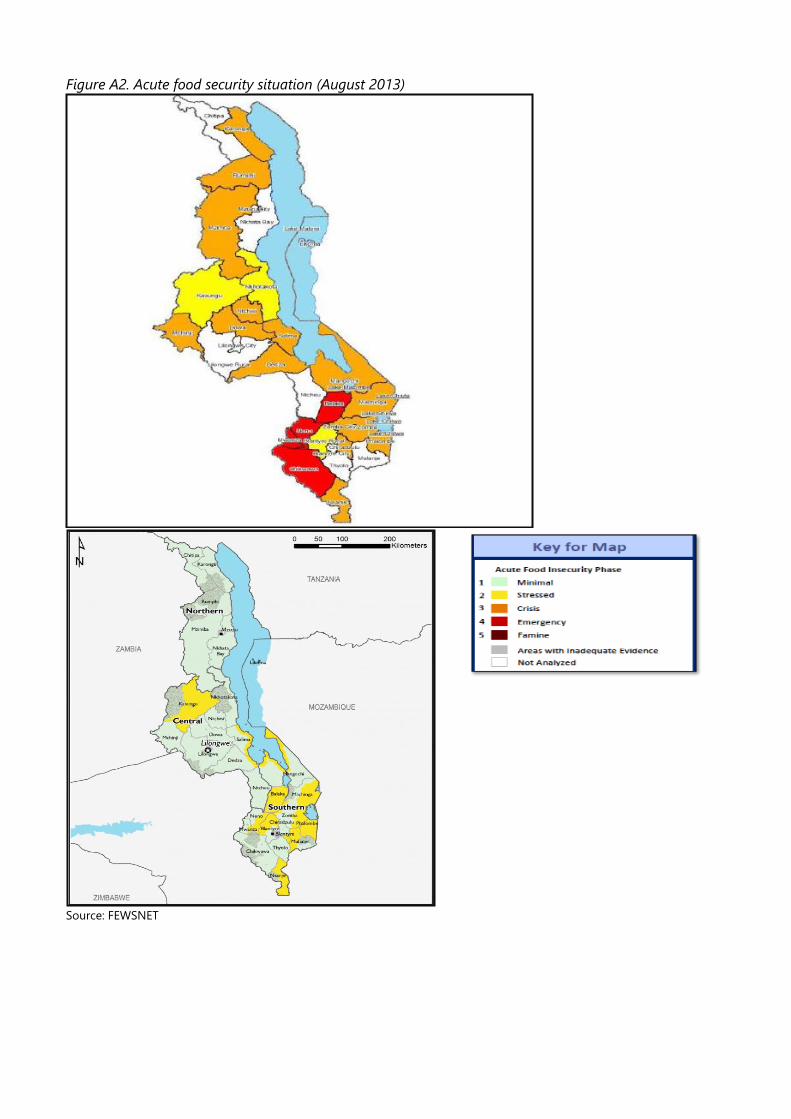
Figure A2. Acute food security situation (August 2013)
Source: FEWSNET
Figure A3. Acute food security situation (July 2018)
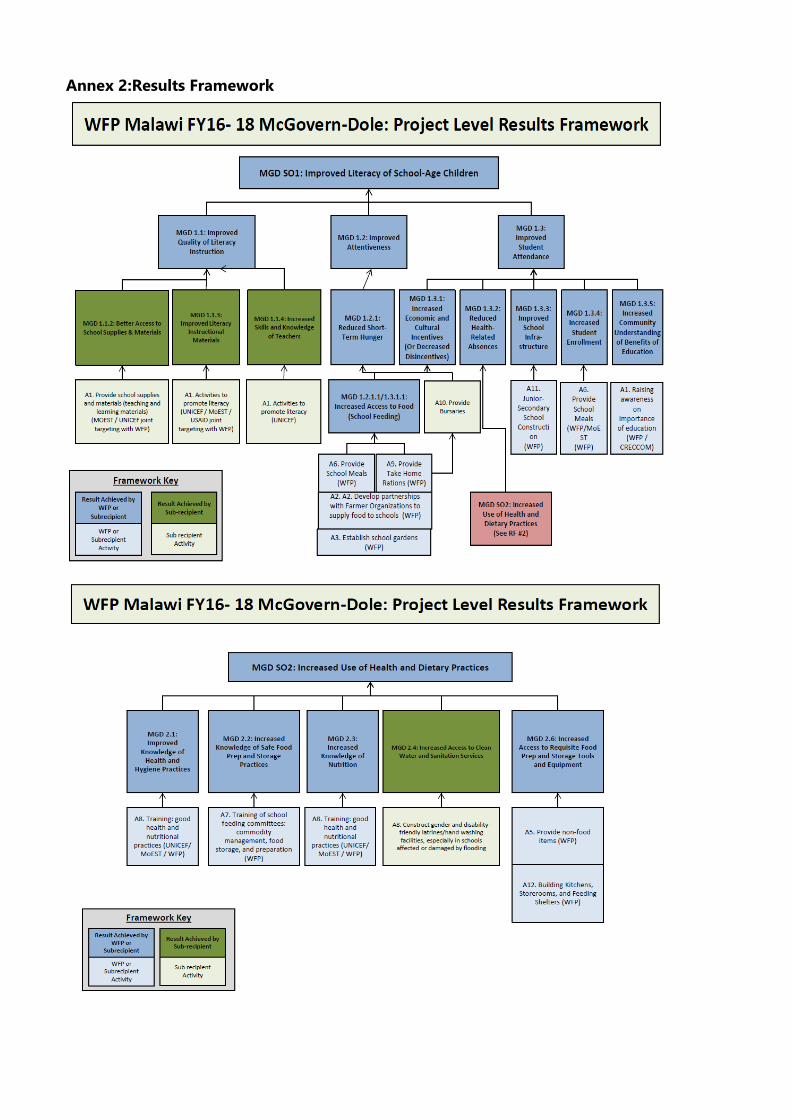
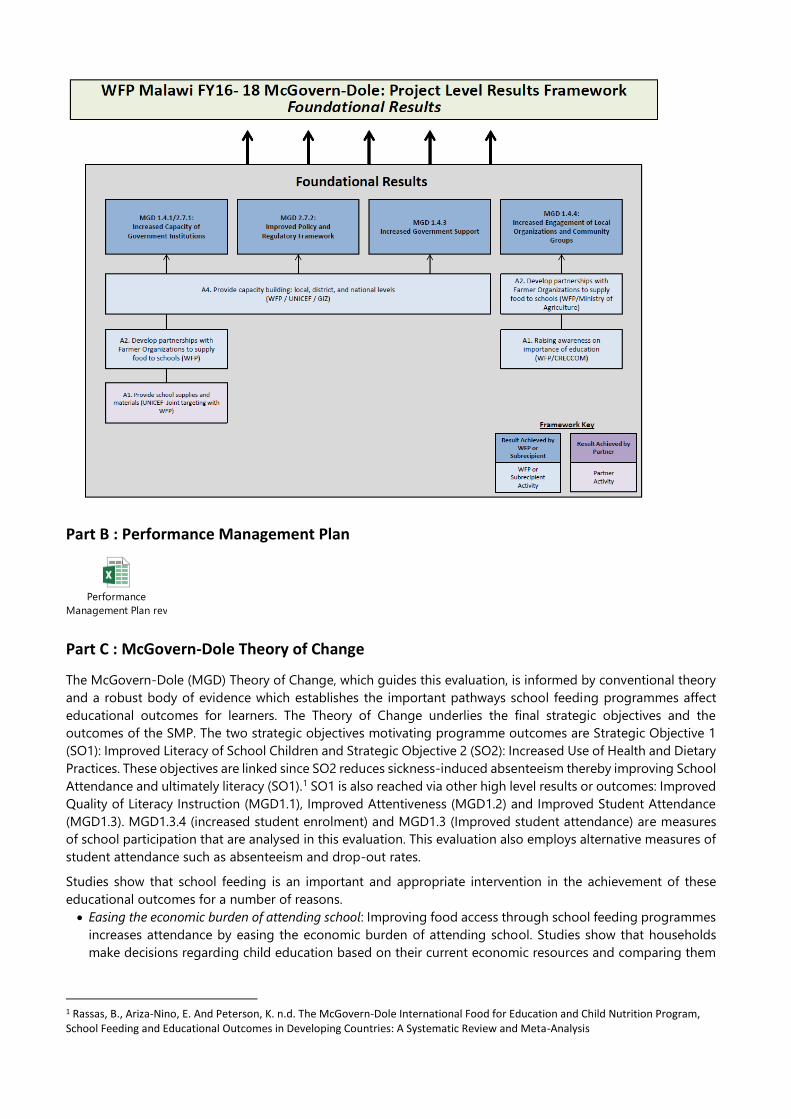
Annex 2:Results Framework
Part B : Performance Management Plan
Performance
Management Plan revised Malawi CO_ Final approved.xlsx
Part C : McGovern-Dole Theory of Change
The McGovern-Dole (MGD) Theory of Change, which guides this evaluation, is informed by conventional theory
and a robust body of evidence which establishes the important pathways school feeding programmes affect
educational outcomes for learners. The Theory of Change underlies the final strategic objectives and the
outcomes of the SMP. The two strategic objectives motivating programme outcomes are Strategic Objective 1
(SO1): Improved Literacy of School Children and Strategic Objective 2 (SO2): Increased Use of Health and Dietary
Practices. These objectives are linked since SO2 reduces sickness-induced absenteeism thereby improving School
Attendance and ultimately literacy (SO1).1 SO1 is also reached via other high level results or outcomes: Improved
Quality of Literacy Instruction (MGD1.1), Improved Attentiveness (MGD1.2) and Improved Student Attendance
(MGD1.3). MGD1.3.4 (increased student enrolment) and MGD1.3 (Improved student attendance) are measures
of school participation that are analysed in this evaluation. This evaluation also employs alternative measures of
student attendance such as absenteeism and drop-out rates.
Studies show that school feeding is an important and appropriate intervention in the achievement of these
educational outcomes for a number of reasons.
• Easing the economic burden of attending school: Improving food access through school feeding programmes
increases attendance by easing the economic burden of attending school. Studies show that households
make decisions regarding child education based on their current economic resources and comparing them
1 Rassas, B., Ariza-Nino, E. And Peterson, K. n.d. The McGovern-Dole International Food for Education and Child Nutrition Program, School Feeding and Educational Outcomes in Developing Countries: A Systematic Review and Meta-Analysis
with potential benefits of education and the costs associated with schooling.2 These costs include school
fees, learning materials (books, stationery and other supplies), uniforms and recurring transport costs.
Households also consider the opportunity costs incurred when children do not perform family housework
or bring in additional income through work. School meals, including take home rations (THRs) act as
conditional in-kind transfers that change the underlying economic rationale in household decision-making
patterns. Households save on food costs, offsetting the price of sending a child to school. As such school
feeding increases economic incentives (MGD 1.3.1) that encourage children to attend school. This is
particularly true for young girls who face many more economic barriers to education, more of which will be
described below.
• Reducing short term hunger: On-site school meals alleviate short-term hunger which attracts children to
school - “magnet” effect - and thereby improves student attendance.3 By reducing short-term hunger (MGD
1.2.1), school feeding programmes improve learner attentiveness (MGD 1.2) and subsequently, literacy
(SO2).4
• Reducing health related absences. Nutritional benefits from on-site meals can reduce health related absences
from school and thereby improve student attendance.5
• Conditionality and spillover effects of THRs. The conditionality of the THRs (80% school attendance) ensures
increased enrolment and attendance. Take-home rations (THRs) also have spillover effects as they are shared
with other household members.6
• Preventing cultural disincentives: Although, the MGD results framework/theory of change is silent about
GEEW indicators, it is plausible that a reduced economic burden may also prevent cultural/gendered
disincentives such as transactional sex and child marriage which adversely affect the attendance and
enrolment of adolescent girls. However, this would dependent on the extent to which such practices are
ingrained in communities.
Mediating factors
Despite these documented accomplishments of school feeding towards educational outcomes, there are
mediating factors that might influence achievement of SO1 and SO2.
Supply side educational factors. Malawi faces problems in supply side educational factors such as school
infrastructure, teacher availability, teacher experience, student/teacher ratio among others, influence the quality
of education, especially the achievement of SO17. An analysis from two surveys conducted in 2011 and 2012
which tested teacher knowledge demonstrated that the majority of primary teachers were skilled in basic
mathematics but not in its application to solve problems as well as critical reading skills for learners in standards
7 and 8.8 A study on teacher effort in Malawi (measured by presence in school and time spent on tasks on an
average working day) suggests motivation is lacking with 20% of instructional time for teachers and students
being “off-task” (where no instructional activity was taking place due to the teacher being otherwise occupied
or not being present in the classroom) and 20% of classroom instruction time devoted to “passive learning”
(where there is rote learning and note dictation).9 Education outcomes are affected by high student/teacher
ratios of 100:1 in lower 2 grades in particular (40:1 in highest 2 grades). Educational outcomes are also impeded
by inadequate classroom infrastructure (classrooms, teachers’ houses and associated infrastructure) which,
according to a 2014 study by USAID, one of the primary factors contributing to high rates of student
2 Adelman, S., Alderman, H., Gilligan, D. O., & Lehrer, K. 2008, The Impact of Alternative Food for Education Programs on Learning Achievement and Cognitive Development in Northern Uganda. Unpublished manuscript. 3 Buttenheim, A. ., Alderman, H., & Friedman, J. A. 2011 Impact Evaluation of School Feeding Programs in Lao PDR. World Bank Policy Research Working Paper, (5518) 4 Rassas, B., Ariza-Nino, E. And Peterson, K. n.dThe McGovern-Dole International Food for Education and Child Nutrition Program, School Feeding and Educational Outcomes in Developing Countries: A Systematic Review and Meta-Analysis 5 Alderman, H., & Bundy, D., 2012, School Feeding Programs and Development: Are We Framing the Question Correctly?. The World Bank Research Observer, 27(2), 204-221. 6 Jacoby, H. G., 2002, Is there an intrahousehold ‘flypaper effect’? Evidence from a school feeding programme, The Economic Journal, 112(476), 196-221. 7Rassas, B., Ariza-Nino, E and K. Peterson. 2016. The McGovern-Dole International Food for Education and Child Nutrition Program School Feeding and Educational Outcomes in Developing Countries: A Systematic Review and Meta-Analysis. QED Group, LLC. 8 World Bank 2016, Primary Education in Malawi: Expenditures, Service Delivery and Outcomes, http://documents.worldbank.org/curated/en/340961468185650405/pdf/104337-PUB-PUBLIC-education-in-malawi.pdf 9 World Bank, 2016
absenteeism, repetition and attrition.10 Despite commitments and ambitious construction targets by the
Government, there has not been enough financing to accomplish these goals, resulting in many instances of
“open-air” teaching.11 The Government has struggled to deploy and retain teachers to schools within
impoverished and rural, hard-to-reach communities. Because access to amenities (such as adequate
accommodation, water facilities and electricity connectivity) in remote areas can be extremely limited, teachers
have a strong preference for postings in or near large settlements.12 The introduction of the rural “hardship”
allowance to attract teachers to remote areas is insufficient to surmount the costs of living in these areas.13
Overall, school feeding can only contribute if the other major elements that have an impact on learning are in
place. If these elements are missing, the benefits of school feeding on learning will be limited or non-existent.
Individual, parental and household characteristics. Studies show that child age and gender, parental background
(education, maternal age) and socio-economic status/poverty mediate education outcomes stipulated in SO11415.
Fulfilment of SO1, especially the minimum acceptable diet by children is also influenced by factors such as
household composition (size, number of children), maternal age and education, characteristics of the head
(gender, education), socio-economic status and contextual factors (access to markets, food prices agro-climate).
Socio-cultural factors. There are also socio-cultural mediating factors that affect the achievement of SO1.
Particular local customs and traditions affect girls disproportionately, creating gender-specific challenges against
educational outcomes. For instance, Malawi has the 11th highest rate of child marriage in the world, with 47%
of women marrying before the age of 1816. Education has a significant relationship to age at first marriage in
Malawi – women with lower levels of education are much more likely to marry and have children early, and child
marriage negatively impacts educational attainment and future earnings of girls17. The incidence of child
marriage results in girls leaving school early, and can expose girls to marital rape, domestic violence, and labour
exploitation.18 Sexual cultural initiation ceremonies coerce girls to engage in unprotected sexual acts with older
men which increase the incidence of teenage pregnancies.19 Other social factors include orphanhood or orphan-
headed households (fail to mobilise resources for education), disability, the effects of HIV/AIDS and lack sufficient
parental support for their education.20
10 USAID, 2014, Report of study on student repetition and attrition in primary education in Malawi, 11 World Bank, 2016 12 Asmin, A. et al, 2017 Moving Teachers to Malawi’s Remote Communities A Data-Driven Approach to Teacher Deployment, Policy Research Working Paper 8253, Education Global Practice Group November 2017, World Bank 13 Mwenda, M. And Mgomezulu, V.Y. 2018, Impact of monetary incentives on teacher retention in and attraction to rural primary schools: Case of the rural allowance in Salima District of Malawi, African Educational Research Journal Vol. 6(3), pp. 120-129, July 2018 DOI: 10.30918/AERJ.63.18.028 ISSN: 2354-2160 Full Length Research Paper 14Guo et al 2018. Gender Differences in How Family Income and Parental Education Relate to Reading Achievement in China: The
Mediating Role of Parental Expectation and Parental Involvement
https://www.ncbi.nlm.nih.gov/pmc/articles/PMC5992380/ 15Huat See, B., & Gorard, S. (2015). The role of parents in young people’s education—a critical review of the causal evidence. Oxford Review of Education, 41(3), 346-366.
16 African Institute for Development Policy 2017, Ending Child Marriage in Malawi What the evidence tells us, Issue Brief, Ministry of Gender,
Children, Disability and Social Welfare https://www.afidep.org/download/Issue-Brief_Final-1.pdf 17 African Institute for Development Policy 2017, Ending Child Marriage in Malawi What the evidence tells us, Issue Brief, Ministry of Gender, Children, Disability and Social Welfare https://www.afidep.org/download/Issue-Brief_Final-1.pdf 18 Varia, N., 2016, Ending child marriage: Meeting the global development goals’ promise to girls. Human Rights Watch, https://www.hrw.org/worldreport/2016/ending-child-marriage 19 Kadzamira, E.C. 2003, Malawi’s Experience in Promoting Girls Education, The Global Women’s Action Network for Children Conference, June 11-13 2003, King Hussein Bin Talal Convention Center, Dead Sea, Jordan http://cdf.childrensdefense.org/site/DocServer/Malawiexperience.pdf?docID=2446 20 Voss Lingenfelter, Whitney & Solheim, Karen & Lawrence, Amy. 2017, Improving secondary education for orphans and vulnerable children in Malawi: One non-governmental organization's perspective. Child & Youth Services.
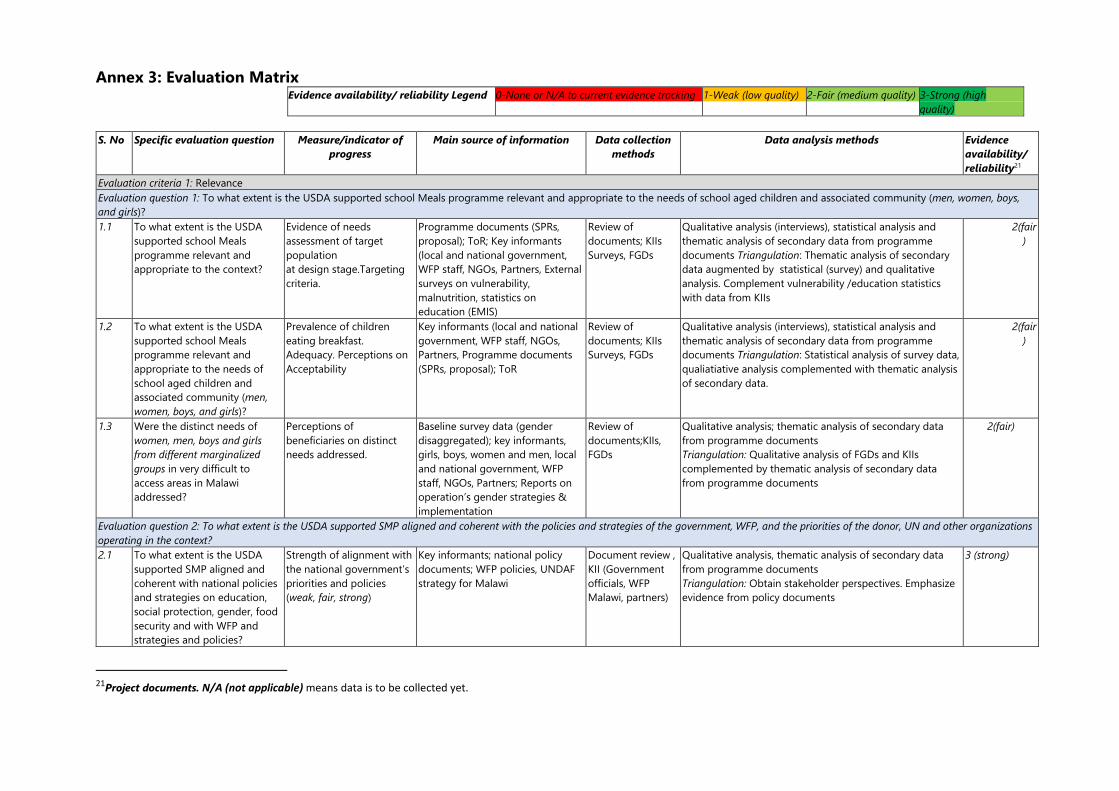
Annex 3: Evaluation Matrix Evidence availability/ reliability Legend 0-None or N/A to current evidence tracking 1-Weak (low quality) 2-Fair (medium quality) 3-Strong (high
quality)
S. No Specific evaluation question Measure/indicator of
progress
Main source of information Data collection
methods
Data analysis methods Evidence
availability/
reliability21
Evaluation criteria 1: Relevance
Evaluation question 1: To what extent is the USDA supported school Meals programme relevant and appropriate to the needs of school aged children and associated community (men, women, boys,
and girls)?
1.1 To what extent is the USDA
supported school Meals
programme relevant and
appropriate to the context?
Evidence of needs
assessment of target
population
at design stage.Targeting
criteria.
Programme documents (SPRs,
proposal); ToR; Key informants
(local and national government,
WFP staff, NGOs, Partners, External
surveys on vulnerability,
malnutrition, statistics on
education (EMIS)
Review of
documents; KIIs
Surveys, FGDs
Qualitative analysis (interviews), statistical analysis and
thematic analysis of secondary data from programme
documents Triangulation: Thematic analysis of secondary
data augmented by statistical (survey) and qualitative
analysis. Complement vulnerability /education statistics
with data from KIIs
2(fair
)
1.2 To what extent is the USDA
supported school Meals
programme relevant and
appropriate to the needs of
school aged children and
associated community (men,
women, boys, and girls)?
Prevalence of children
eating breakfast.
Adequacy. Perceptions on
Acceptability
Key informants (local and national
government, WFP staff, NGOs,
Partners, Programme documents
(SPRs, proposal); ToR
Review of
documents; KIIs
Surveys, FGDs
Qualitative analysis (interviews), statistical analysis and
thematic analysis of secondary data from programme
documents Triangulation: Statistical analysis of survey data,
qualiatiative analysis complemented with thematic analysis
of secondary data.
2(fair
)
1.3 Were the distinct needs of
women, men, boys and girls
from different marginalized
groups in very difficult to
access areas in Malawi
addressed?
Perceptions of
beneficiaries on distinct
needs addressed.
Baseline survey data (gender
disaggregated); key informants,
girls, boys, women and men, local
and national government, WFP
staff, NGOs, Partners; Reports on
operation’s gender strategies &
implementation
Review of
documents;KIIs,
FGDs
Qualitative analysis; thematic analysis of secondary data
from programme documents
Triangulation: Qualitative analysis of FGDs and KIIs
complemented by thematic analysis of secondary data
from programme documents
2(fair)
Evaluation question 2: To what extent is the USDA supported SMP aligned and coherent with the policies and strategies of the government, WFP, and the priorities of the donor, UN and other organizations
operating in the context?
2.1 To what extent is the USDA
supported SMP aligned and
coherent with national policies
and strategies on education,
social protection, gender, food
security and with WFP and
strategies and policies?
Strength of alignment with
the national government’s
priorities and policies
(weak, fair, strong)
Key informants; national policy
documents; WFP policies, UNDAF
strategy for Malawi
Document review ,
KII (Government
officials, WFP
Malawi, partners)
Qualitative analysis, thematic analysis of secondary data
from programme documents
Triangulation: Obtain stakeholder perspectives. Emphasize
evidence from policy documents
3 (strong)
21
Project documents. N/A (not applicable) means data is to be collected yet.
2.2 Is the SMP aligned with donor
priorities? Are the activities and
outputs of the USDA
supported SMP consistent with
the overall goal and the
attainment of its objectives and
intended outcomes?
Degree of consistency of
the activities and outputs
with goals, objectives and
intended outcomes (weak,
fair, strong)
Programme documents; ToR; Key
informants (donor, WFP staff,
government staff)
Review of
documents; KIIs
Qualitative analysis (interviews) and thematic analysis of
secondary data from programme documents
Triangulation: Thematic analysis of secondary data from
programme documents will be complemented by thematic
analysis of KIIs
3 (strong)
2.2 Is the USDA supported SMP
aligned with UN-wide
strategies and complementary
with the programmes of other
organizations working on
school nutrition, health,
nutrition and school feeding
and literacy?
Strength of alignment with
other WFP SMPs (JPGE,
HGSM), partner
programmes and policies
(weak, fair, strong);
Documentary evidence of
linkage between WFP SMP
& other partners’ activities
WFP programme documents;
Documentation by partners; MOUs;
Technical Working Group minutes,
key informants
Document review;
KIIs
Qualitative analysis; thematic analysis of secondary data
from programme documents
Triangulation: Obtain stakeholder perspectives. Emphasize
evidence from partner documentation
3 (strong)
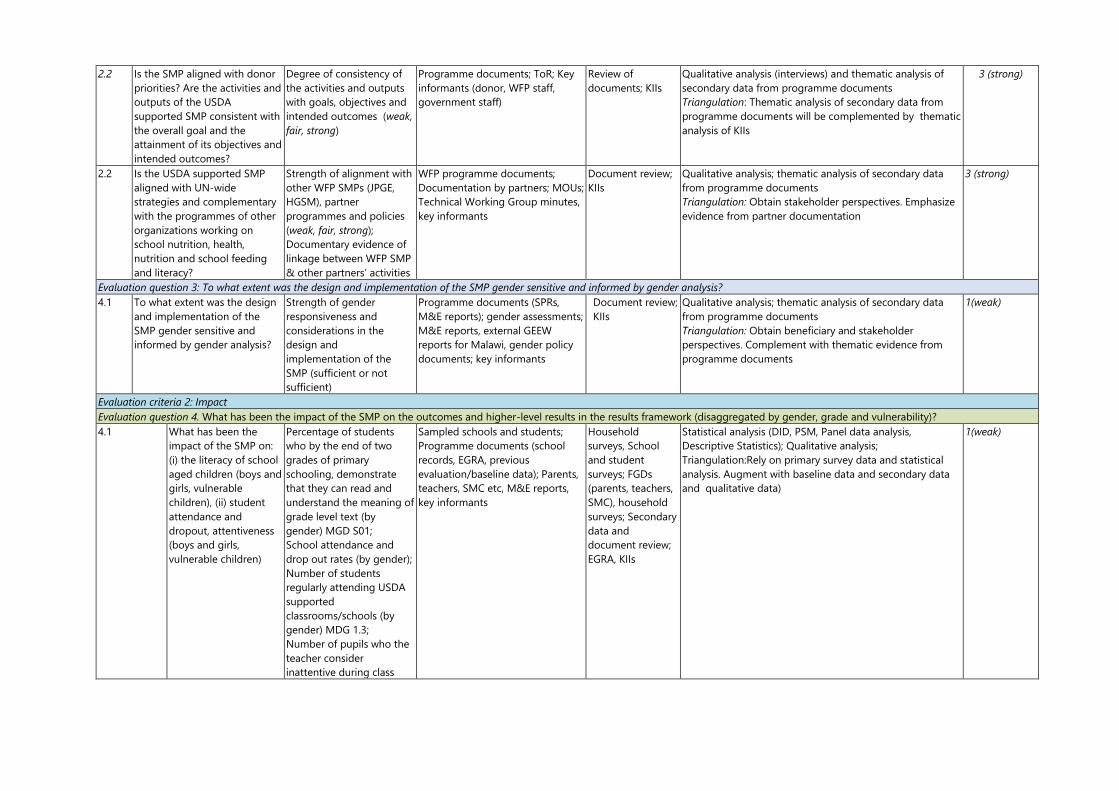
Evaluation question 3: To what extent was the design and implementation of the SMP gender sensitive and informed by gender analysis?
4.1 To what extent was the design
and implementation of the
SMP gender sensitive and
informed by gender analysis?
Strength of gender
responsiveness and
considerations in the
design and
implementation of the
SMP (sufficient or not
sufficient)
Programme documents (SPRs,
M&E reports); gender assessments;
M&E reports, external GEEW
reports for Malawi, gender policy
documents; key informants
Document review;
KIIs
Qualitative analysis; thematic analysis of secondary data
from programme documents
Triangulation: Obtain beneficiary and stakeholder
perspectives. Complement with thematic evidence from
programme documents
1(weak)
Evaluation criteria 2: Impact
Evaluation question 4. What has been the impact of the SMP on the outcomes and higher-level results in the results framework (disaggregated by gender, grade and vulnerability)?
4.1 What has been the
impact of the SMP on:
(i) the literacy of school
aged children (boys and
girls, vulnerable
children), (ii) student
attendance and
dropout, attentiveness
(boys and girls,
vulnerable children)
Percentage of students
who by the end of two
grades of primary
schooling, demonstrate
that they can read and
understand the meaning of
grade level text (by
gender) MGD S01;
School attendance and
drop out rates (by gender);
Number of students
regularly attending USDA
supported
classrooms/schools (by
gender) MDG 1.3;
Number of pupils who the
teacher consider
inattentive during class
Sampled schools and students;
Programme documents (school
records, EGRA, previous
evaluation/baseline data); Parents,
teachers, SMC etc, M&E reports,
key informants
Household
surveys, School
and student
surveys; FGDs
(parents, teachers,
SMC), household
surveys; Secondary
data and
document review;
EGRA, KIIs
Statistical analysis (DID, PSM, Panel data analysis,
Descriptive Statistics); Qualitative analysis;
Triangulation:Rely on primary survey data and statistical
analysis. Augment with baseline data and secondary data
and qualitative data)
1(weak)
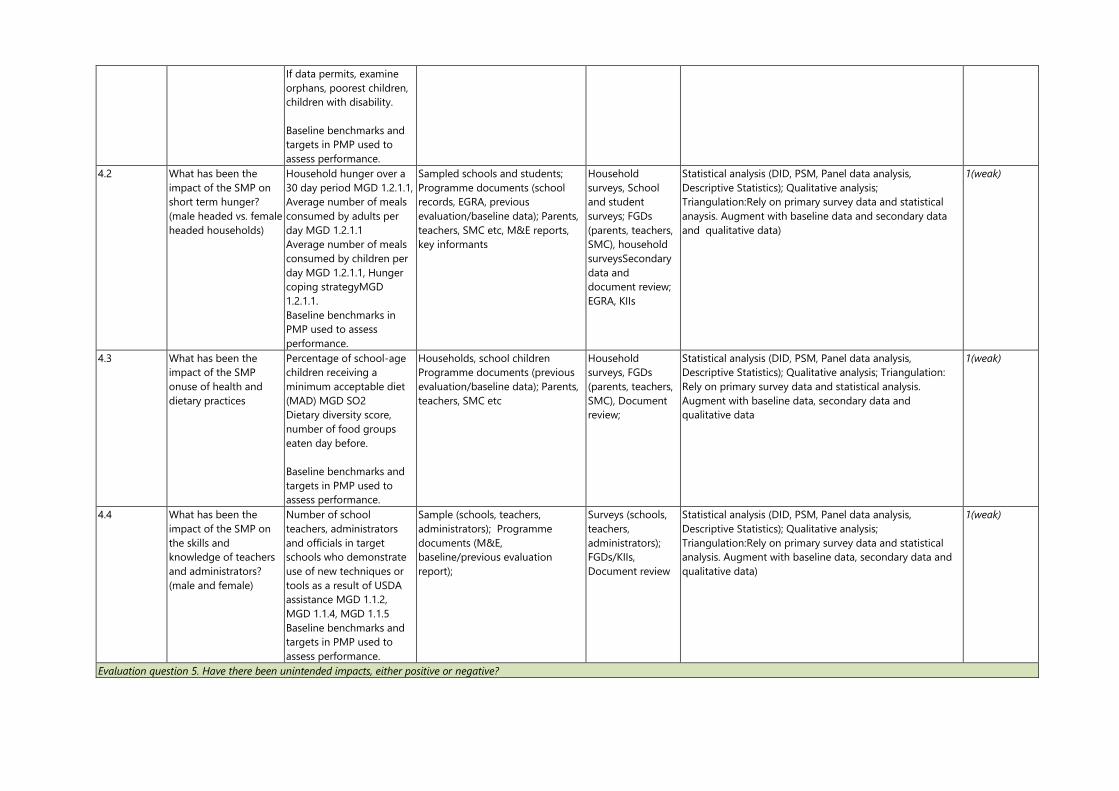
If data permits, examine
orphans, poorest children,
children with disability.
Baseline benchmarks and
targets in PMP used to
assess performance.
4.2 What has been the
impact of the SMP on
short term hunger?
(male headed vs. female
headed households)
Household hunger over a
30 day period MGD 1.2.1.1,
Average number of meals
consumed by adults per
day MGD 1.2.1.1
Average number of meals
consumed by children per
day MGD 1.2.1.1, Hunger
coping strategyMGD
1.2.1.1.
Baseline benchmarks in
PMP used to assess
performance.
Sampled schools and students;
Programme documents (school
records, EGRA, previous
evaluation/baseline data); Parents,
teachers, SMC etc, M&E reports,
key informants
Household
surveys, School
and student
surveys; FGDs
(parents, teachers,
SMC), household
surveysSecondary
data and
document review;
EGRA, KIIs
Statistical analysis (DID, PSM, Panel data analysis,
Descriptive Statistics); Qualitative analysis;
Triangulation:Rely on primary survey data and statistical
anaysis. Augment with baseline data and secondary data
and qualitative data)
1(weak)
4.3 What has been the
impact of the SMP
onuse of health and
dietary practices
Percentage of school-age
children receiving a
minimum acceptable diet
(MAD) MGD SO2
Dietary diversity score,
number of food groups
eaten day before.
Baseline benchmarks and
targets in PMP used to
assess performance.
Households, school children
Programme documents (previous
evaluation/baseline data); Parents,
teachers, SMC etc
Household
surveys, FGDs
(parents, teachers,
SMC), Document
review;
Statistical analysis (DID, PSM, Panel data analysis,
Descriptive Statistics); Qualitative analysis; Triangulation:
Rely on primary survey data and statistical analysis.
Augment with baseline data, secondary data and
qualitative data
1(weak)
4.4 What has been the
impact of the SMP on
the skills and
knowledge of teachers
and administrators?
(male and female)
Number of school
teachers, administrators
and officials in target
schools who demonstrate
use of new techniques or
tools as a result of USDA
assistance MGD 1.1.2,
MGD 1.1.4, MGD 1.1.5
Baseline benchmarks and
targets in PMP used to
assess performance.
Sample (schools, teachers,
administrators); Programme
documents (M&E,
baseline/previous evaluation
report);
Surveys (schools,
teachers,
administrators);
FGDs/KIIs,
Document review
Statistical analysis (DID, PSM, Panel data analysis,
Descriptive Statistics); Qualitative analysis;
Triangulation:Rely on primary survey data and statistical
analysis. Augment with baseline data, secondary data and
qualitative data)
1(weak)
Evaluation question 5. Have there been unintended impacts, either positive or negative?
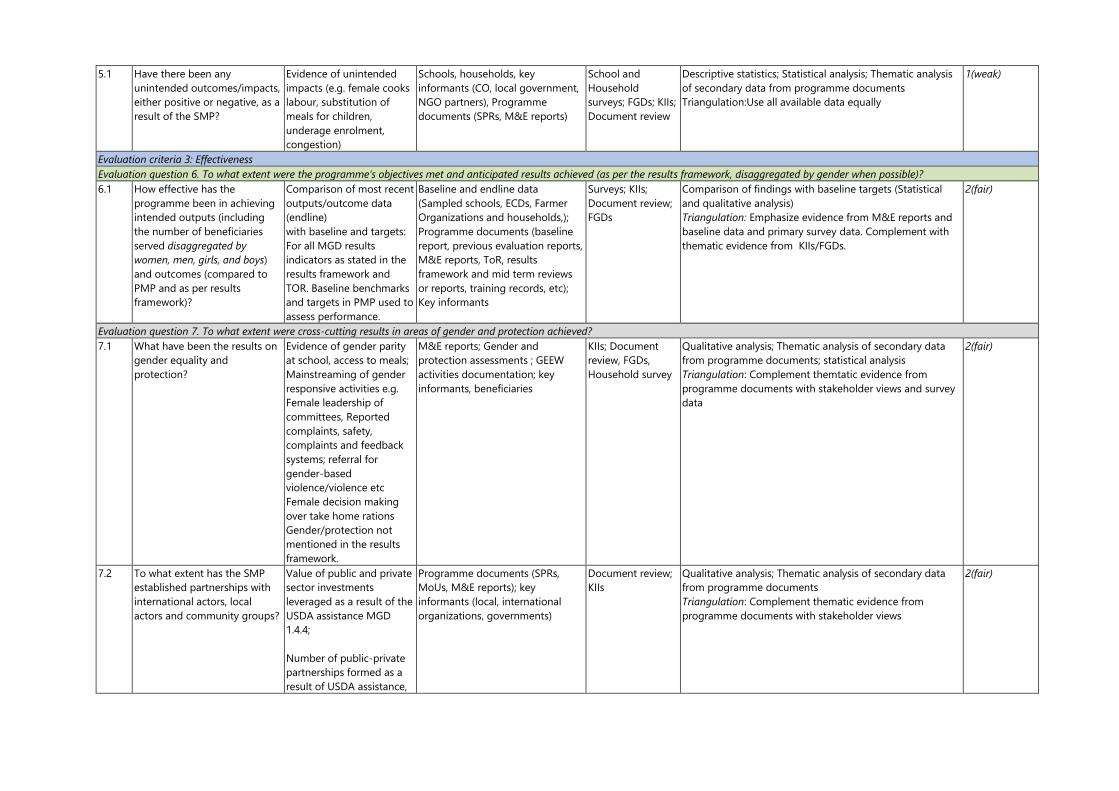
5.1 Have there been any
unintended outcomes/impacts,
either positive or negative, as a
result of the SMP?
Evidence of unintended
impacts (e.g. female cooks
labour, substitution of
meals for children,
underage enrolment,
congestion)
Schools, households, key
informants (CO, local government,
NGO partners), Programme
documents (SPRs, M&E reports)
School and
Household
surveys; FGDs; KIIs;
Document review
Descriptive statistics; Statistical analysis; Thematic analysis
of secondary data from programme documents
Triangulation:Use all available data equally
1(weak)
Evaluation criteria 3: Effectiveness
Evaluation question 6. To what extent were the programme’s objectives met and anticipated results achieved (as per the results framework, disaggregated by gender when possible)?
6.1 How effective has the
programme been in achieving
intended outputs (including
the number of beneficiaries
served disaggregated by
women, men, girls, and boys)
and outcomes (compared to
PMP and as per results
framework)?
Comparison of most recent
outputs/outcome data
(endline)
with baseline and targets:
For all MGD results
indicators as stated in the
results framework and
TOR. Baseline benchmarks
and targets in PMP used to
assess performance.
Baseline and endline data
(Sampled schools, ECDs, Farmer
Organizations and households,);
Programme documents (baseline
report, previous evaluation reports,
M&E reports, ToR, results
framework and mid term reviews
or reports, training records, etc);
Key informants
Surveys; KIIs;
Document review;
FGDs
Comparison of findings with baseline targets (Statistical
and qualitative analysis)
Triangulation: Emphasize evidence from M&E reports and
baseline data and primary survey data. Complement with
thematic evidence from KIIs/FGDs.
2(fair)
Evaluation question 7. To what extent were cross-cutting results in areas of gender and protection achieved?
7.1 What have been the results on
gender equality and
protection?
Evidence of gender parity
at school, access to meals;
Mainstreaming of gender
responsive activities e.g.
Female leadership of
committees, Reported
complaints, safety,
complaints and feedback
systems; referral for
gender-based
violence/violence etc
Female decision making
over take home rations
Gender/protection not
mentioned in the results
framework.
M&E reports; Gender and
protection assessments ; GEEW
activities documentation; key
informants, beneficiaries
KIIs; Document
review, FGDs,
Household survey
Qualitative analysis; Thematic analysis of secondary data
from programme documents; statistical analysis
Triangulation: Complement themtatic evidence from
programme documents with stakeholder views and survey
data
2(fair)
7.2 To what extent has the SMP
established partnerships with
international actors, local
actors and community groups?
Value of public and private
sector investments
leveraged as a result of the
USDA assistance MGD
1.4.4;
Number of public-private
partnerships formed as a
result of USDA assistance,
Programme documents (SPRs,
MoUs, M&E reports); key
informants (local, international
organizations, governments)
Document review;
KIIs
Qualitative analysis; Thematic analysis of secondary data
from programme documents
Triangulation: Complement thematic evidence from
programme documents with stakeholder views
2(fair)

partnerships with
international and local
actors (women’s
organizations), strength of
partnerships
Evaluation question 8. What internal and external factors affected the programme outputs and outcomes?
8.1 What were the other major
external factors influencing the
achievement or non-
achievement of the outputs
and outcomes?
Evidence of influence from
drought; funding
constraints, partnerships
e.t.c. MGD1.4.4
Key informants; SPRs; Market
assessment, vulnerability surveys,
donor reports, beneficiaries
Document review,
KIIs, Surveys, FGDs
Qualitative analysis; thematic analysis of secondary data
from programme documents
Triangulation: complement thematic evidence from
programme documents with stakeholder perceptions
2(fair)
8.2 What was the role of internal
factors such as design and
delivery, partnerships,
personnel, GEEW
mainstreaming etc.?
Evidence of influence of
internal factors (e.g. ration
cuts, timeliness of
distribution, GEEW
activities )
Key informants; SPRs; M&E reports,
beneficiaries
Document review,
KIIs, Surveys, FGDs
Qualitative analysis; Thematic analysis of secondary data
from programme documents
Triangulation: Emphasize stakeholder perceptions.
Augment with any thematic evidence from programme
documents
1(weak)
Evaluation question 9. How effective are the M&E processes and what are the strengths and weaknesses?
9.1 How effective are the
monitoring and evaluation
processes? What needs to be
changed in the M&E system
and processes to improve the
utility, credibility, and reliability
of the data and information
collected?
Strength s /weakenesses
of M&E indicators,
tracking, reporting,
evidence of use and utility
M&E reports; Key informants (CO
staff, USDA, RB)
Document reviews;
KIIs
Qualitative analysis
Triangulation: Emphasize thematic evidence from
programme documents. Complement with stakeholder
views
1(weak)
Evaluation criteria 4: Efficiency
Evaluation question 10: How efficient is the programme in terms of transfer cost and cost per beneficiary compared to alternative School Meals models?
10.1 How much does it cost
(Government, WFP and
communities) to implement the
school feeding programme to
achieve the outcomes and the
impact that it has achieved?
Cost per beneficiary;
Average cost of
meal/school-aged child
cost-transfer ratio (CTR),
Financial data of SMP (SPRs and
actual expenditure), Secondary
documents; Government
documents; Key informants
Financial data
analysis,
Review of school
feeding
evaluations;
KIIs/IDIs with CO’s
finance and
procurement units
Cost efficiency analysis; Operational efficiency analysis;
Triangulation: Emphasize financial data from WFP, compare
wth with similar programs, complement with stakeholder
views
1(weak)
10.2 How efficient is the
programme in terms of
financial and human resources
in relation to achieved outputs
and outcomes?
Total cost transfer ratio
(TCTR)
Alpha score.
Number of staff (quantity);
SMP staff costs
(direct/indirect), Cost of
trainings
SMP financial data; key informants Financial data
analysis, KIIs
Descriptive statistics; Qualitative analysis
Triangulation: Emphasize financial data from WFP, and,
complement with stakeholder views
1(weak)
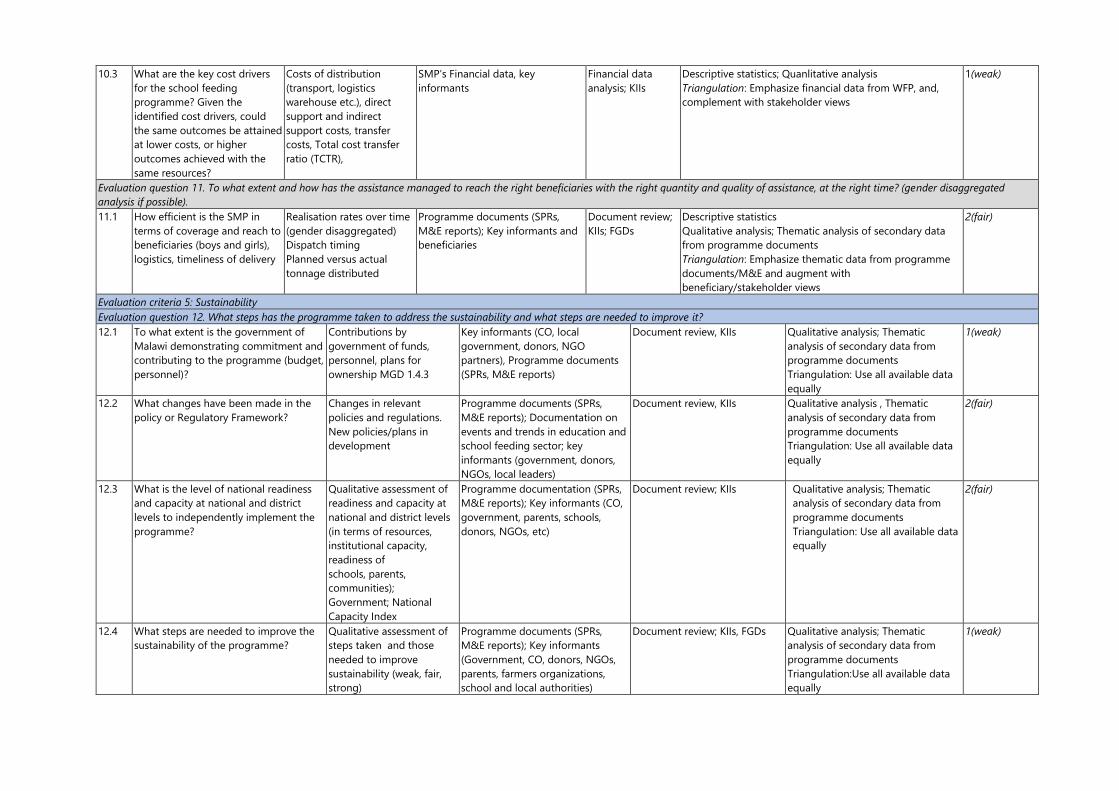
10.3 What are the key cost drivers
for the school feeding
programme? Given the
identified cost drivers, could
the same outcomes be attained
at lower costs, or higher
outcomes achieved with the
same resources?
Costs of distribution
(transport, logistics
warehouse etc.), direct
support and indirect
support costs, transfer
costs, Total cost transfer
ratio (TCTR),
SMP’s Financial data, key
informants
Financial data
analysis; KIIs
Descriptive statistics; Quanlitative analysis
Triangulation: Emphasize financial data from WFP, and,
complement with stakeholder views
1(weak)
Evaluation question 11. To what extent and how has the assistance managed to reach the right beneficiaries with the right quantity and quality of assistance, at the right time? (gender disaggregated
analysis if possible).
11.1 How efficient is the SMP in
terms of coverage and reach to
beneficiaries (boys and girls),
logistics, timeliness of delivery
Realisation rates over time
(gender disaggregated)
Dispatch timing
Planned versus actual
tonnage distributed
Programme documents (SPRs,
M&E reports); Key informants and
beneficiaries
Document review;
KIIs; FGDs
Descriptive statistics
Qualitative analysis; Thematic analysis of secondary data
from programme documents
Triangulation: Emphasize thematic data from programme
documents/M&E and augment with
beneficiary/stakeholder views
2(fair)
Evaluation criteria 5: Sustainability
Evaluation question 12. What steps has the programme taken to address the sustainability and what steps are needed to improve it?
12.1 To what extent is the government of
Malawi demonstrating commitment and
contributing to the programme (budget,
personnel)?
Contributions by
government of funds,
personnel, plans for
ownership MGD 1.4.3
Key informants (CO, local
government, donors, NGO
partners), Programme documents
(SPRs, M&E reports)
Document review, KIIs Qualitative analysis; Thematic
analysis of secondary data from
programme documents
Triangulation: Use all available data
equally
1(weak)
12.2 What changes have been made in the
policy or Regulatory Framework?
Changes in relevant
policies and regulations.
New policies/plans in
development
Programme documents (SPRs,
M&E reports); Documentation on
events and trends in education and
school feeding sector; key
informants (government, donors,
NGOs, local leaders)
Document review, KIIs Qualitative analysis , Thematic
analysis of secondary data from
programme documents
Triangulation: Use all available data
equally
2(fair)
12.3 What is the level of national readiness
and capacity at national and district
levels to independently implement the
programme?
Qualitative assessment of
readiness and capacity at
national and district levels
(in terms of resources,
institutional capacity,
readiness of
schools, parents,
communities);
Government; National
Capacity Index
Programme documentation (SPRs,
M&E reports); Key informants (CO,
government, parents, schools,
donors, NGOs, etc)
Document review; KIIs Qualitative analysis; Thematic
analysis of secondary data from
programme documents
Triangulation: Use all available data
equally
2(fair)
12.4 What steps are needed to improve the
sustainability of the programme?
Qualitative assessment of
steps taken and those
needed to improve
sustainability (weak, fair,
strong)
Programme documents (SPRs,
M&E reports); Key informants
(Government, CO, donors, NGOs,
parents, farmers organizations,
school and local authorities)
Document review; KIIs, FGDs Qualitative analysis; Thematic
analysis of secondary data from
programme documents
Triangulation:Use all available data
equally
1(weak)
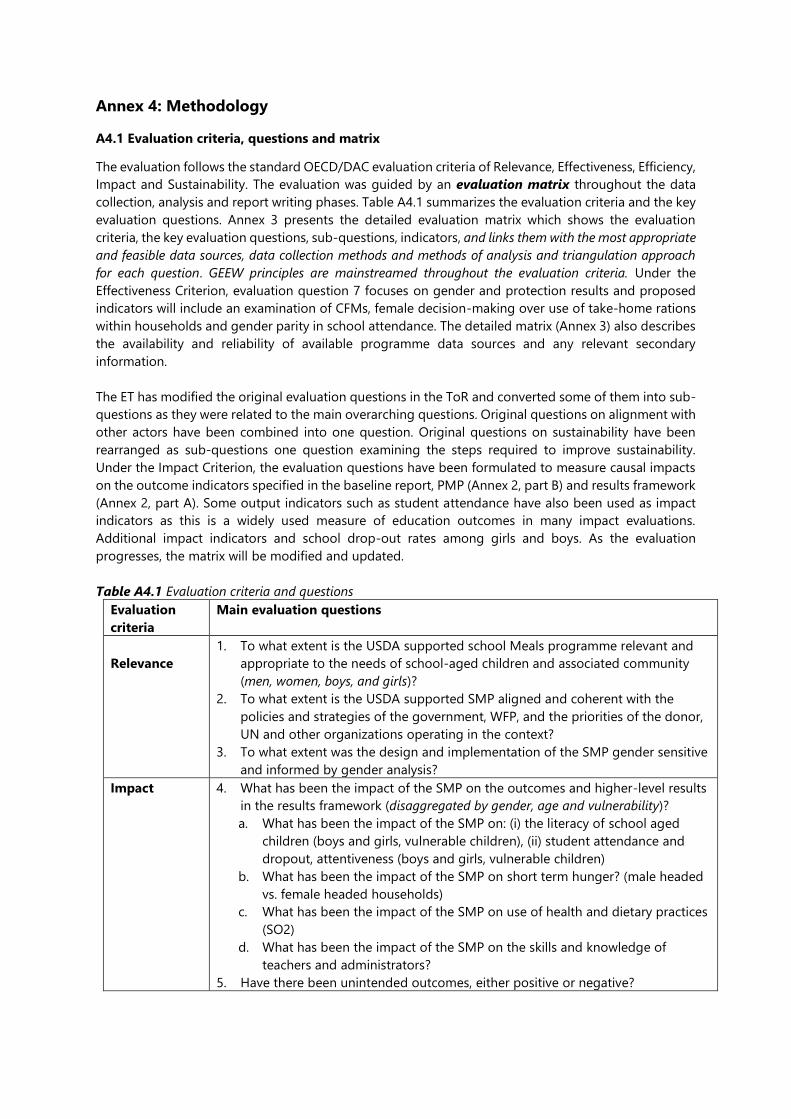
Annex 4: Methodology
A4.1 Evaluation criteria, questions and matrix
The evaluation follows the standard OECD/DAC evaluation criteria of Relevance, Effectiveness, Efficiency,
Impact and Sustainability. The evaluation was guided by an evaluation matrix throughout the data
collection, analysis and report writing phases. Table A4.1 summarizes the evaluation criteria and the key
evaluation questions. Annex 3 presents the detailed evaluation matrix which shows the evaluation
criteria, the key evaluation questions, sub-questions, indicators, and links them with the most appropriate
and feasible data sources, data collection methods and methods of analysis and triangulation approach
for each question. GEEW principles are mainstreamed throughout the evaluation criteria. Under the
Effectiveness Criterion, evaluation question 7 focuses on gender and protection results and proposed
indicators will include an examination of CFMs, female decision-making over use of take-home rations
within households and gender parity in school attendance. The detailed matrix (Annex 3) also describes
the availability and reliability of available programme data sources and any relevant secondary
information.
The ET has modified the original evaluation questions in the ToR and converted some of them into sub-
questions as they were related to the main overarching questions. Original questions on alignment with
other actors have been combined into one question. Original questions on sustainability have been
rearranged as sub-questions one question examining the steps required to improve sustainability.
Under the Impact Criterion, the evaluation questions have been formulated to measure causal impacts
on the outcome indicators specified in the baseline report, PMP (Annex 2, part B) and results framework
(Annex 2, part A). Some output indicators such as student attendance have also been used as impact
indicators as this is a widely used measure of education outcomes in many impact evaluations.
Additional impact indicators and school drop-out rates among girls and boys. As the evaluation
progresses, the matrix will be modified and updated.
Table A4.1 Evaluation criteria and questions
Evaluation
criteria
Main evaluation questions
Relevance
1. To what extent is the USDA supported school Meals programme relevant and
appropriate to the needs of school-aged children and associated community
(men, women, boys, and girls)?
2. To what extent is the USDA supported SMP aligned and coherent with the
policies and strategies of the government, WFP, and the priorities of the donor,
UN and other organizations operating in the context?
3. To what extent was the design and implementation of the SMP gender sensitive
and informed by gender analysis?
Impact 4. What has been the impact of the SMP on the outcomes and higher-level results
in the results framework (disaggregated by gender, age and vulnerability)?
a. What has been the impact of the SMP on: (i) the literacy of school aged
children (boys and girls, vulnerable children), (ii) student attendance and
dropout, attentiveness (boys and girls, vulnerable children)
b. What has been the impact of the SMP on short term hunger? (male headed
vs. female headed households)
c. What has been the impact of the SMP on use of health and dietary practices
(SO2)
d. What has been the impact of the SMP on the skills and knowledge of
teachers and administrators?
5. Have there been unintended outcomes, either positive or negative?

Effectiveness 6. To what extent were the programme’s objectives met and anticipated results
achieved (as per the results framework, disaggregated by gender when possible)?
7. To what extent were cross-cutting results in areas of gender, protection and
partnership achieved?
8. What internal and external factors affected the programme outputs and
outcomes?
9. How effective are the M&E processes and what are the strengths and weaknesses?
Efficiency 10. How efficient is the programme, in terms of transfer cost, cost per beneficiary
compared to alternative School Meals models?
a. How much does it cost (Government, WFP and communities) to implement
the school feeding programme to achieve the outcomes and the impact that
it has achieved?
b. How efficient is the programme in terms of financial and human resources in
relation to achieved outputs and outcomes?
c. What are the key cost drivers for the school feeding programme? Given the
identified cost drivers, could the same outcomes be attained at lower costs,
or higher outcomes achieved with the same resources?
11. To what extent and how has the assistance managed to reach the right
beneficiaries with the right quantity and quality of assistance, at the right time?
(gender disaggregated analysis when possible).
d. How efficient is the SMP in terms of coverage, reach to beneficiaries, logistics
and timeliness of delivery?
Sustainability
12. What steps has the programme taken to address the sustainability and what
steps are needed to improve it?
a. To what extent is the government of Malawi demonstrating commitment and
contributing to the programme (budget, personnel )?
b. What changes have been made in the policy or Regulatory Framework?
c. What is the level of national readiness and capacity at national and district
levels to independently implement the programme?
d. What steps are needed to improve the sustainability of the programme?
A4.1.1 Evaluation approach and design
The evaluation team used a mixed-methods approach since a single evaluation methodology would
not fully capture the complexities of how the programme operates. Accordingly, our approach
combined qualitative and quantitative tools and techniques with document review. The use of such a
mixed-approach has the advantage of enhancing the validity and credibility of the evaluation findings
through triangulation (see section 5.5 for further explanation on triangulation).
A quasi-experimental design was adopted for this evaluation. Schools benefiting from the SMP are
the "treated" schools. Beneficiaries of the SMP include pupils in all targeted schools as well as the
surrounding communities. The non-targeted group will consist of schools (and associated pupils,
parents, household and community actors) that are not directly benefiting from the SMP. The evaluation
will use the baseline non-targeted group. Since there is baseline data - from the endline evaluation of
the previous SMP (Fiscal year or FY 2013) - the evaluation will adopt a prospective design for evaluating
the SMP and will potentially utilize panel/longitudinal data if the endline data is sufficiently similar to
the baseline data.

A4.2 Data collection methods and tools
Primary data collection tools include a household survey questionnaire, school/ECD survey checklists
and EGRA questionnaire. Qualitative data was collected using Key Informant Interviews (KIIs) and Focus
Group Discussions (FGDs) with the aid of a loosely structured interview guides organized around a
specific set of themes. Data collection tools were designed to mirror the baseline tools to permit
comparability. Tools were in English and local languages (e.g. Chichewa). In all cases, data were gender
disaggregated. Secondary data sources include programme and monitoring and evaluation (M&E)
documents and external national survey reports.
Primary data collection
• Household survey: A household survey questionnaire was administered to households with selected
interviewed children attending the targeted schools and surrounding communities (see Table A4.2 for
sample). The household questionnaire captured information on child demographic characteristics,
parental and leaner education and household asset (see Annex 12 for further details).
• School/ECD based surveys: The School/ECD based questionnaires will be used to collect data on the
relevant themes from the PMP e.g. improving SMP, school management and literacy. Specific data
collection tools include questionnaires/checklist for the head teacher and teacher. Similar to the
baseline, a school environment observation checklist was used to collect data on the observable
physical status of school meals structures and equipment including related factors such as availability
of water points and sanitation
• EGRA: EGRA assessment collected individual information of the most basic foundation skills for literacy
acquisition in early grades. It was undertaken using tablets with the help of Tangerine software along
with the EGRA questionnaire (see Annex 12 for data collection tools).
Qualitative surveys: Qualitative interviews generate information on indicators for which quantitative data
cannot be obtained and or cannot be fully revealed from the quantitative analysis. In addition, these
interviews deepen our understanding of the context, enable the exploration of the underlying causes of
observed outcomes, and understand the knowledge, attitudes, preferences, and perceptions of the
stakeholders. Qualitative data also enables us to explore the costs, benefits, risks and operational
effectiveness of the program. Qualitative data were collected using Key Informant Interviews (KIIs) and
Focus Group Discussions (FGDs) with the aid of loosely structured interview guidesorganised around a
specific set of themes.
Stakeholders for the KIIs include staff from the CO and RB, Malawi Ministry of Education, Science and
Technology and other key government ministries/local government officials, USDA, implementing
partners (e.g. World Vision International, Save the Children), farmers organizations, School Feeding
Committee, and School Garden Committees. FGDs were held with learners, teachers, relevant school
committees, mother clubs and parents, farmers organizations, and in separate groups for boys, girls,
men, and women.
Secondary data
a. Baseline data: The ET team used quantitative baseline data from the FY2016 evaluation of the SMP.
The datasets used in the baseline were the same of FY2013-2015 final evaluation. Information had
been collected at school-level and household-level. Due to the nature of the datasets (i.e. the high
prevalence of non-SMP beneficiaries in household data), the ET was able to use only school-level
information to perform inter-temporal analysis with DID methods. The number of schools surveyed
in 2018 and present in the previous dataset was of 124. The attrition is mostly due to former non-
targeted schools now benefitting from other school meals programmes or former SMP schools now
graduated to HGSM.
b. Document review: Quantitative and qualitative findings were triangulated with data from secondary
sources listed in Annex 9. Secondary data sources include documents such as SMP proposal, SPRs,
M&E plan, results framework, PMP, routine progress and monitoring reports, guidelines and other
project documents that have shaped implementation. Other data sources include USAID NRP
(National Reading Programme) data, Education Management Information System (EMIS) and the
District Education Management Information System (DEMIS). Other national sources such as Malawi
Vulnerable Assessment Committee (MVAC) 2016 and 2017; Malawi Demographic and Health Survey
(DHS) 2015-16; and other education reports. The evaluation was also supported by a review of the
existing literature on similar evaluations for comparison with the evaluation findings. A list of the
documents reviewed is in Annex 9.
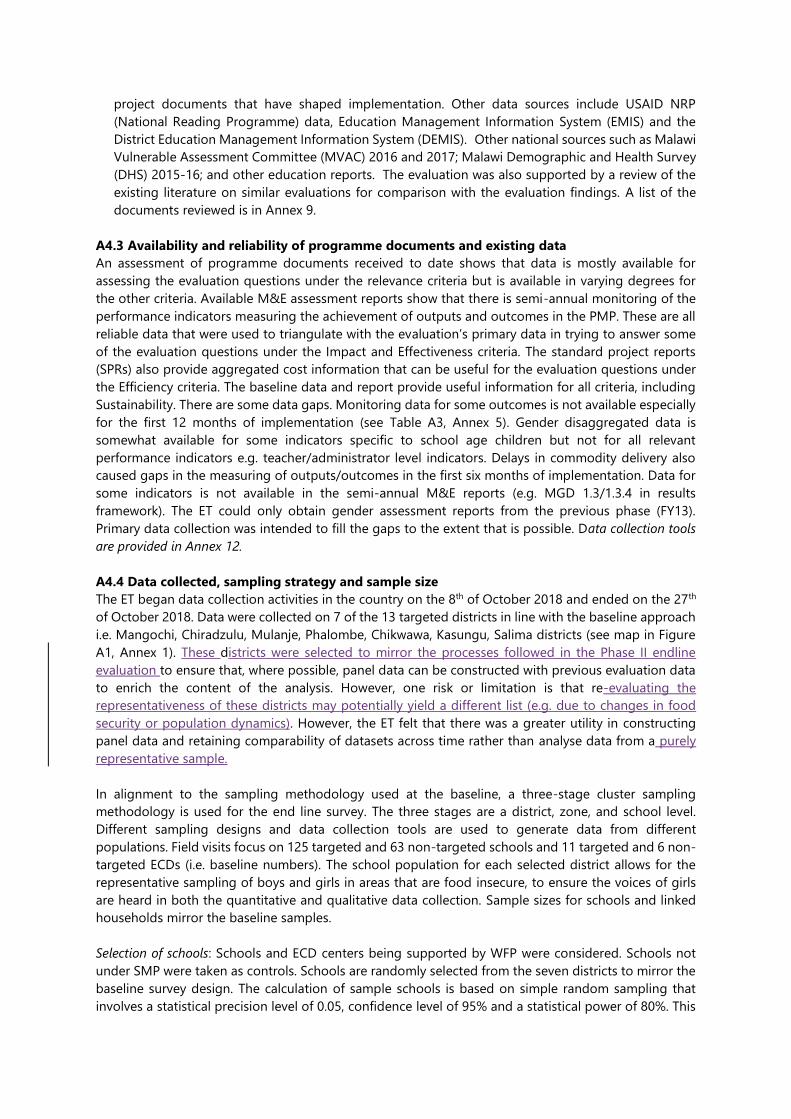
A4.3 Availability and reliability of programme documents and existing data
An assessment of programme documents received to date shows that data is mostly available for
assessing the evaluation questions under the relevance criteria but is available in varying degrees for
the other criteria. Available M&E assessment reports show that there is semi-annual monitoring of the
performance indicators measuring the achievement of outputs and outcomes in the PMP. These are all
reliable data that were used to triangulate with the evaluation’s primary data in trying to answer some
of the evaluation questions under the Impact and Effectiveness criteria. The standard project reports
(SPRs) also provide aggregated cost information that can be useful for the evaluation questions under
the Efficiency criteria. The baseline data and report provide useful information for all criteria, including
Sustainability. There are some data gaps. Monitoring data for some outcomes is not available especially
for the first 12 months of implementation (see Table A3, Annex 5). Gender disaggregated data is
somewhat available for some indicators specific to school age children but not for all relevant
performance indicators e.g. teacher/administrator level indicators. Delays in commodity delivery also
caused gaps in the measuring of outputs/outcomes in the first six months of implementation. Data for
some indicators is not available in the semi-annual M&E reports (e.g. MGD 1.3/1.3.4 in results
framework). The ET could only obtain gender assessment reports from the previous phase (FY13).
Primary data collection was intended to fill the gaps to the extent that is possible. Data collection tools
are provided in Annex 12.
A4.4 Data collected, sampling strategy and sample size
The ET began data collection activities in the country on the 8th of October 2018 and ended on the 27th
of October 2018. Data were collected on 7 of the 13 targeted districts in line with the baseline approach
i.e. Mangochi, Chiradzulu, Mulanje, Phalombe, Chikwawa, Kasungu, Salima districts (see map in Figure
A1, Annex 1). These districts were selected to mirror the processes followed in the Phase II endline
evaluation to ensure that, where possible, panel data can be constructed with previous evaluation data
to enrich the content of the analysis. However, one risk or limitation is that re-evaluating the
representativeness of these districts may potentially yield a different list (e.g. due to changes in food
security or population dynamics). However, the ET felt that there was a greater utility in constructing
panel data and retaining comparability of datasets across time rather than analyse data from a purely
representative sample.
In alignment to the sampling methodology used at the baseline, a three-stage cluster sampling
methodology is used for the end line survey. The three stages are a district, zone, and school level.
Different sampling designs and data collection tools are used to generate data from different
populations. Field visits focus on 125 targeted and 63 non-targeted schools and 11 targeted and 6 non-
targeted ECDs (i.e. baseline numbers). The school population for each selected district allows for the
representative sampling of boys and girls in areas that are food insecure, to ensure the voices of girls
are heard in both the quantitative and qualitative data collection. Sample sizes for schools and linked
households mirror the baseline samples.
Selection of schools: Schools and ECD centers being supported by WFP were considered. Schools not
under SMP were taken as controls. Schools are randomly selected from the seven districts to mirror the
baseline survey design. The calculation of sample schools is based on simple random sampling that
involves a statistical precision level of 0.05, confidence level of 95% and a statistical power of 80%. This
sample size calculation results in a 5% sampling error which is acceptable. The final sample of schools
is 191 schools, with 128 under SMP and 63 being non SMP.
Selection of school respondents: Headteachers, caregiver leaders (in case of ECDs) and mere teachers
were the respondents at school and ECD levels. Three teachers, one from junior primary (standard 1 or
2), 1 from middle (standard 4 and 5) and one from senior primary (standard 6 to 8) were selected from
each school.
Selection of households: Selection of households was based on their linkage with a pupil and schools
and ECD centres. Using proportions of school and ECD enrolment numbers, pupils who were sampled
from each of the selected schools (SMP and non-SMP) and ECD centres. It is worth noting that based
on WFPs technical recommendation, a deliberate decision was made to have a minimum of 100
households per district to allow for better comparison across schools. In alignment to the sampling
methodology used at the baseline, a three-stage cluster sampling methodology is used for the
household survey. The three stages are at district, zone and school level. Sample size calculation is
pegged at 95% confidence interval with 80% power which is deemed satisfactory to generate reliable
and valid data. Since the SMP is administered at a higher level (school level), schools are considered as
clusters for household level sampling. To correct for correlation of outcomes in clusters, an ICC of o.05
is used. Sample size calculation also used a standard deviation of 1.62 considering dietary diversity score
as the main outcome.22The household level sampling also involves the selection of about 7 households
from each 191 sample school. The total sample size for the survey is 1398 (922 from targeted groups
and 476 for non-targeted groups) (Table A4.2).This is higher than the 1131 households interviewed at
baseline (762 targeted and 369 non-targeted). Sample and effect size calculations suggest that the
sample will enable a detectable effect size of 0.29.
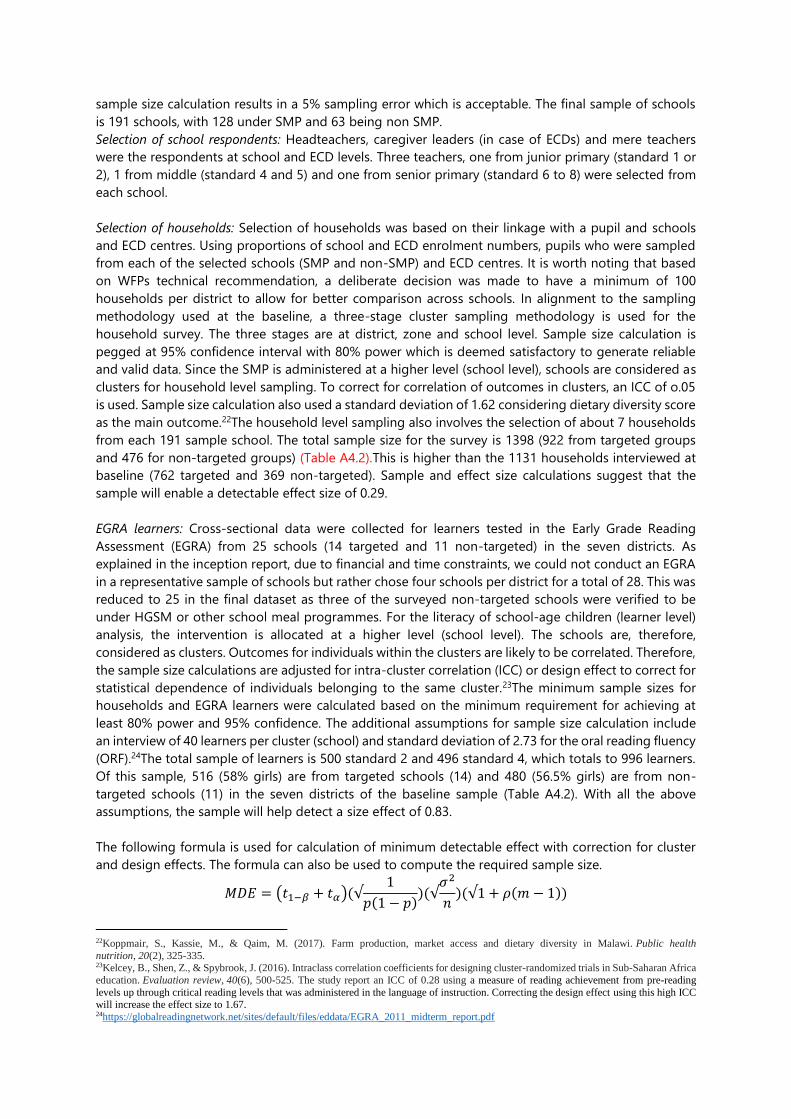
EGRA learners: Cross-sectional data were collected for learners tested in the Early Grade Reading
Assessment (EGRA) from 25 schools (14 targeted and 11 non-targeted) in the seven districts. As
explained in the inception report, due to financial and time constraints, we could not conduct an EGRA
in a representative sample of schools but rather chose four schools per district for a total of 28. This was
reduced to 25 in the final dataset as three of the surveyed non-targeted schools were verified to be
under HGSM or other school meal programmes. For the literacy of school-age children (learner level)
analysis, the intervention is allocated at a higher level (school level). The schools are, therefore,
considered as clusters. Outcomes for individuals within the clusters are likely to be correlated. Therefore,
the sample size calculations are adjusted for intra-cluster correlation (ICC) or design effect to correct for
statistical dependence of individuals belonging to the same cluster.23The minimum sample sizes for
households and EGRA learners were calculated based on the minimum requirement for achieving at
least 80% power and 95% confidence. The additional assumptions for sample size calculation include
an interview of 40 learners per cluster (school) and standard deviation of 2.73 for the oral reading fluency
(ORF).24The total sample of learners is 500 standard 2 and 496 standard 4, which totals to 996 learners.
Of this sample, 516 (58% girls) are from targeted schools (14) and 480 (56.5% girls) are from non-
targeted schools (11) in the seven districts of the baseline sample (Table A4.2). With all the above
assumptions, the sample will help detect a size effect of 0.83.
The following formula is used for calculation of minimum detectable effect with correction for cluster
and design effects. The formula can also be used to compute the required sample size.
𝑀𝐷𝐸 = (𝑡1−𝛽 + 𝑡𝛼)(√1
𝑝(1 − 𝑝))(√
𝜎2
𝑛)(√1 + 𝜌(𝑚 − 1))
22Koppmair, S., Kassie, M., & Qaim, M. (2017). Farm production, market access and dietary diversity in Malawi. Public health
nutrition, 20(2), 325-335. 23Kelcey, B., Shen, Z., & Spybrook, J. (2016). Intraclass correlation coefficients for designing cluster-randomized trials in Sub-Saharan Africa
education. Evaluation review, 40(6), 500-525. The study report an ICC of 0.28 using a measure of reading achievement from pre-reading
levels up through critical reading levels that was administered in the language of instruction. Correcting the design effect using this high ICC will increase the effect size to 1.67. 24https://globalreadingnetwork.net/sites/default/files/eddata/EGRA_2011_midterm_report.pdf

Where MDE is the effect size, n is sample size, σ is standard deviation, ρ is the intra-cluster correlation
coefficient, m is the cluster size (number of observations sampled per cluster) and p is proportion in
treatment.
Table A4.2: Summary of data collected
District
Quantitative surveys
Schools Learners (EGRA) Households
Targeted Non-
targeted Targeted
Non-
targeted Targeted
Non-
targeted
Chikwawa 31 15 80 40 218 109
Chiradzulu 10 6 80 40 77 43
Kasungu 31 14 80 77 227 106
Mangochi 10 4 80 80 61 64
Mulanje 14 11 81 79 104 81
Phalombe 21 9 79 80 154 69
Salima 11 4 80 40 81 34
Total 128 63 516 480 922 476
Girls/Female - - 299 271 28.6% 24.8%
Boys - - 217 209
Standard 2 - - 260 240 - -
Standard 4 - - 256 240 - -
Source: Evaluation Surveys (2018). ‘N’ stands for total number. Schools include 11 targetedECDS and 6 non-targetedECDs.
30. Qualitative interviews totalled62 FGDs of which 34 (55%) are administered in targetedschools and
28 (45%) are administered in non-targetedschools. Table A4.3 provides the distribution of the FGDs and
KIIs conducted at district level.
Table A4.3: Distribution of FGDs at District-Level
Chikwawa Mulanje Phalombe Chiradzul
u
Mangoch
i Salima Kasungu TOTALS
Gender Males 7 46 42 15 15 17 11 153
Females 45 56 62 16 16 57 19 271
Treatment or
Control
T 6 5 9 3 1 6 4 34
C 1 10 5 1 3 7 1 24
Number in
Discussion
Total Number 52 107 104 31 31 74 30 429
Type of FGDs
Parents 4 2 3 1 0 1 0 11
Teachers 1 1 2 1 0 3 0 8
Learners (F) 0 2 3 0 1 1 0 7
Learners (M) 0 3 3 1 1 1 0 8
Parent-Teacher
Associations 0 3 1 0 0 0 1 5
School Feeding
Commitees 1 2 1 0 0 3 2 9
School Management
Commitees 1 1 0 1 0 0 0 3
School Garden
Commitees 0 0 1 0 0 0 0 1
Farmers' Organisations 0 0 0 0 1 1 0 2
Mothers' Clubs 0 1 0 0 1 3 2 7
FGDs were held with learners (Standards 5 to 8), teachers, relevant school committees (Parent Teacher
Associations, School Feeding Committees, School Management Committees, and School Garden
Committees), Mothers’ Clubs, Farmers Organizations, and parents. The majority of FGDs were mixed
gender groups averaging 8-10 participants, and female participation ranged from 52% in Mangochi
district to 87% in Chikwawa. Moreover, 88 KIIs were administered from WFP (CO, RB, NY), Malawi
government ministries, local government officials, World Vision, Save the Children, AECD, CRECCOM,
farmers organizations, School Feeding Committees.
A4.5 Data management and validity
47. Data management: Tablets were used for quantitative data collection to reduce the margin of error
and to ensure cloud storage for verification by the data manager. Quantitative survey data management
and analysis were undertaken using STATA. Qualitative data coding and analysis was facilitated by the
use of Nvivo®. Recorded FGDs were translated to English, transcribed and coded. All data is stored in
a locked cabinet at UNU-MERIT/WFP-Malawi for two years, after which they will be destroyed.
Validity and reliability: Data collection processes were constantly checked to minimize mistakes and
improve the representation of various stakeholders. The ET ensured there was no deliberate
manipulation or unauthorized changes to data and there was a complete documentation of the process
and protocols for primary data collection, data cleaning, and aggregation as required. Accountability
and quality assurance was created through the ET reviewing each process, with assistance from UNU-
MERIT staff where necessary. All processes are replicable through the use of code files shared between
staff members. Data cleaning was conducted using standard methods, common among team members,
clearly explained in accompanying notes. Cleaning of outlying values was conducted in line with
rigorous statistical methods.
A4.6 Triangulation
The ET sought to enhance the validity and reliability of the findings through the triangulation of different
data sources and a robust assessment of the accuracy and comprehensiveness of data sources.
Triangulation enables the verification of findings from primary data with other secondary and desk
resources to help identify anomalies in data (either in primary data or to identify errors in secondary
data). Anomalies may be the result of the systematic error, random error, or through a failure to identify
the voices of marginalised or vulnerable groups. Triangulation of primary quantitative data with
secondary sources and qualitative data enriches the findings and further permits the consideration of a
wide range of factors and underlying causes for results. The use of a mixed-method approach in data
collection enables triangulation between and within methods. It was also used to check for patterns and
trends in gender-disaggregated outcomes. Triangulation of data sources and methods increased the
spectrum of people in the analysis allowing for representation by gender, ethnicity and country of origin.
In addition, qualitative data, was used to triangulate information received through the quantitative
survey, to move beyond individual perspectives to obtain wider community and sector-level
perspectives regarding the SMP and to also ensure that the diverse voices of beneficiaries and non-
beneficiaries, men and especially those of women, boys, girls and vulnerable groups are heard and used.
A4.7 Data analysis
Regressions based on Coarsened Exact Matching: To get an estimate of the causal effect of SMP on EGR
outcomes, the weights computed using CEM is used. The resulting impact estimate is the sample
average treatment effect on the treated (SATT).Coarsened Exact Matching (CEM) is employed to
compare school-age children literacy outcomes across the targetedand non-targetedschools. CEM is
among the new generalized class of matching methods that improve the estimation of causal effects by
reducing the imbalances in the observed characteristics between groups (Blackwell et al., 2009).25 Like
other matching methods such as propensity score matching (PSM), CEM also mimics random
assignment by comparing the outcomes of the targeted group with outcomes of the non-targeted
group after matching the two groups on various observable demographic and socio-economic
characteristics. In this evaluation, the learners from targeted and non-targeted schools are matched
based on historical school attendance (school attendance from 2008 in traditional
25Blackwell, M., Iacus, S., King, G., & Porro, G. (2009). cem: Coarsened exact matching in Stata. The Stata Journal, 9(4), 524-546.
authorities/administrative units that were used to target school during the programme’s expansion in
2007/2008), the age of the learner and mother being uneducated. These factors are assumed to be pre-
targeting/long term indicators that have not been affected by the SMP. In the second stage, OLS
regressions using CEM weights are used to estimate impacts. The CEM algorithm helps to determine
matches through matching of observations on coarsened (broad categories) rather than exact data. The
balance between the targeted (SMP) and non-targeted groups is chosen by ex-ante user choice based
on intuitive information. After pre-processing data with CEM, the impact of SMP on school-age children
literacy is estimated using ordinary least squares using weight generated through CEM. The evaluation
also tests for the presence of heterogeneous effects of SMP on the literacy outcomes for boys and girls,
and asset poor and non-poor households using the same empirical strategy.
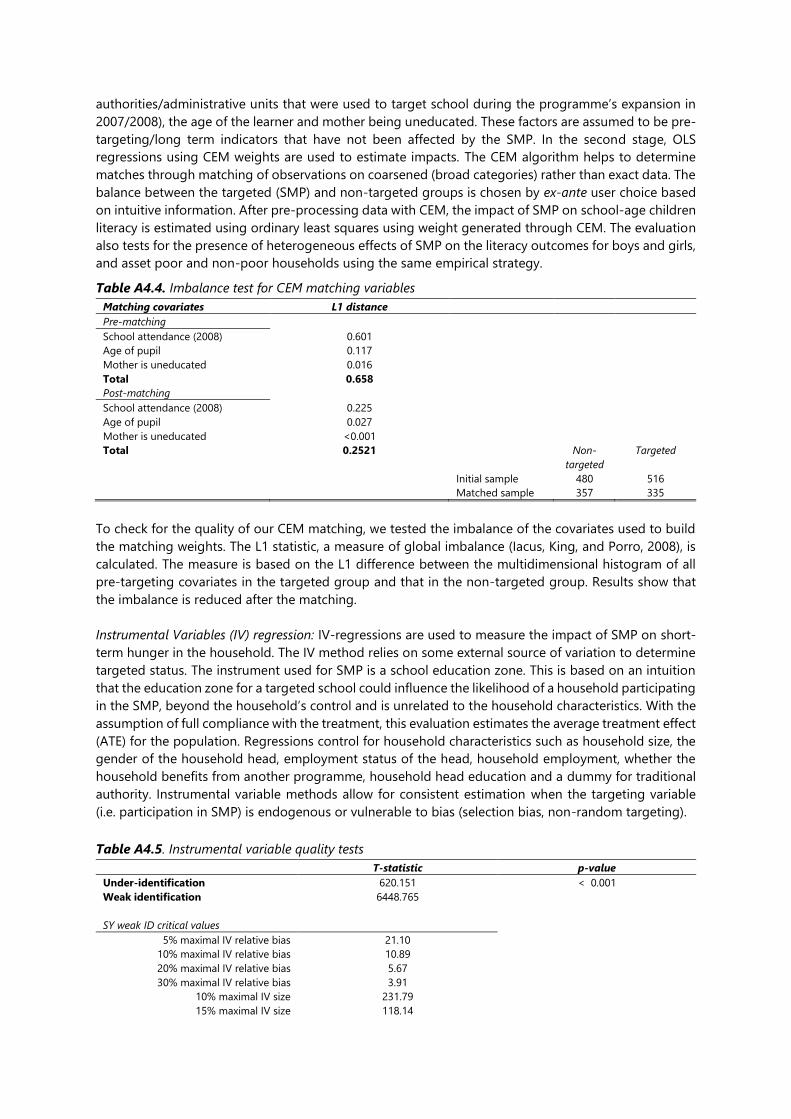
Table A4.4. Imbalance test for CEM matching variables
Matching covariates L1 distance
Pre-matching
School attendance (2008) 0.601
Age of pupil 0.117
Mother is uneducated 0.016
Total 0.658
Post-matching
School attendance (2008) 0.225
Age of pupil 0.027
Mother is uneducated <0.001
Total 0.2521 Non-
targeted
Targeted
Initial sample 480 516
Matched sample 357 335
To check for the quality of our CEM matching, we tested the imbalance of the covariates used to build
the matching weights. The L1 statistic, a measure of global imbalance (Iacus, King, and Porro, 2008), is
calculated. The measure is based on the L1 difference between the multidimensional histogram of all
pre-targeting covariates in the targeted group and that in the non-targeted group. Results show that
the imbalance is reduced after the matching.
Instrumental Variables (IV) regression: IV-regressions are used to measure the impact of SMP on short-
term hunger in the household. The IV method relies on some external source of variation to determine
targeted status. The instrument used for SMP is a school education zone. This is based on an intuition
that the education zone for a targeted school could influence the likelihood of a household participating
in the SMP, beyond the household’s control and is unrelated to the household characteristics. With the
assumption of full compliance with the treatment, this evaluation estimates the average treatment effect
(ATE) for the population. Regressions control for household characteristics such as household size, the
gender of the household head, employment status of the head, household employment, whether the
household benefits from another programme, household head education and a dummy for traditional
authority. Instrumental variable methods allow for consistent estimation when the targeting variable
(i.e. participation in SMP) is endogenous or vulnerable to bias (selection bias, non-random targeting).
Table A4.5. Instrumental variable quality tests
T-statistic p-value
Under-identification 620.151 < 0.001
Weak identification 6448.765
SY weak ID critical values
5% maximal IV relative bias 21.10
10% maximal IV relative bias 10.89
20% maximal IV relative bias 5.67
30% maximal IV relative bias 3.91
10% maximal IV size 231.79
15% maximal IV size 118.14
20% maximal IV size 79.89
25% maximal IV size 60.80
Table A4.5 reports the tests for validity of the instrument used for student level analysis (i.e. school
education zone). The Kleibergen-Paap LM statistic is used to test for underidentification. The significant
result shows that the instrument is correctly identified in the first stage of the two-stage least squares
analysis i.e. the instrument is correlated with the endogenous targeting criteria. The Kleibergen-Paap
Wald F statistic is used to control the strength of the instrument. The F statistic obtained is then
compared with the critical values compiled by Stock and Yogo (2005). The results show that our F
statistic is much larger than any of the critical values, confirming our instrument strength.
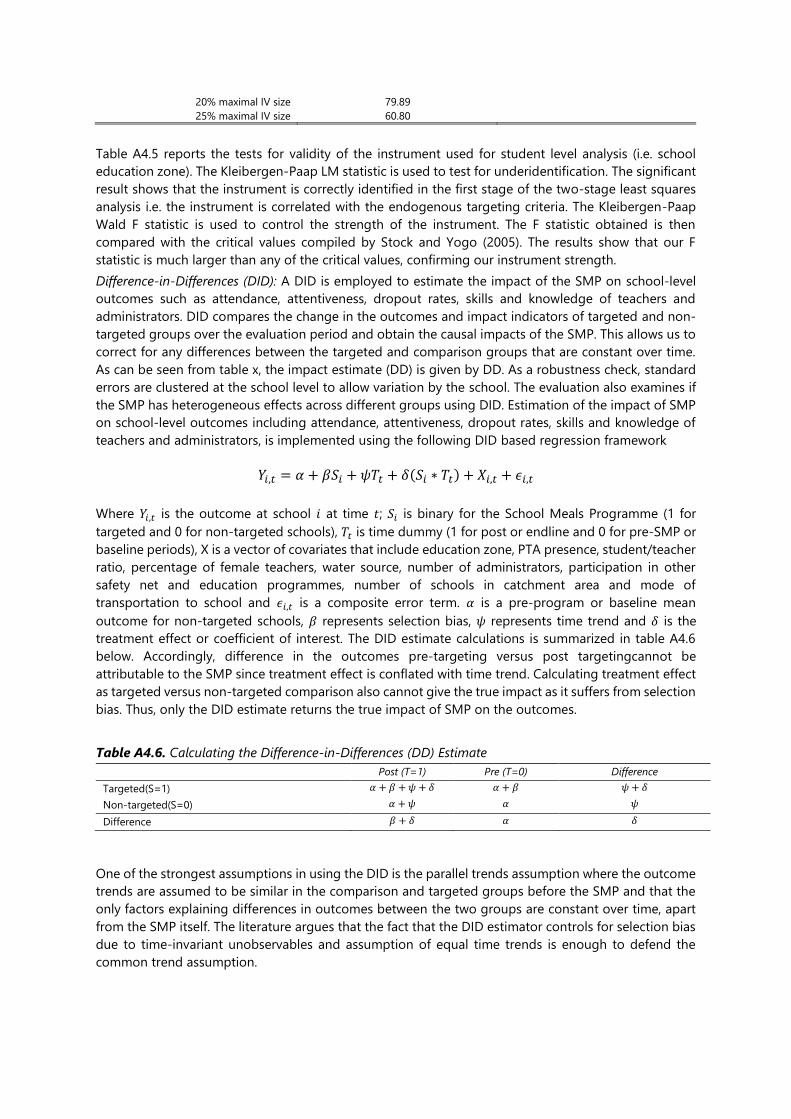
Difference-in-Differences (DID): A DID is employed to estimate the impact of the SMP on school-level
outcomes such as attendance, attentiveness, dropout rates, skills and knowledge of teachers and
administrators. DID compares the change in the outcomes and impact indicators of targeted and non-
targeted groups over the evaluation period and obtain the causal impacts of the SMP. This allows us to
correct for any differences between the targeted and comparison groups that are constant over time.
As can be seen from table x, the impact estimate (DD) is given by DD. As a robustness check, standard
errors are clustered at the school level to allow variation by the school. The evaluation also examines if
the SMP has heterogeneous effects across different groups using DID. Estimation of the impact of SMP
on school-level outcomes including attendance, attentiveness, dropout rates, skills and knowledge of
teachers and administrators, is implemented using the following DID based regression framework
𝑌𝑖,𝑡 = 𝛼 + 𝛽𝑆𝑖 + 𝜓𝑇𝑡 + 𝛿(𝑆𝑖 ∗ 𝑇𝑡) + 𝑋𝑖,𝑡 + 𝜖𝑖,𝑡
Where 𝑌𝑖,𝑡 is the outcome at school 𝑖 at time 𝑡; 𝑆𝑖 is binary for the School Meals Programme (1 for
targeted and 0 for non-targeted schools), 𝑇𝑡 is time dummy (1 for post or endline and 0 for pre-SMP or
baseline periods), X is a vector of covariates that include education zone, PTA presence, student/teacher
ratio, percentage of female teachers, water source, number of administrators, participation in other
safety net and education programmes, number of schools in catchment area and mode of
transportation to school and 𝜖𝑖,𝑡 is a composite error term. 𝛼 is a pre-program or baseline mean
outcome for non-targeted schools, 𝛽 represents selection bias, 𝜓 represents time trend and 𝛿 is the
treatment effect or coefficient of interest. The DID estimate calculations is summarized in table A4.6
below. Accordingly, difference in the outcomes pre-targeting versus post targetingcannot be
attributable to the SMP since treatment effect is conflated with time trend. Calculating treatment effect
as targeted versus non-targeted comparison also cannot give the true impact as it suffers from selection
bias. Thus, only the DID estimate returns the true impact of SMP on the outcomes.
Table A4.6. Calculating the Difference-in-Differences (DD) Estimate
Post (T=1) Pre (T=0) Difference
Targeted(S=1) 𝛼 + 𝛽 +𝜓 + 𝛿 𝛼 + 𝛽 𝜓 + 𝛿
Non-targeted(S=0) 𝛼 + 𝜓 𝛼 𝜓
Difference 𝛽 + 𝛿 𝛼 𝛿
One of the strongest assumptions in using the DID is the parallel trends assumption where the outcome
trends are assumed to be similar in the comparison and targeted groups before the SMP and that the
only factors explaining differences in outcomes between the two groups are constant over time, apart
from the SMP itself. The literature argues that the fact that the DID estimator controls for selection bias
due to time-invariant unobservables and assumption of equal time trends is enough to defend the
common trend assumption.
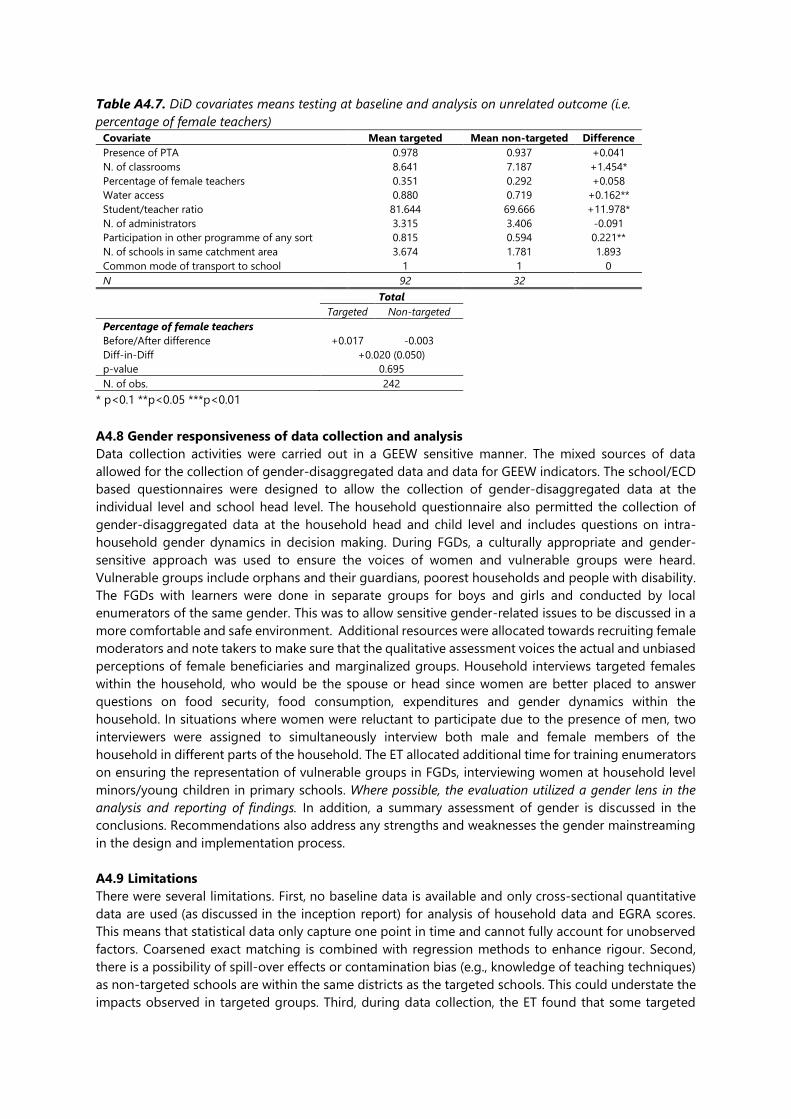
Table A4.7. DiD covariates means testing at baseline and analysis on unrelated outcome (i.e.
percentage of female teachers) Covariate Mean targeted Mean non-targeted Difference
Presence of PTA 0.978 0.937 +0.041
N. of classrooms 8.641 7.187 +1.454*
Percentage of female teachers 0.351 0.292 +0.058
Water access 0.880 0.719 +0.162**
Student/teacher ratio 81.644 69.666 +11.978*
N. of administrators 3.315 3.406 -0.091
Participation in other programme of any sort 0.815 0.594 0.221**
N. of schools in same catchment area 3.674 1.781 1.893
Common mode of transport to school 1 1 0
N 92 32
Total
Targeted Non-targeted
Percentage of female teachers
Before/After difference +0.017 -0.003
Diff-in-Diff +0.020 (0.050)
p-value 0.695
N. of obs. 242
* p<0.1 **p<0.05 ***p<0.01
A4.8 Gender responsiveness of data collection and analysis
Data collection activities were carried out in a GEEW sensitive manner. The mixed sources of data
allowed for the collection of gender-disaggregated data and data for GEEW indicators. The school/ECD
based questionnaires were designed to allow the collection of gender-disaggregated data at the
individual level and school head level. The household questionnaire also permitted the collection of
gender-disaggregated data at the household head and child level and includes questions on intra-
household gender dynamics in decision making. During FGDs, a culturally appropriate and gender-
sensitive approach was used to ensure the voices of women and vulnerable groups were heard.
Vulnerable groups include orphans and their guardians, poorest households and people with disability.
The FGDs with learners were done in separate groups for boys and girls and conducted by local
enumerators of the same gender. This was to allow sensitive gender-related issues to be discussed in a
more comfortable and safe environment. Additional resources were allocated towards recruiting female
moderators and note takers to make sure that the qualitative assessment voices the actual and unbiased
perceptions of female beneficiaries and marginalized groups. Household interviews targeted females
within the household, who would be the spouse or head since women are better placed to answer
questions on food security, food consumption, expenditures and gender dynamics within the
household. In situations where women were reluctant to participate due to the presence of men, two
interviewers were assigned to simultaneously interview both male and female members of the
household in different parts of the household. The ET allocated additional time for training enumerators
on ensuring the representation of vulnerable groups in FGDs, interviewing women at household level
minors/young children in primary schools. Where possible, the evaluation utilized a gender lens in the
analysis and reporting of findings. In addition, a summary assessment of gender is discussed in the
conclusions. Recommendations also address any strengths and weaknesses the gender mainstreaming
in the design and implementation process.
A4.9 Limitations There were several limitations. First, no baseline data is available and only cross-sectional quantitative
data are used (as discussed in the inception report) for analysis of household data and EGRA scores.
This means that statistical data only capture one point in time and cannot fully account for unobserved
factors. Coarsened exact matching is combined with regression methods to enhance rigour. Second,
there is a possibility of spill-over effects or contamination bias (e.g., knowledge of teaching techniques)
as non-targeted schools are within the same districts as the targeted schools. This could understate the
impacts observed in targeted groups. Third, during data collection, the ET found that some targeted
schools from the baseline had transitioned to HGSM. Many non-targeted schools had also transitioned
into the SMP, HGSM or school meal interventions by other actors e.g. Mary’s Meals. Still, 92 targeted
and 32 non-targeted schools created a balanced panel for longitudinal analysis. Selection bias could
also arise if the targeted population can manipulate participation in SMP. Fourth, the Emergency School
Meal Programme was implemented by WFP in non-SMP schools in 2016/2017 which could have raised
baseline values for non-targeted schools resulting in understated impacts. Fifth, it may be difficult to
attribute any changes to the SMP if there are other relevant contemporaneous interventions in the
target districts. Examples include the social cash transfers. To tackle this issue, information on the receipt
of other social and education programmes was controlled for in causal analysis. Sixth, There is no
literacy data from the baseline (end-line of FY13 programme). There is literacy data collected in early
2018 by World Vision Malawi. However, due to time and logistical constraints, the evaluation’s EGRA
was cross sectional and not a follow up to World Vision’ sample. The ET was working on a fast timeline
where data had to be collected from schools, households and learners within three weeks in November
2018 to enable the required submission of the report before the end of the FY 2018. Yet, there was
limited overlap between World Vision’s school sample and Phase II’s endline evaluation school sample.
Since creating a school-level panel dataset with the Phase II’s endline evaluation was a priority, the ET
and the CO deemed it too onerous to survey both the schools required to construct the panel and those
surveyed by World Vision, given the size and remoteness of some districts. While the World Vision
sample covered the same districts as those surveyed by the ET, the World Vision sample size of learners
was lower than the required sample size calculated by the ET. In addition, creating panel data with
World Vision data would not have been as useful as World Vision’s EGRA was conducted just 6 months
prior and therefore not a baseline. The ET felt that very little would have changed in that time.
A4.10 Ensuring quality and ethical safeguards
Quality assurance: This evaluation was guided by the WFP’s Decentralised Evaluation Quality Assurance
System (DEQAS) and the internal quality assurance systems for the ET’s organization (UNU-MERIT), and
both systems are based on the United Nations Evaluation Group (UNEG) norms and standards. During
the evaluation process, the ET closely coordinated with the CO to ensure that the expectations were
clear and feasible and challenges discussed and resolved. The evaluation manager was responsible for
ensuring that the evaluation process follows the DEQAS guidelines and the UNEG norms and standards
and for conducting rigorous quality control of evaluation products before they are finalized. The ET also
regularly consulted with senior researchers/professors at UNU-MERIT for quality support. UNU-MERIT
(at its own cost) assigned a staff member dedicated towards providing internal quality assurance at all
stages of the evaluation. The ET ensured the quality of data by maintaining validity, consistency and
accuracy in all analytical and reporting phases. The use of tablets minimized errors in data capture and
data collection processes were subject to constant verification. The evaluation reports follows the
guidelines in WFP’s DEQAS templates and the Quality Assurance Checklists (QACs) and is assessed by
an outsourced quality support (QS) service managed by WFP’s OEV in Headquarters. Independence:
None of the ET members have vested interests in the SMP and none were involved in the policy-setting
design or overall management of the SMP, nor do they expect to be in the near future. The ET ensured
that they were given full freedom to access information. Impartiality: The evaluation used a mix of data
sources (beneficiaries disaggregated by gender and age, key informants and secondary documents) and
data collection methods (quantitative, qualitative and secondary data) which ensured impartiality and
avoided bias towards any stakeholder, data source or method. Utility: Utility of the evaluation has been
strengthened through stakeholder meetings and workshops during the inception phase, end of
fieldwork debriefing and will be enhanced by the dissemination of findings that will facilitate feedback
and promote buy-in from the WFP and its stakeholders which will also strengthen the credibility of the
evaluation.
Ethical Safeguards: The evaluation conforms to WFP and UNEG ethical standards and norms.
Accordingly, the ET was responsible for safeguarding and ensuring ethics at all stages of the evaluation
cycle. During data collection, the ET addressed the following ethical issues: ensuring the rights, privacy
and safety (both physical and psychological) of respondents, those collecting the data, and
vulnerable persons. The following safeguards and measures were put in place to manage these issues:
• Protection of the rights of the respondent by :i) clearly explained the risks and benefits of the evaluation;
ii) ensured voluntary participation and freedom to terminate interview; iii) obtained verbal or written
informed consent in English or Chichewa; iv) ensured data collection tools do not contain deceptive
or threatening language, are culturally appropriate and accessible (local language), and do not create
distress or discomfort for respondents and enumerators; v) provided contact information for
participants with grievances about the data collection process; and vi) avoided discrimination against
individuals on the basis of sex, race, religion, ethnicity, culture, or other categories by using random
sampling in quantitative surveys and ensured qualitative interviews involved a balanced mix of male,
female voices, children including orphans and other vulnerable groups.
• Guaranteeing privacy and confidentiality by ensuring that: i) individual interviews did not compromise
the privacy of participants; ii)data collected is held in strict confidence and access will not be granted
to anyone outside the evaluation team; iii) use of anonymised data in analysis and reporting and
storage of datasets on secure servers; and iv) that data collection visits were organized at the
appropriate time and place, with advance notification, to minimize risk and disruption to respondents
and enumerators.
• Extra safeguards for vulnerable persons included: i) securing verbal assent from minors; ii) ensuring
that interviewers or enumerators were trained in the collection of sensitive information and were
trained in the interviewing of minors/young children in the early grades of primary schools, and iii)
providing participants with information on how individuals in situations of risk or those who
experience adverse effects during interviews can seek support or counselling (referral)
• Other safeguards: The ET ensured that interviews and interactions with non-targeted schools and
households are treated sensitively to minimise potential grievances and resentment from non-
beneficiaries. All team members signed the code of conduct for evaluators
These issues were monitored and managed during the implementation of the evaluation. No ethical
challenges were encountered.
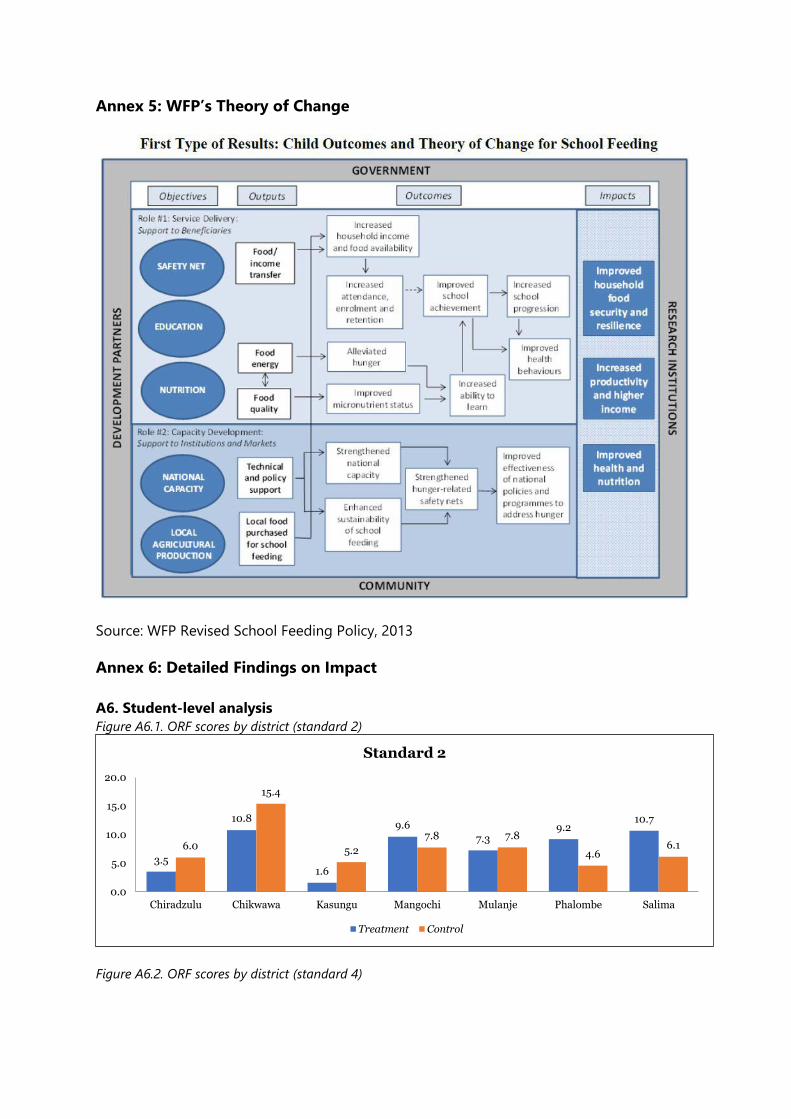
Annex 5: WFP’s Theory of Change
Source: WFP Revised School Feeding Policy, 2013
Annex 6: Detailed Findings on Impact
A6. Student-level analysis
Figure A6.1. ORF scores by district (standard 2)
Figure A6.2. ORF scores by district (standard 4)
3.5
10.8
1.6
9.6
7.39.2
10.7
6.0
15.4
5.2
7.8 7.8
4.66.1
0.0
5.0
10.0
15.0
20.0
Chiradzulu Chikwawa Kasungu Mangochi Mulanje Phalombe Salima
Standard 2
Treatment Control
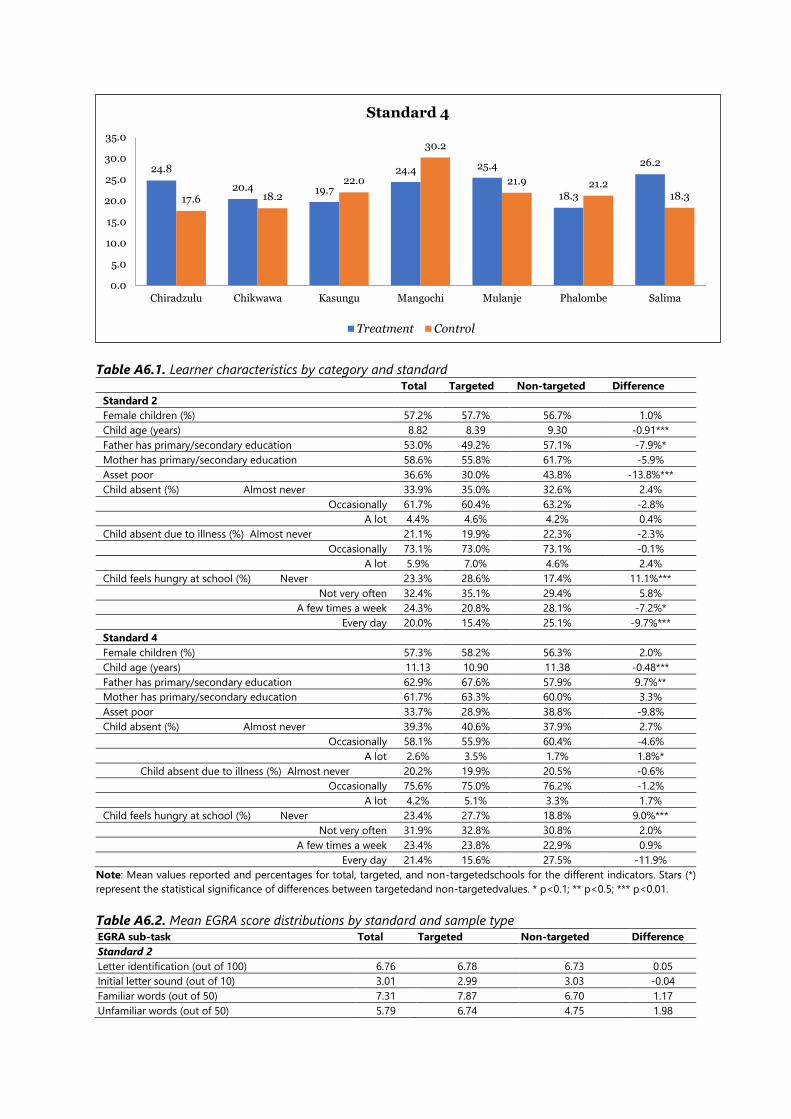
Table A6.1. Learner characteristics by category and standard Total Targeted Non-targeted Difference
Standard 2
Female children (%) 57.2% 57.7% 56.7% 1.0%
Child age (years) 8.82 8.39 9.30 -0.91***
Father has primary/secondary education 53.0% 49.2% 57.1% -7.9%*
Mother has primary/secondary education 58.6% 55.8% 61.7% -5.9%
Asset poor 36.6% 30.0% 43.8% -13.8%***
Child absent (%) Almost never 33.9% 35.0% 32.6% 2.4%
Occasionally 61.7% 60.4% 63.2% -2.8%
A lot 4.4% 4.6% 4.2% 0.4%
Child absent due to illness (%) Almost never 21.1% 19.9% 22.3% -2.3%
Occasionally 73.1% 73.0% 73.1% -0.1%
A lot 5.9% 7.0% 4.6% 2.4%
Child feels hungry at school (%) Never 23.3% 28.6% 17.4% 11.1%***
Not very often 32.4% 35.1% 29.4% 5.8%
A few times a week 24.3% 20.8% 28.1% -7.2%*
Every day 20.0% 15.4% 25.1% -9.7%***
Standard 4
Female children (%) 57.3% 58.2% 56.3% 2.0%
Child age (years) 11.13 10.90 11.38 -0.48***
Father has primary/secondary education 62.9% 67.6% 57.9% 9.7%**
Mother has primary/secondary education 61.7% 63.3% 60.0% 3.3%
Asset poor 33.7% 28.9% 38.8% -9.8%
Child absent (%) Almost never 39.3% 40.6% 37.9% 2.7%
Occasionally 58.1% 55.9% 60.4% -4.6%
A lot 2.6% 3.5% 1.7% 1.8%*
Child absent due to illness (%) Almost never 20.2% 19.9% 20.5% -0.6%
Occasionally 75.6% 75.0% 76.2% -1.2%
A lot 4.2% 5.1% 3.3% 1.7%
Child feels hungry at school (%) Never 23.4% 27.7% 18.8% 9.0%***
Not very often 31.9% 32.8% 30.8% 2.0%
A few times a week 23.4% 23.8% 22.9% 0.9%
Every day 21.4% 15.6% 27.5% -11.9%
Note: Mean values reported and percentages for total, targeted, and non-targetedschools for the different indicators. Stars (*)
represent the statistical significance of differences between targetedand non-targetedvalues. * p<0.1; ** p<0.5; *** p<0.01.
Table A6.2. Mean EGRA score distributions by standard and sample type EGRA sub-task Total Targeted Non-targeted Difference
Standard 2
Letter identification (out of 100) 6.76 6.78 6.73 0.05
Initial letter sound (out of 10) 3.01 2.99 3.03 -0.04
Familiar words (out of 50) 7.31 7.87 6.70 1.17
Unfamiliar words (out of 50) 5.79 6.74 4.75 1.98
24.8
20.4 19.7
24.4 25.4
18.3
26.2
17.6 18.2
22.0
30.2
21.9 21.218.3
0.0
5.0
10.0
15.0
20.0
25.0
30.0
35.0
Chiradzulu Chikwawa Kasungu Mangochi Mulanje Phalombe Salima
Standard 4
Treatment Control
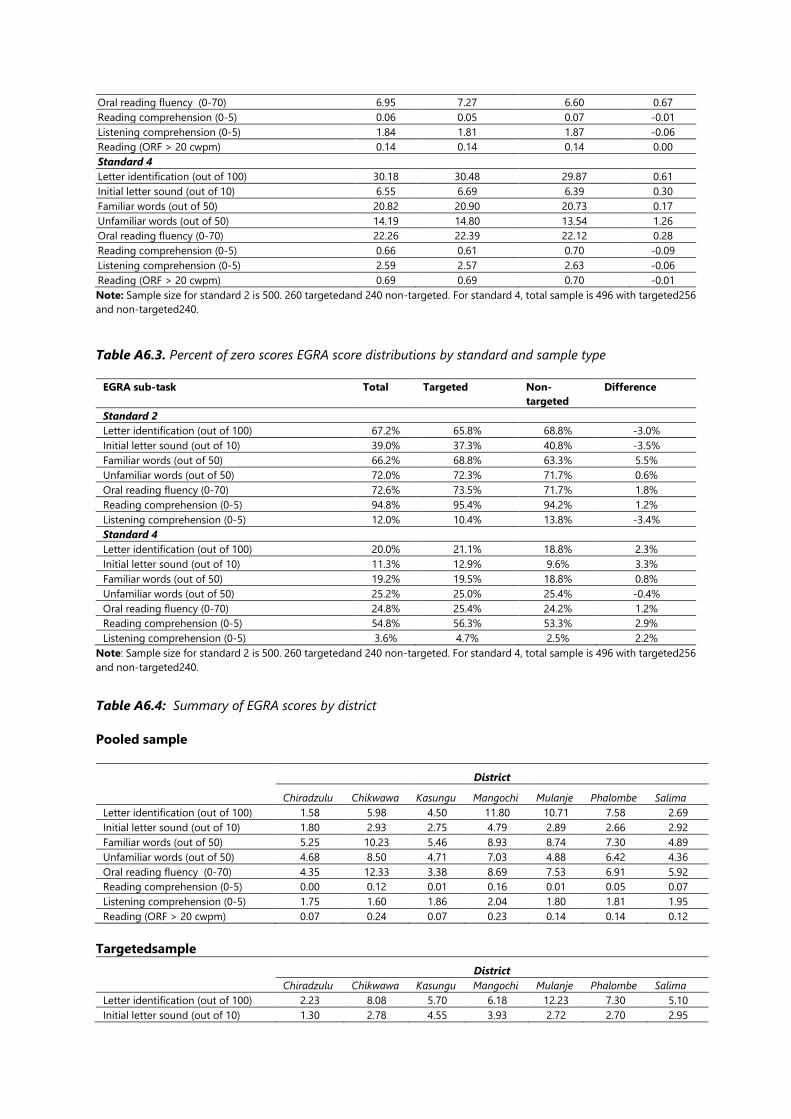
Oral reading fluency (0-70) 6.95 7.27 6.60 0.67
Reading comprehension (0-5) 0.06 0.05 0.07 -0.01
Listening comprehension (0-5) 1.84 1.81 1.87 -0.06
Reading (ORF > 20 cwpm) 0.14 0.14 0.14 0.00
Standard 4
Letter identification (out of 100) 30.18 30.48 29.87 0.61
Initial letter sound (out of 10) 6.55 6.69 6.39 0.30
Familiar words (out of 50) 20.82 20.90 20.73 0.17
Unfamiliar words (out of 50) 14.19 14.80 13.54 1.26
Oral reading fluency (0-70) 22.26 22.39 22.12 0.28
Reading comprehension (0-5) 0.66 0.61 0.70 -0.09
Listening comprehension (0-5) 2.59 2.57 2.63 -0.06
Reading (ORF > 20 cwpm) 0.69 0.69 0.70 -0.01
Note: Sample size for standard 2 is 500. 260 targetedand 240 non-targeted. For standard 4, total sample is 496 with targeted256
and non-targeted240.
Table A6.3. Percent of zero scores EGRA score distributions by standard and sample type
EGRA sub-task Total Targeted Non-
targeted
Difference
Standard 2
Letter identification (out of 100) 67.2% 65.8% 68.8% -3.0%
Initial letter sound (out of 10) 39.0% 37.3% 40.8% -3.5%
Familiar words (out of 50) 66.2% 68.8% 63.3% 5.5%
Unfamiliar words (out of 50) 72.0% 72.3% 71.7% 0.6%
Oral reading fluency (0-70) 72.6% 73.5% 71.7% 1.8%
Reading comprehension (0-5) 94.8% 95.4% 94.2% 1.2%
Listening comprehension (0-5) 12.0% 10.4% 13.8% -3.4%
Standard 4
Letter identification (out of 100) 20.0% 21.1% 18.8% 2.3%
Initial letter sound (out of 10) 11.3% 12.9% 9.6% 3.3%
Familiar words (out of 50) 19.2% 19.5% 18.8% 0.8%
Unfamiliar words (out of 50) 25.2% 25.0% 25.4% -0.4%
Oral reading fluency (0-70) 24.8% 25.4% 24.2% 1.2%
Reading comprehension (0-5) 54.8% 56.3% 53.3% 2.9%
Listening comprehension (0-5) 3.6% 4.7% 2.5% 2.2%
Note: Sample size for standard 2 is 500. 260 targetedand 240 non-targeted. For standard 4, total sample is 496 with targeted256
and non-targeted240.
Table A6.4: Summary of EGRA scores by district
Pooled sample
District
Chiradzulu Chikwawa Kasungu Mangochi Mulanje Phalombe Salima
Letter identification (out of 100) 1.58 5.98 4.50 11.80 10.71 7.58 2.69
Initial letter sound (out of 10) 1.80 2.93 2.75 4.79 2.89 2.66 2.92
Familiar words (out of 50) 5.25 10.23 5.46 8.93 8.74 7.30 4.89
Unfamiliar words (out of 50) 4.68 8.50 4.71 7.03 4.88 6.42 4.36
Oral reading fluency (0-70) 4.35 12.33 3.38 8.69 7.53 6.91 5.92
Reading comprehension (0-5) 0.00 0.12 0.01 0.16 0.01 0.05 0.07
Listening comprehension (0-5) 1.75 1.60 1.86 2.04 1.80 1.81 1.95
Reading (ORF > 20 cwpm) 0.07 0.24 0.07 0.23 0.14 0.14 0.12
Targetedsample
District
Chiradzulu Chikwawa Kasungu Mangochi Mulanje Phalombe Salima
Letter identification (out of 100) 2.23 8.08 5.70 6.18 12.23 7.30 5.10
Initial letter sound (out of 10) 1.30 2.78 4.55 3.93 2.72 2.70 2.95
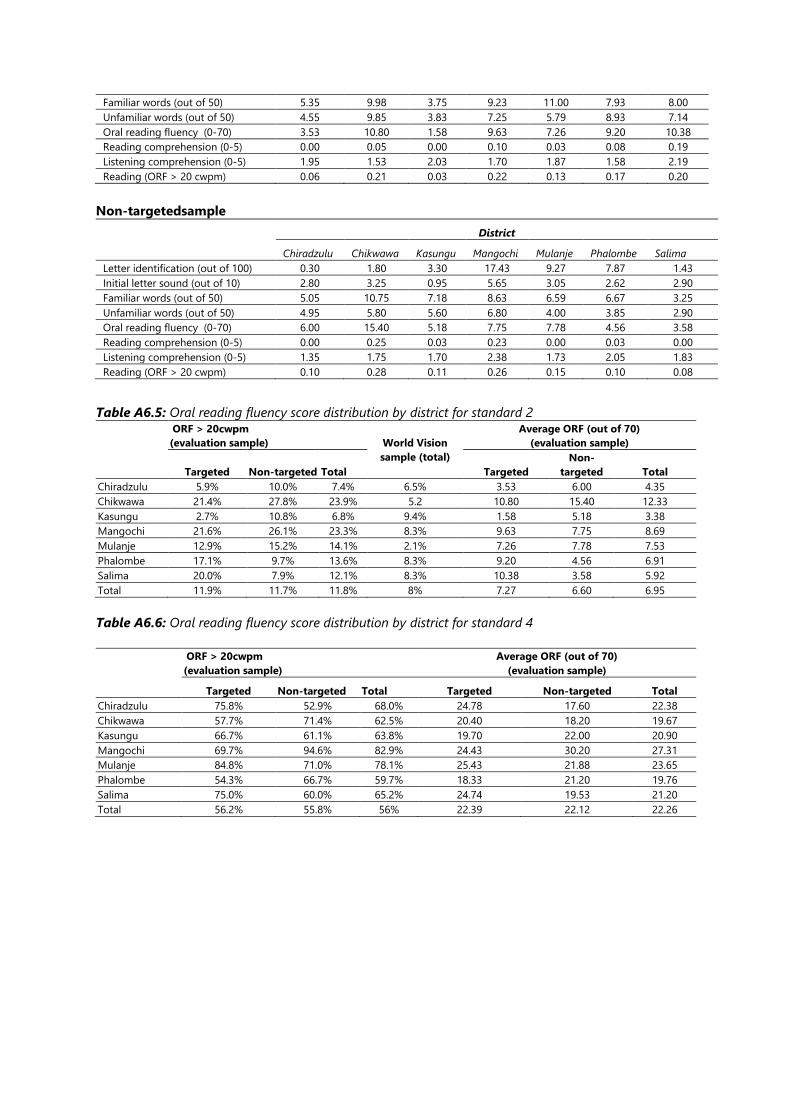
Familiar words (out of 50) 5.35 9.98 3.75 9.23 11.00 7.93 8.00
Unfamiliar words (out of 50) 4.55 9.85 3.83 7.25 5.79 8.93 7.14
Oral reading fluency (0-70) 3.53 10.80 1.58 9.63 7.26 9.20 10.38
Reading comprehension (0-5) 0.00 0.05 0.00 0.10 0.03 0.08 0.19
Listening comprehension (0-5) 1.95 1.53 2.03 1.70 1.87 1.58 2.19
Reading (ORF > 20 cwpm) 0.06 0.21 0.03 0.22 0.13 0.17 0.20
Non-targetedsample
District
Chiradzulu Chikwawa Kasungu Mangochi Mulanje Phalombe Salima
Letter identification (out of 100) 0.30 1.80 3.30 17.43 9.27 7.87 1.43
Initial letter sound (out of 10) 2.80 3.25 0.95 5.65 3.05 2.62 2.90
Familiar words (out of 50) 5.05 10.75 7.18 8.63 6.59 6.67 3.25
Unfamiliar words (out of 50) 4.95 5.80 5.60 6.80 4.00 3.85 2.90
Oral reading fluency (0-70) 6.00 15.40 5.18 7.75 7.78 4.56 3.58
Reading comprehension (0-5) 0.00 0.25 0.03 0.23 0.00 0.03 0.00
Listening comprehension (0-5) 1.35 1.75 1.70 2.38 1.73 2.05 1.83
Reading (ORF > 20 cwpm) 0.10 0.28 0.11 0.26 0.15 0.10 0.08
Table A6.5: Oral reading fluency score distribution by district for standard 2
ORF > 20cwpm
(evaluation sample)
World Vision
sample (total)
Average ORF (out of 70)
(evaluation sample)
Targeted Non-targeted Total Targeted
Non-
targeted Total
Chiradzulu 5.9% 10.0% 7.4% 6.5% 3.53 6.00 4.35
Chikwawa 21.4% 27.8% 23.9% 5.2 10.80 15.40 12.33
Kasungu 2.7% 10.8% 6.8% 9.4% 1.58 5.18 3.38
Mangochi 21.6% 26.1% 23.3% 8.3% 9.63 7.75 8.69
Mulanje 12.9% 15.2% 14.1% 2.1% 7.26 7.78 7.53
Phalombe 17.1% 9.7% 13.6% 8.3% 9.20 4.56 6.91
Salima 20.0% 7.9% 12.1% 8.3% 10.38 3.58 5.92
Total 11.9% 11.7% 11.8% 8% 7.27 6.60 6.95
Table A6.6: Oral reading fluency score distribution by district for standard 4
ORF > 20cwpm
(evaluation sample)
Average ORF (out of 70)
(evaluation sample)
Targeted Non-targeted Total Targeted Non-targeted Total
Chiradzulu 75.8% 52.9% 68.0% 24.78 17.60 22.38
Chikwawa 57.7% 71.4% 62.5% 20.40 18.20 19.67
Kasungu 66.7% 61.1% 63.8% 19.70 22.00 20.90
Mangochi 69.7% 94.6% 82.9% 24.43 30.20 27.31
Mulanje 84.8% 71.0% 78.1% 25.43 21.88 23.65
Phalombe 54.3% 66.7% 59.7% 18.33 21.20 19.76
Salima 75.0% 60.0% 65.2% 24.74 19.53 21.20
Total 56.2% 55.8% 56% 22.39 22.12 22.26
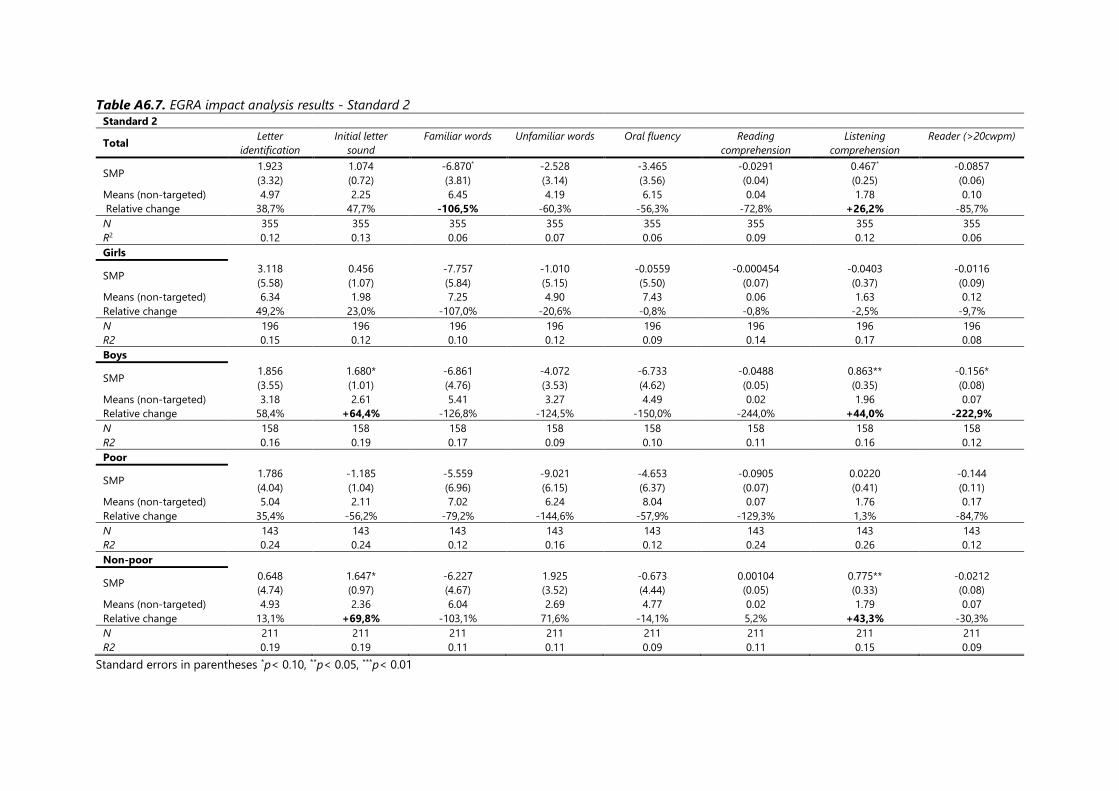
Table A6.7. EGRA impact analysis results - Standard 2 Standard 2
Total Letter
identification
Initial letter
sound
Familiar words Unfamiliar words Oral fluency Reading
comprehension
Listening
comprehension
Reader (>20cwpm)
SMP 1.923
(3.32)
1.074
(0.72)
-6.870*
(3.81)
-2.528
(3.14)
-3.465
(3.56)
-0.0291
(0.04)
0.467*
(0.25)
-0.0857
(0.06)
Means (non-targeted) 4.97 2.25 6.45 4.19 6.15 0.04 1.78 0.10
Relative change 38,7% 47,7% -106,5% -60,3% -56,3% -72,8% +26,2% -85,7%
N 355 355 355 355 355 355 355 355
R2 0.12 0.13 0.06 0.07 0.06 0.09 0.12 0.06
Girls
SMP 3.118
(5.58)
0.456
(1.07)
-7.757
(5.84)
-1.010
(5.15)
-0.0559
(5.50)
-0.000454
(0.07)
-0.0403
(0.37)
-0.0116
(0.09)
Means (non-targeted) 6.34 1.98 7.25 4.90 7.43 0.06 1.63 0.12
Relative change 49,2% 23,0% -107,0% -20,6% -0,8% -0,8% -2,5% -9,7%
N 196 196 196 196 196 196 196 196
R2 0.15 0.12 0.10 0.12 0.09 0.14 0.17 0.08
Boys
SMP 1.856
(3.55)
1.680*
(1.01)
-6.861
(4.76)
-4.072
(3.53)
-6.733
(4.62)
-0.0488
(0.05)
0.863**
(0.35)
-0.156*
(0.08)
Means (non-targeted) 3.18 2.61 5.41 3.27 4.49 0.02 1.96 0.07
Relative change 58,4% +64,4% -126,8% -124,5% -150,0% -244,0% +44,0% -222,9%
N 158 158 158 158 158 158 158 158
R2 0.16 0.19 0.17 0.09 0.10 0.11 0.16 0.12
Poor
SMP 1.786
(4.04)
-1.185
(1.04)
-5.559
(6.96)
-9.021
(6.15)
-4.653
(6.37)
-0.0905
(0.07)
0.0220
(0.41)
-0.144
(0.11)
Means (non-targeted) 5.04 2.11 7.02 6.24 8.04 0.07 1.76 0.17
Relative change 35,4% -56,2% -79,2% -144,6% -57,9% -129,3% 1,3% -84,7%
N 143 143 143 143 143 143 143 143
R2 0.24 0.24 0.12 0.16 0.12 0.24 0.26 0.12
Non-poor
SMP 0.648
(4.74)
1.647*
(0.97)
-6.227
(4.67)
1.925
(3.52)
-0.673
(4.44)
0.00104
(0.05)
0.775**
(0.33)
-0.0212
(0.08)
Means (non-targeted) 4.93 2.36 6.04 2.69 4.77 0.02 1.79 0.07
Relative change 13,1% +69,8% -103,1% 71,6% -14,1% 5,2% +43,3% -30,3%
N 211 211 211 211 211 211 211 211
R2 0.19 0.19 0.11 0.11 0.09 0.11 0.15 0.09
Standard errors in parentheses *p< 0.10, **p< 0.05, ***p< 0.01

Table A6.8. EGRA impact analysis results - Standard 4
Standard 4
Total Letter
identification
Initial letter
sound
Familiar
words
Unfamiliar
words
Oral
fluency
Reading
comprehension
Listening
comprehension
Reader
(>20cwpm)
SMP 5.313
(5.75)
1.989**
(0.86)
3.914
(4.16)
3.787
(3.50)
3.017
(4.75)
0.477**
(0.20)
1.043***
(0.26)
0.265**
(0.12)
Means (non-
targeted)
27.76 5.88 19.15 12.77 19.75 0.58 2.53 0.49
Relative change 19% +34% 20% 30% 15% +82% +41% +54%
N. of obs. 356 356 356 356 356 356 356 356
R2 0.20 0.14 0.08 0.06 0.07 0.11 0.12 0.12
Girls
SMP 9.379
(7.85)
2.902***
(1.07)
7.368
(5.42)
5.796
(4.69)
6.745
(6.18)
0.697***
(0.24)
1.100***
(0.35)
0.239
(0.16)
Means (non-
targeted)
29.26 5.95 20.55 13.67 20.75 0.63 2.42 0.53
Relative change 32,1% +48,8% 35,9% 42,4% 32,5% +110,6% +45,5% 45,1%
N. of obs. 204 204 204 204 204 204 204 204
R2 0.19 0.28 0.13 0.09 0.10 0.16 0.15 0.14
Boys
SMP -2.030
(8.81)
0.551
(1.34)
-1.928
(6.64)
1.219
(5.47)
-1.334
(7.67)
0.191
(0.34)
0.926**
(0.39)
0.315
(0.19)
Means (non-
targeted)
25.66 5.78 17.2 11.51 18.43 0.50 2.68 0.44
Relative change -7,9% 9,5% -11,2% 10,6% -7,2% 38,2% +34,6% 71,6%
N. of obs. 152 152 152 152 152 152 152 152
R2 0.29 0.20 0.13 0.10 0.15 0.19 0.14 0.19
Poor
SMP 8.632
(9.79)
2.253
(1.50)
11.14
(8.20)
5.430
(7.38)
3.767
(9.29)
0.319
(0.32)
1.265***
(0.45)
0.328
(0.20)
Means (non-
targeted)
25.34 5.46 17.36 12.59 16.62 0.43 2.41 0.43
Relative change 34,1% 41,3% 64,2% 43,1% 22,7% 74,2% +52,5% 76,3%
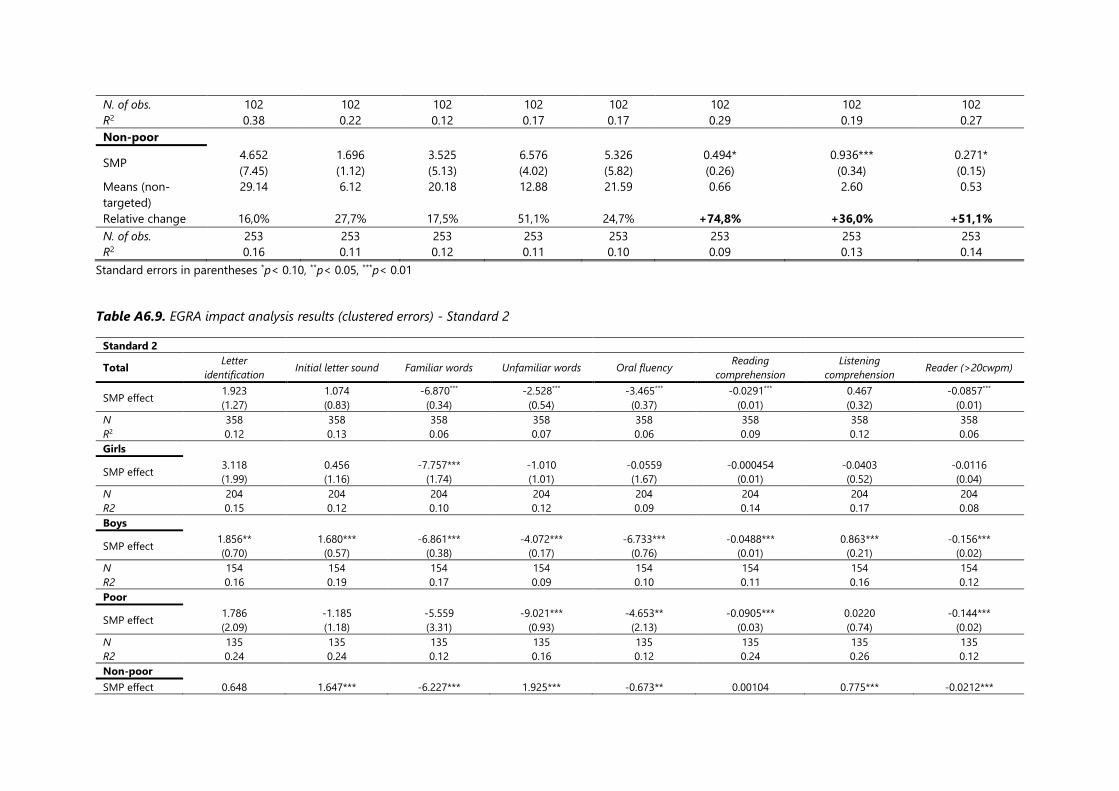
N. of obs. 102 102 102 102 102 102 102 102
R2 0.38 0.22 0.12 0.17 0.17 0.29 0.19 0.27
Non-poor
SMP 4.652
(7.45)
1.696
(1.12)
3.525
(5.13)
6.576
(4.02)
5.326
(5.82)
0.494*
(0.26)
0.936***
(0.34)
0.271*
(0.15)
Means (non-
targeted)
29.14 6.12 20.18 12.88 21.59 0.66 2.60 0.53
Relative change 16,0% 27,7% 17,5% 51,1% 24,7% +74,8% +36,0% +51,1%
N. of obs. 253 253 253 253 253 253 253 253
R2 0.16 0.11 0.12 0.11 0.10 0.09 0.13 0.14
Standard errors in parentheses *p< 0.10, **p< 0.05, ***p< 0.01
Table A6.9. EGRA impact analysis results (clustered errors) - Standard 2
Standard 2
Total Letter
identification Initial letter sound Familiar words Unfamiliar words Oral fluency
Reading
comprehension
Listening
comprehension Reader (>20cwpm)
SMP effect 1.923
(1.27)
1.074
(0.83)
-6.870***
(0.34)
-2.528***
(0.54)
-3.465***
(0.37)
-0.0291***
(0.01)
0.467
(0.32)
-0.0857***
(0.01)
N 358 358 358 358 358 358 358 358
R2 0.12 0.13 0.06 0.07 0.06 0.09 0.12 0.06
Girls
SMP effect 3.118
(1.99)
0.456
(1.16)
-7.757***
(1.74)
-1.010
(1.01)
-0.0559
(1.67)
-0.000454
(0.01)
-0.0403
(0.52)
-0.0116
(0.04)
N 204 204 204 204 204 204 204 204
R2 0.15 0.12 0.10 0.12 0.09 0.14 0.17 0.08
Boys
SMP effect 1.856**
(0.70)
1.680***
(0.57)
-6.861***
(0.38)
-4.072***
(0.17)
-6.733***
(0.76)
-0.0488***
(0.01)
0.863***
(0.21)
-0.156***
(0.02)
N 154 154 154 154 154 154 154 154
R2 0.16 0.19 0.17 0.09 0.10 0.11 0.16 0.12
Poor
SMP effect 1.786
(2.09)
-1.185
(1.18)
-5.559
(3.31)
-9.021***
(0.93)
-4.653**
(2.13)
-0.0905***
(0.03)
0.0220
(0.74)
-0.144***
(0.02)
N 135 135 135 135 135 135 135 135
R2 0.24 0.24 0.12 0.16 0.12 0.24 0.26 0.12
Non-poor
SMP effect 0.648 1.647*** -6.227*** 1.925*** -0.673** 0.00104 0.775*** -0.0212***
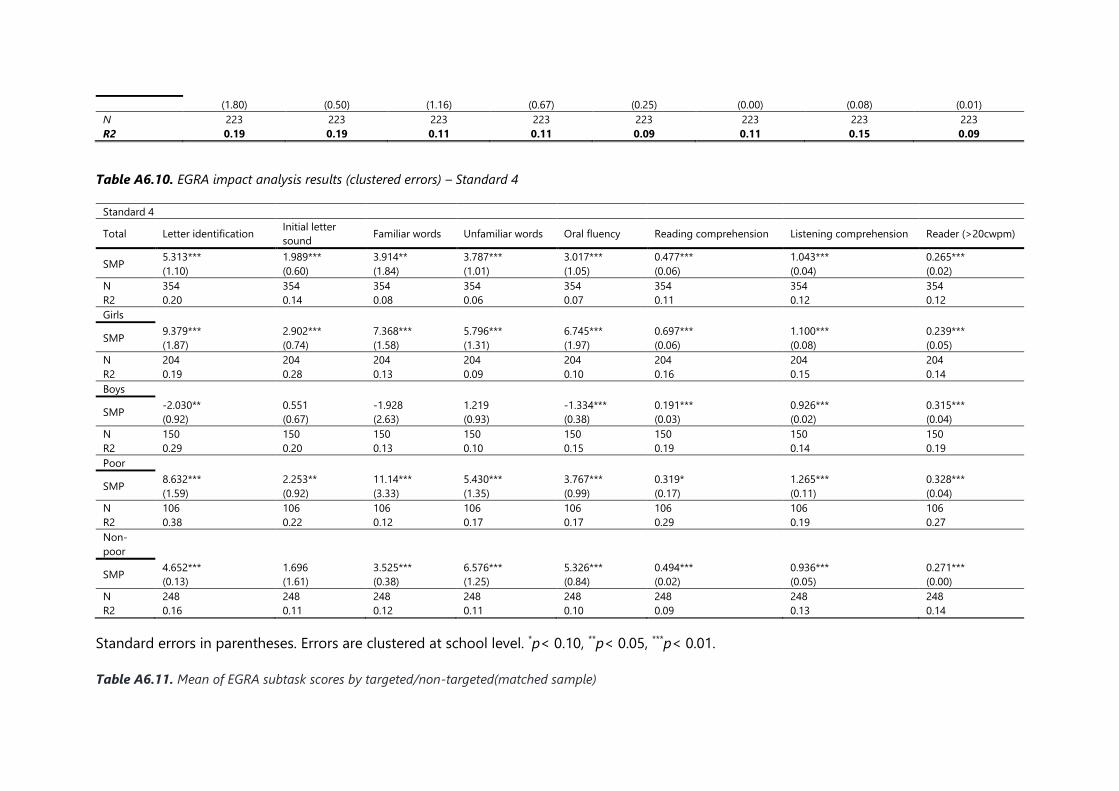
(1.80) (0.50) (1.16) (0.67) (0.25) (0.00) (0.08) (0.01)
N 223 223 223 223 223 223 223 223
R2 0.19 0.19 0.11 0.11 0.09 0.11 0.15 0.09
Table A6.10. EGRA impact analysis results (clustered errors) – Standard 4
Standard errors in parentheses. Errors are clustered at school level. *p< 0.10, **p< 0.05, ***p< 0.01.
Table A6.11. Mean of EGRA subtask scores by targeted/non-targeted(matched sample)
Standard 4
Total Letter identification Initial letter
sound Familiar words Unfamiliar words Oral fluency Reading comprehension Listening comprehension Reader (>20cwpm)
SMP 5.313***
(1.10)
1.989***
(0.60)
3.914**
(1.84)
3.787***
(1.01)
3.017***
(1.05)
0.477***
(0.06)
1.043***
(0.04)
0.265***
(0.02)
N 354 354 354 354 354 354 354 354
R2 0.20 0.14 0.08 0.06 0.07 0.11 0.12 0.12
Girls
SMP 9.379***
(1.87)
2.902***
(0.74)
7.368***
(1.58)
5.796***
(1.31)
6.745***
(1.97)
0.697***
(0.06)
1.100***
(0.08)
0.239***
(0.05)
N 204 204 204 204 204 204 204 204
R2 0.19 0.28 0.13 0.09 0.10 0.16 0.15 0.14
Boys
SMP -2.030**
(0.92)
0.551
(0.67)
-1.928
(2.63)
1.219
(0.93)
-1.334***
(0.38)
0.191***
(0.03)
0.926***
(0.02)
0.315***
(0.04)
N 150 150 150 150 150 150 150 150
R2 0.29 0.20 0.13 0.10 0.15 0.19 0.14 0.19
Poor
SMP 8.632***
(1.59)
2.253**
(0.92)
11.14***
(3.33)
5.430***
(1.35)
3.767***
(0.99)
0.319*
(0.17)
1.265***
(0.11)
0.328***
(0.04)
N 106 106 106 106 106 106 106 106
R2 0.38 0.22 0.12 0.17 0.17 0.29 0.19 0.27
Non-
poor
SMP 4.652***
(0.13)
1.696
(1.61)
3.525***
(0.38)
6.576***
(1.25)
5.326***
(0.84)
0.494***
(0.02)
0.936***
(0.05)
0.271***
(0.00)
N 248 248 248 248 248 248 248 248
R2 0.16 0.11 0.12 0.11 0.10 0.09 0.13 0.14
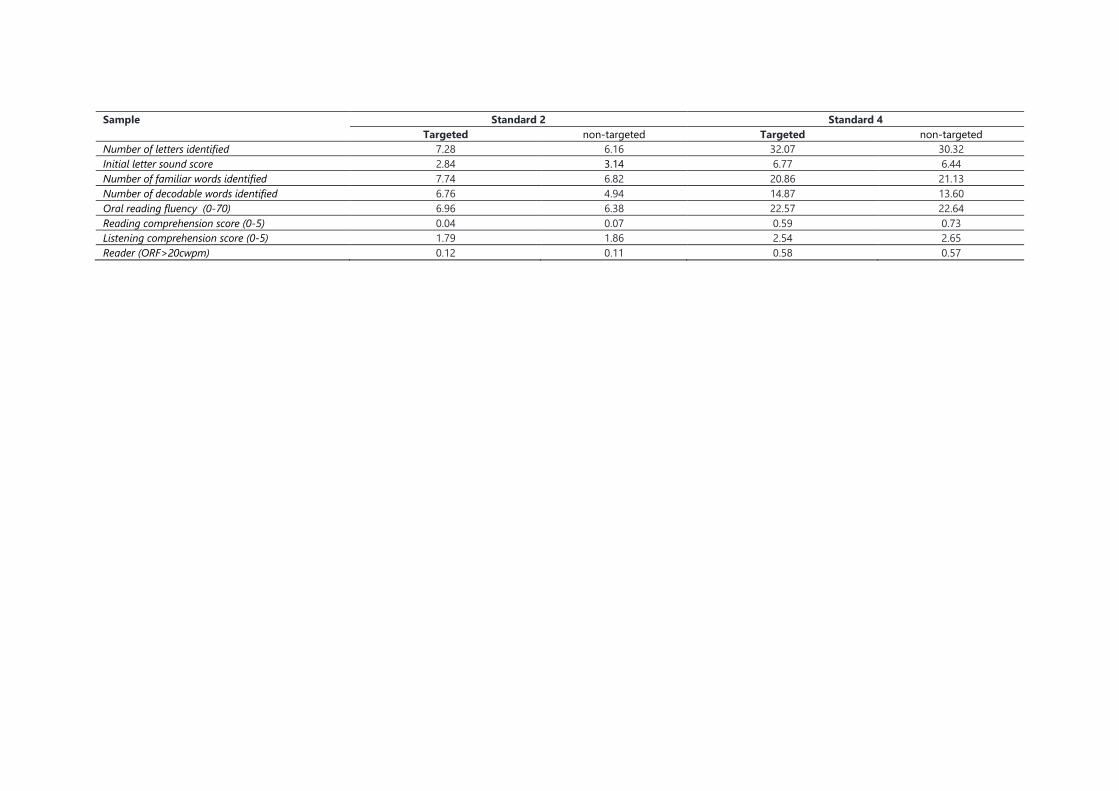
Sample Standard 2 Standard 4
Targeted non-targeted Targeted non-targeted
Number of letters identified 7.28 6.16 32.07 30.32
Initial letter sound score 2.84 3.14 6.77 6.44
Number of familiar words identified 7.74 6.82 20.86 21.13
Number of decodable words identified 6.76 4.94 14.87 13.60
Oral reading fluency (0-70) 6.96 6.38 22.57 22.64
Reading comprehension score (0-5) 0.04 0.07 0.59 0.73
Listening comprehension score (0-5) 1.79 1.86 2.54 2.65
Reader (ORF>20cwpm) 0.12 0.11 0.58 0.57
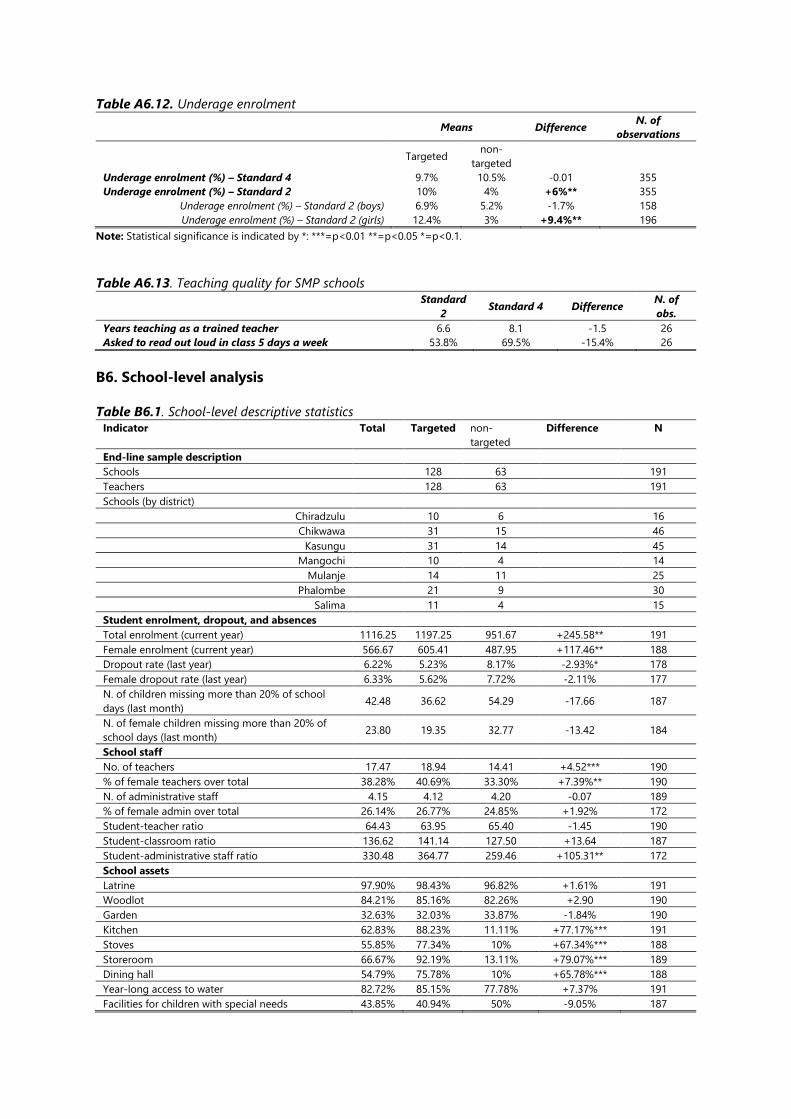
Table A6.12. Underage enrolment
Means Difference
N. of
observations
Targeted
non-
targeted
Underage enrolment (%) – Standard 4 9.7% 10.5% -0.01 355
Underage enrolment (%) – Standard 2 10% 4% +6%** 355
Underage enrolment (%) – Standard 2 (boys) 6.9% 5.2% -1.7% 158
Underage enrolment (%) – Standard 2 (girls) 12.4% 3% +9.4%** 196
Note: Statistical significance is indicated by *: ***=p<0.01 **=p<0.05 *=p<0.1.
Table A6.13. Teaching quality for SMP schools
Standard
2 Standard 4 Difference
N. of
obs.
Years teaching as a trained teacher 6.6 8.1 -1.5 26
Asked to read out loud in class 5 days a week 53.8% 69.5% -15.4% 26
B6. School-level analysis
Table B6.1. School-level descriptive statistics Indicator Total Targeted non-
targeted
Difference N
End-line sample description
Schools 128 63 191
Teachers 128 63 191
Schools (by district)
Chiradzulu 10 6 16
Chikwawa 31 15 46
Kasungu 31 14 45
Mangochi 10 4 14
Mulanje 14 11 25
Phalombe 21 9 30
Salima 11 4 15
Student enrolment, dropout, and absences
Total enrolment (current year) 1116.25 1197.25 951.67 +245.58** 191
Female enrolment (current year) 566.67 605.41 487.95 +117.46** 188
Dropout rate (last year) 6.22% 5.23% 8.17% -2.93%* 178
Female dropout rate (last year) 6.33% 5.62% 7.72% -2.11% 177
N. of children missing more than 20% of school
days (last month) 42.48 36.62 54.29 -17.66 187
N. of female children missing more than 20% of
school days (last month) 23.80 19.35 32.77 -13.42 184
School staff
No. of teachers 17.47 18.94 14.41 +4.52*** 190
% of female teachers over total 38.28% 40.69% 33.30% +7.39%** 190
N. of administrative staff 4.15 4.12 4.20 -0.07 189
% of female admin over total 26.14% 26.77% 24.85% +1.92% 172
Student-teacher ratio 64.43 63.95 65.40 -1.45 190
Student-classroom ratio 136.62 141.14 127.50 +13.64 187
Student-administrative staff ratio 330.48 364.77 259.46 +105.31** 172
School assets
Latrine 97.90% 98.43% 96.82% +1.61% 191
Woodlot 84.21% 85.16% 82.26% +2.90 190
Garden 32.63% 32.03% 33.87% -1.84% 190
Kitchen 62.83% 88.23% 11.11% +77.17%*** 191
Stoves 55.85% 77.34% 10% +67.34%*** 188
Storeroom 66.67% 92.19% 13.11% +79.07%*** 189
Dining hall 54.79% 75.78% 10% +65.78%*** 188
Year-long access to water 82.72% 85.15% 77.78% +7.37% 191
Facilities for children with special needs 43.85% 40.94% 50% -9.05% 187
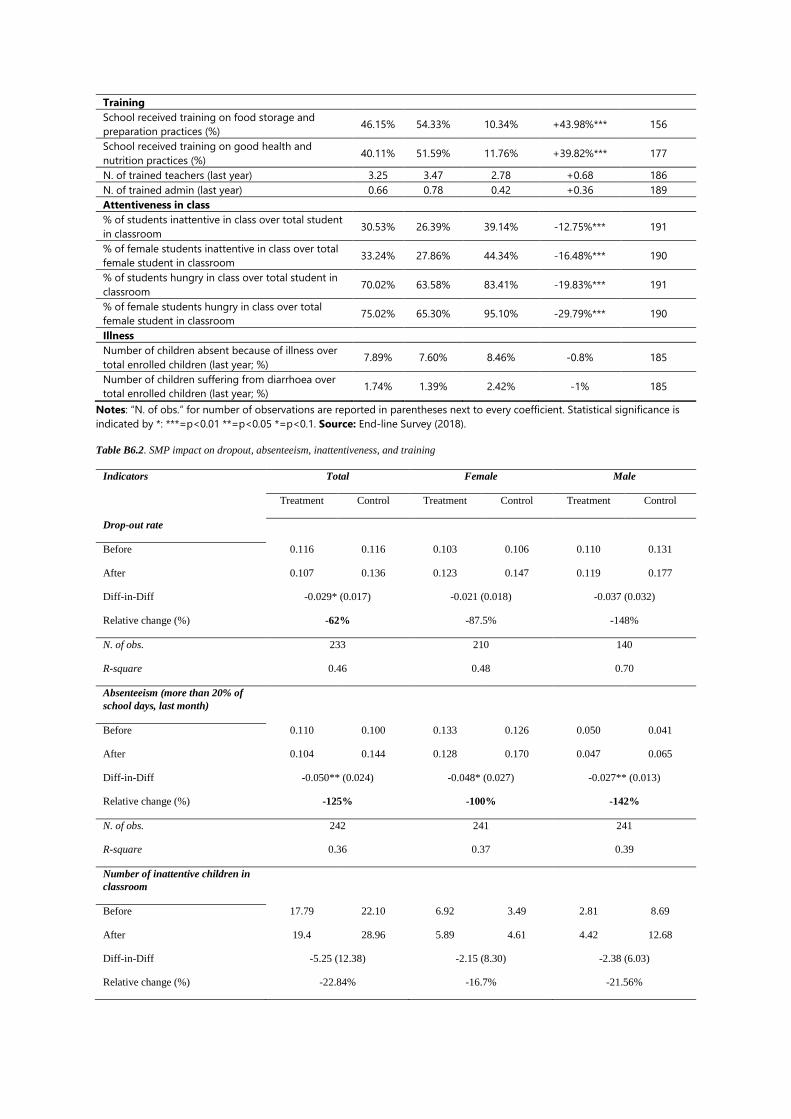
Training
School received training on food storage and
preparation practices (%) 46.15% 54.33% 10.34% +43.98%*** 156
School received training on good health and
nutrition practices (%) 40.11% 51.59% 11.76% +39.82%*** 177
N. of trained teachers (last year) 3.25 3.47 2.78 +0.68 186
N. of trained admin (last year) 0.66 0.78 0.42 +0.36 189
Attentiveness in class
% of students inattentive in class over total student
in classroom 30.53% 26.39% 39.14% -12.75%*** 191
% of female students inattentive in class over total
female student in classroom 33.24% 27.86% 44.34% -16.48%*** 190
% of students hungry in class over total student in
classroom 70.02% 63.58% 83.41% -19.83%*** 191
% of female students hungry in class over total
female student in classroom 75.02% 65.30% 95.10% -29.79%*** 190
Illness
Number of children absent because of illness over
total enrolled children (last year; %) 7.89% 7.60% 8.46% -0.8% 185
Number of children suffering from diarrhoea over
total enrolled children (last year; %) 1.74% 1.39% 2.42% -1% 185
Notes: “N. of obs.” for number of observations are reported in parentheses next to every coefficient. Statistical significance is
indicated by *: ***=p<0.01 **=p<0.05 *=p<0.1. Source: End-line Survey (2018).
Table B6.2. SMP impact on dropout, absenteeism, inattentiveness, and training
Indicators Total Female Male
Treatment Control Treatment Control Treatment Control
Drop-out rate
Before 0.116 0.116 0.103 0.106 0.110 0.131
After 0.107 0.136 0.123 0.147 0.119 0.177
Diff-in-Diff -0.029* (0.017) -0.021 (0.018) -0.037 (0.032)
Relative change (%) -62% -87.5% -148%
N. of obs. 233 210 140
R-square 0.46 0.48 0.70
Absenteeism (more than 20% of
school days, last month)
Before 0.110 0.100 0.133 0.126 0.050 0.041
After 0.104 0.144 0.128 0.170 0.047 0.065
Diff-in-Diff -0.050** (0.024) -0.048* (0.027) -0.027** (0.013)
Relative change (%) -125% -100% -142%
N. of obs. 242 241 241
R-square 0.36 0.37 0.39
Number of inattentive children in
classroom
Before 17.79 22.10 6.92 3.49 2.81 8.69
After 19.4 28.96 5.89 4.61 4.42 12.68
Diff-in-Diff -5.25 (12.38) -2.15 (8.30) -2.38 (6.03)
Relative change (%) -22.84% -16.7% -21.56%
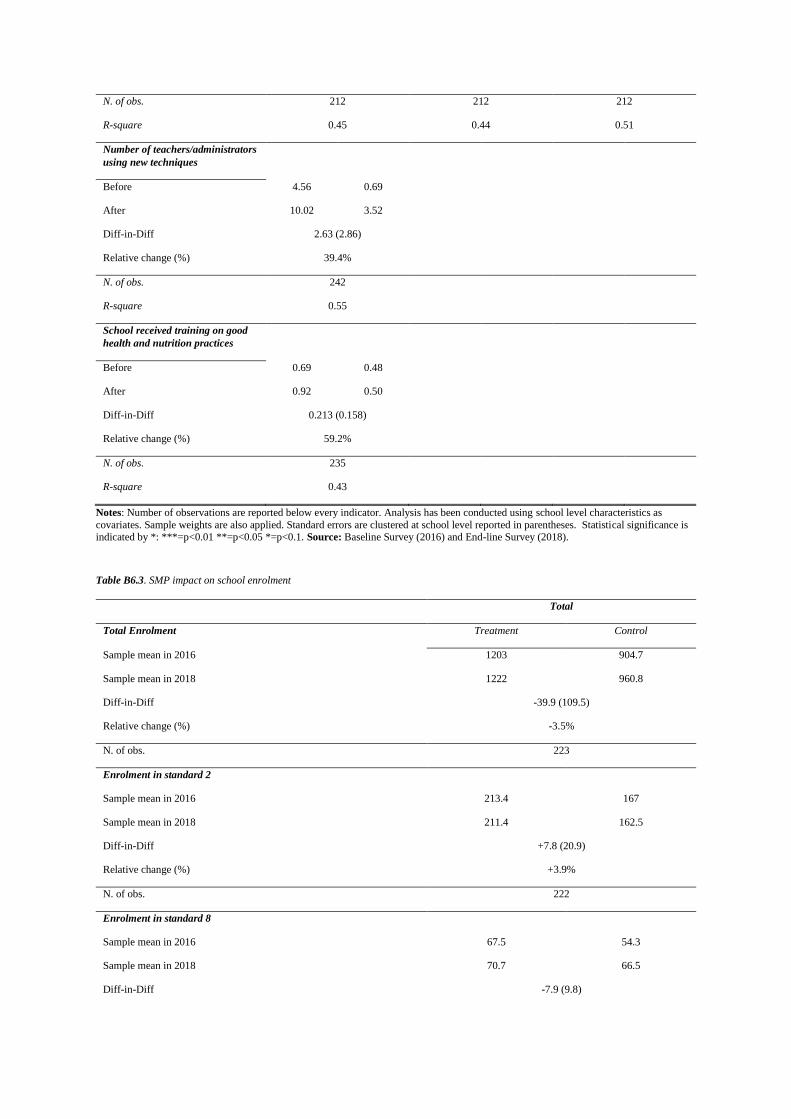
N. of obs. 212 212 212
R-square 0.45 0.44 0.51
Number of teachers/administrators
using new techniques
Before 4.56 0.69
After 10.02 3.52
Diff-in-Diff 2.63 (2.86)
Relative change (%) 39.4%
N. of obs. 242
R-square 0.55
School received training on good
health and nutrition practices
Before 0.69 0.48
After 0.92 0.50
Diff-in-Diff 0.213 (0.158)
Relative change (%) 59.2%
N. of obs. 235
R-square 0.43
Notes: Number of observations are reported below every indicator. Analysis has been conducted using school level characteristics as
covariates. Sample weights are also applied. Standard errors are clustered at school level reported in parentheses. Statistical significance is indicated by *: ***=p<0.01 **=p<0.05 *=p<0.1. Source: Baseline Survey (2016) and End-line Survey (2018).
Table B6.3. SMP impact on school enrolment
Total
Total Enrolment Treatment Control
Sample mean in 2016 1203 904.7
Sample mean in 2018 1222 960.8
Diff-in-Diff -39.9 (109.5)
Relative change (%) -3.5%
N. of obs. 223
Enrolment in standard 2
Sample mean in 2016 213.4 167
Sample mean in 2018 211.4 162.5
Diff-in-Diff +7.8 (20.9)
Relative change (%) +3.9%
N. of obs. 222
Enrolment in standard 8
Sample mean in 2016 67.5 54.3
Sample mean in 2018 70.7 66.5
Diff-in-Diff -7.9 (9.8)

Relative change (%) -12.4%%
N. of obs. 220
Notes: Number of observations are reported below every indicator. Analysis has been conducted using school level characteristics as
covariates. Sample weights are also applied. Standard errors are clustered at school level and reported in parentheses. Statistical significance is indicated by *: ***=p<0.01 **=p<0.05 *=p<0.1. Source: Baseline Survey (2016) and End-line Survey (2018).
Table B6.4. SMP impact on school crowding
Total
Treatment Control
N. of students per classroom
Sample mean in 2016 134.3 112.5
Sample mean in 2018 133.6 114.5
Diff-in-Diff 5.52 (13.12)
Relative change (%) 4.3%
N. of obs. 223
Student/teacher ratio (total)
Sample mean in 2016 85.6 74.3
Sample mean in 2018 65.5 65.1
Diff-in-Diff -10.8 (7.73)
Relative change (%) -12.99%
N. of obs. 223
Student/teacher ratio (Standard 1)
Sample mean in 2016 141.4 132.7
Sample mean in 2018 108.8 114.6
Diff-in-Diff -6.27 (18.8)
Relative change (%) -4.5%
N. of obs. 220
Student/teacher ratio (Standard 2)
Sample mean in 2016 133.7 119.5
Sample mean in 2018 92 95.7
Diff-in-Diff -16.2 (17.5)
Relative change (%) -12.4%
N. of obs. 219
Student/teacher ratio (Standard 3)
Sample mean in 2016 126.5 89.2
Sample mean in 2018 88.1 86.2
Diff-in-Diff -35.7** (16.5)
Relative change (%) -30.4%
N. of obs. 218
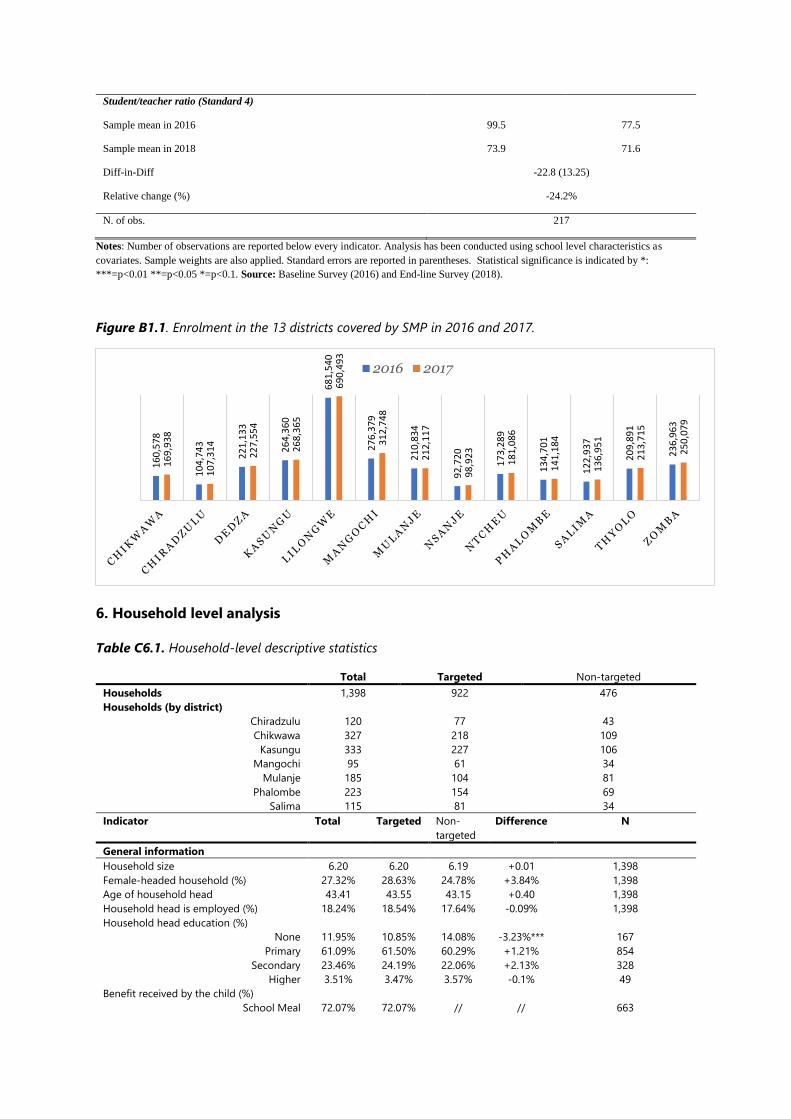
Student/teacher ratio (Standard 4)
Sample mean in 2016 99.5 77.5
Sample mean in 2018 73.9 71.6
Diff-in-Diff -22.8 (13.25)
Relative change (%) -24.2%
N. of obs. 217
Notes: Number of observations are reported below every indicator. Analysis has been conducted using school level characteristics as
covariates. Sample weights are also applied. Standard errors are reported in parentheses. Statistical significance is indicated by *:
***=p<0.01 **=p<0.05 *=p<0.1. Source: Baseline Survey (2016) and End-line Survey (2018).
Figure B1.1. Enrolment in the 13 districts covered by SMP in 2016 and 2017.
6. Household level analysis
Table C6.1. Household-level descriptive statistics
Total Targeted Non-targeted
Households 1,398 922 476
Households (by district)
Chiradzulu 120 77 43
Chikwawa 327 218 109
Kasungu 333 227 106
Mangochi 95 61 34
Mulanje 185 104 81
Phalombe 223 154 69
Salima 115 81 34
Indicator Total Targeted Non-
targeted
Difference N
General information
Household size 6.20 6.20 6.19 +0.01 1,398
Female-headed household (%) 27.32% 28.63% 24.78% +3.84% 1,398
Age of household head 43.41 43.55 43.15 +0.40 1,398
Household head is employed (%) 18.24% 18.54% 17.64% -0.09% 1,398
Household head education (%)
None 11.95% 10.85% 14.08% -3.23%*** 167
Primary 61.09% 61.50% 60.29% +1.21% 854
Secondary 23.46% 24.19% 22.06% +2.13% 328
Higher 3.51% 3.47% 3.57% -0.1% 49
Benefit received by the child (%)
School Meal 72.07% 72.07% // // 663
16
0,5
78
10
4,7
43
22
1,1
33
26
4,3
60
68
1,5
40
27
6,3
79
21
0,8
34
92
,72
0
17
3,2
89
13
4,7
01
12
2,9
37
20
9,8
91
23
6,9
63
16
9,9
38
10
7,3
14
22
7,5
54
26
8,3
65
69
0,4
93
31
2,7
48
21
2,1
17
98
,92
3
18
1,0
86
14
1,1
84
13
6,9
51
21
3,7
15
25
0,0
79
2016 2017
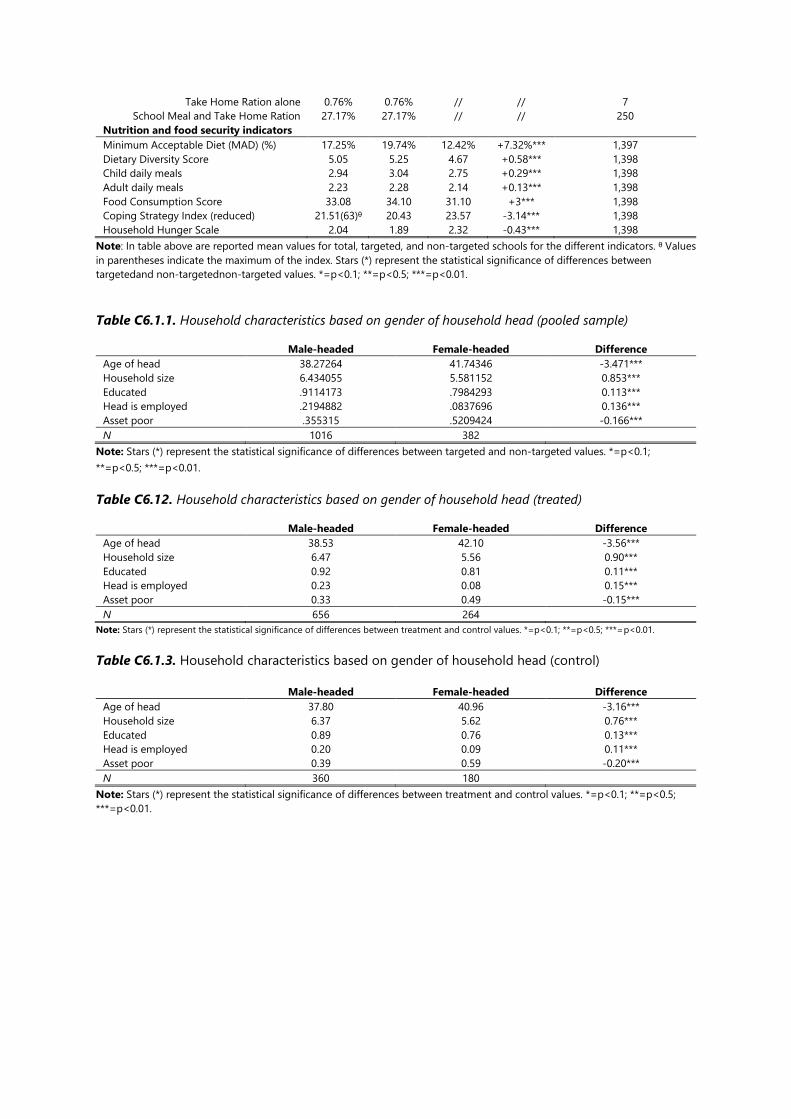
Take Home Ration alone 0.76% 0.76% // // 7
School Meal and Take Home Ration 27.17% 27.17% // // 250
Nutrition and food security indicators
Minimum Acceptable Diet (MAD) (%) 17.25% 19.74% 12.42% +7.32%*** 1,397
Dietary Diversity Score 5.05 5.25 4.67 +0.58*** 1,398
Child daily meals 2.94 3.04 2.75 +0.29*** 1,398
Adult daily meals 2.23 2.28 2.14 +0.13*** 1,398
Food Consumption Score 33.08 34.10 31.10 +3*** 1,398
Coping Strategy Index (reduced) 21.51(63)ᶿ 20.43 23.57 -3.14*** 1,398
Household Hunger Scale 2.04 1.89 2.32 -0.43*** 1,398
Note: In table above are reported mean values for total, targeted, and non-targeted schools for the different indicators. ᶿ Values
in parentheses indicate the maximum of the index. Stars (*) represent the statistical significance of differences between
targetedand non-targetednon-targeted values. *=p<0.1; **=p<0.5; ***=p<0.01.
Table C6.1.1. Household characteristics based on gender of household head (pooled sample)
Male-headed Female-headed Difference
Age of head 38.27264 41.74346 -3.471***
Household size 6.434055 5.581152 0.853***
Educated .9114173 .7984293 0.113***
Head is employed .2194882 .0837696 0.136***
Asset poor .355315 .5209424 -0.166***
N 1016 382
Note: Stars (*) represent the statistical significance of differences between targeted and non-targeted values. *=p<0.1;
**=p<0.5; ***=p<0.01.
Table C6.12. Household characteristics based on gender of household head (treated)
Male-headed Female-headed Difference
Age of head 38.53 42.10 -3.56***
Household size 6.47 5.56 0.90***
Educated 0.92 0.81 0.11***
Head is employed 0.23 0.08 0.15***
Asset poor 0.33 0.49 -0.15***
N 656 264
Note: Stars (*) represent the statistical significance of differences between treatment and control values. *=p<0.1; **=p<0.5; ***=p<0.01.
Table C6.1.3. Household characteristics based on gender of household head (control)
Male-headed Female-headed Difference
Age of head 37.80 40.96 -3.16***
Household size 6.37 5.62 0.76***
Educated 0.89 0.76 0.13***
Head is employed 0.20 0.09 0.11***
Asset poor 0.39 0.59 -0.20***
N 360 180
Note: Stars (*) represent the statistical significance of differences between treatment and control values. *=p<0.1; **=p<0.5;
***=p<0.01.
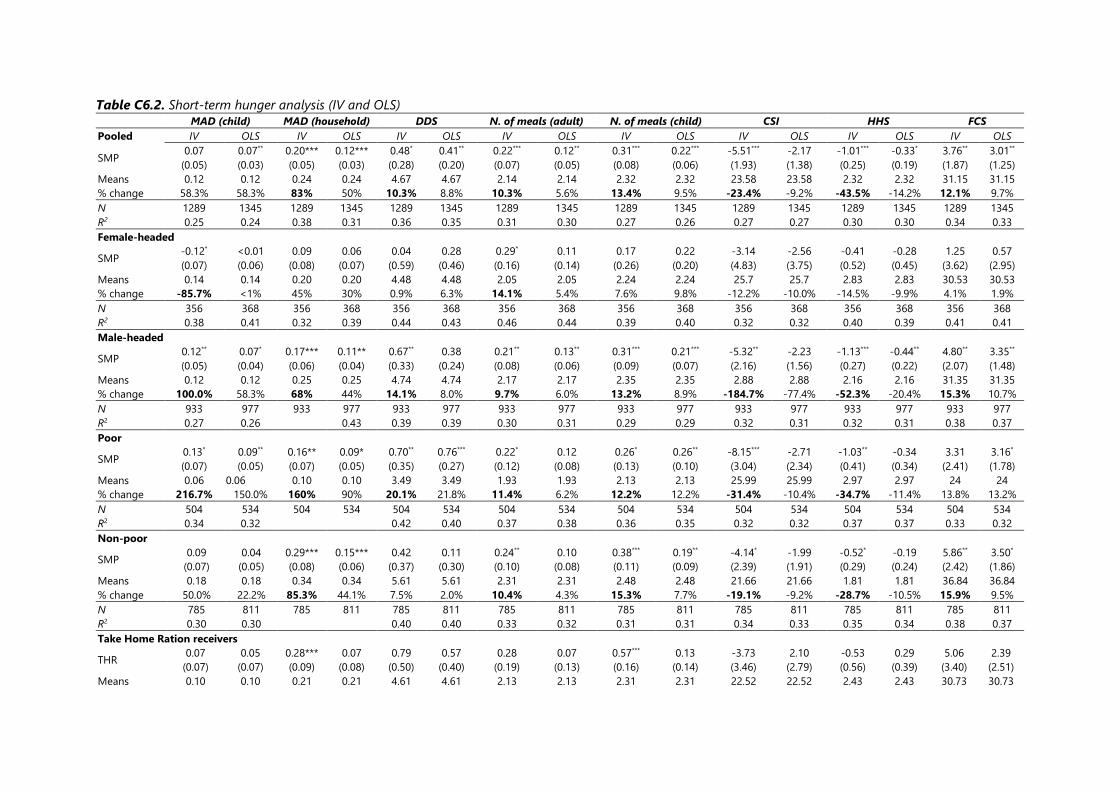
Table C6.2. Short-term hunger analysis (IV and OLS) MAD (child) MAD (household) DDS N. of meals (adult) N. of meals (child) CSI HHS FCS
Pooled IV OLS IV OLS IV OLS IV OLS IV OLS IV OLS IV OLS IV OLS
SMP 0.07
(0.05)
0.07**
(0.03)
0.20***
(0.05)
0.12***
(0.03)
0.48*
(0.28)
0.41**
(0.20)
0.22***
(0.07)
0.12**
(0.05)
0.31***
(0.08)
0.22***
(0.06)
-5.51***
(1.93)
-2.17
(1.38)
-1.01***
(0.25)
-0.33*
(0.19)
3.76**
(1.87)
3.01**
(1.25)
Means 0.12 0.12 0.24 0.24 4.67 4.67 2.14 2.14 2.32 2.32 23.58 23.58 2.32 2.32 31.15 31.15
% change 58.3% 58.3% 83% 50% 10.3% 8.8% 10.3% 5.6% 13.4% 9.5% -23.4% -9.2% -43.5% -14.2% 12.1% 9.7%
N 1289 1345 1289 1345 1289 1345 1289 1345 1289 1345 1289 1345 1289 1345 1289 1345
R2 0.25 0.24 0.38 0.31 0.36 0.35 0.31 0.30 0.27 0.26 0.27 0.27 0.30 0.30 0.34 0.33
Female-headed
SMP -0.12*
(0.07)
<0.01
(0.06)
0.09
(0.08)
0.06
(0.07)
0.04
(0.59)
0.28
(0.46)
0.29*
(0.16)
0.11
(0.14)
0.17
(0.26)
0.22
(0.20)
-3.14
(4.83)
-2.56
(3.75)
-0.41
(0.52)
-0.28
(0.45)
1.25
(3.62)
0.57
(2.95)
Means 0.14 0.14 0.20 0.20 4.48 4.48 2.05 2.05 2.24 2.24 25.7 25.7 2.83 2.83 30.53 30.53
% change -85.7% <1% 45% 30% 0.9% 6.3% 14.1% 5.4% 7.6% 9.8% -12.2% -10.0% -14.5% -9.9% 4.1% 1.9%
N 356 368 356 368 356 368 356 368 356 368 356 368 356 368 356 368
R2 0.38 0.41 0.32 0.39 0.44 0.43 0.46 0.44 0.39 0.40 0.32 0.32 0.40 0.39 0.41 0.41
Male-headed
SMP 0.12**
(0.05)
0.07*
(0.04)
0.17***
(0.06)
0.11**
(0.04)
0.67**
(0.33)
0.38
(0.24)
0.21**
(0.08)
0.13**
(0.06)
0.31***
(0.09)
0.21***
(0.07)
-5.32**
(2.16)
-2.23
(1.56)
-1.13***
(0.27)
-0.44**
(0.22)
4.80**
(2.07)
3.35**
(1.48)
Means 0.12 0.12 0.25 0.25 4.74 4.74 2.17 2.17 2.35 2.35 2.88 2.88 2.16 2.16 31.35 31.35
% change 100.0% 58.3% 68% 44% 14.1% 8.0% 9.7% 6.0% 13.2% 8.9% -184.7% -77.4% -52.3% -20.4% 15.3% 10.7%
N 933 977 933 977 933 977 933 977 933 977 933 977 933 977 933 977
R2 0.27 0.26 0.43 0.39 0.39 0.30 0.31 0.29 0.29 0.32 0.31 0.32 0.31 0.38 0.37
Poor
SMP 0.13*
(0.07)
0.09**
(0.05)
0.16**
(0.07)
0.09*
(0.05)
0.70**
(0.35)
0.76***
(0.27)
0.22*
(0.12)
0.12
(0.08)
0.26*
(0.13)
0.26**
(0.10)
-8.15***
(3.04)
-2.71
(2.34)
-1.03**
(0.41)
-0.34
(0.34)
3.31
(2.41)
3.16*
(1.78)
Means 0.06 0.06 0.10 0.10 3.49 3.49 1.93 1.93 2.13 2.13 25.99 25.99 2.97 2.97 24 24
% change 216.7% 150.0% 160% 90% 20.1% 21.8% 11.4% 6.2% 12.2% 12.2% -31.4% -10.4% -34.7% -11.4% 13.8% 13.2%
N 504 534 504 534 504 534 504 534 504 534 504 534 504 534 504 534
R2 0.34 0.32 0.42 0.40 0.37 0.38 0.36 0.35 0.32 0.32 0.37 0.37 0.33 0.32
Non-poor
SMP 0.09
(0.07)
0.04
(0.05)
0.29***
(0.08)
0.15***
(0.06)
0.42
(0.37)
0.11
(0.30)
0.24**
(0.10)
0.10
(0.08)
0.38***
(0.11)
0.19**
(0.09)
-4.14*
(2.39)
-1.99
(1.91)
-0.52*
(0.29)
-0.19
(0.24)
5.86**
(2.42)
3.50*
(1.86)
Means 0.18 0.18 0.34 0.34 5.61 5.61 2.31 2.31 2.48 2.48 21.66 21.66 1.81 1.81 36.84 36.84
% change 50.0% 22.2% 85.3% 44.1% 7.5% 2.0% 10.4% 4.3% 15.3% 7.7% -19.1% -9.2% -28.7% -10.5% 15.9% 9.5%
N 785 811 785 811 785 811 785 811 785 811 785 811 785 811 785 811
R2 0.30 0.30 0.40 0.40 0.33 0.32 0.31 0.31 0.34 0.33 0.35 0.34 0.38 0.37
Take Home Ration receivers
THR 0.07
(0.07)
0.05
(0.07)
0.28***
(0.09)
0.07
(0.08)
0.79
(0.50)
0.57
(0.40)
0.28
(0.19)
0.07
(0.13)
0.57***
(0.16)
0.13
(0.14)
-3.73
(3.46)
2.10
(2.79)
-0.53
(0.56)
0.29
(0.39)
5.06
(3.40)
2.39
(2.51)
Means 0.10 0.10 0.21 0.21 4.61 4.61 2.13 2.13 2.31 2.31 22.52 22.52 2.43 2.43 30.73 30.73
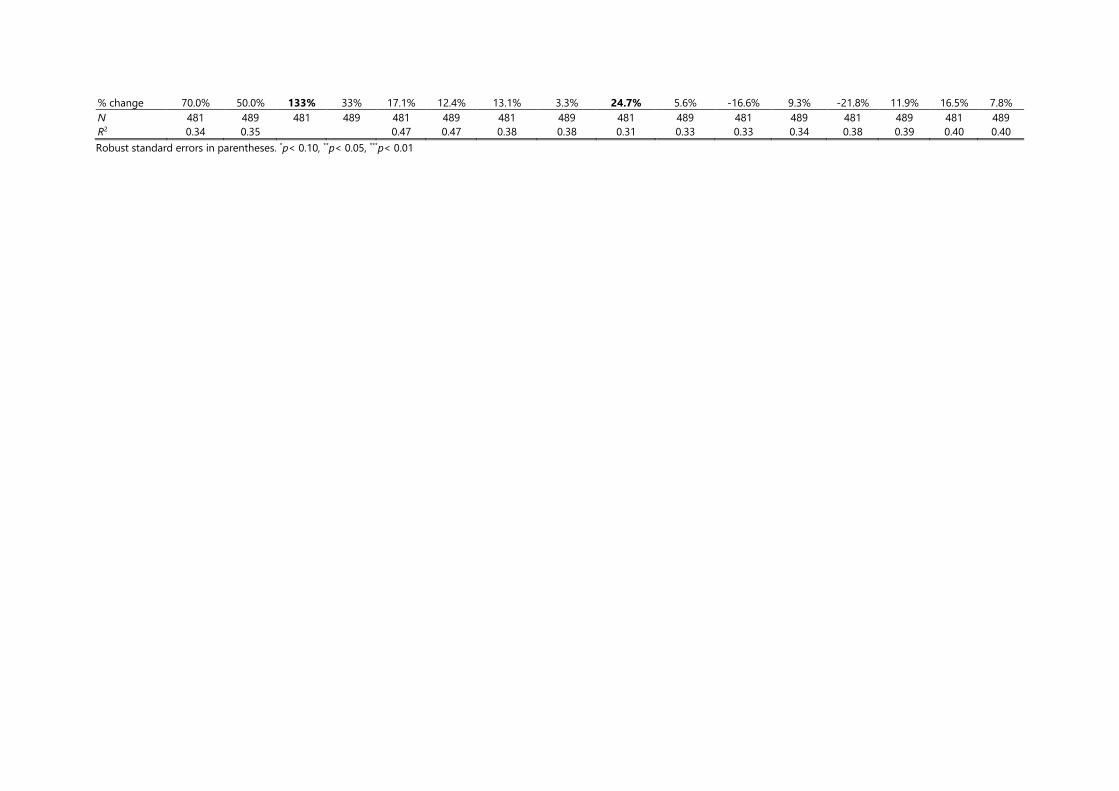
% change 70.0% 50.0% 133% 33% 17.1% 12.4% 13.1% 3.3% 24.7% 5.6% -16.6% 9.3% -21.8% 11.9% 16.5% 7.8%
N 481 489 481 489 481 489 481 489 481 489 481 489 481 489 481 489
R2 0.34 0.35 0.47 0.47 0.38 0.38 0.31 0.33 0.33 0.34 0.38 0.39 0.40 0.40
Robust standard errors in parentheses. *p< 0.10, **p< 0.05, ***p< 0.01
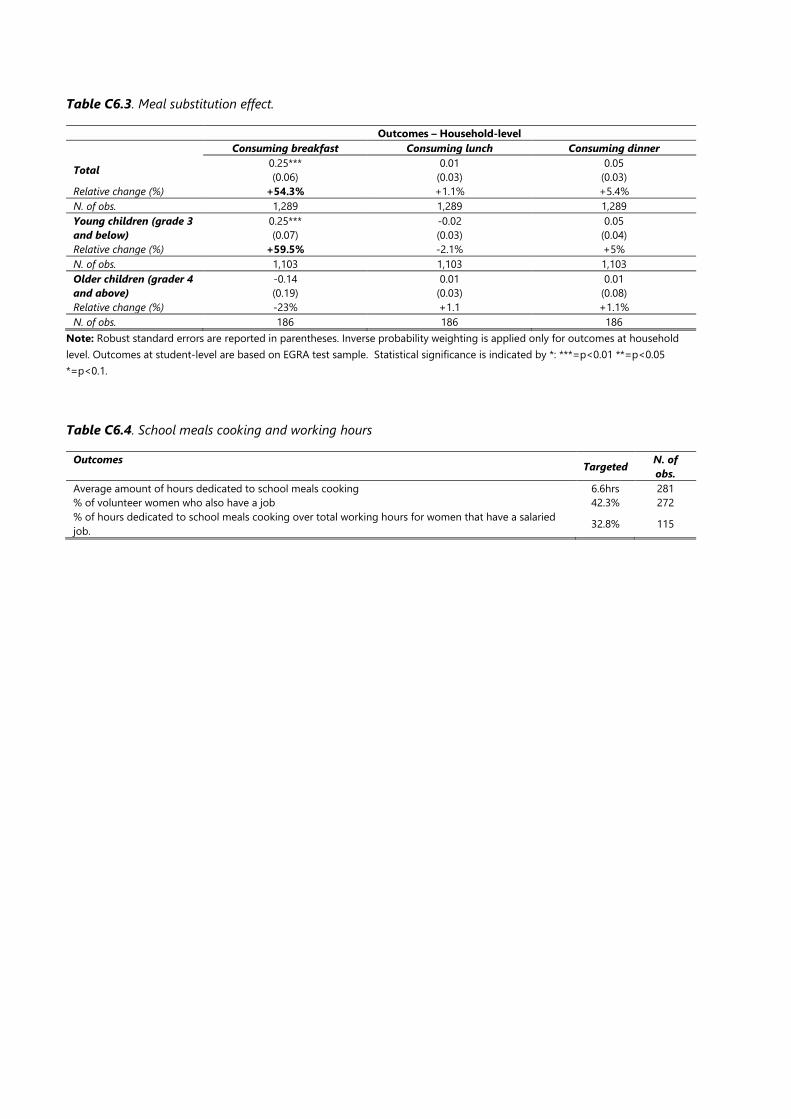
Table C6.3. Meal substitution effect.
Outcomes – Household-level
Consuming breakfast Consuming lunch Consuming dinner
Total 0.25***
(0.06)
0.01
(0.03)
0.05
(0.03)
Relative change (%) +54.3% +1.1% +5.4%
N. of obs. 1,289 1,289 1,289
Young children (grade 3
and below)
0.25***
(0.07)
-0.02
(0.03)
0.05
(0.04)
Relative change (%) +59.5% -2.1% +5%
N. of obs. 1,103 1,103 1,103
Older children (grader 4
and above)
-0.14
(0.19)
0.01
(0.03)
0.01
(0.08)
Relative change (%) -23% +1.1 +1.1%
N. of obs. 186 186 186
Note: Robust standard errors are reported in parentheses. Inverse probability weighting is applied only for outcomes at household
level. Outcomes at student-level are based on EGRA test sample. Statistical significance is indicated by *: ***=p<0.01 **=p<0.05
*=p<0.1.
Table C6.4. School meals cooking and working hours
Outcomes Targeted
N. of
obs.
Average amount of hours dedicated to school meals cooking 6.6hrs 281
% of volunteer women who also have a job 42.3% 272
% of hours dedicated to school meals cooking over total working hours for women that have a salaried
job. 32.8% 115

Annex 7: Achievement of Performance Indicators
Table A7.1. Results indicators by six month period.
MGD Result Activity Indicator Baseline
value
Oct 2016-
Mar 2017
Apr-Sep
2017
Oct 2017-
Mar 2018
Apr 2018-
Sep 2018
End-
line
Final
Target
Achievement of target
Red-not achieved
Green-achieved or exceeded
MGD 1.3 Improved
student
attendance
Number of students regularly (80%)
attending USDA supported
classroom/schools (Total, Male & Female)
0 393,001 510,623 580,844 555,312 580,84
4 573,726
100%
Achieved between October 2017 and
March 2018, but not in any other six-
month period
MGD
1.3/1.3.4
Percent of communities aware of the
importance of education 100% 100% 100%
100%
Value from survey data
MGD 1.1.2
Better access
to school
supplies and
materials
Number of textbooks and other teaching
and learning materials provided as a
result of USDA assistance
0 0 0 0 0 40,000 172,051 23%
Distribution started last period.
Percent of textbooks and other teaching
and learning materials provided as a
result of USDA assistance
0% 0% 0% 0% 0% 23% 35%
65.7%
Number of books provided divided by
target. As above, distribution started last
period
MGD 1.3.1 Provide
bursaries
Number of bursaries provided as a result
of USDA assistance 0 0 0 660 595 1,980 2,080
2.7%
Distribution started in 2018. Result from
Oct 2017-March 2018
Number of individuals receiving bursaries
as a result of USDA assistance 0 0 0 660 595 669 2,080
31.7%
Distribution started in 2018. Result from
Oct 2017-March 2018
MGD 1.1.5
Training:
teachers,
administrators
Number of school administrators and
officials in target schools who demonstrate
use of new techniques or tools as a result
of USDA assistance
0 145 549 75 986 1,753 456
384%
End-line value is cumulative total for all
periods.
MGD 1.1.5
Number of school administrators and
officials trained or certified as a result of
USDA assistance
0 145 549 75 986 1,753 1,374
127%
End-line value is cumulative total for all
periods
Number of school administrators trained
outside USDA funding 586 456 No information present on the indicator.
MGD
1.1.5/2.3
Number of people trained in commodity
management, food storage and
preparation
235 316 4,550 323 866 5,189 912
569%
Target from semi-annual report since the
one from baseline was illogically low.
Cumulative total for entire period.
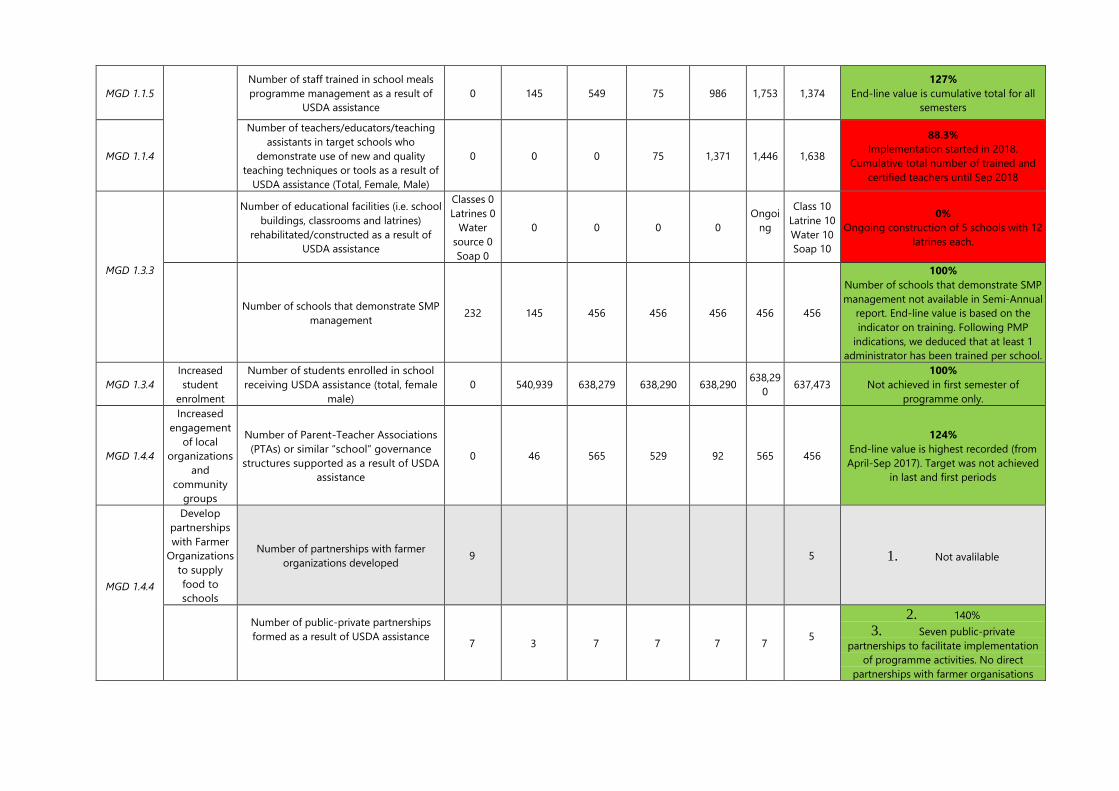
MGD 1.1.5
Number of staff trained in school meals
programme management as a result of
USDA assistance
0 145 549 75 986 1,753 1,374
127%
End-line value is cumulative total for all
semesters
MGD 1.1.4
Number of teachers/educators/teaching
assistants in target schools who
demonstrate use of new and quality
teaching techniques or tools as a result of
USDA assistance (Total, Female, Male)
0
0 0 75 1,371 1,446 1,638
88.3%
Implementation started in 2018.
Cumulative total number of trained and
certified teachers until Sep 2018
MGD 1.3.3
Number of educational facilities (i.e. school
buildings, classrooms and latrines)
rehabilitated/constructed as a result of
USDA assistance
Classes 0
Latrines 0
Water
source 0
Soap 0
0 0 0 0
Ongoi
ng
Class 10
Latrine 10
Water 10
Soap 10
0%
Ongoing construction of 5 schools with 12
latrines each.
Number of schools that demonstrate SMP
management 232 145 456 456 456 456 456
100%
Number of schools that demonstrate SMP
management not available in Semi-Annual
report. End-line value is based on the
indicator on training. Following PMP
indications, we deduced that at least 1
administrator has been trained per school.
MGD 1.3.4
Increased
student
enrolment
Number of students enrolled in school
receiving USDA assistance (total, female
male)
0 540,939 638,279 638,290 638,290 638,29
0 637,473
100%
Not achieved in first semester of
programme only.
MGD 1.4.4
Increased
engagement
of local
organizations
and
community
groups
Number of Parent-Teacher Associations
(PTAs) or similar “school” governance
structures supported as a result of USDA
assistance
0 46 565 529 92 565 456
124%
End-line value is highest recorded (from
April-Sep 2017). Target was not achieved
in last and first periods
MGD 1.4.4
Develop
partnerships
with Farmer
Organizations
to supply
food to
schools
Number of partnerships with farmer
organizations developed 9 5 1. Not avalilable
Number of public-private partnerships
formed as a result of USDA assistance
7
3 7 7 7 7
5
2. 140%
3. Seven public-private
partnerships to facilitate implementation
of programme activities. No direct
partnerships with farmer organisations

MGD
1.4.3/1.4.4
Increased
engagement
of local
organizations
and
community
groups
Number of PTA/SMC/MG supported by
USDA assistance 0 46 565 529 92 565 456
124%
Same values used for number of PTAs or
similar governance structure supported
Increased
government
support
Value of public and private sector
investments leveraged as a result of
USDA assistance
US$ 0 US$ 0 US$
358,720 US$ 0 US$ 0
US$
358,72
0
US$
300,000
119%
Public-private partnership investments
amounted to US$358,720 (US$152,720
from NGOs and US$ 206,000 from the
Government). The contributions made by
the end of 2017 and covered the all of
2018 as well.
MGD 1.4.2
Capacity-
building: at
local, district
and national
levels
Number of educational policies,
regulations and/or administrative
procedures in each of the following stages
of development as a result of USDA
assistance:
Stage 1: Analyzed Stage 2: Drafted and
presented for public/stakeholder
consultation Stage 3: Presented for
legislation/decree Stage 4:
Passed/Approved Stage 5: Passed for
which implementation has begun
0 0 0 0 0 1 6
17%
School Health and Nutrition policy in
place. Operational plan for school feeding
strategy in School Health and Nutrition
Policy at stage 1.
MGD 1.2.1.1
Number of take-home rations provided to
school age children as a result of USDA
assistance
0 0 0 128,469 38,980 128,46
9 167,439
76.7%
Reported value is for Oct 2017-March
2018. Distribution started in January 2018.
MGD 1.2.1.1
Number of individuals receiving take-home
rations as a result of USDA assistance
(total, female, male)
0
0 0 42,823
12,990
(fem =
10,912;
mal =
2,078)
42,823
55,813
(Girls=48,5
57, Boys =
7,256)
76.7%
Reported value is for Oct 2017-March
2018. Gender disaggregation only in last
period. Distribution started in January
2018.
Percent of households’ hunger over a 30-
day period 58.9% 49.2% 25%
51%
Average number of meals consumed by
adults per day 2 2.28 3
76%
Based on survey data
Average number of meals consumed by
children per day 3 2.56 3
85%
Based on survey data
Percent of hunger coping strategy 23% 20.43% 50% 244.7%
Based on survey data (CSI)

MGD 1.2.1.1
Number of daily school meals (breakfast,
snack, lunch) provided as a result of USDA
assistance
0 0 38,628,645 70,850,190 48,510,040 157,98
8,875
215,491,40
0
73.3%
Cumulative total
MGD 1.2.1.1
Number of school-aged children
receiving daily school meals (breakfast,
snack, lunch) as a result of USDA
assistance
0 540,939 638,279 638,290 638,290 638,29
0 548,000
116%
MGD 1.2.1.1/
1.3.1.1/2.5
Increased
access to
preventive
health
interventions
Number of social assistance beneficiaries
participating in productive safety nets as a
result of USDA assistance (total, female,
male)
0 540,939 638,279 638,290 638,290 638,29
0 637,473
100%
MGD 2.3
Number of individuals trained in child
health and nutrition as a result of USDA
assistance (total, female, male)
0 316 4,550 323 866 5,189 1,374
377%
Gender disaggregation only for last
period.
Number of government staff members
trained in good health and nutritional
practices
235 0 0 75 1,371 1,446 1,638
88.3%
Cumulative total of teachers
trained/certified. Final semi-annual report
adds a comment specifying numbers are
for administrators.
Number of community members trained in
good health and nutritional practices 948 316 4,550 323 866 5,189 1,374
377%
Gender disaggregation for last period
MGD 2.4 Number of schools using an improved
water source 0 310 Not available.
MGD 2.4
Number of schools with improved
sanitation facilities 0 310 Not available.
Number of schools with improved kitchen
and facilities 300 456 456 456 456 456 456
100%
Number of schools with school gardens
established 0 35 456
7.7%
MGD 2.5 Number of students receiving de-worming
medication(s) 0 637,473 Not available.
MGD SO2 Percentage of school-age children
receiving Minimum Acceptable Diet (MAD) 16.4% 19.8% 20%
99%
Based on survey data
MGD SO1
Percent of students who by the end of two
grades of primary schooling demonstrate
that they can read and understand the
meaning of grade level test
8% 12% 11% 114%
Based on survey data
MGD SO1
Number of individuals benefiting directly
from USDA-funded interventions (total,
female male)
0 316 638,828 638,613 639,661
639,66
1
640,665
99%
Results from Apr-Sept 2018. The number
includes enrolment and training. No
gender disaggregation. No distribution in
first period
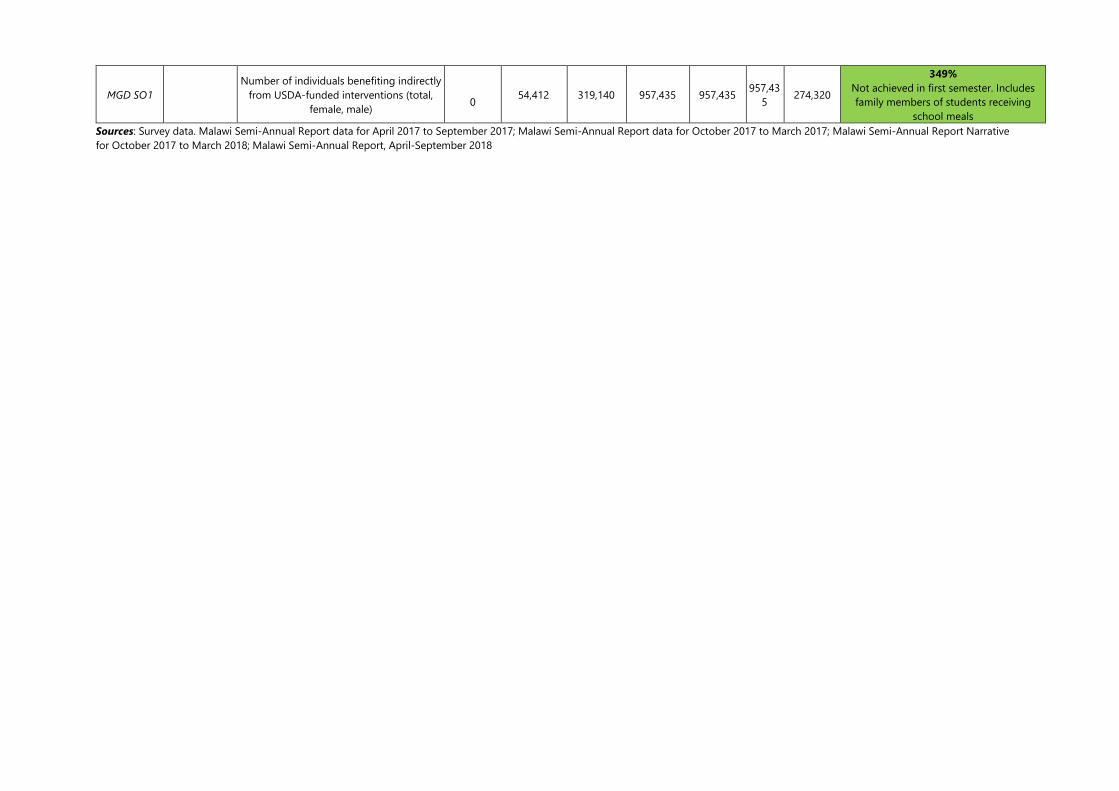
MGD SO1
Number of individuals benefiting indirectly
from USDA-funded interventions (total,
female, male)
0 54,412 319,140 957,435 957,435
957,43
5 274,320
349%
Not achieved in first semester. Includes
family members of students receiving
school meals
Sources: Survey data. Malawi Semi-Annual Report data for April 2017 to September 2017; Malawi Semi-Annual Report data for October 2017 to March 2017; Malawi Semi-Annual Report Narrative
for October 2017 to March 2018; Malawi Semi-Annual Report, April-September 2018
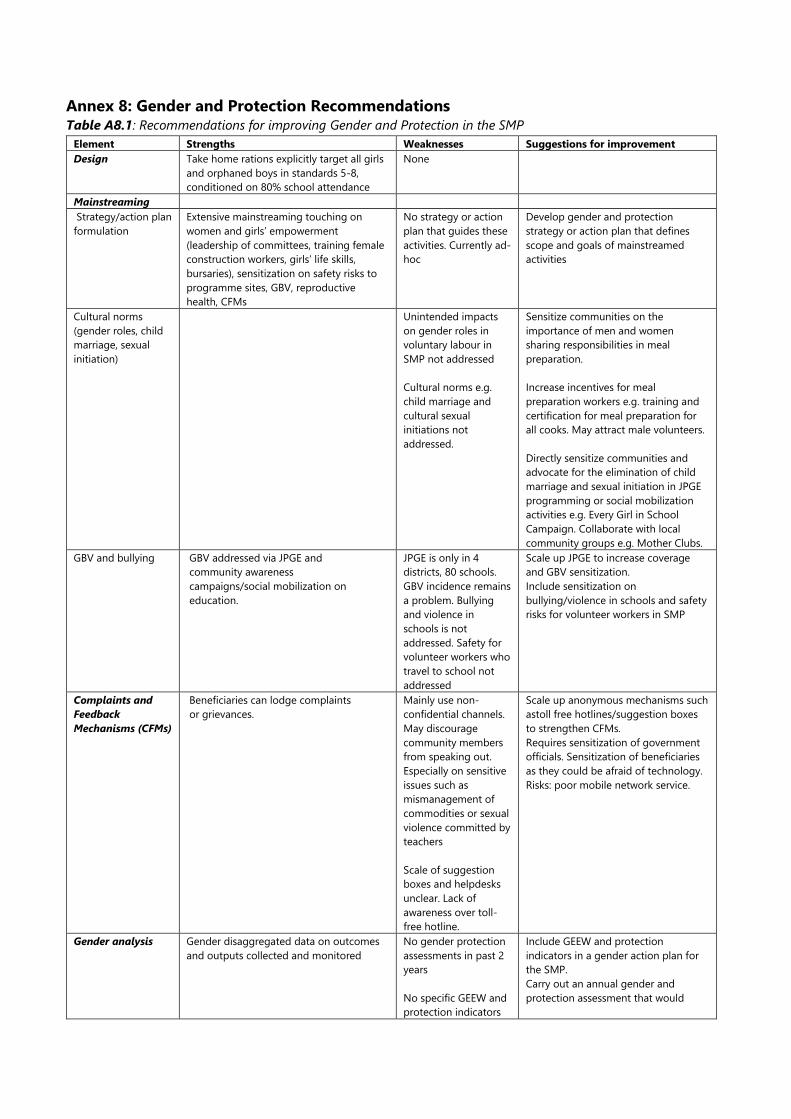
Annex 8: Gender and Protection Recommendations Table A8.1: Recommendations for improving Gender and Protection in the SMP
Element Strengths Weaknesses Suggestions for improvement
Design Take home rations explicitly target all girls
and orphaned boys in standards 5-8,
conditioned on 80% school attendance
None
Mainstreaming
Strategy/action plan
formulation
Extensive mainstreaming touching on
women and girls’ empowerment
(leadership of committees, training female
construction workers, girls’ life skills,
bursaries), sensitization on safety risks to
programme sites, GBV, reproductive
health, CFMs
No strategy or action
plan that guides these
activities. Currently ad-
hoc
Develop gender and protection
strategy or action plan that defines
scope and goals of mainstreamed
activities
Cultural norms
(gender roles, child
marriage, sexual
initiation)
Unintended impacts
on gender roles in
voluntary labour in
SMP not addressed
Cultural norms e.g.
child marriage and
cultural sexual
initiations not
addressed.
Sensitize communities on the
importance of men and women
sharing responsibilities in meal
preparation.
Increase incentives for meal
preparation workers e.g. training and
certification for meal preparation for
all cooks. May attract male volunteers.
Directly sensitize communities and
advocate for the elimination of child
marriage and sexual initiation in JPGE
programming or social mobilization
activities e.g. Every Girl in School
Campaign. Collaborate with local
community groups e.g. Mother Clubs.
GBV and bullying GBV addressed via JPGE and
community awareness
campaigns/social mobilization on
education.
JPGE is only in 4
districts, 80 schools.
GBV incidence remains
a problem. Bullying
and violence in
schools is not
addressed. Safety for
volunteer workers who
travel to school not
addressed
Scale up JPGE to increase coverage
and GBV sensitization.
Include sensitization on
bullying/violence in schools and safety
risks for volunteer workers in SMP
Complaints and
Feedback
Mechanisms (CFMs)
Beneficiaries can lodge complaints
or grievances.
Mainly use non-
confidential channels.
May discourage
community members
from speaking out.
Especially on sensitive
issues such as
mismanagement of
commodities or sexual
violence committed by
teachers
Scale of suggestion
boxes and helpdesks
unclear. Lack of
awareness over toll-
free hotline.
Scale up anonymous mechanisms such
astoll free hotlines/suggestion boxes
to strengthen CFMs.
Requires sensitization of government
officials. Sensitization of beneficiaries
as they could be afraid of technology.
Risks: poor mobile network service.
Gender analysis Gender disaggregated data on outcomes
and outputs collected and monitored
No gender protection
assessments in past 2
years
No specific GEEW and
protection indicators
Include GEEW and protection
indicators in a gender action plan for
the SMP.
Carry out an annual gender and
protection assessment that would
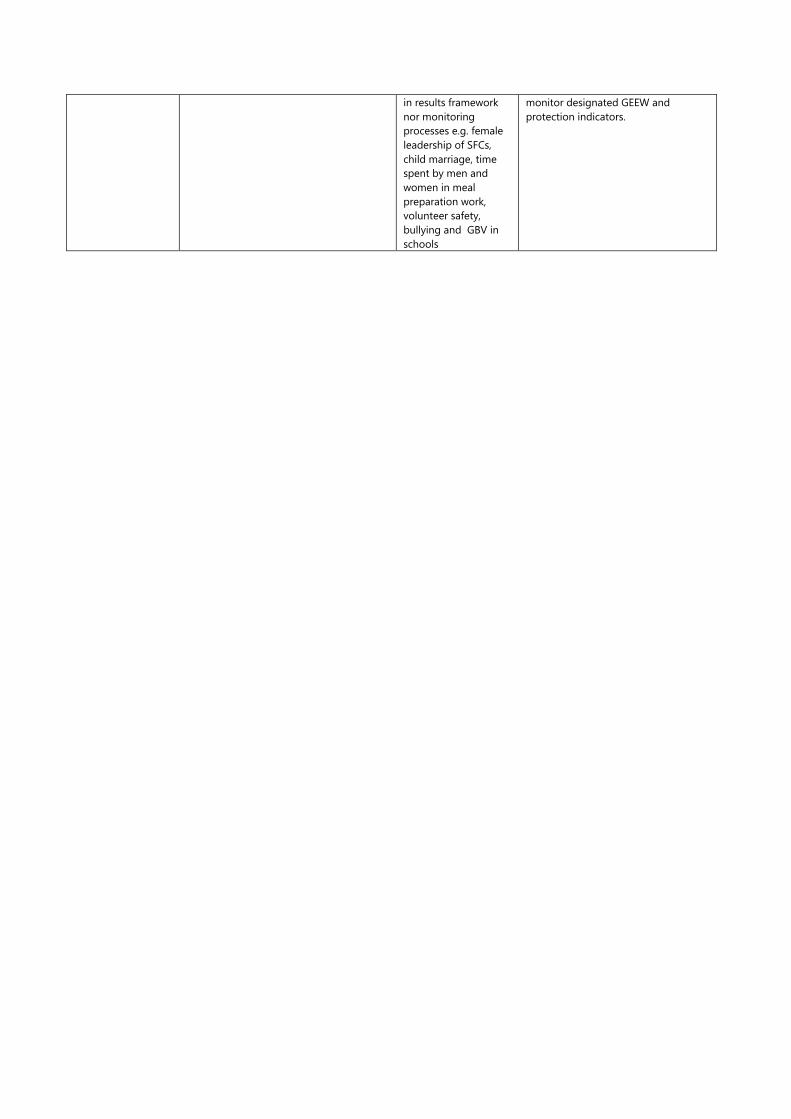
in results framework
nor monitoring
processes e.g. female
leadership of SFCs,
child marriage, time
spent by men and
women in meal
preparation work,
volunteer safety,
bullying and GBV in
schools
monitor designated GEEW and
protection indicators.
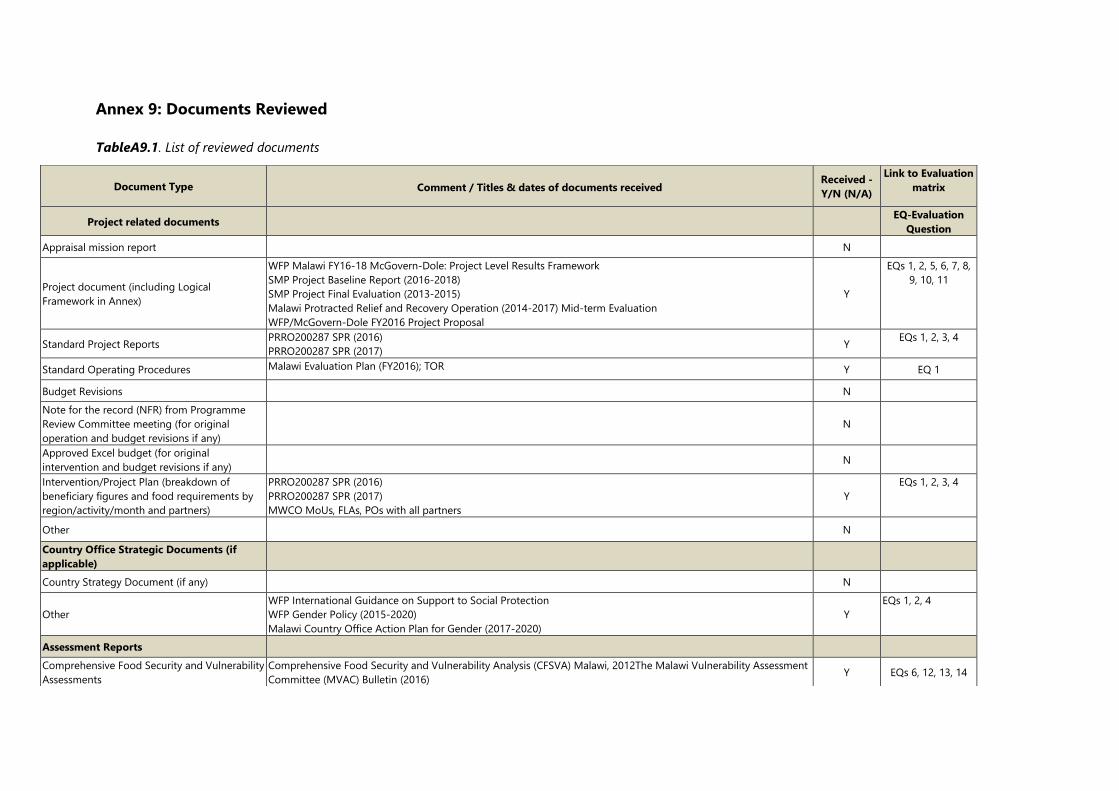
Annex 9: Documents Reviewed
TableA9.1. List of reviewed documents
Document Type
Comment / Titles & dates of documents received Received -
Y/N (N/A)
Link to Evaluation
matrix
Project related documents
EQ-Evaluation
Question
Appraisal mission report N
Project document (including Logical
Framework in Annex)
WFP Malawi FY16-18 McGovern-Dole: Project Level Results Framework
SMP Project Baseline Report (2016-2018)
SMP Project Final Evaluation (2013-2015)
Malawi Protracted Relief and Recovery Operation (2014-2017) Mid-term Evaluation
WFP/McGovern-Dole FY2016 Project Proposal
Y
EQs 1, 2, 5, 6, 7, 8,
9, 10, 11
Standard Project Reports PRRO200287 SPR (2016)
PRRO200287 SPR (2017) Y
EQs 1, 2, 3, 4
Standard Operating Procedures Malawi Evaluation Plan (FY2016); TOR Y EQ 1
Budget Revisions N
Note for the record (NFR) from Programme
Review Committee meeting (for original
operation and budget revisions if any)
N
Approved Excel budget (for original
intervention and budget revisions if any)
N
Intervention/Project Plan (breakdown of
beneficiary figures and food requirements by
region/activity/month and partners)
PRRO200287 SPR (2016)
PRRO200287 SPR (2017)
MWCO MoUs, FLAs, POs with all partners
Y
EQs 1, 2, 3, 4
Other N
Country Office Strategic Documents (if
applicable)
Country Strategy Document (if any) N
Other
WFP International Guidance on Support to Social Protection
WFP Gender Policy (2015-2020)
Malawi Country Office Action Plan for Gender (2017-2020)
Y
EQs 1, 2, 4
Assessment Reports
Comprehensive Food Security and Vulnerability
Assessments
Comprehensive Food Security and Vulnerability Analysis (CFSVA) Malawi, 2012The Malawi Vulnerability Assessment
Committee (MVAC) Bulletin (2016) Y EQs 6, 12, 13, 14

Crop and Food Security Assessments
(FAO/WFP)
N
Emergency Food Security Assessments El Niño: Undermining Resilience, WFP Food Security and Nutrition Report in Southern Africa. Y EQs 6, 12, 13, 14
Food Security Monitoring System Bulletins
The Malawi Vulnerability Assessment Committee (MVAC) Bulletin (March 2016 - April 2017)
The Malawi Vulnerability Assessment Committee (MVAC) Bulletin (2017)
The Malawi Vulnerability Assessment Committee (MVAC) Bulletin (November 2017 update)
Y EQs 6, 12, 13, 14
Market Assessments and Bulletins Malawi National Market Analysis (2016-2017)
Malawi National Market Analysis (2017-2018) Y EQs 6, 12, 13, 14
Joint Assessment Missions (UNHCR/WFP) N
Inter-Agency Assessments N
Rapid needs assessments N
Other N
Monitoring & Reporting
M&E Plan FY2016 McGovern-Dole Proposal – Attachment 6: Evaluation Plan
WFP Malawi FY16-18 McGovern-Dole: Project Level Results Framework Y
EQs 5, 6, 7, 8, 9, 10,
11
Country Situation Report (SITREP) N
Country Executive Brief Malawi Country Brief, May 2018
Y EQs 5, 6, 7, 8, 9, 10,
11
Food Distribution and Post-distribution
Monitoring Reports
PRRO200287 SPR (2016) – yearly report on the status of the project
PRRO200287 SPR (2017) – yearly report on the status of the project Y
EQs 5, 6, 7, 8, 9, 10,
11
Monthly Monitoring Reports
WFP/USDA Semi-annual Report Narrative (Oct 2017-March 2018)
WFP/USDA Semi-annual Report Narrative (Apr 2017-Sep 2017)
WFP/USDA Semi-annual Report Narrative (Oct 2017-March 2018)
WFP/USDA Semi-annual Report Narrative (Oct 2017-March 2018)
WFP/USDA Semi-annual Report Narrative (Oct 2017-March 2018)
WFP/World Vision LPP Project Monthly Monitoring Report (Jan 2018)
WFP/World Vision LPP Project Monthly Monitoring Report (March 2018)
WFP/World Vision LPP Project Monthly Monitoring Report (April 2018)
WFP/World Vision LPP Project Monthly Monitoring Report (May 2018)
WFP/World Vision LPP Project Quarterly Monitoring Report (Jan-March 2018)
WFP ECD Monthly Monitoring Report (Jun 2017)
WFP ECD Monthly Monitoring Report (Aug 2017)
WFP ECD Monthly Monitoring Report (Sep 2017)
WFP ECD Monthly Monitoring Report (Oct 2017)
WFP ECD Monthly Monitoring Report (Nov 2017)
WFP ECD Monthly Monitoring Report (Jan 2018)
WFP EGIS Monthly Monitoring Report (Sep 2017)
WFP EGIS Monthly Monitoring Report (Nov 2017)
WFP EGIS Monthly Monitoring Report (Dec 2017)
WFP EGIS Monthly Monitoring Report (Jan 2018)
Y EQs 5, 6, 7, 8, 9, 10,
11
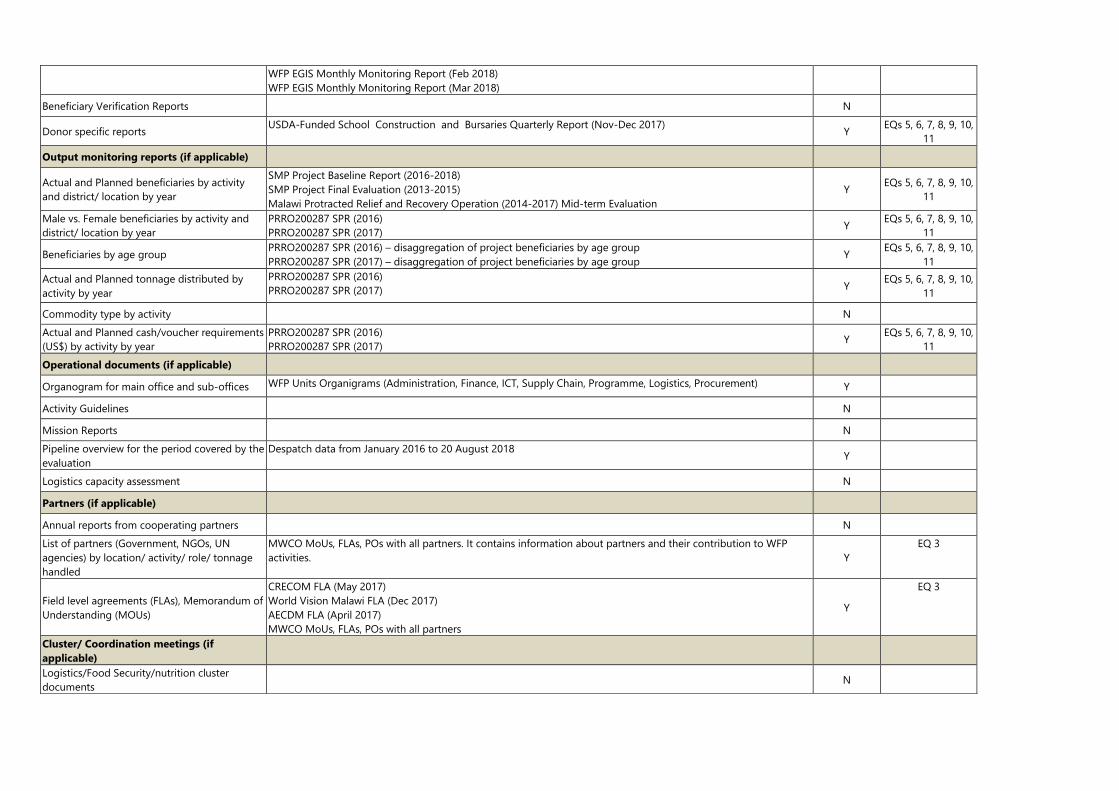
WFP EGIS Monthly Monitoring Report (Feb 2018)
WFP EGIS Monthly Monitoring Report (Mar 2018)
Beneficiary Verification Reports N
Donor specific reports USDA-Funded School Construction and Bursaries Quarterly Report (Nov-Dec 2017)
Y EQs 5, 6, 7, 8, 9, 10,
11
Output monitoring reports (if applicable)
Actual and Planned beneficiaries by activity
and district/ location by year
SMP Project Baseline Report (2016-2018)
SMP Project Final Evaluation (2013-2015)
Malawi Protracted Relief and Recovery Operation (2014-2017) Mid-term Evaluation
Y EQs 5, 6, 7, 8, 9, 10,
11
Male vs. Female beneficiaries by activity and
district/ location by year
PRRO200287 SPR (2016)
PRRO200287 SPR (2017) Y
EQs 5, 6, 7, 8, 9, 10,
11
Beneficiaries by age group PRRO200287 SPR (2016) – disaggregation of project beneficiaries by age group
PRRO200287 SPR (2017) – disaggregation of project beneficiaries by age group Y
EQs 5, 6, 7, 8, 9, 10,
11
Actual and Planned tonnage distributed by
activity by year
PRRO200287 SPR (2016)
PRRO200287 SPR (2017) Y EQs 5, 6, 7, 8, 9, 10,
11
Commodity type by activity N
Actual and Planned cash/voucher requirements
(US$) by activity by year
PRRO200287 SPR (2016)
PRRO200287 SPR (2017) Y
EQs 5, 6, 7, 8, 9, 10,
11
Operational documents (if applicable)
Organogram for main office and sub-offices WFP Units Organigrams (Administration, Finance, ICT, Supply Chain, Programme, Logistics, Procurement) Y
Activity Guidelines N
Mission Reports N
Pipeline overview for the period covered by the
evaluation
Despatch data from January 2016 to 20 August 2018 Y
Logistics capacity assessment
N
Partners (if applicable)
Annual reports from cooperating partners N
List of partners (Government, NGOs, UN
agencies) by location/ activity/ role/ tonnage
handled
MWCO MoUs, FLAs, POs with all partners. It contains information about partners and their contribution to WFP
activities. Y
EQ 3
Field level agreements (FLAs), Memorandum of
Understanding (MOUs)
CRECOM FLA (May 2017)
World Vision Malawi FLA (Dec 2017)
AECDM FLA (April 2017)
MWCO MoUs, FLAs, POs with all partners
Y
EQ 3
Cluster/ Coordination meetings (if
applicable)
Logistics/Food Security/nutrition cluster
documents
N
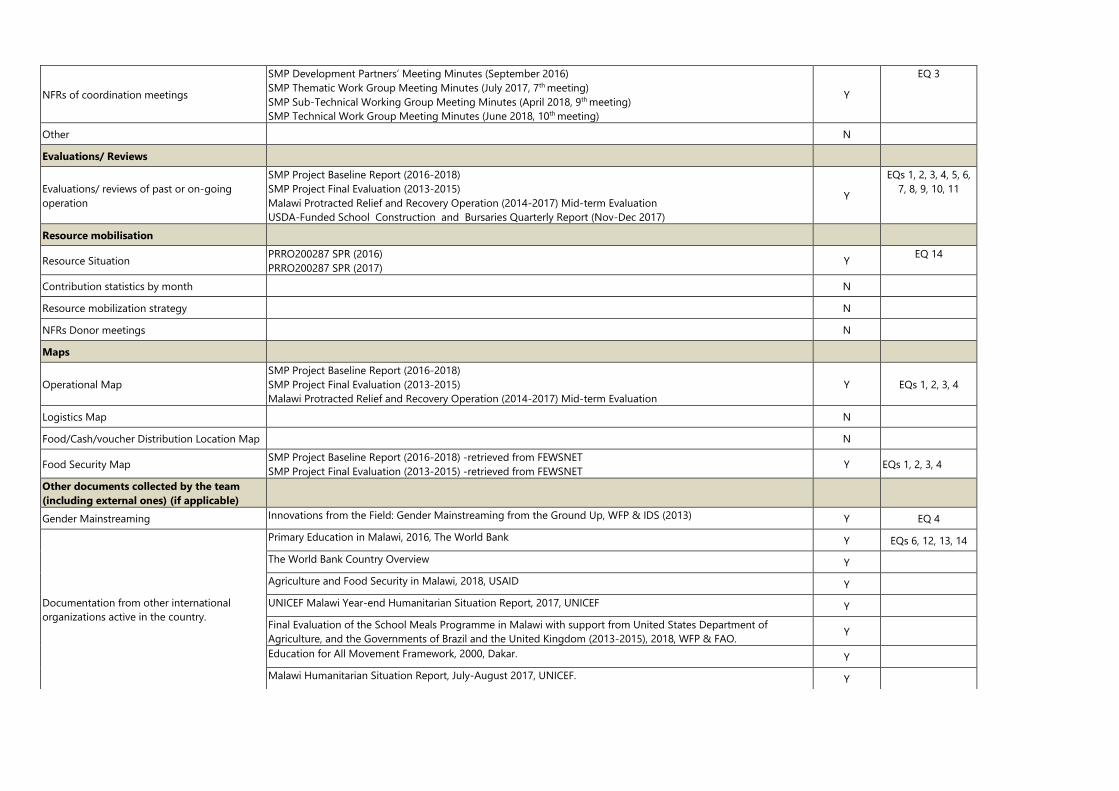
NFRs of coordination meetings
SMP Development Partners’ Meeting Minutes (September 2016)
SMP Thematic Work Group Meeting Minutes (July 2017, 7th meeting)
SMP Sub-Technical Working Group Meeting Minutes (April 2018, 9th meeting)
SMP Technical Work Group Meeting Minutes (June 2018, 10th meeting)
Y
EQ 3
Other N
Evaluations/ Reviews
Evaluations/ reviews of past or on-going
operation
SMP Project Baseline Report (2016-2018)
SMP Project Final Evaluation (2013-2015)
Malawi Protracted Relief and Recovery Operation (2014-2017) Mid-term Evaluation
USDA-Funded School Construction and Bursaries Quarterly Report (Nov-Dec 2017)
Y
EQs 1, 2, 3, 4, 5, 6,
7, 8, 9, 10, 11
Resource mobilisation
Resource Situation PRRO200287 SPR (2016)
PRRO200287 SPR (2017) Y
EQ 14
Contribution statistics by month N
Resource mobilization strategy
N
NFRs Donor meetings N
Maps
Operational Map
SMP Project Baseline Report (2016-2018)
SMP Project Final Evaluation (2013-2015)
Malawi Protracted Relief and Recovery Operation (2014-2017) Mid-term Evaluation
Y EQs 1, 2, 3, 4
Logistics Map
N
Food/Cash/voucher Distribution Location Map N
Food Security Map SMP Project Baseline Report (2016-2018) -retrieved from FEWSNET
SMP Project Final Evaluation (2013-2015) -retrieved from FEWSNET Y EQs 1, 2, 3, 4
Other documents collected by the team
(including external ones) (if applicable)
Gender Mainstreaming Innovations from the Field: Gender Mainstreaming from the Ground Up, WFP & IDS (2013) Y EQ 4
Documentation from other international
organizations active in the country.
Primary Education in Malawi, 2016, The World Bank Y EQs 6, 12, 13, 14
The World Bank Country Overview Y
Agriculture and Food Security in Malawi, 2018, USAID Y
UNICEF Malawi Year-end Humanitarian Situation Report, 2017, UNICEF Y
Final Evaluation of the School Meals Programme in Malawi with support from United States Department of
Agriculture, and the Governments of Brazil and the United Kingdom (2013-2015), 2018, WFP & FAO. Y
Education for All Movement Framework, 2000, Dakar. Y
Malawi Humanitarian Situation Report, July-August 2017, UNICEF. Y
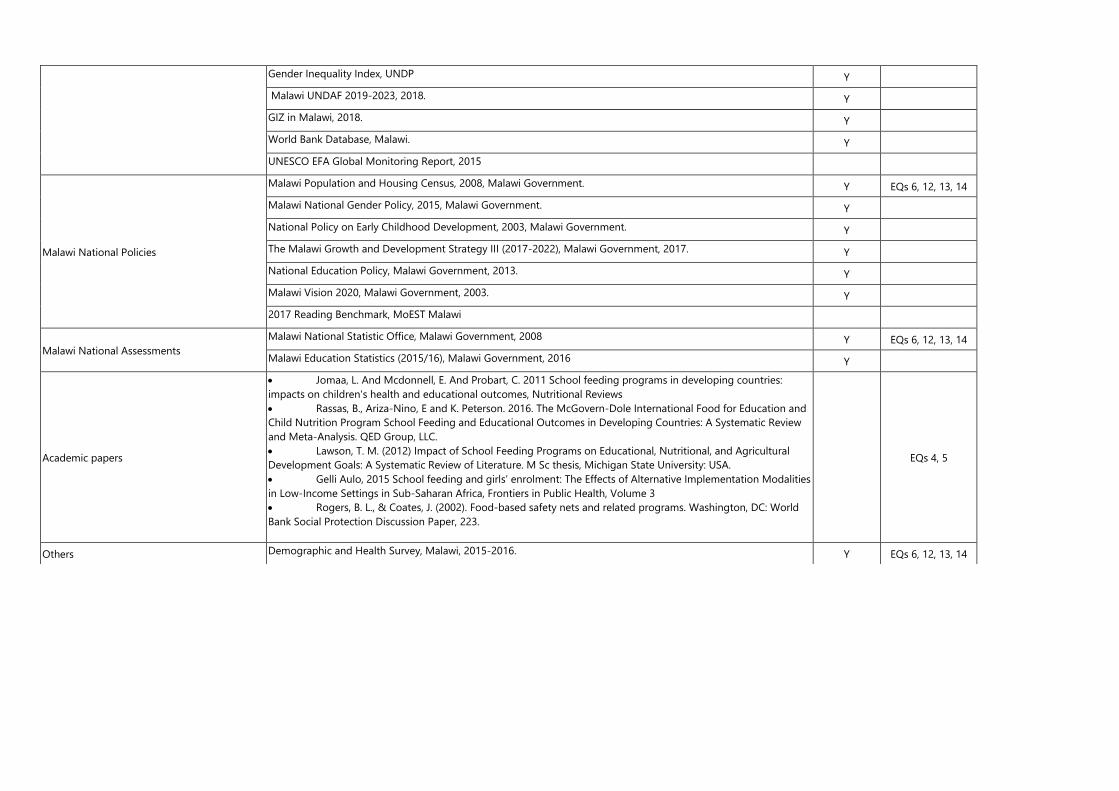
Gender Inequality Index, UNDP Y
Malawi UNDAF 2019-2023, 2018. Y
GIZ in Malawi, 2018. Y
World Bank Database, Malawi. Y
UNESCO EFA Global Monitoring Report, 2015
Malawi National Policies
Malawi Population and Housing Census, 2008, Malawi Government. Y EQs 6, 12, 13, 14
Malawi National Gender Policy, 2015, Malawi Government. Y
National Policy on Early Childhood Development, 2003, Malawi Government. Y
The Malawi Growth and Development Strategy III (2017-2022), Malawi Government, 2017. Y
National Education Policy, Malawi Government, 2013. Y
Malawi Vision 2020, Malawi Government, 2003. Y
2017 Reading Benchmark, MoEST Malawi
Malawi National Assessments
Malawi National Statistic Office, Malawi Government, 2008 Y EQs 6, 12, 13, 14
Malawi Education Statistics (2015/16), Malawi Government, 2016 Y
Academic papers
• Jomaa, L. And Mcdonnell, E. And Probart, C. 2011 School feeding programs in developing countries:
impacts on children's health and educational outcomes, Nutritional Reviews
• Rassas, B., Ariza-Nino, E and K. Peterson. 2016. The McGovern-Dole International Food for Education and
Child Nutrition Program School Feeding and Educational Outcomes in Developing Countries: A Systematic Review
and Meta-Analysis. QED Group, LLC.
• Lawson, T. M. (2012) Impact of School Feeding Programs on Educational, Nutritional, and Agricultural
Development Goals: A Systematic Review of Literature. M Sc thesis, Michigan State University: USA.
• Gelli Aulo, 2015 School feeding and girls’ enrolment: The Effects of Alternative Implementation Modalities
in Low-Income Settings in Sub-Saharan Africa, Frontiers in Public Health, Volume 3
• Rogers, B. L., & Coates, J. (2002). Food-based safety nets and related programs. Washington, DC: World
Bank Social Protection Discussion Paper, 223.
EQs 4, 5
Others Demographic and Health Survey, Malawi, 2015-2016. Y EQs 6, 12, 13, 14
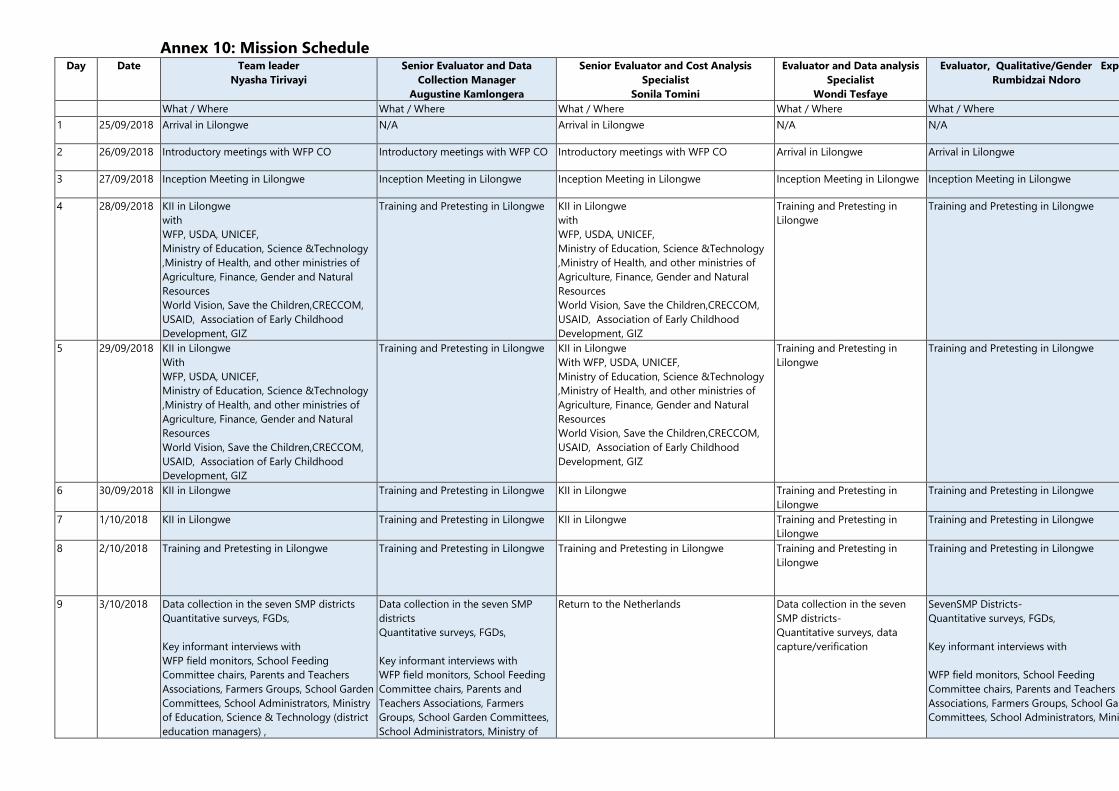
Annex 10: Mission Schedule Day Date Team leader
Nyasha Tirivayi
Senior Evaluator and Data
Collection Manager
Augustine Kamlongera
Senior Evaluator and Cost Analysis
Specialist
Sonila Tomini
Evaluator and Data analysis
Specialist
Wondi Tesfaye
Evaluator, Qualitative/Gender Expert
Rumbidzai Ndoro
What / Where What / Where What / Where What / Where What / Where
1 25/09/2018 Arrival in Lilongwe N/A Arrival in Lilongwe N/A N/A
2 26/09/2018 Introductory meetings with WFP CO Introductory meetings with WFP CO Introductory meetings with WFP CO Arrival in Lilongwe Arrival in Lilongwe
3 27/09/2018 Inception Meeting in Lilongwe Inception Meeting in Lilongwe Inception Meeting in Lilongwe Inception Meeting in Lilongwe Inception Meeting in Lilongwe
4 28/09/2018 KII in Lilongwe
with
WFP, USDA, UNICEF,
Ministry of Education, Science &Technology
,Ministry of Health, and other ministries of
Agriculture, Finance, Gender and Natural
Resources
World Vision, Save the Children,CRECCOM,
USAID, Association of Early Childhood
Development, GIZ
Training and Pretesting in Lilongwe KII in Lilongwe
with
WFP, USDA, UNICEF,
Ministry of Education, Science &Technology
,Ministry of Health, and other ministries of
Agriculture, Finance, Gender and Natural
Resources
World Vision, Save the Children,CRECCOM,
USAID, Association of Early Childhood
Development, GIZ
Training and Pretesting in
Lilongwe
Training and Pretesting in Lilongwe
5 29/09/2018 KII in Lilongwe
With
WFP, USDA, UNICEF,
Ministry of Education, Science &Technology
,Ministry of Health, and other ministries of
Agriculture, Finance, Gender and Natural
Resources
World Vision, Save the Children,CRECCOM,
USAID, Association of Early Childhood
Development, GIZ
Training and Pretesting in Lilongwe KII in Lilongwe
With WFP, USDA, UNICEF,
Ministry of Education, Science &Technology
,Ministry of Health, and other ministries of
Agriculture, Finance, Gender and Natural
Resources
World Vision, Save the Children,CRECCOM,
USAID, Association of Early Childhood
Development, GIZ
Training and Pretesting in
Lilongwe
Training and Pretesting in Lilongwe
6 30/09/2018 KII in Lilongwe
Training and Pretesting in Lilongwe KII in Lilongwe Training and Pretesting in
Lilongwe
Training and Pretesting in Lilongwe
7 1/10/2018 KII in Lilongwe Training and Pretesting in Lilongwe KII in Lilongwe Training and Pretesting in
Lilongwe
Training and Pretesting in Lilongwe
8 2/10/2018 Training and Pretesting in Lilongwe Training and Pretesting in Lilongwe Training and Pretesting in Lilongwe Training and Pretesting in
Lilongwe
Training and Pretesting in Lilongwe
9 3/10/2018 Data collection in the seven SMP districts
Quantitative surveys, FGDs,
Key informant interviews with
WFP field monitors, School Feeding
Committee chairs, Parents and Teachers
Associations, Farmers Groups, School Garden
Committees, School Administrators, Ministry
of Education, Science & Technology (district
education managers) ,
Data collection in the seven SMP
districts
Quantitative surveys, FGDs,
Key informant interviews with
WFP field monitors, School Feeding
Committee chairs, Parents and
Teachers Associations, Farmers
Groups, School Garden Committees,
School Administrators, Ministry of
Return to the Netherlands Data collection in the seven
SMP districts-
Quantitative surveys, data
capture/verification
SevenSMP Districts-
Quantitative surveys, FGDs,
Key informant interviews with
WFP field monitors, School Feeding
Committee chairs, Parents and Teachers
Associations, Farmers Groups, School Garden
Committees, School Administrators, Ministry

Ministry of Health (district school health &
nutrition coordinators)
Education, Science & Technology
(district education managers) ,
Ministry of Health (district school
health & nutrition coordinators)
of Education, Science & Technology (district
education managers) ,
Ministry of Health (district school health &
nutrition coordinators)
10-14 4 to
09/10/2018
Data collection in the seven SMP districts
Quantitative surveys, FGDs,
Key informant interviews
Data collection in the seven SMP
districts
Quantitative surveys, FGDs,
Key informant interviews
Cost and cost-efficiency analysis Data collection in the seven
SMP districts-
Quantitative surveys, data
capture/verification
SevenSMP Districts-
Quantitative surveys, FGDs,
Key informant interviews
15 10/10/2018 Return to the Netherlands Data collection in the seven SMP
districts
Quantitative surveys, FGDs,
Key informant interviews
Cost and cost-efficiency analysis Data collection in the seven
SMP districts-
Quantitative surveys, data
capture/verification
SevenSMP Districts-
Quantitative surveys, FGDs,
Key informant interviews
16-28 11 to
23/10/2018
Preliminary anaysis of qualitative data Data collection in the seven SMP
districts
Quantitative surveys, FGDs,
Key informant interviews.
Cost and cost-efficiency analysis Data collection in the seven
SMP districts-
Quantitative surveys, data
capture/verification
SevenSMP Districts-
Quantitative surveys, FGDs,
Key informant interviews
Preliminary analysis
29 24/10/2018 Return to Lilongwe Data collection in the seven SMP
districts
Quantitative surveys, FGDs,
Key informant interviews. Preliminary
analysis
Cost and cost-efficiency analysis Data collection in the seven
SMP districts-
Quantitative surveys, data
capture/verification.
Preliminary analysis
SevenSMP Districts-
Quantitative surveys, FGDs,
Key informant interviews . Preliminary analysis
30 or
37
25/10 or
1/11 2018
Exit debriefing N/A Exit debriefing Exit debriefing
End of
mission
26 Oct or
2/11/2018
Return to the Netherlands Return to the Netherlands Return to the Netherlands Return to the Netherlands

Annex 11: Stakeholders Interviewed
DISTRICT
COUNTRY ORGANIZATION/LEVEL NAME POSITION
Lilongwe WFP Mietek Maj Deputy Country Director, WFP Malawi
Lilongwe WFP Bernard Owali Head of Programmes, WFP Malawi
Lilongwe WFP Chalizamudzi Matola Head of School Meals, WFP Malawi
Lilongwe MoEST Dr Thoko Banda Chief Director, Basic Education
Lilongwe MoEST Victor Mhoni Technical Advisor to School Health and Nutrition
Lilongwe MoEST Albert Saka Chief, School Health and Nutrition (SHN)/HI/AIDS
Lilongwe WFP Martin Mphangwe Programme Officer, School Meals, WFP Malawi
Lilongwe WFP Margarita Coco JPGE Coordinator, Advisor SMP Unit
Lilongwe WFP Grace Makhalira Head of M&E, WFP Malawi
Lilongwe WFP Polycarp Chigwenembe Finance Office, WFP Malawi
Lilongwe WFP Duncan Ndhlovu Programme Policy Officer, Resilience, WFP Malawi
Lilongwe WFP Christopher Mhone Programme Policy Officer, Gender, WFP Malawi
Lilongwe WFP Orison Mapenda Head of Logistics, WFP Malawi
South Africa WFP Gabriel Khana Regional Gender Officer, WFP Regional Bureau
USA WFP Adair Ackley Partnerships Officer, WFP New York
USA WFP Althea Pickering Partnerships Officer, WFP New York
USA USDA Andi Thomas International Development Specialist
Lilongwe World Vision Sarah Namasala Literacy Project National Coordinator
Lilongwe Save the Children Jeffrey Goveia Chief of Party, Save the Children
Blantyre WFP Sub-Office Blantyre Kiganzi Nyakato Head of WFP Sub-Office, Blantyre
Blantyre WFP Sub-Office Blantyre Elton Mgalamadzi Head of Programmes, WFP Sub-Office, Blantyre
Blantyre WFP Sub-Office Blantyre Madalo Tombozi SMP Officer/Coordinator, WFP Sub-Office
Blantyre AECDM Archie Malisita Executive Director, AEDCM
Blantyre AECOM Maureen Katola Programs Manager, AECDM
Blantyre AECOM Wezi Mkandeve M&E Officer, AECDM
Blantyre CRECCOM Thom Narongo M&E Officer
Blantyre CRECCOM Lilian Monda Project Officer
Blantyre CRECCOM Madalo Samah Executive Director
Blantyre Mary's Meals Richard Sabawo Head of MELR
Blantyre Mary's Meals Dalitso Mcheza Head of Programmes
Chikwawa District-Level Innocent Njera WFP Monitoring Assistant
Chikwawa District-Level Charles Muyanika DSMC/SHN Coordinator
Chikwawa District-Level Jimsons Banda District Extension Officer, Ministry of Agriculture,
Chikwawa University of Malawi Laston Chinkudza Ministry of Agriculture, University of Malawi
Chikwawa District-Level Jessie Phiri Ministry of Agriculture, University of Malawi
Chikwawa District Level Mphatso Graciano Ministry of Agriculture, University of Malawi
Chikwawa District Level Bernadetta Chilumpha Ministry of Agriculture, University of Malawi
Chikwawa District-Level Parks Stesha Coordinating Primary Education Advisor
Chikwawa District-Level Rosemary Mahata [?] District Social Welfare Officer
Chikwawa School-Level Assorted SFC chairman and chief
Chikwawa School-Level Bisi Chimganga Headteacher, Nchalo ECD
Chikwawa School-Level Hopeson Ntotera School Committee Chairman
Chikwawa School-Level Pastor Moses Mwayi Orphan Care ECD
Chikwawa School-Level Elina Lampi Headteacher, Mwayi ECD

Mulanje District-Level Chimwemwe Thandie Phaiys Primary Education Advisor
Mulanje District-Level Lovemore Ali Field Officer
Mulanje District-Level Henry Maruwo School Health Nutrition Coordinator
Mulanje District-Level Chistropher Khumbanyiwa District Schools Meals Coodinator
Mulanje District-Level Temwanani Mujengezulu Food and Nutrition Coordinator
Mulanje School-Level Zakenyu Jaolosi Head Teacer of Bango Primary School
Mulanje School-Level Mercy Jamdayi Headteacher Monjole PS
Mulanje School-Level Alfred Manyama School Feeding Committee (SFC) chairman
Mulanje School-Level Ephraim Magombe SHN Teacher
Mulanje School-Level
Emmanuel Grancrano ;
Innocent Mowingo SGC
Phalombe District-Level Aaron Mmwala Agricultural Business Officer
Phalombe District-Level Hendrix Likeke District Education Manager (DEM)
Phalombe District-Level Noel Friday Namapendeni Coordinating Primary Education Advisor (CPEA)
Phalombe District-Level Harrisons Namazemba SHN Coordinator
Phalombe District-Level Lucy Ndiwo Food and Nutrition Officer (MoAIWD)
Phalombe School-Level Louis Benalou Headteacher, Nasiyaya School
Phalombe School-Level Zimpita Zalimba SHNT Nasiyaya School
Mangochi District-Level Anthony Mbilizi WFP Monitoring Assistant
Mangochi District-Level Joe Magombo District Education Manager (DEM)
Mangochi District-Level Bassanio Kachere Coordinating Primary Education Advisor (CPEA)
Mangochi District-Level Noel Mzunga SHN Coordinator
Mangochi District-Level Owen Kumwenda DADO (MoA)
Mangochi District-Level Macleod Mphande District Social Welfare Officer
Mangochi District-Level Tennyson Kunyada District Social Welfare Assistant
Mangochi District-Level Anthony Zimba District Community Officer
Mangochi School-Level Nkhoma [?} Agricultural School Committee Appropriations
Mangochi School-Level Omar Muande Mdinde School, Chariman of Fos
Mangochi School-Level Msusa Mtamira Deputy Headteacher, Mdinde PS
Mangochi School-Level Jangiya Pondani Village Headman
Mangochi School-Level Esther Yahyaya Chairwoman SFC
Mangochi School-Level Amabas Amidu Headteacher
Salima School-Level Musa Anafi Village headman Chimbalanga
Salima School-Level Bertha Chuanduka Headteacher Chimbalanga
Salima School-Level Emmanuel Bai Headteacher Lifidzi
Salima School-Level Fatima Aleka SFC Chairwoman Lifidzi
Salima School-Level Lieson Makalani Village Headman, Maganga PS
Salima School-Level Catherine James Chairwoman SFC, Manangwa PS
Salima School-Level Sylvester Maseko Managwa PS, headteacher
Salima District-Level Moffat Mukulini SHN Coordinator
Salima School-Level Singitiya Faki SFC Leader
Salima District-Level Serah Phiri SHN Coordinator
Salima District-Level Florence Kasiya Deputy SHN Coordinator
Salima District-Level Thom Kamkodo Field Officer
Salima District-Level Martha Chizule Field Officer
Chiradzulu District-Level Mr Malugwaga SHN Coordinator
Chiradzulu District-Level Gopani Kufa Coordinating Primary Education Advisor (CPEA)
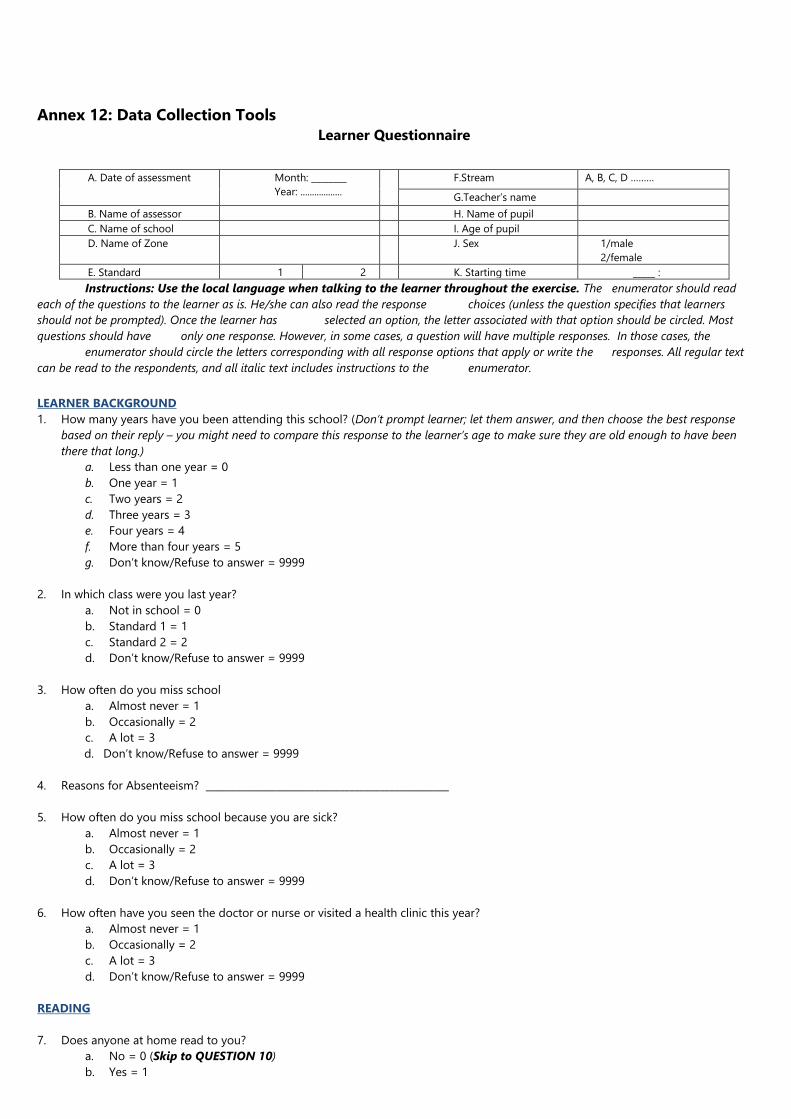
Annex 12: Data Collection Tools
Learner Questionnaire
A. Date of assessment Month: ________
Year: ..................
F.Stream A, B, C, D ………
G.Teacher’s name
B. Name of assessor H. Name of pupil
C. Name of school I. Age of pupil
D. Name of Zone J. Sex 1/male
2/female
E. Standard 1 2 K. Starting time _____ :
Instructions: Use the local language when talking to the learner throughout the exercise. The enumerator should read
each of the questions to the learner as is. He/she can also read the response choices (unless the question specifies that learners
should not be prompted). Once the learner has selected an option, the letter associated with that option should be circled. Most
questions should have only one response. However, in some cases, a question will have multiple responses. In those cases, the
enumerator should circle the letters corresponding with all response options that apply or write the responses. All regular text
can be read to the respondents, and all italic text includes instructions to the enumerator.
LEARNER BACKGROUND
1. How many years have you been attending this school? (Don’t prompt learner; let them answer, and then choose the best response
based on their reply – you might need to compare this response to the learner’s age to make sure they are old enough to have been
there that long.)
a. Less than one year = 0
b. One year = 1
c. Two years = 2
d. Three years = 3
e. Four years = 4
f. More than four years = 5
g. Don’t know/Refuse to answer = 9999
2. In which class were you last year?
a. Not in school = 0
b. Standard 1 = 1
c. Standard 2 = 2
d. Don’t know/Refuse to answer = 9999
3. How often do you miss school
a. Almost never = 1
b. Occasionally = 2
c. A lot = 3
d. Don’t know/Refuse to answer = 9999
4. Reasons for Absenteeism? _________________________________________________
5. How often do you miss school because you are sick?
a. Almost never = 1
b. Occasionally = 2
c. A lot = 3
d. Don’t know/Refuse to answer = 9999
6. How often have you seen the doctor or nurse or visited a health clinic this year?
a. Almost never = 1
b. Occasionally = 2
c. A lot = 3
d. Don’t know/Refuse to answer = 9999
READING
7. Does anyone at home read to you?
a. No = 0 (Skip to QUESTION 10)
b. Yes = 1
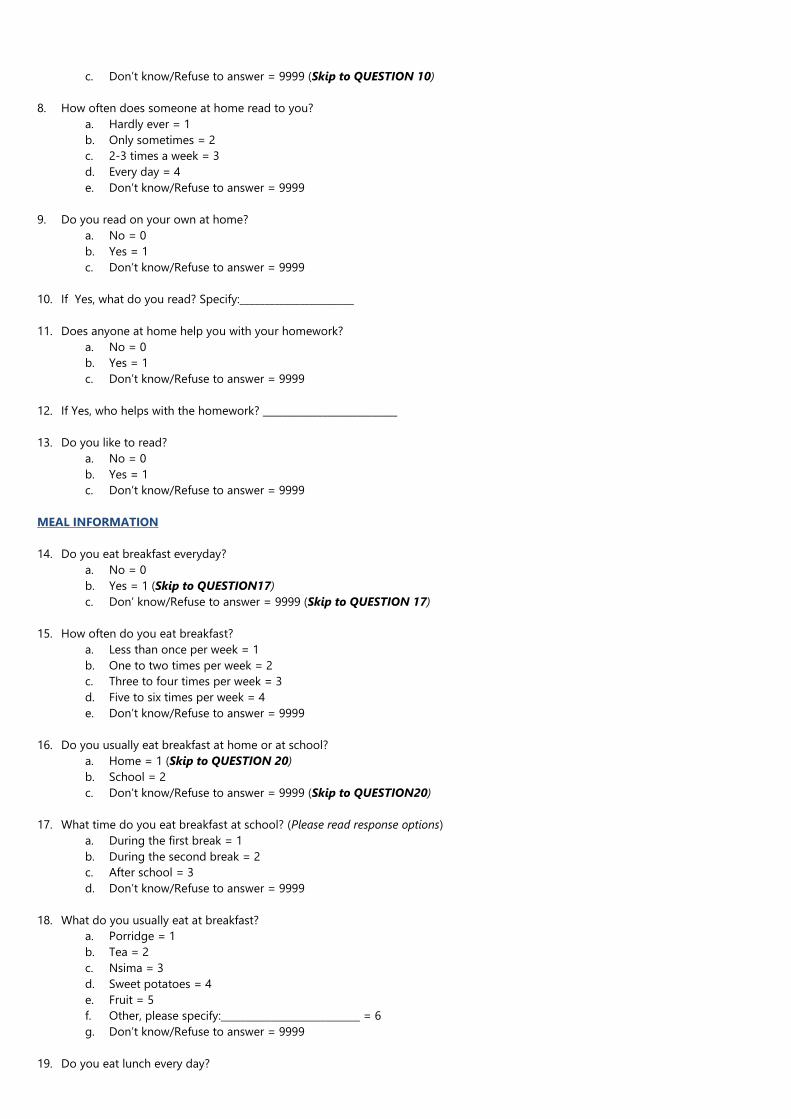
c. Don’t know/Refuse to answer = 9999 (Skip to QUESTION 10)
8. How often does someone at home read to you?
a. Hardly ever = 1
b. Only sometimes = 2
c. 2-3 times a week = 3
d. Every day = 4
e. Don’t know/Refuse to answer = 9999
9. Do you read on your own at home?
a. No = 0
b. Yes = 1
c. Don’t know/Refuse to answer = 9999
10. If Yes, what do you read? Specify:_______________________
11. Does anyone at home help you with your homework?
a. No = 0
b. Yes = 1
c. Don’t know/Refuse to answer = 9999
12. If Yes, who helps with the homework? ___________________________
13. Do you like to read?
a. No = 0
b. Yes = 1
c. Don’t know/Refuse to answer = 9999
MEAL INFORMATION
14. Do you eat breakfast everyday?
a. No = 0
b. Yes = 1 (Skip to QUESTION17)
c. Don’ know/Refuse to answer = 9999 (Skip to QUESTION 17)
15. How often do you eat breakfast?
a. Less than once per week = 1
b. One to two times per week = 2
c. Three to four times per week = 3
d. Five to six times per week = 4
e. Don’t know/Refuse to answer = 9999
16. Do you usually eat breakfast at home or at school?
a. Home = 1 (Skip to QUESTION 20)
b. School = 2
c. Don’t know/Refuse to answer = 9999 (Skip to QUESTION20)
17. What time do you eat breakfast at school? (Please read response options)
a. During the first break = 1
b. During the second break = 2
c. After school = 3
d. Don’t know/Refuse to answer = 9999
18. What do you usually eat at breakfast?
a. Porridge = 1
b. Tea = 2
c. Nsima = 3
d. Sweet potatoes = 4
e. Fruit = 5
f. Other, please specify:____________________________ = 6
g. Don’t know/Refuse to answer = 9999
19. Do you eat lunch every day?
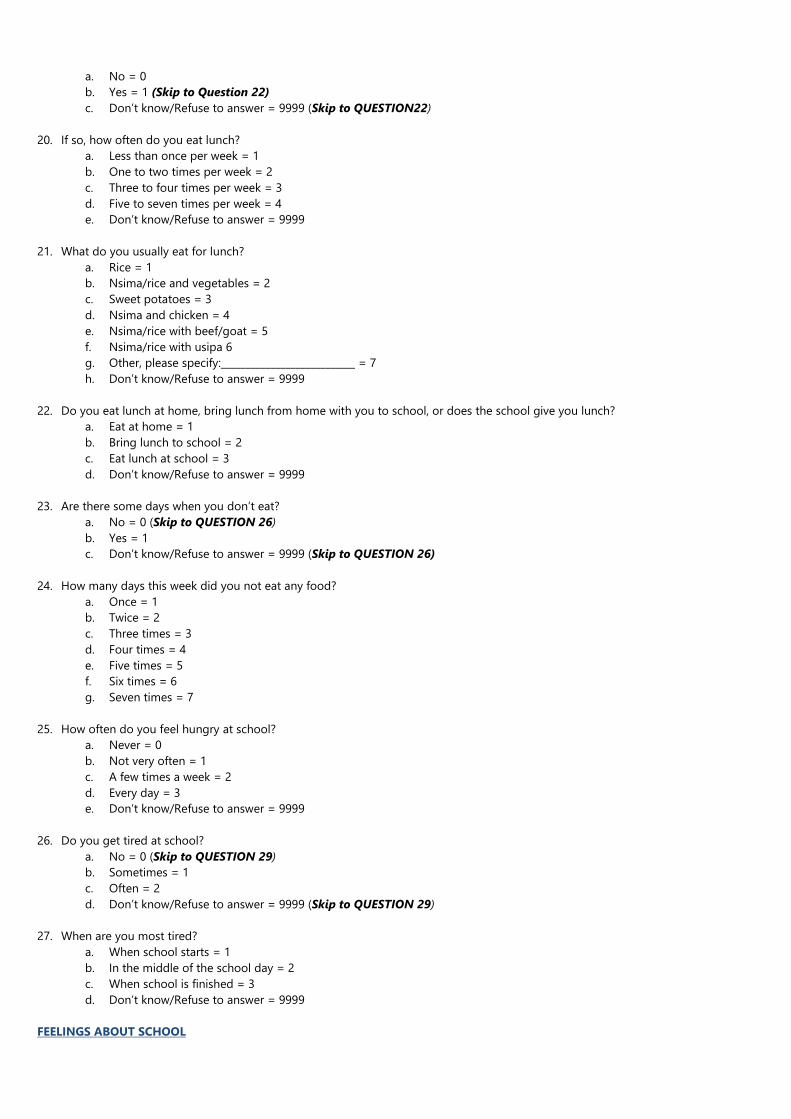
a. No = 0
b. Yes = 1 (Skip to Question 22)
c. Don’t know/Refuse to answer = 9999 (Skip to QUESTION22)
20. If so, how often do you eat lunch?
a. Less than once per week = 1
b. One to two times per week = 2
c. Three to four times per week = 3
d. Five to seven times per week = 4
e. Don’t know/Refuse to answer = 9999
21. What do you usually eat for lunch?
a. Rice = 1
b. Nsima/rice and vegetables = 2
c. Sweet potatoes = 3
d. Nsima and chicken = 4
e. Nsima/rice with beef/goat = 5
f. Nsima/rice with usipa 6
g. Other, please specify:___________________________ = 7
h. Don’t know/Refuse to answer = 9999
22. Do you eat lunch at home, bring lunch from home with you to school, or does the school give you lunch?
a. Eat at home = 1
b. Bring lunch to school = 2
c. Eat lunch at school = 3
d. Don’t know/Refuse to answer = 9999
23. Are there some days when you don’t eat?
a. No = 0 (Skip to QUESTION 26)
b. Yes = 1
c. Don’t know/Refuse to answer = 9999 (Skip to QUESTION 26)
24. How many days this week did you not eat any food?
a. Once = 1
b. Twice = 2
c. Three times = 3
d. Four times = 4
e. Five times = 5
f. Six times = 6
g. Seven times = 7
25. How often do you feel hungry at school?
a. Never = 0
b. Not very often = 1
c. A few times a week = 2
d. Every day = 3
e. Don’t know/Refuse to answer = 9999
26. Do you get tired at school?
a. No = 0 (Skip to QUESTION 29)
b. Sometimes = 1
c. Often = 2
d. Don’t know/Refuse to answer = 9999 (Skip to QUESTION 29)
27. When are you most tired?
a. When school starts = 1
b. In the middle of the school day = 2
c. When school is finished = 3
d. Don’t know/Refuse to answer = 9999
FEELINGS ABOUT SCHOOL

28. What do you likeabout coming to school? (Don’t read these options to the learner. If the learner is slow to respond, wait up to 8
seconds before asking “Are there things you like about coming to school? If so, what are they?” (The learner may not give these exact
responses, but circle all those that are close to what he/she indicates. Select all that apply; multiple responses possible):
a. Seeing my friends
b. Learning new things
c. Seeing my teacher
d. School meals
e. I like everything
f. Other, please specify_________________________________________________
g. I don’t like anything
h. Don’t know/Refuse to answer
29. What do you not like about coming to school? (Don’t read these options to the learner. If the learner is slow to respond, wait up to
8 seconds before asking “Are there things you like about coming to school? If so, what are they?” (The learner may not give these
exact responses, but circle all those that are close to what he/she indicates. Select all that apply; multiple responses possible):
a. Other children are mean
b. It’s boring
c. I don’t understand the lessons
d. The teacher is mean
e. There’s no latrine or it’s too dirty
f. I have to sit on the floor – no desk
g. I can’t see the textbooks or don’t have textbooks
h. I’m too tired
i. I’m hungry
j. It’s hard to pay attention
k. I don’t feel well
l. Other children fight too much
m. I like everything
n. Other, please specify_________________________________________________
o. Don’t know/Refuse to answer
30. Do you like to come to school?
a. No = 0
b. Yes = 1
c. Don’t know/Refuse to answer = 9999
31. How would you describe your teacher?
a. Nice/happy = 1
b. Sometimes nice and sometimes not so nice = 2
c. Mean = 3
d. Don’t know/Refuse to answer = 9999
32. How much do you think you learn at school?
a. Not anything = 0
b. Not much = 1
c. Some = 2
d. A lot = 3
e. Don’t know/Refuse to answer = 9999
33. Do you think school is boring?
a. No = 0
b. Sometimes = 1
c. Yes = 2
d. Don’t know/Refuse to answer = 9999
SCHOOL ENVIRONMENT
34. Do you feel comfortable about using the latrine at school?
a. No = 0
b. Yes = 1 (Skip to QUESTION37)
c. Don’t know/Refuse to answer = 9999 (Skip to QUESTION37
35. Why do you not feel comfortable using the latrine? (Select all that apply; multiple responses possible)
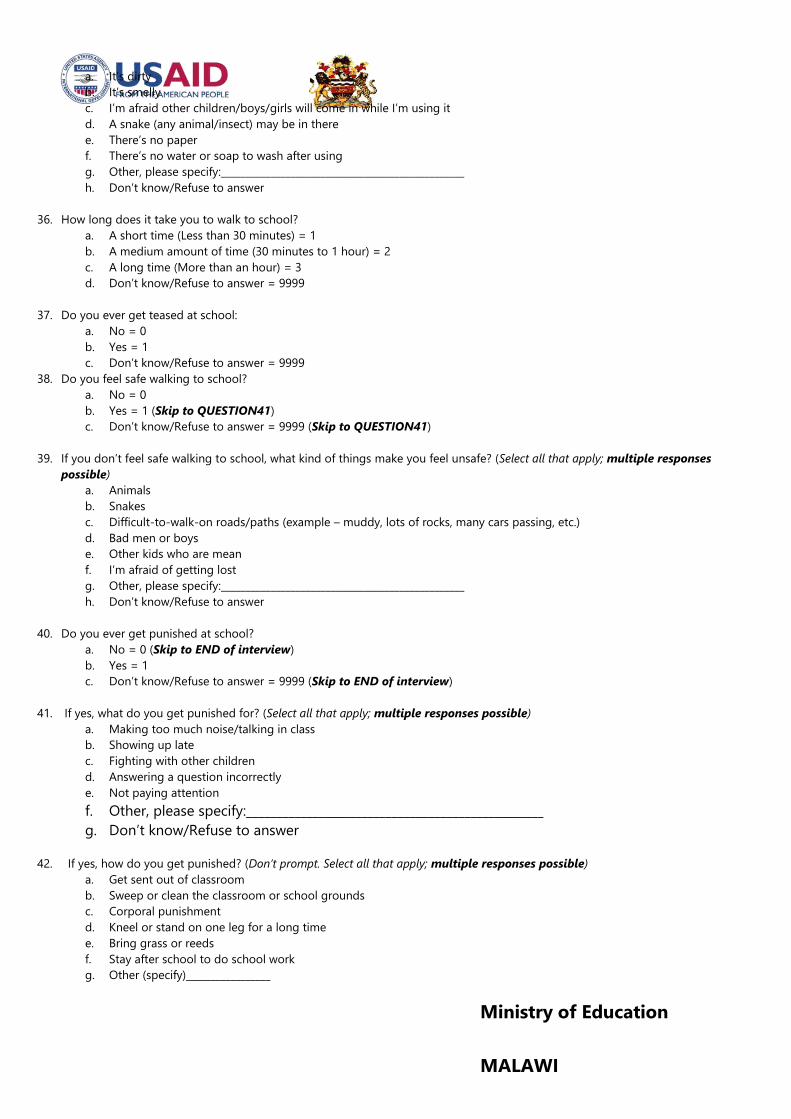
a. It’s dirty
b. It’s smelly
c. I’m afraid other children/boys/girls will come in while I’m using it
d. A snake (any animal/insect) may be in there
e. There’s no paper
f. There’s no water or soap to wash after using
g. Other, please specify:_________________________________________________
h. Don’t know/Refuse to answer
36. How long does it take you to walk to school?
a. A short time (Less than 30 minutes) = 1
b. A medium amount of time (30 minutes to 1 hour) = 2
c. A long time (More than an hour) = 3
d. Don’t know/Refuse to answer = 9999
37. Do you ever get teased at school:
a. No = 0
b. Yes = 1
c. Don’t know/Refuse to answer = 9999
38. Do you feel safe walking to school?
a. No = 0
b. Yes = 1 (Skip to QUESTION41)
c. Don’t know/Refuse to answer = 9999 (Skip to QUESTION41)
39. If you don’t feel safe walking to school, what kind of things make you feel unsafe? (Select all that apply; multiple responses
possible)
a. Animals
b. Snakes
c. Difficult-to-walk-on roads/paths (example – muddy, lots of rocks, many cars passing, etc.)
d. Bad men or boys
e. Other kids who are mean
f. I’m afraid of getting lost
g. Other, please specify:_________________________________________________
h. Don’t know/Refuse to answer
40. Do you ever get punished at school?
a. No = 0 (Skip to END of interview)
b. Yes = 1
c. Don’t know/Refuse to answer = 9999 (Skip to END of interview)
41. If yes, what do you get punished for? (Select all that apply; multiple responses possible)
a. Making too much noise/talking in class
b. Showing up late
c. Fighting with other children
d. Answering a question incorrectly
e. Not paying attention
f. Other, please specify:_________________________________________________
g. Don’t know/Refuse to answer
42. If yes, how do you get punished? (Don’t prompt. Select all that apply; multiple responses possible)
a. Get sent out of classroom
b. Sweep or clean the classroom or school grounds
c. Corporal punishment
d. Kneel or stand on one leg for a long time
e. Bring grass or reeds
f. Stay after school to do school work
g. Other (specify)_________________
Ministry of Education
MALAWI
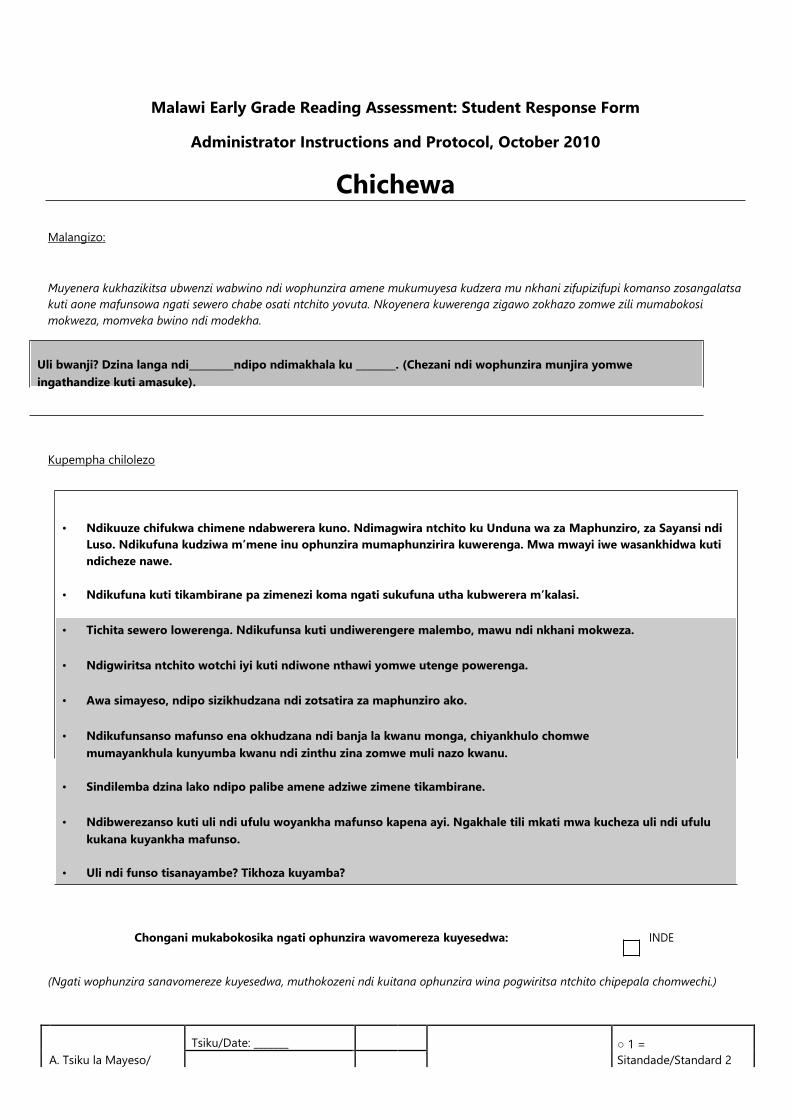
Malawi Early Grade Reading Assessment: Student Response Form
Administrator Instructions and Protocol, October 2010
Chichewa
Malangizo:
Muyenera kukhazikitsa ubwenzi wabwino ndi wophunzira amene mukumuyesa kudzera mu nkhani zifupizifupi komanso zosangalatsa
kuti aone mafunsowa ngati sewero chabe osati ntchito yovuta. Nkoyenera kuwerenga zigawo zokhazo zomwe zili mumabokosi
mokweza, momveka bwino ndi modekha.
Uli bwanji? Dzina langa ndi_________ndipo ndimakhala ku ________. (Chezani ndi wophunzira munjira yomwe
ingathandize kuti amasuke).
Kupempha chilolezo
• Ndikuuze chifukwa chimene ndabwerera kuno. Ndimagwira ntchito ku Unduna wa za Maphunziro, za Sayansi ndi
Luso. Ndikufuna kudziwa m’mene inu ophunzira mumaphunzirira kuwerenga. Mwa mwayi iwe wasankhidwa kuti
ndicheze nawe.
• Ndikufuna kuti tikambirane pa zimenezi koma ngati sukufuna utha kubwerera m’kalasi.
• Tichita sewero lowerenga. Ndikufunsa kuti undiwerengere malembo, mawu ndi nkhani mokweza.
• Ndigwiritsa ntchito wotchi iyi kuti ndiwone nthawi yomwe utenge powerenga.
• Awa simayeso, ndipo sizikhudzana ndi zotsatira za maphunziro ako.
• Ndikufunsanso mafunso ena okhudzana ndi banja la kwanu monga, chiyankhulo chomwe
mumayankhula kunyumba kwanu ndi zinthu zina zomwe muli nazo kwanu.
• Sindilemba dzina lako ndipo palibe amene adziwe zimene tikambirane.
• Ndibwerezanso kuti uli ndi ufulu woyankha mafunso kapena ayi. Ngakhale tili mkati mwa kucheza uli ndi ufulu
kukana kuyankha mafunso.
• Uli ndi funso tisanayambe? Tikhoza kuyamba?
Chongani mukabokosika ngati ophunzira wavomereza kuyesedwa: INDE
(Ngati wophunzira sanavomereze kuyesedwa, muthokozeni ndi kuitana ophunzira wina pogwiritsa ntchito chipepala chomwechi.)
A. Tsiku la Mayeso/
Tsiku/Date: _______ ○ 1 =
Sitandade/Standard 2
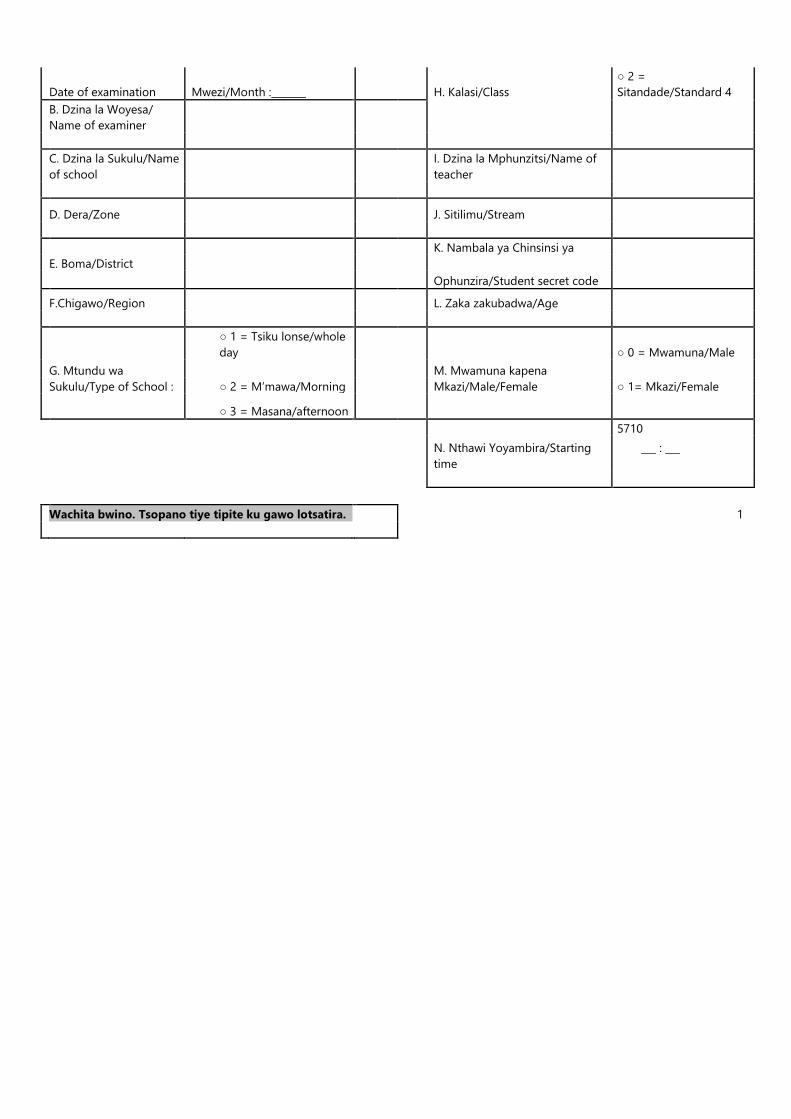
Date of examination Mwezi/Month :_______ H. Kalasi/Class
○ 2 =
Sitandade/Standard 4
B. Dzina la Woyesa/
Name of examiner
C. Dzina la Sukulu/Name
of school
I. Dzina la Mphunzitsi/Name of
teacher
D. Dera/Zone J. Sitilimu/Stream
E. Boma/District
K. Nambala ya Chinsinsi ya
Ophunzira/Student secret code
F.Chigawo/Region L. Zaka zakubadwa/Age
○ 1 = Tsiku lonse/whole
day ○ 0 = Mwamuna/Male
G. Mtundu wa
○ 2 = M’mawa/Morning
M. Mwamuna kapena
Mkazi/Male/Female ○ 1= Mkazi/Female Sukulu/Type of School :
○ 3 = Masana/afternoon
5710
N. Nthawi Yoyambira/Starting
time
___ : ___
1 Wachita bwino. Tsopano tiye tipite ku gawo lotsatira.
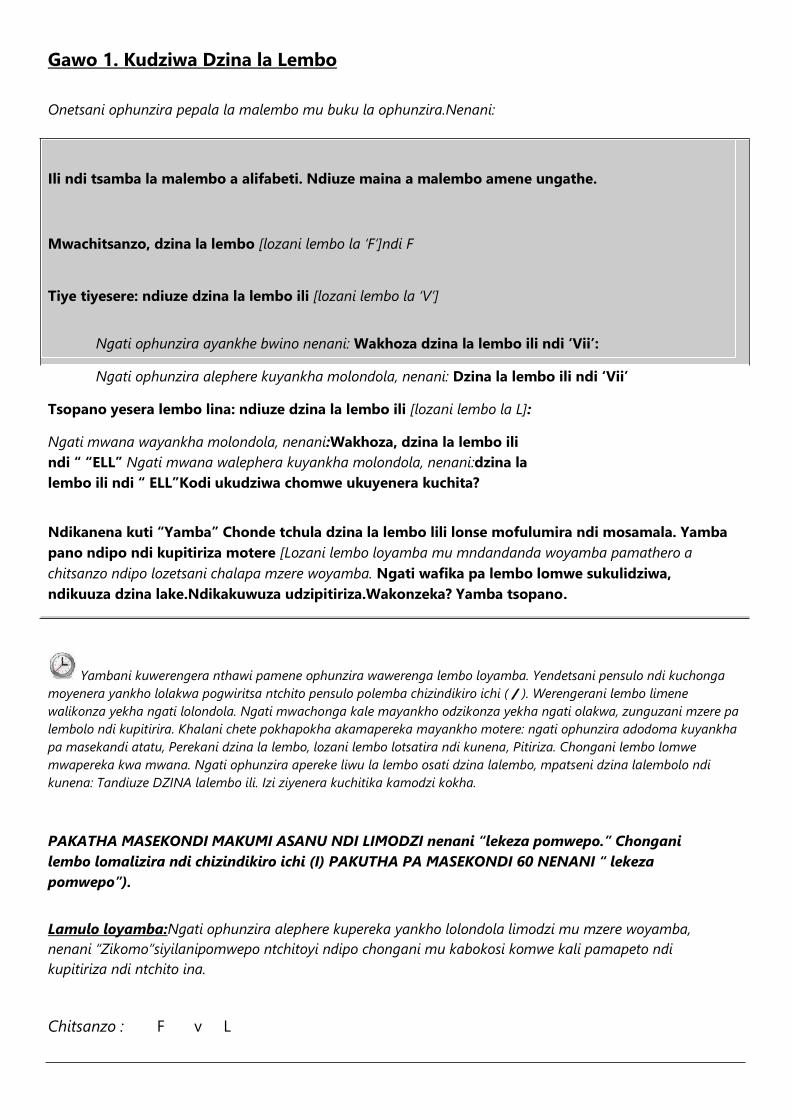
Gawo 1. Kudziwa Dzina la Lembo
Onetsani ophunzira pepala la malembo mu buku la ophunzira.Nenani:
Ili ndi tsamba la malembo a alifabeti. Ndiuze maina a malembo amene ungathe.
Mwachitsanzo, dzina la lembo [lozani lembo la ‘F’]ndi F
Tiye tiyesere: ndiuze dzina la lembo ili [lozani lembo la ‘V’]
Ngati ophunzira ayankhe bwino nenani: Wakhoza dzina la lembo ili ndi ‘Vii’:
Ngati ophunzira alephere kuyankha molondola, nenani: Dzina la lembo ili ndi ‘Vii’
Tsopano yesera lembo lina: ndiuze dzina la lembo ili [lozani lembo la L]:
Ngati mwana wayankha molondola, nenani:Wakhoza, dzina la lembo ili
ndi “ “ELL” Ngati mwana walephera kuyankha molondola, nenani:dzina la
lembo ili ndi “ ELL”Kodi ukudziwa chomwe ukuyenera kuchita?
Ndikanena kuti “Yamba” Chonde tchula dzina la lembo lili lonse mofulumira ndi mosamala. Yamba
pano ndipo ndi kupitiriza motere [Lozani lembo loyamba mu mndandanda woyamba pamathero a
chitsanzo ndipo lozetsani chalapa mzere woyamba. Ngati wafika pa lembo lomwe sukulidziwa,
ndikuuza dzina lake.Ndikakuwuza udzipitiriza.Wakonzeka? Yamba tsopano.
Yambani kuwerengera nthawi pamene ophunzira wawerenga lembo loyamba. Yendetsani pensulo ndi kuchonga
moyenera yankho lolakwa pogwiritsa ntchito pensulo polemba chizindikiro ichi ( / ). Werengerani lembo limene
walikonza yekha ngati lolondola. Ngati mwachonga kale mayankho odzikonza yekha ngati olakwa, zunguzani mzere pa
lembolo ndi kupitirira. Khalani chete pokhapokha akamapereka mayankho motere: ngati ophunzira adodoma kuyankha
pa masekandi atatu, Perekani dzina la lembo, lozani lembo lotsatira ndi kunena, Pitiriza. Chongani lembo lomwe
mwapereka kwa mwana. Ngati ophunzira apereke liwu la lembo osati dzina lalembo, mpatseni dzina lalembolo ndi
kunena: Tandiuze DZINA lalembo ili. Izi ziyenera kuchitika kamodzi kokha.
PAKATHA MASEKONDI MAKUMI ASANU NDI LIMODZI nenani “lekeza pomwepo.” Chongani
lembo lomalizira ndi chizindikiro ichi (I) PAKUTHA PA MASEKONDI 60 NENANI “ lekeza
pomwepo”).
Lamulo loyamba:Ngati ophunzira alephere kupereka yankho lolondola limodzi mu mzere woyamba,
nenani “Zikomo”siyilanipomwepo ntchitoyi ndipo chongani mu kabokosi komwe kali pamapeto ndi
kupitiriza ndi ntchito ina.
Chitsanzo : F v L
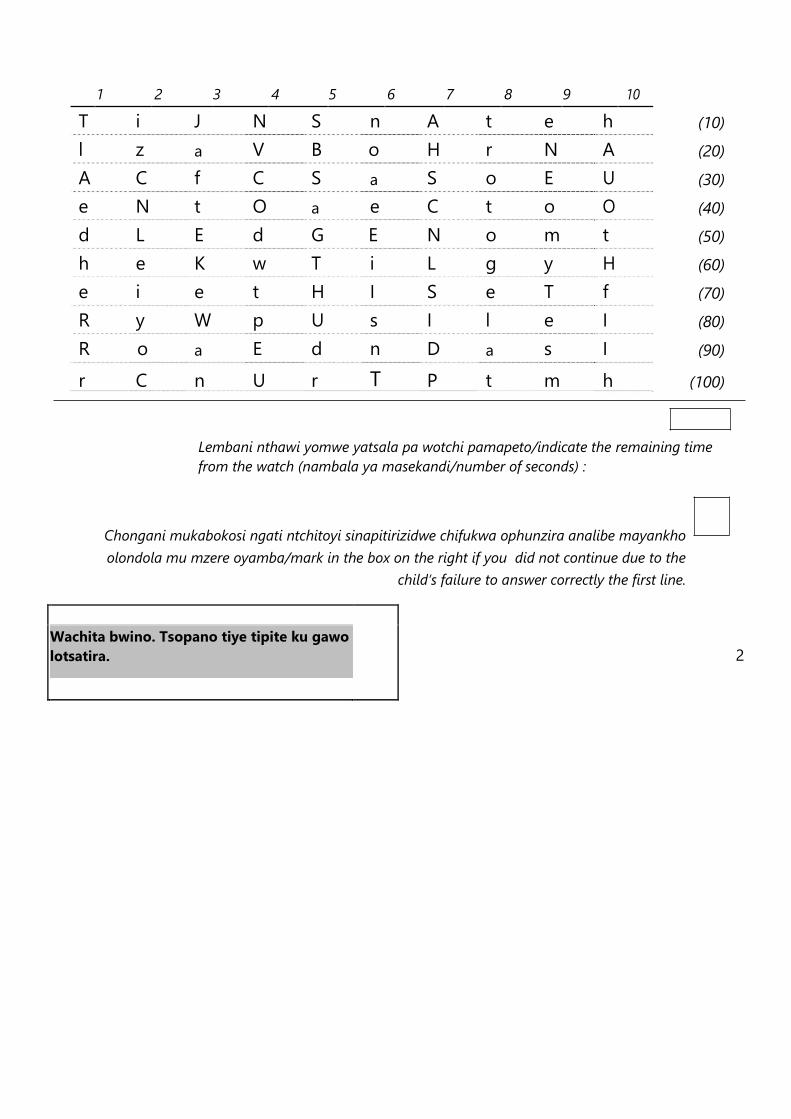
1 2 3 4 5 6 7 8 9 10
T i J N S n A t e h (10)
l z a V B o H r N A (20)
A C f C S a S o E U (30)
e N t O a e C t o O (40)
d L E d G E N o m t (50)
h e K w T i L g y H (60)
e i e t H I S e T f (70)
R y W p U s I l e I (80)
R o a E d n D a s I (90)
r C n U r T P t m h (100)
Lembani nthawi yomwe yatsala pa wotchi pamapeto/indicate the remaining time
from the watch (nambala ya masekandi/number of seconds) :
Chongani mukabokosi ngati ntchitoyi sinapitirizidwe chifukwa ophunzira analibe mayankho
olondola mu mzere oyamba/mark in the box on the right if you did not continue due to the
child’s failure to answer correctly the first line.
2
Wachita bwino. Tsopano tiye tipite ku gawo
lotsatira.

Gawo 2. Maphatikizo a Malembo
Ntchito iyi ndiyongomvera chabe. Ndikuuza mawu ndipo undiuze maphatikizo omwe ali mu mawuwo.
Mwachitsanzo, mu mawu oti “ola” muli maphatikizo awa: “o – la”. Mu ntchito imeneyi ndikufuna kuti undiuze
maphatikizo amene uwamve m’mawu. Nditchula mawuwa kawiri. Umvere kenako undiuze maphatikizo omwe ali
mu mawuwo.
Tiye tiyesere. Undiuze maphatikizo omwe ali m’mawu oti “mayi”? “mayi.”
[Ngati ophunzira ayankhe molondola, nenani]: Wakhoza, maphatikizo a mawu oti “mayi” ndi “ma –yi”.
Ngati mwana walephera kuyankha molondola, nenani: Mveranso kachiwiri: “mayi”. Maphatikizo omweali mu
mawu oti “mayi” ndi “ma-yi.”
Tsopano yesera ena: kodi ndi maphatikizo ati amene ali m’mawu oti “khwanya”? “khwanya”.
[Ngati ophunzira ayankhe molondola, nenani]: Wakhoza, maphatikizo a mawu oti “khwanya” ndi“khwa -
nya ”.
Ngati mwana walephera kuyankha molondola, nenani: Mveranso kachiwiri: “khwanya”. Maphatikizoomwe ali
mu mawu oti “khwanya” ndi “khwa - nya.”
Kodi ukudziwa chomwe uyenera kuchita?
[Ngati ophunzira anene kuti ayi, muuzeni kuti]: Yesetsa mmene ungathere.
Werengani ndi kutchula mawu oyenera kachiwiri. Lolani yankho lokhalo lili ndi liwu lolondola. Ngati ophunizra akanike
kuyankhe mumasekondi atatu, onetsani kuti “Palibe yankho” ndipo pitirizani kutchula mawu otsatira. Tchulani momveka bwino
koma musatsindike kwambiri paphatikizo loyamba la mawu ena ali wonse.
Langizo loyamba :Ngati ophunzira alephere kuyankha molondola kapena kulephera kuwerenga mawu asanuoyambirira, nenani
kuti “Zikomo”, ndipo musapitirize ntchiyoyi ndipo mukatero chongani m’kabokosi kali pamapeto a tsamba lino ndi kuyamba ntchito
yotsatirayo.
Kodi ndi maphatikizo ati amene ali mu mawu awa “_______”? [bwerezani mawuwo kawiri]
Wakhoza = 2 Walakwa/ Palibe yankho = 0
sakudziwa = 1
Bola
Bo –la
o
wakhoza
o Walakwa/
o
palibe yankho
Sakudziwa
Mkaka
Mka – ka
o
wakhoza
o Walakwa/
o
palibe yankho
Sakudziwa
Mwamuna Mwa – mu – na o wakhoza o Walakwa/ o palibe yankho
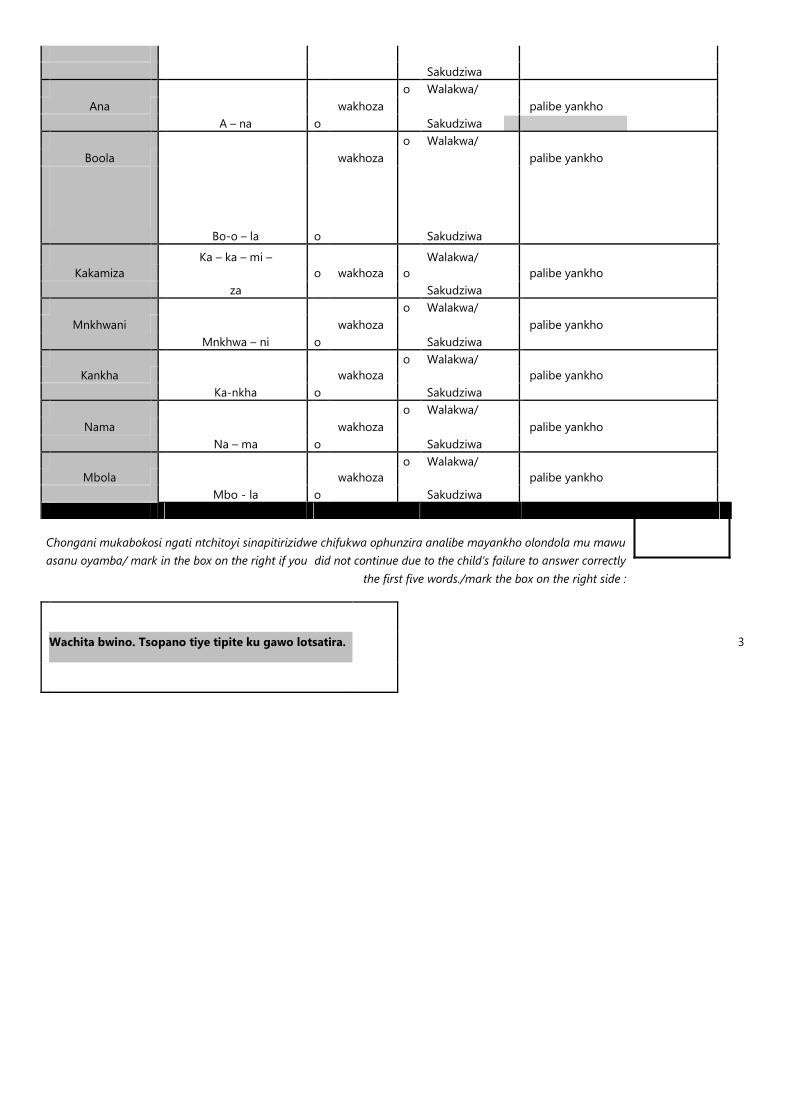
Sakudziwa
Ana
A – na
o
wakhoza
o Walakwa/
o
palibe yankho
Sakudziwa
Boola
Bo-o – la
o
wakhoza
o Walakwa/
o
palibe yankho
(
m
a
w
u
5
)
Sakudziwa
Kakamiza
Ka – ka – mi –
o wakhoza o
Walakwa/
o palibe yankho
za
Sakudziwa
Mnkhwani
Mnkhwa – ni
o
wakhoza
o Walakwa/
o
palibe yankho
Sakudziwa
Kankha
Ka-nkha
o
wakhoza
o Walakwa/
o
palibe yankho
Sakudziwa
Nama
Na – ma
o
wakhoza
o Walakwa/
o
palibe yankho
Sakudziwa
Mbola
Mbo - la
o
wakhoza
o Walakwa/
o
palibe yankho
Sakudziwa
Chongani mukabokosi ngati ntchitoyi sinapitirizidwe chifukwa ophunzira analibe mayankho olondola mu mawu
asanu oyamba/ mark in the box on the right if you did not continue due to the child’s failure to answer correctly
the first five words./mark the box on the right side :
3 Wachita bwino. Tsopano tiye tipite ku gawo lotsatira.

Gawo 3. Kutchula liwu loyamba
Ntchito iyi siyofunika kuwerengera nthawi ndipo PALIBE TSAMBA LAWOPHUNZIRA. Werengani mawu aliwonse kawiri ndipo mufunse
ophunzira kuti atchule liwu loyamba m’mawu amenewa. kumbukirani kutchula maliwu moyenera : /p/ osati /pu/ monga: /p/, -----
“puh” kapena “pe.” Nenani:
Ntchito iyi ndiyomvera chabe. Ndikufuna kuti undiuze liwu loyamba m’mawu ena aliwonse. Mwachitsanzo, m’mawu oti
‘galu’, liwu loyamba ndi “/g/”. Mu ntchito imeneyi, ndifuna undiuze liwu loyamba limene ukulimva mu mawu ena
aliwonse. Nditchula mawuwo kawiri. Umvere mawuwo, kenako undiuze liwu loyamba lomwe likumveka m’mawuwo.
Tiye tiyesere. Kodi liwu loyamba m’mawu oti “mayi”? “mayi” ndi chiyani?
[Ngati ophunzira ayankhe molondola, nenani]: Wakhoza, liwu loyamba mu mawu oti “mayi” ndi /mmmmm/
[Ngati ophunzira sanayankhe molondola, nenani]: mvetsera kawiri: “mmmayi”. Liwu loyamba mu mawu oti“mayi”
ndi /mmmmm/.
Tsopano yesera mawu ena: Kodi ndi liwu liti lomwe lili mmawu oti “nzimbe”? “nzimbe”.
Ngati mwana wayankha molondola, nenani:Wakhoza, liwu loyamba mu mawu oti “nzimbe”ndi “/n/”
Ngati mwana walephera kuyankha molondola, nenani: mveranso kaciwiri:liwu loyamba la mu mawu oti “nzimbe” ndi /n/
Kodi ukudziwa chomwe uyenera kuchita?
[Ngati wophunzira anene kuti ayi, muzeni kuti]: Yesetsa mmene ungathere.
Werengani ndi kutchula mawu oyenera kawiri. Lolani yankho lokhalo lili ndi liwu lolondola. Ngati ophunizra akanike kuyankha mu
masekondi atatu,onetsani kuti “Palibe yankho” ndipo pitirizani kutchula mawu otsatira. Tchulani momveka bwino koma
musatsindike kwambiri liwu loyamba la mawu ena ali wonse.
Langizo loyamba:Ngati ophunzira alephere kuyankha molondola kapena kulephera kuwerenga mawu asanu oyambirira,
nenanikuti “Zikomo”, ndipo musapitirize ntchiyoyi ndipo mukatero chongani m’kabokosi kali pamapeto a tsamba lino ndi kuyamba
ntchito yotsatirayo.
Tchula liwu loyamba mu mawu awa: Kodi liwu loyamba “_______”?
“_______”? [Tchulani mawuwo]
Wakhoza = 2 Walakwa/ Palibe yankho = 0
sakudziwa = 1
Atate
/a/
o
wakhoza
o Walakwa/
o
palibe yankho
Sakudziwa
Bala
/b/
o
wakhoza
o Walakwa/
o
palibe yankho
Sakudziwa
Dona
/d/
o
wakhoza
o Walakwa/
o
palibe yankho
Sakudziwa
Kala
/k/
o
wakhoza
o Walakwa/
o
palibe yankho
Sakudziwa
Khala
/kh/
o
wakhoza
o Walakwa/
o
palibe yankho (mawu 5)
Sakudziwa
Wada
/www/
o
wakhoza
o Walakwa/
o
palibe yankho
Sakudziwa
Gwada
/g/
o
wakhoza
o Walakwa/
o
palibe yankho
Sakudziwa
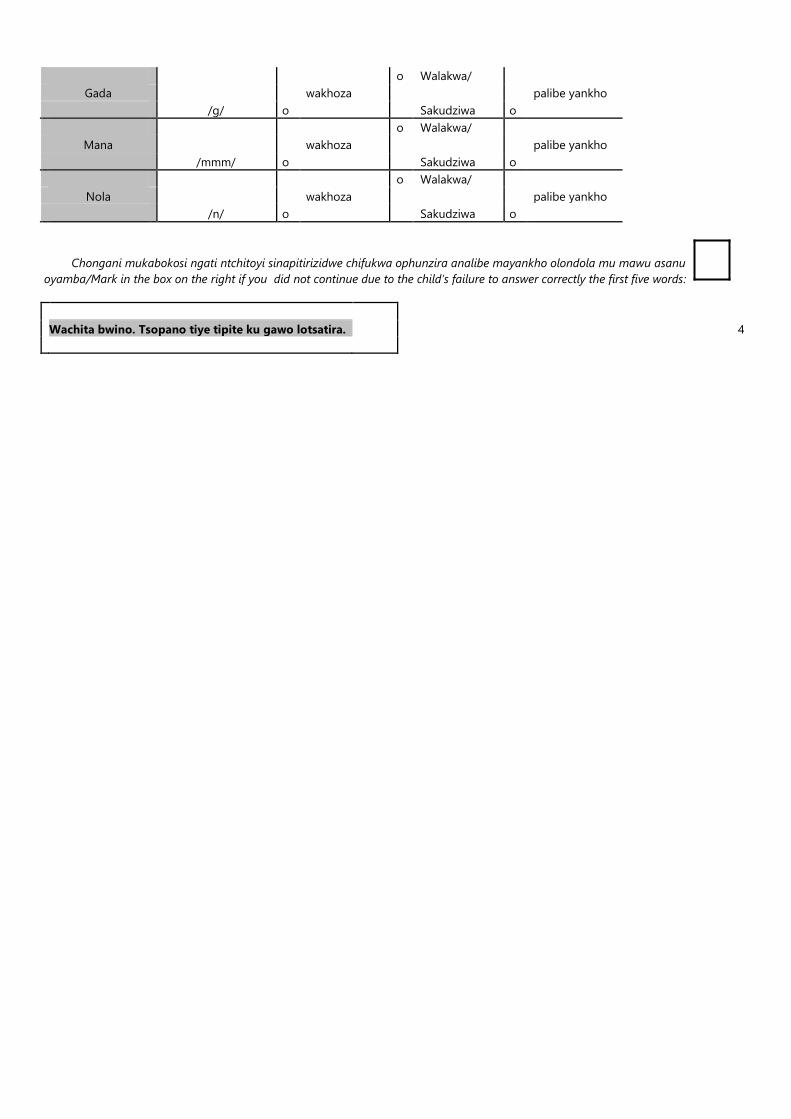
Gada
/g/
o
wakhoza
o Walakwa/
o
palibe yankho
Sakudziwa
Mana
/mmm/
o
wakhoza
o Walakwa/
o
palibe yankho
Sakudziwa
Nola
/n/
o
wakhoza
o Walakwa/
o
palibe yankho
Sakudziwa
Chongani mukabokosi ngati ntchitoyi sinapitirizidwe chifukwa ophunzira analibe mayankho olondola mu mawu asanu
oyamba/Mark in the box on the right if you did not continue due to the child’s failure to answer correctly the first five words:
4 Wachita bwino. Tsopano tiye tipite ku gawo lotsatira.
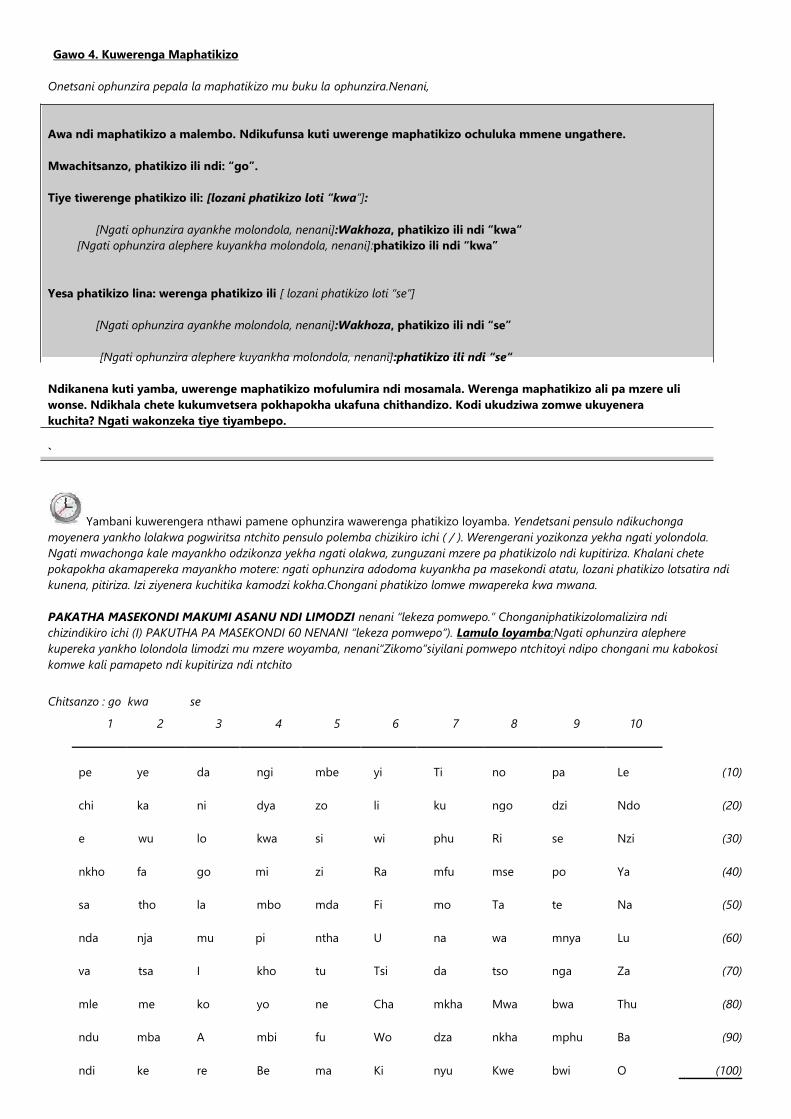
Gawo 4. Kuwerenga Maphatikizo
Onetsani ophunzira pepala la maphatikizo mu buku la ophunzira.Nenani,
Awa ndi maphatikizo a malembo. Ndikufunsa kuti uwerenge maphatikizo ochuluka mmene ungathere.
Mwachitsanzo, phatikizo ili ndi: “go”.
Tiye tiwerenge phatikizo ili: [lozani phatikizo loti “kwa”]:
[Ngati ophunzira ayankhe molondola, nenani]:Wakhoza, phatikizo ili ndi “kwa“
[Ngati ophunzira alephere kuyankha molondola, nenani]:phatikizo ili ndi “kwa”
Yesa phatikizo lina: werenga phatikizo ili [ lozani phatikizo loti “se”]
[Ngati ophunzira ayankhe molondola, nenani]:Wakhoza, phatikizo ili ndi “se”
[Ngati ophunzira alephere kuyankha molondola, nenani]:phatikizo ili ndi “se“
Ndikanena kuti yamba, uwerenge maphatikizo mofulumira ndi mosamala. Werenga maphatikizo ali pa mzere uli
wonse. Ndikhala chete kukumvetsera pokhapokha ukafuna chithandizo. Kodi ukudziwa zomwe ukuyenera
kuchita? Ngati wakonzeka tiye tiyambepo.
`
Yambani kuwerengera nthawi pamene ophunzira wawerenga phatikizo loyamba. Yendetsani pensulo ndikuchonga
moyenera yankho lolakwa pogwiritsa ntchito pensulo polemba chizikiro ichi ( / ). Werengerani yozikonza yekha ngati yolondola.
Ngati mwachonga kale mayankho odzikonza yekha ngati olakwa, zunguzani mzere pa phatikizolo ndi kupitiriza. Khalani chete
pokapokha akamapereka mayankho motere: ngati ophunzira adodoma kuyankha pa masekondi atatu, lozani phatikizo lotsatira ndi
kunena, pitiriza. Izi ziyenera kuchitika kamodzi kokha.Chongani phatikizo lomwe mwapereka kwa mwana.
PAKATHA MASEKONDI MAKUMI ASANU NDI LIMODZI nenani “lekeza pomwepo.” Chonganiphatikizolomalizira ndi
chizindikiro ichi (I) PAKUTHA PA MASEKONDI 60 NENANI “lekeza pomwepo”). Lamulo loyamba:Ngati ophunzira alephere
kupereka yankho lolondola limodzi mu mzere woyamba, nenani“Zikomo”siyilani pomwepo ntchitoyi ndipo chongani mu kabokosi
komwe kali pamapeto ndi kupitiriza ndi ntchito
Chitsanzo : go kwa se
1 2 3 4 5 6 7 8 9 10
(10)
pe ye da ngi mbe yi Ti no pa Le
chi ka ni dya zo li ku ngo dzi Ndo (20)
e wu lo kwa si wi phu Ri se Nzi (30)
nkho fa go mi zi Ra mfu mse po Ya (40)
sa tho la mbo mda Fi mo Ta te Na (50)
nda nja mu pi ntha U na wa mnya Lu (60)
va tsa I kho tu Tsi da tso nga Za (70)
mle me ko yo ne Cha mkha Mwa bwa Thu (80)
ndu mba A mbi fu Wo dza nkha mphu Ba (90)
ndi ke re Be ma Ki nyu Kwe bwi O (100)
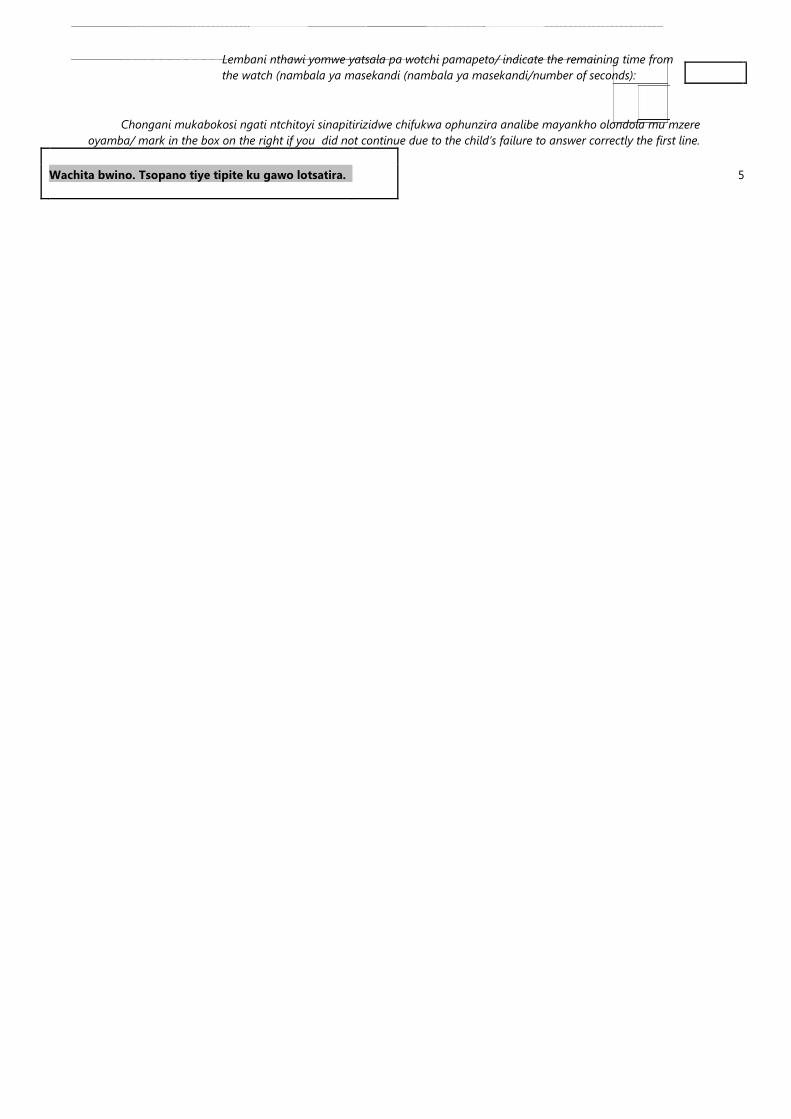
Lembani nthawi yomwe yatsala pa wotchi pamapeto/ indicate the remaining time from
the watch (nambala ya masekandi (nambala ya masekandi/number of seconds):
Chongani mukabokosi ngati ntchitoyi sinapitirizidwe chifukwa ophunzira analibe mayankho olondola mu mzere
oyamba/ mark in the box on the right if you did not continue due to the child’s failure to answer correctly the first line.
5 Wachita bwino. Tsopano tiye tipite ku gawo lotsatira.
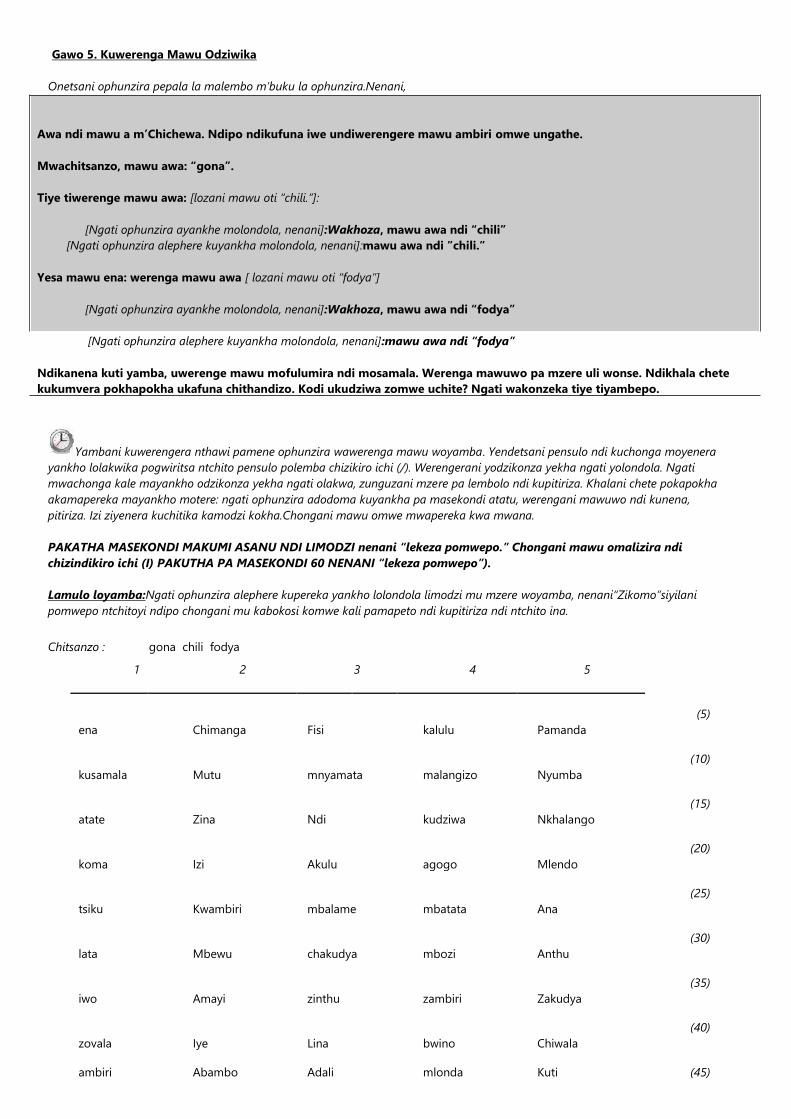
Gawo 5. Kuwerenga Mawu Odziwika
Onetsani ophunzira pepala la malembo m’buku la ophunzira.Nenani,
Awa ndi mawu a m’Chichewa. Ndipo ndikufuna iwe undiwerengere mawu ambiri omwe ungathe.
Mwachitsanzo, mawu awa: “gona”.
Tiye tiwerenge mawu awa: [lozani mawu oti “chili.”]:
[Ngati ophunzira ayankhe molondola, nenani]:Wakhoza, mawu awa ndi “chili”
[Ngati ophunzira alephere kuyankha molondola, nenani]:mawu awa ndi ”chili.”
Yesa mawu ena: werenga mawu awa [ lozani mawu oti “fodya”]
[Ngati ophunzira ayankhe molondola, nenani]:Wakhoza, mawu awa ndi “fodya”
[Ngati ophunzira alephere kuyankha molondola, nenani]:mawu awa ndi “fodya”
Ndikanena kuti yamba, uwerenge mawu mofulumira ndi mosamala. Werenga mawuwo pa mzere uli wonse. Ndikhala chete
kukumvera pokhapokha ukafuna chithandizo. Kodi ukudziwa zomwe uchite? Ngati wakonzeka tiye tiyambepo.
Yambani kuwerengera nthawi pamene ophunzira wawerenga mawu woyamba. Yendetsani pensulo ndi kuchonga moyenera
yankho lolakwika pogwiritsa ntchito pensulo polemba chizikiro ichi (/). Werengerani yodzikonza yekha ngati yolondola. Ngati
mwachonga kale mayankho odzikonza yekha ngati olakwa, zunguzani mzere pa lembolo ndi kupitiriza. Khalani chete pokapokha
akamapereka mayankho motere: ngati ophunzira adodoma kuyankha pa masekondi atatu, werengani mawuwo ndi kunena,
pitiriza. Izi ziyenera kuchitika kamodzi kokha.Chongani mawu omwe mwapereka kwa mwana.
PAKATHA MASEKONDI MAKUMI ASANU NDI LIMODZI nenani “lekeza pomwepo.” Chongani mawu omalizira ndi
chizindikiro ichi (I) PAKUTHA PA MASEKONDI 60 NENANI “lekeza pomwepo”).
Lamulo loyamba:Ngati ophunzira alephere kupereka yankho lolondola limodzi mu mzere woyamba, nenani“Zikomo”siyilani
pomwepo ntchitoyi ndipo chongani mu kabokosi komwe kali pamapeto ndi kupitiriza ndi ntchito ina.
Chitsanzo : gona chili fodya
1 2 3 4 5
(5)
ena Chimanga Fisi kalulu Pamanda
kusamala Mutu mnyamata malangizo Nyumba
(10)
atate Zina Ndi kudziwa Nkhalango
(15)
koma Izi Akulu agogo Mlendo
(20)
tsiku Kwambiri mbalame mbatata Ana
(25)
lata Mbewu chakudya mbozi Anthu
(30)
iwo Amayi zinthu zambiri Zakudya
(35)
zovala Iye Lina bwino Chiwala
(40)
ambiri Abambo Adali mlonda Kuti (45)
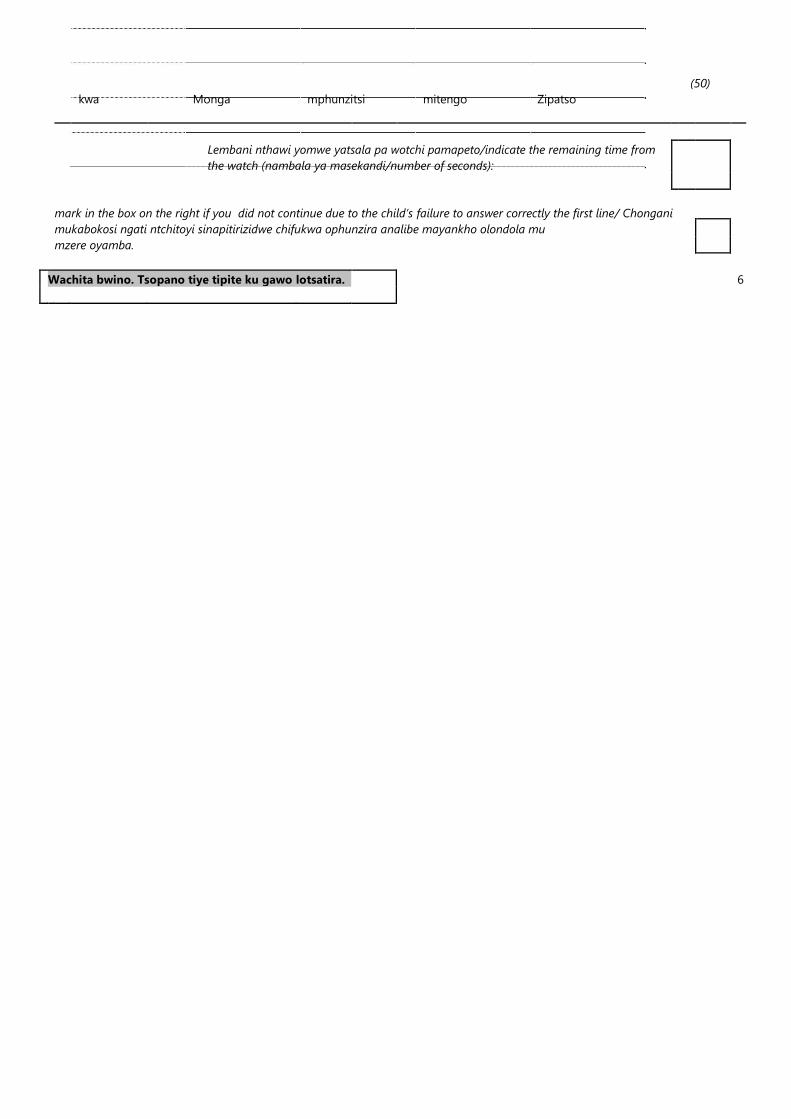
kwa Monga mphunzitsi mitengo Zipatso
(50)
Lembani nthawi yomwe yatsala pa wotchi pamapeto/indicate the remaining time from
the watch (nambala ya masekandi/number of seconds):
mark in the box on the right if you did not continue due to the child’s failure to answer correctly the first line/ Chongani
mukabokosi ngati ntchitoyi sinapitirizidwe chifukwa ophunzira analibe mayankho olondola mu
mzere oyamba.
6 Wachita bwino. Tsopano tiye tipite ku gawo lotsatira.

Gawo 6. Kuwerenga Mawu Opeka
Onetsani wophunzira pepala la malembo m’buku la ophunzira.Nenani,
Awa ndi mawu ongopeka m’Chichewa. Ndipo ndikufuna undiwerengere mawu omwe ungathe. Mwachitsanzo, “yono”.
Yesera kuwerenga mawu awa: [lozani mawu oti “ndodi”]:
[Ngati wophunzira anene kuti “ndodi” nenani]:Wakhoza, mawu awa ndi “ndodi“
[Ngati wophunzira alephere kuwerenga mawu woti “ndodi”nenani] Mawu awa timatchula kuti
“ndodi”Yesera mawu ena: werenga mawu awa [lozani mawu woti “biva“].
[Ngati wophunzira anene kuti”biva” molondola, nenani]:Wakhoza, mawu awa ndi “biva”
[Ngati wophunzira alephere kutchula “biva” molondola nenani]: “Mawu awa timatchula kuti “biva”
Ndikanena kuti yamba, uwerenge mawu mofulumira ndi mosamala. Uwerenge mawuwo kuyambira mzere woyamba.
Ndikhala chete kumvera pamene ukuwerenga, ukalephera kuwerenga mawu ena ndikuthandiza. Ngati wakonzeka
yamba.
Yambani kuwerengera nthawi pamene ophunzira wawerenga lembo loyamba. Yendetsani pensulo ndi kuchonga moyenera
yankho lolakwa pogwiritsa ntchito pennsulo polemba chizindikiro ichi ( / ). Werengerani ngati cholondola pamene wophunzira
wadzikonza yekha. Ngati munachonga kale mayankho wodzikonza yekha ngati olakwa, zunguzani mzere pa mawuwo ndi kupitirira..
Khalani chete wophunzira akamawerenga, ngati wophunzira wadodoma kuyankha pa masekondi atatu, werengani mawuwo ndipo
lozani mawu otsatira ndikumuza kuti “ pitiriza”. Chongani mawu omwe mwapereka kwa wophunzira. Ngati wophunzira awerenga
mawu asanu molakwitsa,asapitilize ndipo chongani mkabosi komwe kali patsamba lotsatira
.
PAKATHA MASEKONDI MAKUMI ASANU NDI LIMODZI NENANI “lekeza pomwepo.” Chongani mawu omalizira ndi
chizindikiro ichi (/)
Lamulo loyamba:Ngati wophunzira walephere kuwerenga mawu a mumzere woyamba, nenani “Zikomo”siyilanipomwepo
ntchitoyi ndipo chongani m’kabokosi komwe kali pamapeto ndi kupitiriza ndi ntchito ina.
.
Chitsanzo : yono ndodi Biva
1 2 3 4 5
(5) iso tapuli patu omo Udo
popo eze mphwika Ilu Nkhiki (10)
phena uto bwazo ntchuka Ngogo (15)
soola ndwigo mng’ene sati Goju (20)
thyata nthibe pwika nkhwena Faano (25)
upa tetu bzyata mnkhawi Leta (30)
Booli fese juje geba Khuda (35)
Atu ono chizi laafi Mpholi (40)
Tchefe nyanu aza thobi Zeepi (45)
Suule mvuvu mnapa deeni Zefa (50)
Indicate the remaining timefrom the watch in the end/Lembani nthawi yomwe yatsala pa wotchi
pamapeto (number of seconds/nambala ya masekandi:
mark in the box on the right if you did not continue due to the child’s failure to answer correctly the first line./Chongani
m’kabokosi ngati ntchitoyi sinapitirizidwe chifukwa wophunzira analibe mayankho olondola mu mzere woyamba.
7 Wachita bwino. Tsopano tiye tipite ku gawo lotsatira.

Gawo 7a. Kumvetsera nkhani Gawo 7b. Kuwerenga ndi kumvetsa nkhani
Iyi ndi nkhani yayifupi. Ndifuna iwe undiwerengere mokweza, mofulumira koma
mosamala. Ukatha kuwerengako ndikufunsa mafunso pa zomwe wawerenga.
Yamba kuwerenga.
Yambani kuwerengera nthawi pamene wophunzira wawerenga mawu oyamba.
Yendetsani pensulo ndi kuchonga moyenera yankho lolakwa pogwiritsantchito pensulo
polemba chizindikiro ichi ( / ). Werengerani ngati cholondola pamene wophunzira
wadzikonza yekha. Ngati munachonga kale mawu wodzikonza yekha ngati olakwa, lembani
mzere mozungulira mawuwa ndi kupitirira. Khalani chete wophunzira akamawerenga, ngati
wophunzira wadodoma kuwerenga pa mphindi zitatu, muwerengereni mawuwo kenak
lozani mawu otsatira ndikumuuza kuti “ pitiriza”. Chongani mawu omwe mwapereka kwa
wophunzira. Izi ziyenera kuchitika kamodzi kokha.
PAKATHA MASEKONDI MAKUMI ASANU NDI LIMODZI NENANI “lekeza
pomwepo.” Chongani mawu omalizira ndi chizindikiro ichi (/)
Lamulo loyamba:Ngati wophunzira walephere kuwerenga mawu a
mumzerewoyamba, nenani “Zikomo”siyila pomwepa kuwerenga. Ndipo chongani
m’kabokosi komwe kali pamapeto ndi kupitiriza ndi ntchito ina.
Pakatha masekandi 60 kapena wophunzira akatsiriza kuwerenga ndime m’masekandi
zosaposera 60, chotsani ndimeyo patsogolo pa ophunzira ndipo werengani funso
loyamba.
Mpatseni wophunzira masekandi 15 kuti ayankhe funsolo, chongani yankho la
wophunzira ndi kumuwerenga funso lotsatira.
Werengani mafunso a mzere uliwonse mpaka pamene ophunzira walekeza
kuwerenga.
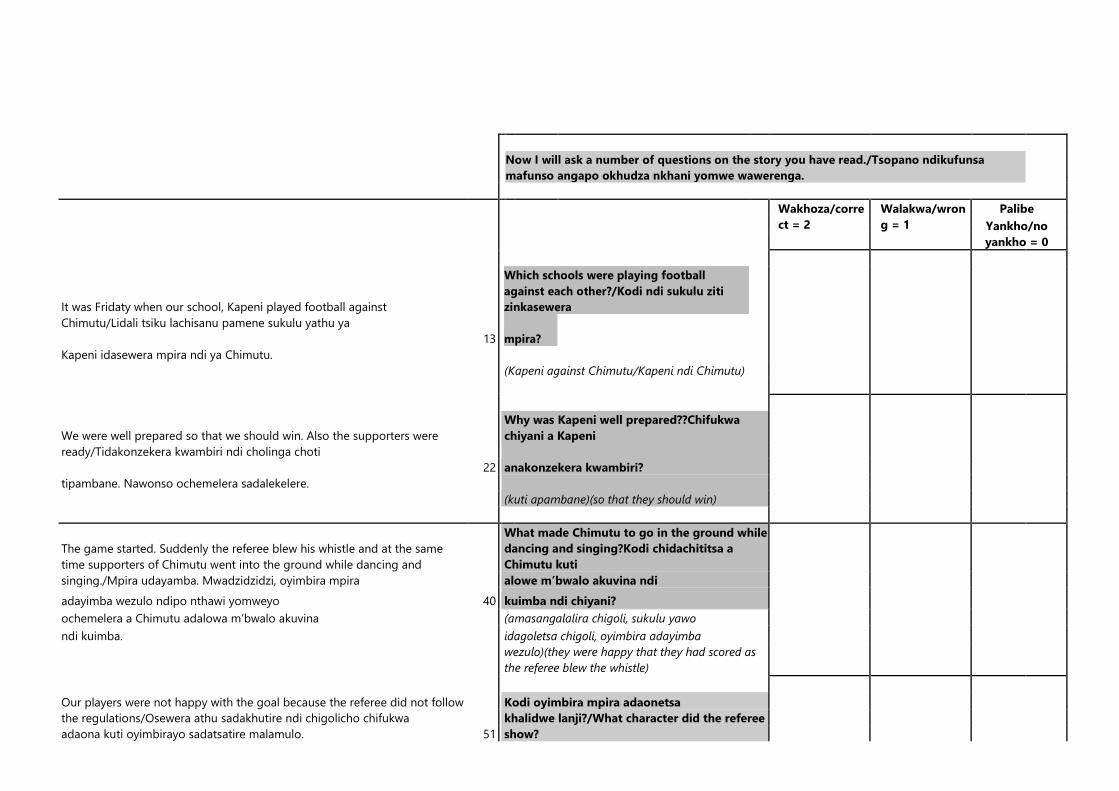
Now I will ask a number of questions on the story you have read./Tsopano ndikufunsa
mafunso angapo okhudza nkhani yomwe wawerenga.
Wakhoza/corre
ct = 2
Walakwa/wron
g = 1
Palibe
Yankho/no
yankho = 0
It was Fridaty when our school, Kapeni played football against
Chimutu/Lidali tsiku lachisanu pamene sukulu yathu ya
Which schools were playing football
against each other?/Kodi ndi sukulu ziti
zinkasewera
13
mpira?
Kapeni idasewera mpira ndi ya Chimutu.
(Kapeni against Chimutu/Kapeni ndi Chimutu)
We were well prepared so that we should win. Also the supporters were
ready/Tidakonzekera kwambiri ndi cholinga choti
Why was Kapeni well prepared??Chifukwa
chiyani a Kapeni
22
anakonzekera kwambiri?
tipambane. Nawonso ochemelera sadalekelere.
(kuti apambane)(so that they should win)
The game started. Suddenly the referee blew his whistle and at the same
time supporters of Chimutu went into the ground while dancing and
singing./Mpira udayamba. Mwadzidzidzi, oyimbira mpira
What made Chimutu to go in the ground while
dancing and singing?Kodi chidachititsa a
Chimutu kuti
alowe m’bwalo akuvina ndi
adayimba wezulo ndipo nthawi yomweyo 40 kuimba ndi chiyani?
ochemelera a Chimutu adalowa m’bwalo akuvina (amasangalalira chigoli, sukulu yawo
ndi kuimba. idagoletsa chigoli, oyimbira adayimba
wezulo)(they were happy that they had scored as
the referee blew the whistle)
Our players were not happy with the goal because the referee did not follow
the regulations/Osewera athu sadakhutire ndi chigolicho chifukwa
Kodi oyimbira mpira adaonetsa
51
khalidwe lanji?/What character did the referee
show?
adaona kuti oyimbirayo sadatsatire malamulo.
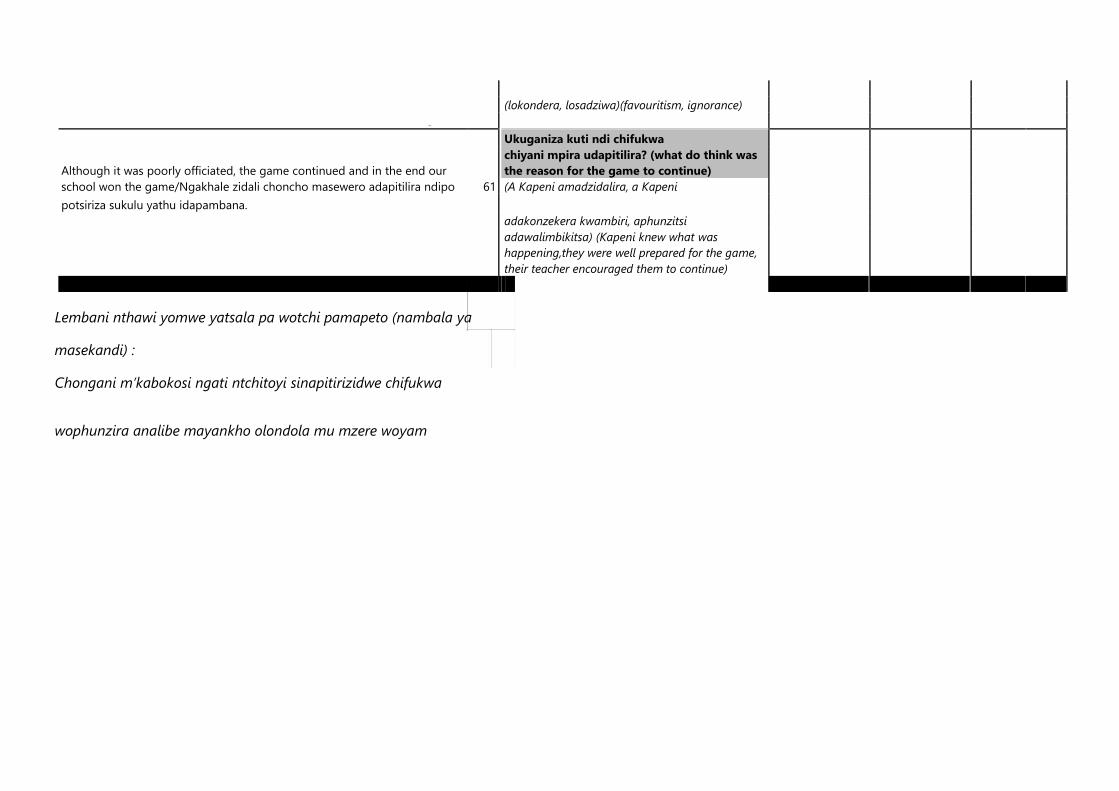
(lokondera, losadziwa)(favouritism, ignorance)
Ukuganiza kuti ndi chifukwa
Although it was poorly officiated, the game continued and in the end our
school won the game/Ngakhale zidali choncho masewero adapitilira ndipo 61
chiyani mpira udapitilira? (what do think was
the reason for the game to continue)
(A Kapeni amadzidalira, a Kapeni
potsiriza sukulu yathu idapambana.
adakonzekera kwambiri, aphunzitsi
adawalimbikitsa) (Kapeni knew what was
happening,they were well prepared for the game,
their teacher encouraged them to continue)
Lembani nthawi yomwe yatsala pa wotchi pamapeto (nambala ya
masekandi) :
Chongani m’kabokosi ngati ntchitoyi sinapitirizidwe chifukwa
wophunzira analibe mayankho olondola mu mzere woyam

Gawo 8. Kumvetsa Nkhani
Ntchito iyi siyofunika kugwiritsa ntchito TSAMBA LA WOPHUNZIRA. (Werengani ndimeyi mokweza kawiri
mopatsa chidwi.)
Ntchito iyi siyofunika kugwiritsa ntchito TSAMBA LA WOPHUNZIRA. Ndiwerengera ndime yayifupi
kawiri kenaka ndidzakufunsa mafunso angapo. Chonde umvetsere bwino pamene ndikuwerengera
nkhaniyi. Uyenera kuyankha mafunsowa mmene ungathere. Kodi ukudziwa chomwe ukuyenera
kuchita? Kodi uli wokonzeka? Tiyeni tiyambe tsopano.
Dzina langa ndine Madalitso. Ndimaphunzira ku Kwerani pulayimale sukulu. Kuyambira Lolemba mpaka
Lachisanu ndimayenera kuvala yunifolomu. Tsiku lina ndikusewera chipako ndi anzanga, ananding’ambira
yunifolomu. Ndinadandaula kwambiri. Ndinadzimvera chisoni ndipo ndinapita kunyumba ndikulira.
Nditafika kunyumba, ndinafotokoza zomwe zinachitika ndipo anandilonjeza kuti andigulira ina
Tsopano ndikufunsa mafunso angapo okhudza nkhani yomwe wawerenga./Now i
will ask a number of questions on the story you have read.
Wakhoza/
Correct
Walakwa/
Wrong
Palibe
Yankho/
No
answer
= 2 = 1
= 0
Which did Madalitso goto?/Kodi ndi sukulu yiti yomwe Madalitso
amaphunzira?
[Madalitso amaphunzira ku Kwerani
pulayimale sukulu](madalitso was gonig to Kwerani Primary School
Why was madalitso worried?/Ndi chifukwa chiyani Madalitso
akudandaula?[Yunifolomu yake
yang’ambidwa, azivala chiyani popita ku
sukulu, a phunzitsi akamubweza/He had no spare uniform to wear to school after the only uniform one
was torn]
What is Madalitso crying about?/Kodi Madalitso akuliranji? [Madalitso
amaopa kuti makolo ake akamukalipira] Madalitso feared that his parents would shout at him
How did Madalitso feel on hearing his parents promise/Madalitso anamva bwanji ndi zomwe
makolo analonjeza?
[Anakondwera, anavinavina]/(happy and danced)
Why is uniform useful?/Kodi ubwino wa yunifolomu ndi
chiyani? [Imadziwitsa komwe mwana
akuphunzira, amaoneka okongola.]It informs us of the school where student goes to, improves the looks
of a student]
Chongani mukabokosi ngati ntchitoyi sinapitirizidwe chifukwa ophunzira analibe mayankho
olondola mu mawu asanu oyamba/ mark in the box on the right if you did not continue due to the
child’s failure to answer correctly the first five words:
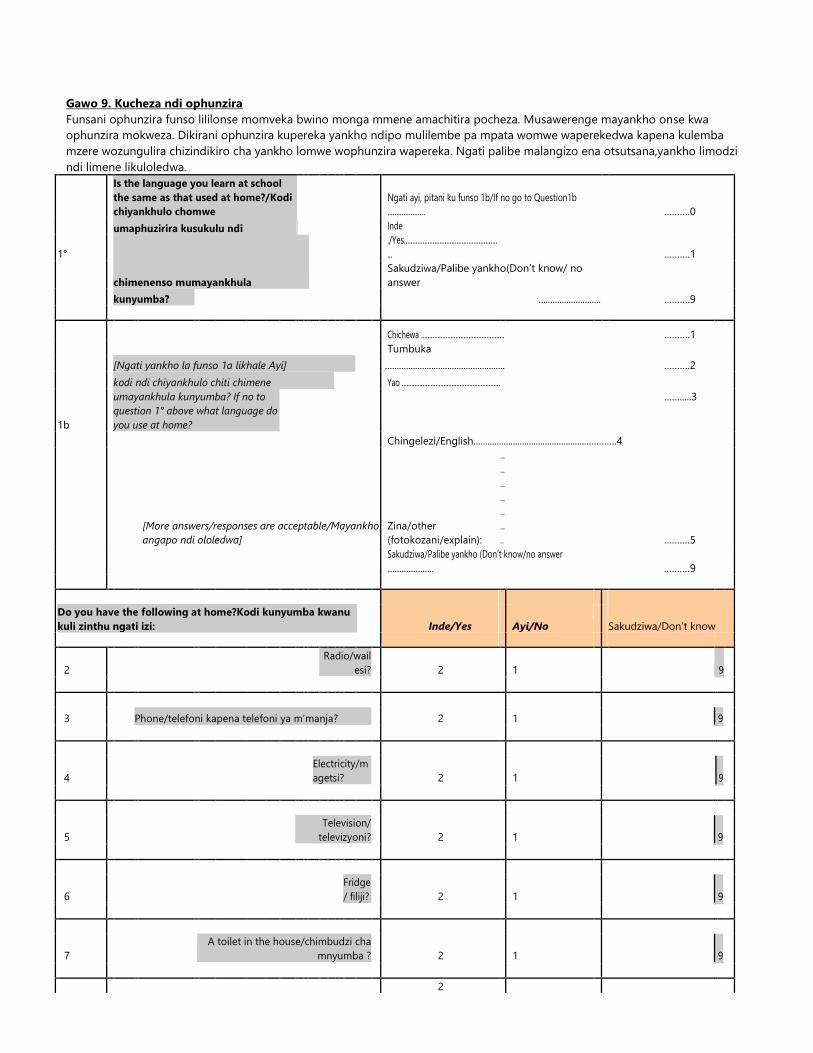
Gawo 9. Kucheza ndi ophunzira
Funsani ophunzira funso lililonse momveka bwino monga mmene amachitira pocheza. Musawerenge mayankho onse kwa
ophunzira mokweza. Dikirani ophunzira kupereka yankho ndipo mulilembe pa mpata womwe waperekedwa kapena kulemba
mzere wozungulira chizindikiro cha yankho lomwe wophunzira wapereka. Ngati palibe malangizo ena otsutsana,yankho limodzi
ndi limene likuloledwa.
Is the language you learn at school
the same as that used at home?/Kodi
chiyankhulo chomwe
Ngati ayi, pitani ku funso 1b/If no go to Question1b
..................... ……….0
1°
umaphuzirira kusukulu ndi Inde
./Yes.......................................................
...
……….1
chimenenso mumayankhula
Sakudziwa/Palibe yankho(Don’t know/ no
answer
……….9 kunyumba? ...........................
Chichewa ................................................... ……….1
Tumbuka
……….2 [Ngati yankho la funso 1a likhale Ayi] ....................................................
kodi ndi chiyankhulo chiti chimene Yao .............................................................
…….....3
1b
umayankhula kunyumba? If no to
question 1° above what language do
you use at home?
Chingelezi/English...................................................……….4
[More answers/responses are acceptable/Mayankho
angapo ndi ololedwa]
Zina/other
(fotokozani/explain):
......
......
......
......
......
......
.... …….…5
Sakudziwa/Palibe yankho (Don’t know/no answer
.......................... .………9
Sakudziwa/Don’t know
Do you have the following at home?Kodi kunyumba kwanu
kuli zinthu ngati izi: Inde/Yes Ayi/No
2
Radio/wail
esi? 2 1 9
2
3 Phone/telefoni kapena telefoni ya m’manja? 1 9
2
4
Electricity/m
agetsi? 1 9
2
5
Television/
televizyoni? 1 9
2
6
Fridge
/ filiji? 1 9
2
7
A toilet in the house/chimbudzi cha
mnyumba ? 1 9
2
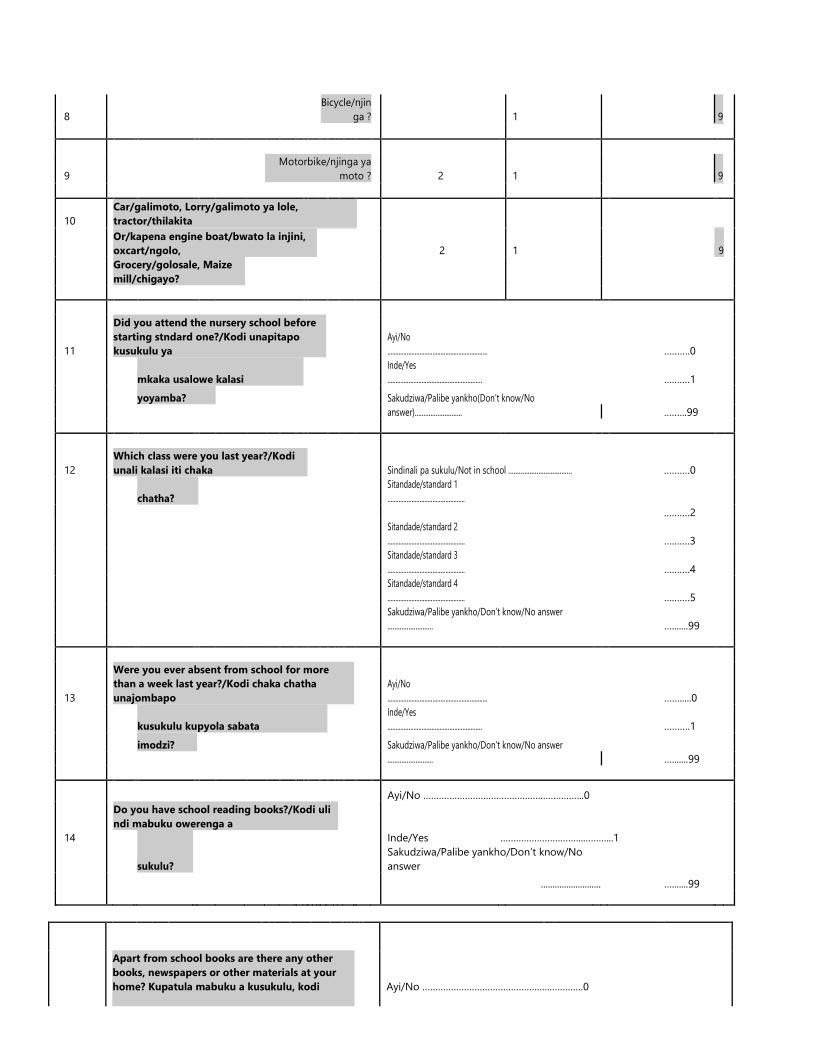
8
Bicycle/njin
ga ? 1 9
2
9
Motorbike/njinga ya
moto ? 1 9
10
Car/galimoto, Lorry/galimoto ya lole,
tractor/thilakita
1
Or/kapena engine boat/bwato la injini,
oxcart/ngolo, 2 9
Grocery/golosale, Maize
mill/chigayo?
11
Did you attend the nursery school before
starting stndard one?/Kodi unapitapo
kusukulu ya
Ayi/No
.............................................................. ……….0
mkaka usalowe kalasi
Inde/Yes
.......................................................... ….……1
yoyamba? Sakudziwa/Palibe yankho(Don’t know/No
answer)...........................
.……..99
12
Which class were you last year?/Kodi
unali kalasi iti chaka Sindinali pa sukulu/Not in school .................................... .………0
chatha?
Sitandade/standard 1
................................................
.………2
Sitandade/standard 2
................................................ ….……3
Sitandade/standard 3
................................................ ….……4
Sitandade/standard 4
................................................ ….……5
Sakudziwa/Palibe yankho/Don’t know/No answer
.......................... ….......99
13
Were you ever absent from school for more
than a week last year?/Kodi chaka chatha
unajombapo
Ayi/No
.............................................................. …….....0
kusukulu kupyola sabata
Inde/Yes
.......................................................... ……….1
imodzi? Sakudziwa/Palibe yankho/Don’t know/No answer
..........................
….......99
Ayi/No ……………………………………………………..0
14
Do you have school reading books?/Kodi uli
ndi mabuku owerenga a
Inde/Yes …………………………..………...1
sukulu?
Sakudziwa/Palibe yankho/Don’t know/No
answer
….......99 ..........................
Apart from school books are there any other
books, newspapers or other materials at your
home? Kupatula mabuku a kusukulu, kodi Ayi/No ………………………………………….………….0
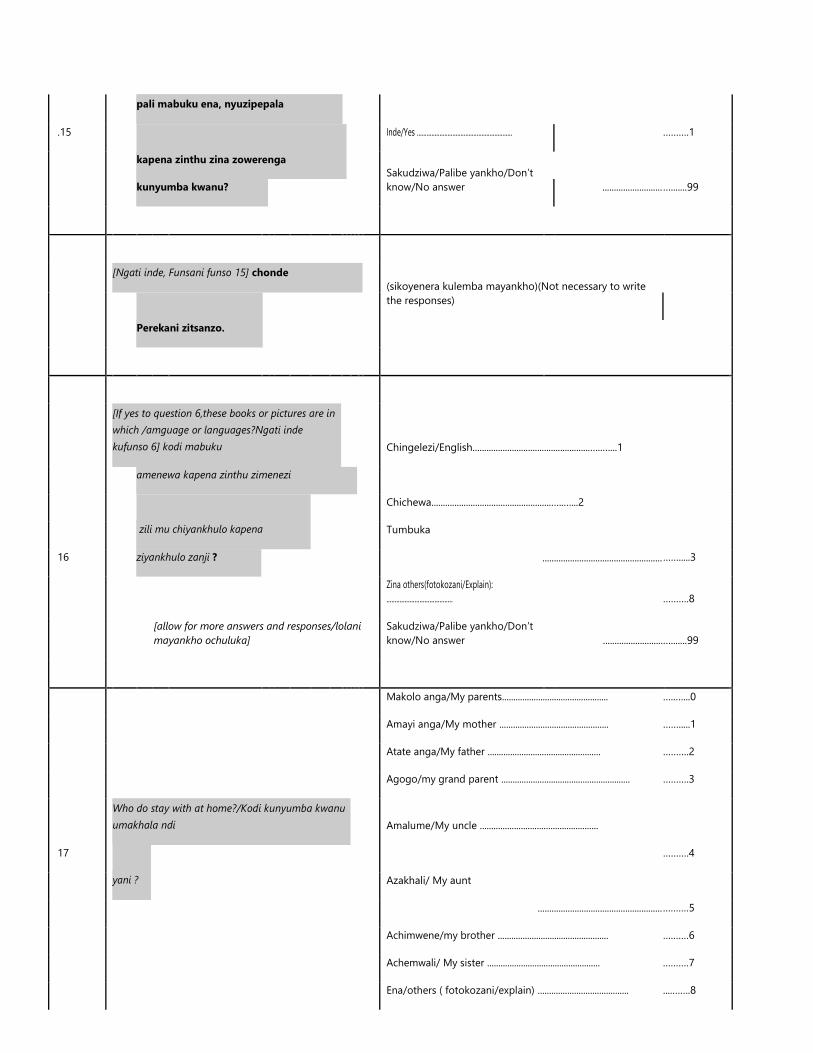
.15
pali mabuku ena, nyuzipepala
Inde/Yes ...........................................................
……….1
kapena zinthu zina zowerenga
Sakudziwa/Palibe yankho/Don’t
know/No answer
….......99
kunyumba kwanu? ..........................
[Ngati inde, Funsani funso 15] chonde
(sikoyenera kulemba mayankho)(Not necessary to write
the responses)
Perekani zitsanzo.
Chingelezi/English...................................................…..…...1
[If yes to question 6,these books or pictures are in
which /amguage or languages?Ngati inde
kufunso 6] kodi mabuku
amenewa kapena zinthu zimenezi
Chichewa....................................................…..…...2
16
zili mu chiyankhulo kapena
Tumbuka
…….....3
ziyankhulo zanji ? ....................................................
Zina others(fotokozani/Explain):
........................................ ……….8
[allow for more answers and responses/lolani
mayankho ochuluka]
Sakudziwa/Palibe yankho/Don’t
know/No answer .......................... ….......99
Makolo anga/My parents............................................... …..…...0
Amayi anga/My mother ................................................ …….....1
Atate anga/My father .................................................. ……….2
Agogo/my grand parent ......................................................... ……….3
17
Who do stay with at home?/Kodi kunyumba kwanu
umakhala ndi Amalume/My uncle ....................................................
……….4
yani ?
Azakhali/ My aunt
.………5
......................................................
Achimwene/my brother ................................................. ….……6
Achemwali/ My sister .................................................. .………7
Ena/others ( fotokozani/explain) ........................................ ....…….8
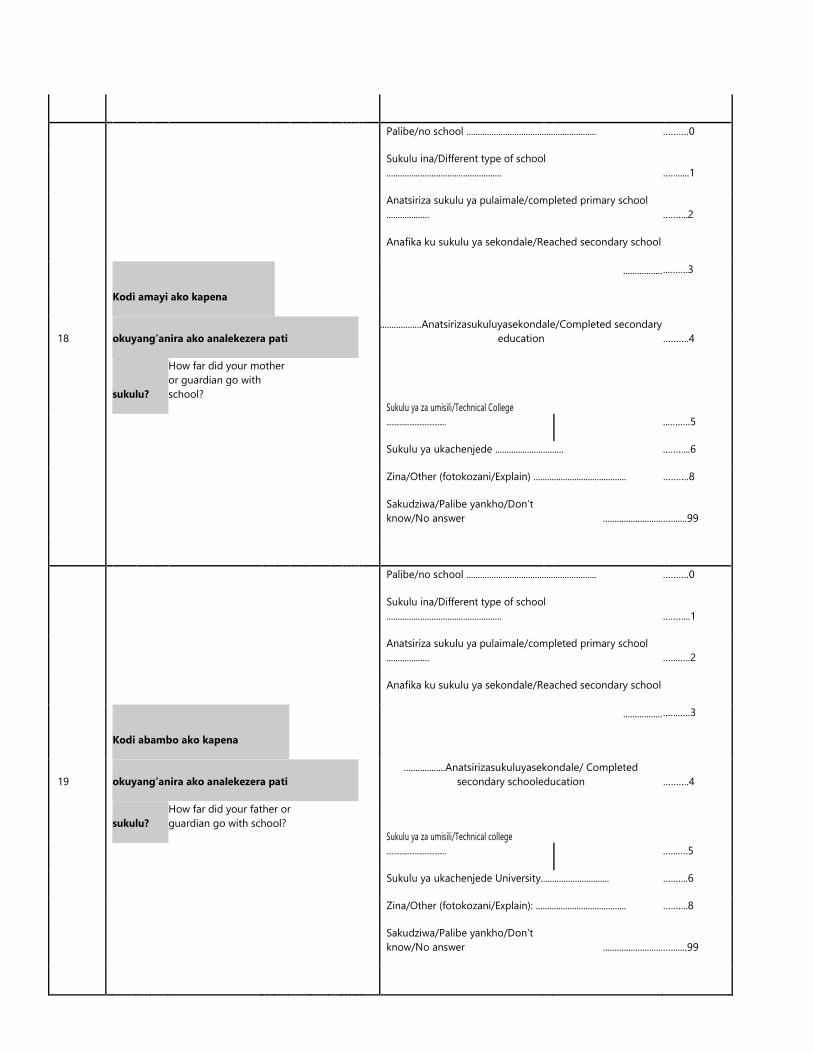
Palibe/no school ......................................................... .………0
Sukulu ina/Different type of school
................................................... ..…......1
Anatsiriza sukulu ya pulaimale/completed primary school
................... ..……..2
Anafika ku sukulu ya sekondale/Reached secondary school
...…….3
18
Kodi amayi ako kapena
.................
okuyang’anira ako analekezera pati
..................Anatsirizasukuluyasekondale/Completed secondary
education ……….4
sukulu?
How far did your mother
or guardian go with
school?
Sukulu ya za umisili/Technical College
....................................
...….….5
Sukulu ya ukachenjede .............................. ..……...6
Zina/Other (fotokozani/Explain) ......................................... ……….8
Sakudziwa/Palibe yankho/Don’t
know/No answer .......................... ….......99
Palibe/no school ......................................................... .………0
Sukulu ina/Different type of school
................................................... ..……...1
Anatsiriza sukulu ya pulaimale/completed primary school
................... .…..…..2
Anafika ku sukulu ya sekondale/Reached secondary school
..…..….3
19
Kodi abambo ako kapena
.................
okuyang’anira ako analekezera pati
..................Anatsirizasukuluyasekondale/ Completed
secondary schooleducation ……….4
sukulu?
How far did your father or
guardian go with school?
Sukulu ya za umisili/Technical college
....................................
.…..….5
Sukulu ya ukachenjede University.............................. …..…..6
Zina/Other (fotokozani/Explain): ........................................ …..…..8
Sakudziwa/Palibe yankho/Don’t
know/No answer .......................... ….......99
Nthawi yomaliza kuyesa ____ : _____ (maola 24/24
hours)
ophunzira/Completion time of
the exercise:
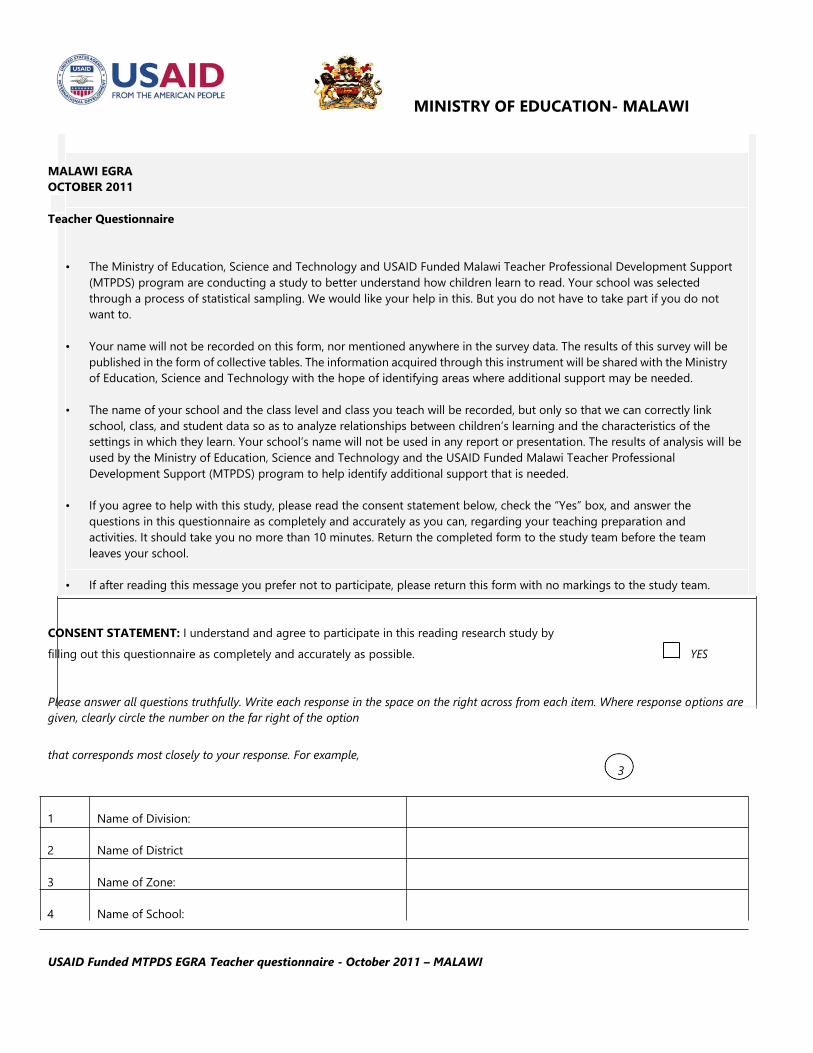
MINISTRY OF EDUCATION- MALAWI
MALAWI EGRA
OCTOBER 2011
Teacher Questionnaire
• The Ministry of Education, Science and Technology and USAID Funded Malawi Teacher Professional Development Support
(MTPDS) program are conducting a study to better understand how children learn to read. Your school was selected
through a process of statistical sampling. We would like your help in this. But you do not have to take part if you do not
want to.
• Your name will not be recorded on this form, nor mentioned anywhere in the survey data. The results of this survey will be
published in the form of collective tables. The information acquired through this instrument will be shared with the Ministry
of Education, Science and Technology with the hope of identifying areas where additional support may be needed.
• The name of your school and the class level and class you teach will be recorded, but only so that we can correctly link
school, class, and student data so as to analyze relationships between children’s learning and the characteristics of the
settings in which they learn. Your school’s name will not be used in any report or presentation. The results of analysis will be
used by the Ministry of Education, Science and Technology and the USAID Funded Malawi Teacher Professional
Development Support (MTPDS) program to help identify additional support that is needed.
• If you agree to help with this study, please read the consent statement below, check the “Yes” box, and answer the
questions in this questionnaire as completely and accurately as you can, regarding your teaching preparation and
activities. It should take you no more than 10 minutes. Return the completed form to the study team before the team
leaves your school.
• If after reading this message you prefer not to participate, please return this form with no markings to the study team.
CONSENT STATEMENT: I understand and agree to participate in this reading research study by
filling out this questionnaire as completely and accurately as possible. YES
Please answer all questions truthfully. Write each response in the space on the right across from each item. Where response options are
given, clearly circle the number on the far right of the option
that corresponds most closely to your response. For example,
3
1 Name of Division:
2 Name of District
3 Name of Zone:
4 Name of School:
USAID Funded MTPDS EGRA Teacher questionnaire - October 2011 – MALAWI
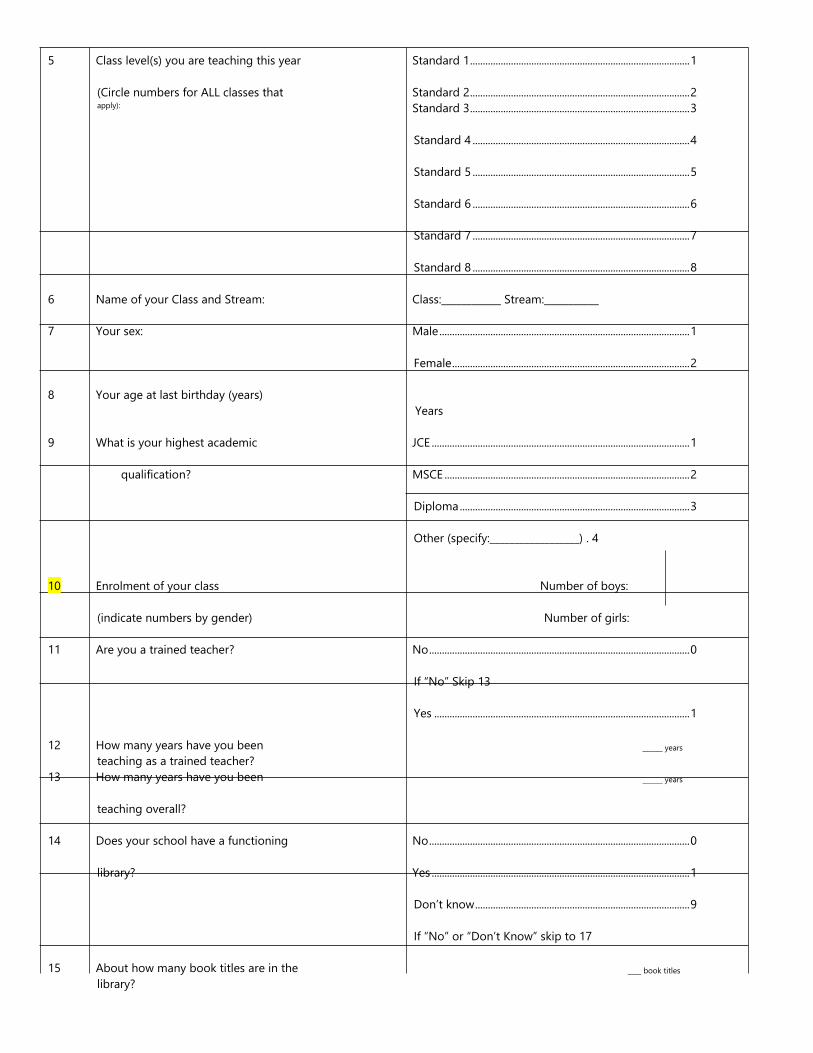
5 Class level(s) you are teaching this year Standard 1 ...................................................................................... 1
(Circle numbers for ALL classes that Standard 2 ...................................................................................... 2 apply): Standard 3 ...................................................................................... 3
Standard 4 ..................................................................................... 4
Standard 5 ..................................................................................... 5
Standard 6 ..................................................................................... 6
Standard 7 ..................................................................................... 7
Standard 8 ..................................................................................... 8
6 Name of your Class and Stream: Class:____________ Stream:___________
7 Your sex: Male .................................................................................................. 1
Female ............................................................................................. 2
8 Your age at last birthday (years)
Years
9 What is your highest academic JCE ..................................................................................................... 1
qualification? MSCE ................................................................................................ 2
Diploma .......................................................................................... 3
Other (specify:__________________) . 4
10 Enrolment of your class Number of boys:
(indicate numbers by gender) Number of girls:
11 Are you a trained teacher? No ...................................................................................................... 0
If “No” Skip 13
Yes .................................................................................................... 1
12 How many years have you been ______ years
teaching as a trained teacher?
13 How many years have you been ______ years
teaching overall?
14 Does your school have a functioning No ...................................................................................................... 0
library? Yes ..................................................................................................... 1
Don’t know .................................................................................... 9
If “No” or “Don’t Know” skip to 17
15 About how many book titles are in the ____ book titles
library?

16 Do you supervise your learners as they No ...................................................................................................... 0
use the library? Yes ..................................................................................................... 1
17 Do you have sufficient learning No ...................................................................................................... 0
materials? Yes ..................................................................................................... 1
Don’t know .................................................................................... 9
18 Does your school have a functioning No ...................................................................................................... 0
USAID Funded MTPDS EGRA Teacher questionnaire - October 2011 - MALAWI 2
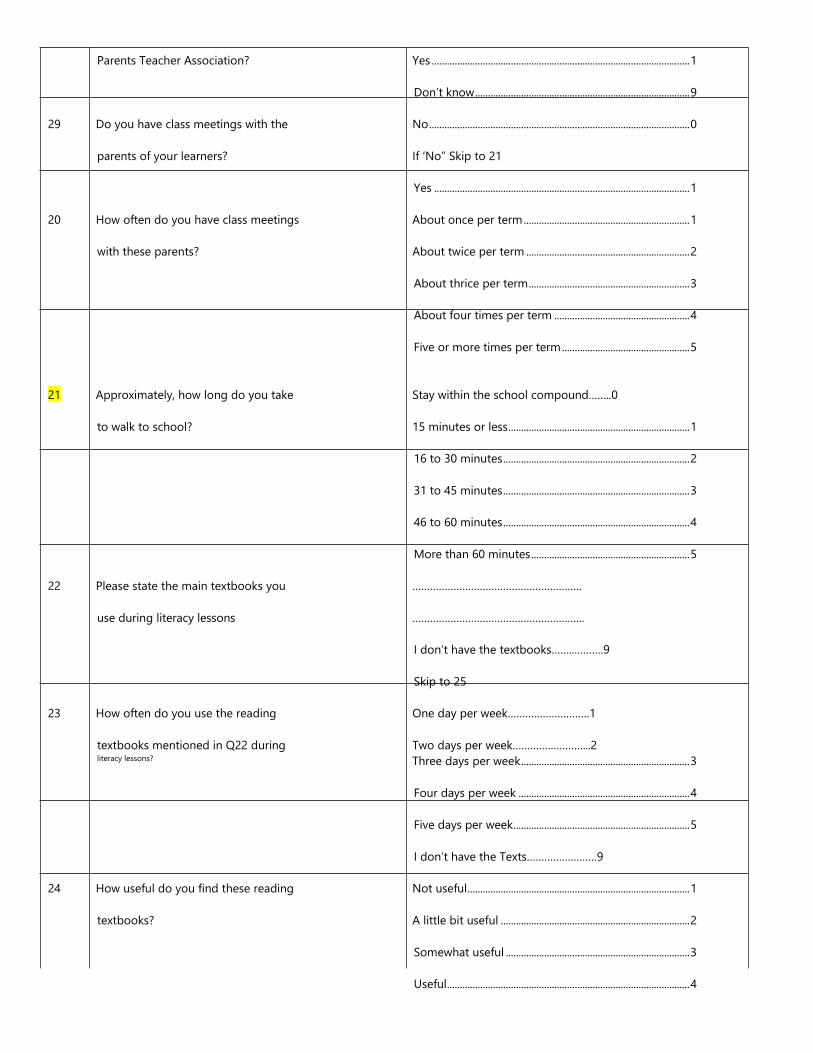
Parents Teacher Association? Yes ..................................................................................................... 1
Don’t know .................................................................................... 9
29 Do you have class meetings with the No ...................................................................................................... 0
parents of your learners? If ‘No” Skip to 21
Yes .................................................................................................... 1
20 How often do you have class meetings About once per term ................................................................. 1
with these parents? About twice per term ................................................................ 2
About thrice per term ............................................................... 3
About four times per term ..................................................... 4
Five or more times per term .................................................. 5
21 Approximately, how long do you take Stay within the school compound……..0
to walk to school? 15 minutes or less ....................................................................... 1
16 to 30 minutes ......................................................................... 2
31 to 45 minutes ......................................................................... 3
46 to 60 minutes ......................................................................... 4
More than 60 minutes .............................................................. 5
22 Please state the main textbooks you ………………………………………………….
use during literacy lessons …………………………………………………..
I don’t have the textbooks……..……….9
Skip to 25
23 How often do you use the reading One day per week……………………….1
textbooks mentioned in Q22 during Two days per week……………………...2 literacy lessons? Three days per week .................................................................. 3
Four days per week ................................................................... 4
Five days per week ..................................................................... 5
I don’t have the Texts……………………9
24 How useful do you find these reading Not useful ....................................................................................... 1
textbooks? A little bit useful .......................................................................... 2
Somewhat useful ........................................................................ 3
Useful ............................................................................................... 4
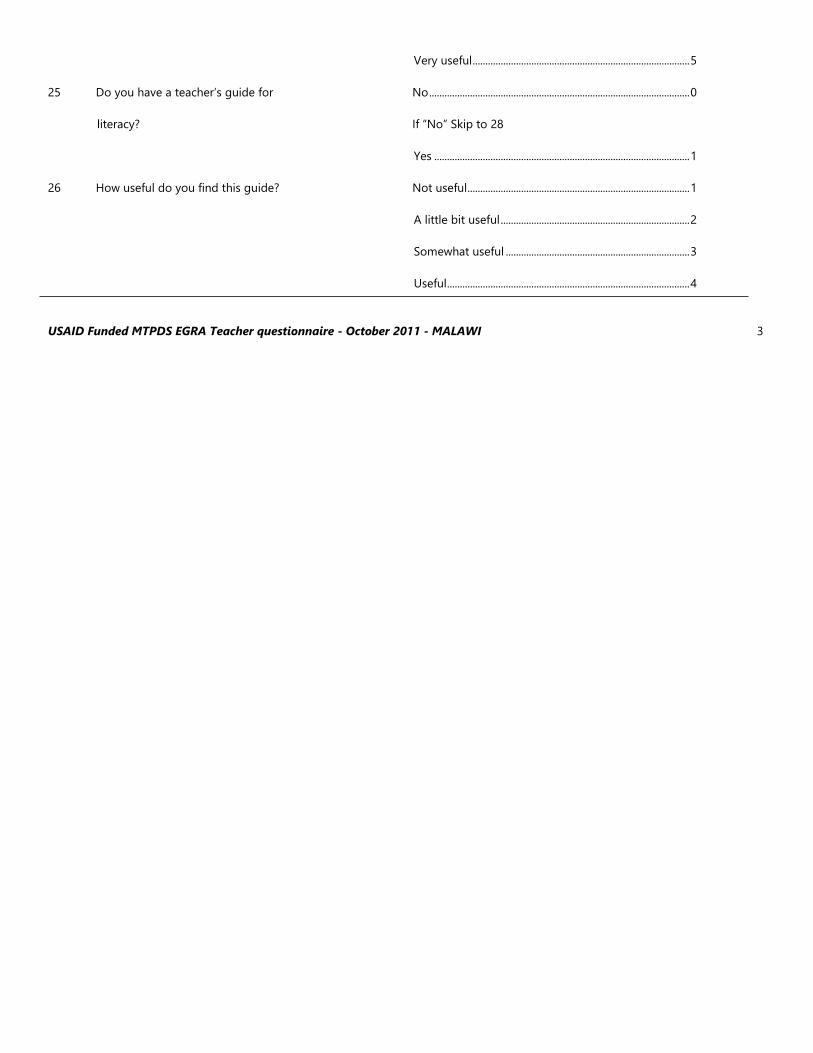
Very useful ..................................................................................... 5
25 Do you have a teacher’s guide for No ...................................................................................................... 0
literacy? If “No” Skip to 28
Yes .................................................................................................... 1
26 How useful do you find this guide? Not useful ....................................................................................... 1
A little bit useful .......................................................................... 2
Somewhat useful ........................................................................ 3
Useful ............................................................................................... 4
USAID Funded MTPDS EGRA Teacher questionnaire - October 2011 - MALAWI 3

Very useful ........................................... 5
27 What improvements to the teacher’s
guide would you recommend?
(Describe):
Following are different activities you might do with your learners. Think about the
last 5 school days and indicate how often each of the following activities took place,
by circling the number on the right
Never
1 day a
2 days
3 days
4 days 5 days a
that corresponds to the closest
week
a week
a week
a week
week
frequency:
28 The whole class repeated
0
1
2
3
4
5
sentences that you said first.
29 Learners copied down text from the
0
1
2
3
4
5
chalkboard.
30 Learners retold a story that they
0
1
2
3
4
5
read.
31 Learners sounded out unfamiliar
0
1
2
3
4
5
words.
32 Learners learned meanings of new
0
1
2
3
4
5
words.
33 Learners read aloud to teacher or
0
1
2
3
4
5
to other learners.
34 Learners were assigned reading to
0
1
2
3
4
5
do on their own during school time.
Which of the following methods do you use to measure your learners’ reading
progress? Indicate how often you use each method by circling the number
the right that corresponds to the
Never
1 day a 2 days 3 days 4 days
5 days a week
closest frequency:
week a week
a week
a week
35 Written evaluations 0 1 2 3 4 5
36 Oral evaluations 0 1 2 3 4 5
37 Review of learner’s progress 0 1 2 3 4 5
38 Checking of exercise books 0 1 2 3 4 5
39 Checking of homework 0 1 2 3 4 5
40 Other methods (please

describe):
In what class should learners FIRST be able to demonstrate each of the
following reading skills? Circle number
Before
Std 1
Std 2
Std 3
Other
of option corresponding most closely to
Std 1
your response for each skill.
41 Read aloud a short passage with few
0 1
2
3
9
mistakes
USAID Funded MTPDS EGRA Teacher questionnaire - October 2011 - MALAWI 4
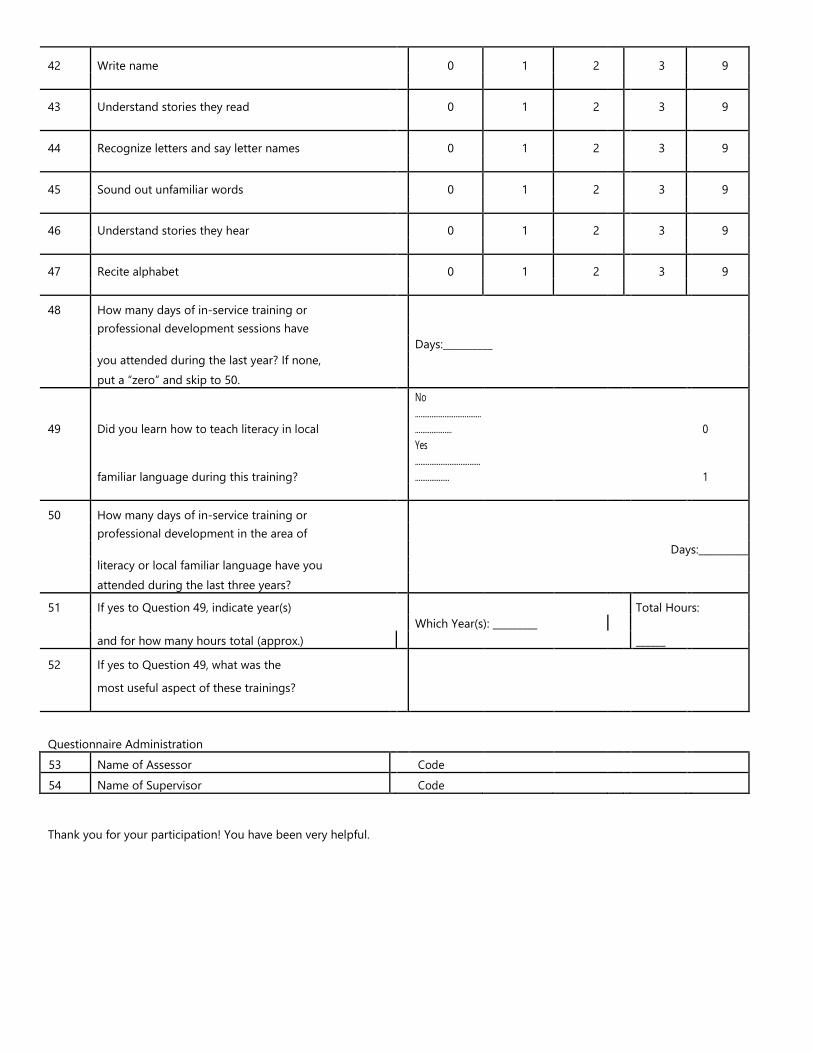
42 Write name 0 1 2 3 9
43 Understand stories they read 0 1 2 3 9
44 Recognize letters and say letter names 0 1 2 3 9
45 Sound out unfamiliar words 0 1 2 3 9
46 Understand stories they hear 0 1 2 3 9
47 Recite alphabet 0 1 2 3 9
48 How many days of in-service training or
professional development sessions have
Days:__________
you attended during the last year? If none,
put a “zero” and skip to 50.
49 Did you learn how to teach literacy in local
No
....................................
.................... 0
familiar language during this training?
Yes
....................................
................... 1
50 How many days of in-service training or
professional development in the area of
Days:__________
literacy or local familiar language have you
attended during the last three years?
51 If yes to Question 49, indicate year(s)
Which Year(s): _________
Total Hours:
and for how many hours total (approx.)
______
52 If yes to Question 49, what was the
most useful aspect of these trainings?
Questionnaire Administration
53 Name of Assessor Code
54 Name of Supervisor Code
Thank you for your participation! You have been very helpful.
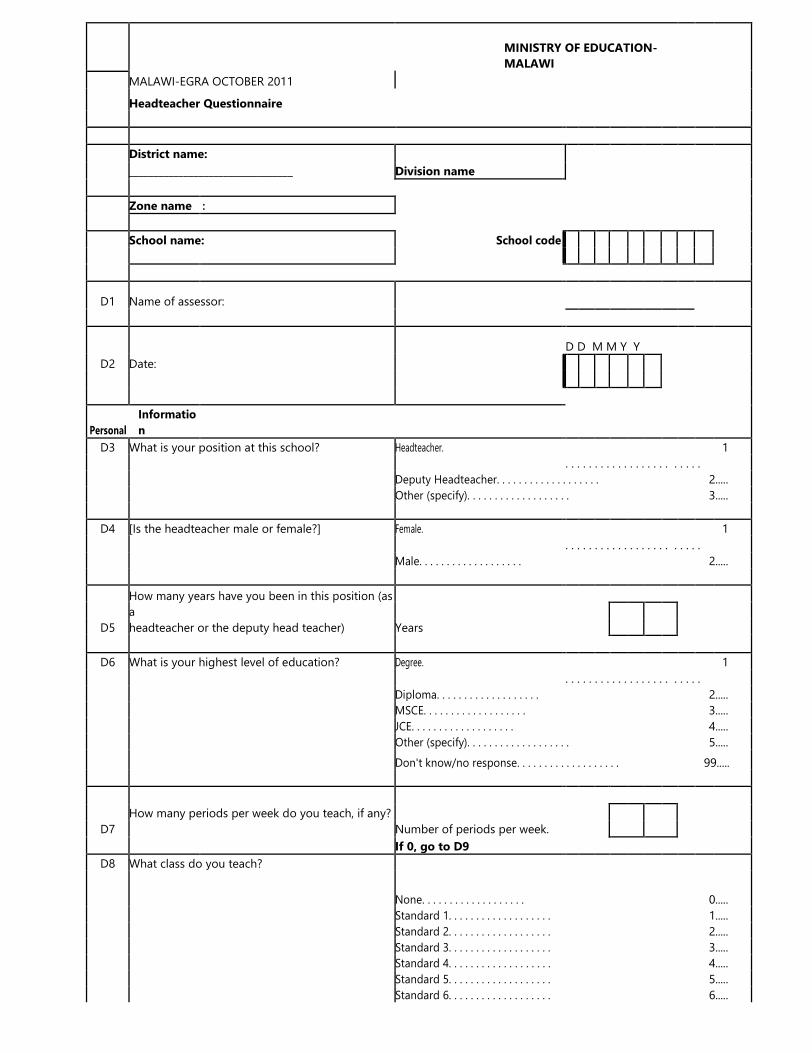
MALAWI-EGRA OCTOBER 2011
MINISTRY OF EDUCATION-
MALAWI
Headteacher Questionnaire
District name:
Division name
_________________________________
Zone name :
School code
School name:
D1 Name of assessor:
D2 Date:
D D M M Y Y
Personal
Informatio
n
D3 What is your position at this school? Headteacher. 1
. . . . . . . . . . . . . . . . . . . . . . .
Deputy Headteacher. . . . . . . . . . . . . . . . . . . 2.....
Other (specify). . . . . . . . . . . . . . . . . . . 3.....
D4 [Is the headteacher male or female?] Female. 1
. . . . . . . . . . . . . . . . . . . . . . .
Male. . . . . . . . . . . . . . . . . . . 2.....
How many years have you been in this position (as
a
D5 headteacher or the deputy head teacher) Years
D6 What is your highest level of education? Degree. 1
. . . . . . . . . . . . . . . . . . . . . . .
Diploma. . . . . . . . . . . . . . . . . . . 2.....
MSCE. . . . . . . . . . . . . . . . . . . 3.....
JCE. . . . . . . . . . . . . . . . . . . 4.....
Other (specify). . . . . . . . . . . . . . . . . . . 5.....
Don't know/no response. . . . . . . . . . . . . . . . . . . 99.....
D7
How many periods per week do you teach, if any?
Number of periods per week.
If 0, go to D9
D8 What class do you teach?
None. . . . . . . . . . . . . . . . . . . 0.....
Standard 1. . . . . . . . . . . . . . . . . . . 1.....
Standard 2. . . . . . . . . . . . . . . . . . . 2.....
Standard 3. . . . . . . . . . . . . . . . . . . 3.....
Standard 4. . . . . . . . . . . . . . . . . . . 4.....
Standard 5. . . . . . . . . . . . . . . . . . . 5.....
Standard 6. . . . . . . . . . . . . . . . . . . 6.....
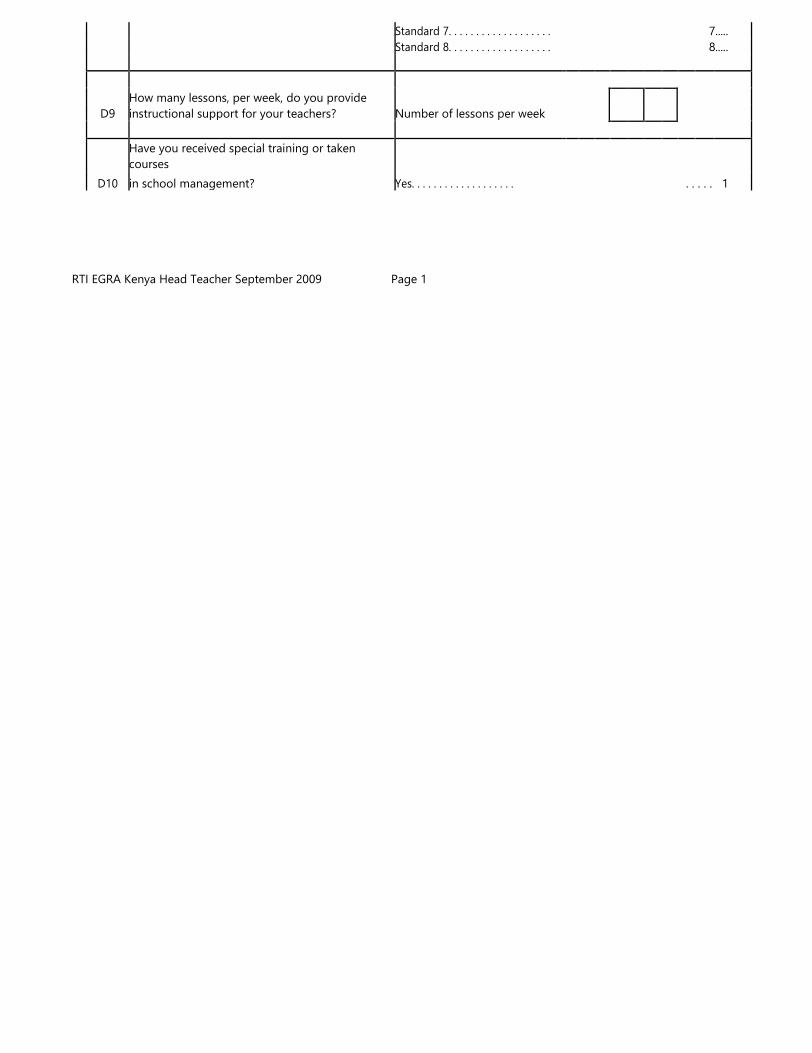
Standard 7. . . . . . . . . . . . . . . . . . . 7.....
Standard 8. . . . . . . . . . . . . . . . . . . 8.....
D9
How many lessons, per week, do you provide
instructional support for your teachers? Number of lessons per week
Have you received special training or taken
courses
D10 in school management? Yes. . . . . . . . . . . . . . . . . . . . . . . . 1
RTI EGRA Kenya Head Teacher September 2009 Page 1

No . . . . . . . . . . . . . . . . . . . . . . . .
0
if No, go to D13
Doesn't know/Refuses to respond . .
. . . . . . . . . . . . . . . . . . . . . . 99
D11 If yes, what was the length of the programme?
[Enter in the period of time elapsed next to the
appropriate measure of time either day, week, or
month] days
weeks
[IF DON'T KNOW, ENTER "DK"]
months
D12 Who initiated this training for you?
My district invited me . . . . . . . . . . . . . . . . . . . . . . . .
1
I initiated it . . . . . . . . . . . . . . . . . . . . . . . .
2
Other . . . . . . . . . . . . . . . . . . . . . . . .
3
If other, specify:_________________________________________
Have you received special training or taken courses
that prepared you to implement a programe in
D13 reading? Yes . . . . . . . . . . . . . . . . . . . . . . . .
1
No . . . . . . . . . . . . . . . . . . . . . . . .
0
If No, go to D17
Doesn't know/Refuses to respond . .
. . . . . . . . . . . . . . . . . . . . . . 99
If yes, what was the length of the programme?
D14
[IF DON'T KNOW, ENTER "DK"]
days
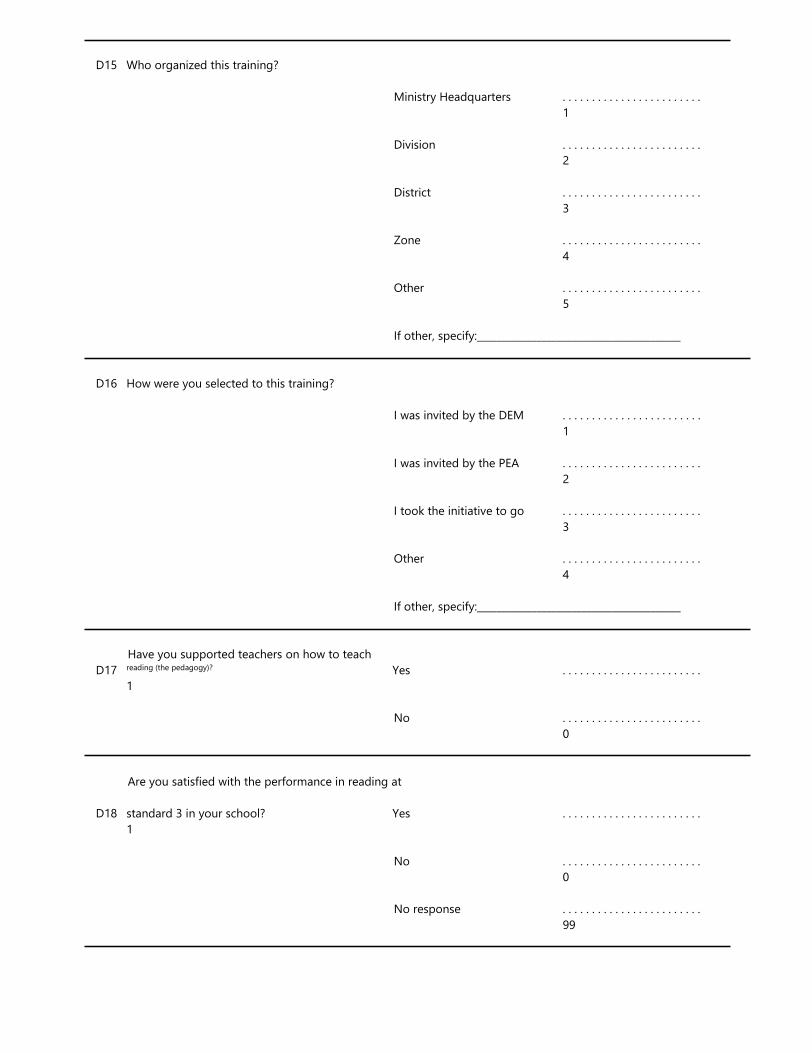
D15 Who organized this training?
Ministry Headquarters . . . . . . . . . . . . . . . . . . . . . . . .
1
Division . . . . . . . . . . . . . . . . . . . . . . . .
2
District . . . . . . . . . . . . . . . . . . . . . . . .
3
Zone . . . . . . . . . . . . . . . . . . . . . . . .
4
Other . . . . . . . . . . . . . . . . . . . . . . . .
5
If other, specify:_________________________________________
D16 How were you selected to this training?
I was invited by the DEM . . . . . . . . . . . . . . . . . . . . . . . .
1
I was invited by the PEA . . . . . . . . . . . . . . . . . . . . . . . .
2
I took the initiative to go . . . . . . . . . . . . . . . . . . . . . . . .
3
Other . . . . . . . . . . . . . . . . . . . . . . . .
4
If other, specify:_________________________________________
Have you supported teachers on how to teach
D17 reading (the pedagogy)? Yes . . . . . . . . . . . . . . . . . . . . . . . .
1
No . . . . . . . . . . . . . . . . . . . . . . . .
0
Are you satisfied with the performance in reading at
D18 standard 3 in your school? Yes . . . . . . . . . . . . . . . . . . . . . . . .
1
No . . . . . . . . . . . . . . . . . . . . . . . .
0
No response . . . . . . . . . . . . . . . . . . . . . . . .
99

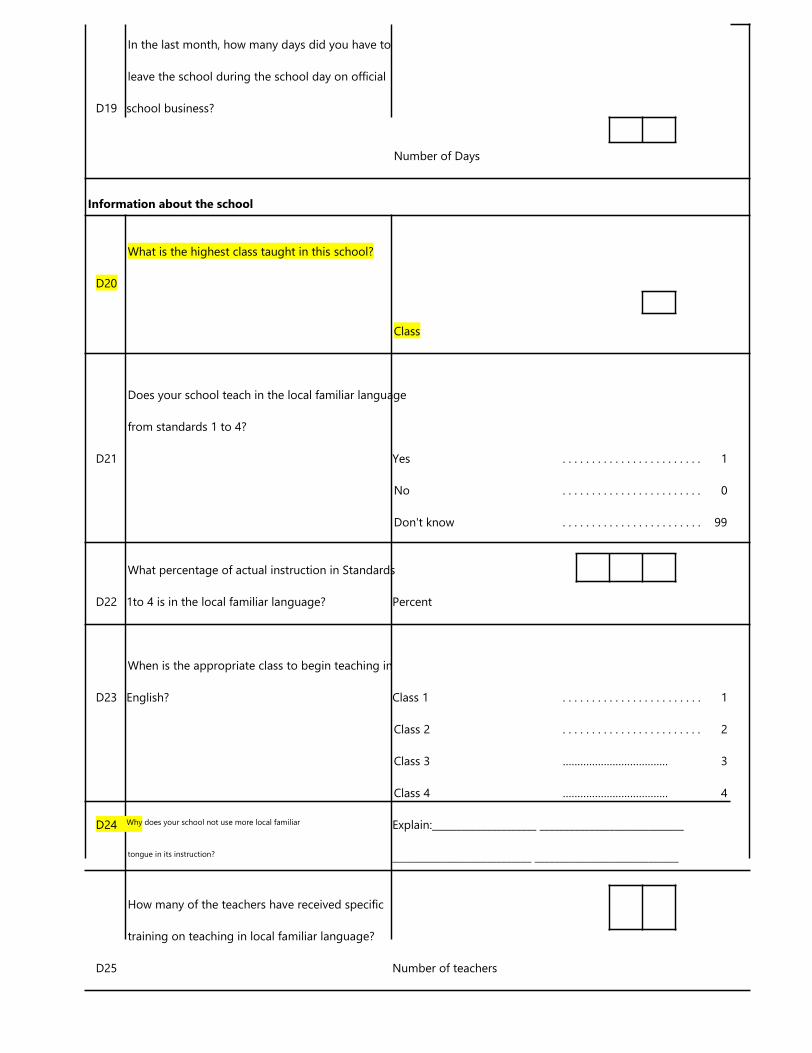
In the last month, how many days did you have to
leave the school during the school day on official
D19 school business?
Number of Days
Information about the school
What is the highest class taught in this school?
D20
Class
Does your school teach in the local familiar language
from standards 1 to 4?
D21 Yes . . . . . . . . . . . . . . . . . . . . . . . . 1
No . . . . . . . . . . . . . . . . . . . . . . . . 0
Don't know . . . . . . . . . . . . . . . . . . . . . . . . 99
What percentage of actual instruction in Standards
D22 1to 4 is in the local familiar language? Percent
When is the appropriate class to begin teaching in
D23 English? Class 1 . . . . . . . . . . . . . . . . . . . . . . . . 1
Class 2 . . . . . . . . . . . . . . . . . . . . . . . . 2
Class 3 ……………………………… 3
Class 4 ……………………………… 4
D24 Why does your school not use more local familiar Explain:_____________________ _____________________________
tongue in its instruction? ____________________________ _____________________________
How many of the teachers have received specific
training on teaching in local familiar language?
D25 Number of teachers
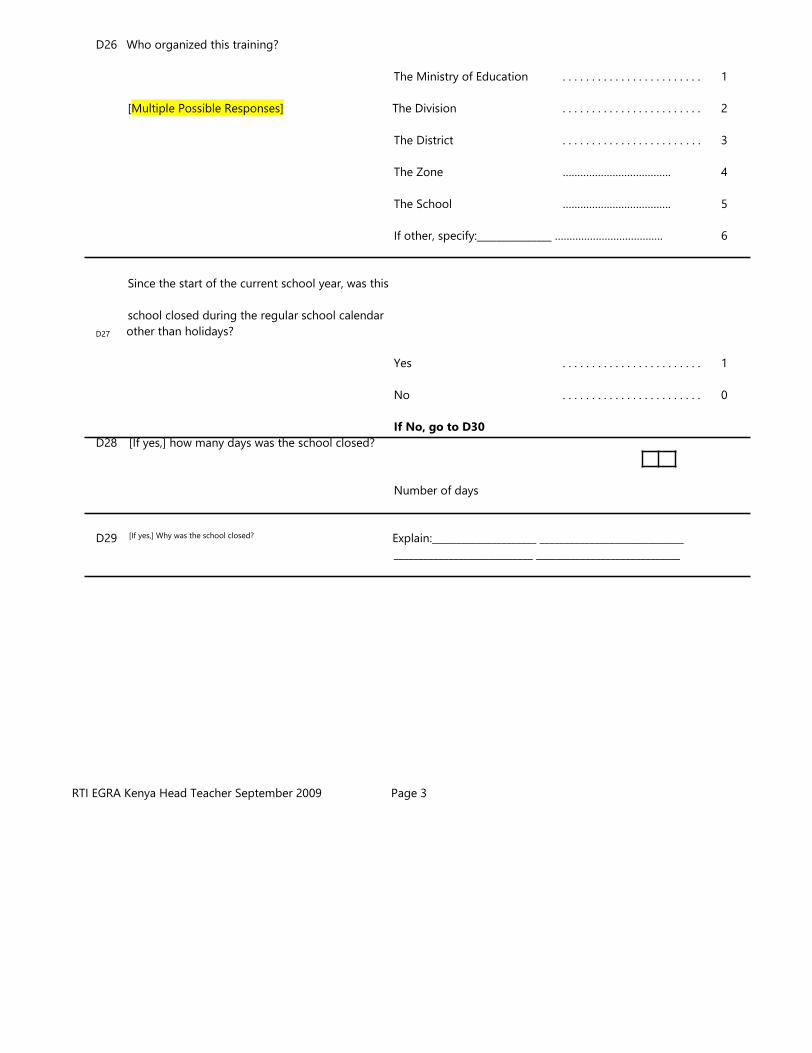
D26 Who organized this training?
The Ministry of Education . . . . . . . . . . . . . . . . . . . . . . . . 1
[Multiple Possible Responses] The Division . . . . . . . . . . . . . . . . . . . . . . . . 2
The District . . . . . . . . . . . . . . . . . . . . . . . . 3
The Zone ………………………………. 4
The School ………………………………. 5
If other, specify:_______________ ………………………………. 6
Since the start of the current school year, was this
school closed during the regular school calendar
D27 other than holidays?
Yes . . . . . . . . . . . . . . . . . . . . . . . . 1
No . . . . . . . . . . . . . . . . . . . . . . . . 0
If No, go to D30
D28 [If yes,] how many days was the school closed?
Number of days
D29 [If yes,] Why was the school closed? Explain:_____________________ _____________________________
____________________________ _____________________________
RTI EGRA Kenya Head Teacher September 2009 Page 3
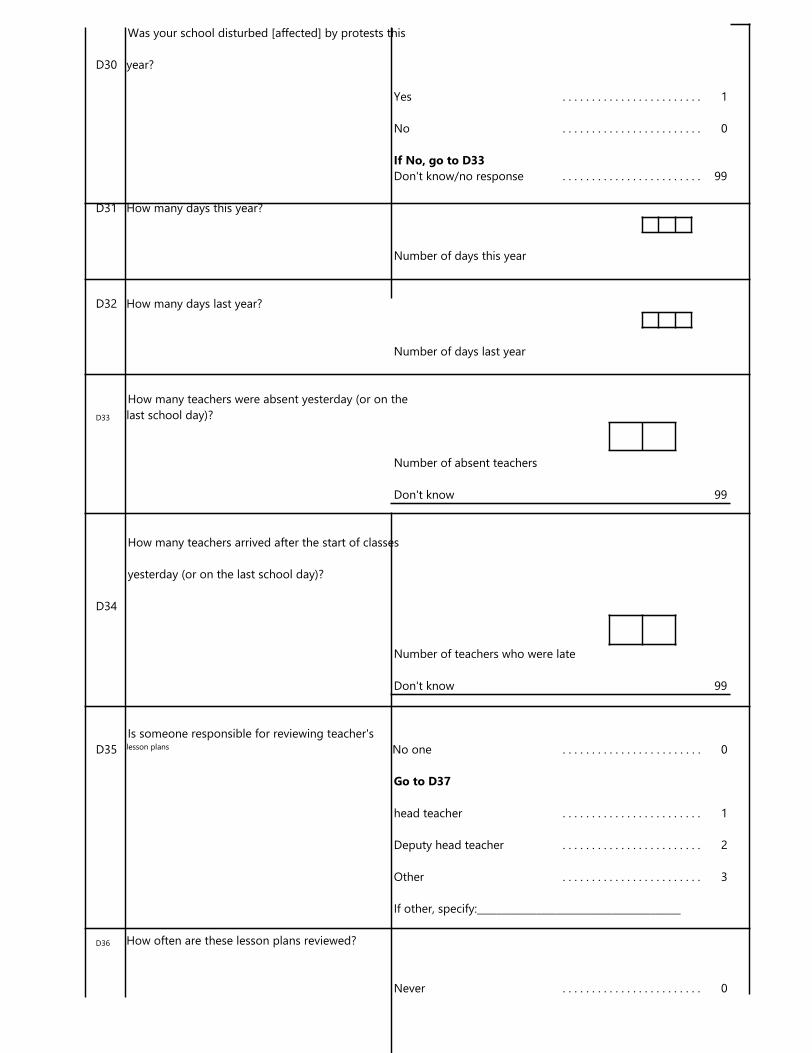
Was your school disturbed [affected] by protests this
D30 year?
Yes . . . . . . . . . . . . . . . . . . . . . . . . 1
No . . . . . . . . . . . . . . . . . . . . . . . . 0
If No, go to D33
Don't know/no response . . . . . . . . . . . . . . . . . . . . . . . . 99
D31 How many days this year?
Number of days this year
D32 How many days last year?
Number of days last year
How many teachers were absent yesterday (or on the
D33 last school day)?
Number of absent teachers
Don't know 99
How many teachers arrived after the start of classes
yesterday (or on the last school day)?
D34
Number of teachers who were late
Don't know 99
Is someone responsible for reviewing teacher's
D35 lesson plans No one . . . . . . . . . . . . . . . . . . . . . . . . 0
Go to D37
head teacher . . . . . . . . . . . . . . . . . . . . . . . . 1
Deputy head teacher . . . . . . . . . . . . . . . . . . . . . . . . 2
Other . . . . . . . . . . . . . . . . . . . . . . . . 3
If other, specify:_________________________________________
D36 How often are these lesson plans reviewed?
Never . . . . . . . . . . . . . . . . . . . . . . . . 0
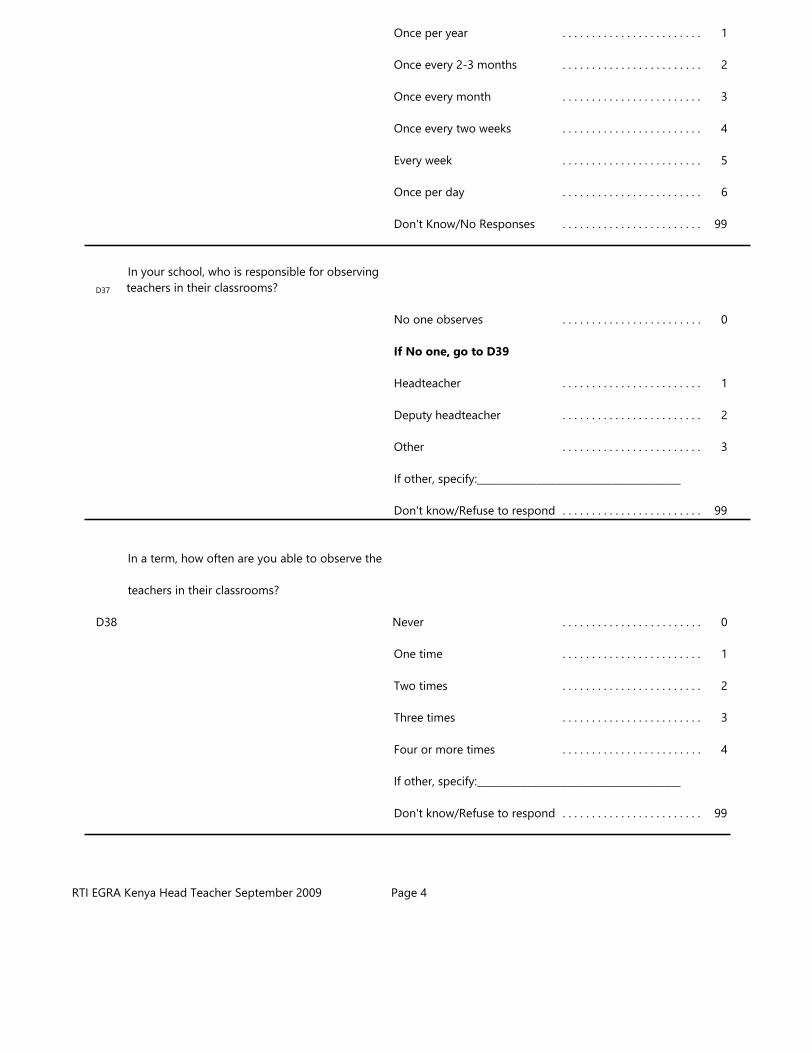
Once per year . . . . . . . . . . . . . . . . . . . . . . . . 1
Once every 2-3 months . . . . . . . . . . . . . . . . . . . . . . . . 2
Once every month . . . . . . . . . . . . . . . . . . . . . . . . 3
Once every two weeks . . . . . . . . . . . . . . . . . . . . . . . . 4
Every week . . . . . . . . . . . . . . . . . . . . . . . . 5
Once per day . . . . . . . . . . . . . . . . . . . . . . . . 6
Don't Know/No Responses . . . . . . . . . . . . . . . . . . . . . . . . 99
In your school, who is responsible for observing
D37 teachers in their classrooms?
No one observes . . . . . . . . . . . . . . . . . . . . . . . . 0
If No one, go to D39
Headteacher . . . . . . . . . . . . . . . . . . . . . . . . 1
Deputy headteacher . . . . . . . . . . . . . . . . . . . . . . . . 2
Other . . . . . . . . . . . . . . . . . . . . . . . . 3
If other, specify:_________________________________________
Don't know/Refuse to respond . . . . . . . . . . . . . . . . . . . . . . . . 99
In a term, how often are you able to observe the
teachers in their classrooms?
D38 Never . . . . . . . . . . . . . . . . . . . . . . . . 0
One time . . . . . . . . . . . . . . . . . . . . . . . . 1
Two times . . . . . . . . . . . . . . . . . . . . . . . . 2
Three times . . . . . . . . . . . . . . . . . . . . . . . . 3
Four or more times . . . . . . . . . . . . . . . . . . . . . . . . 4
If other, specify:_________________________________________
Don't know/Refuse to respond . . . . . . . . . . . . . . . . . . . . . . . . 99
RTI EGRA Kenya Head Teacher September 2009 Page 4
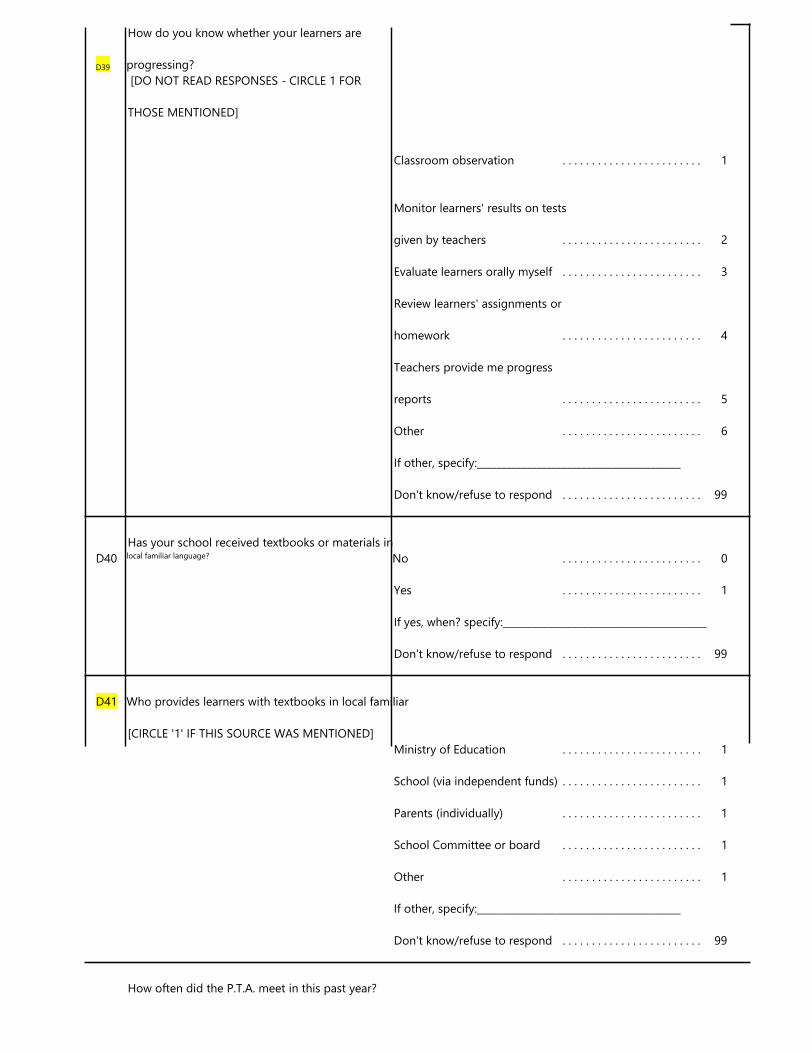
How do you know whether your learners are
D39 progressing?
[DO NOT READ RESPONSES - CIRCLE 1 FOR
THOSE MENTIONED]
Classroom observation . . . . . . . . . . . . . . . . . . . . . . . . 1
Monitor learners' results on tests
given by teachers . . . . . . . . . . . . . . . . . . . . . . . . 2
Evaluate learners orally myself . . . . . . . . . . . . . . . . . . . . . . . . 3
Review learners' assignments or
homework . . . . . . . . . . . . . . . . . . . . . . . . 4
Teachers provide me progress
reports . . . . . . . . . . . . . . . . . . . . . . . . 5
Other . . . . . . . . . . . . . . . . . . . . . . . . 6
If other, specify:_________________________________________
Don't know/refuse to respond . . . . . . . . . . . . . . . . . . . . . . . . 99
Has your school received textbooks or materials in
D40 local familiar language? No . . . . . . . . . . . . . . . . . . . . . . . . 0
Yes . . . . . . . . . . . . . . . . . . . . . . . . 1
If yes, when? specify:_________________________________________
Don't know/refuse to respond . . . . . . . . . . . . . . . . . . . . . . . . 99
D41 Who provides learners with textbooks in local familiar
[CIRCLE '1' IF THIS SOURCE WAS MENTIONED]
Ministry of Education . . . . . . . . . . . . . . . . . . . . . . . . 1
School (via independent funds) . . . . . . . . . . . . . . . . . . . . . . . . 1
Parents (individually) . . . . . . . . . . . . . . . . . . . . . . . . 1
School Committee or board . . . . . . . . . . . . . . . . . . . . . . . . 1
Other . . . . . . . . . . . . . . . . . . . . . . . . 1
If other, specify:_________________________________________
Don't know/refuse to respond . . . . . . . . . . . . . . . . . . . . . . . . 99
How often did the P.T.A. meet in this past year?

D42 Never . . . . . . . . . . . . . . . . . . . . . . . . 0
Once a year . . . . . . . . . . . . . . . . . . . . . . . . 1
Once every 2-3 months . . . . . . . . . . . . . . . . . . . . . . . . 2
Once a month . . . . . . . . . . . . . . . . . . . . . . . . 3
Once a week . . . . . . . . . . . . . . . . . . . . . . . . 4
Don't know/no response . . . . . . . . . . . . . . . . . . . . . . . . 99
CONTINUED ON NEXT PAGE
RTI EGRA Kenya Head Teacher September 2009 Page 5
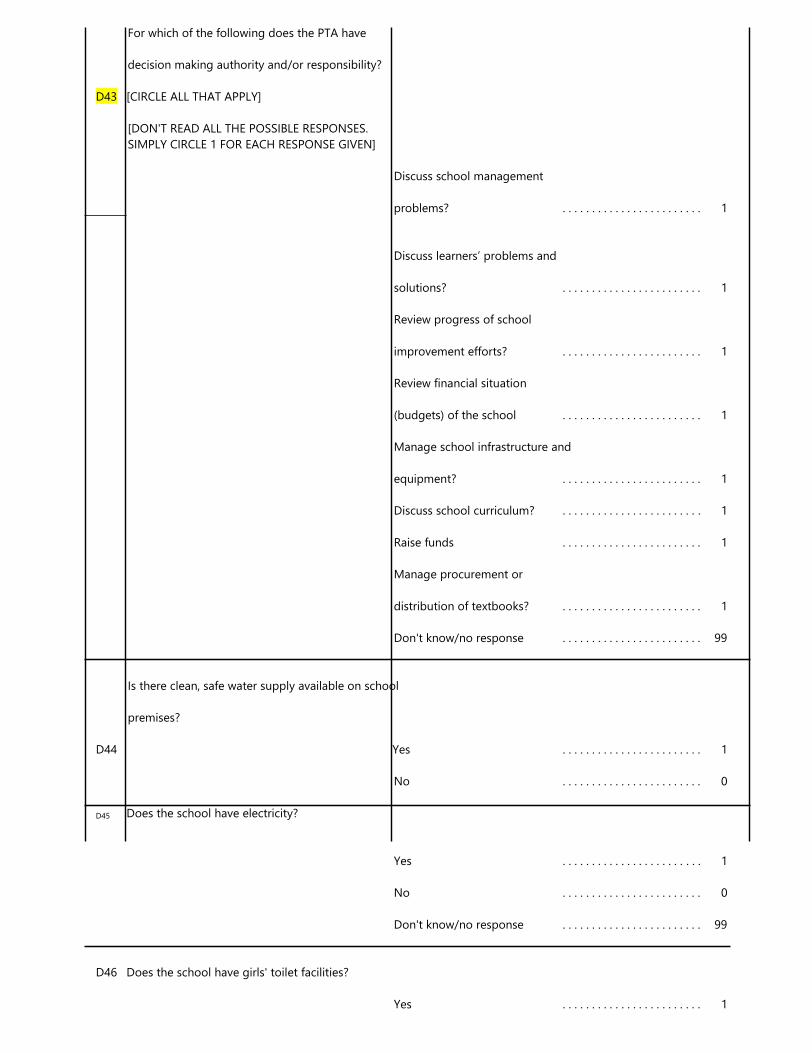
For which of the following does the PTA have
decision making authority and/or responsibility?
D43 [CIRCLE ALL THAT APPLY]
[DON'T READ ALL THE POSSIBLE RESPONSES.
SIMPLY CIRCLE 1 FOR EACH RESPONSE GIVEN]
Discuss school management
problems? . . . . . . . . . . . . . . . . . . . . . . . . 1
Discuss learners’ problems and
solutions? . . . . . . . . . . . . . . . . . . . . . . . . 1
Review progress of school
improvement efforts? . . . . . . . . . . . . . . . . . . . . . . . . 1
Review financial situation
(budgets) of the school . . . . . . . . . . . . . . . . . . . . . . . . 1
Manage school infrastructure and
equipment? . . . . . . . . . . . . . . . . . . . . . . . . 1
Discuss school curriculum? . . . . . . . . . . . . . . . . . . . . . . . . 1
Raise funds . . . . . . . . . . . . . . . . . . . . . . . . 1
Manage procurement or
distribution of textbooks? . . . . . . . . . . . . . . . . . . . . . . . . 1
Don't know/no response . . . . . . . . . . . . . . . . . . . . . . . . 99
Is there clean, safe water supply available on school
premises?
D44 Yes . . . . . . . . . . . . . . . . . . . . . . . . 1
No . . . . . . . . . . . . . . . . . . . . . . . . 0
D45 Does the school have electricity?
Yes . . . . . . . . . . . . . . . . . . . . . . . . 1
No . . . . . . . . . . . . . . . . . . . . . . . . 0
Don't know/no response . . . . . . . . . . . . . . . . . . . . . . . . 99
D46 Does the school have girls' toilet facilities?
Yes . . . . . . . . . . . . . . . . . . . . . . . . 1
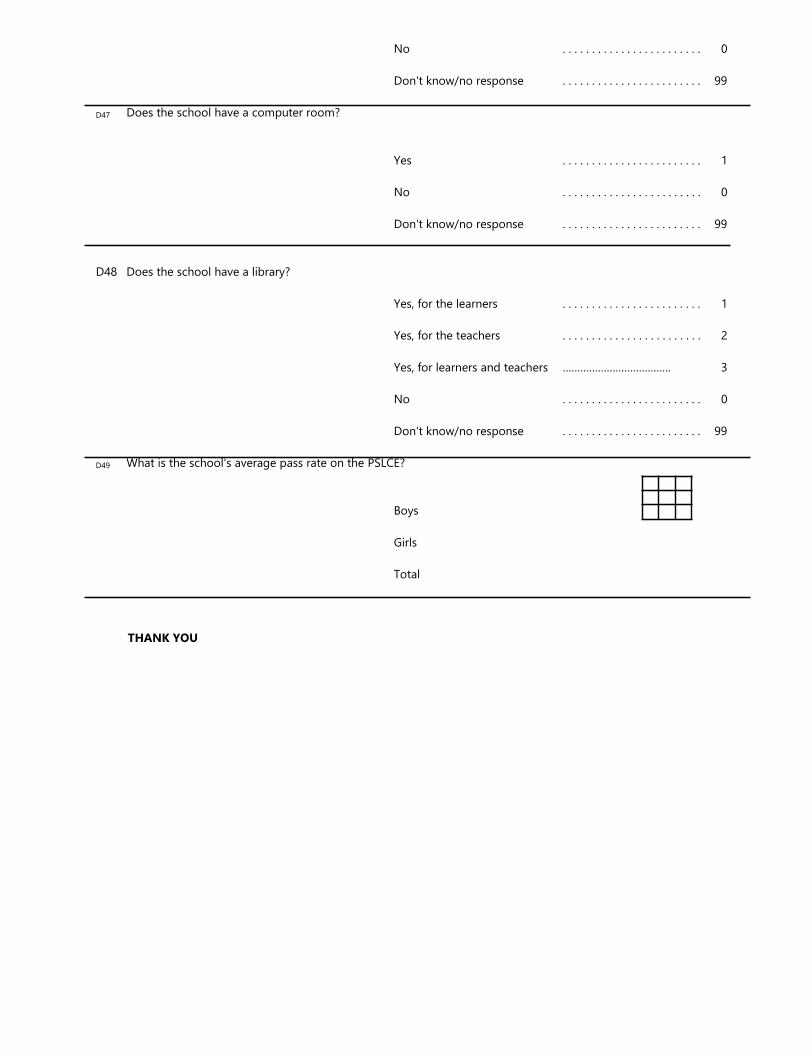
No . . . . . . . . . . . . . . . . . . . . . . . . 0
Don't know/no response . . . . . . . . . . . . . . . . . . . . . . . . 99
D47 Does the school have a computer room?
Yes . . . . . . . . . . . . . . . . . . . . . . . . 1
No . . . . . . . . . . . . . . . . . . . . . . . . 0
Don't know/no response . . . . . . . . . . . . . . . . . . . . . . . . 99
D48 Does the school have a library?
Yes, for the learners . . . . . . . . . . . . . . . . . . . . . . . . 1
Yes, for the teachers . . . . . . . . . . . . . . . . . . . . . . . . 2
Yes, for learners and teachers ………………………………. 3
No . . . . . . . . . . . . . . . . . . . . . . . . 0
Don't know/no response . . . . . . . . . . . . . . . . . . . . . . . . 99
D49 What is the school's average pass rate on the PSLCE?
Boys
Girls
Total
THANK YOU

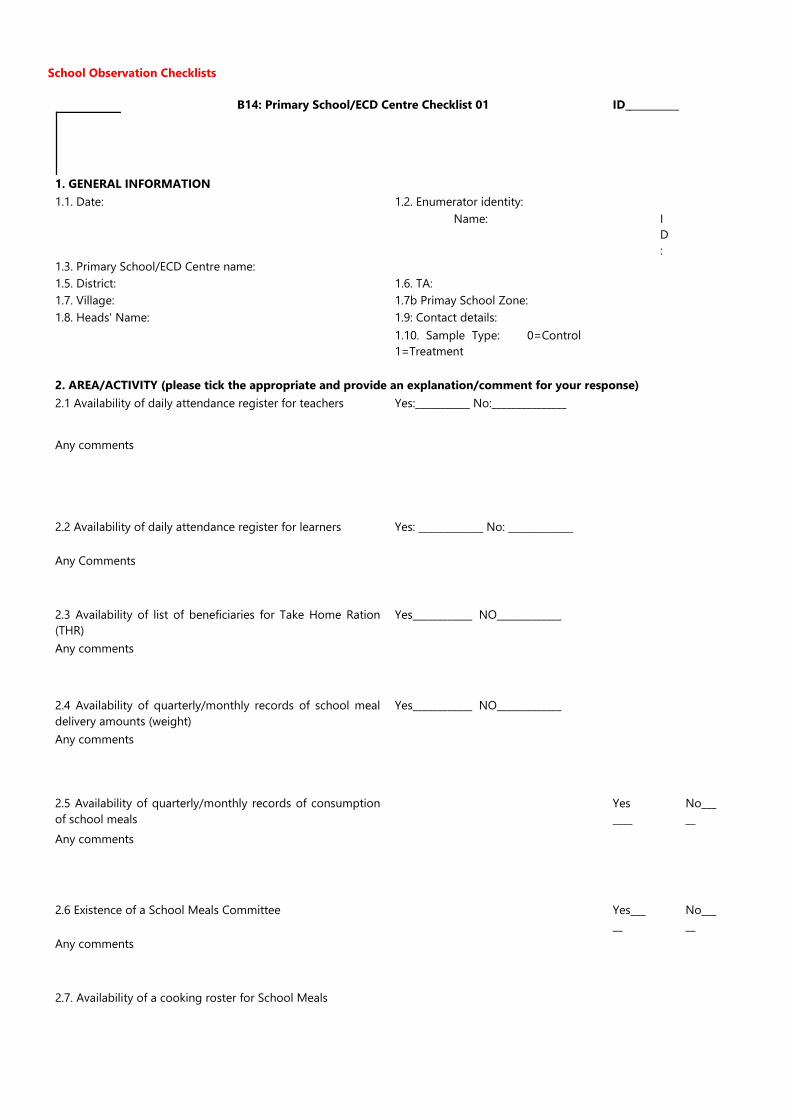
School Observation Checklists
B14: Primary School/ECD Centre Checklist 01 ID___________
1. GENERAL INFORMATION
1.1. Date: 1.2. Enumerator identity:
Name: I
D
:
1.3. Primary School/ECD Centre name:
1.5. District: 1.6. TA:
1.7. Village: 1.7b Primay School Zone:
1.8. Heads' Name: 1.9: Contact details:
1.10. Sample Type: 0=Control
1=Treatment
2. AREA/ACTIVITY (please tick the appropriate and provide an explanation/comment for your response)
2.1 Availability of daily attendance register for teachers Yes:___________ No:_______________
Any comments
2.2 Availability of daily attendance register for learners Yes: _____________ No: _____________
Any Comments
2.3 Availability of list of beneficiaries for Take Home Ration
(THR)
Yes____________ NO_____________
Any comments
2.4 Availability of quarterly/monthly records of school meal
delivery amounts (weight)
Yes____________ NO_____________
Any comments
2.5 Availability of quarterly/monthly records of consumption
of school meals
Yes
____
No___
__
Any comments
2.6 Existence of a School Meals Committee Yes___
__
No___
__
Any comments
2.7. Availability of a cooking roster for School Meals
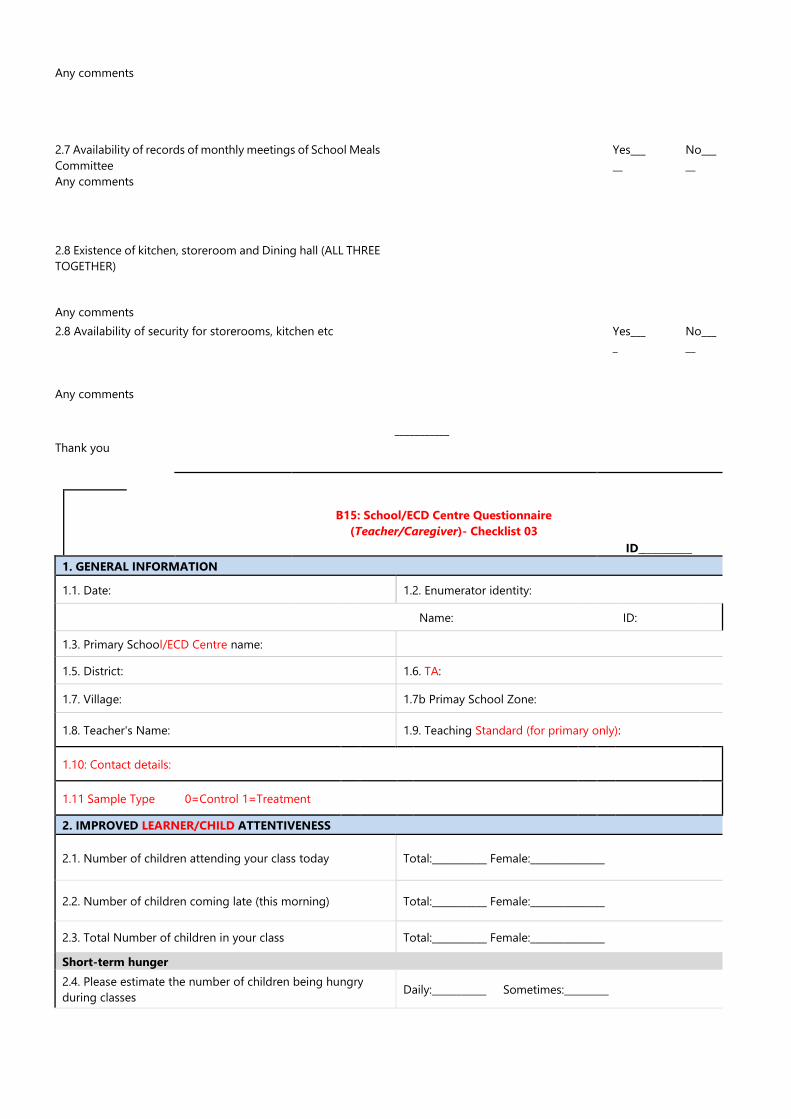
Any comments
2.7 Availability of records of monthly meetings of School Meals
Committee
Yes___
__
No___
__
Any comments
2.8 Existence of kitchen, storeroom and Dining hall (ALL THREE
TOGETHER)
Any comments
2.8 Availability of security for storerooms, kitchen etc Yes___
_
No___
__
Any comments
___________
Thank you
B15: School/ECD Centre Questionnaire
(Teacher/Caregiver)- Checklist 03
ID___________
1. GENERAL INFORMATION
1.1. Date: 1.2. Enumerator identity:
Name: ID:
1.3. Primary School/ECD Centre name:
1.5. District: 1.6. TA:
1.7. Village: 1.7b Primay School Zone:
1.8. Teacher's Name: 1.9. Teaching Standard (for primary only):
1.10: Contact details:
1.11 Sample Type 0=Control 1=Treatment
2. IMPROVED LEARNER/CHILD ATTENTIVENESS
2.1. Number of children attending your class today Total:___________ Female:_______________
2.2. Number of children coming late (this morning) Total:___________ Female:_______________
2.3. Total Number of children in your class Total:___________ Female:_______________
Short-term hunger
2.4. Please estimate the number of children being hungry
during classes Daily:___________ Sometimes:_________

Total:___________ Female:___________
2.4.1. Does it vary by season? Yes:___________ No:___________
2.4.2. If yes, please specify the month of peak lean season ___________
2.5. Please estimate the number of children who are
inattentive (sleepy, inactive) during classes
Daily:___________ Sometimes:___________
Total:___________ Female:_______________
2.5.1. Does it vary by season? Yes:___________ No:___________
2.5.2. If yes, please specify the month of peak season ___________
2.6. Please estimate the number of children who are attentive
or very attentive during class/instruction
Daily:___________ Sometimes:___________
Total:___________ Female:_______________
2.6.1. Does it vary by season? Yes__________ No_______________
2.6.2. If yes, please specify the month of peak season
___________
2.7. Did the number of children frequenting the school
increased/decreased during last lean season? 1= Increased 2=Decreased 3=Remained the same 99=N/A
3. GENERAL COMMENTS: (status, successes, failures, challenges/problems etc) Training on school meals
B16: Primary School/ECD Centre Level Questionnaire Final
Evaluation
I. GENERAL INFORMATION
1.1. Date: 1.2. Enumerator identity:
1.3. Primary School/ECD Centre name: Name: ID
1.3b Primary School EMIS ID 1.4 Sample Type: 1 = Treatment 2= Control
1.4. Region/Division:
1.5. District: 1.6. TA:
1.7. Village: 1.7b Primary School Zone
1.8. Teacher/Caregiver's Name: 1.9. Teaching Standard (for primary)/Year for ECD:
1.10: Contact details:
1.11 Number of children enrolled in this ECD
centre/school year
Total: ________ Female: _________
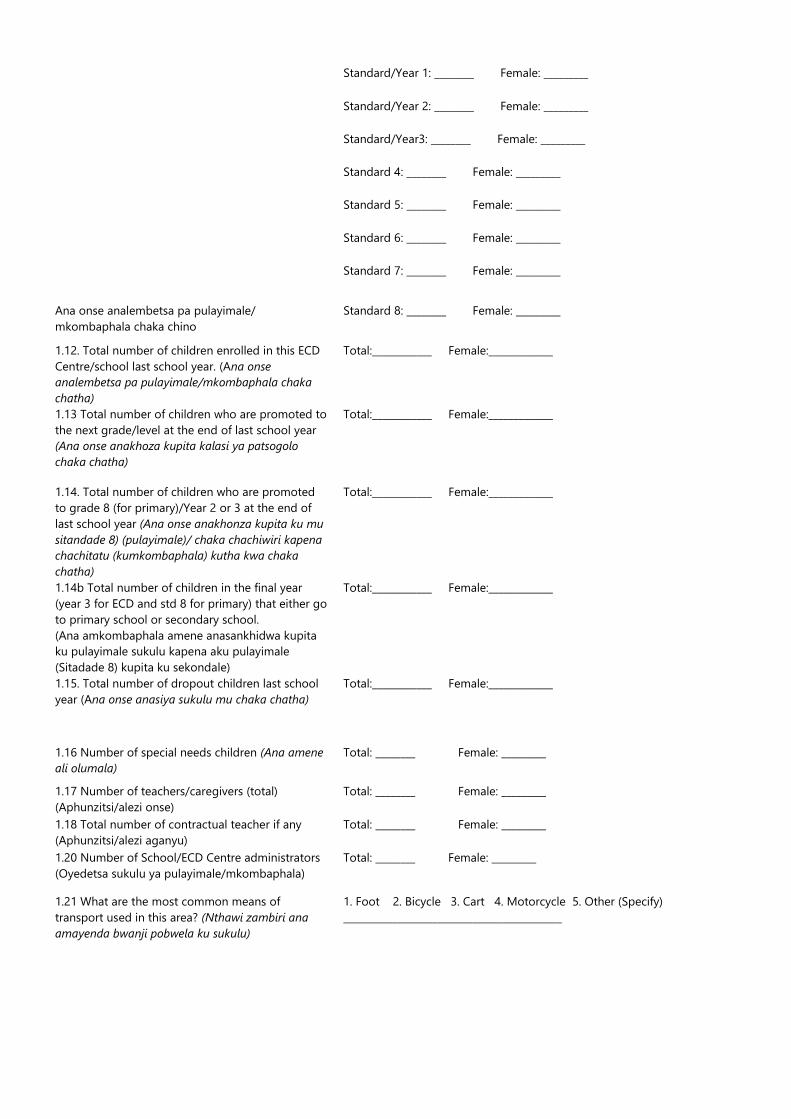
Standard/Year 1: ________ Female: _________
Standard/Year 2: ________ Female: _________
Standard/Year3: ________ Female: _________
Standard 4: ________ Female: _________
Standard 5: ________ Female: _________
Standard 6: ________ Female: _________
Standard 7: ________ Female: _________
Ana onse analembetsa pa pulayimale/
mkombaphala chaka chino
Standard 8: ________ Female: _________
1.12. Total number of children enrolled in this ECD
Centre/school last school year. (Ana onse
analembetsa pa pulayimale/mkombaphala chaka
chatha)
Total:____________ Female:_____________
1.13 Total number of children who are promoted to
the next grade/level at the end of last school year
(Ana onse anakhoza kupita kalasi ya patsogolo
chaka chatha)
Total:____________ Female:_____________
1.14. Total number of children who are promoted
to grade 8 (for primary)/Year 2 or 3 at the end of
last school year (Ana onse anakhonza kupita ku mu
sitandade 8) (pulayimale)/ chaka chachiwiri kapena
chachitatu (kumkombaphala) kutha kwa chaka
chatha)
Total:____________ Female:_____________
1.14b Total number of children in the final year
(year 3 for ECD and std 8 for primary) that either go
to primary school or secondary school.
(Ana amkombaphala amene anasankhidwa kupita
ku pulayimale sukulu kapena aku pulayimale
(Sitadade 8) kupita ku sekondale)
Total:____________ Female:_____________
1.15. Total number of dropout children last school
year (Ana onse anasiya sukulu mu chaka chatha)
Total:____________ Female:_____________
1.16 Number of special needs children (Ana amene
ali olumala)
Total: ________ Female: _________
1.17 Number of teachers/caregivers (total)
(Aphunzitsi/alezi onse)
Total: ________ Female: _________
1.18 Total number of contractual teacher if any
(Aphunzitsi/alezi aganyu)
Total: ________ Female: _________
1.20 Number of School/ECD Centre administrators
(Oyedetsa sukulu ya pulayimale/mkombaphala)
Total: ________ Female: _________
1.21 What are the most common means of
transport used in this area? (Nthawi zambiri ana
amayenda bwanji pobwela ku sukulu)
1. Foot 2. Bicycle 3. Cart 4. Motorcycle 5. Other (Specify)
____________________________________________
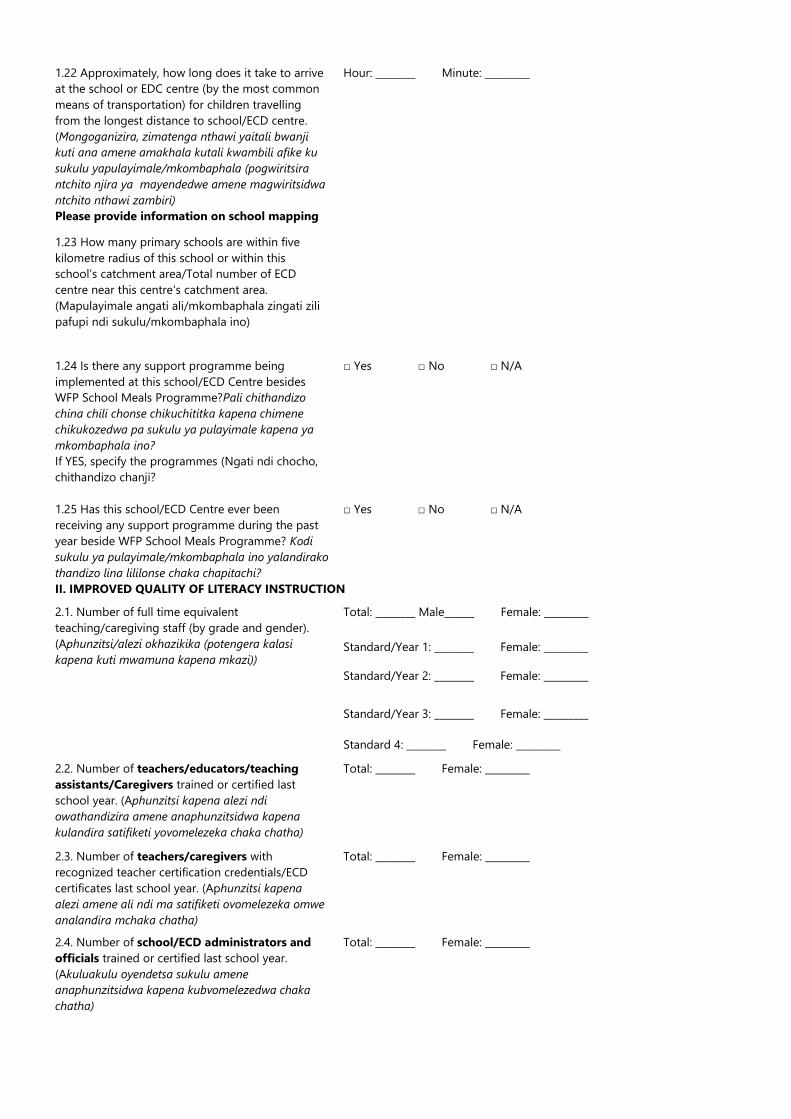
1.22 Approximately, how long does it take to arrive
at the school or EDC centre (by the most common
means of transportation) for children travelling
from the longest distance to school/ECD centre.
(Mongoganizira, zimatenga nthawi yaitali bwanji
kuti ana amene amakhala kutali kwambili afike ku
sukulu yapulayimale/mkombaphala (pogwiritsira
ntchito njira ya mayendedwe amene magwiritsidwa
ntchito nthawi zambiri)
Hour: ________ Minute: _________
Please provide information on school mapping
1.23 How many primary schools are within five
kilometre radius of this school or within this
school’s catchment area/Total number of ECD
centre near this centre's catchment area.
(Mapulayimale angati ali/mkombaphala zingati zili
pafupi ndi sukulu/mkombaphala ino)
1.24 Is there any support programme being
implemented at this school/ECD Centre besides
WFP School Meals Programme?Pali chithandizo
china chili chonse chikuchititka kapena chimene
chikukozedwa pa sukulu ya pulayimale kapena ya
mkombaphala ino?
□ Yes □ No □ N/A
If YES, specify the programmes (Ngati ndi chocho,
chithandizo chanji?
1.25 Has this school/ECD Centre ever been
receiving any support programme during the past
year beside WFP School Meals Programme? Kodi
sukulu ya pulayimale/mkombaphala ino yalandirako
thandizo lina lililonse chaka chapitachi?
□ Yes □ No □ N/A
II. IMPROVED QUALITY OF LITERACY INSTRUCTION
2.1. Number of full time equivalent
teaching/caregiving staff (by grade and gender).
(Aphunzitsi/alezi okhazikika (potengera kalasi
kapena kuti mwamuna kapena mkazi))
Total: ________ Male______ Female: _________
Standard/Year 1: ________ Female: _________
Standard/Year 2: ________ Female: _________
Standard/Year 3: ________ Female: _________
Standard 4: ________ Female: _________
2.2. Number of teachers/educators/teaching
assistants/Caregivers trained or certified last
school year. (Aphunzitsi kapena alezi ndi
owathandizira amene anaphunzitsidwa kapena
kulandira satifiketi yovomelezeka chaka chatha)
Total: ________ Female: _________
2.3. Number of teachers/caregivers with
recognized teacher certification credentials/ECD
certificates last school year. (Aphunzitsi kapena
alezi amene ali ndi ma satifiketi ovomelezeka omwe
analandira mchaka chatha)
Total: ________ Female: _________
2.4. Number of school/ECD administrators and
officials trained or certified last school year.
(Akuluakulu oyendetsa sukulu amene
anaphunzitsidwa kapena kubvomelezedwa chaka
chatha)
Total: ________ Female: _________
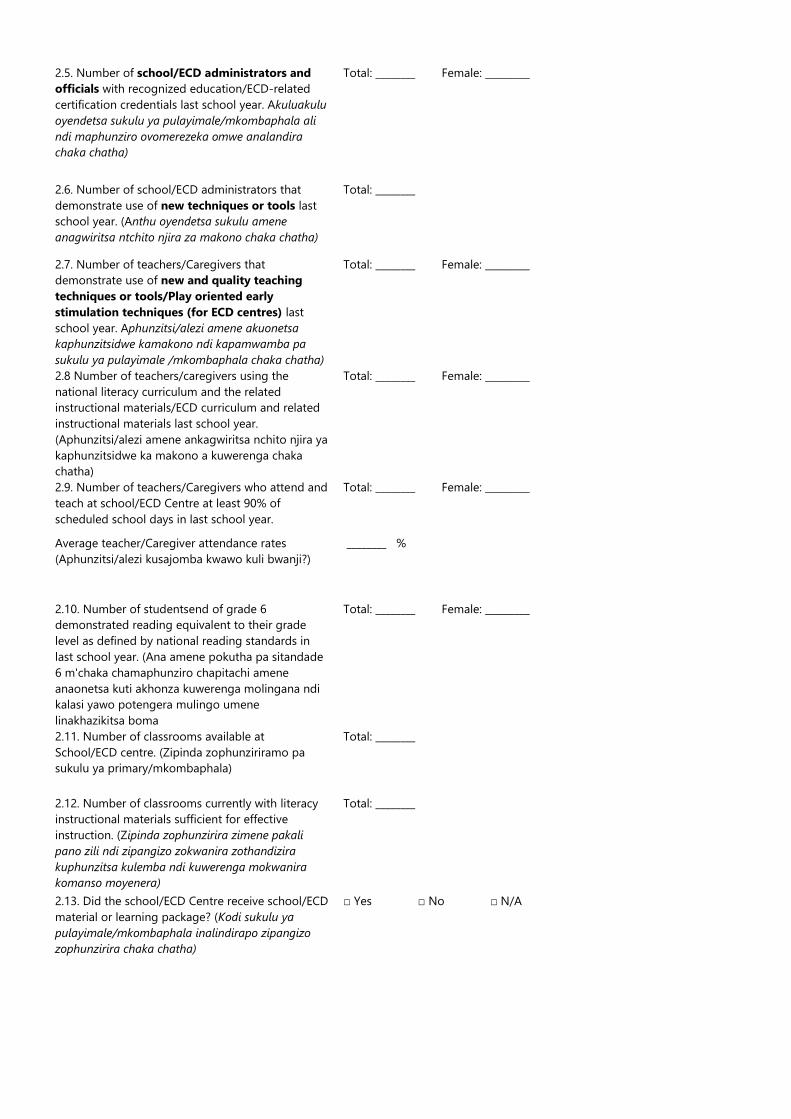
2.5. Number of school/ECD administrators and
officials with recognized education/ECD-related
certification credentials last school year. Akuluakulu
oyendetsa sukulu ya pulayimale/mkombaphala ali
ndi maphunziro ovomerezeka omwe analandira
chaka chatha)
Total: ________ Female: _________
2.6. Number of school/ECD administrators that
demonstrate use of new techniques or tools last
school year. (Anthu oyendetsa sukulu amene
anagwiritsa ntchito njira za makono chaka chatha)
Total: ________
2.7. Number of teachers/Caregivers that
demonstrate use of new and quality teaching
techniques or tools/Play oriented early
stimulation techniques (for ECD centres) last
school year. Aphunzitsi/alezi amene akuonetsa
kaphunzitsidwe kamakono ndi kapamwamba pa
sukulu ya pulayimale /mkombaphala chaka chatha)
Total: ________ Female: _________
2.8 Number of teachers/caregivers using the
national literacy curriculum and the related
instructional materials/ECD curriculum and related
instructional materials last school year.
(Aphunzitsi/alezi amene ankagwiritsa nchito njira ya
kaphunzitsidwe ka makono a kuwerenga chaka
chatha)
Total: ________ Female: _________
2.9. Number of teachers/Caregivers who attend and
teach at school/ECD Centre at least 90% of
scheduled school days in last school year.
Total: ________ Female: _________
Average teacher/Caregiver attendance rates
(Aphunzitsi/alezi kusajomba kwawo kuli bwanji?)
________ %
2.10. Number of studentsend of grade 6
demonstrated reading equivalent to their grade
level as defined by national reading standards in
last school year. (Ana amene pokutha pa sitandade
6 m'chaka chamaphunziro chapitachi amene
anaonetsa kuti akhonza kuwerenga molingana ndi
kalasi yawo potengera mulingo umene
linakhazikitsa boma
Total: ________ Female: _________
2.11. Number of classrooms available at
School/ECD centre. (Zipinda zophunziriramo pa
sukulu ya primary/mkombaphala)
Total: ________
2.12. Number of classrooms currently with literacy
instructional materials sufficient for effective
instruction. (Zipinda zophunzirira zimene pakali
pano zili ndi zipangizo zokwanira zothandizira
kuphunzitsa kulemba ndi kuwerenga mokwanira
komanso moyenera)
Total: ________
2.13. Did the school/ECD Centre receive school/ECD
material or learning package? (Kodi sukulu ya
pulayimale/mkombaphala inalindirapo zipangizo
zophunzirira chaka chatha)
□ Yes □ No □ N/A
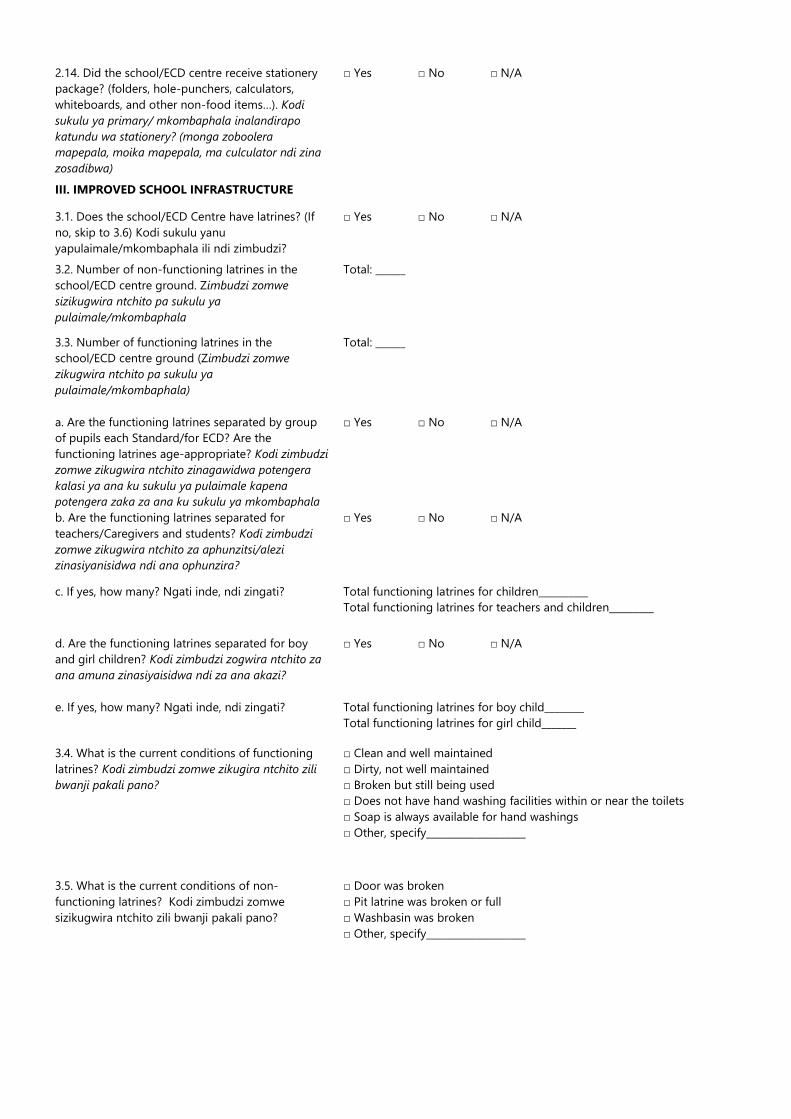
2.14. Did the school/ECD centre receive stationery
package? (folders, hole-punchers, calculators,
whiteboards, and other non-food items…). Kodi
sukulu ya primary/ mkombaphala inalandirapo
katundu wa stationery? (monga zoboolera
mapepala, moika mapepala, ma culculator ndi zina
zosadibwa)
□ Yes □ No □ N/A
III. IMPROVED SCHOOL INFRASTRUCTURE
3.1. Does the school/ECD Centre have latrines? (If
no, skip to 3.6) Kodi sukulu yanu
yapulaimale/mkombaphala ili ndi zimbudzi?
□ Yes □ No □ N/A
3.2. Number of non-functioning latrines in the
school/ECD centre ground. Zimbudzi zomwe
sizikugwira ntchito pa sukulu ya
pulaimale/mkombaphala
Total: ______
3.3. Number of functioning latrines in the
school/ECD centre ground (Zimbudzi zomwe
zikugwira ntchito pa sukulu ya
pulaimale/mkombaphala)
Total: ______
a. Are the functioning latrines separated by group
of pupils each Standard/for ECD? Are the
functioning latrines age-appropriate? Kodi zimbudzi
zomwe zikugwira ntchito zinagawidwa potengera
kalasi ya ana ku sukulu ya pulaimale kapena
potengera zaka za ana ku sukulu ya mkombaphala
□ Yes □ No □ N/A
b. Are the functioning latrines separated for
teachers/Caregivers and students? Kodi zimbudzi
zomwe zikugwira ntchito za aphunzitsi/alezi
zinasiyanisidwa ndi ana ophunzira?
□ Yes □ No □ N/A
c. If yes, how many? Ngati inde, ndi zingati? Total functioning latrines for children__________
Total functioning latrines for teachers and children_________
d. Are the functioning latrines separated for boy
and girl children? Kodi zimbudzi zogwira ntchito za
ana amuna zinasiyaisidwa ndi za ana akazi?
□ Yes □ No □ N/A
e. If yes, how many? Ngati inde, ndi zingati? Total functioning latrines for boy child________
Total functioning latrines for girl child_______
3.4. What is the current conditions of functioning
latrines? Kodi zimbudzi zomwe zikugira ntchito zili
bwanji pakali pano?
□ Clean and well maintained
□ Dirty, not well maintained
□ Broken but still being used
□ Does not have hand washing facilities within or near the toilets
□ Soap is always available for hand washings
□ Other, specify____________________
3.5. What is the current conditions of non-
functioning latrines? Kodi zimbudzi zomwe
sizikugwira ntchito zili bwanji pakali pano?
□ Door was broken
□ Pit latrine was broken or full
□ Washbasin was broken
□ Other, specify____________________
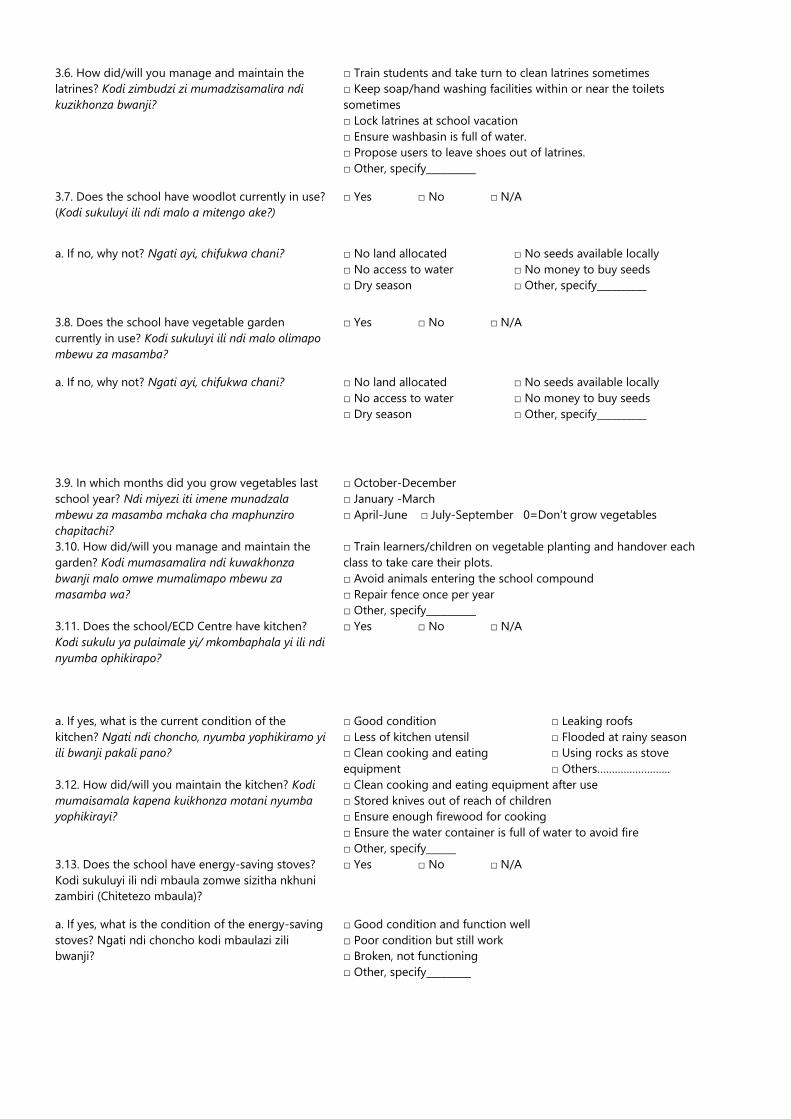
3.6. How did/will you manage and maintain the
latrines? Kodi zimbudzi zi mumadzisamalira ndi
kuzikhonza bwanji?
□ Train students and take turn to clean latrines sometimes
□ Keep soap/hand washing facilities within or near the toilets
sometimes
□ Lock latrines at school vacation
□ Ensure washbasin is full of water.
□ Propose users to leave shoes out of latrines.
□ Other, specify__________
3.7. Does the school have woodlot currently in use?
(Kodi sukuluyi ili ndi malo a mitengo ake?)
□ Yes □ No □ N/A
a. If no, why not? Ngati ayi, chifukwa chani? □ No land allocated
□ No access to water
□ Dry season
□ No seeds available locally
□ No money to buy seeds
□ Other, specify__________
3.8. Does the school have vegetable garden
currently in use? Kodi sukuluyi ili ndi malo olimapo
mbewu za masamba?
□ Yes □ No □ N/A
a. If no, why not? Ngati ayi, chifukwa chani? □ No land allocated
□ No access to water
□ Dry season
□ No seeds available locally
□ No money to buy seeds
□ Other, specify__________
3.9. In which months did you grow vegetables last
school year? Ndi miyezi iti imene munadzala
mbewu za masamba mchaka cha maphunziro
chapitachi?
□ October-December
□ January -March
□ April-June □ July-September 0=Don’t grow vegetables
3.10. How did/will you manage and maintain the
garden? Kodi mumasamalira ndi kuwakhonza
bwanji malo omwe mumalimapo mbewu za
masamba wa?
□ Train learners/children on vegetable planting and handover each
class to take care their plots.
□ Avoid animals entering the school compound
□ Repair fence once per year
□ Other, specify__________
3.11. Does the school/ECD Centre have kitchen?
Kodi sukulu ya pulaimale yi/ mkombaphala yi ili ndi
nyumba ophikirapo?
□ Yes □ No □ N/A
a. If yes, what is the current condition of the
kitchen? Ngati ndi choncho, nyumba yophikiramo yi
ili bwanji pakali pano?
□ Good condition
□ Less of kitchen utensil
□ Clean cooking and eating
equipment
□ Leaking roofs
□ Flooded at rainy season
□ Using rocks as stove
□ Others…………………….
3.12. How did/will you maintain the kitchen? Kodi
mumaisamala kapena kuikhonza motani nyumba
yophikirayi?
□ Clean cooking and eating equipment after use
□ Stored knives out of reach of children
□ Ensure enough firewood for cooking
□ Ensure the water container is full of water to avoid fire
□ Other, specify______
3.13. Does the school have energy-saving stoves?
Kodi sukuluyi ili ndi mbaula zomwe sizitha nkhuni
zambiri (Chitetezo mbaula)?
□ Yes □ No □ N/A
a. If yes, what is the condition of the energy-saving
stoves? Ngati ndi choncho kodi mbaulazi zili
bwanji?
□ Good condition and function well
□ Poor condition but still work
□ Broken, not functioning
□ Other, specify_________
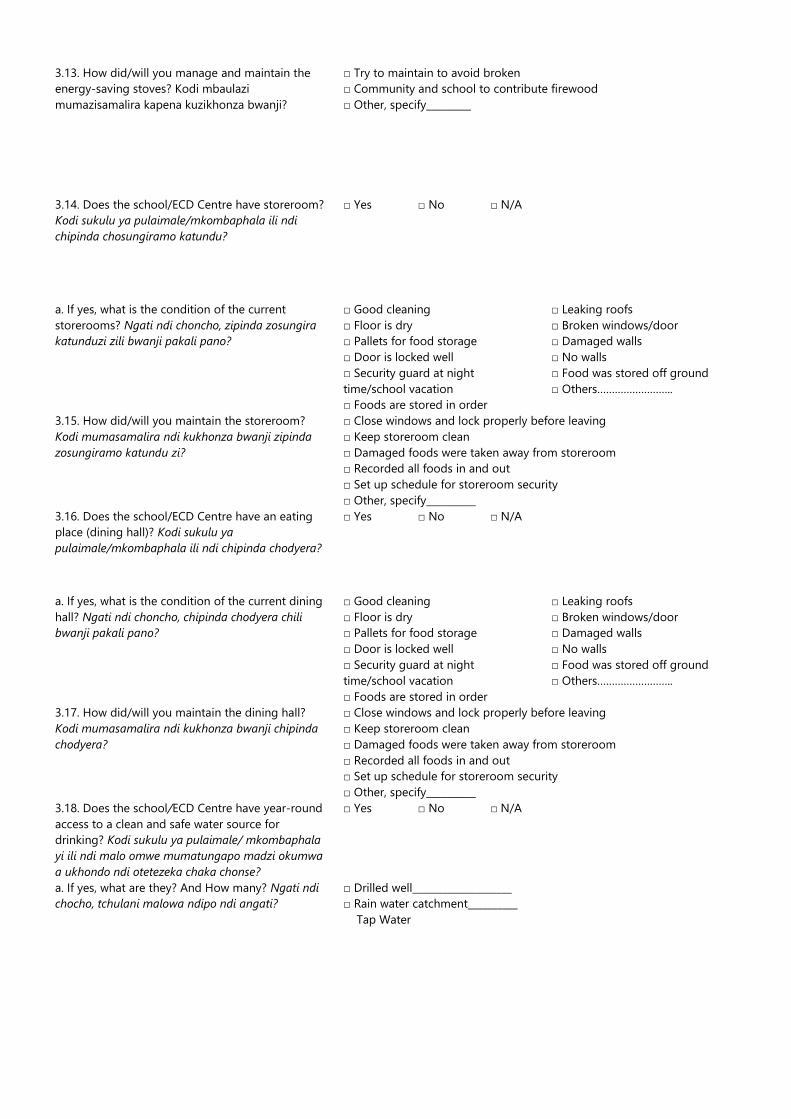
3.13. How did/will you manage and maintain the
energy-saving stoves? Kodi mbaulazi
mumazisamalira kapena kuzikhonza bwanji?
□ Try to maintain to avoid broken
□ Community and school to contribute firewood
□ Other, specify_________
3.14. Does the school/ECD Centre have storeroom?
Kodi sukulu ya pulaimale/mkombaphala ili ndi
chipinda chosungiramo katundu?
□ Yes □ No □ N/A
a. If yes, what is the condition of the current
storerooms? Ngati ndi choncho, zipinda zosungira
katunduzi zili bwanji pakali pano?
□ Good cleaning
□ Floor is dry
□ Pallets for food storage
□ Door is locked well
□ Security guard at night
time/school vacation
□ Foods are stored in order
□ Leaking roofs
□ Broken windows/door
□ Damaged walls
□ No walls
□ Food was stored off ground
□ Others……………………..
3.15. How did/will you maintain the storeroom?
Kodi mumasamalira ndi kukhonza bwanji zipinda
zosungiramo katundu zi?
□ Close windows and lock properly before leaving
□ Keep storeroom clean
□ Damaged foods were taken away from storeroom
□ Recorded all foods in and out
□ Set up schedule for storeroom security
□ Other, specify__________
3.16. Does the school/ECD Centre have an eating
place (dining hall)? Kodi sukulu ya
pulaimale/mkombaphala ili ndi chipinda chodyera?
□ Yes □ No □ N/A
a. If yes, what is the condition of the current dining
hall? Ngati ndi choncho, chipinda chodyera chili
bwanji pakali pano?
□ Good cleaning
□ Floor is dry
□ Pallets for food storage
□ Door is locked well
□ Security guard at night
time/school vacation
□ Foods are stored in order
□ Leaking roofs
□ Broken windows/door
□ Damaged walls
□ No walls
□ Food was stored off ground
□ Others……………………..
3.17. How did/will you maintain the dining hall?
Kodi mumasamalira ndi kukhonza bwanji chipinda
chodyera?
□ Close windows and lock properly before leaving
□ Keep storeroom clean
□ Damaged foods were taken away from storeroom
□ Recorded all foods in and out
□ Set up schedule for storeroom security
□ Other, specify__________
3.18. Does the school/ECD Centre have year-round
access to a clean and safe water source for
drinking? Kodi sukulu ya pulaimale/ mkombaphala
yi ili ndi malo omwe mumatungapo madzi okumwa
a ukhondo ndi otetezeka chaka chonse?
□ Yes □ No □ N/A
a. If yes, what are they? And How many? Ngati ndi
chocho, tchulani malowa ndipo ndi angati?
□ Drilled well____________________
□ Rain water catchment__________
Tap Water

3.19. How many percent of students use safe
drinking water? Kodi ndi ophunzira ngati mwa
ophunzira hundred ali wonse omwe amamwa madzi
otetezedwa?
□ 0%
□ <50%
□ 51% - 70%
□ 71 - 100%
3.20. Number of non functioning drilled wells or
rain water catchments stalled on the school
ground? Nambala ya zitsime zomwe zinakumbidwa
koma sizikugwira ntchito kapena malo osunga
madzi amvula pasukulu ya
pulaimale/mkombaphala pano.
Total non-functioning drilled well: _________________
Total non-functioning water catchments:__________
a. What is the condition of the non-functioning
drilled wells/ rain water catchments? Kodi zitsime
zokumbidwazi zomwe zili zosagwira ntchitozi / malo
osungira madzi amvula ali bwanji pakali pano?
□ Functioning only at rainy season
□ Water is used for animals only
□ Arsenic
□ handpump/rain water catchment was broken
□ Other__________________
No well/water catchment
3.21. Number of functioning drilled wells or rain
water catchments stalled on the school ground?
Nambala ya zitsime zokumbidwa zogwira ntchito/
malo osungira madzi amvula pa sukulupa.
Total functioning drilled well: _________________
Total functioning water chatchments:__________
a. What is the condition of the functioning drilled
wells? Kodi zitsime zokumbidwazi zomwe zili
zogwira ntchitozi / malo osungira madzi amvula ali
bwanji pakali pano?
rain water catchments?
□ Functioning well in year-round
□ Water is used for human consumption
□ Platform is clean
□ System collection the waste water from wells
□ Other, specify_________
No well/water catchment
3.20. How did/will you manage and maintain the
drilled wells/water stations? Kodi mumasamala ndi
kukhonza bwanji zitsimezi ndi malo osungirapo
madzi wa?
□ Repair by own staff with local spare parts by using PB or community
contribution.
□ Remind learners/children to regularly to put wastes in bins
□ Take turn to each class to clean the compound.
□ Lock handpump/ water station at night time/school vacation
□ Other, specify__________
3.22 Does the school/ECD Centre have suitable
facilities accessed by children/learners with special
needs? Kodi sukulu ya pulaimale/mkombaphala yi
ili ndi zipangizo zoyenerera kwa ana/ ophunzira
olumala?
□ Yes □ No
a. If yes, what facilities? Ngati ndi choncho, tchulani □ Latrines for children with special needs
□ Well for children with special needs
□ Building/library/classroom
□ Other, specify
3.23 Are teachers/stakeholders able to explain the
concept of disability? Kodi aphunzitsi ndi anthu ena
okhuzidwa amatha kulongosola zokhuzana ulumali?
□ Yes □ No □ N/A
a. If yes, what is the concept about? Ngati ndi
choncho, amakamba za ulumali wanji?
□ Physical
□ Mental
Both
IV. Local Organization and community groups
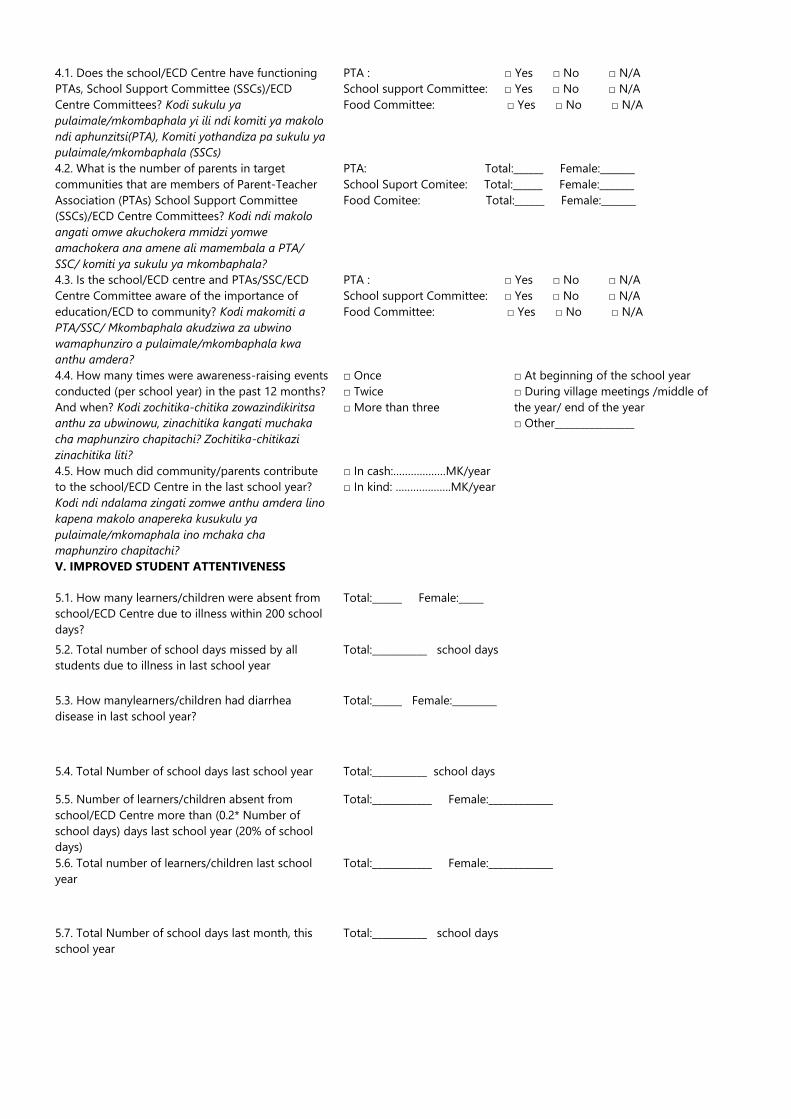
4.1. Does the school/ECD Centre have functioning
PTAs, School Support Committee (SSCs)/ECD
Centre Committees? Kodi sukulu ya
pulaimale/mkombaphala yi ili ndi komiti ya makolo
ndi aphunzitsi(PTA), Komiti yothandiza pa sukulu ya
pulaimale/mkombaphala (SSCs)
PTA : □ Yes □ No □ N/A
School support Committee: □ Yes □ No □ N/A
Food Committee: □ Yes □ No □ N/A
4.2. What is the number of parents in target
communities that are members of Parent-Teacher
Association (PTAs) School Support Committee
(SSCs)/ECD Centre Committees? Kodi ndi makolo
angati omwe akuchokera mmidzi yomwe
amachokera ana amene ali mamembala a PTA/
SSC/ komiti ya sukulu ya mkombaphala?
PTA: Total:______ Female:_______
School Suport Comitee: Total:______ Female:_______
Food Comitee: Total:______ Female:_______
4.3. Is the school/ECD centre and PTAs/SSC/ECD
Centre Committee aware of the importance of
education/ECD to community? Kodi makomiti a
PTA/SSC/ Mkombaphala akudziwa za ubwino
wamaphunziro a pulaimale/mkombaphala kwa
anthu amdera?
PTA : □ Yes □ No □ N/A
School support Committee: □ Yes □ No □ N/A
Food Committee: □ Yes □ No □ N/A
4.4. How many times were awareness-raising events
conducted (per school year) in the past 12 months?
And when? Kodi zochitika-chitika zowazindikiritsa
anthu za ubwinowu, zinachitika kangati muchaka
cha maphunziro chapitachi? Zochitika-chitikazi
zinachitika liti?
□ Once
□ Twice
□ More than three
□ At beginning of the school year
□ During village meetings /middle of
the year/ end of the year
□ Other________________
4.5. How much did community/parents contribute
to the school/ECD Centre in the last school year?
Kodi ndi ndalama zingati zomwe anthu amdera lino
kapena makolo anapereka kusukulu ya
pulaimale/mkomaphala ino mchaka cha
maphunziro chapitachi?
□ In cash:………………MK/year
□ In kind: ……………….MK/year
V. IMPROVED STUDENT ATTENTIVENESS
5.1. How many learners/children were absent from
school/ECD Centre due to illness within 200 school
days?
Total:______ Female:_____
5.2. Total number of school days missed by all
students due to illness in last school year
Total:___________ school days
5.3. How manylearners/children had diarrhea
disease in last school year?
Total:______ Female:_________
5.4. Total Number of school days last school year Total:___________ school days
5.5. Number of learners/children absent from
school/ECD Centre more than (0.2* Number of
school days) days last school year (20% of school
days)
Total:____________ Female:_____________
5.6. Total number of learners/children last school
year
Total:____________ Female:_____________
5.7. Total Number of school days last month, this
school year
Total:___________ school days
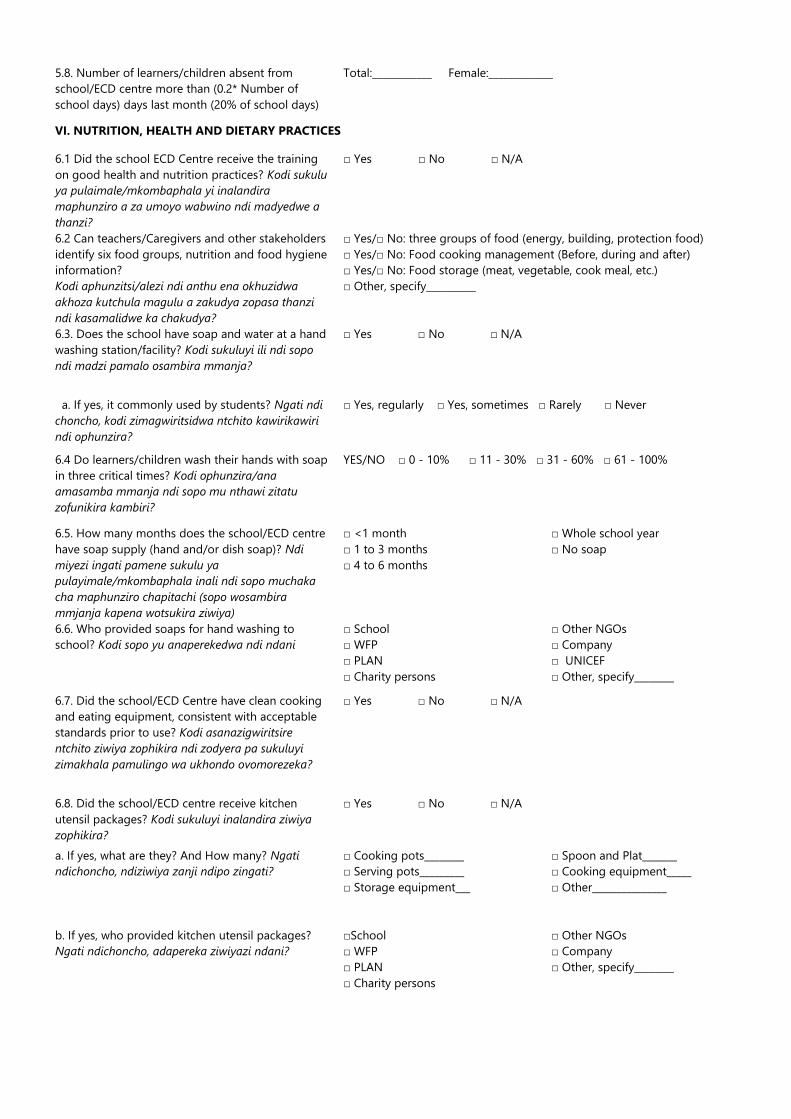
5.8. Number of learners/children absent from
school/ECD centre more than (0.2* Number of
school days) days last month (20% of school days)
Total:____________ Female:_____________
VI. NUTRITION, HEALTH AND DIETARY PRACTICES
6.1 Did the school ECD Centre receive the training
on good health and nutrition practices? Kodi sukulu
ya pulaimale/mkombaphala yi inalandira
maphunziro a za umoyo wabwino ndi madyedwe a
thanzi?
□ Yes □ No □ N/A
6.2 Can teachers/Caregivers and other stakeholders
identify six food groups, nutrition and food hygiene
information?
Kodi aphunzitsi/alezi ndi anthu ena okhuzidwa
akhoza kutchula magulu a zakudya zopasa thanzi
ndi kasamalidwe ka chakudya?
□ Yes/□ No: three groups of food (energy, building, protection food)
□ Yes/□ No: Food cooking management (Before, during and after)
□ Yes/□ No: Food storage (meat, vegetable, cook meal, etc.)
□ Other, specify__________
6.3. Does the school have soap and water at a hand
washing station/facility? Kodi sukuluyi ili ndi sopo
ndi madzi pamalo osambira mmanja?
□ Yes □ No □ N/A
a. If yes, it commonly used by students? Ngati ndi
choncho, kodi zimagwiritsidwa ntchito kawirikawiri
ndi ophunzira?
□ Yes, regularly □ Yes, sometimes □ Rarely □ Never
6.4 Do learners/children wash their hands with soap
in three critical times? Kodi ophunzira/ana
amasamba mmanja ndi sopo mu nthawi zitatu
zofunikira kambiri?
YES/NO □ 0 - 10% □ 11 - 30% □ 31 - 60% □ 61 - 100%
6.5. How many months does the school/ECD centre
have soap supply (hand and/or dish soap)? Ndi
miyezi ingati pamene sukulu ya
pulayimale/mkombaphala inali ndi sopo muchaka
cha maphunziro chapitachi (sopo wosambira
mmjanja kapena wotsukira ziwiya)
□ <1 month
□ 1 to 3 months
□ 4 to 6 months
□ Whole school year
□ No soap
6.6. Who provided soaps for hand washing to
school? Kodi sopo yu anaperekedwa ndi ndani
□ School
□ WFP
□ PLAN
□ Charity persons
□ Other NGOs
□ Company
□ UNICEF
□ Other, specify________
6.7. Did the school/ECD Centre have clean cooking
and eating equipment, consistent with acceptable
standards prior to use? Kodi asanazigwiritsire
ntchito ziwiya zophikira ndi zodyera pa sukuluyi
zimakhala pamulingo wa ukhondo ovomorezeka?
□ Yes □ No □ N/A
6.8. Did the school/ECD centre receive kitchen
utensil packages? Kodi sukuluyi inalandira ziwiya
zophikira?
□ Yes □ No □ N/A
a. If yes, what are they? And How many? Ngati
ndichoncho, ndiziwiya zanji ndipo zingati?
□ Cooking pots________
□ Serving pots_________
□ Storage equipment___
□ Spoon and Plat_______
□ Cooking equipment_____
□ Other_______________
b. If yes, who provided kitchen utensil packages?
Ngati ndichoncho, adapereka ziwiyazi ndani?
□School
□ WFP
□ PLAN
□ Charity persons
□ Other NGOs
□ Company
□ Other, specify________
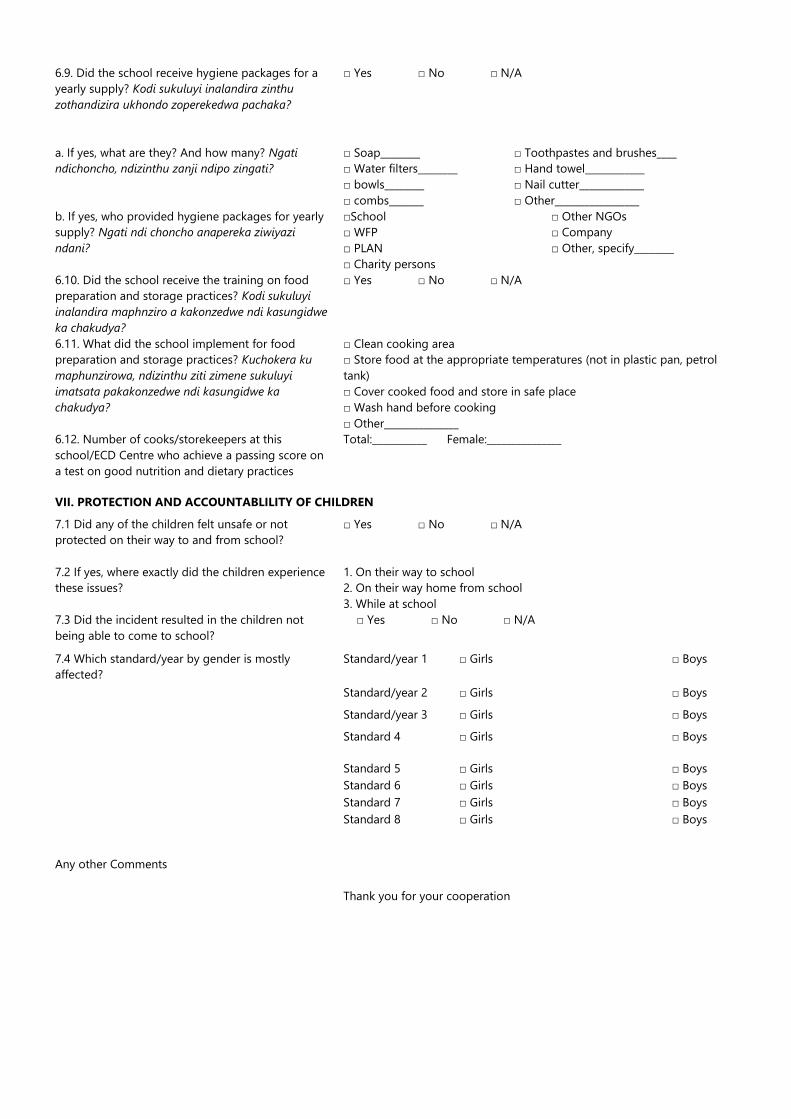
6.9. Did the school receive hygiene packages for a
yearly supply? Kodi sukuluyi inalandira zinthu
zothandizira ukhondo zoperekedwa pachaka?
□ Yes □ No □ N/A
a. If yes, what are they? And how many? Ngati
ndichoncho, ndizinthu zanji ndipo zingati?
□ Soap________
□ Water filters________
□ bowls________
□ combs_______
□ Toothpastes and brushes____
□ Hand towel____________
□ Nail cutter_____________
□ Other_________________
b. If yes, who provided hygiene packages for yearly
supply? Ngati ndi choncho anapereka ziwiyazi
ndani?
□School
□ WFP
□ PLAN
□ Charity persons
□ Other NGOs
□ Company
□ Other, specify________
6.10. Did the school receive the training on food
preparation and storage practices? Kodi sukuluyi
inalandira maphnziro a kakonzedwe ndi kasungidwe
ka chakudya?
□ Yes □ No □ N/A
6.11. What did the school implement for food
preparation and storage practices? Kuchokera ku
maphunzirowa, ndizinthu ziti zimene sukuluyi
imatsata pakakonzedwe ndi kasungidwe ka
chakudya?
□ Clean cooking area
□ Store food at the appropriate temperatures (not in plastic pan, petrol
tank)
□ Cover cooked food and store in safe place
□ Wash hand before cooking
□ Other_______________
6.12. Number of cooks/storekeepers at this
school/ECD Centre who achieve a passing score on
a test on good nutrition and dietary practices
Total:___________ Female:_______________
VII. PROTECTION AND ACCOUNTABLILITY OF CHILDREN
7.1 Did any of the children felt unsafe or not
protected on their way to and from school?
□ Yes □ No □ N/A
7.2 If yes, where exactly did the children experience
these issues?
1. On their way to school
2. On their way home from school
3. While at school
7.3 Did the incident resulted in the children not
being able to come to school?
□ Yes □ No □ N/A
7.4 Which standard/year by gender is mostly
affected?
Standard/year 1 □ Girls □ Boys
Standard/year 2 □ Girls □ Boys
Standard/year 3 □ Girls □ Boys
Standard 4 □ Girls □ Boys
Standard 5 □ Girls □ Boys
Standard 6 □ Girls □ Boys
Standard 7 □ Girls □ Boys
Standard 8 □ Girls □ Boys
Any other Comments
Thank you for your cooperation
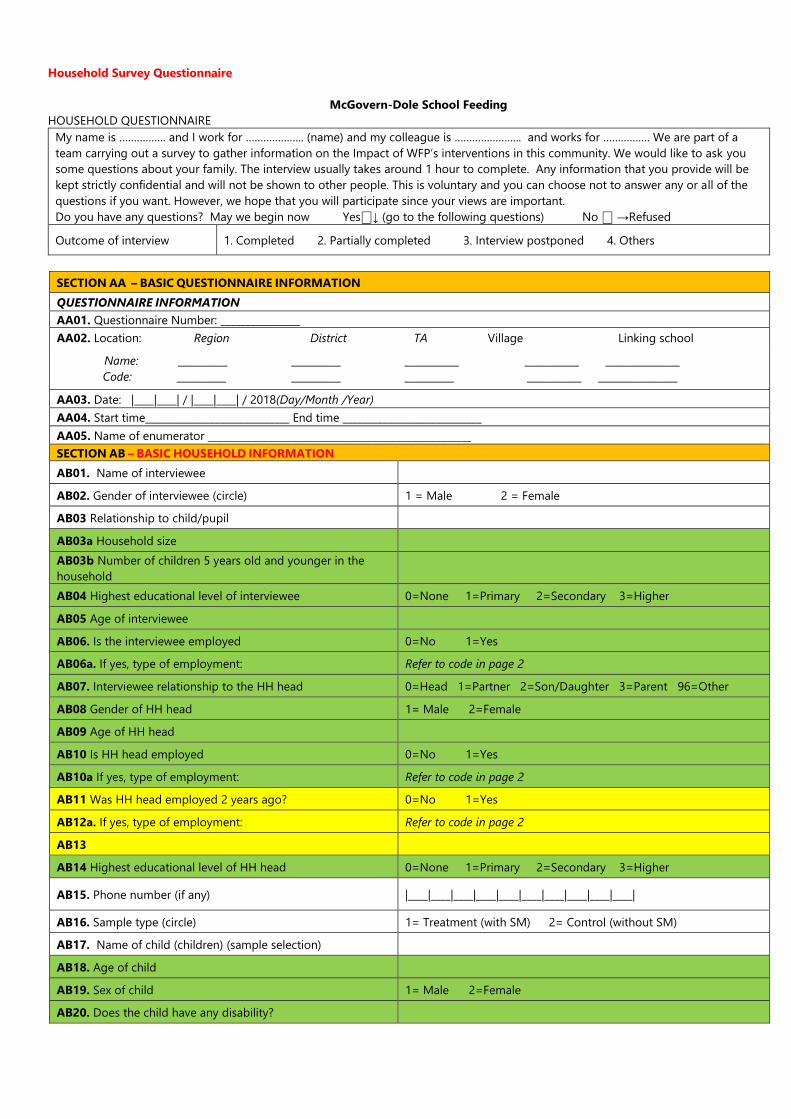
Household Survey Questionnaire
McGovern-Dole School Feeding
HOUSEHOLD QUESTIONNAIRE
My name is ……………. and I work for ……………….. (name) and my colleague is ………………….. and works for ……………. We are part of a
team carrying out a survey to gather information on the Impact of WFP’s interventions in this community. We would like to ask you
some questions about your family. The interview usually takes around 1 hour to complete. Any information that you provide will be
kept strictly confidential and will not be shown to other people. This is voluntary and you can choose not to answer any or all of the
questions if you want. However, we hope that you will participate since your views are important.
Do you have any questions? May we begin now Yes⎕↓ (go to the following questions) No ⎕ →Refused
Outcome of interview 1. Completed 2. Partially completed 3. Interview postponed 4. Others
SECTION AA – BASIC QUESTIONNAIRE INFORMATION
QUESTIONNAIRE INFORMATION
AA01. Questionnaire Number: ________________
AA02. Location: Region District TA Village Linking school
Name: __________ __________ ___________ ___________ _______________
Code: __________ __________ __________ ___________ ________________
AA03. Date: |____|____| / |____|____| / 2018(Day/Month /Year)
AA04. Start time_____________________________ End time ____________________________
AA05. Name of enumerator _____________________________________________________
SECTION AB – BASIC HOUSEHOLD INFORMATION
AB01. Name of interviewee
AB02. Gender of interviewee (circle) 1 = Male 2 = Female
AB03 Relationship to child/pupil
AB03a Household size
AB03b Number of children 5 years old and younger in the
household
AB04 Highest educational level of interviewee 0=None 1=Primary 2=Secondary 3=Higher
AB05 Age of interviewee
AB06. Is the interviewee employed 0=No 1=Yes
AB06a. If yes, type of employment: Refer to code in page 2
AB07. Interviewee relationship to the HH head 0=Head 1=Partner 2=Son/Daughter 3=Parent 96=Other
AB08 Gender of HH head 1= Male 2=Female
AB09 Age of HH head
AB10 Is HH head employed 0=No 1=Yes
AB10a If yes, type of employment: Refer to code in page 2
AB11 Was HH head employed 2 years ago? 0=No 1=Yes
AB12a. If yes, type of employment: Refer to code in page 2
AB13
AB14 Highest educational level of HH head 0=None 1=Primary 2=Secondary 3=Higher
AB15. Phone number (if any) |____|____|____|____|____|____|____|____|____|____|
AB16. Sample type (circle) 1= Treatment (with SM) 2= Control (without SM)
AB17. Name of child (children) (sample selection)
AB18. Age of child
AB19. Sex of child 1= Male 2=Female
AB20. Does the child have any disability?
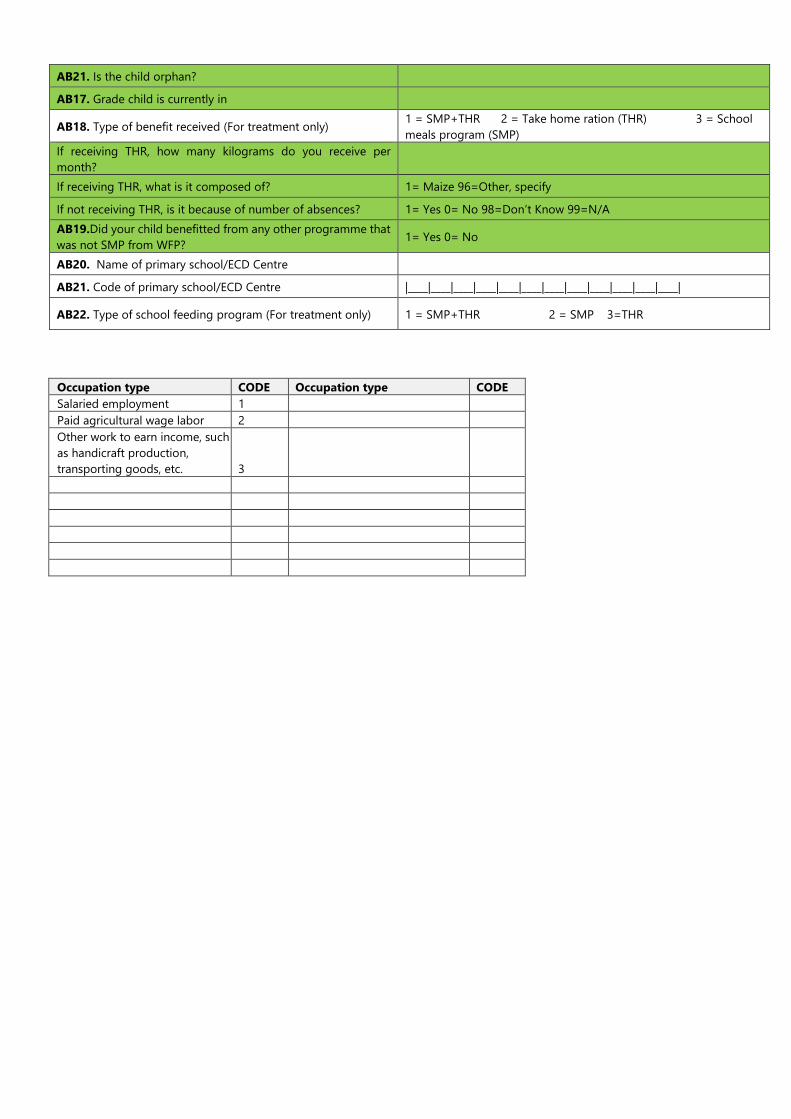
AB21. Is the child orphan?
AB17. Grade child is currently in
AB18. Type of benefit received (For treatment only) 1 = SMP+THR 2 = Take home ration (THR) 3 = School
meals program (SMP)
If receiving THR, how many kilograms do you receive per
month?
If receiving THR, what is it composed of? 1= Maize 96=Other, specify
If not receiving THR, is it because of number of absences? 1= Yes 0= No 98=Don’t Know 99=N/A
AB19.Did your child benefitted from any other programme that
was not SMP from WFP? 1= Yes 0= No
AB20. Name of primary school/ECD Centre
AB21. Code of primary school/ECD Centre |____|____|____|____|____|____|____|____|____|____|____|____|
AB22. Type of school feeding program (For treatment only) 1 = SMP+THR 2 = SMP 3=THR
Occupation type CODE Occupation type CODE
Salaried employment 1
Paid agricultural wage labor 2
Other work to earn income, such
as handicraft production,
transporting goods, etc. 3
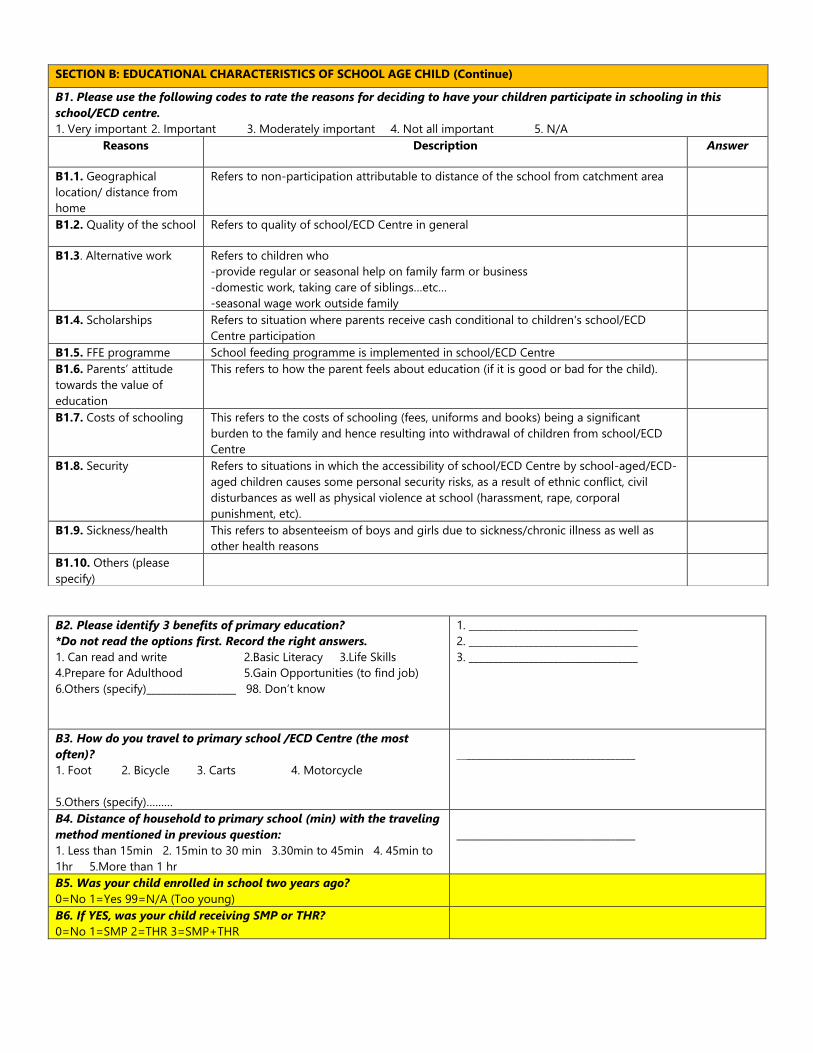
B2. Please identify 3 benefits of primary education?
*Do not read the options first. Record the right answers.
1. Can read and write 2.Basic Literacy 3.Life Skills
4.Prepare for Adulthood 5.Gain Opportunities (to find job)
6.Others (specify)__________________ 98. Don’t know
1. __________________________________
2. __________________________________
3. __________________________________
B3. How do you travel to primary school /ECD Centre (the most
often)?
1. Foot 2. Bicycle 3. Carts 4. Motorcycle
5.Others (specify)………
____________________________________
B4. Distance of household to primary school (min) with the traveling
method mentioned in previous question:
1. Less than 15min 2. 15min to 30 min 3.30min to 45min 4. 45min to
1hr 5.More than 1 hr
____________________________________
B5. Was your child enrolled in school two years ago?
0=No 1=Yes 99=N/A (Too young)
B6. If YES, was your child receiving SMP or THR?
0=No 1=SMP 2=THR 3=SMP+THR
SECTION B: EDUCATIONAL CHARACTERISTICS OF SCHOOL AGE CHILD (Continue)
B1. Please use the following codes to rate the reasons for deciding to have your children participate in schooling in this
school/ECD centre.
1. Very important 2. Important 3. Moderately important 4. Not all important 5. N/A
Reasons Description Answer
B1.1. Geographical
location/ distance from
home
Refers to non-participation attributable to distance of the school from catchment area
B1.2. Quality of the school Refers to quality of school/ECD Centre in general
B1.3. Alternative work Refers to children who
-provide regular or seasonal help on family farm or business
-domestic work, taking care of siblings…etc…
-seasonal wage work outside family
B1.4. Scholarships Refers to situation where parents receive cash conditional to children's school/ECD
Centre participation
B1.5. FFE programme School feeding programme is implemented in school/ECD Centre
B1.6. Parents’ attitude
towards the value of
education
This refers to how the parent feels about education (if it is good or bad for the child).
B1.7. Costs of schooling This refers to the costs of schooling (fees, uniforms and books) being a significant
burden to the family and hence resulting into withdrawal of children from school/ECD
Centre
B1.8. Security Refers to situations in which the accessibility of school/ECD Centre by school-aged/ECD-
aged children causes some personal security risks, as a result of ethnic conflict, civil
disturbances as well as physical violence at school (harassment, rape, corporal
punishment, etc).
B1.9. Sickness/health This refers to absenteeism of boys and girls due to sickness/chronic illness as well as
other health reasons
B1.10. Others (please
specify)
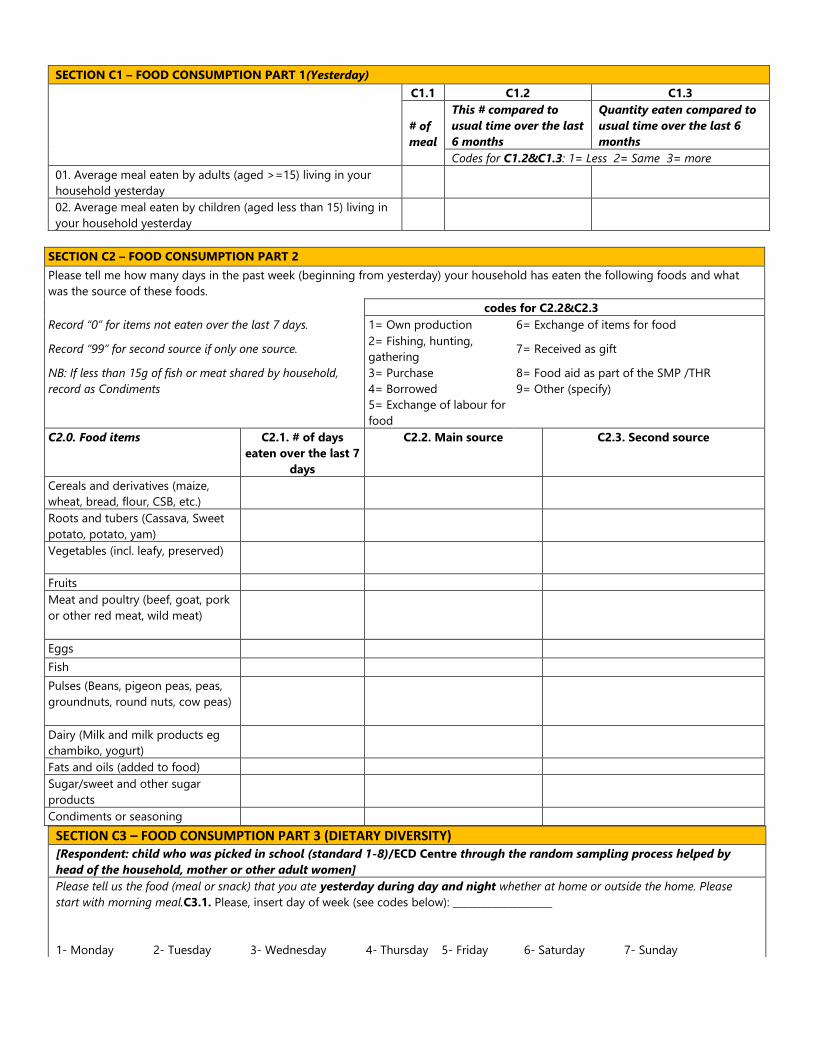
SECTION C1 – FOOD CONSUMPTION PART 1(Yesterday)
C1.1 C1.2 C1.3
# of
meal
This # compared to
usual time over the last
6 months
Quantity eaten compared to
usual time over the last 6
months
Codes for C1.2&C1.3: 1= Less 2= Same 3= more
01. Average meal eaten by adults (aged >=15) living in your
household yesterday
02. Average meal eaten by children (aged less than 15) living in
your household yesterday
SECTION C2 – FOOD CONSUMPTION PART 2
Please tell me how many days in the past week (beginning from yesterday) your household has eaten the following foods and what
was the source of these foods.
codes for C2.2&C2.3
Record “0” for items not eaten over the last 7 days. 1= Own production 6= Exchange of items for food
Record “99” for second source if only one source. 2= Fishing, hunting,
gathering 7= Received as gift
NB: If less than 15g of fish or meat shared by household,
record as Condiments
3= Purchase 8= Food aid as part of the SMP /THR
4= Borrowed 9= Other (specify)
5= Exchange of labour for
food
C2.0. Food items C2.1. # of days
eaten over the last 7
days
C2.2. Main source C2.3. Second source
Cereals and derivatives (maize,
wheat, bread, flour, CSB, etc.)
Roots and tubers (Cassava, Sweet
potato, potato, yam)
Vegetables (incl. leafy, preserved)
Fruits
Meat and poultry (beef, goat, pork
or other red meat, wild meat)
Eggs
Fish
Pulses (Beans, pigeon peas, peas,
groundnuts, round nuts, cow peas)
Dairy (Milk and milk products eg
chambiko, yogurt)
Fats and oils (added to food)
Sugar/sweet and other sugar
products
Condiments or seasoning
SECTION C3 – FOOD CONSUMPTION PART 3 (DIETARY DIVERSITY) [Respondent: child who was picked in school (standard 1-8)/ECD Centre through the random sampling process helped by
head of the household, mother or other adult women]
Please tell us the food (meal or snack) that you ate yesterday during day and night whether at home or outside the home. Please
start with morning meal.C3.1. Please, insert day of week (see codes below): ____________________
1- Monday 2- Tuesday 3- Wednesday 4- Thursday 5- Friday 6- Saturday 7- Sunday
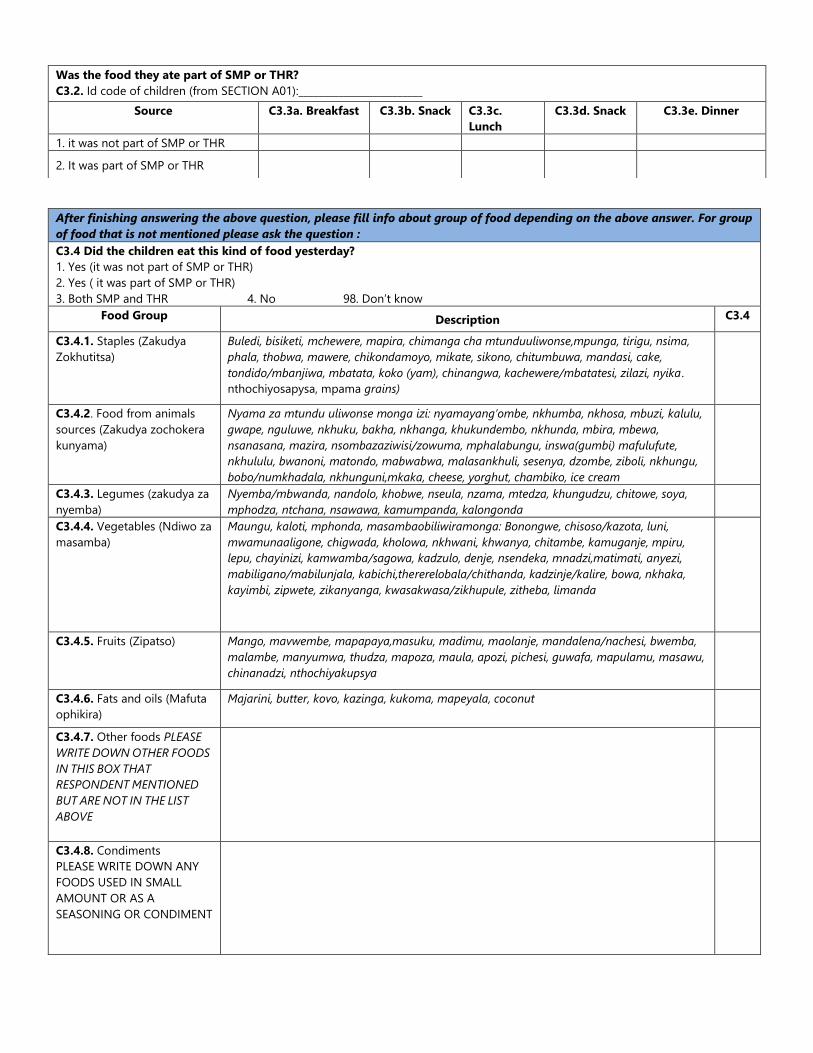
After finishing answering the above question, please fill info about group of food depending on the above answer. For group
of food that is not mentioned please ask the question :
C3.4 Did the children eat this kind of food yesterday?
1. Yes (it was not part of SMP or THR)
2. Yes ( it was part of SMP or THR)
3. Both SMP and THR 4. No 98. Don’t know
Food Group Description C3.4
C3.4.1. Staples (Zakudya
Zokhutitsa)
Buledi, bisiketi, mchewere, mapira, chimanga cha mtunduuliwonse,mpunga, tirigu, nsima,
phala, thobwa, mawere, chikondamoyo, mikate, sikono, chitumbuwa, mandasi, cake,
tondido/mbanjiwa, mbatata, koko (yam), chinangwa, kachewere/mbatatesi, zilazi, nyika.
nthochiyosapysa, mpama grains)
C3.4.2. Food from animals
sources (Zakudya zochokera
kunyama)
Nyama za mtundu uliwonse monga izi: nyamayang’ombe, nkhumba, nkhosa, mbuzi, kalulu,
gwape, nguluwe, nkhuku, bakha, nkhanga, khukundembo, nkhunda, mbira, mbewa,
nsanasana, mazira, nsombazaziwisi/zowuma, mphalabungu, inswa(gumbi) mafulufute,
nkhululu, bwanoni, matondo, mabwabwa, malasankhuli, sesenya, dzombe, ziboli, nkhungu,
bobo/numkhadala, nkhunguni,mkaka, cheese, yorghut, chambiko, ice cream
C3.4.3. Legumes (zakudya za
nyemba)
Nyemba/mbwanda, nandolo, khobwe, nseula, nzama, mtedza, khungudzu, chitowe, soya,
mphodza, ntchana, nsawawa, kamumpanda, kalongonda
C3.4.4. Vegetables (Ndiwo za
masamba)
Maungu, kaloti, mphonda, masambaobiliwiramonga: Bonongwe, chisoso/kazota, luni,
mwamunaaligone, chigwada, kholowa, nkhwani, khwanya, chitambe, kamuganje, mpiru,
lepu, chayinizi, kamwamba/sagowa, kadzulo, denje, nsendeka, mnadzi,matimati, anyezi,
mabiligano/mabilunjala, kabichi,thererelobala/chithanda, kadzinje/kalire, bowa, nkhaka,
kayimbi, zipwete, zikanyanga, kwasakwasa/zikhupule, zitheba, limanda
C3.4.5. Fruits (Zipatso)
Mango, mavwembe, mapapaya,masuku, madimu, maolanje, mandalena/nachesi, bwemba,
malambe, manyumwa, thudza, mapoza, maula, apozi, pichesi, guwafa, mapulamu, masawu,
chinanadzi, nthochiyakupsya
C3.4.6. Fats and oils (Mafuta
ophikira)
Majarini, butter, kovo, kazinga, kukoma, mapeyala, coconut
C3.4.7. Other foods PLEASE
WRITE DOWN OTHER FOODS
IN THIS BOX THAT
RESPONDENT MENTIONED
BUT ARE NOT IN THE LIST
ABOVE
C3.4.8. Condiments
PLEASE WRITE DOWN ANY
FOODS USED IN SMALL
AMOUNT OR AS A
SEASONING OR CONDIMENT
Was the food they ate part of SMP or THR?
C3.2. Id code of children (from SECTION A01):_________________________
Source C3.3a. Breakfast C3.3b. Snack C3.3c.
Lunch
C3.3d. Snack C3.3e. Dinner
1. it was not part of SMP or THR
2. It was part of SMP or THR
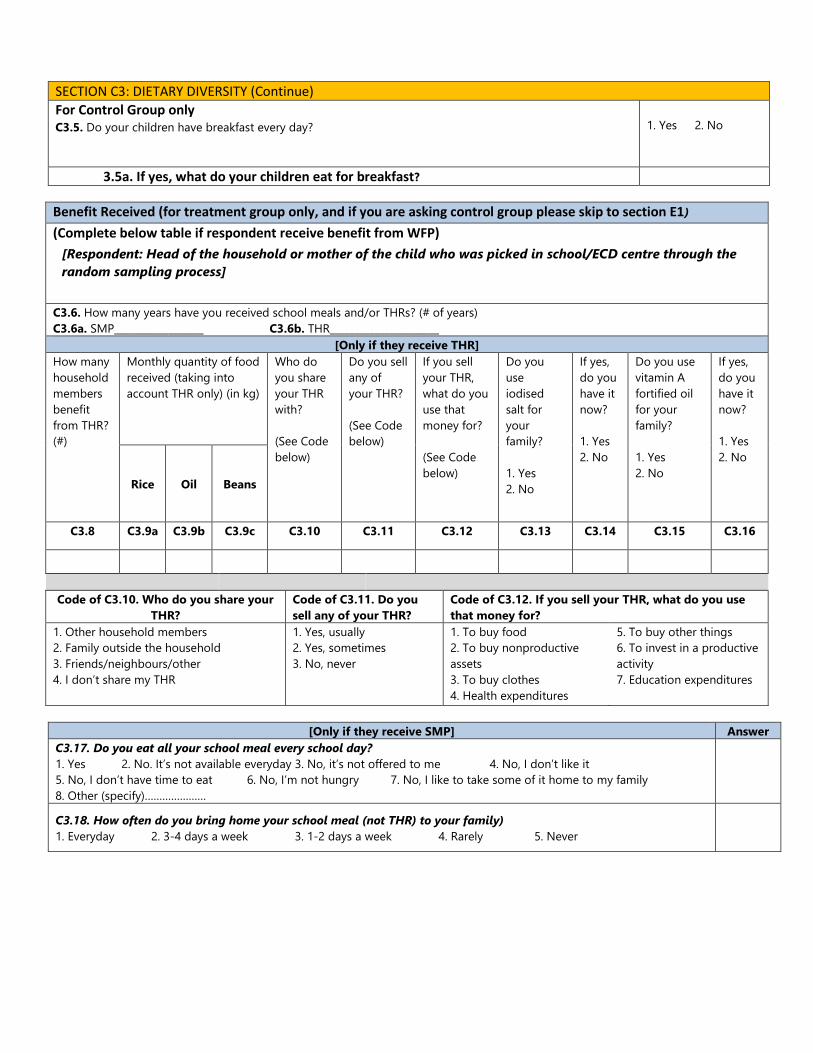
SECTION C3: DIETARY DIVERSITY (Continue)
For Control Group only C3.5. Do your children have breakfast every day?
1. Yes 2. No
3.5a. If yes, what do your children eat for breakfast?
Benefit Received (for treatment group only, and if you are asking control group please skip to section E1)
(Complete below table if respondent receive benefit from WFP)
[Respondent: Head of the household or mother of the child who was picked in school/ECD centre through the
random sampling process]
C3.6. How many years have you received school meals and/or THRs? (# of years)
C3.6a. SMP__________________ C3.6b. THR______________________
[Only if they receive THR]
How many
household
members
benefit
from THR?
(#)
Monthly quantity of food
received (taking into
account THR only) (in kg)
Who do
you share
your THR
with?
(See Code
below)
Do you sell
any of
your THR?
(See Code
below)
If you sell
your THR,
what do you
use that
money for?
(See Code
below)
Do you
use
iodised
salt for
your
family?
1. Yes
2. No
If yes,
do you
have it
now?
1. Yes
2. No
Do you use
vitamin A
fortified oil
for your
family?
1. Yes
2. No
If yes,
do you
have it
now?
1. Yes
2. No
Rice Oil Beans
C3.8 C3.9a C3.9b C3.9c C3.10 C3.11 C3.12 C3.13 C3.14 C3.15 C3.16
Code of C3.10. Who do you share your
THR?
Code of C3.11. Do you
sell any of your THR?
Code of C3.12. If you sell your THR, what do you use
that money for?
1. Other household members
2. Family outside the household
3. Friends/neighbours/other
4. I don’t share my THR
1. Yes, usually
2. Yes, sometimes
3. No, never
1. To buy food
2. To buy nonproductive
assets
3. To buy clothes
4. Health expenditures
5. To buy other things
6. To invest in a productive
activity
7. Education expenditures
[Only if they receive SMP] Answer
C3.17. Do you eat all your school meal every school day?
1. Yes 2. No. It’s not available everyday 3. No, it’s not offered to me 4. No, I don’t like it
5. No, I don’t have time to eat 6. No, I’m not hungry 7. No, I like to take some of it home to my family
8. Other (specify)…………………
C3.18. How often do you bring home your school meal (not THR) to your family)
1. Everyday 2. 3-4 days a week 3. 1-2 days a week 4. Rarely 5. Never

SECTION D2 – NON FOOD EXPENDITURES
How much did your household approximately spend on the following items in the last 6 months? N
Items
Approximate value in
‘000 Malawi Kwacha (in
cash)
Not include your own
product
Approximate value in
‘000 Malawi Kwacha(in
credit)
D2.a D2.b D2.c
D2.1 Education (school fees, books, uniforms)
D2.2 Health for adults and child. > 5years
D2.3 Health for children < 5 years
D2.4 Transportation (maintenance and repair, gasoline and diesel for
own transportation, moving fee)
D2.5 Clothing and footwear
D2.6 Debt repayment
D2.7 Sending remittances
D2.8 House construction/maintenance including electricity & wateror
any other mean to produce heat/light or get water in the house
D2.9 Shop/trade/commerce
D2.10 Farming (seeds, fertilizers, labor costs…), Livestock breeding
(vaccines, fodder…)
D2.11 Fish breeding, fishing
D2.12 Celebrations/social events/donation
D2.13 Total
D3.1 Have you ever encountered difficulties covering the expense? 1. Yes, usually 2. Yes, sometimes 3. No, never
SECTION D1 – FOOD AND SMALL NON FOOD EXPENDITURES
How much did your household approximately spend on the following items in the last 30 days?
Items
Approximate value in
‘000 Kwacha (in cash)
Not include your own
product
Approximate value in
‘000 Kwacha (in credit)
D1.a D1.b D1.c
D1.1 Maize/ Rice
D1.2 Other cereals & staples
D1.3 Pulses/beans/nuts
D1.4 Vegetables
D1.5 Fruits
D1.6 Meat, fish, eggs
D1.7 Cooking oil
D1.8 Other food items
D1.9 Firewood /cooking fuel
D1.10 Energy (e.g., battery, gas)
D1.11 Cigarettes/Alcohol
D1.12 Drinking water
D1.13 Personal care (e.g. soap, toothpaste, razor, sanitary napkins, hair
cut)
D1.14 Communication (cell phone, phone card)
D1.15 Total

SECTION E1 – REDUCED COPING STRATEGIES INDEX
During the last 7 days, how many days did your household have to employ one of
the following strategies to cope with a lack of food or money to buy it? (READ OUT
EACH STRATEGY)
Frequency
(# of days from 0 to 7)
E1.1 Relied on less preferred, less expensive food | |
E1.2 Borrowed food or relied on help from friends or relatives | |
E1.3 Reduced the number of meals eaten per day | |
E1 4 Reduced portion size of meals | |
E1.5 Reduction in the quantities consumed by adults/mothers for young children | |
E1.6 Not able to eat the kinds of foods preferred because of a lack of resources | |
SECTION F – LIVELIHOOD COPING STRATEGIES
F1. During the past 30 days, did anyone in your household have to engage
in any of the following activities because there was not enough food or
money to buy food?
1= Yes
2 = No, because I do not have
the possibility to engage in
this activity.
3 = No, because I did not face
a shortage of food that require
me to do this
F2. Sold household goods (radio, furniture, refrigerator, television, jewelry,
clothes, utensils etc.) | |
F3. Sold productive assets or means of transport (sewing machine,
wheelbarrow, bicycle, ploughing tools, seeds etc.) | |
F4. Sold livestock (e.g. goats, cattle, chickens, pigs)
F5. Reduced essential non-food expenditures such as education, health, etc. | |
F6. Spent savings | |
F7. Borrowed money / food from a formal lender / bank | |
F8. Sold house or land | |
F9. Withdrew children from school | |
F10. Illegal income activities (theft, prostitution, etc.) | |
F11. Sent an adult household member sought work elsewhere (regardless
of the usual seasonal migration) | |
F12. Begged | |
SECTION G – HOUSEHOLD HUNGER SCALE
G1a. In the past 30 days, was there ever no food to eat of any kind in your
house because of lack of resources to get food?
0 = No (Skip to F3.2)
1 = Yes
G1b. How often did this happen in the past 30 days?
1 = Rarely (1–2 times)
2 = Sometimes (3–10 times)
3 = Often (more than 10
times)
G2a. In the past 30 days, did you or any household member go to sleep at
night hungry because there was not enough food?
0 = No (Skip to F3.3)
1 = Yes
G2b. How often did this happen in the past 30 days?
1 = Rarely (1–2 times)
2 = Sometimes (3–10 times)
3 = Often (more than10
times)
G3aIn the past 30 days, did you or any household member go a whole day
and night without eating anything at all because there was not enough food?
0 = No (Skip to Section G)
1 = Yes
G3b How often did this happen in the past 30 days? 1 = Rarely (1–2 times) 2 = Sometimes (3–10 times)
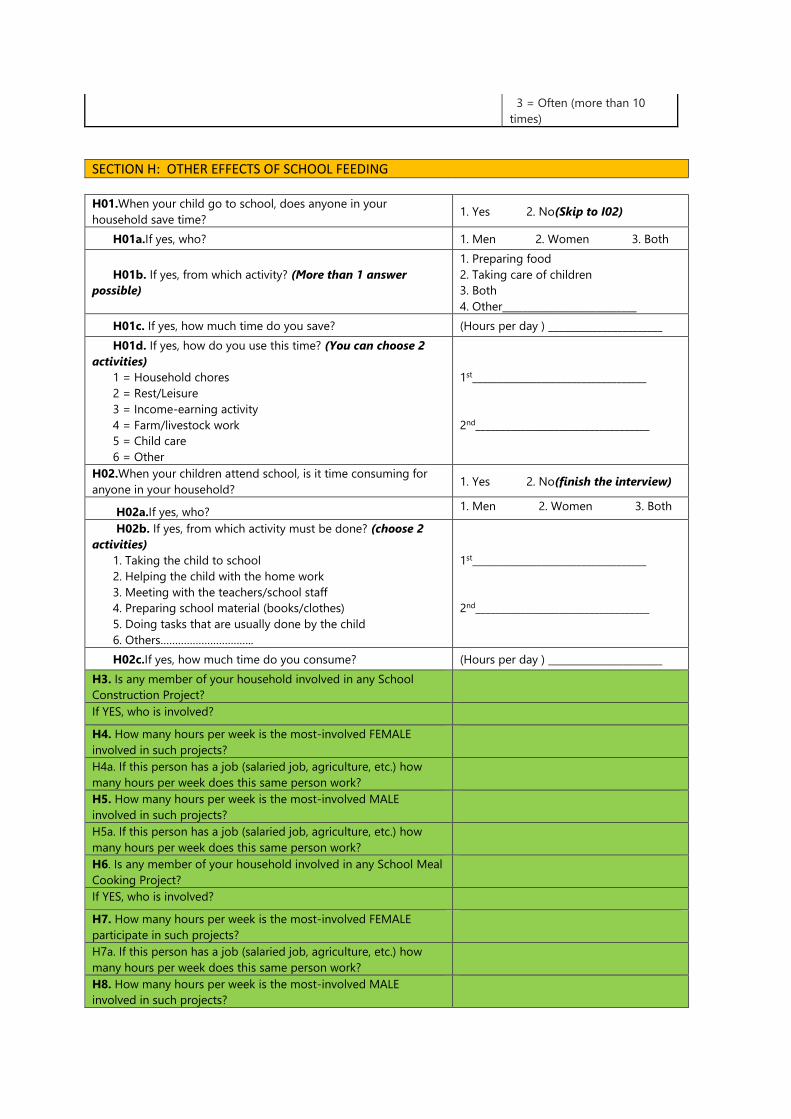
3 = Often (more than 10
times)
SECTION H: OTHER EFFECTS OF SCHOOL FEEDING
H01.When your child go to school, does anyone in your
household save time? 1. Yes 2. No(Skip to I02)
H01a.If yes, who? 1. Men 2. Women 3. Both
H01b. If yes, from which activity? (More than 1 answer
possible)
1. Preparing food
2. Taking care of children
3. Both
4. Other___________________________
H01c. If yes, how much time do you save? (Hours per day ) _______________________
H01d. If yes, how do you use this time? (You can choose 2
activities)
1 = Household chores
2 = Rest/Leisure
3 = Income-earning activity
4 = Farm/livestock work
5 = Child care
6 = Other
1st___________________________________
2nd___________________________________
H02.When your children attend school, is it time consuming for
anyone in your household? 1. Yes 2. No(finish the interview)
H02a.If yes, who? 1. Men 2. Women 3. Both
H02b. If yes, from which activity must be done? (choose 2
activities)
1. Taking the child to school
2. Helping the child with the home work
3. Meeting with the teachers/school staff
4. Preparing school material (books/clothes)
5. Doing tasks that are usually done by the child
6. Others…………………………..
1st___________________________________
2nd___________________________________
H02c.If yes, how much time do you consume? (Hours per day ) _______________________
H3. Is any member of your household involved in any School
Construction Project?
If YES, who is involved?
H4. How many hours per week is the most-involved FEMALE
involved in such projects?
H4a. If this person has a job (salaried job, agriculture, etc.) how
many hours per week does this same person work?
H5. How many hours per week is the most-involved MALE
involved in such projects?
H5a. If this person has a job (salaried job, agriculture, etc.) how
many hours per week does this same person work?
H6. Is any member of your household involved in any School Meal
Cooking Project?
If YES, who is involved?
H7. How many hours per week is the most-involved FEMALE
participate in such projects?
H7a. If this person has a job (salaried job, agriculture, etc.) how
many hours per week does this same person work?
H8. How many hours per week is the most-involved MALE
involved in such projects?
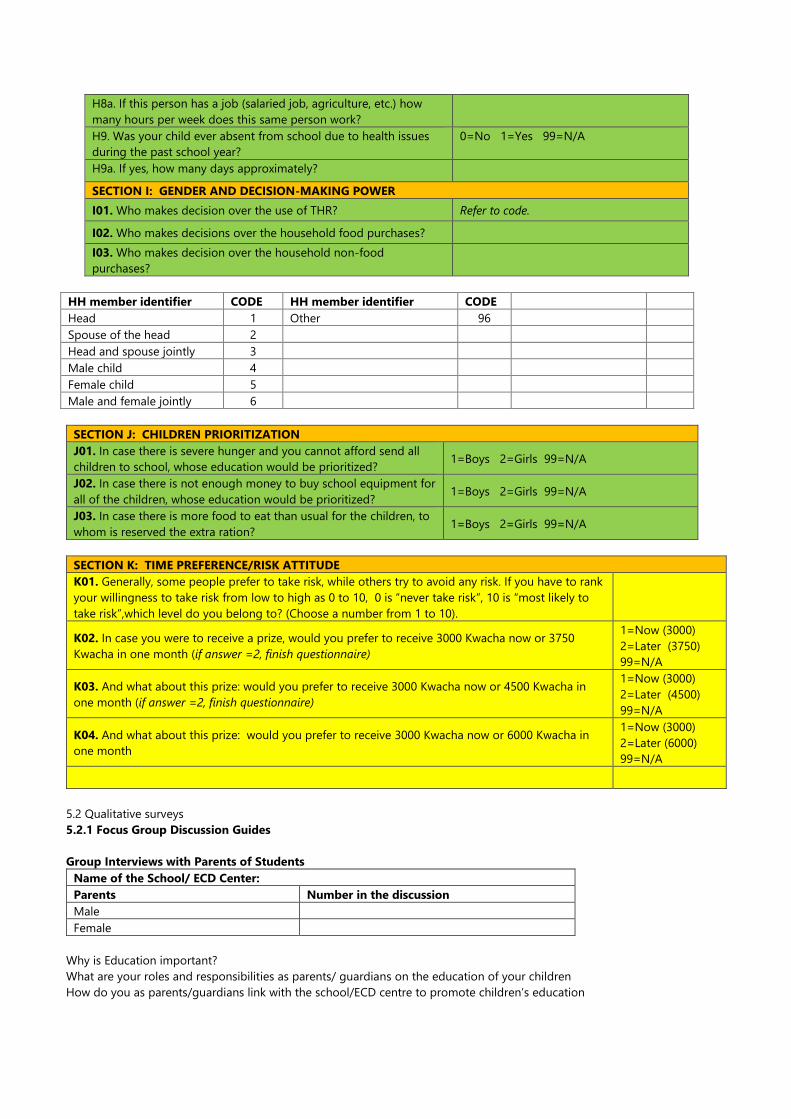
H8a. If this person has a job (salaried job, agriculture, etc.) how
many hours per week does this same person work?
H9. Was your child ever absent from school due to health issues
during the past school year?
0=No 1=Yes 99=N/A
H9a. If yes, how many days approximately?
SECTION I: GENDER AND DECISION-MAKING POWER
I01. Who makes decision over the use of THR? Refer to code.
I02. Who makes decisions over the household food purchases?
I03. Who makes decision over the household non-food
purchases?
HH member identifier CODE HH member identifier CODE
Head 1 Other 96
Spouse of the head 2
Head and spouse jointly 3
Male child 4
Female child 5
Male and female jointly 6
SECTION J: CHILDREN PRIORITIZATION
J01. In case there is severe hunger and you cannot afford send all
children to school, whose education would be prioritized? 1=Boys 2=Girls 99=N/A
J02. In case there is not enough money to buy school equipment for
all of the children, whose education would be prioritized? 1=Boys 2=Girls 99=N/A
J03. In case there is more food to eat than usual for the children, to
whom is reserved the extra ration? 1=Boys 2=Girls 99=N/A
SECTION K: TIME PREFERENCE/RISK ATTITUDE
K01. Generally, some people prefer to take risk, while others try to avoid any risk. If you have to rank
your willingness to take risk from low to high as 0 to 10, 0 is “never take risk”, 10 is “most likely to
take risk”,which level do you belong to? (Choose a number from 1 to 10).
K02. In case you were to receive a prize, would you prefer to receive 3000 Kwacha now or 3750
Kwacha in one month (if answer =2, finish questionnaire)
1=Now (3000)
2=Later (3750)
99=N/A
K03. And what about this prize: would you prefer to receive 3000 Kwacha now or 4500 Kwacha in
one month (if answer =2, finish questionnaire)
1=Now (3000)
2=Later (4500)
99=N/A
K04. And what about this prize: would you prefer to receive 3000 Kwacha now or 6000 Kwacha in
one month
1=Now (3000)
2=Later (6000)
99=N/A
5.2 Qualitative surveys
5.2.1 Focus Group Discussion Guides
Group Interviews with Parents of Students
Name of the School/ ECD Center:
Parents Number in the discussion
Male
Female
Why is Education important?
What are your roles and responsibilities as parents/ guardians on the education of your children
How do you as parents/guardians link with the school/ECD centre to promote children’s education

What are some of the challenges that affect education in this community and what are some of the solutions to the
challenges mentioned
What do you think are the main reasons contributing to
Learners enrolling or failing to enrol at school/ ECD centre at the start of school year
Poor attendance and absenteeism
Are there any specific issues for female learners?
What do you think should be done (are solutions) to improve school enrolment, attendance and reduce absenteeism?
What do you know about the school meals program being implemented at the school/ ECD centre?
Why do you think the SM were introduced and what are the perceived benefits of the program?
Has the introduction of the SM helped to address some of the problems affecting education in the area? Please explain
Has the girl child and orphaned children benefited more from the program? Please explain
Describe how the SM program is being implemented at this school/ECD centre highlighting roles of different players?
Role of teachers
Role of students
Role of parents/ guardians (community members)
What are some of the things that are working well or not working well in the SM program
Management of the activities
Involvement of parents/community
Type and quality of meals provided
Has the programme improved the situation of the families of the school children who benefit? Please explain
What is the community doing to ensure sustainability of the program at the school
Group Interviews with Pupils (Standard 4-7)
Name of the School:
Pupils Present Number
Male pupils
Female Pupils
Why is education important?
What are some of the challenges that you face at school and home that affect your learning and what are some of the
solutions to the challenges mentioned
Challenges at home and in the community
Challenges at school
Why do you think some of your colleagues fail to enrol for school? What do you think are some of the solutions to
encourage enrolment?
Do you sometimes fail to attend school, what are the reasons that make you fail attend school sometimes. What can be
done to ensure that pupils are attending school every day
Why do you think some of your colleagues drop out of school? What do you think can be done to ensure that every
pupil completes school?
Would you know when the SM program was introduced at this school, What do you think were the reasons of
introducing the SM program?
Describe how the SM program is being implemented at this school?
Role of teachers
Role of students
Role of community members
What type of food do you normally eat at this school
Where does the food that you eat at this school come from?
Do you also eat the same type of food at home? Or do you only find this type of food at school?
Do you like the program? Are you happy with the meals that you receive
Are there any challenges that you experience with the SM program
If you have a complaint in the way the program is implemented, what do you do? Is there a reporting mechanism for
complaints?
Do you think the SM program has helped to reduce some of the challenges that you face at home and school? Please
explain
If the school meals were to stop today, what do you think can happen? Can this have any effects on your learning?
Please explain
What do you think should be done to ensure sustainability of the SM program

Group Interviews with Teachers/ Caregivers
Name of the School/ ECD Center:
Teachers/ care givers Present Number at the school Number in the discussion
Male Teachers
Female Teachers
What are some of the challenges that affect education at this school and community and what are some of the
solutions to the challenges mentioned
Challenges faced by learners
Challenges faced by the teachers/ care givers
What do you know about the SM program at this school/ECD centre. What about take home rations?
When was the SM program introduced at this school, What was the process of introducing the SM program? Which
organisation introduced the program?
What are the benefits of the school meals at school/ ECD centre to the pupils, children and community as a whole in
relation to the challenges faced in this area?
Describe how the SM program is being implemented at this school highlighting roles of different players?
Role of teachers
Role of students
Role of community members
What type of food is normally provided at this school, who provides the food to the school
Are there any challenges that you experience with the SM program, how do you address such challenges?
For Primary schools with THR only: What criteria is followed to put some students on take home rations (THR)
For Primary schools with THR only: How does the community react to the fact that some students get THR while
others do not?
Does the school have the necessary structures and facilities to support the SM program (Kitchen, Feeding Shelter,
Water, Toilets)? Who are responsible for ensuring availability of the structures at the school
In your opinion, do you think student literacy, attendance, attentiveness, and student health has improved with the SM
program? Please explain
Do you think male and female pupils are benefiting equally from the program?
Have you or your colleagues at this schools/ ECD centrereceivedany trainingonthe monitoringandmanagement of
theschool mealsprogram, what type of training was provided?
What are the lessons generated from the SM program at your school/ ECD centre
What is working well
What is not working and what should be done
What is your school/ ECD centre doing to ensure sustainability of the program at your school
5.2.2 Key Informant Interview Guides
A. Key Informant Interview Checklist for WFP Program Staff (SMP)
Was the intervention in line with WFP and USDA main goals and strategies in Malawi?
Is the project aligned with national government’s education and school feeding policies and strategies, as well as other
policies and strategies, such as the National Social Support Program and the Malawi Growth and Development Strategy
(MGDS II) and the National Education Sector Plan (NESP)
Does the project complement other donor-funded and government initiatives?
Was the project designed to reach the right people with the right type of assistance?
To what degree have (and have not) the interventions resulted in the expected results and outcomes?
Have student literacy, attendance, attentiveness, and student health improved?
Did assistance reach the right beneficiaries in the right quantity and quality at the right time?
Have there been any unintended outcomes, either positive or negative?
What internal and external factors affected the project achievement of intended results
To which extent has the program addressed lessons learned from the midterm evaluation findings and
recommendations?:
Advocate for a stable budget line for SMP to support government agenda of universal coverage
Strengthen M&E system to ensure data on SMP is included in DEMIS and EMIS
Develop National school meals strategy to provide direction on how government can manage the SMP
Is the program sustainable in the following areas: strategy for sustainability; sound policy alignment; stable funding and
budgeting; quality program design; institutional arrangements; local production and sourcing; partnership and
coordination; community participation and ownership?
Has the WFP strategy for HGSM been appropriate and effective?
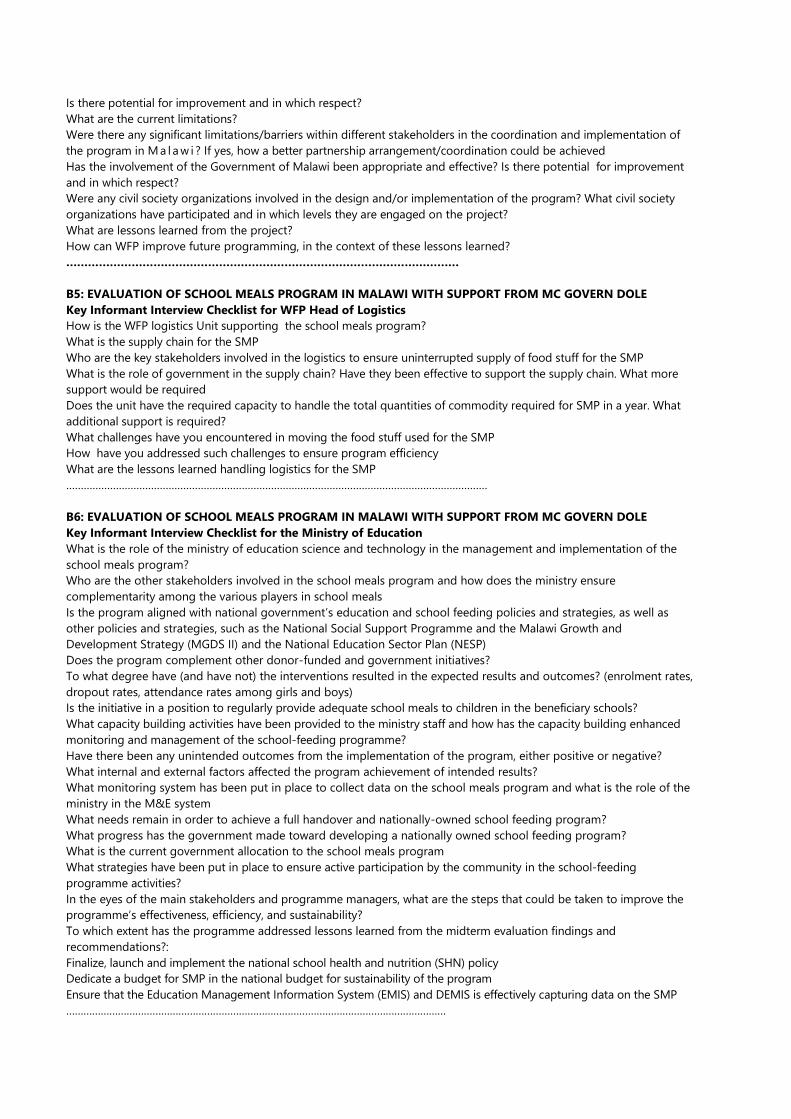
Is there potential for improvement and in which respect?
What are the current limitations?
Were there any significant limitations/barriers within different stakeholders in the coordination and implementation of
the program in M a l a w i ? If yes, how a better partnership arrangement/coordination could be achieved
Has the involvement of the Government of Malawi been appropriate and effective? Is there potential for improvement
and in which respect?
Were any civil society organizations involved in the design and/or implementation of the program? What civil society
organizations have participated and in which levels they are engaged on the project?
What are lessons learned from the project?
How can WFP improve future programming, in the context of these lessons learned?
………………………………………………………………………………………………
B5: EVALUATION OF SCHOOL MEALS PROGRAM IN MALAWI WITH SUPPORT FROM MC GOVERN DOLE
Key Informant Interview Checklist for WFP Head of Logistics
How is the WFP logistics Unit supporting the school meals program?
What is the supply chain for the SMP
Who are the key stakeholders involved in the logistics to ensure uninterrupted supply of food stuff for the SMP
What is the role of government in the supply chain? Have they been effective to support the supply chain. What more
support would be required
Does the unit have the required capacity to handle the total quantities of commodity required for SMP in a year. What
additional support is required?
What challenges have you encountered in moving the food stuff used for the SMP
How have you addressed such challenges to ensure program efficiency
What are the lessons learned handling logistics for the SMP
………………………………………………………………………………………………………………………………
B6: EVALUATION OF SCHOOL MEALS PROGRAM IN MALAWI WITH SUPPORT FROM MC GOVERN DOLE
Key Informant Interview Checklist for the Ministry of Education
What is the role of the ministry of education science and technology in the management and implementation of the
school meals program?
Who are the other stakeholders involved in the school meals program and how does the ministry ensure
complementarity among the various players in school meals
Is the program aligned with national government’s education and school feeding policies and strategies, as well as
other policies and strategies, such as the National Social Support Programme and the Malawi Growth and
Development Strategy (MGDS II) and the National Education Sector Plan (NESP)
Does the program complement other donor-funded and government initiatives?
To what degree have (and have not) the interventions resulted in the expected results and outcomes? (enrolment rates,
dropout rates, attendance rates among girls and boys)
Is the initiative in a position to regularly provide adequate school meals to children in the beneficiary schools?
What capacity building activities have been provided to the ministry staff and how has the capacity building enhanced
monitoring and management of the school-feeding programme?
Have there been any unintended outcomes from the implementation of the program, either positive or negative?
What internal and external factors affected the program achievement of intended results?
What monitoring system has been put in place to collect data on the school meals program and what is the role of the
ministry in the M&E system
What needs remain in order to achieve a full handover and nationally-owned school feeding program?
What progress has the government made toward developing a nationally owned school feeding program?
What is the current government allocation to the school meals program
What strategies have been put in place to ensure active participation by the community in the school-feeding
programme activities?
In the eyes of the main stakeholders and programme managers, what are the steps that could be taken to improve the
programme’s effectiveness, efficiency, and sustainability?
To which extent has the programme addressed lessons learned from the midterm evaluation findings and
recommendations?:
Finalize, launch and implement the national school health and nutrition (SHN) policy
Dedicate a budget for SMP in the national budget for sustainability of the program
Ensure that the Education Management Information System (EMIS) and DEMIS is effectively capturing data on the SMP
……………………………………………………………………………………………………………………
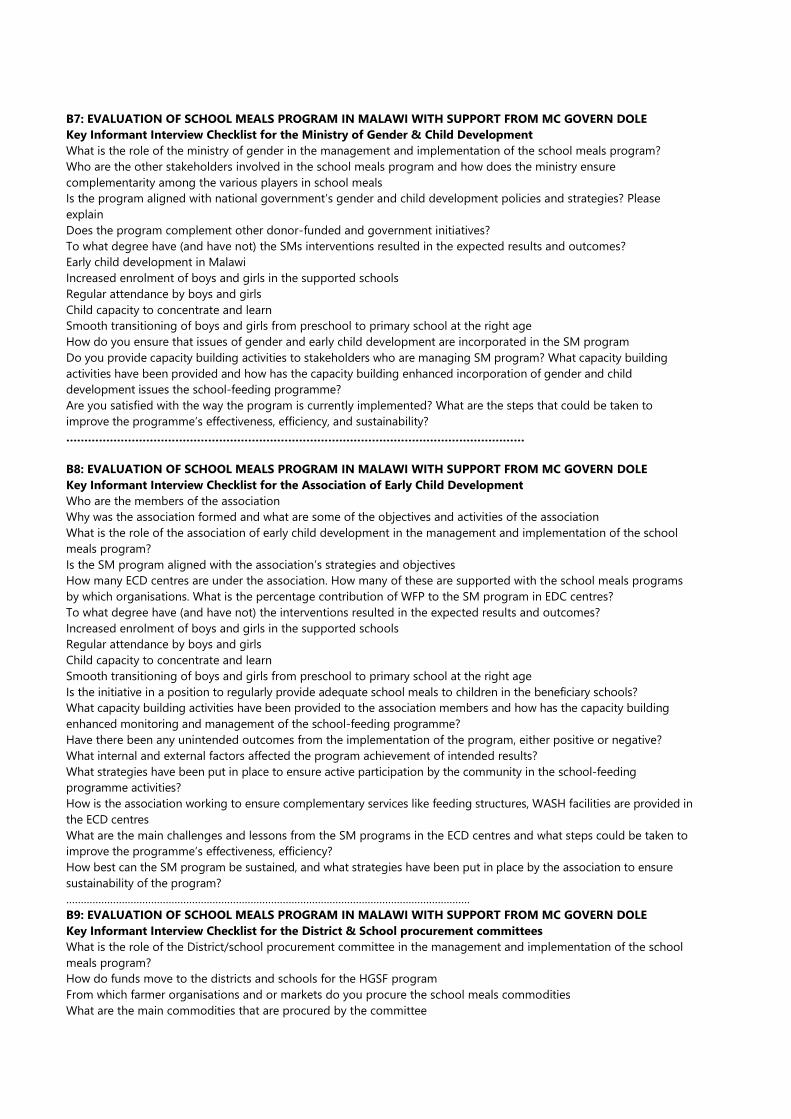
B7: EVALUATION OF SCHOOL MEALS PROGRAM IN MALAWI WITH SUPPORT FROM MC GOVERN DOLE
Key Informant Interview Checklist for the Ministry of Gender & Child Development
What is the role of the ministry of gender in the management and implementation of the school meals program?
Who are the other stakeholders involved in the school meals program and how does the ministry ensure
complementarity among the various players in school meals
Is the program aligned with national government’s gender and child development policies and strategies? Please
explain
Does the program complement other donor-funded and government initiatives?
To what degree have (and have not) the SMs interventions resulted in the expected results and outcomes?
Early child development in Malawi
Increased enrolment of boys and girls in the supported schools
Regular attendance by boys and girls
Child capacity to concentrate and learn
Smooth transitioning of boys and girls from preschool to primary school at the right age
How do you ensure that issues of gender and early child development are incorporated in the SM program
Do you provide capacity building activities to stakeholders who are managing SM program? What capacity building
activities have been provided and how has the capacity building enhanced incorporation of gender and child
development issues the school-feeding programme?
Are you satisfied with the way the program is currently implemented? What are the steps that could be taken to
improve the programme’s effectiveness, efficiency, and sustainability?
………………………………………………………………………………………………………………
B8: EVALUATION OF SCHOOL MEALS PROGRAM IN MALAWI WITH SUPPORT FROM MC GOVERN DOLE
Key Informant Interview Checklist for the Association of Early Child Development
Who are the members of the association
Why was the association formed and what are some of the objectives and activities of the association
What is the role of the association of early child development in the management and implementation of the school
meals program?
Is the SM program aligned with the association’s strategies and objectives
How many ECD centres are under the association. How many of these are supported with the school meals programs
by which organisations. What is the percentage contribution of WFP to the SM program in EDC centres?
To what degree have (and have not) the interventions resulted in the expected results and outcomes?
Increased enrolment of boys and girls in the supported schools
Regular attendance by boys and girls
Child capacity to concentrate and learn
Smooth transitioning of boys and girls from preschool to primary school at the right age
Is the initiative in a position to regularly provide adequate school meals to children in the beneficiary schools?
What capacity building activities have been provided to the association members and how has the capacity building
enhanced monitoring and management of the school-feeding programme?
Have there been any unintended outcomes from the implementation of the program, either positive or negative?
What internal and external factors affected the program achievement of intended results?
What strategies have been put in place to ensure active participation by the community in the school-feeding
programme activities?
How is the association working to ensure complementary services like feeding structures, WASH facilities are provided in
the ECD centres
What are the main challenges and lessons from the SM programs in the ECD centres and what steps could be taken to
improve the programme’s effectiveness, efficiency?
How best can the SM program be sustained, and what strategies have been put in place by the association to ensure
sustainability of the program?
…………………………………………………………………………………………………………………………
B9: EVALUATION OF SCHOOL MEALS PROGRAM IN MALAWI WITH SUPPORT FROM MC GOVERN DOLE
Key Informant Interview Checklist for the District & School procurement committees
What is the role of the District/school procurement committee in the management and implementation of the school
meals program?
How do funds move to the districts and schools for the HGSF program
From which farmer organisations and or markets do you procure the school meals commodities
What are the main commodities that are procured by the committee
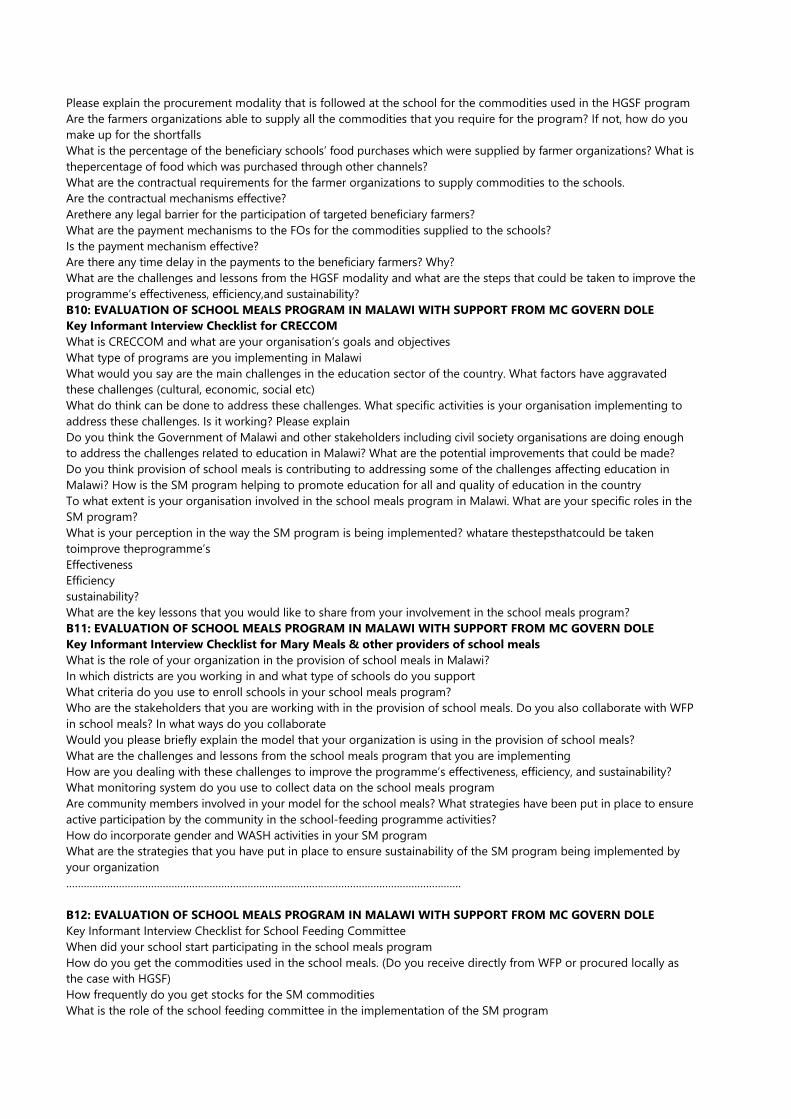
Please explain the procurement modality that is followed at the school for the commodities used in the HGSF program
Are the farmers organizations able to supply all the commodities that you require for the program? If not, how do you
make up for the shortfalls
What is the percentage of the beneficiary schools’ food purchases which were supplied by farmer organizations? What is
thepercentage of food which was purchased through other channels?
What are the contractual requirements for the farmer organizations to supply commodities to the schools.
Are the contractual mechanisms effective?
Arethere any legal barrier for the participation of targeted beneficiary farmers?
What are the payment mechanisms to the FOs for the commodities supplied to the schools?
Is the payment mechanism effective?
Are there any time delay in the payments to the beneficiary farmers? Why?
What are the challenges and lessons from the HGSF modality and what are the steps that could be taken to improve the
programme’s effectiveness, efficiency,and sustainability?
B10: EVALUATION OF SCHOOL MEALS PROGRAM IN MALAWI WITH SUPPORT FROM MC GOVERN DOLE
Key Informant Interview Checklist for CRECCOM
What is CRECCOM and what are your organisation’s goals and objectives
What type of programs are you implementing in Malawi
What would you say are the main challenges in the education sector of the country. What factors have aggravated
these challenges (cultural, economic, social etc)
What do think can be done to address these challenges. What specific activities is your organisation implementing to
address these challenges. Is it working? Please explain
Do you think the Government of Malawi and other stakeholders including civil society organisations are doing enough
to address the challenges related to education in Malawi? What are the potential improvements that could be made?
Do you think provision of school meals is contributing to addressing some of the challenges affecting education in
Malawi? How is the SM program helping to promote education for all and quality of education in the country
To what extent is your organisation involved in the school meals program in Malawi. What are your specific roles in the
SM program?
What is your perception in the way the SM program is being implemented? whatare thestepsthatcould be taken
toimprove theprogramme’s
Effectiveness
Efficiency
sustainability?
What are the key lessons that you would like to share from your involvement in the school meals program?
B11: EVALUATION OF SCHOOL MEALS PROGRAM IN MALAWI WITH SUPPORT FROM MC GOVERN DOLE
Key Informant Interview Checklist for Mary Meals & other providers of school meals
What is the role of your organization in the provision of school meals in Malawi?
In which districts are you working in and what type of schools do you support
What criteria do you use to enroll schools in your school meals program?
Who are the stakeholders that you are working with in the provision of school meals. Do you also collaborate with WFP
in school meals? In what ways do you collaborate
Would you please briefly explain the model that your organization is using in the provision of school meals?
What are the challenges and lessons from the school meals program that you are implementing
How are you dealing with these challenges to improve the programme’s effectiveness, efficiency, and sustainability?
What monitoring system do you use to collect data on the school meals program
Are community members involved in your model for the school meals? What strategies have been put in place to ensure
active participation by the community in the school-feeding programme activities?
How do incorporate gender and WASH activities in your SM program
What are the strategies that you have put in place to ensure sustainability of the SM program being implemented by
your organization
………………………………………………………………………………………………………………………
B12: EVALUATION OF SCHOOL MEALS PROGRAM IN MALAWI WITH SUPPORT FROM MC GOVERN DOLE
Key Informant Interview Checklist for School Feeding Committee
When did your school start participating in the school meals program
How do you get the commodities used in the school meals. (Do you receive directly from WFP or procured locally as
the case with HGSF)
How frequently do you get stocks for the SM commodities
What is the role of the school feeding committee in the implementation of the SM program

Are representatives of the beneficiary pupils involved in the management of the program, please explain their
involvement
What type of meals do you prepare at the school, do the pupils like the meals that are prepared? How do you get
feedback from the pupils
Has the program helped to diversify diets among the students and the communities? Are communities adopting the
menus prepared in the school?
For HGSF schools: Do the school meals meet the national dietary standards (The six food groups for the case of Malawi)
What measures do you put in place to ensure quality of the of the meals prepared
Is foodsafetyassuredadequately(handlingandpreparation,wateravailability,minimum infra-structure for school canteens
and general hygiene practices)?
Have the committee received any training on monitoring and management of the school-feeding programme? What
type of training and who mostly provide the training?
To what degree have (and have not) the interventions resulted in the expected results and outcomes?
Have student enrolment, attendance, attentiveness, and student health improved?
How about dropout rates?
Has the female pupil benefitted as much as the male pupil in the program? How about orphaned children? Please
explain
Does the community actively participate in the school-feeding program activities?
What is the contribution of the community towards the implementation of the school feeding program
What is the contribution of the school feeding committee towards the implementation of the school feeding program
What other programs is the committee implementing at the school to support the school feeding program
How does the school feeding committee in collaboration with the community plan to sustain the school feeding
program. Are you able to complement part of the costs? How?
………………………………………………………………………………………………………………………………
B13: EVALUATION OF SCHOOL MEALS PROGRAM IN MALAWI WITH SUPPORT FROM MC GOVERN DOLE
Key Informant Interview School Garden Committee
When was the school garden established
What are the objectives of establishing a school garden at this school
How is the school gardens initiative implemented and how is the initiative helping to transfer agricultural technologies
to the communities.
What are the main crops and grown and agriculture technologies being promoted in the school gardens?
How many students/local farmers could benefit from a training /technology transfer within the school gardens?
What is the frequency of trainings/seminars for farmers/students that are carried-out in these school gardens?
How does the intervention’s efficiency compare to other agricultural e x t e n s i o n interventions?
How are local communities involved in and contributing toward school gardens? Who provides labour to the activities
happening in the school gardens
How do the school gardens complement the SM program? How do you use the proceeds/harvest from the school
gardens. Do you use some of the crops, fruits & vegetables to supplement school meals?
What are the lessons learned from the school garden initiative?
What are the strategies put in place by the committee to ensure sustainability of the school garden initiative
Annex 13: Bibliography
• Jomaa, L. And Mcdonnell, E. And Probart, C. 2011 School feeding programs in developing countries: impacts
on children's health and educational outcomes, Nutritional Reviews
• Rassas, B., Ariza-Nino, E and K. Peterson. 2016. The McGovern-Dole International Food for Education and Child
Nutrition Program School Feeding and Educational Outcomes in Developing Countries: A Systematic Review
and Meta-Analysis. QED Group, LLC.
• Lawson, T. M. (2012) Impact of School Feeding Programs on Educational, Nutritional, and Agricultural
Development Goals: A Systematic Review of Literature. M Sc thesis, Michigan State University: USA
• Gelli Aulo, 2015 School feeding and girls’ enrolment: The Effects of Alternative Implementation Modalities in
Low-Income Settings in Sub-Saharan Africa, Frontiers in Public Health, Volume 3
• Rogers, B. L., & Coates, J. (2002). Food-based safety nets and related programs. Washington, DC: World Bank
Social Protection Discussion Paper, 223.
• Demographic and Health Survey, Malawi, 2015-2016.
• Primary Education in Malawi, 2016, The World Bank
• Agriculture and Food Security in Malawi, 2018, USAID
• UNICEF Malawi Year-end Humanitarian Situation Report, 2017, UNICEF
• Education for All Movement Framework, 2000, Dakar.
• Malawi Humanitarian Situation Report, July-August 2017, UNICEF.
• Gender Inequality Index, UNDP, 2017.
• Malawi UNDAF 2019-2023, 2018.
• UNESCO EFA Global Monitoring Report, 2015
Annex 14: Terms of Reference
Decentralized Evaluation Quality Assurance System (DEQAS)
Terms of Reference
EVALUATION of
School Meals Programme in Malawi with financial
support from United States Department of Agriculture
(USDA)
2016 to 2018
April 2018
ANNEX 14: TERMS OF REFERENCE ................................................................................................................ 142
1. Introduction
1. The Terms of Reference (TOR) are for the activity evaluation of School Meals Programme in 13 districts of Nsanje,
Chikhwawa, Chiradzulu, Phalombe, Thyolo, Mulanje, Zomba, Mangochi, Ntcheu, Dedza, Lilongwe, Salima and Kasungu.
This evaluation is commissioned by WFP Malawi country office and will cover the period from October 2016 to
December 2018.
2. The TOR was prepared by the WFP Malawi country office based upon an initial document review and consultation with
stakeholders and following a standard template. The purpose of the TOR is twofold. Firstly, it provides key information
to the evaluation team and helps guide them throughout the evaluation process; and secondly, it provides key
information to stakeholders about the proposed evaluation.
3. The School Meals Programme is a two-year programme implemented by Ministry of Education Science and Technology
with technical support of WFP Malawi and financial support from United States Department of Agriculture (USDA). The
aim of the programme is to improve attentiveness on the demand side and improve literacy instruction on the supply
side. These ultimately contributed to the overall goals of improved Literacy of School Aged Children (SO1) and
increased use of Health and Dietary Practices (SO2). Four hundred and twenty-one schools in thirteen districts have
been targeted.
4. A baseline study was conducted as part of the final evaluation of the 2016-2018 grant. The baseline focused on
collecting key indicators of the programme as a basis for assessing progress and overall impact. The baseline data
collection was done in December 2016, as part of the endline survey for the FY13 report. Being a two-year programme,
a mid-term evaluation was not included, however monitoring reports provide information for some of the key indicators
on the implementation progress.
5. Considering that this FY 2016-2018 programme will be ending September 30, 2018, it is imperative to assess the impact
of the programme against the planned results in the targeted 13 districts. If technically feasible, the design should use
comparison schools that are not implementing the school meals programme to compare results, as per the baseline
methodology.
2. Reasons for the Evaluation
6. The reasons for the evaluation being commissioned are presented below.
2.1 Rationale
7. The evaluation is being commissioned for the following reasons:
8. To understand the contribution of the programme in improving access to quality education system in Malawi through the
School Meals Programme. The evaluation will cover the actual implementation period of the programme (October 2016 to
December 2018). However, it should be noted that the evaluation is being conducted before the actual project end date,
which should be considered.
9. In support of the Government of Malawi, efforts towards social development through its Growth and Development Strategy
III, under priority number II focusing on improved access and equity at all levels of the education system including improved
Early Childhood Development, primary and secondary education among others, WFP Malawi has been providing technical
support to the Malawi Government primary education programmes through the implementation of School Meals
Programme. With financial support from USDA and technical support from WFP Malawi, the Malawi government is
implementing the programme with the aim of improving literacy of school aged children and increasing use of health and
dietary Practices.
10. Bearing in mind the important role of the programme to the overall education sector in Malawi, it is crucial to document the
achievements in terms of impact, the potential to improve access to and the quality of education through its multidimensional
approach, the operational processes, successes and challenges, their contributions for Government capacity building and
ability to implement similar programmes in the future.
11. Furthermore, results and lessons learnt will inform and strengthen future initiatives, as well as provide inputs to the
Government on best practices on how School Meals programmes can contribute to other developmental objectives including
social protection.
12. The evaluation, among other objectives, will assess the impact of the programme against the set objectives. Even though
there is no direct WFP accountability for improvement of literacy results26, the evaluation will, to the extent possible, include
a literacy assessment. This will be considered within the context of whether secondary data on literacy does or does not align
to this programme support and timeline. Prior to the start of the evaluation, WFP Malawi will liaise with the USAID Education
26In line with WFP’s school Feeding Policy WFP/EB.2/2013/4-C.See Annex 1 of the theory of change for School Feeding.
to determine whether or not literacy data collected through the USAID-supported National Reading Programme (NRP) is
available. If the data is available, it will be used to triangulate findings.
13. The findings of this evaluation will inform the Government of Malawi through Ministry of Education, WFP, USDA and other
key stakeholders on relevance, effectiveness, efficiency, sustainability and impact that the programme (positive, negative,
intended and unintended) has had at all levels. The findings will also provide valuable lessons to on what has worked and
what has not worked for consideration in the design and implementation of other similar programmes in the future. Most
importantly, the findings will provide valuable information to key stakeholders on the level of sustainability and potential for
replication of good practices beyond the support of the programme.
2.2 Objectives
14. Evaluations in WFP serve the dual and mutually reinforcing objectives of accountability and learning.
• Accountability – The evaluation will assess and report on the performance and results of the School Meals Programme
with financial support from USDA in the thirteen target districts of Nsanje, Chikhwawa, Chiradzulu, Phalombe, Thyolo,
Mulanje, Zomba, Mangochi, Ntcheu, Dedza, Lilongwe, Salima and Kasungu. This evaluation will, therefore, ensure that
the Development Assistance Committee of the Organisation for Economic Cooperation and Development (DAC/OECD)
evaluation criteria of Relevance, Effectiveness, Efficiency, Impact and Sustainability are used to structure the evaluation
and are adequately covered.
• Learning – The evaluation will determine the reasons why certain results occurred, derive good practices and pointers
for learning that can be taken by key stakeholders including WFP, USDA and Government of Malawi in designing,
replicating and implementing similar programmes in the future. It will provide evidence-based findings to inform
operational and strategic decision-making. Findings will be actively disseminated and lessons will be incorporated into
relevant lesson sharing systems.
• Deepening understanding – This evaluation will deepen knowledge and understanding of the underlying assumptions
guiding the design and implementation of the programme and the cultural context in which the programme was
implemented.
2.3 Stakeholders and Users
15. Several stakeholders both inside and outside of WFP have interests in the results of the evaluation, some of which will be
asked to play a role in the evaluation process. Table 1 below provides a preliminary stakeholder analysis, which should be
deepened by the evaluation team as part of the Inception phase.
16. Accountability to affected populations is tied to WFP’s commitments to include beneficiaries as key stakeholders in WFP’s
work. As such, WFP is committed to ensuring gender equality and women’s empowerment in the evaluation process, with
participation and consultation in the evaluation by women, men, boys and girls from different groups.
Table 1: Preliminary Stakeholders’ analysis
Stakeholders Interest in the evaluation and likely uses of evaluation report to this stakeholder
INTERNAL STAKEHOLDERS
WFP Malawi Country
Office
• Responsible for the overall planning and coordination of the evaluation exercise.
• Assess the extent to which the objectives of the programme have been reached concerning
the baseline and set targets.
• Learn what has worked well and what has not worked well including reasons for each
scenario to inform decision-making for scaling up, planning and improvement for the
future.
• Demonstrate accountability and transparency to the Donor, beneficiaries, partners and
other stakeholders in the use of project resources and achievement of planned results.
• Assess impact, sustainability, relevance, effectiveness and efficiency of the programme.
• Inform the development of the UNDAF (2019-2023).
WFP Regional Bureau
(RB) Johannesburg
• Responsible for oversight, technical guidance and support;
• WFP management has interest in an independent/impartial account of the operational
performance as well as in learning from the evaluation findings to apply this in tailoring
support to Malawi as well as using this learning to support other country offices.
WFP Centre of
Excellence Brazil
• Responsible for technical guidance and sharing of knowledge and policy innovations in
linking school meal systems to local agriculture.
WFP Office of
Evaluation (OEV) and
• OEV has a stake in ensuring that all decentralized evaluations commissioned by WFP
country offices deliver quality, credible and useful evaluations respecting provisions for

Executive board (EB) -
(HQ-Rome)
impartiality as well as articulating roles and responsibilities of various decentralized
evaluation stakeholders as identified in the evaluation policy.
• The WFP Executive Board (EB) has interest in being informed about the effectiveness of WFP
operations and in particular progress in the implementation of the WFP evaluation policy
(2016-2021). This evaluation will not be presented to the EB, but its findings may feed into
annual syntheses and corporate learning processes. The successful completion of this
evaluation will contribute towards achievement of the evaluation coverage norms which is
a key performance indicator reported to the EB annually.
EXTERNAL STAKEHOLDERS
Beneficiaries • As the ultimate recipients of food assistance, beneficiaries have a stake in WFP determining
whether its assistance is appropriate and effective. As such, the level of participation in the
evaluation of women, men, boys and girls from different groups will be determined and
their respective perspectives will be sought.
• The beneficiary groups targeted shall include learners (boys and girls), community
members, Parent Teacher Association (PTAs), school committees, smallholder farmers, etc.
• While learners deserve equal access to the support provided irrespective of gender and
other issues, community members and school structures are key enablers of meeting
project objectives. As such, their roles considering gender and protection issues are to be
considered.
• While it may be challenging for the beneficiaries to access the evaluation results, application
of the recommendations in improving programme implementation will be of great use in
further taking into account beneficiaries’ unique needs.
Malawi Government
• The Government of Malawi has a direct interest in knowing whether WFP activities in the
country are aligned with its priorities, harmonised with the action of other partners and
meet the expected results. Issues related to capacity development, handover and
sustainability will be of interest.
• The Government is also interested in knowing the extent to which the objectives of the
programme have been reached concerning the baseline and set targets; and the extent of
capacity development and sustainability of programme activities and benefits beyond the
programme implementation period.
• The key government ministries include Ministry of Education, Science and Technology
(MOEST), Ministry of Health (MOH), Ministry of Agriculture, Irrigation and Water
Development (MOAIW), Ministry of Finance, Economic Planning and Development
(MOFPD) and Ministry of Gender (MOG).
UN Country Team • The UN Country Team’s (UNCT’s) harmonized actions should contribute to the realisation
of the government’s developmental objectives. It therefore has an interest in ensuring that
WFP operations are effective in contributing to the UN’s concerted efforts. Various
agencies are also direct partners of WFP at policy and activity level. For the intervention
under evaluation, WFP works with UNICEF.
NGOs • The NGO partners will, among other things, learn how the interventions and approaches
that have worked and those that have not worked to inform future implementation
modalities, strategic orientations and partnerships;
• Key NGO partners include: CRECOM, Association of Early Childhood Development, World
Vision International (WVI) and Save the Children.
United States Department
of Agriculture (USDA)
• The programme is voluntarily funded by USDA. As a donor, USDA has an interest in knowing
whether their funds have been spent efficiently and if the programme has been effective
and contributed to their stated strategies and objectives.
• Specifically, the goal is to understand the programme’s contribution towards Improved
Literacy of School Aged Children (SO1) and Increased use of Health and Dietary Practices
(SO2).
17. The primary users of this evaluation will be:
• The Malawi Government which will be able to use the results to inform the potential transition to a National Home-
Grown School Feeding Programme. These findings will be disseminated and shared to facilitate learning for other key
stakeholders interested in and supporting social protection and development programming in Malawi.
• The WFP Malawi Country Office and its partners in decision-making, notably related to programme implementation
and/or design, Country Strategy and partnerships, accountability and learning purposes.
• Given the core functions of the Regional Bureau (RB), the RB is expected to use the evaluation findings to provide
strategic guidance, programme support, and oversight.
• WFP HQ may use the evaluation findings for wider organizational learning and accountability.
• OEV may use the evaluation findings, as appropriate, to feed into evaluation syntheses as well as for annual reporting to
the Executive Board.
• USDA may use the evaluation to understand the extent to which the programme met its objectives, key challenges,
lessons learnt and best practices for decision making and replications in other/future support.
18. Other users of the evaluation include:
• Key stakeholders involved in education, social protection and safety net programming, including UN agencies and NGOs.
3. Context and subject of the Evaluation
3.1 Context
19. Geography and Demographics: Malawi is a landlocked country located in East-Southern Africa with a population of 17.7
million, (49 percent males and 51 percent females). Majority (close to 85 percent), live in rural areas relying on rain-fed
subsistence agriculture. The population of Malawi has increased by 32 percent from 1998 to 2008, representing an annual
growth rate of 2.8 percent (National Statistics Office, 2008). The total fertility rate (TFR) has declined from 5.7 in 2010 to 4.4
births per woman. The TFR is particularly high in rural areas where it is reported at 4.7.27 If the fertility rate remains constant,
the population is projected to reach approximately 40.6 million by 2040.28 Subsequently, the number of young people is
projected to increase to 7.9 million by 2025 and to 15.9 million by 205029. The projected growth will place an enormous
burden upon on the education sector.
20. Poverty, food and nutrition insecurity: Malawi is also one of the poorest countries in the world regarding income, health
and education; ranked 170 out of 188 countries (UNDP Human Development Index, 2016). Poverty is compounded by
widespread food and nutrition insecurity, which manifests most significantly in the poor nutritional status of children as
evident by a significant increase in the number of admissions into Community Management of Acute Malnutrition treatment
facilities across the country in 2015-16 (Food and Nutrition Response Plan 2015).
21. Education: Primary education has been free since 1994 and, consequently, enrolment has risen steadily from 4.49 million in
2013 to 4.9 million in 2016 (2.4 boys and 2.5 girls) (EMIS report 2016). Gender Parity index (GPI) is now reported at 1.01 in
2016 from 1.0 in 2013 (EMIS report 2016). However, the GPI decreases as early as Standard 4 grade with girls dropping out
and repeating to a much greater extent than boys. Notable progress has been made in the education sector over the last
decade with the primary net enrolment rate (NER) almost at 100 percent. However, provision of basic education services still
faces significant challenges regarding the Pupils-trained teacher ratio and pupils-classroom ratio, making it extremely difficult
to deliver quality education. The national dropout rate is at 3.9 percent (3.8 percent for boys and 4 percent for girls). Among
other reasons, costs related to schooling (uniforms, books, school development funds, etc.) are indicated as the main reason
for dropout of boys and girls. However, most of the girls are reported to be dropping out because of pregnancies and early
marriages (EMIS report, 2016). Attendance of students and teachers is also problematic, and it is negatively affected by
poverty and economic hardship.
22. Gender: As per the 2015 UN Gender Inequality Index, Malawi ranks 145 out of 188 countries. Inequality is most evident in
rural areas where female-headed households are more likely than male-headed households to be poor and less educated
(IFPRI, 2011). This can be explained in part due to the specific impediments women face in accessing vital productive
resources and education, as well as cultural practices that are a barrier to women’s empowerment. It is recognized that the
many negative educational outcomes for girls are a result of complex contextual factors such as poverty, cultural practices
and gender inequalities; attitudes and behaviours of boys and men, parents, teachers and other community members; as
well negative attitudes and behaviours by the girls themselves.
23. The National Education Policy (NEP), aligns itself to the Education for All (EFA, 2000) goals and other international declarations
including the Sustainable Development Goals.30 Additionally, the policy is aligned to the Malawi Vision 2020 and the Malawi
Growth and Development Strategy III (MGDS III 2017-2022). The NEP is also closely linked to the National Gender Policy and
National Policy on Early Childhood Development (ECD). The implementation of the School Meals Programme’s 10 key
activities and results is aligned with and contributes to the NEP through priority number one, which focuses on quality,
accessible and equitable basic education along with other governing guidelines and related policies.
27 Demographic Health Survey- 2015/16 28 Ministry of Economic Planning and Development, 2012 29 RAPID, 2012 30The National Education Policy, 2016
3.2 Subject of the evaluation
24. The evaluation will assess all the key activities/results specifically on its impact and the extent to which the objectives have
been achieved. The School Meals Programme with USDA financial support was approved in September 2016 and
implementation started in October 2016. The two-year programme which targeted 637,473 learners in 456 primary schools
and 35 Early Childhood Development Centres (ECDs) is expected to end in December 2018. For the implementation of the
two-year programme, USDA provided financial support equivalent to US$22,016,871. Refer to the detailed budget in Annex
9.
25. During the FY 2016-2018 implementation period, the School Meals Programme planned to achieve the following results: (1)
Increased skills and knowledge of school administrators; (2) Improved quality of Literacy instruction and materials; (3)
Increased government engagement and capacity to manage and implement school feeding programmes; (4) Better access
to school supplies and Materials; (5) Increased skills and knowledge of teachers; (6) Increased access to food (school meals);
(7) Improved teacher and student attendance; (8) Improved policy and regulatory framework; (9) Increased knowledge of
health, hygiene, nutrition and sanitation practices and (10) Increased student enrolment rates.
26. The stated results were to be achieved through, fourteen key activities including the following (1) Provide school Meals; (2)
Develop partnerships with farmer Organisations to supply food to schools; (3) Establish school gardens; (4) Provide non-food
items (energy saving stoves, cooking pots and eating utensils); (5) Trainings on commodity management, food storage and
preparation; (6) Capacity building at local, district and national level; (7) Trainings on good health and nutrition practices; (8)
Literacy promotion activities; (9) Distribute school supplies and materials; (10) Raising awareness on importance of education;
(11) Provide Take Home Rations; (12) Provide Bursaries; (13) Construct/Rehabilitate Junior secondary schools and (14)
Construct/Rehabilitate kitchen, storerooms and feeding shelters.
27. To ensure increased skills and knowledge of school administrators, WFP provides trainings and workshops to school
administrators, District Education Managers, Primary Education Advisors, and School Health and Nutrition Coordinators and
build the capacity of communities and government stakeholders to deliver a comprehensive school feeding program. WFP’s
partners include Ministry of Education Officials, district councils, district education managers, school administrators, and
community committees as well as NGO partners.
28. In order to improve quality of literacy instruction and materials, WFP Malawi collaborated with WVI and advocated with the
Government of Malawi to develop and distribute supplementary reading materials to SMP-targeted schools in most need.
WFP School Meals Programme was implemented in the same schools where the USAID supported National Reading
Programme (NRP) was implemented. The NRP aimed to support teacher training, provision of textbooks, monitoring and
supervision as well as improve the quality of literacy instruction particularly for children in grade 1-4. The key role of the
Ministry of Education was to ensure that the teachers were trained, text books were distributed on time and new approaches
of teaching were applied through the USAID project. In addition, WFP activities focused on building the capacity of school-
based committees such as Parent Teacher Associations (PTAs) and School Management Committees in all schools receiving
assistance through the McGovern-Dole Programme and the National Reading Programme as well as the Early Childhood
Development Centres (ECD) to effectively monitor teaching, teacher attendance, and learning activities. Teachers received
in-service training to improve literacy instruction techniques. Community members were also trained to create reading
materials to increase access to reading materials inside and outside the classroom. Lastly, WFP supported and strengthened
the existing reading camps in partnership with World Vision Malawi to provide a chance for children to interact with reading
materials, as well as work with peers in creative ways that promotes literacy and life skills.
29. To increase government engagement and capacity to manage and implement school feeding programmes, WFP participated
and assisted the Government of Malawi in finalizing the development of the National School Health and Nutrition (SHN)
policy, aimed at strengthening the legal framework for school feeding and budget allocation. Secondly, WFP supported the
dissemination and implementation of the SHN policy, review of the National School Health and Nutrition Strategy and the
Best Practices study to inform programming. In addition, WFP facilitated coordination meetings of the school feeding
development partners working group to enhance coordination between partners and Government, and continued to chair
the forum. WFP participated in various technical working groups (TWGs) and provided technical assistance to the
Government of Malawi on the delivery of a quality and sustainable national school meals program. WFP continued to provide
technical guidance and mentorship to the government and supported the SHN department to identify gaps that required
WFP attention in order to effectively implement the programme. WFP recruited technical staff to assist government
implement key strategic activities that will continue to promote government leadership and ownership, leading to
implementation of a universal National School Meals Programme.
30. In order to increase access to school supplies and materials, the programme ensured timely provision and replacement of
School Feeding cooking and eating utensils, including fuel efficient stoves and cooking pots to all project schools to improve
quality of feeding as well as feeding time. In collaboration with the Ministry of Energy and Natural Resources, suppliers and
the Ministry of Education, WFP trained volunteer cooks and community members on use and maintenance of the fuel-
efficient stoves.
31. In order to increase access to food (school meals) and improve attendance, WFP provided school meals to 456 primary
schools in 13 districts and 35 ECD centres in two districts in the most food insecure districts in Malawi. WFP enhanced the

capacity of school feeding committees made up of parents and community members to effectively oversee timely food
preparation and distribution.
32. In order to increase knowledge on health, hygiene, nutrition and sanitation practices, WFP carried out trainings and
mobilization campaigns on good health and nutrition including dissemination of messages on the importance of hand
washing with soap in schools receiving assistance through the McGovern Dole Programme and their surrounding
communities. WFP continued to provide training on good health and nutrition practices for head teachers, school feeding
focal points, primary education advisors, district school health and nutrition coordinators, and district education managers.
33. The key implementing partners for the programme include the MOEST responsible for the implementation of the
programme, Ministry of Health responsible for the implementation of Nutrition and health related components of the
programme in schools and surrounding communities, MOAIW responsible for capacity strengthening activities of the
Smallholder Farmers and Farmer organisations, MOFEPD responsible for the National Social protection activities under which
the School Meals programme is being implemented and MOG for the implementation of the ECD component. Other partners
include CRECOM responsible for social mobilisation through awareness campaigns, Association of Early Childhood
Development responsible for ensuring quality implementation of the ECD programme, WVI responsible for the
implementation of the Literacy component of the programme and Save the Children responsible for the bursary and
construction component.
34. The programme level Results Framework is presented in Annex 7. The Indicators in the results framework are used to measure
the achievements of the programme. The results framework provides detailed and systematic linkages of the overarching
objectives of the programme and the planned activities.
35. More information on implementation and lessons learned will be drawn from the monitoring reports. Results on how these
have been used in programme adjustments will be part of this evaluation to inform future design and implementation
decisions.
4. Evaluation Approach
4.1 Scope
36. This evaluation will follow the United Nations Evaluation Group (UNEG) Norms and Standards. Adopted in 2005 and revised
in 2016, these norms and standards have served in strengthening and harmonizing evaluation practice across the UN system
and are used as a key reference for evaluators around the globe.
37. The School Meals Programme with USDA financial support is a two-year programme implemented in 456 primary schools
and 35 ECD centers in 13 districts. Beneficiaries of the programme include all learners in all the targeted schools as well as
surrounding communities within the target schools. At the local level, the programme has also been working with Farmer
Organizations, Parent Teachers Associations; School Management Committees; peer educators, health facilities; Mother
Groups; Police; Teachers; parents, gate keepers, etc. which should also be targeted by the evaluation. The scope of the
evaluation covers the 13 Districts in which the SMP is implemented, all the programme activities and the period October
2016 to December 2018.
4.2 Evaluation Criteria and Questions
38. Evaluation Criteria The evaluation will apply the international evaluation criteria of relevance, effectiveness, efficiency,
impact and sustainability.31 Gender Equality and Human Rights will be mainstreamed and reflected throughout the evaluation
design (including the tools), implementation (data collection and analysis), results, recommendations, dissemination and
utilization of findings.
39. Evaluation Questions Allied to the evaluation criteria, the evaluation will address the following key questions, which will be
further developed by the evaluation team during the inception phase. Collectively, the questions aim at highlighting the key
lessons and performance of the School Meals Programme, which could inform future strategic and operational decisions.
Table 2: Criteria and evaluation questions
Criteria Evaluation Questions
Relevance of the
programme
• To what extent is the USDA supported school Meals programme still relevant to the needs of
school aged children and to what extent is the programme aligned with school health and
31 For more detail see: http://www.oecd.org/dac/evaluation/daccriteriaforevaluatingdevelopmentassistance.htm and http://www.alnap.org/what-we-do/evaluation/eha
nutrition policy (SHN) as well as the Malawi National Social Support Programme that anchors
school feeding as part of the social protection/safety net and other related sectoral strategies?
• To what extent and How does the USDA supported school Meals programme complement and
link with the work of the Government of Malawi and other SMP partners such as Marys Meals
and other non-governmental organisations and UN agencies working on School Health, nutrition
and school feeding especially the work of USAID’s supported National reading Programme and
Marys Meals support?
• Are the activities and outputs of the USDA supported School Meals programme consistent with
the overall goal and the attainment of its objectives and intended outcomes?
• Were the distinct needs of women, men, boys and girls from different marginalized groups in
very difficult to access areas in Malawi addressed?
Effectiveness • To what extent were the programme’s objectives met and anticipated results achieved (as per the
results framework)?
• How effective has the programme been in achieving intended outputs (including the number of
beneficiaries served disaggregated by women, men, girls, and boys) and outcomes (compared to
plan and as per results framework)?
• How effective are the monitoring and evaluation systems and processes?
• What are the changes to the M&E system and processes that need to be made in order to
improve the utility, credibility, and reliability of the data and information collected?
• To what extent were cross-cutting results in areas of gender, protection and partnership
achieved?
Efficiency • How efficient is the programme, in terms of transfer cost, cost per beneficiary, logistics, and
timeliness of delivery compared to alternative School Meals models?
• To what extent and how has the assistance managed to reach the right beneficiaries with the
right quantity and quality of assistance, at the right time? Attention will be given to gender
disaggregation and analysis.
• How much does it cost (Government, WFP and communities) to implement the school feeding
programme to achieve the outcomes and the impact that it has achieved?
• What are the key cost drivers for the school feeding programme?
• Given the identified cost drivers, could the same outcomes be attained at lower costs, or higher
outcomes achieved with the same resources?
• How efficient is the programme in terms of financial and human resources in relation to achieved
outputs and outcomes?
•
Impact • To what degree have the project outputs and outcomes contributed to progress towards the
higher-level results in the results framework?
• Have there been unintended outcomes, either positive or negative?
• What internal and external factors affected the project outputs and outcomes leading to high
level intended results?
Sustainability • To what extent is the government of Malawi taking ownership of, demonstrating commitment
and contributing to the programme (budget, policies, personnel etc)?
• What is the level of national readiness and capacity at national and district levels to
independently implement the programme?
• What steps has the project taken to address the sustainability of the project activities?
• What additional steps need to be taken in order to improve the chances of sustainability of the
activities and benefits derived from the project activities?
4.3 Evaluability assessment and Data availability
40. Evaluability is the extent to which the subject can be evaluated in a reliable and credible fashion. Evaluability is high if the
subject has: (a) a clear description of the situation before/at the start that can be used as reference point to measure change
(baseline); (b) a clear statement of intended outcomes, i.e. the desired changes that should be observable once
implementation is under way or completed; (c) a set of clearly defined and appropriate indicators with which to measure
changes; and (d) a defined timeframe by which outcomes should be occurring; and (e) A system for regularly collecting,
storing and analysing performance data.
41. The level of evaluability of the School Meals Programme to meet the objectives set out in section 2.2 is assessed to be high
at this preliminary stage because a) A baseline was conducted at the start of the programme in 2016 as part of the end line
survey for the 2013-2016 programme; b) regular monitoring of the programme through the various coordination
mechanisms; c) Final evaluation of the previous programme was conducted. As such, sufficient information exists for
assessment of the achievements of intended outcomes and the utilisation of resources over the period under review. A
detailed evaluability assessment will be carried out at the inception phase to determine the appropriateness of the
methodological approach proposed in section 4.6 below. It is expected that the evaluation will make use of already existing
data as follows:
• Baseline study report and associated data sets
• Routine Progress Reports
• Project proposal including the Results Framework
• Monitoring reports
• Final evaluation of FY2013 and associated data sets
42. The evaluation team will use secondary data from the Education Management Information System (EMIS) and the District
Education Management Information System (DEMIS) of the Malawi MoEST. EMIS includes information on a whole range of
education indicators, such as enrolment, drop-out rates and gender composition, among others. If EMIS is not properly
implemented or absent in the intervention schools, the evaluation team will suggest alternative ways to collect indicators
relating to the programme’s educational outcomes and agree on alternative data sources together with evaluation
committee. Other sources of data include monitoring reports and school records of which the latter will be primary data.
43. The evaluation team will use secondary data from the USAID-supported National Reading Programme. If NRP data is not
available, the evaluation will include literacy assessment to the extent possible.
44. Concerning quality of data and information, the evaluation team should:
• Assess data availability and reliability as part of the inception phase expanding on the information provided. This
assessment will inform the data collection;
• Systematically check accuracy, consistency and validity of collected data and information and acknowledge
limitations/caveats in drawing conclusions using the data.
4.4 Ethical consideration
45. The evaluation will follow UNEG guidelines on the ethical issues in relation to human participants, including children and
vulnerable groups. All participants in the study will be fully informed about the nature and purpose of the evaluation and
their requested involvement. Only participants who have given their written or verbal consent (documented) should be
included in the evaluation process.
46. The evaluation firm is expected to provide a detailed plan on how the following principles will be ensured throughout the
evaluation process: 1) Respect for dignity and diversity 2) Fair representation; 3) Compliance with codes for vulnerable groups
(e.g., ethics of research involving young children or vulnerable groups); 4) Redress; 5) Confidentiality; and 6) Avoidance of
harm.
47. Specific safeguards must be put in place to protect the safety (both physical and psychological) of both respondents and
those collecting the data. These should include:
• A plan to protect the rights of the respondent, including privacy and confidentiality
• The interviewer or data collector is trained in collecting sensitive information;
• Data collection tools are designed in a way that is culturally appropriate and does not create distress for respondents
or discomfort for the data collection staff;
• Data collection visits are organized at the appropriate time and place to minimize risk to respondents;
• The interviewer or data collector can provide information on how individuals in situations of risk can seek support
(referral);
48. Appropriate ethical approval will be sought from the Malawi National Committee on Research in Social Sciences and
Humanities.
49. Within the provisions of the long-term agreement with WFP, the evaluation firm may not publish or disseminate the
Evaluation Report, data collection tools, collected data or any other documents produced from this consultancy without the
express permission of, and acknowledgement of WFP.
4.5 Methodology
50. Efforts will be made to adopt the methodology to Malawi context and in a way, that will respond to the evaluation questions
under each criterion as per section 4.2. Given the availability of data from 2014-16 final evaluation and 2016 baseline, the
design should allow assessment of the impact of the project interventions. A mixed methods approach (using both qualitative
and quantitative methods) will be used and will involve the following processes:
• A careful analysis of existing quantitative and qualitative data from secondary sources (2016 baseline, 2014-16 final
evaluation, EMIS, DEMIS, school records, MGD project documents, the Malawi Vulnerable Assessment Committee
(MVAC) 2016 and 2017; Malawi Demographic and Health Survey (DHS) 2015-16; Malawi Micronutrient Survey Key
Indicators Report 2015-16 and education reports and statistical bulletins).
• Collection of quantitative and qualitative primary data.
51. The sub-sections below provide an overview of the quantitative and qualitive approaches to be applied during collection
of primary data. The full and detailed methodology will be finalized by the evaluation team during the inception phase.
Quantitative Approach
52. A multi-stage sampling design utilizing both probability and non-probability sampling methods will be applied with three
stages. The three stages of sampling will begin with sampling at district level, followed by zonal selection and finally school
level sampling. With the unit of study being the schools, a quasi-experimental design consisting of selected schools under
MGD SMP as targeted/case schools and those without SMP as control schools will be surveyed in the same districts
selected at the first stage. The methodology outlined here is similar to the baseline survey sampling procedures which will
facilitate comparisons with a possibility of significant cases surveyed at baseline being included. Sample size calculation will
be pegged at 95% confidence interval with 5% error margin which is deemed satisfactory to generate reliable and valid
data. The study proposes the use of random selection, with girls and women given equal opportunity as boys and men
throughout the selection process. There may be need for affirmative action in maximizing female participation through
deliberate efforts to include them for interviews and ensure that at least 40% of participants are female.
53. The quantitative methodology will focus on the use of two surveys and a checklist directed at schools/ECDs, households
and teachers/care givers. Sample size and allocation will mirror the baseline with the following breakdown: 125
targetedschools and 63 non-targetedschools; 11 treatment ECDs and 6 non-targetedECDs and finally 762
targetedhouseholds and 369 non-targetedhouseholds.
Qualitative Approach
54. Collection of qualitative data will be done simultaneously with the quantitative survey. It will include interviews
and discussions with stakeholders through Focus Group Discussions (FGD), key informant interviews (KIIs), Group
interviews (GIs) or In-depth interviews (IDIs).
55. Focus Group discussions (FGDs) questionnaires will be administered to learners, teachers, relevant school
committees and parents, in separate groups for boys, girls, men and women. In total there shall be about 40 focus
group discussions (22 targetedand 18 non-targetedgroup).
56. Lastly, key informant interviews shall be conducted with representatives from USDA, school directors, leaders of
relevant school committees, Ministry of Education officials involved in the coordination of the project,
Representatives of the District Councils, Ministry of Gender Children and Social Welfare, WFP and Cooperating
Partner staff who are involved in the management of the project. In total, there shall be around 75 people
interviewed.
57. The number and choice of stakeholders for the qualitative studies was determined in reference to the 2016
baseline to allow comparability of results.
58. The evaluation firm will consider the above proposed methodology and refine the sampling during the proposal stage, and
provide explanations as appropriate. The evaluation team will review and finalize the proposed methodological approach
during the inception phase including the data collection methods identified to ensure that specific evaluation questions are
addressed. This will be reviewed by the evaluation reference group and approved by the Evaluation Committee. The
evaluation manager, in close consultation with the M&E team for the programme will provide an oversight role in ensuring
that the agreed methodology is adhered to during the entire evaluation process. At the very minimum, the proposed
methodology will include the following:
• Employ the relevant DAC evaluation criteria for evaluating Development Assistance (Relevance, Effectiveness, Efficiency,
Impact and Sustainability)
• Demonstrate impartiality and lack of biases by relying on a cross-section of information sources (stakeholder groups,
including beneficiaries, etc.). The selection of field visit sites will also need to demonstrate impartiality.
• Using mixed methods (quantitative, qualitative, participatory etc.) to ensure triangulation of information through a
variety of means. Specifically, mixed methods will be used for the analysis of all levels of results thus at the process,
output, outcome and potential impact.
• Apply an evaluation matrix geared towards addressing the key evaluation questions taking into account the data
availability as discussed in section 4.4, the budget and timing constraints;
• Ensure using mixed methodology, such that women, girls, men and boys from different stakeholder groups participate
and that their different voices are heard and used in the analysis and reflected in the final report;
• Mainstream gender equality and women’s empowerment, as above;
• Articulate description of data sources, data collection methods; proposed data collection instruments; sampling
procedures; data quality assurance mechanisms; and data analysis methods.
59. To ensure independence and impartiality of the evaluation, a multi-stakeholder Evaluation Committee will be established to
oversee the implementation of the evaluation and safeguard its impartiality. This committee will be composed of
representatives from WFP and the government to be represented by Ministry of Education. Additionally, the evaluation team
will be expected to outline steps to be taken towards quality assurance.
4.6 Quality Assurance and Quality Assessment
60. WFP’s Decentralized Evaluation Quality Assurance System (DEQAS) defines the quality standards expected from this
evaluation and sets out processes with in-built steps for Quality Assurance, Templates for evaluation products and Checklists
for their review. DEQAS processes are based on the UNEG norms and standards and good practice of the international
evaluation community and aims to ensure that the evaluation process and products conform to best practice.
61. DEQAS will be systematically applied to this evaluation. The WFP Evaluation Manager will be responsible for ensuring that
the evaluation progresses as per the DEQAS Process Guide and for conducting a rigorous quality control of the evaluation
products ahead of their finalization.
62. WFP has developed a set of Quality Assurance Checklists for its decentralized evaluations. This includes Checklists for
feedback on quality for each of the evaluation products. The relevant Checklist will be applied at each stage, to ensure the
quality of the evaluation process and outputs.
63. To enhance the quality and credibility of this evaluation, an outsourced quality support (QS) service directly managed by
WFP’s Office of Evaluation in Headquarter provides review of the draft terms of reference, inception and evaluation report
and provide:
• Systematic feedback from an evaluation perspective, on the quality of the draft terms of reference, inception and
evaluation report;
• Recommendations on how to improve the quality of the final inception/evaluation report
64. The evaluation manager will review the feedback and recommendations from QS and share with the team leader, who is
expected to use them to finalise the inception/ evaluation report. To ensure transparency and credibility of the process in
line with the UNEG norms and standards [1], a rationale should be provided for any recommendations that the team does not
take into account when finalising the report.
65. This quality assurance process as outlined above does not interfere with the views and independence of the evaluation team,
but ensures the report provides the necessary evidence in a clear and convincing way and draws its conclusions on that basis.
66. The evaluation team will be required to ensure the quality of data (validity, consistency and accuracy) throughout the
analytical and reporting phases. The evaluation team should be assured of the accessibility of all relevant documentation
within the provisions of the directive on disclosure of information. This is available in WFP’s Directive (#CP2010/001) on
Information Disclosure.
67. Furthermore, to ensure independent quality check, an oversight visit by the Regional Evaluation Officer will be part of the
plan. This will in addition ensure alignment to the evaluation management plan.
68. All final evaluation reports will be subjected to a post hoc quality assessment by an independent entity through a process
that is managed by OEV. The overall rating category of the reports will be made public alongside the evaluation reports.
4.7 Risks and Limitations
69. The evaluation firm will assess the limitations of the proposed evaluation methodology. The team shall provide suggestions
for adjustments to the evaluation committee through the inception report. The evaluation team and evaluation committee
shall collaboratively decide how to proceed during the inception phase. However, it comes at a time when at least 80 percent
of the project period will have been completed, hence minimal risk. Enrolment for the last term of 2018 will have begun.
70. Potential Risks: Two potential risks to the methodology have been identified. First risk is related to time constraints, as the
final evaluation is to be completed before the end of the programme in December 2018. Second, the evaluation team is may
have challenges regarding the availability of data for some indicators due to poor record keeping, as well as quality issues.
However, secondary data sources from monitoring may assist for the best estimates possible.
71. Mitigation actions: Using the experience of the baseline survey and end line survey for FY2013, it is possible to estimate
the level of effort that will be required for the end line and make proposals to the team during the inception phase. The team
will then deepen the proposed approach to meet the needs of the evaluation within the overall timeline and budget
constraints. In terms of data, the team will explore different options to fill any data gaps including collection of primary data.
5. Phases and Deliverables
72. The evaluation will proceed through five phases with deliverables and deadlines for each phase as follows:
Figure 1: Summary Process Map

73. Phase 1: Preparation: Drafting the TORs, sharing with stakeholders for review and comments; reviewing for quality
assurance as appropriate and finalising TORs. This will be followed by recruitment of the evaluation team (2 months).
74. Phase 2: Inception - 6 week timeline
• Evaluability assessment and refinement of the evaluation matrix. Desk Review and elaboration of the evaluation
methodology and drafting the inception report comprising an evaluation plan, the methodology and the evaluation
Matrix. Review of relevant Programme documents, reports on data availability, the local context, and the proposed
evaluation methodology. Based on the desk review, an inception report shall be prepared, detailing the evaluators’
understanding of what is being evaluated and why, showing how each evaluation question will be answered by way of
proposed methods, suggested sources of data and data collection procedures. The inception report will include a
proposed schedule of tasks, activities and deliverables, designating a team member with the lead responsibility for each
task or product. Moreover, it shall include a list of indicators for which the evaluation team aims at collecting primary
data and data collection tools.
• There shall be a discussion of the evaluation methodology and evaluation plan with WFP, after which the team will provide
the evaluation committee with an opportunity to verify that they share the same understanding about the evaluation and
clarify any pending issues. The team will incorporate adjustments as appropriate.
• The inception report will then be subjected to quality review by the independent quality support (QS) mechanism
provided by WFP which will provide feedback on how the draft can be improved.
• Finalisation of the inception report will then be approved by the chair of the evaluation committee. Upon approval of
the inception report, the evaluation team will start the data collection.
75. Phase 3: Data collection (field work) – one month timeline
• Field work: Collection of the quantitative and qualitative data as per the evaluation methodology in the inception
report, and guided by the evaluation matrix. If data cannot be collected as foreseen in the inception report, the
evaluation team shall report back to WFP in order to discuss possible alternatives/solutions;
• Preliminary analysis and Debriefing session: After the fieldwork, the evaluation team shall present initial findings
and impression from the fieldwork. The results shall be presented to the ERG, other WFP members and stakeholders
involved in the evaluation for initial inputs.
76. Phase 4: Data Analysis and Reporting
• Data analysis and preparation of a draft evaluation report: The team will carry out data analysis and produce a first
draft of the evaluation report. The evaluation report shall answer the evaluation questions listed in this ToR. Moreover,
the report shall include an executive summary, a detailed description of each activity, a description and justification of
the adopted evaluation methodology and its limitations, a detailed presentation and discussion of the evaluation
results, and a discussion of lessons learned. WFP shall review the first draft evaluation report to ensure that the
evaluation report meets the required quality criteria and planned objectives (4 weeks).
• The final evaluation report will be prepared using the template provided by WFP and follow UNEG evaluation report
standards.
• Review of the draft evaluation report by the evaluation committee and discussions with the team as appropriate. (2
weeks)
• Evaluation team to revise the evaluation report based on the feedback from the evaluation committee to produce the
second draft. (2 weeks)
• The second draft report is submitted to the QS service for review and feedback.
• Team will receive feedback from QS and update the evaluation report to produce third draft (1 week).
• Validation workshop to be held with key stakeholders to discuss evaluation results;
• The team will revise the report based on the discussions during the validation workshop to produce the final Evaluation
Report (3 weeks after the validation workshop).
77. Phase 5: Dissemination follow up: This will include follow up and completion of management responses to the evaluation
recommendations. This phase will be undertaken by WFP upon finalization of the report. WFP management with the
evaluation manager, will institute a tracking system for tracking of the responses.
The deliverables and deadlines for each phase are as follows:
Deliverables Deadline
1. Inception report 6 weeks after the start of evaluation activities
1. Preparation
•Terms of reference
2.
Inception
•Inception Report
3.
Data Collection
•Debriefing PPT
4.
Data Analysis and
Reporting
•Evaluation Report
5.
Disseminate and follow-
up
•Management response to recommendations
2. Fieldwork report 1 week after the end of fieldwork activities
3. Debrief session 1 week after the end of fieldwork activities
4. Draft Evaluation report 2 weeks after the end of fieldwork activities
5. Final Evaluation Report 6 weeks after the end of fieldwork activities
6. Evaluation brief -a 2-4-page summary of evaluation
findings with graphs and charts appropriate for a non-
technical audience
6 weeks after the end of fieldwork activities
7. Power Point Presentation of evaluation results 6 weeks after the end of fieldwork activities
8. Clean datasets of primary data 6 weeks after the end of fieldwork activities
6. Organization of the Evaluation
6.1 Evaluation Conduct
78. The evaluation team will conduct the evaluation under the direction of its team leader and in close communication with the
evaluation manager. The team will be hired following agreement with WFP on its composition.
79. The evaluation team will not have been involved in the design or implementation of the subject of evaluation or have any
other conflicts of interest. Further, they will act impartially and respect the code of conduct of the evaluation profession.
80. The evaluation team shall respect the evaluation schedule in annexe 2. Changes to the timeline are subject to the consent of
WFP Malawi through the evaluation committee and should be detailed in the inception report with justification/rationale for
any deviations from the overall timeline.
81. The evaluation team are expected to be completely impartial in the whole study and will be free to draw its own conclusions,
not influenced from anyone—whether individual or agency and completely free from political manipulations of its
conclusions.
6.2 Team composition and competencies
82. The evaluation team is expected to be composed of three to four team members, including the team leader. The team must
include national and international experts and be gender balanced. The team should include specialists in Education with
expertise in Literacy, Nutrition, Agriculture and Gender/Social Development. The team should also include strong quantitative
and qualitative methods expertise. To the extent possible, the evaluation will be conducted by a gender-balanced,
geographically and culturally diverse team with appropriate skills to assess gender dimensions of the subject as specified in
the scope, approach and methodology sections of the ToR. At least one team member should have WFP experience,
preferably the team leader.
83. The team will be multi-disciplinary and include members who together have an appropriate balance of expertise and practical
knowledge in the following areas:
84. Demonstrated experience in designing and leading complex evaluations;
85. Highly experienced in a range of evaluation approaches including approaches that mix quantitative, qualitative and
participatory methods;
86. Team composition should demonstratefamiliarity and experience in implementation of quasi-experimental studies.
87. Strong knowledge and experience in selection and implementation of statistically accepted sampling methods;
88. Strong data analysis skills for both qualitative and quantitative data; including costs analysis;
89. Excellent report writing skills;
90. Technical competence in the development field with good understanding of the education sector in Malawi and
development issues in the context of Rights Based Approaches and social protection / safety net programming in a
developing country;
91. Gender expertise and good knowledge of gender issues and tools for integrating human rights and their link with
nutrition, health and gender equality in education;
92. The team should have strong analytical and communication skills, evaluation experience and familiarity with Malawi
and/or Eastern and Southern Africa region;
93. At least one team member should have experience in evaluating WFP programmes.
94. The Team leader will have technical expertise in one of the technical areas listed above as well as expertise in designing
methodology and data collection tools and demonstrated experience in leading similar evaluations. She/he will also have
leadership, analytical and communication skills, including a track record of excellent writing and presentation skills.
95. Her/his primary responsibilities will be: i) refining the evaluation approach and methodology (as already outlined in para 49;
ii) guiding and managing the team; iii) leading the evaluation mission and representing the evaluation team; iv) drafting and
revising, as required, the inception report, the end of field work (i.e. exit) debriefing presentation and evaluation report in
line with DEQAS.
96. The team members will bring together a complementary combination of the technical expertise required and have a track
record of written work on similar assignments.
97. Team members will: i) contribute to the methodology in their area of expertise based on a document review; ii) conduct field
work; iii) participate in team meetings and meetings with stakeholders; iv) contribute to the drafting and revision of the
evaluation products in their technical area(s).
6.3 Security Considerations
98. Security clearance will follow the following guide;
99. As an ‘independent supplier’ of evaluation services to WFP, the evaluation company is responsible for ensuring the
security of all persons contracted, including adequate arrangements for evacuation for medical or situational reasons.
The consultants contracted by the evaluation company do not fall under the UN Department of Safety & Security
(UNDSS) system for UN personnel.
100. Consultants hired independently are covered by the UN Department of Safety & Security (UNDSS) system for UN
personnel which cover WFP staff and consultants contracted directly by WFP. Independent consultants must obtain
UNDSS security clearance for travelling to be obtained from designated duty station and complete the UN system’s
Basic and Advance Security in the Field courses in advance, print out their certificates and take them with them.32
101. However, to avoid any security incidents, the Evaluation Manager is requested to ensure that:
102. The WFP CO registers the team members with the Security Officer on arrival in country and arranges a security
briefing for them to gain an understanding of the security situation on the ground.
103. The team members observe applicable UN security rules and regulations – e.g. curfews etc.
104. In overall, there are no specific security issues of concern in relation to this evaluation.
7. Roles and Responsibilities of Stakeholders
105. The WFP Malawi Management (Director or Deputy Director) will be responsible for the following;
106. Appointing a staff as evaluation manager. To ensure a process that is as impartial as possible, the evaluation
manager should not be the staff who are involved in the day-to-day implementation of the programme;
107. Approve the final ToR, inception and evaluation reports.
108. Ensure the independence and impartiality of the evaluation at all stages, including establishment of an Evaluation
Committee and a Reference Group (see Annex 3).
109. Participate in discussions with the evaluation team on the evaluation design and the evaluation subject, its
performance and results with the Evaluation Manager and the evaluation team.
110. Organize and participate in debriefings by the evaluation team after field work, with internal and with external
stakeholders.
111. Oversee dissemination and follow-up processes, including the preparation of a Management Response to the
evaluation recommendations.
112. Evaluation Manager:
113. Manages the evaluation process through all phases including liaising with all members and stakeholders and donors
involved;
114. Ensure quality assurance mechanisms are operational;
115. Consolidate and share comments from evaluation committee on draft ToR, inception and evaluation reports with
the evaluation team;
116. Ensures expected use of quality assurance mechanisms;
117. Ensure that the evaluation team has access to all documentation and information necessary to the evaluation;
facilitate the team’s contacts with local stakeholders; set up meetings, field visits; provide all logistic support during the
fieldwork and arrange for interpretation, if required.
32Field Courses: Basic https://dss.un.org/bsitf/; Advanced http://dss.un.org/asitf
118. Organize security briefings for the evaluation team and provide any materials as required.
119. An internal Evaluation Committee has been formed as part of ensuring the independence and impartiality of the evaluation.
The committee is composed of WFP staff at country and regional office. It will steer the evaluation process and support the
evaluation manager.
120. An Evaluation Resource Group (ERG) has been formed, as appropriate, with representation from the key internal
stakeholders (WFP country office and regional office M&E representatives, programme officers/focal points, and external
stakeholders including representatives from key government ministries and USDA representative). The ERG will review the
evaluation products as a further safeguard against bias and influence.
121. The RB management, through the focal points, will take responsibility to:
122. Participate in discussions with the evaluation team on the evaluation design and on the evaluation subject as
relevant.
123. Provide comments on the draft ToR, Inception and Evaluation reports.
124. Support the preparation of the Management Response to the evaluation and track the implementation of the
recommendations.
125. The Office of EvaluationThe WFP Office of Evaluation has the responsibility to provide access to independent quality
support mechanisms in reviewing draft inception and evaluation reports from an evaluation perspective. It shall also ensure
a help desk function upon request from the Regional Bureaus.
8. Communication and budget
8.1 Communication
126. To ensure a smooth and efficient process and enhance the learning from this evaluation, the evaluation team should place
emphasis on transparent and open communication with key stakeholders. These will be achieved by ensuring a clear
agreement on channels and frequency of communication with and between key stakeholders.
127. The Evaluation manager, in consultation with the evaluation committee, will develop a communication and learning plan that
will outline processes and channels of communication and learning activities.
128. The evaluation manager will be responsible for:
129. Sharing all draft products including TOR, inception report and evaluation report with internal and external
stakeholders to solicit their feedback. The communication will specify the date by when the feedback is expected and
highlight next steps;
130. Documenting systematically how stakeholder feedback has been used in finalising the product, ensuring that where
feedback has not been used a rationale is provided;
131. Informing stakeholders (through the ERG) of planned meetings at least one week before and where appropriate
sharing the agenda for such meetings;
132. Informing the team leader in advance the people who have been invited for meetings that the team leader is
expected to participate and sharing the agenda in advance;
133. Sharing final evaluation products (TOR, inception and Evaluation report) with all internal and external stakeholders
for their information and action as appropriate;
134. To ensure a smooth and efficient process and enhance the learning from this evaluation, the evaluation team will emphasize
transparent and open communication with all key stakeholders. The evaluation team leader will be responsible for:
135. Communicating the rationale for the evaluation design decisions (sampling, methodology, tools) in the inception
report and through discussions;
136. Working with the evaluation managers to ensure a detailed evaluation schedule is communicated to stakeholders
before field work starts;
137. Sharing a brief PowerPoint presentation before the internal and external debriefings to enable stakeholders joining
the briefings remotely to follow the discussions;
138. Including in the final report the list of people interviewed, as appropriate (bearing in mind confidentiality and
protection issues)33
139. Systematically considering all stakeholder feedback when finalising the evaluation report, and transparently provide
rationale for feedback that was not used;
140. As part of the international standards for evaluation, the UN requires that all evaluation reports are made publicly available;
and the links circulated to key stakeholders as appropriate but also in conformity with USDA M&E Policy. The evaluation
managers will be responsible for sharing the final report and the management response with their regional evaluation offices,
33 For example, omitting names of people where appropriate, and instead stating the name of the organisation; not including names of beneficiaries but instead stating the groups or villages as appropriate;

who will ensure that they are uploaded to the appropriate systems (intranet and public websites). The report for public
circulation will be free from any proprietary or information with personal identities.
141. To enhance the use of the evaluation findings, Country representatives may consider holding a dissemination and learning
workshop. Such a workshop will target key government officials, Donors, UN staff and partners. The team leader may be
called upon to co-facilitate the workshop.
8.2 Budget
142. The budget for this evaluation is estimated to be USD 200,000. The actual budget, however, will be determined by the LTA
rates of the selected firm, the number of evaluators included in the team, the level of effort (number of days) required for
each evaluator and sampling approach to collecting quantitative data (i.e. sample sizes). The evaluation will be funded from
the project implementation budget.
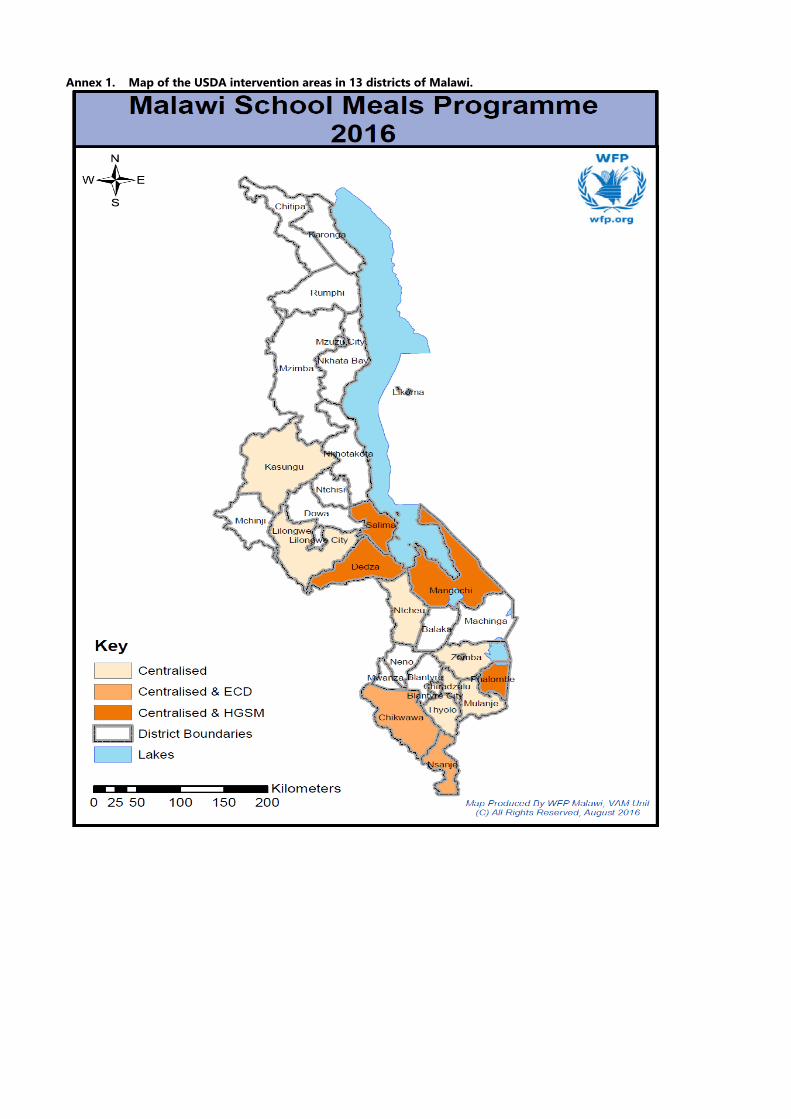
Annex 1. Map of the USDA intervention areas in 13 districts of Malawi.
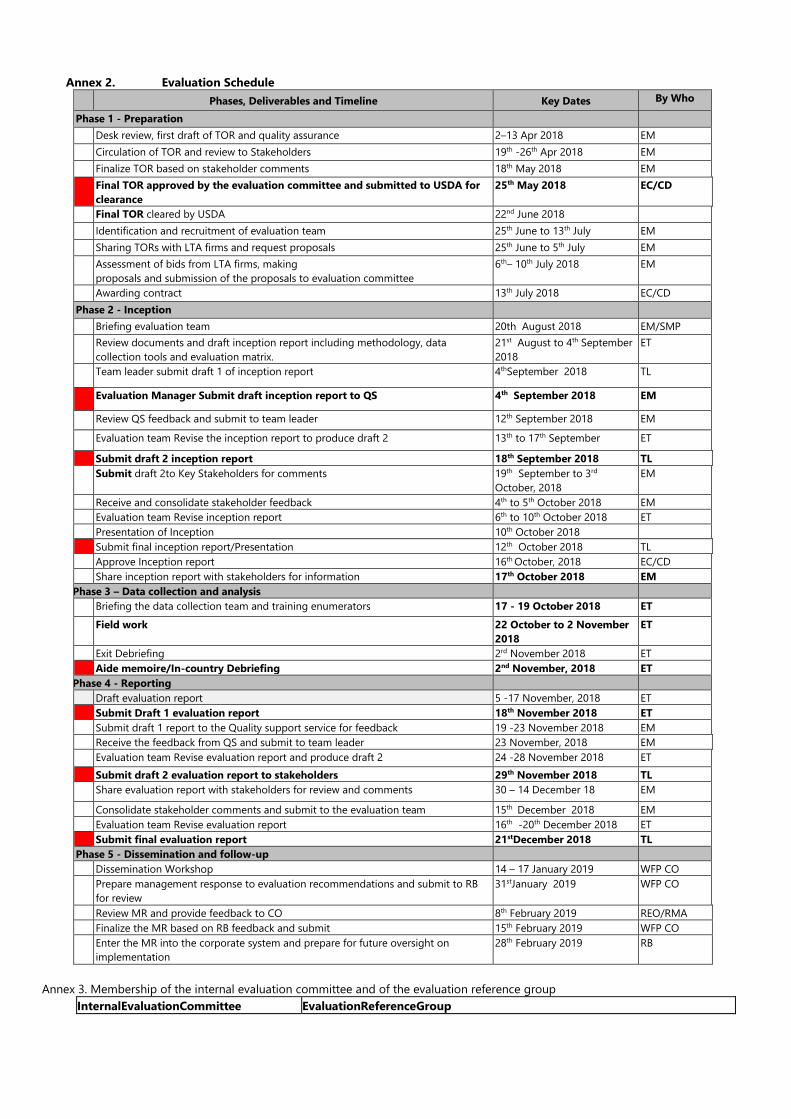
Annex 2. Evaluation Schedule
Phases, Deliverables and Timeline Key Dates By Who
Phase 1 - Preparation
Desk review, first draft of TOR and quality assurance 2–13 Apr 2018 EM
Circulation of TOR and review to Stakeholders 19th -26th Apr 2018 EM
Finalize TOR based on stakeholder comments 18th May 2018 EM
Final TOR approved by the evaluation committee and submitted to USDA for
clearance
25th May 2018 EC/CD
Final TOR cleared by USDA 22nd June 2018
Identification and recruitment of evaluation team 25th June to 13th July EM
Sharing TORs with LTA firms and request proposals 25th June to 5th July EM
Assessment of bids from LTA firms, making
proposals and submission of the proposals to evaluation committee
6th– 10th July 2018 EM
Awarding contract 13th July 2018 EC/CD
Phase 2 - Inception
Briefing evaluation team 20th August 2018 EM/SMP
Review documents and draft inception report including methodology, data
collection tools and evaluation matrix.
21st August to 4th September
2018
ET
Team leader submit draft 1 of inception report 4thSeptember 2018 TL
Evaluation Manager Submit draft inception report to QS 4th September 2018 EM
Review QS feedback and submit to team leader 12th September 2018 EM
Evaluation team Revise the inception report to produce draft 2 13th to 17th September ET
Submit draft 2 inception report 18th September 2018 TL
Submit draft 2to Key Stakeholders for comments 19th September to 3rd
October, 2018
EM
Receive and consolidate stakeholder feedback 4th to 5th October 2018 EM
Evaluation team Revise inception report 6th to 10th October 2018 ET
Presentation of Inception 10th October 2018
Submit final inception report/Presentation 12th October 2018 TL
Approve Inception report 16th October, 2018 EC/CD
Share inception report with stakeholders for information 17th October 2018 EM
Phase 3 – Data collection and analysis
Briefing the data collection team and training enumerators 17 - 19 October 2018 ET
Field work 22 October to 2 November
2018
ET
Exit Debriefing 2rd November 2018 ET
Aide memoire/In-country Debriefing 2nd November, 2018 ET
Phase 4 - Reporting
Draft evaluation report 5 -17 November, 2018 ET
Submit Draft 1 evaluation report 18th November 2018 ET
Submit draft 1 report to the Quality support service for feedback 19 -23 November 2018 EM
Receive the feedback from QS and submit to team leader 23 November, 2018 EM
Evaluation team Revise evaluation report and produce draft 2 24 -28 November 2018 ET
Submit draft 2 evaluation report to stakeholders 29th November 2018 TL
Share evaluation report with stakeholders for review and comments 30 – 14 December 18 EM
Consolidate stakeholder comments and submit to the evaluation team 15th December 2018 EM
Evaluation team Revise evaluation report 16th -20th December 2018 ET
Submit final evaluation report 21stDecember 2018 TL
Phase 5 - Dissemination and follow-up
Dissemination Workshop 14 – 17 January 2019 WFP CO
Prepare management response to evaluation recommendations and submit to RB
for review
31stJanuary 2019 WFP CO
Review MR and provide feedback to CO 8th February 2019 REO/RMA
Finalize the MR based on RB feedback and submit 15th February 2019 WFP CO
Enter the MR into the corporate system and prepare for future oversight on
implementation
28th February 2019 RB
Annex 3. Membership of the internal evaluation committee and of the evaluation reference group
InternalEvaluationCommittee EvaluationReferenceGroup
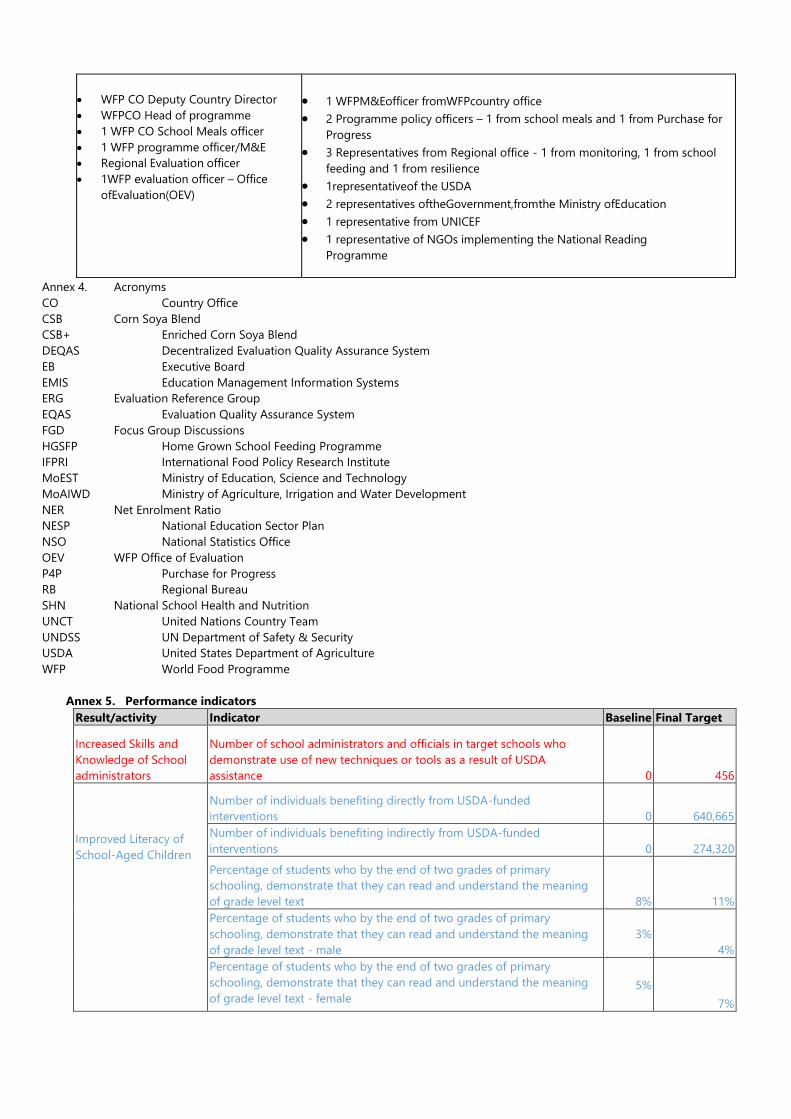
• WFP CO Deputy Country Director
• WFPCO Head of programme
• 1 WFP CO School Meals officer
• 1 WFP programme officer/M&E
• Regional Evaluation officer
• 1WFP evaluation officer – Office
ofEvaluation(OEV)
• 1 WFPM&Eofficer fromWFPcountry office
• 2 Programme policy officers – 1 from school meals and 1 from Purchase for
Progress
• 3 Representatives from Regional office - 1 from monitoring, 1 from school
feeding and 1 from resilience
• 1representativeof the USDA
• 2 representatives oftheGovernment,fromthe Ministry ofEducation
• 1 representative from UNICEF
• 1 representative of NGOs implementing the National Reading
Programme
Annex 4. Acronyms
CO Country Office
CSB Corn Soya Blend
CSB+ Enriched Corn Soya Blend
DEQAS Decentralized Evaluation Quality Assurance System
EB Executive Board
EMIS Education Management Information Systems
ERG Evaluation Reference Group
EQAS Evaluation Quality Assurance System
FGD Focus Group Discussions
HGSFP Home Grown School Feeding Programme
IFPRI International Food Policy Research Institute
MoEST Ministry of Education, Science and Technology
MoAIWD Ministry of Agriculture, Irrigation and Water Development
NER Net Enrolment Ratio
NESP National Education Sector Plan
NSO National Statistics Office
OEV WFP Office of Evaluation
P4P Purchase for Progress
RB Regional Bureau
SHN National School Health and Nutrition
UNCT United Nations Country Team
UNDSS UN Department of Safety & Security
USDA United States Department of Agriculture
WFP World Food Programme
Annex 5. Performance indicators
Result/activity Indicator Baseline Final Target
Increased Skills and
Knowledge of School
administrators
Number of school administrators and officials in target schools who
demonstrate use of new techniques or tools as a result of USDA
assistance 0 456
Improved Literacy of
School-Aged Children
Number of individuals benefiting directly from USDA-funded
interventions 0
640,665
Number of individuals benefiting indirectly from USDA-funded
interventions 0
274,320
Percentage of students who by the end of two grades of primary
schooling, demonstrate that they can read and understand the meaning
of grade level text 8%
11%
Percentage of students who by the end of two grades of primary
schooling, demonstrate that they can read and understand the meaning
of grade level text - male
3%
4%
Percentage of students who by the end of two grades of primary
schooling, demonstrate that they can read and understand the meaning
of grade level text - female 5%
7%
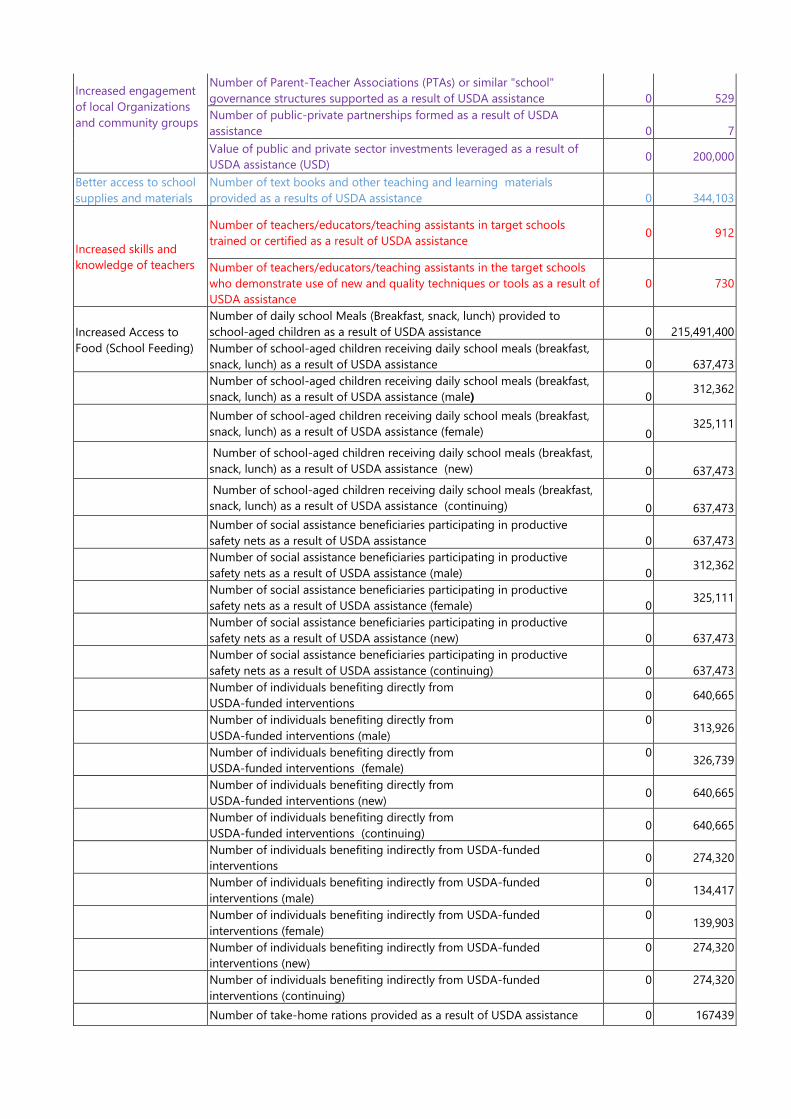
Increased engagement
of local Organizations
and community groups
Number of Parent-Teacher Associations (PTAs) or similar "school"
governance structures supported as a result of USDA assistance 0 529
Number of public-private partnerships formed as a result of USDA
assistance 0 7
Value of public and private sector investments leveraged as a result of
USDA assistance (USD) 0 200,000
Better access to school
supplies and materials
Number of text books and other teaching and learning materials
provided as a results of USDA assistance 0 344,103
Increased skills and
knowledge of teachers
Number of teachers/educators/teaching assistants in target schools
trained or certified as a result of USDA assistance 0 912
Number of teachers/educators/teaching assistants in the target schools
who demonstrate use of new and quality techniques or tools as a result of
USDA assistance
0 730
Increased Access to
Food (School Feeding)
Number of daily school Meals (Breakfast, snack, lunch) provided to
school-aged children as a result of USDA assistance 0 215,491,400
Number of school-aged children receiving daily school meals (breakfast,
snack, lunch) as a result of USDA assistance 0 637,473
Number of school-aged children receiving daily school meals (breakfast,
snack, lunch) as a result of USDA assistance (male) 0 312,362
Number of school-aged children receiving daily school meals (breakfast,
snack, lunch) as a result of USDA assistance (female) 0 325,111
Number of school-aged children receiving daily school meals (breakfast,
snack, lunch) as a result of USDA assistance (new) 0 637,473
Number of school-aged children receiving daily school meals (breakfast,
snack, lunch) as a result of USDA assistance (continuing) 0 637,473
Number of social assistance beneficiaries participating in productive
safety nets as a result of USDA assistance 0 637,473
Number of social assistance beneficiaries participating in productive
safety nets as a result of USDA assistance (male) 0 312,362
Number of social assistance beneficiaries participating in productive
safety nets as a result of USDA assistance (female) 0 325,111
Number of social assistance beneficiaries participating in productive
safety nets as a result of USDA assistance (new) 0 637,473
Number of social assistance beneficiaries participating in productive
safety nets as a result of USDA assistance (continuing) 0 637,473
Number of individuals benefiting directly from
USDA-funded interventions 0 640,665
Number of individuals benefiting directly from
USDA-funded interventions (male)
0 313,926
Number of individuals benefiting directly from
USDA-funded interventions (female)
0 326,739
Number of individuals benefiting directly from
USDA-funded interventions (new) 0 640,665
Number of individuals benefiting directly from
USDA-funded interventions (continuing) 0 640,665
Number of individuals benefiting indirectly from USDA-funded
interventions 0 274,320
Number of individuals benefiting indirectly from USDA-funded
interventions (male)
0 134,417
Number of individuals benefiting indirectly from USDA-funded
interventions (female)
0 139,903
Number of individuals benefiting indirectly from USDA-funded
interventions (new)
0 274,320
Number of individuals benefiting indirectly from USDA-funded
interventions (continuing)
0 274,320
Number of take-home rations provided as a result of USDA assistance 0 167439

Number of individuals receiving take-home rations as a result of USDA
assistance 0 48557
Number of individuals receiving take-home rations as a result of USDA
assistance (male)
0 9,711
Number of individuals receiving take-home rations as a result of USDA
assistance (female)
0 38,846
Number of individuals receiving take-home rations as a result of USDA
assistance (new) 0 48557
Number of individuals receiving take-home rations as a result of USDA
assistance (continuing) 0 48557
Increased access to
clean water and
sanitation services
Number of schools using an improved water source 0 310
Number of schools with improved sanitation facilities 0 310
Improved student
attendance
Number of students regularly (80%) attending USDA supported
classrooms/schools 321,600 509,978
Number of students regularly (80%) attending USDA supported
classrooms/schools (male) 157584 249,889
Number of students regularly (80%) attending USDA supported
classrooms/schools (female) 164016 260,089
Improved Policy and
Regulatory Framework
Number of educational policies, regulations and/or administrative
procedures in each of the following stages of development as a result of
USDA assistance:
Stage 1: Analyzed
Stage 2: Drafted and presented for public/stakeholder consultation
Stage 3: Presented for legislation/decree
Stage 4: Passed/Approved
Stage 5: Passed for which implementation has begun 0 5
Increased Knowledge of
Nutrition
Number of individuals trained in child health and nutrition as a result of
USDA assistance 0 1,368
Number of individuals trained in child health and nutrition as a result of
USDA assistance- male 0 670
Number of individuals trained in child health and nutrition as a result of
USDA assistance - Female 0 698
Increased Student
Enrolment Number of students enrolled in school receiving USDA assistance 400,000 637,473
Number of students enrolled in school receiving USDA assistance -Male
196,000
312,362
Number of students enrolled in school receiving USDA assistance -
Female
204,000
325,111
Provide Bursaries
Number of bursaries provided as a result of USDA assistance 0 2,080
Number of individuals receiving bursaries as a result of USDA assistance 0 2,080
Building/Rehabilitation:
Junior-Secondary
Schools
Number of educational facilities (i.e. school buildings, classrooms, and
latrines) rehabilitated/constructed as a result of USDA assistance (latrines) 0 5
Number of educational facilities (i.e. school buildings, classrooms, and
latrines) rehabilitated/constructed as a result of USDA assistance 0 5
Number of secondary school textbooks and other teaching and learning
materials provided as a result of USDA assistance 0 9,000
Number of students enrolled in junior-secondary schools constructed as a
result of USDA assistance 0 500
Building/Rehabilitation:
Kitchens, Storerooms,
and Feeding Shelters
Number of kitchen-storeroom-feeding shelter units constructed as a
result of USDA assistance 0 35
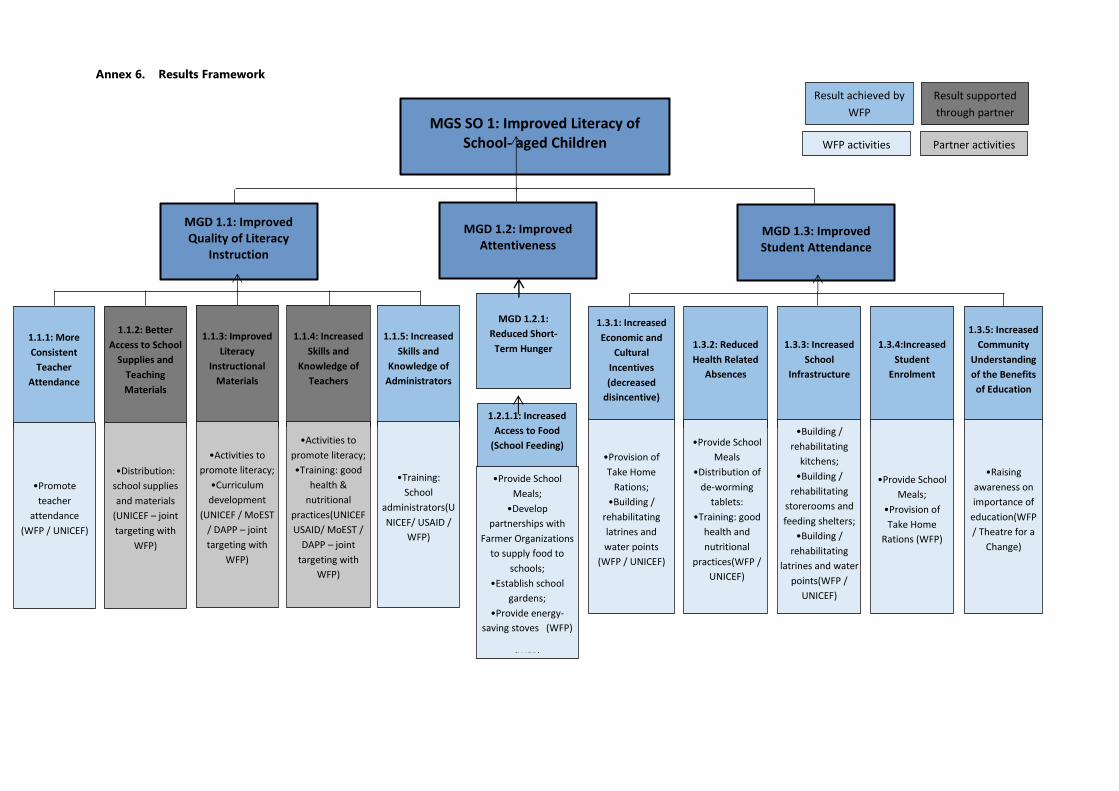
Annex 6. Results Framework
MGS SO 1: Improved Literacy of School- aged Children
MGD 1.1: Improved Quality of Literacy
Instruction
MGD 1.2: Improved Attentiveness
MGD 1.3: Improved Student Attendance
1.1.2: Better
Access to School
Supplies and
Teaching
Materials
1.1.3: Improved
Literacy
Instructional
Materials
1.3.1: Increased
Economic and
Cultural
Incentives
(decreased
disincentive)
1.3.5: Increased
Community
Understanding
of the Benefits
of Education
1.3.4:Increased
Student
Enrolment
•Distribution:
school supplies
and materials
(UNICEF – joint
targeting with
WFP)
•Activities to
promote literacy;
•Curriculum
development
(UNICEF / MoEST
/ DAPP – joint
targeting with
WFP)
•Provision of
Take Home
Rations;
•Building /
rehabilitating
latrines and
water points
(WFP / UNICEF)
•Provide School
Meals;
•Provision of
Take Home
Rations (WFP)
•Raising
awareness on
importance of
education(WFP
/ Theatre for a
Change)
MGD 1.2.1:
Reduced Short-
Term Hunger
1.2.1.1: Increased
Access to Food
(School Feeding)
•Provide School
Meals;
•Develop
partnerships with
Farmer Organizations
to supply food to
schools;
•Establish school
gardens;
•Provide energy-
saving stoves (WFP)
(WFP)
1.1.5: Increased
Skills and
Knowledge of
Administrators
•Training:
School
administrators(U
NICEF/ USAID /
WFP)
1.1.4: Increased
Skills and
Knowledge of
Teachers
•Activities to
promote literacy;
•Training: good
health &
nutritional
practices(UNICEF
USAID/ MoEST /
DAPP – joint
targeting with
WFP)
1.3.3: Increased
School
Infrastructure
•Building /
rehabilitating
kitchens;
•Building /
rehabilitating
storerooms and
feeding shelters;
•Building /
rehabilitating
latrines and water
points(WFP /
UNICEF)
1.3.2: Reduced
Health Related
Absences
•Provide School
Meals
•Distribution of
de-worming
tablets:
•Training: good
health and
nutritional
practices(WFP /
UNICEF)
WFP activities Partner activities
1.1.1: More
Consistent
Teacher
Attendance
•Promote
teacher
attendance
(WFP / UNICEF)
Result achieved by
WFP
Result supported
through partner
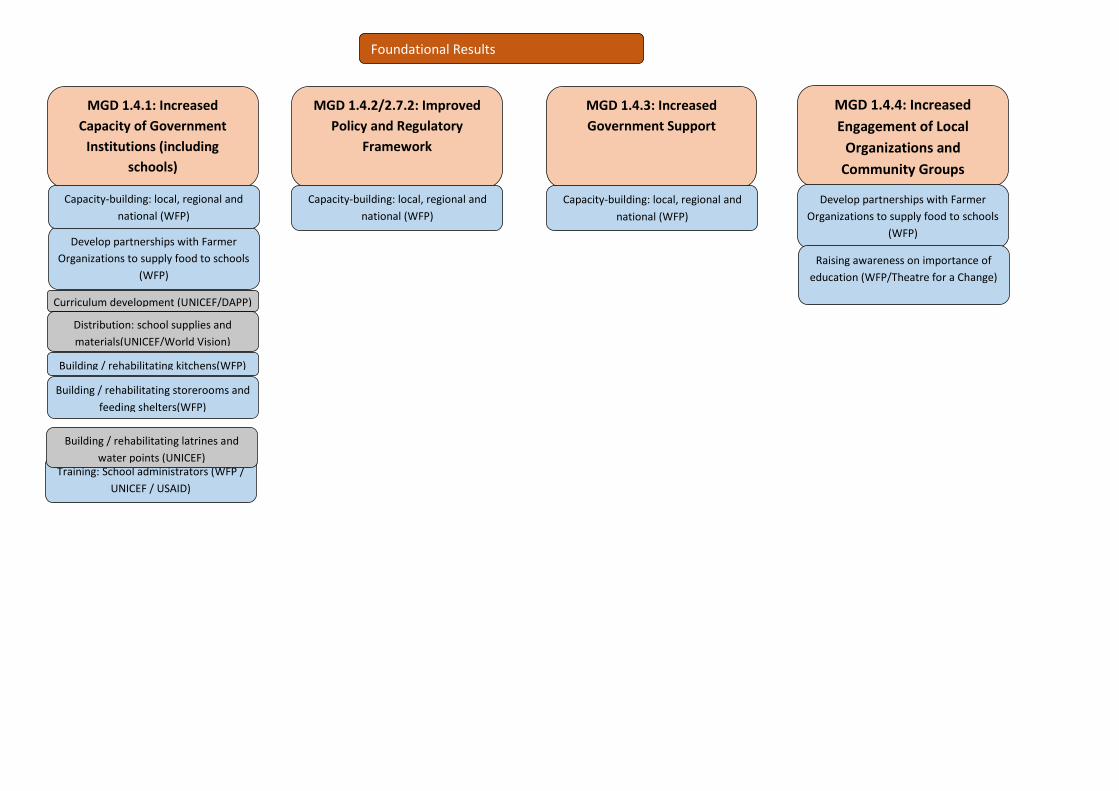
MGD 1.4.1: Increased
Capacity of Government
Institutions (including
schools)
Curriculum development (UNICEF/DAPP)
Develop partnerships with Farmer
Organizations to supply food to schools
(WFP)
Training: School administrators (WFP /
UNICEF / USAID)
Capacity-building: local, regional and
national (WFP)
Distribution: school supplies and
materials(UNICEF/World Vision)
Building / rehabilitating kitchens(WFP)
Building / rehabilitating storerooms and
feeding shelters(WFP)
Building / rehabilitating latrines and
water points (UNICEF)
MGD 1.4.3: Increased
Government Support
MGD 1.4.2/2.7.2: Improved
Policy and Regulatory
Framework
Capacity-building: local, regional and
national (WFP) Capacity-building: local, regional and
national (WFP)
Foundational Results
MGD 1.4.4: Increased
Engagement of Local
Organizations and
Community Groups
Develop partnerships with Farmer
Organizations to supply food to schools
(WFP)
Raising awareness on importance of
education (WFP/Theatre for a Change)
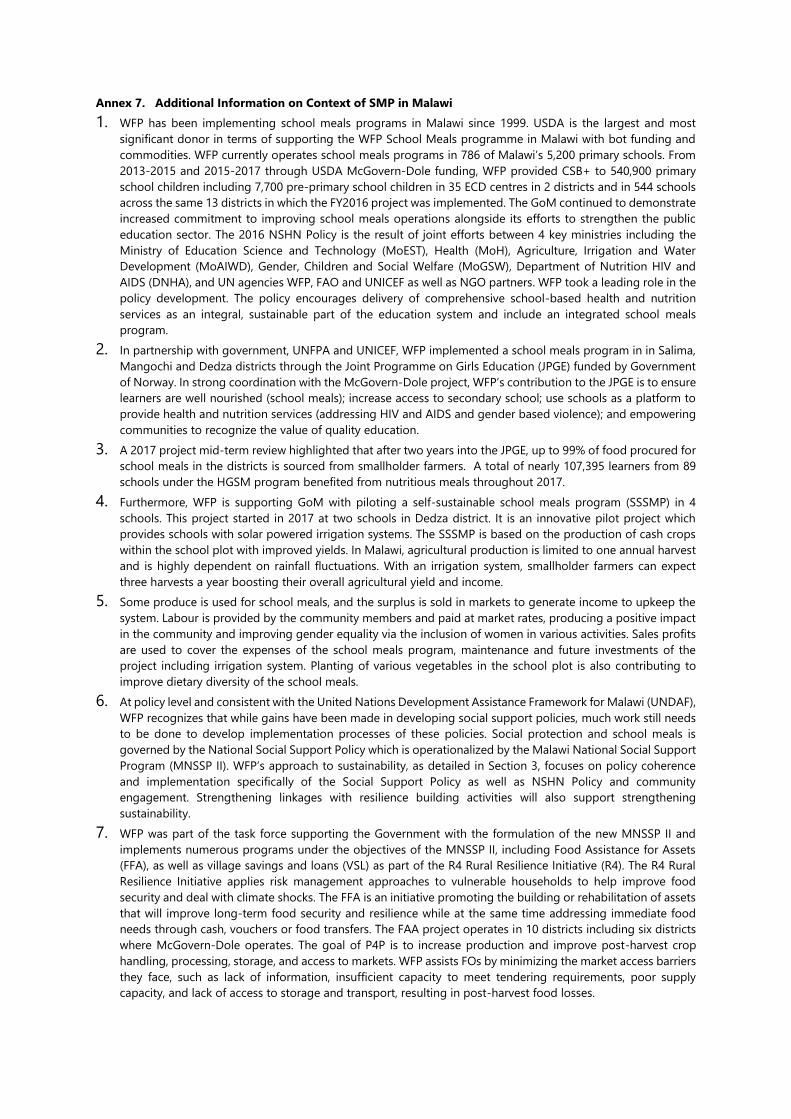
Annex 7. Additional Information on Context of SMP in Malawi
1. WFP has been implementing school meals programs in Malawi since 1999. USDA is the largest and most
significant donor in terms of supporting the WFP School Meals programme in Malawi with bot funding and
commodities. WFP currently operates school meals programs in 786 of Malawi’s 5,200 primary schools. From
2013-2015 and 2015-2017 through USDA McGovern-Dole funding, WFP provided CSB+ to 540,900 primary
school children including 7,700 pre-primary school children in 35 ECD centres in 2 districts and in 544 schools
across the same 13 districts in which the FY2016 project was implemented. The GoM continued to demonstrate
increased commitment to improving school meals operations alongside its efforts to strengthen the public
education sector. The 2016 NSHN Policy is the result of joint efforts between 4 key ministries including the
Ministry of Education Science and Technology (MoEST), Health (MoH), Agriculture, Irrigation and Water
Development (MoAIWD), Gender, Children and Social Welfare (MoGSW), Department of Nutrition HIV and
AIDS (DNHA), and UN agencies WFP, FAO and UNICEF as well as NGO partners. WFP took a leading role in the
policy development. The policy encourages delivery of comprehensive school-based health and nutrition
services as an integral, sustainable part of the education system and include an integrated school meals
program.
2. In partnership with government, UNFPA and UNICEF, WFP implemented a school meals program in in Salima,
Mangochi and Dedza districts through the Joint Programme on Girls Education (JPGE) funded by Government
of Norway. In strong coordination with the McGovern-Dole project, WFP’s contribution to the JPGE is to ensure
learners are well nourished (school meals); increase access to secondary school; use schools as a platform to
provide health and nutrition services (addressing HIV and AIDS and gender based violence); and empowering
communities to recognize the value of quality education.
3. A 2017 project mid-term review highlighted that after two years into the JPGE, up to 99% of food procured for
school meals in the districts is sourced from smallholder farmers. A total of nearly 107,395 learners from 89
schools under the HGSM program benefited from nutritious meals throughout 2017.
4. Furthermore, WFP is supporting GoM with piloting a self-sustainable school meals program (SSSMP) in 4
schools. This project started in 2017 at two schools in Dedza district. It is an innovative pilot project which
provides schools with solar powered irrigation systems. The SSSMP is based on the production of cash crops
within the school plot with improved yields. In Malawi, agricultural production is limited to one annual harvest
and is highly dependent on rainfall fluctuations. With an irrigation system, smallholder farmers can expect
three harvests a year boosting their overall agricultural yield and income.
5. Some produce is used for school meals, and the surplus is sold in markets to generate income to upkeep the
system. Labour is provided by the community members and paid at market rates, producing a positive impact
in the community and improving gender equality via the inclusion of women in various activities. Sales profits
are used to cover the expenses of the school meals program, maintenance and future investments of the
project including irrigation system. Planting of various vegetables in the school plot is also contributing to
improve dietary diversity of the school meals.
6. At policy level and consistent with the United Nations Development Assistance Framework for Malawi (UNDAF),
WFP recognizes that while gains have been made in developing social support policies, much work still needs
to be done to develop implementation processes of these policies. Social protection and school meals is
governed by the National Social Support Policy which is operationalized by the Malawi National Social Support
Program (MNSSP II). WFP’s approach to sustainability, as detailed in Section 3, focuses on policy coherence
and implementation specifically of the Social Support Policy as well as NSHN Policy and community
engagement. Strengthening linkages with resilience building activities will also support strengthening
sustainability.
7. WFP was part of the task force supporting the Government with the formulation of the new MNSSP II and
implements numerous programs under the objectives of the MNSSP II, including Food Assistance for Assets
(FFA), as well as village savings and loans (VSL) as part of the R4 Rural Resilience Initiative (R4). The R4 Rural
Resilience Initiative applies risk management approaches to vulnerable households to help improve food
security and deal with climate shocks. The FFA is an initiative promoting the building or rehabilitation of assets
that will improve long-term food security and resilience while at the same time addressing immediate food
needs through cash, vouchers or food transfers. The FAA project operates in 10 districts including six districts
where McGovern-Dole operates. The goal of P4P is to increase production and improve post-harvest crop
handling, processing, storage, and access to markets. WFP assists FOs by minimizing the market access barriers
they face, such as lack of information, insufficient capacity to meet tendering requirements, poor supply
capacity, and lack of access to storage and transport, resulting in post-harvest food losses.
8. Another example of how the GoM and WFP frames school meals programs within the broader social protection
context is evidenced by establishment of technical working groups. WFP chairs the School Meals Development
partners group and co-chairs the School Meals Technical working group. This is based on the expertise that
WFP has on SMP design and implementation. In these working groups, WFP discusses program
implementation, progress, locations, and challenges faced in order to better coordinate implementation and
leverage partner experiences and provides technical support on effective delivery of schools. In addition, WFP
contributed to the development of the National Resilience Strategy 2017-2023 (NRS), a framework intended
to guide work on breaking the cycle of hunger, leveraging the insights gained through the MNSSP II, social
protection and school meals is a key component of the NRS. The MNSSP II will run from 2018-2023.
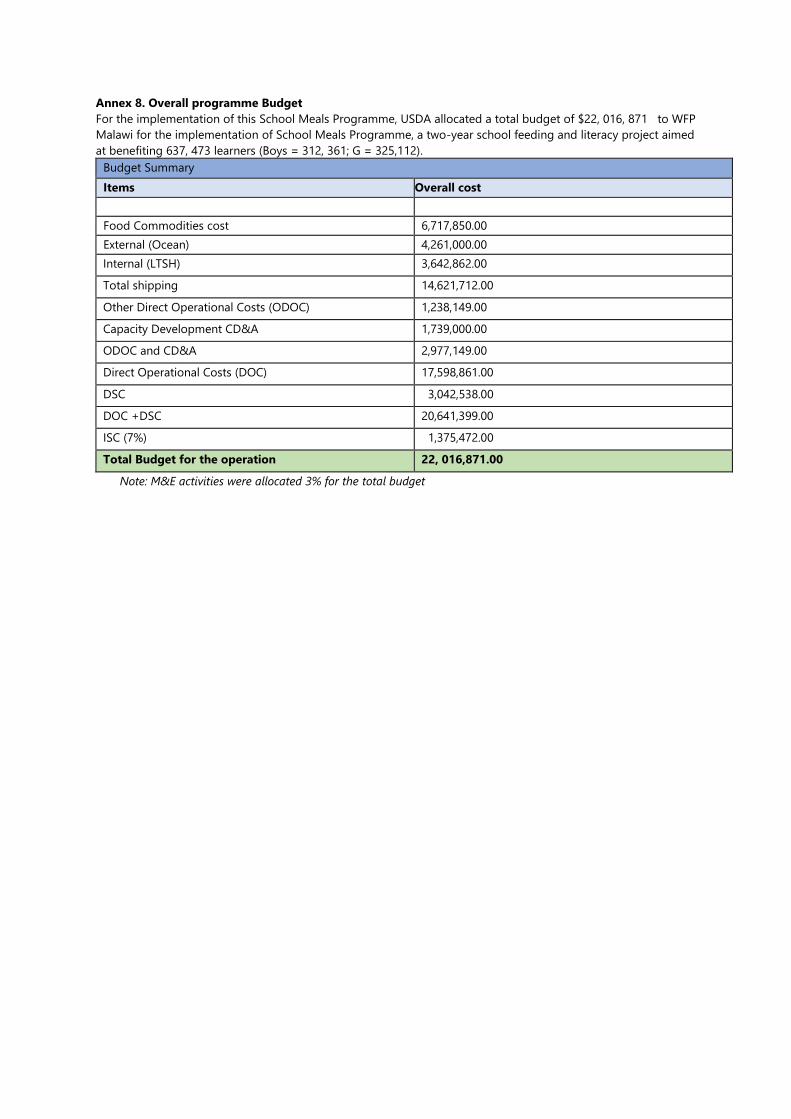
Annex 8. Overall programme Budget
For the implementation of this School Meals Programme, USDA allocated a total budget of $22, 016, 871 to WFP
Malawi for the implementation of School Meals Programme, a two-year school feeding and literacy project aimed
at benefiting 637, 473 learners (Boys = 312, 361; G = 325,112).
Budget Summary
Items Overall cost
Food Commodities cost 6,717,850.00
External (Ocean) 4,261,000.00
Internal (LTSH) 3,642,862.00
Total shipping
14,621,712.00
Other Direct Operational Costs (ODOC) 1,238,149.00
Capacity Development CD&A 1,739,000.00
ODOC and CD&A 2,977,149.00
Direct Operational Costs (DOC) 17,598,861.00
DSC 3,042,538.00
DOC +DSC 20,641,399.00
ISC (7%) 1,375,472.00
Total Budget for the operation 22, 016,871.00
Note: M&E activities were allocated 3% for the total budget
WFP MALAWI COUNTRY OFFICE
www.wfp.org/evaluation
Mala
wi, F
eb
ruary
, 20
19