applying different decentralized loadings on
TRANSCRIPT
http://iaeme.com/Home/journal/IJCIET 2752 [email protected]
International Journal of Civil Engineering and Technology (IJCIET)
Volume 9, Issue 11, November 2018, pp. 2752–2769, Article ID: IJCIET_09_11_276
Available online at http://iaeme.com/Home/issue/IJCIET?Volume=9&Issue=11
ISSN Print: 0976-6308 and ISSN Online: 0976-6316
©IAEME Publication Scopus Indexed
APPLYING DIFFERENT DECENTRALIZED
LOADINGS ON RC CONTINUOUS DEEP BEAMS
USING STM
Ali Mustafa Jalil
Student, University of Diyala, Civil Engineering, Diyala, Iraq
Dr. Mohammed j. Hamood
Assistant Prof. University of Technology, Civil Engineering, Baghdad, Iraq
Dr. Khattab Saleem Abdul-Razzaq
Prof. University of Diyala, Civil Engineering,Diyala Iraq
Dr. Abbas H. Mohammed
University of Diyala, Civil Engineering, Diyala, Iraq
ABSTRACT
This research presents strut and tie modeling for the reinforced concrete
continuous deep beams that are subjected to different types of decentralized loadings.
The different types of loadings area single concentrated force, two concentrated
forces, and a uniformly distributed load. Load movement indicates reducing the
internal shear span to the effective depth ratio (a/d). Detailed procedures to solve the
current questions are presented besides the detailed numerical examples. It is
concluded that, in case of single concentrated force, reducing a/d from 1.36to 1.09,
0.81, and then to 0.54, increased the ultimate capacity by about 13%, 23% and 35%,
respectively. It is also concluded that, in cases of two concentrated forces and
uniformly distributed load, reducing a/d from 1.09 to 0.81, 0.54 and then to 0.27,
increased the ultimate capacity by about 12%, 17% and 21%, respectively. The
increment in the ultimate capacity occurred because upon moving the load from span
center toward the inner support, the length of the inner strut shortens and the
dimensions of its section increase significantly which leads to more strength. It is true
that, in contrast, the length of the external strut increases and its dimensions decrease,
but this decrease in its dimensions is slight, making the weakness cause is due to that,
ineffective and therefore, indecisive.
Keywords: RC, Continuous deep beams, STM, Decent ralized load, Design
procedures.
Ali Mustafa Jalil, Mohammed j. Hamood, Khattab Saleem Abdul-Razzaq and Abbas H. Mohammed
http://iaeme.com/Home/journal/IJCIET 2753 [email protected]
Cite this Article: Ali Mustafa Jalil, Mohammed j. Hamood, Khattab Saleem Abdul-
Razzaq and Abbas H. Mohammed, Applying Different Decentralized Loadings on RC
Continuous Deep Beams Using STM, International Journal of Civil Engineering and
Technology (IJCIET) 9(11), 2018, pp. 2752–2769.
http://iaeme.com/Home/issue/IJCIET?Volume=9&Issue=11
1. INTRODUCTION
Continuous deep beams are divided into two types based on loading conditions; bottom and
top loading. Bottom loaded or indirectly loaded deep beams are widely used as cross-girders
in concrete water tanks or concrete bridges, etc., while top loaded continuous deep beams are
commonly used in reinforced concrete buildings. Also continuous deep beams are divided
into two types based onloading location; centralized or decentralized. Due to the fact that the
stress distribution in the deep beam section is nonlinear, the general beam analysis of linear
elastic theory cannot be used. That is why, ACI code 318 recommends that deep beams
should be designed using non-linear analysis or by using Strut and Tie models (STM). STM is
formulated by straight lines that state resultant forces of compression and tension stresses in
members. According to ACI 318M-14 [1], deep beams are members that are supported on one
face and loaded on the opposite face such that strut-like compression elements can be formed
between the supporting and loading points and that satisfy (a) or (b) [1] below:(a) Clear span
lndoes not exceed four times the overall member depth h. (b) Concentrated loads exist within
a distance 2h from the face of the support. Many investigators have suggested empirical and
semi-empirical expressions to determine the ultimate load capacity of convention allyrein
forced concrete deep beams [2, 3]. Some researchers studied the parameters that affect deep
beam behaviour and capacity [4-11].Since 2002, the ACI-318 Code procedure is based on
empirical equations for the design of deep beams .
According to ACI 318M-14 [1], STM is defined as "a truss model of a structural member
or of a D- region in such a member, made up of struts and ties connected at nodes, capable of
transferring factored loads to the supports or to adjacent B-regions". Provisions for STM have
been taken into considerations for the design purpose. STM complies with the plasticity lower
bound theory, which needs that only yield conditions in addition to equilibrium to be satisfied.
Plasticity lower bound theory states that if the load has such a value that it is possible to find a
distribution of stress corresponding to stresses that keep internal and external equilibrium
within the yield surface, then this load will not cause failure of the body. In other words, the
capacity of a structure as estimated by a lower bound theory will be less than or equal to the
real failure load of the body in question [12].
Strut and tie model is a very useful tool for analyzing and designing reinforced concrete
members in which D-regions exist. The decent realized top loading cases are very common in
structural engineering, while lack of such studies on continuous RC deep beams using STM is
obvious. That is why this study investigates modeling in detail the struts and ties in the
reinforced concrete two-span continuous deep beams under various decentralized loading
cases.
2. RESEARCH METHODOLOGY
According to STM of ACI 318-14 [1], the transfer systems of the main load are tie action of
main longitudinal reinforcement and compressive struts which represent concrete
compression stress fields. Deep beam concrete compressive struts generally considered as
bottle-shaped struts that are commonly idealized as uniformly tapered or prismatic members
in shear spans [13-16]. A tensile tie characterizes one or several steel reinforcement layers.
According to ACI 318-14[1], the main longitudinal reinforcement should be distributed
Applying Different Decentralized Loadings on RC Continuous Deep Beams Using STM
http://iaeme.com/Home/journal/IJCIET 2754 [email protected]
uniformly over thetie width. Strutsand ties meet in nodes, which are considered the joints
where axial forces intersect. There are two main systems of load transfer, one of which is the
strut-and-tie action because of the longitudinal topre in forcement and the other is the strut-
and-tie action developed with the longitudinal bottom reinforcement representing the tie. In a
deep beam that has two spans, the applied loads are transferred from loading to supporting
points through concrete struts of interior and exterior shear spans. Therefore, the continuous
deep beam load capacity PFis:
𝑃𝐹 = 2(𝐹𝑛𝑖𝑠 𝑠𝑖𝑛 𝜗𝑖 + 𝐹𝑛𝑒𝑠 𝑠𝑖𝑛 𝜗𝑒) − 1
where𝐹𝑛𝑖𝑠and 𝐹𝑛𝑒𝑠are the load capacities of interior and exterior concrete struts,
respectively. 𝜗𝑖,𝜗𝑒 are the angles between the interior and exterior concrete strut and
longitudinal axis of the deep beam. These angles can be expressed as tan-1(jd/ai), tan-1(jd/ae),
respectively, where a is the exterior and interior shear span. The distance between the center
of bottom and top nodes jd could be considered as the distance between the center of longitudinal
bottom and top reinforcing bars as below:
𝑗𝑑 = ℎ −𝑤𝑡𝑡
2−
𝑤𝑡𝑏
2− − − − − 2
whereh is the overall section depth;𝑤𝑡𝑡and 𝑤𝑡𝑏 are the heights of nodal zone for top, i.e.
applied load, and bottom, i.e. support, respectively. At the applying load points, they could be
classified as a CCT or CCC type, which are hydrostatic nodes connecting both interior and
exterior compressive struts in sagging zone. In a CCC node type that has equal all in-plane
side stresses, the ratio of each hydrostatic node face width has to be the same as the force
meeting ratio at the node to make the stress state constant in the whole region of the node
[13,14]. The effective width of strut depends on the tie width and loading plate, in addition to
the strut slope. Average effective widths of concrete struts uniformly tapered in exterior shear
spans 𝑤𝑒𝑠and interior 𝑤𝑖𝑠can be calculated by:
𝑤𝑖𝑠 =𝑤𝑠𝑖
2+
𝑤𝑠𝑝𝑖
2− − − − − 3
𝑤𝑒𝑠 =𝑤𝑠𝑒
2+
𝑤𝑠𝑝𝑒
2− − − − − 4
Where 𝑤𝑠𝑒 and 𝑤𝑠𝑖 are the lengths of inclined faces of nodal zone at exterior and interior
support, respectively. 𝑤𝑠𝑝𝑒and𝑤𝑠𝑝𝑖 are the lengths of inclined exterior and interior faces of
nodal zone at applied load, respectively. The load transfer of concrete struts relies on the strut
area and compressive strength of concrete. Therefore, load capacities of interior and exterior
concrete struts are:
𝐹𝑛𝑖𝑠 = 0.85𝛽𝑠. 𝑓𝑐′.𝑏. 𝑤𝑖𝑠 − − − − − 5
𝐹𝑛𝑒𝑠 = 0.85𝛽𝑠. 𝑓𝑐′.𝑏. 𝑤𝑒𝑠 − − − − − 6
where βs, in accordance with Table 23.4.3[1] is a factor that accounts for the cracking
effect and possible transverse reinforcement existence. Values of βs are as follows:
βs = 1.0 for strut with uniform cross-section over its length
βs = 0.75 for sufficiently web-reinforced bottle-shaped strut
βs = 0.6λ for insufficiently web reinforced bottle-shaped strut, whereλ is a correction factor for
lightweight concrete
βs = 0.4 for struts in tension members
βs = 0.6λ for all other cases
The minimum web reinforcement ratios for both horizontal and vertical ones should be
0.0025 with the maximum spacing of d/5 and not more than 300mm [1].
Ali Mustafa Jalil, Mohammed j. Hamood, Khattab Saleem Abdul-Razzaq and Abbas H. Mohammed
http://iaeme.com/Home/journal/IJCIET 2755 [email protected]
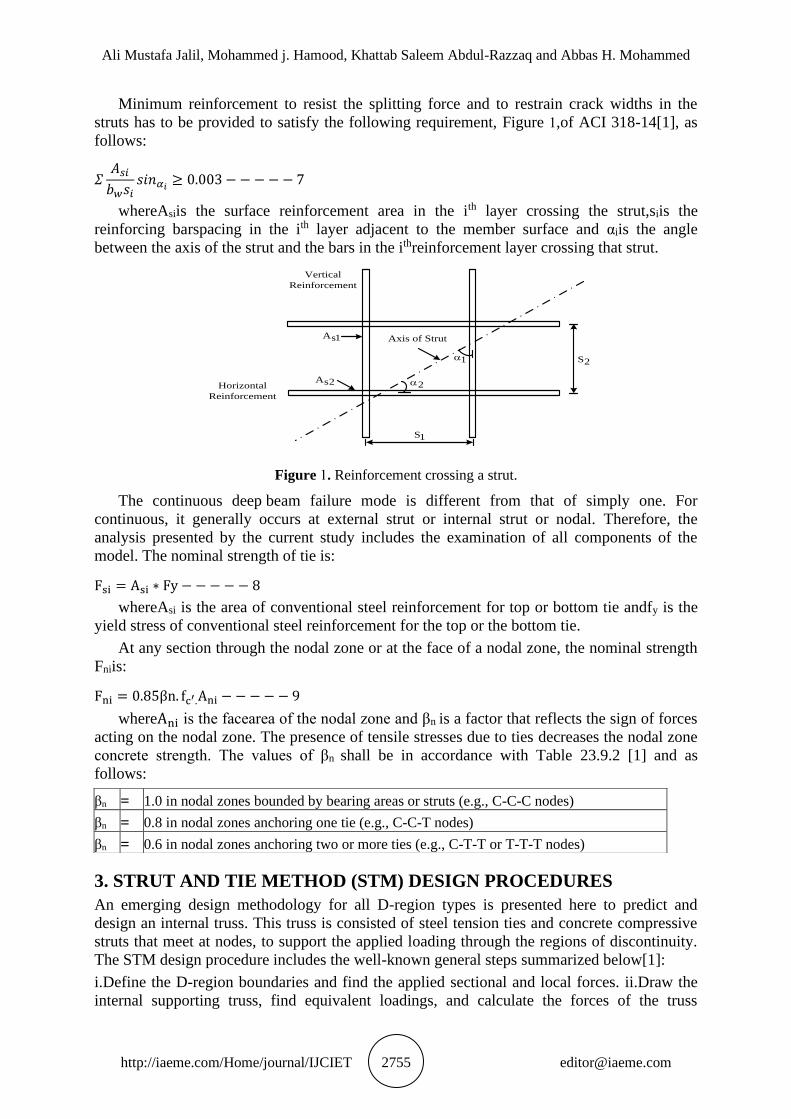
Minimum reinforcement to resist the splitting force and to restrain crack widths in the
struts has to be provided to satisfy the following requirement, Figure 1,of ACI 318-14[1], as
follows:
𝛴𝐴𝑠𝑖
𝑏𝑤𝑠𝑖𝑠𝑖𝑛𝛼𝑖
≥ 0.003 − − − − − 7
whereAsiis the surface reinforcement area in the ith layer crossing the strut,siis the
reinforcing barspacing in the ith layer adjacent to the member surface and αiis the angle
between the axis of the strut and the bars in the ithreinforcement layer crossing that strut.
2
Axis of Strut
1
1sA
2sA
2S
1S
Vertical
Reinforcement
Horizontal
Reinforcement
Figure 1. Reinforcement crossing a strut.
The continuous deep beam failure mode is different from that of simply one. For
continuous, it generally occurs at external strut or internal strut or nodal. Therefore, the
analysis presented by the current study includes the examination of all components of the
model. The nominal strength of tie is:
Fsi = Asi ∗ Fy − − − − − 8
whereAsi is the area of conventional steel reinforcement for top or bottom tie andfy is the
yield stress of conventional steel reinforcement for the top or the bottom tie.
At any section through the nodal zone or at the face of a nodal zone, the nominal strength
Fniis:
Fni = 0.85βn. fc′.Ani − − − − − 9
whereAni is the facearea of the nodal zone and βn is a factor that reflects the sign of forces
acting on the nodal zone. The presence of tensile stresses due to ties decreases the nodal zone
concrete strength. The values of βn shall be in accordance with Table 23.9.2 [1] and as
follows:
3. STRUT AND TIE METHOD (STM) DESIGN PROCEDURES
An emerging design methodology for all D-region types is presented here to predict and
design an internal truss. This truss is consisted of steel tension ties and concrete compressive
struts that meet at nodes, to support the applied loading through the regions of discontinuity.
The STM design procedure includes the well-known general steps summarized below[1]:
i.Define the D-region boundaries and find the applied sectional and local forces. ii.Draw the
internal supporting truss, find equivalent loadings, and calculate the forces of the truss
βn = 1.0 in nodal zones bounded by bearing areas or struts (e.g., C-C-C nodes)
βn = 0.8 in nodal zones anchoring one tie (e.g., C-C-T nodes)
βn = 0.6 in nodal zones anchoring two or more ties (e.g., C-T-T or T-T-T nodes)
Applying Different Decentralized Loadings on RC Continuous Deep Beams Using STM
http://iaeme.com/Home/journal/IJCIET 2756 [email protected]
member. iii. Choose the reinforcing steel to represent the required capacity of the tie and
guarantee that this tie reinforcement is adequately anchored in the nodal zone, i.e. joints of the
truss.
iv.Calculate the dimensions of the nodes and struts, such that the capacities of these nodes and
struts are adequateto carry the values of the design forces.
v. Select the reinforcement distribution to guarantee the D-region ductile behavior.
It is worth to mention that both non-hydrostatic and hydrostatic nodes are reallyidealized.
The use of either non-hydrostatic or hydrostatic nodes is an assumption; a design tool
proposed to present a direct method for STM proportioning. The classical method of node
dimensioning is by node shape arranging in a way that the applied stresses on all sides of the
node are equal. The stress biaxial state in the node is hydrostatic; so, the in-plane stresses are
homogeneous, isotropic, and equal to those on the node sides. Arranging the node in this
shape can be made by sizing the node boundaries in a way that they become proportional and
perpendicular to the forces that acting on them, i.e. hydrostatic [17]. In the case of
decentralized typeof loading, there is no symmetry in checking nodes, struts and tie, because
the truss formed by loading transferring from the applying to supporting nodes is not
symmetric too. In order to recognize designation of specimens easily, Table 1. demonstrates
the way of this designation.
4. APPLYING DIFFERENT TYPES OF DECENTRALIZED LOADS
4.1. One Decentralized Concentrated Force
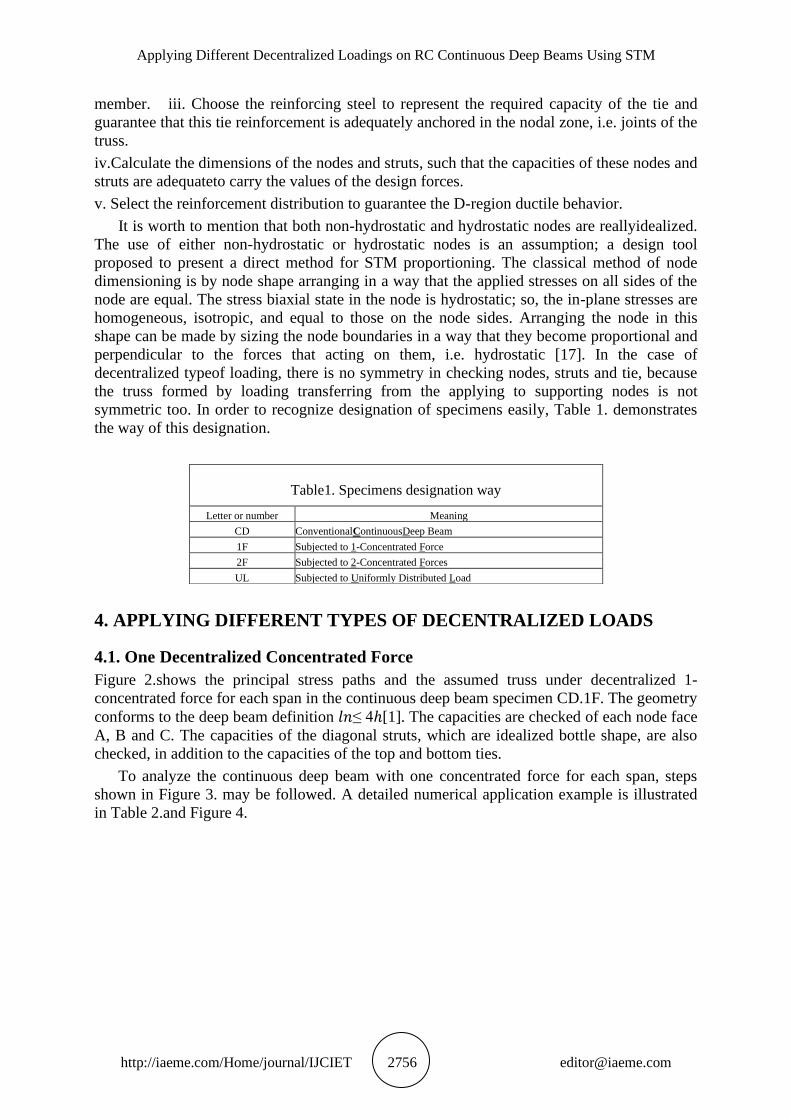
Figure 2.shows the principal stress paths and the assumed truss under decentralized 1-
concentrated force for each span in the continuous deep beam specimen CD.1F. The geometry
conforms to the deep beam definition 𝑙𝑛≤ 4ℎ[1]. The capacities are checked of each node face
A, B and C. The capacities of the diagonal struts, which are idealized bottle shape, are also
checked, in addition to the capacities of the top and bottom ties.
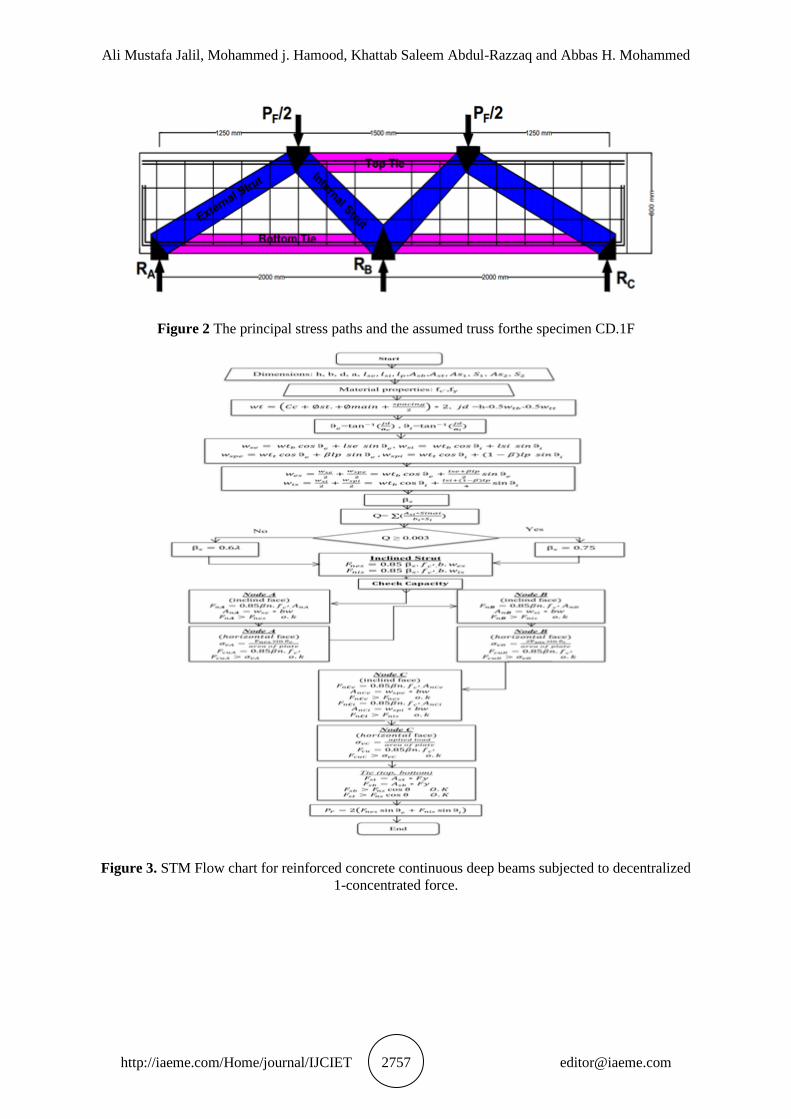
To analyze the continuous deep beam with one concentrated force for each span, steps
shown in Figure 3. may be followed. A detailed numerical application example is illustrated
in Table 2.and Figure 4.
Table1. Specimens designation way
Letter or number Meaning
CD ConventionalContinuousDeep Beam
1F Subjected to 1-Concentrated Force
2F Subjected to 2-Concentrated Forces
UL Subjected to Uniformly Distributed Load
Ali Mustafa Jalil, Mohammed j. Hamood, Khattab Saleem Abdul-Razzaq and Abbas H. Mohammed
http://iaeme.com/Home/journal/IJCIET 2757 [email protected]
Figure 2 The principal stress paths and the assumed truss forthe specimen CD.1F
Figure 3. STM Flow chart for reinforced concrete continuous deep beams subjected to decentralized
1-concentrated force.
Applying Different Decentralized Loadings on RC Continuous Deep Beams Using STM
http://iaeme.com/Home/journal/IJCIET 2758 [email protected]
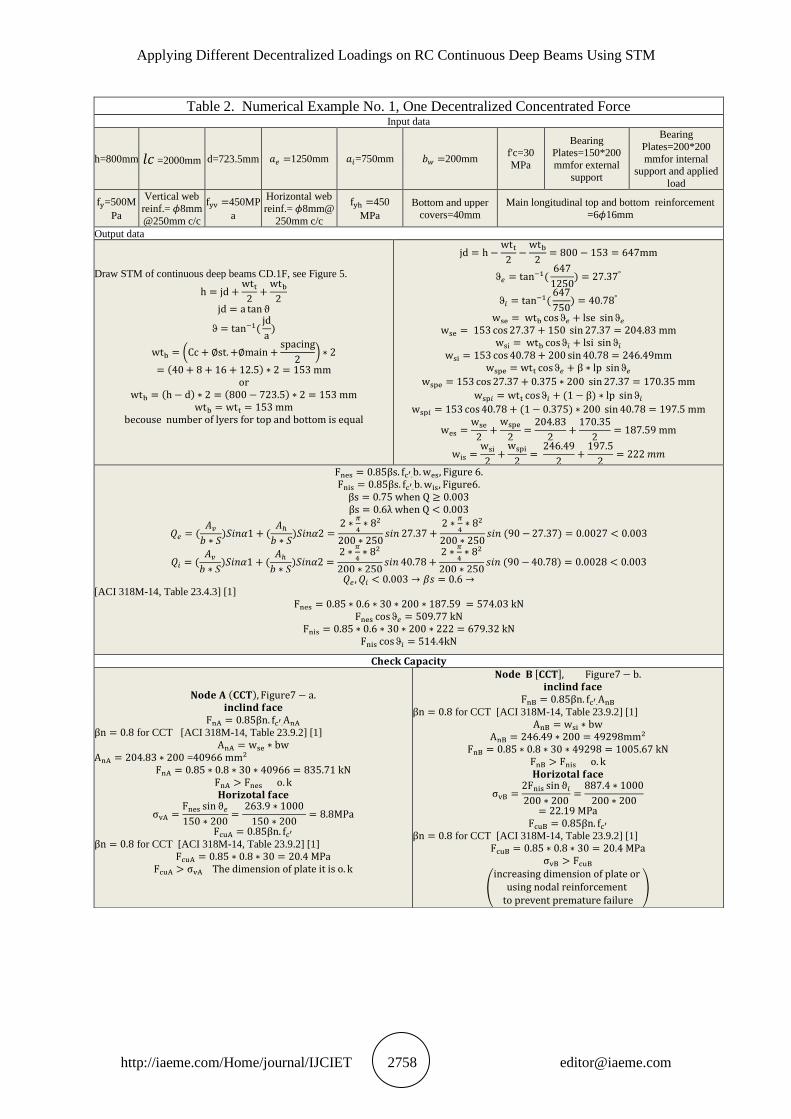
Table 2. Numerical Example No. 1, One Decentralized Concentrated Force Input data
h=800mm 𝑙𝑐 =2000mm d=723.5mm 𝑎𝑒 =1250mm 𝑎𝑖=750mm 𝑏𝑤 =200mm f'c=30
MPa
Bearing Plates=150*200
mmfor external
support
Bearing
Plates=200*200
mmfor internal support and applied
load
fy=500M
Pa
Vertical web
reinf.= 𝜙8mm
@250mm c/c
fyv =450MP
a
Horizontal web
reinf.= 𝜙8mm@
250mm c/c
fyh =450
MPa
Bottom and upper
covers=40mm
Main longitudinal top and bottom reinforcement
=6𝜙16mm
Output data
Draw STM of continuous deep beams CD.1F, see Figure 5.
h = jd +wtt
2+
wtb
2
jd = a tan ϑ
ϑ = tan−1(jd
a)
wtb = (Cc + ∅st. +∅main +spacing
2) ∗ 2
= (40 + 8 + 16 + 12.5) ∗ 2 = 153 mm
or
wtb = (h − d) ∗ 2 = (800 − 723.5) ∗ 2 = 153 mm
wtb = wtt = 153 mm
becouse number of lyers for top and bottom is equal
jd = h −wtt
2−
wtb
2= 800 − 153 = 647mm
ϑ𝑒 = tan−1(647
1250) = 27.37°
ϑ𝑖 = tan−1(647
750) = 40.78°
wse = wtb cos ϑ𝑒 + lse sin ϑ𝑒
wse = 153 cos 27.37 + 150 sin 27.37 = 204.83 mm
wsi = wtb cos ϑ𝑖 + lsi sin ϑ𝑖
wsi = 153 cos 40.78 + 200 sin 40.78 = 246.49mm
wspe = wtt cos ϑ𝑒 + β ∗ lp sin ϑ𝑒
wspe = 153 cos 27.37 + 0.375 ∗ 200 sin 27.37 = 170.35 mm
wsp𝑖 = wtt cos ϑ𝑖 + (1 − β) ∗ lp sin ϑ𝑖
wsp𝑖 = 153 cos 40.78 + (1 − 0.375) ∗ 200 sin 40.78 = 197.5 mm
wes =wse
2+
wspe
2=
204.83
2+
170.35
2= 187.59 mm
wis =wsi
2+
wspi
2=
246.49
2+
197.5
2= 222 𝑚𝑚
Fnes = 0.85βs. fc′.b. wes, Figure 6. Fnis = 0.85βs. fc′.b. wis, Figure6.
βs = 0.75 when Q ≥ 0.003
βs = 0.6λ when Q < 0.003
𝑄𝑒 = (𝐴𝑣
𝑏 ∗ 𝑆)𝑆𝑖𝑛𝛼1 + (
𝐴ℎ
𝑏 ∗ 𝑆)𝑆𝑖𝑛𝛼2 =
2 ∗𝜋
4∗ 82
200 ∗ 250𝑠𝑖𝑛 27.37 +
2 ∗𝜋
4∗ 82
200 ∗ 250𝑠𝑖𝑛 (90 − 27.37) = 0.0027 < 0.003
𝑄𝑖 = (𝐴𝑣
𝑏 ∗ 𝑆)𝑆𝑖𝑛𝛼1 + (
𝐴ℎ
𝑏 ∗ 𝑆)𝑆𝑖𝑛𝛼2 =
2 ∗𝜋
4∗ 82
200 ∗ 250𝑠𝑖𝑛 40.78 +
2 ∗𝜋
4∗ 82
200 ∗ 250𝑠𝑖𝑛 (90 − 40.78) = 0.0028 < 0.003
𝑄𝑒, 𝑄𝑖 < 0.003 → 𝛽𝑠 = 0.6 →
[ACI 318M-14, Table 23.4.3] [1]
Fnes = 0.85 ∗ 0.6 ∗ 30 ∗ 200 ∗ 187.59 = 574.03 kN
Fnes cos ϑ𝑒 = 509.77 kN
Fnis = 0.85 ∗ 0.6 ∗ 30 ∗ 200 ∗ 222 = 679.32 kN
Fnis cos ϑ𝑖 = 514.4kN
𝐂𝐡𝐞𝐜𝐤 𝐂𝐚𝐩𝐚𝐜𝐢𝐭𝐲
𝐍𝐨𝐝𝐞 𝐀 (𝐂𝐂𝐓), Figure7 − a. 𝐢𝐧𝐜𝐥𝐢𝐧𝐝 𝐟𝐚𝐜𝐞
FnA = 0.85βn. fc′.AnA
βn = 0.8 for CCT [ACI 318M-14, Table 23.9.2] [1]
AnA = wse ∗ bw
AnA = 204.83 ∗ 200 =40966 mm2
FnA = 0.85 ∗ 0.8 ∗ 30 ∗ 40966 = 835.71 kN
FnA > Fnes o. k
𝐇𝐨𝐫𝐢𝐳𝐨𝐭𝐚𝐥 𝐟𝐚𝐜𝐞
σvA =Fnes sin ϑ𝑒
150 ∗ 200=
263.9 ∗ 1000
150 ∗ 200= 8.8MPa
FcuA = 0.85βn. fc′
βn = 0.8 for CCT [ACI 318M-14, Table 23.9.2] [1]
FcuA = 0.85 ∗ 0.8 ∗ 30 = 20.4 MPa
FcuA > σvA The dimension of plate it is o. k
𝐍𝐨𝐝𝐞 𝐁 [𝐂𝐂𝐓], Figure7 − b. 𝐢𝐧𝐜𝐥𝐢𝐧𝐝 𝐟𝐚𝐜𝐞
FnB = 0.85βn. fc′.AnB
βn = 0.8 for CCT [ACI 318M-14, Table 23.9.2] [1]
AnB = wsi ∗ bw
AnB = 246.49 ∗ 200 = 49298mm2
FnB = 0.85 ∗ 0.8 ∗ 30 ∗ 49298 = 1005.67 kN
FnB > Fnis o. k
𝐇𝐨𝐫𝐢𝐳𝐨𝐭𝐚𝐥 𝐟𝐚𝐜𝐞
σvB =2Fnis sin ϑ𝑖
200 ∗ 200=
887.4 ∗ 1000
200 ∗ 200
= 22.19 MPa
FcuB = 0.85βn. fc′
βn = 0.8 for CCT [ACI 318M-14, Table 23.9.2] [1]
FcuB = 0.85 ∗ 0.8 ∗ 30 = 20.4 MPa
σvB > FcuB
(
increasing dimension of plate or using nodal reinforcement
to prevent premature failure)
Ali Mustafa Jalil, Mohammed j. Hamood, Khattab Saleem Abdul-Razzaq and Abbas H. Mohammed
http://iaeme.com/Home/journal/IJCIET 2759 [email protected]
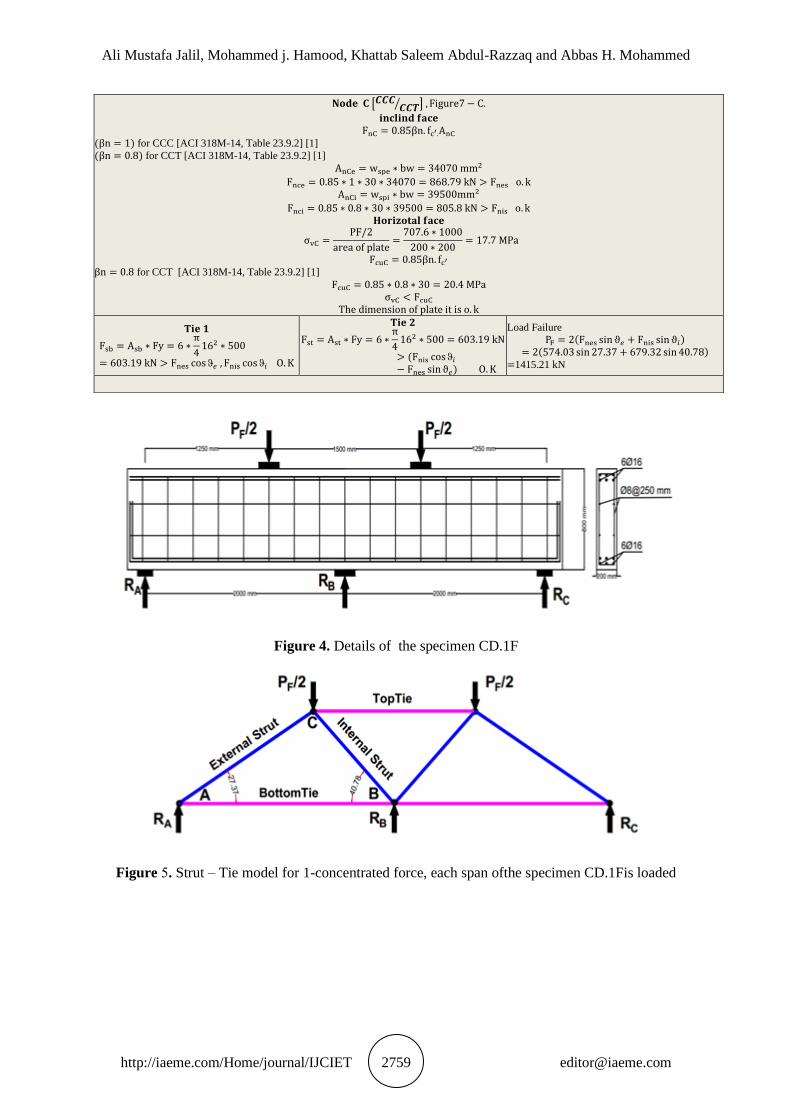
Figure 4. Details of the specimen CD.1F
Figure 5. Strut – Tie model for 1-concentrated force, each span ofthe specimen CD.1Fis loaded
𝐍𝐨𝐝𝐞 𝐂 [𝑪𝑪𝑪𝑪𝑪𝑻⁄ ] , Figure7 − C.
𝐢𝐧𝐜𝐥𝐢𝐧𝐝 𝐟𝐚𝐜𝐞
FnC = 0.85βn. fc′.AnC
(βn = 1) for CCC [ACI 318M-14, Table 23.9.2] [1]
(βn = 0.8) for CCT [ACI 318M-14, Table 23.9.2] [1]
AnCe = wspe ∗ bw = 34070 mm2
Fnce = 0.85 ∗ 1 ∗ 30 ∗ 34070 = 868.79 kN > Fnes o. k
AnCi = wspi ∗ bw = 39500mm2
Fnci = 0.85 ∗ 0.8 ∗ 30 ∗ 39500 = 805.8 kN > Fnis o. k
𝐇𝐨𝐫𝐢𝐳𝐨𝐭𝐚𝐥 𝐟𝐚𝐜𝐞
σvC =PF/2
area of plate=
707.6 ∗ 1000
200 ∗ 200= 17.7 MPa
FcuC = 0.85βn. fc′
βn = 0.8 for CCT [ACI 318M-14, Table 23.9.2] [1]
FcuC = 0.85 ∗ 0.8 ∗ 30 = 20.4 MPa
σvC < FcuC
The dimension of plate it is o. k
𝐓𝐢𝐞 𝟏
Fsb = Asb ∗ Fy = 6 ∗π
4162 ∗ 500
= 603.19 kN > Fnes cos ϑ𝑒 , Fnis cos ϑ𝑖 O. K
𝐓𝐢𝐞 𝟐
Fst = Ast ∗ Fy = 6 ∗π
4162 ∗ 500 = 603.19 kN
> (Fnis cos ϑ𝑖
− Fnes sin ϑ𝑒) O. K
Load Failure
PF = 2(Fnes sin ϑ𝑒 + Fnis sin ϑ𝑖)
= 2(574.03 sin 27.37 + 679.32 sin 40.78)
=1415.21 kN
Applying Different Decentralized Loadings on RC Continuous Deep Beams Using STM
http://iaeme.com/Home/journal/IJCIET 2760 [email protected]
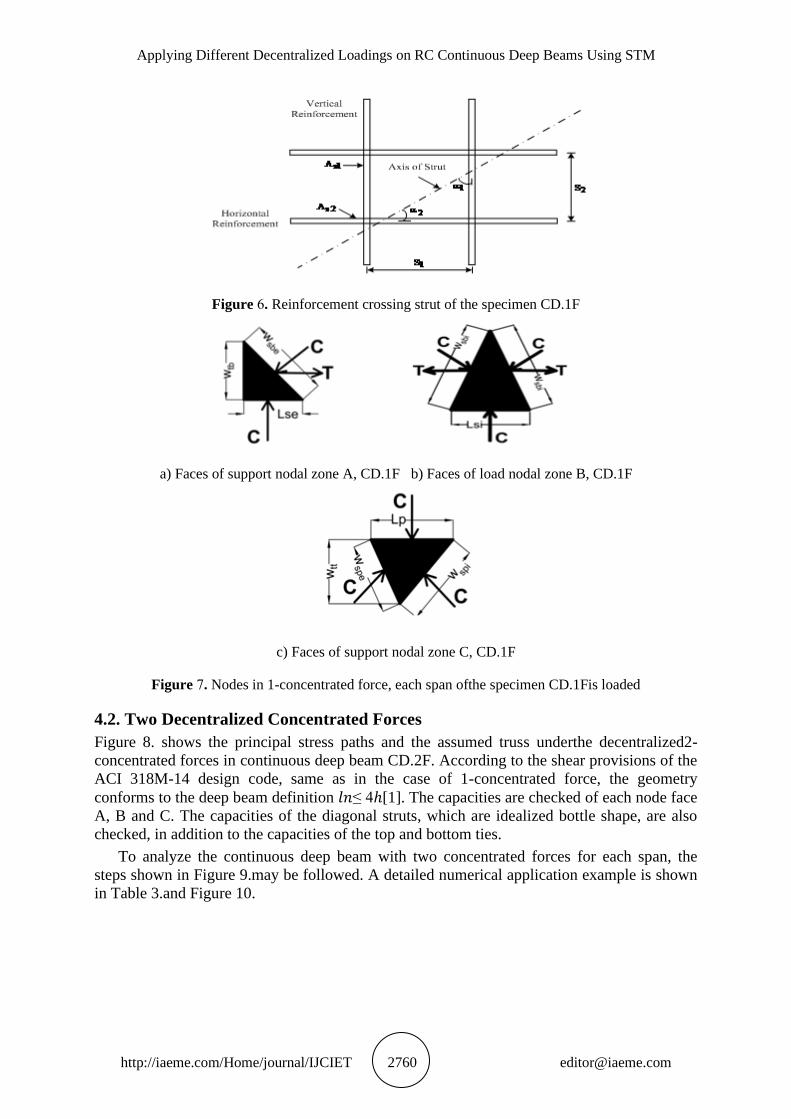
Figure 6. Reinforcement crossing strut of the specimen CD.1F
a) Faces of support nodal zone A, CD.1F b) Faces of load nodal zone B, CD.1F
c) Faces of support nodal zone C, CD.1F
Figure 7. Nodes in 1-concentrated force, each span ofthe specimen CD.1Fis loaded
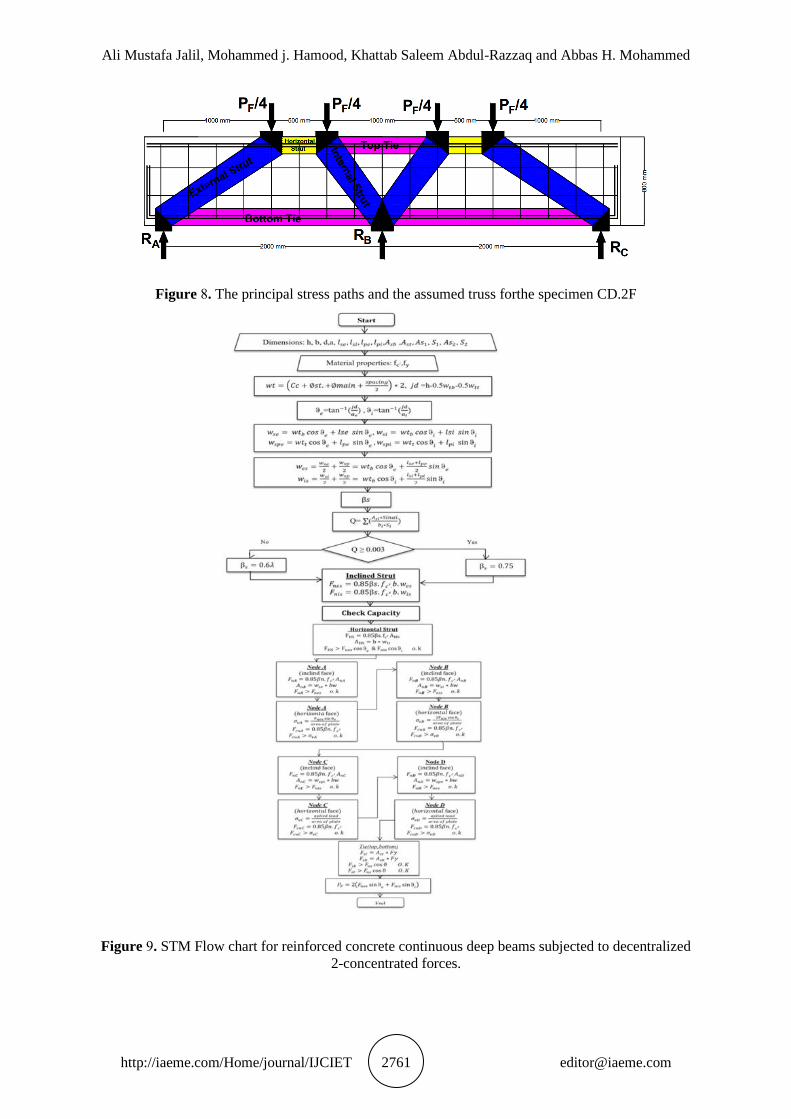
4.2. Two Decentralized Concentrated Forces
Figure 8. shows the principal stress paths and the assumed truss underthe decentralized2-
concentrated forces in continuous deep beam CD.2F. According to the shear provisions of the
ACI 318M-14 design code, same as in the case of 1-concentrated force, the geometry
conforms to the deep beam definition 𝑙𝑛≤ 4ℎ[1]. The capacities are checked of each node face
A, B and C. The capacities of the diagonal struts, which are idealized bottle shape, are also
checked, in addition to the capacities of the top and bottom ties.
To analyze the continuous deep beam with two concentrated forces for each span, the
steps shown in Figure 9.may be followed. A detailed numerical application example is shown
in Table 3.and Figure 10.
Ali Mustafa Jalil, Mohammed j. Hamood, Khattab Saleem Abdul-Razzaq and Abbas H. Mohammed
http://iaeme.com/Home/journal/IJCIET 2761 [email protected]
Figure 8. The principal stress paths and the assumed truss forthe specimen CD.2F
Figure 9. STM Flow chart for reinforced concrete continuous deep beams subjected to decentralized
2-concentrated forces.
Applying Different Decentralized Loadings on RC Continuous Deep Beams Using STM
http://iaeme.com/Home/journal/IJCIET 2762 [email protected]
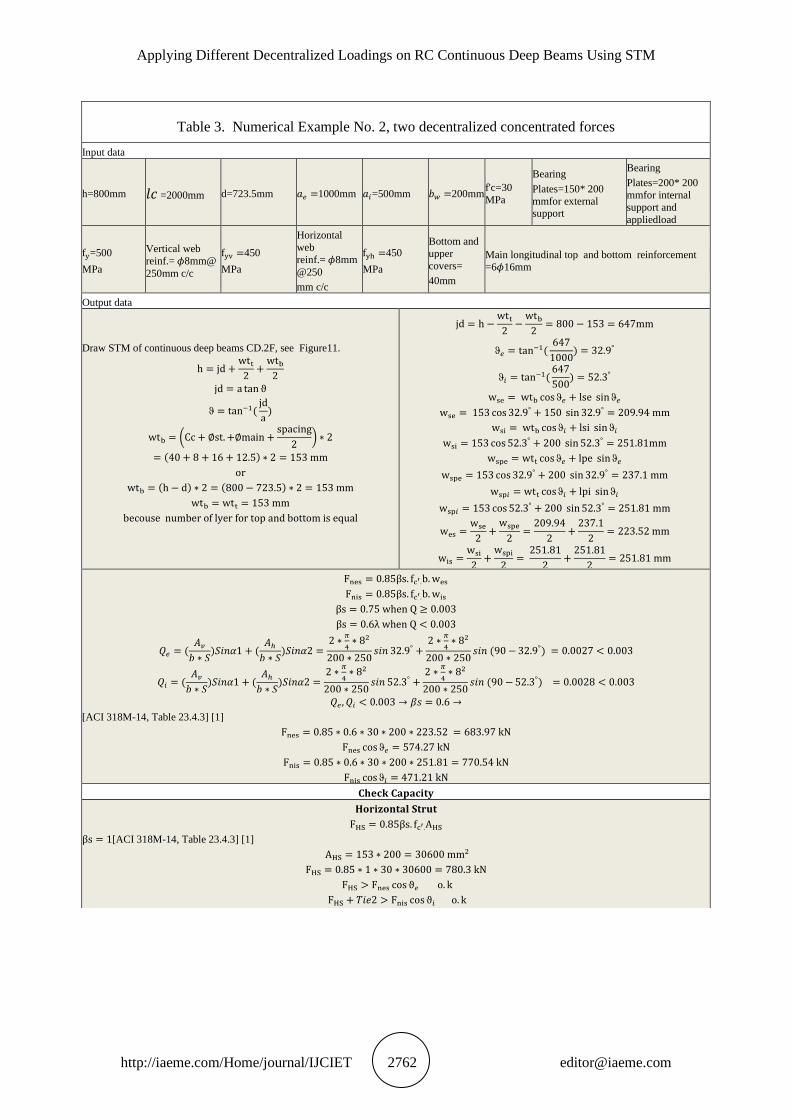
Table 3. Numerical Example No. 2, two decentralized concentrated forces
Input data
h=800mm 𝑙𝑐 =2000mm d=723.5mm 𝑎𝑒 =1000mm 𝑎𝑖=500mm 𝑏𝑤 =200mm f'c=30
MPa
Bearing
Plates=150* 200
mmfor external support
Bearing
Plates=200* 200
mmfor internal
support and
appliedload
fy=500
MPa
Vertical web
reinf.= 𝜙8mm@
250mm c/c
fyv =450
MPa
Horizontal
web
reinf.= 𝜙8mm
@250
mm c/c
fyh =450
MPa
Bottom and
upper
covers=
40mm
Main longitudinal top and bottom reinforcement
=6𝜙16mm
Output data
Draw STM of continuous deep beams CD.2F, see Figure11.
h = jd +wtt
2+
wtb
2
jd = a tan ϑ
ϑ = tan−1(jd
a)
wtb = (Cc + ∅st. +∅main +spacing
2) ∗ 2
= (40 + 8 + 16 + 12.5) ∗ 2 = 153 mm
or
wtb = (h − d) ∗ 2 = (800 − 723.5) ∗ 2 = 153 mm
wtb = wtt = 153 mm
becouse number of lyer for top and bottom is equal
jd = h −wtt
2−
wtb
2= 800 − 153 = 647mm
ϑ𝑒 = tan−1(647
1000) = 32.9°
ϑ𝑖 = tan−1(647
500) = 52.3°
wse = wtb cos ϑ𝑒 + lse sin ϑ𝑒
wse = 153 cos 32.9° + 150 sin 32.9° = 209.94 mm
wsi = wtb cos ϑ𝑖 + lsi sin ϑ𝑖
wsi = 153 cos 52.3° + 200 sin 52.3° = 251.81mm
wspe = wtt cos ϑ𝑒 + lpe sin ϑ𝑒
wspe = 153 cos 32.9° + 200 sin 32.9° = 237.1 mm
wsp𝑖 = wtt cos ϑ𝑖 + lpi sin ϑ𝑖
wsp𝑖 = 153 cos 52.3° + 200 sin 52.3° = 251.81 mm
wes =wse
2+
wspe
2=
209.94
2+
237.1
2= 223.52 mm
wis =wsi
2+
wspi
2=
251.81
2+
251.81
2= 251.81 mm
Fnes = 0.85βs. fc′.b. wes
Fnis = 0.85βs. fc′.b. wis
βs = 0.75 when Q ≥ 0.003
βs = 0.6λ when Q < 0.003
𝑄𝑒 = (𝐴𝑣
𝑏 ∗ 𝑆)𝑆𝑖𝑛𝛼1 + (
𝐴ℎ
𝑏 ∗ 𝑆)𝑆𝑖𝑛𝛼2 =
2 ∗𝜋
4∗ 82
200 ∗ 250𝑠𝑖𝑛 32.9° +
2 ∗𝜋
4∗ 82
200 ∗ 250𝑠𝑖𝑛 (90 − 32.9°) = 0.0027 < 0.003
𝑄𝑖 = (𝐴𝑣
𝑏 ∗ 𝑆)𝑆𝑖𝑛𝛼1 + (
𝐴ℎ
𝑏 ∗ 𝑆)𝑆𝑖𝑛𝛼2 =
2 ∗𝜋
4∗ 82
200 ∗ 250𝑠𝑖𝑛 52.3° +
2 ∗𝜋
4∗ 82
200 ∗ 250𝑠𝑖𝑛 (90 − 52.3°) = 0.0028 < 0.003
𝑄𝑒, 𝑄𝑖 < 0.003 → 𝛽𝑠 = 0.6 →
[ACI 318M-14, Table 23.4.3] [1]
Fnes = 0.85 ∗ 0.6 ∗ 30 ∗ 200 ∗ 223.52 = 683.97 kN
Fnes cos ϑ𝑒 = 574.27 kN
Fnis = 0.85 ∗ 0.6 ∗ 30 ∗ 200 ∗ 251.81 = 770.54 kN
Fnis cos ϑ𝑖 = 471.21 kN
𝐂𝐡𝐞𝐜𝐤 𝐂𝐚𝐩𝐚𝐜𝐢𝐭𝐲
𝐇𝐨𝐫𝐢𝐳𝐨𝐧𝐭𝐚𝐥 𝐒𝐭𝐫𝐮𝐭
FHS = 0.85βs. fc′.AHS
βs = 1[ACI 318M-14, Table 23.4.3] [1]
AHS = 153 ∗ 200 = 30600 mm2
FHS = 0.85 ∗ 1 ∗ 30 ∗ 30600 = 780.3 kN
FHS > Fnes cos ϑ𝑒 o. k
FHS + 𝑇𝑖𝑒2 > Fnis cos ϑ𝑖 o. k
Ali Mustafa Jalil, Mohammed j. Hamood, Khattab Saleem Abdul-Razzaq and Abbas H. Mohammed
http://iaeme.com/Home/journal/IJCIET 2763 [email protected]
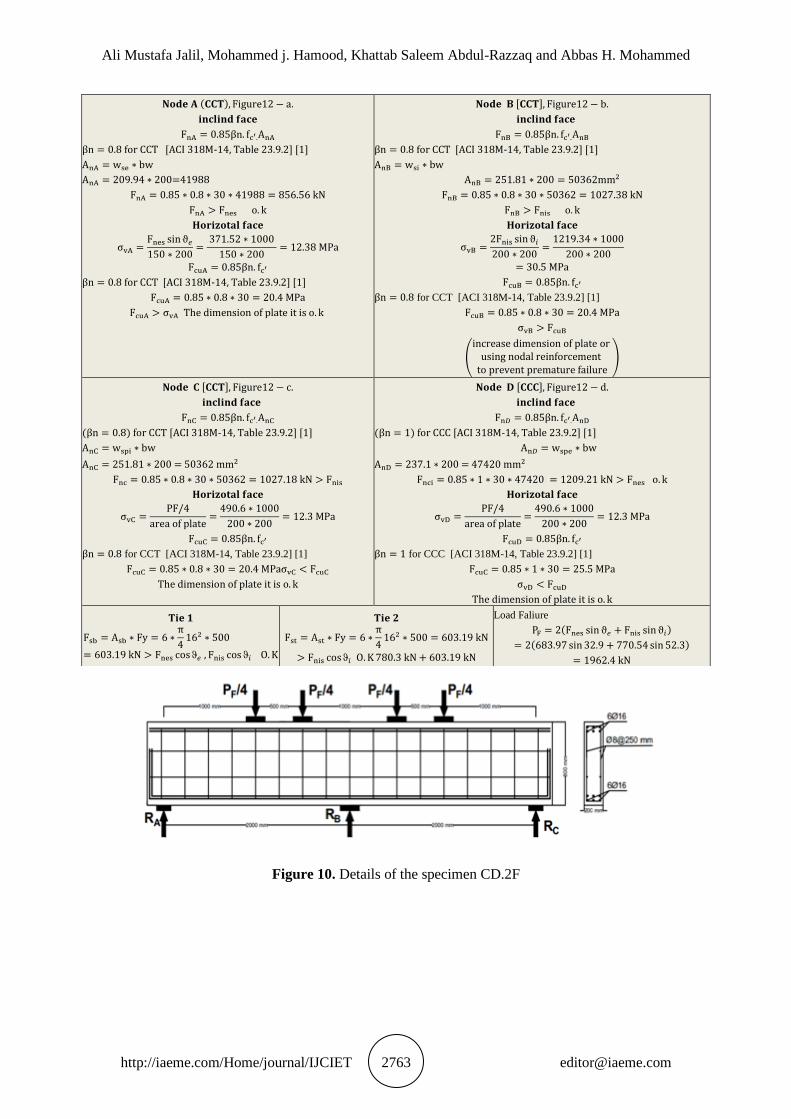
Figure 10. Details of the specimen CD.2F
𝐍𝐨𝐝𝐞 𝐀 (𝐂𝐂𝐓), Figure12 − a.
𝐢𝐧𝐜𝐥𝐢𝐧𝐝 𝐟𝐚𝐜𝐞
FnA = 0.85βn. fc′.AnA
βn = 0.8 for CCT [ACI 318M-14, Table 23.9.2] [1]
AnA = wse ∗ bw
AnA = 209.94 ∗ 200=41988
FnA = 0.85 ∗ 0.8 ∗ 30 ∗ 41988 = 856.56 kN
FnA > Fnes o. k
𝐇𝐨𝐫𝐢𝐳𝐨𝐭𝐚𝐥 𝐟𝐚𝐜𝐞
σvA =Fnes sin ϑ𝑒
150 ∗ 200=
371.52 ∗ 1000
150 ∗ 200= 12.38 MPa
FcuA = 0.85βn. fc′
βn = 0.8 for CCT [ACI 318M-14, Table 23.9.2] [1]
FcuA = 0.85 ∗ 0.8 ∗ 30 = 20.4 MPa
FcuA > σvA The dimension of plate it is o. k
𝐍𝐨𝐝𝐞 𝐁 [𝐂𝐂𝐓], Figure12 − b.
𝐢𝐧𝐜𝐥𝐢𝐧𝐝 𝐟𝐚𝐜𝐞
FnB = 0.85βn. fc′.AnB
βn = 0.8 for CCT [ACI 318M-14, Table 23.9.2] [1]
AnB = wsi ∗ bw
AnB = 251.81 ∗ 200 = 50362mm2
FnB = 0.85 ∗ 0.8 ∗ 30 ∗ 50362 = 1027.38 kN
FnB > Fnis o. k
𝐇𝐨𝐫𝐢𝐳𝐨𝐭𝐚𝐥 𝐟𝐚𝐜𝐞
σvB =2Fnis sin ϑ𝑖
200 ∗ 200=
1219.34 ∗ 1000
200 ∗ 200
= 30.5 MPa
FcuB = 0.85βn. fc′
βn = 0.8 for CCT [ACI 318M-14, Table 23.9.2] [1]
FcuB = 0.85 ∗ 0.8 ∗ 30 = 20.4 MPa
σvB > FcuB
(
increase dimension of plate or using nodal reinforcement
to prevent premature failure)
𝐍𝐨𝐝𝐞 𝐂 [𝐂𝐂𝐓], Figure12 − c.
𝐢𝐧𝐜𝐥𝐢𝐧𝐝 𝐟𝐚𝐜𝐞
FnC = 0.85βn. fc′.AnC
(βn = 0.8) for CCT [ACI 318M-14, Table 23.9.2] [1]
AnC = wspi ∗ bw
AnC = 251.81 ∗ 200 = 50362 mm2
Fnc = 0.85 ∗ 0.8 ∗ 30 ∗ 50362 = 1027.18 kN > Fnis
𝐇𝐨𝐫𝐢𝐳𝐨𝐭𝐚𝐥 𝐟𝐚𝐜𝐞
σvC =PF/4
area of plate=
490.6 ∗ 1000
200 ∗ 200= 12.3 MPa
FcuC = 0.85βn. fc′
βn = 0.8 for CCT [ACI 318M-14, Table 23.9.2] [1]
FcuC = 0.85 ∗ 0.8 ∗ 30 = 20.4 MPaσvC < FcuC
The dimension of plate it is o. k
𝐍𝐨𝐝𝐞 𝐃 [𝐂𝐂𝐂], Figure12 − d.
𝐢𝐧𝐜𝐥𝐢𝐧𝐝 𝐟𝐚𝐜𝐞
Fn𝐷 = 0.85βn. fc′.AnD
(βn = 1) for CCC [ACI 318M-14, Table 23.9.2] [1]
An𝐷 = wspe ∗ bw
AnD = 237.1 ∗ 200 = 47420 mm2
Fnci = 0.85 ∗ 1 ∗ 30 ∗ 47420 = 1209.21 kN > Fnes o. k
𝐇𝐨𝐫𝐢𝐳𝐨𝐭𝐚𝐥 𝐟𝐚𝐜𝐞
σvD =PF/4
area of plate=
490.6 ∗ 1000
200 ∗ 200= 12.3 MPa
FcuD = 0.85βn. fc′
βn = 1 for CCC [ACI 318M-14, Table 23.9.2] [1]
FcuC = 0.85 ∗ 1 ∗ 30 = 25.5 MPa
σvD < FcuD
The dimension of plate it is o. k
𝐓𝐢𝐞 𝟏
Fsb = Asb ∗ Fy = 6 ∗π
4162 ∗ 500
= 603.19 kN > Fnes cos ϑ𝑒 , Fnis cos ϑ𝑖 O. K
𝐓𝐢𝐞 𝟐
Fst = Ast ∗ Fy = 6 ∗π
4162 ∗ 500 = 603.19 kN
> Fnis cos ϑ𝑖 O. K 780.3 kN + 603.19 kN
Load Faliure
PF = 2(Fnes sin ϑ𝑒 + Fnis sin ϑ𝑖)
= 2(683.97 sin 32.9 + 770.54 sin 52.3)
= 1962.4 kN
Applying Different Decentralized Loadings on RC Continuous Deep Beams Using STM
http://iaeme.com/Home/journal/IJCIET 2764 [email protected]
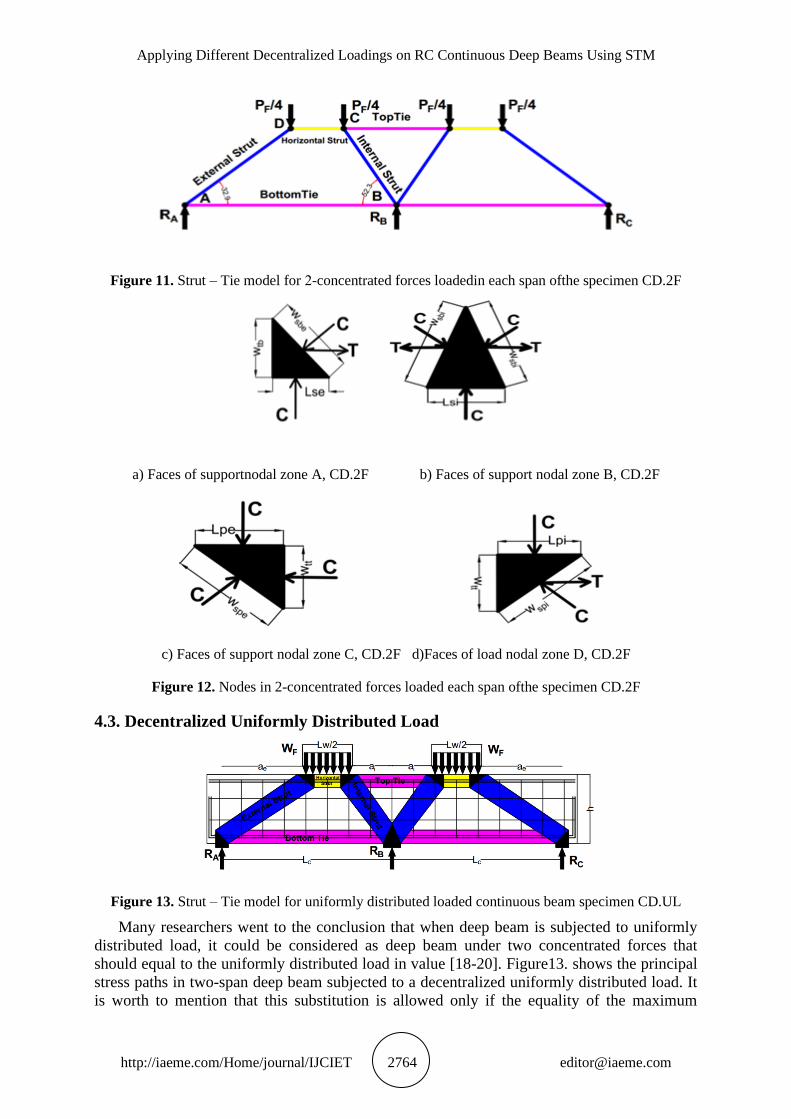
Figure 11. Strut – Tie model for 2-concentrated forces loadedin each span ofthe specimen CD.2F
a) Faces of supportnodal zone A, CD.2F b) Faces of support nodal zone B, CD.2F
c) Faces of support nodal zone C, CD.2F d)Faces of load nodal zone D, CD.2F
Figure 12. Nodes in 2-concentrated forces loaded each span ofthe specimen CD.2F
4.3. Decentralized Uniformly Distributed Load
Figure 13. Strut – Tie model for uniformly distributed loaded continuous beam specimen CD.UL
Many researchers went to the conclusion that when deep beam is subjected to uniformly
distributed load, it could be considered as deep beam under two concentrated forces that
should equal to the uniformly distributed load in value [18-20]. Figure13. shows the principal
stress paths in two-span deep beam subjected to a decentralized uniformly distributed load. It
is worth to mention that this substitution is allowed only if the equality of the maximum
Ali Mustafa Jalil, Mohammed j. Hamood, Khattab Saleem Abdul-Razzaq and Abbas H. Mohammed
http://iaeme.com/Home/journal/IJCIET 2765 [email protected]
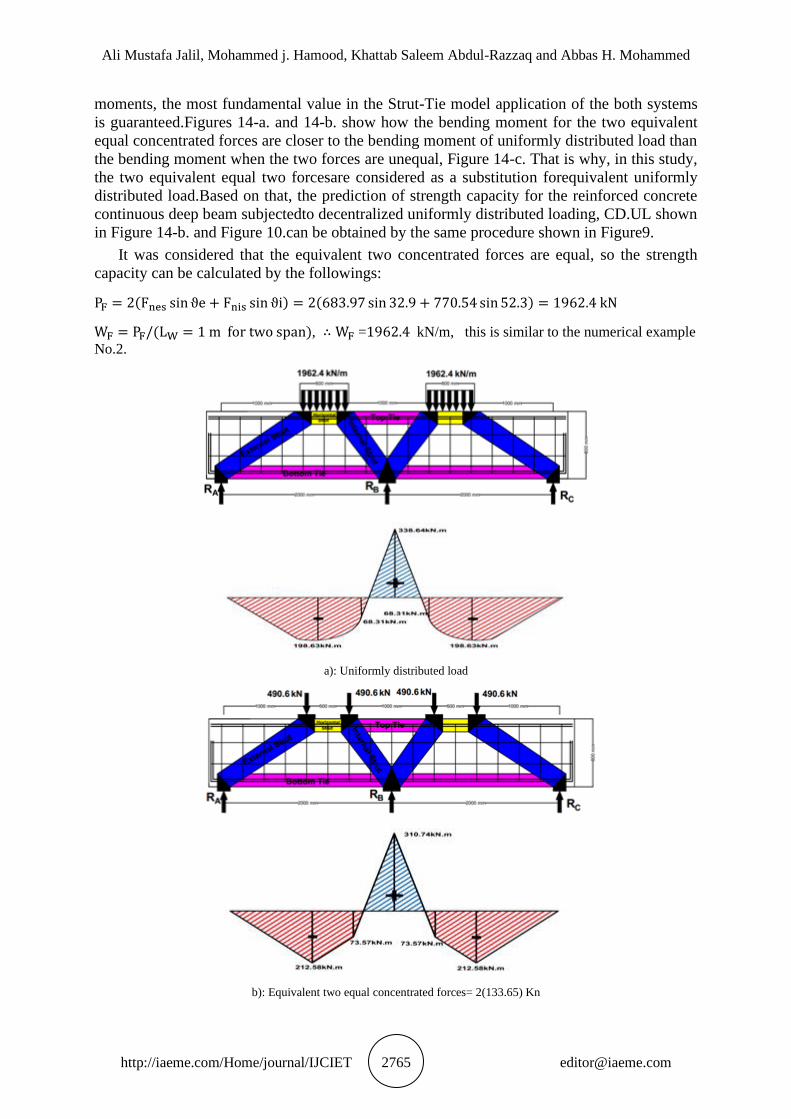
moments, the most fundamental value in the Strut-Tie model application of the both systems
is guaranteed.Figures 14-a. and 14-b. show how the bending moment for the two equivalent
equal concentrated forces are closer to the bending moment of uniformly distributed load than
the bending moment when the two forces are unequal, Figure 14-c. That is why, in this study,
the two equivalent equal two forcesare considered as a substitution forequivalent uniformly
distributed load.Based on that, the prediction of strength capacity for the reinforced concrete
continuous deep beam subjectedto decentralized uniformly distributed loading, CD.UL shown
in Figure 14-b. and Figure 10.can be obtained by the same procedure shown in Figure9.
It was considered that the equivalent two concentrated forces are equal, so the strength
capacity can be calculated by the followings:
PF = 2(Fnes sin ϑe + Fnis sin ϑi) = 2(683.97 sin 32.9 + 770.54 sin 52.3) = 1962.4 kN
WF = PF/(LW = 1 m for two span), ∴ WF =1962.4 kN/m, this is similar to the numerical example
No.2.
a): Uniformly distributed load
b): Equivalent two equal concentrated forces= 2(133.65) Kn
Applying Different Decentralized Loadings on RC Continuous Deep Beams Using STM
http://iaeme.com/Home/journal/IJCIET 2766 [email protected]
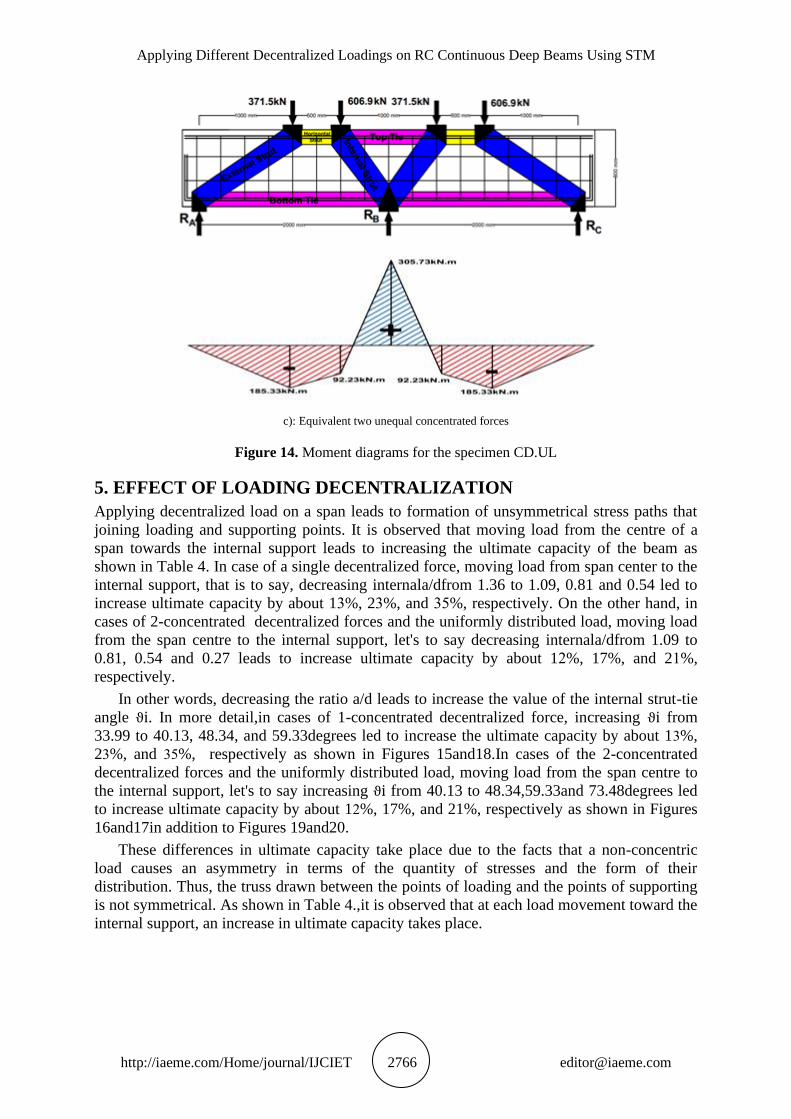
c): Equivalent two unequal concentrated forces
Figure 14. Moment diagrams for the specimen CD.UL
5. EFFECT OF LOADING DECENTRALIZATION
Applying decentralized load on a span leads to formation of unsymmetrical stress paths that
joining loading and supporting points. It is observed that moving load from the centre of a
span towards the internal support leads to increasing the ultimate capacity of the beam as
shown in Table 4. In case of a single decentralized force, moving load from span center to the
internal support, that is to say, decreasing internala/dfrom 1.36 to 1.09, 0.81 and 0.54 led to
increase ultimate capacity by about 13%, 23%, and 35%, respectively. On the other hand, in
cases of 2-concentrated decentralized forces and the uniformly distributed load, moving load
from the span centre to the internal support, let's to say decreasing internala/dfrom 1.09 to
0.81, 0.54 and 0.27 leads to increase ultimate capacity by about 12%, 17%, and 21%,
respectively.
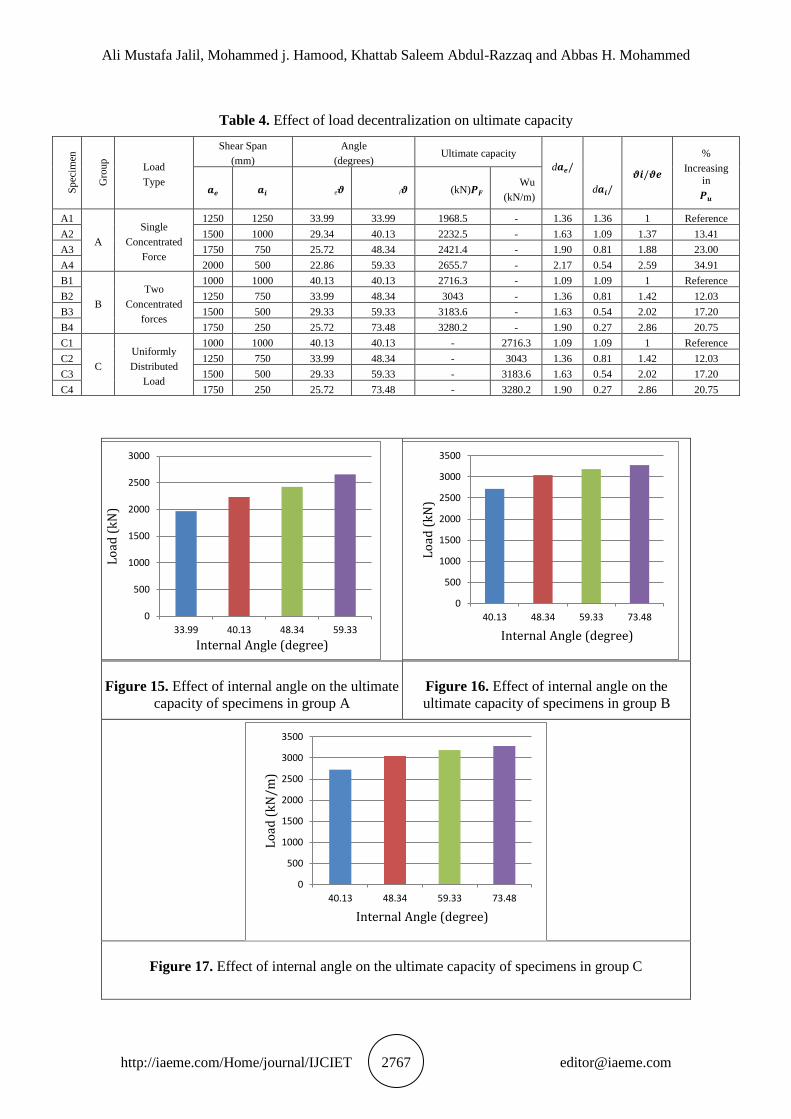
In other words, decreasing the ratio a/d leads to increase the value of the internal strut-tie
angle ϑi. In more detail,in cases of 1-concentrated decentralized force, increasing ϑi from
33.99 to 40.13, 48.34, and 59.33degrees led to increase the ultimate capacity by about 13%,
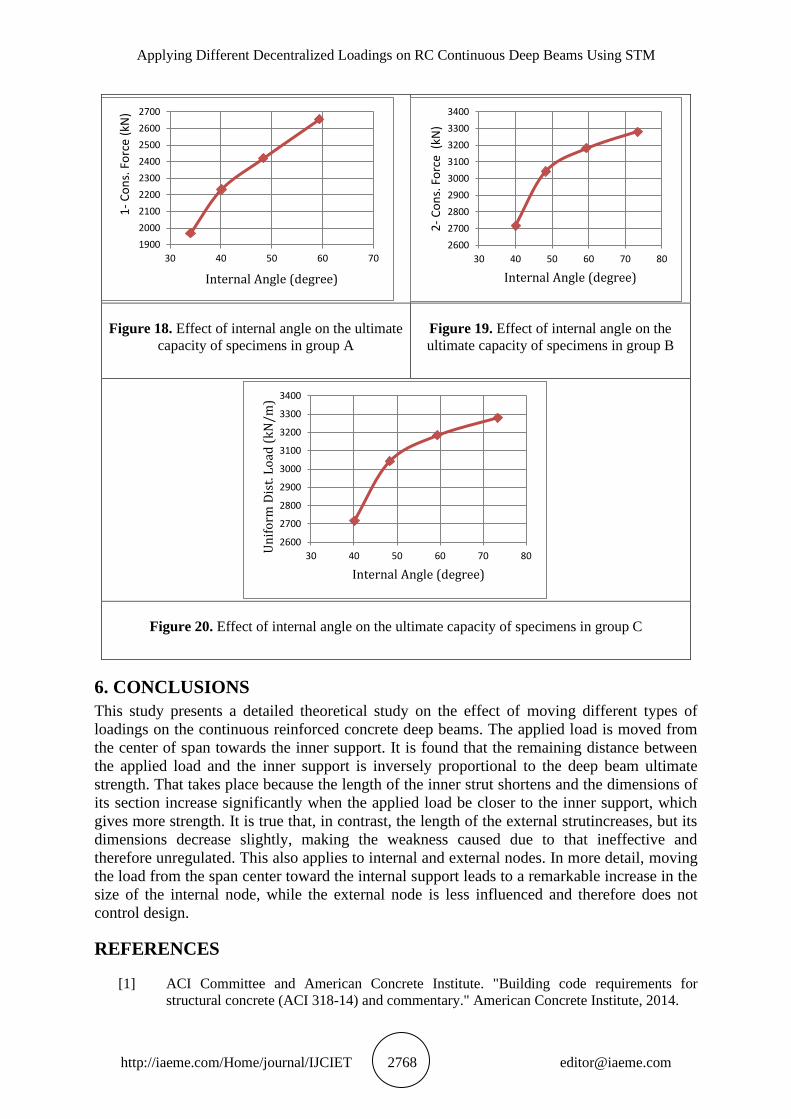
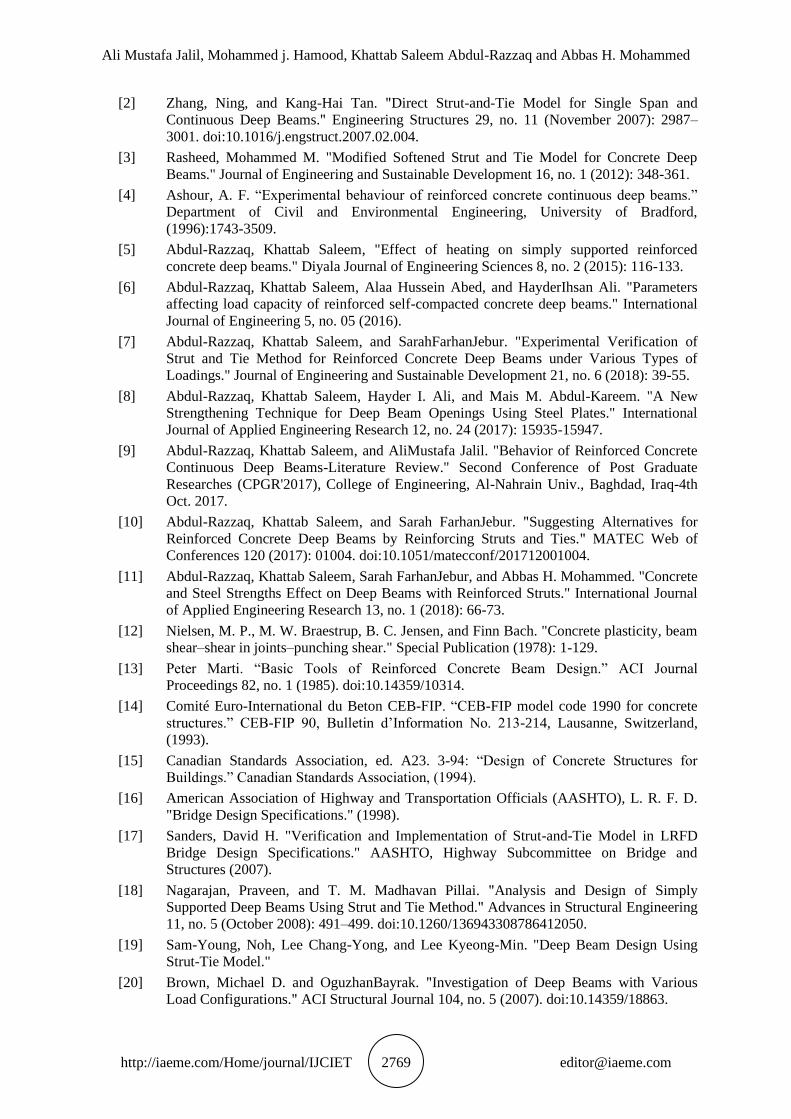
23%, and 35%, respectively as shown in Figures 15and18.In cases of the 2-concentrated
decentralized forces and the uniformly distributed load, moving load from the span centre to
the internal support, let's to say increasing ϑi from 40.13 to 48.34,59.33and 73.48degrees led
to increase ultimate capacity by about 12%, 17%, and 21%, respectively as shown in Figures
16and17in addition to Figures 19and20.
These differences in ultimate capacity take place due to the facts that a non-concentric
load causes an asymmetry in terms of the quantity of stresses and the form of their
distribution. Thus, the truss drawn between the points of loading and the points of supporting
is not symmetrical. As shown in Table 4.,it is observed that at each load movement toward the
internal support, an increase in ultimate capacity takes place.
Ali Mustafa Jalil, Mohammed j. Hamood, Khattab Saleem Abdul-Razzaq and Abbas H. Mohammed
http://iaeme.com/Home/journal/IJCIET 2767 [email protected]
Figure 16. Effect of internal angle on the
ultimate capacity of specimens in group B
Figure 15. Effect of internal angle on the ultimate
capacity of specimens in group A
Figure 17. Effect of internal angle on the ultimate capacity of specimens in group C
0
500
1000
1500
2000
2500
3000
3500
40.13 48.34 59.33 73.48
Lo
ad (
kN
)
Internal Angle (degree)
0
500
1000
1500
2000
2500
3000
33.99 40.13 48.34 59.33
Lo
ad (
kN
)
Internal Angle (degree)
0
500
1000
1500
2000
2500
3000
3500
40.13 48.34 59.33 73.48
Lo
ad (
kN
/m)
Internal Angle (degree)
Table 4. Effect of load decentralization on ultimate capacity
Sp
ecim
en
Gro
up
Load
Type
Shear Span
(mm)
Angle
(degrees) Ultimate capacity
𝒂𝒆/d
𝒂𝒊/d
𝝑𝒊/𝝑𝒆
%
Increasing
in
𝑷𝒖 𝒂𝒆 𝒂𝒊 𝝑e 𝝑i 𝑷𝑭(kN)
Wu
(kN/m)
A1
A
Single
Concentrated
Force
1250 1250 33.99 33.99 1968.5 - 1.36 1.36 1 Reference
A2 1500 1000 29.34 40.13 2232.5 - 1.63 1.09 1.37 13.41
A3 1750 750 25.72 48.34 2421.4 - 1.90 0.81 1.88 23.00
A4 2000 500 22.86 59.33 2655.7 - 2.17 0.54 2.59 34.91
B1
B
Two
Concentrated
forces
1000 1000 40.13 40.13 2716.3 - 1.09 1.09 1 Reference
B2 1250 750 33.99 48.34 3043 - 1.36 0.81 1.42 12.03
B3 1500 500 29.33 59.33 3183.6 - 1.63 0.54 2.02 17.20
B4 1750 250 25.72 73.48 3280.2 - 1.90 0.27 2.86 20.75
C1
C
Uniformly
Distributed
Load
1000 1000 40.13 40.13 - 2716.3 1.09 1.09 1 Reference
C2 1250 750 33.99 48.34 - 3043 1.36 0.81 1.42 12.03
C3 1500 500 29.33 59.33 - 3183.6 1.63 0.54 2.02 17.20
C4 1750 250 25.72 73.48 - 3280.2 1.90 0.27 2.86 20.75
Applying Different Decentralized Loadings on RC Continuous Deep Beams Using STM
http://iaeme.com/Home/journal/IJCIET 2768 [email protected]
Figure 19. Effect of internal angle on the
ultimate capacity of specimens in group B
Figure 18. Effect of internal angle on the ultimate
capacity of specimens in group A
Figure 20. Effect of internal angle on the ultimate capacity of specimens in group C
6. CONCLUSIONS
This study presents a detailed theoretical study on the effect of moving different types of
loadings on the continuous reinforced concrete deep beams. The applied load is moved from
the center of span towards the inner support. It is found that the remaining distance between
the applied load and the inner support is inversely proportional to the deep beam ultimate
strength. That takes place because the length of the inner strut shortens and the dimensions of
its section increase significantly when the applied load be closer to the inner support, which
gives more strength. It is true that, in contrast, the length of the external strutincreases, but its
dimensions decrease slightly, making the weakness caused due to that ineffective and
therefore unregulated. This also applies to internal and external nodes. In more detail, moving
the load from the span center toward the internal support leads to a remarkable increase in the
size of the internal node, while the external node is less influenced and therefore does not
control design.
REFERENCES
[1] ACI Committee and American Concrete Institute. "Building code requirements for
structural concrete (ACI 318-14) and commentary." American Concrete Institute, 2014.
2600
2700
2800
2900
3000
3100
3200
3300
3400
30 40 50 60 70 80
2-
Co
ns.
Fo
rce
(kN
)
Internal Angle (degree)
1900
2000
2100
2200
2300
2400
2500
2600
2700
30 40 50 60 70
1-
Co
ns.
Fo
rce
(kN
)
Internal Angle (degree)
2600
2700
2800
2900
3000
3100
3200
3300
3400
30 40 50 60 70 80
Un
ifo
rm D
ist.
Lo
ad (
kN
/m)
Internal Angle (degree)
Ali Mustafa Jalil, Mohammed j. Hamood, Khattab Saleem Abdul-Razzaq and Abbas H. Mohammed
http://iaeme.com/Home/journal/IJCIET 2769 [email protected]
[2] Zhang, Ning, and Kang-Hai Tan. "Direct Strut-and-Tie Model for Single Span and
Continuous Deep Beams. " Engineering Structures 29, no. 11 (November 2007): 2987–
3001. doi:10.1016/j.engstruct.2007.02.004.
[3] Rasheed, Mohammed M. "Modified Softened Strut and Tie Model for Concrete Deep
Beams." Journal of Engineering and Sustainable Development 16, no. 1 (2012): 348-361.
[4] Ashour, A. F. “Experimental behaviour of reinforced concrete continuous deep beams.”
Department of Civil and Environmental Engineering, University of Bradford,
(1996):1743-3509.
[5] Abdul-Razzaq, Khattab Saleem, "Effect of heating on simply supported reinforced
concrete deep beams." Diyala Journal of Engineering Sciences 8, no. 2 (2015): 116-133.
[6] Abdul-Razzaq, Khattab Saleem, Alaa Hussein Abed, and HayderIhsan Ali. "Parameters
affecting load capacity of reinforced self-compacted concrete deep beams." International
Journal of Engineering 5, no. 05 (2016).
[7] Abdul-Razzaq, Khattab Saleem, and SarahFarhanJebur. "Experimental Verification of
Strut and Tie Method for Reinforced Concrete Deep Beams under Various Types of
Loadings." Journal of Engineering and Sustainable Development 21, no. 6 (2018): 39-55.
[8] Abdul-Razzaq, Khattab Saleem, Hayder I. Ali, and Mais M. Abdul-Kareem. "A New
Strengthening Technique for Deep Beam Openings Using Steel Plates." International
Journal of Applied Engineering Research 12, no. 24 (2017): 15935-15947.
[9] Abdul-Razzaq, Khattab Saleem, and AliMustafa Jalil. "Behavior of Reinforced Concrete
Continuous Deep Beams-Literature Review." Second Conference of Post Graduate
Researches (CPGR'2017), College of Engineering, Al-Nahrain Univ., Baghdad, Iraq-4th
Oct. 2017.
[10] Abdul-Razzaq, Khattab Saleem, and Sarah FarhanJebur. "Suggesting Alternatives for
Reinforced Concrete Deep Beams by Reinforcing Struts and Ties." MATEC Web of
Conferences 120 (2017): 01004. doi:10.1051/matecconf/201712001004.
[11] Abdul-Razzaq, Khattab Saleem, Sarah FarhanJebur, and Abbas H. Mohammed. "Concrete
and Steel Strengths Effect on Deep Beams with Reinforced Struts." International Journal
of Applied Engineering Research 13, no. 1 (2018): 66-73.
[12] Nielsen, M. P., M. W. Braestrup, B. C. Jensen, and Finn Bach. "Concrete plasticity, beam
shear–shear in joints–punching shear." Special Publication (1978): 1-129.
[13] Peter Marti. “Basic Tools of Reinforced Concrete Beam Design.” ACI Journal
Proceedings 82, no. 1 (1985). doi:10.14359/10314.
[14] Comité Euro-International du Beton CEB-FIP. “CEB-FIP model code 1990 for concrete
structures.” CEB-FIP 90, Bulletin d’Information No. 213-214, Lausanne, Switzerland,
(1993).
[15] Canadian Standards Association, ed. A23. 3-94: “Design of Concrete Structures for
Buildings.” Canadian Standards Association, (1994).
[16] American Association of Highway and Transportation Officials (AASHTO), L. R. F. D.
"Bridge Design Specifications." (1998).
[17] Sanders, David H. "Verification and Implementation of Strut-and-Tie Model in LRFD
Bridge Design Specifications." AASHTO, Highway Subcommittee on Bridge and
Structures (2007).
[18] Nagarajan, Praveen, and T. M. Madhavan Pillai. "Analysis and Design of Simply
Supported Deep Beams Using Strut and Tie Method." Advances in Structural Engineering
11, no. 5 (October 2008): 491–499. doi:10.1260/136943308786412050.
[19] Sam-Young, Noh, Lee Chang-Yong, and Lee Kyeong-Min. "Deep Beam Design Using
Strut-Tie Model."
[20] Brown, Michael D. and OguzhanBayrak. "Investigation of Deep Beams with Various
Load Configurations." ACI Structural Journal 104, no. 5 (2007). doi:10.14359/18863.