decentralized evaluation - usaid
TRANSCRIPT

Dec
entr
ali
zed
ev
alu
ati
on
fo
r ev
iden
ce-b
ase
d d
ecis
ion
ma
kin
g
Impact Evaluation of USDA’s Local and
Regional Food Aid Procurement Program
(Rwanda 2017-2019)
Baseline
Final Report
Decentralized Evaluation
February 2018
WFP Rwanda
Evaluation Manager: Nikhila Gill
Agreement:LRP-696-2016/019-00
Prepared by
Muriel Visser, team leader
Laure Steer
Ernest Midega
Alexis Dukundane
Alexis Dukundane
Moses Mwangi

Baseline Report – February 2018
Acknowledgements
The baseline team gratefully acknowledges the contributions of cooperative leaders and
members as well as other stakeholders in Rwanda to this report. The team also thanks
the WFP CO in Rwanda for its assistance in planning and implementing the baseline data
collection.
Disclaimer
The opinions expressed in this report are those of the Evaluation Team, and do not
necessarily reflect those of the World Food Programme. Responsibility for the opinions
expressed in this report rests solely with the authors. Publication of this document does
not imply endorsement by WFP of the opinions expressed.
The designation employed and the presentation of material in maps do no imply the
expression of any opinion whatsoever on the part of WFP concerning the legal or
constitutional status of any country, territory or sea area, or concerning the
delimitation of frontiers.
DISCLAIMER: This publication was produced at the request of the United States Department of Agriculture. It was prepared by an independent third-party evaluation firm. The author’s views expressed in this publication do not necessarily reflect the views of the United States Department of Agriculture or the United States Government.
Accessibility Note: An accessible version of this document can be made available by contacting [email protected]

Baseline Report – February 2018
Table of Contents
Executive Summary ...................................................................................... i
1. Introduction ........................................................................................... 1
1.1. Overview of the Evaluation Subject ......................................................................... 3
1.2. Situational Analysis .................................................................................................. 4
1.3. Evaluation Methodology and Limitations ............................................................... 5
2. Evaluation Findings ................................................................................ 7
2.1. Evaluation Question 1: How relevant is the design of the intervention
in terms of the context needs of the most vulnerable groups; needs of male
and female beneficiaries; and priorities of the government and WFP
partners? ............................................................................................................................ 7
2.1.1. Sub-question 1: To what extent are LRP’s location, priorities and
beneficiary’s selection in line with the needs of the most vulnerable groups? ............. 7
2.1.2. To what extent does the LRP project contribute to the government’s objectives?...................................................................................................................... 9
2.2. What is the level of complementarity with other development
interventions targeting the same regions, including with WFP’s own
intervention? .................................................................................................................... 10
2.3. Evaluation question 2 – cooperatives’ ability ‘to be’, ‘to organize’, ‘to
relate’, and ‘to do’ at baseline level ................................................................................... 11
2.3.1. Sub-question 2.1: Are cooperatives well organized? ........................................ 12
2.3.2. Sub-question 2.2: Are cooperatives developing partnerships? ....................... 17
2.3.3. Sub-question 2.3: Are cooperatives economically dynamic? ......................... 18
2.3.4. Sub Question 2.4 Do activities of the cooperative benefit the members? ....... 21
2.3.5. Conclusions - evaluation question 2 ............................................................... 24
2.4. Evaluation question 3- How does the LRP project affect male and
female SHF capacity and behaviour? .............................................................................. 26
2.4.1. Sub-question 3.1.: What knowledge do SHF have of options and
alternatives? Are there differences between male and female farmers? .................... 27
2.5. Male and female SHF choices around short term productive assets,
marketing and good practices. What are the benefits? ................................................... 31
2.6. Evaluation question 4- What opportunities exist for male and female
SHF? 39
2.6.1. Sub-question 4.1 How are pro-SHF and buyers’ partnerships taken into
account in the strategies and policies? ........................................................................ 39
2.6.2. Sub question 4.2 Are big buyers willing to purchase maize and beans
from SHFs? .................................................................................................................. 39

Baseline Report – February 2018
2.6.3. Sub question 4.3 - Are producers able to respond to demand from big
buyers? ..........................................................................................................................41
2.7. Evaluation question 5- How does the procurement, delivery, and
distribution of the modality for school feeding which is promoted through
LRP compare – in terms of cost-effectiveness and timeliness - to the
alternative modalities of food procurement? .................................................................. 42
2.7.1. Sub-question 5.1.Information on the price of school meals ........................... 42
2.7.2. Sub-question 5.2- Procurement, distribution and delivery time of
different food procurement modalities, and situation with respect to pipeline
breaks 43
2.8. Evaluation question 6- How does the LRP project affect male and
female SHF? ..................................................................................................................... 44
2.8.1. Sub question 6.1. Elements influencing male and female SHFs ‘income ....... 44
2.9. Evaluation question 7- How and to what extent do producers market
food products that meet quality standards and are nutritious and culturally
accepted............................................................................................................................ 47
2.9.1. Sub-question 7.1 - Overall quality of maize and bean products consumed
by SHF? ........................................................................................................................ 48
Quantitative findings ................................................................................................... 48
Qualitative analysis...................................................................................................... 48
2.9.2. Sub-question 7.2 - Evidence that SHF are consuming and marketing
food products that meet quality standards and are nutritious and culturally
acceptable .................................................................................................................... 49
Information on the current situation of schools concerning nutritious and
cultural acceptability of food products ........................................................................ 49
2.10. Evaluation question 8 - What is the level of participation of men and
women? Are women well represented, including in leadership positions? .................... 49
Place and roles of men and women in the maize and beans value chain ................... 50
Women participation in cooperatives ......................................................................... 50
Place of women in leadership position in LRP cooperatives ...................................... 50
2.11. Evaluation question 9- Is there emerging evidence that the
cooperatives have capacity to create linkages with schools ............................................ 51
2.11.1. Sub-question 9.1 What evidence is there of a business relationship between cooperatives and schools? .............................................................................. 51
2.11.2. Sub-question 9.2 - Are there cooperatives delivering food in schools in
the targeted districts? ................................................................................................... 51
2.11.3. Sub-question 9.3 - Do school purchase agriculture products from
cooperatives? ............................................................................................................... 52
2.12. Discussion .............................................................................................................. 52

Baseline Report – February 2018
2.12.1. Differences in findings between quantitative and qualitative findings .......... 52
2.12.2. Risks of mono-cropping and intensification of cropping systems ................. 52
2.12.3. Discussions on cooperative, services and self-financing of cooperatives ....... 53
2.12.4. Discussion of the appropriate model to link cooperatives and schools.......... 53
2.12.5. Discussion on the impact of the increased share of maize on SHFs diet ....... 54
3. Conclusions and Recommendations ..................................................... 54
3.1. Overall Assessment/Conclusions ........................................................................... 54
3.2. Recommendations.................................................................................................. 56
Annexes ..................................................................................................... 58
Annex 1. LRP Project activities and targets .............................................. 58
Annex 2. Detailed Theory of Change for the LRP Project .......................... 59
Annex 3. Evaluation Matrix ...................................................................... 60
Annex 4. Bibliography.............................................................................. 70
Annex 5. Annexes related to EQ1 ............................................................... 71
Annex 5.1 Main issues affecting agriculture in the four targeted districts.......................71
Annex 5.2 Interventions from development partners in the targeted areas ................... 75
Annex 6. Annexes on EQ2 ........................................................................ 77
Annex 6.1 Detailed assessment of cooperatives capacities ............................................. 77
Annex 6.2 Basic information on cooperatives ................................................................. 82
Annex 6.3 Cooperatives’ common vision......................................................................... 87
Annex 6.4 Document keeping .......................................................................................... 88
Annex 6.5 Cooperatives ‘experiences of collective operations ........................................ 89
Annex 6.6 cooperatives’ resource .................................................................................... 90
Annex 6.7 LRP cooperatives partners ............................................................................. 91
Annex 6.8 Decentralization and organization of the agriculture services ...................... 95
Annex 6.9 Cooperatives’ partnership .............................................................................. 96
Annex 6.10 Cooperatives’ choice of crops and rotations ................................................101
Annex 6.11 Factors limiting access to credit for cooperatives ....................................... 103
Annex 6.12 Price of maize and types of buyers.............................................................. 104
Annex 6.13 Quantitative analysis on EQ2.1 ................................................................... 104
Annex 6.14 Quantitative analysis on EQ 2.14 ................................................................ 106

Baseline Report – February 2018
Annex 6.15 Capacity of cooperative to develop self-financing mechanism for
their services to members .............................................................................................. 107
Annex 6.16 Cooperative sales and aggregation rules (qualitative data
collection on 11 cooperatives) ........................................................................................ 108
Annex 7. Annexes on EQ 3 ...................................................................... 109
Annex 7.1 SHFs knowledge on good practices .............................................................. 109
Annex 7.2 Quantitative data analysis on good practices (production and
post-harvest practices) ....................................................................................................110
Annex 7.3 Quantitative analysis on services...................................................................110
Annex 7.5 Investment in short term productive assets .................................................. 111
Annex 7.6 Statistic on production in the districts .......................................................... 113
Annex 7.7 Quantitative analysis of SHFs practices ........................................................ 114
Annex 7.8 Quantitative analysis of SHF investments in short term assets ................... 115
Annex 7.9 Adoption of good agricultural practices ........................................................ 118
Annex 8. Annexes on EQ4 ....................................................................... 119
Annex 8.1 Short presentation of pro-SHF buyers working in Rwanda met
during qualitative data collection ................................................................................... 119
Annex 8.2 Key issues to develop arrangements between cooperatives and big
buyers for maize and bean procurment ......................................................................... 120
Annex 9. Evaluation question 6 ............................................................... 121
Annex 9.1 Production of the main crops grown in the four targeted districts ............... 121
Annex 9.2 Characteristics of the main crops grown in the four targeted
districts ............................................................................................................................ 121
Annex 9.3 Economic calculations .................................................................................. 123
Annex 10. Evaluation question 7 (quantitative analysis) ......................... 125
Table of Figures
Figure 1. Policies and strategies concerning LRPs field of intervention ..................... 9
Figure 2. Number of cooperatives mentioning specific objectives and strategies
of cooperative existence (multiple options possible) ................................................... 13
Figure 3. Representation of LRP cooperative environment (based on
qualitative data collection) ........................................................................................... 17
Figure 4. Types of support received by cooperatives from the sector agronomist
(qualitative data for 11 cooperatives). Multiple options possible. ................................ 17

Baseline Report – February 2018
Figure 5. The different types of services that a farmer organization can offer
(CIRAD-CIEPAC, 2006) ............................................................................................... 23
Figure 6. High potential cooperatives’ abilities representation (scoring based
on qualitative data collection) ...................................................................................... 25
Figure 7. Cooperatives losing momentum abilities representation (scoring
based on qualitative data collection) ............................................................................ 25
Figure 8. Nascent cooperatives abilities representation (scoring based on
qualitative data collection) ........................................................................................... 26
Figure 9. Cooperative sources of information (qualitative data collection on 11
cooperatives), multiple choice options ......................................................................... 29
Figure 10. Cooperative knowledge on post-harvest handling practices
(qualitative data collection, on 11 cooperatives multiple option choice) .................... 30
Figure 11. Positioning of crops in terms of their importance for consumption
and for income (based on responses from the qualitative data collection) ................. 46
Figure 12. Abemerihiigo ............................................................................................... 77
Figure 13. Abibumbye ................................................................................................... 77
Figure 14. Coamanya Gishubi....................................................................................... 78
Figure 15. CCM Muganza ............................................................................................. 78
Figure 16. Kaiimu ......................................................................................................... 79
Figure 17. Kobarwo ....................................................................................................... 79
Figure 18. Koaimu........................................................................................................ 80
Figure 19. Kopianya ..................................................................................................... 80
Figure 20. Koabiwa ....................................................................................................... 81
Figure 21. Duterimbere ................................................................................................ 81
Table of Tables
Table 1 - Overview of evaluation questions and their coverage at baseline ......................... i
Table 2 - Overview of evaluation questions and their coverage at baseline ........................ 2
Table 3 - Division of tasks among members of the baseline team ...................................... 5
Table 4 : Descriptive statistics, percentage of SHFs paying dues to their cooperatives
(quantitative data collection) ....................................................................................... 13
Table 5 : Descriptive statistics, amounts of dues paid (quantitative data collection) ........ 13
Table 6: Possibility of receiving services outside the cooperative (quantitative analysis) 22

Baseline Report – February 2018
Table 7: Cross tabulation of possibility of receiving services from outside the cooperative
(quantitative data collection) ...................................................................................... 22
Table 8: Access to extension services (quantitative data collection) ................................. 28
Table 9: Source of extension (quantitative data collection) .............................................. 28
Table 10: Source of extension according to the size of cooperatives (quantitative data
collection) .................................................................................................................... 28
Table 11: Seeds purchase (quantitative data collection) .................................................... 32
Table 12: Purchase of maize and beans seeds according to gender (quantitative data
collection) .................................................................................................................... 32
Table 13: Amount spent on seeds (quantitative data collection) ....................................... 32
Table 14: SHFs use of fertilizers ......................................................................................... 33
Table 15: Sources of fertilizers (quantitative data collection) ........................................... 33
Table 16 : Use of casual labour by gender (quantitative data collection) .......................... 33
Table 17 : Amount spent by SHFs on fertilizers, tools and casual labour ......................... 34
Table 18: Area planted for maize and bean (quantitative data collection) ........................ 34
Table 19: SHFs cropping choices ....................................................................................... 35
Table 20: SHFs main reasons for acquiring credit ............................................................ 35
Table 21: Volumes of sales of maize and bean (season A and B) quantitative data
collection (in kg) .......................................................................................................... 44
Table 22: Contribution of maize and beans to SHFs income (quantitative data collection)
..................................................................................................................................... 45
Table 23: Quality preference for maize and beans consumed by SHFs (quantitative data
collection) .................................................................................................................... 48
Table 24 :Farmers’ interest in cooperatives: ..................................................................... 83
Table 25 : Date of creation of LRP cooperatives ................................................................ 84
Table 26: Type of land exploited by 11 cooperatives of the qualitative data collection ..... 84
Table 27: Basic information on cooperative (qualitative data collection and WFP data) . 85
Table 28: cooperatives capacity to define a common vision and a strategy to reach its
objectives (qualitative data collection) ........................................................................ 87
Table 29 : Cooperatives' documents requirement ............................................................. 88

Baseline Report – February 2018
Table 30: LRP's capacity in book keeping (qualitative data collection) ............................ 88
Table 31: Cooperatives' exposure to collective operations ................................................ 89
Table 32: Level of payment of shares by members (qualitative data collection) .............. 90
Table 33: Cooperatives’ sources of funds (qualitative data collection) ............................. 90
Table 34 : Crop rotation in the cooperative land .............................................................. 101
Table 35: Production potential for the cooperative ......................................................... 102
Table 36: Maize selling price at harvest time for cooperatives and types of buyers ....... 104
Table 37 - Average amount of dues by gender ................................................................. 104
Table 38 - Average amount of dues by cooperative age ................................................... 104
Table 39 - Payment of dues by gender .............................................................................. 105
Table 40 - Payment of dues by cooperative size ............................................................... 105
Table 41 - Frequency of dues payment by gender ............................................................. 105
Table 42 - Mean amount of dividends received by cooperative capacity, age and size... 106
Table 43 - Table of amount spends on seeds and fertilizer by cooperative size ............... 107
Table 44 - Possibility of receiving services for outside the cooperative ........................... 107
Table 45 - Cross tabulation of possibility of receiving services from outside by gender . 107
Table 46: Cooperative self financing mechanisms ........................................................... 107
Table 47 - Cooperative sales and aggregation rules ......................................................... 108
Table 48 -Frequencies of good agricultural practices ....................................................... 110
Table 49 - Number of cooperatives that benefitted from extension services ................... 110
Table 50 - Number and perentage of cooperatives that received agricultural extension
services by cooperative size ........................................................................................ 110
Table 51: Cooperatives' inputs costs (qualitative data collection) .................................... 113
Table 52: Crops cultivated area at district level (NISR, season A 2017) .......................... 113
Table 53 - SHF reporting of frequency of specific good agricultural practices ................ 114
Table 54 - Good agriculture practice by gender of SHF ................................................... 114
Table 55 - Number of SHF investing seed purchase ......................................................... 115
Table 56 – Maize and beans by gender crosstabulation ................................................... 115

Baseline Report – February 2018
Table 57 - Amount which SHF spend on seeds ................................................................. 115
Table 58 - Amount spent on seeds by gender ................................................................... 115
Table 59 - Amount spent on seeds by cooperative size..................................................... 116
Table 60 - Percentage of male and female SHF purchasing tools .................................... 116
Table 61 - Purchasing of tools by cooperative size ............................................................ 116
Table 62 - Household use fertilizer ................................................................................... 117
Table 63 - Source of fertilizer by size of cooperative ........................................................ 117
Table 64: - Level of adoption of good agricultural practices (field observation and FDGs)
.................................................................................................................................... 118
Table 65 - Production of the main crops in the targeted districts (season A 2017), NISR
.................................................................................................................................... 121
Table 66 - Current and potential profitability of bean cultivation in the marshland for
SHF, calculation from qualitative data collection ...................................................... 123
Table 67 - Current and potential profitability of maize cultivation in the marshland for
SHF ............................................................................................................................. 124
Table 68 - Characteristics of maize and beans ................................................................. 125
Table 69 - Contribution of crops to household ................................................................. 125

Baseline Report - February 2018 | P a g e i
Executive Summary
1. This Baseline Report was commissioned by the Rwanda WFP Country Office and hasbeen prepared as part of the impact evaluation of the Local and Regional Food AidProcurement (LRP) Program project funded by the United States Department ofAgriculture (USDA). The baseline which took place in October-November 2017comprehensively documents the situation at the start of the LRP. It provides abenchmark against which progress will be assessed at the endline in June 2019.
2. The objective of the LRP project which started in 2017 is to improve the effectivenessof food assistance. The strategy to reach this objective is to procure food for schoolmeals from Small Holder Farmers (SHF) through cooperatives. The focus of theproject is on strengthening farmer cooperatives to promote increase use of locallypurchased food for school meals. Expected outcomes include improving access toloans and markets and enhancing cooperative capacity which will be reflected inincreased sales, improved quality of produce, and reduced commodity losses. Atendline the evaluation will provide a comprehensive assessment of the relevance,effectiveness, efficiency and lessons learned from the intervention. At baseline theevaluation establishes key benchmarks of cooperative and SHF practices andcapacity which will be monitored again at endline. Because the project has not yetstarted some aspects of the evaluation’s inquiry can only take place at the endline. Asa result the baseline report covers only eight out of the 10 questions.
Table 1 - Overview of evaluation questions and their coverage at baseline
Evaluation question Focus at baseline
To what extent was the design of the intervention: relevant to wider context; aligned with needs of the most vulnerable groups; cognizant of the needs of male and female beneficiaries; and in line with priorities of the government and WFP partners?
Relevance of the design
What are the effects of the project on the cooperatives ability to be, to organize, to relate, and to do?
Cooperative starting situation
How does the LRP programme affect male and female SHF capacity and behavior? Behaviour of SHF at baseline
Has the LRP contributed to creating new opportunities for male and female Small Holder Farmers (SHF)?
SHF opportunities at baseline
How does the procurement, delivery and distribution of the locally procured food modality for school feeding - which is promoted through LRP - compare in terms of cost effectiveness and timeliness to the alternative modalities of food procurement?
n/a at baseline
What is the level of participation of men and women? Are women well represented, including in leadership positions? What are the disaggregated impacts on women? Has the LRP programme affected male and female SHF differently?
Participation of men and women at baseline
What internal and/or external factors affected the project’s achievement of intended results?
n/a at baseline
How and to what extent does the LRP programme contribute to producers marketing food products that meets quality standards and is nutritious, and is culturally acceptable?
Current marketing practices
How does the LRP programme affect male and female SHF income? Male and female income at baseline
Is there emerging evidence that the cooperatives have capacity to create linkages with schools?
Linkages with schools at baseline

Baseline Report - February 2018 | P a g e ii
Methodology
3. The evaluation used a before and after approach to examining the effects of theintervention. At baseline (T0), quantitative and qualitative data was collected using acombination of documentation/secondary data review, a survey, in-depth keyinformant interviews, and observation. The survey was applied to the 16 targetedcooperatives, and also covered 841 SHF and 10 primary schools. In-depth interviewswere conducted with 11 cooperatives, value chain actors (producers, middlemen,buyers, agro-dealers), support actors (MFI, local NGOs, extension agents), schoolsand staff in schools, as well as national and local authorities and decentralized unitsfrom the relevant ministries. Data collection for the baseline took place in August andSeptember 2017.
4. At final evaluation after the intervention (T1), data will be collected on the samevariables as the baseline, and a comparison done to determine changes in theindicators. The before and after design will be combined with a contribution analysisapproach at endline which will identify whether the changes can be attributed to LRPor other interventions.
5. The baseline data collection faced some limitations. Data collection was done at atime where there was no maize and beans on the market and no marketingoperations by cooperatives and SHFs. This made it difficult to have preciseinformation on practices and processes1. In terms of data collection, the participantsin the focus group discussion were chosen by cooperative leaders which could lead tobias in terms of their level of representation of cooperative membership. The data onvolumes, income and plot size is based on self-report by SHF, and there are somechallenges of precision in the responses. To mitigate these issues, and to the extentfeasible. the evaluation triangulated the information from survey and qualitativeinterviews to establish whether there was consistency in the response, and also crosschecked where possible with WFP data and information from reporting.
Key Findings and conclusions
6. EQ 1 - Project relevance: The design of the project is relevant. The project targetssome of the most important constraints that SHFs face in developing agricultureactivities in a profitable way (access to inputs, credit, capacity building anddevelopment of marketing are the most important ones). LRP design is aligned withthe policies and strategies of the GoR and with the interventions of developmentpartners. Particularly LRP is fully aligned with the strong drive from the GoR topromote farmers’ cooperatives, commercial cultivation of maize, and globalintensification of agriculture.
7. EQ 2 – Cooperative capacity: LRP cooperatives have widely ranging levels ofcapacities. This evaluation examined cooperative capacity from the perspective ofability ‘to be’, ‘to do’, ‘to relate’ and ‘to perform’ and finds that:
• Cooperative ability ‘to be’ is relatively good, though ownership and existence of acommon vision remain low.
• Abilities of cooperatives ‘to do’ is limited, especially as relates to managementtools.
1 The endline evaluation will take place in June-July 2019 when maize and bean from season B are on the market.

Baseline Report - February 2018 | P a g e
iii
• In terms of the ability ‘to relate’ cooperatives are already connected to a network of partners but they tend to be reactive rather than pro-active, i.e. the focus is on grabbing opportunities rather than strategically defining their needs and building partnership to solve their problems or to develop new opportunities.
• Cooperatives ability ‘to perform’ is low. Aggregation of products is limited and the majority of cooperatives does not have a business mind set. Cooperatives do not know whether they are making profit.
8. EQ 3 – Male and female capacity and behaviour: Male and female SHFs behaviour is driven by the need to secure household food consumption, the lack of funds to invest in production, and a focus on minimizing production risks (climatic hazards or pest attacks for example). Farmers’ exposure to good production practices is relatively good, mainly through extension support provided by the GoR. The main limiting factor is the cost of fertilisers and manure. Knowledge and use of good practices for post-harvest handling are far more limited. SHF have low capacity for economic analysis of their practices and choices. Exposure to market information is very low and is not an important factor in explaining their choices. Access to credit is limited: farmers have a good knowledge of credit conditions and there are institutions providing credit (SACCO), but farmers are not confident in credit and the conditions can sometimes make access to loans difficult.
9. EQ 4 – Opportunities for male and female SHF: Agriculture is the main source of income for SHFs, but their connection with the market is low and most of what they produce is consumed or sold locally to purchase other food products. Farmers usually have a plot in the cooperative land (marshland) where they do mono-cropping and one or several plots on the hillsides where they do mixed cropping. Yields are low because of soil fertility problems, inadequate use of inputs, climatic hazards and pest attacks. Under the current cultivation and market conditions, both maize and beans cultivation are not profitable, but both can potentially be profitable (with better agriculture practices, access to inputs, investment in quality and organized sales, which are factors tackled by LRP).
10. EQ 5 – Procurement and distribution of school feeding: The current framework is relatively conducive to the development of partnership and contracts between buyers and SHFs though there is no specific strategy. Big buyers are already purchasing maize from SHF and they have specifics arrangements for cooperatives but it only represents a small part of their procurement. Cooperatives have a low level of awareness of these buyers and their requirements and do not yet have capacity to implement and monitor this type of contracts. Issues affecting the development of these partnerships between buyers and farmers are low product aggregation, poor quality of maize and beans produce, and the lack of contract enforcement (hence a high defaulting rate).
11. EQ 6 – Income of smallholder farmers: SHFs cropping choices are mainly driven by household food needs. An important element of strategy is minimizing risks. Crops that contribute the most to farmer income are maize, coffee and Irish potatoes. Beans are not seen as a source of income.
12. Farmers focus on limiting production risks through mix-cropping practices and use of crops that are considered as famine crops (cassava and sweet potatoes). Income generating crops are gaining importance (mainly maize). Beans are also a high priority crop for farmers.

Baseline Report - February 2018 | P a g e iv
13. With the current production practices maize and beans production a not profitable.For both crops, it is currently less economically interesting for a farmer to work oneday in his maize or bean farm than to sell his workforce. Sustainability of thecropping system is an issue. It is not possible to apply the recommended level ofmanure and to generate profits which over time reduces soil fertility.
14. EQ 7 - Quality of the food marketed by producers: Current quality of maizeand beans marketed by SHFs is low compared to buyers expectations (and WFPstandards). SHFs market small portion of what they produce. Production is mainlyreserved for consumption. Consumption habits have changed in the last five years.Consumption of maize has increased. With the introduction of maize cultivation,LRP farmers are now eating maize flour several times per week. They have limitedquality requirements (colour and dryness). Beans are consumed every day and storedby farmers. They are only sold if the household is in urgent need of cash.
15. EQ 8 – Participation of women: Equal numbers of male and female SHF aremembers of cooperative (although with variation between cooperatives) but this doesnot reflect in the decision making structures (which are male dominated). Factorslimiting the participation of female SHF are time and capacity (given limited skills inliteracy, book keeping and leadership).
16. EQ 9 – Capacity to link with schools: An important objective of LRP is tosupport the development of local procurement for school feeding programmes. Sofar, there is no direct linkage between schools and cooperatives, cooperatives do notsupply schools. However, they do supply to local processing units that are sellingmaize flour to schools (secondary schools). For primary schools, apart from WFPsupported schools, there is no budget for school feeding.
Recommendations
1. Recommendation 1: Further strengthen the LRP project’s focus on SHF by payingspecific attention to economic profitability for SHF of the practices that promoteproduction and strengthen post-harvest practice. Detailed cost estimation could helpin sensitizing big buyers on the price.
2. Recommendation 2: Consider extending the current approach to training to amore comprehensive capacity building approach, to maximize the appropriation ofpractices. For the LRP this would imply promoting close support by extensionservices and visits to work with cooperatives to develop their capacities. Looking atthe current scope of LRP, this could be done through fostering partnership withother actors to provide additional capacity building to cooperatives.
3. Recommendation 3: WFP should consider working from an approach wherecooperatives are encouraged to take responsibility to invest in their owndevelopment and should systematically make a financial contribution to anyequipment or infrastructure that is provided. Similarly, the first priority should be tolook at the existing market based solutions2 before providing direct support.
4. Recommendation 4: Ensure the LRP includes specific strategies to improve theinclusion of poor and female farmers in cooperatives. In paying attention to genderinclusion in cooperatives, the specific place and roles of women in the maize andbean value chain, but also in the global production system should be analysed.
2 Market based solutions being solutions for key inputs such as credit, agricultural inputs, and storage that are locally available.

Baseline Report - February 2018 | P a g e v
Specific capacity building activities of women are recommended to increase their involvement in decision making (book keeping and leadership for example). Attention should be paid to the organisation of the activities to ensure these do not contribute to an overload of women’s work.
5. Recommendation 5: Promote a sustainable approach to production of maize andbeans through lobbying and partnership. LRP implementation partners should takeaccount of the key factors that may affect sustainability of agricultural practice:mono-cropping, pest attacks and soil fertility, and include modules on soilconservation, agro-ecology, integrated pest management and fertility management inits approach. Specific attention should be paid to availability and access to manureand lime.
6. Recommendation 6: To develop business linkages between cooperatives andschools for the school feeding program, WFP should explore the option of developinglinkages with local processing units as these are already providing secondary schoolsand are closer to cooperatives. Possibilities to develop contracts between theseprocessing units and cooperative should be explored. This would require building thecapacities of the processing units.

Baseline Report - February 2018 | P a g e
1
1. Introduction
1. This Baseline Report was commissioned by the WFP Country Office (CO), funded by United States Department of Agriculture (USDA) and has been prepared as part of the impact evaluation of the United States Department of Agriculture’s (USDA) Local and Regional Food Aid Procurement (LRP) Program project in Rwanda. It is implemented by the World Food Programme (WFP) in four districts in Rwanda (Annex 1provides insight into the locations of the LRP).
2. The purpose of the baseline is to comprehensively document the situation at the start of the LRP intervention. It provides a benchmark against which progress will be assessed at the endline. The other products of the impact evaluation are an Inception Report (finalized in October 2017) and an endline report which will draw on data collection that will take place in Rwanda in June 2019.
3. The impact evaluation combines accountability and learning objectives:
a. From an accountability objective, the Terms of Reference (ToR)3 for the evaluation indicate that the evaluation will (at end line) assess and report on the performance of the LRP project to help WFP present credible and high quality evidence of impact to USDA and other relevant stakeholders.
b. From a learning objective, the evaluation will – again at end line - provide insight into the reasons why certain results occurred or not, and bring out lessons, good practices, and priorities for learning.
4. The choice for an impact evaluation relates to the need to demonstrate impact of the intervention on the target population to external stakeholders, and in particular to USDA for which this evaluation is a requirement.
5. In line with WFP and USDA requirements, this baseline report provides information on the context and the subject of the evaluation, the evaluation methodology, and the findings of the evaluation against each of the key questions and sub-questions. The baseline report also includes recommendations for WFP regarding the implementation phase of the LRP programme. A detailed overview of the design of this baseline phase can be found in the Inception Report.
6. During the Inception phase the key overall evaluation questions from the ToR were revised and agreed. The table below shows the coverage of these questions through the baseline and end-line phases.
7. The final impact evaluation will compare the baseline and endline measurement of progress. Selected evaluation questions in the Table below will therefore only be fully answerable at the end-line, i.e. those that are concerned with sustainability, appropriateness, and effectiveness. The baseline thus provides a picture in time at the start against which the end-line will measure change and seek explanations for what worked well and what worked less well.
3 A copy of the Baseline ToRs is part of the Inception Report.

Baseline Report - February 2018 | P a g e 2
Table 2 - Overview of evaluation questions and their coverage at baseline
Evaluation question Evaluation criterion
Data collected at Focus at baseline
To what extent was the design of the intervention: relevant to wider context; aligned with needs of the most vulnerable groups; cognizant of the needs of male and female beneficiaries; and in line with priorities of the government and WFP partners?
Relevance Baseline and end-line
Relevance of the design
What are the effects of the project on the cooperatives ability to be, to organize, to relate, and to do?4
Effectiveness Baseline and end-line
Cooperative starting situation
How does the LRP programme affect male and female SHF capacity and behavior?
Effectiveness Baseline and end-line
Behaviour of SHF at baseline
Has the LRP contributed to creating new opportunities for male and female Small Holder Farmers (SHF)?
Effectiveness Baseline and end-line
SHF opportunities at baseline
How does the procurement, delivery and distribution of the locally procured food modality for school feeding - which is promoted through LRP - compare in terms of cost effectiveness and timeliness to the alternative modalities of food procurement?
Efficiency End-line n/a at baseline
What is the level of participation of men and women? Are women well represented, including in leadership positions? What are the disaggregated impacts on women? Has the LRP programme affected male and female SHF differently?
Effectiveness & impact
Baseline (aspects 1 and 2)
End-line (aspects 1,2,3,4)
Participation of men and women at baseline
What internal and/or external factors affected the project’s achievement of intended results?
Effectiveness & efficiency
End-line n/a at baseline
How and to what extent does the LRP programme contribute to producers marketing food products that meets quality standards and is nutritious, and is culturally acceptable?
Impact End-line n/a at baseline
How does the LRP programme affect male and female SHF income?
Impact Baseline and end-line
Male and female income at baseline
Is there emerging evidence that the cooperatives have capacity to create linkages with schools?
Impact Baseline and end-line
Linkages with schools at baseline
8. The expected users for this report are USDA and the WFP Rwanda CO who will usethe report in decision making, notably related to more detailed programme designand implementation, and in informing decisions on possible adjustments to thestrategies. The report is also expected to be of interest to other stakeholders who areworking on cooperative and small holder farmer strengthening in Rwanda or similarsettings.
4 We will use and adapt different tools to measure cooperatives capacity: the ability methods (South research), the governance matrix (IRAM) if relevant, the 3 circles models (SNV), the level of development of producers organization (IRAM), the PO trajectory tool (IRAM) as well as some scoring tools developed based on these tools (reference : “Sélection de références méthodologiques en analyse organisationnelle”, IRAM, 2009)

Baseline Report - February 2018 | P a g e
3
1.1. Overview of the Evaluation Subject
9. USDA’s LRP was awarded in 2016 and runs for a duration of two years from April 2017 to March 2019. The LRP project has a total budget of two million of which 1.36 million USD will be used for the procurement of food from Small Holder Farmers (SHF). The objective of the program is to improve the effectiveness of food assistance and the expected outcomes include increased value of sales by project beneficiaries. The food will be procured by WFP from farmer cooperatives or through pro-smallholder aggregators, and will be distributed to WFP schools as part of the school feeding programme in two districts in the South of Rwanda (Nyamagabe and Nyamaguru) where WFP is implementing the McGovern- Dole International Food for Education and Child Nutrition program. Two other districts under the McGovern-Dole Program HGSF are serving meals that are prepared using Corn Soya Blend (CSB) porridge which is donated by USDA. Of the remaining LRP budget, 127.000 USD will be used for capacity augmentation (mainly of SHFs and cooperatives) and 370.000 USD will be used for direct support costs (i.e. costs directly related to management of the LRP project).
10. In terms of beneficiaries the LRP will support primary school students and SHFs. The main direct beneficiaries in terms of project activities (capacity building and support) are SHFs who will be targeted through 16 cooperatives. These cooperatives were selected by WFP in four districts (Nyamagabe, Nyamaguru, Huye and Gisagara).
11. The total number of beneficiaries of the LRP over two years is 46.790 primary school pupils and 5,133 farmer beneficiaries (approximately 10 percent). Forty nine percent of the planned beneficiaries are female farmers, and 52 percent of the planned beneficiary pupils are girls.
12. The focus of the project will be on strengthening farmer cooperatives. Expected outcomes include improving access to financial services and markets and enhancing cooperative capacity which will be reflected in increased yields, improved quality of produce, and reduced commodity losses. As noted, the produce that is marketed through the cooperatives will in part be purchased by WFP, using for this purpose the funds of the LRP and in this manner leading to an increasing use of locally purchased food for school meals. Through these interventions the intention is to improve food security among target beneficiaries. An overview of the main project activities is found in Annex 1.The link between WFP/USDA inputs and the outputs, outcomes and impact of the LRP is explained in more detail in the LRP Theory of Change (ToC) which was drawn up at the Inception phase and is also presented in Annex 1.
13. The main partners of LRP are: USDA, the 16 cooperatives that are part of the project who will benefit from training and inputs, two Non-Governmental Organization (NGO) partners5 who will be supporting WFP in implementing the project, and various government ministries and departments who also provide support to cooperatives and will have an oversight and learning role in the project (MINAGRI, the Ministry of Local Government (MINALOC), the Ministry of Trade and Industry, the Ministry of Finance and Economic Planning, and the Ministry of Gender Promotion). MINEDUC (Ministry of Education) is a partner as far as school feeding is concerned and will be involved in the supervision of the school feeding
5 The specific NGO partners were not known at the time of the drafting of the baseline report.

Baseline Report - February 2018 | P a g e
4
components. The provincial government monitors and coordinates support for the cooperatives.
14. As noted in the IR, several other interventions by WFP Rwanda are of relevance to this operation. WFP has been supporting SHF and private sector in Rwanda since 2009. Earlier work through WFPs Purchase for Progress (P4P) programme and a follow-up pilot - the Patient Procurement Platform (PPP) - focused on increasing market access for SHF. P4P continues to be implemented by WFP, together with the Farm to Market Alliance (FTMA) initiative (FTMA is the new name for the Patient Procurement Platform-PPP). FTMA and P4P are of direct relevance to the LRP. P4P has supported over 70 cooperatives with capacity development, provision of market and market linkages since 2009. FTMA provides access to markets, finance and post-handling services for approximately 100 cooperatives. The cooperatives commit to supplying mainly maize and WFP acts as a neutral broker and facilitator bringing together potential buyers and cooperatives, and facilitating access to services.
1.2. Situational Analysis
15. Agriculture plays a key role in the Rwandan economy, contributing 33 percent of the national Gross Domestic Product (GDP). Agricultural is key to export earnings and represents over 80 percent of the total value of exports. Coffee and tea are the two main export crops and the most widely cultivated cash crops. Small-scale subsistence farmers produce most of the agricultural output. The Government of Rwanda has made efforts to diversify the country’s exports by investing heavily in horticulture geared towards exports. The country produces several products as staple foods: maize, sorghum, rice, wheat, beans, soya beans, Irish potato, sweet potato, cassava and bananas. Ninety percent of agricultural production is food crops and 66 percent is consumed by producers.
16. The Strategic Plan for Agriculture Transformation (PSTA III) is part of EDPRS (Economic Development and Poverty Reduction Strategy) 2. It puts the accent on four programme areas: a) agriculture and animal resource intensification; b) research, technology transfer and professionalization of farmers; c) value chain development and private sector investment; and, d) institutional development and cross-cutting issues. The strategic prioritizes value chain development, products quality and obtaining premium prices, as well as arrangements for bulking up production in order to ease access to inputs, services and markets.
17. Cooperatives are considered important vehicles to achieve the GoRs strategic plans. The number of cooperatives in the country has expanded very rapidly over the past years (GoR, 2011; USAID, 2013). At national level, more than 8000 cooperatives are officially registered. In addition, there are also numerous informal producers’ organisations. There are about 1500 cooperatives registered in the Southern province where the LRP is being implemented. There are different types of cooperatives and the way they function varies. Cooperatives also differ in their degree of success in promoting intensification, increasing market orientation and stimulating agricultural growth.
18. Rwanda has made significant progress in promoting gender equality, largely driven by strong Government commitment, and has the fifth highest score in the world on the 2016 Global Gender Index Gap Report6. Gender equality is enshrined in the
6 http://reports.weforum.org/global-gender-gap-report-2016/economies/#economy=RWA Accessed 07 February 2017.

Baseline Report - February 2018 | P a g e
5
constitution and Rwanda was the first country in the world to have more than 50 percent female members of Parliament (64 percent in the lower chamber). Nonetheless, challenges remain in terms of female representation in some areas, in particular in the education and health sectors. Women are also less represented in agribusiness. Women and men farmers in dual households are characterized by unequal power relations, which leaves women with very limited decision-making powers. This affects their control over agricultural assets, inputs, produce and capacity building opportunities, which results in low agriculture productivity. Thus, women’s’ plots are typically less productive than those operated by men.
1.3. Evaluation Methodology and Limitations
19. The evaluation uses a before and after approach to examining the effects of the intervention. The table below summarizes teams members' roles and tasks. At baseline (T0), quantitative and qualitative data was collected using a combination of documentation/secondary data review, a survey, in-depth key informant interviews, and observation. The survey was applied to the 16 targeted cooperatives, and also covered sample of SHF, and a selection of primary schools. In-depth interviews were conducted with cooperatives, value chain actors (producers, middlemen, buyers, agro-dealers), support actors (MFI, local NGOs, extension agents), schools and staff in schools, as well as national and local authorities and decentralized units from the relevant ministries.
Table 3 - Division of tasks among members of the baseline team
Team Member Roles and Tasks
Muriel Visser
Team leader: general coordination of the baseline study and report and
compilation of inputs from other team members.
Overall technical inputs
Laure Steer
Qualitative data collection and analysis
Technical inputs on cooperatives, production, marketing and organisation of the
value chains
Ernest Midega Quantitative data collection and analysis
Alexis Dukundane Qualitative and quantitative data collection
Technical inputs on school feeding
20. The data collection instruments drew on the evaluation ToC and the evaluation matrix. To ensure that the quantitative data is meaningfully collated with qualitative data collected for this study, a preliminary descriptive analysis of the quantitative data was carried out during the data collection phase, and the results were used to develop question for qualitative data collection tools. This ensured that the qualitative data collection provided a deeper understanding and explanation of the trends observed from the quantitative data analysis.
21. At final evaluation after the intervention (T1), data will be collected on the same variables as the baseline, and a comparison done to determine changes in the indicators. The before and after design is combined with a contribution analysis approach which will identify whether the changes can be attributed to LRP or other interventions.
22. The contribution analysis will be reported on at the end line stage. It will map the overall changes in the environment (more broadly therefore than those that would be picked up by the indicators that compare the baseline to the end line), and through a

Baseline Report - February 2018 | P a g e
6
rigorous process of identification will allow the final evaluation to capture the contribution of the LRP and WFP to the observed. This is deemed particularly important in the context of this intervention given that there are a multitude of different actors at local level providing support and services to SHF and cooperatives.
23. A total of 15 cooperatives were covered by the qualitative work, and all 16 participated in the quantitative survey. The survey planned to reach 782 SHF but actually reached 841 as more SHF participated in the survey than planned. All participants were provided with an explanation of the purpose of the study and with the option to withdraw at any time should they wish to do so. Individual responses were kept confidential and coded so that they cannot be related to specific respondents.
24. For the baseline study gender has been considered for all the steps of data collection:
• An equal number of male and female respondents were included in the quantitative survey.
• All the FGDs included 50% women. No gender specific FGD has been organized but a specific attention was given to women participation in the discussion.
• Some specific questions were included in KII and FGDs about place and role of women
25. The qualitative information collected was analysed to triangulate the ideas and words of the actors and with elements of context and emphasize the main issues affecting the actors.
26. Limitations
• Data collection was done at a time where there was no maize and beans on the market and no marketing operations done by cooperatives and SHFs. It results in difficulties to have precise information on practices and processes. Where possible we triangulated the information provided verbally by SHF with that of other informants.
• Cooperatives rarely have records or accounting system, which limits the information collected on production and sales by cooperatives to what they recall.
• Participants to FGD were chosen by cooperative leaders. This may produce a bias concerning how representative they are of cooperative members. The research team sought to address this by explaining to cooperative leaders that SHF selection should reflect the diversity of the full group of members.
• It was not possible to have precise and measured information concerning volumes, incomes and plot size. All the data collected on volumes, prices, plot size is the one mentioned by SHF or cooperative leaders. Triangulation with different cooperatives, and with other sources of information (sector or district agronomist and official statistics mainly) was done when available.

Baseline Report - February 2018 | P a g e
7
2. Evaluation Findings
27. The evaluation findings and the evidence to substantiate them are presented below. They are structured as a response to each evaluation question in turn, and follow the sub-questions that are in the evaluation matrix (Annex 3).
2.1. Evaluation Question 1: How relevant is the design of the intervention in terms of the context needs of the most vulnerable groups; needs of male and female beneficiaries; and priorities of the government and WFP partners?
28. Evaluation question one analyses the relevance of the intervention. It is typically a question that can only be answered at the end line stage. However, the baseline study reviewed some elements about how the project was designed.
Key findings and conclusions – Question 1
• Working in agriculture and promoting staple crops are relevant choices. Rwanda’s staple food sector is growing substantially and the country still faces serious food insecurity issues.
• Supporting cooperatives to improve their production and marketing capacities through forward delivery contracts is particularly relevant. It allows farmers to access new opportunities and increase their income. Inclusion of poorest farmers in cooperatives is not a point of attention for cooperatives and local authorities.
• The project’s design is in line with the GoR strategies and policies as well as district orientation and priorities.
• There are dialogue mechanisms at national level between development partners and the Government of Rwanda. WFP is into regular dialogue with MINEDUC but dialogue with MINAGRI and district authorities is not sufficient.
• LRP design is promising in terms of potential sustainability of the intervention.
2.1.1. Sub-question 1: To what extent are LRP’s location, priorities and beneficiary’s
selection in line with the needs of the most vulnerable groups?
Integration of beneficiary characteristics and needs in the design and activity of LRP
29. Rwanda’s economic structure is dominated by agriculture. Nonetheless, the most recent integrated household living conditions survey (EICV 4) (2013) estimates that poverty level is still of 39%. In 2012, according to the CFSVA, half of all Rwandan households reported food access problems. In that context, targeting improved production of maize and beans is a relevant orientation. LRP programs follows the Crop Intensification Program orientation (mono-cropping and focus on a few priority crops. There is a widely held consensus among many actors7, that cooperative organization is important to reducing poverty and exclusion. Working with cooperatives is therefore a relevant choice for LRP. However, There is no specific
7 Cooperative and the Sustainable development goals: A contribution to the post 2015 development debate, ILO, COOP

Baseline Report - February 2018 | P a g e
8
mechanisms in place to ensure that cooperative are inclusive (the main factors to become a member being having access to cooperative land and being able to pay the shares).
30. Forward delivery contracts can be an effective way to promote production and marketing in agriculture and to increase investment in quality or production standards. When efficiently organized and managed this type of contracts reduces risks and uncertainties for both parties8. Promoting this type of arrangement in the context of LRP is therefore relevant, providing attention is paid to contract conditions (to design contracts that fit with needs and constraints of both parties).
31. In terms of education, primary enrolment in Rwanda is among the highest in the region and the national net enrolment has practically reached the Education Sector Plan target of 97 percent in 2015, with slightly higher enrolment rates for girls than for boys (97.4 percent compared 96.3 percent). However, the Rwanda Demographic and Health Survey (RDHS) 2015 finds that stunting among children, which is an indicator of chronic malnutrition linked to specific livelihood profiles (such as agriculture and daily labour) has defined geographic distribution patterns and its prevalence is 50 percent along the Congo Nile Crest, which include the covered HGSF project area (Nyamagabe and Nyaruguru districts). In that context, continuing support to HGSF seems particularly relevant, especially if these interventions are combined with attention to deworming.
Integration of specificities of districts & agro ecological regions in LRP’s design
32. The LRP is particularly relevant to the challenges and priorities of the four selected districts9. For the four districts, emphasis is clearly put on increasing production through better access to inputs and improved practices. Post-harvest handling and value addition are also key priorities. Working with cooperatives is also particularly relevant as they are identified as a lever for SHFs to access improved production practices, inputs and consolidated land. Developing access to finance for farmers is a key issue in the DDPs (District Development Plans).
Attention to the different needs and situation of male and female beneficiaries
33. In Rwanda’s rural areas, women are the poorest group. This category of Rwanda’s population is basically involved in agricultural activities; they also are responsible for maintaining the welfare of the household. In Rwanda, cooperatives have been used as breeding grounds for socio-economic empowerment of women. In the project design, gender has been taken into consideration in beneficiaries’ selection. Performance indicators selected for monitoring of the project also take into account gender. However, the evidence reviewed fails to demonstrate that the specific needs of men and women in agriculture have been sufficiently taken into account (for example, there are no specific attention points on the roles and tasks of women in the maize value chain).
8 Notes sur la contractualisation, CGAAER, 2016 9 See Annex 5.1

Baseline Report - February 2018 | P a g e
9
2.1.2. To what extent does the LRP project contribute to the government’s objectives?
34. The areas of intervention for LRP project are in line with the policies and strategies currently in place (see table below). More information on policies and programs are in appendix 7.1:
Figure 1. Policies and strategies concerning LRPs field of intervention
Policy/strategy Key focus of the policies and strategies
Government Program (2010-2017)
Promotion of modern farming, increase in production and quality, storage and processing Promotion of cooperatives Regionalisation of crops
Economic Development and Poverty Reduction Strategy 2
Increasing economic growth by investing in and modernizing agriculture. Increasing agriculture productivity Connect Rural Communities to Economic Opportunity
Vision 2020 Promotion of intensification in agriculture Production of high value crops Replace subsistence farming by a fully monetarised, commercial agriculture sector Integration of gender into development policies and strategies
PSTA III Increased production of staple crops Greater involvement of the private sector to increase agricultural exports, processing and value addition Transform Rwandan agriculture from a subsistence sector to a market-oriented, value creating sector Key pillars: Land, irrigation, inputs and infrastructure, soft skills and farmer capacity, value chains and markets, private Sector.
Crop Intensification Program
Increasing agricultural productivity. Facilitation of inputs (improved seeds and fertilizers), consolidation of land use, provision of extension services, and improvement of post-harvest handling and storage mechanisms six priority crops: maize, wheat, rice, Irish potato, beans and cassava.
National policy and promotion of cooperatives
Facilitate development of the cooperatives in the country Creation of National Cooperative Agency (RCA). Cooperatives to become autonomous, self-reliant and democratically managed institutions that are accountable to their members
National Post-Harvest Staple Crop Strategy
Strengthening the harvesting, post-harvest handling, trade, storage, and marketing of staple crop value chains Strengthening food security strengthening competitiveness of the staple crop value Improve efficiency and decrease marketing costs Enhance producers’ access to, and linkages with, markets.
National Gender Policy Promote gender equality and equity Mainstreaming gender needs and concerns across all sectors of development
The Rwanda Education Sector Strategic Plan
Strengthening school nutrition Expansion of a HGSF Programme
National School Health Policy
Improve and expand food and nutrition, as well as school performance in schools (pre-primary, primary and secondary
35. WFP has close relationship with MINEDUC, based on the previous experience with HGSF programme. The focal point in the ministry already has a good knowledge on LRP. However, the links are not so tight with the Ministry of Agriculture. Both at national and district level, representatives from MINAGRI reported that they had no information on LRP and that they were not consulted for project design and in beneficiary selection. There is also a focal point in MINAGRI, but there is far less communication inside the ministry than in MINEDUC about WFP’s activities.

Baseline Report - February 2018 | P a g e
10
36. In terms of School Feeding (SF), Education for All is one of the priorities of the Vision 2020, the EDPRS-2 and the Government’s “7-year programme” (2010-2017) where SF is identified as a key strategy to eliminate malnutrition. The Rwanda Education Sector Strategic Plan (2013/14 – 2017/18) and the National School Health Policy developed in 2012, focus on strengthening school nutrition, through community participation and expansion of the HGSF Programme. There is a distortion in practice between WFP’s SF approach and the priorities of the GoR from two angles. The first is the fact that a part of WFP’s food distribution in SF comes from regional (in the case of salt) and international (vegetable oil and CSB+) imported food (the other part - maize and beans - is locally procured as much as possible), while the GoR preference is that food should be provided by parents or procured from local farmers in the country, thus creating a stable and predictable market for the local SHF. The second angle is the government’s priority for SF covering the full nine and 12-year basic education cycle, while WFP school feeding targets only the primary levels.
2.2. What is the level of complementarity with other development interventions targeting the same regions, including with WFP’s own intervention?
37. There is a dialogue mechanism in place for development partners and the GoR. Sector Working Groups (SWGs) are a forum through which stakeholders meet to discuss sector planning and prioritization. WFP is part of the Agriculture Sector Working Group.
38. Some partners are directly supporting LRP’s beneficiaries. They are very diverse organisations (from local NGO to international donors). They have been identified through qualitative data collection. Information on their intervention is found in Annex 5.2. Alignment with other WFP programmes is developed in the introduction.
39. Most of the development partners have a similar approach to agricultural development, working on productivity and yields and using cooperatives as the main lever of intervention. Some of the cooperatives that LRP has selected have already received support, but capacities remain weak. The interviews in the context of this baseline show that WFP’s (potential) added value in terms of relevance comes from the linkages with buyers and with schools.
40. There is no dialogue mechanism at district level with WFP, local authorities and other development partners. So far, none of the development projects and programs met at baseline was actually aware of LRP and its strategy. Partners met consider that the approach is interesting and complementary to what they are doing but suggested that WFP should put more emphasis on learning lessons from previous projects (both those implemented by WFP and those implemented by other stakeholders).
Does the logic of intervention promote sustainability?
41. In the assessment of the baseline team, some elements of the LRP design are promising in term of sustainability. This includes:
• Increasing the proportion of locally supplied food in the school feeding program.
• Focusing the intervention on capacity building and “soft skills development”.

Baseline Report - February 2018 | P a g e
11
• Aligning the intervention with the market-based inputs supply promoted by GoR (through agro-dealers).
• Selecting crops with potential to improve food security and income.
• Strengthening producers’ capacities to access credit, which is a market-based solution to the structural needs of funds in agriculture.
• Building cooperatives’ entrepreneurship capacity to enhance their position in the value chain and help them become market players.
• Supporting development of maize production and hence supporting Rwanda in increasing its market share in the region.
• Helping cooperatives to build direct relations with schools.
• Supporting cooperatives and buyers to implement forward delivery contracts that are beneficial to: a) guaranteed markets for SHF; and, b) economies of scale and quality’s improvement for buyers
42. The extent to which these interventions are actually sustainable will need to be further assessed at end-line.
2.3. Evaluation question 2 – cooperatives’ ability ‘to be’, ‘to organize’, ‘to relate’, and ‘to do’ at baseline level
43. This question examines cooperative capacity. The baseline used four criteria10 to assess cooperative capacity, as follows:
• Cooperative capacity ‘to be’: referring to governance, ownership, leadership, existence of a common vision and a strategy to achieve its objectives.
• Cooperative capacity ‘to organize’: reflecting human, material and financial resources, management and organization of activities, planning and assessment of the results.
• Cooperative capacity ‘to relate’: ability to develop relations with public sector (local or national authorities, extension agents), with development partners (local or international) and private sector partners (input providers, microfinance institutions, buyers and other value chain stakeholders).
• Cooperative capacity ‘to do’: ability to produce, existence of a post-harvest and marketing system that enables both the cooperative and its members to generate profits.
44. Information on the general characteristics of the cooperatives is provided in Annex 6.1. to assess capacity, eleven cooperatives (qualitative data collection) were scored against the four abilities (see Annex 6.1). Scoring covered all criteria covering capacity indicators. Each criterion was assessed by the evaluation team, and when possible this was complemented by a self-assessment from cooperative leaders. Each criterion was ranked from zero (inexistent or very low) to five (very good). This score was then compiled per each indicator in a percentage form. It provided a transparent and objective guide to assess capacity and to identify gaps that need to be addressed.
10 These criteria refer to the ability methods developed by South Research but they are at the core of most assessment method of organization and cooperatives, as shown by IRAM in the “Sélection de références méthodologiques en analyse organisationnelle”, 2009)

Baseline Report - February 2018 | P a g e
12
An overview of the scoring is presented in Section below, and will be used to compare progress at end-line stage.
45. The summary box below provides an overview of key findings and conclusions for evaluation question 2. The evidence behind each of the findings and conclusions is discussed in the sections that follow below the box and in the relevant annexes. Subsequent evaluation questions follow a similar structure i.e. presenting a summary findings and conclusion box followed by detailed discussion of findings.
Key findings and conclusions – Question 2
• LRP cooperatives are young. They do not yet have the skills and capacity to manage economic activities. Most cooperatives are organised around the common exploitation of marshland, with limited experience of collective operations.
• Capacities of the cooperatives ‘to be’, ‘to do’, ‘to perform’ and ‘to relate’ are very variable.
• Cooperatives have been formed in an exogenous and top-down way. This has hampered their ability to build strong relations with SHFs. It has also restricted their capacity to define a common vision and an implementation strategy.
• Overall, governance of cooperatives is good. Savings and credit groups are particularly strong in bringing together cooperative members. They represent a first level of organisation to build upon.
• Cooperative members have a good vision of the organization of the cooperative and of the roles and frequency of the different statutory meetings
• Capacity of cooperatives to keep records is low. Book keeping is a constraint and none of the cooperative has an operational vision on their financial management.
• Cooperative resources are low. Shares and dues are only partially paid. There is limited self-financing for services. Access to credit is challenging. Current credits conditions are difficult for SHFs.
• Some cooperatives remain very passive and do little to build partnerships. As a result, they are poorly connected to their business environment.
• Cooperative capacity to aggregate production is low, although a few cooperatives manage to sell quantities above 100T. Farmers have financial constraints at harvest time and frequently cannot wait for collective sales to be organised.
• Farmers have limited economic benefits from their cooperative, and this limits the ability of the cooperatives to develop activities and services.
• Cooperatives capacity for providing services varies. The most frequent services are on input supply (provided directly or through a sector agronomist).
2.3.1. Sub-question 2.1: Are cooperatives well organized?
Quantitative findings
46. The quantitative data collected for this question are about the dues that members pay to their cooperatives (see tables below).
• 64.7% of the SHF pay dues to the cooperatives (64.0% of the females, 63.3% of the males)
• 84.1% of the SHF who pay due either pay regularly or always.
• Average amount of dues paid by SHF per month is RWF 1414.95 (1.68 USD).

Baseline Report - February 2018 | P a g e
13
• Significantly more members 0f high potential cooperative (81.2%), mature cooperatives (74.4%) and large size cooperatives (67.5%) pay their dues to cooperatives. (the specific tables are in Annex)
Table 4 : Descriptive statistics, percentage of SHFs paying dues to their cooperatives (quantitative data collection)
Frequency Percent Valid Percent Cumulative Percent
No 295 35.3 35.3 35.3
Yes 541 64.7 64.7 100.0
Total 836 100.0 100.0
Table 5 : Descriptive statistics, amounts of dues paid (quantitative data collection)
N Minimum Maximum Mean Std. Deviation
Amount of the dues 541 0 15000 1414.95 1738.702 Valid N (listwise) 541
Existence of a common vision
47. Creating a common vision gives any group or organization a strong foundation to build on. The sustainability of a cooperative, as well as its risk of failure, is very much connected with the understanding and sense of ownership members have in respect for their cooperative.11 Detailed analysis on the existence of common vision for LRP cooperatives is in Annex 6.3.
48. The baseline data suggest that the establishment of LRP cooperatives is the result of a top-down exogenous process (mainly driven from the government). As a result, most cooperatives are struggling to create strong relations with members.
49. Interview evidence highlighted that overall LRP cooperatives have no clearly defined common vision and strategies. At best, leaders can explain some objectives (see figure below) of the cooperative.
Figure 2. Number of cooperatives mentioning specific objectives and strategies of
cooperative existence (multiple options possible)
11 Orientations pour la construction de programmes de renforcement des capacités des OP, Romain Valleur, AVSF, 2014

Baseline Report - February 2018 | P a g e
14
Meetings of members and leaders
50. Mandates and roles of the General Assembly (GA) are clearly provided by the RCA (Rwanda Cooperative Agency)12. Guidance from RCA is well respected by cooperatives. Out of 15 cooperatives (cooperative checklist) two meet once a year, and thirteen meet twice a year. Out of these thirteen, eight can meet more often if a specific need requires the organization of a meeting. The GA (in March) is mainly used to discuss the results of season A and to plan and organize season B and the second (October) GA is used to discuss results from season B and plan for season A. Only a few cooperatives reported asking all members to join the GA. In most cases, representatives from groups or from zones13 are invited to the GA. Most cooperatives report facing challenges in getting members to participate in the GA.
51. Cooperatives usually have an Executive committee and a supervision committee. RCA advises that both committees meet once a month. Cooperative committees meet regularly. Meetings are convened around issues related to member mobilization, marketing of the products, looking for solutions in case of problems. As the table above shows, five of the 15 cooperatives meet every month. Four cooperatives meet less than three times per year. It appears that frequency of meetings may be correlated with other aspects of cooperative formation, i.e. three of the cooperatives who meet infrequently have not developed a common vision and two of them have very low ownership (Abinumbye and Duterimbere cooperatives).
52. Cooperatives do not undertake many common activities – there was little evidence of product aggregation and the level of collective sales is low. As cooperative activities focus mainly on the organization of the work14, there is no need for frequent meetings, but the frequency of meetings is not sufficient for cooperatives to manage more complex activities.
53. Operational meetings are organized every week. Members meet every week (usually on a day of joint work on the cooperative plot) at group level. For the majority of the cooperatives, meetings are not directly linked to the activity of the cooperative - members mainly meet to around their informal saving and credit group (locally called “tontine”). Only one cooperative mentioned that they intended to implement a sanction mechanism in case of non-attendance. Three cooperatives also mentioned that they were implementing meetings at zone level (once a month), mainly to discuss agriculture and production related issues.
Leaders
54. All the cooperatives report having a committee in place. All committees also have leaders who have a relatively good understanding of their mandates. Six cooperatives (out of the 11 for qualitative data collection) mention that the committee’s abilities to guide and organize the activities of the cooperative are “good”, four cooperatives report they are “fair” (only one cooperative is not yet up to the task). According to the Rwandan law on cooperatives, committees are elected for three years and committee members can only be reelected once. These rules are respected and all committee members have been elected. In all cooperatives that exist for more than three years committee membership has been renewed.
12 Reference: Training programme on management of cooperatives, RCA, 2011 13 Groups refer to informal organisation of 15 to 20 farmers (for saving groups and organisation of extension services), zone refers to subdivision of the marshland. 14 Organization of the cropping seasons and choice of day to work on the cooperative plots

Baseline Report - February 2018 | P a g e
15
55. Leaders are well identified, and members know that the role of the committee is to manage activities of the cooperatives. Committee members appear committed and truly interested in the future of the cooperative. Most committee members show some leadership capacities even if there is a need to strengthen it.
Record keeping and use of accounting system
56. Article 45 of the Law No50/2007 specifies requirements in terms of documents and management books for registered cooperatives. The list is impressive (see Annex 6.4). The evaluation interviews highlighted that the requirements are also extremely demanding for relatively young cooperatives, in an environment where literacy is often an issue and capacity is limited.
57. Most of the cooperatives have a visit and minute book, a register of members (with shares) and bank documents. Some also have cash books. However, with the exception of one cooperative, none of the cooperatives had a full set of documents for review. As a result, estimation of the quality of the documents kept by cooperatives could only be done through self-assessment by leaders.
58. Four cooperatives (out of the 11 met for qualitative data collection) seem to be particularly weak in terms of book keeping15. All cooperatives face challenges in financial book keeping and consider this activity very difficult and time consuming. Interviews highlight that book keeping is seen as an obligation but that the utility for the cooperative is not clear i.e. it is not clear how bookkeeping might help the cooperative be more effective and achieve better results.
59. Four cooperatives have a staff member (manager or accountant) in charge of record keeping and have delegated book keeping to the accountant. This may pose a risk as failure to keep the accounting and payment functions separate – as was the case in one cooperative that was visited16 – may lead to fund embezzlement.
60. Cooperatives that aggregate products or sell inputs to their member have a relatively good accounting system. These cooperatives keep individual records of the funds and products exchanged with members. For example, Coamanya Gisghubi Cooperative records the shares paid per member, the commission on sales, the sanctions paid (if applicable), the contribution to transport expenses, the taxes, and a fee for a political party. Nonetheless, even these cooperatives lack a global view on the cooperative finance and on whether they are making money.
Number of collective operations
61. Annex 6.1gives an overview of cooperatives’ capacity engage in collective operations (either buying or selling).
62. Globally, the evaluation’s analysis of collective cooperative operations (see Annex 6.5) highlights that cooperative capacity to implement collective operations is not very strong. For most farmers, cooperative membership brings benefits in terms of access to land on the equipped marshland. It also provides a means of access to government subsidized inputs. SHF do not necessarily see a role for cooperatives in
15 See Annex 6.4 16 At Kopianya cooperative inputs were being provided to members (on credit) and non-members (without credit), but the staff in charge of the activity gave credit also to non-members and embezzled the from sales. The control from the committee was not tight enough and the cooperative has not only lost part of their capital but they are also struggling to recover the amount given on credit to non-member (they don’t recognize that they got inputs on credit).
Baseline Report - February 2018 | P a g e
16
sales. Ownership by SHF is generally low and members do not feel bound to their cooperative and its rules.
63. In some cases – and as highlighted by SHF interviews - there is also very limited trust in the capacity of the cooperative (and its committee) to manage funds or production from members. Collective sales are also hampered by the practices of buyers who are frequently approach farmers before harvest to purchase maize. It is very tempting for a farmer to sell the crop at this stage and to access cash immediately, even if the profit will be lower. This phenomenon is amplified because most cooperatives have limited post-harvest handling capacity (frequently drying space is insufficient for all members, and engaging in collective sales becomes more difficult once farmers have taken their production home)
Cooperative resources
64. Funding is often a critical issue for farmers’ organizations and cooperatives17. Depending on their business model, cooperatives need funds for agricultural activities (e.g. to purchase inputs), to invest (in post-harvest infrastructure or agriculture equipment), to develop services for members (e.g. extension) and as a guarantee to access credit. Capital is also a key for cooperative sustainability and to ensure its independence vis-à-vis authorities, partners, donors and others.
65. Cooperatives can acquire capital in various ways: through shares (the initial dues that need to be payed when a member joins a cooperative); dues (to be paid per year or per season) and commissions on sales (inputs or maize).18 Low financial capacity can place the cooperative in a vicious circle where low capital reduces the cooperative capacity to fulfill its economic functions. This results in low credibility and makes it more difficult to raise funds, which in turn contributes to reducing capital.
66. Analysis of the data shows that low shares do not necessarily result in increased numbers of members paying. Overall, the amount of shares per farmer seems to be reasonable. The proportion of shares enables cooperatives to have a capital of between 2000 000 RwF and 88200000 RwF (between 2381 USD and 10502 USD), depending on the number of members (if all members pay)19.
67. In addition to shares, some cooperatives also require regular payment of dues (paid in cash or kind), and charge commissions on sales20 of inputs or of products (Annex 6.6). They use dues to pay for operational costs (for example for security guards), to pay committee costs (e.g. for travel), or to pay for staff. Cooperatives that do not have a system of regular dues, often demand a direct contribution from members when they need funds.
68. SHF interviews highlight that for them there is not really a distinction between dues and shares. Evidence reviewed also highlights that many SHF do not meet their obligations in terms of shares. For example, most members of the Icyerekezo cooperative were paying a quarter or less of the required amount of 2000 RwF (2.38 USD), and about 20 percent of the members did not mention any dues/shares. This suggests that there is low ownership from members and that member resource mobilization is a difficult task for cooperative.
17 Pedagogical material on farmers ‘organization and farmers organization support, CIRAD-CIEPAC, 2006 18 It is therefore interesting to note that the LRP impact indicator “increased number of members paying their dues/increased timeliness of payment by member” only covers one dimension of capital building. 19 Except for Kopianya which has a potential capital of only 100 000RwF (119 USD). 20 Commissions on sales are analyzed in sub question 2.4.

Baseline Report - February 2018 | P a g e
17
2.3.2. Sub-question 2.2: Are cooperatives developing partnerships?
Figure 3. Representation of LRP cooperative environment (based on qualitative
data collection)
69. As shown in the figure above, LRP cooperatives are not isolated; they already have a network of partners (public sector, service providers, financial partners and development partners). Annex 6.7provides more details on the different partners of the 11 cooperatives met during qualitative data collection and Annex 6.9 provides more information on each of the partnerships that follow below.
70. Public institutions: The sector agronomist is reported to play a role in the establishment of the cooperative, in organizing inputs, and in organizing the cropping season. Visits from the sector agronomist are irregular.
Figure 4. Types of support received by cooperatives from the sector agronomist
(qualitative data for 11 cooperatives). Multiple options possible.

Baseline Report - February 2018 | P a g e
18
71. Only three cooperatives reported receiving regular visits from sector agronomist, and only three cooperatives mentioned that there were model farmers working with SHFs. None of the cooperatives mentioned that they received extension services. Surprisingly, the focus group discussions highlight that the SHF do not see the sector agronomist as an extension service provider, and do not actually know where/whom to ask specific questions or look for advice.21 RCA is only identified as a partner for registration.
72. Financial partners: All the cooperatives have bank accounts and are familiar with formal banking and credit services. Most of them use the services of the Savings and Credit Cooperatives (SACCOs) which is considered as closer to the farmers than commercial services. Interviews with a selection of commercial banks underscore that agriculture is not a priority for them and only represents a very small part of their portfolio.
73. Service providers: Input providers are the only service providers that have partnerships with cooperatives (Tubura, agro dealers or Agro-Processing Trust Corporation-APTC). They are well identified by the cooperatives and SHFs. Partnership with cooperatives: The vast majority of cooperatives do not have a
relationship with surrounding cooperatives, although they will be aware of their
existence. Only one cooperative is a member of a union of cooperatives.
74. Most development actors work with cooperatives. Various development partners provide support to the LRP cooperatives: among the 11 cooperatives included in qualitative data collection, only one never got support from a development partner. The main support received concerns training on production (mentioned by 10 cooperatives). Other supports received includes: training on post-harvest handling (four cooperatives); provision of funds and inputs (four cooperatives); and, equipment of terraces and marshland (five cooperatives).
75. In most cases the partnership is a response to opportunities, rather than an active seeking out of partners. Sector agronomists are key actors to link cooperatives to partners.
76. Some cooperatives already have relatively good abilities (Annex 6.1) to develop partnerships (CCM Muganza, Coamanya Gishubi, Icierekezo) whilst others are still poorly connected to their business environment (Koaimu, Koabiwa and Abibumbye).
2.3.3. Sub-question 2.3: Are cooperatives economically dynamic?
77. Before analyzing the current situation of the cooperatives in the view of the indicators, it is essential to try and understand what the economic activities of the cooperatives are and to have an idea of their potential. Cooperatives are production cooperatives. The first crop they grow together, as show in the figure below is maize, followed by beans. More information on cooperatives’ choice of crop and rotation is in Annex 6.10.
21 Only in cases of pest attacks did SHF mention that they warned the sector agronomist and that some treatments were organized from the district level.

Baseline Report - February 2018 | P a g e
19
78. Even if the largest part of the production in the cooperative plots is used for SHFs home consumption, they consider that their plot for the cooperative is a “commercial plot”. The choice of crop to be grown is decided according to the recommendation and the restrictions which are communicated by the sector agronomist. For example, crops like sweet potatoes or cassava are forbidden and mixed cropping is forbidden (some elements on the interests and risks of that choice are developed in evaluation sub-question 2.4). The survey showed that LRP cooperatives are mainly growing maize (15 cooperatives) and beans (13 cooperatives). Other crops grown are Irish potatoes (5 cooperatives), vegetables (5 cooperatives). SHFs all have other land on the hillsides where they grow food (usually with a mixed crop system).
79. Maize is seen as a cash crop. Season A is considered as the main cropping season, which is why a majority of cooperatives plant maize during season A. However, in some cases (depending on the drainage capacity of the marshland) the amount of water in season A is too high to grow maize (there are more risks of flooding of the plot). Cooperatives in this situation (Abibumbye or Coamanya Gishubi, for example) prefer growing maize in season B or C. Growing maize in season C is rarely possible - it is a dry season and in most cases crops need to be watered
80. Beans are considered food crops. Except in one case, cooperatives do not (or do not plan to) aggregate and sell beans collectively. Beans are a crop that SHFs consider essential to their food security and that they barely sell.
81. Some of the crop rotation systems used by cooperatives appear risky in terms of soil fertility as they do not insert any legumes in the rotation. Maize and Irish potatoes are very nutrient-demanding crops and even if farmers do use fertilizers and manure, the quantities applied are often below standards. In the long term there is a risk that yields decline.
Business planning
82. In order to successfully develop their activities, cooperatives must manage their activities as a business, and as a means of making profit (both for the cooperative and for its members). There are two parts to business planning. The first is the managerial skills needed to start and run a profitable business and the second is entrepreneurial spirit to seek out opportunities.
83. The evidence suggests that capacities of the cooperatives to plan their business are low. None of the cooperatives have a real business plan. None develop an expense plan or a forecast of expected benefits before the season or analyze the results at the end of the season. As a result, very few have an idea of their benefit.
84. The result of the scoring exercise, show that there are three different levels of business planning amongst the LRP cooperatives:
• Cooperatives with no, or very low business mindset and no or minimum planning of their activities e.g. Abibumbye, Kaiimu, Kobarwo, and Koaimu cooperatives.
• Cooperatives with low business orientation but with some level of planning of their activities: Abmerehiigo, Kopianya, Koabiwa, and Duterimbere cooperatives.
• Cooperatives with some business mindset, they to plan activities as well as expenses and production: Icyerekezo, CCM Muganza and Coamanya Gishubi cooperatives.
85. Overall, business mindset and entrepreneurship are not well understood by cooperatives. Cooperatives rarely consider the different options (e.g. in terms crops

Baseline Report - February 2018 | P a g e
20
choice, work organization, aggregation of the production) in relation to the profit they can expect. They do not have an idea of the expected benefit and of the expenses they made to get benefit. As a result, cooperatives make opportunistic decisions which are partly externally driven (often by the sector agronomist, or by other partners) in the hope to get some benefits at the end.
Skills for credit and loan management
86. Credit is a key element of the business environment. SHFs in developing countries usually face considerable difficulties in accessing credit. However SHFs in Rwanda are in a better position than many other countries because SACCOs provides them with access to microfinance institutions (MFI).22
87. All the cooperatives are interested in accessing credit and most were at least partially aware of the conditions. Most cooperatives (7 out of 11) have not accessed credit. Three of the four cooperatives that received credit had difficulties repaying the loan due to low yields and were obliged to renegotiate the repayment duration.
88. Overall the credit conditions are not adapted to farmers’ realities. From the interviews, it appeared that key factors limiting cooperative’s access to credit are:
• Mutual lack of knowledge and trust.
• Low cooperative capacity to manage funds and credit.
• The cost of credit (interest rates are considered very high and collaterals are hard to get).
• The risk of credit (loss of collateral, difficulties to repay in case of climatic hazards).
89. More information on the limiting factors are on Annex 6.11. Volumes of products sold/net margin
90. It is not possible at this stage to assess the net margin of cooperatives.23 However, analyzing the volumes and amount of sales provides interesting information on cooperatives’ business (see 0).
91. Cooperative sale figure collected at the evaluation baseline differ from those collected by WFP. Most cooperatives do not have weighing scales and estimate their production based on the number of bags collected. In some cooperatives sales were higher that the estimated production (Icierekezo and Coamanya Gishubi).
92. Maize represents about one third of the potential cooperative production (the global amount of maize sold is about 307T). Three cooperatives have not aggregated any maize. Some of these cooperatives are still very young (e.g. Duterimbere or to a lesser extent Kobarwo and Kaiimu cooperatives). Seven cooperatives sell below 20 percent
22 Credit offered by SACCO is a 2% interest rate and cannot exceed duration of 2 years (in most cases, loan duration is below one year). The credit given cannot exceed 4 million RwF (4763 USD) (and a minimum of 30 000 RwF, 35.7 USD). The requirements for a cooperative to receive a loan are presented in the text box below. Rates offered are similar from one MFI to another (except Duterimbere that offers 1% interest rate to finance activities led by women). 23 Cooperatives have low book keeping skills, books were not available and they mostly do not register their expenses. Most cooperatives mentioned that they were not making any profit (and looking at their capacity and business organization, this seems realistic).

Baseline Report - February 2018 | P a g e
21
of their potential production. Only one cooperative sells beans representing about 0.2 percent of production potential.24
93. All the cooperatives consider that it is difficult to aggregate members’ production. This is because of the following factors:
• Farmers largely engage in subsistence farming and keep their production or sell their maize to their neighbors, to middlemen or to the local markets.
• Members see their cooperative essentially as a means of collective production and are not aware that their cooperative is aggregating products.
• Members are not convinced of the ability of the cooperative to sell their products and to distribute the funds to members.
• When cooperatives purchase maize from members (Kopianya for example) and pay them cash, members think it is safer and more profitable to sell to the cooperatives. They view the price as good and believe the cooperative does not cheat them (unlike buyers who may use fake weighing scales).
• Some cooperatives cannot find buyers to absorb the production.
• Farmers are in need of cash at harvest time and it is difficult for them to wait for the cooperative to aggregate, find buyers, and organize sales and payment.
• It is tempting for farmers to sell their maize fresh (on stem) either to be grilled or to be used to produce alcohol. Buyers will approach farmers directly just before harvesting time and in this case the buyer will harvest the plot.25
• Lack of cooperative drying space does not encourage aggregation. Once members take their production home to dry it, it is harder to control the quantity of maize that they will bring to the cooperatives.
94. There is an important variability in the price of maize from one cooperative to the other - ranging from 270 to 320 RwF (0.32 to 0.38 USD) per kilo (see Annex 6.12). The price is higher than the government minimum price (220 RwF, 0.26 USD). Prices also fluctuate during the year. Prices increase soon after harvest to reach between 400 and 450 RwF (0.48 and 0.54 USD) per kilo at planting time. There are also periodic and local variations of price based on the quantity of maize available on local markets.
2.3.4. Sub Question 2.4 Do activities of the cooperative benefit the members?
95. A cooperative is a business owned and controlled by its members. For a member, there are two ways to benefit from its cooperative:
• Receiving part of the profit made by the cooperative (dividends).
• Accessing services adapted to their needs.
24 Targeting beans to develop cooperative sales is likely risky because beans are not seen as a cash crop, and few farmers are willingly going to increase the amount of beans they deliver to the cooperative. 25 This explains why the quantity of aggregated maize is sometimes lower than specified in cooperative rules. Cooperatives usually share the production once it is dried, so if part of it has been sold fresh, it will not be part of the production to be divided. To avoid this, some cooperatives actually hire security guards during harvest time. This is also one of the reasons why cooperatives try to harvest at the same time. One cooperative - Coamanya Gishubi – has experimented with dialogue when a member is defaulting to convince him/her to respect his commitment towards the cooperative.

Baseline Report - February 2018 | P a g e
22
96. Quantitative analysis has been done on two different topics: the payment of dividends and the services offered by cooperatives to their members.
97. Dividends (the tables are in Annex)
• Approximately one in eight cooperatives (12.9%) normally distribute dividend to members (females 12.5%, males 13.2%).
• Of cooperatives that normally distribute dividends, 59.3% distributed in 2016.
• On average, SHF’s received dividends amounting to 10300.9 RwF (males RWF 10565.6, females RWF 9960.7)26
98. Services offered by cooperatives
• Trainings (72.7%), supply of seeds (61.0%) and fertilizers (54.2%) and finding buyers (42.8%) are some of the key services offered by the cooperatives. There is no notable difference in the services offered to male and female SHF’s.
• High potential cooperatives engages more in finding buyers (95.5%), while small cooperative supply more seeds to members (95.0%). The other cooperatives of different ages, capacities and sizes did not however have notable differences from the main services offered.
99. Of the services currently offered by the cooperatives to the members, SHF considered trainings (23.3%) as the top most important service offered, with supply of fertilizers (22.6%) and other agricultural input and other services (24.0%) being the second and their most important services offered consecutively. The table below details the priority of importance of cooperatives services in relation to cooperatives capacities and ages. More than half (63.5%) of the SHF’s reported to be able to find the services offered by cooperatives outside the cooperatives in which they are members. The cooperative capacity and size did not have a notable effect in the possibility of getting’s the services from outside the cooperative.
Table 6: Possibility of receiving services outside the cooperative (quantitative analysis)
Frequency Percent Valid Percent Cumulative Percent
No 531 63.5 63.5 63.5
Yes 305 36.5 36.5 100.0
Total 836 100.0 100.0
Table 7: Cross tabulation of possibility of receiving services from outside the cooperative (quantitative data collection)
Gender
Total Female Male Possibility of receiving services from outside the cooperatives
No Count 261 270 531
% 49.2% 50.8% 100.0%
Yes Count 122 183 305
26 12.27 USD on average, 12.58 USD for males and11.86 USD for females

Baseline Report - February 2018 | P a g e
23
Dividends
100. In the absence of up to date financial records, it is difficult to know whether cooperatives are distributing dividends, but the low economic strength and business capacities of LRP cooperatives do not seem very compatible with the regular distribution of dividends to members.
Services to members
101. In theory, there are different kinds of services to members that a cooperative can offer to its members (see Figure below).
Figure 5. The different types of services that a farmer organization can offer
(CIRAD-CIEPAC, 2006)
102. Low level of services is usually directly linked to lack of ownership and participation by members and may reflect that the decision on services to offer was made without member involvement. If a cooperative does not offer its member services that address their constraints, they will not be interested in participating in the cooperative activities.
103. Most LRP cooperatives do not offer a high level of services. Nonetheless FGD highlighted that SHFs see several advantages of being in a cooperative:
• Some farmers started to grow maize because they joined a cooperative.27
• Being a cooperative member ensures access to support by government partners. For example, to build a drying space, an office or a warehouse.
• Farmers have easier access to inputs when they are part of a cooperative. Six of the eleven cooperatives interviewed during the qualitative data collection reported purchasing and selling inputs to their members, and five of these sometimes provide inputs on credit (to be reimbursed after harvest).
• Some cooperatives have a drying space. In Duterimbere cooperative, members also have a processing unit, which increases the added value of maize.
27 Maize was introduced as a cash crop on the equipped marshland and terraces and joining cooperatives, farmers had the opportunity to access growing techniques, seeds and fertilizers.

Baseline Report - February 2018 | P a g e
24
• Farmers have easier access to sector agronomist.
• For some farmers, joining a cooperative enabled them to access more lands.28
• Working on a cooperative plot creates a valuable exchange between members around good production practices, use of appropriate amounts of seeds and fertilizers, as well as respecting an adequate cropping calendar.
104. Farmers were less aware of the advantages that cooperative membership can bring in marketing of products. However, some SHF mentioned that selling together enables them to get a better price. One cooperative (Icierekezo) reported that selling together enabled them to place a bigger quantity of maize on the market as a result of which buyers are now coming to them (rather than vice versa) and they now have more flexibility to choose among buyers.
Self-financing mechanisms
105. As Annex 6.15shows, only three cooperatives have financing mechanisms with good prospects of sustainability. These cooperatives aggregate production in an efficient way and have put in place a commission on sales that enables the cooperative to develop its activity. Other cooperatives have either no or very little awareness of the importance of financing their activities.
106. Farmers have little economic benefits from their cooperatives and this clearly limits the capacities of cooperatives to develop their activities, to invest and to become reliable business actors. One interesting exception is the provision of inputs to members. When cooperatives have enough resources to procure and make inputs available, this appears to work relatively well (though it was not possible to assess the economic results of the operations or to know the number of farmers that actually benefits from the service). Farmers are satisfied with this service that responds directly to one of their needs, especially when cooperatives supply inputs on credit. Aggregation of products and marketing are only successfully implemented by a few cooperatives and it is something that the others are having difficulties with.
107. Nevertheless, cooperatives provide farmers with a frame to organize their activities, work together, learn, and implement good production and post-harvest practices. Though this is not enough to ensure cooperative sustainability and to allow cooperatives to develop business linkages with high end buyers, it is a good base to work with cooperatives to develop members’ participation, business awareness and common vision building.
2.3.5. Conclusions - evaluation question 2
108. LRP cooperatives differ considerably in terms of their capacities and challenges. Three groups of cooperatives can be distinguished: high potential cooperatives, losing momentum cooperatives, and still nascent cooperatives.
Group 1: High potential cooperatives
109. Some cooperatives emerge as promising in terms of their capacity to develop business linkages.
28 Some farmers were cultivating on the land before, but some of them received a plot there only later once they joined the cooperative. They pay a tax to access this land but it is less expensive than renting.

Baseline Report - February 2018 | P a g e
25
Figure 6. High potential cooperatives’ abilities representation (scoring based on
qualitative data collection)
110. These three cooperatives have relatively balanced abilities ‘to be’, ‘to do’, ‘to relate’ and ‘to perform’ (see figure above). They are able to aggregate relatively big quantities of maize whilst offering several services to their members. They are relatively well managed and already have a base to fund their activities. They are well connected to their environment (though market information is very limited) and are able to develop partnership without being overly dependent on a single partner.
Group 2: cooperatives losing momentum
111. These are cooperatives that are facing production losses, governance or management issues (or theft) which have stopped the cooperative from developing. The problems differ from one cooperative to another and abilities are also different (therefore showing a less balanced result) but the end result is similar: loss of interest from member and difficulties for leaders to galvanize the cooperative and to conduct collective activities.
Figure 7. Cooperatives losing momentum abilities representation (scoring based
on qualitative data collection)
Group 3: Still nascent cooperatives.

Baseline Report - February 2018 | P a g e
26
112. The situation of these cooperatives is relatively similar to group two but for different reasons. These cooperatives are young and have not yet developed their business or functioning model. Overall their capacities are still weak (see figure below). These are recent cooperatives that need to be supported to be able to develop strong relation with their members and sound business systems.
Figure 8. Nascent cooperatives abilities representation (scoring based on
qualitative data collection)
2.4. Evaluation question 3- How does the LRP project affect male and female SHF capacity and behaviour?
113. For LRP to achieve sustainable impact capacity’s strengthening is a key element. The objective is that farmers gain the knowledge and skills to change their behavior, not only because a project is supporting them and they are expecting direct benefits but because they are convinced that this change will be profitable for them. At baseline level, the objective is therefore to analyze the current SHF and cooperatives production and marketing behavior to understand the cause and explanations of their choices. During the final evaluation, the SHFs and cooperatives’ situation will be assessed again to establish whether LRP has managed to act on the underlying factors of their behavior. If some change happens at this level than the impact of the project will be sustainable. Key findings and conclusions – Question 3
• Farmers have very limited market information which weakens their capacity to have good marketing conditions for their products.
• Market information is limited to information on prices (from local traders and middlemen and from relatives or the district agronomist).
• SHF knowledge on technical itinerary and input use is relatively good.
• Sustainability of crop systems, adequate crop rotation, erosion control and soil fertility management are less known by SHFs, although these issues are affecting their production.
• Farmers usually use improved seeds and fertilizers on the cooperative plots, but far less on their personal hillside plots.
• Most SHF receive some extension services, mainly from the agronomist and

Baseline Report - February 2018 | P a g e
27
development partners.
• Extension focuses on technical issues. Sustainable production, post-harvest handling and economic analysis are not sufficiently taken into consideration.
• Farmers’ knowledge of post-harvest practices is limited to mature harvesting and drying. Information on cleaning and sorting grains is not common.
• Productive investment is limited. Farmers use casual labour services to face peak of activities but they also sell their own labour.
• Access to credit is limited (both for formal institutions and from middlemen). Farmers prefer receiving credit from their informal saving and credit groups or selling their workforce to finance their agriculture activities. Farmers recognize that having access to credit can be interesting but they consider it as risky because of climatic hazards. Main limiting factors are the lack of capacity to prepare loan applications and to manage funds, and the need to secure a guarantee and collateral.
2.4.1. Sub-question 3.1.: What knowledge do SHF have of options and alternatives? Are
there differences between male and female farmers?
Quantitative findings
114. The quantitative analysis focused on SHFs knowledge and application of the good practices as well as on the access to extension services.
• Almost all 92.7% (males 94.5%, females 90.6%) of the SHF have heard about good agricultural and post-harvest handling practices.
• Government agricultural extension workers (70.5%), cooperatives (59.6%) and NGO’s (32.1%) are the main sources of information on good agricultural and post-harvest handling practices.
• High potential cooperative members mainly receive training on good agricultural practices from their cooperative (75.8%) however members of cooperatives of different sizes and ages receive trainings mainly from government extension workers.
• Though SHF are trained on most of the good agricultural and post handling practices, almost all the SHF are trained on use of fertilizers (98.4%), planting and spacing (97.9%) and when to harvest (91.4%). There is no notable difference between male and female SHFs.
• Almost all SHF’s who reported to have been trained on different agricultural practises reported to have been practising the same but use of fertilizers (98.4%), planting and spacing (97.9%) and timely harvesting (91.4%) are the most practised. There was no notable difference in the practise of good agricultural practise between males and females and also among members of cooperatives of different sizes, capacities and ages.

Baseline Report - February 2018 | P a g e
28
115. More than three quarters of the SHFs reported to have received extension services see table below). The GoR remains to be the main provider of extension services (78.4%) to SHF’s among other providers including local and international NGO’s (34.0%) local CBO’s (44.3%), WFP and other UN agencies (11.2%). However, more SHFs from smaller cooperatives (85.7%) rely on extension services from the government compared to members of medium (76.4%) and large cooperatives (79.3%). There was a marginal difference (p=0.049) between males (74.8%) and females (69.4%) in relation to receipt of extension services. The illustration below details the extension services to SHF’s.
Table 8: Access to extension services (quantitative data collection)
Frequency Percent Valid Percent Cumulative Percent
No 231 27.6 27.6 27.6
Yes 605 72.4 72.4 100.0
Total 836 100.0 100.0
Table 9: Source of extension (quantitative data collection)
Responses
Percent of Cases N Percent
Source of
extension services
WFP and other UN agencies 68 6.7% 11.2%
Government extension workers 475 46.7% 78.5%
Local and international NGO's 206 20.3% 34.0%
CBO's 268 26.4% 44.3%
Total 1017 100.0% 168.1%
Dichotomy group tabulated at value 1.
Table 10: Source of extension according to the size of cooperatives (quantitative data collection)
Cooperative size
Total Large Medium Small
WFP and other UN
agencies
Count 40 26 2 68
% within coop size 10.2% 13.1% 14.3%
Government extension
workers
Count 311 152 12 475
% within coop size 79.3% 76.4% 85.7%
Local and international
NGO's
Count 139 65 2 206
% within coop size 35.5% 32.7% 14.3%
CBO's Count 161 101 6 268
% within coop size 41.1% 50.8% 42.9%
Total Count 392 199 14 605
Percentages and totals are based on respondents.

Baseline Report - February 2018 | P a g e
29
Market information
116. Farmers who do not have information on main markets, buyers and prices tend to take their productive and commercial decisions based on minimizing risks, rather than on balancing risk and profits. Market information enables farmers to identify new market opportunities and to have a stronger bargaining power.29
Figure 9. Cooperative sources of information (qualitative data collection on 11
cooperatives), multiple choice options
117. According to the results of qualitative data collection, for most of the cooperatives, access to market information is limited to information on price. Information on markets, organization of the value chain, buyers and demand is very limited.
118. As seen in the figure above, most cooperative sources of information are local. None of the cooperative is aware of the e-soko market information system30. Information is collected mainly by sending members to visit the markets or processing units before trying to sell their maize, or through local traders. In one case a cooperative (CCM Muganza) mentioned they used to have a committee that would travel to Kigali to collect information on price and to find buyers, but this was abandoned when the strategy was found to not be cost-effective (they had to pay for travel fees but could not get any market). Eight cooperatives do not seek out market information. In this case, the price is imposed on them by buyers and middlemen.
119. The agronomist reportedly plays a key role in market information. S/he informs cooperatives of the minimum price fixed by the government. However, this price is considered as very low. Some cooperatives hold meetings between members to discuss and collectively decide on the price for their products. However, cooperatives may not succeed in selling at this price.31 Most cooperatives are convinced they would benefit from better market information, but only a few can give specific reasons.
29 Experiences from other country show for example that market information systems (MIS) can have a very positive impact on farmers’ income. In Uganda, for example, the introduction of MIS led to a 15% price increase for maize and a 32% increase of the volume of sales for agriculture products in genera (Reference : les systèmes d’information sur les marchés agricoles dans les pays en développement : nouveaux modèles, nouveaux impacts, Galthier, David-Benz, Subervie, Egg, 2014). 30 E-soko has been established in 2011 by GoR. It enables farmers to access information on prices of agricultural products through their mobile phone or internet on a weekly basis. 31 Most of the cooperatives that have consulted members on the price have sold at a cheaper price because they could not find buyers at the agreed price and could not wait.

Baseline Report - February 2018 | P a g e
30
120. Information on formal buyers (big buyers) is very limited. Cooperatives do not know buyers. One cooperative mentioned that they were scared of this type of markets because they did not know the conditions. Some cooperatives (Abemerihiigo and Iciyerekezo) believe they can get a better price on the local market (especially by targeting processing units). These cooperatives also stated that the WFP price is far too low to interest them.32
SHFs knowledge of production practices
121. For SHFs, good agriculture practices correspond to what is promoted by the GoR through the sector agronomists. This includes respecting the technical itinerary (spacing for example), using fertilizers and improved seeds, and harvesting when the maize is mature. Annex 7.1provides further details on these practices and on SHFs specific knowledge about them. However, good agriculture practices have a broader meaning and include growing crops in ways that both optimize productivity and ensure sustainability.
122. Overall, knowledge on technical itinerary and inputs use is relatively good (except for pest management) as far as maximizing production is concerned. Sustainability of cropping systems, crop rotation, erosion control and soil fertility management are far less known by SHFs.
123. The attitude of producers and cooperatives toward intercropping is mixed. Following the official recommendation from the RAB they consider that mono-cropping is the best way to boost productivity and they respect it but they also perceive it as very risky (their traditional system usually combines numerous crops on the same plot). All the cooperatives met have a rotation pattern for their crops but introduction of leguminous crop is not systematic and producers were not considering it as an issue.
124. The main source of information on production for SHFs is the sector agronomist. At the beginning of each season, s/he advises them on the appropriate quantity of seeds and fertilizers to use. Also, most of the cooperative have received some training on agriculture production by NGOs or UN agencies. Information is also shared between farmers when they are working on the cooperative plots.
SHFs knowledge of post-harvest handling
Figure 10. Cooperative knowledge on post-harvest handling practices (qualitative
data collection, on 11 cooperatives multiple option choice)
32 The cooperatives mentioned that the WFP price is the minimum price + 10 RwF/kg (0.01 USD).

Baseline Report - February 2018 | P a g e
31
125. Good post-harvest-handling practices stimulate agricultural production, prevent post-harvest losses and add value to agricultural products. They are critical issues to improve quality of the food produced by SHF. For maize, the main issue is to bring down the maize grain to a 13 percent moisture level. That requires an adequate drying as well as a timely harvesting. Other important practices are grading out clean from infested or contaminated grain before storage. Proper storage practices include cleaning storage space, good aeration and avoiding storage with other products, especially one that can contaminate maize. For bean, good practices include improved threshing and sorting before storage as well as preventing measures to reduce infestation during storage.
126. The baseline shows that farmers have a lower knowledge on post-harvest handling practices than they do of agricultural practices. The figure above shows that the majority of cooperatives know that they have to harvest maize when it is mature and that maize must be dried. However, they have no information on how to guarantee sufficient dryness of the maize and on the minimum drying time. Good practices in terms of post-harvest handling are not well known by SHF and cooperatives. Information on cleaning and sorting the grain is not common and farmers do not know how to store maize in a good condition.
SHFs access to relevant extension services from LRP implementing partners and from
the government
127. It was clear from FGDs (and confirmed by the quantitative survey) that most farmers have received extension services. The first source of extension service is the sector agronomist who is guiding farmers in organizing the season and provides information on farming practices they have to apply. However, the sector agronomist does not providing day to day extension support. The system implemented by the GoR is the farmer to farmer approach” (“twigire muhinse” system), where a voluntary model farmer is in charge of supporting a group of farmers. However, model farmers are apparently not always well identified (only three cooperatives mentioned that there were model farmers in the area).
128. Access to extension services is well-developed already but there are still issues that should be taken into consideration in the strategy and implementation of the LRP. Extension service is mainly focused on technical issues and implementation of the government standards on maize and bean production. Post-harvest handling is supposed to be part of the extension package, but it is not much developed. Similarly, technical issues and support are not linked with an economic analysis of farmers’ expenses and profit, which does not help farmers acquiring a business-oriented vision of agriculture.
2.5. Male and female SHF choices around short term productive assets, marketing and good practices. What are the benefits?
Quantitative findings
129. The quantitative analysis focused on SHFs investment on short term assets (seeds, tools, fertilizers, and casual labor). The analysis also covers the cropping choices of SHFs, access to credit.

Baseline Report - February 2018 | P a g e
32
130. Seeds: More than nine in 10 SHF’s reported to have purchase seeds in the last planting session A and B. 88.6% reported to have purchased maize seeds while 51.3% reported to have purchased beans seeds.
131. On average, SHF’s spend an average of 12168.9 RwF (14.49 USD) (min 0, max 300000, sd. 22552.8) on purchase of seeds. There was no noted significant difference on the average amount spent by females (av. 11345.73 RwF, 13.51 USD) and males (av. 12862.37 RwF, 15.32 USD) on the purchase of seeds. The difference in amount spent by SHF on seeds was though significant among members of large (Av. 14537.8 RwF, 17.31 USD), medium (Av. 8270.2 RwF, 9.85 USD) and small (Av. 2939.3 RwF) cooperatives.
Table 11: Seeds purchase (quantitative data collection)
Frequency Percent Valid Percent Cumulative Percent
No 29 3.5 3.5 3.5
Yes 807 96.5 96.5 100.0
Total 836 100.0 100.0
Table 12: Purchase of maize and beans seeds according to gender (quantitative data collection)
Gender
Total Female Male
Maize number 316 399 715
% 88.3% 92.8%
Beans number 197 217 414
% 55.0% 50.5%
Total number 358 430 788
Percentages and totals are based on respondents.
Table 13: Amount spent on seeds (quantitative data collection)
Gender Mean N Std. Deviation Minimum Maximum
Female 11345.73 369 21789.056 0 229600
Male 12862.37 438 23178.861 6 300000
Total 12168.89 807 22552.830 0 300000
132. Tools: Most of the SHF’s (81.8%) purchased tools during the last planting season A and B and on average SHF spent F 4271.93Rw, 5.09USD (min 0, max 65200, sd. 4963.8) on tools (see table 15 below). It is a very small amount compared to other expenses.
133. Fertilizers: Almost all (91.3%) the SHF ‘s reported to have used fertilizers in the past the past season A and B. More than half (59.2%) of the SHF’s reported to have purchased the fertilizers from agro dealer (35.8% from cooperatives and 16.5% from government donations). On average, SHF’s spent 13114.12 RwF on fertilizers

Baseline Report - February 2018 | P a g e
33
(min 0, max 125000, sd. 17856.24) with males spending significantly more (average 16401.22 RwF) compared to females (av. 9009.33 RwF)33.
Table 14: SHFs use of fertilizers
Frequency Percent Valid Percent Cumulative Percent
No 73 8.7 8.7 8.7
Yes 763 91.3 91.3 100.0
Total 836 100.0 100.0
Table 15: Sources of fertilizers (quantitative data collection)
Responses
Percent of Cases N Percent
Government donation 126 12.6% 16.5%
Local and international NGO's 89 8.9% 11.7%
Cooperatives 273 27.4% 35.8%
Donations from friends & family 28 2.8% 3.7%
Purchase from agricultural dealers 452 45.3% 59.2%
Others 15 1.5% 2.0%
Borrowing from friends and family 15 1.5% 2.0%
Total 998 100.0% 130.8%
134. Casual labor :50% of the SHFs hire casual labor for the last planting seasons. Men are more frequently hire casual labor than women. As table 15 shows, casual labor is the main source of expenses for SHFs.
Table 16 : Use of casual labour by gender (quantitative data collection)
Gender
Total Female Male
Household use of
casual labour
No Count 229 184 413
% 55.4% 44.6% 100.0%
Yes Count 154 269 423
% 36.4% 63.6% 100.0%
Total Count 383 453 836
% 45.8% 54.2% 100.0%
33 15.6 USD on average, 19.53 USD for males and 10.73 USD for females

Baseline Report - February 2018 | P a g e
34
Table 17 : Amount spent by SHFs on fertilizers, tools and casual labour
N Minimum Maximum Mean Std. Deviation
Amount spent on
fertilizers 441 0 125000 13068.80 17820.169
Amount spent on casual
labour 410 1400 9000000 72107.93 446626.200
Amount spent on tools 666 0 65200 4305.40 5019.273
135. Cropping choice and size of the plots: Normally, almost all the SHF household plant maize (97.5%) and beans (98.8%). The other crops planted by households include sweet potatoes (79.4%), vegetables (36.1%) and Irish potatoes (34.3%) among others. In the past planting season, A, this trend was consistent but with fewer households planting beans (91.4%), maize (67.0%) sweet potatoes (53.5%) and vegetables (19.7%) compared to the number of households who reported to normally plant these crops. In season B, there were even fewer SHF’s who planted maize (44.7%), beans (82.9%), sweet potatoes (42.7%) and vegetables (24.6%). On average, SHF’s allocated 0.156ha for maize (average of 67.1% of the total farm land owned by SHF’s) and 0.185ha (62.06% of the total farm land owned by the SHF’s) for beans in the planting season A compared to 0.136ha for maize (56.6%) and for beans 0.171ha (55.5%) in season B. The amount of land allocated to both maize and beans was significantly higher is males (maize 0.197ha, beans 0.233ha) compared to females (maize 0.099ha, beans 0.126ha); (p>0.001) in season A. However, for season B, the amount of land allocation was only significantly high for beans among males (males 0.206ha, females 0.127ha; p>0.001) and not for maize.
Table 18: Area planted for maize and bean (quantitative data collection)
N Minimum Maximum Mean Std. Deviation
Area planted maize 568 .0012 2.0000 .155803 .2510013
Area planted bean 764 .0015 4.0000 .184589 .2929460

Baseline Report - February 2018 | P a g e
35
Table 19: SHFs cropping choices
Responses
Percent of Cases N Percent
Maize 815 19.9% 97.5%
Coffee 81 2.0% 9.7%
Vegetables 302 7.4% 36.1%
Bananas 138 3.4% 16.5%
Tea 1 .0% .1%
Peas 51 1.2% 6.1%
Groundnuts 48 1.2% 5.7%
Sorghum 343 8.4% 41.0%
Beans 826 20.2% 98.8%
Soybeans 199 4.9% 23.8%
Others 25 .6% 3.0%
Irish Potatoes 287 7.0% 34.3%
Rice 83 2.0% 9.9%
Sweet potatoes 664 16.2% 79.4%
Cassava 236 5.8% 28.2%
Total 4099 100.0% 490.3%
136. Access to credit: In the last planting session, about 1/5th 0f the SHF’s (62.3% males, 37.7% females) required a credit/loan to finance their agricultural activities. Mainly the SHF’s required the credit facilities/loans for purchase of farm inputs (64.6%) and paying for farm labor (27.4%). Of the SHF who required the loan, 69.7% (males 59.0%, females 41.0%) received it. The loans/credit facilities were mainly secured from banks and MFI’s (37.7%), friends and family (32.0%) and from cooperatives (10.7%). More males (47.2%) opted for loans from banks and MFI’s while more females (42.0%) opted for (42.0%) opted for soft loans from friends and family. Main reasons mentioned for not receiving the loan is the lack of collateral.
Table 20: SHFs main reasons for acquiring credit
Responses
Percent of Cases N Percent
Purchase farm inputs 113 46.5% 64.6%
Sustain family during the faming
season
28 11.5% 16.0%
To pay for labour 48 19.8% 27.4%
To purchase extra land 17 7.0% 9.7%
To pay for extension services 32 13.2% 18.3%
To pay for transportation costs 5 2.1% 2.9%
Total 243 100.0% 138.9%

Baseline Report - February 2018 | P a g e
36
Investment in short term productive assets for maize and beans
137. With LRP’s intervention lasting only two years, it is very unlikely that the interventions promoted by the programme will produce structural changes in the income and livelihood of farmers. Therefore, to assess the potential of LRP programme to create some change in the long run, changes in short term choices made by farmers need to be analyzed. The hypothesis is that if farmers are convinced of the interest of maize and beans they will invest in the crop through renting more land, purchasing more tools, and using more inputs. Also if the crop takes a commercial orientation, it is likely that SHFs will use more labor.
138. First, investment in productive assets is not a priority for farmers. It was clear from the FGD that if farmers had the opportunity (hence more funds) they would first invest in paying school fees and collective health insurance, then purchase personal items (clothes, equipment for the house) and then invest in saving through their saving and credit groups. Detailed information on SHFs investment in short term productive assets is in Annex 7.4. Quantitative analysis on productive assets is in Annex 7.
139. Farmers are renting land already. The two main reasons for renting land is because farmers do not have enough land for their households and because they need more land to feed their family. Only a small number of farmers are actually able to rent land to produce for the market (and use the cooperative plot for this purpose). Apparently, farmers do not have difficulties in finding land, but the limiting factor is clearly their ability to buy for the rent of land.
140. Regularly investing in tools is compulsory for farmers. They have to purchase hoes every year as they are getting worn out after six months to one year of utilization. Other small equipment is not frequently used (shelling tools and pesticide sprayers).
141. Hiring casual labor concentrates agricultural activities over a short period of time at the planting season. Casual laborers mainly work on land preparation (clearing the land, preparing the soil) and they also help farmers to transport products (for example farmers use sticks to plant beans, and they often ask a laborer to bring these to the plot). Labor cost is similar in all the villages visited (. Finding laborers is not difficult, and they usually find laborers amongst relatives or in their nearby environment. Most farmers also work as casual labors themselves. Actually, this is the main way for farmers to get cash when they face an unexpected expense, or when they need to purchase agriculture inputs.
142. All the cooperatives try and follow the recommendation from the sector agronomist concerning the quantities of inputs to be used on the cooperative plots. On their own hillside plots, farmers mentioned that is impossible to respect the established standards. Farmers all try to apply some fertilizers as they consider it is impossible to produce without fertilizers but sometimes the quantity applied is very low (about 25 to 50 percent of the recommended quantity). Most farmers do not plant improved seeds on their personal plot. An important issue with improved seeds is their timely availability. Farmers need to have their seeds early enough in the season so their crop can benefit from the rain. From the last two seasons, farmers reported encountering numerous difficulties in accessing seeds early enough. It is clear from the FGD that high costs limit the use of fertilizers by SHF. The SHFs know they will get a better production with fertilizers, but they cannot afford the costs of

Baseline Report - February 2018 | P a g e
37
the full dose. Their strategy is therefore to apply a minimum quantity in all their plots.
143. This insufficient use of fertilizers is not only an issue for production, but it questions the sustainability of their cropping system. Maize is a very nutrient demanding crop, there is no period of fallow, and in some case SHFs do not even add beans in the crop rotation. There is a risk that this will result in a decrease in soil fertility in the medium term. This phenomenon is amplified by the fact that farmers do not use enough manure.
Area cultivated with maize and beans
144. Statistics on the areas cultivated in the different districts for the main crops are in Annex 7.6. To be able to establish whether LRP will result in an increase in the area cultivated in maize and beans, information was collected during the baseline study on the area cultivated by LRP farmers before intervention.
145. Both maize and beans are cultivated both on the cooperative plots and on farmers’ own plots on the hillside. For maize, priority is given to cultivation in the marshland, because farmers consider they can get a higher production. Beans are grown everywhere because it is the most important consumption crop.
SHF access to credit
146. Access to credit is a key to better agricultural results. Access to finance enables investments, which in turn improves economic performance of SHFs.34 Farmers do not have enough funds to purchase an adequate level of inputs. At the same time a majority of SHFs consider that they do not need credit. This shows a lack of understanding of credit purpose and a fear of credit. Farmers prefer growing with their own limited means even if it means they will have a lower production at the end. Farmers also sell their workforce to purchase farm inputs. Only a minority of SHFs report acquiring informal credit from middlemen to purchase inputs.
147. The quantitative survey found that 68.2 percent of the credit requests concern financing of agriculture activities (inputs or/and labor). Only a small percentage of loans are used to invest in land. This is in line with the credit institutions’ policy - they only provide SHFs credit for business activities, not for investment.
148. Information on the loans available to farmers was analyzed in evaluation question 2.2 above. Most farmers who submit a loan application receive credit. It confirms that there is globally a good knowledge and understanding at farmers level of the conditions needed to get credit.
149. Constraints on the credit system have already been explained in sub-question 2.3. Key barriers to SHF’s access to credit relate to: the requisite skills to prepare a loan application, capacity to manage loans and funds, need for an active bank account with at least 20 percent of the required funds, and unavailability of the required collaterals. Climatic hazard is a major issue. Results of the cropping seasons are increasingly difficult to foresee.35 So far, there is no crop insurance system available for farmers. Also there is a need to take a more global approach to the credit
34 Rural financing market in Rwanda : determinant of farmers Housholds credit rationning in formal credit market, Wageningen university, 2012 35 Several cooperatives explained that due to floods or droughts, they had poor production in three out of the four last seasons.

Baseline Report - February 2018 | P a g e
38
needs. It is very understandable that if a farmer need funds to pay food for his family and gets credit to purchase inputs he will use part of the credit to purchase food, even if that will hamper his potential production (and therefore his ability to repay the loan).
150. Soft loans and informal credit are important in facilitating farmers’ access to credit, and do so in a simpler and more accessible way. Savings and credit groups are relatively common. These groups are important because they encourage savings. At the same time, some of the problems affecting formal loan systems also affect these groups. Poor management of funds is a frequent source of conflict amongst members and can also affect the cooperative’s functioning as saving and credit groups as it affects willingness to participate in cooperative initiatives. Cooperative leaders mentioned that when they had to intervene in conflict solving in the cooperative it was very frequently linked to loan repayment difficulties by members (hence blocking loan attribution to other members).
SHF practices in production and post-harvest handling
151. Qualitative findings on good practices show that not all practices are adopted, and that there is a difference in the practices on cooperative plots as compared to personal plots. Annex 7.9 provides further information on the adoption of the different practices.
152. Use of seeds and fertilizers has already been analyzed. Use of manure is insufficient and use of lime is extremely rare even though both are crucial in improving productivity and maintaining soil fertility. Farmers are unaware of the recommended quantities and they apply only what is available. Other practices (planting in line, respecting spacing, sufficient weeding) are relatively well respected by SHFs.
153. There is a low adoption of good practices for post-harvest handling. Farmers have little incentive to invest in good practices as there is no increased added-value for a better quality of maize (and even less for beans), seeds, and no storage which would allow farmers to benefit from higher prices.
154. Farmers are aware that drying is important – especially given the relatively frequent rainfall - but nonetheless spend little time on drying. Drying is mainly done on plastic sheets. It is never done directly on the ground, which would limit contamination from foreign matters. Farmers usually dry maize in cobs for between four days and one week. In the rainy period drying time can increase to a month. Farmers dry maize again after shelling (for about a week). This drying time is not sufficient for high end buyers (and for local processing units).
155. Shelling is done manually. After shelling farmers do not remove damaged grain, which may cause problems of contamination and of conservation of the maize. Winnowing is done but not in a way to effectively removed foreign matter.
156. When farmers are storing maize, they do not usually use pesticides because of the associated costs. Farmers seem to have a low awareness of good storage practices (no storage on the ground, sufficient aeration, no maize bag touching the wall…) though it was not possible to check what they are actually doing (there was no maize and beans stored at the time of the mission).

Baseline Report - February 2018 | P a g e
39
2.6. Evaluation question 4- What opportunities exist for male and female SHF?
157. Male and female farmers need to have new marketing opportunities if they are to make the change from the current self-consumption oriented farming with low connections to the market and low investment in quality to a quality commercial agriculture with aggregation of big volumes of products at cooperative levels. These opportunities should offset the extra effort and investment needed and should allow farmers to minimize risks and create safe and sustainable outlets and services. A better price will most likely not be enough to lead to a real change of practices.
158. To see this change, opportunities must be present and accessible to farmers (meaning that big buyers must be interested in purchasing maize and beans from cooperatives). But an enabling environment (from the government, service providers, banks…) is also essential to provide the framework for these opportunities to emerge and thrive. Lastly, needs, capacities and strategies of SHFs, both male and female need to be taken into account to ensure that they can actually respond to these opportunities. This EQ examines these elements.
Key findings and conclusions – Question 4
• LRP project has not started to implement school feeding activities. However,
WFP is already implementing HGSF project in Nyaruguru and Nyamagabe
districts
• In the four LRP districts, there is also a school feeding program for secondary
schools, organized and financed by the government. The GoR provides 56RwF
per child per day. That covers around 70% of the needs.
• Concerning WFP current HGSF, food is procured at national level (maize meal
and beans), regional level (salt) and international market (vegetable oil).
2.6.1. Sub-question 4.1 How are pro-SHF and buyers’ partnerships taken into account in
the strategies and policies?
159. The GoR puts strong emphasis on improving the engagement of the private sector in agriculture.36 |The GoR encourages investment, both domestic and foreign, in the agricultural sector and is developing a conducive environment for attracting investments. However policies and strategies are not specifically targeted to promoting SHF contracts with big private buyers in Rwanda. Information on what is required to improve an environment that is pro-SHF and increases contracts between SHF and buyers is in 0.
2.6.2. Sub question 4.2 Are big buyers willing to purchase maize and beans from SHFs?
Awareness by large buyers of cooperatives as business partners
160. The maize sector is dominated by a few relatively large local buyers and agro-processors (according to the association of maize millers, there are 20 millers with a processing capacity above 2000T per week). Africa Improved Food (AIF), and Minimex are the two leaders of the sectors. Other important stakeholders in the sectors are Sarura, RGCC and EAX (Annex 8.1). In parallel, there are increasing numbers of small and medium size processing units operating at district levels.
36 This is the focus both of the PSTA and the Trade Policy.

Baseline Report - February 2018 | P a g e
40
161. All the maize and bean produced in Rwanda come from SHFs. Big buyers consider that the maize value chain is very promising and are very positive of the government efforts to increase productivity and production. There are some issues affecting the maize value chain that are common to SHFs and big buyers and on which value chain dialogue could be built. Price volatility and climatic hazards are the most important ones.
162. Quality of maize produced in Rwanda is considered good in comparison with other countries. However, production is very low compared to neighboring countries. Some maize buyers from Uganda and Kenya who come to Rwanda, mix Rwandan maize with maize produced in their own country and export it back to Rwanda. Buyers report that it is difficult for them to obtain the quality of maize that they are looking for (most of the maize they purchase from farmers is grade 3). Selloing maize on the Rwandese market is not difficult as the demand is very high and consumption of maize is increasing. According to Minimex, Rwanda is still a net importer of maize. For beans, there is no regional dynamic so far. Bean produced in Rwanda is a mix of different varieties, and regional buyers look for a uniform (single bean type) production.
163. Buyers already have good awareness of cooperatives. They see forward delivery contracts as potentially growing because these are profitable both for farmers (who have a guaranteed market which encourages them to invest in quality) and for firms (which can access aggregated volumes of products, hence reducing transaction costs).37
Existence of buyers purchasing maize beans from cooperatives
164. There is no overview list of the current big buyers in the maize and bean sector. Buyers who were met during the baseline are all purchasing from cooperatives, regardless of having been previously included in the FTMA project.
Volumes of food procured by WFP from pro-SHF buyers and percentage of food from
the platform going to buyers other than WFP
165. LRP’s activities have not yet started so the volume of food procured by WFP from proSHF buyers is zero T (and zero percent of the food from the platform is going to other buyers.) However, these activities are not new for WFP so results from previous programs can provide useful insights for baseline values.
166. For season A 2016-2017, 4300T of maize have been aggregated by over 70 cooperatives under the FTMA program. The volume of maize contracted was 4900T, implying that most contracts were fulfilled by cooperatives. Contracts were signed with RGCC (46 contracts), Prodev (19 contracts) and Sarura (three contracts). For season A 2015-2016, the volume contracted was 9085T and the volume delivered 2560 T38. This shows that the quantity aggregated has increased and that contracts have been respected. It also suggests better selection of the cooperatives to engage in the contract process to avoid defaulting. Results from the last season are lower: 827T were procured from cooperatives in FTMA in 2017.
37 All companies mentioned that transaction costs affect their activities. 38 Data are different according to different documents and info provided by WFP (see for example the FTMA april to june 2017 update)

Baseline Report - February 2018 | P a g e
41
2.6.3. Sub question 4.3 - Are producers able to respond to demand from big buyers?
Cooperatives’ quality standards management
167. Cooperative need to control and monitor the following aspects to ensure quality produce: humidity levels (the acceptable rate for EAC standards is 13.5 percent), presence of foreign matters, broken grains, presence of mold, damages from insects or other animals (rats), uniform color, absence of bad smell. Cooperatives must also regularly inspect their drying space and their warehouse to control insect infestation and to check for water leakages in the warehouse.
168. Awareness on quality and quality monitoring is low at cooperative level. One cooperative sold maize to AIF in the last season and checked the moisture level which was found to be 16 percent (for a cooperative that is already well organized and has a drying space). Cooperatives are aware of the existence of certain quality product exist (such as minimax flour) but they consider that quality is linked to the quality of the processing. They also believe that local processing units mix their maize with low quality maize from Kenya (which is true) or with cassava and sorghum flour.
169. Cooperatives do not grade the maize they receive from members and they only control that the maize has been harvested at maturity and that it is dry enough. They do not have specific monitoring system. Cooperative requirements are even less demanding for beans (these are only checked for dryness). This basic control is done visually and they also check how hard the grain is to evaluate if drying is sufficient. Cooperatives do not usually reject any production from members. Local buyers do not offer a higher price for good quality maize, but when they purchase maize that is not cleaned and not dried enough, they do a second cleaning and drying at the processing unit level before processing maize into flour.
Numbers of contracts signed between cooperatives and buyers and volumes of products
purchased by big buyers
170. Only Coamanya Gishubi sold 120 T of maize to AIF in season A 2017. No contract was signed because the buyer had enough funds available to purchase all the production at once. So far, contracts are signed only when a buyer has seen some production and want to make sure the product will not be sold elsewhere. Only Duterimbere cooperative signed a contract with a Korean animal feed processor (this was not a forward delivery contract) and only five cooperatives are actually aware that there are big buyers ready to purchase maize.
Current situation in terms of contracts’ defaulting and adaptation of contracts
conditions to the needs and constraints of buyers and SHFs (in terms of schedules,
transport, time of payment, quality and price)
171. As only one of the LRP cooperatives has signed a contract with a buyer it was impossible to assess contract defaulting for these cooperatives. However, big buyers have experience working with cooperatives and they consider that defaulting is an issue. Buyers report that defaulting has reduced over the last years (with sensitization made by government and development partners). Minimex, for example, now has a defaulting rate of about 40 to 50 percent which represents a considerable improvement as they used to have a 90% defaulting rate.

Baseline Report - February 2018 | P a g e
42
172. None of the buyers provide advance payments or finance inputs (which would then be repaid after harvest). Buyers consider it too risky as farmers may take the advance and sell to another buyer.
173. Overall, stronger enforcement of contracts is needed. Some cooperatives sign contracts with several buyers and then decide after harvest where they are going to sell. So far, contracts are not seen as binding arrangement by farmers (the same applies to some smaller companies). Annex 9.2 provides more information on the constraints on contracting.
2.7. Evaluation question 5- How does the procurement, delivery, and distribution of the modality for school feeding which is promoted through LRP compare – in terms of cost-effectiveness and timeliness - to the alternative modalities of food procurement?
Key findings and conclusions – Question 5
• LRP project has not started to implement school feeding activities. However, WFP is already implementing HGSF project in Nyaruguru and Nyamagabe districts.
• In the four LRP districts, there is a government funded school feeding program for secondary schools. The GoR provides 56RwF (0.07 USD) per child per day. This covers around 70% of the needs.
• WFPs current HGSF programme procures food at national level (maize meal and beans), regional level (salt) and on the international market (vegetable oil).
2.7.1. Sub-question 5.1.Information on the price of school meals
174. Eight schools were visited for the purpose of the baseline (two per LRP targeted district). One of the schools has only a primary SF programme supported by WFP (Mugombwa Primary in Nyamagabe District), three schools have primary and secondary SF programmes supported by WFP and the GoR respectively, in conjunction with parents (St. Nicholas Cyanika in Nyamagabe District, G.S. Kibangu and G.S. Kiyonza in Nyaruguru District). The four remaining schools (Kabusanza and G.S. Karama in Huye and Rwamiko and G.S. Nyagahuru II in Gisagara) have the SF programme only at secondary level with covered by the GoR in conjunction with parents’ contributions.
175. At primary level the school meals commodities are purchased by WFP from national traders (maize meals and beans), regional market (salt) and international market (vegetable oil) and delivered to the schools. The secondary level, uses the government funding to purchase school meals from local traders who comply with the conditions of the formal public tendering process. The purchasing price fluctuates depending on prevailing market conditions. The local traders buy food either from local processing units (for maize meals), from local SHF (either directly or through cooperatives) or from national and regional market depending on the availability of products. For secondary schools, the contribution from the government is of 56 RwF/child/day (0.07 USD) and this cover about 70% of the needs (the rest being normally covered by parents). Therefore, the price of a school meal can be estimated about 80 RwF/child/day (0.10 USD).
Baseline Report - February 2018 | P a g e
43
2.7.2. Sub-question 5.2- Procurement, distribution and delivery time of different food
procurement modalities, and situation with respect to pipeline breaks
176. This sub-question will be covered during the end-line. Meanwhile, from the field interviews, the WFP supported SF programme (primary schools) is facing some challenges such as accessibility to schools, especially during the rainy seasons, and the delays of donor funds which affect the delivery of food. To prevent the pipeline breaks food is delivered before stocks run out.
For the secondary programme, funding from parents and the government is not sufficient and meets about 70% of the needs. This is because the parental contribution may fall short of what is expected (i.e. when parents cannot pay) and the government contribution may be delayed. The shortfall is met with produce from the school garden, and other strategies such as reducing portion sizes and feeding only those children whose parents have contributed (others go home or do not eat). In schools where there is also a WFP school meals targeting primary pupils, food sharing between target beneficiaries (primary) and non-target beneficiaries (secondary and pre-primary) is frequent.
177. The WFP commodity rations (also used by the GoR in secondary SF) are as follows: MML (120g/person/day), Beans (30g/person/day), salt (3g/person/day), and vegetable oil (15 g/person/day). Vegetables are mainly harvested from the school garden, brought locally, or are provided to schools free of charge by parents as their contribution. Feeding days are usually 22 days in a month, 180 per year. The costs of firewood, water, and other inputs varies from school to school depending on the capacity of the school and parents.

Baseline Report - February 2018 | P a g e
44
2.8. Evaluation question 6- How does the LRP project affect male and female SHF?
Key findings and conclusions – Question 6
• SHFs cropping choices are mainly driven by households food needs. Another important element of strategy is minimizing risks (climatic hazards, pests…).
• Crops that contribute the most to farmer income are maize, coffee and Irish potatoes. Bean is not seen as a source of income.
• Farmers are limiting production risks through mix-cropping practices and use of crops that are considered as famine crops (cassava and sweet potatoes)
• Income generating crops are gaining importance (mainly maize). Beans are also a high priority crop for farmers.
• With the current production practices maize and beans production a not profitable. For both crops, it is currently less economically interesting for a farmer to work one day in his maize or bean farm than to sell his workforce.
• Providing there is no climatic hazards or pest attacks, both crops can be profitable if producers apply good practices, adequate level of fertilizers, and use improved seeds.
• Sustainability of the cropping system is an issue. It is not possible to apply the recommended level of manure and to generate profits. On the long run, that will reduce soil fertility.
178. In order to increase the volume of food procured locally, the marketable surplus of each individual farmer needs to increase. This way, more maize and beans will be sold to buyers who will in turn supply WFP and other clients (including schools). The impact of this increase should lead to a better income for farmers. It is therefore essential to have information on the current income of farmers. Due to time constraints, it was not possible to conduct a full analysis of farmers’ income. However, the qualitative data collection, allows insight into the key factors influencing farmers income and to measure the net margin of maize and beans. Indicators and results for qualitative analysis of income are in Annex 8.2 and they are completed with quantitative analysis of the volumes and values sales of maize and beans, compared to the volume and values of sales of other important crops.
2.8.1. Sub question 6.1. Elements influencing male and female SHFs ‘income
Quantitative findings
Volumes and value of maize and beans sales by SHF, disaggregated by gender.
Table 21: Volumes of sales of maize and bean (season A and B) quantitative data collection (in kg)
N Minimum Maximum Mean Std. Deviation
Sales of beans (season A) 813 0 3075 41.47 164.593
Sales of beans (season B) 813 0 171000 234.07 5996.857
Sales of maize (season A) 769 0 3000 94.53 257.741
Sales of maize (season B) 769 0 240000 440.93 8756.651

Baseline Report - February 2018 | P a g e
45
179. On average, SHF earned 285.9 RwF /kg (0.34 USD/kg) from season A maize sales compared to 275.9 RwF /kg (0.33 USD/kg) from sales of season B harvests. For beans, the SHF’s earned an average of 528.6 RwF /kg (0.63 USD/kg) from season A sales compared to 578.9 RwF /kg (0.69 USD/kg) from season B sales. Buyers with contracts offered higher prices per kg compared to other buyers while middlemen offered the lower price (av. price of maize; buyers with contract F 399Rw/kg (0.48 USD/kg), cooperatives 391 RwF /kg (0.47 USD/kg); middlemen 357 RwF /kg (0.43 USD/kg), large buyers without contract 357 RwF /kg (0.43 USD/kg) and individuals 385 RwF /kg (0.46 USD/kg)). The place of sale of maize and beans did not have a significant effect on the price of sale of maize and beans.
180. Contribution of maize and beans to SHFs income :
• Crop farming is the main source of income for more than nine out of 10 SHF households.
• Beans (68.7%), sweet potatoes (31.3%) and maize (34.2%) are the three top crops for SHF’s consumption.
• Maize (37.7%), beans (26.2%) and others (25.8%) are the three main crops that provides SHF’s with more money.
Table 22: Contribution of maize and beans to SHFs income (quantitative data collection)
Gender
Total Female Male
Income contribution 30% to 60% Count 153 206 359
% 39.9% 45.5% 42.9%
Less than 30% Count 93 62 155
% 24.3% 13.7% 18.5%
More than 60% Count 137 185 322
% 35.8% 40.8% 38.5%
Total Count 383 453 836
% 100.0% 100.0% 100.0%
SHF farmers cropping and activity systems
181. SHFs cropping choices are mainly driven by household food needs. Most produce is either consumed by the family or sold to purchase other food products (mainly beans). The crops that contribute the most to farmer income are maize, coffee and Irish potatoes. Crops are labor intensive, mechanization is mostly non-existent. Use of inputs is very limited (except for cooperative plots), most farmers use what they have kept from the previous season or purchase from neighbors. Yields and production are low due to low soil fertility (and acidic soils in some areas), high erosion, climatic hazards (drought and floods), inadequate crop rotation and pests and disease.

Baseline Report - February 2018 | P a g e
46
Figure 11. Positioning of crops in terms of their importance for consumption and
for income (based on responses from the qualitative data collection)
182. Similar crops are grown in the four districts (although with different levels of relative importance) (see Annex 8.1). Detailed information on the different crops grown by SHFs in the targeted districts is in Annex 9.2
183. Avoiding risk is another important factor that determines SHFS cropping choices. by investing in mixed cropping (so that if there is a problem with one crop, the farmer can still rely on the other ones) and relying on tubers that can be kept on the ground and harvested gradually. Income-generating crops have started to gain importance because they can contribute to their food security (purchasing food) and because they give producers the opportunity to sell large volumes of products in one go (hence the possibility to invest in products for the family). The figure below shows for each of the crops what their relative importance is in terms of contributing to income and to the consumption of the family. This confirms the double interest of maize (important for both income and consumption).
Profitability of maize and beans for SHF (analysis of net margins)
184. The results of the economic calculation are in Annex 9.3. The calculations show that with the current practices and in marshland conditions the net margin per plot is similar for both crops. In the current situation profitability is low, in terms of net margin per man day. This makes it less economically interesting for a farmer to work one day on his farm than to sell his workforce as casual labor.39 The system works because SHFs do not measure the work they invest in their farm. What matters at the end of the season is to feed their household and if possible to have a surplus to cover other needs.
39 As noted earlier in the report the price of casual labour is 700 RwF (0.83 USD) per day on the marshland and 1000RwF (1.19 USD) on the hillsides.

Baseline Report - February 2018 | P a g e
47
185. The results are based on the price at harvest time. Yet, the price fluctuates a lot during the season (Price volatility was particularly high in 2017: it varied from 300 to 400 RwF40 and up to 450 RwF per kilo for maize). It was not possible to assess the storage costs and the post-harvest losses as cooperatives met were not storing maize, but there is probably a real potential here, providing storage is made in good conditions.
186. Looking at these results, it is clear that for mono-cropping plots, it is interesting for farmers to invest in quality inputs (improved seeds, recommended doses of fertilizers) even if this is an expensive investment. The level of inputs has a favorable impact on production and the benefit level. For mono-cropping plots, if farmers do not invest sufficiently in inputs then their profit will be lower than they would have had when producing in a mixed-cropping system, and farmers will not be able to purchase the same quantity of food with the extra income. Therefore, mono-cropping is only interesting if farmers use a high level of inputs.
187. These calculations also shed light on the limits of the current system in terms of maintaining soil fertility. Even if farmers were to apply the recommended level of manure to make sure that they maintain the fertility of their soil (10 T/hectares), they will not be able to make any profit even under the most favorable conditions. The same applies for lime application. The current application of manure (and no lime) is enough to give them a good production for a few years, but there is a high risk that the soil fertility declines very fast, especially as beans are not systematically included in farmers crops rotation.
2.9. Evaluation question 7- How and to what extent do producers market food products that meet quality standards and are nutritious and culturally accepted.
188. At baseline level, the evaluation looked at the current quality of the maize and beans products and their characteristic in terms of nutritive value and cultural acceptance. At end line level, the evaluation will examine if SHF use their (improved) income to improve their food supply in quantity and/or in quality.
Key findings and conclusions – Question 7
• The majority of the food that SHFs consume comes from their own production or is purchased locally.
• Quality is not considered an important issue for farmers and awareness of quality standards is very low.
• SHFs do not have a preference for specific maize varieties, but they prefer eating traditional varieties of beans.
• Maize is now regularly consumed by SHF, which was not the case five years ago.
• It will be very difficult for farmers to aggregate and sell big quantities of beans, as they consider it as a key crop to keep for family consumption.
40 From 0.36 to 0.48 USD and 0.54 USD for maize

Baseline Report - February 2018 | P a g e
48
2.9.1. Sub-question 7.1 - Overall quality of maize and bean products consumed by SHF?
Quantitative findings
189. The quantitative survey focused on the quality of what SHFS are consuming and on the quality of maize and bean.
• Beans (68.7%), sweet potatoes (31.3%) and maize (34.2%) constitute the three main
crops consumed by the SHF households (See Annex 10).
• If households do not sell maize and beans, 17.2% of SHF households would
completely cover their maize households needs while 12.1% of households would
completely cover their beans household needs.
• SHF prefer maize and beans harvested at a good time (61.2%), graded (43.4%),
cleaned after harvesting (53.2%), not damaged during threshing and shelling (46.3%)
and properly stored 44.1%.
• Knowledge of good agricultural practices and the educational level of the SHF’s did
not have an effect on the characteristic of maize and beans preferred by the SHF
households.
Table 23: Quality preference for maize and beans consumed by SHFs (quantitative data collection)
Responses
Percent of Cases N Percent
characteristics of maize and beans
Without stones 756 20.2% 90.4%
Without smell 246 6.6% 29.4%
Without insects 562 15.0% 67.2%
Very white maize 17 .5% 2.0%
Specific color of beans 686 18.3% 82.1%
Specific variety of maize/beans 463 12.4% 55.4%
Well dried maize/beans 698 18.7% 83.5%
Others 312 8.3% 37.3% Total 3740 100.0% 447.4%
Qualitative analysis
190. Most of the food that SHF consume is food that they produce. They purchase mainly beans and some maize, but it is also locally produced.
191. Awareness of quality standards is very low at farmers’ level. As one farmer mentioned “we eat what is available, we do not care about quality”. SHF do not have specific quality criteria for maize, other than the color (they prefer maize when it is white). Other factors mentioned in FGDs are the dryness and the cleanliness. However, these criteria are mainly important for buyers who will purchase the produce and do not play a role in farmers’ decisions to purchase for own consumption.41 There is no preference for specific maize varieties.42
41 In some cases, farmers even consume maize damaged by insects. In the case of Iciyerekezo, where maize that was stored was attacked by insects, the production was shared among members because they could not sell it anymore.

Baseline Report - February 2018 | P a g e
49
192. For beans, there is no quality preference. SHFs prefer local bean varieties because they are used to them and know how to prepare them. Only one improved variety is appreciated, it is the iron-enriched one. Farmers are convinced it is better for their health.
2.9.2. Sub-question 7.2 - Evidence that SHF are consuming and marketing food products
that meet quality standards and are nutritious and culturally acceptable
193. In all the FGDs, farmers explained that the production of maize and beans was not sufficient to cover the needs of their households. They also explained that the production of maize could sometimes cover all the family needs, but that this was not the case for the production of beans. The hunger gap period is between September and December, when all the production from the previous B season is consumed.
194. The consumption pattern of SHFs has changed considerably in recent years. Five years ago, maize was barely consumed - it is now one of the important crops. SHFs are eating different types of maize products. Farmers consume mainly locally milled flour and they are satisfied with the quality of the flour. The only issue mentioned is that sometimes maize is mixed with cassava or sorghum flour, which reduces the quality. LRP farmers mentioned that they were eating maize flour at least three times a week and were not experiencing difficulties in finding flour (the price ranges from 500 to 700 RwF/kg (from 0.6 USD/kg to 0.83 USD/kg)). Beans remain the main crop - “the meat for the poor” - and it is consumed at every meal.
Information on the current situation of schools concerning nutritious and cultural
acceptability of food products
195. The daily nutritious cooked meals consisting of maize meal, vegetable oil, beans and salt is provided at school canteens supported by WFP. In addition, vegetables (mainly from school gardens or from in-kind parental contributions) are added to the school meals.
2.10. Evaluation question 8 - What is the level of participation of men and women? Are women well represented, including in leadership positions?
196. This section reviews the place and role of women and men in the maize and bean value chains and in cooperative life (including in decision making and management structures). It also examines the project’s strategic choices.
197. At end-line the evaluation will look at the disaggregated impacts of the intervention on women and whether the overall impact of the intervention differs between men and women.
42 Farmers explained that eating maize is something recent, so they do not have preference for the local ones (the local maize was traditionally used for grilling or to prepare alcohol).

Baseline Report - February 2018 | P a g e
50
Key findings and conclusions – Question 8
• Equal numbers of men and women are members of the LRP cooperatives. On average, 53.2% of LRP cooperative members are women.
• Decisions about membership of a cooperative are made at household level. Participation of a woman in a cooperative is not necessarily a sign of empowerment, as men sometimes send their wives to participate when they perceive cooperatives as not being important.
• Women play a limited role in the decision-making structures of the cooperatives. Factors limiting participation of women in committees are lack of time, insufficient reading and writing capacities, and economic difficulties.
• Both men and women are working on the cooperative plot. However, crop intensification can lead to an increased workload for women, because they do more work in agriculture in general and are also in charge of household chores.
• The commercial exploitation of maize and beans increases the risk of exclusion of women from their traditional activities (handling of food crops).
Place and roles of men and women in the maize and beans value chain
198. Cooperative members seem to have been sensitized on gender issues and discussions with farmers (FGDs) showed that both men and women are working on cooperative plots. Usually, husband and wife work together. However, some activities are more men-oriented (land preparation) and other more women-oriented (planting, weeding, carrying products home), especially in their personal hill plots. Harvesting is done jointly. Women are solely in charge of caring for the children cooking and cleaning the house.
Women participation in cooperatives
199. Overall there is a balanced number of men and women in the cooperatives. On average, 53.2 percent of LRP cooperatives are female and this varies from 39.6 percent (CCM Muganza) to 67.5 percent (Abemerihiigo).
200. Some women participate in cooperative’s activities because they are the head of the family. In most cases, each household decides who is going to be a member of the cooperative. It is not possible for both husband and wife to be a member, as only one member is admitted per household (this was confirmed by all cooperatives met for FGDs). FGD also highlight that participation of a woman in a cooperative is not necessarily a sign of empowerment. In some cases, it is more a confirmation of the low interest that farmers have in their cooperatives as men send their wives to attend meetings and to participate in cooperative activity because they consider these activities unimportant (unlike farm activities). Both women and men participate in meetings at the beginning of the season when the main decisions on cropping practices and strategy are taken. According to women met, they also participate in the decision making.
Place of women in leadership position in LRP cooperatives
201. In spite of their important participation in agricultural and cooperative activities women still play a limited role in the decision-making structures of the cooperatives. During the interviews with cooperative leaders, there was an equal participation from men and women in the discussion. However, only one cooperative

Baseline Report - February 2018 | P a g e
51
had a female president (Icyerekezo) and women are in minority in the executive and supervision committees. Nine cooperatives have three women among the eight committee members (including executive and supervision committees). One cooperative has only two women and the remaining six cooperatives have four women among members of the committee. None of the cooperatives have more women than men in a leadership positions.
202. A positive element of women’s involvement in cooperative decision making structures is that because women are considered trustworthy and honest, they often participate in the surveillance committee. They are also quite often in the treasury for the cooperatives (in charge of fund management).
2.11. Evaluation question 9- Is there emerging evidence that the cooperatives have capacity to create linkages with schools
Key findings and conclusions – Question 9
• None of the cooperative have experience of selling maize and beans to schools. Similarly, no school is purchasing directly from cooperatives.
• Primary schools do not have a budget for school feeding. Only secondary schools can purchase directly from cooperatives (without WFP support).
• Schools generally do not trust cooperatives to deliver quality products.
• Main constraints for the development of direct linkages with schools relate to challenges that the cooperatives have in aggregating large volumes of maize and beans, difficulty in providing a regular supply (no storage), low management capacities, and challenges in meeting the tender criteria.
• For maize, there cannot be direct linkages because maize must be processed first. However, using local processing units could make it possible to develop these direct linkages.
2.11.1. Sub-question 9.1 What evidence is there of a business relationship between
cooperatives and schools?
203. None of the cooperatives met in the context of the baseline has experience of selling maize and beans to schools. Interviews with cooperatives highlight that they do not consider schools as potential buyers for their products. Some of the cooperatives do not have schools around them that have a school feeding program. Cooperatives are also not aware of the specific requirements for supplying food to schools.
2.11.2. Sub-question 9.2 - Are there cooperatives delivering food in schools in the targeted
districts?
204. Cooperatives are not directly delivering food to schools in the targeted districts. However, through local processors, schools are purchasing part of their maize locally. There is a recent trend of installation of small processing units at district levels. These processing units link cooperatives to schools. This model is not promoted by LRP because these enterprises’ quality practices do not comply with WFP quality standards and would require a high level of investments before they can produce sufficient quality products. However, this type of actor represents an interesting outlet for the maize produced by cooperatives. They also represent an

Baseline Report - February 2018 | P a g e
52
interesting opportunity for increasing local delivery to schools. These processing units face the same challenges as the high end buyers including: difficulties in getting a sufficient volume of maize (they procure maize from cooperatives when it is available but often resort to purchasing Ugandan maize in Kigali); issues with quality of the maize supplied (dryness and cleanliness); high transportation costs; and underutilization of their processing capacity. The processing units sometimes offer contracts to cooperatives (but only for big transactions) but do not engage in forward delivery contracts (which they consider too risky). They offer contracts only on the production they have seen directly.
2.11.3. Sub-question 9.3 - Do school purchase agriculture products from cooperatives?
205. Schools do not purchase agriculture products from cooperatives. Primary schools do not have a budget for school feeding. Only secondary schools could potentially purchase food products from SHFs but do not currently do so for the reasons specified above.
2.12. Discussion
2.12.1. Differences in findings between quantitative and qualitative findings
206. Most of findings from the quantitative survey and the qualitative data collection are similar. However, differences exist in a few cases:
- Payment of dividends (the quantitative survey mentioned that members receive dividends but cooperative leaders unanimously stated in interviews that no dividends are distributed.
- Payment of dues (few cooperatives have a system of dues in place according to qualitative data collection. This is a contradiction from the quantitative survey)
Some of these differences may be explained by how the survey was understood by enumerators and/or SHFs. For example, concerning the dues, there may be confusion between dues and shares. These elements will be specific point of attention for the end line survey.
2.12.2. Risks of mono-cropping and intensification of cropping systems
207. The model promoted by the LRP based on Crop Intensification Program (CIP) raises questions on the priority given to only a few crops and on the choice of mono-cropping (versus association of crops). In a context where land is fragmented and access to inputs difficult, raising productivity through intensification makes sense. But, in terms of biodiversity, the importance of crops and diversification of varieties as a way to control pests and diseases is completely left aside. Introducing one or two varieties over a large block of lands is putting SHFs at risks in case of pest attack or climatic hazard. This localization of crops is imposed to SHFs at the cost of other crucial crops for food security (sweet potatoes, sorghum, cassava…). Some of this traditional local production which is considered as not productive enough is disappearing to be replaced by exogenous crops. This may lead to a severe loss of agriculture diversity. As a result, there is a decrease of local product availability which may lead to increase in transport of goods, degradation of nutritious quality of vegetables and tuber, higher post-harvest losses and increase in price of locally produced food (MILZ, 2010). Also, this may bear risks on the overall sustainability of the system. Soil fertility is a serious issue in the area targeted given that it is difficult

Baseline Report - February 2018 | P a g e
53
for SHFs to apply adequate amounts of fertilizers and manure to ensure that fertility is maintained.
2.12.3. Discussions on cooperative, services and self-financing of cooperatives
208. Very few producers’ organizations in Africa have succeeded in providing economic services to their members without support from partners or without stable contracts with buyers. Cooperatives working in maize and beans value chain in Rwanda face difficulties in developing economic services because of a number of intrinsic characteristics of the domestic staple food value chain: high variability of production due to climatic hazards; low predictability of the supply; low volumes sold by a cooperative (which limits the potential interest of commission on sales as a viable financial resource for a cooperative); competition with local buyers who purchase maize directly on farmers plots. The other way for a cooperative to develop services is through credit, but as previously discussed only a minority of cooperatives have applied for credit and with questionable results. It is therefore essential to have reasonable expectations of what can be achieved over two years. It is very unlikely that LRP cooperatives are able to function in a fully autonomous and business oriented way by the end of the programme.
2.12.4. Discussion of the appropriate model to link cooperatives and schools
209. Big buyers represent an interesting opportunity for SHFs and cooperatives, but they remain a niche market for cooperatives. Given the objective of increasing direct linkages between schools and cooperatives, other types of markets could be considered as opportunities for cooperatives and SHFs. The majority of the maize produced is sold to local buyers and small to medium level processors. These have the advantages of being closer to the cooperatives and at the same time closer to the schools (which purchase their food for school feeding on the local market). For LRP cooperatives, if the main objective is to supply maize for the WFP HGSF program, then of course links with high end buyers that are supplying WFP should be encouraged. But if the main objective is the sustainable development of business linkages for cooperatives then these types of buyers (the local buyers and medium level processors) should not be discarded. Exploring this option has several interests in line with what LRP wants to achieve:
• Processing units are already familiar with the government school system, so there is a limited entry cost for them and they can act as aggregators for cooperatives that have relatively small volumes of products to sell.
• They do not have very demanding quality requirements (in line with schools requirements), which can facilitate business linkages with cooperatives. The quality they need is a compromise between high quality products that are needed for high end buyers and low quality products that are traded locally. They can also become entry point for awareness on quality.
• They are interested in purchasing locally and consider that the quality of maize produced by cooperatives is far better than maize produced in Uganda. Transport costs are also reduced as they are closer to cooperatives than to the market in Kigali (but the price of maize is higher locally). Therefore with productivity and aggregation increase, cooperative could be competitive clients for these units. That could results in an increased local procurement for schools.

Baseline Report - February 2018 | P a g e
54
2.12.5. Discussion on the impact of the increased share of maize on SHFs diet
210. Lack of economic access to diverse and nutritional food is undoubtedly the major cause of malnutrition in Sub-Saharan Africa. Imbalanced diet also contributes to labor productivity losses, reduced educational attendance, and income. Farmers engaged in the production and marketing of staple food items may ultimately improve household income but will not necessarily achieve a proportionate reduction in malnutrition. However, the question of the impact of crop diversification and income increase on the nutritional status continues to be researched (and has sometimes shown divergent results). Some sources mention for example that improving small farmers access to market seems to be a more effective strategy in improving nutrition than promoting diversification on subsistence farm. Other studies found that agricultural production diversification is positively associated with household dietary diversity. So far there is no clear answer emerging so it is difficult to establish whether the current trend of increasing maize production for the market (will have a positive effect on nutrition status or if it may reduce food diversity for SHF. This should be a point of attention for LRP.
3. Conclusions and Recommendations
211. Based on the findings presented in the previous section, an overall assessment that responds to the evaluation questions is provided below. This is followed by six recommendations focused on ensuring that LRP will achieve sustainable results and impacts.
3.1. Overall Assessment/Conclusions
212. The design of the project is relevant. The project targets some of the most important constraints that SHFs face in developing agriculture activities in a profitable way (access to inputs, credit, capacity building and development of marketing are the most important ones). LRP design is aligned with the policies and strategies of the GoR and with the interventions of development partners. Particularly LRP is fully aligned with the strong drive from the GoR to promote farmers’ cooperatives, commercial cultivation of maize, and global intensification of agriculture.
213. Male and female SHFs behavior is driven by the need to secure household food consumption, the lack of funds to invest in production, and a focus on minimizing production risks (climatic hazards or pest’s attacks for example). Farmers’ exposure to good production practices is relatively good, mainly through extension support provided by the GoR. The main limiting factor is the cost of fertilizers and manure. Knowledge and use of good practices for post-harvest handling are far more limited. SHF have low capacity for economic analysis of their practices and choices. Exposure to market information is very low and is not an important factor in explaining their choices. Access to credit is limited: farmers have a good knowledge of credit conditions and there are institutions providing credit (SACCO), but farmers are not confident in credit and the conditions can sometimes make access to loans difficult.
214. Agriculture is the main source of income for SHFs, but their connection with the market is low and most of what they produce is consumed or sold locally to purchase other food products. Farmers usually have a plot in the cooperative land (marshland) where they do mono-cropping and one or several plots on the hillsides

Baseline Report - February 2018 | P a g e
55
where they do mixed cropping. Yields are low because of soil fertility problems, inadequate use of inputs, climatic hazards and pest attacks. Under the current cultivation conditions, both maize and beans cultivation are not profitable.
215. Consumption habits have changed in the last five years. Consumption of maize has increased. With the introduction of maize cultivation, LRP farmers are now eating maize flour several times per week. They have limited quality requirements (color and dryness). Beans are consumed every day and stored by farmers. They are only sold if the household is in urgent need of cash.
216. Equal numbers of male and female SHF are members of cooperative (although with variation between cooperatives) but this does not reflect in the decision making structures (which are male dominated). Factors limiting the participation of SHF are time and capacity (given limited skills in literacy, book keeping and leadership).
217. LRP cooperatives have widely ranging levels of capacities. This evaluation examined cooperative capacity from the perspective of ability ‘to be’, ‘to do’, ‘to relate’ and ‘to perform’ and finds that:
• Cooperative ability ‘to be’ is relatively good, though ownership and existence of a common vision remain low.
• Abilities of cooperatives ‘to do’ is limited, especially as relates to management tools.
• In terms of the ability ‘to relate’ cooperatives are already connected to a network of partners but they tend to be reactive rather than pro-active, i.e. the focus is on grabbing opportunities rather than strategically defining their needs and building partnership to solve their problems or to develop new opportunities.
• Cooperatives ability ‘to perform’ is low. Aggregation of products is limited and the majority of cooperatives does not have a business mind set. Cooperatives do not know whether they are making profit.
218. The current framework is relatively conducive to the development of partnership and contracts between buyers and SHFs though there is no specific strategy. Big buyers are already purchasing maize from SHF and they have specifics arrangements for cooperatives but it only represents a small part of their procurement. Cooperatives have a low level of awareness of these buyers and their requirements and do not yet have capacity to implement and monitor this type of contracts. Issues affecting the development of these partnerships between buyers and farmers are low product aggregation, poor quality of maize and beans produce, and the lack of contract enforcement (hence a high defaulting rate).
219. An important objective of LRP is to support the development of local procurement for school feeding programmes. So far, there are two school feeding programmes in the targeted districts. For primary schools, school feeding is supported by WFP and food is procured on the national, regional and international market. For secondary schools, school feeding is financed by the GoR and schools purchase food locally but not directly from farmers or cooperatives. There is no direct linkage between schools and cooperatives, cooperatives do not supply schools. However, they do supply to local processing units that are selling maize flour to schools (secondary schools). For primary schools, apart from WFP supported schools, there is no budget for school feeding.

Baseline Report - February 2018 | P a g e
56
3.2. Recommendations
220. Based on the findings and conclusions of this evaluation, the recommendations of the evaluation team are outlined below. These are in order of priority but they are in many ways complementary and should be considered collectively.
221. Recommendation 1: Strengthen the LRP project’s focus on SHF with specific attention to economic profitability for SHF of the practices that are to promote production and to strengthen post-harvest practice. This applies to production practices, for which farmers should be trained on farm budgeting in order to see the impact of a practice on their income or food supply. But it applies even more to post-harvest handling practices. Investing in quality has a cost for farmers (more work, drying material, shelling material...) and this cost should be reflected in the price they get. WFP should do detailed cost estimation and sensitize big buyers on the price. Priority should go to marketing and linkages with the market: secured sales condition can encourage SHF to invest in quality.
222. Recommendation 2: Consider extending the current approach to training to a more comprehensive capacity building approach, to maximize the appropriation of practices. For the LRP this would imply promoting close support by extension services and visits to work with cooperatives to develop their capacities. The priority topics could differ from one cooperative to another and should be identified in a participatory way (though that will require finding an appropriate balance with operational constraints of organising capacity building activities).
223. Recommendation 3: WFP should consider working from an approach where cooperatives are encouraged to take responsibility to invest in their own development and should systematically make a financial contribution to any equipment or infrastructure that is provided. Similarly, the first priority should be to look at the existing market based solutions43 before providing direct support.
224. Recommendation 4: Monitor and develop inclusiveness of cooperatives. As mentioned in the report, some of the poorest farmers may be excluded from cooperatives. This factor should be analysed and strategies formulated to improve inclusion of poor farmers. There should also be attention to monitoring this throughout the project. Similarly, attention should be paid to gender inclusion in cooperatives. WFP should go further than monitoring the number of women included in cooperatives and in cooperative management structures. The specific place and roles of women in the maize and bean value chain, but also in the global production system should be analysed. Specific capacity building activities of women are recommended to increase their involvement in decision making (book keeping and leadership for example). WFP could help building bridges with other development partners working on literacy to improve women’s reading and writing capacities. Lastly, attention should be paid to the organisation of the activities to ensure these do not contribute to an overload of women’s work.
225. Recommendation 5: With the objective of developing business linkages with cooperatives and sustainable linkages between schools and cooperatives for the school feeding program, WFP should explore the option of developing linkages between cooperatives and local processing units. So far, it is likely that their quality
43 Market based solutions being solutions for key inputs such as credit, agricultural inputs, and storage that are locally available.

Baseline Report - February 2018 | P a g e
57
standards are not at the level of WFP’s ones, but they are already providing secondary schools and they are closer to cooperatives. Possibilities to develop contracts between these processing units and cooperative should be explored. This would require building the capacities of the processing units.
226. Recommendation 6: Promote sustainable agriculture through lobbying and partnership. This can be done by including modules on soil conservation, agro-ecology, integrated pest management and fertility management in LRP activities. To make sure that the recommended practices have a positive effect, WFP could link with research institutions working on these topics (to be identified). Specific attention should be paid to availability and access to manure and lime, and to investigating solutions to support farmers in accessing these.

Baseline Report - February 2018 | P a g e
58
Annexes
Annex 1. LRP Project activities and targets
Planned project activities Target Activity 1: Purchase commodities from SHF
Purchase of beans and maize from SHF in Rwanda or other regional markets (e.g. Tanzania or Uganda)
418 metric tons of maize and 225 metric tons of beans
Activity 2: Build capacity of SHF Train in procurement of raw materials, processing, business management and marketing
4 cooperatives
Facilitate trading and marketing relationships between milling cooperatives, factories and 16 other cooperatives for raw materials
16 cooperatives
Train cooperatives on post-harvest handling and storage, warehouse management, organizational governance, agricultural markets, business planning, microfinance, and techniques for increasing production, etc.
16 cooperatives
Coach cooperatives on business plan implementation 16 cooperatives Supply medium sized storage facilities and provide training and technical field support
1000 SHF
Activity 3: Connect farmers to the patient procurement platform Promote market access for SHF through facilitation of forward delivery contracts between private sector off-takers and farmers’ organizations
No target
Activity 4: Connect SHF to new markets Promote pro-smallholder procurement and widen market for SHF by purchasing maize meal and beans through buyers such as MINIMEX (miller), EAX, SARURA and RGCC
No target
Collaborate with superintendent agencies for food inspection and quality testing No target Activity 5: Collaborate with the government of Rwanda
Advocate through agricultural sector working group to advance SHF integration and to advance markets for SHF and institutional procurement
No target
Draft a strategy for sustainable market access for SHF and to increase procurement by national traders and institutional suppliers
One strategy

Baseline Report - February 2018 | P a g e
59
Annex 2. Detailed Theory of Change for the LRP Project

Baseline Report - February 2018 | P a g e
60
Annex 3. Evaluation Matrix
Evaluation
question Sub-Question
Indicator Main sources of
information
Method for data
collection
Method for data
analysis Quality of available data
Relevance
1-To what extent
was the design
of the
intervention:
relevant to
wider context;
aligned with the
needs of the
most vulnerable
groups;
cognizant of the
needs of male
and female
beneficiaries;
and in line with
priorities of the
government and
WFP partners?
1.1-To what extent is
LRP’s location, priorities
and beneficiary selection
in line with the needs of
the most vulnerable
groups?
Integration of beneficiaries
characteristics, activities and
needs in the design and activities
of LRP
Integration of specificities of
districts and agro-ecological
regions in LRP’s design and
activities
Attention to the different needs
and situation of male and female
beneficiaries
LRP project related
documents (reports,
studies…)
SHF, cooperatives and other
value chain actors
Background documents on the
context of agriculture in the
concerned districts
Document review (needs
assessment reports, LRP
documents and background
project design documents,
reports of beneficiaries
engagement meetings)
FGD with cooperatives and
SHF
Descriptive and
inferential analysis of
survey data.
Triangulation of
documents and results
from FGD and key
informant interview
Very little project related
documentation available
Documentation from other projects
and policy documents have been
collected
WFP to provide additional
documentation when available.
Information from stakeholders will
be collected in the field
Quality of the information l largely
depends on whether WFP has
document presenting their strategy
in terms of project design
1.2-To what extent does
the LRP project
contribute to the
government’s
objectives?
Alignment of the approach and
expected results with
government’s objectives and
legislative framework
Evidence that the LRP
intervention has made a specific
contribution to the
implementation of the GoR
objectives
LRP project related planning
and implementation
documents (reports,
studies…)
Policy documents
Documents of other partners
implementing similar
initiatives
Institutional stakeholders
(MINAGRI, MINEDUC,
MINALOC, MINEACOM) at
national and district level
Document review (LRP
documents, policies and
strategies documents from
the government, project
design document, Ministry
of agriculture strategic plan)
KII with institutional
stakeholders (national and
district)
Triangulation of
documents and key
informant interview
Contribution analysis
Documentation from other projects
and policy documents have been
collected
Further documents on the LRP
planning and implementation to be
provided to the evaluation team by
WFP
Information from stakeholders will
be collected in the field
Quality of policy documents is
expected to be good
1.3-What is the level of
complementarity with
Evidence of complementarity of
LRP’s approach with other
LRP project related
documents (reports,
Document review (LRP
project design documents
Descriptive and
inferential analysis of
Information from stakeholders will

Baseline Report - February 2018 | P a g e
61
Evaluation
question Sub-Question
Indicator Main sources of
information
Method for data
collection
Method for data
analysis Quality of available data
other development
interventions targeting
the same regions,
including with WFPs
own interventions?
development projects at the
design stage
Evidence that LRP’s approach
does not duplicate the work by
other actors
Level of implication of partners
in the design and
implementation of LRP
studies…)
Documents from other
projects, partners and donors
Institutional stakeholders
(MINAGRI, MINEDUC,
MINALOC, MINEACOM) at
national and district level,
with other development
actors, and with WFP
and documents from other
projects and donors,
coordination meetings
reports of development
projects)
KII with institutional
stakeholders (national and
district) including with a
view to establish what has
changed in the overall
context over time and to
what extent this can be
attributed to the LRPs
interventions
survey data.
Triangulation of
documents and results
from key informant
interview
Mapping of
interventions in the LRP
area for
complementarity
Contribution analysis
be collected in the field
Information on interventions by
other partners to be collected by the
team with support from WFP
Further documents on the LRP
planning and implementation to
provided to the evaluation team by
WFP, in particular on foreseen
complementarity with other actors
Quality of the information l largely
depends on whether WFP and other
development interventions have
document presenting their strategy
in terms of project design
1.4-Does the logic of
intervention promote
sustainability?
Existence of a clear strategy for
sustainability and exit strategy
Approach and activities of LRP
based on market related
solutions (better business
linkages between chain actors
and cooperatives in order to
improve access to services and
market opportunities for SHF)
Awareness at government level
(both national and district level)
of SHF and pro-SHF buyers
LRP project related
documents (reports,
studies…)
SHF, cooperatives and other
value chain actors, with other
development actors, and with
WFP
Institutional stakeholders
(MINAGRI, MINEDUC,
MINALOC, MINEACOM) at
national and district level
Document review (LRP
projects documents and
progress reports, project
design document, report on
engagement meetings with
government officials)
KII with cooperative and
value chain actors, other
development actors, WFP
and government
FGD with SHF and
cooperatives
Triangulation of
documents and results
from FGD and key
informant interview
Currently there is no project document that provides a complete overview of the sustainability or exit strategy.
Information from stakeholders will be collected in the field
Further documents on the LRP planning and implementation to provided to the evaluation team by WFP, in particular on sustainability/exit strategy
Quality of the information depends on whether WFP have document presenting their intervention strategy (for the market based solutions) and on their exit strategy. For government, quality of the data collected will depend on institutional stakeholder knowledge of the different policies and strategies.

Baseline Report - February 2018 | P a g e
62
Evaluation
question Sub-Question
Indicator Main sources of
information
Method for data
collection
Method for data
analysis Quality of available data
Effectiveness
2-What are the
effects of the
project on the
cooperatives
ability “to be”,
“to organize”,
“to relate”, and
“to do”
2.1-Are cooperative
better organized?
Evidence that cooperative have a common vision.
Evidence that number of meetings of cooperative members and of cooperative leaders has increased
Evidence of increased knowledge of leaders’ roles by cooperative members
Existence of up to date records at cooperative level and regular utilization of accounting systems
Increased number of collective operations registered by cooperative (purchase of inputs or services, sales, access to credit)
Increased number of members paying their dues/improved timeliness of payment by members
Cooperative records and interviews
WFP implementing partners records and interviews
Reports from the relevant government ministries in charge cooperatives
Progress Reports from WFP and implementing partners
WFP baseline and monitoring data on the LRP cooperatives
Cooperatives checklist/review of LRP cooperative baseline data
FGD with cooperative members
KII with cooperative management, implementing partners, and WFP
Review of documentation on cooperatives and from implementing partners
Triangulation of primary & secondary data sources.
Thematic analysis of qualitative data
Descriptive and inferential analysis of survey data.
Information from stakeholders will be collected in the field
WFP also collects information on the cooperatives which will provide a sense of progress against specific indicators.
Documents from WFP and its implementing partners will be provided to the evaluation team
Quality of the data collected will depend on whether cooperatives record are existing and updated.
2.2-Are cooperatives
developing
partnerships?
Number of partnerships with banks, service providers, institutions and other cooperatives
Cooperative records and interviews
WFP baseline and monitoring data on the LRP cooperatives
Cooperatives partners (MFI, service providers, institutions)
Documentations and Progress reports from cooperatives
Progress Reports from WFP and implementing partners
Cooperatives checklist
KII with cooperative management, implementing partners, and WFP
Review of cooperative documentation
Descriptive & inferential analysis of survey data.
Triangulation of qualitative and quantitative data
Triangulation of primary & secondary data sources.
Thematic analysis of qualitative data
It is assumed that cooperatives keep reasonably good records of membership, contracts, etc. This needs to be verified. Information from stakeholders will be collected in the field Documents from WFP and its implementing partners will be provided to the evaluation team Quality of the information from WFP and implementing partners is assumed to be good. Quality of data at cooperatives level depends on the quality of the records. KII should provide good quality data on partnerships.

Baseline Report - February 2018 | P a g e
63
Evaluation
question Sub-Question
Indicator Main sources of
information
Method for data
collection
Method for data
analysis Quality of available data
2.3- Are the
cooperatives becoming
more economically
dynamic?
Cooperatives plan their business
activities at the beginning of the
season and make an assessment
of their result at the end
Cooperatives have better skills
on credit and loans management
Evidence that the cooperative
net margins have improved
Volumes of products sold
through the cooperatives
increased
Cooperative records and
interviews
WFP baseline and monitoring
data on the LRP cooperatives
Other value chain actor
interviews
WFP implementing partners
interviews and documentation
Progress Reports from WFP
and implementing partners
Cooperatives checklist
KII with cooperatives and
value chain actors
Cooperative records
Descriptive & inferential
analysis of survey data.
Triangulation of
qualitative and
quantitative data
Triangulation of primary
& secondary data
sources.
Thematic analysis of
qualitative data
Information from stakeholders will
be collected in the field
Documents from WFP and its
implementing partners will be
provided to the evaluation team
WFP is collecting information on
loans at cooperatives levels. Data on
business skills and planning at
cooperative is expected to be of
medium quality as it requires
cooperatives to have already
sufficient business awareness to talk
about it. Quality of data on volumes
and net margin of cooperatives
depends on the quality of the records
at cooperatives levels (it will be
difficult to have accurate
information during interviews)
2.4-Do activities of the
cooperative benefit to
their members?
Evidence that cooperatives
regularly distribute dividends to
their members
Evidence that cooperatives offer
more effective and timely
services in one or more of these
fields: access to inputs, access to
finance, marketing, access to
information, extension, storage
or processing
There is a self-financing
mechanism for cooperative
activities
Cooperative records
WFP baseline and monitoring
data on the LRP cooperatives
Other value chain actors
SHF who are members of the
cooperative
Cooperatives partners (MFI,
service providers, institutions)
WFP implementing partners
FGD with SHF
KII with cooperative
leadership and partners,
value chain actors and WFP
implementing partners
On site observation
(cooperative documents)
Triangulation of
qualitative and
quantitative data
Triangulation of primary
& secondary data
sources.
Descriptive & inferential
analysis of survey data.
Thematic analysis of
qualitative data
Information from stakeholders will
be collected in the field
It is assumed that cooperatives keep
reasonably good records of their
support to SHF. This needs to be
verified.
Documentation from WFP
implementing partners to be made
available by WFP to the team
Quality of the data will depend on
whether cooperatives have up to
date records. It is expected that the
quality of these data will be poor to
medium.

Baseline Report - February 2018 | P a g e
64
Evaluation
question Sub-Question
Indicator Main sources of
information
Method for data
collection
Method for data
analysis Quality of available data
3 - How does the
LRP programme
affect male and
female SHF
capacity and
behaviour?
3.1 - Has SHF knowledge of options and alternatives improved? Are the benefits equal for male and female farmers?
Cooperatives are more regularly seeking information on markets (options, price, markets...)
SHF demonstrate improved knowledge on production practices
Cooperatives demonstrate improved knowledge on post-harvest handling
SHF have regular extension services adapted to their needs from LRP implementing partners and from the government
SHF survey
Cooperatives checklist/review of LRP cooperative baseline data
FGD with SHF.
Reports reviews from WFP and implementing partners of LRP
Triangulation of information between sources
Thematic analysis of quantitative data.
Descriptive and inferential analysis of survey data.
Information from stakeholders will be collected on the field
Documents and data from WFP will be provided to the evaluation team
Quality of the data is expected to be medium (there is no records at farmers level or cooperative levels on how they seek information or on the adoption of good practices. Triangulation will be a key element to insure quality of the analysis.
3.2-Have SHF choices around short term productive assets, marketing, good practices changed? Are the benefits equal for male and female farmers?
Increased/improved investment by SHF in short term productive assets for maize & beans (seeds, tools, inputs and casual labour)
Increase in the area cultivated in maize and beans
Evidence of improved/increase in access by SHF to credit
Evidence that SHF adopt improved practices in production and post-harvest handling
SHF
Cooperatives
Implementation partners
Cooperatives partners (MFI, service providers, institutions)
Documentation and reports from WFP including WFP baseline and monitoring data on the LRP cooperatives
SHF survey
Cooperatives checklist
KII with sample of SHF.
KII with WFP staff, government representatives, cooperatives leads
Reports reviews from WFP and implementing partners of LRP
Descriptive and inferential analysis of survey data.
Triangulation of information between sources
Thematic analysis of quantitative data.
Information from stakeholders will be collected on the field
Documents and data from WFP and implementing partners will be provided to the evaluation team
Information on access to credit should have a good quality as it is monitored by WFP. Quality of data on short term productive assets and on area cultivated, as well as adoption of good practices is expected to be medium.
4-Has the LRP
contributed to
creating new
opportunities
for male and
female SHF?
4.1-Has LRP contributed to the design and adoption of a pro-SHF and buyers partnership strategy? Does the strategy benefit both male and female SHF?
Existence of a strategy at government level to support development of business partnership between cooperatives and pro-SHF buyers
Evidence of LRP contribution to the design and adoption of a pro-SHF and buyers partnership strategy
Cooperative KII
Institutional stakeholders (MINAGRI, MINEDUC, MINALOC, MINEACOM) at national and district level
Pro-SHF buyers
WFP
KII with government officials, WFP staff, cooperatives and other stakeholders
Review of Reports from WFP
Reports from the relevant government ministries in charge of cooperatives
Triangulation of primary & secondary data
Information from stakeholders will be collected on the field
Documents and data from WFP will be provided to the evaluation team (WFP and FTMA)
Quality is expected to be medium.

Baseline Report - February 2018 | P a g e
65
Evaluation
question Sub-Question
Indicator Main sources of
information
Method for data
collection
Method for data
analysis Quality of available data
4.2 - Are big buyers
increasingly willing to
purchase maize and
beans from SHF??
Evidence of increased awareness
by large buyers of cooperatives
as business partners
Evidence that the number of
buyers purchasing maize and
beans from cooperatives has
increased
Volume of food procured by
WFP from pro-SHF buyers
Percentage of food from the
platform going to buyers other
than WFP
Cooperatives interviews and
records
WFP baseline and monitoring
data on the LRP cooperatives
Pro-SHF buyer interviews and
records
Progress Reports from WFP
and implementing partners
Cooperatives checklist
KII with cooperatives
leaders, buyers, WFP staff,
other stakeholders
Review of Reports from
WFP and implementing
partners
Descriptive and
inferential analysis of
survey data.
Triangulation of
documents and results
from key informant
interview
Thematic analysis of
qualitative data
Information from stakeholders will
be collected on the field
Documents and data from WFP will
be provided to the evaluation team
(WFP and implementing partners)
Quality of the data is expected to
good (it is assumed that large buyers
have records) if buyers are ready to
openly discuss these issues. Quality
of data collected by WFP on food
procurement on the volume of sales
at platform level is expected to be
very good.
4.3 - Are producers able
respond to this
increased demand?
Cooperatives have an effective
system to manage quality
standards
Number of contracts signed
between cooperatives and buyers
Volumes of products from
cooperatives purchased by big
buyers
Evidence of reduction in the
number and percentage of
contract’s defaulting
Contracts ‘conditions in terms of
schedule, transport, time of
payments quality and price are
adapted to needs and constraints
of buyers and SHF
Cooperatives
Documentations and Progress
reports from cooperatives
WFP
Pro-SHF buyers
Progress Reports from WFP
and implementing partners
KII with cooperatives
leaders, pro-SHF buyers and
WFP staff
FGD with SHF
Review of Reports from
WFP and implementing
partners
Review of contracts
Cooperative and buyers’
records
Triangulation of
documents and results
from key informant
interview
Thematic analysis of
qualitative data
Information from stakeholders will
be collected on the field
Documents and data from WFP will
be provided to the evaluation team
(WFP and implementing partners)
Quality of the data collected is
expected to be medium to good
depending on the records kept at
cooperative levels. There may be a
lack of transparency from
cooperatives and buyers on contracts
and contract’s defaulting which
would affect quality of data.

Baseline Report - February 2018 | P a g e
66
Evaluation
question Sub-Question
Indicator Main sources of
information
Method for data
collection
Method for data
analysis Quality of available data
Efficiency
5- How does the
procurement,
delivery, and
distribution of
the modality for
school feeding
which is
promoted
through LRP
compare - in
terms of cost-
effectiveness
and timeliness -
to the
alternative
modalities of
food
procurement?
5.1 Has the LRP
brought about reduced
prices of school meals?
Comparison of the price of school meals in the two main HGSMP modalities (local procurement and imported food)
National and local representatives of MINEDUC
WFP records on food procurement, distribution, and delivery costs for both modalities
WFP reports to USDA and to McGovern Dole
MINEDUC reporting if available
Documentation and WFP data base analysis for information about cost of procurement, handling and delivery.
Triangulation of information between the different data collection methods and sources
Thematic analysis of qualitative data
Most of the data is judged to be available from WFP records
Quality is expected to be very good.
5.2-Has the LRP
resulted in improved
procurement,
distribution and
delivery time, and
enhanced efficiency
compared with other
food procurement
modalities?
Timeliness for procurement, distribution and delivery of food under the two modalities
Cost for procurement, distribution and delivery of food under the two modalities
National and local representatives of MINEDUC
WFP records on food procurement and delivery timelines
Data and information from schools in the two modalities
WFP reports to USDA and to McGovern Dole
MINEDUC reporting if available
Documentation and data base analysis for information related to procurement, handling and delivery.
KII with school heads, SMP officials from MINEDUC and other relevant stakeholders
Interviews with WFP staff, in particular staff involved in procurement and management of food modalities
Triangulation of information between the different data collection methods and sources
Thematic analysis of qualitative data
Most of the data is judged to be available from WFP records
Quality is expected to be very good
5.3-How often does
LRP face pipeline
breaks compared with
other food procurement
modalities?
Frequency and duration of pipeline breaks under the two modalities
Number of school feeding days under the two modalities
WFP records on pipeline management
WFP records on number of days of school feeding per year
WFP reports to USDA and to McGovern Dole
MINEDUC reporting
Documentation review (monitoring reports, reports to the donor)
WFP data base analysis
Triangulation of information between the different data collection methods and sources
Thematic analysis of qualitative data
Most of the data is judged to be available from WFP records
Quality is expected to be very good

Baseline Report - February 2018 | P a g e
67
Evaluation
question Sub-Question
Indicator Main sources of
information
Method for data
collection
Method for data
analysis Quality of available data
Impact
6-How does the
LRP programme
affect male and
female SHF
income?
6.1-Has male and female
SHF income improved?
Volumes and value of maize and beans sales by SHF, disaggregated by gender
Volumes of sales of the main crops grown by smallholder farmers in the southern districts (wheat, rice, cassava and Irish potatoes…), disaggregated by gender
Net margin/ha and net margin/man day from maize and bean production, disaggregated by gender
Maize and beans significant source of income for SHF
SHF
Cooperative
Implementation partners
Cooperatives partners (MFI, service providers, institutions)
Documentation and reports from WFP, including WFP baseline and monitoring data on the LRP cooperatives
SHF survey
Cooperatives checklist
KII with a sample of SHF.
KII with WFP staff, government representatives, cooperatives leads
Reports reviews from WFP and implementing partners of LRP
Triangulation of information between the different data collection methods and sources.
Thematic analysis of quantitative data.
Descriptive and inferential analysis of survey data.
Information from stakeholders will be collected on the field
Documents and data from WFP and implementing partners will be provided to the evaluation team
Quality of the data is expected to be medium (SHF do not usually keep records and there is often different tools used to measure volumes)
7- How and to
what extent
does the LRP
programme
contribute to
producers
marketing food
products that
meets quality
standards and
is nutritious,
and is culturally
acceptable?
(impact)
7.1-Has the overall
quality of maize and
bean products
consumed by SHF
improved?
Evidence of improved quality of maize and beans products utilized by SHF supported by LRP
SHF
Cooperatives
Big buyers
Implementation partners
WFP baseline and monitoring data on the LRP cooperatives
SHF survey
Cooperatives
FGD with cooperatives, big buyers & partners
Descriptive and inferential analysis of survey data.
Triangulation of information
Information from stakeholders will be collected on the field
Quality of the information is expected to be medium
7.2-Is there evidence
that SHF are consuming
and marketing food
products that meets
quality standards and
are nutritious and
culturally acceptable?
SHF keep a part of their quality production for consumption
Evidence from schools confirms that SHF produce is considered nutritious and culturally acceptable
SHF
Cooperatives
Big buyers
Implementation partners
WFP baseline and monitoring data on the LRP cooperatives
Parents and children in schools
SHF survey
KII & FGD w/ cooperatives, buyers & implementing. Partners
School interviews (end-line)
Descriptive and inferential analysis of survey data.
Triangulation of information between sources
Information from stakeholders will be collected on the field
Quality of the information is expected to be medium to good

Baseline Report - February 2018 | P a g e
68
Evaluation
question Sub-Question
Indicator Main sources of
information
Method for data
collection
Method for data
analysis Quality of available data
8-What is the
level of
participation of
men and
women? Are
women well
represented,
including in
leadership
positions? What
are the
disaggregated
impacts on
women Has the
LRP programme
affected male
and female SHF
differently?
8.1-How has the participation of men and women evolved in cooperative decision making structures?
Evidence that the number of women in leadership position in cooperatives has increased
SHF
Cooperatives (leadership and documentation)
WFP and their implementation partners
WFP baseline and monitoring data on the LRP cooperatives
Cooperatives checklist
Review of cooperatives documentation
FGD with SHF and cooperative leaders
Review of reports (WFP & implementing partners of LRP)
Triangulation of information between the different data collection methods and sources
Thematic qualitative data analysis
Information from stakeholders will be collected on the field
Documents and data from WFP will be provided to the evaluation team
Assuming that cooperatives keep records of their members, quality of data is expected to be very good.
8.2- Has the percentage of female SHF who are members of cooperatives increased over time?
Evidence that the relative proportion of male and female beneficiaries has increased in favour of women
SHF
Cooperatives (leadership and documentation)
WFP and their implementation partners
WFP baseline and monitoring data on the LRP cooperatives
Cooperatives checklist
Review of cooperatives documentation
Review of reports from WFP and implementing partners of LRP
Triangulation of information between the different data collection methods and sources
Thematic qualitative data analysis
Information from stakeholders will be collected on the field
Assuming that cooperatives keep records of their members, quality of data is expected to be very good.
Sustainability
9-Is there
emerging
evidence that
the cooperatives
have capacity to
create linkages
with schools?
9.1- Has LRP
contributed to develop
business relationship
between cooperatives
and schools
Evidence that mutual awareness
of school and cooperatives as
business partners has increased
(i.e. school know they can
purchase food at cooperatives
level and cooperatives know they
can sell to school)
Cooperatives (leaders and
documents)
Schools (school head and
documents)
KII with school leads
FGD with cooperative
leaders
Documents review of
cooperatives records
Triangulation of
information between the
different data collection
methods and sources
Descriptive analysis of
cooperative checklist
Information from stakeholders will
be collected on the field
Quality of the data is expected to be
good
9.2- Are there
cooperatives delivering
food to schools
(primary/secondary) in
the targeted districts?
Evidence of increased sales from
cooperatives to schools
Cooperatives (documents)
WFP baseline and monitoring
data on the LRP cooperatives
Cooperatives checklist
Documents review of
cooperatives records
Triangulation of
information between the
different data collection
methods and sources
Descriptive analysis of
cooperative checklist
Information from stakeholders will
be collected on the field
Quality of the data depends on
whether cooperatives have up to
date records on their sales and
clients

Baseline Report - February 2018 | P a g e
69
Evaluation
question Sub-Question
Indicator Main sources of
information
Method for data
collection
Method for data
analysis Quality of available data
9.3- Do school
(primary/secondary)
purchase agriculture
products from
cooperatives?
Existence of a budget for school
to purchase foods
Evidence of direct purchases to
cooperatives from schools
Cooperatives (leaders and
documents)
Schools (school head and
documents)
WFP baseline and monitoring
data on the LRP cooperatives
KII with school leads
FGD with cooperative
leaders
Cooperatives checklist
Documents review of
cooperatives records
Triangulation of
information between the
different data collection
methods and sources
Descriptive analysis of
cooperative checklist
Information from stakeholders will
be collected on the field
Quality of the data is expected to be
good assuming schools have records
of their purchase

Baseline Report - February 2018 | P a g e
70
Annex 4. Bibliography
Agriculture Gender Strategy, Minagri, 2010.
Alinda, Abbott, Agricultural Policy and Institutional framework for Transformation
of Agriculture, Economic Development and Poverty Reduction in Rwanda, Institute
of Policy Analysis and Research – Rwanda, 2012.
Améliorer la position des agriculteurs familiaux sur les marchés en Afrique.
Importance des organisations paysannes en Afrique de l’Ouest et de l’Est et
recommandations politiques, Collectif sécurité alimentaire, 2014.
Assessment of post-harvest opportunities in Rwanda, USAID, 2010.
Huye district development plan, Huye district, 2012.
Galtier F, David-Benz H, Subervie J, Egg J, 2014. Les systèmes d'information sur les
marchés agricoles dans les pays en développement : nouveaux modèles, nouveaux
impacts. Cah Agric 23: 245-58. doi: 0.1684/agr.2014.0715.
Gisagara district development plan, Gisagara district, 2012.
Kiaya, Post-harvest losses and strategies to reduce them, ACF, 2014.
Musabanganji, Contraintes et strategies d’amelioration de la filiere maïs au Rwanda,
Dissertation originale présentée en vue de l’obtention du grade de Docteur,
Université de Liège-Gembloux Agro-Bio Tech, 2017.
National Gender Policy, Ministry of gender and family promotion, 2010.
Nyamagabe district Development plan, Nyamagabe district, 2012.
Nyaruguru district development plan, Nyaruguru district, 2012.
Orientations pour la construction de programmes de renforcement des capacités des
organisations de producteurs, AVSF, 2014.
Pedagogical materials on Farmers’ Organisations and Farmers’ Organisations’
support, CIRAD-CIEPAC, 2006.
Rwanda Comprehensive food security and vulnerability analysis, Minagri, NISR,
WFP, 2015.
Verhofstadt Ellen, Maertens Miet, Can Agricultural Cooperatives Reduce Poverty?
Heterogeneous Impact of Cooperative Membership on Farmers’ Welfare in Rwanda,
Division of Bio economics, Department of Earth and Environmental Sciences, KU
Leuven, 2014.

Baseline Report - February 2018 | P a g e
71
Annex 5. Annexes related to EQ1
Annex 5.1 Main issues affecting agriculture in the four targeted districts
In Huye, 85% of the population depends on agriculture. 1365 hectares of marshland have been
developed as well as about 500 hectares of terraces. The district experiences inadequate rain water
Management, that later causes soil erosion to the farmers. The main challenges affecting
agriculture are low productivity (limited use of improved inputs, mechanisation…), lack of post-
harvest handling and storage services, weak organisation within value chains and low processing
of agriculture products. Farmers have a limited access to finance and limited skills in loan
management. Involvement of the private sector in agriculture is very low. Household poverty in
the district is still high and there is a high prevalence of malnutrition mainly among children and
women. According to the District Development Plan (2013-2018), In agriculture the emphasis will
be put in increasing irrigated areas, consolidated land, mechanization, the use of improved seeds
and fertilizers as well as post-harvest management.
According to Nyagururu DDP (2013-2018), the district is among the districts with higher
percentage of population identified as poor. Agriculture is the main activity (81% of the
population). Maize is grown on 4700 hectares and beans on 30 000 hectares. Nyaruguru district is
characterised by a high proportion of acidic soil (low fertility). The net attendance rate in primary
school in Nyaruguru district is 87%, it is below the national average of 91.7%. At district level,
priority is in infrastructure (road development) and improvement of the quality of soil by
facilitating access to mineral and organic manure. Terraces construction is also a priority.
Economic growth and poverty reduction will be addressed through the mainstream of agriculture
especially by increasing its production and productivity. This will be achieved by high involvement
of people, both men and women and by using modern techniques and inputs. The capacity of
farmers will be built through the enforcement of model cooperatives and sensitization of famers.
Access to finance will be enhanced by sensitization and promotion of a saving policy thus
increasing people’s financial inclusion.
Agriculture sector occupies over 86% of the Gisagara’s workforce. The overwhelming majority of
cultivation is done at the subsistence level, and as result the District is confronted to low
production and high rate of poverty. Beans, rice, banana, maize, cassava and coffee, are the most
cultivated crops. Gisagara district’s priorities are to increase consolidated land use scale and to
develop agro-processing units for agricultural products. Gisagara District has a comparative
advantage to other District due to its cultivation of rice where by 40% of the population are
involved in rice production or processing. Agriculture is still subsistent which engenders low
production and/or productivity. Access to finance in Gisagara District is still very low. For
agriculture, priority is on the promotion of agriculture modernization. More emphasis will be put
on increasing consolidated land use scale, intensifying the use of selected seeds and fertilizers,
initiating agricultural mechanization, developing irrigation, promoting agro processing industries
as well as post harvesting facilities.
Nyamagabe District soils are generally acidic. This generally implies very poor soils considerably degraded by erosion. Land fragmentation and agricultural over-exploitation linked to lack of fallow land and poor agricultural practices due to lack of inputs has led to acute impoverishment of available land. The majority of the population of Nyamagabe District live on agriculture. They produce the following crops by order of importance: beans, Irish potatoes; sweet potatoes, wheat, bananas, sorghum, cassava, passion fruits, peas, maize and soya. Nyamagabe District is among the

Baseline Report - February 2018 | P a g e
72
parts of the country with large proportion of its population living below the poverty line and constantly facing food insecurity. Poverty among farmers has hampered the capacity of families to invest in the improvement of their land capital and scattered housing system makes land development very difficult. The priority in terms of agriculture development are in strengthening of soil protection and conservation, promotion of the use of inputs, professionalization of the agriculture sector, processing and promotion of cooperatives.
Policies and laws relative to LRP’s field of intervention
Government Program (2010-2017): The overall goal is to shift from poor country to a middle
income country. The government program promotes modern farming to increase quality and
quantity of the production as well as storage and processing. Cooperatives formation and post-
harvest storage will be encouraged. Farmers will be encouraged to grow crops with comparative
advantages and suitable to their farming areas and lands. The Government program is
implemented around 4 pillars: good governance, justice, economic development and social well-
being. The overall goal is to shift from poor country to a middle income country. Agriculture
development is covered in pillar 3. The government program promotes modern farming to
increase quality and quantity of the production as well as storage and processing. Land use
consolidation will be promoted and the acreage under consolidation will be increased from 18% to
70%. Soil erosion control will also be promoted. The program will put efforts on raising use of
improved seeds and fertilizers (from 14kg/ha to 45 kg/ha), mechanised farming and irrigation. At
least, 70% of farmers will be encouraged to form cooperatives and post-harvest storage will be
enhanced so that the stored production increases from 10 000T to 200 000T.
Economic Development and Poverty Reduction Strategy 2 (2013-2018).
Economic Development and Poverty Reduction Strategies of Rwanda aims at increasing economic
growth by investing in and modernizing agriculture. EDPRS particularly targets to improve the
agricultural productivity and increase the profitability of small farm holds. EDPRS intends to
encourage increased participation of the private sector in transfer of technology to farmers. It
insists that the government will assist the private sector by improving the investment climate.
EDPRS intends to encourage surplus production of farm produces by subsidizing the acquisition of
key inputs by farmers. To improve the quality of production, EDPRS aspires for significant
improvements in quality and standards.
Vision 2020: The VISION seeks to fundamentally transform Rwanda into a middle-income country by the year 2020. This will require achieving annual per capita income of US$ 900 (US$ 290 today), a poverty rate of 30% and an average life expectance of 55 years. The vision aims to replace subsistence farming by a fully monetized, commercial agricultural sector by 2020. Gender will be integrated as a cross-cutting issue in all development policies and strategies. Contrary to conventional wisdom, the most important issue retarding Rwanda’s agricultural development is not land size, but low productivity associated with traditional peasant-based subsistence farming. Agricultural policy orientation will have to be overhauled, promoting intensification so as to increase productivity and achieve growth rates of 4.5 % to 5% per year. The vision aims to replace subsistence farming by a fully monetized, commercial agricultural sector by 2020. Main areas envisaged are: institutional and legal reforms to ensure security of land ownership, development of a market in land assets, investment in rural infrastructures, use of high yielding varieties and intensive input use, especially fertilisers, promotion of agro-based manufacturing, environmental measures to halt the decline in soil fertility, rural financing schemes and markets. In order to achieve gender equality and equity, Rwanda will continuously update and adapt its laws on gender.

Baseline Report - February 2018 | P a g e
73
The Crop Intensification Program: Crop Intensification Program (CIP) is a flagship program implemented by the Ministry of Agriculture and Animal Resources to attain the goal of increasing agricultural productivity. CIP aims to accomplish this goal by significantly increasing the production of food crops across the country. CIP currently undertakes a multi-pronged approach that includes facilitation of inputs (improved seeds and fertilizers), consolidation of land use, provision of extension services, and improvement of post-harvest handling and storage mechanisms. Started in September 2007, the CIP program focuses on six priority crops namely maize, wheat, rice, Irish potato, beans and cassava.
- Distribution of improved inputs
- Land consolidation
- Proximity extension services
- Post Harvest Handling and Storage (PHHS)
PSTA III:
The primary goals of PSTA III are: To transform Rwandan agriculture from a subsistence sector to a market-oriented, value creating sector, to grow as rapidly as possible, both in relation to production and commercialisation, in order to increase rural incomes and reduce poverty. The key pillars for rapid sector growth are: Land, irrigation, inputs and infrastructure, soft skills and farmer capacity, value chains and markets, private Sector. Investing in in high-value crops while also exploiting the opportunities offered by staple crops is key for the future, facilitating both domestic food security and higher rural incomes. In the short term, continued rapid food production increases will ensure further reductions in rural poverty and malnutrition. In the medium term, the goal is to move Rwandan agriculture from a largely subsistence sector to a more knowledge-intensive, market-oriented sector, sustaining growth and adding value to products. The key pillars for rapid sector growth are: Land, irrigation, inputs and infrastructure, soft skills and farmer capacity, value chains and markets, private Sector.
National policy and promotion of cooperatives: The Government of Rwanda views cooperatives as a potential vehicle through which the cooperatives members could create employment and expand access to income-generating activities, develop their business potential, through education and training; increase savings and investment, and improve social well-being with special emphasis on gender equality, housing, education, health care and community development. A cooperative society may be defined as: “An autonomous association of persons united voluntarily to meet their common economic, social and cultural aspirations through a jointly-owned and democratically-controlled enterprise”. The Government is convinced that cooperatives among other social benefits would contribute to the achievement of Vision 2020. The general objective of the National Policy is to facilitate all round development of the cooperatives in the country in order to make a significant contribution to the national economy, particularly in areas which require people’s participation and community efforts. Through this policy the Government will create a National Cooperative Agency (RCA). Its specific objectives are to increase the numbers of Cooperatives formed countrywide, to ensure good quality of the cooperatives through training, education, information and research so that members attain the ability to perform their cooperative business in an autonomous way, to build a strong cooperative movement which will be able to serve its members efficiently, will contribute significantly to poverty alleviation as well as to social integration and will fully participate to the economic and social development of the country.
National Post-Harvest Staple Crop Strategy: It is a policy framework that will assist with strengthening the harvesting, post-harvest handling, trade, storage, and marketing within staple crop value chains in Rwanda, in an effort to improve markets and linkages for farmers, and reduce

Baseline Report - February 2018 | P a g e
74
post-harvest losses. The National Post-Harvest Strategy will support farmers capture income potential from increased productivity and competitiveness resulting from complimentary investments, including CIP. This requires engagement across ministries, institutions, agencies and stakeholders along the supply chain resulting in a “win-win” for producers, trade, industry and processing, and consumers. Commercial perspectives and market facilitation are critical for regionally competitive staples value chains. The government should provide the enabling environment for private sector development and operation, supportive of competition and market efficiency; investment in public infrastructure including roads to reduce costs in reaching markets; and provide a predictable and transparent policy and regulatory framework.
The National Gender Policy: The policy highlights principal guidelines on which sectoral policies and programmes will base to integrate gender issues in their respective social, cultural, economic and political planning and programming. The overall goal of the National Gender Policy is to promote gender equality and equity in Rwanda through a clearly defined process for mainstreaming gender needs and concerns across all sectors of development. The Policy defines the institutional framework and mechanisms within which gender equality and equity policies and programmes will be designed, implemented, monitored and evaluated, and coordinated. It will thus guide the integration of a gender perspective into all sectors and institutions.

Baseline Report - February 2018 | P a g e
75
Annex 5.2 Interventions from development partners in the targeted areas
Organisation Key information on their intervention in the targeted areas
RDO (Rwanda
Development
Organisation)
Local NGO active in Rwanda for 20 years in agriculture, health,
environment and capacity building sectors.
Support to SHF to increase production and productivity
Value chain approach in maize, bean and soy sector
Support to development of post-harvest handling
Already WFP partner for FTMA
RSSP (Rural
Sector Support
Programme)
The Rural Sector Support Program (RSSP) is MINAGRI’s flagship
vehicle for marshland development. The World Bank finances this
program through a three-phase adaptable program loan. The objective
is agriculture production increases and marshland development, as well
as terraces development. Key activities are promotion of sustainable
land management practices, rehabilitation and development of
marshland irrigated areas, economic infrastructure development,
provision of multi-level capacity, strengthening farmers organizations,
value chain development
World Vision World Vision started its operations in 1994, with the aim of responding
to the humanitarian crisis caused by the Genocide. In 2000, World
Vision Rwanda mission switched from relief to long-term development
World vision is currently working in the 4 targeted districts.
World vision works in education, health and agriculture. Main support
in agriculture consists in inputs provision, capacity building, and
processing unit building. Cooperatives are their entry point.
World vision has already partnered with WFP for HGSF programme.
KOIKA Koika is working in three main sectors: education (technical and
vocational training), ICT, Agriculture and rural development.
In Nyaruguru, KOIKA is implementing the Nyaruguru integrated rural
development project (5 million USD). The program covers marshland
development, erosion control, terraces building, support to farmers to
become seeds multipliers for Irish potatoes and maize. KOIKA is
currently building a maize milling factory in Kibeho sector.
In Nyamagabe, KOIKA is collaborating with WFP for the zero-hunger
project.

Baseline Report - February 2018 | P a g e
76
Apart from partners that are directly working with LRP’s beneficiaries, other partners are
intervening in the targeted district in fields of intervention related to LRP’s:
- Trocaire: Trócaire has been working in Rwanda since 1994. Trócaire has supported more than 30 local partners over the past 23 years. Trócaire currently works in 7 districts (including Nyamagabe and Nyaruguru). It currently focuses on three areas: resources’ rights (including land and water), women’s empowerment and humanitarian programme. Trocaire is working on value chain development, access to microfinance, climate resilience through water harvesting technologies, citizen’s participation and capacity building.
- ICCO-Terrafina: ICCO Terrafina Microfinance is mainly involved in development of agricultural microfinance initiatives, and linking microfinance with value chains. Its programme in Rwanda support inclusive entrepreneurial initiatives
- Caritas: It works in Nyamagame, Gisgara and Huye districts. Amongst different programs, it works in promoting economical and agricultural development and supports over 2000 poor farmers. The programme goal is to reinforce the coherence between agriculture, economical activities and social protection to break out of poverty.
- Duhamic-Adri: It’s a local NGO that works (or has recently worked) in the 4 targeted districts. Amongst many activities supported by several international donors (Trocaire, USAID…), it implements projects in agriculture (support to maize and bean production, saving and credit groups, entrepreneurship…).

Baseline Report - February 2018 | P a g e
77
Annex 6. Annexes on EQ2
Annex 6.1 Detailed assessment of cooperatives capacities
Figure 12. Abemerihiigo
Figure 13. Abibumbye

Baseline Report - February 2018 | P a g e
78
Figure 14. Coamanya Gishubi
Figure 15. CCM Muganza

Baseline Report - February 2018 | P a g e
79
Figure 16. Kaiimu
Figure 17. Kobarwo

Baseline Report - February 2018 | P a g e
80
Figure 18. Koaimu
Figure 19. Kopianya

Baseline Report - February 2018 | P a g e
81
Figure 20. Koabiwa
Figure 21. Duterimbere

Baseline Report - February 2018 | P a g e
82
Annex 6.2 Basic information on cooperatives
Cooperatives selected for the LRP program are relatively young. The oldest one
started its activities around 87 but for most of them the formation is more recent
(around 2010). Formation of LRP’s cooperatives occurred in a context of
cooperatives development all over the country. Several experiences in different
regions of the world show that it took strong cooperatives between 15 and 20 years to
build their capacities in order to have a good command of economic and financial
tools and to become real economics stakeholders44. In that sense, we can still
consider the LRP cooperatives as emerging cooperative. .
Cooperatives are one of the entry points for inputs provision and for equipped
marshland and terraces exploitation. Therefore there was a strong incitation from
the government to form cooperatives. It appears clearly when looking at the creation
process of the cooperatives met for FDG/KII: Out of the 11 cooperatives, nine
mentioned that they were created either following sensitization from the agronomist
after land development or to access to inputs from the government. This drive from
the government is linked with the development of marshlands and terraces. When
the government invests in marshland development and equipment the land remains
the property of the government. It is assigned to farmers through their cooperatives.
A majority of the cooperatives are organized around marshland exploitation (nine
cooperatives only use marshland plots). Working on a marshland is easier for a
cooperative as all farmers’ plots are grouped in the same area. That facilitates inputs
provision, extension service, control of practices and production. There are different
land exploitation models: A few cooperatives are working collectively on the same
land on an assigned day (either all the cooperative work together or there is an
organization per group) but more often, exploitation of the land is individual. There
are also different models: some cooperatives assign a specific day per week to work
on the “cooperative plot”45, other work whenever they want except at harvest time
and for other there is no specific organization.
The number of members of the 16 LRP cooperatives varies from 50 to 82646. Three
cooperatives have less than 100 members, six have between 100 and 300 members
and 7 have more than 300 members. Similarly, the area exploited by cooperative
varies from two, five to 200 hectares with an average per cooperative of 62, six
hectares. There are advantages and constraints related to the size of cooperative.
When a cooperative is small, it can keep straight forward relations between the
committee and members, which facilitate ownership and control of the organization
by its members (hence a better governance). It is also easier to communicate with
members and to have a shared vision of where the cooperative wants to go and on the
44 Reference : les organisations de producteurs en Afrique de l’Ouest et du Centre : attentes fortes, dures réalités-FARM, 2013 45 We’ll use the term cooperative plot to mention the plot that the cooperative assign to an individual member and cooperative land to mention land exploited collectively by members. 46 For the 11 cooperatives included in qualitative data collection, the figures are the ones mentioned by cooperative leaders. For the other 5, they come from information collected by WFP.

Baseline Report - February 2018 | P a g e
83
strategy to reach the objectives. It is also easier for a small cooperative to control
production and marketing practices (use of inputs, extension, and respect of the
aggregation rules) and to manage activities and finance. But a small cooperative
means a low level of resources which hampers its capacity to provide services to
members in an efficient way, to invest in infrastructures or equipment, to access
credit (collaterals and guarantees) and to bear the cost of a technical team
(accountant, agronomist…).
If a cooperative is too small it will be difficult to gather enough products to interest
high ends buyers and the costs of a quality management system will be too expensive.
Lastly, when a cooperative is small it only represents a small number of SHF and it
cannot have a strong negotiation power. That will hamper the development of a pro-
SHF value chain dialogue.
The figures collected vary depending on the source of information. There are
inconsistencies between data collected by WFP during the selection process and data
collected by the evaluation team. For example, Kaiimu leaders mentioned that there
were 430 members whilst data from WFP show 540. Membership dynamic varies
from one cooperative to another. Some are actively including more members, other
do not show a real membership dynamic. The table below shows the main reasons
affecting SHF’s interest in cooperatives.
Table 24 :Farmers’ interest in cooperatives:
Factors limiting interest of SHFs in
cooperatives Incentive for SHFs to join cooperatives
Strong habit of individual work and
individual farm management
Mono-cropping is considered too risky
Management issues in cooperatives
Loss of production (drought, floods) in
cooperative plot
Results from other cooperatives
Political drive
Equipment of the marshland : cooperative to
access land
Accessing new market and sell dry maize

Baseline Report - February 2018 | P a g e
84
Table 25 : Date of creation of LRP cooperatives
Beginning of activities before
2010
Beginning of activities
between 2011 and 2014
Beginning of
activities after 2015
Abishyizhzehamwe Urwonhjya
Kobabomango
Koabiwa
Abishyizhzehamwe Ngera
Abemerimihigo
Abimbumbye
CCM Muganza
Kobarwo
Kopianya
Koaiimu
Coamanya Gishubi
Coamagi
Kopiki
Icyerekezo
Duterimbere
Kaiimu
Table 26: Type of land exploited by 11 cooperatives of the qualitative data collection
Type of land exploited by the
cooperative Cooperatives
Marshland only Kobarwo, Duterimbere, Coamanya Gishubi,
CCM Muganza, Icyerekezo, Abemerihigo,
Abibumbye Koabiwa (they also have a land
on hillside)
Equipped terraces only Koaimu, Kaimu
Marshland and equipped terrace terraces Kopianya

Baseline Report - February 2018 | P a g e
85
Table 27: Basic information on cooperative (qualitative data collection and WFP data)
Cooperative name Number of
members
Number of
female
members
Number of
leaders
Number of
women
leaders
Type of land
Type of
exploitation of
the land
Area
cultivated as a
cooperative
(hectares)
Kobarwo 317 149 8 3 Marshland Individual 40
Koaimu 155 67 8 4 Terraces Individual 100
Kopianya 50 28 8 3 Marsland and
terrace
Collective on
marshland and
individual on
terraces
2,5
koabiwa 147 95 8 3 Marsland Individual 9
Duterimbere 765 425 8 3 Marshland Collective (per
group) 76
Icyerekezo 263 147 8 3 Marshland Individual 30
Abemeriihigo 539 364 8 3 Marshland Individual 62
Abibumbye 826 384 8 3 Marsland Individual 92
Coamanya Gishubi 463 210 8 4 Marshland Individual 80
CCM Muganza 217 86 8 3 Marsland Collective (on 2,5
ha) and individual 25

Baseline Report - February 2018 | P a g e
86
Cooperative name Number of
members
Number of
female
members
Number of
leaders
Number of
women
leaders
Type of land
Type of
exploitation of
the land
Area
cultivated as a
cooperative
(hectares)
Kaiimu 430 220 8 3 Terraces Individual 170
Abishyizhzehamwe
Urwonhjya 649 337 8 4
49
Kobabomango 75 35 8 4 Marsland and
terrace 52
Abishyizhzehamwe
Ngera 67 43 7 2
5
Coamagi 300 187 8 4
200
Kopiki 176 93
10

Baseline Report - February 2018 | P a g e
87
87
Annex 6.3 Cooperatives’ common vision
There is a gap about the level of information about cooperative organization and activities
between members of the cooperative and members of the committee.
In all cases cooperatives were created with a top-down approach and the challenge for all
the cooperatives is to develop links with members. All the cooperatives are organized in
groups of 15-20 farmers and usually in geographical zones, but they are not “official
entities” of the cooperatives. Membership in cooperatives is individual. These groups are
either “Twigire Muhunzi groups” or “tontines” (savings and credit groups). The links
between these groups and the committee are not very strong. There is a gap about the level
of information about cooperative organization and activities between members of the
cooperative and members of the committee.
None of the cooperatives interviewed have clearly defined their vision, objectives and
strategy, and none of them have a strategy document. Some committees are able to envisage
what their cooperative will look like in the future and to define what they want to achieve
(though not in a quantified way) and how they can reach their objectives (see table below).
But some cooperatives have no idea of what they want to achieve, at best they can identify
some needs (or some support they want).
Table 28: cooperatives capacity to define a common vision and a strategy to reach its objectives (qualitative data collection)
No defined common vision
and strategy
Identification of some
needs but no strategy
Existence of a common
vision and strategy
Kobarwo
Kopianya
Duterimbere
Abibumbye
Kaiimu
Koabiwa
Icyerekezo
Coamanya Gishubi
CCM Muganza
Koaimu
Abemerehiigo
When they can mention some objectives (see figure below), and even more for elements of
strategies, they remain vague (no figure, no time line). Objectives cover improving
production (through recruitment of new members, exploitation of more lands and increase
in productivity), improving post-harvest handling (mainly acquiring infrastructures to dry
maize or increasing the size of their drying space47), investing in marketing (purchasing
maize from members to be able to collect bigger quantities, finding big buyers) and
strengthening their capacities (though only through hiring staff or acquiring offices, no
cooperatives mentioned training or capacity building as an objective or a strategy).
Elements of strategies were even less defined by cooperatives: improving the relation with
members (through sensitization, dividends, mobilization of shares), improving production
(for example using more inputs), and developing marketing strategies (starting collective
sales and increasing commission on sales), and accessing credit.
47 Storing maize was only mentioned once, it is not seen as a priority for cooperatives

Baseline Report - February 2018 | P a g e
88
88
Annex 6.4 Document keeping
Table 29 : Cooperatives' documents requirement
Documents about the
cooperative
Documents about the
activities Financial statements
Registry of members
Registry of shares
Assets register
Minutes book
Inventory register
Wages book
Cash book
Sales day book
Purchase day book
Stock control sheet
Stock register
Member personal account
Cash receipt journal
Profit/loss account
Balance sheet
Statement of change
Statement of cash flow
Table 30: LRP's capacity in book keeping (qualitative data collection)
Low capacity for book keeping Medium capacity for book keeping
Abimbumbye
Abemerimihigo
Kobarwo
Kaiimu
Duterimbere
Koaiimu
Icyerekezo
Coamanya Gishubi
Kopianya
Koabiwa
CCM Muganza

Baseline Report - February 2018 | P a g e
89
89
Annex 6.5 Cooperatives ‘experiences of collective operations
Table 31: Cooperatives' exposure to collective operations
Cooperative Type of collective operation
implemented
Exposure/experience of
collective operations
Kobarwo Supply of inputs
Organization of the work
low
Koaimu Organization of the work Very low
Kopianya Supply of inputs
Collective sales
Collective work on cooperative plot
Organization of the work
medium
Koabiwa Collective work on cooperative plot
Supply of inputs
Medium
Duterimbere Organization of the work
Supply of inputs
Collective sales
Medium
Icyerekezo Organization of the work
Collective sales
good
Abemerehiigo Organization of the work
Collective work on cooperative plot
Collective sales
medium
Abibumbye Organization of the work
Collective sales
Very low
Coamanya Gishubi Organization of the work
Supply of inputs
Collective sales
Credit
Good
CCM Muganza Organization of the work
Supply of inputs
Collective sales
credit
good
Kaiimu Organization of the work
Collective sales
medium
For some cooperatives, collective operations are already quite common (Iciyerekezo,
Coamanya Gishubi and CCM Muganza) whilst for other it is marginal (Abibumbye, Koaimu
and Kobarwo). All the cooperatives implement a more or less defined organization of the

Baseline Report - February 2018 | P a g e
90
90
activities of the members. It can be just a global planning of the season with a period for
planting and harvesting, or some specific days allocated to working on the cooperative plot.
Other types of collective operations remain limited, especially collective sales. Aggregation
of products from member is very difficult and the quantity of product sold by cooperative if
often very limited. Collective purchase of inputs for members (paid cash or on credit) is very
appreciated by members, but it requires cooperative to have enough funds to purchase
them, or to get credit, which limit the ability of cooperatives to start this operation.
Annex 6.6 cooperatives’ resource
Table 32: Level of payment of shares by members (qualitative data collection)
Below 50% members have
started to pay
Between 50 and 100%
members have started to pay
shares
100% members have paid
shares
Koaimu
Abibumbye
Kobarwo
Duterimbere
Icyerekezo
Abemeriihigo
Comanya Gishubi
CCM Muganza
Kaiimu
Kopianya
Koabiwa
Table 33: Cooperatives’ sources of funds (qualitative data collection)
Shares Dues Commission On Sales (Inputs
Or Maize)
Kobarwo
Koaimu
Kopianya
Koabiwa
Duterimbere
Icyerekezo
Abemeriihigo
Abibumbye
Coamanya Gishubi
CCM Muganza
Kaiimu
Duterimbere
Icyerekezo
Abemeriihigo
Abibumbye
CCM Muganza
Kaiimu
Kopianya
Icyerekezo
Coamanya Gishubi
CCM Muganza
Kaiimu

Baseline Report - February 2018 | P a g e
91
Annex 6.7 LRP cooperatives partners
Cooperative Partnership With
Service Provider
Partnership
With Banks
Partnership With
Government
Partnership With
Development Actor
Partnership
With Other
Cooperatives
Abibumbye Each member
purchase on its own
at Tubura or at
agrodealers
Bank account
at SACCO
For cooperative creation,
organization of the
cropping season and
inputs supply
Partner with World vision (for
training on production
techniques)
No link with
other cooperative
Kobarwo They purchase inputs
from APTC
Only for bank
account
(SACCO)
For cooperative creation
and organization of inputs
provision
Regular visit of the sector
agronomist but no
extension service
provided
Training on cooperative
management by RCA
Koika for equipment of the
marshland, provision of seeds
and training on production
(maize, irish potatoes and
onions)
No link with
other cooperative
Koaimu No partnership but
sensitization of
members to purchase
with agro-dealers
and Tubura for
inputs provision
SACCO for
bank account
For cooperative creation,
organization of the
cropping season and
inputs supply
Regular visits from sector
agronomist
RSSP (provision of agronomist
and manager), development of
terraces, extension service,
provision of an operational
fund
RDO for training on production
No link with
other
cooperatives

Baseline Report - February 2018 | P a g e
92
Cooperative Partnership With
Service Provider
Partnership
With Banks
Partnership With
Government
Partnership With
Development Actor
Partnership
With Other
Cooperatives
WFP for training on production
and post-harvest handling
Kopianya Relation with APTC
(maize seeds) and
Tubura (Other
inputs) to purchase
inputs
Bank account
and loan from
SACCO
Support from the district
(supply of a warehouse
and support for their
court process), regular
visit from sector
agronomist. No extension
services but there are
model farmers in the
cooperative
PAGOR for introduction of
maize, sensitization on
cooperative and equipment of
terrace (nothing recent)
No partnership
with other
cooperatives
Koabiwa With agrodealers to
purchase inputs, with
support from the
sector agronomist
SACCO only
for bank
account
For cooperative creation,
and inputs provision
No model farmer, no
extension service
Partnership with world vision:
rehabilitation of their drying
facility, provision of small
equipment (sprayer) and
pesticide, training on
production for irish potatoes
No relation with
other
cooperatives
Duterimbere With agrodealer for
inputs purchase
Only for bank
account
For cooperative creation,
organization of the
cropping season and
inputs provision. The
KOIKA for equipment of the
marshland, provision of an
operational funds including
They will be
associated with
two other
cooperatives

Baseline Report - February 2018 | P a g e
93
Cooperative Partnership With
Service Provider
Partnership
With Banks
Partnership With
Government
Partnership With
Development Actor
Partnership
With Other
Cooperatives
CEDO is also regularly
participating in their
meetings
no extension service (no
model farmers)
purchase of seeds
The KOIKA agronomist also
provide extension service
Koika is currently building a
processing unit in another
cooperative that they will be
able to use
supported by
KOIKA for
management of a
processing unit,
but do not know
the modalities yet
Icierekezo No relation between
cooperative and
agrodealers,
members purchase
on their own (aither
with agrodealers or
with Tubura)
Bank account
at SACCO
For cooperative creation,
organization of the
cropping season and
inputs provision.
Project from Belgium
(partnership with a Belgium
town) : for technical training
and study trip
No relation with
other
cooperatives
Abemerihiigo They used to
purchase directly
from agrodealers, but
now members do it
on their own
Bank account
at SACCO,
Banque
populaire and
another one
related with
UNICOOPAGI
For cooperative creation,
organization of the
cropping season and
inputs provision.
There are model farmers
in the cooperative
PDAG, World vision for
production, cooperative
management, and post-harvest
handling
They are part of
UNICOOPAGI

Baseline Report - February 2018 | P a g e
94
Cooperative Partnership With
Service Provider
Partnership
With Banks
Partnership With
Government
Partnership With
Development Actor
Partnership
With Other
Cooperatives
Coamanya
Gishubi
They purchase inputs
with agrodealers
Bank account
and credit at
SACCO
For cooperative creation,
organization of the
cropping season and
inputs provision.
No partner, no training They know other
cooperatives but
do not have
partnership with
them
CCM Muganza Purchase of inputs at ATPC
Credit with Duterimbere
For cooperative creation, organization of the cropping season and inputs provision.
There are model farmers
They have been trained by RAB on seed multiplication
Agroconsult in the past for sensitization and marshland equipment.
Partnership with USAID (post harvest and production, finance management and credit)
No partnership with other cooperatives but they know some and consult them for price
Kaiimu No direct relation but
they sensitize members
Bank account
at SACCO
For cooperative creation,
organization of the cropping
season and inputs provision.
There are model farmers
Regular visit from sector
agronomist
Cellule is supporting them
with an office
RSSP has provided an agronomist
and a manager, training on
production, integrated pest
management, post harvest
handling
No partnership
with other
cooperative

Baseline Report - February 2018 | P a g e
95
Annex 6.8 Decentralization and organization of the agriculture services
Decentralization reforms of 2006 created six levels:
- National level
- Province level (six provinces and the city of Kigali)
- District level (30 districts)
- Sector level (416 sectors)
- Cell level (2150 cells)
- Village level
Local administration is characterized by a mechanism of upward accountability through
performance contracts that tie administrative careers and local level policies to the
government agenda. Sector and cell agronomists, acting in coordination with the sector
Executive Secretary and the district agronomist oversee the reception and implementation
of national policies by farmers. Second, the administrative division also structure political
and social life4849.
Before decentralization, the Ministry for Agriculture (MINAGRI) was directly responsible
for delivering extension services to farmers through agricultural extension workers at the
sector (Monagris), district and provincial level50. These workers were directly accountable
to the Ministry. Following the decentralization and administrative reform of 2004-2005
(the new DIP), delivery of extension services was put under direct responsibility of the
decentralized entities. The reporting system is from sector to district, from district to
province and from province to the Ministry of Local Government. In the new context of
decentralized extension, the main functions of the Ministry for Agriculture and Animal
Resources (MINAGRI) are as follows: (i) coordination and planning of agricultural
development programs, (ii) agricultural sector information function, (iii) monitoring and
evaluation function, (iv) regulation and control function, (v) resources mobilization
function.
MINAGRI works closely with other government institutions (national boards and
ministries), NGOs and development partners. Key among these institutions includes the
Rwanda Agricultural Board (RAB), the National Agricultural Export Development Board
(NAEB), Ministry of Finance and Economic Planning (MINECOFIN), Ministry of Justice
(MINIJUST) and the Institute of Policy Analysis and Research (IPAR).
49 Ref : Rule and rupture : State formation through the production of property and citizenship, Lund, Eilenberg, 2017 50 Ref : Agriculture policy and institutional framework for transformation of agriculture, economic development and poverty reduction in Rwanda, IPAR, 2012

Baseline Report - February 2018 | P a g e
96
Their main responsibilities are:
RAB : Implementing the national policy of agriculture and animal husbandry and
contributing to identification of policy in agriculture, animal husbandry, agricultural and
animal husbandry research and technology.
MINALOC : Ensure good governance in all local administration levels including agricultural
governance at local level, playing an intermediary role in channeling public funds for
development projects, overseeing various local communities agricultural development
related programmes.
MINECOFIN: Coordinates the national budgeting, planning and financing fram ework,
including agricultural services sector, resource mobilization and coordination of
development partners, overseeing allocation of budgets to different ministries, the Ministry
of Agriculture and Anima Resources inclusive.
Land National Centre: Land administration and management both at the national and
decentralized level and support the local level in the sector of land.
Districts: The basic political administrative units.
Department of Agriculture: oversees monitors and provides technical backstopping to
agricultural production activities at district and cell levels, coordinate the public and private
sector partnership in agricultural programs mainly for quality control purposes.
Annex 6.9 Cooperatives’ partnership
Public institutions:
The main contact in the administration for cooperatives is the sector agronomist. All the
cooperatives mentioned that they are regularly working with him. The sector agronomist
has several responsibilities:
- Coordination the extension system: Extension is based on a system of “model farmers”,
who are volunteers’ farmers in charge of organizing and training farmers. Each model
farmers implements a demonstration plot and he provides training to farmers organized
in groups of about 20 farmers (one model farmer monitors five to 10 groups). Model
farmers are trained on extension techniques, production, pest control and marketing)
- Organizing inputs supply: the sector agronomist is in charge of putting together
information concerning the required amounts of inputs, linking farmers to agrodealers
and report to district level for subsidies calculations.
- Collecting and reporting statistic on production

Baseline Report - February 2018 | P a g e
97
Unlike in many countries, the government services are actually present in the cooperative
environment. Cooperatives consider them as their first partner. The sector agronomists
(and to a lesser extend the district agronomists) are committed, know the cooperatives and
are supporting them. Cooperatives are seen as an efficient way to organize farmers and to
make sure that the directives from the government are followed-up. They are the entry
point to build other partnerships, as it is very often the sector agronomist that link
cooperatives to buyers, inputs providers and development partners.
Financial partners
All the cooperatives met have bank accounts and are rather familiar with formal banking
systems (including credit services). It is rather impressive considering that in 2008, only
21% of Rwanda’s bankable population was accessing formal financial services and 52% were
completely financially excluded51. Microfinance sector in Rwanda is relatively recent; it
started to emerge after the 94 genocide.
All cooperatives met (except one that did not give details) have a bank account at SACCO
(Saving and Credit Cooperative, see text box below). SACCOs are member-based
cooperatives that have been created following launch by the government of the National
Savings Mobilization Strategy (2009). Two cooperatives also have another account in a MFI
(Banque populaire and Duterimbere).
Through the interviews done with commercial banks during the mission it clearly appears
that agriculture is not a priority for them and that it represents a very small part of their
portfolio (though they could not give specific information). Those banks are mainly located
in the main towns (Huye, but also district level town like Kibeho in Nyaruguru district).
SACCOs are favored by cooperative because of their proximity and because they are
considered as closer to farmers.
The minimum capital requirement for SACCOs is relatively low, which makes share capital
more affordable for Rwanda’s low-income population. The minimum capital for SACCOs in
Rwanda is 5 million Rwandan Francs (RwF) (USD 7,353), while the minimum capital for an
MFI constituted as a limited liability company is RwF 300 million (USD 441,176).SACCOs
and other MFIs have made a significant contribution to financial inclusion and the growth
of the financial sector in Rwanda. The number of accounts opened at MFIs rose 263% from
2007 to the end of 2013 (from 631,689 to 2,295,589), 72% of which were at SACCOs.
SACCOs represented over 33% of accounts in the entire banking and microfinance sector.
The increase in the number of people saving with MFIs is also reflected in an increase in the
number of deposits and loans granted by MFIs. From 2007 to December 2013, the value of
loans and deposits increased by 174% and 141%. Through SACCO, all Rwandese are now
less than five km away from a financial institution.
51 Ref : Rwanda’s financial inclusion success story : Umurenge SACCOs, Alliance for financial inclusion, 2014

Baseline Report - February 2018 | P a g e
98
One expected potential partner is clearly missing in the picture, the BDF (Business
Development Fund). BDF was established in 2011 as a wholly owned subsidiary of the
Development Bank of Rwanda (BRD), with the objective of assisting SMEs (including
cooperatives) to access finance, particularly those without sufficient collateral to obtain
credit from traditional financial institutions at reasonable rates. BDF’s role was to promote
alternative financing avenues at reasonable costs to help small businesses access credit by
providing credit guarantees, Quasi-Equity support to start-up, managing matching grants,
SACCO Refinancing, and business development advisory services. Though they are present
at district level, cooperatives do not know BDF, their roles or their services. And the
interviews made with BDF show that this lack of knowledge is reciprocal: they could not
give information on the number of cooperatives they supported or on the type of support
they provided them.
Service providers
The only service providers that have partnership with cooperative are inputs providers
(Tubura, agrodealers or APTC). Through CIP, GoR has implemented a “supply-push”
approach to boost use and supply of fertilizers and improved seeds all over the country.
Minagri embarked on developing a market oriented fertilizer distribution system based on a
network of agro-dealers. The objective is to ensure acceptable fertilizer availability and
accessibility of affordable fertilizers at the proximity of the farmer in a timely manner.
Minagri also promotes fertilizers and improved seeds use and provides subsidies to make
inputs affordable. The importers redeem the subsidy cost of fertilizer delivered to farmers.
The importers receive 60% of the subsidy cost upon provision of proof that fertilizers have
been delivered to agro dealers’ stores and 40% after beneficiary farmers receive the
fertilizers. Needs are planned first by MINAGRI based on production targets. Then before
the start of the season, each district send a list of needs based on the actual demand from
farmers. The agro dealers are supervised by the sectors’ executive and agronomist to ensure
timely distribution.
Apart from cooperatives that work directly with APTC, cooperative do not really chose their
partners, it mainly depends on the presence of the actors (and its proximity with farmers).
From the interviews, there was no clear difference made by cooperative depending of the
type of inputs providers, with the exception of Tubura (that is providing inputs on credit).
Agrodealers and Tubura are well identified by the cooperatives and are considered as
proximity partners.
Tubura is the local name for the “1 acre fund” NGO. It started operating in Rwanda in 2007
and is currently working with 200 000 SHF. There is actually two different organizations,
one is actually an NGO providing training and extension service to farmers, and the other
one is a private company supplying inputs to farmers (they chose this private sector model
in order to facilitate their operation of import and distribution of inputs). Concerning
provision of inputs on credit, they apparently do not have a specific credit scheme: there is

Baseline Report - February 2018 | P a g e
99
no interest charged and famers can repay gradually during the season52. Tubura is well
identified for inputs provision on credit (it was mentioned as a source if inputs for SHF by 4
cooperatives) but not for the extension service and training they offer.
APTC (Agro-Processing Trust Corporation Ltd) is a parastatal organization in charge of
distribution of inputs in Rwanda since. It works with eight importers and is supplying
mainly agrodealers. Some cooperatives organize directly the purchase of inputs at their
level, with support from the sector agronomist.
Partnership with other cooperatives
For a cooperative, building partnership with other cooperatives is important to increase
their legitimacy to represent the interest of SHF. On a shorter and more operational term,
building partnership with other cooperative can enable information sharing on good
practices (and economies of scales (for inputs provision or sales for example). Today
cooperatives have little relations with other cooperatives. They usually know there are other
cooperatives around but they do not know their activities or results. There is no dialogue
between cooperatives. Only one cooperative is part of a union of cooperative,
UNICOOPAGI, see text box below.
52 This was explained to the team during meeting with Tubura, but we could not find any document explaining their credit system.
UNICOOPAGI
Unicoopagi is a second level organization of cooperatives. It is based in
Nyamagabe but covers Nyamagabe, Nyaruguru and Huye districts. I was created
in 1991 and gather 61 cooperatives representing 15652 members (42% women). It
mainly focuses on wheat and irish potatoes but also includes maize production.
It has 5 objectives:
- Help cooperatives to find solutions for soil infertility (acidic and low fertility soils)
- Develop a network of cooperatives to facilitate capacity building
- Promote cash crop
- Support cooperative for marketing of agriculture products
- Support cooperatives to get registration

Baseline Report - February 2018 | P a g e
100
Partnership with development actors
A lot of international and national development partners intervene in Rwanda, especially in
supporting the agriculture and rural sector. Cooperative is a common entry point for
development actors, as it is difficult to work with individual farmers. This high presence of
development partners appears in the sample of LRP cooperatives: in the 11 cooperatives
included in qualitative data collection, only one never got support from a development
partners. Partners identified are cooperation agencies (KOIKA, USAID), international
NGOs (Worldvision), Rwandan NGO (RDO), world bank programs implemented by
ministry of agriculture (RSSP, PAGOR, PDAG).
From the discussions with cooperatives some limits of development partners can be
identified:
- Interventions are too punctual, mainly based on training only: several cooperative
regretted that the only support they got from development partners was one or to
training. They regretted a lack of follow-up and support to actually implement what they
have been trained on
- Intervention are designed by development partners without consultations with the
cooperatives to define their needs
- No exit strategy defined from the beginning and insufficiently market based solution:
providing fertilizers and/or improved seeds (as well as small equipment or operational
funds) to cooperative may be useful to spark a new dynamic and to have quick increase
in production but it is also risky as it encourages cooperative to rely on their partners
instead of mobilizing their own resources and find appropriate private sector partners
with whom they could develop partnerships.
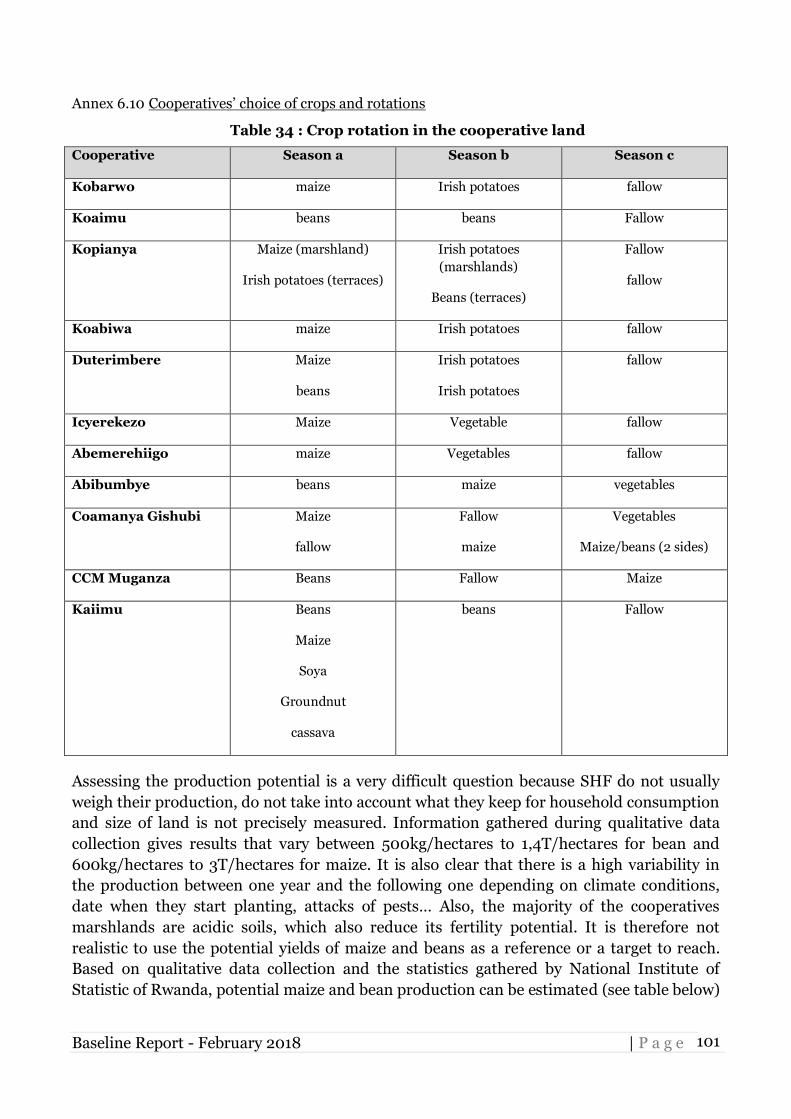
Baseline Report - February 2018 | P a g e
101
Annex 6.10 Cooperatives’ choice of crops and rotations
Table 34 : Crop rotation in the cooperative land
Cooperative Season a Season b Season c
Kobarwo maize Irish potatoes fallow
Koaimu beans beans Fallow
Kopianya Maize (marshland)
Irish potatoes (terraces)
Irish potatoes
(marshlands)
Beans (terraces)
Fallow
fallow
Koabiwa maize Irish potatoes fallow
Duterimbere Maize
beans
Irish potatoes
Irish potatoes
fallow
Icyerekezo Maize Vegetable fallow
Abemerehiigo maize Vegetables fallow
Abibumbye beans maize vegetables
Coamanya Gishubi Maize
fallow
Fallow
maize
Vegetables
Maize/beans (2 sides)
CCM Muganza Beans Fallow Maize
Kaiimu Beans
Maize
Soya
Groundnut
cassava
beans Fallow
Assessing the production potential is a very difficult question because SHF do not usually
weigh their production, do not take into account what they keep for household consumption
and size of land is not precisely measured. Information gathered during qualitative data
collection gives results that vary between 500kg/hectares to 1,4T/hectares for bean and
600kg/hectares to 3T/hectares for maize. It is also clear that there is a high variability in
the production between one year and the following one depending on climate conditions,
date when they start planting, attacks of pests… Also, the majority of the cooperatives
marshlands are acidic soils, which also reduce its fertility potential. It is therefore not
realistic to use the potential yields of maize and beans as a reference or a target to reach.
Based on qualitative data collection and the statistics gathered by National Institute of
Statistic of Rwanda, potential maize and bean production can be estimated (see table below)

Baseline Report - February 2018 | P a g e
102
Table 35: Production potential for the cooperative
Cooperative name Potential maize production per year
(higher estimation)
Potential bean production
(high estimation)
Kobarwo 72 -
Koaimu 160 120
Kopianya 1,8 1,8
Koabiwa 26,2 -
Duterimbere 68,4 45,6
Icierekezo 54 -
Abemerihiigo 111,6 -
Abibumbye 128,8 110,4
Coamanya Gishubi 110 30
CCM Muganza 32,5 30
Kaiimu 176 252

Baseline Report - February 2018 | P a g e
103
Annex 6.11 Factors limiting access to credit for cooperatives
There are several constraints that limit cooperatives’ access to credit. The main factor
explaining the situation is a mutual lack of trust. Finance institutions and cooperatives do
not know each other and they have a low awareness of their respective logics, rules, needs
and constraints.
Cooperatives have a low capacity to monitor and manage their loan. They struggle to keep
records and to implement a proper accounting system, which increase the risk of credit
defaulting or of credit being use for other purpose (or by only a few members). Microfinance
institution usually have credit officer, but they cover and monitor a large number of loans
and they tend to focus more on credit recovering than on training and monitoring
cooperatives to properly manage their loans. As cooperative business capacities are limited,
it is difficult for them to assess their real need for credit and to plan its reimbursement.
Without a proper support, it is also difficult for cooperative to prepare their loan
requirement file.
Interest rate and collaterals also represent a barrier for cooperative.. In some cases,
cooperatives do not have the adequate collaterals. In that case, they usually use collaterals
from one or several members (land title for example). Cooperatives that did not require loan
are scared that they could lose their land or building is they have difficulties to repay a loan.
Credit is not well adapted to farmers’ reality; they consider that loan is to be used for a
single purpose (purchasing inputs) and to be repaid after harvest. But the specificity of
family farming is that there is no clear separation between productive and personal needs.
Farmer may need some cash to pay for inputs but then he will not be able to repay the loan
just after harvest because he may have to pay for school fees or to invest in the next
cropping season. There is not enough flexibility in the current credit system to suit farming
HH (and cooperatives)’ specific needs. Similarly, MFI only give short term loans and
cooperatives do not have opportunities to access credit to finance infrastructure. And even
for production loans delays can cause problems and hamper the production.
Last but not least, agricultural production is intrinsically risked. Climatic factors, pest
attacks or disease may destroy the whole production of a cooperative. That is what
happened to cooperatives that had a bad experience with credit. They got their loan,
purchased the correct amount of inputs but at the end, they could not repay because they
got a very low production. Currently there is no crop insurance system available and there is
no measures that cooperative can take to reduce this risk.

Baseline Report - February 2018 | P a g e
104
Annex 6.12 Price of maize and types of buyers
Table 36: Maize selling price at harvest time for cooperatives and types of buyers
Price of maize at harvest time Type of buyers
Kobarwo 350 Individual sales by members
Koaimu 400 Individual sales by members
Kopianya 315 Sales in detail at the cooperative
Koabiwa 300 Sales in detail at the cooperative
Duterimbere 320 Korean animal feed company
Icierekezo 300 Processing unit
Abemerihiigo 280 Local buyer
Abibumbye 300 Poultry producer
Coamanya Gishubi 270 AIF
CCM Muganza 270 Local buyers
Kaiimu (beans) 300 Individual sales by members
Annex 6.13 Quantitative analysis on EQ2.1
Table 37 - Average amount of dues by gender
Gender of household Mean N Std. Deviation Minimum Maximum
Female 1396.94 245 1812.384 0 15000
Male 1429.86 296 1678.220 0 10000
Total 1414.95 541 1738.702 0 15000
Table 38 - Average amount of dues by cooperative age
Type of cooperative Mean N Std. Deviation
Emerging 2869.80 101 2700.019
Mature 931.56 250 1090.139
Young 1277.63 190 1324.909
Total 1414.95 541 1738.702

Baseline Report - February 2018 | P a g e
105
Table 39 - Payment of dues by gender
Gender
Total Female Male
No Count 138 157 295
% 46.8% 53.2% 100.0%
Yes Count 245 296 541
% 45.3% 54.7% 100.0%
Total Count 383 453 836
% 45.8% 54.2% 100.0%
Table 40 - Payment of dues by cooperative size
Cooperative size
Total Large Medium Small
No Count 175 100 20 295
% 59.3% 33.9% 6.8% 100.0%
Yes Count 363 178 0 541
% 67.1% 32.9% .0% 100.0%
Total Count 538 278 20 836
% 64.4% 33.3% 2.4% 100.0%
Table 41 - Frequency of dues payment by gender
Gender of the household
respondent
Total Female Male
Always Count 57 97 154
% 37.0% 63.0% 100.0%
Never Count 3 0 3
% 100.0% .0% 100.0%
Not regular Count 36 44 80
% 45.0% 55.0% 100.0%
Others Count 1 2 3
% 33.3% 66.7% 100.0%
Regularly Count 148 153 301
% 49.2% 50.8% 100.0%
Total Count 245 296 541
% 45.3% 54.7% 100.0%

Baseline Report - February 2018 | P a g e
106
Annex 6.14 Quantitative analysis on EQ 2.14
Table 42 - Mean amount of dividends received by cooperative capacity, age and size
Coop Classification Coop Category Gender
Males Female P value
Coop Capacity
High potential 2450.00
0.357
Lost momentum 7083.33 10357.14
Nascent 11320.00 12036.36
Not Classified 16000.00 7400.00
Coop Age
Emerging 7833.33 20000.00 0.862
Mature 13093.33 8875.00
Young 8914.44 10160.00
Coop Size
Large 15766.67 22000.00 0.026
Medium 8282.11 8257.89
Small 6760.00 6800.00
Evidence that cooperatives offer more effective and timely services in one or more of these fields: access to inputs, access to finance, marketing, access to information, extension, storage or processing
• Trainings (72.7%), supply of seeds (61.0%) and fertilizers (54.2%) and finding buyers (42.8%) are some of the key services offered by the cooperatives. There is no notable difference in the services offered to male and female SHF’s.
• High potential cooperatives engages more in finding buyers (95.5%), while small cooperative supply more seeds to members (95.0%). The other cooperatives of different ages, capacities and sizes did not however have notable differences from the main services offered.
• Trainings (23.3%), supply of fertilizers and other agricultural inputs (22.6%) and provision of other services are the three most important services to the SHF’s.
0
5
10
15
20
25
30
35
eme
rgin
g
ma
ture
yo
un
g
hig
h p
ote
nti
al
lost
mo
me
ntu
m
na
sce
nt
no
t cl
ass
ifie
d
larg
e
med
ium
sma
ll
Coop Age Coop potential Coop Size
Number of SHF's (by gender) recieving dividents by coop capacity, potetial and size
males females

Baseline Report - February 2018 | P a g e
107
• The is no noted difference in the priority services for males and females but a noted variation in priority services for members of cooperatives of different capacities, ages and sizes.
Table 43 - Table of amount spends on seeds and fertilizer by cooperative size
Cooperative size Amount spent on seeds Amount spent on fertilizers
large Mean 14537.77 13099.95
N 519 304
Std. Deviation 24957.478 18660.504
medium Mean 8270.16 13346.02
N 268 128
Std. Deviation 17120.947 16807.418
small Mean 2939.25 11845.25
N 20 20
Std. Deviation 4302.103 11180.532
Total Mean 12168.89 13114.12
N 807 452
Std. Deviation 22552.830 17856.246
Table 44 - Possibility of receiving services for outside the cooperative
Frequency Percent Valid Percent Cumulative Percent
Valid No 531 63.5 63.5 63.5
Yes 305 36.5 36.5 100.0
Total 836 100.0 100.0
Table 45 - Cross tabulation of possibility of receiving services from outside by gender
Gender
Total Female Male
Possibility of receiving services from outside the cooperatives
No Count 261 270 531
% 49.2% 50.8% 100.0%
Yes Count 122 183 305
% 40.0% 60.0% 100.0%
Total Count 383 453 836
% 45.8% 54.2% 100.0%
Annex 6.15 Capacity of cooperative to develop self-financing mechanism for their services to
members
Table 46: Cooperative self financing mechanisms
No awareness on self-
financing mechanism
Low capacity to self-finance
its activity
Good prospect of
sustainability of the activities
of the cooperative
Duterimbere
Koaimu
Abibumbye
Abemerihiigo
Kaiimu
Kobarwo
Kopianya
Koabiwa
Iciyerekezo
CCM Muganza
Coamanya Gishubi

Baseline Report - February 2018 | P a g e
108
Annex 6.16 Cooperative sales and aggregation rules (qualitative data collection on 11 cooperatives)
Table 47 - Cooperative sales and aggregation rules
Cooperative name Potential
production/year
Cooperatives
sales Aggregation rules
Kobarwo 72 0 No aggregation
Koaimu 160 0 No aggregation
Kopianya 1,8 No idea 40% of the production is
aggregated
Koabiwa 26,2 5T 1/3 of the production is
aggregated
Duterimbere 68,4 4,5 T Each member gives 12 kg
Icierekezo 54 135T 2/3 of the production is
aggregated (but they also sell
maize for individual farmers)
Abemerihiigo 111,6 21,6T No rule, small part of the
production is aggregated
Abibumbye 128,8 523 kg 1 kg per member (objective, 35
kg/member)
Coamanya Gishubi 110 120 T 70% aggregation
CCM Muganza 32,5 20T 4/5 aggregation
Kaiimu (beans) 252 2,165T 30% aggregaration for beans, not
yet for maize

Baseline Report - February 2018 | P a g e
109
Annex 7. Annexes on EQ 3
Annex 7.1 SHFs knowledge on good practices
Respect of the technical itinerary:
Respecting technical itinerary allows a farmer to grow maize and beans in the most efficient
way in a given environment (with specific agronomical conditions but also based on the
needs and potentialities of producers). For both maize and beans, crucial operations to
ensure a good production are adequate land preparation, timely planting, correct spacing,
correct weeding and harvesting when the maize is mature. From the observations in the
field (and looking at the results from quantitative survey), farmers’ knowledge on this issues
are good.
Use of inputs:
All the cooperatives met are aware that they need to use improved seeds and fertilizers to
get a good production. Overall they have a good command of the recommended quantity of
seeds and fertilizers to apply (however three cooperatives had wrong information on the
quantity of fertilizer to apply) and on the specifity of maize and beans requirements.
Similarly they all have adequate information on the organization of the supply system for
inputs. They know that seeds and fertilizers are subsidized but they do not know the
percentage of the subsidy. Their knowledge is less developed on other fertility management
practices. For example, they know about manure application, but information on the
required quantity is less accurate. SHFs have a very limited knowledge on lime application
(that is required to improve fertility of acidic soils). Only one cooperative was aware of lime
utilization.
Adequate cropping system:
The Rwandan agricultural sector is highly vulnerable to climate and weather-related risks.
Research indicates that rainfall patterns are becoming more irregular and unpredictable
with shorter rainy seasons negatively affecting Rwandan agriculture. Therefore, it is
essential for producers to develop adequate cropping systems. There are several good
practices to emphasize. Crop rotation contributes to a smarter use of nutrients. Similarly,
intercropping could be considered. Other practices to consider is the use of crop residues
(for maize and beans) as it reduces on farm organic waste and improve soil moisture
content hence reducing soil degradation. Specific soil conservation practices could also be
considered (reduced tillage for example that can decrease the level of short term production
but increase soil productivity on the long run) as well as efficient soil and water
management to avoid erosion and nutrient leaching. Producers’ awareness on those issues
is not well developed. Producers are aware of erosion issues but not of specific practices or
measures to limit it. Soil conservation measures are not known by SHFs.

Baseline Report - February 2018 | P a g e
110
Annex 7.2 Quantitative data analysis on good practices (production and post-harvest practices)
Table 48 -Frequencies of good agricultural practices
Responses
Percent of Cases N Percent
practising of good agricultural
practisea
Practising seed selection 1 1.0% 1.4%
Practising planting and spacing 18 17.1% 25.7%
Practising use of fertilizers 12 11.4% 17.1%
Practising timely harvesting 10 9.5% 14.3%
Practicing minimization of grain
infestation
25 23.8% 35.7%
Practicing cleaning grains before
storage
5 4.8% 7.1%
Practicing avoiding of damanges
to grain during threshing and
shelling
1 1.0% 1.4%
Practicing good drying 11 10.5% 15.7%
Practicing good storage practices 22 21.0% 31.4%
Total 105 100.0% 150.0%
a. Dichotomy group tabulated at value 2.
b.
Annex 7.3 Quantitative analysis on services
Table 49 - Number of cooperatives that benefitted from extension services
Frequency Percent Valid Percent Cumulative Percent
Valid No 231 27.6 27.6 27.6
Yes 605 72.4 72.4 100.0
Total 836 100.0 100.0
Table 50 - Number and perentage of cooperatives that received agricultural extension services by cooperative size
Size of cooperative
Total large medium small
No Count 146 79 6 231
% 27.1% 28.4% 30.0% 27.6%
Yes Count 392 199 14 605
% 72.9% 71.6% 70.0% 72.4%
Total Count 538 278 20 836
% 100.0% 100.0% 100.0% 100.0%

Baseline Report - February 2018 | P a g e
111
Annex 7.5 Investment in short term productive assets
Investment in land:
In the Southern province, the average land holding per household is 0,37 hectares (EICV3),
66% of the agriculture population cultivating under 0,5 hectares and 32% under 0,2
hectares. Farmers do not invest in lands because they want to develop their income, but
they are struggling to get enough land to produce to cover their family needs. That appears
clearly in the quantitative survey analysis of the reasons why farmers rent land. Only a small
number of farmers are actually able to rent land to produce for the market.
There are two types of lands available for farmers. On the hillside, farmers usually have
some lands that they have inherited, or in rare cases bought (the cost being about 10 000
RwF (11.91 USD) per are (0.1 hectare). Renting land on the hillside is very common and cost
about 1000 to 1500 RwF/are/year (from 1.19 to 1.79 USD). Apparently farmers do not have
difficulties to find land, the limiting factor being their ability to cover the renting cost.
Investment in tools:
Maize and beans cultivation are not mechanized and require very limited equipment (hoes, machetes and sometimes small locally made tools used for shelling maize, as well as pesticide sprayers). Regularly investing in tools is compulsory for farmers. They have to purchase hoes every year as they are getting worn out after six months to one year of utilization. The cost is about 2000-3000 RwF (2.38-3.57 USD), which corresponds to the amount given by farmers. All the households have some hoes, but sometimes, they do not have one per person working in the family land. Family members also usually help each other with some more expensive equipment (pesticide sprayers for example). Two cooperatives have some sprayers available for members.
Investment in casual labor
Hiring casual labor is resulting of the concentration of the agricultural activities over a short period of time at the planting season. This phenomenon is amplified with their participation to cooperative’s activities. They have to prepare their land on the hillside (critical to ensure they have different food products to feed their family) and to prepare their plot on the cooperative land. Priority for farmers is to prepare their plot on the hillside, they consider they cannot sustain themselves only with plots on the cooperative (“you cannot eat only maize”, as a farmer told the baseline team). But as the same time, they have to respect the cooperative organization of the work (most cooperative organize for all members so prepare their land at the same time). In order to prepare both plots on time, they usually hire labor (mainly on the cooperative plot). Casual laborers are mainly working on land preparation (clearing the land, preparing the soil) and they also help farmers to transport products (for example farmers use stick to plant beans, and they often ask a laborer to bring them to the plot). Hiring casual labor for harvesting is not very common: this operation is considered as a key one and farmers do it themselves to control what is done with their products and to avoid thefts.
Both men and women are working as casual labor and farmers similarly hire men and women. Labor cost is similar in all the villages visited) and there is no difference for men and women. They do not provide food to laborers. Finding laborers is not difficult as most farmers sometimes sell their labor force, and they usually find laborers amongst relatives or

Baseline Report - February 2018 | P a g e
112
in their nearby environment.
But most farmers are also working as casual labors. Actually, this is the main way for farmers to get cash when they face an unexpected expense, or when they need to purchase agriculture inputs. The same farmer can work as casual labor some times and hire casual labor another time. It will be interesting to see if they hire more casual labor through a more pronounced business orientation of their crop, but another element that will be worth looking at the evaluation stage is whether farmers are still selling their work force. That will be an element showing that better production, management and marketing practices and opportunities result in less financial constraints for farmers.
Seeds and fertilizer
All the cooperatives try and follow the recommendation from the sector agronomist
concerning the quantities of seeds and beans to be used on the cooperative plots. When
cooperatives are organizing inputs provision, there is a certain level of control about inputs
use and members usually apply more or less the recommended quantities. However, when
members purchase inputs on their own, cooperative leaders recognized that some members
do not respect the standards53. On their own hillside plots, farmers mentioned that is
impossible to respect the standards. They all try to apply some fertilizers as they consider it
is impossible to produce without fertilizers but sometimes very low quantity (about 25 to
50% of the recommended quantity).
There is a very clear difference between cooperative plot and personal hillside plots
concerning the use of maize seeds. Most farmers do not plant improved seeds on their
personal plot. They often mix improved seeds with traditional seeds (with a majority of
traditional seeds). They know the improved seeds are better but they do not have enough
funds to purchase 100% of improved seeds. Mixing some improved seeds is a way for them
to improve their production in spite of meagre resources. For areas where cooperatives are
acting as agrodealer, farmers consider that when a farmer is not a member of the
cooperative, it is more difficult to access to improved seeds (there is a lower awareness on
the importance of the seeds, and cooperatives try to serve their members first). This is
coherent with the result from the quantitative survey. Even if maize is already a crop for
which producers invest in improved seeds, there are still about half of the farmers that do
not purchase maize seeds. It will be very interesting to see how this has changed at the
endline stage. With better opportunities and skills, SHF may invest more in improved seeds
for their personal plot. This would really show an improved interest in maize cultivation as a
cash crop.
Several types of improved seeds have been introduced to farmers. The main one for the last
A and B seasons are PAN 53 and ZM. PAN 53 is an hybrid seed imported from Kenya. The
choice of varieties is made by the government depending on varieties considered as suitable
for the area. An important issue with seeds availability is the delay to get the seeds. Farmers
need to have their seeds early enough in the season so their crop can benefit from the rain.
From the last two seasons, farmers have encountered numerous difficulties to get the seeds
53 25kg of maize seeds, 60 kh of bean seeds, 100 kg of DAP for both maize and beans and 50 kg of urea (per hectare)

Baseline Report - February 2018 | P a g e
113
on time. This element was actually recognized and regretted by the majority of the
stakeholders met (including sectors and districts agronomists). Apparently the problem is
linked to difficulties at the import stage.
Table 51: Cooperatives' inputs costs (qualitative data collection)
Local maize
seeds
PAN 53
seeds
ZM seeds Local bean
seeds
Improved
bean seeds
DAP urea
Duterimbere 250 300 450 360
Kobarwo 325 295 450 360
Koaimu 335 300 480
Kopianya 270 325 295 400 500 430 360
Abibumbye 310 425
Abemerehiigo 250 400 500 450 390
Comanya Gishubi 290 400 410 390
CCM Muganza 400 430 380
Inputs price are fluctuating from one cooperative to the other. The price is apparently not
cheaper for cooperative acting as agro dealers. For those cooperatives, they all use the same
formula to calculate the selling price: they add 30RwF (0.04 USD) (including about 16RwF
(0.02 USD) to pay for the transport cost).
Annex 7.6 Statistic on production in the districts
Table 52: Crops cultivated area at district level (NISR, season A 2017)
maize Paddy rice cassava Sweet
potatoes
Irish potatoes Beans
Gisagara 6114 795 7306 1777 511 13463
Nyaruguru 2427 0 4216 4551 1576 3560
Huye 1359 2014 5167 1712 373 7585
Nyamagabe 3219 0 4617 7394 1125 7160

Baseline Report - February 2018 | P a g e
114
Annex 7.7 Quantitative analysis of SHFs practices
Table 53 - SHF reporting of frequency of specific good agricultural practices
Responses
Percent of Cases N Percent
practising of good agricultural
practisea
Practising seed selection 1 1.0% 1.4%
Practising planting and spacing 18 17.1% 25.7%
Practising use of fertilizers 12 11.4% 17.1%
Practising timely harvesting 10 9.5% 14.3%
Practicing minimization of grain
infestation
25 23.8% 35.7%
Practicing cleaning grains before
storage
5 4.8% 7.1%
Practicing avoiding of damanges
to grain during threshing and
shelling
1 1.0% 1.4%
Practicing good drying 11 10.5% 15.7%
Practicing good storage practices 22 21.0% 31.4%
Total 105 100.0% 150.0%
a. Dichotomy group tabulated at value 2.
Table 54 - Good agriculture practice by gender of SHF
Gender
Total Female Male
practising of good
agricultural practicea
Practising seed selection Count 0 1 1
% .0% 2.7%
Practising planting and spacing
Count 7 11 18
% 21.2% 29.7%
Practising use of fertilizers Count 7 5 12
% 21.2% 13.5%
Practising timely harvesting Count 1 9 10
% 3.0% 24.3%
Practicing minimization of grain infestation
Count 12 13 25
% 36.4% 35.1%
Practicing cleaning grains before storage
Count 2 3 5
% 6.1% 8.1%
Practicing avoiding of damages to grain during threshing and shelling
Count 0 1 1
% .0% 2.7%
Practicing good drying Count 4 7 11
% 12.1% 18.9%
Practicing good storage practices
Count 10 12 22
% 30.3% 32.4%
Total Count 33 37 70
Percentages and totals are based on respondents. a. Dichotomy group tabulated at value 2.

Baseline Report - February 2018 | P a g e
115
Annex 7.8 Quantitative analysis of SHF investments in short term assets
Seeds
Table 55 - Number of SHF investing seed purchase
Frequency Percent Valid Percent Cumulative Percent
Valid No 29 3.5 3.5 3.5
Yes 807 96.5 96.5 100.0
Total 836 100.0 100.0
Table 56 – Maize and beans by gender crosstabulation
Gender
Total Female Male
Maize and beansa maize Count 316 399 715
% 88.3% 92.8%
Beans Count 197 217 414
% 55.0% 50.5%
Total Count 358 430 788
Percentages and totals are based on respondents.
a. Dichotomy group tabulated at value 1.
Report
Table 57 - Amount which SHF spend on seeds
Gender Mean N Std. Deviation Minimum Maximum
Female 11345.73 369 21789.056 0 229600
Male 12862.37 438 23178.861 6 300000
Total 12168.89 807 22552.830 0 300000
Table 58 - Amount spent on seeds by gender
Sum of
Squares df Mean Square F Sig.
Amount spent on seeds
by Gender
Between Groups (Combined) 4.607E8 1 4.607E8 .906 .342
Within Groups 4.095E11 805 5.087E8
Total 4.100E11 806

Baseline Report - February 2018 | P a g e
116
Table 59 - Amount spent on seeds by cooperative size
Cooperative size Mean N Std. Deviation Minimum Maximum
Large 14537.77 519 24957.478 0 300000
Medium 8270.16 268 17120.947 6 229600
Small 2939.25 20 4302.103 700 16550
Total 12168.89 807 22552.830 0 300000
ANOVA Table
Sum of
Squares df Mean Square F Sig.
Amount spent on seeds
* 9.2acoop_size
Between Groups (Combined) 8.690E9 2 4.345E9 8.706 .000
Within Groups 4.013E11 804 4.991E8
Total 4.100E11 806
Tools
Table 60 - Percentage of male and female SHF purchasing tools
Gender_HHH
Total Female Male
Purchase tools No Count 90 62 152
% 23.5% 13.7% 18.2%
Yes Count 293 391 684
% 76.5% 86.3% 81.8%
Total Count 383 453 836
% 100.0% 100.0% 100.0%
Table 61 - Purchasing of tools by cooperative size
9.2acoop_size
Total Large Medium Small
Purchase tools No Count 94 51 7 152
% 17.5% 18.3% 35.0% 18.2%
Yes Count 444 227 13 684
% 82.5% 81.7% 65.0% 81.8%
Total Count 538 278 20 836
% 100.0% 100.0% 100.0% 100.0%

Baseline Report - February 2018 | P a g e
117
Fertilizers
Table 62 - Household use fertilizer
Frequency Percent Valid Percent Cumulative Percent
Valid No 73 8.7 8.7 8.7
Yes 763 91.3 91.3 100.0
Total 836 100.0 100.0
ANOVA Table
Sum of
Squares df Mean Square F Sig.
Amount spent on tools *
9.2acoop_size
Between Groups (Combined) 4.572E7 2 2.286E7 .928 .396
Within Groups 1.678E10 681 2.464E7
Total 1.683E10 683
Table 63 - Source of fertilizer by size of cooperative
9.2acoop_size
Total Large Medium Small
Source of fertilizersa Government donation Count 86 38 2 126
% within coop_size 17.4% 15.3% 10.0%
Local and international NGO's Count 52 37 0 89
% within coop_size 10.5% 14.9% .0%
Cooperatives Count 185 85 3 273
% within coop_size 37.4% 34.3% 15.0%
Donations from friends and
families
Count 20 8 0 28
% within coop_size 4.0% 3.2% .0%
Purchase from agricultural
dealers
Count 304 128 20 452
% within coop_size 61.4% 51.6% 100.0%
Others Count 6 8 1 15
% within coop_size 1.2% 3.2% 5.0%
Borrowing from friends and
family
Count 8 7 0 15
% within coop_size 1.6% 2.8% .0%
Total Count 495 248 20 763
Percentages and totals are based on respondents.
a. Dichotomy group tabulated at value 1.

Baseline Report - February 2018 | P a g e
118
Annex 7.9 Adoption of good agricultural practices
Table 64: - Level of adoption of good agricultural practices (field observation and FDGs)
Cooperative plot Personal plot
Land preparation +++ +++
Timely planting + ++
Use of improved seeds +++ +
Use of adequate amount of fertilizers ++ +
Use of adequate amount of manure + +
Use of lime + -
Planting in line +++ ++
Adequate spacing +++ ++
Correct weeding +++ +++
Timely harvesting ++ ++
Use of manure is insufficient. The recommended quantity to apply is 10T/ hectares which
correspond to 500Kg per plot of five acres. When farmers met applied manure (some are
not applying anything), they apply between 15 kg to 300kg per plot. Farmers do not know
the recommended quantity and they apply only what is available. This is a crucial issue to
work on to improve productivity and to maintain soil fertility. Only in one cooperative some
farmers mentioned that they are using compost (they have been trained on compost
making). Compost is usually made of manure, green organic matter and dry matter that are
kept to decompose for at least three weeks. Other practices (planting in line, respecting
spacing, sufficient weeding) are already relatively well respected by SHFs. Similarly, no
farmer is using lime even if it is extremely important to ensure soil fertility on acidic soil.
Timely planting is sometime an issue, because farmers have to deal with their personal and
cooperative plots.

Baseline Report - February 2018 | P a g e
119
Annex 8. Annexes on EQ4
Annex 8.1 Short presentation of pro-SHF buyers working in Rwanda met during qualitative data
collection
EAX
EAX (East Africa Exchange) is a regional commodity exchange offering commodity trade
services in Rwanda and East Africa Community (EAC) common markets (173 million
consumers) in key staples food crops such as Maize, Beans and Soya. EAX is implementing
a warehouse electronic system that enables SHF to sell their product at a better price. After
harvest, maize is stored and farmers receive a, electronic receipt that they can use as
guarantee at the bank to receive a loan. This way, farmers can wait for the price to increase
before selling their produce
EAX has two warehouses, one in Gisagara and one in Nyanza. They are acting as
intermediaries between sellers and buyers, and they are not purchasing the product
themselves. They have developed a platform allowing buyers to see what is available and to
propose a price to the seller.
For 2017-2018, they plan to collect 15 000T and for 2018-2019, 30 000T. So far their
storage capacity is 19800 T but they are planning to invest in a 10 000T store in Kigali.
Depending on market dynamics, they also purchase maize from other countries (Malawi,
Zambia and Uganda). They have a network of cooperatives they have sensitized and they
register cooperative that are working with them (254 cooperatives registered but they do
not all provide maize).
For maize, their main clients are AIF (60%), Minimex (30% Minagri for the strategic
reserve and the local market. For beans they sell on the local markets (some of the beans
sold on the local market goes to WFP)
PRODEV-MINIMEX
Minimex has started operating in 2007 and prodev was established in 2012. PRODEV and
MINIMEX are sister companies. PRODEV is in charge of sourcing maize and MINIMEX is
processing. MINIMEX is producing maize flour, fortified maize flour, maize grit (sold to
Braliwa to produce beer) and maize bran. They are building an animal feed processing unit
that will value the maize bran produced.
The volume of maize processed is between 28 000 and 30 000 T per year. Their capacity is
45 000T. The feed plant will have a capacity of 60 000T per year (50% of it will be maize).
They will have to increase volumes procured up to 75 000T. They purchase grade 1 maize
for human consumption and grade 2 and 3 for animal feed.
They have a storage capacity of 15 000T.
They are increasingly procuring maize from cooperatives. In 2013, volumes procured from
cooperative represented 7% of the total volume, it is now about 30%. They offer farmers a

Baseline Report - February 2018 | P a g e
120
floor price (higher than the minimum price from the GoR) and they cover transport costs.
They also purchase from Zambia, mainly because maize from Zambia has lower aflatoxin
level than in Rwanda (Uganda has very high level of Aflatoxin, about four times more than
what is found in Rwanda). 30% of their production is exported to DRC. Their other clients
are the armed force (5000T), WFP, some schools
SARURA
SARURA Company was created in 2012. It acts as an intermediary between farmers and
buyers. They also develop a post-harvest training service for cooperatives. They have
collection centres. They collect between 1000 and 2500T per season.
Annex 8.2 Key issues to develop arrangements between cooperatives and big buyers for maize and
bean procurment
In order to develop this kind of arrangements some issues need to be looked at:
- Buyers’ ability to develop a network of cooperatives remains limited. Identifying, assessing and engaging cooperatives require time and a specific expertise.
- Buyers consider that for cooperatives to become reliable business partners there is an acute need for capacity building.
- In order to engage with a cooperative, buyers need to have some guarantee that they can get sufficient volumes. For Minimex, it is interesting to sign a contract with a cooperative if it can provide at least 10T of maize.
- According to all the buyers met, post-harvest handling done by SHFs and cooperatives is not sufficient to have good quality maize.
- Main quality problems concern moisture level, percentage of broken grains, presence of foreign matter, contamination with aflatoxin (the maize produced by SHF is about 25 µg/kg when the norm is 10 µg/kg) and insects ‘attacks. When mold is detected the maize is systematically rejected.

Baseline Report - February 2018 | P a g e
121
Annex 9. Evaluation question 6
Annex 9.1 Production of the main crops grown in the four targeted districts
Table 65 - Production of the main crops in the targeted districts (season A 2017), NISR
Sorghum Rice Cassava
Sweet
potatoes
Irish
potatoes Maize Bean
Gisagara 155T 1909T 16221T 6648T 1296T 7427T 10029T
Nuaruguru 0T 0T 10449T 55900T 10446T 3562T 2824T
Huye 0T 6634T 18331T 5087T 706T 1388T 4058T
Nyamagabe 22T 0 7354T 70945T 4863T 4212T 4966T
As the table above show, there is a high diversity of situation from one district to another.
However, these figures only cover season A 2017. The disaggregated data per districts were
not available for other season or for the whole year. First thing to notice is that bean
production is surprisingly low compared to other crops. This figure is difficult to explain
and is not in line with the data on yield and on areas cultivated. This table shows that the
main crops grown by farmers are sweet potatoes, cassava and irish potatoes. Maize is not
yet representing high production, but considering it is a relatively new crop (only a few
maize were planted in mixed farms) and is only gaining importance on equipped
marshland, the result is not surprising.
Annex 9.2 Characteristics of the main crops grown in the four targeted districts
Bean is the most importance subsistence crop for SHFs. It is often refers to as the meat of the poor. Farmers grow bean both in A and B season. SHFs grow two types of beans: common beans and climbing beans (mainly in the marshlands). RAB has introduced several varieties that are high in iron contents. These varieties were releases to farmers from 2010, in exchange for their traditional seeds. Improved seeds have also been introduced. The main difference with maize is that it is possible for farmers to keep the seeds for the following season (as they are not hybrids). Farmers do not usually purchase improved beans seeds.
Sweet potatoes: SHFs consider sweet potato as a crop which can contribute to food security and sustain their livelihood. One of the main interest of sweet potatoes for farmers in the possibility to keep potatoes in the ground before harvest (and then harvest it gradually when need occur). Farmers consider sweet potatoes as a major crop in case of famine (and according to them period of famines happen every year). Before marshland equipment, farmers were planting sweet potatoes on the hillside for season A and on the marshland for season B. Sweet potatoes is not one of the priority crop for the CIP so its cultivation is not encouraged and is forbidden in the developed marshlands. Some farmers explained that when a farmer planted sweet potatoes anyway he was at risk to see its production destroyed and to lose his access to marshland. This is a big issue for farmers that consider sweet potatoes are an essential crop for their food security.
Vegetables: Vegetable is a crop that is grown on a very small scale.Its production cycle is

Baseline Report - February 2018 | P a g e
122
very short. It’s a very labor intensive crop and requires irrigation. As they are often grown in season C, sales of vegetable can provide an interesting source of funds to prepare season A (that is the main agriculture season).
Coffee: coffee is the main cash crop for LRP farmers, even if only a minority of them possesses coffee plantations. All farmers that have coffee plantation consider that it is their main source of income (in Abemerihiigo cooperative, they explained that about 70% of their income comes from coffee). Rwanda has good growing conditions for Arabica coffee and it is engaged in production of quality coffee since 1998. Coffee farmers cooperatives are more advanced than maize cooperatives, they have a more developed organization of collective activities (around coffee washing stations for example) and collective sales. Income from coffee is treated as unique by farmers since it is generated in a short period due to the seasonal aspect in coffee harvesting and can be obtained as a lump sum.
Cassava: cassava is another very important crop for farmers but the production of cassava has drastically declined in the last decade due to mainly diseases, pests and lack of disease resistant varieties. Biggest phytosanitary problems include the Cassava Mosaic Disease and the Cassava Brown streak disease. Cassava is planted at the same time than maize and/or beans and is left on the plot after harvest of the short-cycle crop. As for sweet potatoes, cassava is interesting because tubers are kept in the ground and harvested when needed.
Irish potatoes: Similarly to maize, Irish potatoes is seen by farmers as a source of income and an important source of food for the family. It is one of the priority crop of GoR and as such, Irish potatoes cultivation is authorized (in monoculture) in the marshlands. Some of LRP cooperative are actually cultivating it in a rotation with maize. Production per hectare remains low and there is room for improvement (varieties, practices). Some cooperatives have been trained into seed multiplication but it is not frequent and accessing good varieties remain an issue because of their costs. Irish potato farmers face many challenges including low quality seed, pests and diseases which lead to low productivity and limited expansion of the crop. Post-harvest management is also a crucial issue as Irish potatoes are more perishable than maize and beans grains for example.

Baseline Report - February 2018 | P a g e
123
Annex 9.3 Economic calculations
Three indicators concerning net margin will be used:
• Net margin of maize and bean production without taking into consideration the
cost of family labor: this indicator reflect the activity system of SHF and is a way
to have information on the real profit that a farmer can make on a given piece of
land
• Net margin of maize and bean production per man day: this indicator enables us
to understand the value of investing a day of work in maize and bean production,
in comparison with other opportunities (for example with the cost of casual labor)
• Net margin of maize and bean production with a monetary value given to family
labor: this indicator reflect the economic interest of maize and bean cultivation.
Table 66 - Current and potential profitability of bean cultivation in the marshland for SHF, calculation from qualitative data collection
Cropping
system Production
Net margin/plot
(without labour) Net margin/manday
Net margin/ha
(including family
labour cost)
Current
situation with
use of inputs
5 kg of
fertilizer/plot
(DAP)
No purchase of
seeds
1.2T/ha 14 950RwF
(17.80 USD)
623RwF
(0.74 USD)
-37000RwF
(-44.06 USD)
Current
situation low
input use
1 kg or
fertilizer/plot
(DAP)
No purchase of
seeds
800 kg 8 750 RwF
(10.42 USD)
380RwF
(0.45 USD)
-147000 RwF
(-175.03 USD)
Potential
situation with
inputs and
good practices
5 kg of fertilizes
(DAP)
20 kg of
manure
Use of
improved seeds
2T 25 150 RwF
(29.95 USD)
898 RwF
(1.07 USD)
111 000 RwF
(132.17 USD)

Baseline Report - February 2018 | P a g e
124
Table 67 - Current and potential profitability of maize cultivation in the marshland for SHF
Cropping
system Production
Net margin/plot
(without labour) Net margin/manday
Net margin/ha
(including family
labour cost)
Current situation
with average
inputs use
1.25 kg of
improved seeds
2.5 kg of urea
5 kg of DAP
20 kg of manure
2T 15 069RwF
(17.94 USD)
793 RwF
(0.94 USD)
35 375 RwF
(42.12 USD)
Current situation
with improved
seeds but low
fertilizers
1.25 kg of
improved seeds
1 kg of urea
2.5 kg of DAP
No manure
1.2T 8779 RwF
(10.45 USD)
549 RwF
(0.65 USD°
-48420 RwF
(-57.65 USD)
Current situation
with local seeds
and low inputs
1.25 kg of local
seeds
1 kg of urea
2.5 kg of DAP
No manure
0.8T 3 742 RwF
(4.46 USD)
234 RwF
(0.28 USD)
-149 160 RwF
(-177.60 USD)
Potential
situation with
inputs and good
practices
1.25 kg of
improved seeds
2.5 kg of urea
5 kg of DAP
150 kg manure
4T 19 069 RwF
(22.71 USD)
1192 RwF
(1.42 USD)
157 380 RwF
(187.39 USD)

Baseline Report - February 2018 | P a g e
125
Annex 10. Evaluation question 7 (quantitative analysis)
Table 68 - Characteristics of maize and beans
Responses
Percent of Cases N Percent
characteristics of maize and
beansa
Without stones 756 20.2% 90.4%
Without smell 246 6.6% 29.4%
Without insects 562 15.0% 67.2%
Very white maize 17 .5% 2.0%
Specific color of beans 686 18.3% 82.1%
Specific variety of maize/beans 463 12.4% 55.4%
Well dried maize/beans 698 18.7% 83.5%
Others 312 8.3% 37.3%
Total 3740 100.0% 447.4%
a. Dichotomy group tabulated at value 1.
Table 69 - Contribution of crops to household
Frequency Percent Valid Percent Cumulative Percent
Valid Bananas 4 .5 .5 .5
Beans 574 68.7 68.7 69.1
Cassava 6 .7 .7 69.9
Coffee 4 .5 .5 70.3
Ground nuts 1 .1 .1 70.5
Irish potatoes 10 1.2 1.2 71.7
Maize 116 13.9 13.9 85.5
Others 3 .4 .4 85.9
Peas 1 .1 .1 86.0
Rice 16 1.9 1.9 87.9
Sorghum 5 .6 .6 88.5
Sweet potatoes 92 11.0 11.0 99.5
Vegetables 4 .5 .5 100.0
Total 836 100.0 100.0
Consumption of maize and bean
SHF’s reported to reserve an average of 322kgs (av. 251.9 kgs in season A and 140.4 kgs in season B) of maize and 247kgs (av. 176.6 kgs in season A and 140.9kgs in season B) of beans
every planting season for household consumption. The amount of maize and beans kept by
the household for consumption in season A was significantly higher than in season B but
there was no significant difference in the average amount of maize (males 461.2kgs, females
205.3kgs; p=0.465) and beans (males 345.7kgs, females 128.3kgs; p=.0410) kept by male
and female headed households. In general, 44.8% (41.6% in season A and 42.9% in season
B) of the total maize harvest and 61.2% (57.3% in season A and 59.2% in season B) of the total beans harvest was reserved for household consumption. Though the amount of maize
and beans reserves was higher in season A compared to season B, the proportions reserved

Baseline Report - February 2018 | P a g e
126
for consumption during the two seasons was not significantly different. There was also no
noted difference in the amount of maize and beans reserves for household consumption
among members of cooperatives of different sizes, ages and capacities. Only 17.2% (females
20.7%, males 14.3%) of the SHF households would be able to completely cover their household maize needs and 12.1% (females 13.8%, males 10.6%) of their beans needs from
the own production if maize and beans were not sold by the households.

Baseline Report - February 2018 | P a g e
127
List of Acronyms
AGRA Alliance for a Green Revolution in Africa
AIF AFRICA Improved Food
APTC Agro-processing Trust Corporation
ASWG Agriculture Sector Working Group
BDF Business Development Fund
BRD Development Bank of Rwanda
CIP Crop Intensification Programme
CFSVA Comprehensive Food Security and Vulnerability Analysis
DDP District Development Plan
DRC Democratic Republic of Congo
EAX East Africa Exchange
EDPRS Economic Development Poverty Reduction Strategy
EICV Integrated Household Living Condition Survey
EU European Union
FAO Food and Agriculture Organization
FGD Focus Group Discussion
FTMA Farmer To Market Alliance
GA General Assembly
GoR Government of Rwanda
Ha Hectare
HGSF Home Grown School Feeding
IFAD International Fund for Agriculture Development
ICT Information and Communication Technology
IPM Integrated Pest Management
IPM Integrated Pest Managment
Kg Kilogram
KII Key Informant Interview
LRP Local and Regional Procurement
MFI Microfinance Institution
MINAGRI Ministry of Agriculture and Animal Resources
MINECOFIN Ministry of Economy and finance
MINECOM Ministry of Commerce
MINEDUC Ministry of Education

Baseline Report - February 2018 | P a g e
128
MIS Market Information System
NGO Non-Governmental Organisation
NISR National Institute for Statistic of Rwanda
OEV Office of Evaluation
P4P Purchase for Progress
PDAG Projet de Développement Agricole dans le region de Gikongoro
PSTA Strategic Plan for the Transformation of Agriculture in Rwanda
RAB Rwanda Agriculture Board
RCA Rwanda Cooperative Agency
RDO Rwanda Development Organisation
RGCC Rwanda Grains and Cereals Corporation
RSSP Rural Sector Support Project
RwF Rwandese Franc
T Ton
SACCO Saving and Credit Cooperatives
SHF Small Holder Farmer
SME Small and Medium Entreprise
SOP Standard Operating Procedure
SWG Sector Working Group
TOR Terms of Reference
UNDP United Nation Development Program
USDA United Stated Department of Agriculture
WFP World Food Programme

[Name of commissioning Office] [Link to the website]
[Kig
ali, F
eb
ru
ar
y 2
018
]