impact evaluation of usaid nurture in laos
TRANSCRIPT
DISCLAIMER: This publication was developed by Social Impact, Inc. under contract No. AID-486-I-14-00001 and produced for review by the United States Agency for International Development (USAID).
IMPACT EVALUATION OF USAID NURTURE IN LAOS Midline Evaluation Report
i
IMPACT EVALUATION OF USAID NURTURE IN LAOS Midline Evaluation Report
Submitted: September 6, 2019 Submitted to: Charles Lewis Project Development Officer USAID/Regional Development Mission Asia Prepared by: Social Impact, Inc. Contract No. AID-OAA-M-11-00019 2300 Clarendon Boulevard Suite 1000 Arlington, VA, 22201 Tel: (703) 465-1884 Fax: (703) 465-1888 [email protected] DISCLAIMER This report was made possible by the support of the American people through the United States Agency for International Development (USAID). The contents of this report are the sole responsibility of Social Impact and do not necessarily reflect the views of USAID or the United States Government.
ii
ACKNOWLEDGMENT The USAID Nurture Impact Evaluation could not have been completed without extensive collaboration and support from many organizations and individuals. First and foremost, the evaluation team would like to thank USAID, both the Regional Development Mission for Asia and the Mission in Laos, for committing to such a long-term and intensive evaluation, demonstrating an impressive commitment to learning and improving their nutrition, WASH, and maternal and child health programming. Specifically, we thank Dr. Nigoon Jitthai, the M&E Specialist, and Charles W. Lewis II, the Program Officer and Mission Gender and Inclusive Development Advisor, who has served as the Contracting Officer’s Representative for the USAID Nurture Impact Evaluation and provided excellent guidance on all matters to the team. We would also like to thank Save the Children International, the implementer of the USAID Nurture program, for engaging in a spirit of learning and collaboration for this evaluation, despite the additional burden an impact evaluation entails. From the evaluation perspective, we would also like to thank our local data collection partner, IndoChina Research Laos (IRL), and particularly Chansada Souvanlasy, Darathip Sounthavong, Khanithalath Koummarasy, and Vipapone Aphayvanh. Finally, we thank the direct program beneficiaries and other stakeholders who participated in data collection. We hope that this report accurately represents their views and experiences and is useful in developing and improving future programs to better support them and their communities. This document was produced by Mike Duthie, Lisette Anzoategui, Anna-Karin Hess, Julia Higgins, and Madeleine Smith of Social Impact, Inc.
iii
ACRONYMS ANC Antenatal care CEM CF
Coarsened Exact Matching Community Facilitator
CIA Conditional Independence Assumption CLTS CU5 CU2
Community-Led Total Sanitation Children under five Children under two
DHS DID DNC
Demographic and Health Surveys Difference in Differences District Nutrition Committee
EBF Exclusive breastfeeding EED ET
Environmental Enteric Dysfunction Evaluation Team
FGD Focus Group Discussion FNSAP Provincial and District Food and Nutrition Action Plans GDP Gross Domestic Product GMP Growth Monitoring and Promotion GOL Government of Laos HH Household IFA IFAD iNuW IR
Iron and Folic Acid International Fund for Agricultural Development Integrated Nutrition and WASH Intermediate Result
IYCF Infant and young child feeding KII Key Informant Interview Laos Lao People’s Democratic Republic MMF MOU MPH
Minimum meal frequency Memorandum of Understanding Ministry of Public Health
NF Nutrition facilitators NNS National Nutrition Strategy NPAN National Plan of Action for Nutrition ODF Open defecation free PLW PSM
Pregnant and lactating women Propensity Score Matching
RDA Rural Development Agency SBCC SC SDA SI TOC UNICEF
Social and Behavior Change Communications Save the Children Small doable actions Social Impact, Inc. Theory of Change United Nations Children’s Fund
USAID VIC WASH
United States Agency for International Development Village iNuW Committee Water, Sanitation, and Hygiene
WB WHO WRA
World Bank World Health Organization Women of Reproductive Age
iv
CONTENTS
ACKNOWLEDGMENT II ACRONYMS III TABLES AND FIGURES VI EXECUTIVE SUMMARY 1 EVALUATION OBJECTIVES 1 PROGRAM BACKGROUND 1 EVALUATION DESIGN 1 KEY FINDINGS AND CONCLUSIONS 2 EVALUATION QUESTION I 2 EVALUATION QUESTION II 3 RECOMMENDATIONS 4
1. INTRODUCTION 6 1.1 PURPOSE 6 1.2 EVALUATION OBJECTIVES 6 1.3 NUTRITION AND WASH CONTEXT 6 1.4 PROGRAM BACKGROUND 8
2. EVALUATION DESIGN 11 2.1 RESEARCH METHODOLOGY 11 2.2 DATA COLLECTION 12 QUANTITATIVE DATA 13 QUALITITATIVE DATA 14 2.3 ANALYTICAL APPROACH 15
3. FINDINGS 17 3.1 CHILD ANTHROPOMETRY 17 ANALYSIS: CHILD ANTHROPOMETRY 19 3.2 IYCF PRACTICES 22 ANALYSIS: IYCF PRACTICES 26 3.3 WASH PRACTICES 28 ANALYSIS: WASH PRACTICES 32 3.4 GMP SERVICES 33 ANALYSIS: GMP SERVICES 34 3.5 ANTENATAL SERVICES 35 ANALYSIS: ANC SERVICES 36 3.6 EVALUATION OF USAID NURTURE PROGRAM COMPONENTS 37 1 & 2: IMPROVED COMMUNITY NUTRITION/HEALTH AND WASH SERVICES & CAPACITY BUILDING TO IMPROVE QUALITY SERVICE DELIVERY 38 3. DEMAND CREATION FOR USE OF NUTRITION, HEALTH, WASH SERVICES AND PRODUCTS 42 4. IMPROVED ENABLING ENVIRONMENT 44
4. CONCLUSIONS 46
v
5. RECOMMENDATIONS 50 ANNEXES 52 ANNEX A: SUMMARY OF KEY INDICATORS 52 ANNEX B: BALANCE CHECKS 76 ANNEX C: REGRESSION TABLES 78 ANNEX D: QUANTITATIVE INSTRUMENT 95 ANNEX E: QUALITATIVE INSTRUMENTS 158 ANNEX F: USAID NURTURE PROGRAM LOGIC EXPECTED OUTCOMES AND ASSUMPTIONS 178 ANNEX G: SUMMARY OF BARRIERS TO PROGRAM OUTCOMES DISCUSSED IN QUALITATIVE INTERVIEWS 181
vi
TABLES AND FIGURES TABLES Table 1: Children’s Descriptive Statistics................................................................................................................... 13 Table 2. Qualitative Sample ........................................................................................................................................... 15 Table 3. Regression Variables ....................................................................................................................................... 16 Table 4: Indicator Descriptions and Notes ............................................................................................................... 56 Table 5: Child Anthropometry Indicators ................................................................................................................. 61 Table 6: Breastfeeding Indicators ................................................................................................................................. 62 Table 7: Complimentary Feeding Indicators ............................................................................................................. 65 Table 8: MAD Indicators ................................................................................................................................................ 67 Table 9: WASH Indicators............................................................................................................................................. 70 Table 10: GMP Services Indicators .............................................................................................................................. 74 Table 11: ANC Indicators .............................................................................................................................................. 75 Table 12: Balance Checks .............................................................................................................................................. 76 Table 13: Anthropometry Regressions ...................................................................................................................... 78 Table 14: Breastfeeding Regressions ........................................................................................................................... 79 Table 15: Complementary Feeding Regressions ...................................................................................................... 82 Table 16: MAD Regressions .......................................................................................................................................... 85 Table 17: WASH Regressions ....................................................................................................................................... 88 Table 17: GMP Regressions........................................................................................................................................... 92 Table 18: ANC Regressions .......................................................................................................................................... 93 FIGURES Figure 1: USAID Nurture Results Framework ......................................................................................................... 10 Figure 2: USAID Nurture Theory of Change ........................................................................................................... 11 Figure 3: Evaluation Timeline ........................................................................................................................................ 12 Figure 4. Prevalence of Stunting in CU2 .................................................................................................................... 18 Figure 5. Prevalence of Underweight in CU2 ........................................................................................................... 18 Figure 6. Prevalence of Wasting in CU2 .................................................................................................................... 19 Figure 7. Stunting, Wasting, and Underweight Comparison of Nurture Boys and Girls at Midline ............ 19 Figure 8. Global Nutrition Report 2016 .................................................................................................................... 21 Figure 9. Median Duration of EBF in Months ............................................................................................................ 22 Figure 10. Percent of Children 0-23 Months ............................................................................................................ 23 Figure 11. Percent of Children who are fed breastmilk ......................................................................................... 23 Figure 12. Complementary Feeding Indicators and Definitions for CU2 ........................................................... 24 Figure 13. Percent of Pregnant Women and WRA who have an Adequate Diet ........................................... 25 Figure 14. Average Number of Food Groups Consumed by Female Caregivers ............................................ 26 Figure 15. Percent of Caregivers in 1,000 day Households Washing Hands Before Eating .......................... 29 Figure 16. Percent of caregivers washing hands after cleaning an infant’s bottom and disposing of child’s feces .................................................................................................................................................................................... 30 Figure 17. Percent of Households Practicing Correct Use of Recommended Household Water Treatment Technologies ................................................................................................................................................ 31 Figure 18. Percent of Caregivers Washing Hands Before Preparing Young Child’s Food ............................. 31 Figure 19. Percent of Caregivers in 1,000 day Households Practicing Safe Disposal of Infant/Young Child.............................................................................................................................................................................................. 31 Figure 20. Percent of Households Practicing Key Hygiene Behaviors (Feces Disposal, Treating Water, and Handwashing) ............................................................................................................................................................ 31 Figure 21. Percent of Caregivers in 1,000 day Households Washing Hands After Defecating .................... 32 Figure 22. Percent of CU2 who received GMP services ........................................................................................ 34
vii
Figure 23. Percent of women with a live birth who received at least four antenatal care visits .................. 35 Figure 24. Percent of Women with a Live Birth who received ANC Within the First 12 weeks of Pregnancy ........................................................................................................................................................................... 36
i
EXECUTIVE SUMMARY
EVALUATION OBJECTIVES The United States Agency for International Development (USAID) aims to test the effectiveness of the Nutrition and Community Sanitation Activity (USAID Nurture, referred to throughout the document as “the Activity”) in reducing child stunting in targeted provinces, districts, and villages in Lao People’s Democratic Republic (Laos) through a targeted, integrated, and multi-sectoral nutrition intervention approach that could be replicated and potentially scaled-up in other settings across the country. Social Impact, Inc. (SI) will investigate the success of this integrated intervention model by evaluating its effectiveness in changing Infant and Young Child Feeding (IYCF) and hygiene and sanitation outcomes and ultimately achieving the overall intended impact: reduced child stunting. This report provides evaluation results at midline. The impact evaluation questions are as follows:
1. What is the effectiveness of the USAID Nurture approach in improving the nutritional status of children under two (CU2) in target areas?
2. To what extent did each of the individual components of the USAID Nurture approach
(maternal, IYCF, and WASH) contribute to the effectiveness of the overall approach?
PROGRAM BACKGROUND The Activity focuses on improving the nutritional status of women and children to reduce stunting in targeted provinces, districts, and villages in Laos. The program, implemented by Save the Children (Save), works to improve nutrition; water, sanitation, and hygiene (WASH) practices; and behaviors at the household and community levels. It concentrates on child and maternal nutrition during the ‘window of opportunity’ – the first 1,000 days from pregnancy until a child’s second birthday. Households with women in their third trimester of pregnancy or CU2 are referred to as “1,000 days households.” This is considered a critical period for children during which the most cognitive and physical damage can occur. The primary target beneficiaries of the program include women of reproductive age (WRA), pregnant and lactating women (PLW), CU2 (and their caregivers and caregivers’ households), and adolescent girls. While these are the primary targeted populations, many of the program components such as the mass media campaigns, greater social mobilization, CLTS, etc. will involve the larger community including older children.
EVALUATION DESIGN The first evaluation question was examined primarily through a quantitative impact evaluation approach. In order to answer the second question, qualitative data were collected on stakeholders’ perceptions of which program elements most effected change. Key indicators are detailed in Annex C and data collection tools are included in the Annex F and Annex G. The Activity is evaluated through a mixed methods quasi-experimental approach, incorporating elements of coarsened exact matching (CEM) to identify a comparison group for the evaluation. Under this design, by 2020, SI will have collected data from treatment (referred to throughout the remainder of the document as “Nurture”) and control households at baseline (completed in 2018) and two annual follow-ups, the first of which is detailed in this report. The sampling approach was designed around our primary unit of analysis: 1,000 day households with pregnant women or women with CU2 years of age. At
2
midline, we completed household surveys including anthropometric measurements with 2,767 households in 346 villages. The midline qualitative evaluation team (ET) conducted a total of 53 interviews, including 41 key informant interviews (KII) and 12 focus group discussions (FGD) with national, provincial, district officials, village-level volunteers and beneficiaries, and USAID Nurture staff. The ET interviewed a total of 98 respondents between June 17 – July 1, 2019. Data were collected in Vientiane and four districts in Khammouane and Savannakhet provinces. The districts were purposively selected based on the following criteria: (a) implementation status (ensuring selected locations are at advanced program implementation stages, (b) geographic representation across both provinces, and (c) access feasibility during field work. The qualitative team collected data in at least one remote district in each province. For each selected district, KII were conducted with government officials, healthcare and WASH providers, and implementation staff.
KEY FINDINGS AND CONCLUSIONS
EVALUATION QUESTION I
Child Anthropometry Overall, the ET found that at midline, the Activity had a number of significant positive impacts on secondary outcomes, although no significant impact on the primary goals of stunting, wasting, and underweight prevalence among CU2. While changes in the primary outcomes in anthropometric data between Nurture and control groups are insignificant, that is perhaps to be expected at this stage given that the Activity has been implemented for less than one year in the target communities. IYCF Practices Results from the evaluation suggest some positive IYCF impacts, particularly among younger children. At midline, 38.3 percent of infants under six months were exclusively breastfed (EBF), although we do not find differences in EBF rates or overall rates of breastfeeding between the treatment and control groups. The Activity increased EBF duration, though this is only significant for children under 6 and 12 months of age. Since the Activity has only been implemented for one year, we would not expect to see impacts in older children who may have already stopped EBF before the Activity started. The Activity had a significant impact on children’s minimum meal frequency (MMF), with children in treatment areas 1.35 times more likely to receive the MMF. The significant impact on MMF contributes to a significant increase in the likelihood of achieving the minimum acceptable diet (MAD), with treatment children 1.67 times more likely. Overall, micronutrient adequacy as measured by MAD-W, was very low with only 5.9 percent of female caregivers in the sample having consumed the minimum acceptable diet at midline. However, the Activity had a significant positive impact in self-reported nutritionally adequate diets for WRA, increasing the odds of consuming an acceptable diet by 2.8 times. WASH Practices In examining WASH outcomes, we found evidence of positive impact for some, but not all, indicators, with greater impacts seen on indicators requiring fewer external resources for achievement. The program did not have an effect on soap presence at 1,000 days households’ handwashing stations, households’ possession of a basic sanitation facility, caregivers giving safe drinking water to children 6 - 23 month of age, use of an improved drinking water source, using a clean play space for children, or open defecation. The data did, however, reveal some significant positive effects. Treatment households were almost two times as likely to use recommended household water treatment technologies. We also found positive effects on indicators related to handwashing and hygiene.
3
GMP Services The percent of CU2 receiving Growth Monitoring and Promotion (GMP) services increased in both the Nurture (75.7 percent) and control (77.9 percent) villages. Despite the large percentage of GMP services accessed, the Activity had a small negative impact on CU2 receiving GMP services. Yet, this diminished for younger children to the point of finding no effect on children under 12 months. Antenatal Services Based on several antenatal care (ANC) outcomes measured, the Activity had a significant positive impact on seeking and obtaining ANC services. This was also mirrored in the qualitative evidence which showed increased learning of both ANC practices, particularly with regards to pregnancy registration and utilizing health care centers, and breast-feeding practices. We did not, however, find evidence of impact on indicators related to information received from a health care provider about breastfeeding or positioning and attachment. Outcomes for Boys Versus Girls On most outcomes, we did not find evidence of significant differences, or differential program impact, for boys compared to girls. We did, however, find important differences with respect to anthropometrics and complementary feeding. Specifically, we found that boys had significantly higher rates of stunting, underweight, and wasting than girls. Both the qualitative and quantitative evidence suggest that this may have been due to gender-based differences in complementary feeding. We found that girls had significantly longer EBF durations and received significantly fewer solid and semi-solid food feedings.
EVALUATION QUESTION II
Overall, qualitative interview participants noted observed progress and high levels of satisfaction with the Activity. Nevertheless, the study also uncovered strong barriers to achieving progress and intended outcomes. Components 1 & 2: Community Nutrition/Health and Wash Services & Quality Service Delivery National, provincial and district level officials, village level volunteers and beneficiaries, and Activity staff noted that the Ministry of Health and other donor-funded programs have a long history of promoting nutrition and WASH knowledge in the past, and many individual practices were familiar. However, adoption of practices and access to services remains a challenge. Respondents stated that the Activity funds not just the technical assistance, but also the cascade training approach logistics, including additional staff, transport, provincial and district level trainer per diems, and other costs associated with delivering the training and services. This support has enabled advisors and healthcare providers to access remote locations to conduct the series of technical training visits, provide routine visits, and facilitate periodic prompting and reminders to promote the nutrition and WASH practices among 1,000 day households and communities. Some remote locations received minimal or no service before the Activity. One overarching success reported is that the Activity instigated a transformational shift from using old training and health extension techniques that previously relied on instructional approaches to a system of facilitated learning that fosters, self-reliance, demonstrations, and small doable actions (SDA). Component 3: Demand Creation for Use of Nutrition, Health, and WASH Services and Products
4
Demand creation for nutritious products was detected through apparent increased knowledge of the five food groups, optimal complementary feeding practices, and efforts to overcome some food taboos and cultural practices that negatively impact infant and young child nutrition. Similarly, ANC service demand creation was reflected in the reported increases in maternal nutrition service utilization; though, many constraints were still reported. Village level beneficiaries also discussed wanting more services from Community Facilitators (CF) such as continuous tool improvement, childcare, transportation to health service providers, and breastfeeding related products such as breast pumps and bottles. Communities widely reported improvement in a range of WASH and baby WASH behaviors and an increase in toilets due to the presence of WASH agents. However, while there are marked improvements detailed in this report, knowledge and understanding of the overall integrated nutrition and WASH (iNuW) approach itself, what was supposed to happen, and knowledge of the modified community-led total sanitation (CLTS) approach as a program component were only mentioned by a few respondents at the national and district levels. 4. Improved Enabling Environment Respondents reported that the Activity made significant contributions to executing actions listed in the National Nutrition Strategy (NNS) to 2025, the National Plan of Action for Nutrition (NPAN) 2016 – 2020, and the National Social and Behavior Change Communication (SBCC) Plan. The iNuW toolkit, notably, the Pink Book, was mentioned as supplying tools and materials at the national, provincial, and district levels that have improved the quality of health and nutrition service delivery and shaped the new National SBBC Plan. There were two main challenges noted: National, provincial, and district level KII expressed some concerns with the role of the Activity as a project that implements activities and reports back to the government versus supporting government systems. Secondly, at the provincial level, respondents indicated they do not receive systematic feedback or interim monitoring data showing program results, such as birth registration rates, how many women are visiting health centers, rates of EBF, etc.
RECOMMENDATIONS Based on these findings, the principal recommendations of this midline evaluation are:
1. The Activity should continue the work on knowledge dissemination, capacity building, facilitation improvement, and technique teaching. There is evidence of positive program impacts, particularly among intermediate outcomes that may lead to impacts on higher level outcomes with sustained implementation.
2. The Activity should develop an incentive and compensation system for the CF and Village iNuW Committees (VIC) to increase coverage and motivation. The CF and VIC play a critical role in the Activity but require assistance to compensate them for their personal costs, ensure they can serve as role models in the community, and to increase motivation, thereby to reducing turnover and encouraging sustainability. Moreover, additional support should be provided to the CF and VIC at the community level to improve capacity and monitoring, especially with regard to implementing the iNuW comprehensive toolkit.
3. The Activity should consider ways to address food access and availability to meet nutritional needs for PLW, CU2, children under five (CU5), and households year-round.
a. In the immediate term, continue to develop the agriculture and food and nutrition security component to the extent possible without a Memorandum of Understanding (MOU) with the Ministry of Agriculture and Forestry, focusing on home food production and access to seeds, livestock, and technologies to promote a diverse and nutrient-dense diet throughout the year for women, children, and all family members.
5
b. Look for ways to collaborate with other agriculture, food and nutrition security, and social protection programs if possible, such as other USAID and United States Department of Agriculture funded programs, International Fund for Agricultural Development (IFAD), the Food and Agriculture Organization of the United Nations, and the World Bank (WB).
c. USAID should consider a more comprehensive nutrition and food systems approach as a long-term strategy. Future nutrition programs should include, or be linked with, full-scale agriculture, natural resources, marketing, social protection, improved agricultural and health technologies, such as improved storage of breast milk, and integration of other nutrition-sensitive components to complement the current scope.
4. The Activity should emphasize the benefits of EBF and delayed initiation of complementary feeding, particularly among boys. Awareness of benefits may help bridge the observed gap in EBF duration and complementary feeding between boys and girls that is hypothesized to contribute to differences in stunting and underweight outcomes. The Activity should also conduct an in-depth behavioral study to further ascertain the behavioral and biological causes for differences in stunting rates between girls and boys, particularly among lower-income quintiles.
5. The Activity should revisit and engage in policy dialogue to discuss and evaluate the efficiency and effectiveness of promoting CLTS as an integrated approach with nutrition as opposed to a separate program as it is promoted elsewhere in the country. This would help the government determine if this practice should be adopted and scaled as a national strategy, or if the Activity should continue to promote CLTS separately.
6. The Activity should develop a cost-sharing mechanism to ensure that the poorest households can be assisted in accessing WASH products and services in a timely and efficient manner. The types of toilets promoted should also be further evaluated and expanded, such as waterless composting toilets that can be used where water supply is a challenge.
7. The Activity should improve planning and coordination for the iNuW visits, trainings, and activities at the village level by providing sufficient advance notice and meeting schedules. The Activity should invest in strengthening local social accountability systems, to increase inclusion, increase capacity of the community-level to understand and fully participate in the project activities, and establish a grievance redress mechanism that enables a transparent case management system and feedback loop. For example, community committees and members, should be aware of what services the project is supposed to deliver and know their responsibilities, such as how may visits are planned, the topics, who should participate, and also be able to report suggestions and grievances. The practice of having meetings and only reaching people who happen to be available will likely result in exclusion and lack of continuity.
8. The Activity should explore other opportunities for collaboration. For example, the new WB financing will adopt a multi-sectoral approach to social protection and strengthening nutrition systems in line with helping the government implement the NNS. A WB-funded water supply project was also mentioned as a potential opportunity for coordination, as water supply in some remote mountainous locations is a clear barrier for communities to build and use toilets and access potable water year-round.
9. In future programming, USAID should integrate or coordinate with cash transfer programs, and activities that provide income generating opportunities, access to informal and formal finance, and improved technologies. Access to income resources, as well as sufficient time was a consistent barrier for households in implementing improved WASH and nutrition behaviors.
6
1. INTRODUCTION
1.1 PURPOSE The United States Agency for International Development (USAID) Nurture Impact Evaluation Midline Report documents a mixed-methods quasi-experimental approach that is studying the efficacy of a USAID-funded Improving Nutrition and Community Sanitation Activity (USAID Nurture, referred to throughout the document as “the Activity”). The Activity focuses on improving nutrition and water, sanitation, and hygiene (WASH) practices and behaviors at the household and community levels in Lao People’s Democratic Republic (Laos). The evaluation is being implemented by Social Impact, Inc. (SI) in cooperation with local data collection partner IndoChina Research Laos (IRL) between 2016 – 2020. This document provides an overview of the program theory of change, summarizes the evaluation methodology, and presents the study’s findings, conclusions, and recommendations at midline.
1.2 EVALUATION OBJECTIVES USAID aims to test the effectiveness of the Activity in reducing child stunting in targeted provinces, districts, and villages in Laos through a targeted, integrated, and multi-sectoral nutrition intervention approach that could be replicated and potentially scaled-up in other settings across the country. SI is investigating the success of this integrated intervention model in terms of its effectiveness in changing infant and young child feeding (IYCF) and hygiene and sanitation outcomes and ultimately achieving the intended overall impact of reduced child stunting. SI is conducting an impact evaluation by combining quantitative and qualitative data collection and analysis, including collection of anthropometric data from household surveys and qualitative key informant interviews (KII) and focus group discussions (FGD) with stakeholders. The impact evaluation questions are as follows:
1. What is the effectiveness of the USAID Nurture approach in improving the nutritional status of children under two (CU2) in target areas?
2. To what extent did each of the individual components of the USAID Nurture approach
(maternal, IYCF, and WASH) contribute to the effectiveness of the overall approach? At each stage of the evaluation, SI is addressing the first question primarily through a quantitative impact evaluation approach. In order to answer the second question, SI relies on qualitative data that capture stakeholders’ perceptions of which program elements most effected change. SI is investigating how maternal, IYCF, nutrition, and WASH behaviors have changed over time and gathering input from stakeholders on contributing factors and barriers that have inhibited behavior change.
1.3 NUTRITION AND WASH CONTEXT Over the last decade, Laos has experienced a sustained increase in per capita Gross Domestic Product (GDP) as well as a significant decrease in the Poverty Headcount Ratio1. Unfortunately, these strides in economic growth have not been accompanied by advancements in other key development areas - particularly maternal and child health and nutrition advancements. On the contrary, Laos sustains one of
1 World Bank. "GDP per Capita (current US$)." World Bank: GDP per Capita (current US$). World Bank Group, 2016. Web.
7
the highest rates of chronic malnutrition in Southeast Asia; approximately 44 percent of children under five years of age (CU5) suffer from chronic malnutrition and stunting2. In Laos, of the estimated 17,300 CU5 deaths, 6,015 (40 percent) are related to malnutrition3 with some studies attributing as much as 60 percent of child deaths to malnutrition.4 Additionally, the rate of CU5 who are moderately to severely stunted is 35.6 percent nationally and as high as 60 percent in certain provinces5. To address concerns and increase child and maternal nutrition across six Districts of two Provinces in Laos, the Activity outlines a set of multi-sectoral interventions that aim to reduce CU5 stunting, wasting, and underweight status. Stunting, defined by the World Health Organization (WHO) as “low height for age”, occurs in approximately 33 percent of CU5 in Laos.6 Residents of certain regions, such as inhabitants of mountainous “upland” areas and minority ethnic groups (Hmong-Mein and Chinese-Tibetan Laotians) display disproportionately high stunting rates: 50 percent and 61 percent, respectively7. Additionally, children of mothers with lower income and less access to education are also subject to higher prevalence of stunting; 61 percent of children from the lowest wealth quintile are stunted compared to just 20 percent in the highest8. Moreover, 20 percent of children aged 0-6 months are already stunted, indicating that poor nutritional practices are adopted immediately following birth.9 In addition to the negative mortality and quality of life outcomes that stem from malnutrition, stunting is also closely linked to low education levels and incomes and decreased national revenues. Laos’ malnourished population costs the country approximately $197 million United States dollars per annum, which equates to 2.4 percent of the nation’s GDP10. These statistics display a need for cross-cutting, multi-sectoral interventions that are designed to target the root causes of poor child and maternal nutrition. Wasting, defined as “low weight-for age,” affects, on average, 6 percent of CU5 in Laos, though this statistic hides variations by “age (13 percent of children 6–11 months of age are wasted), province (21 percent of CU5 are wasted in Luangnamtha Province), and ethnic group (13 percent of Hmong-Mien children are wasted)”11. Though Laos has seen incremental progress in other nutritional outcome indicators since 2012, the wasting rate (also known as the sudden malnutrition rate) has stagnated at 6 percent, indicating that barriers to reducing wasting may be particularly challenging12. Furthermore, natural disasters (relatively common in Laos) can act as catalysts for increased wasting in children and across the population, especially for disadvantaged groups.13
2 Ministry of Health and Lao Statistics Bureau. 2012. Lao PDR Lao Social Indicator Survey (LSIS) 201112 (Multiple Indicator Cluster Survey/Demographic and Health Survey). Vientiane, Lao PDR: Ministry of Health and Lao Statistics Bureau. 3 Ibid 4 USAID Nurture RFP 5 Ministry of Health and Lao Statistics Bureau. 2012. Lao PDR Lao Social Indicator Survey (LSIS) 201112 (Multiple Indicator Cluster Survey/Demographic and Health Survey). Vientiane, Lao PDR: Ministry of Health and Lao Statistics Bureau. 6 Ibid 7 Ibid 8 Ibid 9 Ibid 10 Ministry of Health and Lao Statistics Bureau. 2012. Lao PDR Lao Social Indicator Survey (LSIS) 201112 (Multiple Indicator Cluster Survey/Demographic and Health Survey). Vientiane, Lao PDR: Ministry of Health and Lao Statistics Bureau. 11 Ibid 12 Ibid 13 WFP. WFP Lao PDR Country Strategy 2011-2015. Vientiane, Laos PDR: World Food Program, Laos PDR
8
Another key indicator among CU5, the underweight malnutrition rate, fell from 32 percent in 2006 to 27 percent in 201214. Despite this marginal progress, the chronic and underweight malnutrition rates of the 6-24 month age group are “markedly higher than those of other age groups”15. Relatedly, the depth of food deficit is significantly higher in Laos than the regional average or in low-middle income countries. Depth of food deficit is a crucial catalytic factor behind overall malnourishment among children and adults alike.16 Laos continues to face challenges in economic and social integration, with rural residents - and ethnic groups and women within these regions - facing greater constraints to inclusion and access to services than those in urban areas. Health sector improvements include increased coverage of antenatal care, and an increase in the number of births attended by skilled medical staff. However, women’s biological role in reproduction continues to place women at particular risk. This is illustrated by the country’s high malnutrition rates where an estimated 37 percent of women of reproductive age suffer from moderate anemia. Moreover, early marriage and pregnancy continue to place young women at risk of health complications17. Ethnic minority groups in Laos other than the majority Lao-Tai have a higher incidence of poverty and lag behind in many indicators of welfare18. The welfare gap between ethnic minorities and majority can be attributed to differences in education levels, amount of land owned, income sources, access to electricity, and other economic opportunities which leads to a vicious poverty cycle. For instance, the fertility rate among adolescent girls of Lao-Tai headed households is about half the level observed among girls of other ethno-linguistic groups. More than half of women in Lao-Tai headed households were assisted by a health professional, compared with only one in five women in other ethno-linguistic groups19. This ethno-linguistic dimension has implications for nutrition and WASH outcomes, although there is limited empirical reporting. This report notes significant differences for outcomes in the population sample between Lao and non-Lao mother tongue speakers.
1.4 PROGRAM BACKGROUND The Activity focuses on improving the nutritional status of women and children to reduce stunting in targeted provinces, districts, and villages in Laos. The program works to improve nutrition; water, sanitation and hygiene practices; and behaviors at the household and community levels. The program focuses on child and maternal nutrition during the ‘window of opportunity’ – the first 1,000 days from conception until a child’s second birthday. This is considered a critical period for children during which the most cognitive and physical damage can occur. The program encourages uptake of nutrition, health, and WASH services including community led total sanitation (CLTS) through social and community mobilization via a targeted advocacy and social and behavior change communication (SBCC) approach. Community work is organized around a series of nine visits, during which community support groups and Community Facilitators (CF) are identified, organized, and trained. The primary target beneficiaries of the
14 Ministry of Health and Lao Statistics Bureau. 2012. Lao PDR Lao Social Indicator Survey (LSIS) 201112 (Multiple Indicator Cluster Survey/Demographic and Health Survey). Vientiane, Lao PDR: Ministry of Health and Lao Statistics Bureau. 15 Fanta Program. Laos Nutrition Profile. Rep. Fanta Program, Apr. 2014. Web. 16 World Bank. "Lao PDR." Lao PDR | Data. World Bank Group, 2016. Web. 17 World Bank. “Country Gender Assessment for LAO PDR Reducing Vulnerability and Increasing Opportunity.” World Bank Group, 2012. Web. 18 World Bank, “Lao Poverty Policy Brief: Why Are Ethnic Minorities Poor?” LAO PDR. World Bank Group 2017. Web. 19 DHS. “Lao Social Indicator Survey (LSIS) 2011 – 12”. 2012. Web.
9
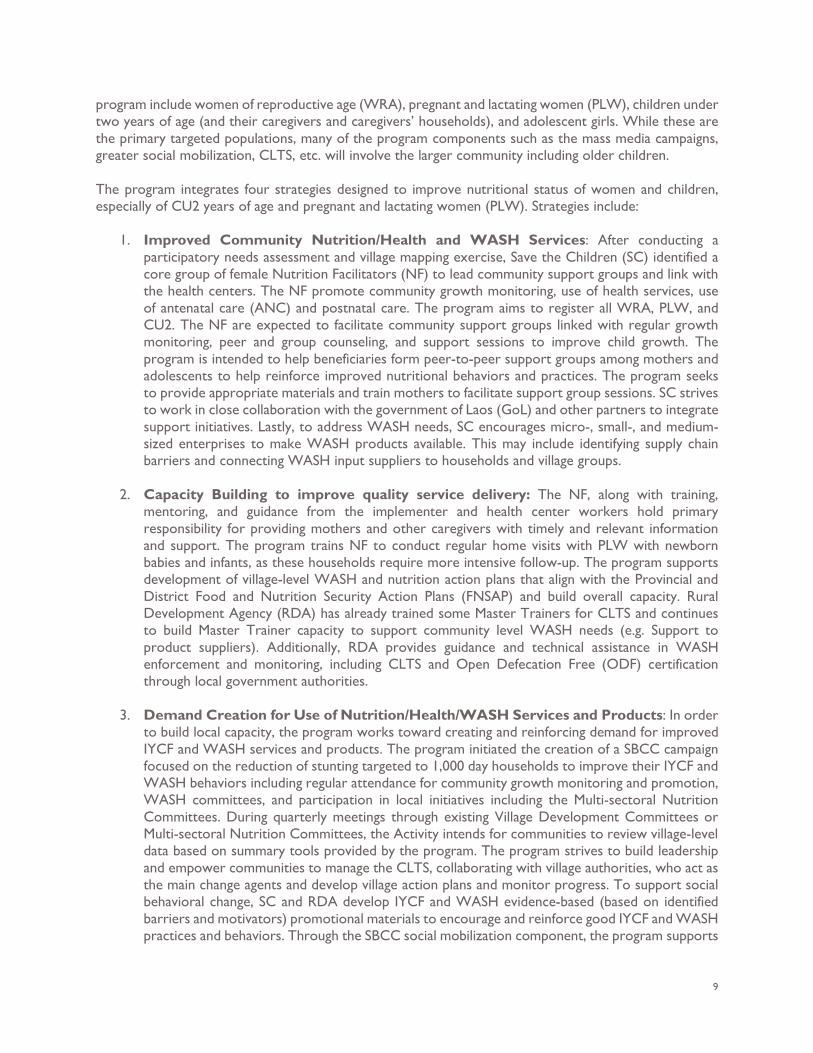
program include women of reproductive age (WRA), pregnant and lactating women (PLW), children under two years of age (and their caregivers and caregivers’ households), and adolescent girls. While these are the primary targeted populations, many of the program components such as the mass media campaigns, greater social mobilization, CLTS, etc. will involve the larger community including older children. The program integrates four strategies designed to improve nutritional status of women and children, especially of CU2 years of age and pregnant and lactating women (PLW). Strategies include:
1. Improved Community Nutrition/Health and WASH Services: After conducting a participatory needs assessment and village mapping exercise, Save the Children (SC) identified a core group of female Nutrition Facilitators (NF) to lead community support groups and link with the health centers. The NF promote community growth monitoring, use of health services, use of antenatal care (ANC) and postnatal care. The program aims to register all WRA, PLW, and CU2. The NF are expected to facilitate community support groups linked with regular growth monitoring, peer and group counseling, and support sessions to improve child growth. The program is intended to help beneficiaries form peer-to-peer support groups among mothers and adolescents to help reinforce improved nutritional behaviors and practices. The program seeks to provide appropriate materials and train mothers to facilitate support group sessions. SC strives to work in close collaboration with the government of Laos (GoL) and other partners to integrate support initiatives. Lastly, to address WASH needs, SC encourages micro-, small-, and medium-sized enterprises to make WASH products available. This may include identifying supply chain barriers and connecting WASH input suppliers to households and village groups.
2. Capacity Building to improve quality service delivery: The NF, along with training, mentoring, and guidance from the implementer and health center workers hold primary responsibility for providing mothers and other caregivers with timely and relevant information and support. The program trains NF to conduct regular home visits with PLW with newborn babies and infants, as these households require more intensive follow-up. The program supports development of village-level WASH and nutrition action plans that align with the Provincial and District Food and Nutrition Security Action Plans (FNSAP) and build overall capacity. Rural Development Agency (RDA) has already trained some Master Trainers for CLTS and continues to build Master Trainer capacity to support community level WASH needs (e.g. Support to product suppliers). Additionally, RDA provides guidance and technical assistance in WASH enforcement and monitoring, including CLTS and Open Defecation Free (ODF) certification through local government authorities.
3. Demand Creation for Use of Nutrition/Health/WASH Services and Products: In order to build local capacity, the program works toward creating and reinforcing demand for improved IYCF and WASH services and products. The program initiated the creation of a SBCC campaign focused on the reduction of stunting targeted to 1,000 day households to improve their IYCF and WASH behaviors including regular attendance for community growth monitoring and promotion, WASH committees, and participation in local initiatives including the Multi-sectoral Nutrition Committees. During quarterly meetings through existing Village Development Committees or Multi-sectoral Nutrition Committees, the Activity intends for communities to review village-level data based on summary tools provided by the program. The program strives to build leadership and empower communities to manage the CLTS, collaborating with village authorities, who act as the main change agents and develop village action plans and monitor progress. To support social behavioral change, SC and RDA develop IYCF and WASH evidence-based (based on identified barriers and motivators) promotional materials to encourage and reinforce good IYCF and WASH practices and behaviors. Through the SBCC social mobilization component, the program supports
10
social changes such as gender equality and better WASH practices, such as use of hand-washing stations.
4. Supportive Enabling Environment: Finally, the Activity serves to strengthen the enabling environment for multi-sectoral nutrition programs and their integration at all levels by supporting a focused advocacy, SBCC and social mobilization campaign to reduce stunting while also strengthening the capacity of local government authorities to manage, coordinate and collaborate in order to increase government resource allocation and improved multi-sectoral coordination.
The program model is anchored by a set of strategies that take into account the realities of Lao’s institutional context, put ownership for responses in the hands of the community, respond to cultural and language challenges and opportunities, support female empowerment and address equity issues, and draw on global, national, and local experiences and innovations including those in the private sector.
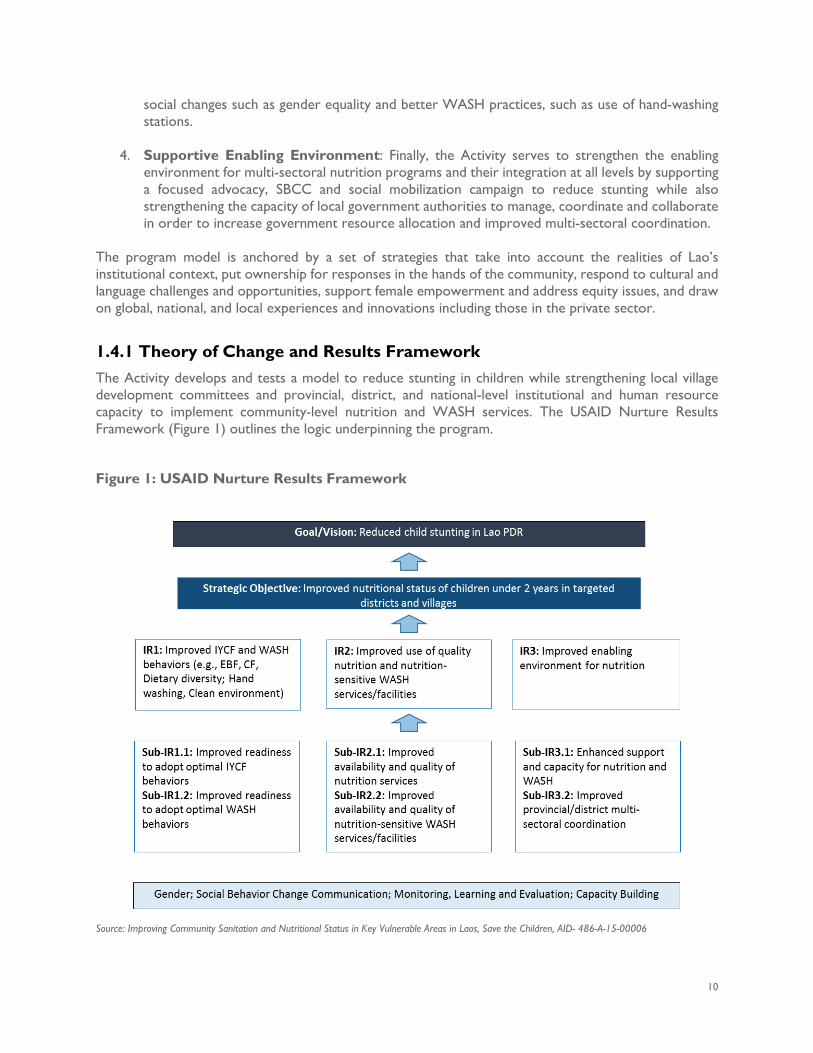
1.4.1 Theory of Change and Results Framework The Activity develops and tests a model to reduce stunting in children while strengthening local village development committees and provincial, district, and national-level institutional and human resource capacity to implement community-level nutrition and WASH services. The USAID Nurture Results Framework (Figure 1) outlines the logic underpinning the program.
Figure 1: USAID Nurture Results Framework
Source: Improving Community Sanitation and Nutritional Status in Key Vulnerable Areas in Laos, Save the Children, AID- 486-A-15-00006
11
The Activity envisions impacting its overall goal of improved child health outcomes by achieving its strategic objective of improved child nutrition through two main intermediate outcome areas: - IYCF practices and behaviors, including early initiation of breastfeeding, exclusive and continued
breastfeeding, complementary feeding, and dietary diversification; and - Hygiene and sanitation behaviors, including improved hand washing with soap, safe water access and
use of improved sanitation (latrines).
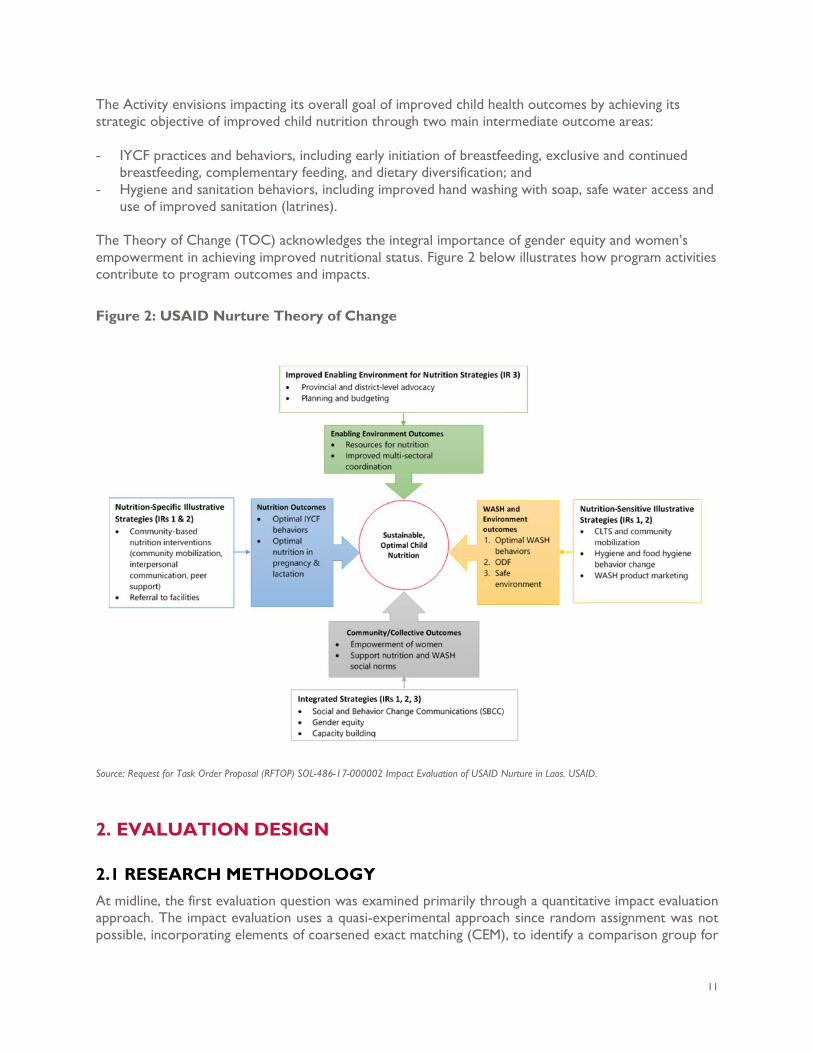
The Theory of Change (TOC) acknowledges the integral importance of gender equity and women’s empowerment in achieving improved nutritional status. Figure 2 below illustrates how program activities contribute to program outcomes and impacts.
Figure 2: USAID Nurture Theory of Change
Source: Request for Task Order Proposal (RFTOP) SOL-486-17-000002 Impact Evaluation of USAID Nurture in Laos. USAID.
2. EVALUATION DESIGN
2.1 RESEARCH METHODOLOGY At midline, the first evaluation question was examined primarily through a quantitative impact evaluation approach. The impact evaluation uses a quasi-experimental approach since random assignment was not possible, incorporating elements of coarsened exact matching (CEM), to identify a comparison group for
12
the evaluation. Specifically, the ET used matching with secondary data to identify a similar set of 346 Nurture and control villages prior to baseline. The ET sampled a random cross section of 1,000 day households in each sampled village at baseline and midline. This design allowed us to compare outcomes of those who participated in the Activity to those of a similar comparison group used to estimate the counterfactual. To estimate program impacts, the ET developed a difference in differences (DiD) regression model including covariates not influenced by the program. More detail on the quantitative methodology is in the design report and Annex A.20 In order to answer the second question, qualitative data was collected on stakeholders’ perceptions of which program elements most effected change. SI investigated how maternal, IYCF, nutrition, and WASH behaviors have changed over time and gathered input from stakeholders on the contributing factors and barriers that have inhibited behavior change. Key Indicators definitions are explained in Annex B and findings are in Annex C. Balance checks and regressions are located in Annex D and Annex E, respectively. Data collection tools are included in Annex F and Annex G. The field-based data collections teams for both quantitative and qualitative comprised of different ethnicities and with a consideration for gender balance to avoid potential biases21. The field-based data collection teams were 46 and 50 percent female for quantitative and qualitive work, respectively.
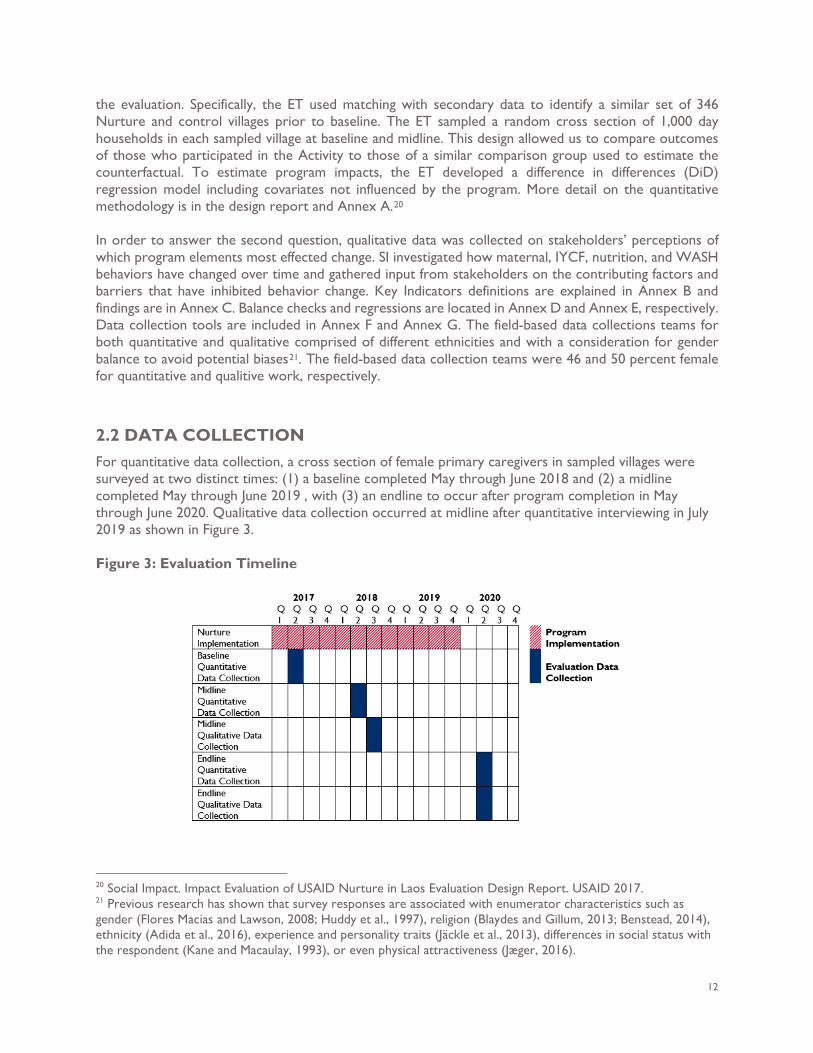
2.2 DATA COLLECTION For quantitative data collection, a cross section of female primary caregivers in sampled villages were surveyed at two distinct times: (1) a baseline completed May through June 2018 and (2) a midline completed May through June 2019 , with (3) an endline to occur after program completion in May through June 2020. Qualitative data collection occurred at midline after quantitative interviewing in July 2019 as shown in Figure 3. Figure 3: Evaluation Timeline
20 Social Impact. Impact Evaluation of USAID Nurture in Laos Evaluation Design Report. USAID 2017. 21 Previous research has shown that survey responses are associated with enumerator characteristics such as gender (Flores Macias and Lawson, 2008; Huddy et al., 1997), religion (Blaydes and Gillum, 2013; Benstead, 2014), ethnicity (Adida et al., 2016), experience and personality traits (Jäckle et al., 2013), differences in social status with the respondent (Kane and Macaulay, 1993), or even physical attractiveness (Jæger, 2016).
13
QUANTITATIVE DATA
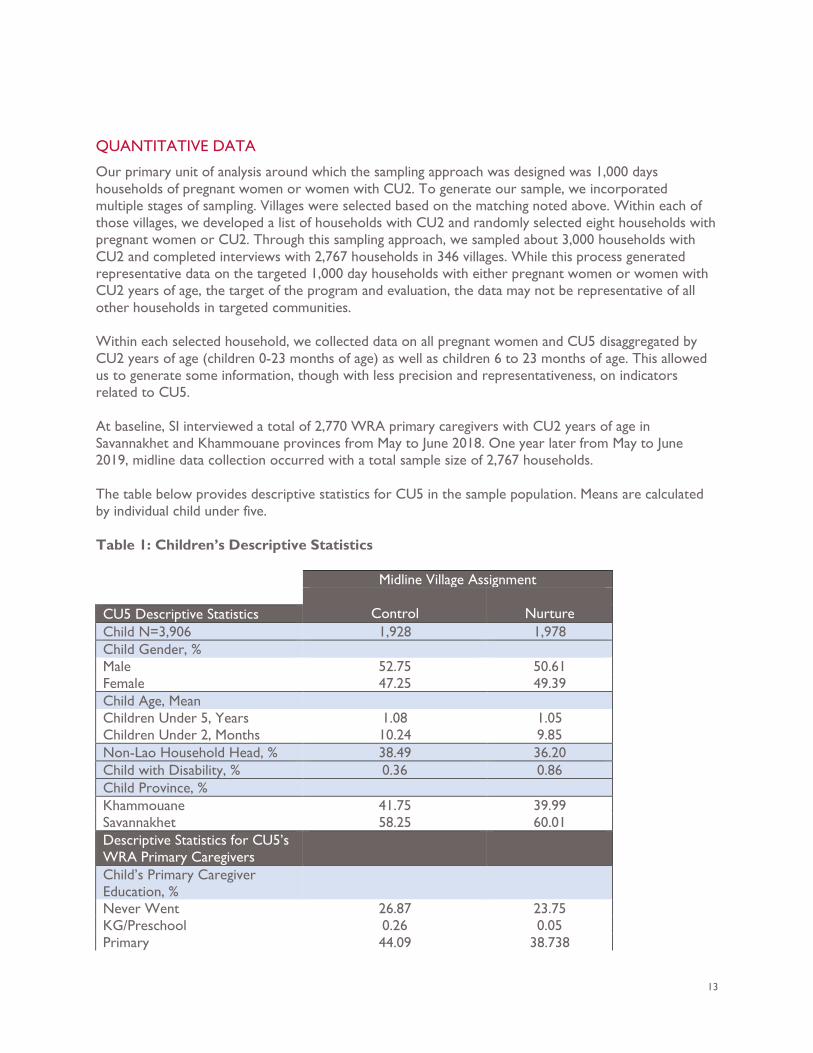
Our primary unit of analysis around which the sampling approach was designed was 1,000 days households of pregnant women or women with CU2. To generate our sample, we incorporated multiple stages of sampling. Villages were selected based on the matching noted above. Within each of those villages, we developed a list of households with CU2 and randomly selected eight households with pregnant women or CU2. Through this sampling approach, we sampled about 3,000 households with CU2 and completed interviews with 2,767 households in 346 villages. While this process generated representative data on the targeted 1,000 day households with either pregnant women or women with CU2 years of age, the target of the program and evaluation, the data may not be representative of all other households in targeted communities. Within each selected household, we collected data on all pregnant women and CU5 disaggregated by CU2 years of age (children 0-23 months of age) as well as children 6 to 23 months of age. This allowed us to generate some information, though with less precision and representativeness, on indicators related to CU5. At baseline, SI interviewed a total of 2,770 WRA primary caregivers with CU2 years of age in Savannakhet and Khammouane provinces from May to June 2018. One year later from May to June 2019, midline data collection occurred with a total sample size of 2,767 households. The table below provides descriptive statistics for CU5 in the sample population. Means are calculated by individual child under five.
Table 1: Children’s Descriptive Statistics Midline Village Assignment
Control
Nurture CU5 Descriptive Statistics Child N=3,906 1,928 1,978 Child Gender, % Male 52.75 50.61 Female 47.25 49.39 Child Age, Mean Children Under 5, Years 1.08 1.05 Children Under 2, Months 10.24 9.85 Non-Lao Household Head, % 38.49 36.20 Child with Disability, % 0.36 0.86 Child Province, % Khammouane 41.75 39.99 Savannakhet 58.25 60.01 Descriptive Statistics for CU5’s WRA Primary Caregivers
Child’s Primary Caregiver Education, %
Never Went 26.87 23.75 KG/Preschool 0.26 0.05 Primary 44.09 38.738
14
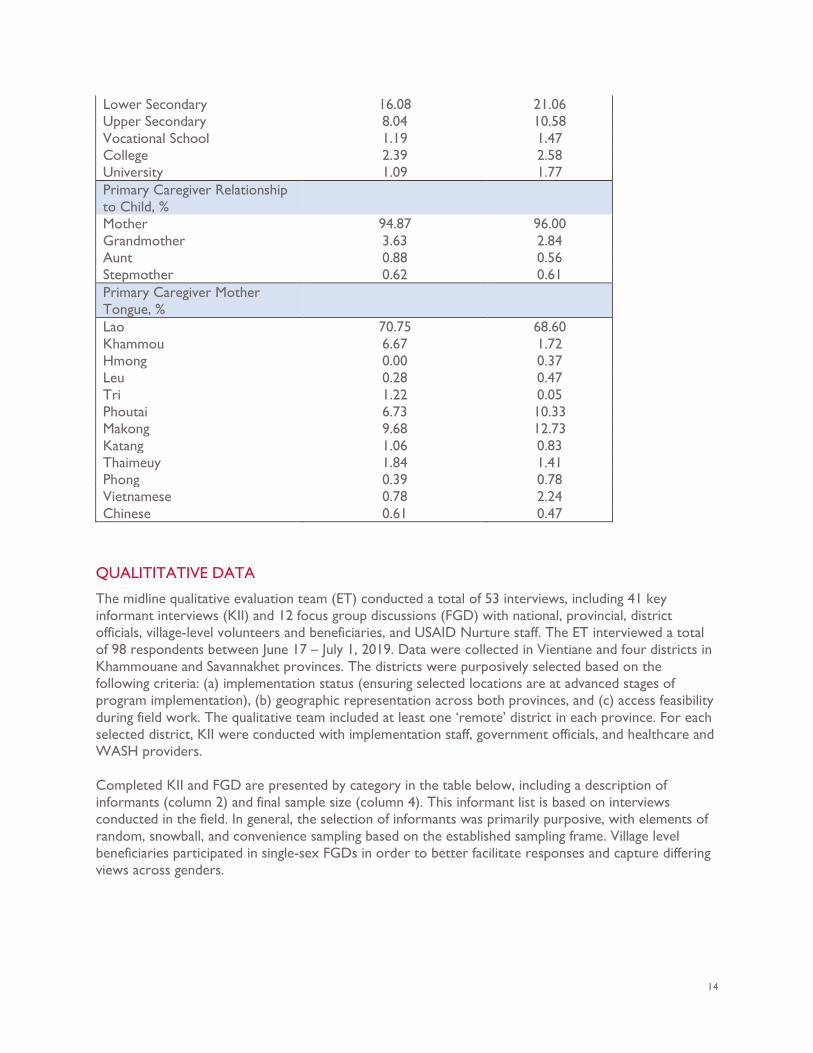
Lower Secondary 16.08 21.06 Upper Secondary 8.04 10.58 Vocational School 1.19 1.47 College 2.39 2.58 University 1.09 1.77 Primary Caregiver Relationship to Child, %
Mother 94.87 96.00 Grandmother 3.63 2.84 Aunt 0.88 0.56 Stepmother 0.62 0.61 Primary Caregiver Mother Tongue, %
Lao 70.75 68.60 Khammou 6.67 1.72 Hmong 0.00 0.37 Leu 0.28 0.47 Tri 1.22 0.05 Phoutai 6.73 10.33 Makong 9.68 12.73 Katang 1.06 0.83 Thaimeuy 1.84 1.41 Phong 0.39 0.78 Vietnamese 0.78 2.24 Chinese 0.61 0.47
QUALITITATIVE DATA
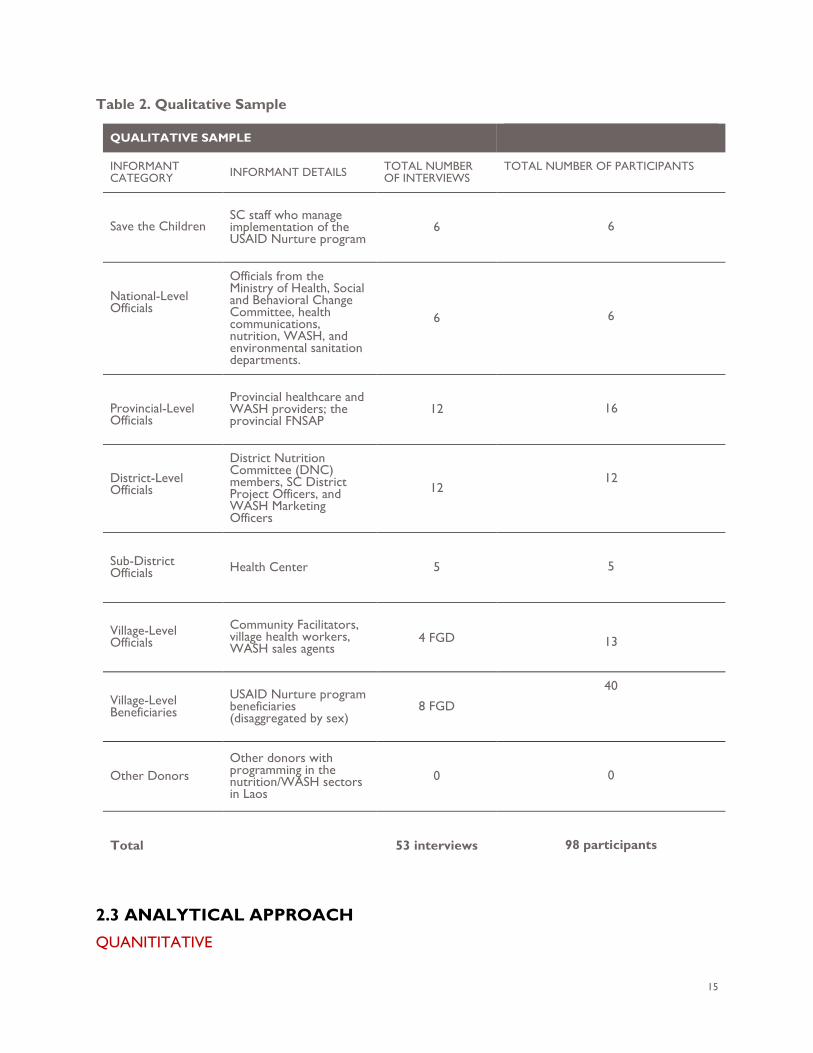
The midline qualitative evaluation team (ET) conducted a total of 53 interviews, including 41 key informant interviews (KII) and 12 focus group discussions (FGD) with national, provincial, district officials, village-level volunteers and beneficiaries, and USAID Nurture staff. The ET interviewed a total of 98 respondents between June 17 – July 1, 2019. Data were collected in Vientiane and four districts in Khammouane and Savannakhet provinces. The districts were purposively selected based on the following criteria: (a) implementation status (ensuring selected locations are at advanced stages of program implementation), (b) geographic representation across both provinces, and (c) access feasibility during field work. The qualitative team included at least one ‘remote’ district in each province. For each selected district, KII were conducted with implementation staff, government officials, and healthcare and WASH providers. Completed KII and FGD are presented by category in the table below, including a description of informants (column 2) and final sample size (column 4). This informant list is based on interviews conducted in the field. In general, the selection of informants was primarily purposive, with elements of random, snowball, and convenience sampling based on the established sampling frame. Village level beneficiaries participated in single-sex FGDs in order to better facilitate responses and capture differing views across genders.
15
Table 2. Qualitative Sample
2.3 ANALYTICAL APPROACH QUANITITATIVE
QUALITATIVE SAMPLE
INFORMANT CATEGORY INFORMANT DETAILS TOTAL NUMBER
OF INTERVIEWS TOTAL NUMBER OF PARTICIPANTS
Save the Children SC staff who manage implementation of the USAID Nurture program
6
6
National-Level Officials
Officials from the Ministry of Health, Social and Behavioral Change Committee, health communications, nutrition, WASH, and environmental sanitation departments.
6
6
Provincial-Level Officials
Provincial healthcare and WASH providers; the provincial FNSAP
12
16
District-Level Officials
District Nutrition Committee (DNC) members, SC District Project Officers, and WASH Marketing Officers
12
12
Sub-District Officials Health Center 5
5
Village-Level Officials
Community Facilitators, village health workers, WASH sales agents
4 FGD
13
Village-Level Beneficiaries
USAID Nurture program beneficiaries (disaggregated by sex)
8 FGD
40
Other Donors Other donors with programming in the nutrition/WASH sectors in Laos
0
0
Total 53 interviews
98 participants
16
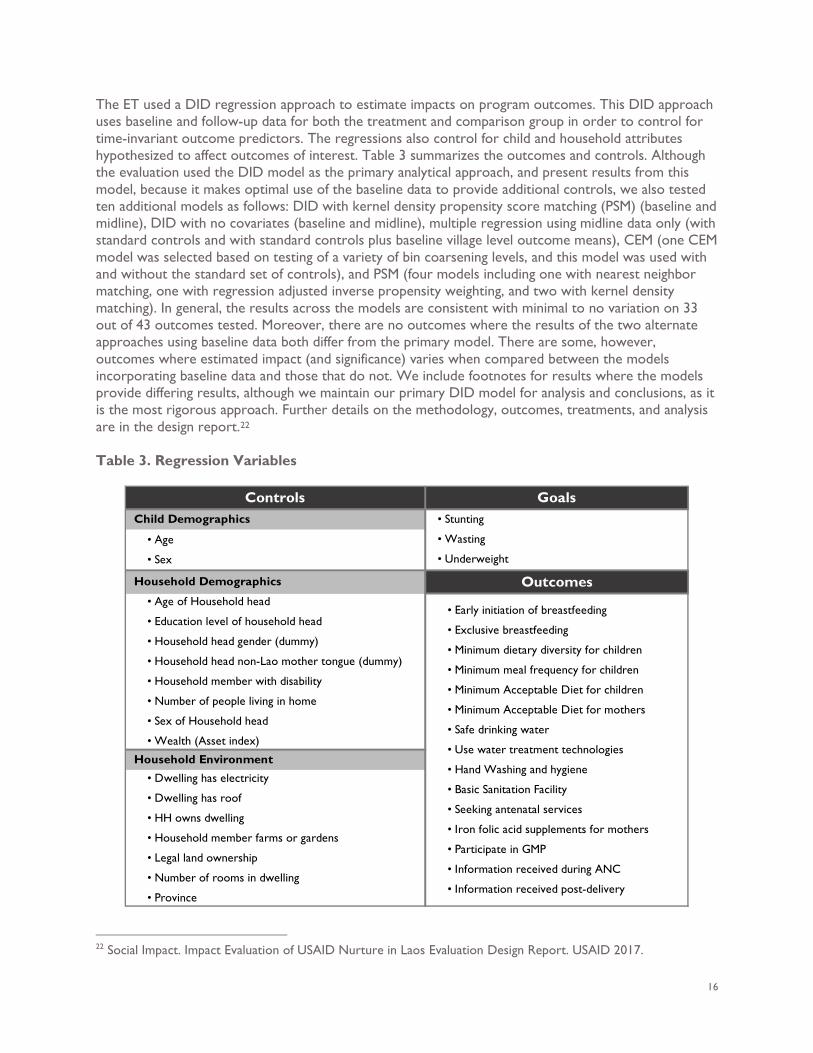
The ET used a DID regression approach to estimate impacts on program outcomes. This DID approach uses baseline and follow-up data for both the treatment and comparison group in order to control for time-invariant outcome predictors. The regressions also control for child and household attributes hypothesized to affect outcomes of interest. Table 3 summarizes the outcomes and controls. Although the evaluation used the DID model as the primary analytical approach, and present results from this model, because it makes optimal use of the baseline data to provide additional controls, we also tested ten additional models as follows: DID with kernel density propensity score matching (PSM) (baseline and midline), DID with no covariates (baseline and midline), multiple regression using midline data only (with standard controls and with standard controls plus baseline village level outcome means), CEM (one CEM model was selected based on testing of a variety of bin coarsening levels, and this model was used with and without the standard set of controls), and PSM (four models including one with nearest neighbor matching, one with regression adjusted inverse propensity weighting, and two with kernel density matching). In general, the results across the models are consistent with minimal to no variation on 33 out of 43 outcomes tested. Moreover, there are no outcomes where the results of the two alternate approaches using baseline data both differ from the primary model. There are some, however, outcomes where estimated impact (and significance) varies when compared between the models incorporating baseline data and those that do not. We include footnotes for results where the models provide differing results, although we maintain our primary DID model for analysis and conclusions, as it is the most rigorous approach. Further details on the methodology, outcomes, treatments, and analysis are in the design report.22 Table 3. Regression Variables
22 Social Impact. Impact Evaluation of USAID Nurture in Laos Evaluation Design Report. USAID 2017.
Controls Goals Child Demographics
Household Demographics Outcomes
Household Environment
• Age
• Sex
• Age of Household head
• Education level of household head
• Household head gender (dummy)
• Household head non-Lao mother tongue (dummy)
• Household member with disability
• Number of people living in home
• Sex of Household head
• Wealth (Asset index)
• Dwelling has electricity
• Dwelling has roof
• HH owns dwelling
• Household member farms or gardens
• Legal land ownership
• Number of rooms in dwelling
• Province
• Stunting
• Wasting
• Underweight
• Early initiation of breastfeeding
• Exclusive breastfeeding
• Minimum dietary diversity for children
• Minimum meal frequency for children
• Minimum Acceptable Diet for children
• Minimum Acceptable Diet for mothers
• Safe drinking water
• Use water treatment technologies
• Hand Washing and hygiene
• Basic Sanitation Facility
• Seeking antenatal services
• Iron folic acid supplements for mothers
• Participate in GMP
• Information received during ANC
• Information received post-delivery
17
The above table lists all controls. To the extent that specific regression models differ, deviations are specified in the body of the report. The ET disaggregated indicator data by sex to identify context-specific gender barriers and opportunities. Further, we also performed two additional forms of statistical analysis. First, we performed tests for differences in means of outcomes for males versus females, which demonstrates whether males or females have higher levels on outcomes, irrespective of the intervention. Next, we also implemented a technical approach to asses gender-related impact. Specifically, with the quantitative data, we preformed additional regression analysis including an interaction term between sex, treatment and time which allows us to estimate any differential program impacts on males versus females. QUALITATIVE All interviews were recorded using digital recorders and detailed notes were created. The notes were used to analyze data and apply thematic codes via excel. Coding refers to marking meaningful segments of transcript text with a term that captures the overall ideas contained therein. The ET developed a preliminary code list based on emergent findings from interviews, as well as the intended outcomes of the Activity. This code list was further refined as additional interviews were coded; emergent codes not included in the preliminary list were added. The final list had 32 codes. One of the most frequently applied codes was “Access - Barriers” – this code also had four different sub-codes including: poverty conditions, physical/transportation barriers, food availability, and dietary practices. After coding was completed, greater attention was given to the codes that were both applied most frequently and related to predefined program impacts.
3. FINDINGS The following sections present the findings for each of the two evaluation questions by noting both statistically significant23 changes in outcomes from baseline to midline measured quantitatively and detailed qualitative findings. Key indicators tables can be found in Annex C and regression tables can be found in Annex E. 3.1 CHILD ANTHROPOMETRY As part of the household survey, enumerators collected anthropometric measures (height and weight) for available children using Laos Ministry of Health and WHO24 prescribed techniques. Anthropometrics were collected for 3,396 children under the age of five as a standard assessment of nutritional status to identify individuals at risk of nutritional deficiencies and evaluate the effect of care and services. These measures permit the calculation of stunting, wasting, and underweight prevalence in both treatment (referred to throughout the remainder of the document as “Nurture”) and control districts. Stunting is
23 All findings displayed are based on multivariate regression analysis, including controls. Significant throughout this report refers to statistical significance. It is the likelihood that a relationship between two or more variables represents a true difference, rather than just random differences between the samples used in the evaluation. Statistical hypothesis testing is used to determine whether the difference between two groups is statistically significant. These tests provide a p-value, representing the probability that random chance could explain the result; In this report, a p-value of 10 percent or lower is considered to be statistically significant. In other words, when the report notes a finding is statistically significant, it means that we are at least 90 percent confident that the result is valid, representing a true difference between the two groups rather than differences due to chance or sampling. In the body of this report, we only present p values for highlighted findings where the confidence level is less than 90 percent (p>0.1). P values for all findings can be found in Annex E. 24 Age-adjusted length and weight Z-scores were calculated using the 2006 WHO Child Growth Standards. WHO. Indicators for assessing infant and young child feeding practices: Part 3 country profiles. Geneva: WHO, 2010.
18
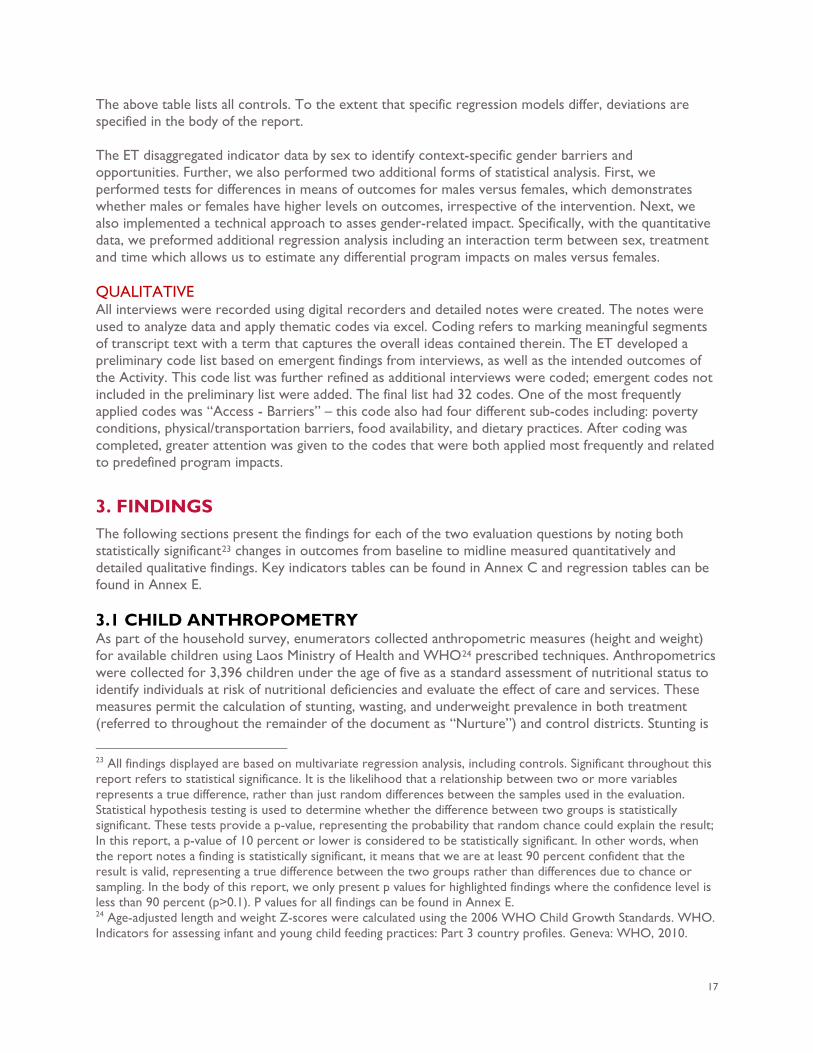
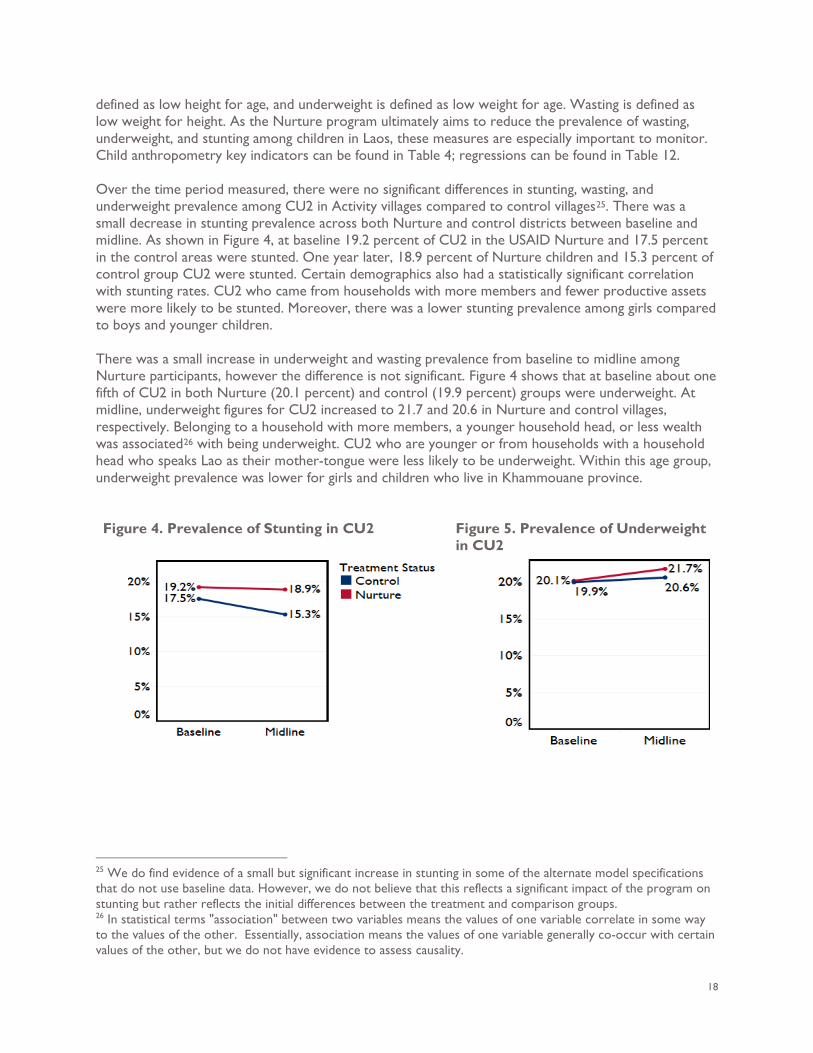
defined as low height for age, and underweight is defined as low weight for age. Wasting is defined as low weight for height. As the Nurture program ultimately aims to reduce the prevalence of wasting, underweight, and stunting among children in Laos, these measures are especially important to monitor. Child anthropometry key indicators can be found in Table 4; regressions can be found in Table 12. Over the time period measured, there were no significant differences in stunting, wasting, and underweight prevalence among CU2 in Activity villages compared to control villages25. There was a small decrease in stunting prevalence across both Nurture and control districts between baseline and midline. As shown in Figure 4, at baseline 19.2 percent of CU2 in the USAID Nurture and 17.5 percent in the control areas were stunted. One year later, 18.9 percent of Nurture children and 15.3 percent of control group CU2 were stunted. Certain demographics also had a statistically significant correlation with stunting rates. CU2 who came from households with more members and fewer productive assets were more likely to be stunted. Moreover, there was a lower stunting prevalence among girls compared to boys and younger children. There was a small increase in underweight and wasting prevalence from baseline to midline among Nurture participants, however the difference is not significant. Figure 4 shows that at baseline about one fifth of CU2 in both Nurture (20.1 percent) and control (19.9 percent) groups were underweight. At midline, underweight figures for CU2 increased to 21.7 and 20.6 in Nurture and control villages, respectively. Belonging to a household with more members, a younger household head, or less wealth was associated26 with being underweight. CU2 who are younger or from households with a household head who speaks Lao as their mother-tongue were less likely to be underweight. Within this age group, underweight prevalence was lower for girls and children who live in Khammouane province.
Figure 4. Prevalence of Stunting in CU2
Figure 5. Prevalence of Underweight in CU2
25 We do find evidence of a small but significant increase in stunting in some of the alternate model specifications that do not use baseline data. However, we do not believe that this reflects a significant impact of the program on stunting but rather reflects the initial differences between the treatment and comparison groups. 26 In statistical terms "association" between two variables means the values of one variable correlate in some way to the values of the other. Essentially, association means the values of one variable generally co-occur with certain values of the other, but we do not have evidence to assess causality.
19
Figure 6. Prevalence of Wasting in CU2
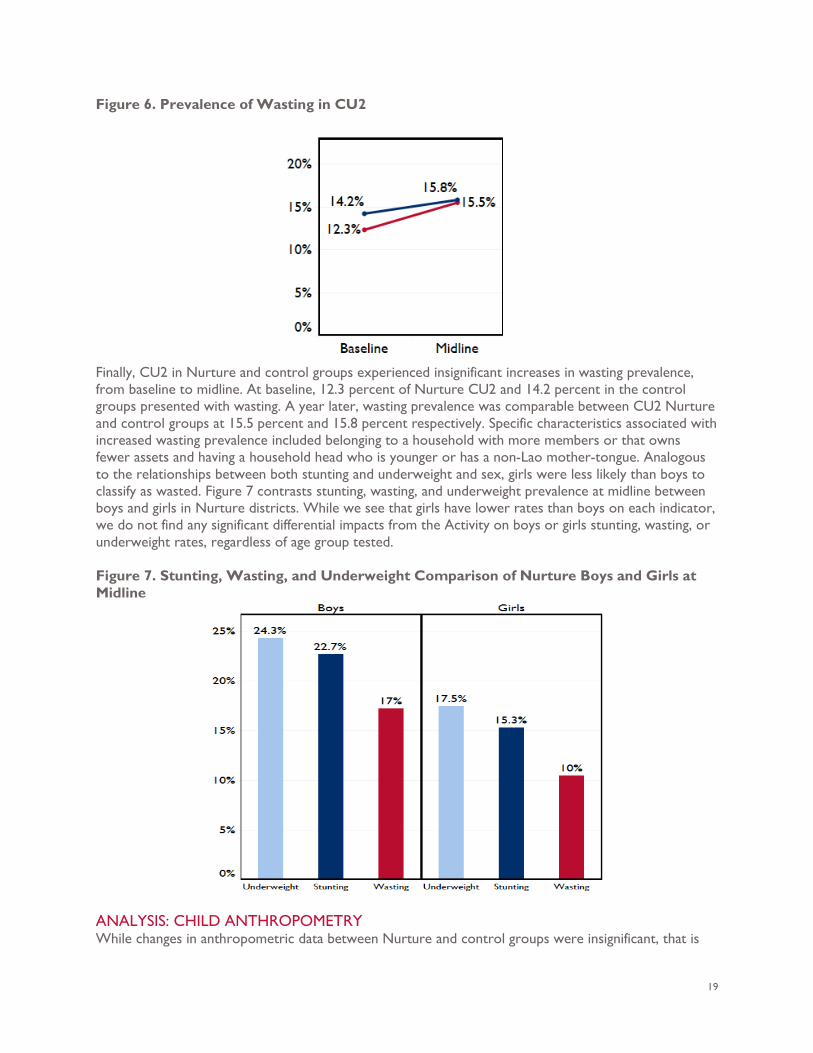
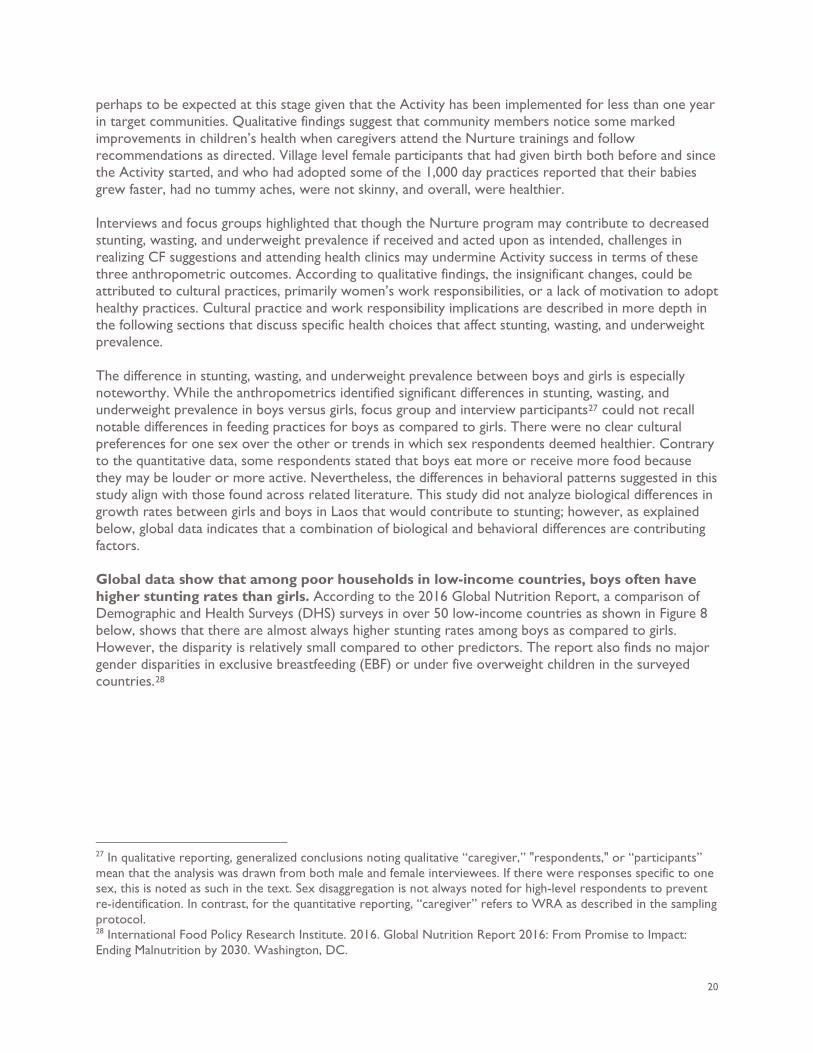
Finally, CU2 in Nurture and control groups experienced insignificant increases in wasting prevalence, from baseline to midline. At baseline, 12.3 percent of Nurture CU2 and 14.2 percent in the control groups presented with wasting. A year later, wasting prevalence was comparable between CU2 Nurture and control groups at 15.5 percent and 15.8 percent respectively. Specific characteristics associated with increased wasting prevalence included belonging to a household with more members or that owns fewer assets and having a household head who is younger or has a non-Lao mother-tongue. Analogous to the relationships between both stunting and underweight and sex, girls were less likely than boys to classify as wasted. Figure 7 contrasts stunting, wasting, and underweight prevalence at midline between boys and girls in Nurture districts. While we see that girls have lower rates than boys on each indicator, we do not find any significant differential impacts from the Activity on boys or girls stunting, wasting, or underweight rates, regardless of age group tested. Figure 7. Stunting, Wasting, and Underweight Comparison of Nurture Boys and Girls at Midline
ANALYSIS: CHILD ANTHROPOMETRY While changes in anthropometric data between Nurture and control groups were insignificant, that is
20
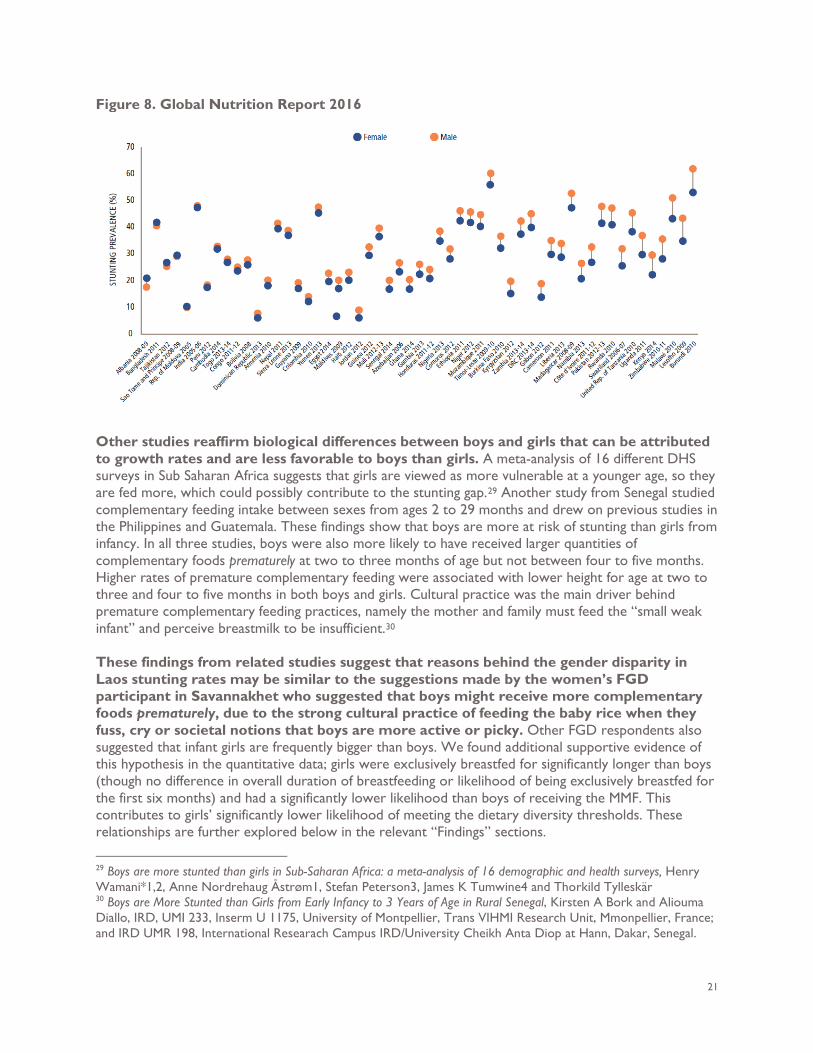
perhaps to be expected at this stage given that the Activity has been implemented for less than one year in target communities. Qualitative findings suggest that community members notice some marked improvements in children’s health when caregivers attend the Nurture trainings and follow recommendations as directed. Village level female participants that had given birth both before and since the Activity started, and who had adopted some of the 1,000 day practices reported that their babies grew faster, had no tummy aches, were not skinny, and overall, were healthier. Interviews and focus groups highlighted that though the Nurture program may contribute to decreased stunting, wasting, and underweight prevalence if received and acted upon as intended, challenges in realizing CF suggestions and attending health clinics may undermine Activity success in terms of these three anthropometric outcomes. According to qualitative findings, the insignificant changes, could be attributed to cultural practices, primarily women’s work responsibilities, or a lack of motivation to adopt healthy practices. Cultural practice and work responsibility implications are described in more depth in the following sections that discuss specific health choices that affect stunting, wasting, and underweight prevalence. The difference in stunting, wasting, and underweight prevalence between boys and girls is especially noteworthy. While the anthropometrics identified significant differences in stunting, wasting, and underweight prevalence in boys versus girls, focus group and interview participants27 could not recall notable differences in feeding practices for boys as compared to girls. There were no clear cultural preferences for one sex over the other or trends in which sex respondents deemed healthier. Contrary to the quantitative data, some respondents stated that boys eat more or receive more food because they may be louder or more active. Nevertheless, the differences in behavioral patterns suggested in this study align with those found across related literature. This study did not analyze biological differences in growth rates between girls and boys in Laos that would contribute to stunting; however, as explained below, global data indicates that a combination of biological and behavioral differences are contributing factors. Global data show that among poor households in low-income countries, boys often have higher stunting rates than girls. According to the 2016 Global Nutrition Report, a comparison of Demographic and Health Surveys (DHS) surveys in over 50 low-income countries as shown in Figure 8 below, shows that there are almost always higher stunting rates among boys as compared to girls. However, the disparity is relatively small compared to other predictors. The report also finds no major gender disparities in exclusive breastfeeding (EBF) or under five overweight children in the surveyed countries.28
27 In qualitative reporting, generalized conclusions noting qualitative “caregiver,” "respondents," or “participants” mean that the analysis was drawn from both male and female interviewees. If there were responses specific to one sex, this is noted as such in the text. Sex disaggregation is not always noted for high-level respondents to prevent re-identification. In contrast, for the quantitative reporting, “caregiver” refers to WRA as described in the sampling protocol. 28 International Food Policy Research Institute. 2016. Global Nutrition Report 2016: From Promise to Impact: Ending Malnutrition by 2030. Washington, DC.
21
Figure 8. Global Nutrition Report 2016
Other studies reaffirm biological differences between boys and girls that can be attributed to growth rates and are less favorable to boys than girls. A meta-analysis of 16 different DHS surveys in Sub Saharan Africa suggests that girls are viewed as more vulnerable at a younger age, so they are fed more, which could possibly contribute to the stunting gap.29 Another study from Senegal studied complementary feeding intake between sexes from ages 2 to 29 months and drew on previous studies in the Philippines and Guatemala. These findings show that boys are more at risk of stunting than girls from infancy. In all three studies, boys were also more likely to have received larger quantities of complementary foods prematurely at two to three months of age but not between four to five months. Higher rates of premature complementary feeding were associated with lower height for age at two to three and four to five months in both boys and girls. Cultural practice was the main driver behind premature complementary feeding practices, namely the mother and family must feed the “small weak infant” and perceive breastmilk to be insufficient.30 These findings from related studies suggest that reasons behind the gender disparity in Laos stunting rates may be similar to the suggestions made by the women’s FGD participant in Savannakhet who suggested that boys might receive more complementary foods prematurely, due to the strong cultural practice of feeding the baby rice when they fuss, cry or societal notions that boys are more active or picky. Other FGD respondents also suggested that infant girls are frequently bigger than boys. We found additional supportive evidence of this hypothesis in the quantitative data; girls were exclusively breastfed for significantly longer than boys (though no difference in overall duration of breastfeeding or likelihood of being exclusively breastfed for the first six months) and had a significantly lower likelihood than boys of receiving the MMF. This contributes to girls’ significantly lower likelihood of meeting the dietary diversity thresholds. These relationships are further explored below in the relevant “Findings” sections.
29 Boys are more stunted than girls in Sub-Saharan Africa: a meta-analysis of 16 demographic and health surveys, Henry Wamani*1,2, Anne Nordrehaug Åstrøm1, Stefan Peterson3, James K Tumwine4 and Thorkild Tylleskär 30 Boys are More Stunted than Girls from Early Infancy to 3 Years of Age in Rural Senegal, Kirsten A Bork and Aliouma Diallo, IRD, UMI 233, Inserm U 1175, University of Montpellier, Trans VIHMI Research Unit, Mmonpellier, France; and IRD UMR 198, International Researach Campus IRD/University Cheikh Anta Diop at Hann, Dakar, Senegal.
22
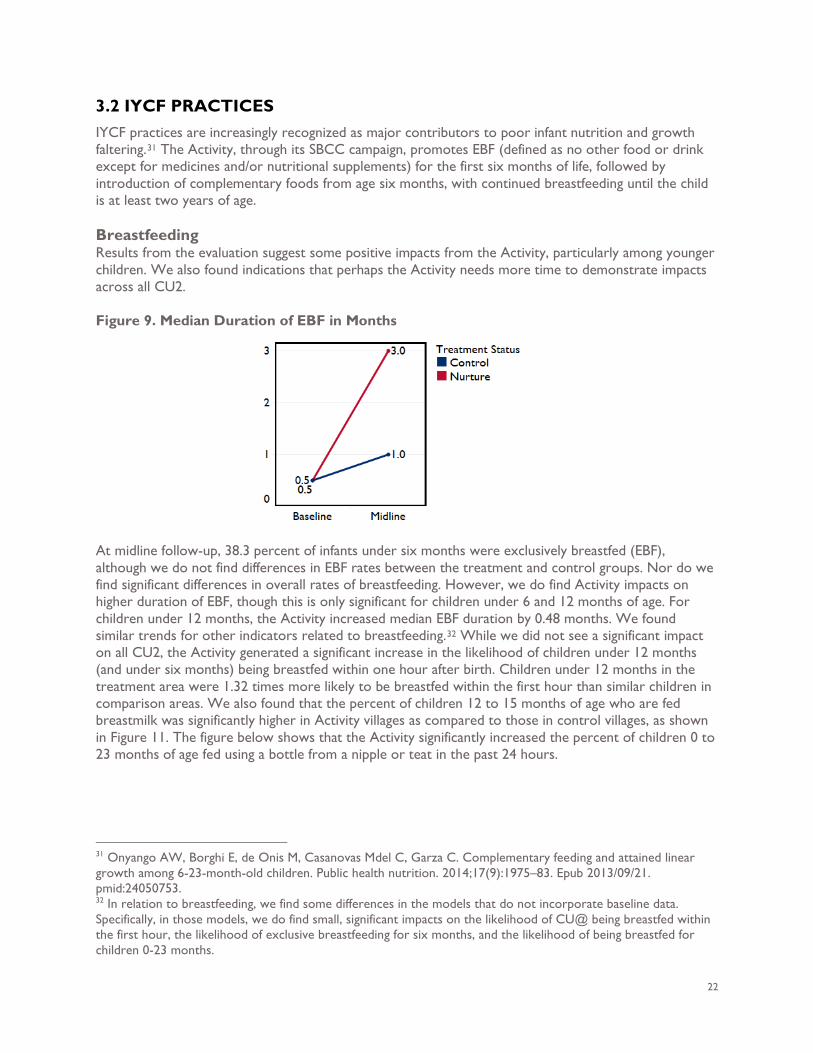
3.2 IYCF PRACTICES IYCF practices are increasingly recognized as major contributors to poor infant nutrition and growth faltering.31 The Activity, through its SBCC campaign, promotes EBF (defined as no other food or drink except for medicines and/or nutritional supplements) for the first six months of life, followed by introduction of complementary foods from age six months, with continued breastfeeding until the child is at least two years of age. Breastfeeding Results from the evaluation suggest some positive impacts from the Activity, particularly among younger children. We also found indications that perhaps the Activity needs more time to demonstrate impacts across all CU2. Figure 9. Median Duration of EBF in Months
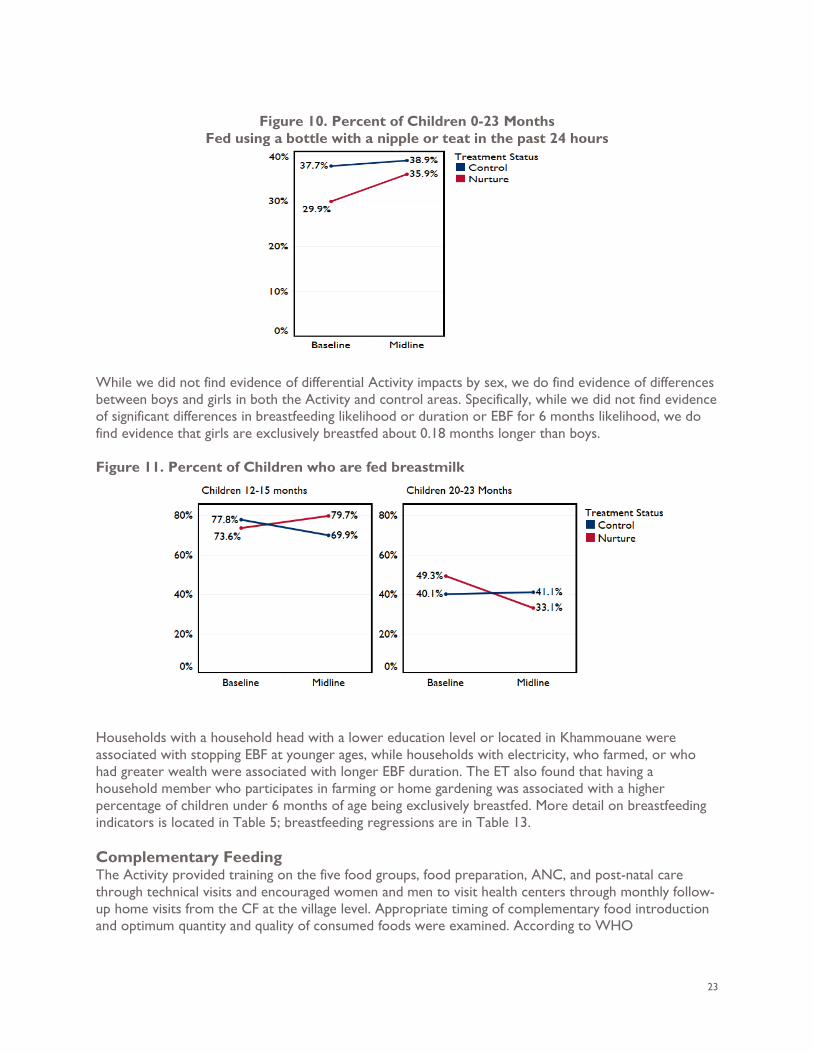
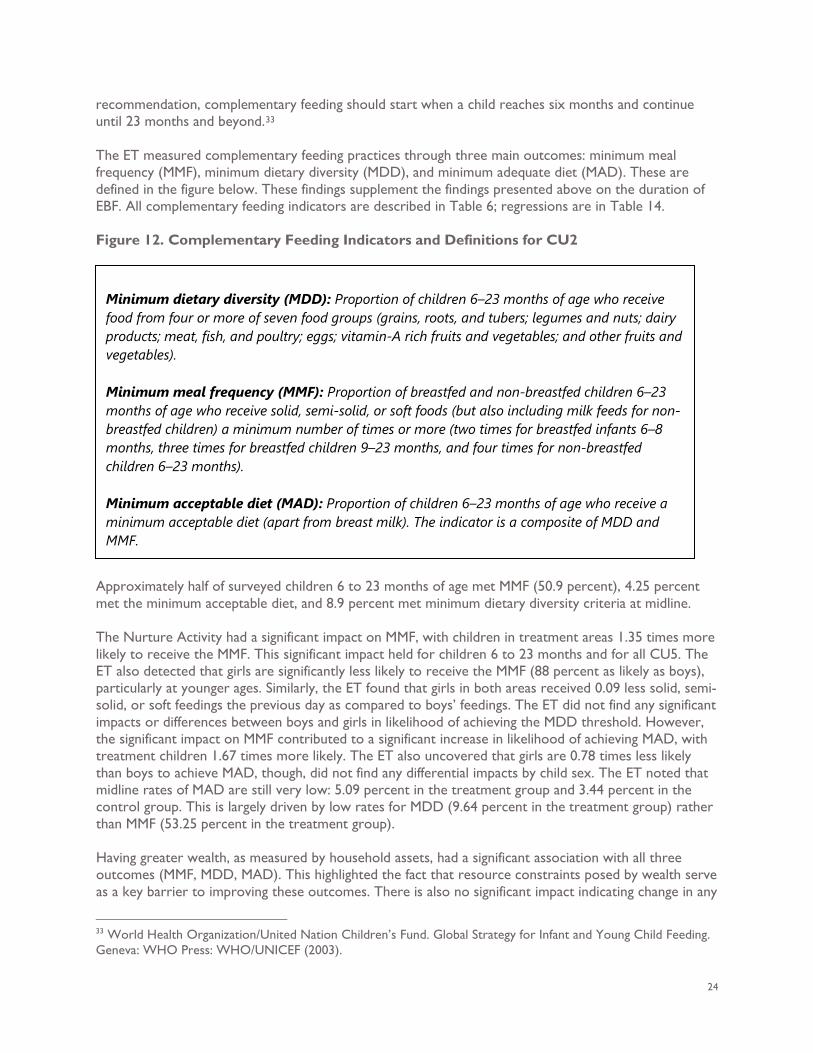
At midline follow-up, 38.3 percent of infants under six months were exclusively breastfed (EBF), although we do not find differences in EBF rates between the treatment and control groups. Nor do we find significant differences in overall rates of breastfeeding. However, we do find Activity impacts on higher duration of EBF, though this is only significant for children under 6 and 12 months of age. For children under 12 months, the Activity increased median EBF duration by 0.48 months. We found similar trends for other indicators related to breastfeeding.32 While we did not see a significant impact on all CU2, the Activity generated a significant increase in the likelihood of children under 12 months (and under six months) being breastfed within one hour after birth. Children under 12 months in the treatment area were 1.32 times more likely to be breastfed within the first hour than similar children in comparison areas. We also found that the percent of children 12 to 15 months of age who are fed breastmilk was significantly higher in Activity villages as compared to those in control villages, as shown in Figure 11. The figure below shows that the Activity significantly increased the percent of children 0 to 23 months of age fed using a bottle from a nipple or teat in the past 24 hours.
31 Onyango AW, Borghi E, de Onis M, Casanovas Mdel C, Garza C. Complementary feeding and attained linear growth among 6-23-month-old children. Public health nutrition. 2014;17(9):1975–83. Epub 2013/09/21. pmid:24050753. 32 In relation to breastfeeding, we find some differences in the models that do not incorporate baseline data. Specifically, in those models, we do find small, significant impacts on the likelihood of CU@ being breastfed within the first hour, the likelihood of exclusive breastfeeding for six months, and the likelihood of being breastfed for children 0-23 months.
23
Figure 10. Percent of Children 0-23 Months
Fed using a bottle with a nipple or teat in the past 24 hours
While we did not find evidence of differential Activity impacts by sex, we do find evidence of differences between boys and girls in both the Activity and control areas. Specifically, while we did not find evidence of significant differences in breastfeeding likelihood or duration or EBF for 6 months likelihood, we do find evidence that girls are exclusively breastfed about 0.18 months longer than boys. Figure 11. Percent of Children who are fed breastmilk
Households with a household head with a lower education level or located in Khammouane were associated with stopping EBF at younger ages, while households with electricity, who farmed, or who had greater wealth were associated with longer EBF duration. The ET also found that having a household member who participates in farming or home gardening was associated with a higher percentage of children under 6 months of age being exclusively breastfed. More detail on breastfeeding indicators is located in Table 5; breastfeeding regressions are in Table 13. Complementary Feeding The Activity provided training on the five food groups, food preparation, ANC, and post-natal care through technical visits and encouraged women and men to visit health centers through monthly follow-up home visits from the CF at the village level. Appropriate timing of complementary food introduction and optimum quantity and quality of consumed foods were examined. According to WHO
24
recommendation, complementary feeding should start when a child reaches six months and continue until 23 months and beyond.33 The ET measured complementary feeding practices through three main outcomes: minimum meal frequency (MMF), minimum dietary diversity (MDD), and minimum adequate diet (MAD). These are defined in the figure below. These findings supplement the findings presented above on the duration of EBF. All complementary feeding indicators are described in Table 6; regressions are in Table 14. Figure 12. Complementary Feeding Indicators and Definitions for CU2
Approximately half of surveyed children 6 to 23 months of age met MMF (50.9 percent), 4.25 percent met the minimum acceptable diet, and 8.9 percent met minimum dietary diversity criteria at midline. The Nurture Activity had a significant impact on MMF, with children in treatment areas 1.35 times more likely to receive the MMF. This significant impact held for children 6 to 23 months and for all CU5. The ET also detected that girls are significantly less likely to receive the MMF (88 percent as likely as boys), particularly at younger ages. Similarly, the ET found that girls in both areas received 0.09 less solid, semi-solid, or soft feedings the previous day as compared to boys’ feedings. The ET did not find any significant impacts or differences between boys and girls in likelihood of achieving the MDD threshold. However, the significant impact on MMF contributed to a significant increase in likelihood of achieving MAD, with treatment children 1.67 times more likely. The ET also uncovered that girls are 0.78 times less likely than boys to achieve MAD, though, did not find any differential impacts by child sex. The ET noted that midline rates of MAD are still very low: 5.09 percent in the treatment group and 3.44 percent in the control group. This is largely driven by low rates for MDD (9.64 percent in the treatment group) rather than MMF (53.25 percent in the treatment group). Having greater wealth, as measured by household assets, had a significant association with all three outcomes (MMF, MDD, MAD). This highlighted the fact that resource constraints posed by wealth serve as a key barrier to improving these outcomes. There is also no significant impact indicating change in any
33 World Health Organization/United Nation Children’s Fund. Global Strategy for Infant and Young Child Feeding. Geneva: WHO Press: WHO/UNICEF (2003).
Minimum dietary diversity (MDD): Proportion of children 6–23 months of age who receive food from four or more of seven food groups (grains, roots, and tubers; legumes and nuts; dairy products; meat, fish, and poultry; eggs; vitamin-A rich fruits and vegetables; and other fruits and vegetables). Minimum meal frequency (MMF): Proportion of breastfed and non-breastfed children 6–23 months of age who receive solid, semi-solid, or soft foods (but also including milk feeds for non-breastfed children) a minimum number of times or more (two times for breastfed infants 6–8 months, three times for breastfed children 9–23 months, and four times for non-breastfed children 6–23 months). Minimum acceptable diet (MAD): Proportion of children 6–23 months of age who receive a minimum acceptable diet (apart from breast milk). The indicator is a composite of MDD and MMF.
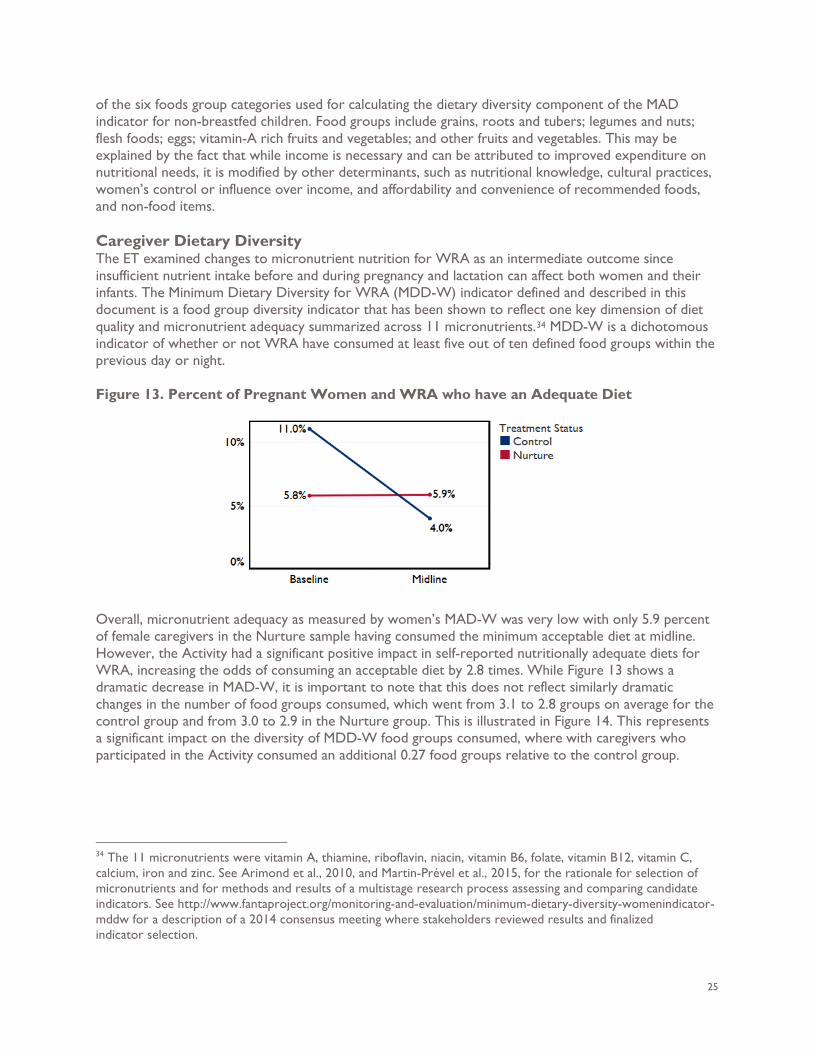
25
of the six foods group categories used for calculating the dietary diversity component of the MAD indicator for non-breastfed children. Food groups include grains, roots and tubers; legumes and nuts; flesh foods; eggs; vitamin-A rich fruits and vegetables; and other fruits and vegetables. This may be explained by the fact that while income is necessary and can be attributed to improved expenditure on nutritional needs, it is modified by other determinants, such as nutritional knowledge, cultural practices, women’s control or influence over income, and affordability and convenience of recommended foods, and non-food items. Caregiver Dietary Diversity The ET examined changes to micronutrient nutrition for WRA as an intermediate outcome since insufficient nutrient intake before and during pregnancy and lactation can affect both women and their infants. The Minimum Dietary Diversity for WRA (MDD-W) indicator defined and described in this document is a food group diversity indicator that has been shown to reflect one key dimension of diet quality and micronutrient adequacy summarized across 11 micronutrients.34 MDD-W is a dichotomous indicator of whether or not WRA have consumed at least five out of ten defined food groups within the previous day or night. Figure 13. Percent of Pregnant Women and WRA who have an Adequate Diet
Overall, micronutrient adequacy as measured by women’s MAD-W was very low with only 5.9 percent of female caregivers in the Nurture sample having consumed the minimum acceptable diet at midline. However, the Activity had a significant positive impact in self-reported nutritionally adequate diets for WRA, increasing the odds of consuming an acceptable diet by 2.8 times. While Figure 13 shows a dramatic decrease in MAD-W, it is important to note that this does not reflect similarly dramatic changes in the number of food groups consumed, which went from 3.1 to 2.8 groups on average for the control group and from 3.0 to 2.9 in the Nurture group. This is illustrated in Figure 14. This represents a significant impact on the diversity of MDD-W food groups consumed, where with caregivers who participated in the Activity consumed an additional 0.27 food groups relative to the control group.
34 The 11 micronutrients were vitamin A, thiamine, riboflavin, niacin, vitamin B6, folate, vitamin B12, vitamin C, calcium, iron and zinc. See Arimond et al., 2010, and Martin-Prével et al., 2015, for the rationale for selection of micronutrients and for methods and results of a multistage research process assessing and comparing candidate indicators. See http://www.fantaproject.org/monitoring-and-evaluation/minimum-dietary-diversity-womenindicator-mddw for a description of a 2014 consensus meeting where stakeholders reviewed results and finalized indicator selection.
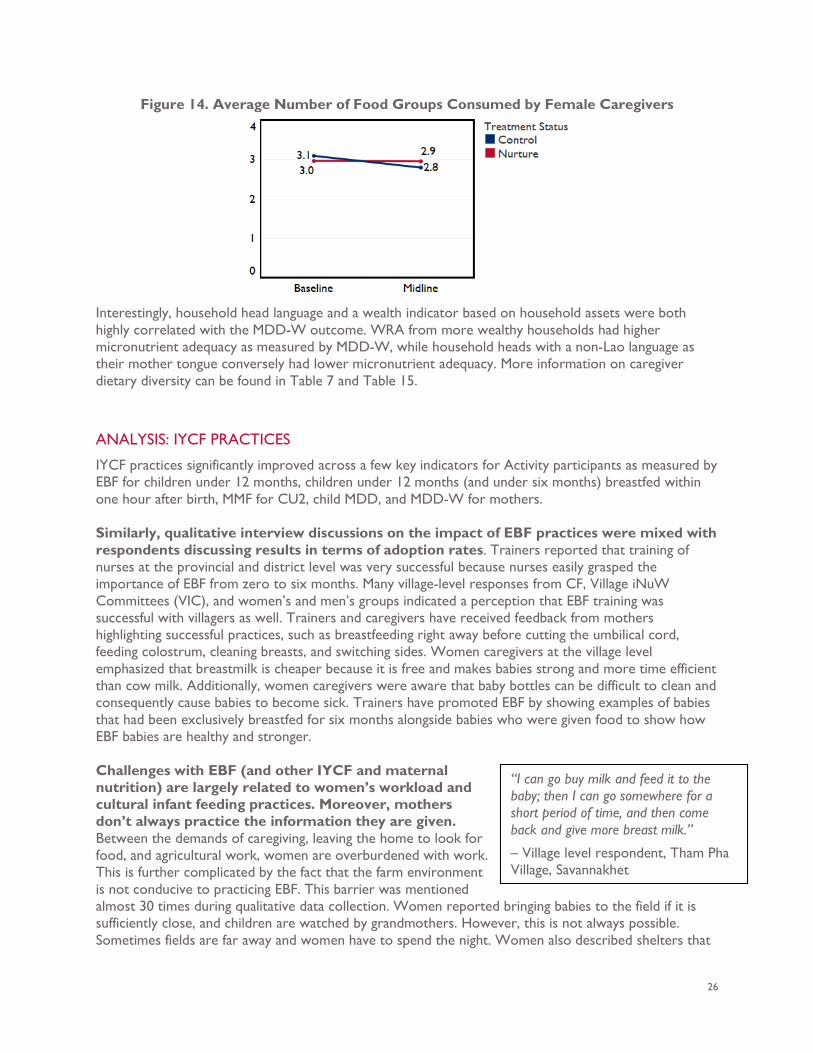
26
Figure 14. Average Number of Food Groups Consumed by Female Caregivers
Interestingly, household head language and a wealth indicator based on household assets were both highly correlated with the MDD-W outcome. WRA from more wealthy households had higher micronutrient adequacy as measured by MDD-W, while household heads with a non-Lao language as their mother tongue conversely had lower micronutrient adequacy. More information on caregiver dietary diversity can be found in Table 7 and Table 15.
ANALYSIS: IYCF PRACTICES
IYCF practices significantly improved across a few key indicators for Activity participants as measured by EBF for children under 12 months, children under 12 months (and under six months) breastfed within one hour after birth, MMF for CU2, child MDD, and MDD-W for mothers. Similarly, qualitative interview discussions on the impact of EBF practices were mixed with respondents discussing results in terms of adoption rates. Trainers reported that training of nurses at the provincial and district level was very successful because nurses easily grasped the importance of EBF from zero to six months. Many village-level responses from CF, Village iNuW Committees (VIC), and women’s and men’s groups indicated a perception that EBF training was successful with villagers as well. Trainers and caregivers have received feedback from mothers highlighting successful practices, such as breastfeeding right away before cutting the umbilical cord, feeding colostrum, cleaning breasts, and switching sides. Women caregivers at the village level emphasized that breastmilk is cheaper because it is free and makes babies strong and more time efficient than cow milk. Additionally, women caregivers were aware that baby bottles can be difficult to clean and consequently cause babies to become sick. Trainers have promoted EBF by showing examples of babies that had been exclusively breastfed for six months alongside babies who were given food to show how EBF babies are healthy and stronger. Challenges with EBF (and other IYCF and maternal nutrition) are largely related to women’s workload and cultural infant feeding practices. Moreover, mothers don’t always practice the information they are given. Between the demands of caregiving, leaving the home to look for food, and agricultural work, women are overburdened with work. This is further complicated by the fact that the farm environment is not conducive to practicing EBF. This barrier was mentioned almost 30 times during qualitative data collection. Women reported bringing babies to the field if it is sufficiently close, and children are watched by grandmothers. However, this is not always possible. Sometimes fields are far away and women have to spend the night. Women also described shelters that
“I can go buy milk and feed it to the baby; then I can go somewhere for a short period of time, and then come back and give more breast milk.”
– Village level respondent, Tham Pha Village, Savannakhet
27
are built around fields; these are places where a woman can sometimes bring her baby and another caregiver to watch the baby while she works. Aside from not always being able to bring children to the field, respondents also noted challenges such as not having access to breast pumps or means for storing breast milk. During the women’s FGD, some female respondents began by saying that they always practice EBF; however, comments made while discussing challenges and during the conversation on complimentary feeding made it apparent that most women and caregivers introduced rice to babies earlier than six months. Women and some men are very knowledgeable of the benefits of EBF and have tried to increase the practice. Some reported succeeding; however, this is still challenging due to work demands and cultural practices among women, grandmothers, and husbands who care for children.
While respondents reported increased knowledge of optimal complementary food, availability and access limits adoption of recommended complementary food practices. Access to optimal complimentary foods is intermittent depending on seasonal variations in availability and affordability at the village level. This is especially salient among the poorest population, isolated villages, and ethnic
minority groups. Therefore, the qualitative findings suggest that while households have increased capacity and knowledge, it is unlikely that most households are able to adopt optimal infant complementary feeding practices or meet dietary diversity recommendations on a regular basis. These responses can explain some of the reasons for the higher rates of MMF as compared to very low rates of MDD and MAD. Other major barriers include traditional infant feeding practices. There is a very deeply seeded belief in Laos that when the baby cries or fusses it should be given food, often rice, to make it feel full. Respondents also noted that it was very hard to change traditional infant feeding practices among grandmothers who often care for babies while mothers work. Both men’s and women’s FGD also indicated that men care for babies while women work, and they tend to follow traditional rice feeding practices. Feeding babies rice when they cry was mentioned almost 30 times and at all levels during the interviews. In fact, during the FGD, women with babies expressed feeling that they had to leave the meeting because their baby had started to fuss. Birth spacing was mentioned as a factor impacting feeding practices because if babies are born too close together, resources are constrained, and the youngest baby gets priority. The older baby may stop receiving breast milk and consume a simple and inadequate complementary diet. Another comment made indicated that after one year, feeding practices and dietary diversity recommendations are not always maintained.
“People believe that when the baby eats “food” [synonymous for rice in Lao food culture], it will feel full and won’t cry, and then the mother can work more.”
– Provincial level government official, Savannakhet
“Before [the USAID Nurture Program] women are the ones who have to find food in the jungle. Now men are the ones. Especially during pregnancy and breastfeeding men will find frogs and insects as a protein for the family. When I visit, they always make food, and have many dishes of bamboo, fish, and mushroom, so not only bamboo.”
– District healthcare provider, Xaybouathong District, Khammouane.
28
Respondents at all levels shared many comments regarding male involvement in maternal nutrition and IYCF including helping with cooking, fetching water, helping with childcare, and assuming the women’s traditional rice cultivation roles to allow wives to rest during pregnancy and breastfeeding. Respondents reported that men were involved in foraging for food, such as frogs, crickets, mushrooms, vegetables and buying food from the market when income was available. One reason cited for men becoming more involved is the initial visit to the healthcare clinic where they learn how to support their wives through pregnancy, birth, and post-natal care. As with IYCF practices, the primary cited challenges to improving maternal nutrition are that women, especially from poorer households, do not have sufficient access to diverse affordable foods in quantity and quality or knowledge on how to cook with certain nutritious ingredients. One national level government official said, “They find food day by day and they don’t know how to manage the food and dietary recommendations. They forage in the forest until it is finished, and then they get more.” Data revealed that women were already overburdened with the demands of agricultural labor and caregiving responsibilities in the household. One women’s FGD village-level participant said, “Even if I had the ingredients, I would not have the time to cook them.”
3.3 WASH PRACTICES Global evidence shows that water, sanitation, and hygiene (WASH) practices are a critical underlying determinant reducing malnutrition. The evaluation examined rates of essential hygiene practices, including handwashing, open defecation, use of a basic sanitation facility, and baby WASH practices that impact nutritional outcomes for 1,000 days households. The evaluation also examined the enabling environment and approaches for promoting the Activity’s integrated nutrition and WASH (iNuW) approach. A full breakdown of WASH indicators and regressions is provided in Table 8 and Table 16.
“The program is changing behavior of pregnant women. Before they believed in food taboos and were told to avoid sweet and fatty food to avoid having a big infant and make delivery easier; however, after project visits, we found they have let these taboos go and women did not feel as bloated during pregnancy.”
- District level government official, Mahaxay District, Khammoune
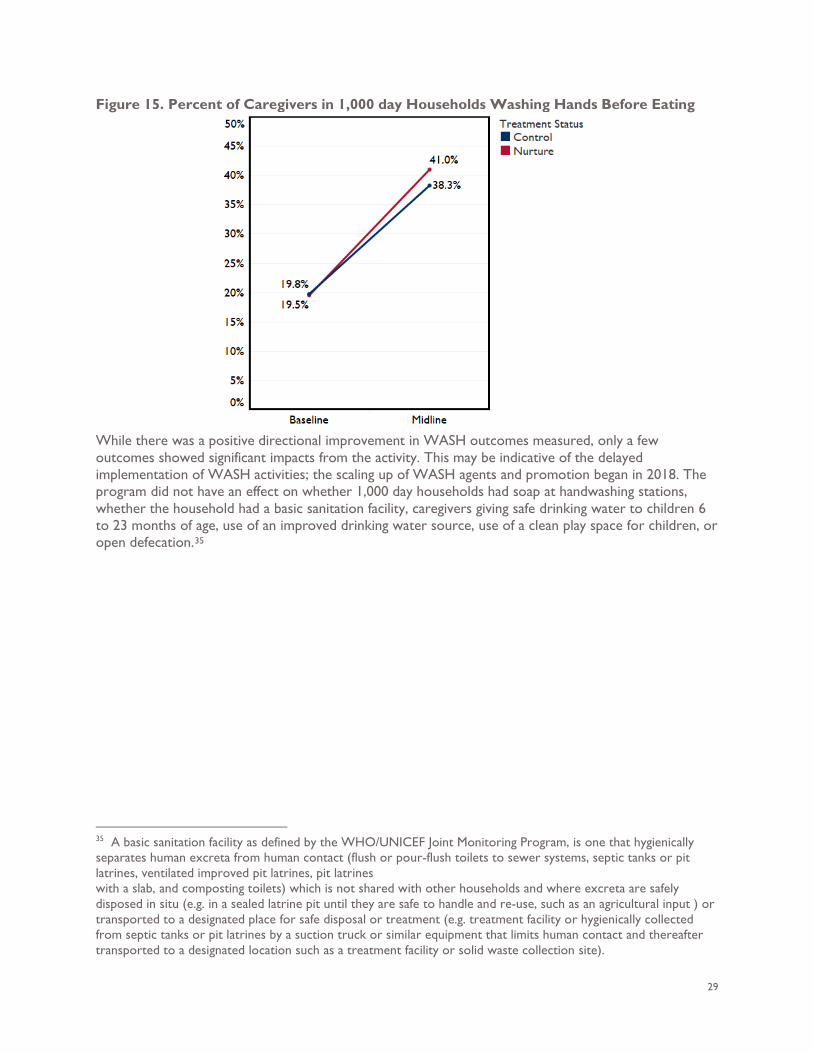
29
Figure 15. Percent of Caregivers in 1,000 day Households Washing Hands Before Eating
While there was a positive directional improvement in WASH outcomes measured, only a few outcomes showed significant impacts from the activity. This may be indicative of the delayed implementation of WASH activities; the scaling up of WASH agents and promotion began in 2018. The program did not have an effect on whether 1,000 day households had soap at handwashing stations, whether the household had a basic sanitation facility, caregivers giving safe drinking water to children 6 to 23 months of age, use of an improved drinking water source, use of a clean play space for children, or open defecation.35
35 A basic sanitation facility as defined by the WHO/UNICEF Joint Monitoring Program, is one that hygienically separates human excreta from human contact (flush or pour-flush toilets to sewer systems, septic tanks or pit latrines, ventilated improved pit latrines, pit latrines with a slab, and composting toilets) which is not shared with other households and where excreta are safely disposed in situ (e.g. in a sealed latrine pit until they are safe to handle and re-use, such as an agricultural input ) or transported to a designated place for safe disposal or treatment (e.g. treatment facility or hygienically collected from septic tanks or pit latrines by a suction truck or similar equipment that limits human contact and thereafter transported to a designated location such as a treatment facility or solid waste collection site).
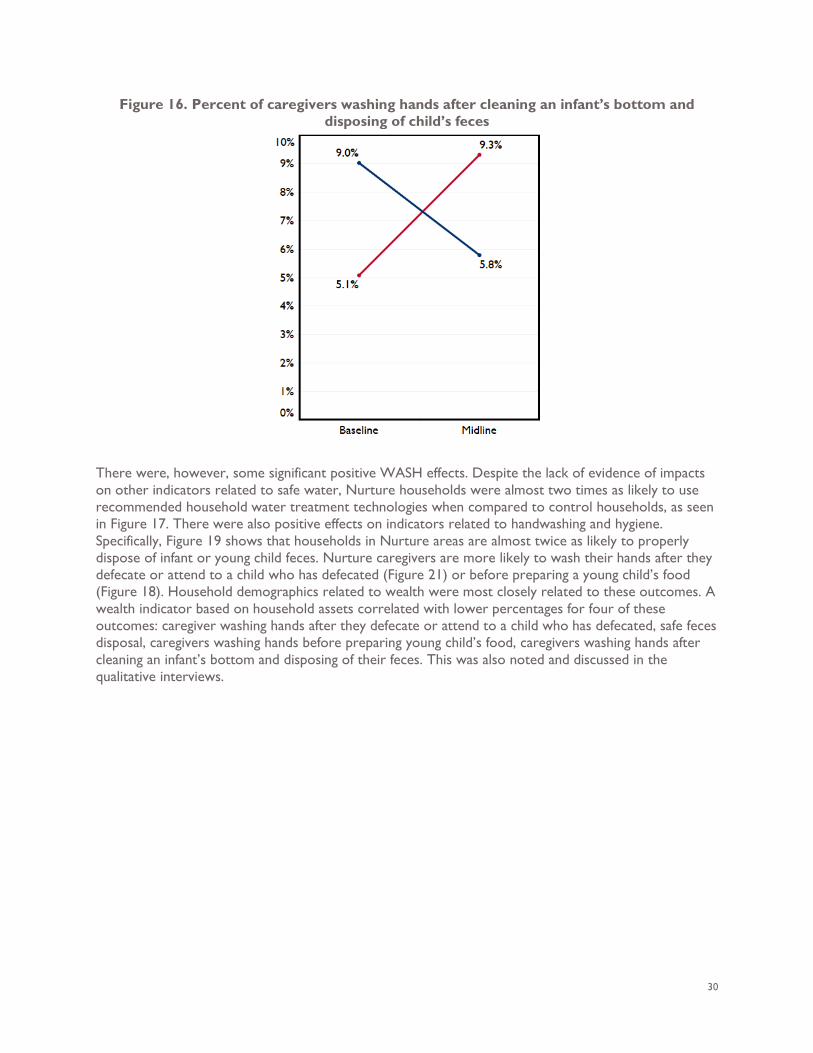
30
Figure 16. Percent of caregivers washing hands after cleaning an infant’s bottom and disposing of child’s feces
There were, however, some significant positive WASH effects. Despite the lack of evidence of impacts on other indicators related to safe water, Nurture households were almost two times as likely to use recommended household water treatment technologies when compared to control households, as seen in Figure 17. There were also positive effects on indicators related to handwashing and hygiene. Specifically, Figure 19 shows that households in Nurture areas are almost twice as likely to properly dispose of infant or young child feces. Nurture caregivers are more likely to wash their hands after they defecate or attend to a child who has defecated (Figure 21) or before preparing a young child’s food (Figure 18). Household demographics related to wealth were most closely related to these outcomes. A wealth indicator based on household assets correlated with lower percentages for four of these outcomes: caregiver washing hands after they defecate or attend to a child who has defecated, safe feces disposal, caregivers washing hands before preparing young child’s food, caregivers washing hands after cleaning an infant’s bottom and disposing of their feces. This was also noted and discussed in the qualitative interviews.
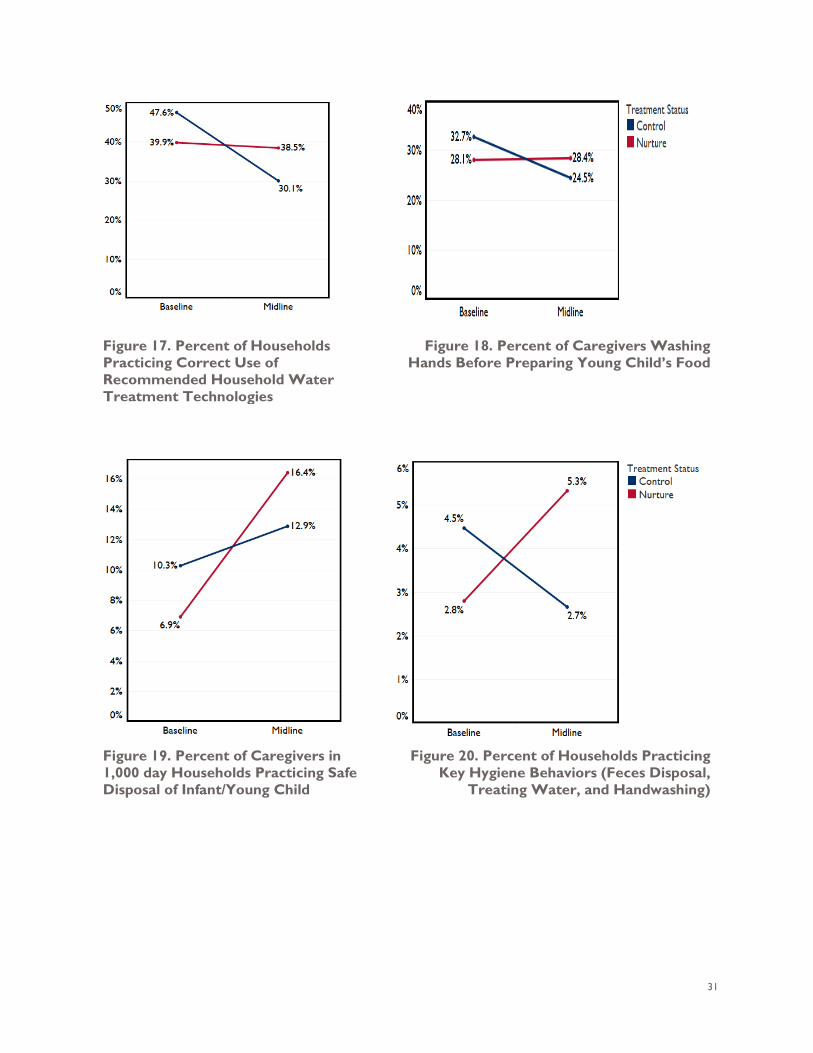
31
Figure 17. Percent of Households Practicing Correct Use of Recommended Household Water Treatment Technologies
Figure 18. Percent of Caregivers Washing Hands Before Preparing Young Child’s Food
Figure 19. Percent of Caregivers in 1,000 day Households Practicing Safe Disposal of Infant/Young Child
Figure 20. Percent of Households Practicing Key Hygiene Behaviors (Feces Disposal,
Treating Water, and Handwashing)
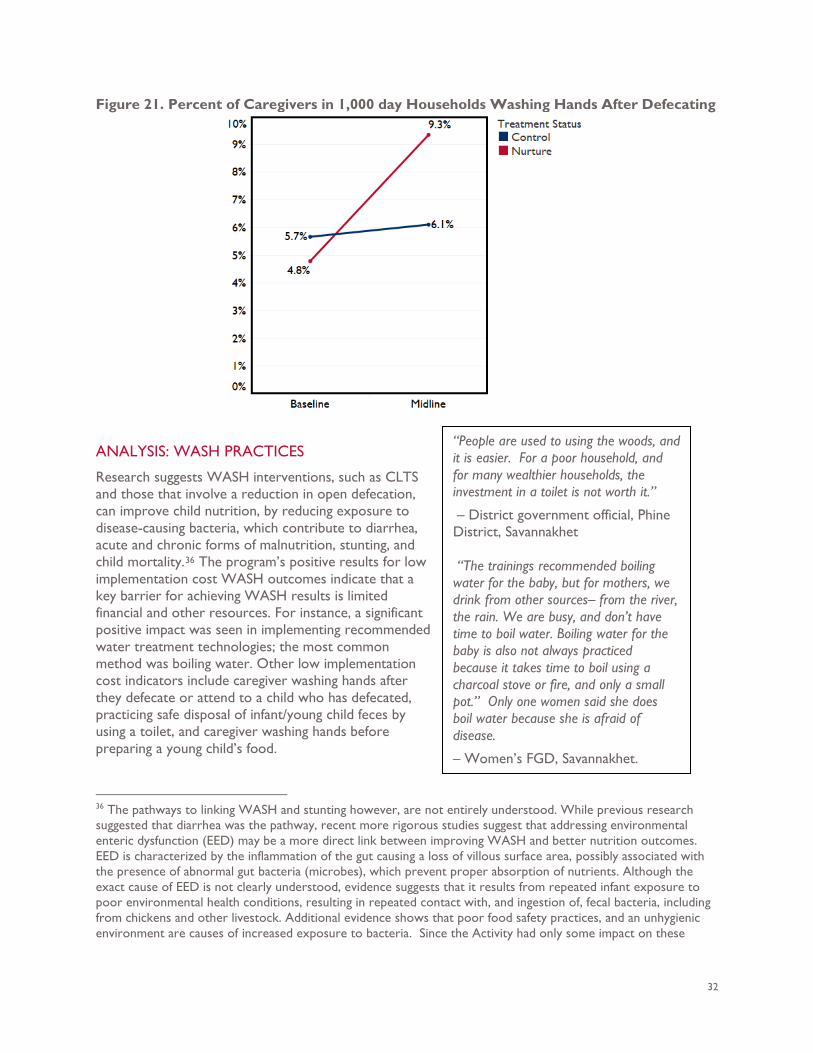
32
Figure 21. Percent of Caregivers in 1,000 day Households Washing Hands After Defecating
ANALYSIS: WASH PRACTICES
Research suggests WASH interventions, such as CLTS and those that involve a reduction in open defecation, can improve child nutrition, by reducing exposure to disease-causing bacteria, which contribute to diarrhea, acute and chronic forms of malnutrition, stunting, and child mortality.36 The program’s positive results for low implementation cost WASH outcomes indicate that a key barrier for achieving WASH results is limited financial and other resources. For instance, a significant positive impact was seen in implementing recommended water treatment technologies; the most common method was boiling water. Other low implementation cost indicators include caregiver washing hands after they defecate or attend to a child who has defecated, practicing safe disposal of infant/young child feces by using a toilet, and caregiver washing hands before preparing a young child’s food.
36 The pathways to linking WASH and stunting however, are not entirely understood. While previous research suggested that diarrhea was the pathway, recent more rigorous studies suggest that addressing environmental enteric dysfunction (EED) may be a more direct link between improving WASH and better nutrition outcomes. EED is characterized by the inflammation of the gut causing a loss of villous surface area, possibly associated with the presence of abnormal gut bacteria (microbes), which prevent proper absorption of nutrients. Although the exact cause of EED is not clearly understood, evidence suggests that it results from repeated infant exposure to poor environmental health conditions, resulting in repeated contact with, and ingestion of, fecal bacteria, including from chickens and other livestock. Additional evidence shows that poor food safety practices, and an unhygienic environment are causes of increased exposure to bacteria. Since the Activity had only some impact on these
“People are used to using the woods, and it is easier. For a poor household, and for many wealthier households, the investment in a toilet is not worth it.”
– District government official, Phine District, Savannakhet “The trainings recommended boiling water for the baby, but for mothers, we drink from other sources– from the river, the rain. We are busy, and don’t have time to boil water. Boiling water for the baby is also not always practiced because it takes time to boil using a charcoal stove or fire, and only a small pot.” Only one women said she does boil water because she is afraid of disease.
– Women’s FGD, Savannakhet.
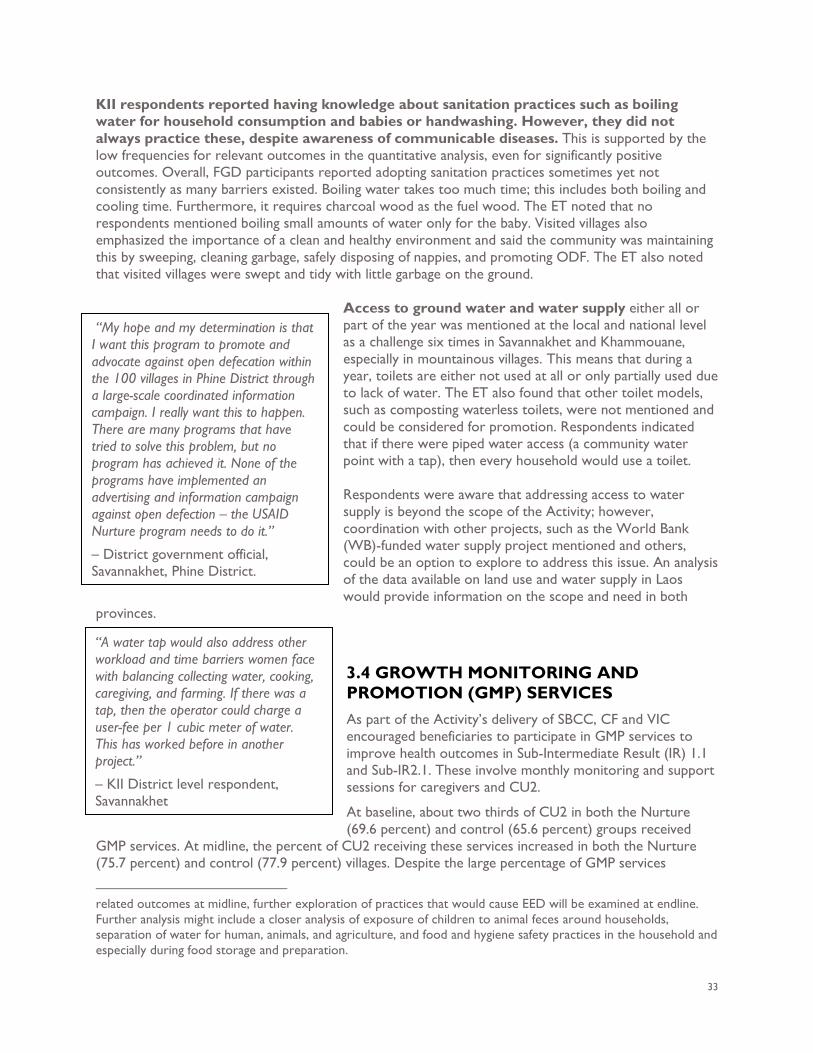
33
KII respondents reported having knowledge about sanitation practices such as boiling water for household consumption and babies or handwashing. However, they did not always practice these, despite awareness of communicable diseases. This is supported by the low frequencies for relevant outcomes in the quantitative analysis, even for significantly positive outcomes. Overall, FGD participants reported adopting sanitation practices sometimes yet not consistently as many barriers existed. Boiling water takes too much time; this includes both boiling and cooling time. Furthermore, it requires charcoal wood as the fuel wood. The ET noted that no respondents mentioned boiling small amounts of water only for the baby. Visited villages also emphasized the importance of a clean and healthy environment and said the community was maintaining this by sweeping, cleaning garbage, safely disposing of nappies, and promoting ODF. The ET also noted that visited villages were swept and tidy with little garbage on the ground.
Access to ground water and water supply either all or part of the year was mentioned at the local and national level as a challenge six times in Savannakhet and Khammouane, especially in mountainous villages. This means that during a year, toilets are either not used at all or only partially used due to lack of water. The ET also found that other toilet models, such as composting waterless toilets, were not mentioned and could be considered for promotion. Respondents indicated that if there were piped water access (a community water point with a tap), then every household would use a toilet. Respondents were aware that addressing access to water supply is beyond the scope of the Activity; however, coordination with other projects, such as the World Bank (WB)-funded water supply project mentioned and others, could be an option to explore to address this issue. An analysis of the data available on land use and water supply in Laos would provide information on the scope and need in both
provinces.
3.4 GROWTH MONITORING AND PROMOTION (GMP) SERVICES As part of the Activity’s delivery of SBCC, CF and VIC encouraged beneficiaries to participate in GMP services to improve health outcomes in Sub-Intermediate Result (IR) 1.1 and Sub-IR2.1. These involve monthly monitoring and support sessions for caregivers and CU2.
At baseline, about two thirds of CU2 in both the Nurture (69.6 percent) and control (65.6 percent) groups received
GMP services. At midline, the percent of CU2 receiving these services increased in both the Nurture (75.7 percent) and control (77.9 percent) villages. Despite the large percentage of GMP services
related outcomes at midline, further exploration of practices that would cause EED will be examined at endline. Further analysis might include a closer analysis of exposure of children to animal feces around households, separation of water for human, animals, and agriculture, and food and hygiene safety practices in the household and especially during food storage and preparation.
“A water tap would also address other workload and time barriers women face with balancing collecting water, cooking, caregiving, and farming. If there was a tap, then the operator could charge a user-fee per 1 cubic meter of water. This has worked before in another project.”
– KII District level respondent, Savannakhet
“My hope and my determination is that I want this program to promote and advocate against open defecation within the 100 villages in Phine District through a large-scale coordinated information campaign. I really want this to happen. There are many programs that have tried to solve this problem, but no program has achieved it. None of the programs have implemented an advertising and information campaign against open defection – the USAID Nurture program needs to do it.”
– District government official, Savannakhet, Phine District.
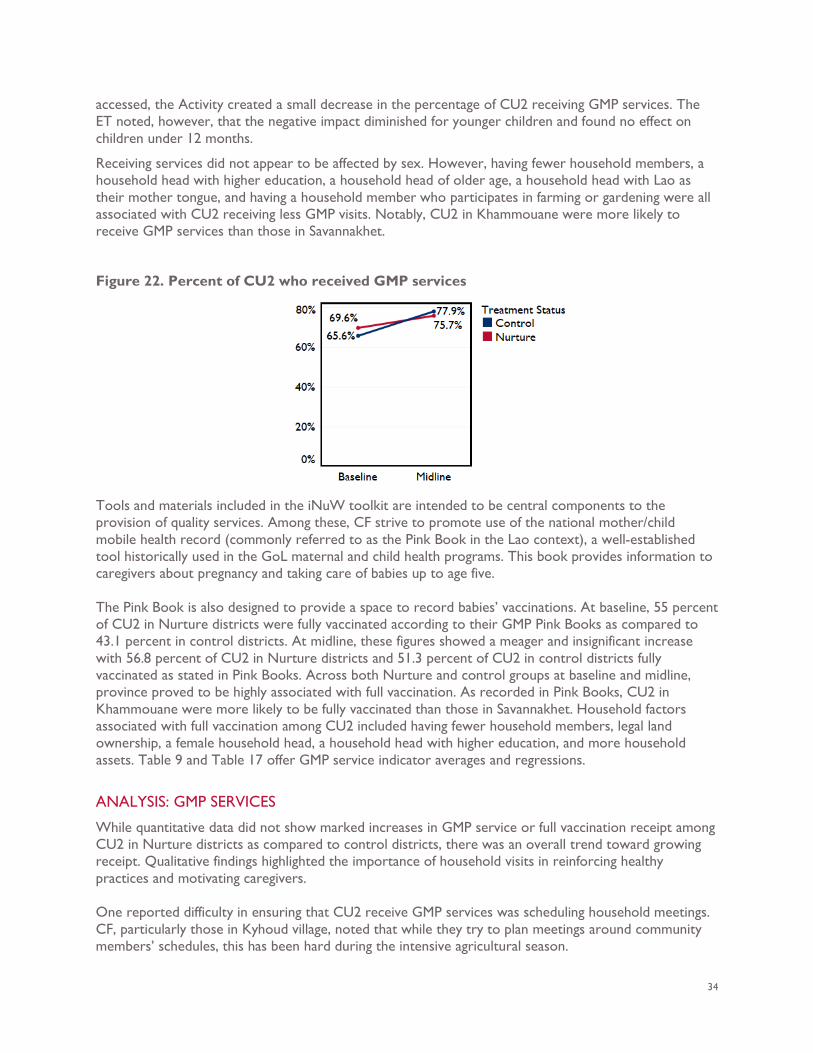
34
accessed, the Activity created a small decrease in the percentage of CU2 receiving GMP services. The ET noted, however, that the negative impact diminished for younger children and found no effect on children under 12 months.
Receiving services did not appear to be affected by sex. However, having fewer household members, a household head with higher education, a household head of older age, a household head with Lao as their mother tongue, and having a household member who participates in farming or gardening were all associated with CU2 receiving less GMP visits. Notably, CU2 in Khammouane were more likely to receive GMP services than those in Savannakhet.
Figure 22. Percent of CU2 who received GMP services
Tools and materials included in the iNuW toolkit are intended to be central components to the provision of quality services. Among these, CF strive to promote use of the national mother/child mobile health record (commonly referred to as the Pink Book in the Lao context), a well-established tool historically used in the GoL maternal and child health programs. This book provides information to caregivers about pregnancy and taking care of babies up to age five. The Pink Book is also designed to provide a space to record babies’ vaccinations. At baseline, 55 percent of CU2 in Nurture districts were fully vaccinated according to their GMP Pink Books as compared to 43.1 percent in control districts. At midline, these figures showed a meager and insignificant increase with 56.8 percent of CU2 in Nurture districts and 51.3 percent of CU2 in control districts fully vaccinated as stated in Pink Books. Across both Nurture and control groups at baseline and midline, province proved to be highly associated with full vaccination. As recorded in Pink Books, CU2 in Khammouane were more likely to be fully vaccinated than those in Savannakhet. Household factors associated with full vaccination among CU2 included having fewer household members, legal land ownership, a female household head, a household head with higher education, and more household assets. Table 9 and Table 17 offer GMP service indicator averages and regressions.
ANALYSIS: GMP SERVICES
While quantitative data did not show marked increases in GMP service or full vaccination receipt among CU2 in Nurture districts as compared to control districts, there was an overall trend toward growing receipt. Qualitative findings highlighted the importance of household visits in reinforcing healthy practices and motivating caregivers. One reported difficulty in ensuring that CU2 receive GMP services was scheduling household meetings. CF, particularly those in Kyhoud village, noted that while they try to plan meetings around community members’ schedules, this has been hard during the intensive agricultural season.
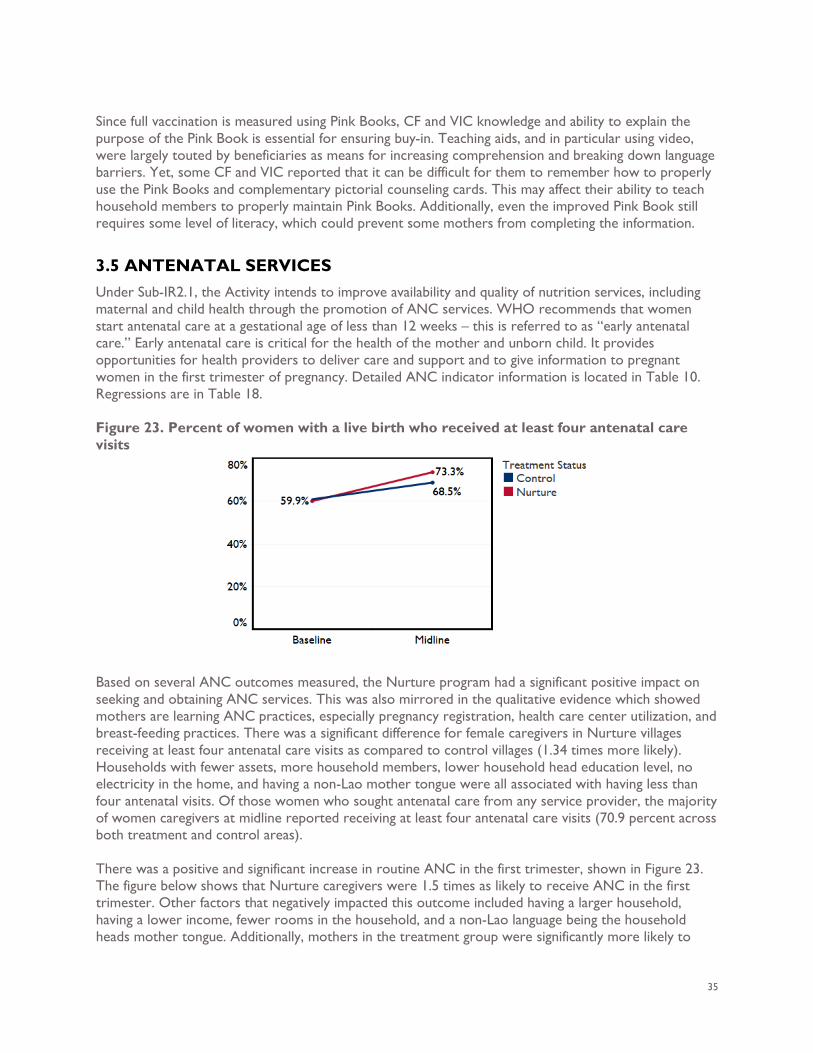
35
Since full vaccination is measured using Pink Books, CF and VIC knowledge and ability to explain the purpose of the Pink Book is essential for ensuring buy-in. Teaching aids, and in particular using video, were largely touted by beneficiaries as means for increasing comprehension and breaking down language barriers. Yet, some CF and VIC reported that it can be difficult for them to remember how to properly use the Pink Books and complementary pictorial counseling cards. This may affect their ability to teach household members to properly maintain Pink Books. Additionally, even the improved Pink Book still requires some level of literacy, which could prevent some mothers from completing the information.
3.5 ANTENATAL SERVICES Under Sub-IR2.1, the Activity intends to improve availability and quality of nutrition services, including maternal and child health through the promotion of ANC services. WHO recommends that women start antenatal care at a gestational age of less than 12 weeks – this is referred to as “early antenatal care.” Early antenatal care is critical for the health of the mother and unborn child. It provides opportunities for health providers to deliver care and support and to give information to pregnant women in the first trimester of pregnancy. Detailed ANC indicator information is located in Table 10. Regressions are in Table 18. Figure 23. Percent of women with a live birth who received at least four antenatal care visits
Based on several ANC outcomes measured, the Nurture program had a significant positive impact on seeking and obtaining ANC services. This was also mirrored in the qualitative evidence which showed mothers are learning ANC practices, especially pregnancy registration, health care center utilization, and breast-feeding practices. There was a significant difference for female caregivers in Nurture villages receiving at least four antenatal care visits as compared to control villages (1.34 times more likely). Households with fewer assets, more household members, lower household head education level, no electricity in the home, and having a non-Lao mother tongue were all associated with having less than four antenatal visits. Of those women who sought antenatal care from any service provider, the majority of women caregivers at midline reported receiving at least four antenatal care visits (70.9 percent across both treatment and control areas). There was a positive and significant increase in routine ANC in the first trimester, shown in Figure 23. The figure below shows that Nurture caregivers were 1.5 times as likely to receive ANC in the first trimester. Other factors that negatively impacted this outcome included having a larger household, having a lower income, fewer rooms in the household, and a non-Lao language being the household heads mother tongue. Additionally, mothers in the treatment group were significantly more likely to
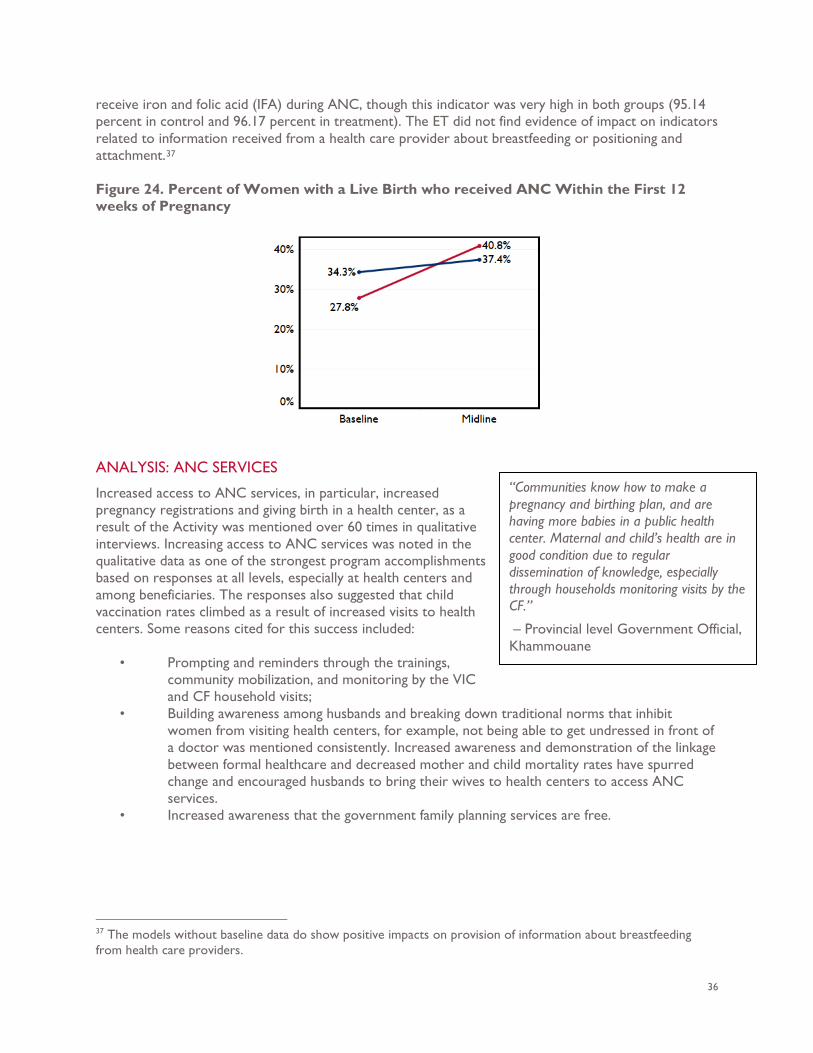
36
receive iron and folic acid (IFA) during ANC, though this indicator was very high in both groups (95.14 percent in control and 96.17 percent in treatment). The ET did not find evidence of impact on indicators related to information received from a health care provider about breastfeeding or positioning and attachment.37 Figure 24. Percent of Women with a Live Birth who received ANC Within the First 12 weeks of Pregnancy
ANALYSIS: ANC SERVICES
Increased access to ANC services, in particular, increased pregnancy registrations and giving birth in a health center, as a result of the Activity was mentioned over 60 times in qualitative interviews. Increasing access to ANC services was noted in the qualitative data as one of the strongest program accomplishments based on responses at all levels, especially at health centers and among beneficiaries. The responses also suggested that child vaccination rates climbed as a result of increased visits to health centers. Some reasons cited for this success included:
• Prompting and reminders through the trainings, community mobilization, and monitoring by the VIC and CF household visits;
• Building awareness among husbands and breaking down traditional norms that inhibit women from visiting health centers, for example, not being able to get undressed in front of a doctor was mentioned consistently. Increased awareness and demonstration of the linkage between formal healthcare and decreased mother and child mortality rates have spurred change and encouraged husbands to bring their wives to health centers to access ANC services.
• Increased awareness that the government family planning services are free.
37 The models without baseline data do show positive impacts on provision of information about breastfeeding from health care providers.
“Communities know how to make a pregnancy and birthing plan, and are having more babies in a public health center. Maternal and child’s health are in good condition due to regular dissemination of knowledge, especially through households monitoring visits by the CF.”
– Provincial level Government Official, Khammouane

37
The main challenges female and male respondents identified in accessing ANC services were physical access to the clinic, lack of income for transport, and traditional practices that dictate women’s movements such as lack of support from her husband. This is consistent with the quantitative data finding that households with fewer resources were less likely to access ANC services.
3.6 PROVINCE LEVEL VARIATION At midline, there was notable outcome variance between Khammouane and Savannakhet provinces. Across various significant indicator categories, data indicated that mothers and CU2 in Khammouane were exercising improved WASH, breastfeeding, and nutrition practices as compared to those in Savannakhet. Among significant WASH indicators, all but one (improved drinking source during the rainy season) were likely to be higher in Khammouane than Savannakhet. Similarly, two of the four ANC indicators, percent of women with a live birth who received at least four antenatal care visits and percent of women with a live birth who received ANC within the first 12 weeks of pregnancy, were significantly predicted by household province. In both cases, percentages were higher for women in Khammouane than those in Savannakhet. CU2 in Khammouane were significantly more likely to receive GMP services and be fully vaccinated according to GMP Pink Book records as compared to those in Savannakhet. Anthropometric indicators for CU2 followed a similar trend. Underweight and wasting were both significantly predicted by province. CU2 in Savannakhet were more likely to be underweight and wasted than those in Khammouane. Stunting was not significantly predicted by province. However, there were some breastfeeding and complementary feeding indicators for which Savannakhet mothers and children appear to fare better than those in Khammouane. While Khammouane children show higher percentage of healthy behavior practice across the majority of indicators, Savannakhet children are more likely to have been bottle fed within the last 24 hours, meet the MMF standard, have been breastfed at 20-23 months, and eaten fruits or vegetables. Indicators pertaining to mothers’ diet were not predicted by province. Potential explanations for provincial level differences were not articulated by KII or FGD participants at midline data collection. This will be further investigated in endline data collection, both quantitative and qualitative.
3.7 EVALUATION OF USAID NURTURE PROGRAM COMPONENTS This section responds to the second evaluation question by examining, primarily through the qualitative data, the extent to which each of the following components of the Activity’s approach contributes to the effectiveness of the overall approach:
1. Improved Community Nutrition/Health and WASH services 2. Capacity Building to improve quality service delivery 3. Demand Creation for Use of Nutrition, Health, WASH Services and Products 4. Improved enabling environment
This analysis draws on responses from stakeholders at all levels, each with different types of engagement with the activity. The responses at each level of government and among beneficiaries focused on the following roles as respondents described them:
“Before USAID Nurture maybe 10 pregnant women came to the health center at a time even to bring children for vaccinations. Now numbers are up to 80, and more women are exclusive breastfeeding.”
– District government official, Khammouane
38
• National level government officials contributed information primarily related to the
program planning, coordination, development of the USAID Nurture MOU, and review of reports. Some of these stakeholders were also involved in developing and reviewing USAID Nurture program tools and materials.
• Provincial level government officials also reported being involved in the Memorandum of Understanding (MOU) development, facilitating coordination with the Activity DPOs, supporting implementation of the promotion of WASH products, participating in capacity building and trainings, and delivering counseling and training to district and village level officials, CF, and VIC.
• District level government officials reported being engaged in trainings for participants, health service providers, and trainers and counselors, primarily for the CF and VIC at the village level. During the nutrition and WASH promotion visits, they also interacted with direct beneficiaries and meeting participants. Additionally, the WASH officials were involved in promoting WASH products and assisting with order and procurement coordination for toilets and water filters.
• The CF and VIC were involved in training at the district level, organizing and facilitating the nutrition and WASH promotion village meetings, using the iNuW tools WASH product manual, providing ongoing support to 1,000 day households through home visits, and coordinating community training and activities to promote WASH practices.
• The FGD respondents at the village level included women and men beneficiaries who were actively engaged in Activity nutrition and WASH activities to those who had only recently heard of the program.
1 & 2: IMPROVED COMMUNITY NUTRITION/HEALTH AND WASH SERVICES & CAPACITY BUILDING TO IMPROVE QUALITY SERVICE DELIVERY
National, provincial, district officials, village-level volunteers and beneficiaries, and USAID Nurture staff noted that the Ministry of Health and other donor-funded programs have a long history of promoting nutrition and WASH knowledge in the past. Many individual practices were familiar; however, adoption of practices and access to services remains a challenge. Respondents recognized the 1,000 day approach supported through the Activity as a new way of promoting mother and child health. For example, trainers, health service providers, and FGD respondents recalled learning and teaching practices in a three-stage approach – ANC, giving birth, and IYCF – and that learning in stages helped them retain knowledge and remember what they needed to do. FGD participants also reported learning a range of new ANC, IYCF, CF, and WASH practices detailed in the Findings section for Evaluation Question 1 in this report. Doctors and nurses and women, men, and village committee FGD groups perceived an increase in the number of ANC visits, registration of pregnancies, births in health centers or hospitals, and awareness that the government services are free of charge. iNuW Village Visits The iNuW Village Visits facilitate entry and access to beneficiary communities and enable support provision to VIC and CF. VIC oversee the overall community effort, and CF mobilize community members for meetings and conduct household visits.
“The program has helped raise the awareness and knowledge in the village on the 1000-day practices. This is a success because of the CF and VIC, and their visits that are personal and one on one with households.”
– District level government official, Savannakhet, Phine District
39
With regard to the iNuW strategy, a contribution noted by respondents is that the Activity has funded not just technical assistance through trainings and improved tools, but also the logistics of the cascade training approach, including additional staff, transport, per diems for provincial and district level trainers, and other costs associated with delivering training and services. Some respondents at all levels offered that without the technical assistance and logistical support, some remote communities would have no access to services. This support has enabled advisors and healthcare providers to access remote locations to conduct the series of technical training visits, provide routine visits, and facilitate periodic prompting and reminders to promote nutrition and WASH practices among 1,000 day households and communities. Some remote locations received minimal or no service before the Activity. However, respondents at national, provincial, and district levels stated that the Activity per diem policy is problematic because it is not aligned with government policies. Both government officials and trainers raised this issue; yet, in one location the government trainers and specialists nominated one person to speak on their behalf because others were reticent to speak up. Specific problems mentioned included that trainers were sometimes paid 150,000 kip rather than the government policy amount: 250,000 per day. Additionally, they were not given the per diem until the last day of the training as what they felt implied that they could not be trusted to deliver the training. Respondents repeated several times that this was unacceptable since it was not in line with the GoL policy. Trainers felt that they should not have had to use their own funds to cover travel expenses. They were required to sleep at health centers when they would prefer to sleep at the district urban centers where possible. The program has established and trained the community-based CF, VIC, and WASH agents who provide monthly household visits and organize meetings to promote nutrition and baby WASH practices among 1,000 day households, predominantly engaging PLW with CU2 and their households. At the village level, the CF and VIC have played a role in engaging husbands, grandparents, and siblings. Grandparents are highly engaged in caring for infants, toddlers, and young children, but were not included in the selection of FGD participants. Respondents indicated that since WASH agents have been established, they have been instrumental in promoting and increasing access to WASH products. Training An overarching reported activity success is the transformational shift from old training and health extension techniques that previously relied on instructional approaches to a system of facilitated learning that fosters self-reliance, demonstrations, and small doable actions (SDA). Prior to the start of the Activity, health educators used to tell doctors what to say and do. In turn, doctors would then give mothers and caregivers a long list of practices dictating a prescriptive list of what they should do following exams. Respondents noted a change in response to the Activity toward teaching and learning based on SBCC. This relies on
“This is very hard for me because I am used to giving instructions, but I am changing slowly.”
– Provincial government official, Savannakhet
“I used to stay in public health care clinic for the whole day and no one came to use our service. Now every month, a DHO official will visit and lead the activities. We have chance to learn and teach new things. We feel that we have better work, and lots of work to do, more patients which makes it worth it to work.”
– District level government official Xaybouathong District; Khammouane
“The CF taught me everything from the time I gave birth, taught me how to hold the baby and squeeze milk.”
– Village FGD respondent, Kyhoud Village, Savannakhet
40
explaining, listening, and breaking concepts down into more manageable segments coupled with constant reminders and support through the CF, VIC, and WASH agents at the community level. Among the 207 positive comments about capacity building, many respondents acknowledged this positive shift. Yet, work remains as respondents noted that model adaptation continues to be very challenging because old ways of teaching are deeply engrained. Respondents recognized that this shift in approaches and techniques takes a long time and therefore, seeing it come to fruition now through the Activity is a significant accomplishment. The trainers and health service providers, and village-level volunteers commended the new training techniques and tools that promoted counseling, listening, praise, self-reliance, continuous reminders and prompts through visits and CF home visits, VIC, and SDA. Other tools mentioned included storytelling, demonstrations, the Pink Book, pictorial counseling cards, and videos that were praised for ease of use, comprehensiveness, and utility in breaking down language barriers for indigenous populations and illiterate individuals. The importance of using video was emphasized by several respondents as has been the most effective tool for addressing language barriers. While videos have been adapted for some of the numerous ethnic languages spoken in Savannakhet and Khammouane, they could still be further adapted for use in other regions of Laos. Video was also noted as the most effective tool for ensuring that training quality does not get diluted through the cascade training approach. It was cited once at the provincial level as one of the most successful program practices. Specifically, showing the community story video as part of Documentary day (Visit 6) before and after a community participated in the program was reported as especially useful. This allowed the beneficiaries to better grasp the importance of improvements in physical conditions and behaviors related to sanitation, clean environments, and knowledge of the 1,000 days period. Seeing their own village as an unkempt and unsanitary environment in a video was a strong driver for change. One respondent suggested making instructional videos for trainers and village facilitators to use as well. Challenges While there are important accomplishments and successes tied to the Activity’s training component, a number of key challenges remain. CF Motivation and Compensation Principally, a high turnover rate for CF was reported in interviews as a major challenge. This was mainly due to issues with compensation, CF marrying or moving, and workload that spanned a large geographic coverage. The high turnover meant some individuals took on both roles as CF and VIC at the request of the village chief. CF, health and nutrition trainers, and promoters at the provincial and district level also have other jobs and obligations. So, they are not always able to focus on specific villages, districts, or areas or work with other trainers to plan visits’ technical content so that it builds on past visits and
“The best thing about this project is that it is strengthening people’s knowledge to act on their own and not rely on other people. For example, making toilets, understanding of disease transmission through fecal-oral contact, and villages knowing they have to clean up. Even the kids understand. He has seen that if one house has a toilet, then the neighboring house sees this and wants a toilet too.”
– District level government official, Savannakhet, Phine District
“One of the main challenges is the language barrier because the ethnic groups speak different languages. Additionally, some villages are huge, and the CF can’t monitor and support all of the households.”
– District government official, Phine District, Savannakhet
41
learning. Consequently, some trainers at the provincial level have gone to all villages but have had to return to the same villages to follow-up, address challenges, and support implementation of practices promoted through previous training. CF and VIC also reported lack of motivation because although the roles are substantial, they received no compensation and even used their own resources to pay for phone credit and fuel to carry out responsibilities in villages. Respondents also noted that some CF and VIC are low income and do not have access to the products and services they aim to promote. They assert that it is difficult for a VIC to promote ODF environments when they do not have access to a toilet themselves. Overwhelmingly, respondents at all levels in Savannakhet and Khammouane indicated that the CF and VIC should receive some form of compensation to motivate them because the entailed time commitment is significant. Respondents suggested some ideas for compensation including a monthly stipend, phone credit, toilet, and water filter for their household and additional training materials and opportunities. Currently, SC has suggested that CF and VIC should be offered a certificate of recognition signed by the Provincial Government. While respondents noted that this could be valuable as a potential first step, this recognition may not be enough. A long-term approach is needed, especially if the CF role is intended to continue and become integral to government services in the form of a volunteer program or institutionalized as a paid position. Further complicating this matter, provincial level, district level, and SC respondents stated that increased coverage is need since there are not enough CF. Planning and Coordination The coordination of the eight iNuW visits at the national level posed challenges for effective outreach and planning. Provincial, district, and village level stakeholders described having the schedule of visits in advance but not knowing who would be conducting which trainings as participation was based on who is available at the time. The CF, VIC, and WASH agent FGD participants reported full participation in district level trainings and were highly appreciative of the Activity and training and capacity building opportunities. However, for technical visits planned at the village level, participants reported not being aware of who was conducting the visits and did not mention having a full schedule or activity plan for how and when the eight visits would be conducted and what each would include. There were cases where the Village Chief, CF, and VIC had very little time to organize a meeting. One CF in Savannakhet reported getting one day’s notice to organize a technical visit, which was very difficult because she also has to work in her own fields, and it takes a lot of time to mobilize the community. Additionally, when the village bell rings in the morning calling people to a meeting with no advance notice, participation is limited to whoever is available at the time, and whoever can get to the meeting point. This process could easily lead to exclusion and inconsistent participation. Indeed, some FGD participants only attended one meeting, and were not aware there had already been eight technical visits. Collaborative Learning and Dissemination At the provincial level, respondents indicated that they do not receive systematic feedback or interim progress data showing training results through reports or interim monitoring outcomes such as birth registration rates, number of women visiting health centers, rates of EBF, etc. This data is consolidated and reported up to the national level on a regular basis; however, based on the responses there is a gap in dissemination and user distribution at the district and provincial levels. Quarterly meetings and quarterly reports are process related and do not discuss or reflect project data and outcomes. District level data and clinic data is available, but this is not digitized or consolidated, so it is hard to utilize. The project reporting systems delivered through USAID provide updates on each IR; but these reports are not disseminated through government channels (and are not
42
intended to be). Moreover, they do not include government health and nutrition statistics. Further detailed review of data reporting structures, required formats, and dissemination is needed to provide trainers and service providers with a “dashboard” of monitoring data they can readily access and utilize to prepare for field visits, document lessons learned, and adapt training as needed. Without this data, they do not know the status of outcomes and activities in villages where they provide training, nor do they know if their past training has been effective. There were more positive sentiments articulated pertaining to reporting structures and receiving feedback at the district level. District KII indicated that they provide a summary of activities submitted to the head of the district, Ministry of Public Health (MPH), and the provincial level officials. According to participants, every activity is reported to the province on a monthly basis. The district office has also received feedback from villages to understand their needs and other implementation aspects they do not understand. A key challenge is that CF lacked comprehensive understanding of nutrition and WASH topics discussed in the iNuW Community Toolkit. CF had difficulty recalling all components of the tool kit, although they spoke highly of the home visit guide, Pink Book, and job aids for care providers. However, the job aids for CF were now so simple that they had an onerous time remembering how to describe each practice based on the picture.
3. DEMAND CREATION FOR USE OF NUTRITION, HEALTH, WASH SERVICES AND PRODUCTS
Nutrition Demand creation for nutritious products was reported as increased knowledge of the five food groups and optimal complementary feeding practices and efforts to overcome some food taboos and cultural practices that negatively impact infant and young child nutrition. Some successes cited by trainers include the fact that using video has helped beneficiaries surmount taboos around mixing eggs and vegetables. Overcoming this taboo was also mentioned by village FGD respondents. Likewise, in 2018, the Activity introduced training on drying and grinding fish and meat to produce a powder that could be added to babies’ porridge and stored in hygienic containers. Households members mentioned that they are learning to keep frogs and fish. Notably, respondents said that they were not aware they could mix pumpkin and eggs, both of which are grown and purchased locally. As noted previously, demand creation was also noted for ANC services, reflected in reported increases in maternal nutrition service utilization, though many constraints were still shared. Beneficiaries discussed wanting more services from CF such as continuous improvement of tools, childcare, transportation to health services, and breastfeeding related products like breast pumps and bottles.
“If we can’t promote the planned activities, then we have to explain why. The government side, including the sector specialists and the USAID Nurture program staff come together to understand the challenges and they resolve the issues. The role of the district office is not to give instructions, but to allow them to promote activities.”
– District government official, Mahaxay District, Khammouane
43
While demand creation for nutrition services and products has grown, data showed that the Activity lacked strong visibility and broad outreach. Participants in the women’s and men’s FGD were not fully aware of the USAID Nurture name despite most having participated in one or more associated activities. The word “Nurture” is not understood in Lao or other local ethnic languages, and visibility through marketing, branding, and other materials was not apparent in the villages. Yet, CF had materials such as cloth bags and t-shirts that displayed the Activity brand and indicated that they passed these out during meetings. The men’s FGD participants in Tham Pha and Kyhoud villages in Savannakhet were vaguely aware of the program, and some had only heard of it the morning of the interview when they were mobilized to participate in the FGD. However, based on their responses to questions, it was clear that some had participated in village meetings, household visits from CF, WASH product marketing, or purchase of toilets and water filters without knowing that an event or action was Activity-supported. Men reported becoming engaged in activities through the larger village meetings and then later seeing the CF household visits occur, participating only if they were available. They did not report being specifically invited. SC did not finalize development of an annual communication plan until program Year 3 (2018), so additional efforts are anticipated for this year. WASH Communities widely reported improvement in a range of WASH and baby WASH behaviors and an increase in toilets resulting from the presence of WASH agents. However, while there are marked improvements detailed in this report, knowledge and understanding of the overall iNuW approach, what was supposed to happen, and knowledge of the modified CLTS approach as one component were only mentioned by a few respondents at the national and district levels. Among CF and VIC respondents at the village level, only a minority of respondents were aware of the WASH approach. The translation of “CLTS” into Lao was not widely known among trainers and WASH agents and not recognized at all at the village level. In the Activity’s approach, CLTS was not treated as a separate activity, and therefore, the terminology may not have been used consistently. Notably, the qualitative interviews suggested that since WASH agents have increased coverage and coordination to help households purchase WASH facilities, more households are building toilets and using water filters. Awareness of other WASH practices, as shared with the qualitative team, was high as well. According to three district officials and one provincial official, WASH agents’ attempts to facilitate access to suppliers who can provide and install toilets was stated as being more effective than the project providing them directly. They noted failures from other projects that have purchased toilets which were not used or maintained because they were not valued by beneficiaries. This said, the challenge in accessing toilets remain significant, especially for poor households. Several respondents in Khammouane indicated that since beneficiaries had received or seen others receiving toilets for free, they were more reluctant to invest in their own. Challenges One women’s FGD group reported that they were not directly asked to be in the program because none of them were pregnant at the time and their children were nearing or over 2 years of age. Yet, the program is still relevant for them as they could benefit from training on using the
“We found there were projects that provided toilets, but communities did not install them. USAID Nurture provided knowledge and connection to suppliers which increased the communities’ interest in building and maintaining their own toilets, and some of them spent their personal money to install it.”
– District level government official, Khammouane
44
Pink Book, counseling cards, and dietary diversity guidelines up to 5 years of age. A few male FGD participants also indicated that they were encouraged to attend meetings and the CF home visits; however, the home visits were not planned around their schedules, so they were a not able to fully participate. Several men had never participated in meetings or home visits. The CF in Kyhoud village reported trying to plan schedules around people’s availability, but his is very hard, especially during the intensive agricultural season because people are working in the field. Trainers at the provincial and district levels also reported arriving in villages to hold meetings only to find no attendees. Consequently, they had to wait and conduct trainings in the evening.
4. IMPROVED ENABLING ENVIRONMENT
Respondents reported that USAID Nurture had made significant contributions to the National Nutrition Strategy (NNS) to 2025, the National Plan of Action for Nutrition (NPAN) 2016 – 2020, and the National SBCC Plan. Comments primarily from KII at the national and provincial levels applauded the program’s contributions to helping the government coordinate and guide technical content of the National Nutrition Coordination Committee, provincial level meetings, coordination of technical assistance in the fields, and strategy implementation. The Activity is in a unique position to support integration nutrition and WASH at all levels and therefore foster a feedback loop. This is because the program advocates for strategic implementation approaches at the national level and helps provincial, district, and community level trainers, healthcare service providers, and community support mechanisms increase capacity, document learning, and improve service delivery. The iNuW toolkit, and notably the Pink Book, were mentioned as tools and materials at the national, provincial, and district levels that have improved the quality of health and nutrition service delivery and shaped the new National SBCC Plan. The Pink Book is a well-established tool historically used in the GoL MCH programs that respondents suggest has been improved through USAID Nurture. Respondents related that the improvements were highly supported and recognized by provincial and district-level counselors, and health clinic staff as being a critical capacity building tool because it provides information on women’s pregnancy and how to take care of the baby until the age of five. USAID Nurture has improved the Pink Book through developing a more user-friendly format that utilizes pictures and is thus easier for illiterate groups to understand and use. However, some respondents noted that the Pink Book is also limited in that it still relies on printed text, which is hard to understand for some, especially the ethnic groups with high rates if illiteracy. The Pink Book is also difficult to translate into other local languages and adapt. The copy in circulation shared with the ET was not the most recent version of the Pink Book; however, it was still viewed by government officials, caregivers, and women as an improvement on older versions. The Activity and GoL are still reviewing a more recent version. One comment made by national level government officials, further discussed below in the overarching challenges section, is that the newest version of the Pink Book has taken the Activity a long time to review and
“When USAID Nurture was introduced during the MOU development it was under the Nutrition Center, and then moved under the Department of Health and Hygiene as the anchor ministry. This was difficult in the beginning because the project approach was not well-understood. Many people on the national Nutrition Committee assumed that social behavior change was only about “talk talk talk talk…and there was nothing else to provide. Other Committee members from didn’t see the benefits of the program. Now they see the benefits of the trainings, seminars, meetings, etc. that the program provides at the provincial, district, and community levels.”
– KII Respondent
“This program responds to government policy and strategies to change behavior, provide a public health care model, stop excrement and improve good sanitation and there is a very good result.”
– Provincial government official, Kammounane Province
45
approve. These comments implied the existence of a similar trend for other project systems such as the CF support at the community level. Overall, the respondents related that the GoL has been anxious to have the newest Pink Book completed and for other support systems to be used as models that additional provinces can learn from and scale up. This tool has been a foundational project achievement and contributes to the implementation of the NNS. Men in one FGD group also recommended that there be a version of the Pink Book developed for men so that they also have a tool to guide them in helping their wives and families with pregnancy, maternal nutrition, childcare, feeding, and managing women’s workload. The Activity’s collaboration with UNICEF (United Nations Children’s Fund) and the WB in supporting the GoL at the national level with systems strengthening to help implement the NNS was favorably mentioned. Comments shared at the national level indicated that the support has been complementary. The Activity worked closely with UNICEF to develop the improved MCH handbook; this is an instrumental change in the delivery of nutrition services and facilitation approaches. Challenges National, provincial, and district level KII expressed some concerns with the role of the Activity as a project that implements activities and reports back to the government versus supporting government systems. Some respondents at the national and provincial levels raised the issue that DPOs often take over coordination instead of building the government staff capacity. Nevertheless, government staff also need to make the effort to significantly increase government involvement in implementation and representation. Moreover, KII respondents at the provincial level would like to see more transparent Activity budget expenditures and planning so that it can be better monitored and coordinated with other resources. They would like to more frequently receive program data and have additional time in meetings to share and exchange lessons learned concerning planning, budgeting, and programmatic themes. It has been a struggle for government and project staff to follow and adapt to the fives changes in Activity Chief of Party. Government staff cannot always identify the SC focal point. They often contact the Activity staff who speak Lao and have provided continuity throughout the program because of the comparative communication ease. At the provincial level, respondents indicated they do not receive systematic feedback or interim monitoring data showing program results, such as birth registration rates, how many women are visiting health centers, rates of EBF, etc. This data is consolidated and reported up to the national level on a regular basis; however, based on the responses there is a gap in the dissemination, and user distribution at the district and provincial levels. Quarterly meetings and quarterly reports are process related and do not discuss or reflect project data and outcomes. District level and clinic data are available, but this is not digitized or consolidated, so they are hard to utilize. The project reporting systems reported through USAID provide updates on each IR; but these reports are not reported through government channels (nor are they intended to be;) they do not include government health and nutrition statistics. Further detailed review of data reporting structures, required formats, and dissemination is needed so that the trainers and service providers have a “dashboard” of monitoring data they can readily access and utilize to prepare for their field visits, document lessons learned, and adapt training as needed. Without this data they do not know the status of the outcomes
“When the DPOs give a presentation, they jump in too quickly to answer questions when they should give the opportunity to the government. Government staff are also passive and need to be reminded to speak.”
– Provincial level respondent, Savannakhet.
46
and activities in villages where they are providing training, nor do they know if their past training has been effective. Provincial level feedback related that they have a weak understanding of the NNS implementation approach and how to coordinate the 22 strategies. The additional data would be opportune for supplementing strategy planning. There was more enthusiasm for reporting structures and receiving feedback at the district level. District KII indicated that they provide a summary of activities that is submitted to the head of the district and MPH and the provincial level. Every activity is reported to the province on a monthly basis. For example, they are promoting ODF, so the activities reported are related to the activities in all villages. The district office receives feedback from villages to understand the needs, and other aspects they don’t understand.
4. CONCLUSIONS Overall, the ET found that at midline, the Activity had a number of significant positive impacts on secondary outcomes, although no significant impact on stunting, wasting, and underweight prevalence among CU2 according to the quantitative analysis. While changes in the primary outcomes in anthropometric data between Nurture and control groups were insignificant, this is to be expected at this stage given that the Activity has been implemented for less than one year in target communities. The program supported the improvement of IYCF practices, particularly for mothers’ nutrition and some indicators for breastfeeding indicators, especially for children under 12 months of age. Based on several ANC outcomes measured, the Activity had a significant positive impact on seeking and obtaining ANC services. This was also mirrored in the qualitative evidence which showed learning in ANC practices, particularly pregnancy registration and health care center utilization, and breast-feeding practices. After examining data, WASH outcomes such as handwashing, open defecation, use of a basic sanitation facility, and safe drinking water experienced evident positive directional improvement in WASH outcomes. Only a few outcomes showed significant improvement, such as likelihood to use recommended household water treatment technologies. There were some positive effects on handwashing and hygiene indicators. The Activity did not increase the number of children and caregivers receiving GMP services. Overall, sentiments articulated throughout qualitative data collection highlighted observed progress and high levels of program satisfaction as well as strong barriers to achieving progress and intended outcomes. A key challenge to improving nutrition and WASH practices in 1,000 day households is ensuring that multi-sectoral coordination has an effective degree of integration, capacity building, and responsibility share at all levels. For components one through three of the Activity, the ongoing training, motivation, supervision, and encouragement by CF and VIC have been critical to program success and crucial for demand creation, capacity building, and improved health services at the village, district, provincial, and national levels throughout the life of the program.
47
Respondents at all levels recognized and strongly emphasized many times that the Activity has had an impact by increasing knowledge and awareness of 1,000 day nutrition and WASH practices, capacity building of health, nutrition, and WASH service providers, and increased service delivery at the district and village levels. When asked about the program’s strengths, participants’ first responses were typically related to augmented knowledge and capacity building; these types of comments were mentioned approximately 275 times throughout the KII and FGD. Given the volunteer nature of project positions, staff have often had many competing priorities, so emphasizing their key role in the overall system, providing compensation, and providing continuous support to enable them to do their jobs is required for successful implementation and program impact. The Activity has heightened demand for use of nutrition and WASH services and products at the village level by strengthening links to health services through the SBCC model that emphasizes self-reliance and SDAs. However, there were still key challenges in interrupting population behavioral patterns and resource limitations that inhibit adopting improved nutrition and WASH behaviors. Specialized targeted approaches are needed to facilitate inclusion of marginalized portions of the population that are isolated, and more bound to traditional practices, such as ethnic minorities, rural communities, elderly, grandmothers, and male caregivers. At the national level, the Activity has provided significant strategic multisectoral coordination and program implementation technical support that has built an enabling environment for nutrition and WASH outcomes, especially through the iNuW toolkit and Pink Book. As discussed in detail below, ensuring government involvement in implementation and representation and sufficient capacity building have remained a challenge.
SUSTAINABILITY Sustainability remains a concern based on the findings. As mentioned above, respondents applauded the knowledge, capacity building, and systems strengthening provided through USAID Nurture that contribute to sustainable and lasting change in the country. Comments regarding sustainability were mainly related to investments in high-level systems and structures and support for the NNS. However, respondents primarily at the higher levels and trainers, but also a few of the CF, expressed some concerns about various sustainability aspects, particularly in two areas:
1. Sustaining quality and continuity of training and service delivery. 2. Continuation and expansion of services beyond the life of the project.
SUSTAINING QUALITY AND CONTINUITY OF TRAINING AND SERVICE DELIVERY
“The project has helped promote a lot of knowledge about how to raise children and promote good nutrition. The major change I saw was that communities used to give food (rice) to their babies, but now they are not doing this anymore. This change can’t be done fast, because everyone has a different knowledge level, so it takes time.”
– District level government official, Savannakhet, Phine District
48
Feedback among several provincial and national level respondents suggested that despite the high quality iNuW tools developed, training and knowledge quality were diluted by the time the training reached the village level due to the cascade training approach. There were still some literacy barriers to reaching illiterate women and ethnic groups. At the village level, several CF and VIC indicated that the trainings expanded their knowledge and facilitation techniques, but it was cumbersome to remember all of the practices and how to use tools, such as the Pink Book and CF handbook once they got back to their village. The pictorial counseling cards used for home visits have been adapted for illiterate households, however, two CF in Savannakhet related that they have forgotten how to explain the practices demonstrated in the pictures. They indicated that they need more refresher trainings on practices and improving facilitation skills and suggested that future versions of the iNuW tools should include a companion tool designed for facilitators that describes what they should be doing. Respondents emphasized the need for continued amelioration of tools, greater variety of training mechanisms and visual tools, and continued CF support at the community level to help them improve facilitation and support skills that will help mothers and caregivers further address barriers and multiply adoption of the 1,000 day nutrition and WASH practices.
Some respondents felt that training and service provision continuity is jeopardized as people change jobs or move over time. Province and district level trainers stated that the lack of opportunity to access information about communities prior to visiting or provide follow-up support following trainings further threatens continuity. Despite these sustainability challenges, the ET noted that roles of the CF and VIC are gaining traction, and their need for constant follow up and program results was recognized; however, these positions are not official structures within the government systems. At
this time, a long-term strategy and future course of action must incorporate how and if these roles should be institutionalized, and if not, then how their support function should continue. SC suggested that it was not certain the CF and VIC roles were needed in the long-term; however, government officials, healthcare workers, CF, VIC, and FGD group participants mentioned how important it was to have constant reminders and follow-up to help women and caregivers adopt practices. Based on these recent responses, there appears to be a need for more and stronger ongoing community level support to maintain continuity and ensure quality and sustainability.
CONTINUATION AND EXPANSION OF SERVICES BEYOND THE LIFE OF THE PROJECT
The Activity is currently funding the logistics and per diems required for program delivery that enable the trainers and health service providers to reach remote areas; without this support, the services would likely stop. Respondents at all levels, including GoL officials, trainers,
“Communities lack knowledge, and once they are trained, they forget the practices and don’t follow them. More support is needed on continuous monitoring, using social media, demonstrations, visual tools, and interactive activities so they don’t feel lost.”
– Provincial government official, Khammouane
“Sustainability is a major challenge. USAID Nurture hired extra staff to implement the project. Many of the trainers work as consultants that work together with the government. This is fine to start, but there should be a plan to transfer knowledge from the project to the government. This recommendation has been made through the project communication channels.”
– National Level Government Official.
“If there is no continued follow up then the project won’t continue. If we don’t say the messages over and over, then women in rural areas will forget. They are now getting between 1-3 times per month.”
– District government official, Phone District, Savannakhet
49
and healthcare providers expressed concerns that without this budgetary support, continued project follow up and expansion would not continue because these services are not currently included in the Ministry of Health, Hygiene, and Population’s budgetary allocations. Respondents all wanted the project to continue and expand to other provinces. GoL officials related that the Government would like to see the Activity act as a model program to be adopted on a national scale; however, this is undermined by the seemingly long time required for approvals and development. KII respondents indicated that they wanted to conduct exchange and learning visits to see other project sites and home visits and talk to CF, VIC, and district-level providers so that the approach can be replicated in other parts of Laos, but Activity staff told them that Nurture villages were not ready to serve as model communities. Overall there is a need for an exit or transition strategy to determine how the project can support the GoL systems, which services should be supported and scaled, and which services should be gradually integrated into the GoL’s overall program plans, budget, and resource allocation.
PROGRAM DESIGN AND THEORY OF CHANGE The primary overarching challenge frequently noted at all levels and mentioned repeatedly in a variety of ways was that the Activity was not designed to address underlying barriers to food and nutrition security as they pertain to availability and access to recommended foods, income, WASH products, and ANC services promoted through the 1,000 days practices. Statements related to various aspects of availability and access obstacles were raised approximately 375 times throughout the interviews. To achieve food and nutrition security, the right foods must be affordable and convenient to meet needs of all, especially the nutritionally vulnerable, household members year-round. Availability and access barriers to food, income, water supply, transportation to clinics and markets, and WASH products were cited by all respondents interviewed. Respondents consistently noted that poor households, minority ethnic groups, and isolated villages faced greater challenges in adopting optimal nutrition and WASH practices. Cultural practices among ethnic minorities and traditional gender roles, particularly excessive women’s workload and limited decision-making power over time, energy, income. and assets were mentioned as barriers to adopting recommended 1,000 day practices. The ET did not explore in-depth questions about resilience and human and productive capital building that could help communities prevent, mitigate, and recover from emergencies. However, some responses related to seasonal shocks such as cyclical flooding and crop loss in Khammouane, intermittent dry season water supply shortages, productive asset loss, isolation, limited economic opportunity, illiteracy, and pervasive poverty suggested that target communities would benefit from a more comprehensive food security and resilience approach inclusive of nutrition and WASH. The ET would like to emphasize that this challenge and conclusion was not a result of the quality of program delivery but rather inherent in the underlying program design and theory of change which make a critical assumption that foods to meet an optimal diet for PLW and CU5, water, and WASH products are available and that households can access them. The ET noted that the Activity targets a large geographic region: 471 villages with relatively less resources than other projects with similar objectives. With current resource levels, it would be difficult to establish a comprehensive food and nutrition
“When the DPOs give a presentation, they jump in too quickly to answer questions when they should give the opportunity to the government. Government staff are also passive and need to be reminded to speak.”
– Provincial government official, Savannakhet.
50
security and resilience program that incorporates agriculture, marketing, food systems, asset creation, and risk mitigation components while reaching the same geographic coverage. This gap in project design has very likely been a key contributor in preventing Activity 1,000 day households from achieving higher adoption rates for all practices on a consistent year-round basis. Greater practice uptake would lead to stronger positive effects on nutritional status, stunting rate reductions, and sustained impact achievement. The types of barriers mentioned by respondents and discussed previously in the report are summarized in Annex I. Higher-level KII respondents who were involved in project design directly mentioned that the project needs to include an agricultural component. Respondents at the community level also requested support for gardening, livestock rearing, increased nutritional knowledge, and income generation that would help them adopt recommended practices by allowing them to pay for food and health center transport costs.
5. RECOMMENDATIONS Based on these findings, the principal recommendations of this midline evaluation are:
1. The Activity should continue the work on knowledge dissemination, capacity building, facilitation improvement, and technique teaching. There is evidence of positive program impacts, particularly among intermediate outcomes that may lead to impacts on higher level outcomes with sustained implementation.
2. The Activity should develop an incentive and compensation system for the CF and VIC to increase coverage and motivation. The CF and VIC play a critical role in the Activity but require assistance to compensate them for their personal costs, ensure they can serve as role models in the community, and to increase motivation, thereby to reducing turnover and encouraging sustainability. Moreover, additional support should be provided to the CF and VIC at the community level to improve capacity and monitoring, especially with regard to implementing the iNuW comprehensive toolkit.
3. The Activity should consider ways to address food access and availability to meet nutritional needs for PLW, CU2, CU5, and households year-round.
a. In the immediate term, continue to develop the agriculture and food and nutrition security component to the extent possible without an MOU with the Ministry of Agriculture and Forestry, focusing on home food production and access to seeds, livestock, and technologies to promote a diverse and nutrient-dense diet throughout the year for women, children, and all family members.
b. Look for ways to collaborate with other agriculture, food and nutrition security, and social protection programs if possible, such as other USAID and United States Department of Agriculture funded programs, IFAD, the Food and Agriculture Organization of the United States, and the WB.
c. USAID should consider a more comprehensive nutrition and food systems approach as a long-term strategy. Future nutrition programs should include, or be linked with, full-scale agriculture, natural resources, marketing, social protection, improved agricultural and health technologies, such as improved storage of breast milk, and integration of other nutrition-sensitive components to complement the current scope.
4. The Activity should emphasize the benefits of EBF and delayed initiation of complementary feeding, particularly among boys. Awareness of benefits may help bridge the observed gap in EBF duration and complementary feeding between boys and girls that is hypothesized to contribute to differences in stunting and underweight outcomes. The Activity should also conduct an in-
51
depth behavioral study to further ascertain the behavioral and biological causes for differences in stunting rates between girls and boys, particularly among lower-income quintiles.
5. The Activity should revisit and engage in policy dialogue to discuss and evaluate the efficiency and effectiveness of promoting CLTS as an integrated approach with nutrition as opposed to a separate program as it is promoted elsewhere in the country. This would help the government determine if this practice should be adopted and scaled as a national strategy, or if the Activity should continue to promote CLTS separately.
6. The Activity should develop a cost-sharing mechanism to ensure that the poorest households can be assisted in accessing WASH products and services in a timely and efficient manner. The types of toilets promoted should also be further evaluated and expanded, such as waterless composting toilets that can be used where water supply is a challenge.
7. The Activity should improve planning and coordination for the iNuW visits, trainings, and activities at the village level by providing sufficient advance notice and meeting schedules. The Activity should invest in strengthening local social accountability systems, to increase inclusion, increase capacity of the community-level to understand and fully participate in the project activities, and establish a grievance redress mechanism that enables a transparent case management system and feedback loop. For example, community committees and members, should be aware of what services the project is supposed to deliver and know their responsibilities, such as how may visits are planned, the topics, who should participate, and also be able to report suggestions and grievances. The practice of having meetings and only reaching people who happen to be available will likely result in exclusion and lack of continuity.
8. The Activity should explore other opportunities for collaboration. For example, the new WB financing will adopt a multi-sectoral approach to social protection and strengthening nutrition systems in line with helping the government implement the NNS. A WB-funded water supply project was also mentioned as a potential opportunity for coordination, as water supply in some remote mountainous locations is a clear barrier for communities to build and use toilets and access potable water year-round.
9. In future programming, USAID should integrate or coordinate with cash transfer programs, and activities that provide income generating opportunities, access to informal and formal finance, and improved technologies. Access to income resources, as well as sufficient time was a consistent barrier for households in implementing improved WASH and nutrition behaviors.
52
6. ANNEXES
ANNEX A: QUANTITATIVE METHODOLOGY
SAMPLING Villages: To select a similar, yet representative set of treatment and comparison villages for the evaluation, we used the following process:
1. Identify sample frame of potential comparison villages: In order to understand the effects of USAID Nurture, we needed to compare treatment villages with similar villages that are not receiving a targeted nutrition intervention. This requires mapping other donor nutrition interventions in Savannakhet and Khammouane Provinces. Based on discussions with SC and on results from a donor mapping exercise conducted in 2016, we identified and excluded from the sample frame villages and districts that were being targeted by other interventions.
2. Identify variables associated with treatment: Using the 2015 census data at the village level, we ran a logit model to determine which variables were predictive of treatment, as these variables were used in the matching approach to help identify similar treatment and comparison villages. We identified the following variables which were then used in matching:
a. % of Households with Electricity b. Average age of household head c. Average age of first birth for female head of household d. Number of CU2 e. Ethnicity f. % Buddhist g. Average total number of children in the household h. Average percent of CU5 who died before reaching 5 i. % of household heads who can read in Lao j. % female headed households k. Average number of household members l. Average education of household head m. % of household heads who are employed n. Total population o. Rural/Urban p. Water supply in village q. Health center in village
3. Select similar treatment and comparison villages: From the sample frame of eligible treatment and comparison villages, the ET sought to sample a set of similar treatment and comparison villages, which were also as representative as possible of the targeted area as a whole. Matching approaches tend to have a trade-off on internal and external validity. That is, by selecting treatment and comparison villages that are as similar as possible (increasing internal validity), we often find this reduces the overall number of matches and their representativeness relative to the full target population (external validity). The ET tested variations of two different matching approaches, PSM and coarsened exact matching (CEM) to find which approach offered the best balance on internal and external validity.
a. In the CEM approach, we temporarily ‘coarsen’ the variables used for matching into distinct bins or strata. Every combination of coarsened values for all variables included in the matching represents a unique stratum, and observations with the same coarsened
53
value on every included variable are placed into the same strata. We then generate exact matches between treatment and comparison units within the strata of these coarsened variables. Strata that include only treatment or only control observations are pruned from the data set as they are considered outside a region of common support among the treatment and comparison sample frames. The remaining matched sample (either randomly pruned or weighted in strata with an imbalanced number of treatment and control units) is analyzed using the original uncoarsened variables. The advantage of this approach is that it allows determination ex ante of the level of imbalance through the researcher’s choice of the degree of coarsening, though with the caveat that finer degrees of coarsening tend to decrease the sample size under common support. To develop the final CEM model, we must set the bon sizes for each variable. Some variables have natural bin sizes (for example, presence of health center). For the other variables, we tested multiple permutations of bin sizes, while ensuring that we maintained at least the minimum number of matched treatment and comparison villages (at least 173 of each) required based on our power analysis.
b. Alternatively, PSM allows the researcher to develop a model to predict treatment based on pre-intervention data, which is used to develop a single score that represents the propensity or likelihood of being selected into treatment based on the model variables. These propensity scores can be used for matching. Again, we tested multiple ways of using the propensity scores to determine matches, including taking the nearest neighbors, taking the highest scores, and sampling proportional to district or province populations.
c. Across all of the CEM and PSM models, we test each model on: i. Imbalance: We tested for differences between the matched treatment and
comparison villages on more than 30 variables from the census data; and ii. External validity: We also tested for differences between the treatment sample
and full population of treatment villages on those same 30 variables. d. Based on those tests, we found that the PSM model which sampled treatment-
comparison matched pairs with the lowest propensity score difference from each province (proportionate to the treatment populations in each province) performed the best.
e. Using this model, we selected 173 treatment and 173 comparison villages for inclusion in the evaluation.
Households: Our primary unit of analysis around which the sampling approach is designed are 1,000-days households of pregnant women or women with children under two years of age. To generate our sample, we incorporated multiple stages of sampling. Villages were selected based on the matching approach described above. Within those villages, we randomly select eight households with pregnant women or children under two using the following approach:
1. Step 1 – we coordinated with district officials to send the survey introduction letter to inform the village head in advance. The letter included the date of survey, target respondents and information that we need. We also asked the village head to communicate with the village health volunteer to make a list of households who have children under 2 years old.
2. Step 2 – the survey team will take the list from village health volunteer and bring the list to check with each unit head. This was very important to ensure all relevant households are included in the list by using the questions listed below:
a. Have any households moved into this village with children but are not included in our list?
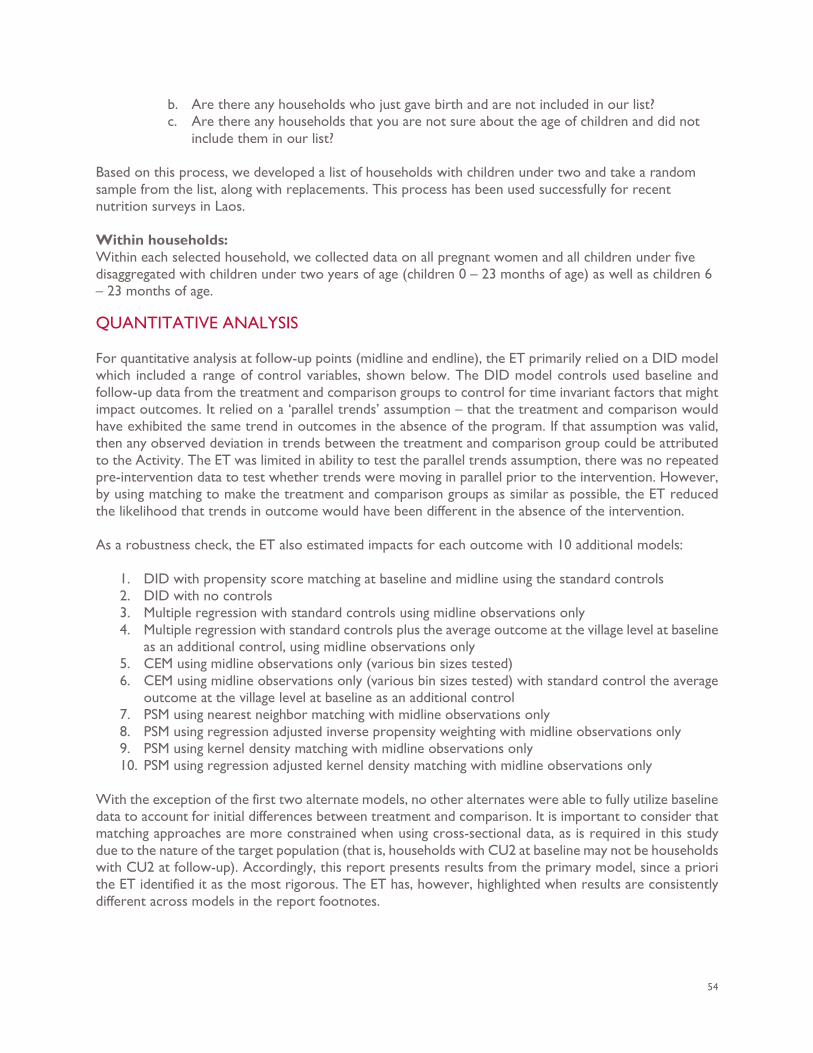
54
b. Are there any households who just gave birth and are not included in our list? c. Are there any households that you are not sure about the age of children and did not
include them in our list? Based on this process, we developed a list of households with children under two and take a random sample from the list, along with replacements. This process has been used successfully for recent nutrition surveys in Laos. Within households: Within each selected household, we collected data on all pregnant women and all children under five disaggregated with children under two years of age (children 0 – 23 months of age) as well as children 6 – 23 months of age.
QUANTITATIVE ANALYSIS For quantitative analysis at follow-up points (midline and endline), the ET primarily relied on a DID model which included a range of control variables, shown below. The DID model controls used baseline and follow-up data from the treatment and comparison groups to control for time invariant factors that might impact outcomes. It relied on a ‘parallel trends’ assumption – that the treatment and comparison would have exhibited the same trend in outcomes in the absence of the program. If that assumption was valid, then any observed deviation in trends between the treatment and comparison group could be attributed to the Activity. The ET was limited in ability to test the parallel trends assumption, there was no repeated pre-intervention data to test whether trends were moving in parallel prior to the intervention. However, by using matching to make the treatment and comparison groups as similar as possible, the ET reduced the likelihood that trends in outcome would have been different in the absence of the intervention. As a robustness check, the ET also estimated impacts for each outcome with 10 additional models:
1. DID with propensity score matching at baseline and midline using the standard controls 2. DID with no controls 3. Multiple regression with standard controls using midline observations only 4. Multiple regression with standard controls plus the average outcome at the village level at baseline
as an additional control, using midline observations only 5. CEM using midline observations only (various bin sizes tested) 6. CEM using midline observations only (various bin sizes tested) with standard control the average
outcome at the village level at baseline as an additional control 7. PSM using nearest neighbor matching with midline observations only 8. PSM using regression adjusted inverse propensity weighting with midline observations only 9. PSM using kernel density matching with midline observations only 10. PSM using regression adjusted kernel density matching with midline observations only
With the exception of the first two alternate models, no other alternates were able to fully utilize baseline data to account for initial differences between treatment and comparison. It is important to consider that matching approaches are more constrained when using cross-sectional data, as is required in this study due to the nature of the target population (that is, households with CU2 at baseline may not be households with CU2 at follow-up). Accordingly, this report presents results from the primary model, since a priori the ET identified it as the most rigorous. The ET has, however, highlighted when results are consistently different across models in the report footnotes.
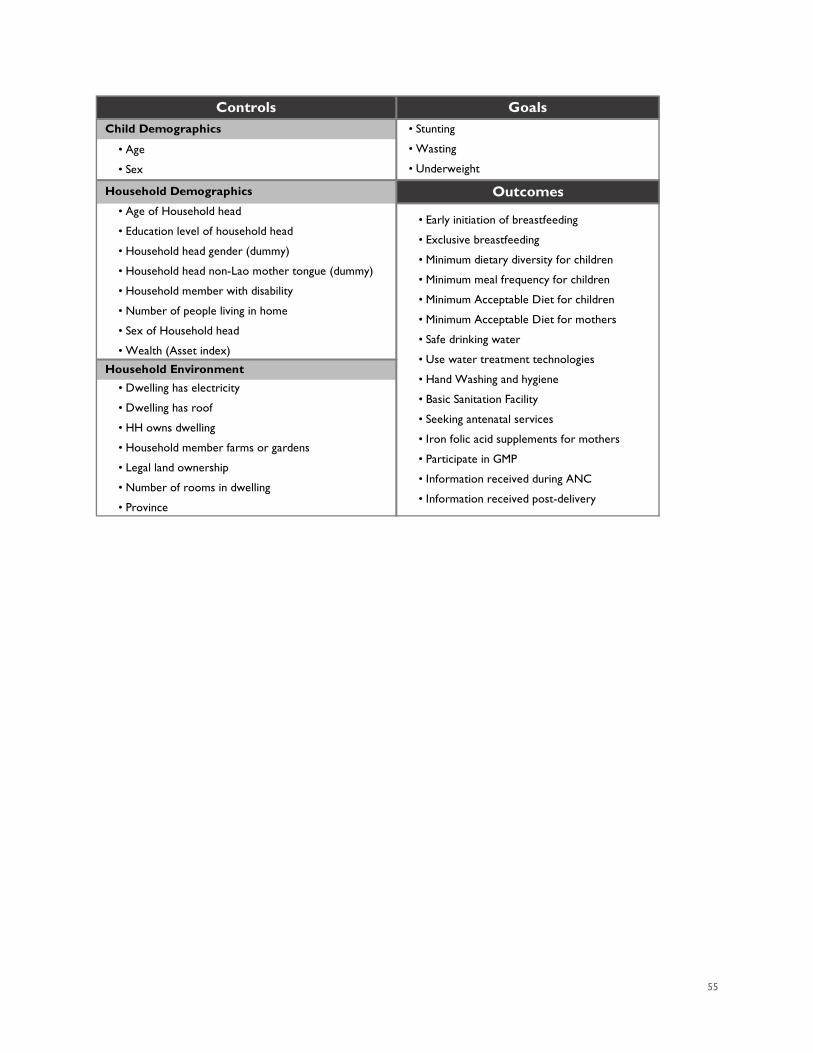
55
Controls Goals Child Demographics
Household Demographics Outcomes
Household Environment
• Age
• Sex
• Age of Household head
• Education level of household head
• Household head gender (dummy)
• Household head non-Lao mother tongue (dummy)
• Household member with disability
• Number of people living in home
• Sex of Household head
• Wealth (Asset index)
• Dwelling has electricity
• Dwelling has roof
• HH owns dwelling
• Household member farms or gardens
• Legal land ownership
• Number of rooms in dwelling
• Province
• Stunting
• Wasting
• Underweight
• Early initiation of breastfeeding
• Exclusive breastfeeding
• Minimum dietary diversity for children
• Minimum meal frequency for children
• Minimum Acceptable Diet for children
• Minimum Acceptable Diet for mothers
• Safe drinking water
• Use water treatment technologies
• Hand Washing and hygiene
• Basic Sanitation Facility
• Seeking antenatal services
• Iron folic acid supplements for mothers
• Participate in GMP
• Information received during ANC
• Information received post-delivery
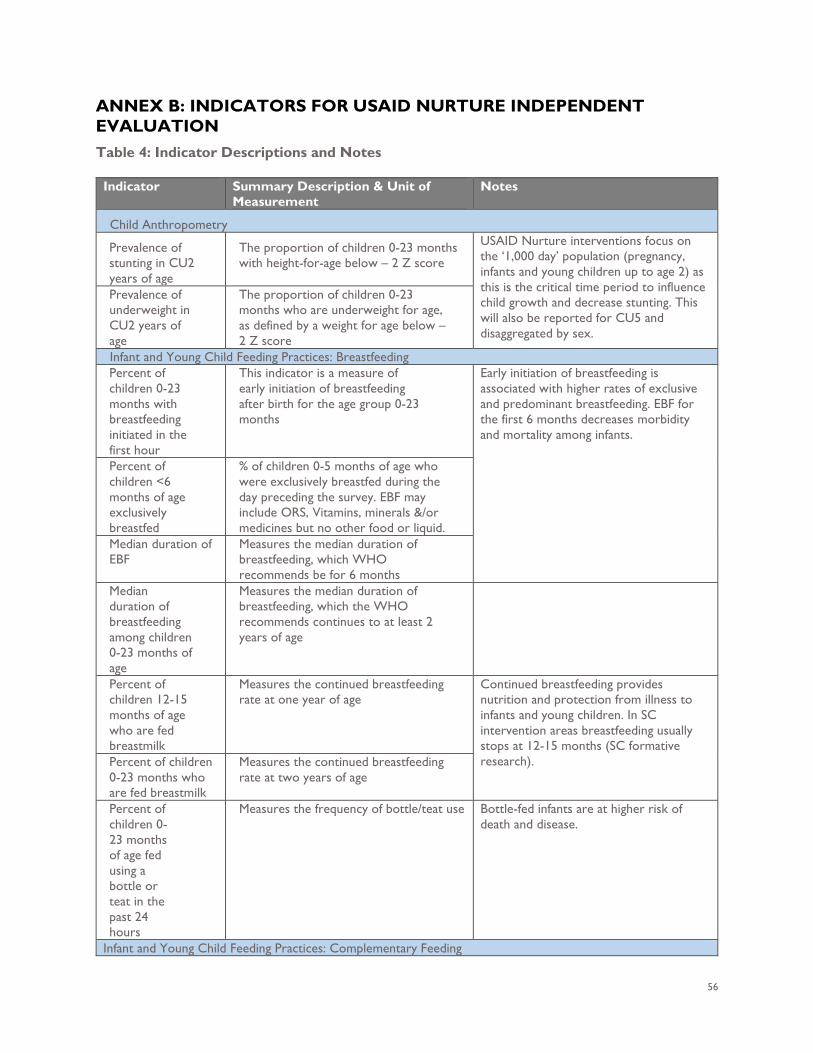
56
ANNEX B: INDICATORS FOR USAID NURTURE INDEPENDENT EVALUATION Table 4: Indicator Descriptions and Notes
Indicator Summary Description & Unit of Measurement
Notes
Child Anthropometry
Prevalence of stunting in CU2 years of age
The proportion of children 0-23 months with height-for-age below – 2 Z score
USAID Nurture interventions focus on the ‘1,000 day’ population (pregnancy, infants and young children up to age 2) as this is the critical time period to influence child growth and decrease stunting. This will also be reported for CU5 and disaggregated by sex.
Prevalence of underweight in CU2 years of age
The proportion of children 0-23 months who are underweight for age, as defined by a weight for age below – 2 Z score
Infant and Young Child Feeding Practices: Breastfeeding Percent of children 0-23 months with breastfeeding initiated in the first hour
This indicator is a measure of early initiation of breastfeeding after birth for the age group 0-23 months
Early initiation of breastfeeding is associated with higher rates of exclusive and predominant breastfeeding. EBF for the first 6 months decreases morbidity and mortality among infants.
Percent of children <6 months of age exclusively breastfed
% of children 0-5 months of age who were exclusively breastfed during the day preceding the survey. EBF may include ORS, Vitamins, minerals &/or medicines but no other food or liquid.
Median duration of EBF
Measures the median duration of breastfeeding, which WHO recommends be for 6 months
Median duration of breastfeeding among children 0-23 months of age
Measures the median duration of breastfeeding, which the WHO recommends continues to at least 2 years of age
Percent of children 12-15 months of age who are fed breastmilk
Measures the continued breastfeeding rate at one year of age
Continued breastfeeding provides nutrition and protection from illness to infants and young children. In SC intervention areas breastfeeding usually stops at 12-15 months (SC formative research). Percent of children
0-23 months who are fed breastmilk
Measures the continued breastfeeding rate at two years of age
Percent of children 0-23 months of age fed using a bottle or teat in the past 24 hours
Measures the frequency of bottle/teat use Bottle-fed infants are at higher risk of death and disease.
Infant and Young Child Feeding Practices: Complementary Feeding
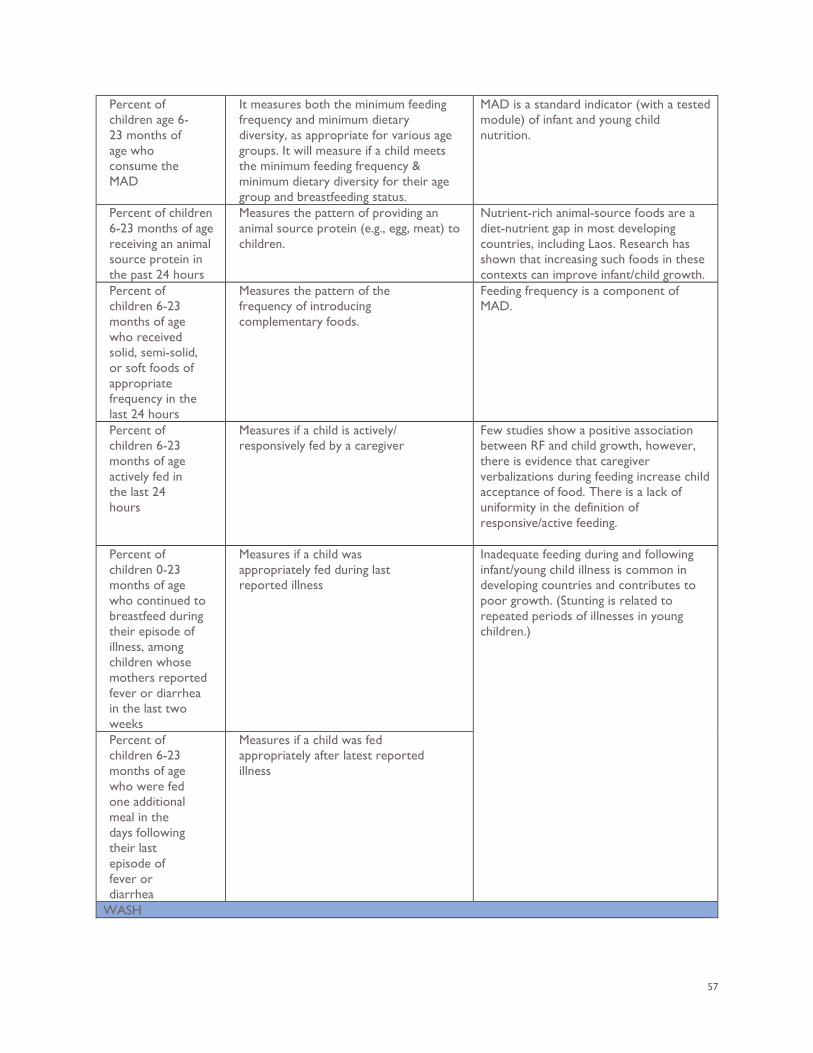
57
Percent of children age 6-23 months of age who consume the MAD
It measures both the minimum feeding frequency and minimum dietary diversity, as appropriate for various age groups. It will measure if a child meets the minimum feeding frequency & minimum dietary diversity for their age group and breastfeeding status.
MAD is a standard indicator (with a tested module) of infant and young child nutrition.
Percent of children 6-23 months of age receiving an animal source protein in the past 24 hours
Measures the pattern of providing an animal source protein (e.g., egg, meat) to children.
Nutrient-rich animal-source foods are a diet-nutrient gap in most developing countries, including Laos. Research has shown that increasing such foods in these contexts can improve infant/child growth.
Percent of children 6-23 months of age who received solid, semi-solid, or soft foods of appropriate frequency in the last 24 hours
Measures the pattern of the frequency of introducing complementary foods.
Feeding frequency is a component of MAD.
Percent of children 6-23 months of age actively fed in the last 24 hours
Measures if a child is actively/ responsively fed by a caregiver
Few studies show a positive association between RF and child growth, however, there is evidence that caregiver verbalizations during feeding increase child acceptance of food. There is a lack of uniformity in the definition of responsive/active feeding.
Percent of children 0-23 months of age who continued to breastfeed during their episode of illness, among children whose mothers reported fever or diarrhea in the last two weeks
Measures if a child was appropriately fed during last reported illness
Inadequate feeding during and following infant/young child illness is common in developing countries and contributes to poor growth. (Stunting is related to repeated periods of illnesses in young children.)
Percent of children 6-23 months of age who were fed one additional meal in the days following their last episode of fever or diarrhea
Measures if a child was fed appropriately after latest reported illness
WASH
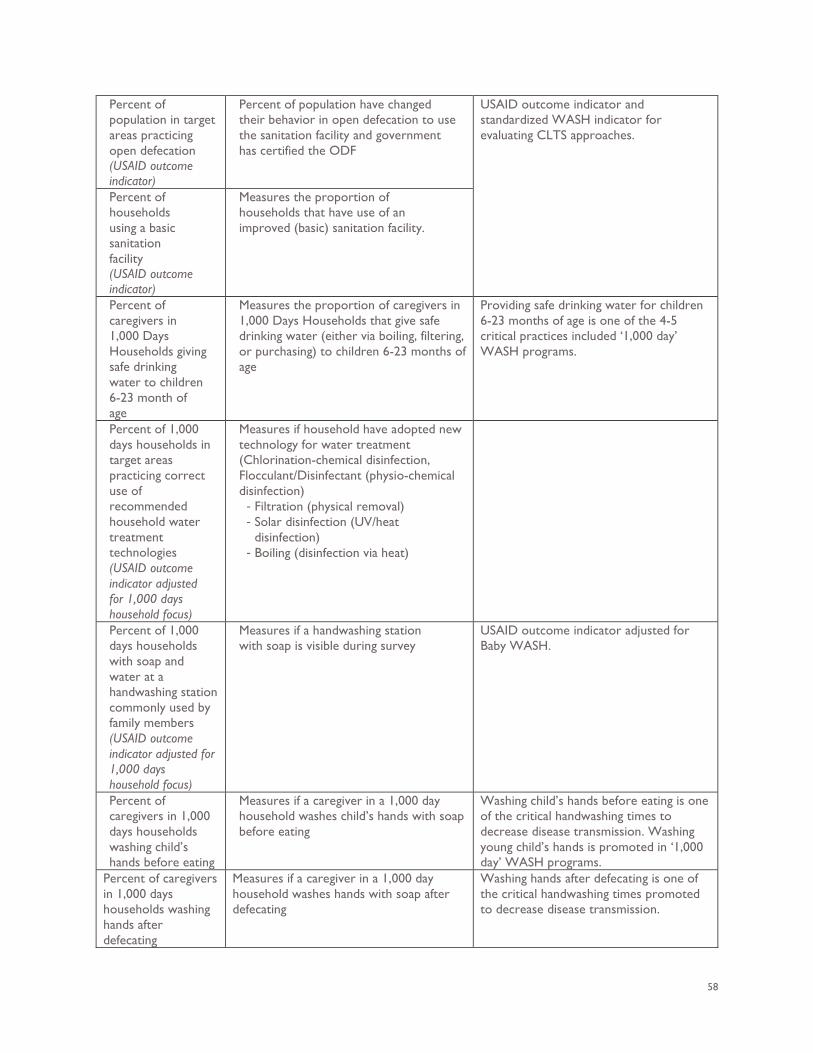
58
Percent of population in target areas practicing open defecation (USAID outcome indicator)
Percent of population have changed their behavior in open defecation to use the sanitation facility and government has certified the ODF
USAID outcome indicator and standardized WASH indicator for evaluating CLTS approaches.
Percent of households using a basic sanitation facility (USAID outcome indicator)
Measures the proportion of households that have use of an improved (basic) sanitation facility.
Percent of caregivers in 1,000 Days Households giving safe drinking water to children 6-23 month of age
Measures the proportion of caregivers in 1,000 Days Households that give safe drinking water (either via boiling, filtering, or purchasing) to children 6-23 months of age
Providing safe drinking water for children 6-23 months of age is one of the 4-5 critical practices included ‘1,000 day’ WASH programs.
Percent of 1,000 days households in target areas practicing correct use of recommended household water treatment technologies (USAID outcome indicator adjusted for 1,000 days household focus)
Measures if household have adopted new technology for water treatment (Chlorination-chemical disinfection, Flocculant/Disinfectant (physio-chemical disinfection)
- Filtration (physical removal) - Solar disinfection (UV/heat
disinfection) - Boiling (disinfection via heat)
Percent of 1,000 days households with soap and water at a handwashing station commonly used by family members (USAID outcome indicator adjusted for 1,000 days household focus)
Measures if a handwashing station with soap is visible during survey
USAID outcome indicator adjusted for Baby WASH.
Percent of caregivers in 1,000 days households washing child’s hands before eating
Measures if a caregiver in a 1,000 day household washes child’s hands with soap before eating
Washing child’s hands before eating is one of the critical handwashing times to decrease disease transmission. Washing young child’s hands is promoted in ‘1,000 day’ WASH programs.
Percent of caregivers in 1,000 days households washing hands after defecating
Measures if a caregiver in a 1,000 day household washes hands with soap after defecating
Washing hands after defecating is one of the critical handwashing times promoted to decrease disease transmission.
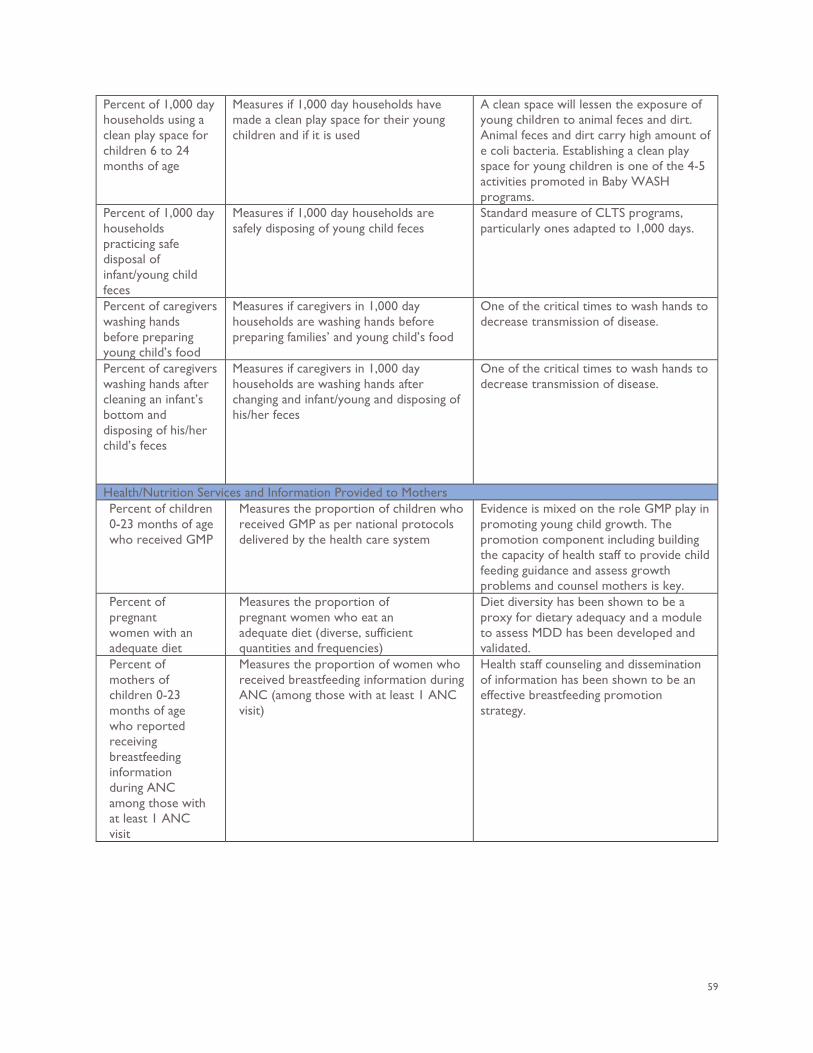
59
Percent of 1,000 day households using a clean play space for children 6 to 24 months of age
Measures if 1,000 day households have made a clean play space for their young children and if it is used
A clean space will lessen the exposure of young children to animal feces and dirt. Animal feces and dirt carry high amount of e coli bacteria. Establishing a clean play space for young children is one of the 4-5 activities promoted in Baby WASH programs.
Percent of 1,000 day households practicing safe disposal of infant/young child feces
Measures if 1,000 day households are safely disposing of young child feces
Standard measure of CLTS programs, particularly ones adapted to 1,000 days.
Percent of caregivers washing hands before preparing young child’s food
Measures if caregivers in 1,000 day households are washing hands before preparing families’ and young child’s food
One of the critical times to wash hands to decrease transmission of disease.
Percent of caregivers washing hands after cleaning an infant’s bottom and disposing of his/her child’s feces
Measures if caregivers in 1,000 day households are washing hands after changing and infant/young and disposing of his/her feces
One of the critical times to wash hands to decrease transmission of disease.
Health/Nutrition Services and Information Provided to Mothers Percent of children 0-23 months of age who received GMP
Measures the proportion of children who received GMP as per national protocols delivered by the health care system
Evidence is mixed on the role GMP play in promoting young child growth. The promotion component including building the capacity of health staff to provide child feeding guidance and assess growth problems and counsel mothers is key.
Percent of pregnant women with an adequate diet
Measures the proportion of pregnant women who eat an adequate diet (diverse, sufficient quantities and frequencies)
Diet diversity has been shown to be a proxy for dietary adequacy and a module to assess MDD has been developed and validated.
Percent of mothers of children 0-23 months of age who reported receiving breastfeeding information during ANC among those with at least 1 ANC visit
Measures the proportion of women who received breastfeeding information during ANC (among those with at least 1 ANC visit)
Health staff counseling and dissemination of information has been shown to be an effective breastfeeding promotion strategy.
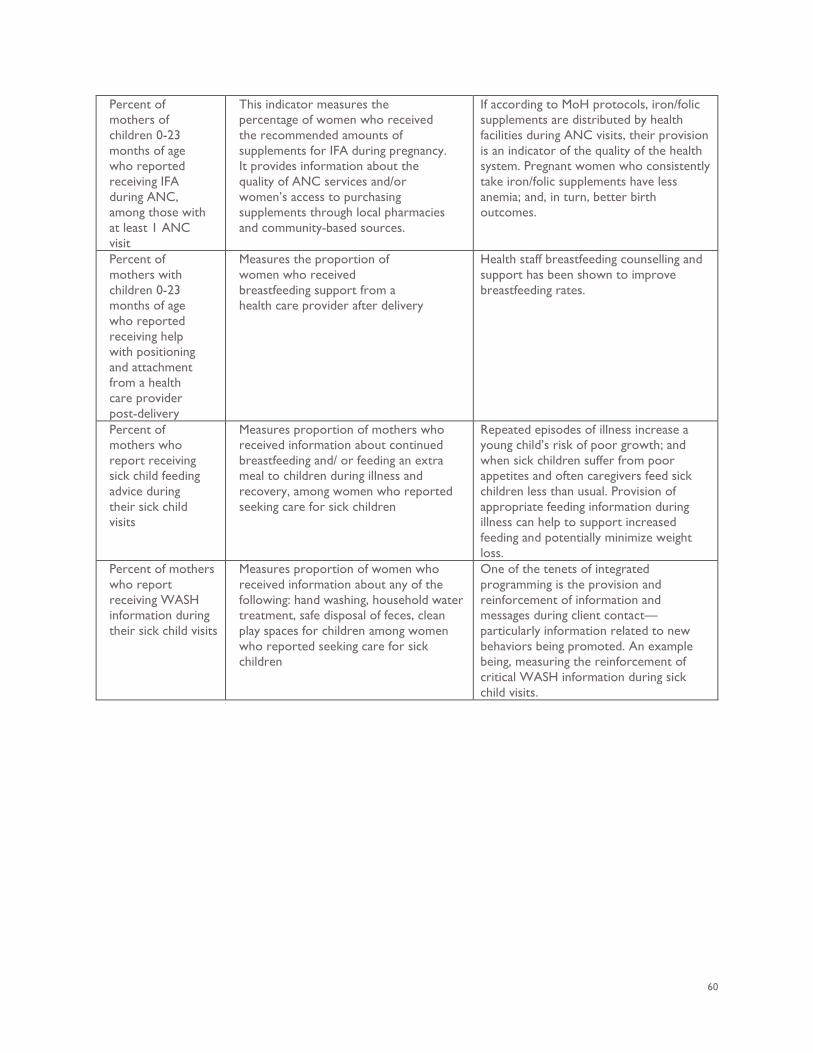
60
Percent of mothers of children 0-23 months of age who reported receiving IFA during ANC, among those with at least 1 ANC visit
This indicator measures the percentage of women who received the recommended amounts of supplements for IFA during pregnancy. It provides information about the quality of ANC services and/or women’s access to purchasing supplements through local pharmacies and community-based sources.
If according to MoH protocols, iron/folic supplements are distributed by health facilities during ANC visits, their provision is an indicator of the quality of the health system. Pregnant women who consistently take iron/folic supplements have less anemia; and, in turn, better birth outcomes.
Percent of mothers with children 0-23 months of age who reported receiving help with positioning and attachment from a health care provider post-delivery
Measures the proportion of women who received breastfeeding support from a health care provider after delivery
Health staff breastfeeding counselling and support has been shown to improve breastfeeding rates.
Percent of mothers who report receiving sick child feeding advice during their sick child visits
Measures proportion of mothers who received information about continued breastfeeding and/ or feeding an extra meal to children during illness and recovery, among women who reported seeking care for sick children
Repeated episodes of illness increase a young child’s risk of poor growth; and when sick children suffer from poor appetites and often caregivers feed sick children less than usual. Provision of appropriate feeding information during illness can help to support increased feeding and potentially minimize weight loss.
Percent of mothers who report receiving WASH information during their sick child visits
Measures proportion of women who received information about any of the following: hand washing, household water treatment, safe disposal of feces, clean play spaces for children among women who reported seeking care for sick children
One of the tenets of integrated programming is the provision and reinforcement of information and messages during client contact—particularly information related to new behaviors being promoted. An example being, measuring the reinforcement of critical WASH information during sick child visits.
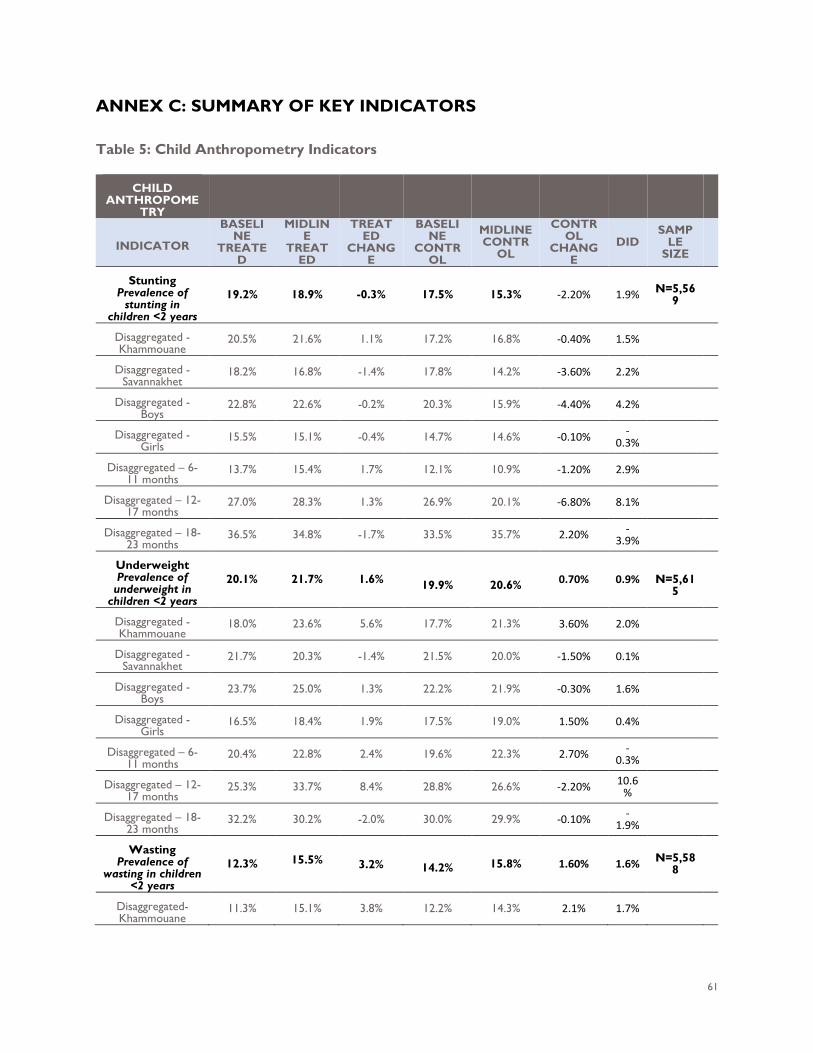
61
ANNEX C: SUMMARY OF KEY INDICATORS Table 5: Child Anthropometry Indicators
CHILD ANTHROPOME
TRY
INDICATOR
BASELINE
TREATED
MIDLINE
TREATED
TREATED
CHANGE
BASELINE
CONTROL
MIDLINE CONTR
OL
CONTROL
CHANGE
DID SAMP
LE SIZE
Stunting Prevalence of
stunting in children <2 years
19.2% 18.9% -0.3% 17.5% 15.3% -2.20% 1.9% N=5,569
Disaggregated - Khammouane
20.5% 21.6% 1.1% 17.2% 16.8% -0.40% 1.5%
Disaggregated - Savannakhet
18.2% 16.8% -1.4% 17.8% 14.2% -3.60% 2.2%
Disaggregated - Boys
22.8% 22.6% -0.2% 20.3% 15.9% -4.40% 4.2%
Disaggregated - Girls
15.5% 15.1% -0.4% 14.7% 14.6% -0.10% -0.3%
Disaggregated – 6-11 months
13.7% 15.4% 1.7% 12.1% 10.9% -1.20% 2.9%
Disaggregated – 12-17 months
27.0% 28.3% 1.3% 26.9% 20.1% -6.80% 8.1%
Disaggregated – 18-23 months
36.5% 34.8% -1.7% 33.5% 35.7% 2.20% -3.9%
Underweight Prevalence of
underweight in children <2 years
20.1% 21.7% 1.6% 19.9%
20.6% 0.70% 0.9%
N=5,61
5
Disaggregated - Khammouane
18.0% 23.6% 5.6% 17.7% 21.3% 3.60% 2.0%
Disaggregated - Savannakhet
21.7% 20.3% -1.4% 21.5% 20.0% -1.50% 0.1%
Disaggregated - Boys
23.7% 25.0% 1.3% 22.2% 21.9% -0.30% 1.6%
Disaggregated - Girls
16.5% 18.4% 1.9% 17.5% 19.0% 1.50% 0.4%
Disaggregated – 6-11 months
20.4% 22.8% 2.4% 19.6% 22.3% 2.70% -0.3%
Disaggregated – 12-17 months
25.3% 33.7% 8.4% 28.8% 26.6% -2.20% 10.6%
Disaggregated – 18-23 months
32.2% 30.2% -2.0% 30.0% 29.9% -0.10% -1.9%
Wasting Prevalence of
wasting in children <2 years
12.3% 15.5% 3.2% 14.2% 15.8% 1.60% 1.6% N=5,588
Disaggregated- Khammouane
11.3% 15.1% 3.8% 12.2% 14.3% 2.1% 1.7%
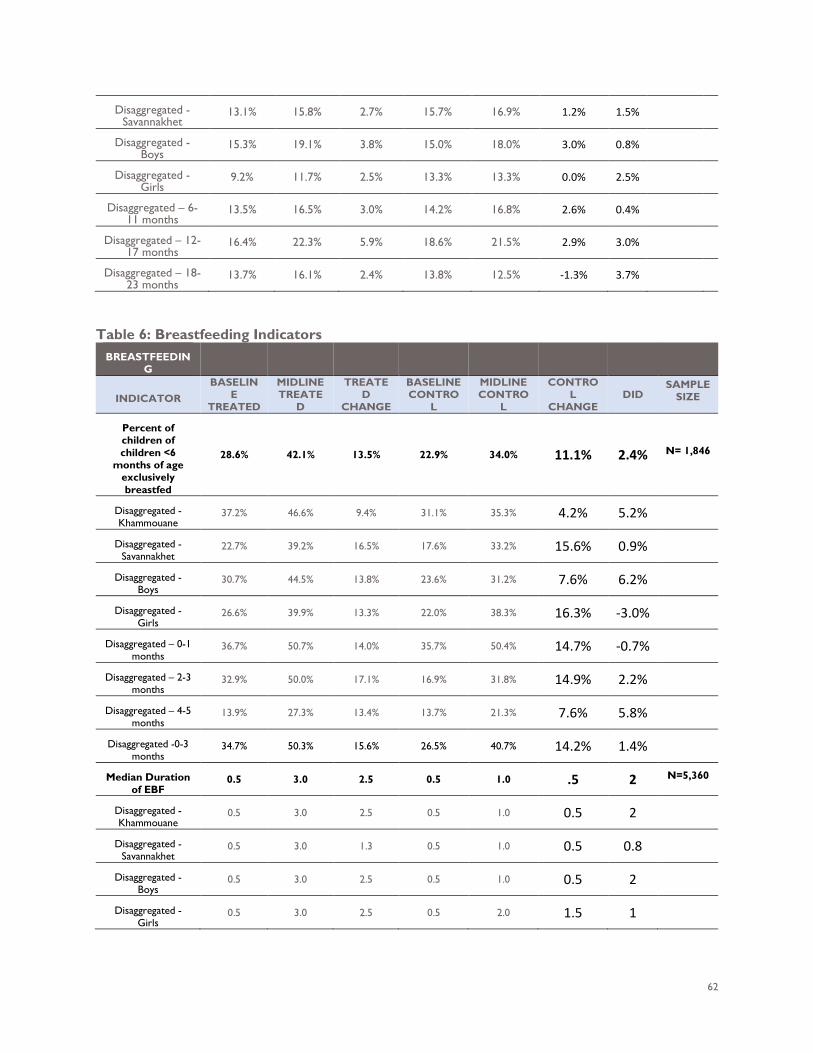
62
Disaggregated - Savannakhet
13.1% 15.8% 2.7% 15.7% 16.9% 1.2% 1.5%
Disaggregated - Boys
15.3% 19.1% 3.8% 15.0% 18.0% 3.0% 0.8%
Disaggregated - Girls
9.2% 11.7% 2.5% 13.3% 13.3% 0.0% 2.5%
Disaggregated – 6-11 months
13.5% 16.5% 3.0% 14.2% 16.8% 2.6% 0.4%
Disaggregated – 12-17 months
16.4% 22.3% 5.9% 18.6% 21.5% 2.9% 3.0%
Disaggregated – 18-23 months
13.7% 16.1% 2.4% 13.8% 12.5% -1.3% 3.7%
Table 6: Breastfeeding Indicators
BREASTFEEDING
INDICATOR BASELIN
E TREATED
MIDLINE TREATE
D
TREATED
CHANGE
BASELINE CONTRO
L
MIDLINE CONTRO
L
CONTROL
CHANGE DID
SAMPLE SIZE
Percent of children of children <6
months of age exclusively breastfed
28.6% 42.1% 13.5% 22.9% 34.0% 11.1% 2.4% N= 1,846
Disaggregated - Khammouane
37.2% 46.6% 9.4% 31.1% 35.3% 4.2% 5.2%
Disaggregated - Savannakhet
22.7% 39.2% 16.5% 17.6% 33.2% 15.6% 0.9%
Disaggregated - Boys
30.7% 44.5% 13.8% 23.6% 31.2% 7.6% 6.2%
Disaggregated - Girls
26.6% 39.9% 13.3% 22.0% 38.3% 16.3% -3.0%
Disaggregated – 0-1 months
36.7% 50.7% 14.0% 35.7% 50.4% 14.7% -0.7%
Disaggregated – 2-3 months
32.9% 50.0% 17.1% 16.9% 31.8% 14.9% 2.2%
Disaggregated – 4-5 months
13.9% 27.3% 13.4% 13.7% 21.3% 7.6% 5.8%
Disaggregated -0-3 months
34.7% 50.3% 15.6% 26.5% 40.7% 14.2% 1.4%
Median Duration of EBF
0.5 3.0 2.5 0.5 1.0 .5 2 N=5,360
Disaggregated - Khammouane
0.5 3.0 2.5 0.5 1.0 0.5 2
Disaggregated - Savannakhet
0.5 3.0 1.3 0.5 1.0 0.5 0.8
Disaggregated - Boys
0.5 3.0 2.5 0.5 1.0 0.5 2
Disaggregated - Girls
0.5 3.0 2.5 0.5 2.0 1.5 1
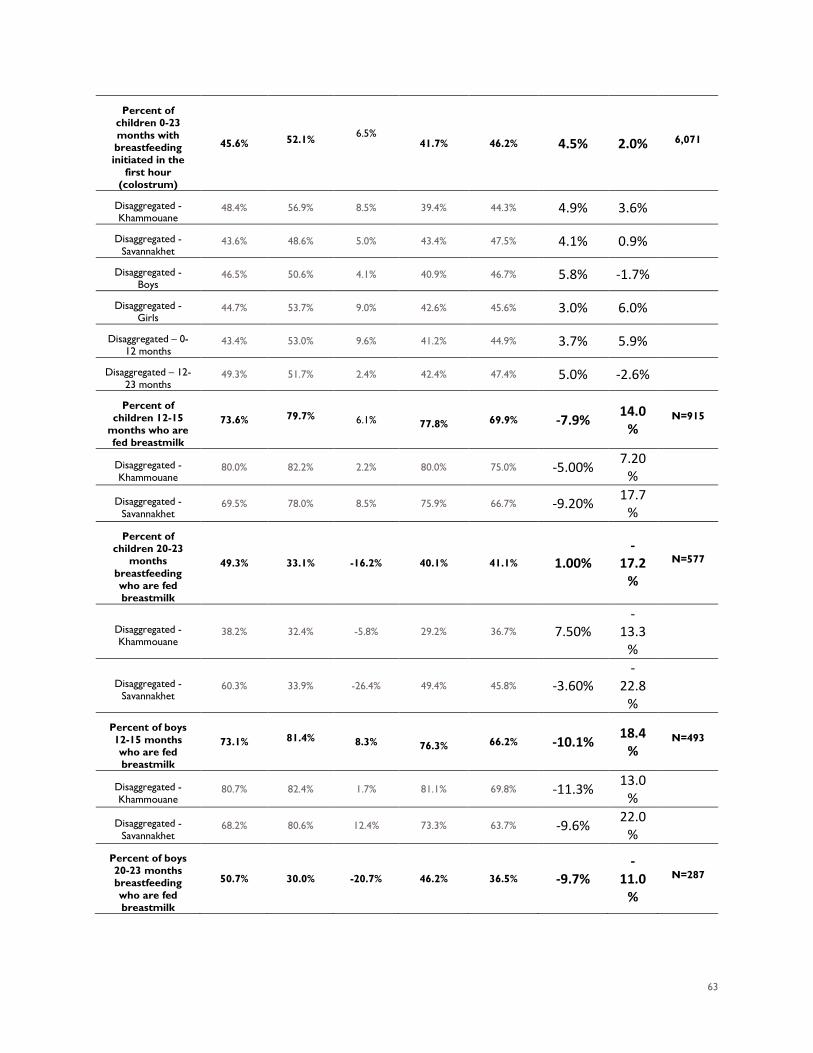
63
Percent of children 0-23 months with breastfeeding initiated in the
first hour (colostrum)
45.6% 52.1% 6.5%
41.7% 46.2% 4.5% 2.0% 6,071
Disaggregated - Khammouane
48.4% 56.9% 8.5% 39.4% 44.3% 4.9% 3.6%
Disaggregated - Savannakhet
43.6% 48.6% 5.0% 43.4% 47.5% 4.1% 0.9%
Disaggregated - Boys
46.5% 50.6% 4.1% 40.9% 46.7% 5.8% -1.7%
Disaggregated - Girls
44.7% 53.7% 9.0% 42.6% 45.6% 3.0% 6.0%
Disaggregated – 0-12 months
43.4% 53.0% 9.6% 41.2% 44.9% 3.7% 5.9%
Disaggregated – 12-23 months
49.3% 51.7% 2.4% 42.4% 47.4% 5.0% -2.6%
Percent of children 12-15
months who are fed breastmilk
73.6% 79.7% 6.1% 77.8% 69.9% -7.9% 14.0
% N=915
Disaggregated - Khammouane
80.0% 82.2% 2.2% 80.0% 75.0% -5.00% 7.20
%
Disaggregated - Savannakhet
69.5% 78.0% 8.5% 75.9% 66.7% -9.20% 17.7
%
Percent of children 20-23
months breastfeeding who are fed breastmilk
49.3% 33.1% -16.2% 40.1% 41.1% 1.00%
-17.2
%
N=577
Disaggregated - Khammouane
38.2% 32.4% -5.8% 29.2% 36.7% 7.50%
-13.3
%
Disaggregated - Savannakhet
60.3% 33.9% -26.4% 49.4% 45.8% -3.60%
-22.8
%
Percent of boys 12-15 months who are fed breastmilk
73.1% 81.4% 8.3% 76.3% 66.2% -10.1% 18.4
% N=493
Disaggregated - Khammouane
80.7% 82.4% 1.7% 81.1% 69.8% -11.3% 13.0
%
Disaggregated - Savannakhet
68.2% 80.6% 12.4% 73.3% 63.7% -9.6% 22.0
%
Percent of boys 20-23 months breastfeeding who are fed breastmilk
50.7% 30.0% -20.7% 46.2% 36.5% -9.7%
-11.0
%
N=287
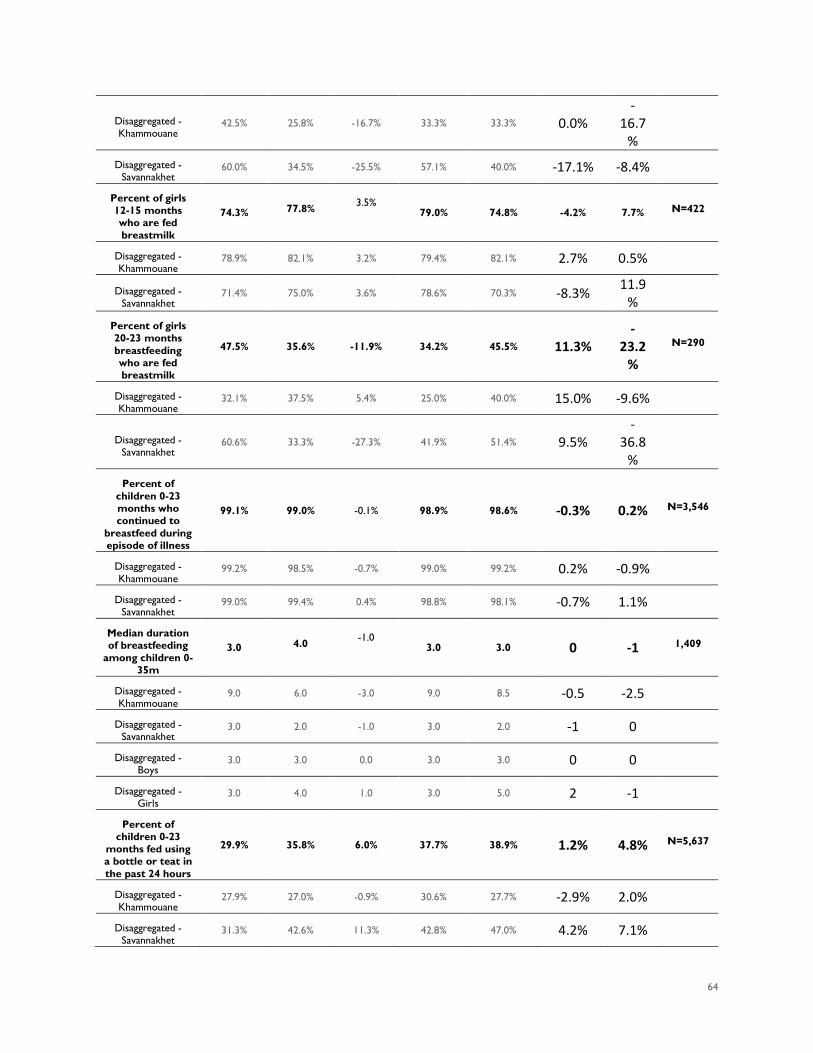
64
Disaggregated - Khammouane
42.5% 25.8% -16.7% 33.3% 33.3% 0.0%
-16.7
%
Disaggregated - Savannakhet
60.0% 34.5% -25.5% 57.1% 40.0% -17.1% -8.4%
Percent of girls 12-15 months who are fed breastmilk
74.3% 77.8% 3.5%
79.0% 74.8% -4.2% 7.7% N=422
Disaggregated - Khammouane
78.9% 82.1% 3.2% 79.4% 82.1% 2.7% 0.5%
Disaggregated - Savannakhet
71.4% 75.0% 3.6% 78.6% 70.3% -8.3% 11.9
%
Percent of girls 20-23 months breastfeeding who are fed breastmilk
47.5% 35.6% -11.9% 34.2% 45.5% 11.3%
-23.2
%
N=290
Disaggregated - Khammouane
32.1% 37.5% 5.4% 25.0% 40.0% 15.0% -9.6%
Disaggregated - Savannakhet
60.6% 33.3% -27.3% 41.9% 51.4% 9.5%
-36.8
%
Percent of children 0-23 months who continued to
breastfeed during episode of illness
99.1% 99.0% -0.1% 98.9% 98.6% -0.3% 0.2% N=3,546
Disaggregated - Khammouane
99.2% 98.5% -0.7% 99.0% 99.2% 0.2% -0.9%
Disaggregated - Savannakhet
99.0% 99.4% 0.4% 98.8% 98.1% -0.7% 1.1%
Median duration of breastfeeding
among children 0-35m
3.0 4.0 -1.0
3.0 3.0 0 -1 1,409
Disaggregated - Khammouane
9.0 6.0 -3.0 9.0 8.5 -0.5 -2.5
Disaggregated - Savannakhet
3.0 2.0 -1.0 3.0 2.0 -1 0
Disaggregated - Boys
3.0 3.0 0.0 3.0 3.0 0 0
Disaggregated - Girls
3.0 4.0 1.0 3.0 5.0 2 -1
Percent of children 0-23
months fed using a bottle or teat in the past 24 hours
29.9% 35.8% 6.0% 37.7% 38.9% 1.2% 4.8% N=5,637
Disaggregated - Khammouane
27.9% 27.0% -0.9% 30.6% 27.7% -2.9% 2.0%
Disaggregated - Savannakhet
31.3% 42.6% 11.3% 42.8% 47.0% 4.2% 7.1%
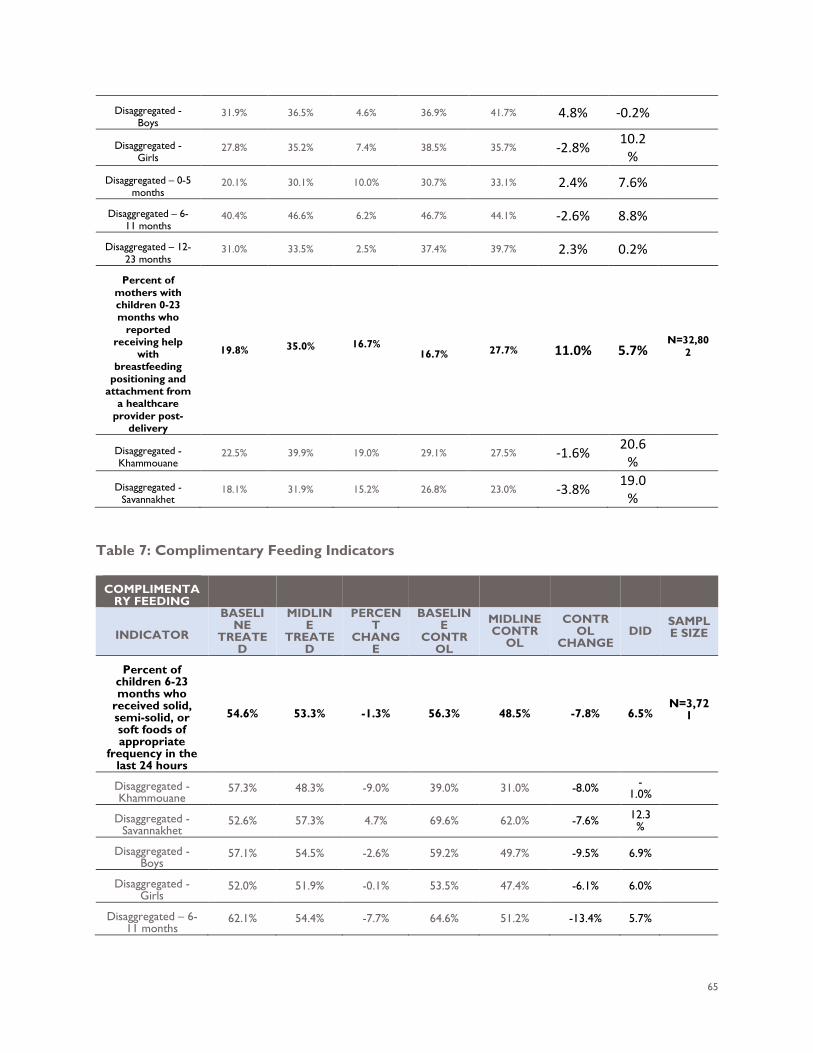
65
Disaggregated - Boys
31.9% 36.5% 4.6% 36.9% 41.7% 4.8% -0.2%
Disaggregated - Girls
27.8% 35.2% 7.4% 38.5% 35.7% -2.8% 10.2
%
Disaggregated – 0-5 months
20.1% 30.1% 10.0% 30.7% 33.1% 2.4% 7.6%
Disaggregated – 6-11 months
40.4% 46.6% 6.2% 46.7% 44.1% -2.6% 8.8%
Disaggregated – 12-23 months
31.0% 33.5% 2.5% 37.4% 39.7% 2.3% 0.2%
Percent of mothers with children 0-23 months who
reported receiving help
with breastfeeding
positioning and attachment from
a healthcare provider post-
delivery
19.8% 35.0% 16.7% 16.7% 27.7% 11.0% 5.7%
N=32,802
Disaggregated - Khammouane
22.5% 39.9% 19.0% 29.1% 27.5% -1.6% 20.6
%
Disaggregated - Savannakhet
18.1% 31.9% 15.2% 26.8% 23.0% -3.8% 19.0
%
Table 7: Complimentary Feeding Indicators
COMPLIMENTARY FEEDING
INDICATOR
BASELINE
TREATED
MIDLINE
TREATED
PERCENT
CHANGE
BASELINE
CONTROL
MIDLINE CONTR
OL
CONTROL
CHANGE DID
SAMPLE SIZE
Percent of children 6-23 months who
received solid, semi-solid, or soft foods of appropriate
frequency in the last 24 hours
54.6% 53.3% -1.3% 56.3% 48.5% -7.8% 6.5% N=3,72
1
Disaggregated - Khammouane
57.3% 48.3% -9.0% 39.0% 31.0% -8.0% -1.0%
Disaggregated - Savannakhet
52.6% 57.3% 4.7% 69.6% 62.0% -7.6% 12.3%
Disaggregated - Boys
57.1% 54.5% -2.6% 59.2% 49.7% -9.5% 6.9%
Disaggregated - Girls
52.0% 51.9% -0.1% 53.5% 47.4% -6.1% 6.0%
Disaggregated – 6-11 months
62.1% 54.4% -7.7% 64.6% 51.2% -13.4% 5.7%
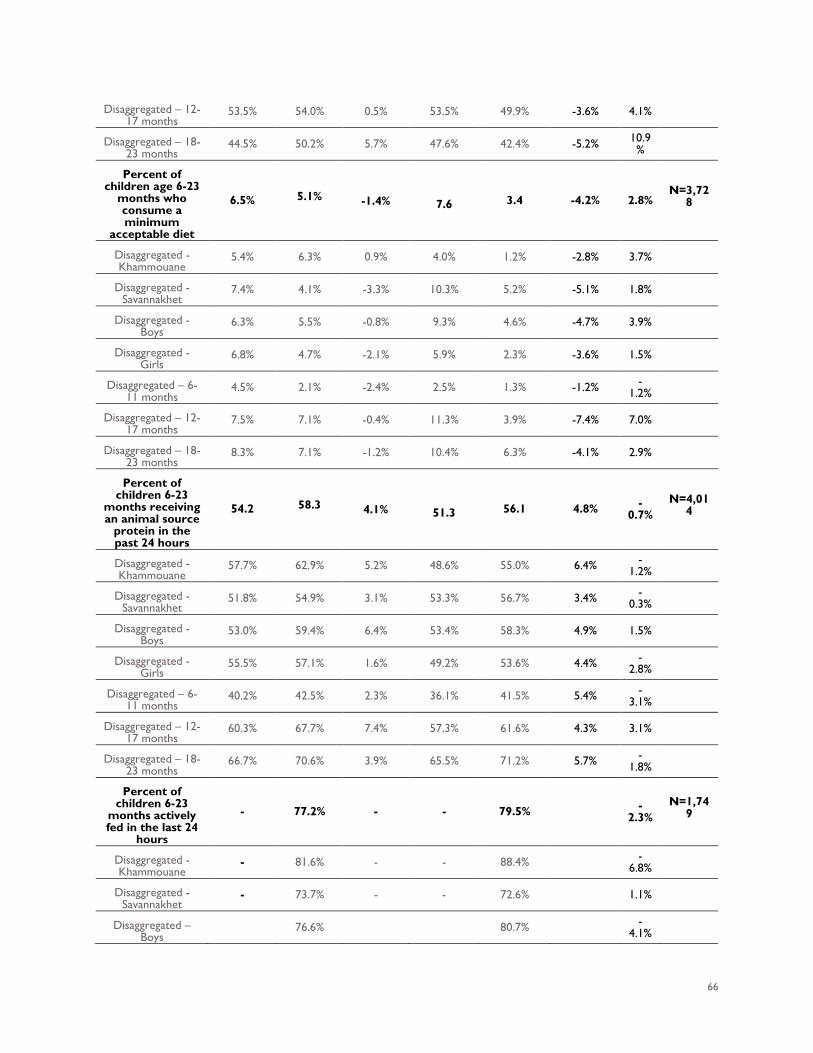
66
Disaggregated – 12-17 months
53.5% 54.0% 0.5% 53.5% 49.9% -3.6% 4.1%
Disaggregated – 18-23 months
44.5% 50.2% 5.7% 47.6% 42.4% -5.2% 10.9%
Percent of children age 6-23
months who consume a minimum
acceptable diet
6.5% 5.1% -1.4% 7.6 3.4 -4.2% 2.8% N=3,72
8
Disaggregated - Khammouane
5.4% 6.3% 0.9% 4.0% 1.2% -2.8% 3.7%
Disaggregated - Savannakhet
7.4% 4.1% -3.3% 10.3% 5.2% -5.1% 1.8%
Disaggregated - Boys
6.3% 5.5% -0.8% 9.3% 4.6% -4.7% 3.9%
Disaggregated - Girls
6.8% 4.7% -2.1% 5.9% 2.3% -3.6% 1.5%
Disaggregated – 6-11 months
4.5% 2.1% -2.4% 2.5% 1.3% -1.2% -1.2%
Disaggregated – 12-17 months
7.5% 7.1% -0.4% 11.3% 3.9% -7.4% 7.0%
Disaggregated – 18-23 months
8.3% 7.1% -1.2% 10.4% 6.3% -4.1% 2.9%
Percent of children 6-23
months receiving an animal source
protein in the past 24 hours
54.2 58.3 4.1% 51.3 56.1 4.8% -0.7%
N=4,014
Disaggregated - Khammouane
57.7% 62.9% 5.2% 48.6% 55.0% 6.4% -1.2%
Disaggregated - Savannakhet
51.8% 54.9% 3.1% 53.3% 56.7% 3.4% -0.3%
Disaggregated - Boys
53.0% 59.4% 6.4% 53.4% 58.3% 4.9% 1.5%
Disaggregated - Girls
55.5% 57.1% 1.6% 49.2% 53.6% 4.4% -2.8%
Disaggregated – 6-11 months
40.2% 42.5% 2.3% 36.1% 41.5% 5.4% -3.1%
Disaggregated – 12-17 months
60.3% 67.7% 7.4% 57.3% 61.6% 4.3% 3.1%
Disaggregated – 18-23 months
66.7% 70.6% 3.9% 65.5% 71.2% 5.7% -1.8%
Percent of children 6-23
months actively fed in the last 24
hours
- 77.2% - - 79.5% -2.3%
N=1,749
Disaggregated - Khammouane
- 81.6% - - 88.4% -6.8%
Disaggregated - Savannakhet
- 73.7% - - 72.6% 1.1%
Disaggregated – Boys
76.6% 80.7% -4.1%
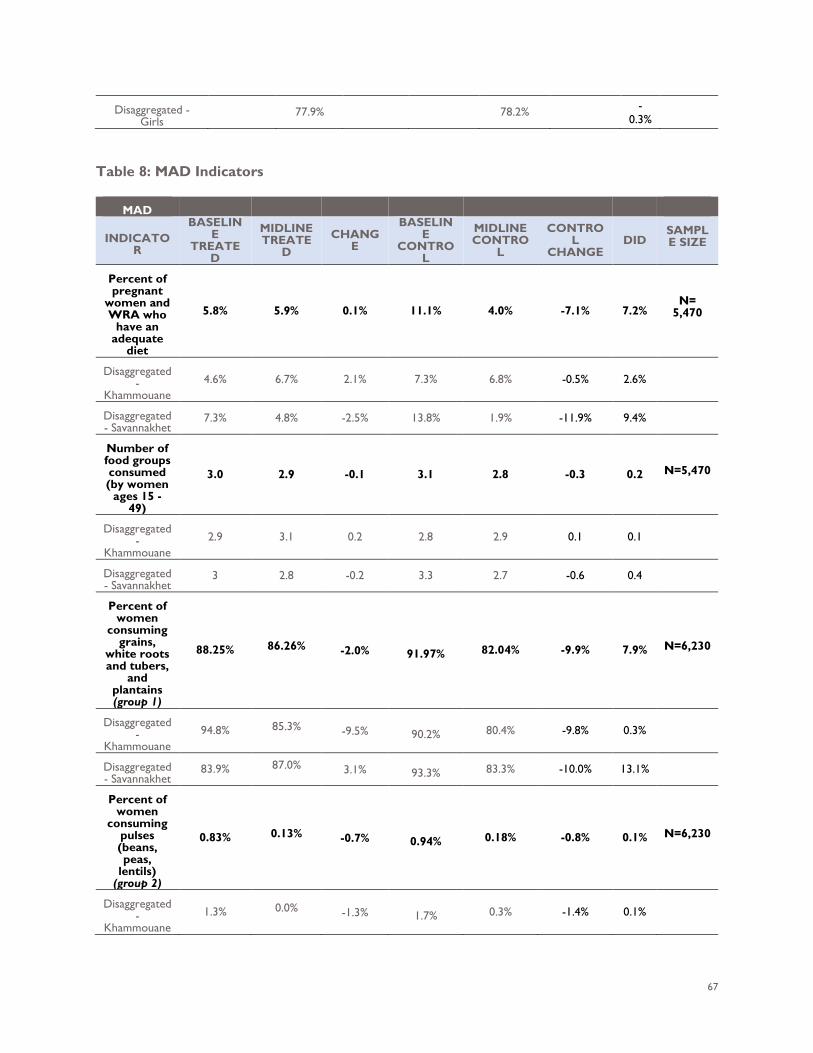
67
Disaggregated - Girls
77.9% 78.2% -0.3%
Table 8: MAD Indicators
MAD
INDICATOR
BASELINE
TREATED
MIDLINE TREATE
D CHANG
E
BASELINE
CONTROL
MIDLINE CONTRO
L
CONTROL
CHANGE DID
SAMPLE SIZE
Percent of pregnant
women and WRA who
have an adequate
diet
5.8% 5.9% 0.1% 11.1% 4.0% -7.1% 7.2% N=
5,470
Disaggregated -
Khammouane 4.6% 6.7% 2.1% 7.3% 6.8% -0.5% 2.6%
Disaggregated - Savannakhet
7.3% 4.8% -2.5% 13.8% 1.9% -11.9% 9.4%
Number of food groups consumed (by women
ages 15 - 49)
3.0 2.9 -0.1 3.1 2.8 -0.3 0.2 N=5,470
Disaggregated -
Khammouane 2.9 3.1 0.2 2.8 2.9 0.1 0.1
Disaggregated - Savannakhet
3 2.8 -0.2 3.3 2.7 -0.6 0.4
Percent of women
consuming grains,
white roots and tubers,
and plantains (group 1)
88.25% 86.26% -2.0% 91.97% 82.04% -9.9% 7.9% N=6,230
Disaggregated -
Khammouane 94.8% 85.3% -9.5% 90.2% 80.4% -9.8% 0.3%
Disaggregated - Savannakhet
83.9% 87.0% 3.1% 93.3% 83.3% -10.0% 13.1%
Percent of women
consuming pulses (beans, peas,
lentils) (group 2)
0.83% 0.13% -0.7% 0.94% 0.18% -0.8% 0.1% N=6,230
Disaggregated -
Khammouane 1.3% 0.0% -1.3% 1.7% 0.3% -1.4% 0.1%
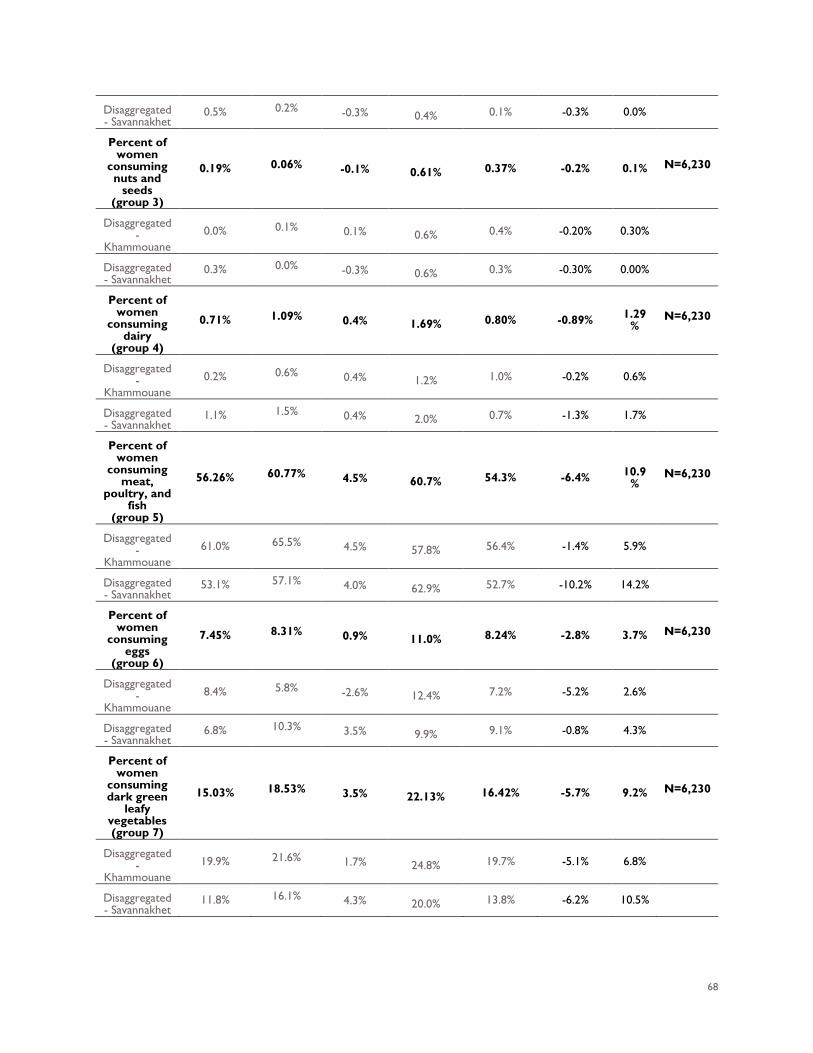
68
Disaggregated - Savannakhet
0.5% 0.2% -0.3% 0.4% 0.1% -0.3% 0.0%
Percent of women
consuming nuts and
seeds (group 3)
0.19% 0.06% -0.1% 0.61% 0.37% -0.2% 0.1% N=6,230
Disaggregated -
Khammouane 0.0% 0.1% 0.1% 0.6% 0.4% -0.20% 0.30%
Disaggregated - Savannakhet
0.3% 0.0% -0.3% 0.6% 0.3% -0.30% 0.00%
Percent of women
consuming dairy
(group 4)
0.71% 1.09% 0.4% 1.69% 0.80% -0.89% 1.29%
N=6,230
Disaggregated -
Khammouane 0.2% 0.6% 0.4% 1.2% 1.0% -0.2% 0.6%
Disaggregated - Savannakhet
1.1% 1.5% 0.4% 2.0% 0.7% -1.3% 1.7%
Percent of women
consuming meat,
poultry, and fish
(group 5)
56.26% 60.77% 4.5% 60.7% 54.3% -6.4% 10.9%
N=6,230
Disaggregated -
Khammouane 61.0% 65.5% 4.5% 57.8% 56.4% -1.4% 5.9%
Disaggregated - Savannakhet
53.1% 57.1% 4.0% 62.9% 52.7% -10.2% 14.2%
Percent of women
consuming eggs
(group 6)
7.45% 8.31% 0.9% 11.0% 8.24% -2.8% 3.7% N=6,230
Disaggregated -
Khammouane 8.4% 5.8% -2.6% 12.4% 7.2% -5.2% 2.6%
Disaggregated - Savannakhet
6.8% 10.3% 3.5% 9.9% 9.1% -0.8% 4.3%
Percent of women
consuming dark green
leafy vegetables (group 7)
15.03% 18.53% 3.5% 22.13% 16.42% -5.7% 9.2% N=6,230
Disaggregated -
Khammouane 19.9% 21.6% 1.7% 24.8% 19.7% -5.1% 6.8%
Disaggregated - Savannakhet
11.8% 16.1% 4.3% 20.0% 13.8% -6.2% 10.5%
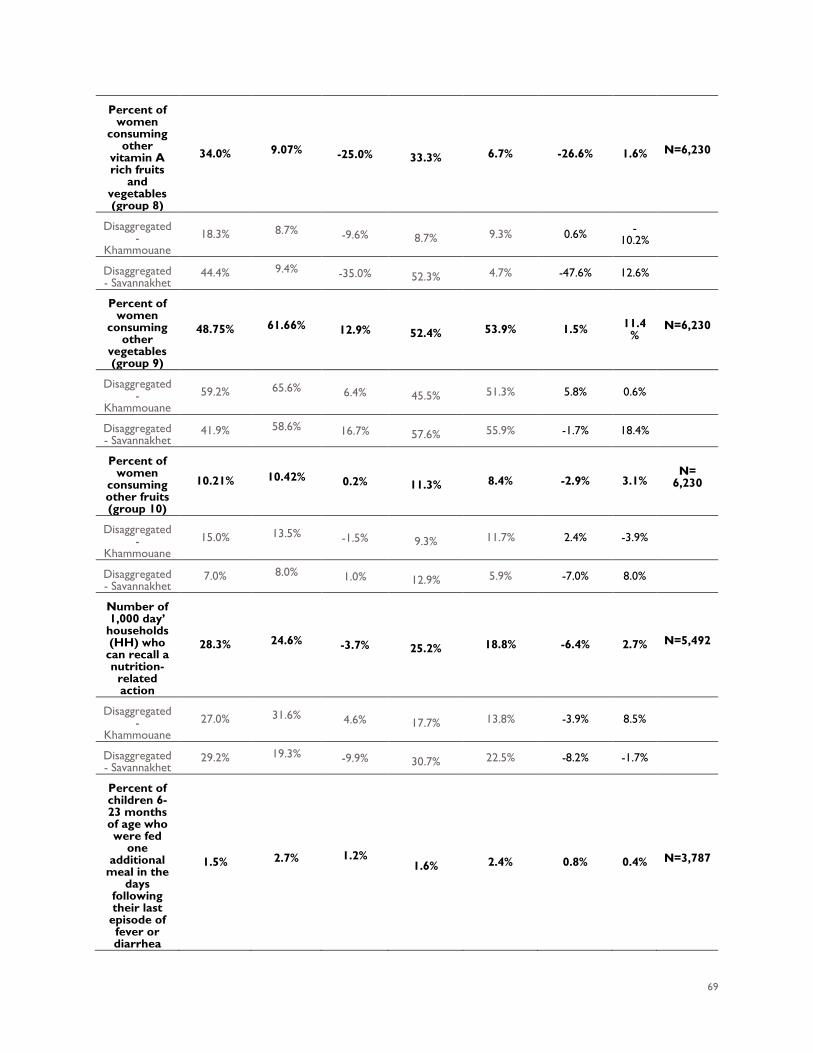
69
Percent of women
consuming other
vitamin A rich fruits
and vegetables (group 8)
34.0% 9.07% -25.0% 33.3% 6.7% -26.6% 1.6% N=6,230
Disaggregated -
Khammouane 18.3% 8.7% -9.6% 8.7% 9.3% 0.6% -
10.2%
Disaggregated - Savannakhet
44.4% 9.4% -35.0% 52.3% 4.7% -47.6% 12.6%
Percent of women
consuming other
vegetables (group 9)
48.75% 61.66% 12.9% 52.4% 53.9% 1.5% 11.4%
N=6,230
Disaggregated -
Khammouane 59.2% 65.6% 6.4% 45.5% 51.3% 5.8% 0.6%
Disaggregated - Savannakhet
41.9% 58.6% 16.7% 57.6% 55.9% -1.7% 18.4%
Percent of women
consuming other fruits (group 10)
10.21% 10.42% 0.2% 11.3% 8.4% -2.9% 3.1% N=
6,230
Disaggregated -
Khammouane 15.0% 13.5% -1.5% 9.3% 11.7% 2.4% -3.9%
Disaggregated - Savannakhet
7.0% 8.0% 1.0% 12.9% 5.9% -7.0% 8.0%
Number of 1,000 day’
households (HH) who
can recall a nutrition-
related action
28.3% 24.6% -3.7% 25.2% 18.8% -6.4% 2.7% N=5,492
Disaggregated -
Khammouane 27.0% 31.6% 4.6% 17.7% 13.8% -3.9% 8.5%
Disaggregated - Savannakhet
29.2% 19.3% -9.9% 30.7% 22.5% -8.2% -1.7%
Percent of children 6-23 months of age who were fed
one additional
meal in the days
following their last
episode of fever or diarrhea
1.5% 2.7% 1.2% 1.6% 2.4% 0.8% 0.4% N=3,787
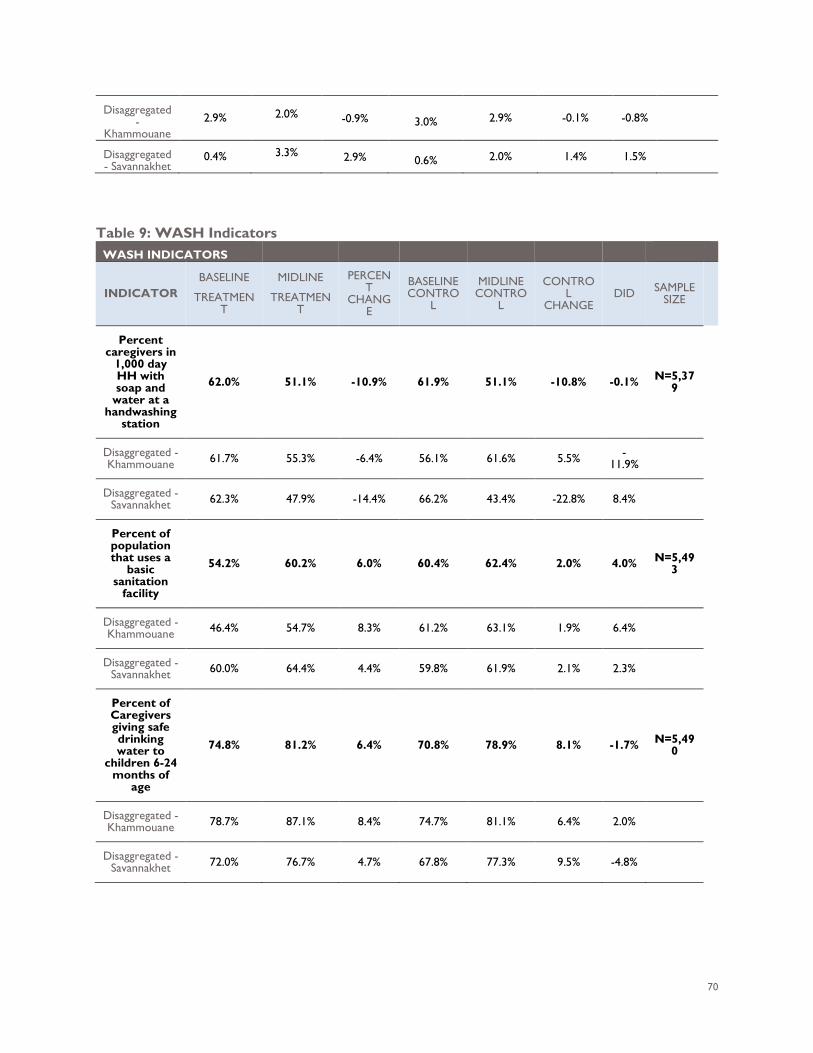
70
Disaggregated -
Khammouane 2.9% 2.0% -0.9% 3.0% 2.9% -0.1% -0.8%
Disaggregated - Savannakhet
0.4% 3.3% 2.9% 0.6% 2.0% 1.4% 1.5%
Table 9: WASH Indicators
WASH INDICATORS
INDICATOR BASELINE
TREATMENT
MIDLINE
TREATMENT
PERCENT
CHANGE
BASELINE CONTRO
L
MIDLINE CONTRO
L
CONTROL
CHANGE DID SAMPLE
SIZE
Percent caregivers in
1,000 day HH with soap and
water at a handwashing
station
62.0% 51.1% -10.9% 61.9% 51.1% -10.8% -0.1% N=5,379
Disaggregated - Khammouane 61.7% 55.3% -6.4% 56.1% 61.6% 5.5% -
11.9%
Disaggregated - Savannakhet 62.3% 47.9% -14.4% 66.2% 43.4% -22.8% 8.4%
Percent of population that uses a
basic sanitation
facility
54.2% 60.2% 6.0% 60.4% 62.4% 2.0% 4.0% N=5,493
Disaggregated - Khammouane 46.4% 54.7% 8.3% 61.2% 63.1% 1.9% 6.4%
Disaggregated - Savannakhet 60.0% 64.4% 4.4% 59.8% 61.9% 2.1% 2.3%
Percent of Caregivers giving safe drinking water to
children 6-24 months of
age
74.8% 81.2% 6.4% 70.8% 78.9% 8.1% -1.7% N=5,490
Disaggregated - Khammouane 78.7% 87.1% 8.4% 74.7% 81.1% 6.4% 2.0%
Disaggregated - Savannakhet 72.0% 76.7% 4.7% 67.8% 77.3% 9.5% -4.8%
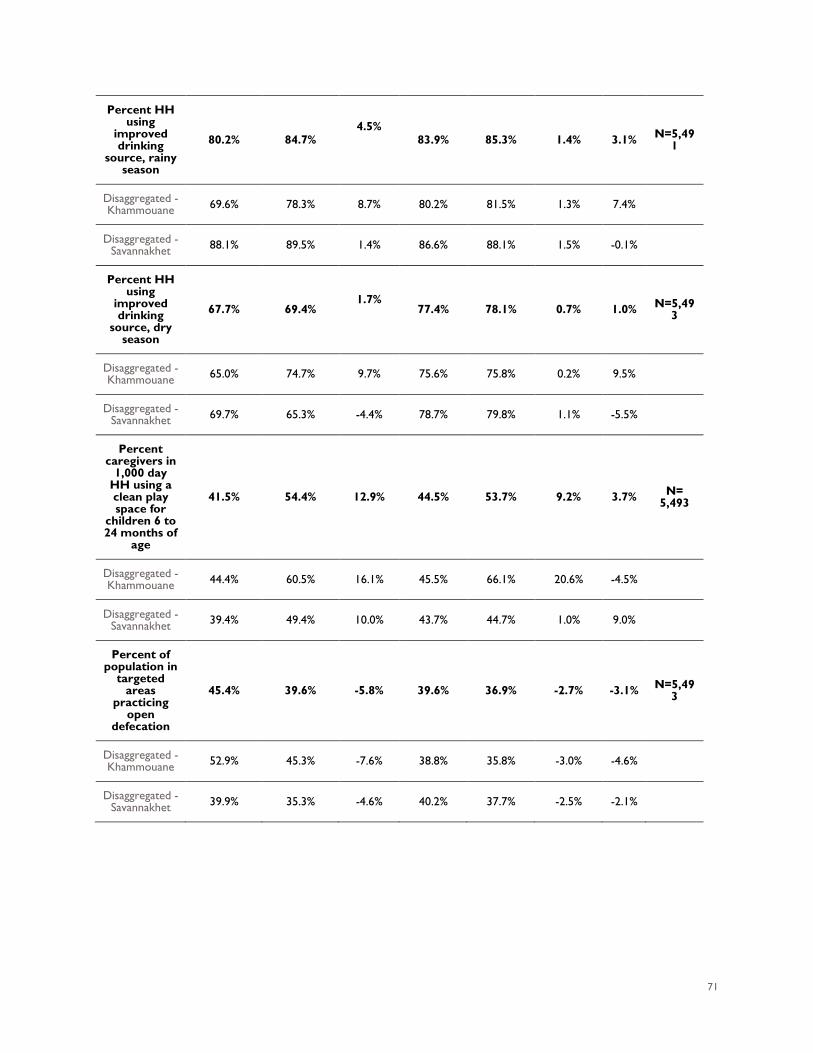
71
Percent HH using
improved drinking
source, rainy season
80.2% 84.7% 4.5%
83.9% 85.3% 1.4% 3.1% N=5,491
Disaggregated - Khammouane 69.6% 78.3% 8.7% 80.2% 81.5% 1.3% 7.4%
Disaggregated - Savannakhet 88.1% 89.5% 1.4% 86.6% 88.1% 1.5% -0.1%
Percent HH using
improved drinking
source, dry season
67.7% 69.4% 1.7%
77.4% 78.1% 0.7% 1.0% N=5,49
3
Disaggregated - Khammouane 65.0% 74.7% 9.7% 75.6% 75.8% 0.2% 9.5%
Disaggregated - Savannakhet 69.7% 65.3% -4.4% 78.7% 79.8% 1.1% -5.5%
Percent caregivers in
1,000 day HH using a clean play space for
children 6 to 24 months of
age
41.5% 54.4% 12.9% 44.5% 53.7% 9.2% 3.7% N= 5,493
Disaggregated - Khammouane 44.4% 60.5% 16.1% 45.5% 66.1% 20.6% -4.5%
Disaggregated - Savannakhet 39.4% 49.4% 10.0% 43.7% 44.7% 1.0% 9.0%
Percent of population in
targeted areas
practicing open
defecation
45.4% 39.6% -5.8% 39.6% 36.9% -2.7% -3.1% N=5,493
Disaggregated - Khammouane 52.9% 45.3% -7.6% 38.8% 35.8% -3.0% -4.6%
Disaggregated - Savannakhet 39.9% 35.3% -4.6% 40.2% 37.7% -2.5% -2.1%
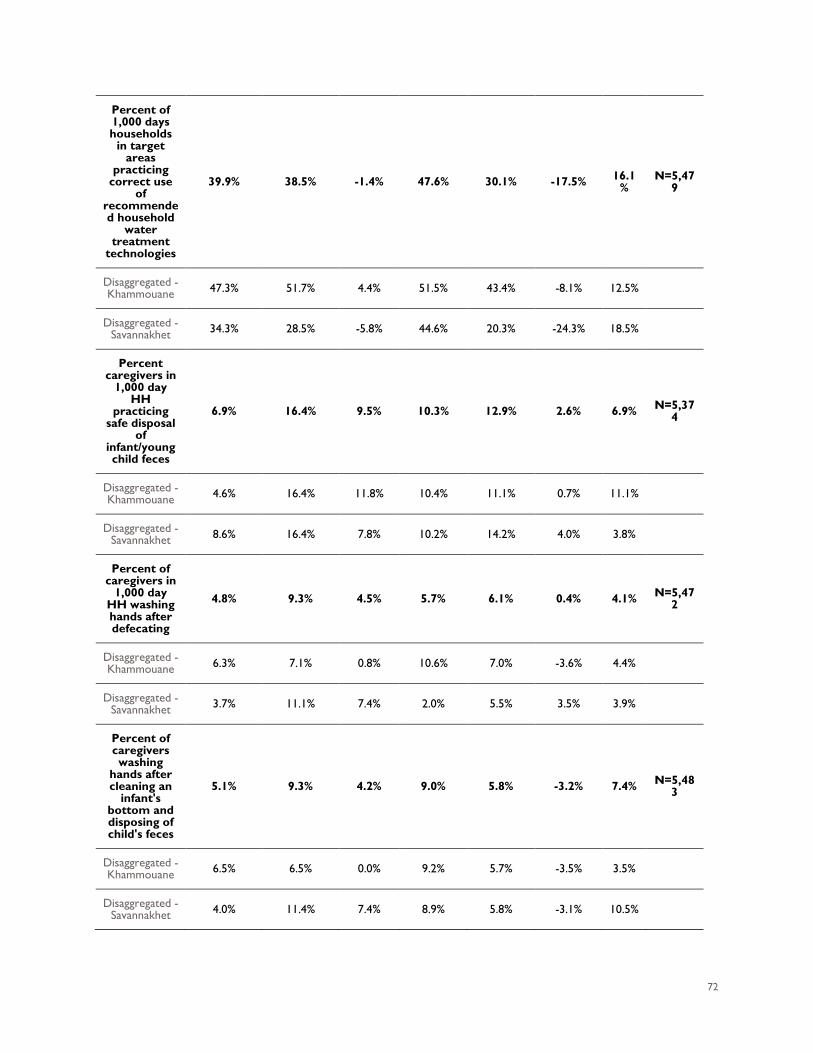
72
Percent of 1,000 days households
in target areas
practicing correct use
of recommended household
water treatment
technologies
39.9% 38.5% -1.4% 47.6% 30.1% -17.5% 16.1%
N=5,479
Disaggregated - Khammouane 47.3% 51.7% 4.4% 51.5% 43.4% -8.1% 12.5%
Disaggregated - Savannakhet 34.3% 28.5% -5.8% 44.6% 20.3% -24.3% 18.5%
Percent caregivers in
1,000 day HH
practicing safe disposal
of infant/young child feces
6.9% 16.4% 9.5% 10.3% 12.9% 2.6% 6.9% N=5,374
Disaggregated - Khammouane 4.6% 16.4% 11.8% 10.4% 11.1% 0.7% 11.1%
Disaggregated - Savannakhet 8.6% 16.4% 7.8% 10.2% 14.2% 4.0% 3.8%
Percent of caregivers in
1,000 day HH washing hands after defecating
4.8% 9.3% 4.5% 5.7% 6.1% 0.4% 4.1% N=5,472
Disaggregated - Khammouane 6.3% 7.1% 0.8% 10.6% 7.0% -3.6% 4.4%
Disaggregated - Savannakhet 3.7% 11.1% 7.4% 2.0% 5.5% 3.5% 3.9%
Percent of caregivers washing
hands after cleaning an
infant's bottom and disposing of child's feces
5.1% 9.3% 4.2% 9.0% 5.8% -3.2% 7.4% N=5,483
Disaggregated - Khammouane 6.5% 6.5% 0.0% 9.2% 5.7% -3.5% 3.5%
Disaggregated - Savannakhet 4.0% 11.4% 7.4% 8.9% 5.8% -3.1% 10.5%
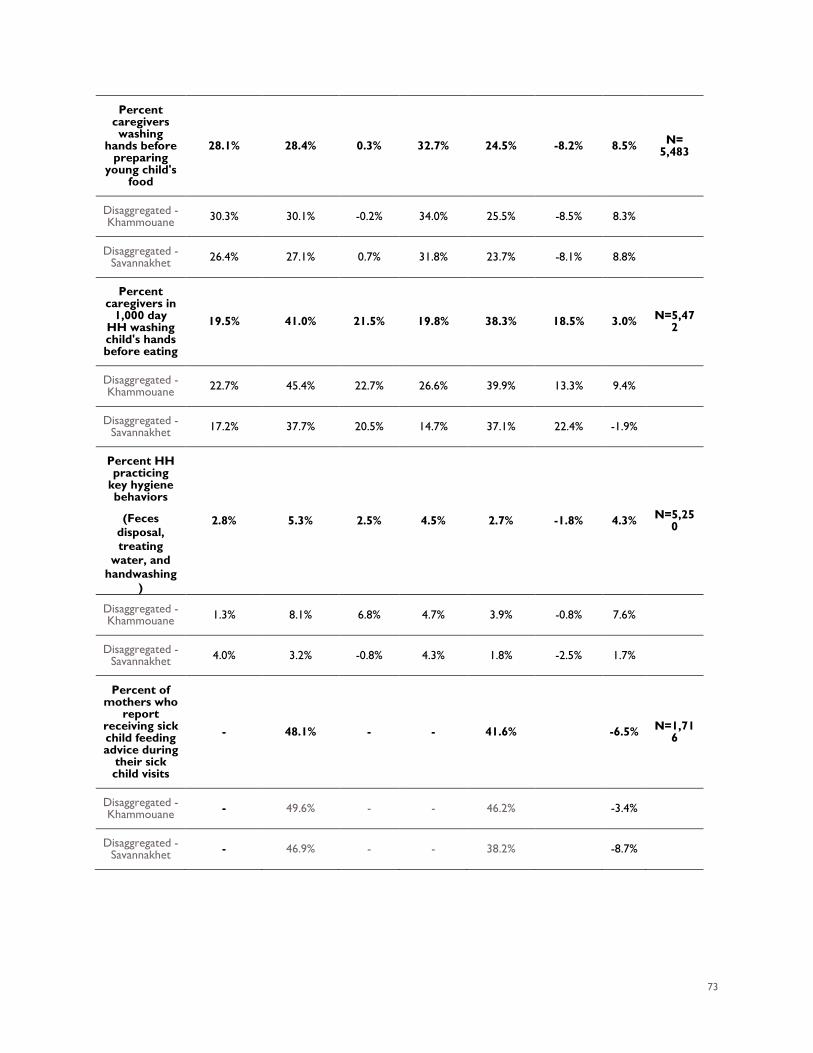
73
Percent caregivers washing
hands before preparing
young child's food
28.1% 28.4% 0.3% 32.7% 24.5% -8.2% 8.5% N= 5,483
Disaggregated - Khammouane 30.3% 30.1% -0.2% 34.0% 25.5% -8.5% 8.3%
Disaggregated - Savannakhet 26.4% 27.1% 0.7% 31.8% 23.7% -8.1% 8.8%
Percent caregivers in
1,000 day HH washing child's hands before eating
19.5% 41.0% 21.5% 19.8% 38.3% 18.5% 3.0% N=5,472
Disaggregated - Khammouane 22.7% 45.4% 22.7% 26.6% 39.9% 13.3% 9.4%
Disaggregated - Savannakhet 17.2% 37.7% 20.5% 14.7% 37.1% 22.4% -1.9%
Percent HH practicing
key hygiene behaviors
(Feces disposal, treating
water, and handwashing
)
2.8% 5.3% 2.5% 4.5% 2.7% -1.8% 4.3% N=5,250
Disaggregated - Khammouane 1.3% 8.1% 6.8% 4.7% 3.9% -0.8% 7.6%
Disaggregated - Savannakhet 4.0% 3.2% -0.8% 4.3% 1.8% -2.5% 1.7%
Percent of mothers who
report receiving sick child feeding advice during
their sick child visits
- 48.1% - - 41.6% -6.5% N=1,716
Disaggregated - Khammouane - 49.6% - - 46.2% -3.4%
Disaggregated - Savannakhet - 46.9% - - 38.2% -8.7%
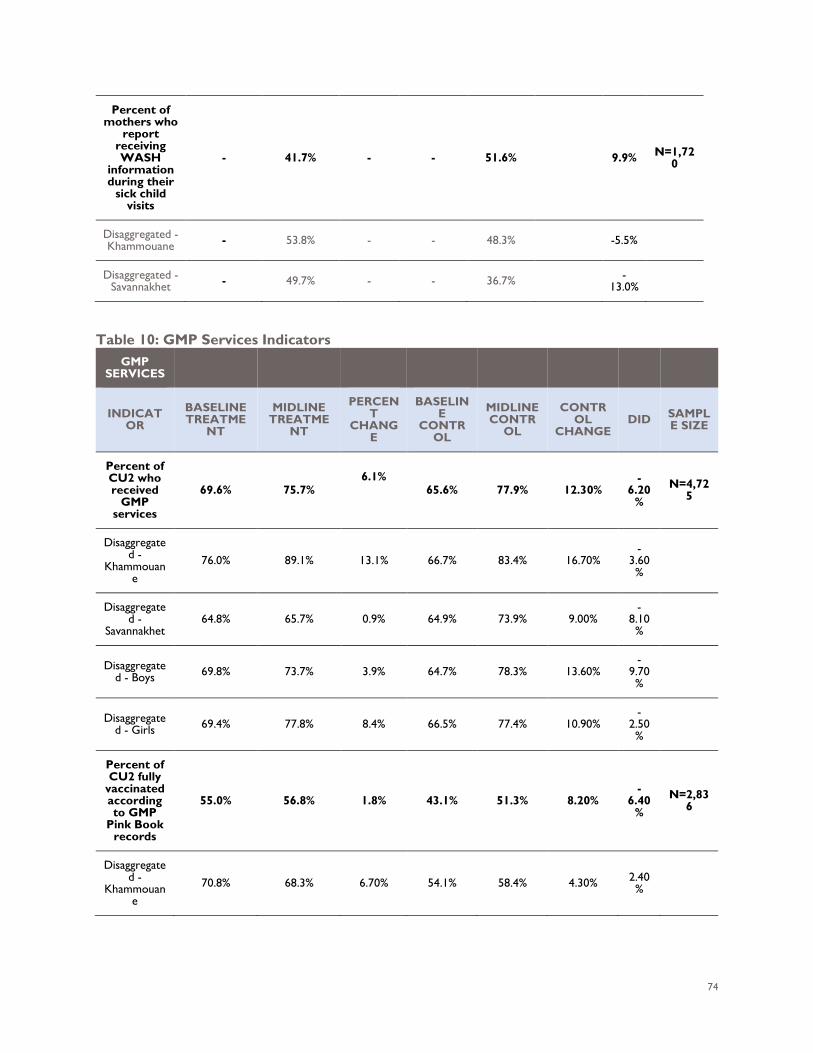
74
Percent of mothers who
report receiving WASH
information during their
sick child visits
- 41.7% - - 51.6% 9.9% N=1,720
Disaggregated - Khammouane - 53.8% - - 48.3% -5.5%
Disaggregated - Savannakhet - 49.7% - - 36.7% -
13.0%
Table 10: GMP Services Indicators
GMP SERVICES
INDICATOR
BASELINE TREATME
NT
MIDLINE TREATME
NT
PERCENT
CHANGE
BASELINE
CONTROL
MIDLINE CONTR
OL
CONTROL
CHANGE DID SAMPL
E SIZE
Percent of CU2 who received
GMP services
69.6% 75.7% 6.1%
65.6% 77.9% 12.30% -
6.20%
N=4,725
Disaggregated -
Khammouane
76.0% 89.1% 13.1% 66.7% 83.4% 16.70% -
3.60%
Disaggregated -
Savannakhet 64.8% 65.7% 0.9% 64.9% 73.9% 9.00%
-8.10%
Disaggregated - Boys 69.8% 73.7% 3.9% 64.7% 78.3% 13.60%
-9.70%
Disaggregated - Girls 69.4% 77.8% 8.4% 66.5% 77.4% 10.90%
-2.50%
Percent of CU2 fully
vaccinated according to GMP
Pink Book records
55.0% 56.8% 1.8% 43.1% 51.3% 8.20% -
6.40%
N=2,836
Disaggregated -
Khammouane
70.8% 68.3% 6.70% 54.1% 58.4% 4.30% 2.40%
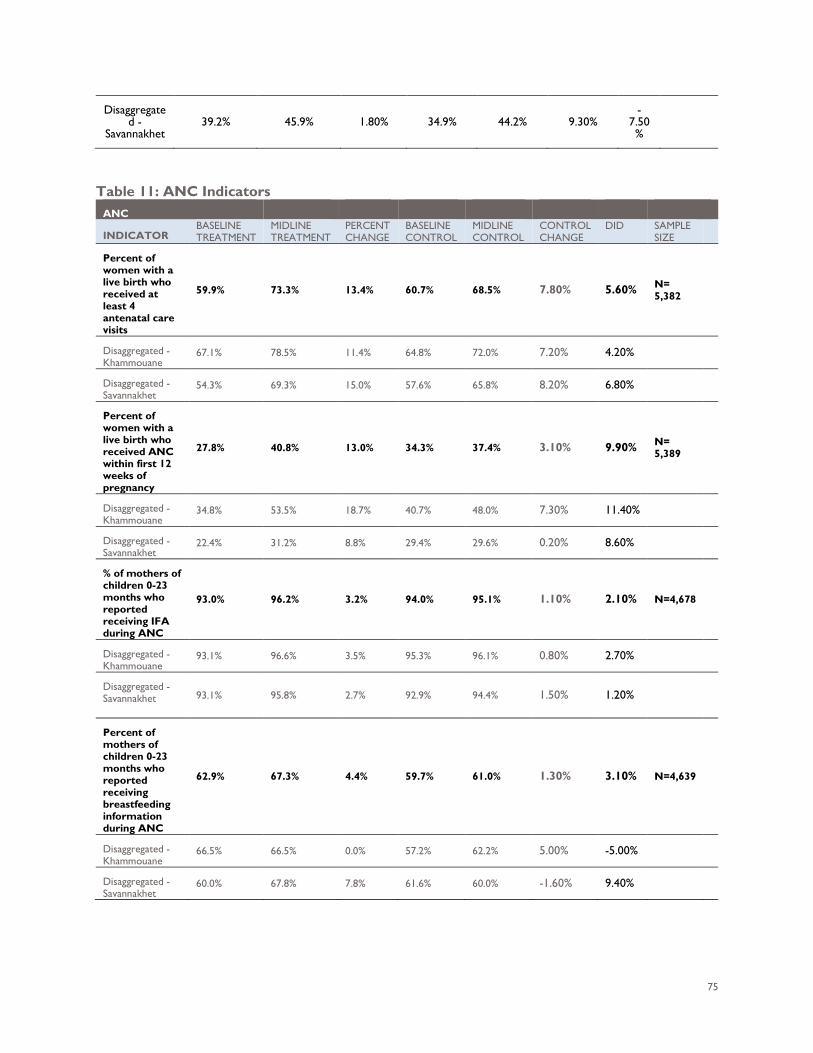
75
Disaggregated -
Savannakhet 39.2% 45.9% 1.80% 34.9% 44.2% 9.30%
-7.50%
Table 11: ANC Indicators
ANC
INDICATOR BASELINE TREATMENT
MIDLINE TREATMENT
PERCENT CHANGE
BASELINE CONTROL
MIDLINE CONTROL
CONTROL CHANGE
DID SAMPLE SIZE
Percent of women with a live birth who received at least 4 antenatal care visits
59.9% 73.3% 13.4% 60.7% 68.5% 7.80% 5.60% N= 5,382
Disaggregated - Khammouane
67.1% 78.5% 11.4% 64.8% 72.0% 7.20% 4.20%
Disaggregated - Savannakhet
54.3% 69.3% 15.0% 57.6% 65.8% 8.20% 6.80%
Percent of women with a live birth who received ANC within first 12 weeks of pregnancy
27.8% 40.8% 13.0% 34.3% 37.4% 3.10% 9.90% N= 5,389
Disaggregated - Khammouane
34.8% 53.5% 18.7% 40.7% 48.0% 7.30% 11.40%
Disaggregated - Savannakhet
22.4% 31.2% 8.8% 29.4% 29.6% 0.20% 8.60%
% of mothers of children 0-23 months who reported receiving IFA during ANC
93.0% 96.2% 3.2% 94.0% 95.1% 1.10% 2.10% N=4,678
Disaggregated - Khammouane
93.1% 96.6% 3.5% 95.3% 96.1% 0.80% 2.70%
Disaggregated - Savannakhet 93.1% 95.8% 2.7% 92.9% 94.4% 1.50% 1.20%
Percent of mothers of children 0-23 months who reported receiving breastfeeding information during ANC
62.9% 67.3% 4.4% 59.7% 61.0% 1.30% 3.10% N=4,639
Disaggregated - Khammouane
66.5% 66.5% 0.0% 57.2% 62.2% 5.00% -5.00%
Disaggregated - Savannakhet
60.0% 67.8% 7.8% 61.6% 60.0% -1.60% 9.40%
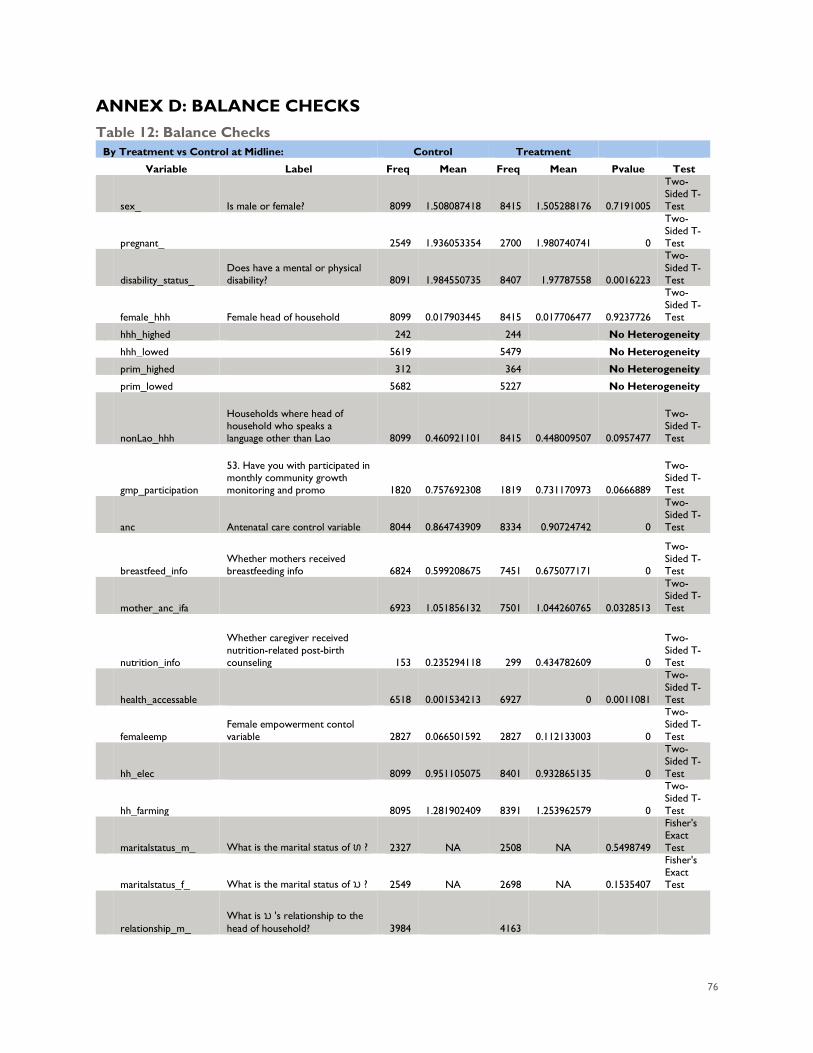
76
ANNEX D: BALANCE CHECKS Table 12: Balance Checks
By Treatment vs Control at Midline: Control Treatment
Variable Label Freq Mean Freq Mean Pvalue Test
sex_ Is male or female? 8099 1.508087418 8415 1.505288176 0.7191005
Two-Sided T-Test
pregnant_ 2549 1.936053354 2700 1.980740741 0
Two-Sided T-Test
disability_status_ Does have a mental or physical disability? 8091 1.984550735 8407 1.97787558 0.0016223
Two-Sided T-Test
female_hhh Female head of household 8099 0.017903445 8415 0.017706477 0.9237726
Two-Sided T-Test
hhh_highed 242 244 No Heterogeneity
hhh_lowed 5619 5479 No Heterogeneity
prim_highed 312 364 No Heterogeneity
prim_lowed 5682 5227 No Heterogeneity
nonLao_hhh
Households where head of household who speaks a language other than Lao 8099 0.460921101 8415 0.448009507 0.0957477
Two-Sided T-Test
gmp_participation
53. Have you with participated in monthly community growth monitoring and promo 1820 0.757692308 1819 0.731170973 0.0666889
Two-Sided T-Test
anc Antenatal care control variable 8044 0.864743909 8334 0.90724742 0
Two-Sided T-Test
breastfeed_info Whether mothers received breastfeeding info 6824 0.599208675 7451 0.675077171 0
Two-Sided T-Test
mother_anc_ifa 6923 1.051856132 7501 1.044260765 0.0328513
Two-Sided T-Test
nutrition_info
Whether caregiver received nutrition-related post-birth counseling 153 0.235294118 299 0.434782609 0
Two-Sided T-Test
health_accessable 6518 0.001534213 6927 0 0.0011081
Two-Sided T-Test
femaleemp Female empowerment contol variable 2827 0.066501592 2827 0.112133003 0
Two-Sided T-Test
hh_elec 8099 0.951105075 8401 0.932865135 0
Two-Sided T-Test
hh_farming 8095 1.281902409 8391 1.253962579 0
Two-Sided T-Test
maritalstatus_m_ What is the marital status of ທ ? 2327 NA 2508 NA 0.5498749
Fisher's Exact Test
maritalstatus_f_ What is the marital status of ນ ? 2549 NA 2698 NA 0.1535407
Fisher's Exact Test
relationship_m_ What is ນ 's relationship to the head of household? 3984 4163

77
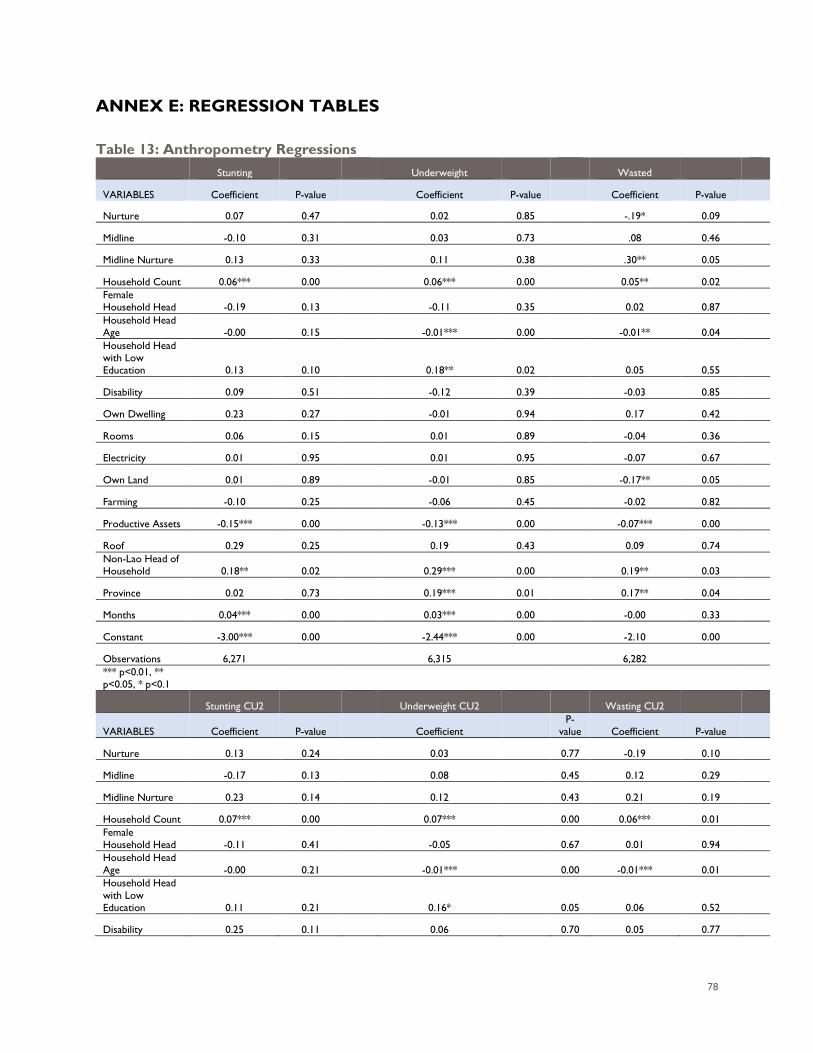
78
ANNEX E: REGRESSION TABLES Table 13: Anthropometry Regressions
Stunting
Underweight
Wasted
VARIABLES Coefficient P-value
Coefficient P-value
Coefficient P-value
Nurture 0.07 0.47
0.02 0.85
-.19* 0.09
Midline -0.10 0.31
0.03 0.73
.08 0.46
Midline Nurture 0.13 0.33
0.11 0.38
.30** 0.05
Household Count 0.06*** 0.00
0.06*** 0.00
0.05** 0.02
Female Household Head -0.19 0.13
-0.11 0.35
0.02 0.87
Household Head Age -0.00 0.15
-0.01*** 0.00
-0.01** 0.04
Household Head with Low Education 0.13 0.10
0.18** 0.02
0.05 0.55
Disability 0.09 0.51
-0.12 0.39
-0.03 0.85
Own Dwelling 0.23 0.27
-0.01 0.94
0.17 0.42
Rooms 0.06 0.15
0.01 0.89
-0.04 0.36
Electricity 0.01 0.95
0.01 0.95
-0.07 0.67
Own Land 0.01 0.89
-0.01 0.85
-0.17** 0.05
Farming -0.10 0.25
-0.06 0.45
-0.02 0.82
Productive Assets -0.15*** 0.00
-0.13*** 0.00
-0.07*** 0.00
Roof 0.29 0.25
0.19 0.43
0.09 0.74
Non-Lao Head of Household 0.18** 0.02
0.29*** 0.00
0.19** 0.03
Province 0.02 0.73
0.19*** 0.01
0.17** 0.04
Months 0.04*** 0.00
0.03*** 0.00
-0.00 0.33
Constant -3.00*** 0.00
-2.44*** 0.00
-2.10 0.00
Observations 6,271
6,315
6,282
*** p<0.01, ** p<0.05, * p<0.1
Stunting CU2
Underweight CU2
Wasting CU2
VARIABLES Coefficient P-value
Coefficient P-
value Coefficient P-value
Nurture 0.13 0.24
0.03
0.77 -0.19 0.10
Midline -0.17 0.13
0.08
0.45 0.12 0.29
Midline Nurture 0.23 0.14
0.12
0.43 0.21 0.19
Household Count 0.07*** 0.00
0.07***
0.00 0.06*** 0.01
Female Household Head -0.11 0.41
-0.05
0.67 0.01 0.94
Household Head Age -0.00 0.21
-0.01***
0.00 -0.01*** 0.01
Household Head with Low Education 0.11 0.21
0.16*
0.05 0.06 0.52
Disability 0.25 0.11
0.06
0.70 0.05 0.77
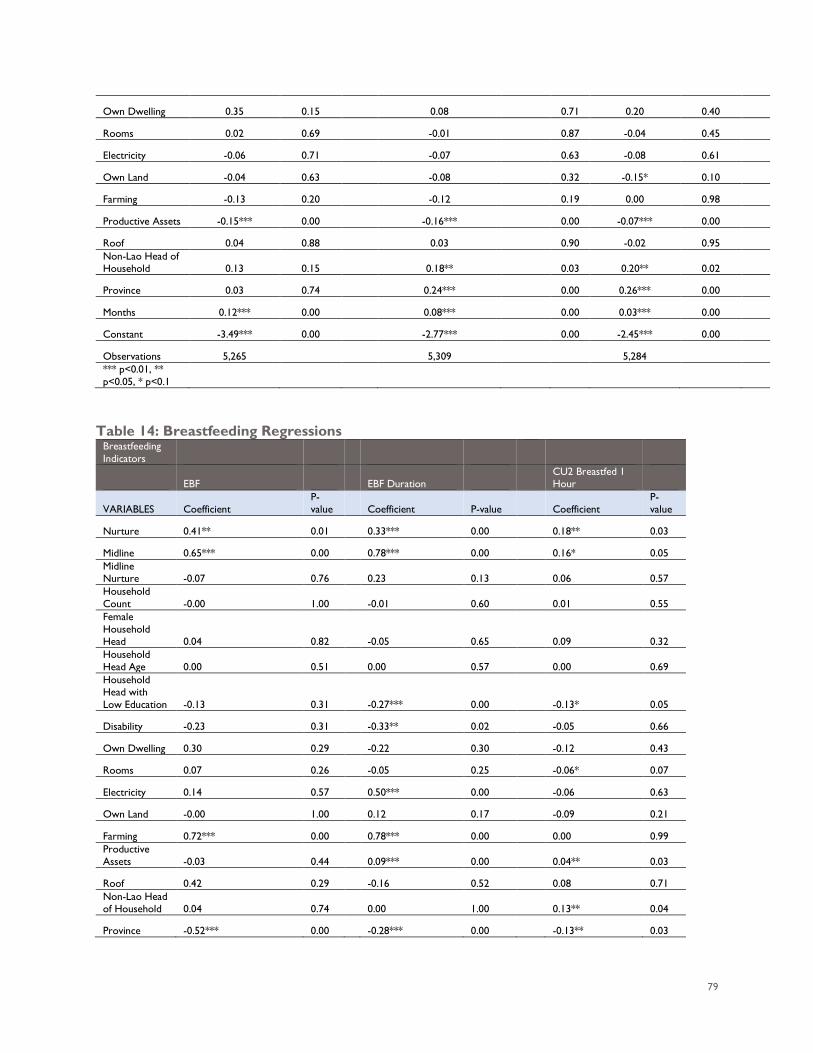
79
Own Dwelling 0.35 0.15
0.08
0.71 0.20 0.40
Rooms 0.02 0.69
-0.01
0.87 -0.04 0.45
Electricity -0.06 0.71
-0.07
0.63 -0.08 0.61
Own Land -0.04 0.63
-0.08
0.32 -0.15* 0.10
Farming -0.13 0.20
-0.12
0.19 0.00 0.98
Productive Assets -0.15*** 0.00
-0.16***
0.00 -0.07*** 0.00
Roof 0.04 0.88
0.03
0.90 -0.02 0.95
Non-Lao Head of Household 0.13 0.15
0.18**
0.03 0.20** 0.02
Province 0.03 0.74
0.24***
0.00 0.26*** 0.00
Months 0.12*** 0.00
0.08***
0.00 0.03*** 0.00
Constant -3.49*** 0.00
-2.77***
0.00 -2.45*** 0.00
Observations 5,265
5,309
5,284
*** p<0.01, ** p<0.05, * p<0.1
Table 14: Breastfeeding Regressions
Breastfeeding Indicators
EBF
EBF Duration CU2 Breastfed 1
Hour
VARIABLES Coefficient P-value
Coefficient P-value
Coefficient
P-value
Nurture 0.41** 0.01
0.33*** 0.00
0.18** 0.03
Midline 0.65*** 0.00
0.78*** 0.00
0.16* 0.05 Midline Nurture -0.07 0.76
0.23 0.13
0.06 0.57
Household Count -0.00 1.00
-0.01 0.60
0.01 0.55
Female Household Head 0.04 0.82
-0.05 0.65
0.09 0.32 Household Head Age 0.00 0.51
0.00 0.57
0.00 0.69
Household Head with Low Education -0.13 0.31
-0.27*** 0.00
-0.13* 0.05
Disability -0.23 0.31
-0.33** 0.02
-0.05 0.66
Own Dwelling 0.30 0.29
-0.22 0.30
-0.12 0.43
Rooms 0.07 0.26
-0.05 0.25
-0.06* 0.07
Electricity 0.14 0.57
0.50*** 0.00
-0.06 0.63
Own Land -0.00 1.00
0.12 0.17
-0.09 0.21
Farming 0.72*** 0.00
0.78*** 0.00
0.00 0.99 Productive Assets -0.03 0.44
0.09*** 0.00
0.04** 0.03
Roof 0.42 0.29
-0.16 0.52
0.08 0.71 Non-Lao Head of Household 0.04 0.74
0.00 1.00
0.13** 0.04
Province -0.52*** 0.00
-0.28*** 0.00
-0.13** 0.03
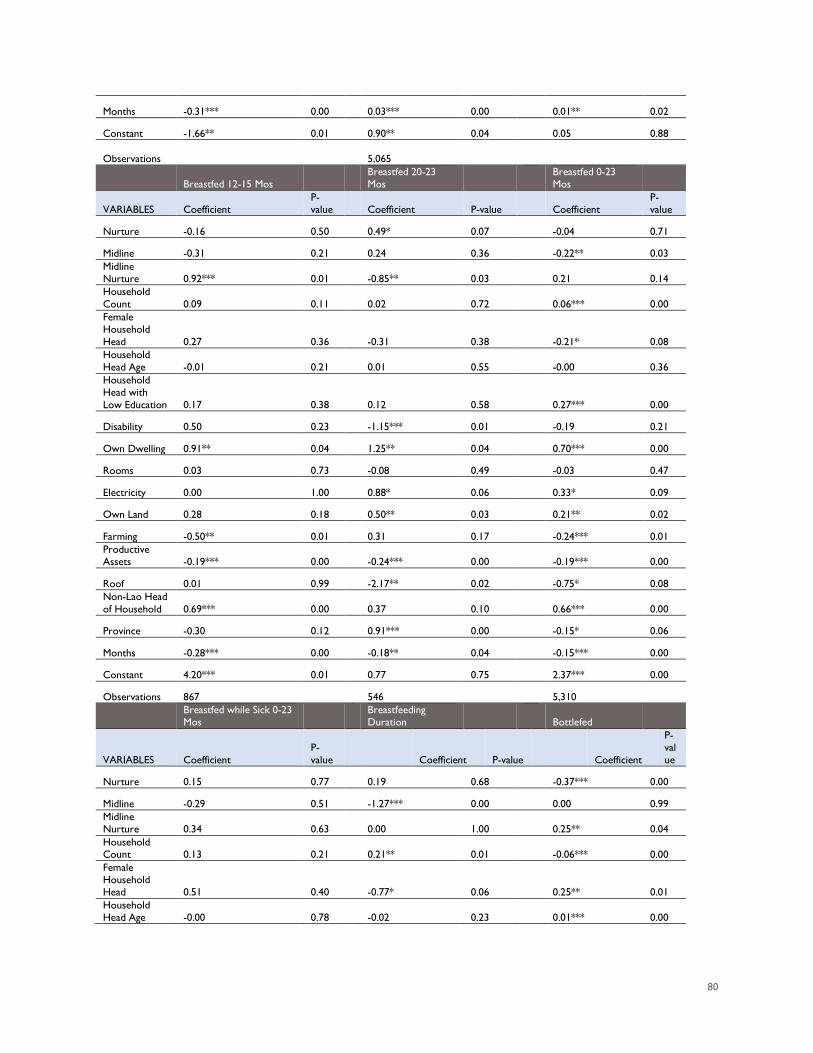
80
Months -0.31*** 0.00
0.03*** 0.00
0.01** 0.02
Constant -1.66** 0.01
0.90** 0.04
0.05 0.88
Observations EBF
5,065 CU2 Breastfed 1
Hour
Breastfed 12-15 Mos Breastfed 20-23
Mos Breastfed 0-23
Mos
VARIABLES Coefficient P-value
Coefficient P-value
Coefficient
P-value
Nurture -0.16 0.50
0.49* 0.07
-0.04 0.71
Midline -0.31 0.21
0.24 0.36
-0.22** 0.03 Midline Nurture 0.92*** 0.01
-0.85** 0.03
0.21 0.14
Household Count 0.09 0.11
0.02 0.72
0.06*** 0.00
Female Household Head 0.27 0.36
-0.31 0.38
-0.21* 0.08 Household Head Age -0.01 0.21
0.01 0.55
-0.00 0.36
Household Head with Low Education 0.17 0.38
0.12 0.58
0.27*** 0.00
Disability 0.50 0.23
-1.15*** 0.01
-0.19 0.21
Own Dwelling 0.91** 0.04
1.25** 0.04
0.70*** 0.00
Rooms 0.03 0.73
-0.08 0.49
-0.03 0.47
Electricity 0.00 1.00
0.88* 0.06
0.33* 0.09
Own Land 0.28 0.18
0.50** 0.03
0.21** 0.02
Farming -0.50** 0.01
0.31 0.17
-0.24*** 0.01 Productive Assets -0.19*** 0.00
-0.24*** 0.00
-0.19*** 0.00
Roof 0.01 0.99
-2.17** 0.02
-0.75* 0.08 Non-Lao Head of Household 0.69*** 0.00
0.37 0.10
0.66*** 0.00
Province -0.30 0.12
0.91*** 0.00
-0.15* 0.06
Months -0.28*** 0.00
-0.18** 0.04
-0.15*** 0.00
Constant 4.20*** 0.01
0.77 0.75
2.37*** 0.00
Observations 867
546
5,310
Breastfed while Sick 0-23 Mos
Breastfeeding Duration
Bottlefed
VARIABLES Coefficient P-value
Coefficient P-value
Coefficient
P-value
Nurture 0.15 0.77
0.19 0.68
-0.37*** 0.00
Midline -0.29 0.51
-1.27*** 0.00
0.00 0.99 Midline Nurture 0.34 0.63
0.00 1.00
0.25** 0.04
Household Count 0.13 0.21
0.21** 0.01
-0.06*** 0.00
Female Household Head 0.51 0.40
-0.77* 0.06
0.25** 0.01 Household Head Age -0.00 0.78
-0.02 0.23
0.01*** 0.00
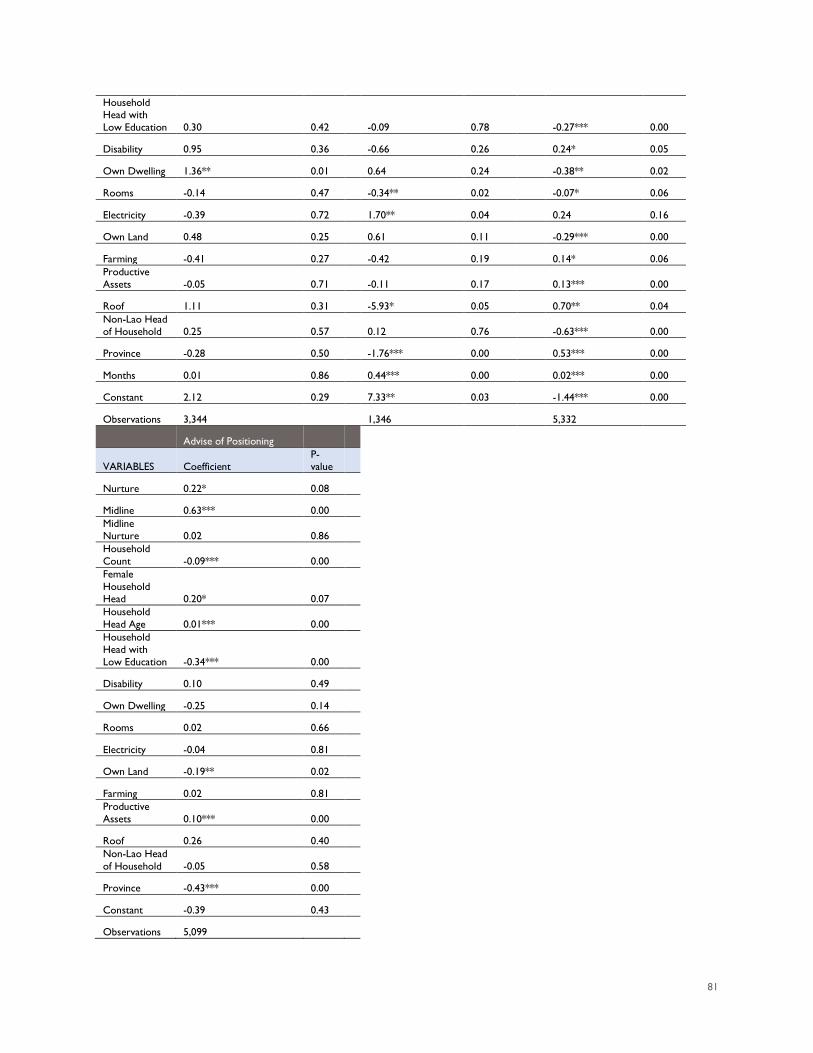
81
Household Head with Low Education 0.30 0.42
-0.09 0.78
-0.27*** 0.00
Disability 0.95 0.36
-0.66 0.26
0.24* 0.05
Own Dwelling 1.36** 0.01
0.64 0.24
-0.38** 0.02
Rooms -0.14 0.47
-0.34** 0.02
-0.07* 0.06
Electricity -0.39 0.72
1.70** 0.04
0.24 0.16
Own Land 0.48 0.25
0.61 0.11
-0.29*** 0.00
Farming -0.41 0.27
-0.42 0.19
0.14* 0.06 Productive Assets -0.05 0.71
-0.11 0.17
0.13*** 0.00
Roof 1.11 0.31
-5.93* 0.05
0.70** 0.04 Non-Lao Head of Household 0.25 0.57
0.12 0.76
-0.63*** 0.00
Province -0.28 0.50
-1.76*** 0.00
0.53*** 0.00
Months 0.01 0.86
0.44*** 0.00
0.02*** 0.00
Constant 2.12 0.29
7.33** 0.03
-1.44*** 0.00
Observations 3,344
1,346
5,332
Advise of Positioning
VARIABLES Coefficient P-value
Nurture 0.22* 0.08
Midline 0.63*** 0.00
Midline Nurture 0.02 0.86
Household Count -0.09*** 0.00
Female Household Head 0.20* 0.07
Household Head Age 0.01*** 0.00
Household Head with Low Education -0.34*** 0.00
Disability 0.10 0.49
Own Dwelling -0.25 0.14
Rooms 0.02 0.66
Electricity -0.04 0.81
Own Land -0.19** 0.02
Farming 0.02 0.81
Productive Assets 0.10*** 0.00
Roof 0.26 0.40
Non-Lao Head of Household -0.05 0.58
Province -0.43*** 0.00
Constant -0.39 0.43
Observations 5,099
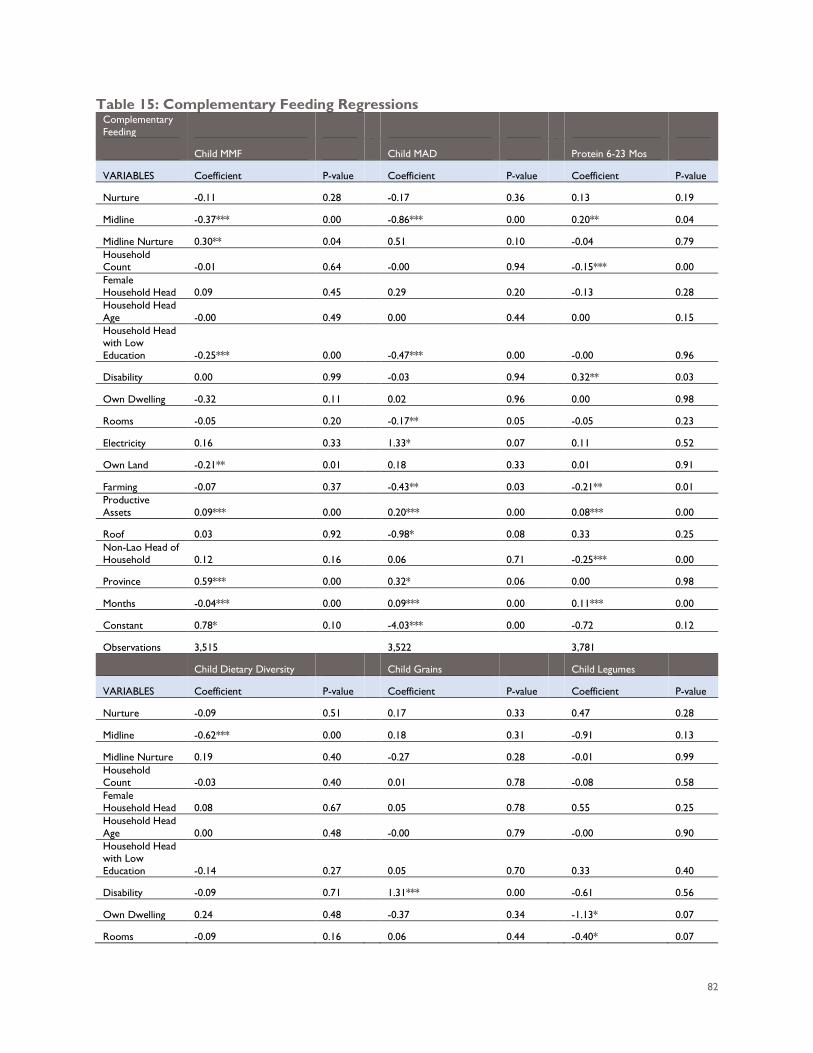
82
Table 15: Complementary Feeding Regressions Complementary Feeding
Child MMF
Child MAD
Protein 6-23 Mos
VARIABLES Coefficient P-value
Coefficient P-value
Coefficient P-value
Nurture -0.11 0.28
-0.17 0.36
0.13 0.19
Midline -0.37*** 0.00
-0.86*** 0.00
0.20** 0.04
Midline Nurture 0.30** 0.04
0.51 0.10
-0.04 0.79 Household Count -0.01 0.64
-0.00 0.94
-0.15*** 0.00
Female Household Head 0.09 0.45
0.29 0.20
-0.13 0.28
Household Head Age -0.00 0.49
0.00 0.44
0.00 0.15
Household Head with Low Education -0.25*** 0.00
-0.47*** 0.00
-0.00 0.96
Disability 0.00 0.99
-0.03 0.94
0.32** 0.03
Own Dwelling -0.32 0.11
0.02 0.96
0.00 0.98
Rooms -0.05 0.20
-0.17** 0.05
-0.05 0.23
Electricity 0.16 0.33
1.33* 0.07
0.11 0.52
Own Land -0.21** 0.01
0.18 0.33
0.01 0.91
Farming -0.07 0.37
-0.43** 0.03
-0.21** 0.01 Productive Assets 0.09*** 0.00
0.20*** 0.00
0.08*** 0.00
Roof 0.03 0.92
-0.98* 0.08
0.33 0.25 Non-Lao Head of Household 0.12 0.16
0.06 0.71
-0.25*** 0.00
Province 0.59*** 0.00
0.32* 0.06
0.00 0.98
Months -0.04*** 0.00
0.09*** 0.00
0.11*** 0.00
Constant 0.78* 0.10
-4.03*** 0.00
-0.72 0.12
Observations 3,515
3,522
3,781
Child Dietary Diversity
Child Grains
Child Legumes
VARIABLES Coefficient P-value
Coefficient P-value
Coefficient P-value
Nurture -0.09 0.51
0.17 0.33
0.47 0.28
Midline -0.62*** 0.00
0.18 0.31
-0.91 0.13
Midline Nurture 0.19 0.40
-0.27 0.28
-0.01 0.99 Household Count -0.03 0.40
0.01 0.78
-0.08 0.58
Female Household Head 0.08 0.67
0.05 0.78
0.55 0.25
Household Head Age 0.00 0.48
-0.00 0.79
-0.00 0.90
Household Head with Low Education -0.14 0.27
0.05 0.70
0.33 0.40
Disability -0.09 0.71
1.31*** 0.00
-0.61 0.56
Own Dwelling 0.24 0.48
-0.37 0.34
-1.13* 0.07
Rooms -0.09 0.16
0.06 0.44
-0.40* 0.07
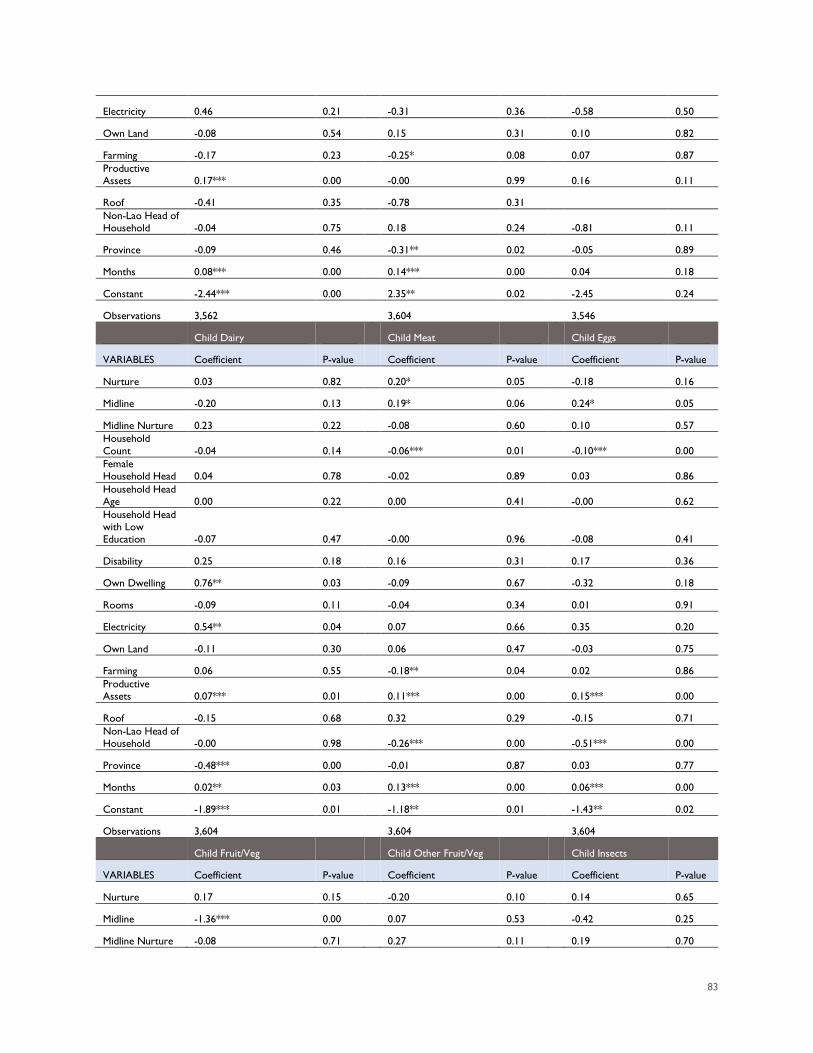
83
Electricity 0.46 0.21
-0.31 0.36
-0.58 0.50
Own Land -0.08 0.54
0.15 0.31
0.10 0.82
Farming -0.17 0.23
-0.25* 0.08
0.07 0.87 Productive Assets 0.17*** 0.00
-0.00 0.99
0.16 0.11
Roof -0.41 0.35
-0.78 0.31
Non-Lao Head of Household -0.04 0.75
0.18 0.24
-0.81 0.11
Province -0.09 0.46
-0.31** 0.02
-0.05 0.89
Months 0.08*** 0.00
0.14*** 0.00
0.04 0.18
Constant -2.44*** 0.00
2.35** 0.02
-2.45 0.24
Observations 3,562
3,604
3,546
Child Dairy
Child Meat
Child Eggs
VARIABLES Coefficient P-value
Coefficient P-value
Coefficient P-value
Nurture 0.03 0.82
0.20* 0.05
-0.18 0.16
Midline -0.20 0.13
0.19* 0.06
0.24* 0.05
Midline Nurture 0.23 0.22
-0.08 0.60
0.10 0.57 Household Count -0.04 0.14
-0.06*** 0.01
-0.10*** 0.00
Female Household Head 0.04 0.78
-0.02 0.89
0.03 0.86
Household Head Age 0.00 0.22
0.00 0.41
-0.00 0.62
Household Head with Low Education -0.07 0.47
-0.00 0.96
-0.08 0.41
Disability 0.25 0.18
0.16 0.31
0.17 0.36
Own Dwelling 0.76** 0.03
-0.09 0.67
-0.32 0.18
Rooms -0.09 0.11
-0.04 0.34
0.01 0.91
Electricity 0.54** 0.04
0.07 0.66
0.35 0.20
Own Land -0.11 0.30
0.06 0.47
-0.03 0.75
Farming 0.06 0.55
-0.18** 0.04
0.02 0.86 Productive Assets 0.07*** 0.01
0.11*** 0.00
0.15*** 0.00
Roof -0.15 0.68
0.32 0.29
-0.15 0.71 Non-Lao Head of Household -0.00 0.98
-0.26*** 0.00
-0.51*** 0.00
Province -0.48*** 0.00
-0.01 0.87
0.03 0.77
Months 0.02** 0.03
0.13*** 0.00
0.06*** 0.00
Constant -1.89*** 0.01
-1.18** 0.01
-1.43** 0.02
Observations 3,604
3,604
3,604
Child Fruit/Veg
Child Other Fruit/Veg
Child Insects
VARIABLES Coefficient P-value
Coefficient P-value
Coefficient P-value
Nurture 0.17 0.15
-0.20 0.10
0.14 0.65
Midline -1.36*** 0.00
0.07 0.53
-0.42 0.25
Midline Nurture -0.08 0.71
0.27 0.11
0.19 0.70
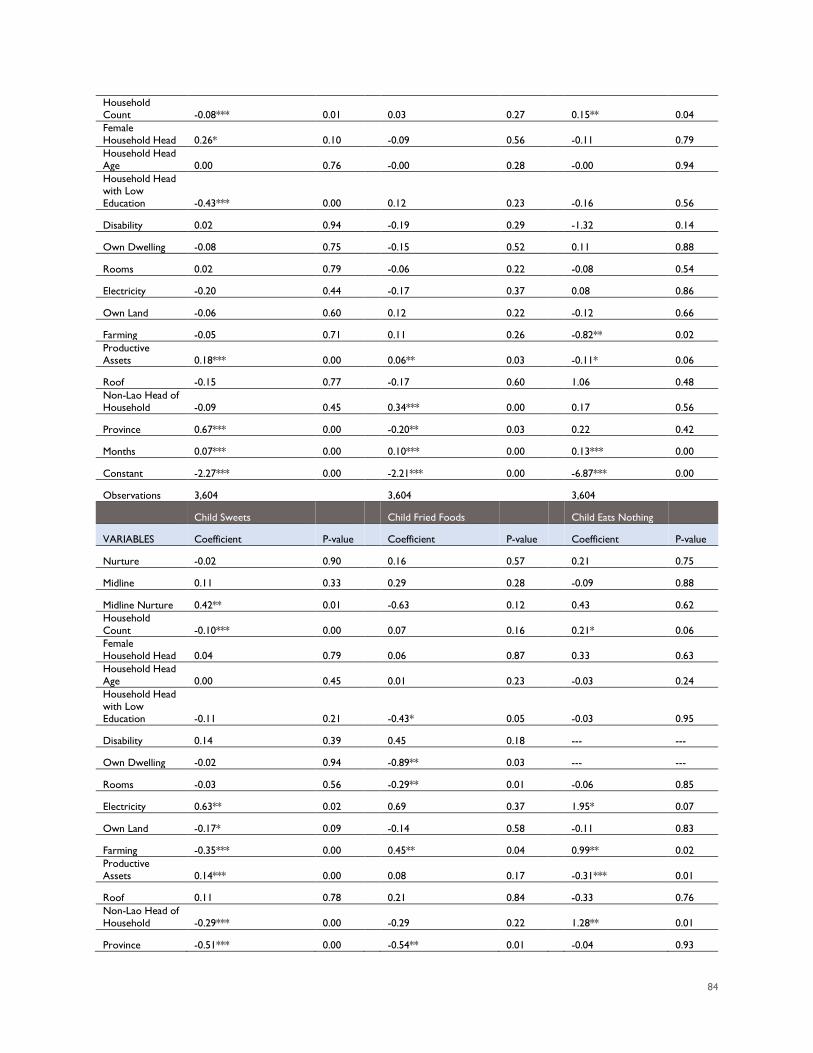
84
Household Count -0.08*** 0.01
0.03 0.27
0.15** 0.04
Female Household Head 0.26* 0.10
-0.09 0.56
-0.11 0.79
Household Head Age 0.00 0.76
-0.00 0.28
-0.00 0.94
Household Head with Low Education -0.43*** 0.00
0.12 0.23
-0.16 0.56
Disability 0.02 0.94
-0.19 0.29
-1.32 0.14
Own Dwelling -0.08 0.75
-0.15 0.52
0.11 0.88
Rooms 0.02 0.79
-0.06 0.22
-0.08 0.54
Electricity -0.20 0.44
-0.17 0.37
0.08 0.86
Own Land -0.06 0.60
0.12 0.22
-0.12 0.66
Farming -0.05 0.71
0.11 0.26
-0.82** 0.02 Productive Assets 0.18*** 0.00
0.06** 0.03
-0.11* 0.06
Roof -0.15 0.77
-0.17 0.60
1.06 0.48 Non-Lao Head of Household -0.09 0.45
0.34*** 0.00
0.17 0.56
Province 0.67*** 0.00
-0.20** 0.03
0.22 0.42
Months 0.07*** 0.00
0.10*** 0.00
0.13*** 0.00
Constant -2.27*** 0.00
-2.21*** 0.00
-6.87*** 0.00
Observations 3,604
3,604
3,604
Child Sweets
Child Fried Foods
Child Eats Nothing
VARIABLES Coefficient P-value
Coefficient P-value
Coefficient P-value
Nurture -0.02 0.90
0.16 0.57
0.21 0.75
Midline 0.11 0.33
0.29 0.28
-0.09 0.88
Midline Nurture 0.42** 0.01
-0.63 0.12
0.43 0.62 Household Count -0.10*** 0.00
0.07 0.16
0.21* 0.06
Female Household Head 0.04 0.79
0.06 0.87
0.33 0.63
Household Head Age 0.00 0.45
0.01 0.23
-0.03 0.24
Household Head with Low Education -0.11 0.21
-0.43* 0.05
-0.03 0.95
Disability 0.14 0.39
0.45 0.18
--- ---
Own Dwelling -0.02 0.94
-0.89** 0.03
--- ---
Rooms -0.03 0.56
-0.29** 0.01
-0.06 0.85
Electricity 0.63** 0.02
0.69 0.37
1.95* 0.07
Own Land -0.17* 0.09
-0.14 0.58
-0.11 0.83
Farming -0.35*** 0.00
0.45** 0.04
0.99** 0.02 Productive Assets 0.14*** 0.00
0.08 0.17
-0.31*** 0.01
Roof 0.11 0.78
0.21 0.84
-0.33 0.76 Non-Lao Head of Household -0.29*** 0.00
-0.29 0.22
1.28** 0.01
Province -0.51*** 0.00
-0.54** 0.01
-0.04 0.93
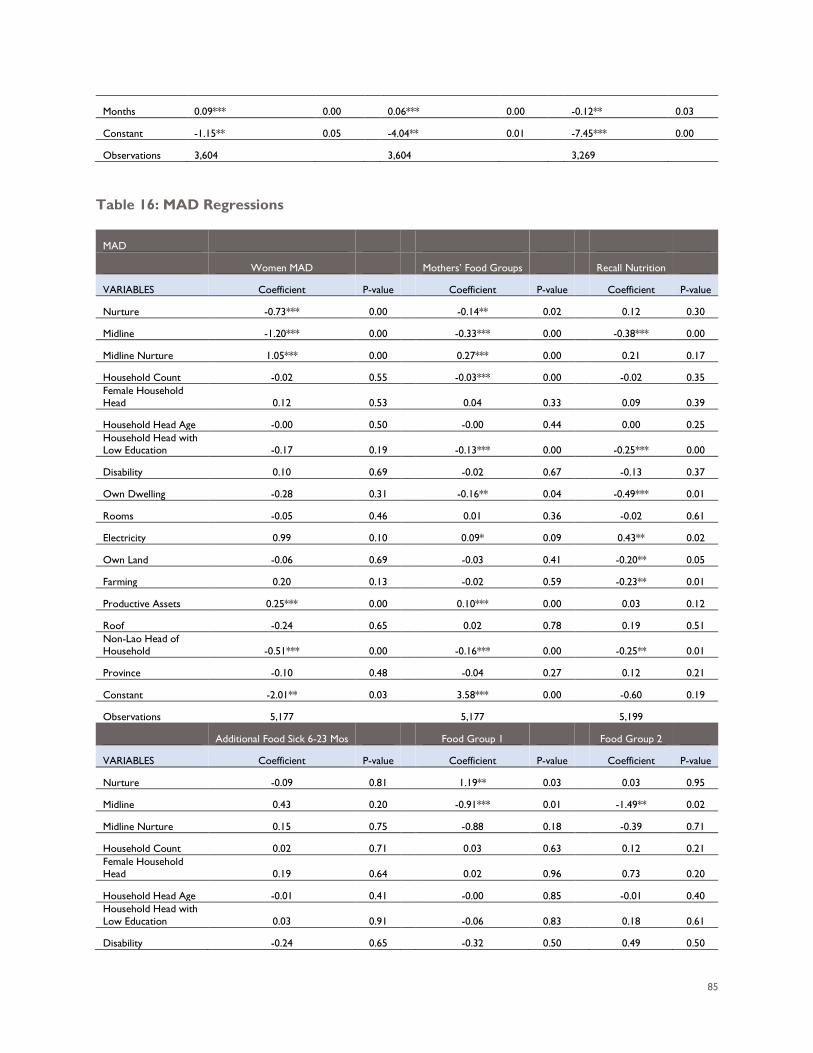
85
Months 0.09*** 0.00
0.06*** 0.00
-0.12** 0.03
Constant -1.15** 0.05
-4.04** 0.01
-7.45*** 0.00
Observations 3,604
3,604
3,269
Table 16: MAD Regressions
MAD
Women MAD
Mothers’ Food Groups
Recall Nutrition
VARIABLES Coefficient P-value
Coefficient P-value
Coefficient P-value
Nurture -0.73*** 0.00
-0.14** 0.02
0.12 0.30
Midline -1.20*** 0.00
-0.33*** 0.00
-0.38*** 0.00
Midline Nurture 1.05*** 0.00
0.27*** 0.00
0.21 0.17
Household Count -0.02 0.55
-0.03*** 0.00
-0.02 0.35 Female Household Head 0.12 0.53
0.04 0.33
0.09 0.39
Household Head Age -0.00 0.50
-0.00 0.44
0.00 0.25 Household Head with Low Education -0.17 0.19
-0.13*** 0.00
-0.25*** 0.00
Disability 0.10 0.69
-0.02 0.67
-0.13 0.37
Own Dwelling -0.28 0.31
-0.16** 0.04
-0.49*** 0.01
Rooms -0.05 0.46
0.01 0.36
-0.02 0.61
Electricity 0.99 0.10
0.09* 0.09
0.43** 0.02
Own Land -0.06 0.69
-0.03 0.41
-0.20** 0.05
Farming 0.20 0.13
-0.02 0.59
-0.23** 0.01
Productive Assets 0.25*** 0.00
0.10*** 0.00
0.03 0.12
Roof -0.24 0.65
0.02 0.78
0.19 0.51 Non-Lao Head of Household -0.51*** 0.00
-0.16*** 0.00
-0.25** 0.01
Province -0.10 0.48
-0.04 0.27
0.12 0.21
Constant -2.01** 0.03
3.58*** 0.00
-0.60 0.19
Observations 5,177
5,177
5,199
Additional Food Sick 6-23 Mos
Food Group 1
Food Group 2
VARIABLES Coefficient P-value
Coefficient P-value
Coefficient P-value
Nurture -0.09 0.81
1.19** 0.03
0.03 0.95
Midline 0.43 0.20
-0.91*** 0.01
-1.49** 0.02
Midline Nurture 0.15 0.75
-0.88 0.18
-0.39 0.71
Household Count 0.02 0.71
0.03 0.63
0.12 0.21 Female Household Head 0.19 0.64
0.02 0.96
0.73 0.20
Household Head Age -0.01 0.41
-0.00 0.85
-0.01 0.40 Household Head with Low Education 0.03 0.91
-0.06 0.83
0.18 0.61
Disability -0.24 0.65
-0.32 0.50
0.49 0.50
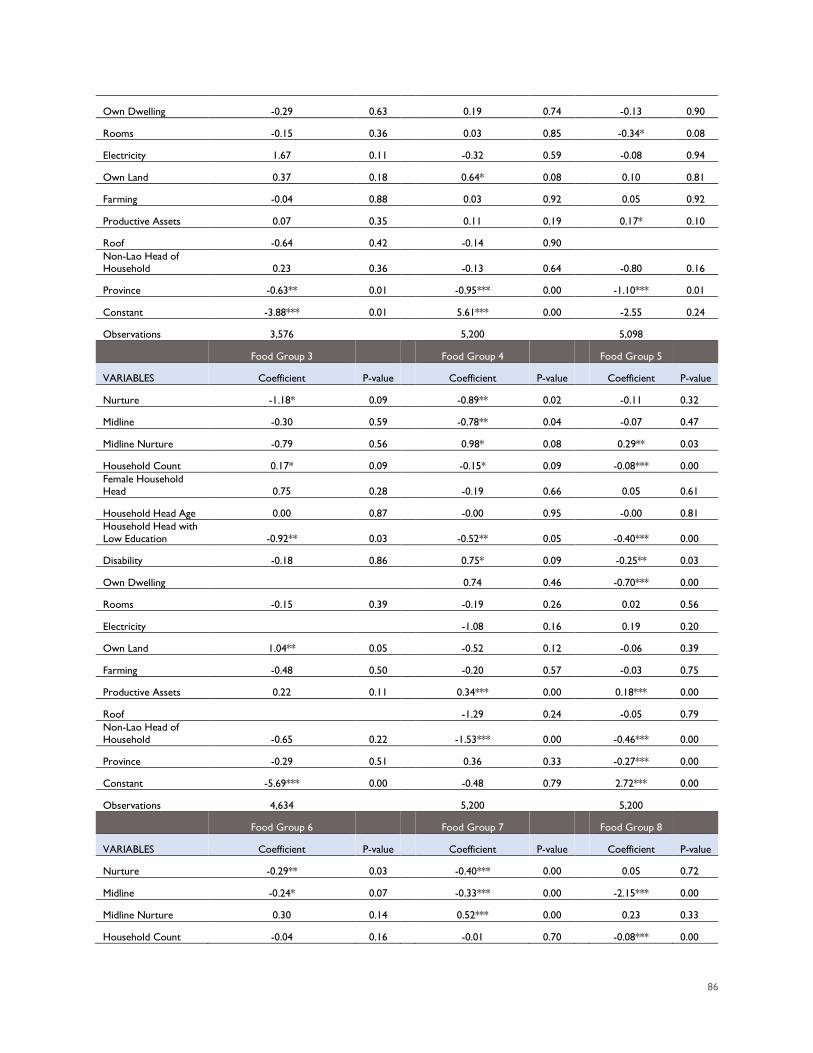
86
Own Dwelling -0.29 0.63
0.19 0.74
-0.13 0.90
Rooms -0.15 0.36
0.03 0.85
-0.34* 0.08
Electricity 1.67 0.11
-0.32 0.59
-0.08 0.94
Own Land 0.37 0.18
0.64* 0.08
0.10 0.81
Farming -0.04 0.88
0.03 0.92
0.05 0.92
Productive Assets 0.07 0.35
0.11 0.19
0.17* 0.10
Roof -0.64 0.42
-0.14 0.90
Non-Lao Head of Household 0.23 0.36
-0.13 0.64
-0.80 0.16
Province -0.63** 0.01
-0.95*** 0.00
-1.10*** 0.01
Constant -3.88*** 0.01
5.61*** 0.00
-2.55 0.24
Observations 3,576
5,200
5,098
Food Group 3
Food Group 4
Food Group 5
VARIABLES Coefficient P-value
Coefficient P-value
Coefficient P-value
Nurture -1.18* 0.09
-0.89** 0.02
-0.11 0.32
Midline -0.30 0.59
-0.78** 0.04
-0.07 0.47
Midline Nurture -0.79 0.56
0.98* 0.08
0.29** 0.03
Household Count 0.17* 0.09
-0.15* 0.09
-0.08*** 0.00 Female Household Head 0.75 0.28
-0.19 0.66
0.05 0.61
Household Head Age 0.00 0.87
-0.00 0.95
-0.00 0.81 Household Head with Low Education -0.92** 0.03
-0.52** 0.05
-0.40*** 0.00
Disability -0.18 0.86
0.75* 0.09
-0.25** 0.03
Own Dwelling
0.74 0.46
-0.70*** 0.00
Rooms -0.15 0.39
-0.19 0.26
0.02 0.56
Electricity
-1.08 0.16
0.19 0.20
Own Land 1.04** 0.05
-0.52 0.12
-0.06 0.39
Farming -0.48 0.50
-0.20 0.57
-0.03 0.75
Productive Assets 0.22 0.11
0.34*** 0.00
0.18*** 0.00
Roof
-1.29 0.24
-0.05 0.79 Non-Lao Head of Household -0.65 0.22
-1.53*** 0.00
-0.46*** 0.00
Province -0.29 0.51
0.36 0.33
-0.27*** 0.00
Constant -5.69*** 0.00
-0.48 0.79
2.72*** 0.00
Observations 4,634
5,200
5,200
Food Group 6
Food Group 7
Food Group 8
VARIABLES Coefficient P-value
Coefficient P-value
Coefficient P-value
Nurture -0.29** 0.03
-0.40*** 0.00
0.05 0.72
Midline -0.24* 0.07
-0.33*** 0.00
-2.15*** 0.00
Midline Nurture 0.30 0.14
0.52*** 0.00
0.23 0.33
Household Count -0.04 0.16
-0.01 0.70
-0.08*** 0.00
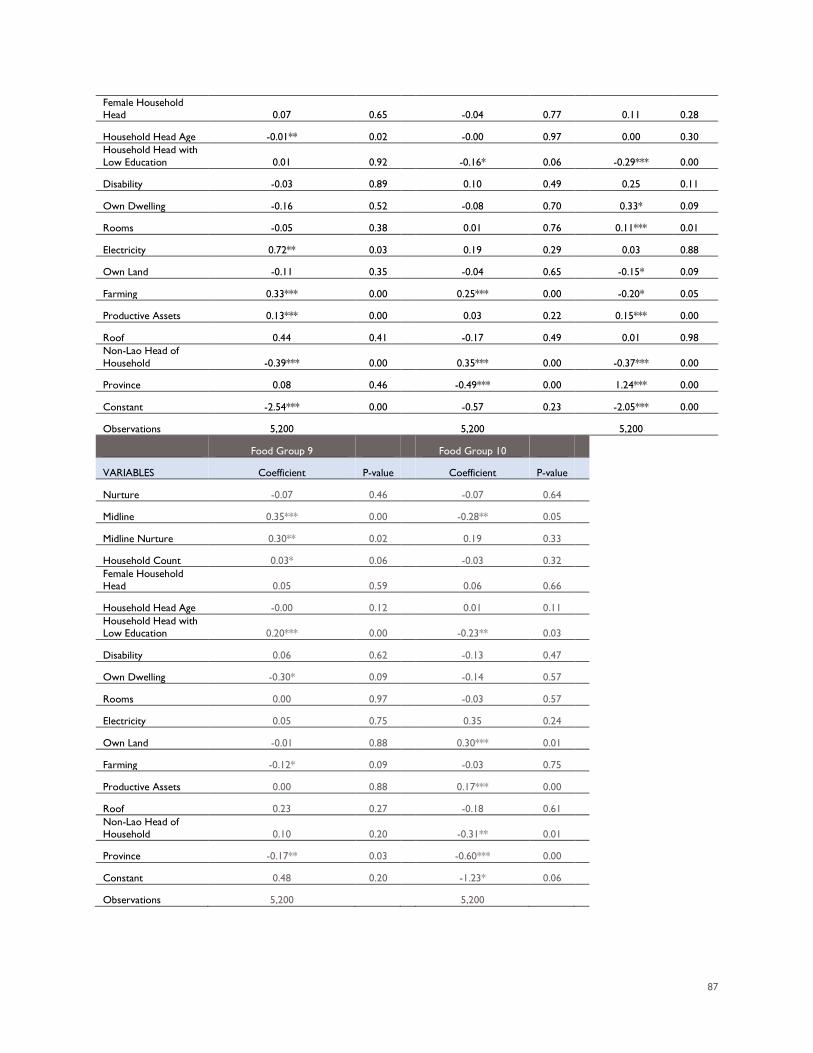
87
Female Household Head 0.07 0.65
-0.04 0.77
0.11 0.28
Household Head Age -0.01** 0.02
-0.00 0.97
0.00 0.30 Household Head with Low Education 0.01 0.92
-0.16* 0.06
-0.29*** 0.00
Disability -0.03 0.89
0.10 0.49
0.25 0.11
Own Dwelling -0.16 0.52
-0.08 0.70
0.33* 0.09
Rooms -0.05 0.38
0.01 0.76
0.11*** 0.01
Electricity 0.72** 0.03
0.19 0.29
0.03 0.88
Own Land -0.11 0.35
-0.04 0.65
-0.15* 0.09
Farming 0.33*** 0.00
0.25*** 0.00
-0.20* 0.05
Productive Assets 0.13*** 0.00
0.03 0.22
0.15*** 0.00
Roof 0.44 0.41
-0.17 0.49
0.01 0.98 Non-Lao Head of Household -0.39*** 0.00
0.35*** 0.00
-0.37*** 0.00
Province 0.08 0.46
-0.49*** 0.00
1.24*** 0.00
Constant -2.54*** 0.00
-0.57 0.23
-2.05*** 0.00
Observations 5,200
5,200
5,200
Food Group 9
Food Group 10
VARIABLES Coefficient P-value
Coefficient P-value
Nurture -0.07 0.46
-0.07 0.64
Midline 0.35*** 0.00
-0.28** 0.05
Midline Nurture 0.30** 0.02
0.19 0.33
Household Count 0.03* 0.06
-0.03 0.32
Female Household Head 0.05 0.59
0.06 0.66
Household Head Age -0.00 0.12
0.01 0.11
Household Head with Low Education 0.20*** 0.00
-0.23** 0.03
Disability 0.06 0.62
-0.13 0.47
Own Dwelling -0.30* 0.09
-0.14 0.57
Rooms 0.00 0.97
-0.03 0.57
Electricity 0.05 0.75
0.35 0.24
Own Land -0.01 0.88
0.30*** 0.01
Farming -0.12* 0.09
-0.03 0.75
Productive Assets 0.00 0.88
0.17*** 0.00
Roof 0.23 0.27
-0.18 0.61
Non-Lao Head of Household 0.10 0.20
-0.31** 0.01
Province -0.17** 0.03
-0.60*** 0.00
Constant 0.48 0.20
-1.23* 0.06
Observations 5,200
5,200
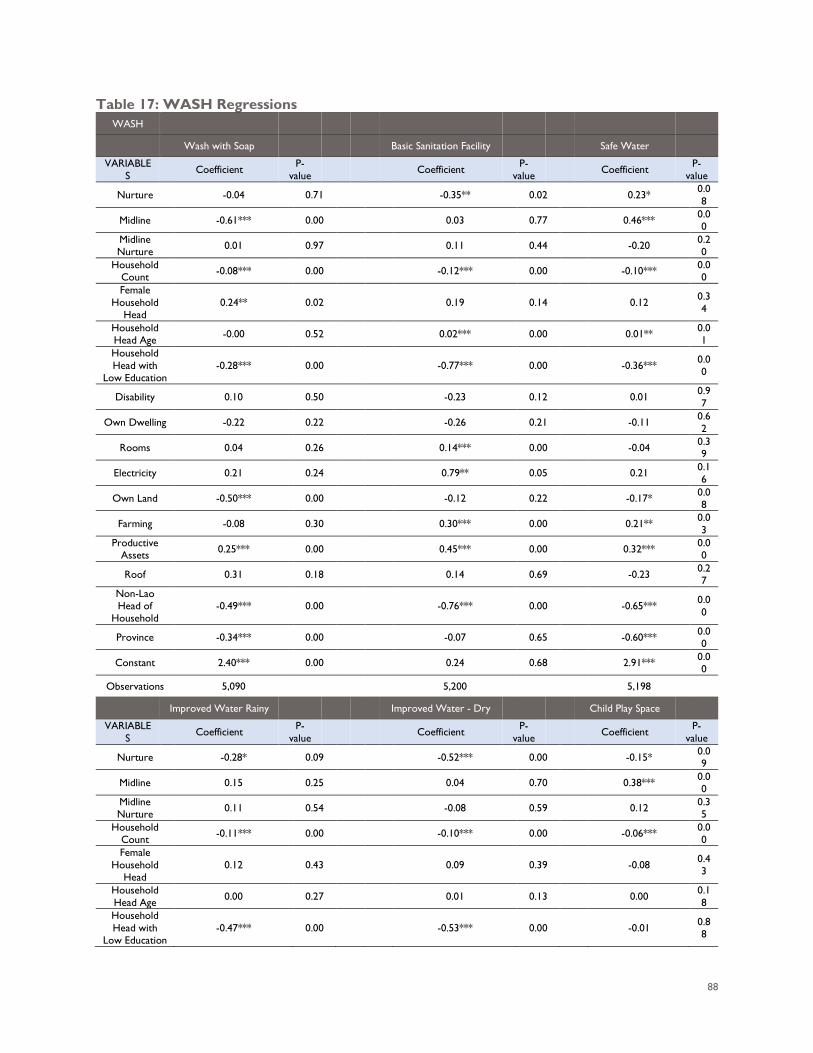
88
Table 17: WASH Regressions WASH
Wash with Soap Basic Sanitation Facility Safe Water
VARIABLES Coefficient P-
value Coefficient P-value Coefficient P-
value
Nurture -0.04 0.71 -0.35** 0.02 0.23* 0.08
Midline -0.61*** 0.00 0.03 0.77 0.46*** 0.00
Midline Nurture 0.01 0.97 0.11 0.44 -0.20 0.2
0 Household
Count -0.08*** 0.00 -0.12*** 0.00 -0.10*** 0.00
Female Household
Head 0.24** 0.02 0.19 0.14 0.12 0.3
4
Household Head Age -0.00 0.52 0.02*** 0.00 0.01** 0.0
1 Household Head with
Low Education -0.28*** 0.00 -0.77*** 0.00 -0.36*** 0.0
0
Disability 0.10 0.50 -0.23 0.12 0.01 0.97
Own Dwelling -0.22 0.22 -0.26 0.21 -0.11 0.62
Rooms 0.04 0.26 0.14*** 0.00 -0.04 0.39
Electricity 0.21 0.24 0.79** 0.05 0.21 0.16
Own Land -0.50*** 0.00 -0.12 0.22 -0.17* 0.08
Farming -0.08 0.30 0.30*** 0.00 0.21** 0.03
Productive Assets 0.25*** 0.00 0.45*** 0.00 0.32*** 0.0
0
Roof 0.31 0.18 0.14 0.69 -0.23 0.27
Non-Lao Head of
Household -0.49*** 0.00 -0.76*** 0.00 -0.65*** 0.0
0
Province -0.34*** 0.00 -0.07 0.65 -0.60*** 0.00
Constant 2.40*** 0.00 0.24 0.68 2.91*** 0.00
Observations 5,090 5,200 5,198
Improved Water Rainy Improved Water - Dry Child Play Space
VARIABLES Coefficient P-
value Coefficient P-value Coefficient P-
value
Nurture -0.28* 0.09 -0.52*** 0.00 -0.15* 0.09
Midline 0.15 0.25 0.04 0.70 0.38*** 0.00
Midline Nurture 0.11 0.54 -0.08 0.59 0.12 0.3
5 Household
Count -0.11*** 0.00 -0.10*** 0.00 -0.06*** 0.00
Female Household
Head 0.12 0.43 0.09 0.39 -0.08 0.4
3
Household Head Age 0.00 0.27 0.01 0.13 0.00 0.1
8 Household Head with
Low Education -0.47*** 0.00 -0.53*** 0.00 -0.01 0.8
8
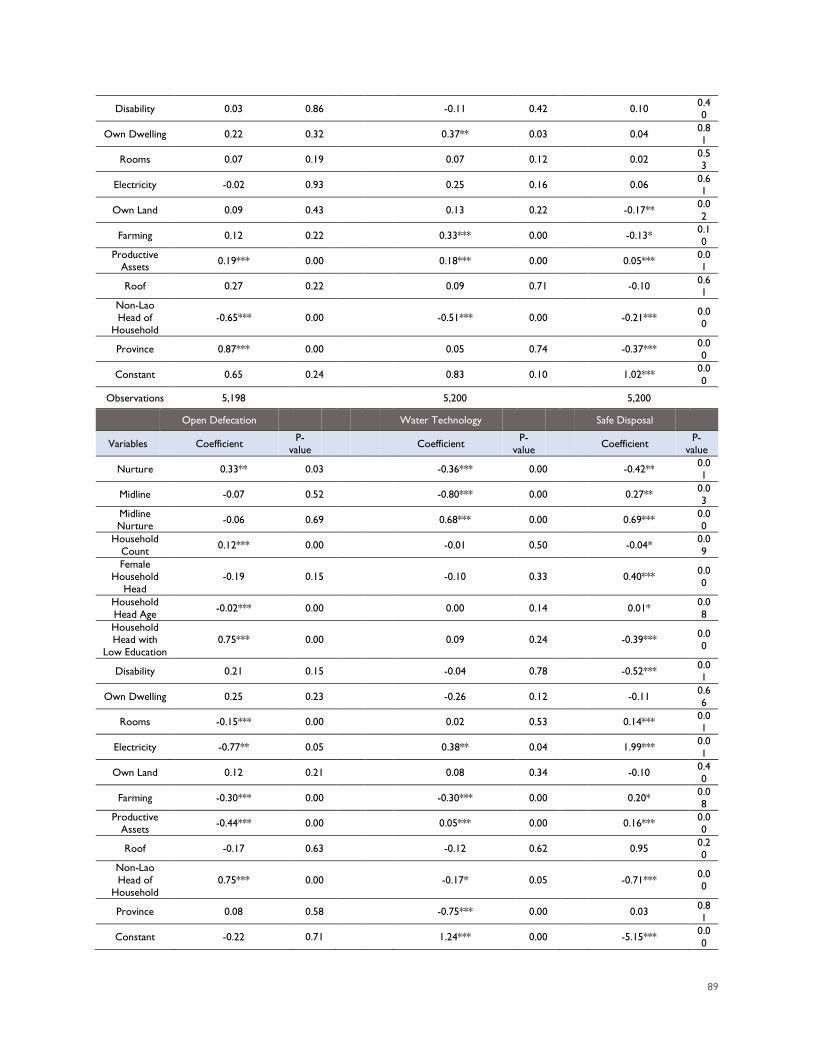
89
Disability 0.03 0.86 -0.11 0.42 0.10 0.40
Own Dwelling 0.22 0.32 0.37** 0.03 0.04 0.81
Rooms 0.07 0.19 0.07 0.12 0.02 0.53
Electricity -0.02 0.93 0.25 0.16 0.06 0.61
Own Land 0.09 0.43 0.13 0.22 -0.17** 0.02
Farming 0.12 0.22 0.33*** 0.00 -0.13* 0.10
Productive Assets 0.19*** 0.00 0.18*** 0.00 0.05*** 0.0
1
Roof 0.27 0.22 0.09 0.71 -0.10 0.61
Non-Lao Head of
Household -0.65*** 0.00 -0.51*** 0.00 -0.21*** 0.0
0
Province 0.87*** 0.00 0.05 0.74 -0.37*** 0.00
Constant 0.65 0.24 0.83 0.10 1.02*** 0.00
Observations 5,198 5,200 5,200
Open Defecation Water Technology Safe Disposal
Variables Coefficient P-value Coefficient P-
value Coefficient P-value
Nurture 0.33** 0.03 -0.36*** 0.00 -0.42** 0.01
Midline -0.07 0.52 -0.80*** 0.00 0.27** 0.03
Midline Nurture -0.06 0.69 0.68*** 0.00 0.69*** 0.0
0 Household
Count 0.12*** 0.00 -0.01 0.50 -0.04* 0.09
Female Household
Head -0.19 0.15 -0.10 0.33 0.40*** 0.0
0
Household Head Age -0.02*** 0.00 0.00 0.14 0.01* 0.0
8 Household Head with
Low Education 0.75*** 0.00 0.09 0.24 -0.39*** 0.0
0
Disability 0.21 0.15 -0.04 0.78 -0.52*** 0.01
Own Dwelling 0.25 0.23 -0.26 0.12 -0.11 0.66
Rooms -0.15*** 0.00 0.02 0.53 0.14*** 0.01
Electricity -0.77** 0.05 0.38** 0.04 1.99*** 0.01
Own Land 0.12 0.21 0.08 0.34 -0.10 0.40
Farming -0.30*** 0.00 -0.30*** 0.00 0.20* 0.08
Productive Assets -0.44*** 0.00 0.05*** 0.00 0.16*** 0.0
0
Roof -0.17 0.63 -0.12 0.62 0.95 0.20
Non-Lao Head of
Household 0.75*** 0.00 -0.17* 0.05 -0.71*** 0.0
0
Province 0.08 0.58 -0.75*** 0.00 0.03 0.81
Constant -0.22 0.71 1.24*** 0.00 -5.15*** 0.00
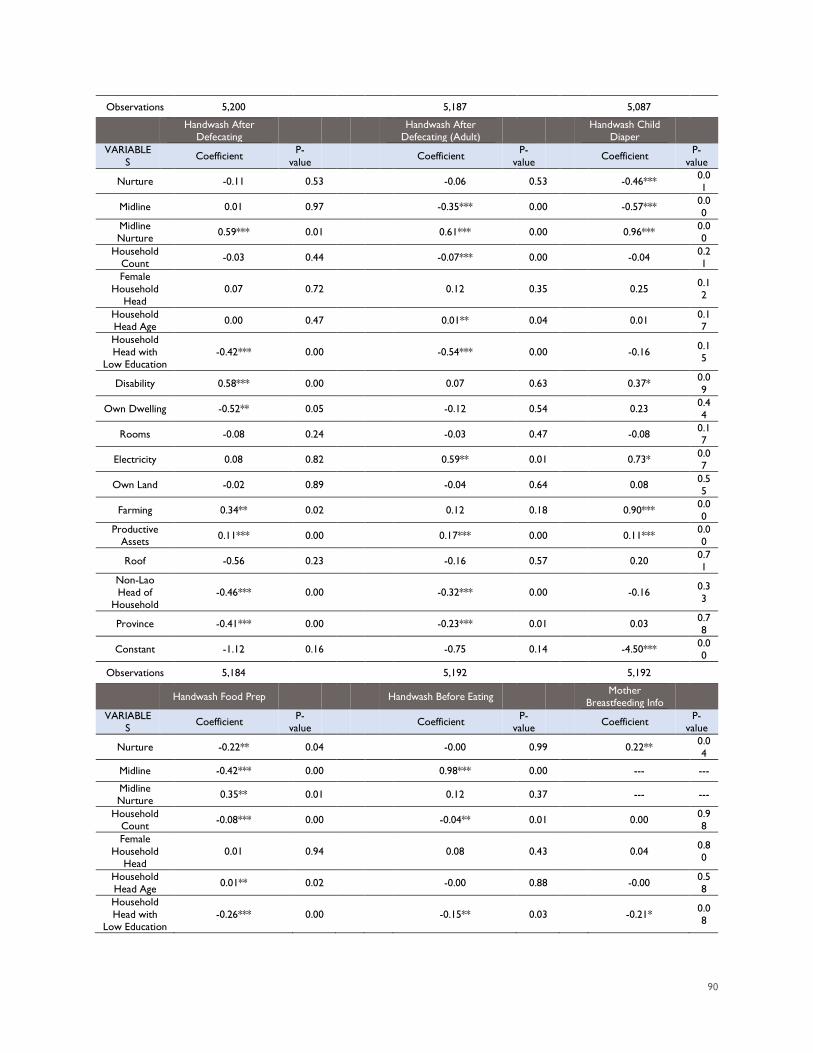
90
Observations 5,200 5,187 5,087
Handwash After Defecating Handwash After
Defecating (Adult) Handwash Child Diaper
VARIABLES Coefficient P-
value Coefficient P-value Coefficient P-
value
Nurture -0.11 0.53 -0.06 0.53 -0.46*** 0.01
Midline 0.01 0.97 -0.35*** 0.00 -0.57*** 0.00
Midline Nurture 0.59*** 0.01 0.61*** 0.00 0.96*** 0.0
0 Household
Count -0.03 0.44 -0.07*** 0.00 -0.04 0.21
Female Household
Head 0.07 0.72 0.12 0.35 0.25 0.1
2
Household Head Age 0.00 0.47 0.01** 0.04 0.01 0.1
7 Household Head with
Low Education -0.42*** 0.00 -0.54*** 0.00 -0.16 0.1
5
Disability 0.58*** 0.00 0.07 0.63 0.37* 0.09
Own Dwelling -0.52** 0.05 -0.12 0.54 0.23 0.44
Rooms -0.08 0.24 -0.03 0.47 -0.08 0.17
Electricity 0.08 0.82 0.59** 0.01 0.73* 0.07
Own Land -0.02 0.89 -0.04 0.64 0.08 0.55
Farming 0.34** 0.02 0.12 0.18 0.90*** 0.00
Productive Assets 0.11*** 0.00 0.17*** 0.00 0.11*** 0.0
0
Roof -0.56 0.23 -0.16 0.57 0.20 0.71
Non-Lao Head of
Household -0.46*** 0.00 -0.32*** 0.00 -0.16 0.3
3
Province -0.41*** 0.00 -0.23*** 0.01 0.03 0.78
Constant -1.12 0.16 -0.75 0.14 -4.50*** 0.00
Observations 5,184 5,192 5,192
Handwash Food Prep Handwash Before Eating Mother Breastfeeding Info
VARIABLES Coefficient P-
value Coefficient P-value Coefficient P-
value
Nurture -0.22** 0.04 -0.00 0.99 0.22** 0.04
Midline -0.42*** 0.00 0.98*** 0.00 --- ---
Midline Nurture 0.35** 0.01 0.12 0.37 --- ---
Household Count -0.08*** 0.00 -0.04** 0.01 0.00 0.9
8 Female
Household Head
0.01 0.94 0.08 0.43 0.04 0.80
Household Head Age 0.01** 0.02 -0.00 0.88 -0.00 0.5
8 Household Head with
Low Education -0.26*** 0.00 -0.15** 0.03 -0.21* 0.0
8
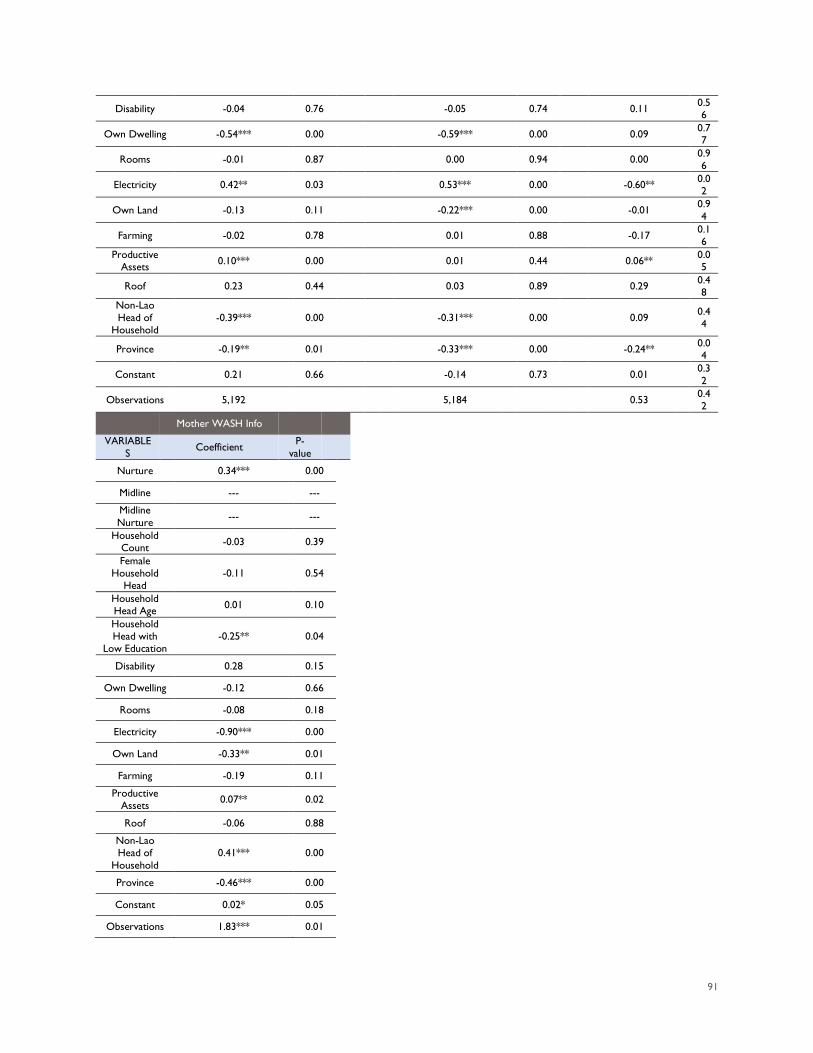
91
Disability -0.04 0.76 -0.05 0.74 0.11 0.56
Own Dwelling -0.54*** 0.00 -0.59*** 0.00 0.09 0.77
Rooms -0.01 0.87 0.00 0.94 0.00 0.96
Electricity 0.42** 0.03 0.53*** 0.00 -0.60** 0.02
Own Land -0.13 0.11 -0.22*** 0.00 -0.01 0.94
Farming -0.02 0.78 0.01 0.88 -0.17 0.16
Productive Assets 0.10*** 0.00 0.01 0.44 0.06** 0.0
5
Roof 0.23 0.44 0.03 0.89 0.29 0.48
Non-Lao Head of
Household -0.39*** 0.00 -0.31*** 0.00 0.09 0.4
4
Province -0.19** 0.01 -0.33*** 0.00 -0.24** 0.04
Constant 0.21 0.66 -0.14 0.73 0.01 0.32
Observations 5,192 5,184 0.53 0.42
Mother WASH Info
VARIABLES Coefficient P-
value
Nurture 0.34*** 0.00
Midline --- ---
Midline Nurture --- ---
Household Count -0.03 0.39
Female Household
Head -0.11 0.54
Household Head Age 0.01 0.10
Household Head with
Low Education -0.25** 0.04
Disability 0.28 0.15
Own Dwelling -0.12 0.66
Rooms -0.08 0.18
Electricity -0.90*** 0.00
Own Land -0.33** 0.01
Farming -0.19 0.11
Productive Assets 0.07** 0.02
Roof -0.06 0.88
Non-Lao Head of
Household 0.41*** 0.00
Province -0.46*** 0.00
Constant 0.02* 0.05
Observations 1.83*** 0.01
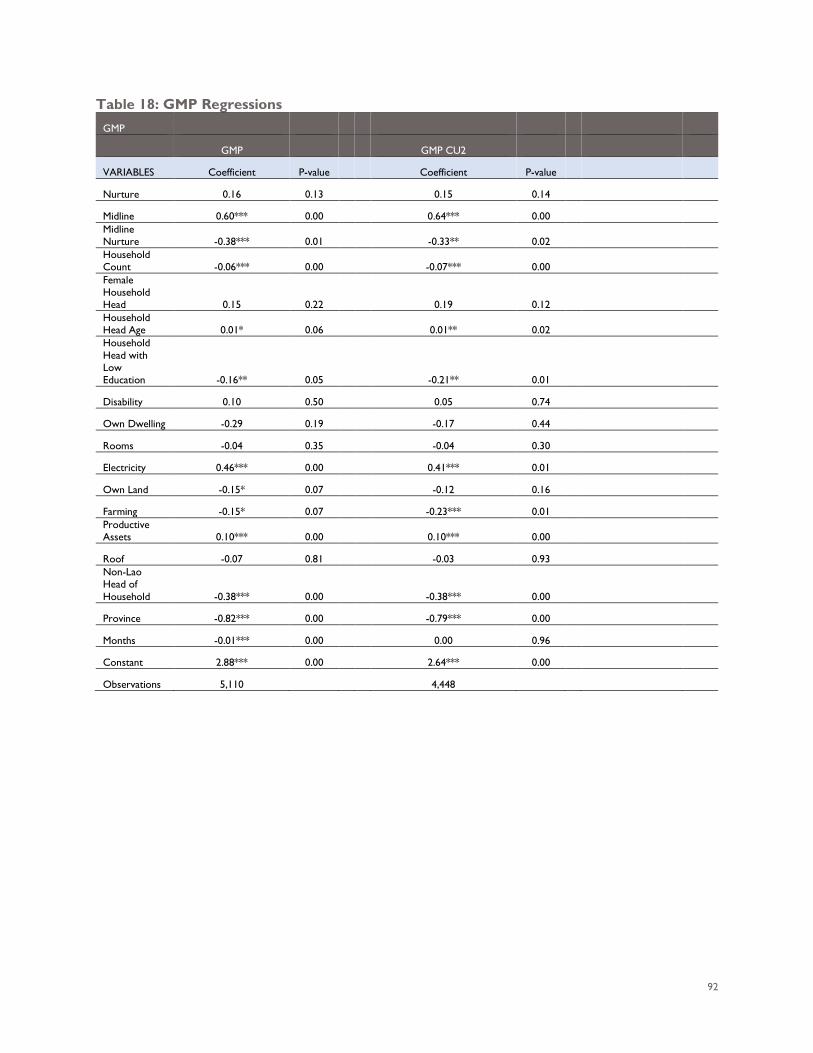
92
Table 18: GMP Regressions GMP
GMP
GMP CU2
VARIABLES Coefficient P-value
Coefficient P-value
Nurture 0.16 0.13
0.15 0.14
Midline 0.60*** 0.00
0.64*** 0.00
Midline Nurture -0.38*** 0.01
-0.33** 0.02
Household Count -0.06*** 0.00
-0.07*** 0.00
Female Household Head 0.15 0.22
0.19 0.12
Household Head Age 0.01* 0.06
0.01** 0.02
Household Head with Low Education -0.16** 0.05
-0.21** 0.01
Disability 0.10 0.50
0.05 0.74
Own Dwelling -0.29 0.19
-0.17 0.44
Rooms -0.04 0.35
-0.04 0.30
Electricity 0.46*** 0.00
0.41*** 0.01
Own Land -0.15* 0.07
-0.12 0.16
Farming -0.15* 0.07
-0.23*** 0.01
Productive Assets 0.10*** 0.00
0.10*** 0.00
Roof -0.07 0.81
-0.03 0.93
Non-Lao Head of Household -0.38*** 0.00
-0.38*** 0.00
Province -0.82*** 0.00
-0.79*** 0.00
Months -0.01*** 0.00
0.00 0.96
Constant 2.88*** 0.00
2.64*** 0.00
Observations 5,110
4,448
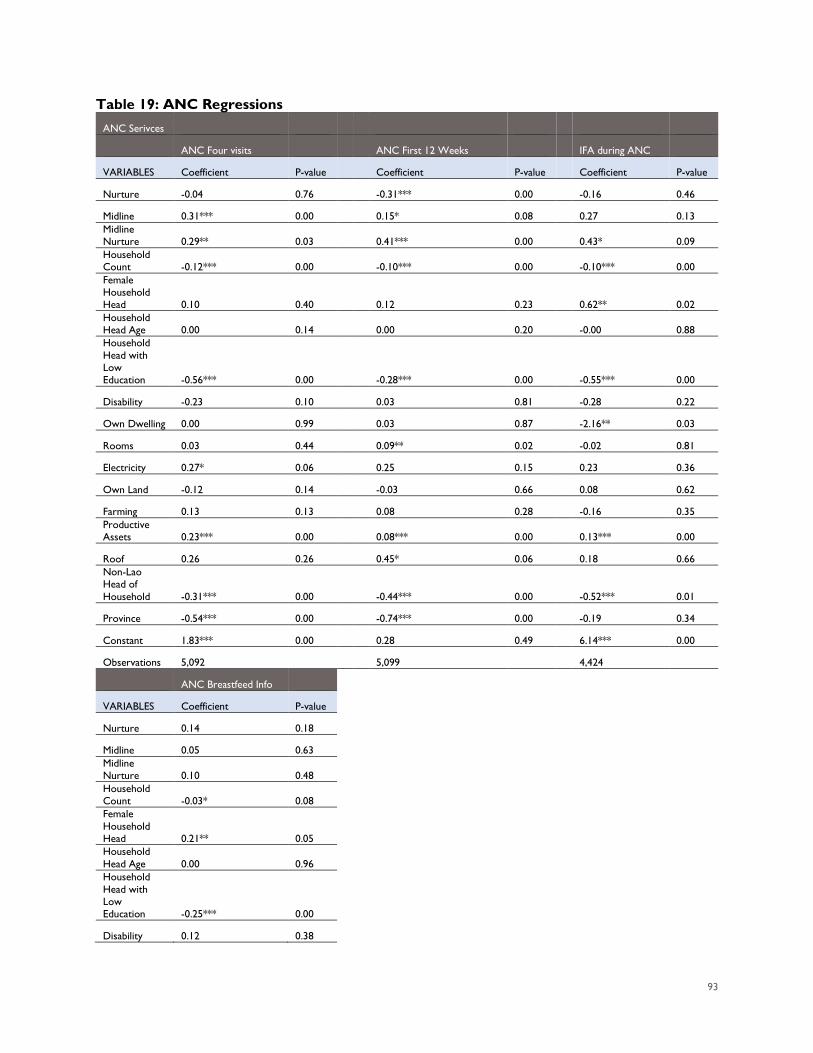
93
Table 19: ANC Regressions ANC Serivces
ANC Four visits
ANC First 12 Weeks
IFA during ANC
VARIABLES Coefficient P-value
Coefficient P-value
Coefficient P-value
Nurture -0.04 0.76
-0.31*** 0.00
-0.16 0.46
Midline 0.31*** 0.00
0.15* 0.08
0.27 0.13 Midline Nurture 0.29** 0.03
0.41*** 0.00
0.43* 0.09
Household Count -0.12*** 0.00
-0.10*** 0.00
-0.10*** 0.00
Female Household Head 0.10 0.40
0.12 0.23
0.62** 0.02 Household Head Age 0.00 0.14
0.00 0.20
-0.00 0.88
Household Head with Low Education -0.56*** 0.00
-0.28*** 0.00
-0.55*** 0.00
Disability -0.23 0.10
0.03 0.81
-0.28 0.22
Own Dwelling 0.00 0.99
0.03 0.87
-2.16** 0.03
Rooms 0.03 0.44
0.09** 0.02
-0.02 0.81
Electricity 0.27* 0.06
0.25 0.15
0.23 0.36
Own Land -0.12 0.14
-0.03 0.66
0.08 0.62
Farming 0.13 0.13
0.08 0.28
-0.16 0.35 Productive Assets 0.23*** 0.00
0.08*** 0.00
0.13*** 0.00
Roof 0.26 0.26
0.45* 0.06
0.18 0.66 Non-Lao Head of Household -0.31*** 0.00
-0.44*** 0.00
-0.52*** 0.01
Province -0.54*** 0.00
-0.74*** 0.00
-0.19 0.34
Constant 1.83*** 0.00
0.28 0.49
6.14*** 0.00
Observations 5,092
5,099
4,424
ANC Breastfeed Info
VARIABLES Coefficient P-value
Nurture 0.14 0.18
Midline 0.05 0.63
Midline Nurture 0.10 0.48
Household Count -0.03* 0.08
Female Household Head 0.21** 0.05
Household Head Age 0.00 0.96
Household Head with Low Education -0.25*** 0.00
Disability 0.12 0.38
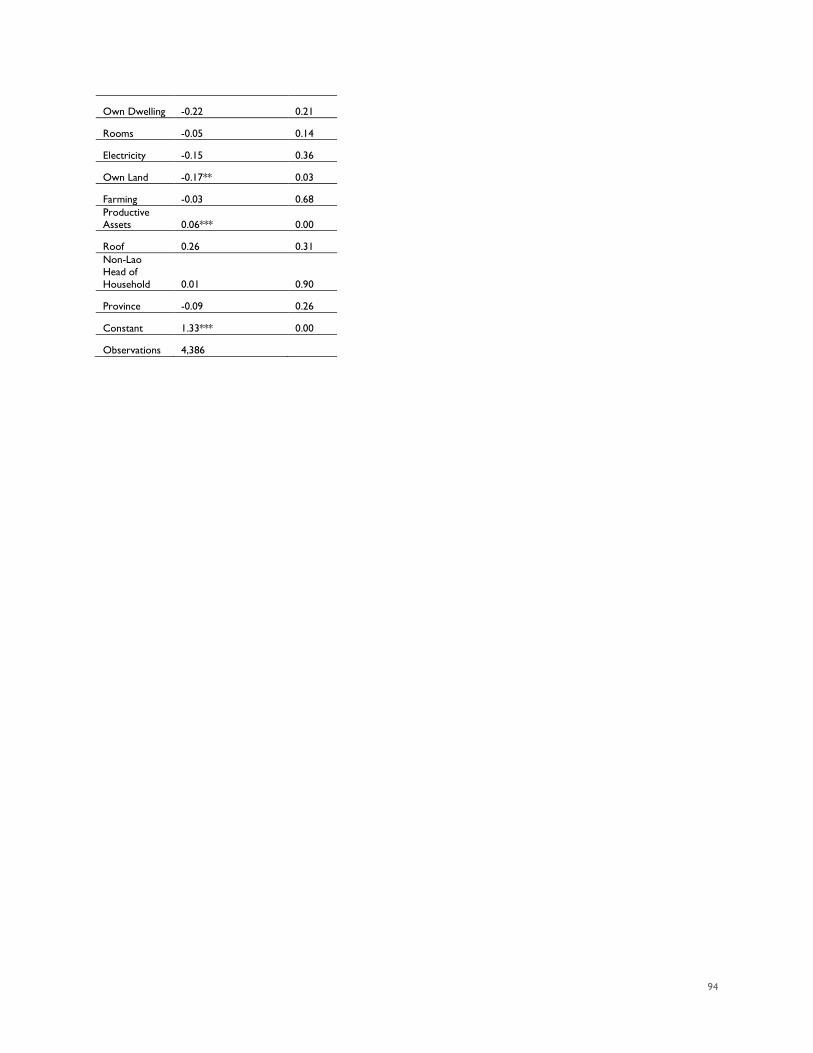
94
Own Dwelling -0.22 0.21
Rooms -0.05 0.14
Electricity -0.15 0.36
Own Land -0.17** 0.03
Farming -0.03 0.68
Productive Assets 0.06*** 0.00
Roof 0.26 0.31
Non-Lao Head of Household 0.01 0.90
Province -0.09 0.26
Constant 1.33*** 0.00
Observations 4,386
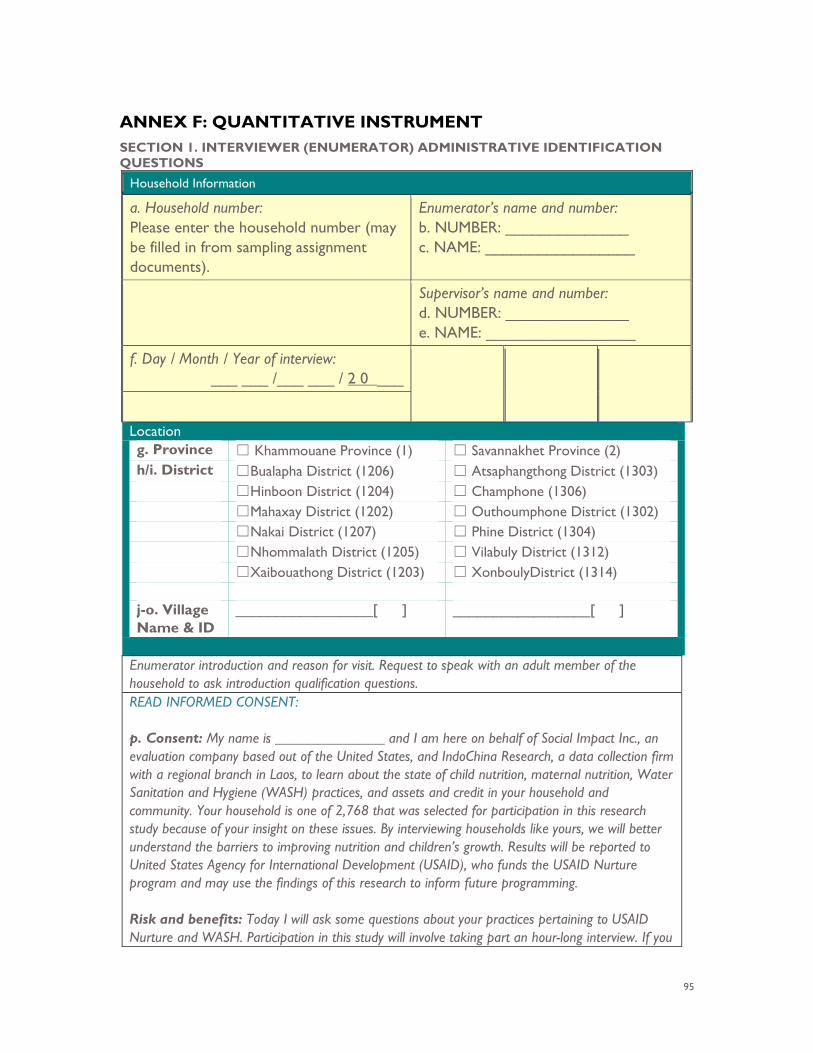
95
ANNEX F: QUANTITATIVE INSTRUMENT SECTION 1. INTERVIEWER (ENUMERATOR) ADMINISTRATIVE IDENTIFICATION QUESTIONS
Household Information
a. Household number: Please enter the household number (may be filled in from sampling assignment documents).
Enumerator’s name and number: b. NUMBER: ______________ c. NAME: _________________
Supervisor’s name and number: d. NUMBER: ______________ e. NAME: _________________
f. Day / Month / Year of interview: ___ ___ /___ ___ / 2 0 ___
Location g. Province ☐ Khammouane Province (1) ☐ Savannakhet Province (2) h/i. District ☐Bualapha District (1206) ☐ Atsaphangthong District (1303) ☐Hinboon District (1204) ☐ Champhone (1306) ☐Mahaxay District (1202) ☐ Outhoumphone District (1302) ☐Nakai District (1207) ☐ Phine District (1304) ☐Nhommalath District (1205) ☐ Vilabuly District (1312) ☐Xaibouathong District (1203) ☐ XonboulyDistrict (1314) j-o. Village Name & ID
_________________[ ] _________________[ ]
Enumerator introduction and reason for visit. Request to speak with an adult member of the household to ask introduction qualification questions. READ INFORMED CONSENT: p. Consent: My name is _______________ and I am here on behalf of Social Impact Inc., an evaluation company based out of the United States, and IndoChina Research, a data collection firm with a regional branch in Laos, to learn about the state of child nutrition, maternal nutrition, Water Sanitation and Hygiene (WASH) practices, and assets and credit in your household and community. Your household is one of 2,768 that was selected for participation in this research study because of your insight on these issues. By interviewing households like yours, we will better understand the barriers to improving nutrition and children’s growth. Results will be reported to United States Agency for International Development (USAID), who funds the USAID Nurture program and may use the findings of this research to inform future programming. Risk and benefits: Today I will ask some questions about your practices pertaining to USAID Nurture and WASH. Participation in this study will involve taking part an hour-long interview. If you
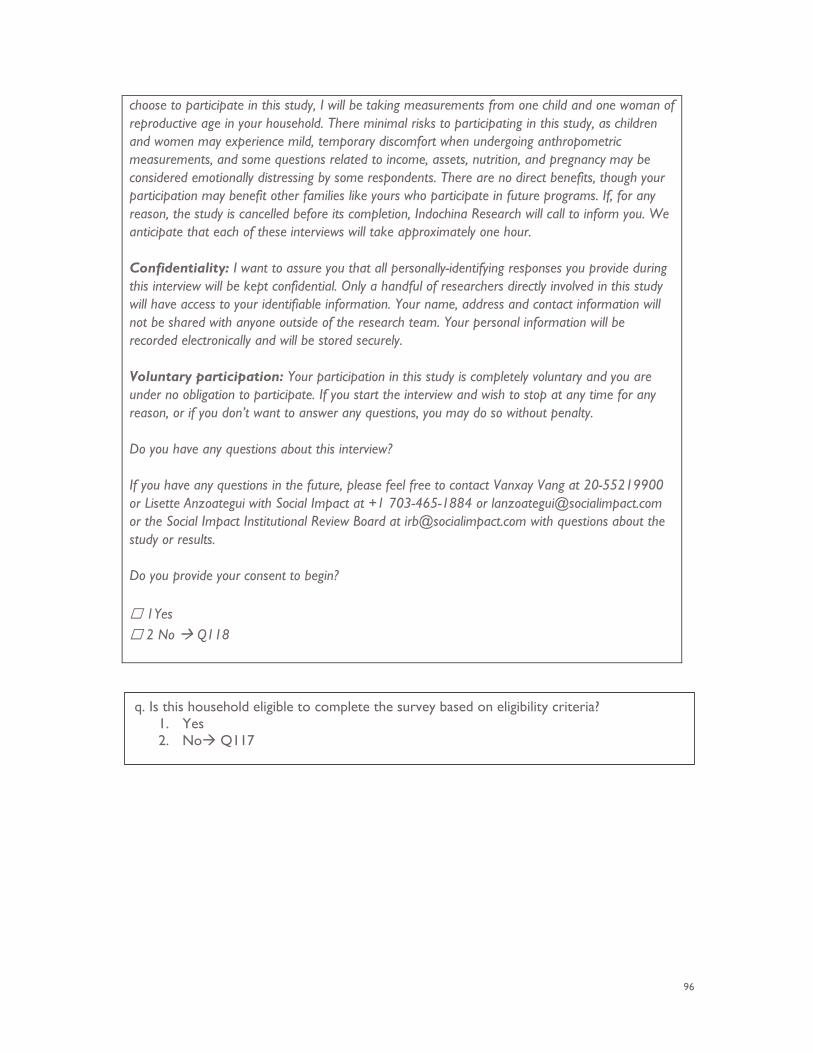
96
choose to participate in this study, I will be taking measurements from one child and one woman of reproductive age in your household. There minimal risks to participating in this study, as children and women may experience mild, temporary discomfort when undergoing anthropometric measurements, and some questions related to income, assets, nutrition, and pregnancy may be considered emotionally distressing by some respondents. There are no direct benefits, though your participation may benefit other families like yours who participate in future programs. If, for any reason, the study is cancelled before its completion, Indochina Research will call to inform you. We anticipate that each of these interviews will take approximately one hour. Confidentiality: I want to assure you that all personally-identifying responses you provide during this interview will be kept confidential. Only a handful of researchers directly involved in this study will have access to your identifiable information. Your name, address and contact information will not be shared with anyone outside of the research team. Your personal information will be recorded electronically and will be stored securely. Voluntary participation: Your participation in this study is completely voluntary and you are under no obligation to participate. If you start the interview and wish to stop at any time for any reason, or if you don’t want to answer any questions, you may do so without penalty. Do you have any questions about this interview? If you have any questions in the future, please feel free to contact Vanxay Vang at 20-55219900 or Lisette Anzoategui with Social Impact at +1 703-465-1884 or [email protected] or the Social Impact Institutional Review Board at [email protected] with questions about the study or results. Do you provide your consent to begin? ☐ 1Yes ☐ 2 No Q118
q. Is this household eligible to complete the survey based on eligibility criteria? 1. Yes 2. No Q117
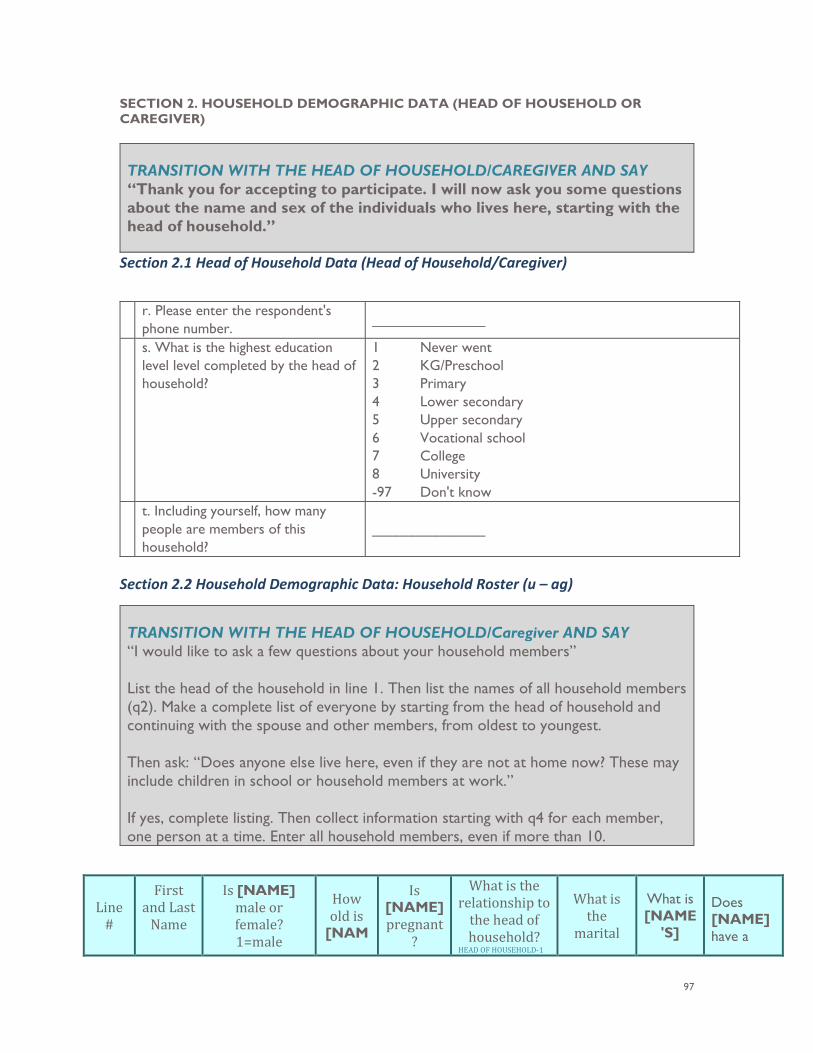
97
SECTION 2. HOUSEHOLD DEMOGRAPHIC DATA (HEAD OF HOUSEHOLD OR CAREGIVER) TRANSITION WITH THE HEAD OF HOUSEHOLD/CAREGIVER AND SAY “Thank you for accepting to participate. I will now ask you some questions about the name and sex of the individuals who lives here, starting with the head of household.”
Section 2.1 Head of Household Data (Head of Household/Caregiver)
r. Please enter the respondent's
phone number. ______________
s. What is the highest education level level completed by the head of household?
1 Never went 2 KG/Preschool 3 Primary 4 Lower secondary 5 Upper secondary 6 Vocational school 7 College 8 University -97 Don't know
t. Including yourself, how many people are members of this household?
______________
Section 2.2 Household Demographic Data: Household Roster (u – ag)
TRANSITION WITH THE HEAD OF HOUSEHOLD/Caregiver AND SAY “I would like to ask a few questions about your household members” List the head of the household in line 1. Then list the names of all household members (q2). Make a complete list of everyone by starting from the head of household and continuing with the spouse and other members, from oldest to youngest. Then ask: “Does anyone else live here, even if they are not at home now? These may include children in school or household members at work.” If yes, complete listing. Then collect information starting with q4 for each member, one person at a time. Enter all household members, even if more than 10.
Line #
First and Last
Name
Is [NAME] male or female? 1=male
How old is
[NAM
Is [NAME] pregnant
?
What is the relationship to
the head of household?
HEAD OF HOUSEHOLD-1
What is the
marital
What is [NAME
'S]
Does [NAME] have a
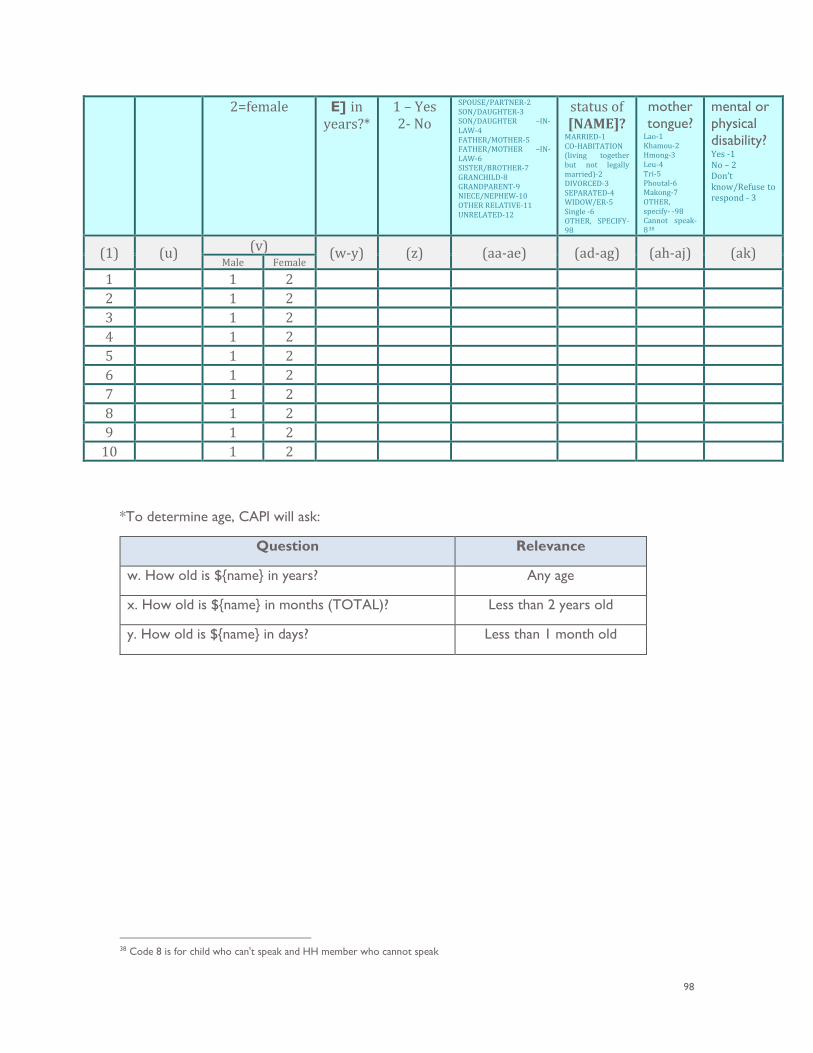
98
2=female E] in years?*
1 – Yes 2- No
SPOUSE/PARTNER-2 SON/DAUGHTER-3 SON/DAUGHTER –IN-LAW-4 FATHER/MOTHER-5 FATHER/MOTHER –IN-LAW-6 SISTER/BROTHER-7 GRANCHILD-8 GRANDPARENT-9 NIECE/NEPHEW-10 OTHER RELATIVE-11 UNRELATED-12
status of [NAME]?
MARRIED-1 CO-HABITATION (living together but not legally married)-2 DIVORCED-3 SEPARATED-4 WIDOW/ER-5 Single -6 OTHER, SPECIFY-98
mother tongue?
Lao-1 Khamou-2 Hmong-3 Leu-4 Tri-5 Phoutal-6 Makong-7 OTHER, specify- -98 Cannot speak-838
mental or physical disability? Yes -1 No – 2 Don’t know/Refuse to respond - 3
(1) (u) (v) (w-y) (z) (aa-ae) (ad-ag) (ah-aj) (ak) Male Female
1 1 2 2 1 2 3 1 2 4 1 2 5 1 2 6 1 2 7 1 2 8 1 2 9 1 2
10 1 2
*To determine age, CAPI will ask:
Question Relevance
w. How old is ${name} in years? Any age
x. How old is ${name} in months (TOTAL)? Less than 2 years old
y. How old is ${name} in days? Less than 1 month old
38 Code 8 is for child who can't speak and HH member who cannot speak
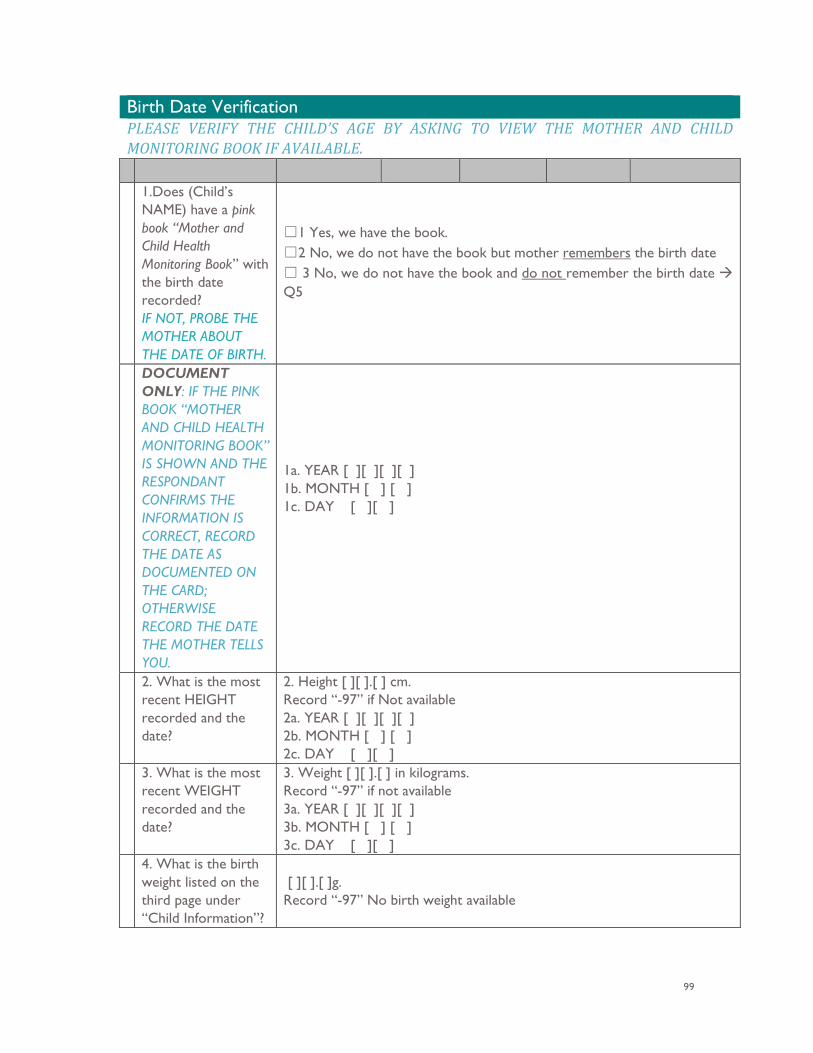
99
Birth Date Verification PLEASE VERIFY THE CHILD’S AGE BY ASKING TO VIEW THE MOTHER AND CHILD MONITORING BOOK IF AVAILABLE. 1.Does (Child’s
NAME) have a pink book “Mother and Child Health Monitoring Book” with the birth date recorded? IF NOT, PROBE THE MOTHER ABOUT THE DATE OF BIRTH.
☐1 Yes, we have the book. ☐2 No, we do not have the book but mother remembers the birth date ☐ 3 No, we do not have the book and do not remember the birth date Q5
DOCUMENT ONLY: IF THE PINK BOOK “MOTHER AND CHILD HEALTH MONITORING BOOK” IS SHOWN AND THE RESPONDANT CONFIRMS THE INFORMATION IS CORRECT, RECORD THE DATE AS DOCUMENTED ON THE CARD; OTHERWISE RECORD THE DATE THE MOTHER TELLS YOU.
1a. YEAR [ ][ ][ ][ ] 1b. MONTH [ ] [ ] 1c. DAY [ ][ ]
2. What is the most recent HEIGHT recorded and the date?
2. Height [ ][ ].[ ] cm. Record “-97” if Not available 2a. YEAR [ ][ ][ ][ ] 2b. MONTH [ ] [ ] 2c. DAY [ ][ ]
3. What is the most recent WEIGHT recorded and the date?
3. Weight [ ][ ].[ ] in kilograms. Record “-97” if not available 3a. YEAR [ ][ ][ ][ ] 3b. MONTH [ ] [ ] 3c. DAY [ ][ ]
4. What is the birth weight listed on the third page under “Child Information”?
[ ][ ].[ ]g. Record “-97” No birth weight available
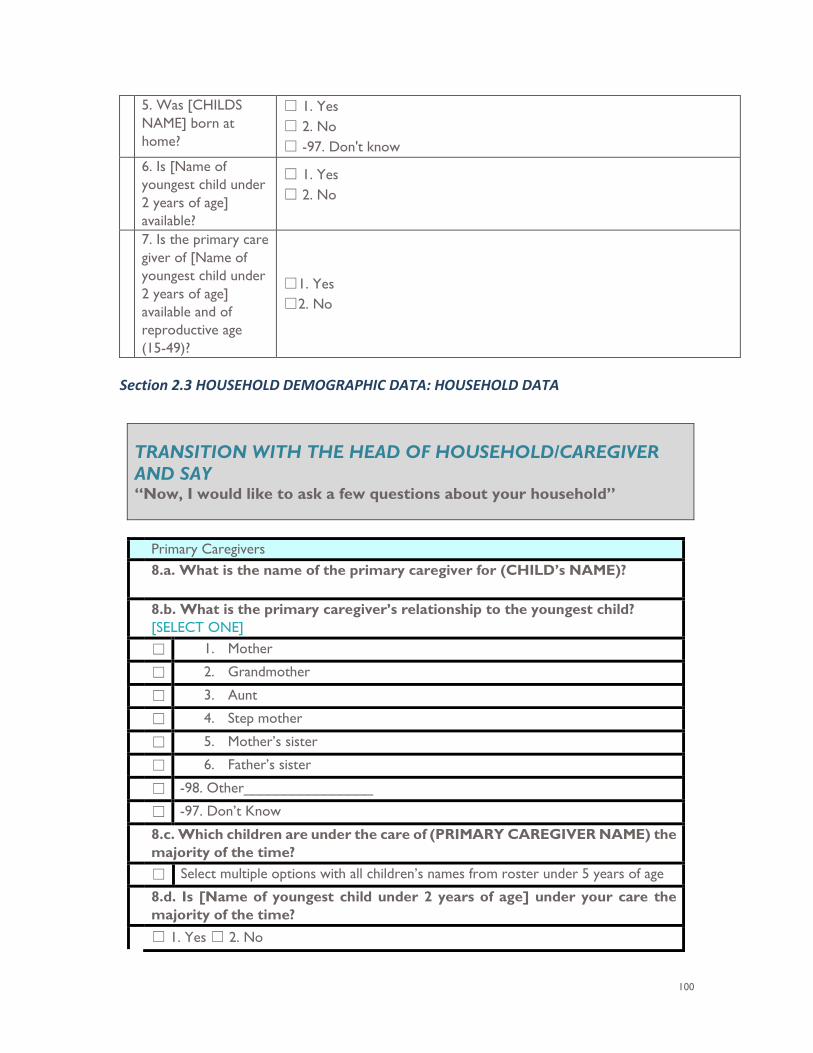
100
5. Was [CHILDS NAME] born at home?
☐ 1. Yes ☐ 2. No ☐ -97. Don't know
6. Is [Name of youngest child under 2 years of age] available?
☐ 1. Yes ☐ 2. No
7. Is the primary care giver of [Name of youngest child under 2 years of age] available and of reproductive age (15-49)?
☐1. Yes ☐2. No
Section 2.3 HOUSEHOLD DEMOGRAPHIC DATA: HOUSEHOLD DATA
TRANSITION WITH THE HEAD OF HOUSEHOLD/CAREGIVER AND SAY “Now, I would like to ask a few questions about your household”
Primary Caregivers 8.a. What is the name of the primary caregiver for (CHILD’s NAME)?
8.b. What is the primary caregiver’s relationship to the youngest child?
[SELECT ONE] ☐ 1. Mother
☐ 2. Grandmother
☐ 3. Aunt
☐ 4. Step mother
☐ 5. Mother’s sister
☐ 6. Father’s sister
☐ -98. Other________________
☐ -97. Don’t Know
8.c. Which children are under the care of (PRIMARY CAREGIVER NAME) the majority of the time?
☐ Select multiple options with all children’s names from roster under 5 years of age
8.d. Is [Name of youngest child under 2 years of age] under your care the majority of the time?
☐ 1. Yes ☐ 2. No
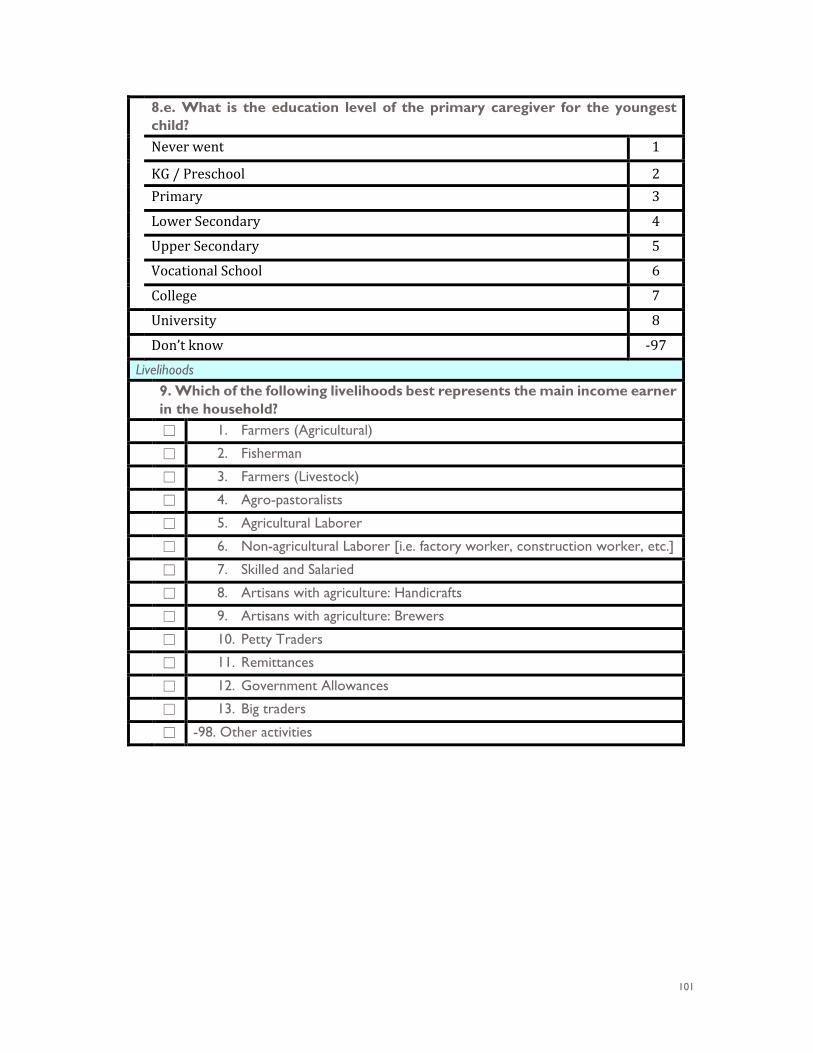
101
8.e. What is the education level of the primary caregiver for the youngest child? Never went 1
KG / Preschool 2 Primary 3
Lower Secondary 4
Upper Secondary 5
Vocational School 6
College 7 University 8
Don’t know -97 Livelihoods 9. Which of the following livelihoods best represents the main income earner
in the household? ☐ 1. Farmers (Agricultural)
☐ 2. Fisherman
☐ 3. Farmers (Livestock)
☐ 4. Agro-pastoralists
☐ 5. Agricultural Laborer
☐ 6. Non-agricultural Laborer [i.e. factory worker, construction worker, etc.]
☐ 7. Skilled and Salaried
☐ 8. Artisans with agriculture: Handicrafts
☐ 9. Artisans with agriculture: Brewers
☐ 10. Petty Traders
☐ 11. Remittances
☐ 12. Government Allowances
☐ 13. Big traders
☐ -98. Other activities
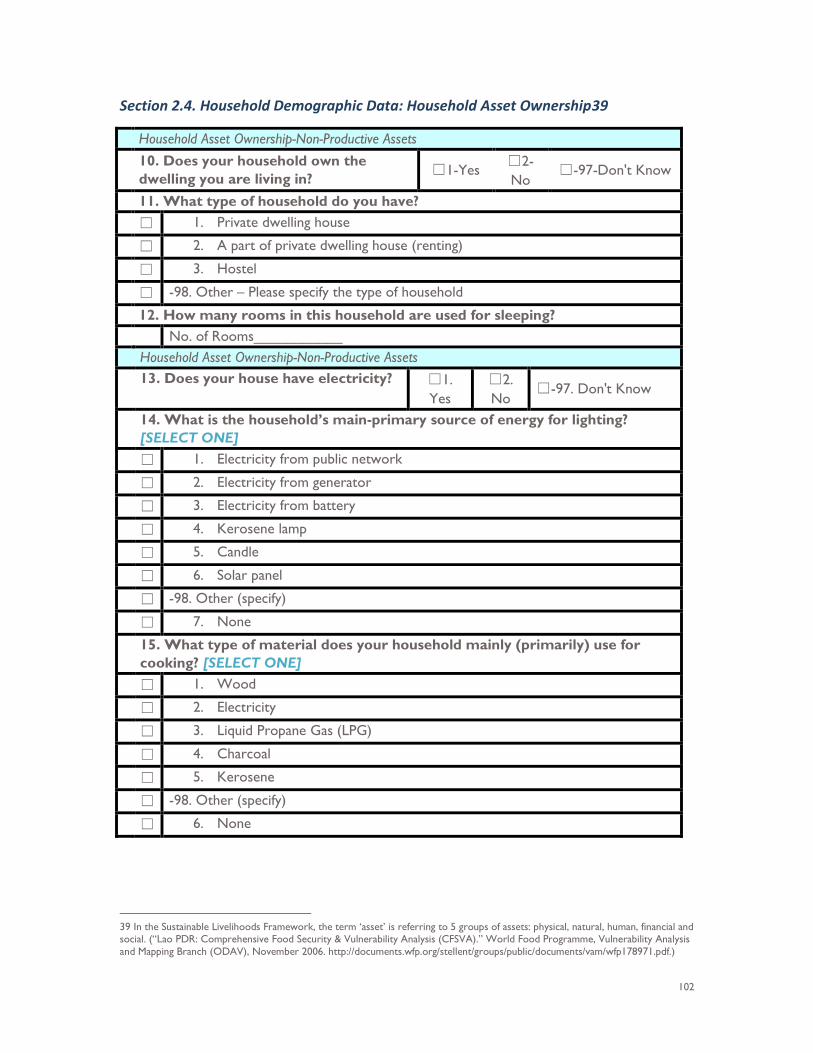
102
Section 2.4. Household Demographic Data: Household Asset Ownership39
Household Asset Ownership-Non-Productive Assets 10. Does your household own the
dwelling you are living in? ☐1-Yes ☐2-No
☐-97-Don't Know
11. What type of household do you have? ☐ 1. Private dwelling house
☐ 2. A part of private dwelling house (renting)
☐ 3. Hostel
☐ -98. Other – Please specify the type of household
12. How many rooms in this household are used for sleeping? No. of Rooms___________ Household Asset Ownership-Non-Productive Assets 13. Does your house have electricity? ☐1.
Yes ☐2. No
☐-97. Don't Know
14. What is the household’s main-primary source of energy for lighting? [SELECT ONE]
☐ 1. Electricity from public network
☐ 2. Electricity from generator
☐ 3. Electricity from battery
☐ 4. Kerosene lamp
☐ 5. Candle
☐ 6. Solar panel
☐ -98. Other (specify)
☐ 7. None
15. What type of material does your household mainly (primarily) use for cooking? [SELECT ONE]
☐ 1. Wood
☐ 2. Electricity
☐ 3. Liquid Propane Gas (LPG)
☐ 4. Charcoal
☐ 5. Kerosene
☐ -98. Other (specify)
☐ 6. None
39 In the Sustainable Livelihoods Framework, the term ‘asset’ is referring to 5 groups of assets: physical, natural, human, financial and social. (“Lao PDR: Comprehensive Food Security & Vulnerability Analysis (CFSVA).” World Food Programme, Vulnerability Analysis and Mapping Branch (ODAV), November 2006. http://documents.wfp.org/stellent/groups/public/documents/vam/wfp178971.pdf.)
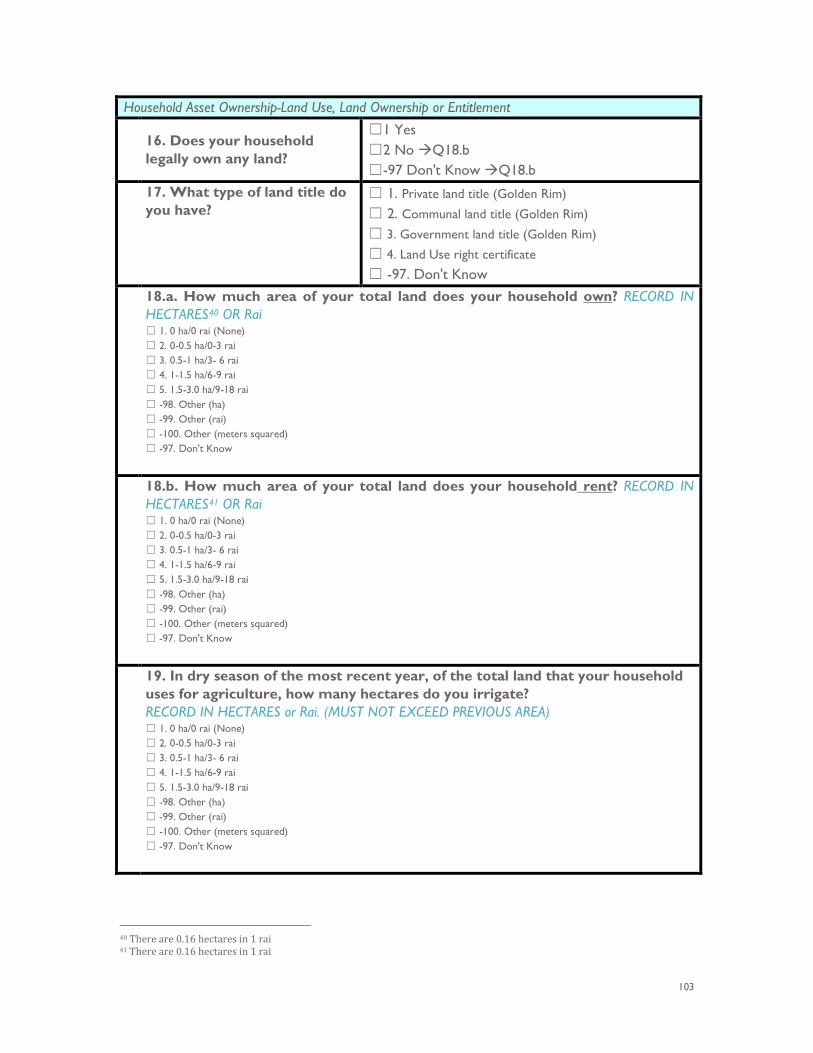
103
Household Asset Ownership-Land Use, Land Ownership or Entitlement
16. Does your household legally own any land?
☐1 Yes ☐2 No Q18.b ☐-97 Don't Know Q18.b
17. What type of land title do you have?
☐ 1. Private land title (Golden Rim)
☐ 2. Communal land title (Golden Rim)
☐ 3. Government land title (Golden Rim)
☐ 4. Land Use right certificate
☐ -97. Don't Know 18.a. How much area of your total land does your household own? RECORD IN
HECTARES40 OR Rai ☐ 1. 0 ha/0 rai (None) ☐ 2. 0-0.5 ha/0-3 rai ☐ 3. 0.5-1 ha/3- 6 rai ☐ 4. 1-1.5 ha/6-9 rai ☐ 5. 1.5-3.0 ha/9-18 rai ☐ -98. Other (ha) ☐ -99. Other (rai) ☐ -100. Other (meters squared) ☐ -97. Don't Know
18.b. How much area of your total land does your household rent? RECORD IN HECTARES41 OR Rai ☐ 1. 0 ha/0 rai (None) ☐ 2. 0-0.5 ha/0-3 rai ☐ 3. 0.5-1 ha/3- 6 rai ☐ 4. 1-1.5 ha/6-9 rai ☐ 5. 1.5-3.0 ha/9-18 rai ☐ -98. Other (ha) ☐ -99. Other (rai) ☐ -100. Other (meters squared) ☐ -97. Don't Know
19. In dry season of the most recent year, of the total land that your household uses for agriculture, how many hectares do you irrigate? RECORD IN HECTARES or Rai. (MUST NOT EXCEED PREVIOUS AREA) ☐ 1. 0 ha/0 rai (None) ☐ 2. 0-0.5 ha/0-3 rai ☐ 3. 0.5-1 ha/3- 6 rai ☐ 4. 1-1.5 ha/6-9 rai ☐ 5. 1.5-3.0 ha/9-18 rai ☐ -98. Other (ha) ☐ -99. Other (rai) ☐ -100. Other (meters squared) ☐ -97. Don't Know
40 There are 0.16 hectares in 1 rai 41 There are 0.16 hectares in 1 rai
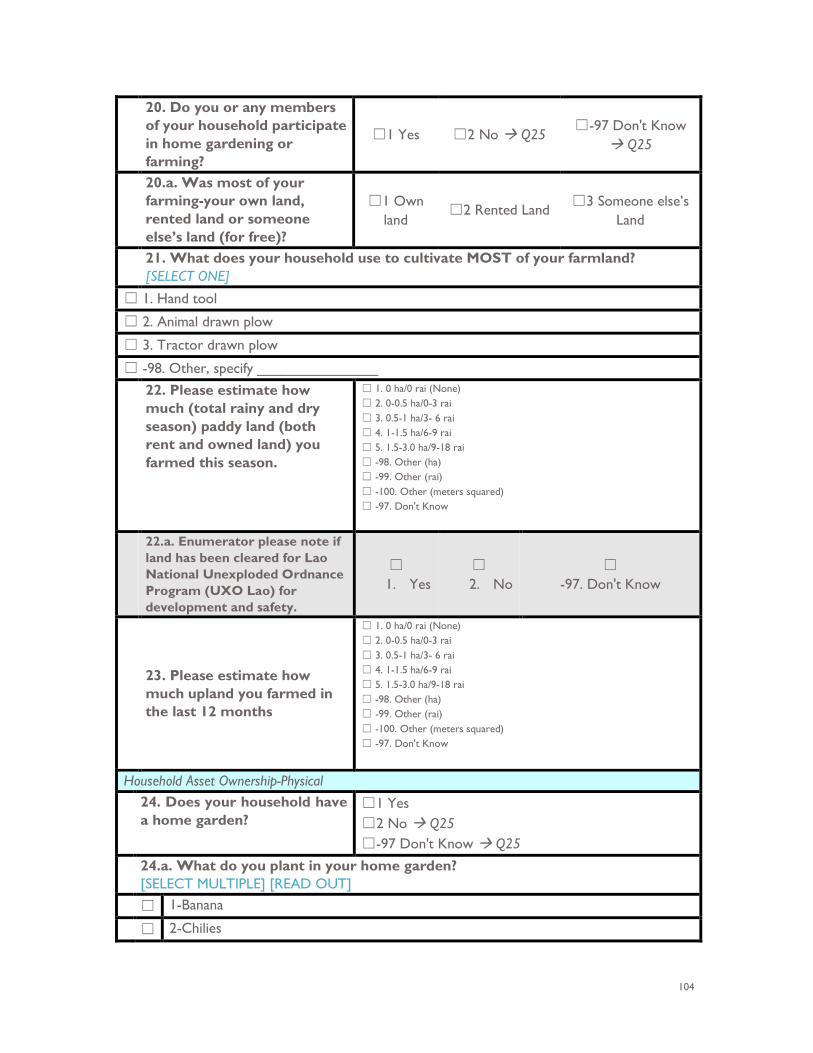
104
20. Do you or any members of your household participate in home gardening or farming?
☐1 Yes ☐2 No Q25 ☐-97 Don't Know
Q25
20.a. Was most of your farming-your own land, rented land or someone else’s land (for free)?
☐1 Own land
☐2 Rented Land ☐3 Someone else’s
Land
21. What does your household use to cultivate MOST of your farmland? [SELECT ONE]
☐ 1. Hand tool
☐ 2. Animal drawn plow
☐ 3. Tractor drawn plow
☐ -98. Other, specify _______________ 22. Please estimate how
much (total rainy and dry season) paddy land (both rent and owned land) you farmed this season.
☐ 1. 0 ha/0 rai (None) ☐ 2. 0-0.5 ha/0-3 rai ☐ 3. 0.5-1 ha/3- 6 rai ☐ 4. 1-1.5 ha/6-9 rai ☐ 5. 1.5-3.0 ha/9-18 rai ☐ -98. Other (ha) ☐ -99. Other (rai) ☐ -100. Other (meters squared) ☐ -97. Don't Know
22.a. Enumerator please note if land has been cleared for Lao National Unexploded Ordnance Program (UXO Lao) for development and safety.
☐ 1. Yes
☐ 2. No
☐ -97. Don't Know
23. Please estimate how much upland you farmed in the last 12 months
☐ 1. 0 ha/0 rai (None) ☐ 2. 0-0.5 ha/0-3 rai ☐ 3. 0.5-1 ha/3- 6 rai ☐ 4. 1-1.5 ha/6-9 rai ☐ 5. 1.5-3.0 ha/9-18 rai ☐ -98. Other (ha) ☐ -99. Other (rai) ☐ -100. Other (meters squared) ☐ -97. Don't Know
Household Asset Ownership-Physical 24. Does your household have
a home garden? ☐1 Yes ☐2 No Q25 ☐-97 Don't Know Q25
24.a. What do you plant in your home garden? [SELECT MULTIPLE] [READ OUT]
☐ 1-Banana
☐ 2-Chilies
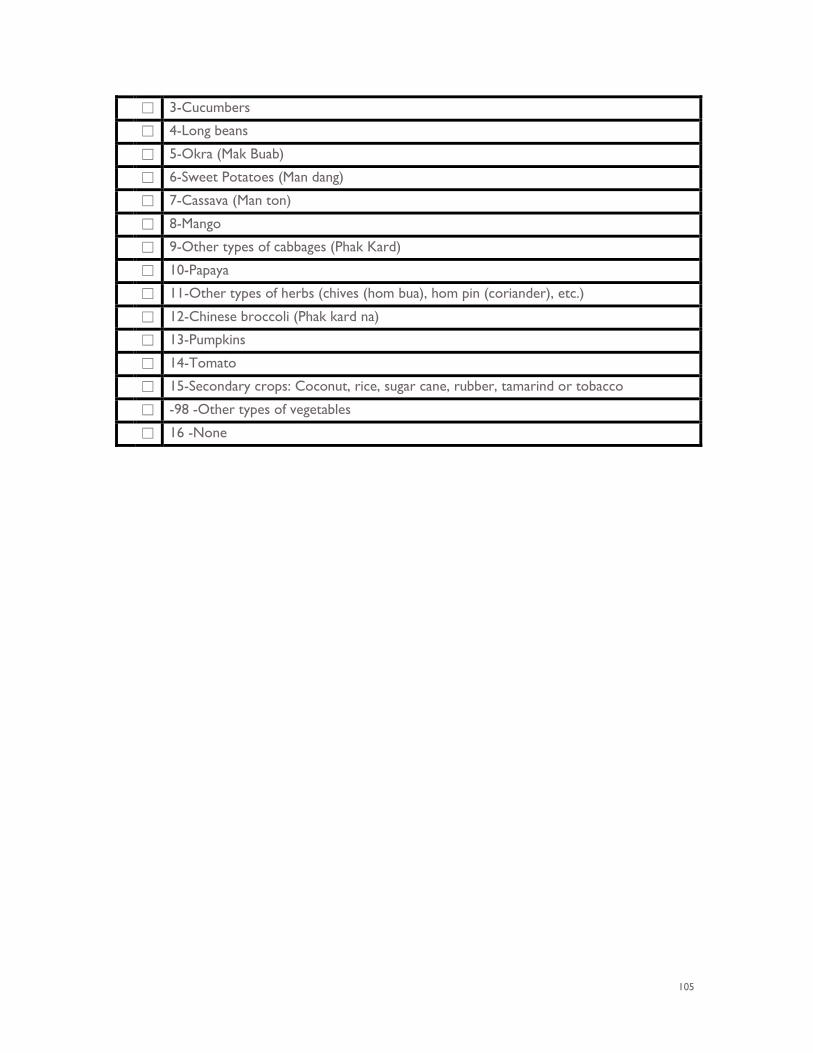
105
☐ 3-Cucumbers
☐ 4-Long beans
☐ 5-Okra (Mak Buab)
☐ 6-Sweet Potatoes (Man dang)
☐ 7-Cassava (Man ton)
☐ 8-Mango
☐ 9-Other types of cabbages (Phak Kard)
☐ 10-Papaya
☐ 11-Other types of herbs (chives (hom bua), hom pin (coriander), etc.)
☐ 12-Chinese broccoli (Phak kard na)
☐ 13-Pumpkins
☐ 14-Tomato
☐ 15-Secondary crops: Coconut, rice, sugar cane, rubber, tamarind or tobacco
☐ -98 -Other types of vegetables
☐ 16 -None
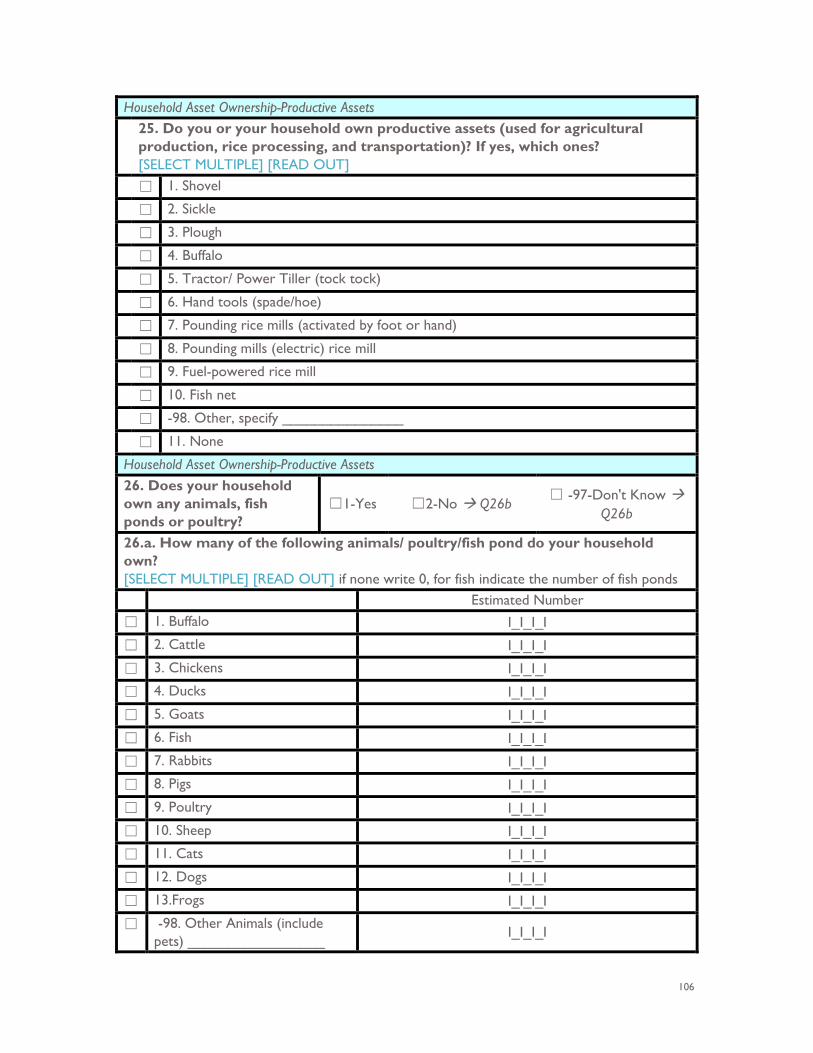
106
Household Asset Ownership-Productive Assets 25. Do you or your household own productive assets (used for agricultural
production, rice processing, and transportation)? If yes, which ones? [SELECT MULTIPLE] [READ OUT]
☐ 1. Shovel
☐ 2. Sickle
☐ 3. Plough
☐ 4. Buffalo
☐ 5. Tractor/ Power Tiller (tock tock)
☐ 6. Hand tools (spade/hoe)
☐ 7. Pounding rice mills (activated by foot or hand)
☐ 8. Pounding mills (electric) rice mill
☐ 9. Fuel-powered rice mill
☐ 10. Fish net
☐ -98. Other, specify _______________
☐ 11. None
Household Asset Ownership-Productive Assets 26. Does your household own any animals, fish ponds or poultry?
☐1-Yes ☐2-No Q26b ☐ -97-Don't Know
Q26b
26.a. How many of the following animals/ poultry/fish pond do your household own? [SELECT MULTIPLE] [READ OUT] if none write 0, for fish indicate the number of fish ponds Estimated Number
☐ 1. Buffalo I_I_I_I
☐ 2. Cattle I_I_I_I
☐ 3. Chickens I_I_I_I
☐ 4. Ducks I_I_I_I
☐ 5. Goats I_I_I_I
☐ 6. Fish I_I_I_I
☐ 7. Rabbits I_I_I_I
☐ 8. Pigs I_I_I_I
☐ 9. Poultry I_I_I_I
☐ 10. Sheep I_I_I_I
☐ 11. Cats I_I_I_I
☐ 12. Dogs I_I_I_I
☐ 13.Frogs I_I_I_I
☐ -98. Other Animals (include pets) _________________
I_I_I_I
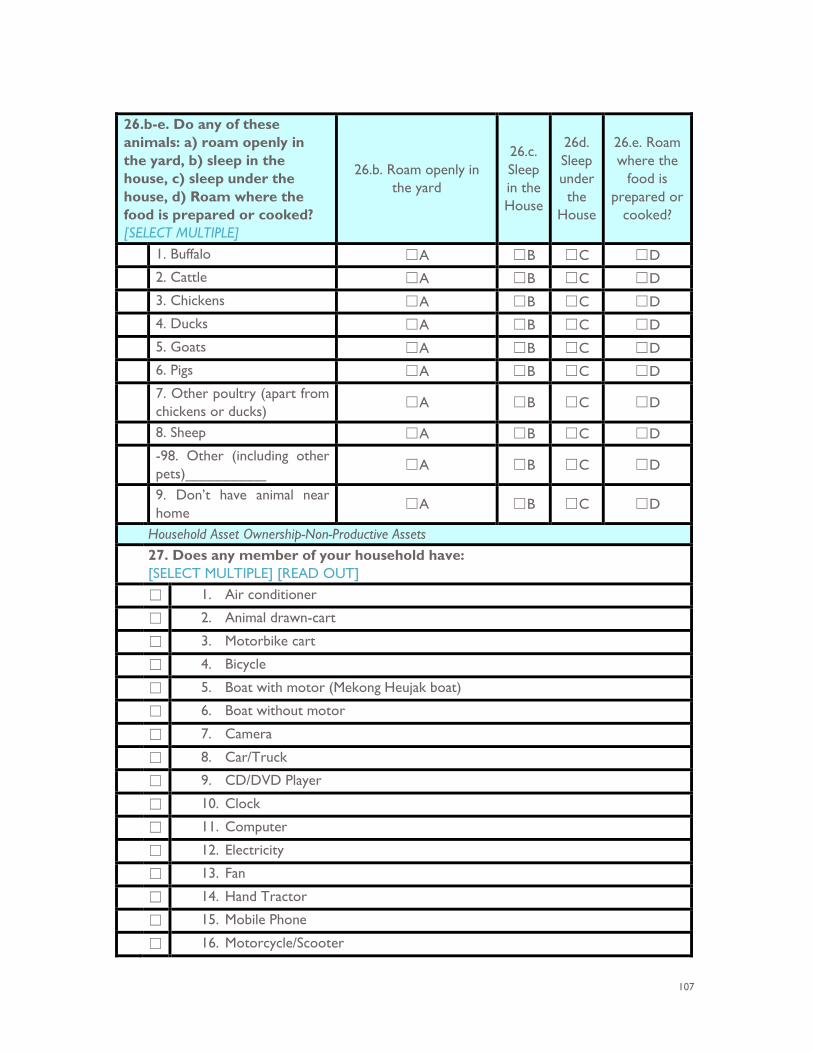
107
26.b-e. Do any of these animals: a) roam openly in the yard, b) sleep in the house, c) sleep under the house, d) Roam where the food is prepared or cooked? [SELECT MULTIPLE]
26.b. Roam openly in the yard
26.c. Sleep in the House
26d. Sleep under the
House
26.e. Roam where the
food is prepared or
cooked?
1. Buffalo ☐A ☐B ☐C ☐D 2. Cattle ☐A ☐B ☐C ☐D 3. Chickens ☐A ☐B ☐C ☐D 4. Ducks ☐A ☐B ☐C ☐D 5. Goats ☐A ☐B ☐C ☐D 6. Pigs ☐A ☐B ☐C ☐D 7. Other poultry (apart from
chickens or ducks) ☐A ☐B ☐C ☐D
8. Sheep ☐A ☐B ☐C ☐D -98. Other (including other
pets)__________ ☐A ☐B ☐C ☐D
9. Don’t have animal near home
☐A ☐B ☐C ☐D
Household Asset Ownership-Non-Productive Assets 27. Does any member of your household have:
[SELECT MULTIPLE] [READ OUT] ☐ 1. Air conditioner
☐ 2. Animal drawn-cart
☐ 3. Motorbike cart
☐ 4. Bicycle
☐ 5. Boat with motor (Mekong Heujak boat)
☐ 6. Boat without motor
☐ 7. Camera
☐ 8. Car/Truck
☐ 9. CD/DVD Player
☐ 10. Clock
☐ 11. Computer
☐ 12. Electricity
☐ 13. Fan
☐ 14. Hand Tractor
☐ 15. Mobile Phone
☐ 16. Motorcycle/Scooter
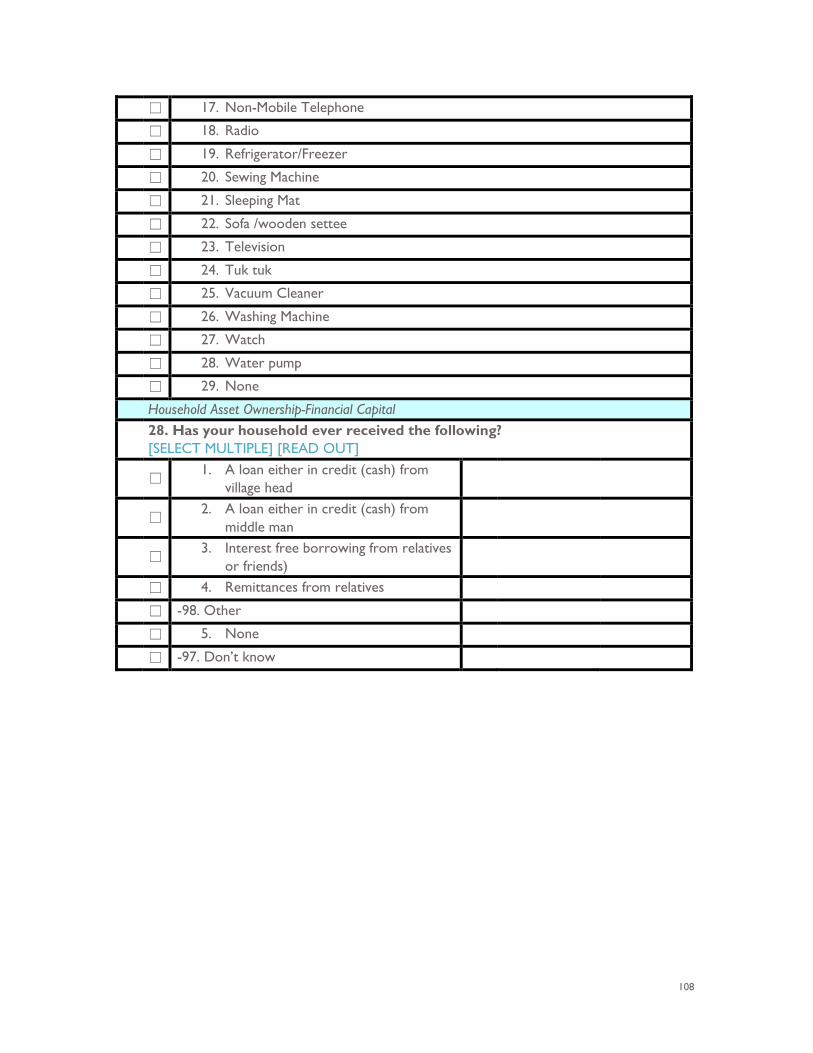
108
☐ 17. Non-Mobile Telephone
☐ 18. Radio
☐ 19. Refrigerator/Freezer
☐ 20. Sewing Machine
☐ 21. Sleeping Mat
☐ 22. Sofa /wooden settee
☐ 23. Television
☐ 24. Tuk tuk
☐ 25. Vacuum Cleaner
☐ 26. Washing Machine
☐ 27. Watch
☐ 28. Water pump
☐ 29. None
Household Asset Ownership-Financial Capital 28. Has your household ever received the following?
[SELECT MULTIPLE] [READ OUT]
☐ 1. A loan either in credit (cash) from
village head
☐
2. A loan either in credit (cash) from middle man
☐
3. Interest free borrowing from relatives or friends)
☐ 4. Remittances from relatives
☐ -98. Other
☐ 5. None
☐ -97. Don’t know
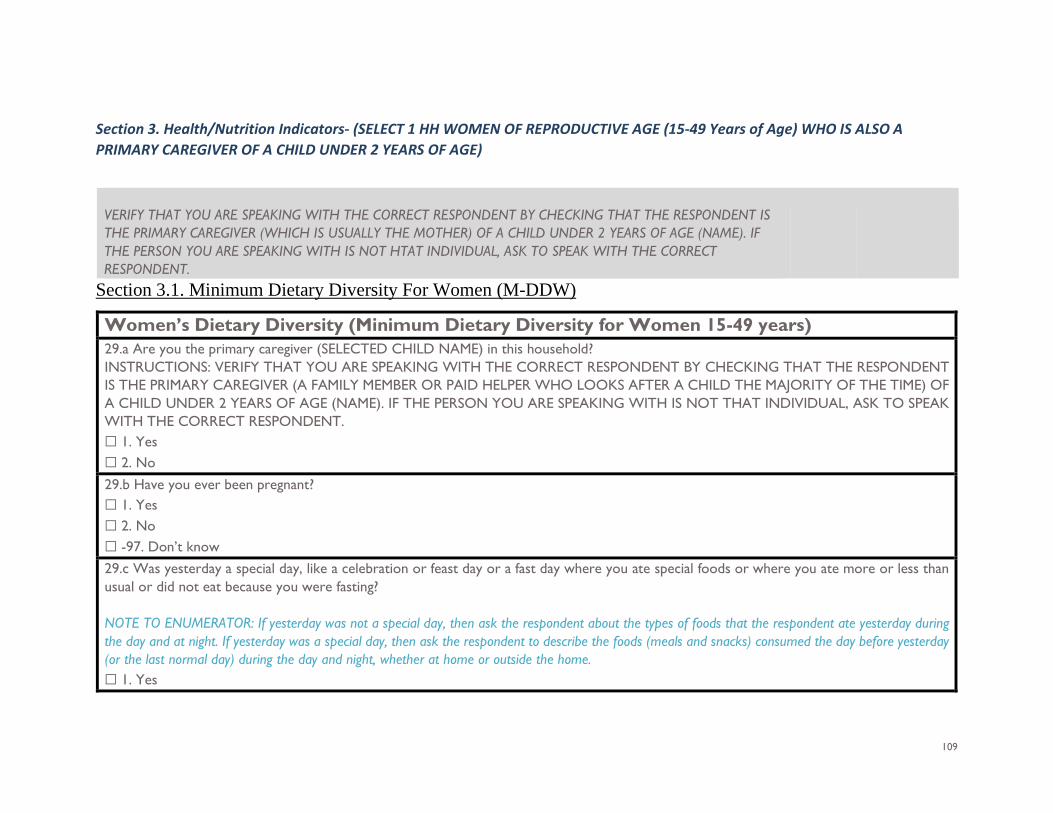
109
Section 3. Health/Nutrition Indicators- (SELECT 1 HH WOMEN OF REPRODUCTIVE AGE (15-49 Years of Age) WHO IS ALSO A PRIMARY CAREGIVER OF A CHILD UNDER 2 YEARS OF AGE)
VERIFY THAT YOU ARE SPEAKING WITH THE CORRECT RESPONDENT BY CHECKING THAT THE RESPONDENT IS THE PRIMARY CAREGIVER (WHICH IS USUALLY THE MOTHER) OF A CHILD UNDER 2 YEARS OF AGE (NAME). IF THE PERSON YOU ARE SPEAKING WITH IS NOT HTAT INDIVIDUAL, ASK TO SPEAK WITH THE CORRECT RESPONDENT.
Section 3.1. Minimum Dietary Diversity For Women (M-DDW)
Women’s Dietary Diversity (Minimum Dietary Diversity for Women 15-49 years) 29.a Are you the primary caregiver (SELECTED CHILD NAME) in this household? INSTRUCTIONS: VERIFY THAT YOU ARE SPEAKING WITH THE CORRECT RESPONDENT BY CHECKING THAT THE RESPONDENT IS THE PRIMARY CAREGIVER (A FAMILY MEMBER OR PAID HELPER WHO LOOKS AFTER A CHILD THE MAJORITY OF THE TIME) OF A CHILD UNDER 2 YEARS OF AGE (NAME). IF THE PERSON YOU ARE SPEAKING WITH IS NOT THAT INDIVIDUAL, ASK TO SPEAK WITH THE CORRECT RESPONDENT. ☐ 1. Yes ☐ 2. No 29.b Have you ever been pregnant? ☐ 1. Yes ☐ 2. No ☐ -97. Don’t know 29.c Was yesterday a special day, like a celebration or feast day or a fast day where you ate special foods or where you ate more or less than usual or did not eat because you were fasting? NOTE TO ENUMERATOR: If yesterday was not a special day, then ask the respondent about the types of foods that the respondent ate yesterday during the day and at night. If yesterday was a special day, then ask the respondent to describe the foods (meals and snacks) consumed the day before yesterday (or the last normal day) during the day and night, whether at home or outside the home. ☐ 1. Yes
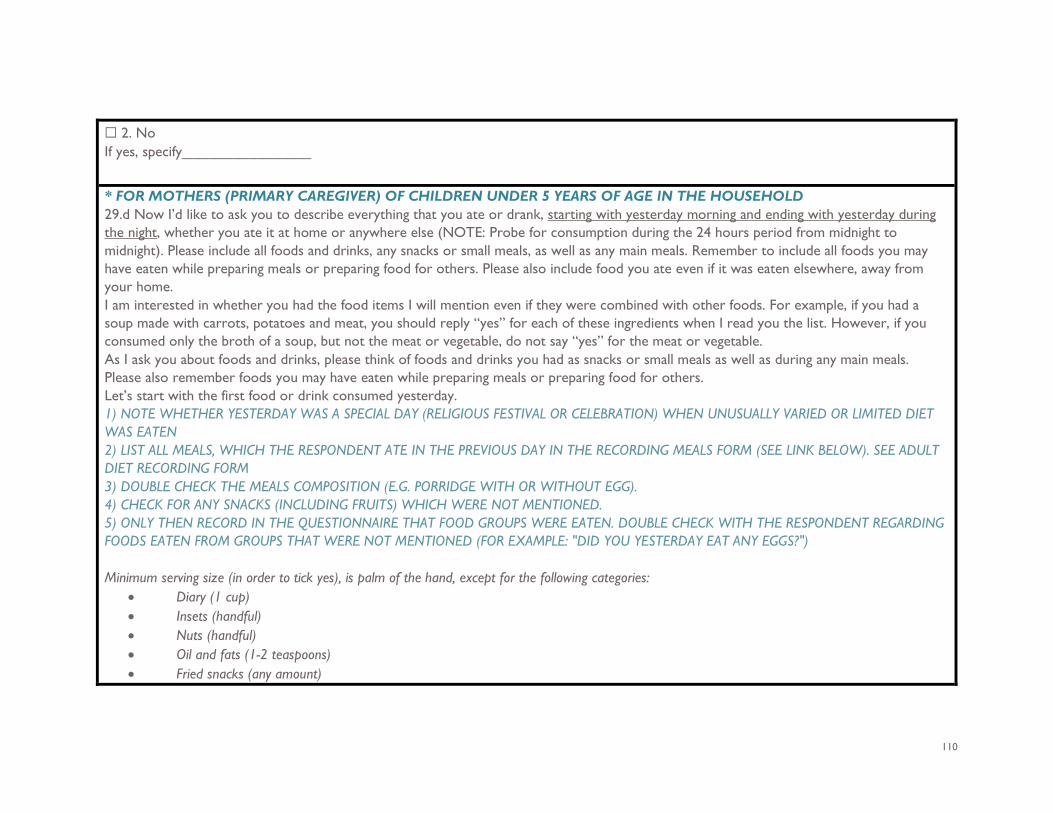
110
☐ 2. No If yes, specify________________ * FOR MOTHERS (PRIMARY CAREGIVER) OF CHILDREN UNDER 5 YEARS OF AGE IN THE HOUSEHOLD 29.d Now I’d like to ask you to describe everything that you ate or drank, starting with yesterday morning and ending with yesterday during the night, whether you ate it at home or anywhere else (NOTE: Probe for consumption during the 24 hours period from midnight to midnight). Please include all foods and drinks, any snacks or small meals, as well as any main meals. Remember to include all foods you may have eaten while preparing meals or preparing food for others. Please also include food you ate even if it was eaten elsewhere, away from your home. I am interested in whether you had the food items I will mention even if they were combined with other foods. For example, if you had a soup made with carrots, potatoes and meat, you should reply “yes” for each of these ingredients when I read you the list. However, if you consumed only the broth of a soup, but not the meat or vegetable, do not say “yes” for the meat or vegetable. As I ask you about foods and drinks, please think of foods and drinks you had as snacks or small meals as well as during any main meals. Please also remember foods you may have eaten while preparing meals or preparing food for others. Let’s start with the first food or drink consumed yesterday. 1) NOTE WHETHER YESTERDAY WAS A SPECIAL DAY (RELIGIOUS FESTIVAL OR CELEBRATION) WHEN UNUSUALLY VARIED OR LIMITED DIET WAS EATEN 2) LIST ALL MEALS, WHICH THE RESPONDENT ATE IN THE PREVIOUS DAY IN THE RECORDING MEALS FORM (SEE LINK BELOW). SEE ADULT DIET RECORDING FORM 3) DOUBLE CHECK THE MEALS COMPOSITION (E.G. PORRIDGE WITH OR WITHOUT EGG). 4) CHECK FOR ANY SNACKS (INCLUDING FRUITS) WHICH WERE NOT MENTIONED. 5) ONLY THEN RECORD IN THE QUESTIONNAIRE THAT FOOD GROUPS WERE EATEN. DOUBLE CHECK WITH THE RESPONDENT REGARDING FOODS EATEN FROM GROUPS THAT WERE NOT MENTIONED (FOR EXAMPLE: "DID YOU YESTERDAY EAT ANY EGGS?") Minimum serving size (in order to tick yes), is palm of the hand, except for the following categories:
• Diary (1 cup) • Insets (handful) • Nuts (handful) • Oil and fats (1-2 teaspoons) • Fried snacks (any amount)
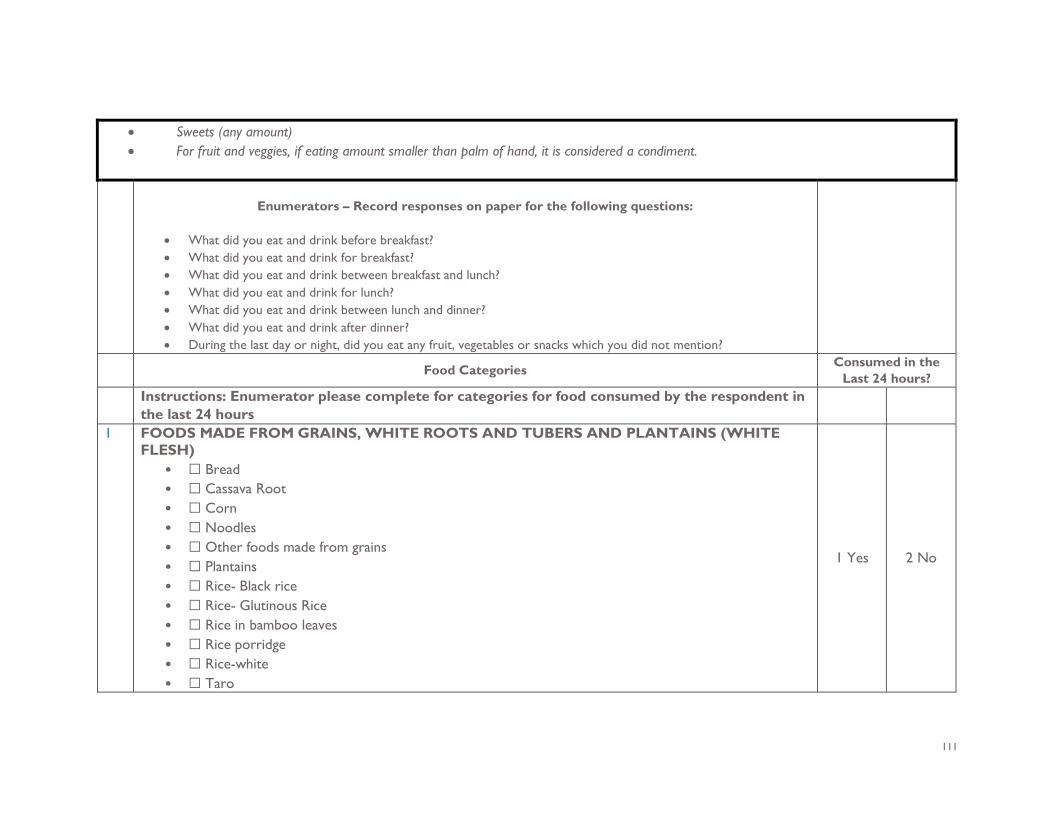
111
• Sweets (any amount) • For fruit and veggies, if eating amount smaller than palm of hand, it is considered a condiment.
Enumerators – Record responses on paper for the following questions:
• What did you eat and drink before breakfast? • What did you eat and drink for breakfast? • What did you eat and drink between breakfast and lunch? • What did you eat and drink for lunch? • What did you eat and drink between lunch and dinner? • What did you eat and drink after dinner? • During the last day or night, did you eat any fruit, vegetables or snacks which you did not mention?
Food Categories Consumed in the Last 24 hours?
Instructions: Enumerator please complete for categories for food consumed by the respondent in the last 24 hours
1 FOODS MADE FROM GRAINS, WHITE ROOTS AND TUBERS AND PLANTAINS (WHITE FLESH)
• ☐ Bread • ☐ Cassava Root • ☐ Corn • ☐ Noodles • ☐ Other foods made from grains • ☐ Plantains • ☐ Rice- Black rice • ☐ Rice- Glutinous Rice • ☐ Rice in bamboo leaves • ☐ Rice porridge • ☐ Rice-white • ☐ Taro
1 Yes 2 No
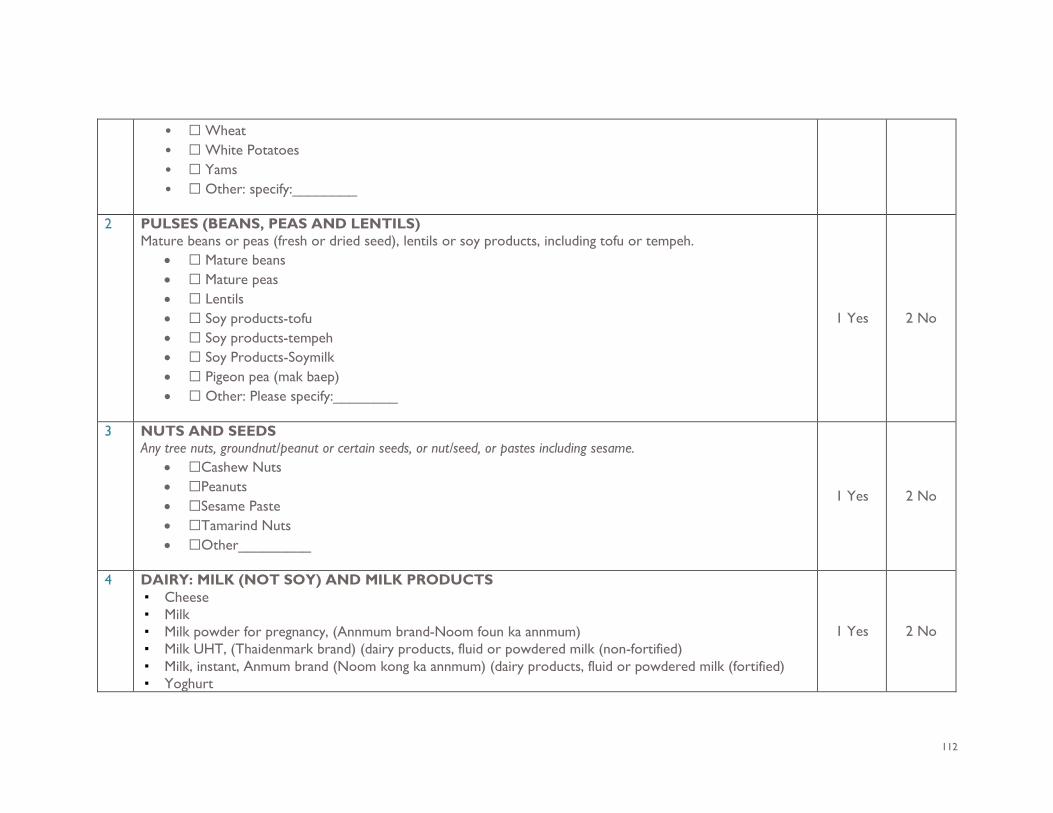
112
• ☐ Wheat • ☐ White Potatoes • ☐ Yams • ☐ Other: specify:________
2 PULSES (BEANS, PEAS AND LENTILS)
Mature beans or peas (fresh or dried seed), lentils or soy products, including tofu or tempeh. • ☐ Mature beans • ☐ Mature peas • ☐ Lentils • ☐ Soy products-tofu • ☐ Soy products-tempeh • ☐ Soy Products-Soymilk • ☐ Pigeon pea (mak baep) • ☐ Other: Please specify:________
1 Yes 2 No
3 NUTS AND SEEDS Any tree nuts, groundnut/peanut or certain seeds, or nut/seed, or pastes including sesame.
• ☐Cashew Nuts • ☐Peanuts • ☐Sesame Paste • ☐Tamarind Nuts • ☐Other_________
1 Yes 2 No
4 DAIRY: MILK (NOT SOY) AND MILK PRODUCTS ▪ Cheese ▪ Milk ▪ Milk powder for pregnancy, (Annmum brand-Noom foun ka annmum) ▪ Milk UHT, (Thaidenmark brand) (dairy products, fluid or powdered milk (non-fortified) ▪ Milk, instant, Anmum brand (Noom kong ka annmum) (dairy products, fluid or powdered milk (fortified) ▪ Yoghurt
1 Yes 2 No
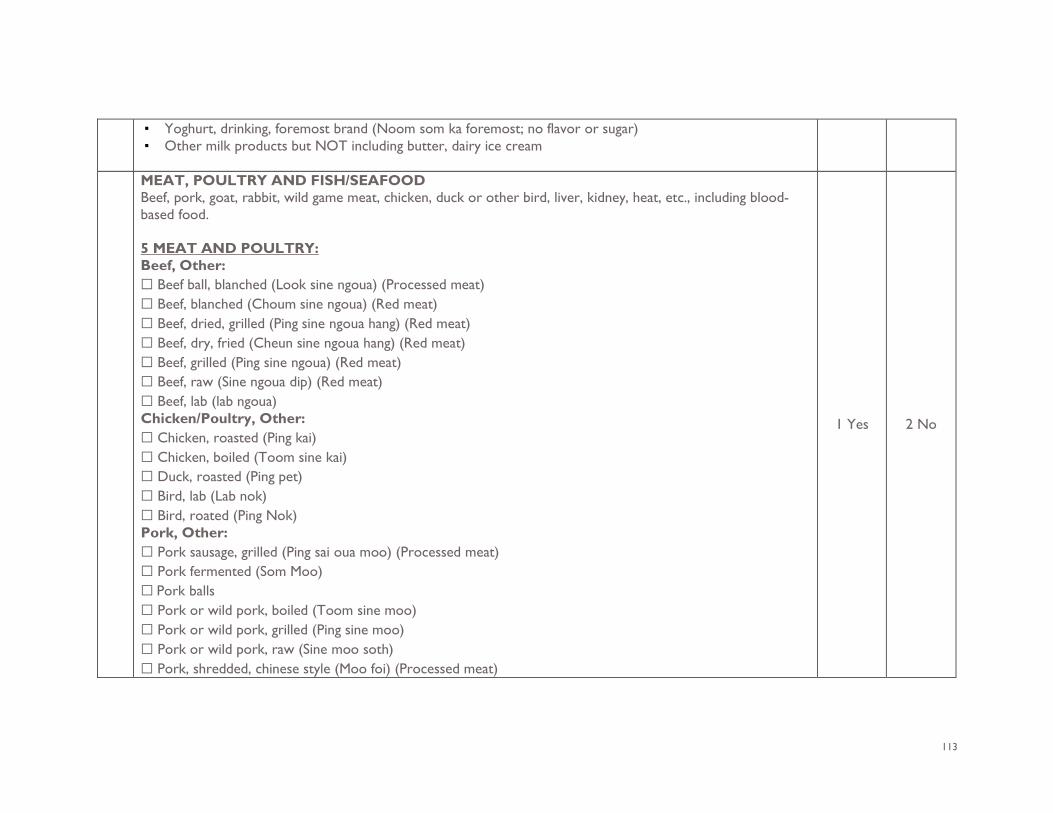
113
▪ Yoghurt, drinking, foremost brand (Noom som ka foremost; no flavor or sugar) ▪ Other milk products but NOT including butter, dairy ice cream
MEAT, POULTRY AND FISH/SEAFOOD Beef, pork, goat, rabbit, wild game meat, chicken, duck or other bird, liver, kidney, heat, etc., including blood-based food. 5 MEAT AND POULTRY: Beef, Other: ☐ Beef ball, blanched (Look sine ngoua) (Processed meat) ☐ Beef, blanched (Choum sine ngoua) (Red meat) ☐ Beef, dried, grilled (Ping sine ngoua hang) (Red meat) ☐ Beef, dry, fried (Cheun sine ngoua hang) (Red meat) ☐ Beef, grilled (Ping sine ngoua) (Red meat) ☐ Beef, raw (Sine ngoua dip) (Red meat) ☐ Beef, lab (lab ngoua) Chicken/Poultry, Other: ☐ Chicken, roasted (Ping kai) ☐ Chicken, boiled (Toom sine kai) ☐ Duck, roasted (Ping pet) ☐ Bird, lab (Lab nok) ☐ Bird, roated (Ping Nok) Pork, Other: ☐ Pork sausage, grilled (Ping sai oua moo) (Processed meat) ☐ Pork fermented (Som Moo) ☐ Pork balls ☐ Pork or wild pork, boiled (Toom sine moo) ☐ Pork or wild pork, grilled (Ping sine moo) ☐ Pork or wild pork, raw (Sine moo soth) ☐ Pork, shredded, chinese style (Moo foi) (Processed meat)
1 Yes 2 No
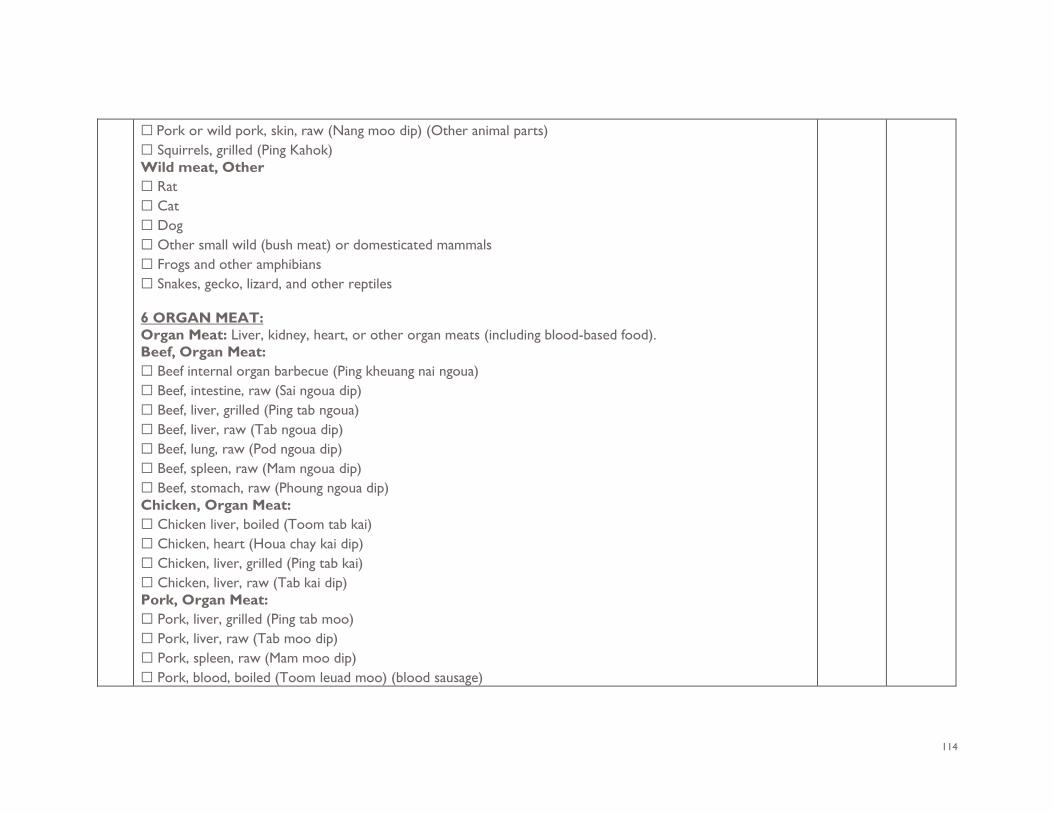
114
☐ Pork or wild pork, skin, raw (Nang moo dip) (Other animal parts) ☐ Squirrels, grilled (Ping Kahok) Wild meat, Other ☐ Rat ☐ Cat ☐ Dog ☐ Other small wild (bush meat) or domesticated mammals ☐ Frogs and other amphibians ☐ Snakes, gecko, lizard, and other reptiles 6 ORGAN MEAT: Organ Meat: Liver, kidney, heart, or other organ meats (including blood-based food). Beef, Organ Meat: ☐ Beef internal organ barbecue (Ping kheuang nai ngoua) ☐ Beef, intestine, raw (Sai ngoua dip) ☐ Beef, liver, grilled (Ping tab ngoua) ☐ Beef, liver, raw (Tab ngoua dip) ☐ Beef, lung, raw (Pod ngoua dip) ☐ Beef, spleen, raw (Mam ngoua dip) ☐ Beef, stomach, raw (Phoung ngoua dip) Chicken, Organ Meat: ☐ Chicken liver, boiled (Toom tab kai) ☐ Chicken, heart (Houa chay kai dip) ☐ Chicken, liver, grilled (Ping tab kai) ☐ Chicken, liver, raw (Tab kai dip) Pork, Organ Meat: ☐ Pork, liver, grilled (Ping tab moo) ☐ Pork, liver, raw (Tab moo dip) ☐ Pork, spleen, raw (Mam moo dip) ☐ Pork, blood, boiled (Toom leuad moo) (blood sausage)
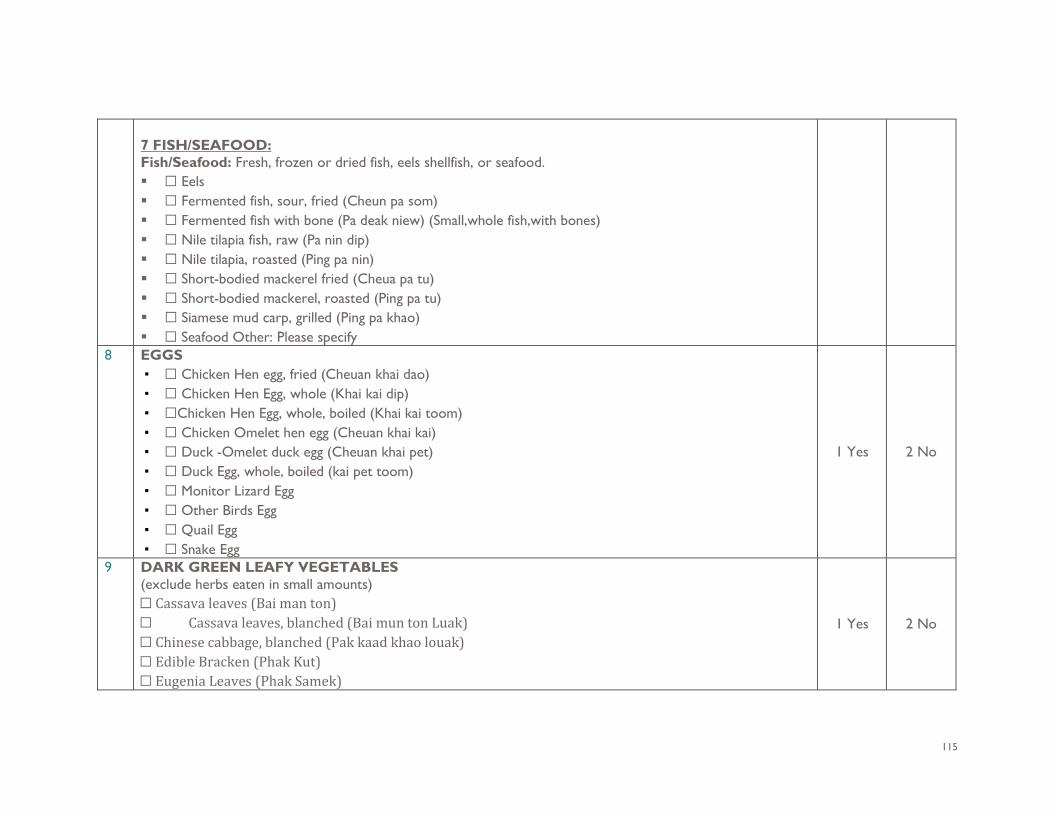
115
7 FISH/SEAFOOD: Fish/Seafood: Fresh, frozen or dried fish, eels shellfish, or seafood. ☐ Eels ☐ Fermented fish, sour, fried (Cheun pa som) ☐ Fermented fish with bone (Pa deak niew) (Small,whole fish,with bones) ☐ Nile tilapia fish, raw (Pa nin dip) ☐ Nile tilapia, roasted (Ping pa nin) ☐ Short-bodied mackerel fried (Cheua pa tu) ☐ Short-bodied mackerel, roasted (Ping pa tu) ☐ Siamese mud carp, grilled (Ping pa khao) ☐ Seafood Other: Please specify
8 EGGS ▪ ☐ Chicken Hen egg, fried (Cheuan khai dao) ▪ ☐ Chicken Hen Egg, whole (Khai kai dip) ▪ ☐Chicken Hen Egg, whole, boiled (Khai kai toom) ▪ ☐ Chicken Omelet hen egg (Cheuan khai kai) ▪ ☐ Duck -Omelet duck egg (Cheuan khai pet) ▪ ☐ Duck Egg, whole, boiled (kai pet toom) ▪ ☐ Monitor Lizard Egg ▪ ☐ Other Birds Egg ▪ ☐ Quail Egg ▪ ☐ Snake Egg
1 Yes 2 No
9 DARK GREEN LEAFY VEGETABLES (exclude herbs eaten in small amounts) ☐ Cassava leaves (Bai man ton) ☐ Cassava leaves, blanched (Bai mun ton Luak) ☐ Chinese cabbage, blanched (Pak kaad khao louak) ☐ Edible Bracken (Phak Kut) ☐ Eugenia Leaves (Phak Samek)
1 Yes 2 No
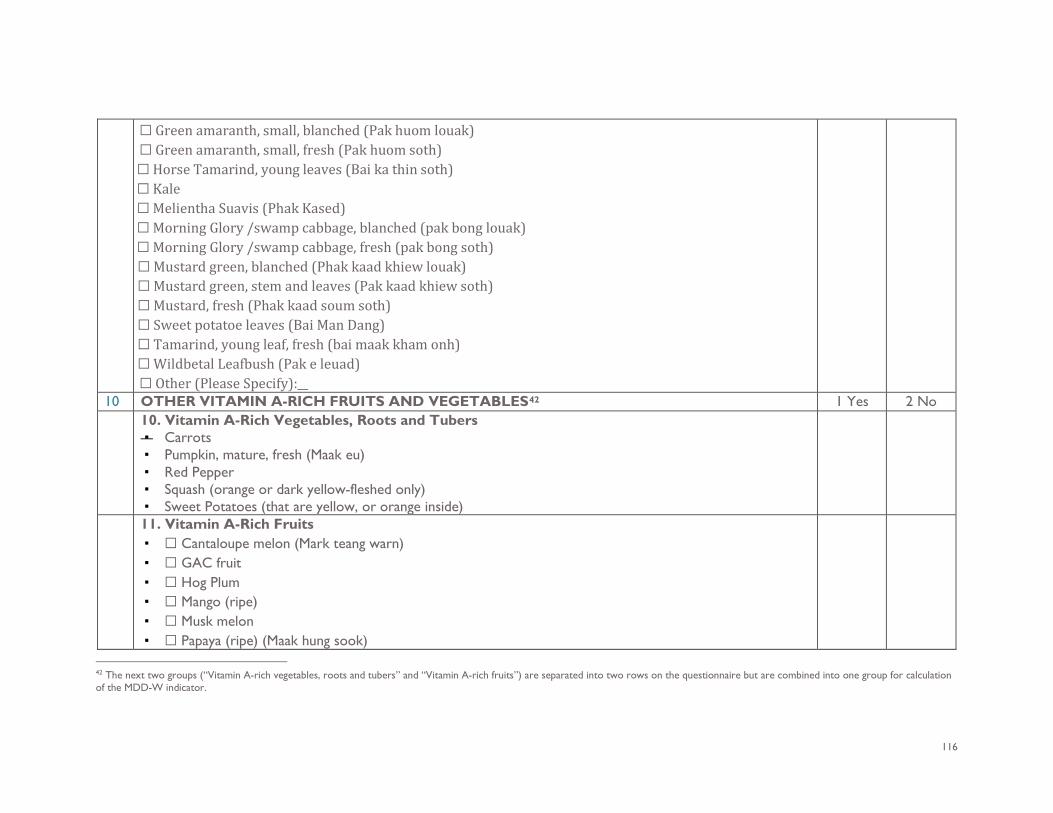
116
☐ Green amaranth, small, blanched (Pak huom louak) ☐ Green amaranth, small, fresh (Pak huom soth) ☐ Horse Tamarind, young leaves (Bai ka thin soth) ☐ Kale ☐ Melientha Suavis (Phak Kased) ☐ Morning Glory /swamp cabbage, blanched (pak bong louak) ☐ Morning Glory /swamp cabbage, fresh (pak bong soth) ☐ Mustard green, blanched (Phak kaad khiew louak) ☐ Mustard green, stem and leaves (Pak kaad khiew soth) ☐ Mustard, fresh (Phak kaad soum soth) ☐ Sweet potatoe leaves (Bai Man Dang) ☐ Tamarind, young leaf, fresh (bai maak kham onh) ☐ Wildbetal Leafbush (Pak e leuad) ☐ Other (Please Specify):__
10 OTHER VITAMIN A-RICH FRUITS AND VEGETABLES42 1 Yes 2 No 10. Vitamin A-Rich Vegetables, Roots and Tubers
▪ Carrots ▪ Pumpkin, mature, fresh (Maak eu) ▪ Red Pepper ▪ Squash (orange or dark yellow-fleshed only) ▪ Sweet Potatoes (that are yellow, or orange inside)
11. Vitamin A-Rich Fruits ▪ ☐ Cantaloupe melon (Mark teang warn) ▪ ☐ GAC fruit ▪ ☐ Hog Plum ▪ ☐ Mango (ripe) ▪ ☐ Musk melon ▪ ☐ Papaya (ripe) (Maak hung sook)
42 The next two groups (“Vitamin A-rich vegetables, roots and tubers” and “Vitamin A-rich fruits”) are separated into two rows on the questionnaire but are combined into one group for calculation of the MDD-W indicator.
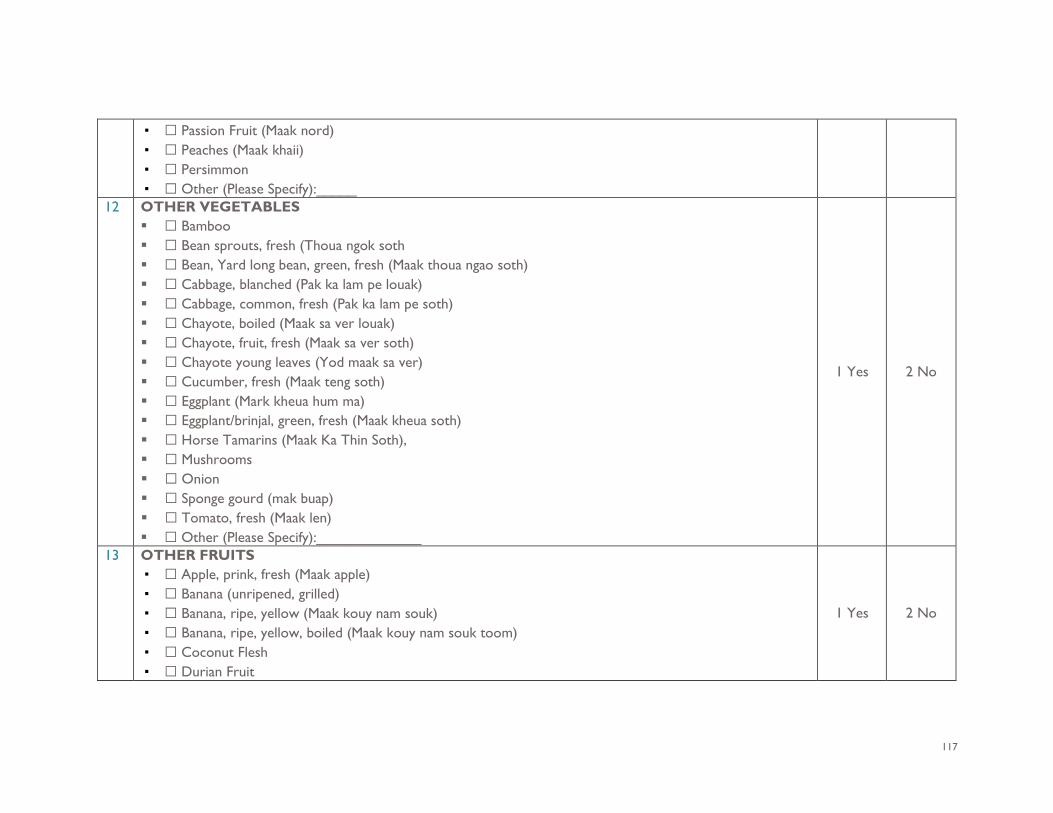
117
▪ ☐ Passion Fruit (Maak nord) ▪ ☐ Peaches (Maak khaii) ▪ ☐ Persimmon ▪ ☐ Other (Please Specify):_____
12 OTHER VEGETABLES ☐ Bamboo ☐ Bean sprouts, fresh (Thoua ngok soth ☐ Bean, Yard long bean, green, fresh (Maak thoua ngao soth) ☐ Cabbage, blanched (Pak ka lam pe louak) ☐ Cabbage, common, fresh (Pak ka lam pe soth) ☐ Chayote, boiled (Maak sa ver louak) ☐ Chayote, fruit, fresh (Maak sa ver soth) ☐ Chayote young leaves (Yod maak sa ver) ☐ Cucumber, fresh (Maak teng soth) ☐ Eggplant (Mark kheua hum ma) ☐ Eggplant/brinjal, green, fresh (Maak kheua soth) ☐ Horse Tamarins (Maak Ka Thin Soth), ☐ Mushrooms ☐ Onion ☐ Sponge gourd (mak buap) ☐ Tomato, fresh (Maak len) ☐ Other (Please Specify):_____________
1 Yes 2 No
13 OTHER FRUITS ▪ ☐ Apple, prink, fresh (Maak apple) ▪ ☐ Banana (unripened, grilled) ▪ ☐ Banana, ripe, yellow (Maak kouy nam souk) ▪ ☐ Banana, ripe, yellow, boiled (Maak kouy nam souk toom) ▪ ☐ Coconut Flesh ▪ ☐ Durian Fruit
1 Yes 2 No
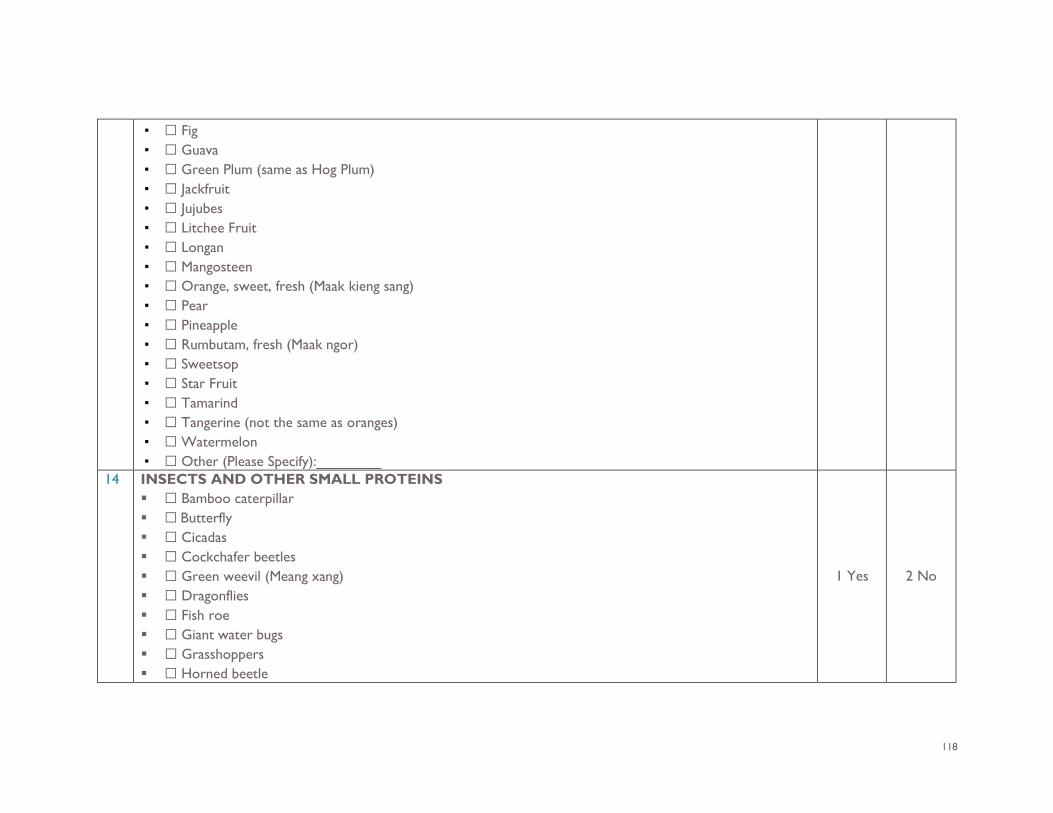
118
▪ ☐ Fig ▪ ☐ Guava ▪ ☐ Green Plum (same as Hog Plum) ▪ ☐ Jackfruit ▪ ☐ Jujubes ▪ ☐ Litchee Fruit ▪ ☐ Longan ▪ ☐ Mangosteen ▪ ☐ Orange, sweet, fresh (Maak kieng sang) ▪ ☐ Pear ▪ ☐ Pineapple ▪ ☐ Rumbutam, fresh (Maak ngor) ▪ ☐ Sweetsop ▪ ☐ Star Fruit ▪ ☐ Tamarind ▪ ☐ Tangerine (not the same as oranges) ▪ ☐ Watermelon ▪ ☐ Other (Please Specify):________
14 INSECTS AND OTHER SMALL PROTEINS ☐ Bamboo caterpillar ☐ Butterfly ☐ Cicadas ☐ Cockchafer beetles ☐ Green weevil (Meang xang) ☐ Dragonflies ☐ Fish roe ☐ Giant water bugs ☐ Grasshoppers ☐ Horned beetle
1 Yes 2 No
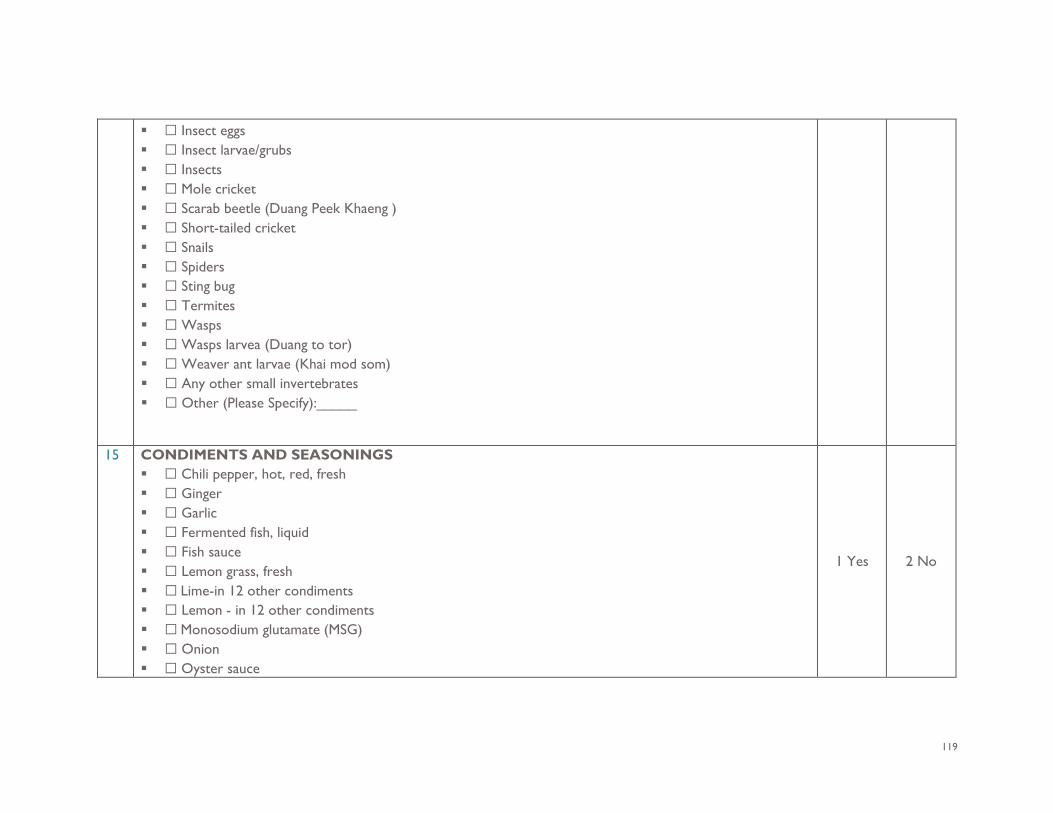
119
☐ Insect eggs ☐ Insect larvae/grubs ☐ Insects ☐ Mole cricket ☐ Scarab beetle (Duang Peek Khaeng ) ☐ Short-tailed cricket ☐ Snails ☐ Spiders ☐ Sting bug ☐ Termites ☐ Wasps ☐ Wasps larvea (Duang to tor) ☐ Weaver ant larvae (Khai mod som) ☐ Any other small invertebrates ☐ Other (Please Specify):_____
15 CONDIMENTS AND SEASONINGS ☐ Chili pepper, hot, red, fresh ☐ Ginger ☐ Garlic ☐ Fermented fish, liquid ☐ Fish sauce ☐ Lemon grass, fresh ☐ Lime-in 12 other condiments ☐ Lemon - in 12 other condiments ☐ Monosodium glutamate (MSG) ☐ Onion ☐ Oyster sauce
1 Yes 2 No
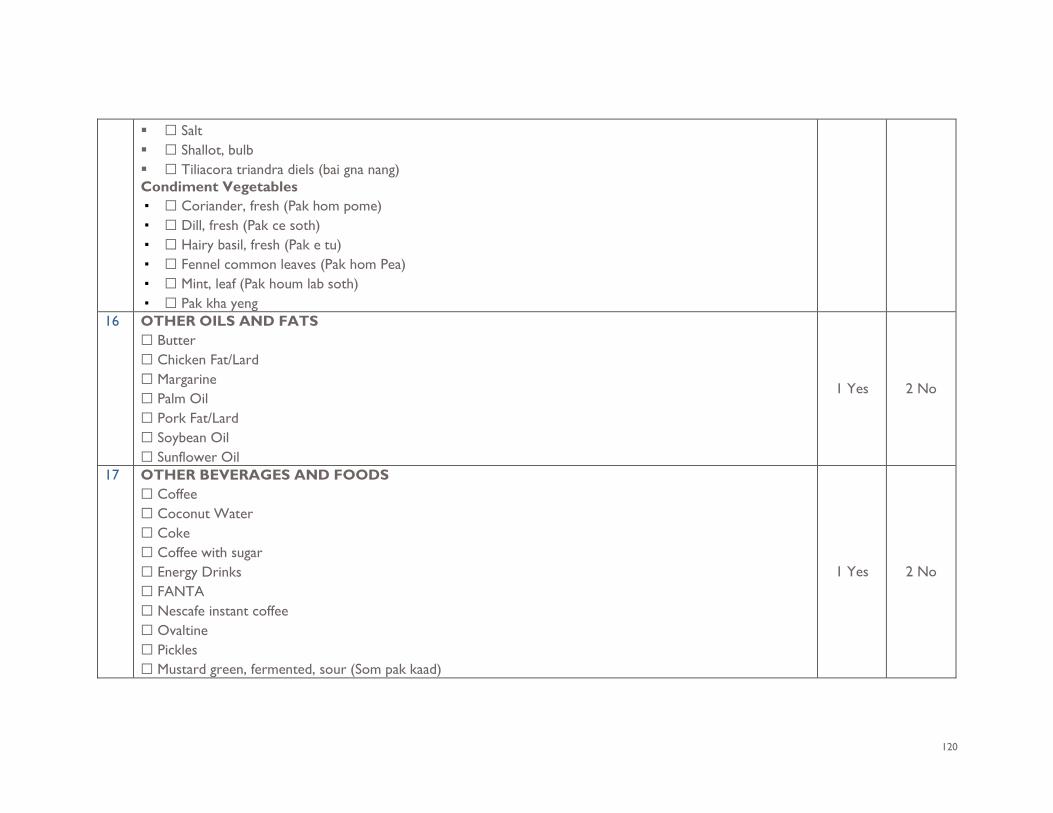
120
☐ Salt ☐ Shallot, bulb ☐ Tiliacora triandra diels (bai gna nang) Condiment Vegetables ▪ ☐ Coriander, fresh (Pak hom pome) ▪ ☐ Dill, fresh (Pak ce soth) ▪ ☐ Hairy basil, fresh (Pak e tu) ▪ ☐ Fennel common leaves (Pak hom Pea) ▪ ☐ Mint, leaf (Pak houm lab soth) ▪ ☐ Pak kha yeng
16 OTHER OILS AND FATS ☐ Butter ☐ Chicken Fat/Lard ☐ Margarine ☐ Palm Oil ☐ Pork Fat/Lard ☐ Soybean Oil ☐ Sunflower Oil
1 Yes 2 No
17 OTHER BEVERAGES AND FOODS ☐ Coffee ☐ Coconut Water ☐ Coke ☐ Coffee with sugar ☐ Energy Drinks ☐ FANTA ☐ Nescafe instant coffee ☐ Ovaltine ☐ Pickles ☐ Mustard green, fermented, sour (Som pak kaad)
1 Yes 2 No
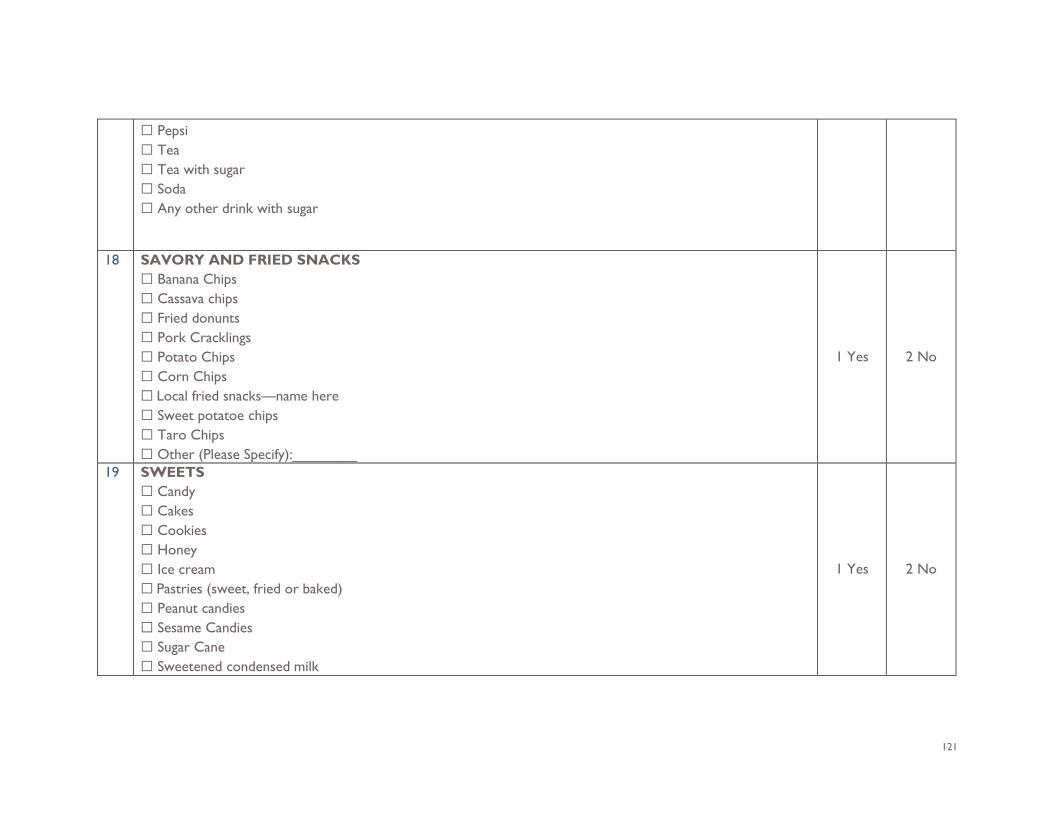
121
☐ Pepsi ☐ Tea ☐ Tea with sugar ☐ Soda ☐ Any other drink with sugar
18 SAVORY AND FRIED SNACKS ☐ Banana Chips ☐ Cassava chips ☐ Fried donunts ☐ Pork Cracklings ☐ Potato Chips ☐ Corn Chips ☐ Local fried snacks—name here ☐ Sweet potatoe chips ☐ Taro Chips ☐ Other (Please Specify):________
1 Yes 2 No
19 SWEETS ☐ Candy ☐ Cakes ☐ Cookies ☐ Honey ☐ Ice cream ☐ Pastries (sweet, fried or baked) ☐ Peanut candies ☐ Sesame Candies ☐ Sugar Cane ☐ Sweetened condensed milk
1 Yes 2 No
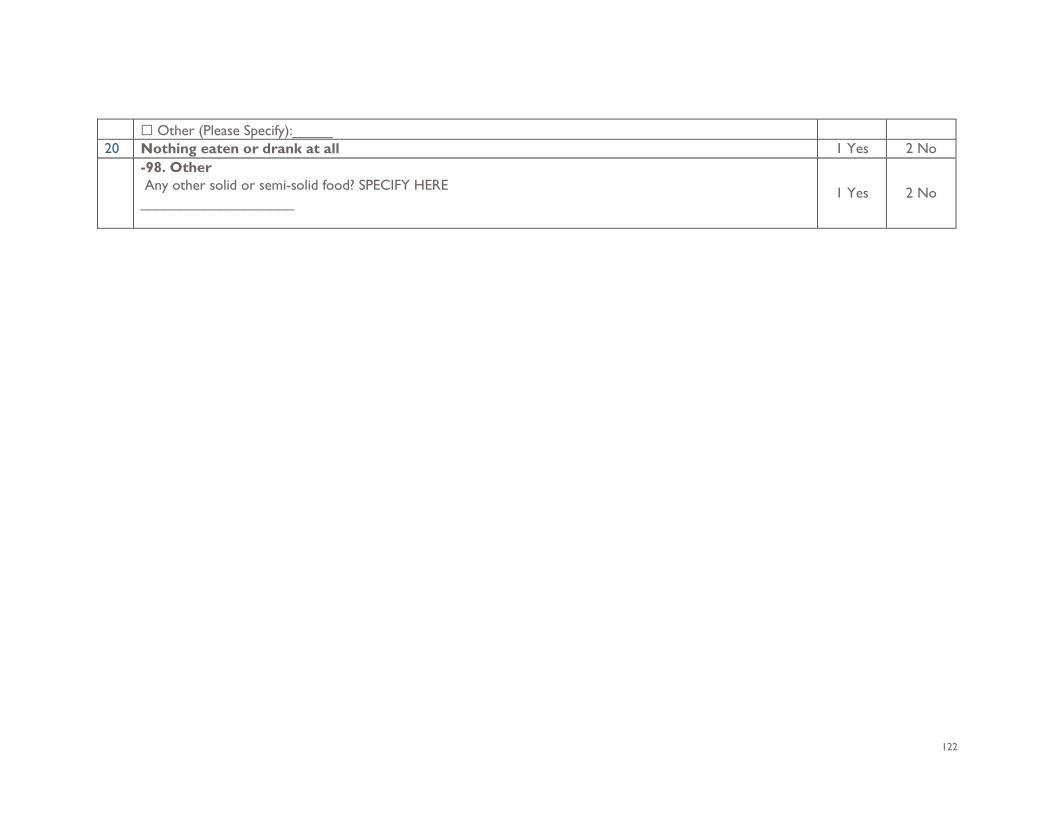
122
☐ Other (Please Specify):_____ 20 Nothing eaten or drank at all 1 Yes 2 No -98. Other
Any other solid or semi-solid food? SPECIFY HERE ___________________
1 Yes 2 No
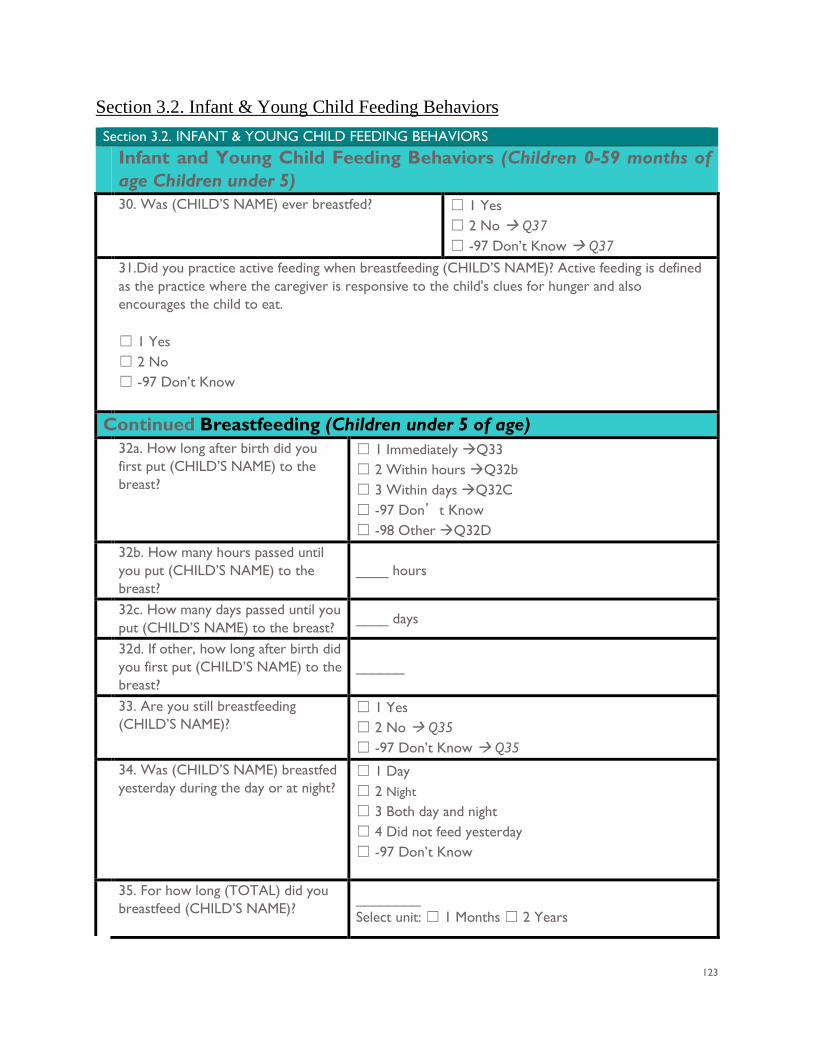
123
Section 3.2. Infant & Young Child Feeding Behaviors Section 3.2. INFANT & YOUNG CHILD FEEDING BEHAVIORS Infant and Young Child Feeding Behaviors (Children 0-59 months of
age Children under 5) 30. Was (CHILD’S NAME) ever breastfed? ☐ 1 Yes
☐ 2 No Q37 ☐ -97 Don’t Know Q37
31.Did you practice active feeding when breastfeeding (CHILD’S NAME)? Active feeding is defined as the practice where the caregiver is responsive to the child's clues for hunger and also encourages the child to eat. ☐ 1 Yes ☐ 2 No ☐ -97 Don’t Know
Continued Breastfeeding (Children under 5 of age) 32a. How long after birth did you
first put (CHILD’S NAME) to the breast?
☐ 1 Immediately Q33 ☐ 2 Within hours Q32b ☐ 3 Within days Q32C ☐ -97 Don’t Know ☐ -98 Other Q32D
32b. How many hours passed until you put (CHILD’S NAME) to the breast?
____ hours
32c. How many days passed until you put (CHILD’S NAME) to the breast?
____ days
32d. If other, how long after birth did you first put (CHILD’S NAME) to the breast?
______
33. Are you still breastfeeding (CHILD’S NAME)?
☐ 1 Yes ☐ 2 No Q35 ☐ -97 Don’t Know Q35
34. Was (CHILD’S NAME) breastfed yesterday during the day or at night?
☐ 1 Day ☐ 2 Night
☐ 3 Both day and night ☐ 4 Did not feed yesterday ☐ -97 Don’t Know
35. For how long (TOTAL) did you breastfeed (CHILD’S NAME)?
________ Select unit: ☐ 1 Months ☐ 2 Years
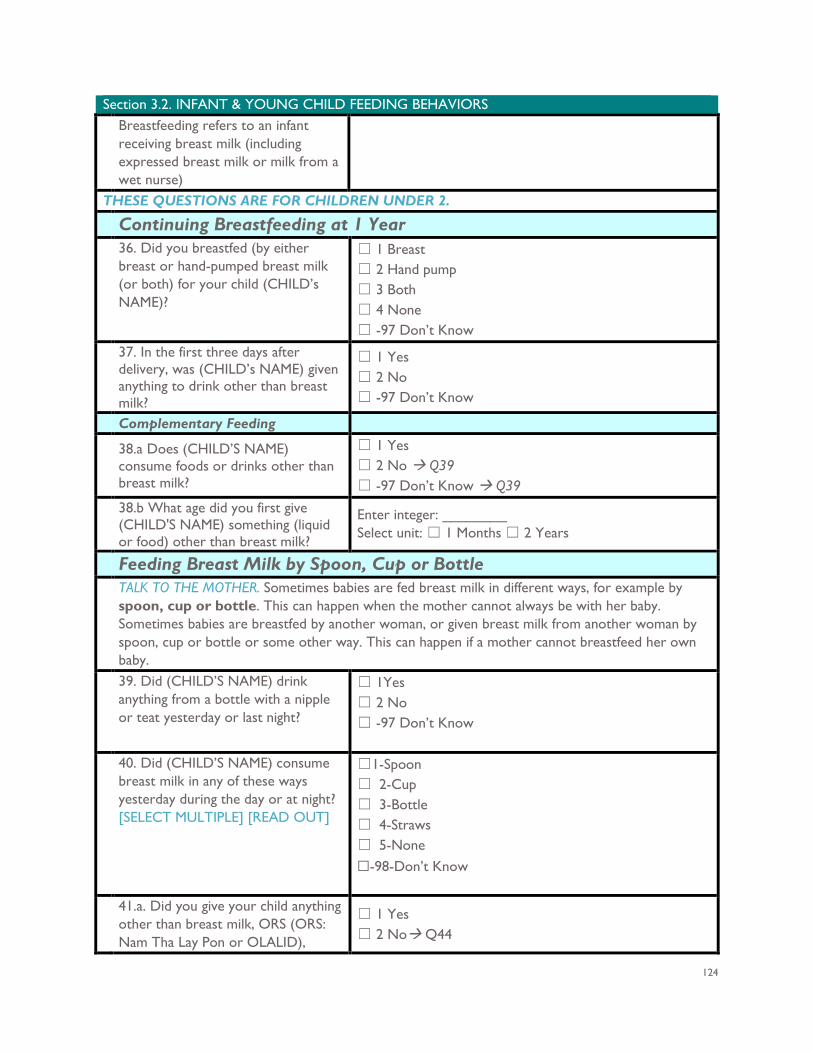
124
Section 3.2. INFANT & YOUNG CHILD FEEDING BEHAVIORS Breastfeeding refers to an infant receiving breast milk (including expressed breast milk or milk from a wet nurse)
THESE QUESTIONS ARE FOR CHILDREN UNDER 2. Continuing Breastfeeding at 1 Year 36. Did you breastfed (by either
breast or hand-pumped breast milk (or both) for your child (CHILD’s NAME)?
☐ 1 Breast ☐ 2 Hand pump ☐ 3 Both ☐ 4 None ☐ -97 Don’t Know
37. In the first three days after delivery, was (CHILD’s NAME) given anything to drink other than breast milk?
☐ 1 Yes ☐ 2 No ☐ -97 Don’t Know
Complementary Feeding 38.a Does (CHILD’S NAME)
consume foods or drinks other than breast milk?
☐ 1 Yes ☐ 2 No Q39 ☐ -97 Don’t Know Q39
38.b What age did you first give (CHILD'S NAME) something (liquid or food) other than breast milk?
Enter integer: ________ Select unit: ☐ 1 Months ☐ 2 Years
Feeding Breast Milk by Spoon, Cup or Bottle TALK TO THE MOTHER. Sometimes babies are fed breast milk in different ways, for example by
spoon, cup or bottle. This can happen when the mother cannot always be with her baby. Sometimes babies are breastfed by another woman, or given breast milk from another woman by spoon, cup or bottle or some other way. This can happen if a mother cannot breastfeed her own baby.
39. Did (CHILD’S NAME) drink anything from a bottle with a nipple or teat yesterday or last night?
☐ 1Yes ☐ 2 No ☐ -97 Don’t Know
40. Did (CHILD’S NAME) consume breast milk in any of these ways yesterday during the day or at night? [SELECT MULTIPLE] [READ OUT]
☐1-Spoon ☐ 2-Cup ☐ 3-Bottle ☐ 4-Straws ☐ 5-None ☐-98-Don’t Know
41.a. Did you give your child anything other than breast milk, ORS (ORS: Nam Tha Lay Pon or OLALID),
☐ 1 Yes ☐ 2 No Q44
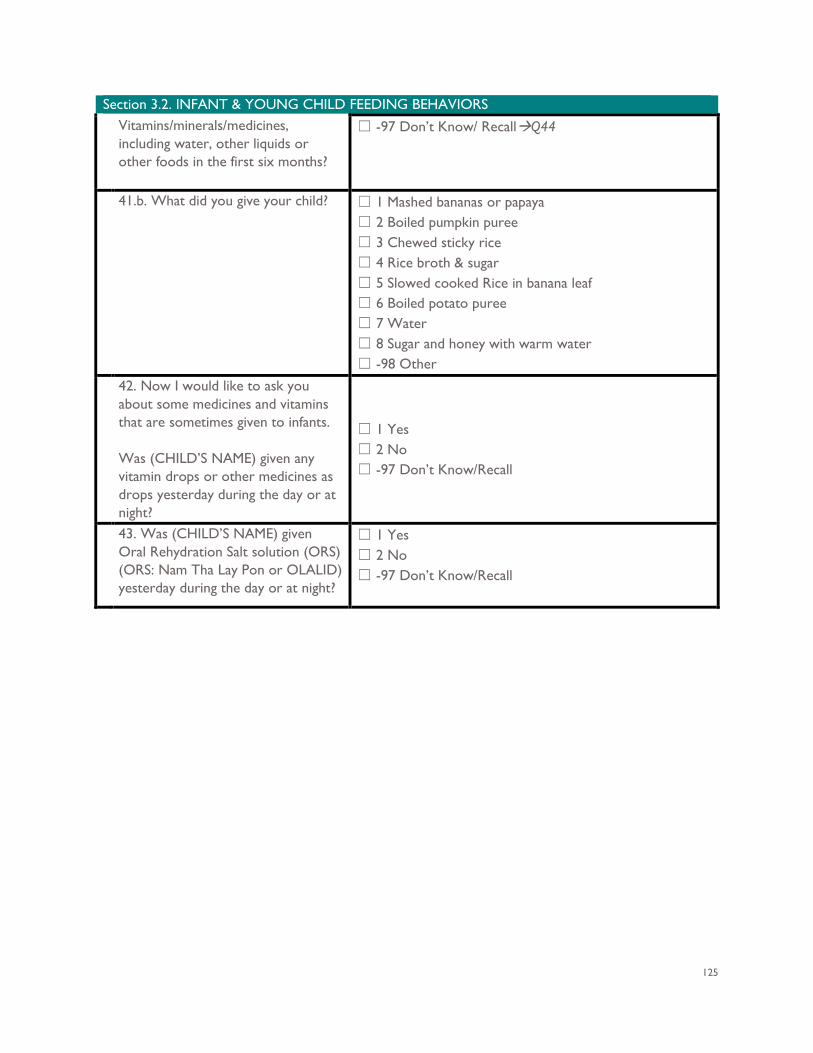
125
Section 3.2. INFANT & YOUNG CHILD FEEDING BEHAVIORS Vitamins/minerals/medicines, including water, other liquids or other foods in the first six months?
☐ -97 Don’t Know/ RecallQ44
41.b. What did you give your child? ☐ 1 Mashed bananas or papaya ☐ 2 Boiled pumpkin puree ☐ 3 Chewed sticky rice ☐ 4 Rice broth & sugar ☐ 5 Slowed cooked Rice in banana leaf ☐ 6 Boiled potato puree ☐ 7 Water ☐ 8 Sugar and honey with warm water ☐ -98 Other
42. Now I would like to ask you about some medicines and vitamins that are sometimes given to infants. Was (CHILD’S NAME) given any vitamin drops or other medicines as drops yesterday during the day or at night?
☐ 1 Yes ☐ 2 No ☐ -97 Don’t Know/Recall
43. Was (CHILD’S NAME) given Oral Rehydration Salt solution (ORS) (ORS: Nam Tha Lay Pon or OLALID) yesterday during the day or at night?
☐ 1 Yes ☐ 2 No ☐ -97 Don’t Know/Recall
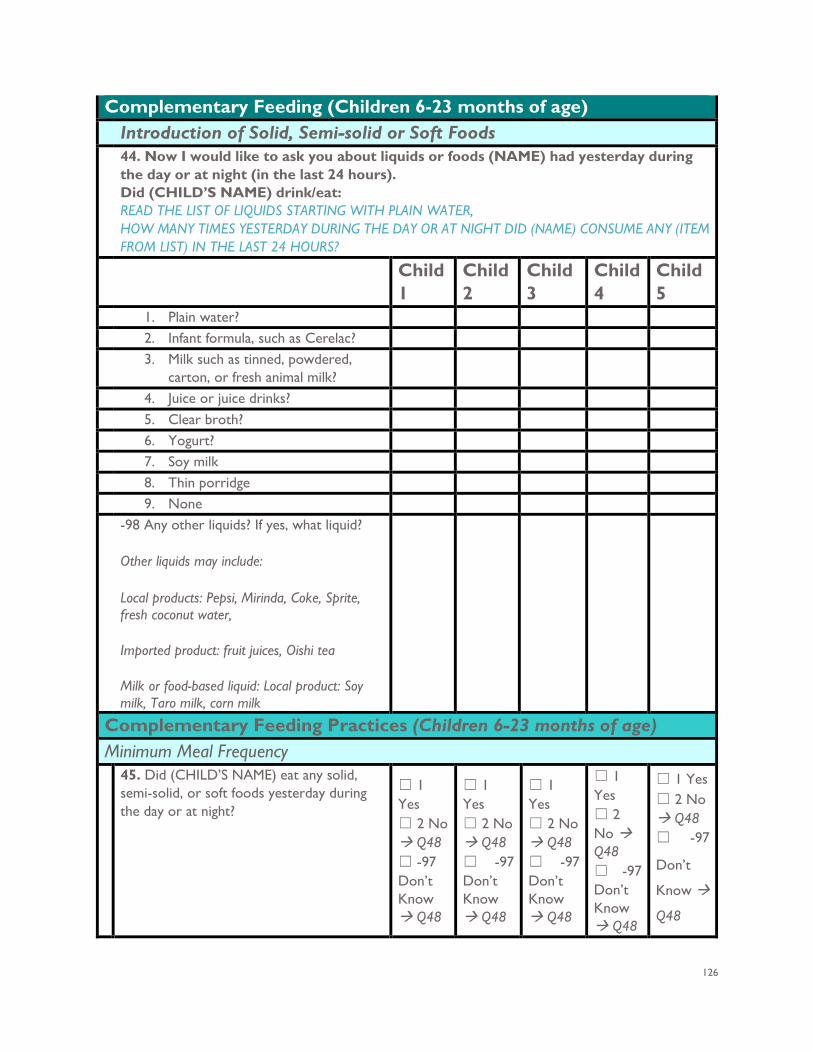
126
Complementary Feeding (Children 6-23 months of age) Introduction of Solid, Semi-solid or Soft Foods 44. Now I would like to ask you about liquids or foods (NAME) had yesterday during
the day or at night (in the last 24 hours). Did (CHILD’S NAME) drink/eat: READ THE LIST OF LIQUIDS STARTING WITH PLAIN WATER, HOW MANY TIMES YESTERDAY DURING THE DAY OR AT NIGHT DID (NAME) CONSUME ANY (ITEM FROM LIST) IN THE LAST 24 HOURS?
Child 1
Child 2
Child 3
Child 4
Child 5
1. Plain water? 2. Infant formula, such as Cerelac? 3. Milk such as tinned, powdered,
carton, or fresh animal milk?
4. Juice or juice drinks? 5. Clear broth? 6. Yogurt? 7. Soy milk 8. Thin porridge 9. None -98 Any other liquids? If yes, what liquid?
Other liquids may include:
Local products: Pepsi, Mirinda, Coke, Sprite, fresh coconut water,
Imported product: fruit juices, Oishi tea
Milk or food-based liquid: Local product: Soy milk, Taro milk, corn milk
Complementary Feeding Practices (Children 6-23 months of age) Minimum Meal Frequency 45. Did (CHILD’S NAME) eat any solid,
semi-solid, or soft foods yesterday during the day or at night?
☐ 1 Yes ☐ 2 No Q48 ☐ -97 Don’t Know Q48
☐ 1 Yes ☐ 2 No Q48 ☐ -97 Don’t Know Q48
☐ 1 Yes ☐ 2 No Q48 ☐ -97 Don’t Know Q48
☐ 1 Yes ☐ 2 No Q48 ☐ -97 Don’t Know Q48
☐ 1 Yes ☐ 2 No Q48 ☐ -97
Don’t
Know
Q48
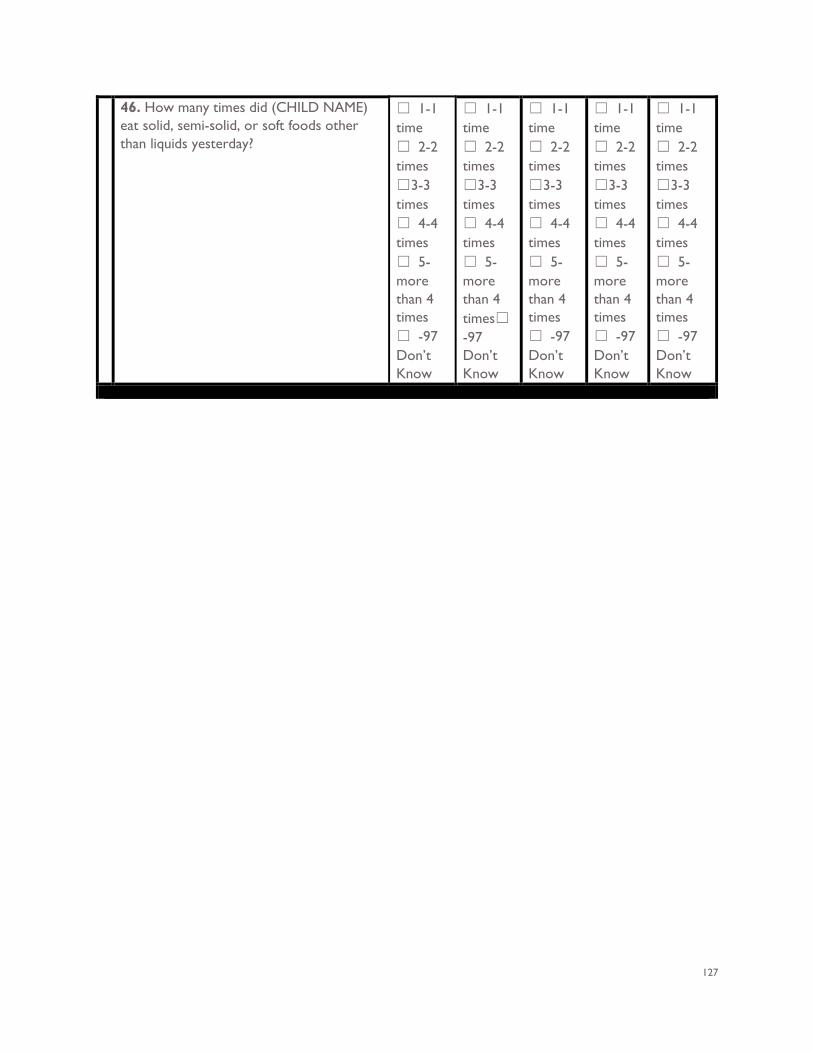
127
46. How many times did (CHILD NAME) eat solid, semi-solid, or soft foods other than liquids yesterday?
☐ 1-1 time ☐ 2-2 times ☐3-3 times ☐ 4-4 times ☐ 5-more than 4 times ☐ -97 Don’t Know
☐ 1-1 time ☐ 2-2 times ☐3-3 times ☐ 4-4 times ☐ 5-more than 4 times☐
-97 Don’t Know
☐ 1-1 time ☐ 2-2 times ☐3-3 times ☐ 4-4 times ☐ 5-more than 4 times ☐ -97 Don’t Know
☐ 1-1 time ☐ 2-2 times ☐3-3 times ☐ 4-4 times ☐ 5-more than 4 times ☐ -97 Don’t Know
☐ 1-1 time ☐ 2-2 times ☐3-3 times ☐ 4-4 times ☐ 5-more than 4 times ☐ -97 Don’t Know
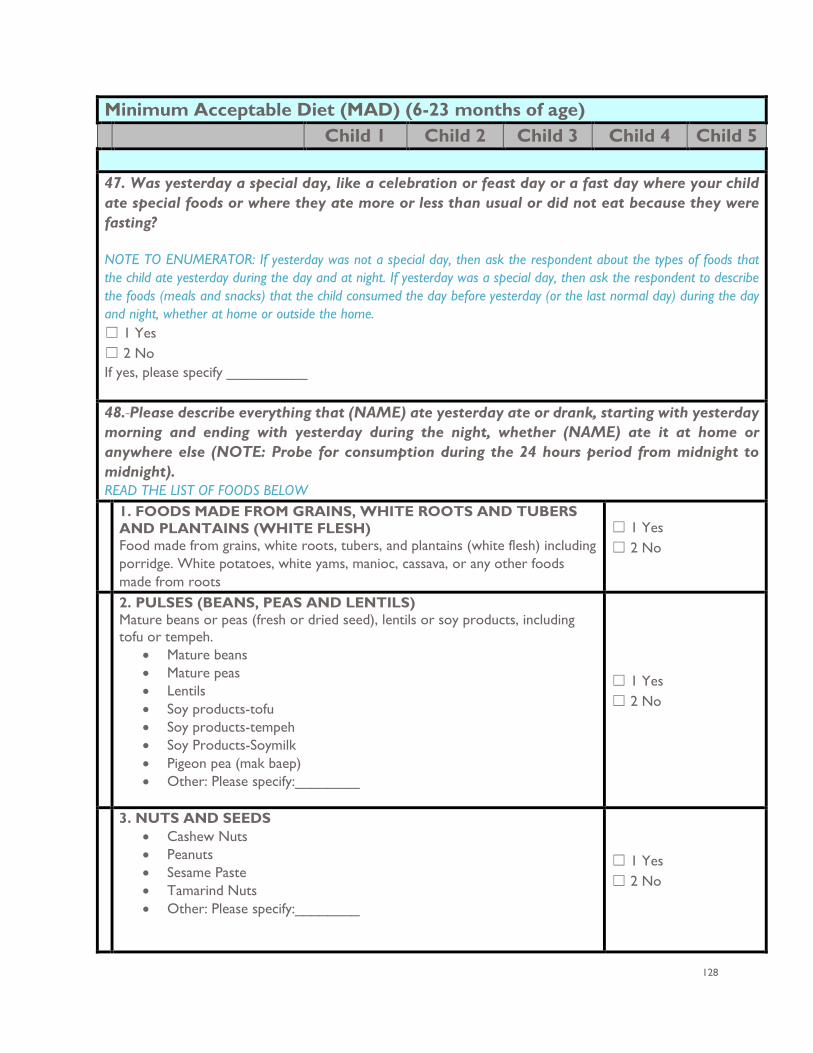
128
Minimum Acceptable Diet (MAD) (6-23 months of age) Child 1 Child 2 Child 3 Child 4 Child 5 47. Was yesterday a special day, like a celebration or feast day or a fast day where your child ate special foods or where they ate more or less than usual or did not eat because they were fasting? NOTE TO ENUMERATOR: If yesterday was not a special day, then ask the respondent about the types of foods that the child ate yesterday during the day and at night. If yesterday was a special day, then ask the respondent to describe the foods (meals and snacks) that the child consumed the day before yesterday (or the last normal day) during the day and night, whether at home or outside the home. ☐ 1 Yes ☐ 2 No If yes, please specify __________
48. Please describe everything that (NAME) ate yesterday ate or drank, starting with yesterday morning and ending with yesterday during the night, whether (NAME) ate it at home or anywhere else (NOTE: Probe for consumption during the 24 hours period from midnight to midnight). READ THE LIST OF FOODS BELOW 1. FOODS MADE FROM GRAINS, WHITE ROOTS AND TUBERS
AND PLANTAINS (WHITE FLESH) Food made from grains, white roots, tubers, and plantains (white flesh) including porridge. White potatoes, white yams, manioc, cassava, or any other foods made from roots
☐ 1 Yes ☐ 2 No
2. PULSES (BEANS, PEAS AND LENTILS) Mature beans or peas (fresh or dried seed), lentils or soy products, including tofu or tempeh.
• Mature beans • Mature peas • Lentils • Soy products-tofu • Soy products-tempeh • Soy Products-Soymilk • Pigeon pea (mak baep) • Other: Please specify:________
☐ 1 Yes ☐ 2 No
3. NUTS AND SEEDS • Cashew Nuts • Peanuts • Sesame Paste • Tamarind Nuts • Other: Please specify:________
☐ 1 Yes ☐ 2 No
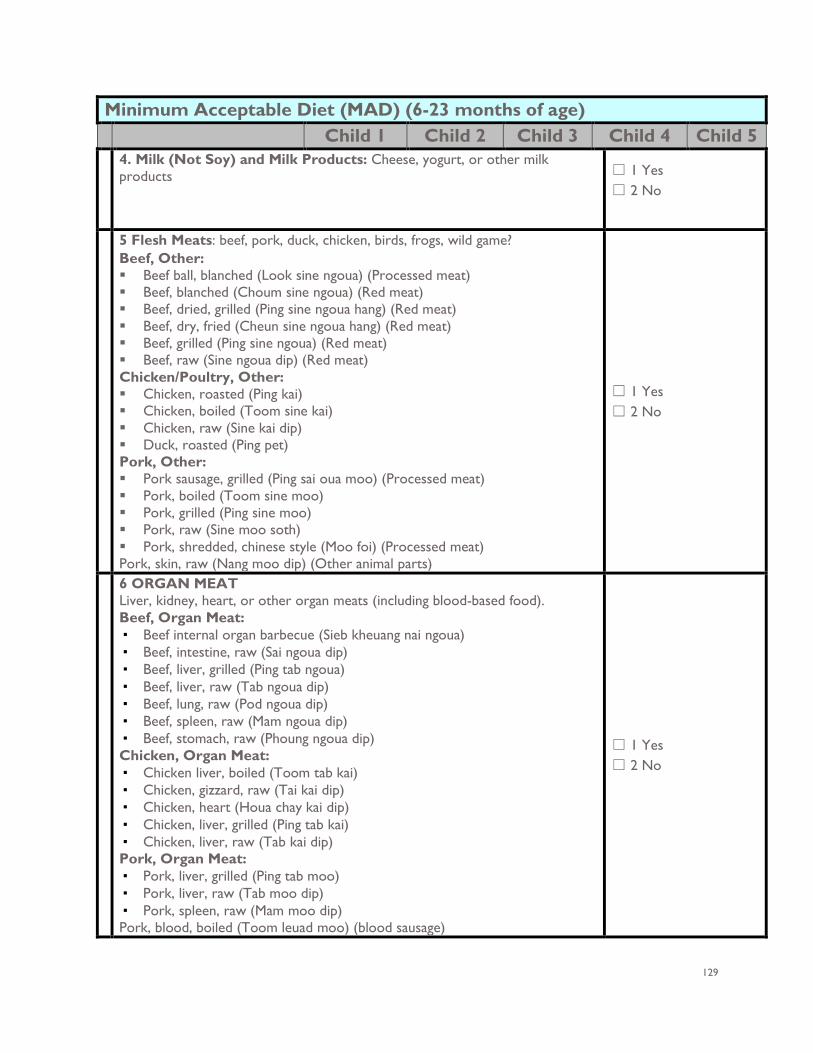
129
Minimum Acceptable Diet (MAD) (6-23 months of age) Child 1 Child 2 Child 3 Child 4 Child 5 4. Milk (Not Soy) and Milk Products: Cheese, yogurt, or other milk
products ☐ 1 Yes ☐ 2 No
5 Flesh Meats: beef, pork, duck, chicken, birds, frogs, wild game? Beef, Other: Beef ball, blanched (Look sine ngoua) (Processed meat) Beef, blanched (Choum sine ngoua) (Red meat) Beef, dried, grilled (Ping sine ngoua hang) (Red meat) Beef, dry, fried (Cheun sine ngoua hang) (Red meat) Beef, grilled (Ping sine ngoua) (Red meat) Beef, raw (Sine ngoua dip) (Red meat) Chicken/Poultry, Other: Chicken, roasted (Ping kai) Chicken, boiled (Toom sine kai) Chicken, raw (Sine kai dip) Duck, roasted (Ping pet) Pork, Other: Pork sausage, grilled (Ping sai oua moo) (Processed meat) Pork, boiled (Toom sine moo) Pork, grilled (Ping sine moo) Pork, raw (Sine moo soth) Pork, shredded, chinese style (Moo foi) (Processed meat) Pork, skin, raw (Nang moo dip) (Other animal parts)
☐ 1 Yes ☐ 2 No
6 ORGAN MEAT Liver, kidney, heart, or other organ meats (including blood-based food). Beef, Organ Meat: ▪ Beef internal organ barbecue (Sieb kheuang nai ngoua) ▪ Beef, intestine, raw (Sai ngoua dip) ▪ Beef, liver, grilled (Ping tab ngoua) ▪ Beef, liver, raw (Tab ngoua dip) ▪ Beef, lung, raw (Pod ngoua dip) ▪ Beef, spleen, raw (Mam ngoua dip) ▪ Beef, stomach, raw (Phoung ngoua dip) Chicken, Organ Meat: ▪ Chicken liver, boiled (Toom tab kai) ▪ Chicken, gizzard, raw (Tai kai dip) ▪ Chicken, heart (Houa chay kai dip) ▪ Chicken, liver, grilled (Ping tab kai) ▪ Chicken, liver, raw (Tab kai dip) Pork, Organ Meat: ▪ Pork, liver, grilled (Ping tab moo) ▪ Pork, liver, raw (Tab moo dip) ▪ Pork, spleen, raw (Mam moo dip) Pork, blood, boiled (Toom leuad moo) (blood sausage)
☐ 1 Yes ☐ 2 No
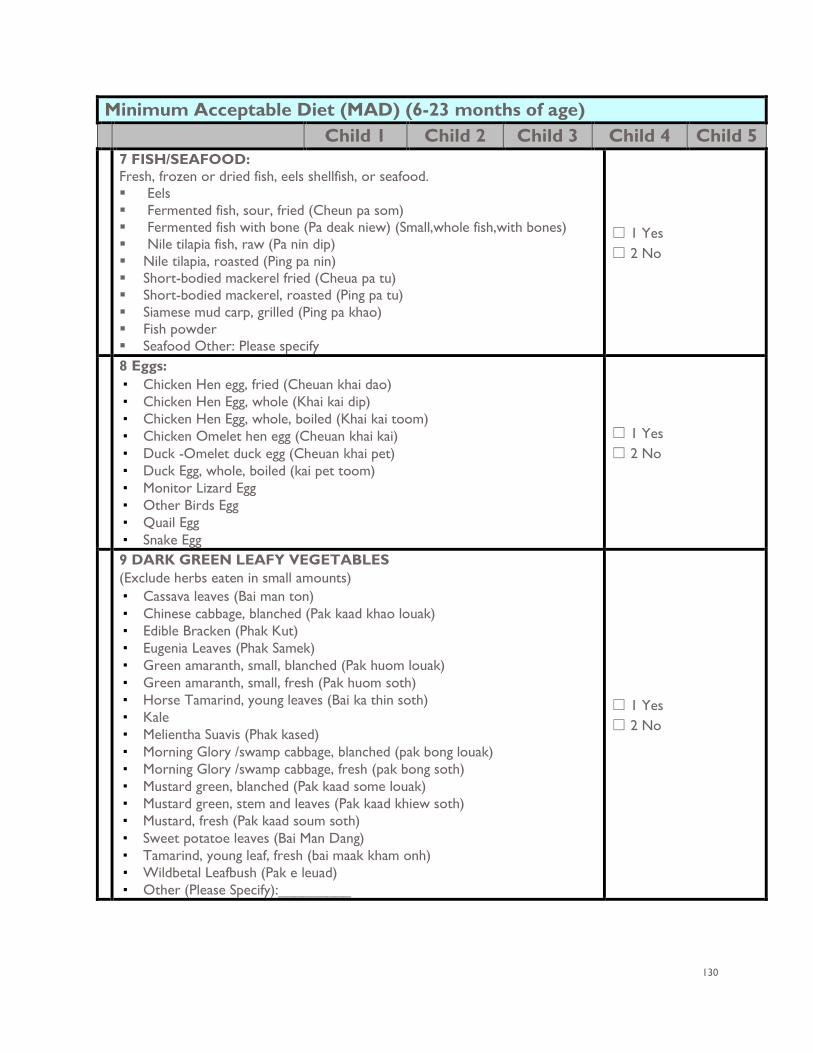
130
Minimum Acceptable Diet (MAD) (6-23 months of age) Child 1 Child 2 Child 3 Child 4 Child 5 7 FISH/SEAFOOD:
Fresh, frozen or dried fish, eels shellfish, or seafood. Eels Fermented fish, sour, fried (Cheun pa som) Fermented fish with bone (Pa deak niew) (Small,whole fish,with bones) Nile tilapia fish, raw (Pa nin dip) Nile tilapia, roasted (Ping pa nin) Short-bodied mackerel fried (Cheua pa tu) Short-bodied mackerel, roasted (Ping pa tu) Siamese mud carp, grilled (Ping pa khao) Fish powder Seafood Other: Please specify
☐ 1 Yes ☐ 2 No
8 Eggs: ▪ Chicken Hen egg, fried (Cheuan khai dao) ▪ Chicken Hen Egg, whole (Khai kai dip) ▪ Chicken Hen Egg, whole, boiled (Khai kai toom) ▪ Chicken Omelet hen egg (Cheuan khai kai) ▪ Duck -Omelet duck egg (Cheuan khai pet) ▪ Duck Egg, whole, boiled (kai pet toom) ▪ Monitor Lizard Egg ▪ Other Birds Egg ▪ Quail Egg ▪ Snake Egg
☐ 1 Yes ☐ 2 No
9 DARK GREEN LEAFY VEGETABLES (Exclude herbs eaten in small amounts) ▪ Cassava leaves (Bai man ton) ▪ Chinese cabbage, blanched (Pak kaad khao louak) ▪ Edible Bracken (Phak Kut) ▪ Eugenia Leaves (Phak Samek) ▪ Green amaranth, small, blanched (Pak huom louak) ▪ Green amaranth, small, fresh (Pak huom soth) ▪ Horse Tamarind, young leaves (Bai ka thin soth) ▪ Kale ▪ Melientha Suavis (Phak kased) ▪ Morning Glory /swamp cabbage, blanched (pak bong louak) ▪ Morning Glory /swamp cabbage, fresh (pak bong soth) ▪ Mustard green, blanched (Pak kaad some louak) ▪ Mustard green, stem and leaves (Pak kaad khiew soth) ▪ Mustard, fresh (Pak kaad soum soth) ▪ Sweet potatoe leaves (Bai Man Dang) ▪ Tamarind, young leaf, fresh (bai maak kham onh) ▪ Wildbetal Leafbush (Pak e leuad) ▪ Other (Please Specify):_________
☐ 1 Yes ☐ 2 No
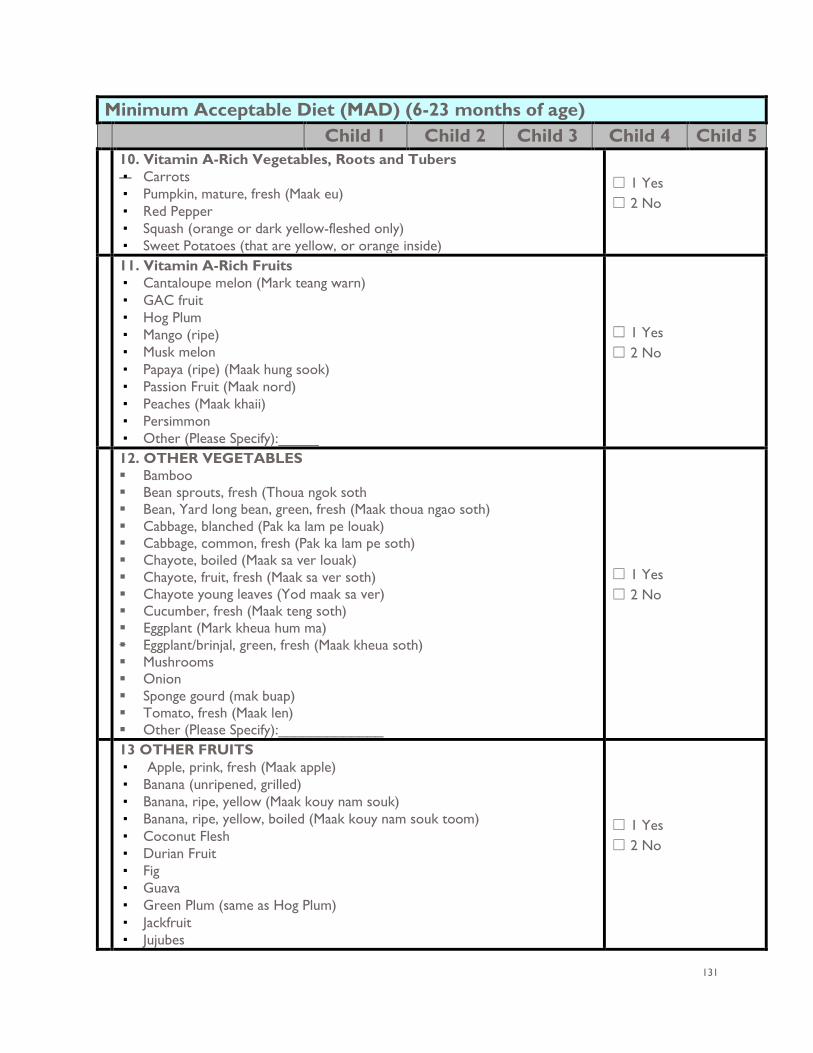
131
Minimum Acceptable Diet (MAD) (6-23 months of age) Child 1 Child 2 Child 3 Child 4 Child 5 10. Vitamin A-Rich Vegetables, Roots and Tubers ▪ Carrots ▪ Pumpkin, mature, fresh (Maak eu) ▪ Red Pepper ▪ Squash (orange or dark yellow-fleshed only) ▪ Sweet Potatoes (that are yellow, or orange inside)
☐ 1 Yes ☐ 2 No
11. Vitamin A-Rich Fruits ▪ Cantaloupe melon (Mark teang warn) ▪ GAC fruit ▪ Hog Plum ▪ Mango (ripe) ▪ Musk melon ▪ Papaya (ripe) (Maak hung sook) ▪ Passion Fruit (Maak nord) ▪ Peaches (Maak khaii) ▪ Persimmon ▪ Other (Please Specify):_____
☐ 1 Yes ☐ 2 No
12. OTHER VEGETABLES Bamboo Bean sprouts, fresh (Thoua ngok soth Bean, Yard long bean, green, fresh (Maak thoua ngao soth) Cabbage, blanched (Pak ka lam pe louak) Cabbage, common, fresh (Pak ka lam pe soth) Chayote, boiled (Maak sa ver louak) Chayote, fruit, fresh (Maak sa ver soth) Chayote young leaves (Yod maak sa ver) Cucumber, fresh (Maak teng soth) Eggplant (Mark kheua hum ma) Eggplant/brinjal, green, fresh (Maak kheua soth) Mushrooms Onion Sponge gourd (mak buap) Tomato, fresh (Maak len) Other (Please Specify):_____________
☐ 1 Yes ☐ 2 No
13 OTHER FRUITS ▪ Apple, prink, fresh (Maak apple) ▪ Banana (unripened, grilled) ▪ Banana, ripe, yellow (Maak kouy nam souk) ▪ Banana, ripe, yellow, boiled (Maak kouy nam souk toom) ▪ Coconut Flesh ▪ Durian Fruit ▪ Fig ▪ Guava ▪ Green Plum (same as Hog Plum) ▪ Jackfruit ▪ Jujubes
☐ 1 Yes ☐ 2 No
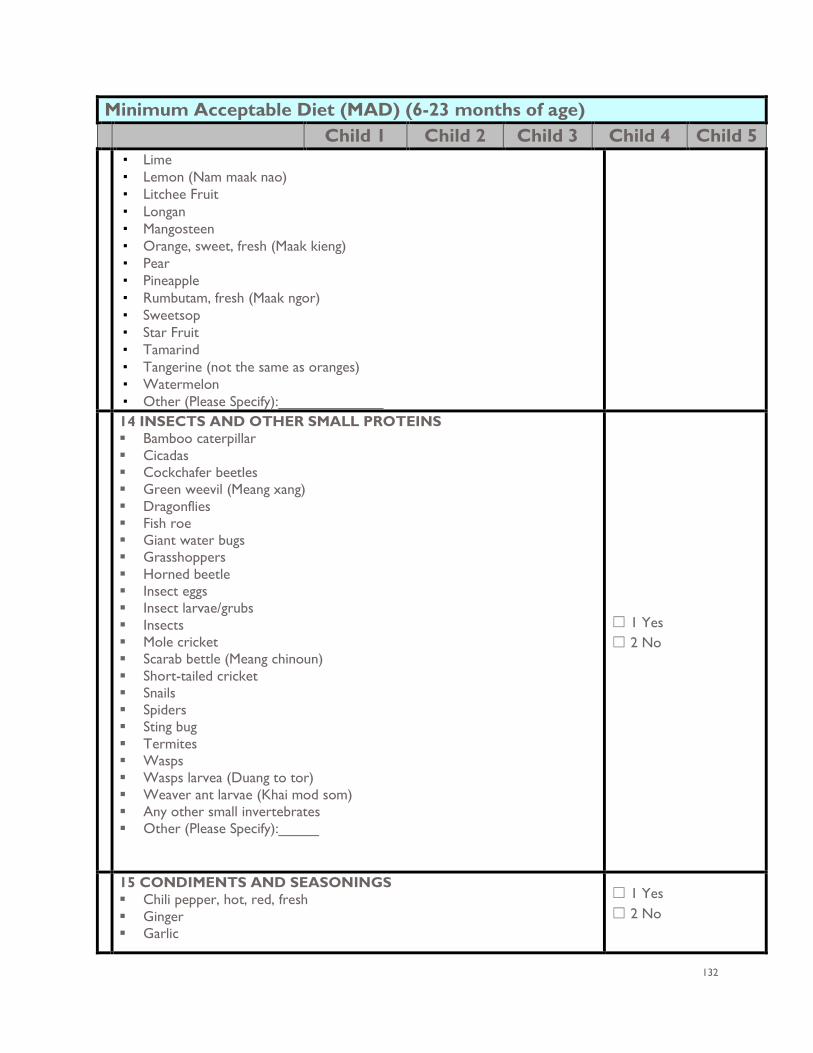
132
Minimum Acceptable Diet (MAD) (6-23 months of age) Child 1 Child 2 Child 3 Child 4 Child 5 ▪ Lime ▪ Lemon (Nam maak nao) ▪ Litchee Fruit ▪ Longan ▪ Mangosteen ▪ Orange, sweet, fresh (Maak kieng) ▪ Pear ▪ Pineapple ▪ Rumbutam, fresh (Maak ngor) ▪ Sweetsop ▪ Star Fruit ▪ Tamarind ▪ Tangerine (not the same as oranges) ▪ Watermelon ▪ Other (Please Specify):_____________
14 INSECTS AND OTHER SMALL PROTEINS Bamboo caterpillar Cicadas Cockchafer beetles Green weevil (Meang xang) Dragonflies Fish roe Giant water bugs Grasshoppers Horned beetle Insect eggs Insect larvae/grubs Insects Mole cricket Scarab bettle (Meang chinoun) Short-tailed cricket Snails Spiders Sting bug Termites Wasps Wasps larvea (Duang to tor) Weaver ant larvae (Khai mod som) Any other small invertebrates Other (Please Specify):_____
☐ 1 Yes ☐ 2 No
15 CONDIMENTS AND SEASONINGS Chili pepper, hot, red, fresh Ginger Garlic
☐ 1 Yes ☐ 2 No
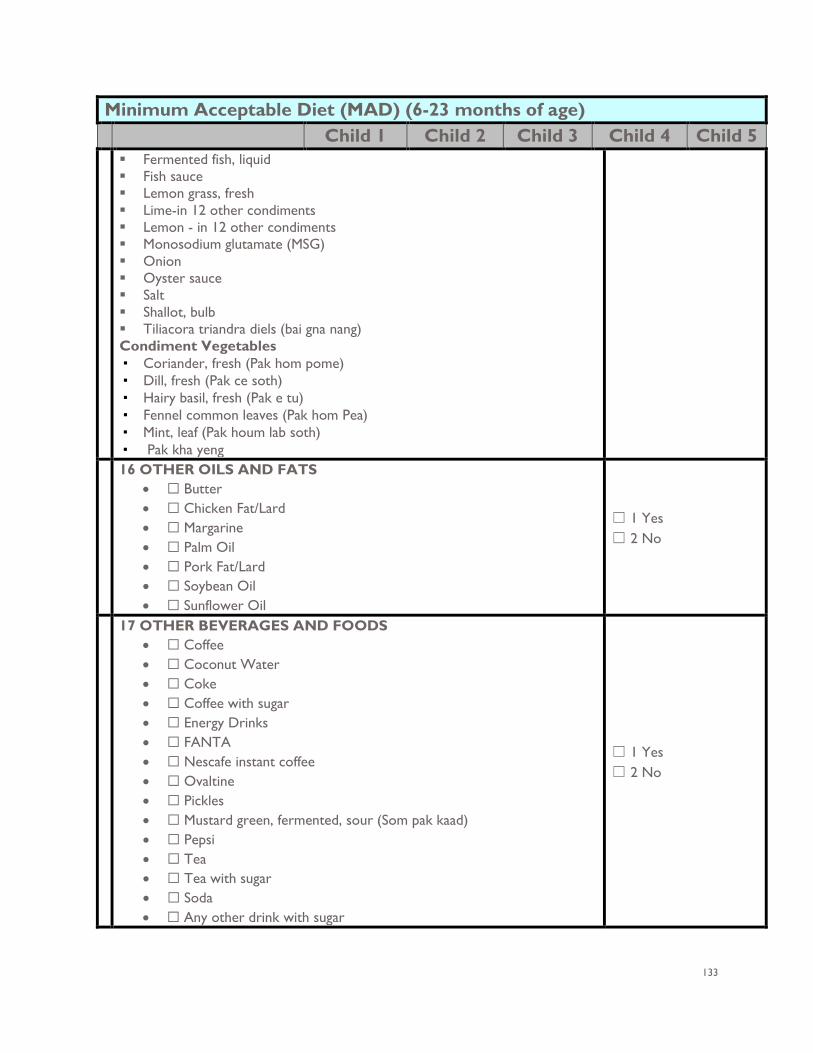
133
Minimum Acceptable Diet (MAD) (6-23 months of age) Child 1 Child 2 Child 3 Child 4 Child 5 Fermented fish, liquid Fish sauce Lemon grass, fresh Lime-in 12 other condiments Lemon - in 12 other condiments Monosodium glutamate (MSG) Onion Oyster sauce Salt Shallot, bulb Tiliacora triandra diels (bai gna nang) Condiment Vegetables ▪ Coriander, fresh (Pak hom pome) ▪ Dill, fresh (Pak ce soth) ▪ Hairy basil, fresh (Pak e tu) ▪ Fennel common leaves (Pak hom Pea) ▪ Mint, leaf (Pak houm lab soth) ▪ Pak kha yeng
16 OTHER OILS AND FATS • ☐ Butter • ☐ Chicken Fat/Lard • ☐ Margarine • ☐ Palm Oil • ☐ Pork Fat/Lard • ☐ Soybean Oil • ☐ Sunflower Oil
☐ 1 Yes ☐ 2 No
17 OTHER BEVERAGES AND FOODS • ☐ Coffee • ☐ Coconut Water • ☐ Coke • ☐ Coffee with sugar • ☐ Energy Drinks • ☐ FANTA • ☐ Nescafe instant coffee • ☐ Ovaltine • ☐ Pickles • ☐ Mustard green, fermented, sour (Som pak kaad) • ☐ Pepsi • ☐ Tea • ☐ Tea with sugar • ☐ Soda • ☐ Any other drink with sugar
☐ 1 Yes ☐ 2 No
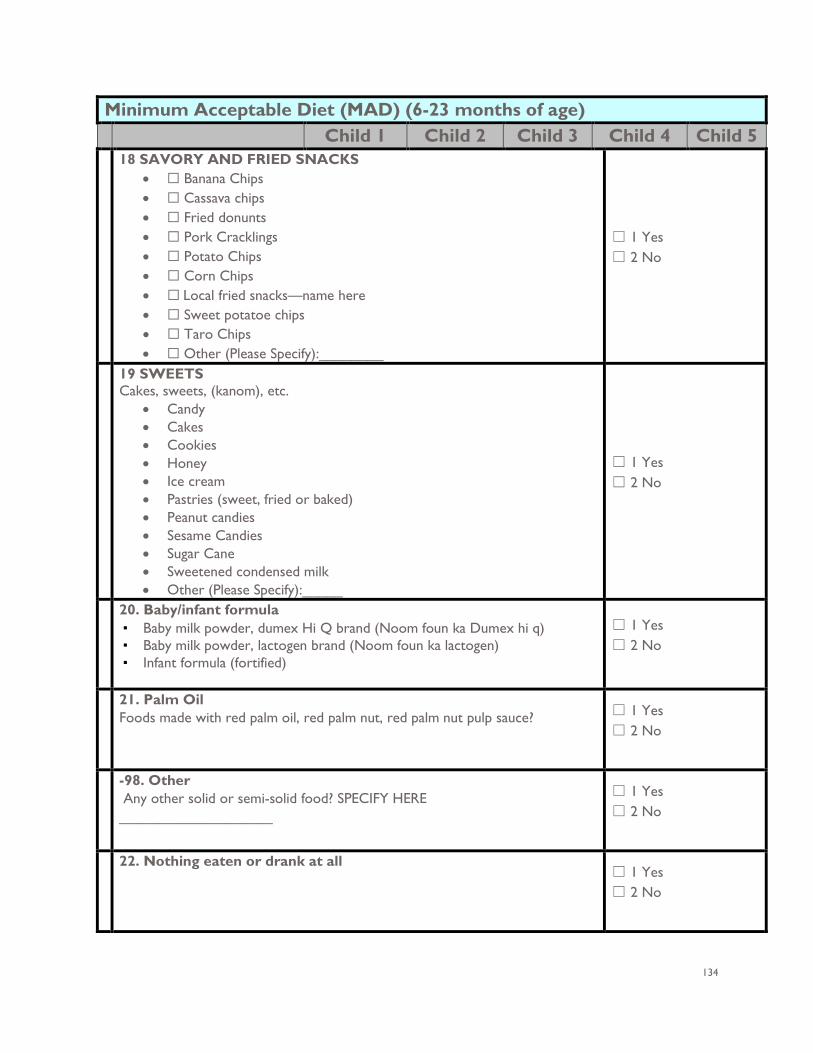
134
Minimum Acceptable Diet (MAD) (6-23 months of age) Child 1 Child 2 Child 3 Child 4 Child 5
18 SAVORY AND FRIED SNACKS • ☐ Banana Chips • ☐ Cassava chips • ☐ Fried donunts • ☐ Pork Cracklings • ☐ Potato Chips • ☐ Corn Chips • ☐ Local fried snacks—name here • ☐ Sweet potatoe chips • ☐ Taro Chips • ☐ Other (Please Specify):________
☐ 1 Yes ☐ 2 No
19 SWEETS Cakes, sweets, (kanom), etc.
• Candy • Cakes • Cookies • Honey • Ice cream • Pastries (sweet, fried or baked) • Peanut candies • Sesame Candies • Sugar Cane • Sweetened condensed milk • Other (Please Specify):_____
☐ 1 Yes ☐ 2 No
20. Baby/infant formula ▪ Baby milk powder, dumex Hi Q brand (Noom foun ka Dumex hi q) ▪ Baby milk powder, lactogen brand (Noom foun ka lactogen) ▪ Infant formula (fortified)
☐ 1 Yes ☐ 2 No
21. Palm Oil Foods made with red palm oil, red palm nut, red palm nut pulp sauce? ☐ 1 Yes
☐ 2 No
-98. Other Any other solid or semi-solid food? SPECIFY HERE ___________________
☐ 1 Yes ☐ 2 No
22. Nothing eaten or drank at all ☐ 1 Yes ☐ 2 No
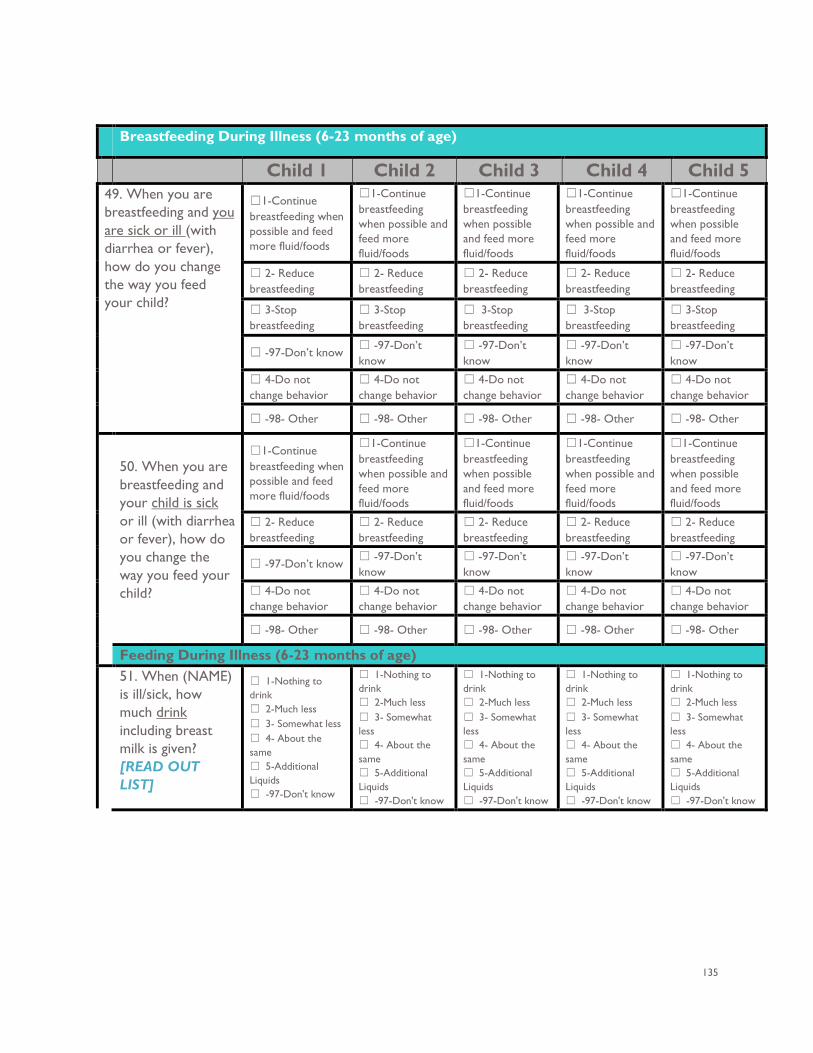
135
Breastfeeding During Illness (6-23 months of age)
Child 1 Child 2 Child 3 Child 4 Child 5 49. When you are breastfeeding and you are sick or ill (with diarrhea or fever), how do you change the way you feed your child?
☐1-Continue breastfeeding when possible and feed more fluid/foods
☐1-Continue breastfeeding when possible and feed more fluid/foods
☐1-Continue breastfeeding when possible and feed more fluid/foods
☐1-Continue breastfeeding when possible and feed more fluid/foods
☐1-Continue breastfeeding when possible and feed more fluid/foods
☐ 2- Reduce breastfeeding
☐ 2- Reduce breastfeeding
☐ 2- Reduce breastfeeding
☐ 2- Reduce breastfeeding
☐ 2- Reduce breastfeeding
☐ 3-Stop breastfeeding
☐ 3-Stop breastfeeding
☐ 3-Stop breastfeeding
☐ 3-Stop breastfeeding
☐ 3-Stop breastfeeding
☐ -97-Don’t know ☐ -97-Don’t know
☐ -97-Don’t know
☐ -97-Don’t know
☐ -97-Don’t know
☐ 4-Do not change behavior
☐ 4-Do not change behavior
☐ 4-Do not change behavior
☐ 4-Do not change behavior
☐ 4-Do not change behavior
☐ -98- Other ☐ -98- Other ☐ -98- Other ☐ -98- Other ☐ -98- Other
50. When you are breastfeeding and your child is sick or ill (with diarrhea or fever), how do you change the way you feed your child?
☐1-Continue breastfeeding when possible and feed more fluid/foods
☐1-Continue breastfeeding when possible and feed more fluid/foods
☐1-Continue breastfeeding when possible and feed more fluid/foods
☐1-Continue breastfeeding when possible and feed more fluid/foods
☐1-Continue breastfeeding when possible and feed more fluid/foods
☐ 2- Reduce breastfeeding
☐ 2- Reduce breastfeeding
☐ 2- Reduce breastfeeding
☐ 2- Reduce breastfeeding
☐ 2- Reduce breastfeeding
☐ -97-Don’t know ☐ -97-Don’t know
☐ -97-Don’t know
☐ -97-Don’t know
☐ -97-Don’t know
☐ 4-Do not change behavior
☐ 4-Do not change behavior
☐ 4-Do not change behavior
☐ 4-Do not change behavior
☐ 4-Do not change behavior
☐ -98- Other ☐ -98- Other ☐ -98- Other ☐ -98- Other ☐ -98- Other
Feeding During Illness (6-23 months of age) 51. When (NAME)
is ill/sick, how much drink including breast milk is given? [READ OUT LIST]
☐ 1-Nothing to drink ☐ 2-Much less ☐ 3- Somewhat less ☐ 4- About the same ☐ 5-Additional Liquids ☐ -97-Don't know
☐ 1-Nothing to drink ☐ 2-Much less ☐ 3- Somewhat less ☐ 4- About the same ☐ 5-Additional Liquids ☐ -97-Don't know
☐ 1-Nothing to drink ☐ 2-Much less ☐ 3- Somewhat less ☐ 4- About the same ☐ 5-Additional Liquids ☐ -97-Don't know
☐ 1-Nothing to drink ☐ 2-Much less ☐ 3- Somewhat less ☐ 4- About the same ☐ 5-Additional Liquids ☐ -97-Don't know
☐ 1-Nothing to drink ☐ 2-Much less ☐ 3- Somewhat less ☐ 4- About the same ☐ 5-Additional Liquids ☐ -97-Don't know
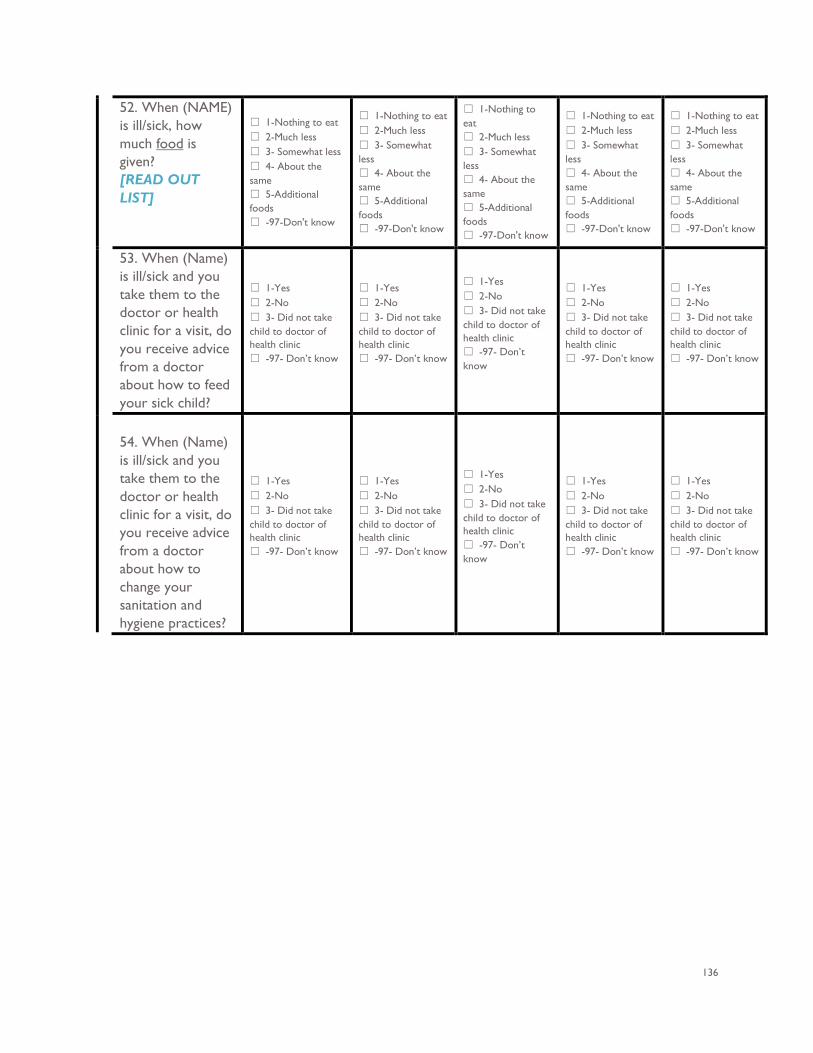
136
52. When (NAME) is ill/sick, how much food is given? [READ OUT LIST]
☐ 1-Nothing to eat ☐ 2-Much less ☐ 3- Somewhat less ☐ 4- About the same ☐ 5-Additional foods ☐ -97-Don't know
☐ 1-Nothing to eat ☐ 2-Much less ☐ 3- Somewhat less ☐ 4- About the same ☐ 5-Additional foods ☐ -97-Don't know
☐ 1-Nothing to eat ☐ 2-Much less ☐ 3- Somewhat less ☐ 4- About the same ☐ 5-Additional foods ☐ -97-Don't know
☐ 1-Nothing to eat ☐ 2-Much less ☐ 3- Somewhat less ☐ 4- About the same ☐ 5-Additional foods ☐ -97-Don't know
☐ 1-Nothing to eat ☐ 2-Much less ☐ 3- Somewhat less ☐ 4- About the same ☐ 5-Additional foods ☐ -97-Don't know
53. When (Name) is ill/sick and you take them to the doctor or health clinic for a visit, do you receive advice from a doctor about how to feed your sick child?
☐ 1-Yes ☐ 2-No ☐ 3- Did not take child to doctor of health clinic ☐ -97- Don’t know
☐ 1-Yes ☐ 2-No ☐ 3- Did not take child to doctor of health clinic ☐ -97- Don’t know
☐ 1-Yes ☐ 2-No ☐ 3- Did not take child to doctor of health clinic ☐ -97- Don’t know
☐ 1-Yes ☐ 2-No ☐ 3- Did not take child to doctor of health clinic ☐ -97- Don’t know
☐ 1-Yes ☐ 2-No ☐ 3- Did not take child to doctor of health clinic ☐ -97- Don’t know
54. When (Name) is ill/sick and you take them to the doctor or health clinic for a visit, do you receive advice from a doctor about how to change your sanitation and hygiene practices?
☐ 1-Yes ☐ 2-No ☐ 3- Did not take child to doctor of health clinic ☐ -97- Don’t know
☐ 1-Yes ☐ 2-No ☐ 3- Did not take child to doctor of health clinic ☐ -97- Don’t know
☐ 1-Yes ☐ 2-No ☐ 3- Did not take child to doctor of health clinic ☐ -97- Don’t know
☐ 1-Yes ☐ 2-No ☐ 3- Did not take child to doctor of health clinic ☐ -97- Don’t know
☐ 1-Yes ☐ 2-No ☐ 3- Did not take child to doctor of health clinic ☐ -97- Don’t know
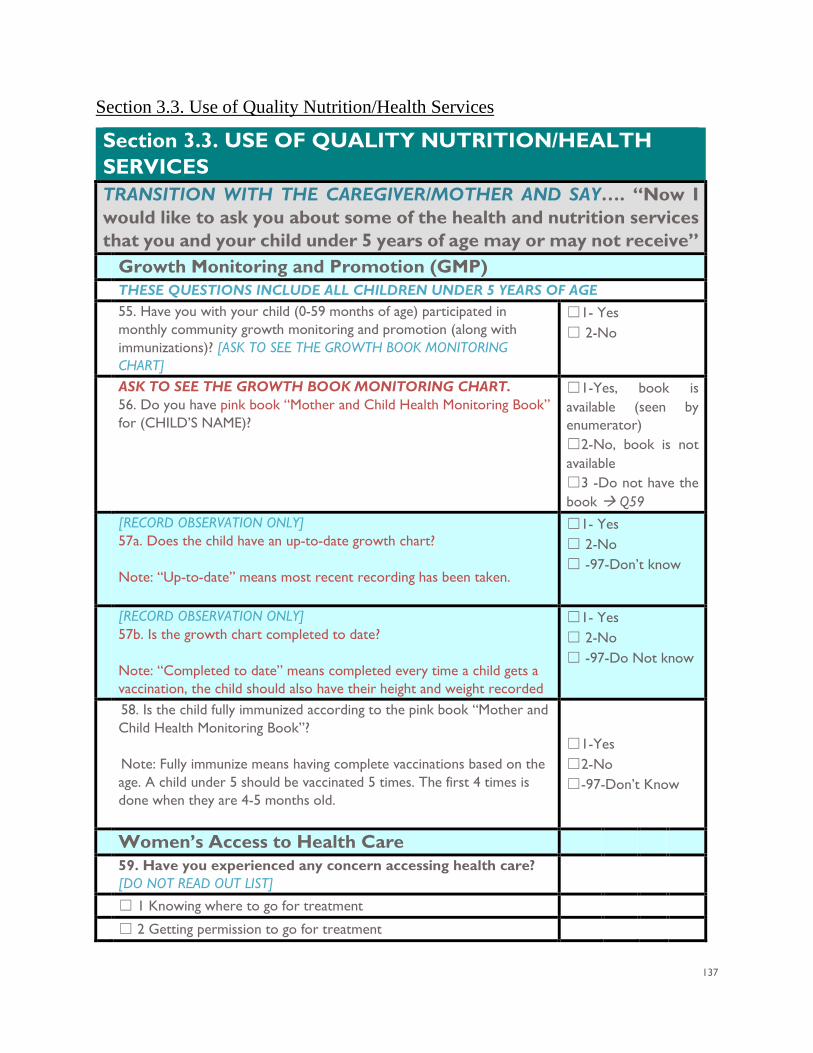
137
Section 3.3. Use of Quality Nutrition/Health Services
Section 3.3. USE OF QUALITY NUTRITION/HEALTH SERVICES TRANSITION WITH THE CAREGIVER/MOTHER AND SAY…. “Now I would like to ask you about some of the health and nutrition services that you and your child under 5 years of age may or may not receive” Growth Monitoring and Promotion (GMP)
THESE QUESTIONS INCLUDE ALL CHILDREN UNDER 5 YEARS OF AGE 55. Have you with your child (0-59 months of age) participated in
monthly community growth monitoring and promotion (along with immunizations)? [ASK TO SEE THE GROWTH BOOK MONITORING CHART]
☐1- Yes ☐ 2-No
ASK TO SEE THE GROWTH BOOK MONITORING CHART. 56. Do you have pink book “Mother and Child Health Monitoring Book” for (CHILD’S NAME)?
☐1-Yes, book is available (seen by enumerator) ☐2-No, book is not available ☐3 -Do not have the book Q59
[RECORD OBSERVATION ONLY] 57a. Does the child have an up-to-date growth chart? Note: “Up-to-date” means most recent recording has been taken.
☐1- Yes ☐ 2-No ☐ -97-Don’t know
[RECORD OBSERVATION ONLY] 57b. Is the growth chart completed to date? Note: “Completed to date” means completed every time a child gets a vaccination, the child should also have their height and weight recorded
☐1- Yes ☐ 2-No ☐ -97-Do Not know
58. Is the child fully immunized according to the pink book “Mother and Child Health Monitoring Book”? Note: Fully immunize means having complete vaccinations based on the age. A child under 5 should be vaccinated 5 times. The first 4 times is done when they are 4-5 months old.
☐1-Yes ☐2-No ☐-97-Don’t Know
Women’s Access to Health Care 59. Have you experienced any concern accessing health care?
[DO NOT READ OUT LIST]
☐ 1 Knowing where to go for treatment
☐ 2 Getting permission to go for treatment
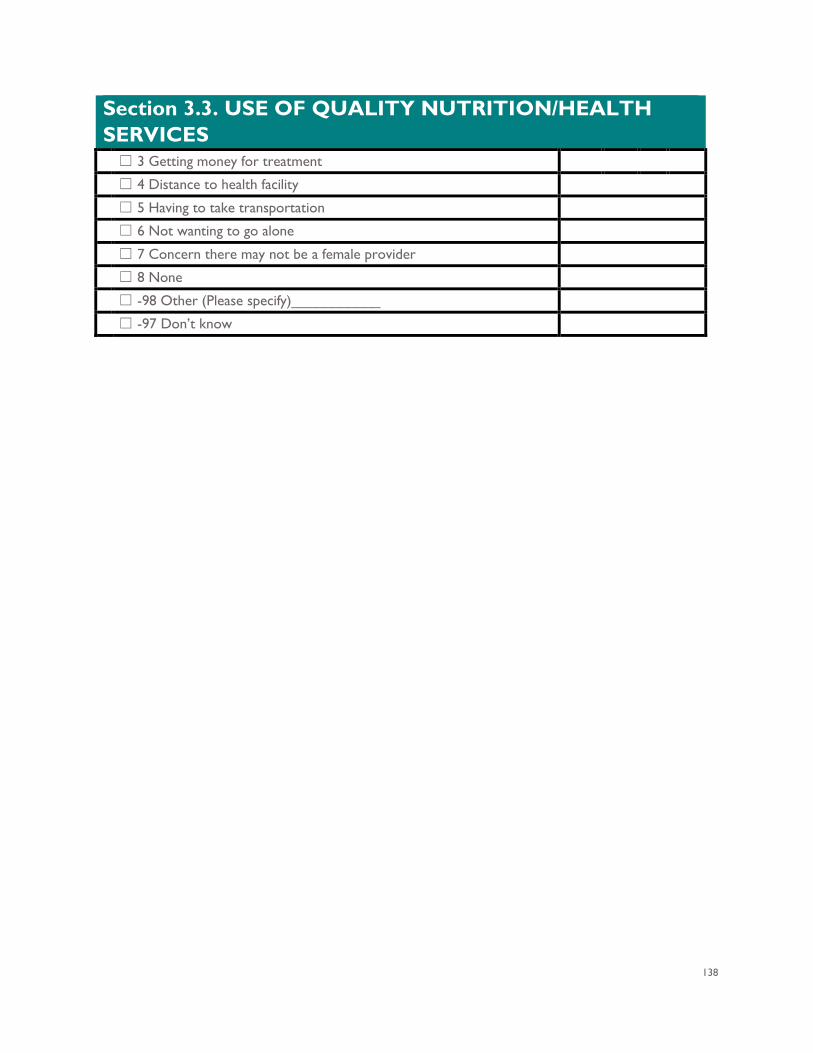
138
Section 3.3. USE OF QUALITY NUTRITION/HEALTH SERVICES ☐ 3 Getting money for treatment
☐ 4 Distance to health facility
☐ 5 Having to take transportation
☐ 6 Not wanting to go alone
☐ 7 Concern there may not be a female provider
☐ 8 None
☐ -98 Other (Please specify)___________
☐ -97 Don’t know
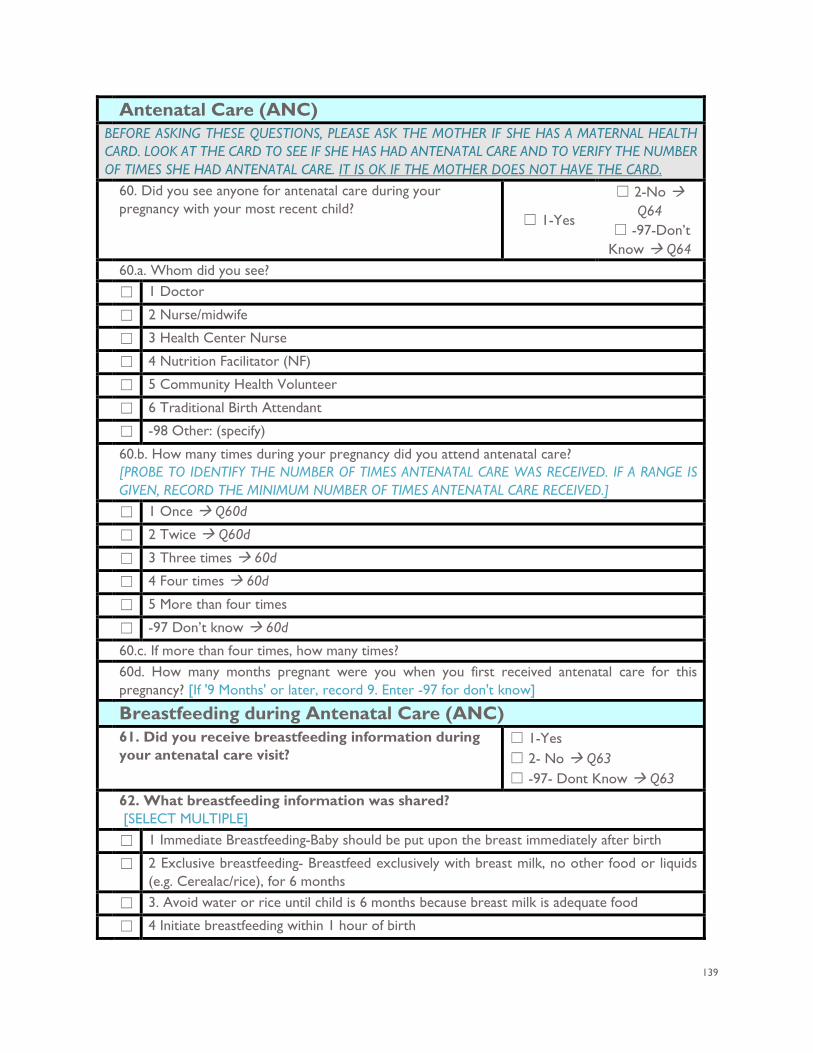
139
Antenatal Care (ANC) BEFORE ASKING THESE QUESTIONS, PLEASE ASK THE MOTHER IF SHE HAS A MATERNAL HEALTH CARD. LOOK AT THE CARD TO SEE IF SHE HAS HAD ANTENATAL CARE AND TO VERIFY THE NUMBER OF TIMES SHE HAD ANTENATAL CARE. IT IS OK IF THE MOTHER DOES NOT HAVE THE CARD. 60. Did you see anyone for antenatal care during your
pregnancy with your most recent child? ☐ 1-Yes
☐ 2-No Q64
☐ -97-Don’t Know Q64
60.a. Whom did you see? ☐ 1 Doctor
☐ 2 Nurse/midwife
☐ 3 Health Center Nurse
☐ 4 Nutrition Facilitator (NF)
☐ 5 Community Health Volunteer
☐ 6 Traditional Birth Attendant
☐ -98 Other: (specify)
60.b. How many times during your pregnancy did you attend antenatal care? [PROBE TO IDENTIFY THE NUMBER OF TIMES ANTENATAL CARE WAS RECEIVED. IF A RANGE IS GIVEN, RECORD THE MINIMUM NUMBER OF TIMES ANTENATAL CARE RECEIVED.]
☐ 1 Once Q60d
☐ 2 Twice Q60d
☐ 3 Three times 60d
☐ 4 Four times 60d
☐ 5 More than four times
☐ -97 Don’t know 60d
60.c. If more than four times, how many times? 60d. How many months pregnant were you when you first received antenatal care for this
pregnancy? [If '9 Months' or later, record 9. Enter -97 for don't know] Breastfeeding during Antenatal Care (ANC) 61. Did you receive breastfeeding information during
your antenatal care visit? ☐ 1-Yes ☐ 2- No Q63 ☐ -97- Dont Know Q63
62. What breastfeeding information was shared? [SELECT MULTIPLE]
☐ 1 Immediate Breastfeeding-Baby should be put upon the breast immediately after birth
☐ 2 Exclusive breastfeeding- Breastfeed exclusively with breast milk, no other food or liquids (e.g. Cerealac/rice), for 6 months
☐ 3. Avoid water or rice until child is 6 months because breast milk is adequate food
☐ 4 Initiate breastfeeding within 1 hour of birth
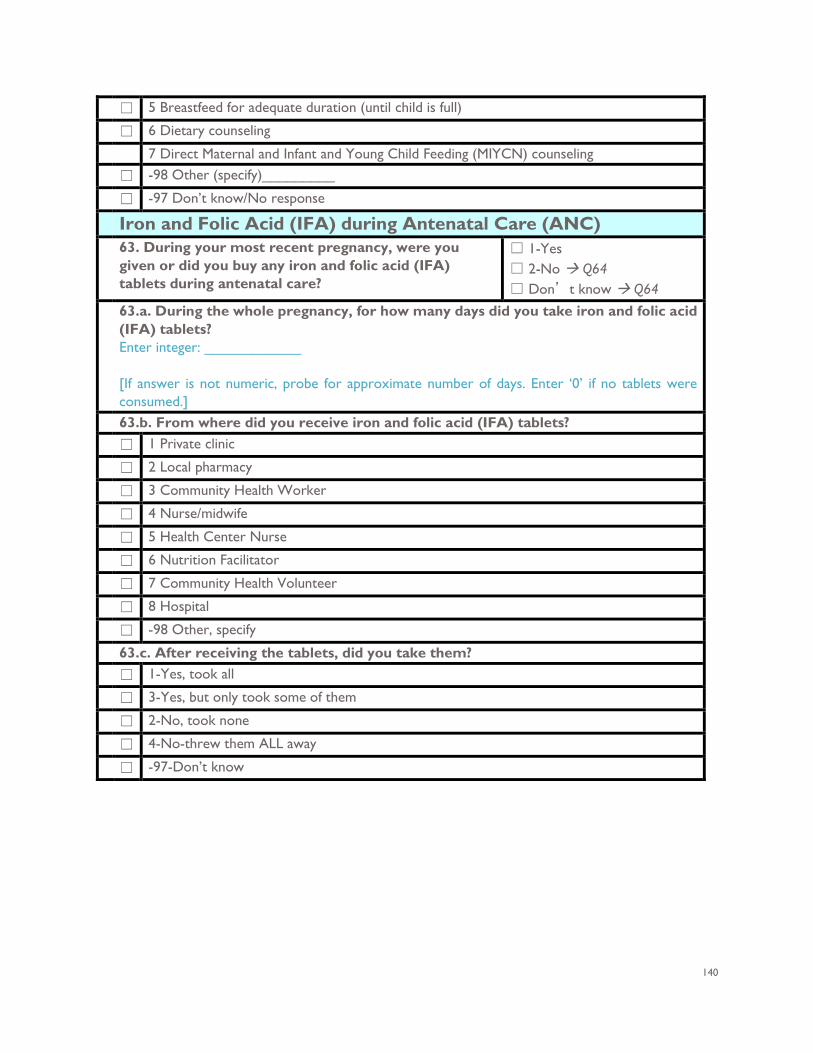
140
☐ 5 Breastfeed for adequate duration (until child is full)
☐ 6 Dietary counseling
7 Direct Maternal and Infant and Young Child Feeding (MIYCN) counseling ☐ -98 Other (specify)_________
☐ -97 Don’t know/No response
Iron and Folic Acid (IFA) during Antenatal Care (ANC)
63. During your most recent pregnancy, were you given or did you buy any iron and folic acid (IFA) tablets during antenatal care?
☐ 1-Yes ☐ 2-No Q64 ☐ Don’t know Q64
63.a. During the whole pregnancy, for how many days did you take iron and folic acid (IFA) tablets? Enter integer: ____________ [If answer is not numeric, probe for approximate number of days. Enter ‘0’ if no tablets were consumed.]
63.b. From where did you receive iron and folic acid (IFA) tablets? ☐ 1 Private clinic
☐ 2 Local pharmacy
☐ 3 Community Health Worker
☐ 4 Nurse/midwife
☐ 5 Health Center Nurse
☐ 6 Nutrition Facilitator
☐ 7 Community Health Volunteer
☐ 8 Hospital
☐ -98 Other, specify
63.c. After receiving the tablets, did you take them? ☐ 1-Yes, took all
☐ 3-Yes, but only took some of them
☐ 2-No, took none
☐ 4-No-threw them ALL away
☐ -97-Don’t know
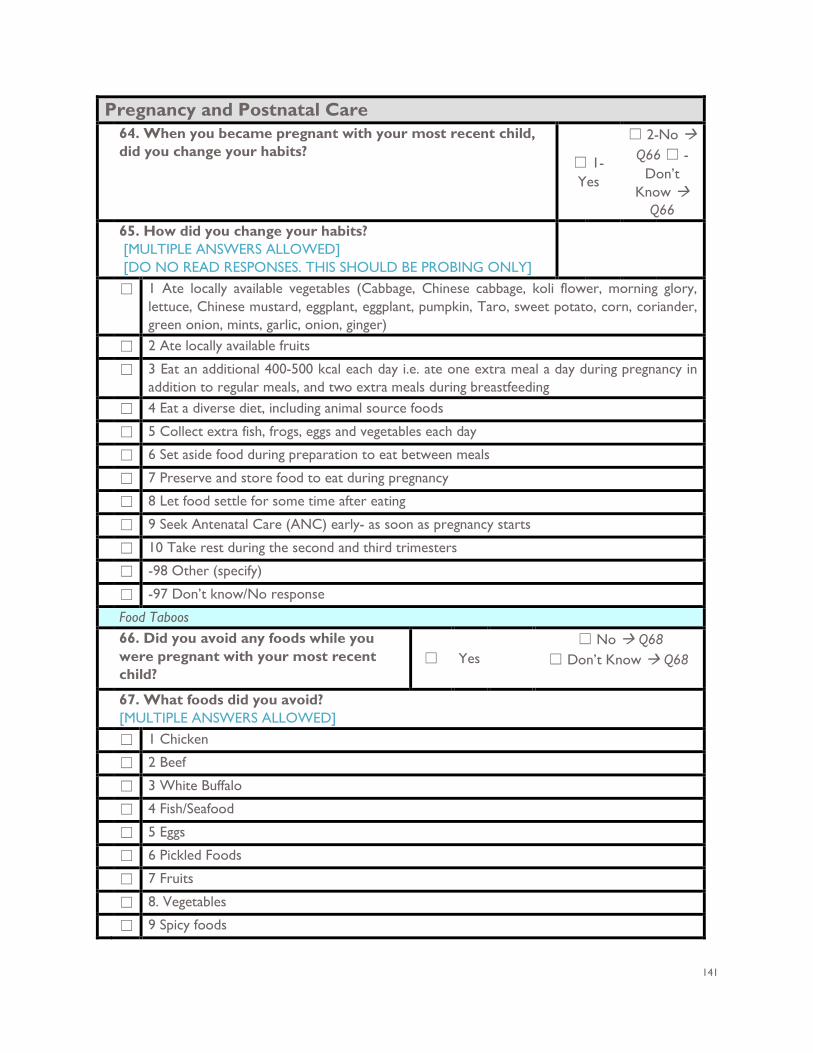
141
Pregnancy and Postnatal Care 64. When you became pregnant with your most recent child,
did you change your habits? ☐ 1-Yes
☐ 2-No Q66 ☐ -
Don’t Know
Q66 65. How did you change your habits?
[MULTIPLE ANSWERS ALLOWED] [DO NO READ RESPONSES. THIS SHOULD BE PROBING ONLY]
☐ 1 Ate locally available vegetables (Cabbage, Chinese cabbage, koli flower, morning glory, lettuce, Chinese mustard, eggplant, eggplant, pumpkin, Taro, sweet potato, corn, coriander, green onion, mints, garlic, onion, ginger)
☐ 2 Ate locally available fruits
☐ 3 Eat an additional 400-500 kcal each day i.e. ate one extra meal a day during pregnancy in addition to regular meals, and two extra meals during breastfeeding
☐ 4 Eat a diverse diet, including animal source foods
☐ 5 Collect extra fish, frogs, eggs and vegetables each day
☐ 6 Set aside food during preparation to eat between meals
☐ 7 Preserve and store food to eat during pregnancy
☐ 8 Let food settle for some time after eating
☐ 9 Seek Antenatal Care (ANC) early- as soon as pregnancy starts
☐ 10 Take rest during the second and third trimesters
☐ -98 Other (specify)
☐ -97 Don’t know/No response
Food Taboos 66. Did you avoid any foods while you
were pregnant with your most recent child?
☐ Yes ☐ No Q68
☐ Don’t Know Q68
67. What foods did you avoid? [MULTIPLE ANSWERS ALLOWED]
☐ 1 Chicken
☐ 2 Beef
☐ 3 White Buffalo
☐ 4 Fish/Seafood
☐ 5 Eggs
☐ 6 Pickled Foods
☐ 7 Fruits
☐ 8. Vegetables
☐ 9 Spicy foods
142
☐ -98 Other (specify)___________
☐ -97 Don’t know/No response
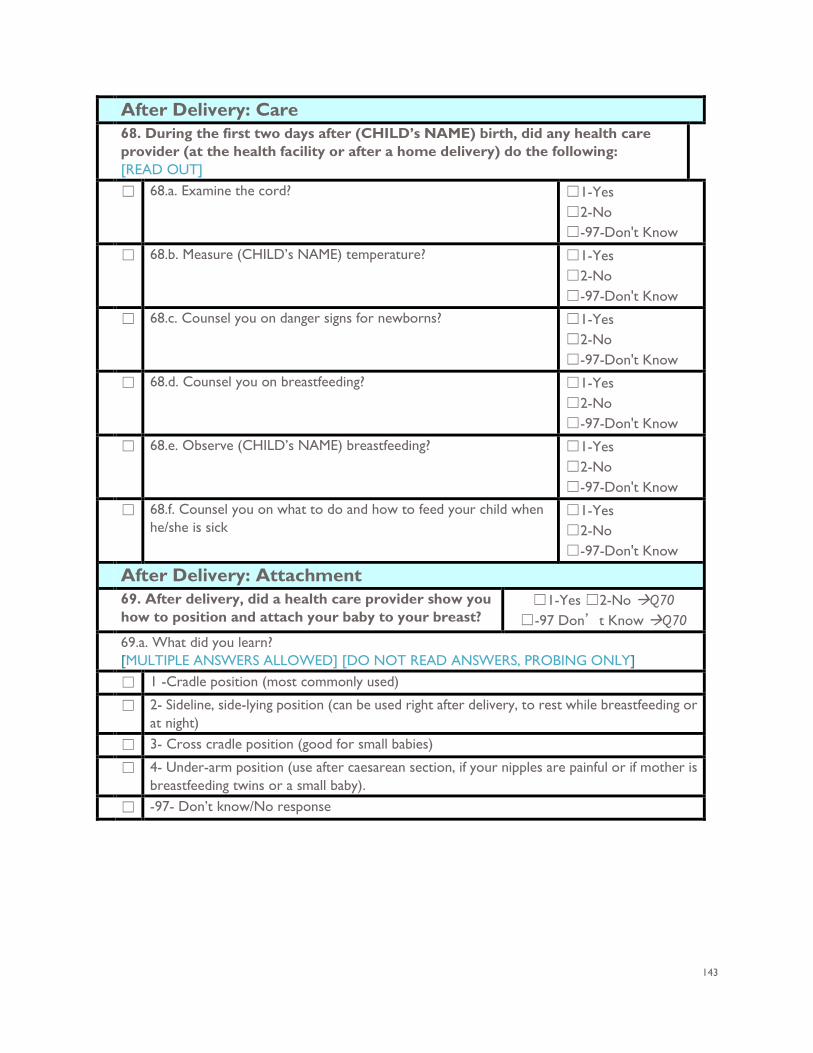
143
After Delivery: Care 68. During the first two days after (CHILD’s NAME) birth, did any health care
provider (at the health facility or after a home delivery) do the following: [READ OUT]
☐ 68.a. Examine the cord? ☐1-Yes ☐2-No ☐-97-Don't Know
☐ 68.b. Measure (CHILD’s NAME) temperature? ☐1-Yes ☐2-No ☐-97-Don't Know
☐ 68.c. Counsel you on danger signs for newborns? ☐1-Yes ☐2-No ☐-97-Don't Know
☐ 68.d. Counsel you on breastfeeding? ☐1-Yes ☐2-No ☐-97-Don't Know
☐ 68.e. Observe (CHILD’s NAME) breastfeeding? ☐1-Yes ☐2-No ☐-97-Don't Know
☐ 68.f. Counsel you on what to do and how to feed your child when he/she is sick
☐1-Yes ☐2-No ☐-97-Don't Know
After Delivery: Attachment 69. After delivery, did a health care provider show you
how to position and attach your baby to your breast? ☐1-Yes ☐2-No Q70
☐-97 Don’t Know Q70 69.a. What did you learn?
[MULTIPLE ANSWERS ALLOWED] [DO NOT READ ANSWERS, PROBING ONLY] ☐ 1 -Cradle position (most commonly used)
☐ 2- Sideline, side-lying position (can be used right after delivery, to rest while breastfeeding or at night)
☐ 3- Cross cradle position (good for small babies)
☐ 4- Under-arm position (use after caesarean section, if your nipples are painful or if mother is breastfeeding twins or a small baby).
☐ -97- Don’t know/No response
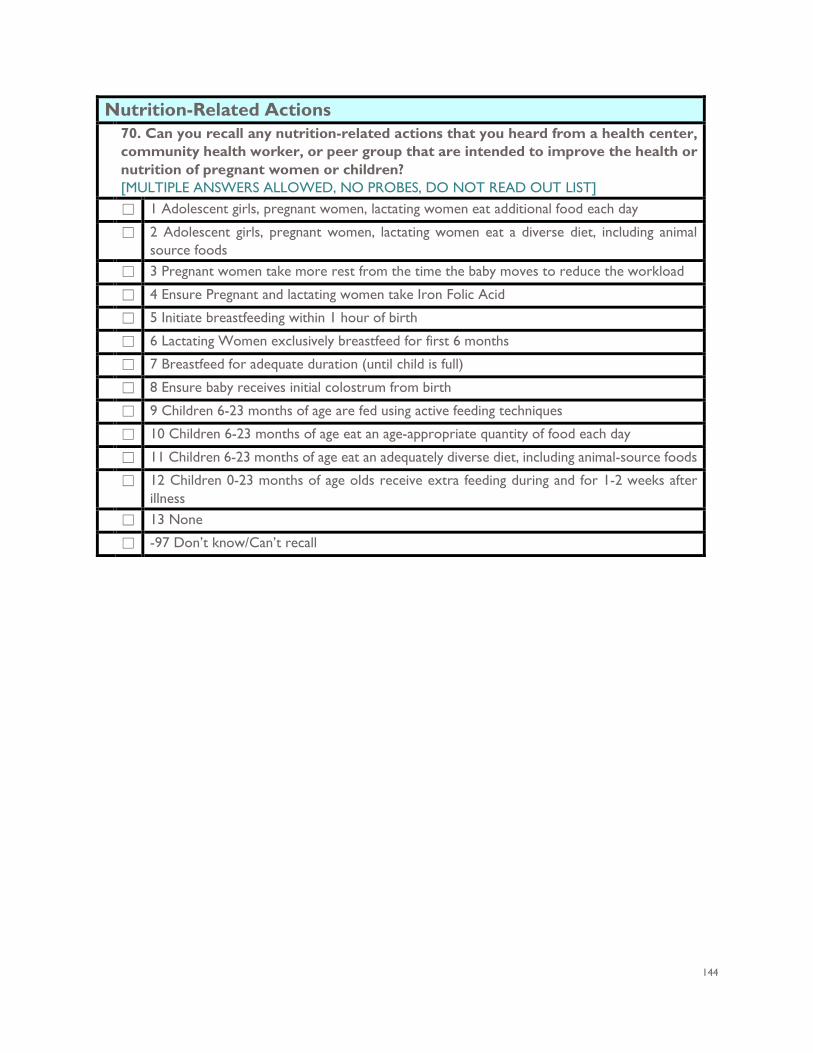
144
Nutrition-Related Actions
70. Can you recall any nutrition-related actions that you heard from a health center, community health worker, or peer group that are intended to improve the health or nutrition of pregnant women or children? [MULTIPLE ANSWERS ALLOWED, NO PROBES, DO NOT READ OUT LIST]
☐ 1 Adolescent girls, pregnant women, lactating women eat additional food each day
☐ 2 Adolescent girls, pregnant women, lactating women eat a diverse diet, including animal source foods
☐ 3 Pregnant women take more rest from the time the baby moves to reduce the workload
☐ 4 Ensure Pregnant and lactating women take Iron Folic Acid
☐ 5 Initiate breastfeeding within 1 hour of birth
☐ 6 Lactating Women exclusively breastfeed for first 6 months
☐ 7 Breastfeed for adequate duration (until child is full)
☐ 8 Ensure baby receives initial colostrum from birth
☐ 9 Children 6-23 months of age are fed using active feeding techniques
☐ 10 Children 6-23 months of age eat an age-appropriate quantity of food each day
☐ 11 Children 6-23 months of age eat an adequately diverse diet, including animal-source foods
☐ 12 Children 0-23 months of age olds receive extra feeding during and for 1-2 weeks after illness
☐ 13 None
☐ -97 Don’t know/Can’t recall
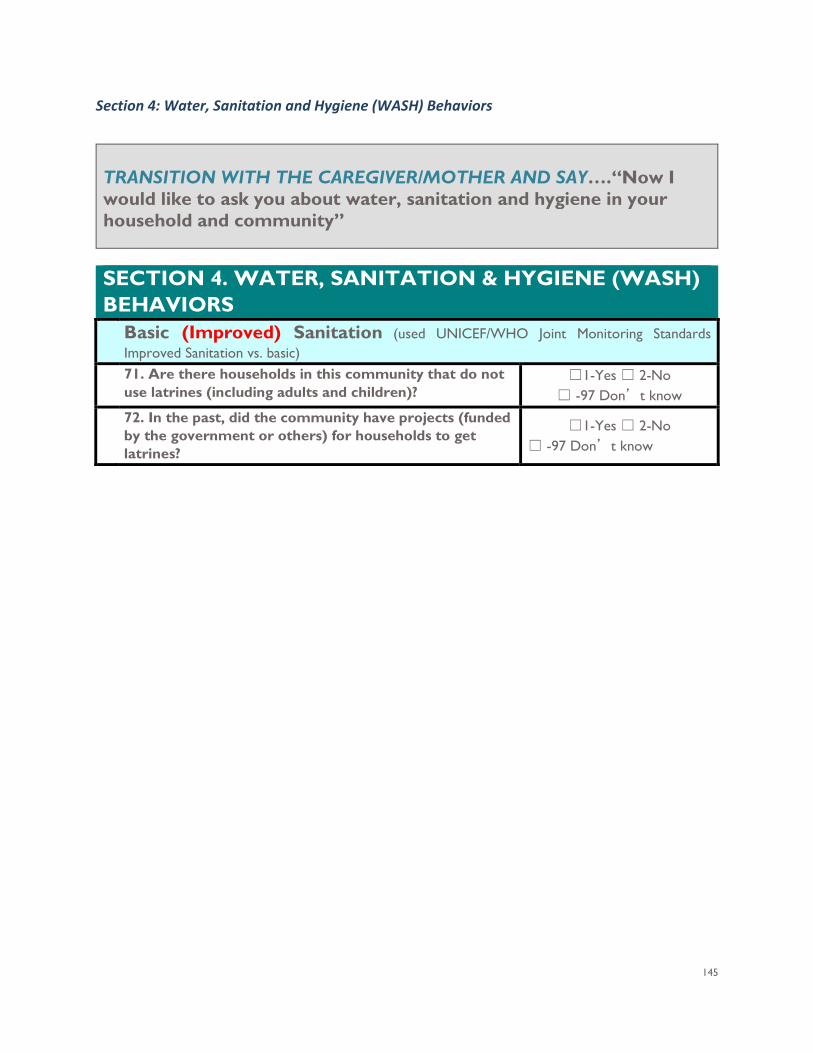
145
Section 4: Water, Sanitation and Hygiene (WASH) Behaviors
TRANSITION WITH THE CAREGIVER/MOTHER AND SAY….“Now I would like to ask you about water, sanitation and hygiene in your household and community”
SECTION 4. WATER, SANITATION & HYGIENE (WASH) BEHAVIORS Basic (Improved) Sanitation (used UNICEF/WHO Joint Monitoring Standards
Improved Sanitation vs. basic) 71. Are there households in this community that do not
use latrines (including adults and children)? ☐1-Yes ☐ 2-No
☐ -97 Don’t know
72. In the past, did the community have projects (funded by the government or others) for households to get latrines?
☐1-Yes ☐ 2-No ☐ -97 Don’t know
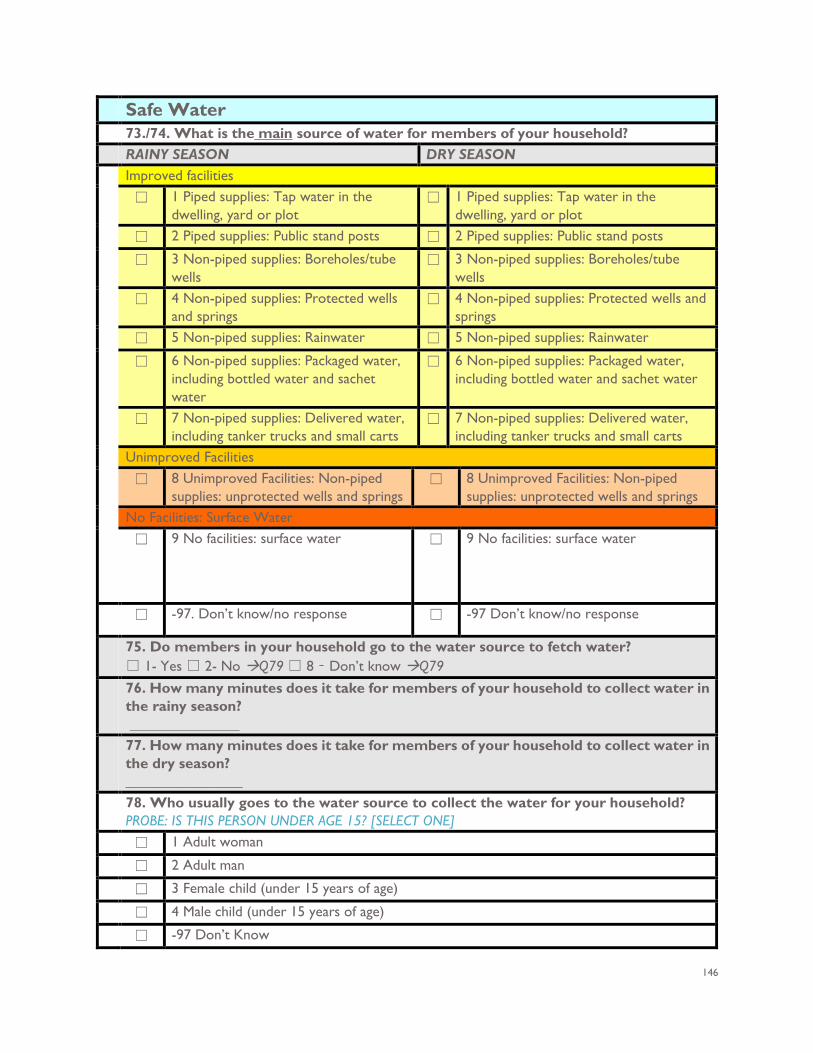
146
Safe Water
73./74. What is the main source of water for members of your household? RAINY SEASON DRY SEASON Improved facilities
☐ 1 Piped supplies: Tap water in the dwelling, yard or plot
☐ 1 Piped supplies: Tap water in the dwelling, yard or plot
☐ 2 Piped supplies: Public stand posts ☐ 2 Piped supplies: Public stand posts
☐ 3 Non-piped supplies: Boreholes/tube wells
☐ 3 Non-piped supplies: Boreholes/tube wells
☐ 4 Non-piped supplies: Protected wells and springs
☐ 4 Non-piped supplies: Protected wells and springs
☐ 5 Non-piped supplies: Rainwater ☐ 5 Non-piped supplies: Rainwater
☐ 6 Non-piped supplies: Packaged water, including bottled water and sachet water
☐ 6 Non-piped supplies: Packaged water, including bottled water and sachet water
☐ 7 Non-piped supplies: Delivered water, including tanker trucks and small carts
☐ 7 Non-piped supplies: Delivered water, including tanker trucks and small carts
Unimproved Facilities
☐ 8 Unimproved Facilities: Non-piped supplies: unprotected wells and springs
☐ 8 Unimproved Facilities: Non-piped supplies: unprotected wells and springs
No Facilities: Surface Water
☐ 9 No facilities: surface water ☐ 9 No facilities: surface water
☐ -97. Don’t know/no response ☐ -97 Don’t know/no response
75. Do members in your household go to the water source to fetch water? ☐ 1- Yes ☐ 2- No Q79 ☐ 8 – Don’t know Q79
76. How many minutes does it take for members of your household to collect water in the rainy season? _______________
77. How many minutes does it take for members of your household to collect water in the dry season? ________________
78. Who usually goes to the water source to collect the water for your household? PROBE: IS THIS PERSON UNDER AGE 15? [SELECT ONE]
☐ 1 Adult woman
☐ 2 Adult man
☐ 3 Female child (under 15 years of age)
☐ 4 Male child (under 15 years of age)
☐ -97 Don’t Know

147
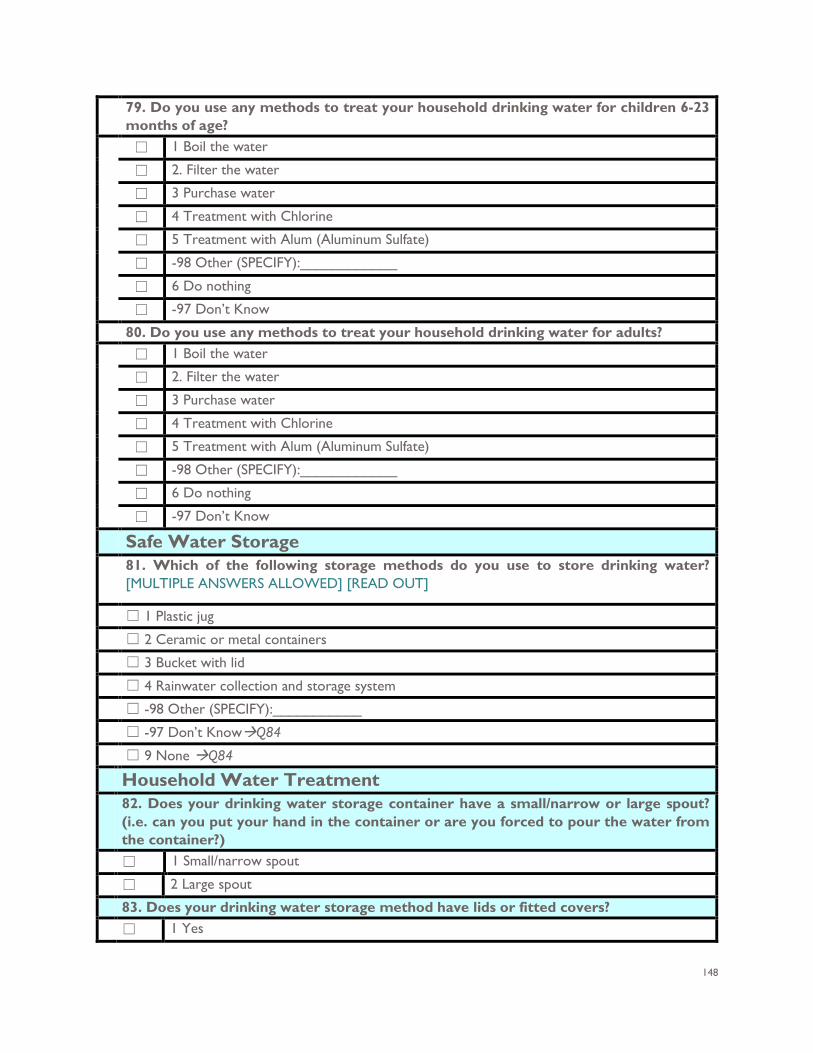
148
79. Do you use any methods to treat your household drinking water for children 6-23 months of age?
☐ 1 Boil the water
☐ 2. Filter the water
☐ 3 Purchase water
☐ 4 Treatment with Chlorine
☐ 5 Treatment with Alum (Aluminum Sulfate)
☐ -98 Other (SPECIFY):____________
☐ 6 Do nothing
☐ -97 Don’t Know
80. Do you use any methods to treat your household drinking water for adults? ☐ 1 Boil the water
☐ 2. Filter the water
☐ 3 Purchase water
☐ 4 Treatment with Chlorine
☐ 5 Treatment with Alum (Aluminum Sulfate)
☐ -98 Other (SPECIFY):____________
☐ 6 Do nothing
☐ -97 Don’t Know
Safe Water Storage 81. Which of the following storage methods do you use to store drinking water?
[MULTIPLE ANSWERS ALLOWED] [READ OUT]
☐ 1 Plastic jug ☐ 2 Ceramic or metal containers ☐ 3 Bucket with lid ☐ 4 Rainwater collection and storage system ☐ -98 Other (SPECIFY):___________ ☐ -97 Don’t KnowQ84 ☐ 9 None Q84 Household Water Treatment 82. Does your drinking water storage container have a small/narrow or large spout?
(i.e. can you put your hand in the container or are you forced to pour the water from the container?)
☐ 1 Small/narrow spout
☐ 2 Large spout
83. Does your drinking water storage method have lids or fitted covers? ☐ 1 Yes
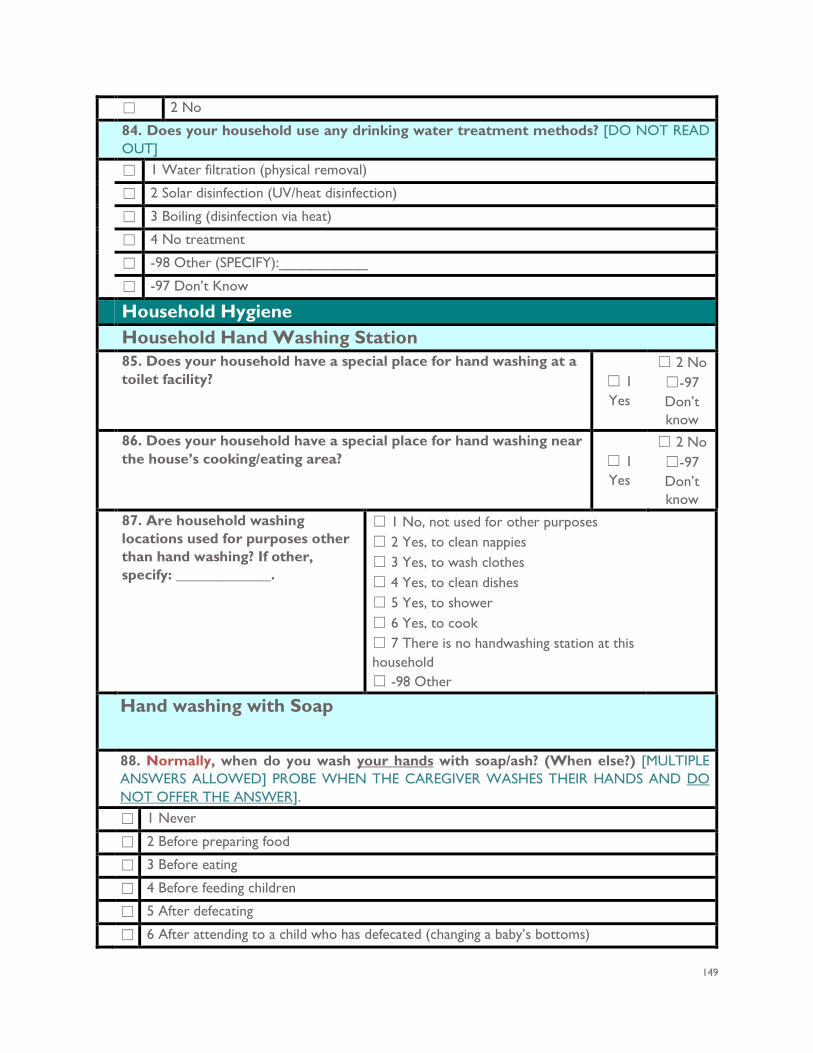
149
☐ 2 No
84. Does your household use any drinking water treatment methods? [DO NOT READ OUT]
☐ 1 Water filtration (physical removal)
☐ 2 Solar disinfection (UV/heat disinfection)
☐ 3 Boiling (disinfection via heat)
☐ 4 No treatment
☐ -98 Other (SPECIFY):___________
☐ -97 Don’t Know
Household Hygiene Household Hand Washing Station
85. Does your household have a special place for hand washing at a toilet facility? ☐ 1
Yes
☐ 2 No ☐-97 Don’t know
86. Does your household have a special place for hand washing near the house’s cooking/eating area? ☐ 1
Yes
☐ 2 No ☐-97 Don’t know
87. Are household washing locations used for purposes other than hand washing? If other, specify: _____________.
☐ 1 No, not used for other purposes ☐ 2 Yes, to clean nappies ☐ 3 Yes, to wash clothes ☐ 4 Yes, to clean dishes ☐ 5 Yes, to shower ☐ 6 Yes, to cook ☐ 7 There is no handwashing station at this household ☐ -98 Other
Hand washing with Soap
88. Normally, when do you wash your hands with soap/ash? (When else?) [MULTIPLE ANSWERS ALLOWED] PROBE WHEN THE CAREGIVER WASHES THEIR HANDS AND DO NOT OFFER THE ANSWER].
☐ 1 Never
☐ 2 Before preparing food
☐ 3 Before eating
☐ 4 Before feeding children
☐ 5 After defecating
☐ 6 After attending to a child who has defecated (changing a baby’s bottoms)
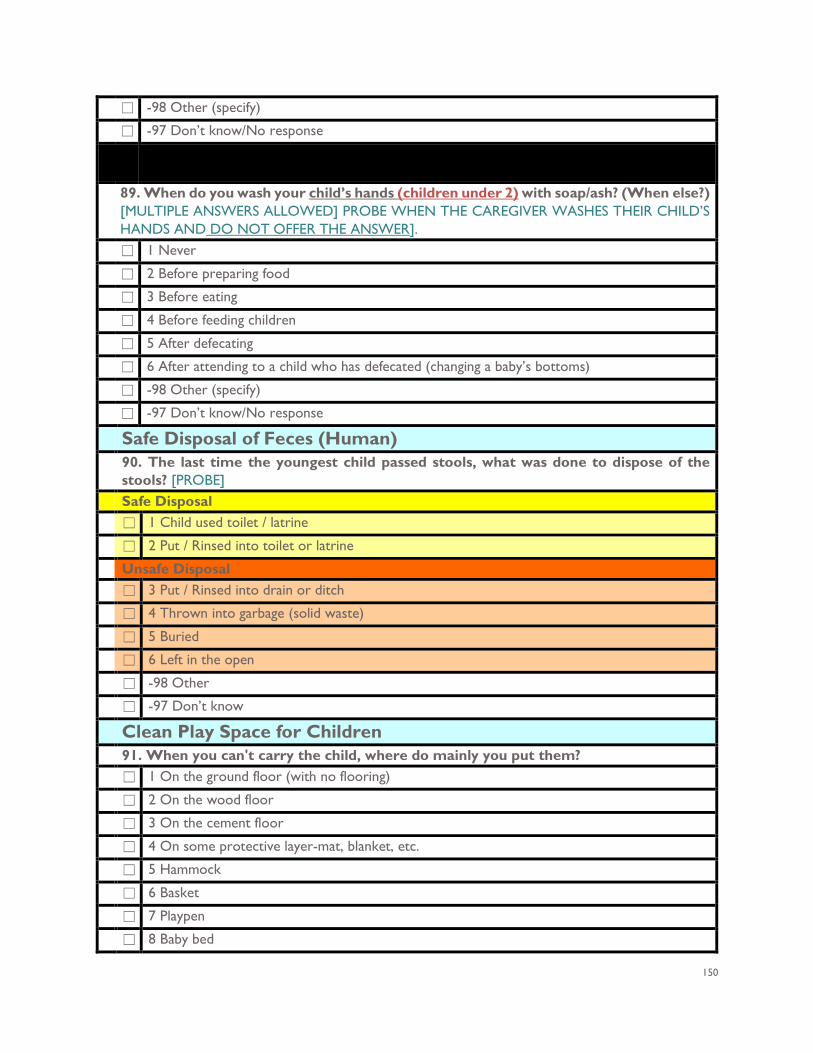
150
☐ -98 Other (specify)
☐ -97 Don’t know/No response
89. When do you wash your child’s hands (children under 2) with soap/ash? (When else?) [MULTIPLE ANSWERS ALLOWED] PROBE WHEN THE CAREGIVER WASHES THEIR CHILD’S HANDS AND DO NOT OFFER THE ANSWER].
☐ 1 Never
☐ 2 Before preparing food
☐ 3 Before eating
☐ 4 Before feeding children
☐ 5 After defecating
☐ 6 After attending to a child who has defecated (changing a baby’s bottoms)
☐ -98 Other (specify)
☐ -97 Don’t know/No response
Safe Disposal of Feces (Human) 90. The last time the youngest child passed stools, what was done to dispose of the
stools? [PROBE] Safe Disposal ☐ 1 Child used toilet / latrine
☐ 2 Put / Rinsed into toilet or latrine
Unsafe Disposal ☐ 3 Put / Rinsed into drain or ditch
☐ 4 Thrown into garbage (solid waste)
☐ 5 Buried
☐ 6 Left in the open
☐ -98 Other
☐ -97 Don’t know
Clean Play Space for Children
91. When you can't carry the child, where do mainly you put them? ☐ 1 On the ground floor (with no flooring)
☐ 2 On the wood floor
☐ 3 On the cement floor
☐ 4 On some protective layer-mat, blanket, etc.
☐ 5 Hammock
☐ 6 Basket
☐ 7 Playpen
☐ 8 Baby bed
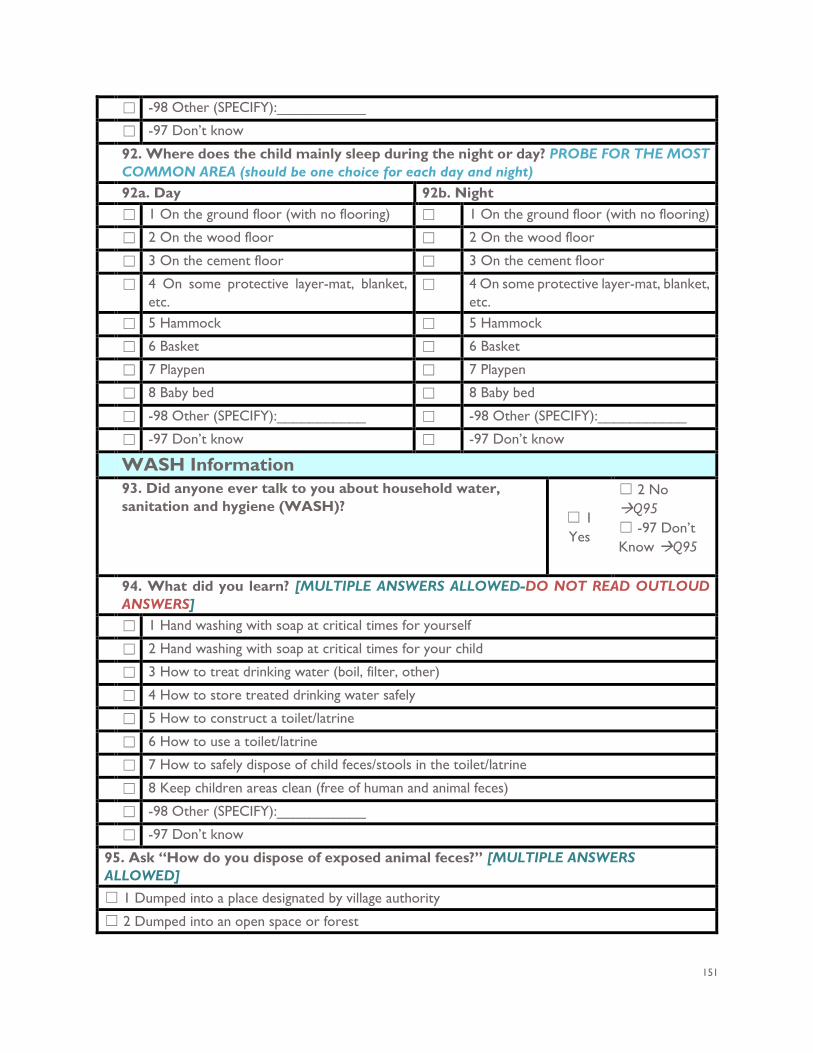
151
☐ -98 Other (SPECIFY):___________
☐ -97 Don’t know
92. Where does the child mainly sleep during the night or day? PROBE FOR THE MOST COMMON AREA (should be one choice for each day and night)
92a. Day 92b. Night ☐ 1 On the ground floor (with no flooring) ☐ 1 On the ground floor (with no flooring)
☐ 2 On the wood floor ☐ 2 On the wood floor
☐ 3 On the cement floor ☐ 3 On the cement floor
☐ 4 On some protective layer-mat, blanket, etc.
☐ 4 On some protective layer-mat, blanket, etc.
☐ 5 Hammock ☐ 5 Hammock
☐ 6 Basket ☐ 6 Basket
☐ 7 Playpen ☐ 7 Playpen
☐ 8 Baby bed ☐ 8 Baby bed
☐ -98 Other (SPECIFY):___________ ☐ -98 Other (SPECIFY):___________
☐ -97 Don’t know ☐ -97 Don’t know
WASH Information 93. Did anyone ever talk to you about household water,
sanitation and hygiene (WASH)? ☐ 1 Yes
☐ 2 No Q95 ☐ -97 Don’t Know Q95
94. What did you learn? [MULTIPLE ANSWERS ALLOWED-DO NOT READ OUTLOUD
ANSWERS] ☐ 1 Hand washing with soap at critical times for yourself
☐ 2 Hand washing with soap at critical times for your child
☐ 3 How to treat drinking water (boil, filter, other)
☐ 4 How to store treated drinking water safely
☐ 5 How to construct a toilet/latrine
☐ 6 How to use a toilet/latrine
☐ 7 How to safely dispose of child feces/stools in the toilet/latrine
☐ 8 Keep children areas clean (free of human and animal feces)
☐ -98 Other (SPECIFY):___________
☐ -97 Don’t know
95. Ask “How do you dispose of exposed animal feces?” [MULTIPLE ANSWERS ALLOWED]
☐ 1 Dumped into a place designated by village authority
☐ 2 Dumped into an open space or forest
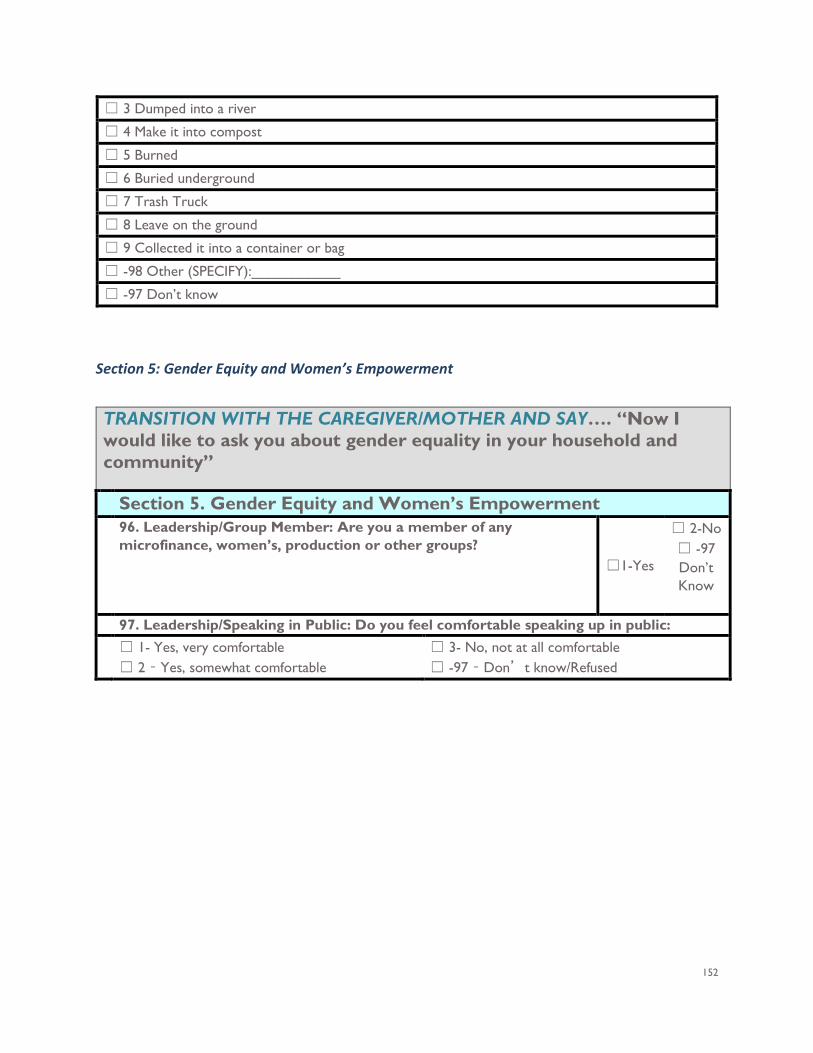
152
☐ 3 Dumped into a river
☐ 4 Make it into compost
☐ 5 Burned
☐ 6 Buried underground
☐ 7 Trash Truck
☐ 8 Leave on the ground
☐ 9 Collected it into a container or bag
☐ -98 Other (SPECIFY):___________
☐ -97 Don’t know
Section 5: Gender Equity and Women’s Empowerment
TRANSITION WITH THE CAREGIVER/MOTHER AND SAY…. “Now I would like to ask you about gender equality in your household and community” Section 5. Gender Equity and Women’s Empowerment 96. Leadership/Group Member: Are you a member of any
microfinance, women’s, production or other groups? ☐1-Yes
☐ 2-No ☐ -97 Don’t Know
97. Leadership/Speaking in Public: Do you feel comfortable speaking up in public: ☐ 1- Yes, very comfortable
☐ 2 – Yes, somewhat comfortable ☐ 3- No, not at all comfortable ☐ -97 – Don’t know/Refused
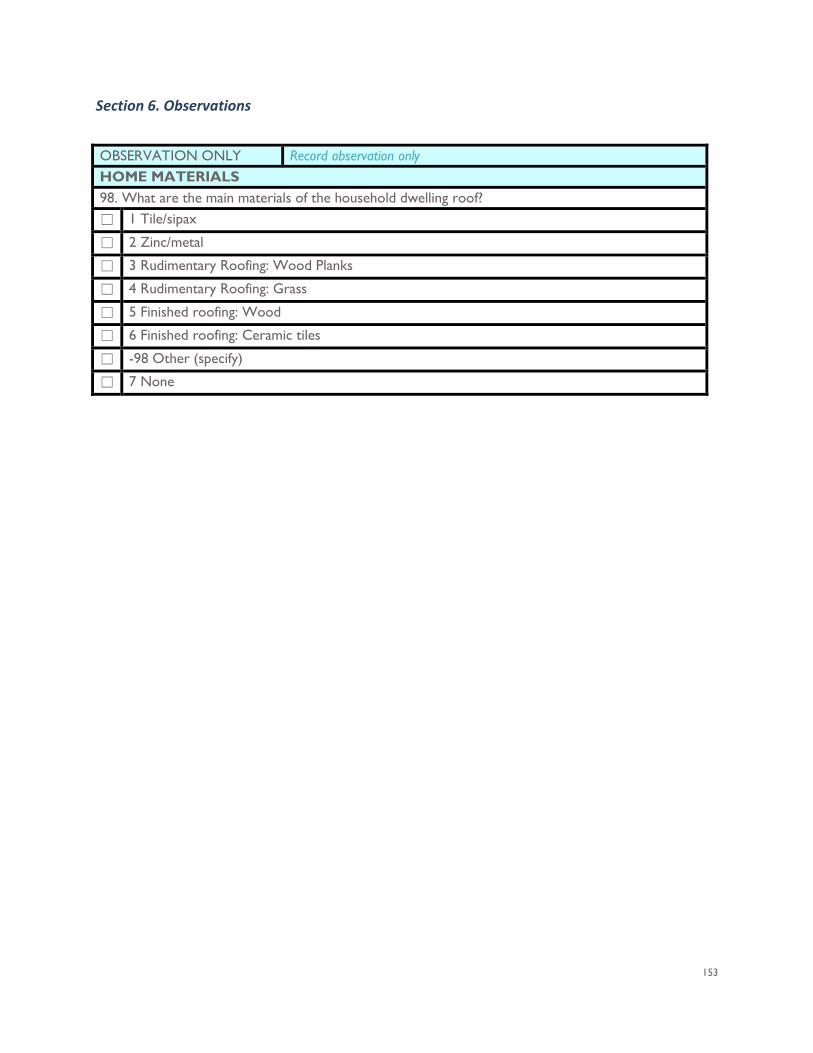
153
Section 6. Observations
OBSERVATION ONLY Record observation only HOME MATERIALS 98. What are the main materials of the household dwelling roof?
☐ 1 Tile/sipax
☐ 2 Zinc/metal
☐ 3 Rudimentary Roofing: Wood Planks
☐ 4 Rudimentary Roofing: Grass
☐ 5 Finished roofing: Wood
☐ 6 Finished roofing: Ceramic tiles
☐ -98 Other (specify)
☐ 7 None
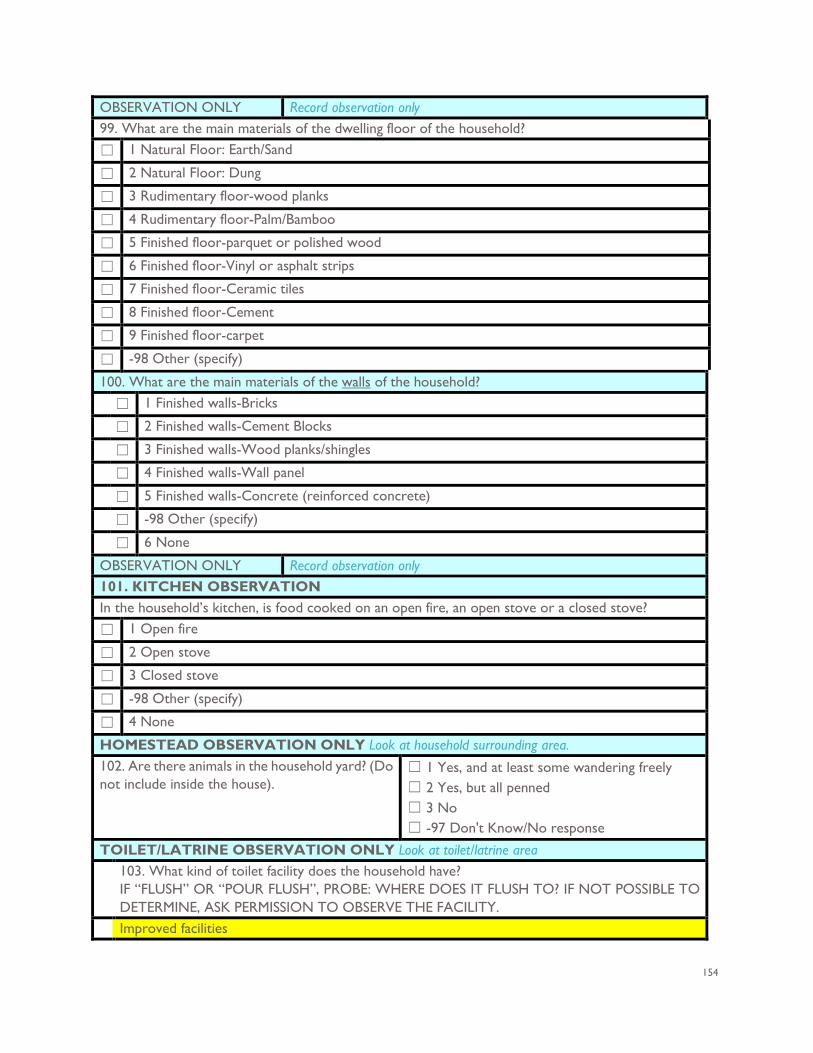
154
OBSERVATION ONLY Record observation only 99. What are the main materials of the dwelling floor of the household?
☐ 1 Natural Floor: Earth/Sand
☐ 2 Natural Floor: Dung
☐ 3 Rudimentary floor-wood planks
☐ 4 Rudimentary floor-Palm/Bamboo
☐ 5 Finished floor-parquet or polished wood
☐ 6 Finished floor-Vinyl or asphalt strips
☐ 7 Finished floor-Ceramic tiles
☐ 8 Finished floor-Cement
☐ 9 Finished floor-carpet
☐ -98 Other (specify)
100. What are the main materials of the walls of the household? ☐ 1 Finished walls-Bricks
☐ 2 Finished walls-Cement Blocks
☐ 3 Finished walls-Wood planks/shingles
☐ 4 Finished walls-Wall panel
☐ 5 Finished walls-Concrete (reinforced concrete)
☐ -98 Other (specify)
☐ 6 None
OBSERVATION ONLY Record observation only 101. KITCHEN OBSERVATION In the household’s kitchen, is food cooked on an open fire, an open stove or a closed stove?
☐ 1 Open fire
☐ 2 Open stove
☐ 3 Closed stove
☐ -98 Other (specify)
☐ 4 None
HOMESTEAD OBSERVATION ONLY Look at household surrounding area. 102. Are there animals in the household yard? (Do not include inside the house).
☐ 1 Yes, and at least some wandering freely ☐ 2 Yes, but all penned ☐ 3 No ☐ -97 Don't Know/No response
TOILET/LATRINE OBSERVATION ONLY Look at toilet/latrine area 103. What kind of toilet facility does the household have?
IF “FLUSH” OR “POUR FLUSH”, PROBE: WHERE DOES IT FLUSH TO? IF NOT POSSIBLE TO DETERMINE, ASK PERMISSION TO OBSERVE THE FACILITY.
Improved facilities
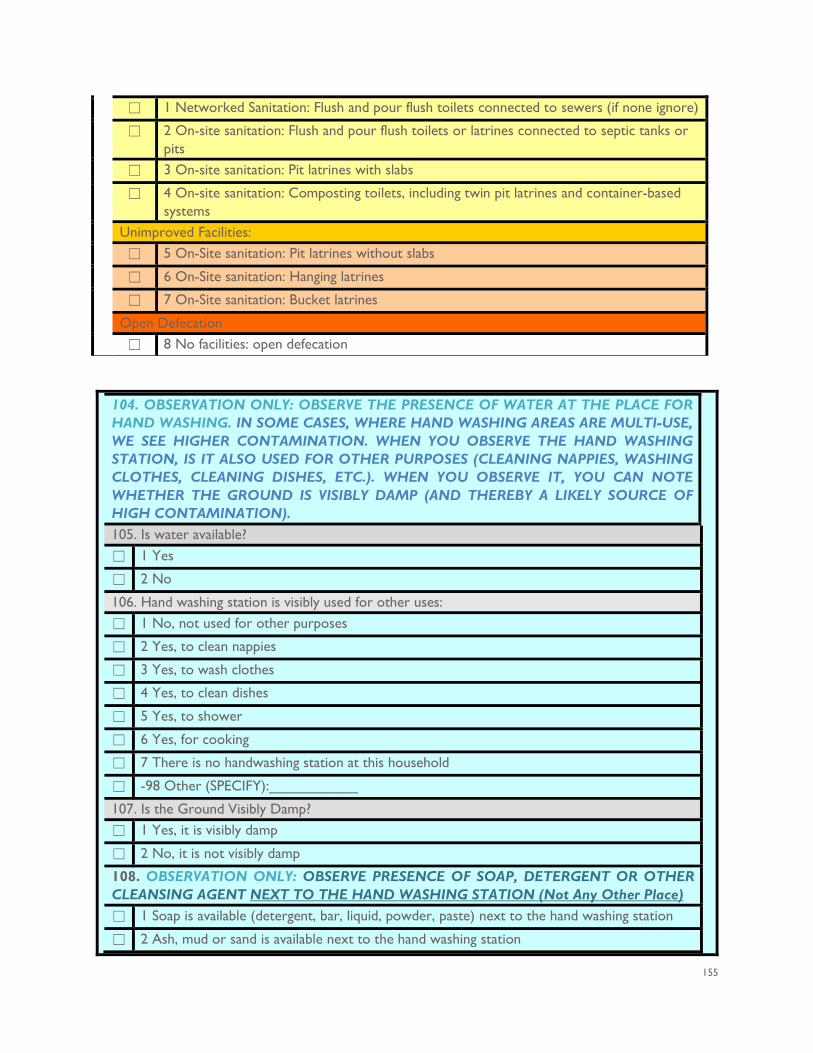
155
☐ 1 Networked Sanitation: Flush and pour flush toilets connected to sewers (if none ignore)
☐ 2 On-site sanitation: Flush and pour flush toilets or latrines connected to septic tanks or pits
☐ 3 On-site sanitation: Pit latrines with slabs
☐ 4 On-site sanitation: Composting toilets, including twin pit latrines and container-based systems
Unimproved Facilities:
☐ 5 On-Site sanitation: Pit latrines without slabs
☐ 6 On-Site sanitation: Hanging latrines
☐ 7 On-Site sanitation: Bucket latrines
Open Defecation
☐ 8 No facilities: open defecation
104. OBSERVATION ONLY: OBSERVE THE PRESENCE OF WATER AT THE PLACE FOR HAND WASHING. IN SOME CASES, WHERE HAND WASHING AREAS ARE MULTI-USE, WE SEE HIGHER CONTAMINATION. WHEN YOU OBSERVE THE HAND WASHING STATION, IS IT ALSO USED FOR OTHER PURPOSES (CLEANING NAPPIES, WASHING CLOTHES, CLEANING DISHES, ETC.). WHEN YOU OBSERVE IT, YOU CAN NOTE WHETHER THE GROUND IS VISIBLY DAMP (AND THEREBY A LIKELY SOURCE OF HIGH CONTAMINATION). 105. Is water available?
☐ 1 Yes
☐ 2 No
106. Hand washing station is visibly used for other uses:
☐ 1 No, not used for other purposes
☐ 2 Yes, to clean nappies
☐ 3 Yes, to wash clothes
☐ 4 Yes, to clean dishes
☐ 5 Yes, to shower
☐ 6 Yes, for cooking
☐ 7 There is no handwashing station at this household
☐ -98 Other (SPECIFY):___________
107. Is the Ground Visibly Damp?
☐ 1 Yes, it is visibly damp
☐ 2 No, it is not visibly damp
108. OBSERVATION ONLY: OBSERVE PRESENCE OF SOAP, DETERGENT OR OTHER CLEANSING AGENT NEXT TO THE HAND WASHING STATION (Not Any Other Place)
☐ 1 Soap is available (detergent, bar, liquid, powder, paste) next to the hand washing station
☐ 2 Ash, mud or sand is available next to the hand washing station
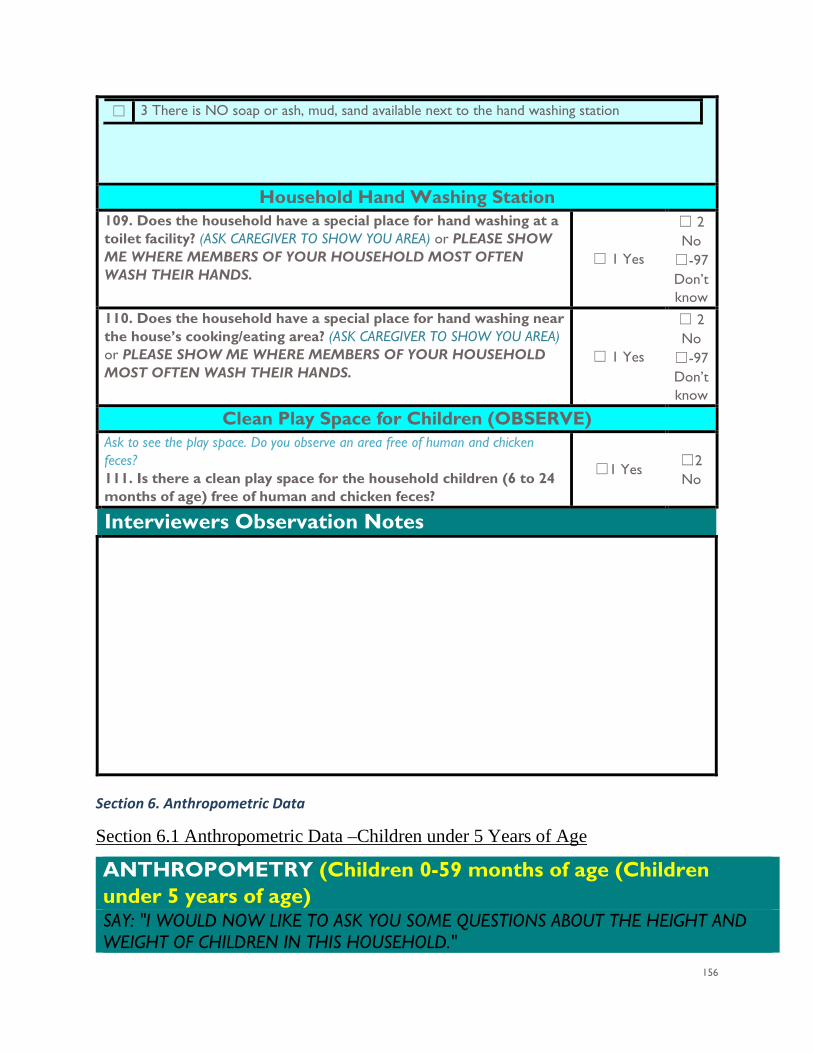
156
☐ 3 There is NO soap or ash, mud, sand available next to the hand washing station
Household Hand Washing Station
109. Does the household have a special place for hand washing at a toilet facility? (ASK CAREGIVER TO SHOW YOU AREA) or PLEASE SHOW ME WHERE MEMBERS OF YOUR HOUSEHOLD MOST OFTEN WASH THEIR HANDS.
☐ 1 Yes
☐ 2 No
☐-97 Don’t know
110. Does the household have a special place for hand washing near the house’s cooking/eating area? (ASK CAREGIVER TO SHOW YOU AREA) or PLEASE SHOW ME WHERE MEMBERS OF YOUR HOUSEHOLD MOST OFTEN WASH THEIR HANDS.
☐ 1 Yes
☐ 2 No ☐-97 Don’t know
Clean Play Space for Children (OBSERVE)
Ask to see the play space. Do you observe an area free of human and chicken feces? 111. Is there a clean play space for the household children (6 to 24 months of age) free of human and chicken feces?
☐1 Yes ☐2 No
Interviewers Observation Notes
Section 6. Anthropometric Data
Section 6.1 Anthropometric Data –Children under 5 Years of Age
ANTHROPOMETRY (Children 0-59 months of age (Children under 5 years of age) SAY: "I WOULD NOW LIKE TO ASK YOU SOME QUESTIONS ABOUT THE HEIGHT AND WEIGHT OF CHILDREN IN THIS HOUSEHOLD."
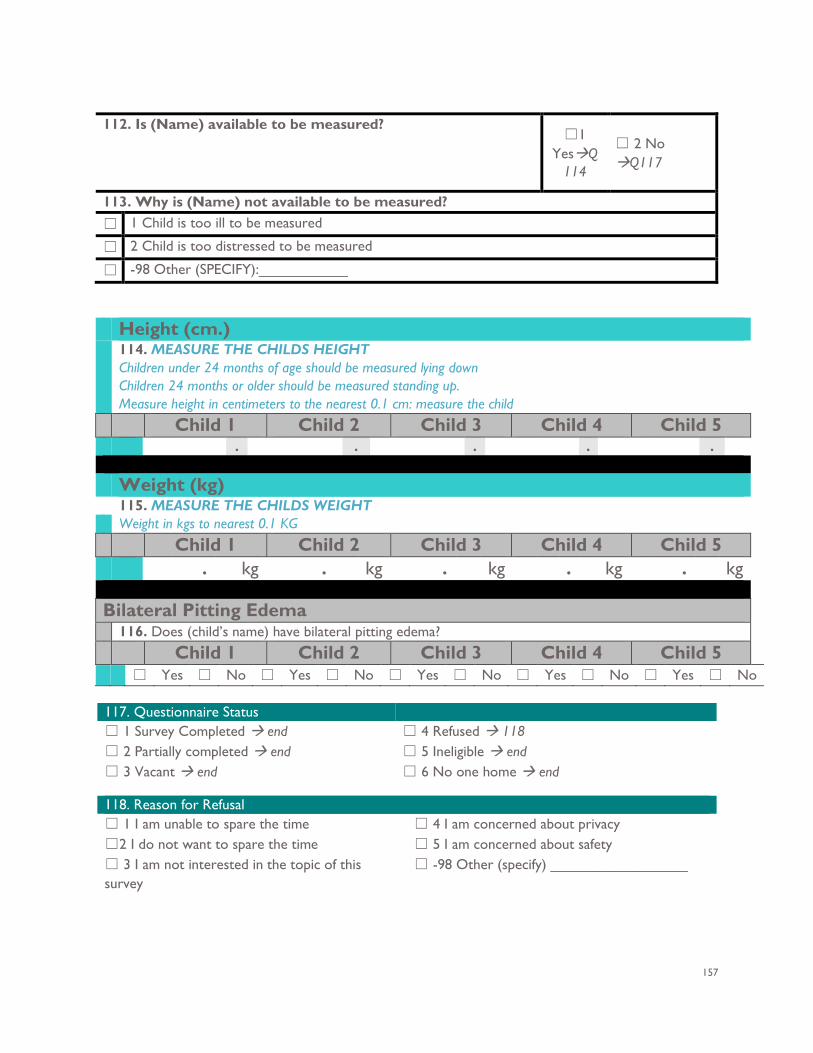
157
112. Is (Name) available to be measured?
☐1 YesQ
114
☐ 2 No Q117
113. Why is (Name) not available to be measured? ☐ 1 Child is too ill to be measured
☐ 2 Child is too distressed to be measured
☐ -98 Other (SPECIFY):___________
Height (cm.) 114. MEASURE THE CHILDS HEIGHT
Children under 24 months of age should be measured lying down Children 24 months or older should be measured standing up. Measure height in centimeters to the nearest 0.1 cm: measure the child
Child 1 Child 2 Child 3 Child 4 Child 5 . . . . .
Weight (kg) 115. MEASURE THE CHILDS WEIGHT Weight in kgs to nearest 0.1 KG Child 1 Child 2 Child 3 Child 4 Child 5 . kg . kg . kg . kg . kg
Bilateral Pitting Edema 116. Does (child’s name) have bilateral pitting edema? Child 1 Child 2 Child 3 Child 4 Child 5 ☐ Yes ☐ No ☐ Yes ☐ No ☐ Yes ☐ No ☐ Yes ☐ No ☐ Yes ☐ No
117. Questionnaire Status ☐ 1 Survey Completed end ☐ 4 Refused 118 ☐ 2 Partially completed end ☐ 3 Vacant end
☐ 5 Ineligible end ☐ 6 No one home end
118. Reason for Refusal ☐ 1 I am unable to spare the time ☐ 4 I am concerned about privacy ☐2 I do not want to spare the time ☐ 5 I am concerned about safety ☐ 3 I am not interested in the topic of this survey
☐ -98 Other (specify) _________________
158
ANNEX G: QUALITATIVE INSTRUMENTS
IMPACT EVALUATION OF USAID NURTURE IN LAOS Midline Qualitative Instruments and Protocol
159
IMPACT EVALUATION OF USAID NURTURE IN LAOS Midline Qualitative Instruments and Protocol
Submitted: April 2019 Submitted to: Charles Lewis Project Development Officer USAID/Regional Development Mission Asia Prepared by: Social Impact, Inc. Contract No. AID-OAA-M-11-00019 2300 Clarendon Boulevard Suite 1000 Arlington, VA, 22201 Tel: (703) 465-1884 Fax: (703) 465-1888 [email protected] DISCLAIMER This report was made possible by the support of the American people through the United States Agency for International Development (USAID). The contents of this report are the sole responsibility of Social Impact and do not necessarily reflect the views of USAID or the United States Government.
160
CONTENTS
INTRODUCTION AND QUALITATIVE EVALUATION STRATEGY 161 SAMPLING 161 QUALITATIVE ANALYSIS 163
INFORMED CONSENT: KEY INFORMANTS 163
INFORMED CONSENT: GROUP INTERVIEWS 164
FOCUS GROUP DISCUSSION GUIDE 165 GUIDE A: CAREGIVER PROGRAM PARTICIPANTS (WOMEN) 165 GUIDE B: CAREGIVER PROGRAM PARTICIPANTS (MEN) 169 GUIDE C: SAVE THE CHILDREN 172
KEY INFORMANT INTERVIEW GUIDE 173 GUIDE D: NATIONAL, PROVINCAL AND DISTRICT LEVEL OFFICIALS AND STAKEHOLDERS 173 GUIDE E: VILLAGE LEVEL OFFICIALS 173
ANNEX 1: FGD CONTROL SHEET 176
ANNEX 2: GROUND RULES & CONFIDENTIALITY 176
161
INTRODUCTION AND QUALITATIVE EVALUATION STRATEGY
USAID aims to test the USAID Nurture program’s effectiveness in reducing child stunting in targeted Provinces/Districts/villages in Laos through a targeted, integrated, multi-sectoral nutrition intervention approach that could be replicated and potentially scaled-up in other settings across the country. Social Impact (SI) will investigate the success of this integrated intervention model by its effectiveness in changing IYCF and hygiene and sanitation outcomes and ultimately reducing child stunting as the overall impact. The impact evaluation questions measure USAID Nurture’s effectiveness in reducing child stunting within the targeted populations. SI will answer these questions through a combination of quantitative and qualitative data collection and analysis, including collection of anthropometric data from household surveys and qualitative key informant interviews (KII) and focus group discussions (FGD) with stakeholders. The impact evaluation questions are as follows:
1. What is the effectiveness of the USAID Nurture approach in improving the nutritional status of CU2 in target areas?
2. To what extent did each of the individual components of the USAID Nurture approach
(maternal, IYCF, and WASH) contribute to the effectiveness of the overall approach? SI will address the first question primarily through a quantitative impact evaluation approach. In order to answer the second question, SI will rely on qualitative data on stakeholders’ perceptions of which program elements most effected change. SI will investigate how maternal, IYCF, nutrition, and WASH behaviors have changed over time and will gather input from stakeholders on what are the contributing factors and barriers that have inhibited behavior change. Preliminary findings obtained from baseline conducted March – June 2018 were used to inform instrument development and sampling considerations for Midline qualitative data collection activities. SI will conduct qualitative data collection at the national, provincial, district, and village levels during both follow up periods to gain a comprehensive understanding of the program impact at the different levels. SAMPLING SI’s qualitative approach will include varied sample units for interviews, including visiting each respondent type identified in the below table. Data will be collected in Vientiane and three - six districts in Khammouane and Savannakhet provinces. The ET will conduct between 21 – 45 semi-structured interviews. The districts will be purposively selected based on the following criteria: 1) implementation status (ensuring selected locations are advanced in program implementation, 2) geographic representation across both provinces, and 3) feasibility of access during field work. We will attempt to include at least one ‘remote’ district in each province, For each selected district, KII will be conducted with Village iNuW Committees, CF, with micro, small and mid-sized enterprises (SME), and with Non-profit associations (NPA), village health workers, local CF, village WASH committees, and lead mothers of peer groups. Key informants are presented by category in the table below, including a description of informants (column 2), the sampling strategy to be used (column 3), and target sample size (column 4). This informant list is based on ET review of available documents and may be expanded during fieldwork as more details about VEP implementation become available. In general, the selection of informants will be primarily purposive, with elements of snowball sampling based on the established sampling frame.
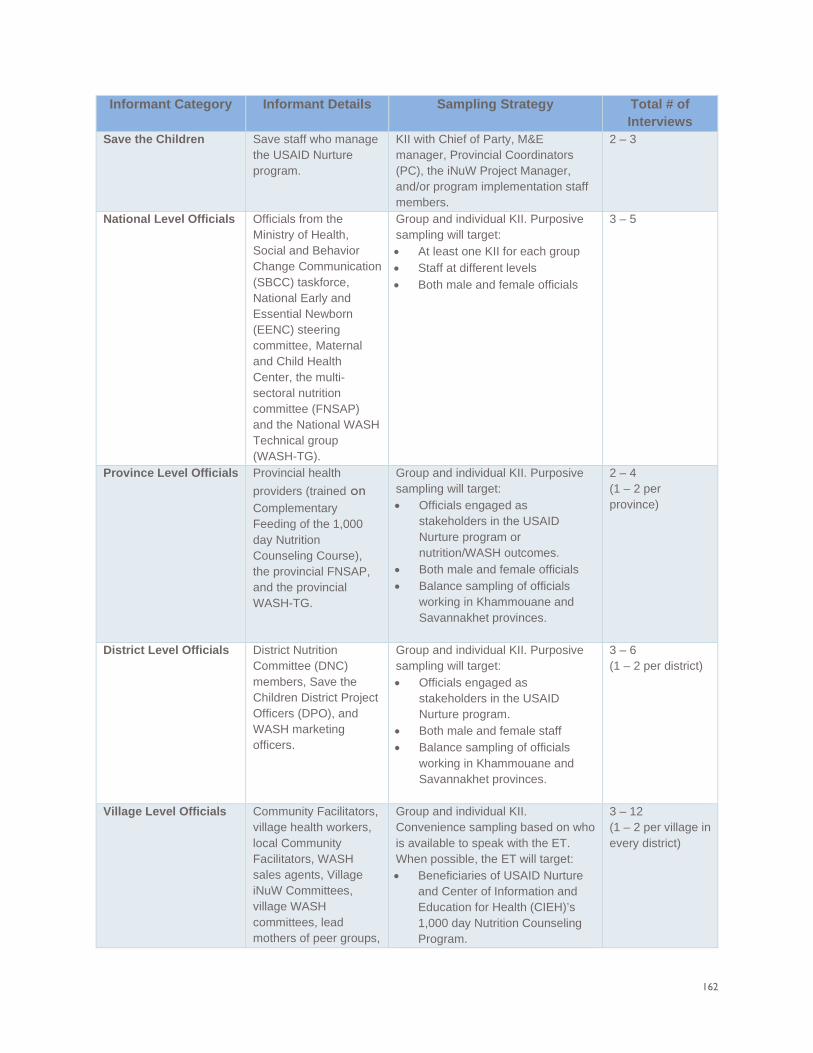
162
Informant Category Informant Details Sampling Strategy Total # of Interviews
Save the Children Save staff who manage the USAID Nurture program.
KII with Chief of Party, M&E manager, Provincial Coordinators (PC), the iNuW Project Manager, and/or program implementation staff members.
2 – 3
National Level Officials Officials from the Ministry of Health, Social and Behavior Change Communication (SBCC) taskforce, National Early and Essential Newborn (EENC) steering committee, Maternal and Child Health Center, the multi-sectoral nutrition committee (FNSAP) and the National WASH Technical group (WASH-TG).
Group and individual KII. Purposive sampling will target: • At least one KII for each group • Staff at different levels • Both male and female officials
3 – 5
Province Level Officials Provincial health providers (trained on Complementary Feeding of the 1,000 day Nutrition Counseling Course), the provincial FNSAP, and the provincial WASH-TG.
Group and individual KII. Purposive sampling will target: • Officials engaged as
stakeholders in the USAID Nurture program or nutrition/WASH outcomes.
• Both male and female officials • Balance sampling of officials
working in Khammouane and Savannakhet provinces.
2 – 4 (1 – 2 per province)
District Level Officials District Nutrition Committee (DNC) members, Save the Children District Project Officers (DPO), and WASH marketing officers.
Group and individual KII. Purposive sampling will target: • Officials engaged as
stakeholders in the USAID Nurture program.
• Both male and female staff • Balance sampling of officials
working in Khammouane and Savannakhet provinces.
3 – 6 (1 – 2 per district)
Village Level Officials Community Facilitators, village health workers, local Community Facilitators, WASH sales agents, Village iNuW Committees, village WASH committees, lead mothers of peer groups,
Group and individual KII. Convenience sampling based on who is available to speak with the ET. When possible, the ET will target: • Beneficiaries of USAID Nurture
and Center of Information and Education for Health (CIEH)’s 1,000 day Nutrition Counseling Program.
3 – 12 (1 – 2 per village in every district)
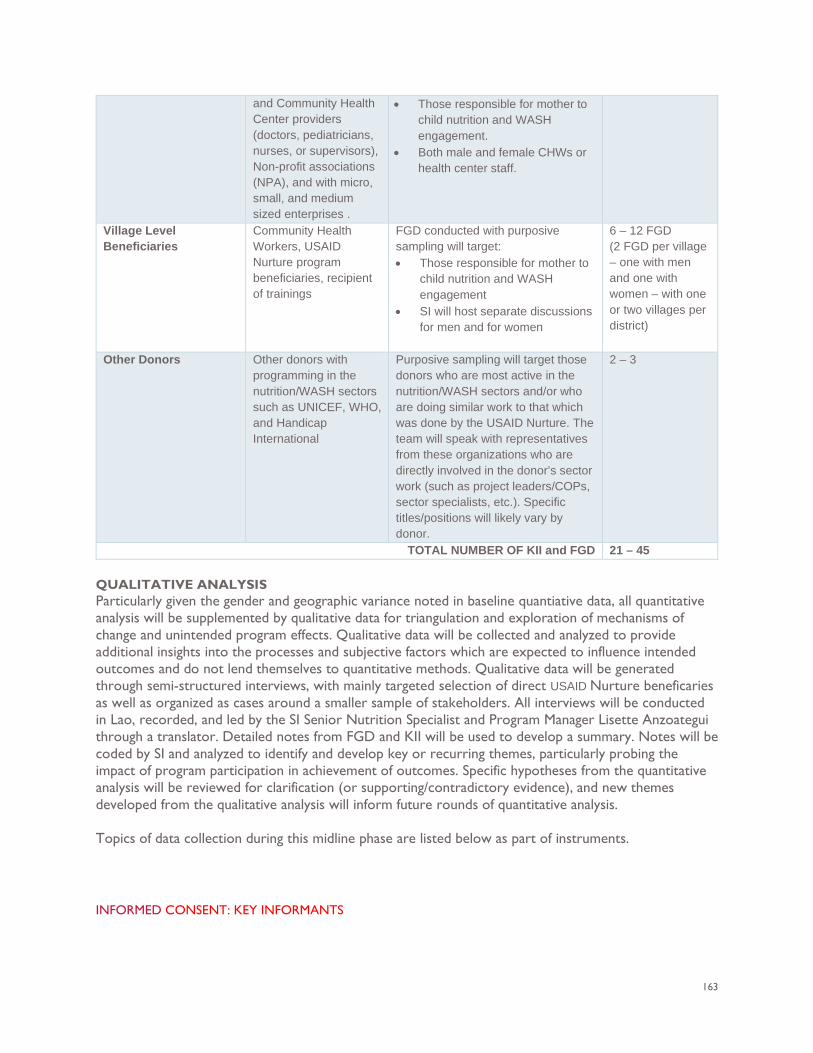
163
and Community Health Center providers (doctors, pediatricians, nurses, or supervisors), Non-profit associations (NPA), and with micro, small, and medium sized enterprises .
• Those responsible for mother to child nutrition and WASH engagement.
• Both male and female CHWs or health center staff.
Village Level Beneficiaries
Community Health Workers, USAID Nurture program beneficiaries, recipient of trainings
FGD conducted with purposive sampling will target: • Those responsible for mother to
child nutrition and WASH engagement
• SI will host separate discussions for men and for women
6 – 12 FGD (2 FGD per village – one with men and one with women – with one or two villages per district)
Other Donors Other donors with programming in the nutrition/WASH sectors such as UNICEF, WHO, and Handicap International
Purposive sampling will target those donors who are most active in the nutrition/WASH sectors and/or who are doing similar work to that which was done by the USAID Nurture. The team will speak with representatives from these organizations who are directly involved in the donor’s sector work (such as project leaders/COPs, sector specialists, etc.). Specific titles/positions will likely vary by donor.
2 – 3
TOTAL NUMBER OF KII and FGD 21 – 45 QUALITATIVE ANALYSIS Particularly given the gender and geographic variance noted in baseline quantiative data, all quantitative analysis will be supplemented by qualitative data for triangulation and exploration of mechanisms of change and unintended program effects. Qualitative data will be collected and analyzed to provide additional insights into the processes and subjective factors which are expected to influence intended outcomes and do not lend themselves to quantitative methods. Qualitative data will be generated through semi-structured interviews, with mainly targeted selection of direct USAID Nurture beneficaries as well as organized as cases around a smaller sample of stakeholders. All interviews will be conducted in Lao, recorded, and led by the SI Senior Nutrition Specialist and Program Manager Lisette Anzoategui through a translator. Detailed notes from FGD and KII will be used to develop a summary. Notes will be coded by SI and analyzed to identify and develop key or recurring themes, particularly probing the impact of program participation in achievement of outcomes. Specific hypotheses from the quantitative analysis will be reviewed for clarification (or supporting/contradictory evidence), and new themes developed from the qualitative analysis will inform future rounds of quantitative analysis. Topics of data collection during this midline phase are listed below as part of instruments.
INFORMED CONSENT: KEY INFORMANTS
164
Introduction: Thank you for taking the time to meet with us today. We are researchers from Social Impact (SI), and we have been contracted by the U.S. Agency for International Development to conduct an evaluation of the United States Agency for International Development (USAID) Nurture program. The USAID Nurture program, led by Save the Children and implemented in partnership with the Government of Lao PDR aims to contribute to a reduction in young child stunting in two target provinces of Laos by improving infant and young child feeding (IYCF) and water, sanitation, and hygiene (WASH) practices. We will be asking questions today about nutrition and WASH in your community and your opinion on the USAID Nurture program. You were selected for this group discussion due to your connection and involvement with the USAID Nurture program. Time: The discussion should take about 1-1.5 hours. Risks and benefits: There is no direct benefit to you if you participate, other than knowing you are helping to generate knowledge about a program that aims to help children and their families. We do not anticipate that you will incur any risk from participating in this discussion. However, some of our discussions will deal with some potentially sensitive topics, including your parenting practices. We aim to minimize the risk to discussing these topics openly by ensuring that your responses are kept in confidence by the evaluation team. Participating in the group discussion will have no impact with regards to your ability to receive or not receive benefits from the USAID Nurture program. You will receive a gift of soap for your time and participation. Voluntary participation: Your participation is voluntary. If you do not want to participate or to answer specific questions you do not have to. You may also cease to participate at any time. There are no consequences for not participating. Confidentiality: Your responses in this discussion will be kept in confidence by the evaluation team. Only the evaluation team will have access to notes and transcripts. Neither yours nor your child’s name will appear in any reporting. Please be advised that although the researchers will take every precaution to maintain confidentiality of this discussion, the nature of group discussions prevents us from guaranteeing confidentiality. We would like to remind participants to respect the privacy of your fellow participants and not repeat what is said in the group discussion to others. Public report: We expect to speak with approximately 21 – 45 people as part of this evaluation in Laos. The information that you and others provide will be used to write an evaluation report on the status of the USAID Nurture program, which will be shared with USAID for comment, and then made publicly available. As noted above, no identifying information or potentially identifying information will be included in the report. Informed consent questions
• Do you have any questions for us before we get started? • Are you willing to participate in this interview? Yes / No
If you have any questions or concerns you may contact the Social Impact Program Manager Lisette Anzoategui at [email protected] or at 001-703-465-1884 ext. 226, Leslie Hodel, the chair of a research body design to protect study participants at [email protected], or the SI Local Data Collection Coordinator Vanxay Vang at 02-055219900 or [email protected]
INFORMED CONSENT: GROUP INTERVIEWS Introduction: Thank you for taking the time to meet with us today. We are researchers from Social Impact (SI), and we have been contracted by the U.S. Agency for International Development to conduct an evaluation of the United States Agency for International Development (USAID) Nurture program. The USAID Nurture program, led by Save the Children and implemented in partnership with the Government of Lao PDR aims to contribute to a reduction in young child stunting in two target provinces of Laos by improving infant and young child feeding (IYCF) and water, sanitation, and hygiene (WASH) practices. We will be asking questions today about nutrition and WASH in your community
165
and your opinion on the USAID Nurture program. You were selected for this group discussion due to your connection and involvement with the USAID Nurture program. Time: The interview will be conducted as a group discussion and should take about 1-1.5 hours. Risks and benefits: There is no direct benefit to you if you participate, other than knowing you are helping to generate knowledge about a program that aims to help children and their families. We do not anticipate that you will incur any risk from participating in this discussion. However, some of our discussions will deal with some potentially sensitive topics, including your parenting practices. We aim to minimize the risk to discussing these topics openly by ensuring that your responses are kept in confidence by the evaluation team. Participating in the group discussion will have no impact with regards to your ability to receive or not receive benefits from the USAID Nurture program. Voluntary participation: Your participation is voluntary. If you do not want to participate or to answer specific questions you do not have to. You may also cease to participate at any time. There are no consequences for not participating Confidentiality: Your responses in this discussion will be kept in confidence by the evaluation team. Only the evaluation team will have access to notes and transcripts. Neither yours nor your child’s name will appear in any reporting. Please be advised that although the researchers will take every precaution to maintain confidentiality of this discussion, the nature of group discussions prevents us from guaranteeing confidentiality. We would like to remind participants to respect the privacy of your fellow participants and not repeat what is said in the group discussion to others. Public report: We expect to speak approximately 21 – 45 people as part of this evaluation in Laos. The information that you and others provide will be used to write an evaluation report on the status of the USAID Nurture program, which will be shared with USAID for comment, and then made publicly available. As noted above, no identifying information or potentially identifying information will be included in the report. Informed consent questions
• Do you have any questions for us before we get started? • Are you willing to participate in this interview? Yes / No
If you have any questions or concerns you may contact the Social Impact Program Manager Lisette Anzoategui at [email protected] or at 001-703-465-1884 ext. 226, Leslie Hodel, the chair of a research body design to protect study participants at [email protected], or the SI Local Data Collection Coordinator at Vanxay Vang at 02-055219900 or [email protected]. FOCUS GROUP DISCUSSION GUIDE Guide A: Caregiver Program participants (Women)
OBJECTIVES • Identify barriers and opportunities for the role of women in optimizing hygiene, maternal and
child nutrition during lactation, continuous breastfeeding for infants, and the appropriate and timely introduction of complementary foods.
• How the program has impacted beneficiaries, if at all. • What factors may be helping the program thrive, or blocking the program from thriving. • What challenges participants and communities face that may not be addressed by this program.
QUESTIONS Infant & Young Child Feeding Practices Now, let’s talk about infant and young child feeding in general. Remember there are no right or wrong answers. I am just interested to hear your personal experiences and thoughts.
166
• Tell me about your breastfeeding practices from the time the baby is born until 2 years of age: o Are there any differences in breastfeeding practices or duration for boys versus girls? o Have you learned anything new about breastfeeding from the USAID Nurture project?
If so, what did you learn? How have you applied that knowledge? Why or why not? Who taught you?
o Describe for me what foods, and how and when you introduce complementary foods to your infant / young child. Are there any differences in feeding practices or duration for boys versus girls?
• Have you learned anything new about complementary feeding practices for food and drink from the USAID Nurture project? o If so, what did you learn? How have you applied that knowledge? Why or why not?
Who taught you? • In your view, do you think there are noticeable differences between young boys and girls
after 24 months in their height/weight? o If so, why do you think that is?
• Can you tell us about how you have accessed the foods that the USAID Nurture program is recommending through the program activities?
• What is the most significant change you’ve learned and adopted from the USAID Nurture project with respect to IYCF?
Program participation • Explain the specific aspects of this program that made it easy / enjoyable for you to participate
o Probe on favorite aspect and why. o Probe on programmatic aspects: Content of activity; Venue and setting; Time and
duration of activities; Frequencies of the visits; Project team outreach: Communication skills pre-arrangement and informed notice, any issues with team composition i.e gender; Language used during the outreach/visits; IEC Materials: comprehensible and comprehensive?
• Explain challenges or things you did not like while taking part in the program o Probe on least favorite aspect and why.
• What specific recommendations do you have for improving this program in the future? o Probe on recommended changes or wishes.
• I want to ask you about each specific activity quickly to get your perception of its purpose and benefit.
o Probe on purpose and benefits to monthly weighing. o Probe on purpose and benefits to receiving the education materials and training on
nutrition. o Probe on purpose and benefits to receiving the WASH information. o Probe on purpose and benefits to receiving the messaging and sensitization. o Probe on purpose and benefits to receiving support groups.
Maternal Nutrition
• First, discuss for me your perceptions of the nutrition recommendations for pregnant women discussed during this program. Tell me your perceptions of the recommended food diversity for pregnant & lactating women?
o What impacts on health and nutrition did the program recommendations have for you? o Describe how easy or difficult it was to access and consume the foods recommended
for maternal nutrition and reasons why.
167
If needed probe on types and quantities of foods are consumed by mothers. Were new foods introduced? Were quantities increased?
Probe on the possible key barriers, such as: cost, package size, distance to market, cultural practices and taboos, decision making within the household on what is grown, use of income to meet nutritional needs.
• Tell me about health and nutrition services you have engaged in during USAID Nurture intervention
o What was most helpful? Least? Why?
WASH • First, can you please tell us about the WASH program activities conducted in the community,
and if the community has started implementing the Community Led Total Sanitation Approach? o Probe on if approach not initiated, why?
• Can you please talk about WASH practices, and new practices you’ve learned during the USAID Nurture Project?
o If needed probe on storage, treatment, food hygiene, handwashing at key times, clean play spaces, separation of was for ag, livestock, and human consumption.
• Which WASH and Baby WASH practices have been the easiest/difficult to adopt, and where do you experience the greatest challenges? Please explain why. Are other caregiver/mothers in your group(s) and the broader community adopting the practices?
o Probe on potential locally acceptable solutions to challenges noted. • What are the most significant changes you’ve learned and adopted from the USAID Nurture
project with respect to WASH and Baby WASH?
Behavior Change Communications / Sensitization • Now let’s talk about the messaging and related support that this program provided. Tell me how
this messaging changed your knowledge and attitude toward health and nutrition from before the program until now.
o Probe on most important things learned from the messaging and support in this program.
o Probe on any language barriers for communication and potential solutions. Conclusion
• Thank you for talking to me today. Could you share any final recommendations to improve your experience with this program?
• Do you have any final questions/comments for me? Additional Questions (if time permits) ---Infant & Young Child Feeding Practices
• Talk about who informs your knowledge and impacts decision-making for feeding your infant and young child o Probe on challenges related to the influence of others o Probe on strongest influences in this community
• Describe in detail what you learned, or wish you had learned, about infant and young child feeding from participation in this program. o Probe on factors influencing the ability to do these behaviors (easier or harder) o Probe on any specific changes from being part of this USAID Nurture program related
to infant and young child feeding • Please describe in detail IYCF-related decision making
168
o Explain who decides what to do with the food consumption (share a portion, who eats the food)
o Explain who makes decisions about child feeding practices, reason why o Any gendered differences?
---Maternal Nutrition
• Probe on types and quantities of foods are consumed by mothers. Were new foods introduced? Were quantities increased?
• Probe on the possible key barriers, such as: cost, package size, distance to market, cultural practices and taboos, decision making within the household on what is grown, use of income to meet nutritional needs.
• Probe on potential solutions to overcome barriers noted.
---Behavior Change Communications / Sensitization • What were your general impressions about the messaging and support you received?
o Probe on aspects that the person enjoyed the most about messaging sensitization o Probe on aspects that the person did not enjoy about messaging/sensitization
• Discuss what channel you most enjoyed receiving information through. o Probe on reasons why one channel was preferred over others
• Explain your perception of the effectiveness of the materials for educating you about infant and young child feeding?
o Probe on reasons why the materials and support were effective / not effective o Probe suggested alternatives for future programs
---Food Access
• Describe for me what types of foods you have introduced into your infant’s diet o How often do you give complementary weaning foods? o How often do you give other foods? o How do you decide what foods to introduce? o Can you tell us about your food preparation practices?
Probe on how it is cleaned and stored. If feeding formula probe on use of safe water and preparation practices
• Can you tell us how food is accessed and stored? o Are complementary weaning foods and other foods affordable and convenient for
your households? o Probe on the types of recommended foods that have been easy to access, prepare,
and store – why?, and key barriers, such as: cost, package size, distance to market, cultural practices and taboos, decision making within the household on what is grown, use of income to meet nutritional needs.
---WASH
• Can you talk about how you access WASH-related products, and if you have made purchases through a WASH sales person? If yes, did they identify themselves as part of the USAID Nurture Project?
• Can you describe if this service helped you access WASH products, and how or if this impacted your ability to adopt the recommended WASH behaviors? What were the main challenges?
o Probe on demand, availability, affordability, convenience, suitability to the setting, and any related training/marketing benefits on WASH products sold.
o Probe on potential solutions to overcome barriers noted.
169
Guide B: Caregiver Program participants (men)
OBJECTIVES • Identify barriers and opportunities for the role of men in optimizing hygiene, maternal and child
nutrition during lactation, continuous breastfeeding for infants, and the appropriate and timely introduction of complementary foods.
• How the program has impacted beneficiaries, if at all. • What factors may be helping the program thrive, or blocking the program from thriving. • What challenges participants and communities face that may not be addressed by this program
QUESTIONS Infant & Young Child Feeding Practices Now, let’s talk about infant and young child feeding in general. Remember there are no right or wrong answers. I am just interested to hear your personal experiences and thoughts.
• Tell me about your role in supporting your spouse, the infant, and other children, during breastfeeding practices from the time the baby is born until 2 years of age. o Are there any differences in breastfeeding practices or duration for boys versus girls? o Have you learned anything new about breastfeeding and male involvement in
supporting optimal feeding practices from the USAID Nurture project? If so, what did you learn? How have you applied that knowledge? Why or why
not? Who taught you? • Describe for me how and when you introduce complementary foods to your infant / young
child. o Are there any differences in feeding practices or duration for boys versus girls? Why
or why not? • Have you learned anything new about complementary feeding practices for food and drink
from the USAID Nurture project? o If so, what did you learn? How have you applied that knowledge? Who taught you?
• In your view, do you think there are noticeable differences between young boys and girls after 24 months in their height/weight? o If so, why do you think that is?
Maternal Nutrition
• Did you receive any information about male involvement in maternal nutrition for pregnant women from the USAID Nurture program or other sources?
o Probe to understand what was received from the program and/or existing resources. • If you received information, discuss for me your perceptions of the nutrition recommendations
for pregnant women discussed during this program. Can you tell me your perceptions of the recommended food diversity for pregnant & lactating women?
o What impacts on health did the program recommendations have for pregnant women in your household?
o Explain how food sharing occurs in the household and community. o Describe how easy or difficult it was to ensure mothers in the household received the
nutrition recommendations and reasons why. o Probe on potential solutions to overcome barriers noted.
170
• Can you describe the most significant change you’ve seen in your household and community with regards to male involvement in helping PLW meet optimal nutritional needs?
WASH
• First, can you please tell us about the WASH program activities conducted in the community, and if the community has started implementing the Community Led Total Sanitation Approach?
o Probe on if approach not initiated, why? • Can you please talk about WASH practices, and new practices you’ve learned during the USAID
Nurture Project? o If needed probe on storage, treatment, food hygiene, handwashing at key times, clean
play spaces, separation of was for ag, livestock, and human consumption. • Which WASH and Baby WASH practices have been the easiest/difficult to adopt, and where do
you experience the greatest challenges? Please explain why. Are other caregiver/mothers in your group(s) and the broader community adopting the practices?
o Probe on potential locally acceptable solutions to challenges noted. • What are the most significant changes you’ve learned and adopted from the USAID Nurture
project with respect to WASH and Baby WASH? Behavior Change Communications / Sensitization
• Now let’s talk about the messaging and related support that this program provided. Give me example and tell me how this messaging changed your knowledge and attitude toward health and nutrition from before the program until now.
o Probe on most important things learned from the messaging and support in this program
o Probe on any language barriers for communication and potential solutions. Program participation
• Explain the specific aspects of this program that made it easy / enjoyable for you to participate o Probe on favorite aspect and why o Probe on programmatic aspects: Content of activity; Venue and setting; Time and
duration of activities; Frequencies of the visits; Project team outreach: Communication skills pre-arrangement and informed notice, any issues with team composition i.e gender; Language used during the outreach/visits; IEC Materials: comprehensible and comprehensive?
• Explain challenges or things you didn’t like while taking part in the program o Probe on least favorite aspect and why
• What specific recommendations do you have for improving this program in the future? o Probe on recommended changes or wishes
• I want to ask you about each specific activity quickly to get your perception of its purpose and benefit.
o Probe on purpose and benefits to monthly weighing o Probe on purpose and benefits to receiving the education materials and training on
nutrition o Probe on purpose and benefits to receiving the WASH information o Probe on purpose and benefits to receiving the messaging and sensitization o Probe on purpose and benefits to receiving support groups
Conclusion
171
• Thank you for talking to me today. Could you share any final recommendations to improve your experience with this program?
• Do you have any final questions/comments for me? Additional Questions (if time permits) ---Infant & Young Child Feeding Practices
• Talk about who informs your knowledge and impacts decision-making for feeding your infant and young child o Probe on challenges related to the influence of others o Probe on strongest influences in this community
• Describe in detail what you learned, or wish you had learned, about infant and young child feeding from participation in this program. o Probe on factors influencing the ability to do these behaviors (easier or harder) o Probe on any specific changes from being part of this USAID Nurture program related
to infant and young child feeding • Please describe in detail in regards to the IYCF-related decision making
o Explain who decides what to do with the food consumption (share a portion, who eats the food)
o Explain who makes decisions about child feeding practices, reason why. o Any gendered differences?
---Maternal Nutrition
• Have you assumed responsibilities for any caregiving, household, other tasks when women in your household became pregnant and started breast feeding? If yes, then what have you done differently?
o Probe on laborious tasks, such as helping women with transport and ensuring women seek prenatal and antenatal care, carrying water, taking care of animals, collecting manure, agricultural work, going to the market to sell/purchase foods.
o Can you talk about any traditional cultural practices with regards to men’s roles that have changed over time and as a result of the USAID Nurture program, and how?
• Describe for me what types of foods, or additional quantities of foods have been introduced into the women’s diet when they became pregnant.
o Can you tell us how food is accessed? What types of food are grown? What is purchased? If new foods and additional quantities were introduced, can you tell us how you accessed them?
o Can you tell us how decisions are made in the with respect to meeting the recommended nutritional needs of PLW?
o Probe on the types of recommended foods that have been easy to access and prepare and why? What are the key barriers? Probe on cost, package size, distance to market, cultural practices and taboos, decision making within the household on what is grown, use of income to meet nutritional needs.
---Food Access • Describe for me what types of foods you have introduced into your infant’s diet
o How often do you give complementary weaning foods? o How often do you give other foods? o How do you decide what foods to introduce? o Can you tell us about your food preparation practices?
Probe on how it is cleaned and stored. If feeding formula probe on use of safe water and preparation practices
172
• Can you tell us how food is accessed and stored? o Are complementary weaning foods and other foods affordable and convenient for
your households? Probe on the types of recommended foods that have been easy to access, prepare, and store –
why, and key barriers, such as: cost, package size, distance to market, cultural practices and taboos, decision making within the household on what is grown, use of income to meet nutritional needs.
---Behavior Change Communications / Sensitization
• What were your general impressions about the messaging and support you received? o Probe on aspects that the person enjoyed the most about messaging sensitization o Probe on aspects that the person did not enjoy about messaging/sensitization
• Discuss what channel you most enjoyed receiving information through. o Probe on reasons why one channel was preferred over others
• Explain your perception of the effectiveness of the materials for educating you about infant and young child feeding?
o Probe on reasons why the materials and support were effective / not effective o Probe suggested alternatives for future programs
---WASH
• Can you talk about how you access WASH-related products, and if you have made purchases through a WASH sales person? If yes, did they identify themselves as part of the USAID Nurture Project?
• Can you describe if this service helped you access WASH products, and how or if this impacted your ability to adopt the recommended WASH behaviors? What were the main challenges?
o Probe on demand, availability, affordability, convenience, suitability to the setting, and any related training/marketing benefits on WASH products sold.
o Probe on potential solutions to overcome barriers noted. Guide C: Save the Children
OBJECTIVES • Get a better understanding of the program from the implementer’s point of view. • Hear about challenges they are facing • Discuss potential program changes moving forward
QUESTIONS
• Please tell us about your role with Save the Children and your involvement with the USAID Nurture program.
• What do you think are this program’s greatest strengths? Why? • Which program components do you think have been the most and least successful? Why?
o Probe on programmatic aspects: Content of activity; Venue and setting; Time and duration of activities; Frequencies of the visits; Project team outreach: Communication skills pre-arrangement and informed notice, any issues with team composition i.e gender; Language used during the outreach/visits; IEC Materials: comprehensible and comprehensive?
• What do you see as reasons for why some families are benefiting from the program more than others?
173
• Please tell us about the challenges that USAID Nurture has faced with implementing this program.
• Are there any aspects of the program that you think could be improved? What are they? Please explain.
• Are there any significant changes you expect to see in the program over the next year? What are they? What are the key factors that help achieve these changes?
KEY INFORMANT INTERVIEW GUIDE
GUIDE D: NATIONAL, PROVINCAL AND DISTRICT LEVEL OFFICIALS AND STAKEHOLDERS National: Officials from the Ministry of Health, SUN Focal Point and Networks; Social and Behavior Change Communication (SBCC) taskforce, National Early and Essential Newborn (EENC) steering committee, Maternal and Child Health Center, the multi-sectoral nutrition committee (FNSAP), the National WASH Technical group (WASH-TG), Rural Development Agency, members of the DNC that is facilitated by Save the Children and UNICEF. Provincial: Provincial health providers (trained on Complementary Feeding of the 1,000 day Nutrition Counseling Course), the provincial FNSAP, and the provincial WASH-TG. District: DNC members, Save the Children District Project Officers (DPO), and WASH marketing officers. OBJECTIVES
• How the program has impacted the communities at large, if at all. • What factors may be helping the program thrive or blocking the program from thriving. • What challenges participants and communities face that may not be addressed by this program • What sort of support they would like to see being offered in the communities? • What is expected to happen to this program later on?
QUESTIONS
• Please tell us about your role with Save the Children and your involvement with the USAID Nurture program.
• What are the main challenges for nutrition and WASH practices in 1,000 day households (those with pregnant/lactating women and CU2) in your opinion?
• How does the USAID Nurture program help them address these challenges? • What have been the most and least successful program activities or components? Why? • What is the government impression of this program? Or How does the Government
counterpart respond to the program interventions? o How well does the USAID Nurture program fit into the National Nutrition Strategy
(NNS) to 2025, the NPAN 2016 – 2020, the National Social and Behavior Change Communication (SBCC) Plan, and other GoL goals?
• How have communities changed, if at all, with the supports from USAID Nurture program? • Are there any factors that you believe may prevent this program from thriving? What are they
and how to overcome those inhibiting factors? • What other support, if any, do you think that caregivers and their families need, that may go
beyond the scope of this program? • What is your hope for this program?
GUIDE E: VILLAGE LEVEL OFFICIALS
174
Community Facilitators, village health workers, Village iNuW Committees, village WASH committees, lead mothers of peer groups, WASH sales agents, and Community Health Center providers (doctors, pediatricians, nurses, or supervisors), and Non-profit associations (NPA). OBJECTIVES
• Get a better understanding of the program from the local stakeholder’s point of view. • Hear about challenges they are facing. • Explore causes for any nutrition/WASH improvements for some groups and not for others.
Specifically, to understand stunting and wasting differences between boys and girls after 24 months noted in quantitative data.
QUESTIONS USAID Nurture Program
• Which program components do you think have been the most and least successful? Why? • How many men and women regularly attend Village iNuW Committees and village WASH
committee meetings? • (For Community Facilitators and Village Health Workers): What is the quality and effectiveness
of training materials and trainings? o Probe on if trainings or materials built capacity specifically in:
Nutrition education Food availability and access Food preparation and sanitation Improved knowledge as related to cultural practices and taboos Decision making within the household on what is grown Use of income to meet nutritional needs
o Probe on if it changed their ability to provide services, coverage, or address challenges in service delivery.
o Probe on how food and nutrition information is provided through extension services either through nutrition front-line workers, and agricultural extension agents if relevant.
o What are the key successes and challenges in providing extension services to the community, and the most nutritionally vulnerable groups?
Infant & Young Child Feeding Practices
• What aspects of the USAID Nurture program were successful / unsuccessful in improving infant and young child feeding by primary caregivers? Why/why not?
o Probe on actions taken, if any, as a result of the program o Probe on practices that vary between boys and girls. o Any changes with regards to who makes decisions about child feeding practices, (share a
portion, who eats the food) in a household? • Tell me about the breastfeeding practices promoted from the time a baby is born until 2 years
of age in your community o Probe on changes in BF practices observed from before USAID Nurture program to
currently/during USAID Nurture. o Probe on practices that vary between boys and girls.
• In your view, do you think there are noticeable differences between young boys and girls after 24 months in their height/weight?
o If so, why do you think that is? • Can you talk about any traditional cultural practices with regards to men’s roles that have
changed over time and as a result of the USAID Nurture program, and how?
175
Probe on laborious tasks, such as helping women with transport and ensuring women seek prenatal and antenatal care, carrying water, taking care of animals, collecting manure, agricultural work, going to the market to sell/purchase foods.
Can you describe the most significant change you’ve seen in your household and community with regards to male involvement in helping PLW meet optimal nutritional needs? What triggers this significant change?
Any suggestions to further improve IYCF in the community that are practical and locally acceptable? WASH (For WASH committee members)
• First, can you please tell us about the WASH program activities conducted in the community, and if the community has started implementing the Community Led Total Sanitation Approach?
• What has been successful or unsuccessful in the USAID Nurture’s program approach to addressing access to clean water, sanitation, hygiene, and waste disposal?
• Does the program adequately address behavior change in relationship to WASH? Why/why not? o Probe on gendered differences
• Have you and noticed any changes in the incidence of diarrhea or other illness in your children, and in the community?
• What are the most significant changes you have learned and adopted from the USAID Nurture project with respect to household and community WASH and Baby WASH? What triggers this significant change?
• Have you come into contact with group or door-to-door sales of WASH products? o Probe on demand for the WASH products promoted, including, ability to pay,
availability, quality, and convenience, and decision making on use of HH income. Additional Questions (if time permits) ---Microenterprise and SME/Distributors selling nutrition and WASH products (Cerelac) First, we would like to ask you if you are aware of the USAID Nurture project implemented in
this community, and if yes, have you had any engagement with the project activities? Can you please tell us about a range of nutrition and WASH products you sell?
o Probe on weaning foods, WASH products, package size, price; o Can you tell us about your clientele served and volume of sales? Do you have
constraints in ensuring quality and meeting local demand? o Can you tell us about your distribution and marketing channels, and if you reach rural
and poor populations? If yes, what is your outreach approach? If no, then what are the main barriers for you as a business in reaching rural areas?
As a private business serving a critical role in nutrition and food systems, what are some possible ways you think your business may be able to reduce malnutrition, and reach more economically and nutritionally vulnerable HH?
o Probe on use of marketing agents, advertising, ICT, package size, public private partnerships and working with NGOs and projects.
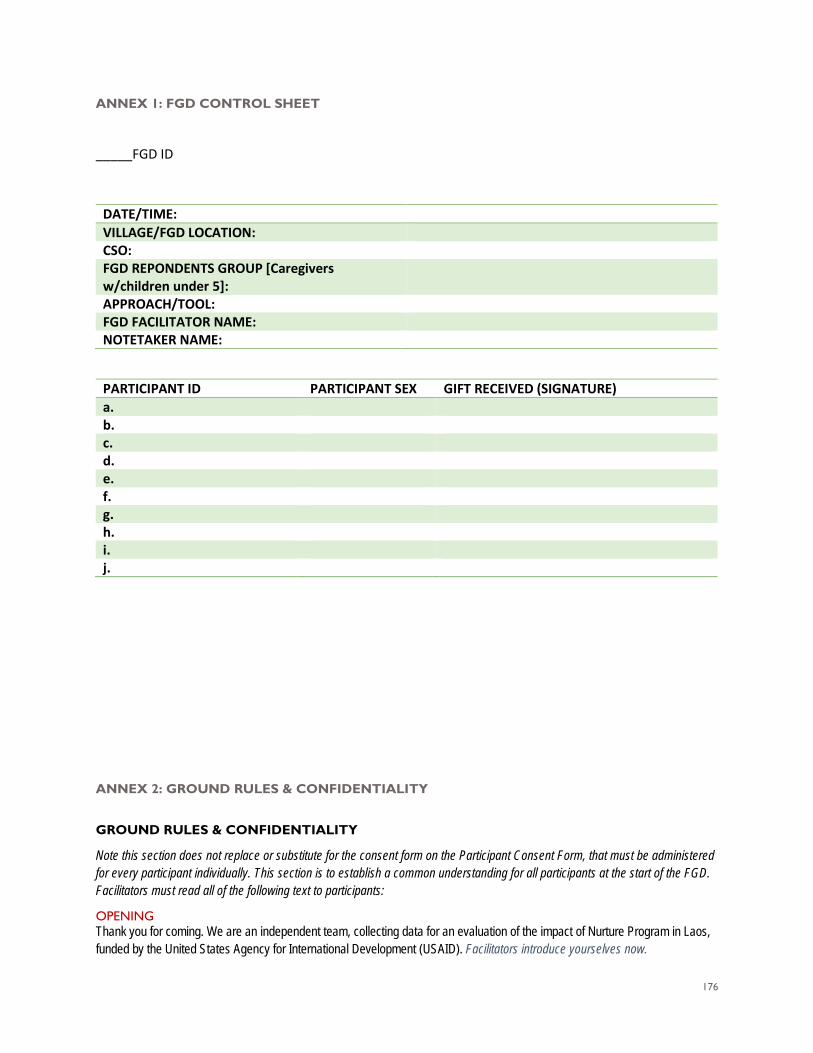
176
ANNEX 1: FGD CONTROL SHEET _____FGD ID
DATE/TIME: VILLAGE/FGD LOCATION: CSO: FGD REPONDENTS GROUP [Caregivers w/children under 5]:
APPROACH/TOOL: FGD FACILITATOR NAME: NOTETAKER NAME:
PARTICIPANT ID PARTICIPANT SEX GIFT RECEIVED (SIGNATURE) a. b. c. d. e. f. g. h. i. j.
ANNEX 2: GROUND RULES & CONFIDENTIALITY
GROUND RULES & CONFIDENTIALITY
Note this section does not replace or substitute for the consent form on the Participant Consent Form, that must be administered for every participant individually. This section is to establish a common understanding for all participants at the start of the FGD. Facilitators must read all of the following text to participants:
OPENING Thank you for coming. We are an independent team, collecting data for an evaluation of the impact of Nurture Program in Laos, funded by the United States Agency for International Development (USAID). Facilitators introduce yourselves now.
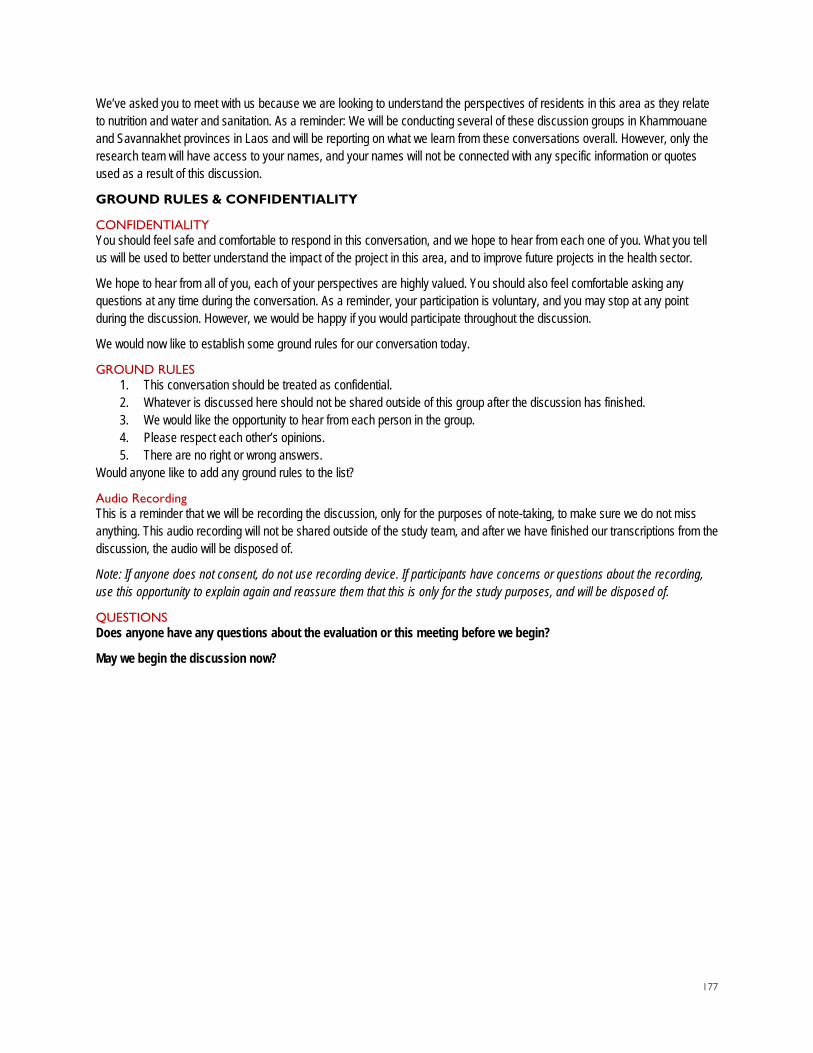
177
We’ve asked you to meet with us because we are looking to understand the perspectives of residents in this area as they relate to nutrition and water and sanitation. As a reminder: We will be conducting several of these discussion groups in Khammouane and Savannakhet provinces in Laos and will be reporting on what we learn from these conversations overall. However, only the research team will have access to your names, and your names will not be connected with any specific information or quotes used as a result of this discussion.
GROUND RULES & CONFIDENTIALITY
CONFIDENTIALITY You should feel safe and comfortable to respond in this conversation, and we hope to hear from each one of you. What you tell us will be used to better understand the impact of the project in this area, and to improve future projects in the health sector.
We hope to hear from all of you, each of your perspectives are highly valued. You should also feel comfortable asking any questions at any time during the conversation. As a reminder, your participation is voluntary, and you may stop at any point during the discussion. However, we would be happy if you would participate throughout the discussion.
We would now like to establish some ground rules for our conversation today.
GROUND RULES 1. This conversation should be treated as confidential. 2. Whatever is discussed here should not be shared outside of this group after the discussion has finished. 3. We would like the opportunity to hear from each person in the group. 4. Please respect each other’s opinions. 5. There are no right or wrong answers.
Would anyone like to add any ground rules to the list?
Audio Recording This is a reminder that we will be recording the discussion, only for the purposes of note-taking, to make sure we do not miss anything. This audio recording will not be shared outside of the study team, and after we have finished our transcriptions from the discussion, the audio will be disposed of.
Note: If anyone does not consent, do not use recording device. If participants have concerns or questions about the recording, use this opportunity to explain again and reassure them that this is only for the study purposes, and will be disposed of.
QUESTIONS Does anyone have any questions about the evaluation or this meeting before we begin?
May we begin the discussion now?
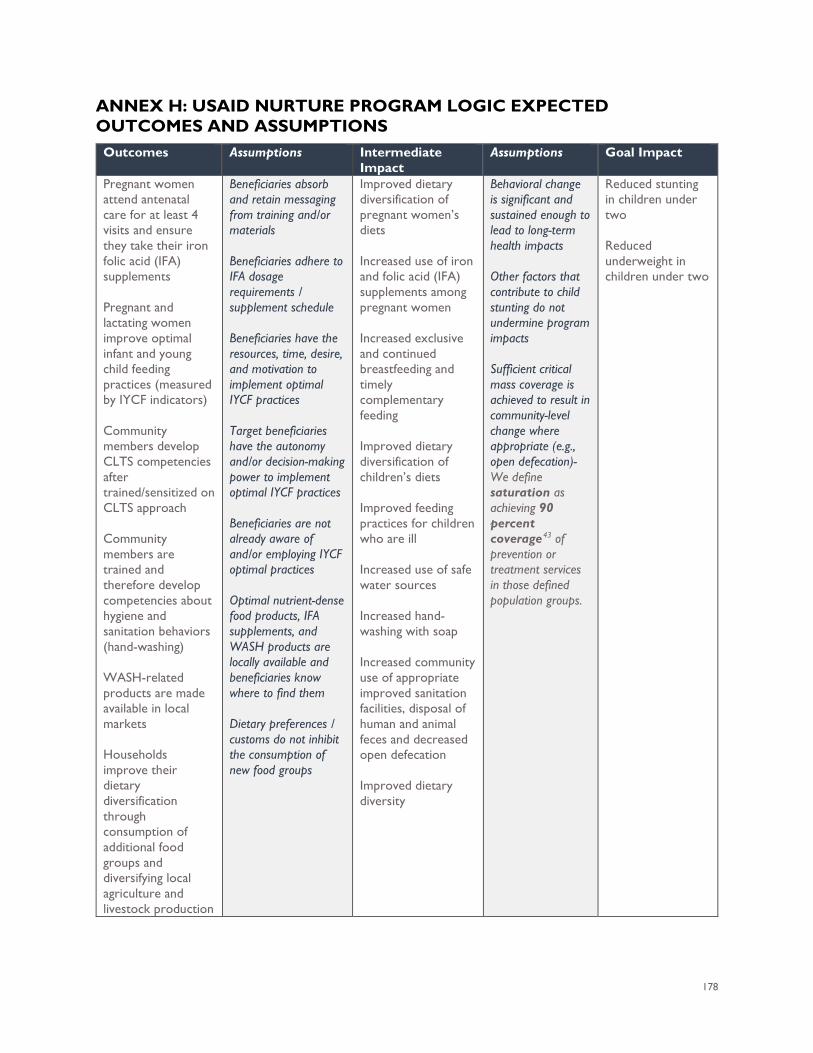
178
ANNEX H: USAID NURTURE PROGRAM LOGIC EXPECTED OUTCOMES AND ASSUMPTIONS
Outcomes Assumptions Intermediate Impact
Assumptions Goal Impact
Pregnant women attend antenatal care for at least 4 visits and ensure they take their iron folic acid (IFA) supplements Pregnant and lactating women improve optimal infant and young child feeding practices (measured by IYCF indicators) Community members develop CLTS competencies after trained/sensitized on CLTS approach Community members are trained and therefore develop competencies about hygiene and sanitation behaviors (hand-washing) WASH-related products are made available in local markets Households improve their dietary diversification through consumption of additional food groups and diversifying local agriculture and livestock production
Beneficiaries absorb and retain messaging from training and/or materials Beneficiaries adhere to IFA dosage requirements / supplement schedule Beneficiaries have the resources, time, desire, and motivation to implement optimal IYCF practices Target beneficiaries have the autonomy and/or decision-making power to implement optimal IYCF practices Beneficiaries are not already aware of and/or employing IYCF optimal practices Optimal nutrient-dense food products, IFA supplements, and WASH products are locally available and beneficiaries know where to find them Dietary preferences / customs do not inhibit the consumption of new food groups
Improved dietary diversification of pregnant women’s diets Increased use of iron and folic acid (IFA) supplements among pregnant women Increased exclusive and continued breastfeeding and timely complementary feeding Improved dietary diversification of children’s diets Improved feeding practices for children who are ill Increased use of safe water sources Increased hand-washing with soap Increased community use of appropriate improved sanitation facilities, disposal of human and animal feces and decreased open defecation Improved dietary diversity
Behavioral change is significant and sustained enough to lead to long-term health impacts Other factors that contribute to child stunting do not undermine program impacts Sufficient critical mass coverage is achieved to result in community-level change where appropriate (e.g., open defecation)- We define saturation as achieving 90 percent coverage43 of prevention or treatment services in those defined population groups.
Reduced stunting in children under two Reduced underweight in children under two
179
43 Bhutta ZA, Das JK, Rizvi A, et al, The Lancet Nutrition Interventions Review Group, and the Maternal and Child Nutrition Study Group. Evidence-based interventions for improvement of maternal and child nutrition: what can be done and at what cost? Lancet 2013; published online June 6. http://dx.doi.org/10.1016/S0140-6736(13)60996–4.

181
ANNEX I: SUMMARY OF BARRIERS TO PROGRAM OUTCOMES DISCUSSED IN QUALITATIVE INTERVIEWS The types of barriers mentioned by respondents discussed in the report above are summarized as follows:
• Reduced food availability and access due to: o Poverty and limited income and economic opportunity, especially in isolated areas; o Limited year-round production of diverse foods for an optimal diet; limited availability
and access to seeds and technologies; lack of ground water for agriculture, reliance on small livestock for resilience rather than consumption and resilience;
o Seasonality and limited availability of foraged food; o Absence of or distance to a market and limited transport; absence of food to purchase
in markets; o Limited food storage mechanisms, breast pumps and sanitary milk storage, and cold
chain technology that could be used to store breast milk o Cyclical seasonal flooding and crop loss; o Women’s excessive workload that limits time for foraging and cooking; cultural
practices that still place most of the burden on women for food production and preparation.
• Inconsistent access to health centers due to: o Poverty; o Limited transport or income to pay for transport; o Isolation due to travel distance, lack of transport, rivers, lack of bridges; o Cultural practices and gender roles that prevent women from accessing formal health
care. • Limited availability and access to toilets and water filters due to:
o Poverty, limited income to purchase the toilet o Lack of ground water o Limited supply of toilets and water filters due to isolation and high-risk investment for
WASH product suppliers.