d6.2 waternomics integrated outcome (methodology ... - cordis
TRANSCRIPT
D6.2 WATERNOMICS Integrated outcome (Methodology, Software & Data Management and
Analysis Components)
Project Acronym: Waternomics Project Title: ICT for Water Resource Management Project Number: 619660 Instrument: Collaborative project Thematic Priority: FP7-ICT-2013.11

619660
© WATERNOMICS Consortium Page 2 of 161
D6.2 Work Package: WP6 Methodology, Platform and Analysis Refinement Due Date: M36 Submission Date: M39 Start Date of Project: 01/02/2014 Duration of Project: 36 Months Organisation Responsible of Deliverable: R2M Version: 1.0
Status: Ready Author name(s): Domenico Perfido
Massimiliano Raciti Wassim Derguech Souleiman Hasan Sander Smit Christos Kouroupetroglou Louise Hannon Sandra de Vries Leonardo Alonso Schalk-Jan Van Andel Jan Mink Thomas Messervey Diego Reforgiato Riccardo Puglisi Umair ul Hasan Edward Curry Asra Aslam
R2M R2M NUIG NUIG BM-Change U4 NUIG TUD UNESCO-IHE UNESCO-IHE VTEC R2M R2M R2M NUIG NUIG NUIG NUIG NUIG
Reviewer(s): Schalk-Jan Van Andel Wassim Derguech Edward Curry
IHE NUIG NUIG
Nature: R – Report P – Prototype
D – Demonstrator O - Other Dissemination level: PU - Public
CO - Confidential, only for members of the consortium
(including the Commission)
RE - Restricted to a group specified by the consortium (including the Commission Services)
Project co-funded by the European Commission within the Seventh Framework Program (2007-2013)

619660
© WATERNOMICS Consortium Page 3 of 161
Revision History Version Date Modified by Comments 0.1 06/09/16 Domenico Perfido Initial Version of Document and
outline 0.2 19/12/2016 Wassim Derguech Data Management and Analysis 0.3 22/12/2016 Souleiman Hasan Lessons Learnt from Realtime Data
Management (Section 4.1.1.1) 0.4 02/01/2017 Sandra de Vries and
Leonardo Alfonso Section 4.3; Leakage detection
0.5 09/01/2017 Umair Hassan Lessons Learnt from Historical Data Management (Section 4.1.1.2) and Catalog Service (Section 4.1.1.3)
0.6 10/01/2017 Domenico Perfido & R2M team
Introduction and Methodology sections completed
0.7 11/01/2017 Sander Smit Focus on business aspect and validation added
0.8 12/10/17 Christos Kouroupetroglou
Waternomic Platform section completed
0.9 13/01/2017 Louise Hannon Domenico Perfido
Rule based FDD section completed Model based FDD section completed
0.10 13/01/2017 Jan Mink Flow meters section completed 0.11 14/01/2017 Domenico Perfido & R2M
team Amalgamate Pilot Contribution and completed Conclusions section
0.12 17/01/2017 Schalk Jan van Andel Wassim Derguech
Revisions
0.13 23/01/2017 Domenico Perfido Edits prior to Team Review 0.14 26/01/2017 Domenico Perfido Edits following Team Review 0.15 31/01/2017 Domenico Perfido Final Edits / Revisions 1.0 11/04/2017 Wassim Derguech Final version prepration
Copyright © 2017, WATERNOMICS Consortium
The WATERNOMICS Consortium (http://www.WATERNOMICS.eu/) grants third parties the right to use
and distribute all or parts of this document, provided that the WATERNOMICS project and the document
are properly referenced.
THIS DOCUMENT IS PROVIDED BY THE COPYRIGHT HOLDERS AND CONTRIBUTORS "AS IS"
AND ANY EXPRESS OR IMPLIED WARRANTIES, INCLUDING, BUT NOT LIMITED TO, THE IMPLIED
WARRANTIES OF MERCHANTABILITY AND FITNESS FOR A PARTICULAR PURPOSE ARE
DISCLAIMED. IN NO EVENT SHALL THE COPYRIGHT OWNER OR CONTRIBUTORS BE LIABLE
FOR ANY DIRECT, INDIRECT, INCIDENTAL, SPECIAL, EXEMPLARY, OR CONSEQUENTIAL
DAMAGES (INCLUDING, BUT NOT LIMITED TO, PROCUREMENT OF SUBSTITUTE GOODS OR
SERVICES; LOSS OF USE, DATA, OR PROFITS; OR BUSINESS INTERRUPTION) HOWEVER
CAUSED AND ON ANY THEORY OF LIABILITY, WHETHER IN CONTRACT, STRICT LIABILITY, OR
TORT (INCLUDING NEGLIGENCE OR OTHERWISE) ARISING IN ANY WAY OUT OF THE USE OF
THIS DOCUMENT, EVEN IF ADVISED OF THE POSSIBILITY OF SUCH DAMAGE.
619660
© WATERNOMICS Consortium Page 4 of 161
Executive Summary WATERNOMICS aims to engage the end-users into optimizing their water usage. To meet this need Waternomics makes available for different users their water usage in a new way: by using ICT technologies, tools to create new forms of awareness and by allowing comparisons with benchmarks, providing information about how to implement Water Efficiency Measures (WEMs), developing new Fault and Leakage detection methods in order to provide information at a time scale useful for decision making.
This deliverable describes the different final versions of outcomes developed under the scope of Waternomics project as the following:
- Standard based Methodology for implementing a Water Management Plan (WMP) - Waternomics Applications Platform (WApP) - Data management and analysis - Fault and Leakage detection method and sensors - Flow meters
The before mentioned outcomes have been already detailed in earlier deliverables and are now refined in order to capture the feedbacks from the pilot sites experience (WP5).
The first version of the standards-based methodology for the development and implementation of ICT-enabled water management programs has been already presented in the deliverable D2.1. The methodology aims to give constraints, standards, corporate preferences, and key performance indicators (KPIs), provide decision makers and designers with a systematic way to select technologies, measurement points, data collection methods, and data management techniques for ICT-based water management systems. This report details the final version of the methodology after the lessons learnt captured from the pilot sites experience.
The Waternomics Application Platform (WApP) has been discussed earlier in the deliverable D3.3 and it represents a key component of the Waternomics project, because it aims at collecting water consumption and contextual information from different sources to be used for effective data analytics to drive decision making: e.g., planning, adjustments and predictions and to raise user awareness of water consumption. This report presents the final version of the WApP and together with the methodology; it can be regarded as the integrator of all the outcomes of the project because it uses effective data from smart water meters, provides information to the users about fault detection and leakage detection in real time.
Data management and analysis already have been discussed in the deliverables D3.1.1 and D3.1.2. In this report the lessons learnt and platform validation within the Waternomics project are presented.
Leak detection and Fault Detection and Diagnosis (FDD) rules have already been discussed in the deliverables D4.1, D4.2 and D4.3. This report presents the final version of the methods and sensors developed for the different environments targeted by the Waternomics project.
Flow meters and devices have already been discussed in the deliverable D4.1 and this report provides the lessons learnt from each pilot site and user guidelines for implementing the installation and the maintenance phases.
This report is divided in the following way:
• Section 2 presents the final version of Waternomics methodology to implement a Water management plan.

619660
© WATERNOMICS Consortium Page 5 of 161
• Section 3 details the final version of the Waternomics Application Platform (WApP) developed in the project. It helps in pointing out the water system related information to help carry out the Water management plan in accordance with the methodology.
• Section 4 provides details of the Data Platform, Fault Detection and Diagnosis, Leakage Detection, Meters and data transfer technologies developed within the project
• Section 5 provides the conclusions of this report. • Appendices are used to provide a complete set of tools such as users guidelines and
instructions for use for Waternomics Application Platform, Flow meters and Decision Support System components.
In the project itself, the methodology as well as the other outcomes are implemented in four pilots and the refined version that incorporates lessons learnt from pilot activities is available in this report entitled Deliverable 6.2 (Integrated Outcome: Methodology, Software & Data Management and Analysis Components).
The report describes the work conducted in the Waternomics project and its outcomes, and it shows how the Waternomics overall system can be one step and contribution in the development of a Smart Water Management System that will lead to increased user awareness regarding their water consumption and so to an overall behaviour change.
Some aspects of the outcomes (leakage detection and FDD) yet need some effort to meet in the best way the market needs but the future plans of some of the Waternomics consortium partners are working in this way by exploring new market opportunities and new funded projects in order to increase the technology readiness level and maturity.
619660
© WATERNOMICS Consortium Page 6 of 161
Table of Contents Executive Summary ................................................................................................................... 41 Introduction ......................................................................................................................... 9
1.1 Work Package 6 (WP6) Objectives .............................................................................. 91.2 The Role of Deliverable D6.2 ........................................................................................ 91.3 Relationship with other Activities in the Project .......................................................... 101.4 Document Outline ....................................................................................................... 11
2 Waternomics Methodology final report .......................................................................... 122.1 Summary of the methodology ..................................................................................... 122.2 Overall lesson learnt (experience from the pilots) ...................................................... 132.3 Validation of the methodology and final version ......................................................... 16
3 Final Waternomics Platform ............................................................................................ 213.1 Overall lesson learnt (experience from the pilots) ...................................................... 213.2 Validation of the Waternomics Platform and final version .......................................... 23
4 Other WATERNOMICS Outcomes ................................................................................... 264.1 Data Management and Analysis ................................................................................. 26
4.1.1 Overall lesson learnt (experience from the pilots) .................................... 274.1.2 Validation of the Data Management and final version ............................. 30
4.2 Fault detection and diagnosis (FDD) .......................................................................... 314.2.1 Rule based FDD ...................................................................................... 314.2.2 Model based FDD – refinement and outcomes ....................................... 35
4.3 Leakage detection, refinement and outcomes ............................................................ 384.3.1 Information flow & lesson learned from pilots .......................................... 384.3.2 Validation of the leakage detection method and analysis of new results . 40
4.4 Flow meters ................................................................................................................ 444.4.1 Overall lessons learnt (experience from the pilots) .................................. 464.4.2 Validation of the Flow meters and final version ....................................... 51
5 Conclusions ...................................................................................................................... 53Appendix A – User Guidelines Waternomics Platform ......................................................... 55Appendix B – Description of project datasets ....................................................................... 58Appendix C – User Guidelines – DSS tool ............................................................................. 74Appendix D – User Guidelines – Mini Water Meter ............................................................... 95Appendix E – User Guidelines – Ultrasonic Flow Meter ....................................................... 97Appendix F – User Guidelines – BBB ................................................................................... 143References .............................................................................................................................. 159

619660
© WATERNOMICS Consortium Page 7 of 161
Index of Figures Figure 1 : WATERNOMICS WP structure. ................................................................................................. 10Figure 2: Relationships between D6.2 and other activities in Waternomics ............................................... 10Figure 3: Waternomics Methodology Phases ............................................................................................. 13Figure 4: Waternomics Methodology TRELLO Board ................................................................................ 15Figure 5: Waternomics Methodology stream .............................................................................................. 17Figure 6: Phase 0 - ASSESS ..................................................................................................................... 18Figure 7: Phase 1 - PLAN .......................................................................................................................... 18Figure 8: Phase 2 – DO (reviewed with pilots sites’ feedbacks) ................................................................ 18Figure 9: Phase 3: CHECK ........................................................................................................................ 19Figure 10: Phase 4: ACT ............................................................................................................................ 19Figure 11: Final version of Waternomics Standard-based Methodology .................................................... 20Figure 12: Example of application design after UI redesign ....................................................................... 22Figure 13: System Architecture [Available in Section 5 of D3.1.1] ............................................................. 27Figure 14: Retention Time Observer Application Statistics M36 ................................................................ 32Figure 15: Waternomics Rule-based FDD Application Training Underway at NUIG .................................. 33Figure 16: Managers Dashboard Application Logins Galway Pilots M32 – M36 ........................................ 33Figure 17: Example of Email Fault Notification from Rule-based FDD Application .................................... 34Figure 18: Example of Rule-based FDD Application Alarm History ........................................................... 34Figure 19: Waternomics Model Based FDD Methodology ......................................................................... 35Figure 20: DSS component developed in the Explore section of the Platform ........................................... 36Figure 21: Implementation of the ADWICE in the Linate setting ................................................................ 37Figure 22: Information flow; from the installed Raspberry Pi to the Weaved platform, where after the data is sent to the Waternomics platform ........................................................................................................... 39Figure 23: Number of collected files in the period between June and December 2016 ............................. 40Figure 24 Results of fingerprinting method ran in feed mode for household B .......................................... 41Figure 25 Identified files during feed mode ................................................................................................ 43Figure 26 Identified files during feed mode, when using threshold number 3, for a total of 1713 files ....... 44Figure 27. Typical setup for a domestic water flow measurement system ................................................. 45Figure 28. Wireless Sensor box to Transmitter box via LAN ...................................................................... 46

619660
© WATERNOMICS Consortium Page 8 of 161
Index of Tables Table 1 - Waternomics Pilot managers ...................................................................................................... 14Table 2 - Perceived value of Waternomics Smart Water System .............................................................. 23Table 3 - Water demand points used for the manual files .......................................................................... 42Table 4 - Self-explanatory filenames of the different combinations of water demand points ..................... 42Table 5 - Obtained result of detecting the silence files ............................................................................... 42Table 6 - Ultra sonic flowmeter ................................................................................................................... 45
619660
© WATERNOMICS Consortium Page 9 of 161
1 Introduction Waternomics is targeted to explore how ICT can help households, businesses and municipalities with reducing their consumption and losses of water in the framework of a water management program. To this end a key component of the Waternomics project is to provide water consumption and contextual information from different sources to be used for effective data analytics in order to drive decision making that optimises water consumption and to raise user awareness of water consumption. In doing this, The project has developed some tools and products like:
- a standards-based methodology with which to plan, implement and assess Water Efficiency Measures.
- a web based Platform with which provide information to the different end-users targeted about their water consumption
- a data management plan aimed to support all the web based system - a Rule based and Model based fault detection and diagnosis (FDD) tools with wich to
point out what’s wrong in the operational phase of a water network at different scale and avoid in this way loss of water
- a leakage detection method coupled with new acoustic leakage sensors with which to asses at an early stage water leakages in an house water network environment
- flow meters and an innovative data transmission system by using the beagle Bone Black board
The objective of this report is to prepare the afore mentioned project results for the post project uptake.
1.1 Work Package 6 (WP6) Objectives
WP6 is the repository of the lessons learnt from the different Waternomics pilot sites in applying the tools / products developed within the Waternomics project and it is intended as a deliberate feedback loop from pilot activities into the project technical and methodological development prior to post project exploitation. In doing this the WP6 objective is to finalize the technical outcomes and to ensure they are complete, accurate and polished.
The objectives of WP6 are:
- to refine data management, analysis, FDD and lead detection methods; - to reflect pilot lessons learnt into the project methodology - to finalize the water information services platform and user environment.
The work of this WP relies on the expertise and field experience of the consortium partners as well as input from the Pilot sites and Pilot managers. Through this, the WP produces as output the final version of the methodology, Platform, FDD methods, Data Management plan, Leakage detection method and flow meters. To prepare the outputs for the post-project uptake, also support-tools such as users’ help guidelines and instructions for use will be presented for the appropriate project outputs.
1.2 The Role of Deliverable D6.2
To align itself with the WP6 objectives this report (D6.2) is aimed to capture the learnings from the technical validation, end-user validation and business validation of the Waternomics Platform and Methodology as a whole and from the individual components of the Waternomics project.

619660
© WATERNOMICS Consortium Page 10 of 161
1.3 Relationship with other Activities in the Project
WATERNOMICS is organized in eight different WPs as shown in Figure 1.
Figure 1 : WATERNOMICS WP structure.
WP6 has been active in the last months of the project, from M28 to M36, and it aimed to refine the projects results with the pilot activities and feedbacks before being made available for exploitation and training (WP7). The links between WP6 / D6.2 and other activities in the project are outlined in Figure 2.
Figure 2: Relationships between D6.2 and other activities in Waternomics
Figure 2 shows the interdependencies and relationships between WPs as they relate to WP6 and Deliverable D6.2 and we can summarize as follows:
Link 1 – From WP1, its stakeholder workshops and D1.1, D1.2 and D1.3, WP6 received the project scenarios, information related to sensing technologies, the overall architecture, KPIs particular to delivering water efficiency for the targeted groups and user needs. The scenarios are the basis for the economic validation of the project results.
WP1–Explora-on,Scoping,EngagingStakeholdersandArchitecture
D1.1–UsageCaseandIni-alExploita-onScenarios
D1.2–WaterICTTechnologies,PoliciesandStandardsV1
D1.3–SystemArchitectureandKPIs
WP5–PilotandCaseStudies
D5.1–PilotPlan
D5.2–ConsolidatedWaternomicsPilotReports(Corporate,Userand
Municipal)
2
WP6–Methodology,PlaNormandAnalysisrefinement
D6.1–WATERNOMICSMethodologyBrochure
D6.2–WATERNOMICSIntegratedoutcome(Methodology,SoSware&DataManagementandAnalysis
Components)
WP2–Standards-BasedICT-EnabledWaterManagementSystems
D2.1–WaternomicsMethodology
D2.2–PilotMeasurementFrameworks
WP4–DataAnalysisandDiagnosis
D4.1–WaternomicsDevices(SmartMeter,MEMSFlow-meterandLeak
Detec-onSensor)
D4.2–WaternomicsAnalysis(LeakDetec-on,FDDrulesanddroughtmonitoringanalysisapplica-ons)
D4.3–WaternomicsMonitoringTechnicalReport
WP3–WaternomicsPlaNorm
D3.1.1–LinkedWaterDataspace
D3.1.2–LinkedWaterDataspace
D3.2–SupportServicesAPIsandComponentsLibraries
D3.3–WaternomicsApps
1 2
45
3
WP7–Dissemina-on,Exploita-onandTraining
D7.1–Projectwebsite
D7.4–Businessmodellingandexploita-onac-vi-es
D7.2–WaternomicsKeyIdeasbrochure&poster
D7.3–WaternomicsWaterBill
D7.5–ReportonDissemina-onandStandardswork
6
7
619660
© WATERNOMICS Consortium Page 11 of 161
Link 2 – From WP2 the WP6 received the first draft of the project standard – based methodology. The developed methodology is refined through the pilot sites feedbacks.
Link 3 – From WP3 the WP6 received the overall Applications Platform. It is refined with the pilot sites feedback in order to achieve the final version. The Application Platform is an aggregator element of all project results.
Link 4 – From WP4, initial information related to leak detection, fault detection and data analysis are considered and refined to achieve the final version.
Link 5 – From WP5, operational feedbacks, governance aspects, physical infrastructure data and consumption data observed in applying the Water Efficiency Measures (WEMs) are the basis for the refinement and improvement of the Waternomics methodology.
Link 6 & 7 – WP7 is directly connected to the WP6 outputs. Indeed the results from WP6 are exploited and disseminated through the WP7 activities and the WP6 training documents help in doing this.
1.4 Document Outline
The remainder of this document is organised as follows:
Section 2 summarizes the Waternomics methodology framework, the activities and methods to implement each phase, a particular focus is made on the lessons learnt from the pilot sites and on the validation of the methodology. Section 2 is divided into three sub-sections:
• Section 2.1 summarizes definitions, ideation & process of the Methodology
• Section 2.2 describes the lesson learnt from the pilot sites
• Section 2.3 describes the validation of the Waternomics methodology and the final version
Section 3 describes the lessons learnt from each pilot site about the application of the Waternomics Application Platform and a particular focus is made on the validation of the Waternomics Platform and the final version. Section 3 is divided into two sub-sections:
• Section 3.1 describes the overall lessons leaned from each pilot sites (experience from pilots)
• Section 3.2 describes the final version of the Waternomics Platform
Section 4 presents information aggregated about the other Waternomics outputs: Rule based FDD, model based FDD, Data management, leakage detection and flow meters. Section 4 is organized into four sub-sections:
• Section 4.1 presents a mapping of data management plan developed within the Waternomics project
• Section 4.2 provides an analysis of fault detection methods developed within the project (rule based and model based FDD) and presents their final version.
• Section 4.3 presents an analysis and the updated version of the leakage detection method and sensors developed within the project
• Section 4.4 describes several operational conducted to adjust the sensors hardware and software to implement the data transmission system within the Waternomics project
Section 5 provides conclusions related to the Waternomics integrated outcomes, future steps to implement in order to achieve the market exploitation.

619660
© WATERNOMICS Consortium Page 12 of 161
2 Waternomics Methodology final report The Waternomics Methodology is a project outcome and it provides a set of knowledge, tools and references related to water efficiency and water management to help the different end-users targeted by the project in implementing a water management plan. Use of the developed methodology provides a standard-based pathway that can lead to both organizational change (management procedures) and individual change (behaviour change) and serve as a manual or guideline on how to get started.
Already from the beginning of the project, one of the main points was how to create a simple and effective guideline for users in order to obtain a change in behaviour against the waste of water resources. To meet that need it was a deliberate choice to develop a “standards-based” methodology. In this way, it is possible to align with concepts and terminology that high replication-potential decision makers are already familiar with. As is often the case, frameworks and methodologies are general so that they can be adopted, adapted and applied to a wide range of stakeholders.
The proposed Methodology has been applied in the four Waternomics pilot sites and each pilot manager has followed it in order to create a water management plan, implement WEMs and assess the results. Also a visual graphic of the methodology has been introduced through the Trello Board application in order to assist implementation and eliminate the potential gap between overarching procedural steps and the actions required to accomplish them.
In the following subsections will be presented the final version of the Methodology that comes out after a feedbacks loop from the pilots experience.
2.1 Summary of the methodology
The methodology introduced in the earlier deliverable D2.1_”WATERNOMICS Methodology” is targeted to fill the gap in the water sector where not many standards are available for implementing a WMP. The methodology provides a basis for water management improvement and effectively shows how different standards, also taken from energy sector, can drive organizations and households to use water more efficiently.
To meet this need the methodology proposes a method resulting in an effective combination of existing water and energy related standards (ISO 50001, IPMVP, ISO 50002 and ISO 14046).
A knowledge base of the methodology has been founded on the ISO 50001 processes, Plan-Do-Check-Act cycle and the integration of all the other standards criteria represents a novelty. This knowledge base contributes to better understanding and implementing water management system, since it starts from the relationship between the scientifically recognized ISO 50001, the Plan-Do-Check-Act cycle, which underpins all the standards for systems management. Added to the PDCA cycle is an initial “Assess” phase. Because end-users may be less aware of water efficiency, water scarcity and how/why it affects them, the Assess Phase in the Waternomics methodology is a deliberate attempt to engage and educate the end-users.
Processes within the WATERNOMICS methodology are designed to adapt to organizations of any size and take you from initiating a water management program to monitoring the performance of the actions taken through five phases (Figure 3).�

619660
© WATERNOMICS Consortium Page 13 of 161
Figure 3: Waternomics Methodology Phases
Assess: Determine whether or not an end-user or decision maker should engage in the construct of a water management program, take water efficiency measures and/or implement a water information system.� Establish the baseline, objectives, targets and action plans necessary to deliver results in accordance with opportunities to improve water consumption.
Plan: Establish the baseline, objectives, targets and action plans necessary to deliver results in accordance with opportunities to improve water consumption.
Do: Implement the water management action plans.�
Check: Monitor and measure processes and the key characteristics of its operations that determine energy performance against the water objectives.
Act: Take actions to continually improve water performance.
The model is universal and can be applied for all type of organizations, as well as in service sectors. The proposed methodology can serve as a basis for national and international certifications for water excellence.
2.2 Overall lesson learnt (experience from the pilots)
The developed methodology has been applied in the four Waternomics pilot sites in order to test it in different environments and with different end-users.
Each of the four pilot sites is managed at a project level by a WATERNOMICS consortium partner. Due the fact that the proposed methodology was in an experimental phase, basically it was led by a pilot manager in each of the four pilot sites.
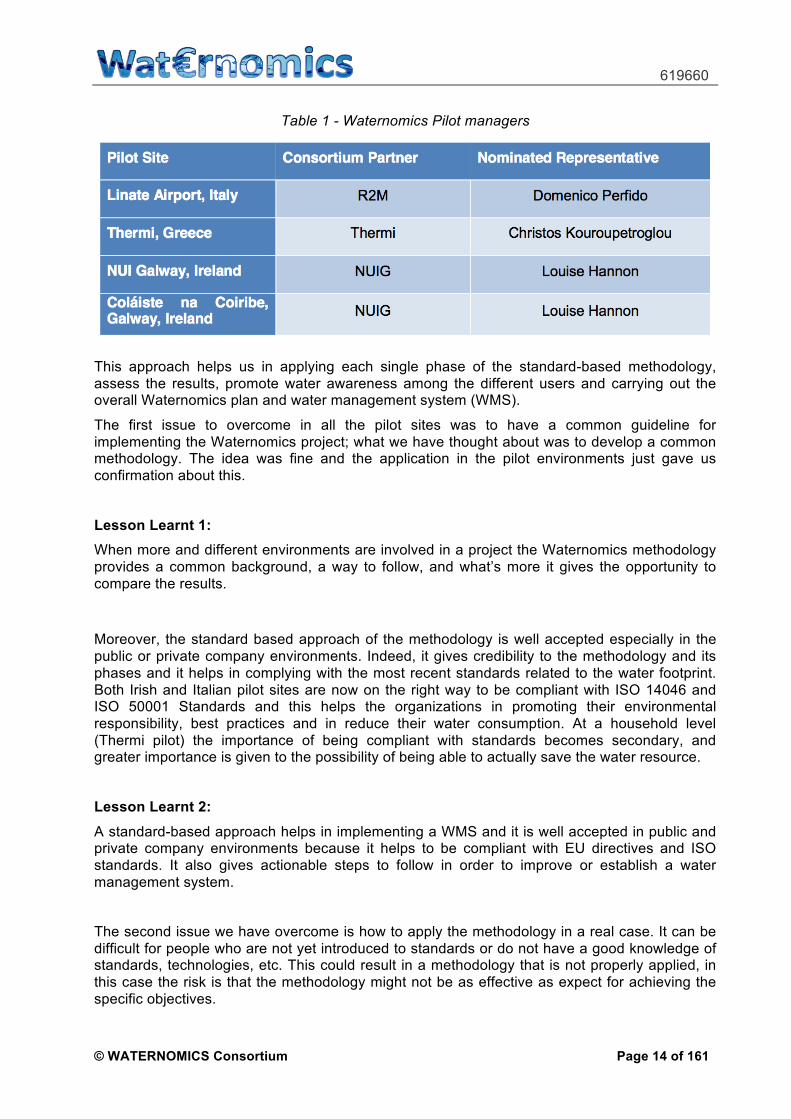
Table 1 describes the consortium partner assigned to each pilot site and the nominated representative from the partner organisation. The pilot site managers work closely with representatives from the permanent staff at each of the pilot sites to ensure the successful implementation of the WATERNOMICS methodology phases and the achievement of the pilot specific objectives.
619660
© WATERNOMICS Consortium Page 14 of 161
Table 1 - Waternomics Pilot managers
This approach helps us in applying each single phase of the standard-based methodology, assess the results, promote water awareness among the different users and carrying out the overall Waternomics plan and water management system (WMS).
The first issue to overcome in all the pilot sites was to have a common guideline for implementing the Waternomics project; what we have thought about was to develop a common methodology. The idea was fine and the application in the pilot environments just gave us confirmation about this.
Lesson Learnt 1: When more and different environments are involved in a project the Waternomics methodology provides a common background, a way to follow, and what’s more it gives the opportunity to compare the results.
Moreover, the standard based approach of the methodology is well accepted especially in the public or private company environments. Indeed, it gives credibility to the methodology and its phases and it helps in complying with the most recent standards related to the water footprint. Both Irish and Italian pilot sites are now on the right way to be compliant with ISO 14046 and ISO 50001 Standards and this helps the organizations in promoting their environmental responsibility, best practices and in reduce their water consumption. At a household level (Thermi pilot) the importance of being compliant with standards becomes secondary, and greater importance is given to the possibility of being able to actually save the water resource.
Lesson Learnt 2: A standard-based approach helps in implementing a WMS and it is well accepted in public and private company environments because it helps to be compliant with EU directives and ISO standards. It also gives actionable steps to follow in order to improve or establish a water management system.
The second issue we have overcome is how to apply the methodology in a real case. It can be difficult for people who are not yet introduced to standards or do not have a good knowledge of standards, technologies, etc. This could result in a methodology that is not properly applied, in this case the risk is that the methodology might not be as effective as expect for achieving the specific objectives.

619660
© WATERNOMICS Consortium Page 15 of 161
To avoid this problem the Waternomics methodology is made of five phases and those phases are broken into a series of activities and these activities can be considered a method to conduct each phase. Moreover, we also have introduced different methods to conduct specific activities to capture a baseline, conduct a water audit, determine strategy and so on (see D2.1_Waternomics Methodology) and the novelty is that we have coupled our methodology with a web based management tool the “Trello Board”.
The Waternomics methodology TRELLO Board is a user-friendly way to both engage the users and make them follow the methodology phases.
Through Trello board, the pilot managers and the project team had the possibility to apply the methodology in each of the different pilot sites and it results to be a good method to share ideas, document, progress, problems solutions and to check at every moment what is the next action to implement in order to apply the Water Efficiency Measures (WEMs). In this way, the Trello tool has promoted knowledge sharing and dissemination within the project team as well as the progress tracking and actions prompting.
The Trello board has been managed and experimented by the project team and we found it as a key idea for the methodology market exploitation.
Figure 4: Waternomics Methodology TRELLO Board
Lesson Learnt 3: A methodology may be as exhaustive as possible when listing the actions to be implemented, but without the accompanying tools will always be difficult to apply it to the real case. Through use of the Waternomics Methodology TRELLO Board, an organization can better ensure that a water management program is performed in a consistent way and have relevant information captured and communicated all in one place.
Certainly, there have been some problems in the implementation phase, however, they have been analysed and have contributed in the methodology improvement. As for example, ordinary problems encountered in each pilot site are: - obtain information from end users on their water consumption - get the updated plans of the water network These issues have been solved with physical surveys and the implementation of awareness questionnaires developed “ad hoc” for the end-users.
619660
© WATERNOMICS Consortium Page 16 of 161
On the other side, the compliance of the operational asset of the methodology with well-recognized ISO standards results in very detailed phases in a certain sense that are suitable to be tested in different environments with clear steps to follow and actions to implement. This results in few changes in our methodology framework. However, we have introduced a Water audit - “Phase 0” - to better understand the real needs of the end-users. We have merged many aspects taken from the energy sector with the water one and by implementing the methodology some aspects have been reviewed and readapted. As for example the Phase 2 “DO”, at the beginning, included the validation as part of the activities to be conducted, however, we recognized that these validation activities have to be targeted not only to the meters installed (equipment) but also to the data gathered from them. Problems such as data integrity and accuracy, calibration of the meters and sensors have persistently caused issues and delays during the project development. For this reason, the activity of data verification became a separate activity placed within the ‘Do’ phase of the Waternomics methodology. In addition, in the Phase 1 “PLAN”, at the beginning, was included the Baseline development. We recognized that there might be a requirement for baselining of usage data also in the Phase 2 “DO” as information may not be available until after new metering has been installed and not possible in earlier Phase 1. From the pilot sites experience all the other methodology Phases and actions are well planned and placed and they don’t need changes.
Lesson Learnt 4: The standards background gives a solid structure to the Waternomics Methodology. This results in the necessity to introduce very little changes. In addition, what we can understand is that a methodology is helpful but also the directives of a water manager (in our case the pilot managers) are necessary to comply with each single phase/action.
The standard approach gives the possibility to include in the methodology new standards to comply with organizations needs and governance. The D7.5 _ “Report on Standard Work” will show in detail how in implementing the Waternomics methodology the pilot sites executed many of the aspects that comply with new standards, e.g. water aspects of ISO 14001:2015 – Environmental Management Systems.
In general, we can conclude by saying that the methodology is a starting point for implementing a WMS and the Waternomics team and pilot managers find it very useful to achieve the pilot specific objectives. Moreover, it can lead to obtain a water consumption reduction excellence certification by being compliant with the most recent EU directives.
2.3 Validation of the methodology and final version
The pilot results show that the Waternomics Methodology helped with setting priorities, selecting technologies, planning the work and aligning stakeholders and partners. While the pilot environment does not fully reflect a commercial business setting, it can be concluded that the Waternomics Methodology lowers the barrier for organisations to purchase and install a smart water system. It functions like a guide or manual and increases the efficiency of the investment an organisation makes for adopting a smart water system.
A smart water system is complex and touches many organisational units and business processes. External consultants can help organisations with defining a proper strategy for adopting a smart water system, selecting the right technology and offer support and guidance during the implementation of the system. Linking a consultancy agency with a technology provider enables a new value proposition where the Waternomics Information Platform can be

619660
© WATERNOMICS Consortium Page 17 of 161
offered on a Smart Water as a Service (SWaaS) basis to industrial customers. The consultancy company manages the customer interface and the technology provider delivers and manages the required technology. Within the Waternomics consortium, partners Ultra-4, a technology provider, and R2M-Solution, a consultancy agency, are investigating collaborative post-project exploitation of the Waternomics Platform and Methodology on a SWaaS basis, targeting at industries and public buildings in southern Europe.
For the Waternomics methodology to remain relevant, it needs to stay aligned with the further development of the Waternomics Platform and adopt relevant newly developed tools and techniques that become available on the market.
The final version of the Waternomics Methodology includes in itself the feedbacks from the pilot sites. However, as described in the previous section, the standard-based approach assures a strong background. The result is that no many changes are needed due the consolidate ISO 50001 structure. The pilots case studies clearly show also the utility of the first Audit phase “ASSESS” which aim is to engage the end-users in checking if a real WMS is necessary in their organization. A detailed description of the five phases of the Methodology is provided in D2.1_ Waternomics Methodology and in the following we will present again a short overview, with user friendly images, each single phase and the corresponding actions to be taken to comply with the pilots’ feedback. In red colour are pointed out the changes resulted from the pilots feedback.
The five phases are consolidated; each single phase contains in itself the action that needs to be taken from the end-users in order to reach the specific objectives and each one should happen in the right order as shown in the Figure 5 below.
What we have to point out is that the methodology process is a cyclic loop, so the last phase is strictly connected with the first one. This because such a thing helps organizations in applying effective Water Efficiency Measures and establishing an efficient WMS compliant with the organizations’ needs.
Figure 5: Waternomics Methodology stream
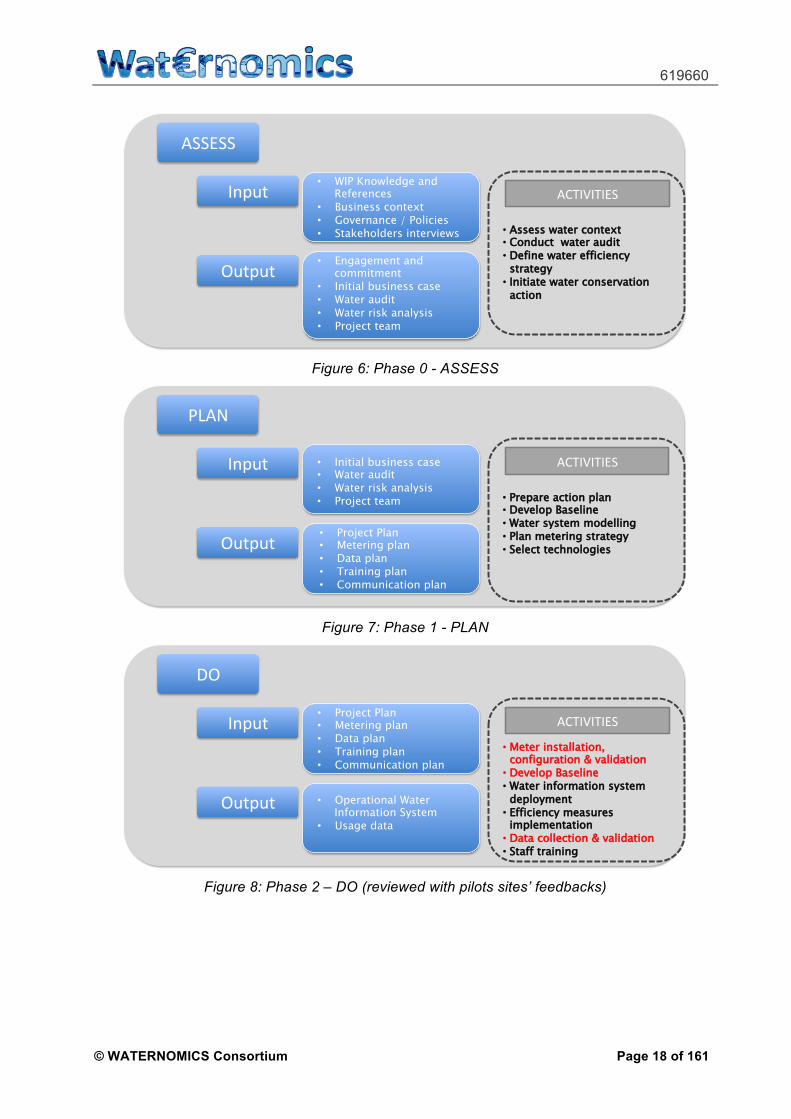
In a further detailing of Figure 5, Figures 6 - 10 provide an intuitive view of the methodology.
619660
© WATERNOMICS Consortium Page 18 of 161
Figure 6: Phase 0 - ASSESS
Figure 7: Phase 1 - PLAN
Figure 8: Phase 2 – DO (reviewed with pilots sites’ feedbacks)
ASSESS
Input
Output
ACTIVITIES
• Assess water context • Conduct water audit • Define water efficiency
strategy • Initiate water conservation
action
• WIP Knowledge and References
• Business context • Governance / Policies • Stakeholders interviews
• Engagement and commitment
• Initial business case • Water audit • Water risk analysis • Project team
PLAN
Input
Output
ACTIVITIES
• Prepare action plan • Develop Baseline • Water system modelling • Plan metering strategy • Select technologies
• Initial business case • Water audit • Water risk analysis • Project team
• Project Plan • Metering plan • Data plan • Training plan • Communication plan
DO
Input
Output
ACTIVITIES
• Meter installation, configuration & validation • Develop Baseline • Water information system
deployment • Efficiency measures
implementation • Data collection & validation • Staff training
• Project Plan • Metering plan • Data plan • Training plan • Communication plan
• Operational Water Information System
• Usage data
619660
© WATERNOMICS Consortium Page 19 of 161
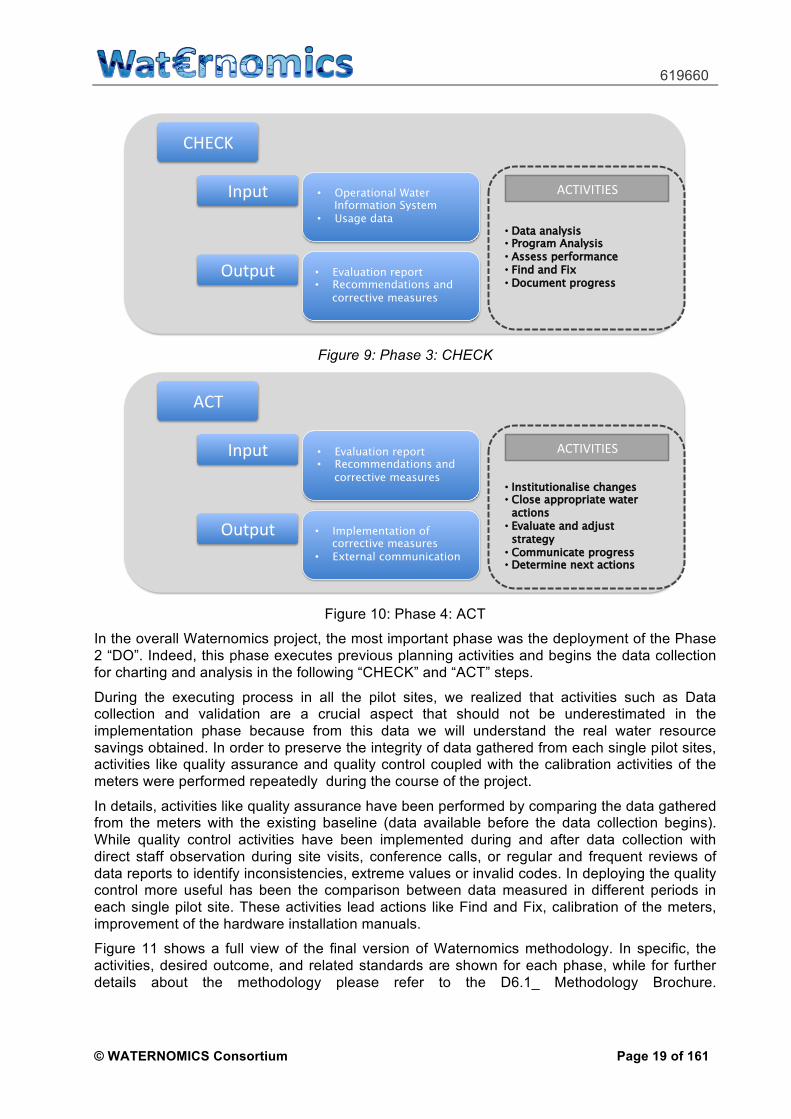
Figure 9: Phase 3: CHECK
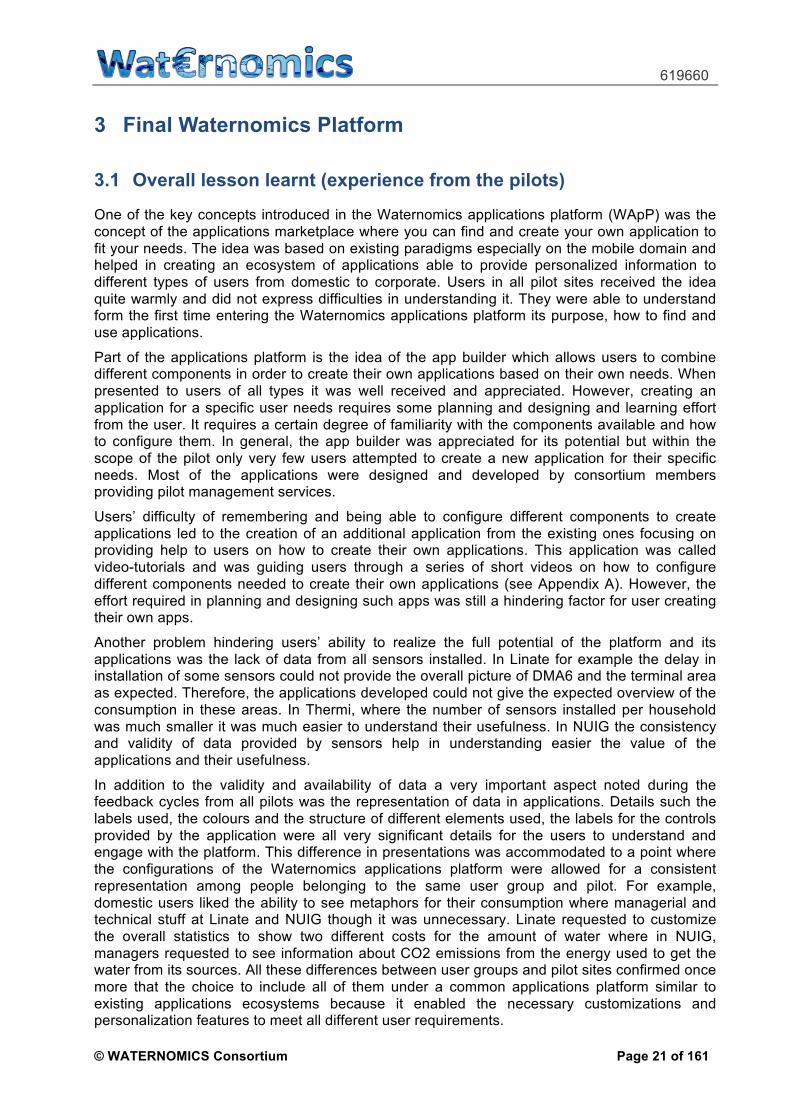
Figure 10: Phase 4: ACT
In the overall Waternomics project, the most important phase was the deployment of the Phase 2 “DO”. Indeed, this phase executes previous planning activities and begins the data collection for charting and analysis in the following “CHECK” and “ACT” steps.
During the executing process in all the pilot sites, we realized that activities such as Data collection and validation are a crucial aspect that should not be underestimated in the implementation phase because from this data we will understand the real water resource savings obtained. In order to preserve the integrity of data gathered from each single pilot sites, activities like quality assurance and quality control coupled with the calibration activities of the meters were performed repeatedly during the course of the project.
In details, activities like quality assurance have been performed by comparing the data gathered from the meters with the existing baseline (data available before the data collection begins). While quality control activities have been implemented during and after data collection with direct staff observation during site visits, conference calls, or regular and frequent reviews of data reports to identify inconsistencies, extreme values or invalid codes. In deploying the quality control more useful has been the comparison between data measured in different periods in each single pilot site. These activities lead actions like Find and Fix, calibration of the meters, improvement of the hardware installation manuals.
Figure 11 shows a full view of the final version of Waternomics methodology. In specific, the activities, desired outcome, and related standards are shown for each phase, while for further details about the methodology please refer to the D6.1_ Methodology Brochure.
CHECK
Input
Output
ACTIVITIES
• Data analysis • Program Analysis • Assess performance • Find and Fix • Document progress
• Operational Water Information System
• Usage data
• Evaluation report • Recommendations and
corrective measures
ACT
Input
Output
ACTIVITIES
• Institutionalise changes • Close appropriate water
actions • Evaluate and adjust
strategy • Communicate progress • Determine next actions
• Evaluation report • Recommendations and
corrective measures
• Implementation of corrective measures
• External communication

619660
© WATERNOMICS Consortium Page 20 of 161
Figure 11: Final version of Waternomics Standard-based Methodology
619660
© WATERNOMICS Consortium Page 21 of 161
3 Final Waternomics Platform
3.1 Overall lesson learnt (experience from the pilots)
One of the key concepts introduced in the Waternomics applications platform (WApP) was the concept of the applications marketplace where you can find and create your own application to fit your needs. The idea was based on existing paradigms especially on the mobile domain and helped in creating an ecosystem of applications able to provide personalized information to different types of users from domestic to corporate. Users in all pilot sites received the idea quite warmly and did not express difficulties in understanding it. They were able to understand form the first time entering the Waternomics applications platform its purpose, how to find and use applications.
Part of the applications platform is the idea of the app builder which allows users to combine different components in order to create their own applications based on their own needs. When presented to users of all types it was well received and appreciated. However, creating an application for a specific user needs requires some planning and designing and learning effort from the user. It requires a certain degree of familiarity with the components available and how to configure them. In general, the app builder was appreciated for its potential but within the scope of the pilot only very few users attempted to create a new application for their specific needs. Most of the applications were designed and developed by consortium members providing pilot management services.
Users’ difficulty of remembering and being able to configure different components to create applications led to the creation of an additional application from the existing ones focusing on providing help to users on how to create their own applications. This application was called video-tutorials and was guiding users through a series of short videos on how to configure different components needed to create their own applications (see Appendix A). However, the effort required in planning and designing such apps was still a hindering factor for user creating their own apps.
Another problem hindering users’ ability to realize the full potential of the platform and its applications was the lack of data from all sensors installed. In Linate for example the delay in installation of some sensors could not provide the overall picture of DMA6 and the terminal area as expected. Therefore, the applications developed could not give the expected overview of the consumption in these areas. In Thermi, where the number of sensors installed per household was much smaller it was much easier to understand their usefulness. In NUIG the consistency and validity of data provided by sensors help in understanding easier the value of the applications and their usefulness.
In addition to the validity and availability of data a very important aspect noted during the feedback cycles from all pilots was the representation of data in applications. Details such the labels used, the colours and the structure of different elements used, the labels for the controls provided by the application were all very significant details for the users to understand and engage with the platform. This difference in presentations was accommodated to a point where the configurations of the Waternomics applications platform were allowed for a consistent representation among people belonging to the same user group and pilot. For example, domestic users liked the ability to see metaphors for their consumption where managerial and technical stuff at Linate and NUIG though it was unnecessary. Linate requested to customize the overall statistics to show two different costs for the amount of water where in NUIG, managers requested to see information about CO2 emissions from the energy used to get the water from its sources. All these differences between user groups and pilot sites confirmed once more that the choice to include all of them under a common applications platform similar to existing applications ecosystems because it enabled the necessary customizations and personalization features to meet all different user requirements.

619660
© WATERNOMICS Consortium Page 22 of 161
Although personalization was indeed appreciated by users, the general User Interface (UI) and the experience on the platform was a significant factor in improving their engagement. In particular, the initial design of the UI had some visual inconsistencies that were not hindering its functionality but were reducing the appeal factor of the platform in overall. During the pilot implementation, a redesign and restructuring of the most important components took place. As a result, most of the applications developed for users were updated accordingly. This redesign received a positive feedback from users in all pilot sites which was followed by an increase in interest.
Figure 12: Example of application design after UI redesign
However, this increase in interest and positive feedback were not enough to keep users engaged and returning often to the platform. A common comment coming from all different user groups in all pilot sites was that water management was just one of their obligations between many others. Therefore, keeping track of their consumption wasn’t that important for them in order to check their consumption on a daily or even weekly basis. In order to tackle this low engagement problem, we interviewed users from all pilot sites and identified that regardless of their profile, all of them were checking their emails on a daily basis. Managers and technicians in Linate and NUIG were doing so as part of their job and domestic users were doing so as part of their everyday routines. Having identified a common path to their daily routines we designed and released an app that users could configure to get daily, weekly and monthly digest emails
Figure 12: Example of application design before UI redesign
619660
© WATERNOMICS Consortium Page 23 of 161
with a very simple short text informing them of their consumption metering in selected meters or group of meters.
This application was initially intended to target social media and publish posts or tweets to personal timelines. However, a lot of the users were not daily users of social media and on the other hand filtering algorithms would possibly affect the outcome as they might hide some of the posts created by the platform applications. Therefore, the application was decided to change to an application sending those short reports through emails that was a common part of daily routines of all types of users. Another concern raised with the use of social media to publish and inform about water consumption was the privacy that such a process might violate. Although it was explained that such posts would remain private for the users only, many of them, especially in corporate environments, expressed their concern. Emails were thought to be more private than social media and similar concerns were not raised.
Finally, another important aspect appreciated by users in all pilot sites apart from the periodic digest emails were the applications that offered to users a kind of “peace of mind” service. In particular, the application titled “Goal setter” enabled users to set a number of rules to get personalized notifications. This allowed them to set up rules to get notifications for unexpected large amounts of consumption and gave them a peace of mind that whenever something was going wrong they can get notified by the system through email which was their most preferred communication channel. This, once again, demonstrates the fact that monitoring applications providing information about consumption to specific points are useful but not easy to integrate into daily routines of users. People did not find it easy to visit often the platform so such services allowed them to utilize the monitoring applications without having to visit them regularly.
3.2 Validation of the Waternomics Platform and final version
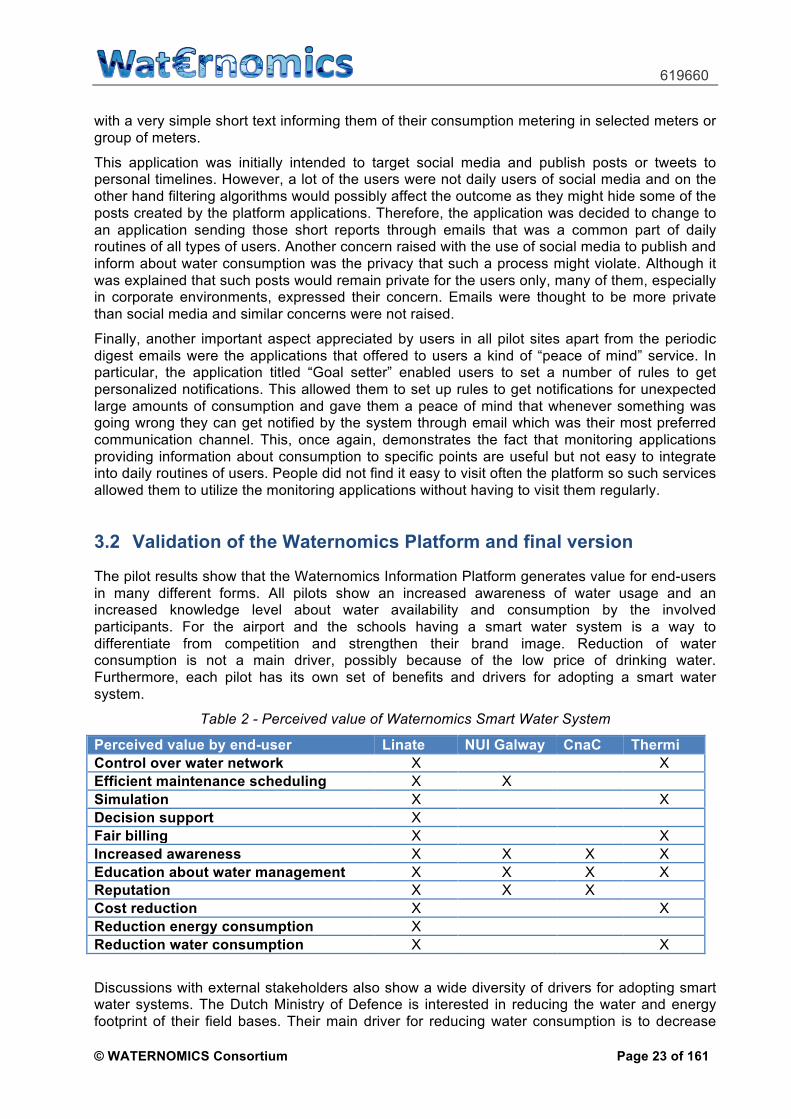
The pilot results show that the Waternomics Information Platform generates value for end-users in many different forms. All pilots show an increased awareness of water usage and an increased knowledge level about water availability and consumption by the involved participants. For the airport and the schools having a smart water system is a way to differentiate from competition and strengthen their brand image. Reduction of water consumption is not a main driver, possibly because of the low price of drinking water. Furthermore, each pilot has its own set of benefits and drivers for adopting a smart water system.
Table 2 - Perceived value of Waternomics Smart Water System
Perceived value by end-user Linate NUI Galway CnaC Thermi Control over water network X X
Efficient maintenance scheduling X X
Simulation X X
Decision support X
Fair billing X X
Increased awareness X X X X
Education about water management X X X X
Reputation X X X
Cost reduction X X
Reduction energy consumption X
Reduction water consumption X X
Discussions with external stakeholders also show a wide diversity of drivers for adopting smart water systems. The Dutch Ministry of Defence is interested in reducing the water and energy footprint of their field bases. Their main driver for reducing water consumption is to decrease

619660
© WATERNOMICS Consortium Page 24 of 161
logistical movements since all drinking water is currently delivered through air or road transport, often in a hostile environment. Another important factor is that most conflict areas where the Dutch military operates, are located in dry regions, like Mali or Iraq, who already suffer from drought.
In a second case, we talked to Simaxx, a provider of smart building solutions, who collects all available data from an office building and uses this data to generate recommendations for building management. Key drivers are reducing operational costs while maintaining a good level of comfort for the inhabitants of the building. A pilot has been defined to investigate how the Waternomics platform complements with the Simaxx platform. Water sensors and adapter software will be linked to Simaxx platform and the Waternomics dashboard application and public display application will be ported onto the Simaxx platform. This way, smart water services will be integrated in a smart building service, offering building managers a single point of entry for managing the energy efficiency and comfort levels of their building.
Project deliverable D1.1 - ”Usage Case and Exploitation Scenarios” identifies three target markets for the Waternomics Information System. In the next section the impact of the findings on perceived value on the business strategies, is discussed shortly for each of these markets.
1 Corporate users: With an increasing focus on sustainability and the environmental footprint of companies, businesses can benefit from smart water systems in multiple ways. To control and manage their water usage and network a smart water system can be obtained on a transaction basis or as a managed service. Using a company’s real data for simulations and support for strategic investment decisions, smart water system can be offered as part of a long-term consultancy service, where sustainability experts help a company with increasing water and energy efficiency. Adoption rate for smart water services will be highest when bundled with other smart building services and especially with smart energy services.
2 Municipalities and water utilities: Water utilities benefit from a smart water system by reducing their operational costs due to a more efficient management of their water distribution network, and by reducing the number of disputes with clients because of more accurate billing. Also, real-time local metering data can be used for educational, awareness campaigns or promotional activities targeted at their customers. Metering and billing can be offered as a managed service to water utilities as already is done by a broad range of service providers. To reduce resistance against the installation of smart water meters amongst their end-users, utilities should consider providing free value added services for their customers, letting them share the benefits.
3 Domestic users: When targeting smart water systems directly to domestic users, three things need to be considered. Currently, the consumer market is flooded with smart devices, for example thermostats, electricity meters or smoke alarms. To have consumers adopt a smart water system, it should integrate with existing smart solutions which are already longer on the market. An interview with a representative from Toon, the provider of in-home energy displays, stated that adding support for water related information is on their 2017 product roadmap. Smart water products or services should be user-centred and fit in a smart home context. Next to that, implementing a smart water system in a house gives the house-owner the opportunity to regain ownership of its water consumption data. It doesn’t make sense to have two smart water meters installed next to each other so it would be more efficient to provide water utilities access to the households’ water metering data via the house-owners smart water system. This is an opportunity for private household data vault solution providers such as HelloData. Finally, the most valued features for households seem to be control over their water consumption and network, e.g. alerts upon leakages or open taps, and water saving tips and challenges. This would be offered best on a subscription basis, bundled with other related smart home services like energy services or security services.
In terms of potential concepts to be followed in providing such services to end-users, in all cases, is the idea of the applications marketplace where users can find applications best fitting
619660
© WATERNOMICS Consortium Page 25 of 161
their needs is one that can have a significant impact. People are already familiar with the concept and providing an ecosystem of applications for bundled services including water, energy, security, etc. can lead to easier adoption of such solutions from end-users in all cases. Moreover, such an architecture allows device vendors to easily open their hardware to be used in combination with others by third party developers.
To this extensibility, factor solutions such as the app builder provided in the Waternomics platform can help in specific user cases. Most users would like to have ready to use applications so that they don’t deal with configuring and setting them up. However, consultancy service providers to corporate users and water utilities personal will probably find the ability to design their own custom applications interesting and valuable.
Finally, another key point to be taken from the Waternomics experience is to provide services and applications that are able to link the information provided in the platform with existing daily routines. Either this is a display in the bathroom or an app that sends an email on a daily basis people need to have often and prominent triggers to remind them of the available information and actions they can take. This way the applications provided will gradually weave into daily routines of users and become even more useful.
619660
© WATERNOMICS Consortium Page 26 of 161
4 Other WATERNOMICS Outcomes
4.1 Data Management and Analysis
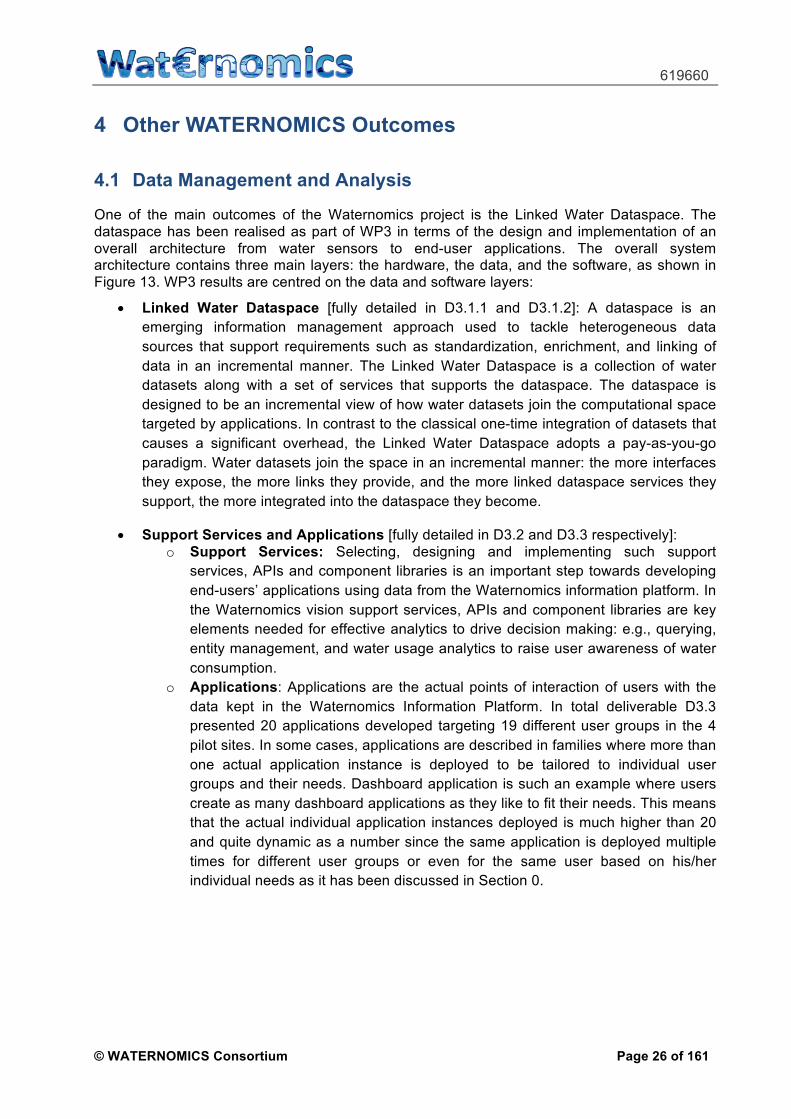
One of the main outcomes of the Waternomics project is the Linked Water Dataspace. The dataspace has been realised as part of WP3 in terms of the design and implementation of an overall architecture from water sensors to end-user applications. The overall system architecture contains three main layers: the hardware, the data, and the software, as shown in Figure 13. WP3 results are centred on the data and software layers:
• Linked Water Dataspace [fully detailed in D3.1.1 and D3.1.2]: A dataspace is an
emerging information management approach used to tackle heterogeneous data
sources that support requirements such as standardization, enrichment, and linking of
data in an incremental manner. The Linked Water Dataspace is a collection of water
datasets along with a set of services that supports the dataspace. The dataspace is
designed to be an incremental view of how water datasets join the computational space
targeted by applications. In contrast to the classical one-time integration of datasets that
causes a significant overhead, the Linked Water Dataspace adopts a pay-as-you-go
paradigm. Water datasets join the space in an incremental manner: the more interfaces
they expose, the more links they provide, and the more linked dataspace services they
support, the more integrated into the dataspace they become.
• Support Services and Applications [fully detailed in D3.2 and D3.3 respectively]: o Support Services: Selecting, designing and implementing such support
services, APIs and component libraries is an important step towards developing
end-users’ applications using data from the Waternomics information platform. In
the Waternomics vision support services, APIs and component libraries are key
elements needed for effective analytics to drive decision making: e.g., querying,
entity management, and water usage analytics to raise user awareness of water
consumption.
o Applications: Applications are the actual points of interaction of users with the
data kept in the Waternomics Information Platform. In total deliverable D3.3
presented 20 applications developed targeting 19 different user groups in the 4
pilot sites. In some cases, applications are described in families where more than
one actual application instance is deployed to be tailored to individual user
groups and their needs. Dashboard application is such an example where users
create as many dashboard applications as they like to fit their needs. This means
that the actual individual application instances deployed is much higher than 20
and quite dynamic as a number since the same application is deployed multiple
times for different user groups or even for the same user based on his/her
individual needs as it has been discussed in Section 0.

619660
© WATERNOMICS Consortium Page 27 of 161
Figure 13: System Architecture [Available in Section 5 of D3.1.1]
An overview of the data collected for each Work Package, Task and Pilot is made in Appendix B The overview shows the reference name of the data set, the mandatory Metadata (if any), data set specific Metadata, and a dataset description. It furthermore sets out a reference to existing standards in the topic area governing its data collection, aggregation, storage and how the data will be shared. It also mentions archiving and preservation intentions. This in order to allow a handover or some continuity of the Waternomics insights and systems at the pilot sites when the project ends.
4.1.1 Overall lesson learnt (experience from the pilots)
4.1.1.1 Lessons Learnt from Real-time Data Management
The real-time data management takes place in the Waternomics project as a part of the Linked Water Dataspace. The Waternomics architecture adopts a Lambda paradigm that handles, in parallel, data-in-motion and data-at-rest. The data-in-motion part connects the data that comes from the sensors with the adapters and the processing Spark jobs at the core of the dataspace, where most of the aggregation takes place. A part of the realtime data management is the ingestion of aggregated streams from the Spark jobs into the Druid storage which plays the role of a serving layer through queries.
The following lessons can be compiled from dealing with the real-time data in Waternomics:

619660
© WATERNOMICS Consortium Page 28 of 161
1. The Loosely Coupled Paradigm
• It has been effective at the design and development phase to use a loosely
coupled model that depends on a distribution middleware. Data is exchanged
through topics or queues in the middleware, and applications and services play
the roles of consumers and/or producers. That removes dependencies between
parties and helps efficient development and maintenance.
2. The Lambda Architecture
• It is important to account for two types of data: data-in-motion and data-at-rest. In
Waternomics for example, different pilots have different types of data. Some of it
can or must be processed in batch processes. Some has to be in real-time. The
architecture shall support both batch and realtime and shall not try to force a
realtime pipeline into a batch one, or the other way around. Both types can be
integrated if possible at various stages, and be served in a transparent way to
users through a homogeneous query mechanism.
3. Sensor Data
• It proves effective and efficient that sensors play the role of clients which push
data into an HTTP Restful API provided by the dataspace. The main advantage
comes from the standardization through Web protocols. HTTP in its native form
was sufficient for the pilots, but other protocols such MQTT and Web Sockets
can be used for high rates.
• Sensor programming and maintenance is a challenge. It is very important that
sensor programmers handle exceptions and account for various types of possible
faults. Auto-restart and memory management can also be used to improve
reliability. Remote access and maintenance of sensors can be very critical
especially in pilots where it is difficult to reach the sensors often as in residential
settings. Plug-and-play sensors are the ideal goal for future projects where the
cost to program and maintain the sensors is minimized.
4. Archiving
• It is useful and maybe necessary to archive close-to-raw data. Although the end
point of the Lambda architecture stores aggregated versions of the data, it was
useful to store close-to-raw version, either to reconstruct data in the case of
failure, or to allow new forms of analysis that was un-envisioned previously and
which need granular data.
5. Time and Time Zones
• It is important to handle timestamps and time zones carefully from early stages of
the data pipeline. In Waternomics for instance, the four pilots exist in three
European countries, which have up to three time zones. If a query is interested in
an overall picture of the data, or if the user exists in a country different from
where the data was originated, timestamps should fully support time zones.
Wrong time zones can result in data being considered out-of-window for realtime
processing and thus be lost.
6. Processing data-on-the fly vs. store-and-query cultures
• The store-and-query culture is more common between developers and users.
Nonetheless, with the proliferation of new sources of data, processing data on-
the-fly and detecting only that of interest in realtime, without storage in many
cases, can be challenging as a paradigm (aka. event processing) to understand
by some developers or users. That can happen mostly in points of interoperability

619660
© WATERNOMICS Consortium Page 29 of 161
where services by two different parties have to talk to each other. It can be useful
to clarify the two different paradigms and have domain and technical discussions
within a team or between teams to maximize the benefits of both paradigms.
4.1.1.2 Lessons Learnt from Historical Data Management
The management of historical data in the Waternomics project is also supported as a part of the Linked Water Dataspace. Similar to the data-in-motion part, the data-at-rest part processes the historical data that is collected from sensors with the adapters over time. The majority is data processing is performed through batch jobs. First step in batch jobs is downloading data from Web-based and local files. Second step involves rejection of incorrect data and aggregation of correct. Last step of batch processing is the ingestion of this aggregated data from the into the Druid storage through schedule jobs.
The following lessons can be compiled from dealing with the real-time data in Waternomics:
1. Batch layer of the Lambda Architecture
• A key part of our implementation of the Lambda architecture is its batch layer,
under the umbrella of historical data management. While realtime pipeline
primarily focuses of immediate available of sensors data, the batch processes
ensure that data accumulated over time is checked for data quality issues and re-
indexed in the database. Therefore, it is important to align both aspects of the
Lambda architecture in a seamless way. Our DRUID based implementation
allowed us to achieve it successfully with very few difficulties.
2. Processing Sensor Data in Bulk
• The batch process typically deals with large databases and files that need to be
made available for querying. Therefore, the batch process needs to be deployed
on servers that are capable of in-memory processing with large datasets. We
experienced specific challenges when processing data collected over 1 year by
Building Management System in the Galway pilot. In this case, the batch
processes were carefully designed to minimize the possible of memory overflow.
• To reduce the need large data transfer over network, the batch processes were
implemented within a single server which also hosted the Historical node of
DRUID. This approach allowed us to process and store multiple datasets locally.
3. Frequency of Batch Processing
• As the sensor data accumulates over time it is necessary to also update the
historical data accordingly. In this sense, the batch processes need to be
scheduled for timely updates. A major challenge in this respect is the timing for
batch processes which can depend on the sources sensors their associated real-
time processes. We found out the scheduling the batch processes out of the
office hours allowed us more bandwidth in terms of network and server capacity.
However, there were some challenges in synchronizing the batch processes with
when the data for sources was made available in-time due to network issues at
the pilot sites. Programming appropriate exception handling and notifications was
important in such cases.
4. Data Quality Issues
• A major challenge in batch processing the data quality issues which include but
are not limited to incorrect file formats, incorrect timestamps, unusual water
usage values, multiple and conflicting values, and missing data. Specifically, in
terms of the timestamps, the different time zones for pilot sites in different

619660
© WATERNOMICS Consortium Page 30 of 161
countries posed a challenge, as well as the time changes due to the Daylight
Savings Time.
4.1.1.3 Lessons Learnt from Catalog Service
A key support service for the Linked Water Dataspace was the catalog service. This service provided support for all processes that were concerned with data-in-motion and data-at-rest. The catalog services server a crucial role in providing information services over data that is part of the dataspace. Primarily it provided search, browse, and query services over descriptions of datasets and data sources.
The following lessons can be compiled from dealing with the real-time data in Waternomics:
1. Organization of data sources and datasets
• At a basic level the catalog can list the entire datasets or data source that
constitute the Linked Water Dataspace; however, so form of systematic
organization can help in both browsing and queries. In the respect, we have
organized the datasets according to the pilot sites in Waternomics dataspace.
Further support for browsing includes tagging, dataset format, etc.
2. Queries over entities and metadata
• Allows programmable access to the catalog services in very important since in
facilitate applications over dataspace. A key lesson here is to enable queries
over dataset descriptions as well as the entities contained in the datasets.
Therefore, the catalog service served a canonical source for identifiers for
entities in the Linked Water Dataspace and it provided metadata in machine
readable formats.
3. Access control
• Limiting access to dataset descriptions and entities to the authorized users only
was also a critical aspect of the catalog services. In this regard, we used
individual user accounts to manage access. This also enables site specific
management of users and their datasets. As a further step, this access control in
catalog also allowed us to manage queries over the DRUID by resolving access
level of queries from the catalog services.
4. Change management
• Keeping provenance of changes to datasets, entities, and their descriptions is
also necessary. In our catalog services, each update to dataset metadata was
recording accordingly to be viewed later on by users, thus allowing tracking of
changes over time. This becomes especially useful as the catalog services starts
to include and describe openly available datasets which are not in direct control
on the dataspace managers.
4.1.2 Validation of the Data Management and final version
The Waternomics Data Management Platform (DMP) is designed specifically for collecting, storing and analysing water consumption related data. As such, the Waternomics DMP differs from existing water DMP’s from which the majority is designed specifically for water utilities. Examples of such water DMP’s are IBM’s Intelligent Water software, Aquarius Time-Series products from Aquatic or Siemens Smart Water Platform who focus on topics such as non-revenue water, pressure optimization and pipe failure prediction and offer modules for supporting business processes like asset management, customer billing or customer support.

619660
© WATERNOMICS Consortium Page 31 of 161
The unique selling points of Waternomics DMP are threefold:
1. The Waternomics data taxonomy provides clear definitions on the data sources, data
categories and use cases specifically for the end-user domain. Adding new data sources
requires minimal effort because standardised adapters for data sets are available and
the data taxonomy supports al kind of water applications, domestic as well as industrial.
2. Waternomics DMP already supports multiple open data sets like the dataset from
Waterfootprint.org, which is used to show users their water consumption in new and
more engaging ways, EDO drought data which is used to alert users about drought
periods in their region, and open calendar data sets which provide context information
such as public holidays, weekends and school terms, which are required to, for example,
analyse water usage in working vs. non-working days.
3. The Lambda architecture ensures scalability of the Waternomics DMP. The used
technologies, such as Spark, Kafka and Druid are similar to the. technologies that
companies such as Netflix, eBay, or Twitter are using for their (big) data analytics.
A DMP in itself doesn’t generate value. Only when a DMP is linked to Key Performance Indicators and business objectives and the DMP creates insight in why something happens and actionable information is generated, its real value is unlocked. From the pilots and the interviews with external stakeholders, it can be concluded that Waternomics DMP generates the most value in domestic environments and in industrial environments, specifically at industries who consume large amounts of water in their operations. Waternomics DMP can be used for the delivery of smart water services by municipalities to their citizens. Because the DMP manages entities and data flows on-demand, a pay-as-you-go (PAYG) revenue model would fit perfectly in this domain.
For Waternomics DMP to work in office buildings the DMP should be able to work together seamlessly with existing building information systems.
4.2 Fault detection and diagnosis (FDD)
The fault detection and diagnosis (FDD) developments as part of the Waternomics Project are well described in Project Deliverables D4.2 – Waternomics Analysis (leak detection, FDD rules, and drought monitoring analysis applications) and D4.3 - Waternomics Monitoring Technical Report: Documentation of WP4 technical work.
FDD is a measurement science that brings automation to the process of
• detecting faults in physical systems
• diagnosing their causes
D4.2 outlines the development of model-based FDD for use at the Linate Pilot Site and rule-based FDD system at the NUIG Pilot Site and D4.3 present further details of the testing, monitoring and analysis of the FDD applications at the Pilots sites. The following subsection describe the lessons learnt from the pilot sites and the refinement of the FDD methods.
4.2.1 Rule based FDD
An FDD methodology to monitor the residence time of potable water within the water network of the NUIG Pilot Site was developed as part of the Waternomics Project. The issue of extended water residence time negatively effecting the quality of potable water at the NUIG Pilot Site was identified in the course of stakeholder interviews documented in Project Deliverable D1.3 System Architecture and KPIs. The generalised FDD methodology to automate the identification
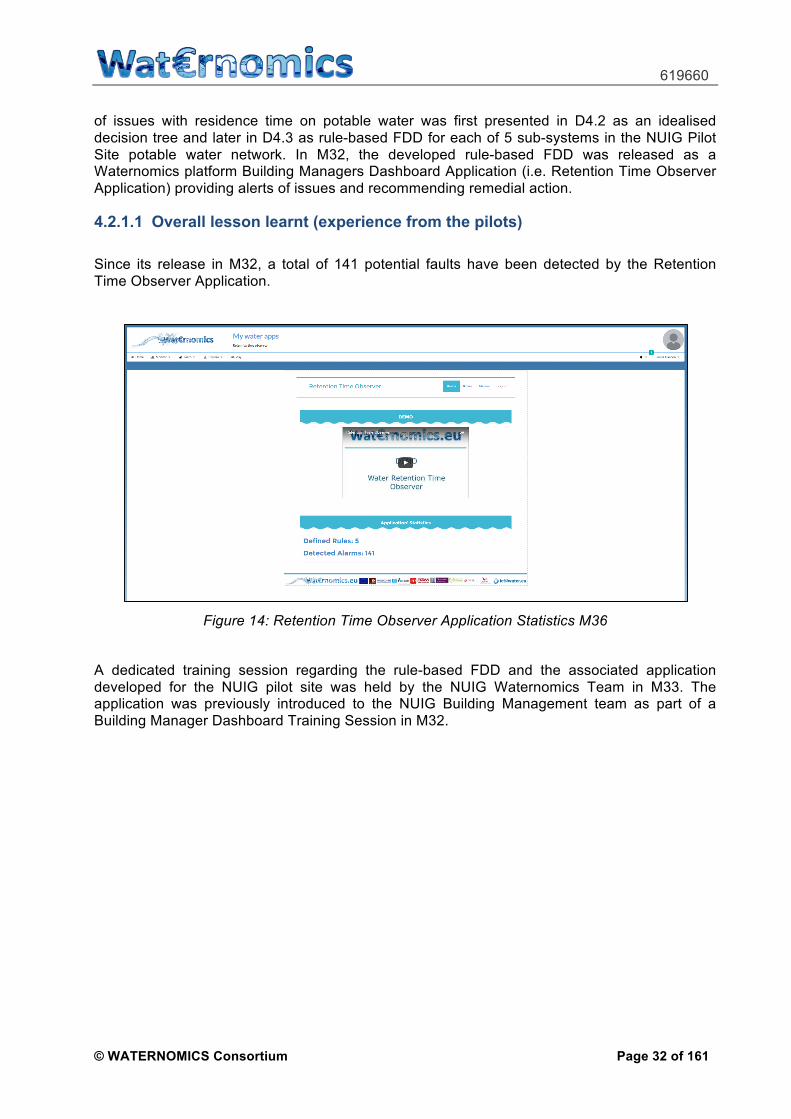
619660
© WATERNOMICS Consortium Page 32 of 161
of issues with residence time on potable water was first presented in D4.2 as an idealised decision tree and later in D4.3 as rule-based FDD for each of 5 sub-systems in the NUIG Pilot Site potable water network. In M32, the developed rule-based FDD was released as a Waternomics platform Building Managers Dashboard Application (i.e. Retention Time Observer Application) providing alerts of issues and recommending remedial action.
4.2.1.1 Overall lesson learnt (experience from the pilots)
Since its release in M32, a total of 141 potential faults have been detected by the Retention Time Observer Application.
Figure 14: Retention Time Observer Application Statistics M36
A dedicated training session regarding the rule-based FDD and the associated application developed for the NUIG pilot site was held by the NUIG Waternomics Team in M33. The application was previously introduced to the NUIG Building Management team as part of a Building Manager Dashboard Training Session in M32.

619660
© WATERNOMICS Consortium Page 33 of 161
Figure 15: Waternomics Rule-based FDD Application Training Underway at NUIG
The training session generated a significant discussion regarding potential to further refine the parameters adopted for the rules and it was agreed that a physical water network model will be constructed at the NUIG Pilot Site to study the degradation of water quality over time and allow the refinement of the rules. This work will be progressed after completion of the Waternomics Project in support of an automation of remedial measures required to address identified faults.
The feedback from the NUIG Pilot Site Building Manager regarding the FDD Methodology and its application was very positive and the receipt of email notifications of detected faults and recommended remedial action was found to be very useful.
As described in D4.3, it was found that the frequency of fault alert notifications must be carefully considered i.e. the rule-based FDD System for the Potable Water Retention Time Observer is designed to alert Building Managers of a fault when simple remedial action is possible i.e. before a situation becomes critical. Overwhelming recipients with notifications of potential faults was found to be counterproductive leading to a potential disregarding of fault alert messages. The Building Manager at the Engineering Building agreed that a single fault alert notification in the morning period is the most suitable approach.
Despite the positive feedback regarding the Rule-based FDD system and the acknowledgement that the system fully satisfies the KPI identified in D1.3, the email fault alert notifications fail to translate into Manager Dashboard Logins and interaction with the managers’ dashboard platform applications (combined total for two pilot sites in Galway) recording a total of 47 logins from Galway as registered by Google analytics for the period 01 September 2016 (M32) to 01 January 2017 (M36).
Figure 16: Managers Dashboard Application Logins Galway Pilots M32 – M36
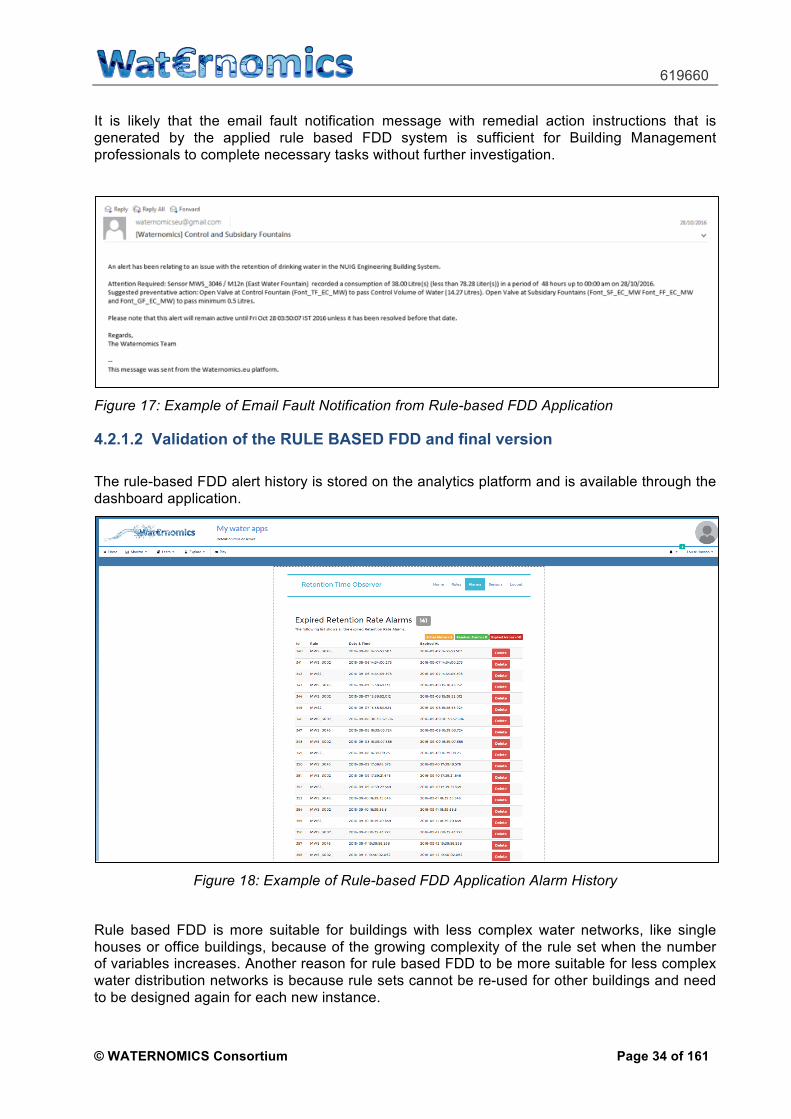
619660
© WATERNOMICS Consortium Page 34 of 161
It is likely that the email fault notification message with remedial action instructions that is generated by the applied rule based FDD system is sufficient for Building Management professionals to complete necessary tasks without further investigation.
Figure 17: Example of Email Fault Notification from Rule-based FDD Application
4.2.1.2 Validation of the RULE BASED FDD and final version
The rule-based FDD alert history is stored on the analytics platform and is available through the dashboard application.
Figure 18: Example of Rule-based FDD Application Alarm History
Rule based FDD is more suitable for buildings with less complex water networks, like single houses or office buildings, because of the growing complexity of the rule set when the number of variables increases. Another reason for rule based FDD to be more suitable for less complex water distribution networks is because rule sets cannot be re-used for other buildings and need to be designed again for each new instance.

619660
© WATERNOMICS Consortium Page 35 of 161
It is technically possible to automate actions upon notifications from the FDD but it raises some legal issues. If third parties can interfere with a supplier’s system, the supplier may not be willing to fix problems under their warranty. It is expected that legal issues will be resolved in the near future and smart building systems will directly interfere with the systems in a building by changing set-points, opening/closing valves etc.
4.2.2 Model based FDD – refinement and outcomes
The model based FDD method developed within the Waternomics project is detailed in the deliverable D4.2 and the test results are fully detailed in the D4.3. The method is based on the analysis of both pressure and flow variations produced by leakage in the Water Distribution System (WDS). For this reason, this technique differs from the others that we can find in the literature because it is not based on the transient analysis of the pressure waves but on the comparison of real pressure and flow data with their estimation using the simulation of the mathematical network model.
The methodology proposed is derived from the energy sector and it is composed of 5 phases described in Figure 19 below.
Figure 19: Waternomics Model Based FDD Methodology
The automated FDD is suitable for large water networks and the Linate pilot water network match this characteristic due the fact that the WDS has an extension of about 10 Km.
The FDD method coupled with the Decision Support System (DSS) developed with the cooperation of another European project (IceWater) and fully detailed in D4.2, D4.3 and D5.2, is intended to give the opportunity to the decision makers to simulate different operational scenarios with their water network without having technical knowledge about water and hydraulic simulation model and check how the water network is working. A guideline of the DSS tool is available in the Appendix C.

619660
© WATERNOMICS Consortium Page 36 of 161
Figure 20: DSS component developed in the Explore section of the Platform The following sections are intended to show the refinement of the model based FDD method and the real test performed in the Linate airport water network.
4.2.2.1 Overall lessons learnt (experience from the pilots) As described in the D4.2, whichever water network we consider, “the leakages exist; and they have to be localized and measured” (B. Brunone et al. - 2008). This problem is more enforced when we have to face cases in which large water networks are implied and where, due the many variables coming into play, it could be very difficult to detect anomalies or fault in the system with rule-based or approaches that require deeper knowledge of the system dynamics.
For this reason, the Linate water network is found to be highly suitable for the application of the model-based FDD method rather than the water networks of the other three Waternomics pilot sites.
The Model-Based FDD method also needs a considerable amount of data gathered from the meters to perform the training phase of the ADWICE algorithm to work effectively at detection time. For this reason, at the delivery time of the deliverables D4.2 and D4.3 (M30 and M32), due to the fact that the installation phase in Linate pilot was still going on, the historical data which are used to train the anomaly detection algorithm have not been obtained by the measuring instruments but from a mathematical simulation of the loss in the water network through an EPANET model of the water network itself.
However, the results obtained really convinced the Linate Mangers and the operational staff. The FDD application was integrated in the Waternomics Applications Platform and received a very positive feedback. The ability to know the operational phase of the water network in real time by changing the inputs in the Epanet hydraulic model (size of the pipes, roughness, water demand patterns, etc.) thanks the Decisional Support System (DSS) and the ability to perform the fault detection also by receiving email notifications of detected faults was found to be very useful.
Positive feedbacks was also received from external stakeholders (Water Utilities) that have joined the Waternomics workshop held in Thermi in October 2015.
Basically, starting from the early test results of the FDD method, the need for an efficient Water Management System (WMS) is strongly felt both the internal Waternomics partner (SEA) and external stakeholders as they see the possibility to implement the fault detection in the water

619660
© WATERNOMICS Consortium Page 37 of 161
network at an early stage as an essential ability to manage the water resource in a sustainable way by avoiding both the waste of the natural resource and the waste of money.
4.2.2.2 Validation of the Model-Based FDD and final version
In earlier deliverables (D4.2 and D4.3) we have described how we simulated link flow and node pressure to generate data used both for training and testing (i.e. discovering anomalies). The next step is to use real sensor data stored in the Waternomics dataspace and process them to feed the anomaly detection algorithm for fault detection.
The model-based FDD algorithm has been implemented and deployed in the server hosting the DSS. The input to the anomaly detection algorithm is fetched from the Waternomics dataspace through a Python script that aggregates sensor data on a daily basis, fuses them is a feature vector and calls ADWICE to perform anomaly detection on that vector. The output of the algorithm, which is essentially a bit which assumes the value 1 if an anomalous condition is detected and 0 otherwise, is sent for display in the Waternomics platform or sent by email (Figure 21).
Figure 21: Implementation of the ADWICE in the Linate setting
The sensor data gathered in the Waternomics dataspace is, however, pretty limited to perform a complete and comprehensive training and test cycle. The first flow sensors have been installed in the Linate network as early as September 2016, with the following ones being added incrementally. The pressure sensors have been installed starting from October 2016. In both cases, a calibration procedure had to be performed to provide accurate data. In total, about two months of complete data were acquired at the time of writing of this deliverable.
Since a long period is required to gather enough data to capture the typical behaviour of the system and create a normality model of a system that is likely going to show seasonal variations. For this reason, the first step was to evaluate the results of applying anomaly detection on real sensor data using the model built with simulated data. The results have shown that a divergence is present when evaluating it with the available data (e.g. a lot of anomalies are raised) indicating that either the Epanet model of the network needs to be revised to reflect the real operating conditions of the water network and the algorithm needs to be fine-tuned on its internal settings (tolerance gap, number and order of the features etc..) to better calibrate its accuracy. In order to do so, however, a larger amount of real data is required.
We have also discovered that the real sensor data fetched from the dataspace was not always reliable (some values were out of scale). To deal with this the data pre-processor has also been programmed to replace the wrong or missing values with appropriate values. These can be zero values or averages on recent historical readings.
With the methodology, we proposed, by having few months of real data, one can refine the overall FDD method by training on simulated data and testing on real data; by reiterating the revision of the model, training and detection phase until little-to-no outliners are detected one can be ready to deploy the model based FDD to give outcomes on real data from then on.

619660
© WATERNOMICS Consortium Page 38 of 161
In the longer term, when at least one year of data is collected, one can abandon the simulated model, retrain the FDD and use the real sensor data to perform both training and validation.
For model-based FDD, a model of the building’s water distribution network and water applications needs to be generated before the system can analyse actual performance versus measured performance. Developing the model is a major task and the quality of the model defines the efficiency and accuracy of the FDD. Advantage is that with model-based FDD the analytical software can be re-used, only the models need to be created for each new building. This makes replication of the FDD algorithms for other buildings easier and more cost effective. Model-based FDD is suitable because of its ability to handle large numbers of variables efficiently, more suitable for environments with complex water distribution networks like industries, airports or hospitals.
4.3 Leakage detection, refinement and outcomes
Since the last reporting in D4.3, the following activities have been carried out in order to refine the acoustic leakage method developed within the Waternomics project:
1. Improvement of the information flow sensor – server – analysis 2. Collection of data in household A during 6 months 3. Replication of system in household B for two months 4. Analysis of new results
The leakage method developed is a novelty in the water leakage detection sector. Due the early experimental stage, it was decided to test it first in household environments in Delft, rather than from the Thermi pilot site of the Waternomics project.
4.3.1 Information flow & lesson learned from pilots
In previous reports (D4.2 and D4.3) the information flow of the leakage detection method, including sound recordings, FTP server storage, and analyses were presented. It was demonstrated that the method performed satisfactorily for the lab setup and that it was ready for the household experimentation. The first experiments in the household A, however, revealed that the use of an FTP server to store the recordings was adding an extra complexity to the data management, in particular because such FTP server was localised in the lab. This situation implied different shortcuts in the data collection.
In order to improve the situation, it was decided to skip the data transfer to the FTP server, and, instead, to access directly the information of the Raspberry Pi platform and transfer the data to the local PC where the fingerprinting software was installed. To this end, a procedure in Python was developed, which grabs the information from the Raspberry Pi platform, synchronise it with a local PC folder and then runs the algorithms of the audio fingerprinting. The option to send the data to the Waternomics platform was unaffected. A diagram that depicts the new information flow is summarised below in Figure 22.
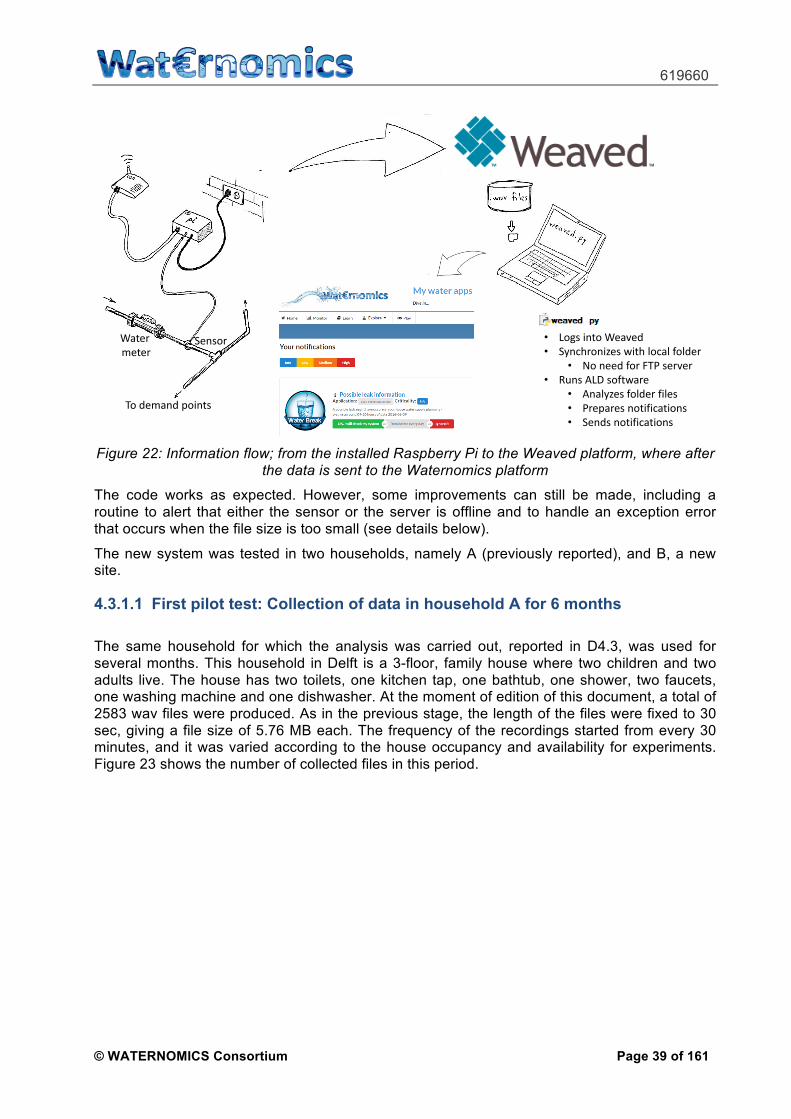
619660
© WATERNOMICS Consortium Page 39 of 161
Figure 22: Information flow; from the installed Raspberry Pi to the Weaved platform, where after the data is sent to the Waternomics platform
The code works as expected. However, some improvements can still be made, including a routine to alert that either the sensor or the server is offline and to handle an exception error that occurs when the file size is too small (see details below).
The new system was tested in two households, namely A (previously reported), and B, a new site.
4.3.1.1 First pilot test: Collection of data in household A for 6 months
The same household for which the analysis was carried out, reported in D4.3, was used for several months. This household in Delft is a 3-floor, family house where two children and two adults live. The house has two toilets, one kitchen tap, one bathtub, one shower, two faucets, one washing machine and one dishwasher. At the moment of edition of this document, a total of 2583 wav files were produced. As in the previous stage, the length of the files were fixed to 30 sec, giving a file size of 5.76 MB each. The frequency of the recordings started from every 30 minutes, and it was varied according to the house occupancy and availability for experiments. Figure 23 shows the number of collected files in this period.
• LogsintoWeaved• Synchronizeswithlocalfolder
• NoneedforFTPserver• RunsALDsoftware
• Analyzesfolderfiles• Preparesnotifications• Sendsnotifications
Watermeter
Todemandpoints
Sensor
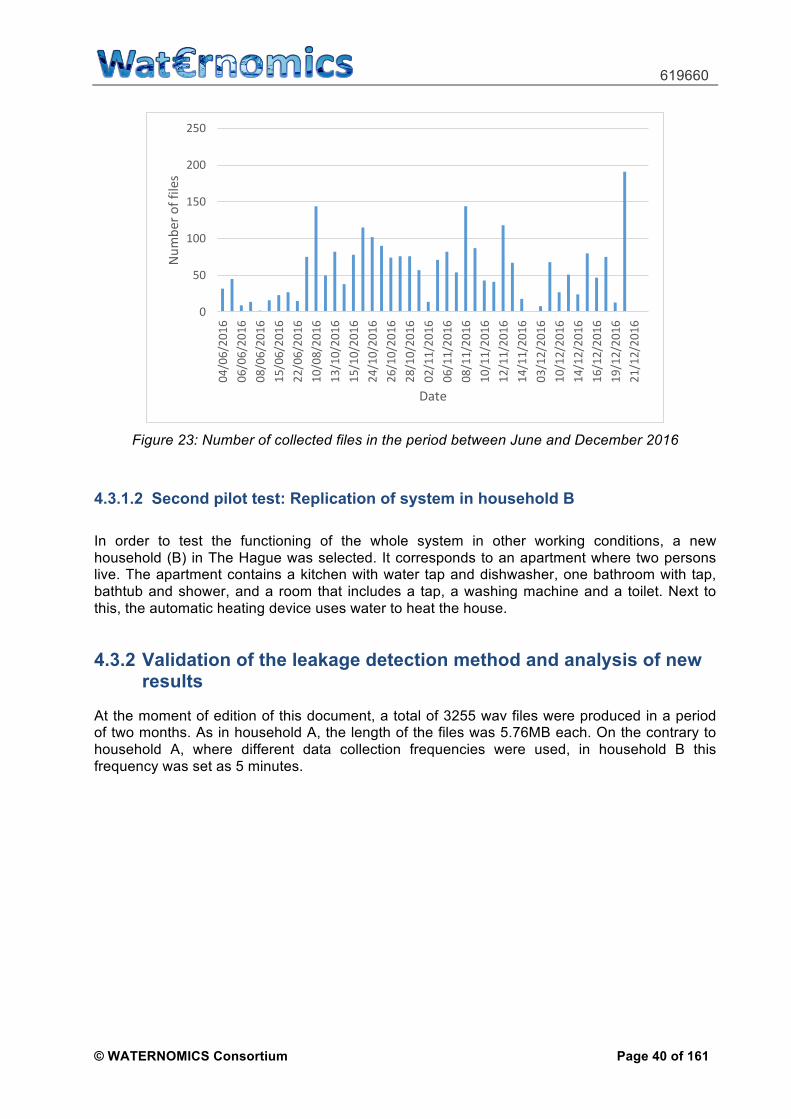
619660
© WATERNOMICS Consortium Page 40 of 161
Figure 23: Number of collected files in the period between June and December 2016
4.3.1.2 Second pilot test: Replication of system in household B
In order to test the functioning of the whole system in other working conditions, a new household (B) in The Hague was selected. It corresponds to an apartment where two persons live. The apartment contains a kitchen with water tap and dishwasher, one bathroom with tap, bathtub and shower, and a room that includes a tap, a washing machine and a toilet. Next to this, the automatic heating device uses water to heat the house.
4.3.2 Validation of the leakage detection method and analysis of new results
At the moment of edition of this document, a total of 3255 wav files were produced in a period of two months. As in household A, the length of the files was 5.76MB each. On the contrary to household A, where different data collection frequencies were used, in household B this frequency was set as 5 minutes.
0
50
100
150
200
250
04/06/20
1606
/06/20
1608
/06/20
1615
/06/20
1622
/06/20
1610
/08/20
1613
/10/20
1615
/10/20
1624
/10/20
1626
/10/20
1628
/10/20
1602
/11/20
1606
/11/20
1608
/11/20
1610
/11/20
1612
/11/20
1614
/11/20
1603
/12/20
1610
/12/20
1614
/12/20
1616
/12/20
1619
/12/20
1621
/12/20
16
Numbe
roffiles
Date

619660
© WATERNOMICS Consortium Page 41 of 161
Figure 24 Results of fingerprinting method ran in feed mode for household B
As in the case of household A, the first part of the recording period was used by the fingerprinting algorithm to populate its database (feed mode, Figure 24). This is, the majority of files in the first week were not found and inserted. In addition, towards the end of the period, the majority of files were found in the database. Approximately 30% of the files recorded in the first half of the period were not found and inserted, whereas this percentage dropped to 5% for the second half of the period. These results are in agreement to those obtained in household A. This shows that, although it was not possible to test with real leaks in either house, after a period of training time, the sound fingerprint detection of unusual patterns occurring in the water network, including leaks, is possible.
4.3.2.1 Additional experiments
During the analysis of all previous experiments, interesting facts were observed, such as the potential of the fingerprinting method as a possible way to monitor domestic water uses. This new use could have interesting applications such as characterising water consumption by appliance, profiling water use and estimating accurate water demand patterns for improved network designs. In order to explore this potential, which is in addition to the scope of the originally planned method, a new experiment was conducted. The objective of the experiment was to corroborate that the fingerprinting software operating in detection mode can detect the recordings taken manually at home for possible combinations of water demand at different points. The method used was the following:
1. With a clean database, run ALD software in feed mode using the files taken manually (with informative filenames).
2. Run the ALD software in detection mode for the files recorded by the sensor.
The hypothesis to test is that a file containing a signal of a water demand point will be identified, by labelling its title with the corresponding informative filename.
0
50
100
150
200
250
300
0
5
10
15
20
25
30
35
40
Numbe
rofrecordingsfou
nd
Numbe
rofrecordingsn
otfo
undandinserted
NotFoundandInserted Found

619660
© WATERNOMICS Consortium Page 42 of 161
The files taken manually in the original household used different combinations of the water demand points shown in Table 3.
Table 3 - Water demand points used for the manual files
The (self-explanatory) filenames are demonstrated in Table 4 below.
Table 4 - Self-explanatory filenames of the different combinations of water demand points
BathShower_03-10-2016_20-33.wav
Bathtub.wav
Bathtube_03-10-2016_20-28.wav
BathtubeShowerGarden_03-10-2016_20-32.wav
BathtubeShowerToilet_03-10-2016_20-35.wav
BathtubeShowerTwoFaucets_03-10-2016_20-30.wav
BathtubeShowerTwoFaucetsGarden_03-10-2016_20-31.wav
DishMachine.wav
Faucet0.wav
Faucet1.wav
FaucetK.wav
HalfBathtubeHalfBathtubeShower_03-10-2016_23-32.wav
HalfBathtubeHalfKitchen_03-10-2016_23-21.wav
kitchen_03-10-2016_20-41.wav
Shower.wav
ShowerHighestTap.wav
ShowerToilet_03-10-2016_20-36.wav
Toilet0.wav
Toilet1.wav
WashingMachine.wav
A first experimental stage with 1848 files was made, in which the fingerprinting software was run in detection mode and adding an additional “silence” file, corresponding to the file Silence_12-11-2016_04-00.wav. The following table was obtained.
Table 5 - Obtained result of detecting the silence files
Num Waterpoint1 Toilet02 Faucet03 FaucetK4 Dishmachine5 GardenHose6 Shower7 Faucet18 Bathtub9 Toilet110 Faucet_small
Secondfloor 11 Wash_machine
Groundfloor
Firstfloor
Status Found
RowLabels CountofFileNameihe01_2016-11-12_04-00.wav 950kitchen_03-10-2016_20-41 2GrandTotal 952

619660
© WATERNOMICS Consortium Page 43 of 161
As it can be seen, the kitchen tap was identified two times, whereas the silence file was recognised 950 times. Although more appliances were expected to be detected, the fact that the noise file was identified so many times is a good indication, because, as stated above, an important number of files were recorded during the night.
The same experiment was repeated, now in feed mode. Interestingly, more files from Table 4 were identified, in the proportion shown in the graph below.
Figure 25 Identified files during feed mode
It must be noted that a file called ihe01_2016-10-13_11-40.wav was identified 1040 times, while it did not correspond to the silence file. A possible explanation is that in the month of October a new gas meter was installed, which could have created interference in the collection of signals. The moment a wav file with this new signal was added to the database, without any informative name, the fingerprinting software started identifying many signals like these. It is worth noting also that in the month of November the heater started functioning, adding additional noise to the signals. Unfortunately, no proper logs for the exact dates of functioning are available.
The same experiment was made but now changing the threshold for building the fingerprinting tables in the databases (please refer to D4.2). In the previous experiments this threshold was set to 4. Recall that if the fingerprinting software finds Threshold number of matches in each table, then file is eligible to be selected. If there are many, then it reports them all, sorted by the threshold values. If Threshold=25 it means exact match (the same file, basically). 2: almost all is recognised as match; 3: about 60% similarity. 5: almost as strict as the exact match. As 4 seemed to be OK after several experiments, it was fixed so far as a result of the laboratory tests for leak detection. However, the sensitivity of this threshold is important to analyse. The results for th=3 is shown in the figure below. Note that it only accounts for 13 files. The rest of the files appeared to be as background noise as in the previous exercise. The same exercise was repeated for th=2 and more than 80% of the files were recognised already as a match in the initial training period of two days, which implies that a large amount of detections would actually be false alarms.
Total
ShowerToilet_03-10-2016_20-36
ShowerHighestTap
Showerlowesttap
kitchen_03-10-2016_20-41
HalfBathtubeHalfKitchen_03-10-2016_23-21
Faucetfirstfloor,showerroom
BathtubeShowerTwoFaucetsGarden_03-10-2016_20-31
BathtubeShowerToilet_03-10-2016_20-35
BathtubeShowerGarden_03-10-2016_20-32
Bathtube

619660
© WATERNOMICS Consortium Page 44 of 161
Figure 26 Identified files during feed mode, when using threshold number 3, for a total of 1713 files
Another parameter to consider is the length of the file to be analysed. In the previous experiments, this was set to 15 seconds. The procedure consisted on feeding an empty fingerprinting database using the files in Table 4, then running the software in detection mode with a particular amount of seconds to be analysed for each of the 1713 files collected for this analysis and store the detection results. The exercise was repeated for analysed file lengths of 5, 10, 15, 20 and 25 seconds. The result showed that the amount of recognised files is not higher than the 15% of the total, and that this performance is similar for different lengths of analysis.
As a general conclusion, automatic acoustic leak detection method for households has been developed with both hardware (sensor) and software (fingerprinting). Results in the lab and in test houses show promising results, as the capacity to detect unusual behaviour in water pipes sounds is proven, provided enough period of training. In addition, an unforeseen potential use of the technology is the detection of water uses, which could have implications for demand profiling, better estimates of demand and improved design of piped networks.
The work initiated in this project is to be continued with extended R&D in cooperation with SME partner VTEC. The performance of the method in buildings different from households will be analysed, such as in the NUIG engineering building.
4.4 Flow meters
In Waternomics two types of flow meters have been installed in the pilots from partners within the consortium. The first is the mini water meter and the second is an ultrasonic flow meter. For both types a short introduction will be given.
Total
Bathtube
Bathtube_03-10-2016_20-28
BathtubeShowerToilet_03-10-2016_20-35
Dishwashermachine
KitchenFaucet
kitchen_03-10-2016_20-41
ShowerHighestTap
Toiletfirstfloor
WashingMachine
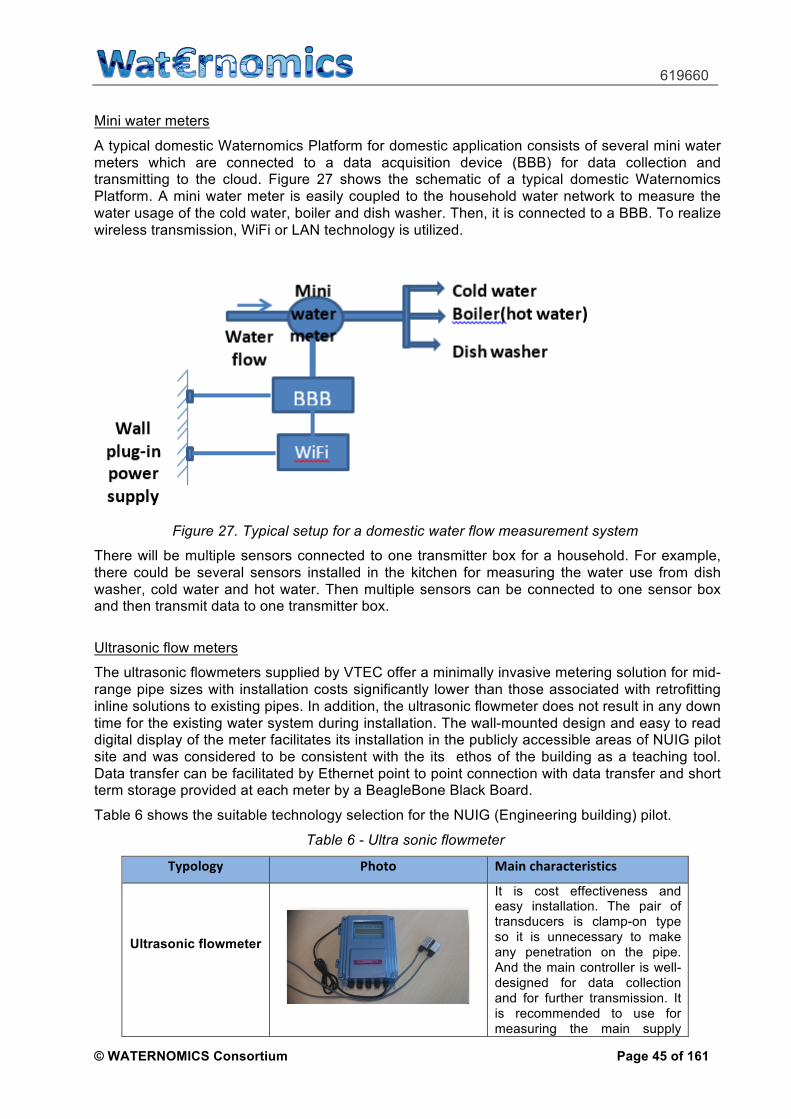
619660
© WATERNOMICS Consortium Page 45 of 161
Mini water meters
A typical domestic Waternomics Platform for domestic application consists of several mini water meters which are connected to a data acquisition device (BBB) for data collection and transmitting to the cloud. Figure 27 shows the schematic of a typical domestic Waternomics Platform. A mini water meter is easily coupled to the household water network to measure the water usage of the cold water, boiler and dish washer. Then, it is connected to a BBB. To realize wireless transmission, WiFi or LAN technology is utilized.
Figure 27. Typical setup for a domestic water flow measurement system
There will be multiple sensors connected to one transmitter box for a household. For example, there could be several sensors installed in the kitchen for measuring the water use from dish washer, cold water and hot water. Then multiple sensors can be connected to one sensor box and then transmit data to one transmitter box.
Ultrasonic flow meters
The ultrasonic flowmeters supplied by VTEC offer a minimally invasive metering solution for mid-range pipe sizes with installation costs significantly lower than those associated with retrofitting inline solutions to existing pipes. In addition, the ultrasonic flowmeter does not result in any down time for the existing water system during installation. The wall-mounted design and easy to read digital display of the meter facilitates its installation in the publicly accessible areas of NUIG pilot site and was considered to be consistent with the its ethos of the building as a teaching tool. Data transfer can be facilitated by Ethernet point to point connection with data transfer and short term storage provided at each meter by a BeagleBone Black Board.
Table 6 shows the suitable technology selection for the NUIG (Engineering building) pilot.
Table 6 - Ultra sonic flowmeter
Typology Photo Maincharacteristics
Ultrasonic flowmeter
It is cost effectiveness and easy installation. The pair of transducers is clamp-on type so it is unnecessary to make any penetration on the pipe. And the main controller is well-designed for data collection and for further transmission. It is recommended to use for measuring the main supply

619660
© WATERNOMICS Consortium Page 46 of 161
water.
Data acquisition device and wireless data transmission
(BeagleBone Black Board)
The data acquisition platform is to use BeagleBone Black (BBB), a very smart and cost-effective single-board computer.
The picture below shows the proposed transfer of data from the pilot sites NUIG and Coláiste na Coiribe to the Waternomics platform (Figure 28). The ultrasonic meters at NUIG have a wired connected via BeagleBone Black process (also wired) to the NUIG data communication system. The electromagnetic meters at Coláiste na Coiribe also have a wired connection to the proposed Building Management System at the School.
Figure 28. Wireless Sensor box to Transmitter box via LAN
4.4.1 Overall lessons learnt (experience from the pilots)
The Waternomics pilots have been extremely useful to get experience for the development, the installation/maintenance as well as the regulatory aspects.
In the project the sensors system has been developed for scratch. This means that the initial phase test has been done for the functional aspects of the devices in a controlled environment. After transfer of the sensor systems to the pilots sites a lot of practical problems have come up and have been addressed as good as possible.
Thermi pilot
The Thermi pilot is a domestic pilot with the sensor systems installed in homes. Problems that have been encountered are related to visual aspects of the products, the Internet infrastructure,

619660
© WATERNOMICS Consortium Page 47 of 161
the components of the systems, time differences, updating of the software, controlled remote operation of the devices. Due to the very good cooperation of the participants and a close cooperation between VTEC, NUIG and Ultra4 and no regulatory issues the problems could be solved in a practical way. In the following table an overview of problems is given
Issue Ref. Date Unit Reference Brief Description of Issue House BBB Sensor
1 5-2-2016 H01 both all
The software of the BBBs in the first test house needed to be updated to send data to dataspace
2 17-2-2016 H01, H22 both all BBBs sending data to dataspace without timestamp
3 29-2-2016 5 houses all all Stability issues. Sensors stop sending data after some time
4 3-3-2016 some houses some all
Some BBBs even in the same house exhibit different behaviour. One sending and the other not sending data
5 24-3-2016
H20, H02, H22 and others all all
Complaints from owners that internet speed is significantly reduced when connecting the BBBs
6 24-3-2016 All all all
Change in data sending frequency led to requiring change in the data to be sent. Flow should be changed now to volume.
7 8-4-2016 All all all Large number in consumption registered from sensors that started sending data
8 17-2-2016 All all all Need for remote update mechanism identified
9 18-4-2016 All all all Stability issues. Sensors stop sending data after some time
10 12-5-2016 All all all
Double measurements registered for sensors connected in the third place of the transmitter box
11 12-5-2016 All all all
Bad wiring. Sensors connected to the first place were sending data as if connected to the third place for the transmitter box
12 1-6-2016 All all all Memory leak identified in U4 offices BBBs local logger script
13 30-5-2016 H04 and H07 all all
BBBs seem to shut down shortly after plugging them in
NUIG Engineering Building
Similar problems are encountered in this pilot with the completeness of the testing during the development but the problems that appeared during the installation have been different. In this case the solving of the problems has to be addressed in cooperation with the maintenance team of NUIG, again problems have been addressed and mostly solved in close cooperation between VTEC and NUIG. An overview of the problems encountered is given in the following table:
Issue Ref. Date Unit Reference Brief Description of Issue Sensor Controller Unit Type
1 12-10-2015 USF_08
Grey Water West CWS top up (CWS7_US)
Not working repositioned transducers numerous times removed insulation fully around pipe
2 18-12-2015 USF_10
Complete CWS (Cold Water Service) (MR.WM.002_CW_US)
no data on the cloud since 18/12/15. Saujan working on meter for Kafka, said data may be lost (22/12/15)

619660
© WATERNOMICS Consortium Page 48 of 161
3 6-1-2016 USF_04
Male Showers/Sinks (CWS) (ENG-G004) (CWS3_US)
Issue with dates fixed with NTP server. Past data labelled with wrong dates, a number of different days labelled with the same dates. Cut off value for velocity set to 0.03m/s had been 0. Recording ok now
4 11-12-2015 USF_05
Zinc (CWS) (CWS4_US)
Flow recorded through the night. Could not zero the meter on 21/12/15 because of bad signal on meter. Signal seems to worsen since 11/12/15 but variable. Since 29/12/15 no data on cloud
5 12/3/0205 USF_06
Lab (CWS) (ENG-G034) (CWS5_US)
Restarted on 3/12/15 as no data recorded previously. Flashes negatively values on display. Data recording, although less data since 29/12/15
6 6-1-2016 USF_07
Grey water East CWS top up (CSW6_US)
Some flow recorded when it is know there is no flow (noise)
7 6-1-2016 USF_08
Grey Water West CWS top up (CWS7_US)
Wasn't working since 12/10/15. Repositioned transducers and removed insulation on 14/12/15, got a good signal. Since 29/12/15 bad signal again
8 6-1-2016 USF_09
Complete DHW (Domestic hot Water) (CWS8_US)
Some flow recorded when it is know there is no flow (noise)
9 6-1-2016 USF_03
Female Showers/Sinks (CWS) (ENG-G036) (CWS9_US)
Meter working and showing data on website but no data on cloud since 29/12/15
10 18-1-2016 USF_10
Complete CWS (Cold Water Service) (MR.WM.002_CW_US) no data stored
11 18-1-2016 USF_04
Male Showers/Sinks (CWS) (ENG-G004) (CWS3_US) data stored vtec cloud
12 18-1-2016 USF_05
Zinc (CWS) (CWS4_US) no data stored
13 18-1-2016 USF_06
Lab (CWS) (ENG-G034) (CWS5_US) data stored vtec cloud
14 18-1-2016 USF_07
Grey water East CWS top up (CSW6_US) data stored vtec cloud
15 18-1-2016 USF_08
Grey Water West CWS top up (CWS7_US)
data stored vtec cloud *H Bad signal
16 18-1-2016 USF_09
Complete DHW (Domestic hot Water) data stored vtec cloud

619660
© WATERNOMICS Consortium Page 49 of 161
(CWS8_US)
17 18-1-2016 USF_03
Female Showers/Sinks (CWS) (ENG-G036) (CWS9_US) no data stored
18 1-2-2016 USF_04
Male Showers/Sinks (CWS) (ENG-G004) (CWS3_US)
Flow recorded when it is known there is no flow.
19 1-2-2016 USF_05 Zinc (CWS) (CWS4_US)
Flow recorded through the night. Could not zero the meter on 21/12/15 because of bad signal on meter. Signal seems to worsen since 11/12/15 but variable. Flow recorded when it is known there is no flow.
20 1-2-2016 USF_06
Lab (CWS) (ENG-G034) (CWS5_US)
Flow recorded when it is known there is no flow. Flashes negatively values on display. Sometimes displaying error signal 'I' on downloaded data, but not on physical meter.
21 1-2-2016 USF_07
Grey water East CWS top up (CSW6_US)
Flow recorded when it is known there is no flow
22 1-2-2016 USF_08
Grey Water West CWS top up (CWS7_US)
Wasn't working since 12/10/15. Repositioned transducers and removed insulation on 14/12/15, got a good signal. Since 29/12/15 bad signal again. Flow recorded when it is known there is no flow.
23 1-2-2016 USF_09
Complete DHW (Domestic hot Water) (CWS8_US)
Flow recorded when it is known there is no flow
24 1-2-2016 USF_03
Female Showers/Sinks (CWS) (ENG-G036) (CWS9_US)
Flow recorded when it is known there is no flow
25 8-2-2016 USF_04
Male Showers/Sinks (CWS) (ENG-G004) (CWS3_US)
DateTime 2 hours ahead of local time
26 8-2-2016 USF_05 Zinc (CWS) (CWS4_US) Bad signal *H
27 8-2-2016 USF_08
Grey Water West CWS top up (CWS7_US)
Mounting method change to N, *R signal again.
28 8-2-2016 (mounting method defaults to V after power outage)
29 8-2-2016 USF_09
Complete DHW (Domestic hot Water) (CWS8_US)
DateTime 2 hours ahead of local time
30 8-2-2016 USF_03
Female Showers/Sinks (CWS) (ENG-G036) (CWS9_US)
No data since 19/1/16. BBB hard reset, after noticed offline.
31 2-6-2016 USF_10 Complete CWS Flow recorded by USF when

619660
© WATERNOMICS Consortium Page 50 of 161
(Cold Water Service) (MR.WM.002_CW_US)
there is no actual flow - 14% error from inline water meter
32 2-6-2016 USF_04
Male Showers/Sinks (CWS) (ENG-G004) (CWS3_US)
Flow recorded by USF when there is no actual flow
33 2-6-2016 USF_06
Lab (CWS) (ENG-G034) (CWS5_US)
Flow recorded by USF when there is no flow, a lot of noise when no flow, 50% error (underpredicting volume)
34 2-6-2016 USF_07
Grey water East CWS top up (CSW6_US)
DateTime 1 hour behind of local time on sql database data and Flow recorded by USF when there is no flow
35 2-6-2016 USF_08
Grey Water West CWS top up (CWS7_US)
DateTime 1 hour behind of local time on sql database data and Flow recorded by USF when there is no flow
36 2-6-2016 USF_09
Complete DHW (Domestic hot Water) (CWS8_US)
Flow recorded by USF when there is no actual flow
37 2-6-2016 USF_03
Female Showers/Sinks (CWS) (ENG-G036) (CWS9_US)
Issues with data transfer partly solved by using ntp server/Flow recorded by USF when there is no actual flow
Problems are related to installation, calibration, read-out, time differences, connection to proprietary databases, etc.
Linate
R2M and VTEC have spent significant time on the transfer of knowledge for the installation and required modifications of the sensors systems. Major difference for these installations is the addition of batteries and GPRS for the remote and independent operation of the USF sensors.
This and the position of the sensors in the Linate Airport proved to be difficult to get them operational. The issues encountered in this pilot are listed below.
Issue Ref. Date**
Unit Reference Location Brief Description of Issue
Sensor Controller Unit Type
1 November
2015
MW3 (portable meter -
data saved locally) BBB USF
Administrative offices. The meters measures the water input of the
administrative building
the BBB not works properly,
the measurement frequency is
unstable and the time / data are
inconsistent
2
February / March 2016
MW3 (normal
USF meter) BBB USF
RCT pumping station. The meters measures
1 water input of the aerostation
the BBB not works properly,
the measurement frequency is
unstable and the time / data are
inconsistent
3
February / march 2016 R1 BBB USF RCT well
the BBB stops to work and to send
data
4 February / R2 BBB USF DeMONTIS well the BBB stops to
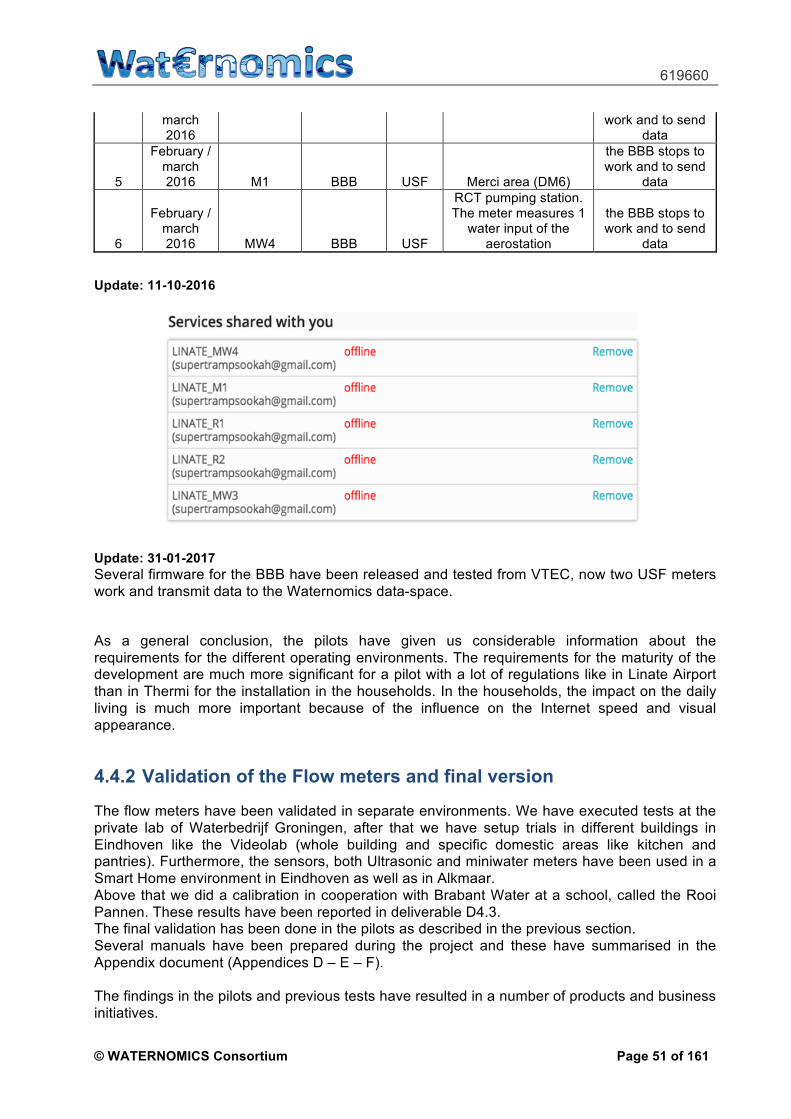
619660
© WATERNOMICS Consortium Page 51 of 161
march 2016
work and to send data
5
February / march 2016 M1 BBB USF Merci area (DM6)
the BBB stops to work and to send
data
6
February / march 2016 MW4 BBB USF
RCT pumping station. The meter measures 1
water input of the aerostation
the BBB stops to work and to send
data
Update: 11-10-2016
Update: 31-01-2017 Several firmware for the BBB have been released and tested from VTEC, now two USF meters work and transmit data to the Waternomics data-space.
As a general conclusion, the pilots have given us considerable information about the requirements for the different operating environments. The requirements for the maturity of the development are much more significant for a pilot with a lot of regulations like in Linate Airport than in Thermi for the installation in the households. In the households, the impact on the daily living is much more important because of the influence on the Internet speed and visual appearance.
4.4.2 Validation of the Flow meters and final version
The flow meters have been validated in separate environments. We have executed tests at the private lab of Waterbedrijf Groningen, after that we have setup trials in different buildings in Eindhoven like the Videolab (whole building and specific domestic areas like kitchen and pantries). Furthermore, the sensors, both Ultrasonic and miniwater meters have been used in a Smart Home environment in Eindhoven as well as in Alkmaar. Above that we did a calibration in cooperation with Brabant Water at a school, called the Rooi Pannen. These results have been reported in deliverable D4.3. The final validation has been done in the pilots as described in the previous section. Several manuals have been prepared during the project and these have summarised in the Appendix document (Appendices D – E – F). The findings in the pilots and previous tests have resulted in a number of products and business initiatives.

619660
© WATERNOMICS Consortium Page 52 of 161
VTEC offers now the Ultrasonic Flowmeter and also the miniwater meter both coupled with BBB as a product (flyer can be found in the appendix – Appendix D-E-F). The selling price for the US Flow meter is, dependent on the volumes, around 1000 €. The mini water meter is offered in combination with a subscription for monitoring the Daily life of elderly people with the possibility to create an alarm when deviations from normal life are detected. The target selling price for the mini water meter for this application is 25€ and a subscription of 3€/month. The product is marketed under the name Yourlifebeacon. New projects, (S-Clusiv and a cooperation between BM-Change, VTEC and Simaxx) are initiated for monitoring the efficient use of energy in buildings where water usage is an additional parameter to be considered. The IoT platform is the technical basis for a new company, ISENSIT, focusing on the fitness and health of workers. For this application, the IOT platform has been extended with other sensors like accelerometers, gyroscopes, temperature, humidity etc. VTEC is also involved in a new project, SMART SYSTEMS, where the IOT platform is offered as a fieldlab for other parties to accelerate their business development by having a fast complete technical/commercial infrastructure to bring their specific, differentiated product to the market.

619660
© WATERNOMICS Consortium Page 53 of 161
5 Conclusions This report points out the Waternomics outcomes. The results as a whole represent an integrated system through which every kind of organization can achieve the goal of increasing water awareness and reducing its water consumption.
In detail this report has outlined the following:
- Methodology: It’s a novel aspect in the water sector and the tools, references and best practices gathered from the application in the project pilot sites. It details a useful guideline to assist organizations in the construction and implementation of water management programs and the execution of water efficiency measures. The final methodology presented consists of five phases: Assess, Plan, Do, Check, Act. The methodology is based on standards so that the approach overall has a higher likelihood of adoption, uptake and replication. Also a user friendly visualization mode of the methodology is presented: the Waternomics methodology Trello Board. It consists in a web based management tool that replicates the methodology phases to help the end-users in the implementation of WEMs. U4 and R2M are working together to explore the possibility to introduce the Methodology as a service in the market to help organizations to be compliant with existing and new standards.
- Waternomics Application Platform (WApP): In order to implement a WMS and WEMs it’s important to make users aware of their water consumption. Only this knowledge can lead to a change of users’ behaviour and can increase their awareness of the importance of safeguarding water resources. This is the objective of the Waternomics project and we can define the WApP the tool through which Waternomics achieves this objective. The Platform is targeted to different end-users and it is customizable to meet all the different users’ needs. Moreover, the WApP offers a unique and easy way to understand the water consumption through comparisons, metaphors and user-friendly graphs. The execution of the WApP in the four pilot sites leads to an effective improvement of the platform and the final version really is able to address all the users’ requests and their necessities of water consumption knowledge. U4 and R2M are working together to explore the possibility to introduce the WApP merged with the Methodology as a service in the market to help organizations to implement a smart water system.
- Data management and analysis: A Data Management Platform (DMP) has been developed, refined with the pilots’ feedback and implemented to support the overall Waternomics project. In order to allow a handover and the exploitation of both the Waternomics activities and outcomes this work also presents a detailed Data Management Plan.
- Fault detection and diagnosis: NUIG pilot test results of the rule-based fault detection for too long retention time, show the effective working of the application and its notification system. In the same time Linate test results of the model-based fault detection and diagnosis algorithm on Linate airport water-system model data, for some real scenarios simulated, show that the method works well. The algorithm provides higher accuracy when detecting localized leakages than with multiple leakages at the same time. However, the Model-based FDD need more effort to improve the leakage localization and it should be integrated in the Waternomics Application Platform. In consideration of the positive feedback from the Linate airport operator and external stakeholders, R2M is going to invest more effort and research to introduce this FDD method in the market.
- Acoustic Leakage detection: test results of the newly developed acoustic detection method in some households in the Netherlands showed that the methods works relatively well but more effort needs to be spent in order to introduce it in the market. This has been taken up in post-project exploitation activities.
- Flow meters: this work demonstrated that in deploying a new generation of flow meters a lot of problem have to be faced in the real pilot test field. However, all the problems
619660
© WATERNOMICS Consortium Page 54 of 161
encountered lead to an improvement of both the hardware and the software. Every step forward is a step closer to the commercialization of the product. This is clear also by considering the great amount of guideline / troubleshooting materials developed for future clients.
Now that the Waternomics outcomes are assessed, implemented for the first time in the project pilot activities which include domestic, municipal and corporate settings, and improved with the lessons learnt from the pilot tests; the Waternomics overall system can be one step and contribution in the development of a Smart Water Management System that lead to increase users’ awareness regarding their water consumption and so to an overall behaviour change.
Some aspects of the outcomes (such as leakage detection and FDD) need further effort to meet in the best way the market needs but the future plans of some of the Waternomics consortium partners are working in this way by exploring new market opportunities and new funded projects in order to increase the technology readiness and maturity levels.
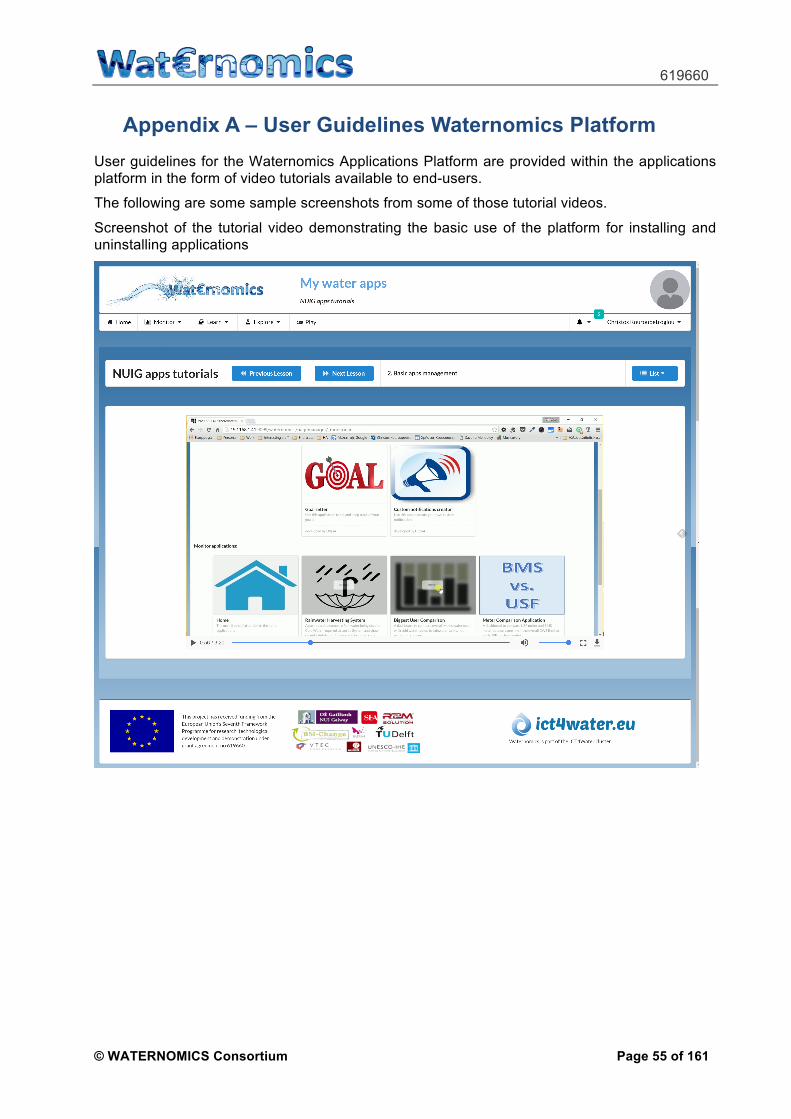
619660
© WATERNOMICS Consortium Page 55 of 161
Appendix A – User Guidelines Waternomics Platform User guidelines for the Waternomics Applications Platform are provided within the applications platform in the form of video tutorials available to end-users.
The following are some sample screenshots from some of those tutorial videos.
Screenshot of the tutorial video demonstrating the basic use of the platform for installing and uninstalling applications

619660
© WATERNOMICS Consortium Page 56 of 161
Screenshot of the tutorial video demonstrating the result of using a multiple points graph component

619660
© WATERNOMICS Consortium Page 57 of 161
Screenshot of the video tutorials in Greek for Thermi.

619660
© WATERNOMICS Consortium Page 58 of 161
Appendix B – Description of project datasets
WP / Task & Data Manager WP2 / T2.2: Methodology Design� / R2M
Data set reference/name Methodology framework
Mandatory Metadata European Union
FP7
WATERNOMICS:619660
Data set Specific Metadata (keyword(s) that categorize data to make it linked/searchable)
Waternomics Standard-Based Methodology
Data set description (data description, origin, nature, scale, if it underpins a publication, who useful to, existence of similar data, possibilities for reuse)
The Methodology, introduced in the deliverable D2.1_”WATERNOMICS Methodology”, is targeted to fill the gap in the water sector where not many standards are available for implementing a WMP. The methodology provides a basis for water management improvement and effectively shows how different standards, also taken from energy sector, can drive organizations and households to use water more efficiently.
Standards and metadata (reference to existing standards in topic area governing data collection, aggregation, storage and sharing)
ISO 50001
ISO 50002
IPMVP
ISO 14046
Data sharing (how data will be shared, identification of repository, existence of embargo period if any, identification of software or tools necessary for reuse)
Results from the T2.2 will be stored on Waternomics Dropbox
folder (project share point). Graphs and tables utilized to
summarize results of the Methodology may be included within
PU reports and available in online management tool named
“Trello Board”
Archiving and preservation (storage/backup): (procedure for long-term
preservation, length of preservation, estimation of costs and how covered)
Manage through DROPBOX service

619660
© WATERNOMICS Consortium Page 59 of 161
WP / Task & Data Manager WP4 / T4.4: Fault Detection and Diagnosis� / R2M
Data set reference/name Fault Detection and Diagnosys (FDD)
Mandatory Metadata European Union
FP7
WATERNOMICS:619660
Data set Specific Metadata (keyword(s) that categorize data to make it linked/searchable)
Waternomics Rule Based and Model Based FDD
Data set description (data description, origin, nature, scale, if it underpins a publication, who useful to, existence of similar data, possibilities for reuse)
The Fault Detection and Diagnosis, introduced in the
deliverable D4.2_”Analysis (leak detection, FDD rules, and
drought monitoring analysis applications) ”, is targeted to
develop a more efficient Water Management System through
the development of methods to implement fault detection in
the water network (e.g. pipe break, water leakage, abnormal
pressure or consumption). When faults are detected early,
corrective actions can be taken resulting in more sustainable
water management through avoiding the waste of natural
resources and consequent economical losses
Standards and metadata (reference to existing standards in topic area governing data collection, aggregation, storage and sharing)
No specific standards for these data, but where relevant, will
comply with ISO data management and transfer practices
(http://www.iso.org/iso/iso_catalogue/catalogue_tc/catalogu
e_tc_browse.htm?commid=45342 ) when managing data.
Data sharing (how data will be shared, identification of repository, existence of embargo period if any, identification of software or tools necessary for reuse)
Results from the T4.4 will be stored on Waternomics Dropbox
folder (project share point). Graphs, tables, Algorithms and
methods utilized to achieve the results in the early detection of
faults in the water system are classified as “confidential” and a
summary may be included within PU reports or scientific
publications.
Archiving and preservation (storage/backup): (procedure for long-term
preservation, length of preservation, estimation of costs and how covered)
Manage through DROPBOX service
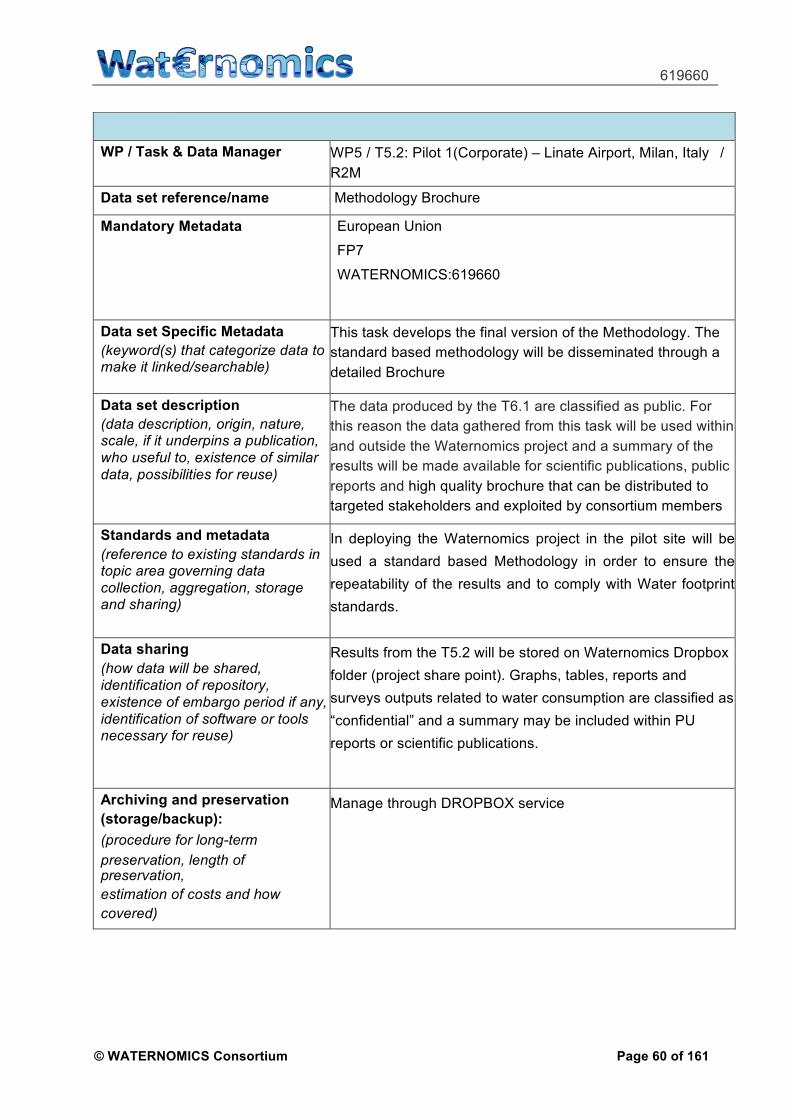
619660
© WATERNOMICS Consortium Page 60 of 161
WP / Task & Data Manager WP5 / T5.2: Pilot 1(Corporate) – Linate Airport, Milan, Italy� /
R2M
Data set reference/name Methodology Brochure
Mandatory Metadata European Union
FP7
WATERNOMICS:619660
Data set Specific Metadata (keyword(s) that categorize data to make it linked/searchable)
This task develops the final version of the Methodology. The
standard based methodology will be disseminated through a
detailed Brochure
Data set description (data description, origin, nature, scale, if it underpins a publication, who useful to, existence of similar data, possibilities for reuse)
The data produced by the T6.1 are classified as public. For
this reason the data gathered from this task will be used within
and outside the Waternomics project and a summary of the
results will be made available for scientific publications, public
reports and high quality brochure that can be distributed to
targeted stakeholders and exploited by consortium members promoted by ACI.
Standards and metadata (reference to existing standards in topic area governing data collection, aggregation, storage and sharing)
In deploying the Waternomics project in the pilot site will be
used a standard based Methodology in order to ensure the
repeatability of the results and to comply with Water footprint
standards.
Data sharing (how data will be shared, identification of repository, existence of embargo period if any, identification of software or tools necessary for reuse)
Results from the T5.2 will be stored on Waternomics Dropbox
folder (project share point). Graphs, tables, reports and
surveys outputs related to water consumption are classified as
“confidential” and a summary may be included within PU
reports or scientific publications.
Archiving and preservation (storage/backup): (procedure for long-term
preservation, length of preservation, estimation of costs and how covered)
Manage through DROPBOX service
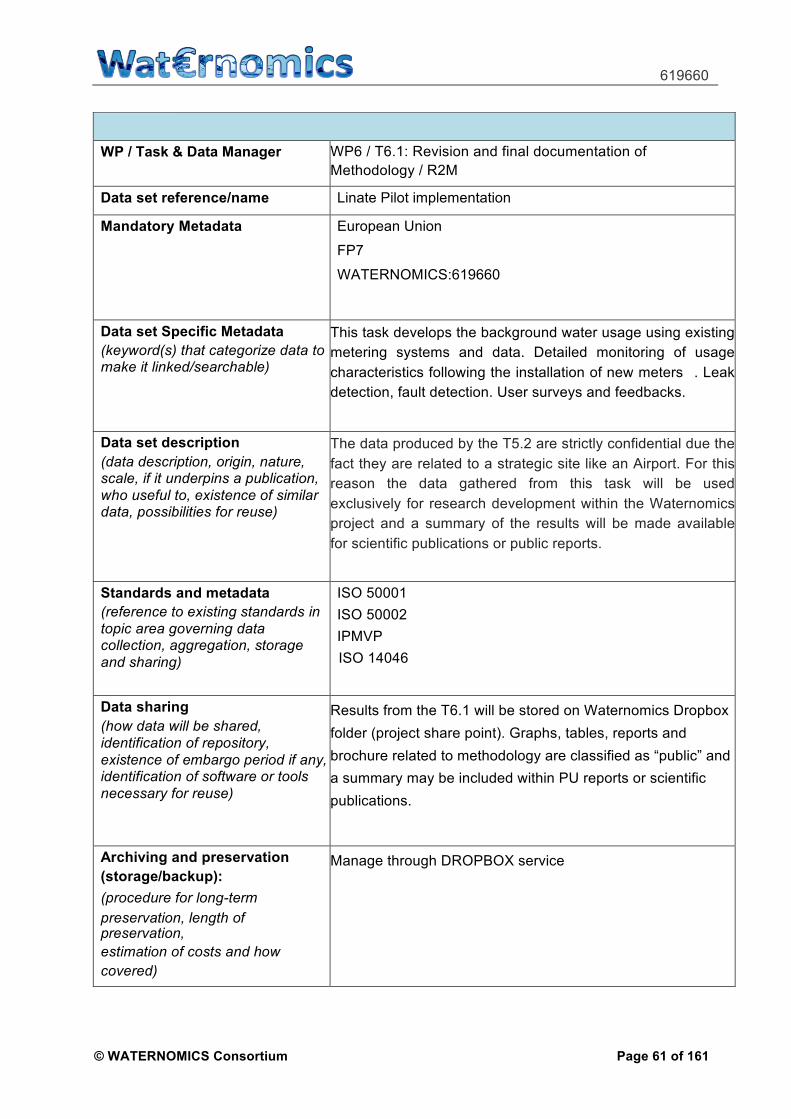
619660
© WATERNOMICS Consortium Page 61 of 161
WP / Task & Data Manager WP6 / T6.1: Revision and final documentation of
Methodology / R2M
Data set reference/name Linate Pilot implementation
Mandatory Metadata European Union
FP7
WATERNOMICS:619660
Data set Specific Metadata (keyword(s) that categorize data to make it linked/searchable)
This task develops the background water usage using existing
metering systems and data. Detailed monitoring of usage
characteristics following the installation of new meters� . Leak
detection, fault detection. User surveys and feedbacks.
Data set description (data description, origin, nature, scale, if it underpins a publication, who useful to, existence of similar data, possibilities for reuse)
The data produced by the T5.2 are strictly confidential due the
fact they are related to a strategic site like an Airport. For this
reason the data gathered from this task will be used
exclusively for research development within the Waternomics
project and a summary of the results will be made available
for scientific publications or public reports.
Standards and metadata (reference to existing standards in topic area governing data collection, aggregation, storage and sharing)
ISO 50001
ISO 50002
IPMVP
ISO 14046
Data sharing (how data will be shared, identification of repository, existence of embargo period if any, identification of software or tools necessary for reuse)
Results from the T6.1 will be stored on Waternomics Dropbox
folder (project share point). Graphs, tables, reports and
brochure related to methodology are classified as “public” and
a summary may be included within PU reports or scientific
publications.
Archiving and preservation (storage/backup): (procedure for long-term
preservation, length of preservation, estimation of costs and how covered)
Manage through DROPBOX service

619660
© WATERNOMICS Consortium Page 62 of 161
Entities meta data from NEB pilot
WP / Task & Data Manager WP3
Data set reference/name http://vmwaternomics02.deri.ie:8001/dataset/neb-entities
Mandatory Metadata
Data set Specific Metadata (keyword(s) that categorize data to make it linked/searchable)
Identifier, Type, Description, Parent, Alternative Name, SubType, Location, Monitors Outlet and UserGroup (details can be found in D3.1.2)
Data set description (data description, origin, nature, scale, if it underpins a publication, who useful to, existence of similar data, possibilities for reuse)
The data set contains all entities in this pilot: locations,
sensors, user groups and water outlets)
Standards and metadata (reference to existing standards in topic area governing data collection, aggregation, storage and sharing)
Data is available in WKAN (Waternomics data catalog –
See D3.1.2 and D3.2)
Data is available in 3 formats: CSV, RDF/XML and RDF/N3
Data sharing (how data will be shared, identification of repository, existence of embargo period if any, identification of software or tools necessary for reuse)
Data can be queried from WKAN (See D3.1.2, D3.2 and
CKAN documentation for details)
Archiving and preservation (storage/backup): (procedure for long-term
preservation, length of preservation, estimation of costs and how covered)
The data will be available until the end of the project on this
repository. There is no guarantee to keep the data after the
end of the project. The original files containing the data sets
are available in Google drive.
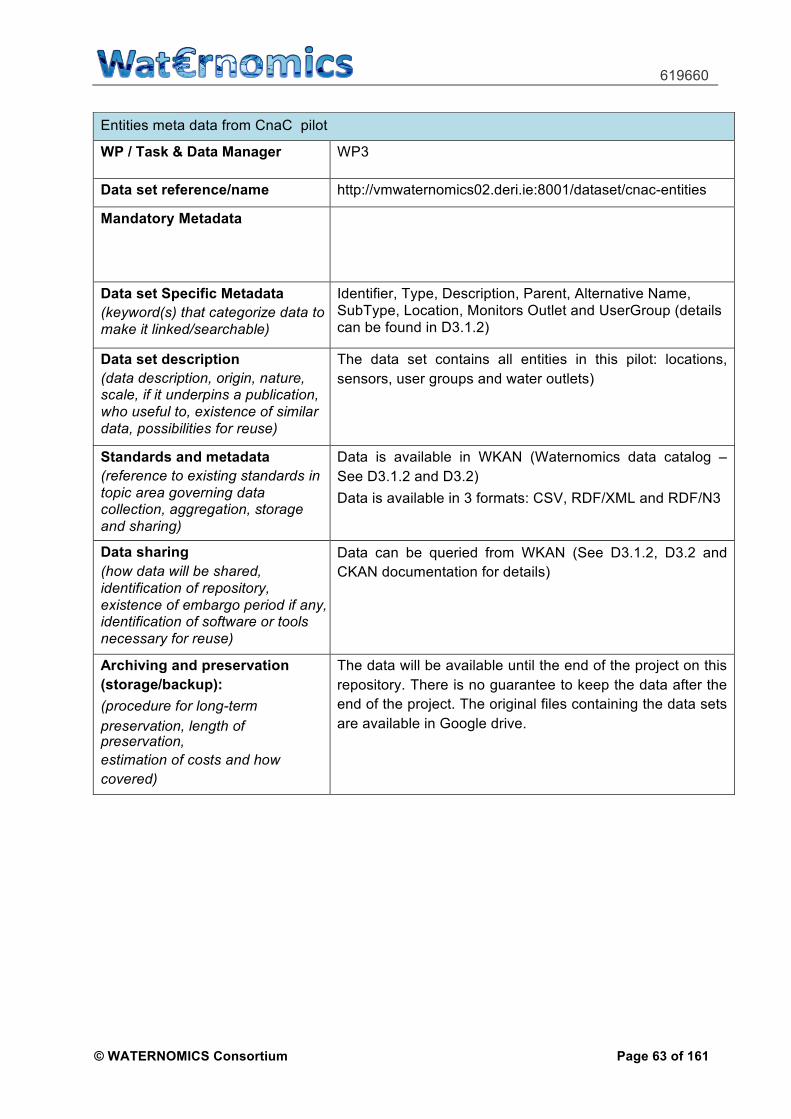
619660
© WATERNOMICS Consortium Page 63 of 161
Entities meta data from CnaC pilot
WP / Task & Data Manager WP3
Data set reference/name http://vmwaternomics02.deri.ie:8001/dataset/cnac-entities
Mandatory Metadata
Data set Specific Metadata (keyword(s) that categorize data to make it linked/searchable)
Identifier, Type, Description, Parent, Alternative Name, SubType, Location, Monitors Outlet and UserGroup (details can be found in D3.1.2)
Data set description (data description, origin, nature, scale, if it underpins a publication, who useful to, existence of similar data, possibilities for reuse)
The data set contains all entities in this pilot: locations,
sensors, user groups and water outlets)
Standards and metadata (reference to existing standards in topic area governing data collection, aggregation, storage and sharing)
Data is available in WKAN (Waternomics data catalog –
See D3.1.2 and D3.2)
Data is available in 3 formats: CSV, RDF/XML and RDF/N3
Data sharing (how data will be shared, identification of repository, existence of embargo period if any, identification of software or tools necessary for reuse)
Data can be queried from WKAN (See D3.1.2, D3.2 and
CKAN documentation for details)
Archiving and preservation (storage/backup): (procedure for long-term
preservation, length of preservation, estimation of costs and how covered)
The data will be available until the end of the project on this
repository. There is no guarantee to keep the data after the
end of the project. The original files containing the data sets
are available in Google drive.

619660
© WATERNOMICS Consortium Page 64 of 161
Entities meta data from Thermi pilot
WP / Task & Data Manager WP3
Data set reference/name http://vmwaternomics02.deri.ie:8001/organization/municipality-of-thermi
Mandatory Metadata
Data set Specific Metadata (keyword(s) that categorize data to make it linked/searchable)
Identifier, Type, Description, Parent, Alternative Name, SubType, Location, Monitors Outlet and UserGroup (details can be found in D3.1.2)
Data set description (data description, origin, nature, scale, if it underpins a publication, who useful to, existence of similar data, possibilities for reuse)
The data set contains all entities in this pilot: locations,
sensors, user groups and water outlets)
Standards and metadata (reference to existing standards in topic area governing data collection, aggregation, storage and sharing)
Data is available in WKAN (Waternomics data catalog –
See D3.1.2 and D3.2)
Data is available in 3 formats: CSV, RDF/XML and RDF/N3
Data sharing (how data will be shared, identification of repository, existence of embargo period if any, identification of software or tools necessary for reuse)
Data can be queried from WKAN (See D3.1.2, D3.2 and
CKAN documentation for details)
Archiving and preservation (storage/backup): (procedure for long-term
preservation, length of preservation, estimation of costs and how covered)
The data will be available until the end of the project on this
repository. There is no guarantee to keep the data after the
end of the project. The original files containing the data sets
are available in Google drive.
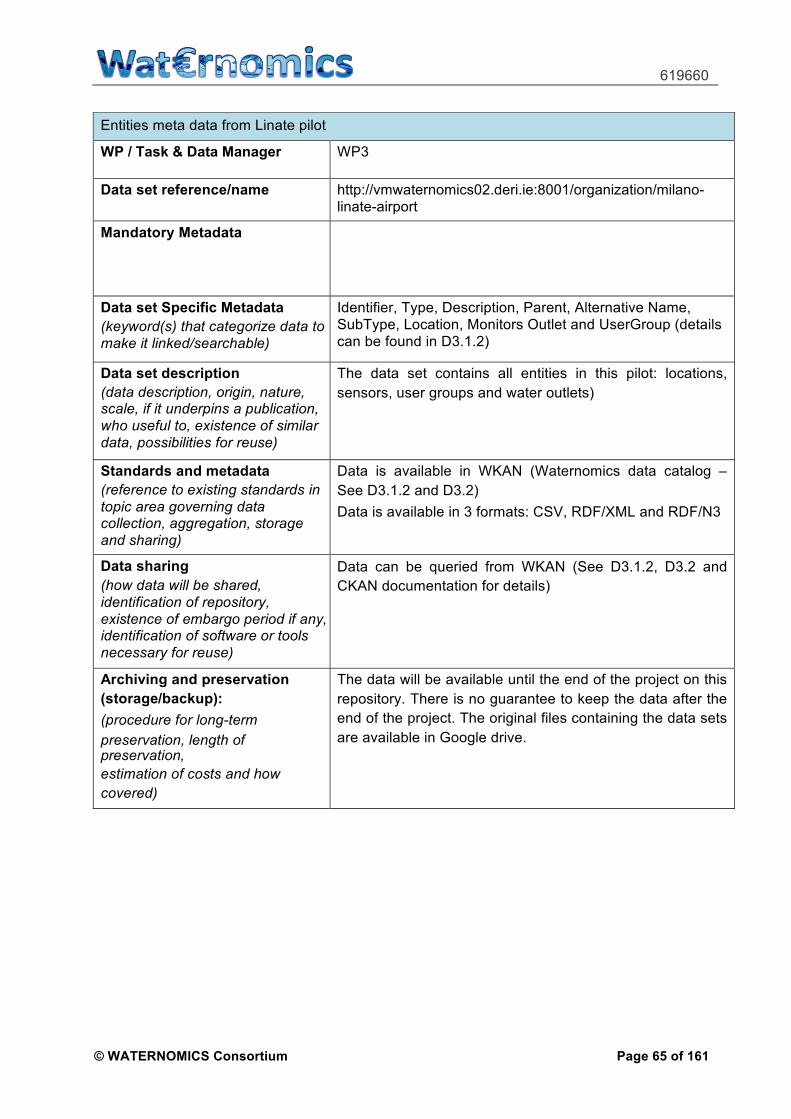
619660
© WATERNOMICS Consortium Page 65 of 161
Entities meta data from Linate pilot
WP / Task & Data Manager WP3
Data set reference/name http://vmwaternomics02.deri.ie:8001/organization/milano-linate-airport
Mandatory Metadata
Data set Specific Metadata (keyword(s) that categorize data to make it linked/searchable)
Identifier, Type, Description, Parent, Alternative Name, SubType, Location, Monitors Outlet and UserGroup (details can be found in D3.1.2)
Data set description (data description, origin, nature, scale, if it underpins a publication, who useful to, existence of similar data, possibilities for reuse)
The data set contains all entities in this pilot: locations,
sensors, user groups and water outlets)
Standards and metadata (reference to existing standards in topic area governing data collection, aggregation, storage and sharing)
Data is available in WKAN (Waternomics data catalog –
See D3.1.2 and D3.2)
Data is available in 3 formats: CSV, RDF/XML and RDF/N3
Data sharing (how data will be shared, identification of repository, existence of embargo period if any, identification of software or tools necessary for reuse)
Data can be queried from WKAN (See D3.1.2, D3.2 and
CKAN documentation for details)
Archiving and preservation (storage/backup): (procedure for long-term
preservation, length of preservation, estimation of costs and how covered)
The data will be available until the end of the project on this
repository. There is no guarantee to keep the data after the
end of the project. The original files containing the data sets
are available in Google drive.

619660
© WATERNOMICS Consortium Page 66 of 161
Sensor data from NEB pilot
WP / Task & Data Manager WP3
Data set reference/name http://vmwaternomics02.deri.ie:8001/dataset/neb-druid-sources
Mandatory Metadata
Data set Specific Metadata (keyword(s) that categorize data to make it linked/searchable)
Timestamp and readingValue
Data set description (data description, origin, nature, scale, if it underpins a publication, who useful to, existence of similar data, possibilities for reuse)
The data set contains the data sources for sensor readings
for this pilot.
Standards and metadata (reference to existing standards in topic area governing data collection, aggregation, storage and sharing)
Data is available in WKAN (Waternomics data catalog –
See D3.1.2 and D3.2)
The actual sensor data can be queried via DRUID or the
Analytics service (See D3.1.2 and D3.2)
Data sharing (how data will be shared, identification of repository, existence of embargo period if any, identification of software or tools necessary for reuse)
Data sources can be queried from WKAN (See D3.1.2, D3.2
and CKAN documentation for details) and the actual sensor
readings can be querried via DRUID or the Analytics service
(See D3.1.2 and D3.2)
Archiving and preservation (storage/backup): (procedure for long-term
preservation, length of preservation, estimation of costs and how covered)
A backup mechanism is put in place to keep original data at
INSIGHT @ NUIG servers.
The data will be available until the end of the project on this
repository. There is no guarantee to keep the data after the
end of the project.

619660
© WATERNOMICS Consortium Page 67 of 161
Sensor data from CNAC pilot
WP / Task & Data Manager WP3
Data set reference/name http://vmwaternomics02.deri.ie:8001/dataset/cnac-druid-sources
Mandatory Metadata
Data set Specific Metadata (keyword(s) that categorize data to make it linked/searchable)
Timestamp and readingValue
Data set description (data description, origin, nature, scale, if it underpins a publication, who useful to, existence of similar data, possibilities for reuse)
The data set contains the data sources for sensor readings
for this pilot.
Standards and metadata (reference to existing standards in topic area governing data collection, aggregation, storage and sharing)
Data is available in WKAN (Waternomics data catalog –
See D3.1.2 and D3.2)
The actual sensor data can be queried via DRUID or the
Analytics service (See D3.1.2 and D3.2)
Data sharing (how data will be shared, identification of repository, existence of embargo period if any, identification of software or tools necessary for reuse)
Data sources can be queried from WKAN (See D3.1.2, D3.2
and CKAN documentation for details) and the actual sensor
readings can be querried via DRUID or the Analytics service
(See D3.1.2 and D3.2)
Archiving and preservation (storage/backup): (procedure for long-term
preservation, length of preservation, estimation of costs and how covered)
A backup mechanism is put in place to keep original data at
INSIGHT @ NUIG servers.
The data will be available until the end of the project on this
repository. There is no guarantee to keep the data after the
end of the project.

619660
© WATERNOMICS Consortium Page 68 of 161
Sensor data from Thermi pilot
WP / Task & Data Manager WP3
Data set reference/name http://vmwaternomics02.deri.ie:8001/dataset/thermi-druid-sources
Mandatory Metadata
Data set Specific Metadata (keyword(s) that categorize data to make it linked/searchable)
Timestamp and readingValue
Data set description (data description, origin, nature, scale, if it underpins a publication, who useful to, existence of similar data, possibilities for reuse)
The data set contains the data sources for sensor readings
for this pilot.
Standards and metadata (reference to existing standards in topic area governing data collection, aggregation, storage and sharing)
Data is available in WKAN (Waternomics data catalog –
See D3.1.2 and D3.2)
The actual sensor data can be queried via DRUID or the
Analytics service (See D3.1.2 and D3.2)
Data sharing (how data will be shared, identification of repository, existence of embargo period if any, identification of software or tools necessary for reuse)
Data sources can be queried from WKAN (See D3.1.2, D3.2
and CKAN documentation for details) and the actual sensor
readings can be querried via DRUID or the Analytics service
(See D3.1.2 and D3.2)
Archiving and preservation (storage/backup): (procedure for long-term
preservation, length of preservation, estimation of costs and how covered)
A backup mechanism is put in place to keep original data at
INSIGHT @ NUIG servers.
The data will be available until the end of the project on this
repository. There is no guarantee to keep the data after the
end of the project.

619660
© WATERNOMICS Consortium Page 69 of 161
Sensor data from Linate pilot
WP / Task & Data Manager WP3
Data set reference/name http://vmwaternomics02.deri.ie:8001/dataset/linate-druid-sources
Mandatory Metadata
Data set Specific Metadata (keyword(s) that categorize data to make it linked/searchable)
Timestamp and readingValue
Data set description (data description, origin, nature, scale, if it underpins a publication, who useful to, existence of similar data, possibilities for reuse)
The data set contains the data sources for sensor readings
for this pilot.
Standards and metadata (reference to existing standards in topic area governing data collection, aggregation, storage and sharing)
Data is available in WKAN (Waternomics data catalog –
See D3.1.2 and D3.2)
The actual sensor data can be queried via DRUID or the
Analytics service (See D3.1.2 and D3.2)
Data sharing (how data will be shared, identification of repository, existence of embargo period if any, identification of software or tools necessary for reuse)
Data sources can be queried from WKAN (See D3.1.2, D3.2
and CKAN documentation for details) and the actual sensor
readings can be querried via DRUID or the Analytics service
(See D3.1.2 and D3.2)
Archiving and preservation (storage/backup): (procedure for long-term
preservation, length of preservation, estimation of costs and how covered)
A backup mechanism is put in place to keep original data at
INSIGHT @ NUIG servers.
The data will be available until the end of the project on this
repository. There is no guarantee to keep the data after the
end of the project.
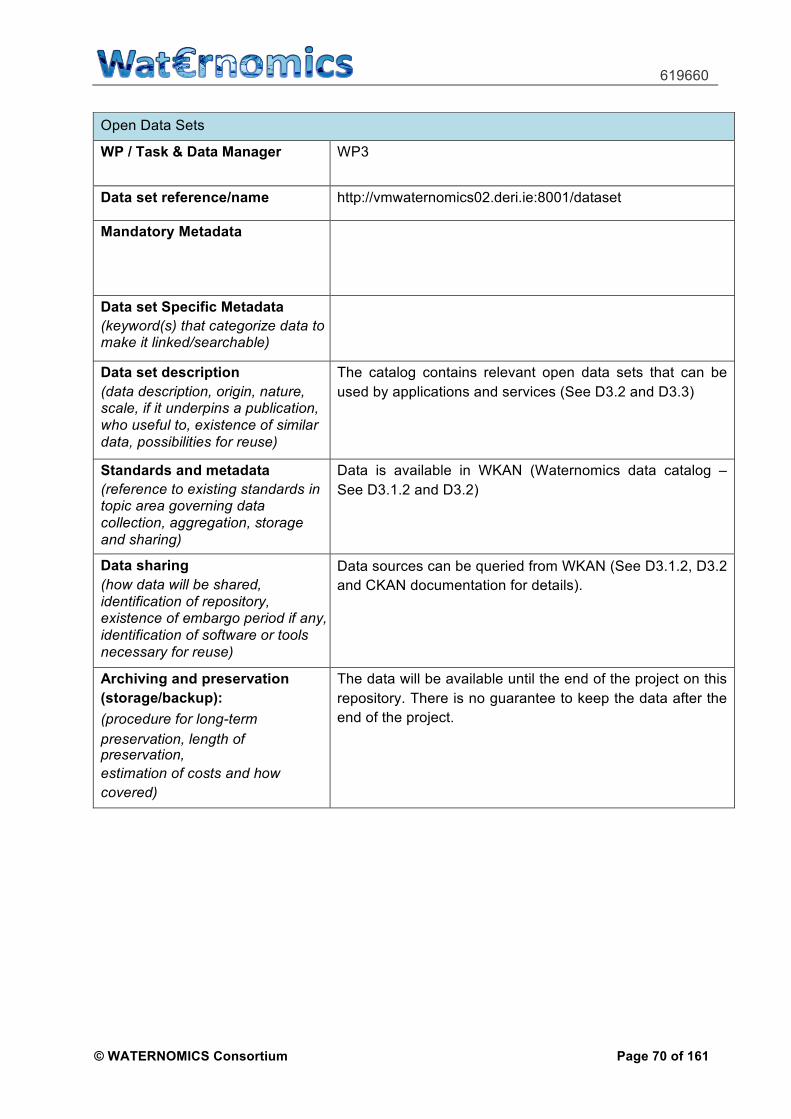
619660
© WATERNOMICS Consortium Page 70 of 161
Open Data Sets
WP / Task & Data Manager WP3
Data set reference/name http://vmwaternomics02.deri.ie:8001/dataset
Mandatory Metadata
Data set Specific Metadata (keyword(s) that categorize data to make it linked/searchable)
Data set description (data description, origin, nature, scale, if it underpins a publication, who useful to, existence of similar data, possibilities for reuse)
The catalog contains relevant open data sets that can be
used by applications and services (See D3.2 and D3.3)
Standards and metadata (reference to existing standards in topic area governing data collection, aggregation, storage and sharing)
Data is available in WKAN (Waternomics data catalog –
See D3.1.2 and D3.2)
Data sharing (how data will be shared, identification of repository, existence of embargo period if any, identification of software or tools necessary for reuse)
Data sources can be queried from WKAN (See D3.1.2, D3.2
and CKAN documentation for details).
Archiving and preservation (storage/backup): (procedure for long-term
preservation, length of preservation, estimation of costs and how covered)
The data will be available until the end of the project on this
repository. There is no guarantee to keep the data after the
end of the project.
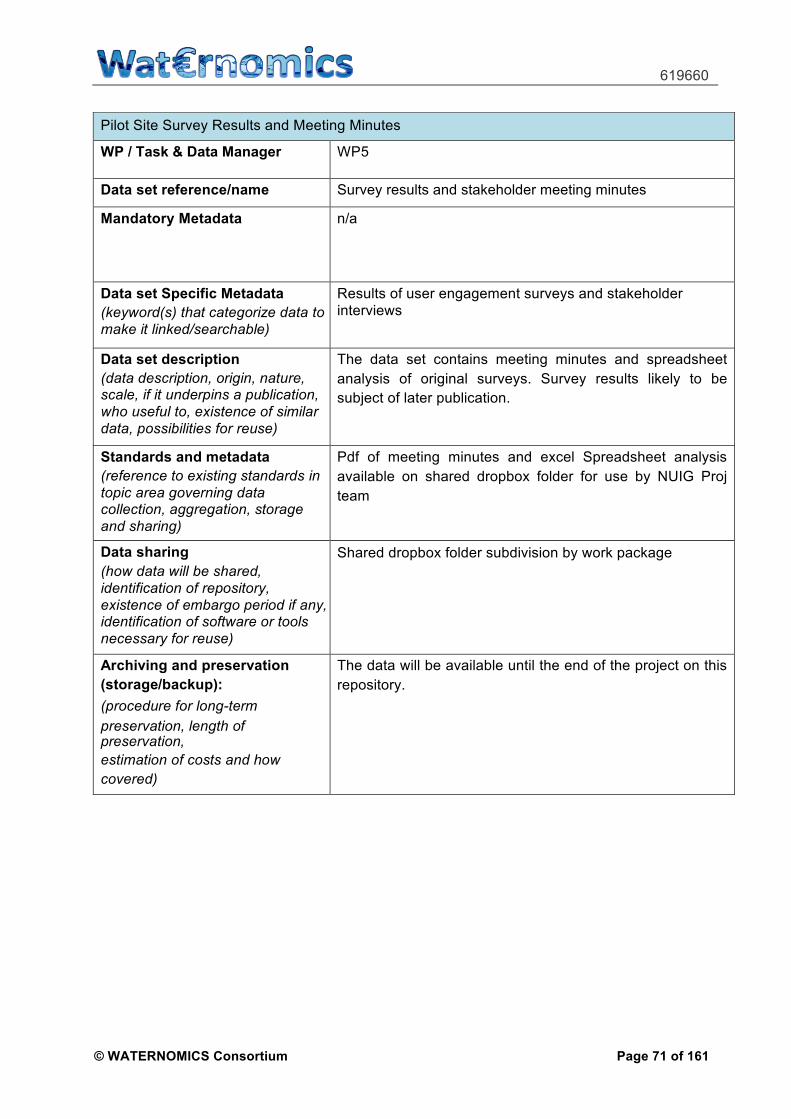
619660
© WATERNOMICS Consortium Page 71 of 161
Pilot Site Survey Results and Meeting Minutes
WP / Task & Data Manager WP5
Data set reference/name Survey results and stakeholder meeting minutes
Mandatory Metadata n/a
Data set Specific Metadata (keyword(s) that categorize data to make it linked/searchable)
Results of user engagement surveys and stakeholder interviews
Data set description (data description, origin, nature, scale, if it underpins a publication, who useful to, existence of similar data, possibilities for reuse)
The data set contains meeting minutes and spreadsheet
analysis of original surveys. Survey results likely to be
subject of later publication.
Standards and metadata (reference to existing standards in topic area governing data collection, aggregation, storage and sharing)
Pdf of meeting minutes and excel Spreadsheet analysis
available on shared dropbox folder for use by NUIG Proj
team
Data sharing (how data will be shared, identification of repository, existence of embargo period if any, identification of software or tools necessary for reuse)
Shared dropbox folder subdivision by work package
Archiving and preservation (storage/backup): (procedure for long-term
preservation, length of preservation, estimation of costs and how covered)
The data will be available until the end of the project on this
repository.

619660
© WATERNOMICS Consortium Page 72 of 161
Layout Drawings and Installation Documents
WP / Task & Data Manager WP5
Data set reference/name Layout Drawings and Installation Documents
Mandatory Metadata n/a
Data set Specific Metadata (keyword(s) that categorize data to make it linked/searchable)
Layout drawings indicating installation of new metering equipment
Data set description (data description, origin, nature, scale, if it underpins a publication, who useful to, existence of similar data, possibilities for reuse)
The data set contains layout drawings and installation
documentation for pilot site installations.
Standards and metadata (reference to existing standards in topic area governing data collection, aggregation, storage and sharing)
Available as Pdf on shared dropbox folder for use by NUIG
Proj team
Data sharing (how data will be shared, identification of repository, existence of embargo period if any, identification of software or tools necessary for reuse)
Shared dropbox folder subdivision by work package
Archiving and preservation (storage/backup): (procedure for long-term
preservation, length of preservation, estimation of costs and how covered)
The data will be available until the end of the project on this
repository.
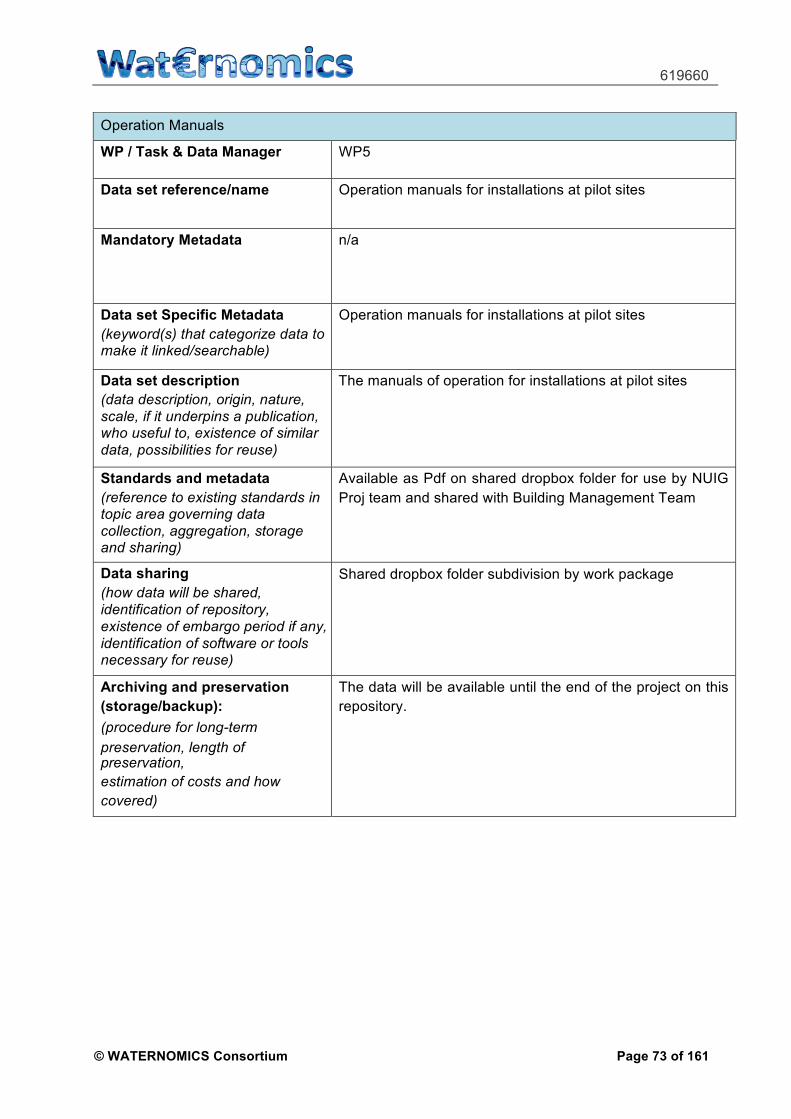
619660
© WATERNOMICS Consortium Page 73 of 161
Operation Manuals
WP / Task & Data Manager WP5
Data set reference/name Operation manuals for installations at pilot sites
Mandatory Metadata n/a
Data set Specific Metadata (keyword(s) that categorize data to make it linked/searchable)
Operation manuals for installations at pilot sites
Data set description (data description, origin, nature, scale, if it underpins a publication, who useful to, existence of similar data, possibilities for reuse)
The manuals of operation for installations at pilot sites
Standards and metadata (reference to existing standards in topic area governing data collection, aggregation, storage and sharing)
Available as Pdf on shared dropbox folder for use by NUIG
Proj team and shared with Building Management Team
Data sharing (how data will be shared, identification of repository, existence of embargo period if any, identification of software or tools necessary for reuse)
Shared dropbox folder subdivision by work package
Archiving and preservation (storage/backup): (procedure for long-term
preservation, length of preservation, estimation of costs and how covered)
The data will be available until the end of the project on this
repository.

619660
© WATERNOMICS Consortium Page 74 of 161
Appendix C – User Guidelines – DSS tool
WATERNOMICS MODEL BASED FDD
Decision Support System (DSS) Guideline
Page 1/21
R 2 M S o l u t i o n s . r . l . | V i a F r a t e l l i C u z i o , 4 2 | 2 7 1 0 0 P a v i a | I t a l y | V A T R e g . N o . : 0 4 9 9 8 3 8 0 8 7 9 | w w w . r 2 m s o l u t i o n . c o m
P a v i a | C a t a n i a | L o n d o n | M a d r i d
A l l r i g h t s r e s e r v e d | T u t t i i c o n t e n u t i d i q u e s t o d o c u m e n t o d a l d i r i t t o d ’ a u t o r e p r e v i s t o a i s e n s i d i l e g g e ( L e g g e 2 2 a p r i l e 1 9 4 1 n . 6 3 3 )
DECISION SUPPORT SYSTEM GUIDELINE
The Decision Support System (DSS) application is the result of the collaboration between Waternomics Project and IceWater project. In detail the Waternomics project provided the hydraulic model simulation in Epanet of the Linate Water network while the IceWater project provided the visualization software. The availability of a hydraulic simulation model of the water network has multiple advantages. Such a model can be used as a DSS component by itself, for testing various operational strategies in a pure simulation mode (testing different strategies in a ‘what-if’ manner). The users have the opportunity to run hydraulic simulation scenarios by changing the input in the Epanet software by using a user-friendly visualization mode. The application also supports a georeferenced map of the existing water network and obtains information data from every single pipe or meter installed within it. The DSS tool is available in the Waternomics Applications Platform (WApP). In the following a detailed guideline on how to use the tool is provided.
619660
© WATERNOMICS Consortium Page 75 of 161
WATERNOMICS MODEL BASED FDD
Decision Support System (DSS) Guideline
Page 2/21
R 2 M S o l u t i o n s . r . l . | V i a F r a t e l l i C u z i o , 4 2 | 2 7 1 0 0 P a v i a | I t a l y | V A T R e g . N o . : 0 4 9 9 8 3 8 0 8 7 9 | w w w . r 2 m s o l u t i o n . c o m
P a v i a | C a t a n i a | L o n d o n | M a d r i d
A l l r i g h t s r e s e r v e d | T u t t i i c o n t e n u t i d i q u e s t o d o c u m e n t o d a l d i r i t t o d ’ a u t o r e p r e v i s t o a i s e n s i d i l e g g e ( L e g g e 2 2 a p r i l e 1 9 4 1 n . 6 3 3 )
Wternomics&IceWatercollaborationEpanetDSSHandout

619660
© WATERNOMICS Consortium Page 76 of 161
WATERNOMICS MODEL BASED FDD
Decision Support System (DSS) Guideline
Page 3/21
R 2 M S o l u t i o n s . r . l . | V i a F r a t e l l i C u z i o , 4 2 | 2 7 1 0 0 P a v i a | I t a l y | V A T R e g . N o . : 0 4 9 9 8 3 8 0 8 7 9 | w w w . r 2 m s o l u t i o n . c o m
P a v i a | C a t a n i a | L o n d o n | M a d r i d
A l l r i g h t s r e s e r v e d | T u t t i i c o n t e n u t i d i q u e s t o d o c u m e n t o d a l d i r i t t o d ’ a u t o r e p r e v i s t o a i s e n s i d i l e g g e ( L e g g e 2 2 a p r i l e 1 9 4 1 n . 6 3 3 )
1 Step 1. Access to the DSS tool ................................................................................................ 5
2 Step 2. Linate case selection .................................................................................................... 6
3 Step 3. Main GUI of Hydraulic Simulation after case is selected .......................................... 6
4 Step 4. Nodes element .............................................................................................................. 7
5 Step 5. Node Pattern Display .................................................................................................... 9
6 Step 6. Links element .............................................................................................................. 10
7 Step 7. Pumps element ........................................................................................................... 11
8 Step 8. Valves element ............................................................................................................ 13
9 Step 9. Option .......................................................................................................................... 14
10 Step 10. Pattern ..................................................................................................................... 15
11 Step 11. Save and SaveAs page ........................................................................................... 17
12 Step 12. Display Map Results ............................................................................................... 19
13 Step 13. Display Chart Results ............................................................................................. 21

619660
© WATERNOMICS Consortium Page 77 of 161
WATERNOMICS MODEL BASED FDD
Decision Support System (DSS) Guideline
Page 4/21
R 2 M S o l u t i o n s . r . l . | V i a F r a t e l l i C u z i o , 4 2 | 2 7 1 0 0 P a v i a | I t a l y | V A T R e g . N o . : 0 4 9 9 8 3 8 0 8 7 9 | w w w . r 2 m s o l u t i o n . c o m
P a v i a | C a t a n i a | L o n d o n | M a d r i d
A l l r i g h t s r e s e r v e d | T u t t i i c o n t e n u t i d i q u e s t o d o c u m e n t o d a l d i r i t t o d ’ a u t o r e p r e v i s t o a i s e n s i d i l e g g e ( L e g g e 2 2 a p r i l e 1 9 4 1 n . 6 3 3 )
Figures Figure1:MainwindowoftheDSStool..............................................................................................5Figure2SelecthydraulicsimulationcaseLinate................................................................................6Figure3MainGraphicalUserInterfaceforhydraulicsimulation......................................................7Figure4Elementnode.......................................................................................................................8Figure5Theindividualpatterndisplayofeachnode........................................................................9Figure6Linksediting........................................................................................................................10Figure7Pumpediting......................................................................................................................11Figure8Theindividualpatterndisplayofeachpump.....................................................................12Figure9Elementvalve.....................................................................................................................13Figure10Theoptionsforhydraulicmodel......................................................................................14Figure11Patterns............................................................................................................................16Figure12SaveAsnewhydraulicmodel............................................................................................18Figure13Saveahydraulicmodel.....................................................................................................18Figure14Displayresultonthemap.................................................................................................20Figure15Plotresultcurve...............................................................................................................21
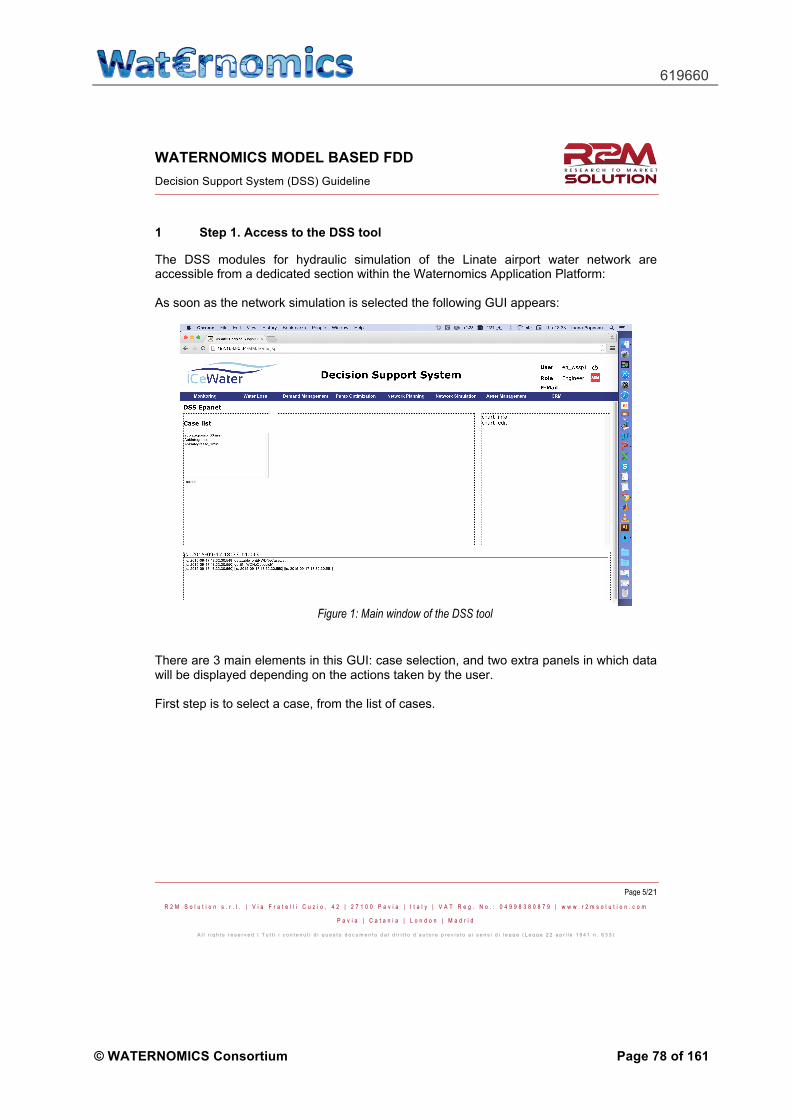
619660
© WATERNOMICS Consortium Page 78 of 161
WATERNOMICS MODEL BASED FDD
Decision Support System (DSS) Guideline
Page 5/21
R 2 M S o l u t i o n s . r . l . | V i a F r a t e l l i C u z i o , 4 2 | 2 7 1 0 0 P a v i a | I t a l y | V A T R e g . N o . : 0 4 9 9 8 3 8 0 8 7 9 | w w w . r 2 m s o l u t i o n . c o m
P a v i a | C a t a n i a | L o n d o n | M a d r i d
A l l r i g h t s r e s e r v e d | T u t t i i c o n t e n u t i d i q u e s t o d o c u m e n t o d a l d i r i t t o d ’ a u t o r e p r e v i s t o a i s e n s i d i l e g g e ( L e g g e 2 2 a p r i l e 1 9 4 1 n . 6 3 3 )
1 Step 1. Access to the DSS tool
The DSS modules for hydraulic simulation of the Linate airport water network are accessible from a dedicated section within the Waternomics Application Platform: As soon as the network simulation is selected the following GUI appears:
Figure 1: Main window of the DSS tool
There are 3 main elements in this GUI: case selection, and two extra panels in which data will be displayed depending on the actions taken by the user. First step is to select a case, from the list of cases.

619660
© WATERNOMICS Consortium Page 79 of 161
WATERNOMICS MODEL BASED FDD
Decision Support System (DSS) Guideline
Page 6/21
R 2 M S o l u t i o n s . r . l . | V i a F r a t e l l i C u z i o , 4 2 | 2 7 1 0 0 P a v i a | I t a l y | V A T R e g . N o . : 0 4 9 9 8 3 8 0 8 7 9 | w w w . r 2 m s o l u t i o n . c o m
P a v i a | C a t a n i a | L o n d o n | M a d r i d
A l l r i g h t s r e s e r v e d | T u t t i i c o n t e n u t i d i q u e s t o d o c u m e n t o d a l d i r i t t o d ’ a u t o r e p r e v i s t o a i s e n s i d i l e g g e ( L e g g e 2 2 a p r i l e 1 9 4 1 n . 6 3 3 )
2 Step 2. Linate case selection
The main page of case selection contains three parts: case list, model information and case description.
• The case list (on the left side of the page) displays the list of available modelling cases, as created by the user. Select ‘Rete totale_1M’ case and press the Select button.
• As soon as a case is selected model information is displayed in the middle panel of the page. It consists of basic information of the hydraulic simulation model.
• The case description panel on the left indicates the basic information of the case.
Figure 2 shows the Graphical User Interface before selecting the case.
Figure 2 Select hydraulic simulation case Linate
3 Step 3. Main GUI of Hydraulic Simulation after case is selected
The page with the main hydraulic simulation GUI contains three parts: element selection panel, map display panel and element edit area.
• The element selection panel, located on the left side of the page is composed of two parts. The first part is ‘Sensor’. The second part contains the details of all the Epanet elements of the selected case. In the sensor section, user can turn on or off the display of all sensors on the map. The Epanet elements part lists all the elements for hydraulic simulation model: Nodes, Links, Option, Pattern curve, and ‘Epanet’ (for saving and running the model).

619660
© WATERNOMICS Consortium Page 80 of 161
WATERNOMICS MODEL BASED FDD
Decision Support System (DSS) Guideline
Page 7/21
R 2 M S o l u t i o n s . r . l . | V i a F r a t e l l i C u z i o , 4 2 | 2 7 1 0 0 P a v i a | I t a l y | V A T R e g . N o . : 0 4 9 9 8 3 8 0 8 7 9 | w w w . r 2 m s o l u t i o n . c o m
P a v i a | C a t a n i a | L o n d o n | M a d r i d
A l l r i g h t s r e s e r v e d | T u t t i i c o n t e n u t i d i q u e s t o d o c u m e n t o d a l d i r i t t o d ’ a u t o r e p r e v i s t o a i s e n s i d i l e g g e ( L e g g e 2 2 a p r i l e 1 9 4 1 n . 6 3 3 )
• The map display area, located in the middle of the page, plots background and the network maps. The background map is loaded from Open street map service. On top of the background map layer, a Geoserver-based service provides the network map layer.
• The element edit panel, located on the right, contains all the variable input interface elements. These are based on the type of element that is selected by the user. When the user enters this page for the first time, it shows total number of elements of the case.
Figure 3 shows this on the GUI.
Figure 3 Main Graphical User Interface for hydraulic simulation
4 Step 4. Nodes element
The nodes element page contains the same 3 parts as the main GUI of hydraulic simulation.
• The element selection is on the left side of the page • The map display area (in the middle) plots background and the network maps. On
the top of the background map layer is presented. After selecting a node, the popup

619660
© WATERNOMICS Consortium Page 81 of 161
WATERNOMICS MODEL BASED FDD
Decision Support System (DSS) Guideline
Page 8/21
R 2 M S o l u t i o n s . r . l . | V i a F r a t e l l i C u z i o , 4 2 | 2 7 1 0 0 P a v i a | I t a l y | V A T R e g . N o . : 0 4 9 9 8 3 8 0 8 7 9 | w w w . r 2 m s o l u t i o n . c o m
P a v i a | C a t a n i a | L o n d o n | M a d r i d
A l l r i g h t s r e s e r v e d | T u t t i i c o n t e n u t i d i q u e s t o d o c u m e n t o d a l d i r i t t o d ’ a u t o r e p r e v i s t o a i s e n s i d i l e g g e ( L e g g e 2 2 a p r i l e 1 9 4 1 n . 6 3 3 )
window will be active, and it will show local coordinates and elevation value of the selected node.
• The element edit panel contains all the parameters of a node. If you select a node type “Junction” the panel shows three parameters: elevation, demand, and description of this junction. This panel has a list of all the junctions, parameter edit area and additional buttons.
Figure 4 shows the Graphical User Interface and indicates the steps to change the parameters.
1. On the element selection panel find the ”Nodes”. After double clicking, the node element will be expanded and all the types of nodes will be listed.
2. Click “Junction”. The “Junction” will be highlighted. It helps users to understand the element that they are editing.
3. Find the junction id from the junction list on the right panel (element edit area). Alternatively you can select the junction from the WFS map.
4. Click the Select button on the right of the list to confirm the selection. 5. Edit the parameters. If the value has been changed, the input area will be filled by
red color. 6. When the editing of parameters is finished, click the Save button. This will send the
new value to the server. The new value will immediately be recorded in a text file on the server. However, the database will not yet be updated.
Figure 4 Element node

619660
© WATERNOMICS Consortium Page 82 of 161
WATERNOMICS MODEL BASED FDD
Decision Support System (DSS) Guideline
Page 9/21
R 2 M S o l u t i o n s . r . l . | V i a F r a t e l l i C u z i o , 4 2 | 2 7 1 0 0 P a v i a | I t a l y | V A T R e g . N o . : 0 4 9 9 8 3 8 0 8 7 9 | w w w . r 2 m s o l u t i o n . c o m
P a v i a | C a t a n i a | L o n d o n | M a d r i d
A l l r i g h t s r e s e r v e d | T u t t i i c o n t e n u t i d i q u e s t o d o c u m e n t o d a l d i r i t t o d ’ a u t o r e p r e v i s t o a i s e n s i d i l e g g e ( L e g g e 2 2 a p r i l e 1 9 4 1 n . 6 3 3 )
5 Step 5. Node Pattern Display
If ‘Show Pattern’ is clicked from the right panel the node pattern will be displayed. It contains three areas, pattern information table, chart area and data table.
• The pattern information table is on the top of the page. • The chart area plots the time series of the pattern. When the cursor moves over
one of the points, a pair of values will be displayed. Users can also zoom in the chart by holding the left mouse button and dragging on the chart. A reset button is below the chart area, which brings the chart back to the original view.
• The data table is on the right side of the interface. • The pattern list and the apply button are below the data table.
Figure 5 shows the Graphical User Interface.
Figure 5 The individual pattern display of each node

619660
© WATERNOMICS Consortium Page 83 of 161
WATERNOMICS MODEL BASED FDD
Decision Support System (DSS) Guideline
Page 10/21
R 2 M S o l u t i o n s . r . l . | V i a F r a t e l l i C u z i o , 4 2 | 2 7 1 0 0 P a v i a | I t a l y | V A T R e g . N o . : 0 4 9 9 8 3 8 0 8 7 9 | w w w . r 2 m s o l u t i o n . c o m
P a v i a | C a t a n i a | L o n d o n | M a d r i d
A l l r i g h t s r e s e r v e d | T u t t i i c o n t e n u t i d i q u e s t o d o c u m e n t o d a l d i r i t t o d ’ a u t o r e p r e v i s t o a i s e n s i d i l e g g e ( L e g g e 2 2 a p r i l e 1 9 4 1 n . 6 3 3 )
6 Step 6. Links element
The links element page contains the same three parts as the nodes element page. Figure 6 shows the Graphical User Interface and indicates the steps for changing the parameters of links.
1. On the element selection panel find the ”Links”, double click it, and the link element will be expanded and all types of links will be listed.
2. Click “Pipes” and the “Pipes” will be highlighted. 3. Find the pipe id from the pipe list on the right panel (element edit area), or select
the pipes from the WFS map. 4. Click the Select button on the right of the list to confirm the selection. 5. Edit the parameters. If the value has been changed, the input area will be filled by
red color. 6. When finished with the parameter edits, click the Save button.
Figure 6 Links editing

619660
© WATERNOMICS Consortium Page 84 of 161
WATERNOMICS MODEL BASED FDD
Decision Support System (DSS) Guideline
Page 11/21
R 2 M S o l u t i o n s . r . l . | V i a F r a t e l l i C u z i o , 4 2 | 2 7 1 0 0 P a v i a | I t a l y | V A T R e g . N o . : 0 4 9 9 8 3 8 0 8 7 9 | w w w . r 2 m s o l u t i o n . c o m
P a v i a | C a t a n i a | L o n d o n | M a d r i d
A l l r i g h t s r e s e r v e d | T u t t i i c o n t e n u t i d i q u e s t o d o c u m e n t o d a l d i r i t t o d ’ a u t o r e p r e v i s t o a i s e n s i d i l e g g e ( L e g g e 2 2 a p r i l e 1 9 4 1 n . 6 3 3 )
7 Step 7. Pumps element
This pumps element page contains the same three parts as the nodes element page.
• Figure 7,
Figure 8 show the Graphical User Interface and indicates the steps for changing the parameters of pumps.
1. On the element selection panel find the ”Links”, double click it, and the link element will be expanded and all types of links will be listed.
2. Click “Pumps” and the “Pumps” will be highlighted. 3. Find the pump id from the pump list on the right panel (element edit area), or select
the pump from the WFS map. 4. Click the Select button on the right of the list to confirm the selection. 5. Edit the parameters. If the value has been changed, the input area will be filled by
red color. 6. When finished with the parameter edits, click the Save button.
Figure 7 Pump editing
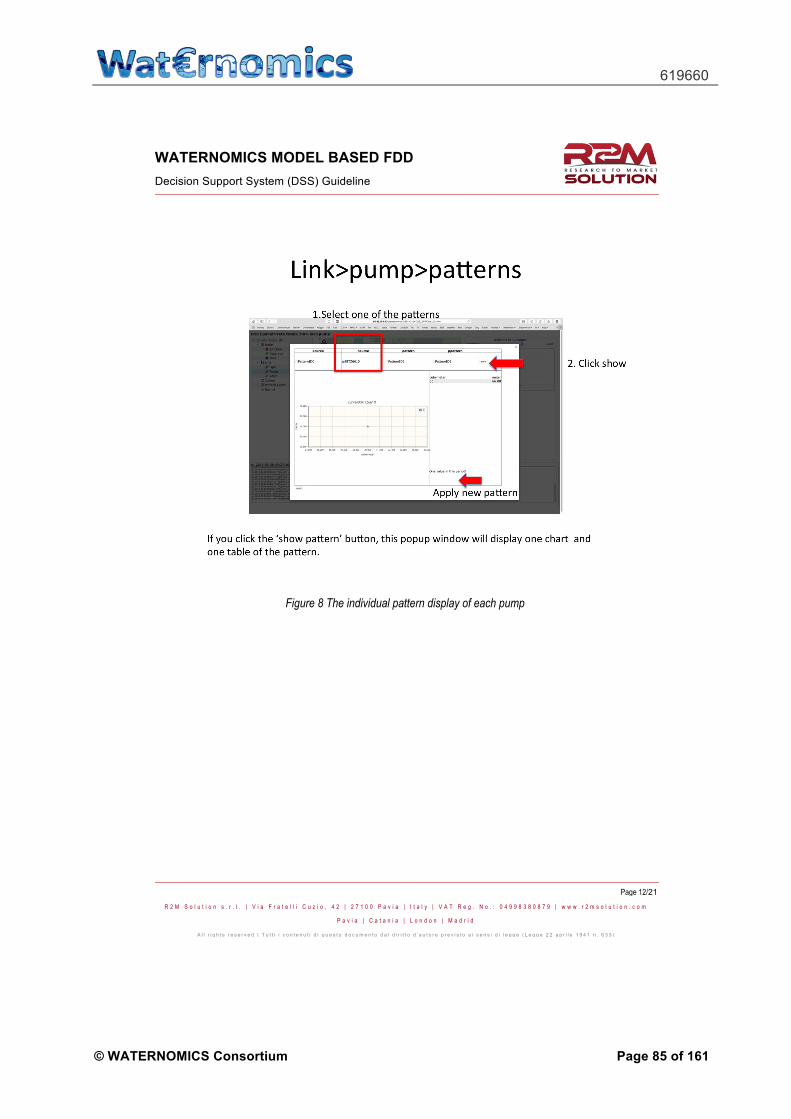
619660
© WATERNOMICS Consortium Page 85 of 161
WATERNOMICS MODEL BASED FDD
Decision Support System (DSS) Guideline
Page 12/21
R 2 M S o l u t i o n s . r . l . | V i a F r a t e l l i C u z i o , 4 2 | 2 7 1 0 0 P a v i a | I t a l y | V A T R e g . N o . : 0 4 9 9 8 3 8 0 8 7 9 | w w w . r 2 m s o l u t i o n . c o m
P a v i a | C a t a n i a | L o n d o n | M a d r i d
A l l r i g h t s r e s e r v e d | T u t t i i c o n t e n u t i d i q u e s t o d o c u m e n t o d a l d i r i t t o d ’ a u t o r e p r e v i s t o a i s e n s i d i l e g g e ( L e g g e 2 2 a p r i l e 1 9 4 1 n . 6 3 3 )
Figure 8 The individual pattern display of each pump

619660
© WATERNOMICS Consortium Page 86 of 161
WATERNOMICS MODEL BASED FDD
Decision Support System (DSS) Guideline
Page 13/21
R 2 M S o l u t i o n s . r . l . | V i a F r a t e l l i C u z i o , 4 2 | 2 7 1 0 0 P a v i a | I t a l y | V A T R e g . N o . : 0 4 9 9 8 3 8 0 8 7 9 | w w w . r 2 m s o l u t i o n . c o m
P a v i a | C a t a n i a | L o n d o n | M a d r i d
A l l r i g h t s r e s e r v e d | T u t t i i c o n t e n u t i d i q u e s t o d o c u m e n t o d a l d i r i t t o d ’ a u t o r e p r e v i s t o a i s e n s i d i l e g g e ( L e g g e 2 2 a p r i l e 1 9 4 1 n . 6 3 3 )
8 Step 8. Valves element
The valves element page contains the same three parts.
Figure 9 shows the Graphical User Interface and indicates the steps to change the parameters.
1. On the element selection panel find the ”Valves”, double click it, and the valve element will be expanded and all types of valves will be listed.
2. Click “PRV” and the “PRV” will be highlighted. 3. Find the prv id from the prv list on the right panel (element edit area) or select the
prv from the WFS map. 4. Click the select button on the right of the list to confirm the selection. 5. Edit the parameters. If the value has been changed, the input area will be filled by
red color. 6. When finished with the parameter edits, click the Save button.
Figure 9 Element valve

619660
© WATERNOMICS Consortium Page 87 of 161
WATERNOMICS MODEL BASED FDD
Decision Support System (DSS) Guideline
Page 14/21
R 2 M S o l u t i o n s . r . l . | V i a F r a t e l l i C u z i o , 4 2 | 2 7 1 0 0 P a v i a | I t a l y | V A T R e g . N o . : 0 4 9 9 8 3 8 0 8 7 9 | w w w . r 2 m s o l u t i o n . c o m
P a v i a | C a t a n i a | L o n d o n | M a d r i d
A l l r i g h t s r e s e r v e d | T u t t i i c o n t e n u t i d i q u e s t o d o c u m e n t o d a l d i r i t t o d ’ a u t o r e p r e v i s t o a i s e n s i d i l e g g e ( L e g g e 2 2 a p r i l e 1 9 4 1 n . 6 3 3 )
9 Step 9. Option
The option page contains the same three parts.
Figure 10 shows the Graphical User Interface and indicates the steps to change the parameters.
1. On the element selection panel find the ”Option”, double click it, and the option element will be expanded and all the types of options will be listed.
2. Click “Energy”, “Time” or “Hydraulic” and the corresponding option will be highlighted.
3. Edit the parameters. If the value has been changed, the input area will be filled by red color.
4. When finished with the parameter edits, click the save button.
Figure 10 The options for hydraulic model

619660
© WATERNOMICS Consortium Page 88 of 161
WATERNOMICS MODEL BASED FDD
Decision Support System (DSS) Guideline
Page 15/21
R 2 M S o l u t i o n s . r . l . | V i a F r a t e l l i C u z i o , 4 2 | 2 7 1 0 0 P a v i a | I t a l y | V A T R e g . N o . : 0 4 9 9 8 3 8 0 8 7 9 | w w w . r 2 m s o l u t i o n . c o m
P a v i a | C a t a n i a | L o n d o n | M a d r i d
A l l r i g h t s r e s e r v e d | T u t t i i c o n t e n u t i d i q u e s t o d o c u m e n t o d a l d i r i t t o d ’ a u t o r e p r e v i s t o a i s e n s i d i l e g g e ( L e g g e 2 2 a p r i l e 1 9 4 1 n . 6 3 3 )
10 Step 10. Pattern
The pattern section on the left allows for editing and saving different patterns (e.g. demand patterns) and curves (e.g. pump curves) needed for hydraulic simulations.
Figure 11 shows the Graphical User Interface and the steps to select a pattern. 1. On the element selection panel find the ”Pattern Curve”, double click it, and the
Pattern element will be expanded. All types of patterns will be listed. 2. Click “Pattern” or “Curve” and the corresponding will be highlighted. 3. Select the pattern id from the list. Click on the “select” button. The data table will be
shown. 4. If you want to upload a new pattern or curve, click the “new” button, and a popup
window will appear. 5. In the popup window, enter the name of the pattern, data resolution, type, and
choose a file for uploading. Click “Save as” button to start the process. The pattern text file has the following format: [id(integer) \t “yyyy-mm-dd hh:MM:ss” \t value(float)]. For example 1 “2015-09-10 00:00:00” 1.1 2 “2015-09-10 00:01:00” 1.2 Similarly the curve text file has the following format: [id(integer) \t value(float) \t value(float)]. For example: 1 0.1 1.1 2 0.2 1.2

619660
© WATERNOMICS Consortium Page 89 of 161
WATERNOMICS MODEL BASED FDD
Decision Support System (DSS) Guideline
Page 16/21
R 2 M S o l u t i o n s . r . l . | V i a F r a t e l l i C u z i o , 4 2 | 2 7 1 0 0 P a v i a | I t a l y | V A T R e g . N o . : 0 4 9 9 8 3 8 0 8 7 9 | w w w . r 2 m s o l u t i o n . c o m
P a v i a | C a t a n i a | L o n d o n | M a d r i d
A l l r i g h t s r e s e r v e d | T u t t i i c o n t e n u t i d i q u e s t o d o c u m e n t o d a l d i r i t t o d ’ a u t o r e p r e v i s t o a i s e n s i d i l e g g e ( L e g g e 2 2 a p r i l e 1 9 4 1 n . 6 3 3 )
Figure 11 Patterns

619660
© WATERNOMICS Consortium Page 90 of 161
WATERNOMICS MODEL BASED FDD
Decision Support System (DSS) Guideline
Page 17/21
R 2 M S o l u t i o n s . r . l . | V i a F r a t e l l i C u z i o , 4 2 | 2 7 1 0 0 P a v i a | I t a l y | V A T R e g . N o . : 0 4 9 9 8 3 8 0 8 7 9 | w w w . r 2 m s o l u t i o n . c o m
P a v i a | C a t a n i a | L o n d o n | M a d r i d
A l l r i g h t s r e s e r v e d | T u t t i i c o n t e n u t i d i q u e s t o d o c u m e n t o d a l d i r i t t o d ’ a u t o r e p r e v i s t o a i s e n s i d i l e g g e ( L e g g e 2 2 a p r i l e 1 9 4 1 n . 6 3 3 )
11 Step 11. Save and SaveAs page
Changes from previous steps will be finally updated into the database on the server side by using Save or SaveAs buttons.
Figure 12 shows the Graphical User Interface and steps for saving the simulation as a new case and running it.
1. On the right side, click the SaveAs button, and wait until the SaveAs window pops up.
2. Enter the new case name and description of the case if needed. 3. Click the “SaveAs” button, and wait until it finishes the saving process. 4. Go to the left side, single click on Run, and the Run button will be displayed on the
right area. Click this “Run” button to trigger the Epanet simulation engine.
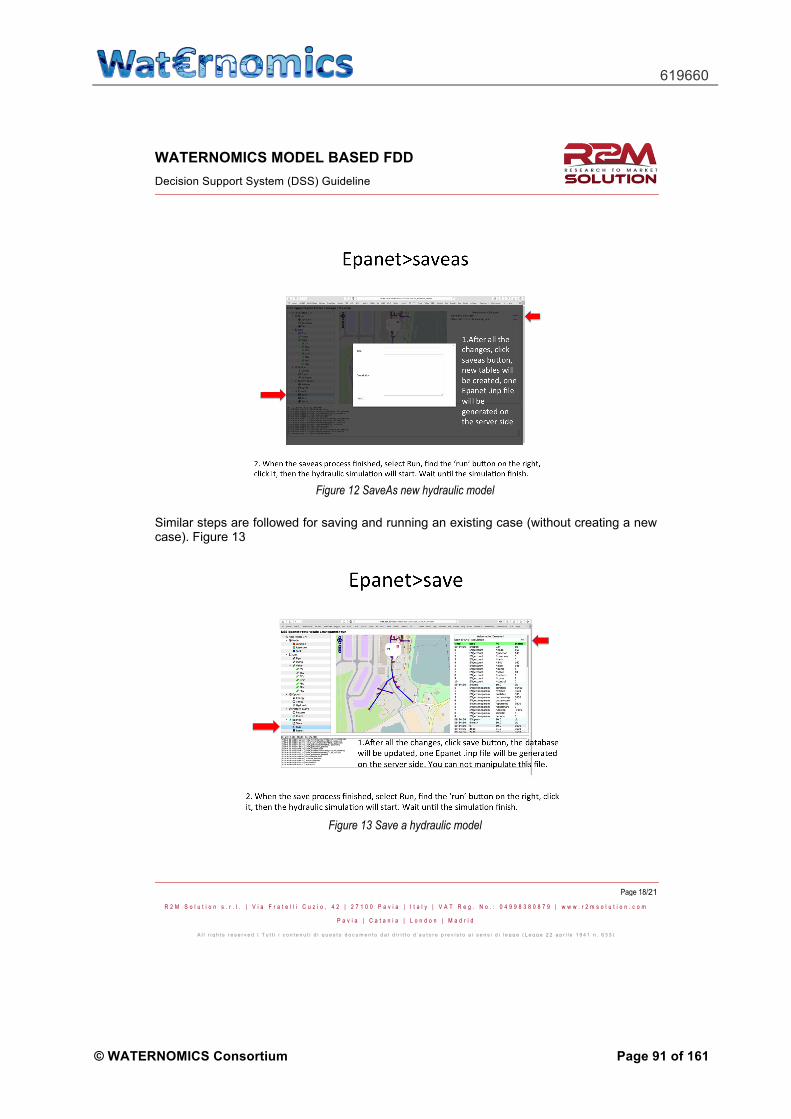
619660
© WATERNOMICS Consortium Page 91 of 161
WATERNOMICS MODEL BASED FDD
Decision Support System (DSS) Guideline
Page 18/21
R 2 M S o l u t i o n s . r . l . | V i a F r a t e l l i C u z i o , 4 2 | 2 7 1 0 0 P a v i a | I t a l y | V A T R e g . N o . : 0 4 9 9 8 3 8 0 8 7 9 | w w w . r 2 m s o l u t i o n . c o m
P a v i a | C a t a n i a | L o n d o n | M a d r i d
A l l r i g h t s r e s e r v e d | T u t t i i c o n t e n u t i d i q u e s t o d o c u m e n t o d a l d i r i t t o d ’ a u t o r e p r e v i s t o a i s e n s i d i l e g g e ( L e g g e 2 2 a p r i l e 1 9 4 1 n . 6 3 3 )
Figure 12 SaveAs new hydraulic model
Similar steps are followed for saving and running an existing case (without creating a new case). Figure 13
Figure 13 Save a hydraulic model

619660
© WATERNOMICS Consortium Page 92 of 161
WATERNOMICS MODEL BASED FDD
Decision Support System (DSS) Guideline
Page 19/21
R 2 M S o l u t i o n s . r . l . | V i a F r a t e l l i C u z i o , 4 2 | 2 7 1 0 0 P a v i a | I t a l y | V A T R e g . N o . : 0 4 9 9 8 3 8 0 8 7 9 | w w w . r 2 m s o l u t i o n . c o m
P a v i a | C a t a n i a | L o n d o n | M a d r i d
A l l r i g h t s r e s e r v e d | T u t t i i c o n t e n u t i d i q u e s t o d o c u m e n t o d a l d i r i t t o d ’ a u t o r e p r e v i s t o a i s e n s i d i l e g g e ( L e g g e 2 2 a p r i l e 1 9 4 1 n . 6 3 3 )
12 Step 12. Display Map Results
The result page contains the three parts: element selection panel, map display panel and result selection area.
• The element selection is on the left side of the page • The map display area plots background and the network maps. This panel is
located in the middle of the page. • The result selection panel contains all the variables for nodes and links. This panel
has a list of all the results, and detailed variable selection area. Figure 14 shows the Graphical User Interface and indicates the steps to plot results.
1. On the element selection panel find the “result” and single click on it. 2. From the result list on the top right side of the web page, choose the result name
and click the Select button. After this two green areas will be shown on the screen. One is ‘node’, and the other one is ‘link’.
3. Click on the green area of ‘node’. The node area will be expanded. All the parameters of the node results are made available.
4. Choose ‘pressure’ from the variable list. 5. Set up the time stamp you want to plot. 6. Insert upper and lower limit values. 7. Click the “refresh” button, and wait for WMS map, which will be regenerated from
the Geoserver. A table will be displayed which contains number of nodes over and below the specified limits.
8. If you want to know where a node is, which is out of the limits, click on the table, the map will zoom to the location of the node. The id of node will be selected in the list.
9. The previous step can also be achieved by ticking Features inside the green node area. The WFS map of node will be shown on the map. Click on the red node point, and the id of the node can also be selected in the list.

619660
© WATERNOMICS Consortium Page 93 of 161
WATERNOMICS MODEL BASED FDD
Decision Support System (DSS) Guideline
Page 20/21
R 2 M S o l u t i o n s . r . l . | V i a F r a t e l l i C u z i o , 4 2 | 2 7 1 0 0 P a v i a | I t a l y | V A T R e g . N o . : 0 4 9 9 8 3 8 0 8 7 9 | w w w . r 2 m s o l u t i o n . c o m
P a v i a | C a t a n i a | L o n d o n | M a d r i d
A l l r i g h t s r e s e r v e d | T u t t i i c o n t e n u t i d i q u e s t o d o c u m e n t o d a l d i r i t t o d ’ a u t o r e p r e v i s t o a i s e n s i d i l e g g e ( L e g g e 2 2 a p r i l e 1 9 4 1 n . 6 3 3 )
Figure 14 Display result on the map

619660
© WATERNOMICS Consortium Page 94 of 161
WATERNOMICS MODEL BASED FDD
Decision Support System (DSS) Guideline
Page 21/21
R 2 M S o l u t i o n s . r . l . | V i a F r a t e l l i C u z i o , 4 2 | 2 7 1 0 0 P a v i a | I t a l y | V A T R e g . N o . : 0 4 9 9 8 3 8 0 8 7 9 | w w w . r 2 m s o l u t i o n . c o m
P a v i a | C a t a n i a | L o n d o n | M a d r i d
A l l r i g h t s r e s e r v e d | T u t t i i c o n t e n u t i d i q u e s t o d o c u m e n t o d a l d i r i t t o d ’ a u t o r e p r e v i s t o a i s e n s i d i l e g g e ( L e g g e 2 2 a p r i l e 1 9 4 1 n . 6 3 3 )
13 Step 13. Display Chart Results
This result page of chart contains three parts: information panel, chart panel and data table.
• The information panel is on the top of the page • The chart panel is located on the left. • The data table area is on the right. •
Figure 15 shows the Graphical User Interface and steps to plot the result curve.
1. Select the node id, (see step 11 in Display Map Results). 2. Select the variable, (see step 11 Display Map Results). 3. Click the chart button 4. On the popup window, user can select the sensor from the list, click “ok” button to
plot the sensor measured data into the simulation result. 5. The date of the sensor data can be selected /changed in the input text area.
Figure 15 Plot result curve

619660
© WATERNOMICS Consortium Page 95 of 161
Appendix D – User Guidelines – Mini Water Meter
VTEC Mini Water Meter
1. Connection method:
2. Calculation:
z Output wave: square wave z Wire connection:
a) Red: IN connect to ‘+’ b) Yellow: OUT connect to ‘output’ c) Black: GND connect to ‘-‘
z Frequency Frequency = 7.5*Q (L/min) Q: 1-30L/min Hence, frequencymin = 7.5*1*60 = 450; frequencymax = 7.5*30*60 = 13500 Error: ±2% Voltage: 3.5 – 24 VDC, current: <10mA
3. Mechanical drawing:

619660
© WATERNOMICS Consortium Page 96 of 161
MWM-VTEC MINI WATER METER
VTEC mini water meter consists of a plastic body, a water rotor and a hall-effect sensor. The measuring principle of this water meter is that the rotor rotates with the water flowing and the hall-effect sensor outputs the corresponding pulse signal. The main features of this mini water meter are small size and simple data collection for the residential and commercial water network.
FEATURES
x Small size x Pulse output x Flow range 1 ~ 30 L/min x Precision ±2% x Pressure ≤ 17.5 bar x Easy installation
APPLICATIONS
x Flow measurement in residential and commercial drinking water network
x Water heaters x Drinking water machines x Water vending machines
SPECIFICATION
Parameters Values
Flow range 1 ~ 30 L/min
Precision ±2%
Mini. working voltage DC 4.5V
Max. working current 15mA (DC 5V)
Working voltage DC 5 ~ 18V
Load capacity ≤ 10 mA (DC 5V) Operating Temperature ≤800C
Allowing pressure 17.5bar
Liquid temperature ≤120oC
Operating humidity 35% ~ 90%RH (no frost)
Storage temperature -25 ~ +80 °C
External threads 1/2”
Outer diameter 20mm
Intake diameter 9mm
Outlet diameter 12mm
Note: VTEC reserves the right to change the detail specifications and designs as may be required to permit improvements in its products. Specifications are subject to change without notice.
VTEC Lasers & Sensors Torenallee 20, 5617BC Eindhoven, the Netherlands
Email: [email protected] Website: www.vtec-ls.nl

619660
© WATERNOMICS Consortium Page 97 of 161
Appendix E – User Guidelines – Ultrasonic Flow Meter
1/#!�'4E8DE���.8@EADE
� � �
,G<6=�.F4DF M�)*1 � �� 18DE<A@ ��
��������� ������������������!������
�3)#*��2"02
1/#!�'4E8DE���.8@EADE
� � �
,G<6=�.F4DF M�)*1 � �� 18DE<A@ ��
��������� ������������������!������
�3)#*��2"02
1/#!�'4E8DE���.8@EADE
� � �
,G<6=�.F4DF M�)*1 � �� 18DE<A@ ��
��������� ������������������!������
�3)#*��2"02

619660
© WATERNOMICS Consortium Page 98 of 161
1/#!�'4E8DE���.8@EADE
� � �
,G<6=�.F4DF M�)*1 � �� 18DE<A@ ��
�612%,��4%04)%5
�0%/"0"2).-
�� 0@B46=��!;86=�4>>�F;8�B4DFE�<@�F;8�5AJ�
�� +D8B4D8�F;8�B<B8�EGD9468��-8?AH8�F;8�<EA>4F<A@�4DAG@7�F;8 B<B8�4@7�6>84@�F;8�B<B8�
$<:GD8���.KEF8?�*H8DH<8I
�� 1
$>AI
/D4@E7G68D�� /D4@E7G68D� (4<@�6A@FDA>�G@<F
�� ?� -.����
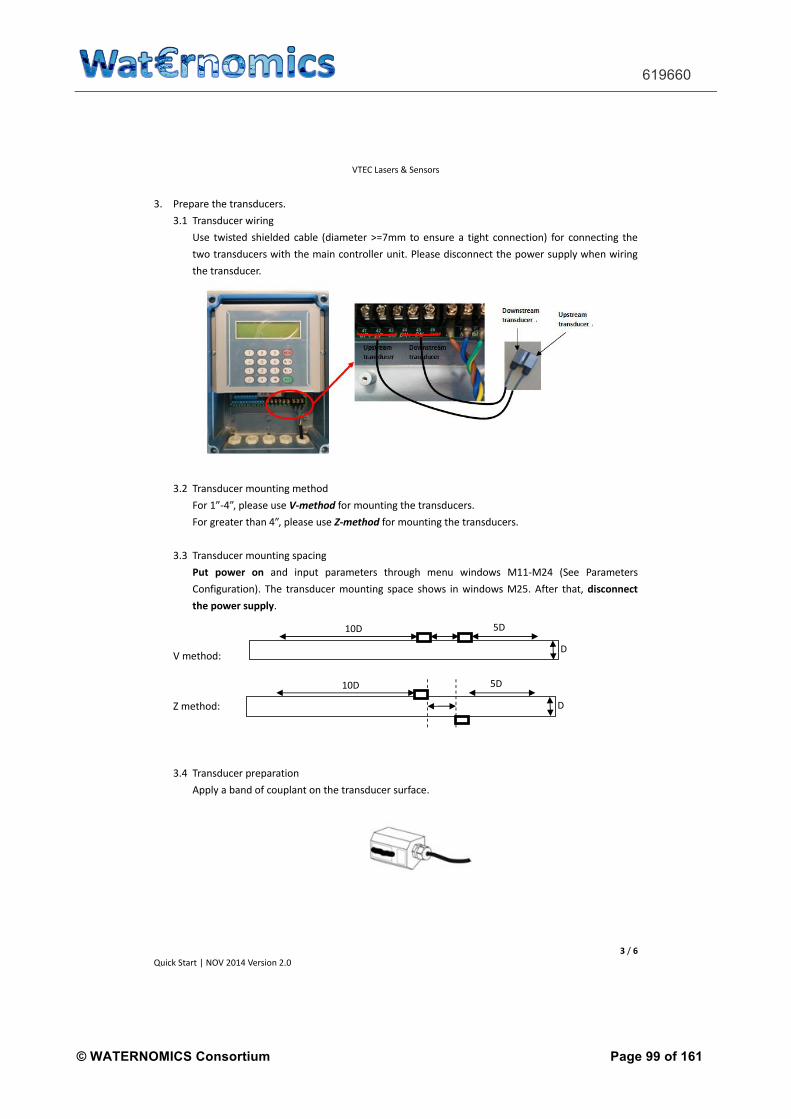
619660
© WATERNOMICS Consortium Page 99 of 161
1/#!�'4E8DE���.8@EADE
� �
,G<6=�.F4DF M�)*1 � �� 18DE<A@ ��
�� +D8B4D8�F;8�FD4@E7G68DE�
��� /D4@E7G68D I<D<@:
0E8� FI<EF87� E;<8>787� 645>8 �7<4?8F8D ���?? FA 8@EGD8 4 F<:;F 6A@@86F<A@� 9AD� 6A@@86F<@:� F;8
FIA�FD4@E7G68DE�I<F;�F;8�?4<@�6A@FDA>>8D�G@<F� +>84E8�7<E6A@@86F�F;8�BAI8D�EGBB>K�I;8@�I<D<@:
F;8�FD4@E7G68D�
��� /D4@E7G68D�?AG@F<@: ?8F;A7
$AD��P�P�B>84E8�GE8 ������� 9AD�?AG@F<@:�F;8�FD4@E7G68DE�
$AD�:D84F8D�F;4@��P�B>84E8�GE8 ������� 9AD�?AG@F<@:�F;8�FD4@E7G68DE�
��� /D4@E7G68D ?AG@F<@: EB46<@:
�32� /.5%0� .- 4@7� <@BGF� B4D4?8F8DE� F;DAG:;� ?8@G� I<@7AIE� (��(�� �.88� +4D4?8F8DE
!A@9<:GD4F<A@�� /;8� FD4@E7G68D�?AG@F<@:� EB468 E;AIE <@�I<@7AIE�(��� �9F8D� F;4F $)1#.--%#2
2(%�/.5%0�13//+6�
1�?8F;A7�
3�?8F;A7�
��� /D4@E7G68D�BD8B4D4F<A@
�BB>K�4�54@7�A9�6AGB>4@F�A@�F;8�FD4@E7G68D�EGD9468�
� " �"
"
� " �"
"

619660
© WATERNOMICS Consortium Page 100 of 161
1/#!�'4E8DE���.8@EADE
� �
,G<6=�.F4DF M�)*1 � �� 18DE<A@ ��
�2%/1�2.�#.-&)'30%�/"0",%2%01
�� +D8EE �<@BGF�B<B8�AGF8D�7<4?8F8D�4@7�BD8EE �
�� +D8EE FA�8@F8D�(���I<@7AI�<@BGF�I4>>�F;<6=@8EE�4@7�BD8EE �
�� +D8EE FA� 8@F8D� (�� I<@7AI� 4@7 BD8EE FA� E8>86F� B<B8� ?4F8D<4>
4@7�BD8EE �
�� +D8EE FA� 8@F8D�(� I<@7AI� 4@7 FA E8>86F� 9>G<7� FKB8� 4@7� BD8EE
�
�� +D8EE FA�8@F8D�(���I<@7AI�4@7 FA�E8>86F�FD4@E7G68D�FKB8��&9�<F
<E�/.�FKB8�6;AAE8 ��� <9�<F�<E�/(�FKB8�6;AAE8 ����+D8EE �
�� +D8EE FA� 8@F8D� (��� I<@7AI� 4@7 FA� E8>86F� F;8� FD4@E7G68D� ?AG@F<@:
?8F;A7��&9�<F�<E�/.�FKB8�E8>86F ���<9�<F�<E�/(�FKB8�4@7�B<B8�7<4?8F8D�<E�:D84F8D�F;4@��P�E8>86F ���+D8EE
�
�� +D8EE FA� 8@F8D� (��� I<@7AI� I;<6;� I<>>� 7<EB>4K� F;8� FD4@E7G68D� ?AG@F<@:
7<EF4@68�
�� &9�F;8�GE8D�I4@FE�FA 1"4% 2(%�#.-&)'30"2).-�BD8EE FA�8@F8D�(���I<@7AI�FA
E8>86F � 4@7�BD8EE �
�-12"++"2).-
&@EF4>>� F;8� G>FD4EA@<6� 9>AI�?8F8D� +>84E8 $)1#.--%#2� 2(%� /.5%0� 13//+6 I;8@� EF4>><@:� F;8�?8F8D� /DK� FA
4HA<7�F;8�E87<?8@F�E<78�A9�F;8�B<B8��/;8�GE8D�64@�GE8�4�DG>8D�4E�4�FAA>�
�-12"++"2).-�#(%#*�3/
+D8EE FA�8@F8D�( ��I<@7AI�FA�6;86=�<9�F;8�<@EFDG?8@F�IAD=E�BDAB8D>K� N��O�<E�7<EB>4K87�
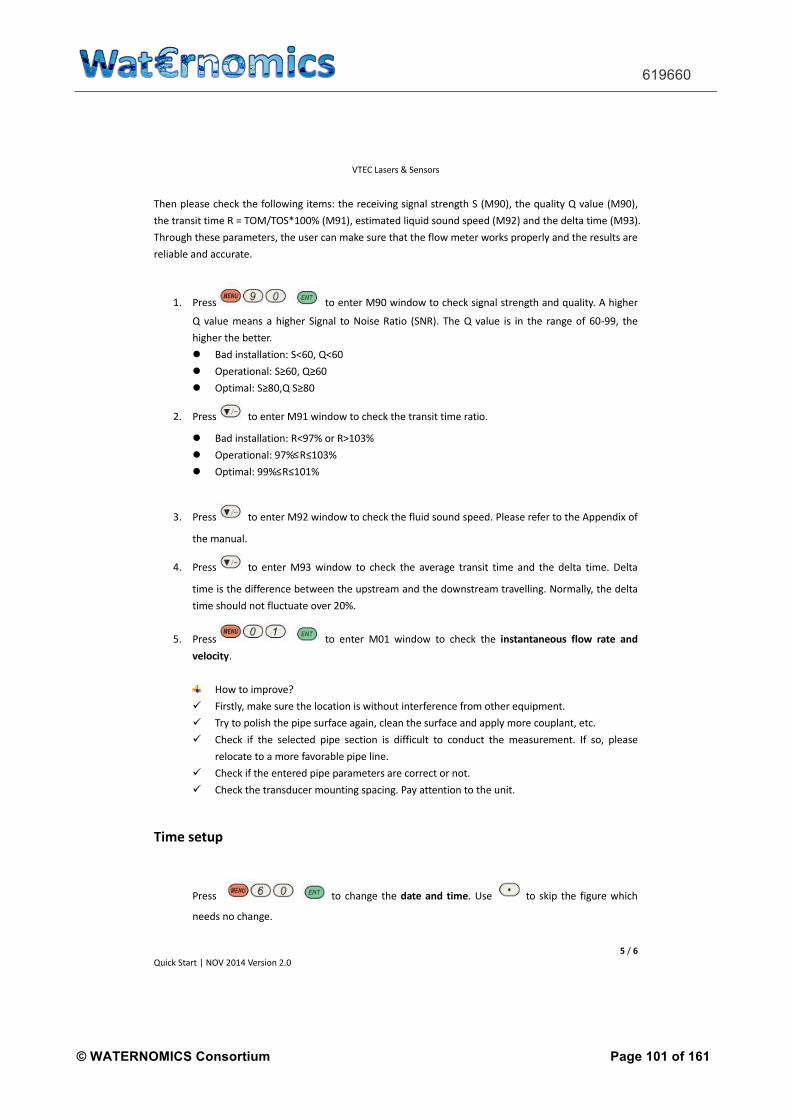
619660
© WATERNOMICS Consortium Page 101 of 161
1/#!�'4E8DE���.8@EADE
� � �
,G<6=�.F4DF M�)*1 � �� 18DE<A@ ��
/;8@ B>84E8�6;86=�F;8�9A>>AI<@:�<F8?E��F;8�D868<H<@:�E<:@4>�EFD8@:F;�. �(� ��F;8�CG4><FK�,�H4>G8 �(� �
F;8�FD4@E<F�F<?8�-���/*(�/*.�� ���(����8EF<?4F87�><CG<7�EAG@7�EB887��(����4@7 F;8�78>F4�F<?8 �(����
/;DAG:;�F;8E8�B4D4?8F8DE F;8�GE8D�64@�?4=8�EGD8�F;4F�F;8�9>AI�?8F8D�IAD=E�BDAB8D>K�4@7�F;8�D8EG>FE�4D8
D8><45>8�4@7�466GD4F8�
�� +D8EE FA�8@F8D�(� �I<@7AI�FA�6;86=�E<:@4>�EFD8@:F;�4@7�CG4><FK� ��;<:;8D
,� H4>G8�?84@E� 4�;<:;8D� .<:@4>� FA�)A<E8�-4F<A� �.)-���/;8�,�H4>G8� <E� <@� F;8� D4@:8�A9� � ��� F;8
;<:;8D�F;8�58FF8D�
� 47�<@EF4>>4F<A@��.�� �,��
� *B8D4F<A@4>��.R� �,R�
� *BF<?4>��.R� , .R�
�� +D8EE FA�8@F8D�(���I<@7AI�FA�6;86=�F;8�FD4@E<F�F<?8�D4F<A�
� 47�<@EF4>>4F<A@��-�����AD�-�� ��
� *B8D4F<A@4>�����Q-Q� ��
� *BF<?4>� ���Q-Q� ��
�� +D8EE FA�8@F8D�(���I<@7AI�FA�6;86=�F;8�9>G<7�EAG@7�EB887��+>84E8�D898D�FA�F;8��BB8@7<J�A9
F;8�?4@G4>�
�� +D8EE FA� 8@F8D�(���I<@7AI� FA� 6;86=� F;8� 4H8D4:8� FD4@E<F� F<?8� 4@7� F;8� 78>F4� F<?8��"8>F4
F<?8�<E�F;8�7<998D8@68�58FI88@�F;8�GBEFD84?�4@7�F;8�7AI@EFD84?�FD4H8>><@:� )AD?4>>K�F;8�78>F4
F<?8�E;AG>7�@AF�9>G6FG4F8�AH8D�� ��
�� +D8EE FA� 8@F8D� ( �� I<@7AI� FA� 6;86=� F;8 )-12"-2"-%.31� &+.5� 0"2%� "-$
4%+.#)26�
%AI�FA�<?BDAH8�
� $<DEF>K�?4=8�EGD8�F;8�>A64F<A@�<E�I<F;AGF�<@F8D98D8@68�9DA?�AF;8D�8CG<B?8@F�
� /DK�FA�BA><E;�F;8�B<B8�EGD9468�4:4<@�6>84@�F;8�EGD9468�4@7�4BB>K�?AD8�6AGB>4@F�8F6�
� !;86=� <9� F;8� E8>86F87� B<B8� E86F<A@� <E� 7<99<6G>F� FA� 6A@7G6F� F;8� ?84EGD8?8@F�� &9� EA� B>84E8
D8>A64F8�FA�4�?AD8�94HAD45>8�B<B8�><@8�
� !;86=�<9�F;8�8@F8D87�B<B8�B4D4?8F8DE�4D8�6ADD86F�AD�@AF�
� !;86=�F;8�FD4@E7G68D�?AG@F<@:�EB46<@:��+4K�4FF8@F<A@�FA�F;8�G@<F�
�),% 1%23/
+D8EE FA�6;4@:8� F;8 $"2% "-$� 2),%��0E8 FA� E=<B� F;8� 9<:GD8�I;<6;
@887E�@A�6;4@:8�

619660
© WATERNOMICS Consortium Page 102 of 161
1/#!�'4E8DE���.8@EADE
� � �
,G<6=�.F4DF M�)*1 � �� 18DE<A@ ��
�%23/�&.0�#.--%#2)-'����
/A�EF4DF�6A??G@<64F<@: I<F; �F;8�GE8D�@887E�FA�7A�F;8�9A>>AI<@:�E8FGB�<@�F;8�6A@FDA>>8D�5AJ�
�� +D8EE
� 4G7D4F8��� �F;8@�BD8EE
� +4D<FK��)A@8�F;8@�BD8EE
� "4F4� <FE����F;8@�BD8EE
� .FAB� <FE����F;8@�BD8EE
�� +D8EE 4@7 FA�E8>86F ����%-$��.�������
�� +D8EE FA�E8F�74F4�>A::8D ���F;8@�BD8EE FA 6;AAE8 F;8�9A>>AI<@:
B4D4?8F8DE �� �GE8 FA�E8>86F��
� ��"4F8�4@7�/<?8
� ��.KEF8?�.F4FGE
� ���.<:@4>�.FD8@:F;
� ��$>AI -4F8
� ��18>A6<FK
� ���)#/�/AF4><L8D
� ����$>G<7�18>A6<FK
� ����2AD=<@:�/<?8D
� � ��$>AI�/A74K

619660
© WATERNOMICS Consortium Page 103 of 161
UFM-TM/TS VTEC ULTRASONIC FLOW METER
User manual
Flow rate measurement for water distribution system

619660
© WATERNOMICS Consortium Page 104 of 161
VTEC ULTRASONIC FLOW METER
2 / 40
User manual_version 2.0
VTEC Lasers & Sensors
Torenallee 20, 5617BC Eindhoven, the Netherlands
Email: [email protected] Website: www.vtec-ls.nl
VTEC reserves the right to change the detail user manual and designs as may be required to permit improvements in its products. User manual is subject to change without notice

619660
© WATERNOMICS Consortium Page 105 of 161
VTEC ULTRASONIC FLOW METER
3 / 40
User manual_version 2.0
TABLE OF CONTENTS
1 Introduction ..................................................................................................................................... 6
1.1 Preface ................................................................................................................................. 6
1.2 Measuring principle ............................................................................................................. 6
1.3 Features ............................................................................................................................... 7
1.4 Typical applications .............................................................................................................. 7
1.5 Technical specifications ....................................................................................................... 8
1.6 Packing list ........................................................................................................................... 9
2 Installation and Measurement ...................................................................................................... 10
2.1 Unpacking .......................................................................................................................... 10
2.2 Installing the main control unit .......................................................................................... 10
2.2.1 Cables ..................................................................................................................... 10
2.2.2 Distance from Main Unit to Transducer ................................................................. 11
2.3 Installing transducers ......................................................................................................... 11
2.3.1 Transducer mounting allocation ............................................................................ 11
2.3.2 Transducer mounting methods .............................................................................. 12
2.3.3 Transducer spacing ................................................................................................. 13
2.3.4 Transducer wiring ................................................................................................... 13
2.3.5 Prepare the pipe surface ........................................................................................ 13
2.3.6 Prepare the Transducers ........................................................................................ 17
2.3.7 Installation check-up .............................................................................................. 17
VTEC ULTRASONIC FLOW METER USER MANUAL

619660
© WATERNOMICS Consortium Page 106 of 161
VTEC ULTRASONIC FLOW METER
4 / 40
User manual_version 2.0
2.4 Electrical Connection ......................................................................................................... 19
2.4.1 Power supply connection ....................................................................................... 19
2.4.2 RS485 Port .............................................................................................................. 19
2.4.3 4-20mA Output wiring ............................................................................................ 20
2.5 Operation guide ................................................................................................................. 20
2.5.1 Keypad .................................................................................................................... 20
2.5.2 Power ON/OFF ........................................................................................................ 20
2.5.3 Parameters configuration ....................................................................................... 21
3 Menu windows .............................................................................................................................. 22
4 Serial communication .................................................................................................................... 29
4.1 Communication Protocol ................................................................................................... 29
4.1.1 Basic Commands ..................................................................................................... 29
4.1.2 Protocol Prefix Usage .............................................................................................. 31
4.2 The M command and the ASCII Codes ............................................................................... 32
5 Troubleshooting ............................................................................................................................ 33
5.1 Introduction ....................................................................................................................... 33
5.2 Power-on Errors ................................................................................................................. 33
5.3 Working Status Errors ........................................................................................................ 34
5.4 Other Problems and Solutions ........................................................................................... 35
6 Appendix........................................................................................................................................ 37
6.1 Sound Speed Tables ........................................................................................................... 37

619660
© WATERNOMICS Consortium Page 107 of 161
VTEC ULTRASONIC FLOW METER
5 / 40
User manual_version 2.0
List of figures
Figure 1-1 System overview ............................................................................................................ 6
Figure 1-2 Flow measuring principle ............................................................................................... 6
Figure 2-1 Outline diagram of the main control unit .................................................................... 10
Figure 2-2 V-method ..................................................................................................................... 12
Figure 2-3 Z-method ...................................................................................................................... 12
Figure 2-4 W-method .................................................................................................................... 13
Figure 2-5 Transducer wiring ........................................................................................................ 13
Figure 2-6 Applying coulpant to the transducer surface ............................................................... 17
Figure 2-7 RS 485 wiring & 4-20mA output connection ................................................................ 20
Figure 2-8 Keypad layout .............................................................................................................. 20
List of tables
Table 2-1 Installation site selection ............................................................................................. 12
Table 3-1 Menu windows ............................................................................................................. 22
Table 4-1 Basic commands ........................................................................................................... 29
Table 4-2 ASCII codes and corresponding keys ........................................................................... 32
Table 5-1 Hardware self-diagnosis errors and solutions............................................................. 33
Table 5-2 Working status errors and solutions ........................................................................... 34
Table 6-1 Sound Speed in Water at atmosphere pressure ......................................................... 37
Table 6-2 Sound Speed and Viscosity Data of Liquids ................................................................. 38
Table 6-3 Sound Speed Data of Solids ......................................................................................... 39
Table 6-3 (continued): Sound Speeds in Solids ........................................................................... 40

619660
© WATERNOMICS Consortium Page 108 of 161
VTEC ULTRASONIC FLOW METER
6 / 40
User manual_version 2.0
1 Introduction
1.1 Preface
VTEC ultrasonic flow is based on transit-time flow measurement principle. It measures the flow rate of the liquid in a closed pipe by using a pair of clamp-on transducers.
The system consists of two transducers and a main control unit. See the overview in Figure 1-1.
1.2 Measuring principle
As shown in Figure 1-2, a pair of ultrasonic transducers are mounted on the pipe upstream and downstream respectively. Each transducer functions as both ultrasonic transmitter and receiver. The main unit operates by alternately transmitting and receiving a coded burst of sound energy between the two transducers. The transit-time in the upstream direction as well as in the downstream direction is measured. The difference of the two transit time is directly and exactly related to the velocity of the liquid in the pipe.
Down stream transducer
spacing
flow
Upstream transducer
Tdown
Tup θ
220V
Flow
Transducer A Transducer B Main control unit
Figure 1-1 System overview
Figure 1-2 Flow measuring principle

619660
© WATERNOMICS Consortium Page 109 of 161
VTEC ULTRASONIC FLOW METER
7 / 40
User manual_version 2.0
downup TTTMDVx'
u T2sin
Where
θ is the angle between the sound path and the flow direction.
M is the number of times the sound traverses the flow.
D is the pipe diameter.
Tup is the time for the beam travelling from the upstream transducer to the downstream transducer
Tdown is the time for the beam travelling from the downstream transducer to the upstream transducer.
ΔT = Tup – Tdown
1.3 Features
x Easy installation
x Better than 1% linearity
x ±0.2% of repeatability
x ±1% of accuracy at velocity above 0.6ft/s (0.2m/s)
x Positive / negative / net flow totaliser
x Die-cast Aluminum weather-resistant enclosure (standard version)
x RS 485 interface. Complete communication protocol for instrument networking.
x Can be used as a flow RTU
x Analogue 4-20mA output
x Relay output
x OCT output
1.4 Typical applications
The flow meter can be applied to a wide range of pipe flow measurements. Applicable liquids include pure liquids as well as liquid with small quantity of tiny particles. Examples are:
x Flow measurement in water distribution network

619660
© WATERNOMICS Consortium Page 110 of 161
VTEC ULTRASONIC FLOW METER
8 / 40
User manual_version 2.0
x Water and waste water management x Petroleum process monitoring and control x Food and beverage processing x Pipeline leakage detection
1.5 Technical specifications
Table 1-1 Technical specifications
Mai
n Un
it
Linearity Better than ±1%.
Accuracy ±1% of reading at rates > 0.6ft/s (0.2m/s) assuming a fully developed flow profile.
Repeatability ±0.2%.
Velocity ±0.03 - ±105ft/s (±0.01 - ±30m/s), bi-directional
Measurement Period
0.5s
Display LCD with backlight. 2x20 letters.
Keypad 4x4-key membrane keypad with tactile feedback
Units English (U.S.) or metric.
Outputs Analogue output: 4-20mA or 0-20mA current output. Impedance 0 - 1k:. Accuracy 0.1%.
Isolated OCT output: for frequency output (0 - 9,999Hz), alarm driver, or totaliser pulse output, ON/OFF control, etc. Relay output 1A@125VAC or 2A@30VDC. For ON/OFF control, alarm driver, totaliser output, etc.
Internal Alarm (Buzzer): user programmable. External Alarm Driver: alarm signal can be transmitted to Relay or OCT output terminals to drive an external alarm. RS 485 serial port
Others Capable of offline compensation for flow totaliser, automatic / manual selectable. Self-diagnosis. Automatically record the following information:
x The totaliser data of the last 64 days / 64 months / 5 years. x The power-on time and corresponding flow rate of the last 64
power on and off events. Allow manual or automatic flow loss compensation.
x The instrument working status of the last 64 days.
Enclosure Die-cast aluminum enclosure. Protection Class: IP65 (NEMA 4X). Weather-resistant. Size: 9.88”x7.56”x3.15” (251x192x80mm3) for standard version

619660
© WATERNOMICS Consortium Page 111 of 161
VTEC ULTRASONIC FLOW METER
9 / 40
User manual_version 2.0
Tran
sduc
er Clamp-on TM-type: DN50 - 700mm
TS-type: DN15 - 100mm
Liqu
ids
Liquid Types Virtually all commonly used clean liquids. Liquids with small quantity of tiny particles may also be applicable. Particle size should be less than 75um, particle concentration less than 10,000ppm. Liquids should contain no or very minor air bubbles. Examples are chilled/hot water, sea water, waste water, chemical liquids, oil, crude oil, alcohol, beer, etc.
Liquid Temp 32˚F - 212˚F (0˚C - 100˚C) for clamp-on transducer.
Suspension concentration
< 10,000ppm and particle size less than 80um. May contain very small amount of air bubbles.
Pipe
Pipe Size DN15mm - DN700mm
Pipe Material All metals, most plastics, fiber glass, etc. Allow pipe liner.
Pipe Straight run
15D in most cases, 30D if a pump is near upstream, where D is pipe diameter.
Cabl
e
Shielded transducer cable. Standard length 15’ (5m). Can be extended to 1640’ (500m). Cable should not be laid in parallel with high-voltage power lines, neither should it be close to strong interference source such as power transformers.
Envi
ronm
ent Temperature Main unit: 14˚F - 158˚F (-10˚C - 70˚C)
Clamp-on transducer: -22˚F - 212˚F (-30˚C - 100˚C)
Humidity Main unit: 85% RH
Transducer: IP 68 water-submersible, water depth less than 10’ (3m)
Pow
er AC: 220V
DC: 8VDC - 36VDC
Wei
ght Standard main unit: 6.6lb (3kg)
1.6 Packing list
Main control unit 1 unit Clamp-on transducers 1 pair Clamp-on fixture 1 set Couplant 1 unit User’s manual 1 unit
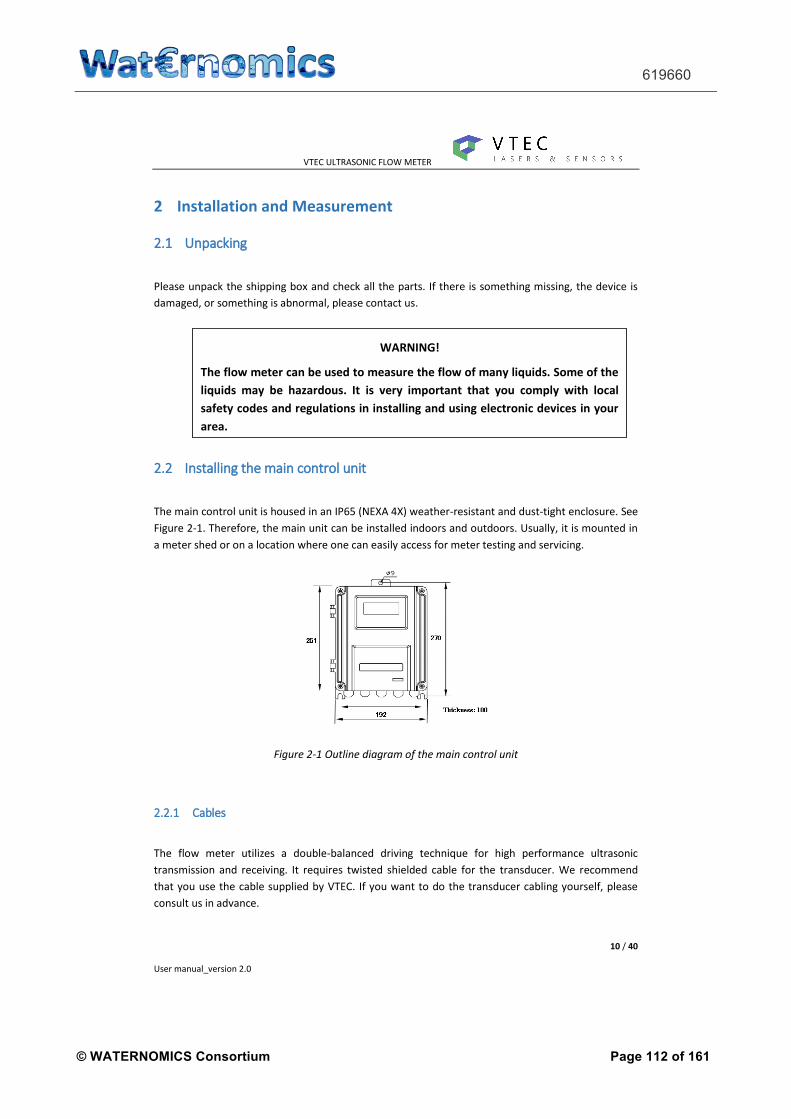
619660
© WATERNOMICS Consortium Page 112 of 161
VTEC ULTRASONIC FLOW METER
10 / 40
User manual_version 2.0
2 Installation and Measurement
2.1 Unpacking
Please unpack the shipping box and check all the parts. If there is something missing, the device is
damaged, or something is abnormal, please contact us.
2.2 Installing the main control unit
The main control unit is housed in an IP65 (NEXA 4X) weather-resistant and dust-tight enclosure. See
Figure 2-1. Therefore, the main unit can be installed indoors and outdoors. Usually, it is mounted in
a meter shed or on a location where one can easily access for meter testing and servicing.
Figure 2-1 Outline diagram of the main control unit
2.2.1 Cables
The flow meter utilizes a double-balanced driving technique for high performance ultrasonic
transmission and receiving. It requires twisted shielded cable for the transducer. We recommend
that you use the cable supplied by VTEC. If you want to do the transducer cabling yourself, please
consult us in advance.
WARNING!
The flow meter can be used to measure the flow of many liquids. Some of the liquids may be hazardous. It is very important that you comply with local safety codes and regulations in installing and using electronic devices in your area.

619660
© WATERNOMICS Consortium Page 113 of 161
VTEC ULTRASONIC FLOW METER
11 / 40
User manual_version 2.0
Do not route the transducer cable along with high current AC lines. Avoid strong interference
sources. Make sure the cables and cable connections are protected from weather and corrosive
conditions.
2.2.2 Distance from Main Unit to Transducer
In general, the closer the transducer to the main unit, the better the signals are. All major cable
suppliers can supply up to 1640ft (500m) long transducer cable.
2.3 Installing transducers
2.3.1 Transducer mounting allocation
Firstly, select an optimal location for installing the transducers in order to make the measurement
reliable and accurate.
An optimal location would be defined as a long straight pipe line full of liquid that is to be measured.
The piping can be in vertical or horizontal position. Table 2-1 shows examples of optimal locations.
x Principles to select an optimal location:
(1) Pipe must be full of liquids at the measurement site.
(2) No heavy corrosion of deposition inside of the pipe.
(3) Must be a safe location.
(4) The straight pipe should be long enough to eliminate irregular-flow-induced error. Typically, the length of the straight pipe should be 15 times of the pipe diameter. The longer the better. The transducers should be installed at a pipe section where the length of the straight pipe at upstream side is at least 10D and at downstream side is at least 5D, where D stands for pipe outer diameter.
(5) If there are flow disturbing parts such as pumps, valves, etc. on the upstream, the straight pipe length should be increased (refer to Table 1.) The disturbance strength are in the following order (low to high): Single Bend -> Pipe Reduction / Enlargement -> Outflow Tee -> Same Plane Multiple Bends -> Inflow Tee -> Out of Plane Multiple Bends -> Valve -> Pump.
(6) Make sure that the temperature on the location does not exceed the range for the transducers. Generally speaking, the closer to the room temperature, the better.
(7) Select a relatively new straight pipe line if it is possible. Old pipe tends to have corrosions and depositions, which could affect the results. If you have to work on an old pipe, we recommend you to treat the corrosions and depositions as if they are part of the pipe wall or as part of the liner. For example, you can add an extra value to the pipe wall thickness parameter or the liner thickness parameter to take into account the deposition.
(8) Some pipes may have a kind of plastic liner which creates a certain amount of gaps between liner and the inner pipe wall. These gaps could prevent ultrasonic waves from direct travelling. Such conditions will make the measurement very difficult. Whenever possible, try to avoid this kind of
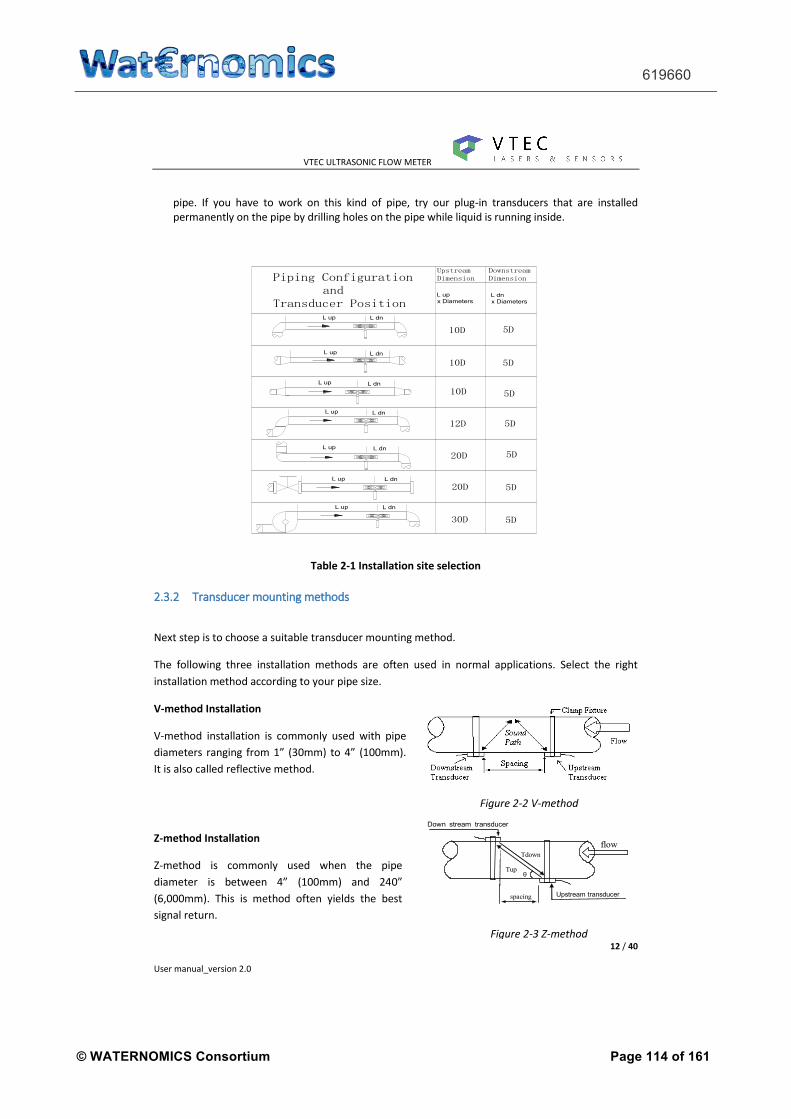
619660
© WATERNOMICS Consortium Page 114 of 161
VTEC ULTRASONIC FLOW METER
12 / 40
User manual_version 2.0
pipe. If you have to work on this kind of pipe, try our plug-in transducers that are installed permanently on the pipe by drilling holes on the pipe while liquid is running inside.
L up L dn
L up L dn
L up
L up
L up
L dn
L dn
L dn
Piping Configuration andTransducer Position
Upstream Dimension
Downstream Dimension
L dnx Diameters
L upx Diameters
10D 5D
10D
10D
12D
20D
20D 5D
5D
5D
5D
5D
L up L dn
30D 5D
L up L dn
Table 2-1 Installation site selection
2.3.2 Transducer mounting methods
Next step is to choose a suitable transducer mounting method.
The following three installation methods are often used in normal applications. Select the right installation method according to your pipe size.
V-method Installation
V-method installation is commonly used with pipe diameters ranging from 1” (30mm) to 4” (100mm). It is also called reflective method.
Z-method Installation
Z-method is commonly used when the pipe diameter is between 4” (100mm) and 240” (6,000mm). This is method often yields the best signal return.
Down stream transducer
spacing
flow
Upstream transducer
Tdown
Tup θ
Figure 2-2 V-method
Figure 2-3 Z-method
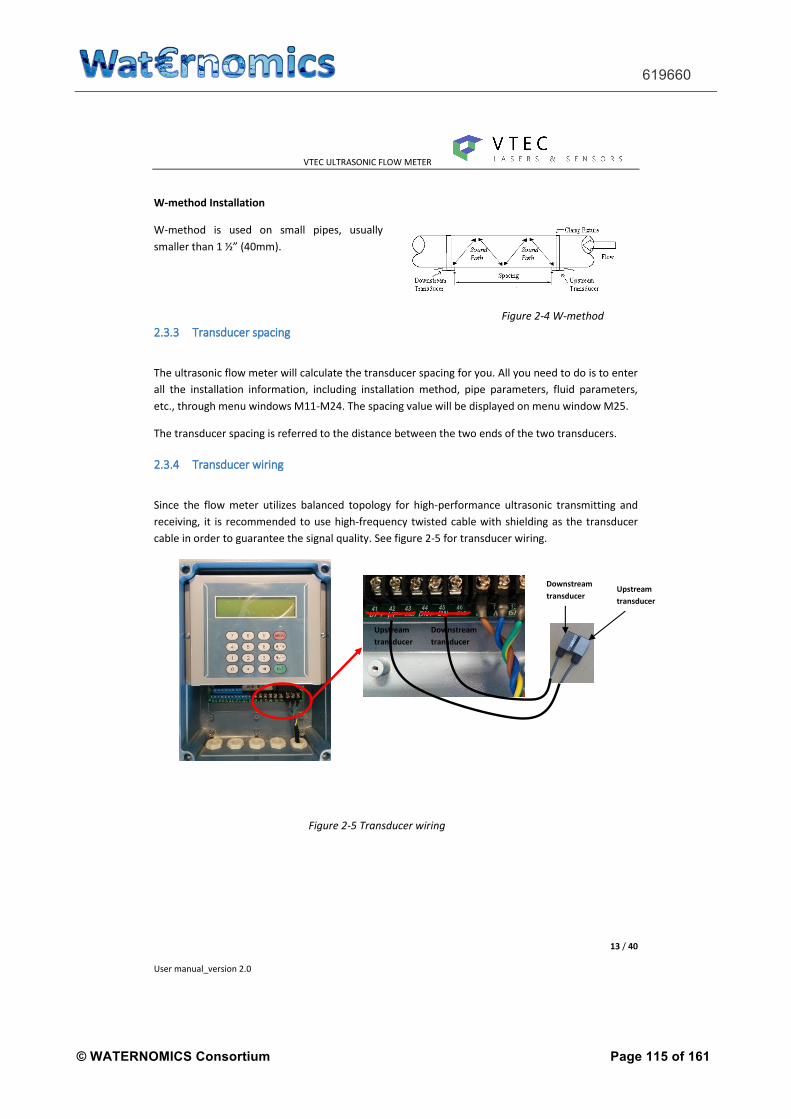
619660
© WATERNOMICS Consortium Page 115 of 161
VTEC ULTRASONIC FLOW METER
13 / 40
User manual_version 2.0
W-method Installation
W-method is used on small pipes, usually
smaller than 1 ½” (40mm).
2.3.3 Transducer spacing
The ultrasonic flow meter will calculate the transducer spacing for you. All you need to do is to enter all the installation information, including installation method, pipe parameters, fluid parameters,
etc., through menu windows M11-M24. The spacing value will be displayed on menu window M25.
The transducer spacing is referred to the distance between the two ends of the two transducers.
2.3.4 Transducer wiring
Since the flow meter utilizes balanced topology for high-performance ultrasonic transmitting and receiving, it is recommended to use high-frequency twisted cable with shielding as the transducer cable in order to guarantee the signal quality. See figure 2-5 for transducer wiring.
Figure 2-4 W-method
Figure 2-5 Transducer wiring
Upstream transducer
Downstream transducer
Upstream transducer
Downstream transducer

619660
© WATERNOMICS Consortium Page 116 of 161
VTEC ULTRASONIC FLOW METER
14 / 40
User manual_version 2.0
Step by step
1. Tools: hex key(provided by VTEC), small screw driver and wire stripper(prepared by yourself)
2. Take out the transducers and the shielded cables (diameter: 7mm).
Note: If the user uses a smaller diameter cable, it could be lose with the transducer connector. In this case, the user needs to fasten with a knot.
3. Open the metal cover around the transducer.
4. Cutting the cable and remove the black plastic jacket and metallic shield.
5. Remove the white plastic insulator.
6. Remove one piece of the jackets at the end of the red and black inner wires.
7. Put the cable into the transducer’s cabinet through the transducer’s connector.
Loose the transducer cap if it is too tight to go through in.

619660
© WATERNOMICS Consortium Page 117 of 161
VTEC ULTRASONIC FLOW METER
15 / 40
User manual_version 2.0
8. Use the screw driver to connect the red wire to the ‘+’ and the black wire to ‘-’.
9. After fixing the wires, tighten the connector cap.
10. Cover the transducer with the metal cover.
11. Then deal with the other end of the cable.
12. Remove the black plastic jacket.
13. Bundle the metallic shield layer.
14. Remove the white plastic isolator.

619660
© WATERNOMICS Consortium Page 118 of 161
VTEC ULTRASONIC FLOW METER
16 / 40
User manual_version 2.0
15. Remove the one piece of the jackets at the end of the red and black inner wires.
16. Open the controller box.
17. Put the cable through the connector in the controller box. Adjust the connector
cap to tighten or loosen.
18. Screw the red wire to ‘UP+’, black wire to ‘UP-’ and the shielded bundle to ‘GND’.
19. Repeat the whole process for the wiring of the second transducer(downstream
transducer). Screw the red wire to ‘DOWN+’, black wire to ‘DOWN-’ and the shielded bundle to ‘GND’.

619660
© WATERNOMICS Consortium Page 119 of 161
VTEC ULTRASONIC FLOW METER
17 / 40
User manual_version 2.0
2.3.5 Prepare the pipe surface
Clean any dust and rust on the spot where the transducers are to be installed. For a better result,
polishing the pipe outer surface with a sander is strongly recommended. A dry, clean surface will
ensure a good acoustic bond between transducer and pipe.
Based on the transducer spacing, accurately mark the transducer installation spots on the pipe
surface. Make sure the two spots are in the cleaned area.
2.3.6 Prepare the Transducers
Clean the transducer surface. Keep the surface dry.
Apply a wide band of ultrasonic couplant down the centre of each transducer face as shown in
Figure 2-6. Also apply a band of couplant on the pipe surface. If the couplant is very sticky, you may
need to slightly massage the pipe surface with the couplant so that the couplant can fill up the tiny
pits which may exist on pipe surface.
Figure 2-6 Applying coulpant to the transducer surface
2.3.7 Installation check-up
After the completion of transducer installation, the user should check the following items: the
receiving signal strength S, the signal quality Q value, the delta time (traveling time difference
between the upstream and the downstream signals), the estimated liquid sound speed, the transit
time ratio R, and etc. As such, one can be sure that the flow meter is working properly and the
results are reliable and accurate.
x Signal Strength
Signal strength S indicates the amplitude of receiving ultrasonic signals.
Although the instrument works well when the signal strength ranges from 60 to 99, stronger signal
strength should be pursued. A stronger signal means a better result. The following methods are
recommended to obtain strong signals:
(1) If the current location is not good enough for a stable and reliable flow reading, or if the signal
strength is lower than 60, relocate to a more favorable location.
619660
© WATERNOMICS Consortium Page 120 of 161
VTEC ULTRASONIC FLOW METER
18 / 40
User manual_version 2.0
(2) Try to polish the outer surface of the pipe, and apply more couplant to increase the signal strength.
(3) Tenderly adjust the position of the two transducers, both vertically and horizontally, while checking the signal strength. Stop at the position where the signal strength reaches to maximum. Then, check the transducer spacing to make sure it is the same as or very close to what window M25 shows.
(4) If the installation method is V-method and the pipe is big, you may need to try Z-method in order to get stronger signals.
x Signal Quality
Signal quality is indicated as the Q value in the instrument. A higher Q value would mean a higher Signal to Noise Ratio (SNR), and accordingly a higher degree of accuracy able to be achieved. Under normal pipe condition, the Q value is in the range of 60-99, the higher the better.
Reasons for a lower Q value could be:
(1) Interference from other instruments and devices nearby. Try to relocate the flow meter to a new place where the interference can be reduced.
(2) Bad sonic coupling between the transducers and the pipe. Try to polish the pipe surface again, clean the surface and apply more couplant.
(3) The selected pipe section is difficult to conduct the measurement. Relocate to a more favorable pipe line.
x Total Transit Time and Delta Time
The total transit time (or traveling time) and the delta time are displayed on menu window M93. They are the primary data for the instrument to calculate the flow rate. Therefore, the measured flow rate will vary as the total transit time and delta time vary.
The total transit time should remain stable or vary in a very small range.
The delta time normally varies less than 20%. If the variation exceeds 20% in either positive or negative direction, there could be certain kinds of problems with the transducer installation. The user should check the installation for sure.
x Transit Time Ratio
Transit-time ratio R is usually used to check whether the transducer installation is good and whether the entered pipe parameters are in consistency with their actual values. If the pipe parameters are correct and the transducers are installed properly, the transit time ratio should be in the range of 100±3 %. Particularly, when the flow is stand-still, the ratio should be very close to 100%. If this range is exceeded, the user should check:
a) If the entered pipe parameters are correct?

619660
© WATERNOMICS Consortium Page 121 of 161
VTEC ULTRASONIC FLOW METER
19 / 40
User manual_version 2.0
b) If the actual spacing of the transducers is the same as or close to what shown on window M25?
c) If the transducer are installed properly in the right direction?
d) If the mounting location is good, if the pipe has changed shape, or if the pipe is too old (i.e., too much corrosion or deposition inside the pipe)?
e) If there is any interference source inside of the pipe?
f) If there are other aspects which do not meet the measurement requirements as recommended earlier?
2.4 Electrical Connection
2.4.1 Power supply connection
The meter can use 220VAC or 24 VDC power supply. The user should make sure the power supply
type of the flow meter matches the power source to which the flow meter will be connected. Please
indicate the power supply type when ordering.
If 24VDC power source is used, then 4-20mA output may not be available.
2.4.2 RS485 Port
The ultrasonic flow meter provides RS 485 communication interface and a complete set of
communication protocol. See figure 2-7 for RS 485 wiring.
WARNING!
Be careful about the power supply type of your flow meter and the power supply wiring! Connecting to a wrong type power source or improper connection of line power could damage the flow meter. It may also cause hazardous voltage at enclosure, the transducer, flow cell, and associated piping.
4-20mA RS485
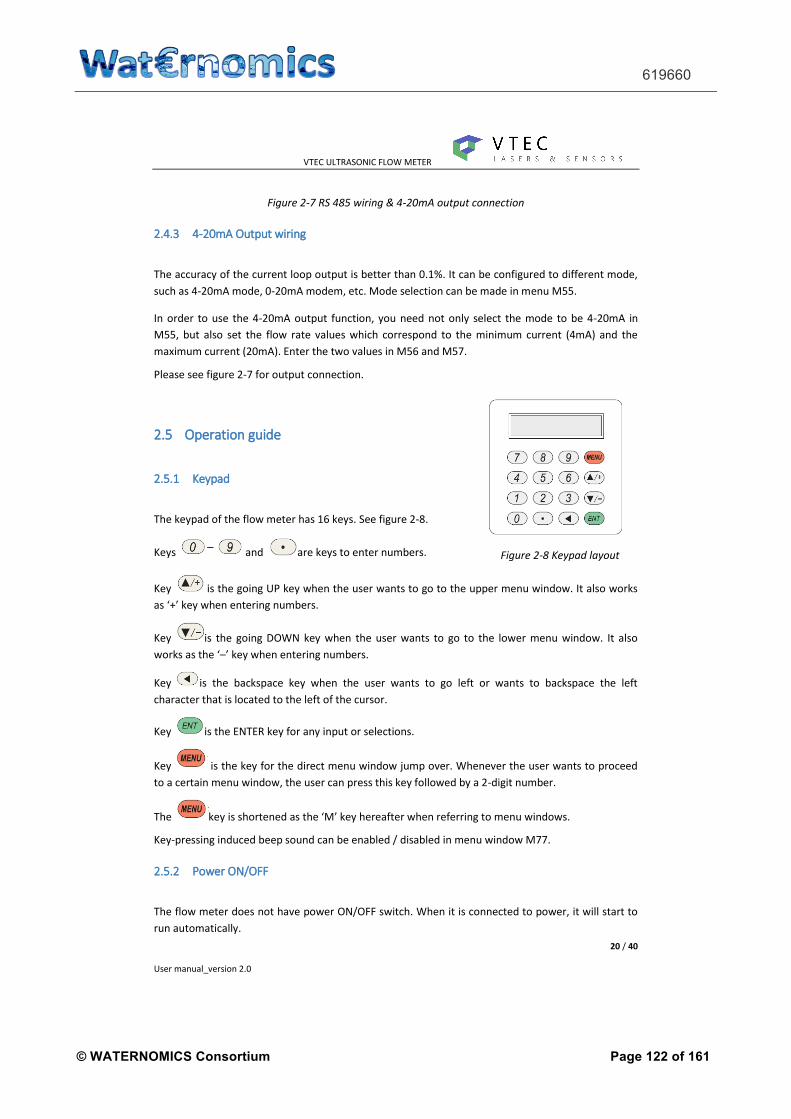
619660
© WATERNOMICS Consortium Page 122 of 161
VTEC ULTRASONIC FLOW METER
20 / 40
User manual_version 2.0
Figure 2-7 RS 485 wiring & 4-20mA output connection
2.4.3 4-20mA Output wiring
The accuracy of the current loop output is better than 0.1%. It can be configured to different mode, such as 4-20mA mode, 0-20mA modem, etc. Mode selection can be made in menu M55.
In order to use the 4-20mA output function, you need not only select the mode to be 4-20mA in M55, but also set the flow rate values which correspond to the minimum current (4mA) and the maximum current (20mA). Enter the two values in M56 and M57.
Please see figure 2-7 for output connection.
2.5 Operation guide
2.5.1 Keypad
The keypad of the flow meter has 16 keys. See figure 2-8.
Keys and are keys to enter numbers.
Key is the going UP key when the user wants to go to the upper menu window. It also works as ‘+’ key when entering numbers.
Key is the going DOWN key when the user wants to go to the lower menu window. It also works as the ‘–’ key when entering numbers.
Key is the backspace key when the user wants to go left or wants to backspace the left character that is located to the left of the cursor.
Key is the ENTER key for any input or selections.
Key is the key for the direct menu window jump over. Whenever the user wants to proceed to a certain menu window, the user can press this key followed by a 2-digit number.
The key is shortened as the ‘M’ key hereafter when referring to menu windows.
Key-pressing induced beep sound can be enabled / disabled in menu window M77.
2.5.2 Power ON/OFF
The flow meter does not have power ON/OFF switch. When it is connected to power, it will start to run automatically.
Figure 2-8 Keypad layout

619660
© WATERNOMICS Consortium Page 123 of 161
VTEC ULTRASONIC FLOW METER
21 / 40
User manual_version 2.0
After the power is turned on, the flow meter will run a self-diagnostic program, checking first the
hardware and then the software integrity. If there is any abnormality, corresponding error
messages1 will be displayed.
After successful internal checks, the flow meter will display menu window M01, or the menu
window which was active at last power off. It will also start the measurements by using the
parameters configured last time by the user or by the initial program.
The flow measurement program always operates in the background of the user interface. This
means that the flow measurement will keep running regardless of any user menu window browsing
or viewing. Only when the user enters new pipe parameters will the flow meter change
measurement to reflect the new parameter changes.
When the power is turned on or new pipe parameters are entered, the flow meter will enter into a
self-adjusting mode to adjust the gain of the receiving circuits so that the signal strength will be
within a proper range. By this step, the flow meter finds the best system gain which matches the
pipe material and fluid type. If the self-adapting process is completed successfully, letter “R” will be displayed.
When the user adjusts the position of the installed transducers, the flow meter will re-adjust the
signal gain automatically.
Any user-entered configuration value will be stored in the NVRAM (non-volatile memory), until it is
modified by the user.
2.5.3 Parameters configuration
In order to make the flow meter work properly, the user must follow the following steps to configure
the system parameters:
(1) Press [MENU] [1] [1] to enter M11 window, input pipe outer diameter. Press [ENT]. (2) Press [▼/-] to enter M12 window, input wall thickness and press [ENT]. (3) Press [▼/-] [▼/-] to enter M14 window and [ENT] [▼/-] [▲/+] to select pipe material, and press
[ENT]. (4) Press [▼/-] to enter M16 window and [ENT] [▼/-] [▲/+] to select liner material, and press [ENT]. (5) Press [▼/-] to enter M20 window and [ENT] [▼/-] [▲/+] to select fluid type, and press [ENT]. (6) Press [▼/-] to enter M23 window and [ENT] [▼/-] [▲/+] to select the transducer type, and press
[ENT]. (7) Press [▼/-] to enter M24 window and [ENT] [▼/-] [▲/+] to select the transducer mounting method,
and press [ENT]. (8) Press [▼/-] to enter M25 window, which will display the correct transducer mounting distance. (9) Press [MENU] [0] [1] [ENT], the flow rate and the velocity of the flow will be displayed upon
completion of the gain adjusting process.
1 Please refer to chapter 5 for trouble shooting.
WARNING!
Before connecting the device to power source, please do a final check to make sure all the wirings are correct and all the local safety codes are followed.

619660
© WATERNOMICS Consortium Page 124 of 161
VTEC ULTRASONIC FLOW METER
22 / 40
User manual_version 2.0
3 Menu windows
Note: To quickly switch to a menu window, just press MENU followed by the window number (a two digit number). To move from one window to the next, use ▲/+ or [▼/-] key.
Table 3-1 Menu windows
Menu window
No.
Function
M00 Display flow rate and net totaliser value.
If the net totaliser is turned off in M34, the net totaliser value shown on the screen is the total prior to its turn off.
M01 Display flow rate and velocity.
M02 Display flow rate and POS (positive) totaliser.
Select the positive totaliser units in menu M31.
If the POS totaliser is turned off, its value shown on the screen is the total prior to its turn off.
M03 Display flow rate and NEG (negative) totaliser. Select the negative totaliser units in M31.
If the NEG totaliser is turned off, its value shown on the screen is the total prior to its turn off.
M04 Display the current date time and flow rate. The time setting method is found in M60.
M05 Display Instantaneous Caloric and Totalized Caloric.
M06 Display Analogue Input AI1 / AI2 current value and its corresponding temperature, pressure or liquid level value.
M07 Display Analog Input AI3 / AI4.
M08 System Error Codes
Display the working condition and the system error codes. Refer to Chapter 5 for details.
M09 Display today’s total NET flow
M10 Window for entering the peripheral of the pipe.
If pipe outer diameter is known, skip this menu and go to menu M11 to enter the outer diameter.
M11 Window for entering the outer diameter of the pipe. Valid range: 15 to 700mm.
Note, you just need to enter either outer diameter in M11 or pipe peripheral in M10.
M12 Window for entering pipe wall thickness. You may skip this menu and enter inner diameter in M13 instead.
M13 Window for entering the inner diameter of the pipe. If pipe outer diameter and wall thickness are entered correctly, the inner
diameter will be calculated automatically, thus no need to change anything in this window.
M14 Window for selecting pipe material.
Standard pipe materials (no need to enter the material sound speed) include:
(0) carbon steel (1) stainless steel (2) cast iron (3) ductile iron
(4) copper (5) PVC (6) aluminum (7) asbestos
(8) fiberglass-epoxy (9) Other (need to enter sound speed in M15)
M15 Window for entering the sound speed of non-standard pipe materials

619660
© WATERNOMICS Consortium Page 125 of 161
VTEC ULTRASONIC FLOW METER
23 / 40
User manual_version 2.0
M16 Window for selecting the liner material. Select none for pipes without any liner.
Standard liner materials (no need to enter liner sound speed) include:
(1) Tar Epoxy (2) Rubber (3) Mortar (4) Polypropylene
(5) Polystryol (6)Polystyrene (7) Polyester (8) Polyethylene
(9) Ebonite (10) Teflon (11) Other (need to enter sound speed in M17)
M17 Window for entering the sound speed of non-standard liner materials
M18 Window for entering the liner thickness, if there is a liner
M19 -
M20 Window for selecting fluid type
For standard liquids (no need to enter liquid sound speed) include:
(0) Water (1) Sea Water (2) Kerosene (3) Gasoline (4) Fuel oil
(5) Crude Oil (6) Propane at -45C (7) Butane at 0C
(8) Other (need to enter sound speed in M21 and viscosity in M22)
(9) Diesel Oil (10) Caster Oil (11) Peanut Oil (12) #90 Gasoline
(13) #93 Gasoline (14) Alcohol (15) Hot water at 125C
M21 Window for entering the sound speed of non-standard liquids. Used only when item 8 “Other” is selected in menu M20.
M22 Window for entering the viscosity of non-standard liquids. Used only when item 8 “Other” is selected in menu M20.
M23 Window for selecting transducer type. There are 23 types: In this case, please select 10 for TM type and 11 for TS type.
M24 Window for selecting the transducer mounting methods
Four methods can be selected:
0. V-method (commonly used);
1. Z-method (most commonly used);
2. N-method (for small pipe. rarely used);
3. W-method (for small pipe).
M25 Display the transducer mounting spacing or distance
M26 Default settings to store data.
M27 Save / load parameters
M28 Entry to determine whether or not to keep the last good value when poor signal condition occurs. This function allows continued flow totalizing. YES is the factory default.
M29 Entry to set empty pipe signal threshold. When the signal strength is less than this threshold, the pipe is classified as empty pipe, and the flow meter will not totalize the flow.
This is based on the fact that, when the pipe is empty, the transducer can still receive signal, just smaller than normal. As a result, the flow meter will show normal operation, which is not correct.
M2A Maximum flow rate.
M30 Window for selecting unit system. The conversion from English to Metric or vice versa will not affect the unit for totalisers.
M31 Window for selecting flow rate unit system.
Flow rate can be in
0. Cubic meter short for (m3)
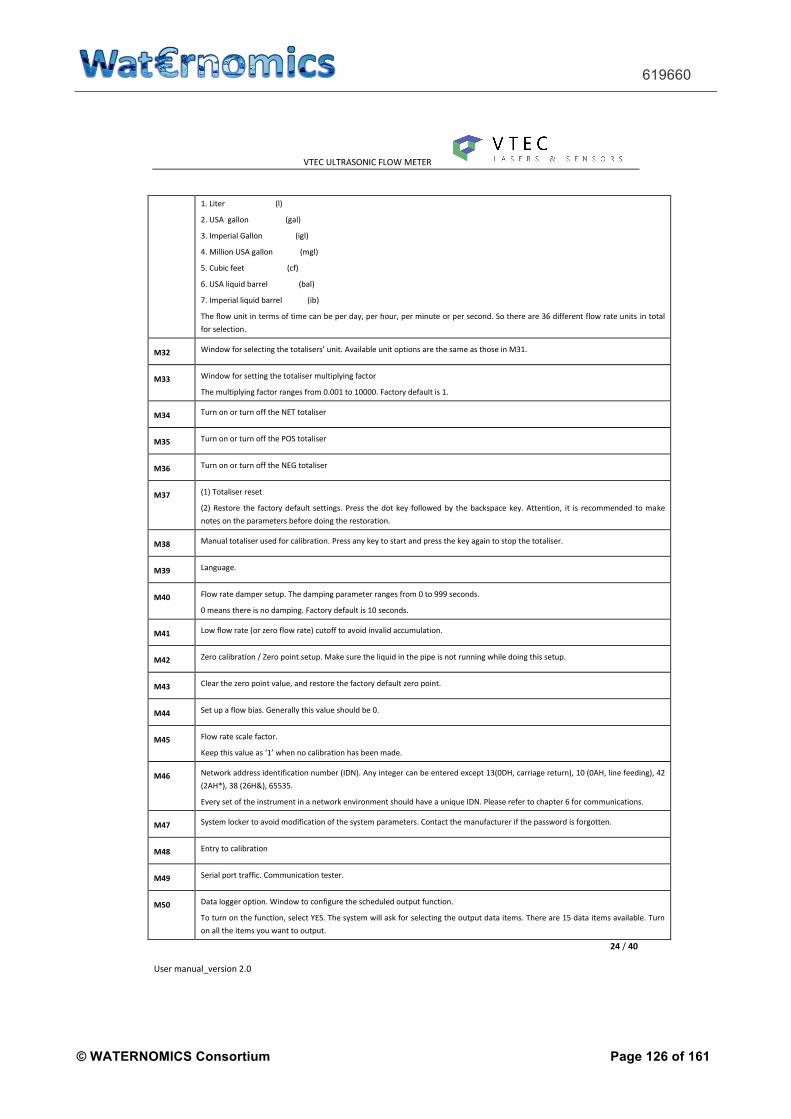
619660
© WATERNOMICS Consortium Page 126 of 161
VTEC ULTRASONIC FLOW METER
24 / 40
User manual_version 2.0
1. Liter (l)
2. USA gallon (gal)
3. Imperial Gallon (igl)
4. Million USA gallon (mgl)
5. Cubic feet (cf)
6. USA liquid barrel (bal)
7. Imperial liquid barrel (ib)
The flow unit in terms of time can be per day, per hour, per minute or per second. So there are 36 different flow rate units in total for selection.
M32 Window for selecting the totalisers’ unit. Available unit options are the same as those in M31.
M33 Window for setting the totaliser multiplying factor
The multiplying factor ranges from 0.001 to 10000. Factory default is 1.
M34 Turn on or turn off the NET totaliser
M35 Turn on or turn off the POS totaliser
M36 Turn on or turn off the NEG totaliser
M37 (1) Totaliser reset
(2) Restore the factory default settings. Press the dot key followed by the backspace key. Attention, it is recommended to make notes on the parameters before doing the restoration.
M38 Manual totaliser used for calibration. Press any key to start and press the key again to stop the totaliser.
M39 Language.
M40 Flow rate damper setup. The damping parameter ranges from 0 to 999 seconds.
0 means there is no damping. Factory default is 10 seconds.
M41 Low flow rate (or zero flow rate) cutoff to avoid invalid accumulation.
M42 Zero calibration / Zero point setup. Make sure the liquid in the pipe is not running while doing this setup.
M43 Clear the zero point value, and restore the factory default zero point.
M44 Set up a flow bias. Generally this value should be 0.
M45 Flow rate scale factor.
Keep this value as ‘1’ when no calibration has been made.
M46 Network address identification number (IDN). Any integer can be entered except 13(0DH, carriage return), 10 (0AH, line feeding), 42 (2AH*), 38 (26H&), 65535.
Every set of the instrument in a network environment should have a unique IDN. Please refer to chapter 6 for communications.
M47 System locker to avoid modification of the system parameters. Contact the manufacturer if the password is forgotten.
M48 Entry to calibration
M49 Serial port traffic. Communication tester.
M50 Data logger option. Window to configure the scheduled output function.
To turn on the function, select YES. The system will ask for selecting the output data items. There are 15 data items available. Turn on all the items you want to output.

619660
© WATERNOMICS Consortium Page 127 of 161
VTEC ULTRASONIC FLOW METER
25 / 40
User manual_version 2.0
M51 Data-logger set up. Window to setup the time of the scheduled output function. This includes start time, time interval and lasting period. Minimum time unit is second. Maximum time interval is 24 hours.
M52 Send Log-Data to 0. Internal SerBus 1. Send To RS-485
M53 Used for analogue input AI5.
Display the current loop value and corresponding temperature / pressure / liquid level of analogue input channel AI5.
M54 OCT Pulse width..
M55 Select the current loop (CL) mode. Available options:
0. 4-20mA Output Mode (set up the output range from 4-20mA)
1. 0-20mA Output Mode (set up the output range from 0-20mA)
2. RS232 controls 0-20mA (set up to control by Serial Port)
3. Turn off the current loop (turn off the current loop to save battery life. Default.)
4. 20-4-20mA Mode (set up the output range from 20-4-20mA)
5. 0-4-20mA Mode (set up the output range from 0-4-20mA)
6. 20-0-20mA Mode (set up the output range from 20-0-20mA)
7. 4-20mA Corresponding Velocity (set up the current loop output range from 4-20mA)
8. 4-20mA Corresponding Heat Flow (set up the current loop output range from 4-20mA)
The output current value is controlled by sending a parameterized command to the flow meter through its RS232 serial port. The command formats are explained in chapter 6.
Example, if you want to output a 6mA current through the current loop, you need to select mode “0-20mA Via RS232” in menu M55 and send command “A06 (CR)” to the flow meter. This function allows the flow meter to control valve openness.
Other different current output characteristics are illustrated in the following figures. The user can select one of them according to his actual requirements. The minimum and maximum values indicated in the figure are those set in menu windows M57 and M58. In the 4-20mA and 0-20mA modes, the minimum and maximum can be a positive or negative flow value as long as the two values are not the same. In the 20-4-20mA and 20-0-20mA modes, the polarity of the actual flow reading is ignored. In 0-4-20mA mode, the minimum must be negative, and the maximum must be positive.
The last one in the following figures is for velocity output. The output current represents flow velocity.
M56 4mA or 0mA output value
Set the flow rate value which corresponds to 4mA or 0mA output current (4mA or 0mA is determined by the settings in M55). The flow unit options are the same as those in M31. If “velocity 4-20mA” is selected in M55, the unit should be set to m/s.
M57 20mA output value
Set the flow rate value which corresponds to 20mA output current. Refer to M31 for flow unit options.
M58 Current loop verification.
Check if the current loop has been calibrated before leaving the factory. Press ENT, and use ▼/+ or ▼/- to display 0mA, 4mA - 24mA one after another. For each one, check with an ammeter to verify that current loop output terminals agree with the displayed values. It is necessary to re-calibrate the current loop if over the permitted tolerance. For more information, refer to section §3.29 for analogue output calibration.
M59 Display present output of the current loop circuit.
Re-calibration is needed if the displayed value differs significantly from the actual output value measured with an ammeter.
M60 Set up system date and time. Press ENT for modification. Use the dot key to skip the digits that need no modification.
M61 Display software version information and Electronic Serial Number (ESN) that are unique for each OMNI-TUF-200F series flow meter.
The user can use the ESN for instrumentation management

619660
© WATERNOMICS Consortium Page 128 of 161
VTEC ULTRASONIC FLOW METER
26 / 40
User manual_version 2.0
M62 RS-485 configuration. All the devices connected with RS232 link should have matched serial configuration.
The following parameters can be configured: Baud rate (75 to 115,200 bps), parity, data bits and stop bit.
M63 Select communication protocol.
M64 AI3 value range
Used to enter the temperature / press values represented by 4mA and 20mA input current.
M65 AI4 value range
Used to enter the temperature / press values represented by 4mA and 20mA input current.
M66 AI5value range
Used to enter the temperature / press values represented by 4mA and 20mA input current.
M67 Window to set up the frequency range (lower limit and upper limit) for the frequency output function.
Note that the frequency signal can only be transmitted through the OCT output. Therefore, you need to set the OCT to be in frequency output mode.
M68 Window to set up the minimum flow rate which corresponds to the lower frequency limit of the frequency output
M69 Window to set up the maximum flow rate which corresponds to the upper frequency limit of the frequency output
M70 LCD backlight control.
When Lighting For option is selected, you need to enter a value which indicates how many seconds the backlight will be on with every key pressing.
M71 LCD contrast control. The LCD will become darker when a small value is entered.
M72 Working timer. It can be reset by pressing ENT key, and then select YES.
M73 Alarm #1 lower threshold setup.
When flow rate is below this threshold, the Alarm #1 OCT circuit or relay will be activated.
There are two alarming methods, OCT and relay. User must select the alarming output method in window M78 or M79.
M74 Alarm #1 upper threshold setup.
When flow rate is above this threshold, the Alarm #1 OCT circuit or relay will be activated.
There are two alarming methods, OCT and relay. User must select the alarming output method in window M78 or M79.
M75 Alarm #2 lower threshold setup.
When flow rate is below this threshold, the Alarm #2 OCT circuit or relay will be activated.
There are two alarming methods, OCT and relay. User must select the alarming output method in window M78 or M79.
M76 Alarm #2 upper threshold setup.
When flow rate is below this threshold, the Alarm #2 OCT circuit or relay will be activated.
There are two alarming methods, OCT and relay. User must select the alarming output method in window M78 or M79.
M77 Buzzer setup.
If a proper input source is selected, the buzzer will beep when the trigger event occurs. The available trigger sources are:
0. No Signal 9. POS Int Pulse 18. Timer (M51 Daily)
1. Poor Signal 10. NEG Int Pulse 19. Timed Alarm #1
2. Not Ready 11. NET Int Pulse 20. Timed Alarm #2
3. Reverse Flow 12. Energy POS Pulse 21. Batch total full
4. AO Over 120% 13. Energy NEG Pulse 22. Timer by M51
5. FO Over 120% 14.Energy NET Pulse 23.Batch 90% full
6. Alarm #1 15. MediaVel > Threshold 24.Key stroking ON
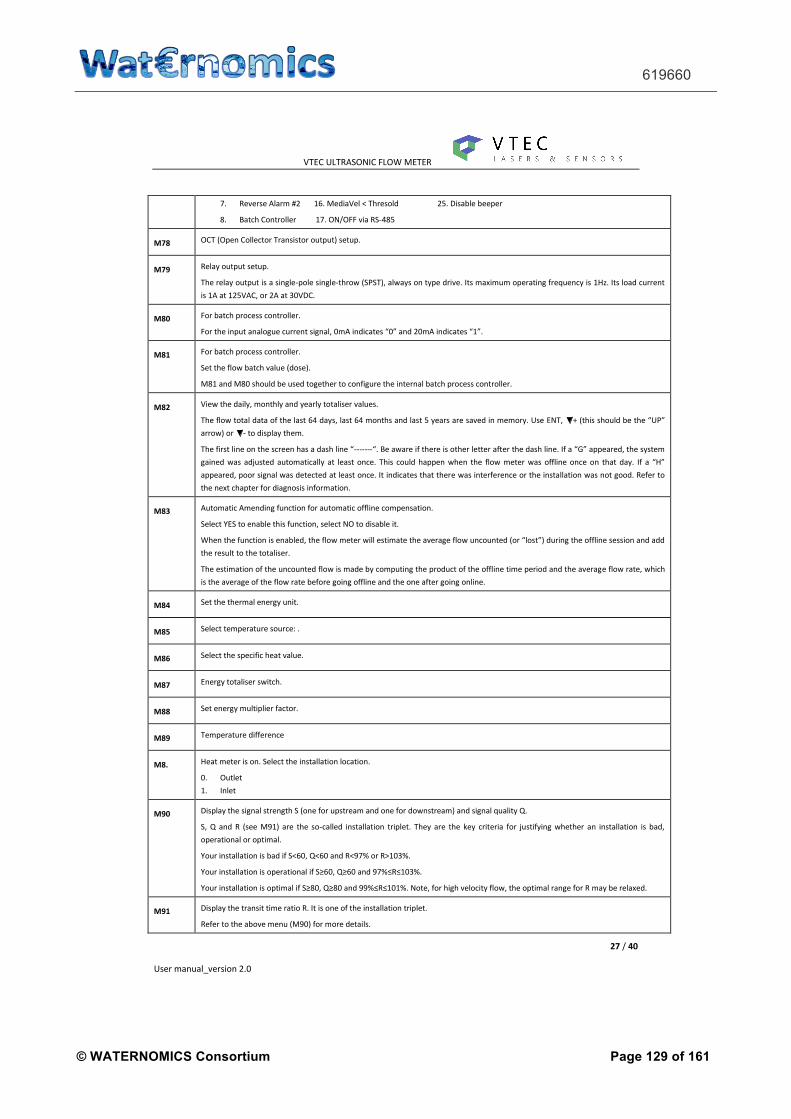
619660
© WATERNOMICS Consortium Page 129 of 161
VTEC ULTRASONIC FLOW METER
27 / 40
User manual_version 2.0
7. Reverse Alarm #2 16. MediaVel < Thresold 25. Disable beeper
8. Batch Controller 17. ON/OFF via RS-485
M78 OCT (Open Collector Transistor output) setup.
M79 Relay output setup.
The relay output is a single-pole single-throw (SPST), always on type drive. Its maximum operating frequency is 1Hz. Its load current
is 1A at 125VAC, or 2A at 30VDC.
M80 For batch process controller.
For the input analogue current signal, 0mA indicates “0” and 20mA indicates “1”.
M81 For batch process controller.
Set the flow batch value (dose).
M81 and M80 should be used together to configure the internal batch process controller.
M82 View the daily, monthly and yearly totaliser values.
The flow total data of the last 64 days, last 64 months and last 5 years are saved in memory. Use ENT, ▼/+ (this should be the “UP” arrow) or ▼/- to display them.
The first line on the screen has a dash line “-------“. Be aware if there is other letter after the dash line. If a “G” appeared, the system gained was adjusted automatically at least once. This could happen when the flow meter was offline once on that day. If a “H”
appeared, poor signal was detected at least once. It indicates that there was interference or the installation was not good. Refer to
the next chapter for diagnosis information.
M83 Automatic Amending function for automatic offline compensation.
Select YES to enable this function, select NO to disable it.
When the function is enabled, the flow meter will estimate the average flow uncounted (or “lost”) during the offline session and add the result to the totaliser.
The estimation of the uncounted flow is made by computing the product of the offline time period and the average flow rate, which
is the average of the flow rate before going offline and the one after going online.
M84 Set the thermal energy unit.
M85 Select temperature source: .
M86 Select the specific heat value.
M87 Energy totaliser switch.
M88 Set energy multiplier factor.
M89 Temperature difference
M8. Heat meter is on. Select the installation location.
0. Outlet
1. Inlet
M90 Display the signal strength S (one for upstream and one for downstream) and signal quality Q.
S, Q and R (see M91) are the so-called installation triplet. They are the key criteria for justifying whether an installation is bad,
operational or optimal.
Your installation is bad if S<60, Q<60 and R<97% or R>103%.
Your installation is operational if S≥60, Q≥60 and 97%≤R≤103%.
Your installation is optimal if S≥80, Q≥80 and 99%≤R≤101%. Note, for high velocity flow, the optimal range for R may be relaxed.
M91 Display the transit time ratio R. It is one of the installation triplet.
Refer to the above menu (M90) for more details.

619660
© WATERNOMICS Consortium Page 130 of 161
VTEC ULTRASONIC FLOW METER
28 / 40
User manual_version 2.0
M92 Display the fluid sound speed estimated by using the measured transit-time.
If this value has an obvious difference with the actual fluid sound speed, the user is recommended to check if the pipe parameters
are correct and if the transducer installation is good.
M93 Display the average transit time and the delta time (transit time difference between upstream and downstream traveling).
Normally, the delta time should not fluctuate over 20%. If it does, the system is not in stable condition. You need to check your
transducer installation and the entered installation parameters.
For small pipe, the transit time value may not be stable. In such case, try to adjust transducer position until the transit time becomes
stable.
M94 Display the Reynolds number and the pipe factor used by the flow rate measurement program. Pipe factor is calculated from the
line-averaged velocity and cross-section-averaged velocity information.
M+ 0 View the last 64 records of power on and off events. The recorded information include the date and time as well as the
corresponding flow rate when the power on or off occurs
M+1 Display the total working time of the instrument since the flow meter left the factory.
M+2 Display the date and time of the last power-off event.
M+3 Display the flow rate of the last power-off event.
M+4 Display the total number of times the flow meter has been powered on and off since the flow meter left the factory.
M+5 A scientific calculator for the convenience of field applications.
All the values are in single accuracy. All the mathematic operators are selected from a list.
The calculator can be used while the flow meter is conducting flow measurement.
M+6 Set fluid sound speed threshold.
M+7 Total flow for month
M+8 Total flow this year
M+9 No-ready timer. Time for all time of abnormal measuring. ENT to clear.
M.2 Store Zero-point
M.5 Display threshold for Q (signal quality)
M.8 Day MAX and Month MAX
M.9 .Serial port traffic
M-0 Entry to hardware adjusting windows. Valid for the manufacturer only.

619660
© WATERNOMICS Consortium Page 131 of 161
VTEC ULTRASONIC FLOW METER
29 / 40
User manual_version 2.0
4 Serial communication
4.1 Communication Protocol
The protocol is comprised of a set of basic commands that are strings in ASCII format, ending with a carriage (CR) and line feed (LF). Commonly used commands are listed in the following table.
4.1.1 Basic Commands
Table 4-1 Basic commands
Command Function Data Format
DQD(CR) 1 Return flow rate per day ±d.ddddddE±dd(CR)(LF)2
DQH(CR) Return flow rate per hour ±d.ddddddE±dd(CR)(LF)
DQM(CR) Return flow rate per minute ±d.ddddddE±dd(CR)(LF)
DQS(CR) Return flow rate per second ±d.ddddddE±dd(CR)(LF)
DV(CR) Return instantaneous flow velocity ±d.ddddddE±dd(CR)(LF)
DI+(CR) Return POS totaliser ±dddddddE±d(CR)(LF)3
DI-(CR) Return NEG totaliser ±dddddddE±d(CR)(LF)
DIN(CR) Return NET totaliser ±dddddddE±d(CR)(LF)
DIE(CR) Return Caloric Totaliser Value ±dddddddE±d(CR)(LF)
DID(CR) Return Identification Number (IDN) ddddd(CR)(LF)
E(CR) Return Instantaneous Caloric Value ±d.ddddddE±dd(CR)(LF)
DL(CR) Return signal strength and signal quality UP:dd.d,DN:dd.d, Q=dd(CR)(LF)
DS(CR) Return the percentage of analogue output A0. ±d.ddddddE±dd(CR)(LF)
DC(CR) Return the present error code 4
DA(CR) OCT or RELAY alarm signal TR:s, RL:s(CR)(LF) 5
DT(CR) Return the current date and time yy-mm-dd hh:mm:ss(CR)(LF)
M@(CR)**** Send a key value as if a key is pressed M@(CR) )(LF) 6
LCD(CR) Return the current display contents
C1(CR) OCT close
C0(CR) OCT open
R1(CR) RELAY close
R0(CR) RELAY open
FOdddd(CR) Force the FO output to output a frequency of dddd Hz Fdddd(CR)(LF)
Aoa(CR) Output current a at the current loop output terminal A0a(CR)(LF) 7

619660
© WATERNOMICS Consortium Page 132 of 161
VTEC ULTRASONIC FLOW METER
30 / 40
User manual_version 2.0
BA1(CR) Return current value of AI1 (0-20mA) ±d.ddddddE±dd(CR)(LF)
BA2(CR) Return current value of AI2 (0-20mA) ±d.ddddddE±dd(CR)(LF)
BA3(CR) Return current value of AI3 (0-20mA) ±d.ddddddE±dd(CR)(LF)
BA4(CR) Return current value of AI4 (0-20mA) ±d.ddddddE±dd(CR)(LF)
AI1(CR) Return temperature/pressure value of AI1
±d.ddddddE±dd(CR)(LF)
AI2(CR) Return temperature/pressure value of AI2
±d.ddddddE±dd(CR)(LF)
AI3(CR) Return temperature/pressure value of AI3
±d.ddddddE±dd(CR)(LF)
AI4(CR) Return temperature/pressure value of AI4
±d.ddddddE±dd(CR)(LF)
ESN(CR) Return the electronic serial number (ESN) of the flow meter
dddddddt(CR)(LF) 8
W Prefix of an IDN-addressing-based networking command. The IDN address is a word, ranging 0-65534.
9
N Prefix of an IDN-addressing-based networking command. The IDN address here is a single byte value, ranging 00-255.
9
P Prefix of any command with checksum
& Command binder to make a longer command by combining up to 6 commands
RING(CR)(LF) Handshaking Request from a MODEM ATA(CR)(LF)
OK(CR) Acknowledgement from a MODEM No action
Handshaking Request from a Flow meter AT(CR)(LF)
GA(CR) A Command for GSM messaging 10 Please contact the manufacturer for detail
GB(CR) B Command for GSM messaging 10
GC(CR) C Command for GSM messaging
DUMP 11 Return the print buffer content In ASCII string format
DUMP0 Clear the whole print buffer In ASCII string format
DUMP1(CR) Return the whole print buffer content In ASCII string Format (24KB long)
Notes:
1. (CR) stands for Carriage Return. Its ASCII code is 0DH. (LF) strands for Line Feed. Its ASCII code is 0AH.
2. “d” stands for a digit number of 0~9. 0 is expressed as +0.000000E+00. 3. “d” stands for a digit number of 0~9. The number before “E” is integer. 4. Working status code, 1-6 letters. Refer to Table 5.2 for error code. 5. “s” is “ON”, “OFF” or “UD’”. For instance, “TR:ON, RL:UD” means that the OCT is in
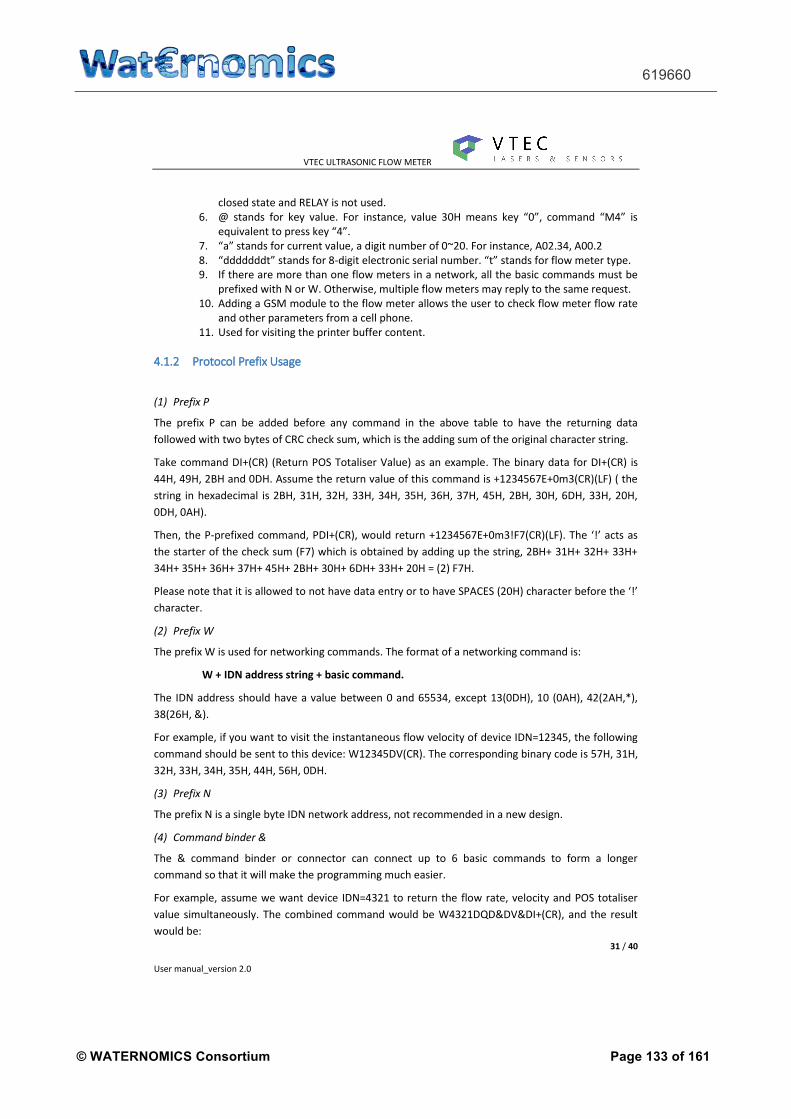
619660
© WATERNOMICS Consortium Page 133 of 161
VTEC ULTRASONIC FLOW METER
31 / 40
User manual_version 2.0
closed state and RELAY is not used.
6. @ stands for key value. For instance, value 30H means key “0”, command “M4” is equivalent to press key “4”.
7. “a” stands for current value, a digit number of 0~20. For instance, A02.34, A00.2
8. “dddddddt” stands for 8-digit electronic serial number. “t” stands for flow meter type. 9. If there are more than one flow meters in a network, all the basic commands must be
prefixed with N or W. Otherwise, multiple flow meters may reply to the same request.
10. Adding a GSM module to the flow meter allows the user to check flow meter flow rate
and other parameters from a cell phone.
11. Used for visiting the printer buffer content.
4.1.2 Protocol Prefix Usage
(1) Prefix P
The prefix P can be added before any command in the above table to have the returning data
followed with two bytes of CRC check sum, which is the adding sum of the original character string.
Take command DI+(CR) (Return POS Totaliser Value) as an example. The binary data for DI+(CR) is
44H, 49H, 2BH and 0DH. Assume the return value of this command is +1234567E+0m3(CR)(LF) ( the
string in hexadecimal is 2BH, 31H, 32H, 33H, 34H, 35H, 36H, 37H, 45H, 2BH, 30H, 6DH, 33H, 20H,
0DH, 0AH).
Then, the P-prefixed command, PDI+(CR), would return +1234567E+0m3!F7(CR)(LF). The ‘!’ acts as the starter of the check sum (F7) which is obtained by adding up the string, 2BH+ 31H+ 32H+ 33H+
34H+ 35H+ 36H+ 37H+ 45H+ 2BH+ 30H+ 6DH+ 33H+ 20H = (2) F7H.
Please note that it is allowed to not have data entry or to have SPACES (20H) character before the ‘!’ character.
(2) Prefix W
The prefix W is used for networking commands. The format of a networking command is:
W + IDN address string + basic command.
The IDN address should have a value between 0 and 65534, except 13(0DH), 10 (0AH), 42(2AH,*),
38(26H, &).
For example, if you want to visit the instantaneous flow velocity of device IDN=12345, the following
command should be sent to this device: W12345DV(CR). The corresponding binary code is 57H, 31H,
32H, 33H, 34H, 35H, 44H, 56H, 0DH.
(3) Prefix N
The prefix N is a single byte IDN network address, not recommended in a new design.
(4) Command binder &
The & command binder or connector can connect up to 6 basic commands to form a longer
command so that it will make the programming much easier.
For example, assume we want device IDN=4321 to return the flow rate, velocity and POS totaliser
value simultaneously. The combined command would be W4321DQD&DV&DI+(CR), and the result
would be:

619660
© WATERNOMICS Consortium Page 134 of 161
VTEC ULTRASONIC FLOW METER
32 / 40
User manual_version 2.0
+1.234567E+12m3/d(CR)
+3.1235926E+00m/s(CR)
+1234567E+0m3(CR)
4.2 The M command and the ASCII Codes
The protocol provides the capability of virtual key-pressing. A remote RS-485 terminal can send an ‘M’ command along with a key code to simulate the scenario that the key is pressed through the keypad of the flow meter. This functionality allows the user to operate the flow meter in the office far away from the testing site.
The ASCII codes and corresponding key values of the keypad keys are listed in the following table.
Table 4-2 ASCII codes and corresponding keys
Key Hexadecimal Key code
Decimal Key code
ASCII Code
Key Hexadecimal Key code
Decimal Key code
ASCII Code
0 30H 48 0 8 38H 56 8
1 31H 49 1 9 39H 57 9
2 32H 50 2 . 3AH 58 :
3 33H 51 3 ◄ 3BH,0BH 59 ;
4 34H 52 4 MENU 3CH,0CH 60 <
5 35H 53 5 ENT 3DH,0DH 61 =
6 36H 54 6 ▲/+ 3EH 62 >
7 37H 55 7 ▼/- 3FH 63 ?

619660
© WATERNOMICS Consortium Page 135 of 161
VTEC ULTRASONIC FLOW METER
33 / 40
User manual_version 2.0
5 Troubleshooting
5.1 Introduction
The flow meter series flow meters utilized high-reliability design, thus, their malfunction probability
is quite low. However, due to improper settings, harsh environment or misusage, problem could
occur. Therefore, flow meter is equipped with a complete set of self-diagnosis functions. The errors
are displayed in the upper right corner of the menu window via identification code in a timely order.
Hardware self-diagnosis is conducted every time when power is on. Some errors can even be
detected during normal operation. For those errors undetectable due to incorrect settings or
improper testing conditions, the flow meter will also display useful information to help the user to
quickly debug the error and solve the problem.
There are two types of errors, one is hardware error, and the other is operational error. Details are
presented in the following sections.
5.2 Power-on Errors
When powered on, the ultrasonic flow meter automatically starts the self-diagnosis process to find if
there are any hardware and software problems. If a problem is identified, an error message will be
displayed. The following table shows the possible error messages, the corresponding causes and
their solutions.
Table 5-1 Hardware self-diagnosis errors and solutions
Error message Causes Solutions
ROM Parity Error ROM operation illegal / error (1) Reboot the system
(2) Contact the manufacturer.
Stored Data Error User-entered parameters lost. (1) Reboot the system
(2) If problem persists, press ENT key to restore
the factory default configuration.
SCPU Fatal Error SCPU hardware fatal error
(1) Reboot the system
(2) Contact the manufacturer.
System Clock Slow or Fast
Error
Problem with the system clock or
the crystal oscillator.
CPU or IRQ Error Problem with CPU or IRQ
hardware
System RAM Error Problem with RAM chip
Time Date Error Problem with date/time chip (1) Initialize the calendar in menu window M61.
(2) Contact the manufacturer.
No Display. Erratic or
Abnormal Operation
Problem with wiring Double check wiring connections.
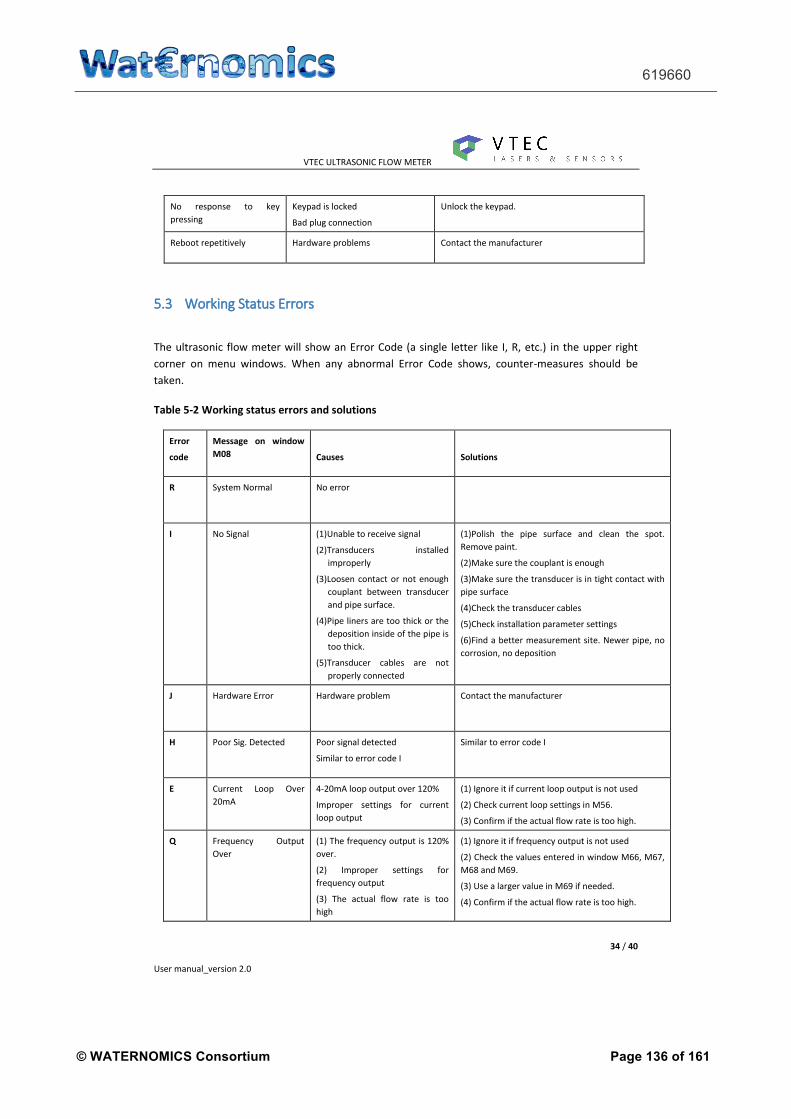
619660
© WATERNOMICS Consortium Page 136 of 161
VTEC ULTRASONIC FLOW METER
34 / 40
User manual_version 2.0
No response to key pressing
Keypad is locked
Bad plug connection
Unlock the keypad.
Reboot repetitively Hardware problems Contact the manufacturer
5.3 Working Status Errors
The ultrasonic flow meter will show an Error Code (a single letter like I, R, etc.) in the upper right corner on menu windows. When any abnormal Error Code shows, counter-measures should be taken.
Table 5-2 Working status errors and solutions
Error code
Message on window M08
Causes
Solutions
R System Normal No error
I No Signal (1)Unable to receive signal
(2)Transducers installed improperly
(3)Loosen contact or not enough couplant between transducer and pipe surface.
(4)Pipe liners are too thick or the deposition inside of the pipe is too thick.
(5)Transducer cables are not properly connected
(1)Polish the pipe surface and clean the spot. Remove paint.
(2)Make sure the couplant is enough
(3)Make sure the transducer is in tight contact with pipe surface
(4)Check the transducer cables
(5)Check installation parameter settings
(6)Find a better measurement site. Newer pipe, no corrosion, no deposition
J Hardware Error Hardware problem Contact the manufacturer
H Poor Sig. Detected Poor signal detected
Similar to error code I
Similar to error code I
E Current Loop Over 20mA
4-20mA loop output over 120%
Improper settings for current loop output
(1) Ignore it if current loop output is not used
(2) Check current loop settings in M56.
(3) Confirm if the actual flow rate is too high.
Q Frequency Output Over
(1) The frequency output is 120% over.
(2) Improper settings for frequency output
(3) The actual flow rate is too high
(1) Ignore it if frequency output is not used
(2) Check the values entered in window M66, M67, M68 and M69.
(3) Use a larger value in M69 if needed.
(4) Confirm if the actual flow rate is too high.

619660
© WATERNOMICS Consortium Page 137 of 161
VTEC ULTRASONIC FLOW METER
35 / 40
User manual_version 2.0
F System RAM Error
Date Time Error
CPU or IRQ Error
ROM Parity Error
(1) Temporary problems with RAM, RTC
(2) Permanent problems with hardware
(1) Reboot the system
(2) Contact the manufacturer
Refer to Table 5.1 as well
G Adjusting Gain >s1
Adjusting Gain >s2
Adjusting Gain >s3
Adjusting Gain >s4
(shown in M00-M03)
Instrument is in the progress of adjusting the gain for the signal, and the number indicates the progressive steps
No need for action
K Empty pipe (1) No liquid inside the pipe
(2) Incorrect setup in M29
(2) If the pipe is not full, relocate the meter to where the pipe is full of liquid
(3) If the pipe is full, enter 0 in M29
5.4 Other Problems and Solutions
(1) Q: Why the instrument displays 0.0000 flow rate while the liquid in the pipe is actually flowing? The signal strength is checked to be good (the working status is “R”) and the signal quality Q has a satisfactory value.
A: The problem is likely to be caused by the incorrect “Zero Point” setting. The user may have conducted the “Zero Point” setup while the flow was not standstill. To solve this problem, use the ‘Reset Zero’ function in menu window M43 to clear the zero point.
(2) Q: The displayed flow rate is much lower or much higher than the actual flow rate in the pipe under normal working conditions. Why?
A: The entered offset value might be wrong. Enter ‘0’ offset in window M44.
(a) Incorrect transducer installation. Re-install the transducers carefully.
(b) The ‘Zero Point’ is wrong. Go to window M42 and redo the “Zero Point” setup. Make sure that the flow inside the pipe is standstill. No velocity is allowed during this setup process.
(3) Q: Why there is no signal? The installation requirements are met, pipe is new and pipe material is in good quality.
A: Check the following:
(a) Is the installation method suitable for your pipe size?
(b) Are the entered installation parameters correct?
(c) Are the wirings correct?
(d) Adequate couplant? Transducers are in good contact with pipe?
(e) Is pipe full?
(f) Is the transducer distance in consistency with the one shown in M25?
(g) Is transducer head/tail in the right direction?
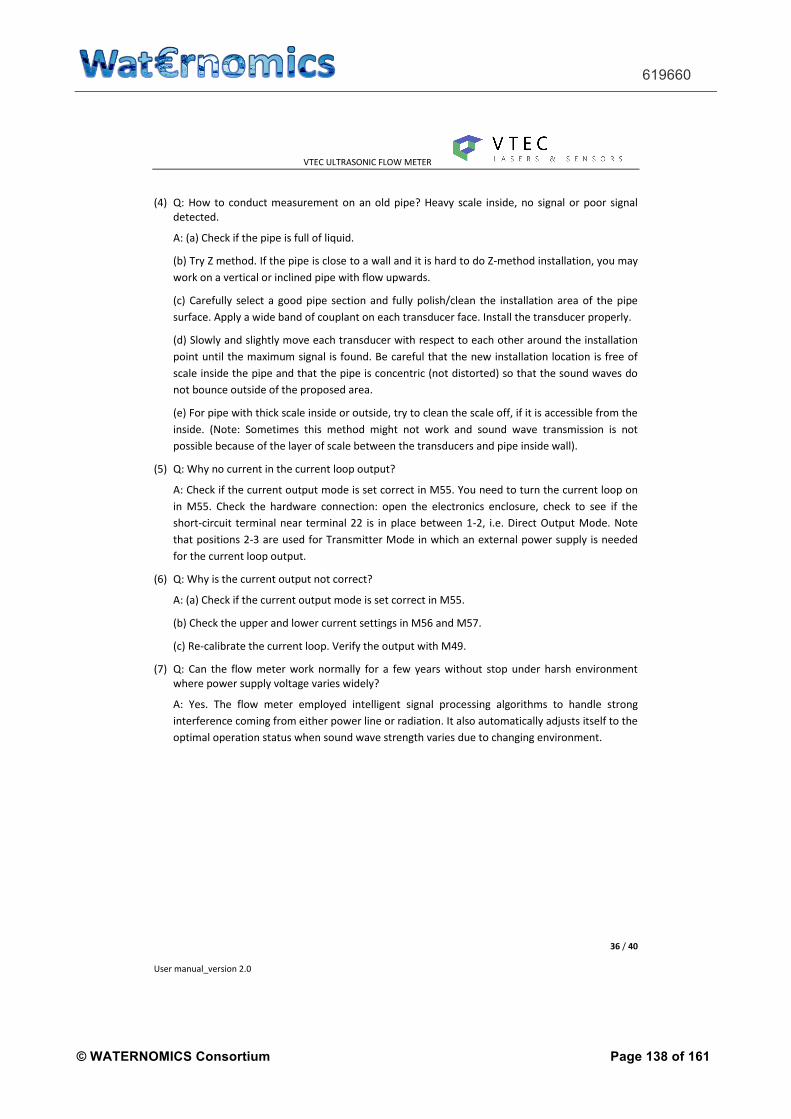
619660
© WATERNOMICS Consortium Page 138 of 161
VTEC ULTRASONIC FLOW METER
36 / 40
User manual_version 2.0
(4) Q: How to conduct measurement on an old pipe? Heavy scale inside, no signal or poor signal detected.
A: (a) Check if the pipe is full of liquid.
(b) Try Z method. If the pipe is close to a wall and it is hard to do Z-method installation, you may work on a vertical or inclined pipe with flow upwards.
(c) Carefully select a good pipe section and fully polish/clean the installation area of the pipe surface. Apply a wide band of couplant on each transducer face. Install the transducer properly.
(d) Slowly and slightly move each transducer with respect to each other around the installation point until the maximum signal is found. Be careful that the new installation location is free of scale inside the pipe and that the pipe is concentric (not distorted) so that the sound waves do not bounce outside of the proposed area.
(e) For pipe with thick scale inside or outside, try to clean the scale off, if it is accessible from the inside. (Note: Sometimes this method might not work and sound wave transmission is not possible because of the layer of scale between the transducers and pipe inside wall).
(5) Q: Why no current in the current loop output?
A: Check if the current output mode is set correct in M55. You need to turn the current loop on in M55. Check the hardware connection: open the electronics enclosure, check to see if the short-circuit terminal near terminal 22 is in place between 1-2, i.e. Direct Output Mode. Note that positions 2-3 are used for Transmitter Mode in which an external power supply is needed for the current loop output.
(6) Q: Why is the current output not correct?
A: (a) Check if the current output mode is set correct in M55.
(b) Check the upper and lower current settings in M56 and M57.
(c) Re-calibrate the current loop. Verify the output with M49.
(7) Q: Can the flow meter work normally for a few years without stop under harsh environment where power supply voltage varies widely?
A: Yes. The flow meter employed intelligent signal processing algorithms to handle strong interference coming from either power line or radiation. It also automatically adjusts itself to the optimal operation status when sound wave strength varies due to changing environment.
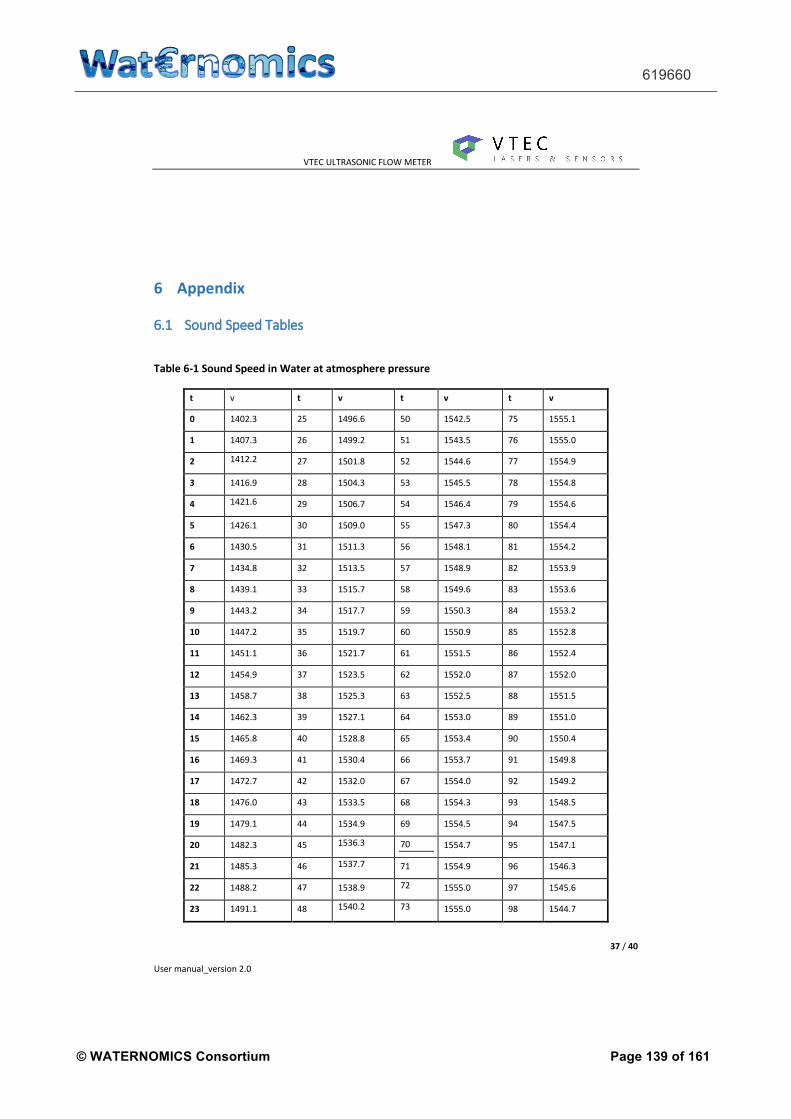
619660
© WATERNOMICS Consortium Page 139 of 161
VTEC ULTRASONIC FLOW METER
37 / 40
User manual_version 2.0
6 Appendix
6.1 Sound Speed Tables
Table 6-1 Sound Speed in Water at atmosphere pressure
t v t v t v t v
0 1402.3 25 1496.6 50 1542.5 75 1555.1
1 1407.3 26 1499.2 51 1543.5 76 1555.0
2 1412.2 27 1501.8 52 1544.6 77 1554.9
3 1416.9 28 1504.3 53 1545.5 78 1554.8
4 1421.6 29 1506.7 54 1546.4 79 1554.6
5 1426.1 30 1509.0 55 1547.3 80 1554.4
6 1430.5 31 1511.3 56 1548.1 81 1554.2
7 1434.8 32 1513.5 57 1548.9 82 1553.9
8 1439.1 33 1515.7 58 1549.6 83 1553.6
9 1443.2 34 1517.7 59 1550.3 84 1553.2
10 1447.2 35 1519.7 60 1550.9 85 1552.8
11 1451.1 36 1521.7 61 1551.5 86 1552.4
12 1454.9 37 1523.5 62 1552.0 87 1552.0
13 1458.7 38 1525.3 63 1552.5 88 1551.5
14 1462.3 39 1527.1 64 1553.0 89 1551.0
15 1465.8 40 1528.8 65 1553.4 90 1550.4
16 1469.3 41 1530.4 66 1553.7 91 1549.8
17 1472.7 42 1532.0 67 1554.0 92 1549.2
18 1476.0 43 1533.5 68 1554.3 93 1548.5
19 1479.1 44 1534.9 69 1554.5 94 1547.5
20 1482.3 45 1536.3 70 1554.7 95 1547.1
21 1485.3 46 1537.7 71 1554.9 96 1546.3
22 1488.2 47 1538.9 72 1555.0 97 1545.6
23 1491.1 48 1540.2 73 1555.0 98 1544.7

619660
© WATERNOMICS Consortium Page 140 of 161
VTEC ULTRASONIC FLOW METER
38 / 40
User manual_version 2.0
24 1493.9 49 1541.3 74 1555.1 99 1543.9
Table 6-2 Sound Speed and Viscosity Data of Liquids
Liquids Sound Speed
@ 25oC (77qF)
Kinematic Viscosity
X 10-6 m/s ft/s m2/s ft2/s
Acetone 1,174 3,851.7 0.399 4.293
Acetaldehyde Alcohol 1,180 3,870
Alcohol 1,207 3,960 1.396 15.02
Aviation kerosene 1,298 4,257
Benzene 1,306 4,284.8 0.711 7.65
Carbine 1,121 3,677
Ethanol 1,207 3,690 1.39 14.956
Ethyl benzene 1,586 4,389.8
(68°F)
0.797
(17oC)
8.575
(63°F) Ethylene chloride 1,193 3,914 0.61 6.563
Ethylene trichloride 1,050 3,444
Gasoline 1,250 4,100 0.8 0.1980
Gasoline 66# 1,171 3,841
Gasoline 80# 1,139 3,736
Glycol 1658 5,439.6
50%Glycol / 50%H2O 1,578 5,177
Glycerin 1,904 6,246.7 757.1 8,081.8
Ketone 1,310 4,297
Kerosene 1,420 4,658 2.3 24.7
Oil (Castor) 1,477 4,854.8 0.670 7.209
Oil (Diesel) 1,250 4,101
Oil (Peanut) 1,458 4,783.5
Petroleum 1,290 4,231
Tetrachlor-Methane 926 3,038.1 0.607 6.531
Toluene 1,328
(20oC)
4,357
(68°F)
0.644 6.929
Water, distilled 1,498 4,914.7 1.0 10.76

619660
© WATERNOMICS Consortium Page 141 of 161
VTEC ULTRASONIC FLOW METER
39 / 40
User manual_version 2.0
Table 6-3 Sound Speed Data of Solids
Material
Sound Speed
Shear Wave(25oC)
Sound Speed
Long. Wave(25oC) m/s ft/s mm/us in/us
Steel, 1% Carbon, hardened 3,150 10,335 5.88 0.2315
Carbon Steel 3,230 10,598 5.89 0.2319
Mild Steel 3,235 10,614 5.89 0.2319
Steel,1% Carbon 3,220 10,565
302 Stainless Steel 3,120 10,236 5.690 0.224
303 Stainless Steel 3,120 10,236 5.640 0.222
304 Stainless Steel 3,141 10,306 5.920 0.233
304L Stainless Steel 3,070 10,073 5.790 0.228
316 Stainless Steel 3,272 10,735 5.720 0.225
347 Stainless Steel 3,095 10,512 5.720 0.225
Aluminum 3,100 10,171 6.32 0.2488
Aluminum(rolled) 3,040 9,974
Copper 2,260 7,415 4.66 0.1835
Copper(annealed) 2,235 7,628
Copper(rolled) 2,270 7,448
CuNi(70%Cu 30%Ni) 2,540 8,334 5.03 0.1980
CuNi(90%Cu 10%Ni) 2,060 6,759 4.01 0.1579
Brass(Naval) 2,120 6,923 4.43 0.1744
Gold(hard-drawn) 1,200 3,937 3.24 0.1276
Inconel 3,020 9,909 5.82 0.2291
Iron(electrolytic) 3,240 10,630 5.90 0.2323
Iron(Armco) 3,240 10,630 5.90 0.2323
Ductile Iron 3,000 9,843
Cast Iron 2,500 8,203 4.55 0.1791
Monel 2,720 8,924 5.35 0.2106

619660
© WATERNOMICS Consortium Page 142 of 161
��������� ������������������� ������
&� �%$% '%��� <4;9*:762,� /47>� 5.;.9
897=2-.:� 5*93.;�4.*-260� 8.9/795*6,.:� >2;1
.*:?� 26:;*44*;276� *6-� <:. %1.� 5.*:<9260
8926,284.� 7/� ;12:� /47>� 5.;.9� 2:� +*:.-� 76 ;1.
-2//.9.6,.� 7/� ;1.� ;9*6:2;� ;25.� 7/� <4;9*:762,
:206*4: %1.�<4;9*:762,�:206*4:�*9.�;9*6:52;;.-
+.;>..6�;>7�;9*6:-<,.9:�>12,1�>793�*:�+7;1
*� :7<6-� ;9*6:52;;.9� *6-� *� :7<6-� 9.,.2=.9
%1.� -2//.9.6,.� 7/� ;9*6:2;� ;25.� 7,,<9:� >1.6
;1.�/4<2-�57=.:�*6-�2:�-29.,;4?�897879;276*4�;7
;1.�/47>�=.47,2;?
��������
• �*:?�26:;*44*;276
• �,,<9*,?���
• #.8.*;*+242;?�� �
• "7:2;2=.6.0*;2=.6.;�/47>�;7;*[email protected]
• #$ ����� � 5��7<;8<;
• �<24;�26�,*42+9*;276
������������
• �47>�5.*:<9.5.6; 26�>*;.9
-2:;92+<;276 6.;>793
• (*;.9�*6-�>*:;.�>*;.9
5*6*0.5.6;
• ".;974.<5�897,.::�5762;79260�*6-
,76;974
• �77-�*6-�+.=.9*0.�897,.::260
• "28.426.�4.*3*0.�-.;.,;276
�������������
"*9*5.;.9: '*4<.:
�(+%!/(15 ���
�##2/!#5 ����7/�9.*-260�*; 9*;.: � � 5:
�%-%!1!"()(15 �� �
�%),#(15 A����A���5:��+2�-29.,;276*4
�%!02/%*%+1�-%/(,$ �� :
�21-210 �6*470<.�7<;8<;���� � 5��79
�� � 5��,<99.6;�7<;8<;
#$���� :.92*4�879;
�+#),02/% �"�����!� ���)�
�/!+0$2#%/ �4*58�76
$���/79�828.�:2@. �!����!��� 55
���/79�828.�:2@.��!����!��� 55
�(.2($ 1%*-%/!12/% �B�����B�
�(-%�*!1%/(!) �44�5.;*4:��57:;�84*:;2,:��/2+.9�04*::�
.;,��447>�828.�426.9
�/!+0$2#%/�-/,1%#1(,+�)%3%) �"���
�,4%/ ���� � '� ����� '��� '
����� ������������������������������������ �������������������� � ������
��� ����������� ���������������������������������� ����� ����������������
������������������������ �������
������!0%/0����%+0,/0
�,/%+!))%%��� �� ����(+$',3%+��1'% �%1'%/)!+$0
�*!()� (+&,�31%#�)0�+) %"0(1%� 444�31%#�)0�+)

619660
© WATERNOMICS Consortium Page 143 of 161
Appendix F – User Guidelines – BBB
STARTING UP - AUGUST 2014 1
Starting Up Vtec Waternomics Application
Torenallee 20 5617BC Eindhoven, The Netherlands
p. [Telephone] f. [Fax]
[Email] [Web address]
619660
© WATERNOMICS Consortium Page 144 of 161
STARTING UP - AUGUST 2014 2
Table of Contents
I. Table of Contents .................................................. 2
II. Figures ................................................................... 3
III. Abbreviations ......................................................... 3
IV. Definitions ............................................................. 3
V. About This Guide .................................................. 4
VI. Introducing Beaglebone Black for Users.............. 4
Unboxing the Beaglebone
VII. Installation ............................................................. 5
The Setup
VIII. Getting Started ....................................................... 5
IX. Ultrasonic Flowmeter ............................................ 5
Dashboard: Front Panel Dashboard: Control Panel
X. For Developers ...................................................... 7
XI. BBB Session .......................................................... 7
Serial Port SSH
XII. Software ................................................................. 8
XIII. Installation ............................................................. 8
Downloading installer Running the Installer
XIV. Installer .................................................................. 9
XV. Modules ................................................................. 9
XVI. Appendix ............................................................... 10
Some Known Issues and Bugs
XVII. Wallmount Ultrasonic flowmeter setup ............... 11
On Menu 50: Data Logger Option On Menu 51: Data Logger Setup On Menu 52: Send Log-Data to On Menu 62: RS-485/RS-232 Setup
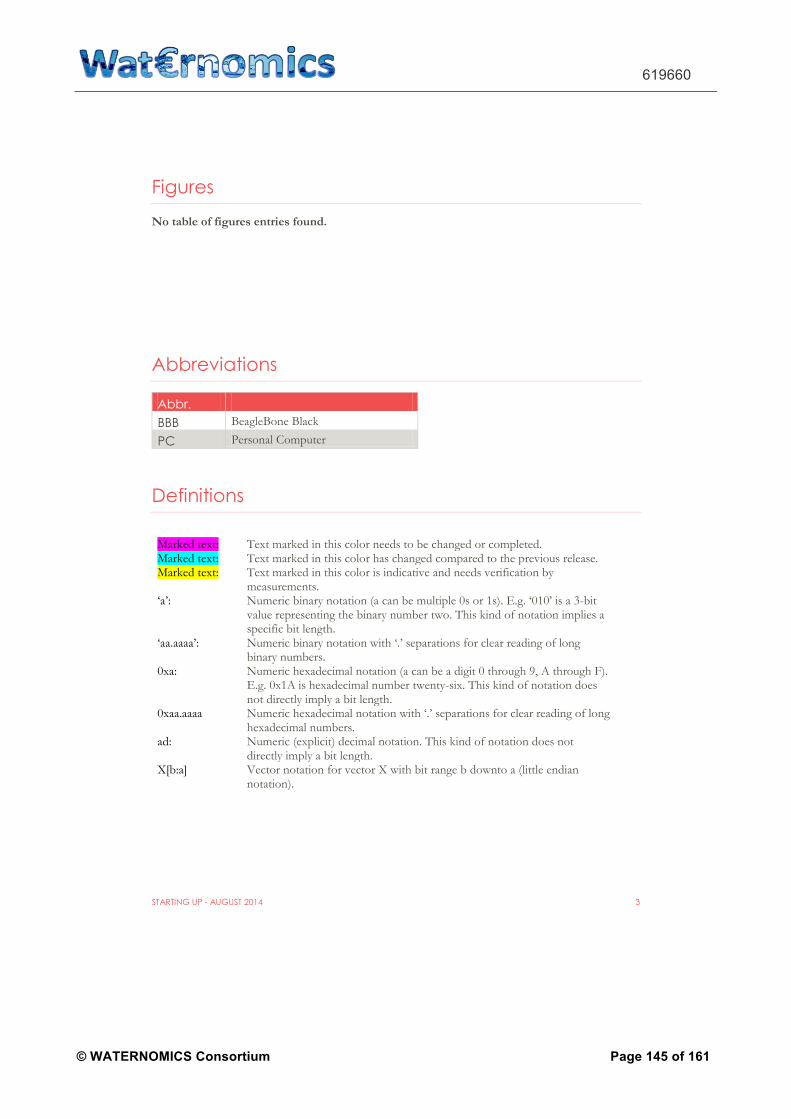
619660
© WATERNOMICS Consortium Page 145 of 161
STARTING UP - AUGUST 2014 3
Figures No table of figures entries found.
Abbreviations
Abbr. BBB BeagleBone Black
PC Personal Computer
Definitions Marked text: Text marked in this color needs to be changed or completed. Marked text: Text marked in this color has changed compared to the previous release. Marked text: Text marked in this color is indicative and needs verification by
measurements. ‘a’: Numeric binary notation (a can be multiple 0s or 1s). E.g. ‘010’ is a 3-bit
value representing the binary number two. This kind of notation implies a specific bit length.
‘aa.aaaa’: Numeric binary notation with ‘.’ separations for clear reading of long binary numbers.
0xa: Numeric hexadecimal notation (a can be a digit 0 through 9, A through F). E.g. 0x1A is hexadecimal number twenty-six. This kind of notation does not directly imply a bit length.
0xaa.aaaa Numeric hexadecimal notation with ‘.’ separations for clear reading of long hexadecimal numbers.
ad: Numeric (explicit) decimal notation. This kind of notation does not directly imply a bit length.
X[b:a] Vector notation for vector X with bit range b downto a (little endian notation).
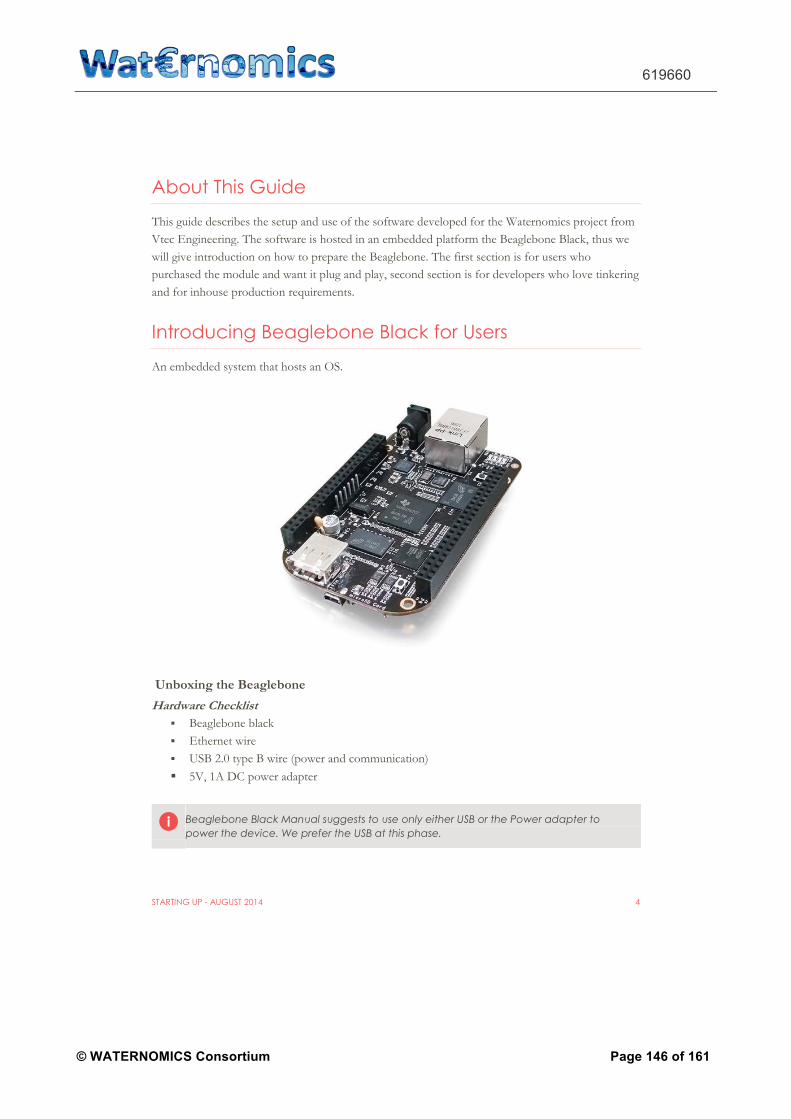
619660
© WATERNOMICS Consortium Page 146 of 161
STARTING UP - AUGUST 2014 4
About This Guide This guide describes the setup and use of the software developed for the Waternomics project from Vtec Engineering. The software is hosted in an embedded platform the Beaglebone Black, thus we will give introduction on how to prepare the Beaglebone. The first section is for users who purchased the module and want it plug and play, second section is for developers who love tinkering and for inhouse production requirements.
Introducing Beaglebone Black for Users An embedded system that hosts an OS.
Unboxing the Beaglebone Hardware Checklist
� Beaglebone black
� Ethernet wire
� USB 2.0 type B wire (power and communication) � 5V, 1A DC power adapter
Beaglebone Black Manual suggests to use only either USB or the Power adapter to power the device. We prefer the USB at this phase.
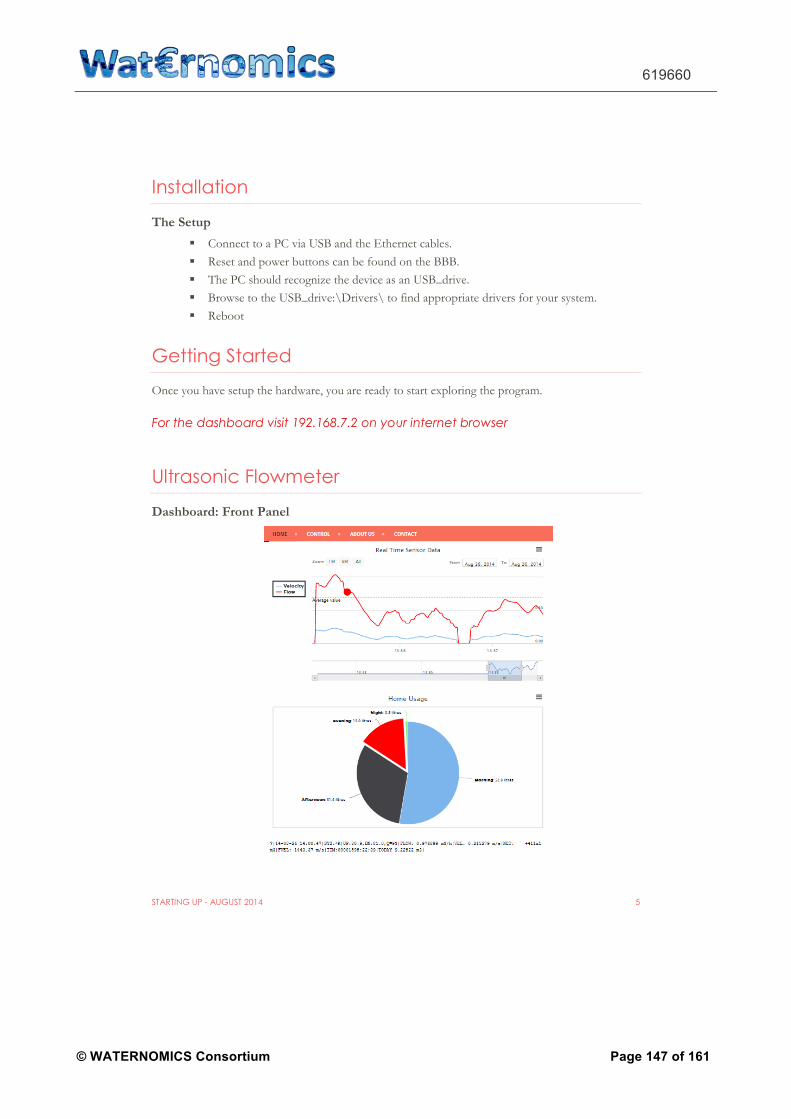
619660
© WATERNOMICS Consortium Page 147 of 161
STARTING UP - AUGUST 2014 5
Installation
The Setup � Connect to a PC via USB and the Ethernet cables. � Reset and power buttons can be found on the BBB. � The PC should recognize the device as an USB_drive. � Browse to the USB_drive:\Drivers\ to find appropriate drivers for your system. � Reboot
Getting Started Once you have setup the hardware, you are ready to start exploring the program.
For the dashboard visit 192.168.7.2 on your internet browser
Ultrasonic Flowmeter
Dashboard: Front Panel

619660
© WATERNOMICS Consortium Page 148 of 161
STARTING UP - AUGUST 2014 6
This page provides real-time data from the flowmeter system and can be monitored as a stock chart. The net data is provided as a pie chart below. Please hover over the charts to view various numeric values.
Dashboard: Control Panel
This page displays numeric values received from the system.
A user with login privileges can login and gain access to controlling the real hardware. Please refer to controlling the hardware section for more information.

619660
© WATERNOMICS Consortium Page 149 of 161
STARTING UP - AUGUST 2014 7
For Developers This section is intended for developers who would like to tinker with the system for the purpose of updating or maintaining the system.
BBB Session
To start sessions with the embedded host SSH sessions or serial port can be used. Software
clients like PuTTY can be used to achieve this. (Free to download at
http://www.chiark.greenend.org.uk/~sgtatham/putty/download.html )
Serial Port � Find the COM Port via My Computer <properties>/Device Manager/Ports (COM &
LPT) dropdown/Your device
� Use serial login menu in PuTTY, select Serial radio button in Connection Type(or
others) with baud rate of 115200
� A blank screen maybe shown, press <Enter/return>
� On the login prompt enter username : root
SSH � To connect via USB:SSH open putty, click SSH as the Connection Type and connect to
192.168.7.2 at port 22, username : root
� To connect via Ethernet please assign static IP address to /etc/network/interfaces (for
advanced developer)

619660
© WATERNOMICS Consortium Page 150 of 161
STARTING UP - AUGUST 2014 8
Software This section will describe the various software modules involved and the overall setup of the framework.
Installation Installations of all the modules and applications have been simplified and been provided as one script. This is provided as ‘vtec_installer’ folder. Please find the installer on the Dropbox or the github online, the steps are provided below.
Downloading installer All the latest releases will be provided on a github page (Dropbox link has not been finalized yet.). In the shell, type
ping 8.8.8.8 –c 2
to check if the BBB has an internet connection.
If the ping returns successfully, run the following to clone the vtec installer from github
`git clone https://github.com/sookah/vtec_installer/`
Running the Installer Go into vtec_installer directory
cd vtec_installer
Chmod the install.sh executable to give administrative rights for read and write
chmod +x install.sh
Run the installer with ./
./install.sh

619660
© WATERNOMICS Consortium Page 151 of 161
STARTING UP - AUGUST 2014 9
Installer The installer contains a menu showing all modules that can be installed on the BBB. Instructions are provided within.
Modules Here all the modules on the menu and their sub modules will be described, if any modules in the future are added please update this section.
Module Sub-Module
Description
Vtec Base
Installs all the base applications for BBB to become functional and also implements tweaks and hacks. Run only once when the BBB is newly opened however running it again updates the applications already installed to latest version causing no harm.
MySql The RDMS used, follow instructions in the screen for username (root) and password (root)
MWM This is the VTEC Mini Water Meter installer which will enable the BBB to interact with the MWM sensors
Reader Module for reading the sensors, installed by default
Local Logger This will install and enable local database logging
Vtec Cloud This will install and enable vtec cloud logging
Kafka This will install and enable kakfa cloud sending
Timezone picker
This will help set the timezone of the BBB and its time servers
USF Installs VTEC Ultrasonic Flow Meters interface
Reader Module for reading the sensors, installed by default
Local Logger This will install and enable local database logging
Vtec Cloud This will install and enable vtec cloud logging
Kafka This will install and enable kakfa cloud sending
Verify Run this at the end when a module is installed to check the device (datetime, ids etc)

619660
© WATERNOMICS Consortium Page 152 of 161
STARTING UP - AUGUST 2014 10
Appendix
Some Known Issues and Bugs
These are the bugs and issues that are currently being tackled with few others to make a reliable and robust system.
GUI Frontend (Website) Backend (Beaglebone Black)

619660
© WATERNOMICS Consortium Page 153 of 161
STARTING UP - AUGUST 2014 11
Wallmount Ultrasonic flowmeter setup
On Menu 50: Data Logger Option � Press <ENT> and set Data Logger option to ON with <▼>
� On the same screen Press <ENT> again to enter the submenu use <▼▲ > to browse
menu
� Set the following sub-parameters to ‘ON’ : Date and Time , System Status, Signal Strength, Flow Rate, Velocity, NET Totalizer, Fluid Velocity, Working Timer, Flow Today
On Menu 51: Data Logger Setup � Press <ENT> and <ENT> again to set the start time to **:**:** for current time.
� Set Interval to 00:00:01 via the number pad, and press <ENT>
� Set Log Times to 9000, this is continuous logging.
On Menu 52: Send Log-Data to � Set it to Send To RS-485
On Menu 62: RS-485/RS-232 Setup � Set Baud Rate to 9600
� Parity: None
� Data Bits: 8
� Stop Bits: 1
Currently all of the processes mentioned here are being automated thus requiring no human intervention in the future.

619660
© WATERNOMICS Consortium Page 154 of 161
UPDATING FIRMWARE - JUNE 2015 1
Updating Firmware Vtec BBB
Torenallee 20 5617BC Eindhoven, The Netherlands
p. [Telephone] f. [Fax]
[Email] [Web address]

619660
© WATERNOMICS Consortium Page 155 of 161
UPDATING FIRMWARE - JUNE 2015 2
Table of Contents
I. Table of Contents .................................................................................................. 2
II. Abbreviations ......................................................................................................... 3
III. Definitions ............................................................................................................. 3
IV. About This Guide .................................................................................................. 4
V. Downloading the update ....................................................................................... 4
Downloading the repository/update files Installing the update

619660
© WATERNOMICS Consortium Page 156 of 161
UPDATING FIRMWARE - JUNE 2015 3
Abbreviations
Abbr. BBB BeagleBone Black
PC Personal Computer
Definitions Marked text: Text marked in this color needs to be changed or completed. Marked text: Text marked in this color has changed compared to the previous release. Marked text: Text marked in this color is indicative and needs verification by
measurements. ‘a’: Numeric binary notation (a can be multiple 0s or 1s). E.g. ‘010’ is a 3-bit
value representing the binary number two. This kind of notation implies a specific bit length.
‘aa.aaaa’: Numeric binary notation with ‘.’ separations for clear reading of long binary numbers.
0xa: Numeric hexadecimal notation (a can be a digit 0 through 9, A through F). E.g. 0x1A is hexadecimal number twenty-six. This kind of notation does not directly imply a bit length.
0xaa.aaaa Numeric hexadecimal notation with ‘.’ separations for clear reading of long hexadecimal numbers.
ad: Numeric (explicit) decimal notation. This kind of notation does not directly imply a bit length.
X[b:a] Vector notation for vector X with bit range b downto a (little endian notation).

619660
© WATERNOMICS Consortium Page 157 of 161
UPDATING FIRMWARE - JUNE 2015 4
About This Guide This guide describes the updating and use of the software developed for the Waternomics project from Vtec Engineering. The software is hosted in an embedded platform the Beaglebone Black, thus we will give the steps to update the BBB.
Downloading the update Make sure the BBB has internet access first as we will be downloading the update repository aswell as other open source softwares.
Downloading the repository/update files As of now the Vtec update software has been hosted in Github.com. A global platform for repositories. Do the following to get the repository
1. Make sure BBB has git installed.
which git
The terminal should return with
/usr/bin/git
If not install git
sudo apt-get install git
2. Clone the git content
git clone https://github.com/sookah/vtec_installer
Installing the update In this step two things can be done either a fresh new copy of installation where all the files will be rechecked and reinstalled (if you’re unsure about the previous version) or just an update to already existing file if the previous version is known and exists.
1. Go to the directory that was downloaded
cd vtec_installer

619660
© WATERNOMICS Consortium Page 158 of 161
UPDATING FIRMWARE - JUNE 2015 5
2. Make files executable
chmod +x ./*
3. To run complete new firmware installation (will take longer), run the install script
./installBBB.sh
If prompted for password for MySql type in root (password characters by default cannot be seen in Linux)
4. to only update from previous version
./updateBBB.sh
BBB will restart at this point once complete

619660
© WATERNOMICS Consortium Page 159 of 161
References E. Curry, V. Degeler, E. Clifford, D. Coakley, A. Costa, S.-J. Van Andel, N. Van De Giesen, C. Kouroupetroglou, T. Messervey, J. Mink, and S. Smit, “Linked Water Data For Water Information Management,” in 11th International Conference on Hydroinformatics (HIC 2014), 2014.
Boonstra J. (2013) - Cultural Change and Leadership in Organizations – a practical guide to successful organisational change, John Wiley & Sons.
Bredero M. (2003) “Linking the technology choice with operation and maintenance in the context of community water supply and sanitation” - WHO 2003
Whitney, C.W., Lind, B.K., Wahl, P.W. (1998). Quality assurance and quality control in longitudinal studies. Epidemiologic Reviews, 20(1): 71-80.
WHO (2006) Guidelines for conducting cost–benefit analysis of household energy and health interventions, WHO Library Cataloguing-in-Publication Data
WWF (2011), Assessing Water Risk: A practical approach for financial institutions
Claridge et al. (1994). International Performance Measurement and Verification Protocol – Vol. 1: 19 http://www.coned.com/energyefficiency/PDF/EVO%20-%20IPMVP%202012.pdf , accessed March 2015
European Commission (2014), Guide to Cost-Benefit Analysis of Investment Projects Economic appraisal tool for Cohesion Policy 2014-2020, Publications Office of the European Union
Haberl et al. (1995). International Performance Measurement and Verification Protocol – Vol. 1: 19 http://www.coned.com/energyefficiency/PDF/EVO%20-%20IPMVP%202012.pdf , accessed March 2015
Hofstede G. (1984), Cultural dimensions in management and planning, Asia Pacific journal of management
Kim B (2013) The adequacy of free water risk tools, CINCS InFocus
Knatterud.,G.L., Rockhold, F.W., George, S.L., Barton, F.B., Davis, C.E., Fairweather, W.R., Honohan, T., Mowery, R, O’Neill, R. (1998). Guidelines for quality assurance in multicenter trials: a position paper. Controlled Clinical Trials, 19:477-493.
Laspidou C.S. (2014) ICT and stakeholder participation for improved urban water management in the cities of the future, Water Utility Journal 8: 79-85, 2014
Most, Craddick, Crawford, Redican, Rhodes, Rukenbrod, and Laws (2003). Dietary quality assurance processes of the DASH-Sodium controlled diet study. Journal of the American Dietetic Association, 103(10): 1339-1346
Mueller S ao (2014) Requirements for water assessment tools: An automotive industry perspective, Water Resources and Industry 9, 2015, pages 30–44, Elsevier
Olson E. (2008) Creating an enterprise-level ‘‘green’’ strategy, JOURNAL OF BUSINESS STRATEGY, VOL. 29 NO. 2 2008, pp. 22-30, Emerald Group Publishing Limited
Parr J. and Shaw R (1996), Choosing an appropriate technology, WEDC Loughborough University Leicestershire (UK). 49.
Piper S. and Wade M. (1999) Assessing the financial and economic feasibility of rural water system improvements, Impact Assessment and Project Appraisal, volume 17, number 3, September 1999, pages 171–182, Beech Tree Publishing Reed M. (2008), Stakeholder participation for environmental management: A literature review, Biological Conservation 141, 2417-2431, Elsevier

619660
© WATERNOMICS Consortium Page 160 of 161
Rueda-Manzanares A. ao (2007), The Influence of Stakeholders on the Environmental Strategy of Service Firms: The Moderating Effects of Complexity, Uncertainty and Munificence, British Journal of Management, Vol. 19, 185–203
Schmeer, Kammi. (1999). Guidelines for Conducting a Stakeholder Analysis. November 1999.
Bethesda, MD: Partnerships for Health Reform, Abt Associates Inc.
Corral-Verdugo, Víctor, et al. (2008) - Environmental Beliefs and Endorsement of Sustainable Development Principles in Water Conservation Toward a New Human Interdependence Paradigm Scale. Environment and Behaviour 40.5: 703-725.
United States (US) Department of Energy (DOE) (2010) - Improving water efficiency at Federal sites, Water Management Planning Lessons Learnt from the Y-12 National Security Complex Water Assessment.
K. Bruton, P. Raftery, B. Kennedy, M.M. Keane, D.T.J. O'Sullivan (2013) “Review of Automated Fault Detection and Diagnostic Tools in Air Handling Units”, Energy Efficiency 7(2): 335–51. http://link.springer.com/10.1007/s12053-013-9238-2 (January 4, 2015).
O. Zheng, M. Shashanka, R. Brahme (2011) "Real time model-based energy diagnostics in buildings" 12th Conference of International Building Performance Simulation Association, Sydney, 2011.
J. M. Cavanillas, E. Curry, and W. Wahlster, Eds., New Horizons for a Data-Driven Economy: A Roadmap for Usage and Exploitation of Big Data in Europe. Cham: Springer International Publishing, 2016.
K. Burbeck and S. Nadjm-Tehrani (2007) "Adaptive Real-time Anomaly Detection with Incremental Clustering", Information Security Technical Report, vol. 12, no. 1, 2007.
M. Raciti, J. Cucurull, and S. Nadjm-Tehrani (2012) "Anomaly Detection in Water Management Systems", in Advances in Critical Infrastructure Protection: Information Infrastructure Models, Analysis, and Defense (J. Lopez, R. Setola, and S. Wolthusen, eds.), vol. 7130 of Lecture Notes in Computer Science, pp. 98--119, Springer Berlin / Heidelberg, 2012.
M. Raciti and S. Nadjm-Tehrani (2012) "Embedded Cyber-Physical Anomaly Detection in Smart Meters", in Proceedings of the 7th International Conference on Critical Information Infrastructures Security (CRITIS'12), 2012.
A. Lambert (2000) "What do we know about Pressure-Leakages relationship in distribution system", Proceeding of the AWWA Conference.
M. A. Khadam, Shammas N. K., Al Feraiheedi Y. (1991) "Water losses from municipal Utilities and their Impacts, Water International, n. 16.
E. Curry, S. Dustdar, Q. Z. Sheng, and A. Sheth, “Smart cities – enabling services and applications,” J. Internet Serv. Appl., vol. 7, no. 1, p. 6, 2016.
H. Khaled, Sendil U. (1992) "Relationship between pressure and leakages in a water distribution network", Proceeding of AWWA Conference, 1992.
V. Milano (2008) "Dipendenza delle perdite di una tubazione dalla pressione di esercizio", L’Acqua, n.3.
B. Brunone, M. Ferrante, S. Meniconi (2008) “Ricerca e controllo dell perdite nelle reti di condotte” - CittàStudi edizioni
“The Open Definition.” [Online]. Available: http://opendefinition.org/. �
E. Bruke, “An Autonomic Approach to Real-Time Predictive Analytics using Open Data and the Web of � Things,” National University of Ireland, Galway, 2013. �

619660
© WATERNOMICS Consortium Page 161 of 161
S. Hasan and E. Curry, “Tackling Variety in Event-based Systems,” in Proceedings of the 9th ACM � International Conference on Distributed Event-Based Systems, 2015, pp. 256–265. �
M. Franklin, A. Halevy, and D. Maier, “From Databases to Dataspaces : A New Abstraction for Information � Management,” Data Manag., vol. 34, no. 4, 2005. �
A. Halevy, M. Franklin, and D. Maier, “Principles of dataspace systems,” Proc. twenty-fifth ACM SIGMOD- � SIGACT-SIGART Symp. Princ. database Syst. - Pod. ’06, pp. 1–9, 2006. �
N. Marz and J. Warren, Big Data: Principles and best practices of scalable realtime data systems. O’Reilly � Media, 2013. �
Waternomics (2014) D1.1 – Usage Case and Initial Exploitation Scenarios, Final Version
Waternomics (2014) D1.2 – Water ICT Technologies, Policies and Standards V1
Waternomics (2014) D1.3 – System Architecture and KPIs
Waternomics (2015) D2.1 – Waternomics Methodology
Waternomics (2014) D3.1.1 – Linked water dataspace (Software + report) M12
Waternomics (2015) D3.1.2 – Linked water dataspace (Software + report) M24
Waternomics (2015) D3.2 – Waternomics Apps M18
Waternomics (2015) D3.3 – Waternomics Apps M24
Waternomics (2015) D4.1 – Waternomics Devices
Waternomics (2016) D4.2 – Waternomics Analysis
Waternomics (2016) D4.3 – Waternomics Monitoring technical report
Waternomics (2016) D5.2 – Consolidate Waternomics Pilot reports
Waternomics (2016) D6.1 – Waternomics Methodology Brochure