d5.2 cost benefit analysis - cordis
TRANSCRIPT
BATS (317533) D5.2
D5.2
Cost Benefit Analysis
Instrument Collaborative Project
Topic ICT-2011.1.1
Project Title Broadband Access via Integrated Terrestrial & Satellite Systems
Project Number 317533
Project Acronym BATS
Contractual Delivery Date 31/12/2014
Actual Delivery Date 29/04/2014
Contributing WP WP5.2
Project Start Date 01/10/2012
Project Duration 36 months
Dissemination Level PU
Editor AVA
Contributors AVA, FH-FK,R
Ref. Ares(2017)4277027 - 01/09/2017

BATS (317533) D5.2
29/04/2015 i
Disclaimer
This document reflects the contribution of the participants of the research project BATS. The European Union and its agencies are not liable or otherwise responsible for the contents of this document; its content reflects the view of its authors only. This document is provided without any warranty and does not constitute any commitment by any participant as to its content, and specifically excludes any warranty of correctness or fitness for a particular purpose. The user will use this document at the user's sole risk.

BATS (317533) D5.2
29/04/2015 ii
Document History
Version Date Modifications Source
0.0 01/11/2014 Document created AVA
11/14-3/15 Content added and edited AVA, R, FH-FK
0.9 10/3/15 Submitted to QA AVA
1.0 29/04/15 Final version AVA
BATS (317533) D5.2
29/04/2015 iii
Table of Contents
List of Figures ...........................................................................................................................................v List of Tables .......................................................................................................................................... vii List of Acronyms .................................................................................................................................... viii Executive Summary ................................................................................................................................. 1 1 Introduction ...................................................................................................................................... 3
1.1 Overview .................................................................................................................................. 3 1.2 Summary of content ................................................................................................................ 3
2 Baseline: Market analysis and coverage ......................................................................................... 5 2.1 Rationale and selection of consultant ...................................................................................... 5 2.2 Methodology and Assumptions ............................................................................................... 6 2.3 Addressable Market for BATS ................................................................................................. 7
2.3.1 DSL Technology Advances ............................................................................................. 9 2.3.2 NGA Coverage ................................................................................................................ 9 2.3.3 LTE Coverage ................................................................................................................ 11
2.4 Affordability ............................................................................................................................ 15 2.4.1 Price Elasticity ............................................................................................................... 15 2.4.2 Valid price range ............................................................................................................ 19
2.5 Usage .................................................................................................................................... 22 2.5.1 Growth in usage ............................................................................................................. 22 2.5.2 Data volume and line speed .......................................................................................... 23 2.5.3 Application drivers ......................................................................................................... 26
3 LTE capability assessments .......................................................................................................... 27 3.1 Reasons for looking at fixed broadband access LTE capability ............................................ 27 3.2 Methodology .......................................................................................................................... 27
3.2.1 Measuring Procedure .................................................................................................... 28 3.3 Measurement Results ............................................................................................................ 28
3.3.1 Summary of Findings ..................................................................................................... 31 3.4 Capacity demands and LTE delivery costs ........................................................................... 32
3.4.1 Modelling costs .............................................................................................................. 32 3.4.2 Findings ......................................................................................................................... 33
3.5 LTE for NGA .......................................................................................................................... 33 4 Baseline: Cost to deliver pan European NGA terrestrially ............................................................ 35
4.1 Methodology .......................................................................................................................... 35 4.2 Commercial investment ......................................................................................................... 35 4.3 Public investment................................................................................................................... 36 4.4 Conclusion ............................................................................................................................. 38
5 Traffic and data analysis ................................................................................................................ 39 5.1 Available research on data volumes and rates ..................................................................... 39
5.1.1 Analysys Mason BATS Consultancy Study ................................................................... 39 5.1.2 BSG Domestic Demand for Bandwidth 2013-2023 (UK)............................................... 39 5.1.3 Cisco Visual Networking Index: Forecast and Methodology, 2013-2018 ...................... 42 5.1.4 Ofcom Infrastructure Report 2013 (UK)......................................................................... 43 5.1.5 Ofcom Infrastructure Report 2014 (UK)......................................................................... 44 5.1.6 Sandvine Global Internet Phenomena Report 2014 ...................................................... 45 5.1.7 Summary of CAGR’s from all sources ........................................................................... 46 5.1.8 Conclusion ..................................................................................................................... 47
5.2 Internet Traffic Predictions ..................................................................................................... 47 5.2.1 Data Consumption per Traffic Category up to 2023 ...................................................... 47 5.2.2 Projection of Bandwidth Demand and Composition ...................................................... 49
5.3 Data distribution between satellite and terrestrial links ......................................................... 49 5.3.1 Predicted distribution ..................................................................................................... 51
5.4 BATS satellite capacity (supply) assessment ........................................................................ 55 5.4.1 Geographic Information System (QGIS)........................................................................ 55 5.4.2 Modelling software (Matlab) .......................................................................................... 56 5.4.3 Google Fusion Tables.................................................................................................... 56
BATS (317533) D5.2
29/04/2015 iv
5.4.4 Satellite capacity distribution ......................................................................................... 57 5.5 Assessment of take up .......................................................................................................... 59 5.6 Spreadsheet structure ........................................................................................................... 60
6 Predicting BATS target market and capacity ................................................................................. 63 6.1 Scenarios and sensitivities .................................................................................................... 63
6.1.1 Baseline ......................................................................................................................... 63 6.1.2 Nationally Optimised Pricing .......................................................................................... 63 6.1.3 Baseline -50% traffic ...................................................................................................... 63 6.1.4 Optimised pricing -50% traffic ........................................................................................ 63 6.1.5 Baseline with focussed sales ......................................................................................... 63 6.1.6 Sensitivity analyses ....................................................................................................... 64
6.2 Baseline traffic model ............................................................................................................ 65 6.3 The other scenarios ............................................................................................................... 70 6.4 Sensitivity analysis................................................................................................................. 71 6.5 Summary of findings .............................................................................................................. 73
7 BATS cost model ........................................................................................................................... 75 7.1 Methodology .......................................................................................................................... 75 7.2 Cost sources .......................................................................................................................... 75 7.3 Pan-European versus national costs ..................................................................................... 75
8 BATS satellite service element cost model ................................................................................... 77 8.1 Scope ..................................................................................................................................... 77 8.2 Cost elements ........................................................................................................................ 77
8.2.1 Spacecraft ...................................................................................................................... 77 8.2.2 Backbone network and INGs ......................................................................................... 78 8.2.3 Ground network (gateway) costs ................................................................................... 78
8.3 Findings ................................................................................................................................. 78 8.3.1 Satellite service costs .................................................................................................... 78 8.3.2 Comparing with LTE costs ............................................................................................. 79
9 BATS service delivery cost model ................................................................................................. 81 9.1 Introduction ............................................................................................................................ 81
9.1.1 Cost elements ................................................................................................................ 81 9.2 Cost of CPE ........................................................................................................................... 81
9.2.1 VSAT ............................................................................................................................. 81 9.2.2 IUG................................................................................................................................. 82 9.2.3 Installation and maintenance ......................................................................................... 83 9.2.4 Affordability impact ........................................................................................................ 83
9.3 Service delivery costs in Spain (MVNO Lead) ...................................................................... 84 9.3.1 Detailed view of Service delivery costs in Spain (MVNO Lead) .................................... 84 9.3.2 Bundling of the BATS service ........................................................................................ 89 9.3.3 Examples of bundles ..................................................................................................... 90
9.4 Service delivery costs in UK (Satco lead) ............................................................................. 91 9.4.1 Source of costs .............................................................................................................. 91 9.4.2 Should we include mobile in the UK calculations? ........................................................ 92 9.4.3 Calculating service cost ................................................................................................. 93 9.4.4 Cost benefit findings for the UK ..................................................................................... 95
9.5 Others .................................................................................................................................... 95 9.5.1 Turkey ............................................................................................................................ 95
10 Analysing the findings ................................................................................................................ 97 10.1 Impact of service delivery costs on total BATS market ......................................................... 97 10.2 Benefits of government support............................................................................................. 97 10.3 Comparing BATS and non-BATS cost models ...................................................................... 98 10.4 Commercial Applicability of the BATS ................................................................................... 98
11 Summary and Conclusions ........................................................................................................ 99 11.1 Summary ............................................................................................................................... 99 11.2 Conclusions ......................................................................................................................... 101
12 References .............................................................................................................................. 103
BATS (317533) D5.2
29/04/2015 v
List of Figures
Figure 1-1: WP5.2 in overall WP5 structure. ........................................................................................... 3 Figure 1-2: WP5.2 chapter structure. ...................................................................................................... 4 Figure 2-1: Broadband reach................................................................................................................... 5 Figure 2-2: Three step methodology to forecast the BATS addressable market. ................................... 6 Figure 2-3: Addressable market distribution. ........................................................................................... 7 Figure 2-4: Base case 2020 fixed-line NGA coverage. ........................................................................... 7 Figure 2-5: Proportion of households not covered by at least 2Mbit/s DSL services in 2020 ................. 8 Figure 2-6: DSL download speed by line length...................................................................................... 9 Figure 2-7: Base case 2020 fixed line NGA coverage. ......................................................................... 10 Figure 2-8: Premises per speed bracket for an illustrative NUTS3 region (2014). ............................... 11 Figure 2-9: Proportion population within LTE coverage in 2020. .......................................................... 12 Figure 2-10: LTE coverage by fixed-line speed bracket. ....................................................................... 12 Figure 2-11: Number of premises in BATS addressable segments for top 18 countries. ..................... 14 Figure 2-12: Fixed broadband penetration in relation to income. .......................................................... 15 Figure 2-13: Spend on fixed broadband per home in relation to income. ............................................. 16 Figure 2-14: Spend on fixed broadband per home in relation to income. ............................................. 16 Figure 2-15: Distribution of disposable income by household decile. ................................................... 16 Figure 2-16: Variation in spending power. ............................................................................................. 17 Figure 2-17: Fixed broadband penetration in relation to income in selected rural UK areas. ............... 17 Figure 2-18: Income distribution based take-up elasticity illustration. ................................................... 18 Figure 2-19: Elasticity relationship between price and take-up. ............................................................ 18 Figure 2-20: Viable BATS price ranges across Europe. ....................................................................... 20 Figure 2-21: Map of ARPU across Europe& Turkey. ............................................................................ 21 Figure 2-22: Average monthly data volumes (GB) per broadband connection per country. ................. 22 Figure 2-23: Analysys Mason predictions for busy hour average bit rate. ............................................ 23 Figure 2-24: Relationship between access speed and usage (FCC). ................................................... 23 Figure 2-25: Relationship between access speed and usage (DTag). ................................................. 24 Figure 2-26: Relationship between access speed and usage (Ofcom). ............................................... 25 Figure 2-27: Worldwide trend in upload/download traffic. ..................................................................... 26 Figure 2-28: Japan trend in upload/download traffic showing law reducing P2P traffic. ....................... 26 Figure 3-1: Zafaco measurement centres ............................................................................................. 28 Figure 3-2: LTE download rate measurements across different times of the day ................................. 29 Figure 3-3: LTE download rate measurements across different times of the day ................................. 29 Figure 3-4 LTE summary across all Regions ........................................................................................ 30 Figure 3-5 Percentage of users within Speed Brackets for Rural Areas ............................................... 30 Figure 3-6 Percentage of users within Speed Brackets for Suburban Areas ........................................ 31 Figure 3-7 Percentage of users within Speed Brackets for Urban Areas.............................................. 31 Figure 3-8: LTE-A fixed broadband cost contribution (€ per month). .................................................... 33 Figure 4-1: Network cost model............................................................................................................. 35 Figure 4-2: Forecast increase in capex and coverage by technology (commercial investment). ......... 36 Figure 4-3: Public intervention funding methodology. ........................................................................... 37 Figure 4-4: Summary of costs to provide 100% 30Mbit/s wireline coverage. ....................................... 38 Figure 5-1: British household usage profiles for the year 2023. ............................................................ 40 Figure 5-2: Bandwidth demand distribution for UK households during peak. ....................................... 41 Figure 5-3: Total data consumption in Petabytes by UK residents in 2013. ......................................... 41 Figure 5-4: Ofcom daily traffic by category and monthly traffic trends in the UK. ................................. 43 Figure 5-5: Average monthly data downloaded, by average download speed. .................................... 44 Figure 5-6: European fixed access peak period traffic composition...................................................... 45 Figure 5-7: Projected growth of traffic categories (2018 to 2023) using Cisco VNI report. ................... 48 Figure 5-8: Plot of the distribution of internet traffic over the four primary categories. ......................... 49 Figure 5-9: Forward link supplied capacity per country. ........................................................................ 57 Figure 5-10: Forward link supplied capacity per NUTS3 region. ........................................................... 58 Figure 5-11: Forward link capacity per thousand premises per NUTS3 region. ................................... 59 Figure 6-1: The four main scenarios. .................................................................................................... 63 Figure 6-2: The fifth scenario, focussing sales on the underserved market. ........................................ 64 Figure 6-3: Demand versus satellite capacity for the Baseline scenario. ............................................. 67 Figure 6-4: Demand versus satellite capacity in Spain for the Baseline scenario. ............................... 68 Figure 6-5: Demand versus satellite capacity in Turkey for the Baseline scenario. .............................. 68 Figure 6-6: Demand per NUTS3 region for the Baseline scenario. ....................................................... 69

BATS (317533) D5.2
29/04/2015 vi
Figure 7-1: Cost benefit model process. ............................................................................................... 75 Figure 8-1: Satellite service cost benefit model extent. ......................................................................... 77 Figure 9-1: 2015 DSL+MOBILE+TV COMBO. ...................................................................................... 90 Figure 9-2: 2020 DSL+MOBILE+TV COMBO. ...................................................................................... 90
BATS (317533) D5.2
29/04/2015 vii
List of Tables
Table 2-1: Data sources and assumptions in forecasting addressable market. ..................................... 6 Table 2-2: Consultant’s comparison of satellite and LTE. ..................................................................... 13 Table 2-3: Satellite opportunity by speed bracket. ................................................................................ 13 Table 2-4: Number of premises in BATS addressable segments. ........................................................ 14 Table 2-5: Analysys Mason’s price range (€ per month excluding VAT). ............................................. 19 Table 4-1: Results of intervention modelling. ........................................................................................ 37 Table 5-1: Average required bandwidth by common computer applications in UK (2012/13). ............. 40 Table 5-2: Video streaming throughput demands with compression improvement. ............................. 41 Table 5-3: Definition of traffic categories used in the Cisco report........................................................ 42 Table 5-4: European data usage in petabytes (PB) and as a percentage of the total usage. .............. 42 Table 5-5: UK daily internet traffic by category and time of day. ........................................................... 44 Table 5-6: UK monthly data consumption growth. ................................................................................ 45 Table 5-7: Definition of traffic categories. .............................................................................................. 46 Table 5-8: European traffic distribution by application. ......................................................................... 46 Table 5-9: Summary of CAGR's for available sources. ......................................................................... 46 Table 5-10: Regional European CAGR's by traffic category from the Cisco VNI report. ...................... 47 Table 5-11: Cisco VNI tool CAGR's per traffic category. ....................................................................... 47 Table 5-12: Predicted aggregate data consumption by category.......................................................... 50 Table 5-13: Predicted busy hour throughputs (Mbps) by category. ...................................................... 50 Table 5-14: Traffic data distribution per connection with an available ADSL < 2 Mbps. ....................... 51 Table 5-15: Traffic data distribution per connection with an available ADSL 2-8 Mbps. ....................... 52 Table 5-16: Traffic data distribution per connection with an available ADSL 8-15 Mbps. ..................... 53 Table 5-17: Traffic data distribution per connection with an available ADSL 15-30 Mbps. ................... 54 Table 5-18: Traffic data distribution per connection with LTE. .............................................................. 55 Table 5-19: BATS market take-up per category. ................................................................................... 60 Table 5-20: BATS market analysis spreadsheet. .................................................................................. 61 Table 6-1: Key parameters. ................................................................................................................... 64 Table 6-2: Key parameters – baseline scenario. ................................................................................... 65 Table 6-3: Country distribution – baseline scenario. ............................................................................. 65 Table 6-4: Country supply and demand – baseline scenario (Mbps). ................................................... 66 Table 6-5: Beam fill distribution – baseline scenario. ............................................................................ 67 Table 6-6: Key parameters – Nationally optimised pricing. ................................................................... 70 Table 6-7: Key parameters – Baseline -50% traffic. .............................................................................. 70 Table 6-8: Key parameters – Optimised pricing and -50% traffic. ......................................................... 70 Table 6-9: Key parameters – Focussed sale. ........................................................................................ 70 Table 6-10: Key parameters – varying NGA case. ................................................................................ 71 Table 6-11: Key parameters – varying NGA line length dependency. .................................................. 71 Table 6-12: Key parameters – doubling LTE not-spot proportions. ...................................................... 71 Table 6-13: Doubled LTE not-spot proportions. .................................................................................... 71 Table 6-14: Key parameters – doubling LTE BATS usage. .................................................................. 72 Table 6-15: Varying the proportion of traffic over satellite. .................................................................... 72 Table 6-16: Halving market take-up. ..................................................................................................... 72 Table 8-1: BATS satellite service cost element. .................................................................................... 78 Table 9-1: BATS service cost elements. ............................................................................................... 81 Table 9-2: IUG cost estimates. .............................................................................................................. 83 Table 9-3: Market Key Parameters for all scenarios – EU27+Turkey ................................................... 85 Table 9-4: Market Key Parameters for all scenarios – Spain ................................................................ 85 Table 9-5: Cost analysis for all scenarios with DSL speed <2Mbps ..................................................... 87 Table 9-6: Cost analysis for all scenarios with DSL speed 2-8Mbps .................................................... 87 Table 9-7: Cost analysis for all scenarios with DSL speed 8-15Mbps .................................................. 88 Table 9-8: Cost margin for all scenarios with DSL cost reduction of 95% ............................................ 89 Table 9-9: Calculating service bundling costs (€ pcm) .......................................................................... 89 Table 9-10: BATS satco service cost element sources. ........................................................................ 91 Table 9-11: BTW key service prices. ..................................................................................................... 91 Table 10-1: Partially subsidised BATS satellite service costs. .............................................................. 97
BATS (317533) D5.2
29/04/2015 viii
List of Acronyms
ARPU Average Revenue Per User (more commonly per HH) ATM Asynchronous Transfer Mode BATS Broadband Access via Integrated Terrestrial & Satellite Systems CAGR Compound Annual Growth Rate CoS Class of Service CPE Customer Premise Equipment DSL Digital Subscriber Line EMS Electronic Manufacturing System ESA European Space Agency EU European Union EU27 (+T) Twenty seven European Union states before Croatia joined (+Turkey) EU28 Twenty eight European Union states including Croatia FCC Federal Communications Commission FTP File Transfer Protocol FTTx Fibre to the …, where:
x = undefined; C = cabinet; H = House P = Premise
FWA Fixed Wireless Access GDP Gross Domestic Product HD High Definition TV HDD Hard Disc Drive HH HouseHold HMLV High Mix Low Volume HSPA+ High Speed Packet Access HTTP Hypertext Transfer Protocol IC Integrated Circuit ICMP Internet Control Message Protocol IETF Internet Engineering Task Force ING Intelligent Network Gateway ISP Internet Service Provider IT Information Technology IUG Intelligent User Gateway LAN Local Area Network LNB Low Noise Block downconvertor LTE Long Term Evolution (“4G”) LTE-A Long Term Evolution - Advanced (“4G+” or “4.5G”) MIMO Multiple Input, Multiple Output MTBF Mean Time Between Failure NGA Next Generation (broadband) Access NFV Network Function Virtualisation NPV Net Present Value NTP Network Time Protocol NUTS3 Nomenclature of territorial UniTs for Statistics OSS Operational Support System P2P Peer to Peer PPP Point to Point Protocol QoE Quality of Experience QoS Quality of Service SD Service Desk SNMP Simple Network Management Protocol SOC System On a Chip SOHO Small Office Home Office SSH Secure SHell SSL Secure Socket Layer SSPA Solid State Power Amplifier STB Set Top Box

BATS (317533) D5.2
29/04/2015 ix
VNC Virtual Network Console VPN Virtual Private Network VSAT Very Small Aperture Terminal VULA Virtual Unbundled Local Access WAP Wireless Application Protocol
BATS (317533) D5.2
29/04/2015 1
Executive Summary
This deliverable reports the findings of the work done in WP5.2 “Cost benefit analysis”. The analysis includes inputs from two external contractors have been employed; the first to review the addressable market for BATS, provide business cases for LTE delivery and for the non-BATS delivery of NGA; the second provided information on fixed premise LTE service delivery in Germany.
Other inputs to this deliverable were the design decisions in WP3 that considered the IxGs along with those from WP4 looking at the satellite and air interface capabilities. The findings will be used in WP5.4 that will look to define and articulate the business case. The analysis was performed at a NUTS3 level and then totalled per country and across the EU27+Turkey (EU27+T). NUTS3 are “small regions for specific diagnoses” defined by Eurostat [1] and widely used for analyses.
This deliverable has considered and found the following:
The addressable market for BATS and the proportion of households within that market that can afford this for a given monthly price;
The competition from LTE has been assessed and, given that LTE is relatively costly at twice the cost to deliver 250GB compared with satellite, the impact on BATS is predicted to be fairly low. There are also some concerns on the resulting service;
The cost to increase the delivery of terrestrial NGA to 96% of household was calculated to be €80Bn with an additional €91Bn required if LTE is not to be used;
The data rates required per household in 2020 were extrapolated, the Analysys Mason data rates being twice as high as calculated from Cisco data;
The satellite supply using the BATS WP4 2020 design was calculated per NUTS3 region. The model uses this data to ensure that dimensioned demand does not exceed supply. This leads to the finding that a further level of satellite optimisation would better serve the BATS target market;
The model analyses a number of different scenarios and sensitivities. It is critically dependant on the amount of data carried by satellite. The BATS model benefits from optimising pricing per country and by targeting the underserved ahead of the unserved;
The BATS satellite service and terrestrial costs parts are calculated;
o It seems that a cost effective service can be offered in the UK as long as good wholesale pricing is available,
o In Spain an MVNO might be able to use current wholesale terrestrial costs by selling the BATS service as part of a bundle,
o This will be looked at further in WP5.4;
The benefits of government subsidy show that the BATS service can made very attractive for end users and service providers for a 25% lower subsidy per household served than the replacing LTE with terrestrial. This would help Turkey and will be looked at further in WP5.4.

BATS (317533) D5.2
29/04/2015 2
Intentionally blank
BATS (317533) D5.2
29/04/2015 3
1 Introduction
1.1 Overview This deliverable reports the findings of the work done in WP5.2 “Cost Benefit Analysis”. Two external contractors have been employed to support this work in specific areas:
Analysys Mason: Looked at the addressable market for BATS, provided business cases for LTE delivery and for the non-BATS delivery of NGA;
Zafaco: Provided information on fixed premise LTE service delivery in Germany.
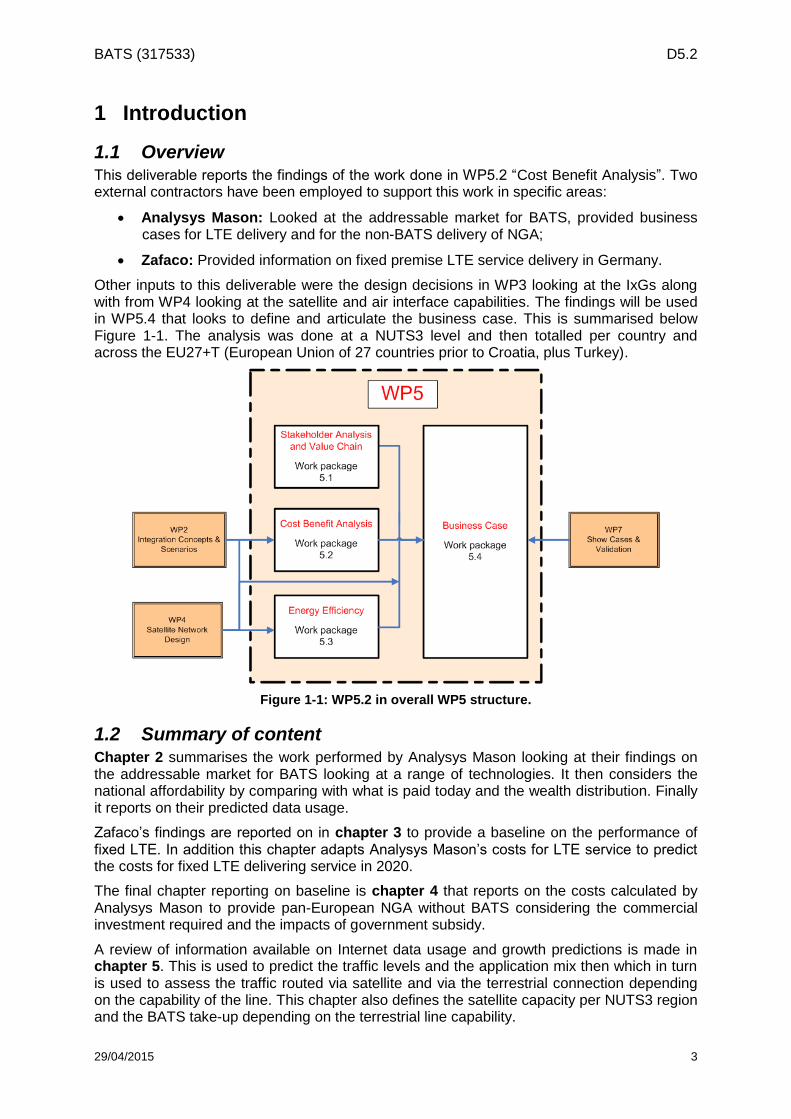
Other inputs to this deliverable were the design decisions in WP3 looking at the IxGs along with from WP4 looking at the satellite and air interface capabilities. The findings will be used in WP5.4 that looks to define and articulate the business case. This is summarised below Figure 1-1. The analysis was done at a NUTS3 level and then totalled per country and across the EU27+T (European Union of 27 countries prior to Croatia, plus Turkey).
Figure 1-1: WP5.2 in overall WP5 structure.
1.2 Summary of content Chapter 2 summarises the work performed by Analysys Mason looking at their findings on the addressable market for BATS looking at a range of technologies. It then considers the national affordability by comparing with what is paid today and the wealth distribution. Finally it reports on their predicted data usage.
Zafaco’s findings are reported on in chapter 3 to provide a baseline on the performance of fixed LTE. In addition this chapter adapts Analysys Mason’s costs for LTE service to predict the costs for fixed LTE delivering service in 2020.
The final chapter reporting on baseline is chapter 4 that reports on the costs calculated by Analysys Mason to provide pan-European NGA without BATS considering the commercial investment required and the impacts of government subsidy.
A review of information available on Internet data usage and growth predictions is made in chapter 5. This is used to predict the traffic levels and the application mix then which in turn is used to assess the traffic routed via satellite and via the terrestrial connection depending on the capability of the line. This chapter also defines the satellite capacity per NUTS3 region and the BATS take-up depending on the terrestrial line capability.
BATS (317533) D5.2
29/04/2015 4
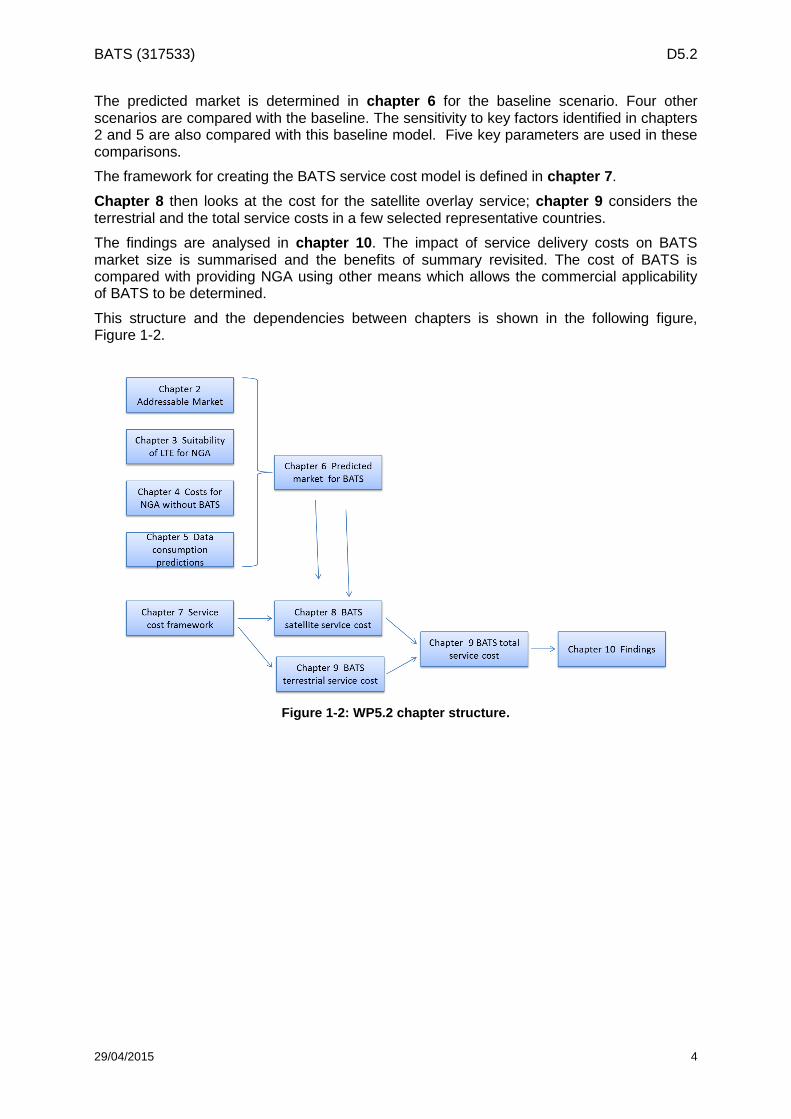
The predicted market is determined in chapter 6 for the baseline scenario. Four other scenarios are compared with the baseline. The sensitivity to key factors identified in chapters 2 and 5 are also compared with this baseline model. Five key parameters are used in these comparisons.
The framework for creating the BATS service cost model is defined in chapter 7.
Chapter 8 then looks at the cost for the satellite overlay service; chapter 9 considers the terrestrial and the total service costs in a few selected representative countries.
The findings are analysed in chapter 10. The impact of service delivery costs on BATS market size is summarised and the benefits of summary revisited. The cost of BATS is compared with providing NGA using other means which allows the commercial applicability of BATS to be determined.
This structure and the dependencies between chapters is shown in the following figure, Figure 1-2.
Figure 1-2: WP5.2 chapter structure.
BATS (317533) D5.2
29/04/2015 5
2 Baseline: Market analysis and coverage
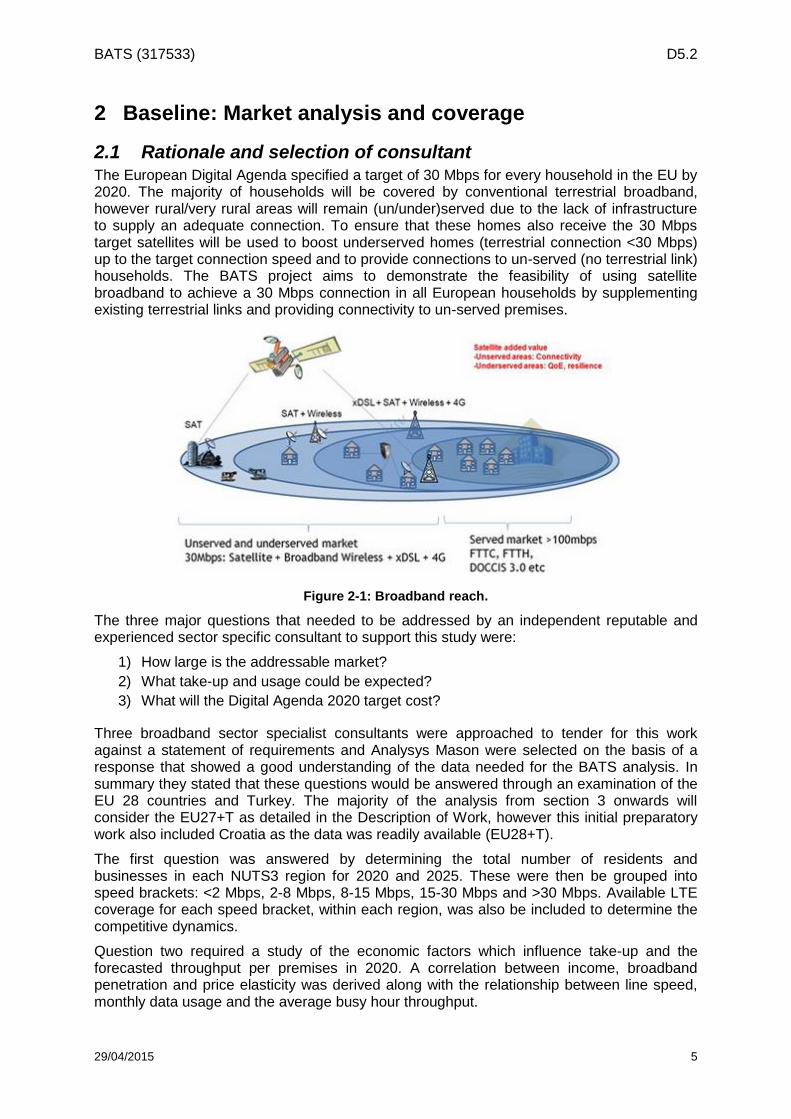
2.1 Rationale and selection of consultant The European Digital Agenda specified a target of 30 Mbps for every household in the EU by 2020. The majority of households will be covered by conventional terrestrial broadband, however rural/very rural areas will remain (un/under)served due to the lack of infrastructure to supply an adequate connection. To ensure that these homes also receive the 30 Mbps target satellites will be used to boost underserved homes (terrestrial connection <30 Mbps) up to the target connection speed and to provide connections to un-served (no terrestrial link) households. The BATS project aims to demonstrate the feasibility of using satellite broadband to achieve a 30 Mbps connection in all European households by supplementing existing terrestrial links and providing connectivity to un-served premises.
Figure 2-1: Broadband reach.
The three major questions that needed to be addressed by an independent reputable and experienced sector specific consultant to support this study were:
1) How large is the addressable market?
2) What take-up and usage could be expected?
3) What will the Digital Agenda 2020 target cost?
Three broadband sector specialist consultants were approached to tender for this work against a statement of requirements and Analysys Mason were selected on the basis of a response that showed a good understanding of the data needed for the BATS analysis. In summary they stated that these questions would be answered through an examination of the EU 28 countries and Turkey. The majority of the analysis from section 3 onwards will consider the EU27+T as detailed in the Description of Work, however this initial preparatory work also included Croatia as the data was readily available (EU28+T).
The first question was answered by determining the total number of residents and businesses in each NUTS3 region for 2020 and 2025. These were then be grouped into speed brackets: <2 Mbps, 2-8 Mbps, 8-15 Mbps, 15-30 Mbps and >30 Mbps. Available LTE coverage for each speed bracket, within each region, was also be included to determine the competitive dynamics.
Question two required a study of the economic factors which influence take-up and the forecasted throughput per premises in 2020. A correlation between income, broadband penetration and price elasticity was derived along with the relationship between line speed, monthly data usage and the average busy hour throughput.
BATS (317533) D5.2
29/04/2015 6
Lastly, question three required a baseline cost model for meeting the digital agenda by 2020 in the EU 27. This required the determination of the cost to provide NGA to 100% of premises, and the analysis of the commercial roll out case with expected government subsidy requirements.
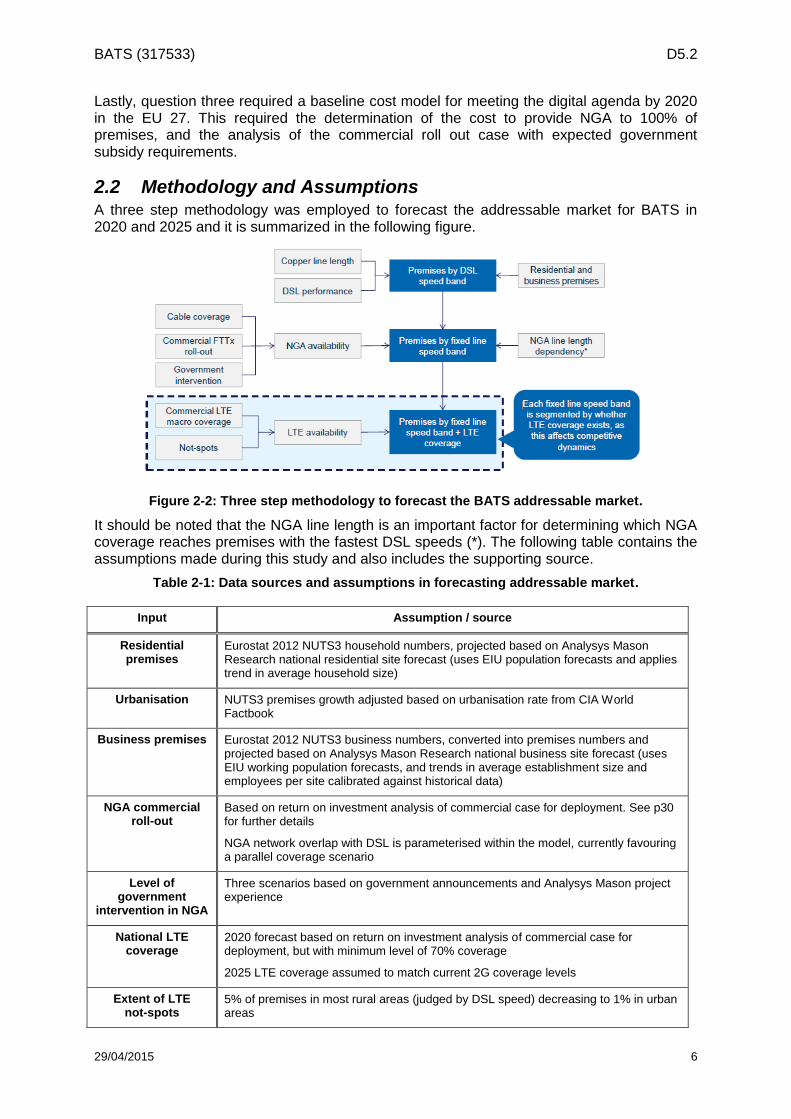
2.2 Methodology and Assumptions A three step methodology was employed to forecast the addressable market for BATS in 2020 and 2025 and it is summarized in the following figure.
Figure 2-2: Three step methodology to forecast the BATS addressable market.
It should be noted that the NGA line length is an important factor for determining which NGA coverage reaches premises with the fastest DSL speeds (*). The following table contains the assumptions made during this study and also includes the supporting source.
Table 2-1: Data sources and assumptions in forecasting addressable market.
Input Assumption / source
Residential premises
Eurostat 2012 NUTS3 household numbers, projected based on Analysys Mason Research national residential site forecast (uses EIU population forecasts and applies trend in average household size)
Urbanisation NUTS3 premises growth adjusted based on urbanisation rate from CIA World Factbook
Business premises Eurostat 2012 NUTS3 business numbers, converted into premises numbers and projected based on Analysys Mason Research national business site forecast (uses EIU working population forecasts, and trends in average establishment size and employees per site calibrated against historical data)
NGA commercial roll-out
Based on return on investment analysis of commercial case for deployment. See p30 for further details
NGA network overlap with DSL is parameterised within the model, currently favouring a parallel coverage scenario
Level of government
intervention in NGA
Three scenarios based on government announcements and Analysys Mason project experience
National LTE coverage
2020 forecast based on return on investment analysis of commercial case for deployment, but with minimum level of 70% coverage
2025 LTE coverage assumed to match current 2G coverage levels
Extent of LTE not-spots
5% of premises in most rural areas (judged by DSL speed) decreasing to 1% in urban areas
BATS (317533) D5.2
29/04/2015 7
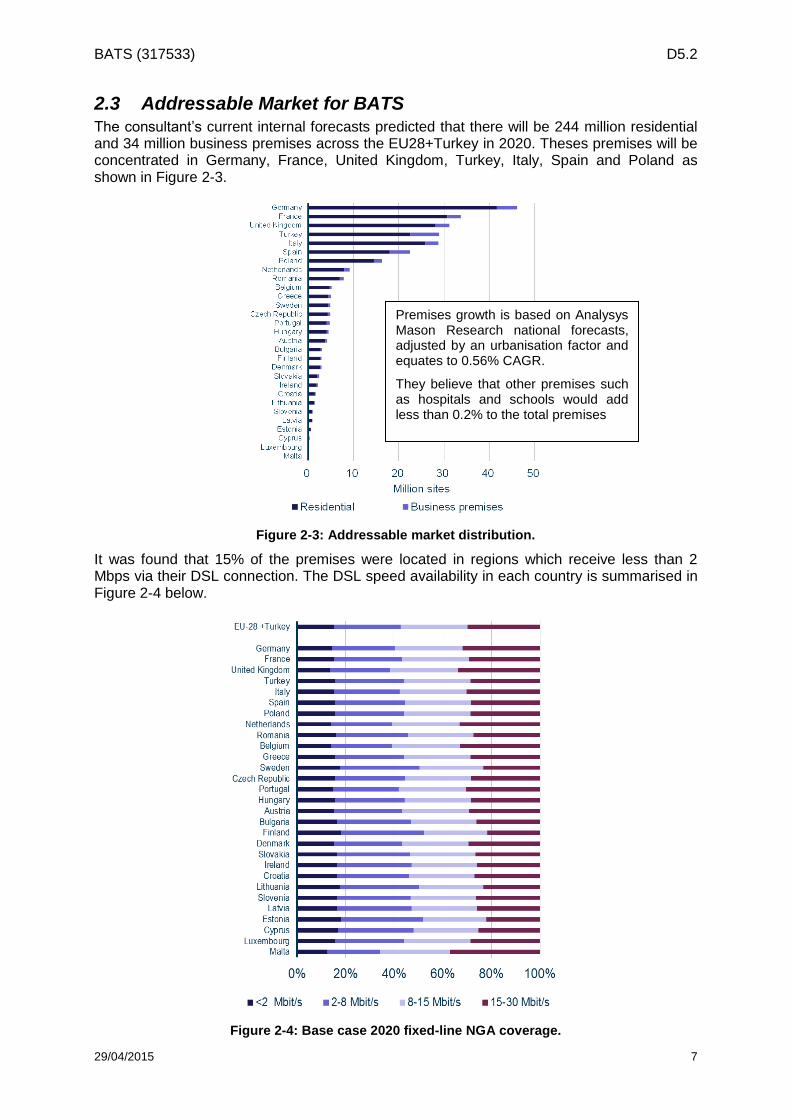
2.3 Addressable Market for BATS The consultant’s current internal forecasts predicted that there will be 244 million residential and 34 million business premises across the EU28+Turkey in 2020. Theses premises will be concentrated in Germany, France, United Kingdom, Turkey, Italy, Spain and Poland as shown in Figure 2-3.
Figure 2-3: Addressable market distribution.
It was found that 15% of the premises were located in regions which receive less than 2 Mbps via their DSL connection. The DSL speed availability in each country is summarised in Figure 2-4 below.
Figure 2-4: Base case 2020 fixed-line NGA coverage.
Premises growth is based on Analysys Mason Research national forecasts, adjusted by an urbanisation factor and equates to 0.56% CAGR.
They believe that other premises such as hospitals and schools would add less than 0.2% to the total premises
BATS (317533) D5.2
29/04/2015 8
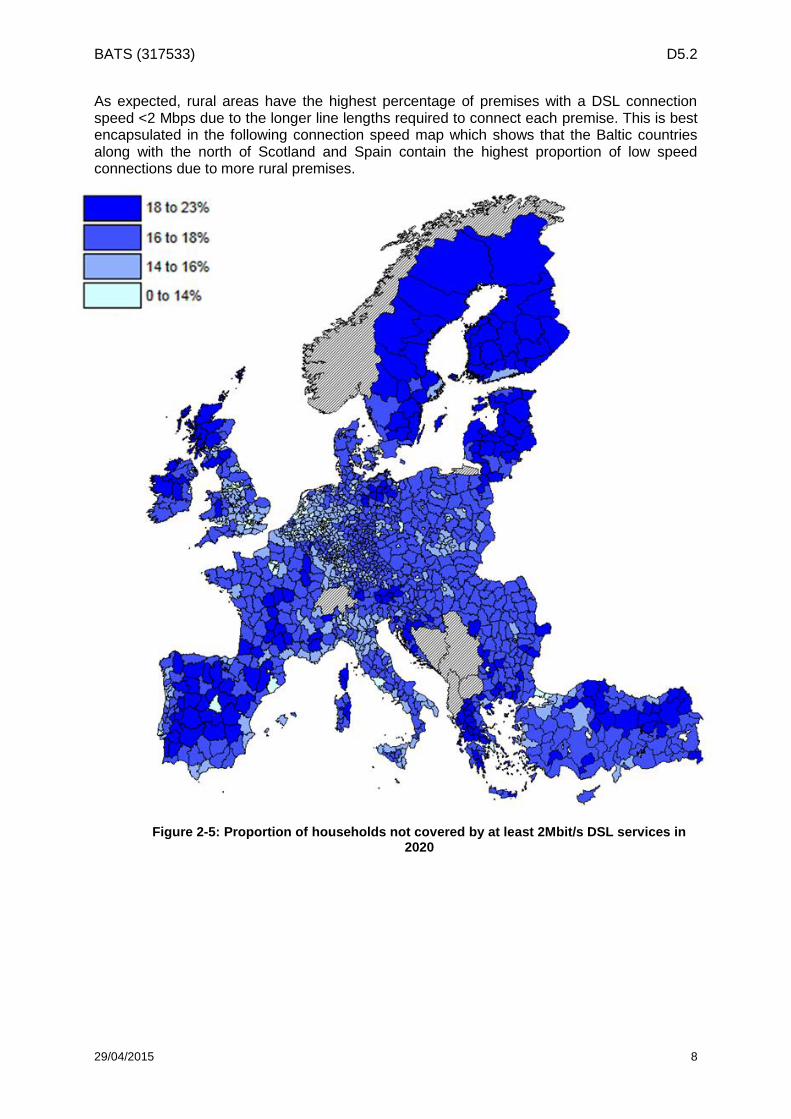
As expected, rural areas have the highest percentage of premises with a DSL connection speed <2 Mbps due to the longer line lengths required to connect each premise. This is best encapsulated in the following connection speed map which shows that the Baltic countries along with the north of Scotland and Spain contain the highest proportion of low speed connections due to more rural premises.
Figure 2-5: Proportion of households not covered by at least 2Mbit/s DSL services in 2020
BATS (317533) D5.2
29/04/2015 9
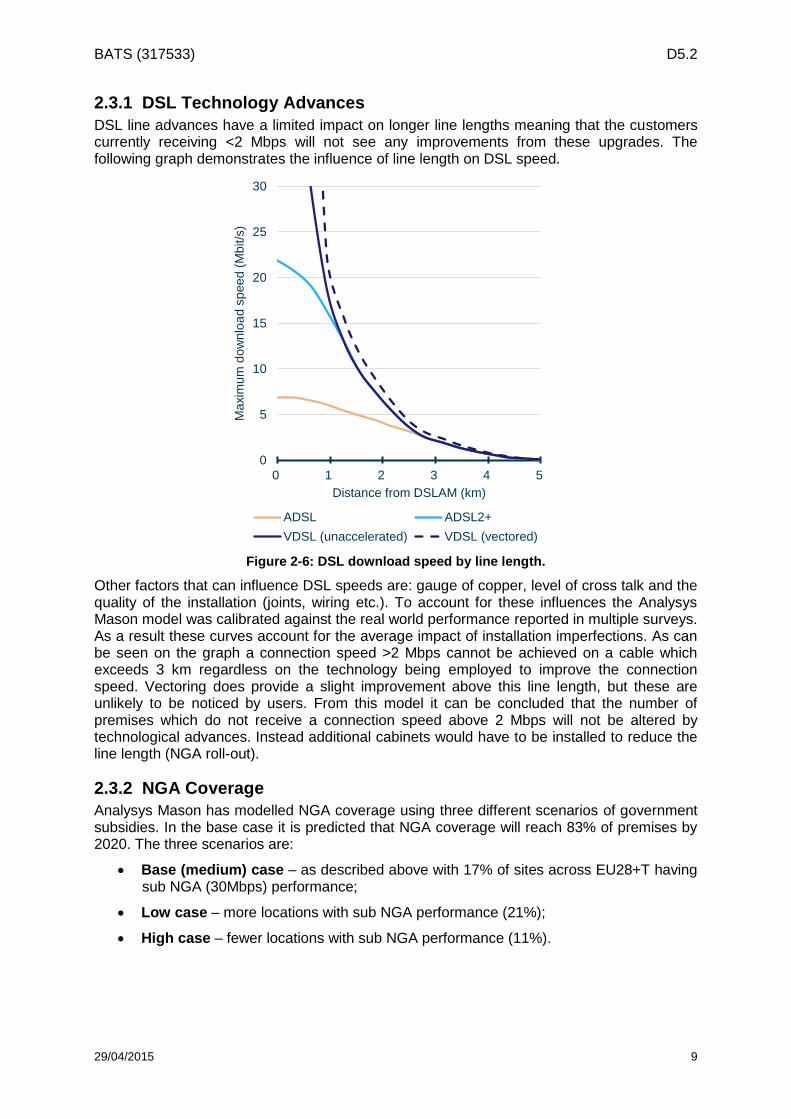
2.3.1 DSL Technology Advances
DSL line advances have a limited impact on longer line lengths meaning that the customers currently receiving <2 Mbps will not see any improvements from these upgrades. The following graph demonstrates the influence of line length on DSL speed.
0
5
10
15
20
25
30
0 1 2 3 4 5
Ma
xim
um
do
wn
loa
d s
pe
ed
(M
bit/s
)
Distance from DSLAM (km)
ADSL ADSL2+
VDSL (unaccelerated) VDSL (vectored)
Figure 2-6: DSL download speed by line length.
Other factors that can influence DSL speeds are: gauge of copper, level of cross talk and the quality of the installation (joints, wiring etc.). To account for these influences the Analysys Mason model was calibrated against the real world performance reported in multiple surveys. As a result these curves account for the average impact of installation imperfections. As can be seen on the graph a connection speed >2 Mbps cannot be achieved on a cable which exceeds 3 km regardless on the technology being employed to improve the connection speed. Vectoring does provide a slight improvement above this line length, but these are unlikely to be noticed by users. From this model it can be concluded that the number of premises which do not receive a connection speed above 2 Mbps will not be altered by technological advances. Instead additional cabinets would have to be installed to reduce the line length (NGA roll-out).
2.3.2 NGA Coverage
Analysys Mason has modelled NGA coverage using three different scenarios of government subsidies. In the base case it is predicted that NGA coverage will reach 83% of premises by 2020. The three scenarios are:
Base (medium) case – as described above with 17% of sites across EU28+T having sub NGA (30Mbps) performance;
Low case – more locations with sub NGA performance (21%);
High case – fewer locations with sub NGA performance (11%).
BATS (317533) D5.2
29/04/2015 10
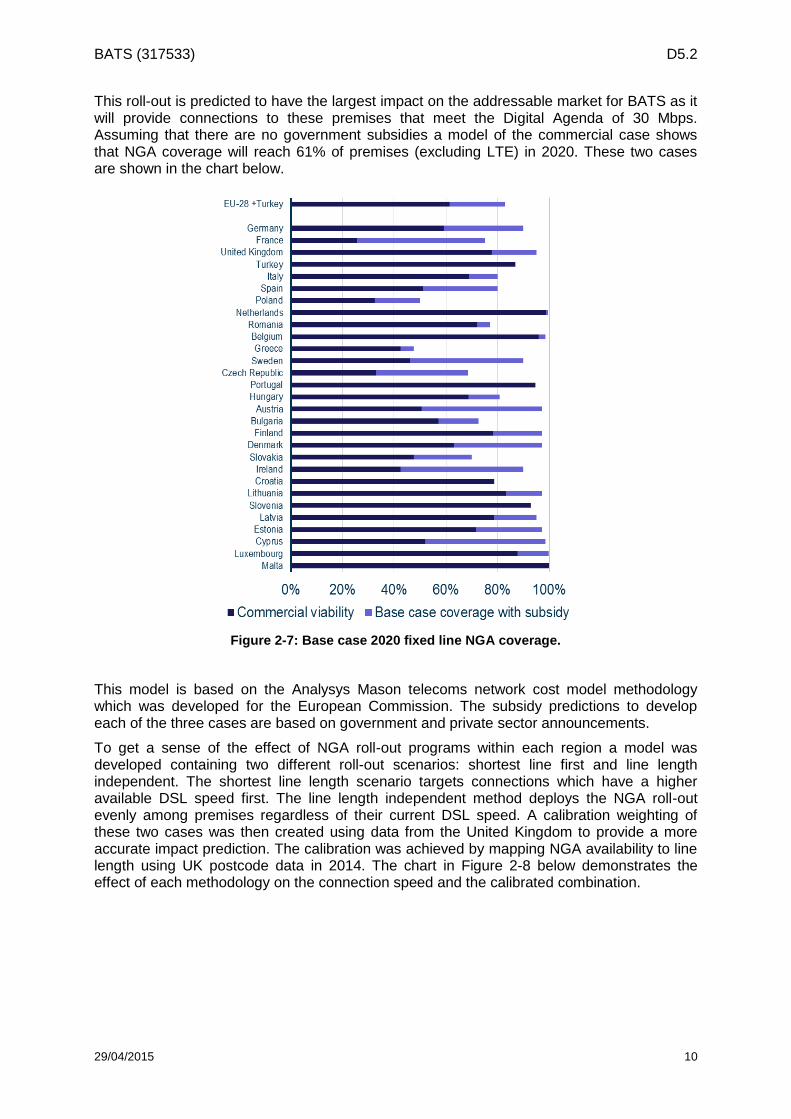
This roll-out is predicted to have the largest impact on the addressable market for BATS as it will provide connections to these premises that meet the Digital Agenda of 30 Mbps. Assuming that there are no government subsidies a model of the commercial case shows that NGA coverage will reach 61% of premises (excluding LTE) in 2020. These two cases are shown in the chart below.
Figure 2-7: Base case 2020 fixed line NGA coverage.
This model is based on the Analysys Mason telecoms network cost model methodology which was developed for the European Commission. The subsidy predictions to develop each of the three cases are based on government and private sector announcements.
To get a sense of the effect of NGA roll-out programs within each region a model was developed containing two different roll-out scenarios: shortest line first and line length independent. The shortest line length scenario targets connections which have a higher available DSL speed first. The line length independent method deploys the NGA roll-out evenly among premises regardless of their current DSL speed. A calibration weighting of these two cases was then created using data from the United Kingdom to provide a more accurate impact prediction. The calibration was achieved by mapping NGA availability to line length using UK postcode data in 2014. The chart in Figure 2-8 below demonstrates the effect of each methodology on the connection speed and the calibrated combination.
BATS (317533) D5.2
29/04/2015 11
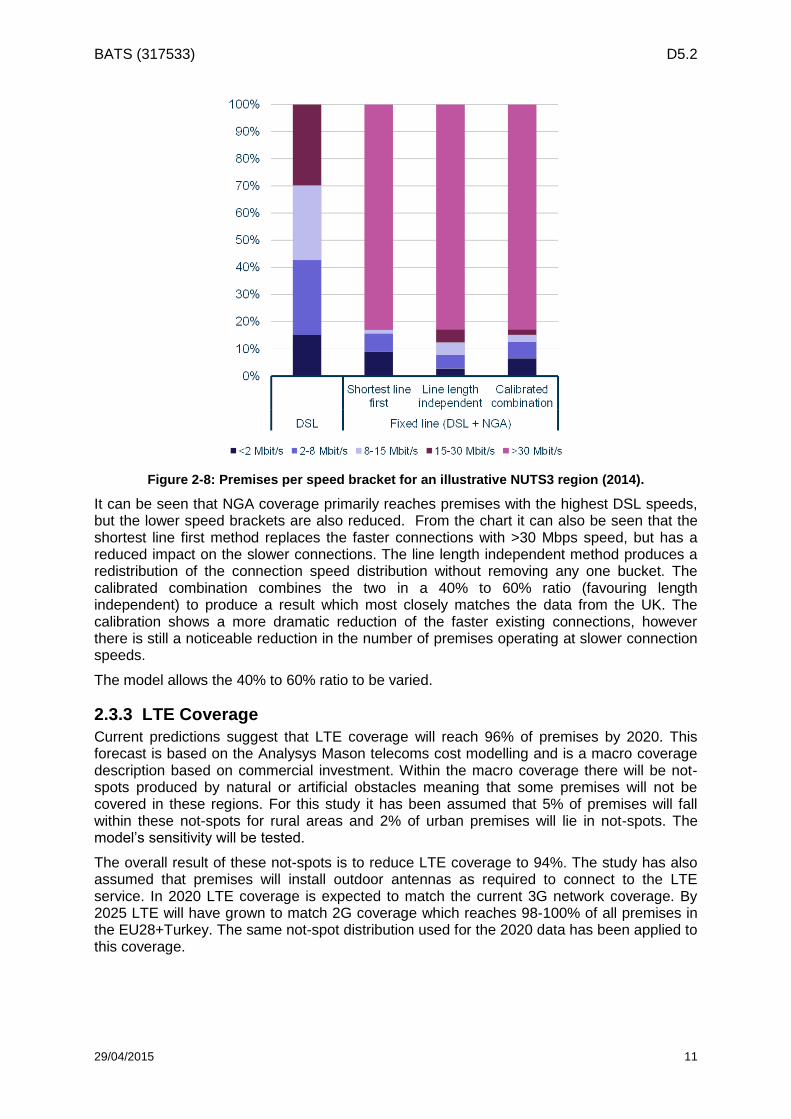
Figure 2-8: Premises per speed bracket for an illustrative NUTS3 region (2014).
It can be seen that NGA coverage primarily reaches premises with the highest DSL speeds, but the lower speed brackets are also reduced. From the chart it can also be seen that the shortest line first method replaces the faster connections with >30 Mbps speed, but has a reduced impact on the slower connections. The line length independent method produces a redistribution of the connection speed distribution without removing any one bucket. The calibrated combination combines the two in a 40% to 60% ratio (favouring length independent) to produce a result which most closely matches the data from the UK. The calibration shows a more dramatic reduction of the faster existing connections, however there is still a noticeable reduction in the number of premises operating at slower connection speeds.
The model allows the 40% to 60% ratio to be varied.
2.3.3 LTE Coverage
Current predictions suggest that LTE coverage will reach 96% of premises by 2020. This forecast is based on the Analysys Mason telecoms cost modelling and is a macro coverage description based on commercial investment. Within the macro coverage there will be not-spots produced by natural or artificial obstacles meaning that some premises will not be covered in these regions. For this study it has been assumed that 5% of premises will fall within these not-spots for rural areas and 2% of urban premises will lie in not-spots. The model’s sensitivity will be tested.
The overall result of these not-spots is to reduce LTE coverage to 94%. The study has also assumed that premises will install outdoor antennas as required to connect to the LTE service. In 2020 LTE coverage is expected to match the current 3G network coverage. By 2025 LTE will have grown to match 2G coverage which reaches 98-100% of all premises in the EU28+Turkey. The same not-spot distribution used for the 2020 data has been applied to this coverage.
BATS (317533) D5.2
29/04/2015 12
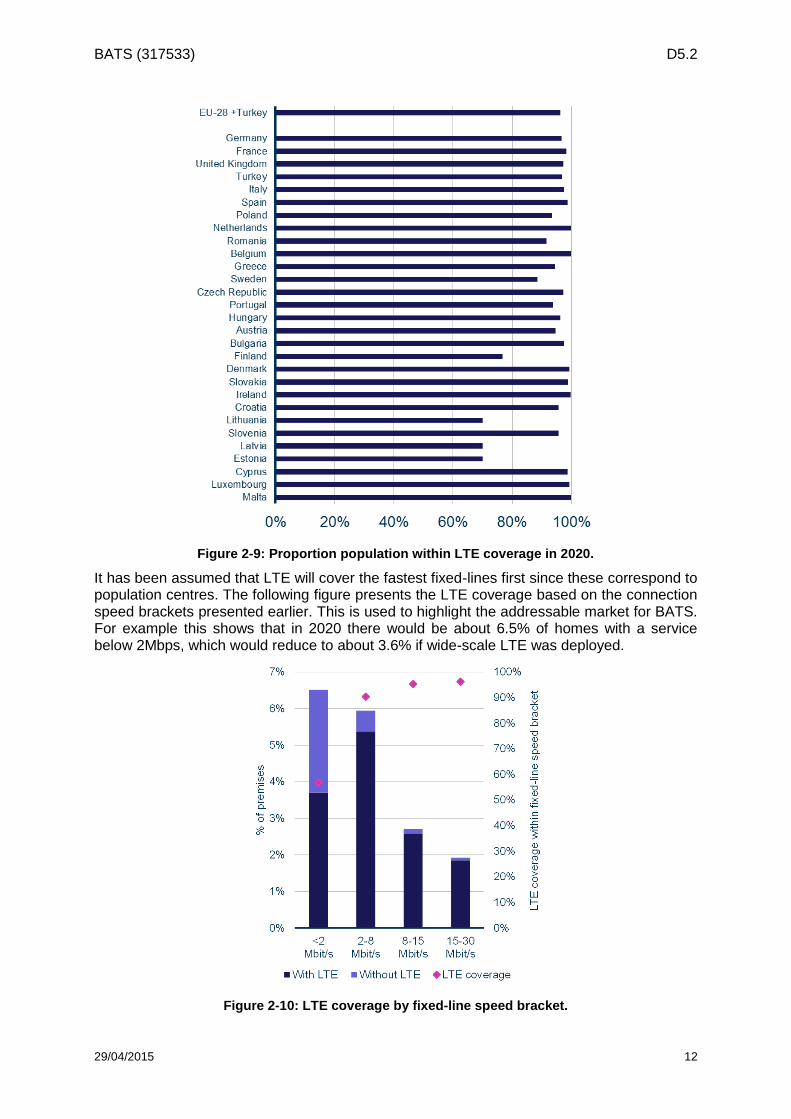
Figure 2-9: Proportion population within LTE coverage in 2020.
It has been assumed that LTE will cover the fastest fixed-lines first since these correspond to population centres. The following figure presents the LTE coverage based on the connection speed brackets presented earlier. This is used to highlight the addressable market for BATS. For example this shows that in 2020 there would be about 6.5% of homes with a service below 2Mbps, which would reduce to about 3.6% if wide-scale LTE was deployed.
Figure 2-10: LTE coverage by fixed-line speed bracket.
BATS (317533) D5.2
29/04/2015 13
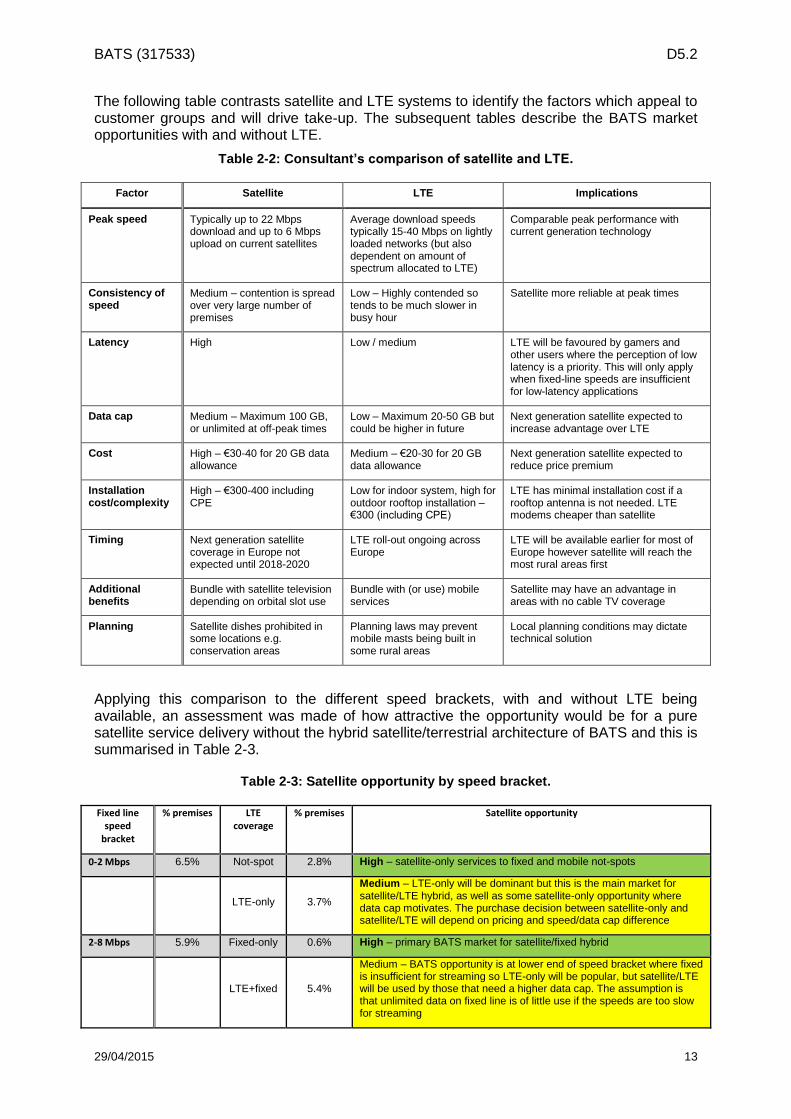
The following table contrasts satellite and LTE systems to identify the factors which appeal to customer groups and will drive take-up. The subsequent tables describe the BATS market opportunities with and without LTE.
Table 2-2: Consultant’s comparison of satellite and LTE.
Factor Satellite LTE Implications
Peak speed Typically up to 22 Mbps download and up to 6 Mbps upload on current satellites
Average download speeds typically 15-40 Mbps on lightly loaded networks (but also dependent on amount of spectrum allocated to LTE)
Comparable peak performance with current generation technology
Consistency of speed
Medium – contention is spread over very large number of premises
Low – Highly contended so tends to be much slower in busy hour
Satellite more reliable at peak times
Latency High Low / medium LTE will be favoured by gamers and other users where the perception of low latency is a priority. This will only apply when fixed-line speeds are insufficient for low-latency applications
Data cap Medium – Maximum 100 GB, or unlimited at off-peak times
Low – Maximum 20-50 GB but could be higher in future
Next generation satellite expected to increase advantage over LTE
Cost High – €30-40 for 20 GB data allowance
Medium – €20-30 for 20 GB data allowance
Next generation satellite expected to reduce price premium
Installation cost/complexity
High – €300-400 including CPE
Low for indoor system, high for outdoor rooftop installation – €300 (including CPE)
LTE has minimal installation cost if a rooftop antenna is not needed. LTE modems cheaper than satellite
Timing Next generation satellite coverage in Europe not expected until 2018-2020
LTE roll-out ongoing across Europe
LTE will be available earlier for most of Europe however satellite will reach the most rural areas first
Additional benefits
Bundle with satellite television depending on orbital slot use
Bundle with (or use) mobile services
Satellite may have an advantage in areas with no cable TV coverage
Planning Satellite dishes prohibited in some locations e.g. conservation areas
Planning laws may prevent mobile masts being built in some rural areas
Local planning conditions may dictate technical solution
Applying this comparison to the different speed brackets, with and without LTE being available, an assessment was made of how attractive the opportunity would be for a pure satellite service delivery without the hybrid satellite/terrestrial architecture of BATS and this is summarised in Table 2-3.
Table 2-3: Satellite opportunity by speed bracket.
Fixed line speed
bracket
% premises LTE coverage
% premises Satellite opportunity
0-2 Mbps 6.5% Not-spot 2.8% High – satellite-only services to fixed and mobile not-spots
LTE-only 3.7%
Medium – LTE-only will be dominant but this is the main market for satellite/LTE hybrid, as well as some satellite-only opportunity where data cap motivates. The purchase decision between satellite-only and satellite/LTE will depend on pricing and speed/data cap difference
2-8 Mbps 5.9% Fixed-only 0.6% High – primary BATS market for satellite/fixed hybrid
LTE+fixed 5.4%
Medium – BATS opportunity is at lower end of speed bracket where fixed is insufficient for streaming so LTE-only will be popular, but satellite/LTE will be used by those that need a higher data cap. The assumption is that unlimited data on fixed line is of little use if the speeds are too slow for streaming
BATS (317533) D5.2
29/04/2015 14
Fixed line speed
bracket
% premises LTE coverage
% premises Satellite opportunity
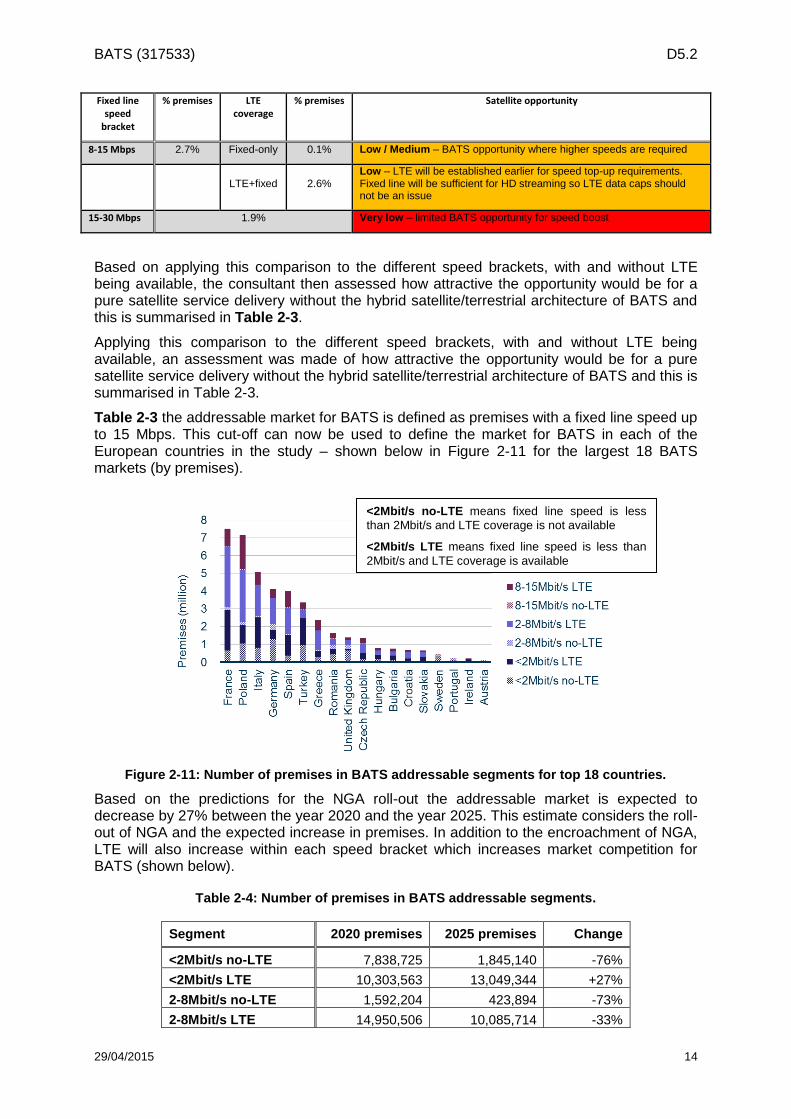
8-15 Mbps 2.7% Fixed-only 0.1% Low / Medium – BATS opportunity where higher speeds are required
LTE+fixed 2.6% Low – LTE will be established earlier for speed top-up requirements. Fixed line will be sufficient for HD streaming so LTE data caps should not be an issue
15-30 Mbps 1.9% Very low – limited BATS opportunity for speed boost
Based on applying this comparison to the different speed brackets, with and without LTE being available, the consultant then assessed how attractive the opportunity would be for a pure satellite service delivery without the hybrid satellite/terrestrial architecture of BATS and this is summarised in Table 2-3.
Applying this comparison to the different speed brackets, with and without LTE being available, an assessment was made of how attractive the opportunity would be for a pure satellite service delivery without the hybrid satellite/terrestrial architecture of BATS and this is summarised in Table 2-3.
Table 2-3 the addressable market for BATS is defined as premises with a fixed line speed up to 15 Mbps. This cut-off can now be used to define the market for BATS in each of the European countries in the study – shown below in Figure 2-11 for the largest 18 BATS markets (by premises).
Figure 2-11: Number of premises in BATS addressable segments for top 18 countries.
Based on the predictions for the NGA roll-out the addressable market is expected to decrease by 27% between the year 2020 and the year 2025. This estimate considers the roll-out of NGA and the expected increase in premises. In addition to the encroachment of NGA, LTE will also increase within each speed bracket which increases market competition for BATS (shown below).
Table 2-4: Number of premises in BATS addressable segments.
Segment 2020 premises 2025 premises Change
<2Mbit/s no-LTE 7,838,725 1,845,140 -76%
<2Mbit/s LTE 10,303,563 13,049,344 +27%
2-8Mbit/s no-LTE 1,592,204 423,894 -73%
2-8Mbit/s LTE 14,950,506 10,085,714 -33%
<2Mbit/s no-LTE means fixed line speed is less
than 2Mbit/s and LTE coverage is not available
<2Mbit/s LTE means fixed line speed is less than
2Mbit/s and LTE coverage is available
BATS (317533) D5.2
29/04/2015 15
8-15Mbit/s no-LTE 353,864 171,456 -52%
8-15Mbit/s LTE 7,172,980 5,427,079 -24%
Total <15Mbit/s 42,211,842 31,002,627 -27%
These numbers reflect the total addressable market and make no distinction between what might be addressed directly by satellite or addressed using the BATS hybrid architecture.
2.4 Affordability
2.4.1 Price Elasticity
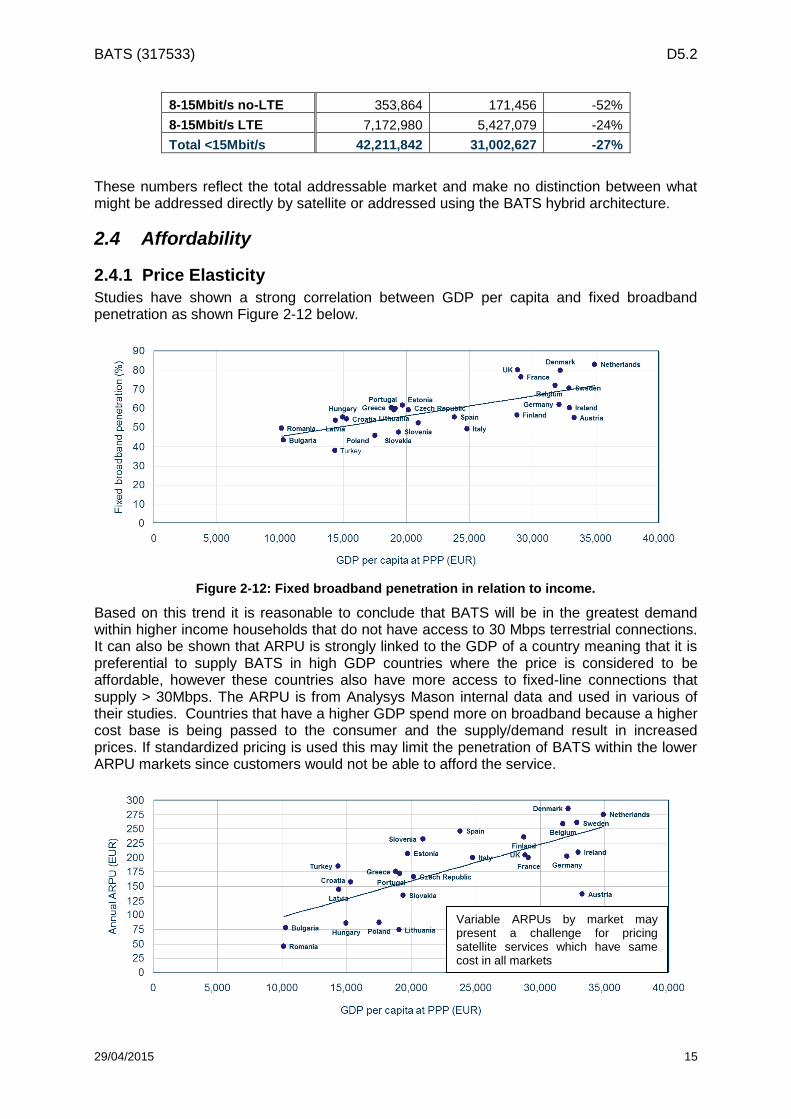
Studies have shown a strong correlation between GDP per capita and fixed broadband penetration as shown Figure 2-12 below.
Figure 2-12: Fixed broadband penetration in relation to income.
Based on this trend it is reasonable to conclude that BATS will be in the greatest demand within higher income households that do not have access to 30 Mbps terrestrial connections. It can also be shown that ARPU is strongly linked to the GDP of a country meaning that it is preferential to supply BATS in high GDP countries where the price is considered to be affordable, however these countries also have more access to fixed-line connections that supply > 30Mbps. The ARPU is from Analysys Mason internal data and used in various of their studies. Countries that have a higher GDP spend more on broadband because a higher cost base is being passed to the consumer and the supply/demand result in increased prices. If standardized pricing is used this may limit the penetration of BATS within the lower ARPU markets since customers would not be able to afford the service.
Variable ARPUs by market may present a challenge for pricing satellite services which have same cost in all markets
BATS (317533) D5.2
29/04/2015 16
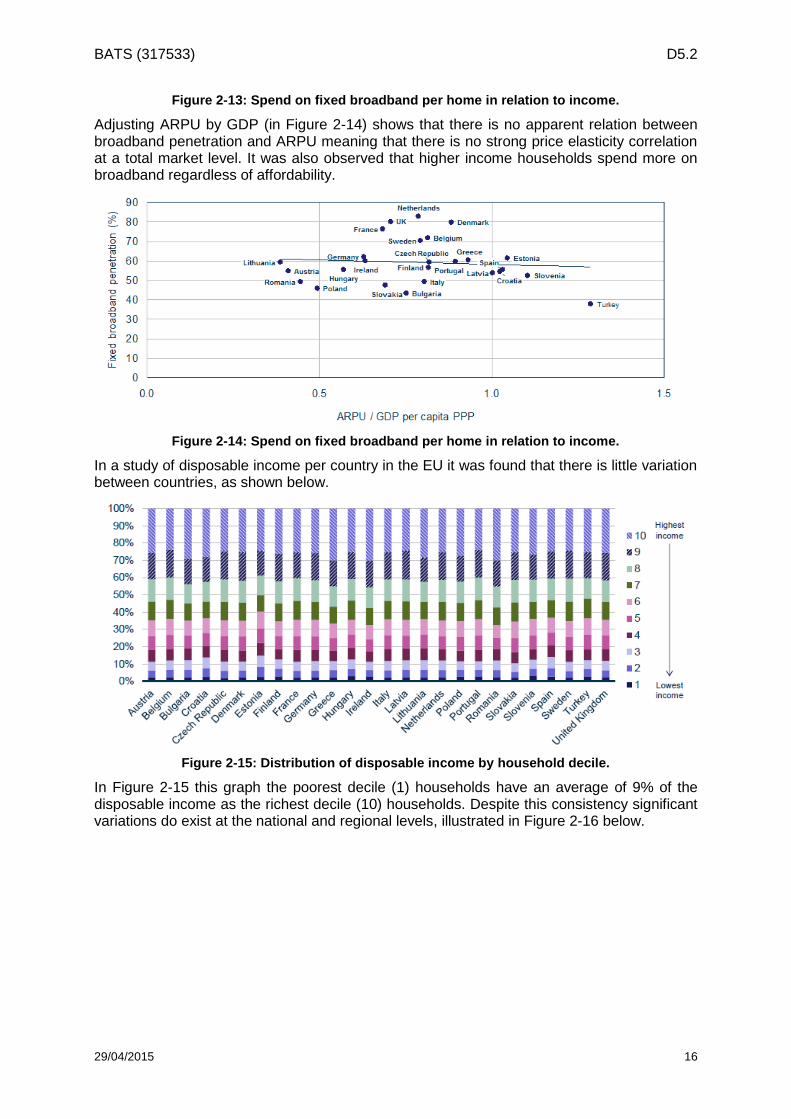
Figure 2-13: Spend on fixed broadband per home in relation to income.
Adjusting ARPU by GDP (in Figure 2-14) shows that there is no apparent relation between broadband penetration and ARPU meaning that there is no strong price elasticity correlation at a total market level. It was also observed that higher income households spend more on broadband regardless of affordability.
Figure 2-14: Spend on fixed broadband per home in relation to income.
In a study of disposable income per country in the EU it was found that there is little variation between countries, as shown below.
Figure 2-15: Distribution of disposable income by household decile.
In Figure 2-15 this graph the poorest decile (1) households have an average of 9% of the disposable income as the richest decile (10) households. Despite this consistency significant variations do exist at the national and regional levels, illustrated in Figure 2-16 below.
BATS (317533) D5.2
29/04/2015 17
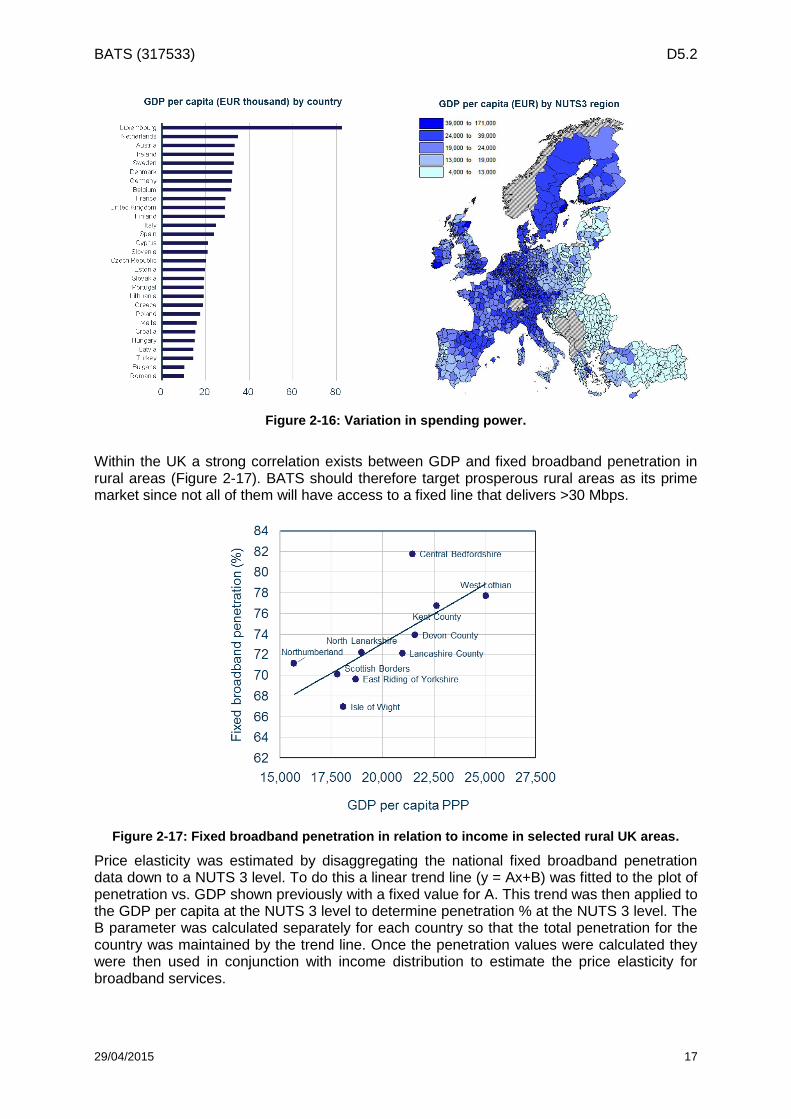
Figure 2-16: Variation in spending power.
Within the UK a strong correlation exists between GDP and fixed broadband penetration in rural areas (Figure 2-17). BATS should therefore target prosperous rural areas as its prime market since not all of them will have access to a fixed line that delivers >30 Mbps.
Figure 2-17: Fixed broadband penetration in relation to income in selected rural UK areas.
Price elasticity was estimated by disaggregating the national fixed broadband penetration data down to a NUTS 3 level. To do this a linear trend line (y = Ax+B) was fitted to the plot of penetration vs. GDP shown previously with a fixed value for A. This trend was then applied to the GDP per capita at the NUTS 3 level to determine penetration % at the NUTS 3 level. The B parameter was calculated separately for each country so that the total penetration for the country was maintained by the trend line. Once the penetration values were calculated they were then used in conjunction with income distribution to estimate the price elasticity for broadband services.
BATS (317533) D5.2
29/04/2015 18
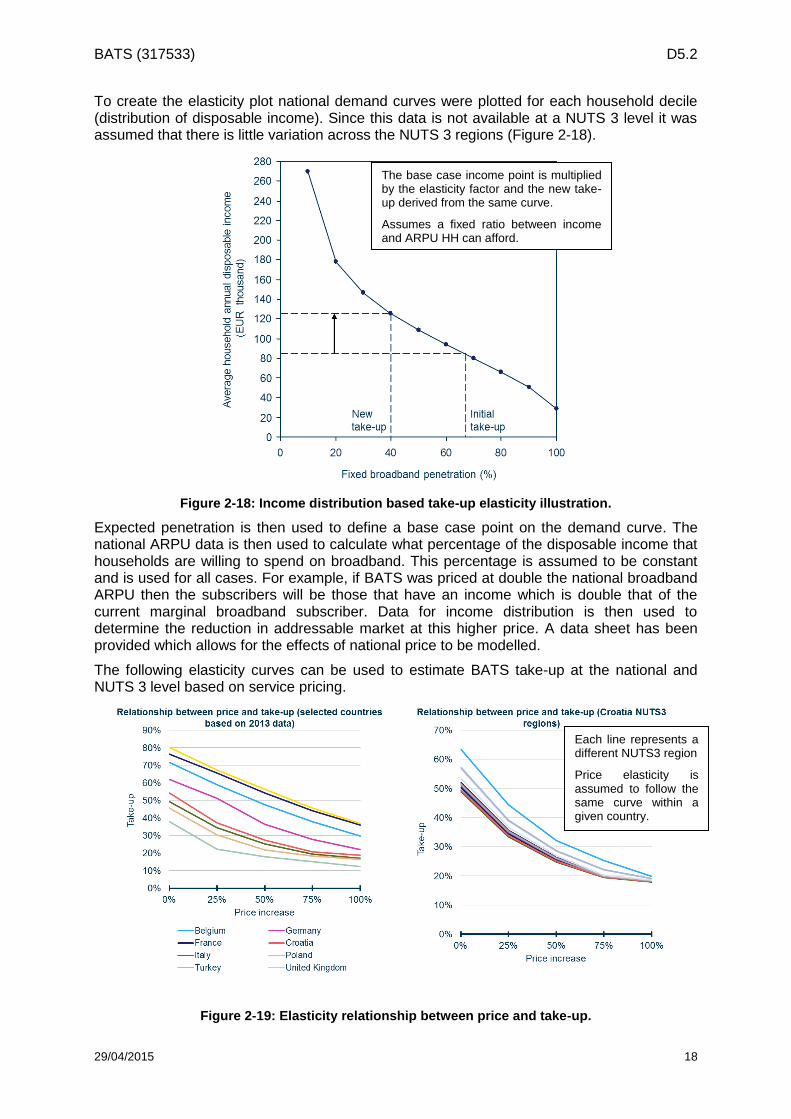
To create the elasticity plot national demand curves were plotted for each household decile (distribution of disposable income). Since this data is not available at a NUTS 3 level it was assumed that there is little variation across the NUTS 3 regions (Figure 2-18).
Figure 2-18: Income distribution based take-up elasticity illustration.
Expected penetration is then used to define a base case point on the demand curve. The national ARPU data is then used to calculate what percentage of the disposable income that households are willing to spend on broadband. This percentage is assumed to be constant and is used for all cases. For example, if BATS was priced at double the national broadband ARPU then the subscribers will be those that have an income which is double that of the current marginal broadband subscriber. Data for income distribution is then used to determine the reduction in addressable market at this higher price. A data sheet has been provided which allows for the effects of national price to be modelled.
The following elasticity curves can be used to estimate BATS take-up at the national and NUTS 3 level based on service pricing.
Figure 2-19: Elasticity relationship between price and take-up.
The base case income point is multiplied by the elasticity factor and the new take-up derived from the same curve.
Assumes a fixed ratio between income and ARPU HH can afford.
Each line represents a different NUTS3 region
Price elasticity is assumed to follow the same curve within a given country.
BATS (317533) D5.2
29/04/2015 19
2.4.2 Valid price range
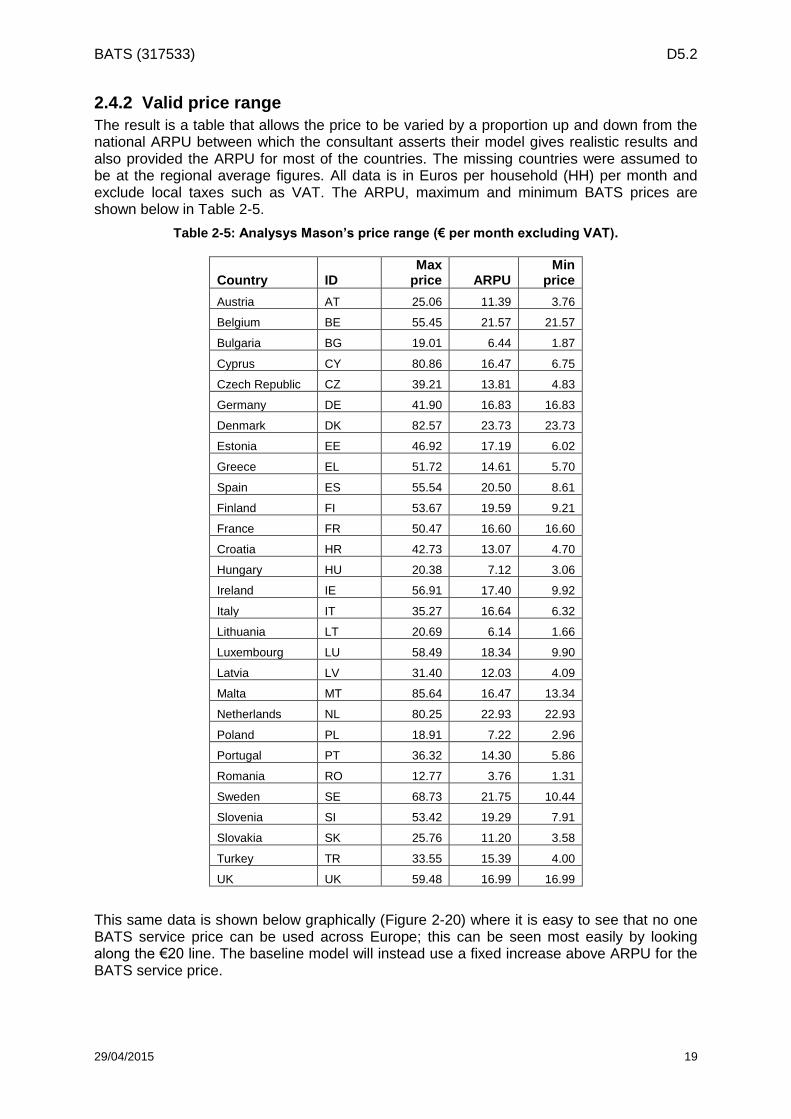
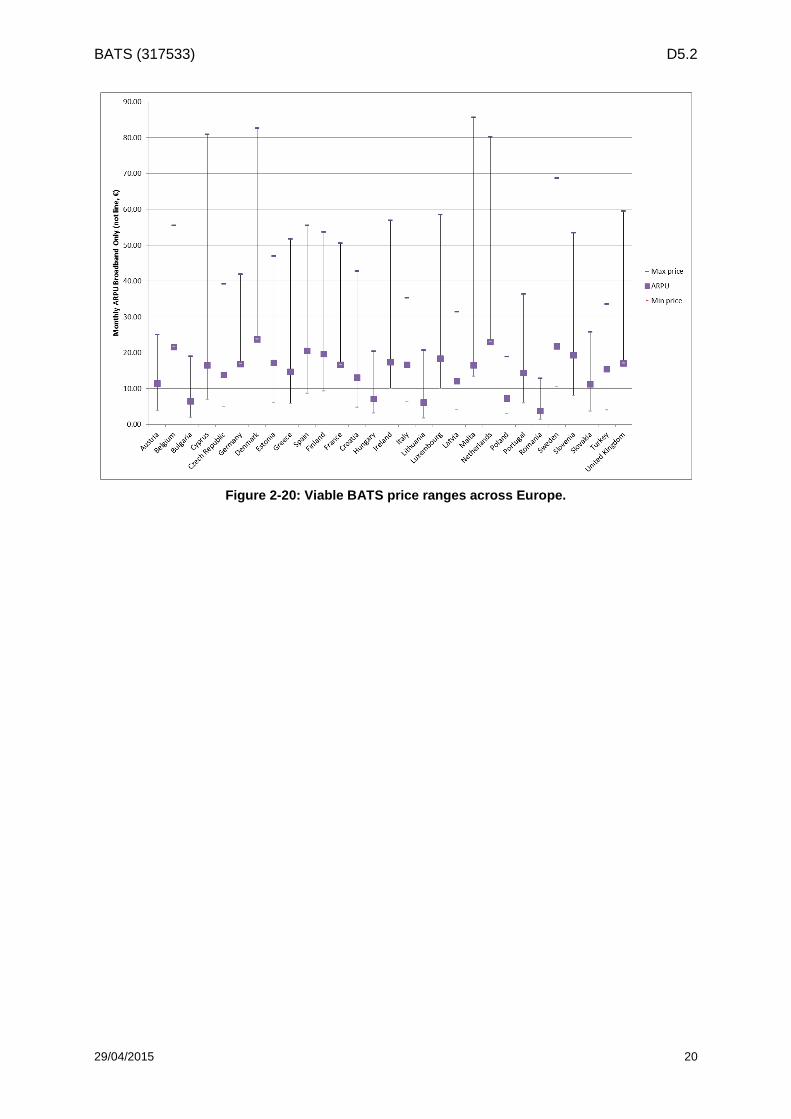
The result is a table that allows the price to be varied by a proportion up and down from the national ARPU between which the consultant asserts their model gives realistic results and also provided the ARPU for most of the countries. The missing countries were assumed to be at the regional average figures. All data is in Euros per household (HH) per month and exclude local taxes such as VAT. The ARPU, maximum and minimum BATS prices are shown below in Table 2-5.
Table 2-5: Analysys Mason’s price range (€ per month excluding VAT).
Country ID Max
price ARPU Min
price
Austria AT 25.06 11.39 3.76
Belgium BE 55.45 21.57 21.57
Bulgaria BG 19.01 6.44 1.87
Cyprus CY 80.86 16.47 6.75
Czech Republic CZ 39.21 13.81 4.83
Germany DE 41.90 16.83 16.83
Denmark DK 82.57 23.73 23.73
Estonia EE 46.92 17.19 6.02
Greece EL 51.72 14.61 5.70
Spain ES 55.54 20.50 8.61
Finland FI 53.67 19.59 9.21
France FR 50.47 16.60 16.60
Croatia HR 42.73 13.07 4.70
Hungary HU 20.38 7.12 3.06
Ireland IE 56.91 17.40 9.92
Italy IT 35.27 16.64 6.32
Lithuania LT 20.69 6.14 1.66
Luxembourg LU 58.49 18.34 9.90
Latvia LV 31.40 12.03 4.09
Malta MT 85.64 16.47 13.34
Netherlands NL 80.25 22.93 22.93
Poland PL 18.91 7.22 2.96
Portugal PT 36.32 14.30 5.86
Romania RO 12.77 3.76 1.31
Sweden SE 68.73 21.75 10.44
Slovenia SI 53.42 19.29 7.91
Slovakia SK 25.76 11.20 3.58
Turkey TR 33.55 15.39 4.00
UK UK 59.48 16.99 16.99
This same data is shown below graphically (Figure 2-20) where it is easy to see that no one BATS service price can be used across Europe; this can be seen most easily by looking along the €20 line. The baseline model will instead use a fixed increase above ARPU for the BATS service price.
BATS (317533) D5.2
29/04/2015 20
Figure 2-20: Viable BATS price ranges across Europe.
BATS (317533) D5.2
29/04/2015 21
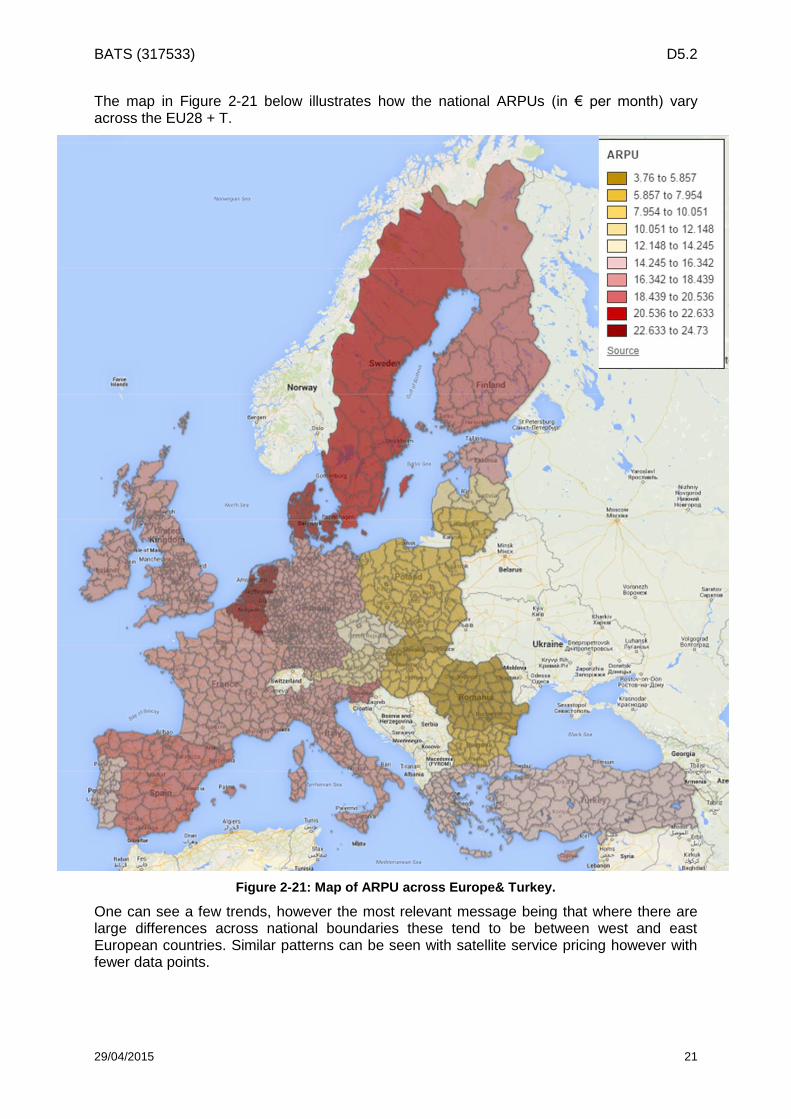
The map in Figure 2-21 below illustrates how the national ARPUs (in € per month) vary across the EU28 + T.
Figure 2-21: Map of ARPU across Europe& Turkey.
One can see a few trends, however the most relevant message being that where there are large differences across national boundaries these tend to be between west and east European countries. Similar patterns can be seen with satellite service pricing however with fewer data points.
BATS (317533) D5.2
29/04/2015 22
2.5 Usage
2.5.1 Growth in usage
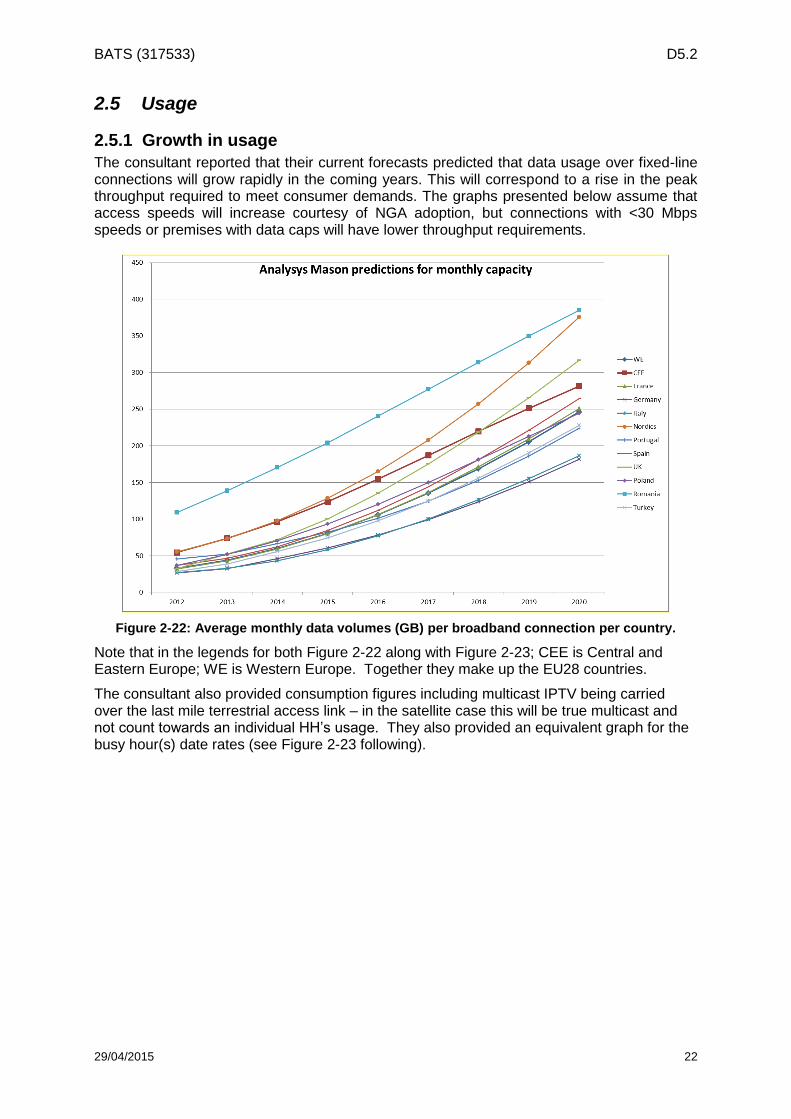
The consultant reported that their current forecasts predicted that data usage over fixed-line connections will grow rapidly in the coming years. This will correspond to a rise in the peak throughput required to meet consumer demands. The graphs presented below assume that access speeds will increase courtesy of NGA adoption, but connections with <30 Mbps speeds or premises with data caps will have lower throughput requirements.
Figure 2-22: Average monthly data volumes (GB) per broadband connection per country.
Note that in the legends for both Figure 2-22 along with Figure 2-23; CEE is Central and Eastern Europe; WE is Western Europe. Together they make up the EU28 countries.
The consultant also provided consumption figures including multicast IPTV being carried over the last mile terrestrial access link – in the satellite case this will be true multicast and not count towards an individual HH’s usage. They also provided an equivalent graph for the busy hour(s) date rates (see Figure 2-23 following).
BATS (317533) D5.2
29/04/2015 23
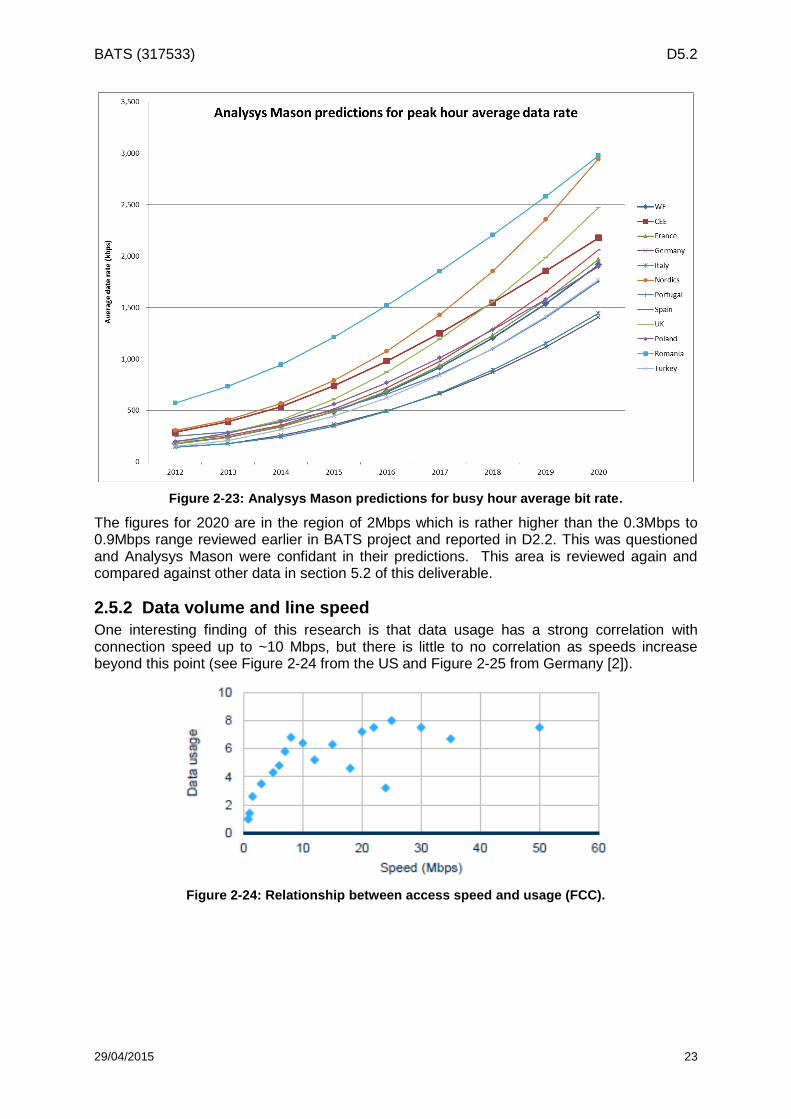
Figure 2-23: Analysys Mason predictions for busy hour average bit rate.
The figures for 2020 are in the region of 2Mbps which is rather higher than the 0.3Mbps to 0.9Mbps range reviewed earlier in BATS project and reported in D2.2. This was questioned and Analysys Mason were confidant in their predictions. This area is reviewed again and compared against other data in section 5.2 of this deliverable.
2.5.2 Data volume and line speed
One interesting finding of this research is that data usage has a strong correlation with connection speed up to ~10 Mbps, but there is little to no correlation as speeds increase beyond this point (see Figure 2-24 from the US and Figure 2-25 from Germany [2]).
Figure 2-24: Relationship between access speed and usage (FCC).
BATS (317533) D5.2
29/04/2015 24
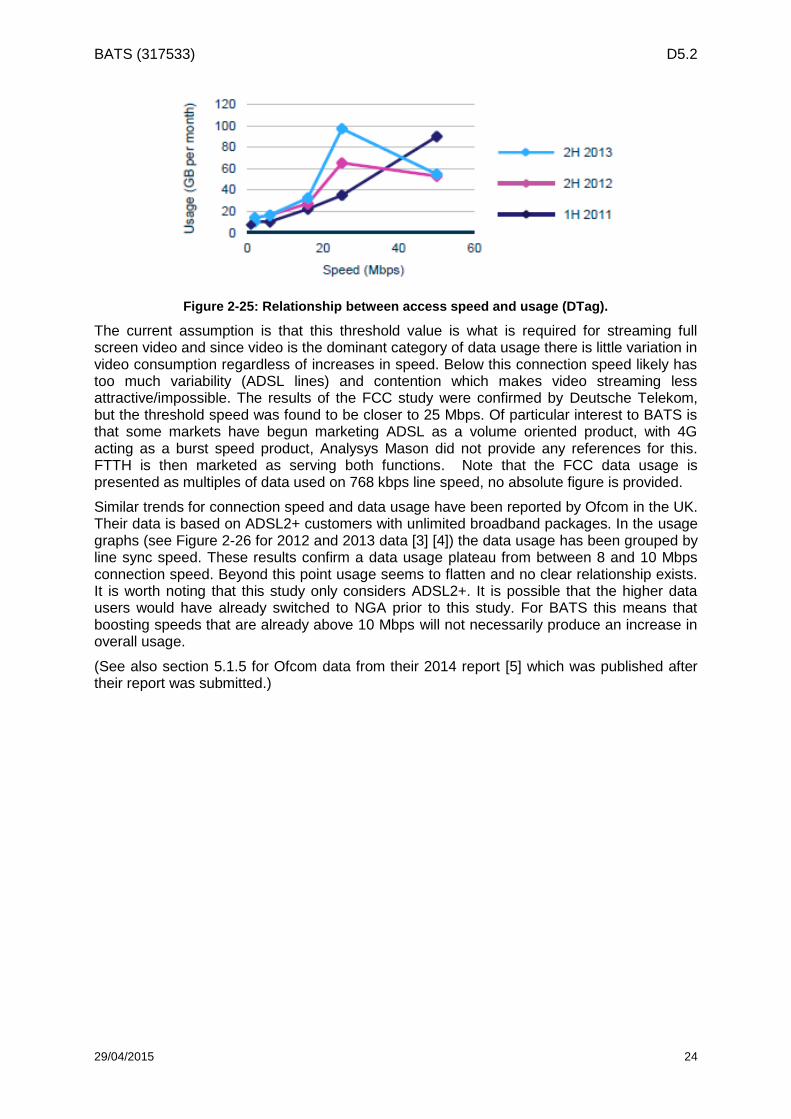
Figure 2-25: Relationship between access speed and usage (DTag).
The current assumption is that this threshold value is what is required for streaming full screen video and since video is the dominant category of data usage there is little variation in video consumption regardless of increases in speed. Below this connection speed likely has too much variability (ADSL lines) and contention which makes video streaming less attractive/impossible. The results of the FCC study were confirmed by Deutsche Telekom, but the threshold speed was found to be closer to 25 Mbps. Of particular interest to BATS is that some markets have begun marketing ADSL as a volume oriented product, with 4G acting as a burst speed product, Analysys Mason did not provide any references for this. FTTH is then marketed as serving both functions. Note that the FCC data usage is presented as multiples of data used on 768 kbps line speed, no absolute figure is provided.
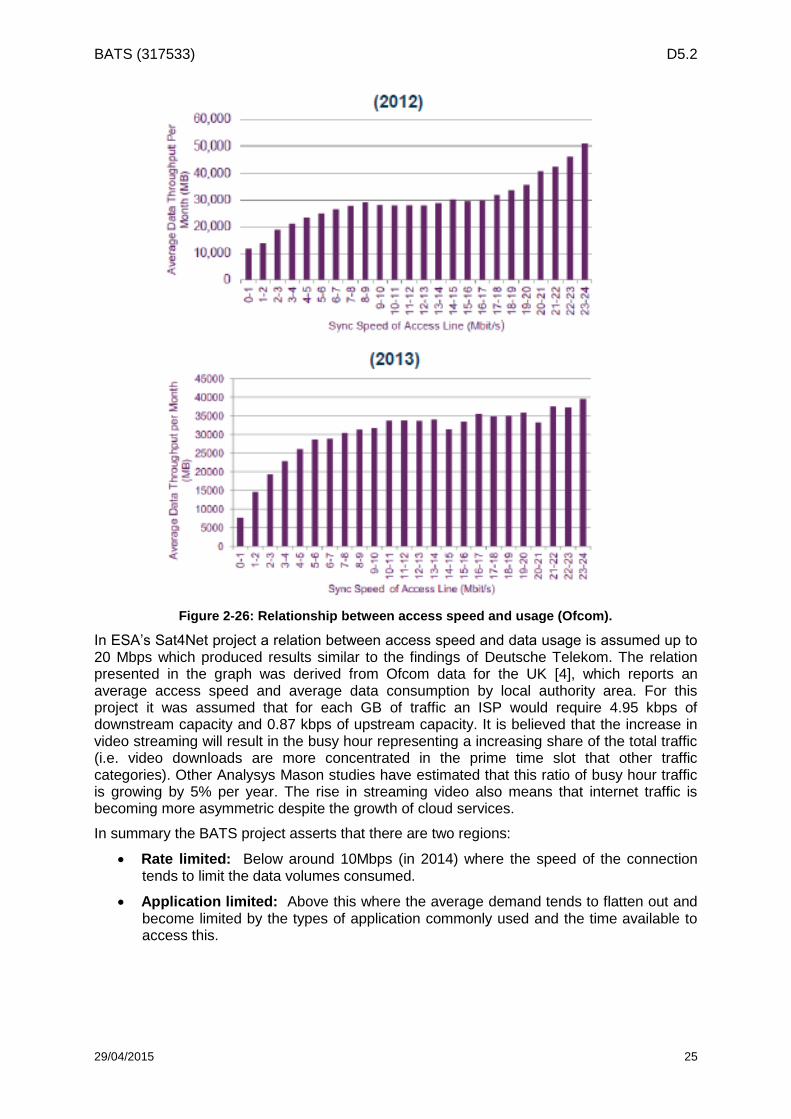
Similar trends for connection speed and data usage have been reported by Ofcom in the UK. Their data is based on ADSL2+ customers with unlimited broadband packages. In the usage graphs (see Figure 2-26 for 2012 and 2013 data [3] [4]) the data usage has been grouped by line sync speed. These results confirm a data usage plateau from between 8 and 10 Mbps connection speed. Beyond this point usage seems to flatten and no clear relationship exists. It is worth noting that this study only considers ADSL2+. It is possible that the higher data users would have already switched to NGA prior to this study. For BATS this means that boosting speeds that are already above 10 Mbps will not necessarily produce an increase in overall usage.
(See also section 5.1.5 for Ofcom data from their 2014 report [5] which was published after their report was submitted.)
BATS (317533) D5.2
29/04/2015 25
Figure 2-26: Relationship between access speed and usage (Ofcom).
In ESA’s Sat4Net project a relation between access speed and data usage is assumed up to 20 Mbps which produced results similar to the findings of Deutsche Telekom. The relation presented in the graph was derived from Ofcom data for the UK [4], which reports an average access speed and average data consumption by local authority area. For this project it was assumed that for each GB of traffic an ISP would require 4.95 kbps of downstream capacity and 0.87 kbps of upstream capacity. It is believed that the increase in video streaming will result in the busy hour representing a increasing share of the total traffic (i.e. video downloads are more concentrated in the prime time slot that other traffic categories). Other Analysys Mason studies have estimated that this ratio of busy hour traffic is growing by 5% per year. The rise in streaming video also means that internet traffic is becoming more asymmetric despite the growth of cloud services.
In summary the BATS project asserts that there are two regions:
Rate limited: Below around 10Mbps (in 2014) where the speed of the connection tends to limit the data volumes consumed.
Application limited: Above this where the average demand tends to flatten out and become limited by the types of application commonly used and the time available to access this.
BATS (317533) D5.2
29/04/2015 26
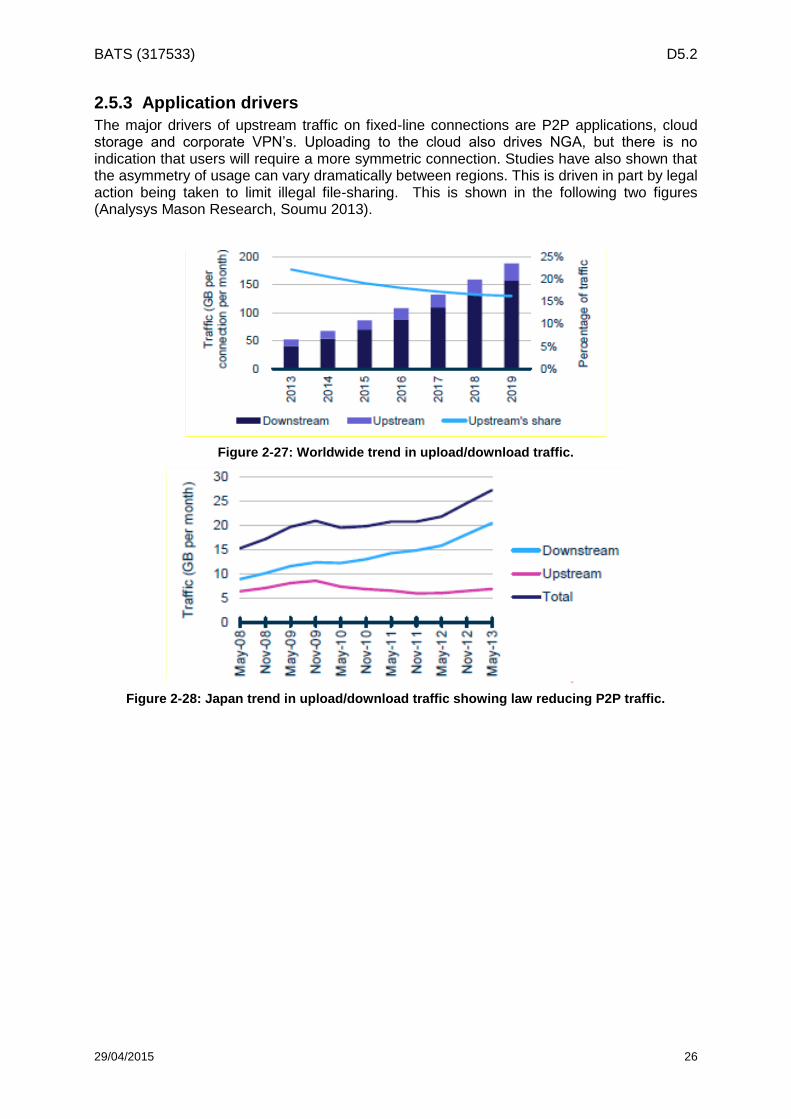
2.5.3 Application drivers
The major drivers of upstream traffic on fixed-line connections are P2P applications, cloud storage and corporate VPN’s. Uploading to the cloud also drives NGA, but there is no indication that users will require a more symmetric connection. Studies have also shown that the asymmetry of usage can vary dramatically between regions. This is driven in part by legal action being taken to limit illegal file-sharing. This is shown in the following two figures (Analysys Mason Research, Soumu 2013).
Figure 2-27: Worldwide trend in upload/download traffic.
Figure 2-28: Japan trend in upload/download traffic showing law reducing P2P traffic.
BATS (317533) D5.2
29/04/2015 27
3 LTE capability assessments
This chapter provides real data obtained from measurements carried out by Zafaco GmbH and analysed by FH-FK to show actual capability of LTE in Germany. These measurements are obtained from the end user side of the network. Fixed broadband access was used as a control measurement for the “crowd sourced” end user measurements.
In addition this chapter analyses the cost implication of using LTE to deliver NGA in 2020. This is to assess the realistic feasibility of using LTE to supplement other terrestrial access to extend the reach of NGA.
The availability of fixed LTE in 2020 depends on the investment by the operators.
3.1 Reasons for looking at fixed broadband access LTE capability BATS project aims to bridge the potentially widening Broadband divide between urban and rural areas in order to meet the objectives set forth in the EC Digital Agenda. This agenda targets “universal availability of Broadband speeds of at least 30 Mb/s throughout Europe, with 50% having speeds above 100 Mb/s” by 2020. In Germany, the NGA target is even stricter with 100% coverage at 50Mbit/s by 2018.
The quality of an Internet access service is determined by the end customer's direct connection to the provider's infrastructure (access). Access can be provided using various technologies such as xDSL, TV cable technologies, fibre optics technologies or a variety of wireless technologies including LTE. 95,317 data samples were collected across Germany with the objective to verify the quality of 'broadband' access from real end users across rural, suburban and urban regions based on 3 KPIs (Download rate, Upload rate and ping time).
3.2 Methodology The measurement campaigns lasted 5 months (July 2014 – November 2014). The quality of Internet access service was evaluated using an integrated measuring concept that consists of two components:
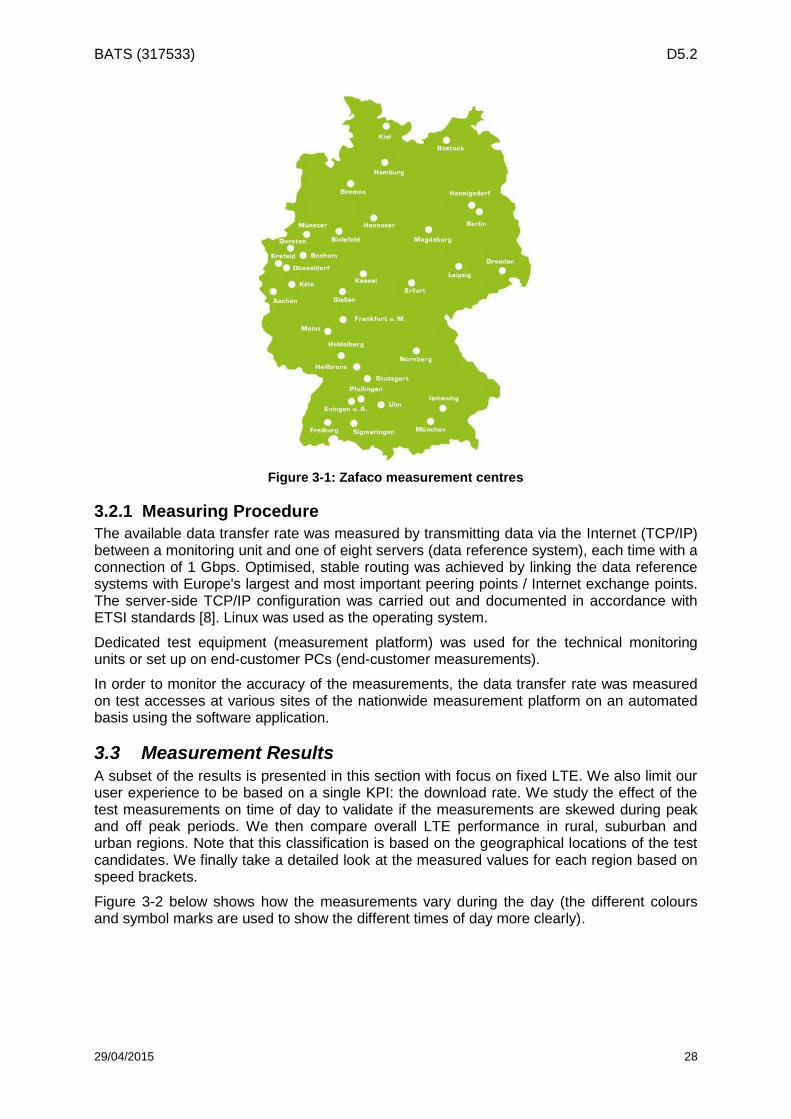
1. A measurement platform consisting of monitoring units at 34 locations (Figure 3-1) throughout the core Internet in Germany and several server systems which served as, among other things, counter test points for the data measurements) conducted measurements in a fully-controlled measuring environment;
2. The (upload and download) data transfer rate of fixed Internet access services was determined as part of the measurements conducted by end customers. For this, end customers measured the data transfer rate of their Internet connection using special web-based software. The fundamental accuracy of the values obtained using the software application was monitored on an on-going basis by randomly comparing the values generated by the two methods. The results are based on a total of 95,317 valid measurements. See section 7.4 of [9] for more information on the test measurement procedure.
3. Attribution to federal state and geographical area (urban, semiurban or rural) are based on the population density of the respective postal code area. The definition of geographical area is from Eurostat while population density if from the ‘List of Municipalities, territorial status’ by the Federal Statistics Office, Germany, January 2012.
BATS (317533) D5.2
29/04/2015 28
Figure 3-1: Zafaco measurement centres
3.2.1 Measuring Procedure
The available data transfer rate was measured by transmitting data via the Internet (TCP/IP) between a monitoring unit and one of eight servers (data reference system), each time with a connection of 1 Gbps. Optimised, stable routing was achieved by linking the data reference systems with Europe's largest and most important peering points / Internet exchange points. The server-side TCP/IP configuration was carried out and documented in accordance with ETSI standards [8]. Linux was used as the operating system.
Dedicated test equipment (measurement platform) was used for the technical monitoring units or set up on end-customer PCs (end-customer measurements).
In order to monitor the accuracy of the measurements, the data transfer rate was measured on test accesses at various sites of the nationwide measurement platform on an automated basis using the software application.
3.3 Measurement Results A subset of the results is presented in this section with focus on fixed LTE. We also limit our user experience to be based on a single KPI: the download rate. We study the effect of the test measurements on time of day to validate if the measurements are skewed during peak and off peak periods. We then compare overall LTE performance in rural, suburban and urban regions. Note that this classification is based on the geographical locations of the test candidates. We finally take a detailed look at the measured values for each region based on speed brackets.
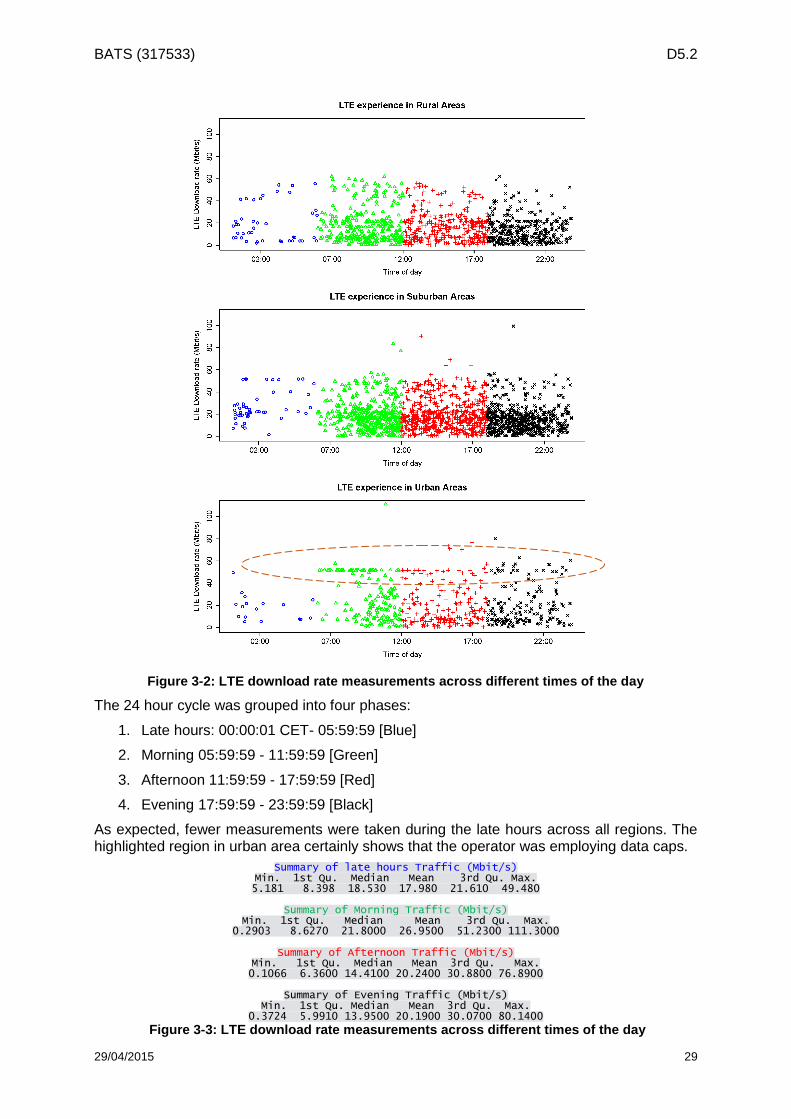
Figure 3-2 below shows how the measurements vary during the day (the different colours and symbol marks are used to show the different times of day more clearly).
BATS (317533) D5.2
29/04/2015 29
Figure 3-2: LTE download rate measurements across different times of the day
The 24 hour cycle was grouped into four phases:
1. Late hours: 00:00:01 CET- 05:59:59 [Blue]
2. Morning 05:59:59 - 11:59:59 [Green]
3. Afternoon 11:59:59 - 17:59:59 [Red]
4. Evening 17:59:59 - 23:59:59 [Black]
As expected, fewer measurements were taken during the late hours across all regions. The highlighted region in urban area certainly shows that the operator was employing data caps.
Summary of late hours Traffic (Mbit/s) Min. 1st Qu. Median Mean 3rd Qu. Max. 5.181 8.398 18.530 17.980 21.610 49.480
Summary of Morning Traffic (Mbit/s)
Min. 1st Qu. Median Mean 3rd Qu. Max. 0.2903 8.6270 21.8000 26.9500 51.2300 111.3000
Summary of Afternoon Traffic (Mbit/s)
Min. 1st Qu. Median Mean 3rd Qu. Max. 0.1066 6.3600 14.4100 20.2400 30.8800 76.8900
Summary of Evening Traffic (Mbit/s)
Min. 1st Qu. Median Mean 3rd Qu. Max. 0.3724 5.9910 13.9500 20.1900 30.0700 80.1400
Figure 3-3: LTE download rate measurements across different times of the day
BATS (317533) D5.2
29/04/2015 30
Based on the above summary, we can deduce that for urban areas, the majority of the test candidates had a better user experience in the late hours or in the morning. Note that the basis of our summary is the median values and not the mean due to the presence of outliers.
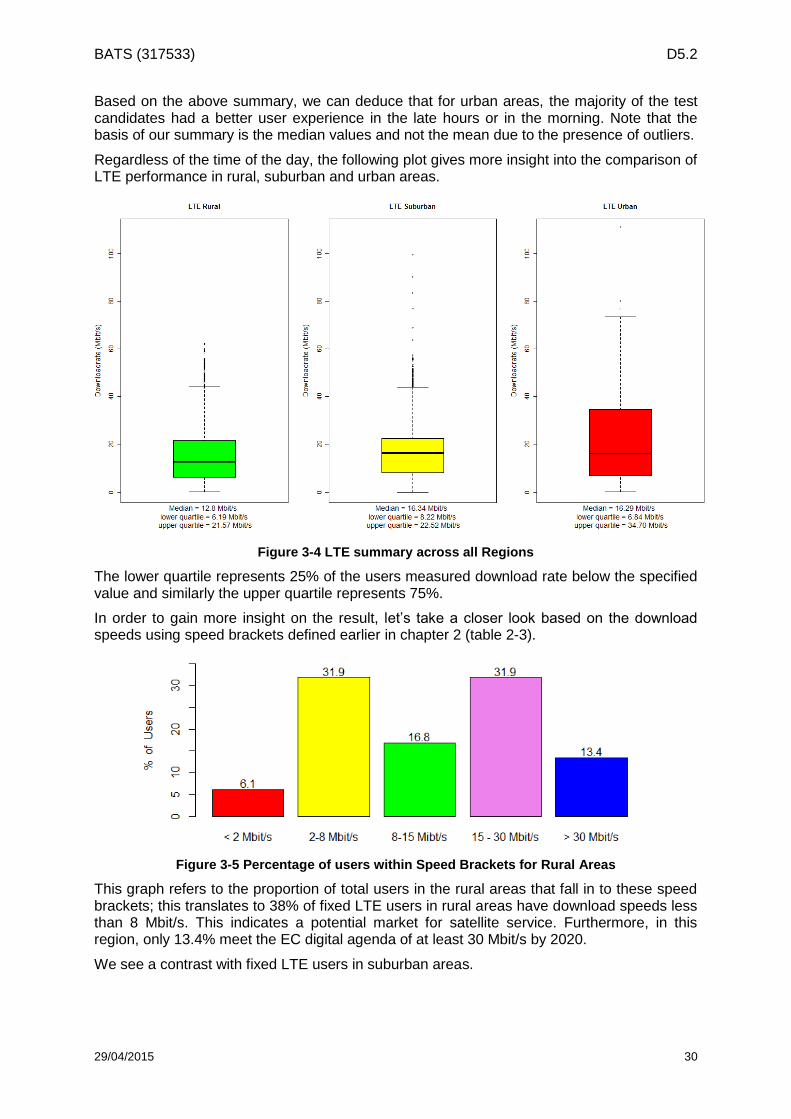
Regardless of the time of the day, the following plot gives more insight into the comparison of LTE performance in rural, suburban and urban areas.
Figure 3-4 LTE summary across all Regions
The lower quartile represents 25% of the users measured download rate below the specified value and similarly the upper quartile represents 75%.
In order to gain more insight on the result, let’s take a closer look based on the download speeds using speed brackets defined earlier in chapter 2 (table 2-3).
Figure 3-5 Percentage of users within Speed Brackets for Rural Areas
This graph refers to the proportion of total users in the rural areas that fall in to these speed brackets; this translates to 38% of fixed LTE users in rural areas have download speeds less than 8 Mbit/s. This indicates a potential market for satellite service. Furthermore, in this region, only 13.4% meet the EC digital agenda of at least 30 Mbit/s by 2020.
We see a contrast with fixed LTE users in suburban areas.
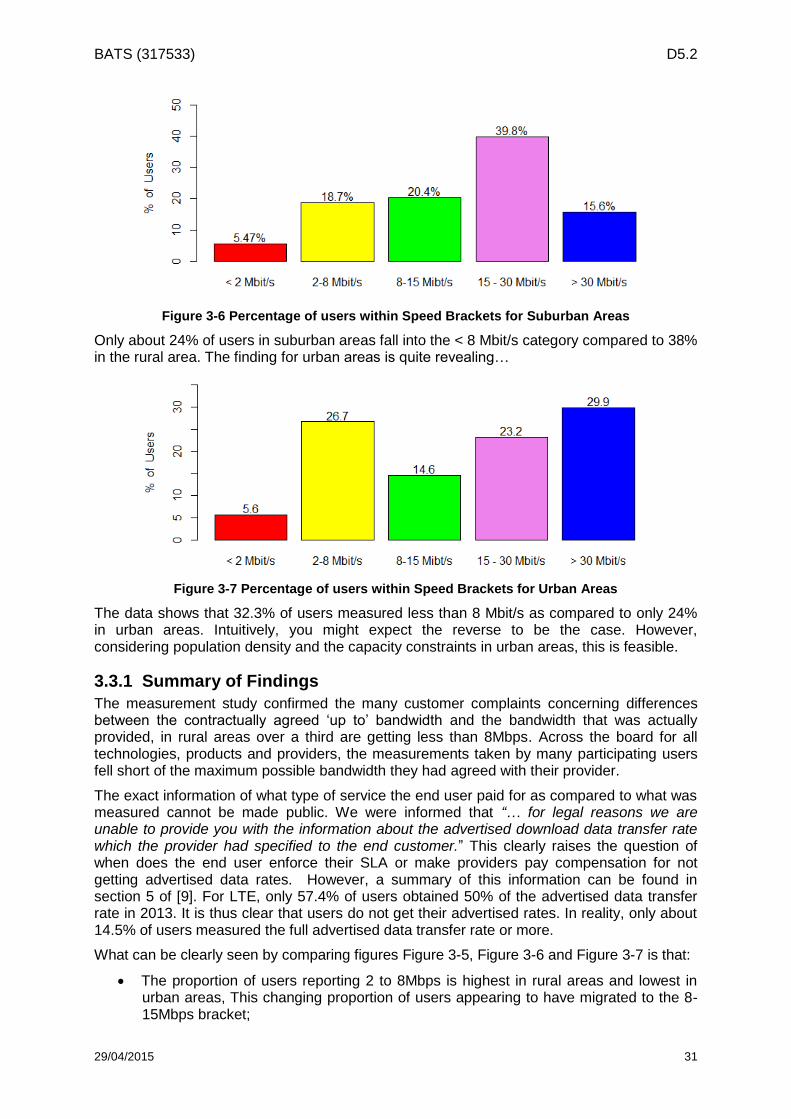
BATS (317533) D5.2
29/04/2015 31
Figure 3-6 Percentage of users within Speed Brackets for Suburban Areas
Only about 24% of users in suburban areas fall into the < 8 Mbit/s category compared to 38% in the rural area. The finding for urban areas is quite revealing…
Figure 3-7 Percentage of users within Speed Brackets for Urban Areas
The data shows that 32.3% of users measured less than 8 Mbit/s as compared to only 24% in urban areas. Intuitively, you might expect the reverse to be the case. However, considering population density and the capacity constraints in urban areas, this is feasible.
3.3.1 Summary of Findings
The measurement study confirmed the many customer complaints concerning differences between the contractually agreed ‘up to’ bandwidth and the bandwidth that was actually provided, in rural areas over a third are getting less than 8Mbps. Across the board for all technologies, products and providers, the measurements taken by many participating users fell short of the maximum possible bandwidth they had agreed with their provider.
The exact information of what type of service the end user paid for as compared to what was measured cannot be made public. We were informed that “… for legal reasons we are unable to provide you with the information about the advertised download data transfer rate which the provider had specified to the end customer.” This clearly raises the question of when does the end user enforce their SLA or make providers pay compensation for not getting advertised data rates. However, a summary of this information can be found in section 5 of [9]. For LTE, only 57.4% of users obtained 50% of the advertised data transfer rate in 2013. It is thus clear that users do not get their advertised rates. In reality, only about 14.5% of users measured the full advertised data transfer rate or more.
What can be clearly seen by comparing figures Figure 3-5, Figure 3-6 and Figure 3-7 is that:
The proportion of users reporting 2 to 8Mbps is highest in rural areas and lowest in urban areas, This changing proportion of users appearing to have migrated to the 8-15Mbps bracket;
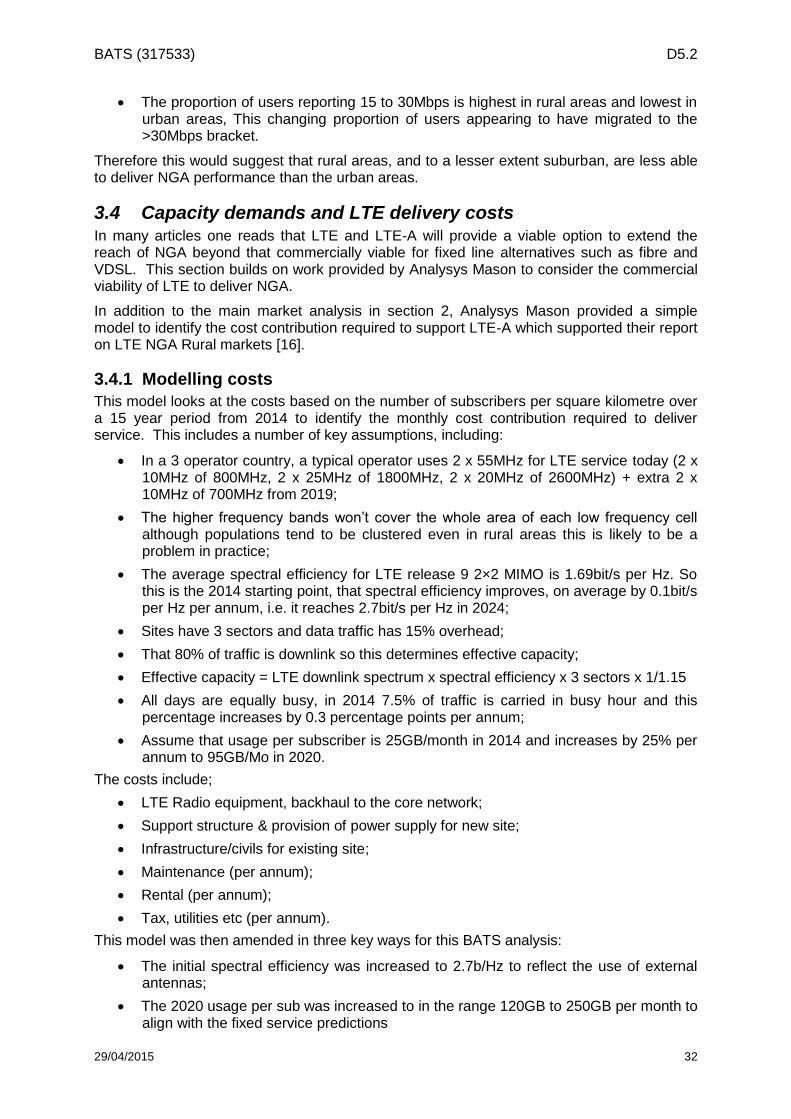
BATS (317533) D5.2
29/04/2015 32
The proportion of users reporting 15 to 30Mbps is highest in rural areas and lowest in urban areas, This changing proportion of users appearing to have migrated to the >30Mbps bracket.
Therefore this would suggest that rural areas, and to a lesser extent suburban, are less able to deliver NGA performance than the urban areas.
3.4 Capacity demands and LTE delivery costs In many articles one reads that LTE and LTE-A will provide a viable option to extend the reach of NGA beyond that commercially viable for fixed line alternatives such as fibre and VDSL. This section builds on work provided by Analysys Mason to consider the commercial viability of LTE to deliver NGA.
In addition to the main market analysis in section 2, Analysys Mason provided a simple model to identify the cost contribution required to support LTE-A which supported their report on LTE NGA Rural markets [16].
3.4.1 Modelling costs
This model looks at the costs based on the number of subscribers per square kilometre over a 15 year period from 2014 to identify the monthly cost contribution required to deliver service. This includes a number of key assumptions, including:
In a 3 operator country, a typical operator uses 2 x 55MHz for LTE service today (2 x 10MHz of 800MHz, 2 x 25MHz of 1800MHz, 2 x 20MHz of 2600MHz) + extra 2 x 10MHz of 700MHz from 2019;
The higher frequency bands won’t cover the whole area of each low frequency cell although populations tend to be clustered even in rural areas this is likely to be a problem in practice;
The average spectral efficiency for LTE release 9 2×2 MIMO is 1.69bit/s per Hz. So this is the 2014 starting point, that spectral efficiency improves, on average by 0.1bit/s per Hz per annum, i.e. it reaches 2.7bit/s per Hz in 2024;
Sites have 3 sectors and data traffic has 15% overhead;
That 80% of traffic is downlink so this determines effective capacity;
Effective capacity = LTE downlink spectrum x spectral efficiency x 3 sectors x 1/1.15
All days are equally busy, in 2014 7.5% of traffic is carried in busy hour and this percentage increases by 0.3 percentage points per annum;
Assume that usage per subscriber is 25GB/month in 2014 and increases by 25% per annum to 95GB/Mo in 2020.
The costs include;
LTE Radio equipment, backhaul to the core network;
Support structure & provision of power supply for new site;
Infrastructure/civils for existing site;
Maintenance (per annum);
Rental (per annum);
Tax, utilities etc (per annum).
This model was then amended in three key ways for this BATS analysis:
The initial spectral efficiency was increased to 2.7b/Hz to reflect the use of external antennas;
The 2020 usage per sub was increased to in the range 120GB to 250GB per month to align with the fixed service predictions
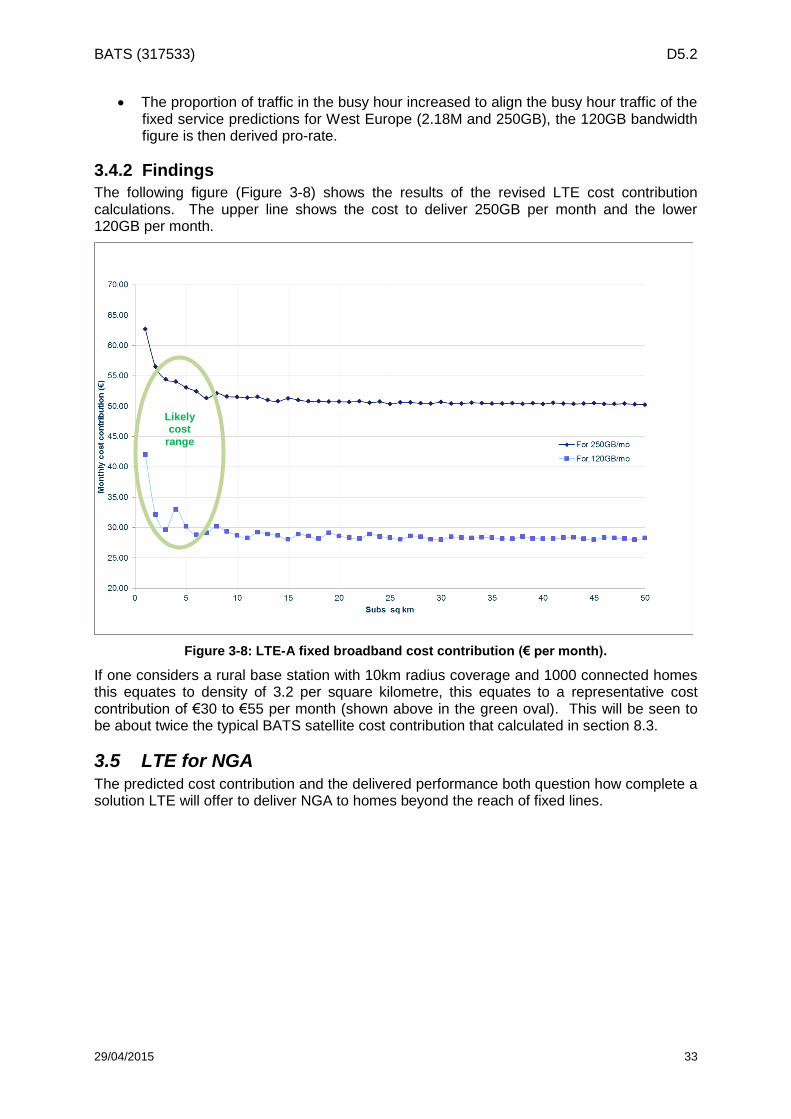
BATS (317533) D5.2
29/04/2015 33
The proportion of traffic in the busy hour increased to align the busy hour traffic of the fixed service predictions for West Europe (2.18M and 250GB), the 120GB bandwidth figure is then derived pro-rate.
3.4.2 Findings
The following figure (Figure 3-8) shows the results of the revised LTE cost contribution calculations. The upper line shows the cost to deliver 250GB per month and the lower 120GB per month.
Figure 3-8: LTE-A fixed broadband cost contribution (€ per month).
If one considers a rural base station with 10km radius coverage and 1000 connected homes this equates to density of 3.2 per square kilometre, this equates to a representative cost contribution of €30 to €55 per month (shown above in the green oval). This will be seen to be about twice the typical BATS satellite cost contribution that calculated in section 8.3.
3.5 LTE for NGA The predicted cost contribution and the delivered performance both question how complete a solution LTE will offer to deliver NGA to homes beyond the reach of fixed lines.
Likely cost
range

BATS (317533) D5.2
29/04/2015 34
Intentionally blank
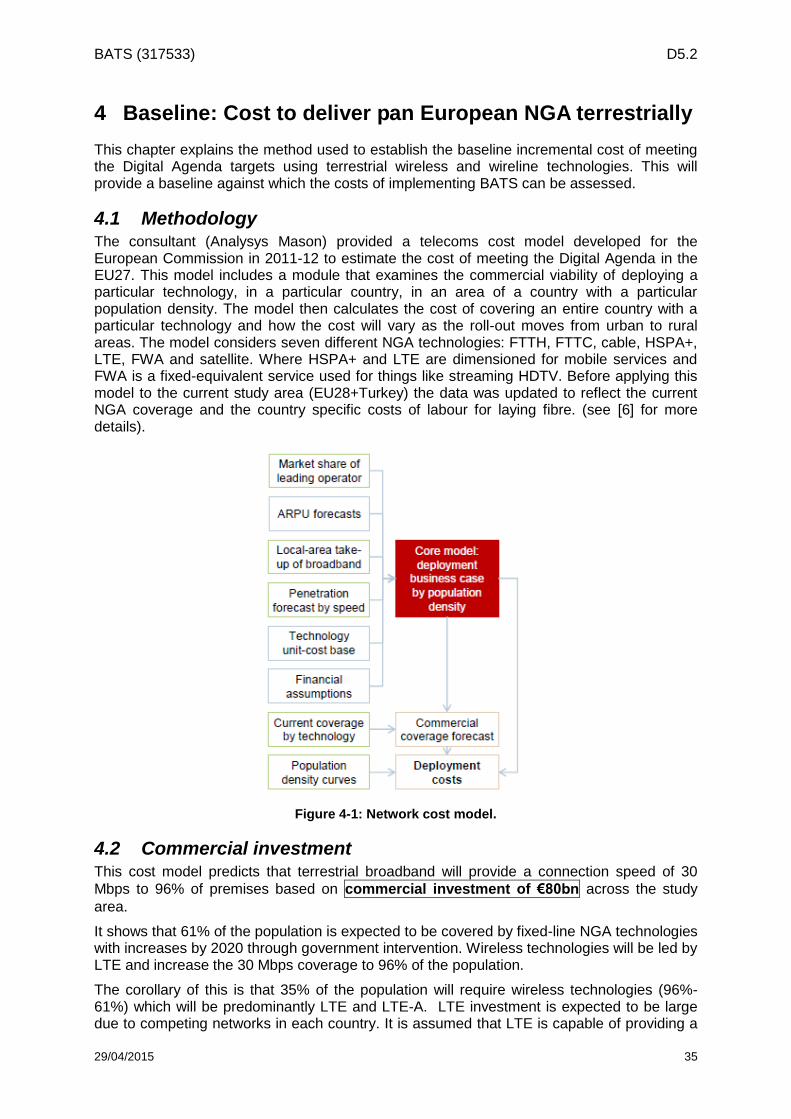
BATS (317533) D5.2
29/04/2015 35
4 Baseline: Cost to deliver pan European NGA terrestrially
This chapter explains the method used to establish the baseline incremental cost of meeting the Digital Agenda targets using terrestrial wireless and wireline technologies. This will provide a baseline against which the costs of implementing BATS can be assessed.
4.1 Methodology The consultant (Analysys Mason) provided a telecoms cost model developed for the European Commission in 2011-12 to estimate the cost of meeting the Digital Agenda in the EU27. This model includes a module that examines the commercial viability of deploying a particular technology, in a particular country, in an area of a country with a particular population density. The model then calculates the cost of covering an entire country with a particular technology and how the cost will vary as the roll-out moves from urban to rural areas. The model considers seven different NGA technologies: FTTH, FTTC, cable, HSPA+, LTE, FWA and satellite. Where HSPA+ and LTE are dimensioned for mobile services and FWA is a fixed-equivalent service used for things like streaming HDTV. Before applying this model to the current study area (EU28+Turkey) the data was updated to reflect the current NGA coverage and the country specific costs of labour for laying fibre. (see [6] for more details).
Figure 4-1: Network cost model.
4.2 Commercial investment This cost model predicts that terrestrial broadband will provide a connection speed of 30
Mbps to 96% of premises based on commercial investment of €80bn across the study
area.
It shows that 61% of the population is expected to be covered by fixed-line NGA technologies with increases by 2020 through government intervention. Wireless technologies will be led by LTE and increase the 30 Mbps coverage to 96% of the population.
The corollary of this is that 35% of the population will require wireless technologies (96%-61%) which will be predominantly LTE and LTE-A. LTE investment is expected to be large due to competing networks in each country. It is assumed that LTE is capable of providing a
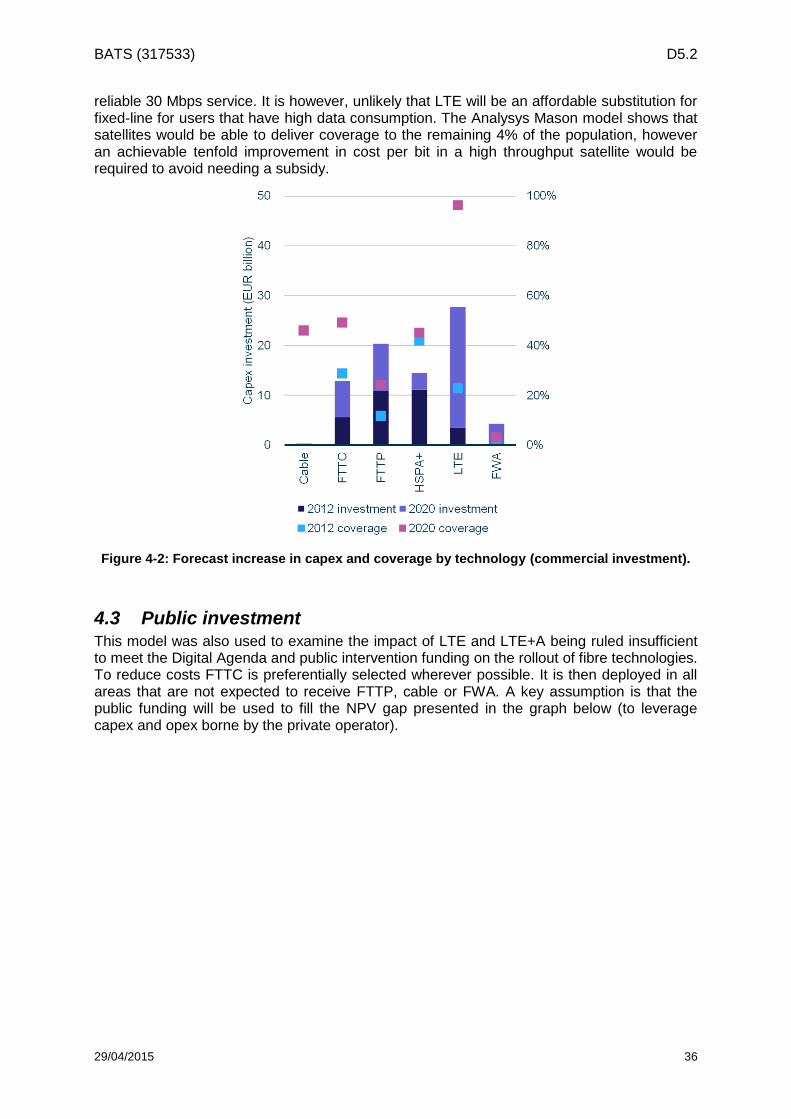
BATS (317533) D5.2
29/04/2015 36
reliable 30 Mbps service. It is however, unlikely that LTE will be an affordable substitution for fixed-line for users that have high data consumption. The Analysys Mason model shows that satellites would be able to deliver coverage to the remaining 4% of the population, however an achievable tenfold improvement in cost per bit in a high throughput satellite would be required to avoid needing a subsidy.
Figure 4-2: Forecast increase in capex and coverage by technology (commercial investment).
4.3 Public investment This model was also used to examine the impact of LTE and LTE+A being ruled insufficient to meet the Digital Agenda and public intervention funding on the rollout of fibre technologies. To reduce costs FTTC is preferentially selected wherever possible. It is then deployed in all areas that are not expected to receive FTTP, cable or FWA. A key assumption is that the public funding will be used to fill the NPV gap presented in the graph below (to leverage capex and opex borne by the private operator).
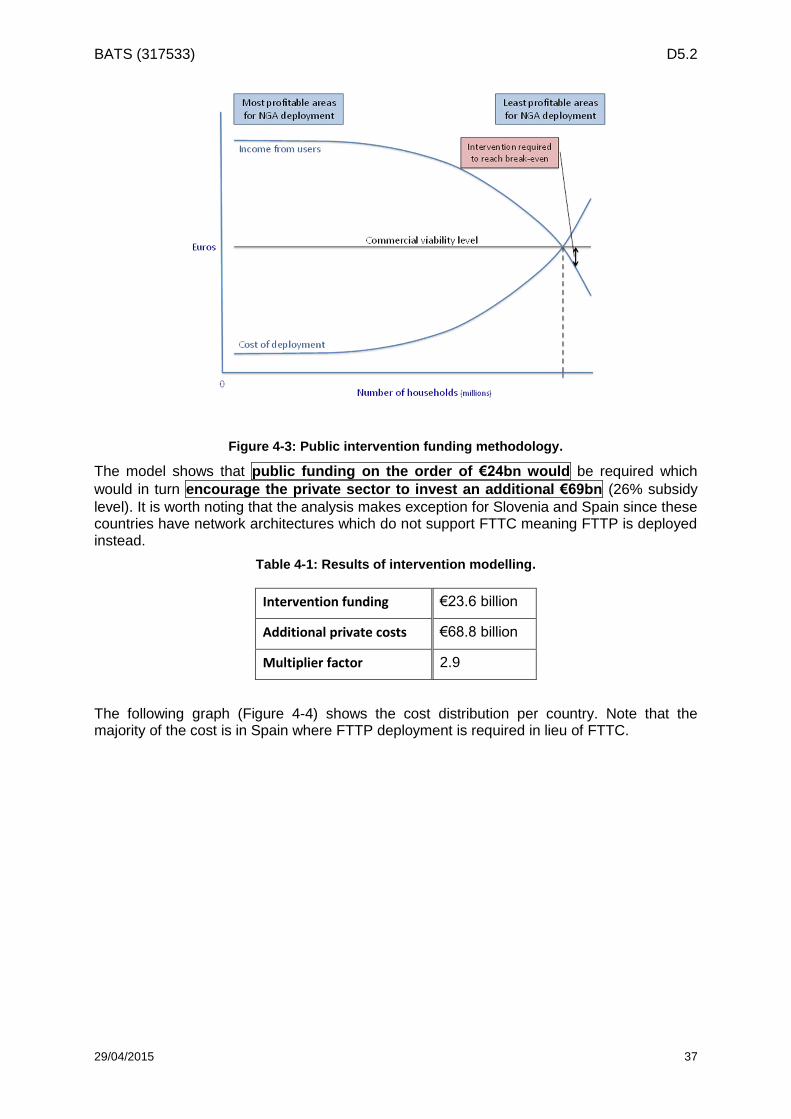
BATS (317533) D5.2
29/04/2015 37
Figure 4-3: Public intervention funding methodology.
The model shows that public funding on the order of €24bn would be required which
would in turn encourage the private sector to invest an additional €69bn (26% subsidy
level). It is worth noting that the analysis makes exception for Slovenia and Spain since these countries have network architectures which do not support FTTC meaning FTTP is deployed instead.
Table 4-1: Results of intervention modelling.
Intervention funding €23.6 billion
Additional private costs €68.8 billion
Multiplier factor 2.9
The following graph (Figure 4-4) shows the cost distribution per country. Note that the majority of the cost is in Spain where FTTP deployment is required in lieu of FTTC.
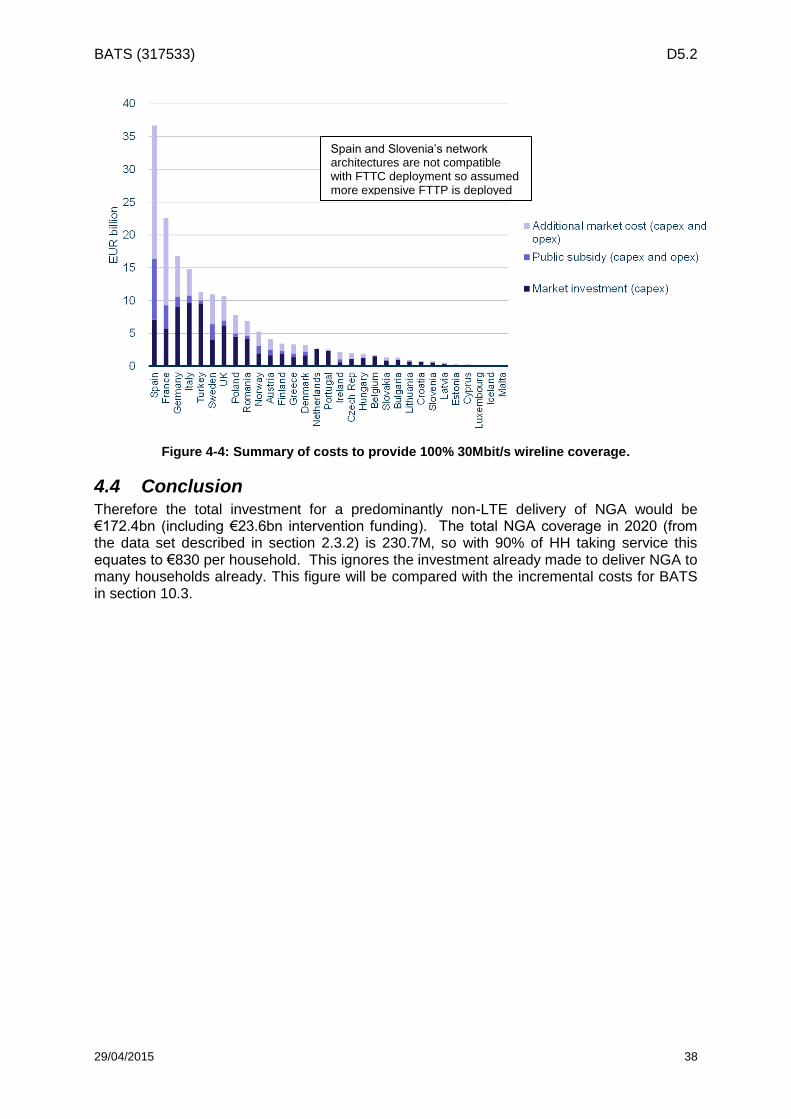
BATS (317533) D5.2
29/04/2015 38
Figure 4-4: Summary of costs to provide 100% 30Mbit/s wireline coverage.
4.4 Conclusion Therefore the total investment for a predominantly non-LTE delivery of NGA would be €172.4bn (including €23.6bn intervention funding). The total NGA coverage in 2020 (from the data set described in section 2.3.2) is 230.7M, so with 90% of HH taking service this equates to €830 per household. This ignores the investment already made to deliver NGA to many households already. This figure will be compared with the incremental costs for BATS in section 10.3.
Spain and Slovenia’s network architectures are not compatible with FTTC deployment so assumed more expensive FTTP is deployed
BATS (317533) D5.2
29/04/2015 39
5 Traffic and data analysis
This chapter considers the traffic predictions and the BATS satellite capacity available. This data forms key inputs to the cost modelling presented later in this document. Three key parameters are needed:
1. Current data consumption;
2. Growth in consumption to 2020 and beyond;
3. The proportion of the data that will be routed via satellite and via the terrestrial links.
5.1 Available research on data volumes and rates In order to determine how many household can be supported by the BATS satellites and the data demands of the terrestrial connectivity one must determine the proportion of the traffic that is carried over each path. As the capability of the terrestrial link varies and this means its ability to support different applications varies, this assessment needs to be carried out for each different speed bracket.
5.1.1 Analysys Mason BATS Consultancy Study
As detailed in section 2, Analysys Mason conducted a detailed study of the state of broadband coverage within Europe for BATS, including the creation of forecast models to predict the future demand in terms of coverage and data consumption. Of particular interest for this work is their prediction of average data volume and average peak throughput per broadband connection. (See Figure 2-22 and Figure 2-23):
The average busy hour data rate1 for 2020 will be around 2Mbps (varying across the targeted countries, Figure 2-23);
The average busy hour data rate will grow with a CAGR of 30% + 5% depending on country or region between 2012 and 2020;
The monthly data consumption will be around 250GB in 2020 (Figure 2-22);
The ratio between these will grow from around 5.4kbps per GB/Mo in 2012 to around 7.8kbps per GB/Mo in 2020. They state this is due to the increase of video consumption making the demand more peaky (presumably reflecting people watching TV more in the evening than at other times of the day).
These findings are used as the baseline for the model (see particularly section 6.1).
5.1.2 BSG Domestic Demand for Bandwidth 2013-2023 (UK)
The Broadband Stakeholder Group conducted a study of internet usage in the United Kingdom to develop a predictive model of its growth into the year 2023 to help guide the development of infrastructure to ensure that the ever increasing demands of internet traffic can be met [7]. Unlike other studies, which focus on population size and penetration, this research focused on application use to determine the required bandwidth per household per month during peak periods of activity.
1 The average busy hour data rate is a measure of the amount of data a house will download during
the peak hours and can be used to dimension the constraining links in a contended network.
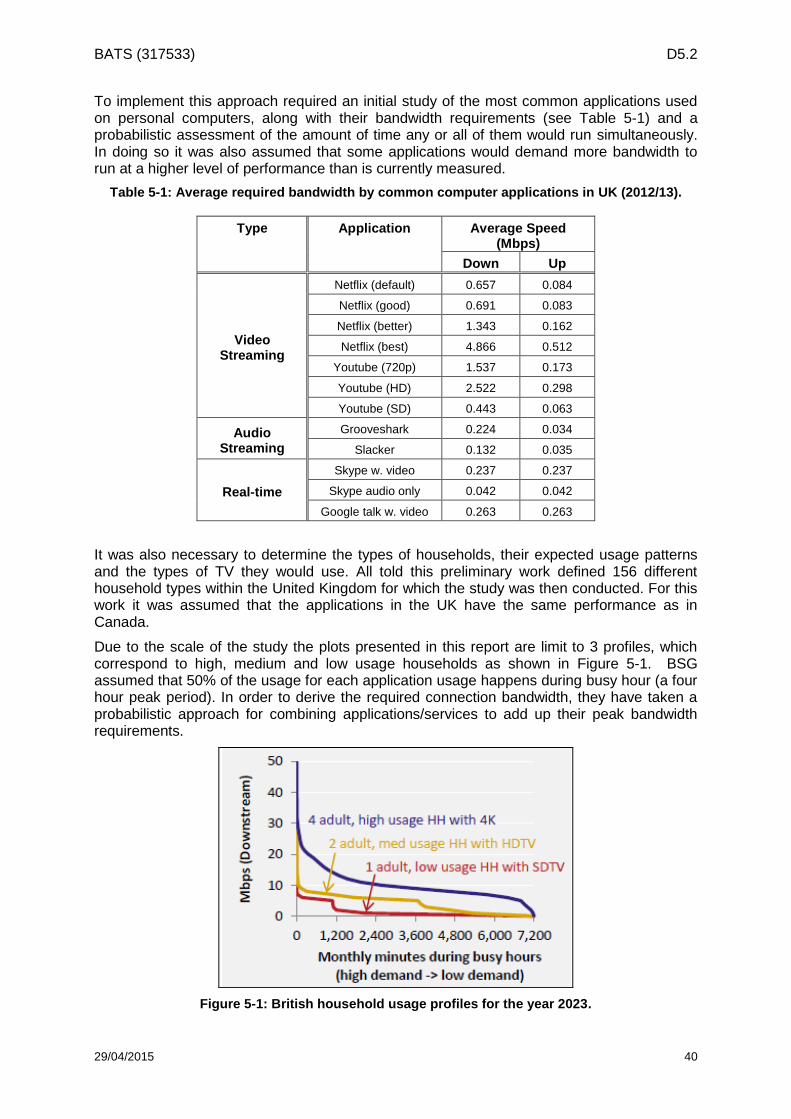
BATS (317533) D5.2
29/04/2015 40
To implement this approach required an initial study of the most common applications used on personal computers, along with their bandwidth requirements (see Table 5-1) and a probabilistic assessment of the amount of time any or all of them would run simultaneously. In doing so it was also assumed that some applications would demand more bandwidth to run at a higher level of performance than is currently measured.
Table 5-1: Average required bandwidth by common computer applications in UK (2012/13).
Type Application Average Speed (Mbps)
Down Up
Video Streaming
Netflix (default) 0.657 0.084
Netflix (good) 0.691 0.083
Netflix (better) 1.343 0.162
Netflix (best) 4.866 0.512
Youtube (720p) 1.537 0.173
Youtube (HD) 2.522 0.298
Youtube (SD) 0.443 0.063
Audio Streaming
Grooveshark 0.224 0.034
Slacker 0.132 0.035
Real-time
Skype w. video 0.237 0.237
Skype audio only 0.042 0.042
Google talk w. video 0.263 0.263
It was also necessary to determine the types of households, their expected usage patterns and the types of TV they would use. All told this preliminary work defined 156 different household types within the United Kingdom for which the study was then conducted. For this work it was assumed that the applications in the UK have the same performance as in Canada.
Due to the scale of the study the plots presented in this report are limit to 3 profiles, which correspond to high, medium and low usage households as shown in Figure 5-1. BSG assumed that 50% of the usage for each application usage happens during busy hour (a four hour peak period). In order to derive the required connection bandwidth, they have taken a probabilistic approach for combining applications/services to add up their peak bandwidth requirements.
Figure 5-1: British household usage profiles for the year 2023.
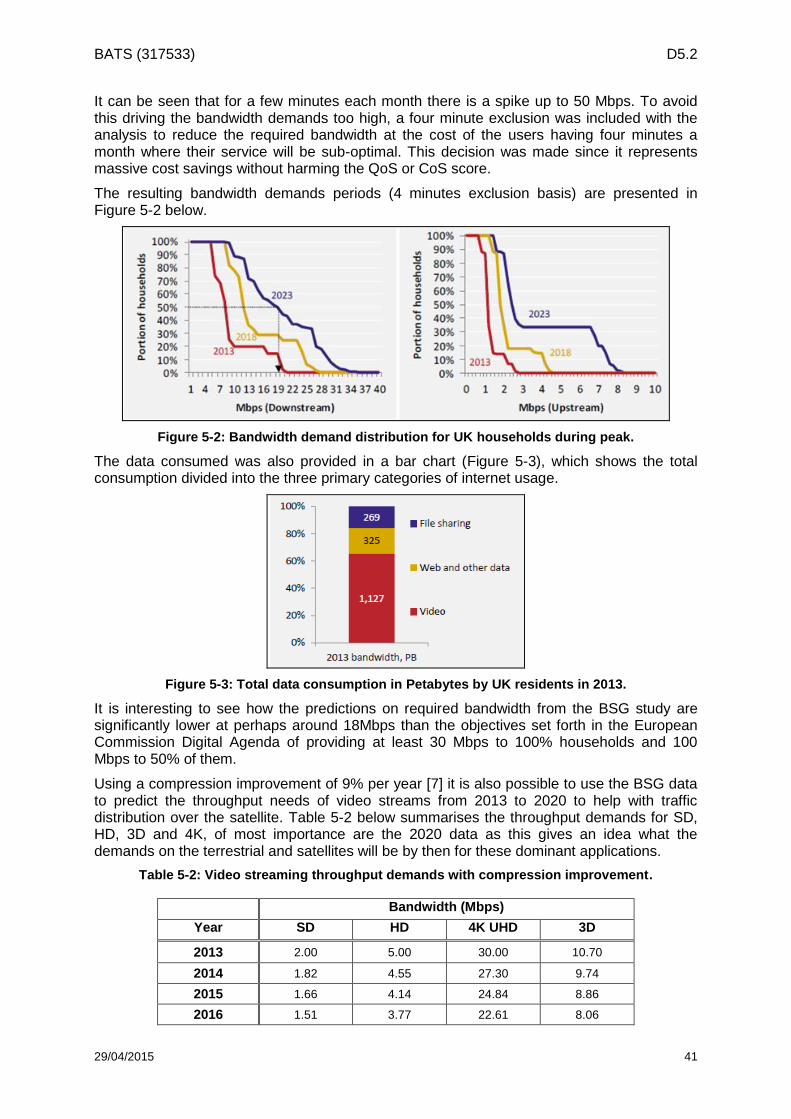
BATS (317533) D5.2
29/04/2015 41
It can be seen that for a few minutes each month there is a spike up to 50 Mbps. To avoid this driving the bandwidth demands too high, a four minute exclusion was included with the analysis to reduce the required bandwidth at the cost of the users having four minutes a month where their service will be sub-optimal. This decision was made since it represents massive cost savings without harming the QoS or CoS score.
The resulting bandwidth demands periods (4 minutes exclusion basis) are presented in Figure 5-2 below.
Figure 5-2: Bandwidth demand distribution for UK households during peak.
The data consumed was also provided in a bar chart (Figure 5-3), which shows the total consumption divided into the three primary categories of internet usage.
Figure 5-3: Total data consumption in Petabytes by UK residents in 2013.
It is interesting to see how the predictions on required bandwidth from the BSG study are significantly lower at perhaps around 18Mbps than the objectives set forth in the European Commission Digital Agenda of providing at least 30 Mbps to 100% households and 100 Mbps to 50% of them.
Using a compression improvement of 9% per year [7] it is also possible to use the BSG data to predict the throughput needs of video streams from 2013 to 2020 to help with traffic distribution over the satellite. Table 5-2 below summarises the throughput demands for SD, HD, 3D and 4K, of most importance are the 2020 data as this gives an idea what the demands on the terrestrial and satellites will be by then for these dominant applications.
Table 5-2: Video streaming throughput demands with compression improvement.
Bandwidth (Mbps)
Year SD HD 4K UHD 3D
2013 2.00 5.00 30.00 10.70
2014 1.82 4.55 27.30 9.74
2015 1.66 4.14 24.84 8.86
2016 1.51 3.77 22.61 8.06
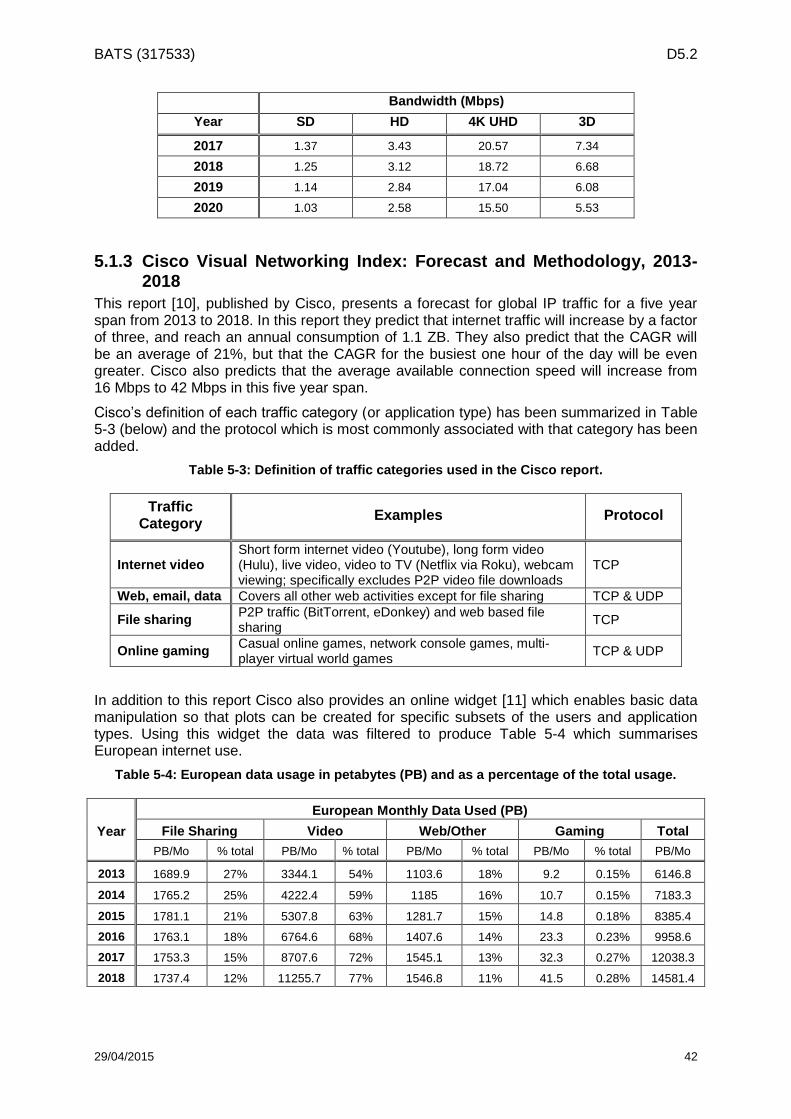
BATS (317533) D5.2
29/04/2015 42
Bandwidth (Mbps)
Year SD HD 4K UHD 3D
2017 1.37 3.43 20.57 7.34
2018 1.25 3.12 18.72 6.68
2019 1.14 2.84 17.04 6.08
2020 1.03 2.58 15.50 5.53
5.1.3 Cisco Visual Networking Index: Forecast and Methodology, 2013-2018
This report [10], published by Cisco, presents a forecast for global IP traffic for a five year span from 2013 to 2018. In this report they predict that internet traffic will increase by a factor of three, and reach an annual consumption of 1.1 ZB. They also predict that the CAGR will be an average of 21%, but that the CAGR for the busiest one hour of the day will be even greater. Cisco also predicts that the average available connection speed will increase from 16 Mbps to 42 Mbps in this five year span.
Cisco’s definition of each traffic category (or application type) has been summarized in Table 5-3 (below) and the protocol which is most commonly associated with that category has been added.
Table 5-3: Definition of traffic categories used in the Cisco report.
Traffic Category
Examples Protocol
Internet video Short form internet video (Youtube), long form video (Hulu), live video, video to TV (Netflix via Roku), webcam viewing; specifically excludes P2P video file downloads
TCP
Web, email, data Covers all other web activities except for file sharing TCP & UDP
File sharing P2P traffic (BitTorrent, eDonkey) and web based file sharing
TCP
Online gaming Casual online games, network console games, multi-player virtual world games
TCP & UDP
In addition to this report Cisco also provides an online widget [11] which enables basic data manipulation so that plots can be created for specific subsets of the users and application types. Using this widget the data was filtered to produce Table 5-4 which summarises European internet use.
Table 5-4: European data usage in petabytes (PB) and as a percentage of the total usage.
Year
European Monthly Data Used (PB)
File Sharing Video Web/Other Gaming Total
PB/Mo % total PB/Mo % total PB/Mo % total PB/Mo % total PB/Mo
2013 1689.9 27% 3344.1 54% 1103.6 18% 9.2 0.15% 6146.8
2014 1765.2 25% 4222.4 59% 1185 16% 10.7 0.15% 7183.3
2015 1781.1 21% 5307.8 63% 1281.7 15% 14.8 0.18% 8385.4
2016 1763.1 18% 6764.6 68% 1407.6 14% 23.3 0.23% 9958.6
2017 1753.3 15% 8707.6 72% 1545.1 13% 32.3 0.27% 12038.3
2018 1737.4 12% 11255.7 77% 1546.8 11% 41.5 0.28% 14581.4
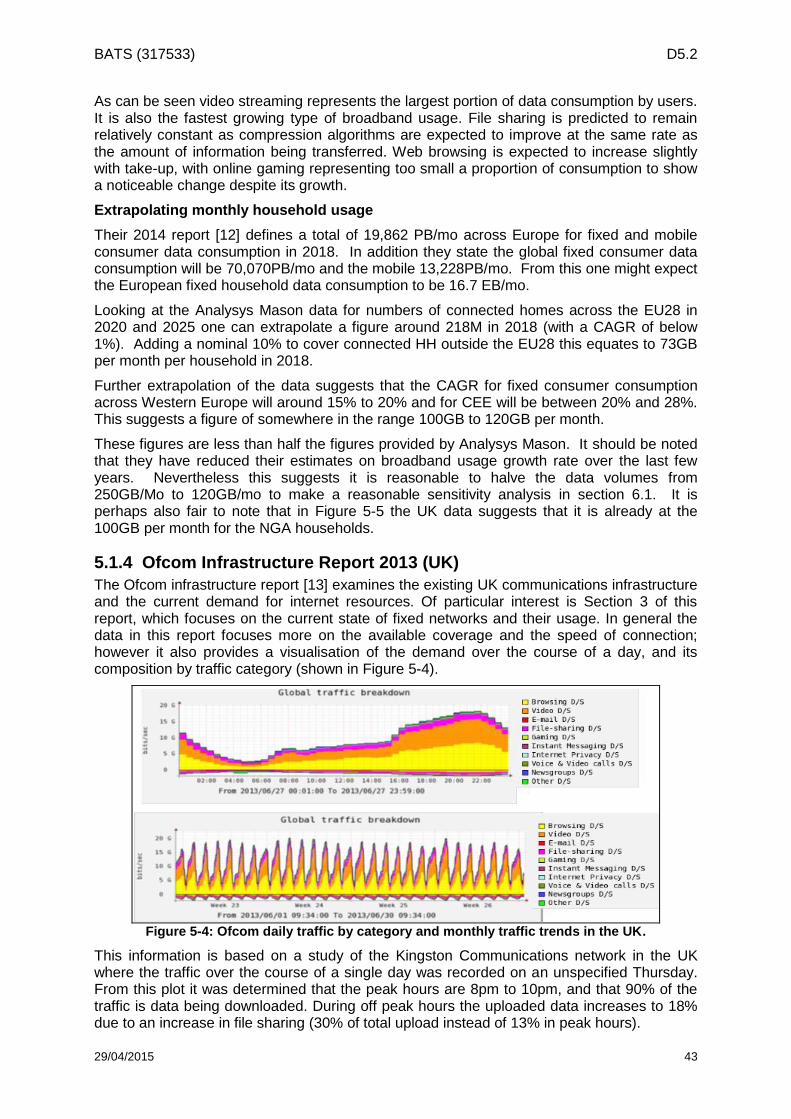
BATS (317533) D5.2
29/04/2015 43
As can be seen video streaming represents the largest portion of data consumption by users. It is also the fastest growing type of broadband usage. File sharing is predicted to remain relatively constant as compression algorithms are expected to improve at the same rate as the amount of information being transferred. Web browsing is expected to increase slightly with take-up, with online gaming representing too small a proportion of consumption to show a noticeable change despite its growth.
Extrapolating monthly household usage
Their 2014 report [12] defines a total of 19,862 PB/mo across Europe for fixed and mobile consumer data consumption in 2018. In addition they state the global fixed consumer data consumption will be 70,070PB/mo and the mobile 13,228PB/mo. From this one might expect the European fixed household data consumption to be 16.7 EB/mo.
Looking at the Analysys Mason data for numbers of connected homes across the EU28 in 2020 and 2025 one can extrapolate a figure around 218M in 2018 (with a CAGR of below 1%). Adding a nominal 10% to cover connected HH outside the EU28 this equates to 73GB per month per household in 2018.
Further extrapolation of the data suggests that the CAGR for fixed consumer consumption across Western Europe will around 15% to 20% and for CEE will be between 20% and 28%. This suggests a figure of somewhere in the range 100GB to 120GB per month.
These figures are less than half the figures provided by Analysys Mason. It should be noted that they have reduced their estimates on broadband usage growth rate over the last few years. Nevertheless this suggests it is reasonable to halve the data volumes from 250GB/Mo to 120GB/mo to make a reasonable sensitivity analysis in section 6.1. It is perhaps also fair to note that in Figure 5-5 the UK data suggests that it is already at the 100GB per month for the NGA households.
5.1.4 Ofcom Infrastructure Report 2013 (UK)
The Ofcom infrastructure report [13] examines the existing UK communications infrastructure and the current demand for internet resources. Of particular interest is Section 3 of this report, which focuses on the current state of fixed networks and their usage. In general the data in this report focuses more on the available coverage and the speed of connection; however it also provides a visualisation of the demand over the course of a day, and its composition by traffic category (shown in Figure 5-4).
Figure 5-4: Ofcom daily traffic by category and monthly traffic trends in the UK.
This information is based on a study of the Kingston Communications network in the UK where the traffic over the course of a single day was recorded on an unspecified Thursday. From this plot it was determined that the peak hours are 8pm to 10pm, and that 90% of the traffic is data being downloaded. During off peak hours the uploaded data increases to 18% due to an increase in file sharing (30% of total upload instead of 13% in peak hours).
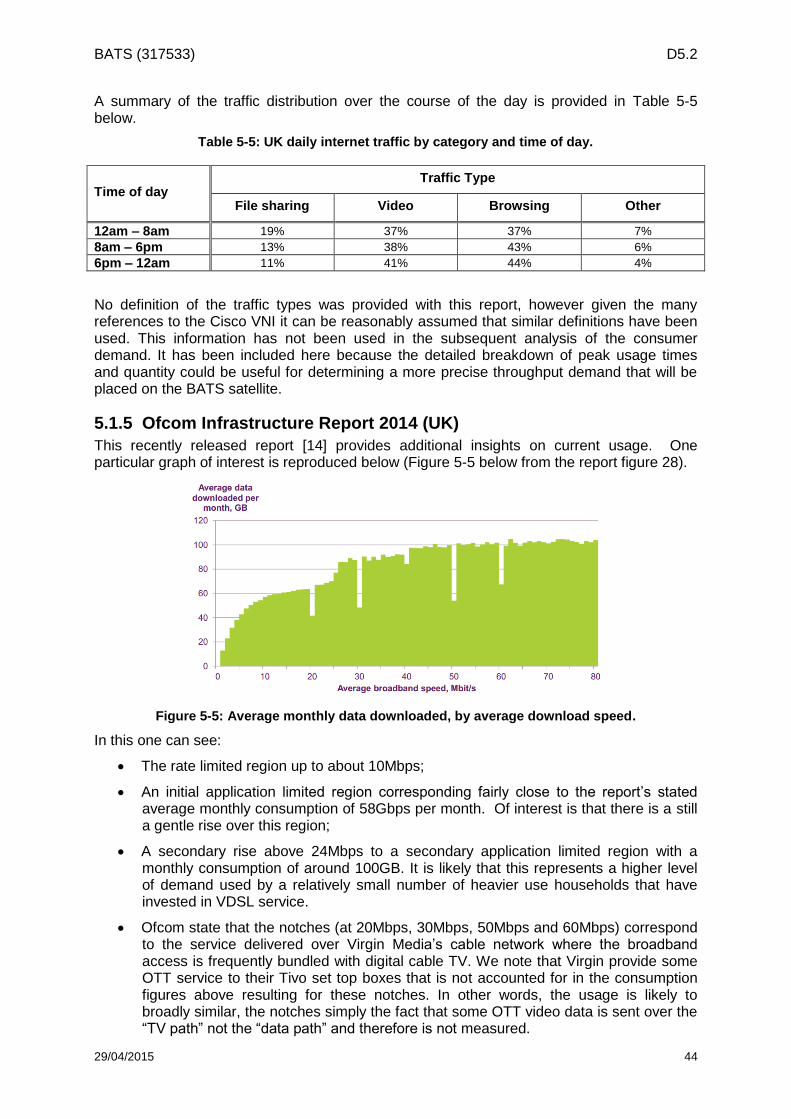
BATS (317533) D5.2
29/04/2015 44
A summary of the traffic distribution over the course of the day is provided in Table 5-5 below.
Table 5-5: UK daily internet traffic by category and time of day.
Time of day Traffic Type
File sharing Video Browsing Other
12am – 8am 19% 37% 37% 7%
8am – 6pm 13% 38% 43% 6%
6pm – 12am 11% 41% 44% 4%
No definition of the traffic types was provided with this report, however given the many references to the Cisco VNI it can be reasonably assumed that similar definitions have been used. This information has not been used in the subsequent analysis of the consumer demand. It has been included here because the detailed breakdown of peak usage times and quantity could be useful for determining a more precise throughput demand that will be placed on the BATS satellite.
5.1.5 Ofcom Infrastructure Report 2014 (UK)
This recently released report [14] provides additional insights on current usage. One particular graph of interest is reproduced below (Figure 5-5 below from the report figure 28).
Figure 5-5: Average monthly data downloaded, by average download speed.
In this one can see:
The rate limited region up to about 10Mbps;
An initial application limited region corresponding fairly close to the report’s stated average monthly consumption of 58Gbps per month. Of interest is that there is a still a gentle rise over this region;
A secondary rise above 24Mbps to a secondary application limited region with a monthly consumption of around 100GB. It is likely that this represents a higher level of demand used by a relatively small number of heavier use households that have invested in VDSL service.
Ofcom state that the notches (at 20Mbps, 30Mbps, 50Mbps and 60Mbps) correspond to the service delivered over Virgin Media’s cable network where the broadband access is frequently bundled with digital cable TV. We note that Virgin provide some OTT service to their Tivo set top boxes that is not accounted for in the consumption figures above resulting for these notches. In other words, the usage is likely to broadly similar, the notches simply the fact that some OTT video data is sent over the “TV path” not the “data path” and therefore is not measured.
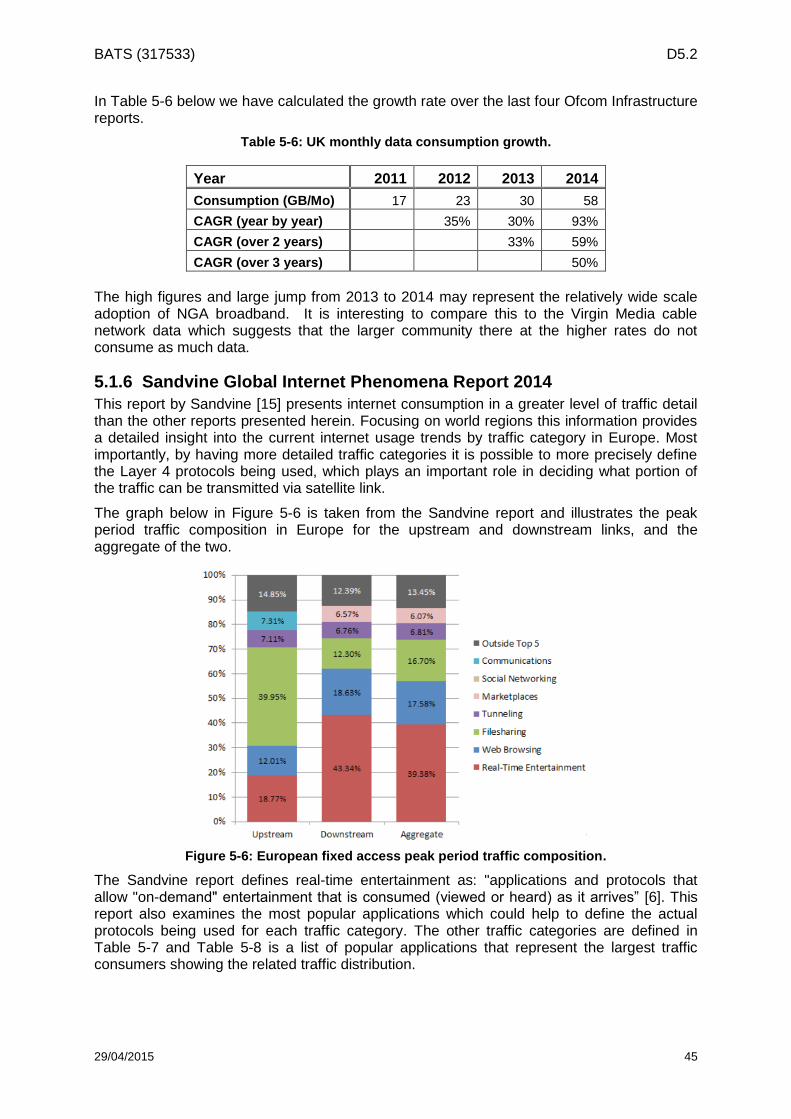
BATS (317533) D5.2
29/04/2015 45
In Table 5-6 below we have calculated the growth rate over the last four Ofcom Infrastructure reports.
Table 5-6: UK monthly data consumption growth.
Year 2011 2012 2013 2014
Consumption (GB/Mo) 17 23 30 58
CAGR (year by year) 35% 30% 93%
CAGR (over 2 years) 33% 59%
CAGR (over 3 years) 50%
The high figures and large jump from 2013 to 2014 may represent the relatively wide scale adoption of NGA broadband. It is interesting to compare this to the Virgin Media cable network data which suggests that the larger community there at the higher rates do not consume as much data.
5.1.6 Sandvine Global Internet Phenomena Report 2014
This report by Sandvine [15] presents internet consumption in a greater level of traffic detail than the other reports presented herein. Focusing on world regions this information provides a detailed insight into the current internet usage trends by traffic category in Europe. Most importantly, by having more detailed traffic categories it is possible to more precisely define the Layer 4 protocols being used, which plays an important role in deciding what portion of the traffic can be transmitted via satellite link.
The graph below in Figure 5-6 is taken from the Sandvine report and illustrates the peak period traffic composition in Europe for the upstream and downstream links, and the aggregate of the two.
Figure 5-6: European fixed access peak period traffic composition.
The Sandvine report defines real-time entertainment as: "applications and protocols that allow "on-demand" entertainment that is consumed (viewed or heard) as it arrives” [6]. This report also examines the most popular applications which could help to define the actual protocols being used for each traffic category. The other traffic categories are defined in Table 5-7 and Table 5-8 is a list of popular applications that represent the largest traffic consumers showing the related traffic distribution.
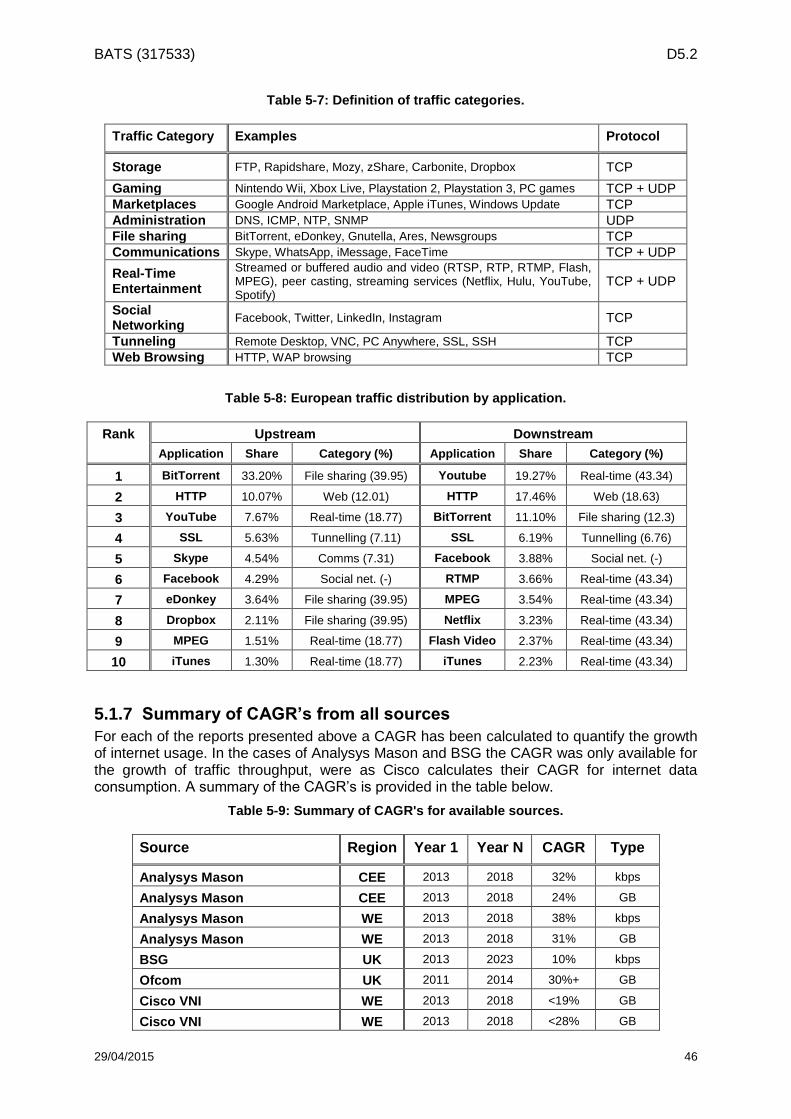
BATS (317533) D5.2
29/04/2015 46
Table 5-7: Definition of traffic categories.
Traffic Category Examples Protocol
Storage FTP, Rapidshare, Mozy, zShare, Carbonite, Dropbox TCP
Gaming Nintendo Wii, Xbox Live, Playstation 2, Playstation 3, PC games TCP + UDP
Marketplaces Google Android Marketplace, Apple iTunes, Windows Update TCP
Administration DNS, ICMP, NTP, SNMP UDP
File sharing BitTorrent, eDonkey, Gnutella, Ares, Newsgroups TCP
Communications Skype, WhatsApp, iMessage, FaceTime TCP + UDP
Real-Time Entertainment
Streamed or buffered audio and video (RTSP, RTP, RTMP, Flash, MPEG), peer casting, streaming services (Netflix, Hulu, YouTube, Spotify)
TCP + UDP
Social Networking
Facebook, Twitter, LinkedIn, Instagram TCP
Tunneling Remote Desktop, VNC, PC Anywhere, SSL, SSH TCP
Web Browsing HTTP, WAP browsing TCP
Table 5-8: European traffic distribution by application.
Rank Upstream Downstream
Application Share Category (%) Application Share Category (%)
1 BitTorrent 33.20% File sharing (39.95) Youtube 19.27% Real-time (43.34)
2 HTTP 10.07% Web (12.01) HTTP 17.46% Web (18.63)
3 YouTube 7.67% Real-time (18.77) BitTorrent 11.10% File sharing (12.3)
4 SSL 5.63% Tunnelling (7.11) SSL 6.19% Tunnelling (6.76)
5 Skype 4.54% Comms (7.31) Facebook 3.88% Social net. (-)
6 Facebook 4.29% Social net. (-) RTMP 3.66% Real-time (43.34)
7 eDonkey 3.64% File sharing (39.95) MPEG 3.54% Real-time (43.34)
8 Dropbox 2.11% File sharing (39.95) Netflix 3.23% Real-time (43.34)
9 MPEG 1.51% Real-time (18.77) Flash Video 2.37% Real-time (43.34)
10 iTunes 1.30% Real-time (18.77) iTunes 2.23% Real-time (43.34)
5.1.7 Summary of CAGR’s from all sources
For each of the reports presented above a CAGR has been calculated to quantify the growth of internet usage. In the cases of Analysys Mason and BSG the CAGR was only available for the growth of traffic throughput, were as Cisco calculates their CAGR for internet data consumption. A summary of the CAGR’s is provided in the table below.
Table 5-9: Summary of CAGR's for available sources.
Source Region Year 1 Year N CAGR Type
Analysys Mason CEE 2013 2018 32% kbps
Analysys Mason CEE 2013 2018 24% GB
Analysys Mason WE 2013 2018 38% kbps
Analysys Mason WE 2013 2018 31% GB
BSG UK 2013 2023 10% kbps
Ofcom UK 2011 2014 30%+ GB
Cisco VNI WE 2013 2018 <19% GB
Cisco VNI WE 2013 2018 <28% GB
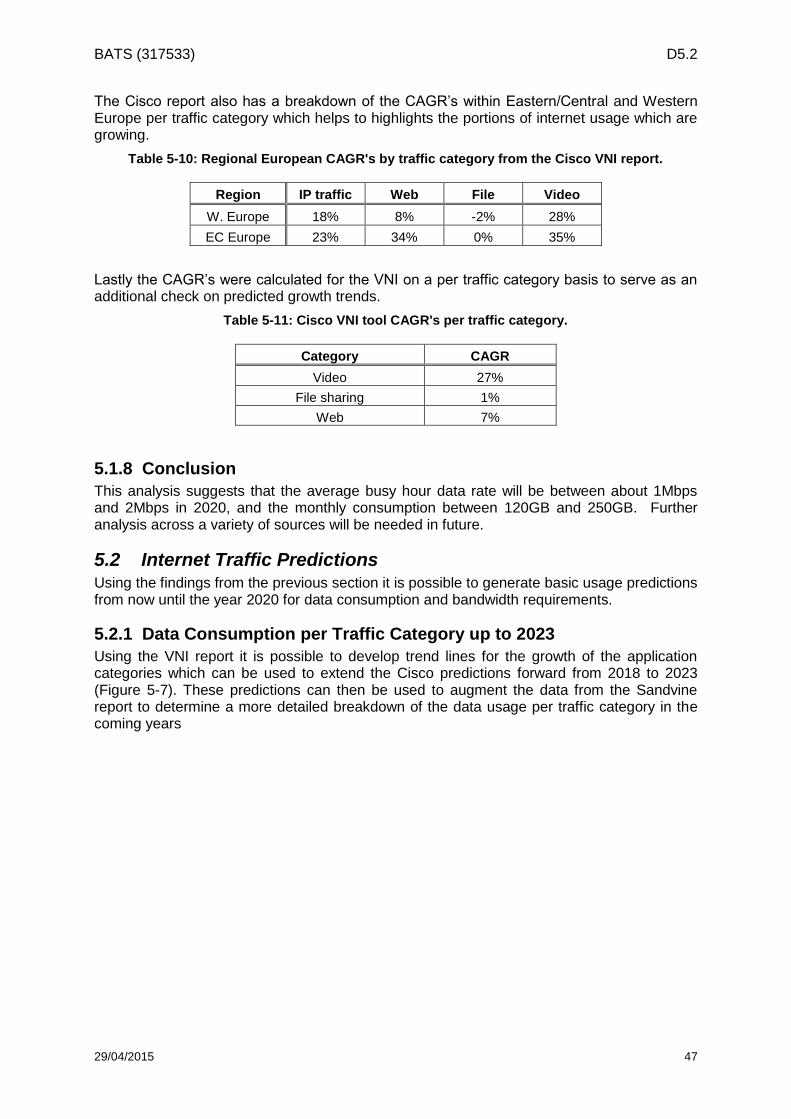
BATS (317533) D5.2
29/04/2015 47
The Cisco report also has a breakdown of the CAGR’s within Eastern/Central and Western Europe per traffic category which helps to highlights the portions of internet usage which are growing.
Table 5-10: Regional European CAGR's by traffic category from the Cisco VNI report.
Region IP traffic Web File Video
W. Europe 18% 8% -2% 28%
EC Europe 23% 34% 0% 35%
Lastly the CAGR’s were calculated for the VNI on a per traffic category basis to serve as an additional check on predicted growth trends.
Table 5-11: Cisco VNI tool CAGR's per traffic category.
Category CAGR
Video 27%
File sharing 1%
Web 7%
5.1.8 Conclusion
This analysis suggests that the average busy hour data rate will be between about 1Mbps and 2Mbps in 2020, and the monthly consumption between 120GB and 250GB. Further analysis across a variety of sources will be needed in future.
5.2 Internet Traffic Predictions Using the findings from the previous section it is possible to generate basic usage predictions from now until the year 2020 for data consumption and bandwidth requirements.
5.2.1 Data Consumption per Traffic Category up to 2023
Using the VNI report it is possible to develop trend lines for the growth of the application categories which can be used to extend the Cisco predictions forward from 2018 to 2023 (Figure 5-7). These predictions can then be used to augment the data from the Sandvine report to determine a more detailed breakdown of the data usage per traffic category in the coming years
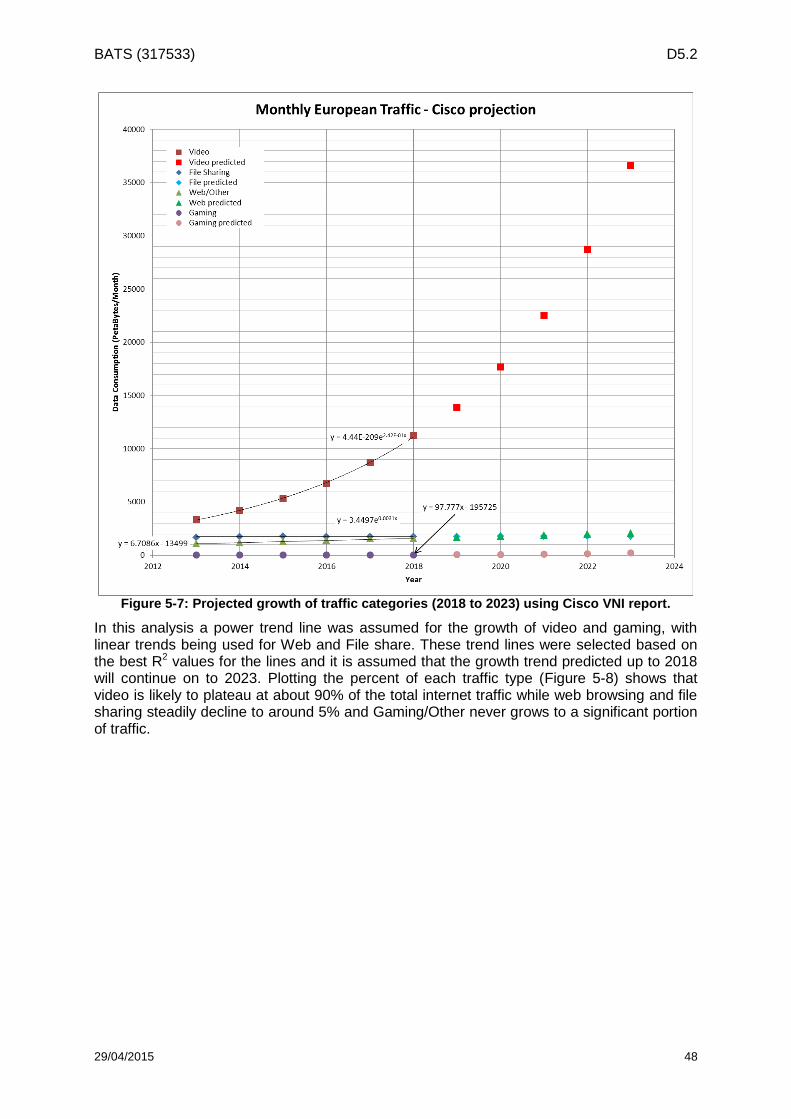
BATS (317533) D5.2
29/04/2015 48
Figure 5-7: Projected growth of traffic categories (2018 to 2023) using Cisco VNI report.
In this analysis a power trend line was assumed for the growth of video and gaming, with linear trends being used for Web and File share. These trend lines were selected based on the best R2 values for the lines and it is assumed that the growth trend predicted up to 2018 will continue on to 2023. Plotting the percent of each traffic type (Figure 5-8) shows that video is likely to plateau at about 90% of the total internet traffic while web browsing and file sharing steadily decline to around 5% and Gaming/Other never grows to a significant portion of traffic.
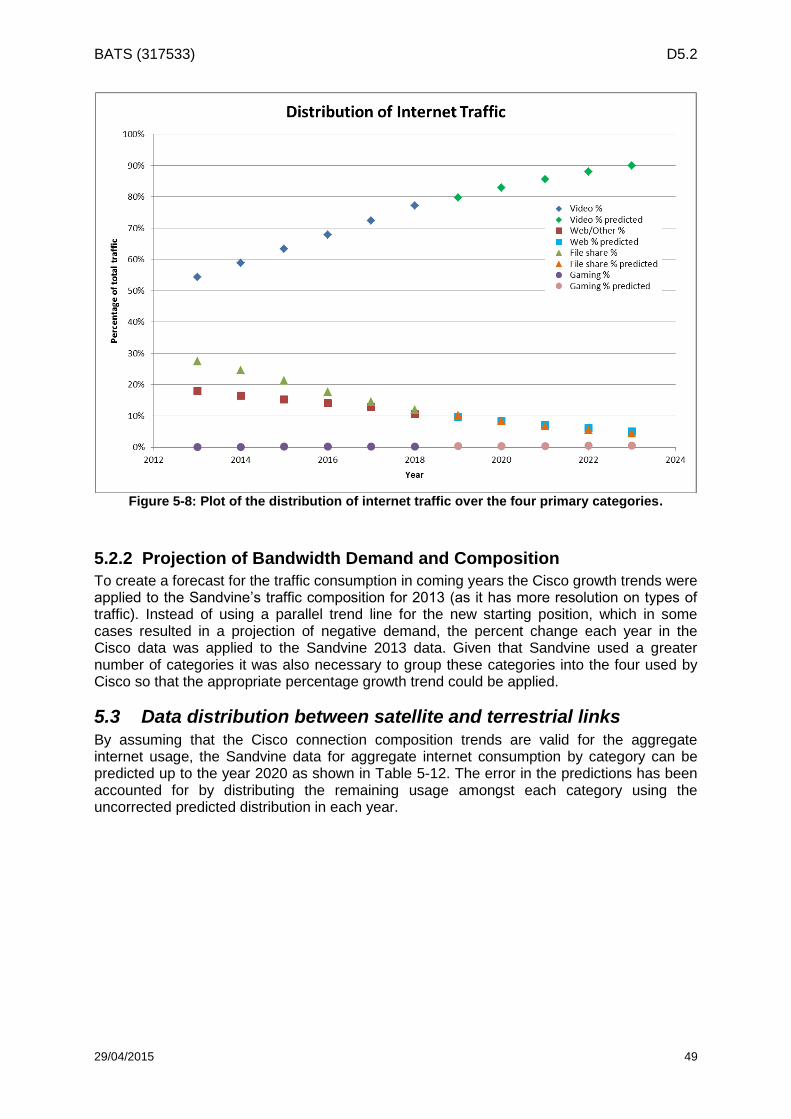
BATS (317533) D5.2
29/04/2015 49
Figure 5-8: Plot of the distribution of internet traffic over the four primary categories.
5.2.2 Projection of Bandwidth Demand and Composition
To create a forecast for the traffic consumption in coming years the Cisco growth trends were applied to the Sandvine’s traffic composition for 2013 (as it has more resolution on types of traffic). Instead of using a parallel trend line for the new starting position, which in some cases resulted in a projection of negative demand, the percent change each year in the Cisco data was applied to the Sandvine 2013 data. Given that Sandvine used a greater number of categories it was also necessary to group these categories into the four used by Cisco so that the appropriate percentage growth trend could be applied.
5.3 Data distribution between satellite and terrestrial links By assuming that the Cisco connection composition trends are valid for the aggregate internet usage, the Sandvine data for aggregate internet consumption by category can be predicted up to the year 2020 as shown in Table 5-12. The error in the predictions has been accounted for by distributing the remaining usage amongst each category using the uncorrected predicted distribution in each year.
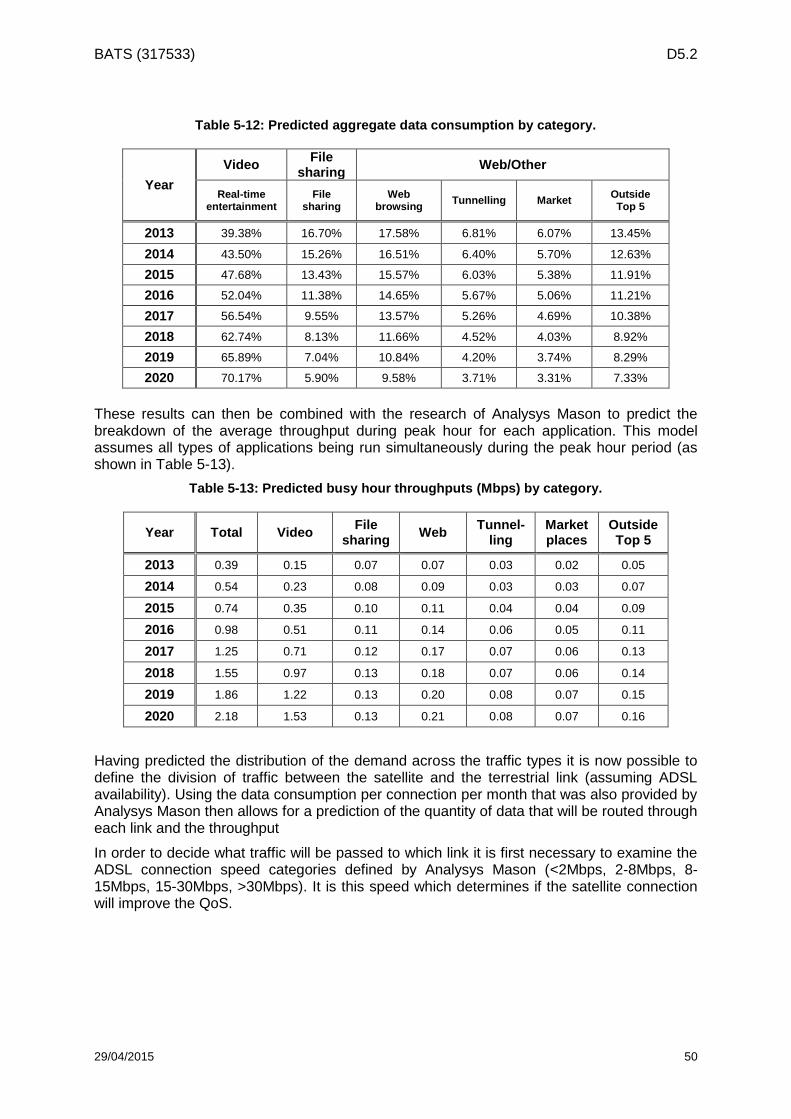
BATS (317533) D5.2
29/04/2015 50
Table 5-12: Predicted aggregate data consumption by category.
Year
Video File
sharing Web/Other
Real-time entertainment
File sharing
Web browsing
Tunnelling Market Outside Top 5
2013 39.38% 16.70% 17.58% 6.81% 6.07% 13.45%
2014 43.50% 15.26% 16.51% 6.40% 5.70% 12.63%
2015 47.68% 13.43% 15.57% 6.03% 5.38% 11.91%
2016 52.04% 11.38% 14.65% 5.67% 5.06% 11.21%
2017 56.54% 9.55% 13.57% 5.26% 4.69% 10.38%
2018 62.74% 8.13% 11.66% 4.52% 4.03% 8.92%
2019 65.89% 7.04% 10.84% 4.20% 3.74% 8.29%
2020 70.17% 5.90% 9.58% 3.71% 3.31% 7.33%
These results can then be combined with the research of Analysys Mason to predict the breakdown of the average throughput during peak hour for each application. This model assumes all types of applications being run simultaneously during the peak hour period (as shown in Table 5-13).
Table 5-13: Predicted busy hour throughputs (Mbps) by category.
Year Total Video File
sharing Web
Tunnel-ling
Market places
Outside Top 5
2013 0.39 0.15 0.07 0.07 0.03 0.02 0.05
2014 0.54 0.23 0.08 0.09 0.03 0.03 0.07
2015 0.74 0.35 0.10 0.11 0.04 0.04 0.09
2016 0.98 0.51 0.11 0.14 0.06 0.05 0.11
2017 1.25 0.71 0.12 0.17 0.07 0.06 0.13
2018 1.55 0.97 0.13 0.18 0.07 0.06 0.14
2019 1.86 1.22 0.13 0.20 0.08 0.07 0.15
2020 2.18 1.53 0.13 0.21 0.08 0.07 0.16
Having predicted the distribution of the demand across the traffic types it is now possible to define the division of traffic between the satellite and the terrestrial link (assuming ADSL availability). Using the data consumption per connection per month that was also provided by Analysys Mason then allows for a prediction of the quantity of data that will be routed through each link and the throughput
In order to decide what traffic will be passed to which link it is first necessary to examine the ADSL connection speed categories defined by Analysys Mason (<2Mbps, 2-8Mbps, 8-15Mbps, 15-30Mbps, >30Mbps). It is this speed which determines if the satellite connection will improve the QoS.
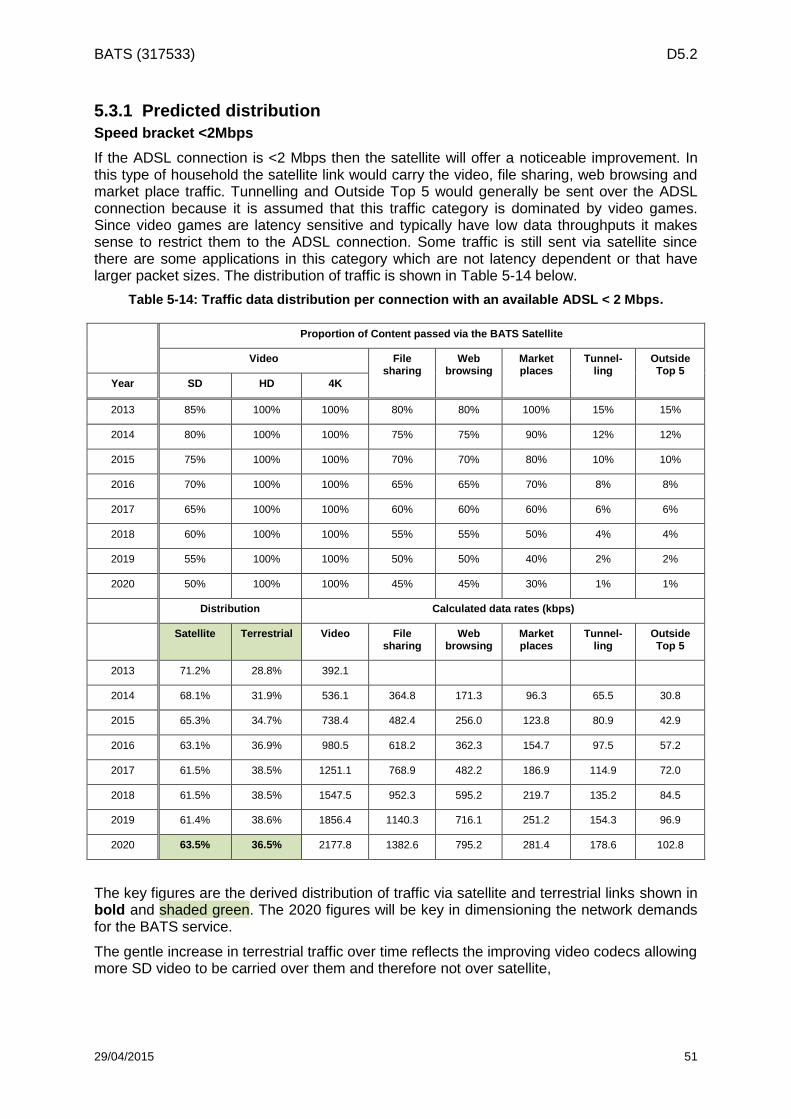
BATS (317533) D5.2
29/04/2015 51
5.3.1 Predicted distribution
Speed bracket <2Mbps
If the ADSL connection is <2 Mbps then the satellite will offer a noticeable improvement. In this type of household the satellite link would carry the video, file sharing, web browsing and market place traffic. Tunnelling and Outside Top 5 would generally be sent over the ADSL connection because it is assumed that this traffic category is dominated by video games. Since video games are latency sensitive and typically have low data throughputs it makes sense to restrict them to the ADSL connection. Some traffic is still sent via satellite since there are some applications in this category which are not latency dependent or that have larger packet sizes. The distribution of traffic is shown in Table 5-14 below.
Table 5-14: Traffic data distribution per connection with an available ADSL < 2 Mbps.
Proportion of Content passed via the BATS Satellite
Video File sharing
Web browsing
Market places
Tunnel-ling
Outside Top 5
Year SD HD 4K
2013 85% 100% 100% 80% 80% 100% 15% 15%
2014 80% 100% 100% 75% 75% 90% 12% 12%
2015 75% 100% 100% 70% 70% 80% 10% 10%
2016 70% 100% 100% 65% 65% 70% 8% 8%
2017 65% 100% 100% 60% 60% 60% 6% 6%
2018 60% 100% 100% 55% 55% 50% 4% 4%
2019 55% 100% 100% 50% 50% 40% 2% 2%
2020 50% 100% 100% 45% 45% 30% 1% 1%
Distribution Calculated data rates (kbps)
Satellite Terrestrial Video File sharing
Web browsing
Market places
Tunnel-ling
Outside Top 5
2013 71.2% 28.8% 392.1
2014 68.1% 31.9% 536.1 364.8 171.3 96.3 65.5 30.8
2015 65.3% 34.7% 738.4 482.4 256.0 123.8 80.9 42.9
2016 63.1% 36.9% 980.5 618.2 362.3 154.7 97.5 57.2
2017 61.5% 38.5% 1251.1 768.9 482.2 186.9 114.9 72.0
2018 61.5% 38.5% 1547.5 952.3 595.2 219.7 135.2 84.5
2019 61.4% 38.6% 1856.4 1140.3 716.1 251.2 154.3 96.9
2020 63.5% 36.5% 2177.8 1382.6 795.2 281.4 178.6 102.8
The key figures are the derived distribution of traffic via satellite and terrestrial links shown in bold and shaded green. The 2020 figures will be key in dimensioning the network demands for the BATS service.
The gentle increase in terrestrial traffic over time reflects the improving video codecs allowing more SD video to be carried over them and therefore not over satellite,
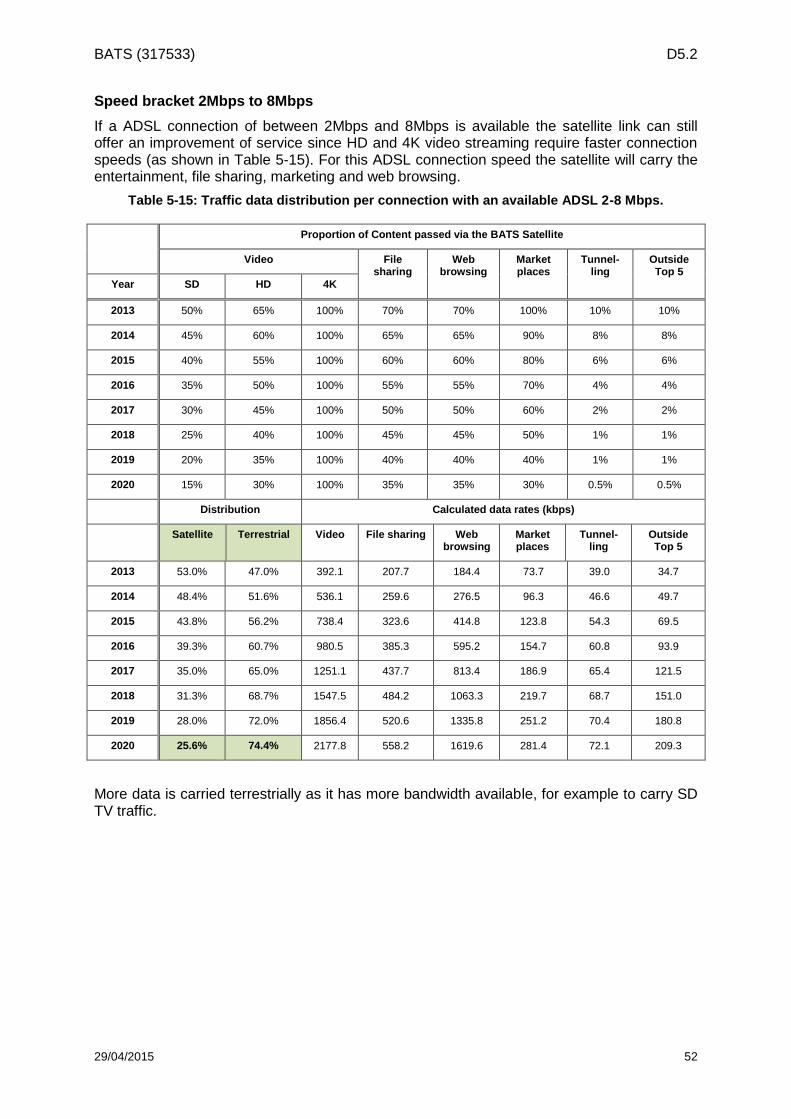
BATS (317533) D5.2
29/04/2015 52
Speed bracket 2Mbps to 8Mbps
If a ADSL connection of between 2Mbps and 8Mbps is available the satellite link can still offer an improvement of service since HD and 4K video streaming require faster connection speeds (as shown in Table 5-15). For this ADSL connection speed the satellite will carry the entertainment, file sharing, marketing and web browsing.
Table 5-15: Traffic data distribution per connection with an available ADSL 2-8 Mbps.
Proportion of Content passed via the BATS Satellite
Video File sharing
Web browsing
Market places
Tunnel-ling
Outside Top 5
Year SD HD 4K
2013 50% 65% 100% 70% 70% 100% 10% 10%
2014 45% 60% 100% 65% 65% 90% 8% 8%
2015 40% 55% 100% 60% 60% 80% 6% 6%
2016 35% 50% 100% 55% 55% 70% 4% 4%
2017 30% 45% 100% 50% 50% 60% 2% 2%
2018 25% 40% 100% 45% 45% 50% 1% 1%
2019 20% 35% 100% 40% 40% 40% 1% 1%
2020 15% 30% 100% 35% 35% 30% 0.5% 0.5%
Distribution Calculated data rates (kbps)
Satellite Terrestrial Video File sharing Web browsing
Market places
Tunnel-ling
Outside Top 5
2013 53.0% 47.0% 392.1 207.7 184.4 73.7 39.0 34.7
2014 48.4% 51.6% 536.1 259.6 276.5 96.3 46.6 49.7
2015 43.8% 56.2% 738.4 323.6 414.8 123.8 54.3 69.5
2016 39.3% 60.7% 980.5 385.3 595.2 154.7 60.8 93.9
2017 35.0% 65.0% 1251.1 437.7 813.4 186.9 65.4 121.5
2018 31.3% 68.7% 1547.5 484.2 1063.3 219.7 68.7 151.0
2019 28.0% 72.0% 1856.4 520.6 1335.8 251.2 70.4 180.8
2020 25.6% 74.4% 2177.8 558.2 1619.6 281.4 72.1 209.3
More data is carried terrestrially as it has more bandwidth available, for example to carry SD TV traffic.
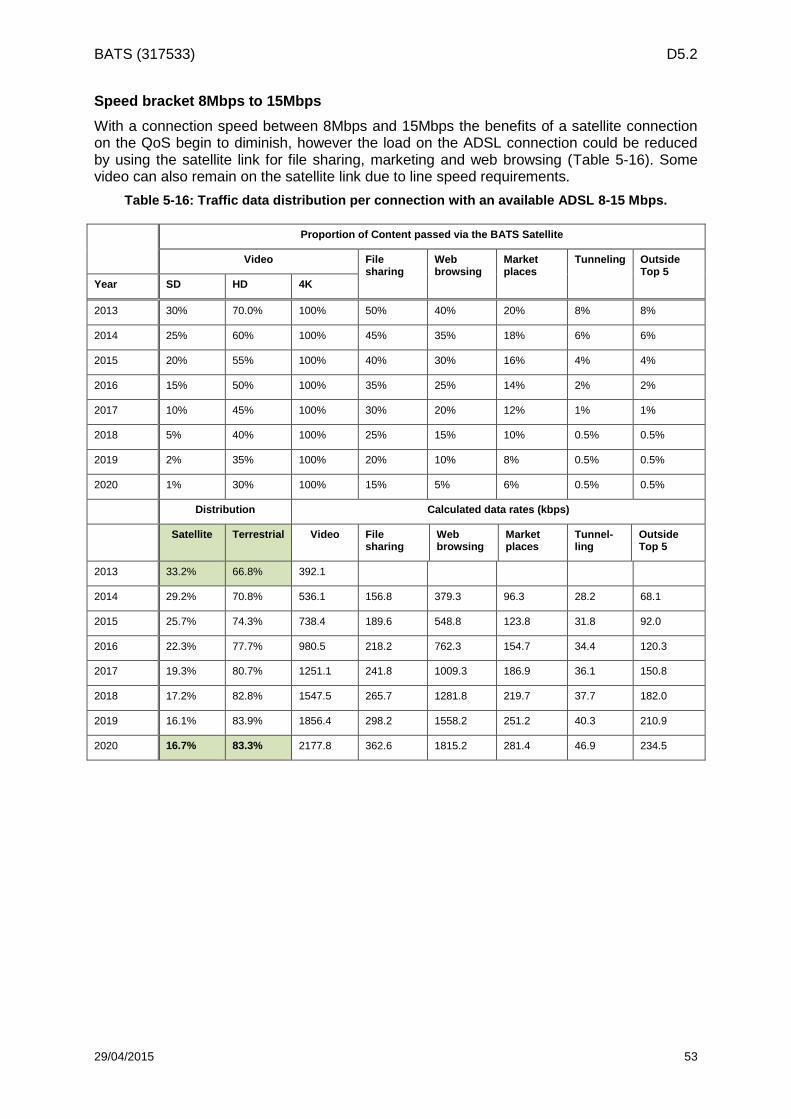
BATS (317533) D5.2
29/04/2015 53
Speed bracket 8Mbps to 15Mbps
With a connection speed between 8Mbps and 15Mbps the benefits of a satellite connection on the QoS begin to diminish, however the load on the ADSL connection could be reduced by using the satellite link for file sharing, marketing and web browsing (Table 5-16). Some video can also remain on the satellite link due to line speed requirements.
Table 5-16: Traffic data distribution per connection with an available ADSL 8-15 Mbps.
Proportion of Content passed via the BATS Satellite
Video File sharing
Web browsing
Market places
Tunneling Outside Top 5
Year SD HD 4K
2013 30% 70.0% 100% 50% 40% 20% 8% 8%
2014 25% 60% 100% 45% 35% 18% 6% 6%
2015 20% 55% 100% 40% 30% 16% 4% 4%
2016 15% 50% 100% 35% 25% 14% 2% 2%
2017 10% 45% 100% 30% 20% 12% 1% 1%
2018 5% 40% 100% 25% 15% 10% 0.5% 0.5%
2019 2% 35% 100% 20% 10% 8% 0.5% 0.5%
2020 1% 30% 100% 15% 5% 6% 0.5% 0.5%
Distribution Calculated data rates (kbps)
Satellite Terrestrial Video File sharing
Web browsing
Market places
Tunnel-ling
Outside Top 5
2013 33.2% 66.8% 392.1
2014 29.2% 70.8% 536.1 156.8 379.3 96.3 28.2 68.1
2015 25.7% 74.3% 738.4 189.6 548.8 123.8 31.8 92.0
2016 22.3% 77.7% 980.5 218.2 762.3 154.7 34.4 120.3
2017 19.3% 80.7% 1251.1 241.8 1009.3 186.9 36.1 150.8
2018 17.2% 82.8% 1547.5 265.7 1281.8 219.7 37.7 182.0
2019 16.1% 83.9% 1856.4 298.2 1558.2 251.2 40.3 210.9
2020 16.7% 83.3% 2177.8 362.6 1815.2 281.4 46.9 234.5
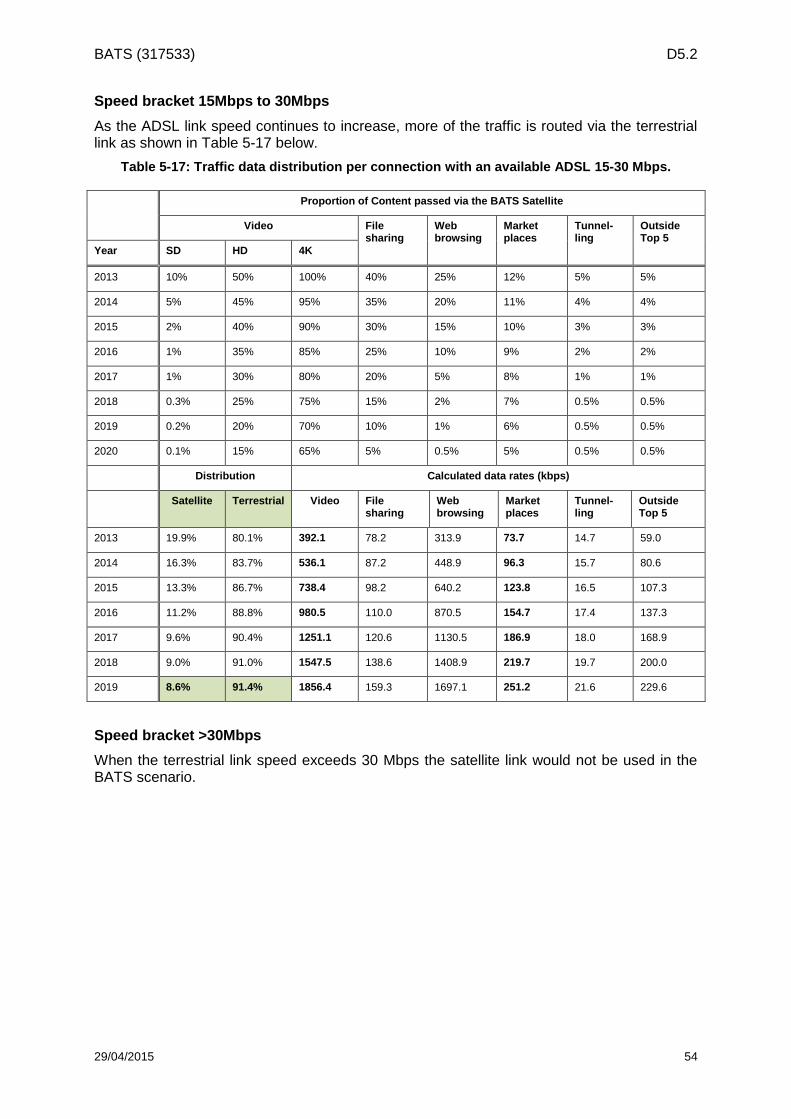
BATS (317533) D5.2
29/04/2015 54
Speed bracket 15Mbps to 30Mbps
As the ADSL link speed continues to increase, more of the traffic is routed via the terrestrial link as shown in Table 5-17 below.
Table 5-17: Traffic data distribution per connection with an available ADSL 15-30 Mbps.
Proportion of Content passed via the BATS Satellite
Video File sharing
Web browsing
Market places
Tunnel-ling
Outside Top 5
Year SD HD 4K
2013 10% 50% 100% 40% 25% 12% 5% 5%
2014 5% 45% 95% 35% 20% 11% 4% 4%
2015 2% 40% 90% 30% 15% 10% 3% 3%
2016 1% 35% 85% 25% 10% 9% 2% 2%
2017 1% 30% 80% 20% 5% 8% 1% 1%
2018 0.3% 25% 75% 15% 2% 7% 0.5% 0.5%
2019 0.2% 20% 70% 10% 1% 6% 0.5% 0.5%
2020 0.1% 15% 65% 5% 0.5% 5% 0.5% 0.5%
Distribution Calculated data rates (kbps)
Satellite Terrestrial Video File sharing
Web browsing
Market places
Tunnel-ling
Outside Top 5
2013 19.9% 80.1% 392.1 78.2 313.9 73.7 14.7 59.0
2014 16.3% 83.7% 536.1 87.2 448.9 96.3 15.7 80.6
2015 13.3% 86.7% 738.4 98.2 640.2 123.8 16.5 107.3
2016 11.2% 88.8% 980.5 110.0 870.5 154.7 17.4 137.3
2017 9.6% 90.4% 1251.1 120.6 1130.5 186.9 18.0 168.9
2018 9.0% 91.0% 1547.5 138.6 1408.9 219.7 19.7 200.0
2019 8.6% 91.4% 1856.4 159.3 1697.1 251.2 21.6 229.6
Speed bracket >30Mbps
When the terrestrial link speed exceeds 30 Mbps the satellite link would not be used in the BATS scenario.
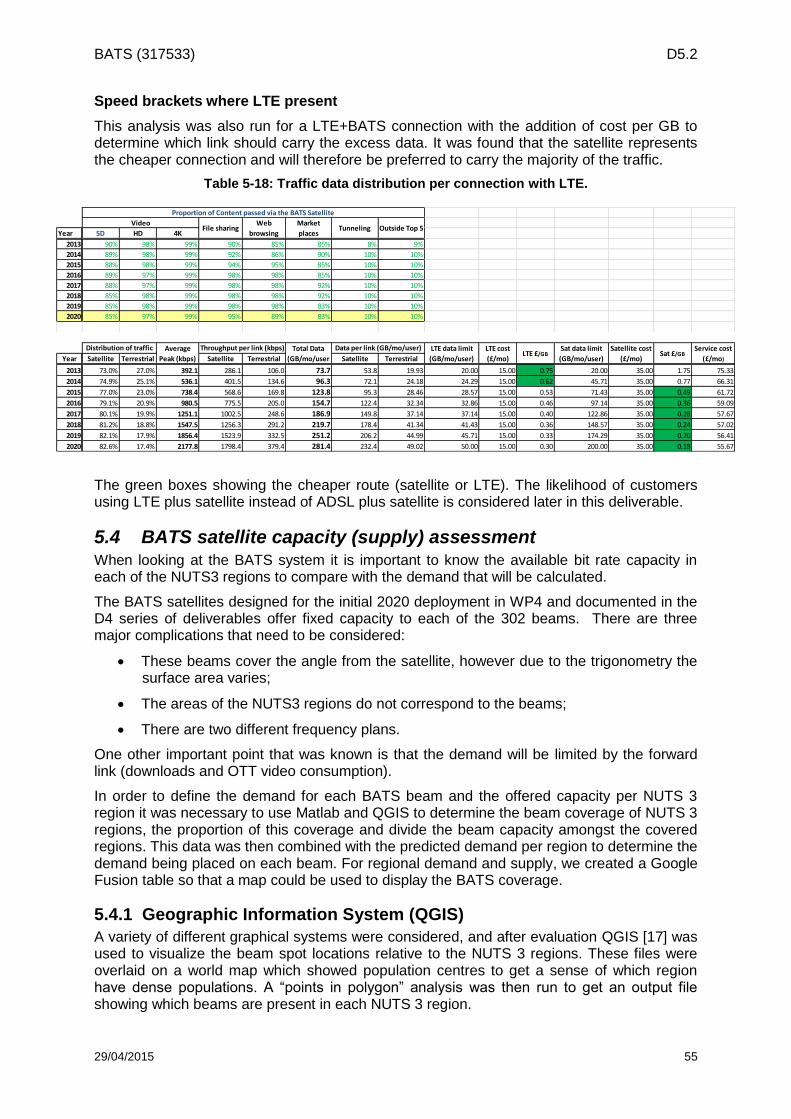
BATS (317533) D5.2
29/04/2015 55
Speed brackets where LTE present
This analysis was also run for a LTE+BATS connection with the addition of cost per GB to determine which link should carry the excess data. It was found that the satellite represents the cheaper connection and will therefore be preferred to carry the majority of the traffic.
Table 5-18: Traffic data distribution per connection with LTE.
Year SD HD 4K
2013 90% 98% 99% 90% 85% 85% 8% 9%
2014 89% 98% 99% 92% 86% 90% 10% 10%
2015 88% 98% 99% 94% 95% 85% 10% 10%
2016 89% 97% 99% 98% 98% 85% 10% 10%
2017 88% 97% 99% 98% 98% 92% 10% 10%
2018 85% 98% 99% 98% 98% 92% 10% 10%
2019 85% 98% 99% 98% 98% 83% 10% 10%
2020 85% 97% 99% 95% 89% 83% 10% 10%
Year Satellite Terrestrial Satellite Terrestrial Satellite Terrestrial
2013 73.0% 27.0% 392.1 286.1 106.0 73.7 53.8 19.93 20.00 15.00 0.75 20.00 35.00 1.75 75.33
2014 74.9% 25.1% 536.1 401.5 134.6 96.3 72.1 24.18 24.29 15.00 0.62 45.71 35.00 0.77 66.31
2015 77.0% 23.0% 738.4 568.6 169.8 123.8 95.3 28.46 28.57 15.00 0.53 71.43 35.00 0.49 61.72
2016 79.1% 20.9% 980.5 775.5 205.0 154.7 122.4 32.34 32.86 15.00 0.46 97.14 35.00 0.36 59.09
2017 80.1% 19.9% 1251.1 1002.5 248.6 186.9 149.8 37.14 37.14 15.00 0.40 122.86 35.00 0.28 57.67
2018 81.2% 18.8% 1547.5 1256.3 291.2 219.7 178.4 41.34 41.43 15.00 0.36 148.57 35.00 0.24 57.02
2019 82.1% 17.9% 1856.4 1523.9 332.5 251.2 206.2 44.99 45.71 15.00 0.33 174.29 35.00 0.20 56.41
2020 82.6% 17.4% 2177.8 1798.4 379.4 281.4 232.4 49.02 50.00 15.00 0.30 200.00 35.00 0.18 55.67
Service cost
(£/mo)
Sat data limit
(GB/mo/user)
Satellite cost
(£/mo)LTE £/GB Sat £/GB
LTE data limit
(GB/mo/user)
LTE cost
(£/mo)
Proportion of Content passed via the BATS Satellite
VideoFile sharing
Web
browsing
Market
placesTunneling Outside Top 5
Distribution of traffic Average
Peak (kbps)
Throughput per link (kbps) Total Data
(GB/mo/user
Data per link (GB/mo/user)
The green boxes showing the cheaper route (satellite or LTE). The likelihood of customers using LTE plus satellite instead of ADSL plus satellite is considered later in this deliverable.
5.4 BATS satellite capacity (supply) assessment When looking at the BATS system it is important to know the available bit rate capacity in each of the NUTS3 regions to compare with the demand that will be calculated.
The BATS satellites designed for the initial 2020 deployment in WP4 and documented in the D4 series of deliverables offer fixed capacity to each of the 302 beams. There are three major complications that need to be considered:
These beams cover the angle from the satellite, however due to the trigonometry the surface area varies;
The areas of the NUTS3 regions do not correspond to the beams;
There are two different frequency plans.
One other important point that was known is that the demand will be limited by the forward link (downloads and OTT video consumption).
In order to define the demand for each BATS beam and the offered capacity per NUTS 3 region it was necessary to use Matlab and QGIS to determine the beam coverage of NUTS 3 regions, the proportion of this coverage and divide the beam capacity amongst the covered regions. This data was then combined with the predicted demand per region to determine the demand being placed on each beam. For regional demand and supply, we created a Google Fusion table so that a map could be used to display the BATS coverage.
5.4.1 Geographic Information System (QGIS)
A variety of different graphical systems were considered, and after evaluation QGIS [17] was used to visualize the beam spot locations relative to the NUTS 3 regions. These files were overlaid on a world map which showed population centres to get a sense of which region have dense populations. A “points in polygon” analysis was then run to get an output file showing which beams are present in each NUTS 3 region.

BATS (317533) D5.2
29/04/2015 56
The raw NUS 3 data from Eurostat is provided as polygons and points so that each region is represented by two features on the map. Using QGIS it is possible to separate out these two features so that the file used in the Google Fusion tables only contains the polygons when mapped. This was an important feature as it produces a map which is easier to read and access the data.
Because of the visual interface it was possible to manually verify the results produced by QGIS. It was also possible to use QGIS for the error checking of Matlab to ensure that beam spot counts per region were accurate.
Key assumptions:
1) Any regions too small to contain at least one point from a beam will have a sufficiently high population density and connection speed to make them unattractive targets for BATS.
2) That the following map files are available in kml format: NUTS 3 regions, beam locations.
5.4.2 Modelling software (Matlab)
The Matlab script combines multiple workbooks produced over the course of the BATS project with the results of the QGIS analysis to determine the supply and demand at the NUTS 3 level and on a per satellite beam basis.
The small regions within Europe are ignored due to the fact that they are assumed to contain a high population density and therefore likely already, or will soon, have the requisite connection speed of 30 Mbps. Beam spots which fall outside of the designated NUTS 3 regions have also been discarded so that the satellite capacity can be properly distributed to each region within the study area.
Key assumptions:
1) All files that contain a NUTS 3 column will be sorted by the NUTS 3 codes from A to Z with the blanks at the end.
2) Files containing beam number and no NUTS 3 code will be sorted by the beam number. (If both are present then the NUTS 3 codes take precedence)
3) Distributing capacity and demand based on percentage of spots present within a region belonging to a particular beam is assumed to be a valid distribution irrespective of actual population distribution.
Note that essential the same process will be used later to show other parameters such as demand, unmet demand etc. A manual process was followed on ten of NUTS3 regions to check the MATLAB findings.
5.4.3 Google Fusion Tables
When creating a Google Fusion table you are given the option of importing kml or csv files to Google Drive. The kml file provides the geometries of the NUTS 3 regions and the csv whatever data you have “joined” in the file with QGIS. We then used the merge feature in the fusion tables to combine csv data files with the kml file using the NUTS 3 region codes as the merge layer. Then we created a new table which contains both the NUTS 3 regions and and Supply for each region.
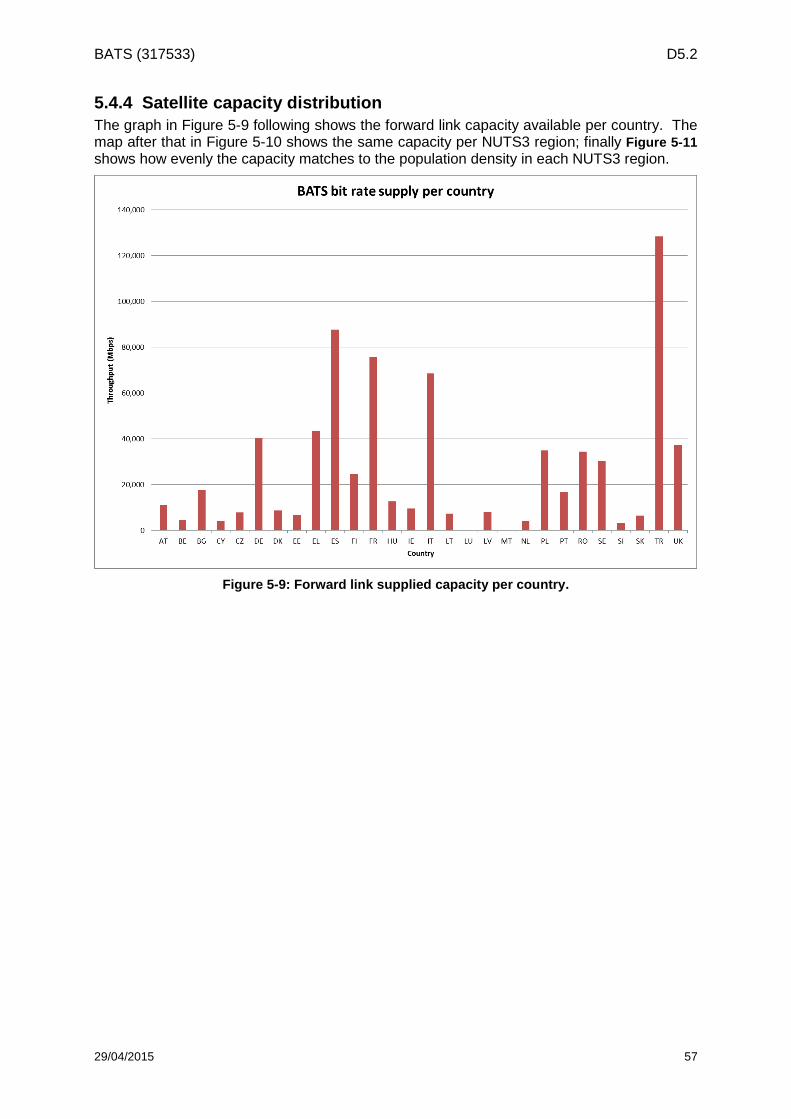
BATS (317533) D5.2
29/04/2015 57
5.4.4 Satellite capacity distribution
The graph in Figure 5-9 following shows the forward link capacity available per country. The map after that in Figure 5-10 shows the same capacity per NUTS3 region; finally Figure 5-11 shows how evenly the capacity matches to the population density in each NUTS3 region.
Figure 5-9: Forward link supplied capacity per country.
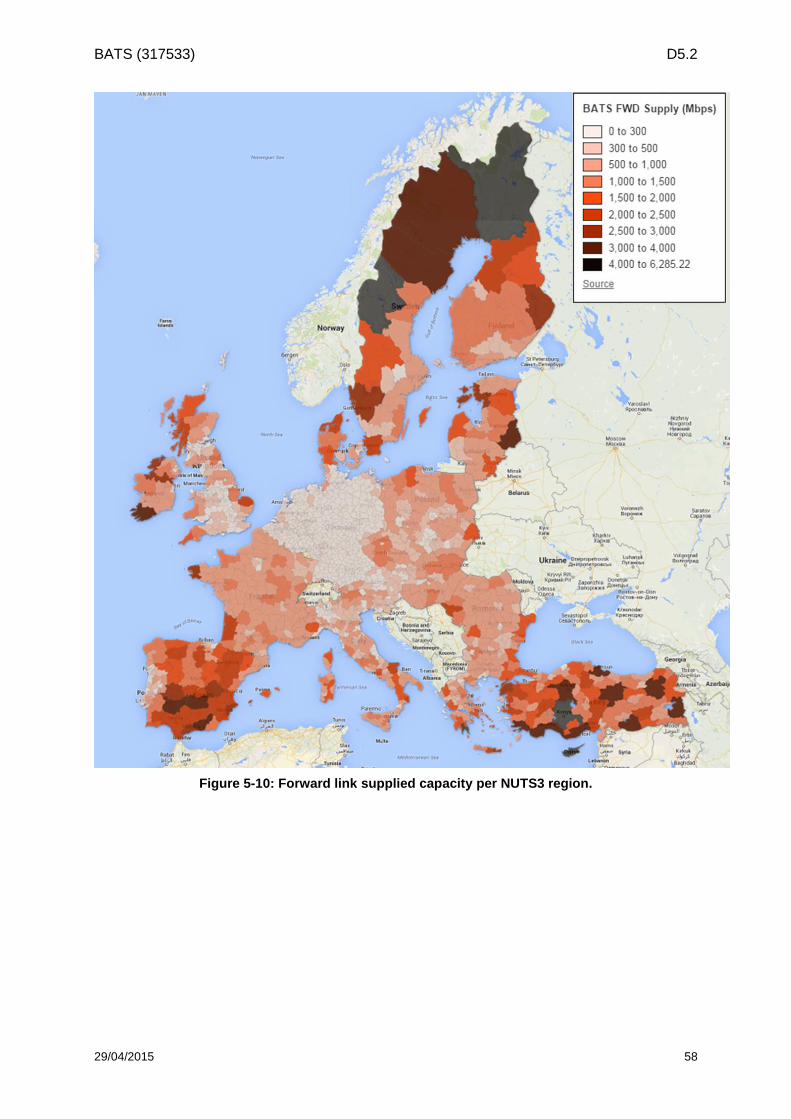
BATS (317533) D5.2
29/04/2015 58
Figure 5-10: Forward link supplied capacity per NUTS3 region.
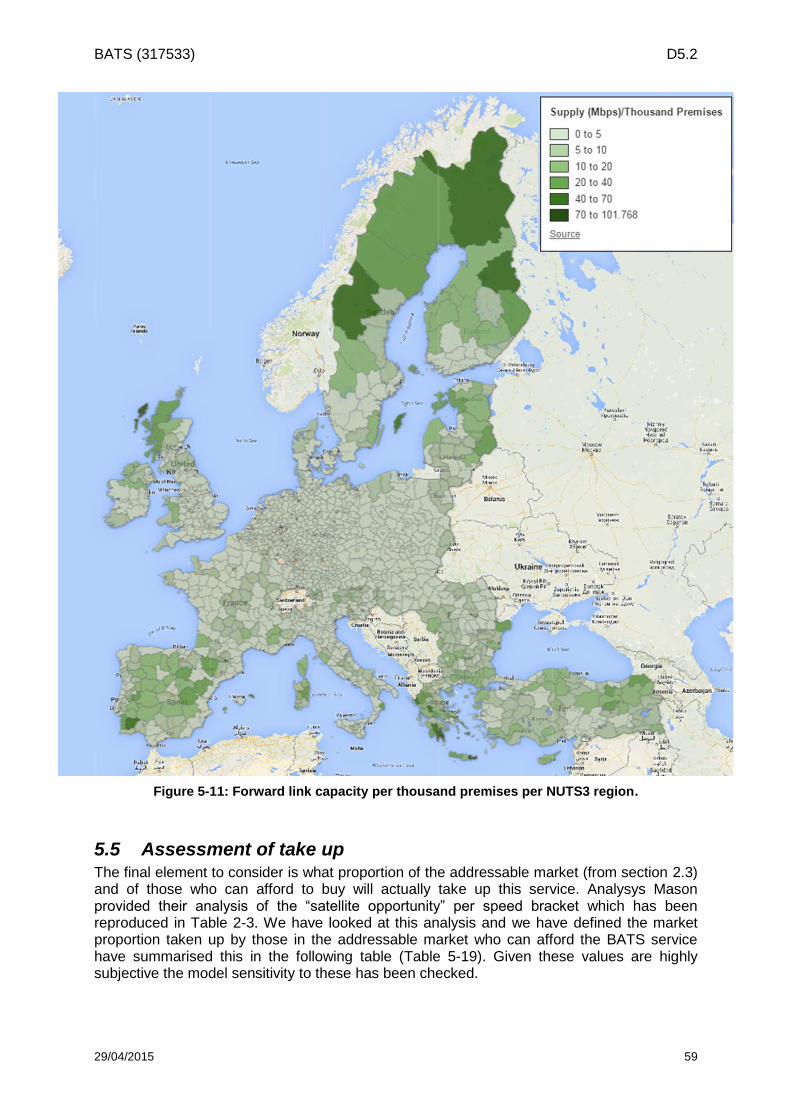
BATS (317533) D5.2
29/04/2015 59
Figure 5-11: Forward link capacity per thousand premises per NUTS3 region.
5.5 Assessment of take up The final element to consider is what proportion of the addressable market (from section 2.3) and of those who can afford to buy will actually take up this service. Analysys Mason provided their analysis of the “satellite opportunity” per speed bracket which has been reproduced in Table 2-3. We have looked at this analysis and we have defined the market proportion taken up by those in the addressable market who can afford the BATS service have summarised this in the following table (Table 5-19). Given these values are highly subjective the model sensitivity to these has been checked.
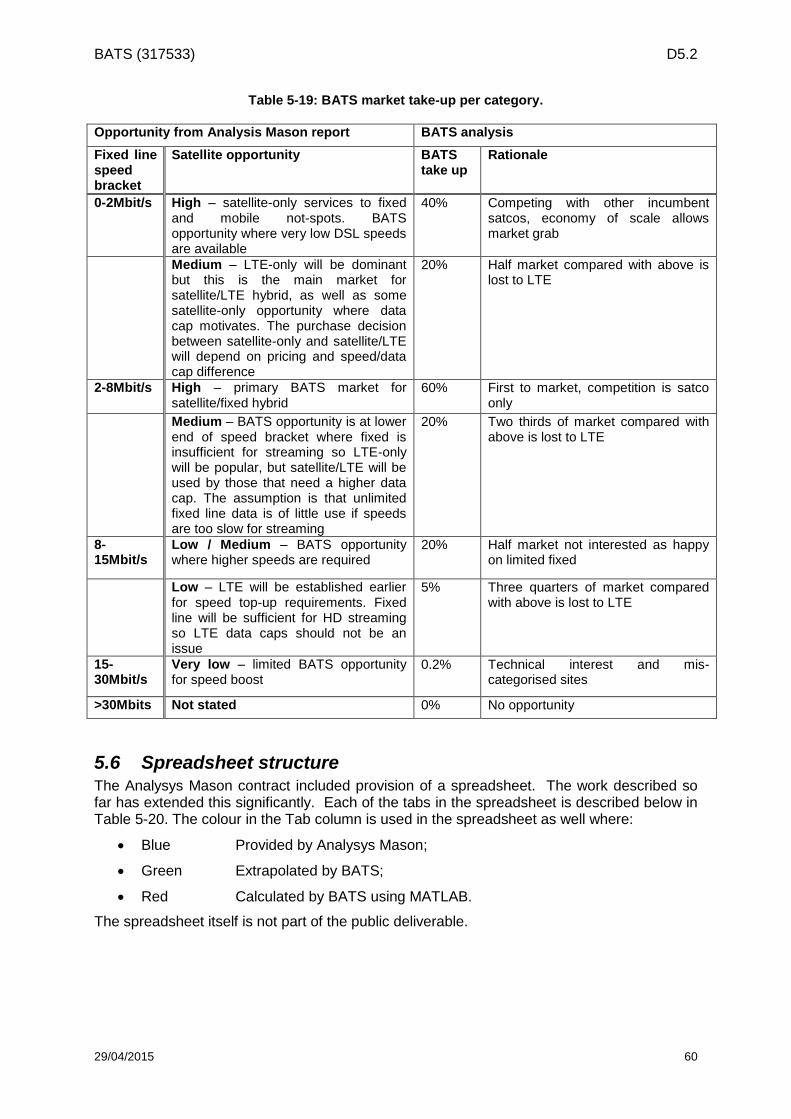
BATS (317533) D5.2
29/04/2015 60
Table 5-19: BATS market take-up per category.
Opportunity from Analysis Mason report BATS analysis
Fixed line speed bracket
Satellite opportunity BATS take up
Rationale
0-2Mbit/s High – satellite-only services to fixed and mobile not-spots. BATS opportunity where very low DSL speeds are available
40% Competing with other incumbent satcos, economy of scale allows market grab
Medium – LTE-only will be dominant but this is the main market for satellite/LTE hybrid, as well as some satellite-only opportunity where data cap motivates. The purchase decision between satellite-only and satellite/LTE will depend on pricing and speed/data cap difference
20% Half market compared with above is lost to LTE
2-8Mbit/s High – primary BATS market for satellite/fixed hybrid
60% First to market, competition is satco only
Medium – BATS opportunity is at lower end of speed bracket where fixed is insufficient for streaming so LTE-only will be popular, but satellite/LTE will be used by those that need a higher data cap. The assumption is that unlimited fixed line data is of little use if speeds are too slow for streaming
20% Two thirds of market compared with above is lost to LTE
8-15Mbit/s
Low / Medium – BATS opportunity where higher speeds are required
20% Half market not interested as happy on limited fixed
Low – LTE will be established earlier for speed top-up requirements. Fixed line will be sufficient for HD streaming so LTE data caps should not be an issue
5% Three quarters of market compared with above is lost to LTE
15-30Mbit/s
Very low – limited BATS opportunity for speed boost
0.2% Technical interest and mis-categorised sites
>30Mbits Not stated 0% No opportunity
5.6 Spreadsheet structure The Analysys Mason contract included provision of a spreadsheet. The work described so far has extended this significantly. Each of the tabs in the spreadsheet is described below in Table 5-20. The colour in the Tab column is used in the spreadsheet as well where:
Blue Provided by Analysys Mason;
Green Extrapolated by BATS;
Red Calculated by BATS using MATLAB.
The spreadsheet itself is not part of the public deliverable.
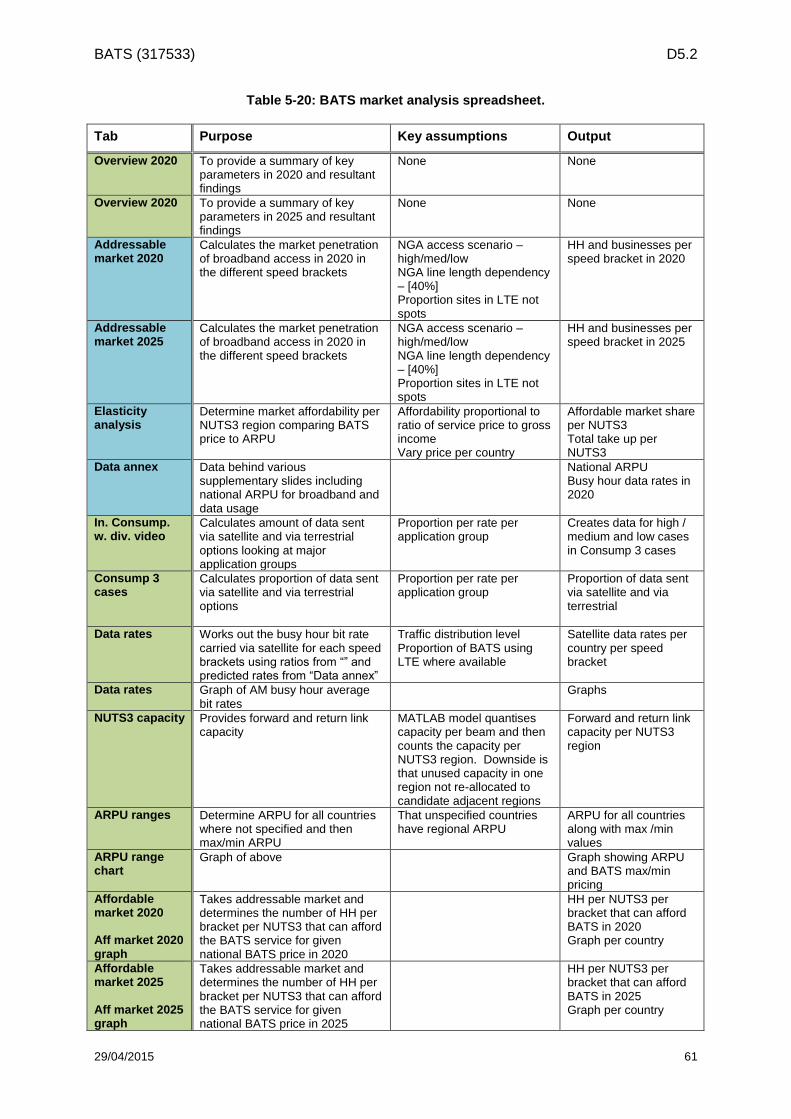
BATS (317533) D5.2
29/04/2015 61
Table 5-20: BATS market analysis spreadsheet.
Tab Purpose Key assumptions Output
Overview 2020 To provide a summary of key parameters in 2020 and resultant findings
None None
Overview 2020 To provide a summary of key parameters in 2025 and resultant findings
None None
Addressable market 2020
Calculates the market penetration of broadband access in 2020 in the different speed brackets
NGA access scenario – high/med/low NGA line length dependency – [40%] Proportion sites in LTE not spots
HH and businesses per speed bracket in 2020
Addressable market 2025
Calculates the market penetration of broadband access in 2020 in the different speed brackets
NGA access scenario – high/med/low NGA line length dependency – [40%] Proportion sites in LTE not spots
HH and businesses per speed bracket in 2025
Elasticity analysis
Determine market affordability per NUTS3 region comparing BATS price to ARPU
Affordability proportional to ratio of service price to gross income Vary price per country
Affordable market share per NUTS3 Total take up per NUTS3
Data annex Data behind various supplementary slides including national ARPU for broadband and data usage
National ARPU Busy hour data rates in 2020
In. Consump. w. div. video
Calculates amount of data sent via satellite and via terrestrial options looking at major application groups
Proportion per rate per application group
Creates data for high / medium and low cases in Consump 3 cases
Consump 3 cases
Calculates proportion of data sent via satellite and via terrestrial options
Proportion per rate per application group
Proportion of data sent via satellite and via terrestrial
Data rates Works out the busy hour bit rate carried via satellite for each speed brackets using ratios from “” and predicted rates from “Data annex”
Traffic distribution level Proportion of BATS using LTE where available
Satellite data rates per country per speed bracket
Data rates Graph of AM busy hour average bit rates
Graphs
NUTS3 capacity Provides forward and return link capacity
MATLAB model quantises capacity per beam and then counts the capacity per NUTS3 region. Downside is that unused capacity in one region not re-allocated to candidate adjacent regions
Forward and return link capacity per NUTS3 region
ARPU ranges Determine ARPU for all countries where not specified and then max/min ARPU
That unspecified countries have regional ARPU
ARPU for all countries along with max /min values
ARPU range chart
Graph of above Graph showing ARPU and BATS max/min pricing
Affordable market 2020 Aff market 2020 graph
Takes addressable market and determines the number of HH per bracket per NUTS3 that can afford the BATS service for given national BATS price in 2020
HH per NUTS3 per bracket that can afford BATS in 2020 Graph per country
Affordable market 2025 Aff market 2025 graph
Takes addressable market and determines the number of HH per bracket per NUTS3 that can afford the BATS service for given national BATS price in 2025
HH per NUTS3 per bracket that can afford BATS in 2025 Graph per country
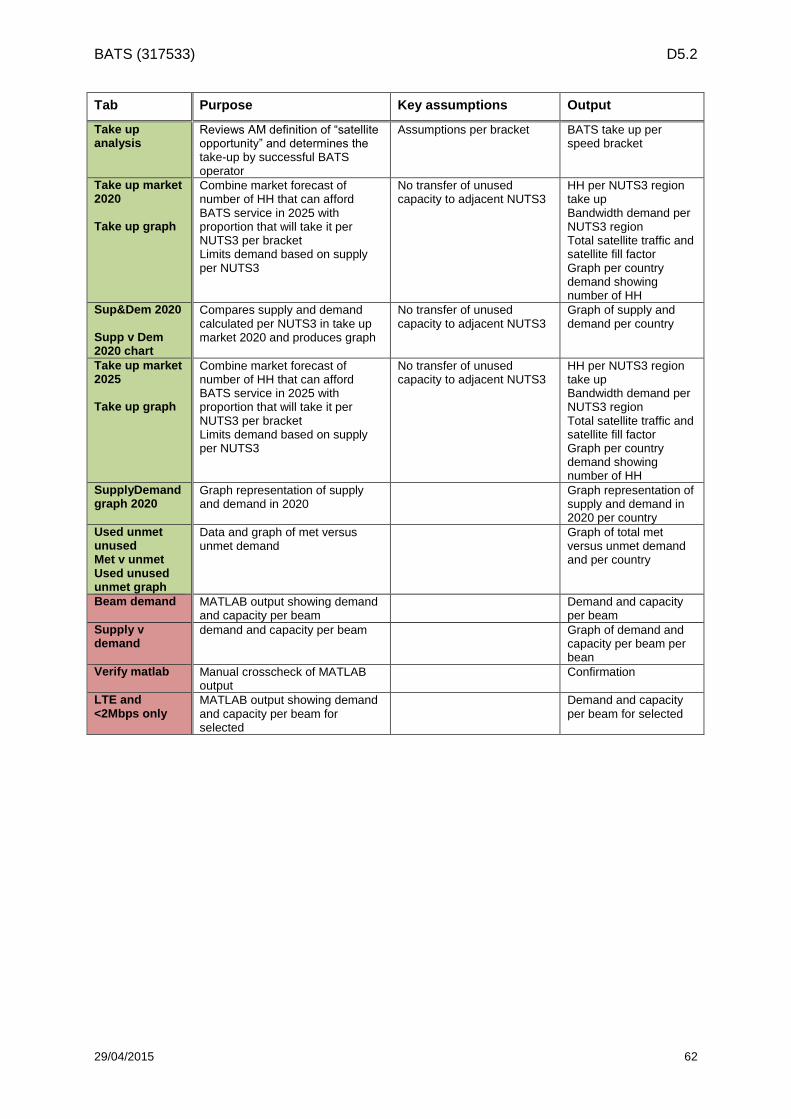
BATS (317533) D5.2
29/04/2015 62
Tab Purpose Key assumptions Output
Take up analysis
Reviews AM definition of “satellite opportunity” and determines the take-up by successful BATS operator
Assumptions per bracket BATS take up per speed bracket
Take up market 2020 Take up graph
Combine market forecast of number of HH that can afford BATS service in 2025 with proportion that will take it per NUTS3 per bracket Limits demand based on supply per NUTS3
No transfer of unused capacity to adjacent NUTS3
HH per NUTS3 region take up Bandwidth demand per NUTS3 region Total satellite traffic and satellite fill factor Graph per country demand showing number of HH
Sup&Dem 2020 Supp v Dem 2020 chart
Compares supply and demand calculated per NUTS3 in take up market 2020 and produces graph
No transfer of unused capacity to adjacent NUTS3
Graph of supply and demand per country
Take up market 2025 Take up graph
Combine market forecast of number of HH that can afford BATS service in 2025 with proportion that will take it per NUTS3 per bracket Limits demand based on supply per NUTS3
No transfer of unused capacity to adjacent NUTS3
HH per NUTS3 region take up Bandwidth demand per NUTS3 region Total satellite traffic and satellite fill factor Graph per country demand showing number of HH
SupplyDemand graph 2020
Graph representation of supply and demand in 2020
Graph representation of supply and demand in 2020 per country
Used unmet unused Met v unmet Used unused unmet graph
Data and graph of met versus unmet demand
Graph of total met versus unmet demand and per country
Beam demand MATLAB output showing demand and capacity per beam
Demand and capacity per beam
Supply v demand
demand and capacity per beam Graph of demand and capacity per beam per bean
Verify matlab Manual crosscheck of MATLAB output
Confirmation
LTE and <2Mbps only
MATLAB output showing demand and capacity per beam for selected
Demand and capacity per beam for selected
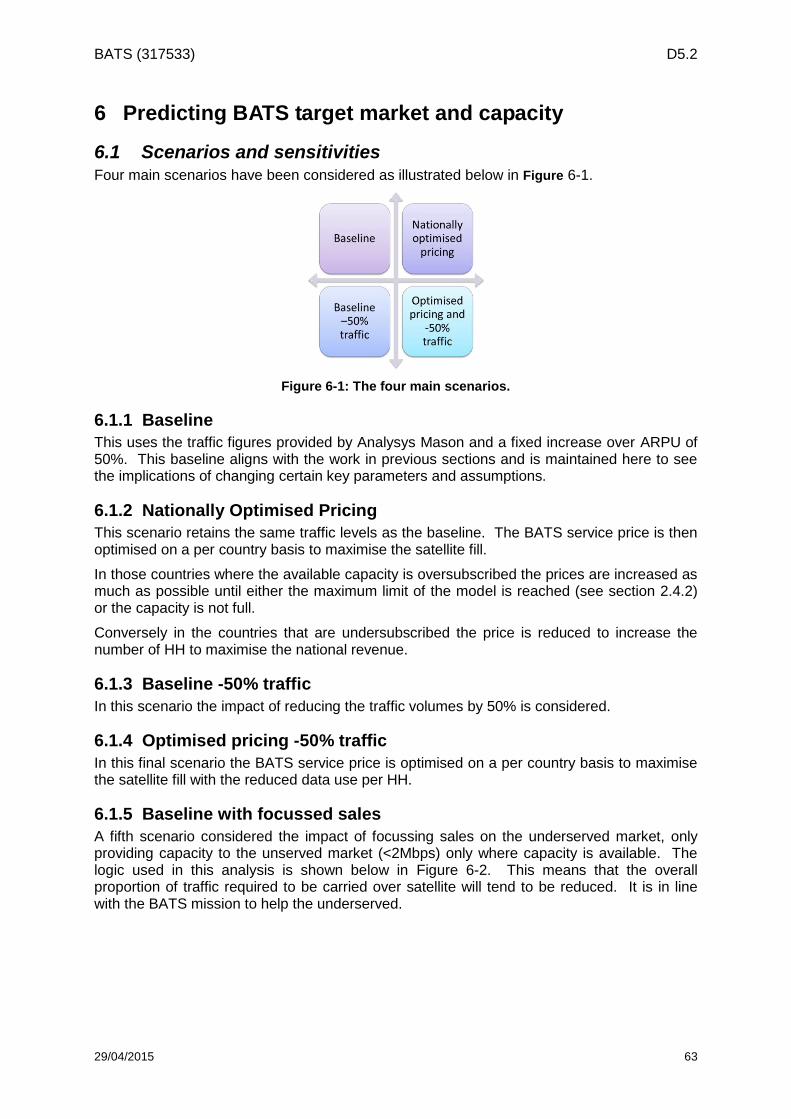
BATS (317533) D5.2
29/04/2015 63
6 Predicting BATS target market and capacity
6.1 Scenarios and sensitivities Four main scenarios have been considered as illustrated below in Figure 6-1.
Figure 6-1: The four main scenarios.
6.1.1 Baseline
This uses the traffic figures provided by Analysys Mason and a fixed increase over ARPU of 50%. This baseline aligns with the work in previous sections and is maintained here to see the implications of changing certain key parameters and assumptions.
6.1.2 Nationally Optimised Pricing
This scenario retains the same traffic levels as the baseline. The BATS service price is then optimised on a per country basis to maximise the satellite fill.
In those countries where the available capacity is oversubscribed the prices are increased as much as possible until either the maximum limit of the model is reached (see section 2.4.2) or the capacity is not full.
Conversely in the countries that are undersubscribed the price is reduced to increase the number of HH to maximise the national revenue.
6.1.3 Baseline -50% traffic
In this scenario the impact of reducing the traffic volumes by 50% is considered.
6.1.4 Optimised pricing -50% traffic
In this final scenario the BATS service price is optimised on a per country basis to maximise the satellite fill with the reduced data use per HH.
6.1.5 Baseline with focussed sales
A fifth scenario considered the impact of focussing sales on the underserved market, only providing capacity to the unserved market (<2Mbps) only where capacity is available. The logic used in this analysis is shown below in Figure 6-2. This means that the overall proportion of traffic required to be carried over satellite will tend to be reduced. It is in line with the BATS mission to help the underserved.
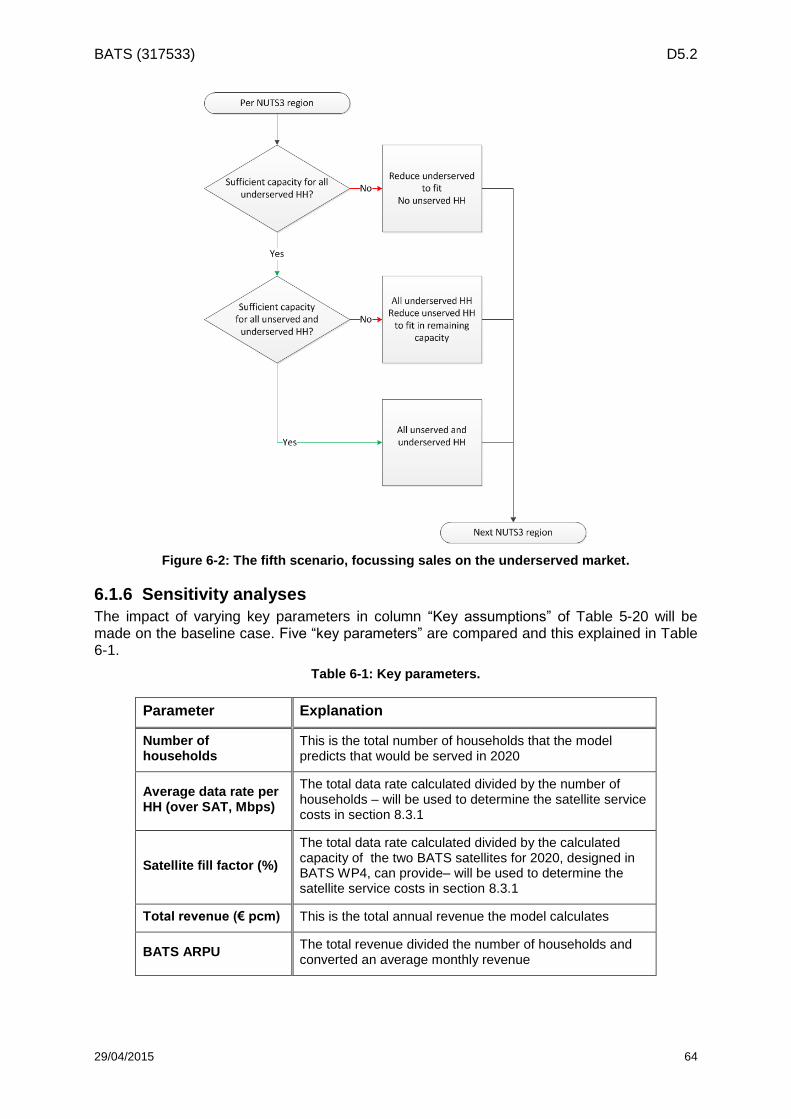
BATS (317533) D5.2
29/04/2015 64
Figure 6-2: The fifth scenario, focussing sales on the underserved market.
6.1.6 Sensitivity analyses
The impact of varying key parameters in column “Key assumptions” of Table 5-20 will be made on the baseline case. Five “key parameters” are compared and this explained in Table 6-1.
Table 6-1: Key parameters.
Parameter Explanation
Number of households
This is the total number of households that the model predicts that would be served in 2020
Average data rate per HH (over SAT, Mbps)
The total data rate calculated divided by the number of households – will be used to determine the satellite service costs in section 8.3.1
Satellite fill factor (%)
The total data rate calculated divided by the calculated capacity of the two BATS satellites for 2020, designed in BATS WP4, can provide– will be used to determine the satellite service costs in section 8.3.1
Total revenue (€ pcm) This is the total annual revenue the model calculates
BATS ARPU The total revenue divided the number of households and converted an average monthly revenue
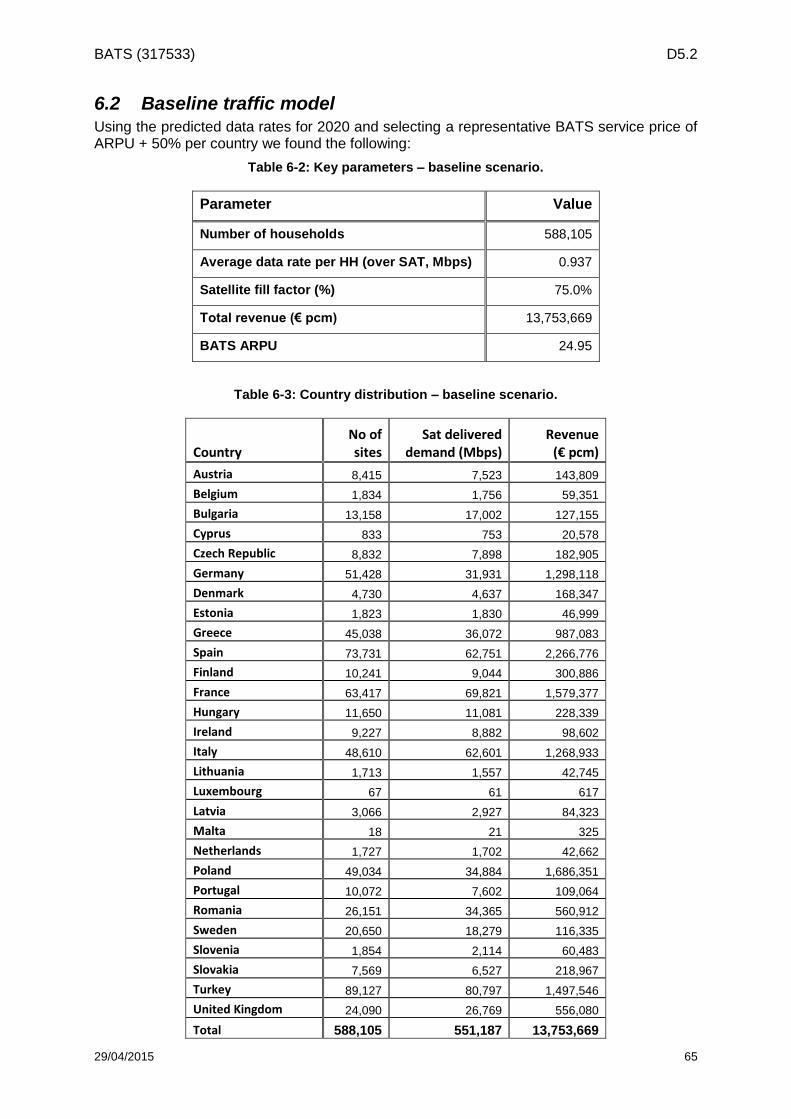
BATS (317533) D5.2
29/04/2015 65
6.2 Baseline traffic model Using the predicted data rates for 2020 and selecting a representative BATS service price of ARPU + 50% per country we found the following:
Table 6-2: Key parameters – baseline scenario.
Parameter Value
Number of households 588,105
Average data rate per HH (over SAT, Mbps) 0.937
Satellite fill factor (%) 75.0%
Total revenue (€ pcm) 13,753,669
BATS ARPU 24.95
Table 6-3: Country distribution – baseline scenario.
Country No of sites
Sat delivered demand (Mbps)
Revenue (€ pcm)
Austria 8,415 7,523 143,809
Belgium 1,834 1,756 59,351
Bulgaria 13,158 17,002 127,155
Cyprus 833 753 20,578
Czech Republic 8,832 7,898 182,905
Germany 51,428 31,931 1,298,118
Denmark 4,730 4,637 168,347
Estonia 1,823 1,830 46,999
Greece 45,038 36,072 987,083
Spain 73,731 62,751 2,266,776
Finland 10,241 9,044 300,886
France 63,417 69,821 1,579,377
Hungary 11,650 11,081 228,339
Ireland 9,227 8,882 98,602
Italy 48,610 62,601 1,268,933
Lithuania 1,713 1,557 42,745
Luxembourg 67 61 617
Latvia 3,066 2,927 84,323
Malta 18 21 325
Netherlands 1,727 1,702 42,662
Poland 49,034 34,884 1,686,351
Portugal 10,072 7,602 109,064
Romania 26,151 34,365 560,912
Sweden 20,650 18,279 116,335
Slovenia 1,854 2,114 60,483
Slovakia 7,569 6,527 218,967
Turkey 89,127 80,797 1,497,546
United Kingdom 24,090 26,769 556,080
Total 588,105 551,187 13,753,669
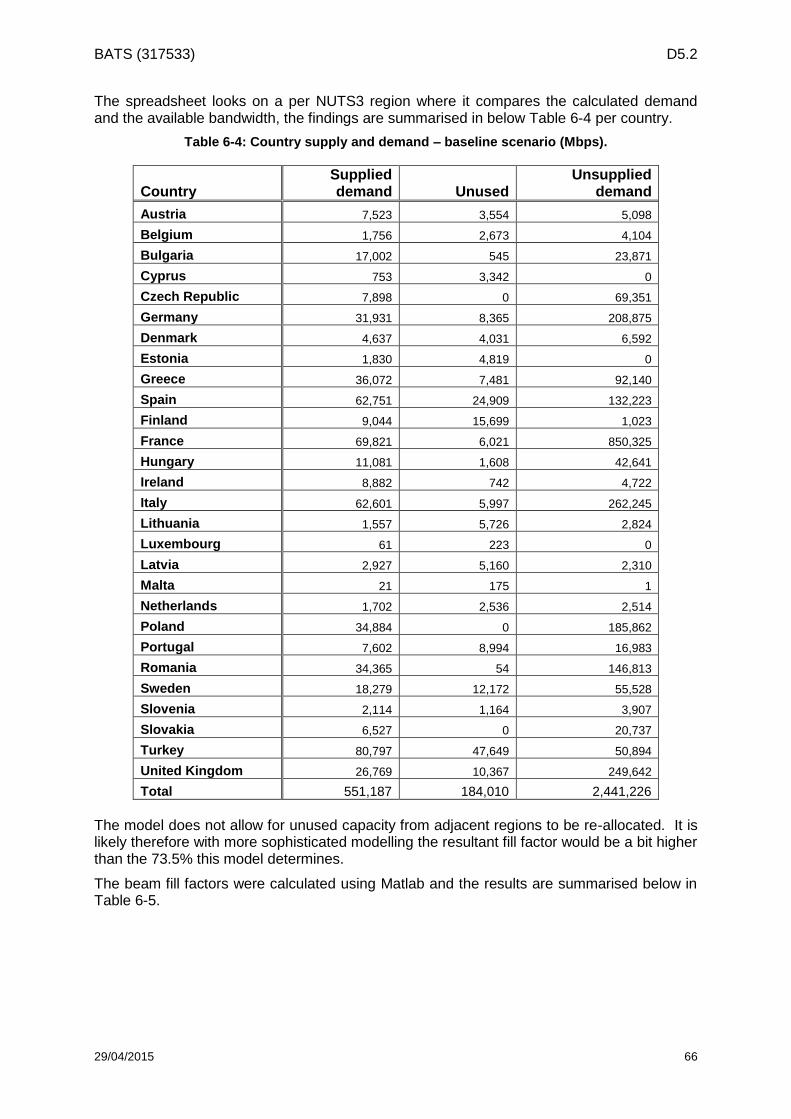
BATS (317533) D5.2
29/04/2015 66
The spreadsheet looks on a per NUTS3 region where it compares the calculated demand and the available bandwidth, the findings are summarised in below Table 6-4 per country.
Table 6-4: Country supply and demand – baseline scenario (Mbps).
Country Supplied demand Unused
Unsupplied demand
Austria 7,523 3,554 5,098
Belgium 1,756 2,673 4,104
Bulgaria 17,002 545 23,871
Cyprus 753 3,342 0
Czech Republic 7,898 0 69,351
Germany 31,931 8,365 208,875
Denmark 4,637 4,031 6,592
Estonia 1,830 4,819 0
Greece 36,072 7,481 92,140
Spain 62,751 24,909 132,223
Finland 9,044 15,699 1,023
France 69,821 6,021 850,325
Hungary 11,081 1,608 42,641
Ireland 8,882 742 4,722
Italy 62,601 5,997 262,245
Lithuania 1,557 5,726 2,824
Luxembourg 61 223 0
Latvia 2,927 5,160 2,310
Malta 21 175 1
Netherlands 1,702 2,536 2,514
Poland 34,884 0 185,862
Portugal 7,602 8,994 16,983
Romania 34,365 54 146,813
Sweden 18,279 12,172 55,528
Slovenia 2,114 1,164 3,907
Slovakia 6,527 0 20,737
Turkey 80,797 47,649 50,894
United Kingdom 26,769 10,367 249,642
Total 551,187 184,010 2,441,226
The model does not allow for unused capacity from adjacent regions to be re-allocated. It is likely therefore with more sophisticated modelling the resultant fill factor would be a bit higher than the 73.5% this model determines.
The beam fill factors were calculated using Matlab and the results are summarised below in Table 6-5.
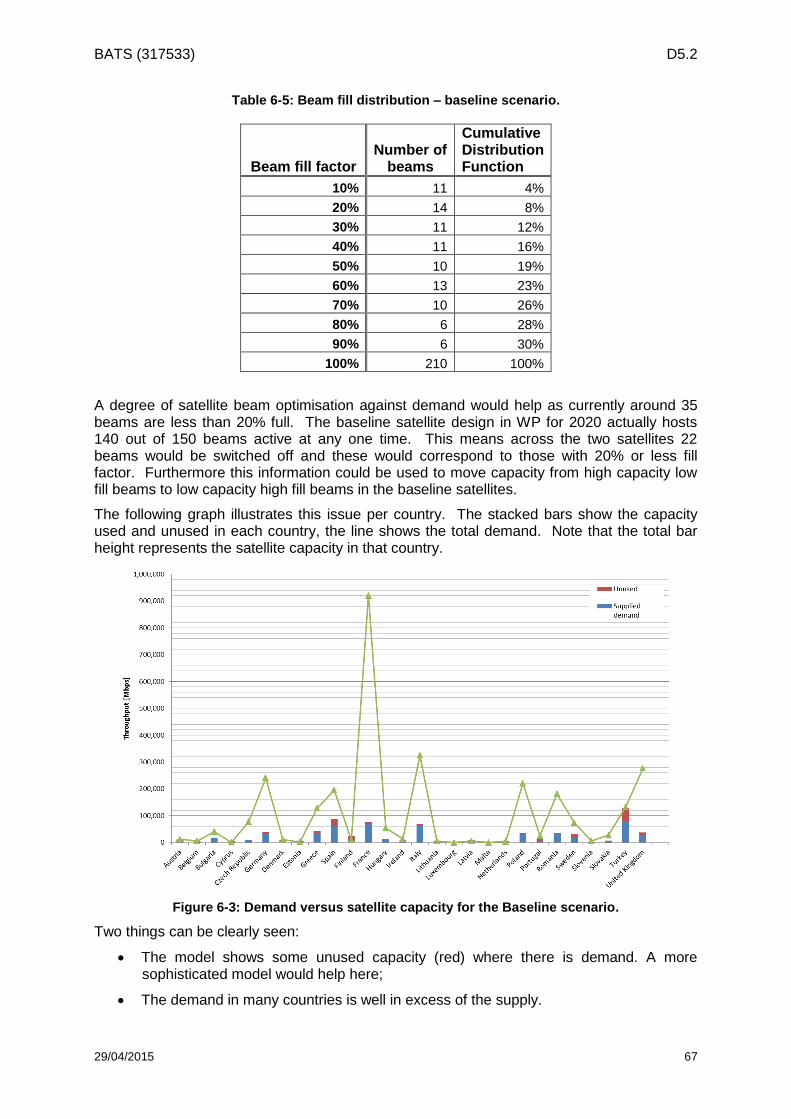
BATS (317533) D5.2
29/04/2015 67
Table 6-5: Beam fill distribution – baseline scenario.
Beam fill factor Number of
beams
Cumulative Distribution Function
10% 11 4%
20% 14 8%
30% 11 12%
40% 11 16%
50% 10 19%
60% 13 23%
70% 10 26%
80% 6 28%
90% 6 30%
100% 210 100%
A degree of satellite beam optimisation against demand would help as currently around 35 beams are less than 20% full. The baseline satellite design in WP for 2020 actually hosts 140 out of 150 beams active at any one time. This means across the two satellites 22 beams would be switched off and these would correspond to those with 20% or less fill factor. Furthermore this information could be used to move capacity from high capacity low fill beams to low capacity high fill beams in the baseline satellites.
The following graph illustrates this issue per country. The stacked bars show the capacity used and unused in each country, the line shows the total demand. Note that the total bar height represents the satellite capacity in that country.
Figure 6-3: Demand versus satellite capacity for the Baseline scenario.
Two things can be clearly seen:
The model shows some unused capacity (red) where there is demand. A more sophisticated model would help here;
The demand in many countries is well in excess of the supply.
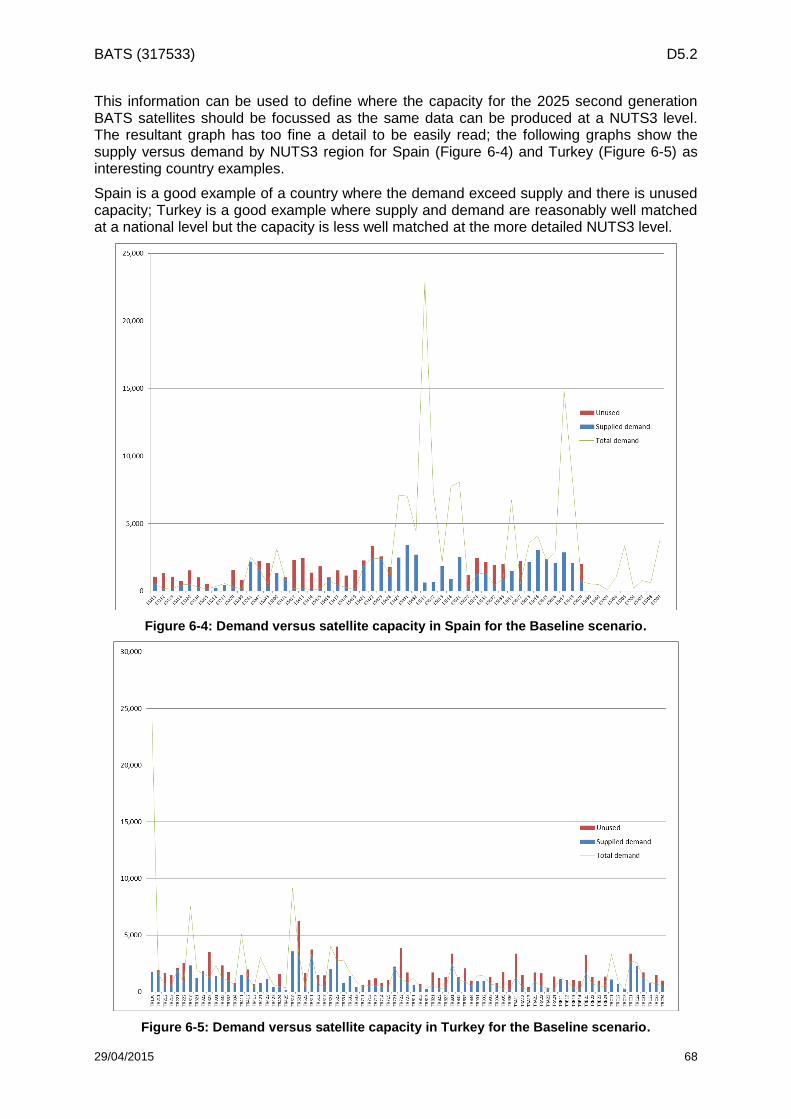
BATS (317533) D5.2
29/04/2015 68
This information can be used to define where the capacity for the 2025 second generation BATS satellites should be focussed as the same data can be produced at a NUTS3 level. The resultant graph has too fine a detail to be easily read; the following graphs show the supply versus demand by NUTS3 region for Spain (Figure 6-4) and Turkey (Figure 6-5) as interesting country examples.
Spain is a good example of a country where the demand exceed supply and there is unused capacity; Turkey is a good example where supply and demand are reasonably well matched at a national level but the capacity is less well matched at the more detailed NUTS3 level.
Figure 6-4: Demand versus satellite capacity in Spain for the Baseline scenario.
Figure 6-5: Demand versus satellite capacity in Turkey for the Baseline scenario.
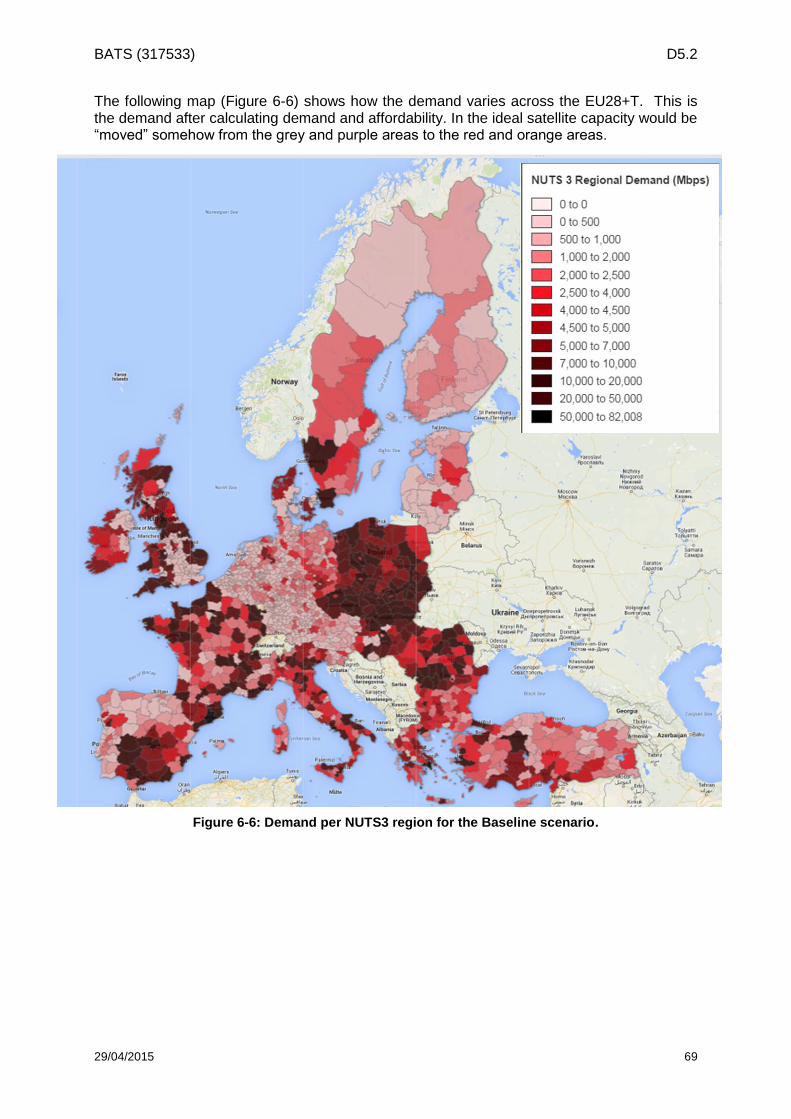
BATS (317533) D5.2
29/04/2015 69
The following map (Figure 6-6) shows how the demand varies across the EU28+T. This is the demand after calculating demand and affordability. In the ideal satellite capacity would be “moved” somehow from the grey and purple areas to the red and orange areas.
Figure 6-6: Demand per NUTS3 region for the Baseline scenario.
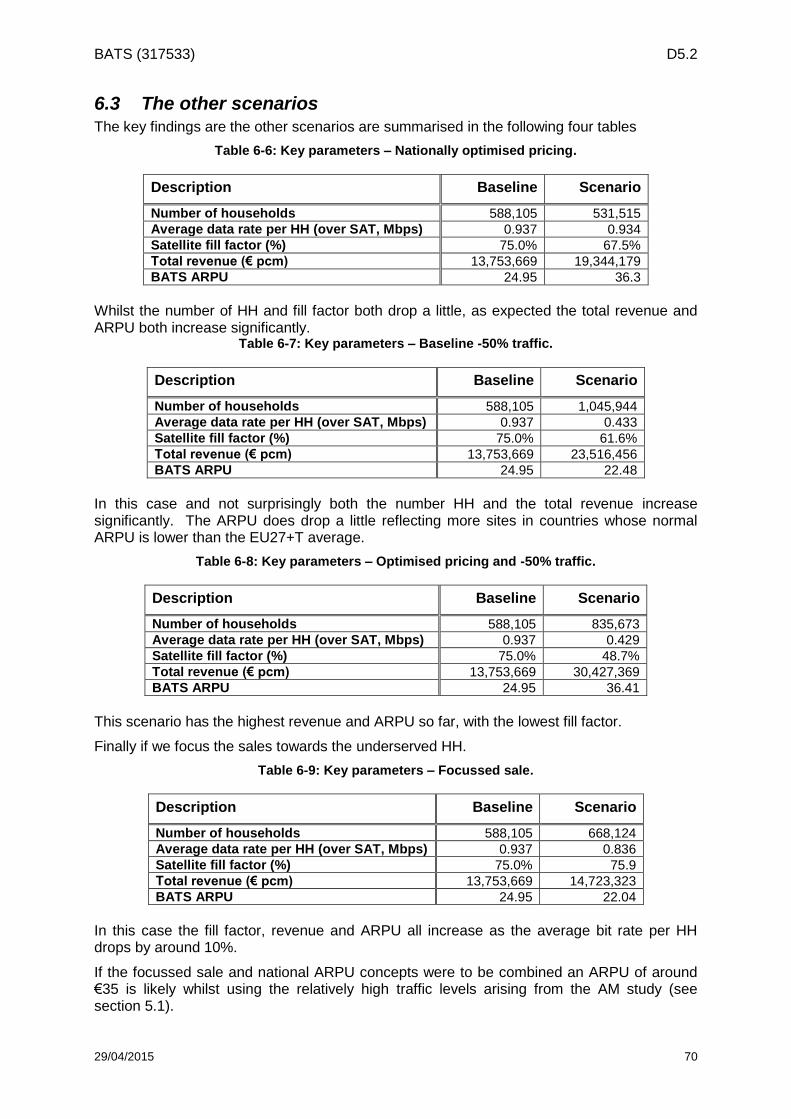
BATS (317533) D5.2
29/04/2015 70
6.3 The other scenarios The key findings are the other scenarios are summarised in the following four tables
Table 6-6: Key parameters – Nationally optimised pricing.
Description Baseline Scenario
Number of households 588,105 531,515
Average data rate per HH (over SAT, Mbps) 0.937 0.934
Satellite fill factor (%) 75.0% 67.5%
Total revenue (€ pcm) 13,753,669 19,344,179
BATS ARPU 24.95 36.3
Whilst the number of HH and fill factor both drop a little, as expected the total revenue and ARPU both increase significantly.
Table 6-7: Key parameters – Baseline -50% traffic.
Description Baseline Scenario
Number of households 588,105 1,045,944
Average data rate per HH (over SAT, Mbps) 0.937 0.433
Satellite fill factor (%) 75.0% 61.6%
Total revenue (€ pcm) 13,753,669 23,516,456
BATS ARPU 24.95 22.48
In this case and not surprisingly both the number HH and the total revenue increase significantly. The ARPU does drop a little reflecting more sites in countries whose normal ARPU is lower than the EU27+T average.
Table 6-8: Key parameters – Optimised pricing and -50% traffic.
Description Baseline Scenario
Number of households 588,105 835,673
Average data rate per HH (over SAT, Mbps) 0.937 0.429
Satellite fill factor (%) 75.0% 48.7%
Total revenue (€ pcm) 13,753,669 30,427,369
BATS ARPU 24.95 36.41
This scenario has the highest revenue and ARPU so far, with the lowest fill factor.
Finally if we focus the sales towards the underserved HH.
Table 6-9: Key parameters – Focussed sale.
Description Baseline Scenario
Number of households 588,105 668,124
Average data rate per HH (over SAT, Mbps) 0.937 0.836
Satellite fill factor (%) 75.0% 75.9
Total revenue (€ pcm) 13,753,669 14,723,323
BATS ARPU 24.95 22.04
In this case the fill factor, revenue and ARPU all increase as the average bit rate per HH drops by around 10%.
If the focussed sale and national ARPU concepts were to be combined an ARPU of around €35 is likely whilst using the relatively high traffic levels arising from the AM study (see section 5.1).
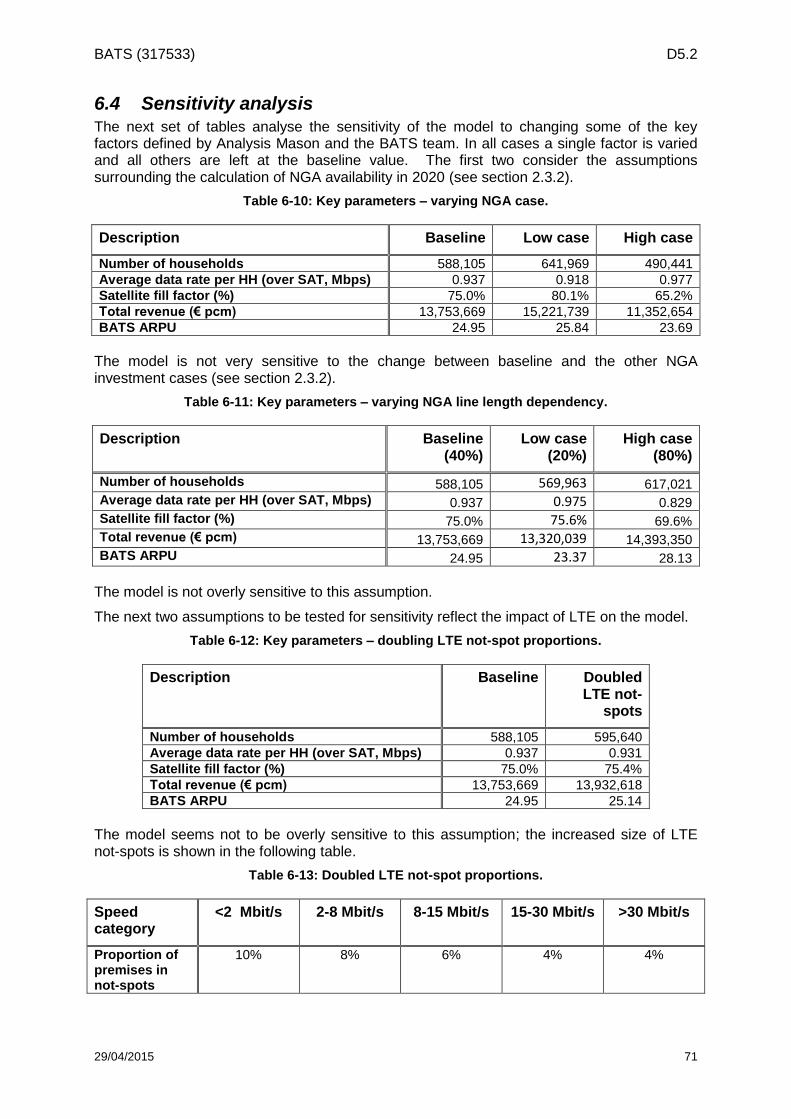
BATS (317533) D5.2
29/04/2015 71
6.4 Sensitivity analysis The next set of tables analyse the sensitivity of the model to changing some of the key factors defined by Analysis Mason and the BATS team. In all cases a single factor is varied and all others are left at the baseline value. The first two consider the assumptions surrounding the calculation of NGA availability in 2020 (see section 2.3.2).
Table 6-10: Key parameters – varying NGA case.
Description Baseline Low case High case
Number of households 588,105 641,969 490,441
Average data rate per HH (over SAT, Mbps) 0.937 0.918 0.977
Satellite fill factor (%) 75.0% 80.1% 65.2%
Total revenue (€ pcm) 13,753,669 15,221,739 11,352,654
BATS ARPU 24.95 25.84 23.69
The model is not very sensitive to the change between baseline and the other NGA investment cases (see section 2.3.2).
Table 6-11: Key parameters – varying NGA line length dependency.
Description Baseline (40%)
Low case (20%)
High case (80%)
Number of households 588,105 569,963 617,021 Average data rate per HH (over SAT, Mbps) 0.937 0.975 0.829 Satellite fill factor (%) 75.0% 75.6% 69.6% Total revenue (€ pcm) 13,753,669 13,320,039 14,393,350 BATS ARPU 24.95 23.37 28.13
The model is not overly sensitive to this assumption.
The next two assumptions to be tested for sensitivity reflect the impact of LTE on the model.
Table 6-12: Key parameters – doubling LTE not-spot proportions.
Description Baseline Doubled LTE not-
spots
Number of households 588,105 595,640
Average data rate per HH (over SAT, Mbps) 0.937 0.931
Satellite fill factor (%) 75.0% 75.4%
Total revenue (€ pcm) 13,753,669 13,932,618
BATS ARPU 24.95 25.14
The model seems not to be overly sensitive to this assumption; the increased size of LTE not-spots is shown in the following table.
Table 6-13: Doubled LTE not-spot proportions.
Speed category
<2 Mbit/s 2-8 Mbit/s 8-15 Mbit/s 15-30 Mbit/s >30 Mbit/s
Proportion of premises in not-spots
10% 8% 6% 4% 4%
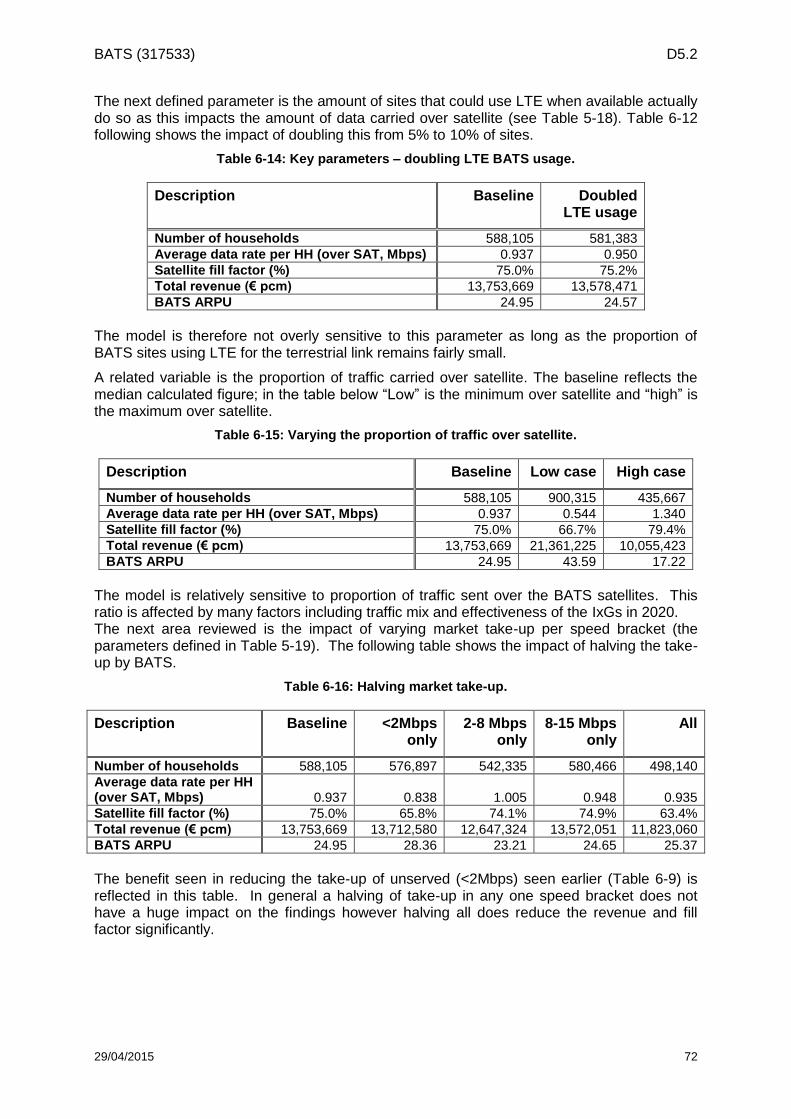
BATS (317533) D5.2
29/04/2015 72
The next defined parameter is the amount of sites that could use LTE when available actually do so as this impacts the amount of data carried over satellite (see Table 5-18). Table 6-12 following shows the impact of doubling this from 5% to 10% of sites.
Table 6-14: Key parameters – doubling LTE BATS usage.
Description Baseline Doubled LTE usage
Number of households 588,105 581,383
Average data rate per HH (over SAT, Mbps) 0.937 0.950
Satellite fill factor (%) 75.0% 75.2%
Total revenue (€ pcm) 13,753,669 13,578,471
BATS ARPU 24.95 24.57
The model is therefore not overly sensitive to this parameter as long as the proportion of BATS sites using LTE for the terrestrial link remains fairly small.
A related variable is the proportion of traffic carried over satellite. The baseline reflects the median calculated figure; in the table below “Low” is the minimum over satellite and “high” is the maximum over satellite.
Table 6-15: Varying the proportion of traffic over satellite.
Description Baseline Low case High case
Number of households 588,105 900,315 435,667 Average data rate per HH (over SAT, Mbps) 0.937 0.544 1.340 Satellite fill factor (%) 75.0% 66.7% 79.4% Total revenue (€ pcm) 13,753,669 21,361,225 10,055,423 BATS ARPU 24.95 43.59 17.22
The model is relatively sensitive to proportion of traffic sent over the BATS satellites. This ratio is affected by many factors including traffic mix and effectiveness of the IxGs in 2020. The next area reviewed is the impact of varying market take-up per speed bracket (the parameters defined in Table 5-19). The following table shows the impact of halving the take-up by BATS.
Table 6-16: Halving market take-up.
Description Baseline <2Mbps only
2-8 Mbps only
8-15 Mbps only
All
Number of households 588,105 576,897 542,335 580,466 498,140
Average data rate per HH (over SAT, Mbps) 0.937 0.838 1.005 0.948 0.935
Satellite fill factor (%) 75.0% 65.8% 74.1% 74.9% 63.4%
Total revenue (€ pcm) 13,753,669 13,712,580 12,647,324 13,572,051 11,823,060
BATS ARPU 24.95 28.36 23.21 24.65 25.37
The benefit seen in reducing the take-up of unserved (<2Mbps) seen earlier (Table 6-9) is reflected in this table. In general a halving of take-up in any one speed bracket does not have a huge impact on the findings however halving all does reduce the revenue and fill factor significantly.

BATS (317533) D5.2
29/04/2015 73
6.5 Summary of findings The suitability of the baseline model can be significantly improved by:
Moving to more optimised beam capacity on the satellite;
Optimising the service price per country against affordability;
Optimising sales on the underserved and “topping-up” with unserved sites to get the maximum number of paying customers supporting the satellite investment.
The calculations are based on the Analysys Mason traffic data which appear to be somewhat high, reducing the traffic naturally makes the service more affordable as the BATS satellites can support more end users.

BATS (317533) D5.2
29/04/2015 74
Intentionally blank
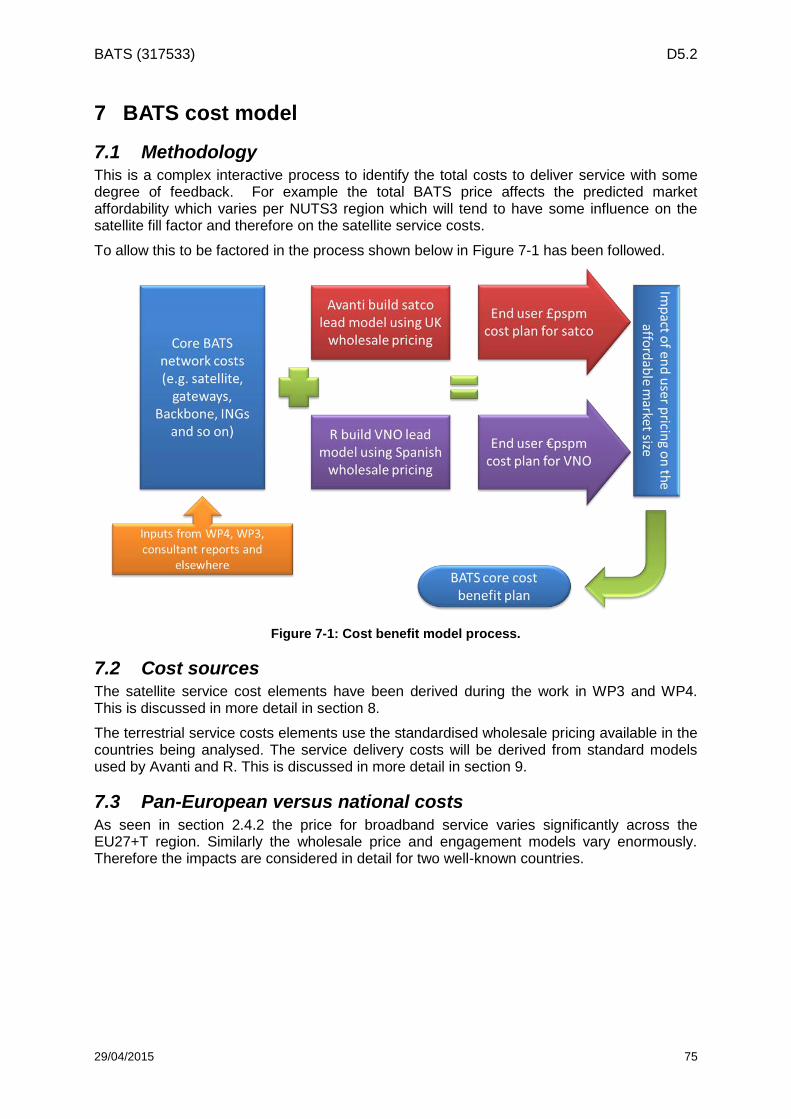
BATS (317533) D5.2
29/04/2015 75
7 BATS cost model
7.1 Methodology This is a complex interactive process to identify the total costs to deliver service with some degree of feedback. For example the total BATS price affects the predicted market affordability which varies per NUTS3 region which will tend to have some influence on the satellite fill factor and therefore on the satellite service costs.
To allow this to be factored in the process shown below in Figure 7-1 has been followed.
Figure 7-1: Cost benefit model process.
7.2 Cost sources The satellite service cost elements have been derived during the work in WP3 and WP4. This is discussed in more detail in section 8.
The terrestrial service costs elements use the standardised wholesale pricing available in the countries being analysed. The service delivery costs will be derived from standard models used by Avanti and R. This is discussed in more detail in section 9.
7.3 Pan-European versus national costs As seen in section 2.4.2 the price for broadband service varies significantly across the EU27+T region. Similarly the wholesale price and engagement models vary enormously. Therefore the impacts are considered in detail for two well-known countries.

BATS (317533) D5.2
29/04/2015 76
Intentionally blank

BATS (317533) D5.2
29/04/2015 77
8 BATS satellite service element cost model
8.1 Scope The satellite service cost model uses a simplified standard model to cover the central costs required to provide the BATS satellite service element. The extent of this is shown within the green edged box in Figure 8-1 below.
Figure 8-1: Satellite service cost benefit model extent.
The VSAT and IUG required for the complete satellite service will be obtained wholesale, installed and managed by the service provided so their costs are considered in section 9.
The costs for the 2020 satellite network with Q/V feeders will be considered.
8.2 Cost elements
8.2.1 Spacecraft
WP4 provided a cost range of $640M to $760M to cover the satellite bus and payload along with the launch for the first two (“baseline”) satellites. Noting that both the bus and launch costs are reasonably well known and comparing with other research projects it is reasonable to assume the lower end figure which equates to €518M.
This cost can then be considered to be written off over the 15 year project life with a 6.5% cost of money (a typical industry figure in 2014 and as used in the BB Med study [18]).
In addition a sum needs to be paid for orbital insurance. From the BB Med study this costs 1.5% in year one declining linearly to 0% at the end of year 15.
In addition there are license costs for the orbital slots and the gateway transmit licenses. For two satellites in one slot and 40GW sites this equates to around €300k per year.
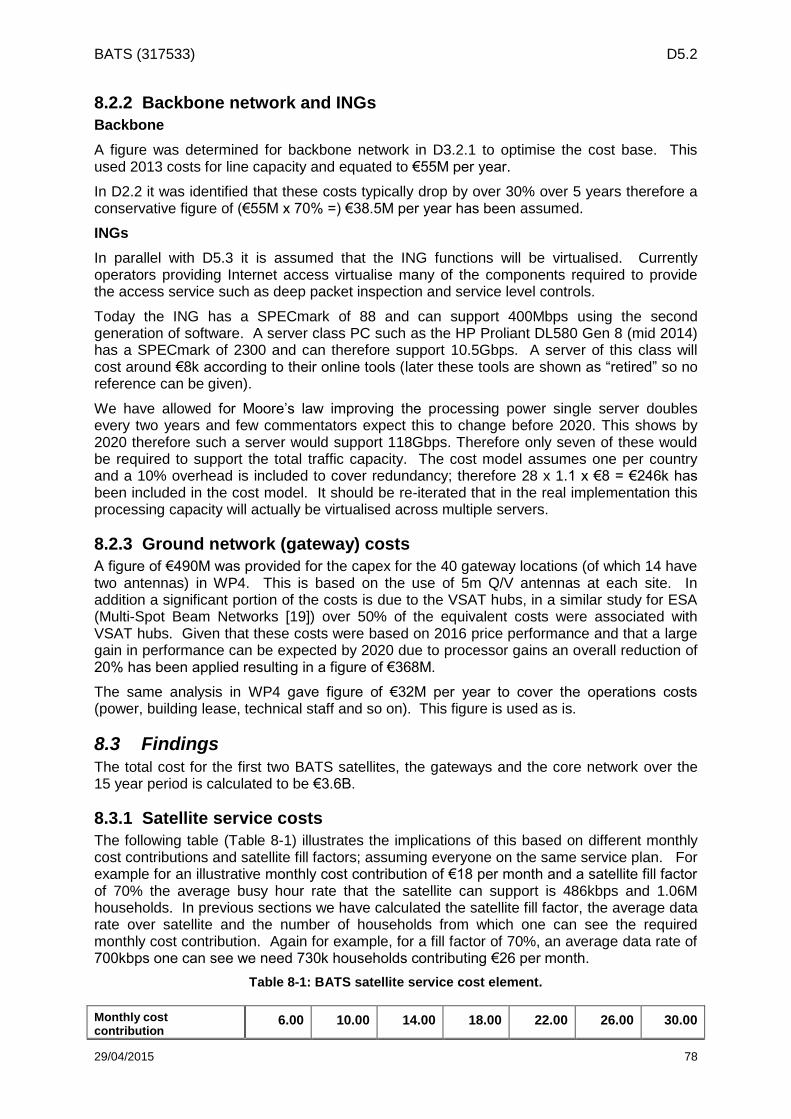
BATS (317533) D5.2
29/04/2015 78
8.2.2 Backbone network and INGs
Backbone
A figure was determined for backbone network in D3.2.1 to optimise the cost base. This used 2013 costs for line capacity and equated to €55M per year.
In D2.2 it was identified that these costs typically drop by over 30% over 5 years therefore a conservative figure of (€55M x 70% =) €38.5M per year has been assumed.
INGs
In parallel with D5.3 it is assumed that the ING functions will be virtualised. Currently operators providing Internet access virtualise many of the components required to provide the access service such as deep packet inspection and service level controls.
Today the ING has a SPECmark of 88 and can support 400Mbps using the second generation of software. A server class PC such as the HP Proliant DL580 Gen 8 (mid 2014) has a SPECmark of 2300 and can therefore support 10.5Gbps. A server of this class will cost around €8k according to their online tools (later these tools are shown as “retired” so no reference can be given).
We have allowed for Moore’s law improving the processing power single server doubles every two years and few commentators expect this to change before 2020. This shows by 2020 therefore such a server would support 118Gbps. Therefore only seven of these would be required to support the total traffic capacity. The cost model assumes one per country and a 10% overhead is included to cover redundancy; therefore 28 x 1.1 x €8 = €246k has been included in the cost model. It should be re-iterated that in the real implementation this processing capacity will actually be virtualised across multiple servers.
8.2.3 Ground network (gateway) costs
A figure of €490M was provided for the capex for the 40 gateway locations (of which 14 have two antennas) in WP4. This is based on the use of 5m Q/V antennas at each site. In addition a significant portion of the costs is due to the VSAT hubs, in a similar study for ESA (Multi-Spot Beam Networks [19]) over 50% of the equivalent costs were associated with VSAT hubs. Given that these costs were based on 2016 price performance and that a large gain in performance can be expected by 2020 due to processor gains an overall reduction of 20% has been applied resulting in a figure of €368M.
The same analysis in WP4 gave figure of €32M per year to cover the operations costs (power, building lease, technical staff and so on). This figure is used as is.
8.3 Findings The total cost for the first two BATS satellites, the gateways and the core network over the 15 year period is calculated to be €3.6B.
8.3.1 Satellite service costs
The following table (Table 8-1) illustrates the implications of this based on different monthly cost contributions and satellite fill factors; assuming everyone on the same service plan. For example for an illustrative monthly cost contribution of €18 per month and a satellite fill factor of 70% the average busy hour rate that the satellite can support is 486kbps and 1.06M households. In previous sections we have calculated the satellite fill factor, the average data rate over satellite and the number of households from which one can see the required monthly cost contribution. Again for example, for a fill factor of 70%, an average data rate of 700kbps one can see we need 730k households contributing €26 per month.
Table 8-1: BATS satellite service cost element.
Monthly cost contribution
6.00 10.00 14.00 18.00 22.00 26.00 30.00
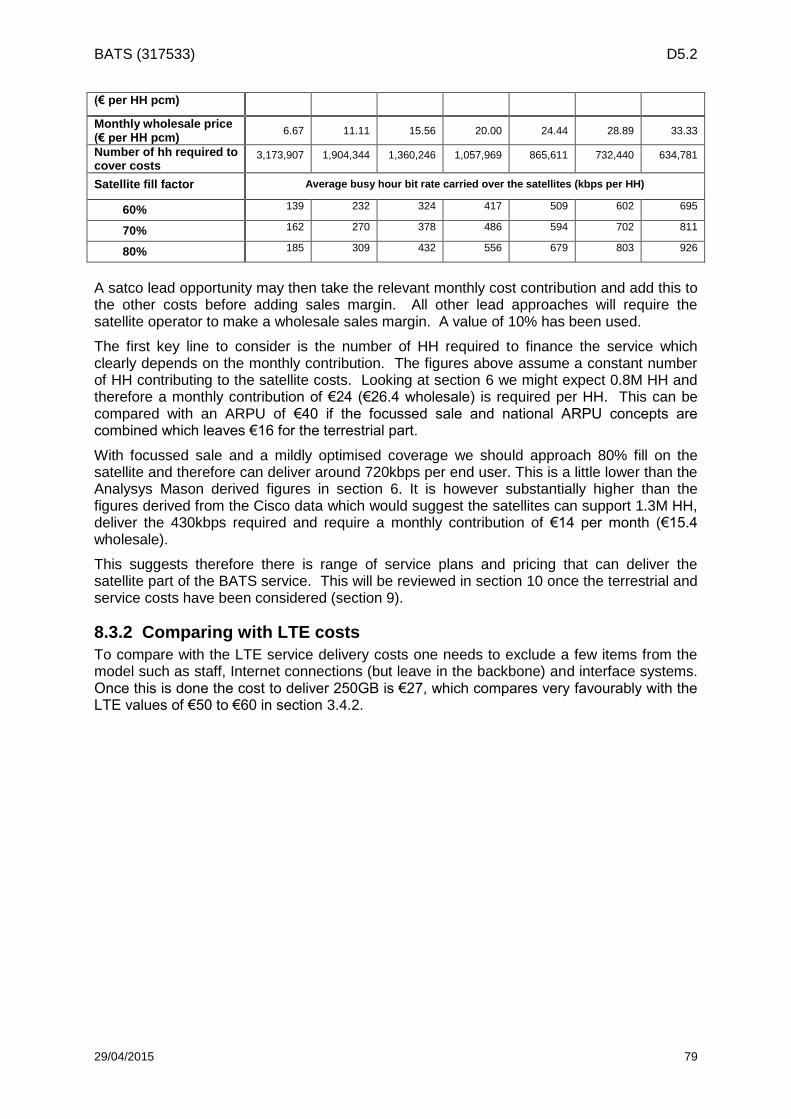
BATS (317533) D5.2
29/04/2015 79
(€ per HH pcm)
Monthly wholesale price (€ per HH pcm)
6.67 11.11 15.56 20.00 24.44 28.89 33.33
Number of hh required to cover costs
3,173,907 1,904,344 1,360,246 1,057,969 865,611 732,440 634,781
Satellite fill factor Average busy hour bit rate carried over the satellites (kbps per HH)
60% 139 232 324 417 509 602 695
70% 162 270 378 486 594 702 811
80% 185 309 432 556 679 803 926
A satco lead opportunity may then take the relevant monthly cost contribution and add this to the other costs before adding sales margin. All other lead approaches will require the satellite operator to make a wholesale sales margin. A value of 10% has been used.
The first key line to consider is the number of HH required to finance the service which clearly depends on the monthly contribution. The figures above assume a constant number of HH contributing to the satellite costs. Looking at section 6 we might expect 0.8M HH and therefore a monthly contribution of €24 (€26.4 wholesale) is required per HH. This can be compared with an ARPU of €40 if the focussed sale and national ARPU concepts are combined which leaves €16 for the terrestrial part.
With focussed sale and a mildly optimised coverage we should approach 80% fill on the satellite and therefore can deliver around 720kbps per end user. This is a little lower than the Analysys Mason derived figures in section 6. It is however substantially higher than the figures derived from the Cisco data which would suggest the satellites can support 1.3M HH, deliver the 430kbps required and require a monthly contribution of €14 per month (€15.4 wholesale).
This suggests therefore there is range of service plans and pricing that can deliver the satellite part of the BATS service. This will be reviewed in section 10 once the terrestrial and service costs have been considered (section 9).
8.3.2 Comparing with LTE costs
To compare with the LTE service delivery costs one needs to exclude a few items from the model such as staff, Internet connections (but leave in the backbone) and interface systems. Once this is done the cost to deliver 250GB is €27, which compares very favourably with the LTE values of €50 to €60 in section 3.4.2.

BATS (317533) D5.2
29/04/2015 80
Intentionally blank
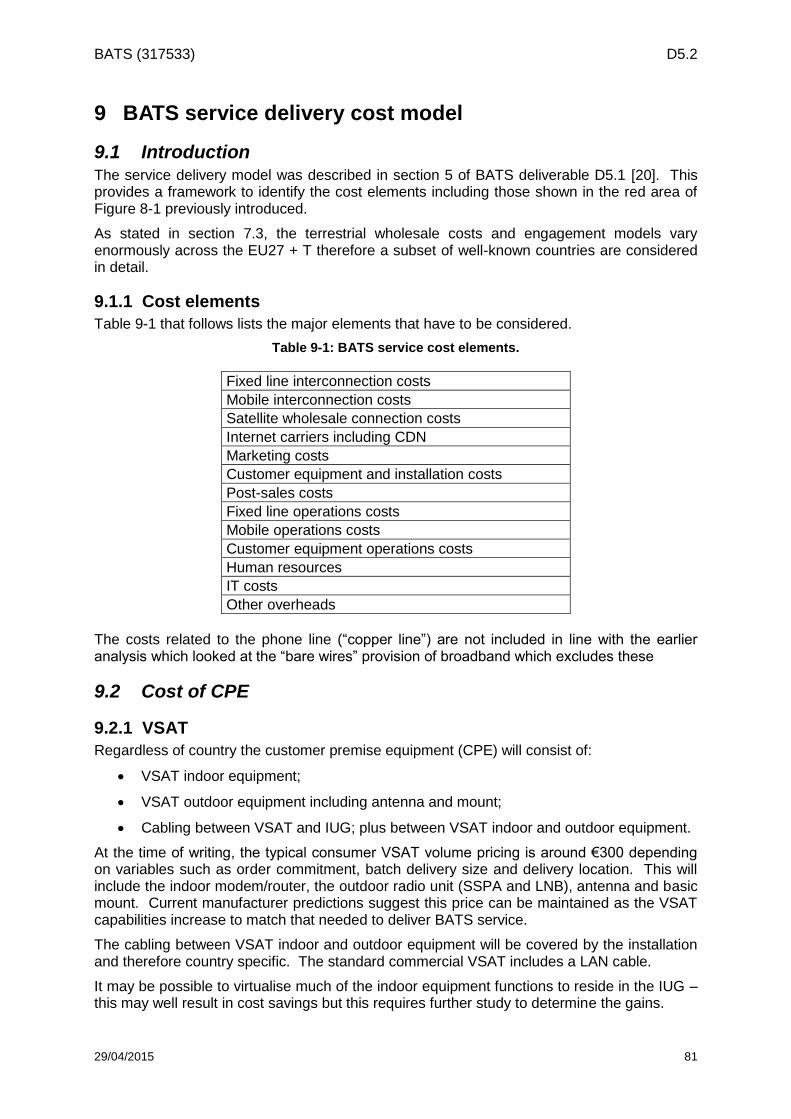
BATS (317533) D5.2
29/04/2015 81
9 BATS service delivery cost model
9.1 Introduction The service delivery model was described in section 5 of BATS deliverable D5.1 [20]. This provides a framework to identify the cost elements including those shown in the red area of Figure 8-1 previously introduced.
As stated in section 7.3, the terrestrial wholesale costs and engagement models vary enormously across the EU27 + T therefore a subset of well-known countries are considered in detail.
9.1.1 Cost elements
Table 9-1 that follows lists the major elements that have to be considered.
Table 9-1: BATS service cost elements.
Fixed line interconnection costs
Mobile interconnection costs
Satellite wholesale connection costs
Internet carriers including CDN
Marketing costs
Customer equipment and installation costs
Post-sales costs
Fixed line operations costs
Mobile operations costs
Customer equipment operations costs
Human resources
IT costs
Other overheads
The costs related to the phone line (“copper line”) are not included in line with the earlier analysis which looked at the “bare wires” provision of broadband which excludes these
9.2 Cost of CPE
9.2.1 VSAT
Regardless of country the customer premise equipment (CPE) will consist of:
VSAT indoor equipment;
VSAT outdoor equipment including antenna and mount;
Cabling between VSAT and IUG; plus between VSAT indoor and outdoor equipment.
At the time of writing, the typical consumer VSAT volume pricing is around €300 depending on variables such as order commitment, batch delivery size and delivery location. This will include the indoor modem/router, the outdoor radio unit (SSPA and LNB), antenna and basic mount. Current manufacturer predictions suggest this price can be maintained as the VSAT capabilities increase to match that needed to deliver BATS service.
The cabling between VSAT indoor and outdoor equipment will be covered by the installation and therefore country specific. The standard commercial VSAT includes a LAN cable.
It may be possible to virtualise much of the indoor equipment functions to reside in the IUG – this may well result in cost savings but this requires further study to determine the gains.
BATS (317533) D5.2
29/04/2015 82
9.2.2 IUG
The IDU market is split in two very different markets for access routers: residential “boxes” and business routers. Generally end-users have no choice but to receive the router supplied by the Service Provider. In this context, the shipment volume and schedule are keys to determine the pricing.
Residential routers, usually called “box”, are the evolution of the year 2000 ADSL modem that was providing basic connectivity from an ATM or PPP link to the subscriber home via a USB or RJ45 Ethernet port for single computer LAN. Residential boxes have evolved to sophisticated platforms to address the dual-play (Internet + fixed phone), triple-play (dual-play + TV) and quad-play ((triple-play + mobile phone) markets. Functionalities now include features such as Wi-Fi, HDD, content management, multi-screen video delivery, home automation and also more advanced features for gamers or even Small-Office, Home Office (SOHO). It is obvious that greater functionality will exist in 2020 to support even more services such as home automation and entertainment.
Business routers come with enhanced reliability, both hardware and software, stronger security with firewall and VPN, and flexible configurable Quality of Service to fit the business requirements for confidentiality and availability as well as to better support critical applications. Business routers support more DSL flavors, sometime fiber and/or cable.
The industry is converging towards (embedded) Linux, available distributions cannot always fulfil the requirements and both residential and business routers integrate third-party software with the associated fees, for voice coding, firewalling and others. Those fees are not expected to get lower, obsolete licences being replaced with new innovations. Initiatives such as Open Services Gateway Initiative (now OSGi Alliance) launched in 1999 target a dramatic reduction the software development cost but have proved generally successful so far.
Not only is the business software more expensive than consumer software, reflecting of the higher stability and wider diversity, but the component and manufacturing requirements quality are usually stronger on business routers. Note there are exceptions considering the much higher residential volumes – as return/repair must be kept as low as possible.
Looking ahead a major CPE re-architecture must be taken into account: the 2020 CPE will leverage the current Software Defined Network work of the Broadband Forum and IETF on Network Function Virtualization (NFV). Allowing the Service Provider to reduce the overall system cost by centralizing its functions in the already optimized datacenter in a Network Virtual Function infrastructure (NFVi), the IDU renamed vCPE (v standing for virtual) is expected to rely on a lower-cost platform. The standard is far from stable and there are open debates today on how much lower this cost will be and also how dual-headed functions such as Hybrid Access will be implemented. The cost predictions below cannot therefore take this evolution into account with accuracy.
From a hardware prospective, the BATS IUG prototype relies on a surface mounted PCB with discrete CPU, memory and interfaces to achieve short time to market for products to build to a maximum of about a hundred thousand units. The industrialization of the solution will be a single box integrated equipment with Consumer and Business versions. For the envisioned production volumes, the unnecessary hardware will be first removed (extra ports for example) or adjusted (RAM and storage for example) and a System on a Chip (SOC) technology will be chosen as the more cost effective technology thanks to the integration of all those components into, potentially, a single Integrated Circuit (IC). The total number of components will drive the final price.
From a production point of view, residential and business routers are built on the same assembly lines by the same Electronic Manufacturing Services (EMS) as the volume falls in the High Mix Low Volume (HMLV) category. For example, a HMLV EMS may produce tens of thousands of both residential and business boxes on the same lines in the next month. EMS prices consist of the manufacturing line amortization per produced unit and the human resources.
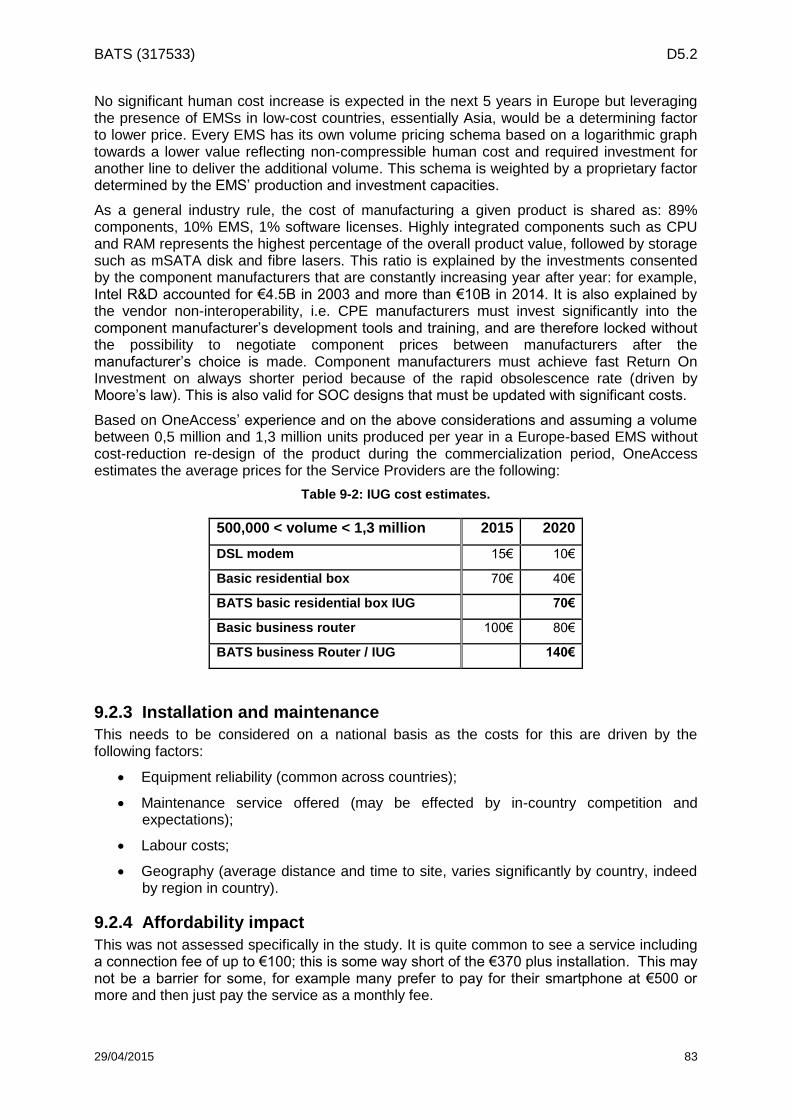
BATS (317533) D5.2
29/04/2015 83
No significant human cost increase is expected in the next 5 years in Europe but leveraging the presence of EMSs in low-cost countries, essentially Asia, would be a determining factor to lower price. Every EMS has its own volume pricing schema based on a logarithmic graph towards a lower value reflecting non-compressible human cost and required investment for another line to deliver the additional volume. This schema is weighted by a proprietary factor determined by the EMS’ production and investment capacities.
As a general industry rule, the cost of manufacturing a given product is shared as: 89% components, 10% EMS, 1% software licenses. Highly integrated components such as CPU and RAM represents the highest percentage of the overall product value, followed by storage such as mSATA disk and fibre lasers. This ratio is explained by the investments consented by the component manufacturers that are constantly increasing year after year: for example, Intel R&D accounted for €4.5B in 2003 and more than €10B in 2014. It is also explained by the vendor non-interoperability, i.e. CPE manufacturers must invest significantly into the component manufacturer’s development tools and training, and are therefore locked without the possibility to negotiate component prices between manufacturers after the manufacturer’s choice is made. Component manufacturers must achieve fast Return On Investment on always shorter period because of the rapid obsolescence rate (driven by Moore’s law). This is also valid for SOC designs that must be updated with significant costs.
Based on OneAccess’ experience and on the above considerations and assuming a volume between 0,5 million and 1,3 million units produced per year in a Europe-based EMS without cost-reduction re-design of the product during the commercialization period, OneAccess estimates the average prices for the Service Providers are the following:
Table 9-2: IUG cost estimates.
500,000 < volume < 1,3 million 2015 2020
DSL modem 15€ 10€
Basic residential box 70€ 40€
BATS basic residential box IUG 70€
Basic business router 100€ 80€
BATS business Router / IUG 140€
9.2.3 Installation and maintenance
This needs to be considered on a national basis as the costs for this are driven by the following factors:
Equipment reliability (common across countries);
Maintenance service offered (may be effected by in-country competition and expectations);
Labour costs;
Geography (average distance and time to site, varies significantly by country, indeed by region in country).
9.2.4 Affordability impact
This was not assessed specifically in the study. It is quite common to see a service including a connection fee of up to €100; this is some way short of the €370 plus installation. This may not be a barrier for some, for example many prefer to pay for their smartphone at €500 or more and then just pay the service as a monthly fee.
BATS (317533) D5.2
29/04/2015 84
Other customers may prefer to see this cost bundled in to their monthly service plan. If, say, €360 is funded over 3 years this equates to €10 per month plus any cost of money.
9.3 Service delivery costs in Spain (MVNO Lead) In this section we look at the cost analysis of BATS service delivery from an MVNO point of view with particular attention to Spanish cost models. The analysis is based on current prices for DSL and Mobile traffic.
MVNOs bear, as of today, a traffic/GB wholesale cost at least an order of magnitude higher that that specified in the section 3.4.2 for MNO LTE traffic total costs (250GB instead of 25GB per month). This Gigabyte monthly price for MVNO applies both to 3G and LTE and, although is supposed to be lower in the LTE case, still is much higher that the MNO LTE internal price used in 3.4.2.
A reflection of this price is that today’s MVNO are offering flat data rates in the order of 1-2GB/month, while in this document 100GB and 250GB cases in 2020 are studied.
For the fixed line side of the monthly costs, the situation is similar although less dramatic. The wholesale cost for the DSL operator hosted in the incumbent fixed network amounts roughly to the end user price forecasted in this document.
Bearing the former two points in mind, there are three ways for the MVNO model to fit in the BATS business case:
To assume that, during the 2015-2020 period, wholesale costs for both mobile and
fixed networks will be dramatically reduced through enforced regulation; a calculation
on the required % of reduction is offered below;
To bundle the BATS service with other more profitable services, using the BATS
service as a hook to sell to an underserved premise mobile, paytv, home automation
and other services; a calculation on how much margin has to recovered is offered
below;
To use public grants and other subsidies covering leftover costs.
9.3.1 Detailed view of Service delivery costs in Spain (MVNO Lead)
For this analysis the total cost of BATS service delivery is divided into direct and indirect costs.
Direct costs include satellite cost function and operation costs, which depend on the market scenario. In Table 9-3 is reported the analysis done in previous sections of the EU27+Turkey market parameters for all scenarios. Monthly satellite costs per HH are highlighted together with the average data rate per HH over satellite and BATS ARPU.
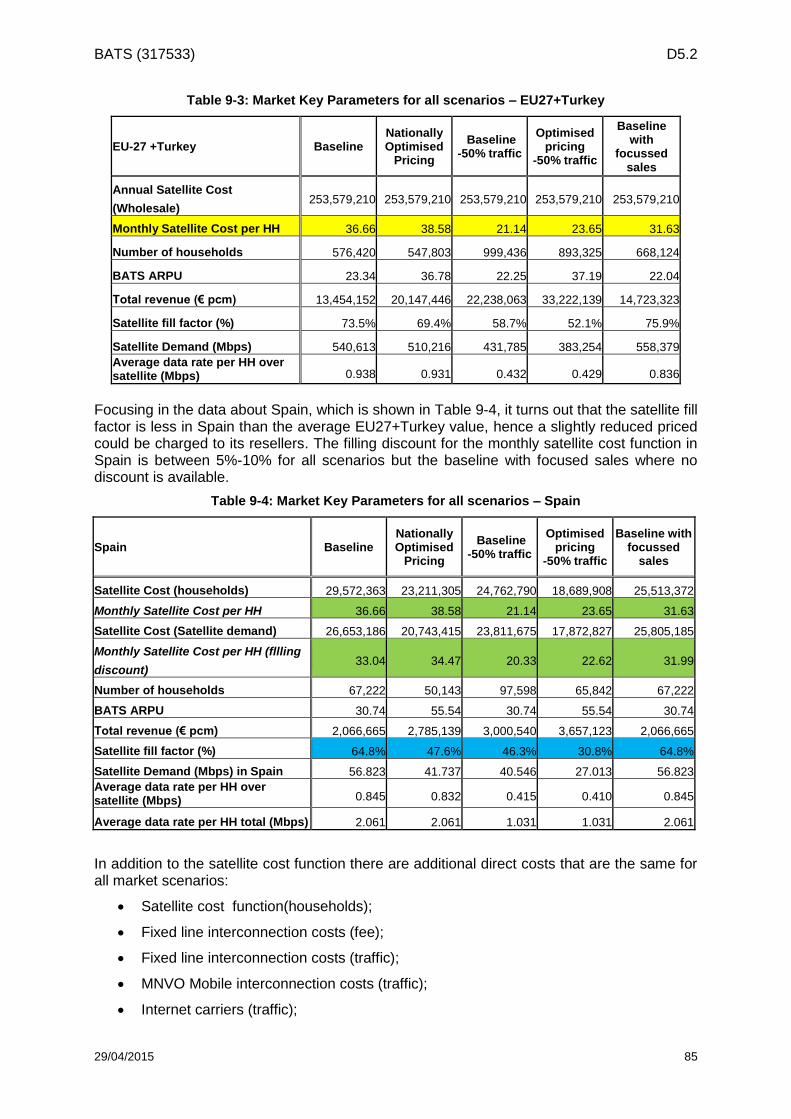
BATS (317533) D5.2
29/04/2015 85
Table 9-3: Market Key Parameters for all scenarios – EU27+Turkey
EU-27 +Turkey Baseline Nationally Optimised
Pricing
Baseline -50% traffic
Optimised pricing
-50% traffic
Baseline with
focussed sales
Annual Satellite Cost
(Wholesale) 253,579,210 253,579,210 253,579,210 253,579,210 253,579,210
Monthly Satellite Cost per HH 36.66 38.58 21.14 23.65 31.63
Number of households 576,420 547,803 999,436 893,325 668,124
BATS ARPU 23.34 36.78 22.25 37.19 22.04
Total revenue (€ pcm) 13,454,152 20,147,446 22,238,063 33,222,139 14,723,323
Satellite fill factor (%) 73.5% 69.4% 58.7% 52.1% 75.9%
Satellite Demand (Mbps) 540,613 510,216 431,785 383,254 558,379
Average data rate per HH over satellite (Mbps) 0.938 0.931 0.432 0.429 0.836
Focusing in the data about Spain, which is shown in Table 9-4, it turns out that the satellite fill factor is less in Spain than the average EU27+Turkey value, hence a slightly reduced priced could be charged to its resellers. The filling discount for the monthly satellite cost function in Spain is between 5%-10% for all scenarios but the baseline with focused sales where no discount is available.
Table 9-4: Market Key Parameters for all scenarios – Spain
Spain Baseline Nationally Optimised
Pricing
Baseline -50% traffic
Optimised pricing
-50% traffic
Baseline with focussed
sales
Satellite Cost (households) 29,572,363 23,211,305 24,762,790 18,689,908 25,513,372
Monthly Satellite Cost per HH 36.66 38.58 21.14 23.65 31.63
Satellite Cost (Satellite demand) 26,653,186 20,743,415 23,811,675 17,872,827 25,805,185
Monthly Satellite Cost per HH (fllling
discount) 33.04 34.47 20.33 22.62 31.99
Number of households 67,222 50,143 97,598 65,842 67,222
BATS ARPU 30.74 55.54 30.74 55.54 30.74
Total revenue (€ pcm) 2,066,665 2,785,139 3,000,540 3,657,123 2,066,665
Satellite fill factor (%) 64.8% 47.6% 46.3% 30.8% 64.8%
Satellite Demand (Mbps) in Spain 56.823 41.737 40.546 27.013 56.823
Average data rate per HH over satellite (Mbps) 0.845 0.832 0.415 0.410 0.845
Average data rate per HH total (Mbps) 2.061 2.061 1.031 1.031 2.061
In addition to the satellite cost function there are additional direct costs that are the same for all market scenarios:
Satellite cost function(households);
Fixed line interconnection costs (fee);
Fixed line interconnection costs (traffic);
MNVO Mobile interconnection costs (traffic);
Internet carriers (traffic);
BATS (317533) D5.2
29/04/2015 86
Customer equipment and installation costs;
Post-sales costs;
Fixed line operations costs;
Mobile operations costs;
Customer equipment operations costs.
The cost estimation for DSL is based on the NEBA DSL model (or Neuvo Servicio Ethernet de Banda Ancha – Telefonica Spain’s wholesale DSL service), the new bitstream service offering by Telefonica which has just been approved by the Spanish telecom regulator and charges Spanish operators by peak capacity. Each additional simultaneous Mbps in the “province” interconnection point has to be accounted for and has a different pricing per each QoS type (best effort or real time).
It follows an example of Spain DSL traffic cost for BATS service using the data rates reported in Table 9-4.
The cost of each “peak Mbps” at interconnection points in Spain is €21.19 pcm. If we consider BATS with baseline scenario and with speed bracket 0-2Mbps, wherein the average date rate over satellite per HH is 0.845Mbps, we have 1.21Mbps average data rate over the terrestrial path which translates in €14.55 pcm for direct DSL traffic cost. Both costs have been derived applying best effort QoS price.
All other costs are real costs obtained from real operators averaged per customer.
Besides the direct costs, there are the indirect costs which do not depend on DSL/wireless speed offered and consist of operator network amortization, marketing costs, human resources, IT costs and other overheads.
These costs values are real costs obtained from real operators averaged per customer:
MVNO general Network amortisation cost
Marketing costs
Human resources
IT costs
Other overheads
The MVNO general network amortisation cost allows one to eliminate annual capital expenditure and include an amount that takes into account all capital costs incurred in the past needed for the as operational expenditure of the MVNO operator
Putting all together, there is a general result for each speed scenario, given that each speed bracket has a different allocation of traffic in the satellite, terrestrial and wireless segments. The results are reported in Table 9-5, Table 9.6 and Table 9-7 together with the profit/loss analysis for each DSL speed and each market scenario.
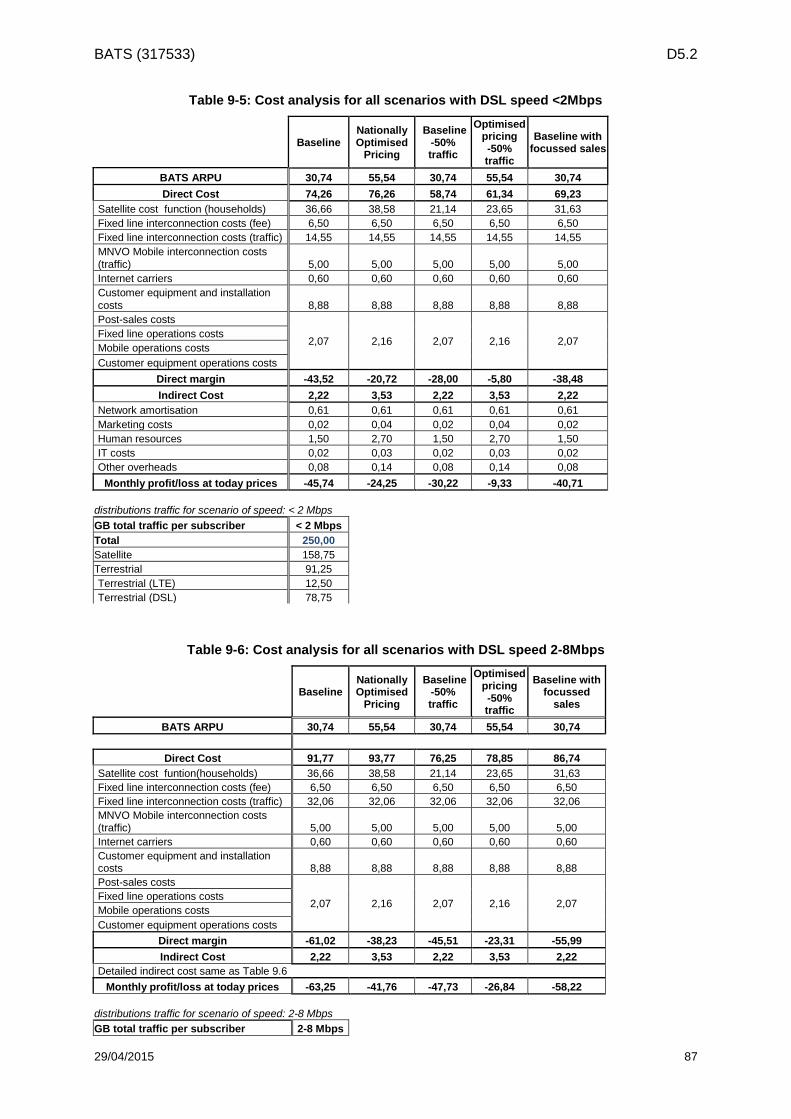
BATS (317533) D5.2
29/04/2015 87
Table 9-5: Cost analysis for all scenarios with DSL speed <2Mbps
Baseline Nationally Optimised
Pricing
Baseline -50% traffic
Optimised pricing -50% traffic
Baseline with focussed sales
BATS ARPU 30,74 55,54 30,74 55,54 30,74
Direct Cost 74,26 76,26 58,74 61,34 69,23
Satellite cost function (households) 36,66 38,58 21,14 23,65 31,63
Fixed line interconnection costs (fee) 6,50 6,50 6,50 6,50 6,50
Fixed line interconnection costs (traffic) 14,55 14,55 14,55 14,55 14,55
MNVO Mobile interconnection costs
(traffic) 5,00 5,00 5,00 5,00 5,00
Internet carriers 0,60 0,60 0,60 0,60 0,60
Customer equipment and installation
costs 8,88 8,88 8,88 8,88 8,88
Post-sales costs
2,07 2,16 2,07 2,16 2,07 Fixed line operations costs
Mobile operations costs
Customer equipment operations costs
Direct margin -43,52 -20,72 -28,00 -5,80 -38,48
Indirect Cost 2,22 3,53 2,22 3,53 2,22
Network amortisation 0,61 0,61 0,61 0,61 0,61
Marketing costs 0,02 0,04 0,02 0,04 0,02
Human resources 1,50 2,70 1,50 2,70 1,50
IT costs 0,02 0,03 0,02 0,03 0,02
Other overheads 0,08 0,14 0,08 0,14 0,08
Monthly profit/loss at today prices -45,74 -24,25 -30,22 -9,33 -40,71
distributions traffic for scenario of speed: < 2 Mbps
GB total traffic per subscriber < 2 Mbps
Total 250,00
Satellite 158,75
Terrestrial 91,25
Terrestrial (LTE) 12,50
Terrestrial (DSL) 78,75
Table 9-6: Cost analysis for all scenarios with DSL speed 2-8Mbps
Baseline Nationally Optimised
Pricing
Baseline -50% traffic
Optimised pricing -50% traffic
Baseline with focussed
sales
BATS ARPU 30,74 55,54 30,74 55,54 30,74
Direct Cost 91,77 93,77 76,25 78,85 86,74
Satellite cost funtion(households) 36,66 38,58 21,14 23,65 31,63
Fixed line interconnection costs (fee) 6,50 6,50 6,50 6,50 6,50
Fixed line interconnection costs (traffic) 32,06 32,06 32,06 32,06 32,06
MNVO Mobile interconnection costs (traffic) 5,00 5,00 5,00 5,00 5,00
Internet carriers 0,60 0,60 0,60 0,60 0,60
Customer equipment and installation costs 8,88 8,88 8,88 8,88 8,88
Post-sales costs
2,07 2,16 2,07 2,16 2,07 Fixed line operations costs
Mobile operations costs
Customer equipment operations costs
Direct margin -61,02 -38,23 -45,51 -23,31 -55,99
Indirect Cost 2,22 3,53 2,22 3,53 2,22
Detailed indirect cost same as Table 9.6
Monthly profit/loss at today prices -63,25 -41,76 -47,73 -26,84 -58,22
distributions traffic for scenario of speed: 2-8 Mbps
GB total traffic per subscriber 2-8 Mbps
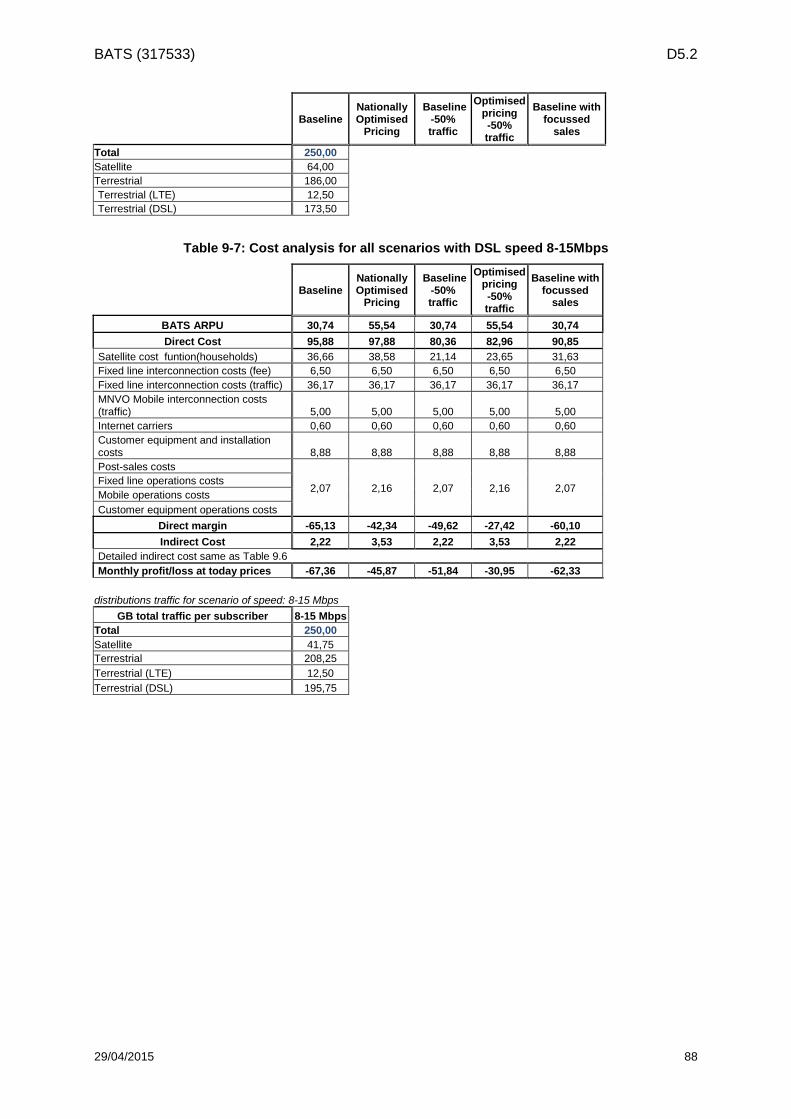
BATS (317533) D5.2
29/04/2015 88
Baseline Nationally Optimised
Pricing
Baseline -50% traffic
Optimised pricing -50% traffic
Baseline with focussed
sales
Total 250,00
Satellite 64,00
Terrestrial 186,00
Terrestrial (LTE) 12,50
Terrestrial (DSL) 173,50
Table 9-7: Cost analysis for all scenarios with DSL speed 8-15Mbps
Baseline Nationally Optimised
Pricing
Baseline -50% traffic
Optimised pricing -50% traffic
Baseline with focussed
sales
BATS ARPU 30,74 55,54 30,74 55,54 30,74
Direct Cost 95,88 97,88 80,36 82,96 90,85
Satellite cost funtion(households) 36,66 38,58 21,14 23,65 31,63
Fixed line interconnection costs (fee) 6,50 6,50 6,50 6,50 6,50
Fixed line interconnection costs (traffic) 36,17 36,17 36,17 36,17 36,17
MNVO Mobile interconnection costs (traffic) 5,00 5,00 5,00 5,00 5,00
Internet carriers 0,60 0,60 0,60 0,60 0,60
Customer equipment and installation costs 8,88 8,88 8,88 8,88 8,88
Post-sales costs
2,07 2,16 2,07 2,16 2,07 Fixed line operations costs
Mobile operations costs
Customer equipment operations costs
Direct margin -65,13 -42,34 -49,62 -27,42 -60,10
Indirect Cost 2,22 3,53 2,22 3,53 2,22
Detailed indirect cost same as Table 9.6
Monthly profit/loss at today prices -67,36 -45,87 -51,84 -30,95 -62,33
distributions traffic for scenario of speed: 8-15 Mbps
GB total traffic per subscriber 8-15 Mbps
Total 250,00
Satellite 41,75
Terrestrial 208,25
Terrestrial (LTE) 12,50
Terrestrial (DSL) 195,75
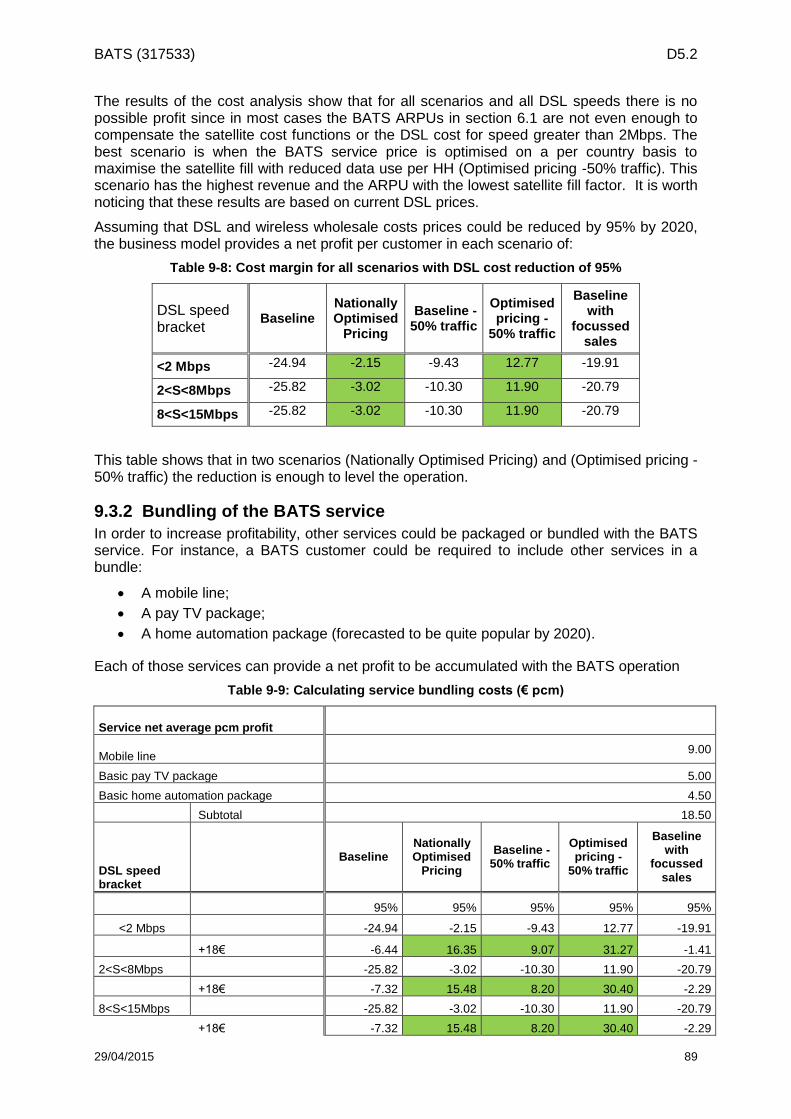
BATS (317533) D5.2
29/04/2015 89
The results of the cost analysis show that for all scenarios and all DSL speeds there is no possible profit since in most cases the BATS ARPUs in section 6.1 are not even enough to compensate the satellite cost functions or the DSL cost for speed greater than 2Mbps. The best scenario is when the BATS service price is optimised on a per country basis to maximise the satellite fill with reduced data use per HH (Optimised pricing -50% traffic). This scenario has the highest revenue and the ARPU with the lowest satellite fill factor. It is worth noticing that these results are based on current DSL prices.
Assuming that DSL and wireless wholesale costs prices could be reduced by 95% by 2020, the business model provides a net profit per customer in each scenario of:
Table 9-8: Cost margin for all scenarios with DSL cost reduction of 95%
DSL speed bracket
Baseline Nationally Optimised
Pricing
Baseline -50% traffic
Optimised pricing -
50% traffic
Baseline with
focussed sales
<2 Mbps -24.94 -2.15 -9.43 12.77 -19.91
2<S<8Mbps -25.82 -3.02 -10.30 11.90 -20.79
8<S<15Mbps -25.82 -3.02 -10.30 11.90 -20.79
This table shows that in two scenarios (Nationally Optimised Pricing) and (Optimised pricing -50% traffic) the reduction is enough to level the operation.
9.3.2 Bundling of the BATS service
In order to increase profitability, other services could be packaged or bundled with the BATS service. For instance, a BATS customer could be required to include other services in a bundle:
A mobile line;
A pay TV package;
A home automation package (forecasted to be quite popular by 2020).
Each of those services can provide a net profit to be accumulated with the BATS operation
Table 9-9: Calculating service bundling costs (€ pcm)
Service net average pcm profit
Mobile line 9.00
Basic pay TV package 5.00
Basic home automation package 4.50
Subtotal 18.50
DSL speed bracket
Baseline Nationally Optimised
Pricing
Baseline -50% traffic
Optimised pricing -
50% traffic
Baseline with
focussed sales
95% 95% 95% 95% 95%
<2 Mbps -24.94 -2.15 -9.43 12.77 -19.91
+18€ -6.44 16.35 9.07 31.27 -1.41
2<S<8Mbps -25.82 -3.02 -10.30 11.90 -20.79
+18€ -7.32 15.48 8.20 30.40 -2.29
8<S<15Mbps -25.82 -3.02 -10.30 11.90 -20.79
+18€ -7.32 15.48 8.20 30.40 -2.29
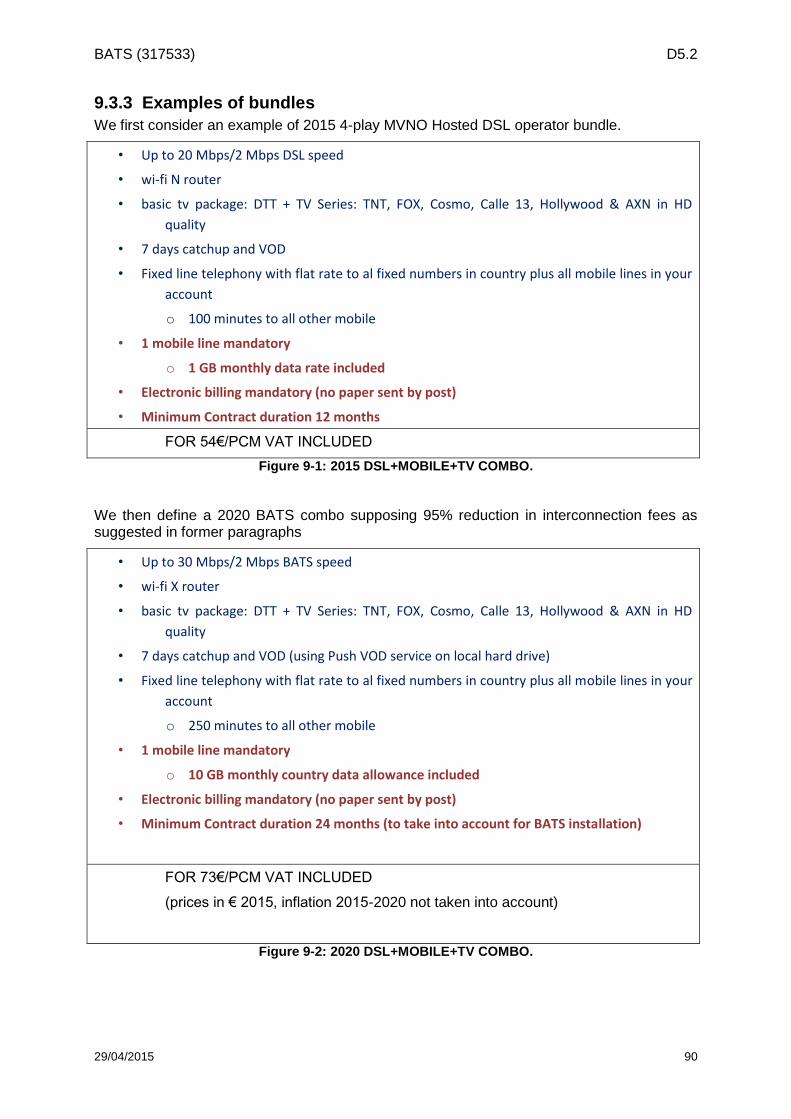
BATS (317533) D5.2
29/04/2015 90
9.3.3 Examples of bundles
We first consider an example of 2015 4-play MVNO Hosted DSL operator bundle.
• Up to 20 Mbps/2 Mbps DSL speed
• wi-fi N router
• basic tv package: DTT + TV Series: TNT, FOX, Cosmo, Calle 13, Hollywood & AXN in HD
quality
• 7 days catchup and VOD
• Fixed line telephony with flat rate to al fixed numbers in country plus all mobile lines in your
account
o 100 minutes to all other mobile
• 1 mobile line mandatory
o 1 GB monthly data rate included
• Electronic billing mandatory (no paper sent by post)
• Minimum Contract duration 12 months
FOR 54€/PCM VAT INCLUDED
Figure 9-1: 2015 DSL+MOBILE+TV COMBO.
We then define a 2020 BATS combo supposing 95% reduction in interconnection fees as suggested in former paragraphs
• Up to 30 Mbps/2 Mbps BATS speed
• wi-fi X router
• basic tv package: DTT + TV Series: TNT, FOX, Cosmo, Calle 13, Hollywood & AXN in HD
quality
• 7 days catchup and VOD (using Push VOD service on local hard drive)
• Fixed line telephony with flat rate to al fixed numbers in country plus all mobile lines in your
account
o 250 minutes to all other mobile
• 1 mobile line mandatory
o 10 GB monthly country data allowance included
• Electronic billing mandatory (no paper sent by post)
• Minimum Contract duration 24 months (to take into account for BATS installation)
FOR 73€/PCM VAT INCLUDED
(prices in € 2015, inflation 2015-2020 not taken into account)
Figure 9-2: 2020 DSL+MOBILE+TV COMBO.
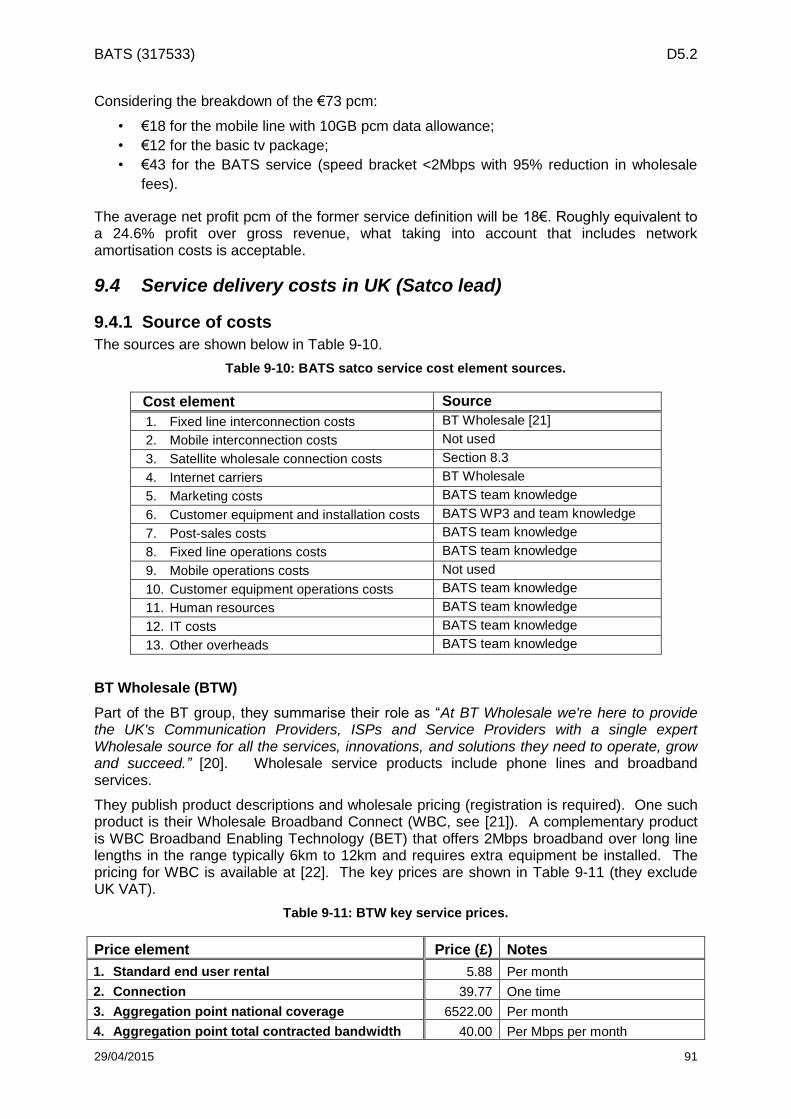
BATS (317533) D5.2
29/04/2015 91
Considering the breakdown of the €73 pcm:
• €18 for the mobile line with 10GB pcm data allowance;
• €12 for the basic tv package;
• €43 for the BATS service (speed bracket <2Mbps with 95% reduction in wholesale
fees).
The average net profit pcm of the former service definition will be 18€. Roughly equivalent to a 24.6% profit over gross revenue, what taking into account that includes network amortisation costs is acceptable.
9.4 Service delivery costs in UK (Satco lead)
9.4.1 Source of costs
The sources are shown below in Table 9-10.
Table 9-10: BATS satco service cost element sources.
Cost element Source
1. Fixed line interconnection costs BT Wholesale [21]
2. Mobile interconnection costs Not used
3. Satellite wholesale connection costs Section 8.3
4. Internet carriers BT Wholesale
5. Marketing costs BATS team knowledge
6. Customer equipment and installation costs BATS WP3 and team knowledge
7. Post-sales costs BATS team knowledge
8. Fixed line operations costs BATS team knowledge
9. Mobile operations costs Not used
10. Customer equipment operations costs BATS team knowledge
11. Human resources BATS team knowledge
12. IT costs BATS team knowledge
13. Other overheads BATS team knowledge
BT Wholesale (BTW)
Part of the BT group, they summarise their role as “At BT Wholesale we're here to provide the UK's Communication Providers, ISPs and Service Providers with a single expert Wholesale source for all the services, innovations, and solutions they need to operate, grow and succeed.” [20]. Wholesale service products include phone lines and broadband services.
They publish product descriptions and wholesale pricing (registration is required). One such product is their Wholesale Broadband Connect (WBC, see [21]). A complementary product is WBC Broadband Enabling Technology (BET) that offers 2Mbps broadband over long line lengths in the range typically 6km to 12km and requires extra equipment be installed. The pricing for WBC is available at [22]. The key prices are shown in Table 9-11 (they exclude UK VAT).
Table 9-11: BTW key service prices.
Price element Price (£) Notes
1. Standard end user rental 5.88 Per month
2. Connection 39.77 One time
3. Aggregation point national coverage 6522.00 Per month
4. Aggregation point total contracted bandwidth 40.00 Per Mbps per month
BATS (317533) D5.2
29/04/2015 92
In 2014 AM state that the average subscriber requires 409kbps in the busy hour, so consider a large reseller where item 3 is negligible (say ~100,000 customers, equating to ~£0.07 per HH per month). This equates to a wholesale monthly price of £5.88 + £0.07 + £40 * 0.409Mbps = £22.31 which is considerably higher than the national ARPU they quote of €16.99 (or about £13.50 at €1.26 = £1).
Given that the reseller needs to make some margin and that the end user rental is fixed this suggests either a hidden discount or significant overbooking on the access point bandwidth. If one assumes a high volume 10% retail margin then one can estimate the effective bandwidth as follows:
ARPU £13.50; Less margin of 10% £1.35 £12.15; Less rental £5.88 £ 6.27; Less aggregation and other ~£1.27 ~£5.00.
This leaves around £5 per month to cover the aggregated bandwidth, £5/£40 => around 125kbps per HH is allocated, about a twentieth (1/20th) of the Analysys Mason figure.
To be fair Analysys Mason has published its views on this in two articles on their web site [24][25], one of which states clearly that:
“In most countries where the development of non-linear IPTV services leads to a significant change in average traffic profile, regulators and operators will need to revisit the pricing structure of bitstream and VULA [Virtual Unbundled Local Access] offers in order to ensure replicability. This is likely to result in a reduced variable component of bitstream and VULA prices and, potentially, in an increased fixed component.”.
Ofcom are reviewing the market requirements for VULA in UK at the time of writing [26].
It is likely that the successful users of wholesale capacity from BT Openreach who also offer unbundling and do not publish their pricing. BT Openreach [27] is the infrastructure division of BT. It was established in 2006 following an agreement between BT and Ofcom to ensure that rival telecom operators have equality of access to BT's local network.
Openreach manages BT's local access network which connects customers to their local telephone exchange, starting at the Main Distribution Frame (MDF) in the exchange and ending at the network termination point (NTP) at the end user's premises. Openreach also manages the connections between the MDF and the BT Wholesale/Local Loop Unbundling (LLU) termination points located in the exchange, often referred to as “jumper connections.”
So we can consider what sort of values would retain the ARPU levels and deliver the 2020 NGA traffic that Analysys Mason predicts. If we arbitrarily set the rental to £8 per month this leaves £3 for the bandwidth of 2.47Mbps, which equates to £1.28 per Mbps, more than thirty times cheaper than today. Leaving the fixed part unchanged at £5.88 results in £2 per Mbps (twenty times cheaper). In the absence of available BT Openreach pricing we will cost on the latter basis (£2 per Mbps per month).
In [28] ISPreview reported in October 2013 that “Dido Harding, CEO of TalkTalk, said: “We pay £7.50-£8 per home per month for a superfast broadband connection” which is consistent with analysis above and below in section 9.4.3.
9.4.2 Should we include mobile in the UK calculations?
Given that in section 3 we found that the costs and particularly the service delivery of LTE (and LTE-A) fell short of the requirements these will not be included in the UK cost model.
BATS (317533) D5.2
29/04/2015 93
9.4.3 Calculating service cost
From the baseline spreadsheet (section 6.2) we can determine that there are 24,090 HH consuming 26,769Mbps of satellite capacity which equates to 1.11Mbps per HH. AM predict that total bandwidth per HH in 2020 will be 2.47Mbps therefore the terrestrial traffic will be 1.36Mbps. With the same bandwidth demands and optimised ARPU the equivalent figures are 21,351HH, 23,644Mbps; hence still 1.11Mbps over satellite and 1.36Mbps carried terrestrially.
From section 9.4.1 we can calculate the raw terrestrial service monthly costs as follows:
Rental £5.88 €7.41; Bandwidth (1.36 x £2) £2.72 €3.43; Total xDSL 21CN service £8.60 €10.84.
From the data provided by AM the baseline ARPU (national ARPU + 50%) for the UK is €25.49; and the optimised ARPU is €59.48 per HH per month. Including VAT at 20% the higher ARPU equates to a retail price of £56.65 per month.
The satellite cost model calculates €35 per HH per month to provide the 1.1Mbps needed. As this totals €45.84 when adding the terrestrial costs, clearly therefore the service price will need to close to the €59.48 to leave funds for operations and profit.
If however the bandwidth demands are more in line with that from Cisco then the terrestrial service costs drop to €9.31 and the satellite costs to €18, making a total of €27.31. This means that it will be possible to put together an affordable end user service plan with a target market in excess of 21,350 HH. This, however, is a relatively small number of HH and it is therefore likely that, unless an Ofcom initiative changes things, this is too small to be able to get competitive costs from BT Openreach. It does however indicate that selling the satellite service overlay as a wholesale proposition to an existing UK ISP could be viable.
Referring back to the cost elements in Table 9-10, items 5, 6, 7, 10, 11, 12 and 13 have to be considered on top of the raw terrestrial and satellite costs developed so far. Considering each in turn:
Marketing costs (5)
There is no real opportunity to reach this market sector across multiple countries therefore the marketing has to be specific to the target country, in this case the UK. To develop a national brand awareness would cost millions of pounds per year; spread across the addressable market this would be cost prohibitive (£1M / 25,000HH is £33.33 per month per HH).
This can be offset either by:
a) Supporting an existing brand: This might take the form of using their sales and web site to be responsible for customer acquisition where the brand’s terrestrial reach was inadequate. This might include a small “reward” payment to the brand for each confirmed customer;
b) Government support: This could range from being redirected to a web site to providing names and contact details.
Customer equipment and installation (6) plus Operations (10)
The customer premise equipment (CPE) will consist of:
IUG;
VSAT indoor equipment;
VSAT outdoor equipment including antenna and mount;
Cabling between VSAT and IUG; plus between VSAT indoor and outdoor equipment.
These costs have already been covered in section 9.2.
BATS (317533) D5.2
29/04/2015 94
Unlike some mainland European countries there is no significant precedent for self-installation of satellite antennas in the UK despite this being well within the reach of a competent “handyman”. Therefore we must assume installation by the operator who will employ a combination of in-house technicians and external contractors.
In the UK the typical end user price for installation of a TV antenna and STB is £80 [28] including cabling and VAT; whereas a high volume VSAT installation commercial in a commercial property will be perhaps two or three times higher this however this will include longer cable runs and a more sophisticated antenna mount. A figure of around £75 or €95 (excluding VAT) would seem reasonable for the installation of antenna, indoor components, connection to IUG and service activation.
The implications of whether these upfront costs are prepaid, bundled in some way or subsidised have been considered in section 9.2.4.
Regarding the ongoing operations of the CPE there are no significant costs other than HR (see below).
Post sales costs (7)
The primary cost here is the replacement of CPE due to failure. Typically the first year is covered by manufacturer warranty in the UK. The current general generation of VSAT systems offer a mean time between failures (MTBF) for installed systems in excess of ten years.
The service can either include free repairs and equipment replacement or charge a fixed fee. For example Sky TV charges a fixed fee of £75 after the first year for problems with the Sky+ STB or minidish whereas Virgin Media include maintenance of the STB with their equivalent cable TV service packages.
Given the relatively good MTBF it is proposed that a fixed fee be charged for BATS customer premise equipment failure after the first year.
Human resources and IT costs (11, 12)
The primary human resource dedicated to this kind of service will be in the service desk (SD) team. Of course other people will be involved from time to time however on a per site basis this will be at a very low level and therefore easiest considered within the corporate overhead. If the operator already has an SD then one needs to consider the incremental impact of the support.
One benefit with the BATS technical architecture is that should either the satellite or terrestrial link fail then the end user is still left with internet access via the alternative path, therefore the use of “self-help” via web sites can be encouraged. This can then be supplemented by the use of a premium cost phone number to contact the SD priced to cover the incremental SD costs. It would be reasonable to cap this per event, perhaps by the SD operator script requiring them to call back the end user after a pre-defined period. The residual costs for these exceptional calls can be covered by overheads.
The IT costs relate to the following (all other costs such as operator PC, phone and so on would usually be considered with the overheads):
OSS upgrade;
Server upgrades for additional OSS loads.
Avanti’s OSS has the capability to include end user details such as contact name and number; it also includes end-user access to specific pages. This would need adaptation for the BATS service, not least the inclusion of links to the terrestrial management systems and the IxGs. An approximate figure for this work is 12PM at €500 per day which equates to €112.5k; averaged over 25k sites and 15 years this is €0.025 per site per month. From this it can be seen that the server upgrades will themselves be similarly small compared to the other costs.
BATS (317533) D5.2
29/04/2015 95
Other overheads (13)
Looking at Avanti internal confidential data the overheads can be seen to be around 1% of the cost; which for a €55 service at 15% margin would be a bit below €0.50 per site per month.
9.4.4 Cost benefit findings for the UK
The baseline model costs total around €46.50 including other costs, clearly therefore the service price will need to close to the maximum €59.48 to leave funds for profit. For example a sale price of €55 would deliver a margin of 15.5% and result in sale price including VAT of £52.80 per month.
If however the bandwidth demands are more in line with that from Cisco then the service costs drop to a total of around €28.31. This means that it will be possible to put together an affordable end user service plan with a target market in excess of 21,350 HH. A price around €31.50 would seem achievable (£30.25 including VAT).
This, however, is a relatively small number of HH and it is therefore harder that, unless an Ofcom initiative changes things, to get competitive costs from BT Openreach. Beyond Broadband however suggest in [29] that this should be possible. It does however indicate that selling the satellite service overlay as a wholesale proposition to an existing UK ISP could be viable.
9.5 Others
9.5.1 Turkey
In Turkey, Turk Telecom offer a wholesale xDSL service for €17 per month. This covers “reasonable” bandwidth, interconnection to the Internet and basic CPE management to configure the DSL service.
The ARPU in Turkey is €15.38 (less than the wholesale price) and the AM elasticity model is valid up to €33.55. This leaves just €16.55 for the BATS service which would allow 400kbps to 500kbps over the satellite. This suggests it will be hard to build a reseller service in Turkey even noting that AM predict that their bandwidth demands are towards the lower end at 1.77Mbps in 2020.
Given the market size in Turkey is predicted to be between 90k and 110k this may be sufficient for the incumbent to provide a BATS service with profiles set to maximise the traffic routed via the terrestrial link, perhaps complimented with some form of data capping on the satellite link. It is likely that this can achieve a viable business model.

BATS (317533) D5.2
29/04/2015 96
Intentionally blank
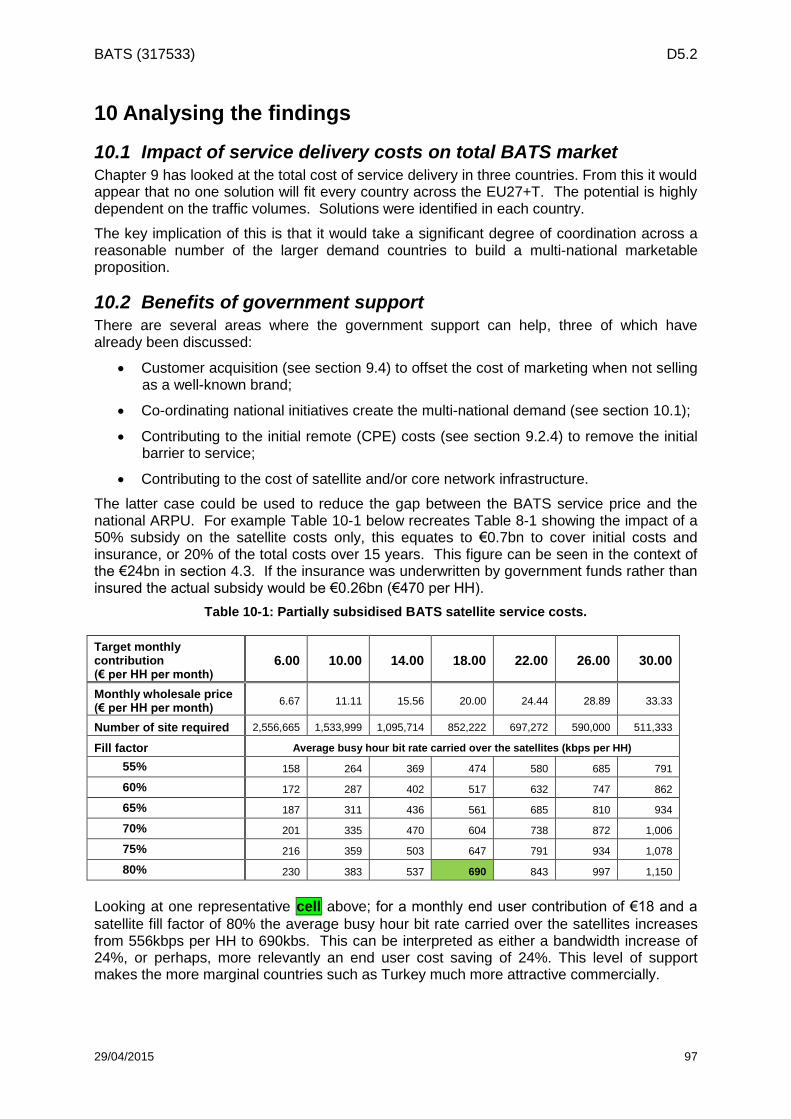
BATS (317533) D5.2
29/04/2015 97
10 Analysing the findings
10.1 Impact of service delivery costs on total BATS market Chapter 9 has looked at the total cost of service delivery in three countries. From this it would appear that no one solution will fit every country across the EU27+T. The potential is highly dependent on the traffic volumes. Solutions were identified in each country.
The key implication of this is that it would take a significant degree of coordination across a reasonable number of the larger demand countries to build a multi-national marketable proposition.
10.2 Benefits of government support There are several areas where the government support can help, three of which have already been discussed:
Customer acquisition (see section 9.4) to offset the cost of marketing when not selling as a well-known brand;
Co-ordinating national initiatives create the multi-national demand (see section 10.1);
Contributing to the initial remote (CPE) costs (see section 9.2.4) to remove the initial barrier to service;
Contributing to the cost of satellite and/or core network infrastructure.
The latter case could be used to reduce the gap between the BATS service price and the national ARPU. For example Table 10-1 below recreates Table 8-1 showing the impact of a 50% subsidy on the satellite costs only, this equates to €0.7bn to cover initial costs and insurance, or 20% of the total costs over 15 years. This figure can be seen in the context of the €24bn in section 4.3. If the insurance was underwritten by government funds rather than insured the actual subsidy would be €0.26bn (€470 per HH).
Table 10-1: Partially subsidised BATS satellite service costs.
Target monthly contribution (€ per HH per month)
6.00 10.00 14.00 18.00 22.00 26.00 30.00
Monthly wholesale price (€ per HH per month)
6.67 11.11 15.56 20.00 24.44 28.89 33.33
Number of site required 2,556,665 1,533,999 1,095,714 852,222 697,272 590,000 511,333
Fill factor Average busy hour bit rate carried over the satellites (kbps per HH)
55% 158 264 369 474 580 685 791
60% 172 287 402 517 632 747 862
65% 187 311 436 561 685 810 934
70% 201 335 470 604 738 872 1,006
75% 216 359 503 647 791 934 1,078
80% 230 383 537 690 843 997 1,150
Looking at one representative cell above; for a monthly end user contribution of €18 and a
satellite fill factor of 80% the average busy hour bit rate carried over the satellites increases from 556kbps per HH to 690kbs. This can be interpreted as either a bandwidth increase of 24%, or perhaps, more relevantly an end user cost saving of 24%. This level of support makes the more marginal countries such as Turkey much more attractive commercially.
BATS (317533) D5.2
29/04/2015 98
10.3 Comparing BATS and non-BATS cost models The limitation of the non-BATS cost model is that provides an average across all HH and not those harder to reach. In other words looking again at Figure 4-3, the non-BATS cost model provides two half costs, the €80bn for those HH to the left of the dashed vertical line, and the €91.6bn to the right of the line; but it is not easy to determine the number of HH this dashed vertical line represents.
Looking at the baseline data provided we have data for 2020 showing total HH with fixed line plus LTE available to provide NGA (224.5M), and fixed line only (no LTE, 6.2M). The report states that the DSL only can serve 61% of the market and LTE takes it to the full 94%. The €91.6bn investment therefore represents 35% of the market which equates to (35/94 x 224.5M =) 81.8M HH. This has a cost of €1120 per HH.
This can perhaps best be compared to the capital investment for the satellite and core network which is €888M to support the number of HH show in in Table 8-1, for example 1.06M HH. This has a cost of €837 per HH, which is 25% cheaper than the investment per household needed to deliver fixed line in place of the anticipated LTE coverage (see section 4.3).
10.4 Commercial Applicability of the BATS In this analysis it has been shown that cost benefit models can be created across a number of representative countries however these vary from country to country. All would benefit from some government support however this is not critical.
Whilst some detailed adaptation of the spacecraft and terrestrial designs can be expected from that described in the deliverables WP3 and WP4 these would not consist of a brand new concept.
The most significant barrier to creating this will be building a set of national plans supporting this multi-national service delivery. Looking at Figure 6-3 it might be envisaged that a commercially funded satellite and backhaul network focussed on supporting the wealthier nations where demand exceeds supply might be the easiest solution to get off the ground, perhaps with the capability to provide some capacity to smaller adjacent countries.
BATS (317533) D5.2
29/04/2015 99
11 Summary and Conclusions
11.1 Summary In chapter 2 we detailed the model provided by Analysys Mason that allowed us to predict the addressable market for the BATS service and to determine at a NUTS3 level the proportion of this that could afford this for a given ARPU in 2020 and 2025. This was analysed over four terrestrial line speed brackets, both with LTE available and where it is not predicted to be. This report also predicted the monthly data volumes plus average busy hour demand per household in 2020. One interesting finding is that there is not one single ARPU that can be used across the EU27+T.
Then in chapter 3 we looked at the prospects for LTE to provide a NGA service to fixed homes by analysing the data from the Zafaco study in Germany (section 3.1). This found some doubts about LTE’s ability to delivery NGA service. BATS also adapted an Analysys Mason cost model to determine the costs per household to support the demands of NGA. This calculation suggests that LTE might be an expensive proposition.
The calculations of the cost to deliver pan-European NGA terrestrially by Analysys Mason were reported in chapter 5 which found that a commercial investment of €80Bn would see 96% of premises of which 61% would be fixed line and 35% would be fixed LTE(-A) delivery. This suggests without BATS satellite can still address 4% of the total European market. They also calculated that for a public contribution of €24Bn along with commercial investment of an additional €69Bn the LTE sites could be serviced by fixed line terrestrial connections.
The predicted traffic rates for 2020 were further reviewed and refined in chapter 5 which found that the Analysys Mason figures were more than twice the size one can derive from the available Cisco data. The Analysys Mason figures were retained as the baseline and sensitivity analyses will be made at half this data rate. Looking at the relationship between headline speed and data consumption one can see that there are home who are rate limited (the connection speed limits their consumption) and homes who are application limited (where it seems the use of applications defines the amount of data consumed not the connection speed). Data caps a bit above the average application limit might prove both beneficial for service management and not obtrusive to most users. A model for predicting the proportion of traffic sent via satellite and via the different categories of terrestrial line was defined and implemented to allow a sensitivity analysis to be made. Finally this chapter describes how the 2020 satellite capacity was apportioned to each NUTS3 region to allow the model to limit the demanded bandwidth to that available.
Chapter 6 predicts the BATS target market and satellite capacity requirements for five scenarios:
Baseline – uses Analysys Mason traffic figures and fixed increase above ARPU;
Nationally optimised pricing – uses Analysys Mason traffic figures and pricing
adjusted to maximise revenue in each country;
Baseline - 50% – uses half of Analysys Mason traffic figures and fixed increase
above ARPU;
Nationally optimised pricing - 50% – uses half of Analysys Mason traffic figures and
pricing adjusted to maximise revenue in each country;
Baseline with focussed sales - uses Analysys Mason traffic figures and fixed increase
above ARPU but selling first to the underserved locations, then to unserved locations
if there is sufficient capacity.
BATS (317533) D5.2
29/04/2015 100
This chapter also looks at the sensitivities to various definitions in the model, in each case comparing with the baseline assumptions. Five key parameters are compared:
Number of households served by BATS;
Average data rate per HH over satellite;
Satellite fill factor;
Total revenue per year;
The BATS service average ARPU across all households served.
The baseline finds that in a number of key countries demand exceeds supply significantly and even in some countries such as Turkey where supply and demand are reasonable well matched nationally there are mismatches at NUTS3 level which means there is unserved demand. This suggests a further round of refining the satellite design to better match supply and demand per beam would be beneficial. The most effective model is to combine focussed sales and optimised ARPU pricing. The main sensitivities are in the amount of data required to be transported over the satellite link and clearly if the traffic volumes end up lower that the consultants expect this benefits matters significantly.
The core network and satellite service elements are considered in chapter 8. These are presented in tabular form where one looks at the satellite fill and average busy hour data rate over satellite. A range of suitable figures are shown. The cost contribution required to deliver 250GB per month is calculated to be around half that for LTE when comparing like for like.
The service costs for the terrestrial part are considered for Spain, UK, and Turkey. One major finding there is that the current wholesale pricing will not allow a MVNO to deliver the service rates predicted for 2020. The need to be address this perhaps with some preferential pricing has been identified. For BATS this has been addressed in Spain by considering bundling different services and using BATS to win new accounts. In the UK it seems possible that an ISP with access to good VULA costs can deliver profitable service even at the baseline traffic levels. The Turkey data suggests that a solution can be found for an incumbent operator who is willing to route as much as possible terrestrially. These will be considered further in WP5.4.
The benefits of government support are considered in chapter 10. This finds that BATS can be made a very attractive proposition for lower investment per household than converting NGA LTE sites to fixed wireless. In summary reasonable commercial solutions can be found for BATS.
BATS (317533) D5.2
29/04/2015 101
11.2 Conclusions We reach the following conclusions:
a) National pricing will be required as there is not one single ARPU that can be used across the EU27+T;
b) Monthly capacity will tend to application limited once a threshold access speed is reached (the thresholds and capacities will vary over time and country);
c) The feasibility of the use of LTE to provide NGA is questioned given the performance in Germany and the costs to deliver the data volumes predicted in 2020;
d) the total investment for a predominantly non-LTE delivery of NGA would be €172.4bn (including €23.6bn intervention funding);
e) The monthly downloads will average between 120GB and 250GB per month with associated average busy hour data rates of 1 to 2Mbps;
f) Video usage will increasingly dominate traffic volumes, this offset to a small degree there will be a small improvement in video codec rates over time;
g) Depending on detailed assumptions the addressable BATS market for 2020 will be 0.5M to1M and this is ultimately satellite capacity limited which suggests some beam capacity optimisation is advisable;
h) The affordable ARPU for the BATS service will be between €25 and €40 per month and varies by country,
i) Optimising the service price per country against affordability and optimising sales on the underserved and “topping-up” with unserved sites to get the maximum number of paying customers supporting the satellite investment will be beneficial;
j) Using the BATS two WP4 “baseline” satellites and backbone will cost around €27 which compares favourably with the LTE costs of €50 to €55.
k) For example 0.8M HH and 80% fill on the satellite and delivering around 720kbps per end user requires a monthly contribution of €24 (€26.4 wholesale) per HH, this can be compared with an ARPU of €40 if the focussed sale and national ARPU concepts are combined which leaves €16 for the terrestrial part;
l) Viable business models can be found on a country by country basis;
a. In Spain a profitable BATS service can be delivered by an MVNO by either bundling this with other services such as TV and phone, or if the wholesale costs are reduced significantly;
b. In the UK a profitable BATS service can be delivered by a satellite operator if it can access the current VULA pricing from BT Openreach rather than the more expensive, regulated BT Wholesale pricing;
c. In Turkey a viable business model looks achievable albeit with either some data capping or with some government investment;
m) Government investment in satellite delivery and BATS to deliver NGA is 25% cheaper per household that benefits than the incremental investment required to deliver with fixed line rather than LTE.
These conclusions will need to be analysed further in D5.4 to articulate the right messages to the various stakeholders.

BATS (317533) D5.2
29/04/2015 102
Intentionally blank
BATS (317533) D5.2
29/04/2015 103
12 References
[1] Eurostat NUTS overview http://ec.europa.eu/eurostat/web/nuts/overview
[2] Fixed network data traffic worldwide: forecasts and analysis 2014–2019, Analysis Mason.
[3] 2012 UK Communications Infrastructure Report, Ofcom http://stakeholders.ofcom.org.uk/binaries/research/telecoms-research/infrastructure-report/Infrastructure-report2012.pdf
[4] 2013 UK Communications Infrastructure Report, Ofcom http://stakeholders.ofcom.org.uk/binaries/research/telecoms-research/infrastructure-report/IRU_2013.pdf
[5] 2014 UK Communications Infrastructure Report, Ofcom http://stakeholders.ofcom.org.uk/binaries/research/infrastructure/2014/infrastructure-14.pdf
[6] http://ec.europa.eu/digital-agenda/en/news/study-socio-economic-impact-bandwidth-smart-20100033
[7] R. Kenny, "Domestic Demand for Bandwidth”, Broadband Stakeholder Group, 2013.
[8] ETSI EG 202 057-4 “Speech Processing, Transmission and Quality Aspects (STQ); User related QoS parameter definitions and measurements; Part 4: Internet access”, http://www.etsi.org/deliver/etsi_eg/202000_202099/20205704/01.01.01_60/eg_20205704v010101p.pdf.
[9] Zafaco GmbH “The Quality of Service of Broadband Accesses II; Study conducted on behalf of the Bundesnetzagentur” 2013, http://www.bundesnetzagentur.de/SharedDocs/Downloads/EN/BNetzA/Areas/Telecommunications/TelecomRegulation/QualityStudy/QualityStudy_2013.pdf?__blob=publicationFile&v=2
[10] Cisco Visual Networking Index, "Forecast and Methodology, 2013-2018" Cisco, 2014.
[11] "VNI Forecast Widget," Cisco, 2014. http://www.ciscovni.com/forecast-widget/advanced.html [Accessed 1 October 2014].
[12] Cisco VNI 2014 report.
[13] Ofcom, "Infrastructure Report," Ofcom, 2013.
[14] Ofcom, "Infrastructure Report," Ofcom, 2014, http://stakeholders.ofcom.org.uk/binaries/research/infrastructure/2014/infrastructure-14.pdf.
[15] Sandvine, "Global Internet Phenomena Report 1H 2014," Sandvine, 2014.
[16] Analysys Mason “LTE as a next-generation access platform in rural markets: cost–benefit analysis”, July 2013.
[17] http://www.qgis.org/en/site/.
[18] ESA ARTES 1 “Broadband Mediterranean Development” (BB-MED), http://artes.esa.int/projects/broadband-mediterranean-development-bb-med.
[19] ESA ARTES 5.1 “Techniques And Technologies For Ultra High Throughput Multi-Spot Beam Networks” MSBN, http://artes.esa.int/projects/techniques-and-technologies-ultra-high-throughput-multi-spot-beam-networks.
[20] BT Wholesale home page https://www.btwholesale.com/pages/static/About_Us/index.htm.
BATS (317533) D5.2
29/04/2015 104
[21] BT Wholesale Broadband Connect (Registration required) https://www.btwholesale.com/pages/static/Products/Broadband/Wholesale_Broadband_Connect/index.htm.
[22] WBC pricing (section 44 part 7) https://www.btwholesale.com/pages/static/Library/Pricing_and_Contractual_Information/Part_7_BT_Wholesale_Broadband_Connect__WBC_/index.htm.
[23] BATS Deliverable D5.1 “Service Deployment and Operational Analysis”; http://batsproject.eu/images/PublicDeliverables/BATS_D5.1_AVA_v1_F.pdf.
[24] Analysys Mason “Without reform of the level and structure of tariffs, some wholesale services will be doomed to irrelevance” Dec 2013, http://www.analysysmason.com/Research/Content/Viewpoints/wholesale-broadband-access-Dec2013-RDTW0/ .
[25] Analysys Mason “Bitstream AND VULA tariffs in several European countries will need rebalancing to enable IPTV replicability”, October 2014, http://www.analysysmason.com/About-Us/News/Newsletter/Bitstream-VULA-IPTV-Oct2014/.
[26] Ofcom June 2014 “Fixed Access Market Reviews: Approach to the VULA margin”, http://stakeholders.ofcom.org.uk/consultations/VULA-margin/.
[27] Wikipedia entry on BT Openreach http://en.wikipedia.org/wiki/Openreach.
[28] ISPReview October 2013 http://www.ispreview.co.uk/index.php/2013/10/talktalk-uk-want-bt-wholesale-charge-isps-4-fttc-broadband.html.
[29] Beyond Broadband “Next Generation Access – regulation of key input products” http://www.beyondbroadband.coop/kb/next-generation-access-%E2%80%93-regulation-key-input-products#_ftn4.
[30] Example Freesat installation offer http://www.currys.co.uk/gbuk/knowhow-freesat-install-424-commercial.html .