cost-benefit analysis of rail electrification for next
TRANSCRIPT
DOT/FRA/ORD-15/28 Final Report August 2015
U.S. Department of Transportation
Federal Railroad Administration
Cost-Benefit Analysis of Rail Electrification for Next Generation Freight and Passenger Rail Transportation
Office of Research, Development, and Technology Washington, DC 20590
NOTICE
This document is disseminated under the sponsorship of the Department of Transportation in the interest of information exchange. The United States Government assumes no liability for its contents or use thereof. Any opinions, findings and conclusions, or recommendations expressed in this material do not necessarily reflect the views or policies of the United States Government, nor does mention of trade names, commercial products, or organizations imply endorsement by the United States Government. The United States Government assumes no liability for the content or use of the material contained in this document.
NOTICE
The United States Government does not endorse products or manufacturers. Trade or manufacturers’ names appear herein solely because they are considered essential to the objective of this report.
i
REPORT DOCUMENTATION PAGE Form Approved OMB No. 0704-0188
Public reporting burden for this collection of information is estimated to average 1 hour per response, including the time for reviewing instructions, searching existing data sources, gathering and maintaining the data needed, and completing and reviewing the collection of information. Send comments regarding this burden estimate or any other aspect of this collection of information, including suggestions for reducing this burden, to Washington Headquarters Services, Directorate for Information Operations and Reports, 1215 Jefferson Davis Highway, Suite 1204, Arlington, VA 22202-4302, and to the Office of Management and Budget, Paperwork Reduction Project (0704-0188), Washington, DC 20503.
1. AGENCY USE ONLY (Leave blank)
2. REPORT DATE August 2015
3. REPORT TYPE AND DATES COVERED Technical Report – October 2014
4. TITLE AND SUBTITLE Cost Benefit Analysis of Rail Electrification for Next Generation Freight and Passenger Rail Transportation
5. FUNDING NUMBERS
DTFR53-12-D-00002
6. AUTHOR(S) Booz Allen Hamilton, Inc. and Gannett Fleming
7. PERFORMING ORGANIZATION NAME(S) AND ADDRESS(ES) Booz Allen Hamilton, Inc. Gannett Fleming 8283 Greensboro Drive 1010 Adams Avenue McLean, VA 22102 Audubon, PA 19403
8. PERFORMING ORGANIZATION REPORT NUMBER
32130200232
9. SPONSORING/MONITORING AGENCY NAME(S) AND ADDRESS(ES) U.S. Department of Transportation Federal Railroad Administration Office of Railroad Policy, Development, and Technololgy Office of Research and Development Washington, DC 20590
10. SPONSORING/MONITORING AGENCY REPORT NUMBER
DOT/FRA/ORD-15/28
11. SUPPLEMENTARY NOTES
COTR: Melissa Shurland 12a. DISTRIBUTION/AVAILABILITY STATEMENT This document is available to the public through the FRA Web site at http://www.fra.dot.gov.
12b. DISTRIBUTION CODE
13. ABSTRACT (Maximum 200 words) The study team researched and evaluated the relative costs, benefits, impacts, and strategies related to electrification of portions of the U.S. rail network for passenger and freight transportation. Through case-study review of the potential costs and benefits of electrifying the western portion of Pennsylvania’s Keystone Corridor, the research team found that current conditions do not present a compelling justification to pursue electrification at this time. Built on key assumptions, namely the construction of a new track alignment to support high-speed rail travel, this analysis explored the costs and benefits of the electrification component itself as infrastructure that may be implemented across other existing track alignments elsewhere. As a result of this analysis, the study found that the costs for electrification infrastructure remain significant, while the benefits are only modest, or in some cases nonexistent.
14. SUBJECT TERMS electrification, passenger train, freight train, rail transportation, railroad, emissions, energy
15. NUMBER OF PAGES 48
16. PRICE CODE
17. SECURITY CLASSIFICATION OF REPORT Unclassified
18. SECURITY CLASSIFICATION OF THIS PAGE Unclassified
19. SECURITY CLASSIFICATION OF ABSTRACT Unclassified
20. LIMITATION OF ABSTRACT
NSN 7540-01-280-5500 Standard Form 298 (Rev. 2-89) Prescribed by ANSI Std. 239-18
298-102
ii
METRIC/ENGLISH CONVERSION FACTORS
ENGLISH TO METRIC METRIC TO ENGLISH
LENGTH (APPROXIMATE) LENGTH (APPROXIMATE) 1 inch (in) = 2.5 centimeters (cm) 1 millimeter (mm) = 0.04 inch (in) 1 foot (ft) = 30 centimeters (cm) 1 centimeter (cm) = 0.4 inch (in)
1 yard (yd) = 0.9 meter (m) 1 meter (m) = 3.3 feet (ft) 1 mile (mi) = 1.6 kilometers (km) 1 meter (m) = 1.1 yards (yd)
1 kilometer (km) = 0.6 mile (mi)
AREA (APPROXIMATE) AREA (APPROXIMATE) 1 square inch (sq in, in2) = 6.5 square centimeters (cm2) 1 square centimeter (cm2) = 0.16 square inch (sq in, in2)
1 square foot (sq ft, ft2) = 0.09 square meter (m2) 1 square meter (m2) = 1.2 square yards (sq yd, yd2) 1 square yard (sq yd, yd2) = 0.8 square meter (m2) 1 square kilometer (km2) = 0.4 square mile (sq mi, mi2) 1 square mile (sq mi, mi2) = 2.6 square kilometers (km2) 10,000 square meters (m2) = 1 hectare (ha) = 2.5 acres
1 acre = 0.4 hectare (he) = 4,000 square meters (m2)
MASS - WEIGHT (APPROXIMATE) MASS - WEIGHT (APPROXIMATE) 1 ounce (oz) = 28 grams (gm) 1 gram (gm) = 0.036 ounce (oz) 1 pound (lb) = 0.45 kilogram (kg) 1 kilogram (kg) = 2.2 pounds (lb)
1 short ton = 2,000 pounds (lb)
= 0.9 tonne (t) 1 tonne (t)
= =
1,000 kilograms (kg) 1.1 short tons
VOLUME (APPROXIMATE) VOLUME (APPROXIMATE) 1 teaspoon (tsp) = 5 milliliters (ml) 1 milliliter (ml) = 0.03 fluid ounce (fl oz)
1 tablespoon (tbsp) = 15 milliliters (ml) 1 liter (l) = 2.1 pints (pt) 1 fluid ounce (fl oz) = 30 milliliters (ml) 1 liter (l) = 1.06 quarts (qt)
1 cup (c) = 0.24 liter (l) 1 liter (l) = 0.26 gallon (gal) 1 pint (pt) = 0.47 liter (l)
1 quart (qt) = 0.96 liter (l) 1 gallon (gal) = 3.8 liters (l)
1 cubic foot (cu ft, ft3) = 0.03 cubic meter (m3) 1 cubic meter (m3) = 36 cubic feet (cu ft, ft3) 1 cubic yard (cu yd, yd3) = 0.76 cubic meter (m3) 1 cubic meter (m3) = 1.3 cubic yards (cu yd, yd3)
TEMPERATURE (EXACT) TEMPERATURE (EXACT)
[(x-32)(5/9)] °F = y °C [(9/5) y + 32] °C = x °F
QUICK INCH - CENTIMETER LENGTH CONVERSION10 2 3 4 5
InchesCentimeters 0 1 3 4 52 6 1110987 1312
QUICK FAHRENHEIT - CELSIUS TEMPERATURE CONVERSIO -40° -22° -4° 14° 32° 50° 68° 86° 104° 122° 140° 158° 176° 194° 212°
°F
°C -40° -30° -20° -10° 0° 10° 20° 30° 40° 50° 60° 70° 80° 90° 100°
For more exact and or other conversion factors, see NIST Miscellaneous Publication 286, Units of Weights and Measures. Price $2.50 SD Catalog No. C13 10286 Updated 6/17/98
iii
Contents
Executive Summary ...................................................................................................................... 6
1. Introduction .............................................................................................................................. 7 1.1 Objective ........................................................................................................................... 7 1.2 Scope ................................................................................................................................. 7
2. The Keystone West Corridor .................................................................................................... 9 2.1 The Keystone Corridor as a Regional Line....................................................................... 9
3. Technology Overview and Requirements for Keystone West Electrification ......................... 13 3.1 Introduction to Electrification Technologies .................................................................... 13
4. Analysis of Costs and Benefits ................................................................................................. 17 4.1 Costs .................................................................................................................................. 17 4.2 Benefits ............................................................................................................................. 19 4.3 Analysis of Costs and Benefits ......................................................................................... 21
5. Impacts of Electrification ......................................................................................................... 24 5.1 Potential Impacts on the National Rail System................................................................. 24 5.2 Impacts of Electrification on Local and Regional Utilities .............................................. 26 5.3 Effects on Domestic Energy Markets ............................................................................... 28
6. Potential Barriers to Electrification .......................................................................................... 29 6.1 Investment Financing and Right-Of-Way ......................................................................... 29 6.2 Operational Obstacles to Electrification ........................................................................... 29
7. Potential Strategies to Enable Electrification ........................................................................... 31 7.1 Plan Economies of Scale ................................................................................................... 31 7.2 Establish Public-Private Partnerships ............................................................................... 32 7.3 Leverage International Experience with Government-Led Investment in Infrastructure . 32
8. Conclusion ................................................................................................................................ 35
Appendix A. Detailed Cost Estimates ......................................................................................... 36
Abbreviations and Acronyms ....................................................................................................... 42
References ..................................................................................................................................... 43
iv
Figures
Figure 1. Keystone Corridor West (Existing Alignment) ............................................................. 11
Figure 2. Keystone Corridor West (New Alignment) ................................................................... 11
Figure 3. Study Segment ............................................................................................................... 12
Figure 4. Emissions Benefit Estimation Methodology ................................................................. 19
Figure 5. Average Cost per Mile by Energy Source ..................................................................... 21
Figure 6. Approximate Siting of New Substations ....................................................................... 27
v
Tables
Table 1. Distance from Work Census Block to Home Census Block: Harrisburg, PA ................ 10
Table 2. Estimated Total Costs for the Keystone West Study Segment (million 2013 dollars) ... 18
Table 3. Estimated Maintenance and Repair Costs for the Keystone West Study Segment (thousand 2013 dollars)......................................................................................................... 18
Table 4. Locomotive Emissions Factors by Pollutant Type and Year (grams per gallon) ........... 20
Table 5. Social Cost of Emissions by Pollutant Type and Year (dollars per gram) ..................... 20
Table 6. Summary Comparison of Diesel and Electric Costs and Benefits .................................. 21

6
Executive Summary
The study team researched and evaluated the potential costs, benefits, impacts, and strategies related to electrification of the U.S. rail network for passenger and freight transportation. Through a case-study review of the projected costs and benefits of electrifying the western portion of Pennsylvania’s Keystone Corridor, the research team found that current conditions do not present a compelling justification to pursue electrification at this time. Built on key assumptions, namely, the construction of a new track alignment to support high-speed operations, this analysis explored the costs and benefits of the electrification component itself as infrastructure that may be implemented across other existing track alignments elsewhere. As a result of this analysis, the study finds that the costs for electrification infrastructure remain significant, while the benefits are only modest, or in some cases nonexistent.
The principal sources of benefits described in this study are the number of passenger trains traveling the route and the number of passengers. At present, there is only a single, daily round-trip Amtrak passenger train operating over this line. The rail line that hosts the service is owned by Norfolk Southern Railway, which operates approximately 25 freight trains per day.1 The company has previously indicated interest in utilizing electric power for freight transportation, but lacking strong returns on investment, their interest is limited. Without the participation of freight railroads, the full potential benefits of electrification cannot be realized. Ancillary benefits, such as reduction in passenger travel time, are principally due to high-speed rail, which is best achieved with electric power, but not exclusively associated with it.
The study team found that connections to local commercial power sources and impacts on regional power supply do not present significant barriers to electrification. Local utility companies reported that transmission lines and power supply could be satisfied with reasonable capital investments. Depending on changes in passenger traffic and the rate at which electric power supply is adopted by freight rail providers, generation and grid capacity may become more significant issues; however, under current conditions they do not present significant barriers.
Achieving electrification on portions of the Nation’s rail network can best be accomplished as part of high-speed intercity passenger rail initiatives across high-traffic corridors. In addition, achieving cost advantages for everything from electric locomotives to power grid upgrades, as well as the core components of the electrification infrastructure, is a key requirement to facilitate the transformation from current operating modes to electricity-powered operations. Economies of scale may be achieved through government-led investment or even through public-private partnerships, where costs, benefits, and risks can be shared among stakeholders.
7
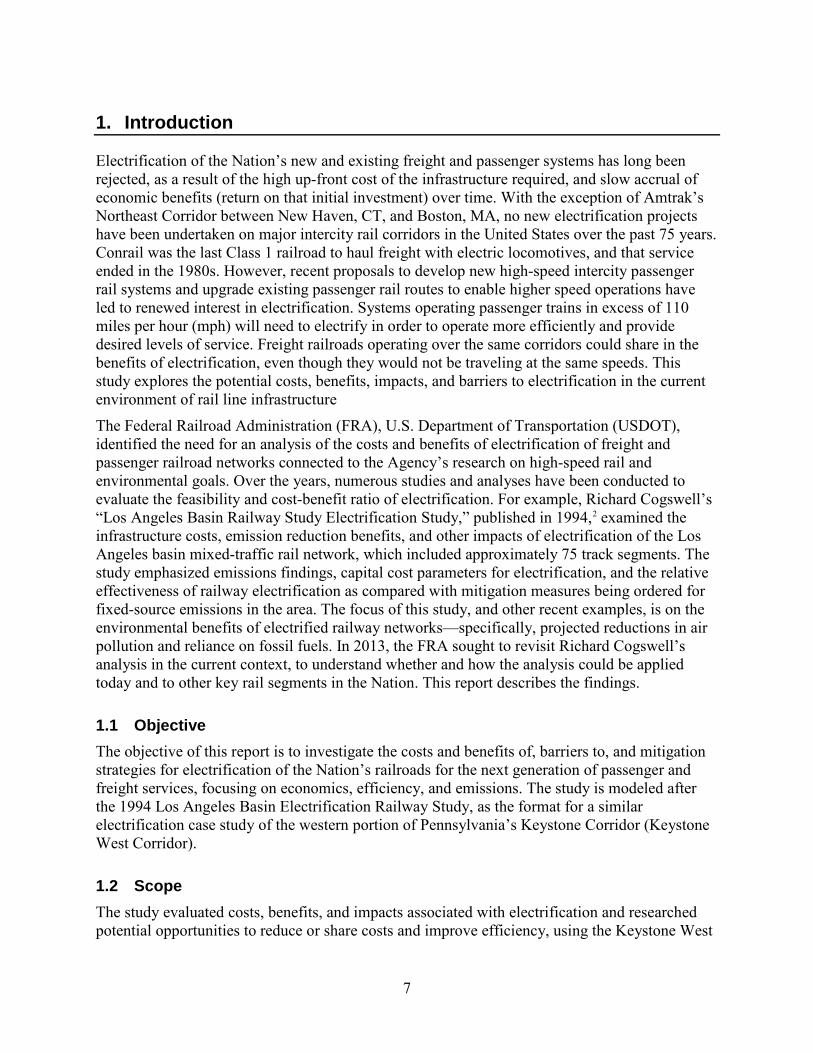
1. Introduction
Electrification of the Nation’s new and existing freight and passenger systems has long been rejected, as a result of the high up-front cost of the infrastructure required, and slow accrual of economic benefits (return on that initial investment) over time. With the exception of Amtrak’s Northeast Corridor between New Haven, CT, and Boston, MA, no new electrification projects have been undertaken on major intercity rail corridors in the United States over the past 75 years. Conrail was the last Class 1 railroad to haul freight with electric locomotives, and that service ended in the 1980s. However, recent proposals to develop new high-speed intercity passenger rail systems and upgrade existing passenger rail routes to enable higher speed operations have led to renewed interest in electrification. Systems operating passenger trains in excess of 110 miles per hour (mph) will need to electrify in order to operate more efficiently and provide desired levels of service. Freight railroads operating over the same corridors could share in the benefits of electrification, even though they would not be traveling at the same speeds. This study explores the potential costs, benefits, impacts, and barriers to electrification in the current environment of rail line infrastructure
The Federal Railroad Administration (FRA), U.S. Department of Transportation (USDOT), identified the need for an analysis of the costs and benefits of electrification of freight and passenger railroad networks connected to the Agency’s research on high-speed rail and environmental goals. Over the years, numerous studies and analyses have been conducted to evaluate the feasibility and cost-benefit ratio of electrification. For example, Richard Cogswell’s “Los Angeles Basin Railway Study Electrification Study,” published in 1994,2 examined the infrastructure costs, emission reduction benefits, and other impacts of electrification of the Los Angeles basin mixed-traffic rail network, which included approximately 75 track segments. The study emphasized emissions findings, capital cost parameters for electrification, and the relative effectiveness of railway electrification as compared with mitigation measures being ordered for fixed-source emissions in the area. The focus of this study, and other recent examples, is on the environmental benefits of electrified railway networks—specifically, projected reductions in air pollution and reliance on fossil fuels. In 2013, the FRA sought to revisit Richard Cogswell’s analysis in the current context, to understand whether and how the analysis could be applied today and to other key rail segments in the Nation. This report describes the findings.
1.1 Objective The objective of this report is to investigate the costs and benefits of, barriers to, and mitigation strategies for electrification of the Nation’s railroads for the next generation of passenger and freight services, focusing on economics, efficiency, and emissions. The study is modeled after the 1994 Los Angeles Basin Electrification Railway Study, as the format for a similar electrification case study of the western portion of Pennsylvania’s Keystone Corridor (Keystone West Corridor).
1.2 Scope The study evaluated costs, benefits, and impacts associated with electrification and researched potential opportunities to reduce or share costs and improve efficiency, using the Keystone West
8
Corridor as the study segment. In the context of this research, costs and benefits were quantified in terms of economics and impacts on emissions. The study identifies barriers to the electrification of the U.S. right-of-way for both freight and passenger locomotives.
In addition, the scope identified other areas of investigation, which are addressed in the study. They include, among others: (1) operational obstacles associated with electrification; (2) impacts on the fluidity of the national rail system that would result from creating a regional electrification system; (3) the feasibility of creating regional systems, and their effects on the fluidity of the national rail system; (4) requirements for overhead contact systems (OCS) for passenger systems and for freight operations; (5) OCS requirements for operations in tunnels; and (6) voltage requirements for passenger and freight operations. The study also explores, at a high level, the issue of capacity on the current domestic electricity supply system, and how electrification of the rail system would impact that system, as well as potential mitigation strategies to reduce congestion of the supply system.
The Keystone West Corridor was chosen for this analysis due to current efforts being made to assess high-speed rail along the same portion. Thus, detailed infrastructure inventory information was available and could be leveraged to generate the cost estimates for electrification. The route within the Keystone West Corridor was selected because it is physically representative of many segments in the Northeast region that also are subjects of studies for high-speed rail. Electrification typically is associated with high-speed rail, because high-speed travel powered by electricity is more efficient and more cost-effective over the long run than travel powered by other types of energy. This study assumes track alignment and construction that would allow for high-speed travel—defined as trains operating at speeds greater than or equal to 110 mph; however, those improvements are not included in the scope of costs and benefits for this study, which instead focuses only on costs and benefits related to electrification of the railway.
9
2. The Keystone West Corridor
The Keystone West Corridor connects Harrisburg and Pittsburgh across western Pennsylvania. Traffic along the Corridor is predominantly freight, with limited passenger service. This section describes the role of the Keystone West Corridor in the regional transit network and the new alignment that was assumed for further cost-benefit analysis in this report.
2.1 The Keystone Corridor as a Regional Line
2.1.1 Passenger Traffic As a regional line, the Keystone Corridor extends from Philadelphia to Pittsburgh. Amtrak operates an extension of its Pennsylvanian line (which runs primarily between New York City and Harrisburg) across the western portion of the Corridor, providing service to Pittsburgh. In total, the Pennsylvanian provides service to almost 220,000 riders a year; however, most of the riders board and alight from the train along the heavily used Northeast Corridor (NEC) between Philadelphia and New York City, and ridership along the rest of the Corridor is low. Also, the Keystone West Corridor has significantly lower ridership than the Keystone East Corridor—the so-called “Mainline” between Harrisburg and Philadelphia.
The major drivers for passenger rail demand are population and employment. For example, the Philadelphia–New York Corridor is a heavily populated region with high employment. The demographics and socioeconomic conditions in the Pittsburgh–Harrisburg Corridor are significantly different from those between Philadelphia and New York, lacking the characteristics that generally are associated with higher passenger rail demand, such as population density and professional service industries.
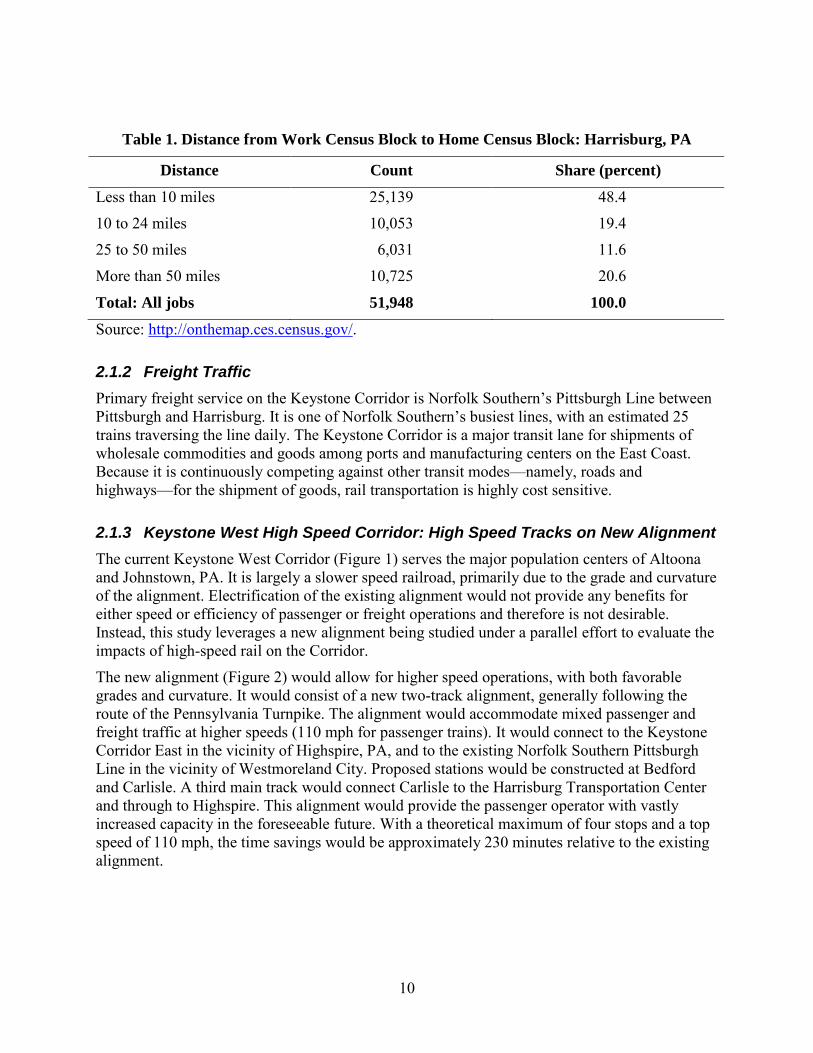
However, as a predominantly rural area in comparison with the rest of the NEC, the Keystone West segment presents some interesting possibilities to provide alternative transportation for commuters traveling long distances to work in cities, such as Harrisburg. Table 1 provides a snapshot of the number of commuters in Harrisburg by commuting distance. Almost one-half of the commuters with jobs in Harrisburg, PA, travel less than 10 miles to work, and most do not use passenger rail service. Interestingly, however, more than 20 percent travel more than 50 miles to and from Harrisburg, which suggests that there is potential for more passenger rail service if the transit nodes are appropriately identified.
10
Table 1. Distance from Work Census Block to Home Census Block: Harrisburg, PA
Distance Count Share (percent)
Less than 10 miles 25,139 48.4
10 to 24 miles 10,053 19.4
25 to 50 miles 6,031 11.6
More than 50 miles 10,725 20.6
Total: All jobs 51,948 100.0
Source: http://onthemap.ces.census.gov/.
2.1.2 Freight Traffic Primary freight service on the Keystone Corridor is Norfolk Southern’s Pittsburgh Line between Pittsburgh and Harrisburg. It is one of Norfolk Southern’s busiest lines, with an estimated 25 trains traversing the line daily. The Keystone Corridor is a major transit lane for shipments of wholesale commodities and goods among ports and manufacturing centers on the East Coast. Because it is continuously competing against other transit modes—namely, roads and highways—for the shipment of goods, rail transportation is highly cost sensitive.
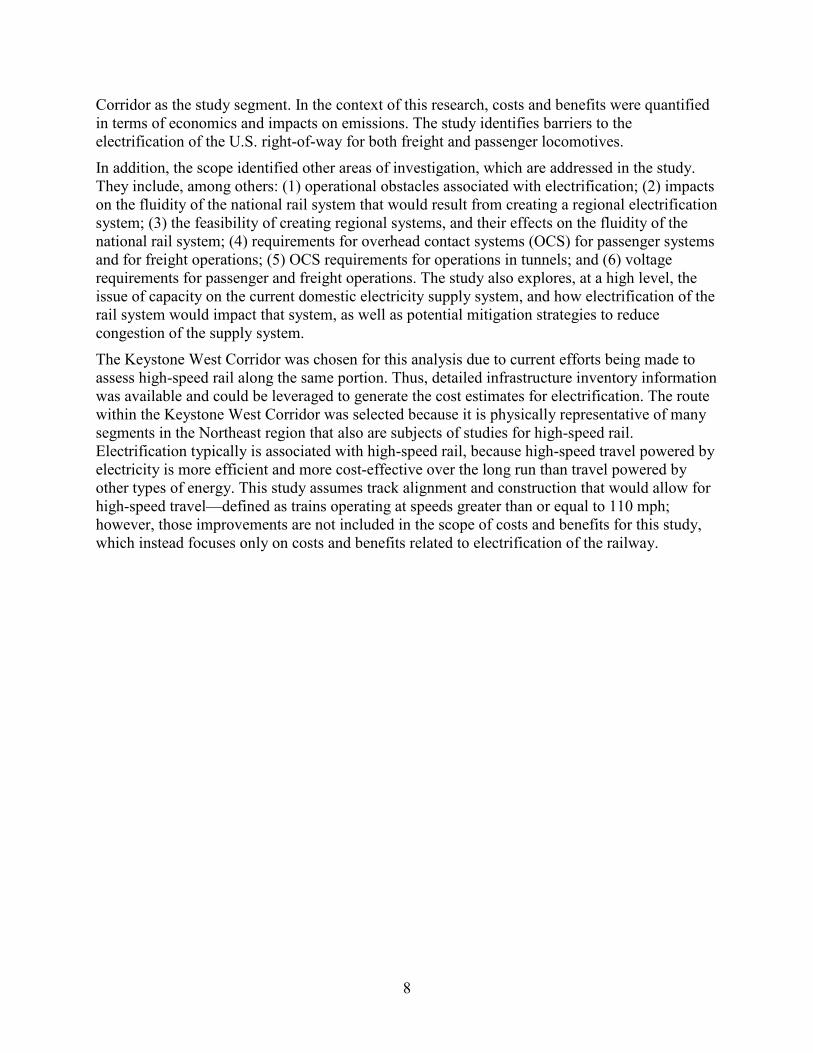
2.1.3 Keystone West High Speed Corridor: High Speed Tracks on New Alignment The current Keystone West Corridor (Figure 1) serves the major population centers of Altoona and Johnstown, PA. It is largely a slower speed railroad, primarily due to the grade and curvature of the alignment. Electrification of the existing alignment would not provide any benefits for either speed or efficiency of passenger or freight operations and therefore is not desirable. Instead, this study leverages a new alignment being studied under a parallel effort to evaluate the impacts of high-speed rail on the Corridor.
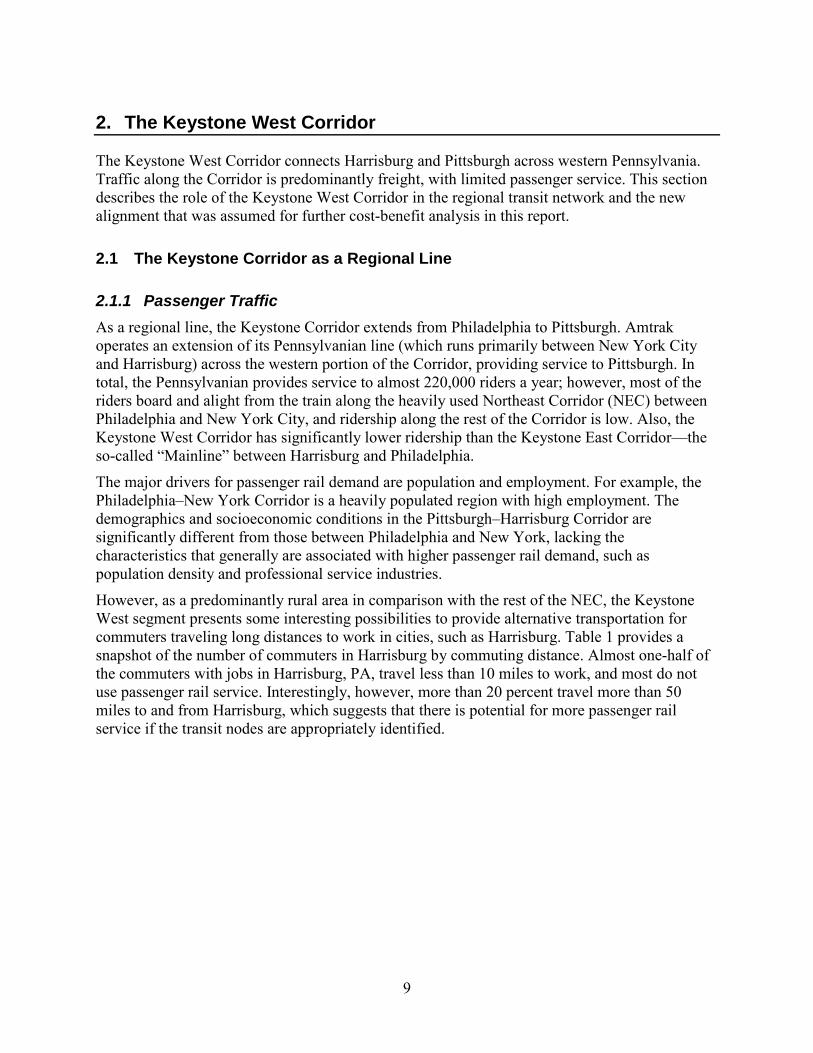
The new alignment (Figure 2) would allow for higher speed operations, with both favorable grades and curvature. It would consist of a new two-track alignment, generally following the route of the Pennsylvania Turnpike. The alignment would accommodate mixed passenger and freight traffic at higher speeds (110 mph for passenger trains). It would connect to the Keystone Corridor East in the vicinity of Highspire, PA, and to the existing Norfolk Southern Pittsburgh Line in the vicinity of Westmoreland City. Proposed stations would be constructed at Bedford and Carlisle. A third main track would connect Carlisle to the Harrisburg Transportation Center and through to Highspire. This alignment would provide the passenger operator with vastly increased capacity in the foreseeable future. With a theoretical maximum of four stops and a top speed of 110 mph, the time savings would be approximately 230 minutes relative to the existing alignment.
11
Figure 1. Keystone Corridor West (Existing Alignment)
Figure 2. Keystone Corridor West (New Alignment)
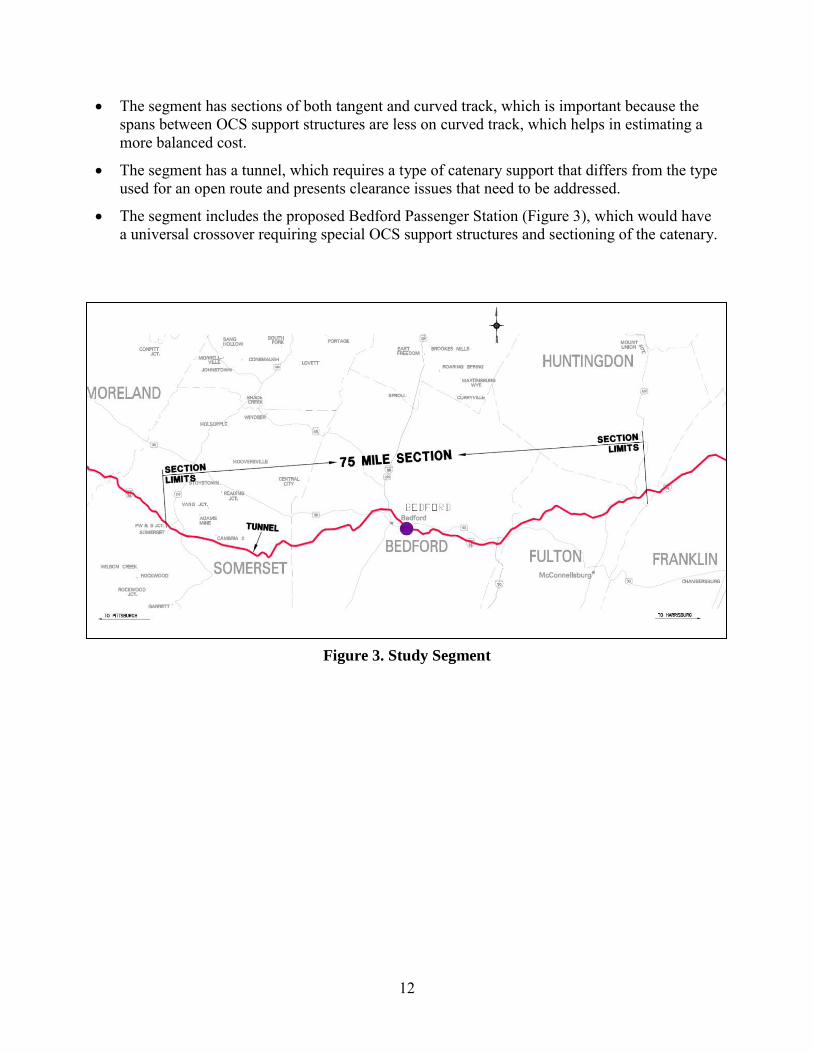
For the analysis in this report, a 75-mile segment from M.P. 110 to M.P. 185 on the new alignment was selected for use in developing an estimate of construction costs. Specifically, this segment was selected for the following reasons:
12
• The segment has sections of both tangent and curved track, which is important because the spans between OCS support structures are less on curved track, which helps in estimating a more balanced cost.
• The segment has a tunnel, which requires a type of catenary support that differs from the type used for an open route and presents clearance issues that need to be addressed.
• The segment includes the proposed Bedford Passenger Station (Figure 3), which would have a universal crossover requiring special OCS support structures and sectioning of the catenary.
Figure 3. Study Segment
13
3. Technology Overview and Requirements for Keystone West Electrification
As a technology, electric traction power and locomotives pre-date today’s more common diesel-electric technologies. Diesel and, more specifically, diesel-electric locomotives became more cost-effective as the technology improved and the cost of diesel fuel declined throughout the 20th century. In North America today, railroad electrification, whether OCS or third-rail systems, continues to be used for several reasons. Typically, where there are significant segments of underground or tunnel operations, or where station platforms are located below ground (e.g., urban centers), electric locomotives are preferred over steam and diesel locomotives. Electric locomotives themselves produce no emissions—as opposed to diesel engines and steam engines—and reduce the need for major ventilation systems in underground settings. Historically, electric locomotives also have been preferred in helper service over extreme grades and curves, because they provided significant tractive effort at low speeds for a low cost. However, the advantages of electric-powered locomotives for such uses have been eliminated largely by modern alternating-current (AC) traction locomotives equipped with distributed power (DP) capability. Electric locomotives still are preferred over steam and diesel at high speeds, because both steam and diesel locomotives lose efficiency at speeds of 100–110 mph, and therefore must be considered in conjunction with electrification analyses.
3.1 Introduction to Electrification Technologies The types of electrified railway lines range from high-speed intercity systems to commuter and freight systems and specialized industrial applications, such as mining. Higher speeds, requiring higher voltages, are in demand for intercity passenger services. Lower speed, lower voltage systems can service freight and commuter rail lines effectively. Each system presents slightly different dynamics, requiring different technologies and requirements according to the transit requirements of the line. The Keystone West Corridor presents a mix of limited passenger traffic and more frequent freight traffic across the Corridor.
3.1.1 General Electrification The present standard for electrified mixed passenger-freight railways is a 25-kilovolt (kV) auto-transformer system (±25 kV) at 50–60 Hertz (Hz). This type of system is in use in the New Haven to Boston NEC and has been proposed for the CalTrain Electrification project. Lower voltage technologies also are in use in different systems, such as the 11-kV, 25-Hz system that powers the Keystone East Corridor, and which had been used on Conrail exclusive freight lines along the NEC prior to their removal in the 1980s. Lower voltage systems, such as that currently in use on the Keystone East Corridor, typically are older, dating as far back as 1905, and are candidates for replacement because of their diminishing performance and the lack of support for newer electrified technologies.3 Beginning in the 1960s, studies began to show that 25-kV systems were more cost-effective, because they reduced the number of substations required, reduced conductor sizing, and allowed the use of lighter supporting structures.4 Commuter rail operations utilize either third-rail or OCS, ranging from 600-V direct current (DC) third-rail systems to 25-kV, 60-Hz OCS.
14
Mining operations and other specialized industrial applications use 50-kV systems or greater in some limited instances to deliver the power required to move heavy loads with high frequency. Those systems are used often in reduced-ventilation environments or across great distances with less access to electricity generation and transmission infrastructure. Such operations−for example, the Sishen-Saldhana line in South Africa, which features some of the longest trains in the world—often use significantly larger trains that require civil structures significantly different from those in place across the United States.5 Those high-voltage lines are used in closed systems specially designed for a single purpose, such as hauling coal from a mine to a power plant or port. Given current traffic levels across routes like the Keystone West, that type of technology, with the associated modifications required in civil structures, is not recommended for broader application.
3.1.2 Overhead Contact System An OCS is the preferred electrification system for the high-voltage AC power supply required for the Keystone West Corridor. An OCS—also referred to as a “catenary system”—is made up of conductors above each track, supported on OCS structures. A catenary system consists of a messenger wire that sags between the support structures and suspends a grooved level contact wire from hangers. Each of the catenary conductors is energized, and continuity jumpers are installed between the messenger and contact wires at regular intervals.6
The catenary wires normally are supported by hinged cantilever arms that extend horizontally over the track from vertical steel OCS poles. In complex areas, multi-track support structures, such as portal structures, are employed. The OCS poles are mounted on cast-in-place or pre-cast bolted-base concrete foundations.7
To provide better pantograph-to-contact wire operation, a type of Auto-Tension (AT) system is used. The tension in the messenger and contact wires is maintained over a wide range of temperatures by use of balance-weight assemblies, which move to take up the expansion and contraction of the catenary and keep the tension in the wires constant.8
Because the Keystone West Corridor has mixed passenger and freight operations, the catenary system must have sufficient vertical and horizontal clearances to allow freight railroad operations. On its new alignment, the required clearance envelope can be provided in most locations, including tunnels, with the only exception being those locations that may contain obstructions or existing infrastructure and are grossly cost-prohibitive. In such areas, reduced envelope clearances can be accomplished by using low-profile OCS registered with “resilient” insulated steady assemblies, or a suitably supported rigid conductor-rail system. Clearances in the vicinity of obstructions or existing infrastructure can be improved by lowering the roadbed or shifting the alignment, although speed considerations may reduce the likelihood of such actions. The existing infrastructure also can be altered or relocated, depending on the particular item.9 Reasonable cost estimates for work of this type are difficult to generate, because they are based on the particulars of each site, and the range of costs can vary significantly. In this case, the new track alignment will avoid additional modification costs to existing infrastructure, which can be substantial.
A single OCS system with larger conductors and good dynamic mechanical characteristics (includes compatible pantograph design) can be developed to meet the needs of both slow, heavy freight trains and faster, lighter passenger trains.

15
3.1.3 Traction Power System The traction power system is made up of traction power substations, switching stations, and paralleling stations. The 25-kV auto-transformer power feed system arrangement would require the installation of traction power supply substations, which are fed by high-voltage utility connections approximately 50 miles apart to meet the demand requirements for the Keystone West Corridor. In addition, there would be a switching station and paralleling stations between the traction power supply substations. The paralleling stations direct additional power to the loaded OCS section and permit increased spacing of the supply substations.
The supply substation, switching stations, and paralleling stations would be similar to the ones installed between New Haven to Boston for the NEC. Switching stations would be installed approximately at the midpoint between the supply substations, and paralleling stations would be installed at regular intervals between the supply substations and switching stations.
3.1.4 Technological Opportunities
Operating Voltage In general, higher voltage systems, such as a 50-kV or greater OCS, are often more economical for freight operations, but the increased conductor clearances and modifications of civil structures required can prove costly, particularly when tunnels, restrictive overhead bridges, and through-truss bridges are included in the rail system. However, use of a 2x25-kV autotransformer distribution system offers the advantage of “50-kV” transmission via OCS and along track feeders operating at 25 kV, thus permitting the smaller 25-kV electrical conductor clearances.10
Nonstandard Components Nonstandard components can reduce identified costs and improve efficiency; however, actual savings depend on many factors, such as off-track access, availability of vendors, and the contractor’s means and methods.
Nonstandard components include:
• OCS support structures o Direct buried steel poles
o Direct buried spun concrete poles
o Pre-fabricated foundations vs. cast-in-place
• Traction Power Substations o Modular construction
o New breaker types.
For the purpose of this report, nonstandard components—which represent a negotiable construction cost savings per mile—are not included in the construction costs. Construction costs are based on standard components and thus represent a more conservative view of potential actual costs.
16
3.1.5 Maintenance and Repair
Maintenance and Repair Facility Electric locomotive repair facilities exist in the current system, such as Amtrak’s Wilmington, Delaware and Washington, D.C. shops, and other existing repair facilities are available presently.11 In sum, Amtrak operates seven full-service locomotive maintenance yards in the Northeast Region and others throughout the country that can service electric locomotives. Other shops that currently do not service electric locomotives can be upgraded to accomplish this service with minimal investment. If a new facility is installed along the Keystone West Corridor, then the storage yard and shops need to have OCS installed in order to ease the movement of vehicles; however, this cost is for the extension of only a few hundred yards of OCS from the main line.
According to Cogswell,12 introducing electric locomotives into an existing diesel locomotive system requires some basic modifications and changes to the facilities. Pantograph inspection platforms need to be provided, along with an interlocked system to ensure catenary de-energization whenever personnel are working on or adjacent to the pantographs. Additional catenary safety-related items, such as interlocks and sanding facilities, may need to be provided. Because the study lacked specific details, it assumed a lump-sum value to cover the additional costs of maintenance facilities.
Electrification System The most significant maintenance requirement for electrification is associated with the right-of-way, which comprises the OCS system and supports, transmission, substation, feeder lines, and other infrastructure. Some of these elements require out-of-service inspection and repair time, thus temporarily slowing traffic on the railway while maintenance is performed. Maintenance of the OCS and the traction power substation and distribution system will be performed by fully dedicated maintenance crews; therefore, costs for the maintenance crews, including material, equipment, and labor, are included in the evaluation.
17
4. Analysis of Costs and Benefits
There are numerous strategies for estimating the costs and benefits of rail electrification, as presented in numerous studies conducted over the years. Since Cogswell’s 1994 “Los Angeles Basin Railway Study Electrification Study,” no mainline railroad electrification investments of this kind have been completed, and there are no actual costs or benefits to be cited. Therefore, this study reviewed recent estimates, such as those developed for the Caltrain electrification effort as well as other studies, to estimate current costs and benefits for the Keystone West Corridor. The benefits pool primarily covers economic benefits from potential fuel cost savings and emissions reductions. The passenger value of time was also considered, but due to the overlap with high-speed rail improvements, it is not possible to parse only the time savings attributable to electrification.
4.1 Costs The study team started the cost analysis by defining site-specific parameters and requirements for this Keystone West Corridor, based on the 75-mile representative sample of the entire Corridor (as described in Section 2 above). Using this segment, a bottom-up estimation approach was employed to develop the cost analysis from information and assumptions at the unit and quantity levels. An estimate for each element was developed by estimating required labor hours, a unit quantity of materials, and other add-on costs, and then these lower-level elements were rolled up to arrive at an estimate for the entire component. The methodology used here is consistent with other recent studies reviewed. This section details the estimates of capital, operations, and maintenance costs.
4.1.1 Key Assumptions • The period of analysis for the costs and benefits is 30 years, based on an industry average life
cycle for the constituent components.
• No cyclic replacements or reinvestments are assumed for any major element after the initial construction during the 30-year period of analysis. Regular annual maintenance costs are assumed to be sufficient for the preservation of infrastructure.
• Once the segment is electrified along its new alignment, an average of ten passenger trains per day is assumed.
• Current ridership on the Harrisburg-to-Pittsburgh segment (Keystone West) is assumed to be 5% of the total ridership. Total ridership on the existing Pennsylvanian route (New York-to-Philadelphia-to-Harrisburg-to-Pittsburgh) is about 218,000 passengers per year, according to Amtrak’s 2013 report.13
• The value of time is assumed to be $15 per hour (the value used in calculating the benefit of building a high-speed infrastructure).14 All costs are given in 2013 constant dollars.
• The discount rate used is taken from OMB Circular A-94 (http://www.whitehouse.gov/omb/circulars_a094/).
18
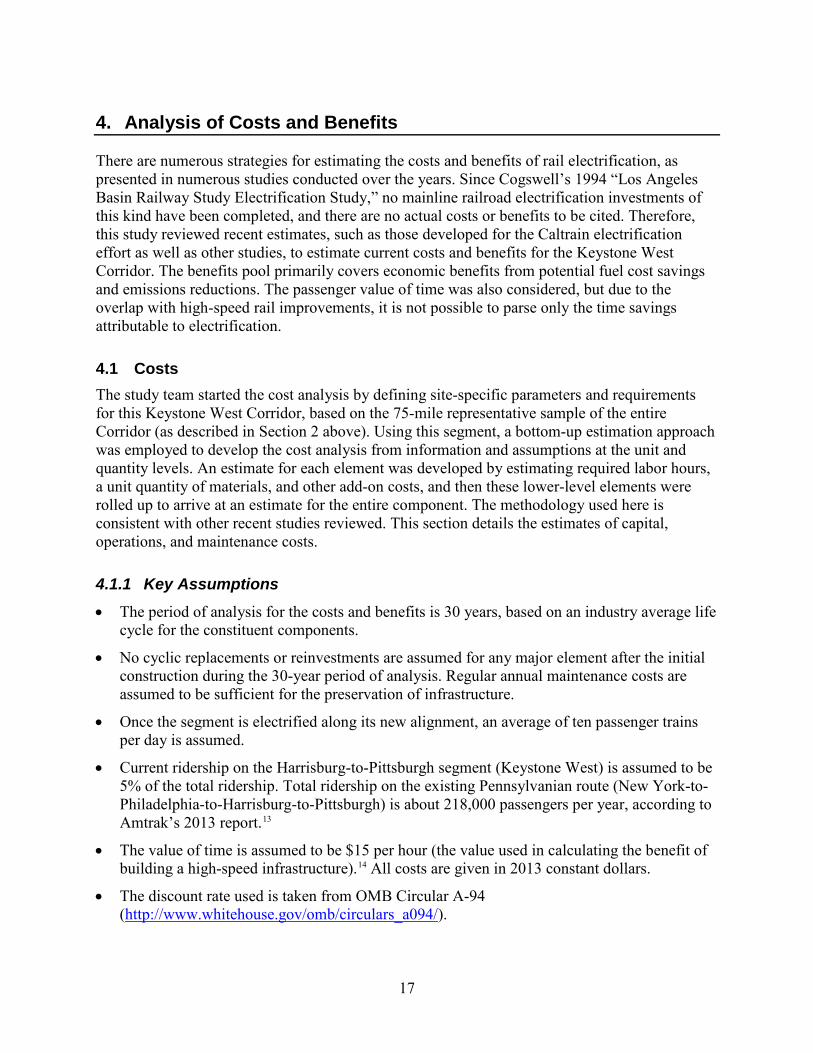
4.1.2 Capital Costs Estimates of the overall construction costs of the traction power supply for this 75-mile double-track segment (all costs in 2013 dollars) are shown in Table 2 below. Description, quantity, unit cost, and total cost are provided in Appendix 1, “Detailed Cost Estimates,” for each cost item. In comparison, Cogswell estimated a cost of $1.5 billion for 1080 km of track in 1992 dollars,15 which translates to roughly $3.6 million per mile in 2013 dollars. Our estimate for electrifying the Keystone West segment totals about $4.3 million per mile.
Table 2. Estimated Total Costs for the Keystone West Study Segment (million 2013 dollars)
Element Quantity Unit Unit Cost Total Cost
Traction power substation 2 Each 16.50 32.9
Switching substation 2 Each 6.00 12.1
Paralleling station 9 Each 5.20 46.5
Wayside feeders 75 Route miles 0.01 0.7
Overhead contact system (OCS) 75 Route miles 3.00 227.2
Total 319.4
Additionally, there would be costs associated with the procurement of electric locomotives to be used on the newly electrified track. Currently, an electric passenger locomotive is estimated to cost about $7 million per unit, based on Amtrak’s recent acquisitions. Assuming that all the passenger locomotives on this segment of track would be electric, we project that the local operator would need to purchase 5 electric locomotives, with a total costing of about $35 million.16
4.1.3 Maintenance and Repair Costs Annual maintenance costs for the Traction Power system and OCS are included in this analysis. Activities included in the costs comprise inspections, preventive maintenance, corrective maintenance, and minor component replacement. The estimates do not include periodic replacements of major life-cycle components. Quantities, units, and total costs are summarized in Table 3 below.
Table 3. Estimated Maintenance and Repair Costs for the Keystone West Study Segment (thousand 2013 dollars)
Element Annual Cost Annual Cost Per Route Mile
Traction power supply (materials) 306 4.1
Traction power maintenance staff (labor) 601 8.0
19
4.2 Benefits Unlike the Los Angeles Basin, the area around the Keystone West Corridor is not grappling with excessively high emissions, smog, and related pollutants. However, the current diesel-only traffic along the line does produce some emissions, and their reduction or elimination is therefore a measurable benefit that may be derived through electrification. Further, benefits for this study overlap with a portion of high-speed rail improvements, given that electric traction power will allow for tighter scheduling of trains relative to diesel power, due to improved acceleration and deceleration. Finally, the analysis discusses the potential reduction in locomotive operating costs due to fuel savings.
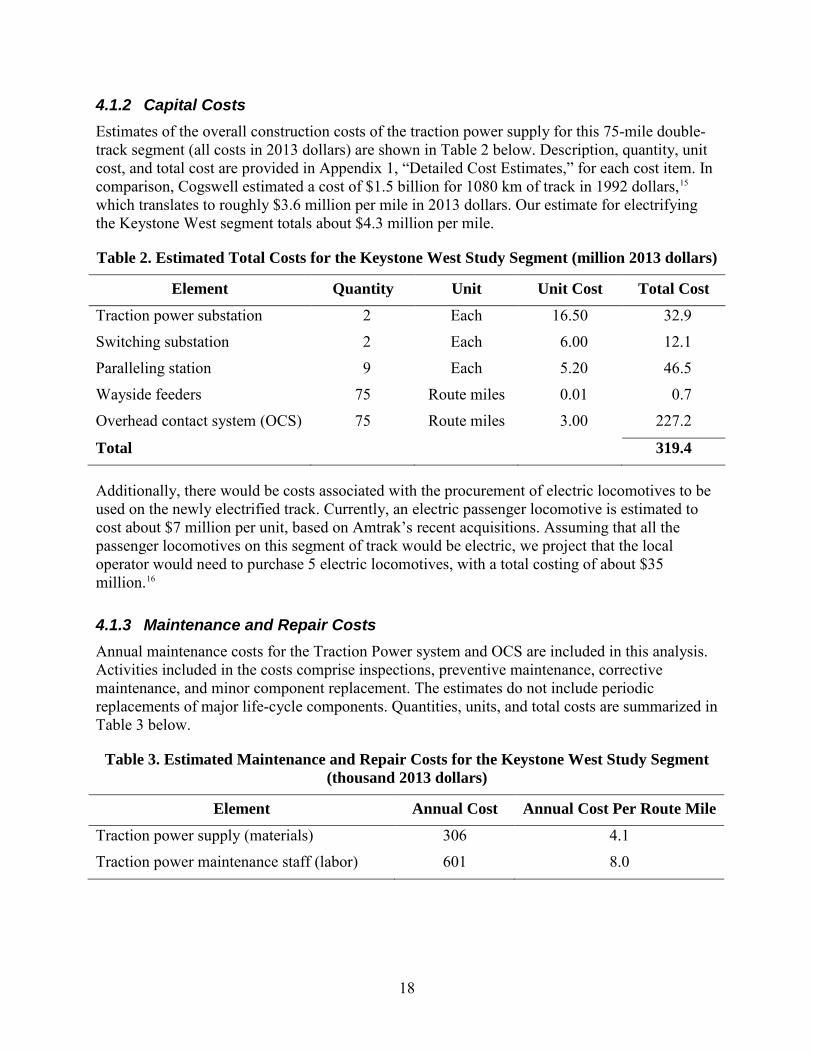
4.2.1 Emissions The study employed a standard approach, using U.S. Environmental Protection Agency (EPA)-sourced values to estimate emissions-related benefits. Figure 4 illustrates the basic methodology used by the study team to estimate the emissions-related benefits of electrification. In the first step of the process, the team identified the 75-mile segment of track developed for this study. Then, the team computed total emissions for the “no-build” (baseline) scenario, using EPA emission rates. The results from this analysis were compared to the “build” scenario (electrified track), which lowers emissions. The difference between the two scenarios provided the emissions-related benefits. The difference was then multiplied by the social cost of pollution to compute a monetary value for emission reductions, or the benefit of electrification. EPA provides emissions factors to compute emissions by pollutant type.17
Figure 4. Emissions Benefit Estimation Methodology
20
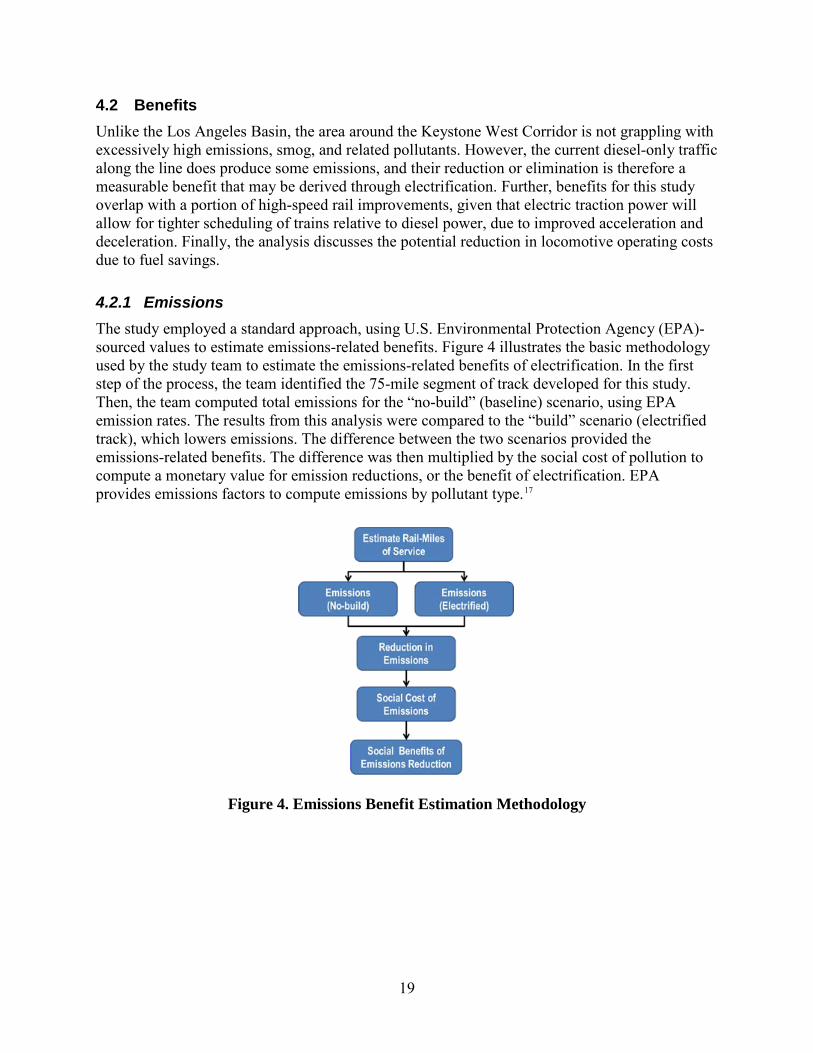
Table 4. Locomotive Emissions Factors by Pollutant Type and Year (grams per gallon)
Pollutant/Year 2013 2014 2015 2016 2017 2018 2019 2020 2021 2022 2023 2024 2025 2026
NOx 147 138 131 119 112 105 98 93 88 83 78 73 68 64
PM10 3.9 3.6 3.4 3.1 2.8 2.6 2.3 2.1 2.0 1.8 1.7 1.5 1.4 1.2
HC 6.9 6.3 5.8 5.2 4.6 4.1 3.5 3.1 2.9 2.7 2.4 2.2 2.0 1.8
Pollutant/Year 2027 2028 2029 2030 2031 2032 2033 2034 2035 2036 2037 2038 2039 2040
NOx 60 56 52 49 46 42 39 36 33 30 28 26 24 23
PM10 1.1 1 0.9 0.8 0.7 0.7 0.6 0.6 0.5 0.5 0.4 0.4 0.4 0.3
HC 1.6 1.5 1.3 1.2 1.1 1.0 0.9 0.8 0.7 0.7 0.6 0.6 0.5 0.5
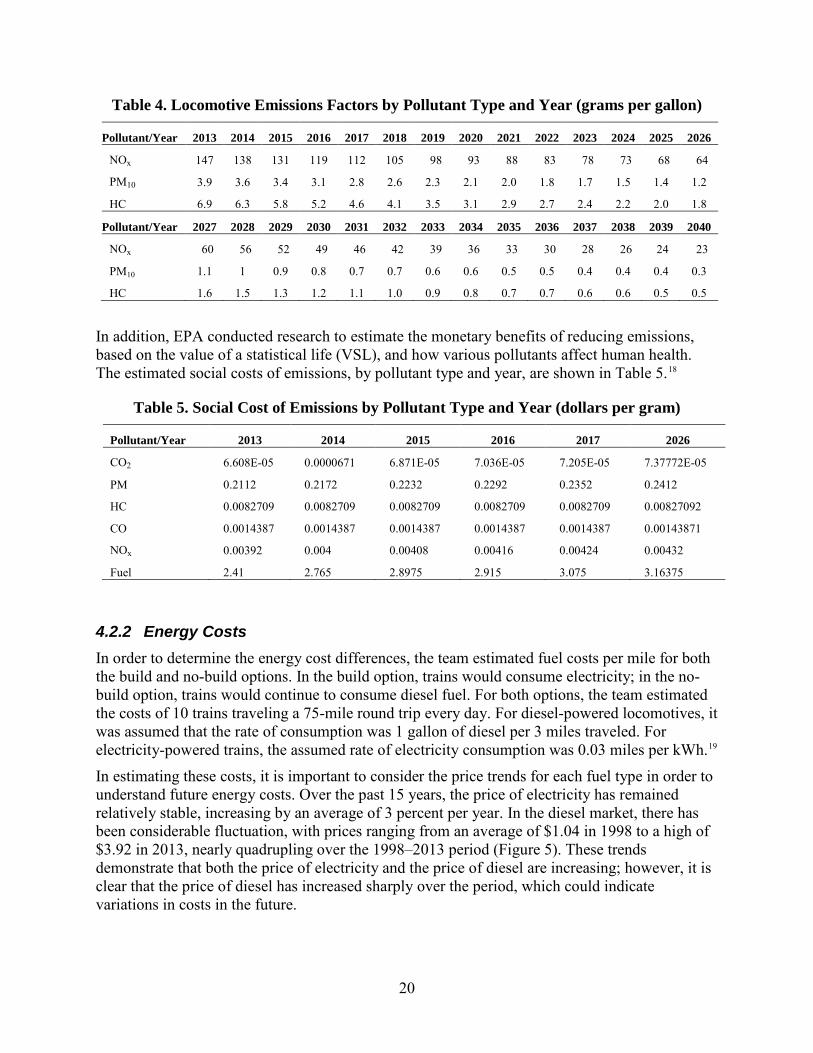
In addition, EPA conducted research to estimate the monetary benefits of reducing emissions, based on the value of a statistical life (VSL), and how various pollutants affect human health. The estimated social costs of emissions, by pollutant type and year, are shown in Table 5.18
Table 5. Social Cost of Emissions by Pollutant Type and Year (dollars per gram)
4.2.2 Energy Costs In order to determine the energy cost differences, the team estimated fuel costs per mile for both the build and no-build options. In the build option, trains would consume electricity; in the no-build option, trains would continue to consume diesel fuel. For both options, the team estimated the costs of 10 trains traveling a 75-mile round trip every day. For diesel-powered locomotives, it was assumed that the rate of consumption was 1 gallon of diesel per 3 miles traveled. For electricity-powered trains, the assumed rate of electricity consumption was 0.03 miles per kWh.19
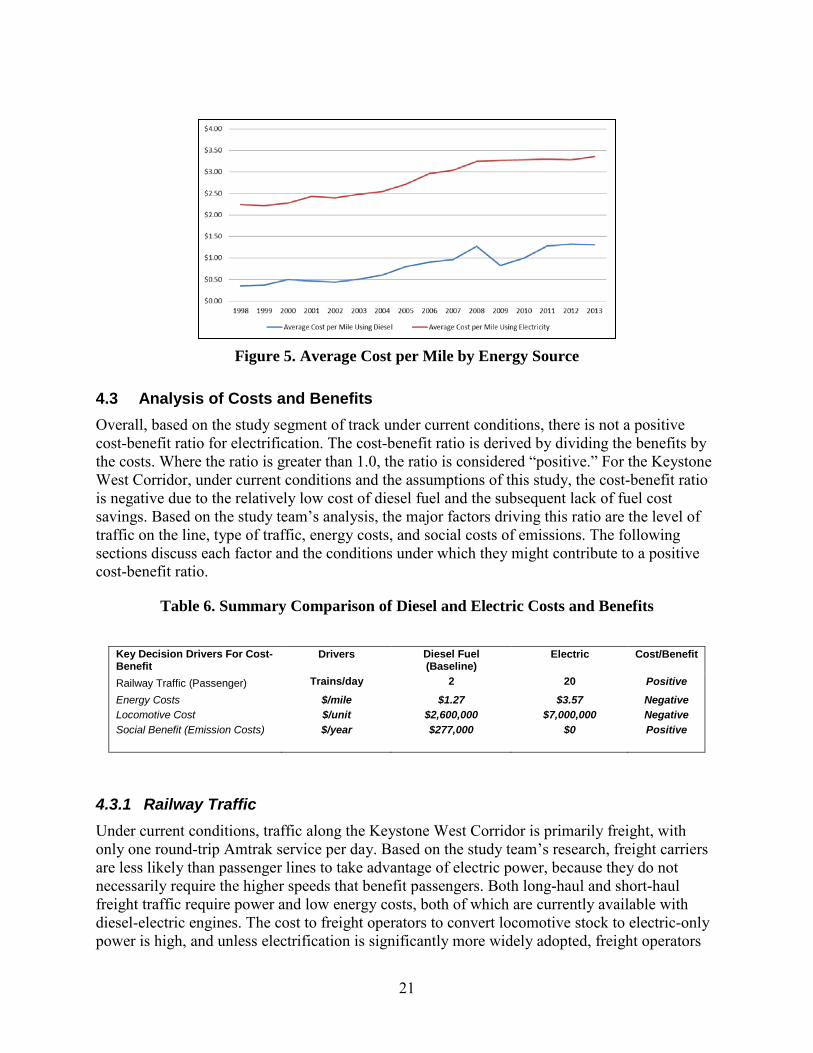
In estimating these costs, it is important to consider the price trends for each fuel type in order to understand future energy costs. Over the past 15 years, the price of electricity has remained relatively stable, increasing by an average of 3 percent per year. In the diesel market, there has been considerable fluctuation, with prices ranging from an average of $1.04 in 1998 to a high of $3.92 in 2013, nearly quadrupling over the 1998–2013 period (Figure 5). These trends demonstrate that both the price of electricity and the price of diesel are increasing; however, it is clear that the price of diesel has increased sharply over the period, which could indicate variations in costs in the future.
Pollutant/Year 2013 2014 2015 2016 2017 2026
CO2 6.608E-05 0.0000671 6.871E-05 7.036E-05 7.205E-05 7.37772E-05
PM 0.2112 0.2172 0.2232 0.2292 0.2352 0.2412
HC 0.0082709 0.0082709 0.0082709 0.0082709 0.0082709 0.00827092
CO 0.0014387 0.0014387 0.0014387 0.0014387 0.0014387 0.00143871
NOx 0.00392 0.004 0.00408 0.00416 0.00424 0.00432
Fuel 2.41 2.765 2.8975 2.915 3.075 3.16375
21
Figure 5. Average Cost per Mile by Energy Source
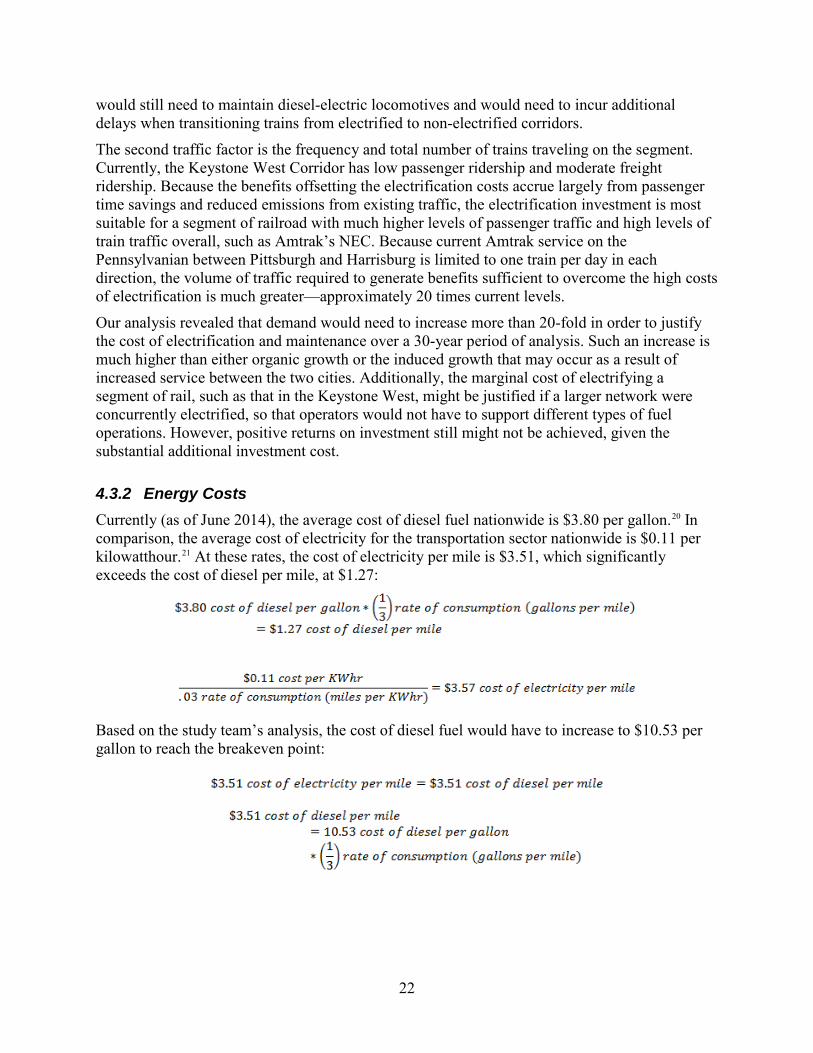
4.3 Analysis of Costs and Benefits Overall, based on the study segment of track under current conditions, there is not a positive cost-benefit ratio for electrification. The cost-benefit ratio is derived by dividing the benefits by the costs. Where the ratio is greater than 1.0, the ratio is considered “positive.” For the Keystone West Corridor, under current conditions and the assumptions of this study, the cost-benefit ratio is negative due to the relatively low cost of diesel fuel and the subsequent lack of fuel cost savings. Based on the study team’s analysis, the major factors driving this ratio are the level of traffic on the line, type of traffic, energy costs, and social costs of emissions. The following sections discuss each factor and the conditions under which they might contribute to a positive cost-benefit ratio.
Table 6. Summary Comparison of Diesel and Electric Costs and Benefits
4.3.1 Railway Traffic Under current conditions, traffic along the Keystone West Corridor is primarily freight, with only one round-trip Amtrak service per day. Based on the study team’s research, freight carriers are less likely than passenger lines to take advantage of electric power, because they do not necessarily require the higher speeds that benefit passengers. Both long-haul and short-haul freight traffic require power and low energy costs, both of which are currently available with diesel-electric engines. The cost to freight operators to convert locomotive stock to electric-only power is high, and unless electrification is significantly more widely adopted, freight operators
Key Decision Drivers For Cost-Benefit
Drivers Diesel Fuel (Baseline)
Electric Cost/Benefit
Railway Traffic (Passenger) Trains/day 2 20 Positive Energy Costs Locomotive Cost
$/mile $/unit
$1.27 $2,600,000
$3.57 $7,000,000
Negative Negative
Social Benefit (Emission Costs)
$/year $277,000 $0 Positive
22
would still need to maintain diesel-electric locomotives and would need to incur additional delays when transitioning trains from electrified to non-electrified corridors.
The second traffic factor is the frequency and total number of trains traveling on the segment. Currently, the Keystone West Corridor has low passenger ridership and moderate freight ridership. Because the benefits offsetting the electrification costs accrue largely from passenger time savings and reduced emissions from existing traffic, the electrification investment is most suitable for a segment of railroad with much higher levels of passenger traffic and high levels of train traffic overall, such as Amtrak’s NEC. Because current Amtrak service on the Pennsylvanian between Pittsburgh and Harrisburg is limited to one train per day in each direction, the volume of traffic required to generate benefits sufficient to overcome the high costs of electrification is much greater—approximately 20 times current levels.
Our analysis revealed that demand would need to increase more than 20-fold in order to justify the cost of electrification and maintenance over a 30-year period of analysis. Such an increase is much higher than either organic growth or the induced growth that may occur as a result of increased service between the two cities. Additionally, the marginal cost of electrifying a segment of rail, such as that in the Keystone West, might be justified if a larger network were concurrently electrified, so that operators would not have to support different types of fuel operations. However, positive returns on investment still might not be achieved, given the substantial additional investment cost.
4.3.2 Energy Costs Currently (as of June 2014), the average cost of diesel fuel nationwide is $3.80 per gallon.20 In comparison, the average cost of electricity for the transportation sector nationwide is $0.11 per kilowatthour.21 At these rates, the cost of electricity per mile is $3.51, which significantly exceeds the cost of diesel per mile, at $1.27:
Based on the study team’s analysis, the cost of diesel fuel would have to increase to $10.53 per gallon to reach the breakeven point:
23
4.3.3 Social Costs of Emissions Currently, the cost of emissions is determined by the EPA, as discussed above. In this analysis, emissions levels are determined by traffic levels on the Corridor and the efficiency of locomotives. Based on locomotive emissions and their corresponding social cost, as determined by the EPA, the estimated total social cost of emissions would be $277,000 per year, which is significantly less than the additional cost per mile of switching from diesel to electricity.22 The social cost of each gram of pollutant is determined by society’s willingness to pay the cost of avoiding an adverse effect. This valuation is calculated by the EPA, based on observed sales of products that would similarly reduce the mortality of individuals, and from survey responses.23
24
5. Impacts of Electrification
The study team explored the estimated impacts of electrification on U.S. national and regional rail networks, the impact on regional utilities, and the effects on domestic energy markets. The analysis uncovered both positive and negative impacts of electrification, in addition to the costs and benefits discussed above. As a whole, electrification would significantly change the dynamics and interactions of the transportation infrastructure in the study region, and those findings can be extrapolated to evaluate the impacts on a larger scale. However, the impacts on electricity markets would not be as significant, unless railroad traffic levels increased significantly as a result of the investment.
One of major assumptions of this study is the new alignment of track. As discussed in Section 2, above, the study assumes that a new high-speed rail route would be constructed before, or concurrently with, the electrification investment. Ownership of the new track remains an open question; likely, it would be a combination of owners, including both public and private operators and investors. Given that the purpose of the new alignment would be to deliver improved rail speeds, the study team assumed that all passenger traffic would be routed along the new alignment. However, whether freight operators would also avail themselves of the new alignment and electrified tracks is less certain. Therefore, the potential impacts on passenger operators and freight operators are discussed separately.
5.1 Potential Impacts on the National Rail System Electrification facilitates high-speed rail travel, presenting as a significant benefit for passengers who are seeking to reduce their travel times, and who are presented with other modes of transportation, such as airplanes and automobiles. In the case of this study, the area of analysis focuses on an area of relatively low passenger traffic but with significant freight operations. Across railroads nationwide, freight traffic is much more prevalent than passenger traffic. In addition to transit times, the major impacts of electrification are reductions in emissions and fuel consumption. However, those impacts are accrued primarily when freight operators also convert to electric traction power.
5.1.1 Increase in Traffic and Ridership and Reduction in Passenger Travel Time Electrification in general may increase the demand for passenger train travel, provided that the electrification occurs in connection with other investments in high-speed rail that would allow for high-speed passenger train travel.24 Without the additional improvements, there is no evidence to support the assumption that ridership and demand would increase due to rail electrification alone.
This study did not explore the possible changes in demand that could be assumed to occur as a result of improvements in electrified high-speed rail. Other studies have researched the potential correlation, using comprehensive, multi-modal transit analysis to understand the dynamics that drive transportation demand overall, and the tradeoffs that users would evaluate when choosing among transportation options. This study does conclude, however, that traffic levels and ridership are key variables driving the benefits of electrification and, therefore, if a transit analysis did predict significant increases in traffic and/or ridership as a result of expanding the
25
availability of high-speed rail, the finding could have a positive impact on assessments of the potential benefits of electrification.
Amtrak’s Keystone service between New York and Harrisburg currently consists of 13 daily round trips on weekdays. As discussed above, the distribution of ridership between New York and Harrisburg is unknown, as are the origin, destination, and purpose of the trips taken along the route. For example, there may be a significant number of trips using the Keystone service from New York to Philadelphia as the destination, a significant number of trips from Philadelphia to Harrisburg as the destination, but few trips from New York to Harrisburg. In addition, electrifying the Keystone West Corridor may create an effective market for service from Philadelphia to Pittsburgh, given the ability to operate at speeds exceeding 110 mph.
5.1.2 Continuity of Power Along Continuous Routes, and Elimination of Locomotive Switching
Electrification of the Keystone West Corridor would allow for continuous service of the current Amtrak Pennsylvanian service between New York and Pittsburgh, by eliminating schedule time lost in changing from electric to diesel locomotives at Harrisburg. In addition, on routes where trains frequently start and stop (local service), electric locomotives generally would provide the ability to start, achieve maximum speed, and stop more quickly than diesel locomotives, thus providing better schedule performance overall. This could easily apply to any local service initiated on the Corridor.
5.1.3 Reduced Operational Flexibility for Freight Operations If dual-power operating conditions persist in the national railroad network, any future potential energy cost savings associated with electrification are likely to be offset by a failure of electric operations to provide flexibility to freight operators, such as Norfolk Southern. Because most freight trains and cars originate and terminate at points outside the electrified network of which the Keystone West Corridor is a part, diesel locomotives are needed in order to originate the trains at their origins or deliver them to their final destinations. The “run-through” nature of the current North American railroad freight business dictates that locomotives of all railroads may operate on any property from coast to coast, as well as into Canada and Mexico. This efficiency of operations and the just-in-time nature of the business dictate fluid operations at terminals, crew change points, inspection points, and interfaces between connecting railroads. Flexibility is greatly restricted if a change from diesel to electric locomotives is required for a portion of the route, with a subsequent change back to diesel locomotives. The logistics of operating such a network are significant. In addition, additional diesel locomotives may be required to support an electrified segment in the middle of the network, as freight originates and terminates outside the electrified zone. In addition, diesel operations are required because none of the regional freight yards, intermodal facilities, or secondary, main, or industrial tracks are electrified.
Introducing electric freight locomotives to only portions of the network would require specialized maintenance facilities and personnel to be located at some point along the electrified zone. Electric locomotives would become an inflexible component of the national network.
The study team could not assume that any electrified freight operations could be extended beyond the Keystone West Corridor. The Keystone East Corridor and portions of the NEC are at capacity today with passenger operations, and it may not be practical to use electric locomotives
26
on current Norfolk Southern freight trains that operate on the Philadelphia-Washington portion of the NEC or in the New York/New Jersey Conrail zone.
Additionally, Norfolk Southern currently operates freight trains between New York and Washington, DC, along portions of the electrified NEC. Currently, Norfolk Southern operates only diesel locomotives in this Corridor, has no electrified operations, and owns no electric locomotives. Because no off-the-shelf electric freight locomotives are manufactured in North America, significant research and development costs would be borne either by Norfolk Southern exclusively, or by interested freight railroads collectively, to develop a new North American electric freight locomotive or adapt a design used elsewhere in the world for use in North America. The costs most likely would offset any benefits of using the locomotive, unless use could be expanded to a larger portion of the North American freight rail network.
5.1.4 Potential Establishment of Alternative Freight-Only Right-of-Ways The Pittsburgh to Harrisburg Corridor is part of the greater Norfolk Southern Corridor between the gateways of St. Louis and Chicago and the Atlantic seaboard. East of Harrisburg, Norfolk Southern makes connections north to New York and New Jersey, and south to Baltimore, Washington, and the Southeast. The St. Louis and Chicago gateways provide access to the western Class 1 railroads and create the opportunity for seamless transcontinental service. Norfolk Southern does not have parallel corridors, and most of its east-west traffic uses the existing Corridor. Therefore, one cannot assume that additional traffic could be routed to a new Corridor. It also cannot be assumed that traffic from railroads with similar east-west traffic patterns could or would be routed to a new Corridor.
Because CSX, which is the main competitor to Norfolk Southern, has different routes to reach the eastern seaboard from Chicago and St. Louis, as well as different destination yards and markets, it also cannot be assumed that the current concept of consolidated operations in major metropolitan areas involving either shared assets carriers or terminal railroads owned by multiple Class 1 railroads could be applied to a Corridor in central Pennsylvania. Terminal operations differ considerably from road operations, and the Conrail Shared Assets properties are unique, in that their creation was a condition of the Conrail breakup, because the assets in Detroit and New York/New Jersey could not be divided equitably.
The current state of the North American railroad business does not reflect a willingness on the part of the Class 1 railroads to consolidate operations of a certain type (such as intermodal) by all railroads on the most efficient Corridor between major endpoints for that business type, regardless of ownership of the Corridor. Clearing this major hurdle could allow the freight railroads to consider alternative means of operation, such as electrification, at some point in the future.
5.2 Impacts of Electrification on Local and Regional Utilities There are several factors to be considered in evaluating the impact of electrification on local and regional utilities, including the level of additional traffic (demand) that would require electric power, the infrastructure costs to connect railroad substations to the distribution network, and the maintenance and inspection costs for additional infrastructure. Overall, the research team found that the impacts are manageable and not a significant concern for the utility companies in the study area. However, the process of permitting and securing right-of-way for new power
27
transmission lines remains a challenge, presenting the possibility of significant schedule delays and additional compliance costs.
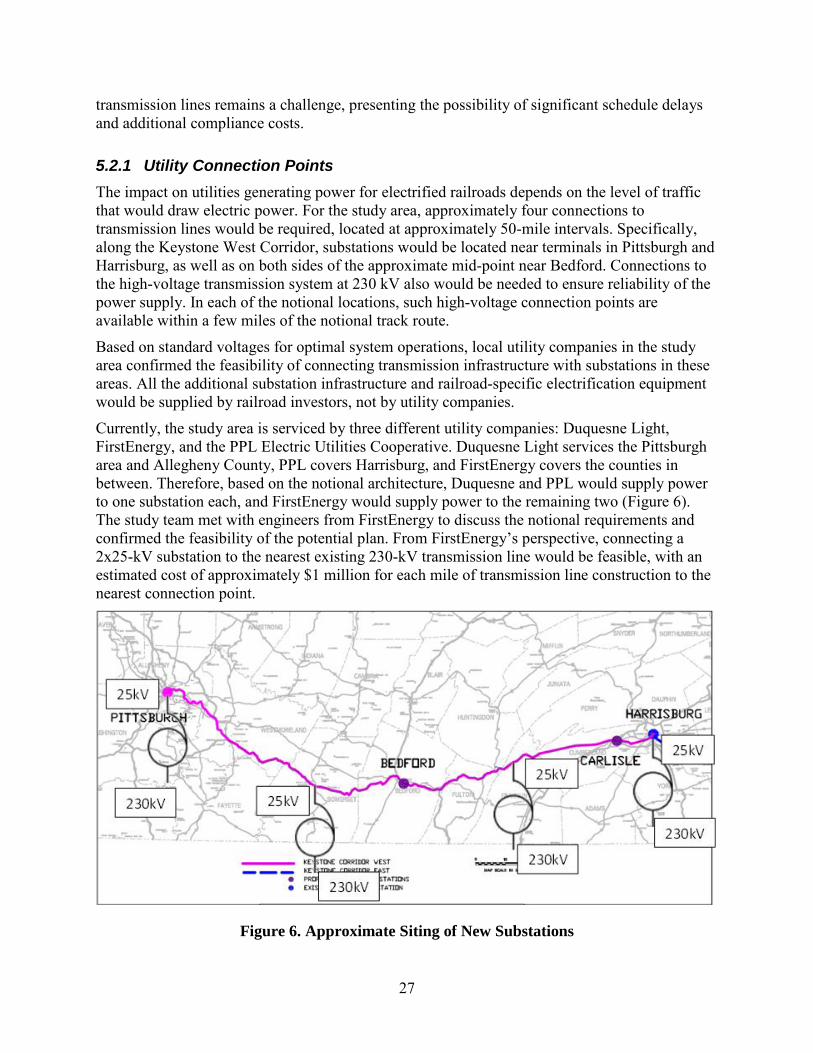
5.2.1 Utility Connection Points The impact on utilities generating power for electrified railroads depends on the level of traffic that would draw electric power. For the study area, approximately four connections to transmission lines would be required, located at approximately 50-mile intervals. Specifically, along the Keystone West Corridor, substations would be located near terminals in Pittsburgh and Harrisburg, as well as on both sides of the approximate mid-point near Bedford. Connections to the high-voltage transmission system at 230 kV also would be needed to ensure reliability of the power supply. In each of the notional locations, such high-voltage connection points are available within a few miles of the notional track route.
Based on standard voltages for optimal system operations, local utility companies in the study area confirmed the feasibility of connecting transmission infrastructure with substations in these areas. All the additional substation infrastructure and railroad-specific electrification equipment would be supplied by railroad investors, not by utility companies.
Currently, the study area is serviced by three different utility companies: Duquesne Light, FirstEnergy, and the PPL Electric Utilities Cooperative. Duquesne Light services the Pittsburgh area and Allegheny County, PPL covers Harrisburg, and FirstEnergy covers the counties in between. Therefore, based on the notional architecture, Duquesne and PPL would supply power to one substation each, and FirstEnergy would supply power to the remaining two (Figure 6). The study team met with engineers from FirstEnergy to discuss the notional requirements and confirmed the feasibility of the potential plan. From FirstEnergy’s perspective, connecting a 2x25-kV substation to the nearest existing 230-kV transmission line would be feasible, with an estimated cost of approximately $1 million for each mile of transmission line construction to the nearest connection point.
Figure 6. Approximate Siting of New Substations
28
5.2.2 Impact on Power Demand To forecast the approximate impact on demand for electric power in the study area, the team estimated the capacity requirement, based on average consumption of 33 kWh per mile, and multiplied by a factor of 2. Because the length of the proposed track in the study area is approximately 150 miles, hourly consumption of electricity would average 4,950 kWh. Assuming uniform usage, this number translates to about 5 megawatts (MW) of demand. In 2010, a study performed for the Metrolinx public transit system in Toronto estimated that the ratio between seconds/minutes demand and hourly demand can be 2.25 Therefore, as a conservative estimate, the study team used a factor of 3 and arrived at an estimated peak demand of approximately 15 megavolt-amperes (MVA). The study team found no significant generation or transmission issues with the local utility at these levels. Based on conversations with FirstEnergy, power generation for current levels of traffic is not an issue and would be ensured, as defined through service level agreements (SLAs).
5.3 Effects on Domestic Energy Markets As a whole, the study team found no evidence that power generation capacity would be significantly affected by conversion to electrical energy on the study portion of rail. The major determinant of this impact is the level of traffic, which currently is modest. Based on current ridership for the region, hourly consumption, and distance traveled, the team estimated that peak demand would be 15 MVA.
Currently, Pennsylvania is one of the top electricity-producing States in the Nation. In June 2014, Pennsylvania generated 19,348 thousand megawatthours—a 2.3-percent increase over June 2013. As a whole, Pennsylvania has less consumption per capita than the national average and thus is an important electricity supplier to other States in the Northeast. 26 As result, meeting the increase in power demand for electrification of the Keystone West Corridor should not be difficult for local utilities. If electrification and high-speed rail leads to a significant increase in traffic across electrified rails, generating capacity eventually will be affected, and costs to all consumers could rise significantly as a result of expenditures for additional generating capacity.
29
6. Potential Barriers to Electrification
Potential barriers to railway electrification include operational obstacles, such as interoperability issues across operation types; operator-specific concerns, such as ownership and right-of-way; and an environment of significant costs for modest benefits.
6.1 Investment Financing and Right-Of-Way The significant requirement for up-front investment in both infrastructure and new locomotives continues to be the largest obstacle to successful conversion of railroad operations to electric power. In addition, the costs associated with new track alignments that would allow for high-speed rail travel compound the burden for electrification. Most railroads are privately owned, typically by the major freight shipping companies, such as Norfolk Southern. Passenger service railroads, particularly along commuter lines, typically are owned by local and regional transit agencies, while Amtrak operates between privately owned intercity freight lines and across local or regional transit lines at an incremental cost. Therefore, the question of electrification investment and the ownership of electrification infrastructure is complex.
In the case of the Keystone West Corridor, Norfolk Southern’s ownership of the existing track alignment would necessitate a partnership with government, investors, and potentially other stakeholders to ensure that long-term maintenance, capital renewal, and right-of-way access issues related to the new electrified route are addressed.
6.2 Operational Obstacles to Electrification There are numerous operational obstacles to electrification of railways, some of which are significant. For the Keystone West Corridor, the study team identified critical barriers including but not limited to the following:27
• OCS clearance for double stack intermodal freight. As more freight operators move to double-stack configurations, and significant investments are made in clearances and route alignments to accommodate this type of traffic, freight operators are increasingly moving away from operations that might support electric traction power.
• Need for compatibility of signal systems and operating rules when multiple rail operators are involved. New electrification-compatible coded AC-signal track circuits must be part of a new electrification segment. With multiple rail operators on the segment, the new signal systems and operating rules must be compatible among the operators. The impending installation of Positive Train Control (PTC) systems on much of the existing rail system may present an opportunity to accomplish the necessary compatibility as part of the new PTC installations. Fully compatible communications infrastructure for train operations and the electric traction system must also be installed on the new segment. For a new alignment these signal costs are negligible. Operating rules are easily addressed, but they may present a more significant challenge on operating railroads where existing systems must be maintained while new systems are rolled out.
• Procurement of electric locomotives. Because this will be a new alignment—in fact, an extension of the existing electrified Keystone East—the increased number of electrified

30
locomotives may be less than the number of diesel locomotives, as Amtrak could run through electrified trains west of Harrisburg. However, depending on the level of freight traffic electrification, procurement of electrified locomotives may present a barrier to realizing the full benefit of the investment.
• Restricted vertical and horizontal envelope clearances due to tunnels, overhead bridges, and footbridges. The vertical clearance required for electrified railroads, from top of rail to underside of bridge/tunnel, is greater than the clearance required for non-electrified railroads. However, assuming that electrification is implemented in concert with a new track alignment, clearances would be addressed up front.
31
7. Potential Strategies to Enable Electrification
Strategies to enable electrification must account for all obstacles and consider numerous stakeholders. The obstacles described above, while considerable, are not insurmountable. At present, electrification of passenger service, including intercity lines like the Keystone West Corridor, presents as more feasible than electrification of freight lines as well. Bringing freight lines and freight operators into an electrified environment would require a sharp turn from the direction that their business has been heading over the past several decades.
As freight traffic operates increasingly with efficient and low-cost diesel-electric power, and passenger service in high-traffic areas along the east coast moves toward high-speed travel and new track alignments, significant operational questions are raised regarding the use of a common railway infrastructure. These questions also serve to align stakeholders on opposing sides of the electrification question. Nevertheless, CEOs of some of the largest freight operating companies in the country, including Norfolk Southern, remain open to the possibility of electrifying at some point.28 Fundamentally, when the economic analysis presents a favorable business case for investment, freight operators will invest in electrification infrastructure.
Until a strong business case exists, more creative solutions may be considered, such as government investment or some type of partnership to share the costs, benefits, and risks of the investment. At the same time, efforts on a smaller scale may contribute to a more favorable climate for future investments by addressing individual obstacles in turn. For example, in the near future a significant number of used, but serviceable, electric locomotives may become available from Amtrak and other transit operators, which may be modified for use by the freight operators on electrified segments. Eventually, joint use of a fleet of electric locomotives could reduce the number of units needed for supporting multiple operators.
In order to be able to justify electrification of the Keystone West Corridor, the significant issues and barriers to electrification must be mitigated.
7.1 Plan Economies of Scale In the present environment, there is a weak business justification for investing in electrification of the Keystone West Corridor. A major factor behind this is the low level of traffic and ridership along the route. Electrification of higher traffic routes presents a stronger business case. If the case for electrification is broadened to include a larger network of lines, such as more western and southern routes that connect more population centers and economic zones, traffic and ridership across longer corridors may likely increase as the mode of transportation becomes more time- and cost-effective for riders. The increase in ridership across a larger zone would help offset the costs of the investment in lower ridership areas.29 Additionally, a larger electrified network presents greater incentive for freight operators to utilize electric power.
A larger network for potential electrification also increases the opportunities for partnerships in the investment. A network that connects intercity passenger lines with local and regional transit services, as well as potentially freight shipping lines, presents opportunities for longer, continuous routes utilizing a common power, which may present operators with additional options for routing traffic. Increasing the route area to include more operators increases the potential number of financial stakeholders in the investment, thus potentially providing greater

32
opportunities for partnerships and cost-sharing. Due to the close relationship between electrification and high-speed rail, any strategy to deliver high-speed rail should be coupled with electrification across the same lines.
7.2 Establish Public-Private Partnerships If electrification is to become an economically viable opportunity for investment, freight operators must be able to find benefit from this type of power source. Without financial incentives for their participation, the cost for passenger-only electrified rail operating either in parallel or as a shared right-of-way with freight operators is simply too high at this time. Only through sharing the costs and economic benefits of the electrification investment can the overall investment become economically feasible. This would entail a joint effort between the Federal government, State and local authorities, as well as private rail (freight) operators and other financing entities, such as banks and other financial institutions. These partnerships must be organized around the principles of shared costs, benefits, and risk.
7.3 Leverage International Experience with Government-Led Investment in Infrastructure
Electrified railways are becoming the norm across Europe and increasingly present in parts of Asia and South America. The majority of these investments were led by government action through direct investment not only in railroad and transmission infrastructure, but also in the power generation and transmission grid to support electrified rail. The following case studies highlight some of the approaches that are being employed across the world and may be useful reference points for a national policy effort in the United States.
7.3.1 United Kingdom Most of Great Britain’s railway system (excluding Northern Ireland and the London underground) is owned and operated by Network Rail, a central government body. This entity has a framework agreement with the British Department for Transport and currently receives almost all of its funding from the government.30 Any future borrowing would also need to be agreed to by the British government.31
As a result of the government’s unique relationship with Network Rail, any future initiatives to further electrify the railways in Great Britain would rely heavily on the use of public funds. Moving forward, Network Rail plans to electrify more than 2,000 km of track by 2021, at an expected cost of roughly £4 billion; at the completion of the project, about 55 percent of Great Britain’s railways will be electric.32
In recent years, the cost of operating the railways has been increasing, making it difficult for Network Rail to be profitable. Since the mid-2000s, the government’s support to the rail industry has been significantly larger than in the 1990s. In 2006, the rail industry received a high of £7.2bn, which is 330 percent more than the average of £ 2.2bn in the 1990s. The most recent funding levels are 31 percent less than the high, totaling £5.1bn in 2012.33 Electrifying larger portions of the British railway system would help to reduce costs; provide additional sources of revenue from electricity transmission; allow for larger, higher capacity trains; reduce carbon emissions; and support more economic growth across Britain.
33
However, there have been some challenges in securing funding and more generally, some opposition to the initiative. Power companies are concerned that they will have to pay for some of the new infrastructure and will have to modify their current networks to accommodate the additional energy usage, which would result in higher energy costs for consumers.34 Also, there are engineering challenges and public policy decisions that must be addressed. Currently, a significant amount of the railway in southern England uses a DC power system as opposed to the AC system which is required for overhead power lines and heavier freight trains. The government will need to establish AC as the standard power system and then retrofit a large portion of the electric railway to comply with these new standards.35 Furthermore, electrifying the railway is a tremendously expensive endeavor which would take financial resources away from competing public policy issues.
7.3.2 India Indian Railways is the entity in charge of maintaining and operating the railway system in India, which is one of the largest rail systems in the world. It is a state-owned enterprise, owned by the government of India and administered through the Ministry of Railways.36 Because Indian Railways is an extension of the government, it receives most of its funding from public sources and ridership.
The government has tremendous involvement in the electrification efforts in India since, as the operator, it is responsible for policymaking and implementing infrastructure changes on the railways. Its most recent priorities indicate that the government will be focusing on expanding freight segments and strategizing on increasing ridership in the most profitable areas.37 This strategy to drive revenue directly relates to the government’s ongoing efforts to electrify large portions of the railway. Currently, a total of 24,891 km have been electrified as of April 2014, with a target of 33,000 km to be completed by 2020. In the current system, 51 percent of the passenger traffic and 67 percent of freight traffic are now on electric rails, which will be further increased in upcoming years.38
However, one of the biggest challenges in increasing the amount of electrified railways is financial constraints. There are competing priorities for the financial resources both within Indian Railways and in the government as a whole. Recently, Indian Railways has undertaken several major initiatives, including building a dedicated freight Corridor to help increase transportation capacity, but this has also taken resources away from electrifying the railways. One avenue that is being considered is engaging in an annuity-based public-private partnership to continue the electrification efforts. In this arrangement, the contractor would receive the savings generated from the electrification on a yearly basis for a defined period time, and Indian Railways would not see a change in its current costs.39
7.3.3 China In China, the government is also the primary decisionmaker and is responsible for planning and implementing changes in the railway system. The Chinese rail system is operated by the Chinese Railway Corporation, which is a government-owned enterprise.
One of the major initiatives in the 12th 5-year plan proposed by the government is to reduce carbon emissions in China across all sectors. Building a cleaner transportation system is the nexus to achieving this goal, since transportation is both a significant source of carbon emissions
34
and also a contributor to the carbon footprint of finished goods. By continuing to electrify the railways, China would further reduce its carbon emissions and make rail a preferred mode of transportation for raw materials and finished products.40
Thus, China is planning to have 60 percent of its rail network electrified by 2015, according to the 12th 5-year plan.41 This initiative, which represents an ambitious goal, will continue to ensure that China has the largest electrified rail network in the world.42 The biggest source of funding for these electrification projects is through the use of public funds; however, since the late 1990s China has been more willing to use public private partnerships (PPP) as a means to raise money. This marks a departure from its past policies of not engaging in PPP ventures, as it was strictly forbidden for the private sector to take part in the construction and operation of public infrastructure. However, in the early 2000s the Chinese government has taken steps to make PPP possible for foreign investors and has provided tax incentives for private companies that participate in PPPs.43
Conversely, there are also significant risks to both parties in engaging in PPPs. In China, the absence of legal safeguards could hurt private investment and drive it away from possible PPP projects. This is a significant problem that has led several partnerships to fall through in recent years. Likewise, the government also takes a risk when devising the revenue-sharing and risk allocation in a PPP contract. When the a PPP project relies on revenue sharing from ridership, incentives such as “shadow patronage” might need to be incorporated into the contract to compensate the private partner against lower ridership than expected. This might lead the public sector to bear more of the cost than the private sector.44
35
8. Conclusion
This study found that economic and social returns from electrification as a standalone investment still remain elusive. Given the present efficiency of diesel-electric locomotives, the low price of diesel fuel, and the low level of passenger travel on the study segment, the benefits are insignificant, even negative compared with the status quo. This environment could change if factors such as the cost of diesel or passenger travel increase considerably relative to current levels; however, under current conditions, which are likely to persist into the near term, these factors keep the cost-benefit ratio unfavorable for this investment.
Investments in high-speed rail, which would require electric power, were not covered by the scope of this study but may present a different cost-benefit ratio that would prove favorable. However, this is most likely the case for segments of railroad that connect large population centers or heavy commuting areas, as opposed to longer intercity routes that are used more extensively for freight.
This study found that freight operators have indicated openness to electrification in the past, but the high cost barriers and potential operational barriers to adoption remain significant challenges. Ultimately, potential strategies exist that may facilitate future adoption of electrification technologies, although most indicators suggest that success will depend on large-scale adoption at a national level, often driven by significant government investment.
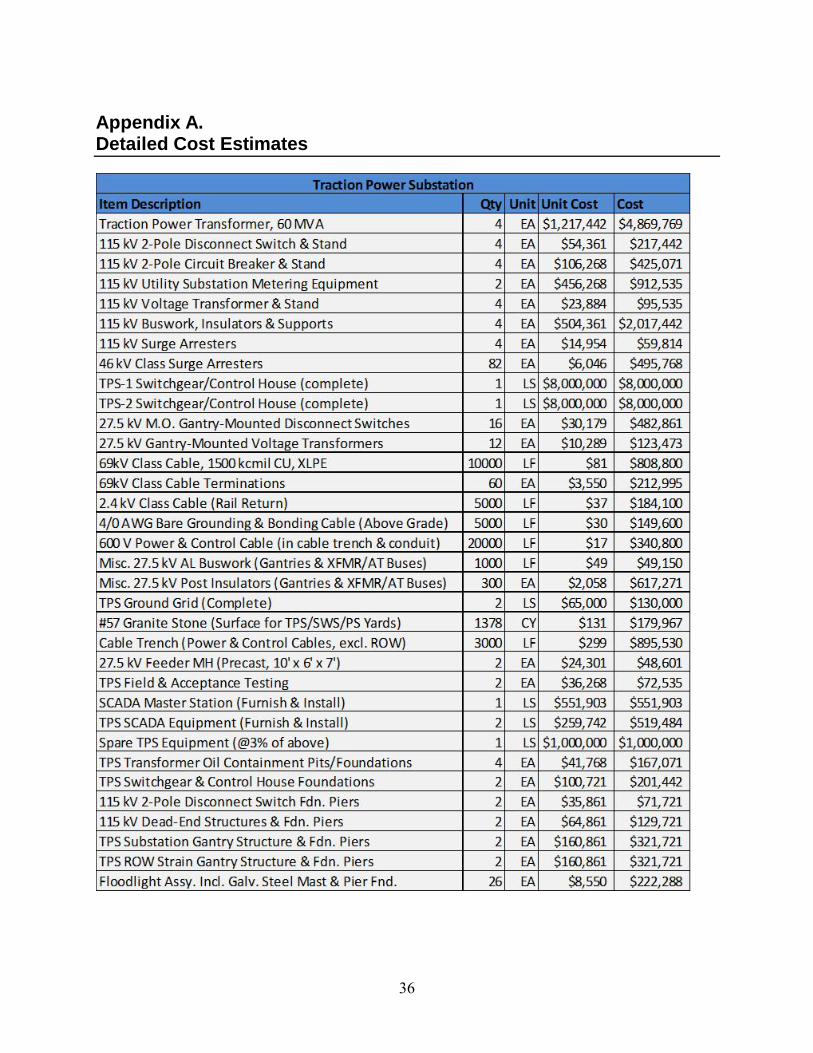
36
Appendix A. Detailed Cost Estimates
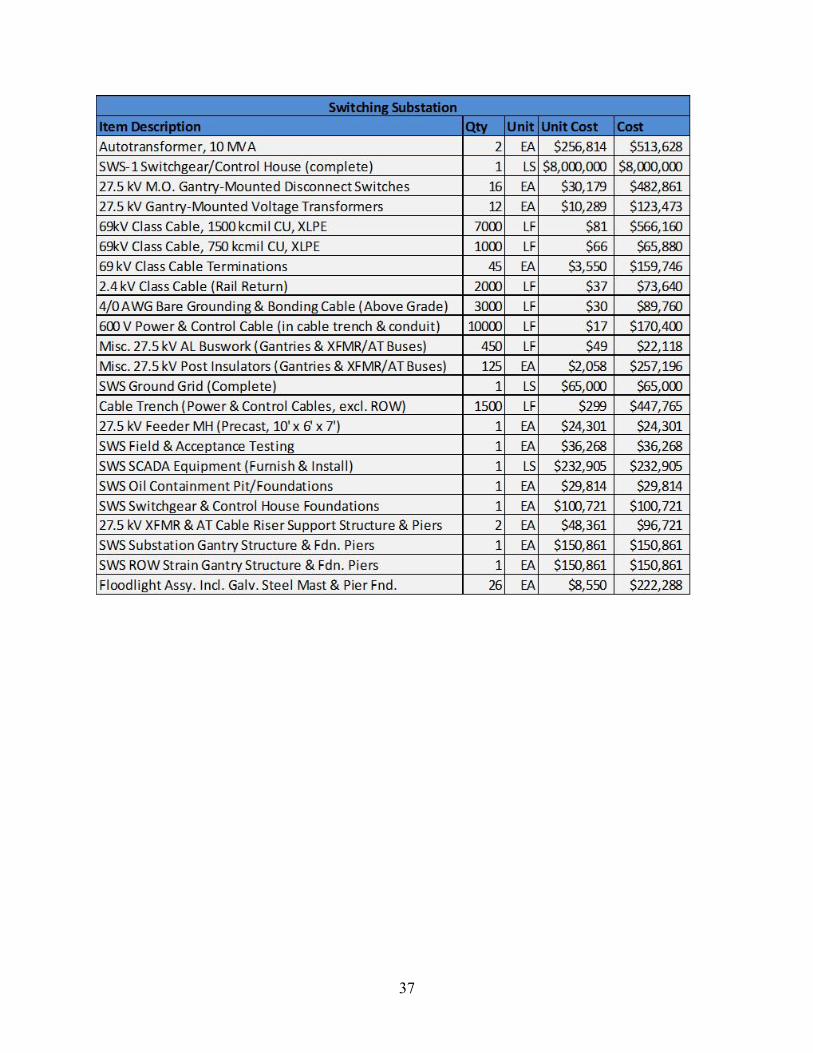
37
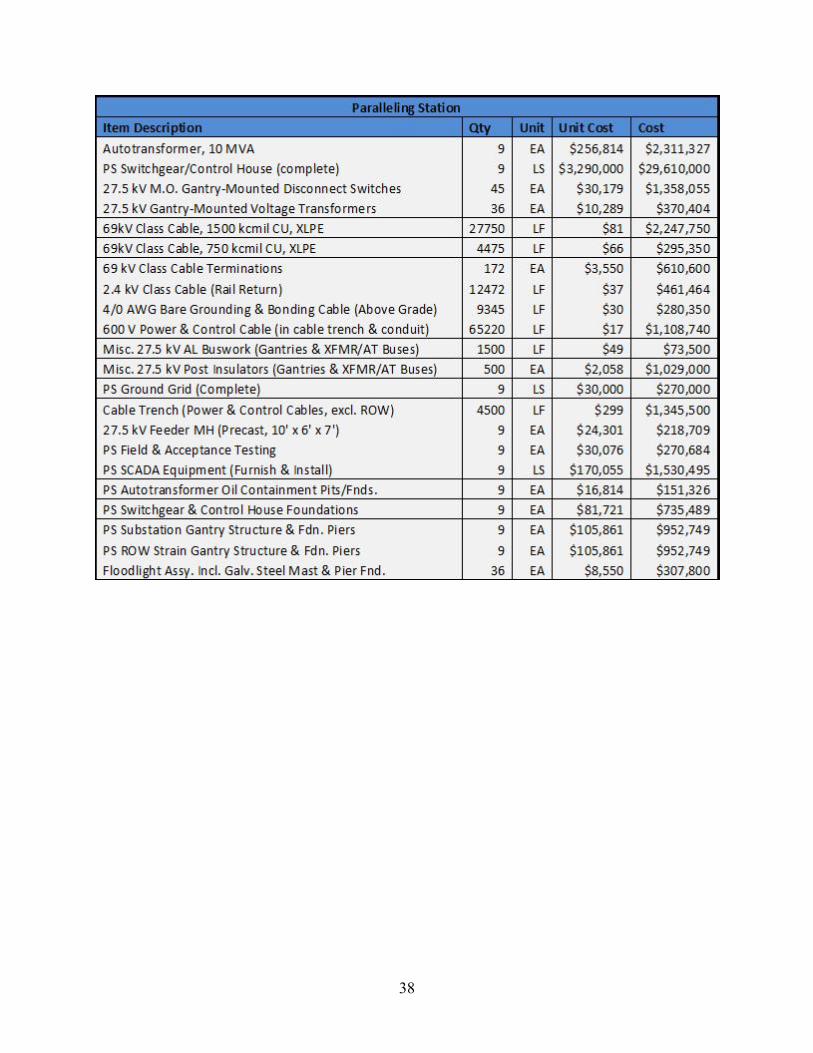
38
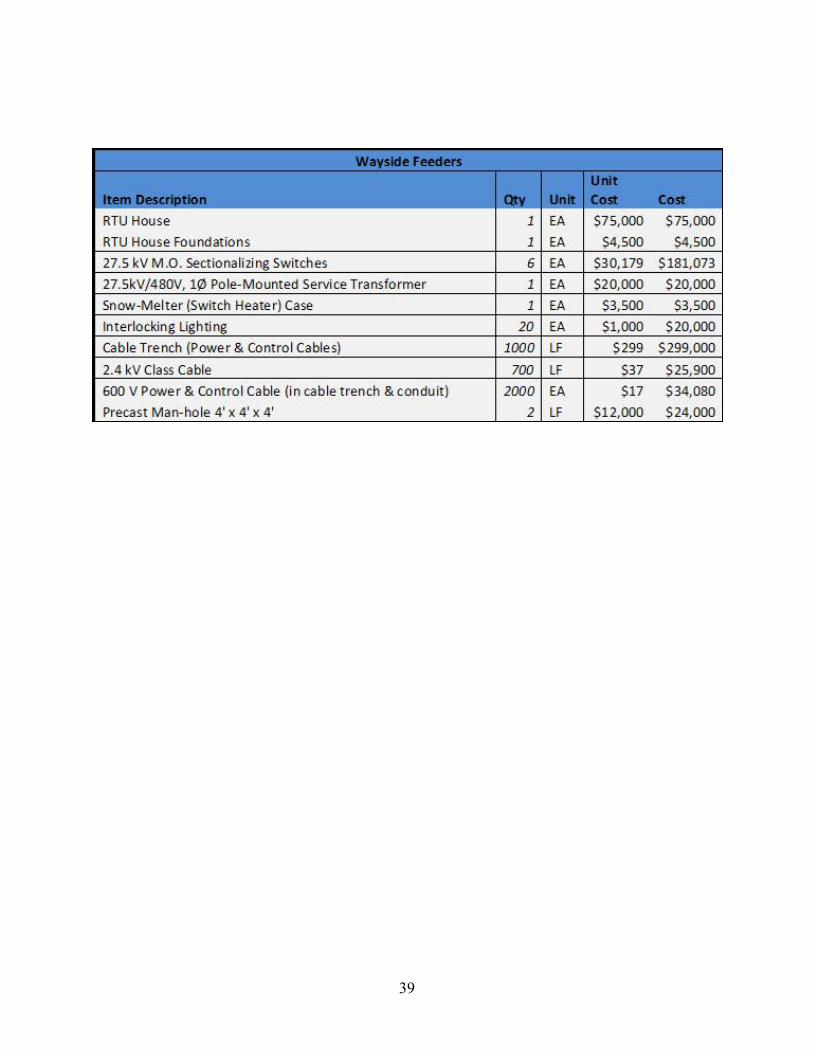
39
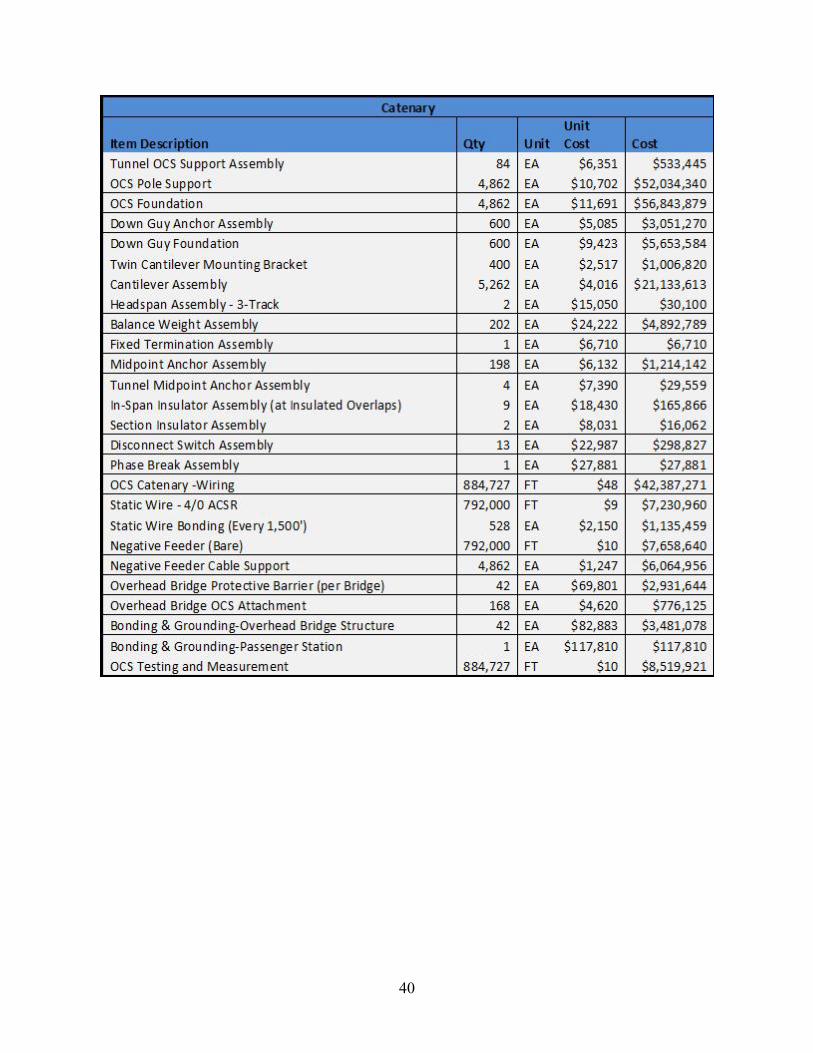
40
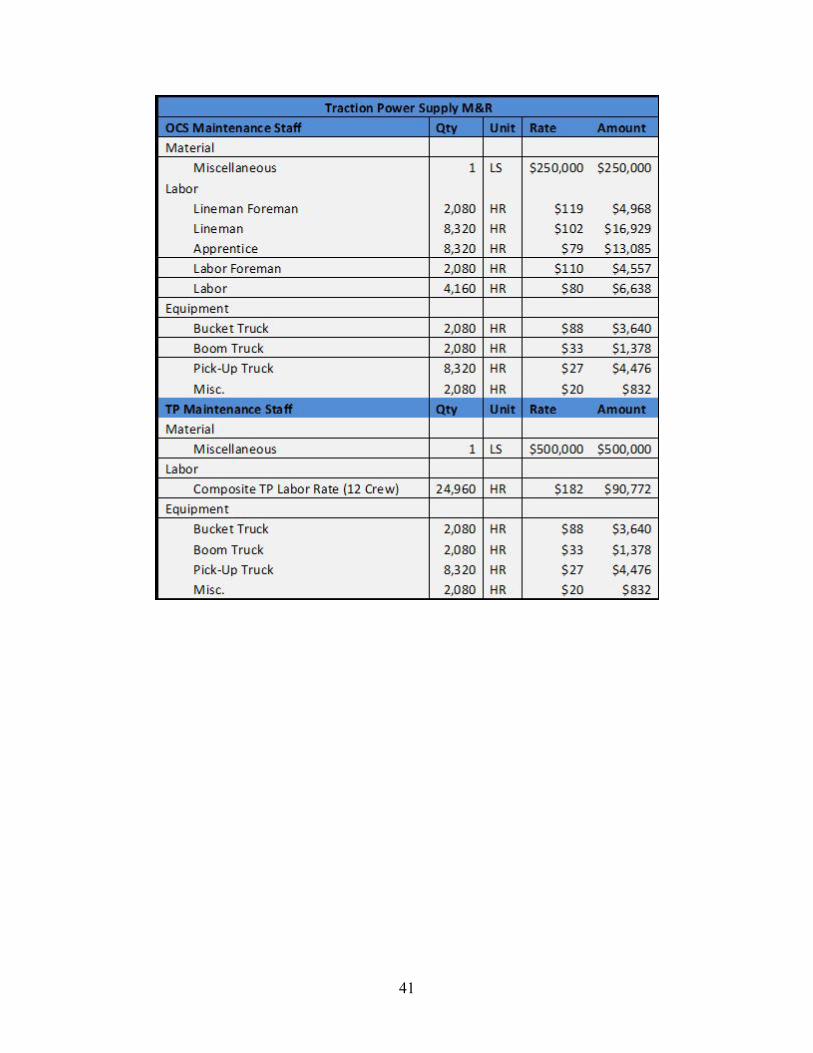
41

42
Abbreviations and Acronyms
AC alternating-current
AT Auto-Tension (system)
DC direct current
DP distributed power
EPA U.S. Environmental Protection Agency
FRA Federal Railroad Administration
Hz Hertz
kV kilovolt
mph miles per hour
MVA megavolt-amperes
MW megawatts
NEC Northeast Corridor
OCS overhead contact system
PPP public private partnership
PTC Positive Train Control
SLAs service level agreements
USDOT U.S. Department of Transportation
VSL value of a statistical life
43
References
1Fontaine, T. (2013). State commits annual $3.8M to Pittsburgh- Harrisburg Amtrak Line. Trib
Total Media, Inc. http://triblive.com/news/allegheny/4073882-74/state-amtrak-pennsylvanian. 2Cogswell, R.U. (1994). Railroad research issues. Los Angeles Basin railway electrification
study. Transportation Research Record, 1470. http://www.trb.org/Publications/Pages/262.aspx
(out-of-print). 3Federal Railroad Administration (March 2004). Technical monograph: Transportation planning
for the Philadelphia-Harrisburg “Keystone” railroad Corridor.
http://www.fra.dot.gov/Elib/Details/L04162 and www.fra.dot.gov/Elib/Document/2753. 4Gillespie, A.J., & and Hayes, H.I. (2003). “Railway electrification,” in American Railway
Engineering and Maintenance of Way Association (AREMA), Practical guide to railway
engineering. https://www.arema.org/publications/pgre/index.aspx. 5Schmid, F., and Goodman, C.J. (2009). Electric railway systems in common use.
http://ieeexplore.ieee.org. 6EarthTech and Korve Engineering. (2007). Bay Area regional rail plan, Technical Memorandum
4e, Electrification of the bay area regional rail system cost, issues and potential.
http://www.mtc.ca.gov/planning/rail/downloads/tech_memos/4e_System_Electrification.pdf. 7Ibid. 8Ibid. 9Ibid. 10Metrolinx. (2010). Go electrification study: final report.”
http://88.198.249.35/get/xzXKdMwiu7iLYK1FgWVws7xF7b2QsygbfaFB8s5UNb4,/110119-
GO-Electricification-Study-Final-Report-VB-H-amp-F.pdf. 11Amtrak Office of Inspector General. (2013). Asset management: Amtrak is preparing to
operate and maintain new locomotives, but several risks to fully achieving intended benefits
exist.” http://www.amtrakoig.gov/sites/default/files/reports/oig-e-2013-021.pdf. 12Cogswell, op. cit. (1994).
44
13Amtrak FY13 Ridership Report, News Release (October 14, 2013),
http://www.amtrak.com/ccurl/730/658/FY13-Record-Ridership-ATK-13-122.pdf. 14U.S. Department of Transportation. (2012). TIGER benefit-cost analysis resource guide,
http://www.dot.gov/sites/dot.dev/files/docs/TIGER_BCA_RESOURCE_GUIDE.pdf. 15Cogswell, op. cit. (1994). 16Amtrak. (2010). Amtrak awards $466 million contract for 70 new locomotives.
http://www.amtrak.com/servlet/BlobServer?blobcol=urldata&blobtable=MungoBlobs&blobkey=
id&blobwhere=1249216633199&blobheader=application%2Fpdf&blobheadername1=Content-
disposition&blobheadervalue1=attachment;filename=Amtrak_ATK-10-
141a_Amtrak_Electric_Locos_Release.pdf. 17U.S. Environmental Protection Agency. (2009). Emissions factors for locomotives.
http://www.epa.gov/nonroad/locomotv/420f09025.pdf. 18U.S. Environmental Protection Agency. (2013). The social cost of carbon.
http://www.epa.gov/climate/climatechange/EPAactivities/economics/scc.html. 19U.S. Department of Transportation, Bureau of Transportation Statistics. Table 4-18: Amtrak
Fuel Consumption and Travel.
http://www.rita.dot.gov/bts/sites/rita.dot.gov.bts/files/publications/national_transportation_statist
ics/html/table_04_18.html. 20U.S. Energy Information Administration. (September 15, 2014). Petroleum and other liquids:
weekly retail gasoline and diesel prices.
http://www.eia.gov/dnav/pet/pet_pri_gnd_dcus_nus_w.htm. 21U.S. Energy Information Administration. (September 2014). Table 5.6 A. Average Retail Price
of Electricity to Ultimate Customers by End Use Sector, June 2014.
http://www.eia.gov/electricity/monthly/epm_table_grapher.cfm?t=epmt_5_6_a. 22U.S. Environmental Protection Agency (2009). Emissions factors for locomotives.
http://www.epa.gov/nonroad/locomotv/420f09025.pdf. 23U.S. Environmental Protection Agency. (1999). The benefits and costs of the Clean Air Act,
1990 to 2010. http://www.epa.gov/cleanairactbenefits/1990-2010/chap1130.pdf.
45
24Federal Railroad Administration. (2009). Vision for high speed rail in America.
http://www.apta.com/gap/legissues/passengerrail/Documents/FRA_HSR_Strategic_Plan.pdf. 25Conceptual design of electrification system, Appendix 7. (2010). Prepared for Metrolinx by
Delcan + Arup JV. 26U.S. Energy Information Administration. (June 2014). Pennsylvania State profile and energy
estimates. http://www.eia.gov/state/data.cfm?sid=PA#ReservesSupply. 27Federal Railroad Administration. (2004). Technical monograph: Transportation planning for
the Philadelphia-Harrisburg “Keystone” railroad Corridor. 28J. Boyd. (2009). NS mulls electrification; UP looks away. The Journal of Commerce, June 9,
2009. 29Federal Railroad Administration. (2009). Vision for high speed rail in America.
http://www.apta.com/gap/legissues/passengerrail/Documents/FRA_HSR_Strategic_Plan.pdf. 30Department for Transport (London, UK). 2014. Network Rail Framework Agreement. 31Network Rail. (Accessed September 15, 2014). Our governance structure.
http://www.networkrail.co.uk/about-us/governance/. 32rail.co.uk (Great Britain). (2014). 11 percent of the UK rail network to be electrified under
Network Rail’s £4bn national electrification programme. http://www.rail.co.uk/rail-
news/2014/uk-rail-network-to-be-electified-under-network-rail-programme/. 33M. Keep. (2014). Railways: Government support and public expenditure. House of Commons
Library: January 8, 2014. 34E. Godsen. (2014). UK bill-payers “may fund rail electrification by back door.” The Telegraph
(June 24, 2013). http://www.telegraph.co.uk/finance/newsbysector/energy/10137721/UK-bill-
payers-may-fund-rail-electrification-by-back-door.html. 35Atkins (2014). Rail electrification in the UK: going live? http://angles.atkinsglobal.com/1917-
rail-electrification-in-the-uk-going-live. 36Ministry of Railways (Railway Board) CMS Team. (2014) Organisation structure.
http://www.indianrailways.gov.in/railwayboard/view_section.jsp?lang=0&id=0,1,304,305.
46
37Ministry of Finance (India). (2014). Economic survey: 2013-2014, Chapter 11, Sections 11.23
through 11.3. 2013-2014. 38Central Organization for Railway Electrification (India). (2014). Brief on railway
electrification (August 28, 2014).
http://www.core.indianrailways.gov.in/view_section.jsp?lang=0&id=0,294,302,532. 39R. Arora. (2013). Railways plans PPP for route electrification. The Financial Express (August
27, 2013). http://www.financialexpress.com/news/railways-plans-ppp-for-route-
electrification/1160508. 40KPMG China. (2011). China’s 12th 5 Year Plan: Transportation and logistics.
http://www.kpmg.com/CN/en/IssuesAndInsights/ArticlesPublications/Documents/China-12th-
Five-Year-Plan-Transportation-Logistics-201104.pdf. 41OSEC Business Network Switzerland. (2011). Final report: China Railway market study.
http://www.s-ge.com/en/filefield-private/files/1673/field_blog_public_files/7908. 42xinhuatnet.com. (2012). China’s electric railway exceeds 48,000km (December 4, 2012).
http://news.xinhuanet.com/english/business/2012-12/04/c_132019195.htm. 43Z. Chang. (2013). Public-private partnerships in China: A case for the Beijing No. 4 metro line.
Transport Policy, Vol. 30 (2013), pp. 153-160. 44Ibid.