cost-effective control of air quality and greenhouse gases in europe: modeling and policy...
TRANSCRIPT
at SciVerse ScienceDirect
Environmental Modelling & Software 26 (2011) 1489e1501
Contents lists available
Environmental Modelling & Software
journal homepage: www.elsevier .com/locate/envsoft
Cost-effective control of air quality and greenhouse gases in Europe: Modelingand policy applications
Markus Amanna,*, Imrich Bertoka, Jens Borken-Kleefelda, Janusz Cofalaa, Chris Heyesa,Lena Höglund-Isakssona, Zbigniew Klimonta, Binh Nguyena, Maximilian Poschb, Peter Rafaja,Robert Sandlera, Wolfgang Schöppa, Fabian Wagnera, Wilfried Winiwartera
a International Institute for Applied Systems Analysis (IIASA), Schlossplatz 1, A-2361 Laxenburg, AustriabNational Institute for Public Health and the Environment (RIVM), Bilthoven, Netherlands
a r t i c l e i n f o
Article history:Received 10 November 2010Received in revised form13 July 2011Accepted 16 July 2011Available online 15 September 2011
Keywords:Air pollutionIntegrated assessmentCost-effectivenessGAINS modelConvention on Long-range transboundaryair pollutionScienceepolicy interfaceDecision support
* Corresponding author. Tel.: þ43 2236 807 432; faE-mail address: [email protected] (M. Amann).
1364-8152/$ e see front matter � 2011 Elsevier Ltd.doi:10.1016/j.envsoft.2011.07.012
a b s t r a c t
Environmental policies in Europe have successfully eliminated the most visible and immediate harmfuleffects of air pollution in the last decades. However, there is ample and robust scientific evidence thateven at present rates Europe’s emissions to the atmosphere pose a significant threat to human health,ecosystems and the global climate, though in a less visible and immediate way. As many of the ‘lowhanging fruits’ have been harvested by now, further action will place higher demands on economicresources, especially at a time when resources are strained by an economic crisis. In addition, interactionsand interdependencies of the various measures could even lead to counter-productive outcomes ofstrategies if they are ignored.
Integrated assessment models, such as the GAINS (Greenhouse gas e Air pollution Interactions andSynergies) model, have been developed to identify portfolios of measures that improve air quality andreduce greenhouse gas emissions at least cost. Such models bring together scientific knowledge andquality-controlled data on future socio-economic driving forces of emissions, on the technical andeconomic features of the available emission control options, on the chemical transformation anddispersion of pollutants in the atmosphere, and the resulting impacts on human health and the envi-ronment. The GAINS model and its predecessor have been used to inform the key negotiations on airpollution control agreements in Europe during the last two decades.
This paper describes the methodological approach of the GAINS model and its components. It presentsa recent policy analysis that explores the likely future development of emissions and air quality in Europein the absence of further policy measures, and assesses the potential and costs for further environmentalimprovements. To inform the forthcoming negotiations on the revision of the Gothenburg Protocol of theConvention on Long-range Transboundary Air Pollution, the paper discusses the implications of alter-native formulations of environmental policy targets on a cost-effective allocation of further mitigationmeasures.
� 2011 Elsevier Ltd. All rights reserved.
1. Introduction
Environmental policies in Europe have successfully eliminatedthe most visible and immediate harmful effects of air pollution inthe last decades. However, there is ample and robust scientificevidence that even at present rates Europe’s emissions to theatmosphere pose a significant threat to human health, ecosystemsand the global climate, though in a less visible and immediate way.Refined scientific methods reveal that, e.g., via the long-term
x: þ43 2236 807 533.
All rights reserved.
exposure to fine particulate matter, current levels of air pollutionshorten the statistical life expectancy of European citizens byseveral months (CEC, 2005). Biodiversity and Europe’s geneticresource base is under threat from the excessive release of nitrogento the atmosphere from energy combustion and intensive agricul-ture (Galloway et al., 2008). Europe’s greenhouse gas emissions,currently twice as high on a per-capita basis as the world average,and historically responsible for about a quarter of current concen-trations in the atmosphere, make a significant contribution toglobal climate change (den Elzen et al., 2005).
To protect the quality of life of European citizens, the sustain-ability of the services provided by its ecosystems, and to avoid
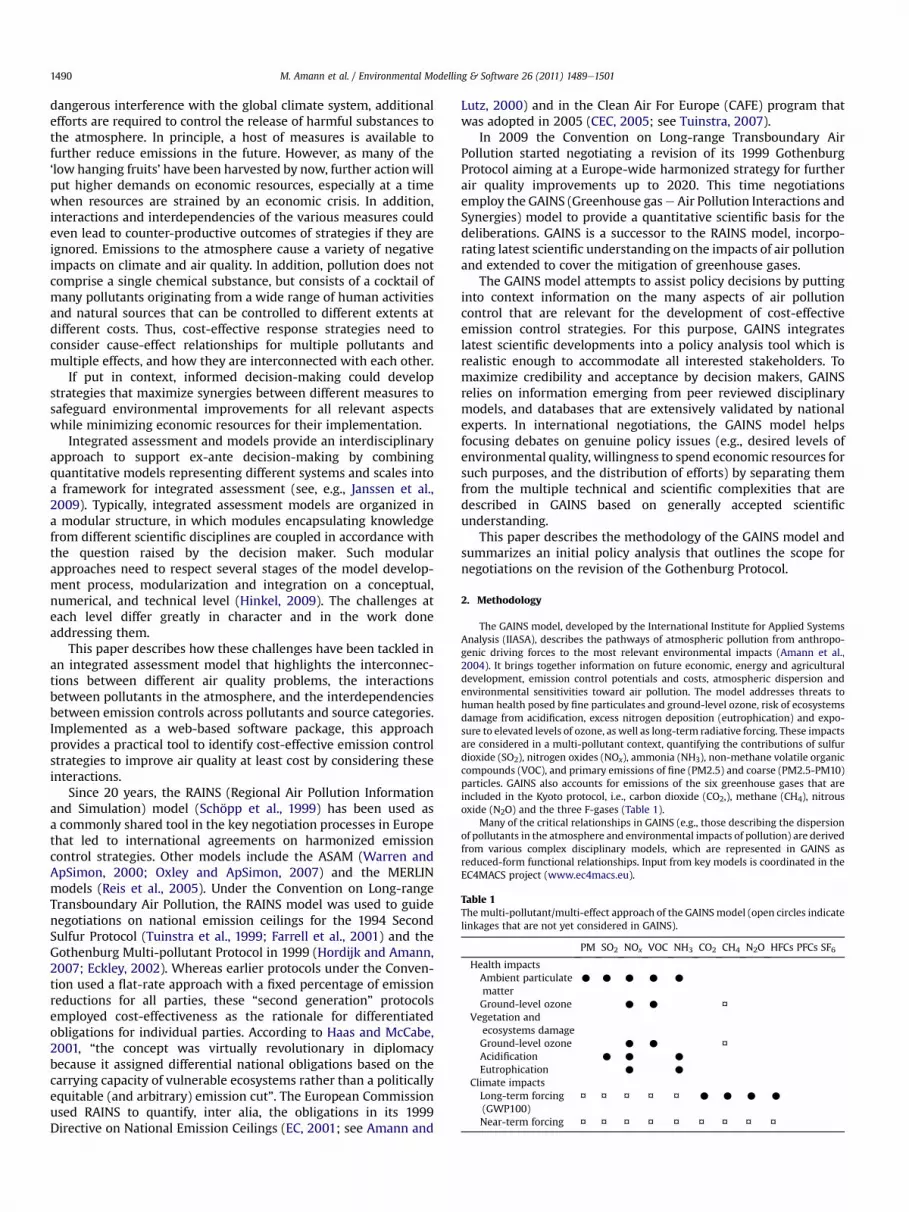
Table 1Themulti-pollutant/multi-effect approach of the GAINSmodel (open circles indicatelinkages that are not yet considered in GAINS).
PM SO2 NOx VOC NH3 CO2 CH4 N2O HFCs PFCs SF6
Health impactsAmbient particulatematter
C C C C C
Ground-level ozone C C ¤Vegetation and
ecosystems damageGround-level ozone C C ¤Acidification C C C
Eutrophication C C
Climate impactsLong-term forcing(GWP100)
¤ ¤ ¤ ¤ ¤ C C C C
Near-term forcing ¤ ¤ ¤ ¤ ¤ ¤ ¤ ¤ ¤
M. Amann et al. / Environmental Modelling & Software 26 (2011) 1489e15011490
dangerous interference with the global climate system, additionalefforts are required to control the release of harmful substances tothe atmosphere. In principle, a host of measures is available tofurther reduce emissions in the future. However, as many of the‘low hanging fruits’ have been harvested by now, further actionwillput higher demands on economic resources, especially at a timewhen resources are strained by an economic crisis. In addition,interactions and interdependencies of the various measures couldeven lead to counter-productive outcomes of strategies if they areignored. Emissions to the atmosphere cause a variety of negativeimpacts on climate and air quality. In addition, pollution does notcomprise a single chemical substance, but consists of a cocktail ofmany pollutants originating from a wide range of human activitiesand natural sources that can be controlled to different extents atdifferent costs. Thus, cost-effective response strategies need toconsider cause-effect relationships for multiple pollutants andmultiple effects, and how they are interconnected with each other.
If put in context, informed decision-making could developstrategies that maximize synergies between different measures tosafeguard environmental improvements for all relevant aspectswhile minimizing economic resources for their implementation.
Integrated assessment and models provide an interdisciplinaryapproach to support ex-ante decision-making by combiningquantitative models representing different systems and scales intoa framework for integrated assessment (see, e.g., Janssen et al.,2009). Typically, integrated assessment models are organized ina modular structure, in which modules encapsulating knowledgefrom different scientific disciplines are coupled in accordance withthe question raised by the decision maker. Such modularapproaches need to respect several stages of the model develop-ment process, modularization and integration on a conceptual,numerical, and technical level (Hinkel, 2009). The challenges ateach level differ greatly in character and in the work doneaddressing them.
This paper describes how these challenges have been tackled inan integrated assessment model that highlights the interconnec-tions between different air quality problems, the interactionsbetween pollutants in the atmosphere, and the interdependenciesbetween emission controls across pollutants and source categories.Implemented as a web-based software package, this approachprovides a practical tool to identify cost-effective emission controlstrategies to improve air quality at least cost by considering theseinteractions.
Since 20 years, the RAINS (Regional Air Pollution Informationand Simulation) model (Schöpp et al., 1999) has been used asa commonly shared tool in the key negotiation processes in Europethat led to international agreements on harmonized emissioncontrol strategies. Other models include the ASAM (Warren andApSimon, 2000; Oxley and ApSimon, 2007) and the MERLINmodels (Reis et al., 2005). Under the Convention on Long-rangeTransboundary Air Pollution, the RAINS model was used to guidenegotiations on national emission ceilings for the 1994 SecondSulfur Protocol (Tuinstra et al., 1999; Farrell et al., 2001) and theGothenburg Multi-pollutant Protocol in 1999 (Hordijk and Amann,2007; Eckley, 2002). Whereas earlier protocols under the Conven-tion used a flat-rate approach with a fixed percentage of emissionreductions for all parties, these “second generation” protocolsemployed cost-effectiveness as the rationale for differentiatedobligations for individual parties. According to Haas and McCabe,2001, “the concept was virtually revolutionary in diplomacybecause it assigned differential national obligations based on thecarrying capacity of vulnerable ecosystems rather than a politicallyequitable (and arbitrary) emission cut”. The European Commissionused RAINS to quantify, inter alia, the obligations in its 1999Directive on National Emission Ceilings (EC, 2001; see Amann and
Lutz, 2000) and in the Clean Air For Europe (CAFE) program thatwas adopted in 2005 (CEC, 2005; see Tuinstra, 2007).
In 2009 the Convention on Long-range Transboundary AirPollution started negotiating a revision of its 1999 GothenburgProtocol aiming at a Europe-wide harmonized strategy for furtherair quality improvements up to 2020. This time negotiationsemploy the GAINS (Greenhouse gase Air Pollution Interactions andSynergies) model to provide a quantitative scientific basis for thedeliberations. GAINS is a successor to the RAINS model, incorpo-rating latest scientific understanding on the impacts of air pollutionand extended to cover the mitigation of greenhouse gases.
The GAINS model attempts to assist policy decisions by puttinginto context information on the many aspects of air pollutioncontrol that are relevant for the development of cost-effectiveemission control strategies. For this purpose, GAINS integrateslatest scientific developments into a policy analysis tool which isrealistic enough to accommodate all interested stakeholders. Tomaximize credibility and acceptance by decision makers, GAINSrelies on information emerging from peer reviewed disciplinarymodels, and databases that are extensively validated by nationalexperts. In international negotiations, the GAINS model helpsfocusing debates on genuine policy issues (e.g., desired levels ofenvironmental quality, willingness to spend economic resources forsuch purposes, and the distribution of efforts) by separating themfrom the multiple technical and scientific complexities that aredescribed in GAINS based on generally accepted scientificunderstanding.
This paper describes the methodology of the GAINS model andsummarizes an initial policy analysis that outlines the scope fornegotiations on the revision of the Gothenburg Protocol.
2. Methodology
The GAINS model, developed by the International Institute for Applied SystemsAnalysis (IIASA), describes the pathways of atmospheric pollution from anthropo-genic driving forces to the most relevant environmental impacts (Amann et al.,2004). It brings together information on future economic, energy and agriculturaldevelopment, emission control potentials and costs, atmospheric dispersion andenvironmental sensitivities toward air pollution. The model addresses threats tohuman health posed by fine particulates and ground-level ozone, risk of ecosystemsdamage from acidification, excess nitrogen deposition (eutrophication) and expo-sure to elevated levels of ozone, as well as long-term radiative forcing. These impactsare considered in a multi-pollutant context, quantifying the contributions of sulfurdioxide (SO2), nitrogen oxides (NOx), ammonia (NH3), non-methane volatile organiccompounds (VOC), and primary emissions of fine (PM2.5) and coarse (PM2.5-PM10)particles. GAINS also accounts for emissions of the six greenhouse gases that areincluded in the Kyoto protocol, i.e., carbon dioxide (CO2,), methane (CH4), nitrousoxide (N2O) and the three F-gases (Table 1).
Many of the critical relationships in GAINS (e.g., those describing the dispersionof pollutants in the atmosphere and environmental impacts of pollution) are derivedfrom various complex disciplinary models, which are represented in GAINS asreduced-form functional relationships. Input from key models is coordinated in theEC4MACS project (www.ec4macs.eu).

M. Amann et al. / Environmental Modelling & Software 26 (2011) 1489e1501 1491
GAINS holds the essential information on all aspects listed above for 43 Euro-pean countries and links this data in such away that the environmental implicationsof alternative assumptions on economic development and emission control strate-gies can be assessed. The GAINS model allows simulation of the costs and envi-ronmental impacts of user-defined emission control scenarios. Its optimizationmode balances emission control measures across countries, pollutants andeconomic sectors in such a way that user-defined target levels on the variousenvironmental impacts are met at least costs.
The GAINSmodel is implemented as an interactive web-based software tool thatcommunicates with an ORACLE database. Access is freely available over the Internet(http://gains.iiasa.ac.at). The interface allows the user to display all calculationresults, such as emissions and costs (to various levels of aggregation) for alternativescenarios. Impacts can be displayed in tabular or graphical form (maps), and allresults can be exported to Excel for further analysis. One may examine all input data,such as cost parameters, activity projections, technology characteristics andassumptions about future emission control policies as well as technology portfolios.It is also possible to download, modify and upload this information to generate new,user-defined and user-owned scenarios with alternative configurations of activityprojections, assumptions about policies and emission characteristics. Data can beshared by predefined groups of users, e.g. within an organization. This flexibilityallows us to effectively communicate with stakeholders, such as representatives ofenvironmental agencies and ministries in European countries, and to grant themownership over their own contributions. Ownership and a hierarchy of user privi-leges also allow users and stakeholders to study the implications of their ownalternative scenarios in a non-public part of the database.
In addition to this simulation mode, GAINS also features a stand-alone optimi-zation module that can be used by the authors to identify cost-effective technologyportfolios, for given sets of environmental objectives and subject to variousconstraints. The optimization is formulated as a linear programming (LP) problem inthe GAMS programming code (Brooke et al., 1988) and is solved using the CPLEX12.2.0.0 optimization software. Due to the complexities in the formulation ofmeaningful optimization problems and their interpretation, this optimizationmodule is not accessible over the Internet.
In principle, the GAINS model aims at providing relevant information to inter-national negotiations on the cost-effectiveness of alternative emission controlstrategies and distributional aspects of involved economic burdens and environ-mental benefits. Due to its wide spatial and sectoral coverage, it is less suited toprovide detailed results, e.g., on environmental impacts, for small areas. To informnational decision makers about country-specific implications of different Europe-wide strategies, national models with finer resolutions are employed on a regularbasis (e.g., for the UK: Oxley et al., 2003; for Italy: D’Elia et al., 2009).
In recent negotiations, iterative analyses with the GAINS model identified cost-effective sets of emission reductions that meet environmental targets specified bythe negotiating parties. Considering the implications for different countries andsectors, negotiators developed revised sets of environmental targets until a politi-cally acceptable balance between emission control costs and environmental bene-fits, and their distribution across countries, was found. The resulting reductionrequirements for different countries were then used as quantitative starting pointfor political negotiations.
2.1. Emission estimates
For each of the pollutants listed in Table 1, GAINS estimates current and futureemissions based on activity data, uncontrolled emission factors, the removal effi-ciency of emission control measures and the extent to which such measures areapplied:
Ei;p ¼Xk
Xm
Ai;kefi;k;m;pxi;k;m;p (1)
where:i, k, m, p-Country, activity type, abatement measure, pollutant, respectively.Ei,p-Emissions of pollutant p (for SO2, NOx, VOC, NH3, PM2.5, CO2, CH4, N2O,
F-gases) in country i.Ai,k-Activity level of type k (e.g., coal consumption in power plants) in country i.efi,k,m,p-Emission factor of pollutant p for activity k in country i after application
of control measure m.xi,k,m,p-Share of total activity of type k in country i to which a control measurem
for pollutant p is applied.In a further step, the uncontrolled emission factors and removal efficiencies are
summarized in an emission factor that represents emissions after application ofa given control measure in Equation (1). This approach allows capturing criticaldifferences across economic sectors and countries that could justify differentiatedemission reduction requirements in a cost-effective strategy. Structural differencesin emission sources are reflected through country-specific activity levels. Majordifferences in emission characteristics of specific sources and fuels are representedthrough source-specific emission factors, which account for the degrees at whichemission control measures are applied. GAINS estimates future emissions accordingto Equation (1) by varying the activity levels along exogenous projections of
anthropogenic driving forces and by adjusting the implementation rates of emissioncontrol measures.
The GAINS model holds relevant databases for all European countries, whichemploy international energy and agricultural statistics and appropriate emissionfactors. In principle, the GAINS model reproduces nationally reported emissionswith large accuracy. Exceptions are clearly highlighted, when nationally reportedinformation contradicts international statistics or is inconsistent with definitionsused for other countries. These databases have been extensively verified by nationalexperts, although uncertainties cannot be fully eliminated (see also Section 2.7).
2.2. Emission control measures and their costs
Three groups of measures to reduce emissions can be distinguished:
(i) Behavioral changes reduce anthropogenic driving forces that generate pollu-tion. Such changes in human activities can emerge autonomously (e.g.,changes in lifestyles), they could be fostered by command-and-controlapproaches (e.g., legal traffic restrictions), or they can be triggered byeconomic incentives (e.g., pollution taxes, emission trading systems, etc.). TheGAINS concept does not internalize such behavioral responses, but reflectssuch changes through alternative exogenous scenarios of the driving forces.
(ii) Structural measures that supply the same level of (energy) services to theconsumer but with less polluting activities. This group includes fuel substi-tution (e.g., switch from coal to natural gas) and energy conservation/energyefficiency improvements. Such measures do not modify the projection ofanthropogenic driving forces (e.g., the demand for energy services such astransport distance or heated floor area, etc.), but involve far-reaching infra-structural changes with complex interactions and feedbacks within nationaleconomies. The greenhouse-gas related part of GAINS includes about 350measures of this type, however, they are usually not employed in air pollution-focused policy analyses as they would require changes in energy policies.
(iii) Awide range of technical measures has been developed to capture emissions attheir sources before they enter the atmosphere. Emission reductions achievedthrough these options neither modify the driving forces of emissions norchange the structural composition of energy systems or agricultural activities.GAINS considers about 3500 pollutant-specific measures for reducing emis-sions of SO2, NOx, VOC, NH3, PM, CH4, N2O and F-gases.
Any optimal allocation of emission control measures across countries andsectors is crucially influenced by differences in emission control costs across emis-sion sources. It is therefore of utmost importance to systematically identify thefactors leading to variations in emission control costs among countries, economicsectors and pollutants. Diversity is caused, i.a., by differences in the structuralcomposition of existing emission sources (e.g., fuel use pattern, fleet composition,etc.), the state of technological development, and the extent to which emissioncontrol measures are already applied. The aggregation of emission sources andcontrol options chosen for the GAINS model attempts to reflect these differenceswhile considering the availability of high quality input data for all countries.
GAINS estimates emission control costs from the perspective of a social planner,with a focus on resource costs of emission controls to societies. While thisperspective is different from that of private profit oriented actors, it is the appro-priate approach for decisions on the optimal allocation of societal resources (Turneret al., 1994). Costs are calculated based on the assumption that, at a free market foremission control technologies, the same technology will be available to all countriesat the same costs. Also, technological progress is assumed in the performance andcost data, based on literature estimates. Country- and sector-specific circumstances(e.g., size distributions of plants, plant utilization, fuel quality, energy and laborcosts, etc.) lead to justifiable differences in the actual costs at which a given tech-nology removes pollution at different sources. For each of the 3500 emission controloptions, GAINS estimates their costs of local application considering annualizedinvestments (Ian), fixed (OMfix) and variable (OMvar) operating costs, and how theydepend on technologym, country i and activity type k (Cofala and Syri, 1998b,1998a;Klimont et al., 2000, Klimont et al., 2002; Klimont and Brink, 2006; Cofala et al.,2009; Borken-Kleefeld et al., 2009; Höglund-Isaksson et al., 2009). Unit costs ofabatement (ca), related to one unit of activity (A), add up to:
cai;k;m ¼Iani;k;m þ OMfix
i;k;m
Ai;kþ OMvar
i;k;m: (2)
For a cost-effectiveness analysis these costs can be related to the emissionreductions achieved. The costs per unit of abated emissions (cn) of a pollutant p arecalculated as:
cni;k;m;p ¼ cai;k;mefi;k;0;p � efi;k;m;p
(3)
where efi,k,0,p is the uncontrolled emission factor in absence of any emission controlmeasure (m ¼ 0).
M. Amann et al. / Environmental Modelling & Software 26 (2011) 1489e15011492
For its optimization routine the GAINS model produces cost curves for emissioncontrol, which provide for each country a ranking of the available emission controlmeasures according to their marginal costs. If, for a given activity k, more than onecontrol option is available, marginal costs (mc) for control optionm for pollutant p incountry i are calculated as:
mci;k;m;p ¼ cni;k;m;pefi;k;m;p � cni;k;m�1;pefi;k;m�1;p
efi;k;m;p � efi;k;m�1;p: (4)
2.3. Atmospheric dispersion
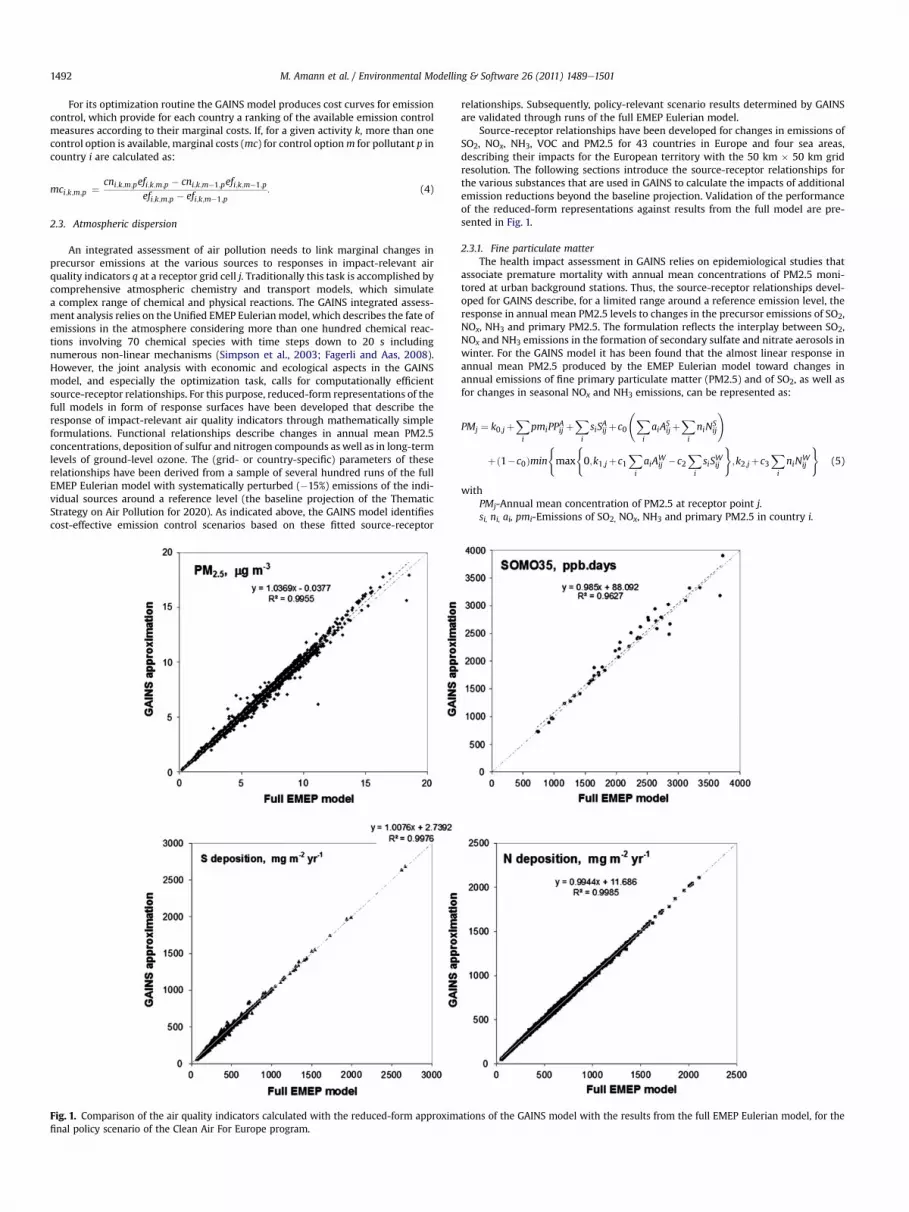
An integrated assessment of air pollution needs to link marginal changes inprecursor emissions at the various sources to responses in impact-relevant airquality indicators q at a receptor grid cell j. Traditionally this task is accomplished bycomprehensive atmospheric chemistry and transport models, which simulatea complex range of chemical and physical reactions. The GAINS integrated assess-ment analysis relies on the Unified EMEP Eulerian model, which describes the fate ofemissions in the atmosphere considering more than one hundred chemical reac-tions involving 70 chemical species with time steps down to 20 s includingnumerous non-linear mechanisms (Simpson et al., 2003; Fagerli and Aas, 2008).However, the joint analysis with economic and ecological aspects in the GAINSmodel, and especially the optimization task, calls for computationally efficientsource-receptor relationships. For this purpose, reduced-form representations of thefull models in form of response surfaces have been developed that describe theresponse of impact-relevant air quality indicators through mathematically simpleformulations. Functional relationships describe changes in annual mean PM2.5concentrations, deposition of sulfur and nitrogen compounds as well as in long-termlevels of ground-level ozone. The (grid- or country-specific) parameters of theserelationships have been derived from a sample of several hundred runs of the fullEMEP Eulerian model with systematically perturbed (�15%) emissions of the indi-vidual sources around a reference level (the baseline projection of the ThematicStrategy on Air Pollution for 2020). As indicated above, the GAINS model identifiescost-effective emission control scenarios based on these fitted source-receptor
Fig. 1. Comparison of the air quality indicators calculated with the reduced-form approximfinal policy scenario of the Clean Air For Europe program.
relationships. Subsequently, policy-relevant scenario results determined by GAINSare validated through runs of the full EMEP Eulerian model.
Source-receptor relationships have been developed for changes in emissions ofSO2, NOx, NH3, VOC and PM2.5 for 43 countries in Europe and four sea areas,describing their impacts for the European territory with the 50 km � 50 km gridresolution. The following sections introduce the source-receptor relationships forthe various substances that are used in GAINS to calculate the impacts of additionalemission reductions beyond the baseline projection. Validation of the performanceof the reduced-form representations against results from the full model are pre-sented in Fig. 1.
2.3.1. Fine particulate matterThe health impact assessment in GAINS relies on epidemiological studies that
associate premature mortality with annual mean concentrations of PM2.5 moni-tored at urban background stations. Thus, the source-receptor relationships devel-oped for GAINS describe, for a limited range around a reference emission level, theresponse in annual mean PM2.5 levels to changes in the precursor emissions of SO2,NOx, NH3 and primary PM2.5. The formulation reflects the interplay between SO2,NOx and NH3 emissions in the formation of secondary sulfate and nitrate aerosols inwinter. For the GAINS model it has been found that the almost linear response inannual mean PM2.5 produced by the EMEP Eulerian model toward changes inannual emissions of fine primary particulate matter (PM2.5) and of SO2, as well asfor changes in seasonal NOx and NH3 emissions, can be represented as:
PMj ¼ k0;jþXi
pmiPPAij þ
Xi
siSAij þc0
Xi
aiASijþXi
niNSij
!
þð1�c0Þmin
(max
(0;k1;jþc1
Xi
aiAWij �c2
Xi
siSWij
);k2;jþc3
Xi
niNWij
)(5)
withPMj-Annual mean concentration of PM2.5 at receptor point j.si, ni, ai, pmi-Emissions of SO2, NOx, NH3 and primary PM2.5 in country i.
ations of the GAINS model with the results from the full EMEP Eulerian model, for the
M. Amann et al. / Environmental Modelling & Software 26 (2011) 1489e1501 1493
Áxij, N
xij, S
xij, PP
xij-Matrices with coefficients for reduced (A) and oxidized (N)
nitrogen, sulfur (S) and primary PM2.5 (PP), for season X, where X ¼ W (winter), S(summer) and A (annual)
c0, c1, c2, c3-Model parameters derived by regression analyses.k0,j, k1,j, k2,j-Constants to take into account background concentrations.While the above equation with a computationally complex min-max formula-
tion is required to capture changes in chemical regimes when ratios between theabundances of sulfur, nitrogen and ammonia in the atmosphere are changing due todifferent emission reduction rates of the pollutants involved, a simpler formulationhas been found to perform reasonably well when only marginal changes in emis-sions around a reference point are considered. For such optimization problems,Equation (5) has been transformed to a linear form, which is then used in GAINS:
PMj ¼Xi
pmi$PPAij þ
Xi
si$SAij þ
Xi
ai$AAij þ
Xi
ni$NAij þ k0;j (6)
This formulation only describes the formation of PM from anthropogenicprimary PM emissions and secondary inorganic aerosols. It excludes PM fromnatural sources and primary and secondary organic aerosols due to insufficientconfidence in the current modeling ability. Thus, the approach does not reproducethe full mass of PM2.5 that is observed in ambient air. Consequently, results can becompared only against observations of the individual species that are modeled(Fig. 1). The health impact assessment in GAINS is consequently only conducted forchanges in the specified anthropogenic precursor emissions, and excludes the largelyunknown role of secondary organic aerosols and natural sources.
The regional scale assessment is performed for all of Europe with a spatialresolution of 50 km � 50 km. Health impacts are, however, most pertinent to urbanareas where a major share of the European population lives. Any assessment witha 50 km resolution will systematically underestimate higher pollution levels inEuropean cities. To link the European-scale analysis with exposure levels in urbanareas, GAINS employs a downscaling approach that has been developed based on theresults of the City-Delta model intercomparison. City-Delta brought together the 17major European urban and regional scale atmospheric dispersion models (Thuniset al., 2007) and developed a generalized methodology to describe the incrementsin PM2.5 concentrations in urban background air that originatee on top of the long-range transport component e from local emission sources. These relationshipsassociate the difference in the annual mean PM2.5 concentrations between an urbanarea and the average concentrations calculated over the 50 km � 50 km grid cellsurrounding the city with spatial variations in emission densities of low-levelsources and city-specific meteorological and topographic factors.
The GAINS/City-Delta methodology starts from the hypothesis that urbanincrements in PM2.5 concentrations originate predominantly from primary PMemissions from low-level sources within the city. The formation of secondaryinorganic aerosols, as well as the dispersion of primary PM2.5 emissions from highstacks, is reflected in the background computed by the regional-scale dispersionmodel. Consistent with atmospheric diffusion theory, a functional form has beendeveloped that includes wind speed and city diameter as important parameters thatdetermine the incremental PM2.5 concentration within a city:
DPMurban ¼ 12ffiffiffi2
p $1ffiffiffiffiK
p $QA$
�DU
�1=2(7)
where:DPMurban-Difference in PM2.5 concentration between the urban area and the
PM concentration averaged for a 50 km � 50 km grid cell.Q/A-Primary PM2.5 emission density from low-level sources within the city.D-City diameter.U-Mean wind speed in the city.K-Eddy diffusivity.
Two terms a, b representing1
2ffiffiffi2
p $1ffiffiffiffiK
p for high and low wind speed days,
respectively, have been determined through regression analyses from a sample ofmodel results with four different urban dispersion models for six European cities(see Amann et al., 2007):
DPMurban ¼ QA$
�DU
�1=2
$
�a$
365� d365
þ b$d
365
�(8)
withd-Number of days with low wind speed (less than 1 m/s)a, b-Regression coefficients based on the City Delta results, including the
conversion factors for the different dimensions.Urban areas and diameters were derived from the JRC European population
density data set and the www.citypopulation.de database using a special algorithmthat associates populated areas with the individual urban agglomerations underconsideration. Wind speed data have been extracted from the MARS meteorologicaldatabase of JRC (http://www.marsop.info), which provides interpolated meteoro-logical information derived from 2000 weather stations in Europe. In the absence ofcity-specific emission inventories available at the European scale, urban emissionshave been estimated on a sectoral basis from the gridded emission inventorycompiled for the EMEP model (http://webdab.emep.int/).
To avoid double-counting of the urban emissions (i.e., in the regional scalecalculation and the urban increment), the “City-Delta” correction, DPMCD, that has tobe applied to the regional value in order to derive estimates of urban air quality iscalculated as:
DPMCD ¼ QC$1ffiffiffiffiU
p �
a$365� d365
þ b$d
365
�$
ffiffiffiffiffiffiDC
pAC
� a$365� d365
$
ffiffiffiffiffiffiAE
4pAE
!(9)
with the index C indicating city-related data and the index E values for the entire50 km � 50 km EMEP grid cell, and A relating to the respective areas (for moredetails see Amann et al., 2007).
2.3.2. Deposition of sulfur and nitrogen compoundsFor quantifying ecosystems risks from acidification and eutrophication the
GAINS models employs the critical loads approach. Critical loads have been definedas ‘quantitative estimates of an exposure to one or morepollutantsbelow which signif-icant harmful effects on specified sensitive elements of theenvironmentdo not occuraccording to present knowledge” (Nilsson and Grennfelt, 1988). Thereby, the impact-relevant air quality indicator compares (ecosystem-specific) annual mean deposi-tion of acidifying compounds (i.e., sulfur, oxidized and reduced nitrogen) against thecritical loads. Significant non-linearities in the spatial source-receptor relationshipsdue to co-deposition of sulfur with ammonia have been found for the substantialemission reductions that have occurred over the last two decades (Fowler et al.,2005). However, the EMEP Eulerian model suggests e for the technically feasiblerange of further emissions reductions beyond the baseline projectione nearly linearresponses in annual mean deposition of sulfur and nitrogen compounds towardchanges in SO2, NOx and NH3 emissions:
Depp;j ¼ Depp;j;0 �Xi
Pi;j;p;0�Ei;p;0 � Ei;p
�(10)
withDepp,j-Annual deposition of pollutant p at receptor point j.Depp,j,0-Reference deposition of pollutant p at receptor point j.Ei,p-Annual emission of pollutant p (SO2, NOx, NH3) in country i.Ei,p,0-Reference emissions of pollutant p in country i.Pi,j,p,0-Transfer matrix for pollutant p for emission changes around the reference
emissions.
2.3.3. Formation of ground-level ozoneThe 2003 WHO systematic review of health aspects of air quality in Europe
(WHO, 2003) emphasized that new scientific studies have strengthened theevidence for health impacts from ozone not only from peak episodes, but also fromlower ozone concentrations as they occur throughout the year. Subsequently, theUNECE/WHO Task Force on Health recommended for health impact assessments theso-called SOMO35 as the relevant ozone indicator (UNECE/WHO, 2004). SOMO35 iscalculated as the sum over the year of the daily 8-h maximum ozone concentrationsin excess of a 35 ppb threshold.
A wide body of scientific literature has highlighted important non-linearities inthe response of ozone concentrations to changes in the precursor emissions, mostnotably with respect to the levels of NOx emissions (e.g., Seinfeld and Pandis, 1998).At sufficiently high ambient concentrations of NO and NO2, lower NOx emissionscould lead to increased levels of ozone peaks. In earlier analyses for the negotiationsof the Gothenburg protocol in 1999, the GAINS model reflected this non-linearresponse through source-receptor relationships that describe the effect of NOx
emission reductions on accumulated ozone concentrations above 60 ppb (AOT60) inform of quadratic polynomials (Heyes et al., 1996). A re-analysis of the Eulerianmodel results with a focus on the likely emission levels for the year 2020 (Amannand Lutz, 2000) suggests that such non-linearities will become less important forthree reasons:
(i) In 2020 “current legislation” baseline NOx emissions are expected to be 50percent lower than in the year 2000.
(ii) The chemical processes that cause these non-linearities show less effect onthe new long-term impact indicator (SOMO35) than for ozone peak concen-trations (e.g., ATO60), and
(iii) such non-linearities diminish even further when population-weightedcountry-means of SOMO35 (that represent total population exposure) areconsidered.
It was found that within the policy-relevant range of emissions (i.e., between thebaseline and the maximum technically feasible emissions reductions in 2020),changes in the SOMO35 indicator could be described with sufficient accuracy bya linear formulation:
O3l ¼ O3l;0 �Xi
Ni;l�ni;0 � ni
��Xi
Vi;l�vi;0 � vi
�(11)
whereO3l-Health-relevant long-term ozone indicator measured as the population-
weighted SOMO35 in receptor country l.
M. Amann et al. / Environmental Modelling & Software 26 (2011) 1489e15011494
O3l,0-Population-weighted SOMO35 in receptor country l due to referenceemissions n0, v0
ni, vi-Emissions of NOx and VOC in source country i.Ni,l, Vi,l-Coefficients describing the changes in population-weighted SOMO35 in
receptor country l due to emissions of NOx and VOC in source country i.Validations of the reduced-form formulations described above against results of
the full EMEP model, e.g., for the final policy scenario of the Clean Air For Europe(CAFE) program, show good agreement (Fig. 1).
2.4. Air quality impacts
2.4.1. Health impacts from PMBased on the findings of the WHO review on health impacts of air pollution
(WHO, 2003, WHO, 2007), the GAINS model quantifies for different emissionscenarios premature mortality that can be attributed to long-term exposure toPM2.5, following the outcomes of the American Cancer Society cohort study (Popeet al., 2002) and its re-analysis (Pope et al., 2009). Cohort- and country-specificmortality data extracted from life table statistics are used to calculate for eachcohort the baseline survival function over time. The survival function lc(t) indicatesthe percentage of a cohort c alive after time t elapsed since starting timew0. lc(t) is anexponential function of the sum of the mortality rates ìa,b, which are derived fromlife tables with a as age and b as calendar time. As the relative risk function takenfrom Pope et al. (2002) applies only to cohorts that are at least w0 ¼ 30 years old,younger cohorts were excluded from this analysis. Accordingly, for a cohort aged c,lc(t) is:
lcðtÞ ¼ exp
�Xtz¼ c
mz;z�cþw0
!(12)
The survival function is modified by the exposure to PM pollution, whichchanges the mortality rate and consequently the remaining life expectancy (ec). Fora given exposure to PM2.5 (PM), life expectancy lc is calculated as the integral overthe remaining life time:
ec ¼Zw1
c
lcðtÞdt ¼Zw1
c
exp
� RRPM
Xtz¼ c
mz;z�cþw0
!dt (13)
where w1 is the maximum age considered and RRPM the relative risk for a givenconcentration of PM2.5. With some simplifying assumptions and approximations(Vaupel and Yashin, 1985), the change in life expectancy per person (Dec) of a cohortc can be expressed as:
Dec ¼ bPMZw1
c
lcðtÞloglcðtÞdt (14)
where e within the studied exposure range e RRPM has been approximated asRRPM ¼ b$PM þ 1 with b ¼ 0.006 as given in Pope et al. (2002). For all cohorts ina country l the change in life years DLl is then calculated in GAINS as the sum of thechange in life years for the cohorts living in the grid cells j of the country l:
DLl ¼Xw1
c¼w0
DLc;i ¼ bXj˛l
PMjPopjPopl
Xw1
c¼w0
Popc;l
Zw1
c
lcðtÞloglcðtÞdt (15)
whereΔLc,l-Change in life years lived for cohort c in country l.Popc,l-Population in cohort c in country l.Popj-Total population in grid cell j (at least of age w0 ¼ 30)Popl-Total population in country l (at least of age w0 ¼ 30).For the health impact assessment of policy scenarios, GAINS calculates the loss
in statistical life expectancy according to Equation 14 as well as the total amount oflife years lost (YOLL) for the entire population over 30 years. Health impacts forpeople younger than 30 years, and in particular the impacts on infant mortality, arepresently not considered in GAINS.
2.4.2. Health impacts from ozoneBased on a comprehensive meta-analysis of time series studies conducted for
the World Health Organization (Anderson et al., 2004) and on advice received fromthe UNECE/WHO Task Force on Health (UNECE/WHO, 2004), the GAINS modelquantifies premature mortality through an association with the so-called SOMO35indicator for long-term ozone concentrations in ambient air (see Section 2.3.3). TheGAINS calculation estimates for the full year daily changes in mortality as a functionof daily 8-hmaximum ozone concentrations, employing the concentration-responsecurves derived in the meta-analysis (Anderson et al., 2004). The threshold wasintroduced (i) to acknowledge uncertainties about the validity of the linearconcentration-response function for lower ozone concentrations, and (ii) in ordernot to overestimate the health effects. The annual cases of premature mortalityattributable to ozone are then calculated as
Mortl ¼1
365Deathsl$RRO3$O3l (16)
whereMortl-Cases of premature mortality per year in country l.Deathsl-Baseline mortality (number of deaths per year) in country l.RRO3-Relative risk for one percent increase in daily mortality per ppb 8-h
maximum ozone concentration per day.O3l-Population-weighted SOMO35 in country l.In addition to themortality effects, there is clear evidence about acutemorbidity
impacts of ozone (e.g., various types of respiratory diseases). However, the GAINSmodel quantifies only mortality impacts of ozone, as they emerge as the dominantfactor in any economic benefit assessment. Morbidity impacts are quantified ex-postin associated benefit assessments (Holland et al., 2005, 2008).
2.4.3. Protection of ecosystems against acidification and eutrophicationThe GAINS model uses the critical loads concept as a quantitative indicator for
sustainable levels of sulfur and nitrogen deposition. The GAINS analysis makes use ofthe critical loads databases compiled by the Coordination Centre for Effects (CCE) ofthe UNECE Working Group on Effects. These critical loads have been computed bynational focal centers using internationally agreed methodologies (UBA, 2004) andthe current database contains details about 1.1 million ecosystems in Europe(Hettelingh et al., 2007, 2008).
To evaluate the ecological impacts of emission control scenarios, GAINScompares computed depositions with these critical loads employing the averageaccumulated exceedance (AAE) concept as a quantitative summary indicator for theexcess of critical loads of all ecosystems in a region (country). For effect q andcountry l the AAE is defined as (Posch et al., 2001):
AAEq;l ¼Xj˛l
Xu
Aq;j;u$maxnDepp;j � CLq;j;u; 0
o.Xj˛l
Xu
Aq;j;u (17)
where CLq,j,u is the critical load of effect q for ecosystem u in grid jwith area Aq,j,u andDepp,j is the ecosystem-specific deposition of pollutant p in grid j onto thatecosystem. The summation runs over all ecosystems and all grid cells j withincountry l. The ‘maximum’ in the equation makes sure that an ecosystem contributeszero to the AAE, if the deposition is smaller than the critical load, i.e., if there is non-exceedance.
For the optimization mode of GAINS, the AAE for effect q in country l has beenrelated to emissions by a linear model:
AAEq;l ¼ AAEq;l;0 �Xp
Xi
ai;l;p;q�Ei;p;0 � Ei;p
�(18)
where the sum is over all emitter regions i and all pollutants p contributing to criticalload excess (sulfur and nitrogen species for acidification, nitrogen species foreutrophication); as earlier, the index 0 refers to reference emission levels for whichthe approximation was carried out. The so-called ‘impact coefficients’ ai,l,p,q arederived at the CCE by first computing, via Equation 10, the depositions in country jfrom the emissions Ei,p in country iwith the emissions in all other countries equal toEk,p,0 (ksi) and then the AAE according to Equation 17. This procedure is carried outfor all country source-receptor combinations, resulting in a total of about 9000coefficients for acidification and eutrophication, of which, however, a large numberis (close to) zero (Posch et al., 2005). Equation 18 describes the AAE calculation fora single pollutant, such as total nitrogen for eutrophication. For acidification, the AAEcalculations are more complicated since they include the effects of sulfur andnitrogen deposition (for technical details see Posch et al., 2001; UBA, 2004). Toderive exact estimates of policy-relevant scenarios, the AAE and protectionpercentages of optimized scenarios are validated in an ex-post analysis throughdirect calculations from the individual critical load values for each country(Hettelingh et al., 2007).
2.4.4. Vegetation impacts from ground-level ozoneElevated levels of ozone have been shown to cause widespread damage to vege-
tation. In earlier policy analyses for the NEC Directive of the EU and the GothenburgProtocol in1999,GAINSapplied theconceptofcritical levels toquantifyprogress towardtheenvironmental long-termtargetof fullprotectionofvegetation fromozonedamage,using a formulation similar to Equation 11. Critical levels are defined as "concentrationsof pollutants in the atmosphere above which direct adverse effects on receptors, such ashumanbeings, plants, ecosystems ormaterials,mayoccuraccording to present knowledge"(http://www.unece.org/env/lrtap/WorkingGroups/wge/definitions.htm). Excess ofcritical levels for vegetation is measured with the AOT metric, which quantifies the‘accumulated ozone exposure over a threshold of 40 ppb’ (UBA, 2004).
After 1999, several important limitations and uncertainties of the AOT approachhave been pointed out, inter alia, a potential mismatch with critical features ofimportant physiological processes. Alternative concepts, including the ozone fluxconcept, were developed and suggested as superior alternatives to the AOT40approach (Karlsson et al., 2004). As quantifications of all parameters that arenecessary to compute ozone fluxes for the relevant vegetation types have justrecently been developed, after 1999 ozone damage to vegetation has been
M. Amann et al. / Environmental Modelling & Software 26 (2011) 1489e1501 1495
determined with the flux approach outside the GAINS model in an ex-post analysis(e.g., Holland et al., 2005; Mills et al., 2011).
2.4.5. Climate impactsAs an indicator of the contribution to global climate change of the (long-lived)
greenhouse gas emissions of a country, the current version of the GAINS modeldetermines the integrated radiative forcing (RF) resulting from emissions i ina country j over the next 100 years based on the global warming potentials(GWP100) (other notations as in Equation (1)):
RF100j ¼Xi
Ei;j � GWP100i (19)
While this metric is used by the Kyoto protocol for comparing different long-lived gases and therefore relevant for the policy analysis of cost-effective mitiga-tion strategies, it is not an accurate indicator of the actual climate change impacts asa comprehensive assessment would involve complex general circulation models.
There is growing insight on the radiative effects of short-lived substances suchas black and organic carbon, SO2, and tropospheric ozone that cause climate changeat the regional scale in the near term (Shindell et al., 2008; Shine et al., 2007). As thespatial and temporal scales of these effects are clearly different from the concerns onglobal and long-term climate change, it seems prudent for a policy analysis not tolump long- and short-term impacts into one indicator. Instead, work is underway toinclude the near-term climate effects of aerosol and ozone precursor emissions asanother effect of air pollutants within the multi-pollutant/multi-effect framework ofGAINS (Table 1).
2.5. (Cost-)benefit analysis
A monetary evaluation of the benefits of emission control strategies couldprovide essential information that helps decision makers in striking the rightbalance between environmental ambition and the economic implications. However,in practice monetary evaluations of environmental benefits are loaded with a widerange of problems that make their results in many cases rather controversial if theyare used in a policy context (Patt, 2001). For instance, it is difficult to attributeeconomic values to certain non-market goods, most notably to human life andecosystems, especially in an international context.
While recognizing the potential usefulness of such economic evaluation tech-niques, it has been decided not to internalize such controversial techniques into theGAINS model, and restrict the formal model calculations to fields where generalconsensus (about physical processes, economic evaluations of costs, etc.) exists.However, interfaces have been established that pass GAINS estimates of physicaldamage to other modeling teams for a monetary evaluation that are conducted forthe most policy-relevant cost-optimized scenarios (Holland et al., 2008).
2.6. Cost-effectiveness analysis
As one of its most policy-relevant features, the optimization approach of theGAINSmodel allows a systematic search for costeminimal combinations of emissioncontrol measures that meet user-supplied air quality and greenhouse gas targets,taking into account regional differences in emission control costs and atmosphericdispersion characteristics. In essence, GAINS formulates an optimization problemwith the objective to minimize total European control costs (summing over allcountries i, activity type k and control measure m):
Xi
Xk
Xm
Ci;k;m/min: (20)
Control costs for each measure Ci,k,m depend on the activity level Ai,k, the extentto which this activity is subject to control measure m (xi,k,m), and the unit cost peractivity level ca. In principle, the GAINS optimization considers end-of-pipe emis-sion control measures that do not change activity levels (e.g., energy consumption),as well as structural measures (e.g., energy conservation) that deliver the sameenergy service with different inputs. However, for the policy analyses of the Goth-enburg Protocol, which do not consider energy policy measures, the latter optionsare excluded, and the optimization deals only with end-of-pipe air pollution controlmeasures.
Technological progress is considered when specifying unit abatement costs andremoval efficiencies for individual emission control measures. This means that costdata contained in the GAINS database refer to a future year and assume techno-logical progress that could be achieved by that time. Such a solution seems appro-priate for short- to medium-term analyses (e.g., up to 2030); however, longer timehorizons would require a more sophisticated treatment of technological progress.
Total costs (19) are minimized subject to a number of constraints: first, there arephysical constraints that can be expressed as mass balances. For example, energysupply needs to meet energy demand. Second, there are various constraints on theapplication rates of measures or technologies: not all measures can be applied to100%, but only to a lesser extent. For example, Euro standards in the transport sectorcannot be applied retroactively to the whole vehicle stock, only new vehicles can beequipped with technologies that bring emissions down to meet new emission
standards. Thirdly, there may be environmental constraints for the various airquality problems q (i.e., health impacts from PM and ozone as well as ecosystemsprotection against acidification and eutrophication). Numerical values for theseconstraints can be specified by the user (i.e., policy analyst) and reflect the envi-ronmental policy targets for which a least-cost emission control strategy should beexplored. In the optimization problem, these environmental constraints are linkedvia the source-receptor relationships hi/j,q with emissions strengths (Ei,p) and thuswith emission controls (xi,k,m) at individual emission sources m:
Targijj;q ¼ hijj;q�Ei;p� ¼ hijj;q
�Ei;p�xi;k;m
��(21)
Depending on user preferences, targets Targ for an effect q can be specified forindividual grid cells j, countries i, or for the entire EU as receptor domains. Todescribe the relations hi/j,q between emission sources (Ei,p) and environmentalimpacts q, GAINS applies the source-receptor relationships described in Eqs. 5through 11, and the quantifications of the various impacts following Eqs. 12through 19. The full mathematical formulation of the GAINS optimizationapproach is provided in Wagner et al. (2007).
2.7. Treatment of uncertainties
Like all models, GAINS attempts to develop a holistic understanding ofa complex reality through a variety of reductionist steps. This simplification processis burdened with many uncertainties related to methodological issues, lack ofunderstanding and insufficient data. Thus, there exist considerable uncertainties inalmost all parts of the GAINS model, e.g., in the emission inventories, the estimatesof emission control potentials, the atmospheric dispersion calculations and theimpact assessment. In addition, uncertainties are pertinent in all other componentsof the integrated assessment framework that feed information into GAINS (e.g.,models of energy and agricultural activities, atmospheric dispersion and environ-mental impacts).
A full quantitative assessment of the role of individual model and data uncer-tainties in an integrated assessment model framework such as GAINS is a complexand time-consuming task. A methodology has been developed (Schöpp et al., 2005)to quantify how statistical errors (i.e., quantified uncertainties) in input parameterspropagate through the GAINS model calculations to policy-relevant output, e.g.,from projections of economic activity to the protection of ecosystems. In practice,however, it was found difficult to reliably quantify the input uncertainties on a solidbasis, so that a robust quantification of the uncertainties themselves was consideredthe most uncertain element in the analysis. Furthermore, a solid quantification ofcorrelations between input parameters (or, in several cases, even their signs) turnedout to be an almost impossible task, although they could have overwhelminginfluence on the conclusions of an uncertainty assessment. It was found by a peerreview team (CEC, 2004) that such traditional statistical analyses are still important,but they may be of limited value in a policy context if not considered in relation toother uncertainties, such as uncertainties due to biases in model formulation, lack ofscientific understanding, or the inability to predict future behavior (e.g., compliancewith existing regulations). Therefore, the review team pointed out the need fora comprehensive management of all uncertainties.
As a practical approach, uncertainty management was already considered as animportant guiding principle during the GAINS model development phase. A varietyof measures in model design and scenario planning were adopted to systematicallyminimize the potential influence of uncertainties on policy-relevant model output.For instance, at all phases of model development and use, explicit confidenceintervals (for emission control potentials, deposition ranges, ozone levels, ecosys-tems sensitivities, etc.) defined the range within which the model was proven towork with sufficient accuracy. Wherever possible, preference was given to relativemodel results, e.g., by deriving policy conclusions from the difference between twomodel results, e.g., with a ‘gap closure’ approach (see Section 3) rather than fromabsolute model estimates.
A workshop on uncertainty treatment in integrated assessment modeling withmodel developers and decision makers (UNECE, 2002) concluded that policymakers, in contrast to scientists, are usually less interested in the detailed statisticsabout uncertainties. They are more interested in robust strategies. Robustnessimplies that control needs and priorities between countries, sectors and pollutantsdo not significantly change due to changes in the uncertain model elements. Robuststrategies should avoid regret investments (no-regret approach) and/or the risk ofserious damage (precautionary approach). Following this argument, the GAINSmodel was designed in such a way that with high probability the emission reduc-tions resulting from the model calculations could be considered as minimumrequirements, implying that there is only little chance that emission controlmeasures suggested by the model would need to be reversed in the future in thelight of new information. Thereby, the model deliberately employs certain biases.For instance, emission control costs are most likely overestimated, since potentiallycheaper measures involving structural changes are excluded. For PM formation, therole of secondary organic aerosols is excluded due to the prevailing scientificuncertainties on the quantification of the relevant processes. The relatively coarsespatial resolution of the impact assessment (50 km� 50 km) does not capture small-scale effects at hot spots of pollution or for small sensitive ecosystems, and thus

0%
20%
40%
60%
80%
100%
120%
140%
160%
180%
Popula
tion
GDP (PPP)
Energy
use
CO2
non-C
O2 gas
esSO2
NOxPM
NH3VOCEc
onom
ic d
river
s, e
nerg
y use
and
bas
elin
e
emis
sion
s in
202
0 re
lativ
e to
200
5
EU-27 non-EU
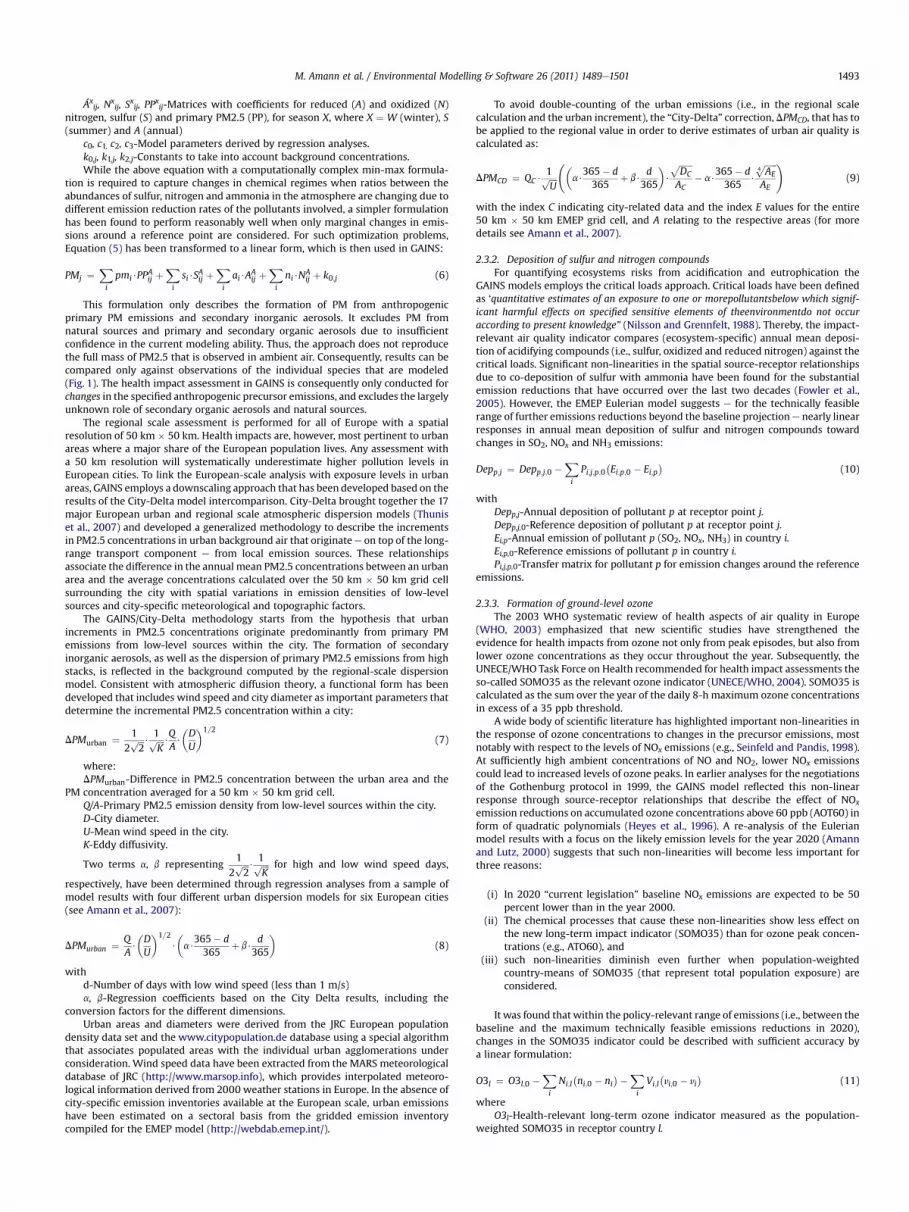
Fig. 2. Economic drivers, energy use and baseline emissions in 2020 relative to 2005,for the EU-27 and the non-EU countries.
M. Amann et al. / Environmental Modelling & Software 26 (2011) 1489e15011496
systematically underestimates environmental impacts. GAINS makes conservativeassumptions about increasing levels of hemispheric background ozone, so thatfuture ozone damage and the need for emissions controls could be underestimated.For the quantification of health impacts from ozone a concentration threshold isassumed in GAINS, although there is scientific evidence for effects at lower levels.GAINS considers mortality effects from PM and ozone, but does not quantifymorbidity, despite its social and economic relevance. Infant mortality is not quan-tified at all. The critical loads concept does not reflect the need to reach depositionbelow the steady-state critical loads if ecosystems are to recover from past acidifi-cation. As indicated above, these biases have been deliberately introduced into theanalysis in order to minimize the risk for regret investments into emission controls.At the same time, they need to be kept in mind when interpreting model results,especially about the levels of environmental protection that would emerge froma given emission control strategy.
3. Results
Under the Convention on Long-range Transboundary AirPollution the GAINS model is currently applied to inform thenegotiations on the revision of the Gothenburg Protocol (Kelly et al.,2010). For this purpose a baseline projection has been developedwith GAINS that illustrates the likely development of emissions andair quality resulting from the expected economic development andprogressive implementation of emission control legislation in the43 European countries. The analysis also explored the scope for andthe cost-effectiveness of additional emission reduction measures,and how different ways of specifying environmental targets wouldaffect the distribution and effectiveness of additional measuresacross countries.
3.1. A baseline projection of future emissions
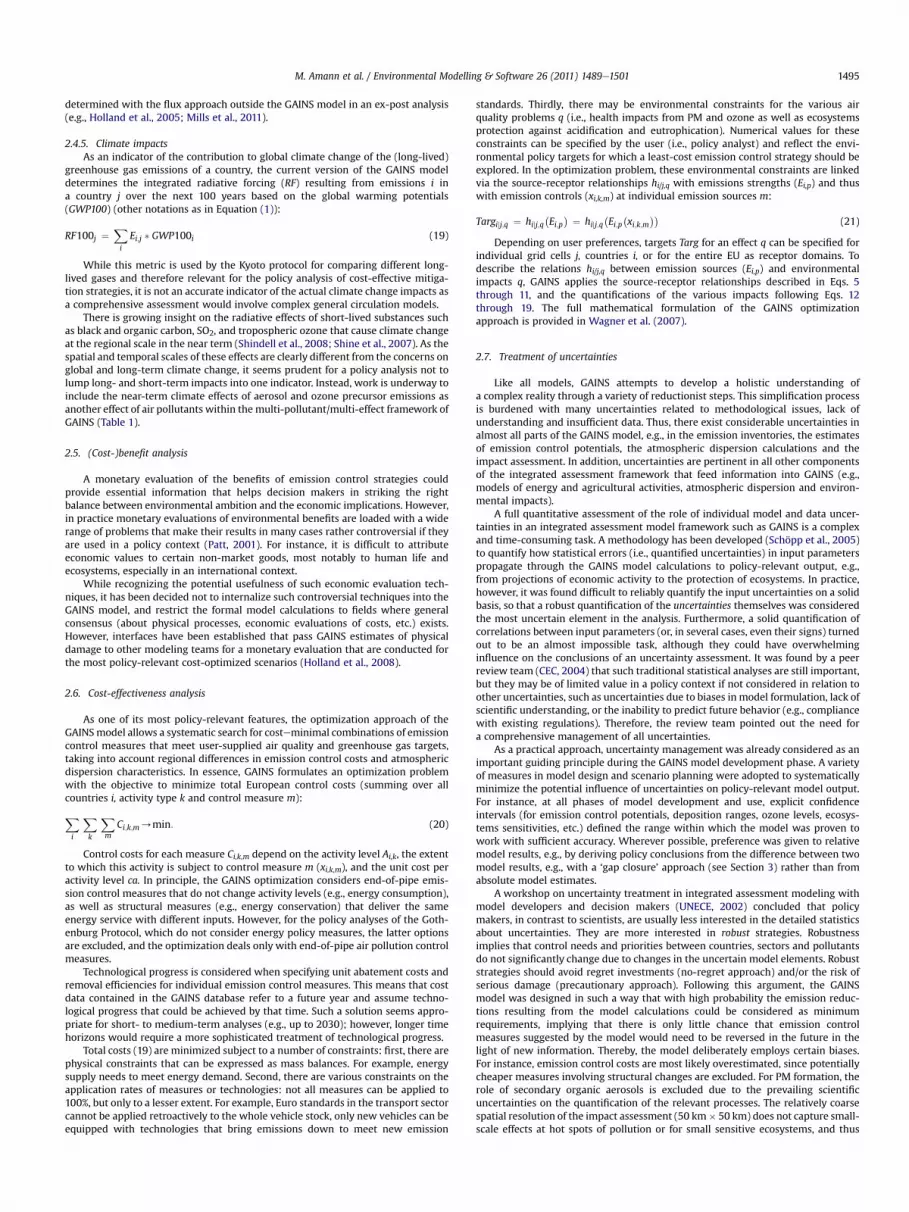
As a common quantitative starting point for the negotiations, 17Parties of the Convention on Long-range Transboundary AirPollution submitted their most recent governmental projections offuture economic development, energy use and agricultural activi-ties to IIASA as an input to the GAINS model. Projections for othercountries were taken from the World Energy Outlook 2009 (IEA,2009) of the International Energy Agency (IEA), the PRIMESenergy model (i.e., updates of scenarios presented in Capros et al.,2008) and the CAPRI agricultural model (Britz and Witzke, 2008).As these projections, which date back before the current economiccrisis, reflect perspectives of individual national governments, theyare not necessarily internationally consistent in their assumptionson future economic development and energy prices. In particular,climate policies have strong impact on the future energy systemsand air pollution emissions; however, these national projections donot rely on internationally coherent assumptions on future climatepolicies. For the 27 EU countries, these national projections assumeGDP to increase by about 30% between 2005 and 2020, while totalenergy use is assumed to increase by only three percent. Non-EUcountries anticipate, for constant population, GDP growing in thisperiod by about 60%, associated with a 12% increase in energy use.Thus, governments imply a decoupling between GDP growth andprimary energy consumption (Fig. 2), as a consequence of theeconomic restructuring toward less energy-intensive sectors,autonomous technological progress and dedicated energy policiesthat promote energy efficiency improvements. However, differenttrends are expected for different economic sectors. In the EU-27energy demand is expected to increase by 9% in the transportsector up to 2020 (relative to 2005), and by 3% for households andindustry. In contrast, fuel input to the power sector will decline upto 2020. The number of dairy cows and other cattle is expected todecrease as a consequence of changes in the EU Common Agricul-tural Policy, but there will be more pigs and poultry.
The activity projections have been provided by nationalgovernments to IIASA before the decision of the European Union on
the Energy and Climate Package, and do in most cases not achievethe new targets of the package. Thus, these projections imply forthe 27 EU countries a six percent decline in CO2 emissions between2005 and 2020, and an 11 percent increase for the non-EU coun-tries. For air pollution emissions, future levels will be stronglyinfluenced both by the assumed economic development, theenergy and climate policies, and the implementation of dedicatedemission control measures. The baseline scenario considersa detailed inventory of national emission control legislation as of2009, and assumes that these regulations will be fully implementedin all countries according to the foreseen time schedule. In partic-ular, the analysis reflects for EU countries the transposition of EU-wide legislation, including the recent directives for emissions ofstationary (e.g., for large combustion plants, for industrial emis-sions, on the sulfur content of fuels, etc.) and mobile sources (up toEuro 6/VI standards for light and heavy duty vehicles). For non-EUcountries the baseline scenario considers current national legisla-tion (derived from IEACCC, 2009 and DieselNet, 2009) as well as theobligations laid down in the treaty on the European “EnergyCommunity” that has been recently signed by Albania, Bosnia andHerzegovina, Kosovo, Croatia, Macedonia, Montenegro and Serbia.
As a consequence, significant changes are expected for emis-sions of air pollutants in the coming decade. SO2 emissions in theEU-27 should decline by about two thirds between 2005 and 2020,NOx emissions by half, and primary PM and VOC emissions by aboutone third. However, no significant changes are anticipated for NH3emissions. In non-EU countries, smaller improvements are envis-aged as national legislation is less stringent than in the EU, and theirimplementation less certain. The introduction of emission stan-dards for mobile sources should reduce NOx and VOC emissions byabout one quarter, despite increasing traffic volumes. SO2, NH3 andprimary PM emissions would change by less than 10 percent(Fig. 2).
For international shipping, the baseline scenario includes thedecisions of the International Maritime Organization taken at themeeting of its Marine Environment Protection Committee in 2008(IMO MEPC57). As a consequence of this legislation, sharp declinesin SO2 and primary PM2.5 emissions from ships are expected after2020, but NOx and VOC emissions would grow by a factor of 1.5e3,respectively.
3.2. A baseline projection of air quality impacts
The anticipated decline in air pollutant emissions will havesignificant impacts on future air quality and alleviate harmful
M. Amann et al. / Environmental Modelling & Software 26 (2011) 1489e1501 1497
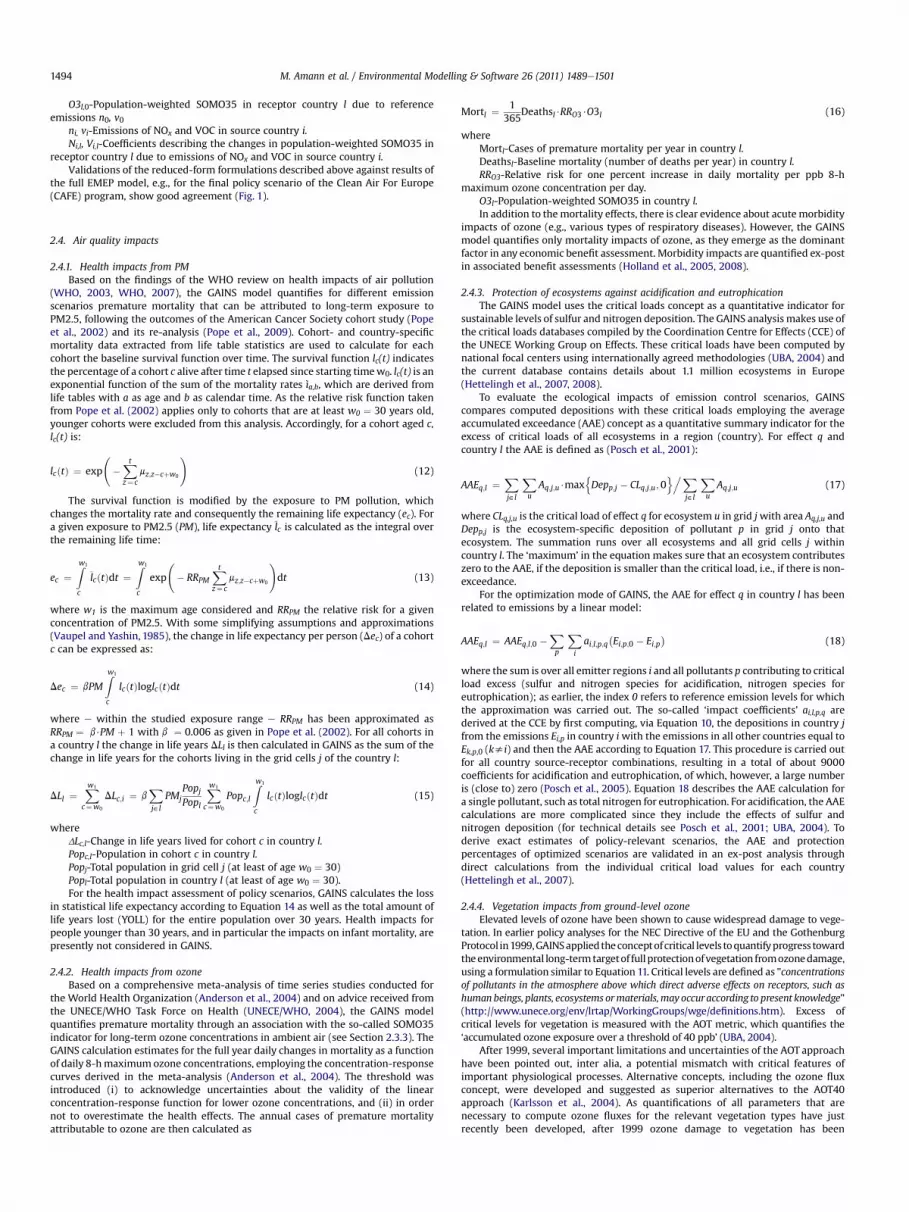
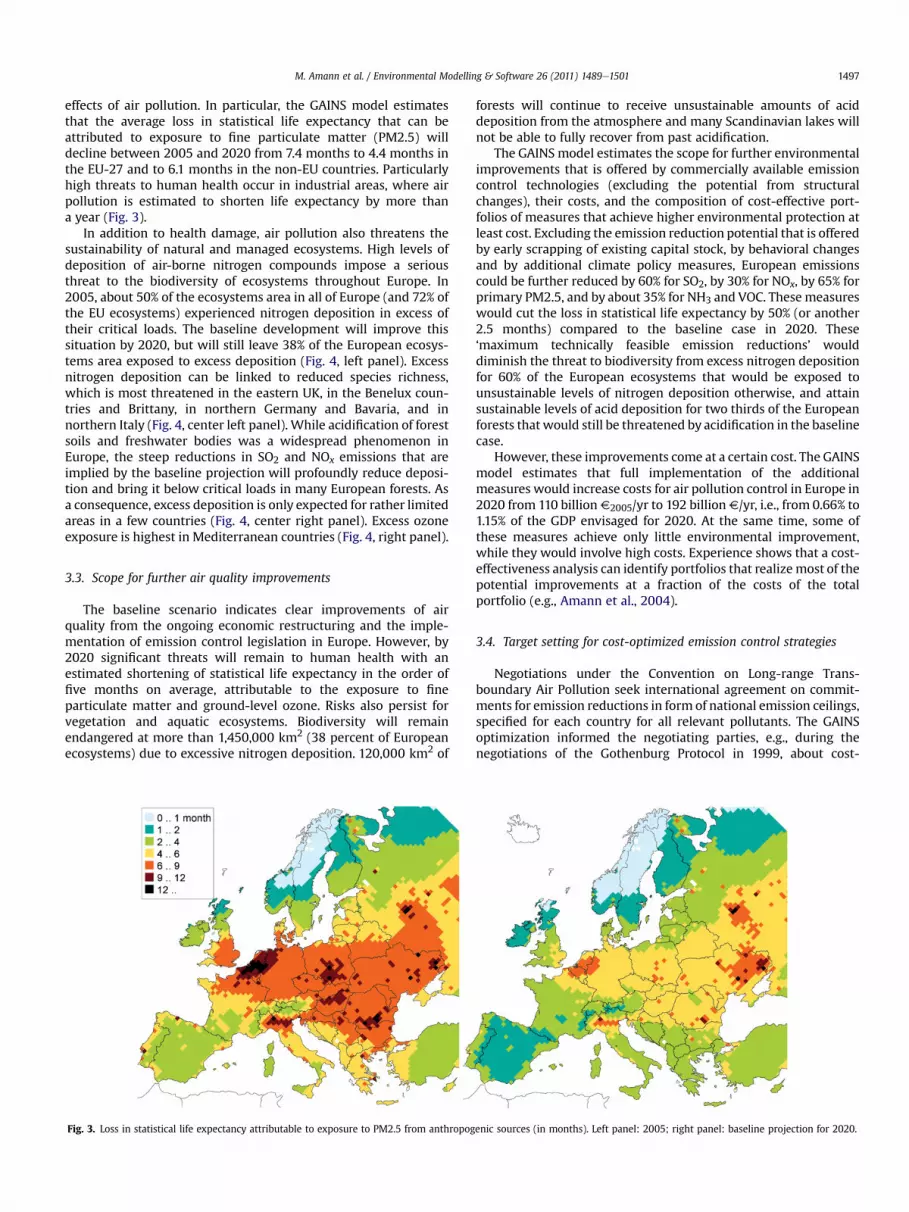
effects of air pollution. In particular, the GAINS model estimatesthat the average loss in statistical life expectancy that can beattributed to exposure to fine particulate matter (PM2.5) willdecline between 2005 and 2020 from 7.4 months to 4.4 months inthe EU-27 and to 6.1 months in the non-EU countries. Particularlyhigh threats to human health occur in industrial areas, where airpollution is estimated to shorten life expectancy by more thana year (Fig. 3).
In addition to health damage, air pollution also threatens thesustainability of natural and managed ecosystems. High levels ofdeposition of air-borne nitrogen compounds impose a seriousthreat to the biodiversity of ecosystems throughout Europe. In2005, about 50% of the ecosystems area in all of Europe (and 72% ofthe EU ecosystems) experienced nitrogen deposition in excess oftheir critical loads. The baseline development will improve thissituation by 2020, but will still leave 38% of the European ecosys-tems area exposed to excess deposition (Fig. 4, left panel). Excessnitrogen deposition can be linked to reduced species richness,which is most threatened in the eastern UK, in the Benelux coun-tries and Brittany, in northern Germany and Bavaria, and innorthern Italy (Fig. 4, center left panel). While acidification of forestsoils and freshwater bodies was a widespread phenomenon inEurope, the steep reductions in SO2 and NOx emissions that areimplied by the baseline projection will profoundly reduce deposi-tion and bring it below critical loads in many European forests. Asa consequence, excess deposition is only expected for rather limitedareas in a few countries (Fig. 4, center right panel). Excess ozoneexposure is highest in Mediterranean countries (Fig. 4, right panel).
3.3. Scope for further air quality improvements
The baseline scenario indicates clear improvements of airquality from the ongoing economic restructuring and the imple-mentation of emission control legislation in Europe. However, by2020 significant threats will remain to human health with anestimated shortening of statistical life expectancy in the order offive months on average, attributable to the exposure to fineparticulate matter and ground-level ozone. Risks also persist forvegetation and aquatic ecosystems. Biodiversity will remainendangered at more than 1,450,000 km2 (38 percent of Europeanecosystems) due to excessive nitrogen deposition. 120,000 km2 of
Fig. 3. Loss in statistical life expectancy attributable to exposure to PM2.5 from anthropog
forests will continue to receive unsustainable amounts of aciddeposition from the atmosphere and many Scandinavian lakes willnot be able to fully recover from past acidification.
The GAINSmodel estimates the scope for further environmentalimprovements that is offered by commercially available emissioncontrol technologies (excluding the potential from structuralchanges), their costs, and the composition of cost-effective port-folios of measures that achieve higher environmental protection atleast cost. Excluding the emission reduction potential that is offeredby early scrapping of existing capital stock, by behavioral changesand by additional climate policy measures, European emissionscould be further reduced by 60% for SO2, by 30% for NOx, by 65% forprimary PM2.5, and by about 35% for NH3 and VOC. Thesemeasureswould cut the loss in statistical life expectancy by 50% (or another2.5 months) compared to the baseline case in 2020. These‘maximum technically feasible emission reductions’ woulddiminish the threat to biodiversity from excess nitrogen depositionfor 60% of the European ecosystems that would be exposed tounsustainable levels of nitrogen deposition otherwise, and attainsustainable levels of acid deposition for two thirds of the Europeanforests that would still be threatened by acidification in the baselinecase.
However, these improvements come at a certain cost. The GAINSmodel estimates that full implementation of the additionalmeasures would increase costs for air pollution control in Europe in2020 from 110 billionV2005/yr to 192 billionV/yr, i.e., from 0.66% to1.15% of the GDP envisaged for 2020. At the same time, some ofthese measures achieve only little environmental improvement,while they would involve high costs. Experience shows that a cost-effectiveness analysis can identify portfolios that realize most of thepotential improvements at a fraction of the costs of the totalportfolio (e.g., Amann et al., 2004).
3.4. Target setting for cost-optimized emission control strategies
Negotiations under the Convention on Long-range Trans-boundary Air Pollution seek international agreement on commit-ments for emission reductions in form of national emission ceilings,specified for each country for all relevant pollutants. The GAINSoptimization informed the negotiating parties, e.g., during thenegotiations of the Gothenburg Protocol in 1999, about cost-
enic sources (in months). Left panel: 2005; right panel: baseline projection for 2020.

Fig. 4. Impact indicators estimated for 2005 (top row) and for the baseline scenario in 2020 (bottom row). Shown are nitrogen deposition in excess of the critical loads foreutrophication (left column), potential richness of species in forest ecosystems under different nitrogen deposition regimes (center left column, calculated in an ex-post analysis byCCE), acid deposition in excess of the critical loads in forests (center right column) and the accumulated ozone exposure over a 40 ppb threshold (AOT40, calculated by the full EMEPmodel), which is used as one indicator of ozone damage to forest trees (right column).
M. Amann et al. / Environmental Modelling & Software 26 (2011) 1489e15011498
effective balances of emission control measures across countries,economic sectors and pollutants that achieve environmental policyobjectives (e.g., a given reduction of negative health effects from airpollution). Cost-effective strategies for further environmentalimprovements involve differentiated reduction requirements forindividual countries, owing to the variations in environmentalvulnerability and costs for further emission reductions acrossEurope. The GAINS optimization minimizes total European emis-sion control costs subject to a set of constraints that reflect envi-ronmental policy targets. Thus, any cost-optimal solution isobviously critically driven by the chosen set of constraints, i.e., bythe spatial distribution of targets across Europe and their over allstringency. Decisions on both aspects, i.e., where in Europe airquality should be improved and by how much, involve valuejudgments that need to be shared by all decision makers. Suchvalue judgments are clearly beyond what a scientific model canprovide without an assumed preference structure of the negoti-ating parties, and therefore are at the core of the political negoti-ations among countries. Once negotiators have reached agreementon the nature and stringency of such targets, the model can provideinformation on how these targets could be achieved with least useof economic resources, and the implied distribution of effortsamong countries. In 1999 negotiations of the Gothenburg Protocolinvolved several iterations between negotiators specifying poten-tial targets and the model determining costs and benefits for allparties (Hordijk and Amann, 2007).
For the revision of the Gothenburg Protocol in 2011, negotiatorswill need to find a revised agreement on the environmentalambitions and their distributional aspects if again the cost-effectiveness rationale should be applied for determining obliga-tions of individual parties. Any practical set of targets must beachievable in all countries and should result in internationallybalanced costs and benefits. To inform the negotiators, four alter-native approaches for target setting have been developed thatillustrate the implications of different policy choices:
(i) Targets could establish uniform environmental quality criteriathat should be achieved everywhere in Europe, so that allEuropean citizens and ecosystems could enjoy equal airquality conditions. However, this would require areas withcurrently the highest pollution to invest most into clean-up,while there would be no incentives for improvements thatare possible in less polluted areas.
(ii) Targets could call in each country for equal relative improve-ment in environmental quality compared to the situation ina base year. Such a target setting approach would result ina more equal distribution of efforts. However, countries at thefringes of Europe that already enjoy relatively clean condi-tions, but are strongly dominated by emissions from non-European sources (e.g., Cyprus) would face disproportion-ately high costs as they have only little potential to efficientlyimprove their air quality through additional measures withinthe country. Aligning the quantitative targets for all countrieswith the feasible range for such countries will not triggerfurther improvements in other parts of Europe, where addi-tional measures are available that would lead to substantialenvironmental improvements.
(iii) Targets could aim in each country for equal relative progresswithin the feasible space of environmental improvements, i.e.,between the baseline and the maximum reduction cases. Bydefinition such reductions are technically feasible in allcountries and would give a more equal distribution of costs,but they are sensitive to weakly defined reference cases, i.e.,the baseline and maximum reduction cases.
(iv) As a variant of option (iii), a fourth approach would optimizetotal environmental improvements for Europe as a wholeirrespective of their location. Such an approach would offera more cost-effective result than target setting approachesthat entail equity criteria, and would lead to lower costs foralmost all countries. This concept has been accepted asa rationale for the Clean Air For Europe (CAFE) program of the
M. Amann et al. / Environmental Modelling & Software 26 (2011) 1489e1501 1499
European Commission for human health (Tuinstra, 2007).However, in the pan-European context of the GothenburgProtocol such an approach would shift additional efforts (andbenefits) to countries with less stringent emission controlmeasures in their baseline (e.g., non-EU countries). Thedifferent target setting options are analyzed in more detail in(Amann et al., 2010).
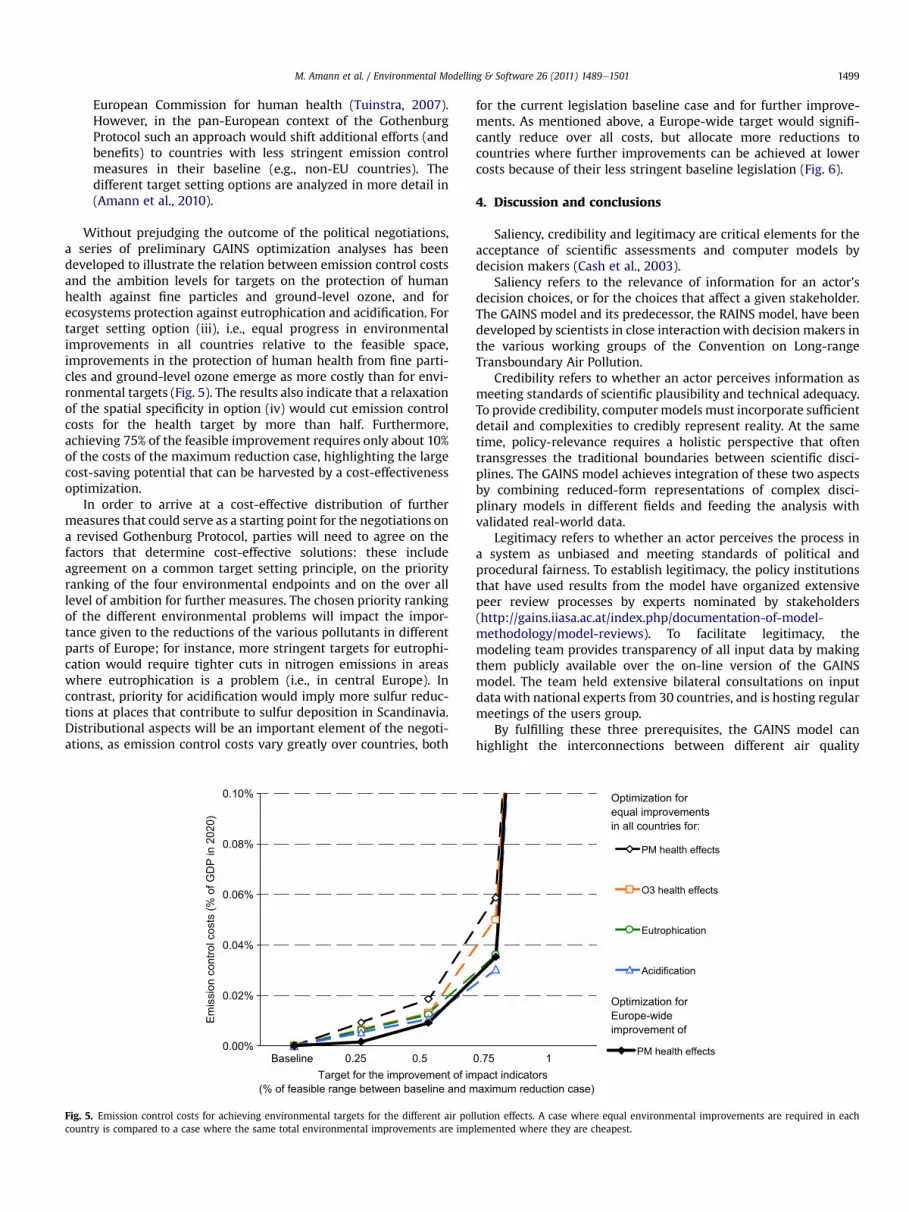
Without prejudging the outcome of the political negotiations,a series of preliminary GAINS optimization analyses has beendeveloped to illustrate the relation between emission control costsand the ambition levels for targets on the protection of humanhealth against fine particles and ground-level ozone, and forecosystems protection against eutrophication and acidification. Fortarget setting option (iii), i.e., equal progress in environmentalimprovements in all countries relative to the feasible space,improvements in the protection of human health from fine parti-cles and ground-level ozone emerge as more costly than for envi-ronmental targets (Fig. 5). The results also indicate that a relaxationof the spatial specificity in option (iv) would cut emission controlcosts for the health target by more than half. Furthermore,achieving 75% of the feasible improvement requires only about 10%of the costs of the maximum reduction case, highlighting the largecost-saving potential that can be harvested by a cost-effectivenessoptimization.
In order to arrive at a cost-effective distribution of furthermeasures that could serve as a starting point for the negotiations ona revised Gothenburg Protocol, parties will need to agree on thefactors that determine cost-effective solutions: these includeagreement on a common target setting principle, on the priorityranking of the four environmental endpoints and on the over alllevel of ambition for further measures. The chosen priority rankingof the different environmental problems will impact the impor-tance given to the reductions of the various pollutants in differentparts of Europe; for instance, more stringent targets for eutrophi-cation would require tighter cuts in nitrogen emissions in areaswhere eutrophication is a problem (i.e., in central Europe). Incontrast, priority for acidification would imply more sulfur reduc-tions at places that contribute to sulfur deposition in Scandinavia.Distributional aspects will be an important element of the negoti-ations, as emission control costs vary greatly over countries, both
0.00%
0.02%
0.04%
0.06%
0.08%
0.10%
Baseline 0.25 0.5Target for the improvement of im
(% of feasible range between baseline and m
Emis
sion
con
trol c
osts
(% o
f GD
P in
202
0)
Fig. 5. Emission control costs for achieving environmental targets for the different air polcountry is compared to a case where the same total environmental improvements are imp
for the current legislation baseline case and for further improve-ments. As mentioned above, a Europe-wide target would signifi-cantly reduce over all costs, but allocate more reductions tocountries where further improvements can be achieved at lowercosts because of their less stringent baseline legislation (Fig. 6).
4. Discussion and conclusions
Saliency, credibility and legitimacy are critical elements for theacceptance of scientific assessments and computer models bydecision makers (Cash et al., 2003).
Saliency refers to the relevance of information for an actor’sdecision choices, or for the choices that affect a given stakeholder.The GAINS model and its predecessor, the RAINS model, have beendeveloped by scientists in close interactionwith decision makers inthe various working groups of the Convention on Long-rangeTransboundary Air Pollution.
Credibility refers to whether an actor perceives information asmeeting standards of scientific plausibility and technical adequacy.To provide credibility, computermodels must incorporate sufficientdetail and complexities to credibly represent reality. At the sametime, policy-relevance requires a holistic perspective that oftentransgresses the traditional boundaries between scientific disci-plines. The GAINS model achieves integration of these two aspectsby combining reduced-form representations of complex disci-plinary models in different fields and feeding the analysis withvalidated real-world data.
Legitimacy refers to whether an actor perceives the process ina system as unbiased and meeting standards of political andprocedural fairness. To establish legitimacy, the policy institutionsthat have used results from the model have organized extensivepeer review processes by experts nominated by stakeholders(http://gains.iiasa.ac.at/index.php/documentation-of-model-methodology/model-reviews). To facilitate legitimacy, themodeling team provides transparency of all input data by makingthem publicly available over the on-line version of the GAINSmodel. The team held extensive bilateral consultations on inputdatawith national experts from 30 countries, and is hosting regularmeetings of the users group.
By fulfilling these three prerequisites, the GAINS model canhighlight the interconnections between different air quality
0.75 1pact indicators aximum reduction case)
PM health effects
O3 health effects
Eutrophication
Acidification
Series2
PM health effects
Optimization for Europe-wideimprovement of
Optimization for equal improvements in all countries for:
lution effects. A case where equal environmental improvements are required in eachlemented where they are cheapest.

0.0%
0.2%
0.4%
0.6%
0.8%
1.0%
1.2%
1.4%
1.6%
1.8%
2.0%
AT BE BG CY CZ
DK EE FI FR DE
GR
HU IE IT LV LT LU MT NL PL PT RO SK SI ES SE UK
EU-2
7 AL BY BA CR
MK
MD
NO RU RS
CH UA
Non
-EU
Sum
Emis
sion
con
trol c
osts
in %
of G
DP(
PPP)
Baseline 75% of possible YOLL improvement 75% YOLL improvement Europe-wide
Fig. 6. Emission control costs (as percentage of the GDP expressed in purchasing power parities) for the baseline case and for the two optimization scenarios that aim at a 75%percent improvement in the health effects attributable to PM.
M. Amann et al. / Environmental Modelling & Software 26 (2011) 1489e15011500
problems, the interactions between pollutants in the atmosphere,and the interdependencies between emission controls acrosspollutants and source categories. Its multi-pollutant/multi-effectperspective has shaped the European policy approach on airquality in the last decades, as now implemented in a series ofinternational emission reduction accords. It demonstrated consid-erable economic synergies in emission control strategies by tack-ling several problems simultaneously, and it helped to designcommon approaches that yield environmental benefits to allcountries across Europe, even if they suffer from different airquality problems.
This paper demonstrates that, in order to protect the quality oflife of European citizens, the sustainability of the services providedby its ecosystems and to avoid dangerous interference with theglobal climate system, additional efforts are required to control therelease of harmful substances to the atmosphere. A host ofmeasures is available to further reduce emissions in the future.However, as many of the ‘low hanging fruits’ have been harvestedby now, further action will put higher demands on economicresources, especially at a time when resources are strained by theeconomic crisis. The optimization feature of the GAINS modelallows the identification of cost-effective portfolios of emissionreductions that achieve further environmental improvementswhile putting least burden on the economy. However, acceptance ofsuch cost-effective solutions that require common but differenti-ated efforts by all European countries needs political agreement onthe stringency and the international distribution of the envisagedenvironmental improvements. The forthcoming negotiations ona revised Gothenburg Protocol under the Convention on Long-range Transboundary Air Pollution have put these questions ontheir agenda.
Acknowledgments
The authors acknowledge funding for the development of theGAINS model from the LIFE financial instrument of the EuropeanCommunity (LIFE06 ENV/AT/PREP/06).
References
Amann, M., Lutz, M., 2000. The revision of the air quality legislation in the EuropeanUnion related to ground-level ozone. Journal of Hazardous Materials 78, 41e62.
Amann, M., Cofala, J., Heyes, C., Klimont, Z., Mechler, R., Posch, M., Schöpp, W., 2004.The RAINS Model. Documentation of the Model Approach Prepared for theRAINS Review. International Institute for Applied Systems Analysis (IIASA),Laxenburg, Austria.
Amann, M., et al., 2007. Estimating Concentrations of Fine Particulate Matter inUrban Background Air of European Cities. International Institute for AppliedSystems Analysis (IIASA), Laxenburg, Austria.
Amann, M., Bertok, I., Cofala, J., Heyes, C., Klimont, Z., Rafaj, P., Schöpp, W.,Wagner, F., 2010. Scope for Further Environmental Improvements in 2020Beyond the Baseline Projections. International Institute for Applied SystemsAnalysis (IIASA), Laxenburg, Austria.
Anderson, H.R., Atkinson, R.W., Peacock, J.L., Marston, L., Konstantinou, K., 2004.Meta-analysis of Time-series Studies and Panel Studies of Particulate Matter(PM) and Ozone (O3). World Health Organization, Bonn.
Borken-Kleefeld, J., Cofala, J., Rafaj, P., 2009. GHG Mitigation Potentials and Costs inthe Transport Sector of Annex I Countries. International Institute for AppliedSystems Analysis, Laxenburg, Austria.
Brooke, A., Kendrick, D., Meeraus, A., 1988. GAMS: A Users Guide. Scientific Press,California.
CEC, 2004. Service Contract for Review of the RAINS Integrated Assessment Model.Commission of the European Communities, Brussels, Belgium.
CEC, 2005. Communication from the Commission to the Council and the EuropeanParliament on a Thematic Strategy on Air Pollution. Commission of the Euro-pean Communities, Brussels, Belgium.
Capros, P., Mantzos, L., Papandreou, V., Tasios, N., 2008. European Energy andTransport Trends to 2030 d Update 2007. European Commission Directorate-General for Energy and Transport, Brussels, Belgium.
Cash, D., Clark, W., Alcock, F., Dickson, N., Eckley, N., Guston, D., Jaeger, J.,Mitchell, R.B., 2003. Knowledge systems for sustainable development.Proceedings of the National Academy of Sciences of the United States ofAmerica 100 (14), 8086e8091.
Cofala, J., Syri, S., 1998a. Nitrogen Oxides Emissions, Abatement Technologies andRelated Costs for Europe in the RAINS Model Database. International Institutefor Applied Systems Analysis (IIASA), Laxenburg, Austria.
Cofala, J., Syri, S., 1998b. Sulfur Emissions, Abatement Technologies and RelatedCosts for Europe in the RAINS Model Database. International Institute forApplied Systems Analysis (IIASA), Laxenburg, Austria.
Cofala, J., Purohit, P., Rafaj, P., Klimont, Z., 2009. GHG Mitigation Potentials and Costsfrom Energy Use and Industrial Sources in Annex I Countries. InternationalInstitute for Applied Systems Analysis (IIASA), Laxenburg, Austria.
den Elzen, M., Fuglestvedt, J.S., Höhne, N., Trudinger, C., Lowe, J., Matthews, B.,Romstad, B., de Campos, C.P., Andronova, N., 2005. Analysing countries’contribution to climate change: scientific and policy-related choices. Environ-mental Science and Policy 8 (6), 614e636.
M. Amann et al. / Environmental Modelling & Software 26 (2011) 1489e1501 1501
DieselNet, 2009. Emission Standards. Summary of Worldwide Diesel EmissionStandards.
D’Elia, I., et al., 2009. Technical and non-technical measures for air pollutionemission reduction: the integrated assessment of the regional air qualitymanagement plans through the Italian national model. Atmospheric Environ-ment 43 (39), 6182e6189.
EC, 2001. In: European Communites (Ed.), Directive 2001/81/EC of the EuropeanParliament and of the Council of 23 October 2001 on National Emission Ceilingsfor Certain Atmospheric Pollutants Brussels, Belgium.
Eckley, N., 2002. Dependable dynamism: lessons for designing scientific assessmentprocesses in consensus negotiations. Global Environmental Change 12 (1),15e23.
Fagerli, H., Aas, W., 2008. Trends of nitrogen in air and precipitation: model resultsand observations at EMEP sites in Europe, 1980e2003. Environmental Pollution154, 448e461.
Farrell, A., VanDeveer, S.D., Jaeger, J., 2001. Environmental assessments: four under-appreciated elements of design. Global Environmental Change 11, 311e333.
Fowler, D., Muller, J., Smith, R.I., Cape, J.N., Erisman, J.W., 2005. Nonlinearities insource receptor relationships for sulfur and nitrogen compounds. Ambio 34 (1),41e46.
Galloway, J.N., Townsend, A.R., Erisman, J.W., Bekunda, M., Cai, Z., Freney, J.R.,Martinelli, L.A., Seitzinger, S.P., Sutton, M.A., 2008. Transformation of thenitrogen cycle: recent trends, questions, and potential solutions. Science 320,889e892.
Haas, P., McCabe, M., 2001. Amplifiers or Dampeners: International Institutions andSocial Learning in the Management of Global Environmental Risks. The SocialLearning Group. Learning to Manage Global Environmental Risks: A Compara-tive History of Social Responses to Climate Change, Ozone Depletion and AcidRain. MIT Press, Cambridge, MA.
Hettelingh, J.-P., Posch, M., Slootweg, J., Reinds, G.J., Spranger, T., Tarrason, L., 2007.Critical loads and dynamic modelling to assess European areas at risk of acid-ification and eutrophication. Water, Air and Soil Pollution Focus 7, 379e384.
Hettelingh, J.-P., Posch, M., Slootweg, J., 2008. Critical Load, Dynamic Modelling andImpact Assessment in Europe. Coordination Centre for Effects. Bilthoven,Netherlands.
Heyes, C., Schöpp, W., Amann, M., Unger, S., 1996. A Reduced-Form Model to PredictLong-Term Ozone Concentrations in Europe. International Institute for AppliedSystems Analysis, Laxenburg, Austria.
Hinkel, J., 2009. The PIAM approach to modular integrated assessment modelling.Environmental Modelling & Software 24 (6), 739e748.
Höglund-Isaksson, L., Winiwarter, W., Tohka, A., 2009. Potentials and Costs forMitigation of Non-CO2 Greenhouse Gases in Annex I Countries. InternationalInstitute for Applied Systems Analysis (IIASA), Laxenburg, Austria.
Holland, M., Watkiss, P., Pye, S., Oliveira, A., Regemorter, D.V., 2005. Cost-benefitAnalysis of Policy Option Scenarios for the Clean Air for Europe Programme.AEA Technology, Didcot, UK.
Holland, M., Pye, S., Jones, G., Hunt, A., Markandya, A., 2008. Benefits Assessmentand Comparison of Costs and Benefits. International Institute for AppliedSystems Analysis (IIASA), Laxenburg, Austria.
Hordijk, L., Amann, M., 2007. How science and policy combined to combat airpollution problems. Environmental Policy and Law 37 (4), 336e340.
IEA, 2009. World Energy Outlook 2009. OECD/IEA, Paris.IEACCC, 2009. Coal Power Database. IEA Clean Coal Centre, London.Janssen, S., Ewert, F., Li, Hongtao, Athanasiadis, I.N., Wien, J.J.F., Thérond, O.,
Knapen, M.J.R., Bezlepkina, I., Alkan-Olsson, J., Rizzoli, A.E., Belhouchette, H.,Svensson, M., van Ittersum, M.K., 2009. Defining assessment projects andscenarios for policy support: use of ontology in integrated assessment andmodelling. Environmental Modelling & Software 24 (12), 1491e1500.
Karlsson, G.P., Karlsson, P.E., Soja, G., Vandermeiren, K., Pleijel, H., 2004. Test of theshort-term critical levels for acute ozone injury on plantse improvements byozone uptake modelling and the use of an effect threshold. AtmosphericEnvironment 38 (15), 2237e2245.
Kelly, A., Lumbreras, J., Maas, R., Pignatelli, T., Ferreira, F., Engleryd, A., 2010. Settingnational emission ceilings for air pollutants: policy lessons from an ex-postevaluation of the Gothenburg protocol. Environmental Science & Policy 13(1), 28e41.
Klimont, Z., Brink, C., 2006. Modelling of Emissions of Air Pollutants and Green-house Gases from Agricultural Sources in Europe. International Institute forApplied Systems Analysis (IIASA), Laxenburg, Austria.
Klimont, Z., Amann, M., Cofala, J., 2000. Estimating costs for controlling emissions ofvolatile organic compounds from stationary sources in Europe. InternationalInstitute for Applied Systems Analysis, Laxenburg, Austria.
Klimont, Z., Cofala, J., Bertok, I., Amann, M., Heyes, C., Gyarfas, F., 2002. ModellingParticulate Emissions in Europe: A Framework to Estimate Reduction Potentialand Control Costs. International Institute for Applied Systems Analysis (IIASA),Laxenburg, Austria.
Mills, G., et al., 2011. Evidence of widespread effects of ozone on crops and (semi-)natural vegetation in Europe (1990e2006) in relation to AOT40- and flux-basedrisk maps. Global Change Biology 17 (1), 592e613.
Nilsson, J., Grennfelt, P., 1988. Critical Loads for Sulphur and Nitrogen. NordicCouncil of Ministers, Copenhagen, Denmark.
Oxley, T., ApSimon, H.M., 2007. Space, time and nesting integrated assessmentmodels. Environmental Modelling & Software 22 (12), 1732e1749.
Oxley, Tim, et al., 2003. The UK integrated assessment model, UKIAM: a nationalscale approach to the analysis of strategies for abatement of atmosphericpollutants under the convention on long-range transboundary air pollution.Integrated Assessment 4 (4), 236e249.
Patt, A., 2001. Transboundary air pollution: lessons for useful analysis. In: Linner-ooth-Bayer, J., Loefstedt, R.E., Sjoestedt, G. (Eds.), Transboundary RiskManagement. Earthscan Publications Ltd, London, UK, pp. 91e120.
Pope, C.A., Burnett, R., Thun, M.J., Calle, E.E., Krewski, D., Ito, K., Thurston, G.D., 2002.Lung cancer, cardiopulmonary mortality and long-term exposure to fineparticulate air pollution. Journal of the American Medical Association 287 (9),1132e1141.
Pope, C.A., Ezzati, M., Dockery, D.W., 2009. Fine-particulate air pollution and lifeexpectancy in the United States. The New England Journal of Medicine 360,376e386.
Posch, M., Hettelingh, J.-P., de Smet, P.A.M., 2001. Characterization of critical loadexceedances in Europe. Water, Air and Soil Pollution 130, 1139e1144.
Posch, M., Slootweg, J., Hettelingh, J.-P., 2005. European Critical Loads and DynamicModelling. Coordination Centre for Effects, Bilthoven, Netherlands.
Reis, S., Nitter, S., Friedrich, R., 2005. Innovative approaches in integrated assess-ment modelling of European air pollution control strategies - implications ofdealing with multi-pollutant multi-effect problems. Environmental Modelling& Software 20 (12), 1524e1531.
Schöpp, W., Amann, M., Cofala, J., Heyes, C., Klimont, Z., 1999. Integrated assessmentof European air pollution emission control strategies. Environmental Modelingand Software 14 (1), 1e9.
Schöpp, W., Klimont, Z., Suutari, R., Cofala, J., 2005. Uncertainty analysis of emissionestimates in the RAINS integrated assessment model. Environmental Science &Policy 8, 601e613.
Seinfeld, J.H., Pandis, S.N., 1998. Atmospheric Chemistry and Physics, from AirPollution to Climate Change. John Wiley, New York, ISBN 0-471-17815-2.
Shindell, D., Lamarque, J.-F., Unger, N., Koch, D., Faluvegi, G., Bauer, S., Amann, M.,Cofala, J., Teich, H., 2008. Climate forcing and air quality change due to regionalemissions reductions by economic sector. Atmospheric Chemistry and Physics8, 7101e7113.
Shine, K., Berntsen, T., Fuglestvedt, J.S., Skeie, R.B., Stuber, N., 2007. Comparing theclimate effect of emissions of short- and long-lived climate agents. Philosoph-ical Transactions of the Royal Society A 365, 1903e1914.
Simpson, D., Fagerli, H., Jonson, J.E., Tsyro, S., Wind, P., Tuovinen, J.-P., 2003.Transboundary Acidification, Eutrophication and Ground Level Ozone inEurope. Part 1: Unified EMEP Model Description. EMEP MeteorologicalSynthesizing Centre-West, Norwegian Meteorological Institute, Oslo, Norway.
Thunis, P., Rouil, L., Cuvelier, C., Stern, R., Kerschbaumer, A., Bessagnet, B.,Schaap, M., Builtjes, P., Tarrason, L., Douros, J., Moussiopoulos, N., Pirovano, G.,Bedogni, M., 2007. Analysis of model responses to emission-reduction scenarioswithin the citydelta project. Atmospheric Environment 41 (1), 208e220.
Tuinstra, W., 2007. Preparing for the European thematic strategy on air pollution: atthe interface between science and policy. Environmental Science & Policy 10(5), 434e444.
Tuinstra, W., Hordijk, L., Amann, M., 1999. Using computer models in internationalnegotiations. The case of acidification in Europe. Environment 41 (9), 33e42.
Turner, R.K., Pearce, D., Bateman, I., 1994. Environmental Economics: an ElementaryIntroduction. Johns Hopkins University Press, ISBN 0-7450-1083-0.
UBA, 2004. Manual on Methodologies and Criteria for Modelling and Mapping ofCritical Loads and Levels and Air Pollution Effects, Risks and Trends. Umwelt-bundesamt, Dessau, Germany.
UNECE, 2002. Progress Report Prepared by the Chairman of the Task Force onIntegrated Assessment Modelling. United Nations Economic Commission forEurope, Geneva, Switzerland.
UNECE/WHO, 2004. Modelling and Assessment of the Health Impact of ParticulateMatter and Ozone. United Nations Economic Commission for Europe, Geneva,Switzerland.
Vaupel, J.W., Yashin, A.I., 1985. Targetting Lifesaving: Demographic LinkagesBetween Population Structure and Life Expectancy. International Institute forApplied Systems Analysis (IIASA), Laxenburg, Austria.
WHO, 2003. Health Aspects of Air Pollution with Particulate Matter, Ozone andNitrogen Dioxide. World Health Organization, Bonn, Germany.
WHO, 2007. Health Relevance of Particulate Matter from Various Sources. Report ona WHO workshop Bonn, Germany, 26e27 March 2007. World Health Organi-zation, Regional Office for Europe, Copenhagen, Denmark.
Wagner, F., Amann, M., Schöpp, W., 2007. The GAINS Optimization Module as of 1February 2007. IIASA Interim Report IR-07e004. International Institute forApplied Systems Analysis, Laxenburg, Austria.
Warren, R.F., ApSimon, H.M., 2000. Integrated assessment of sulphur dioxidereduction schemes: Robustness studies, choice of environmental targets andcountry roles. Journal of Environmental Management 59 (1), 3e20.