greenhouse gases fluxes and soil thermal properties in a pasture in central missouri
TRANSCRIPT
jesc.a
c.cn
Journal of Environmental Sciences 2010, 22(7) 1029–1039
Greenhouse gases fluxes and soil thermal properties in a pasturein central Missouri
Nsalambi Vakanda Nkongolo1,2,∗, Shane Johnson1, Kent Schmidt1, Frieda Eivazi1
1. Department of Agriculture and Environmental Sciences, College of Agriculture and Natural Science, Lincoln University, Jefferson City,MO 65102-0029, USA. E-mail: [email protected]
2. Harvard Forest, Faculty of Arts and Sciences, Harvard University, 324 North Main Street, Petersham, MA 01366-9504, USA
Received 10 September 2009; revised 02 December 2009; accepted 04 January 2010
AbstractFluctuations of greenhouse gases emissions and soil properties occur at short spatial and temporal scales, however, results are
often reported for larger scales studies. We monitored CO2, CH4, and N2O fluxes and soil temperature (T), thermal conductivity(K), resistivity (R) and thermal diffusivity (D) from 2004 to 2006 in a pasture. Soil air samples for determination of CO2, CH4 and N2Oconcentrations were collected from static and vented chambers and analyzed within two hours of collection with a gas chromatograph.T, K, R and D were measured in-situ using a KD2 probe. Soil samples were also taken for measurements of soil chemical and physicalproperties. The pasture acted as a sink in 2004, a source in 2005 and again a sink of CH4 in 2006. CO2 and CH4 were highest, but N2Oas well as T, K and D were lowest in 2004. Only K was correlated with CO2 in 2004 while T correlated with both N2O (r = 0.76, p =
0.0001) and CO2 (r = 0.88, p = 0.0001) in 2005. In 2006, all gases fluxes were significantly correlated with T, K and R when the datafor the entire year were considered. However, an in-depth examination of the data revealed the existence of month-to-month shifts, lackof correlation and differing spatial structures. These results stress the need for further studies on the relationship between soil propertiesand gases fluxes. K and R offer a promise as potential controlling factors for greenhouse gases fluxes in this pasture.
Key words: greenhouse gases; soil thermal properties; fluxes
DOI: 10.1016/S1001-0742(09)60214-X
Introduction
Soil and its use contribute greatly to the enhancedwarming of the earth’s surface and lower atmosphere asa result of increased emissions of greenhouse gases intothe atmosphere by human activities such as agriculture(Dobbie and Smith, 2003). In soil, these greenhouse gasesare mainly emitted through microbiological processes andtheir flux variations are regulated by processes that controlmicrobial activities (Kang et al., 2000, 2003), such as soiltemperature (T) (Brito et al., 2009; Almagro et al., 2009),soil water content (Rover et al., 1999, Dobbie and Smith,2003), depth to the water table (Huttunen et al., 2003), rootactivities (Raich and Tufekgcioglu, 2000), decompositionof organic matter (Epron et al., 2006; Xu and Qi, 2001),availability of substrate (Smith, 2000), soil N dynamicsand C and N availabilities (Turner et al., 2008; Davidsonet al., 2000; Mutegi et al., 2009; Le Mer and Roger, 2001;Raich and Tufekgcioglu, 2000; Saiz et al., 2006). Bothgreenhouse gases fluxes and their controlling factors alsoexhibit tremendous variability across ecosystems and thisvariability poses a serious problem in estimating N2O, CH4and N2O fluxes at larger scales (Nkongolo et al., 2009a,
* Corresponding author. E-mail: [email protected]
2009b; Raich et al., 1990; Stoyan et al., 2000) and inassessing the relationship between soil properties and N2O,CH4 and N2O fluxes (Nkongolo et al., 2008a, 2008b; John-son et al., 2007; Paro et al., 2007). Among soil properties,the relationship between T and greenhouse gases fluxeshas received more attention. However, in many studiessoil temperature has been correlated or not correlated withgreenhouse gases fluxes (Smith et al., 2003). Other soilproperties such as thermal properties have not receiveddue attention. However, soil thermal properties control themovement of heat in the soil, therefore, affect directlythe production and escape of greenhouse gases from thesesoils (Hopmans et al., 2002). Scientists have documentedthe importance of soil thermal properties as early as the19th century (Forbes, 1849). Soil thermal properties influ-ence the partitioning of energy at the ground surface andare related to T and the transfer of heat and water acrossthe ground surface (Ochsner et al., 2001). Fluctuations ofboth greenhouse gases fluxes and soil controlling occurat short temporal and spatial scales, but results of studiesare often reported for larger scales (several years). In fact,across shorter temporal and spatial scales, abrupt changesin greenhouse gases emissions may occur in response toa change in a soil controlling factor or any other event(Curtin et al., 2000; Duiker and Lal, 2000). The first
jesc.a
c.cn
1030 Nsalambi Vakanda Nkongolo et al. Vol. 22
objective of this study was to assess the fluctuations ofCO2, CH4, and N2O emissions and soil thermal propertiesin a pasture in central Missouri. A second objective was toinvestigate the relationship between soil thermal propertiesand greenhouse gases fluxes in this pasture.
1 Materials and methods
1.1 Study area
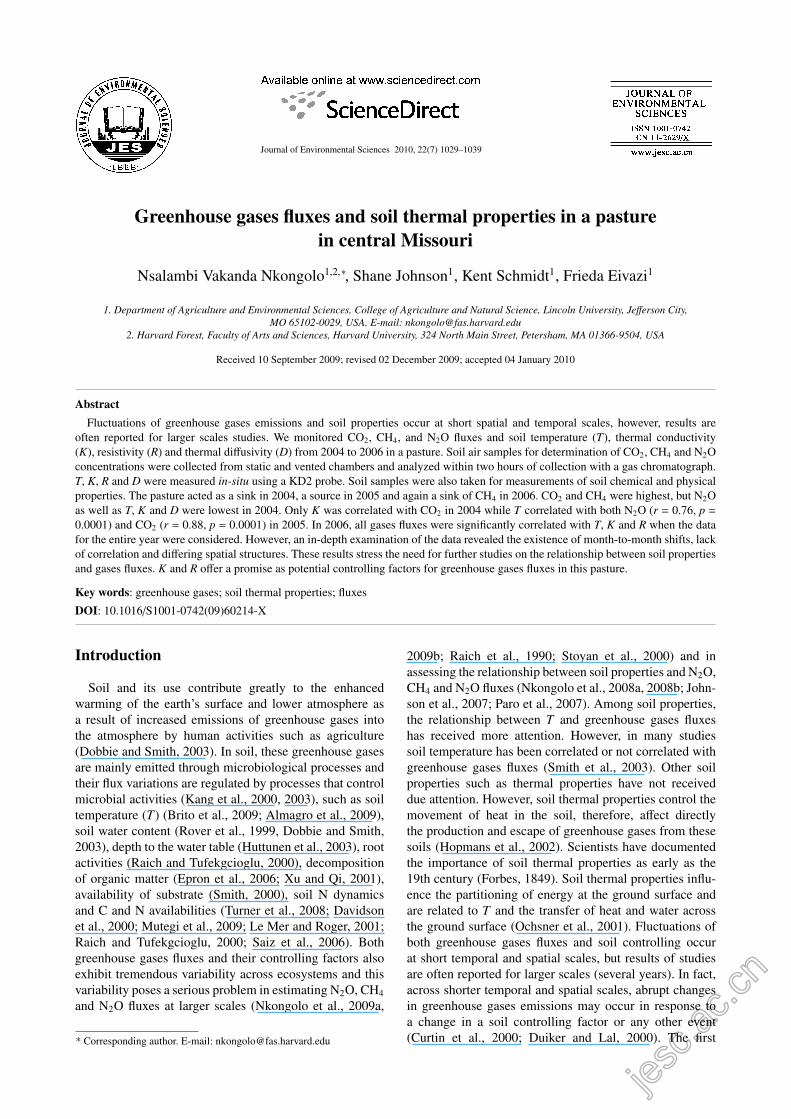
The experiment was conducted on a pasture at GeorgeWashington Carver farm at Lincoln University in JeffersonCity, Missouri (USA). The experiment was started in 2003when twenty chambers were permanently inserted in thesoil of pasture at a first site (site 1). Soil air samples for thedetermination of CO2, CH4 and N2O concentrations werecollected every two weeks a year later in 2004, 2005 and2006 at site 1 before the study was moved to second site(site 2) in 2007 and where data are still being collected(2007, 2008 and 2009). This study focuses on site 1 andmainly on data collected in 2006 even though an accountis also given for 2004 and 2005 sampling period. Theexperimental field is shown in Fig. 1. The geographicalcoordinates of the site are 38◦31′45′′N and 92◦08′07′′W.The soil type of this site is a Freedom Silt-Loam (AquicHapludalfs). The total rainfall from June through Novem-ber was 310 mm with an average temperature of 27°C.This area has experienced a drought during the springand summer months of 2006. The study area was 1.42 haarea dominated by Brome grass (Brumus inermis). Bromegrass is a cool season grass that is very popular in theproduction of hay. The sampling chambers were arrangedin a rectangular grid of 30 m by 35 m.
1.2 Soil air sampling and gas measurement
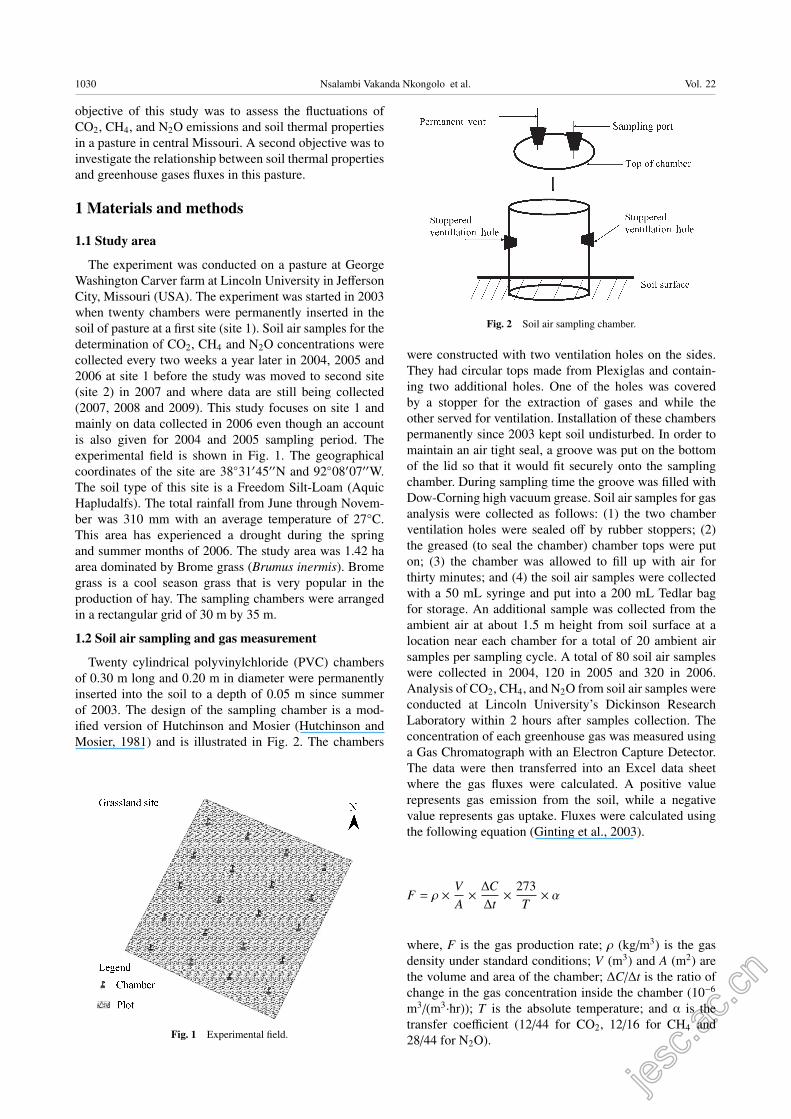
Twenty cylindrical polyvinylchloride (PVC) chambersof 0.30 m long and 0.20 m in diameter were permanentlyinserted into the soil to a depth of 0.05 m since summerof 2003. The design of the sampling chamber is a mod-ified version of Hutchinson and Mosier (Hutchinson andMosier, 1981) and is illustrated in Fig. 2. The chambers
Fig. 1 Experimental field.
Fig. 2 Soil air sampling chamber.
were constructed with two ventilation holes on the sides.They had circular tops made from Plexiglas and contain-ing two additional holes. One of the holes was coveredby a stopper for the extraction of gases and while theother served for ventilation. Installation of these chamberspermanently since 2003 kept soil undisturbed. In order tomaintain an air tight seal, a groove was put on the bottomof the lid so that it would fit securely onto the samplingchamber. During sampling time the groove was filled withDow-Corning high vacuum grease. Soil air samples for gasanalysis were collected as follows: (1) the two chamberventilation holes were sealed off by rubber stoppers; (2)the greased (to seal the chamber) chamber tops were puton; (3) the chamber was allowed to fill up with air forthirty minutes; and (4) the soil air samples were collectedwith a 50 mL syringe and put into a 200 mL Tedlar bagfor storage. An additional sample was collected from theambient air at about 1.5 m height from soil surface at alocation near each chamber for a total of 20 ambient airsamples per sampling cycle. A total of 80 soil air sampleswere collected in 2004, 120 in 2005 and 320 in 2006.Analysis of CO2, CH4, and N2O from soil air samples wereconducted at Lincoln University’s Dickinson ResearchLaboratory within 2 hours after samples collection. Theconcentration of each greenhouse gas was measured usinga Gas Chromatograph with an Electron Capture Detector.The data were then transferred into an Excel data sheetwhere the gas fluxes were calculated. A positive valuerepresents gas emission from the soil, while a negativevalue represents gas uptake. Fluxes were calculated usingthe following equation (Ginting et al., 2003).
F = ρ × VA× ∆C
∆t× 273
T× α
where, F is the gas production rate; ρ (kg/m3) is the gasdensity under standard conditions; V (m3) and A (m2) arethe volume and area of the chamber; ∆C/∆t is the ratio ofchange in the gas concentration inside the chamber (10−6
m3/(m3·hr)); T is the absolute temperature; and α is thetransfer coefficient (12/44 for CO2, 12/16 for CH4 and28/44 for N2O).
jesc.a
c.cn
No. 7 Greenhouse gases fluxes and soil thermal properties in a pasture in central Missouri 1031
1.3 Soil chemical and physical properties
At each chamber location soil samples were taken foranalyses of soil chemical properties. These samples weresent to the Soil and Testing Lab at the University ofMissouri-Columbia for the chemical analysis. The prop-erties studied were soil pH, organic matter (OM), P, Ca,Mg, K, cation exchange capacity, SO4
2−, Fe, electricalconductivity (EC), NO3
−, NH4+, and total nitrogen. For
soil physical properties, soil samples were also taken ateach chamber location using a soil sampling probe at 0.10m depth. The soil fresh weights were measured and thenthe soil samples were put into an oven to be dried at105°C for 72 hr. After drying to constant weight, soilphysical properties were calculated as follows: (1) bulkdensity (ρb = Ms/Vt), where ρb (kg/m3) is the bulk density,Ms (kg) is the mass of dry solids determined after dryingthe soil sample to constant weight at 105°C and Vt (m3)is the total volume of soil; (2) total pore space (TPS) =
Vw + Va/Vt = 1–(ρb/2.65 (kg·m3)), where TPS (m3/m3) isthe total pore space or the total space of soil filled withfluid (air and water), ρb (kg/m3) is the soil particle density;(3) gravimetric water content (θg = Mt–Ms/Ms), where,θg (kg/kg) is the gravimetric water content or mass ofwater present in each unit mass of dry soil; (4) volumetricwater content (θv = Mt-s/Vt) where θv (m3/m3) is volumetricwater content or the volume of water present in a unitvolume of soil, (5) air filled porosity ( fa = TPS–θv), wherefa (m3/m3) is the air content or the portion of the porespace occupied by air, (6) water filled pore space (WFPS =
100×((TPS- fa)/TPS). The relative gas diffusion coefficient(Ds/Do) and the pore tortuosity factor (τ) were calculatedfrom diffusivity models based on air-filled porosity. TheBuckingham (1904) model (Ds/Do = 1/ fa) was used forDs/Do calculation and an approach developed in Nkongoloand Hatano (2009) was used to calculate the pore tortuosityfactor (τ).
1.4 Soil thermal properties
The soil thermal properties were measured in-situ ineach chamber or on its neighborhood with a KD2 thermalproperties meter (Decagon) at 0.06 m depth. The KD2thermal meter uses three sensors to measure thermal dif-fusivity (D), thermal conductivity (K), thermal resistivity(R) as well and soil temperature. KD2 takes measurementsat one second intervals during a 90 sec measurement cycleby using the transient line heat source method. The soil
thermal properties were measured during every samplingdate.
1.5 Mapping and statistical analysis
Statistix 9.0 was used to calculate simple statistics,Pearson correlation matrix and to run a linear regressionanalysis for CO2, N2O, and CH4 and the soil properties.GS+5.1 software (Gamma Design Software, 2005) wasused to fit data to semivariogram models and produce mapsportraying the spatial distribution of greenhouse gasesfluxes across the pasture.
2 Results
2.1 Soil chemical and physical properties
The summary of simple statistics for soil chemicalproperties and nutrients measured in 2006 is shown inTable 1.
Soil chemical properties in 2004 and 2005 were alsoomitted to avoid data redundancy. The average pH of thispasture was 5, implying that the soil was acidic. The sum ofN-indices (NO3
− + NH4+) was 8.7 mg/kg and an average
OM of 17 mg/kg. The cation exchange capacity was 12meq/100 g (data not shown). The pasture contained moreCa (2611.0 kg/ha) as compared to major nutrients suchas K (258.0 kg/ha) or secondary nutrients such as Mg(341.0 kg/ha). The distribution of soil pH, acidity, EC,SO4
2−, Fe and OM approached normality as shown by theirmean values closer or equal to their respective medians.Soil chemical properties and nutrients showed a rangeof variability with coefficient of variation (CV) rangingfrom 3.1 for soil pH to 227% for NH4
+. Overall, indicesof N-availability (NO3
− and NH4+) showed the highest
variability with highest value of CV (227%). As expected,NO3
− and NH4+ also had the highest skew and kurtosis
values. The summary of simple statistics for soil physicalproperties measured in 2006 is shown in Table 2. Similarlyto soil chemical properties, soil physical properties in 2004and 2005 are not shown to avoid data redundancy. Table2 shows that at the time of sampling, the soil of thispasture had an average air filled porosity of 0.3 m3/m3
and a soil bulk density of 1.2 kg/m3. Soil water was at anadequate level for plant growth as reflected by an averagegravimetric water content of 0.2 kg/kg and a volumetricwater content value of 0.3 m3/m3. The pore tortuosityfactor (II) was 4.0 m/m while the relative gas diffusion
Table 1 Summary of simple statistics for soil chemical properties in pasture in 2006
pH EC NO3− NH4
+ P K Ca Mg SO42− OM
(mg/kg) (mg/kg) (mg/kg) (kg/ha) (kg/ha) (kg/ha) (kg/ha) (mg/kg) (g/kg)
Mean 5.0 0.2 1.7 7.0 50.0 258.0 2611.0 341.0 4.0 17.0SD 0.2 0.1 2.1 15.1 24.0 96.0 1357.0 276.0 0.8 3.0CV (%) 3.1 40.3 121.0 227.0 44.0 37.0 52.0 80.0 22.0 17.0Minimun 5.0 0.1 0.3 1.0 15.0 92.0 1400.0 111.0 1.7 12.0Median 5.0 0.2 1.0 2.5 49.0 287.0 1940.0 220.1 3.8 17.0Maximum 5.0 0.3 7.0 63.0 93.0 389.0 5637.0 990.0 5.0 23.0Skew 0.3 0.6 2.0 3.5 –0.02 –0.2 1.2 1.4 –0.9 0.5Kurtosis –1.3 –0.6 3.0 11.0 –0.9 –1.2 –0.04 0.6 0.2 0.04
EC: electrical conductivity; OM: organic matter; CV: coefficient of variation.
jesc.a
c.cn
1032 Nsalambi Vakanda Nkongolo et al. Vol. 22
Table 2 Summary of simple statistics for soil physical properties in pasture in 2006
fa (m3/m3) ρb (kg/m3) Ds/Do (m2/(sec·m2·sec)) θg (kg/kg) θv (m3/m) τ (m/m) WFPS (%) TPS (m3/m3)
Mean 0.3 1.2 0.1 0.2 0.3 4.0 50.0 0.5SD 0.04 0.1 0.02 0.01 0.01 0.5 4.0 0.03Variance 0.0 0.01 0.0 0.0 0.0 0.3 19.0 0.0CV (%) 14.0 6.0 28.0 4.4 4.0 13.6 8.0 5.0Minimum 0.2 1.1 0.04 0.2 0.3 2.9 42.0 0.5Median 0.3 1.0 0.1 0.2 0.3 3.8 51.0 0.5Maximum 0.4 1.0 0.1 0.2 0.3 4.8 59.0 0.6Skew 0.5 –0.8 1.0 0.2 0.5 0.3 0.03 0.8Kurtosis 0.6 0.4 1.5 –0.8 0.01 –0.3 0.1 0.4
fa: air-filled porosity, ρb: bulk density, Ds/Do: relative gas diffusion coefficient, θg: gravimetric water content, θv: volumetric water content, τ: poretortuosity factor, WFPS: water-filled pore space, TPS: total pore space.
coefficient (Ds/Do) was 0.1 (m2/(sec·m2·sec)). Only 50%of the total pore space was filled with water.
Overall, soil physical properties were in the range ofnormally reported data with very low variability (highestCV = 28% for calculated Ds/Do). The distribution of thesesoil properties also approached normality as showed bymeans and medians which are equal.
2.2 Soil thermal properties
The summary of simple statistics for T, K, R, and Dmeasured in 2004, 2005 and 2006 are shown in Table 3.
The mean T was the highest in 2006 as compared to2004 and 2005. In addition, soil thermal K, R and Dwere the highest in 2006 as compared to either 2004 or2005. Coefficients of variation for soil thermal propertiesranged from 17% to 127% with the lowest CV observedfor T in 2004, and the highest for D in 2006. A monthto month assessment of soil thermal properties in 2006revealed that the mean for all four months was 20°C,with a minimum temperature of 7°C and a maximum of26°C. Soil temperature increased by five units from June(21°C) to July (26°C), then decreased about one unit inAugust (24°C) and finally decreased sharply about 14 units
in September (10°C). The mean of K, R, and D for allfour months were 1.0 (W/(m·°C)); 4 (m·°C)/W; and 0.5mm2/sec, respectively. Results showed that soil thermalproperties had high monthly variability with CV rangingfrom 20% to 138%. The decrease in T from June to Julyhad an impact on K and R which decreased also duringthe same period. However, in opposition to this June–Julytrend, the decrease in T in August was accompanied byan increase in K, R and D. However, this trend did notcontinue in September as shown in the analysis of thespatial distribution of soil thermal properties across thepasture below.
2.3 Greenhouse gases fluxes
The summary of simple statistics for the greenhouse gasfluxes in 2004, 2005 and 2006 is shown in Table 4.
On average, there was more N2O emitted in 2006 (32µg N2O-N/(m2·hr)) as compared to either 2004 (16 µgN2O-N/(m2·hr)) or 2005 (9.5 µg N2O-N/(m2·hr)). Carbondioxide emissions decreased from 179 to 85 mg CO2-C/
(m2·hr) in 2004 and 2006, respectively. Methane fluxesshifted from uptake in 2004 (–30 µg CH4-C/(m2·hr)) toemissions in 2005 (17 µg CH4-C/(m2·hr)) and again to
Table 3 Summary of simple statistics for soil thermal properties in 2004, 2005 and 2006
T (°C) K (W/(m·°C)) D (mm2/sec) R ((m·°C)/W)2004 2005 2006 2004 2005 2006 2004 2005 2006 2004 2005 2006
n 40 40 160 40 40 160 40 40 160 40 40 160Mean 23.0 14.1 20.0 0.9 0.5 1.1 0.2 0.1 0.5 1.5 2.3 4.0SD 4.0 11.0 6.0 0.3 0.1 0.5 0.1 0.03 0.6 1.4 0.8 2.0CV (%) 17.0 81.3 30.0 35.0 29.0 46.0 27.0 20.0 127.0 91.0 33.4 44.0Minimum 19.0 2.3 7.4 0.1 0.3 0.2 0.1 0.10 0.2 0.7 1.3 0.7Maximum 31.0 28.0 27.0 1.4 0.8 2.1 0.3 0.2 5.0 7.3 4.0 9.0Skew 0.3 0.02 –0.9 –0.5 0.03 0.01 0.6 2.0 7.3 3.4 0.7 0.8Kurtosis –1.3 –2.0 –0.8 0.2 –0.9 –1.0 1.0 2.9 50.0 10.4 –0.9 0.5
T: soil temperature; K: thermal conductivity; D: thermal diffusivity; R: thermal resistivity.
Table 4 Summary of simple statistics for greenhouse gas fluxes in 2004, 2005 and 2006
N2O (µg N2O-N/(m2·hr)) CO2 (mg CO2-C/(m2·hr)) CH4 (µg CH4-C/(m2·hr))2004 2005 2006 2004 2005 2006 2004 2005 2006
n 40 40 160 40 40 160 40 40 160Mean 16.0 9.5 32.0 179.0 138.0 85.0 –30.0 17.0 –17.0SD 22.0 12.0 37.0 78.0 107.0 60.0 14.0 30.0 60.0CV (%) 130.0 125.0 117.0 40.0 78.0 71.0 45.0 205.0 357.0Minimum –15.0 –10.0 –22.0 17.0 6.0 2.1 –59.0 –38.0 –133.0Maximum 96.0 34.0 255.0 275.0 337.0 348.0 –1.8 120.0 93.0Skew 2.0 0.1 3.4 –0.7 0.3 1.6 0.2 1.2 –0.5Kurtosis 5.0 –0.7 16.3 –0.7 –1.3 3.6 –0.8 2.0 –0.9
jesc.a
c.cn
No. 7 Greenhouse gases fluxes and soil thermal properties in a pasture in central Missouri 1033
uptake in 2006 (–17 µg CH4-C/(m2·hr)). However, theminimum fluxes for both N2O and CH4 were all negative in2004, 2005 and 2006, suggesting that there was uptake ofthese two gases in the soil. As for soil thermal properties,N2O, CO2, and CH4 also showed strong variability acrossthe pasture with CV ranging from 40% to 357% for CO2in 2004 and CH4 in 2006, respectively. A month to monthassessment of the data in 2006 revealed that N2O, CH4 andCO2 fluxes shifted significantly as showed in the analysisof the spatial distribution of greenhouse gases fluxes acrossthe pasture.
2.4 Variogram models for soil thermal properties andgreenhouse gases fluxes in 2006
Table 5 shows the summary of variogram models towhich T, K, R and D responded in June and July 2006. Datafor August and September were discussed, but omitted forclarity reasons.
GS+ GeoStatistics for the Environmental Sciences soft-ware, version 5.1 was used to fit data to models. Thecriterion for model selection was maximum r2, except incases where another model was obviously more appro-priate based on visual examination of the semivariogram.Neither an active lag distance nor a lag interval was set.Default values given by the program were used. Soil tem-perature and K data fitted to spherical variogram modelsin June and July, and to linear models in August andSeptember. Soil thermal resistivity fitted to a sphericalmodel in June and August, and a linear model in Julyand September. Soil thermal diffusivity fitted to a Gaussianmodel in June, a linear model in August and an exponentialvariogram model in September. The ranges of spatialdependence for T and K increased when the data fitted tolinear variogram models. However, no specific trend wasobserved for the range of spatial dependence for either Ror D. Overall, the r2 values for field measured T, K, Rand D ranged from 0.80 to 0.99, suggesting the presenceof moderate to highly developed spatial structure. Table 6
shows the summary of variogram models to which CO2,CH4 and N2O responded for June and July 2006. Data forAugust and September is discussed but not showed.
As for soil thermal properties, greenhouse gases fluxesresponded to several variogram models. Except for themonth of August when the data responded to a sphericalmodel, CO2 was fitted to a linear variogram model inJune, July and September. CH4 fluxes responded solelyto a spherical variogram model in June, July, August andSeptember. N2O shifted from an exponential variogram inJune, to a spherical model in July and finally to a linearvariogram model in August and September. The variogramspatial structure was highly developed for CO2 data asshowed by r2 values above 0.90 at each sampling period.The same trend was also found for CH4 throughout thisexperiment, except in July when the spatial structure wasmoderately developed (r2 = 0.60). Similarly to variogrammodels, the r2 values for N2O also shifted from low to highin June to July and August to September.
2.5 Spatial distribution of soil thermal properties andgreenhouse gases fluxes in 2006
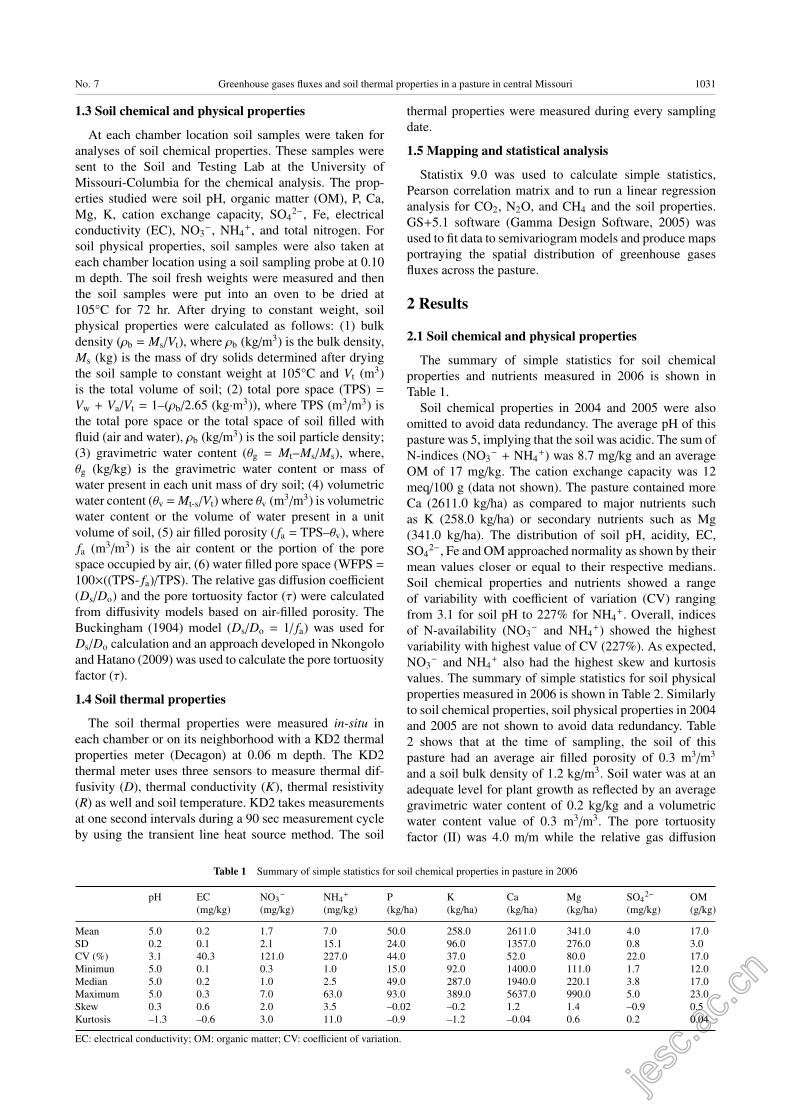
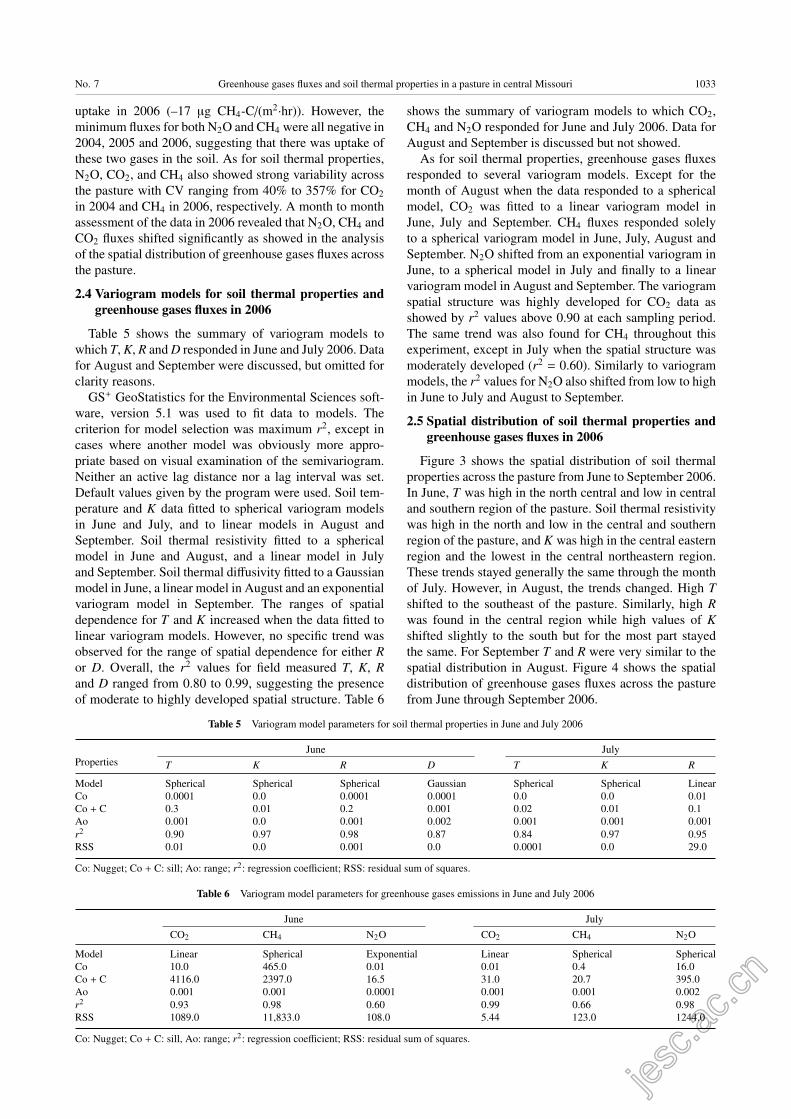
Figure 3 shows the spatial distribution of soil thermalproperties across the pasture from June to September 2006.In June, T was high in the north central and low in centraland southern region of the pasture. Soil thermal resistivitywas high in the north and low in the central and southernregion of the pasture, and K was high in the central easternregion and the lowest in the central northeastern region.These trends stayed generally the same through the monthof July. However, in August, the trends changed. High Tshifted to the southeast of the pasture. Similarly, high Rwas found in the central region while high values of Kshifted slightly to the south but for the most part stayedthe same. For September T and R were very similar to thespatial distribution in August. Figure 4 shows the spatialdistribution of greenhouse gases fluxes across the pasturefrom June through September 2006.
Table 5 Variogram model parameters for soil thermal properties in June and July 2006
June JulyProperties T K R D T K R
Model Spherical Spherical Spherical Gaussian Spherical Spherical LinearCo 0.0001 0.0 0.0001 0.0001 0.0 0.0 0.01Co + C 0.3 0.01 0.2 0.001 0.02 0.01 0.1Ao 0.001 0.0 0.001 0.002 0.001 0.001 0.001r2 0.90 0.97 0.98 0.87 0.84 0.97 0.95RSS 0.01 0.0 0.001 0.0 0.0001 0.0 29.0
Co: Nugget; Co + C: sill; Ao: range; r2: regression coefficient; RSS: residual sum of squares.
Table 6 Variogram model parameters for greenhouse gases emissions in June and July 2006
June JulyCO2 CH4 N2O CO2 CH4 N2O
Model Linear Spherical Exponential Linear Spherical SphericalCo 10.0 465.0 0.01 0.01 0.4 16.0Co + C 4116.0 2397.0 16.5 31.0 20.7 395.0Ao 0.001 0.001 0.0001 0.001 0.001 0.002r2 0.93 0.98 0.60 0.99 0.66 0.98RSS 1089.0 11,833.0 108.0 5.44 123.0 1244.0
Co: Nugget; Co + C: sill, Ao: range; r2: regression coefficient; RSS: residual sum of squares.
jesc.a
c.cn
1034 Nsalambi Vakanda Nkongolo et al. Vol. 22
Fig. 3 Soil temperature (T), resistivity (R), thermal conductivity (K) and thermal diffusivity (D) in a pasture from June to September 2006.
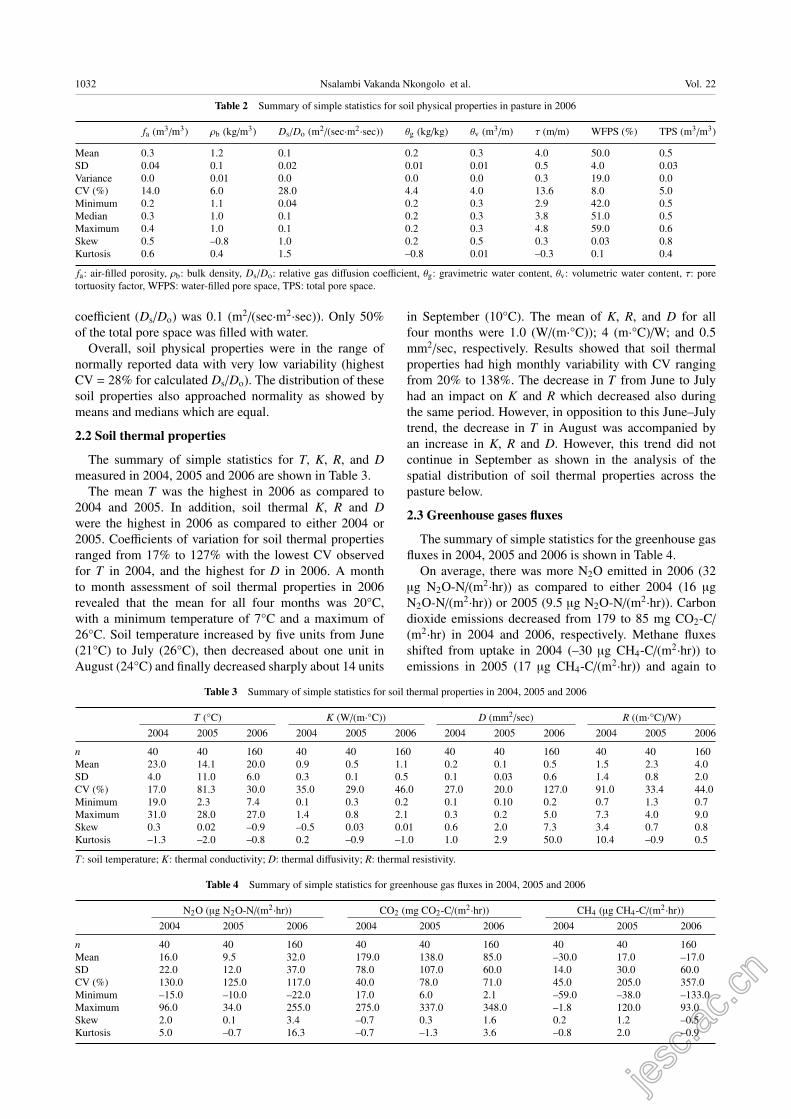
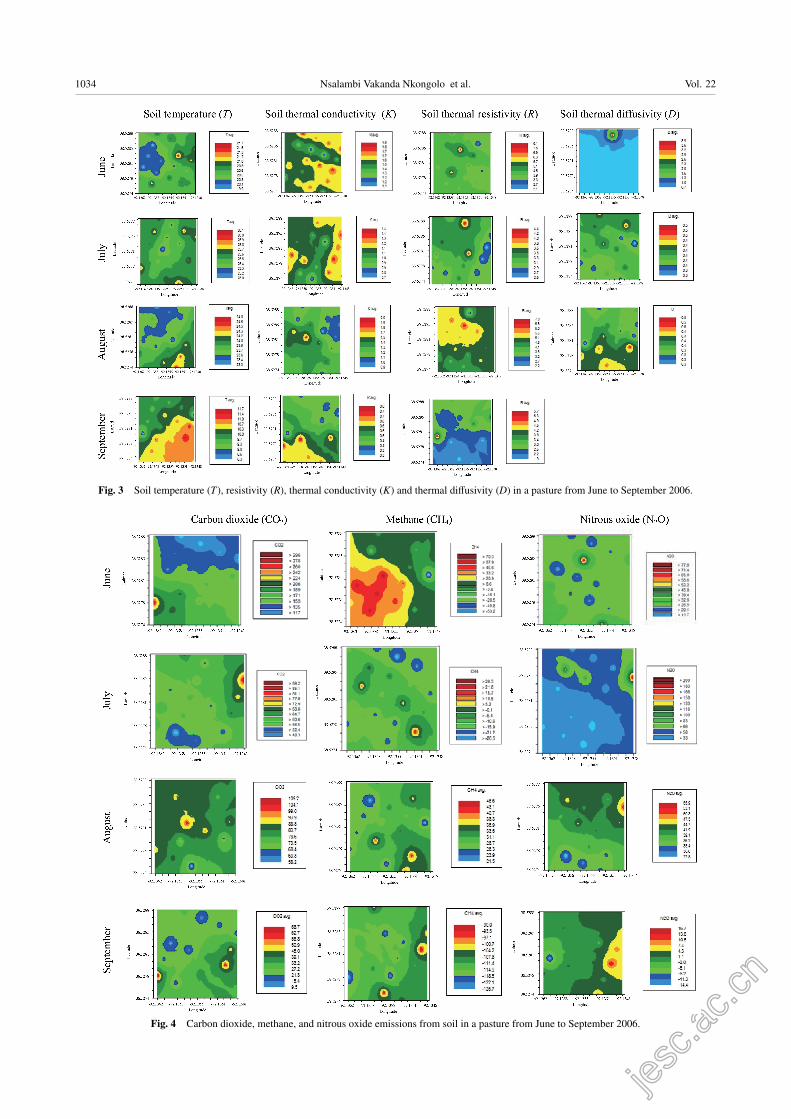
Fig. 4 Carbon dioxide, methane, and nitrous oxide emissions from soil in a pasture from June to September 2006.
jesc.a
c.cn
No. 7 Greenhouse gases fluxes and soil thermal properties in a pasture in central Missouri 1035
Maps portrayed three zones of distribution for green-house gases fluxes. In June, CO2 emissions were low inthe north and high in the southwest region of the pasture.This spatial pattern shifted to high in the east and low in thesouth during the month of July. In August the CO2 fluxesshifted from the east to the north. However, in September,CO2 showed high emissions in the north, low emissionsin the south just as it did in June. CH4 uptake was higherin the east and southwest region of the pasture and low inthe north and east region for the month of June. This trendshifted to high in the central region and low in the north andsouth region. In August and September emissions changedto high emissions in the southeast and the low emissionstayed relatively the same. N2O was high in the centralregion of the pasture and low in the south in June. Thetrend shifted to high in the northeast in July. This trendstayed through out August. The high emissions in thenorth shifted to the east during the month of September.These shifts in emissions pattern over the months makesit difficult to predict with accuracy the distribution of gasfluxes. Shifts in greenhouse gases seem to agree with shiftsin soil thermal properties.
2.6 Correlation between greenhouse gas fluxes and soilthermal properties in 2006
The monthly linear correlation matrices between green-house gas fluxes and soil thermal properties are shown inTable 7 for September only. Data for June, July and Augustare discussed, but the corresponding tables are omitted toreduce data redundancy.
In June, only three significant correlations were found:CO2 emissions was negatively correlated with D wasnegatively while N2O positively correlated with K andnegatively correlated with R. In July, only one significantcorrelation was found between CO2 and K. In addition,CO2 and N2O significantly correlated among themselves(p = 0.004; r = 0.62). In August, there was no correlationbetween greenhouse gases fluxes and soil thermal prop-erties, but CO2 and N2O significantly correlated amongthemselves again (p = 0.04; r = 0.47). In September (Table7), five significant correlations were found between gasesfluxes and soil thermal properties: CO2 was positivelycorrelated with T and K. N2O positively correlated withT and K and negatively correlated with R. In addition,CO2 and N2O significantly correlated among themselves(p = 0.03; r = 0.49). The correlation matrix between soilthermal properties and gases fluxes for the entire 2006 isshowed in Table 8.
Table 7 Correlation matrix (r values) for greenhouse gases fluxes andsoil thermal properties in September 2006 (n = 40)
CO2 CH4 N2O T K
CH4 –0.09ns
N2O 0.49* 0.38ns
T 0.56* 0.01ns 0.52*R –0.36ns 0.01ns –0.59** –0.68***K 0.48* –0.01ns 0.49* 0.62** –0.89****
*, **, ***, ****, *****: significantly different at 0.05, 0.01, 0.001, 0.0001and 0.00001 probability level, respectively. ns: not significantly different.
Table 8 Correlation matrix (r values) for greenhouse gases fluxes andsoil thermal properties for June to September 2006 (n = 160)
CO2 CH4 N2O T K R
CH4 0.61****N2O 0.52**** 0.69****T 0.54**** 0.89***** 0.78****K 0.62**** 0.76***** 0.47**** 0.71****R 0.29* 0.45** 0.53**** 0.47**** 0.13ns
D –0.03ns 0.10ns 0.12ns 0.13ns 0.09ns –0.29*
*, **, ***, ****, *****: significantly different at 0.05, 0.01, 0.001, 0.0001 and0.00001 probability level, respectively. ns: not significantly different.
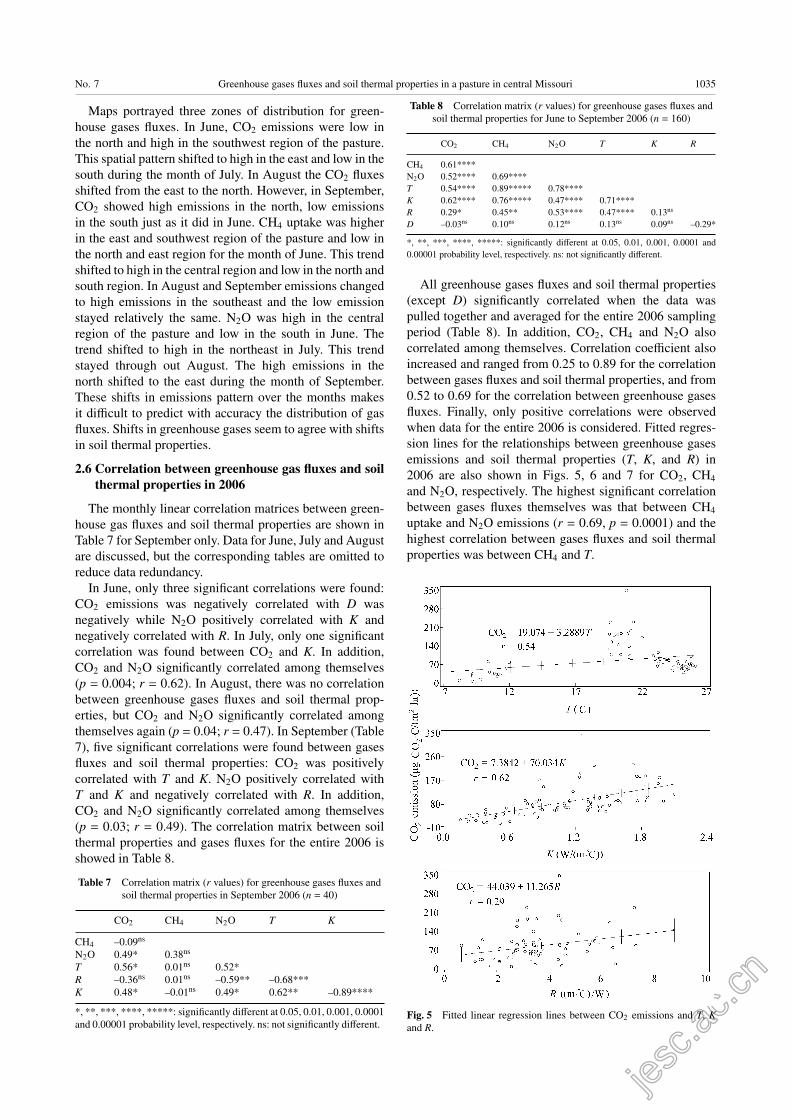
All greenhouse gases fluxes and soil thermal properties(except D) significantly correlated when the data waspulled together and averaged for the entire 2006 samplingperiod (Table 8). In addition, CO2, CH4 and N2O alsocorrelated among themselves. Correlation coefficient alsoincreased and ranged from 0.25 to 0.89 for the correlationbetween gases fluxes and soil thermal properties, and from0.52 to 0.69 for the correlation between greenhouse gasesfluxes. Finally, only positive correlations were observedwhen data for the entire 2006 is considered. Fitted regres-sion lines for the relationships between greenhouse gasesemissions and soil thermal properties (T, K, and R) in2006 are also shown in Figs. 5, 6 and 7 for CO2, CH4and N2O, respectively. The highest significant correlationbetween gases fluxes themselves was that between CH4uptake and N2O emissions (r = 0.69, p = 0.0001) and thehighest correlation between gases fluxes and soil thermalproperties was between CH4 and T.
Fig. 5 Fitted linear regression lines between CO2 emissions and T, Kand R.
jesc.a
c.cn
1036 Nsalambi Vakanda Nkongolo et al. Vol. 22
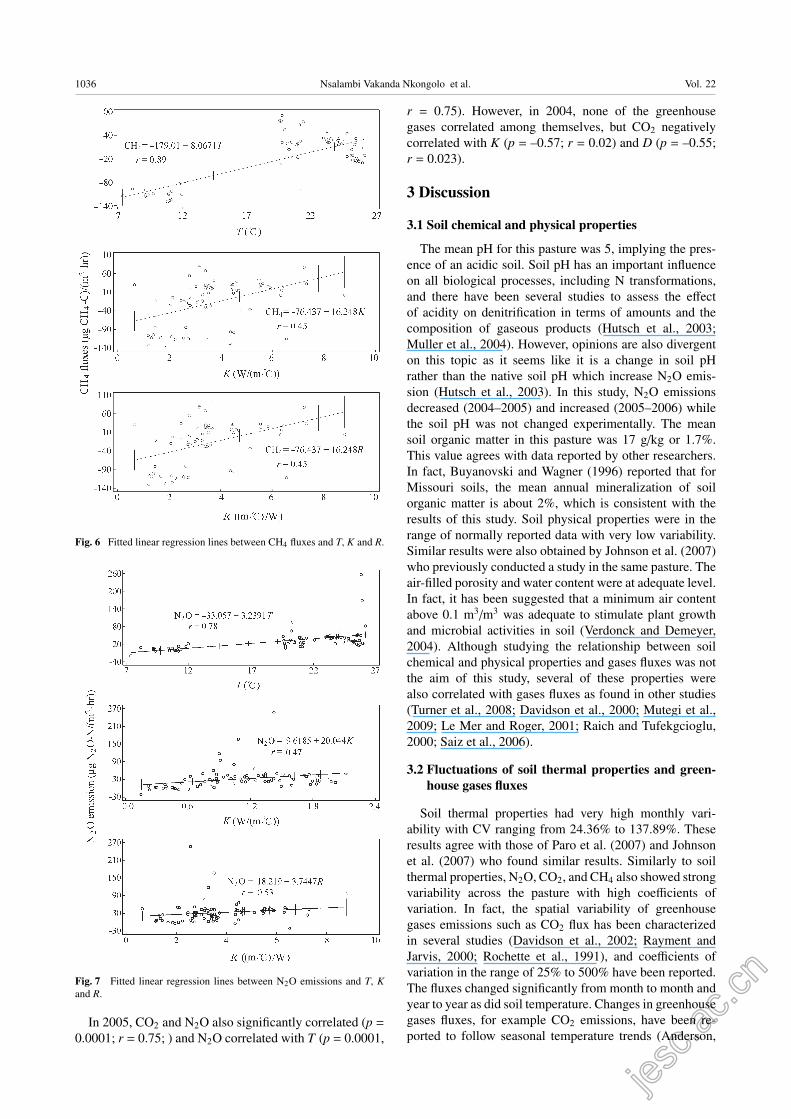
Fig. 6 Fitted linear regression lines between CH4 fluxes and T, K and R.
Fig. 7 Fitted linear regression lines between N2O emissions and T, Kand R.
In 2005, CO2 and N2O also significantly correlated (p =
0.0001; r = 0.75; ) and N2O correlated with T (p = 0.0001,
r = 0.75). However, in 2004, none of the greenhousegases correlated among themselves, but CO2 negativelycorrelated with K (p = –0.57; r = 0.02) and D (p = –0.55;r = 0.023).
3 Discussion
3.1 Soil chemical and physical properties
The mean pH for this pasture was 5, implying the pres-ence of an acidic soil. Soil pH has an important influenceon all biological processes, including N transformations,and there have been several studies to assess the effectof acidity on denitrification in terms of amounts and thecomposition of gaseous products (Hutsch et al., 2003;Muller et al., 2004). However, opinions are also divergenton this topic as it seems like it is a change in soil pHrather than the native soil pH which increase N2O emis-sion (Hutsch et al., 2003). In this study, N2O emissionsdecreased (2004–2005) and increased (2005–2006) whilethe soil pH was not changed experimentally. The meansoil organic matter in this pasture was 17 g/kg or 1.7%.This value agrees with data reported by other researchers.In fact, Buyanovski and Wagner (1996) reported that forMissouri soils, the mean annual mineralization of soilorganic matter is about 2%, which is consistent with theresults of this study. Soil physical properties were in therange of normally reported data with very low variability.Similar results were also obtained by Johnson et al. (2007)who previously conducted a study in the same pasture. Theair-filled porosity and water content were at adequate level.In fact, it has been suggested that a minimum air contentabove 0.1 m3/m3 was adequate to stimulate plant growthand microbial activities in soil (Verdonck and Demeyer,2004). Although studying the relationship between soilchemical and physical properties and gases fluxes was notthe aim of this study, several of these properties werealso correlated with gases fluxes as found in other studies(Turner et al., 2008; Davidson et al., 2000; Mutegi et al.,2009; Le Mer and Roger, 2001; Raich and Tufekgcioglu,2000; Saiz et al., 2006).
3.2 Fluctuations of soil thermal properties and green-house gases fluxes
Soil thermal properties had very high monthly vari-ability with CV ranging from 24.36% to 137.89%. Theseresults agree with those of Paro et al. (2007) and Johnsonet al. (2007) who found similar results. Similarly to soilthermal properties, N2O, CO2, and CH4 also showed strongvariability across the pasture with high coefficients ofvariation. In fact, the spatial variability of greenhousegases emissions such as CO2 flux has been characterizedin several studies (Davidson et al., 2002; Rayment andJarvis, 2000; Rochette et al., 1991), and coefficients ofvariation in the range of 25% to 500% have been reported.The fluxes changed significantly from month to month andyear to year as did soil temperature. Changes in greenhousegases fluxes, for example CO2 emissions, have been re-ported to follow seasonal temperature trends (Anderson,
jesc.a
c.cn
No. 7 Greenhouse gases fluxes and soil thermal properties in a pasture in central Missouri 1037
1973; Buyanovsky et al., 1985; Franzluebbers et al., 2002;Rochette et al., 1991; Raich and Tufekcioglu, 2000). Itwas found that the pasture released more CO2 during themonths that received more rainfall. Similar trends werereported in Hatano and Lipiec (2004). Negative fluxesof N2O were observed in 2004, 2005 and 2006. Thisbehavior is unusual as in most studies, soils have beenreported a source of N2O (Ball et al., 2000, Matsonet al., 1990). However, several studies where soils haveacted occasionally as sinks have also been reported. Usinga micrometeorological method, Maggiotto and Wagner-Riddle (2001) measured N2O, NO and NOx fluxes fromryegrass field fertilized with three different mineral fertiliz-ers. They found that NO2 fluxes were always negative (–6µg N/(m2·sec)), but decreased to –2 µg N/(m2·sec) whensnow was present on the soil surface. They suggested thatthe form of inorganic N applied had an effect on NO +
N2O emissions but not on NO2 fluxes. Glatzel and Stahr(2001) examined the effect of fertilization on the exchangeof N2O and CH4 in the soil-plant system of meadowagroecosystems in southern Germany. Using closed cham-ber method, they regularly determined the gases fluxesand associated environmental parameters. They found thatN2O fluxes at the unfertilized and fertilized plots weresmall, generally between 50 and –20 µg N/(m2·hr). Theyidentified some incidents of N2O uptake. They concludedthat apparently, rapid N mineralization and uptake in thedensely rooted topsoil prevents N losses and the inhibitionof CH4 oxidation.
3.3 Correlations between greenhouse gases fluxes andsoil thermal properties
CO2 consistently correlated with N2O during two ofthe three years of this study and during three of fourmonths in 2006 investigation. Although N2O and CO2emissions are different processes in soil, these significantcorrelations confirm that some common factors controlledN2O and CO2 emissions in this pasture. In fact, both N2Oand CO2 were significantly correlated with T and K inyears and months when these two gases also correlated.The correlation between gases has also been reported byKonda et al. (2005) and Zhang et al. (2000, 2001). Soiltemperature could not be correlated with any of the gasesin 2004, but correlated with two in 2005 and with all gasesin 2006.
A month to month examination of the 2006 data revealedthat during three months successively (June, July andAugust) out of the four months study, T could not actas a controlling factors for CO2, CH4 and N2O fluxes.However, sporadic correlations between soil K, R or Dwere found when T could not act as controlling factorfor with gases fluxes. Several authors have suggested thatconsistent correlations between soil controlling factors andgreenhouse gases have mainly been observed in controlledenvironments (Hatano and Lipiec, 2004; Pilegaard et al.,2006; Schindlbacher et al., 2004) with conflicting resultsin field environments (Janssens et al., 2001). In a studyassessing the spatial variability of soil properties and gasesemissions in southern Ohio (USA), Jacinthe and Lal (2006)
found stronger and statistically significant relationshipsbetween gas emissions and soil properties in July 2003.However, in May 2004, this trend changed and theyobserved only few statistically significant relationships.Paro et al. (2007) studied the spatial variability of soilthermal properties and CO2, CH4 and N2O emissions incentral Missouri. They reported a significant correlationbetween T and CO2 and N2O emissions, but no correlationwith CH4. However, Johnson et al. (2007) conducted asimilar study in a pasture in central Missouri, but couldnot relate CO2 and N2O to T. In opposite, only CH4 wasrelated to T. Jones et al. (2007) studied the influence ofand mineral N fertilizer on N2O emissions from temperategrassland in Scotland. They investigated the influence ofenvironmental conditions on N2O emissions by a series ofsingle and multiple regression analysis but could not find arelationship between soil moisture and N2O.
4 Conclusions
We monitored CO2, CH4, and N2O fluxes and soilthermal properties from 2004 to 2006 in a pasture atLincoln University of Missouri and conducted a month-to-month assessment of trends in fluxes and soil thermalproperties in 2006 data. Our results showed that the pastureacted as a sink in 2004, a source in 2005 and again a sinkof CH4 in 2006. CO2, CH4, and N2O and soil thermalproperties shifted from month to month, and year to year,exhibiting various trends. CO2, CH4, and N2O correlatedamong themselves with a consistent correlation betweenN2O and CO2 in two out of three years of this study. Soiltemperature and thermal properties (K, R, and D) actedas controlling factors for CO2, CH4, and N2O, but notconsistently. Studies in various ecosystems and conditionsare therefore still needed to increase our understanding ofgreenhouse gases fluctuations and potential soil controllingfactors.
Acknowledgments
This research was supported by the United StatesDepartment of Agriculture, USDA-CSREES, Evans-Allen, Project number: MOX-NKONGOLO, Accession #:0208180
References
Almagro M, Lopez J, Querejeta M, Martınez-Mena M, 2009.Temperature dependence of soil CO2 efflux is stronglymodulated by seasonal patterns of moisture availability ina Mediterranean ecosystem. Soil Biology and Biochemistry,41: 594–605.
Anderson J M, 1973. Carbon dioxide evolution from two temper-ate deciduous woodland soils. Journal of Applied Ecology,10: 361–378.
Ball B C, Parker J P, Horgan G W, 2000. Short-range spatialvariation of nitrous oxide fluxes in relation to compactionand straw residues. European Journal of Soil Science, 51:607–616.
Brito L F, Junior J M, Pereira G T, Souza Z M, Junior N,
jesc.a
c.cn
1038 Nsalambi Vakanda Nkongolo et al. Vol. 22
2000. Soil CO2 emission of sugarcane fields as affected bytopography. Scientia Agricola (Piracicaba, Braz.), 66: 77–83.
Buckingham E, 1904. Contributions to our knowledge of theaeration of soils. USDA, Bureau of Soil Bulletin No. 25.US Government Printing Office, Washington DC, USA.
Buyanovsky G A, Wagner G H, 1996. Crop residue input to soilorganic matter on Sanborn field. In: Soil Organic Matterin Temperate Agroecoystems: Long-Term Experiments inNorth America (Paul E A, Paustian K, Elliot E T, Cole C V,eds.). CRPC Press Inc., Boca Raton, FL. 73–84.
Buyanovsky G A, Kucera C L, Wagner G H, 1985. Comparativecarbon balance in natural and agricultural ecosystems.Bulletin of the Ecological Society of America, 66: 149–150.
Curtin D H, Want H, Selles F, McConkey B G, Campbell C A,2000. Tillage effects on carbon fluxes in continuous wheatand fallow-wheat rotations. Soil Science Society of AmericaJournal, 64: 2080–2086.
Davidson E A, Savage K L, Verchot L V, Navarro R, 2002. Mini-mizing artifacts and biases in chamber-based measurementsof soil respiration. Agricultural and Forest Meteorology,113: 21–37.
Davidson E A, Keller M, Erickson H E, Verchot L V, VeldkampE, 2000. Testing a conceptual model of soil emissions ofnitrous and nitric oxides. Bioscience, 50: 667–680.
Dobbie K E, Smith K A, 2003. Nitrous oxide emission factors foragricultural soils in Great Britain: the impact of soil-waterfilled pore space and other controlling variables. GlobalChange Biology, 9: 204–218.
Duiker S W, Lal R, 2000. Carbon budget study using CO2 fluxmeasurements from a no till system in central Ohio. Soil &
Tillage Research, 54: 21–30.Epron D, Bosc A, Bonal D, Freycon V, 2006. Spatial variation of
soil respiration across a topographic gradient in a tropicalrain forest in French Guiana. Journal of Tropical Ecology,22: 565–574.
Forbes J D, 1849. Account of some experiments on the tempera-ture of the earth at different depths and in different soils nearEdinburgh. Transactions of the Royal Society of Edinburgh,16: 189–236.
Franzluebbers K, Franzluebbers A J, Jawson M D, 2002. Envi-ronmental controls on soil and whole-ecosystem respirationfrom a tallgrass prairie. Soil Science Society of AmericaJournal, 66: 254–262.
Gamma Design Software, 2005. GS+User’s Guide Version 5.1.Geostatistics for the Environmental Sciences. Gamma De-sign Software, Plainwell, Michigan, USA.
Ginting D, Kessavalou A, Eghball B, Doran J W, 2003. Geen-house gas emissions and soil indicators four years aftermanure and compost applications. Journal of Environmen-tal Quality, 32: 23–32.
Glatzel S, Stahr K, 2001. Methane and nitrous oxide exchange indifferently fertilized grassland in southern Germany. Plant& Soil, 231: 21–35.
Jacinthe P A, Lal R, 2006. Spatial variability of soil propertiesand trace gas emissions in reclaimed mine land of south-eastern Ohio. Geoderma, 136: 598–608.
Janssens I, Lankreijer A H, Matteucci G, Kowalski A, BuchmannN, Epron D et al., 2001. Productivity and disturbanceovershadow temperature in determining soil and ecosystemrespiration across European forests. Global Change Biolo-gy, 7: 269–278.
Hatano R, Lipiec J, 2004. Effects of land use and cultural prac-tices on greenhouse gases fluxes in soil. Acta Agrophysica,
109: 1–51.Hopmans J W, Simunek J, Bristow K L, 2002. Indirect estima-
tion of soil thermal properties and water flux using heatpulse probe measurements: Geometry and effects. WaterResources Research, 38: 33–45.
Hutsch B W, Zhang S, Feng K, Yan F, Schubert S, 2003. Effectof pH on denitrification losses from different arable soils.Plant Nutrition, 92: 962–963.
Huttunen J T, Nykanen H, Martikainen P J, Nieminen M, 2003.Fluxes of nitrous oxide and methane from drained peatlandsfollowing forest clear-felling in southern Finland. Plant andSoil, 255: 457–462.
Hutchinson G L, Mosier A R, 1981. Improved soil cover methodfor field measurements on nitrous oxide fluxes. Soil ScienceSociety of America Journal, 45: 311–316.
Johnson S, Nkongolo N V, Paro R, Eivazi F, 2007. Spatialvariability of soil thermal properties and CO2, CH4 and N2Oemissions from a pasture in Central Missouri. Journal ofEnvironmental Monitoring and Restoration, 3: 314–322.
Jones S K, Ress R M, Skiba U M, Ball B C, 2007. Influenceof organic and mineral N fertilizer on N2O emissionsfrom a temperate grassland. Agriculture Ecosystems andEnvironments, 121: 74–83.
Kang S, Doh S, Lee D, Jin V L, Kimball J, 2003. Topographic andclimatic controls on soil respiration in six temperate mixed-hardwood forest slopes, Korea. Global Change Biology, 9:1427–1437.
Kang S, Kim S, Doh S, Lee D, 2000. Predicting spatial andtemporal patterns of soil temperature based on topography,surface cover and air temperature. Forest Ecology andManagement, 136: 173–184.
Konda R, Ohta S, Ishizuka S, Arai S, Ansoric S, Tanaka N etal., 2005. Spatial structures of N2O, CO2, and CH4 fluxesfrom Acacia mangium plantation soils during a relativelydry season in Indonesia. Soil Biology and Biochemistry, 40:3021–3030.
Le Mer J, Roger P, 2001. Production, oxidation, emission andconsumption of methane by soils: A review. EuropeanJournal of Soil Biology, 37: 25–50.
Maggiotto S R, Wagner-Riddle C, 2001. Winter and springthaw measurements of N2O, NO and NOx fluxes using amicrometeorological method. Water, Air, & Soil Pollutions,1: 89–98.
Matson P, Vitousek P M, Livingtone G P, Swanberg N A, 1990.Sources of variation in nitrous oxide flux from Amazonianecosystems. Journal of Geophysical Research, 95: 16789–16798.
Mutegi J K, Petersen S O, Munkolm L J, Petersen B M, 2009. Ni-trous oxide emissions and soil physico-chemical changes:effects of tillage systems. IOP Conference Series: earthand Environmental Science, 6: 242029. DOI:10.1088/1755-1307/6/4/242029.
Muller C, Stevens R J, Laughlin R J, Jogera H J, 2004. Microbialprocesses and the site of N2O production in a temperategrassland soil. Soil Biology and Biochemistry, 36: 453–461.
Nkongolo N V, Kuramochi K, Hatano R, 2009a. Nitrous oxide(N2O) emissions from a Japanese lowland soil croppedto onion: I. Spatial and temporal variability of fluxes.International Journal of Agricultural Research, 4: 17–28.
Nkongolo N V, Kuramochi K, Hatano R, 2009b. Nitrous oxide(N2O) emissions from a Japanese lowland soil croppedto onion: III. Relationship with soil physical properties.International Journal of Agricultural Research, 4: 1–16.
Nkongolo N V, Kuramochi K, Hatano R, 2008a. Effect of
jesc.a
c.cn
No. 7 Greenhouse gases fluxes and soil thermal properties in a pasture in central Missouri 1039
mechanized tillage operations on soil physical propertiesand greenhouse gases fluxes in two agricultural fields.Research Journal of Environmental Sciences, 2: 68–80.
Nkongolo N V, Kuramochi K, Hatano R, 2008b. Nitrous oxide(N2O) emissions from a Japanese lowland soil croppedto onion: II. Relationship with soil chemical properties.International Journal of Agricultural Research, 3: 371–385.
Nkongolo N V, Hatano R, 2010. Diffusivity models and green-house fluxes from a forest, pasture, grassland and corn fieldin northern Hokkaido. Pedosphere (Accepted).
Ochsner T E, Horton R, Ren T, 2001. A new perspective on soilthermal properties. Soil Science Society of America Journal,65: 1641–1647.
Paro R, Nkongolo N V, Johnson S, Eivazi F, 2007. Spatialvariability of CO2, CH4 and N2O fluxes and soil thermalproperties of a secondary forest soil in Central Missouri.Journal of Environmental Monitoring and Restoration, 3:42–52.
Pilegaard K, Skiba U, Ambus P, Beier C, Bruggemann N,Butterbach-Bahl K et al., 2006. Factors controlling regionaldifferences in forest soil emission of nitrogen oxides (NOand N2O). Biogeosciences, 3: 651–661.
Raich J W, Bowden R D, Steudler P A, 1990. Comparison of twostatic chamber techniques for determining carbon dioxideefflux from forest soils. Soil Science Society of AmericaJournal, 54: 1754–1757.
Raich J W, Tufekcioglu A, 2000. Vegetation and soil respiration:Correlations and controls. Biogeochemistry, 48: 71–90.
Rayment M B, Jarvis P G, 2000. Temporal and spatial variationof soil CO2 efflux in a Canadian boreal forest. Soil Biology& Biochemistry, 32: 35–45.
Rochette P, Desjardins R L, Pattey E, 1991. Spatial and temporalvariability of soil respiration in agricultural fields. Canadi-an Journal of Soil Science, 71: 189–196.
Rover M, Heinemeyer O, Munch J C, Kaiser E A, 1999. Spatialheterogeneity within the plough layer: high variability ofN2O emission rates. Soil Biology & Biochemistry, 31: 167–173.
Saiz G, Green C, Butterbach-Bahl K, Kiese R, Avitabile V, FarrellE, 2006. Seasonal and spatial variability of soil respirationin four Sitka spruce stands. Plant and Soil, 287: 161–176.
Schindlbacher A, Zechmeister-Boltenstern S, Butterbach-Bahl K,2004. Effects of soil moisture and temperature on NO, NO2
and N2O emissions from European forest soils. Journal ofGeophysical Research, 109: D17302–D17302.
Smith U A, 2000. The control of nitrous oxide emissions fromagricultural and natural soils. Global Change Science, 2:379–386.
Smith K A, Ball T, Conen F, Dobbie K E, Massheder J, ReyA, 2003. Exchange of greenhouse gases between soil andatmosphere: interactions of soil physical factors and bio-logical processes. European Journal of Soil Science, 54:779–791.
Smolander A, Priha O, Paavolainen L, Steer J, Malkonen E, 1998.Nitrogen and carbon transformations before and after clear-cutting in repeatedly N-fertilized and limed forest soil. SoilBiology & Biochemistry, 30: 477–490.
Stoyan H, De-Polli H, Bohm S, Robertson G P, Paul E A,2000. Spatial heterogeneity of soil respiration and relatedproperties at the plant scale. Plant and Soil, 222: 203–214.
Turner D A, Chen D, Galbally I E, Leuning R, Edis R B, Li Yet al., 2008. Spatial variability of nitrous oxide emissionsfrom an Australian irrigated dairy pasture. Plant and Soil,309: 55–62.
Verdonck O, Demeyer P, 2004. The Influence of the particlesizes on the physical properties of growing media. ActaHorticulturae, 644: 99–101.
Xu M, Qi Y, 2001. Soil-surface CO2 efflux and its spatial andtemporal variations in a young ponderosa pine plantation innorthern California. Global Change Biology, 7: 667–677.
Zhang X J, Xu H, Chen G X, 2000. Effects of soil moisture andtemperature on CH4 oxidation and N2O emission of forestsoil. Journal of Forestry Research, 11: 203–206.
Zhang X J, Xu H, Chen G X, 2001. Major factors controllingnitrous oxide emission and methane uptake from forest soil.Journal of Forestry Research, 12: 239–242.