continuation analysis of aircraft ground loads during high-speed turns
TRANSCRIPT

Krauskopf, B., Coetzee, E. B., & Lowenburg, M. H. (2011). Continuationanalysis of aircraft ground loads during high-speed turns.
Preprint (usually an early version)
Link to publication record in Explore Bristol ResearchPDF-document
University of Bristol - Explore Bristol ResearchGeneral rights
This document is made available in accordance with publisher policies. Please cite only the publishedversion using the reference above. Full terms of use are available:http://www.bristol.ac.uk/pure/about/ebr-terms.html
Take down policy
Explore Bristol Research is a digital archive and the intention is that deposited content should not beremoved. However, if you believe that this version of the work breaches copyright law please [email protected] and include the following information in your message:
• Your contact details• Bibliographic details for the item, including a URL• An outline of the nature of the complaint
On receipt of your message the Open Access Team will immediately investigate your claim, make aninitial judgement of the validity of the claim and, where appropriate, withdraw the item in questionfrom public view.

Continuation Analysis of Aircraft Ground Loadsduring High-speed Turns
Etienne CoetzeeSystems Engineering Specialist
Airbus OperationsSystems General
Bristol, UK, BS99 7AREmail: [email protected]
Bernd KrauskopfProfessor
Department of Engineering MathematicsFaculty of Engineering
University of BristolBristol, UK, BS8 1TR
Email: [email protected]
Mark LowenbergSenior Lecturer
Department of Aerospace EngineeringFaculty of Engineering
University of BristolBristol, UK, BS8 1TR
Email: [email protected]
ABSTRACT
The current lateral ground loads requirement, FAR25.495, for an aircraft during a high-speed turn, was writtenin the middle of the last century, when relatively small aircraft with tricycle landing gear arrangements started toemerge. This requirement is known to be conservative when applied to large modern passenger aircraft. Nonlin-earities (such as tyre forces) have a significant effect at the edge of operating envelopes, placing a renewed intereston analysis methods that can classify the dynamics in these regions. In this paper we use continuation methods toassess the loads that can be generated for different aircraft configurations during high-speed turns, and comparethe results to the original requirement. A comparison is made between test results from an FAA study and continua-tion results, where all the significant test data points are located within an envelope constructed from continuationanalysis. Continuation methods therefore provide a conservative estimate of the maximum lateral load factors.These values are however less than the value prescribed in the regulation.
1 Introduction
The aim of this study is to employ continuation methods to assess the loads that can be generated during typical operationalground manoeuvres for the Airbus A320 and A380. These results are compared with the current lateral ground loads re-quirement for an aircraft during a high-speed turn, FAR25.495, which was written in the middle of the last century, whenrelatively small aircraft with tricycle landing gear arrangements started to emerge. Modern aircraft are however quite differ-ent in terms of size and landing gear configuration, especially for an aircraft such as the A380. This requirement is known tobe conservative for large aircraft such as the A380, where nonlinear effects, such as tyre forces, ensure that this aircraft doesnot experience the high lateral loads that are stipulated in the FAA requirement [1]. Comparisons are also made between thetwo aircraft types, which show significantly different dynamics in terms of stability and loads.
Section 2 discusses the limitations related to the requirement. It also discusses the main findings from an operational groundloads measurement campaign of in-service aircraft [2], which was specifically conducted to compare operational loads with
1

W1
N1 N2
W4
W2 W3
N1 N2
W4
W7
W1
W6
W2 W3
W12
W11
W16
W15
W20
W19
W13
W14
W17
W18
W9
W10
W5 W8
BLGL BLGR
WLGL WLGR
Figure 1: Wheel numbering definition for the A320 on the left, and the A380 on the right.
the requirement. This study confirmed that an increase in aircraft size is accompanied by a reduction in the maximum lateralload. A B747-400 experiences smaller lateral load factors compared to, say, an A320. The authors of [2] have also publishedsome empirical formulae that were derived from the measured data, to help with predictions for aircraft that were not part ofthe study. These formulae are used here to make predictions of the maximum lateral loads that an aircraft such as the A380is likely to experience in its lifetime.
In this study we use validated models of the A320 and the A380 [1, 3–5]. The A320 has three landing gears: one nose gear,and two main gears that are attached to the wings. Each gear has an axle with two wheels. The A380 has five landing gears:one nose gear, two main gears attached to the wings, and two main gears attached to the fuselage. Each wing landing gear(WLG) consists of a bogie with four wheels on each gear, while each body landing gear (BLG) consists of a bogie with sixwheels. The aft axle of each BLG is steered. Six tyres are therefore present in the case of the A320 model, and 22 tyres inthe A380 model. Figure 1 contains the numbering conventions of the wheels for both the A320 and A380 models.
The models that are used at Airbus are built with different test platforms in mind. MSC.Adams models are used for detailedground manoeuvrability studies, while SimMechanics models are used on the test rigs, where the real-time performance ofthe models is critical. The MSC.Adams environment is user-friendly and is the preferred model development environment.MSC.Adams models are converted to SimMechanics for testing with the avionics that will be implemented on the aircraft.Figure 2 contains the SimMechanics representation of the A380. Similar models exist for the A320 and are used in exactlythe same way. The high cost associated with simulations makes continuation techniques attractive, due to the speed withwhich a global picture of the dynamics can be constructed. Previous studies of the A320 showed how bifurcation methodscan be used to detect stability margins, showing how specific bifurcations can be attributed to the loss of grip at specific tyreson the aircraft [1, 4, 5].
It is important to note that the simulation models that are used for the test rigs are in fact also used for the bifurcationanalysis. This is a very useful feature, as these models are likely to be developed in other parts of the company. Hence it ispossible to “plug” existing models into the bifurcation analysis framework provided by the Dynamical Systems Toolbox thatwas developed at the University of Bristol [3]. It allows for the seamless integration of Simulink or SimMechanics models,avoiding the rebuilding of models specifically for the purpose of bifurcation analysis. Another benefit of the toolbox is theadditional information that can be obtained from the models. For instance, it is possible to represent the data in new ways thatgives one a much better understanding of how the loads are distributed amongst the tyres. Figures 15 and 16 in Section 5.3are a good example of new types of graphs that can be used to depict a global view of the force distribution in the tyres.
Section 3 compares dynamic and steady-state loads for an A320 and an A380 at a typical runway exit, and shows that thedynamic loads at the main gears are almost equal to the steady-state loads that are obtained from continuation methods. Theload factor at the CG (for both aircraft) builds up towards a maximum value, without any overshoot. The maximum dynamic
2

0:0
Figure 2: Top-level SimMechanics model of an A380.
tyre loads for the A320 are approximately 10% higher than the maximum steady-state values, while the steady-state tyreloads for most of the tyres of the A380 are in fact the maximum values. The dynamic values are 10% higher than the steady-state values on the aft axles of the BLGs. These findings are directly applicable to the high-speed turn that is discussed inthis paper, where the regulation pertaining to the high-speed turn assumes steady-state conditions. We therefore propose thatcontinuation methods can be used to obtain the loads at runway exits, and more significantly, the loads that are generatedduring high-speed turns. The use of continuation methods for lateral loads studies has previously been conducted on anaircraft with a traditional three post landing gear arrangement [6]. No lateral loads studies, using continuation methods, haveso far been conducted on larger aircraft with more than three landing gears and multi-axle bogies.
Section 4 shows how aircraft manufacturers interpret the high-speed lateral loads requirement. A simple analysis methodbased on static balance equations is used to calculate accurate landing gear loads for an aircraft with three landing gears. Thismethod can, however, not be employed for aircraft with more than two main gears (due to the static indeterminate nature ofsuch landing gear arrangements). Multibody simulations are needed to obtain the dynamic response of the aircraft. Validatedmodels and methods therefore form the basis of such predictions.
Section 5 contains the continuation results for the high-speed turn, as obtained from the detailed A320 and the A380 models.The analysis is conducted in accordance with the regulations at the maximum ramp weight (MRW) condition, with fore andaft CG positions. The stability results in Section 5.1 for the A320 compare well with the results from previous studies [1,4,5].A clear boundary is formed by Hopf bifurcations, indicating a loss of grip at the inner main gear tyres [1, 4]. These areasof instability occur at relatively low speeds, hence the aerodynamics does not play any significant role as far as the A320is concerned. The results in Section 5.2 for the A380 is significantly different from that of the A320: no bifurcations weredetected, and the aircraft is in fact remarkably stable. Problematic areas are however identified in terms of manoeuvring atmoderate velocities. The analysis shows that, when a runway exit turn is conducted, the nose gear tyres cannot generateenough side force above 8 m/s. The maximum prescribed velocity of 4 m/s for the A380 avoids this problem. We showthat the gear loads can be classified across the entire operating envelope, where the WLGs act in the opposite direction tothe BLGs at low velocities, contrary to the assumption in the regulation. Section 5.3 shows how continuation results can beused to assess the lateral load factors on individual tyres. Only the inner tyres in a turn experience load factors that are in thevicinity of the values stipulated by the requirement. The lateral load factors on the outer tyres are significantly less than therequirement, confirming its conservative nature.
Section 6 compares the maximum load values that were obtained from the operational loads measurement campaign withpredicted results from continuation analysis. A maximum load factor envelope was constructed from the continuation results.All the significant data points are located within this envelope, showing that continuation methods provide a conservativeestimate of the maximum lateral load factors. However, it is still less than the value prescribed in the regulation. This sectionalso explains how an A320 could generate significant lateral loads. The velocity where this extreme value occurs is then usedas an extreme case for the A380. The lateral load factor provided by continuation methods is approximately 10% larger thanpredicted from the operational study. Continuation methods do however provide complete coverage of the entire operating
3

envelope, allowing one to pinpoint the exact steering angle, and velocity, where the maximum load factor will occur.
2 Side Loads Requirements
One of the main design cases for aircraft ground loads pertains to the high-speed turn, which tends to be the critical case forthe design of the attachments of the main landing gears. Federal Aviation Regulation (FAR) 25.495 [7] deals with this loadcase, and is phrased as follows:
“In the static position, in accordance with figure 7 [Figure 3(a)] of Appendix A, the aeroplane is assumed to executea steady turn by nose gear steering, or by application of sufficient differential power, so that the limit load factorsapplied at the centre of gravity are 1.0 vertically and 0.5 laterally. The side ground reaction of each wheel must be0.5 of the vertical reaction”.
Figure 3(a) depicts this requirement. The type of aircraft in the picture shows that the origins of the requirement are probablyfrom the 1940’s or 1950’s. This load case forms one of the bookcases for ground loads as stated in the regulations [7],and needs to be considered by aircraft manufacturers in the design of their aircraft. All of these cases consist of staticexternal forces that usually require ground reactions to be balanced by applying inertia forces and moments. We recap, bynoting that the lateral load factor ny is defined as the ratio of the lateral force over the vertical force, which is 0.5 for thisspecific regulation. Reference [2] states that little is known about the origin of this regulation, or even under what operationalconditions such a loading condition might occur. The regulation was clearly brought in when aircraft were much smallerthan they are nowadays, and it may be that aircraft with more than two main gears did not exist at the point in history whenthe regulation was drafted; however, we have no evidence for this assertion. Reference [2] also states that landing gear andaircraft manufacturers believe that the current 0.5g lateral load factor requirement specified by FAR 25.495 is too stringent.The regulatory authorities are however extremely reluctant to modify this requirement in the absence of data to back such adecision. The requirement has clearly ensured safe aircraft operations, and consequently overwhelming evidence would beneeded for its relaxation.
2.1 Limitations of the Regulation
The loads produced by the high-speed turn form one of the limit load cases and, as such, contribute towards the aircraft andlanding gear limit load envelopes. The loads can be calculated accurately for aircraft with statically determinate (tricycle)gear arrangements such as the A320, where the fuselage and gears are assumed to be rigid [4, 5]. However, staticallyindeterminate (more than three gears) arrangements such as the A380, pose computational challenges, where minimumenergy techniques are needed to calculate the response of the aircraft [3]. Such an approach is needed to protect any onegear against disproportionate loading due to the stiffness characteristics of the gears and fuselage [8]. For this reason aircraftmanufacturers tend to include other cases (in addition to the bookcases) into their analysis. These cases are based on yearsof experience that try to cover day-to-day operational scenarios. These additional cases are known as rational cases, as theyutilise models that contain a more accurate representation of the real physics and dynamics of the system. In particular,the dynamic response of the airplane is included. Structural inertia, flexibility, and damping are accounted for, as well asdistributed aerodynamic lift and moments. This is a more realistic method of investigating the actual forces on the aircraft.
Dynamic calculations are employed for rational cases such as taxiing or landing, and may form part of the limit load envelope.It is also normal practice to use such dynamic calculations to establish the aircraft fatigue loads. Nonlinear effects within thetyres and landing gears make it difficult to find the exact values for the steering angles and velocities where the maximumlateral loading may occur. This is the reason for adhering to the bookcase approach, with the addition of rational cases.Nonlinear effects could for instance lead to multiple steady-states for the same thrust and steering angle settings, whenconsidering the high-speed turn, such that the response depends on the initial conditions and size of the perturbations onthe system [1, 4]. A large perturbation could for instance cause a “jump” to another steady-state. This type of behaviouris the motivation to use methods from the field of Dynamical Systems theory, to analyse the dynamics of an aircraft on theground [1, 3–6].
4

0.5VM2
0.5VN
0.5VM1
VM2
VM1
NOSE WHEEL TYPE
THE AIRPLANE INERTIA FACTORS AT
CENTER OF GRAVITY ARE COMPLETELY
BALANCED BY THE WHEEL REACTIONS
AS SHOWN
0.5W W
(a) Original image depicting the lateral load factor requirement; from [7].
10-6
10-5
10-4
10-3
10-2
10-1
100
101
102
103
0 0.05 0.1 0.15 0.2 0.25 0.3 0.35 0.4
Taxi out Corrected
Take off roll corrected
Landing roll corrected
Turn off corrected
Taxi in corrected
Combined corrected
A320
33541.9 Flight hours
10066 Flights
Cum
ula
tive
Occ
uure
nce
s per
Fli
ght
Lateral Load Factor Ny, (g)
(b) Side loads as measured on an A320 aircraft; reproduced from [2].
Figure 3: FAR 25.495 side load requirements for the high-speed turn.
2.2 FAA Operational Loads Study
In answer to the points mentioned in the previous section and in Reference [2], the FAA conducted a large operational loadstesting campaign, where it aimed to identify the maximum operational loads that can be experienced by in-service aircraft. Acritical assessment of the loads was then made against the current regulations [2]. The findings from this study showed thatit was very difficult to obtain lateral accelerations above 0.3g for any aircraft types. As an example, Figure 3(b) shows themeasured side loads for the A320 that was used in [2]; it shows that they did not exceed 0.25g for the approximately 10,000flights that were recorded. The authors of [2] collated the information for all the assessed aircraft and derived an empiricalformula to predict the likelihood of obtaining a certain g-level in 1000 flights as
N = N0e−lsnlmn2
y . (1)
5

10 15 20 25 30 355
10
15
200.15
0.2
0.25
0.30.35
(a)
A320 A321
A330-200A340-600
A380
An-124
C5
B737-400B737-900
B747-8B777-300ER
B787
MD-81
MD-11
Wheel base ln (m)
Trac
kw
idth
l m(m
)
B-737-400MD-82/83 A-320
B-767-200ERB-747-400
0
0.1
0.2
0.3
0.4
0.5
0.6(b)
Aircraft
Lat
eral
Loa
dFa
ctor
n y(g
)
Taxi-outTaxi-in
Figure 4: Predicted lateral load factors obtained from FAA operational loads study [2]. The contours in panel (a) representthe maximum load that can be expected at least once in 100,000 flights, while panel (b) compares the equal probability lateralload factors during ground turning for five aircraft; reproduced from [2].
Here N is the number of cumulative occurrences of any lateral load factor ny in 1000 flights, where ny is the maximum lateralload factor measured during a turn; ln represents the wheel base and lm the track width. N0 is the number of cumulativeoccurrences at ny = 0; s represents a shape parameter specific to the aircraft being studied. Each aircraft therefore has itsown factor for N0 and s, that are derived from the study. The authors of [2] average the factors of all the aircraft to obtaina generic formula that can be used for any aircraft. Their initial assessments show that the taxi-in phase seems to generatelarger load factors, but they point out that corrections need to be made to the taxi-in data, due to the fuel that is burnedbetween the maximum ramp weight (MRW) and maximum landing weight (MLW) condition. Nonetheless, the taxi-in phasestill seems to be more critical, even after such corrections are made. The generic formula to obtain the lateral load factor forthe taxi-in phase then becomes
N = 2225.7e−l0.498n lmn2
y . (2)
This equation can be rearranged to obtain the lateral load factor as a function of the layout of the gears, and the probabilityof an occurrence of the obtained factor in 1000 flights. If we assume that the life of an aircraft is no more than 100,000flights, then the value of N becomes 0.01. Figure 4(a) contains a contour map of the maximum lateral load factor that canbe expected at least once in 100,000 flights, for different track width and wheel base combinations. Existing aircraft areoverlaid onto the contour map, which shows that smaller aircraft experience higher lateral load factors than larger aircraft.This maximum value is still significantly lower than the 0.5g specified by the regulation. It can be seen that a maximum valueof 0.28g is predicted for the A320, which has never been measured in the tests (see Figure 3(b)), and a value of between 0.16and 0.17 is predicted for the A380.
The authors of [2] then insert the dimensions of the Boeing 737-400 into this equation, and calculate the probability ofexperiencing a 0.5g lateral load factor. This probability is used as a baseline for a comparison with other aircraft. Equation (2)is then used to obtain the maximum lateral expected load. Figure 4(b) shows the results from this study [2]. It is apparentfrom both parts of Figure 4 that the gear positioning and size of the aircraft have a major influence on the lateral load factorthat can be achieved. This information can now be used by the FAA for future considerations pertaining to the regulation.
6
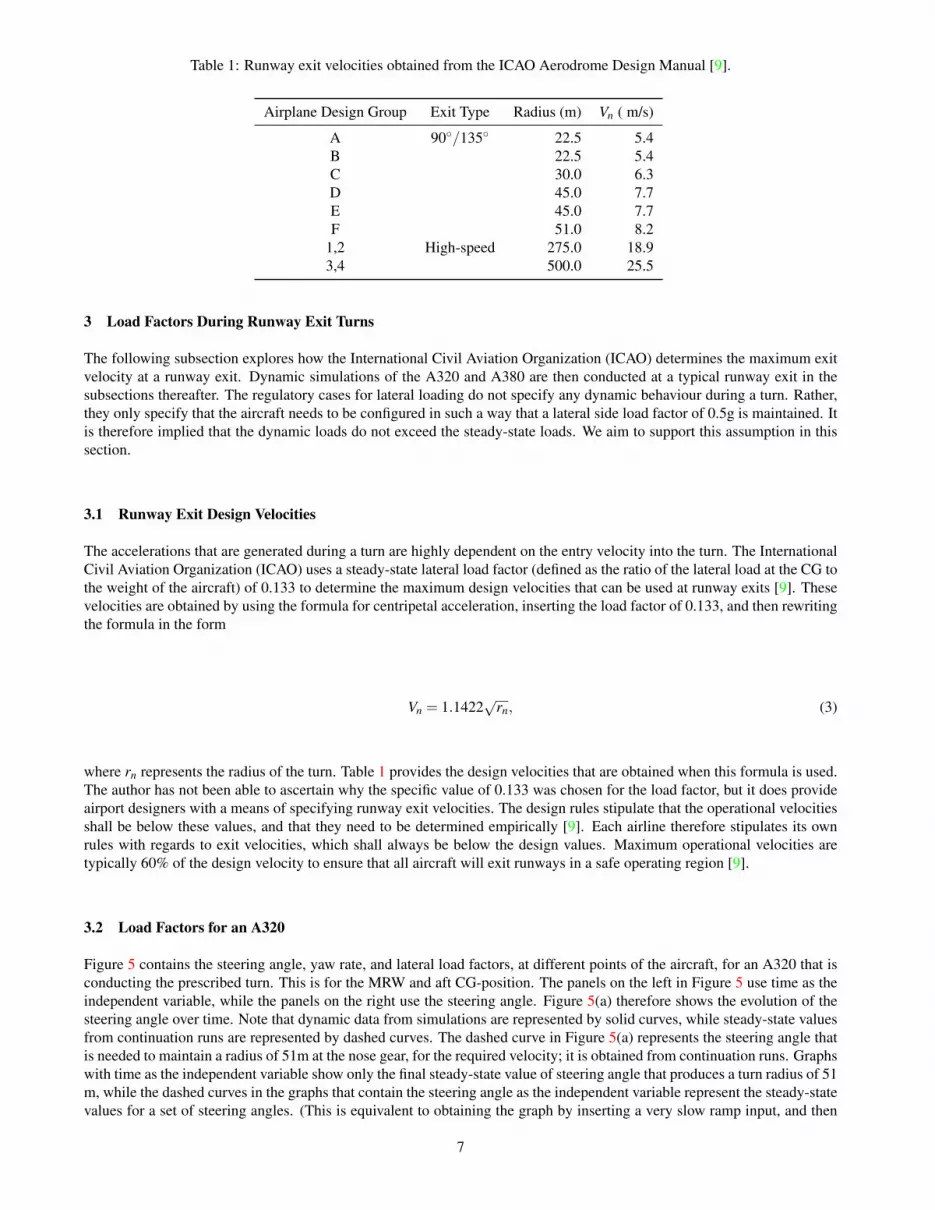
Table 1: Runway exit velocities obtained from the ICAO Aerodrome Design Manual [9].
Airplane Design Group Exit Type Radius (m) Vn ( m/s)
A 90◦/135◦ 22.5 5.4B 22.5 5.4C 30.0 6.3D 45.0 7.7E 45.0 7.7F 51.0 8.2
1,2 High-speed 275.0 18.93,4 500.0 25.5
3 Load Factors During Runway Exit Turns
The following subsection explores how the International Civil Aviation Organization (ICAO) determines the maximum exitvelocity at a runway exit. Dynamic simulations of the A320 and A380 are then conducted at a typical runway exit in thesubsections thereafter. The regulatory cases for lateral loading do not specify any dynamic behaviour during a turn. Rather,they only specify that the aircraft needs to be configured in such a way that a lateral side load factor of 0.5g is maintained. Itis therefore implied that the dynamic loads do not exceed the steady-state loads. We aim to support this assumption in thissection.
3.1 Runway Exit Design Velocities
The accelerations that are generated during a turn are highly dependent on the entry velocity into the turn. The InternationalCivil Aviation Organization (ICAO) uses a steady-state lateral load factor (defined as the ratio of the lateral load at the CG tothe weight of the aircraft) of 0.133 to determine the maximum design velocities that can be used at runway exits [9]. Thesevelocities are obtained by using the formula for centripetal acceleration, inserting the load factor of 0.133, and then rewritingthe formula in the form
Vn = 1.1422√
rn, (3)
where rn represents the radius of the turn. Table 1 provides the design velocities that are obtained when this formula is used.The author has not been able to ascertain why the specific value of 0.133 was chosen for the load factor, but it does provideairport designers with a means of specifying runway exit velocities. The design rules stipulate that the operational velocitiesshall be below these values, and that they need to be determined empirically [9]. Each airline therefore stipulates its ownrules with regards to exit velocities, which shall always be below the design values. Maximum operational velocities aretypically 60% of the design velocity to ensure that all aircraft will exit runways in a safe operating region [9].
3.2 Load Factors for an A320
Figure 5 contains the steering angle, yaw rate, and lateral load factors, at different points of the aircraft, for an A320 that isconducting the prescribed turn. This is for the MRW and aft CG-position. The panels on the left in Figure 5 use time as theindependent variable, while the panels on the right use the steering angle. Figure 5(a) therefore shows the evolution of thesteering angle over time. Note that dynamic data from simulations are represented by solid curves, while steady-state valuesfrom continuation runs are represented by dashed curves. The dashed curve in Figure 5(a) represents the steering angle thatis needed to maintain a radius of 51m at the nose gear, for the required velocity; it is obtained from continuation runs. Graphswith time as the independent variable show only the final steady-state value of steering angle that produces a turn radius of 51m, while the dashed curves in the graphs that contain the steering angle as the independent variable represent the steady-statevalues for a set of steering angles. (This is equivalent to obtaining the graph by inserting a very slow ramp input, and then
7

0 10 20 30 40 500
5
10
15
20(a)
0 4 8 12 160
2
4
6(b)
0 10 20 30 40 500
0.01
0.02
0.03
0.04(c1)
0 4 8 12 160
0.01
0.02
0.03
0.04(c2)
0 10 20 30 40 50-0.2
-0.1
0
0.1
0.2(d1)
0 4 8 12 16-0.2
-0.1
0
0.1
0.2(d2)
0 10 20 30 40 50
(e1)
Time (s)
0 4 8 12 16-0.01
0
0.01
0.02
0.03
0.04
0.05(e2)
-0.010
0.01
0.02
0.03
0.04
0.05
N1N2
W1
W4
N1N2
W1
W4
δ (deg)
δ(d
eg)
ωz
at C
G (
deg
/s)
ny
at C
Gn
yat
NL
Gn
yat
ML
G
Figure 5: Evolution of the lateral forces of an A320 aircraft conducting a turn at a Group VI runway exit, while maintaininga nose gear velocity of 4 m/s. Panel (a) shows the evolution of the steering angle δ over time, where the dashed line indicatesthe steady-state steering angle that is obtained from the bifurcation method. Panel (b) shows the yaw rate ωz around the CGas the steering angle is varied. The dashed line again depicts the steady-state values obtained from the bifurcation method.Panels (c1) and (c2) show the lateral load factor ny at the CG-position. Panels (d1) and (d2) show the load factors for theouter (N1) and inner (N2) nose gear tyres. Panels (e1) and (e2) show the load factors for W1 and W4 .
recording the state values at each steering angle.) It can be seen that the steering angle reaches the steady-state steering angleduring the turn, maintains this condition for a while, and then reduces to zero when the exit position from the turn is reached.
Figure 5(b) shows the yaw rate at the CG, and it illustrates that the yaw rate never exceeds the final steady-state value.Figures 5(c1) and (c2) depict the lateral load factor at the CG, used in the ground loads regulations. The graph shows that thelateral load factor converges to the final steady-state value without any overshoot. This result is unexpected, as there mightbe an overshoot that is larger than the final steady-state value. Overshoot usually occurs when step inputs are provided tothe system, which is not the case in this analysis where an exponential input is used. Ramp inputs are also often used insimulations, where the nose gear is allowed to deviate from the centreline within certain margins [6]. The current approachof an exponential function that was developed in [10] for the steering angle is deemed to be the most realistic, as the pilotwould act as a controller that maintains the nose gear close to the centreline.
Figures 5(d1) and (d2) show that the nose gear initially has to provide enough force to decelerate the aircraft along thefuselage axis, while accelerating the aircraft around the yaw-axis. The dashed curves once again represent the steady-statevalues when the nose gear follows a radius of 51m. Both components of the force are provided by the nose gear tyres. Theaircraft will not be able to conduct the turn at the required radius if these forces cannot be provided. The force consequently
8

W1 W2 W3 W40
0.01
0.02
0.03
0.04
0.05
Wheel Number
n y
Maximum steady-state forceMaximum dynamic force
Figure 6: Dynamic and steady-state load factors on the main gear tyres for the A320 and Vn = 4 m/s. The nose gear maintainsa radius of 51m.
builds up rapidly at the onset of the turn, and then reduces to the steady-state value. A significant overshoot is thereforepresent.
Figures 5(e1) and (e2) contain the lateral load factors for the outermost main gear tyre, W1, and innermost main gear tyre,W4. The main gear tyres initially resist the rotational motion at the onset of the turn, which can be seen from the negativevalues for the load factor. The forces then change direction and orientate to the general direction of the turn centre. In thiscase the forces build up towards the steady-state values. Note that the outer gear load factor is less than the inner gear loadfactor, even though the outer gear experiences higher vertical loads. This is due to a larger slip angle on the inner wheel(W4) when compared to the outer wheel (W1). An opposing force is also present when the aircraft tries to straighten out atthe exit point of the turn.
The hysteresis in the graphs is indicative of nonlinearity in the system, which is mainly due to the tyre characteristics in thesecases. The overshoot value for the main gear tyres do not exceed 10% of the steady-state value. It is possible to obtain thesteady-state values directly from bifurcation diagrams, and then we can assume that the dynamic value will be approximately10% larger than this value. This dynamic effect is ignored in the regulation for high-speed turns, but we will include thiseffect for the analysis of the A320. Figure 6 shows the maximum load factors that occur in the main gear tyres, associatedwith the peak values of the opposing force as the aircraft straightens out. Shown are the maximum dynamic, and steady-statevalues when the steering angle is maintained to follow a constant radius of 51 m. The steady-state values are not higher than10% of the maximum dynamic values.
3.3 Load Factors for an A380
The next step is to look at an aircraft with more than two main gears. An A380 model at MRW and aft CG position is usedfor this purpose. A similar velocity and exit radius is used to that of the case for the A320, with a turn direction to the right.Figure 7 contains the steering angle, yaw rate, and lateral load factors at different points of the aircraft. In Figure 7(a) itcan be seen that the steady-state steering angle is not reached for the case of a 90◦ exit, due to the larger wheel base; this isconsistent with the steering angle results from Appendix C, where a steering angle of 32.72◦ is predicted, at the exit position,for the A380. This is in good agreement with Figure 7(a). It is interesting to note that the yaw-rate from the simulationsin Figure 7(b) (solid line) is very close to the steady-state values that are obtained from continuation analysis (dashed line).The yaw rate at the CG-position does not reach the final steady-state value, and consequently it can be assumed that thesteady-state value could be used as a maximum value for design purposes. Figures 7(c1) and (c2) show that the lateral loadfactor at the CG builds up towards a value that is close to the steady-state value, and contains no overshoot. The simulationresults are once again close to the continuation results.
The largest difference in load factor occurs between the inner-most, and outer-most tyres, hence these tyres are used for theA380 comparisons that follow. The comparisons always progress from the nose gear tyres to the first row of the wing gear,
9

0 10 20 30 40 500
10
20
30
40
50(a)
0 10 20 30 400
2
4
6(b)
0 10 20 30 40 500
0.01
0.02
0.03
0.04(c1)
0 10 20 30 400
0.01
0.02
0.03
0.04(c2)
0 10 20 30 40 500
0.1
0.2
0.3
0.4(d1)
0 10 20 30 400
0.1
0.2
0.3
0.4(d2)
0 10 20 30 40 50-0.4
-0.3
-0.2
-0.1
0(e1)
0 10 20 30 40-0.4
-0.3
-0.2
-0.1
0(e2)
0 10 20 30 40 500
0.1
0.2
0.3
0.4(f1)
0 10 20 30 400
0.1
0.2
0.3
0.4(f2)
0 10 20 30 40 500
0.1
0.2
0.3
0.4(g1)
Time (s)
0 10 20 30 400
0.1
0.2
0 3:
0.4(g2)
2
δ(d
eg)
ny
at C
Gn
yat
NL
Gn
yat
ML
Gn
yat
BL
Gn
yA
ftA
xle
BL
G
ωz
at C
G (
deg
/s)
N1
N2
W1
W4
W16
W13
W17
W20
δ (deg)
N1
N2
W1
W4
W16
W13
W17
W20
Figure 7: Evolution of the lateral forces of an A380 aircraft conducting a turn at a Group VI runway exit, where Vn = 4 m/s.The representation of the data in the different panels is as in Figure 5.
10

W1 W2 W3 W4 W5 W6 W7 W8 W9 W10 W11 W12 W13 W14 W15 W16 W17 W18 W19 W20−0.3
−0.2
−0.1
0
0.1
0.2
0.3
Wheel Number
n y
Maximum steady-state forceMaximum dynamic force
Figure 8: Dynamic and steady-state load factors on main gear tyres for the A380, when a radius of 51 m at the nose gear ismaintained, for a nose gear velocity of 4 m/s.
then to the middle row of the body gear, and finally, the aft row of the body gear. The load factors in the other rows aresignificantly lower and are consequently not shown in the detailed comparisons. Figures 7(d1) and (d2) show that a largehysteresis loop exists in the nose gear tyres, N1 and N2, indicating nonlinear effects. Even though the dynamic values fromsimulations are significantly higher than the steady-state values, they still do not exceed the steady-state values when a turnradius of 51m is maintained.
Figures 7(e1) and (e2) depict the load factors for tyres W1 and W4. Figure 7(e1) shows that the final steady-state is notreached, while Figure 7(e2) shows that the dynamic values are close to the steady-state values during the turn. Figures 7(f1)and (f2) can be interpreted in a similar manner for W13 and W16. The tyres on the aft axle of the BLG, tyres W17 and W20,are shown in Figure 7(g1) and (g2), indicating similar load factors in both tyres. The dynamic loads are also larger thanthe final steady-state value if a radius of 51m is maintained. The kink in the curves indicate the point where the body gearsteering switches on, indicating that significant load relief can be obtained by adding steering onto the aft axles of the BLGs.Figure 7(g2) shows that the dynamic values are not far from the steady-state values.
Figure 8 contains the steady-state load factors on all 20 of the main gear tyres when the nose gear maintains a radius of 51m,and also the maximum dynamic load factor values for a 90◦ exit. The steady-state values are more critical for most of thetyres, apart from the tyres on the aft axles of the BLGs, where the maximum dynamic values are approximately 10% higherfor the aft axle wheels, when compared to the steady-state values. The overall steady-state loads on the BLGs are largerthan the overall dynamic gear loads. The maximum tyre loads occur at the exit point from the turn (θ90) for W1-W16. Themaximum for W17-W20 occurs after θ90 when the aircraft straightens out. A similar pattern to that of the A320 emerges,where the inner tyres have a larger load factor compared to the outer tyres, even though the outer gears experience largervertical loads.
We can therefore conclude that the dynamic load factors on the tyres of the A320 will be approximately 10% higher thanthe steady-state values. This is in contrast to the A380, where the steady-state values are more critical for most of the tyres,which is consistent with the interpretation of the lateral loads regulation. Towing loads cause significantly higher loads inthe aft tyres of the BLGs, hence the dynamic effect on the aft axles of the BLGs are likely to be less important than for thetowing case. One could therefore use the steady-state loads on an aircraft such as the A380 for design purposes, and add acorrection to incorporate the dynamic effect for a smaller aircraft such as the A320. Continuation analysis provides thesesteady-state values.
4 Aircraft Loads from the Static Balance Equations
The high-speed turn regulation is interpreted by aircraft manufacturers to require the aircraft to conduct a turn by using nosewheel steering or differential power. A lateral acceleration of 0.5g and a vertical acceleration of 1g at the centre of gravity
11

Fzm Fzn
mg
lcnlcm
hc
z
x
(a) Side view.
Fzmr FzmlFzn
0.5Fzmr 0.5Fzml0.5Fzn
mg
0.5mg
lm
z
y
(b) Front view.
Figure 9: FAR25.495 lateral loads requirement depicted in free-body diagrams.
are considered. This section shows how the forces can be obtained from the static balance equations for an aircraft with threelanding gears.
The aircraft is assumed to be in the level position, hence no roll angle is present. The lateral load at each gear is set tobe half its vertical load. This scenario is depicted in Figure 9(b). The critical centres of gravity are chosen in accordancewith the general requirement for ground loads (FAR-25.471), hence the range must be selected so that the maximum designloads are obtained in each landing gear element. Thus, both maximum forward and aft centre of gravity positions areinvestigated. Also, concerning the weight of the aircraft, FAR-25.489 states that unless otherwise prescribed, the landinggear and aeroplane structure must be investigated for the aeroplane at the MRW. No wing lift may be considered. The shockabsorbers and tyres may be assumed to be in their static position. Finally, the runway conditions are assumed to be dry.This is significant, because patches of ice on the runway could reduce the friction on a specific gear, with a subsequent loadtransfer to other gears [11].
The loads can then be calculated by considering the static load balance of the aircraft. The vertical loads at the nose andmain gear positions can be obtained by deriving the static balance equations from Figure 9(a). The thrust is ignored for thesecalculations (but is used later for the continuation analysis). The sum of the vertical forces at the tyres needs to equal theweight of the aircraft, while the moments around the CG also need to be in balance. The forces on the main gears also needto resist the rolling moment that is created by a lateral load factor ny, and consequently the left-hand gear will see largerforces than the right-hand gear, for a turn to the right; as before, assume that a turn is made to the right, from the pilot’sperspective. Figure 9(b) contains the forces and dimensions of interest for the lateral loading of the gears. The forces at eachmain gear can then be calculated as
12
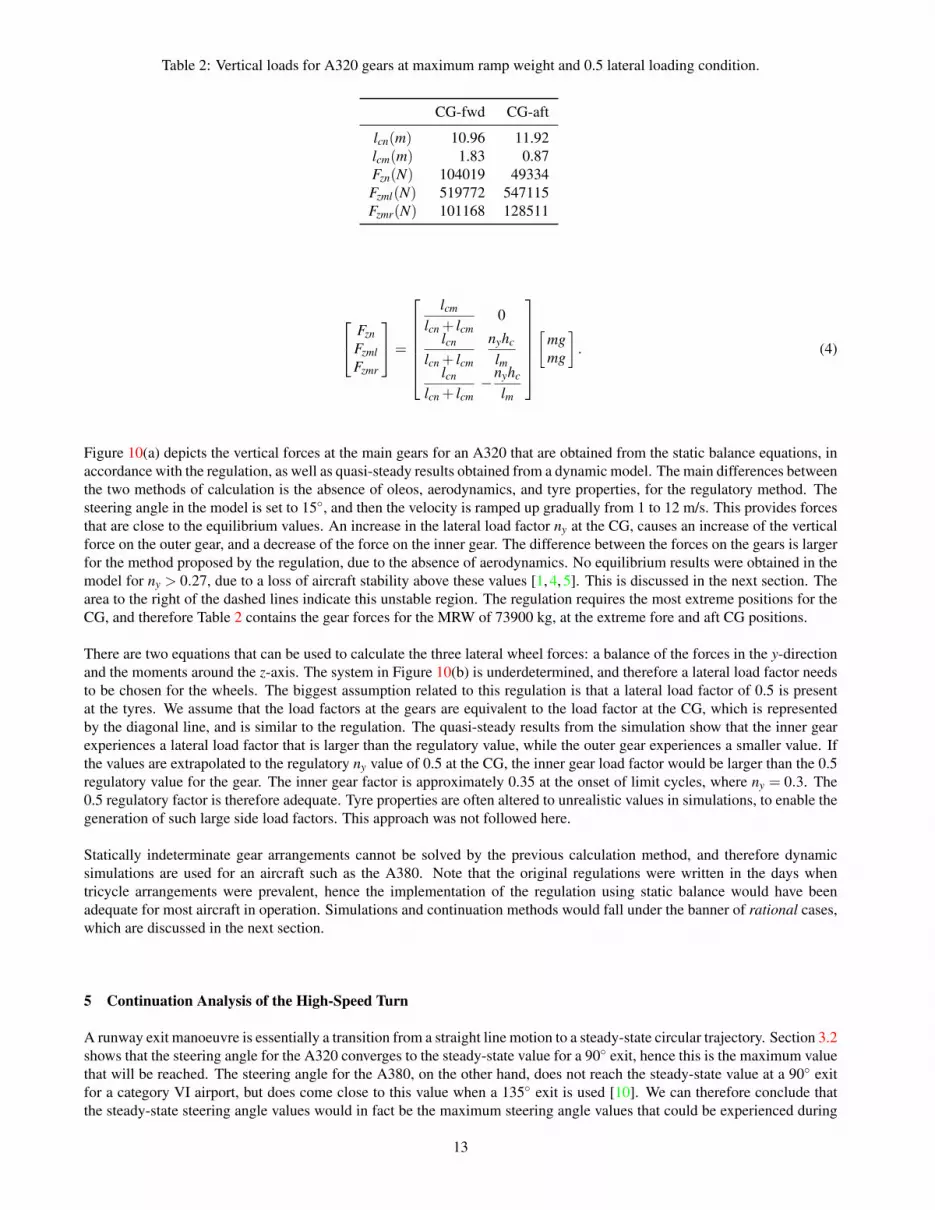
Table 2: Vertical loads for A320 gears at maximum ramp weight and 0.5 lateral loading condition.
CG-fwd CG-aft
lcn(m) 10.96 11.92lcm(m) 1.83 0.87Fzn(N) 104019 49334Fzml(N) 519772 547115Fzmr(N) 101168 128511
FznFzmlFzmr
=
lcm
lcn + lcm0
lcn
lcn + lcm
nyhc
lmlcn
lcn + lcm−
nyhc
lm
[
mgmg
]. (4)
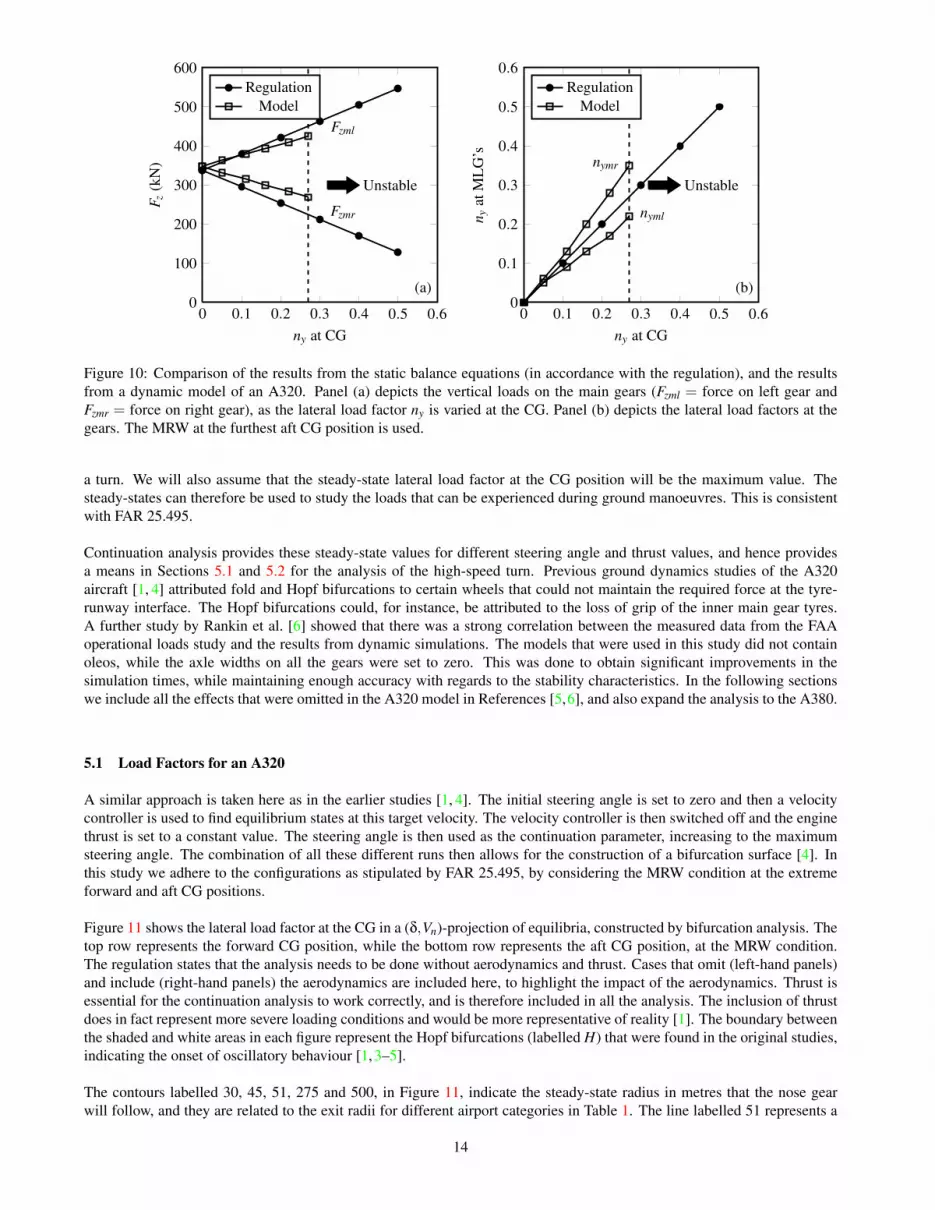
Figure 10(a) depicts the vertical forces at the main gears for an A320 that are obtained from the static balance equations, inaccordance with the regulation, as well as quasi-steady results obtained from a dynamic model. The main differences betweenthe two methods of calculation is the absence of oleos, aerodynamics, and tyre properties, for the regulatory method. Thesteering angle in the model is set to 15◦, and then the velocity is ramped up gradually from 1 to 12 m/s. This provides forcesthat are close to the equilibrium values. An increase in the lateral load factor ny at the CG, causes an increase of the verticalforce on the outer gear, and a decrease of the force on the inner gear. The difference between the forces on the gears is largerfor the method proposed by the regulation, due to the absence of aerodynamics. No equilibrium results were obtained in themodel for ny > 0.27, due to a loss of aircraft stability above these values [1, 4, 5]. This is discussed in the next section. Thearea to the right of the dashed lines indicate this unstable region. The regulation requires the most extreme positions for theCG, and therefore Table 2 contains the gear forces for the MRW of 73900 kg, at the extreme fore and aft CG positions.
There are two equations that can be used to calculate the three lateral wheel forces: a balance of the forces in the y-directionand the moments around the z-axis. The system in Figure 10(b) is underdetermined, and therefore a lateral load factor needsto be chosen for the wheels. The biggest assumption related to this regulation is that a lateral load factor of 0.5 is presentat the tyres. We assume that the load factors at the gears are equivalent to the load factor at the CG, which is representedby the diagonal line, and is similar to the regulation. The quasi-steady results from the simulation show that the inner gearexperiences a lateral load factor that is larger than the regulatory value, while the outer gear experiences a smaller value. Ifthe values are extrapolated to the regulatory ny value of 0.5 at the CG, the inner gear load factor would be larger than the 0.5regulatory value for the gear. The inner gear factor is approximately 0.35 at the onset of limit cycles, where ny = 0.3. The0.5 regulatory factor is therefore adequate. Tyre properties are often altered to unrealistic values in simulations, to enable thegeneration of such large side load factors. This approach was not followed here.
Statically indeterminate gear arrangements cannot be solved by the previous calculation method, and therefore dynamicsimulations are used for an aircraft such as the A380. Note that the original regulations were written in the days whentricycle arrangements were prevalent, hence the implementation of the regulation using static balance would have beenadequate for most aircraft in operation. Simulations and continuation methods would fall under the banner of rational cases,which are discussed in the next section.
5 Continuation Analysis of the High-Speed Turn
A runway exit manoeuvre is essentially a transition from a straight line motion to a steady-state circular trajectory. Section 3.2shows that the steering angle for the A320 converges to the steady-state value for a 90◦ exit, hence this is the maximum valuethat will be reached. The steering angle for the A380, on the other hand, does not reach the steady-state value at a 90◦ exitfor a category VI airport, but does come close to this value when a 135◦ exit is used [10]. We can therefore conclude thatthe steady-state steering angle values would in fact be the maximum steering angle values that could be experienced during
13
0 0.1 0.2 0.3 0.4 0.5 0.60
100
200
300
400
500
600
Unstable
Fzml
Fzmr
(a)
ny at CG
F z(k
N)
RegulationModel
0 0.1 0.2 0.3 0.4 0.5 0.60
0.1
0.2
0.3
0.4
0.5
0.6
Unstable
nyml
nymr
(b)
ny at CG
n yat
ML
G’s
RegulationModel
Figure 10: Comparison of the results from the static balance equations (in accordance with the regulation), and the resultsfrom a dynamic model of an A320. Panel (a) depicts the vertical loads on the main gears (Fzml = force on left gear andFzmr = force on right gear), as the lateral load factor ny is varied at the CG. Panel (b) depicts the lateral load factors at thegears. The MRW at the furthest aft CG position is used.
a turn. We will also assume that the steady-state lateral load factor at the CG position will be the maximum value. Thesteady-states can therefore be used to study the loads that can be experienced during ground manoeuvres. This is consistentwith FAR 25.495.
Continuation analysis provides these steady-state values for different steering angle and thrust values, and hence providesa means in Sections 5.1 and 5.2 for the analysis of the high-speed turn. Previous ground dynamics studies of the A320aircraft [1, 4] attributed fold and Hopf bifurcations to certain wheels that could not maintain the required force at the tyre-runway interface. The Hopf bifurcations could, for instance, be attributed to the loss of grip of the inner main gear tyres.A further study by Rankin et al. [6] showed that there was a strong correlation between the measured data from the FAAoperational loads study and the results from dynamic simulations. The models that were used in this study did not containoleos, while the axle widths on all the gears were set to zero. This was done to obtain significant improvements in thesimulation times, while maintaining enough accuracy with regards to the stability characteristics. In the following sectionswe include all the effects that were omitted in the A320 model in References [5,6], and also expand the analysis to the A380.
5.1 Load Factors for an A320
A similar approach is taken here as in the earlier studies [1, 4]. The initial steering angle is set to zero and then a velocitycontroller is used to find equilibrium states at this target velocity. The velocity controller is then switched off and the enginethrust is set to a constant value. The steering angle is then used as the continuation parameter, increasing to the maximumsteering angle. The combination of all these different runs then allows for the construction of a bifurcation surface [4]. Inthis study we adhere to the configurations as stipulated by FAR 25.495, by considering the MRW condition at the extremeforward and aft CG positions.
Figure 11 shows the lateral load factor at the CG in a (δ,Vn)-projection of equilibria, constructed by bifurcation analysis. Thetop row represents the forward CG position, while the bottom row represents the aft CG position, at the MRW condition.The regulation states that the analysis needs to be done without aerodynamics and thrust. Cases that omit (left-hand panels)and include (right-hand panels) the aerodynamics are included here, to highlight the impact of the aerodynamics. Thrust isessential for the continuation analysis to work correctly, and is therefore included in all the analysis. The inclusion of thrustdoes in fact represent more severe loading conditions and would be more representative of reality [1]. The boundary betweenthe shaded and white areas in each figure represent the Hopf bifurcations (labelled H) that were found in the original studies,indicating the onset of oscillatory behaviour [1, 3–5].
The contours labelled 30, 45, 51, 275 and 500, in Figure 11, indicate the steady-state radius in metres that the nose gearwill follow, and they are related to the exit radii for different airport categories in Table 1. The line labelled 51 represents a
14

0.1 0.2 0.25
0 5 10 15 20 25 30 35
35
30
25
20
15
10
5
0
0.150.3
Unstable
(a1)
0.1 0.2 0.250.15 0.3
(a2)
5 10 15 20 25 30 35
35
30
25
20
15
10
5
00
Unstable
30
45
51
275
500
0.1 0.2 0.250.15
(b1)
0 5 10 15 20 25 30 35
35
30
25
20
15
10
5
0
Unstable
0.1 0.2 0.25
0.15
(b2)
5 10 15 20 25 30 35
35
30
25
20
15
10
5
0
Unstable
0
30
45
51
275
500
30
45
51
275
500
30
45
51
275
500
0.133
0.133
0.133
0.133
A
AA
H H
HH
Aero: OffCG: Forward
Aero: OnCG: Forward
Aero: OnCG: Aft
Aero: OffCG: Aft
Vn
(m/s
)
δ (deg)
Vn
(m/s
)
δ (deg)
A
D
C
B
B
Figure 11: Lateral load factor contours at the CG for the A320 at the MRW, obtained from bifurcation analysis. The onset ofinstability is characterised by limit point and Hopf bifurcations. Panel (a1) is for forward CG position without aerodynamics;Panel (a2) is for the same configuration with aerodynamics included. Panel (b1) is with an aft CG position; panel (b2) is forthe same configuration with aerodynamics included. The behaviour at points A, B, C and D are compared.
runway exit at a category VI airport; it shows that a steering angle of approximately 15◦ is needed to maintain a radius of51m at the nose gear. The thick contour line between the 0.1 and 0.15 lines in the plots, represents the 0.133 ICAO lateralload condition, which is used for runway exit designs, as discussed in Section 3.1. The intersection points between the radiicontours and the 0.133 contour provide the maximum steering angles and design exit velocities that can be used, according tothe ICAO design rules. For example, point C in Figure 11(a2) indicates that a design runway exit velocity of approximately8 m/s should be used for a 90◦ exit at a Category VI airport, which is consistent with the values in Table 1 that were derivedfrom the ICAO method.
A comparison of Figure 11(a1) and (a2) shows that the aerodynamics has a stabilising effect at higher velocities: the unstableregion is moved to the right. Both diagrams are very similar for velocities below 10 m/s. This added stability at higher speedsis not of any real benefit for this configuration due to the restrictions placed by the design velocities. Point A represents the25.5 m/s design velocity for a high-speed exit as contained in Table 1. This intersection point shows that a maximum steeringangle of approximately 2◦ would be required for a high-speed exit. In both cases point A falls within the stable region. Theaft CG position is more critical, as is shown in Figures 11(b1) and (b2), as is evident from the movement of the Hopf-curvetowards the lower left-hand corner. Panel (b1) is for no aerodynamics, and panel (b2) has this effect included. It is clear frompanel (b1) that the 25.5 m/s exit velocity, as prescribed by the ICAO design rules, would be too high: point A falls withinthe unstable region. The aerodynamics once again plays a stabilising effect; panel (b2) shows that an aft CG configuration is
15

0 15 30 45 60 750
0.1
0.2
0.3
0.4
0.5
(a1)
n y
W1
W2
W3
W4
CG
0 15 30 45 60 750
0.1
0.2
0.3
0.4
0.5
(a2)
0 15 30 45 60 750
0.1
0.2
0.3
0.4
0.5
(b1)
δ (deg)
n y
0 15 30 45 60 750
0.1
0.2
0.3
0.4
0.5
(b2)
δ (deg)
Figure 12: Maximum possible lateral load factors at the CG and wheel positions for the A320, MRW configuration. Panel(a1) is with a forward CG position, without aerodynamics. Panel (a2) if for the same configuration with aerodynamic effectsincluded. Panel (b1) is for an aft CG position, while panel (b2) is for the same configuration, with aerodynamics included.
less stable than a forward CG configuration. This is to be expected.
FAR 25.495 aims to cover the extreme loading cases, hence another useful comparison is to plot the envelope of the maximumload factors at the CG and tyre positions. The data points from the bifurcation analysis can be represented as a cloud ofindividual points, where each point is associated with a steering angle, velocity and lateral load factor. All the data pointsare projected onto the (δ,ny) plane. Maximum load factor envelopes for the CG and tyres are automatically generated bythe Convex-Hull algorithms available in Matlab. Note that all the stable and unstable solutions are considered, giving themaximum possible values that can be generated. Figure 12 shows the maximum lateral load factors that can be achievedacross the entire envelope for the MRW condition. The same configurations are considered as in Figure 11. Note that theload factors in the tyres are increased by 10% from the steady-state values to account for the overshoot that was observed inSection 3.
It is clear that the load factor at the CG of the A320 is not anywhere near the 0.5 value that is prescribed in the regulation. Theinner-most tyres in the turn can experience lateral load factors that are close to the 0.5 value, but the tyres on the outside of theturn experience load factors that are significantly lower than the inside tyres, and slightly higher than the factors experiencedat the CG, even though the vertical loads on the outside tyres are larger than the vertical loads on the inside tyres. This isdue to smaller slip-angles on the outside gear. The velocity of the outside gear is larger than the inside gear, hence a smallerslip-angle is created. The forward CG position creates a gradual decline in the load factor as δ is increased, while the aft CGposition seems to create a reasonably constant value, with a sudden drop after 60◦ of steering. The aerodynamics makes asignificant difference at small steering angles and relates to the area around point A in Figure 11.
16

5.2 Load Factors for an A380
The A380 nose gear velocity drops very steeply towards lower velocities at small steering angles, when a constant thrust isused. Hence a large section of the envelope is not covered. This is not the case for the A320. The analysis technique forthe A380 is therefore different to the approach taken for the A320. The velocity controller is not switched off during thecontinuation runs, and consequently the thrust is allowed to change as the steering angle is varied. A constant velocity ismaintained at the nose gear, allowing for complete coverage of the envelope. This approach is only valid if no bifurcationsare found. Bifurcations could indicate that some dominant engine modes are present if a velocity controller is used, whichwas indeed the case when the original studies were done for the A320 [1]. A lack of bifurcations for this case would meanthat the results from a constant thrust or constant velocity approach would provide equivalent results. Note that the thrustwas only applied to the inboard engines, which is similar to the way in which pilots taxi the aircraft. Figures 13(a1) to (b2)contain the results for the A380 lateral load factor at the CG, with similar MRW configurations as before. No bifurcationswere found, hence no region of instability is present when compared to the dynamics of the A320. A lack of bifurcationsindicate how remarkably stable this aircraft is when compared to a tricycle arrangement. The area below the 0.133 lateralload factor contour is again used to define the design envelope. This is the first time that a comprehensive map of the lateralload factor has been constructed for such a large aircraft, where such a wide range of steering angles and velocities arecovered.
The areas below the 0.133 contour in panels (a1) to (b2) are almost equivalent, showing that the CG position does not haveany significant influence on the loads within the design envelope. The left-hand panels (a1 and b1) have no aerodynamics in-cluded. The inclusion of aerodynamics in the right-hand panels (a2 and b2) shows that the aerodynamics causes a significantreduction in the overall loads that can be achieved. The aerodynamics reduces the maximum load factor by approximately21% to 0.26 for the forward CG position, and by approximately 34% to 0.23 for the aft CG position, at the MRW. This mayseem significant when compared to the A320, but note that these differences occur again at high-speed outside of the designenvelope.
The most significant areas in the graphs in Figure 13 are in the bottom right hand corner of each panel, which corresponds to90◦ and 135◦ exit manoeuvres at Category VI runway exits. The lines marked 51 are therefore of relevance. In panels (a2)and (b2) the effect of the aerodynamics pushes the 51 line closer to the 0.133 contour (the design envelope), when comparedto panels (a1) and (b1). This is surprising when one considers that the velocity is only approximately 8 m/s. This may seemlike a low velocity, but the huge aerodynamic surfaces of the A380 cause significant forces, even at such low velocities. Inthis particular case, this is due to the vertical tailplane. In Figure 13(b2) it can be seen that the combination of the aft CGposition and the aerodynamics causes interesting ground handling problems at velocities in the region of 8 m/s. The 51 mcurve transitions from an almost vertical gradient at low velocities to an almost horizontal gradient at approximately 8 m/s.A smaller force is present at the NLG due to the aft CG position, hence the NLG tyres saturate earlier when compared to theforward CG position. This means that no additional force can be generated from the NLG tyres, which are operating at thelimit of their performance [1, 4]. The implication is that the aircraft cannot conduct a tighter turn than 51m when a velocityof 8 m/s is maintained at the NLG. The recommended velocity of 4 m/s (8 knots) ensures that these types of turns can beconducted safely for all configurations.
The curves representing the 275 m and 500 m radius high-speed exits show interesting behaviour in regions that the aircraftwill never venture into. As an example, let us examine Figure 13(b2). If the aircraft maintains a velocity of 25 m/s at theNLG, and the steering angle is gradually increased, the radius of the nose gear trajectory will decrease, until the steeringangle reaches a value of approximately 11◦. The trajectory of the nose gear will maintain an almost constant radius between11◦ and 20◦ degrees. This radius will increase after 20◦ as the steering angle is increased. This is due to the nonlinear natureof the tyre, and it can be seen in all the panels; the maximum side force available from the tyres is limited, as indicatedby the white region in panels (b1) and (b2). The nose gear tyres in panels (a1) and (a2) are close to saturation in a similarregion, and are operating at approximately 95% of the total available force. The aircraft is stable within the design envelopeat high-speed exits. One could argue that the close spacing of the contours at low steering angles and high velocities make iteasy to generate significant lateral load factors at high-speed exits. However, a pilot would not oversteer easily at such exitsdue to large radii of the turns, and also due to envelope protection laws in the flight control system.
The lateral loads requirement assumes that the forces on the gears act towards the turn centre, hence all the forces act inthe same direction. This is however not the case for the A380. Figure 14 contains the lateral load factor contours in the(δ,Vn)-plane. Panels (a1) and (a2) contain the load factors on the WLGs, and (b1) and (b2) the BLGs. The negative contoursat low velocities in panels (a1) and (a2) indicate that the gear forces on the WLGs act in an opposite direction to that ofthe BLGs, and change direction (to act in the same direction as the BLGs) at nose gear velocities above 10 m/s. This effectcan be mainly attributed to the geometric layout of the landing gears, and to a lesser extent the tyre properties. The slip-
17

51
275
500
35
30
25
20
15
10
5
0 10 20 300
0 40 50
(b2)
δ (deg)
51
275
500
35
30
25
20
15
10
5
Vn
(m/s
)
0 10 20 300
0 40 50
(b1)
δ (deg)
0.26
51
275
500
(a2)35
30
25
20
15
10
5
0 10 20 300
0 40 50
(a1)35
30
25
20
15
10
5
Vn
(m/s
)
0 10 20 300
0 40 50
0.33
275
500
51
500
275
500
275
500
275
500
275
NoseGearSaturated
NoseGearSaturated
0.23
0.35
NoseGearSaturated
B
B
Figure 13: Lateral load factors at the CG obtained from continuation analysis for the A380 in the MRW configuration. Panel(a1) is for a forward CG position without aerodynamics; panel (a2) if for the same configuration with aerodynamics included.Panel (b1) is for an aft CG position; panel (b2) is for the same configuration with aerodynamics included.
angle is positive at low velocities, creating negative lateral loads. An increase in the velocity decreases the slip-angles, andconsequently the lateral loads decrease. This can be observed in the reduction of the magnitude of the negative contours, inthe bottom right-hand corner of Figures 14(a1) and (a2). Velocities above 10 m/s create negative slip-angles, with positiveloads on the WLGs. If we start in the lower left-hand corner of panels (b1) and (b2), an increase in velocity and steeringangle would lead to an increase in lateral load. The opposite is true in the top right-hand corners of these panels. The effectof the steering system on the aft axles of the BLGs is not readily apparent from these graphs; it will be more pronounced inthe next section, when the focus shifts to the tyres.
5.3 Individual Tyre Loads for an A380
The extensive amounts of information provided from bifurcation methods allows one to present the results in a different way.Figure 15 is an example. It shows a map of the tyre that is carrying the largest lateral load as the steering angle and velocityis varied. A complex pattern emerges for the A380. For example, for Vn = 5 m/s the maximum load switches betweenfive different tyres. The inner tyre on the aft axle of the body gear, W20, initially generates the highest load. The bodywheel steering system engages at 20◦ and a consequent shift occurs to W18, then W4, progressing on to W16, and finally toW15. This type of diagram allows engineers to gain a much improved understanding of the loading in the system, and it is apertinent example of how complex the behaviour of such a large aircraft can be.
18

0 10 20 30 40 50 60 700
5
10
15
20
25
30
35
-0.22
0.15
0.1
0.05
0.05
0-0.05-0.1
(a1)WLGL
V n(m
/s)
0 10 20 30 40 50 60 700
5
10
15
20
25
30
35
-0.26
0.2
0.15
0.1
0.1
0.050.05
0-0.05-0.1-0.15-0.2
(a2)WLGR
0 10 20 30 40 50 60 700
5
10
15
20
25
30
35
0.23
0.2
0.2
0.15
0.150.1
0.1
0.05
0.05
(b1)BLGL
δ (deg)
V n(m
/s)
0 10 20 30 40 50 60 700
5
10
15
20
25
30
35
0.28 0.25
0.2
0.2
0.150.15
0.1
0.1
0.05
0.05
(b2)BLGR
δ (deg)
Figure 14: Lateral load factor on each gear for the MRW aft CG configuration of an A380.
0 10 20 30 40 50 60 700
5
10
15
20
25
30
35
V n(m
/s)
δ (deg)
W20
W9
W4W18 W16
W15W13
W9
W15
W17
Figure 15: Map of tyres of the A380 that carry the highest load as the steering angle and velocity are varied. The number ineach area indicates the tyre with the highest lateral load. The MRW condition with an aft CG position is used.
19

0 10 20 30 40 50 60 700
5
10
15
20
25
30
35
0.20.150.1
0.1
0.05
0.05
0.30
(W1)
0 10 20 30 40 50 60 700
5
10
15
20
25
30
35
0.25
0.25
0.2
0.2
0.15
0.1
5
0.1
0.1
0.050.05
0.0
5
0.37
(W4)
0 10 20 30 40 50 60 700
5
10
15
20
25
30
35
0.15
0.1
0.1
0.0
5
0.05
0.05
0.17 (W5)
0 10 20 30 40 50 60 700
5
10
15
20
25
30
35
0.2
5
0.2
0.15
0.1
5
0.1
0.1
0.1
0.0
5
0.05
0.05
0.29 (W8)
0 10 20 30 40 50 60 700
5
10
15
20
25
30
35
0.30.25
0.2
0.2
0.15
0.1
5
0.1
0.1
0.0
5
0.05 0.33
(W9)
0 10 20 30 40 50 60 700
5
10
15
20
25
30
35
0.350.3
0.25
0.2
5
0.20.2
0.15
0.15
0.1
0.1
0.0
5
0.05 0.40
(W12)
0 10 20 30 40 50 60 700
5
10
15
20
25
30
35
0.35
0.30.250.20.2
0.150.15
0.1
0.1
0.0
5
0.0
5
0.36
(W13)
0 10 20 30 40 50 60 700
5
10
15
20
25
30
35
0.40.350.30.250.25
0.2
0.2
0.15
0.15
0.1
0.1
0.0
5
0.0
5
0.44
(W16)
0 10 20 30 40 50 60 700
5
10
15
20
25
30
35
0.25
0.2
0.1
5
0.1
0.1
0.1
0.05
0.0
5
0.0
5
0.27
(W17)
(deg)
0 10 20 30 40 50 60 700
5
10
15
20
25
30
35
0.3
0.3
0.2
5
0.2
5
0.2
0.2
0.15
0.1
50.1
5
0.1
0.1
0.1
0.0
5
0.05
0.0
5
0.43
(W20)
(deg)
(deg) (deg)
Body L
andin
g G
ear
Win
g L
andin
g G
earV
n(m
/s)
Vn
(m/s
)
Vn
(m/s
)V
n(m
/s)
Vn
(m/s
)
A A
A A
A A
AA
A A
0.3
dd
d d
Figure 16: Contour maps of the absolute steady-state lateral load factor, for the outer-most and inner-most tyres, during aturn. The panel numbers depict the wheel numbering convention from Figure 1.
20

The last piece of the puzzle is to consider the lateral load factor on individual tyres. Only the inner-most (W4,W8,W12,W16,W20)and outer-most (W1,W5,W9,W13,W17) tyres are considered in Figure 16. The absolute values are shown. We can observethat the inner tyres experience a higher load factor than the outer tyres. This is due lower slip-angles on the outer tyres.The maximum forces at the tyres can easily be obtained for a Group VI runway exit. A steering angle of approximately 37◦
represents the steady-state steering angle for a Group VI exit [10]. If the exit velocity is restricted to 4 m/s, the coordinates(δ,Vn) = (37,4), would indicate the point where the maximum tyre forces can be expected for this type of exit. These co-ordinates are represented by the points labelled A in Figure 16. If we then look at the load factors at these points, it can beseen that the first row of tyres on the wing gear, and the middle row of tyres on the body gear, carry the highest loads. Thiswould be the most likely scenario in terms of operational velocities and steering angles. An unrealistic scenario would be atapproximately 11 m/s, where the second row of tyres on the wing gears carry the highest load factors, and most of the othertyres appear to have low load factors.
The body wheel steering does not seem to have much of an effect on the load factors at the wing gear tyres. There is howevera significant effect on the body gear tyres, as can be observed by the patterns in the contours around a 20◦ steering angle. Thebody wheel steering does provide significant load alleviation in the body gear tyres, W17 and W20, which was also apparentin the simulation results in Section 3. The difference between the load factors on the inner and outer gears are less than forthe A320. Most of the wheels are not anywhere near the 0.5 factor stipulated by the FAA regulation, apart from the innerwheels of the body gear. We see, therefore, that continuation methods allow for a full classification of the load factors withinthe tyres. The exact conditions where these maximum values occur can be identified very efficiently.
6 Relating the Continuation Results to the FAA Study
The final step is to relate the statistics from the FAA study with the results obtained in the previous sections. Only themore realistic cases with aerodynamics are considered here. Figure 17 compares the envelope that is obtained from thecontinuation analysis, with the A320 data from the FAA study in [12]. The lateral load factors were recorded over 10066flights, where approximately half of the runway exit angles were below 60◦, a quarter were between 60−120◦, and a quarterwere larger than 120◦. The outliers at zero velocity are likely to be due to measurement errors, or could possibly be attributedto gusts on the apron; they can be safely ignored. All the data of significance therefore lies within the envelope. Runwayexits smaller than 60◦ seem to generate the highest loads; however, there are significantly more data points for this type ofexit. Similar maximum values may arise when more data points are added for the other exits. It is interesting to note that [12]could not show any statistical correlation between the exit velocity and the lateral load factor that is generated. The large voidat higher velocities shows that the analysis method covers cases that would not occur operationally. The lower maximumload factor of 0.33, when compared to the 0.5 value from the regulation, indicates that the method is less restrictive than theregulation, yet seems to be adequate to cover the operational cases.
The results can also be used to determine the maximum likely lateral load factor in operation. It can be seen from Figure 4(a)that a lateral load factor of approximately 0.28 can be expected at least once in a lifetime for an A320, and a load factor of0.17 for an A380. The fact that the exit velocity and exit type seems to be statistically insignificant, makes the choice ofan operating point difficult. We therefore choose a point that is representative. Point B in Figures 11(a2) and (b2) wouldcorrespond to a load factor of approximately 0.28 at a runway exit for a Category VI airport. We will therefore assume that12 m/s is an extreme exit velocity at a 90◦ exit for the A320 and A380, and also that all 90◦ runway exit manoeuvres areconducted below this velocity.
The lateral load factor of 0.28 at point B in Figure 11(a2) can be reached in one of two ways. The first scenario is where theentry velocity into the turn is approximately 12 m/s, while the pilot adjusts the thrust through the turn to try and maintain thevelocity. The second scenario is that the pilot enters the turn at 6 m/s (point D), then increases the thrust to try and maintainthe velocity, over-correcting the thrust above the required value and accelerating through the turn up to point B. This scenarioseems more plausible if it is assumed that pilots adhere to the rules.
If we assume a maximum nose gear velocity of 12 m/s for the A380 in a turn, and then determine the maximum load factorin the region below 12 m/s, the maximum condition is then indicated by point B in Figures 13(a2) and (b2). Even when weignore the fact that the aircraft would be unable to maintain a radius of 51 m at this velocity, we can see that it would beimpossible to obtain a load factor of more than 0.2 for the forward CG configuration in panel (a2), and 0.17 for the aft CGposition in panel (b2). Note that the contours are also spaced further apart from each other for the case of the A380. Hence,a change in thrust would not have as much significance when compared to the closely spaced contours for the A320. Theclosely spaced contours of the A320 mean that it is easier to obtain higher load values close to the unstable area. The value
21

0 10 20 30 40 50 60 70 800
0.05
0.10
0.15
0.20
0.25
0.30
0.35
Vx (m/s)
Max
n y< 60◦ Turns
60−120◦ Turns> 120◦ Turns
Figure 17: Comparison of maximum lateral load factor envelope (solid line) obtained from continuation analysis, and datapoints obtained from FAA study [12]. The MRW aft CG configuration is used for the envelope calculations.
of 0.2 for the forward CG is 10% higher than the expected 0.17 value, while the aft CG correlates exactly with the initialpredictions in Figure 4(a).
7 Conclusions
An operational loads study by the FAA showed that large aircraft with statically indeterminate gear arrangements, such asthe A380, do not generate the high loads that are stipulated in the requirements for a high-speed turn. We therefore comparedthe loads that can be generated by a relatively small (A320) and large aircraft (A380) to see how the results compare withthe findings of the FAA. Static equilibrium equations were used to calculate the vertical forces on the gears of the A320. Weshowed that assumptions were needed with regards to the lateral load factor on each gear, due to the underdetermined natureof these equations in the lateral direction. The FAA therefore assume a 0.5 load factor, and it is this factor that gives rise tothe conservative nature of the regulation. Simulations of the A320 showed that the inner gear experiences a higher lateralload factor than the outer gear. Extrapolation showed that a higher lateral load factor than the 0.5 value from the regulationwould be experienced at the inner gear, if it were feasible for the aircraft to generate 0.5g at the CG position. This is howevernot possible, as the aircraft loses lateral stability at approximately 0.27g. Static balance equations cannot be used for theanalysis of the gear loads of the A380, due to the underdetermined nature of the equations in all directions. Continuationmethods were therefore used to obtain the lateral load values for this aircraft type.
Contour maps of the lateral load factor were constructed as a function of the steering angle and velocity at the nose gear of theA320, for the MRW condition. Different CG positions and aerodynamic configurations were considered. The aerodynamicsdid not have a significant effect on the maximum load that could be generated, as the maximum condition tends to occur atrelatively low velocities (below 10 m/s). The results confirmed the findings from the simulations and showed that the loadfactors on the outer tyres are significantly lower than the load factors on the inner tyres. This is due to the larger velocity ofthe outer tyres, and consequent lower slip-angles. The results were also used to show how the maximum lateral load factorsfrom the FAA study might have occurred. Similar maps were constructed for the A380 at the MRW condition with differentaerodynamic configurations; they showed far less interesting dynamics from the dynamical systems perspective.
The demonstrated stability of the A380 during ground manoeuvres is of course desirable from an engineering perspective.We showed that the aerodynamics plays a significant role in the alleviation of the lateral loads. It was shown that theaerodynamics causes the nose landing gear tyres to saturate, moving the effective steering envelope closer to the designenvelope specified by ICAO. The aerodynamics also causes a significant reduction in the lateral load factor, when comparedto the case without aerodynamics. The analysis also showed that, at low velocities, the lateral loads on the WLGs act inan opposite direction to that of the BLGs. This is contrary to the assumption made in the regulation, where it is assumedthat the forces on the gears act towards the turn centre. The forces on the WLGs reduce with an increase in velocity andeventually act in the same direction as the BLGs. Continuation analysis also allows for the construction of complex maps
22

that show how the tyre forces evolve as the steering angle and velocity is varied. This is very useful when parameter studiesare conducted. We therefore showed that an aircraft such as the A380 would not exceed a lateral load factor of 0.26 acrossthe entire envelope – almost half the value of the stipulated regulation.
The last section defined a typical operating envelope for the A380, and it compared the results from the analysis with theoriginal FAA studies. These results show that a maximum lateral load factor between 0.17 and 0.2 would be experiencedover the life time of the aircraft, and this correlates very well with the results from the FAA study. This provides additionalevidence that a lateral load factor of 0.5 cannot be reached for such a large aircraft.
References
[1] Coetzee, E., 2006. “Nonlinear Aircraft Ground Dynamics”. Master’s thesis, University of Bristol.[2] Tipps, D., Rustenburg, J., Skinn, D., and DeFiore, T., 2003. Side Load Factor Statistics From Commercial Aircraft
Ground Operations. Tech. Rep. UDR-TR 2002-00119, Federal Aviation Administration, U.S. Department of Trans-portation, Federal Aviation Administration, Office of Aviation Research, Washington, DC 20591, January.
[3] Coetzee, E., Krauskopf, B., and Lowenberg, M., 2010. “Application of Bifurcation Methods to the Prediction ofLow-Speed Aircraft Ground Performance”. Journal of Aircraft, 47(0021-8669), pp. 1248–1255.
[4] Rankin, J., Coetzee, E., Krauskopf, B., and Lowenberg, M., 2009. “Bifurcation and Stability Analysis of AircraftTurning on the Ground”. AIAA Journal of Guidance, Control, and Dynamics, 32(2), March, pp. 500–511.
[5] Rankin, J., Krauskopf, B., Lowenberg, M., and Coetzee, E., 2010. “Operational Parameter Study of Aircraft Dynamicson the Ground”. ASME Journal of Computational and Nonlinear Dynamics(CND-09-1022).
[6] Rankin, J., Krauskopf, B., Lowenberg, M., and Coetzee, E., 2010. “Nonlinear Analysis of Lateral Loading DuringTaxiway Turns”. Accepted for publication - Journal of Aircraft.
[7] Anon. Part 25. Tech. rep., Federal Aviation Administration, year = 1980, journal = Airworthiness Standards: TransportCategory Airplanes. FAR, pages = 252–439.
[8] Wright, J., and Cooper, J., 2007. Introduction to Aircraft Aeroelasticity and Loads. Wiley.[9] International Civil Aviation Organization, 2005. Aerodrome Design Manual (Doc 9157) Part 2: Taxiways, Aprons and
Holding Bays. Tech. Rep. 9157,AN/901, International Civil Aviation Organization.[10] Coetzee, E., Krauskopf, B., and Lowenberg, M., 2010. “Analysis of Medium-Speed Runway Exit Maneuvers”. In
AIAA Modelling and Simulation Technologies Conference, AIAA, ed., no. AIAA-2010-7616, American Institute ofAeronautics and Astronautics, AIAA.
[11] Finn, E., Gleich, R., Green, K., Saccarelli, R., and Szot, M., 2007. Investigation of Limit Design Lateral GroundManeuver Load Conditions. Tech. Rep. DOT/FAA/AR-07/38, Federal Aviation Administration, June.
[12] Rustenburg, J. W., Skinn, D. A., and Tipps, D. O., 2002. Statistical Loads Data for the Airbus A320 Aircraft inCommercial Operations. Tech. Rep. DOT/FAA/AR-02/35, Federal Aviation Administration, April.
23