consumers and economic cooperation - cuts citee
TRANSCRIPT
Consumers and Economic CooperationCost of Economic Non-cooperation
to Consumers in South Asia

Consumers and Economic CooperationCost of Economic Non-cooperation
to Consumers in South Asia
Bipul ChatterjeeDeputy Executive Director, CUTS International
Joseph GeorgeResearch Associate, CUTS International
D-217, Bhaskar Marg, Bani ParkJaipur 302016, India
Tel: +91.141.2282821, Fax: +91.141.2282485Email: [email protected]
Web site: www.cuts-international.org
With the support of
©CUTS International, 2012
First published: June 2012
This paper has been produced with the financial assistance of TheAsia Foundation under the project entitled, �Cost of Economic Non-cooperation to Consumers in South Asia�. The views expressed hereare those of the commentators/authors and can therefore in no waybe taken to reflect the positions of CUTS International & The Asia
Foundation
ISBN: 978-81-8257-166-2
Printed in India by Jaipur Printers Private Limited, Jaipur
#1207
Consumers and Economic CooperationCost of Economic Non-cooperation to Consumers in South Asia
Published by
Contents
Abbreviations i
Foreword iii
Preface v
Acknowledgement ix
Executive Summary xiii
1. Impact of Trade Liberalisation on ConsumerWelfare in South Asia 1Introduction 1
Trade Liberalisation and Consumer Welfare:What Does Theory Say? 5
Regional Economic Cooperation in South Asia 11
South Asian Free Trade Agreement: A Review of Literature 17
Conclusions 30
2. Potential Impacts of SAFTA on Consumer Welfare:A Quantitative Assessment 32Introduction 32
Assessing Consumer Welfare Gains under SAFTA:Methodology and Product Selection 34
Results of Consumer Welfare Gains 37
Export Opportunities in Selected Products andTrade Potential 46
From Minimum to Maximum Gains 50
Extension of Analysis Beyond Sensitive Lists:Implications for Non-Tariff Reforms 53
Summary and Conclusions 59
3. Perceptions and Expectations about RegionalEconomic Cooperation in South Asia 61Introduction 61
Perception Survey: Method 62
Perceptions and Expectations of SAFTA 65
What Shapes Perceptions 67
Stakeholders� View on Future Steps 70
Conclusions 73
4. Conclusions 74
Priorities for Future Research 77
References 79
Endnotes 89
Annexure Tables 93
Questionnaire (Perception Survey) 136
List of Tables
1.1: Key Indicators of South Asia 14
1.2: Average Annual Growth of GDP, GDP Per Capita andExports and Imports of Goods and Services, 1990-2010 16
2.1: Summary of Results on Aggregate Consumer WelfareGains (analysis for products in the sensitive lists) 37
2.2: Summary of Results on Consumer WelfareGains for Bangladesh 39
2.3: Summary of Results on Consumer WelfareGains for India 41
2.4: Summary of Results on Consumer WelfareGains for Nepal 42
2.5: Summary of Results on Consumer WelfareGains for Pakistan 44
2.6: Summary of Results on Consumer WelfareGains for Sri Lanka 45
2.7: Summary of Results of Aggregate Consumer WelfareGains (analysis for products outside the sensitive lists) 54
2.8: Country-Wise Summary of Results of ConsumerWelfare Gains 56
List of Figures
2.1: Country-wise share in Aggregate Regional ConsumerWelfare Gains 38
2.2: Country-wise Origin of Consumer Welfare Gains(Bangladesh) 39
2.3: Product-Wise Origin of Consumer Welfare Gains(Bangladesh) 40
2.4: Country-wise Origin of Consumer Welfare Gains (India) 41
2.5: Product-wise Origin of Consumer Welfare Gains (India) 41
2.6: Country-wise Origin of Consumer Welfare Gains (Nepal) 42
2.7: Product-wise Origin of Consumer Welfare Gains (Nepal) 43
2.8: Country-wise Origin of Consumer Welfare Gains(Pakistan) 44
2.9: Product-wise Origin of Consumer Welfare Gains(Pakistan) 44
2.10: Country-wise Origin of Consumer Welfare Gains(Sri Lanka) 45
2.11: Product-wise Origin of Consumer Welfare Gains(Sri Lanka) 46
2.12: Product Category-wise Export Opportunities 48
2.13: Country-Wise Share in Aggregate Regional ConsumerWelfare Gains (Non-Sensitive List Products) 55
3.1: Country-wise share of responses 63
3.2: Group-wise share of responses 64
Abbreviations
ADB Asian Development Bank
BA Bangkok AgreementBFTAs Bilateral Free Trade AgreementsBIMSTEC Bangladesh, India, Myanmar, Sri Lanka
and Thailand Economic Cooperation
CGE Computable General Equilibrium
DFQF Duty Free Quota Free
EDI Electronic Data Interchange
FDI Foreign Direct InvestmentFTA Free Trade Agreement
GDP Gross Domestic ProductGTAP Global Trade Analysis Project
IOR-ARC Indian Ocean Rim Association forRegional Cooperation
ISFTA India Sri Lanka Free Trade AgreementIT Information Technology
LDCs Least Developed Countries
MFN Most-Favoured-NationMTAs Multilateral Agreements
NTBs Non-tariff BarriersNTT New Trade Theories
PTAs Preferential Trade Agreements
RoO Rules of OriginRoW Rest of the WorldRTAs Regional Trade Agreements
SAARC South Asian Association forRegional Cooperation
SAFTA SAARC Preferential trading ArrangementSAPTA South Asian Free Trade AreaSCOE SAFTA Committee of ExpertsSMC SAFTA Ministerial Council
T&C Textiles and ClothingTII Trade Intensity IndexTLP Tariff Liberalisation Programme
UNCOMTRADE UN Commodity TradeUNCTAD United Nations Conference on
Trade and Development
WTO World Trade Organisation
ii Consumers and Economic Cooperation
Foreword
I am happy to learn that CUTS International has undertaken astudy on the costs of economic non cooperation in South Asiashowing the benefits that South Asia could derive fromenhancing trade and other forms of economic cooperationwithin the sub-region.
South Asia faces major policy challenges in reducingpoverty, and is home to more than 20 percent of the world�spoor. All the countries of South Asia have recognised thatmutually beneficial cooperation is a powerful instrument tohelp us to achieve our economic goals, and that regionalcooperation determination has been expressed in the SouthAsia Free Trade Agreement, the implementation of which isprogressing.
It is, in this context, that the present study is valuable,looking also at the benefits of Trade in enhancing consumerwelfare. The study thus offers a powerful argument for furthertrade liberalisation and integration in South Asia.
I congratulate CUTS International, India and its partnerlike-minded organisations in other South Asian countries onthis timely initiative and hope that it will spur enhancedregional integration.
Shivshanker MenonNational Security Adviser
Prime Minister�s OfficeNew Delhi, India

Preface
In mid 90s we did a study on cost of non-cooperation toconsumers in South Asia. We found that our consumers wereunnecessarily paying a huge cost. It sets our agenda to challengethe conventional notion that �exports are good, imports arebad�.
Our aim is to ensure that consumer welfare agenda is firmlyplaced at the centre of a country�s trade policy. This project isa significant milestone in that direction.
We understand that a single-point agenda of exportexpansion is neither in conjunction with gains from trade, noris it practically feasible because it can lead to beggar-thy-neighbour.
Surprisingly, very little credit is given in the vast body oftrade literature to the notion of �growth through imports�.Those who are ignorant of this notion overlook the circularnature of basic income generation � the most basic fundamentalof macroeconomics. A major source of productive investmentis savings on the part of consumers. When prices ofconsumption items come down through competitive importsand other means they raise the real income of consumers andsome of it is ploughed back into the real economy throughmore consumption and investment.
An economy cannot sustain its growth unless saving-investment-growth cycle and consumption-production-growthcycle work in tandem.
vi Consumers and Economic Cooperation
It is true that as a result of trade liberalisation importcompeting sectors will experience a painful phase of transition.But their transition to efficient producers and/or gradual deathto take rebirth in other sectors is absolutely necessary for thevitality and sustainability of any aspiring economy. A majorchallenge before trade policy maker is to not lose sight of hugegains by way of long-run resource efficiency, superiorproduction possibility structure, institutionalisation ofpractices and systems which more and gradual exposure totrade can bring along with greater consumer satisfaction.
How do South Asian countries feature in respect to theirtrade liberalisation and concomitant consumer welfareenhancement efforts? The implementation of the South AsianFree Trade Agreement is progressing in a right direction. Itsagenda is also expanding to include services and investmentliberalisation.
In spite of this, there is hardly any discussion at the politicallevel about the benefits that enhanced intra-regional tradewould bring to consumers of our region. It is this vacuum thatthis study addresses. By employing a simple analyticalframework, it shows how much gain would accrue to ourconsumers if some imports, sourced from outside the region,are sourced from within the region.
Our estimated total gain to consumers is US$2bn per year.And this is a static gain. By effectively addressing non-tariffmeasures and other costs of doing trade, the dynamic gainwould be at least five times this amount.
Given that trade liberalisation efforts always get politicised,in this study we are not advocating for any blind increase inimports. We are also aware of the implication of ourrecommendations on government revenue, particularly inrelatively more poor countries of the region.
Based on the results of this study, we will step up ouradvocacy for enhanced regional integration of South Asia.
Being aware of political economy aspects of this work, wewill take forward the larger message that �Good Economicsis Good Politics�.
I thank The Asia Foundation for its support; not just forthis project but, more importantly, to this cause. We lookforward to strengthen our partnership. Last but not the leastI thank my colleagues who have made this study possible
May this study be widely read, may it generate more intereston this subject and may it ultimately lead to well informedpolicy choices free of cynicism.
Pradeep S MehtaSecretary General
CUTS International
Consumers and Economic Cooperation vii

Acknowledgement
The idea of this study germinated during a group discussionbetween CUTS staff and Nick Langton and Bruce J. Tolentinoof The Asia Foundation in November 2010.
We express our gratitude to The Asia Foundation forsupporting the implementation of this project. Special thanksare due to Nick Langton, Bruce J. Tolentino, Gareth Aicken,George Varughese, Saima Anwer, Shahid Fiaz, Syed Al-Muti,Veronique Salze-Lozach, Nina Merchant, Katherine Loh andMandakini D. Surie of The Asia Foundation for their deepinvolvement. We thank them and others at the Foundation forthoroughly reviewing our drafts as well as providing usefulsuggestions for their improvement.
The study benefited from unreserved assistance extendedby our partner organisations from other South Asian countries.Their valuable contributions including conducting theperception survey of stakeholders, organising regionalmeetings, facilitating media briefings and reviewing thetechnical content of the study are acknowledged. We expressour gratitude to them, particularly:� Syed Munir Khasru, Arbaaz Nayeem, Tahmid Zami, Zarif
Islam and Ayman Chowdhury of Institute for Policy,Advocacy and Governance, Dhaka, Bangladesh
� Poshraj Pandey, Ratnakar Adhikari, Chandan Sapkota,Paras Kharel and Neeraj Shrestha of South Asia Watch onTrade, Economics & Environment, Kathmandu, Nepal
� Abid Suleri, Qasim Shah, Vaqar Ahmed, Faisal Gorchaniand Sadia Yousafi of Sustainable Development PolicyInstitute, Islamabad, Pakistan
� Saman Kelegama, Dushni Weerakoon and AshaniAbayasekara of Institute of Policy Studies, Sri Lanka
Many experts have shared valuable suggestions for improvingthe value of this study. We thank all of them,
� Amitendu Palit, Institute of South Asian Studies, NationalUniversity of Singapore
� Amrit Lugun, SAARC Secretariat, Kathmandu� Edwin Laurent, Commonwealth Secretariat, London� M. A. Razzaque, Commonwealth Secretariat, London� M. A. Taslim, University of Dhaka, Bangladesh� Mustafizur Rahman, Centre for Policy Dialogue,
Bangladesh� Paras Kharel, South Asian Watch on Trade, Economics &
Environment, Nepal� Prabir De, Research and Information System for Developing
Countries, India� Rajan Sudesh Ratna, Directorate General of Foreign Trade,
Department of Commerce, Government of India� Rashid S. Kaukab, CUTS International, Geneva� Rupa Chanda, Indian Institute of Management, India� Saman Kelegama, Institute of Policy Studies, Sri Lanka� Saikat Sinha Roy, Jadavpur University, India� Shafqat Munir, Journalists for Democracy and Human
Rights, Pakistan� Vaqar Ahmed, Sustainable Development Policy Institute,
Pakistan
We also thank all participants of the Inception Meetingheld in Jaipur April, 2011; the Review Meeting held in Dhakain June, 2011; and the Dissemination Meeting held in
x Consumers and Economic Cooperation
Kathmandu in February, 2012. A draft version of our studywas presented at the 14th Sustainable Development Conferenceof the Sustainable Development Policy Institute, Islamabad inDecember 2011. We acknowledge valuable comments receivedfrom the participants of our session on this subject.
We acknowledge the meticulous efforts of our colleaguesat CUTS Centre for International Trade, Economics &Environment in implementing the project. Special thanks aredue to Archana Jatkar, Anutosh Biswas, Palak Chadha andReena Purohit. We thank Dhananjay Ghei, a student at theIndian Institute of Technology, who while undergoing hisinternship at our Centre, has meticulously worked with PalakChadha for data collection and related work. Thanks are alsodue to Ravi Tewari, Madhuri Vasnani and Mukesh Tyagi ofCUTS International for their assistance in editing and lay-outing of this publication, and to Arun Talwar, G. C. Jain andL. N. Sharma for their work in preparing financial reports ofthe project.
Many other names deserve special mention, but could notbe referred here for want of space. A large number ofstakeholders have participated in the perception survey andgave valuable suggestions for taking forward the agenda ofenhanced regional integration. We thank all of them.
Finally, any error that may have remained is solely ours.
Consumers and Economic Cooperation xi

Executive Summary
The ProjectWith support from The Asia Foundation and in partnership
with a group of like-minded organisations, CUTS Internationalimplemented a project entitled �Cost of Economic Non-Cooperation to Consumers in South Asia�.
The objective of the COENCOSA project is to assesspotential benefits to consumers from enhanced trade amongthe South Asian countries. The study covered five of the eightSouth Asian countries, viz. Bangladesh, India, Nepal, Pakistanand Sri Lanka.
Based on a meta-analysis of the existing literature oneconomic integration in South Asia, a qualitative analysis, anda survey of some key stakeholders on their perception onregional trade integration, the study estimated the gains thatwould accrue to consumers from enhanced intra-regionaltrade.
Key FindingsGains from trade fundamentally treat consumer welfare
gains inseparable from producer welfare gains, both beingequally important beneficial outcomes of trade liberalisationprocess. Furthermore, net positive consumer welfare gainsfollowing a more open and predictable international traderegime is considered as assured.
Literature on the functioning of trade agreementscategorically shows that reciprocity is the most elementary
principle of ideal trade agreements, wherein exchange ofimport concessions for export opportunities is a key. Despitethis understanding, imports are often viewed disapprovinglyowing to the challenges they may pose to domestic industries.This is observed in successive rounds of negotiations on theSouth Asian Free Trade Agreement (SAFTA).
A general reason identified for relative non-success ofSAFTA (as compared to other regional trade agreements indifferent parts of the world) is existence of a large number ofproducts with intra-regional trade potential under respectivesensitive lists by SAFTA member countries with the objectiveof resisting possible import surges. Consumer welfare onaccount of trade liberalisation is largely ignored.
The quantitative assessment of the COENCOSA studyshows a minimum consumer welfare gain of approximatelyUS$2bn a year by way of savings on aggregate consumerexpenditure on imported products in selected categories.
Potential consumer welfare accruing to each country isderived by taking the difference between the total importexpenditure in the selected products incurred by the countryunder consideration and likely import expenditure if thatcountry were to import the same products from SAFTAtrading partners at a lower price currently offered by them.
However, the estimated figure represents only theminimum gains which will increase exponentially if the long-run impacts of positive cycle of growth in intra-regional areconsidered. In other words, gains to consumers, as estimatedin this study, is a static gain as it is based on existing tariffstructure. It is a well-known fact that today tariff accountsfor about 15-20 percent of the cost of doing trade of acommodity.
Non-tariff measures including customs procedures andother procedural non-tariff measures account for more than80 percent of cost of doing trade. In South Asia, if non-tariff
xiv Consumers and Economic Cooperation
measures affecting the cost of doing trade are addressedproperly then gains to consumers from an enhanced intra-regional trade regime would be much than static gains. Furthergains can be achieved from gradual liberalisation of intra-regional trade in services and investment.
A survey of some key stakeholders on their perception aboutenhanced intra-regional trade reveals that lack of reference toconsumer welfare gains in the academic literature as well asin popular media has heavily influenced the perception of allcategories of respondents.
Generally, there exist very low expectations aboutconsumer welfare gains, owing to either ignorance about theissue or negligence as an unimportant issue. While amongproducers/exporters and their associations, consumer groupsand media ignorance about the issue is the main reason for
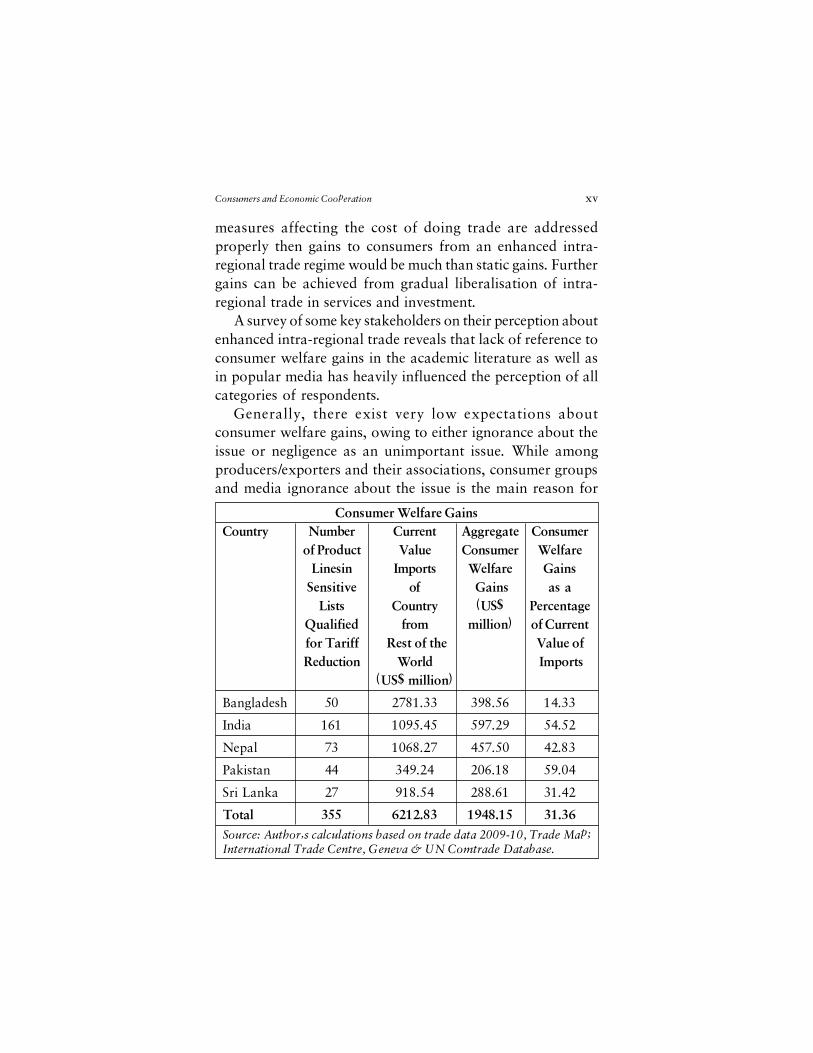
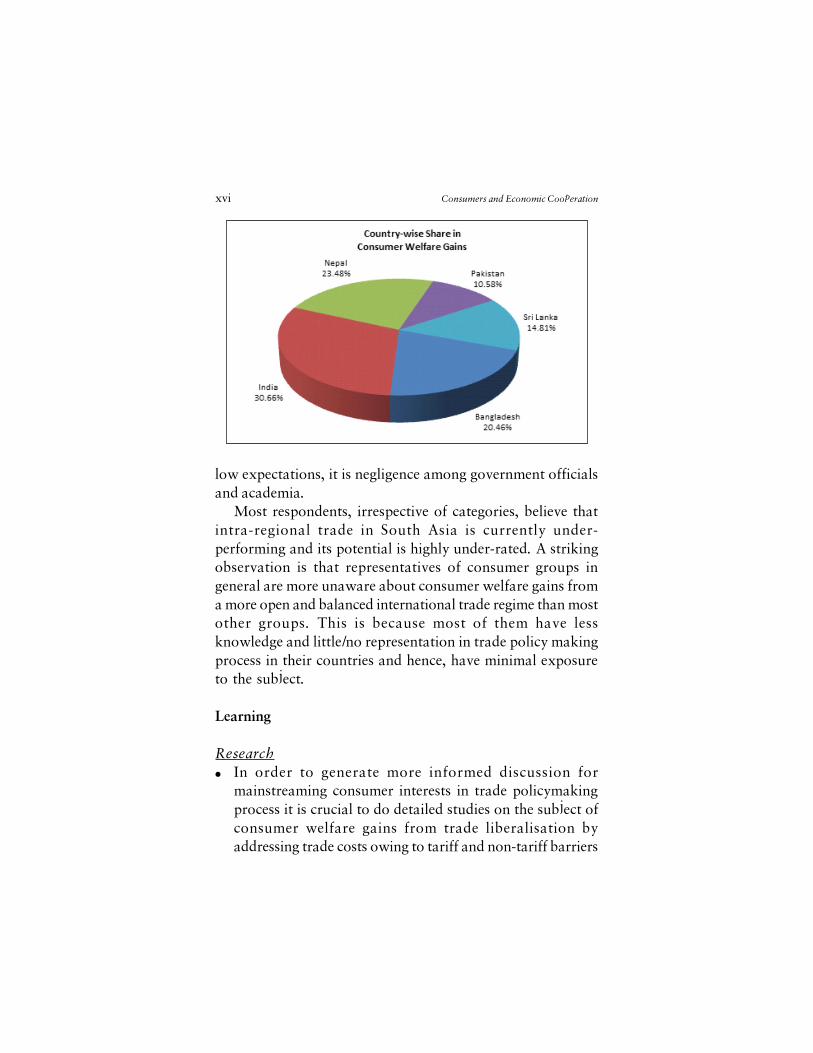
Consumers and Economic Cooperation xv
Consumer Welfare GainsCountry Number Current Aggregate Consumer
of Product Value Consumer WelfareLinesin Imports Welfare Gains
Sensitive of Gains as aLists Country (US$ Percentage
Qualified from million) of Currentfor Tariff Rest of the Value ofReduction World Imports
(US$ million)
Bangladesh 50 2781.33 398.56 14.33
India 161 1095.45 597.29 54.52
Nepal 73 1068.27 457.50 42.83
Pakistan 44 349.24 206.18 59.04
Sri Lanka 27 918.54 288.61 31.42
Total 355 6212.83 1948.15 31.36Source: Author�s calculations based on trade data 2009-10, Trade Map;International Trade Centre, Geneva & UN Comtrade Database.
low expectations, it is negligence among government officialsand academia.
Most respondents, irrespective of categories, believe thatintra-regional trade in South Asia is currently under-performing and its potential is highly under-rated. A strikingobservation is that representatives of consumer groups ingeneral are more unaware about consumer welfare gains froma more open and balanced international trade regime than mostother groups. This is because most of them have lessknowledge and little/no representation in trade policy makingprocess in their countries and hence, have minimal exposureto the subject.
Learning
Research� In order to generate more informed discussion for
mainstreaming consumer interests in trade policymakingprocess it is crucial to do detailed studies on the subject ofconsumer welfare gains from trade liberalisation byaddressing trade costs owing to tariff and non-tariff barriers
xvi Consumers and Economic Cooperation
Advocacy� Consumer concerns on trade policy matters should be
adequately represented at national, regional andinternational level
� Producer concerns such as safeguards to import sensitivesectors, non-tariff barriers including procedural barriersshould be taken into account for a balanced approach totrade liberalisation
� Publicise consumer welfare impact of enhanced intra-regional trade through popular media
� SAARC Secretariat should facilitate trade policy relateddialogues between national trade policy making bodies,industry associations and civil society organisations withthe objective of aligning consumers� interest, producers�interest and government�s concern about revenuegeneration
� SAARC Chamber of Commerce and Industry shouldconduct targeted consultations with industry associationsand consumer groups
Networking� Lack of awareness about consumer welfare gains and lack
of involvement of consumer organisations in trade policyissues are equally important causes of oversight of gainsfrom imports
� Build network of consumer organisations in the region todiscuss and spread awareness about consumer welfare gainsfrom trade liberalisation
Key Messages� One fifth of the world�s poor live in South Asia and they
are bearing the brunt of cost of economic non-cooperation� Intra-regional trade in South Asia has potential to enhance
consumer welfare gains
Consumers and Economic Cooperation xvii
� Influence of protectionism on imports marginalisesprospects of consumer welfare gains
� Trade policies and agreements have not highlightedconsumers� gains from trade liberalisation
� Lack of awareness about consumer welfare gains fromtrade liberalisation lowers stakeholders� expectations fromintra-regional trade
� Increased media and policy spaces on consumer welfaregains will change stakeholders� perceptions on the virtuesof enhanced and improved intra-regional trade
� Turn around is possible: Let us separate political issuesplaguing the region for better economic cooperation
xviii Consumers and Economic Cooperation
Chapter 1Impact of Trade
Liberalisation onConsumer Welfare in
South Asia
IntroductionThe volume and impact of international trade in the world
economy has grown phenomenally over the past few decades.The share of global trade in world GDP has gone up from 39percent in 1985 to 50 percent in 2010.1
To a large extent, this growth was made possible by anupsurge in the participation of developing countries in globaltrade, as they underwent a paradigm shift in their nationaleconomic policy outlook, embracing the now familiar conceptof �trade � an engine of growth�. This is vindicated by the factthat lower middle income countries experienced a sharperrise in trade to GDP ratio, from 32 to 56 percent during period1985-2010.2 Today, trade liberalisation has become a standardnorm throughout the developing world, albeit with varyingdegrees of levels and success.
Though numerous factors, including technology-ledreduction in transaction costs, development of production
2 Consumers and Economic Cooperation
networks, better transportation facilities, etc., have contributedto the expansion of trade in developing countries, new tradeagreements, and the role they have played in reducing tradebarriers, have been fundamental. The birth of the World TradeOrganisation (WTO) in 1995 is the single most important eventin this context.
With a strong current membership of 153 countries, theWTO popularised the importance of trade in economic growth,reinforced worldwide faith in multilateral trade negotiationsand created strong institutional support and legal instrumentsfor conducting trade negotiations based on the principles ofreciprocity and non-discrimination.
Multilateral trade liberalisation is generally considered thebest possible way for advancing the agenda of removing tradebarriers globally. It ensures market opportunities for the mostefficient and competitive producers in the world, as marketaccess to each member country are provided to all tradingpartners on a non-discriminatory basis.
However, in recent times, mediating the reciprocalexchange of trade concessions has been increasingly difficultat the multilateral level. It would be incorrect to single outone particular reason for this trend, but a closer look revealsthat a fundamentally incorrect approach towards tradeliberalisation � wherein countries look to expand their exportmarkets while preventing an increase in imports to theirdomestic markets - is one of the basic problems which oftenclouds economic reasoning.
Benefit from trade has two streams � gains to producersand gains to consumers � which are essentially inseparable.When it is said about trade that the best amongst producers ineach traded sector will capture the market by out-competinginefficient competitors and earn their right to sell, it necessarilyalso means that buyers get to choose from the best qualityproducts at the lowest possible prices. But, consumer welfare
Consumers and Economic Cooperation 3
effects of trade are often neglected, as consumers� savings dueto imports are not as visible as producers� export earnings.Moreover, import is often viewed with discontent, owing tothe challenge it may pose to the sustainability of domesticindustries.
Irrespective of the expectations and goals of participatingcountries and of the level at which it operates (multilateral,preferential/regional or bilateral), a trade agreement cannotoperate without reciprocal exchange of an import concessionfor an export opportunity. Trade agreements, by design, cannotserve a unilateral agenda of export promotion along withimport substitution. When signatories undermine theimportance of imports and view it only as a threat, tradenegotiations most likely face an impasse. This may be observedfrom the way many preferential trade agreements across theglobe function.
South Asian regional economic cooperation is spearheadedby the SAFTA. Despite this and other bilateral tradeagreements currently in operation in the region, South Asiaremains one of the least integrated regions in the world. Tradenegotiations under SAFTA have failed to influence growth inintra-regional trade in a significant way so far. The share ofintra-regional trade in total trade in the region has onlymarginally improved from 2.5 percent to 4.8 percent during1995 to 2010. Though political tensions in the region are oftenblamed for slow progress in negotiations, the propensity ofmember states to resist import risks can be found as an equallymajor cause for the limited success of SAFTA.3
It is generally recognised that SAFTA failed to achieve itsintended objective of enhancing intra-regional trade as a resultof limited product coverage.4 Though South Asian countriesshifted to more outward looking policies in the 1990s, reducingrestrictions on private sector involvement in business and trade,remnants from the previous economic policy approaches still
4 Consumers and Economic Cooperation
remain. Export promotion has replaced import substitutionas the central theme for most governments in the region, butthere are echoes of mercantilist attitude � increasing exports,while still attempting to restrict imports (World Bank, 2010).5
Protective tendency of the SAFTA member states is evidentfrom the large sensitive lists maintained by them containingproducts kept out of bounds of the Agreement�s TariffLiberalisation programme.
Concerns of unequal distribution of gains and unbalancednegotiating outcomes have also affected the interests in SAFTAfor its members. India being the largest economy by far, it hasalways been deemed that political involvement, particularlythat of India, has to be delicately balanced, so to not threatenthe negotiating positions of smaller members for the successof the Agreement (Weerakoon, 2010).
Failure to arrive at this delicate balance is often cited asanother reason for the slow rate of progress in regional trade.Longstanding border disputes and political discord,particularly Indo-Pak conflicts, have been accused of havingaffected economic relations as well.
While these factors have contributed to the weak regionalintegration of South Asia, one of the notable and oftenoverlooked results of economic non-cooperation amongcountries in the region are the high costs to consumers.
Enhanced regional trade would bring down prices of manykey commodities significantly by avoiding additional costs ofimports from outside the region. For instance, certainestimates show that Pakistan stands to save between US$400mnand US$900mn on its import bill if it allows imports fromIndia on several items replacing its present imports from othercountries at higher cost (Qamar, 2005).6
This study analyse the consumer welfare impacts of regionaltrade liberalisation in South Asia. It enquires into the resultsof previous studies on this topic as well as attempts a
Consumers and Economic Cooperation 5
quantitative assessment of potential consumer welfare gainsfrom enhanced intra-regional trade. The study also includesthe results from a perception survey which was conducted toascertain the opinions of key stakeholders in the region on therole and relative importance of consumer welfare in tradenegotiations under SAFTA.
Trade Liberalisation and Consumer Welfare: WhatDoes Theory Say?Consumer Welfare in International Trade Theory
Mercantilism, a pre-classical school of economic thoughtwhich had widespread influence in Europe during the period1500-1750, did place significant importance on internationaltrade, but only as a means of expanding the wealth of sovereignstates and maintain their military power. It was important fora country to maintain a positive trade balance � exports morethan imports � in order to ensure the net inflow of earningsfrom trade to the country were positive.7
The mercantilists prescribed that wages and other inputcosts should be kept low, so as to keep the prices of goodslower in the international markets and facilitate exports. Therewas hardly any place for consumer welfare effects of trade inthis approach.
The early classical economists, particularly David Hume(Political Discourses, 1752), pointed out a fundamental flawin the mercantilistic approach to trade. A continued inflow ofexport earnings will lead to a situation in which more moneywill be in circulation in the domestic market than is needed toclear the total goods and services available for purchase. Thiswill lead to inflation in the domestic market and, as prices goup, their price competence in the international marketdiminishes, eroding the state�s positive trade balance.8
A new approach to trade, proposed by Adam Smith (AnEnquiry into the Nature and Causes of the Wealth of Nations,
6 Consumers and Economic Cooperation
1776), popularly known as the absolute advantage theory,replaced the merchantilistic approach by pointing out hithertounrecognised benefits of trade between countries. The centralthesis is that if countries allocate their productive resourcesto produce only those goods in which they are best at andthereafter trade their surpluses with each other, it is possiblefor consumers in each country to consume more of all goods.9
Since this system entrusts production of each good to thebest producers, not only will consumers benefit from greaterquantities available for consumption but also will have theluxury of choosing the best quality products at the lowestpossible prices.
The absolute advantage theory was a radical departure fromthe earlier understanding of benefits from trade and it putconsumer welfare impact on trade centre stage.10 A subsequentqualification was made to it by the theory of comparativeadvantage proposed by David Ricardo (The Principles ofPolitical Economy and Taxation, 1817).
Comparative advantage theory reaffirmed the importanceof international trade and advances a better case for it bystating that, even if a country possesses an absolute advantagein producing all or most varieties of goods in demand, it shouldallocate its resources to produce only those goods in which ithas an advantage compared to other goods and leave productionof the rest to its trading partners. This also results in a win-win situation for all partner countries engaged in trade as totalavailability of all goods for consumption increases.
The Ricardian theory is based on productivity differencesbetween countries. But, it did not offer an explanation for theunderlying dynamics of how such productivity differencesoriginate or the role of consumer demand in sustaining trade.A series of propositions on both demand and production/supplysides of the classical trade theory augmented it and threwfurther light on potential gains from trade.11
Consumers and Economic Cooperation 7
Supply-side analysis basically enquired into the origins of acountry�s comparative advantages arising from its endowmentof the underlying factors of production.12 Accordingly,differences in technology and usage of factor proportionsdetermine the inter-country variation in production costs andhence prices, leading up to determination of relative marketcompetence of products originating from a country. Low pricestrigger demand for a particular good in the international marketand factors of production (labour and capital) seeking betterreturns naturally get reallocated to that sector in the producingcountry.
This version of neo-classical trade theory continues to havea special appeal to economists championing the cause of freetrade on the grounds of optimisation at a global level, ofproductive efficiency, consumption and the automaticutilisation of factors of production at full capacity. Here,consumer preference for goods is as important as the supplyfactors in determining price competitiveness of goods fortrading nations.
Thus, the classical trade theory and its modern variants,centred on the concept of comparative advantage, essentiallytreat consumer welfare as an integral part of benefits of opentrade and as inseparable from producer welfare.
Furthermore, positive consumer welfare gains followingopen international trade can be treated as more predictableand assured in the classical approach, while net producerwelfare gains depend on the result of redistribution of incomeof factors of production, as they are reallocated from non-tradable sectors to tradable sectors, which could be positiveor negative. It may additionally be noted that, while lowerprices directly contribute to consumer welfare gains, the risein returns to productive factors resulting from trade alsoenhance the same by raising purchasing power.
8 Consumers and Economic Cooperation
In the later period, post the development of neoclassicaltrade theories, empirical testing of real world trade patternsrevealed many interesting facts which could not be explainedsolely by the factor endowment models and their corollariesderived from classical theory. These include occurrences liketrade between countries with similar factor endowment andproductivity levels, intra-industry trade or export and importof same product categories, trade in intermediate goods orlarge amounts of multinational production, etc. A large bodyof literature, which is often classified as New Trade Theories(NTT), helped to provide partial explanations to suchphenomenon and predict patterns of trade flows (Sen, 2005).
NTTs attempt to explain the role of market structures andscale economies in determining trade patterns. Naturalpreferences of industry location and trade with movement offactors across borders are some of the areas of enquiry. But,as various commentators have noted, new theories are inconsonance with traditional classical theory and have focusedon analysing the exceptions in the traditional theory whichcall for better explanations.
Hence, the foundation of classical comparative advantagetheory, inherently embedded in the notion of consumerwelfare, still remains the single most important influence onreal world trade policy-making.
Consumer Welfare and Theory of Trade AgreementsTheoretical literature on the purpose and role of trade
agreements cite �terms-of-trade� as the major motivation andexplanation for the existence of trade agreements. A country,in an attempt to improve its terms-of-trade or in other wordslower the costs of its imports relative to earnings from itsexports, affects the terms-of-trade of its trading partners andthereby causes a negative externality on their aggregatenational welfare.
Consumers and Economic Cooperation 9
Retaliation in kind from trading partners triggers a tradewar. The basic premise of the terms-of-trade approach is that,without mediation and legally enforceable commitments toundertake trade liberalisation, trading partners willcompetitively engage in a race to improve their relative terms-of-trade with each other, causing global welfare loss (Grossmanand Helpman, 1995).
Trade agreements provide necessary legal instruments toprevent countries from falling into terms-of-trade-driven tradewars. Two of the most important principles underlying the legalinstruments of an ideal trade agreement are non-discriminationand reciprocity (Bagwell and Staiger, 1999 and 2001).13
Reciprocity forms the fundamental basis of tradenegotiations, where import allowances are exchanged forexport opportunities, guaranteeing restriction of unilateralattempts to influence own terms-of-trade by trading partners.Thus, the elementary theory of trade agreements necessitatesimport relaxation as an integral part of the trade liberalisationprocess and underscores the essential fact that producerwelfare can only coexist with consumer welfare.
One of the key questions addressed in the literature ontrade agreements is whether multilateral agreements (MTAs)are superior to preferential trade agreements (PTAs), in whichparticipation is restricted to only a small subset of countriesacross the world. Multilateral trade liberalisation under theWTO is often considered as the first best option, as non-discriminatory market access granted to all countries spanningthe WTO membership ensures self-selection of the bestproducers from a global pool. PTAs thus stand the risk ofdiverting imports from possibly more efficient producersoutside the preferential region to those enjoying preferenceswithin the preferential region.
But, PTAs have proliferated and thrived across the worldeven as the membership and scope of the multilateral systemhas widened since the formation of the WTO in 1995. A
10 Consumers and Economic Cooperation
number of alternative explanations exist to explain this. Therelative ease of negotiations with smaller membershipcompared to multilateral system, the motive of advancing tradepolicy reforms in stages, quicker way to increasing marketsize, a means to signal openness to foreign investors, etc., arefactors which make PTAs a more attractive option. A countrymay sign PTAs to lock-in its trade policy reforms and to weakenthe chances of reversal of trade liberalisation policies at thenational level. The relative ease of negotiations also means thatdeeper levels of trade liberalisation, beyond mere tariff reductionin goods, may be more easily achieved at the regional level andhence PTAs are preferred to multilateral agreements to pursethe goals of cross-border investments and trade in services(Bhagwati and Panagariya, 1996).
A number of political motives are also attributed to thegrowth of PTAs. PTAs are often used as a tool to reinforcediplomatic relationships between countries. Such agreementsare entered into with the intention of pooling commonresources, warding off external threats, by showing regionalsolidarity and increasing collective bargaining power at themultilateral level (Rodrik, 1995).
Some empirical research studies discount the negative tradediversion effects of PTAs and find economic justification inPTAs signed between countries closer to each other in termsof physical distance, complementary export and import basketsand those with comparable economic size (see WTO, 2011).
Irrespective of their relative economic merits, themultilateral trading system and PTAs function under the sameguiding principles and share many common objectives. Thebasic construct of reciprocity is necessarily the backbone ofPTAs as well. Without realising the importance of imports ina mutually beneficial trade relationship, PTAs cannot function,despite their advantage in terms of smaller administration costs.Thus, consumer welfare, though often overlooked, is animperative at all levels of trade liberalisation.
Consumers and Economic Cooperation 11
Regional Economic Cooperation in South AsiaSouth Asian countries with relatively open economies in
the immediate post-independence period in the 1940s generallyresorted to inward-looking policies subsequently and rankedamongst some of the most protected countries in the worldby the 1970s. Government interventions in economic activitywere high and tariff and non-tariff barriers made South Asianmarkets inaccessible, until a gradual reversal in economicoutlook started in the region from the 1980s onwards.
Nevertheless, the move towards opening up and liberalisingstate control has been gradual and countries in the regionfocused on exploring other export markets outside the regionrather than within. From the early 1990s, led by the reformprocess in India, trade liberalisation in the region expanded,resulting in high growth in trade and domestic income(Weerakoon, 2010).
The South Asian Association for Regional Cooperation(SAARC) comprising seven South Asian countries, Bangladesh,Bhutan, India, Maldives, Nepal, Pakistan and Sri Lanka, wasformed in 1985 with the adoption of its Charter at its firstSummit in Dhaka, Bangladesh. It was created to enable andfacilitate periodic, regional consultations on matters of mutualinterest and to explore the possibility of cooperation ineconomic, social, cultural and other fields.
In April 1993, the proposal to set up a SAARC PreferentialTrading Agreement (SAPTA) was accepted by all sevenmember states and SAPTA came into formal operation inDecember 1995. SAPTA was initially viewed as an instrumentthat could transform the South Asian trade landscape throughgreater regional integration. This optimism began to wane withthe slow progress of SAPTA under four rounds of tradenegotiations, as it did not increase the volume of intra-regionaltrade and investment flows. This was mainly because of thelimited tariff preferences extended to a country�s trading
12 Consumers and Economic Cooperation
interest, limited depth in tariff cuts and prevalence of non-tariff barriers (NTBs).
Contrary to general belief, the rules of origin of SAPTAwere more liberal compared to other PTAs, as a product wouldbe considered as originating from a country if it generated alocal value-added content of 40 percent (30 percent for LDCs).This also included profit made not only by the manufacturersbut also by the traders. The non-qualifying/minimal operationswere confined to packaging and transportation operations only.
These problems were visible in the first preferential tradingarrangement in Asia, the Bangkok Agreement (BA), and werehighlighted before SAPTA came into operation.14 Free tradeagreements make substantial provisions on simplification ofbanking facilities for import financing, transit facilities for thelandlocked countries, removal of barriers to intra-SAARCinvestments, macroeconomic consultation, rules for faircompetition and promotion of venture capital, developmentof communication systems and transportation infrastructure,easing foreign exchange controls on repatriation of profits andsimplification of procedures for business visa, etc., that mayremove existing impediments to further expansion of intra-regional trade.
Intra-regional trade remains disappointingly low, accountingfor about four percent of trade in South Asia. Political tensionsin the region, particularly between India and Pakistan, haveonly served to undermine regional economic cooperation(Weerakoon and Wijayasiri, 2001). A number of SAARCmember countries decided to embark on bilateral free tradeagreements (BFTAs). The Indo-Lanka BFTA was signed inlate 1998 and came into operation in early 2000. Long existingIndo-Nepal treaties were formalised as a BFTA in 1996 (RIS,2004).15
In addition, several South Asian countries joined widerregional groupings in Asia such as the Indian Ocean Rim
Consumers and Economic Cooperation 13
Association for Regional Cooperation (IOR-ARC initiated in1997) and BIMSTEC (Bangladesh, India, Myanmar, Sri Lankaand Thailand Economic Cooperation initiated in 1997). Boththese groupings were not preferential trading blocs � IOR-ARC was based on open regionalism, where unilateral tradeliberalisation was advocated, while BIMSTEC was initiallybased on sectoral cooperation. Membership in such pan-Asianregional groupings was obtained by some South Asian countriesin the hope of gaining more economic benefits, which theSAPTA process was not delivering. These regional groupingswere also not very effective in generating trade among membercountries.
The SAFTA Agreement was signed in January 2004 duringthe twelfth SAARC Summit in Pakistan. The Agreement cameinto force in January 2006. The Agreement has come at atime when the trading environment in South Asia wascomplicated by the slow progress of SAPTA and a number ofparallel regional and pan-regional initiatives were being put inplace. Hence it consists of far-reaching trade and investmentliberalisation measures that go beyond the removal of tariffsand NTBs (Hirantha, 2002).
The SAFTA Ministerial Council (SMC) has also beenestablished, which comprises of the Commerce Ministers ofall the Member States. To assist SMC, a SAFTA Committeeof Experts (SCOE) has been formed. So far, seven meetings ofthe SAFTA Committee of Experts have been held. The seventhmeeting is scheduled to be held in 2012 in Pakistan. In August2011, the total value of exports of Member States of SAFTAhas reached around US$1.3bn since the launching of SAFTATrade Liberalisation Programme in July 2006.
The member countries in SAFTA not only have close culturaland historical ties but also follow similar trade policies aftertheir independence. When comparing in terms of economicstructure, namely, savings as a percentage of GDP,
14 Consumers and Economic Cooperation
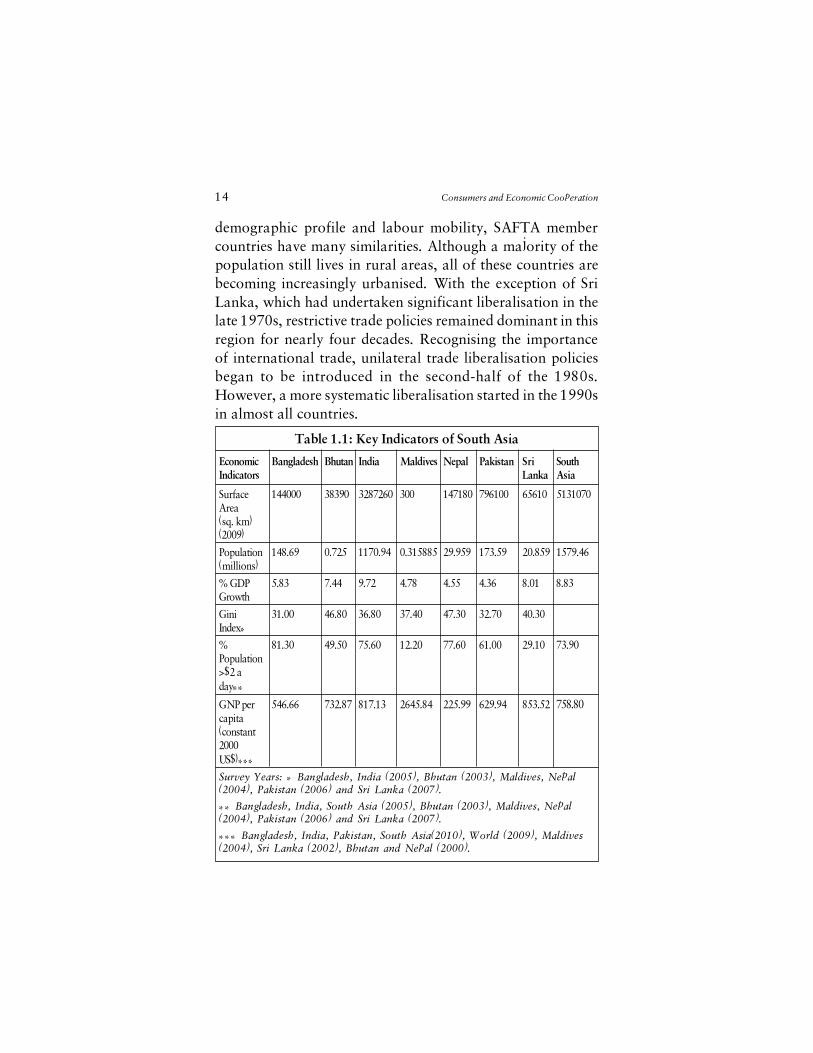
demographic profile and labour mobility, SAFTA membercountries have many similarities. Although a majority of thepopulation still lives in rural areas, all of these countries arebecoming increasingly urbanised. With the exception of SriLanka, which had undertaken significant liberalisation in thelate 1970s, restrictive trade policies remained dominant in thisregion for nearly four decades. Recognising the importanceof international trade, unilateral trade liberalisation policiesbegan to be introduced in the second-half of the 1980s.However, a more systematic liberalisation started in the 1990sin almost all countries.
Table 1.1: Key Indicators of South Asia
Economic Bangladesh Bhutan India Maldives Nepal Pakistan Sri SouthIndicators Lanka Asia
Surface 144000 38390 3287260 300 147180 796100 65610 5131070Area(sq. km)(2009)
Population 148.69 0.725 1170.94 0.315885 29.959 173.59 20.859 1579.46(millions)
% GDP 5.83 7.44 9.72 4.78 4.55 4.36 8.01 8.83Growth
Gini 31.00 46.80 36.80 37.40 47.30 32.70 40.30Index*
% 81.30 49.50 75.60 12.20 77.60 61.00 29.10 73.90Population>$2 aday**
GNP per 546.66 732.87 817.13 2645.84 225.99 629.94 853.52 758.80capita(constant2000US$)***
Survey Years: * Bangladesh, India (2005), Bhutan (2003), Maldives, Nepal(2004), Pakistan (2006) and Sri Lanka (2007).
** Bangladesh, India, South Asia (2005), Bhutan (2003), Maldives, Nepal(2004), Pakistan (2006) and Sri Lanka (2007).
*** Bangladesh, India, Pakistan, South Asia(2010), World (2009), Maldives(2004), Sri Lanka (2002), Bhutan and Nepal (2000).
Consumers and Economic Cooperation 15
Economic growth accelerated in many of these countriespost-1990s and the average annual growth of GDP per capitaimproved in almost all countries in the period 1996-2006. HighGDP growth rates did not contribute to the improvement inper capita income in these countries, reflecting a highpopulation growth rate, with the exception of Bhutan. Indiais the largest country, followed by Pakistan, in terms of bothsurface area and population. Therefore, India and Pakistanhave crucial roles to play in ensuring successful regionalcooperation in the South Asian region (Hirantha 2002).
Trade in the SAFTA region is currently low. Most of theSAFTA member countries have a low trade-GDP ratio andhave initiated external sector liberalisation (that is, bringingdown tariff barriers), starting only in the 1990s. A large numberof NTBs currently exist in the region (Banik, 2001).
As McCombie and Thirlwall (1997) and Paulino andThirlwall (2004) point out, robust economic growthencourages a more liberalised trade regime. With a similarexport profile, trading partners are better off with fewerrestrictions. Because countries in the SAFTA region share asimilar export profile, they also face the same types of NTBs.
Hence, they share a similar negotiating stance for removingthese barriers. Most countries in SAFTA are undertakingconsiderable external sector liberalisation (ESCAP, 2006).
South Asian countries exhibit many similarities in economicactivity, implying that long run movements in real output arelikely to be similar. Such co-movements of outputs may bedue to common factors such as geographical proximity andsimilar industrial profile. When countries share a similarindustrial profile and are located closely, demand shocks inone country may spread regionally. This could also arise asthese economies all share common trade linkages with majorexport markets such as the EU and the Middle East.
16 Consumers and Economic Cooperation
Another reason for the presence of common economictrends and hence co-movements of output could be explainedthrough intra-industry trade. As far as the trade structure isrepresentative of the output structure, the cycles shouldbecome more synchronised because they would be affectedby common shocks. This is the argument of Kenen (1969),who stated that when countries trade in similar commodities,this increases the synchronicity of their output.16
In fact, this aforementioned economic characteristic ofSouth Asian countries will enable them to go beyond the FTAframework and work for deeper economic integration, suchas forming a common market and economic union (Banik,Biswas and Saunders, 2006).
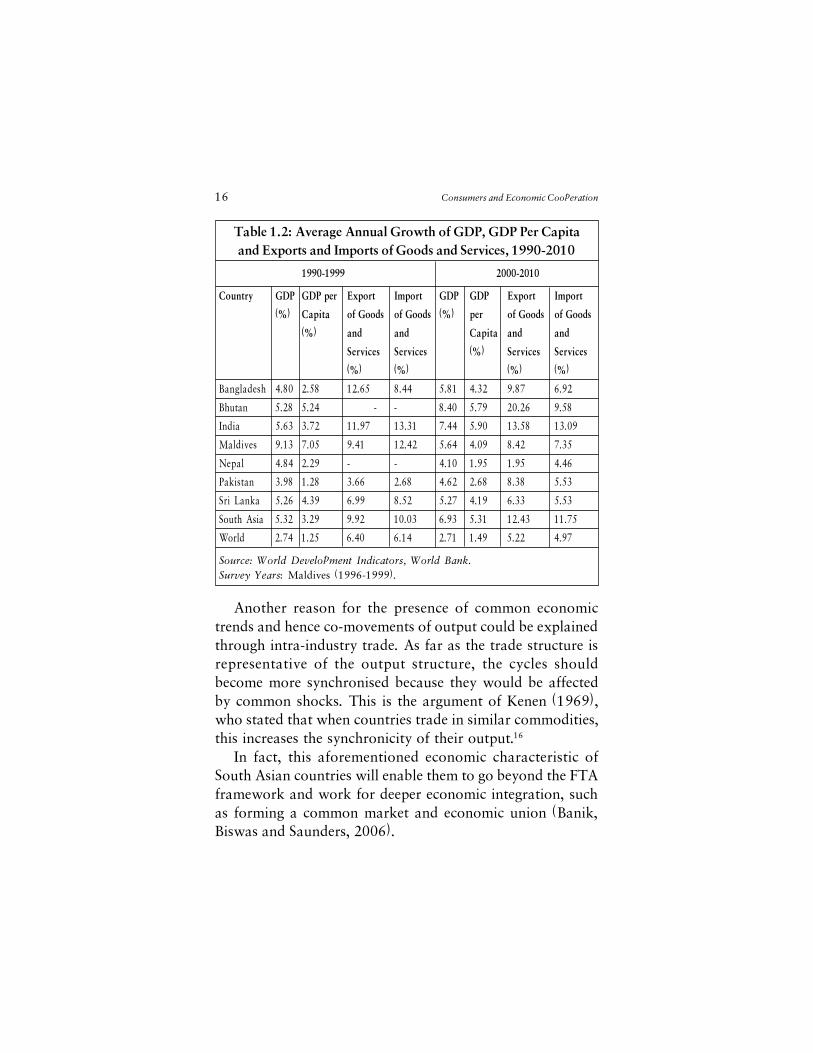
Table 1.2: Average Annual Growth of GDP, GDP Per Capitaand Exports and Imports of Goods and Services, 1990-2010
1990-1999 2000-2010
Country GDP GDP per Export Import GDP GDP Export Import
(%) Capita of Goods of Goods (%) per of Goods of Goods
(%) and and Capita and and
Services Services (%) Services Services
(%) (%) (%) (%)
Bangladesh 4.80 2.58 12.65 8.44 5.81 4.32 9.87 6.92
Bhutan 5.28 5.24 - - 8.40 5.79 20.26 9.58
India 5.63 3.72 11.97 13.31 7.44 5.90 13.58 13.09
Maldives 9.13 7.05 9.41 12.42 5.64 4.09 8.42 7.35
Nepal 4.84 2.29 - - 4.10 1.95 1.95 4.46
Pakistan 3.98 1.28 3.66 2.68 4.62 2.68 8.38 5.53
Sri Lanka 5.26 4.39 6.99 8.52 5.27 4.19 6.33 5.53
South Asia 5.32 3.29 9.92 10.03 6.93 5.31 12.43 11.75
World 2.74 1.25 6.40 6.14 2.71 1.49 5.22 4.97
Source: World Development Indicators, World Bank.Survey Years: Maldives (1996-1999).
Consumers and Economic Cooperation 17
More liberal government policies are likely to be beneficialfor an FTA. There is a general consensus in the literature thattrade volume, for both exports and imports, increases followingexternal sector liberalisation (Agosin and Kohli, 1991). Highertrade volume resulting from external sector liberalisation isexpected to increase the likelihood of FTA formation.
Today, South Asia accounts for only three percent of globalgross domestic product (GDP), even though one-fifth of theworld�s population lives in the region (UNCTAD 2008a). Inthe area of investment, according to ADB�s Asian DevelopmentOutlook (2007), South Asia has averaged more than 7.5 percentgrowth since 2003.
In 2004-06, FDI to South Asia increased by an average ofUS$13.3bn per year. FDI inflows to South Asia in 2006amounted to US$22274mn � a paltry 2.1 percent of the region�sGDP and a mere 1.6 percent of world FDI. South Asia�s FDIshare is not even an eighth of East Asia�s US$214.2bn(UNCTAD 2008a).
In 2006, FDI outflows from South Asia amounted toUS$9820mn. These numbers show the extent of untappedopportunity, in terms of foreign markets and investments,which exist for South Asia.
South Asian Free Trade Agreement: A Review ofLiterature
Because of the current low levels of intraregional trade inSouth Asia and the limitations of the SAFTA process to providedynamism to regional trade, many observers believe thatregional economic integration in South Asia is likely to remaina distant dream. However, many researchers are of the viewthat SAFTA should be better judged by its unexploitedpotential, rather than by its achievements so far. Accordingly,the performance of the Agreement so far may not be the idealmeasuring road for evaluating its desirability.
18 Consumers and Economic Cooperation
While there is a rich body of literature on the benefits andfeasibility of SAFTA, there is no consensus on the potentialeconomic effects of SAFTA. Nevertheless, internationalinstitutions and bodies recognise it is vital for the region�sgrowth aspirations. The Asian Development Bank (ADB)recognises the critical role of regional cooperation andintegration in South Asia in achieving the MillenniumDevelopment Goals by 2015, in that they can help in unlockingthe region�s vast economic potential, in achieving sustainedand rapid growth and in reducing poverty (ADB, 2008). 17
It is widely recognised that irrespective of precise economicoutcomes in the short run, in the long term, regionalcooperation and integration will enable South Asia to play amore effective role in wider Asian integration (Kelegama andAdhikari, 2002, Kemal, 2004, Delgado, 2007, Kabir, 2007,ADB and UNCTAD, 2008, Lee, 2008 and De, 2009). Evenstudies which are sceptical about the monetary outcomes ofthe initiative, find benefits in terms of regional peace and othernon-economic dividends (Panagaria, 2003, and Nag, 2008).
Since it is not practical to cover the entire gamut of issuescoming under the purview of regional economic cooperation,focus in each work has been restricted to a numbered part ofthem and hence the outcomes and predictions also vary acrossstudies because of the partial nature of analysis. In the sectionsbelow, a review is offered which distinguishes betweenconceptual arguments and empirical results in the literatureon South Asian trade. It is followed by an assessment of thekey gaps in existing literature on regional economic integrationin South Asia.
Economic Case of SAFTAMany studies have analysed the success of SAFTA on the
basis of the existence of necessary economic conditions forsuccess of RTAs like trade complementarities and differences
Consumers and Economic Cooperation 19
in competitiveness of the countries. Indices of tradecomplementarity, which indicate reciprocal demand fortrading partners� exported products, are used to assess whethera proposed regional trade agreement will succeed. Kemal etal. (2000) used such indices for all five leading South Asiancountries and found that there is a lack of strong tradecomplementarity in the bilateral trade structures of South Asiaand hence expressed low expectations from the futureprospects of SAFTA.
Pitgala (2005) addresses the issue of whether the SouthAsian countries possess the requisite conditions to become asuccessful trading block by going beyond simplecomplementarity, using the �natural trading block� hypothesis.The study uses three definitions of the �natural trading block�hypothesis, i.e. the trade volume, geographic proximity andthe complementarily approaches. By trade volume approach,which suggests that members of a regional agreement shouldtrade disproportionately with each other in order to be asuccessful bloc, it was found that the South Asian economiesfall short.
Evidence from this work does not support the �geographicalproximity� hypothesis, reflected by the trade intensity index(TII), either, with the South Asian countries demonstratingan increased tendency to trade with industrial countries dueto cultural ethnic or religious affiliations. Results of theapplication of complementarity criterion also confirmed earlierresults that prospects of regional trade are quite low.18
Krueger (2004) puts forward a similar view that, althoughpotential gains exist from SAFTA, the South Asian region doesnot meet most of the theory-based criteria for successful tradeagreements. The study concludes that, since the profile ofregional trade indicates trade in similar goods, SAFTA haslimited capability to increase intra-regional or extra-regionaltrade for its member states.
20 Consumers and Economic Cooperation
Nevertheless, there are counter arguments which critiquesuch claims. One of the major problems of analysis in theapplication of various criteria in the studies mentioned aboveis that they account for only past trends in goods trade fromthe era of regional trade restrictions. Despite reforms in theexternal sector, trade among South Asian countries is stillrestrictive, especially considering the sectors whereopportunities for trade exist (Ghani and Din, 2006).
The comparative advantage of these countries lies in thelow technology-intensive items such as agricultural products,leather footwear, textiles and clothing. As the level ofeconomic development increased following reforms, the regionhas exhibited diversification in export baskets and trends inintra-industry trade have also changed (Hassan, 2001,Rodriguez-Delgado, 2007).
One of the most frequent arguments levelled against SAFTAis that the Agreement is expected to increase regional trade (tradecreation) but may do so at the expense of trade flows from moreefficient non-regional suppliers (trade diversion). Baysan et al,(2006), examine the economic case for SAFTA in the light ofother preferential trading arrangements in the region, particularlyIndia Sri Lanka Free Trade Agreement (ISFTA).
The study suggests that SAFTA is unlikely to find the mostefficient suppliers within the region and harmful tradediversion may result. But, SAFTA will present firms in membercountries with the opportunity to exploit economies of scalethrough access to an enlarged and diversified market.
Complementarities which previously did not exist wouldbe found in such a scenario. Some quantitative studies basedon Global Trade Analysis Project (GTAP) modelling point tonet welfare gains for the region as a whole and suggest thatSAFTA will be trade-creating, which, in turn, would offerdynamic gains (Derosa and Govindan, (1996). Some studiesdemonstrate that such gains would be much larger for theregion when liberalisation is on a non-discriminatory basis.
Consumers and Economic Cooperation 21
Currently, the level of protection amongst SAARC countriesis very high and barriers to intra-regional trade are especiallyhigh. Much of the unexploited potential thus cannot beunearthed by observing past trends. One of the reasons whichmakes the economic case for SAFTA appear weak is thepolitical economy of selection of the excluded sectors fromapplication of preferential rates and rules of origin (RoO) issue.
As domestic lobbies make sure that the sectors that do notwithstand competition are excluded from tariff preferencesand go along free trade in sectors in which they are competitive,inefficient selection of excluded products is the outcome whichsubsequently results in weak possibilities for actual trade andthus real potential remains hidden.
A similar outcome occurs due to strict RoO. One of themain arguments advanced in favour of SAFTA is that there issubstantial informal trade between countries. An FTA maymake formal trade even more expensive than informal tradeby adding to the costs of complying with the RoO. SimplifiedROOs and application of preferential trade thus may makeformal trade viable and thus a major chunk of the unaccountedtrade will surface to the effect that the Agreement�s role inadvancing trade relations will be found much more thanconventional expectations (Weerakoon, 2010).
It has often been argued, particularly in earlier studies, thatthe move toward SAFTA gained momentum due to politicalreasons. Following a trend around the world, SAFTA wasconceived with a political agenda, rather than economic.SAFTA is often seen as a vehicle for promoting political tiesbetween India and Pakistan.
Bandara and Wusheng (2001) and Hossain (2006) expressthe view that the possibility of free trade will not be operationalwithout resolving political issues between member countries.Frail diplomatic relations between India and Pakistan havebeen analysed as a major hindrance to the success and future
22 Consumers and Economic Cooperation
of SAFTA in South Asia (Hussain, 1999, Mukherjee, 2004,and Dhungel, 2008). It should be noted that trade negotiationsare often seen as a means of resolving political conflict, evenas political tensions are accused of preventing the progress ofnegotiations.
SAFTA is likely to lead to stronger economic growth,notwithstanding the controversies pertaining to trade anddevelopment policies and the mixed results of specific impactsfrom various studies. The Agreement would help to promotepolicy credibility by �locking in� uniform trade and investmentpolicies among member countries (Ahmed and Ghani, 2008).19
Group action may influence all members to abide by acommon reform agenda. Of course, RTAs do not guaranteeequal distribution of benefits to members. Since India is a largeand rapidly growing member country of SAFTA, it has thepotential to serve as a �growth-pole� for the region and couldhave growth-enhancing effects for the region.
In addition, further inroads towards smoother functioningof SAFTA are yet to be made by bringing trade in servicesunder its purview. This is necessary in view of the fact thatabout 50 percent of the value added to South Asian GDPoriginates from the services sector. The content and meaningof the discussion on the viability of regional trade based onindicators like complementarity will change substantially, oncethe scope of the Agreement increases.
Quantitative AssessmentsAs mentioned in the previous section, one of the most
pressing questions is whether the regional agreement wouldresult in overall inefficiency induced by trade diversion.Hirantha (2002) examined the progress of SAPTA and theprospects of SAFTA using trade data for 1996 to 2002, usinga gravity model. The gravity model results show strongevidence of trade creation in the region under SAPTA with no
Consumers and Economic Cooperation 23
trade diversion effects, as far as trade with non-members isconcerned. According to the study, this is because an increasein intra-regional trade would be accompanied by an increasein trade with non-members.
Based on studies conducted using the framework of thegravity model, RIS (2004) reports similar results. In conformitywith previous studies, RIS suggests that complete eliminationof tariffs under SAFTA may increase the intra-regional trade1.6 times. It further suggests that, in the dynamic framework,the gains from liberalisation are at least 25 percent higherthan the static gains and the long run trade diversion effectswould be minimal, as a competitive environment would helpdomestic industries to mature in due course.
SAFTA consists of far reaching trade and investmentliberalisation measures that go beyond the removal of tariffsand NTBs. Free trade agreements make substantial provisionson simplification of banking facilities for import financing,transit facilities for landlocked countries, removal of barriersto intra-SAARC investments, macroeconomic consultation,rules for fair competition and promotion of venture capital,development of communication systems and transportationinfrastructure, easing foreign exchange controls on repatriationof profits, simplification of procedures for business visa, etc.,that may remove existing impediments to further expansionof intra-regional trade.
A series of studies incorporated the effects of suchdimensions in the traditional analysis and found that a numberof factors would contribute to generating welfare-generatingoutcomes from trade in the long run.
Further, some of these studies also suggest that long runefficiency gains in export industries due to positive spillovereffects from intra-regional trade will enhance trade with non-members.
24 Consumers and Economic Cooperation
It is, therefore, suggested that efforts are made to expeditenecessary structural adjustments in member states and tradepolicy reforms and allied facilitation measures shouldnecessarily be adopted with tariff negotiations. Thus, theproposition that comprehensive regional integration will bringabout substantial benefits to SAARC region is well foundedin the literature.
Raihan and Razzaque (2007), using computable generalequilibrium (CGE) modelling, estimated the trade creation andtrade diversion effects of SAFTA. They show that a fullimplementation of SAFTA will lead to welfare gains for India,Sri Lanka and other South Asian countries, though Bangladeshwill suffer from welfare loss. Bangladesh�s welfare loss ismainly driven by the negative trade diversion effect.
However, the simulation results also suggest that thenegative trade diversion effect can be undermined by someassociated unilateral trade liberalisation measures. Bangladeshand other LDCs in South Asia will have to raise their exportshare into the Indian market substantially, in order to increasewelfare through positive terms of trade effect. Exportdiversification in this regard is very important.
Kumar and Saini (2007) examined different scenarios forSAFTA and its implications on the welfare of each country.They find that a South Asian Free Trade Area, as envisagedunder SAFTA, does not result in equal welfare gains for allthe member countries. SAFTA results in small welfare gainsfor all the South Asian countries, with the exception ofBangladesh. The rest of South Asia gains by about half-a-billiondollars, while India gains by about US$204mn and Sri Lankaby just US$89mn. Bangladesh, on the other hand, sufferswelfare losses of about US$225mn. The gains in welfare forIndia and Sri Lanka are basically due to gains in terms of tradeand, to a lesser extent, from improvements in allocativeefficiency.
Consumers and Economic Cooperation 25
The results of this study also show that Bangladesh�s apparelsector gains more on account of its increase in global exports,which could increase as much as six percent on account ofSAFTA. As a result of SAFTA phase II, Bangladesh�s globalexports of wearing apparel show increase of about US$262mn,of which only US$3mn are apparel exports to South Asiancountries. Thus, 98 percent of wearing apparel exports are tothe rest of the world. This is also corroborated by the factthat, in SAFTA phase II, India�s textiles exports to Bangladeshincrease by 84 percent and 90 percent of India�s total SouthAsian textile exports increase goes to Bangladesh.
Certain studies show sectoral gains in agricultural andchemical products, electrical and electronic equipment, etc.20
Sectoral predictions include India�s gains in agricultural sectorslike sugar, poultry, dairy and manufacturing, including motorvehicle parts. There are losses to sectors like wearing appareland leather. Pakistan gains mainly in wheat, horticulture andtextiles, with setbacks likely in sugar and wearing apparel. SriLankan gains would be less pronounced, since it already hasan FTA with India, and is about to conclude an FTA withPakistan. There is likely to be a similar situation with Bhutanand Nepal.
One of the most important observations from sectoralstudies is that India�s gains would suffer if Pakistan partiallyparticipates in SAFTA. These results indicate that predictedlosses to LDCs can be offset by exploiting key sectors ofcompetence. Even studies which foresee marginal welfarelosses predict overall positive employment generation effectsfor LDCs, particularly Bangladesh (Gilbert, 2008, and Bouetet al., 2010).
In addition, quantitative studies acknowledge the limitationsof subjecting the potential benefits from greaterrapprochement, diplomacy and stability owing to greaterinvolvement through SAFTA.21 However, despite such
26 Consumers and Economic Cooperation
omissions owing to methodological limitations, the neteconomic impact of SAFTA can be seen as beneficial. Allcountries experience welfare gains albeit at varying degrees,but it would be important to give some flexibility to countriesto protect their vulnerable sectors � this is particularly thecase for the manufacturing sector in the smaller LDCs (Dayalet al., 2008).
Even in the case of LDCs, gains are generally predicted tobe modest only in the initial phase of liberalisation and wouldturn out to be significant subsequently, once there iscomprehensive liberalisation.
Omissions in the Traditional AnalysisA larger role of a free trade agreement for the overall benefit
of South Asia with its wide-ranging potential impacts has beenwell recognised in the literature, though all the previous studiesmiss out on certain specific positive outcomes, which areextremely difficult to quantify. It is crucial to pay attention tothe main observations on intangible benefits, which are oftenforgotten, in order to truly appreciate the prospects of SAFTA.
Zalazar-Xirinachs (2004) observes in the context of anextensive survey on Latin American trade agreements that amajor positive influence of RTAs on domestic policy reformis by way of positive behavioural changes in the traditionallyrent-seeking behaviour by the business communities. The studynotes that �in many countries, the prospect and the reality ofincreased import competition has led the local businesscommunities to be more interested in reducing domesticdistortions in transportation costs, the costs of telephone calls,electricity rates and interest rates that hinder their ability tocompete with firms from countries with which FTAs havebeen entered�.
A joint report by ADB and UNCTAD (2008) predicts thispossibility in the case of South Asia. SAFTA, to the extent
Consumers and Economic Cooperation 27
that it reduces rents for high tariff protected intermediateproducts, will reduce costs for downstream finished productmanufacturers and make them more cost competitive, bothregionally and globally. Regional Trade Agreements can,therefore, help countries build on their comparativeadvantages, sharpen their industrial efficiency and act as aspringboard to integrate into the world economy. It has beenargued that increased economic integration would carry withit the ability not only to secure new and larger markets fortraditional products but also to enable the diversification ofdomestic economic structures.
More recent studies have highlighted this aspect and have,therefore, argued for pursuing deeper economic integrationin South Asia, not only in trade in goods but also in servicesand investment (Chanda, 2005, De, 2005, 2009) and Mehta,2005.
Trade facilitation, covering a wide range of reforms foreasing trade flows, is a sensitive issue which has not beenadequately examined in existing literature. Transportation isperhaps the most troublesome aspect of trade facilitation inthe region. Roy and Banerjee (2010) note that, despite anintegrated road and rail network that connected most of SouthAsia during the colonial era, overland connectivity betweenSouth Asian countries today is suffering and is hostage to thepolitical climate prevailing in the region.
The most important observation on this topic is in fact that,in South Asia, unlike most other developing regions in theworld, lack of adequate transport infrastructure is not themost pressing issue (Weeraheva, 2009, Hertel and Mirza,2009), but an antipathy towards putting it to use is a muchgreater hurdle.22
Pakistan�s refusal to allow overland traffic to India fromAfghanistan and Bangladesh�s reluctance to open an overlandroute connecting north-east India to the rest of South Asia
28 Consumers and Economic Cooperation
and the port of Chittagong has prevented a trans-South Asianroad network from emerging. Even where overland routes doexist, such as between Bangladesh and Nepal and Bangladeshand Bhutan through India, rent-seeking officialdom is identifiedto have made trade unduly expensive. Like roads, railwaysalso suffer from behind-the-border issues like:� Lack of efficient railway dry ports with logistical support;� Rent-seeking and theft of cargo while in transit;� Lack of multi-modal linkages with railways; and� Lack of efficient and cheap trans-shipment facilities
between rail hubs and seaports (in some cases).Smooth transit is of very high intrinsic value and should
necessarily be an integral element of any cross-bordermovement of goods and vehicles and yields significant influenceon national and regional economies.23 The presentarrangement of transit in South Asia is bilateral, where Indiaprovides overland transit to Bangladesh, Nepal and Bhutanfor their bilateral trade and maritime transit to Nepal andBhutan for their international trade. The prospect of growthin trade volume is definitely going to focus attention on totransit-related administrative reform, governance and security.Improvement in these areas will hike the current modestestimates of trade benefits in unimaginable ways. These factorsneed to be taken into consideration in the traditional analysis.
An efficient overland infrastructure would allow goods tomove smoothly across South Asia, reaching out to the mostefficient hub using multi-modal means. The resultantcompetition would lead to the emergence of efficient hub andfeeder route combinations, using rail, road, and regionalshipping routes, greatly reducing the transaction costs imposedon South Asia�s entrepreneurs. Many of these entrepreneursare left out of the global and the regional market preciselybecause they are priced out of it by the incidence of transactioncosts on trading (Banerjee and Roy, 2010).24
Consumers and Economic Cooperation 29
As can be seen from the global trend of reforms of customsadministrations, South Asian countries too have seenimprovements in the overall quality of their customs-relatedbureaucracy, though it still leaves scope for improvement by ahuge margin. With the exception of Afghanistan and Bhutan,the widespread use of electronic data interchange (EDI) andthe increasing use of paperless transactions has become thenorm in South Asia�s customs administration.
However, the scope of EDI and the use of informationtechnology (IT) are still limited and there is ample room forimproving the level of procedural simplicity and documentationrequirements. In all countries, many agencies, apart fromcustoms, involved with the clearance of goods, are not yet upto the mark in automation and hence paper trails remain. It isnot so much the absence of an IT infrastructure, whichincreasingly is less of a concern, but rather the lack ofmovement in procedural reforms that is holding up furtherefficiency gains at South Asia�s customs gateways (Banerjeeand Roy, 2010).
South Asian economies are aiming to undertake tradefacilitation measures that will greatly reduce current physicaland non-physical barriers to trade by means of both visibleinfrastructure (such as multi-modal corridors and terminals)and invisible infrastructure (such as reformed policies,procedures and regulations).
Due to the lack of adequate research on trade facilitation,not much information is available on either the multiplier effectsit will generate or on the benefits through inter-industrylinkages such a situation will kick-start. This is not only anarea of research that needs special attention from scholars inSouth Asia but is also a key consideration for policy makerstaking decisions on the issue.
30 Consumers and Economic Cooperation
ConclusionsIn classical trade theory and its modern variants, centred
on the concept of comparative advantage, consumer welfareis treated as inseparable from producer welfare. Further,positive consumer welfare gains, following open internationaltrade, are considered as more predictable and assured, as netproducer welfare gains depend on the results of redistributionof productive factors from non-tradable sectors to tradablesectors, which can be positive or negative.
New Trade Theories, which attempt to explain phenomenalike intra-industry trade, effects of externalities, technologicaladvancements, increasing returns to scale owing to trade, etc.,go beyond the restrictive assumptions of classical comparativeadvantage theory, but none of these schools of thought can beobserved to critique, in any way, the potential positiveconsumer welfare gains arising out of open international trade.
Theories of trade agreements (principally, the terms-of-trade theory) show that the primary function of tradeagreements is to resolve the mistrust between trading partnersdriven by terms-of-trade wars which lead to sub-optimal traderelations between them.
For this, these theories predict that reciprocity andtransparency are the most crucial or inevitable principles ofideal trade agreements. This strand of theoretical literaturealso reveals that consumer and producer welfare gains areoften wrongly treated separately, because they accrue distinctlyto the importing and exporting countries respectively.
The critical observation here is that it is both theoreticallyand practically impossible for a trade agreement to function ifone or more of participating countries expect either onlyproducer welfare gains or only consumer welfare gains out ofit. Each member state must show willingness to accept amixture of both.
Consumers and Economic Cooperation 31
A frequently cited reason for the hitherto failure of SAFTAis the preservation by member countries of a large number ofproducts with intra-regional trade potential under sensitiveor protective lists. Quantitative assessments on the economicimpacts of SAFTA, are by and large inconclusive, as studiesfind both overall positive as well as negative impacts. Empiricalresults depend primarily on the assumptions made in theunderlying modes used for the analysis and they vary widelybetween studies.
Similarly, there exist arguments for and against the positivepotential effects of SAFTA in the studies using theoretical andpolitical economy approaches. For instance there arecompelling counter arguments in the literature to prove thatthere need not be any negative trade diversion impact as aresult of trade liberalisation under SAFTA, which has beenoften cited as a major concern.
The consumer welfare impact of SAFTA is almostcompletely ignored in the literature so far. Consumer welfaregains find a mention only in quantitative studies using generalequilibrium models. Even in such studies, this concept istreated only partially as general equilibrium models generateonly overall gains net of producer and consumer welfare gains.
Chapter 2Potential Impacts
of SAFTA onConsumer Welfare:
A Quantitative Assessment
IntroductionAs narrated in the previous chapter, though existing
literature on potential impact of SAFTA remains inconclusive,most of the available research results do not discount thepossibility of member countries drawing high economic andpolitical dividends from the initiative. Many researchers areof the view that the potential of SAFTA to contribute towardseconomic growth and development in the region is hidden bythe Agreement�s inability so far to generate actual tradepreferences within the region, sufficient enough to stimulatethe minimum level of intra-regional trade flows which wouldkick-start a positive vicious cycle of trade leading to moretrade.
The rapid growth in world trade during the past twodecades has been achieved not only by reduction in traderestrictions but also by the transformation of productionpatterns and processes. The current global trend of
Consumers and Economic Cooperation 33
specialisation and fragmentation of production processes isthe result of access to efficient, reliable and low cost supplychains and the cause of competitiveness of both firms andcountries.
Transport and other supply chain costs have beensignificantly reduced because of scale economies as trade grewand this has further inspired more trade and commerce. Thiscircular link is missing in South Asia, as SAFTA members arestill grappling with preferential market access issues in goodstrade and are yet to embark on services trade liberalisationand other complementing trade policy reforms.
Though South Asian countries have shifted to more outwardlooking policies in 1990s, reducing restrictions on privatesector involvement in business and trade, remnants from theprevious economic policy approaches still remain. Exportpromotion has replaced import substitution as the centraltheme for most governments in the region, but there are echoesof mercantilist attitude, increasing exports, while stillattempting to restrict imports (World Bank, 2008).
The review of select literature carried out under this studyhas also revealed that an assessment of the consumer welfaregains from trade liberalisation has not been adequatelyresearched in the context of SAFTA. A change in this attitudeis imperative to push the tariff liberalisation agenda forward,without which deeper economic integration will remainunattainable.
The first step towards this is to realise the importance ofgranting import concessions, not only just as a policy tool togain export markets but also as a significant source of economicbenefits on its own. In this chapter, an empirical analysis isundertaken to assess potential welfare gains to South Asianconsumers arising out of enhanced intra-regional imports. Theanalysis uses a basic method to measure consumer welfareimpacts from an increase in imports, as currently reserved
34 Consumers and Economic Cooperation
product categories are brought under the ambit of the tariffliberalisation scheme under SAFTA.
The basis for this analysis is drawn from the notion that,when countries are allowed to choose sectors that can beexcluded from tariff preferences under a PTA, domestic lobbieswork to ensure exclusion of products in which they may notwithstand competition from the partner countries, as isobserved from India-Sri Lanka FTA (Baysan, Panagaria andPitgala, 2006). Thus lists of excluded products often providea good starting point for identifying sectors of importance forintra-regional trade.
Assessing Consumer Welfare Gains under SAFTA:Methodology and Product Selection
It is generally recognised that SAPTA, the predecessor ofSAFTA, failed to achieve its intended objective of enhancingintra-regional trade as a result of limited product coverageand limited extent of tariff concessions exchanged amongmember countries. The primary objective sought throughSAFTA was, therefore, to generate sufficient tariff preferencesby increasing product coverage under the Agreement�s tariffliberalisation programme (TLP).25
Though member countries adopted a reduced sensitive listcontaining items which are not subject to tariff reduction, therespective lists maintained are still large and include manyitems in which SAFTA trading partners� exhibits �revealedcomparative advantage�.
With the exception of Bhutan, all other seven memberselected to exclude more than 10 percent of total product lines(HS 6-Digit Level) from the ambit of the TLP. At the timepreferential tariff reductions were initiated under SAFTA in2006, all the major five member countries kept 15 to 25 percentof total product lines out of bounds under their respective
Consumers and Economic Cooperation 35
sensitive lists. Since then, only a marginal reduction in the listof restricted product lines has been achieved. While Indiabrought down it lists for LDCs from 744 to 484 product lines,the list for non-LDCs has remained the same at around 860product lines. Bangladesh, Nepal, Pakistan and Sri Lanka stillretain more than 1000 product categories in their lists, withan unfulfilled commitment to bring about a 20-percentreduction.
In this study, a two stage method has been used todetermine the consumer welfare gains from enhanced intra-regional trade in the region. In the first stage, an algorithmicprocess is used to select products from the sensitive lists offive major SAFTA member nations (Bangladesh, Nepal, India,Pakistan and Sri Lanka), in order to calculate figures ofminimum gains for product categories with maximum potentialeffects on consumer welfare.
The selection of products is carried out by sequentiallyapplying two criteria: (i) products in sensitive lists of a SAFTAmember country (m) with high shares in the total exports ofSAFTA partner countries (p) to rest of the world (RoW),reflecting the export potential of partner countries in suchproducts, (ii) the list thus selected is further filtered by selectingproducts in which exports of partner countries to the membercountry is minimal and imports of the member country arehigh, reflecting high intra-regional trade potential in future.
In the second stage, the potential consumer welfare gainsfor each SAFTA member is calculated as the difference betweencurrent import expenditure incurred by the member countryon the selected products and likely import expenditure if thatcountry were to import the same products from SAFTAtrading partners at a lower price currently offered by them.26
CWmi = ? (PmiQmi � PpiQmi), where;CWmi � Consumer Welfare due to change in import price of
country m in product i
36 Consumers and Economic Cooperation
Pmi � Import price of member country m in product i fromROW
Ppi � Export price of SAFTA partner country (p) in product(i) to ROW27
Qmi � Import Quantity of member country (m) in product(i) from ROW
In the second stage calculation process, those productcategories will automatically get eliminated in which thecurrent export price of the SAFTA trading partner to RoWexceeds the current import price of a member country fromRoW. Only those products with potential for savings onimports leading to reduction in consumer expenditure areconsidered and thus the estimation method helps to identifyproducts with maximum potential consumer welfare gains foreach country and, therefore, qualify for removal from theirrespective sensitive lists.
One of the important features of this methodology is thatit minimises the risks of displacement of domestic industriesowing to imports � the single most important concern of animporting country � because it ensures selection of productcategories which already rank high in the import baskets ofthe respective SAFTA members. Another objection oftenraised against reduction of imports tariffs is the loss of revenuefrom the same.
As will be dealt with in the next section, the intra-regionaltrade scenario emerging from tariff reductions on selectedproducts in their sensitive lists, each SAFTA member standsto gain in terms of an increase in export earnings which couldbe taxed to offset the loss of customs revenue. Dependenceon customs revenue is to be forgone in any case with theprogress of multilateral trade liberalisation to which theselected SAFTA members are committed as WTO signatories.
The estimates arrived at using this method would form thebasis for more detailed studies on the effects of reduction in
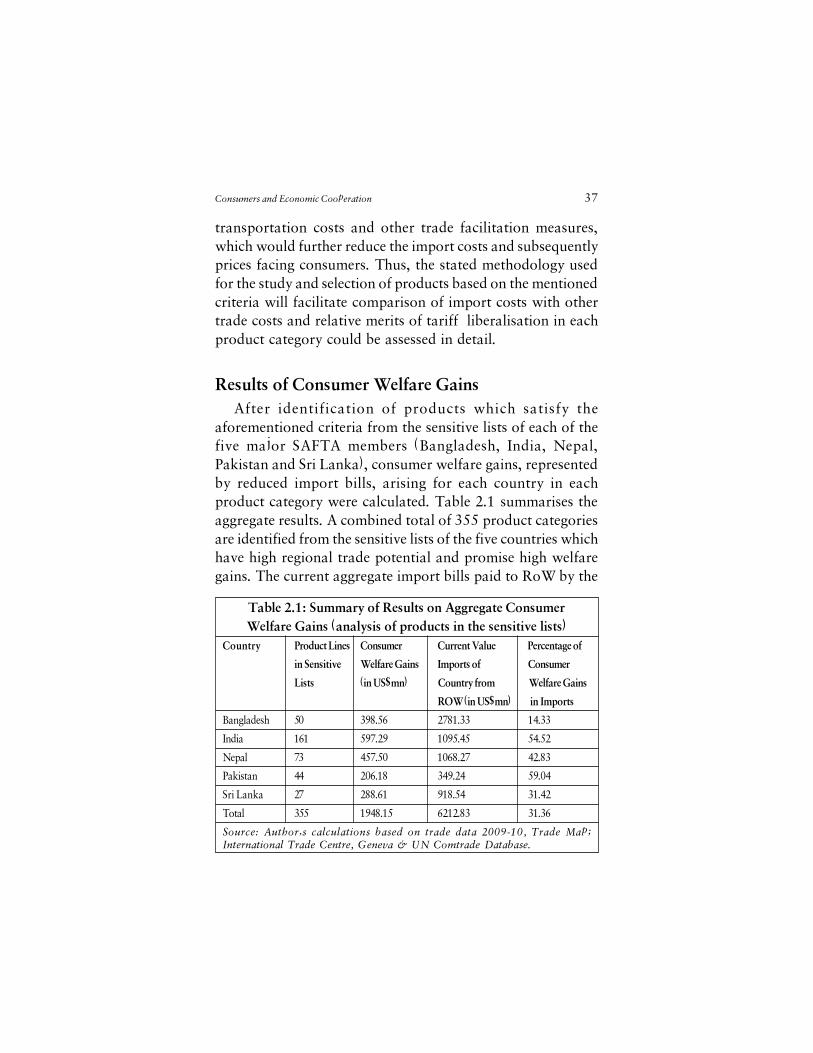
Consumers and Economic Cooperation 37
transportation costs and other trade facilitation measures,which would further reduce the import costs and subsequentlyprices facing consumers. Thus, the stated methodology usedfor the study and selection of products based on the mentionedcriteria will facilitate comparison of import costs with othertrade costs and relative merits of tariff liberalisation in eachproduct category could be assessed in detail.
Results of Consumer Welfare GainsAfter identification of products which satisfy the
aforementioned criteria from the sensitive lists of each of thefive major SAFTA members (Bangladesh, India, Nepal,Pakistan and Sri Lanka), consumer welfare gains, representedby reduced import bills, arising for each country in eachproduct category were calculated. Table 2.1 summarises theaggregate results. A combined total of 355 product categoriesare identified from the sensitive lists of the five countries whichhave high regional trade potential and promise high welfaregains. The current aggregate import bills paid to RoW by the
Table 2.1: Summary of Results on Aggregate ConsumerWelfare Gains (analysis of products in the sensitive lists)
Country Product Lines Consumer Current Value Percentage of
in Sensitive Welfare Gains Imports of Consumer
Lists (in US$mn) Country from Welfare Gains
ROW (in US$mn) in Imports
Bangladesh 50 398.56 2781.33 14.33
India 161 597.29 1095.45 54.52
Nepal 73 457.50 1068.27 42.83
Pakistan 44 206.18 349.24 59.04
Sri Lanka 27 288.61 918.54 31.42
Total 355 1948.15 6212.83 31.36
Source: Author�s calculations based on trade data 2009-10, Trade Map;International Trade Centre, Geneva & UN Comtrade Database.
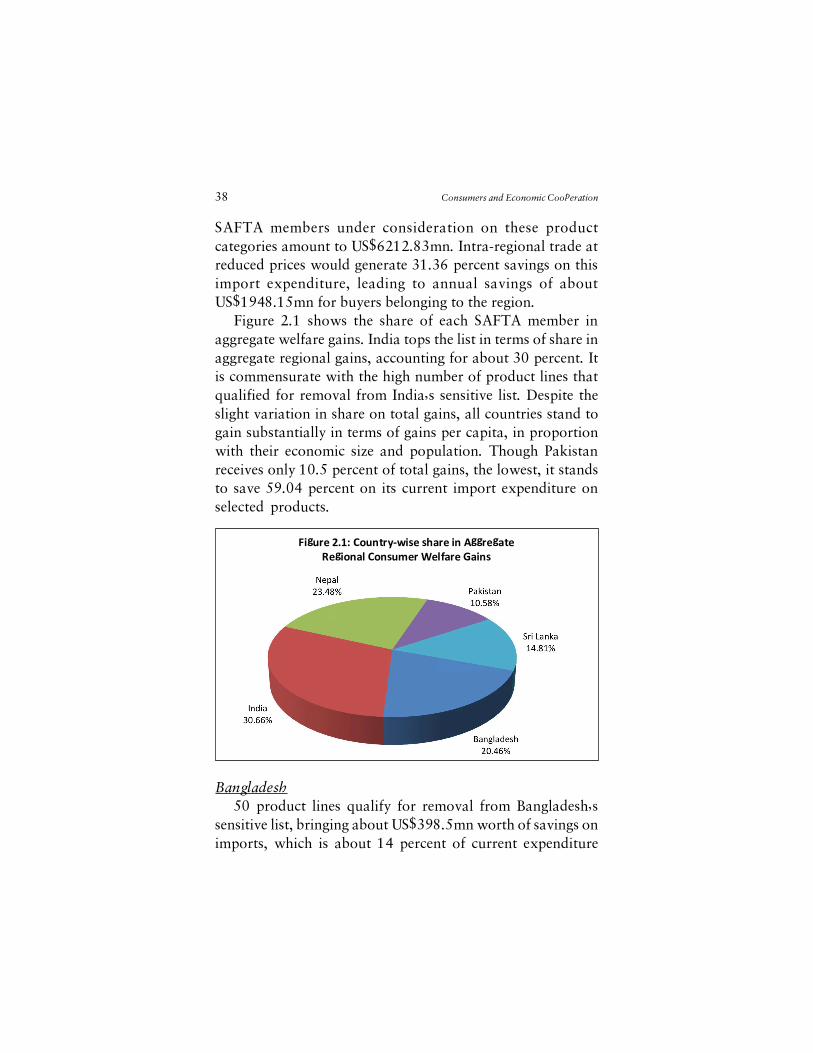
38 Consumers and Economic Cooperation
SAFTA members under consideration on these productcategories amount to US$6212.83mn. Intra-regional trade atreduced prices would generate 31.36 percent savings on thisimport expenditure, leading to annual savings of aboutUS$1948.15mn for buyers belonging to the region.
Figure 2.1 shows the share of each SAFTA member inaggregate welfare gains. India tops the list in terms of share inaggregate regional gains, accounting for about 30 percent. Itis commensurate with the high number of product lines thatqualified for removal from India�s sensitive list. Despite theslight variation in share on total gains, all countries stand togain substantially in terms of gains per capita, in proportionwith their economic size and population. Though Pakistanreceives only 10.5 percent of total gains, the lowest, it standsto save 59.04 percent on its current import expenditure onselected products.
Bangladesh50 product lines qualify for removal from Bangladesh�s
sensitive list, bringing about US$398.5mn worth of savings onimports, which is about 14 percent of current expenditure
Figure 2.1: Country-wise share in AggregateRegional Consumer Welfare Gains
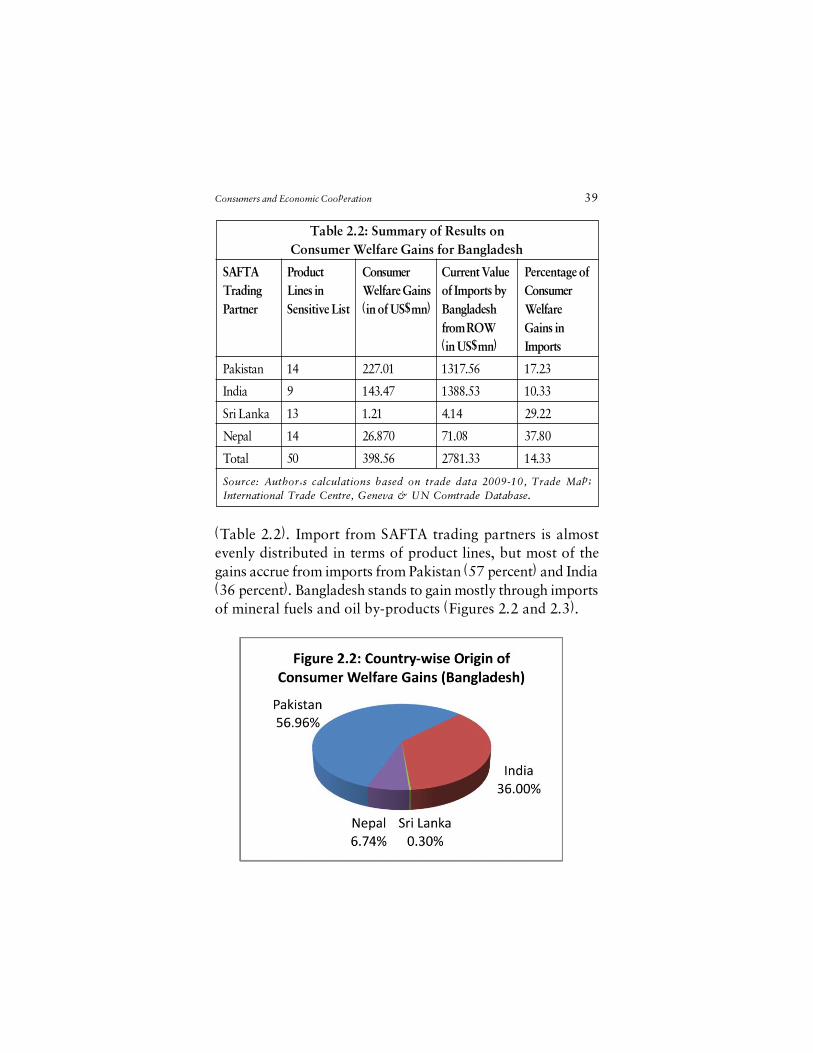
Consumers and Economic Cooperation 39
Table 2.2: Summary of Results onConsumer Welfare Gains for Bangladesh
SAFTA Product Consumer Current Value Percentage ofTrading Lines in Welfare Gains of Imports by ConsumerPartner Sensitive List (in of US$mn) Bangladesh Welfare
from ROW Gains in(in US$mn) Imports
Pakistan 14 227.01 1317.56 17.23
India 9 143.47 1388.53 10.33
Sri Lanka 13 1.21 4.14 29.22
Nepal 14 26.870 71.08 37.80
Total 50 398.56 2781.33 14.33
Source: Author�s calculations based on trade data 2009-10, Trade Map;International Trade Centre, Geneva & UN Comtrade Database.
(Table 2.2). Import from SAFTA trading partners is almostevenly distributed in terms of product lines, but most of thegains accrue from imports from Pakistan (57 percent) and India(36 percent). Bangladesh stands to gain mostly through importsof mineral fuels and oil by-products (Figures 2.2 and 2.3).
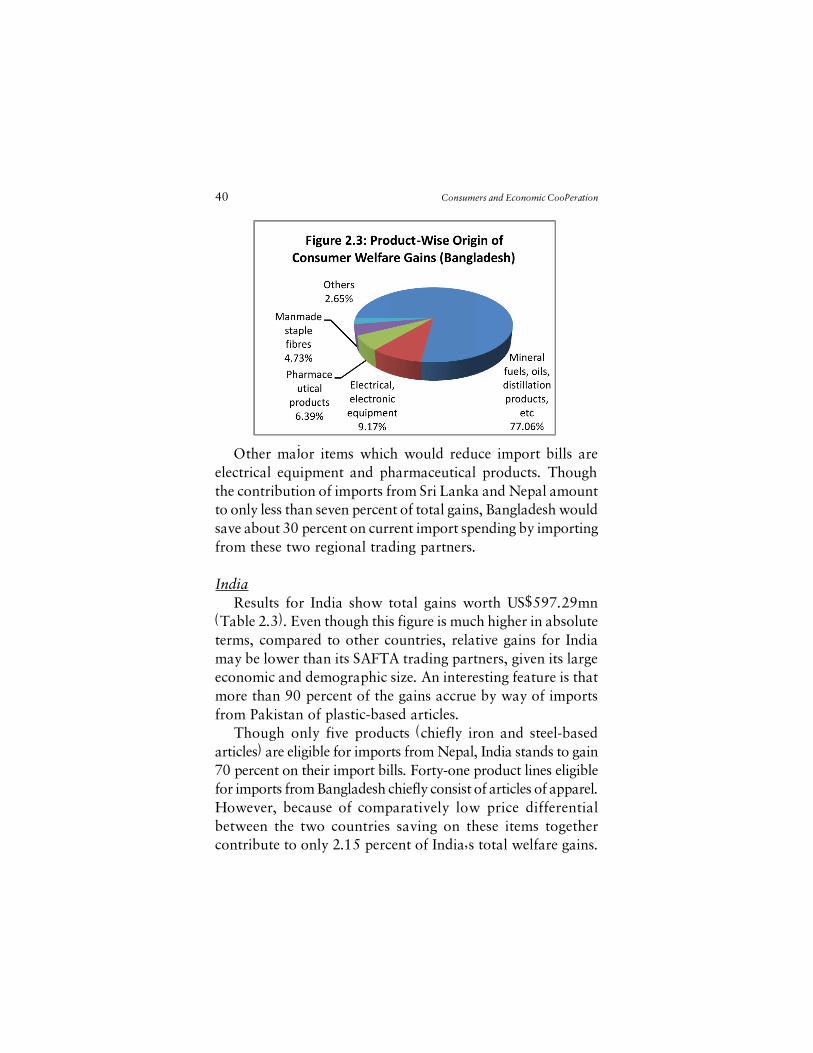
40 Consumers and Economic Cooperation
Other major items which would reduce import bills areelectrical equipment and pharmaceutical products. Thoughthe contribution of imports from Sri Lanka and Nepal amountto only less than seven percent of total gains, Bangladesh wouldsave about 30 percent on current import spending by importingfrom these two regional trading partners.
IndiaResults for India show total gains worth US$597.29mn
(Table 2.3). Even though this figure is much higher in absoluteterms, compared to other countries, relative gains for Indiamay be lower than its SAFTA trading partners, given its largeeconomic and demographic size. An interesting feature is thatmore than 90 percent of the gains accrue by way of importsfrom Pakistan of plastic-based articles.
Though only five products (chiefly iron and steel-basedarticles) are eligible for imports from Nepal, India stands to gain70 percent on their import bills. Forty-one product lines eligiblefor imports from Bangladesh chiefly consist of articles of apparel.However, because of comparatively low price differentialbetween the two countries saving on these items togethercontribute to only 2.15 percent of India�s total welfare gains.
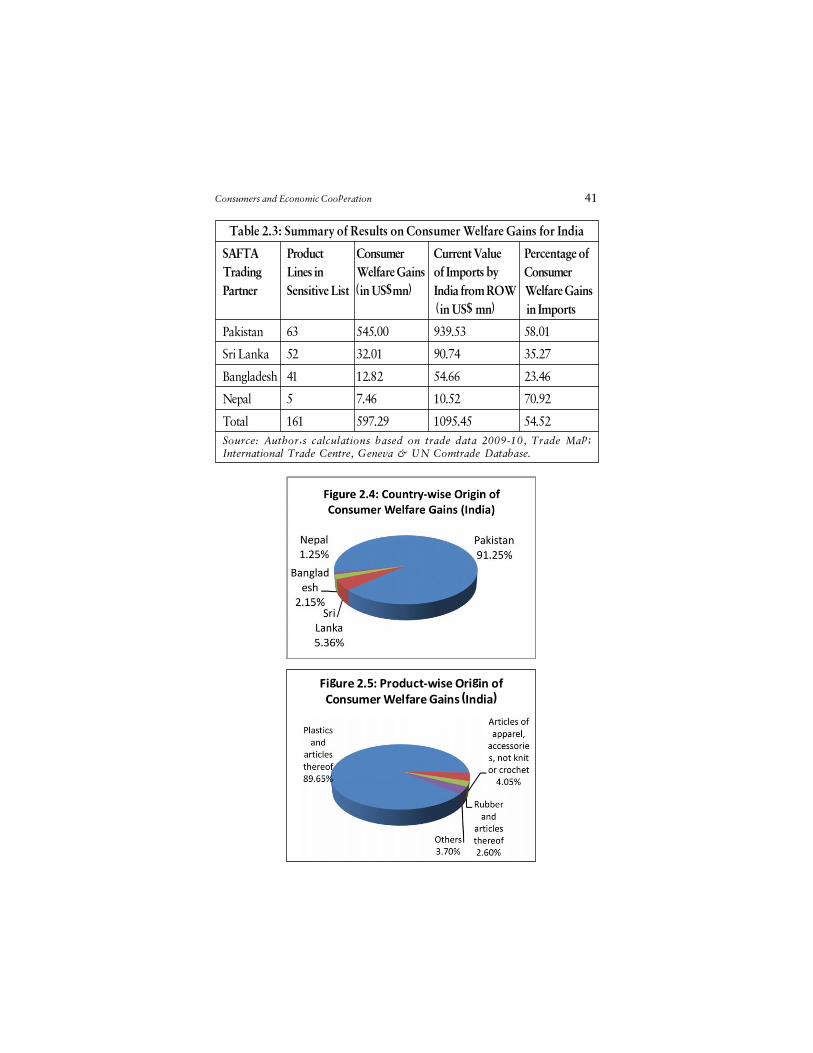
Consumers and Economic Cooperation 41
Table 2.3: Summary of Results on Consumer Welfare Gains for India
SAFTA Product Consumer Current Value Percentage ofTrading Lines in Welfare Gains of Imports by ConsumerPartner Sensitive List (in US$mn) India from ROW Welfare Gains
(in US$ mn) in Imports
Pakistan 63 545.00 939.53 58.01
Sri Lanka 52 32.01 90.74 35.27
Bangladesh 41 12.82 54.66 23.46
Nepal 5 7.46 10.52 70.92
Total 161 597.29 1095.45 54.52Source: Author�s calculations based on trade data 2009-10, Trade Map;International Trade Centre, Geneva & UN Comtrade Database.
Figure 2.5: Product-wise Origin ofConsumer Welfare Gains (India)
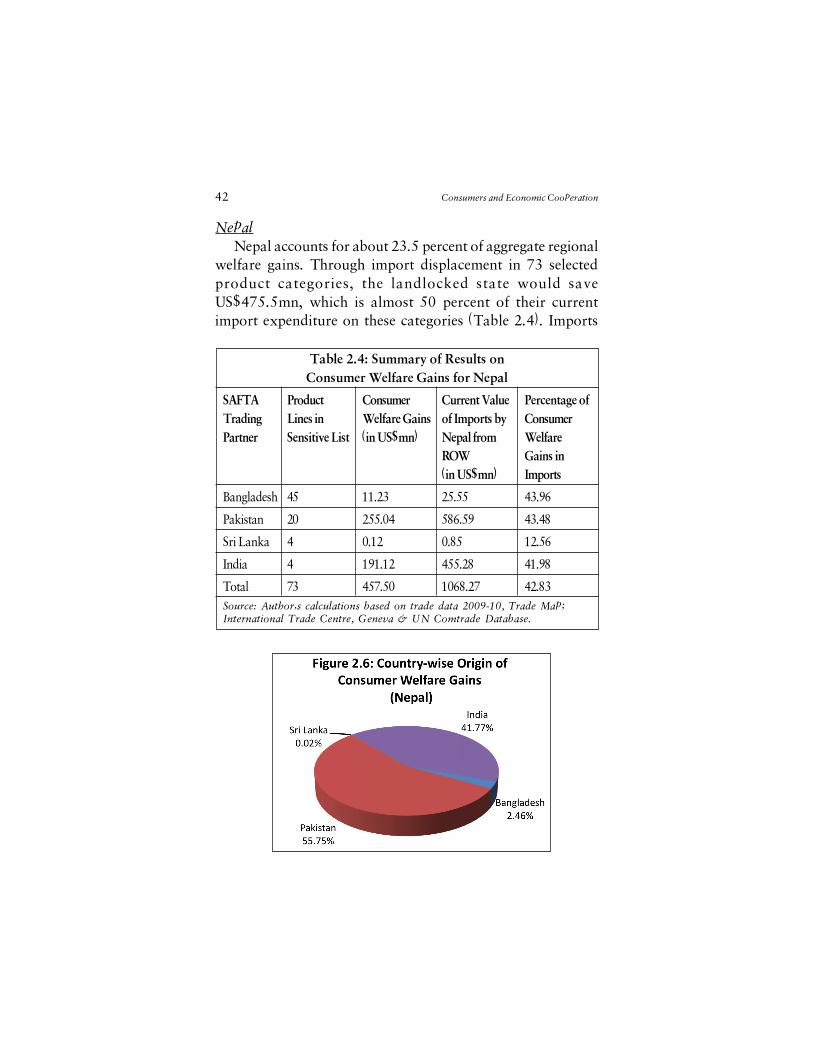
42 Consumers and Economic Cooperation
NepalNepal accounts for about 23.5 percent of aggregate regional
welfare gains. Through import displacement in 73 selectedproduct categories, the landlocked state would saveUS$475.5mn, which is almost 50 percent of their currentimport expenditure on these categories (Table 2.4). Imports
Table 2.4: Summary of Results onConsumer Welfare Gains for Nepal
SAFTA Product Consumer Current Value Percentage ofTrading Lines in Welfare Gains of Imports by ConsumerPartner Sensitive List (in US$mn) Nepal from Welfare
ROW Gains in(in US$mn) Imports
Bangladesh 45 11.23 25.55 43.96
Pakistan 20 255.04 586.59 43.48
Sri Lanka 4 0.12 0.85 12.56
India 4 191.12 455.28 41.98
Total 73 457.50 1068.27 42.83Source: Author�s calculations based on trade data 2009-10, Trade Map;International Trade Centre, Geneva & UN Comtrade Database.
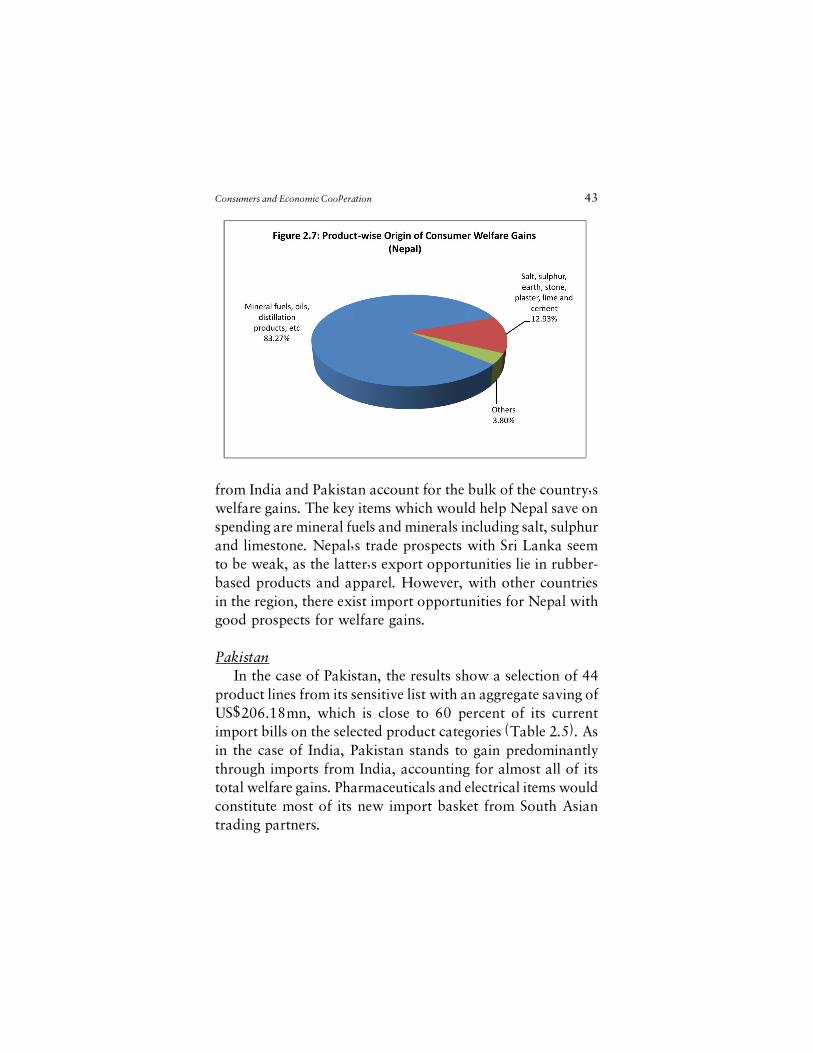
Consumers and Economic Cooperation 43
from India and Pakistan account for the bulk of the country�swelfare gains. The key items which would help Nepal save onspending are mineral fuels and minerals including salt, sulphurand limestone. Nepal�s trade prospects with Sri Lanka seemto be weak, as the latter�s export opportunities lie in rubber-based products and apparel. However, with other countriesin the region, there exist import opportunities for Nepal withgood prospects for welfare gains.
PakistanIn the case of Pakistan, the results show a selection of 44
product lines from its sensitive list with an aggregate saving ofUS$206.18mn, which is close to 60 percent of its currentimport bills on the selected product categories (Table 2.5). Asin the case of India, Pakistan stands to gain predominantlythrough imports from India, accounting for almost all of itstotal welfare gains. Pharmaceuticals and electrical items wouldconstitute most of its new import basket from South Asiantrading partners.
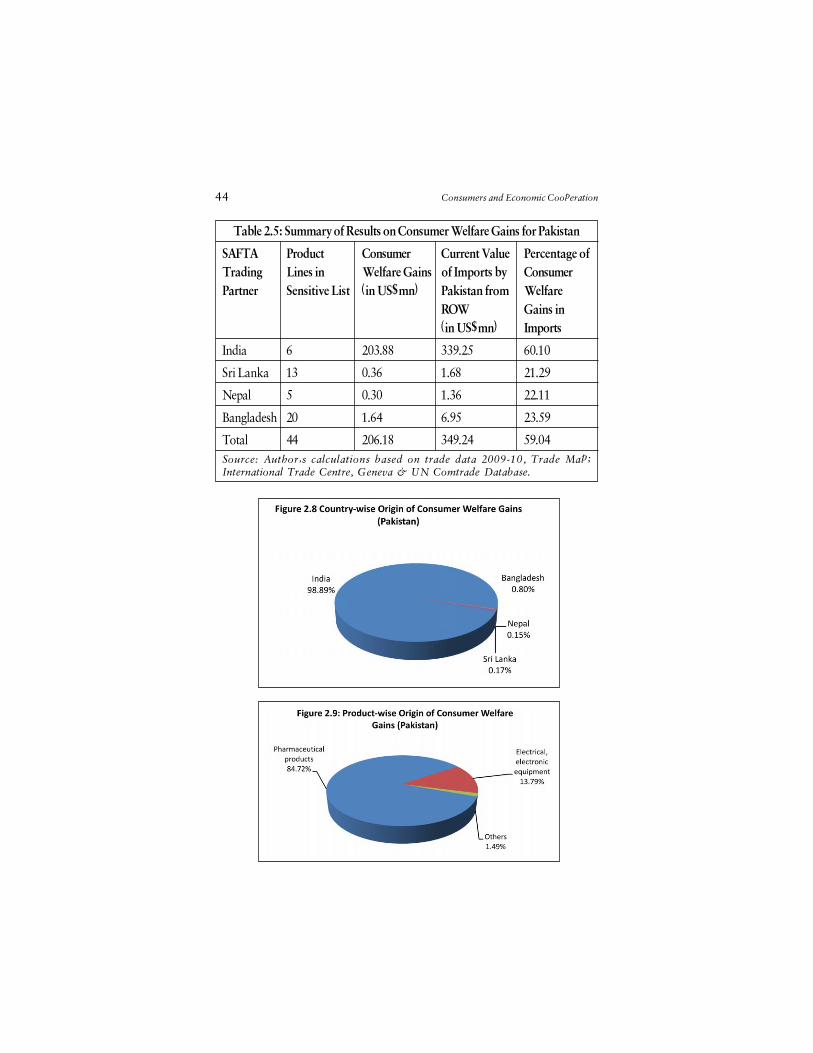
44 Consumers and Economic Cooperation
Table 2.5: Summary of Results on Consumer Welfare Gains for Pakistan
SAFTA Product Consumer Current Value Percentage ofTrading Lines in Welfare Gains of Imports by ConsumerPartner Sensitive List (in US$mn) Pakistan from Welfare
ROW Gains in(in US$mn) Imports
India 6 203.88 339.25 60.10
Sri Lanka 13 0.36 1.68 21.29
Nepal 5 0.30 1.36 22.11
Bangladesh 20 1.64 6.95 23.59
Total 44 206.18 349.24 59.04Source: Author�s calculations based on trade data 2009-10, Trade Map;International Trade Centre, Geneva & UN Comtrade Database.
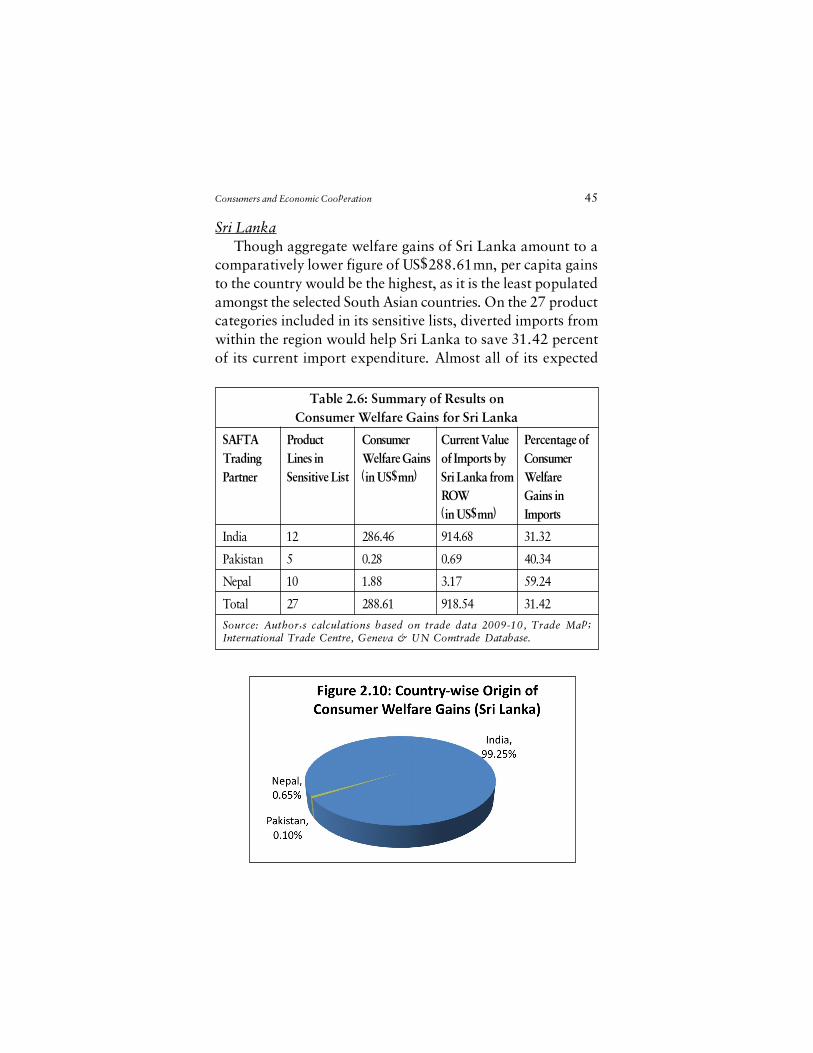
Consumers and Economic Cooperation 45
Sri LankaThough aggregate welfare gains of Sri Lanka amount to a
comparatively lower figure of US$288.61mn, per capita gainsto the country would be the highest, as it is the least populatedamongst the selected South Asian countries. On the 27 productcategories included in its sensitive lists, diverted imports fromwithin the region would help Sri Lanka to save 31.42 percentof its current import expenditure. Almost all of its expected
Table 2.6: Summary of Results onConsumer Welfare Gains for Sri Lanka
SAFTA Product Consumer Current Value Percentage ofTrading Lines in Welfare Gains of Imports by ConsumerPartner Sensitive List (in US$mn) Sri Lanka from Welfare
ROW Gains in(in US$mn) Imports
India 12 286.46 914.68 31.32
Pakistan 5 0.28 0.69 40.34
Nepal 10 1.88 3.17 59.24
Total 27 288.61 918.54 31.42
Source: Author�s calculations based on trade data 2009-10, Trade Map;International Trade Centre, Geneva & UN Comtrade Database.
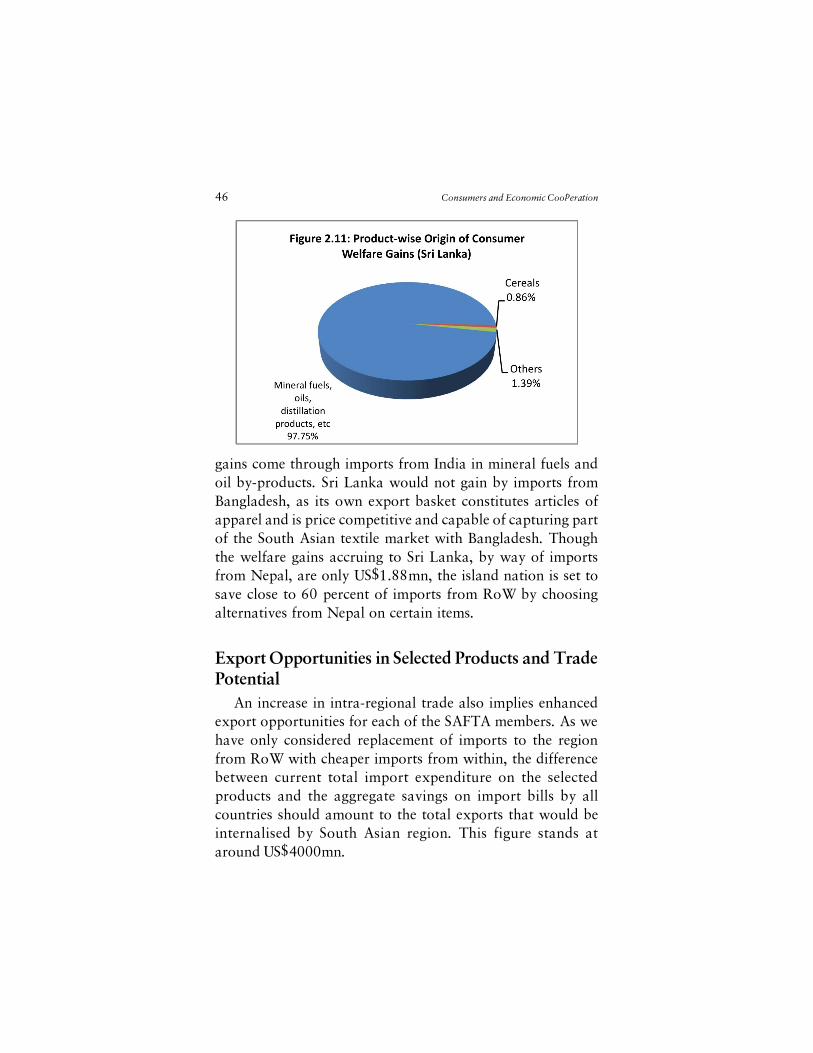
46 Consumers and Economic Cooperation
gains come through imports from India in mineral fuels andoil by-products. Sri Lanka would not gain by imports fromBangladesh, as its own export basket constitutes articles ofapparel and is price competitive and capable of capturing partof the South Asian textile market with Bangladesh. Thoughthe welfare gains accruing to Sri Lanka, by way of importsfrom Nepal, are only US$1.88mn, the island nation is set tosave close to 60 percent of imports from RoW by choosingalternatives from Nepal on certain items.
Export Opportunities in Selected Products and TradePotential
An increase in intra-regional trade also implies enhancedexport opportunities for each of the SAFTA members. As wehave only considered replacement of imports to the regionfrom RoW with cheaper imports from within, the differencebetween current total import expenditure on the selectedproducts and the aggregate savings on import bills by allcountries should amount to the total exports that would beinternalised by South Asian region. This figure stands ataround US$4000mn.
Consumers and Economic Cooperation 47
While it may be argued that only internalisation of exportscould occur in this scenario, without a real increase in exportvolume, we must consider the dynamic effects on regionalexports. The key issue that confronts intra-regional tradepotential is the supply capacity of trading partners from theregion. If the supply capacity remains static, mere diversionof exports to RoW with exports to SAFTA partners is theprobable result which may lower the aggregate nominal exportearnings for a country, but, in all likelihood, it raises theprofitability in real terms, since lower preferential tariffs withinthe SAFTA region allow producers/exporters to lower theirprice, while raising profit margins.
Trade potential in a particular product category with a staticsupply capacity scenario can be assessed as the differencebetween the minimum set (importing country�s total worldimports, exporting South Asian partner�s total world exports)and existing imports of the importing country from thatparticular partner country, where exports and imports are inquantity terms. This simplistic measure shows whether SouthAsian trading partners can meet each others� importrequirements with their current export quantity. Thoughrequired data on all the selected product categories is notavailable, intra-regional trade potential assessed using thismeasure stands between 80 to 90 percent of current importsfrom RoW.
There are two key elements to be considered here withrespect to potential export market expansion. Firstly, assumingthat global market conditions remain the same, there is noparticular reason why existing export markets in RoW cannotbe retained by South Asian countries, while new exportopportunities emerge within the region. Secondly, dependingon the magnitude of the import price elasticity of the respectiveproducts in the importing countries, lower prices wouldincrease import demand and thereby expand the intra-regional
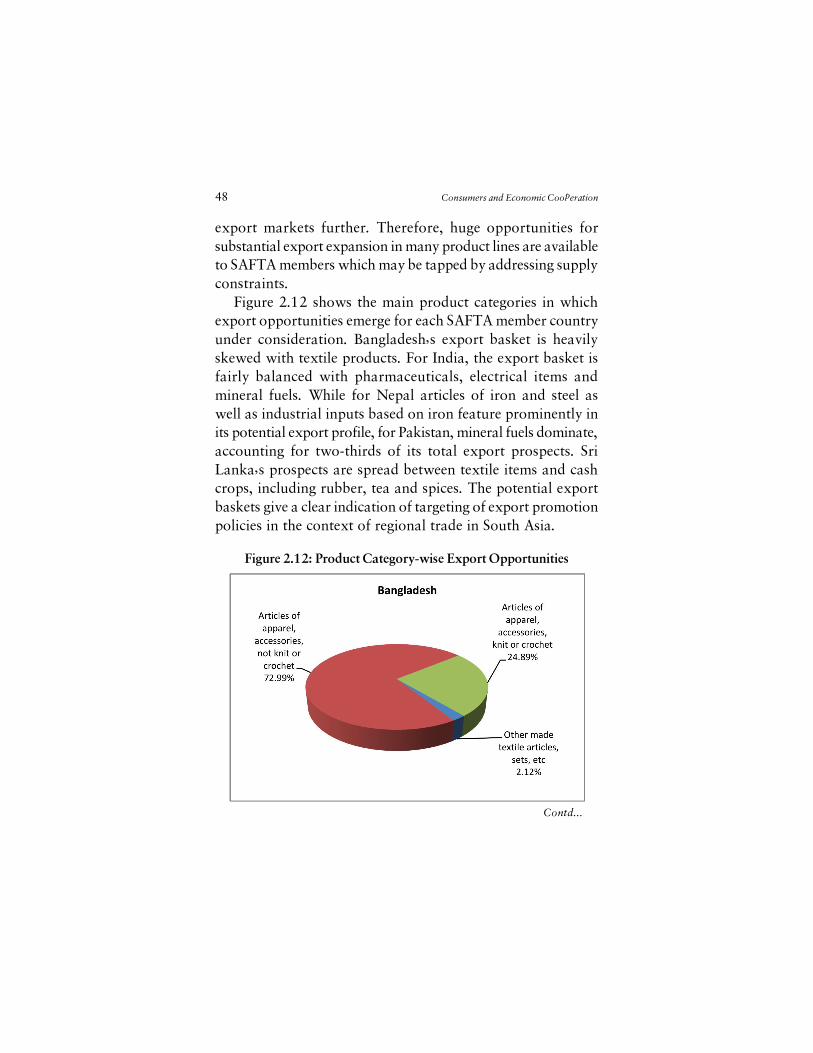
48 Consumers and Economic Cooperation
export markets further. Therefore, huge opportunities forsubstantial export expansion in many product lines are availableto SAFTA members which may be tapped by addressing supplyconstraints.
Figure 2.12 shows the main product categories in whichexport opportunities emerge for each SAFTA member countryunder consideration. Bangladesh�s export basket is heavilyskewed with textile products. For India, the export basket isfairly balanced with pharmaceuticals, electrical items andmineral fuels. While for Nepal articles of iron and steel aswell as industrial inputs based on iron feature prominently inits potential export profile, for Pakistan, mineral fuels dominate,accounting for two-thirds of its total export prospects. SriLanka�s prospects are spread between textile items and cashcrops, including rubber, tea and spices. The potential exportbaskets give a clear indication of targeting of export promotionpolicies in the context of regional trade in South Asia.
Figure 2.12: Product Category-wise Export Opportunities
Contd...
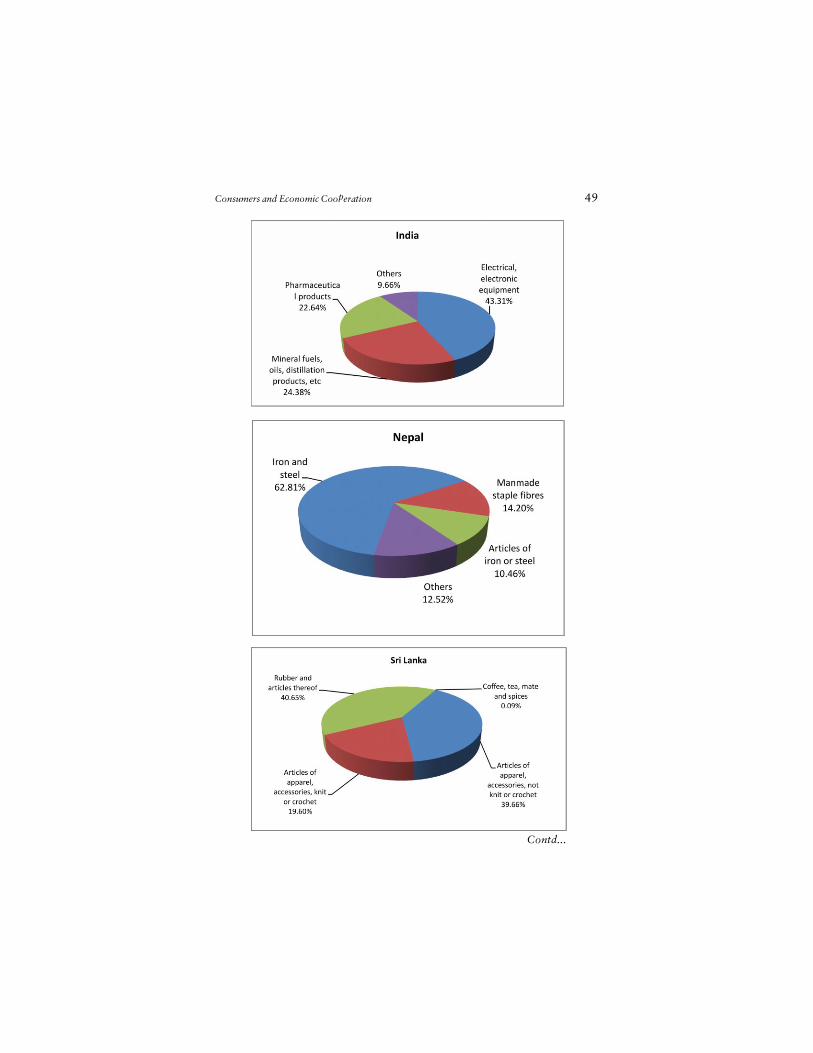
Consumers and Economic Cooperation 49
Contd...
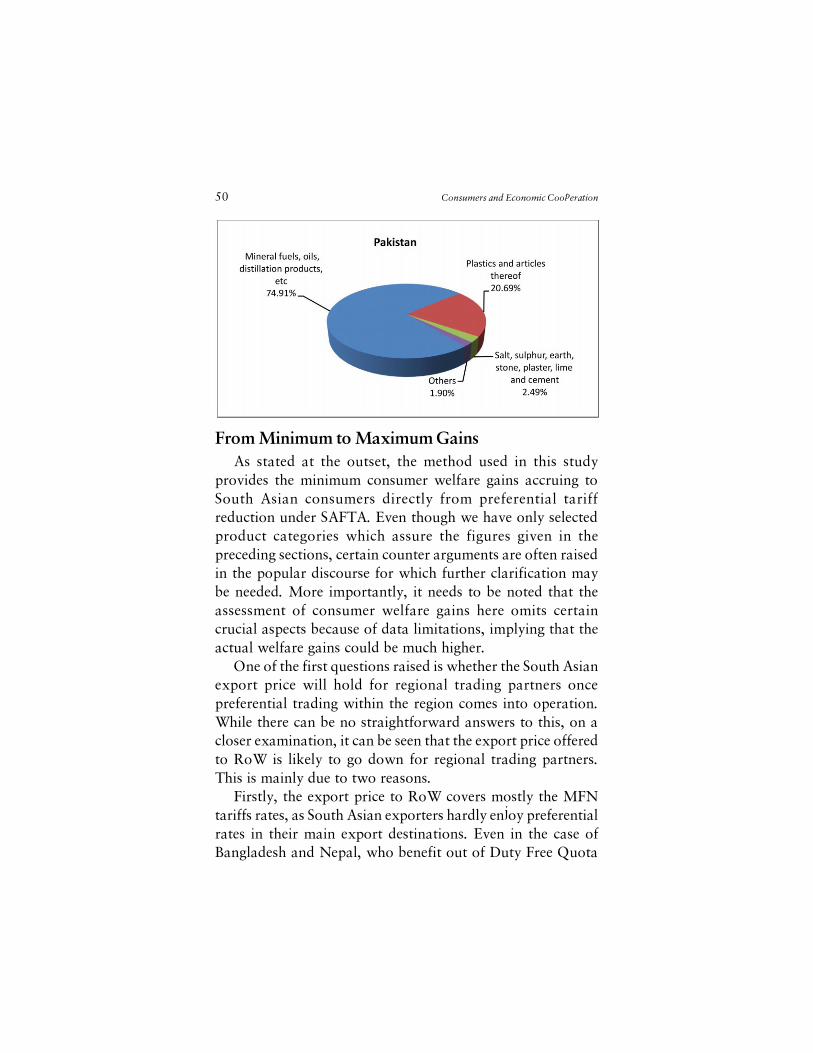
50 Consumers and Economic Cooperation
From Minimum to Maximum GainsAs stated at the outset, the method used in this study
provides the minimum consumer welfare gains accruing toSouth Asian consumers directly from preferential tariffreduction under SAFTA. Even though we have only selectedproduct categories which assure the figures given in thepreceding sections, certain counter arguments are often raisedin the popular discourse for which further clarification maybe needed. More importantly, it needs to be noted that theassessment of consumer welfare gains here omits certaincrucial aspects because of data limitations, implying that theactual welfare gains could be much higher.
One of the first questions raised is whether the South Asianexport price will hold for regional trading partners oncepreferential trading within the region comes into operation.While there can be no straightforward answers to this, on acloser examination, it can be seen that the export price offeredto RoW is likely to go down for regional trading partners.This is mainly due to two reasons.
Firstly, the export price to RoW covers mostly the MFNtariffs rates, as South Asian exporters hardly enjoy preferentialrates in their main export destinations. Even in the case ofBangladesh and Nepal, who benefit out of Duty Free Quota
Consumers and Economic Cooperation 51
Free (DFQF) rates applicable to LDCs in certain developedcountry markets, preferential market access is limited to afixed number of product lines.
Secondly, since a preferential rate below MFN is on offerunder SAFTA, there is no particular reason for the exportprice to rise. Further, if it is safe to assume that transportationcosts would be less because of proximity to each other withinthe region, export prices (South Asia to RoW) may actuallyfall when it comes to intra-regional trade.
Another major concern raised is the possibility of tradediversion. With respect to selected products mentioned in thepreceding sections, the fact that at least one South Asian partnercountry has revealed comparative advantage in terms of itscurrent export performance in global markets lessens theprobability of negative trade diversion effects. Since SouthAsian exporters are already price competitive, compared toRoW even before liberalisation, removal of these productsfrom the sensitive list is unlikely to replace more efficientproducers from outside the preferential region.
Further, the figures for consumer welfare gains generatedunder this study only show the effects of change in importprice with fixed quantity of imports. But, the initial changesin import prices owing to preferential trade are only a startingpoint, which trigger other factors into action, with a combinedeffect of increasing consumer welfare gains several times theinitial figures. Specifically, the following three main effectsshould be considered:� Effects of domestic price reduction due to enhanced import
competition,� Effects of trade creation due to increase in import demand,
and� Effects of reduction in trade costs and subsequently import
prices within the SAARC region following development oftrade infrastructure.
52 Consumers and Economic Cooperation
The first effect here implies savings on consumerexpenditure on not only imported products but alsodomestically manufactured items facing import competition.A fall in import prices within the South Asian region will havea competitive effect on domestic manufacturing in the selectedsectors as well as exports from RoW, leading to overall controleffects on prices of the commodities under consideration. Thesecond effect of trade creation is closely linked with this. Here,as the affordability of consumers rises because of fall in prices,more of the imported product will be in demand, implyingpossible trade creation. In general, irrespective of whethertrade creation actually occurs or not, consumption baskets ofbuyers expand, as their real income increases.
The third effect refers to an often hidden positive impacton consumption. The fact that South Asian countries areimporting the selected products from RoW, although regionaltrading partners are relatively more price competitive, suggeststhat non-tariff barriers (NTBs) could be impeding trade in suchproducts more than tariffs and that these NTBs hurt SouthAsian exporters more than RoW exporters. As noted in theprevious chapter, intra-regional trade costs because of poorconnectivity, transport infrastructure, costly customsprocedures and absence of adequate trade finance are veryhigh in South Asia.
There is a dire need for trade policy reforms at the regionallevel to improve this situation, which could not be initiatedwithout actual increase in trade volume between South Asiancountries. As trade volume increases, it would naturally fuelgrowth of trade relationships, resulting in better tradefacilitation measures, procedural ease and economies of scalein the transport sector, better returns and rents frominvestments in trade infrastructure and additional incentivesfor private enterprises to explore regional markets. Substantialcuts in trade costs can surely be expected from such a virtuouscycle of trade to more trade.
Consumers and Economic Cooperation 53
Extension of Analysis beyond Sensitive Lists:Implications for Non-Tariff Reforms
Since the efforts to reintegrate South Asia are still stuck atthe first stage of tariff reforms, physical blockades maintainedfor four decades at the international borders in the regionpreceding the formation of SAARC continue to be leftunattended. As exposed in Chapter 1, there exists evidence inabundance in the literature for numerous barriers whichrestrict trade even after the application of preferential tariffrates.
As mentioned in detail earlier, the most commonly citednon-tariff barriers in South Asia are poor trade infrastructureat borders and ports, lack of transit arrangements andprocedural delays on account of border security measures. Itis noted that such trade impediments are common throughoutthe Asia Pacific region and, in addition, documentationrequirements for accessing the benefits of preferential ratesmake it extremely difficult for traders to take advantage oftrade agreements without incurring significant compliancecosts (James, 2007).
It has been reported in the context of the functioning ofmany Asian regional trade agreements that a major part of theexisting trade happens outside the preference regime. Such atrend is visible in the case of SAFTA as well. Many stakeholdersand researchers have raised an important concern that, evenafter the application of preferential rates, traders prefer notto avail because of strict rules and costs associated withdocumentation for proving local manufacturing content ofexported products. Thus, many products outside the sensitivelists also face significant levels of trade barriers and are notregionally sourced, even though there are cheaper alternatives,in the absence of avoidable trade barriers and consequentcosts.
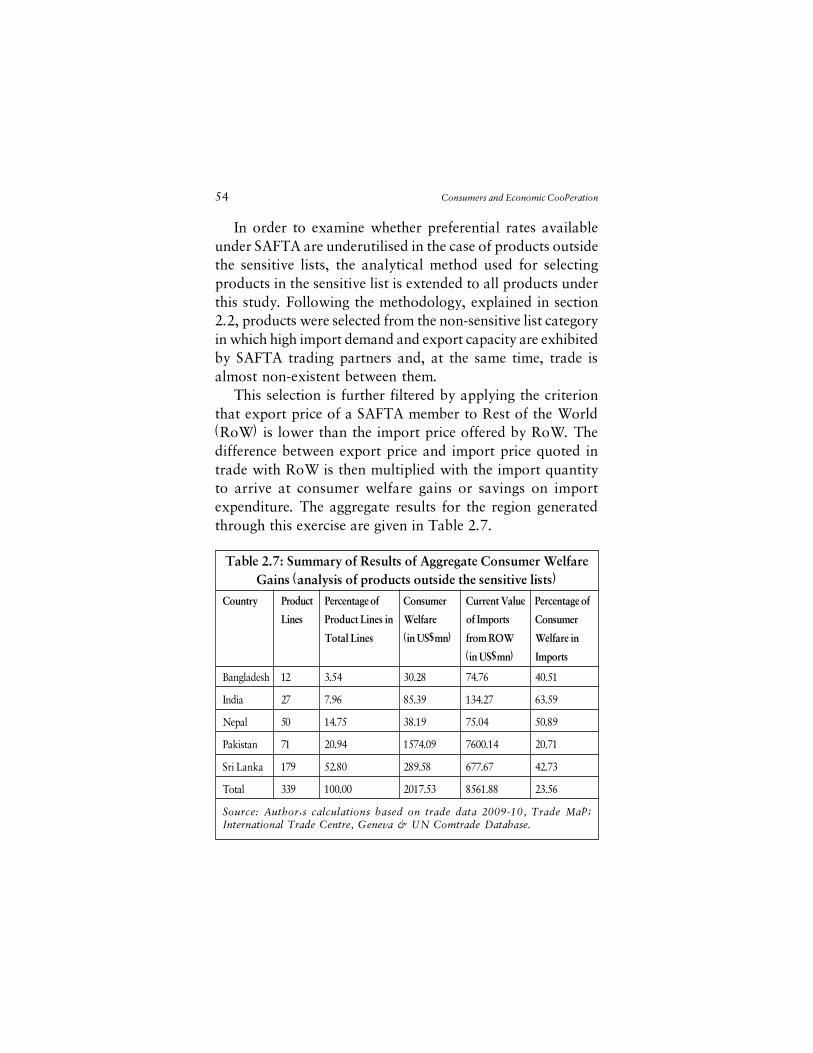
54 Consumers and Economic Cooperation
In order to examine whether preferential rates availableunder SAFTA are underutilised in the case of products outsidethe sensitive lists, the analytical method used for selectingproducts in the sensitive list is extended to all products underthis study. Following the methodology, explained in section2.2, products were selected from the non-sensitive list categoryin which high import demand and export capacity are exhibitedby SAFTA trading partners and, at the same time, trade isalmost non-existent between them.
This selection is further filtered by applying the criterionthat export price of a SAFTA member to Rest of the World(RoW) is lower than the import price offered by RoW. Thedifference between export price and import price quoted intrade with RoW is then multiplied with the import quantityto arrive at consumer welfare gains or savings on importexpenditure. The aggregate results for the region generatedthrough this exercise are given in Table 2.7.
Table 2.7: Summary of Results of Aggregate Consumer WelfareGains (analysis of products outside the sensitive lists)
Country Product Percentage of Consumer Current Value Percentage of
Lines Product Lines in Welfare of Imports Consumer
Total Lines (in US$mn) from ROW Welfare in
(in US$mn) Imports
Bangladesh 12 3.54 30.28 74.76 40.51
India 27 7.96 85.39 134.27 63.59
Nepal 50 14.75 38.19 75.04 50.89
Pakistan 71 20.94 1574.09 7600.14 20.71
Sri Lanka 179 52.80 289.58 677.67 42.73
Total 339 100.00 2017.53 8561.88 23.56
Source: Author�s calculations based on trade data 2009-10, Trade Map;International Trade Centre, Geneva & UN Comtrade Database.
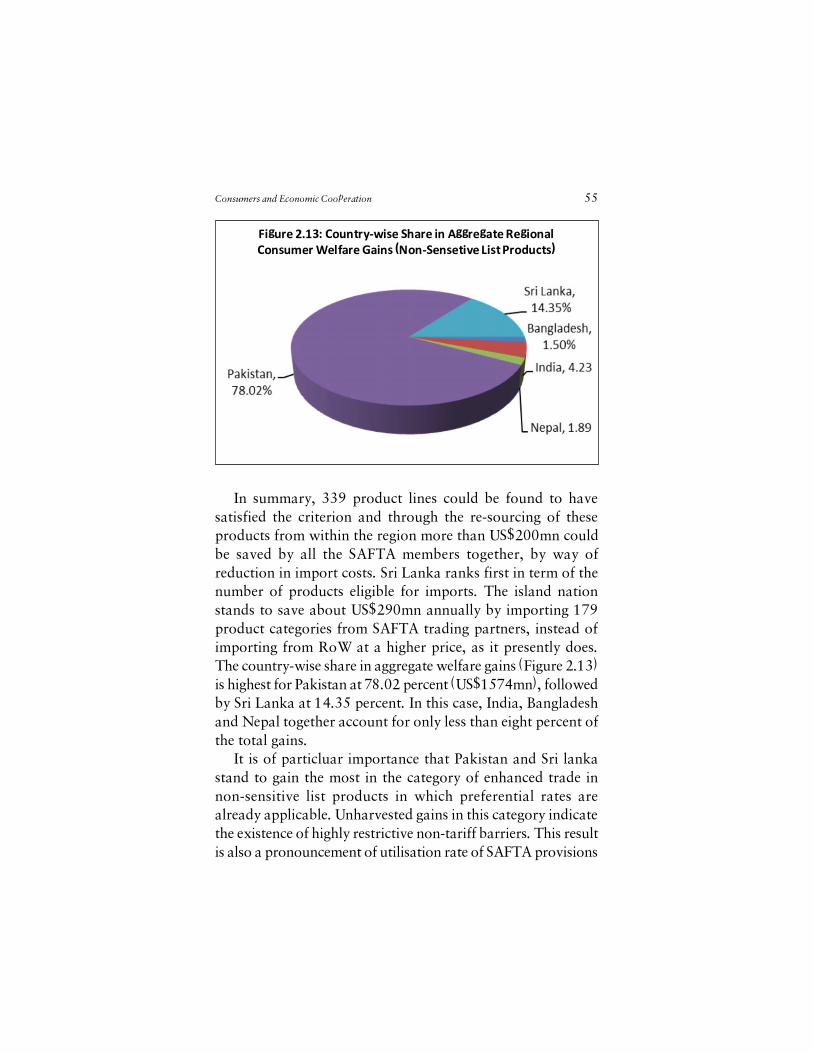
Consumers and Economic Cooperation 55
In summary, 339 product lines could be found to havesatisfied the criterion and through the re-sourcing of theseproducts from within the region more than US$200mn couldbe saved by all the SAFTA members together, by way ofreduction in import costs. Sri Lanka ranks first in term of thenumber of products eligible for imports. The island nationstands to save about US$290mn annually by importing 179product categories from SAFTA trading partners, instead ofimporting from RoW at a higher price, as it presently does.The country-wise share in aggregate welfare gains (Figure 2.13)is highest for Pakistan at 78.02 percent (US$1574mn), followedby Sri Lanka at 14.35 percent. In this case, India, Bangladeshand Nepal together account for only less than eight percent ofthe total gains.
It is of particluar importance that Pakistan and Sri lankastand to gain the most in the category of enhanced trade innon-sensitive list products in which preferential rates arealready applicable. Unharvested gains in this category indicatethe existence of highly restrictive non-tariff barriers. This resultis also a pronouncement of utilisation rate of SAFTA provisions
Figure 2.13: Country-wise Share in Aggregate RegionalConsumer Welfare Gains (Non-Sensetive List Products)
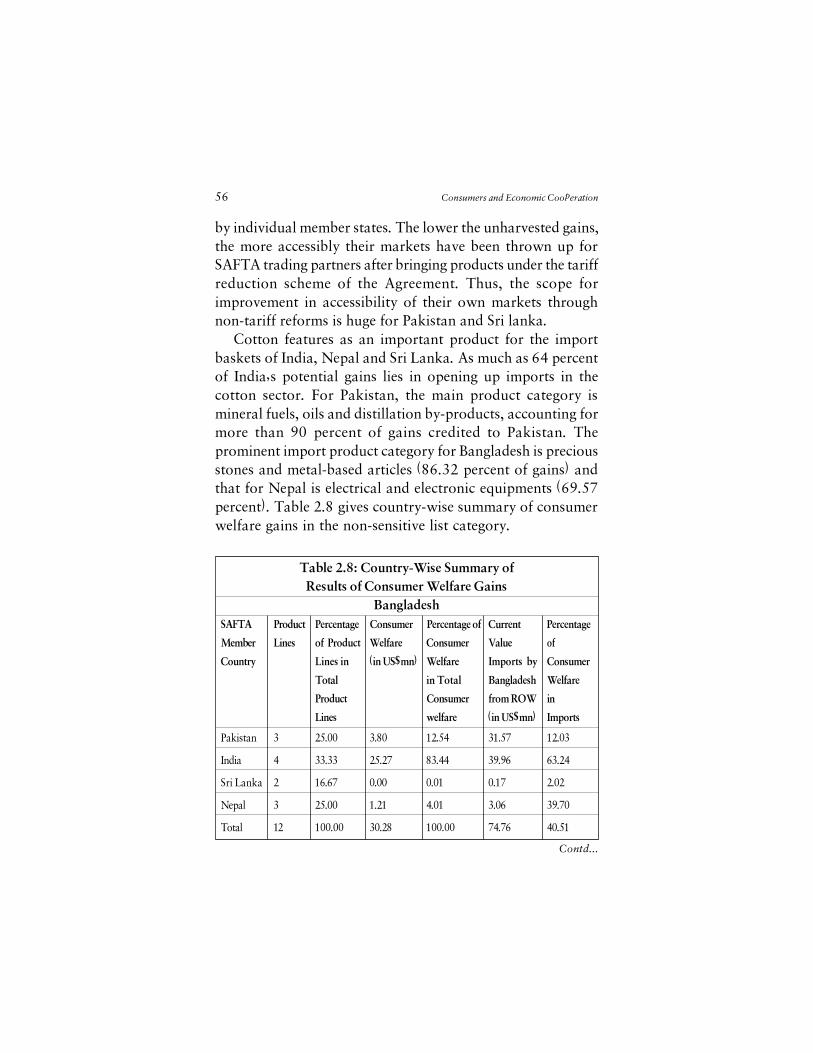
56 Consumers and Economic Cooperation
by individual member states. The lower the unharvested gains,the more accessibly their markets have been thrown up forSAFTA trading partners after bringing products under the tariffreduction scheme of the Agreement. Thus, the scope forimprovement in accessibility of their own markets throughnon-tariff reforms is huge for Pakistan and Sri lanka.
Cotton features as an important product for the importbaskets of India, Nepal and Sri Lanka. As much as 64 percentof India�s potential gains lies in opening up imports in thecotton sector. For Pakistan, the main product category ismineral fuels, oils and distillation by-products, accounting formore than 90 percent of gains credited to Pakistan. Theprominent import product category for Bangladesh is preciousstones and metal-based articles (86.32 percent of gains) andthat for Nepal is electrical and electronic equipments (69.57percent). Table 2.8 gives country-wise summary of consumerwelfare gains in the non-sensitive list category.
Table 2.8: Country-Wise Summary ofResults of Consumer Welfare Gains
BangladeshSAFTA Product Percentage Consumer Percentage of Current Percentage
Member Lines of Product Welfare Consumer Value of
Country Lines in (in US$mn) Welfare Imports by Consumer
Total in Total Bangladesh Welfare
Product Consumer from ROW in
Lines welfare (in US$mn) Imports
Pakistan 3 25.00 3.80 12.54 31.57 12.03
India 4 33.33 25.27 83.44 39.96 63.24
Sri Lanka 2 16.67 0.00 0.01 0.17 2.02
Nepal 3 25.00 1.21 4.01 3.06 39.70
Total 12 100.00 30.28 100.00 74.76 40.51
Contd...
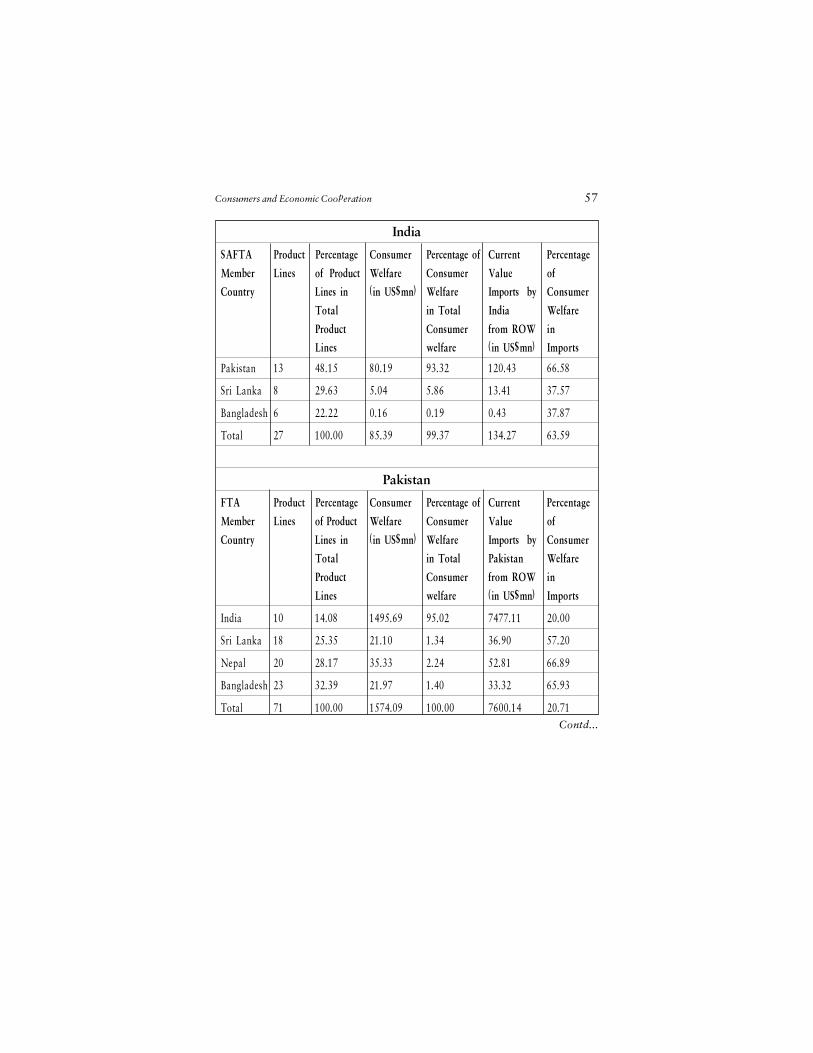
Consumers and Economic Cooperation 57
India
SAFTA Product Percentage Consumer Percentage of Current Percentage
Member Lines of Product Welfare Consumer Value of
Country Lines in (in US$mn) Welfare Imports by Consumer
Total in Total India Welfare
Product Consumer from ROW in
Lines welfare (in US$mn) Imports
Pakistan 13 48.15 80.19 93.32 120.43 66.58
Sri Lanka 8 29.63 5.04 5.86 13.41 37.57
Bangladesh 6 22.22 0.16 0.19 0.43 37.87
Total 27 100.00 85.39 99.37 134.27 63.59
Pakistan
FTA Product Percentage Consumer Percentage of Current Percentage
Member Lines of Product Welfare Consumer Value of
Country Lines in (in US$mn) Welfare Imports by Consumer
Total in Total Pakistan Welfare
Product Consumer from ROW in
Lines welfare (in US$mn) Imports
India 10 14.08 1495.69 95.02 7477.11 20.00
Sri Lanka 18 25.35 21.10 1.34 36.90 57.20
Nepal 20 28.17 35.33 2.24 52.81 66.89
Bangladesh 23 32.39 21.97 1.40 33.32 65.93
Total 71 100.00 1574.09 100.00 7600.14 20.71Contd...
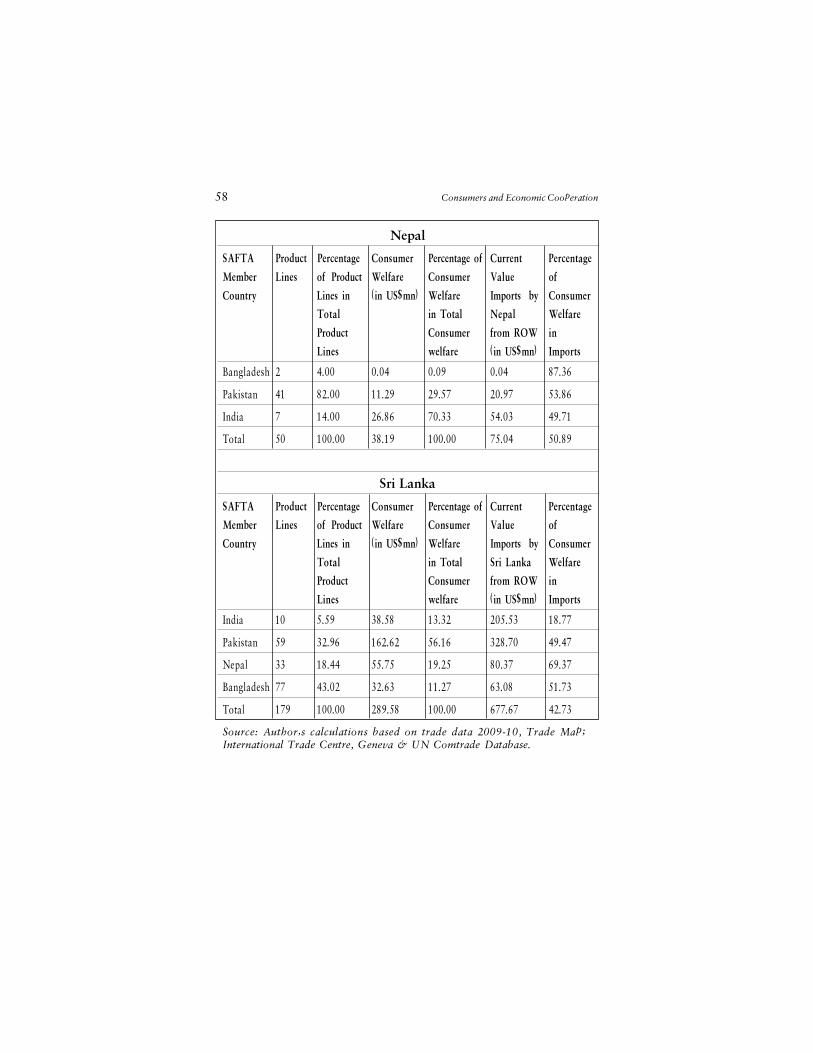
58 Consumers and Economic Cooperation
Nepal
SAFTA Product Percentage Consumer Percentage of Current Percentage
Member Lines of Product Welfare Consumer Value of
Country Lines in (in US$mn) Welfare Imports by Consumer
Total in Total Nepal Welfare
Product Consumer from ROW in
Lines welfare (in US$mn) Imports
Bangladesh 2 4.00 0.04 0.09 0.04 87.36
Pakistan 41 82.00 11.29 29.57 20.97 53.86
India 7 14.00 26.86 70.33 54.03 49.71
Total 50 100.00 38.19 100.00 75.04 50.89
Sri Lanka
SAFTA Product Percentage Consumer Percentage of Current Percentage
Member Lines of Product Welfare Consumer Value of
Country Lines in (in US$mn) Welfare Imports by Consumer
Total in Total Sri Lanka Welfare
Product Consumer from ROW in
Lines welfare (in US$mn) Imports
India 10 5.59 38.58 13.32 205.53 18.77
Pakistan 59 32.96 162.62 56.16 328.70 49.47
Nepal 33 18.44 55.75 19.25 80.37 69.37
Bangladesh 77 43.02 32.63 11.27 63.08 51.73
Total 179 100.00 289.58 100.00 677.67 42.73
Source: Author�s calculations based on trade data 2009-10, Trade Map;International Trade Centre, Geneva & UN Comtrade Database.
Consumers and Economic Cooperation 59
Summary and ConclusionsThe method used for assessing potential consumer welfare
gains of SAFTA in this study, started by selecting thoseproducts with high intraregional trade potential, which arecurrently retained in the sensitive lists of the 5 largest economiesout of the 8 member states of SAFTA (Bangladesh, India,Nepal, Pakistan and Sri Lanka). Such products were selectedfrom the respective sensitive lists of each of the five countriesby applying two criteria to assess intraregional trade potential:(i) high import demand for such products in the country underconsideration as reflected by their current imports from thenon-SAFTA region, and (ii) high export capacity in suchproducts by one or more of other SAFTA members as reflectedby their exports to the non-SAFTA region.
The potential consumer welfare accruing to each countryis derived by taking the difference between the total importexpenditure in the selected products incurred by the countryunder consideration and likely import expenditure if thatcountry were to import the same products from SAFTAtrading partners at a lower price currently offered by them.
Results show an aggregate minimum consumer welfare gainof US$1948.15mn per annum to the South Asian region byway of savings on aggregate consumer expenditure on importedproducts in the selected categories. This figure (savings onconsumer expenditure) is about 31 percent of the total currentimport expenditure on these categories. In certain productcategories, the savings go up to more than 80 percent of thecurrent import expenditure.
When the analysis was extended to non-sensitive listproducts, it was found that there is scope to increase tradeeven in product categories where tariff liberalisation underSAFTA is already being implemented. This provides empiricalsupport to the argument that the lack of non-tariff tradereforms and adequate trade facilitation measures is currently
60 Consumers and Economic Cooperation
undercutting the advantages of preferential tariff rates, andthereby leading to the underutilisation of the provisions of theAgreement. Such underutilisation is seen most prominently inthe case of Pakistan, followed by Sri Lanka.
The estimation method used in this study helps to identifyproducts with the maximum potential consumer welfare gainsfor each country and therefore, qualify for removal from theirrespective sensitive lists. The estimates form the basis for moredetailed studies on the potential effects of reduction intransportation costs and other trade facilitation measureswhich will augment consumer welfare gains and will facilitatecomparison with other trade costs and relative merits of tariffliberalisation in each product category.
Chapter 3Perceptions and
Expectations aboutRegional Economic
Cooperation in South Asia
IntroductionThe popular discourse on South Asian economic relations
has undergone many transformations since the idea of SAARCwas proposed and realised in the early 1980s. One of the maingoals of SAARC was the �promotion and strengthening ofcollective self-reliance among the countries of South Asia�.28
However, the discourse has been heavily influenced by theever-tilting kaleidoscope of bilateral political relations betweenSAARC member states. As a result, an objective analysis ofthe economic costs and benefits of open trade in South Asiawithout considering political implications has always remainedinconsequential.
In the wake of the formation of WTO in 1995, closelyfollowing policy reorientation in all the leading countries inthe region towards export-based growth strategies, theimmediate focus was their participation in the multilateralnegotiations to expand trade liberalisation. Though SAPTAalso came into force in 1995, regionalism took backseat during
62 Consumers and Economic Cooperation
this period, as exploration of export markers in theneighbourhood was not considered worth the enormousnegotiating capital required for keeping non-trade issues atbay. Proliferation of PTAs amongst WTO member nationsand success stories elsewhere rekindled interest in SAPTA,leading to its subsequent upgradation to SAFTA in 2004.
During this period, mercurial bilateral relations betweenIndia and Pakistan, the largest member states, played a bigrole in shaping the expectations of various stakeholders fromall over South Asia about the potential of a regional tradeagreement. Consequently, around the turn of the century, itwas widely believed that bilateral trade pacts would have betterprospects and these were pursued with greater emphasis.India-Sri Lanka (1998), Pakistan-Sri Lanka (2002), India-Bangladesh (amended Agreement, 2006), Bhutan-India (2006)etc. were the major developments in this direction.
Due to this multifaceted approach towards trade policy aswell as frequent changes in the focus of dialogues on trade-related issues, opinions about regional trade vary widelybetween and within different stakeholder groups directlyassociated with trade in South Asia. The diversity in viewpointshas naturally fed into the policy formulation process at thenational level and has had a strong bearing on the course ofregional trade negotiations thus far. Analysing the perceptionsof relevant stakeholder groups is useful in understanding thenuances of SAFTA negotiations. The findings from aperceptions survey conducted as a part of this study arepresented and discussed in the following sections.
Perception Survey: MethodThe perception survey of key informants and stakeholders
on regional trade integration in South Asia was carried outbased on the premise that political economy considerations
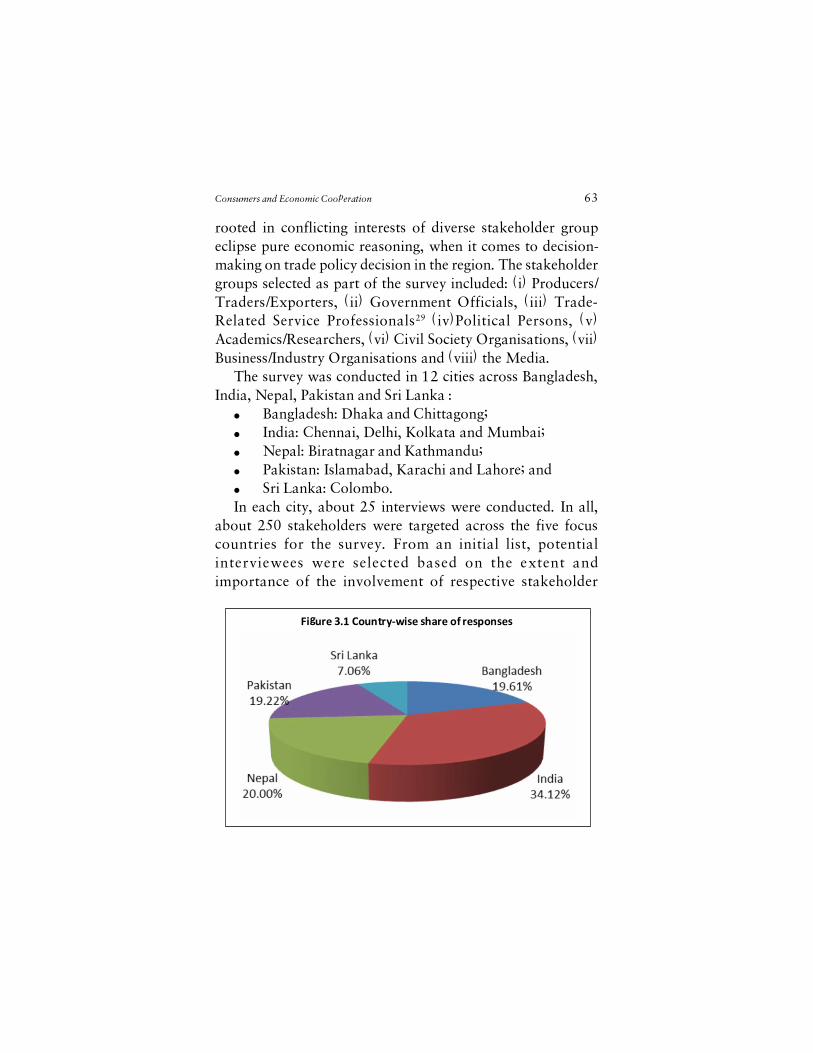
Consumers and Economic Cooperation 63
rooted in conflicting interests of diverse stakeholder groupeclipse pure economic reasoning, when it comes to decision-making on trade policy decision in the region. The stakeholdergroups selected as part of the survey included: (i) Producers/Traders/Exporters, (ii) Government Officials, (iii) Trade-Related Service Professionals29 (iv)Political Persons, (v)Academics/Researchers, (vi) Civil Society Organisations, (vii)Business/Industry Organisations and (viii) the Media.
The survey was conducted in 12 cities across Bangladesh,India, Nepal, Pakistan and Sri Lanka :
� Bangladesh: Dhaka and Chittagong;� India: Chennai, Delhi, Kolkata and Mumbai;� Nepal: Biratnagar and Kathmandu;� Pakistan: Islamabad, Karachi and Lahore; and� Sri Lanka: Colombo.In each city, about 25 interviews were conducted. In all,
about 250 stakeholders were targeted across the five focuscountries for the survey. From an initial list, potentialinterviewees were selected based on the extent andimportance of the involvement of respective stakeholder
Figure 3.1 Country-wise share of responses
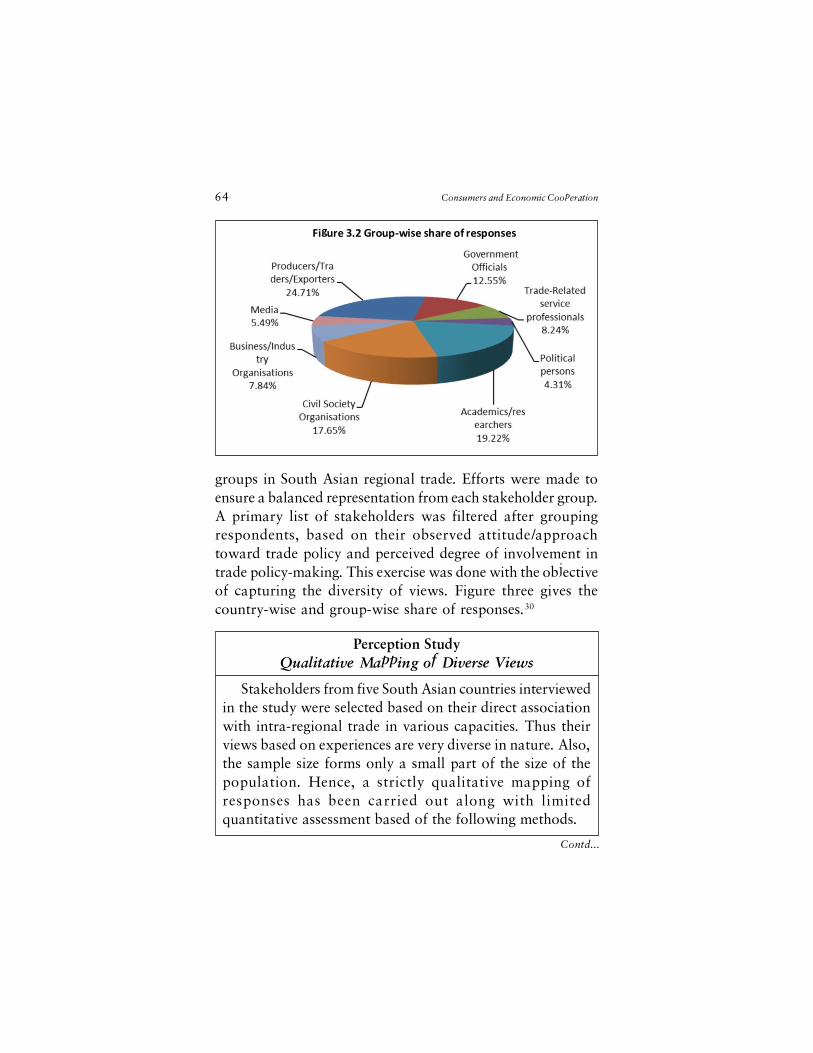
64 Consumers and Economic Cooperation
groups in South Asian regional trade. Efforts were made toensure a balanced representation from each stakeholder group.A primary list of stakeholders was filtered after groupingrespondents, based on their observed attitude/approachtoward trade policy and perceived degree of involvement intrade policy-making. This exercise was done with the objectiveof capturing the diversity of views. Figure three gives thecountry-wise and group-wise share of responses.30
Figure 3.2 Group-wise share of responses
Perception StudyQualitative Mapping of Diverse Views
Stakeholders from five South Asian countries interviewedin the study were selected based on their direct associationwith intra-regional trade in various capacities. Thus theirviews based on experiences are very diverse in nature. Also,the sample size forms only a small part of the size of thepopulation. Hence, a strictly qualitative mapping ofresponses has been carried out along with limitedquantitative assessment based of the following methods.
Contd...
Consumers and Economic Cooperation 65
Perceptions and Expectations of SAFTAThe feedback form used for the survey consisted of
questions addressing two broad objectives: (i) gauge theperceptions of stakeholders about the merits of instrumentsof economic cooperation in South Asia in general and therelative merits of SAFTA, and (ii) gauge stakeholderexpectations about the future prospects of intra-regional tradein South Asia.
As regards the first objective, the perception assessment islinked to two possible underlying factors; (a) awareness about
a) Categorisation � Responses for each questions aregrouped into categories; eg; 4 categories for those whofavour and disfavour SAFTA as an effective instrumentfor regional integration with high and low awarenesslevels, 4 categories for those who favour and disfavourSAFTA as an effective instrument for regionalintegration with optimistic and pessimistic opinion onpolitical feasibility of the Agreement.
b) Cross-Correlations � A measure of similarity (rangingbetween -1 to 1; high negative to high positive) forrecognising patterns; eg; cross-correlation betweenawareness and optimism about political feasibility ofSAFTA amongst those who favour SAFTA on thegrounds of economic potential.
c) Paraphrasing � Transcripts of selected representativeresponses in largest categories with high crosscorrelation between relevant variables, awareness,general opinion about political feasibility and economicpotential etc.The perception survey results helps to gauge the overall
outlook of stakeholders in general and are not representativeof the outlook of any particular stakeholder category.
66 Consumers and Economic Cooperation
SAFTA and its relative economic merits and demerits, and (b)the influence of political realities on perceptions, as comparedto economic arguments. An additional emphasis has been givento the awareness of the economic merits and consumer welfareimpacts of SAFTA. Similarly, stakeholders� expectations fromintra-regional trade are assessed on the basis of dependencyof such expectations on (a) objective economic reasoning and(b) perceptions based on past experiences.
At the outset, it is instructive to note the relationshipbetween perceptions and expectations using a simplecorrelation indicator. While 61 percent of the respondentsbelieved SAFTA has not been an effective instrument forgaining benefits from trade in the region, 82 percent were ofthe opinion that intra-regional trade is currently far below theexpectations. From this pool, a correlation check between therating of SAFTA (high, low) and economic potential of theregional trade pact (high, low) returns a low coefficient of0.01. The observation to be noted here is as follows:
In general, for the majority of stakeholders, opinionsabout SAFTA as an effective instrument for enhancingregional trade are not linked to their opinions on theimportance of regional trade integration.A starting point for enquiry would be to ask why faith in
benefits of regional trade sustains, while the most significantinstrument for harnessing the same does not elicit the sameconfidence from stakeholders. One of the straightforwardanswers is that bilateral agreements are now seen as a relativelyless complicated way of enhancing trade in the neighbourhood,while not discounting the importance of market integrationof the region as a whole. This view is founded on recent successof bilateral arrangements as well as the stalling of SAFTA andWTO negotiations. But, it is still neither clear whether theSouth Asian trade community sees the problems of SAFTAnegotiations perceived by them as unsolvable nor evident
Consumers and Economic Cooperation 67
whether they are rightly informed opinions. A deeper lookinto the nature of opinions is needed for a clearer picture.
What Shapes PerceptionsA key observation which emerged from the survey is that
ideas about trade and its effects are highly influenced by thenature of stakeholder engagement with the topic. There is amarked difference between viewpoints across stakeholdergroups. A majority of the respondents from academia andpolicy groups reported that regional trade liberalisation isinferior to the multilateral route. These views appear to belargely based on what has been stated in existing literature onthe subject. Traders directly associated with the export-importsector, on the other hand find bilateral agreements, withadministrative efficiency and faster results, to be moretransparent and beneficial. By matching stakeholder responsesto different issues, certain common themes could however beidentified.
How SAFTA Is Compared to AlternativesOne of the common elements in perceptions is the way
regionalism is compared to other alternative modes of tradeliberalisation. Very few identified their opinion withmaximisation of efficiency gains from multilateralliberalisation. Most of those who do admit that self-selectionof best producers at the global level results in best possibleprices and quality discredit participation of South Asiancountries in the WTO process as uncertain and timeconsuming. Likewise, in a comparison between SAFTA andbilateral agreements, bilateral agreements are preferred onthe same grounds. For beneficiaries, actual and speedy resultsmatter more than what theorists say about the pros and consof an international trade agreement at all levels.
68 Consumers and Economic Cooperation
There are two particular aspects noticeable fromcomparative viewpoints. Firstly, complexity of negotiations,as reflected by reports in the popular media, has much largerimpact on the opinions of stakeholders belonging to allcategories. Secondly, those who find merit in trade agreementsin the reverse order � from bilateral to multilateral � think soprimarily because they see bilateral as building blocks toregional and subsequently multilateral negotiations. Thus,complexity owing to intrusion of non-trade issues31 into tradetalks could be resolved in a stage by stage process.
An overwhelming 96 percent of the interviewees suggestedthat political priorities influence far more than economic logicin trade talks at all levels. Variability of comparativeperspectives with reasons for failure of SAFTA returns a highcorrelation between the two (0.86), showing that SAFTA isconsidered the second-best choice because of more non-tradeissues to be sorted out before negotiations can progress,compared to bilateral negotiations. Following this reasoning,it may so be generalised that:
There is hardly any resistance to SAFTA on the groundsthat the Agreement lacks economic merits, rather popularsupport for it, which would determine its success in thefuture, critically depends on the extent to which non-tradeissues are disentangled from trade negotiations.
On Economics and Politics of South Asian RegionalismAs most stakeholders believe that trade talks cannot be
separated from political considerations, the overwhelmingresponse was that better returns from SAFTA negotiationsshould contribute to lessen the intensity of other internationaldisputes in the region, rather than trade negotiations gettingaffected by them. Through diverse expressions, a commontheme emerges - economics and politics of trade negotiationsare necessarily complementary, not competing, ends. Political
Consumers and Economic Cooperation 69
establishments create strongholds in their domesticconstituencies by proving themselves harvesters of commercialopportunities wherever available, so as to improve the standardof living of the masses.
When asked about the predominant reason why the regionaleconomic cooperation agenda continues to stagnate in South Asia,interviewees selected distrust among South Asia countries as thekey factor over other issues such as the lack of complementarityin production consumption patterns in South Asia and the lackof economic potential. More than 75 percent of the respondentswho held this view also raised doubts about the effectiveness ofSAFTA in bringing about a change in the scenario.
In conjunction with the earlier observation, it clearly showsthat regional trade negotiations have always been seen througha political prism and leadership in the region has failed toeffectively connect economic benefits from trade with SAFTAnegotiations. This is evident from the fact that while tradeliberalisation has been aggressively pursued during the reformperiod, numerous agreements (with the exception of SAFTA)between South Asian countries have turned out to beprogressive whenever political leadership delivered oneconomic promises.
A substantial transformation in the course of SAFTA ishighly probable if political leadership realises and uses thepotential of the Agreement for the fulfilment of their non-economic objectives.32
Place of Consumer Welfare in Perceptions of Trade ImpactsAnother striking observation is that consumer welfare gain
is rarely recognised as a positive result of open trade. Thegeneral discourse on trade only deals with the production side.Across all stakeholder groups, including researchers onregional economic issues, there is a lack of understanding and/or neglect of the consumption aspects of trade. More than 60
70 Consumers and Economic Cooperation
percent of the stakeholders interviewed were unaware ofconsumer welfare impacts of trade, and even less so of thepotential for such benefits from SAFTA. Any estimation ofreduction in import bills due to cheaper goods in the contextof regional trade could not be recalled.
One of the most interesting results from the survey is that,out of the respondents who expressed ignorance about thetopic, almost all agreed that consumer welfare aspects alsoshould be considered in future analysis to get a clearer andbalanced picture about the potential of the Agreement. Thoughthe conviction behind such opinion in the context of the surveymay be questioned, it goes undisputed that a phenomenalavenue for change lies on this point. Spreading awarenessabout this often-forgotten topic has the potential to sway theperceptions of trade objectives, in general, and regionalism,in particular, from one way to another. Augmenting thehighlighted result in previous section, it may be stated that:
A hitherto ignored catalyst for change in politicalutilisation of SAFTA is awareness generation on consumerwelfare gains from the Agreement, given the fact thatconsumers, as a group, constitute the entire electorate.
Stakeholders� Views on Future StepsApart from a lack of awareness, a lack of inclusivity in
trade policy making was one of the main concerns raised bystakeholders. Omissions have been made in the past becauseof partial or limited involvement of affected stakeholder groupsdue to the lack of institutional mechanisms to facilitate thesame in South Asian countries. While it is recognised that achange in the policy formulation process by way of institutionaland procedural restructuring is not possible in the short run,it has been suggested that stakeholder groups can proactivelymake efforts to provide inputs to make the process at thegovernmental level better informed.
Consumers and Economic Cooperation 71
While members of the business community andadministrative and political representatives as stakeholdershave direct access to policy-making processes at the nationallevel and the academic community has relatively better chanceof exerting influence, consumer organisations lack bothawareness of trade issues concerning them and channels ofinfluence.
Given this scenario, ideas on steps for the future differedacross groups. For the former categories, objective and in-depth studies on effects of the Agreement featured as thepriority, while, for consumer groups, the urgency was onawareness generation and usage of collective bargaining powerto gain access to policy-making process.
On the question of the principal deterrents of regional tradenegotiations, the lack of adequate representation of allcategories of beneficiaries was ranked as the second mostimportant factor after political distrust. The majority reportedthat an attitudinal change is warranted. Protectionism stillobscures the right approach to trade negotiations and comeswith heavy cost of lagging traditional sectors ridden withproductive inefficiencies.
Overcoming Hurdles: Networking Is the Key All stakeholder categories unequivocally agreed that, as a
first step, national dialogues on a wide scale deserveconsideration. In such dialogues, three aspects should behighlighted: (1) prospects of peace dividends from economiccooperation, (2) benefits from increases in imports and (3)other benefits of regional integration, considering growingregionalism at the global level which increasingly threatens torestrict market expansion plans of South Asian countriesoutside the region.
As far as the promotion of such dialogues across countriesis concerned, networking and discussion with the objective of
72 Consumers and Economic Cooperation
awareness generation at the national level should strengtheninternational initiatives of composite dialogues. The order ofpriority is: (1) networking amongst consumer organisationsat the national and regional level, (2) media campaigns atnational and regional level and (3) networking amongst policymakers, industry and consumer organisations at the nationallevel.
With the objective of weaving in consumer welfare as animportant consideration in the trade policy-making process,deeper research results on the topic are imperative. Richerliterature is the starting point for advocacy and the academiccommunity as a stakeholder group should contribute in therespect.
It is critical to inspire further detailed studies on the topicof consumer welfare gains, generating more informeddiscussions and subsequently mainstreaming the issue in thepolicy-making process. With the objective of inspiring furtherstudies, a workshop specifically targeting trade economistsfrom within and outside the region shall be conducted, whichshould have a snowballing effect.
As observed from the survey and unlike the popular notion,most stakeholders in the region have positive expectations fromSAFTA, which is only hidden by pessimism aboutintergovernmental political relations in the region. Thisgeneral positive expectation can be tapped best by buildingnetworks of producer/exporter and consumer organisationsin the region.
Since consumer welfare is an issue dearer to consumergroups, who lack liaison with trade policy-making mechanismsand producer groups, though they have strong liaison withthe trade policy-making process, are ignorant about how muchimportant pursuing consumer welfare is to their on interest,the missing link is proper communication between these twogroups. Advocacy efforts in the future should tap into the
Consumers and Economic Cooperation 73
complementarity of mutual interests of consumer and producergroups in regional trade liberalisation and use the existingstrong channels of trade/industry organisations to influencepolicy-making.
ConclusionsPerceptions about regional trade vary widely between and
within different stakeholder groups associated with trade inall South Asian countries and such perceptions have directlyand indirectly influenced the progress of regional tradenegotiations. The survey suggests that stakeholder opinionabout SAFTA is largely pessimistic. This is largely due toscepticism on its political feasibility, rather than a reflectionof the lack of the Agreement�s economic merits.
Most stakeholders believe in SAFTA�s economic potentialand are of the opinion that the future of the Agreement dependson the extent to which non-trade issues are disentangled fromtrade negotiations.
Consumer welfare has not been prioritised in trade talksin the region and remains a widely ignored issue. Awarenessgeneration on the benefits of imports is necessary to bringinclusiveness and balance to discussions on trade policyformation at the national level. Subsequently, it would help toensure informed participation of different stakeholders inregional negotiations. Consideration of consumer welfare gainsis also necessary for resolving protectionist tendencies in SouthAsian countries.
In addition, consumers as a group form a strong politicalconstituency and the prospects of consumption benefits havethe potential to bring about a major attitudinal change in theapproach of political leadership towards regional tradeliberalisation. Networking amongst consumer organisationsand awareness generation campaigns are the starting pointsfor bringing about this change.
Chapter 4Conclusions
From a conceptual as well as practical view point, consumerwelfare and producer welfare are two inseparable outcomesof open international trade, since efficiency gains in productionin turn benefit consumers through the availability of cheaperand better quality products. An increase in imports will alsoexpand consumer choice.
Moreover, trade agreements � the vehicles of liberalisation� can only function on the basis of a reciprocal exchange ofexport opportunities for import concessions. Thoughconsumer welfare gain following open international trade isoften more predictable and assured it is not given dueconsideration in the mainstream discourse on trade and itsimpacts on economic development.
It is widely recognised that SAFTA members maintain largesensitive lists with high intra-regional trade potential. Whileprotectionist tendencies continue at the regional level, benefitsfrom an increase in imports are disregarded in policy circles,despite the fact that denying such benefits is detrimental tothe expansion of production and exports as well. The endresult is stagnant regional trade and recognition of theAgreement as an ineffective tool.
While existing literature is divided on the economic effectsof South Asian regional trade, evidence suggests positive net
Consumers and Economic Cooperation 75
gains on many counts which are often not considered undertraditional analysis done for predictive purposes because ofmethodological and practical limitations. Moreover manyarguments raised in the literature such as the potential harmfultrade diversion effects have been shown to stand on uncertaingrounds in later works.
The consumer welfare impact of SAFTA is almostcompletely ignored in much of the existing literature. Thisstudy has therefore attempted an empirical exercise to assessthe consumer welfare gains from SAFTA arising out ofsubjecting currently excluded products to preferential ratesunder the Agreement.
Using an algorithmic process of selection, products withhigh intraregional trade potential currently retained in thesensitive lists of 5 largest economies out of the 8 member statesof SAFTA (Bangladesh, India, Nepal, Pakistan and Sri Lanka)were chosen. Potential consumer welfare accruing to eachcountry was then derived by taking the difference betweenthe total import expenditure in the selected products incurredby the country under consideration and likely importexpenditure if that country were to import the same productsfrom SAFTA trading partners at a lower price currently offeredby them.
Results show an aggregate minimum consumer welfare gainof more than US$1.9bn per annum to the South Asian regionby way of savings on aggregate consumer expenditure. Thisfigure (savings on consumer expenditure) is about 31 percentof the total current import expenditure on these categories.The exercise helped to identify products with maximumpotential consumer welfare gains for each country andtherefore, qualify for removal from their respective sensitivelist. The estimated figures are only the starting point or minimalassured gains and enlisting them will facilitate comparison withother trade costs and relative merits of tariff liberalisation in
76 Consumers and Economic Cooperation
each product category. More detailed studies on the effectsof reduction in transportation costs and other trade facilitationmeasures would inflate these figures.
The analysis was extended for products outside the sensitivelists in order to find out whether there are products with hightrade potential which remain non-traded even after applicationof preferential tariff rates under SAFTA because of high tradecosts owing to numerous NTBs including poor tradeinfrastructure at borders and ports, lack of transitarrangements and procedural delays on account of testing anddocumentation requirements. A total of 339 product linescould be found to be in this category, implying highunderutilisation of tariff liberalisation because of lack ofmatching reforms for reducing non-tariff barriers. Anadditional US$2bn per annum could be saved by facilitatingtrade in these products. This figure of consumer welfare gainsis also reflective of avoidable trade costs owing to NTBs withinSouth Asian region.
The study also carried out a perceptions survey of keystakeholders associated with trade issues in the region. Thesurvey found that opinions about regional trade varies widelybetween and within different stakeholder groups in all SouthAsian countries and such perceptions play important role inshaping the course of regional trade negotiations. Mostnotably, it came to the fore that most stakeholders believe thelack of SAFTA�s success till date is largely because of politicalrather than economic reasons, for which solutions do exist.
Policy makers should focus on separating non-trade issuesfrom trade negotiations as much as possible. Buildingwidespread awareness about the untapped and neglectedaspects of consumer welfare gains will help to refocus thedebate on economic issues. It will also serve to better informon-going negotiations and thereby help to check protectionisttendencies in the region. The most important complementary
Consumers and Economic Cooperation 77
feature of this approach will be to shift the focus of politicalaspirations of the regional leadership without actually havingto eliminate it from SAFTA proceedings.
As consumers as a group form a strong constituency, theprospects of political dividends from catering to their needswill surface and thus political intervention on trade issues couldbe constructive rather than obstructive as it has been in thepast. Initiatives for networking amongst consumerorganisations at the national and international level in SouthAsia with this objective in mind offer the prospect of bringingabout a long awaited change in the history of regionalism inSouth Asia.
Priorities for Future ResearchConsumer gains have not received adequate attention in
literature on regional trade in South Asia and are generallyimplicitly expressed in studies based on general equilibriummodels. This study is an effort towards analysing the consumerwelfare gains of trade in isolation.
Existing studies mostly describe trade processes and tradeconstraints and provide empirical assessments of the outcomesof trade liberalisation. They cover mainly goods, with onlylimited coverage of trade in services and cross-borderinvestment. Extending the existing line of analysis to theconsumer welfare outcomes of deeper economic integration,including services trade and investment flows, is one of themost important priorities for further research.
A comparison of the South Asian scenario with theexperiences of other trading blocs as well as the identificationof trade complementarities are two useful additional analyticalexercises. This study can also be advanced by moving on tosector specific analysis. A more formal and full analyticalstructure can be adopted to analyse product substitutability
78 Consumers and Economic Cooperation
including an analysis of product quality differences as well assupply side capacity.
Analytical extension linking future growth of regional tradeunder alternative scenarios and changes in consumer welfaregains will help to unfold the dynamic scenario as against thestatic analysis carried out under this study.
One of the main concerns is loss of government revenueowing to tariff reduction. This issue can be addressed bysearching for ways in which trade costs can be minimisedwithout inflicting drastic cuts in tariff revenue. Growth intrade can also be linked to growth in income and employmentwhich will offset revenue losses. By highlighting the cases inwhich neighbors are natural trading partners, a betterunderstanding about the most profitable sectors from regionaltrade can be obtained.
Further research should be done with the objective ofsupporting informative policy actions. Studies on tradeliberalisation must be linked to its developmental outcomesand must be presented in non-technical ways. Research onissues such as product variety and increase in consumer choicesand allied benefits, possibility of reduction in trade coasts bynon-tariff trade reforms, identification of consumers� gainsthrough trade in non-traditional sectors, value added services,tourism, BPOs etc. can be of immense value to policy makers.
References
Abdin, Md. J., (2009), �An Analysis of SAFTA in the context ofBangladesh�, Bangladesh Development Research Working Paper SeriesNo. 6, Bangladesh Development Research Centre (BDRC).
Adhikari, R., (2009), �Intra Regional Free Trade AgreementsImplications for regional Trade Integration in South Asia�, South AsiaWatch on Trade, Economics and Environment (SAWTEE), Briefing PaperNo. 9.
Agosin, M., (1991), �Trade Policy Reform and Economic Performance: AReview of the Issues and Some Preliminary Evidence�, UNCTADDiscussion Papers, No. 41, UNCTAD, Geneva.
Ahmed, S. and E. Ghani, (2008), �Making Regional Cooperation Workfor South Asia�s Poor�, Policy Research Working Paper 4736, WorldBank, South Asia Region, South Asia Regional Programs Unit,Washington, DC.
Ahmed, S., S. Kelegama and E. Ghani, (2010), �Promoting EconomicCooperation in South Asia�, The World Bank, Washington DC.
Ali, J.H., (2007), �Energy Resources and Regional EconomicCooperation in SAARC Countries�, mimeos.
Anderson, J.E., and E.V. Wincoop, (2004), �Trade Costs�, Journal ofEconomic Literature, Volume XLII, No.3, Pages 691-751.
Armstrong, S., P. Drysdale and K. Kaliranjan, (2008), �Asian tradestructures and trade potential: An initial analysis of south and east asiantrade�. Crawford school of economics and government, AustraliaNational University, Sydney.
Asian Development Bank (ADB) and United Nations Conference onTrade and Development (UNCTAD), (2008), �Qualification of Benefitsfrom Economic Cooperation in South Asia�, Macmillan India Ltd., NewDelhi.
80 Consumers and Economic Cooperation
Asian Development Bank (ADB), (2007), �Preparing the South Asia Subregional Economic Cooperation Transport Logistics and TradeFacilitation Report�, Regional Technical Assistance Report, Project No.39454, Asian Development Bank, Manila.
Asian Development Bank (ADB), (2008), �Emerging Asian Regionalism:A Partnership for Shared Prosperity�, Asian Development Bank, Manila.
Athukorala, P.C. and H. Hill, (2010), �Asian trade: long term patternsand key policy issues�, Crawford School of Economics and Government,The Australian National University, Canberra.
Bagwell, K. and R. W. Staiger (1999), �An Economic Theory of GATT,�American Economic Review Vol. 89 (1), 215�248.
Bagwell, K. and R. W. Staiger (2001), �Reciprocity, Non-Discriminationand Preferential Agreements in the Multilateral Trading System,�European Journal of Political Economy, Vol. 17 (2), 281�325.
Baldwin, R. E., (2006), �Multilateralising Regionalism: Spaghetti Bowls asBuilding blocks on the Path to Global Free Trade�, The World Economy.
Bandara, J.S. and M. Mc Gillivray, (1998), �Trade Policy Reforms inSouth Asia�, The World Economy, Volume 21, Issue 7, Pages 881�896.
Bandara, J.S. and W. Yu, (2003), �How Desirable is the South Asian FreeTrade Area? A Quantitative Economic Assessment�, The WorldEconomy, Volume 26, Issue 9, Pages 1293�1323.
Banerjee P. and J. Roy, (2010), �Connecting South Asia-The Centrality ofTrade Facilitation for Regional Economic Integration�, in PromotingEconomic Cooperation in South Asia, written by S. Ahmed, S. Kelegamaand E. Ghani, The World Bank report.
Banik, N. (2006), �How Promising is SAFTA?� Asia Pacific Trade andInvestment Review, Volume 2.
Banik, N., B. Biswas and P.Saunders, (2006), �An optimum currency areain South Asia: is it plausible?�, Journal of World Trade, Vol.40, Pages387-405.
Baysan, T., A. Panagariya, and N. Pitigala, (2006), �Preferential Tradingin South Asia�, World Bank Policy Research Working Paper 3813,World Bank, Washington.
Bhagwati, J. and A. Panagariya (1996), �The Theory of Preferential TradeAgreements: Historical Evolution and Current Trends�, AmericanEconomic Review, Vol. 86(2): 82�87.
Consumers and Economic Cooperation 81
Bouet, A., S. Mevel and M. Thomas, (2010), �Is SAFTA Trade Creatingor Trade Diverting? A Computational General Equilibrium Assessmentwith a focus on Sri Lanka� IFPRI Discussion Paper 00950, IFPRI.
Bowles, P. and B. Maclean, (1996), �Understanding Trade BlocFormation: The Case of the ASEAN Free Trade Area�, Review ofInternational Political Economy, Pages 319-348.
Chanda, R. and G. Sasidaran, (2009), �Understanding India�s RegionalInitiatives with East and South East Asia�, Asian Pacific EconomicsLiterature, 23(1): 66-78.
Chanda, R., (2005), �Trade in Services and South Asia: An AggressiveAgenda�, in South Asian Yearbook of Trade and Development, (ed.)CENTAD, New Concept Information Systems, New Delhi, Pages 105-208.
Chaturvedi, S., (2006), �An Evaluation of the Need and Cost of SelectedTrade Facilitation Measures in India: Implications for the WTONegotiations�, ARTNeT Working Paper No. 4, UNESCAP, Bangkok.
Chaturvedi, S., (2007), �Trade Facilitation Measures in South AsianFTAs: An Overview of Initiatives and policy Approaches�, RISDiscussion Papers, Research and Information System for DevelopingCountries, New Delhi.
Chugh N., (2008), �Antidumping and Competition Law: IndianPerspective� Research paper, Competition Commission of India.
CUTS, (2008), �Domestic Preparedness for Services Trade Liberalization:Are South Asian Countries Prepared for Further Liberalization?�Working Paper No. 3/2008, CUTS, Jaipur.
Das, D.K., (2008), �South Asia�s Integration with the Rest of Asia: asurvey�, Journal compiled by Crawford School of Economics andGovernment, The Australian National University and BlackwellPublishing Asia Pty Ltd.
Dayal, P, A. Das, R. Banga, K. Iyengar and S. Ahmed, (2008),�Qualification of Benefits for Economic Cooperation in South Asia�,Asian Development Bank (ADB) and United Nations Conference onTrade and Development (UNCTAD), Pages 4-75.
De, P, (2008), �Realising the Gains from Full Regional Connectivity inSouth Asia: The Transport Costs Dimension�, Vol. 30, No.1, Pages 27-44.
De, P., (2005), �Transaction Costs as Barriers to Economic Integration inAsia: An Empirical Exploration�, RIS Discussion Papers, Research andInformation System for Developing Countries, New Delhi.
82 Consumers and Economic Cooperation
De, P., (2009), �Regional Cooperation for regional InfrastructureDevelopment: Challenges and Policy Options for South Asia�, RISDiscussion Paper 160, Research and Information System for DevelopingCountries, New Delhi.
De, P., (2010), �Does Governance Matter for Enhancing Trade?� RISDiscussion Paper 164, Research and Information System for DevelopingCountries, New Delhi.
Derosa, A. and K. Govindan, (1996), �Agriculture, Trade andRegionalism in South Asia�, Journal of Asian Economics, 7(2), Pages293-316.
Dhungel, K.R., (2008), �Regional Energy Trade in South Asia: Problemsand Prospects�, South Asia Economic Journal, 9(1): 173-93.
Domus, A.D., (2005), �South Asia Transport and Trade FacilitationConference Briefing Book�, Prepared for United States Trade andDevelopment Agency, Washington DC.
Drope, J.M., (2007), �The Political Economy of Nontariff Trade Barriersin Emerging Economies�, Political Research Quarterly Volume 60,Number 3, Pages 401-414.
Drysdale, P., (1969), �Japan and Australia: The prospect for CloserEconomic Integration�, Economic Papers, 30, Pages 12-28.
ESCAP, (2006), �Economic and Social Survey of Asia and the Pacific2006-Energising the Global Economy�, ST/ESCAP/2396, United Nationspublications, Pages 102-119.
Ethier, Wilfred J. (2007), �The Theory of Trade Policy and TradeAgreements: A Critique�, European Journal of Political Economy, Vol. 23(3), 605-623.
Eusuf M.A., and A. Rahman, (2005), �Cost of Non Cooperation inSouth Asia�, Briefing Paper No. 6/2005, CUTS International, Jaipur.
Export Import Bank of India, (2002), �Sri Lanka: A Study of India�sTrade and Investment Potential�, Occasional Paper No. 92.
Export Import Bank of India. (2004). �BIMST-EC Initiative: A Study ofIndia�s Trade and Investment Potential with Select Asian Countries�,Occasional Paper No. 100.
Forte, R., (2004), �The Relationship between Foreign Direct Investmentand International Trade Substitution or Complementary? A Survey� FEPWorking Paper 140, Faculdade De Economia, Universidade Do Porto.
Consumers and Economic Cooperation 83
Ghani, E. and M. Din, (2006), �Regional Trade Integration in South Asia:Rationale, Impediment and the Way Forward�, ARTNeT Policy BriefNo.7.
Gilbert, J., (2008), �Trade Policy, Poverty and Income Distribution inCGE Models: An Application to SAFTA�, Department of Economics andFinance Working Paper Series, Department of Economics and Finance,Huntsman School of Business, Utah State University.
Grossman, G. and E. Helpman (1995), �Trade Wars and Trade Talks,�Journal of political Economy, Vol. 85 (4), 667�690.
Hertel, T.W. and T. Mirza, (2009), �The Role of Trade Facilitation inSouth Asian Economic Integration�, Chapter-2, Asian DevelopmentBank.
Hirantha, S.W., (2004), �From SAPTA to SAFTA: Gravity Analysis ofSouth Asian Free Trade�, Paper presented at the European Trade StudyGroup (ETSG) 2004 Programme, Nottingham.
Hassan, M.K. (2001), �Is SAARC a Viable Economic Block? Evidencefrom Gravity Model�, Journal of Asian Economics, Vol. 12(2), 263�290.
Hussain, R.M., (1999), �SAARC 1985-1995: A Review and Analysis ofprogress�, in E. Gonsalves and N. Jetly (eds), �The Dynamics of SouthAsia: Regional Cooperation and SAARC�, Pages 22-39, SagePublications, New Delhi.
James, William E. (2007), �Rules of origin in emerging Asia-Pacificpreferential trade agreements: Will PTAs promote trade anddevelopment?�, pp. 137-159, Chapter IV in ESCAP, Trade facilitationbeyond the multilateral trade negotiations: Regional practices, customsvaluation and other emerging issues � A study by the Asia-PacificResearch and Training Network on Trade, United Nations, New York.
Kabir, ASM, (2007), �Sanguinity and Aspiration toward South AsianRegional Integration: A Case Study of the South Asian Free Trade Area(SAFTA) Agreement�, MPRA Paper No. 3871, University of EastLondon.
Kalirajan, K. and K. Singh, (2007) �A Comparative Analysis of China�sand India�s Recent Export Performances�, Asian Economic Papers, Vol.7, Issue 1, Pages 1-28.
Kalirajan, K., (2007), �Regional Cooperation and Bilateral Trade Flows:An Empirical Measurement of Resistance.� The International TradeJournal, Vol. XXI, No. 2.
84 Consumers and Economic Cooperation
Karmakar, S., (2005), �India-ASEAN Cooperation in Services- AnOverview�, Working Paper No. 176, Indian Council for Research onInternational Economic Relations (ICRIER), New Delhi.
Kelegama, S. and R. Adhikari, (2002), �Regional Integration in the WTOEra: South Asia at Crossroads�, Discussion Paper, South Asia Watch onTrade, Economics and Environment, Kathmandu and CUTS Centre forInternational Trade, Economics and Environment, Jaipur.
Kelegama, S., (2004), �SAFTA: A Journal� South Asian Journal.
Kemal A.R., (2004) �SAFTA and Economic Cooperation� SAFMARegional Conference August 20-21, Dhaka.
Kemal, A.R. (2004), �Exploring Pakistan�s Regional EconomicCooperation Potential�, The Pakistan Development Review 43:4 Part1,Pages 313-334.
Khalil, R.U., (2011), �Removal of Non-Tariff Barriers Key to SAFTAImplementation�, The International News.
Kitson, M. and J. Michie, (1995), �Conflict, Cooperation and Change:The Political Economy of Trade and Trade Policy�, Review ofInternational Political Economy, Pages 632-657.
Kohli, U., (1991), �Technology Duality and Foreign Trade�, Universityof Michigan Press, Ann Arbor.
Krueger, E., R.Pinto, V. Thomas, and T.To. (2004). �Impacts of SouthAsia Free Trade Agreement�, La Follette School of Public Affairs 869,Spring, University of Wisconsin-Madison, Madison.
Kumar, A.G. and G.K. Saini, (2007), �Economic Cooperation in SouthAsia: The Dilemma of SAFTA and Beyond� Indira Gandhi Institute ofDevelopment and Research (IGIDR), Mumbai.
Kumar, G.A., D. Roy, and A.Gulati, (2010), �Liberalizing FoodgrainsMarkets�, International Food Policy Research Institute (IFPRI).
Kundu, K. K., (2004), �Free Trade at a Heavy Cost for India�. AsiaTimes Online.
Lee, K.W. (2008), �Development Cooperation for Economic Integrationof east and South Asia� CNAEC Research Series 08-01, Korea Institutefor International Economic Policy, Korea.
Mehta, R., (2005), �Non-Tariff Barriers Affecting India�s Exports�,Asian Development Bank.
Mehta, R., (2006), �Implication of WTO on India�s Trade Policy�, SouthAsian Journal.
Consumers and Economic Cooperation 85
Mehta, R., and K. Bhattacharya. (1999), �The South Asian PreferentialTrading Agreement: Impact on Intra-Regional trade�, The Asia PacificJournal of Economics and Business 4(1).
Mehta, R., and P. Agarwal, (2004), �WTO Non Agriculture MarketAccess Modalities� RIS Discussion Papers, Research and InformationSystem for Developing Countries, New Delhi.
Michaely, M., (1994), �Trade Preferential Agreements in Latin America:An Ex-Ante Assessment�, World Bank policy research paper 1583.
Mohanty, S.K., and S. Chaturvedi, (2006), �Impact of SAFTA on Tradein Environmentally Goods in South Asia: Emerging Challenges and PolicyOptions�, Asia Pacific Trade and Investment Review, Volume 2, No.2.
Moinuddin, M., (2008), �Rethinking Regionalism in South Asia:Prospects and strategic Implications of SAFTA�, Discussion Paper,Yokohama National University, Japan.
Moktan S., (2008), �Evaluating the Intra Regional Exports and TradeCreation and Trade Diversion Effects of Trade Agreements in SAARCCountries�, South Asia Journal, Vol9, Pages 233-260.
Mukherji, I.N., (2000), �Charting a Free Trade Area in South Asia:Instruments and Modalities�, presented at the second conference of theSouth Asia Network of Economic Research Institutes (SANEI), 26-9August, Kathmandu.
Mukherji, I.N., (2004), �Towards a Free Trade Area in South Asia:Charting a Feasible Course for Trade Liberalization with Reference toIndia�s Role�, RIS, Discussion Paper No. 86, Research and InformationSystem for Developing Countries, New Delhi.
Nag, S.R., (2008), �Regional Cooperation and Integration Prospects inAsia�, RIS Discussion Paper No. 131, Research and Information Systemfor Developing Countries, New Delhi.
Panagariya, A., (2003), �South Asia: Does Preferential TradeLiberalization Make Sense?� Centre for International Economics,Department of Economics, University of Maryland.
Peng, D., (2002), �Invisible Linkages: A Regional Perspective of EastAsian Political Economy�, International Studies Quarterly 46, Pages 423-447.
Pitigala, N., (2005), �What does Regional Trade in South Asia revealabout Future Trade Integration? Some Empirical Evidence�, World BankPolicy Research Working Paper 3497, World Bank, Washington.
86 Consumers and Economic Cooperation
Rahman, M., (2001), �Bangladesh-India Bilateral Trade: AnInvestigation into Trade in Services�, prepared under South AsiaNetwork of Economic Research Institutes (SANEI) Study Programme,Centre for Policy Dialogue, Dhaka.
Rahman, M., W.B.Shadat and N.C.Das, (2006), �Trade Potential inSAFTA: An Application of Augmented Gravity Model�, Paper 61, Centrefor Policy Dialogue.
Rahman, T. and M.A. Amin, (2009), �Prospects of EconomicCooperation in the Bangledesh, China, India and Myanmar Region: AQuantitative Assessment�, Asia Pacific Research and Training Networkon Trade Working Paper Series No. 73.
Raihan, S. and M.A. Razzaque, (2007), �Welfare Effects of South AsianFree Trade Area (SAFTA), Regional Trading Arrangements (RTAs) inSouth Asia: Implications for the Bangladesh Economy�, Paper preparedfor the UNDP Regional Centre Colombo.
Razzaque, M. A., (2008), �Weaker Economies in SAFTA: Issues andConcerns�, Paper prepared for the first South Asian Economic Summit,28-30 August, Colombo, Sri Lanka.
RIS, (2006), �Facilitating India�s overland trade in the easternneighborhood�, Policy Brief, Research and Information System forDeveloping Countries, New Delhi.
RIS, (2007), Summary of Proceedings of Regional Conference on�Economic Cooperation in SAARC: SAFTA and Beyond� India HabitatCentre, New Delhi.
RIS, (2008), �SAARC Regional Study on Potential for Trade in Servicesunder SAFTA�. Research and Information System for DevelopingCountries, New Delhi.
RIS, (2008), �South Asia Cooperation and Development Report�Research and Information System for Developing Countries (RIS),Oxford University Press, New Delhi.
Rodríguez-Delgado, J.D. (2007), �SAFTA: Living in a World of RegionalTrade Agreements�, IMF Working Paper 07/23, International MonetaryFund (IMF), Washington, D.C.
Rodriguez, J.D. and Delgado, (2007), �SAFTA: Living in the World ofRegional Trade Agreements� IMF Working Paper, IMF.
Rodrik, D. (1995), �Political Economy of Trade Policy.� in Grossman, G.and K. Rogoff (eds.), Handbook of International Economics(Amsterdam: North-Holland), 1457�1495.
Consumers and Economic Cooperation 87
Roy, Jayanta and Pritam Banerjee (2010), �The Centrality of TradeFacilitation for Regional Economic Integration�, in Sadiq Ahmed, SamanKelegama, Ejaz Ghani (Eds.) �Promoting Economic Cooperation in SouthAsia�, The World Bank and Sage Publications, Washington.
Saini, G.K., (2011), �Prospects of Regional Economic Cooperation inSouth Asia with Special Studies on Indian Industry�, ChandosPublishing, UK.
Saqib, M. and N. Taneja, (2005), �Non-Tariff Barriers and India�sExports: The case of ASEAN and Sri Lanka�, ICRIER Working PaperNo. 165, Indian Council for Research and International EconomicRelations (ICRIER).
Scott, D. (ed.), (2011), �Handbook of India�s International Relations�.
Sen, Sunanda (2005), �International Trade Theory and Policy: What IsLeft of the Free Trade Paradigm?�, Development and Change, Vol. 36(6),1011�29.
Taneja, N. and A. Mukherjee, (2004), �Indo-Sri Lanka Trade in Services:FTA 2 and Beyond�, Indian Council for Research and InternationalEconomic Relations (ICRIER).
Taneja, N., (1999), �Informal trade in the SAARC Region�, Indian Councilfor Research on International Economic Relations (ICRIER).
Taneja, N., (2007), �India Pakistan Trade Possibilities and Non-TariffBarriers�, ICRIER, Working Paper No. 200, Indian Council for Researchand International Economic Relations (ICRIER).
Taneja, N., S. Ray, N. Kaushal and D.R.Chowdhury, (2011), �EnhancingIntra-SAARC Trade: Pruning India�s Sensitive List under SAFTA�,ICRIER Working Paper 225, Indian Council for Research onInternational Economic Relations (ICRIER).
Tewari, M. (2008), �Deepening Intraregional Trade and Investment inSouth Asia: The Case of the Textile and Clothing Industry�, ICRIERWorking Paper No. 213, Indian Council for Research on InternationalEconomic Relations (ICRIER).
UNCTAD (2009) �Trade and Development Report�.
Verma, R. and J. Dubey, (2010) �What does Gravity Model Reveal aboutSAFTA?� Ideas Repec.
Walkrenhorst, P., and T. Yasui, (2003), �Quantitative Assessment of theBenefits of Trade Facilitation�, Organisation for Economic Co-operationand Development (OECD).
88 Consumers and Economic Cooperation
Weeraheva, J., (2009), �Impact of Trade Facilitation Measures andRegional Trade Agreements on Food and Agricultural Trade in SouthAsia�, Working Paper Series, No.69, Asia Pacific Research and TrainingNetwork on Trade.
Weerakon, D., (2010), �The Political Economy of Trade Integration inSouth Asia: The Role of India�, The World Economy.
Weerakoon, D. and J. Wijayasiri, (2001), �Regional EconomicCooperation in South Asia: A Sri Lankan Perspective�, InternationalEconomic Series, No. 6, Institute of Policy Studies, Colombo.
Weerakoon, D., (2008), �SAFTA: Current Status and Prospect�, Institutefor Policy Studies, Colombo.
Wilson, J.S., C.L. Mann, and T. Otsuki. (2004), �Assessing the PotentialBenefit of Trade Facilitation: A Global Perspective�, World Bank PolicyResearch Working Paper 3224.
World Bank, (2006), �India Bangladesh Bilateral Trade and PotentialFree Trade Agreement� Bangladesh Development Series Paper No: 13,World Bank.
World Bank, (2007), �Fact Sheet- South Asia Growth and RegionalIntegration�. World Bank, Washington DC.
World Bank, (2010), �World Bank South Asia Economic Update�,World Bank, Washington DC.
WTO (2011), �The WTO and Preferential Trade Agreements: Fromco-existence to coherence�, The World Trade Report 2011, WTOSecretariat, Geneva
Zalazar-Xirinachus, Jose M. (2004), �The proliferation of RegionalTrade Agreements in the Americas: An assessment of key issues�, inVinod K. Aggarwal, Ralph Espach and Joseph S. Tulchin (Eds.), �Thestrategic Dynamics of Latin American Trade�, Woodrow Wilson CentrePress Washington.
Endnotes
1 World Development Indicators (WDI Database), World Bank,2011.
2 Ibid. Middle income countries also registered a sharper growth intrade-GDP ratio and developing countries together now account forabout 35 percent of world trade.
3 This is evident from the reluctance on the part of SAFTA membersto reduce items in their sensitive lists on which tariff reduction is notapplied. Detailed exposition is given in Chapter 2.
4 See Moinuddin (2008) and Moktan (2008).
5 For similar view, see also �Fact Sheet- South Asia Growth andRegional Integration�, World Bank, 2007.
6 Based on 2003-2004 data, Qamar (2005) shows that afterexcluding the items that are on the positive list for India, 45 percentof the items could be imported by Pakistan at a lowerr cost fromIndia than the current cost of import from the rest of the world.
7 Mercantilist thinking is based on the view that national wealthcorresponds to the country�s holdings of precious metals andpositive trade balance is a means of accumulating it.
8 This argument by Hume is based on his proposition based on price-specie flow mechanism. For detailed exposition on mercatilisticapproach to trade and its shortcomings, see Appleyard and Field(2001).
9 Ibid. On the production side, divisions of labour and scaleeconomies are the driving forces behind efficiency gains in terms oflesser input costs per unit of output.
10 For detailed exposition, see Coats (1975) and Irvin (1996).
11 For important contributions towards the development of classicaltrade theory, see Chipman (1965).
12 Ibid. Supply-side analysis referred to encompasses the Heckscher-Ohlin model and subsequent qualifications inspired by it.
90 Consumers and Economic Cooperation
13 Most Favoured Nation (MFN) and National Treatment clausesstand for non-discrimination principle. Reciprocity is designed intothe method of negotiations under a trade agreement. For a criticalreview of the traditional theory of trade agreements see Ethier(2007).
14 It was highlighted that the Bangkok Agreement failed to be aneffective preferential agreement due to such shortcomings andSAPTA should take due caution of this (Kelegama, 1996).
15 A number of other sub-regional initiatives such as growthquadrangles (Bangladesh, Bhutan, Nepal and India) and triangles(Sri Lanka, Maldives and South India) were mooted. These sub-regional initiatives were not considered for preferential trading butfor sectoral cooperation.
16 Symmetry in economic activity also implies that there is a lessercontradiction in terms of formulating internal and externalmacroeconomic policies.
17 ADB has launched Strategy 2020 for South Asia, which includesregional integration as one of the three development agendas (theothers are inclusive economic growth and environmentallysustainable growth), see ADB (2008) for details.
18 Lack of complementarities is generally attributed to the fact thatmost of the countries in the region are competitors in the exportmarkets, dominated by textile and apparel exports.
19 For a conceptual exposure on trade costs due to lack ofaccompanying reforms see Anderson and Wincoop (2004). Thepositive impacts of trade agreement on domestic policy reforms inthe South Asian context have been extensively dealt with in Ahmedet al. (2004), Kemal (2004), Chanda (2005) and ADB (2007).
20 See Bandara and Yu (2003), Rahman et al., (2006), Rahman andAmin (2009) and Moktan (2008).
21 Almost all quantitative studies have duly acknowledged this aspect.See Pitgala (2005) and Kalicharan (2007).
22 Among the major causes of high trade transaction costs in easternSouth Asia are the cumbersome and complex cross-border tradingpractices, which also increase the possibility of corruption. Thegoods carried by road in South Asia are largely subject totransshipment at the border, which imposes serious impediments toregional and multilateral trade. The position is further compoundedby lack of harmonisation of technical standards. It is argued thatwith only accompanying reforms in these areas will SAFTA wouldfunction to achieve the eventual benefits of moving to a CustomsUnion in 2015 and an Economic Union in 2020 (Chaturvedi, 2006,and De, 2008).
Consumers and Economic Cooperation 91
23 A general overview of experiences from world over on this topicand a conceptual treatment on benefits of trade facilitation areavailable in Walkrenhorst and Yasui (2003) and Wilson et al.(2004).
24 For instance, it has been documented that exports from Nepalheaded to Europe or North America would benefit if they couldeffectively access Mumbai port, rather than using Kolkata/Haldia.The cost of exporting a carpet from Nepal to Europe using Mumbaiinstead of Kolkata would save US$1,300, a substantial amountequaling 30 to 40 percent of the total value of export and wouldsave 7-10 days in terms of time (Subramanian and Arnold, 2001).
25 SAFTA TLP stipulates reduction of tariff rates to upper limits of 20and 30 percent for developing and least developed countriesrespectively within 2 years from the date of enforcement of theAgreement (1.1.2006). It also requires annual reduction of 10percent for developing countries and 5 percent for least developedcountries during this period for products with tariff rates less thanthe prescribed upper limits on the date of enforcement.
26 Country wise trade data for the analysis is accessed from UNCommodity Trade database (UNCOMTRADE) and data onimport and export prices and quantity for the year 2009 is accessedfrom Trade Maps, International Trade Centre. The analysis iscarried out at HS07 6-Digit level
27 Export price of SAFTA member is taken as the current importprices faced by their RoW partners in selected products. These pricefigures include MFN tariff rates and transportation charges whichare deemed higher for countries outside the region. Therefore, it isimplied here that these figures are likely to be even lower for SAFTAtrading partners because of geographical proximity.
28 Article 1, Charter of SAARC.
29 Sectors such as transport, insurance, banking etc.
30 A strictly qualitative assessment of the survey responses is carriedout in the following sections.
31 Non-trade issues here refer to border disputes, water-sharingarrangements, etc., and allied differences in the political front.
32 This implies political class would have the incentive to mainstreamconsumer welfare gains in trade policy discourse, consumers beingtheir largest constituency. Thus, by changing the incentive structureof key stakeholders in terms of their participation in the regionaltrade negotiations, the direction and rate of progress of thenegotiations are likely to change, as the relative position ofconsumers as a stakeholder group improves.

Annexure Tables

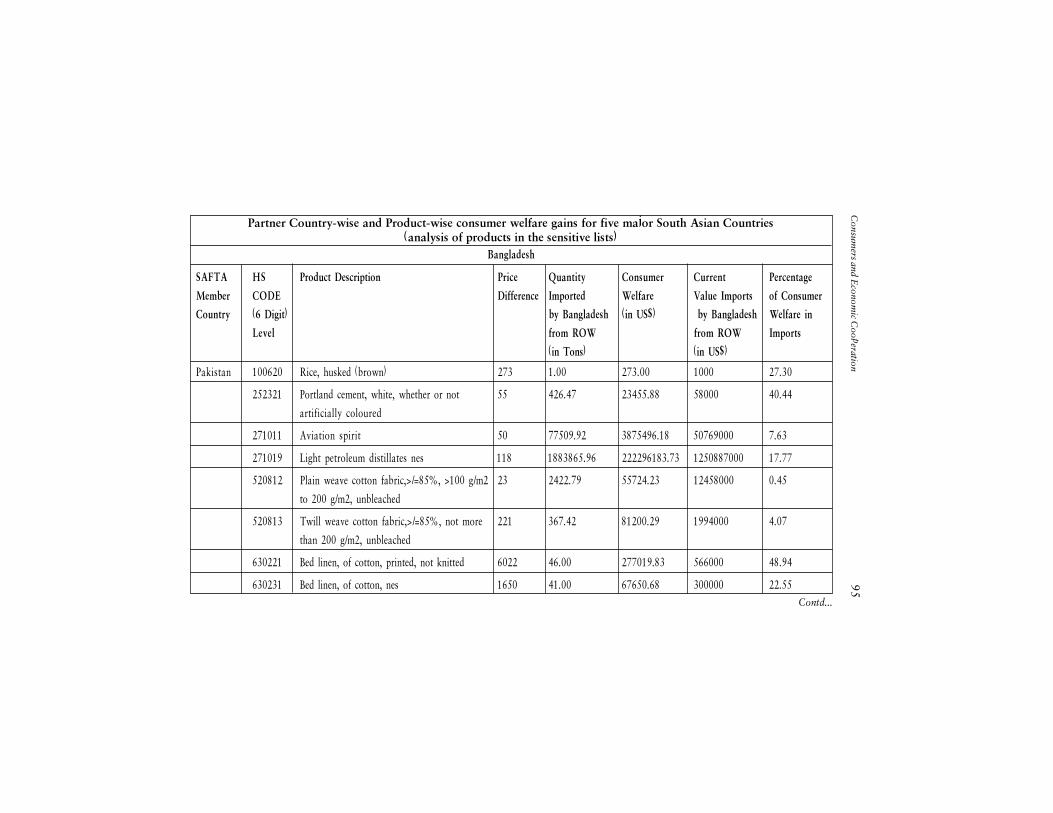
Consum
ers and Econom
ic Cooperation
95
Bangladesh
SAFTA HS Product Description Price Quantity Consumer Current Percentage
Member CODE Difference Imported Welfare Value Imports of Consumer
Country (6 Digit) by Bangladesh (in US$) by Bangladesh Welfare in
Level from ROW from ROW Imports
(in Tons) (in US$)
Pakistan 100620 Rice, husked (brown) 273 1.00 273.00 1000 27.30
252321 Portland cement, white, whether or not 55 426.47 23455.88 58000 40.44
artificially coloured
271011 Aviation spirit 50 77509.92 3875496.18 50769000 7.63
271019 Light petroleum distillates nes 118 1883865.96 222296183.73 1250887000 17.77
520812 Plain weave cotton fabric,>/=85%, >100 g/m2 23 2422.79 55724.23 12458000 0.45
to 200 g/m2, unbleached
520813 Twill weave cotton fabric,>/=85%, not more 221 367.42 81200.29 1994000 4.07
than 200 g/m2, unbleached
630221 Bed linen, of cotton, printed, not knitted 6022 46.00 277019.83 566000 48.94
630231 Bed linen, of cotton, nes 1650 41.00 67650.68 300000 22.55Contd...
Partner Country-wise and Product-wise consumer welfare gains for five major South Asian Countries(analysis of products in the sensitive lists)
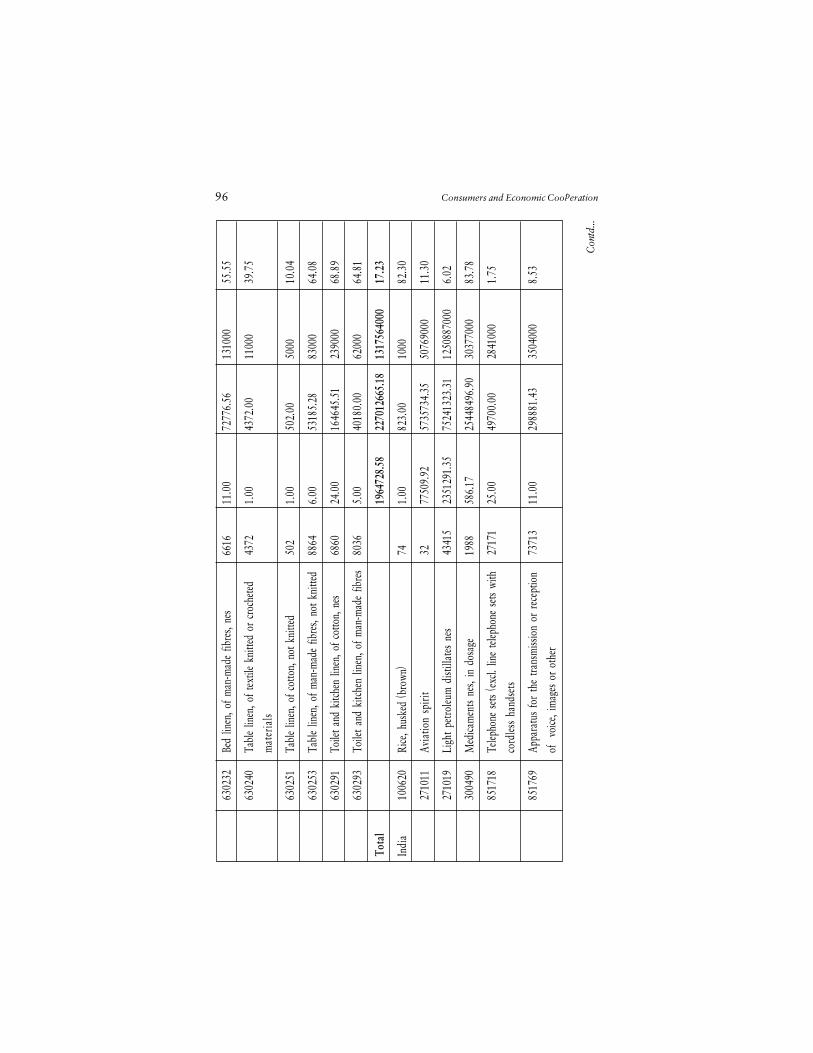
96 Consumers and Economic Cooperation
63
0232
Bed
linen
, of m
an-m
ade
fibre
s, ne
s66
1611
.00
7277
6.56
1310
0055
.55
63
0240
Tabl
e lin
en, o
f tex
tile
knitt
ed o
r cr
oche
ted43
721.
0043
72.0
011
000
39.7
5
mat
eria
ls
63
0251
Tabl
e lin
en, o
f cot
ton,
not
kni
tted
502
1.00
502.
0050
0010
.04
63
0253
Tabl
e lin
en, o
f man
-mad
e fib
res,
not k
nitte
d88
646.
0053
185.
2883
000
64.0
8
63
0291
Toile
t and
kitc
hen
linen
, of c
otto
n, n
es68
6024
.00
1646
45.5
123
9000
68.8
9
63
0293
Toile
t and
kitc
hen
linen
, of m
an-m
ade
fibre
s80
365.
0040
180.
0062
000
64.8
1
Tota
l
1964
728.
5822
7012
665.
1813
1756
4000
17.2
3
Indi
a10
0620
Rice
, hus
ked
(bro
wn)
741.
0082
3.00
1000
82.3
0
27
1011
Avia
tion
spiri
t32
7750
9.92
5735
734.
3550
7690
0011
.30
27
1019
Ligh
t pe
troleu
m d
istill
ates
nes
4341
523
5129
1.35
7524
1323
.31
1250
8870
006.
02
30
0490
Med
icam
ents
nes,
in d
osag
e19
8858
6.17
2544
8496
.90
3037
7000
83.7
8
85
1718
Telep
hone
sets
(exc
l. lin
e tel
epho
ne s
ets w
ith27
171
25.0
049
700.
0028
4100
01.
75
cord
less
hand
sets
85
1769
Appa
ratu
s fo
r th
e tra
nsm
issio
n or
rec
eptio
n73
713
11.0
029
8881
.43
3504
000
8.53
of
voice
, im
ages
or
othe
r
Con
td...
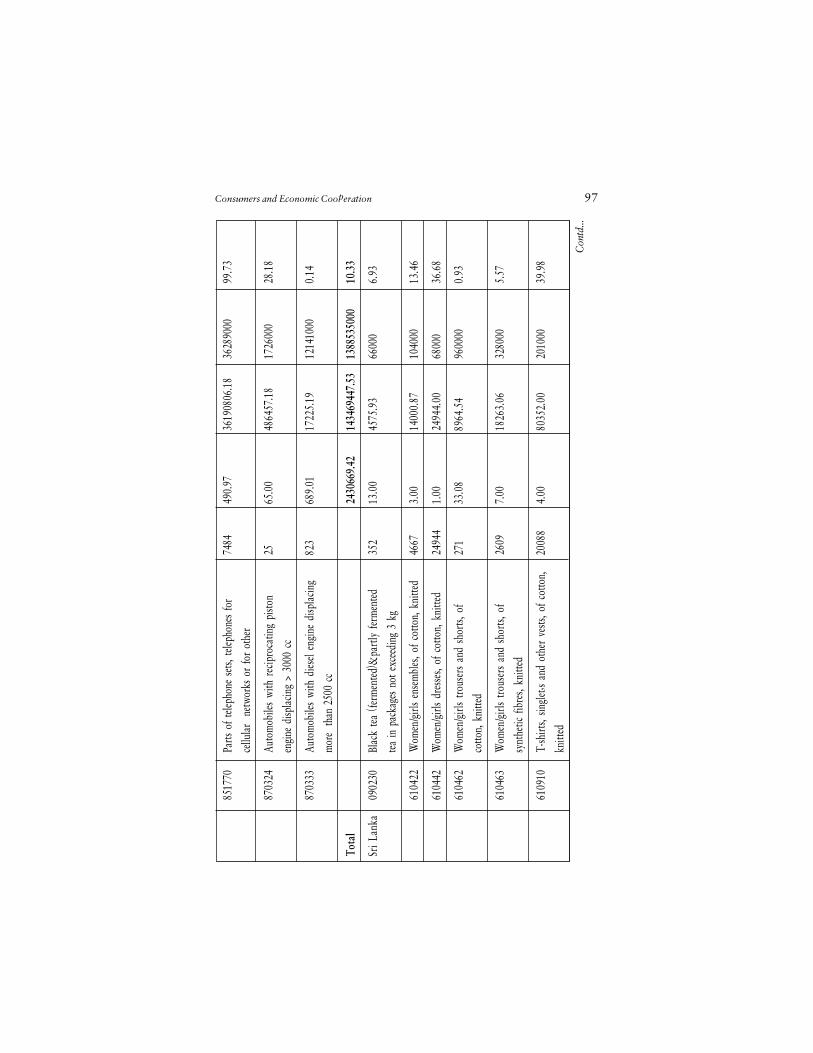
Consumers and Economic Cooperation 97
Con
td...
85
1770
Parts
of t
eleph
one
sets,
telep
hone
s fo
r74
8449
0.97
3619
0806
.18
3628
9000
99.7
3
cellu
lar
netw
orks
or
for
othe
r
87
0324
Auto
mob
iles
with
rec
ipro
catin
g pi
ston
2565
.00
4864
57.1
817
2600
028
.18
engi
ne d
ispla
cing
> 30
00 c
c
87
0333
Auto
mob
iles
with
dies
el en
gine
disp
lacin
g82
368
9.01
1722
5.19
1214
1000
0.14
mor
e th
an 2
500
cc
Tota
l
2430
669.
4214
3469
447.
5313
8853
5000
10.3
3
Sri L
anka
0902
30Bl
ack
tea
(ferm
ente
d)&
partl
y fe
rmen
ted
352
13.0
045
75.9
366
000
6.93
tea in
pac
kage
s no
t exc
eedi
ng 3
kg
61
0422
Wom
en/g
irls
ense
mbl
es, o
f cot
ton,
kni
tted
4667
3.00
1400
0.87
1040
0013
.46
61
0442
Wom
en/g
irls
dres
ses,
of c
otto
n, k
nitte
d24
944
1.00
2494
4.00
6800
036
.68
61
0462
Wom
en/g
irls
trous
ers
and
shor
ts, o
f27
133
.08
8964
.54
9600
000.
93
cotto
n, k
nitte
d
61
0463
Wom
en/g
irls
trous
ers
and
shor
ts, o
f26
097.
0018
263.
0632
8000
5.57
synt
hetic
fibr
es, k
nitte
d
61
0910
T-sh
irts,
singl
et�s
and
othe
r ve
sts, o
f cot
ton,
2008
84.
0080
352.
0020
1000
39.9
8
knitt
ed
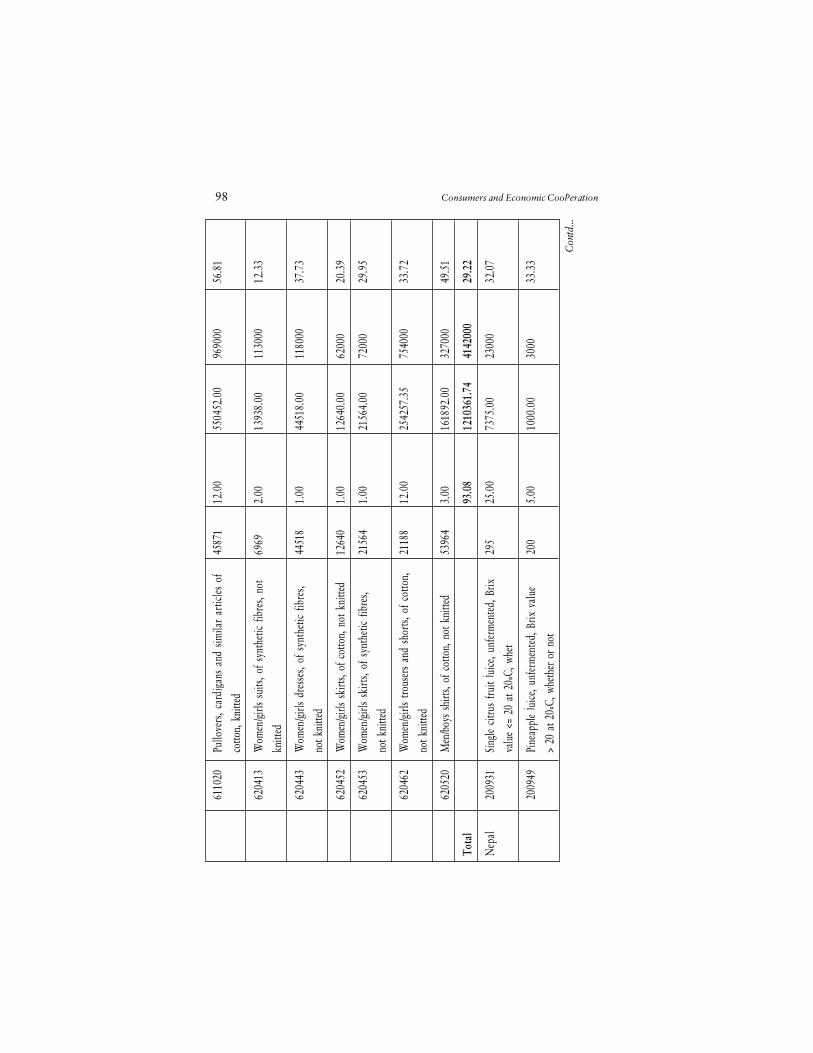
98 Consumers and Economic Cooperation
61
1020
Pullo
vers
, car
diga
ns a
nd s
imila
r ar
ticles
of
4587
112
.00
5504
52.0
096
9000
56.8
1
cotto
n, k
nitte
d
62
0413
Wom
en/g
irls
suits
, of s
ynth
etic
fibre
s, no
t69
692.
0013
938.
0011
3000
12.3
3
knitt
ed
62
0443
Wom
en/g
irls
dres
ses,
of s
ynth
etic
fibre
s,44
518
1.00
4451
8.00
1180
0037
.73
not k
nitte
d
62
0452
Wom
en/g
irls
skirt
s, of
cot
ton,
not
kni
tted
1264
01.
0012
640.
0062
000
20.3
9
62
0453
Wom
en/g
irls
skirt
s, of
syn
thet
ic fib
res,
2156
41.
0021
564.
0072
000
29.9
5
not k
nitte
d
62
0462
Wom
en/g
irls
trous
ers
and
shor
ts, o
f cot
ton,
2118
812
.00
2542
57.3
575
4000
33.7
2
not k
nitte
d
62
0520
Men
/boy
s sh
irts,
of c
otto
n, n
ot k
nitte
d53
964
3.00
1618
92.0
032
7000
49.5
1
Tota
l
93
.08
1210
361.
7441
4200
029
.22
Nep
al20
0931
Sing
le cit
rus
fruit
juice
, unf
erm
ente
d, B
rix29
525
.00
7375
.00
2300
032
.07
valu
e <=
20
at 2
0°C,
whe
t
20
0949
Pine
appl
e ju
ice, u
nfer
men
ted,
Brix
val
ue20
05.
0010
00.0
030
0033
.33
> 20
at 2
0°C,
whe
ther
or n
ot
Con
td...
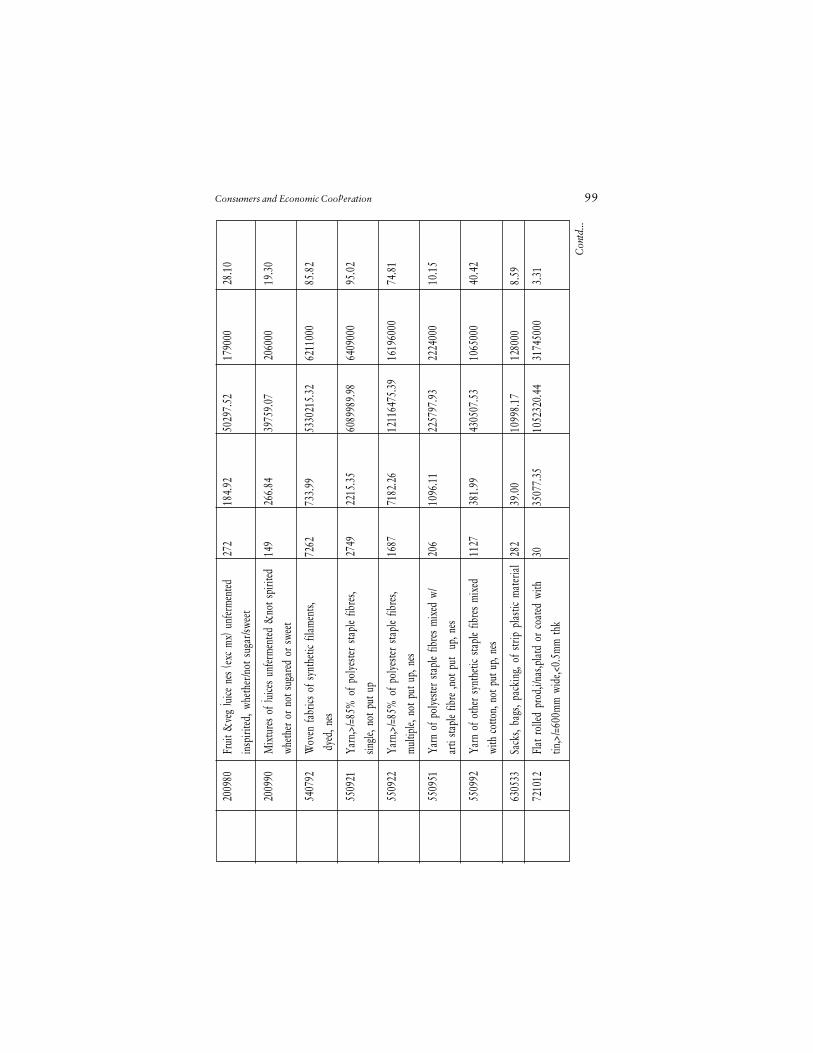
Consumers and Economic Cooperation 99
20
0980
Frui
t &ve
g ju
ice n
es (e
xc m
x) u
nfer
men
ted27
218
4.92
5029
7.52
1790
0028
.10
insp
irite
d, w
heth
er/n
ot s
ugar
/swee
t
20
0990
Mix
ture
s of
juice
s un
ferm
ente
d &
not s
pirit
ed14
926
6.84
3975
9.07
2060
0019
.30
wheth
er o
r no
t sug
ared
or
swee
t
54
0792
Wov
en fa
brics
of s
ynth
etic
filam
ents,
7262
733.
9953
3021
5.32
6211
000
85.8
2
dye
d, n
es
55
0921
Yarn
,>/=
85%
of p
olye
ster
stapl
e fib
res,
2749
2215
.35
6089
989.
9864
0900
095
.02
single
, not
put
up
55
0922
Yarn
,>/=
85%
of p
olye
ster
stapl
e fib
res,
1687
7182
.26
1211
6475
.39
1619
6000
74.8
1
mul
tiple,
not
put
up,
nes
55
0951
Yarn
of p
olye
ster
stapl
e fib
res
mix
ed w
/20
610
96.1
122
5797
.93
2224
000
10.1
5
arti
stapl
e fib
re ,n
ot p
ut
up, n
es
55
0992
Yarn
of o
ther
syn
thet
ic sta
ple
fibre
s m
ixed
1127
381.
9943
0507
.53
1065
000
40.4
2
with
cot
ton,
not
put
up,
nes
63
0533
Sack
s, ba
gs, p
acki
ng, o
f str
ip p
lasti
c m
ater
ial
282
39.0
010
998.
1712
8000
8.59
72
1012
Flat
rol
led p
rod,
i/nas
,pla
td o
r co
ated
with
3035
077.
3510
5232
0.44
3174
5000
3.31
tin,>
/=60
0mm
wid
e,<0.
5mm
thk
Con
td...
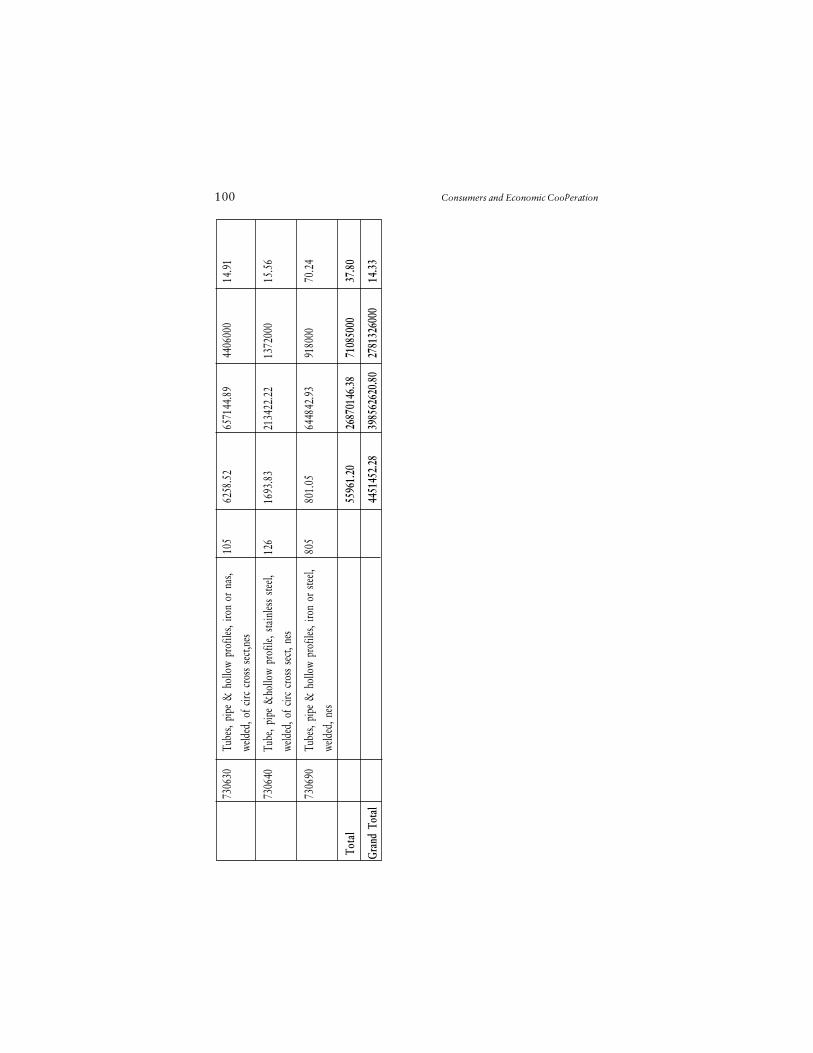
100 Consumers and Economic Cooperation
73
0630
Tube
s, pi
pe &
hol
low
prof
iles,
iron
or n
as,
105
6258
.52
6571
44.8
944
0600
014
.91
weld
ed, o
f circ
cro
ss s
ect,n
es
73
0640
Tube
, pip
e &
hollo
w pr
ofile
, sta
inles
s ste
el,12
616
93.8
321
3422
.22
1372
000
15.5
6
weld
ed, o
f circ
cro
ss se
ct, n
es
73
0690
Tube
s, pi
pe &
hol
low
prof
iles,
iron
or s
teel,
805
801.
0564
4842
.93
9180
0070
.24
weld
ed, n
es
Tota
l
5596
1.20
2687
0146
.38
7108
5000
37.8
0
Gran
d To
tal
44
5145
2.28
3985
6262
0.80
2781
3260
0014
.33
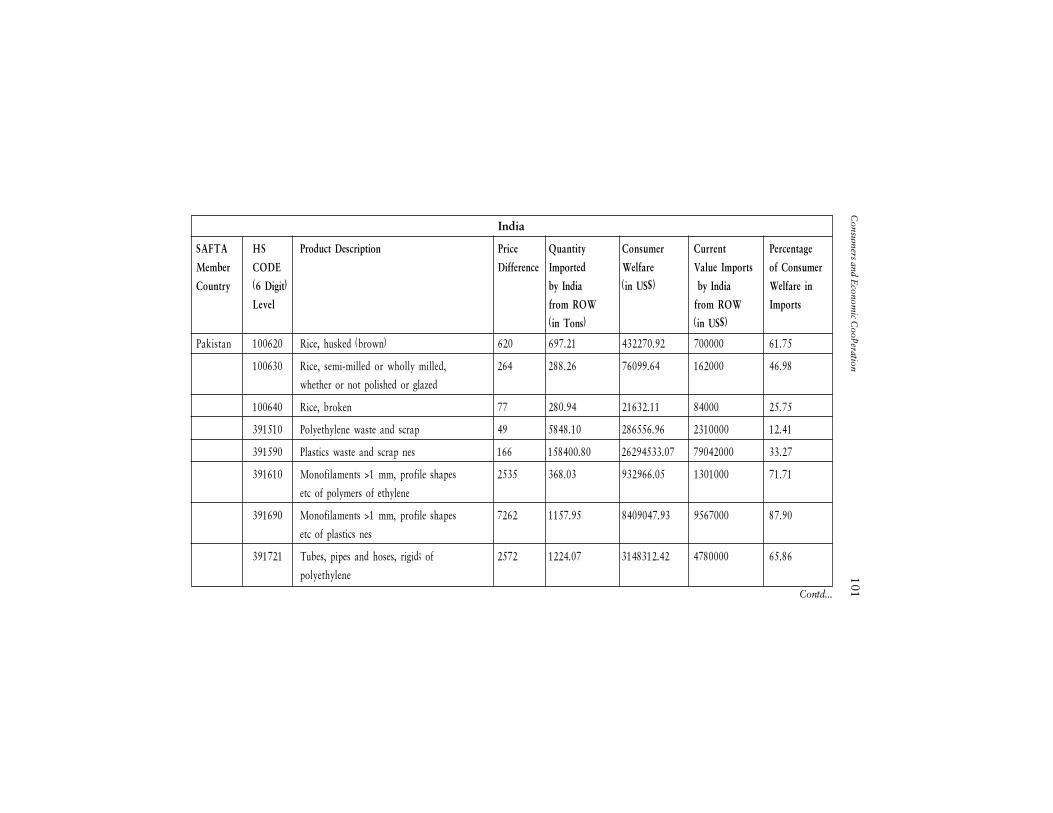
Consum
ers and Econom
ic Cooperation
101
India
SAFTA HS Product Description Price Quantity Consumer Current Percentage
Member CODE Difference Imported Welfare Value Imports of Consumer
Country (6 Digit) by India (in US$) by India Welfare in
Level from ROW from ROW Imports
(in Tons) (in US$)
Pakistan 100620 Rice, husked (brown) 620 697.21 432270.92 700000 61.75
100630 Rice, semi-milled or wholly milled, 264 288.26 76099.64 162000 46.98
whether or not polished or glazed
100640 Rice, broken 77 280.94 21632.11 84000 25.75
391510 Polyethylene waste and scrap 49 5848.10 286556.96 2310000 12.41
391590 Plastics waste and scrap nes 166 158400.80 26294533.07 79042000 33.27
391610 Monofilaments >1 mm, profile shapes 2535 368.03 932966.05 1301000 71.71
etc of polymers of ethylene
391690 Monofilaments >1 mm, profile shapes 7262 1157.95 8409047.93 9567000 87.90
etc of plastics nes
391721 Tubes, pipes and hoses, rigid; of 2572 1224.07 3148312.42 4780000 65.86
polyethylene
Contd...
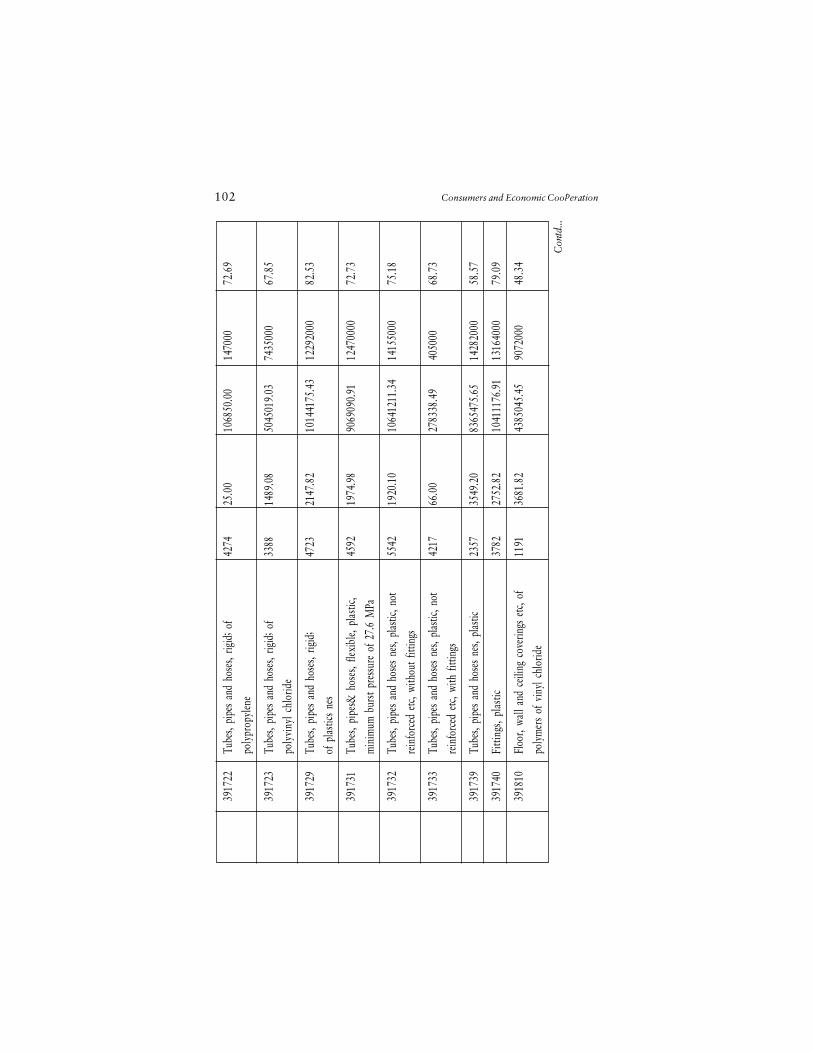
102 Consumers and Economic Cooperation
Con
td...
39
1722
Tube
s, pi
pes
and
hose
s, rig
id; o
f42
7425
.00
1068
50.0
014
7000
72.6
9
poly
prop
ylen
e
39
1723
Tube
s, pi
pes
and
hose
s, rig
id; o
f33
8814
89.0
850
4501
9.03
7435
000
67.8
5
poly
viny
l chl
orid
e
39
1729
Tube
s, pi
pes
and
hose
s, rig
id;
4723
2147
.82
1014
4175
.43
1229
2000
82.5
3
of p
lasti
cs n
es
39
1731
Tube
s, pi
pes&
hos
es, f
lexib
le, p
lasti
c,45
9219
74.9
890
6909
0.91
1247
0000
72.7
3
min
imum
bur
st pr
essu
re o
f 27.
6 M
Pa
39
1732
Tube
s, pi
pes
and
hose
s ne
s, pl
astic
, not
5542
1920
.10
1064
1211
.34
1415
5000
75.1
8
rein
forc
ed e
tc, w
ithou
t fitt
ings
39
1733
Tube
s, pi
pes
and
hose
s ne
s, pl
astic
, not
4217
66.0
027
8338
.49
4050
0068
.73
rein
forc
ed e
tc, w
ith fi
tting
s
39
1739
Tube
s, pi
pes
and
hose
s ne
s, pl
astic
2357
3549
.20
8365
475.
6514
2820
0058
.57
39
1740
Fitti
ngs,
plas
tic37
8227
52.8
210
4111
76.9
113
1640
0079
.09
39
1810
Floo
r, wa
ll an
d ce
iling
cov
erin
gs e
tc, o
f11
9136
81.8
243
8504
5.45
9072
000
48.3
4
poly
mer
s of
vin
yl c
hlor
ide
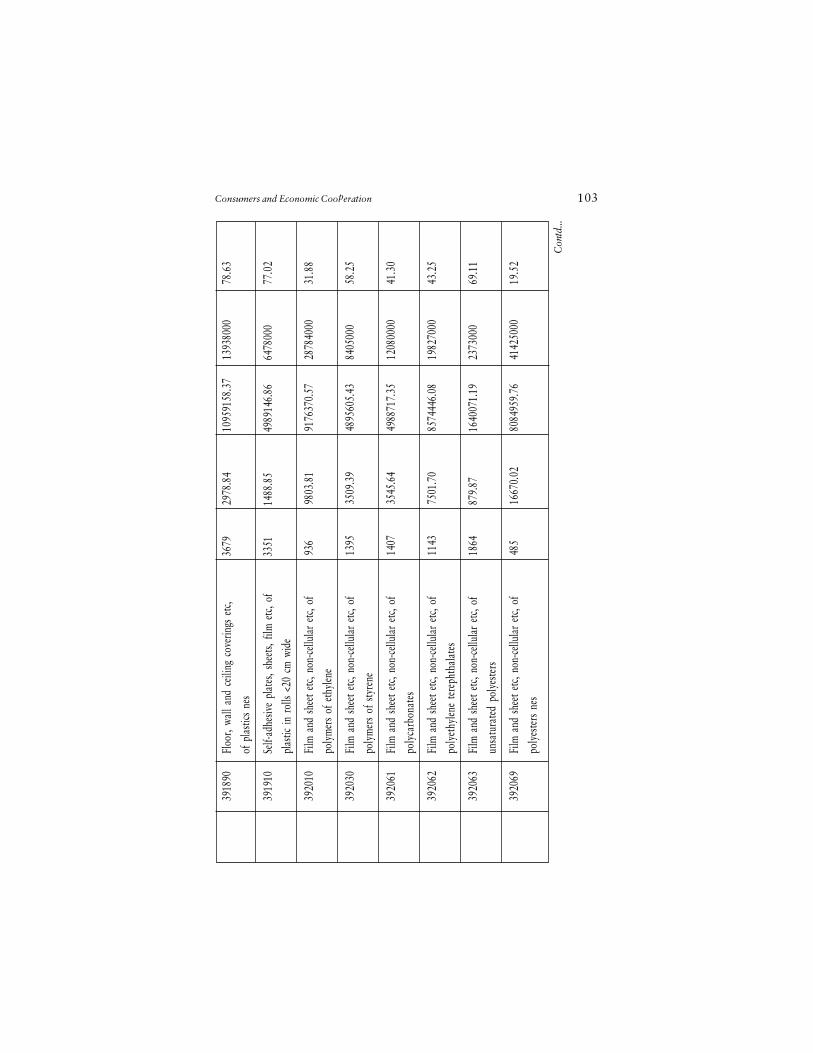
Consumers and Economic Cooperation 103
39
1890
Floo
r, wa
ll an
d ce
iling
cov
erin
gs e
tc,
3679
2978
.84
1095
9158
.37
1393
8000
78.6
3
of p
lasti
cs n
es
39
1910
Self-
adhe
sive
plat
es, s
heet
s, fil
m e
tc, o
f33
5114
88.8
549
8914
6.86
6478
000
77.0
2
plas
tic in
rol
ls <2
0 cm
wid
e
39
2010
Film
and
she
et e
tc, n
on-c
ellul
ar e
tc, o
f93
698
03.8
191
7637
0.57
2878
4000
31.8
8
poly
mer
s of
eth
ylen
e
39
2030
Film
and
she
et e
tc, n
on-c
ellul
ar e
tc, o
f13
9535
09.3
948
9560
5.43
8405
000
58.2
5
poly
mer
s of
sty
rene
39
2061
Film
and
she
et e
tc, n
on-c
ellul
ar e
tc, o
f14
0735
45.6
449
8871
7.35
1208
0000
41.3
0
poly
carb
onat
es
39
2062
Film
and
she
et e
tc, n
on-c
ellul
ar e
tc, o
f11
4375
01.7
085
7444
6.08
1982
7000
43.2
5
poly
ethy
lene
tere
phth
alat
es
39
2063
Film
and
she
et etc
, non
-cellu
lar
etc, o
f18
6487
9.87
1640
071.
1923
7300
069
.11
unsa
tura
ted
poly
este
rs
39
2069
Film
and
she
et e
tc, n
on-c
ellul
ar e
tc, o
f48
516
670.
0280
8495
9.76
4142
5000
19.5
2
poly
este
rs n
es
Con
td...
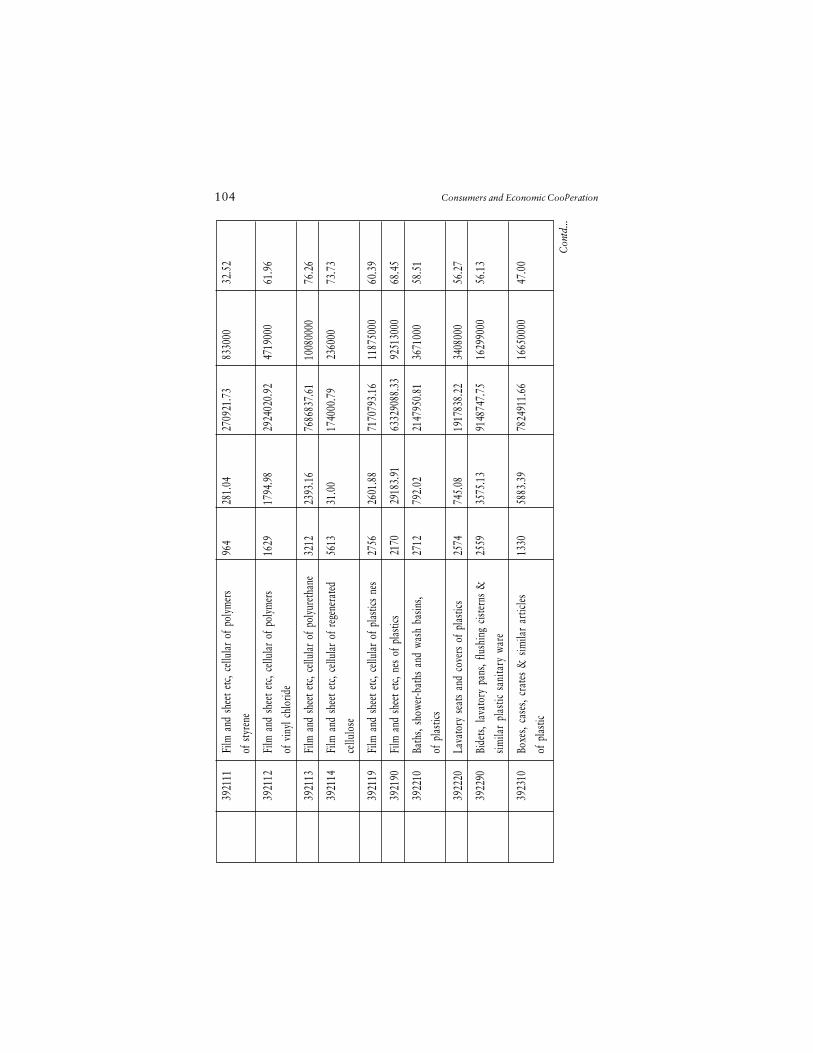
104 Consumers and Economic Cooperation
39
2111
Film
and
she
et e
tc, c
ellul
ar o
f pol
ymer
s96
428
1.04
2709
21.7
383
3000
32.5
2
of s
tyre
ne
39
2112
Film
and
she
et e
tc, c
ellul
ar o
f pol
ymer
s16
2917
94.9
829
2402
0.92
4719
000
61.9
6
of v
inyl
chl
orid
e
39
2113
Film
and
she
et e
tc, c
ellul
ar o
f pol
yure
than
e32
1223
93.1
676
8683
7.61
1008
0000
76.2
6
39
2114
Film
and
she
et e
tc, c
ellul
ar o
f reg
ener
ated
5613
31.0
017
4000
.79
2360
0073
.73
cellu
lose
39
2119
Film
and
she
et e
tc, c
ellul
ar o
f pla
stics
nes
2756
2601
.88
7170
793.
1611
8750
0060
.39
39
2190
Film
and
she
et e
tc, n
es o
f pla
stics
2170
2918
3.91
6332
9088
.33
9251
3000
68.4
5
39
2210
Bath
s, sh
ower
-bat
hs a
nd w
ash
basin
s,27
1279
2.02
2147
950.
8136
7100
058
.51
of p
lasti
cs
39
2220
Lava
tory
sea
ts an
d co
vers
of
plas
tics
2574
745.
0819
1783
8.22
3408
000
56.2
7
39
2290
Bide
ts, la
vato
ry p
ans,
flush
ing
ciste
rns
&25
5935
75.1
391
4874
7.75
1629
9000
56.1
3
simila
r pl
astic
san
itary
war
e
39
2310
Boxe
s, ca
ses,
crat
es &
sim
ilar
artic
les13
3058
83.3
978
2491
1.66
1665
0000
47.0
0
of p
lasti
c
Con
td...
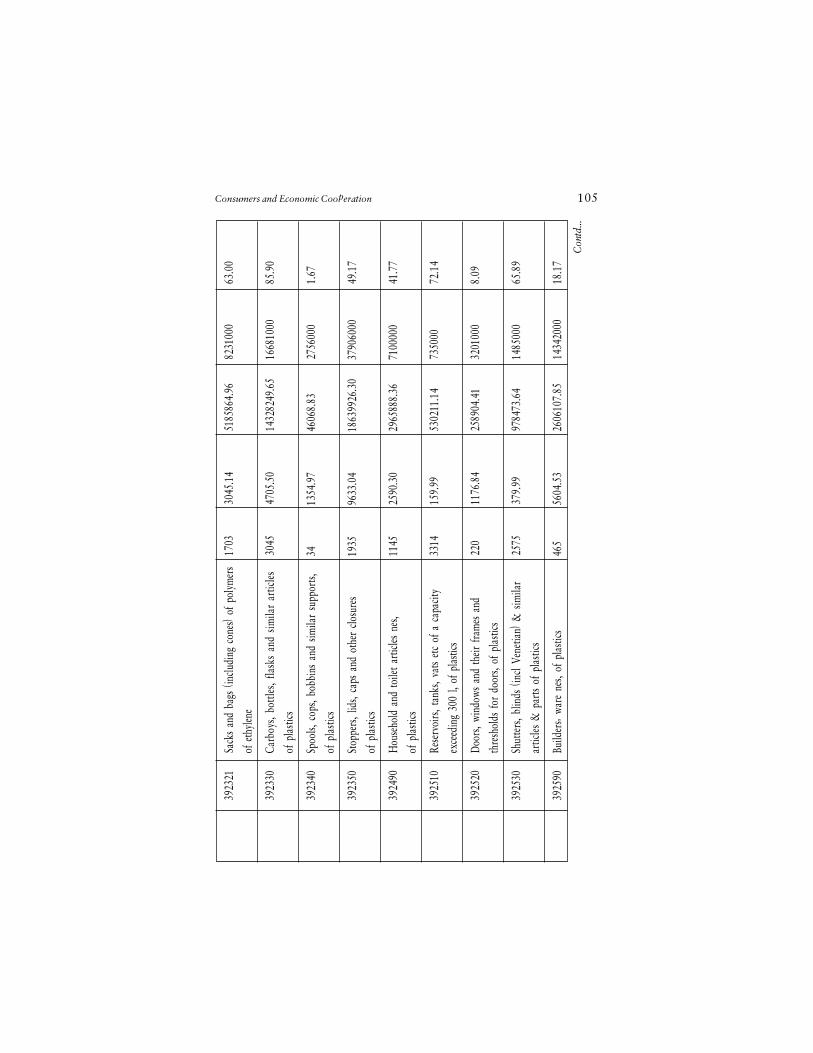
Consumers and Economic Cooperation 105
Con
td...
39
2321
Sack
s an
d ba
gs (i
nclu
ding
con
es) o
f pol
ymer
s17
0330
45.1
451
8586
4.96
8231
000
63.0
0
of e
thyle
ne
39
2330
Carb
oys,
bottl
es, f
lask
s an
d sim
ilar
artic
les30
4547
05.5
014
3282
49.6
516
6810
0085
.90
of p
lasti
cs
39
2340
Spoo
ls, c
ops,
bobb
ins
and
simila
r su
ppor
ts,34
1354
.97
4606
8.83
2756
000
1.67
of p
lasti
cs
39
2350
Stop
pers
, lid
s, ca
ps a
nd o
ther
clo
sure
s19
3596
33.0
418
6399
26.3
037
9060
0049
.17
of p
lasti
cs
39
2490
Hou
seho
ld a
nd to
ilet a
rticle
s ne
s,11
4525
90.3
029
6588
8.36
7100
000
41.7
7
of p
lasti
cs
39
2510
Rese
rvoi
rs, t
anks
, vat
s et
c of
a c
apac
ity33
1415
9.99
5302
11.1
473
5000
72.1
4
exce
edin
g 30
0 l,
of p
lasti
cs
39
2520
Door
s, wi
ndow
s an
d th
eir fr
ames
and
220
1176
.84
2589
04.4
132
0100
08.
09
thre
shol
ds fo
r do
ors,
of p
lasti
cs
39
2530
Shut
ters
, blin
ds (
incl
Vene
tian)
& s
imila
r25
7537
9.99
9784
73.6
414
8500
065
.89
artic
les &
par
ts of
pla
stics
39
2590
Build
ers�
war
e ne
s, of
pla
stics
465
5604
.53
2606
107.
8514
3420
0018
.17
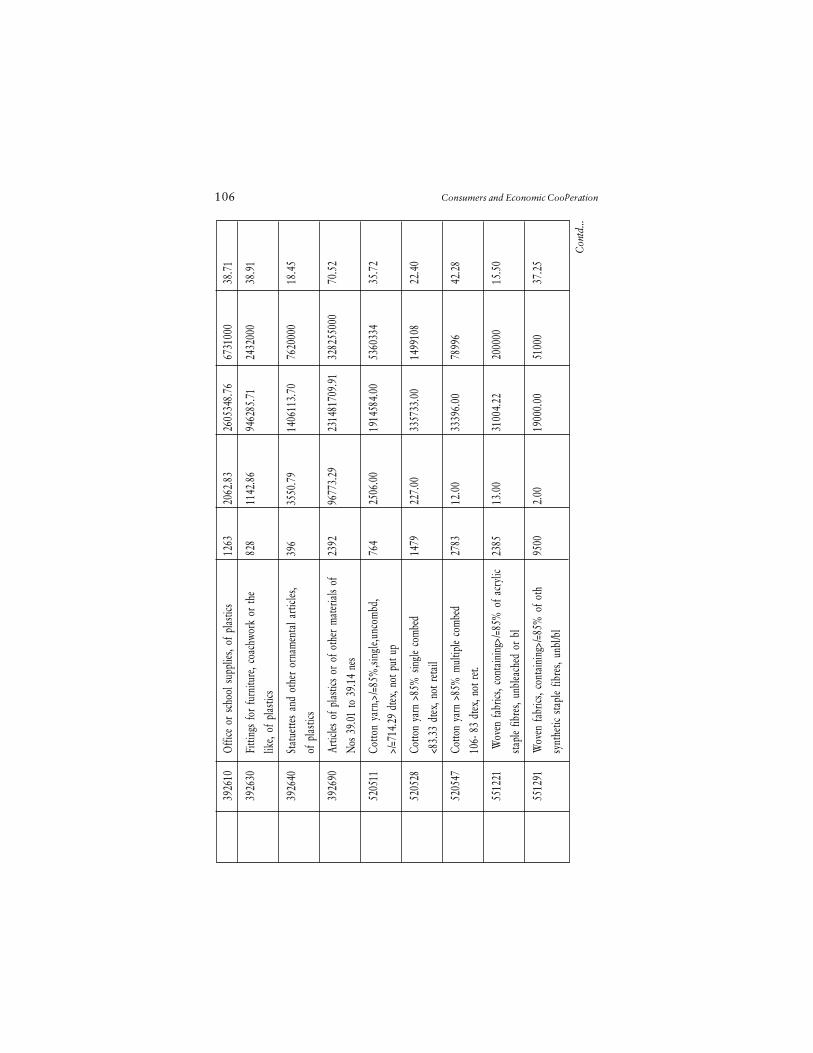
106 Consumers and Economic Cooperation
Con
td...
39
2610
Offi
ce o
r sc
hool
sup
plies
, of p
lasti
cs12
6320
62.8
326
0534
8.76
6731
000
38.7
1
39
2630
Fitti
ngs
for
furn
iture
, coa
chwo
rk o
r th
e82
811
42.8
694
6285
.71
2432
000
38.9
1
like,
of p
lasti
cs
39
2640
Stat
uette
s an
d ot
her
orna
men
tal a
rticle
s,39
635
50.7
914
0611
3.70
7620
000
18.4
5
of p
lasti
cs
39
2690
Artic
les o
f pla
stics
or
of o
ther
mat
eria
ls of
2392
9677
3.29
2314
8170
9.91
3282
5500
070
.52
Nos
39.
01 to
39.
14 n
es
52
0511
Cotto
n ya
rn,>
/=85
%,si
ngle,
unco
mbd
,76
425
06.0
019
1458
4.00
5360
334
35.7
2
>/=7
14.2
9 dt
ex, n
ot p
ut u
p
52
0528
Cotto
n ya
rn >
85%
sin
gle
com
bed
1479
227.
0033
5733
.00
1499
108
22.4
0
<83.
33 d
tex, n
ot r
etail
52
0547
Cotto
n ya
rn >
85%
mul
tiple
com
bed
2783
12.0
033
396.
0078
996
42.2
8
106-
83
dtex
, not
ret.
55
1221
Wov
en fa
brics
, con
tain
ing>
/=85
% o
f acr
ylic
2385
13.0
031
004.
2220
0000
15.5
0
stapl
e fib
res,
unbl
each
ed o
r bl
55
1291
Wov
en fa
brics
, con
tain
ing>
/=85
% o
f oth
9500
2.00
1900
0.00
5100
037
.25
synt
hetic
sta
ple
fibre
s, un
bl/b
l
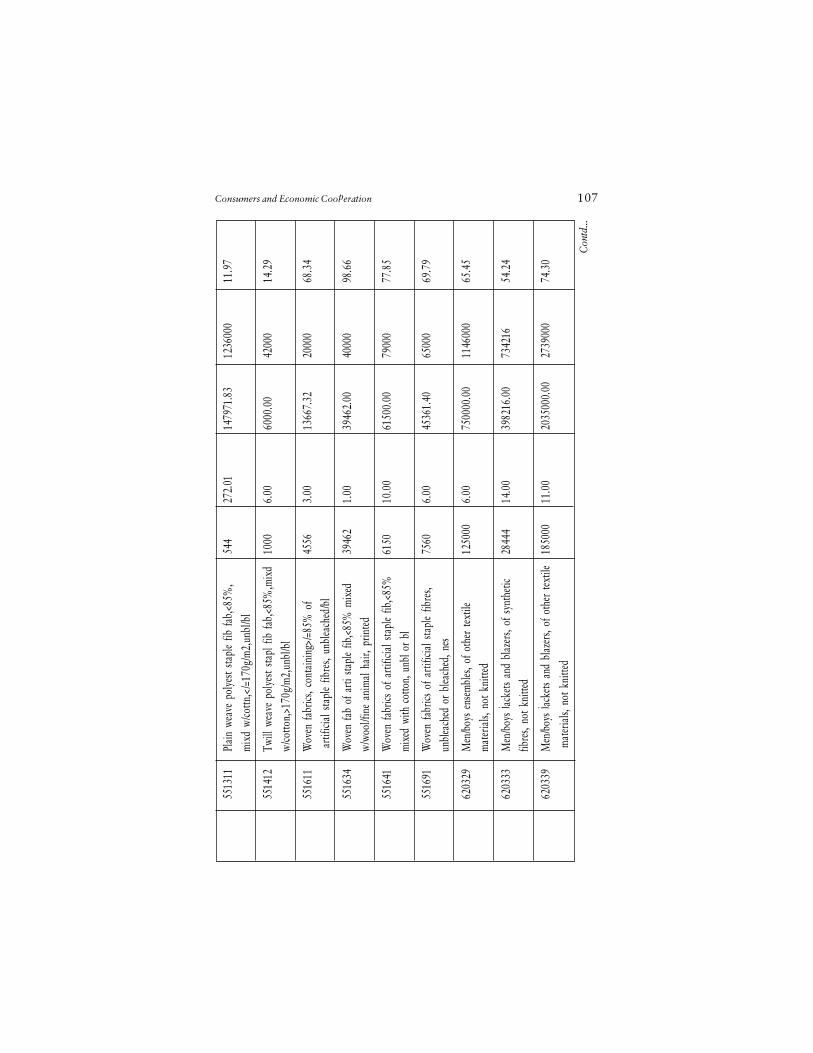
Consumers and Economic Cooperation 107
Con
td...
55
1311
Plai
n we
ave
poly
est s
tapl
e fib
fab,
<85%
,54
427
2.01
1479
71.8
312
3600
011
.97
mix
d w
/cottn
,</=
170g
/m2,
unbl
/bl
55
1412
Twill
wea
ve p
olye
st sta
pl fi
b fa
b,<8
5%,m
ixd
1000
6.00
6000
.00
4200
014
.29
w/co
tton,
>170
g/m
2,un
bl/b
l
55
1611
Wov
en fa
brics
, con
tain
ing>
/=85
% o
f45
563.
0013
667.
3220
000
68.3
4
arti
ficia
l sta
ple
fibre
s, un
blea
ched
/bl
55
1634
Wov
en fa
b of
arti
sta
ple
fib,<
85%
mix
ed39
462
1.00
3946
2.00
4000
098
.66
w/w
ool/f
ine
anim
al h
air,
prin
ted
55
1641
Wov
en fa
brics
of a
rtific
ial s
tapl
e fib
,<85
%61
5010
.00
6150
0.00
7900
077
.85
mix
ed w
ith c
otto
n, u
nbl o
r bl
55
1691
Wov
en fa
brics
of a
rtific
ial s
tapl
e fib
res,
7560
6.00
4536
1.40
6500
069
.79
unbl
each
ed o
r bl
each
ed, n
es
62
0329
Men
/boy
s en
sem
bles
, of o
ther
text
ile12
5000
6.00
7500
00.0
011
4600
065
.45
mat
eria
ls, n
ot k
nitte
d
62
0333
Men
/boy
s ja
cket
s an
d bl
azer
s, of
syn
thet
ic28
444
14.0
039
8216
.00
7342
1654
.24
fibre
s, no
t kni
tted
62
0339
Men
/boy
s ja
cket
s an
d bl
azer
s, of
oth
er te
xtile
1850
0011
.00
2035
000.
0027
3900
074
.30
mat
eria
ls, n
ot k
nitte
d
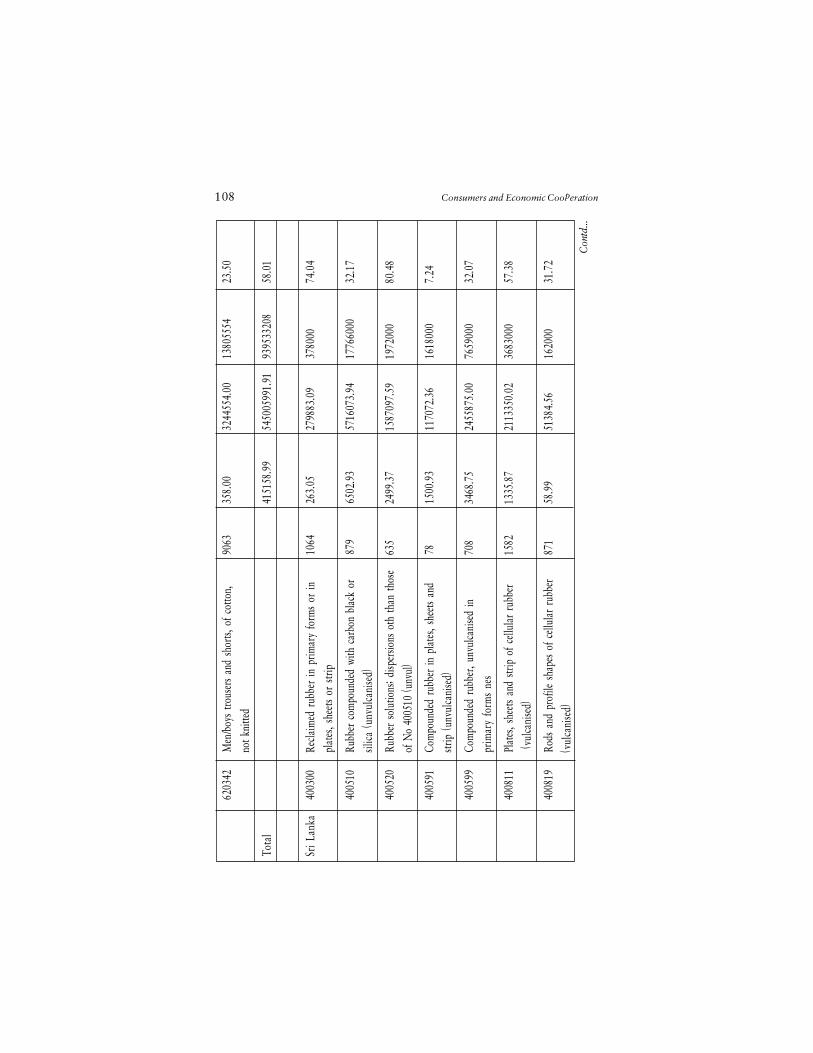
108 Consumers and Economic Cooperation
62
0342
Men
/boy
s tro
user
s an
d sh
orts,
of c
otto
n,90
6335
8.00
3244
554.
0013
8055
5423
.50
not k
nitte
d
Tota
l
4151
58.9
954
5005
991.
9193
9533
208
58.0
1
Sri L
anka
4003
00Re
claim
ed r
ubbe
r in
prim
ary
form
s or
in10
6426
3.05
2798
83.0
937
8000
74.0
4
plat
es, s
heet
s or
stri
p
40
0510
Rubb
er c
ompo
unde
d wi
th c
arbo
n bl
ack
or87
965
02.9
357
1607
3.94
1776
6000
32.1
7
silica
(un
vulca
nise
d)
40
0520
Rubb
er s
olut
ions
; disp
ersio
ns o
th th
an th
ose
635
2499
.37
1587
097.
5919
7200
080
.48
of N
o 40
0510
(unv
ul)
40
0591
Com
poun
ded
rubb
er in
pla
tes,
shee
ts an
d78
1500
.93
1170
72.3
616
1800
07.
24
strip
(un
vulca
nise
d)
40
0599
Com
poun
ded
rubb
er, u
nvul
cani
sed
in70
834
68.7
524
5587
5.00
7659
000
32.0
7
prim
ary
form
s ne
s
40
0811
Plat
es, s
heet
s an
d str
ip o
f cell
ular
rub
ber
1582
1335
.87
2113
350.
0236
8300
057
.38
(vu
lcani
sed)
40
0819
Rods
and
pro
file
shap
es o
f cell
ular
rub
ber
871
58.9
951
384.
5616
2000
31.7
2
(vul
cani
sed)
Con
td...
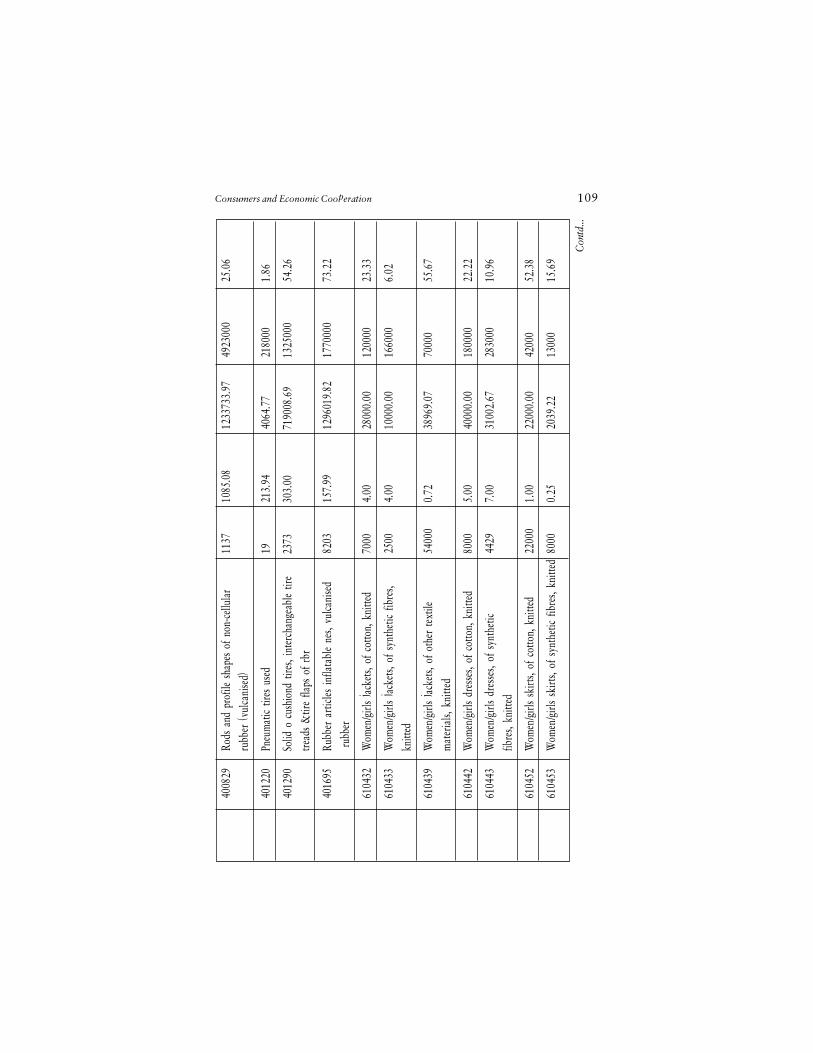
Consumers and Economic Cooperation 109
Con
td...
40
0829
Rods
and
pro
file
shap
es o
f non
-cell
ular
1137
1085
.08
1233
733.
9749
2300
025
.06
rubb
er (
vulca
nise
d)
40
1220
Pneu
mat
ic tir
es u
sed
1921
3.94
4064
.77
2180
001.
86
40
1290
Solid
o c
ushi
ond
tires
, int
erch
ange
able
tire
2373
303.
0071
9008
.69
1325
000
54.2
6
tread
s &
tire
flaps
of r
br
40
1695
Rubb
er a
rticle
s in
flata
ble
nes,
vulca
nise
d82
0315
7.99
1296
019.
8217
7000
073
.22
rub
ber
61
0432
Wom
en/g
irls
jack
ets,
of c
otto
n, k
nitte
d70
004.
0028
000.
0012
0000
23.3
3
61
0433
Wom
en/g
irls
jack
ets,
of s
ynth
etic
fibre
s,25
004.
0010
000.
0016
6000
6.02
knitt
ed
61
0439
Wom
en/g
irls
jack
ets,
of o
ther
text
ile54
000
0.72
3896
9.07
7000
055
.67
mat
eria
ls, k
nitte
d
61
0442
Wom
en/g
irls
dres
ses,
of c
otto
n, k
nitte
d80
005.
0040
000.
0018
0000
22.2
2
61
0443
Wom
en/g
irls
dres
ses,
of s
ynth
etic
4429
7.00
3100
2.67
2830
0010
.96
fibre
s, kn
itted
61
0452
Wom
en/g
irls
skirt
s, of
cot
ton,
kni
tted
2200
01.
0022
000.
0042
000
52.3
8
61
0453
Wom
en/g
irls
skirt
s, of
syn
thet
ic fib
res,
knitt
ed80
000.
2520
39.2
213
000
15.6
9
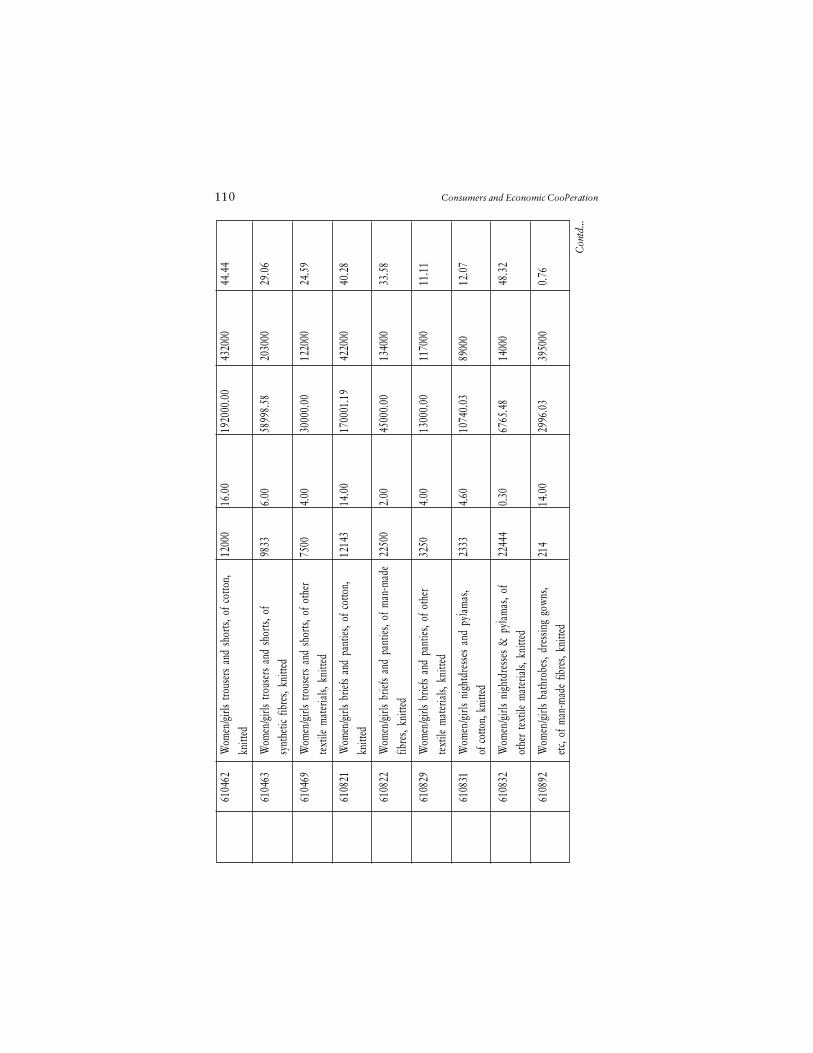
110 Consumers and Economic Cooperation
Con
td...
61
0462
Wom
en/g
irls
trous
ers
and
shor
ts, o
f cot
ton,
1200
016
.00
1920
00.0
043
2000
44.4
4
knitt
ed
61
0463
Wom
en/g
irls
trous
ers
and
shor
ts, o
f98
336.
0058
998.
5820
3000
29.0
6
synt
hetic
fibr
es, k
nitte
d
61
0469
Wom
en/g
irls
trous
ers
and
shor
ts, o
f oth
er75
004.
0030
000.
0012
2000
24.5
9
text
ile m
ater
ials,
kni
tted
61
0821
Wom
en/g
irls
brief
s an
d pa
nties
, of c
otto
n,12
143
14.0
017
0001
.19
4220
0040
.28
knitt
ed
61
0822
Wom
en/g
irls
brief
s an
d pa
nties
, of m
an-m
ade
2250
02.
0045
000.
0013
4000
33.5
8
fibre
s, kn
itted
61
0829
Wom
en/g
irls
brief
s an
d pa
nties
, of o
ther
3250
4.00
1300
0.00
1170
0011
.11
text
ile m
ater
ials,
kni
tted
61
0831
Wom
en/g
irls
nigh
tdre
sses
and
pyj
amas
,23
334.
6010
740.
0389
000
12.0
7
of c
otto
n, k
nitte
d
61
0832
Wom
en/g
irls
nigh
tdre
sses
& p
yjam
as, o
f22
444
0.30
6765
.48
1400
048
.32
othe
r te
xtile
mat
eria
ls, k
nitte
d
61
0892
Wom
en/g
irls
bath
robe
s, dr
essin
g go
wns
,21
414
.00
2996
.03
3950
000.
76
etc,
of m
an-m
ade
fibre
s, kn
itted
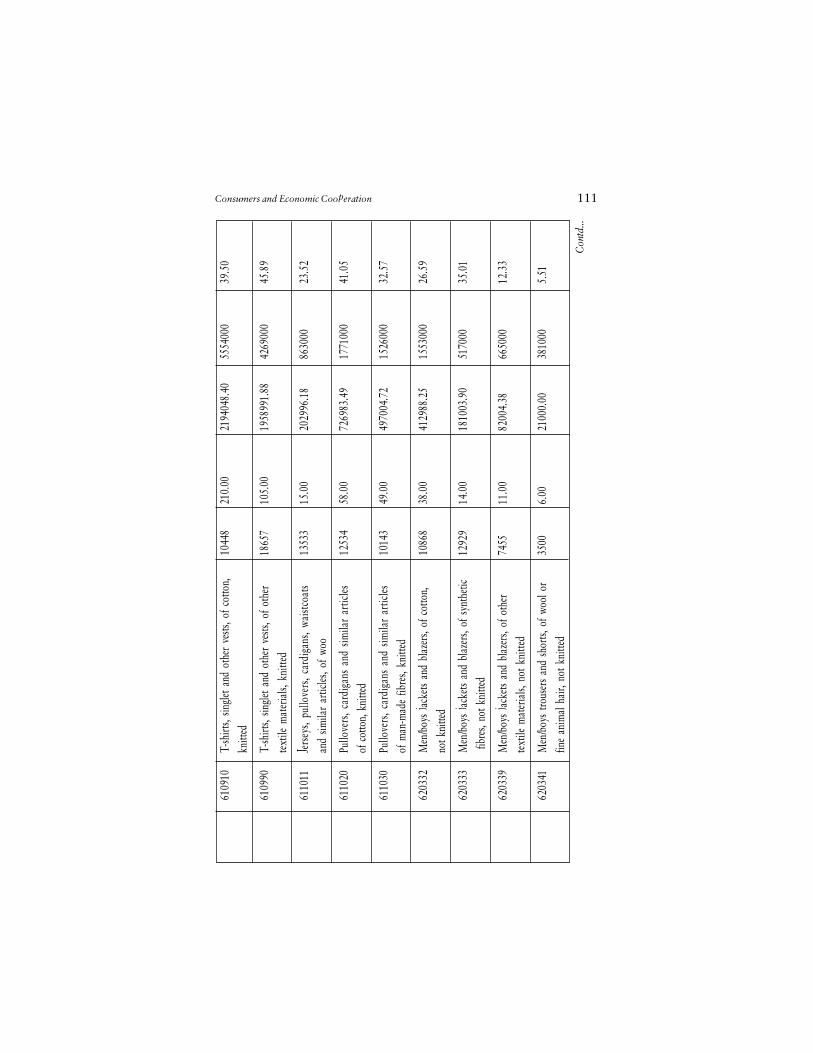
Consumers and Economic Cooperation 111
Con
td...
61
0910
T-sh
irts,
singl
et a
nd o
ther
ves
ts, o
f cot
ton,
1044
821
0.00
2194
048.
4055
5400
039
.50
knitt
ed
61
0990
T-sh
irts,
singl
et a
nd o
ther
ves
ts, o
f oth
er18
657
105.
0019
5899
1.88
4269
000
45.8
9
text
ile m
ater
ials,
kni
tted
61
1011
Jers
eys,
pullo
vers
, car
diga
ns, w
aistc
oats
1353
315
.00
2029
96.1
886
3000
23.5
2
and
simila
r ar
ticles
, of
woo
61
1020
Pullo
vers
, car
diga
ns a
nd s
imila
r ar
ticles
1253
458
.00
7269
83.4
917
7100
041
.05
of c
otto
n, k
nitte
d
61
1030
Pullo
vers
, car
diga
ns a
nd s
imila
r ar
ticles
1014
349
.00
4970
04.7
215
2600
032
.57
of m
an-m
ade
fibre
s, kn
itted
62
0332
Men
/boy
s ja
cket
s an
d bl
azer
s, of
cot
ton,
1086
838
.00
4129
88.2
515
5300
026
.59
not k
nitte
d
62
0333
Men
/boy
s ja
cket
s an
d bl
azer
s, of
syn
thet
ic12
929
14.0
018
1003
.90
5170
0035
.01
fibr
es, n
ot k
nitte
d
62
0339
Men
/boy
s ja
cket
s an
d bl
azer
s, of
oth
er74
5511
.00
8200
4.38
6650
0012
.33
text
ile m
ater
ials,
not
kni
tted
62
0341
Men
/boy
s tro
user
s an
d sh
orts,
of w
ool o
r35
006.
0021
000.
0038
1000
5.51
fine
anim
al h
air,
not k
nitte
d
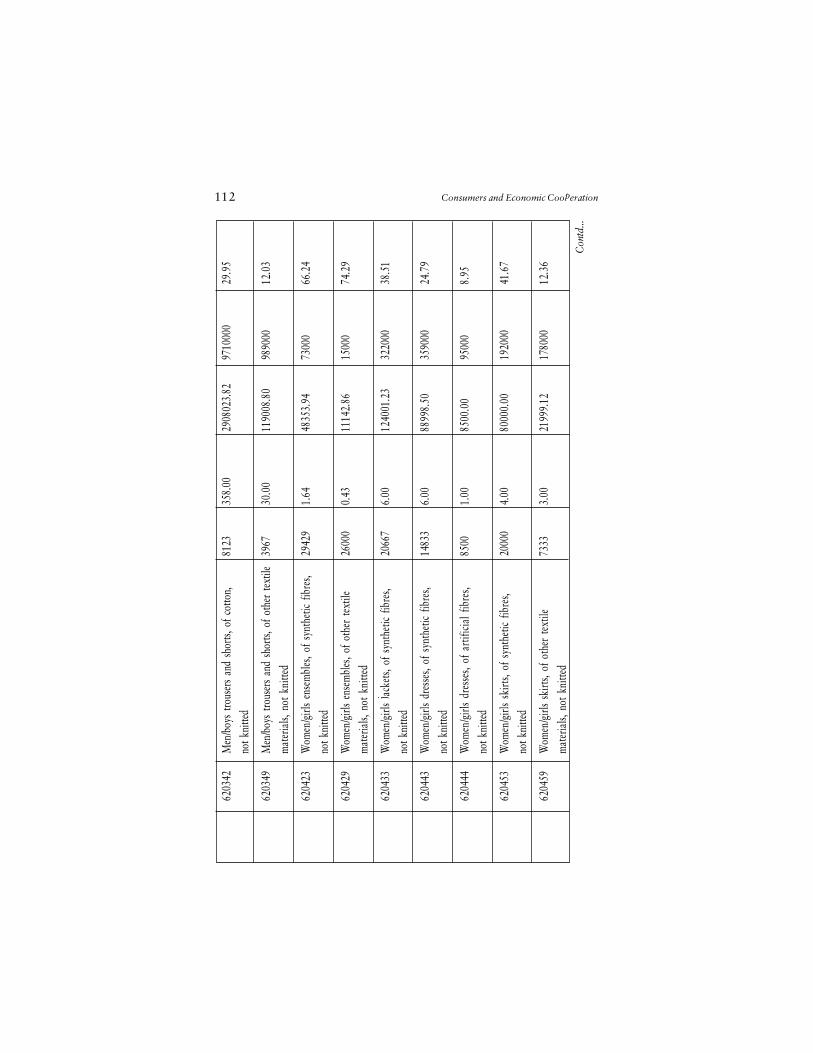
112 Consumers and Economic Cooperation
Con
td...
62
0342
Men
/boy
s tro
user
s an
d sh
orts,
of c
otto
n,81
2335
8.00
2908
023.
8297
1000
029
.95
not k
nitte
d
62
0349
Men
/boy
s tro
user
s an
d sh
orts,
of o
ther
text
ile39
6730
.00
1190
08.8
098
9000
12.0
3
mat
eria
ls, n
ot k
nitte
d
62
0423
Wom
en/g
irls
ense
mbl
es, o
f sy
nthe
tic f
ibre
s,29
429
1.64
4835
3.94
7300
066
.24
not k
nitte
d
62
0429
Wom
en/g
irls
ense
mbl
es, o
f oth
er te
xtile
2600
00.
4311
142.
8615
000
74.2
9
mat
eria
ls, n
ot k
nitte
d
62
0433
Wom
en/g
irls
jack
ets,
of s
ynth
etic
fibre
s,20
667
6.00
1240
01.2
332
2000
38.5
1
not k
nitte
d
62
0443
Wom
en/g
irls
dres
ses,
of s
ynth
etic
fibre
s,14
833
6.00
8899
8.50
3590
0024
.79
not k
nitte
d
62
0444
Wom
en/g
irls
dres
ses,
of a
rtific
ial f
ibre
s,85
001.
0085
00.0
095
000
8.95
not k
nitte
d
62
0453
Wom
en/g
irls
skirt
s, of
syn
thet
ic fib
res,
2000
04.
0080
000.
0019
2000
41.6
7
not k
nitte
d
62
0459
Wom
en/g
irls
skirt
s, of
oth
er te
xtile
7333
3.00
2199
9.12
1780
0012
.36
mat
eria
ls, n
ot k
nitte
d
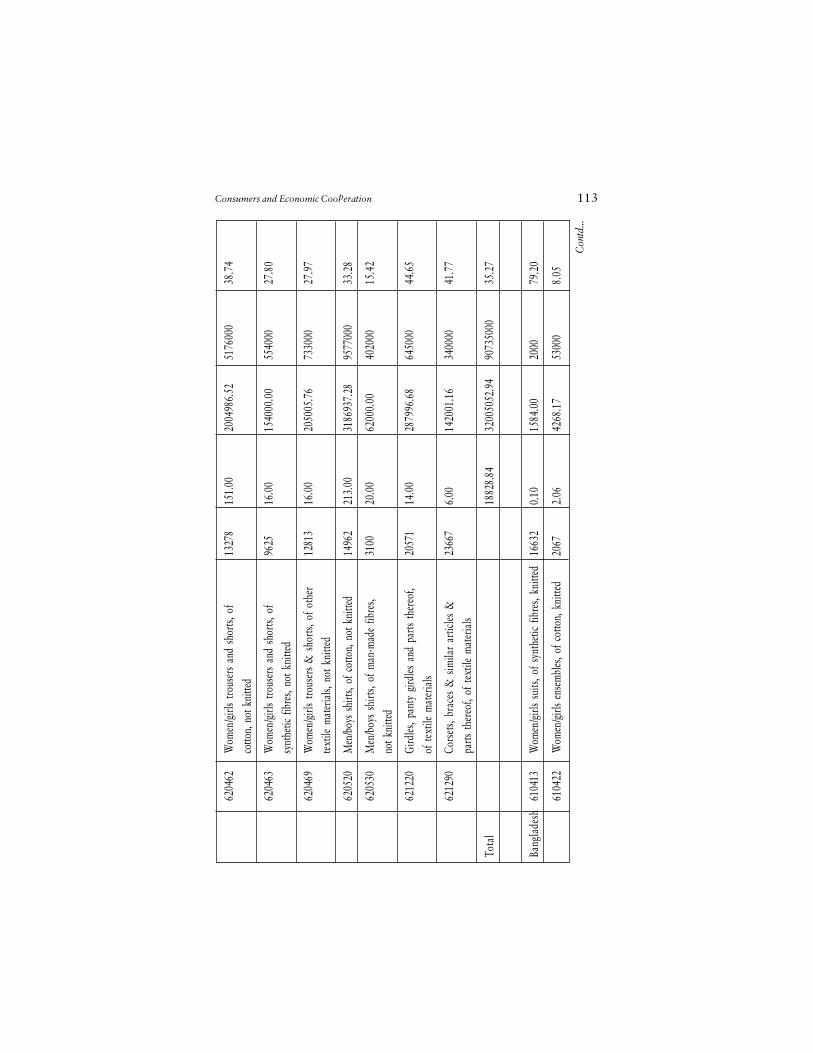
Consumers and Economic Cooperation 113
Con
td...
62
0462
Wom
en/g
irls
trous
ers
and
shor
ts, o
f13
278
151.
0020
0498
6.52
5176
000
38.7
4
cotto
n, n
ot k
nitte
d
62
0463
Wom
en/g
irls
trous
ers
and
shor
ts, o
f96
2516
.00
1540
00.0
055
4000
27.8
0
synt
hetic
fibr
es, n
ot k
nitte
d
62
0469
Wom
en/g
irls
trous
ers
& s
horts
, of o
ther
1281
316
.00
2050
05.7
673
3000
27.9
7
text
ile m
ater
ials,
not
kni
tted
62
0520
Men
/boy
s sh
irts,
of c
otto
n, n
ot k
nitte
d14
962
213.
0031
8693
7.28
9577
000
33.2
8
62
0530
Men
/boy
s sh
irts,
of m
an-m
ade
fibre
s,31
0020
.00
6200
0.00
4020
0015
.42
not k
nitte
d
62
1220
Gird
les, p
anty
gird
les a
nd p
arts
ther
eof,
2057
114
.00
2879
96.6
864
5000
44.6
5
of t
extil
e m
ater
ials
62
1290
Cors
ets,
brac
es &
sim
ilar
artic
les &
2366
76.
0014
2001
.16
3400
0041
.77
parts
ther
eof,
of te
xtile
mat
eria
ls
Tota
l
1882
8.84
3200
5052
.94
9073
5000
35.2
7
Bang
lade
sh61
0413
Wom
en/g
irls
suits
, of s
ynth
etic
fibre
s, kn
itted
1663
20.
1015
84.0
020
0079
.20
61
0422
Wom
en/g
irls
ense
mbl
es, o
f cot
ton,
kni
tted
2067
2.06
4268
.17
5300
08.
05
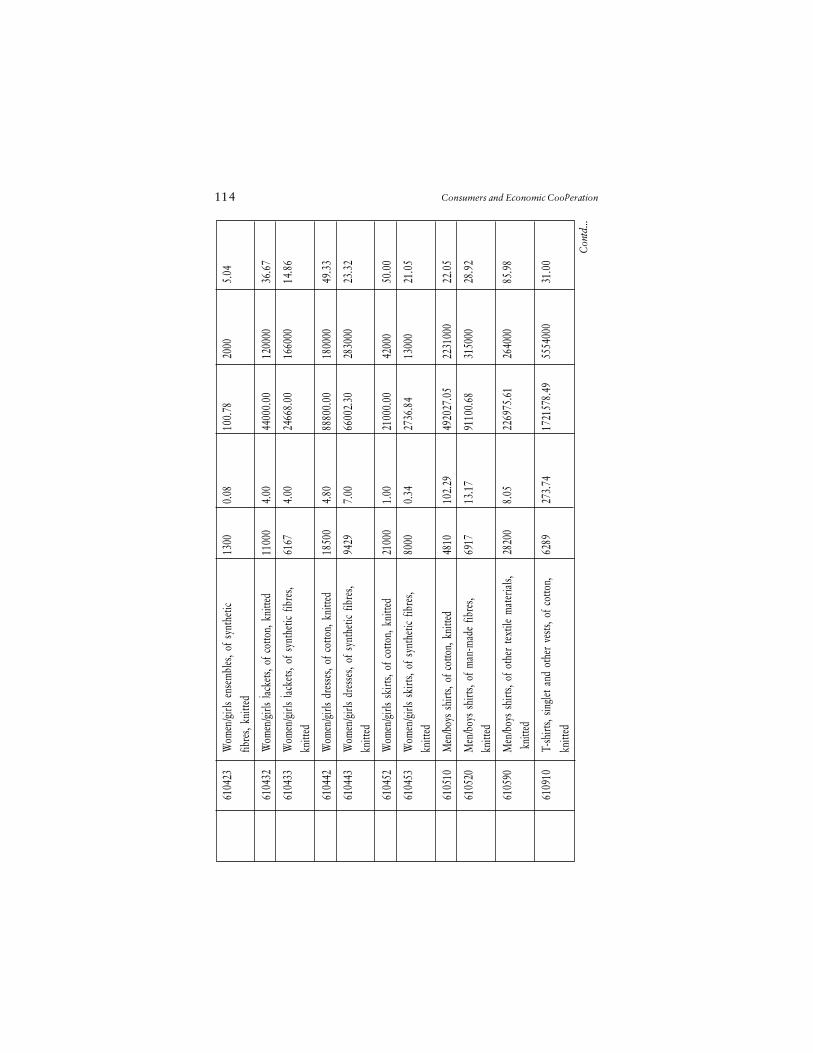
114 Consumers and Economic Cooperation
Con
td...
61
0423
Wom
en/g
irls
ense
mbl
es, o
f sy
nthe
tic13
000.
0810
0.78
2000
5.04
fibre
s, kn
itted
61
0432
Wom
en/g
irls
jack
ets,
of c
otto
n, k
nitte
d11
000
4.00
4400
0.00
1200
0036
.67
61
0433
Wom
en/g
irls
jack
ets,
of s
ynth
etic
fibre
s,61
674.
0024
668.
0016
6000
14.8
6kn
itted
61
0442
Wom
en/g
irls
dres
ses,
of c
otto
n, k
nitte
d18
500
4.80
8880
0.00
1800
0049
.33
61
0443
Wom
en/g
irls
dres
ses,
of s
ynth
etic
fibre
s,94
297.
0066
002.
3028
3000
23.3
2kn
itted
61
0452
Wom
en/g
irls
skirt
s, of
cot
ton,
kni
tted
2100
01.
0021
000.
0042
000
50.0
0
61
0453
Wom
en/g
irls
skirt
s, of
syn
thet
ic fib
res,
8000
0.34
2736
.84
1300
021
.05
knitt
ed
61
0510
Men
/boy
s sh
irts,
of c
otto
n, k
nitte
d48
1010
2.29
4920
27.0
522
3100
022
.05
61
0520
Men
/boy
s sh
irts,
of m
an-m
ade
fibre
s,69
1713
.17
9110
0.68
3150
0028
.92
knitt
ed
61
0590
Men
/boy
s sh
irts,
of o
ther
text
ile m
ater
ials,
2820
08.
0522
6975
.61
2640
0085
.98
kni
tted
61
0910
T-sh
irts,
singl
et a
nd o
ther
ves
ts, o
f cot
ton,
6289
273.
7417
2157
8.49
5554
000
31.0
0
knitt
ed
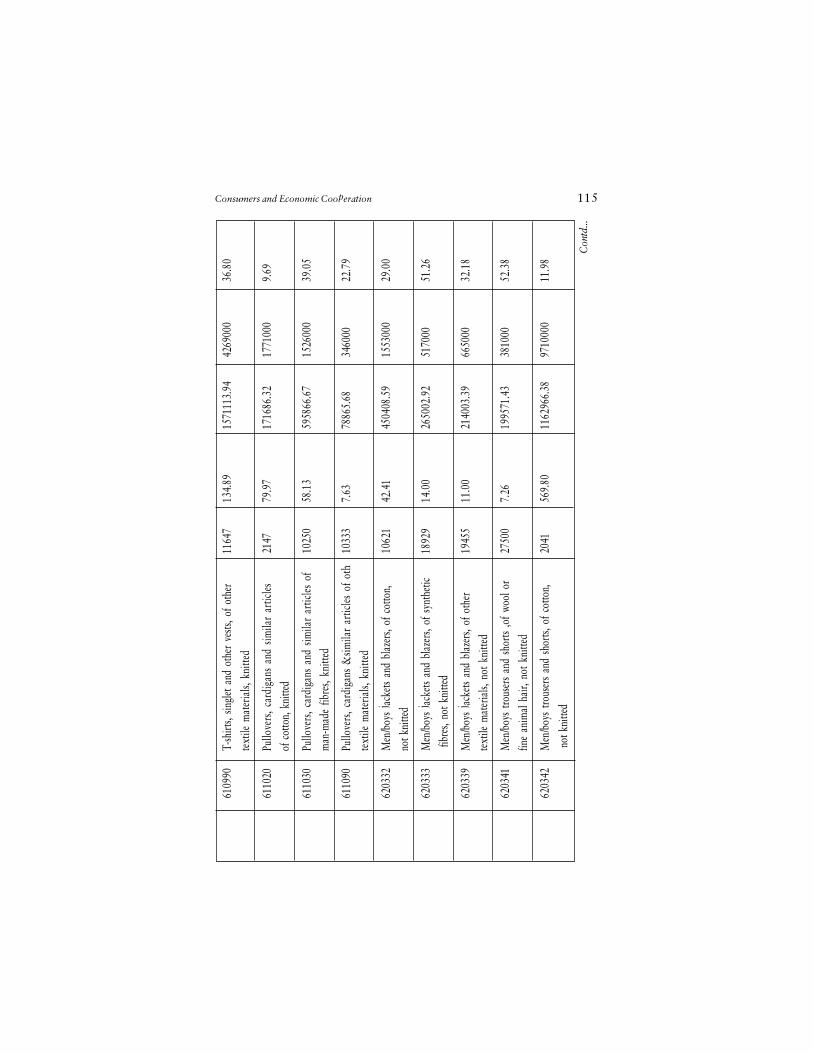
Consumers and Economic Cooperation 115
Con
td...
61
0990
T-sh
irts,
singl
et a
nd o
ther
ves
ts, o
f oth
er11
647
134.
8915
7111
3.94
4269
000
36.8
0
text
ile m
ater
ials,
kni
tted
61
1020
Pullo
vers
, car
diga
ns a
nd s
imila
r ar
ticles
2147
79.9
717
1686
.32
1771
000
9.69
of c
otto
n, k
nitte
d
61
1030
Pullo
vers
, car
diga
ns a
nd s
imila
r ar
ticles
of
1025
058
.13
5958
66.6
715
2600
039
.05
man
-mad
e fib
res,
knitt
ed
61
1090
Pullo
vers
, car
diga
ns &
simila
r ar
ticles
of
oth
1033
37.
6378
865.
6834
6000
22.7
9
text
ile m
ater
ials,
kni
tted
62
0332
Men
/boy
s ja
cket
s an
d bl
azer
s, of
cot
ton,
1062
142
.41
4504
08.5
915
5300
029
.00
not k
nitte
d
62
0333
Men
/boy
s ja
cket
s an
d bl
azer
s, of
syn
thet
ic18
929
14.0
026
5002
.92
5170
0051
.26
fibr
es, n
ot k
nitte
d
62
0339
Men
/boy
s ja
cket
s an
d bl
azer
s, of
oth
er19
455
11.0
021
4003
.39
6650
0032
.18
text
ile m
ater
ials,
not
kni
tted
62
0341
Men
/boy
s tro
user
s an
d sh
orts
,of w
ool o
r27
500
7.26
1995
71.4
338
1000
52.3
8
fine
anim
al h
air,
not k
nitte
d
62
0342
Men
/boy
s tro
user
s an
d sh
orts,
of c
otto
n,20
4156
9.80
1162
966.
3897
1000
011
.98
not
kni
tted
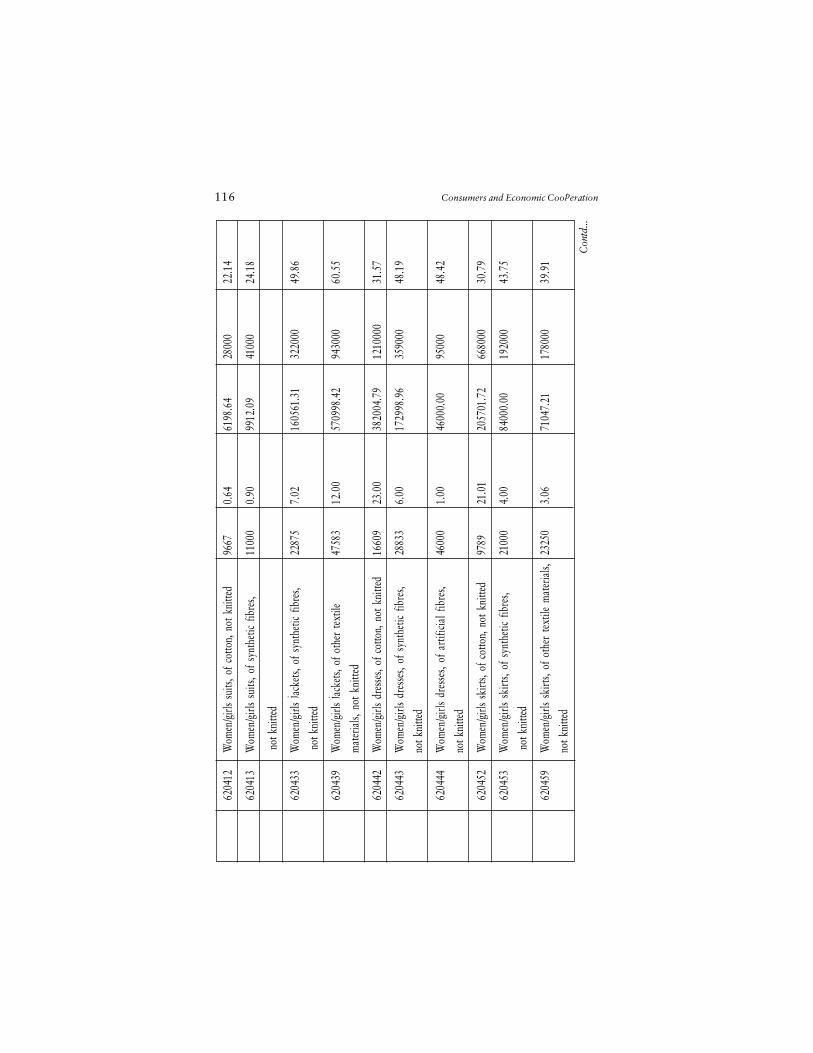
116 Consumers and Economic Cooperation
Con
td...
62
0412
Wom
en/g
irls
suits
, of c
otto
n, n
ot k
nitte
d96
670.
6461
98.6
428
000
22.1
4
62
0413
Wom
en/g
irls
suits
, of
synt
hetic
fib
res,
1100
00.
9099
12.0
941
000
24.1
8
not
kni
tted
62
0433
Wom
en/g
irls
jack
ets,
of s
ynth
etic
fibre
s,22
875
7.02
1605
61.3
132
2000
49.8
6
not
kni
tted
62
0439
Wom
en/g
irls
jack
ets,
of o
ther
text
ile47
583
12.0
057
0998
.42
9430
0060
.55
mat
eria
ls, n
ot k
nitte
d
62
0442
Wom
en/g
irls
dres
ses,
of c
otto
n, n
ot k
nitte
d16
609
23.0
038
2004
.79
1210
000
31.5
7
62
0443
Wom
en/g
irls
dres
ses,
of s
ynth
etic
fibre
s,28
833
6.00
1729
98.9
635
9000
48.1
9
not k
nitte
d
62
0444
Wom
en/g
irls
dres
ses,
of a
rtific
ial f
ibre
s,46
000
1.00
4600
0.00
9500
048
.42
not k
nitte
d
62
0452
Wom
en/g
irls
skirt
s, of
cot
ton,
not
kni
tted
9789
21.0
120
5701
.72
6680
0030
.79
62
0453
Wom
en/g
irls
skirt
s, of
syn
thet
ic fib
res,
2100
04.
0084
000.
0019
2000
43.7
5
not
kni
tted
62
0459
Wom
en/g
irls
skirt
s, of
oth
er t
extil
e m
ater
ials,
2325
03.
0671
047.
2117
8000
39.9
1
not k
nitte
d
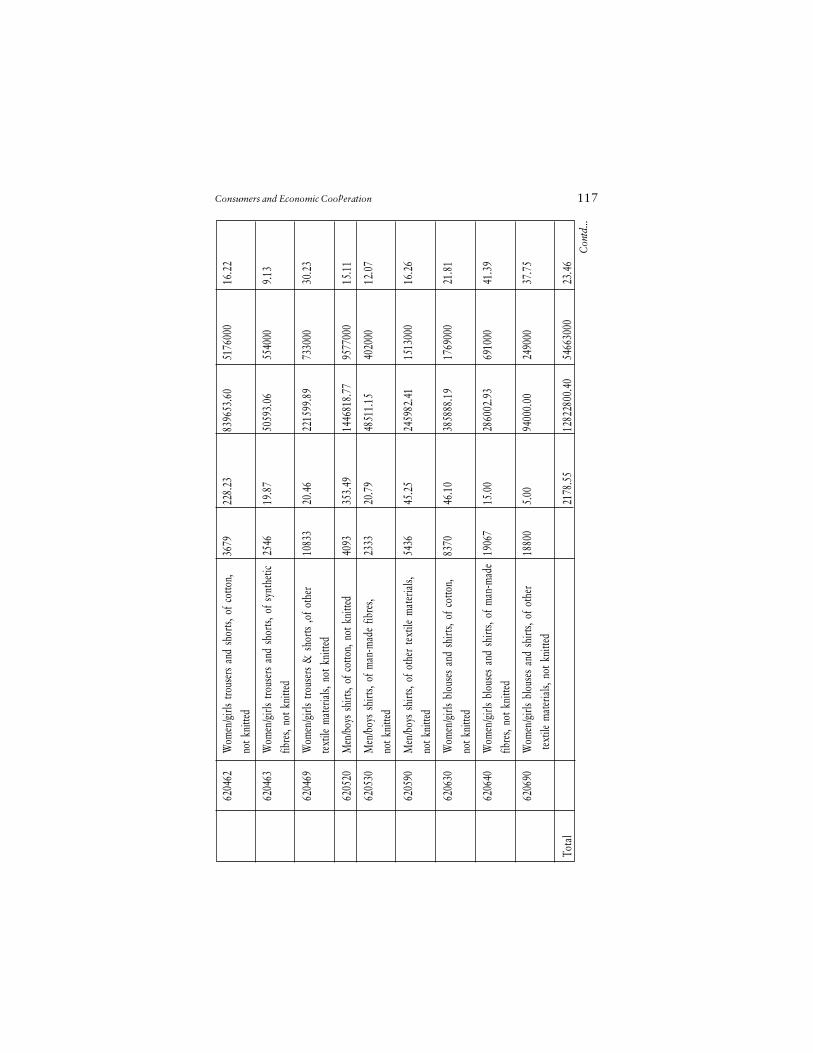
Consumers and Economic Cooperation 117
Con
td...
62
0462
Wom
en/g
irls
trous
ers
and
shor
ts, o
f cot
ton,
3679
228.
2383
9653
.60
5176
000
16.2
2
not k
nitte
d
62
0463
Wom
en/g
irls
trous
ers
and
shor
ts, o
f syn
thet
ic25
4619
.87
5059
3.06
5540
009.
13
fibre
s, no
t kni
tted
62
0469
Wom
en/g
irls
trous
ers
& s
horts
,of o
ther
1083
320
.46
2215
99.8
973
3000
30.2
3
text
ile m
ater
ials,
not
kni
tted
62
0520
Men
/boy
s sh
irts,
of c
otto
n, n
ot k
nitte
d40
9335
3.49
1446
818.
7795
7700
015
.11
62
0530
Men
/boy
s sh
irts,
of m
an-m
ade
fibre
s,23
3320
.79
4851
1.15
4020
0012
.07
not k
nitte
d
62
0590
Men
/boy
s sh
irts,
of o
ther
text
ile m
ater
ials,
5436
45.2
524
5982
.41
1513
000
16.2
6
not k
nitte
d
62
0630
Wom
en/g
irls
blou
ses
and
shirt
s, of
cot
ton,
8370
46.1
038
5888
.19
1769
000
21.8
1
not k
nitte
d
62
0640
Wom
en/g
irls
blou
ses
and
shirt
s, of
man
-mad
e19
067
15.0
028
6002
.93
6910
0041
.39
fibre
s, no
t kni
tted
62
0690
Wom
en/g
irls
blou
ses
and
shirt
s, of
oth
er18
800
5.00
9400
0.00
2490
0037
.75
text
ile m
ater
ials,
not
kni
tted
Tota
l
2178
.55
1282
2800
.40
5466
3000
23.4
6
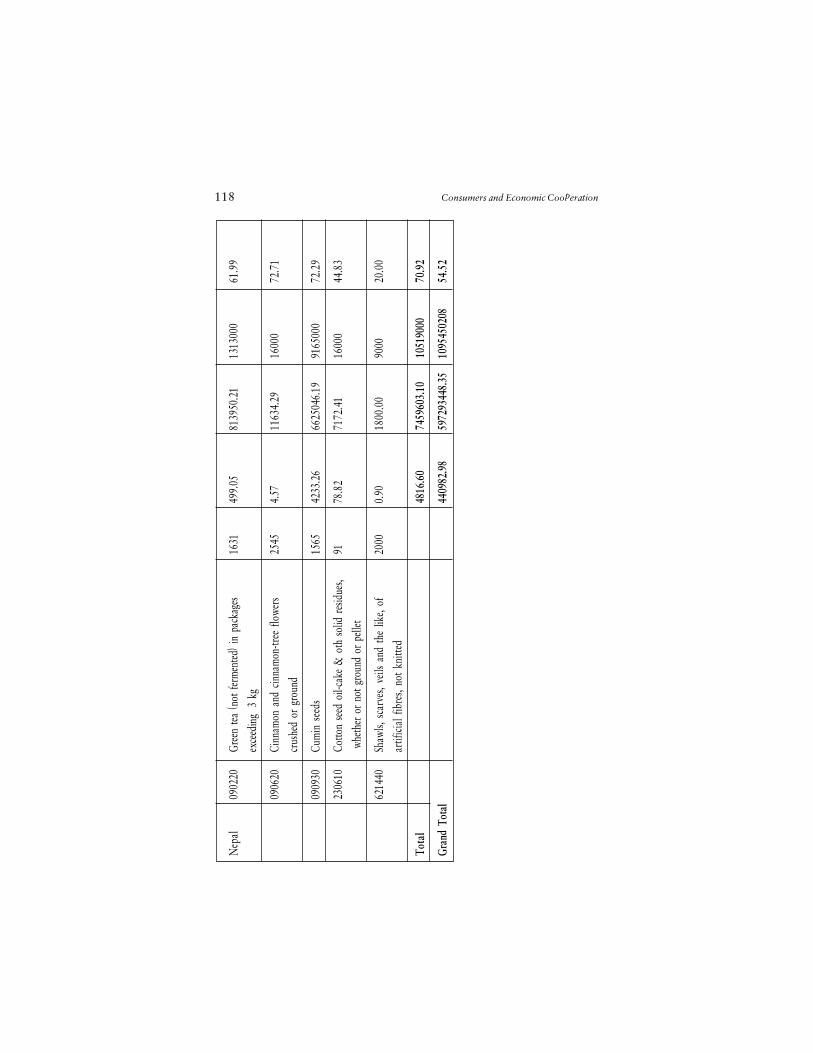
118 Consumers and Economic Cooperation
Nep
al09
0220
Gree
n tea
(not
ferm
ented
) in
pack
ages
1631
499.
0581
3950
.21
1313
000
61.9
9
exce
edin
g 3
kg
09
0620
Cinn
amon
and
cin
nam
on-tr
ee fl
ower
s25
454.
5711
634.
2916
000
72.7
1
crus
hed
or g
roun
d
09
0930
Cum
in s
eeds
1565
4233
.26
6625
046.
1991
6500
072
.29
23
0610
Cotto
n se
ed o
il-ca
ke &
oth
sol
id r
esid
ues,
9178
.82
7172
.41
1600
044
.83
whe
ther
or n
ot g
roun
d or
pell
et
62
1440
Shaw
ls, s
carv
es, v
eils
and
the
like,
of20
000.
9018
00.0
090
0020
.00
artif
icial
fibr
es, n
ot k
nitte
d
Tota
l
4816
.60
7459
603.
1010
5190
0070
.92
Gran
d To
tal
4409
82.9
859
7293
448.
3510
9545
0208
54.5
2
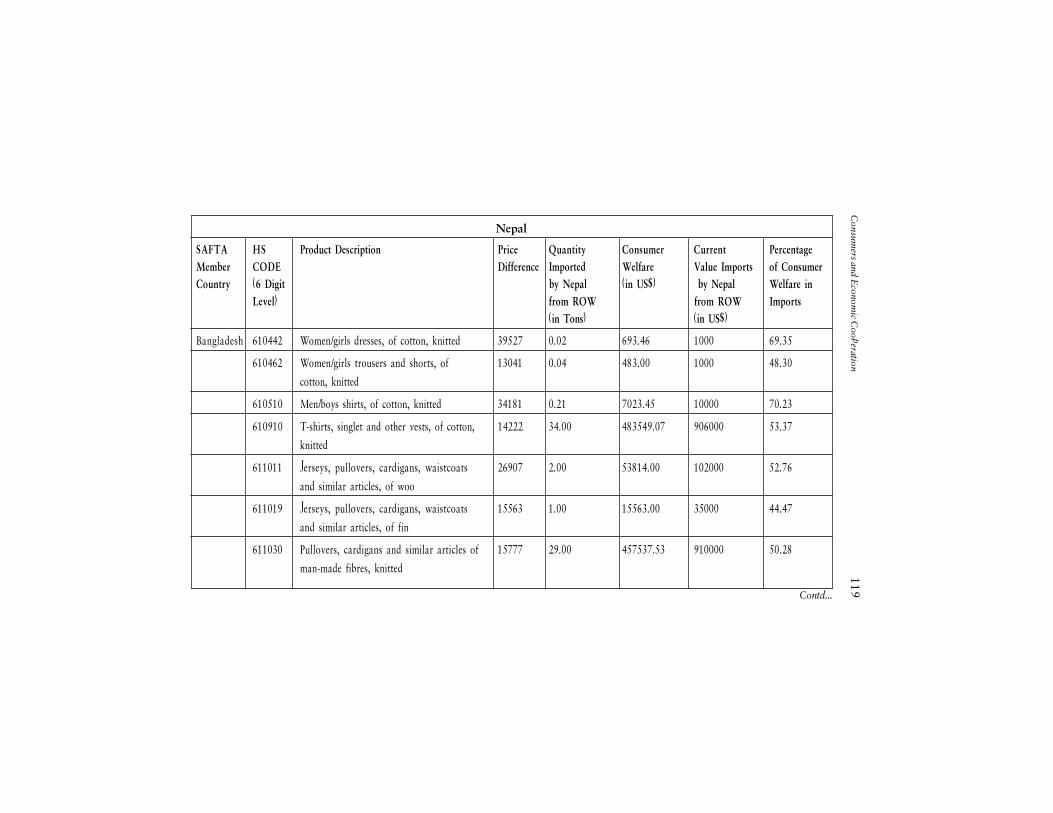
Consum
ers and Econom
ic Cooperation
119
Nepal
SAFTA HS Product Description Price Quantity Consumer Current PercentageMember CODE Difference Imported Welfare Value Imports of ConsumerCountry (6 Digit by Nepal (in US$) by Nepal Welfare in
Level) from ROW from ROW Imports(in Tons) (in US$)
Bangladesh 610442 Women/girls dresses, of cotton, knitted 39527 0.02 693.46 1000 69.35
610462 Women/girls trousers and shorts, of 13041 0.04 483.00 1000 48.30
cotton, knitted
610510 Men/boys shirts, of cotton, knitted 34181 0.21 7023.45 10000 70.23
610910 T-shirts, singlet and other vests, of cotton, 14222 34.00 483549.07 906000 53.37
knitted
611011 Jerseys, pullovers, cardigans, waistcoats 26907 2.00 53814.00 102000 52.76
and similar articles, of woo
611019 Jerseys, pullovers, cardigans, waistcoats 15563 1.00 15563.00 35000 44.47
and similar articles, of fin
611030 Pullovers, cardigans and similar articles of 15777 29.00 457537.53 910000 50.28
man-made fibres, knitted
Contd...
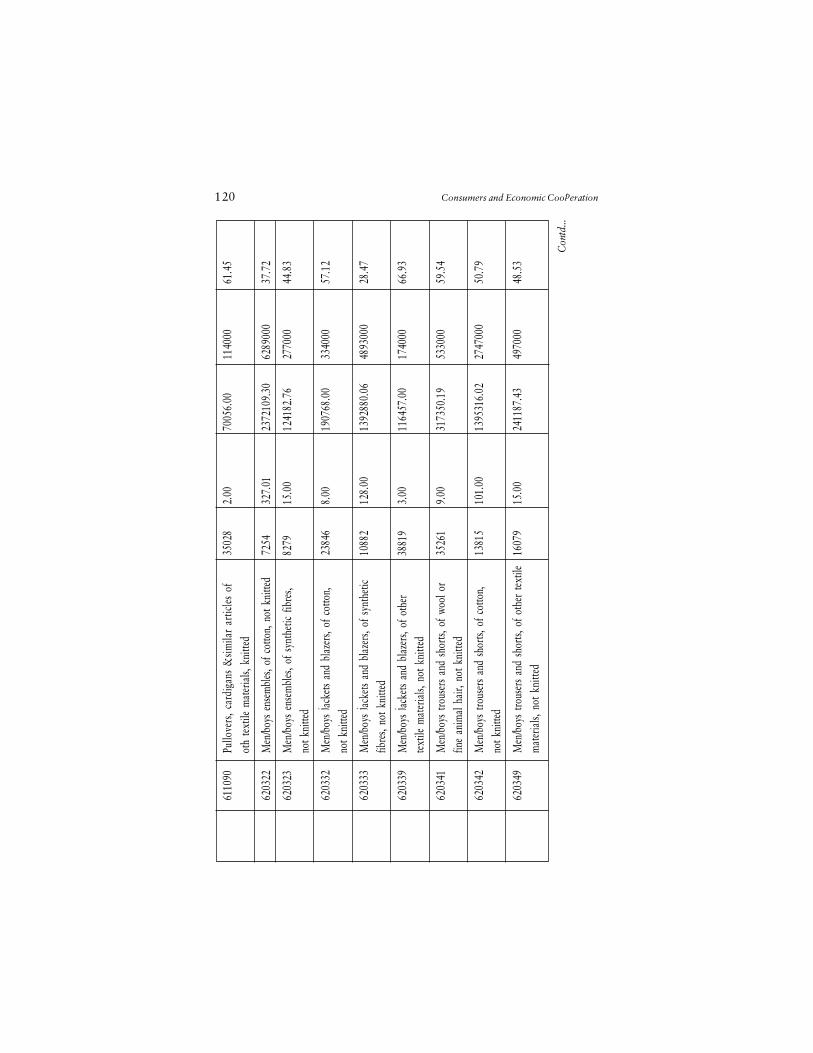
120 Consumers and Economic Cooperation
Con
td...
61
1090
Pullo
vers
, car
diga
ns &
simila
r ar
ticles
of
3502
82.
0070
056.
0011
4000
61.4
5
oth
text
ile m
ater
ials,
kni
tted
62
0322
Men
/boy
s en
sem
bles
, of c
otto
n, n
ot k
nitte
d72
5432
7.01
2372
109.
3062
8900
037
.72
62
0323
Men
/boy
s en
sem
bles
, of s
ynth
etic
fibre
s,82
7915
.00
1241
82.7
627
7000
44.8
3no
t kni
tted
62
0332
Men
/boy
s ja
cket
s an
d bl
azer
s, of
cot
ton,
2384
68.
0019
0768
.00
3340
0057
.12
not k
nitte
d
62
0333
Men
/boy
s ja
cket
s an
d bl
azer
s, of
syn
thet
ic10
882
128.
0013
9288
0.06
4893
000
28.4
7fib
res,
not k
nitte
d
62
0339
Men
/boy
s ja
cket
s an
d bl
azer
s, of
oth
er38
819
3.00
1164
57.0
017
4000
66.9
3te
xtile
mat
eria
ls, n
ot k
nitte
d
62
0341
Men
/boy
s tro
user
s an
d sh
orts,
of w
ool o
r35
261
9.00
3173
50.1
953
3000
59.5
4fin
e an
imal
hai
r, no
t kni
tted
62
0342
Men
/boy
s tro
user
s an
d sh
orts,
of c
otto
n,13
815
101.
0013
9531
6.02
2747
000
50.7
9no
t kni
tted
62
0349
Men
/boy
s tro
user
s an
d sh
orts,
of o
ther
text
ile16
079
15.0
024
1187
.43
4970
0048
.53
mat
eria
ls, n
ot k
nitte
d
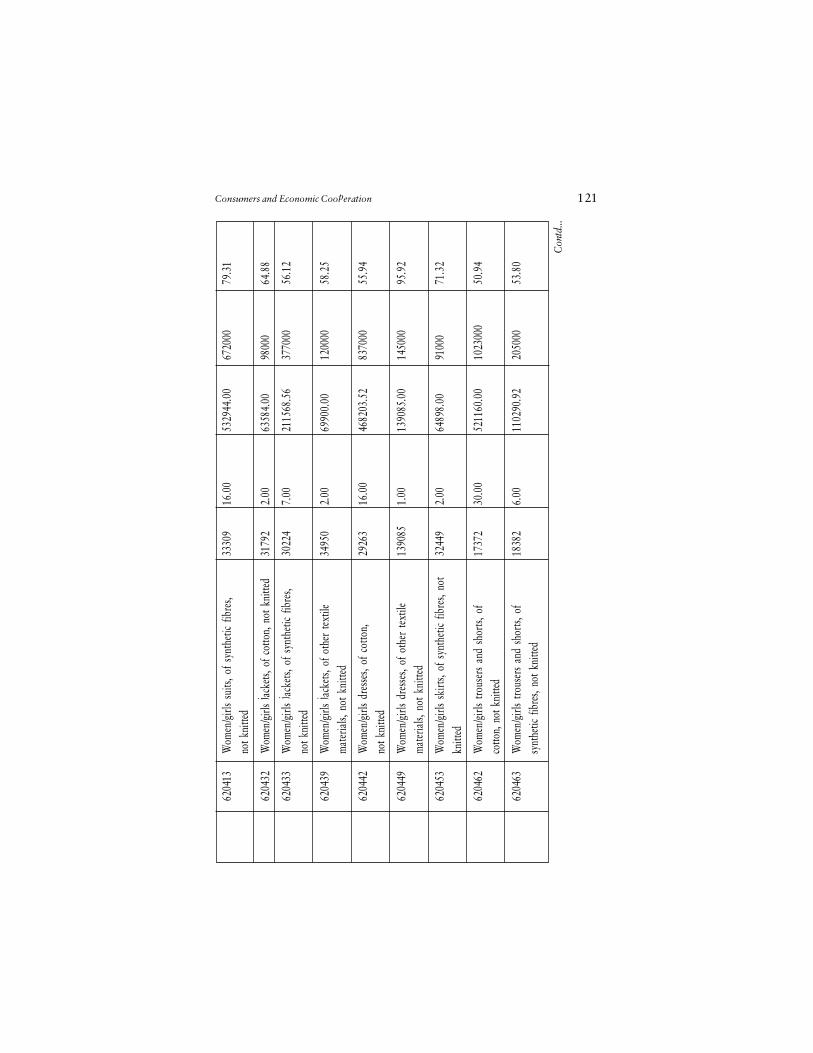
Consumers and Economic Cooperation 121
62
0413
Wom
en/g
irls
suits
, of
synt
hetic
fib
res,
3330
916
.00
5329
44.0
067
2000
79.3
1no
t kni
tted
62
0432
Wom
en/g
irls
jack
ets,
of c
otto
n, n
ot k
nitte
d31
792
2.00
6358
4.00
9800
064
.88
62
0433
Wom
en/g
irls
jack
ets,
of s
ynth
etic
fibre
s,30
224
7.00
2115
68.5
637
7000
56.1
2no
t kni
tted
62
0439
Wom
en/g
irls
jack
ets,
of o
ther
text
ile34
950
2.00
6990
0.00
1200
0058
.25
mat
eria
ls, n
ot k
nitte
d
62
0442
Wom
en/g
irls
dres
ses,
of c
otto
n,29
263
16.0
046
8203
.52
8370
0055
.94
not k
nitte
d
62
0449
Wom
en/g
irls
dres
ses,
of o
ther
text
ile13
9085
1.00
1390
85.0
014
5000
95.9
2m
ater
ials,
not
kni
tted
62
0453
Wom
en/g
irls
skirt
s, of
syn
thet
ic fib
res,
not
3244
92.
0064
898.
0091
000
71.3
2kn
itted
62
0462
Wom
en/g
irls
trous
ers
and
shor
ts, o
f17
372
30.0
052
1160
.00
1023
000
50.9
4co
tton,
not
kni
tted
62
0463
Wom
en/g
irls
trous
ers
and
shor
ts, o
f18
382
6.00
1102
90.9
220
5000
53.8
0sy
nthe
tic fi
bres
, not
kni
tted
Con
td...
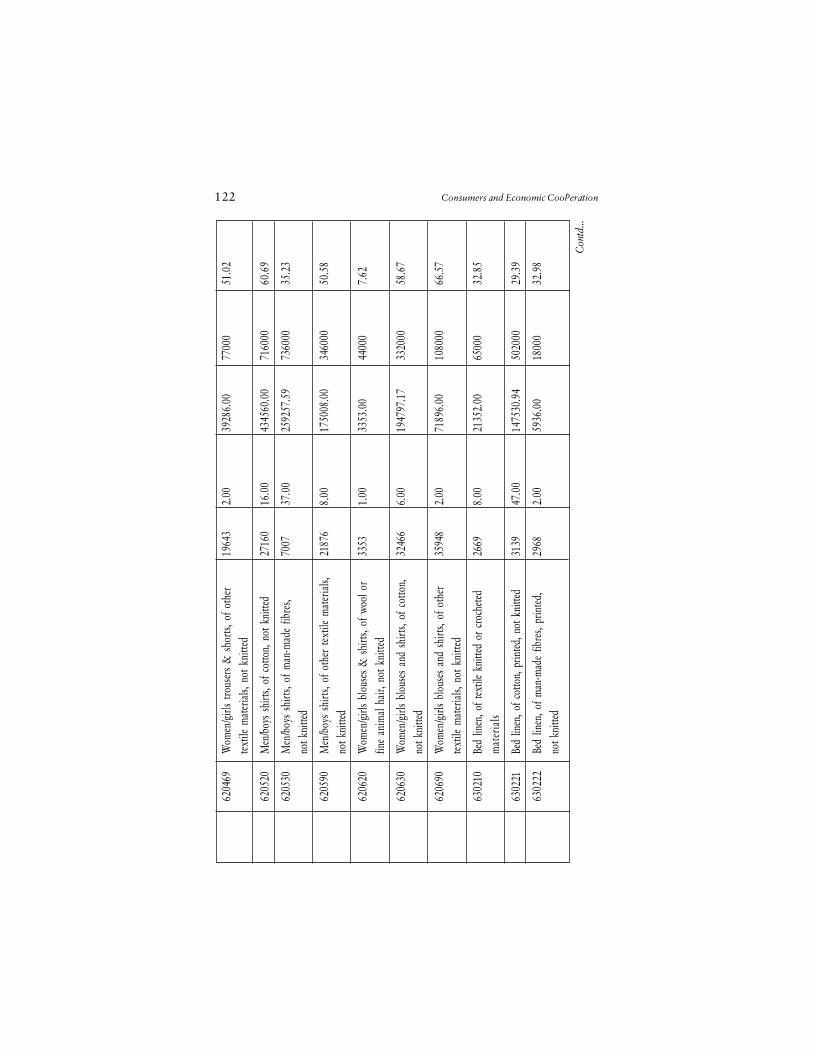
122 Consumers and Economic Cooperation
62
0469
Wom
en/g
irls
trous
ers
& s
horts
, of o
ther
1964
32.
0039
286.
0077
000
51.0
2te
xtile
mat
eria
ls, n
ot k
nitte
d
62
0520
Men
/boy
s sh
irts,
of c
otto
n, n
ot k
nitte
d27
160
16.0
043
4560
.00
7160
0060
.69
62
0530
Men
/boy
s sh
irts,
of m
an-m
ade
fibre
s,70
0737
.00
2592
57.5
973
6000
35.2
3no
t kni
tted
62
0590
Men
/boy
s sh
irts,
of o
ther
text
ile m
ater
ials,
2187
68.
0017
5008
.00
3460
0050
.58
not k
nitte
d
62
0620
Wom
en/g
irls
blou
ses
& s
hirts
, of w
ool o
r33
531.
0033
53.0
044
000
7.62
fine
anim
al h
air,
not k
nitte
d
62
0630
Wom
en/g
irls
blou
ses
and
shirt
s, of
cot
ton,
3246
66.
0019
4797
.17
3320
0058
.67
not k
nitte
d
62
0690
Wom
en/g
irls
blou
ses
and
shirt
s, of
oth
er35
948
2.00
7189
6.00
1080
0066
.57
text
ile m
ater
ials,
not
kni
tted
63
0210
Bed
linen
, of t
extil
e kn
itted
or
croc
heted
2669
8.00
2135
2.00
6500
032
.85
mat
eria
ls
63
0221
Bed
linen
, of c
otto
n, p
rinted
, not
kni
tted
3139
47.0
014
7530
.94
5020
0029
.39
63
0222
Bed
linen
, of m
an-m
ade
fibre
s, pr
inte
d,29
682.
0059
36.0
018
000
32.9
8no
t kni
tted
Con
td...
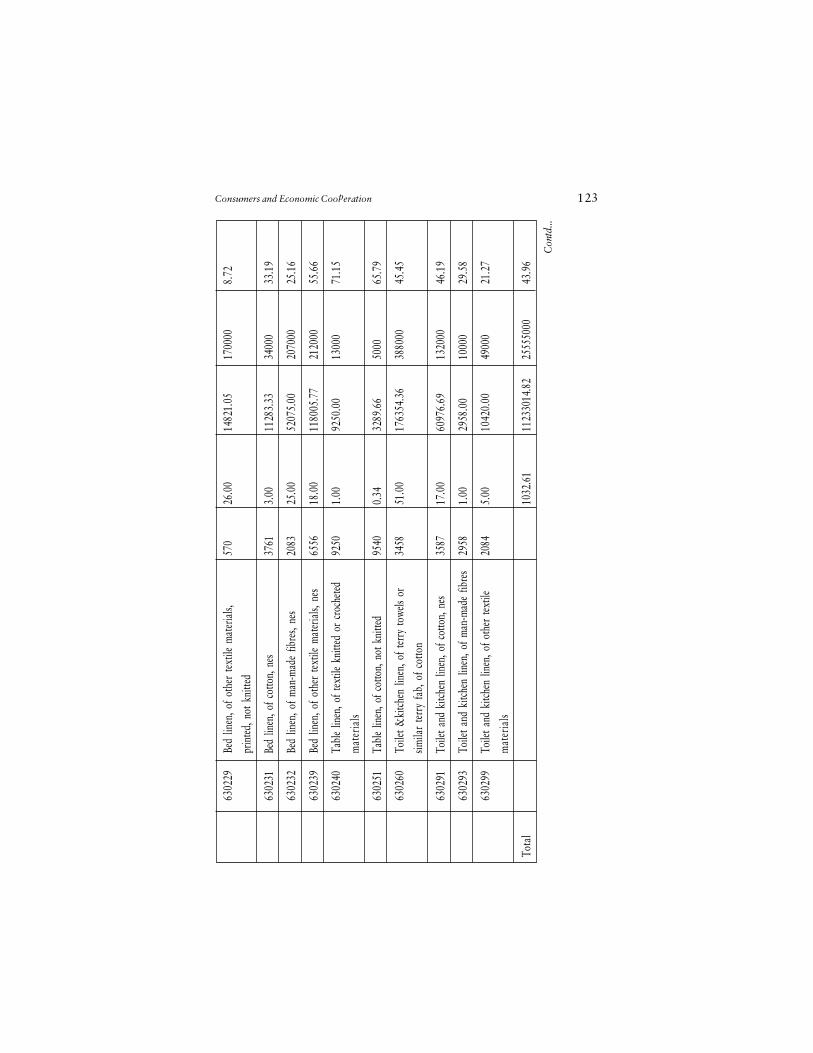
Consumers and Economic Cooperation 123
63
0229
Bed
linen
, of o
ther
text
ile m
ater
ials,
570
26.0
014
821.
0517
0000
8.72
prin
ted, n
ot k
nitte
d
63
0231
Bed
linen
, of c
otto
n, n
es37
613.
0011
283.
3334
000
33.1
9
63
0232
Bed
linen
, of m
an-m
ade
fibre
s, ne
s20
8325
.00
5207
5.00
2070
0025
.16
63
0239
Bed
linen
, of o
ther
text
ile m
ater
ials,
nes
6556
18.0
011
8005
.77
2120
0055
.66
63
0240
Tabl
e lin
en, o
f tex
tile
knitt
ed o
r cr
oche
ted92
501.
0092
50.0
013
000
71.1
5
mat
eria
ls
63
0251
Tabl
e lin
en, o
f cot
ton,
not
kni
tted
9540
0.34
3289
.66
5000
65.7
9
63
0260
Toile
t &ki
tchen
line
n, o
f ter
ry to
wels
or34
5851
.00
1763
54.3
638
8000
45.4
5
simila
r te
rry
fab,
of c
otto
n
63
0291
Toile
t and
kitc
hen
linen
, of c
otto
n, n
es35
8717
.00
6097
6.69
1320
0046
.19
63
0293
Toile
t and
kitc
hen
linen
, of m
an-m
ade
fibre
s29
581.
0029
58.0
010
000
29.5
8
63
0299
Toile
t and
kitc
hen
linen
, of o
ther
text
ile20
845.
0010
420.
0049
000
21.2
7
mat
eria
ls
Tota
l
1032
.61
1123
3014
.82
2555
5000
43.9
6
Con
td...
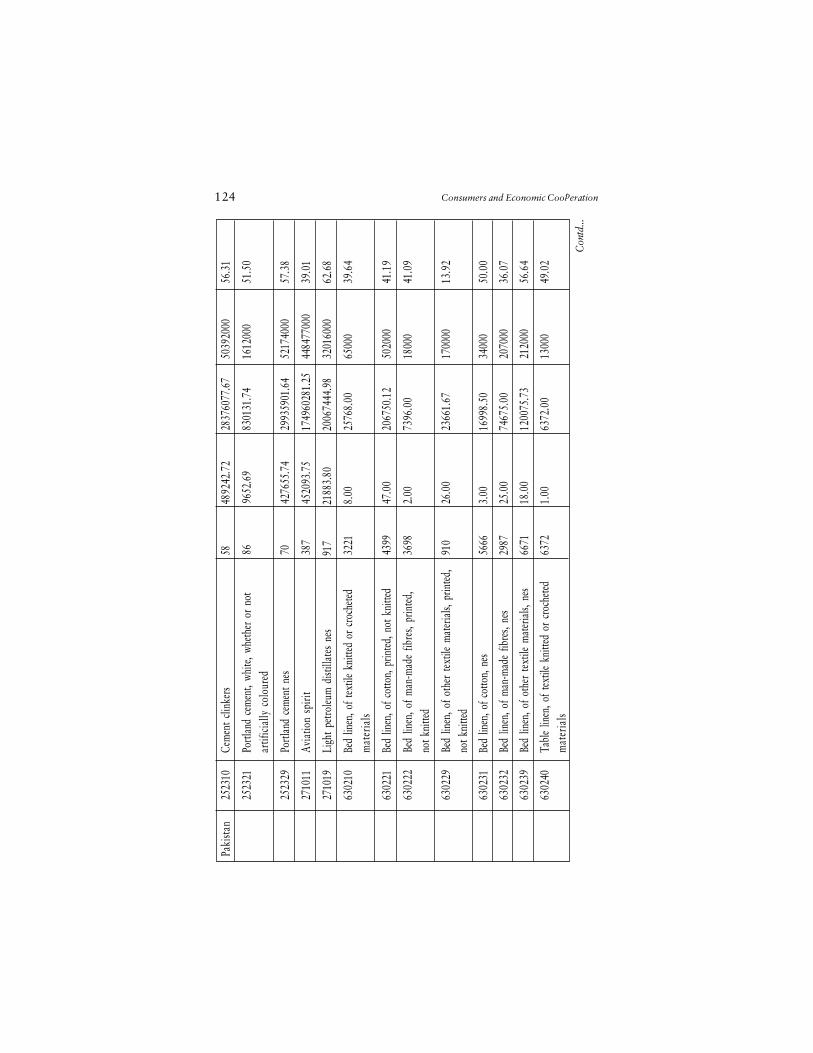
124 Consumers and Economic Cooperation
Con
td...
Paki
stan
2523
10Ce
men
t cli
nker
s58
4892
42.7
228
3760
77.6
750
3920
0056
.31
25
2321
Portl
and
cem
ent,
white
, whe
ther
or
not
8696
52.6
983
0131
.74
1612
000
51.5
0ar
tifici
ally
col
oure
d
25
2329
Portl
and
cem
ent n
es70
4276
55.7
429
9359
01.6
452
1740
0057
.38
27
1011
Avia
tion
spiri
t38
745
2093
.75
1749
6028
1.25
4484
7700
039
.01
27
1019
Ligh
t pet
roleu
m d
istill
ates
nes
917
2188
3.80
2006
7444
.98
3201
6000
62.6
8
63
0210
Bed
linen
, of t
extil
e kn
itted
or
croc
heted
3221
8.00
2576
8.00
6500
039
.64
mat
eria
ls
63
0221
Bed
linen
, of c
otto
n, p
rinted
, not
kni
tted
4399
47.0
020
6750
.12
5020
0041
.19
63
0222
Bed
linen
, of m
an-m
ade
fibre
s, pr
inte
d,36
982.
0073
96.0
018
000
41.0
9no
t kni
tted
63
0229
Bed
linen
, of o
ther
text
ile m
ater
ials,
prin
ted,
910
26.0
023
661.
6717
0000
13.9
2no
t kni
tted
63
0231
Bed
linen
, of c
otto
n, n
es56
663.
0016
998.
5034
000
50.0
0
63
0232
Bed
linen
, of m
an-m
ade
fibre
s, ne
s29
8725
.00
7467
5.00
2070
0036
.07
63
0239
Bed
linen
, of o
ther
text
ile m
ater
ials,
nes
6671
18.0
012
0075
.73
2120
0056
.64
63
0240
Tabl
e lin
en, o
f tex
tile
knitt
ed o
r cr
oche
ted63
721.
0063
72.0
013
000
49.0
2m
ater
ials
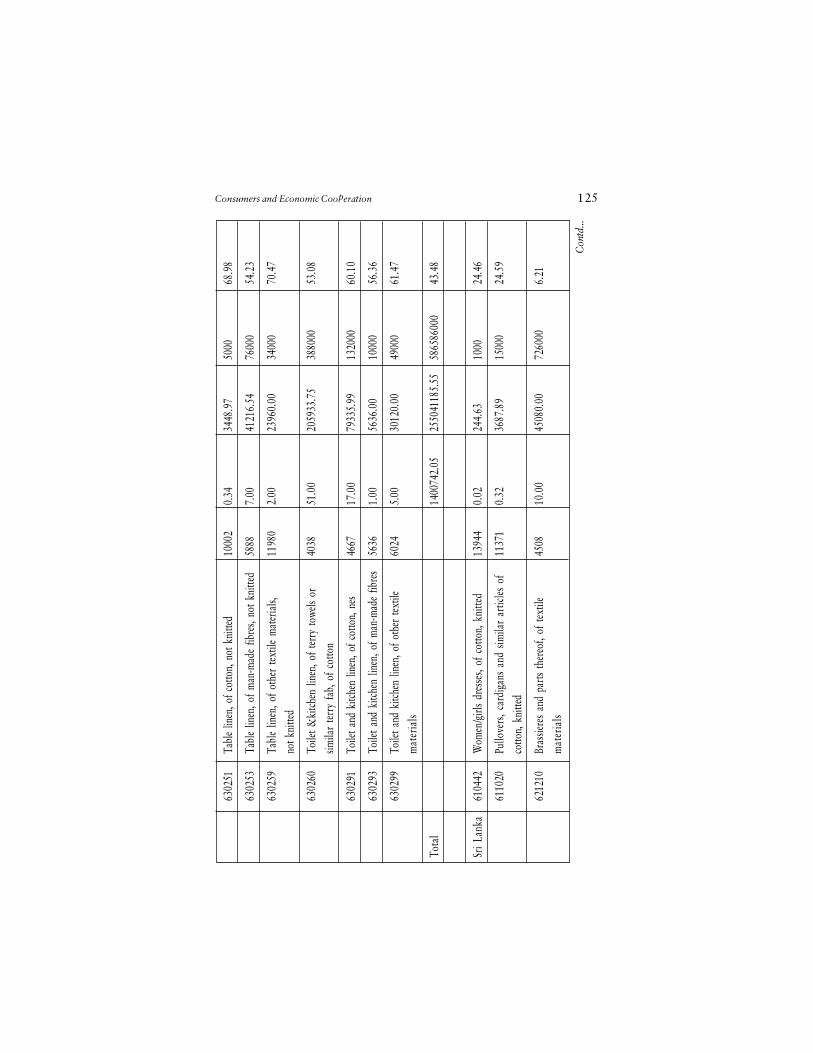
Consumers and Economic Cooperation 125
Con
td...
63
0251
Tabl
e lin
en, o
f cot
ton,
not
kni
tted
1000
20.
3434
48.9
750
0068
.98
63
0253
Tabl
e lin
en, o
f man
-mad
e fib
res,
not k
nitte
d58
887.
0041
216.
5476
000
54.2
3
63
0259
Tabl
e lin
en, o
f oth
er te
xtile
mat
eria
ls,11
980
2.00
2396
0.00
3400
070
.47
not k
nitte
d
63
0260
Toile
t &ki
tchen
line
n, o
f ter
ry to
wels
or40
3851
.00
2059
33.7
538
8000
53.0
8
simila
r te
rry
fab,
of c
otto
n
63
0291
Toile
t and
kitc
hen
linen
, of c
otto
n, n
es46
6717
.00
7933
5.99
1320
0060
.10
63
0293
Toile
t and
kitc
hen
linen
, of m
an-m
ade
fibre
s56
361.
0056
36.0
010
000
56.3
6
63
0299
Toile
t and
kitc
hen
linen
, of o
ther
text
ile60
245.
0030
120.
0049
000
61.4
7
mat
eria
ls
Tota
l
1400
742.
0525
5041
185.
5558
6586
000
43.4
8
Sri L
anka
6104
42W
omen
/girl
s dr
esse
s, of
cot
ton,
kni
tted
1394
40.
0224
4.63
1000
24.4
6
61
1020
Pullo
vers
, car
diga
ns a
nd s
imila
r ar
ticles
of
1137
10.
3236
87.8
915
000
24.5
9
cotto
n, k
nitte
d
62
1210
Bras
siere
s an
d pa
rts th
ereo
f, of
text
ile45
0810
.00
4508
0.00
7260
006.
21
mat
eria
ls
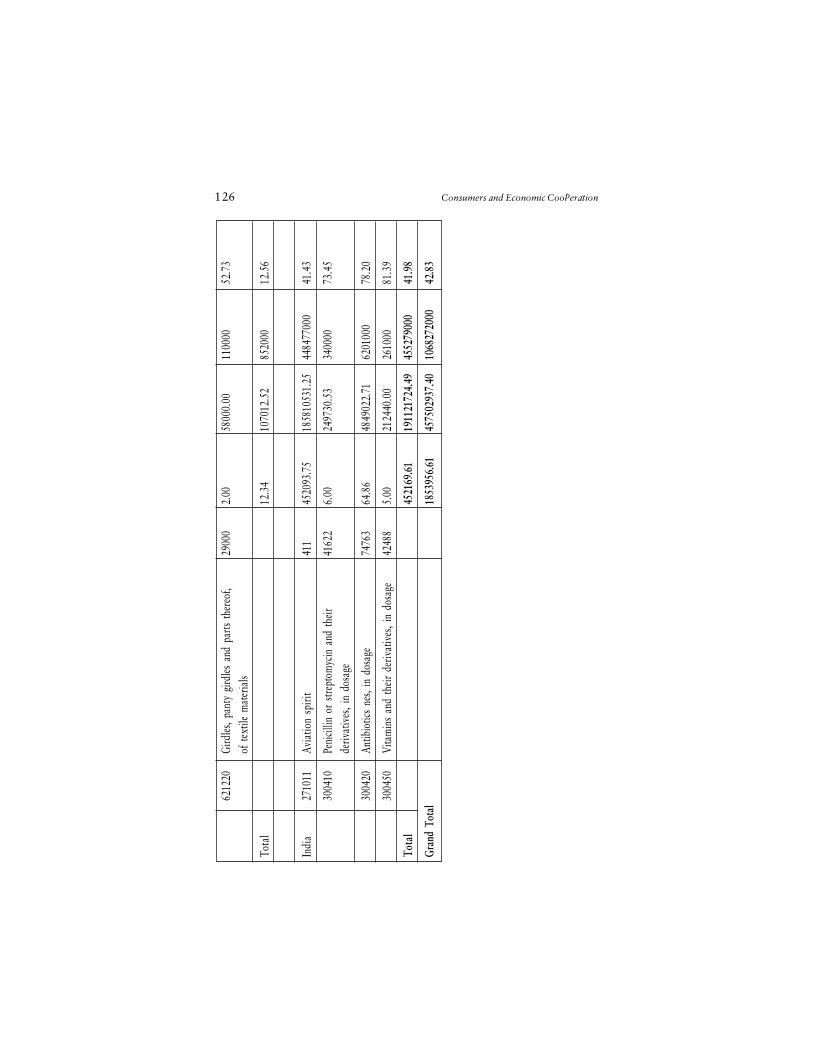
126 Consumers and Economic Cooperation
62
1220
Gird
les, p
anty
gird
les a
nd p
arts
ther
eof,
2900
02.
0058
000.
0011
0000
52.7
3of
tex
tile
mat
eria
ls
Tota
l
12.3
410
7012
.52
8520
0012
.56
Indi
a27
1011
Avia
tion
spiri
t41
145
2093
.75
1858
1053
1.25
4484
7700
041
.43
30
0410
Peni
cillin
or
strep
tom
ycin
and
their
4162
26.
0024
9730
.53
3400
0073
.45
deriv
ativ
es, i
n do
sage
30
0420
Antib
iotic
s ne
s, in
dos
age
7476
364
.86
4849
022.
7162
0100
078
.20
30
0450
Vita
min
s an
d th
eir d
eriv
ativ
es, i
n do
sage
4248
85.
0021
2440
.00
2610
0081
.39
Tota
l
4521
69.6
119
1121
724.
4945
5279
000
41.9
8
Gran
d To
tal
1853
956.
6145
7502
937.
4010
6827
2000
42.8
3
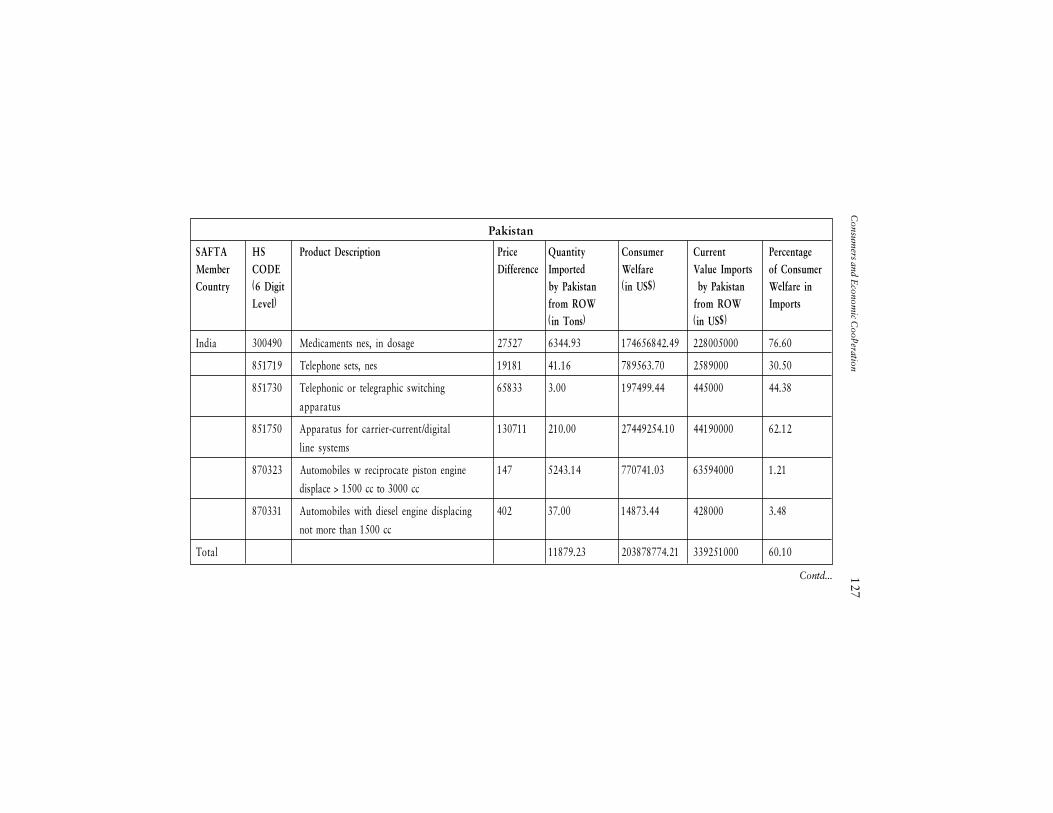
Consum
ers and Econom
ic Cooperation
127
Pakistan
SAFTA HS Product Description Price Quantity Consumer Current PercentageMember CODE Difference Imported Welfare Value Imports of ConsumerCountry (6 Digit by Pakistan (in US$) by Pakistan Welfare in
Level) from ROW from ROW Imports(in Tons) (in US$)
India 300490 Medicaments nes, in dosage 27527 6344.93 174656842.49 228005000 76.60
851719 Telephone sets, nes 19181 41.16 789563.70 2589000 30.50
851730 Telephonic or telegraphic switching 65833 3.00 197499.44 445000 44.38
apparatus
851750 Apparatus for carrier-current/digital 130711 210.00 27449254.10 44190000 62.12
line systems
870323 Automobiles w reciprocate piston engine 147 5243.14 770741.03 63594000 1.21
displace > 1500 cc to 3000 cc
870331 Automobiles with diesel engine displacing 402 37.00 14873.44 428000 3.48
not more than 1500 cc
Total 11879.23 203878774.21 339251000 60.10
Contd...
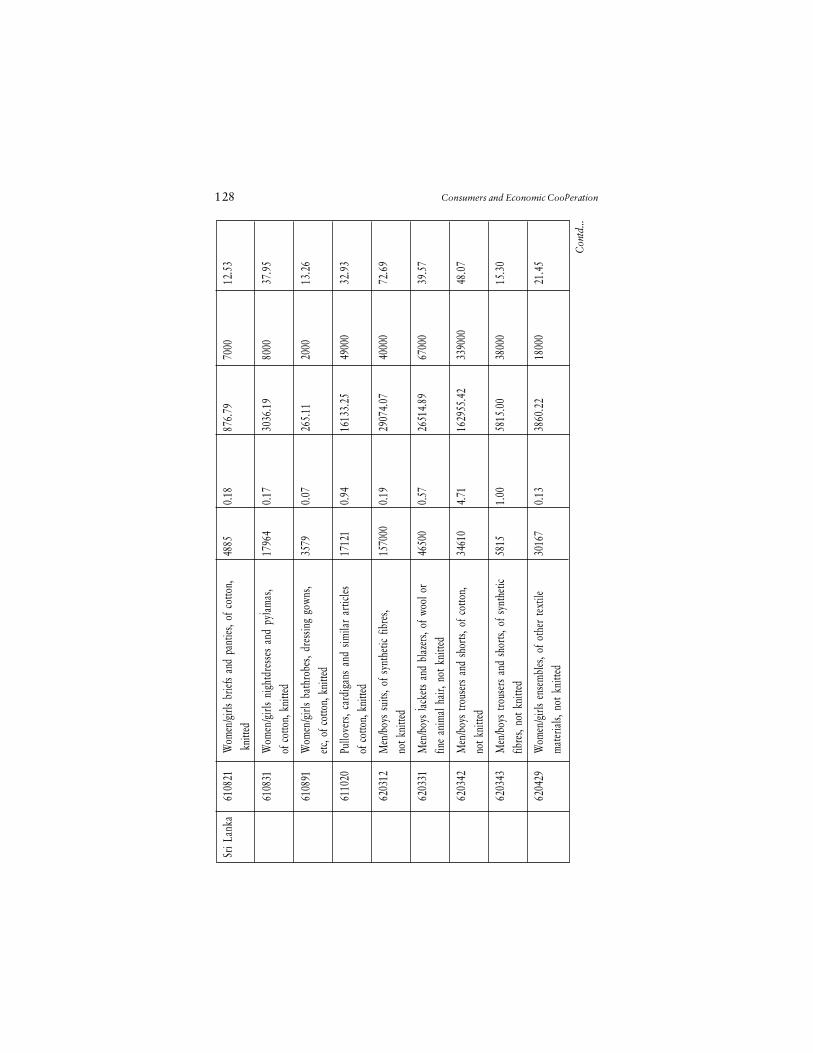
128 Consumers and Economic Cooperation
Con
td...
Sri L
anka
6108
21W
omen
/girl
s br
iefs
and
pant
ies, o
f cot
ton,
4885
0.18
876.
7970
0012
.53
kni
tted
61
0831
Wom
en/g
irls
nigh
tdre
sses
and
pyj
amas
,17
964
0.17
3036
.19
8000
37.9
5of
cot
ton,
kni
tted
61
0891
Wom
en/g
irls
bath
robe
s, dr
essin
g go
wns
,35
790.
0726
5.11
2000
13.2
6etc
, of c
otto
n, k
nitte
d
61
1020
Pullo
vers
, car
diga
ns a
nd s
imila
r ar
ticles
1712
10.
9416
133.
2549
000
32.9
3of
cot
ton,
kni
tted
62
0312
Men
/boy
s su
its, o
f syn
thet
ic fib
res,
1570
000.
1929
074.
0740
000
72.6
9no
t kni
tted
62
0331
Men
/boy
s ja
cket
s an
d bl
azer
s, of
woo
l or
4650
00.
5726
514.
8967
000
39.5
7fin
e an
imal
hai
r, no
t kni
tted
62
0342
Men
/boy
s tro
user
s an
d sh
orts,
of c
otto
n,34
610
4.71
1629
55.4
233
9000
48.0
7no
t kni
tted
62
0343
Men
/boy
s tro
user
s an
d sh
orts,
of s
ynth
etic
5815
1.00
5815
.00
3800
015
.30
fibre
s, no
t kni
tted
62
0429
Wom
en/g
irls
ense
mbl
es, o
f oth
er te
xtile
3016
70.
1338
60.2
218
000
21.4
5m
ater
ials,
not
kni
tted
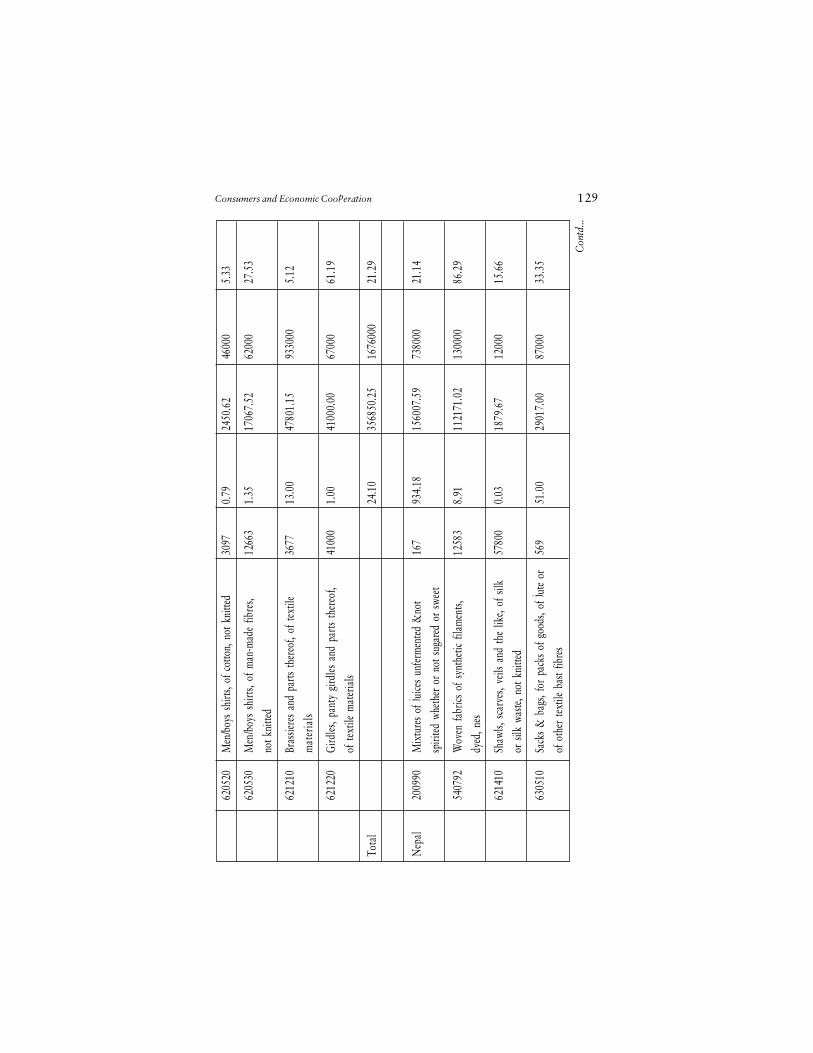
Consumers and Economic Cooperation 129
62
0520
Men
/boy
s sh
irts,
of c
otto
n, n
ot k
nitte
d30
970.
7924
50.6
246
000
5.33
62
0530
Men
/boy
s sh
irts,
of m
an-m
ade
fibre
s,12
663
1.35
1706
7.52
6200
027
.53
not k
nitte
d
62
1210
Bras
siere
s an
d pa
rts th
ereo
f, of
text
ile36
7713
.00
4780
1.15
9330
005.
12
mat
eria
ls
62
1220
Gird
les, p
anty
gird
les a
nd p
arts
ther
eof,
4100
01.
0041
000.
0067
000
61.1
9
of t
extil
e m
ater
ials
Tota
l
24.1
035
6850
.25
1676
000
21.2
9
Nep
al20
0990
Mix
ture
s of
juice
s un
ferm
ente
d &
not
167
934.
1815
6007
.59
7380
0021
.14
spiri
ted w
heth
er o
r no
t sug
ared
or
swee
t
54
0792
Wov
en fa
brics
of s
ynth
etic
filam
ents,
1258
38.
9111
2171
.02
1300
0086
.29
dyed
, nes
62
1410
Shaw
ls, s
carv
es, v
eils
and
the
like,
of s
ilk57
800
0.03
1879
.67
1200
015
.66
or s
ilk w
aste,
not
kni
tted
63
0510
Sack
s &
bag
s, fo
r pa
cks
of g
oods
, of j
ute
or56
951
.00
2901
7.00
8700
033
.35
of o
ther
text
ile b
ast f
ibre
s
Con
td...
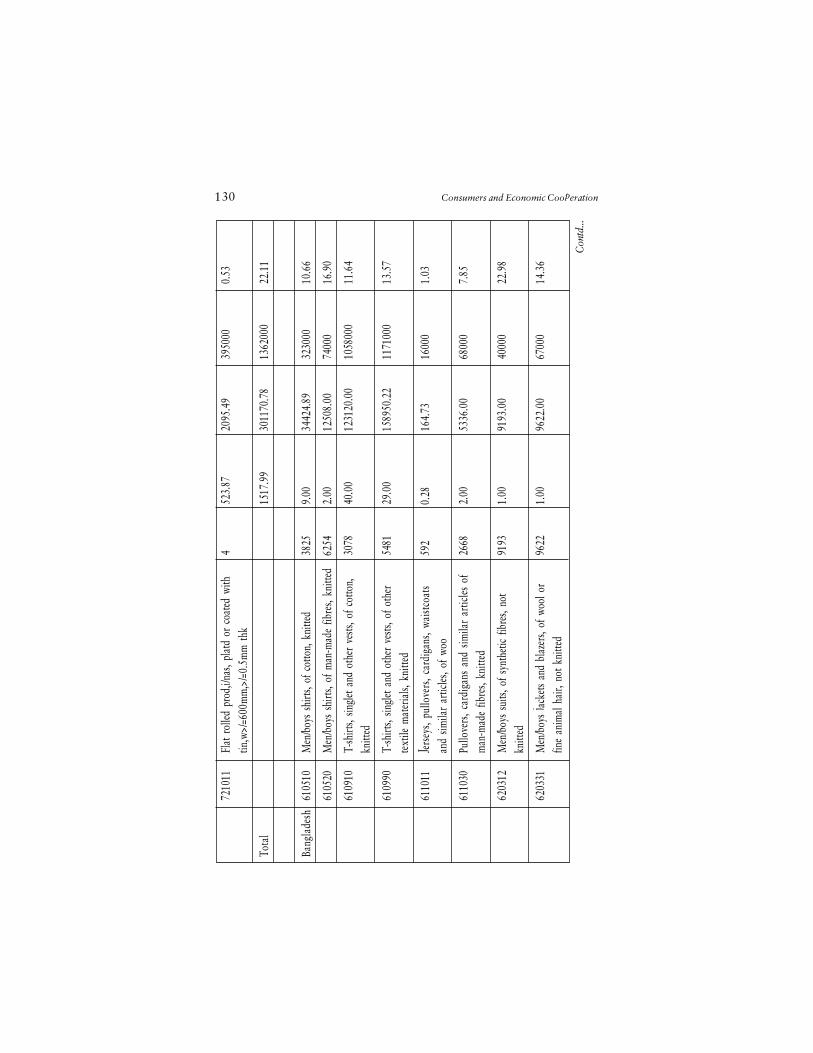
130 Consumers and Economic Cooperation
72
1011
Flat
rol
led p
rod,
i/nas
, pla
td o
r co
ated
with
452
3.87
2095
.49
3950
000.
53tin
,w>/
=600
mm
,>/=
0.5m
m t
hk
Tota
l
1517
.99
3011
70.7
813
6200
022
.11
Bang
lade
sh61
0510
Men
/boy
s sh
irts,
of c
otto
n, k
nitte
d38
259.
0034
424.
8932
3000
10.6
6
61
0520
Men
/boy
s sh
irts,
of m
an-m
ade
fibre
s, kn
itted
6254
2.00
1250
8.00
7400
016
.90
61
0910
T-sh
irts,
singl
et a
nd o
ther
ves
ts, o
f cot
ton,
3078
40.0
012
3120
.00
1058
000
11.6
4kn
itted
61
0990
T-sh
irts,
singl
et a
nd o
ther
ves
ts, o
f oth
er54
8129
.00
1589
50.2
211
7100
013
.57
text
ile m
ater
ials,
kni
tted
61
1011
Jers
eys,
pullo
vers
, car
diga
ns, w
aistc
oats
592
0.28
164.
7316
000
1.03
and
simila
r ar
ticles
, of
woo
61
1030
Pullo
vers
, car
diga
ns a
nd s
imila
r ar
ticles
of
2668
2.00
5336
.00
6800
07.
85m
an-m
ade
fibre
s, kn
itted
62
0312
Men
/boy
s su
its, o
f syn
thet
ic fib
res,
not
9193
1.00
9193
.00
4000
022
.98
knitt
ed
62
0331
Men
/boy
s ja
cket
s an
d bl
azer
s, of
woo
l or
9622
1.00
9622
.00
6700
014
.36
fine
anim
al h
air,
not k
nitte
d
Con
td...

Consumers and Economic Cooperation 131
Con
td...
62
0339
Men
/boy
s ja
cket
s an
d bl
azer
s, of
oth
er te
xtile
418
5.00
2090
.00
3140
000.
67m
ater
ials,
not
kni
tted
62
0341
Men
/boy
s tro
user
s an
d sh
orts,
of w
ool o
r26
507
38.6
410
2420
1.03
2782
000
36.8
2fin
e an
imal
hai
r, no
t kni
tted
62
0342
Men
/boy
s tro
user
s an
d sh
orts,
of c
otto
n,17
4012
.00
2088
0.00
3390
006.
16no
t kni
tted
62
0343
Men
/boy
s tro
user
s an
d sh
orts,
of s
ynth
etic
1160
21.
0011
602.
0038
000
30.5
3fib
res,
not k
nitte
d
62
0419
Wom
en/g
irls
suits
, of
othe
r te
xtile
mat
eria
ls,24
892
0.66
1637
6.32
5000
032
.75
not k
nitte
d
62
0429
Wom
en/g
irls
ense
mbl
es, o
f oth
er te
xtile
6208
40.
1379
44.3
818
000
44.1
4m
ater
ials,
not
kni
tted
62
0439
Wom
en/g
irls
jack
ets,
of o
ther
text
ile25
026
2.00
5005
2.00
1700
0029
.44
mat
eria
ls, n
ot k
nitte
d
62
0449
Wom
en/g
irls
dres
ses,
of o
ther
text
ile10
029
0.38
3774
.08
6000
62.9
0m
ater
ials,
not
kni
tted
62
0469
Wom
en/g
irls
trous
ers
& s
horts
, of o
ther
5861
1.00
5861
.00
4400
013
.32
text
ile m
ater
ials,
not
kni
tted
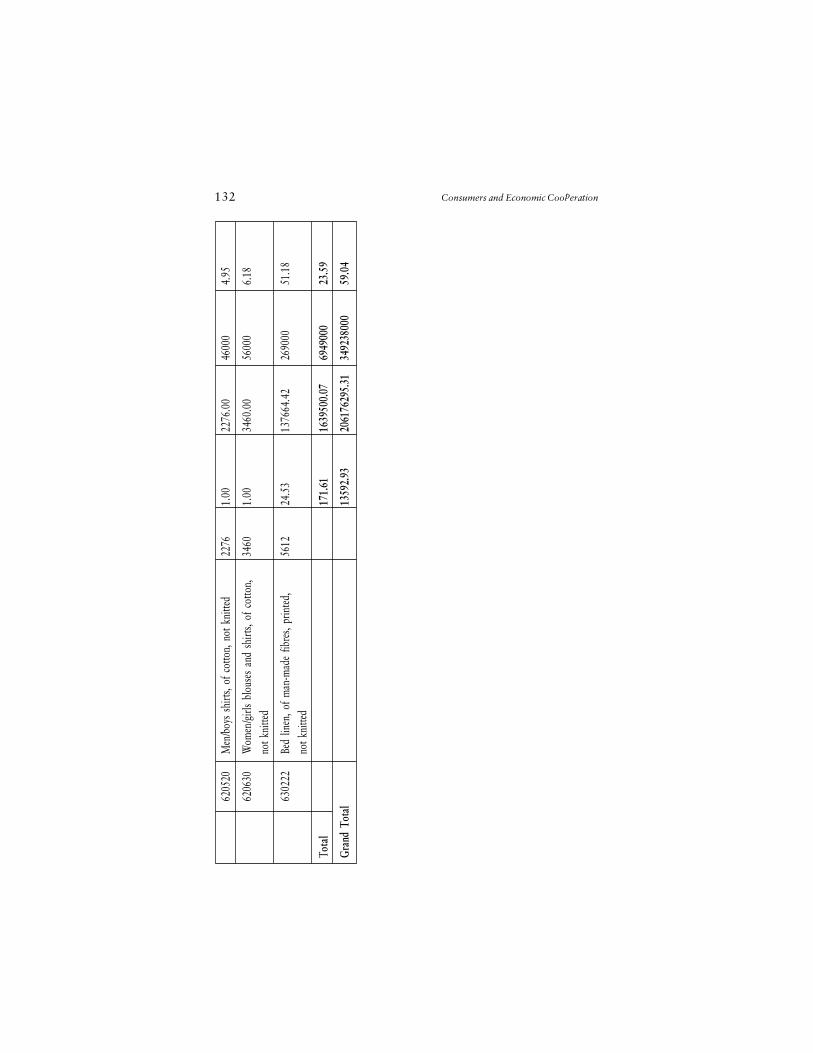
132 Consumers and Economic Cooperation
62
0520
Men
/boy
s sh
irts,
of c
otto
n, n
ot k
nitte
d22
761.
0022
76.0
046
000
4.95
62
0630
Wom
en/g
irls
blou
ses
and
shirt
s, of
cot
ton,
3460
1.00
3460
.00
5600
06.
18no
t kni
tted
63
0222
Bed
linen
, of m
an-m
ade
fibre
s, pr
inte
d,56
1224
.53
1376
64.4
226
9000
51.1
8no
t kni
tted
Tota
l
171.
6116
3950
0.07
6949
000
23.5
9
Gran
d To
tal
1359
2.93
2061
7629
5.31
3492
3800
059
.04
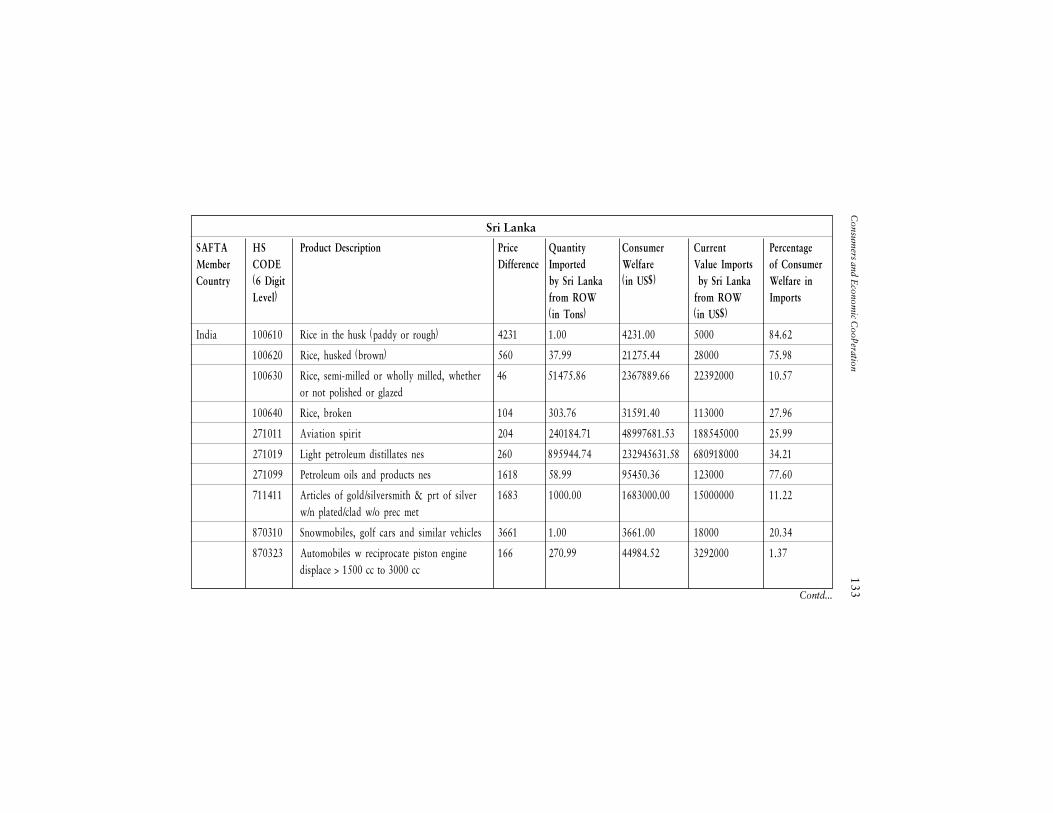
Consum
ers and Econom
ic Cooperation
133
Sri Lanka
SAFTA HS Product Description Price Quantity Consumer Current PercentageMember CODE Difference Imported Welfare Value Imports of ConsumerCountry (6 Digit by Sri Lanka (in US$) by Sri Lanka Welfare in
Level) from ROW from ROW Imports(in Tons) (in US$)
India 100610 Rice in the husk (paddy or rough) 4231 1.00 4231.00 5000 84.62
100620 Rice, husked (brown) 560 37.99 21275.44 28000 75.98
100630 Rice, semi-milled or wholly milled, whether 46 51475.86 2367889.66 22392000 10.57or not polished or glazed
100640 Rice, broken 104 303.76 31591.40 113000 27.96
271011 Aviation spirit 204 240184.71 48997681.53 188545000 25.99
271019 Light petroleum distillates nes 260 895944.74 232945631.58 680918000 34.21
271099 Petroleum oils and products nes 1618 58.99 95450.36 123000 77.60
711411 Articles of gold/silversmith & prt of silver 1683 1000.00 1683000.00 15000000 11.22w/n plated/clad w/o prec met
870310 Snowmobiles, golf cars and similar vehicles 3661 1.00 3661.00 18000 20.34
870323 Automobiles w reciprocate piston engine 166 270.99 44984.52 3292000 1.37displace > 1500 cc to 3000 cc
Contd...
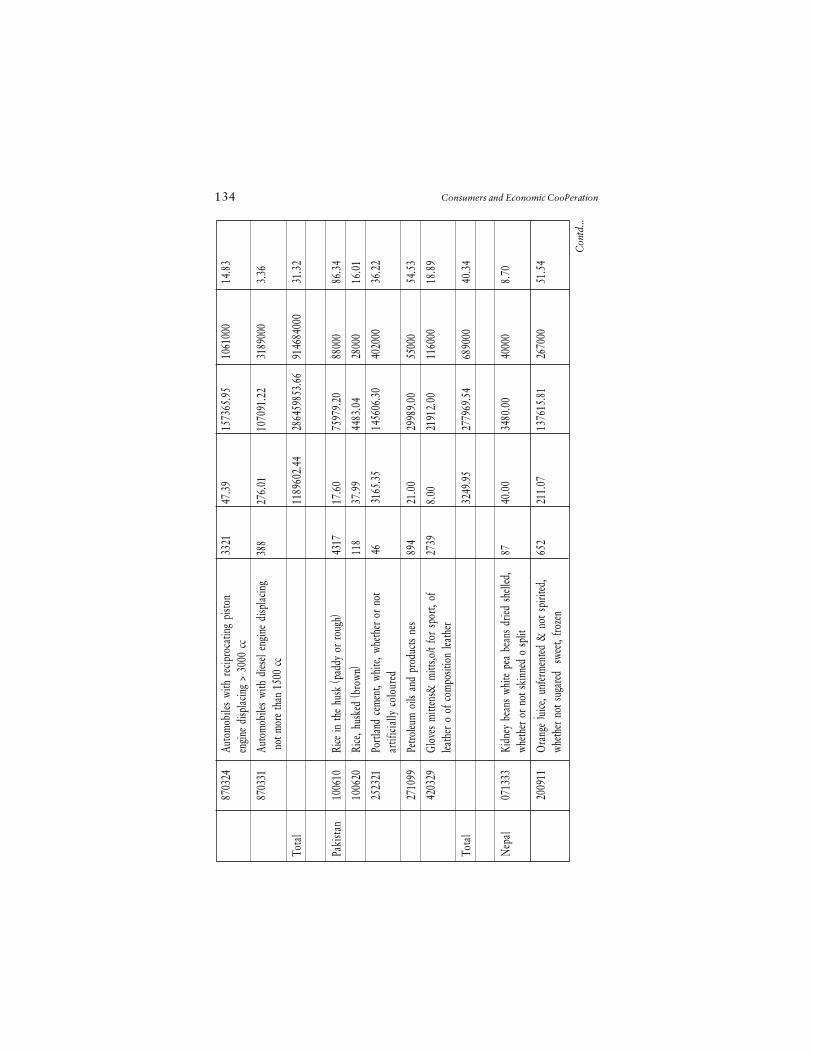
134 Consumers and Economic Cooperation
Con
td...
87
0324
Auto
mob
iles
with
rec
ipro
catin
g pi
ston
3321
47.3
915
7365
.95
1061
000
14.8
3en
gine
disp
lacin
g >
3000
cc
87
0331
Auto
mob
iles
with
dies
el en
gine
disp
lacin
g38
827
6.01
1070
91.2
231
8900
03.
36 n
ot m
ore
than
150
0 cc
Tota
l
1189
602.
4428
6459
853.
6691
4684
000
31.3
2
Paki
stan
1006
10Ri
ce in
the
husk
(pad
dy o
r ro
ugh)
4317
17.6
075
979.
2088
000
86.3
4
10
0620
Rice
, hus
ked
(bro
wn)
118
37.9
944
83.0
428
000
16.0
1
25
2321
Portl
and
cem
ent,
white
, whe
ther
or
not
4631
65.3
514
5606
.30
4020
0036
.22
artif
icial
ly c
olou
red
27
1099
Petro
leum
oils
and
pro
duct
s ne
s89
421
.00
2998
9.00
5500
054
.53
42
0329
Glov
es m
itten
s& m
itts,o
/t fo
r sp
ort,
of27
398.
0021
912.
0011
6000
18.8
9lea
ther
o o
f com
posit
ion
leath
er
Tota
l
3249
.95
2779
69.5
468
9000
40.3
4
Nep
al07
1333
Kidn
ey b
eans
whi
te p
ea b
eans
drie
d sh
elled
,87
40.0
034
80.0
040
000
8.70
wheth
er o
r no
t ski
nned
o s
plit
20
0911
Ora
nge
juice
, unf
erm
ente
d &
not
spi
rited
,65
221
1.07
1376
15.8
126
7000
51.5
4wh
ether
not
sug
ared
sw
eet,
froze
n
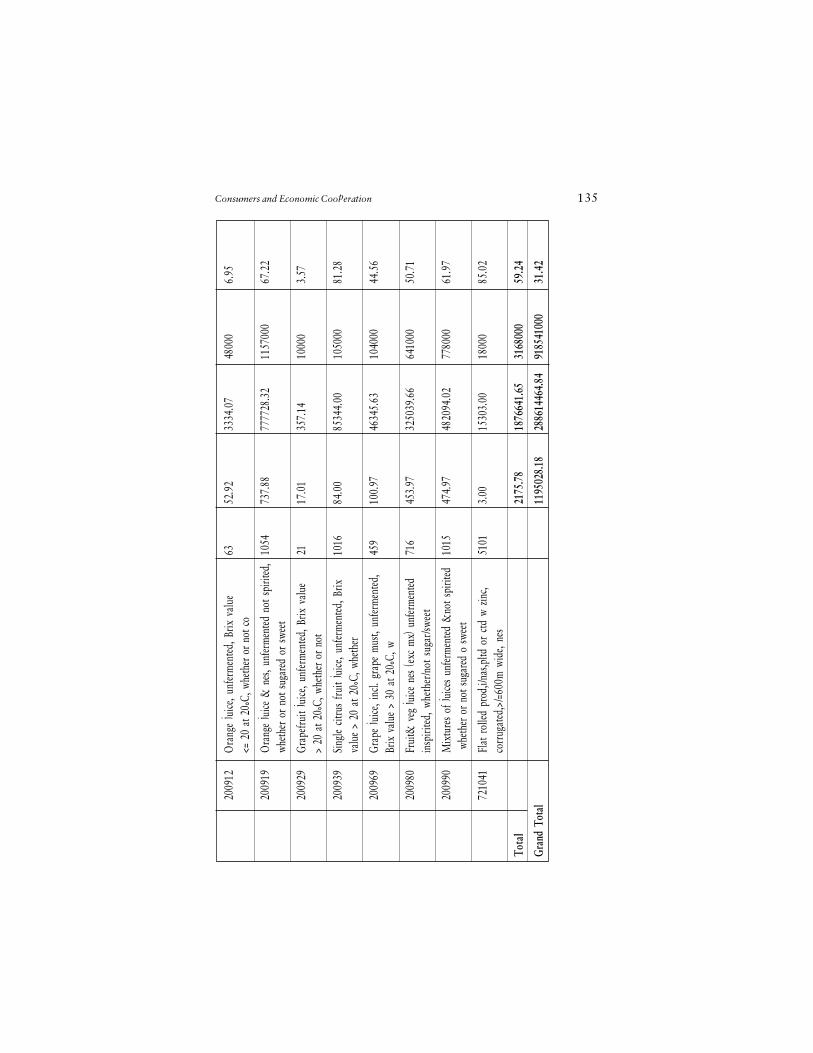
Consumers and Economic Cooperation 135
20
0912
Ora
nge
juice
, unf
erm
ente
d, B
rix v
alue
6352
.92
3334
.07
4800
06.
95<=
20
at 2
0°C,
whe
ther
or n
ot c
o
20
0919
Ora
nge
juice
& n
es, u
nfer
men
ted
not s
pirit
ed,
1054
737.
8877
7728
.32
1157
000
67.2
2wh
ether
or
not s
ugar
ed o
r sw
eet
20
0929
Gra
pefru
it ju
ice, u
nfer
men
ted,
Brix
val
ue21
17.0
135
7.14
1000
03.
57>
20 a
t 20°
C, w
heth
er o
r not
20
0939
Sing
le cit
rus
fruit
juice
, unf
erm
ente
d, B
rix10
1684
.00
8534
4.00
1050
0081
.28
valu
e >
20 a
t 20°
C, w
heth
er
20
0969
Grap
e ju
ice, i
ncl.
grap
e m
ust,
unfe
rmen
ted,
459
100.
9746
345.
6310
4000
44.5
6Br
ix v
alue
> 30
at 2
0°C,
w
20
0980
Frui
t& v
eg ju
ice n
es (e
xc m
x) u
nfer
men
ted71
645
3.97
3250
39.6
664
1000
50.7
1in
spiri
ted,
whe
ther
/not
sug
ar/sw
eet
20
0990
Mix
ture
s of
juice
s un
ferm
ente
d &
not s
pirit
ed10
1547
4.97
4820
94.0
277
8000
61.9
7 w
heth
er o
r not
suga
red
o sw
eet
72
1041
Flat
rol
led p
rod,
i/nas
,pltd
or
ctd
w zin
c,51
013.
0015
303.
0018
000
85.0
2co
rrug
ated
,>/=
600m
wid
e, ne
s
Tota
l
2175
.78
1876
641.
6531
6800
059
.24
Gran
d To
tal
11
9502
8.18
2886
1446
4.84
9185
4100
031
.42
Cost of Economic Non-Cooperation toConsumers in South Asia Questionnaire
(Perception Survey)
General Informationi) Name of Respondent
ii) Education: Graduation ( ); Post Graduation and above ( )
iii) Age
iv) Sex: Male ( ); Female ( )
v) City
vi) Country
vii) Respondent�s Profile: Producer/Trader/Exporter ( ); GovernmentOfficial ( ); Trade-Related Service ( ); Political Person ( );Academic/Researcher ( ); Civil Society Organisation ( ); Business/Industry Organisation ( ); Media ( )
viii) Name of the Organisation
ix) Email Address
Questions1. What is your thinking about overall impact of trade agreements
signed by your country?Multilateral Trade Agreement (World Trade OrganisationAgreement):
Regional Trade Agreement (South Asian Free Trade Agreement):
Bilateral Trade Agreements:
2. How do you perceive the current trade and regional cooperationscenario among South Asian countries? Explain your choice.As per expectations ( )
Consumers and Economic Cooperation 137
Below expectations ( )
Above expectations ( )
3. Are regional/bilateral trade negotiations among and betweenSouth Asian countries influenced by political priorities ratherthan economic logic? Explain your Argument.Yes ( )
No ( )
4. Do you believe that more trade liberalisation at the regional(South Asian) level is beneficial to consumers of your country?Explain your Point.Yes ( )
No ( )
5. Is trade-related consumer welfare ignored by trade policy makersof your country? Explain your Argument.Yes ( )
No ( )
6. What ought to be the volume of intra-regional trade amongSouth Asian countries in 2020? Explain your Choice.5-10% ( )
10-20% ( )
20-30% ( )
Above 30% ( )
7. What do you think is the best mode to deepen trade integrationin the South Asian region? Explain your Choice.Multilateral Trade Liberalisation (WTO) ( )
Regional Trade Agreement (SAFTA) ( )
Bilateral Trade Agreements ( )
138 Consumers and Economic Cooperation
8. Can economic and political relations in South Asia becomplimentary to each other to enhance trade and regionaleconomic cooperation? Explain your Choice.Yes ( )
No ( )
9. What factors hinder South Asian countries to enhance regionaltrade and economic cooperation? Explain your Choice.Please select what do you thinking most important factor (bymarking 1) and what do you think least important factor (bymarking 2)
Distrust among South Asian countries ( )Lack of complementarity in production and consumption ( )Lack of awareness about consumer benefits from regionaleconomic cooperation ( )
Lack of expectations about other economic benefits fromregional economic cooperation ( )
10. Do you think that consumer welfare impact analysis needs tobe taken into account in trade policy making? Explain yourArgument.Yes ( )No ( )
11. What do you think about generating more awareness aboutpositive consumer welfare impact of greater regional tradecooperation? Explain your Choice.Rank them in order of your choice � 1 = Lowest priority; 4 =Highest priority
Media campaign at national and regional level ( )Networking among consumer organisations at national andregional level ( )Networking among producers and consumers at national andregional level ( )Dialogue between politicians, producers and consumers atnational level ( )
Consumers and Economic Cooperation 139
12. What kind of steps must be taken by the political leadership ofSouth Asian countries to enhance regional trade and economiccooperation? Explain your Choice.Rank them in order of your choice � 1 = Lowest priority; 3 =Highest priority
Stop distrusting each other ( )
Highlight peace dividends from enhanced regional economiccooperation in their actions ( )
Take part in civil society initiatives toward enhancing regionaleconomic cooperation ( )
13. State some of your general views on the values and virtues ofgreater regional trade and economic cooperation.