mapping the cuts
TRANSCRIPT
Belinda Pratten and Rosie Chapman Associates
Mapping the Cuts
A report to the Esmee Fairbairn
Foundation
By
Belinda Pratten
May 2013
Belinda Pratten and Rosie Chapman Associates Page 2 of 21 www.bprcassociates.com
Mapping the cuts: Executive Summary
This reports brings together evidence from a range of sources to build a picture of the impact
of welfare reform and public spending cuts on communities in the UK. It begins by looking at
the extent of poverty in the UK, highlighting differences within and between the four nations.
It then examines the impact of:
welfare reforms, particularly in the English regions;
cuts to local government funding;
cuts to the voluntary and community sector generally;
cuts to sectors of particular interest to Esmee Fairbairn Foundation, namely early
years and education; the arts; and the environment; and
wider policy changes to the voluntary and community sector.
A key finding is the extent of cumulative disadvantage arising from these measures: the
most vulnerable people in the most deprived areas are most affected by each and every one
of these changes.
Welfare reform
Welfare reforms hit hardest where deprivation is greatest; the worst affected areas are:
older, industrial areas – Yorkshire, North West & North East England will lose
around £5.2 billion a year; South Wales valleys (£1.07bn)
seaside towns such as Blackpool, Hastings, Yarmouth & Margate
some London Boroughs
In contrast, much of southern and eastern England and rural areas in the north will remain
largely unaffected by these changes.
Public spending cuts
The same pattern can be seen in relation to cuts to local authority funding: the frontloading
of cuts and targeting of specific grants to deprived authorities, has meant that these
authorities are being cut faster and harder. More deprived authorities are also more grant
dependent, and so lose more in absolute terms.
Council spending will be cut further next year: by 2015 it is estimated that councils will have
lost one third of their budgets; by 2019/20 councils will have a 29% shortfall between
revenue and spending, a funding gap of £16.5 billion a year
A key issue is the cumulative impact of cuts on the most disadvantaged individuals and
households: as well as losing income from benefit cuts, they are also most reliant on public
services and least able to afford alternatives.
Impact on voluntary and community organisations
All voluntary and community organisations (VCOs) are experiencing rising demand for their
services and falling income across all income streams. However, organisations in the most
deprived areas are more likely to be funded by the state and therefore more susceptible to
reductions in public expenditure.
Children’s services have been hit hard by local authority cuts: it is estimated that voluntary
organisations working with children and young people will lose over £400 million between
2011/12 and 2015/6.
Arts funding will be significantly squeezed in coming years, both as a result of Arts Council
cuts and as councils prioritise social and other public services.
Belinda Pratten and Rosie Chapman Associates Page 3 of 21 www.bprcassociates.com
These cuts will hit smaller and regional arts organisations and those working in and with
local communities hardest: these organisations are more reliant on public funding,
particularly from local authorities.
The environment appears to have been less affected by funding cuts but more affected by
a lack of policy coherence. There may be a need to build the capacity of the environmental
sector to enable it to shape and influence policy agendas.
More generally, VCOs are experiencing turbulence as a result of changes to
commissioning, with many local organisations not so much squeezed as squashed: too
small to compete, too big to survive without funding.
While there have been a number of government initiatives to help VCOs compete in this
environment, less attention and resources has been given to other roles that VCOs play:
campaigning and advocacy; developing and mobilising social capital; facilitating social and
economic participation; or as a source of social innovation finding new ways of addressing
social problems, from the bottom up.
The way ahead
The speed, scale and scope of change is unprecedented. We are now entering uncharted
waters, where there are no easy solutions and where social innovation is at a premium.
Meeting the needs of disadvantaged communities will require
effective co-operation and co-ordination across sectors and organisations;
the engagement of communities themselves; and
holistic approaches that address and create synergies between economic
development, social / community development and the local environment;
In the past communities would look to the state for support, but while many local authorities
are doing what they can to mitigate austerity, there is a limit to what they can now do.
Charitable foundations, however, could play a crucial role as social innovators, bringing
together people, ideas, money and power to create social change. The challenge for them is
to consider what austerity means for them and their willingness to test out what might work
in this new environment.
Belinda Pratten and Rosie Chapman Associates Page 4 of 21 www.bprcassociates.com
Mapping the Cuts
Introduction
This reports brings together evidence from a range of sources to build a picture of the impact
of welfare reform and public spending cuts on communities in the UK. It begins by looking at
the extent of poverty in the UK, highlighting differences within and between the four nations.
It then examines the impact of:
welfare reforms, particularly in the English regions;
cuts to local government funding;
cuts to the voluntary and community sector generally;
cuts to sectors of particular interest to Esmee Fairbairn Foundation, namely early
years and education; the arts; and the environment; and
wider policy changes to the voluntary and community sector.
A key finding is the extent of cumulative disadvantage arising from these measures: the
most vulnerable people in the most deprived areas are most affected by each and every one
of these changes. The final section highlights the need for innovative and holistic
approaches to tackle the problems that are starting to arise and which are likely to worsen as
austerity tightens its grip, with the bulk of cuts still to come.
Poverty & Inequality
Inequalities in income and wealth in the UK are high, both compared with other industrialised
countries and with 30 years ago.
The experience of poverty has changed in that time:
the proportion of pensioners living in poverty has halved since the early 1990s,i
although the majority of pensioners living below the breadline are women;ii
in-work poverty has increased in the last 3 years, a result of low pay and
underemployment: 1.4 million part time workers want full time jobs
there is a high turnover of people claiming Job Seekers Allowance: although the
number of claimants at any one time stayed at 1.6 million between 2010-2012, 4.8
million claimed JSA at some point in that period;
the number of unemployed young adults seeking work has been rising since before
the recession: 22% of 16-24 year olds were unemployed in the first quarter of 2012,
compared to 6% of 25-64 year oldsiii
In Scotland: deprivation is less severe than for the UK as a wholeiv: the child poverty rate is
7% lower than the UK average, but this is largely due to lower housing costs.
In Northern Ireland, 36% of households do not have what people consider to be basic
necessities; comparisons across a range of indicators show that social exclusion has
increased since 2003.v
In 2009/10 22% of people in NI were living in poverty. Since the middle of the last decade
poverty for children, working age adults and pensioners has increased (NI is the only country
where pensioner poverty has increased). Other key trends:
increase in in-work poverty: half of the 120,000 children living in poverty live in
working households
between 2009 and 2011, 34% of working age adults in NI were not in paid work –
higher than UK average, but similar to Wales & north east of England
Belinda Pratten and Rosie Chapman Associates Page 5 of 21 www.bprcassociates.com
7% of working age people are out of work because of long term sickness and
disability, compared to UK average of 4%vi
In Wales nearly 400,000 working age adults; 200,000 children and 100,000 pensioners in
Wales are in poverty (after housing costs)
One third of these adults are either disabled or have a disabled partner
One quarter of these children live with a disabled adult.
Half the children in poverty belong to working families
Half the improvement in the child poverty rate between mid-1990s and mid-2000s
has been lost in the last 5 years
The London factor: ‘inequality in any dimension is wider in London than any other region.
And inequality in earnings and income has risen faster in London over the last decade than
anywhere else’vii.
Unemployment
There have been significant increases in underemployment and in male unemployment in
Wales; those with the lowest qualifications have been hit hardest by the recession – a 10%
drop in their employment rate in the 3 years from 2007viii. The Central Valleys area has the
third highest percentage of workless households in the UK at 28.7%.
In Scotland underemployment and youth unemployment, are, on average, similar to other
parts of the UKix. However, Glasgow City has the fourth highest percentage of workless
households in the UK at 28.7%.
In England, 31.6% of households in Liverpool are without work, this is the highest
percentage in the UK (and has been for the last four years). South Teeside and
Sunderland are also experiencing high levels of worklessness, affecting 29.1% and 28.2%
of households respectively.
Of the five local authority areas with the fewest number of workless households, four are in
the south of England, Oxfordshire being the lowest. The other is East Cumbria, highlighting
disparities within regions.
Public sector employment
In December 2012, 5.7 million people worked in the public sector in the UK, representing
19.2% of the workforce, the lowest percentage since records began in 1999.
Public sector employment is highest in Northern Ireland (27.7%) and Wales (25.7%).
In England, the public sector accounts for just over 19% of the workforce, but it is higher in
the North East (22.2%), the North West (20.3%) and Yorkshire and Humber (20.6%).
These areas are more vulnerable to public sector cuts: local government employment has
already fallen by 24% in the North East and by 14% in the North West of England.
The loss of public sector jobs will also have a disproportionate impact on women and people
from Black and minority ethnic (BME) communities, who are more likely to work in this
sectorx.
Yet it is estimated that 75% of public sector job losses are still to come.
Inequalities between social groups
Belinda Pratten and Rosie Chapman Associates Page 6 of 21 www.bprcassociates.com
Although deep-seated and systematic differences between social groups (eg by gender,
ethnicity, disability) remain, some of the widest gaps have narrowed in the last decade.
Nevertheless:
women’s unemployment is at a 25 year high and women’s pay remains on average
22% below that of men, but public sector jobs have offered more equal pay and
career opportunitiesxi;
between 2008-2011 BME employment rates declined, with Black African and
Caribbean people 2.5 times as likely to be unemployed as White people (and more
likely to be / have been working in the public sector)xii;
although the proportion of disabled people not working fell slightly from 2001-2011,
from 53% to 49%, they are still more likely to lack work but want work and if in work
to be low paid;xiii
the low level of part time pay is a crucial factor in the earnings of women, certain
ethnic groups and disabled people, but these groups also experience an
‘employment penalty’ that cannot be explained by qualifications or occupation.
However, inequalities within groups is growing, eg the gap between high and low paid
women is now as significant as between women and menxiv.
Impact of welfare reform in England & Walesxv
Welfare reforms hit hardest where deprivation is greatest; the growing spatial polarisation of
wealth and income, particularly in England, will mean that they will have a significant impact
in some areas. This in turn will have a knock on effect on local economies.
The worst affected areas are:
older, industrial areas – Yorkshire, North West & North East England will lose
around £5.2 billion a year; South Wales valleys (£1.07bn)
seaside towns such as Blackpool, Hastings, Yarmouth & Margate
some London Boroughs
beyond the largest cities, County Durham and Cornwall are particularly adversely
affected
Much of southern and eastern England and rural areas in the north will remain largely
unaffected by these changes.
A key issue is the cumulative impact of cuts on individuals and households:
the biggest financial impact comes from the reform of incapacity benefits: individuals
affected can expect to lose £3500 a year;
many of them will also be affected by changes to Disability Living Allowance, and
may expect to lose an average of £3000 a year
they may also lose entitlement to housing benefit changes, leading to a further
significant loss of income, often £1000 a year
While these reforms appear to target individuals with some level of disability, it should be
noted that:
nearly half of those reporting ‘work-limiting’ disability or classed as disabled under the
DDA have no or low qualifications – twice as many as those who are not disabled;
their paid employment rates are less than half of people who are not disabled – and
this ‘disability penalty’ has grown over the last 30 years, with some evidence to
suggest discrimination by employers;
Belinda Pratten and Rosie Chapman Associates Page 7 of 21 www.bprcassociates.com
DDA disabled have a median net income 30% less than that for working age adults –
even taking into account social security benefits intended to cover the extra costs of
being disabledxvi.
Given the extent of change, it is likely that more claimants will need professional advice and
support to claim their entitlements. But a £350 million cut to the legal aid budget in this
financial year (2013/14) will make this more difficult to come by, with Shelter, the Red Cross
and Citizens Advice Bureau all reporting significant cuts in advice services.
The introduction of Universal Credit will not, by itself, change the amount of income
households receive, but it will:
be paid on a monthly, rather than weekly basis;
include housing benefit, previously paid direct to the landlord; and
go to fathers rather than mothers in two-parent households (unlike child benefit).
This will be challenging for many people: already an increasing number of families are
experiencing food poverty, in London alone the number of food banks rose from six food
banks feeding 400 people in 2009, to 40 feeding 34,000 in 2012/13. One third of households
currently do not have enough money to cope with necessary but unexpected costsxvii - and
changes to the social fund, making it discretionary, will make it even harder to budget for
such events, leading to more rent arrears and evictionsxviii.
And this is taking place against a background of entrenched financial exclusion in some
communities. Five million households do not have access to financial services; in the most
deprived areas there are very few free ATMs for those who do. Because poorer people are
more likely to take out smaller amounts more frequently, they are doubly disadvantaged by
chargesxix.
Further cuts to welfare spending are expected to be announced in June, when the
Chancellor will announce his spending intentions for 2015-16. This includes a previously
announced cap on annually managed expenditure, of which working aged benefits, including
tax credits, housing benefit and some disability benefits are the main target.
Geographical impact
Blackpool is the worst affected area, with a high proportion of adults on out of work benefits;
one of the highest incapacity claimant rates in the country; and a high proportion of
households in the private rented sector.
Knowsley will also be hard hit, with all changes except the household benefit cap having a
significant impact.
South Tyneside will be particularly affected by changes to under-occupation; council tax
benefits and non-dependent deductions.
As noted below, both Knowsley and South Tyneside councils have been amongst those
hardest hit by changes to local authority funding.
The South Wales Valleys will be severely affected by changes to Disability Living
Allowance and Incapacity Benefit (IB): the three most affected areas for IB, and 7 of the ‘top
twenty’, are in South Wales.
Wales has a higher dependence on welfare benefits than Great Britain as a whole. For
example, in May 2011, 18.4 per cent of the working-age population in Wales were claiming
Belinda Pratten and Rosie Chapman Associates Page 8 of 21 www.bprcassociates.com
welfare benefits compared to the average of 14.5 per cent for great Britain. The main reason
for this is the higher proportion of people claiming disability and sickness benefits.xx
Liverpool, the most deprived local authority area in Britain, is amongst the 20 hardest hit
areas for all categories.
London
The Household Benefit Cap (HBC) impacts overwhelmingly on London, largely because of
high rent levels and high numbers of people claiming housing benefit; outside of London it
has hardly any impact at all.
Although it impacts on fewer households, the impact on each is relatively large. Therefore
the HBC and other housing benefit reforms mean that Westminster is the second highest
loser (after Blackpool) in financial terms.
However, in terms of the number of individuals and / or households, Brent is the worst
affected borough; it too is particularly affected by the HBC and changes to Local Housing
Allowance for households living in private rented accommodation.
Some London boroughs have said that they want to transfer homeless families and others in
priority housing need to areas such as Stoke or Walsall where housing is cheaper. However,
while there is political capital to be made from such announcements, councils may find it
more pragmatic to go for a more dispersed approach. It is not yet clear what the picture will
look like in a years time, except that there will be increased insecurity and transience for the
most vulnerable families.
Elsewhere, places such as Croxteth in Liverpool report social housing being boarded up as
tenants move out of ‘underoccupied’ homes, leading to further decline of the areaxxi.
Scotland
Scotland is less affected, partly because poverty is less concentrated and partly because
housing costs are lower. Nevertheless the Scottish Government has estimated that the
cumulative impact of welfare reform in Scotland to amount to a £4.5 billion cut in income; £1
billion of which will have a direct impact on children
The Scottish Government has sought to mitigate the impact of these reforms by funding
social landlords and advice agencies, including Citizens Advice Scotland, and pilot projects
in 3 local authority areas, to provide advice and support to those affected.xxii
Both the Scottish Government and the Welsh Assembly have chosen not to pass on
reductions in Council Tax Benefit (CTB) to local authorities.
In England, 18% of councils will retain the current level of CTB, but 71% will require all
working-age adults to pay at least some council taxxxiii. In North West England, for example,
the poorest residents in Blackpool will not have to pay any council tax, while in Knowsley
every person of working age will have to pay at least 20%.
Changes to local government funding
The 2010 Comprehensive Spending review cut central government funding to local
authorities by 28% over 4 years.
Key features of the new formula, including frontloading of cuts and targeting of specific
grants to deprived authorities, has meant that these authorities ‘face a swifter and more
severe cut.’ More deprived authorities are also more grant dependent, and so are likely to
lose more in absolute terms. xxiv
Belinda Pratten and Rosie Chapman Associates Page 9 of 21 www.bprcassociates.com
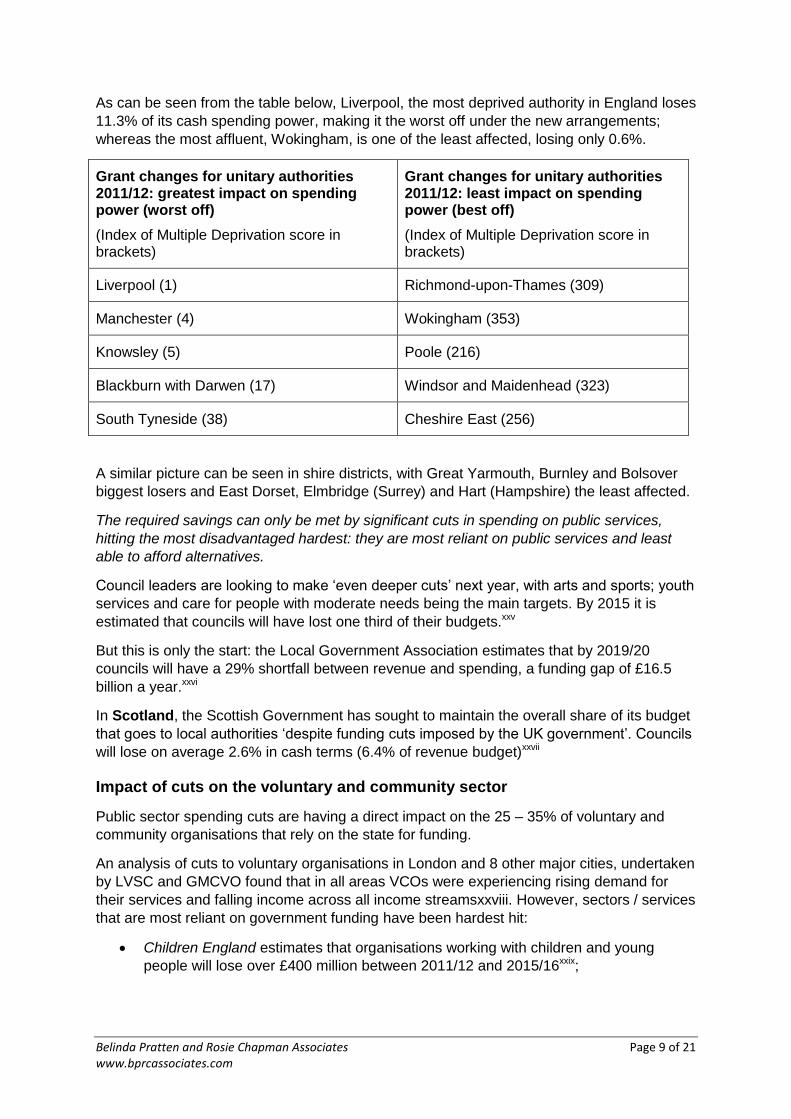
As can be seen from the table below, Liverpool, the most deprived authority in England loses
11.3% of its cash spending power, making it the worst off under the new arrangements;
whereas the most affluent, Wokingham, is one of the least affected, losing only 0.6%.
Grant changes for unitary authorities 2011/12: greatest impact on spending power (worst off)
(Index of Multiple Deprivation score in brackets)
Grant changes for unitary authorities 2011/12: least impact on spending power (best off)
(Index of Multiple Deprivation score in brackets)
Liverpool (1) Richmond-upon-Thames (309)
Manchester (4) Wokingham (353)
Knowsley (5) Poole (216)
Blackburn with Darwen (17) Windsor and Maidenhead (323)
South Tyneside (38) Cheshire East (256)
A similar picture can be seen in shire districts, with Great Yarmouth, Burnley and Bolsover
biggest losers and East Dorset, Elmbridge (Surrey) and Hart (Hampshire) the least affected.
The required savings can only be met by significant cuts in spending on public services,
hitting the most disadvantaged hardest: they are most reliant on public services and least
able to afford alternatives.
Council leaders are looking to make ‘even deeper cuts’ next year, with arts and sports; youth
services and care for people with moderate needs being the main targets. By 2015 it is
estimated that councils will have lost one third of their budgets.xxv
But this is only the start: the Local Government Association estimates that by 2019/20
councils will have a 29% shortfall between revenue and spending, a funding gap of £16.5
billion a year.xxvi
In Scotland, the Scottish Government has sought to maintain the overall share of its budget
that goes to local authorities ‘despite funding cuts imposed by the UK government’. Councils
will lose on average 2.6% in cash terms (6.4% of revenue budget)xxvii
Impact of cuts on the voluntary and community sector
Public sector spending cuts are having a direct impact on the 25 – 35% of voluntary and
community organisations that rely on the state for funding.
An analysis of cuts to voluntary organisations in London and 8 other major cities, undertaken
by LVSC and GMCVO found that in all areas VCOs were experiencing rising demand for
their services and falling income across all income streamsxxviii. However, sectors / services
that are most reliant on government funding have been hardest hit:
Children England estimates that organisations working with children and young
people will lose over £400 million between 2011/12 and 2015/16xxix;
Belinda Pratten and Rosie Chapman Associates Page 10 of 21 www.bprcassociates.com
CLINKS reported that in 2011 86% of organisations working in criminal justice had
been negatively affected by the cuts and wider policy changes; 80% reported a fall in
income, 77% were drawing on reservesxxx;
Justice for All has claimed that ‘advice agencies are on the brink of collapse’, with
22% facing closure and most making major cutbacks
WRC reports that 75% of women’s organisations in London had to reduce or close
services and 58% made staff redundancies in 2012/13, even though demand for their
services had increased during that timexxxi.
Although there are more voluntary and community organisations (VCOs) in less deprived
areas, these are more likely to be unfunded organisations working in the field of arts, culture
and education, reflecting the greater levels of social and cultural capital in such areas.
Organisations in the most deprived areas tend to be larger (£100,000+) and more involved
in economic well-being and delivering public services; significantly organisations in these
areas are more likely to be publically funded and therefore more susceptible to reductions
in public expenditurexxxii.
This suggests a high degree of interdependence between local authorities and local
voluntary organisations in certain neighbourhoods: the voluntary sector providing reach and
responsiveness; councils providing resources. The combined pressures on both is likely to
lead to reduced provision and worse outcomes in the most deprived areas.
Local authority planning and development budgets were an early spending target, being cut
by 43% on average in 2010/11. This was largely due to significant cuts in economic and
community development programmes, particularly in London and the northern and midlands
regions of Englandxxxiii. This is likely to have had a knock on effect on the resilience of local
communities.
At the same time, Regional Development Agencies were replaced by Local Economic
Partnerships, with much greater involvement of business and no requirement to engage the
voluntary and community sector (or local communities). This means that local organisations
and local people will be excluded from development decisions in many areas.
Belinda Pratten and Rosie Chapman Associates Page 11 of 21 www.bprcassociates.com
Impact of cuts by sub-sector
Early years and education
People’s occupational and economic destinations in adulthood depend to an important
degree on their origins. The early years have a significant impact on life chances:
children entering primary school in 2005-6 whose mothers had degrees were 6
months ahead of those with no qualifications;
every £100 per month in income when children were small was associated with a
difference equivalent to a months development.
This gaps widens through childhood:
By age 16, half of boys receiving free school meals have results in bottom 25% in
England; bottom 20% in Wales;
White British, Black Caribbean boys and mixed WB / BC boys have lowest average
assessment of any group except Gypsy and Traveller children (who have the worst
results at age 16);
Low income acts as a barrier to post-compulsory education: young people with
GCSE results above the national median who were in receipt of free school meals
are less likely to go on to HE.
Today, youth unemployment stands at 1 million, and rising – the third highest in the OECD
after Spain and Greece – the costs of which will be borne by individual young people and the
society as a whole for many years to come.xxxiv Given the relationship between disadvantage
and low achievement, young people from the poorest backgrounds will be most affected.
A study of children who ‘succeed against the odds’ highlights the importance of the home
environment: parents who value learning and engage their children in learning activities from
a young age and throughout their schooling.
As well as supporting school-related activities, these parents draw on what cultural capital is
available within their own social networks, however limited, and encourage a variety extra-
curricula activities, giving children a positive attitude to learning and to themselves as
learners. This, together with average or good quality pre-school education, can alleviate the
effects of disadvantage. xxxv
Evaluation of the previous government’s Sure Start programme found that those attending
Children’s Centre’s experienced positive improvements in the home environment, including
more cognitive stimulation. However, children’s services have been hit hard by local
authority cuts and the removal of ring fenced funding for Children’s Centre’s will exacerbate
this, so that future families may not benefit from the Sure Start approach.
The cuts have had a particular impact on local voluntary organisations working with children
and young people. According to Children England:
‘It has been cautiously estimated that the children, young people and families
voluntary and community sector will lose a total of almost £405 million in statutory
funding between 2011/12 and 2015/16. The lion’s share of this cut, £324 million will
come from local government …’xxxvi
There appears to be an expectation that the voluntary sector will replace lost statutory
provision, but it cannot do this without funding and the children’s sector has been more
reliant on statutory funding than other voluntary organisations.
Belinda Pratten and Rosie Chapman Associates Page 12 of 21 www.bprcassociates.com
At the same time funding cuts to arts and cultural events will limit access to school visits and
extra-curricular activities with a corresponding loss of essential creative learning
opportunities.
Changes to housing benefit and tenure will also make vulnerable children’s lives more
transient, more frequent moves between accommodation and less emphasis on maintaining
a local connection will have a direct impact on their schooling and their life chances.
Children England describe these changes as a ‘perfect storm’.
Both the Scottish Government and the Welsh Assembly have anti-poverty strategies that
include a strong focus on early years support and developing skills and work experience
opportunities for young people.
Arts sector funding
In 2011 just over half of the art sector’s income came from statutory sources; approximately
one third came from income generation (box office; shops) and one sixth from private
sources.
However, it is not just the amount of funding that is important, but the way it can be used as
leverage: according to the National Council for the Arts, every £1 invested by the Arts
Council generates a further £2 from private and commercial sources. While the funding mix
could be improved, it is not clear that this can be achieved by cutting public subsidies.xxxvii
In 2011, 206 arts organisations received 100% funding cuts, worth, £19.1 million from Arts
Council England. The majority of these organisations were visual arts (24.8%); combined
arts (21.8%) and theatre (18.4%).
Local government has been the second most important funder of the arts (£220.5 million in
2009/10), cuts to council spending is having a major impact, with Somerset and Moray both
cutting their arts budgets by 100% and others seeing it as a ‘soft target’.
It is clear that the Arts will be significantly squeezed in coming years as councils prioritise
social and other public services, as the recent controversy in Newcastle has demonstrated.
These cuts will hit smaller and regional arts organisations and those working in and with
local communities hardest: these organisations are more reliant on public funding,
particularly from local authorities.xxxviii
A survey of the impact of budget cuts on theatres found that:
2/3 of respondents had cancelled one or more productions since April 2012;
fewer new plays are being commissioned or produced (with a consequent impact on
the development of new writers / writing);
again, regional theatres have been disproportionately affected, along with youth and
community theatre work;
staff are spending increasing amounts of time fundraising, rather than on core artistic
activity in the face of multiple cuts (Arts Council, local authority, trusts and
foundations) and reduced consumer spending.xxxix
A similar survey by the Museums Associationxl found that:
51% of respondents had their funding cut in 2012/13 (60% local authority, 26%
independent);

Belinda Pratten and Rosie Chapman Associates Page 13 of 21 www.bprcassociates.com
almost 1/3 were cut by 10% or more and of these 83% had reduced staffing levels;
43% had reduced access to their collections; 49% had introduced or increased
charges for school visits;
of those who had experienced a cut of less than 10%, 42% had cut staff, 22% had
reduced access
31% had had their budget cut two years in a row, and 1/3 of these had experienced
cumulative cuts of 35% or more.
As a consequence, museums are becoming more focused on audiences, and more effective
at engaging with groups and communities, but there is a concern that this is at the expense
of research, development and curating, leading to a loss of core skills and expertise in these
areas over time.
Although charges are not the only barrier preventing people from poor and marginalised
groups accessing museums and galleries, they are a barrierxli that if introduced or increased
would make it more difficult for those parents who are trying to help their children ‘succeed
against the odds’.
The Government has said that the case for future arts funding will rest solely on its economic
value. This case can be made: Nesta has estimated that the creative industries contribute
some £50 billion every yearxlii.
However it is important that value is defined broadly. Creative skills and achievement is
‘obvious in the arts but essential to achievement in all other fields, including the sciences
and business’. In a knowledge-based economy these skills encourage innovation,
communication, motivation and self-esteem.xliii
A recent study of community arts projects has found that participation in arts groups helps to
create social networks and promote social cohesion as well as leading to increased
confidence and the development of transferable skills for future employment for individual
participants (but less evidence of a direct economic impact)xliv.
It is not at all clear that private philanthropy will fill the gap left by the loss of statutory funding
and the leverage it provides, particularly in relation to smaller, less prestigious organisations
and those working with communities. And as major funders such as the Arts Council and
local authorities disengage, other potential funders may be unwilling to support ventures that
might be considered to be ‘sub-prime’.
The organisation Mission Models Money has identified a need for greater collaboration
between arts organisations to build up the resilience of both individual organisations and the
arts sector as a whole. It suggests that funders can play a key role in promoting collaboration
by:
using their convening power to connect potential collaborators;
building on existing assets and sharing learning from successful partnerships; and
support the costs of technical assistance needed to facilitate collaboration.xlv
In this way funders can make best use of their funding and create a more healthy and
sustainable ecosystem.
The environment
Although local government spending on environmental services were cut in 2010/11, this is
one area where spending was expected to rise, by 1.7% in real terms in subsequent years.
However, transport spending has been harder hit, with some councils seeing real-terms
Belinda Pratten and Rosie Chapman Associates Page 14 of 21 www.bprcassociates.com
reductions in spending of more than 23.7 However, this does vary, with a few councils
reporting expected increases, albeit very slight.xlvi
A more significant issue appears to be the lack of a detailed policy framework for the
environment at central government level, with reports of political disagreement between
Coalition partners on this issue adding to a sense of disarray. For example, attempts to
promote pro-environmental policies are sometimes seen as adding to the burden of ‘red
tape’, and therefore as having a negative impact on business and the economy, as the
recent debate on the use of neonicotinoids has shown. Confusion over feed-in tariffs for
solar energy has also had a negative impact on the development and implementation of
renewables.
Anecdotal evidence from key environmental organisations suggests that this makes it harder
for them to engage with government at the level of strategy and policy, instead they are
having to react to decisions that have already been taken on an ad hoc basis.
Environmental issues are only on governmental agendas because of campaigns by
environmental NGOs. Yet despite overwhelming scientific evidence demonstrating the
causes and consequences of climate change, and the fragility of many ecosystems,
wholehearted support is still lacking. Many opinion-formers, including those in the media and
in Parliament, remain sceptical. Perhaps it is time for those NGOs to reclaim the agenda and
play a more active role in leading and shaping policy.
For this to happen, resources will be needed to develop policy skills and capacity within
these organisations and build strategic alliances across the sector, so that their collective
expertise and voice can influence policy agendas. The Esmee Fairbairn Foundation has a
long history of supporting environmental action and promoting collaboration in this area and
therefore would be well-placed to identify potential collaborators and leaders who could take
on this mantle, giving them the support they need to set the agenda.
Wider impact of policy change on the VCS
VCOs are also experiencing turbulence as wider policy changes impact on the sector’s
operating environment. Local and regional surveys of the VCS in England suggest a middle
that is not so much squeezed as squashed: too small to compete, too big to survive without
funding.
Over the last two decades, the role of many local voluntary organisations has changed from
providing services that are complimentary or ancillary to the welfare state, to delivering
services on behalf of the state. Linked to this has been a shift in funding from grants to
contracts. This has left them vulnerable to rapid and significant changes in contracting and a
much more competitive environment.
Statutory funders are allocating scarce resources to those in greatest need, leading to cuts
in prevention and ‘non-crisis’ services that VCOs are more likely to provide. At the same
time, new commissioning and procurement arrangements make it more difficult for them to
compete:
Payment by results: favoured by central government, the most prominent example being the
Work Programme. VCOs have been disadvantaged because they are too small to be prime
providers; have been given unfavourable terms of contract from primes; and have received
fewer referrals than anticipated. A lack of working capital also makes it harder for them to
manage deferred payments.
Belinda Pratten and Rosie Chapman Associates Page 15 of 21 www.bprcassociates.com
Any Qualified Provider: more contracts are open to tender from providers in any sector:
public, private or voluntary. In this environment, size is more significant than sector, with
local voluntary organisations and small local businesses now having to compete against
larger, national VCOs or companies such as Serco that can afford to invest in bidding for
contracts and have the expertise to do so.
Economies of scale: as local authorities and other statutory bodies seek to make efficiency
savings they are offering fewer, larger contracts, making it more difficult for smaller ‘niche’
providers to compete.
Personalisation: in theory the personalisation agenda should play to the sector’s strengths,
which include: closeness to the clients / communities they serve; understanding their needs;
and developing tailored responses to meet those needs. However, it also brings with it the
uncertainty of irregular usage (and the possibility of future cuts to individual budgets) as well
as much higher administrative costs associated with individual rather than block contracts.
There may be a role for VCOs in providing advocacy or brokerage services to those with
individual budgets, but this would need to be appropriately funded and supported, a prospect
that does not seem likely in the current financial climate.
Many VCOs are having to decide whether or not to compete in this environment. It is
possible that the increased marketization of public services leads to less choice for service
users as these providers are squeezed out.
Potential responses
One response from charitable foundations might be to identify ways of enabling
organisations to compete more effectively in this environment. For example, there is
evidence to suggest that those organisations with the confidence and experience to
challenge ‘prime contractors’ have fared better under the work programme than others.
However, there is already some investment in these areas, for example:
Capacity building: this is a major focus of the Big Lottery Fund’s infrastructure
workstream and anecdotally some local authorities also see this as a priority for
infrastructure (one will only fund ‘market development’);
Social investment: Big Society Capital has been established to bolster the social
investment market and address issues of under-capitalisation.
But a concern is whether VCOs are becoming more like business in this environment, rather
than simply more business-like. There are huge dilemmas for mission-driven organisations
trying to survive in a market-driven world.
What is missing in the current environment is any focus, or resources, on the other roles that
VCOs play:
advocating on behalf of marginalised individuals and communities, ‘speaking truth to
power’;
giving people the skills and confidence to speak for themselves;
developing social networks and social capital and increasing social and economic
participation, particularly in disadvantaged areas (often in ways that reduce reliance
on public services); and
as a source of social innovation, finding new ways of addressing social problems,
from the bottom up.
Belinda Pratten and Rosie Chapman Associates Page 16 of 21 www.bprcassociates.com
Voice and advocacy
Anecdotal evidence from VCOs suggests that Government tends to consult at a late stage,
seeking input on implementation rather than policy development. Indeed, the decision to
reduce the minimum time for consultation implies that it is not valued, seen as a delaying
tactic rather than a means of improving policy. Failure to consult effectively means that the
sector’s expertise is lost and the voices of marginalised individuals and communities are
excluded from policy debates.
Government criticism of advocacy and campaigning has been mounting in recent years and
is likely to intensify in coming months. Eric Pickles, for example, has told local councils they
should save money by cutting funding to ‘sock puppets and fake charities’xlvii while
campaigns by Save the Children and Shelter, highlighting the plight of people in poverty in
the UK, have come under sustained criticism in some quarters for being ‘political’.
There is also evidence of:
the increasing use of gagging clauses in Government contracts; xlviii
self-censorship by some organisations either because they do not want to ‘bite the
hand that feeds them’ at a time of austerity or because ‘there is no money in
advocacy’xlix; and
nobody is listening.
National charities with a high fundraising profile are perhaps better able to speak out than
medium-sized charities that are more reliant on restricted funding for particular projects or
services: most funders will only fund frontline work. The Women’s Resource Centre, for
example, has lost almost all of its funding for policy work and even larger bodies such as
NCVO have made major cuts in this area. The loss of policy skills and capacity, combined
with the rapid pace of change, makes it harder for VCOs to be proactive, to set the agenda
rather than simply respond to Government initiatives.
Locally, the focus on the capacity building role of local infrastructure organisations (LIOs),
means that fewer resources are available to build connections between organisations at this
level (bridging social capital) or to represent their interests to decision-makers (linking social
capital).
Without this it is harder for organisations to work together to support local communities,
share experiences and learning or make common cause: a healthy voluntary sector
ecosystem needs LIOs to make these bridges and links.
Against this background charitable foundations play a crucial role in ensuring that space for
campaigning is protected and organisations have the confidence and skills needed to be
effective advocates and campaigners and enable individuals and communities to make
themselves heard.
Social capital and community resilience
A key finding here is the cumulative impact of austerity on poorer communities and the
negative impact this will have (is having) on the resilience of local people in disadvantaged
communities and their ability to challenge or engage with decisions that affect their lives. But
it is important that attempts to counter this see individuals and communities as active change
agents, not as passive victims.
Social networks can be restricting, limiting aspiration to the lowest common denominator.
But they can also be a significance source of social capital and social exchange, enabling
Belinda Pratten and Rosie Chapman Associates Page 17 of 21 www.bprcassociates.com
people to share resources and opportunities and work together to address or challenge
common problems. This is particularly important for those in poverty:
‘Networks also underpin economic and collective resilience, reinforcing a shared
capacity to recover from setbacks and adapt to changing circumstances.’l
The Greater Manchester Poverty Commission recently found evidence of such resilience:
‘communities working together to alleviate the negative impacts of poverty and make their
communities better places to live’. The question it poses is what more can be done to
harness this energy and creativity, eg supporting communities that want to set up informal
co-operatives.li
While VCOs can – and do - facilitate and support social networks, opportunities for casual
interaction in an area, for ‘sociability’, at local events or amenities such as shops, pubs,
parks or other public spaces are also important, enabling networks to grow organically. This
suggests that the quality of the physical and economic fabric of an area can help or hinder
people getting to know and trust each other. It can therefore have a crucial effect on
community resilience.lii
Attempts to mitigate the impact of austerity on disadvantaged areas therefore need to use
holistic approaches that address and create synergies between economic development,
social / community development and the local environment, focusing on place as well as
people. As previous regeneration programmes have found:
‘locally tailored interventions with individually tailored support, sustained over time,
are important factors in success, as long as there are strong connections with the
wider labour market.’ liii
This focus on place is important because the way in which the austerity agenda is playing
out in different areas reflect factors that are specific to each locality, including:
its relationship to the housing market;
links to the wider economy and the quality and quantity of jobs available;
the fabric of the physical environment;
the existence of social networks that foster a sense of community, leading to a
culture of resistance and resilience;
the role of the local council and other influential bodies, including grant funders.
Going forward
Public spending cuts have already had a significant impact, but this is only the tip of the
iceberg, deeper cuts to jobs and services are yet to hit. In England there are also signs of a
growing north – south divide, with many disadvantaged areas being hit by the triple whammy
of welfare reform; the loss of public services; and cuts to voluntary and community
organisations.
The speed, scale and scope of change is unprecedented. We are now entering uncharted
waters, where there are no easy solutions and where social innovation is at a premium.
In the past communities would look to the state for support, but while many authorities are
doing what they can to mitigate austerity, there is a limit to what they can now do.
This also has an impact on the role that charitable trusts and foundations might play:
previously they might have pump primed innovative projects or services that would, if
Belinda Pratten and Rosie Chapman Associates Page 18 of 21 www.bprcassociates.com
successful, become part of the ‘mainstream’. Today the mainstream has dried up. As one
CVS Director has said, ‘what we are left with is a lot of rusty old pumps’.
Meeting the needs of disadvantaged communities will require effective co-operation and co-
ordination across sectors and organisations and the engagement of communities
themselves. This might include, for example:
harnessing local assets, including the creativity and imagination of local people as
well as local agencies - schools, business, arts organisations, the local council;
developing leadership and entrepreneurial skills in those who are most marginalised
in the labour market (eg women, young people, people from BME communities);
facilitating new partnerships eg between the financial services industry and third
sector organisations, including social landlords, to ensure that people have access to
basic banking services and objective debt advice.
Specifically there is a need for approaches that
respond to the needs of particular areas, addressing causes rather than symptoms;
deal with problems in their complexity, rather than just one element;
encourage experimentation and creativity;
enable small organisations to test out new ways of working with local communities,
particularly with hard to reach groups;
create new partnerships and synergies between different organisations, agencies
and activities, for example recognising and valuing the role of arts organisations in
community regeneration and resilience.
Charitable Foundations such as Esmee Fairbairn are therefore well placed to become a
catalyst for change. But they need to do all of the above at the same time: bringing their
experience of working across different strands of activity to more intensive work to counter
the impact of degeneration in specific localities.
Belinda Pratten and Rosie Chapman Associates Page 19 of 21 www.bprcassociates.com
References
ii H Aldridge et al, 2012 Monitoring Poverty and Social Exclusion 2012 York: Joseph Rowntree Foundation / New
Policy Institute http://www.jrf.org.uk/publications/monitoring-poverty-2012 accessed 08.04.13
ii J Hills et al 2010 An Anatomy of Economic Inequality in the UK: Report of the national Equality Panel Summary
London: Government Equalities Office http://webarchive.nationalarchives.gov.uk/20100212235759/http:/www.equalities.gov.uk/pdf/NEP%20Report%20bookmarkedfinal.pdf accessed 11.04.13
iii H Aldridge et al, 2012 Monitoring Poverty and Social Exclusion 2012 York: Joseph Rowntree Foundation /
New Policy Institute http://www.jrf.org.uk/publications/monitoring-poverty-2012 accessed 08.04.13
iv PSE UK survey 2012 Headline results for Scotland http://www.poverty.ac.uk/pse-research/pse-uk-2012
accessed 10.04.13
v PSE Survey 2012 Results for Northern Ireland http://www.poverty.ac.uk/pse-research/pse-uk-2012 accessed
10.04.03
vi T McInnis et al, 2012 Monitoring Poverty and Social Exclusion in Northern Ireland York: JRF / NPI
http://www.jrf.org.uk/publications/monitoring-poverty-northern-ireland-2012 accessed 08.04.13
vii J Hills et al 2010 ibid p.27
viii A Parekh & P Kenway, 2011, Monitoring Poverty and Social Exclusion in Wales York: JRF / NPI
http://www.jrf.org.uk/publications/monitoring-poverty-and-social-exclusion-wales-2011 accessed 08.04.13
ix A Parekh et al, 2013, Monitoring Poverty and Social Exclusion in Scotland 2013 York: JRF / NPI
http://www.jrf.org.uk/publications/mopse-scotland-2010 accessed 08.04.13
x Fawcett Society, 2013 The Changing Labour Market: Delivering for women, delivering for growth
http://www.fawcettsociety.org.uk/new-report-warns-of-female-unfriendly-labour-market-as-womens-unemployment-continues-to-rise/fawcett-the-changing-labour-market/ accessed 26.04.13; L. Yaojin, 2012, Ethnicity & Public Sector Employment During the Recession: A summary London: Runnymede Trust acced
xi A Parekh et al, 2013, Monitoring Poverty and Social Exclusion in Scotland 2013 York: JRF / NPI
http://www.jrf.org.uk/publications/mopse-scotland-2010 accessed 08.04.13
xii L. Yaojin, 2012, Ethnicity & Public Sector Employment During the Recession: A summary London: Runnymede
Trust
xiii H Aldridge et al, 2012 ibid
xiv J Hills et al 2010 ibid
xv C. Beatty & S. Fothergill, 2013 Hitting the Poorest Hardest: the local and regional impact of welfare reform
Sheffield Hallam University
xvi J Hills et al 2010
xvii ONS, 2013, Poverty & social exclusion in the UK and EU http://www.ons.gov.uk/ons/rel/household-
income/poverty-and-social-exclusion-in-the-uk-and-eu/2005-2011/rpt--poverty-and-social-exclusion.html accessed 27.04.13
xviii Joseph Rowntree Foundation, 2013 Decline starting to show as cuts hit and debt mounts
http://www.jrf.org.uk/austerity-liverpool accessed 27.04.13
xix See for example the work of the Financial Exclusion Centre: http://inclusioncentre.co.uk/wordpress29/
xx Welsh Assembly, 2012 Analysing the impact of UK Government’s Welfare reforms in Wales – Stage 1
analysis Summary of findings http://wales.gov.uk/docs/dcells/publications/120228reformsummaryen.pdf accessed 10.04.13
Belinda Pratten and Rosie Chapman Associates Page 20 of 21 www.bprcassociates.com
xxi
Joseph Rowntree Foundation, 2013 Decline starting to show as cuts hit and debt mounts http://www.jrf.org.uk/austerity-liverpool accessed 27.04.13
xxii The Scottish Government website, UK Welfare Reform in Scotland:
http://www.scotland.gov.uk/Topics/People/welfarereform accessed 10.04.13
xxiii Joseph Rowntree Foundation, 2013, Impact of Localising Council Tax Benefit
xxiv Data for England in this section taken from: A Hastings et al 2012 Serving Deprived Communities in a
recession York: JRF http://www.jrf.org.uk/publications/serving-deprived-communities-recession accessed 08.04.13
xxv M Taylor et al, 2013 ‘ Council cuts will bring local authorities to their knees’ in The Guardian 26 March 2013
http://www.guardian.co.uk/society/2013/mar/25/council-cuts-local-government-knees
xxvi Local Government Association, 2012, Funding Outlook for Councils: Preliminary modelling
http://www.local.gov.uk/c/document_library/get_file?uuid=c98405b7-b4a6-4b25-aebf-a63b5bcfa5c1&groupId=10171 accessed 27.04.13
xxvii Scottish Government: http://www.scotland.gov.uk/Topics/Government/local-
government/17999/CoreRevenueFunding accessed 12.04.13
xxviii S van der Feen et al, 2012 The Big Squeeze London: LVSC
xxix N Davies, K Evans, 2012, Perfect Storms London: Children England
http://www.childrenengland.org.uk/upload/Perfect%20Storms%20-%20FINAL.pdf accessed 16.04.13
xxx Clinks, 2012, When the dust settles: London: Clinks
xxxi Women’s Resource Centre, 2013, London Briefing London: WRC
xxxii D. Clifford, 2011, Voluntary sector organisations working at the neighbourhood level in England: patterns by
local area deprivation Third Sector Research Centre (Working Paper 65)
xxxiii R. Crawford, D Phillips, 2012, Local Government: where is the axe falling London: Institute for Fiscal Studies
http://www.ifs.org.uk/budgets/gb2012/12chap6.pdf accessed 30.04.13
xxxiv The Work Foundation, 2013 http://www.theworkfoundation.com/Research/Socio-Economic/Labour-
Market-Disadvantage/Youth-Unemployment accessed 01.05.13
xxxv I Siraj-Blatchford et al, 2011, Performing against the odds
https://www.gov.uk/government/uploads/system/uploads/attachment_data/file/183318/DFE-RR128.pdf accessed 23.04.13
xxxvi N Davies, K Evans, 2012, Perfect Storms London: Children England
http://www.childrenengland.org.uk/upload/Perfect%20Storms%20-%20FINAL.pdf accessed 16.04.13
xxxvii National Campaign for te Arts, 2011, Written evidence to Culture, Media and Sport Select Committee
Inquiry in Funding of the Arts and Heritage http://www.publications.parliament.uk/pa/cm201011/cmselect/cmcumeds/464/46402.htm#evidence accessed 13.04.2013
xxxviii House of Commons Culture Media and Sport Committee Third Report 2010/11
http://www.publications.parliament.uk/pa/cm201011/cmselect/cmcumeds/464/46402.htm#evidence accessed 13.04.2013
xxxix F Kennedy, 2013 In Battalions http://finkennedy.blogspot.co.uk/2013/02/in-battalions.html accessed
16.04.13
xl G Evans, 2012, The impact of cuts on UK museums London: Museums Association
http://www.museumsassociation.org/download?id=770702 accessed 23.04.13
xli H Wilkinson, 2003 To charge or not to charge: Museums admissions dilemmas
http://www.insights.org.uk/articleitem.aspx?title=To+Charge+or+not+to+Charge+%E2%80%93+Museums%2527+Admission+Dilemma accessed 23.04.13
Belinda Pratten and Rosie Chapman Associates Page 21 of 21 www.bprcassociates.com
xlii
NESTA, 2013 A manifesto for the creative economy http://www.nesta.org.uk/home1/assets/features/a_manifesto_for_the_creative_economy accessed 23.04.13
xliii Sir K Robinson, 1999, All Our Futures London: National Advisory Committee for Creative Education
http://finkennedy.blogspot.co.uk/2013/02/in-battalions.html accessed 23.04.13
xliv A McCabe, J Phillimore 2012, The impact of grassroots arts activities in communities: a scoping paper
Birmingham: Third Sector Research Centre http://www.tsrc.ac.uk/Research/BelowtheRadarBtR/Theimpactofgrassrootsartsactivities/tabid/865/Default.aspx accessed 23.04.13
xlv C Cooper 2010, How Funders can facilitate collaborative working Mission Models Money
http://www.missionmodelsmoney.org.uk/blog/how-funders-can-encourage-collaborative-working accessed 23.04.13
xlvi R. Crawford, D Phillips, 2012, Local Government: where is the axe falling London: Institute for Fiscal Studies
http://www.ifs.org.uk/budgets/gb2012/12chap6.pdf accessed 30.04.13
xlvii E Pickles, 2013, 50 ways to save London Department for Communities and Local Government
https://www.gov.uk/government/uploads/system/uploads/attachment_data/file/39264/50_ways_2.pdf accessed 25 April 2013; see also IEA, June 2012, Sock puppets: How the government lobbies itself and why, IEA Discussion Paper No 39, and Taxpayers’ Alliance, August 2009, Taxpayer funded lobbing and political campaigning
xlviii Independence Panel, 2013 The voluntary sector under threat London: Barings Foundation
http://www.independencepanel.org.uk/wp-content/uploads/2013/03/Independence-Under-Threat_webV.pdf accessed 10.04.13
xlix Personal communication with the Director of Services at a large national charity
l A Gilchrist, P Kyprianou, 2011, Social Networks, Poverty and Ethnicity York: JRF http://www.jrf.org.uk/sites/files/jrf/poverty-ethnicity-social-networks-full.pdf
li Greater Manchester Poverty Commission, 2013, Evidence report Manchester: GMCVO
http://www.povertymanchester.org/
lii Brooke Lyndhurst Consultancy 2010, Social Cpaital and Quality of life in rural areas: a report for DEFRA
http://www.brooklyndhurst.co.uk/social-capital-a-rural-perspective-_111.html accessed 26.04.13
liii M Taylor, 2008, Transforming disadvantaged places: effective strategies for places and people York: JRF
http://www.jrf.org.uk/publications/transforming-disadvantaged-places-effective-strategies-places-and-people