economic analysis of consumers' awareness
TRANSCRIPT
ECONOMIC ANALYSIS OF CONSUMERS’ AWARENESS AND WILLINGNESS TO
PAY FOR GEOGRAPHICAL INDICATORS AND OTHER QUALITY ATTRIBUTES OF
HONEY IN KENYA
By
NABWIRE Ephamia Juma Charity
A thesis submitted in partial fulfilment of the requirements for the degree of Master of
Science in Agricultural and Applied Economics
Department of Agricultural Economics
University of Nairobi
November 2016

DECLARATION AND APPROVAL
DECLARATION
This thesis is my original work and has not been presented for any award in any other
university.
NABWIRE Ephamia Juma Charity
Reg. No.A512/60012/2013
Signature ~ . r: fer ("0[6Date .. '.f;J ":'\- .
APPROVAL
Dr. David Jakinda Otieno
Signature 6J:. .Prof. Willis Oluoch-Kosura
Department of Agricultural Economics, University of Nairobi
~Signature ...~ NcO if (lb L-o t C.Date : ; .
Dr. Amos Gyau, World Agroforestry Centre
Signature~
Dr. Judith Beatrice Auma Oduol, World Agroforestry Centre
t'r~ll- ?oIl>Date .
Signature. ~ . Date .. .1.1.((/( ~~!.~ ..

ii
DEDICATION
To my only sister Angela and my brothers Justus, Tony, Shanon, Douglas and Michael, for
your cooperation, love, understanding and prayers during this study that encouraged me.
iii
ACKNOWLEDGEMENTS
First, I thank God for giving me strength and divine wisdom throughout my time of study; for
the far He has taken me.
I am highly indebted to my supervisors; Dr. David Jakinda Otieno and Prof. Willis Oluoch-
Kosura, both of the University of Nairobi for their unlimited guidance throughout the study. I
sincerely thank my supervisors, Dr. Amos Gyau and Dr. Judith Oduol both of World
Agroforestry Centre (ICRAF) for believing in me and awarding your time, advice and
encouragement throughout the study.
My sincere gratitude goes to ICRAF for the funding of the field research of this study and for
the financial support for my upkeep. This helped me to concentrate better in my academics. I
would like to express my gratitude to African Economic Research Consortium (AERC) for
providing the funding for the software used in this research and my master’s studies at the
University of Nairobi. This thesis would not have been completed without their financial
support.
Sincere thanks also go to all Collaborative masters in Applied Agriculture Economics
(CMAAE) 2013 lecturers for their valuable academic inputs. Thanks to my colleagues
CMAAE class of 2013 for providing a team learning environment. Thanks to all enumerators
involved in data collection for their committed efforts and to all consumers who took part in
the focus group discussion and survey for their important information to this research.
Last but not least, I would like to thank my family members, for without their encouragement
and support, I would not have completed this study.
iv
TABLE OF CONTENTS
DECLARATION AND APPROVAL ........................................... Error! Bookmark not defined.
DEDICATION ................................................................................................................................ ii
ACKNOWLEDGEMENTS ........................................................................................................... iii
TABLE OF CONTENTS ............................................................................................................... iv
LIST OF TABLES ........................................................................................................................ vii
LIST OF FIGURES ...................................................................................................................... vii
LIST OF ACRONYMS ............................................................................................................... viii
ABSTRACT ................................................................................................................................... ix
CHAPTER ONE ............................................................................................................................. 1
1.0 INTRODUCTION .................................................................................................................... 1
1.1 Background Information .................................................................................................. 1
1.2 The Research Problem Statement .................................................................................... 4
1.3 Purpose and Objectives of the Study ............................................................................... 5
1.4 Research Hypotheses ....................................................................................................... 6
1.5 Justification of the Study ................................................................................................. 6
1.6 Study Area ....................................................................................................................... 7
1.7 Thesis Organization ......................................................................................................... 9
CHAPTER TWO .......................................................................................................................... 10
2.0 LITERATURE REVIEW ....................................................................................................... 10
2.1 Trends in Honey Production, Marketing and Use ......................................................... 10
2.2 Knowledge Gaps in Consumer Awareness and Preferences ......................................... 12
2.3 Review of Preference Analysis Methods ....................................................................... 16
References ............................................................................................................................ 19
CHAPTER THREE ...................................................................................................................... 25
3.0 HONEY VALUE CHAIN AND CONSUMER’S CHARACTERISTICS ............................ 25
3.1 Background Information ................................................................................................ 25
3.2 Methodology .................................................................................................................. 27
3.2.1 Conceptual Framework ........................................................................................... 27
3.2.2 Sampling and Data Collection ................................................................................ 29
3.2.3 Data Analysis .......................................................................................................... 31
v
3.3 Results and Discussion .................................................................................................. 31
3.3.1 The Honey Value Chain in Kenya .......................................................................... 31
3.3.2 Characteristics of the Respondents and their Households ...................................... 34
3.4 Conclusions and Implications ........................................................................................ 36
References ............................................................................................................................ 37
CHAPTER FOUR ......................................................................................................................... 40
4.0 CONSUMER AWARENESS OF GI LABELLING .............................................................. 40
4.1 Background Information ................................................................................................ 40
4.2 Methodology .................................................................................................................. 42
4.2.1 Model Specification ................................................................................................ 42
4.3 Results and Discussion .................................................................................................. 47
4.3:1 Awareness of GI in Kenya ...................................................................................... 47
4.3.2 Honey Consumption Patterns ................................................................................. 50
4.3.3. Determinants of Consumers’ Awareness of GI ..................................................... 51
4.4 Conclusions and Implications ........................................................................................ 55
References ..................................................................................................................................... 56
CHAPTER FIVE .......................................................................................................................... 60
5.0 CONSUMER’S PERCEPTIONS AND WILLINGNESS TO PAY FOR
GEOGRAPHICAL INDICATION LABELLING ....................................................................... 60
5.1 Background information ................................................................................................ 60
5.2 Methodology .................................................................................................................. 62
5.2.1 Definition of Attributes ........................................................................................... 62
5.2.2 Choice Experiment Design ..................................................................................... 65
5.2.3 Data and the experimental context .......................................................................... 67
5.2.4 Model Specification ................................................................................................ 68
5.3 Results and Discussions ................................................................................................. 71
5.3.1 Consumers’ Preferences for Various Honey Attributes.......................................... 71
5.3.2 Consumer Perceptions of Honey Attributes ........................................................... 73
5.3.3 Consumers Preference for GI Label and Other Quality Honey Attributes ............. 74
vi
5.3.4 Factors Influencing Consumers WTP for GI .......................................................... 80
5.4 Conclusion and Implications.......................................................................................... 84
References ............................................................................................................................ 85
CHAPTER SIX ............................................................................................................................. 90
6.0 SUMMARY, CONCLUSIONS AND RECOMMENDATIONS .......................................... 90
6.1 Summary ........................................................................................................................ 90
6.2 Conclusions and Policy Recommendations ................................................................... 92
6.3 Contribution to Knowledge and Suggestions for Future Research ................................ 94
Appendices .................................................................................................................................... 95
Appendix 1: Maps of the Study Areas in Kenya .......................................................................... 95
Appendix 2: Checklist Questions Used in the Focused Group Discussions ................................. 96
Appendix 3: Household Survey Questionnaire............................................................................. 97
Appendix 4: Ngene Choice Experiment Syntax ......................................................................... 103
Appendix 5: List of All Choice Sets Used in the CE Survey ..................................................... 104
Appendix 6: Probit Commands ................................................................................................... 111
Appendix 7: Random Parameter Logit (RPL) Commands ......................................................... 111
Appendix 8: Summary of Honey Consumption Patterns ............................................................ 112
vii
LIST OF TABLES
Table 1: Socioeconomic Characteristics of the Respondents .................................................. 35
Table 2: The expected sign and VIF values of Variables affecting consumer awareness of GI
.................................................................................................................................................. 46
Table 3: Factors influencing GI awareness of honey consumers ............................................ 54
Table 4: Description of attributes and their levels ................................................................... 63
Table 5: Variables used in the preference analysis .................................................................. 71
Table 6: A summary of consumer preferences for different honey features ........................... 73
Table 7: RPL estimates for GI and other Quality Attributes of Honey ................................... 75
Table 8: Marginal WTP estimates for GI and quality attributes of honey ............................... 80
Table 9: Factors influencing WTP for GI and quality attributes of honey .............................. 83
LIST OF FIGURES
Figure 1: Honey Production Trends in Kenya ......................................................................... 11
Figure 2: Conceptual Framework ............................................................................................ 28
Figure 3: A Value Chain of Honey Flow in Kenya. ................................................................ 33
Figure 4: Honey issues encountered by consumers ................................................................. 51
Figure 5: Example of choice card presented to respondents during the survey ....................... 66
Figure 6: A chart depiction of consumer perceptions of honey quality factors ....................... 74
viii
LIST OF ACRONYMS
ASALs Arid and Semi-Arid Lands
CBD Central Business District
CE Choice Experiment
COO Country of Origin
COOL Country of Origin Label
EU European Union
FGD Focus Group Discussion
GI Geographical Indication
GM Genetically Modified
KEBs Kenya Bureau of Standards
KIPI Kenya Institute of Property Rights
Kshs Kenya Shillings
Kgs Kilograms
LCM Latent Class Model
MNL Multinomial Logit
MWTP Marginal Willingness to Pay
PDO Protected Designation of Origin
PGI Protected Geographical Indication
RPL Random Parameter Logit
RP Revealed preference
TRIPS Trade Related Intellectual Property Rights
USA United States of America
USD United States Dollar
WTP Willingness to Pay
ix
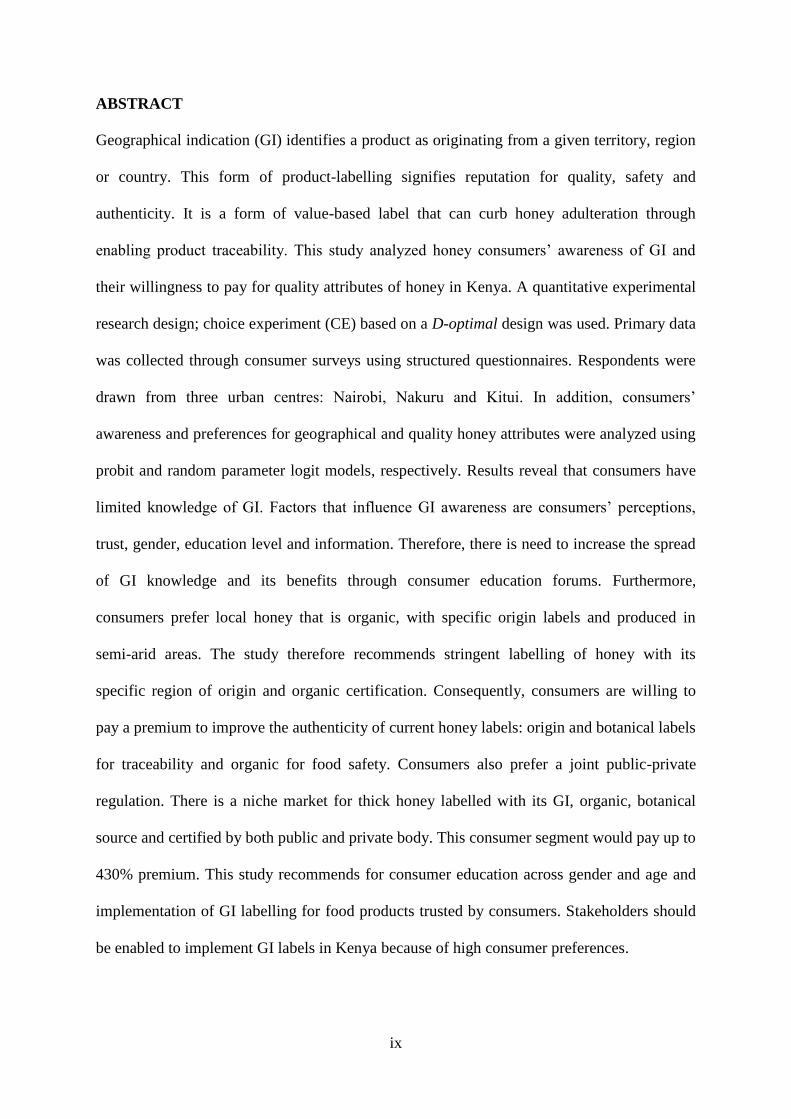
ABSTRACT
Geographical indication (GI) identifies a product as originating from a given territory, region
or country. This form of product-labelling signifies reputation for quality, safety and
authenticity. It is a form of value-based label that can curb honey adulteration through
enabling product traceability. This study analyzed honey consumers’ awareness of GI and
their willingness to pay for quality attributes of honey in Kenya. A quantitative experimental
research design; choice experiment (CE) based on a D-optimal design was used. Primary data
was collected through consumer surveys using structured questionnaires. Respondents were
drawn from three urban centres: Nairobi, Nakuru and Kitui. In addition, consumers’
awareness and preferences for geographical and quality honey attributes were analyzed using
probit and random parameter logit models, respectively. Results reveal that consumers have
limited knowledge of GI. Factors that influence GI awareness are consumers’ perceptions,
trust, gender, education level and information. Therefore, there is need to increase the spread
of GI knowledge and its benefits through consumer education forums. Furthermore,
consumers prefer local honey that is organic, with specific origin labels and produced in
semi-arid areas. The study therefore recommends stringent labelling of honey with its
specific region of origin and organic certification. Consequently, consumers are willing to
pay a premium to improve the authenticity of current honey labels: origin and botanical labels
for traceability and organic for food safety. Consumers also prefer a joint public-private
regulation. There is a niche market for thick honey labelled with its GI, organic, botanical
source and certified by both public and private body. This consumer segment would pay up to
430% premium. This study recommends for consumer education across gender and age and
implementation of GI labelling for food products trusted by consumers. Stakeholders should
be enabled to implement GI labels in Kenya because of high consumer preferences.
1
CHAPTER ONE
1.0 INTRODUCTION
This chapter provides the context of the study. It also expounds on the motivation of the
study which is the issue of honey adulteration. The study’s purpose, objectives and
hypothesis are also outlined here. This is followed by the study’s justification and lastly a
description of the study area.
1.1 Background Information
Geographical indication (GI) identify a product as originating from a certain region or
country (African Union and European Commission, 2011). Internationally, GI stays protected
under the Uruguay round agreement on Trade Related aspects of Intellectual Property Rights
(TRIPs) described in article 22 of World Trade Organization (WTO) agreement, where it also
allows petition for cases of misuse of GI names (European Commission, 2012). Kenya is a
member of the WTO and subscribes to its TRIPs agreement, which provides for the extension
of GI protection to other products other than wine. In Kenya, registered GI products are
protected by the Trademarks Act under the certification and collective marks that are
managed by Kenya Institute of Property Rights (KIPI) (Republic of Kenya, 2009). It is also
possible to acquire certification trademarks through the African Regional Intellectual
Property Organization (ARIPO) by virtue of the Banjul Protocol on Trademarks, to which
Kenya is a member.
GI is popular for protection of wines and spirits in the European Union (EU) and it recently
extended to other products (European Commission, 2012). This applies as long as the GI
product reputation for quality, safety and authenticity can be linked to its geographical origin.
For instance, Manuka honey from New Zealand and Oku honey from Cameroon are examples
2
of popular GI honey (Blakeney et al., 2012). However, in Africa very few products have been
registered as GIs despite majority of African countries being members of the WTO and
having subscribed to several agreements. Nevertheless, South Africa leads with registered GI
products, which range from wines, spirits and agricultural foods for example, Rooibos tea. In
Kenya though GI honey is yet to be registered, tea and coffee are registered through
certification marks (Bagal et al., 2013).
Labeling products with GI has the potential of reducing information asymmetry that remains
rampant in the local and international product market by assuring product traceability
(O'connor, 2013). Recent studies have shown that a considerable number of consumers are
increasingly willing to pay a premium in many developed countries for country of origin
(COO) or region of origin labels (Lim et al., 2013; Loureiro and Umberger, 2003). However,
this important aspect is yet to be evaluated in Kenya.
Some awareness studies have been conducted to gauge consumers’ knowledge on various
products’ peculiar attributes that make them different from others. For instance, Kimenju et
al. (2005) assessed awareness and attitudes towards GM foods in Kenya and found some
level of awareness. Moreover, Kenyan honey brands are popular in the East African region
commanding over 40% of honey import markets in both Uganda and Tanzania, because they
are deemed to be of better quality (Jackson, 2003). However, Kenyan local consumers and
farmers are aware of honey adulteration with concentrated sugar solution, molasses, jaggery,
melted sugar and crushed bananas (Muthui, 2012).
A product’s attributes are important for consumer choices among different product brand, by
giving information about a product composition and geographical origin. Product attributes
are further ranked in order of preference by the consumers. For instance, price is the most
considered product attribute by consumers when buying honey in Ireland (Murphy, 2000).
3
Similarly, in Kenya honey viscosity and taste/flavour is the most valued honey attributes
(Warui et al., 2014).
Understanding socioeconomic factors that influence consumers’ Willingness to Pay (WTP)
for a product allows for segmenting consumers for strategic marketing. Consumers’ social
ideologies like affiliations with product origin, scale of production, animal welfare
compliance, beliefs of health benefits of a product and firms with social responsibilities leads
to their WTP a premium for food products. Economic factors like the level of education and
high income levels also increase WTP (Kimenju and De Groote, 2005).
Consumers’ socioeconomic factors interact with product attributes to determine their WTP
for a given food product. For example, consumers with lower income levels can be locked
out of honey consumption when prices are too high. Similarly, presence of young children in
homes increases consumers’ considerations of food safety (Ngigi et al., 2010). Likewise,
scale of production also influences well-off consumers’ WTP (Murphy et al., 2000).
Furthermore, fresh local food fetch a premium from consumers (Lai et al., 1997).
Previous studies have identified important quality attributes of honey as preferred by Kenyan
honey users (Warui et al., 2014). However, little is known about value chain of the honey
sector particularly issues concerning product origin. In addition, consumers’ awareness and
the monetary value attached to the attributes in Kenya are yet to be determined. Also, it is
still unknown, which consumers’ socio-economic factors influence their preference and WTP
for food products, in particular honey in Kenya. Therefore, the current study analysed
consumers’ awareness and WTP for GI and other quality attributes of bee honey in Kenya.
4
1.2 The Research Problem Statement
Food fraud reduces consumer confidence in a given food brand and it is globally estimated to
cost between 30 to 40 billion USD annually (Everstine et al., 2013). Additionally, food fraud
has led to deaths like in China where about 300,000 children were poisoned and six infants
died from ‘melamine milk scandal (Everstine et al., 2013). In Africa, Cawthorn et al. (2013)
found traces of donkey, goat and water buffalo meats passed as beef in retail sections in
South Africa. Issues of food safety and adulteration have also been reported in Kenya where
vegetables - kales sold in Nairobi were tested and results showed they contained harmful
traces of the lead metal (Kutto et al., 2011). In the case of honey, in Kenya it is adulterated by
addition of concentrated sugar solution, molasses, jaggery, melted sugar and crushed bananas
(Muthui, 2012).
Honey is among the foods that are highly adulterated because it is expensive and produced in
varying weather and harvesting conditions. However, harm to consumers’ health as a result
of honey adulteration is yet to be documented, since the perpetrators may never want to be
detected. Product adulteration negatively influences market growth by destroying consumer
trust (Johnson, 2014). Furthermore, Kenya has a potential of about 75% of bee products
production that could yield up to Kshs. 15 billion from honey alone, which is yet to be
exploited (Kiptarus et al., 2011). Therefore, any means of guaranteeing honey quality is
important to consumers, producers and monitoring authorities.
Currently in Kenya, just like the rest of the world honey bees have reduced in number and
there is presence of information asymmetry and inefficiencies (Kiptarus et al., 2011). Cases
of traders colluding to control the market in their favour has led to high marketing costs and
product adulteration (Oyuga, 2008). Furthermore, urban consumers have adapted by buying
unprocessed honey from individuals from upcountry (Mutisya, 2011). One of the suggested
solution is collective action among producers to ensure efficient pricing in the honey market
5
(Oyuga, 2008). More so, the introduction of GI would be an effective way of collective
action.
Kenya already acknowledges the benefits of geographical indicators to both consumers and
producers (Ramba, 2013). The geographical names are protected under the Kenya
Trademarks Act through certification marks or collective marks (Republic of Kenya, 2007).
A joint project between the Government of Kenya and the Swiss Government identified a
potential for geographical indicators labelling including the honey sector. In fact a number of
local honey brands were suggested to include Kitui Honey, Yatta Honey, Turkana honey,
Mwingi honey, West Pokot honey and Baringo honey (KIPI, 2009). This is possible since
honey from these regions is of high quality with varying flavour and are sold at different
prices (KIPI, 2009). Moreover, Kenya has a segment of consumers that would be willing to
pay premium for quality as evidenced by imports from Australia (Mutisya, 2011).
However, it is not known if Kenya’s primary shoppers who purchase and consume honey are
aware and willing to pay a premium for a product labelled with local geographical indicators
over an identical product whose origin is not specified. Furthermore, it is uncertain, which
key factors determine their awareness and WTP for honey labelled with geographical
indicators. More so, policy makers need this information in coming up with policies that
concern collective marketing for locally produced agricultural goods.
1.3 Purpose and Objectives of the Study
The purpose of this study was to describe the honey value chain, assess consumers’
awareness and willingness to pay for and the factors influencing GI and other quality
attributes of honey in Kenya. The specific objectives were to:
characterize the honey value chain in Kenya.
assess honey consumers’ awareness of GI labelling.
6
determine consumer WTP for GI and other quality attributes of honey.
analyze factors influencing consumers’ WTP for GI and other quality
attributes of honey.
1.4 Research Hypotheses
1. Socio-demographic factors (age, gender, income, education level) do not significantly
influence consumers’ awareness of GI labelling in honey.
2. Consumers in Kenya are not willing to pay a significant amount of money for GI and other
quality attributes of honey.
3. Socio-demographic and psychographic factors (age, income, education level, perceptions
of honey standards) do not influence consumer’s WTP for GI and other quality attributes of
honey.
1.5 Justification of the Study
The study provides an insight into consumers’ awareness and their expectations of local
honey in terms of pricing and origin. It also, points out consumer interest in food safety,
labelling, traceability and quality of honey. Similarly, the findings from this study are
relevant to Kenyan honey producers and marketers in developing formidable marketing
strategies in their efforts to boost demand for Kenyan honey in the face of rising competition
from honey imports. It likewise informs policymakers who are in the process of making laws
and policies on geographical indicators and traceability of agricultural food products. In
addition, the study fills the gap in Kenyan agribusiness strategy, particularly the value-
addition strategic objective that missed on GI as a possible market targeting intervention
(Republic of Kenya, 2012). Moreover, the study contributes to Agricultural Sector
Development Strategy (ASDS) 2010–2020 that focuses on value addition of agricultural
produce, improving market access for farmers and development of Arid and Semi-Arid Areas
7
(ASALS), found under the subsector strategic focus on livestock. This is because beekeeping
is viable in areas with erratic rains, mainly the ASALs. Furthermore, beekeeping contributes
to food security, increased household incomes of up to Kshs.15 billion through value added
bee products for over 10,000 small scale farmers, employment creation for over 1,000
individuals, youth and groups, increased access to markets and conservation of the
environment (Kiptarus et al., 2011).
1.6 Study Area
Kenya produces honey from different regions, with 80% coming from ASALs (Republic of
Kenya, 2001). Kitui County leads in beekeeping activities with farmers from this county
investing in more than 389,000 beehives followed by Baringo County with 176,000 among
others (Kiptarus et al., 2011). Honey consumption takes place all over Kenya for food,
cultural, preservation and medicinal reasons. In addition, 80% of marketed honey ends up in
Nairobi (Baiya and Nyakundi, 2007). Purposive sampling was used to identify three areas in
the country for data collection. These were Nairobi, Nakuru and Kitui areas (maps are shown
in Appendix).
According to the Kenya National Bureau of Statistics (KNBS) (2014), Nairobi has a
population of 3.1 million with 4515 population density per square kilometre. According to
World Bank, Nairobi is the eighth richest county with a per capita GDP of kshs. 108,100
(kshs. 100 = 1$). Majority of marketed honey in Kenya is sold in Nairobi. In addition,
producers from neighbouring countries; Uganda and Tanzania travel for long distances and
sell honey in Nairobi (Jackson, 2003). Moreover, Nairobi contributes up to 60% of Kenya’s
gross domestic product (GDP), though there is a high incidence of poverty and income
inequality; reflected by a Gini coefficient of 0.59. This shows the importance of class as a
factor of mobilization and determinant of opportunities (Dafe, 2009).
8
A stratified sampling method was used in Nairobi County in relation to income levels.
Nairobi is put into three stratus; the rich who can easily spend up to Kshs. 200,000 (kshs. 100
=1$) a month; middle income who spend between Kshs. 24,000 (kshs. 100=1USD) and
120,000 (kshs. 100=1$) per month; and the poor in Kenya who spend less than Kshs. 24,000
(kshs. 100=1$) a month . Honey is a special product that is easily afforded by well-off
individuals. So, Nairobi’s rich estates were listed. Eventually, Westlands was picked as a
commercial centre with a high number of shopping malls unlike other upmarket estates in
Nairobi. For middle income estates, Kasarani was picked. But in order to also capture the low
income honey consumers, the list of poor suburbs of Nairobi was made and Kawangware was
picked purposively as a low income area according to the Kenya National Bureau of Statistics
(KNBS) (2014).
Nakuru is a highland area and according to Kenya National Bureau of Statistics (KNBS)
(2014), it has a population of 1,603,325. According to World Bank, Nakuru is the fourth
richest county in Kenya with a consumer per capita income of Kshs. 141,300 (kshs. 100 =1$)
and it has Gini index of 0.376. Agriculture is the main source of livelihood as most of the
residents grow food and cash crops as compared to commercial, industrial, tourism, and
tertiary activities. The region has a history of honey production by communities around Mau
forest, particularly the indigenous Ogiek people, for cultural and spiritual purposes (Micheli,
2013). Specifically, respondents in the major retail outlets found in the Central Business
District (CBD) were interviewed.
According to World Bank, Kitui County has a Gini index of 0.388. It is the thirtieth county
with GDP per capita of kshs. 37,300 (kshs.100 =1 $). It is a semi-arid region with a
population size of 1,012,709 people according to Kenya National Bureau of Statistics
(KNBS) (2014). Agriculture is the main livelihood activity, though residents get food aid
because of unreliable rainfall. It was among the identified sites for geographic labelling of
9
honey before by KIPI (2009). Almost every man in Kitui owns a bee hive, though not all
have bee colonies; this makes it the leading honey producing region in Kenya. More so, some
consumers in the area buy honey from neighbours and others buy beer and herbal medicines
that contains honey from Nairobi (Muthui, 2012). Kitui town was purposively picked to
capture more cosmopolitan respondents as compared to its rural dwellers. This study area
could reveal peri-urban honey consumers’ preferences in the country.
1.7 Thesis Organization
This thesis has six chapters. The context of the study has been set in this introductory chapter.
The next chapter provides a review of relevant literature. The honey value chain and
consumer’s characteristics are described in chapter three. In chapter four, consumers’
awareness of GI in Kenya is presented. The analysis of consumers WTP for GI is
documented in chapter five. Important conclusions and policy recommendations are offered
in the sixth chapter.
10
CHAPTER TWO
2.0 LITERATURE REVIEW
This Chapter provides a review of past literatures that are relevant to the honey sector in
Kenya, Geographical Indications and preferences analysis methods. Important knowledge
gaps are also identified here.
2.1 Trends in Honey Production, Marketing and Use
In Kenya, bee keeping has been practiced since the prehistoric time by mainly small scale
farmers found in dry areas in Kenya (Gachora, 2003). Its policies have focused on improved
bee product markets and practices. This has improved honey production with use of modern
hives as opposed to conventional hives and handling. Being a rural enterprise, beekeeping
contributes significantly to improved livelihoods of most rural communities in Kenya
(Shiluli et al., 2012). Nevertheless, the honey industry also sustains the urban areas by
employing individuals in confectionery, pharmaceutical, herbal, brewing, cosmetics,
transport, supply of packaging material and other players along the beekeeping value chain.
Hence, it contributes to food security, household income, employment creation, access to
markets and environmental conservation. However, the sector faces several challenges; low
production and technology adoption, low capacity building. In addition, honey production has
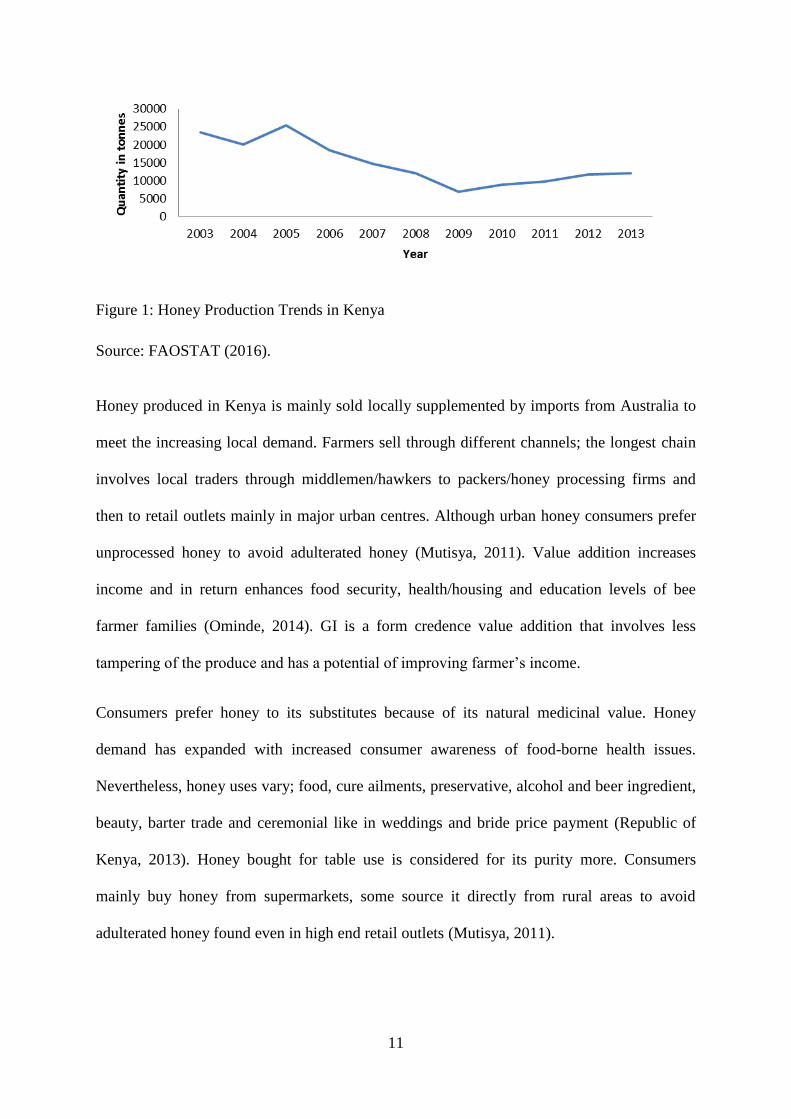
been on a declining trend in Kenya (Figure 1), caused mainly by the declining bee colonies
due to climate change (Kiptarus et al., 2011).
11
Figure 1: Honey Production Trends in Kenya
Source: FAOSTAT (2016).
Honey produced in Kenya is mainly sold locally supplemented by imports from Australia to
meet the increasing local demand. Farmers sell through different channels; the longest chain
involves local traders through middlemen/hawkers to packers/honey processing firms and
then to retail outlets mainly in major urban centres. Although urban honey consumers prefer
unprocessed honey to avoid adulterated honey (Mutisya, 2011). Value addition increases
income and in return enhances food security, health/housing and education levels of bee
farmer families (Ominde, 2014). GI is a form credence value addition that involves less
tampering of the produce and has a potential of improving farmer’s income.
Consumers prefer honey to its substitutes because of its natural medicinal value. Honey
demand has expanded with increased consumer awareness of food-borne health issues.
Nevertheless, honey uses vary; food, cure ailments, preservative, alcohol and beer ingredient,
beauty, barter trade and ceremonial like in weddings and bride price payment (Republic of
Kenya, 2013). Honey bought for table use is considered for its purity more. Consumers
mainly buy honey from supermarkets, some source it directly from rural areas to avoid
adulterated honey found even in high end retail outlets (Mutisya, 2011).
12
Honey is among the products identified by a project conducted by the Swiss and the Kenyan
Government as a potential for GI labelling (KIPI, 2009). However, this is still at the pilot
stage, with a legal means for positive GI protection. Hence, it is still possible to realise the
benefits of GI labelling; premium pricing by increased differentiation as a brand and
mitigation of inefficiencies of imperfect information (Republic of Kenya, 2007). Though, this
is challenged by lack of adequate access to technical assistance and capacity building
(Ramba, 2013). Also, there is a knowledge dearth on awareness and consumer preferences for
GI labels; the latter motivated the current study.
2.2 Knowledge Gaps in Consumer Awareness and Preferences
Consumer product knowledge (awareness) influences their decision making process and their
perceptions of a product. Furthermore, more knowledgeable consumers have better cognitive
capacity to evaluate comparative alternatives (Awada and Yiannaka, 2011). In this context of
GI labelling, consumers with higher levels of GI awareness are able to evaluate traceability
labels more accurately and become less favourable and amenable to non-labelled goods.
However, unanimous lack of consumer awareness towards an innovation (value-based labels)
may hinder its acceptance and adoption (Larceneux and Carpenter, 2008). Moreover, risk
perceptions influences consumer awareness of foods purchased (Lin et al., 2004), in this case,
exposure to adulterated honey and its negative effects may increase awareness of mitigating
strategies like GI labelling.
Origin labels are crucial in providing a consumer traceability information. If consumers can
process this information, they reduce their perceived risk in buying a product. However, those
with prior knowledge of the product, in a hurry and lack interest may not read origin labels.
Moreover, family income that facilitates access to food labels in high end stores and interest
in preparing healthy meals in the home explains label readership (Schupp et al., 1998).
13
Lusk et al. (2006), noted that previous work by agricultural economists had failed to
adequately identify why consumers desire COOL.Abraham (2015), found that COO is
important where the brand is unfamiliar and highly knowledgeable consumers on product and
country. Although, in some cases origin label is not an important cue in the choice processes
(Liefeld, 2004), but if used as a quality assurance mark it increases consumer loyalty
(Profeta et al., 2012). This should be in addition to direct indications of quality, including
mandatory information cues such as best-before dates and species names, but also including
quality marks (Verbeke, 2009).
Consumer awareness of origin labels are dynamic and vary across the continents. For EU
consumers, Verbeke et al. (2012), found majority of European consumers knew about
Protected Designation of Origin (PDO), then Protected Geographical Indication (PGI) and
lastly Traditional Speciality Guaranteed. This varied with gender and age, so consumer
education could be segment specific. Another study by Velčovská and Sadílek (2014)
revealed that EU consumers have limited knowledge and they are willing to learn more
about PGI and PDO labels, which influences their perceptions of product credibility.
Although the United States of America (USA) consumers are not keen with origin labelling
laws and are indifferent to an important aspect of the implementation of current mandatory
COO information rules. Therefore, consumer information influences product performance
expectation and preferences (Crosby and Taylor, 1981). This in turn requires an
understanding of, which consumers are aware of GI labelling and what factors are associated
with their awareness. Moreover, there is need to help multiple stakeholders involved with GI
labelling to address consumer expectations and concerns in developing countries.
Consumers nowadays have higher preference for local foods, especially for easily perishable
foods like beef (Loureiro and Umberger, 2005). This makes traceability a value based label
that is necessary in consumer choice. Loureiro and Umberger (2005), found consumers in the
14
USA prefer local beef because of food safety issues and would pay small indirect premium
for costs related to a mandatory COOL and traceability-enabled attribute (Lim et al., 2013).
Consumer preferences for local foods is also influenced by consumers’ risk handling
behaviour; their attitude on risk associated with beef, their risk aversion to risks from use of
beef and perceptions of the food-safety level of imported beef (Lim et al., 2014)
Kenyan consumers have positive preference for nutritional benefits of food bio-fortification
and would pay a premium for bio-fortified pearl millet products. This was influenced by
demographic factors; whether one is a household head or otherwise, previous exposure to
bio-fortified products, household monthly income and awareness, about nutritional benefits
of consuming bio-fortified products pearl millet product (Okech-Ongudi et al., 2015).
Furthermore, preference for healthy foods like quality of leafy vegetables is affected by
safety, nutrition, price, sensory, convenience, environmental friendliness, hygiene and ethics.
This was determined by income levels, confidence and consistency, subjective knowledge,
reference point, income and age of children the consumer (Ngigi et al., 2010). Also, Brouwer
et al. (2015), reported that a risk on health status of household members influence their WTP
values. Further, income is a key factor for rural consumers, WTP.
In the EU origin labels are highly accepted and studies have gone further to test consumer
preferences for various classes of origin labels. Menapace et al. (2009), reported that, EU’s
food oil consumers WTP values varied from COO, but higher for GI labelled compared to
non-GI from the same country. However, consumers were indifferent in valuing PDOs and
PGIs. Also, Aprile et al. (2012), assessed EU’s olive oil consumers preferences and WTP for
GI’s quality labels; PDO and PGI, organic and other product quality attributes. They
employed choice experiment and Random parameter logit (RPL) and showed that various
forms of GI labelling have varied implication as a signal of quality. Their results revealed that
PDO led, followed by organic farming label, a quality cue describing the product as extra-
15
virgin olive oil and lastly a PGI label. These shows that GI labelling is not a panacea to all
food safety issues and other quality attributes should equally be evaluated along GI.
Formulation of GI labelling policies involves the premium that consumers are willing to pay
for the credence value added. To determine consumers WTP and their preferences, product
attributes are essential to get the trade-offs they are willing to make for a given positive gain
from product improvement. Danish consumers value more organic to local honey that is
value added Campbell et al. (2012). The Italians too value the price of honey, product of
Italy, certification by a public institution and provision of information whether written or by
use of information technology Menozzi et al. (2010). Recently, honey origin is fetching more
attention as revealed by Cosmina et al. (2016), especially local honey, followed by organic
then landscape of production and lastly if honey was liquid. Furthermore consumers would
pay more for local honey as compared to organic.
For market segmented strategies, it is necessary to evaluate consumer factors that influence
their preferences for honey and its quality attributes. In Nigeria important honey attributes
includes nutrient honey content, low sugar content and medicinal value. Consumer factors
were marital status, educational status, annual income, farm size and household size (Nwibo,
2012). Arvanitoyannis and Krystallis (2006), used education, age, income, occupation,
gender, marital status, presence of children and working women to cluster consumers into
three groups; common consumers, those that were young and indifferent to honey and the
enthusiastic who would pay a premium for organic honey in Romania. Lastly, Roman et al.
(2013), found that honey factors; nutritional, taste, prophylactic, and medicinal values; their
economic factors and knowledge influenced decision to buy honey, while psychological and
social factors influenced choice of varieties of honey.
16
Previous studies on honey sector in Kenya have shown the different honey value chains, its
production, its use, its challenges and opportunities (Berem et al., 2011; Oyuga, 2008; Gatere
et al., 1985). More so studies on safety of local honey reveals adulteration by middle men.
Previous studies seem to focus on other aspects of honey and give minimal or no
considerations at all for use of labels and other forms of certification as a way of curbing
honey adulteration. Origin, food safety, floral source and third party certification are among
new innovative means of meeting consumer satisfaction. This is despite, the literature review
on various aspects of honey revealing the need to use innovative ways to curb honey
adulteration. Consumer awareness and acceptance of such labels is essential to its success.
However, little is known about the honey consumers’ awareness and WTP for and the factors
influencing, their preference for GI and other quality attributes of honey in Kenya. The
current study attempts to fill this knowledge gap.
2.3 Review of Preference Analysis Methods
Non-market valuation methods are broadly grouped into two categories; revealed preference
(RP) and stated preference (SP). In RP methods, buyers and sellers reveal their preferences
directly through their actions, which create the price of the commodity. But, in cases where
the product does not exist in the market or a pretest, the SP method is used since it is
hypothetical (Adamowicz et al., 1998).
The RP methods also known as indirect methods are based on analysis of real behavior of
individuals to build economic models of choice for a given product. This facilitates valuation
of goods that exist in the market by observing the choice made by consumers when buying
goods. The first RP method is Travel cost method that considers the value of time and money
people spend in the use of a good. It is mainly applied in environmental studies where the
values placed by visitors on environmental amenity services are inferred from the costs that
they incur in order to experience the services. Chen et al. (2004), used travel cost method to
17
evaluate the recreational benefits of a beach along the eastern coast of Xiamen Island in
China. They found that the beach had an economic value and charging fees for visitors would
provide for its maintenance.
The second RP method is Hedonic Pricing Method, where a good is valued in relation to
characteristics of factors surrounding a good. It is mainly used to infer a premium that
households were likely to pay to buy a property near an environmental amenity (Boyle,
2003). Yim et al. (2014), applied the Hedonic Pricing Method because of a high variation in
meal prices, to examine important attributes influencing average customer meal prices in
restaurants in Seoul, Korea. They identified determinants of food prices and significant
surrounding factors that influence the average meal prices. However RP methods are limited
in that they condition valuation on current and previous levels of the non-market good. In
addition, they are unable measure non-use values (Adamowicz et al., 1998). Due to these
limitations, research on value of the non-market goods has been adopting the stated
preference methods.
The SP method on the other hand uses simulated market to elicit WTP and Willingness To
Accept value for changes in service provision and it is the appropriate method for use and
non-use values of a good (Boyle, 2003). Stated Preference methods include conjoint analysis,
contingent valuation method and choice experiment (CE). Contingent valuation method
compares one policy scenario with a business as usual scenario. It involves describing the
good or programme to be valued, the respondents are asked directly to identify the maximum
amount of money they would pay. It has the limitation of being sensitive to biases in survey
design and implementation (Adamowicz et al., 1998).
The CE method is a type of conjoint analysis where respondents take choices across goods
with varying attributes. However, it differs from conjoint analysis whereby individuals go
18
beyond ranking and rating bundles of product attributes (Louviere et al., 2010). The main
advantage of CE over contingent valuation is its ability to simultaneously elicit values for a
range of goods and services (Boxall et al., 1996). CE is useful for eliciting passive use values
basing it on random utility theory ( RUT) (Adamowicz et al., 1998). CE method is developed
in transport and marketing areas of research (Louviere et al., 2008; Louviere et al., 2000).
Theoretically, it is grounded on Lancaster’s characteristics theory of value (Lancaster, 1966)
and random utility model guides its econometric basis (McFadden and Manski, 2001). The
CE advocates for a good or service to be valued in terms of its attributes and their levels.
The first application of CE method in non-market valuation was by Adamowicz (1994). Over
time a number of studies in various fields have employed this method: for example
environment studies include, (Michaud et al., 2012; Boxall and Adamowicz, 2002). Health
sector too (Kruk et al., 2009; Green and Gerard, 2009). Moreover, Ruto et al. (2008) and
Otieno et al. (2011) employed CE in valuing animal genetic resources and determining the
demand for disease free zone in Kenya. To inform proper way of providing public and private
goods and services, Bonger et al. (2004), recommends the use of CE.
The honey sector in Kenya has been developing since the pre-colonial period (JIACAF,
2009), it however faces product adulteration problems (Muthui, 2012). The current study
applies the CE to elicit consumer preferences for honey quality attributes and GI. The main
aim is to inform policy of the potential of GI labelling in curbing information asymmetry in
the honey sector in Kenya.
19
References
Abraham A. M. (2015). ''The Role of Consumer Knowledge Dimensions on Country of
Origin Effects: An Enquiry of Fast-consuming Product in India''. Vision: The Journal
of Business Perspective, 19(1), 1-12.
Adamowicz L., W. (1994). ''Combining Revealed and Stated Preferences Methods for
valuing Environmental amenities''. Journal of Envronmental Economics and
Management, 26(1994), 271-292.
Adamowicz W., Boxall, P., Williams, M. and Louviere, J. (1998). ''Stated preference
approaches for measuring passive use values: choice experiments and contingent
valuation''. American journal of agricultural economics, 80(1), 64-75.
African Union and European Commission. (2011). Report of workshop on Geographical
Indications & “Power Of Origin. Kampala.
Aprile M. C., Caputo, V. and Nayga, R. M. (2012). ''Consumers' valuation of food quality
labels: the case of the European geographic indication and organic farming labels''.
International Journal of Consumer Studies, 36(2), 158-165.
Arvanitoyannis I. and Krystallis, A. (2006). ''An empirical examination of the determinants of
honey consumption in Romania''. International journal of food science & technology,
41(10), 1164-1176.
Awada L. and Yiannaka, A. (2011). ''Consumer perceptions and the effects of country of
origin labeling on purchasing decisions and welfare''. Food Policy, 37(1), 21-30. doi:
http://dx.doi.org/10.1016/j.foodpol.2011.10.004
Bagal M., Belletti, G., Marescotti, A. and Onori, G. (2013). Study on the potential of
marketing of Kenyan Coffee as Geographical Indication. In R. SA (Ed.), study on the
potential for marketing agricultural products of the ACP countries using
geographical indications and origin branding Lausanne: European Commission.
Baiya H. and Nyakundi, B. (2007). Plan Bee: Linking Kenyan Beekeepers to the Market
Synthesis Report SITE Enterprise Promotion. Nairobi.
Berem R. M., Owuor, G. O. and Obare, G. (2011). ''Value addition in honey and poverty
reduction in ASALs: Empirical evidence from Baringo County, Kenya''. Livestock
Research for Rural Development, 23(12), 243.
Blakeney M., Coulet, T., Mengistie, G. and Mahop, T., M. (2012). Extending the protection
of Geographical indicattions: Case studies of Agricultural products in Africa:
Earthscan: ISBN ISBN 9780415501026.
Bonger T., Ayele, G. and Kumsa, T. (2004). ''Agricultural extension, adoption and diffusion
in Ethiopia''. Ethiopian Development Research Institute (EDRI) Research Report, 1.
Boxall P., C. and Adamowicz, L., W. (2002). ''Understanding Heterogeneous Preferences in
Random Utility Models: A Latent Class Approach''. Environmental and Resource
Economics, 23, 421-446.
20
Boxall P., C., Adamowicz, L., W., Swait, J., Williams, M. and Louviere e, J. (1996). ''A
comparison of stated preference methods for environmental valuation ''. Ecological
Economics, 18(1996), 243-253.
Boyle K., J. (2003). Introduction to Revealed Preference Methods. In P. Champ, K. Boyleand
T. Brown (Eds.), A Primer on Nonmarket Valuation (Vol. 3, pp. 259-267): Springer
Netherlands: ISBN 978-1-4020-1445-1.
Brouwer R., Job, F., van der Kroon, B. and Johnston, R. (2015). ''Comparing Willingness to
Pay for Improved Drinking-Water Quality Using Stated Preference Methods in Rural
and Urban Kenya''. Applied Health Economics and Health Policy, 13(1), 81-94. doi:
10.1007/s40258-014-0137-2
Campbell D., Mørkbak, M. R. and Olsen, S. B. (2012). Response latency in stated choice
experiments: impact on preference, variance and processing heterogeneity. Paper
presented at the 19 th Annual Conference of the European Association of
Environmental and Resource Economists, Prague, Czech Republic, 27–30 June 2012.
Cawthorn D.-M., Steinman, H. A. and Hoffman, L. C. (2013). ''A high incidence of species
substitution and mislabelling detected in meat products sold in South Africa''. Food
Control, 32(2), 440-449.
Chen W., Hong, H., Liu, Y., Zhang, L., Hou, X. and Raymond, M. (2004). ''Recreation
demand and economic value: An application of travel cost method for Xiamen
Island''. China Economic Review, 15(4), 398-406. doi:
http://dx.doi.org/10.1016/j.chieco.2003.11.001
Cosmina M., Gallenti, G., Marangon, F. and Troiano, S. (2016). ''Attitudes towards honey
among Italian consumers: A choice experiment approach''. Appetite, 99, 52-58. doi:
http://dx.doi.org/10.1016/j.appet.2015.12.018
Crosby L. A. and Taylor, J. R. (1981). ''Effects of consumer information and education on
cognition and choice''. Journal of Consumer Research, 43-56.
Dafe F. (2009). ''No business like slum business? The political economy of the continued
existence of slums: A case study of Nairobi''. Development Studies Institute, London
School of Economics Working Paper, 12.
Everstine K., Spink, J. and Kennedy, S. (2013). ''Economically motivated adulteration (EMA)
of food: common characteristics of EMA incidents''. Journal of Food Protection®,
76(4), 723-735.
Gachora M. (2003). Towards Realization of Kenya‟s Full Beekeeping Potential: A Case
Study of Baringo District. . (Phd), University of Bonn, Bonn,Germany.
Gatere K., Kasolia, J. D. and Mwangeka, R. (1985). ''Production and marketing of honey and
beeswax in Kenya''. 175-178.
Green C. and Gerard, K. (2009). ''Exploring the social value of health‐care interventions: a
stated preference discrete choice experiment''. Health economics, 18(8), 951-976.
Jackson M. (2003). ''Honey Market in Uganda''. Apiacata, 4(2003).
21
JIACAF. (2009). Development of Beekeeping in Developing Countries and Practical
Procedures – Case Study in Africa Akasaka, Japan: Japan Association for
International Collaboration of Agriculture and Forestry.
Johnson R. (2014). Food fraud and “Economically Motivated Adulteration” of food and food
ingredients. Paper presented at the Vols. 7–5700, R43358, pp. 1–40). Washington,
DC: Library of Congress.
Kenya National Bureau of Statistics (KNBS). (2014). Statistical abstract. Nairobi.
Kimenju S., C. and De Groote, H. (2005). Consumers’ Willingness to Pay for Genetically
Modified foods in Kenya. Paper presented at the 11thInternational Congress of the
EAAE (European Association of Agricultural Economists), The Future of Rural
Europe in the Global AgriFood System, Copenhagen, Denmark, .
Kimenju S., C., De Groote, H., Karugia, J., Mbogoh, S. and Poland , D. (2005). ''Consumer
awareness and attitudes toward GM foods in Kenya''. African Journal of
Biotechnology, 4(10), 1066-1075.
KIPI. (2009). MoU Swiss-Kenya project on Geographical indications (SKGI). Nairobi.
Kiptarus, Asiko, G., Muriuki, J. and Biwott, A. (2011). Beekeeping In Kenya: The Current
Situation. Paper presented at the 42nd International Apicultural Congress, Buenos
Aires, Argentina.
Kruk M., E., Paczkowski, M., Mbaruku, G., de Pinho, H. and Galea, S. (2009). ''Women's
preferences for place of delivery in rural Tanzania: a population-based discrete choice
experiment''. American journal of public health, 99(9), 1666.
Kutto E. K., Ngigi, M. W., Karanja, N., Kange’the, E., Bebora, L. C., Lagerkvist, C. J., . . .
Okello, J. J. (2011). ''Bacterial contamination of kale (brassica oleracea acephala)
along the supply chain in nairobi and its environment''. East African Medical Journal,
88(2), 46–53.
Lai Y., Florkowski, W., Huang, C., Bruckner, B. and Schonhof, I. (1997). Consumer
Willingness to pay for inproved attributes of fresh vegetables:A comparison between
Atlanta and Berlin. Paper presented at the WAEA, Reno.
Lancaster K., J. . (1966). ''A New Approach to Consumer Theory''. Journal of Political
Economy, 74(2), 132-157.
Larceneux F. and Carpenter, M. (2008). ''Third party labeling and the consumer decision
process: the case of the PGI European label''.
Liefeld J. P. (2004). ''Consumer knowledge and use of country-of-origin information at the
point of purchase''. Journal of Consumer Behaviour, 4(2), 85-87. doi: 10.1002/cb.161
Lim K. H., Hu, W., Maynard, L. J. and Goddard, E. (2013). ''U.S. Consumers’ Preference and
Willingness to Pay for Country-of-Origin-Labeled Beef Steak and Food Safety
Enhancements''. Canadian Journal of Agricultural Economics/Revue canadienne
d'agroeconomie, 61(1), 93-118. doi: 10.1111/j.1744-7976.2012.01260.x
22
Lim K. H., Hu, W., Maynard, L. J. and Goddard, E. (2014). ''A Taste for Safer Beef? How
Much Does Consumers’ Perceived Risk Influence Willingness to Pay for Country-of-
Origin Labeled Beef''. Agribusiness, 30(1), 17-30. doi: 10.1002/agr.21365
Lin C.-T. J., Jensen, K. L. and Yen, S. T. (2004). Determinants of Consumer Awareness of
Foodborne Pathogens. Paper presented at the AAEA annual meeting, Denver CO.
Loureiro M. L. and Umberger, W. J. (2003). ''Estimating consumer willingness to pay for
country-of-origin labeling''. Journal of Agricultural and Resource Economics, 287-
301.
Loureiro M. L. and Umberger, W. J. (2005). ''Assessing Consumer Preferences for Country-
of-Origin Labeling''. Journal of Agricultural and Applied Economics, 37(01), 49-63.
doi: doi:10.1017/S1074070800007094
Louviere J., J., Flynn, N., T. and Carson, R., T. (2010). ''Discrete Choice Experiments Are
Not ConjointAnalysis''. Journal of Choice Modelling, 3(3), 57-72.
Louviere J., J., Hensher, D., A. and Swait, J., D. (2000). Stated choice methods: analysis and
applications: Cambridge University Press: ISBN 0521788307.
Louviere J. J., Street, D., Burgess, L., Wasi, N., Islam, T. and Marley, A. A. (2008).
''Modeling the choices of individual decision-makers by combining efficient choice
experiment designs with extra preference information''. Journal of Choice Modelling,
1(1), 128-164.
Lusk J. L., Brown, J., Mark, T., Proseku, I., Thompson, R. and Welsh, J. (2006). ''Consumer
behavior, public policy, and country-of-origin labeling''. Applied Economic
Perspectives and Policy, 28(2), 284-292.
McFadden D. and Manski, C., F. . (2001). ''The Econometric Analysis of Discrete Choice''.
The Scandinavian Journal of Economics, 103(2(Jun., 2001)), 217-229.
Menapace L., Colson, G., Grebitus, C. and Facendola, M. (2009). ''Consumer preferences for
country-of-origin, geographical indication, and protected designation of origin labels''.
Menozzi D., Mora, C., Chryssochoidis, G. and Kehagia, O. (2010). ''Traceability, quality and
food safety in consumer perception''. ECONOMIA AGRO-ALIMENTARE, 12(1), 137-
158
Michaud C., Llerena, D. and Joly, I. (2012). ''Willingness to pay for environmental attributes
of non-food agricultural products: a real choice experiment''. European Review of
Agricultural Economics. doi: 10.1093/erae/jbs025
Micheli I. (2013). ''Honey and Beekeeping among the Okiek1 of Mariashoni, Mau Forest
Escarpment, Nakuru District, Kenya''.
Murphy M. (2000). The Importance of Price to the Irish Honey Industry Pricing Strategy.
Ireland: Cork Institute of Technology.
23
Murphy M., Cowan, C., Henchion, M. and O’Reilly, S., Vol. 102 Iss: 8, pp. (2000). ''Irish
consumer preferences for honey: a conjoint approach''. British Food Journal, 102(8),
585 - 598. doi: 10.1108/00070700010348424
Muthui B., N. (2012). Physiochemical properties of honey from Mwingi and selected urban
areas in Kenya, effect of adulterations and some community awareness levels of
honey adulteration. (Master of science), Kenyatta University, Nairobi.
Mutisya J., S. (2011). An entrepreneurial assessment of the market access for honey and
honey product in the city of Nairobi, Kenya. (PhD Dissertation), University of
Nairobi, Nairobi, Kenya.
Ngigi M., W., Okello, J. J., Lagarkvist, C., Karanja, N. and Mburu, J. (2010). Assessment of
developing-country urban consumers’ willingness to pay for quality of leafy
vegetables: The case of middle and high income consumers in Nairobi, Kenya. Paper
presented at the 3rd African Association of Agricultural Economics, AAEA/ AEASA
Conference Cape Town, South Africa.
Nwibo S., U. (2012). ''Assessment of willingness to pay for honey among farming households
in Abakalilki local government area of Ebonyi state, nigeria''. Journal of Agriculture
and Veterinary Sciences, 4(December 2012).
O'connor B. (2013). GIs and other instruments for protecting producers' assets in the origin
and tradition of their products:factors of success in ACP countries. Paper presented at
the Geography of food:reconnecting with origin in the food system, Brussels.
Okech-Ongudi S., Ngigi, M. and Kimurto, P. (2015). ''Determinants of consumers’ choice
and potential willingness to pay higher prices for Biofortified pearl millet products in
Kenya''.
Ominde G. O. (2014). Influence of value addition in bee-farming products on the livelihood
of bee-farmers in Kakamega central sub-county, Kenya. University of Nairobi,
Nairobi, Kenya.
Otieno D. J., Ruto, E. and Hubbard, L. (2011). ''Cattle Farmers’ Preferences for Disease‐Free
Zones in Kenya: An application of the Choice Experiment Method''. Journal of
Agricultural Economics, 62(1), 207-224.
Oyuga J., K. (2008). Honey market structure and pricing efficiency in the pastoral areas of
Baringo District, Kenya. (Masters), university of Nairobi, Nairobi, Kenya.
Profeta A., Balling, R. and Roosen, J. (2012). ''The relevance of origin information at the
point of sale''. Food Quality and Preference, 26(1), 1-11. doi:
http://dx.doi.org/10.1016/j.foodqual.2012.03.001
Ramba M., G. (2013). Protection of Geographical Indications in Kenya. Paper presented at
the EU/ARIPO/KIPI Workshop on Geographical Indications, Nairobi-Kenya.
Republic of Kenya. (2001). Apiculture (Bee Keeping) Industry Sub-sector. Nairobi.
Republic of Kenya. (2007). Draft Geographical indications Bill. Nairobi: GoK.
24
Republic of Kenya. (2009). The Trade Marks AcT: Chapter 506 Nairobi: National Council
for Law Reporting.
Republic of Kenya. (2012). National Agribusiness Strategy ;Making Kenya’s agribusiness
sector a competitive driver of growth. Nairobi: GoK.
Republic of Kenya. (2013). State Department of livestock regional pastoral livelihoods
resilience project Vulnerable and marginalised groups framework. Nairobi: Ministry
of livestock and fisheries.
Ruto E., Garrod, G. and Scarpa, R. (2008). ''Valuing animal genetic resources: a choice
modeling application to indigenous cattle in Kenya''. Agricultural Economics, 38(1),
89-98.
Schupp A., Gillespie, J. and Reed, D. (1998). ''Consumer awareness and use of nutrition
labels on packaged fresh meats: a pilot study''. Journal of Food Distribution
Research, 29, 24-30.
Shiluli M., Magenya, O., E, V., Kanda, R., Gesicho, M., Kidula, N., Miruka, M., . . . Simioni,
E. (2012). Beekeeping in Trans Mara: a baseline study 13nth KARI Biennial Scientific
Conference;book of abstracts. Nairobi: KARI.
Velčovská Š. and Sadílek, T. (2014). ''The system of the geographical indication–important
component of the politics of the consumers’protection in European Union''.
Amfiteatru Economic, 16(35), 228.
Verbeke W. (2009). ''Market differentiation potential of country-of-origin, quality and
traceability labeling''. The Estey Centre Journal of International Law and Trade
Policy, 10(1), 20.
Verbeke W., Pieniak, Z., Guerrero, L. and Hersleth, M. (2012). ''Consumers’ awareness and
attitudinal determinants of European Union quality label use on traditional foods''.
Bio-based and Applied Economics, 1(2), 213-229.
Warui M., Gikungu, M., Bosselmann, A., Hansted, L. and Mburu, J. (2014). An assessment
of high quality honeys with a potential for Geographical Indication (GI) labeling and
initiatives that add value to the honey sector in Kenya. Paper presented at the
Apimondia conference.
Yim E., S., Lee, S. and Kim, W., G. (2014). ''Determinants of a restaurant average meal price:
An application of the hedonic pricing model''. International Journal of Hospitality
Management, 39(0), 11-20. doi: http://dx.doi.org/10.1016/j.ijhm.2014.01.010
25
CHAPTER THREE
3.0 HONEY VALUE CHAIN AND CONSUMER’S CHARACTERISTICS
This chapter covers the honey value chain and consumer characteristics. Descriptive statistics
was used, to analyse primary data collected for 478 respondents drawn from Nairobi, Kitui
and Nakuru counties through multistage sampling. The study reveals that honey consumers
prefer local honey that is labelled by the specific region of origin name, organic but they are
indifferent to type of processing. The main sources of honey are the supermarket and farm
gate. Urban honey consumers are youthful, learned with high income levels.
3.1 Background Information
The livestock sector in Kenya contributes up to 10% of the national GDP and the beekeeping
subsector’s share is about 2% of the agricultural GDP (Kiptarus et al., 2011; Muya, 2004).
Moreover, beekeeping enables farmers to earn revenue and be food secure by providing
honey, beeswax and pollen as food. For medicine the subsector provides propolis, bee venom
and royal jelly. The subsector is also known to conserving the natural environment and
through pollination it enhances biodiversity in food and seed production (Kiptarus et al.,
2011; Muya, 2004). For instance, every three food bites made in the world is as a result of
pollination, which bees are essential (Carrol, 2006).
Value chain analysis enables stakeholders to understand which role, strengths, opportunities
and challenges faced by different actors in adding value to the product before it gets to the
final consumer. The honey value chain is unique and the main actors in developing countries
include those that supply inputs, honey producers, those that bulk, those that process,
transporters who may also trade the product, those who sell in the export market, those who
sell at wholesale, retail sellers and end users (Kilimo Trust, 2012).
26
The value chains in developing nations are usually unstructured with small scale farmers and
processors, this makes the quality of honey sold to be of less quality. In addition, farmers use
traditional ways of honey production and handling, this makes them to produce below
potential. This forces other actors to operate below their potential because of low supply.
Consumers though are supplemented with quality imports from diverse imports, which is
usually quite expensive (Kilimo Trust, 2012).
Honey production is an alternative source of livelihood for farmers living in areas with erratic
rainfall, mainly the ASALs. As an investment opportunity, honey production has minimal
land and the capital requirements as compared to other agricultural activities. This makes it
viable for low income earners (Carrol, 2006). Moreover the demand for honey is always
growing, especially the urban dwellers whose disposable income has increased and they are
more mindful of the benefits consuming natural foods like honey. However, the supply of
honey has dwindled over time and cannot meet the local level of honey demand. This is set to
worsen with climate change, increased use of chemical pesticides, farmers continued use of
rudimentary means of honey production and financial challenges (Kiptarus et al., 2011). As a
result the supply side should be improved through informed means like research focusing on
its value chain.
To be able to understand better the Honey sector in Kenya with regards to product origin, it
was necessary to evaluate the value chain from both past studies and primary data. This
covers how producers are linked to where consumers source their honey, the average honey
supply, consumers demand, service providers at every stage of the chain and how the actors
relate with each other. The challenges and opportunities experienced by the actors are also
researched. The current study sought to describe honey consumers characteristics and the
value chain of honey in Kenya.
27
3.2 Methodology
3.2.1 Conceptual Framework
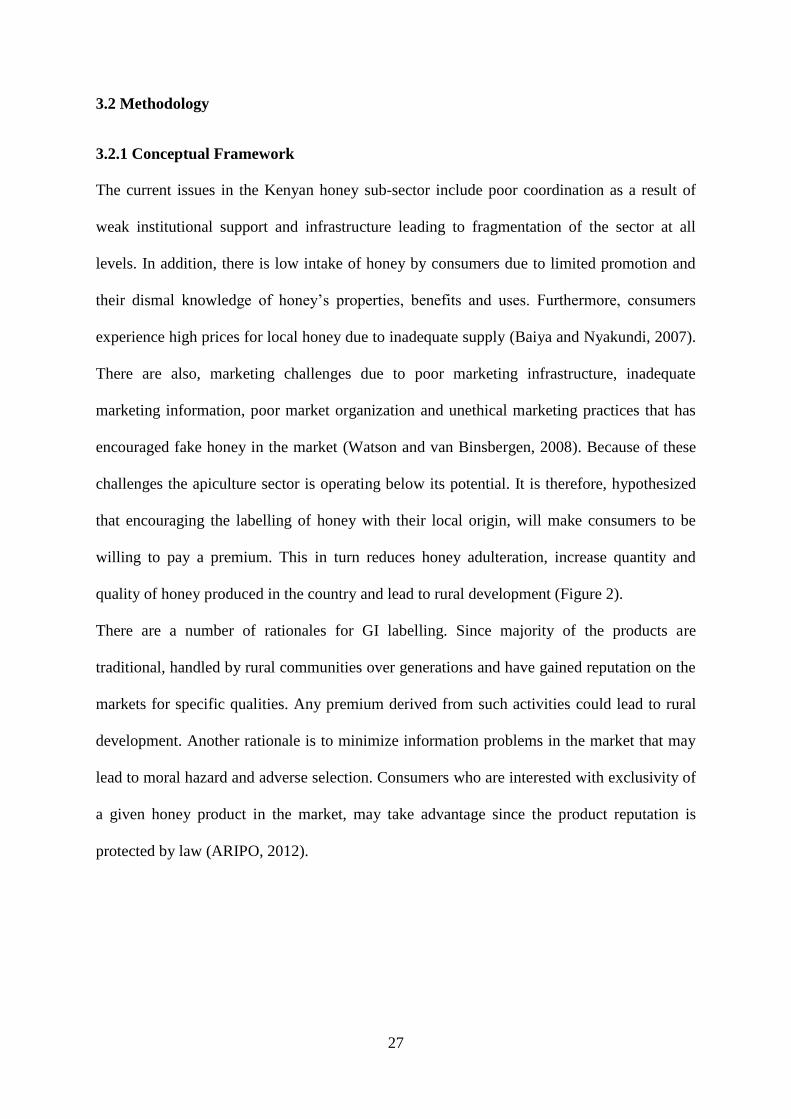
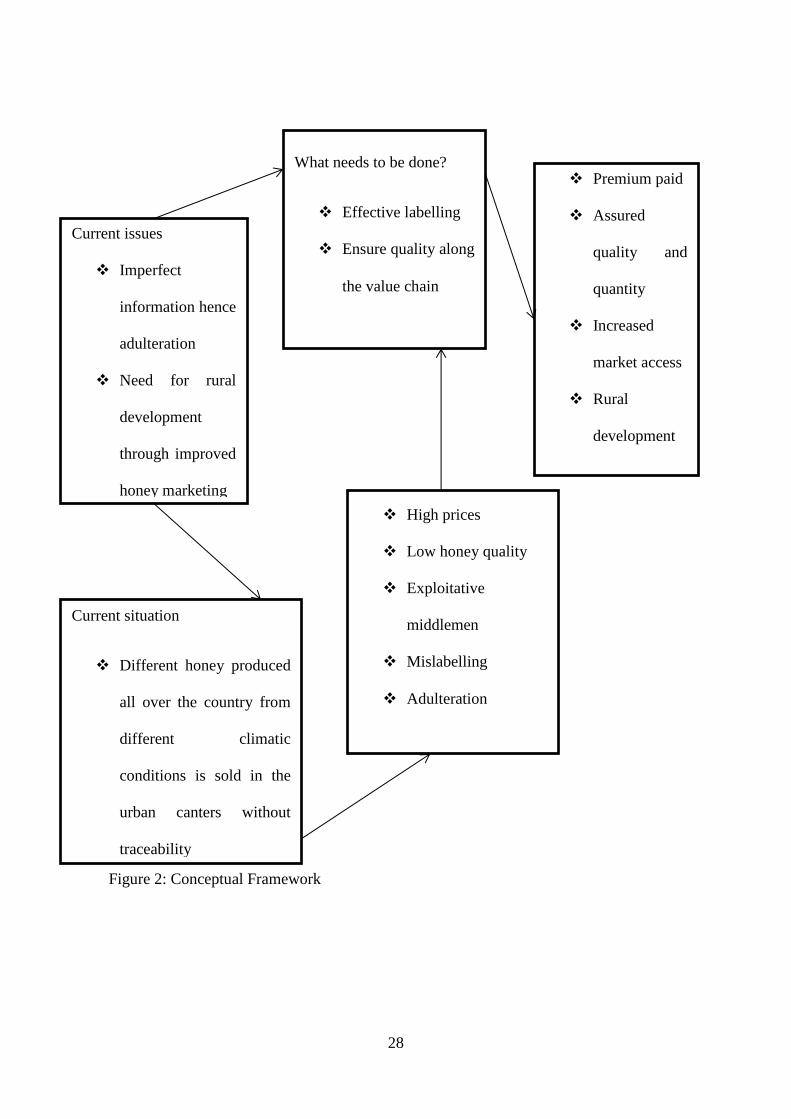
The current issues in the Kenyan honey sub-sector include poor coordination as a result of
weak institutional support and infrastructure leading to fragmentation of the sector at all
levels. In addition, there is low intake of honey by consumers due to limited promotion and
their dismal knowledge of honey’s properties, benefits and uses. Furthermore, consumers
experience high prices for local honey due to inadequate supply (Baiya and Nyakundi, 2007).
There are also, marketing challenges due to poor marketing infrastructure, inadequate
marketing information, poor market organization and unethical marketing practices that has
encouraged fake honey in the market (Watson and van Binsbergen, 2008). Because of these
challenges the apiculture sector is operating below its potential. It is therefore, hypothesized
that encouraging the labelling of honey with their local origin, will make consumers to be
willing to pay a premium. This in turn reduces honey adulteration, increase quantity and
quality of honey produced in the country and lead to rural development (Figure 2).
There are a number of rationales for GI labelling. Since majority of the products are
traditional, handled by rural communities over generations and have gained reputation on the
markets for specific qualities. Any premium derived from such activities could lead to rural
development. Another rationale is to minimize information problems in the market that may
lead to moral hazard and adverse selection. Consumers who are interested with exclusivity of
a given honey product in the market, may take advantage since the product reputation is
protected by law (ARIPO, 2012).
28
Current issues
Imperfect
information hence
adulteration
Need for rural
development
through improved
honey marketing
High prices
Low honey quality
Exploitative
middlemen
Mislabelling
Adulteration
What needs to be done?
Effective labelling
Ensure quality along
the value chain
Premium paid
Assured
quality and
quantity
Increased
market access
Rural
development
Current situation
Different honey produced
all over the country from
different climatic
conditions is sold in the
urban canters without
traceability
Figure 2: Conceptual Framework
29
3.2.2 Sampling and Data Collection
The target population included urban households residing in Nairobi, Nakuru and Kitui
counties. In order to test the theoretical concept stated in this study, the survey method was
employed. The survey was conducted through direct interviews conducted in October through
November 2014. Direct interviews were preferred since clarifications could be made as issues
arose. This yielded satisfying responses. In addition, only household shoppers that consumed
honey were allowed to answer the questionnaire. This reduced getting biased results from
non-users. Respondents to the final survey were mainly honey consumers in Kenya. The
sampling unit was a honey consumer and their household.
Focus group discussions (FGDs) were held in each of the three study sites and participants
were chosen purposively based on key informants along the honey value chain, they were
made up of equal numbers of both genders. The key informants ranged from technocrats,
marketers, consumers and some producers in the honey sector. They had varied education
backgrounds and experience in the honey sector. FGDs were held mainly to verify the issues,
acquire timely information and the relevance of GI labelling in the local honey sector.
Participants confirmed the relevance of questions that rose from this study to honey users.
Further their recommendations were used to streamline the questionnaires used in the final
survey.
The study employed a multistage sampling method. This is because there was no prior list of
all honey consumers in Kenya. In addition, the method is most suited since there was a
possibility of consumption diversity within the study areas in terms of knowledge levels and
preferences of different quality honey attributes. First, a purposive sampling of three counties
for data collection was done. Nairobi County qualified because majority of the urban
population are found here. Also Majority of marketed honey (80%) ends up in Nairobi (Baiya
and Nyakundi, 2007). Kitui County was also picked since it represented the leading area of
30
honey production, hence an in-depth knowledge on honey by residents. Nakuru County
qualified as another net urban honey consumption region that was near the second largest
honey producing zone, Baringo.
In Nairobi, stratified sampling was used. Three income strata were used for high income
settlements, middle income and the low income suburbs of Nairobi; Westlands, Kasarani and
Kawangware respectively. Consumers were interviewed randomly from these households
found in all the three strata. This was necessary in capturing consuming households that
bought directly from farmers or through informal channels and those that bought from other
retail outlets. It was well established that majority of honey was bought from supermarkets
and in processed form (Mutisya, 2011; Carroll, 2002).
In Kitui, Kitui town was picked purposively, because it was more cosmopolitan and high
heterogeneity among consumer socio demographics was expected. Also most of the urban
settlers buy the honey consumed in the households (KIT and IIRR, 2010) . Honey consumers
were randomly sampled in major streets and markets of Kitui town.
In Nakuru, the retail outlets around the CBD were picked purposively. Consumers were
randomly picked to respond to questionnaires. Nakuru is near Baringo and Marigat: high
honey producing zones.
Having three data collection areas, respondents were apportioned depending on heterogeneity
of the population and the distribution. A total of 478 questionnaires were fully answered from
the three study areas as; 233 respondents in Nairobi, 119 respondents in Kitui and 126
respondents in Nakuru counties.
31
3.2.3 Data Analysis
This study uses data from both primary and secondary literature for various actors along the
honey value chain in Kenya. The data collected for this section was mainly qualitative. It was
analysed in STATA software version 12 to estimate the descriptive statistics; means and
percentages.
3.3 Results and Discussion
3.3.1 The Honey Value Chain in Kenya
A number of studies have tackled the traditional honey value chain in Kenya (Kimitei et al.,
2012; Kosgei et al., 2011; KIT and IIRR, 2010). In addition, these studies reveal main market
actors to be; individual farmers, cooperatives, Community Based Organizations, Non-
Governmental Organizations, traders, processors, packers and other actors in the value chain
(Baiya and Nyakundi, 2007; Jiwa, 2003; Carroll, 2002). Also, the beekeeping production
tools include hives, bee protective clothing, bee smokers, hive tools, containers for honey and
beeswax (Republic of Uganda, 2012). Bees collect nectar from agricultural crops, fruit trees,
ornamentals and wild flowers (Carroll, 2002). Hive products are processed both on farm by
processing centres owned by the community and by commercial processors. Honey among
other hive products, is processed by extraction, pressing, and straining (FAO, 2001). All the
same, the production of hive products is way below its potential (Republic of Kenya, 2001).
Even though better production technologies have been introduced, majority of farmers keep
on using indigenous knowledge, skills and equipment (Mugendi, 2012; Muriuki, 2004). This
is despite the fact that honey contributes a significant source of income to farmers mainly in
the ASALs where due to erratic climate other agricultural activities are not viable (Kimitei
and Korir, 2012; Gatere et al., 1985).
32
Farmers face many challenges; drought, pests and diseases of honey bee, lack of apiary
equipment and death of colony, marketing problems and shortages of bee forage and lack of
adequate apiary skills (Kosgei et al., 2011). However, there is a market for local honey
(Mutisya, 2011; Oyuga, 2008). Even though, honey marketing is inefficient because of
disaggregated market information, unethical marketing practices and high consumer prices
due to low supply (Kimitei et al., 2012; Orina 2012; Okinyi et al., 2005). Other identified
challenges in the honey sector in Kenya include, limited processing of honey and its products,
incomplete institutional support and technological transfer, partial establishment of
inspectorate services for quality control and lack of value adding through processing and
packaging (Kiptarus, 2005).
However, to the best of our knowledge none of the studies in Kenya has incorporated
consumer perceptions with regard to local honey origin aspects. This study therefore made
inquiries from consumers about their preferences for different aspects of honey origin. The
findings are informative for consideration during future GI labelling and honey handling.
Results from the current study show that, about 95% of respondents prefer local honey from
Kenyan regions to imported brands. This is similar to results recorded by (Cosmina et al.,
2016; Wu et al., 2015); most consumers prefer locally produced honey to imported ones.
Moreover, the most preferred local honey brands sold in major retail outlets include Kitui
woodlands, pure natural honey, green forest, Baringo, Tharaka, Asali poa, Mwingi natural
honey, Baraka honey and Kipepeo. This finding is in line with results reported by (Mutisya,
2011). They also account for over 16% of the entire honey market share. Nevertheless, honey
from Australia is highly preferred by those who wish for imported honey brands. Though,
approximately 84% of the respondents chose labelling of honey with the specific region of
origin unlike just the COO (Wu et al., 2015). This is attributed to honey characteristics
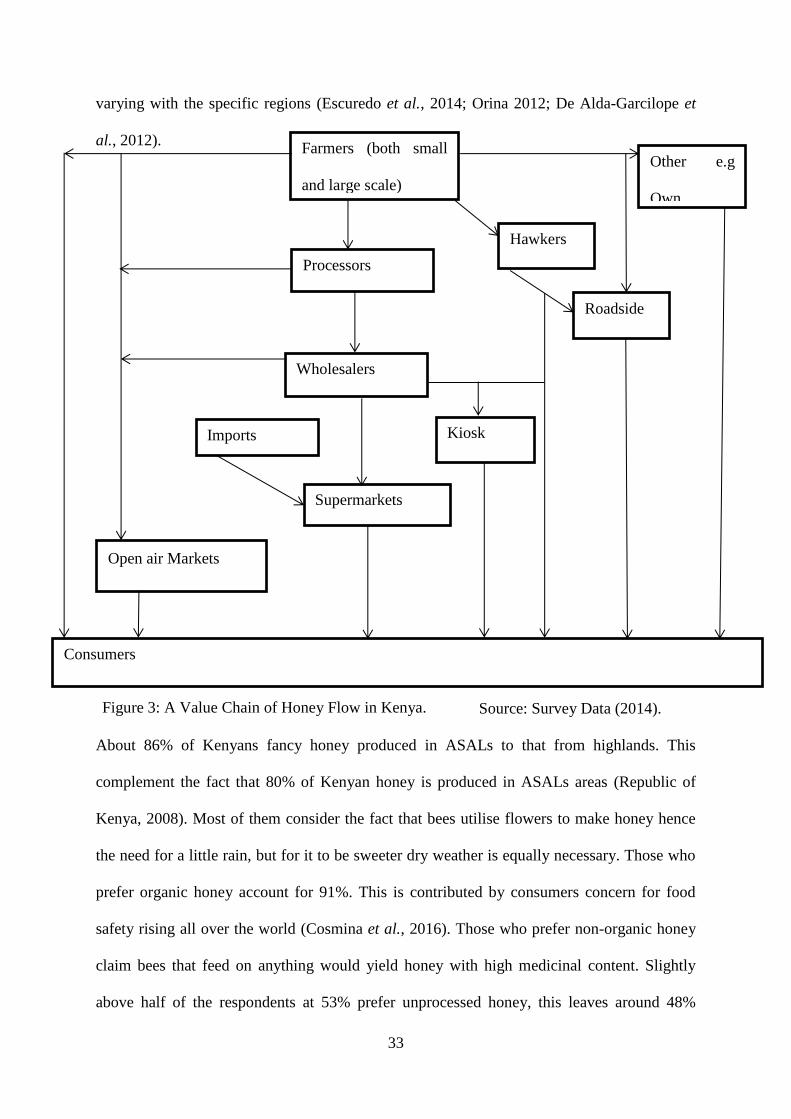
33
varying with the specific regions (Escuredo et al., 2014; Orina 2012; De Alda-Garcilope et
al., 2012).
Source: Survey Data (2014).
About 86% of Kenyans fancy honey produced in ASALs to that from highlands. This
complement the fact that 80% of Kenyan honey is produced in ASALs areas (Republic of
Kenya, 2008). Most of them consider the fact that bees utilise flowers to make honey hence
the need for a little rain, but for it to be sweeter dry weather is equally necessary. Those who
prefer organic honey account for 91%. This is contributed by consumers concern for food
safety rising all over the world (Cosmina et al., 2016). Those who prefer non-organic honey
claim bees that feed on anything would yield honey with high medicinal content. Slightly
above half of the respondents at 53% prefer unprocessed honey, this leaves around 48%
Farmers (both small
and large scale)
Other e.g
Own
Processors
Kiosk
Open air Markets
Imports
Wholesalers
Supermarkets
Consumers
Hawkers
Roadside
Figure 3: A Value Chain of Honey Flow in Kenya.
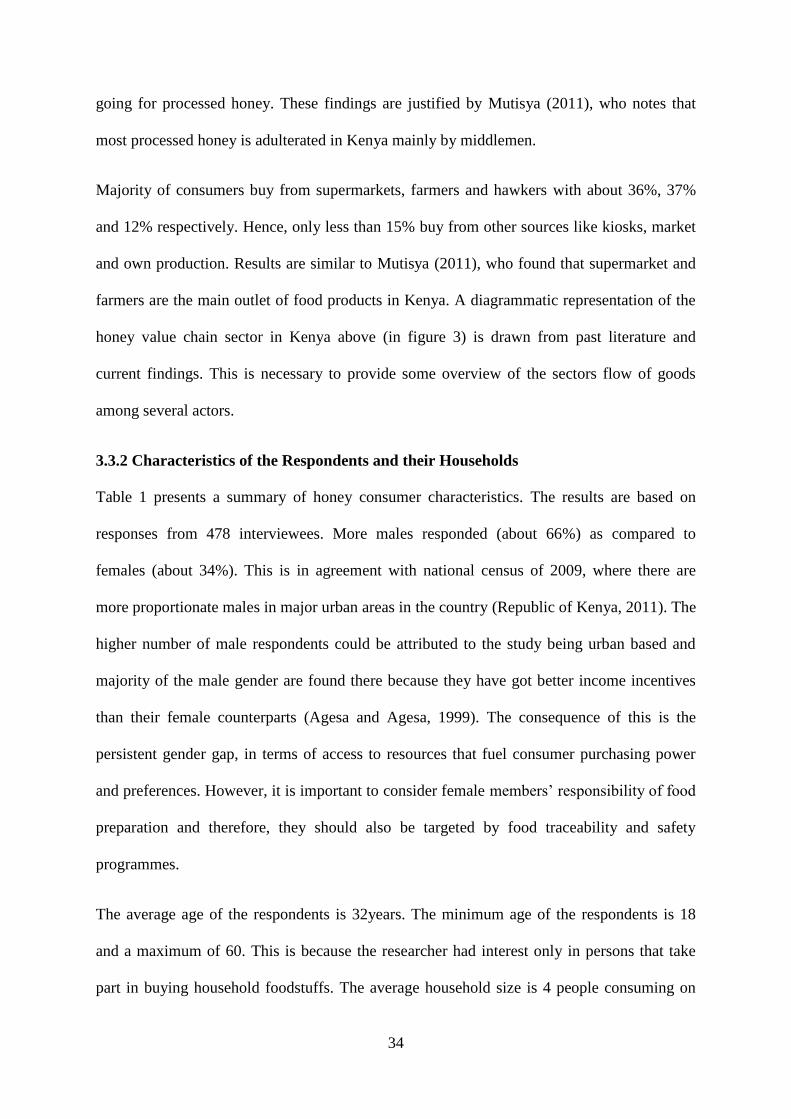
34
going for processed honey. These findings are justified by Mutisya (2011), who notes that
most processed honey is adulterated in Kenya mainly by middlemen.
Majority of consumers buy from supermarkets, farmers and hawkers with about 36%, 37%
and 12% respectively. Hence, only less than 15% buy from other sources like kiosks, market
and own production. Results are similar to Mutisya (2011), who found that supermarket and
farmers are the main outlet of food products in Kenya. A diagrammatic representation of the
honey value chain sector in Kenya above (in figure 3) is drawn from past literature and
current findings. This is necessary to provide some overview of the sectors flow of goods
among several actors.
3.3.2 Characteristics of the Respondents and their Households
Table 1 presents a summary of honey consumer characteristics. The results are based on
responses from 478 interviewees. More males responded (about 66%) as compared to
females (about 34%). This is in agreement with national census of 2009, where there are
more proportionate males in major urban areas in the country (Republic of Kenya, 2011). The
higher number of male respondents could be attributed to the study being urban based and
majority of the male gender are found there because they have got better income incentives
than their female counterparts (Agesa and Agesa, 1999). The consequence of this is the
persistent gender gap, in terms of access to resources that fuel consumer purchasing power
and preferences. However, it is important to consider female members’ responsibility of food
preparation and therefore, they should also be targeted by food traceability and safety
programmes.
The average age of the respondents is 32years. The minimum age of the respondents is 18
and a maximum of 60. This is because the researcher had interest only in persons that take
part in buying household foodstuffs. The average household size is 4 people consuming on
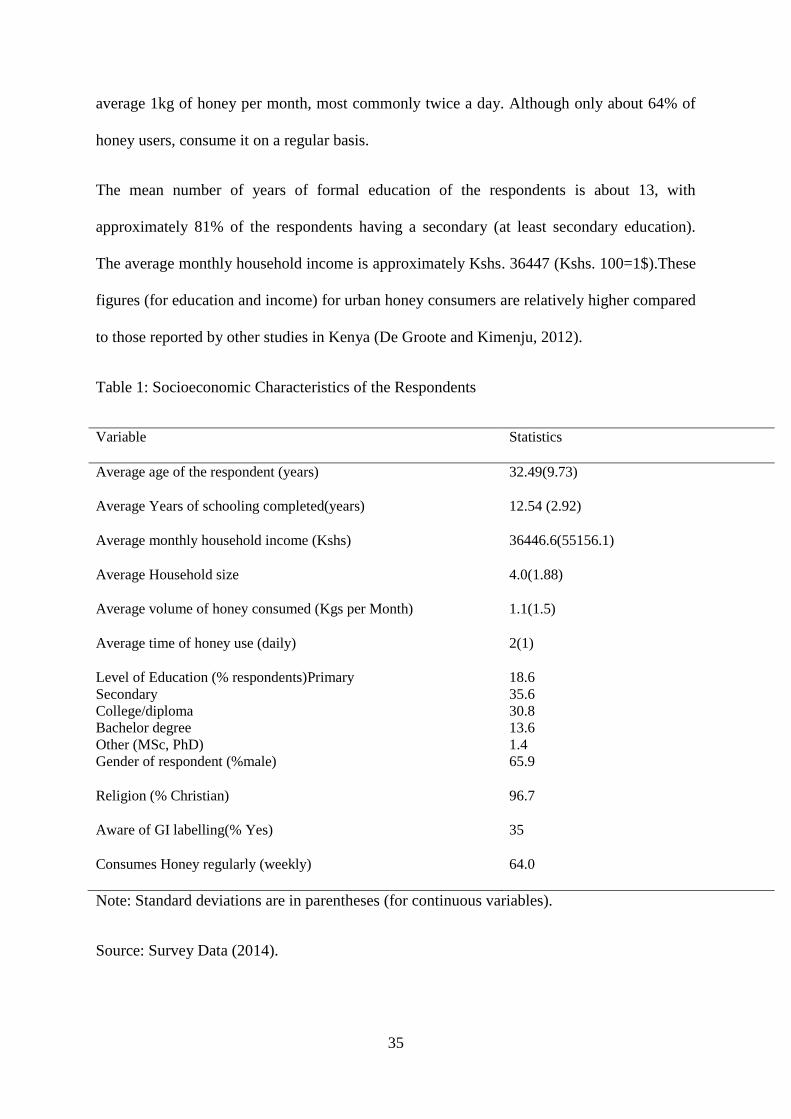
35
average 1kg of honey per month, most commonly twice a day. Although only about 64% of
honey users, consume it on a regular basis.
The mean number of years of formal education of the respondents is about 13, with
approximately 81% of the respondents having a secondary (at least secondary education).
The average monthly household income is approximately Kshs. 36447 (Kshs. 100=1$).These
figures (for education and income) for urban honey consumers are relatively higher compared
to those reported by other studies in Kenya (De Groote and Kimenju, 2012).
Table 1: Socioeconomic Characteristics of the Respondents
Variable Statistics
Average age of the respondent (years) 32.49(9.73)
Average Years of schooling completed(years) 12.54 (2.92)
Average monthly household income (Kshs) 36446.6(55156.1)
Average Household size 4.0(1.88)
Average volume of honey consumed (Kgs per Month) 1.1(1.5)
Average time of honey use (daily) 2(1)
Level of Education (% respondents)Primary
Secondary
College/diploma
Bachelor degree
Other (MSc, PhD)
18.6
35.6
30.8
13.6
1.4
Gender of respondent (%male) 65.9
Religion (% Christian) 96.7
Aware of GI labelling(% Yes) 35
Consumes Honey regularly (weekly) 64.0
Note: Standard deviations are in parentheses (for continuous variables).
Source: Survey Data (2014).
36
3.4 Conclusions and Implications
The Kenyan honey value chain is highly disjointed with actors producing below potential that
has seen the local honey demand surpassing supply. For instance honey production is
rudimentary with several challenges; although it still sustains many small scale farmers in
areas with erratic rainfall. Moreover, consumers prefer local honey that is specified by the
specific region of origin name, organic, from ASALs but they are indifferent to type of
processing. The main sources of honey are the supermarket and farm gate. A typical urban
honey consumer is a youth, male, who has spent about 13 years spent in education and high
income levels, from a household with 4 members that uses 1kg of honey per month, twice
daily.
This calls for stakeholders to provide necessary environment for increased honey production
and value addition locally, because there is demand for local safe honey, that is used for
medicinal and health reasons. Honey that has additional label the reveal the specific region of
origin is bound to attract many sales as revealed by consumer preferences. Lastly, honey
marketing strategies for urban areas could target the youth elites since they are the majority.
37
References
Agesa J. and Agesa, R. U. (1999). ''Gender differences in the incidence of rural to urban
migration: Evidence from Kenya''. The Journal of Development Studies, 35(6), 36-58.
doi: 10.1080/00220389908422601
ARIPO. (2012). The protection of Geographical Indications (GIs) in Africa. Paper presented
at the Information Seminar on the Implementation of the EU-ESA Interim EPA,
Mauritius.
Baiya H. and Nyakundi, B. (2007). Plan Bee: Linking Kenyan Beekeepers to the Market
Synthesis Report SITE Enterprise Promotion. Nairobi.
Carrol T. (2006). A beginner’s guide to beekeeping in Kenya: Legacy Books Press. Nairobi.
Carroll T. (2002). ''A study of the beekeeping sector in Kenya June 2001 - January 2002''.
Self Help Development International (SHDI).
Cosmina M., Gallenti, G., Marangon, F. and Troiano, S. (2016). ''Attitudes towards honey
among Italian consumers: A choice experiment approach''. Appetite, 99, 52-58. doi:
http://dx.doi.org/10.1016/j.appet.2015.12.018
De Alda-Garcilope C., Gallego-Picó, A., Bravo-Yagüe, J., C. , Garcinuño-Martínez , R. M.
and Fernández-Hernando, P. (2012). ''Characterization of Spanish honeys with
protected designation of origin ‘‘Miel de Granada’’ according to their mineral
content''. Food chemistry, 135(2012), 1785–1788.
De Groote H. and Kimenju, S. C. (2012). ''Consumer preferences for maize products in urban
Kenya''. Food & Nutrition Bulletin, 33(2), 99-110.
Escuredo O., Dobre, I., Fernández-González, M. and Seijo, M. C. (2014). ''Contribution of
botanical origin and sugar composition of honeys on the crystallization phenomenon''.
Food chemistry, 149(0), 84-90. doi:
http://dx.doi.org/10.1016/j.foodchem.2013.10.097
FAO. (2001). ''Revised codex standard for honey''. Codex stan, 12, 1982.
Gatere K., Kasolia, J. D. and Mwangeka, R. (1985). ''Production and marketing of honey and
beeswax in Kenya''. 175-178.
Jiwa F. (2003). ''Honey Care Africa's Tripartite Model;An Innovative Approach To
sustainable Beekeeping In Kenya''. Apimondia Journal.
Kilimo Trust. (2012). ''Development of Inclusive Markets in Agriculture and Trade
(DIMAT): The Nature and Markets of Honey Value Chains in Uganda''.
Kimitei R., K. and Korir, B., K. (2012). Indigenous Beekeeping for Sustainable Beekeeping
Development: A Case Study in Kibwezi District, Kenya. Paper presented at the
National Council for Science and Technology, Kenyatta International Conference
Centre (KICC),Nairobi.
38
Kimitei R., K., Korir, B., K. and Kaguthi, P. (2012). Honey Production and Marketing
System, Challenges and Opportunities In South Eastern Kenya 13nth KARI Biannual
conference;book of absracts. Niarobi: KARI.
Kiptarus, Asiko, G., Muriuki, J. and Biwott, A. (2011). Beekeeping In Kenya: The Current
Situation. Paper presented at the 42nd International Apicultural Congress, Buenos
Aires, Argentina.
Kiptarus J., K. (2005). Focus On Livestock Sector: Supply Policy Framework Strategies
Status And Links WIith Value Addition. Paper presented at the Value Asses Food &
Export Investment, The Grand Regency Hotel, Nairobi.
KIT and IIRR. (2010). Financing the honey chain in Kitui, Eastern Kenya Value Chain
Finance: Beyond microfinance for rural entrepreneurs. Nirobi, Kenya: Royal
Tropical Institute, Amsterdam International Institute of Rural Reconstruction: ISBN
139789460220555.
Kosgei R., Sulo, T. and Chepng'eno, W. (2011). ''Structure, conduct and performance of
honey marketing in West Pokot district, Kenya''. European Journal of Management,
11(4).
Mugendi K., D. (2012). Adoption Of Bee Farming As An Adaptation Strategy For Rainfall
Variability Effects On Food Security Among The Vulnerability Communities In
Kenya: Case Of Kitui County. (Masters), University Of Nairobi, Nairobi.
Muriuki J., M. (2004). Beekeeping technology adoption and its effects on reaource
productivity in Southern Kenya Rangelands. (masters), University of Nairobi,
Nairobi.
Mutisya J., S. (2011). An entrepreneurial assessment of the market access for honey and
honey product in the city of Nairobi, Kenya. (PhD Dissertation), University of
Nairobi, Nairobi, Kenya.
Muya B. I. (2004). ''An analysis report on Kenya’s apiculture sub-sector''. BENFLO
consultants, Nairobi.
Okinyi B., P., Mbae, R., M. , Ruhi, Z., W. and Mbithi, J. (2005). Survey Of Honey Quality
In Kenyan Markets. In A. a. E. L. D. i. t. M. o. Livestock (Ed.). Nairobi: Government
of Kenya.
Orina N., I. (2012). Quality And Safety Characteristics Of Honey Produced In Different
Regions Of Kenya. (Master of Science ), Jomo Kenyatta University of Technology,
Nairobi, Kenya.
Oyuga J., K. (2008). Honey market structure and pricing efficiency in the pastoral areas of
Baringo District, Kenya. (Masters), university of Nairobi, Nairobi, Kenya.
Republic of Kenya. (2001). Apiculture (Bee Keeping) Industry Sub-sector. Nairobi.
Republic of Kenya. (2008). Session Paper No2 Of 2008 On National Livestock Policy.
Nairobi.
39
Republic of Kenya. (2011). Kenya Population Datasheet.
Republic of Uganda. (2012). The National Bee Keeping Training and Extension Manual.
Kampala: GoU.
Watson D., J. and van Binsbergen, J. (2008). Livelihood diversifi cation opportunities for
pastoralists in Turkana, Kenya ILRI Research Report 5 (pp. 43). Nairobi, Kenya: ILRI
(International Livestock Research Institute).
Wu S., Fooks, J. R., Messer, K. D. and Delaney, D. (2015). ''Consumer demand for local
honey''. Applied Economics, 47(41), 4377-4394. doi:
10.1080/00036846.2015.1030564
40
CHAPTER FOUR
4.0 CONSUMER AWARENESS OF GI LABELLING
This chapter discusses consumer awareness of origin labels; it was motivated by honey
adulteration problem. Urban honey consumers were interviewed in multistage sampling
method to evaluate their knowledge of GI and the factors influencing their awareness. The
results reveal limited consumer knowledge of GI. Also positive determinants of GI awareness
are gender, trust, education, source of honey and seeking prior information. However, the
negative significant influencer includes consumers’ confidence in honey produced by local
farmers. Therefore, consumers should be educated on GI as it is implemented in the country.
4.1 Background Information
No interest without awareness, consumers would only be willing to buy and by extension pay
a premium for what they know. So it is important to gauge their prior knowledge of GI.
Product awareness is the ability of the decision-makers in organizational buying centres to
recognize or recall a product brand (Homburg et al., 2010). In this case, Kenyan consumers’
ability to identify geographical indicated products from others. Moreover there are popular
honey brands that have been awarded Protected Geographic Indication (PGI) internationally,
such as Oku honey from Cameroon, which is white in colour with naturally creamy texture
(Boto et al., 2013). In addition, Manuka honey from New Zealand is sold for medicinal
values and Coorg honey from India is popular for biodiversity conservation (Belletti et al.,
2011). Some more brands have been proposed for having a potential like the Nile honey from
Uganda (Boto et al., 2013).
In Kenya, coffee and tea have been registered for geographical protection through
certification marks; Ngoro Ngoro Mountain coffee, Gathuthi tea, Kisii. Moreover, potential
honey included Kitui, West Pokot and Baringo Honey (O'connor, 2013; ARIPO, 2012).
41
However, local Geographical labelled honey is yet to be registered. Local consumers still
have access to imported honey brands that are geographically indicated.
Studies have been done in developed nations to gauge the awareness and preference of
different GI labels (Cottrill, 2015; Awada and Yiannaka, 2011; Menapace et al., 2009). To
characterise different food products with regard to geographical spatial distribution (De Alda-
Garcilope et al., 2012). Also, consumer WTP for different GI labels(Seetisarn and
Chiaravutthi, 2011). In addition, reviews on the economics of GI and ways of evaluating GI
(Belletti et al., 2011; Menapace et al., 2009). Moreover, there has been increased interest on
investigating GI in developing continents like Africa (ARIPO, 2012; Blakeney et al., 2012).
To be specific, in Kenya coffee has been studied as potential GI product (Bagal et al., 2013).
Following the challenges of information asymmetry problems mainly honey adulteration, it is
expected that consumers would be aware of food labels that ensure food quality like
geographical indicators. However, consumers may be aware of food safety risk but still be
unaware of solutions to it like organic foods. Since GI aims at reducing information cost
(WIPO, 2009), it is important to note that, Kenyans are aware of innovations that reduce
transaction costs and have adopted them like M-banking in Kenya (Kirui et al., 2010). Also,
mass media is important for awareness (Ajayi, 2014).
Previous studies in Kenya have widely covered various food product aspects; genetic
modification, organic, types of standardisation bodies and environmental issues like climate
change (Okello et al., 2011; Kimemia and Oyare, 2006; Kimenju and De Groote, 2005).
Furthermore, awareness studies of different quality product labels have been done both
locally and internationally for organic products and genetically modified(GM) foods
(Kimemia and Oyare, 2006; Kimenju and De Groote, 2005). However, there is literature gap
on consumer awareness of GI in developing nations and specifically honey urban consumers
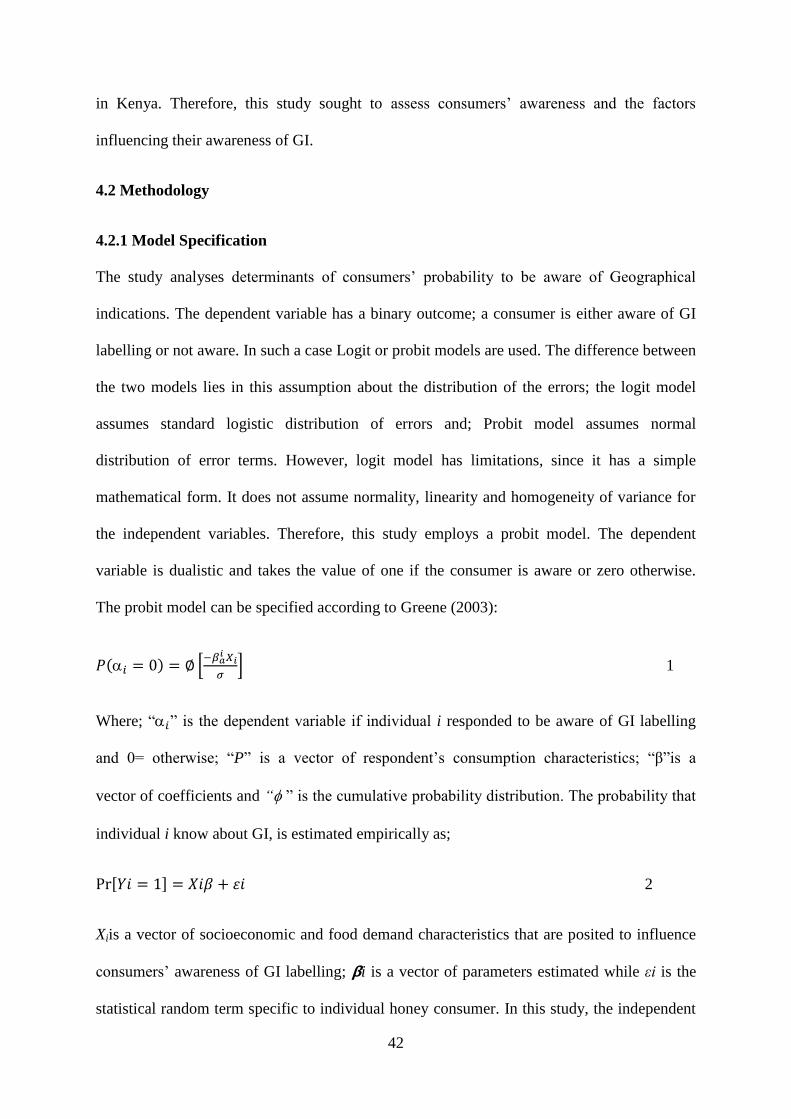
42
in Kenya. Therefore, this study sought to assess consumers’ awareness and the factors
influencing their awareness of GI.
4.2 Methodology
4.2.1 Model Specification
The study analyses determinants of consumers’ probability to be aware of Geographical
indications. The dependent variable has a binary outcome; a consumer is either aware of GI
labelling or not aware. In such a case Logit or probit models are used. The difference between
the two models lies in this assumption about the distribution of the errors; the logit model
assumes standard logistic distribution of errors and; Probit model assumes normal
distribution of error terms. However, logit model has limitations, since it has a simple
mathematical form. It does not assume normality, linearity and homogeneity of variance for
the independent variables. Therefore, this study employs a probit model. The dependent
variable is dualistic and takes the value of one if the consumer is aware or zero otherwise.
The probit model can be specified according to Greene (2003):
𝑃(𝑖 = 0) = ∅ [−𝛽𝑎
𝑖 𝑋𝑖
𝜎] 1
Where; “𝑖” is the dependent variable if individual i responded to be aware of GI labelling
and 0= otherwise; “P” is a vector of respondent’s consumption characteristics; “β”is a
vector of coefficients and “ ” is the cumulative probability distribution. The probability that
individual i know about GI, is estimated empirically as;
Pr[𝑌𝑖 = 1] = 𝑋𝑖𝛽 + 𝜀𝑖 2
Xiis a vector of socioeconomic and food demand characteristics that are posited to influence
consumers’ awareness of GI labelling; 𝝱i is a vector of parameters estimated while εi is the
statistical random term specific to individual honey consumer. In this study, the independent
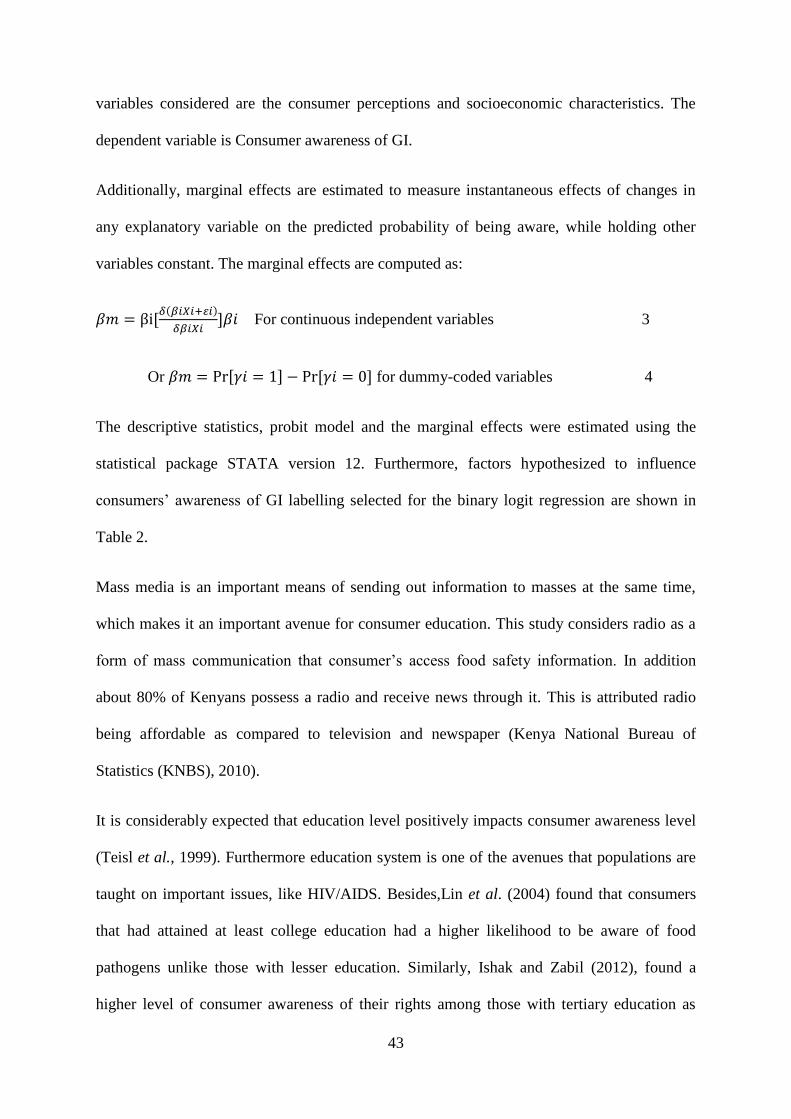
43
variables considered are the consumer perceptions and socioeconomic characteristics. The
dependent variable is Consumer awareness of GI.
Additionally, marginal effects are estimated to measure instantaneous effects of changes in
any explanatory variable on the predicted probability of being aware, while holding other
variables constant. The marginal effects are computed as:
𝛽𝑚 = βi[𝛿(𝛽𝑖𝑋𝑖+ 𝑖)
𝛿𝛽𝑖𝑋𝑖]𝛽𝑖 For continuous independent variables 3
Or 𝛽𝑚 = Pr[𝛾𝑖 = 1] − Pr[𝛾𝑖 = 0] for dummy-coded variables 4
The descriptive statistics, probit model and the marginal effects were estimated using the
statistical package STATA version 12. Furthermore, factors hypothesized to influence
consumers’ awareness of GI labelling selected for the binary logit regression are shown in
Table 2.
Mass media is an important means of sending out information to masses at the same time,
which makes it an important avenue for consumer education. This study considers radio as a
form of mass communication that consumer’s access food safety information. In addition
about 80% of Kenyans possess a radio and receive news through it. This is attributed radio
being affordable as compared to television and newspaper (Kenya National Bureau of
Statistics (KNBS), 2010).
It is considerably expected that education level positively impacts consumer awareness level
(Teisl et al., 1999). Furthermore education system is one of the avenues that populations are
taught on important issues, like HIV/AIDS. Besides,Lin et al. (2004) found that consumers
that had attained at least college education had a higher likelihood to be aware of food
pathogens unlike those with lesser education. Similarly, Ishak and Zabil (2012), found a
higher level of consumer awareness of their rights among those with tertiary education as
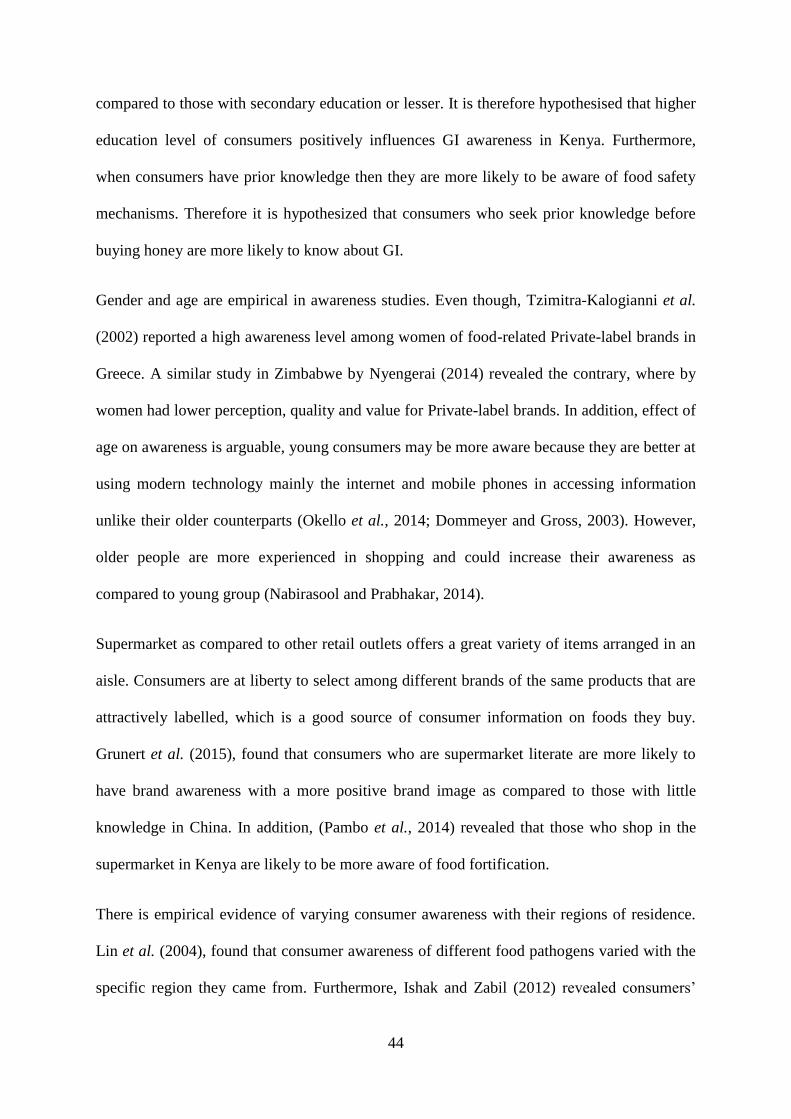
44
compared to those with secondary education or lesser. It is therefore hypothesised that higher
education level of consumers positively influences GI awareness in Kenya. Furthermore,
when consumers have prior knowledge then they are more likely to be aware of food safety
mechanisms. Therefore it is hypothesized that consumers who seek prior knowledge before
buying honey are more likely to know about GI.
Gender and age are empirical in awareness studies. Even though, Tzimitra-Kalogianni et al.
(2002) reported a high awareness level among women of food-related Private-label brands in
Greece. A similar study in Zimbabwe by Nyengerai (2014) revealed the contrary, where by
women had lower perception, quality and value for Private-label brands. In addition, effect of
age on awareness is arguable, young consumers may be more aware because they are better at
using modern technology mainly the internet and mobile phones in accessing information
unlike their older counterparts (Okello et al., 2014; Dommeyer and Gross, 2003). However,
older people are more experienced in shopping and could increase their awareness as
compared to young group (Nabirasool and Prabhakar, 2014).
Supermarket as compared to other retail outlets offers a great variety of items arranged in an
aisle. Consumers are at liberty to select among different brands of the same products that are
attractively labelled, which is a good source of consumer information on foods they buy.
Grunert et al. (2015), found that consumers who are supermarket literate are more likely to
have brand awareness with a more positive brand image as compared to those with little
knowledge in China. In addition, (Pambo et al., 2014) revealed that those who shop in the
supermarket in Kenya are likely to be more aware of food fortification.
There is empirical evidence of varying consumer awareness with their regions of residence.
Lin et al. (2004), found that consumer awareness of different food pathogens varied with the
specific region they came from. Furthermore, Ishak and Zabil (2012) revealed consumers’
45
awareness varied with location and more-urban dwellers were less aware of their rights in
Malaysia. However, it is also possible that City residents may be more aware of GI because
they have access to more information channels like public campaigns than their rural
counterparts.
Consumer trust in food products influence their attitude and eventually purchase decision.
More so, Chen (2013), found consumer trust in manufacturers and retailer positively impacts
food safety decisions. Therefore, the current study hypothesizes that if a consumer trusts their
potential listed GI food product, then they are likely to be more aware of GI as compared to
those that luck trust.
Consumers’ strong perception of local honey at farm level is a pre-requisite of GI
implementation, its impact on awareness is also important. The challenge of honey
adulteration in the country made it necessary to see into consumers’ confidence in local
honey at farm gate. Previous studies have however reported that confidence in farmers is not
directly related to food safety perception (Chen, 2013). Nevertheless, because GI relates to
product origin, the current study hypothesizes that consumers who are confident in local
honey at farm level maybe more aware of GI.
Marriage and members of the same households (household size) in this study are considered
as an organisation just like formal groups. There is usually structured flow of information in
such organisation, which makes it members to be more aware than the rest (Pambo et al.,
2014). Therefore, it is expected that if a consumer is married or from a larger household size,
they are likely to be more aware about GI.
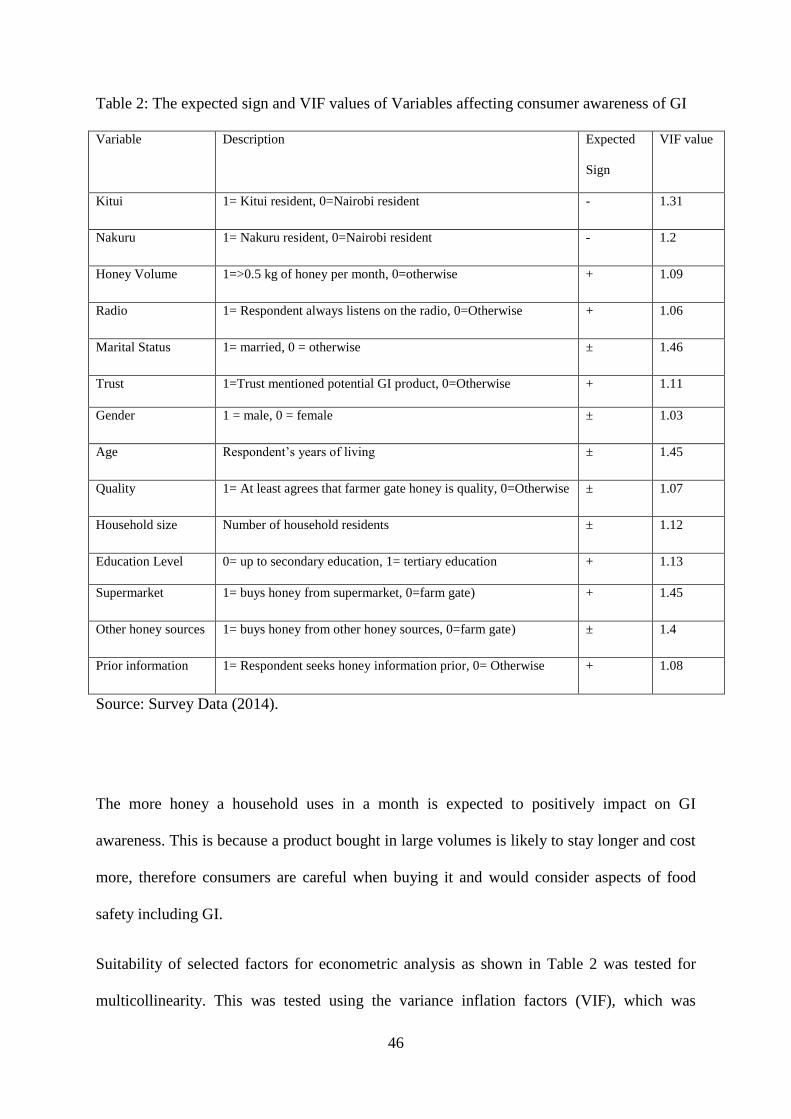
46
Table 2: The expected sign and VIF values of Variables affecting consumer awareness of GI
Variable Description Expected
Sign
VIF value
Kitui 1= Kitui resident, 0=Nairobi resident - 1.31
Nakuru 1= Nakuru resident, 0=Nairobi resident - 1.2
Honey Volume 1=>0.5 kg of honey per month, 0=otherwise + 1.09
Radio 1= Respondent always listens on the radio, 0=Otherwise + 1.06
Marital Status 1= married, 0 = otherwise ± 1.46
Trust 1=Trust mentioned potential GI product, 0=Otherwise + 1.11
Gender 1 = male, 0 = female ± 1.03
Age Respondent’s years of living ± 1.45
Quality 1= At least agrees that farmer gate honey is quality, 0=Otherwise ± 1.07
Household size Number of household residents ± 1.12
Education Level 0= up to secondary education, 1= tertiary education + 1.13
Supermarket 1= buys honey from supermarket, 0=farm gate) + 1.45
Other honey sources 1= buys honey from other honey sources, 0=farm gate) ± 1.4
Prior information 1= Respondent seeks honey information prior, 0= Otherwise + 1.08
Source: Survey Data (2014).
The more honey a household uses in a month is expected to positively impact on GI
awareness. This is because a product bought in large volumes is likely to stay longer and cost
more, therefore consumers are careful when buying it and would consider aspects of food
safety including GI.
Suitability of selected factors for econometric analysis as shown in Table 2 was tested for
multicollinearity. This was tested using the variance inflation factors (VIF), which was
47
computed for each of the consumer characteristics. The VIF computation involves estimation
of ‘artificial’ ordinary least squares (OLS) regressions between each of the consumer
characteristics as the ‘dependent’ variable with the rest as dependent variables (Pambo et al.,
2014; Otieno, 2012). The VIF for each factor is calculated as:
𝑉𝐼𝐹𝑖 =1
1−𝑅𝑖2 5
Where 𝑅𝑖2is the R
2 of the artificial regression with the ith independent variable as a
‘dependent’ variable.
The mean VIF was 1.21with individual ranging from 1.46 to 1.03 indicating absence of
multicollinearity. Maddala (2001), suggested that variables with VIF<5 have no
multicollinearity; hence they are selected for inclusion in the probit regression. In addition,
there was a problem of non-constant variance, which was solved by use of robust standard
errors. All the same the binary probit regression fit the data well with an R-squared of about
0.20, this is acceptable since, works done by Domencich and McFadden (1975), revealed that
R squared values between 0.2-0.4 are correspond to values between 0.7-0.9 for the same in
ordinary linear regression. In addition, the analysis had significant chi of 78.42 at 1% and a
log-likelihood with the right negative sign of -256.86.
4.3 Results and Discussion
4.3:1 Awareness of GI in Kenya
About 35% of honey consumers claim to know about GI in the urban areas of Kenya. Results
show that education and income explain GI awareness significantly at 1%. Kimenju and De
Groote (2005), reported almost similar results: about 38% of Nairobi consumers were aware
of GM foods. More so, income and education significantly affected GM awareness.

48
To evaluate the depth of GI knowledge, respondents picked the definition they deemed best
for GI, among four definitions that the author provided. The best definition of GI was picked
by only 31% of the respondents; in addition, the least definition was selected by the majority
59%. This shows limited levels of GI knowledge depth despite the convincing numbers of
those who claim to have heard about it. About 10% of respondents have average knowledge
of GI. The paired t-test shows a significant (1%) relationship between the level of education
and the definition picked. These findings show the need for creating awareness about GI and
its role in development as a whole.
The study also investigated the different sources of GI knowledge; the rationale being the
identification of various channels is that most suit future information dissemination. Friends
and mass media lead by 36% and 41% respectively. The former shows the relevance of social
capital in spreading information. Hence need to explore various channels like social media in
information transmission. The latter is backed up by the findings of a number of awareness
studies (Ajayi, 2014; Cheng, 2011; Kimenju et al., 2005). Other sources of GI information
are mainly different forms of learning like schooling and work experience.
About 73% of respondents claim to know a potential GI product. Honey, tea, rice, Sugar and
milk are the products listed to be the likely potential GI goods in Kenya. Honey and tea have
been identified before in a baseline study by a joint project between the Government of
Kenya and Swiss; although, it is the first time for sugar, rice and milk to be documented
(KIPI, 2009). These products have to come from a specific area, which impact the uniqueness
of the product; therefore respondents had to state the area source. Honey from Kitui or
Baringo, Milk from Molo, rice from Mwea and Ahero, Sugar from Mumias and tea from
Kericho were the most commonly listed potential GI foods. When asked if they trust their
listed potential GI products, about 83% trust them. Consumer’s trust for food products is
49
important since it influences even the level of consumer’s WTP for certified animal-friendly
products (Nocella et al., 2007).
Approximately 57% of urban Kenyan honey consumers know a potential GI honey; about
53% of these have used this honey. Those that have consumed the potential GI honey claim it
to be better from other brands by it being pure, tasty, natural, quality, sweeter, thick and
colour. These are honey attributes that consumers rank to be important or missing in the
honey market. These attributes originate from various rainfall and specific cultures observed
by residents of an area. However, some consumers are indifferent on potential GI honey and
others. Those that have not consumed potential GI honey that they mentioned earlier blame it
on its unavailability, lack of labels, expensive, lack of interest, and lack of information. Some
consumers claim potential GI honey as untrustworthy because of adulteration; this is a show
of mistrust in local standard bodies.
GI labelling has plenty of benefits for both consumers and producers (Teuber, 2011). Its
importance in quality assurance is agreed on by majority of respondents by about 65%. This
is in line with the recent consumer concern of product quality (Ngigi et al., 2010) and use of
GI as a quality indicator (Menapace and Moschini, 2011). Moreover, about 35.8% of honey
consumers agree that GI labelling could enhance rural development. Since the study is urban
it therefore shows the concern that urban consumers have for rural farmers’ welfare.
Protection of reputation of product follows closely by 35.6%, this is important in conserving
traditional and cultural values of different products (O'connor, 2013; Smith, 1973). The last
ranked GI benefit is spread of information with about 26% this could explain the limits of GI
knowledge in Kenya as recorded in the study.
50
4.3.2 Honey Consumption Patterns
Honey is consumed regularly by roughly 64% urban residents in Kenya. The main honey use
for about a half of the population is bread spread. These results are in line with Mutisya
(2011), who found honey’s main use is food. Honey is mainly used as medicine by about
22% of respondents. This is mentioned for its ability to naturally cure common cold (Muthui,
2012). Most individuals that are advised by their doctors not to consume sugar use honey as a
sweetener. They account for 18% of the respondents. Baby use, honey as a preservative and
cookery accounts jointly for 4% of respondents. Other honey uses include licking, alcohol
production, beauty, and as water additive.
The main reasons picked by those who don’t consume honey regularly include it being
expensive to about 31% of them. Other reasons follow by 25%; honey being too sugary, used
for medicinal purpose only, causing allergy, consumers’ preference for substitutes, stomach-
ache respectively. About 23% of these report unavailability of honey. Nearly 15% find honey
quality sold by major retail outlets to be untrustworthy. This is a major issue in the world
honey market (CIAFS, 2012), and it leads to different standards for curbing adulteration.
However, 6% could not tell why they don’t consume honey regularly.
Majority of honey consumers in Kenya find medicinal and health benefits combined as their
motivation of honey consumption (41%). Medicinal use slightly supersedes the healthy
lifestyle motivation, they account for 26% and 27% each. Those who find religious and
customary reasons and those who have no idea of what motivates their honey consumption
are jointly only about 3%.
On average, consumers use honey twice a day. However, almost half of the respondents use
honey once a day, twice are only about 28% and three times are approximately 12%. The
other times of use include once in a while, once or twice a week and a lot of times.
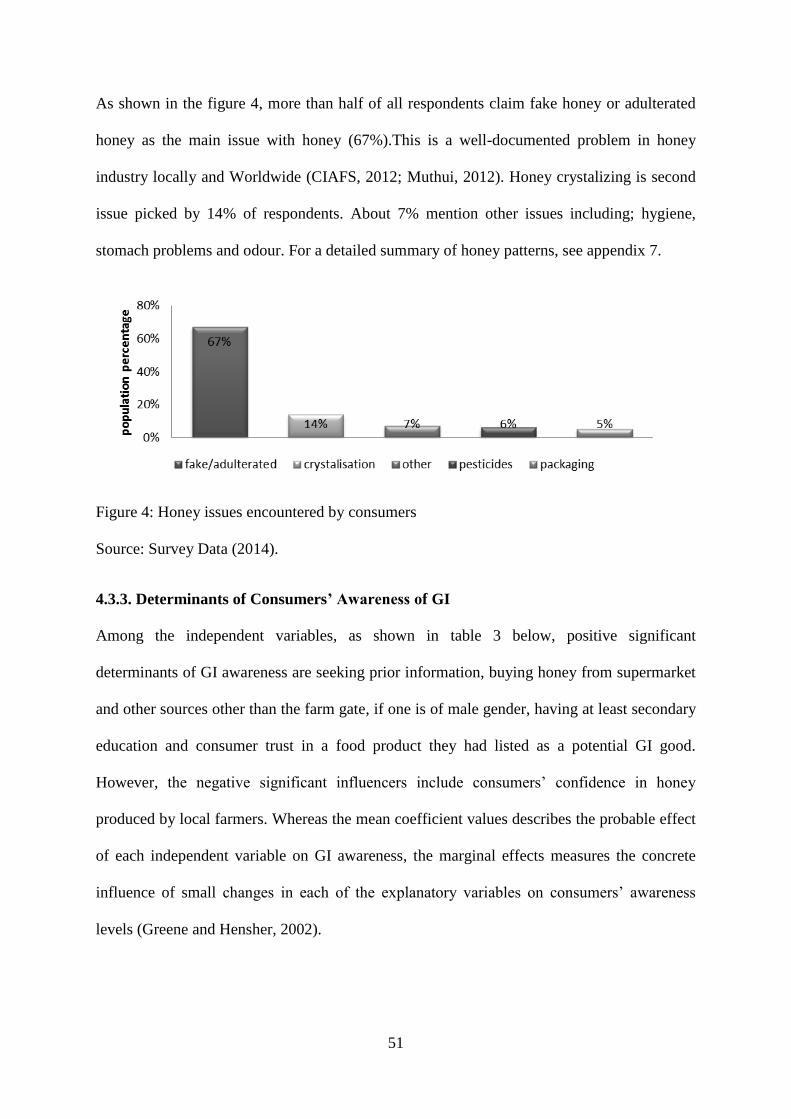
51
As shown in the figure 4, more than half of all respondents claim fake honey or adulterated
honey as the main issue with honey (67%).This is a well-documented problem in honey
industry locally and Worldwide (CIAFS, 2012; Muthui, 2012). Honey crystalizing is second
issue picked by 14% of respondents. About 7% mention other issues including; hygiene,
stomach problems and odour. For a detailed summary of honey patterns, see appendix 7.
Figure 4: Honey issues encountered by consumers
Source: Survey Data (2014).
4.3.3. Determinants of Consumers’ Awareness of GI
Among the independent variables, as shown in table 3 below, positive significant
determinants of GI awareness are seeking prior information, buying honey from supermarket
and other sources other than the farm gate, if one is of male gender, having at least secondary
education and consumer trust in a food product they had listed as a potential GI good.
However, the negative significant influencers include consumers’ confidence in honey
produced by local farmers. Whereas the mean coefficient values describes the probable effect
of each independent variable on GI awareness, the marginal effects measures the concrete
influence of small changes in each of the explanatory variables on consumers’ awareness
levels (Greene and Hensher, 2002).
52
From the results we note that information is a substantial determinant of GI awareness. If a
consumer seeks prior information about different labelling aspect of honey, then their chance
of knowing about GI increases unlike those that don’t seek prior information by 13%.
The negative relationship between consumers’ confidence in local honey producers and
awareness of GI means that when consumers are contented with the quality of products they
buy, they may not be interested to know about other food labels that may insinuate quality.
There is however no significant difference across countries for confidence in local honey
handled by farmers. Likewise, Verbeke (2009), found that consumers rely more on other
quality marks other than origin marks. More so, buying honey from the supermarket and
other sources other than the farm gate increases consumer’s awareness of GI by 14% and
16% respectively. This is because Supermarkets provide additional information for a variety
of product brands, displayed in an attractive way.
Consumer trust is crucial for product loyalty and the belief in its nutritional content (Nocella
et al., 2007; Moon and Balasubramanian, 2004). Results show that consumers, who trust
potential GI food they had identified, have higher likelihood of being aware of GI relative to
those who don’t trust. This is also main determinant of GI awareness. However, Consumers
trust in their listed potential GI products significantly varies across the counties, with Nakuru
leading by about 74% and Kitui the least with 45%. This means when implementing GI
products, its adoption will also vary across regions.
Honey is a special product that relates well with the origins nature like climate, floral source
and the culture of those who handles it(Stolzenbach et al., 2011; Kaškonienė and
Venskutonis, 2010). Hence, ability to consume more than 0.5 kgs of honey bought per month
in the household increases the likelihood of GI awareness by 0.08, ceteris peribus. The study
also reveals that majority of large volumes of honey are bought from farmers who come from
53
a specific area. This is already relates to GI. This also relates to the purity of honey, since the
less honey is processed or the shorter the value chain the more likely that it is unadulterated
(Oyuga, 2008).
If a respondent is of male gender, their likelihood of consumer’s GI awareness increases as
compared to their female counterparts. Furthermore, about 70% of those who know about GI
and still 80% of those who picked the best GI definition are male. This is despite the
immense decision making and food preparation roles women play as the shoppers of meals
consumed in the households. Likewise, Tzimitra-Kalogianni et al. (2002) found that male
consumers were more aware of Food-Related Private–Label Brands.
Having attained tertiary education increases awareness relative to those with secondary
school education or lower. In addition, the main other sources (about 6%) of GI knowledge is
through learning institution. Furthermore, majority of Nairobi residents have post-secondary
education and are more aware of GI relative to their counterparts in Kitui and Nakuru. These
results are similar to Lin et al. (2004), who found that consumers with at least college
education were more likely to have heard of pathogen unlike those with less education. This
shows the relevance of consumer education in spreading awareness. Hence relevant
stakeholders should adopt this avenue in increasing consumer awareness.
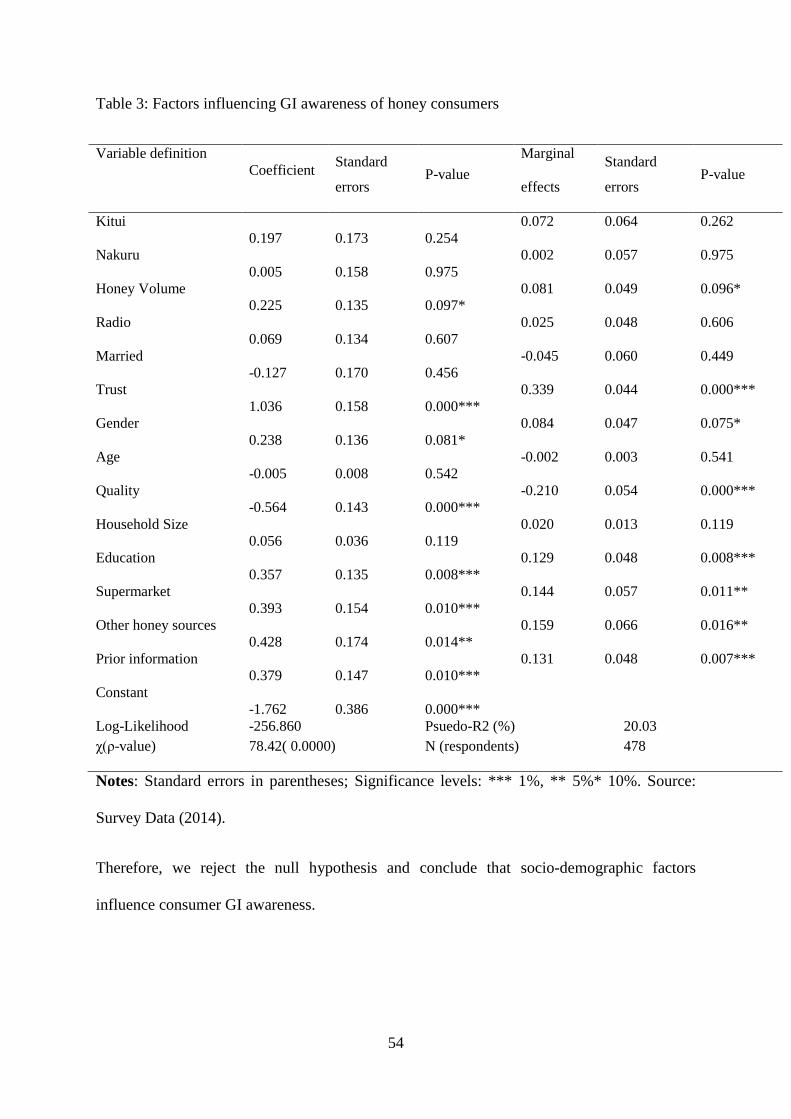
54
Table 3: Factors influencing GI awareness of honey consumers
Variable definition
Coefficient Standard
errors P-value
Marginal
effects
Standard
errors P-value
Kitui
0.197 0.173 0.254
0.072 0.064 0.262
Nakuru
0.005 0.158 0.975
0.002 0.057 0.975
Honey Volume
0.225 0.135 0.097*
0.081 0.049 0.096*
Radio
0.069 0.134 0.607
0.025 0.048 0.606
Married
-0.127 0.170 0.456
-0.045 0.060 0.449
Trust
1.036 0.158 0.000***
0.339 0.044 0.000***
Gender
0.238 0.136 0.081*
0.084 0.047 0.075*
Age
-0.005 0.008 0.542
-0.002 0.003 0.541
Quality
-0.564 0.143 0.000***
-0.210 0.054 0.000***
Household Size
0.056 0.036 0.119
0.020 0.013 0.119
Education
0.357 0.135 0.008***
0.129 0.048 0.008***
Supermarket
0.393 0.154 0.010***
0.144 0.057 0.011**
Other honey sources
0.428 0.174 0.014**
0.159 0.066 0.016**
Prior information
0.379 0.147 0.010***
0.131 0.048 0.007***
Constant
-1.762 0.386 0.000***
Log-Likelihood -256.860 Psuedo-R2 (%) 20.03
χ(ρ-value) 78.42( 0.0000) N (respondents) 478
Notes: Standard errors in parentheses; Significance levels: *** 1%, ** 5%* 10%. Source:
Survey Data (2014).
Therefore, we reject the null hypothesis and conclude that socio-demographic factors
influence consumer GI awareness.
55
4.4 Conclusions and Implications
The study reveals that a 35% of consumers are aware of GI through friends and mass media.
However, they have limited GI knowledge. Never the less, about 83% of consumers trust tea,
milk, honey, rice and sugar as having a potential for GI labelling. But, potential GI honey
should be pure, tasty, natural, quality, sweeter, thick and with a distinct colour. Consumers
perceive the benefits of GI labelling as mainly for quality assurance. Majority of honey
consumers (64%), use it regularly as bread spread. However, high honey prices hamper its
use, motivated mainly for its medicinal and health benefits. The main issue is honey
adulteration.
Further, results revealed that positive significant determinants of GI awareness are seeking
prior information, the more honey volumes a household consumes, if one is of male gender,
having tertiary education and consumer trust in a food product they had listed as a potential
GI good. Therefore, stakeholders should educate female honey shoppers and those that are
confident with farm gate honey, on GI labels and its benefits since women mostly play a
major role in their household’s food choices. Also, trusted foods should be prioritised when
implementing GI. Also, keen consumers that are learned and those that buy large volumes of
honey should be provided with sufficient information to aid in their choice among honey
brands.
56
References
Ajayi J., O. (2014). ''Awareness of Climate Change and Implications for Attaining the
Millennium Development Goals (MDGS) in Niger Delta Region of Nigeria''. Agris
on-line Papers in Economics and Informatics, VI.
ARIPO. (2012). The protection of Geographical Indications (GIs) in Africa. Paper presented
at the Information Seminar on the Implementation of the EU-ESA Interim EPA,
Mauritius.
Awada L. and Yiannaka, A. (2011). ''Consumer perceptions and the effects of country of
origin labeling on purchasing decisions and welfare''. Food Policy, 37(1), 21-30. doi:
http://dx.doi.org/10.1016/j.foodpol.2011.10.004
Bagal M., Belletti, G., Marescotti, A. and Onori, G. (2013). Study on the potential of
marketing of Kenyan Coffee as Geographical Indication. In R. SA (Ed.), study on the
potential for marketing agricultural products of the ACP countries using
geographical indications and origin branding Lausanne: European Commission.
Belletti G., Paus, M., Reviron, S., Deppeler, A., Stamm, H. and Thévenod-Mottet, E. (2011).
''The Effects of Protecting Geographical Indications Ways and Means of their
Evaluation''. Publication, 7(07.11).
Blakeney M., Coulet, T., Mengistie, G. and Mahop, T., M. (2012). Extending the protection
of Geographical indicattions: Case studies of Agricultural products in Africa:
Earthscan: ISBN ISBN 9780415501026.
Boto I., Philips, S., Fay, F. and Vassilakis, G. (2013). The Geography of food: reconnecting
with origin in the food system. Paper presented at the Brussels Rural Development
Briefings: A series of meetings on ACP-EUEU development issues, Brussels.
Chen W. (2013). ''The effects of different types of trust on consumer perceptions of food
safety: An empirical study of consumers in Beijing Municipality, China''. China
Agricultural Economic Review, 5(1), 43-65. doi: doi:10.1108/17561371311294757
Cheng K.-W. (2011). ''The Effect of Contraceptive Knowledge on Fertility: The Roles of
Mass Media and Social Networks''. Journal of Family and Economic Issues, 32(2),
257-267. doi: 10.1007/s10834-011-9248-1
CIAFS. (2012). The world market for honey Market survey#1: Capacity to improve
agriculture and food security.
Cottrill C. D. (2015). ''Location privacy preferences: A survey-based analysis of consumer
awareness, trade-off and decision-making''. Transportation Research Part C:
Emerging Technologies, 56, 132-148.
De Alda-Garcilope C., Gallego-Picó, A., Bravo-Yagüe, J., C. , Garcinuño-Martínez , R. M.
and Fernández-Hernando, P. (2012). ''Characterization of Spanish honeys with
protected designation of origin ‘‘Miel de Granada’’ according to their mineral
content''. Food chemistry, 135(2012), 1785–1788.
57
Domencich T. and McFadden, D. (1975). ''Urban travel demand: a behavioural approach''.
Amsterdam: North-Hollan Publishing Co.
Dommeyer C. J. and Gross, B. L. (2003). ''What consumers know and what they do: An
investigation of consumer knowledge, awareness, and use of privacy protection
strategies''. Journal of Interactive Marketing, 17(2), 34-51.
Greene W. (2003). Econometric Analysis New York.: Macmillan Publishers. New York.
Greene W., H. and Hensher, D., A. (2002). ''A latent class model for discrete choice analysis:
contrasts with mixed logit''. Transportation Research Part B, 37(2003), 681–698. doi:
10.1016/S0191-2615(02)00046-2
Grunert K. G., Loebnitz, N. and Zhou, Y. (2015). Supermarket literacy and use of branding in
China: The case of fresh meat. Paper presented at the 143rd Joint EAAE/AAEA
Seminar, March 25-27, 2015, Naples, Italy.
Homburg C., Klarmann, M. and Schmitt, J. (2010). ''Brand awareness in business markets:
When is it related to firm performance''. Intern. J. of Research in Marketing,
27(2010), 201–212.
Ishak S. and Zabil, N. F. M. (2012). ''Impact of Consumer Awareness and Knowledge to
Consumer Effective Behavior''. Asian Social Science, 8(13).
Kaškonienė V. and Venskutonis, P., R. (2010). ''Floral Markers in Honey of Various
Botanical and Geographic Origins: A Review''. Comprehensive Reviews in Food
Science and Food Safety, 9(6), 620-634. doi: 10.1111/j.1541-4337.2010.00130.x
Kenya National Bureau of Statistics (KNBS). (2010). 2009 Population and Housing Censu.
Nairobi.
Kimemia C. and Oyare, E. (2006). The status of organic Agriculture, production and Trade in
Kenya; Report of the Initial Bckground study of the National Integrated Assessment
of Organic Agriculture sector- Kenya. Nairobi.
Kimenju S., C. and De Groote, H. (2005). Consumers’ Willingness to Pay for Genetically
Modified foods in Kenya. Paper presented at the 11thInternational Congress of the
EAAE (European Association of Agricultural Economists), The Future of Rural
Europe in the Global AgriFood System, Copenhagen, Denmark, .
Kimenju S., C., De Groote, H., Karugia, J., Mbogoh, S. and Poland , D. (2005). ''Consumer
awareness and attitudes toward GM foods in Kenya''. African Journal of
Biotechnology, 4(10), 1066-1075.
KIPI. (2009). MoU Swiss-Kenya project on Geographical indications (SKGI). Nairobi.
Kirui O., K. , Okello, J., J. and Nyikal, R., A. (2010). Awareness and use of m-banking
services in agriculture: The case of smallholder farmers in Kenya. Paper presented at
the Joint 3rd African Association of Agricultural Economists (AAAE) and 48th
Agricultural Economists Association of South Africa (AEASA) Cape Town,South
Africa.
58
Lin C.-T. J., Jensen, K. L. and Yen, S. T. (2004). Determinants of Consumer Awareness of
Foodborne Pathogens. Paper presented at the AAEA annual meeting, Denver CO.
Maddala G. S. (2001). Introduction to Econometrics (Vol. 3rd edition): Wiley and Sons, Inc:
ISBN 13978-0470015124.
Menapace L., Colson, G., Grebitus, C. and Facendola, M. (2009). ''Consumer preferences for
country-of-origin, geographical indication, and protected designation of origin labels''.
Menapace L. and Moschini, G. (2011). ''Quality certification by geographical indications,
trademarks and firm reputation''. European Review of Agricultural Economics, jbr053.
Moon W. and Balasubramanian, S. K. (2004). ''Public attitudes toward agrobiotechnology:
The mediating role of risk perceptions on the impact of trust, awareness, and outrage''.
Review of Agricultural Economics, 26(2), 186-208.
Muthui B., N. (2012). Physiochemical properties of honey from Mwingi and selected urban
areas in Kenya, effect of adulterations and some community awareness levels of
honey adulteration. (Master of science), Kenyatta University, Nairobi.
Mutisya J., S. (2011). An entrepreneurial assessment of the market access for honey and
honey product in the city of Nairobi, Kenya. (PhD Dissertation), University of
Nairobi, Nairobi, Kenya.
Nabirasool D. and Prabhakar, D. (2014). ''Role of Media in Consumer Protection''. IOSR
Journal of Business and Management (IOSR-JBM), 16(2), 01-05.
Ngigi M., W., Okello, J. J., Lagarkvist, C., Karanja, N. and Mburu, J. (2010). Assessment of
developing-country urban consumers’ willingness to pay for quality of leafy
vegetables: The case of middle and high income consumers in Nairobi, Kenya. Paper
presented at the 3rd African Association of Agricultural Economics, AAEA/ AEASA
Conference Cape Town, South Africa.
Nocella G., Hubbard, L. and Scarpa, R. (2007). Consumer trust and willingness to pay for
certified animal-friendly products. University of Waikato, Hamilton, New Zealand.
Nyengerai S. (2014). ''The Relationship between Gender, Product Category and the
Constructs of Private Label Brand Perception in Zimbabwe''. International Journal of
Science and Research (IJSR), 5(622).
O'connor B. (2013). GIs and other instruments for protecting producers' assets in the origin
and tradition of their products:factors of success in ACP countries. Paper presented at
the Geography of food:reconnecting with origin in the food system, Brussels.
Okello J. J., Kirui, O. K., Gitonga, Z. M., Njiraini, G. W. and Nzuma, J. M. (2014).
''Determinants of Awareness and Use ICT-based Market Information Services in
Developing-Country Agriculture: The Case of Smallholder Farmers in Kenya''.
Quarterly Journal of International Agriculture, 53(3), 263-282.
Okello J. J., Narrod, C. A. and Roy, D. (2011). ''Export standards, market institutions and
smallholder farmer exclusion from fresh export vegetable high value chains:
59
experiences from Ethiopia, Kenya and Zambia''. Journal of Agricultural Science, 3(4),
p188.
Otieno D. J. (2012). ''Market and non-market factors influencing farmers’ adoption of
improved beef cattle in Arid and semi-arid areas of Kenya''. Journal of Agricultural
Science, 5(1), p32.
Oyuga J., K. (2008). Honey market structure and pricing efficiency in the pastoral areas of
Baringo District, Kenya. (Masters), university of Nairobi, Nairobi, Kenya.
Pambo K. O., Otieno, D. J. and Okello, J. J. (2014). Consumer awareness of food fortification
in Kenya: The case of vitamin-A-fortified sugar. Paper presented at the International
Food and Agribusiness Management Association (IFAMA) 24th annual world
symposium to be held in Cape Town, South Africa, 16-17 June, 2014, Cape Town,
South Africa.Seetisarn P. and Chiaravutthi, Y. (2011). ''Thai Consumers Willingness
to Pay for Food Products with Geographical Indications''. International Business
Research, 4(3).
Smith D. M. (1973). The geography of social well-being in the United States: An
introduction to territorial social indicators: McGraw-Hill: ISBN 0070585504.
Stolzenbach S., Byrne, D., V. and Bredie, W., L, P. (2011). ''Sensory local uniqueness of
Danish honeys''. Food Research International, 44(2011), 2766-2774.
Teisl M. F., Levy, A. S. and Derby, B. M. (1999). ''The effects of education and information
source on consumer awareness of diet-disease relationships''. Journal of Public Policy
& Marketing, 197-207.
Teuber R. (2011). The economics of geographically differentiated agri-food products:
Theoretical considerations and empirical evidence. (PhD Doctorial dissertation),
Universitätsbibliothek Giessen, Gießen, Germany.
Tzimitra-Kalogianni I., Kamenidou, I., Priporas, C.-V. and Tziakas, V. (2002). ''Age and
Gender Affects on Consumers’ Awareness and Source of Awareness for Food-
Related Private–Label Brands''. Agricultural Economics Review, 3(1), 23-36.
Verbeke W. (2009). ''Market differentiation potential of country-of-origin, quality and
traceability labeling''. The Estey Centre Journal of International Law and Trade
Policy, 10(1), 20.
WIPO. (2009). The Economics Of Intellectual Property;Suggestions for Further Research in
Developing Countries and Countries with Economies in Transition: World Intellectual
Property Organization.
60
CHAPTER FIVE
This Chapter analyses honey consumers perceptions and willingness to pay geographical
indications and other quality attributes of honey, inspired by the issue of honey adulteration.
The findings reveal that consumers have positive preferences for organic, origin, floral
source, thick and either private or a synergy between public and private certification of
honey. Their preference is influenced by education, income levels and attitudes towards
honey standards. We recommend for labelling of foods with GI to control for adulteration.
5.0 CONSUMER’S PERCEPTIONS AND WILLINGNESS TO PAY FOR
GEOGRAPHICAL INDICATION LABELLING
5.1 Background information
The codex Alimentarius is a joint FAO/WHO food standards programme that advocates for
food safety for various foods marketed internationally. Therefore, it provides for the standard
definition of honey and essential attributes of quality honey sold commercially; natural honey
comprises of different sugars, organic acids, enzymes and solid particles resulting from honey
collection (FAO, 2001).
In evaluating consumers’ WTP for quality attributes of honey, the attributes are put into
search, experience and credence attributes according to information theory(Nelson, 1974;
Darby and Karni, 1973; Nelson, 1970). The latter, can never fully be evaluated even after
purchase and consumption and are expensive to judge. If a product attribute is of this nature
then branding and client relationship could help to establish quality (Darby and Karni, 1973).
Honey search attributes includes color, price, appearance, packaging material and size. Then
experience attributes comprises of aroma, flavor, nose/mouth feel, and aftertaste/after feel
(Srinual and Intipunya, 2009). Finally, credence attributes entails labeling with product
61
origin, method of production and with pollen source (Yeow et al., 2013). Honey remains the
most important primary product of beekeeping, since ancient times. It has been put to various
uses that affect consumers’ perception of its diverse attributes. In developed countries various
honey attributes have been extensively studied, which makes it easy classify honey according
to place of origin (Piana et al., 2004).
Labelling of honey in the retail outlets is important and consumers consider its origin and
expiry date (Carroll, 2002). Furthermore, labelling entails the name honey on the package
with floral source or geographical origin (FAO, 2001). Addition of credence attributes like
ways of production and plant source of pollen are vital. This is for the reason that at times
bees may collect pollen that could be poisonous or cause allergies to some consumers (Yeow
et al., 2013).
The main issue in the honey sector worldwide is honey adulteration. This is because, honey is
a scarce product that makes its price too high in comparison to its substitutes(Kosgei et al.,
2011). Thus majority of the countries have standardization bodies like the EU that at some
point banned honey from China for this reason. This however, has led to another level of food
fraud, where honey origin is lied about to avoid high tariffs set for banned countries
(Everstine et al., 2013).
From past literature a number of honey quality attributes are identified, consumers value
different attributes differently and this affects the monetary value they attach to each
attribute. In Kenya it is not known the level of Marginal Willingness to Pay (MWTP) for
quality honey attributes. To be specific, there is no published study on consumer’s WTP for
quality honey in relation to product origin. This leaves agribusinesses and policymakers to
make policy decisions based on asymmetric information about geographical indicators in the
locally produced agricultural products. This study assesses consumers’ WTP for and
62
identified significant factors that influence their WTP for GI and other quality attributes of
honey in Kenya.
5.2 Methodology
The study’s conceptual framework and Sampling and Data Collection methods are already
presented in chapter three.
5.2.1 Definition of Attributes
A review of relevant past studies revealed key honey attributes and their levels that relate to
geographical labelling and other quality honey attributes choice decisions. The attributes
affect respondents’ choices, they are relevant to policy and they are amenable to policy
changes with regards to consumer preferences (Bliemer and Rose, 2010).
The attributes are either: Compulsory features necessary to build confidence for honey
consumers by providing a regulatory framework. This includes Codex standards governing
bee honey essential composition and quality factors, hygiene, contaminants, methods of
sampling and analysis of honey. In addition, the Standards Act Chapter 496 of the laws of
Kenya is implemented by the Kenya Bureau of Standards (KEBS), which is established under
section 3 of the Act to promote the standardization of commodities with reference to their
attributes and how they may be handled (Republic of Kenya, 2012).
The Public Health Act Chapter 242 of the Laws of Kenya, sections 9, 10 and 11, provides for
sanitation rules and orders for protection of food stuffs and storage of food stuffs(Republic of
Kenya, 2012). Also the Food, Drug and Chemical Substances Act Chapter 254 of the laws of
Kenya provides for food labeling, additives and standards(Republic of Kenya, 2012).
Voluntary (optional) attributes are the ones that go into CE design; they provide options for
consumers to make their preferences. They are well illustrated in table 4.
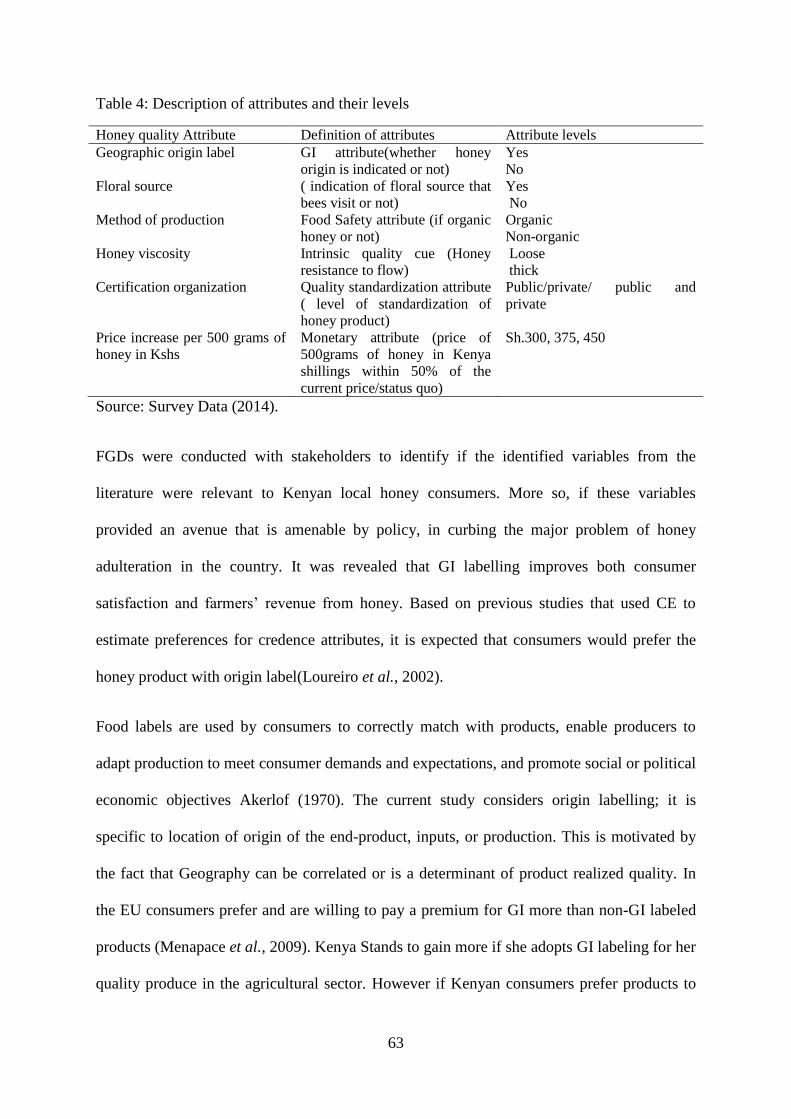
63
Table 4: Description of attributes and their levels
Honey quality Attribute Definition of attributes Attribute levels
Geographic origin label GI attribute(whether honey
origin is indicated or not)
Yes
No
Floral source ( indication of floral source that
bees visit or not)
Yes
No
Method of production Food Safety attribute (if organic
honey or not)
Organic
Non-organic
Honey viscosity Intrinsic quality cue (Honey
resistance to flow)
Loose
thick
Certification organization Quality standardization attribute
( level of standardization of
honey product)
Public/private/ public and
private
Price increase per 500 grams of
honey in Kshs
Monetary attribute (price of
500grams of honey in Kenya
shillings within 50% of the
current price/status quo)
Sh.300, 375, 450
Source: Survey Data (2014).
FGDs were conducted with stakeholders to identify if the identified variables from the
literature were relevant to Kenyan local honey consumers. More so, if these variables
provided an avenue that is amenable by policy, in curbing the major problem of honey
adulteration in the country. It was revealed that GI labelling improves both consumer
satisfaction and farmers’ revenue from honey. Based on previous studies that used CE to
estimate preferences for credence attributes, it is expected that consumers would prefer the
honey product with origin label(Loureiro et al., 2002).
Food labels are used by consumers to correctly match with products, enable producers to
adapt production to meet consumer demands and expectations, and promote social or political
economic objectives Akerlof (1970). The current study considers origin labelling; it is
specific to location of origin of the end-product, inputs, or production. This is motivated by
the fact that Geography can be correlated or is a determinant of product realized quality. In
the EU consumers prefer and are willing to pay a premium for GI more than non-GI labeled
products (Menapace et al., 2009). Kenya Stands to gain more if she adopts GI labeling for her
quality produce in the agricultural sector. However if Kenyan consumers prefer products to
64
be labeled by GI is a dearth of knowledge. This attribute will reveal Kenyan consumers
preference for origin labels.
For honey sold internationally, labelling entails the name honey on the package with floral
source or geographical origin (FAO, 2001). In developed nations honeys are further labelled
with floral source; multiflora or single floral honeys, for example Acacia honey (Piana et al.,
2004). Honey floral source influences the final taste and colour of honey (Anupama et al.,
2003) and consumers vary in their preferences for different taste. Although honey is produced
from all over Kenya under different climatic conditions and floral sources, it is not known
how much consumers value floral source label.
Organic foods are perceived to be safer and their demand is growing with increased consumer
awareness of the effects foods they use (Valerian et al., 2011). There are stringent
requirements for production of organic honey along the value chain, which ensures safety.
Organic honey fetches a premium of up to 300% in the market because of its safe (Kimemia
and Oyare, 2006). It is important to analyse consumer preferences for organic honey as a
quality attribute. More so, in Kenya there is an increase of the middle income consumers who
are aware of food born health risks and would be interested in a products mode of production
(Ngigi et al., 2010).
Honey is a viscous liquid when freshly harvested. Its viscosity varies with honey water
content, temperature and floral source(Srinual and Intipunya, 2009). Some consumers tend to
think loose honey has been diluted. Kenyan honey consumers are therefore hypothesized to
prefer viscous honey to the loose one.
A number of studies have reviewed the role of public regulation and private safety and
quality standards (Henson and Reardon, 2005), third-party certifications(Hatanaka et al.,
2005), grades and standards along the supply food chains (Berdegué et al., 2005). Kenya has
65
a standardizing institution, the KEBs and yet it still experiences the challenges of honey
adulteration. Other alternatives like private standardization and a synergy between public and
private standardization are considered in this study, consumers’ preferences for the three
standardization bodies is evaluated.
Price helps in the identification of welfare interaction effect between the attributes (Bliemer
and Rose, 2010). It provides for WTP for other attributes. The price levels are derived from
the mean price of honey currently 300 for a 500 gram packaged plastic honey filled clear
container. The others 375 and 450 are within the half mean price level (Gonzalez et al.,
2010).
5.2.2 Choice Experiment Design
Choice experiment was used to generate hypothetical alternatives, from the attributes and
levels, which were put together to create choice sets. This produced a full factorial design,
which is made up of all possible combinations of the different levels of each attribute. The
combinations of attributes and their levels were too many; this makes it too costly and tedious
to have respondents to attend to them all (Kuhfeld, 2005). The current design had six
attributes, two with three levels and four attributes with two levels, (42 × 23) = 128 possible
alternatives.
A fractional factorial design was then used, which uses the minimum multiplier of the
different numbers of attributes and levels in the study, 36 product scenarios of two
alternatives were derived in the orthogonal design. These were blocked into 6 profiles of 6
scenarios with two alternatives each. Each honey consumers interviewed in the pilot survey,
responded to 6 scenarios, which was analyzed using Multinomial Logit Model(MNL) to
acquire priors used in another fractional factorial design, that estimated both main and
interaction effects, and alternatives for an efficient design were selected.
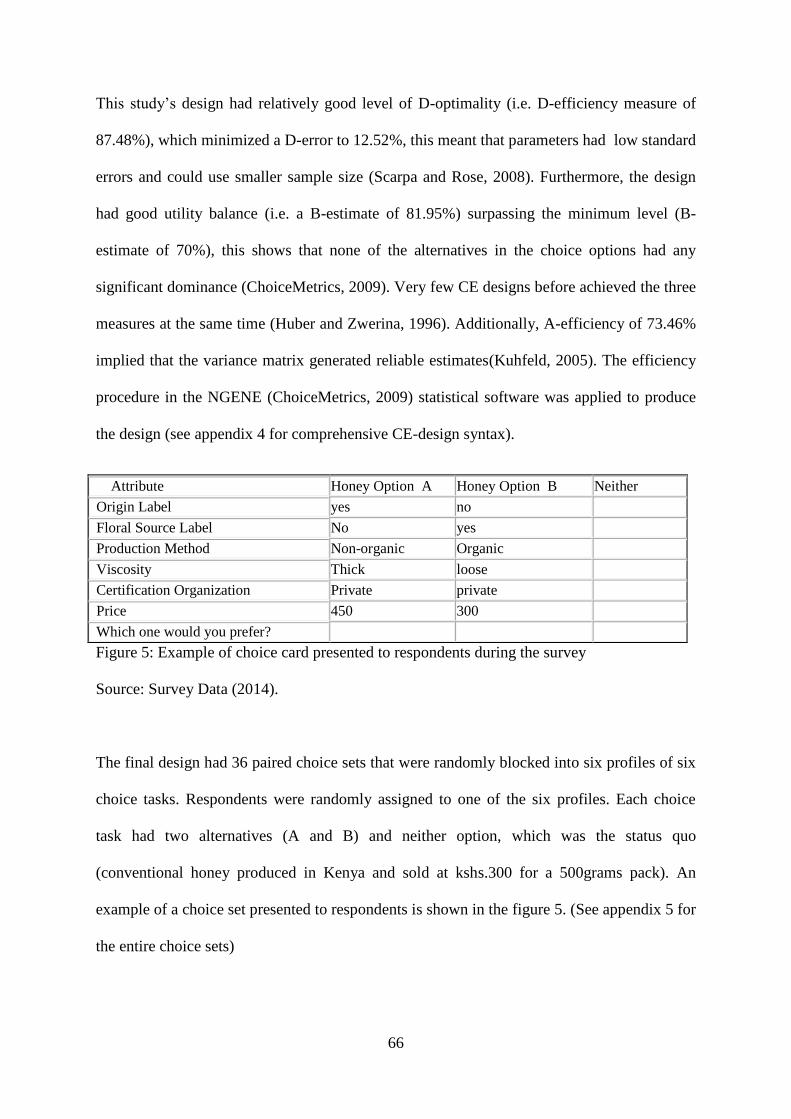
66
This study’s design had relatively good level of D-optimality (i.e. D-efficiency measure of
87.48%), which minimized a D-error to 12.52%, this meant that parameters had low standard
errors and could use smaller sample size (Scarpa and Rose, 2008). Furthermore, the design
had good utility balance (i.e. a B-estimate of 81.95%) surpassing the minimum level (B-
estimate of 70%), this shows that none of the alternatives in the choice options had any
significant dominance (ChoiceMetrics, 2009). Very few CE designs before achieved the three
measures at the same time (Huber and Zwerina, 1996). Additionally, A-efficiency of 73.46%
implied that the variance matrix generated reliable estimates(Kuhfeld, 2005). The efficiency
procedure in the NGENE (ChoiceMetrics, 2009) statistical software was applied to produce
the design (see appendix 4 for comprehensive CE-design syntax).
Attribute Honey Option A Honey Option B Neither
Origin Label yes no
Floral Source Label No yes
Production Method Non-organic Organic
Viscosity Thick loose
Certification Organization Private private
Price 450 300
Which one would you prefer?
Figure 5: Example of choice card presented to respondents during the survey
Source: Survey Data (2014).
The final design had 36 paired choice sets that were randomly blocked into six profiles of six
choice tasks. Respondents were randomly assigned to one of the six profiles. Each choice
task had two alternatives (A and B) and neither option, which was the status quo
(conventional honey produced in Kenya and sold at kshs.300 for a 500grams pack). An
example of a choice set presented to respondents is shown in the figure 5. (See appendix 5 for
the entire choice sets)
67
5.2.3 Data and the experimental context
The questionnaire briefly introduced what the interview entailed and a criterion for fit
respondents (See Appendix 3). Questions of consumer knowledge of GI and preferences for
honey they buy followed. Consumers then picked their preferred choice among three
alternatives A, B and a neither option. Lastly, data on the demographic and socio-economic
characteristics, such as income level, household size, employment status, education and age
was collected.
A pilot survey, an FGD and preliminary survey were done to validate and determine the
ample number of choice sets. This revealed that consumers could comfortably handle six
choice sets, since they were sure about the relevance of the proposed attributes in improving
the honey industry.
Respondents were explained for the compulsory and voluntary attributes, their levels and the
choice exercise keenly (see Appendix 5), before making choices. Respondents’ were also
reminded to consider the choice like a real purchase, consider their budget constraints, the
kind of honey they consume, this was meant to reduce the hypothetical bias that is inherent in
SP studies(Pambo, 2013). This is because results of this study would inform delivery of
certain types of GI labeled food products in the retail section.
The study adopted a quantitative research approach using a survey design, as a strategy for
collecting and analyzing data that answer research questions in a way that allows the
researcher to gather information, summarize, present and interpret data. Both quantitative and
qualitative data was collected. The data needed was explained by six honey quality attributes
(see table 4) and levels as well as socioeconomic explanatory variables. Both primary data
through administering semi-structured questionnaires, FGDs and secondary data was vital in
68
providing an insight to the study areas and honey consumption in Kenya. These included past
literature and government documents.
5.2.4 Model Specification
The CE is anchored in two micro-economic theories. Lancaster’s theory of consumer choice
(Lancaster, 1966); the theory asserts that a consumer will decide to consume a product
because he/she derives utility from the attributes of that product unlike the good as a whole.
Attributes, A1, A2, A3, A4…… An. The functional form of the utility 𝑈iA of an individual iis then:
U iA= B i1 U A1+ B i2 U A2+ B i3 U A3+ …..+B in U A 6
Where U A1, U A2, U A3…. U An, are respectively the levels of utility generated by the
consumption of the n attributes. CE aims at identifying the trade-offs that individual i made
between the attributes in order to estimate𝛽𝑖𝑛.
The Random Utility Theory (RUT) by McFadden and Manski (2001)underpins econometric
basis of CE. It stipulates that individual i’s indirect utility 𝑈ij, is the sum of a deterministic
term 𝑉ij and a random term (𝜀):
𝑈𝑖𝑗=𝑉ij(𝑍𝑗,𝑆𝑖)+𝜀(𝑍𝑗Si) 7
Where for any respondent i a given level utility, is associated with any honey choice set
alternative j and depended on quality attributes (𝑍) and socioeconomic characteristics of
respondents (S). The choices made between alternatives are a function of the probability that
the utility associated with a particular option j is higher than those for other alternatives.
(𝑖𝑗)= ((𝑍𝑖𝑗, 𝑆𝑖) + (𝑍𝑖𝑗, 𝑆𝑖)) > ((𝑍𝑖𝑘, 𝑆𝑖) + (𝑍𝑖𝑗, 𝑆𝑖)) 8
The error term (𝑍ij,Si) is not observed by the analyst. Assuming its distribution is identically
and independently type, I extreme, the MNL distribution;
69
ρni=Ʃ m
m=1Sm(eb'mXni/Ʃjeb'mXnj) 9
The MNL is popular and a basis of econometric models for discrete choice modelling.
However, it has limitations that led to invention of better models that relax its assumptions.
First is a RPL model, which generalizes standard multinomial logit model. It relaxes MNL’s
assumptions by; making the alternatives not to be independent, making the model not to
exhibit the independence of irrelevant alternatives property, and; ensuring there is an explicit
account for unobserved heterogeneity (Boxall and Adamowicz, 2002). However, RPL does
not explain the sources of heterogeneity and assumes distribution of utilities. This makes the
second model, Latent Class model (LCM) to be superior by it relaxing the mentioned
assumptions of RPL. It allows for multiplication of the conditional distribution with the
probability of being in a segment where the segments are the finite analogue to the random
parameters distributions. The distributions are well specified and thus the estimation of the
joint distribution occurs (Greene and Hensher, 2002). Furthermore, studies have indicated the
importance of heterogeneity among respondents for goodness of fit (Campbell et al., 2012).
However, the MNL is subject to various limitations and the RPL model can overcome them.
This is achieved through the assumption that parameters were randomly distributed in the
population. In this case the heterogeneity is captured by estimating the mean and variance of
the random parameter distribution and individuals are assumed to be draws from a taste
distribution.
Ρni= eb'xniƩjeb'xnj 10
Majorly, the random parameters are specified to be normally or log-normally distributed,
which imply behaviourally inconsistent WTP values. In particular, normal and log-normal
distributions are problematic because of the possibility of negative signs when a normal
distribution is used and fat tails when a log-normal distribution is used. The LCM provides
70
another alternative to the multinomial logit model and requires, unlike the RPL model, no
assumptions about the distribution of preferences. The LCM approach assumes that M
segments exist in the population, each with a different preference structure.
Lni(B)=eVni(B)/Ʃjj=1eVnj(B) 11
Changes in welfare due to a marginal change in a given attribute can be calculated using the
marginal willingness-to-pay measure:
MWTP = -1 B honey attribute 12
B price for honey
The current study used RPL, which is estimated by means of LIMDEP version 10/NLOGIT
5, econometric software (Greene, 2012). Discussions are based on the results from this
analysis.
The variables used in the analysis of GI, and their coding are given in table 5. All the
indicated utility entered the model as random parameters assuming a normal distribution,
except the price attribute that was specified as fixed in order to calculate MWTP, by
eliminating the risk of obtaining extreme none zero trade off values (Train, 1998).

71
Table 5: Variables used in the preference analysis
Variable Description
Geographic origin label GI attribute(whether honey origin was indicated or not)areas
(1=Yes; 0=Otherwise)
Floral source (indication of floral source that bees visit or not) (1=Yes;0=Otherwise)
Method of production Food Safety attribute (if organic honey or not) (1=Yes; 0=Otherwise)
Honey viscosity Intrinsic quality cue (Honey resistance to flow) (1=Thick;0=loose)
Certification organization Quality standardization attribute ( level of standardization of honey
product) (0 = public, 1 = private, 2 = both)
Price increase per 500 grams
of honey in Kshs.
Monetary attribute (price of 500grams of honey in Kenya shillings
within 50% of the current price/status quo)(Sh.300, 375, 450)
Source: Survey Data (2014).
5.3 Results and Discussions
5.3.1 Consumers’ Preferences for Various Honey Attributes
To determine the most important factors that influence honey purchase decisions, consumers
were asked to rate nine product characteristics. This was according to their level of
importance prior to purchasing honey, using a Likert scale that ranged from not at all
important (1) to very important (5). These were honey viscosity, taste, organic, country or
specific area of origin, texture, colour, price, packaging, labelling is how consumers’ rank
these indicators of quality during purchase. How viscous honey is therefore the most
important honey attribute used by consumers use to judge if it is quality. This is similar to
findings by (Carroll, 2002), who reported honey viscosity to be an important visual attribute
before use. The taste of honey followed as quality reason they use to decide whether they will
be loyal to a given brand. If farmers certified their honey as organic, then consumers will
deem it as quality. The specific country or region of origin is crucial in telling if honey
produced will be quality or not. In Kenya, some regions are more famous for good honey
72
production. Moreover, the recent devolution they seem to be keen interest among people on
the origin of products in different regions of Kenya(Burugu, 2010). Honey texture and colour
are more important to the price set for Kenyan honey consumers. How honey is packaged or
labelled would mean less to consumers without considering the above factors. Similarly, that
accounts for the significant number of consumers buying directly from farmers, whose
product is barely neither packaged nor labelled.
This suggested that honey origin and sensory characteristics (measured as taste and colour)
ranks higher than price, packaging and other labels by the majority of honey consumers’ in
Kenya. These results compare well to those reported by (Kaneko and Chern, 2005) and
indicate that some consumers will accept geographical labelled foods if they get labelled.
It is evident that Kenyan urban consumers prefer local honey, labelled with specific region of
origin unlike a COOL, produced in semi-arid area, organically but though majority prefer
unprocessed honey they may not be so different from those who want their honey to be
processed (Table 6).
The identified popular local brands of honey are Kitui woodlands, Pure natural honey, Green
forest, Baringo, Tharaka, Asalipoa, Mwingi natural honey, Baraka honey and Kipepeo. They
account for over 16% of the entire honey market share. Australian honey is the main
imported honey.Mutisya (2011), found almost similar results; Kitui and pure natural honeys
lead. The rationale of consumers preferring Kitui woodlands honey may show their intention
to buy GI goods. Even though, Kitui is yet a GI registered product, the use of a name that
relates to an area of good quality honey in Kenya makes most consumers to perceive it as a
GI. The same trend is realised with Baringo, Tharaka, and Mwingi natural honey. These are
the main quality honey producing zone names.
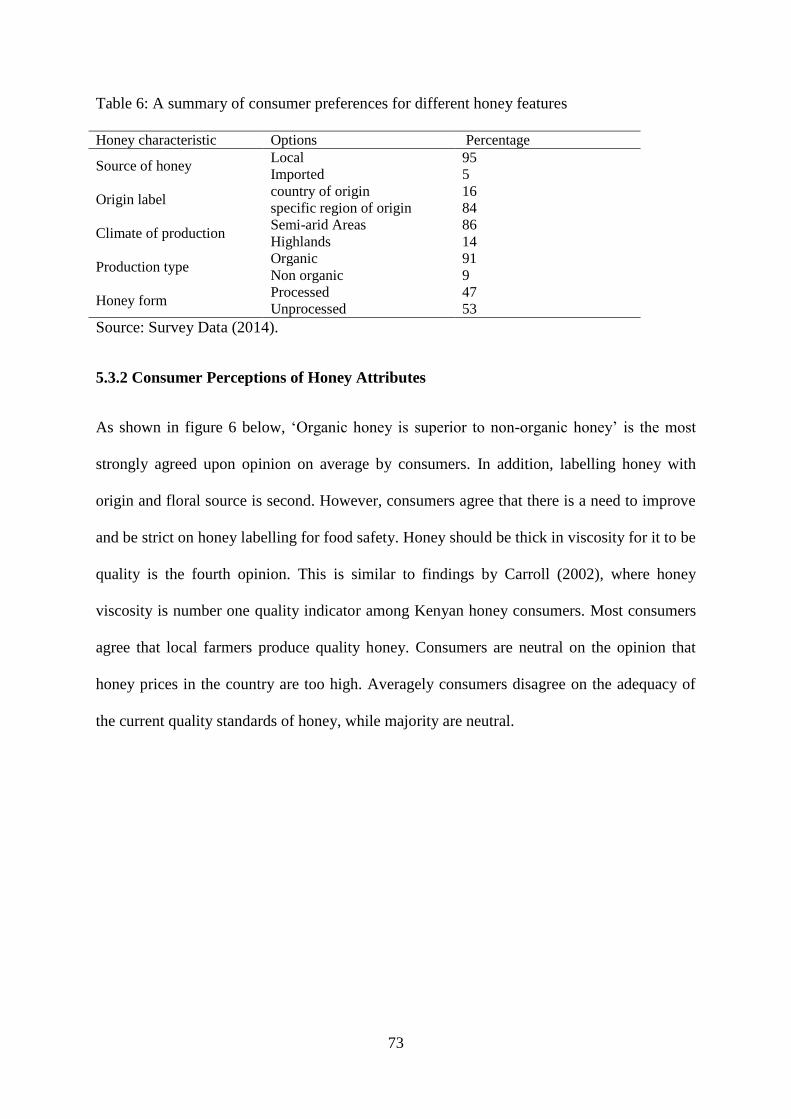
73
Table 6: A summary of consumer preferences for different honey features
Honey characteristic Options Percentage
Source of honey Local 95
Imported 5
Origin label country of origin 16
specific region of origin 84
Climate of production Semi-arid Areas 86
Highlands 14
Production type Organic 91
Non organic 9
Honey form Processed 47
Unprocessed 53
Source: Survey Data (2014).
5.3.2 Consumer Perceptions of Honey Attributes
As shown in figure 6 below, ‘Organic honey is superior to non-organic honey’ is the most
strongly agreed upon opinion on average by consumers. In addition, labelling honey with
origin and floral source is second. However, consumers agree that there is a need to improve
and be strict on honey labelling for food safety. Honey should be thick in viscosity for it to be
quality is the fourth opinion. This is similar to findings by Carroll (2002), where honey
viscosity is number one quality indicator among Kenyan honey consumers. Most consumers
agree that local farmers produce quality honey. Consumers are neutral on the opinion that
honey prices in the country are too high. Averagely consumers disagree on the adequacy of
the current quality standards of honey, while majority are neutral.
74
Figure 6: A chart depiction of consumer perceptions of honey quality factors
Source: Survey Data (2014).
5.3.3 Consumers Preference for GI Label and Other Quality Honey Attributes
The survey team conducted a total of 478 respondents completely answered the
questionnaire. Therefore, the econometric model includes all the 8,604 observations, a solid
base of the results.
In the questionnaire, respondents faced two honey alternatives described by attributes shown
in Table 5. The maximum likelihood estimates for the RPL model, estimated for the sample
are reported in Table 7. The model is estimated using maximum simulated likelihood
procedures in NLOGIT 5.0 econometric software utilizing 100 halton draws for the
simulations. The price coefficient is significant with expected negative sign.
All variables are statistically significant at below the 1% level (p<0.001), with the exception
of private standard body, which is significant at 10% level of significance. This means
majority of the variables are relevant and contribute to explaining consumer preferences for
the choices presented to them. This being a probabilistic model, the estimated coefficients are
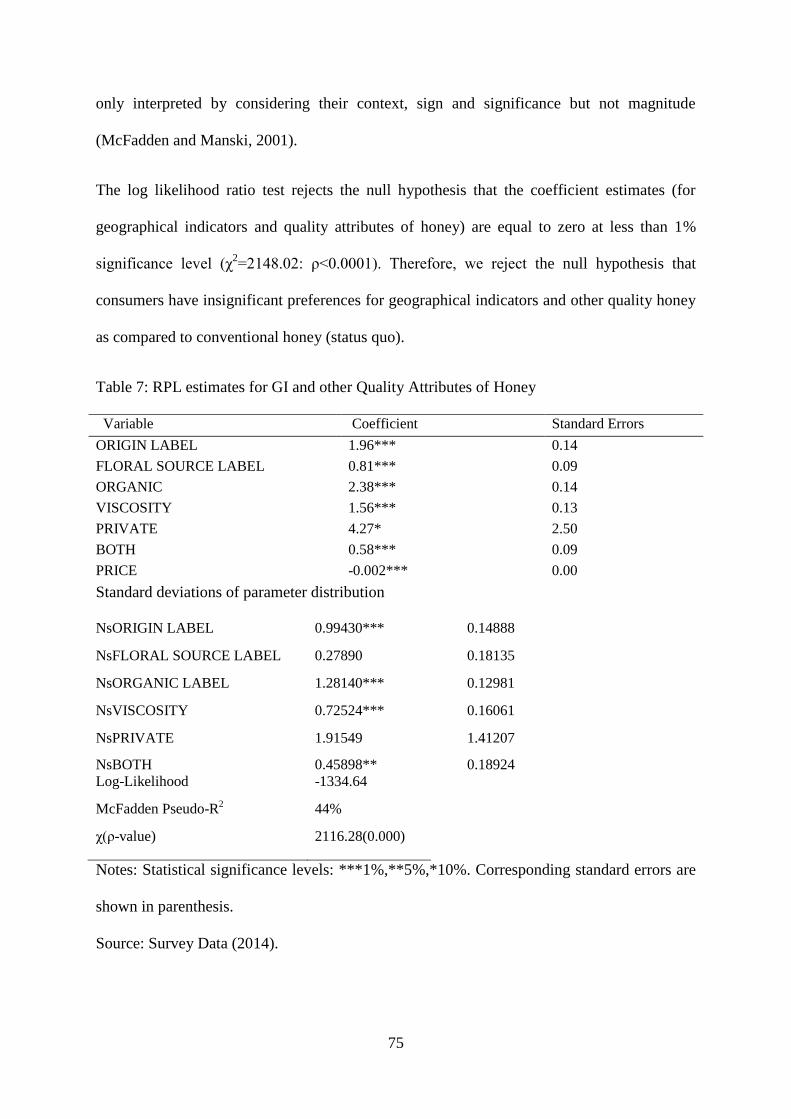
75
only interpreted by considering their context, sign and significance but not magnitude
(McFadden and Manski, 2001).
The log likelihood ratio test rejects the null hypothesis that the coefficient estimates (for
geographical indicators and quality attributes of honey) are equal to zero at less than 1%
significance level (χ2=2148.02: ρ<0.0001). Therefore, we reject the null hypothesis that
consumers have insignificant preferences for geographical indicators and other quality honey
as compared to conventional honey (status quo).
Table 7: RPL estimates for GI and other Quality Attributes of Honey
Variable Coefficient Standard Errors
ORIGIN LABEL 1.96*** 0.14
FLORAL SOURCE LABEL 0.81*** 0.09
ORGANIC 2.38*** 0.14
VISCOSITY 1.56*** 0.13
PRIVATE 4.27* 2.50
BOTH 0.58*** 0.09
PRICE -0.002*** 0.00
Standard deviations of parameter distribution
NsORIGIN LABEL 0.99430*** 0.14888
NsFLORAL SOURCE LABEL 0.27890 0.18135
NsORGANIC LABEL 1.28140*** 0.12981
NsVISCOSITY 0.72524*** 0.16061
NsPRIVATE 1.91549 1.41207
NsBOTH 0.45898** 0.18924
Log-Likelihood -1334.64
McFadden Pseudo-R2
44%
χ(ρ-value)
2116.28(0.000)
Notes: Statistical significance levels: ***1%,**5%,*10%. Corresponding standard errors are
shown in parenthesis.
Source: Survey Data (2014).
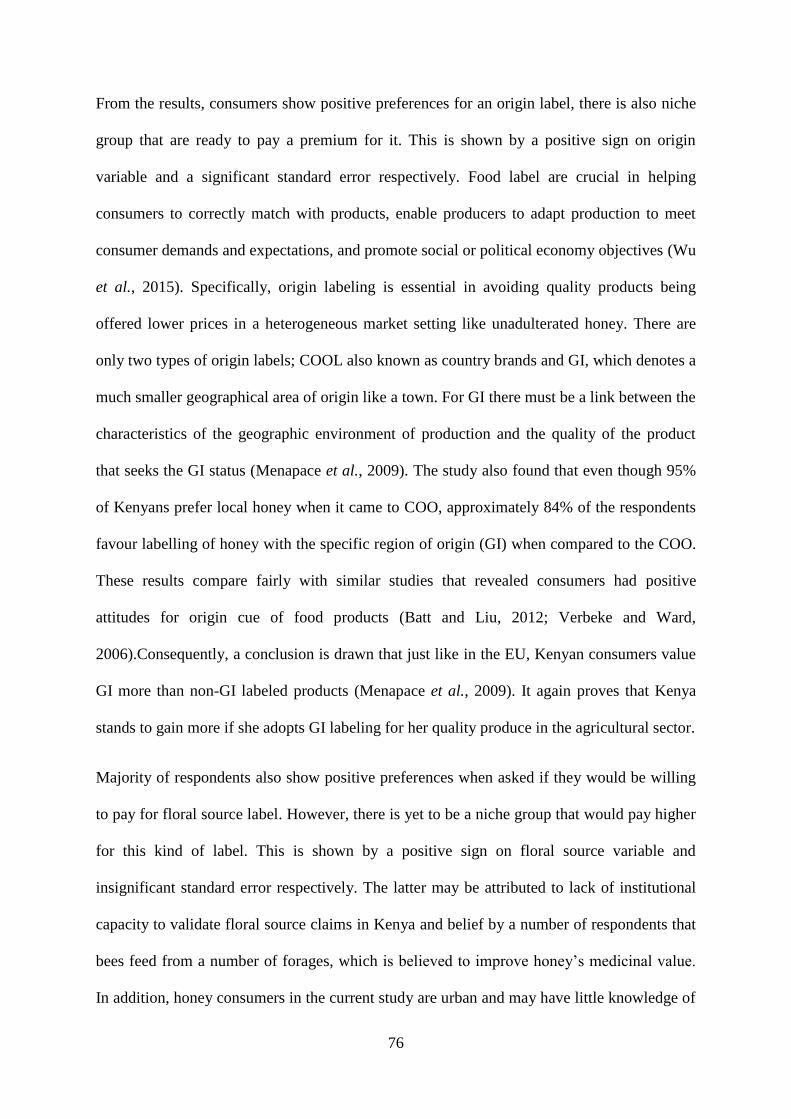
76
From the results, consumers show positive preferences for an origin label, there is also niche
group that are ready to pay a premium for it. This is shown by a positive sign on origin
variable and a significant standard error respectively. Food label are crucial in helping
consumers to correctly match with products, enable producers to adapt production to meet
consumer demands and expectations, and promote social or political economy objectives (Wu
et al., 2015). Specifically, origin labeling is essential in avoiding quality products being
offered lower prices in a heterogeneous market setting like unadulterated honey. There are
only two types of origin labels; COOL also known as country brands and GI, which denotes a
much smaller geographical area of origin like a town. For GI there must be a link between the
characteristics of the geographic environment of production and the quality of the product
that seeks the GI status (Menapace et al., 2009). The study also found that even though 95%
of Kenyans prefer local honey when it came to COO, approximately 84% of the respondents
favour labelling of honey with the specific region of origin (GI) when compared to the COO.
These results compare fairly with similar studies that revealed consumers had positive
attitudes for origin cue of food products (Batt and Liu, 2012; Verbeke and Ward,
2006).Consequently, a conclusion is drawn that just like in the EU, Kenyan consumers value
GI more than non-GI labeled products (Menapace et al., 2009). It again proves that Kenya
stands to gain more if she adopts GI labeling for her quality produce in the agricultural sector.
Majority of respondents also show positive preferences when asked if they would be willing
to pay for floral source label. However, there is yet to be a niche group that would pay higher
for this kind of label. This is shown by a positive sign on floral source variable and
insignificant standard error respectively. The latter may be attributed to lack of institutional
capacity to validate floral source claims in Kenya and belief by a number of respondents that
bees feed from a number of forages, which is believed to improve honey’s medicinal value.
In addition, honey consumers in the current study are urban and may have little knowledge of
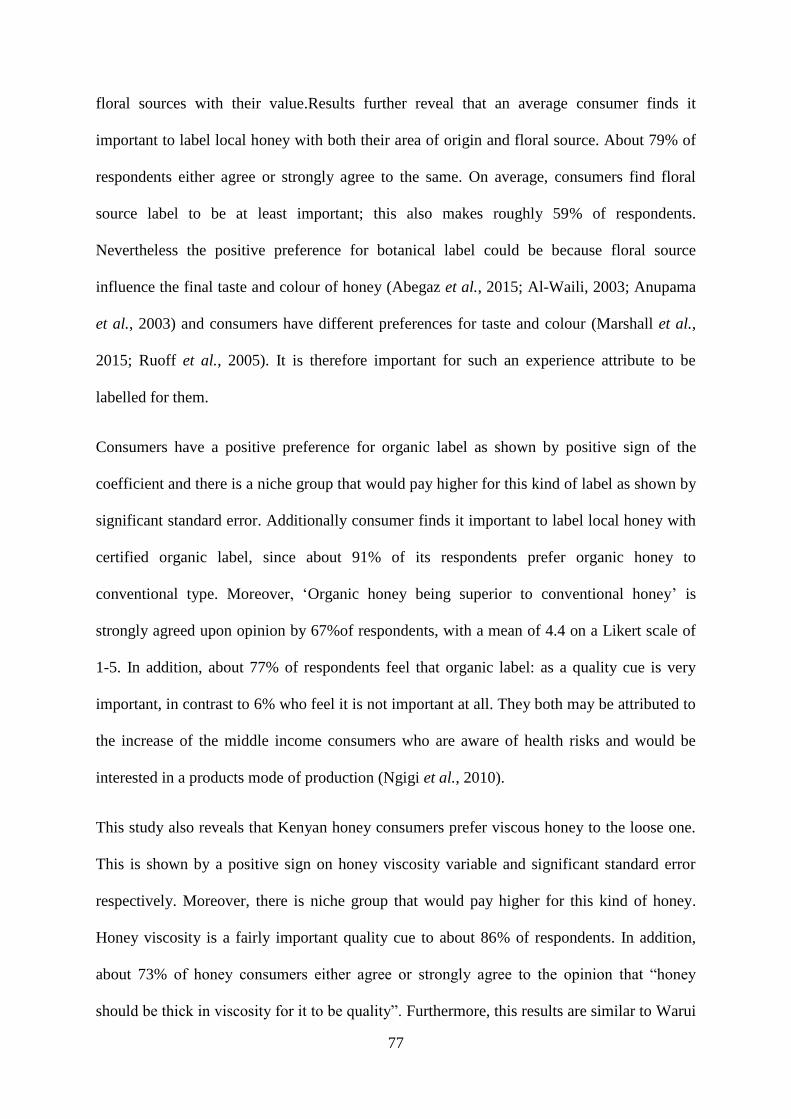
77
floral sources with their value.Results further reveal that an average consumer finds it
important to label local honey with both their area of origin and floral source. About 79% of
respondents either agree or strongly agree to the same. On average, consumers find floral
source label to be at least important; this also makes roughly 59% of respondents.
Nevertheless the positive preference for botanical label could be because floral source
influence the final taste and colour of honey (Abegaz et al., 2015; Al-Waili, 2003; Anupama
et al., 2003) and consumers have different preferences for taste and colour (Marshall et al.,
2015; Ruoff et al., 2005). It is therefore important for such an experience attribute to be
labelled for them.
Consumers have a positive preference for organic label as shown by positive sign of the
coefficient and there is a niche group that would pay higher for this kind of label as shown by
significant standard error. Additionally consumer finds it important to label local honey with
certified organic label, since about 91% of its respondents prefer organic honey to
conventional type. Moreover, ‘Organic honey being superior to conventional honey’ is
strongly agreed upon opinion by 67%of respondents, with a mean of 4.4 on a Likert scale of
1-5. In addition, about 77% of respondents feel that organic label: as a quality cue is very
important, in contrast to 6% who feel it is not important at all. They both may be attributed to
the increase of the middle income consumers who are aware of health risks and would be
interested in a products mode of production (Ngigi et al., 2010).
This study also reveals that Kenyan honey consumers prefer viscous honey to the loose one.
This is shown by a positive sign on honey viscosity variable and significant standard error
respectively. Moreover, there is niche group that would pay higher for this kind of honey.
Honey viscosity is a fairly important quality cue to about 86% of respondents. In addition,
about 73% of honey consumers either agree or strongly agree to the opinion that “honey
should be thick in viscosity for it to be quality”. Furthermore, this results are similar to Warui
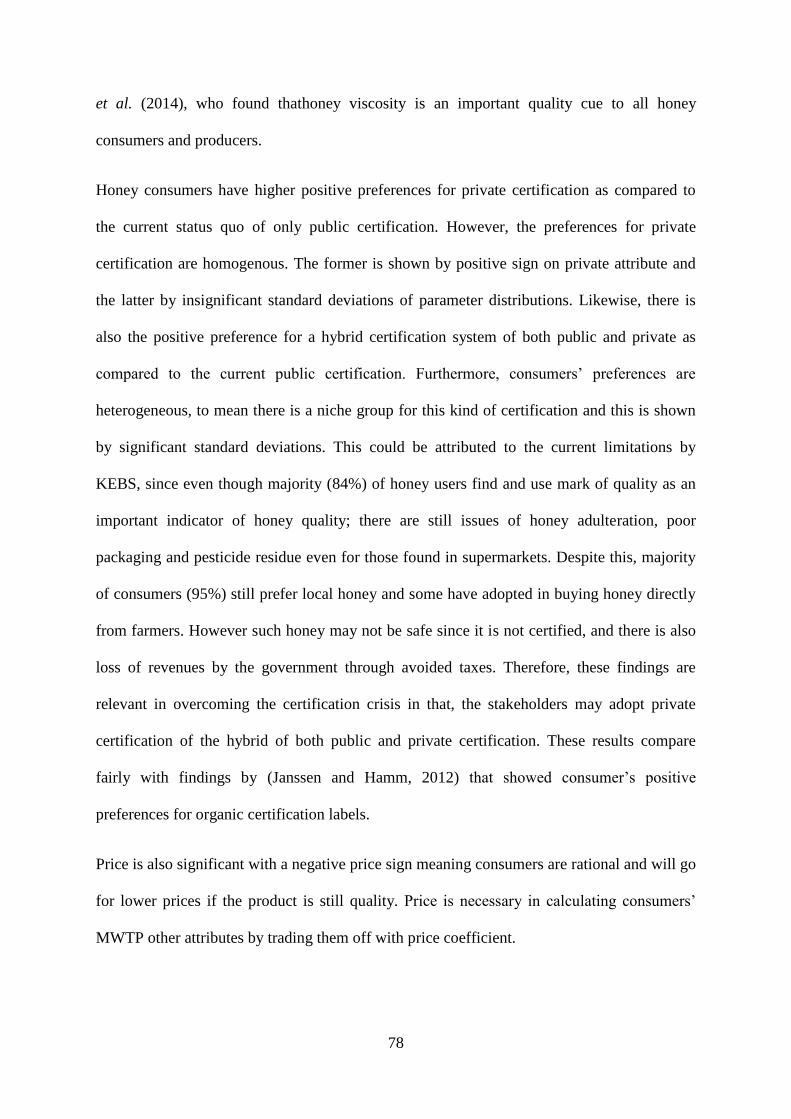
78
et al. (2014), who found thathoney viscosity is an important quality cue to all honey
consumers and producers.
Honey consumers have higher positive preferences for private certification as compared to
the current status quo of only public certification. However, the preferences for private
certification are homogenous. The former is shown by positive sign on private attribute and
the latter by insignificant standard deviations of parameter distributions. Likewise, there is
also the positive preference for a hybrid certification system of both public and private as
compared to the current public certification. Furthermore, consumers’ preferences are
heterogeneous, to mean there is a niche group for this kind of certification and this is shown
by significant standard deviations. This could be attributed to the current limitations by
KEBS, since even though majority (84%) of honey users find and use mark of quality as an
important indicator of honey quality; there are still issues of honey adulteration, poor
packaging and pesticide residue even for those found in supermarkets. Despite this, majority
of consumers (95%) still prefer local honey and some have adopted in buying honey directly
from farmers. However such honey may not be safe since it is not certified, and there is also
loss of revenues by the government through avoided taxes. Therefore, these findings are
relevant in overcoming the certification crisis in that, the stakeholders may adopt private
certification of the hybrid of both public and private certification. These results compare
fairly with findings by (Janssen and Hamm, 2012) that showed consumer’s positive
preferences for organic certification labels.
Price is also significant with a negative price sign meaning consumers are rational and will go
for lower prices if the product is still quality. Price is necessary in calculating consumers’
MWTP other attributes by trading them off with price coefficient.
79
Based on the mean and standard deviation of the estimated parameters can be calculated the
share of the population that places positive or negative value on each one of the program
attributes. The mean and standard deviation of the coefficient of floral source label and
private standardisation body are not significant, indicating that there is no heterogeneity in
preferences and that the whole population does not see the benefit of the two. This implies
that, as expected, all the population considers this type of label and certification a negative
factor.
The nature and strength of origin effects depend on such factors as the product category, the
product stimulus employed in the research, respondent demographics, consumer prior
knowledge and experience with the product category, and consumer information processing
style.
As shown in Table 8, even though, there is a positive consumer preference for thick and
privately certified honey as compared to loose and publicly certified honey respectively, the
study could not generate significant monetary values attached to these attributes.
Nevertheless, the study revealed honey consumers are willing to pay highest for organic
label, followed closely by origin label, then floral source label and lastly certification by both
Public and Private. However, the values obtained from these results are way higher than the
base price for honey as whole of Kshs. 300 for a 500gm found on retail shelf, for example
consumers are willing to pay for organic label, about kshs. 1068.23. This could be attributed
to the study being hypothetical and the heterogeneity of sampled respondents from different
counties. In addition, there are costs involved for honey to qualify as organic like the
production and certification costs are much higher compared to conventional honey.
However, these values should not be taken in absolute as a price for GI honey, rather be seen
as high consumer preferences and pressing need for this labels. More so, the challenge of
honey adulteration could have made consumers preferences to be quite high.
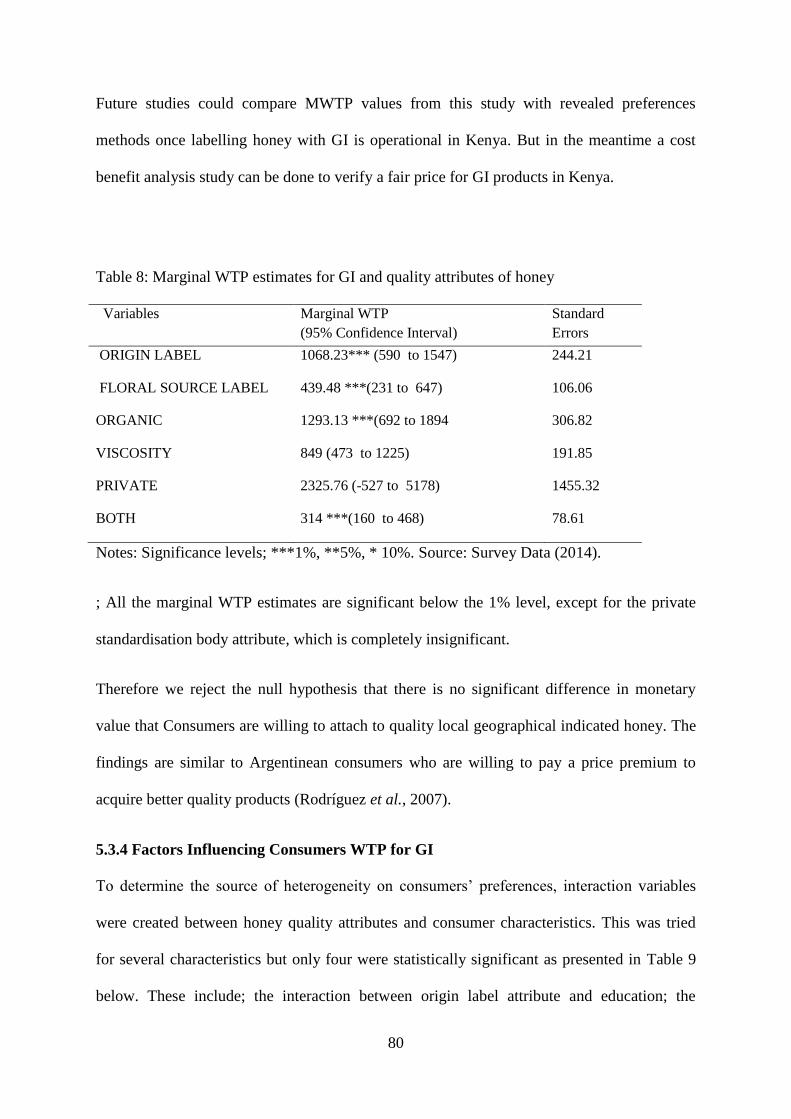
80
Future studies could compare MWTP values from this study with revealed preferences
methods once labelling honey with GI is operational in Kenya. But in the meantime a cost
benefit analysis study can be done to verify a fair price for GI products in Kenya.
Table 8: Marginal WTP estimates for GI and quality attributes of honey
Variables Marginal WTP
(95% Confidence Interval)
Standard
Errors
ORIGIN LABEL 1068.23*** (590 to 1547) 244.21
FLORAL SOURCE LABEL 439.48 ***(231 to 647) 106.06
ORGANIC 1293.13 ***(692 to 1894 306.82
VISCOSITY 849 (473 to 1225) 191.85
PRIVATE 2325.76 (-527 to 5178) 1455.32
BOTH 314 ***(160 to 468) 78.61
Notes: Significance levels; ***1%, **5%, * 10%. Source: Survey Data (2014).
; All the marginal WTP estimates are significant below the 1% level, except for the private
standardisation body attribute, which is completely insignificant.
Therefore we reject the null hypothesis that there is no significant difference in monetary
value that Consumers are willing to attach to quality local geographical indicated honey. The
findings are similar to Argentinean consumers who are willing to pay a price premium to
acquire better quality products (Rodríguez et al., 2007).
5.3.4 Factors Influencing Consumers WTP for GI
To determine the source of heterogeneity on consumers’ preferences, interaction variables
were created between honey quality attributes and consumer characteristics. This was tried
for several characteristics but only four were statistically significant as presented in Table 9
below. These include; the interaction between origin label attribute and education; the
81
interaction between organic attribute and consumers income level; the interaction between
consumers’ degree of agreeing that KEBS has set adequate standards for honey sector in
Kenya and certification by both public and private bodies; and the interaction between
presence of an elderly person in a household and organic attribute.
However the highly significant standard deviations of the parameters indicate that there is
unaccounted preference heterogeneity, which probably could be explained by other variables
not included in the model. The top part of Table 9 belowis the RPL estimates, which was
discussed earlier under Table 7.
The results in the middle part of Table 9 show that if a consumer at least agrees the standards
set by KEBS are adequate; this reduces their likelihood of their WTP for GI, relative to those
who disagree. In addition, their odds of having positive preferences for both public and
private certification are reduced by about 32% as compared to those who disagree with the
same. This also means that the 40% of consumers who think the local standard body is
adequately doing its job may never prefer both private and public bodies to be better than the
current public body. The possible explanation are the identified issues of honey adulteration
in the country along the value chain, poor labelling and packaging of products as recorded
earlier by consumers. More so, consumers are aware of such issues and 67% of them
complained of honey adulteration as the main honey issue. An average consumer finds it
important and about 79% at least agree to labelling local honey with both its area of Origin
and floral source. This results are in tandem with the notion that GI can as well be a quality
and food safety attribute since it enables traceability of products (Verbeke and Ward, 2006).
In addition, some consumers prefer locally produced food products since they are deemed
fresher (Awada and Yiannaka, 2011) and they even pay for premium for fresher foods (Lai et
al., 1997). For example the attribute “Colorado Grown” carries a higher premium than
organic and Genetically Modified Organism-free attributes (Loureiro et al., 2002). In
82
addition, the average consumer prefers a mandatory, discrete label with a high-quality
standard while poor consumers prefer a mandatory, discrete label with a low standard
(Bernard and Bernard, 2009).
Likewise, an interaction between consumer education level and origin attribute has a negative
significant effect on the WTP values for origin labels. This contradicts theory in that more
learned persons may be willing to pay higher for traceability labels (Nwibo, 2012; Seetisarn
and Chiaravutthi, 2011). However, this result can be debated since origin labels are yet to be
implemented in the country and this makes the more learned persons to be more skeptical
about hypothetical cases.
Also, the interaction between organic attribute and consumers’ income level reveals
consumers with higher incomes would prefer organic labels. An explanation would be
consumers with higher incomes may care more about their health and environmental effects
from what they consume (Roitner-Schobesberger et al., 2008; Batte et al., 2007; Wier and
Calverley, 2002). The proceeding statement is backed up with the fact that all respondents
falling in the highest income category agree that organic honey is superior to conventional
honey. The rest of income categories have at least a few people who at most are neutral to the
same statement. They may be learned enough to know the benefits of organic foods; because
of the high correlation between education and income or they may just want to buy luxury
since some organic products may not necessarily be up to standards (Sheng et al., 2009). This
results compare fairly with Dickinson et al. (2003), who found that consumers would pay
even more if traceability are bundled with other characteristics such as animal welfare or
enhanced food safety. In addition, respondents who had bought organic vegetables tend to be
older, with higher education level and a higher family income than those who had not bought
them (Roitner-Schobesberger et al., 2008; Batte et al., 2007; Wier and Calverley, 2002).
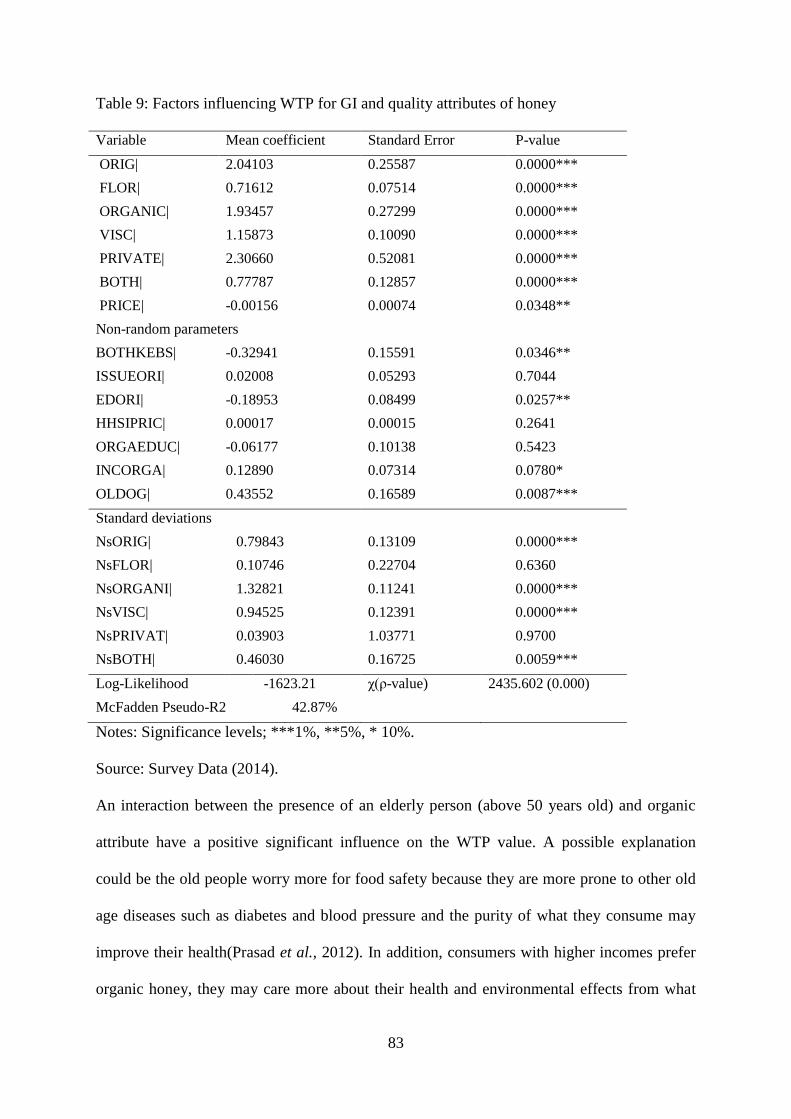
83
Table 9: Factors influencing WTP for GI and quality attributes of honey
Variable Mean coefficient Standard Error P-value
ORIG| 2.04103 0.25587 0.0000***
FLOR| 0.71612 0.07514 0.0000***
ORGANIC| 1.93457 0.27299 0.0000***
VISC| 1.15873 0.10090 0.0000***
PRIVATE| 2.30660 0.52081 0.0000***
BOTH| 0.77787 0.12857 0.0000***
PRICE| -0.00156 0.00074 0.0348**
Non-random parameters
BOTHKEBS| -0.32941 0.15591 0.0346**
ISSUEORI| 0.02008 0.05293 0.7044
EDORI| -0.18953 0.08499 0.0257**
HHSIPRIC| 0.00017 0.00015 0.2641
ORGAEDUC| -0.06177 0.10138 0.5423
INCORGA| 0.12890 0.07314 0.0780*
OLDOG| 0.43552 0.16589 0.0087***
Standard deviations
NsORIG| 0.79843 0.13109 0.0000***
NsFLOR| 0.10746 0.22704 0.6360
NsORGANI| 1.32821 0.11241 0.0000***
NsVISC| 0.94525 0.12391 0.0000***
NsPRIVAT| 0.03903 1.03771 0.9700
NsBOTH| 0.46030 0.16725 0.0059***
Log-Likelihood -1623.21 χ(ρ-value) 2435.602 (0.000)
McFadden Pseudo-R2 42.87%
Notes: Significance levels; ***1%, **5%, * 10%.
Source: Survey Data (2014).
An interaction between the presence of an elderly person (above 50 years old) and organic
attribute have a positive significant influence on the WTP value. A possible explanation
could be the old people worry more for food safety because they are more prone to other old
age diseases such as diabetes and blood pressure and the purity of what they consume may
improve their health(Prasad et al., 2012). In addition, consumers with higher incomes prefer
organic honey, they may care more about their health and environmental effects from what
84
they consume (Roitner-Schobesberger et al., 2008; Batte et al., 2007; Wier and Calverley,
2002). It is known that there is a positive correlation between age and income, as a result of
accumulated wealth over years. Therefore we reject the null hypothesis and conclude that
socio-demographic and psychographic factors (age, income, education level, perceptions of
honey standards) influence consumer’s WTP for GI and other quality attributes of honey.
5.4 Conclusion and Implications
Adulteration is the major issue for honey consumers. They have consequently adapted by
sourcing their honey directly from farmers or buying imported brands. However, they are
equally willing to pay a premium to improve the authenticity of current honey labels; origin
for traceability and organic for food safety. In addition, consumers are not satisfied with the
current standards set by the local public body and wish for it to work together with private
body to fulfil its mandate or be replaced by a private standard body. However, honey
consumers are not ready to be manned by private body alone. There is a niche market for
thick honey labelled with its GI, organic, botanical source and certified by both public and
private body. In addition, this consumer segment would pay up to 430% premium.
Consumers want quality honey and are willing to pay a premium. Among the highly
preferred components of quality honey are traceability, standardization and food safety
labels. Hence mechanisms should be put in place to ensure consumer trust for locally
produced honey is reinstated. This consequently increases the market for local small scale
farmers.
85
References
Abegaz S. M., Belay, A., Solomon, W. K., Geremew, B. and Adgabe, N. (2015). ''Botanical
origin, color, granulation and sensory properties of the Herenna Forest Honey''. Food
chemistry, 167, 213-219.
Akerlof G., A. . (1970). ''The Market for Lemons: Quality Uncertainty and the Market
Mechanism''. Quarterly Journal of Economics, 84(488-500).
Al-Waili N. S. (2003). ''Effects of daily consumption of honey solution on hematological
indices and blood levels of minerals and enzymes in normal individuals''. Journal of
medicinal food, 6(2), 135-140.
Anupama D., Bhat, K., K. and Sapna, V., K. (2003). ''Sensory and physico-chemical
properties of commercial samples of honey''. Food Research International, 36(2),
183-191.
Awada L. and Yiannaka, A. (2011). ''Consumer perceptions and the effects of country of
origin labeling on purchasing decisions and welfare''. Food Policy, 37(1), 21-30. doi:
http://dx.doi.org/10.1016/j.foodpol.2011.10.004
Batt P. J. and Liu, A. (2012). ''Consumer behaviour towards honey products in Western
Australia''. British Food Journal, 114(2), 285-297.
Batte M. T., Hooker, N. H., Haab, T. C. and Beaverson, J. (2007). ''Putting their money
where their mouths are: Consumer willingness to pay for multi-ingredient, processed
organic food products''. Food Policy, 32(2), 145-159.
Berdegué J., A., Balsevich, F., Flores, L. and Reardon, T. (2005). ''Central American
supermarkets’ private standards of quality and safety in procurement of fresh fruits
and vegetables''. Food Policy, 30(3), 254-269.
Bernard J. C. and Bernard, D. J. (2009). ''What is it about organic milk? An experimental
analysis''. American journal of agricultural economics, 91(3), 826-836.
Bliemer M., C, J. and Rose, J., M. (2010). ''Construction of experimental designs for mixed
logit models allowing for correlation across choice observations''. Transportation
Research Part B: Methodological, 44(6), 720-734.
Boxall P., C. and Adamowicz, L., W. (2002). ''Understanding Heterogeneous Preferences in
Random Utility Models: A Latent Class Approach''. Environmental and Resource
Economics, 23, 421-446.
Burugu J. N. (2010). ''The county: understanding devolution and governance in Kenya''.
Campbell D., Mørkbak, M. R. and Olsen, S. B. (2012). Response latency in stated choice
experiments: impact on preference, variance and processing heterogeneity. Paper
presented at the 19 th Annual Conference of the European Association of
Environmental and Resource Economists, Prague, Czech Republic, 27–30 June 2012.
Carroll T. (2002). '''A study of the beekeeping sector in Kenya June 2001 - January 2002'''.
Self Help Development International (SHDI).
86
ChoiceMetrics. (2009). ''Ngene 1.0 user manual and refernce guide: the cutting edge in
experimental design''.
Darby M., R. and Karni, E. (1973). ''Free competition and the optimal amount of fraud''.
Journal of law and economics, 67-88.
Dickinson D. L., Hobbs, J. E. and Bailey, D. (2003). A comparison of US and Canadian
consumers’ willingness to pay for red-meat traceability. Paper presented at the
American Agricultural Economics Association Annual Meetings, Montreal, Canada.
Everstine K., Spink, J. and Kennedy, S. (2013). ''Economically motivated adulteration (EMA)
of food: common characteristics of EMA incidents''. Journal of Food Protection®,
76(4), 723-735.
FAO. (2001). ''Revised codex standard for honey''. Codex stan, 12, 1982.
Gonzalez C., Johnson, N. and Qaim, M. (2010). ''Consumer Acceptance of second generation
GM foods: The case of biofortified cassava in the North-East of Brazil''. Journal of
Agrucltural Economics, 42(1), 1-18.
Greene W., H. and Hensher, D., A. (2002). ''A latent class model for discrete choice analysis:
contrasts with mixed logit''. Transportation Research Part B, 37(2003), 681–698. doi:
10.1016/S0191-2615(02)00046-2
Greene W. H. (2012). ''LIMDEP Version 10/NLOGIT Version5 Econometric Modeling
GuidePlainview,NY;Econmetric Software''.
Hatanaka M., Bain, C. and Busch, L. (2005). ''Third-party certification in the global agrifood
system''. Food Policy, 30(3), 354-369.
Henson S. and Reardon, T. (2005). ''Private agri-food standards: Implications for food policy
and the agri-food system''. Food Policy, 30(3), 241-253.
Huber J. and Zwerina, K. (1996). ''The importance of utility balance in efficient choice
designs''. Journal of marketing research, 307-317.
Janssen M. and Hamm, U. (2012). ''Product labelling in the market for organic food:
Consumer preferences and willingness-to-pay for different organic certification
logos''. Food Quality and Preference, 25(1), 9-22.
Kaneko N. and Chern, W. S. (2005). ''Willingness to pay for genetically modified oil,
cornflakes, and salmon: Evidence from a US telephone survey''. Journal of
Agricultural and Applied Economics, 37(03), 701-719.
Kimemia C. and Oyare, E. (2006). The status of organic Agriculture, production and Trade in
Kenya; Report of the Initial Bckground study of the National Integrated Assessment
of Organic Agriculture sector- Kenya. Nairobi.
Kosgei R., Sulo, T. and Chepng'eno, W. (2011). ''Structure, conduct and performance of
honey marketing in West Pokot district, Kenya''. European Journal of Management,
11(4).
87
Kuhfeld W., F. (2005). ''Marketing research methods in SAS''. Experimental Design, Choice,
Conjoint, and Graphical Techniques. Cary, NC, SAS-Institute TS-722.
Lai Y., Florkowski, W., Huang, C., Bruckner, B. and Schonhof, I. (1997). Consumer
Willingness to pay for inproved attributes of fresh vegetables:A comparison between
Atlanta and Berlin. Paper presented at the WAEA, Reno.
Lancaster K., J. . (1966). ''A New Approach to Consumer Theory''. Journal of Political
Economy, 74(2), 132-157.
Loureiro M. L., Hine, S. and Association, A. A. E. (2002). ''Discovering niche markets: A
comparison of consumer willingness to pay for local (Colorado grown), organic, and
GMO-free products''. Journal of Agricultural and Applied Economics, 34(3), 477-488.
Marshall S., Gu, L. and Schneider, K. R. (2015). ''Health Benefits and Medicinal Value of
Honey''.
McFadden D. and Manski, C., F. . (2001). ''The Econometric Analysis of Discrete Choice''.
The Scandinavian Journal of Economics, 103(2(Jun., 2001)), 217-229.
Menapace L., Colson, G., Grebitus, C. and Facendola, M. (2009). ''Consumer preferences for
country-of-origin, geographical indication, and protected designation of origin labels''.
Mutisya J., S. (2011). An entrepreneurial assessment of the market access for honey and
honey product in the city of Nairobi, Kenya. (PhD Dissertation), University of
Nairobi, Nairobi, Kenya.
Nelson P. (1970). ''Information and consumer behavior''. Journal of Political Economy,
78(March-April), 311-329.
Nelson P. (1974). ''Advertising as information''. Journal of Political Economy, 82, 729-754.
Ngigi M., W., Okello, J. J., Lagarkvist, C., Karanja, N. and Mburu, J. (2010). Assessment of
developing-country urban consumers’ willingness to pay for quality of leafy
vegetables: The case of middle and high income consumers in Nairobi, Kenya. Paper
presented at the 3rd African Association of Agricultural Economics, AAEA/ AEASA
Conference Cape Town, South Africa.
Nwibo S., U. (2012). ''Assessment of willingness to pay for honey among farming households
in Abakalilki local government area of Ebonyi state, nigeria''. Journal of Agriculture
and Veterinary Sciences, 4(December 2012).
Pambo K. O. (2013). Analysis of consumer awareness and preferences for fortified sugar in
Kenya. (Master of Science), University of Nairobi, Nairobi.
Piana M., L., Oddo, L., P., Bentabol, A., Bruneau, E., Bogdanov, S. and Declerck, C., G.
(2004). ''Sensory analysis applied to honey: state of the art''. Apidologie, 35(2004),
S26–S37. doi: 10.1051/apido:2004048
Prasad S., Sung, B. and Aggarwal, B. B. (2012). ''Age-associated chronic diseases require
age-old medicine: Role of chronic inflammation''. Preventive Medicine, 54,
Supplement, S29-S37. doi: http://dx.doi.org/10.1016/j.ypmed.2011.11.011
88
Republic of Kenya. (2012). Food , Drugs and Chemicals Substances Act. National Council
for Law Reporting Retrieved from www.kenyalaw.org.
Republic of Kenya. (2012). Public Health Act; CAP. 242. Nairobi: National Council for Law
Reporting.
Republic of Kenya. (2012). Standards Act: CAP 496. Nairobi: National Council for Law
Reporting with the Authority of Kenya.
Rodríguez E., Lacaze, V. and Lupín, B. (2007). ''Willingness to pay for organic food in
Argentina: Evidence from a consumer survey''. International marketing and trade of
quality food products, 297.
Roitner-Schobesberger B., Darnhofer, I., Somsook, S. and Vogl, C. R. (2008). ''Consumer
perceptions of organic foods in Bangkok, Thailand''. Food Policy, 33(2), 112-121.
Ruoff K., Karoui, R., Dufour, E., Luginbühl, W., Bosset, J.-O., Bogdanov, S. and Amadò, R.
(2005). ''Authentication of the botanical origin of honey by front-face fluorescence
spectroscopy. A preliminary study''. Journal of agricultural and food chemistry,
53(5), 1343-1347.
Scarpa R. and Rose, J., M. (2008). ''Design efficiency for non‐market valuation with choice
modelling: how to measure it, what to report and why*''. Australian journal of
agricultural and resource economics, 52(3), 253-282.
Seetisarn P. and Chiaravutthi, Y. (2011). ''Thai Consumers Willingness to Pay for Food
Products with Geographical Indications''. International Business Research, 4(3).
Sheng J., Shen, L., Qiao, Y., Yu, M. and Fan, B. (2009). ''Market trends and accreditation
systems for organic food in China''. Trends in Food Science & Technology, 20(9),
396-401.
Srinual K. and Intipunya, P. (2009). ''Effects of crystallization and processing on sensory and
physicochemical qualities of Thai sunflower honey''. Asian Journal of Food and
Agro-Industry, 2(04), 749-754.
Valerian J., Domonko, E., Mwita, S. and Shirima, A. (2011). ''Assessment of the Willingness
to Pay for Organic Products amongst Households in Morogoro Municipal''.
Verbeke W. and Ward, R. W. (2006). ''Consumer interest in information cues denoting
quality, traceability and origin: An application of ordered probit models to beef
labels''. Food Quality and Preference, 17(6), 453-467.
Warui M., Gikungu, M., Bosselmann, A., Hansted, L. and Mburu, J. (2014). An assessment
of high quality honeys with a potential for Geographical Indication (GI) labeling and
initiatives that add value to the honey sector in Kenya. Paper presented at the
Apimondia conference.
Wier M. and Calverley, C. (2002). ''Market potential for organic foods in Europe''. British
Food Journal, 104(1), 45-62.

89
Wu S., Fooks, J. R., Messer, K. D. and Delaney, D. (2015). ''Consumer demand for local
honey''. Applied Economics, 47(41), 4377-4394. doi:
10.1080/00036846.2015.1030564
Yeow S., H, C., Chin, S. T., S., Yeow, J., A. and and Tan, K., S. (2013). ''Consumer
Purchase Intentions and Honey Related Products''. Journal of Marketing Research &
Case Studies, 2013(2013), 15. doi: 10.5171/2013.197440
90
CHAPTER SIX
This chapter provides a summary of the thesis objectives, methods and findings. The thesis
conclusion and the recommendation follow. Lastly, there is study’s contribution to
knowledge and the gaps for future studies.
6.0 SUMMARY, CONCLUSIONS AND RECOMMENDATIONS
6.1 Summary
The study analysed honey consumers’ awareness of geographical indicators and willingness
to pay for it and other quality attributes of honey in Kenya. It employs a choice experiment
(CE) based on a D-optimal design, which is a quantitative experimental research design. In
addition, primary data was collected through consumer surveys using structured
questionnaires and about 478 respondents were drawn from major urban centres: Nairobi,
Nakuru and Kitui, using multistage sampling method. Furthermore, consumers’ awareness
and preferences for geographical and quality honey attributes was analysed using probit and
RPL model respectively. The study as well uses STATA 12 and LIMDEP version
10/NLOGIT 5, econometric software in the analysis, respectively.
Results show that about 95% of consumers prefer local honey from Kenyan regions to
imported honey. Moreover, the most preferred local honey brands sold in major retail outlets
include Kitui woodlands, Pure natural honey, Green forest, Baringo, Tharaka, Asalipoa,
Mwingi natural honey, Baraka honey and Kipepeo. For imported brands honey from
Australia is highly preferred. Furthermore, almost all respondents favour labelling of honey
with the specific region of origin unlike just the country of origin. Similarly, about all of
Kenyans prefer honey produced in Semi-Arid areas to that from Highlands. This
complements the fact that majority of Kenyan honey is produced in ASALs majority of
consumers prefers organic honey for food safety reasons. Slightly above half of the
91
respondents prefer unprocessed honey, and the rest prefer processed honey. This has been
noted earlier as processed honey is adulterated in Kenya mainly by middlemen. Lastly,
majority of consumers buy from supermarkets, farmers and hawkers respectively.
Slightly over a third of Kenyans are aware of GI labelling of food products. This is highly
influenced by higher levels of income and education. However only a third of them have in
depth knowledge of this, majority have a rough idea. The main sources of GI knowledge are
friends and media. Even though GI is yet to be fully implemented in Kenya, consumers
already identify their ideal local GI foods. Honey from Kitui or Baringo, Milk from Molo and
Kinangop, rice from Mwea and Ahero, Sugar from Mumias and tea from Kericho. In addition,
about 83% consumers trust the potential GI foods listed. To be specific over half of honey
consumers have an ideal local honey that could qualify to be a GI and a half of them have
used it before. This honey is desirable since it is pure, tasty, natural, quality, sweeter, thick
and colour. However, those that have not consumed potential GI honey that they have
mentioned blamed it on its unavailability, lack of labels, expensive, lack of interest, and lack
of information. Some still claim it to be untrustworthy because of adulteration. Similarly
consumers rank benefits of GI labelling to be quality assurance, boosting rural developments,
and protecting reputation of product respectively.
Results of probit regression showed that the likelihood to become aware of GI increased with
access to prior information, buying honey from supermarkets and other sources other than the
farm gate and in large volumes, having tertiary education and consumer trust. Male
consumers also had a higher chance of becoming aware about GI. Results, however, showed
a negative relationship between the likelihood to become aware about GI and consumer’s
high confidence in the quality of honey produced by local farmers. Therefore, we reject the
null hypothesis and conclude that socio-demographic factors influence consumer GI
awareness.
92
All attributes; Origin, floral source, organic labels, viscosity, certification by both public and
private bodies are statistically significant at below the 1% level of significance (p<0.005),
with the exception of private standard body, which is significant at 10% level of significance.
This shows positive preferences by consumers towards these attributes. With a significant
negative price sign, MWTP were calculated and consumers are willing to pay up to 430%
premium for organic label. We therefore reject the null hypothesis that consumers have
insignificant preferences for geographical indicators and other quality honey. The study
concludes that there exists a niche markets for all attributes with the exception of private
standardization. Lastly, factors that influence consumers WTP are identified as confidence in
the current standard body, higher education, presence of the elderly in the household and low
income levels of respondents. The null hypothesis that there is no significant difference in
monetary value that Consumers are willing to attach to quality local geographical indicated
honey was rejected.
6.2 Conclusions and Policy Recommendations
Consumers knowledge of GI is limited, there is need to create public awareness through
consumer education before implanting the same. Furthermore, the study shows that honey
consumers are reasonably learned (able to read labels), and are aware of major honey issues
in the country so they have opted to source for honey from the rural areas. To capitalize on
the reading ability of honey users, the study suggests genuine labelling of GI and other
quality aspects of food products. Indicating the aspired consumption of honey for its food and
medicinal value, while reiterating safety measures could show fears inherent in consumers
regarding honey adulteration. These measures are geared towards promoting consumers’
recognition of GI labelling and consequently its role in bringing sanity in the food industry.
Another fact is majority of consumers have experienced honey adulteration, this shows
consumers’ concern on the level of quality standards set for honey in the country. However,
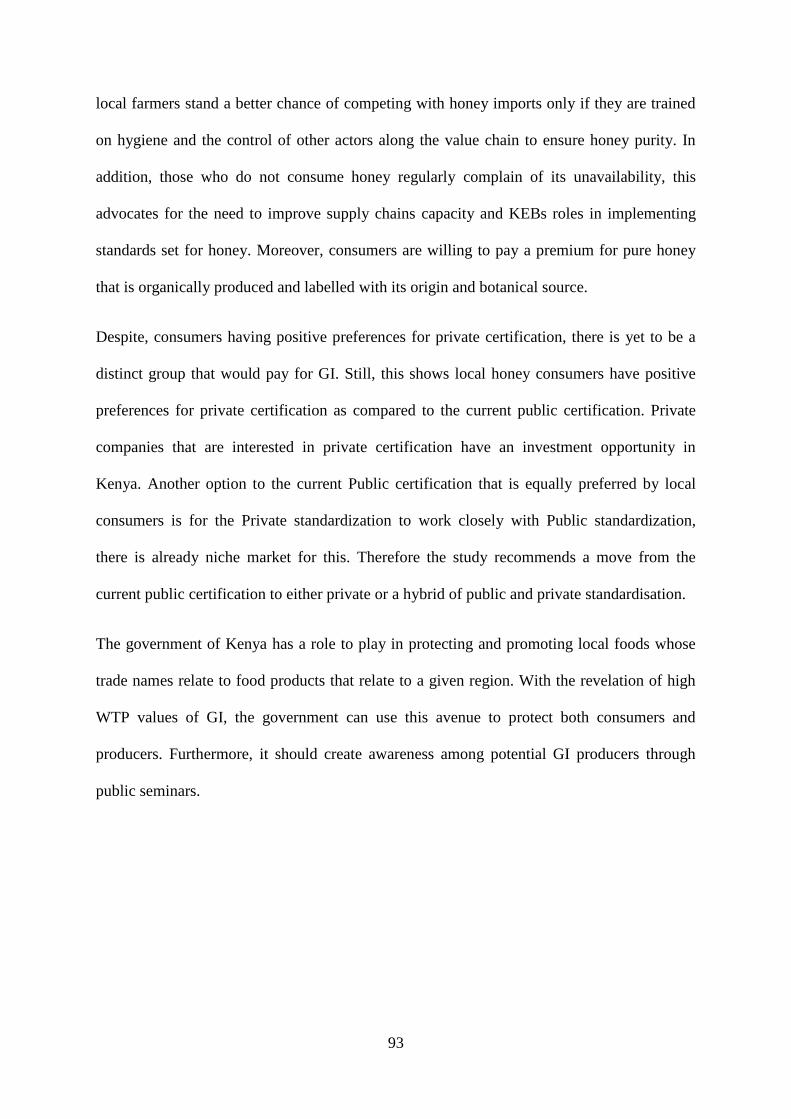
93
local farmers stand a better chance of competing with honey imports only if they are trained
on hygiene and the control of other actors along the value chain to ensure honey purity. In
addition, those who do not consume honey regularly complain of its unavailability, this
advocates for the need to improve supply chains capacity and KEBs roles in implementing
standards set for honey. Moreover, consumers are willing to pay a premium for pure honey
that is organically produced and labelled with its origin and botanical source.
Despite, consumers having positive preferences for private certification, there is yet to be a
distinct group that would pay for GI. Still, this shows local honey consumers have positive
preferences for private certification as compared to the current public certification. Private
companies that are interested in private certification have an investment opportunity in
Kenya. Another option to the current Public certification that is equally preferred by local
consumers is for the Private standardization to work closely with Public standardization,
there is already niche market for this. Therefore the study recommends a move from the
current public certification to either private or a hybrid of public and private standardisation.
The government of Kenya has a role to play in protecting and promoting local foods whose
trade names relate to food products that relate to a given region. With the revelation of high
WTP values of GI, the government can use this avenue to protect both consumers and
producers. Furthermore, it should create awareness among potential GI producers through
public seminars.
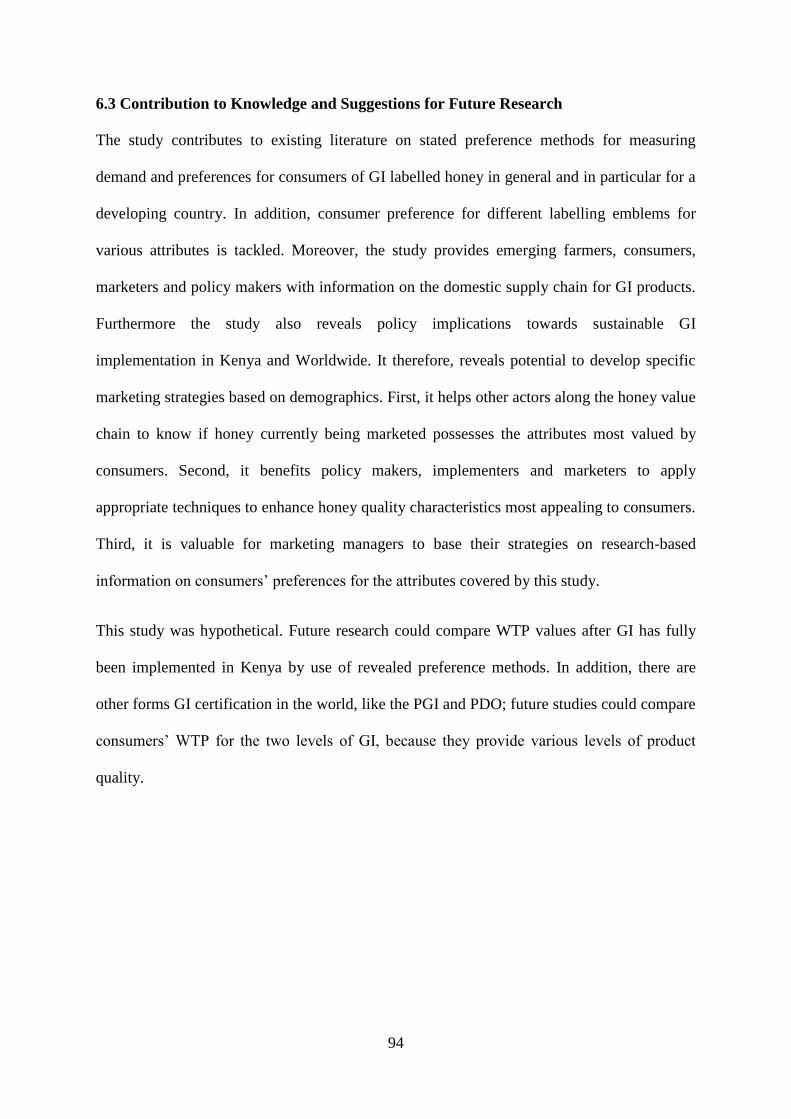
94
6.3 Contribution to Knowledge and Suggestions for Future Research
The study contributes to existing literature on stated preference methods for measuring
demand and preferences for consumers of GI labelled honey in general and in particular for a
developing country. In addition, consumer preference for different labelling emblems for
various attributes is tackled. Moreover, the study provides emerging farmers, consumers,
marketers and policy makers with information on the domestic supply chain for GI products.
Furthermore the study also reveals policy implications towards sustainable GI
implementation in Kenya and Worldwide. It therefore, reveals potential to develop specific
marketing strategies based on demographics. First, it helps other actors along the honey value
chain to know if honey currently being marketed possesses the attributes most valued by
consumers. Second, it benefits policy makers, implementers and marketers to apply
appropriate techniques to enhance honey quality characteristics most appealing to consumers.
Third, it is valuable for marketing managers to base their strategies on research-based
information on consumers’ preferences for the attributes covered by this study.
This study was hypothetical. Future research could compare WTP values after GI has fully
been implemented in Kenya by use of revealed preference methods. In addition, there are
other forms GI certification in the world, like the PGI and PDO; future studies could compare
consumers’ WTP for the two levels of GI, because they provide various levels of product
quality.
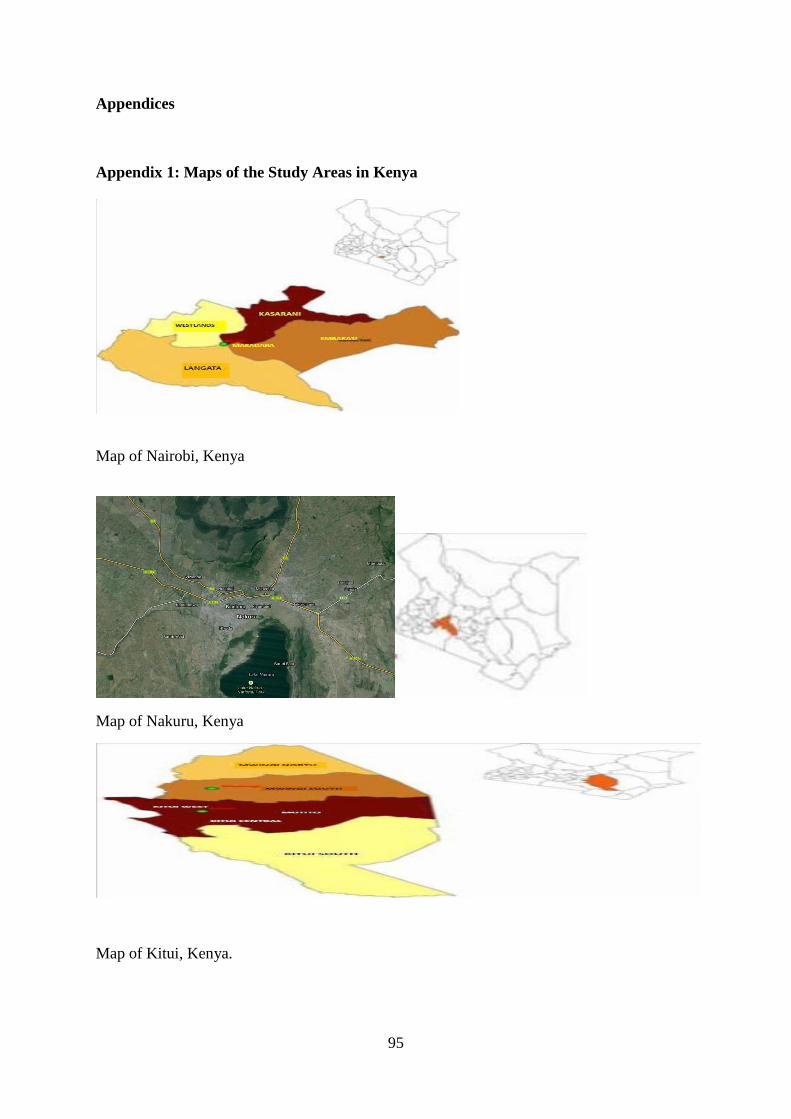
95
Appendices
Appendix 1: Maps of the Study Areas in Kenya
Map of Nairobi, Kenya
Map of Nakuru, Kenya
Map of Kitui, Kenya.
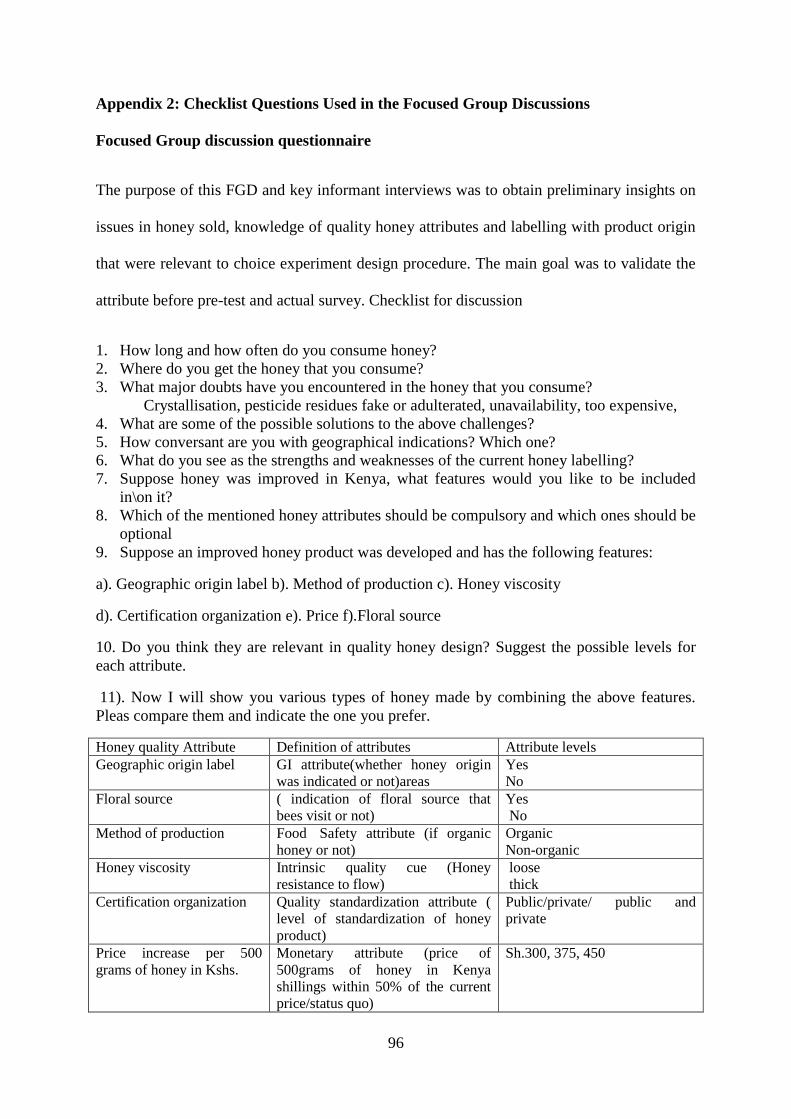
96
Appendix 2: Checklist Questions Used in the Focused Group Discussions
Focused Group discussion questionnaire
The purpose of this FGD and key informant interviews was to obtain preliminary insights on
issues in honey sold, knowledge of quality honey attributes and labelling with product origin
that were relevant to choice experiment design procedure. The main goal was to validate the
attribute before pre-test and actual survey. Checklist for discussion
1. How long and how often do you consume honey?
2. Where do you get the honey that you consume?
3. What major doubts have you encountered in the honey that you consume?
Crystallisation, pesticide residues fake or adulterated, unavailability, too expensive,
4. What are some of the possible solutions to the above challenges?
5. How conversant are you with geographical indications? Which one?
6. What do you see as the strengths and weaknesses of the current honey labelling?
7. Suppose honey was improved in Kenya, what features would you like to be included
in\on it?
8. Which of the mentioned honey attributes should be compulsory and which ones should be
optional
9. Suppose an improved honey product was developed and has the following features:
a). Geographic origin label b). Method of production c). Honey viscosity
d). Certification organization e). Price f).Floral source
10. Do you think they are relevant in quality honey design? Suggest the possible levels for
each attribute.
11). Now I will show you various types of honey made by combining the above features.
Pleas compare them and indicate the one you prefer.
Honey quality Attribute Definition of attributes Attribute levels
Geographic origin label GI attribute(whether honey origin
was indicated or not)areas
Yes
No
Floral source ( indication of floral source that
bees visit or not)
Yes
No
Method of production Food Safety attribute (if organic
honey or not)
Organic
Non-organic
Honey viscosity Intrinsic quality cue (Honey
resistance to flow)
loose
thick
Certification organization Quality standardization attribute (
level of standardization of honey
product)
Public/private/ public and
private
Price increase per 500
grams of honey in Kshs.
Monetary attribute (price of
500grams of honey in Kenya
shillings within 50% of the current
price/status quo)
Sh.300, 375, 450
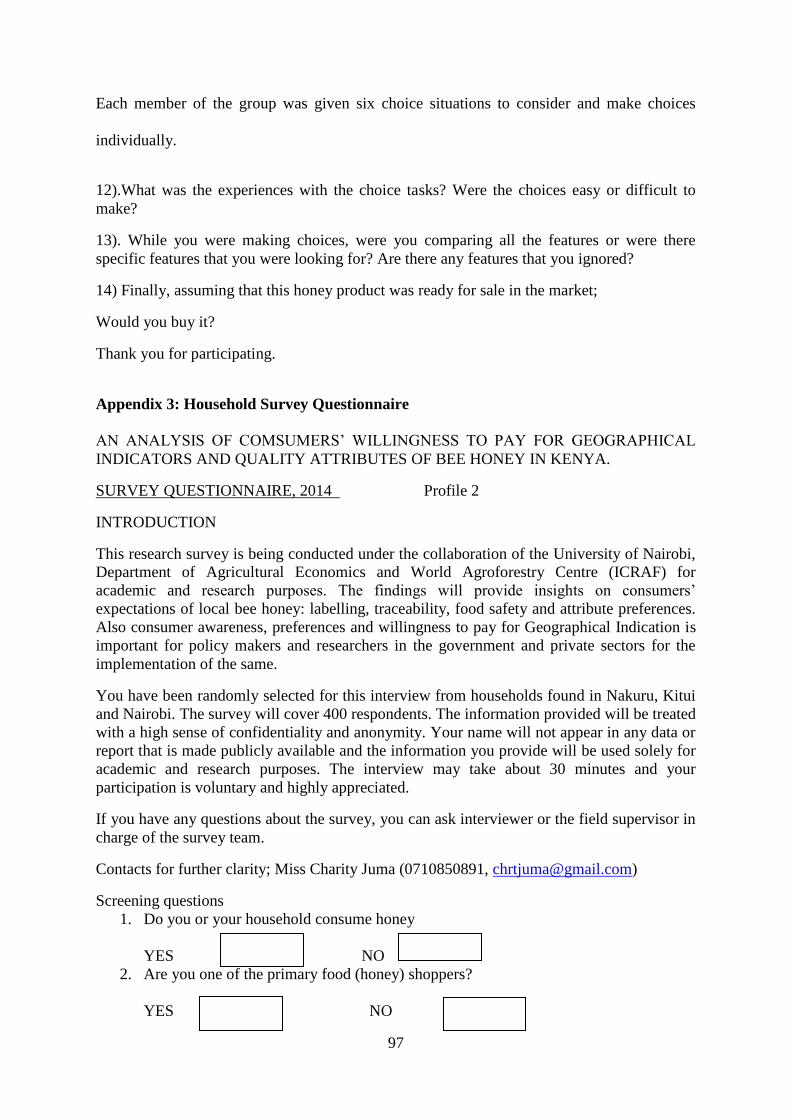
97
Each member of the group was given six choice situations to consider and make choices
individually.
12).What was the experiences with the choice tasks? Were the choices easy or difficult to
make?
13). While you were making choices, were you comparing all the features or were there
specific features that you were looking for? Are there any features that you ignored?
14) Finally, assuming that this honey product was ready for sale in the market;
Would you buy it?
Thank you for participating.
Appendix 3: Household Survey Questionnaire
AN ANALYSIS OF COMSUMERS’ WILLINGNESS TO PAY FOR GEOGRAPHICAL
INDICATORS AND QUALITY ATTRIBUTES OF BEE HONEY IN KENYA.
SURVEY QUESTIONNAIRE, 2014 Profile 2
INTRODUCTION
This research survey is being conducted under the collaboration of the University of Nairobi,
Department of Agricultural Economics and World Agroforestry Centre (ICRAF) for
academic and research purposes. The findings will provide insights on consumers’
expectations of local bee honey: labelling, traceability, food safety and attribute preferences.
Also consumer awareness, preferences and willingness to pay for Geographical Indication is
important for policy makers and researchers in the government and private sectors for the
implementation of the same.
You have been randomly selected for this interview from households found in Nakuru, Kitui
and Nairobi. The survey will cover 400 respondents. The information provided will be treated
with a high sense of confidentiality and anonymity. Your name will not appear in any data or
report that is made publicly available and the information you provide will be used solely for
academic and research purposes. The interview may take about 30 minutes and your
participation is voluntary and highly appreciated.
If you have any questions about the survey, you can ask interviewer or the field supervisor in
charge of the survey team.
Contacts for further clarity; Miss Charity Juma (0710850891, [email protected])
Screening questions
1. Do you or your household consume honey
YES NO
2. Are you one of the primary food (honey) shoppers?
YES NO
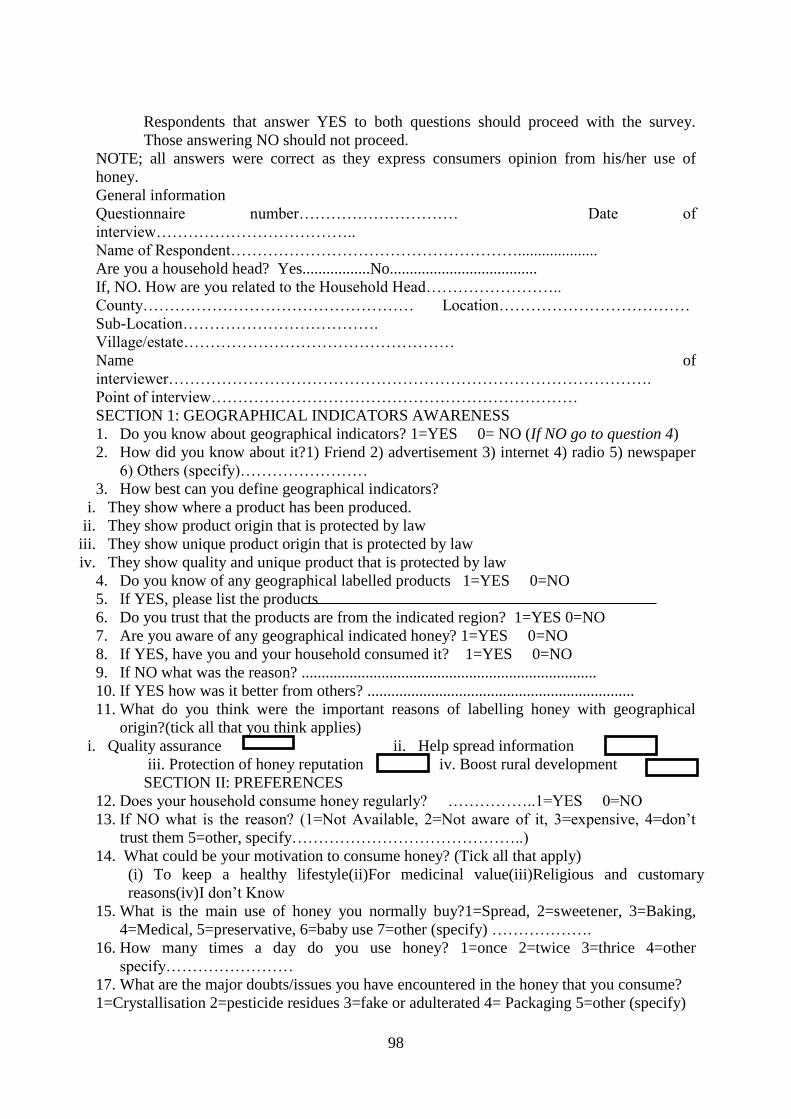
98
Respondents that answer YES to both questions should proceed with the survey.
Those answering NO should not proceed.
NOTE; all answers were correct as they express consumers opinion from his/her use of
honey.
General information
Questionnaire number………………………… Date of
interview………………………………..
Name of Respondent………………………………………………....................
Are you a household head? Yes.................No.....................................
If, NO. How are you related to the Household Head……………………..
County…………………………………………… Location………………………………
Sub-Location……………………………….
Village/estate……………………………………………
Name of
interviewer……………………………………………………………………………….
Point of interview……………………………………………………………
SECTION 1: GEOGRAPHICAL INDICATORS AWARENESS
1. Do you know about geographical indicators? 1=YES 0= NO (If NO go to question 4)
2. How did you know about it?1) Friend 2) advertisement 3) internet 4) radio 5) newspaper
6) Others (specify)……………………
3. How best can you define geographical indicators?
i. They show where a product has been produced.
ii. They show product origin that is protected by law
iii. They show unique product origin that is protected by law
iv. They show quality and unique product that is protected by law
4. Do you know of any geographical labelled products 1=YES 0=NO
5. If YES, please list the products
6. Do you trust that the products are from the indicated region? 1=YES 0=NO
7. Are you aware of any geographical indicated honey? 1=YES 0=NO
8. If YES, have you and your household consumed it? 1=YES 0=NO
9. If NO what was the reason? ..........................................................................
10. If YES how was it better from others? ...................................................................
11. What do you think were the important reasons of labelling honey with geographical
origin?(tick all that you think applies)
i. Quality assurance ii. Help spread information
iii. Protection of honey reputation iv. Boost rural development
SECTION II: PREFERENCES
12. Does your household consume honey regularly? ……………..1=YES 0=NO
13. If NO what is the reason? (1=Not Available, 2=Not aware of it, 3=expensive, 4=don’t
trust them 5=other, specify……………………………………..)
14. What could be your motivation to consume honey? (Tick all that apply)
15. What is the main use of honey you normally buy?1=Spread, 2=sweetener, 3=Baking,
4=Medical, 5=preservative, 6=baby use 7=other (specify) ……………….
16. How many times a day do you use honey? 1=once 2=twice 3=thrice 4=other
specify……………………
17. What are the major doubts/issues you have encountered in the honey that you consume?
1=Crystallisation 2=pesticide residues 3=fake or adulterated 4= Packaging 5=other (specify)
(i) To keep a healthy lifestyle(ii)For medicinal value(iii)Religious and customary
reasons(iv)I don’t Know
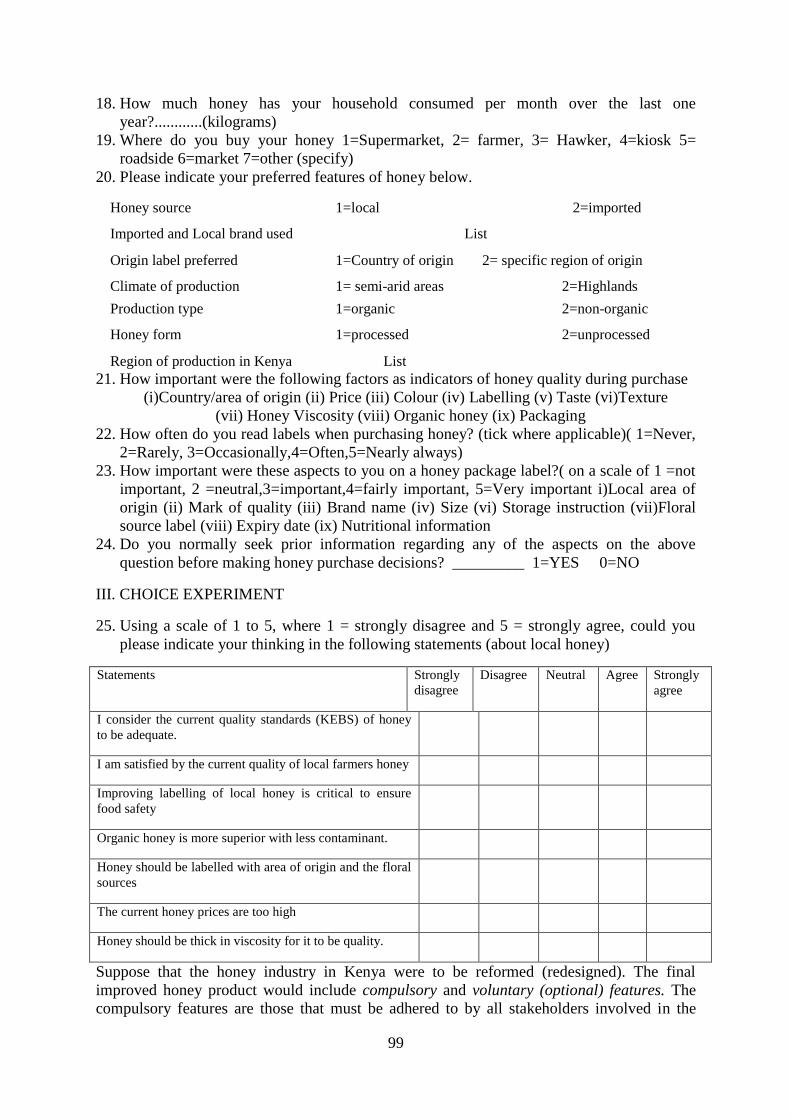
99
18. How much honey has your household consumed per month over the last one
year?............(kilograms)
19. Where do you buy your honey 1=Supermarket, 2= farmer, 3= Hawker, 4=kiosk 5=
roadside 6=market 7=other (specify)
20. Please indicate your preferred features of honey below.
Honey source 1=local 2=imported
Imported and Local brand used List
Origin label preferred 1=Country of origin 2= specific region of origin
Climate of production 1= semi-arid areas 2=Highlands
Production type 1=organic 2=non-organic
Honey form 1=processed 2=unprocessed
Region of production in Kenya List
21. How important were the following factors as indicators of honey quality during purchase
(i)Country/area of origin (ii) Price (iii) Colour (iv) Labelling (v) Taste (vi)Texture
(vii) Honey Viscosity (viii) Organic honey (ix) Packaging
22. How often do you read labels when purchasing honey? (tick where applicable)( 1=Never,
2=Rarely, 3=Occasionally,4=Often,5=Nearly always)
23. How important were these aspects to you on a honey package label?( on a scale of 1 =not
important, 2 =neutral,3=important,4=fairly important, 5=Very important i)Local area of
origin (ii) Mark of quality (iii) Brand name (iv) Size (vi) Storage instruction (vii)Floral
source label (viii) Expiry date (ix) Nutritional information
24. Do you normally seek prior information regarding any of the aspects on the above
question before making honey purchase decisions? _________ 1=YES 0=NO
III. CHOICE EXPERIMENT
25. Using a scale of 1 to 5, where 1 = strongly disagree and 5 = strongly agree, could you
please indicate your thinking in the following statements (about local honey)
Statements Strongly
disagree
Disagree Neutral Agree Strongly
agree
I consider the current quality standards (KEBS) of honey
to be adequate.
I am satisfied by the current quality of local farmers honey
Improving labelling of local honey is critical to ensure
food safety
Organic honey is more superior with less contaminant.
Honey should be labelled with area of origin and the floral
sources
The current honey prices are too high
Honey should be thick in viscosity for it to be quality.
Suppose that the honey industry in Kenya were to be reformed (redesigned). The final
improved honey product would include compulsory and voluntary (optional) features. The
compulsory features are those that must be adhered to by all stakeholders involved in the
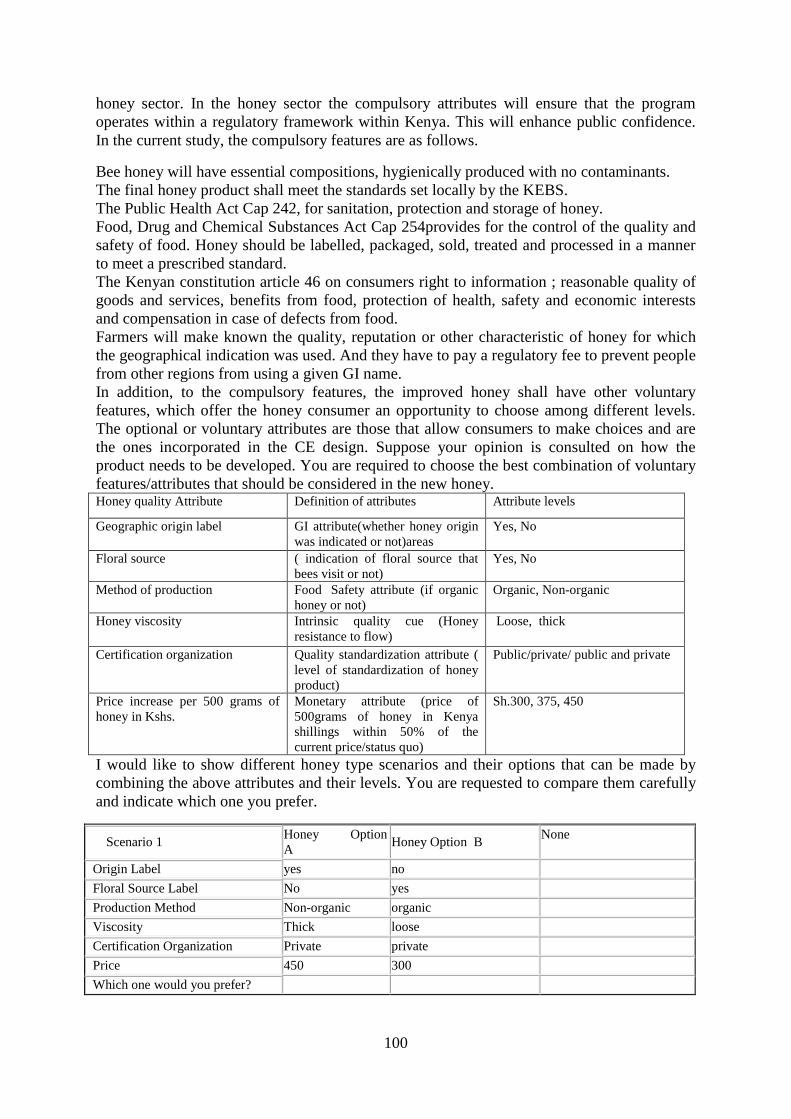
100
honey sector. In the honey sector the compulsory attributes will ensure that the program
operates within a regulatory framework within Kenya. This will enhance public confidence.
In the current study, the compulsory features are as follows.
Bee honey will have essential compositions, hygienically produced with no contaminants.
The final honey product shall meet the standards set locally by the KEBS.
The Public Health Act Cap 242, for sanitation, protection and storage of honey.
Food, Drug and Chemical Substances Act Cap 254provides for the control of the quality and
safety of food. Honey should be labelled, packaged, sold, treated and processed in a manner
to meet a prescribed standard.
The Kenyan constitution article 46 on consumers right to information ; reasonable quality of
goods and services, benefits from food, protection of health, safety and economic interests
and compensation in case of defects from food.
Farmers will make known the quality, reputation or other characteristic of honey for which
the geographical indication was used. And they have to pay a regulatory fee to prevent people
from other regions from using a given GI name.
In addition, to the compulsory features, the improved honey shall have other voluntary
features, which offer the honey consumer an opportunity to choose among different levels.
The optional or voluntary attributes are those that allow consumers to make choices and are
the ones incorporated in the CE design. Suppose your opinion is consulted on how the
product needs to be developed. You are required to choose the best combination of voluntary
features/attributes that should be considered in the new honey. Honey quality Attribute Definition of attributes Attribute levels
Geographic origin label GI attribute(whether honey origin
was indicated or not)areas
Yes, No
Floral source ( indication of floral source that
bees visit or not)
Yes, No
Method of production Food Safety attribute (if organic
honey or not)
Organic, Non-organic
Honey viscosity Intrinsic quality cue (Honey
resistance to flow)
Loose, thick
Certification organization Quality standardization attribute (
level of standardization of honey
product)
Public/private/ public and private
Price increase per 500 grams of
honey in Kshs.
Monetary attribute (price of
500grams of honey in Kenya
shillings within 50% of the
current price/status quo)
Sh.300, 375, 450
I would like to show different honey type scenarios and their options that can be made by
combining the above attributes and their levels. You are requested to compare them carefully
and indicate which one you prefer.
Scenario 1 Honey Option
A Honey Option B
None
Origin Label yes no
Floral Source Label No yes
Production Method Non-organic organic
Viscosity Thick loose
Certification Organization Private private
Price 450 300
Which one would you prefer?
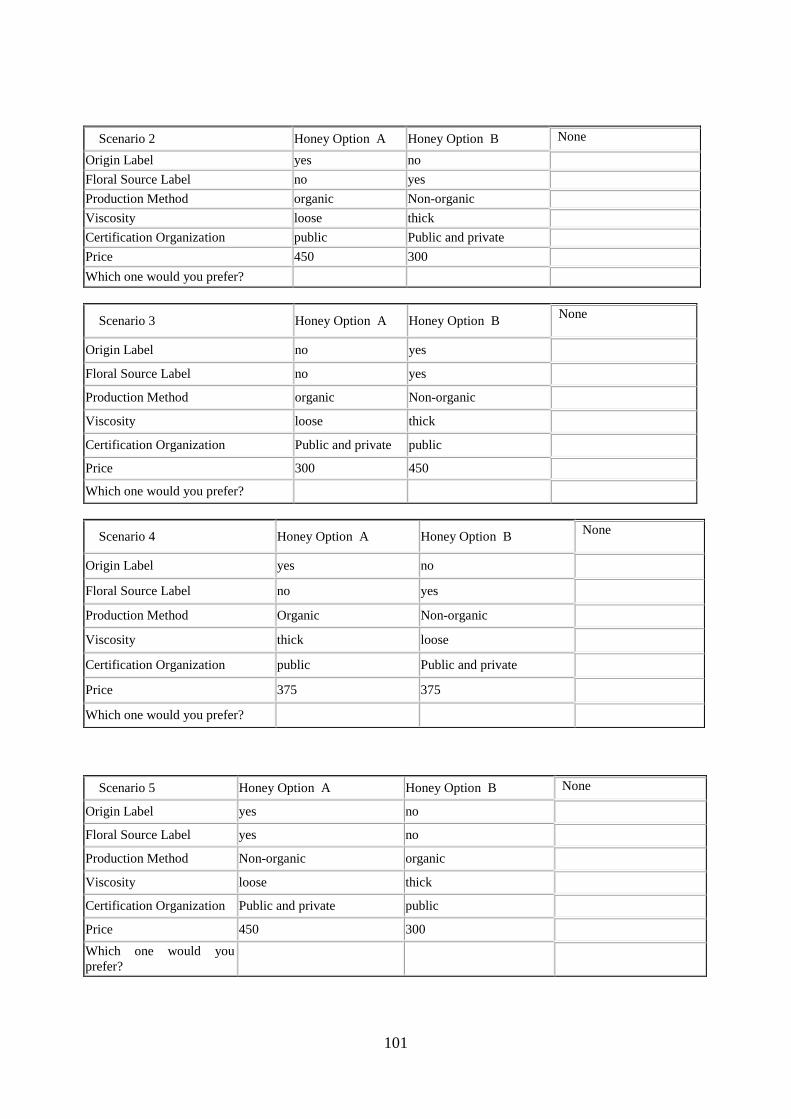
101
Scenario 2 Honey Option A Honey Option B None
Origin Label yes no
Floral Source Label no yes
Production Method organic Non-organic
Viscosity loose thick
Certification Organization public Public and private
Price 450 300
Which one would you prefer?
Scenario 3 Honey Option A Honey Option B None
Origin Label no yes
Floral Source Label no yes
Production Method organic Non-organic
Viscosity loose thick
Certification Organization Public and private public
Price 300 450
Which one would you prefer?
Scenario 4 Honey Option A Honey Option B None
Origin Label yes no
Floral Source Label no yes
Production Method Organic Non-organic
Viscosity thick loose
Certification Organization public Public and private
Price 375 375
Which one would you prefer?
Scenario 5 Honey Option A Honey Option B None
Origin Label yes no
Floral Source Label yes no
Production Method Non-organic organic
Viscosity loose thick
Certification Organization Public and private public
Price 450 300
Which one would you
prefer?
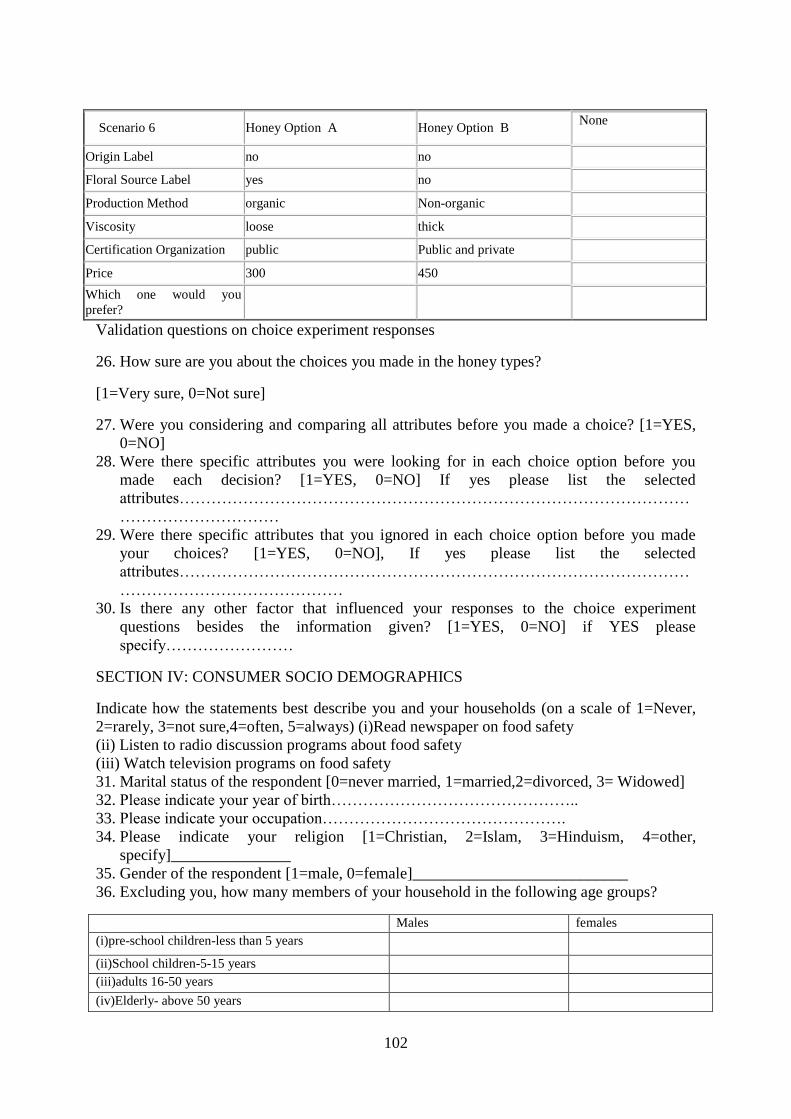
102
Scenario 6 Honey Option A Honey Option B None
Origin Label no no
Floral Source Label yes no
Production Method organic Non-organic
Viscosity loose thick
Certification Organization public Public and private
Price 300 450
Which one would you
prefer?
Validation questions on choice experiment responses
26. How sure are you about the choices you made in the honey types?
[1=Very sure, 0=Not sure]
27. Were you considering and comparing all attributes before you made a choice? [1=YES,
0=NO]
28. Were there specific attributes you were looking for in each choice option before you
made each decision? [1=YES, 0=NO] If yes please list the selected
attributes……………………………………………………………………………………
…………………………
29. Were there specific attributes that you ignored in each choice option before you made
your choices? [1=YES, 0=NO], If yes please list the selected
attributes……………………………………………………………………………………
……………………………………
30. Is there any other factor that influenced your responses to the choice experiment
questions besides the information given? [1=YES, 0=NO] if YES please
specify……………………
SECTION IV: CONSUMER SOCIO DEMOGRAPHICS
Indicate how the statements best describe you and your households (on a scale of 1=Never,
2=rarely, 3=not sure,4=often, 5=always) (i)Read newspaper on food safety
(ii) Listen to radio discussion programs about food safety
(iii) Watch television programs on food safety
31. Marital status of the respondent [0=never married, 1=married,2=divorced, 3= Widowed]
32. Please indicate your year of birth………………………………………..
33. Please indicate your occupation……………………………………….
34. Please indicate your religion [1=Christian, 2=Islam, 3=Hinduism, 4=other,
specify]_______________
35. Gender of the respondent [1=male, 0=female]___________________________
36. Excluding you, how many members of your household in the following age groups?
Males females
(i)pre-school children-less than 5 years
(ii)School children-5-15 years
(iii)adults 16-50 years
(iv)Elderly- above 50 years
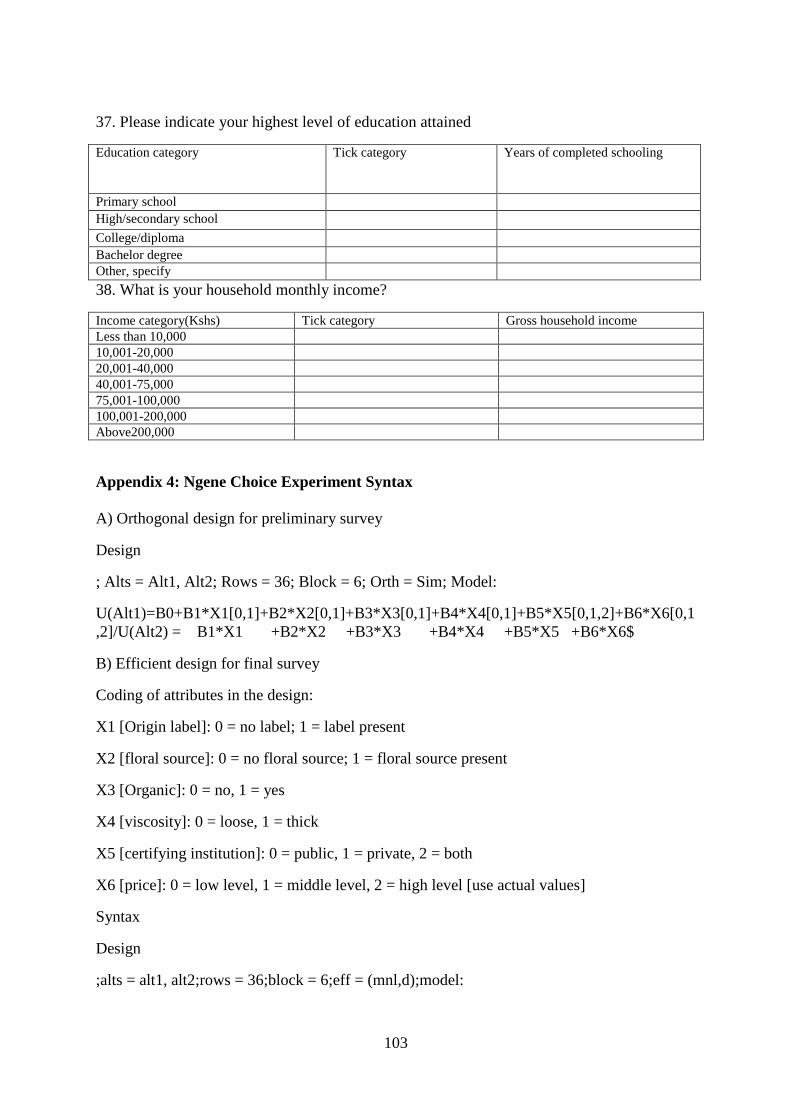
103
37. Please indicate your highest level of education attained
Education category Tick category Years of completed schooling
Primary school
High/secondary school
College/diploma
Bachelor degree
Other, specify
38. What is your household monthly income?
Income category(Kshs) Tick category Gross household income
Less than 10,000
10,001-20,000
20,001-40,000
40,001-75,000
75,001-100,000
100,001-200,000
Above200,000
Appendix 4: Ngene Choice Experiment Syntax
A) Orthogonal design for preliminary survey
Design
; Alts = Alt1, Alt2; Rows = 36; Block = 6; Orth = Sim; Model:
U(Alt1)=B0+B1*X1[0,1]+B2*X2[0,1]+B3*X3[0,1]+B4*X4[0,1]+B5*X5[0,1,2]+B6*X6[0,1
,2]/U(Alt2) = B1*X1 +B2*X2 +B3*X3 +B4*X4 +B5*X5 +B6*X6$
B) Efficient design for final survey
Coding of attributes in the design:
X1 [Origin label]: 0 = no label; 1 = label present
X2 [floral source]: 0 = no floral source; 1 = floral source present
X3 [Organic]: 0 = no, 1 = yes
X4 [viscosity]: 0 = loose, 1 = thick
X5 [certifying institution]: 0 = public, 1 = private, 2 = both
X6 [price]: 0 = low level, 1 = middle level, 2 = high level [use actual values]
Syntax
Design
;alts = alt1, alt2;rows = 36;block = 6;eff = (mnl,d);model:
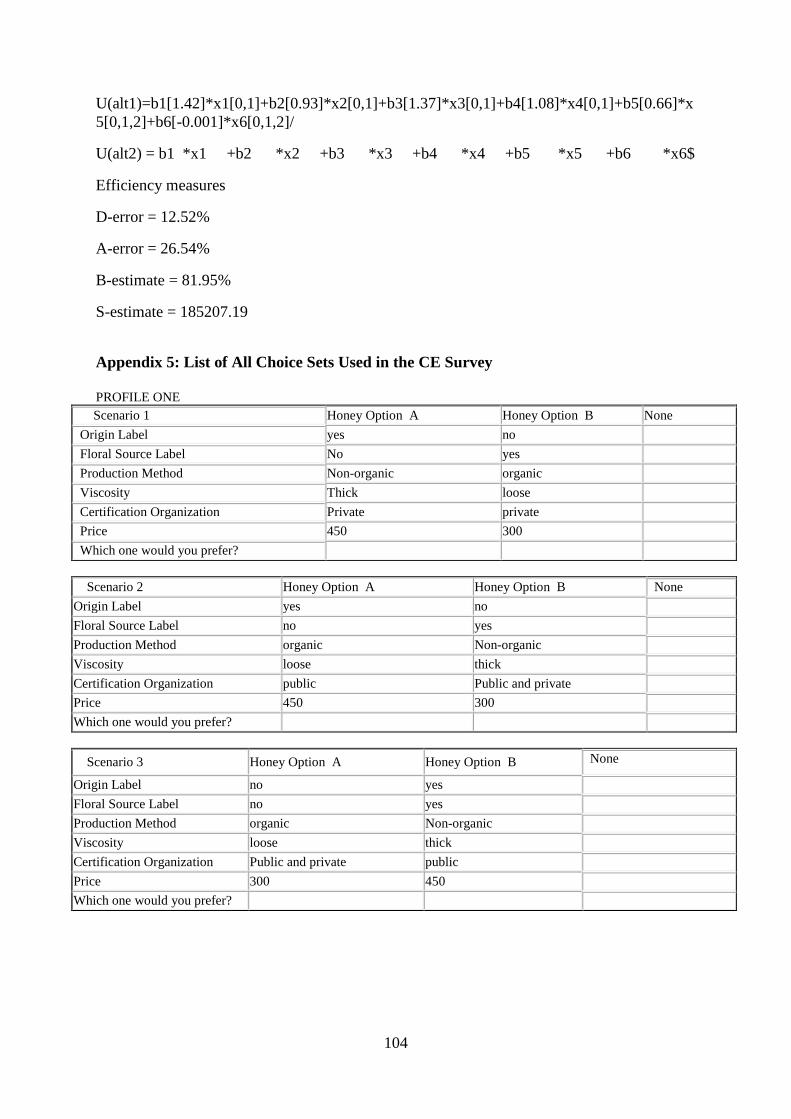
104
U(alt1)=b1[1.42]*x1[0,1]+b2[0.93]*x2[0,1]+b3[1.37]*x3[0,1]+b4[1.08]*x4[0,1]+b5[0.66]*x
5[0,1,2]+b6[-0.001]*x6[0,1,2]/
U(alt2) = b1 *x1 +b2 *x2 +b3 *x3 +b4 *x4 +b5 *x5 +b6 *x6$
Efficiency measures
D-error = 12.52%
A-error = 26.54%
B-estimate = 81.95%
S-estimate = 185207.19
Appendix 5: List of All Choice Sets Used in the CE Survey
PROFILE ONE
Scenario 1 Honey Option A Honey Option B None
Origin Label yes no
Floral Source Label No yes
Production Method Non-organic organic
Viscosity Thick loose
Certification Organization Private private
Price 450 300
Which one would you prefer?
Scenario 2 Honey Option A Honey Option B None
Origin Label yes no
Floral Source Label no yes
Production Method organic Non-organic
Viscosity loose thick
Certification Organization public Public and private
Price 450 300
Which one would you prefer?
Scenario 3 Honey Option A Honey Option B None
Origin Label no yes
Floral Source Label no yes
Production Method organic Non-organic
Viscosity loose thick
Certification Organization Public and private public
Price 300 450
Which one would you prefer?
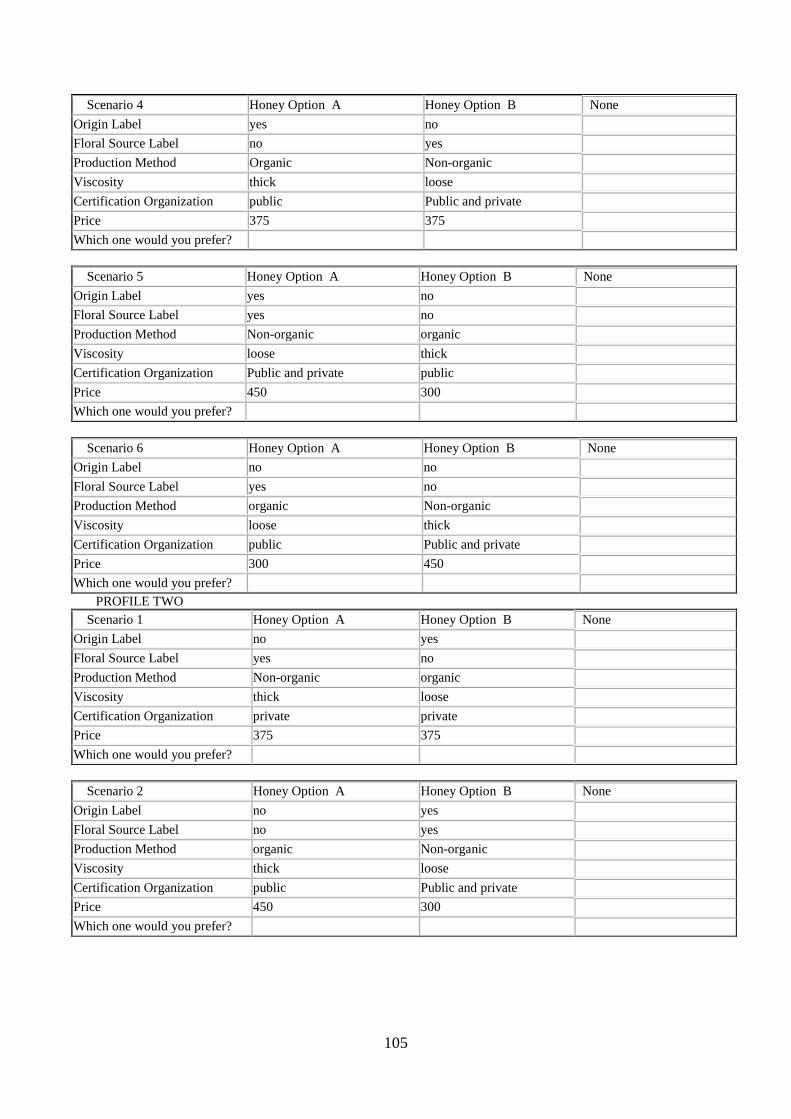
105
Scenario 4 Honey Option A Honey Option B None
Origin Label yes no
Floral Source Label no yes
Production Method Organic Non-organic
Viscosity thick loose
Certification Organization public Public and private
Price 375 375
Which one would you prefer?
Scenario 5 Honey Option A Honey Option B None
Origin Label yes no
Floral Source Label yes no
Production Method Non-organic organic
Viscosity loose thick
Certification Organization Public and private public
Price 450 300
Which one would you prefer?
Scenario 6 Honey Option A Honey Option B None
Origin Label no no
Floral Source Label yes no
Production Method organic Non-organic
Viscosity loose thick
Certification Organization public Public and private
Price 300 450
Which one would you prefer?
PROFILE TWO
Scenario 1 Honey Option A Honey Option B None
Origin Label no yes
Floral Source Label yes no
Production Method Non-organic organic
Viscosity thick loose
Certification Organization private private
Price 375 375
Which one would you prefer?
Scenario 2 Honey Option A Honey Option B None
Origin Label no yes
Floral Source Label no yes
Production Method organic Non-organic
Viscosity thick loose
Certification Organization public Public and private
Price 450 300
Which one would you prefer?
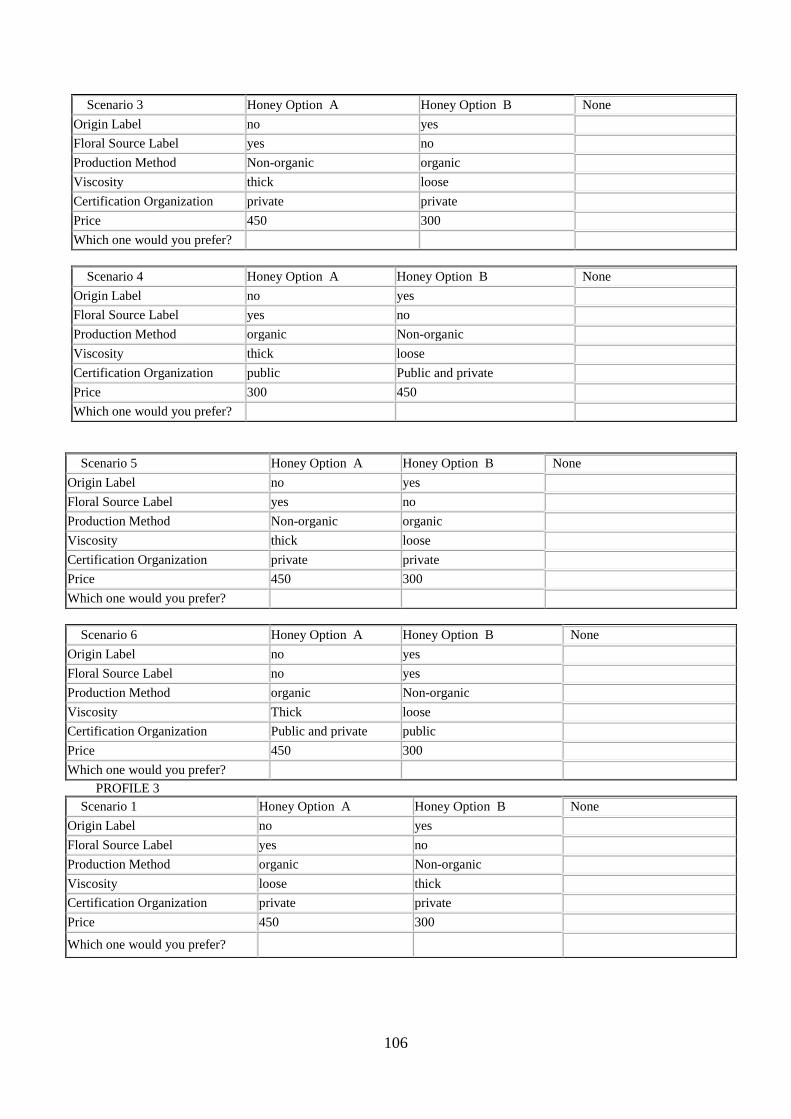
106
Scenario 3 Honey Option A Honey Option B None
Origin Label no yes
Floral Source Label yes no
Production Method Non-organic organic
Viscosity thick loose
Certification Organization private private
Price 450 300
Which one would you prefer?
Scenario 4 Honey Option A Honey Option B None
Origin Label no yes
Floral Source Label yes no
Production Method organic Non-organic
Viscosity thick loose
Certification Organization public Public and private
Price 300 450
Which one would you prefer?
Scenario 5 Honey Option A Honey Option B None
Origin Label no yes
Floral Source Label yes no
Production Method Non-organic organic
Viscosity thick loose
Certification Organization private private
Price 450 300
Which one would you prefer?
Scenario 6 Honey Option A Honey Option B None
Origin Label no yes
Floral Source Label no yes
Production Method organic Non-organic
Viscosity Thick loose
Certification Organization Public and private public
Price 450 300
Which one would you prefer?
PROFILE 3
Scenario 1 Honey Option A Honey Option B None
Origin Label no yes
Floral Source Label yes no
Production Method organic Non-organic
Viscosity loose thick
Certification Organization private private
Price 450 300
Which one would you prefer?
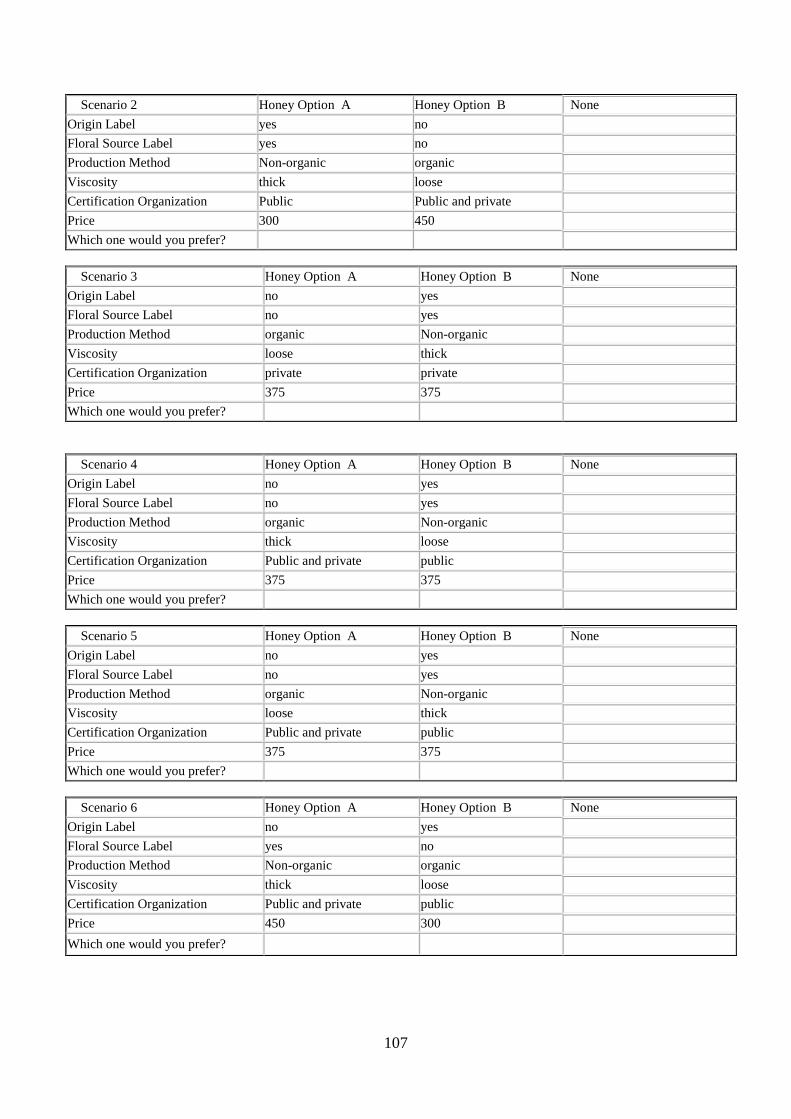
107
Scenario 2 Honey Option A Honey Option B None
Origin Label yes no
Floral Source Label yes no
Production Method Non-organic organic
Viscosity thick loose
Certification Organization Public Public and private
Price 300 450
Which one would you prefer?
Scenario 3 Honey Option A Honey Option B None
Origin Label no yes
Floral Source Label no yes
Production Method organic Non-organic
Viscosity loose thick
Certification Organization private private
Price 375 375
Which one would you prefer?
Scenario 4 Honey Option A Honey Option B None
Origin Label no yes
Floral Source Label no yes
Production Method organic Non-organic
Viscosity thick loose
Certification Organization Public and private public
Price 375 375
Which one would you prefer?
Scenario 5 Honey Option A Honey Option B None
Origin Label no yes
Floral Source Label no yes
Production Method organic Non-organic
Viscosity loose thick
Certification Organization Public and private public
Price 375 375
Which one would you prefer?
Scenario 6 Honey Option A Honey Option B None
Origin Label no yes
Floral Source Label yes no
Production Method Non-organic organic
Viscosity thick loose
Certification Organization Public and private public
Price 450 300
Which one would you prefer?
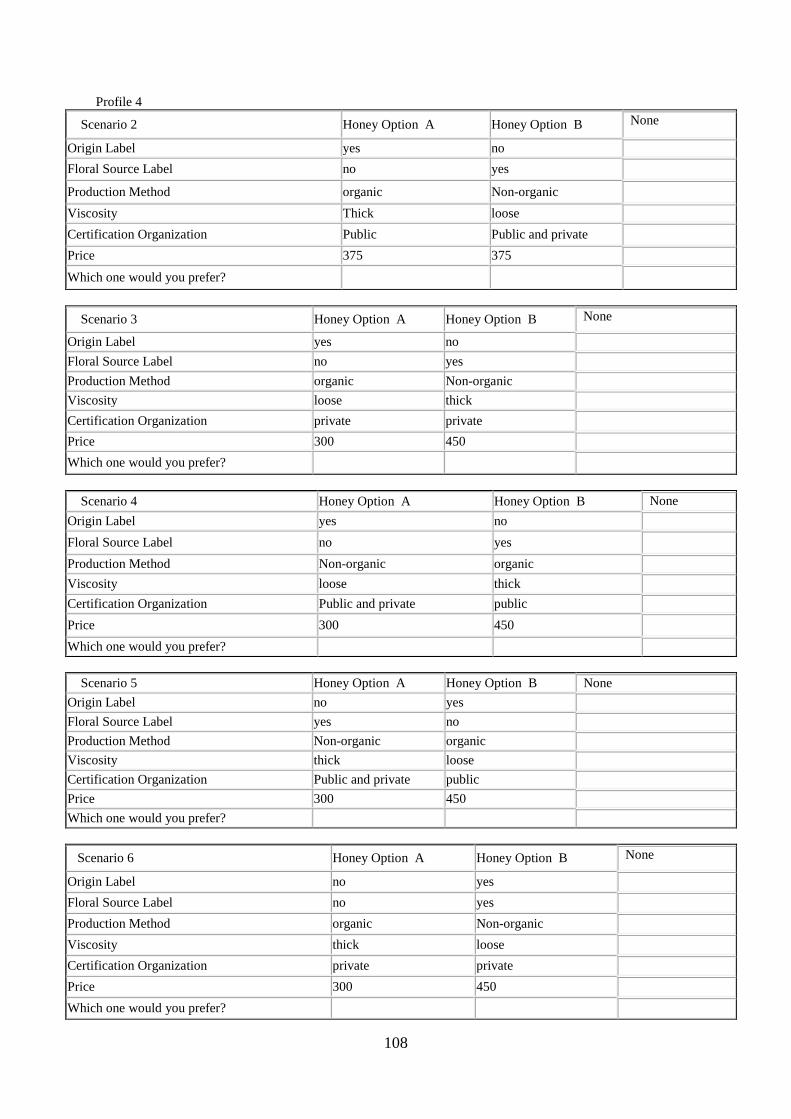
108
Profile 4
Scenario 2 Honey Option A Honey Option B None
Origin Label yes no
Floral Source Label no yes
Production Method organic Non-organic
Viscosity Thick loose
Certification Organization Public Public and private
Price 375 375
Which one would you prefer?
Scenario 3 Honey Option A Honey Option B None
Origin Label yes no
Floral Source Label no yes
Production Method organic Non-organic
Viscosity loose thick
Certification Organization private private
Price 300 450
Which one would you prefer?
Scenario 4 Honey Option A Honey Option B None
Origin Label yes no
Floral Source Label no yes
Production Method Non-organic organic
Viscosity loose thick
Certification Organization Public and private public
Price 300 450
Which one would you prefer?
Scenario 5 Honey Option A Honey Option B None
Origin Label no yes
Floral Source Label yes no
Production Method Non-organic organic
Viscosity thick loose
Certification Organization Public and private public
Price 300 450
Which one would you prefer?
Scenario 6 Honey Option A Honey Option B None
Origin Label no yes
Floral Source Label no yes
Production Method organic Non-organic
Viscosity thick loose
Certification Organization private private
Price 300 450
Which one would you prefer?
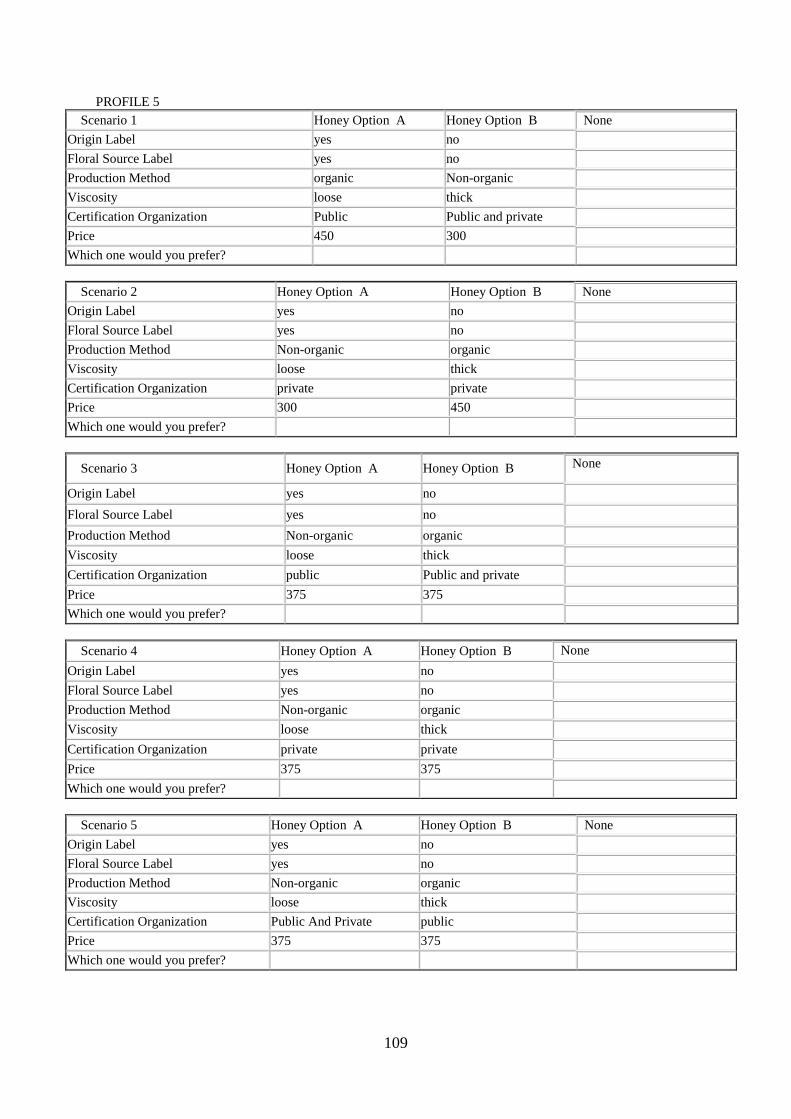
109
PROFILE 5
Scenario 1 Honey Option A Honey Option B None
Origin Label yes no
Floral Source Label yes no
Production Method organic Non-organic
Viscosity loose thick
Certification Organization Public Public and private
Price 450 300
Which one would you prefer?
Scenario 2 Honey Option A Honey Option B None
Origin Label yes no
Floral Source Label yes no
Production Method Non-organic organic
Viscosity loose thick
Certification Organization private private
Price 300 450
Which one would you prefer?
Scenario 3 Honey Option A Honey Option B None
Origin Label yes no
Floral Source Label yes no
Production Method Non-organic organic
Viscosity loose thick
Certification Organization public Public and private
Price 375 375
Which one would you prefer?
Scenario 4 Honey Option A Honey Option B None
Origin Label yes no
Floral Source Label yes no
Production Method Non-organic organic
Viscosity loose thick
Certification Organization private private
Price 375 375
Which one would you prefer?
Scenario 5 Honey Option A Honey Option B None
Origin Label yes no
Floral Source Label yes no
Production Method Non-organic organic
Viscosity loose thick
Certification Organization Public And Private public
Price 375 375
Which one would you prefer?
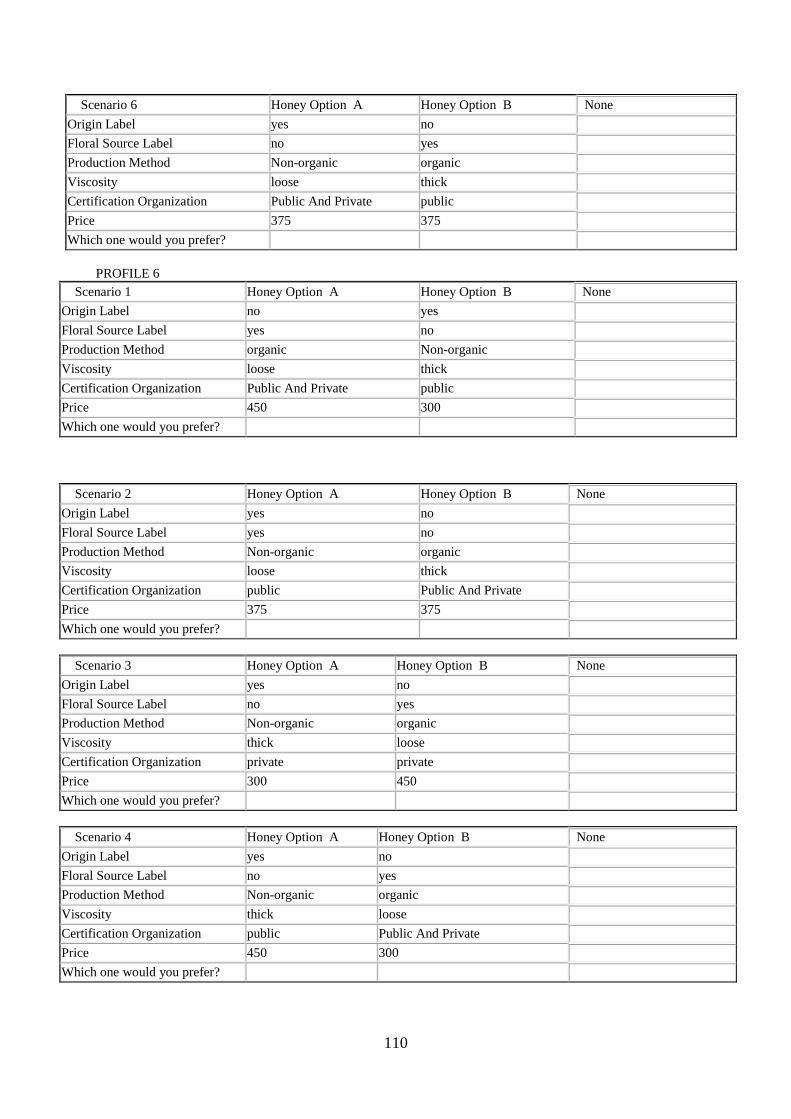
110
Scenario 6 Honey Option A Honey Option B None
Origin Label yes no
Floral Source Label no yes
Production Method Non-organic organic
Viscosity loose thick
Certification Organization Public And Private public
Price 375 375
Which one would you prefer?
PROFILE 6
Scenario 1 Honey Option A Honey Option B None
Origin Label no yes
Floral Source Label yes no
Production Method organic Non-organic
Viscosity loose thick
Certification Organization Public And Private public
Price 450 300
Which one would you prefer?
Scenario 2 Honey Option A Honey Option B None
Origin Label yes no
Floral Source Label yes no
Production Method Non-organic organic
Viscosity loose thick
Certification Organization public Public And Private
Price 375 375
Which one would you prefer?
Scenario 3 Honey Option A Honey Option B None
Origin Label yes no
Floral Source Label no yes
Production Method Non-organic organic
Viscosity thick loose
Certification Organization private private
Price 300 450
Which one would you prefer?
Scenario 4 Honey Option A Honey Option B None
Origin Label yes no
Floral Source Label no yes
Production Method Non-organic organic
Viscosity thick loose
Certification Organization public Public And Private
Price 450 300
Which one would you prefer?
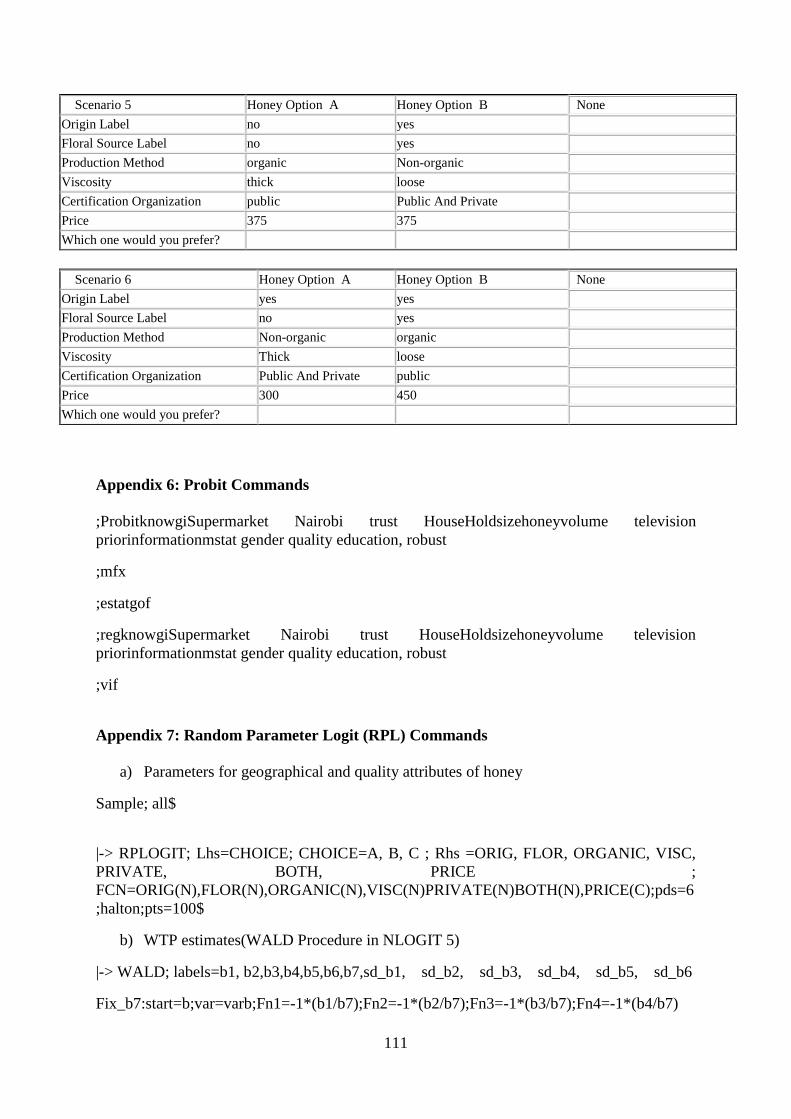
111
Scenario 5 Honey Option A Honey Option B None
Origin Label no yes
Floral Source Label no yes
Production Method organic Non-organic
Viscosity thick loose
Certification Organization public Public And Private
Price 375 375
Which one would you prefer?
Scenario 6 Honey Option A Honey Option B None
Origin Label yes yes
Floral Source Label no yes
Production Method Non-organic organic
Viscosity Thick loose
Certification Organization Public And Private public
Price 300 450
Which one would you prefer?
Appendix 6: Probit Commands
;ProbitknowgiSupermarket Nairobi trust HouseHoldsizehoneyvolume television
priorinformationmstat gender quality education, robust
;mfx
;estatgof
;regknowgiSupermarket Nairobi trust HouseHoldsizehoneyvolume television
priorinformationmstat gender quality education, robust
;vif
Appendix 7: Random Parameter Logit (RPL) Commands
a) Parameters for geographical and quality attributes of honey
Sample; all$
|-> RPLOGIT; Lhs=CHOICE; CHOICE=A, B, C ; Rhs =ORIG, FLOR, ORGANIC, VISC,
PRIVATE, BOTH, PRICE ;
FCN=ORIG(N),FLOR(N),ORGANIC(N),VISC(N)PRIVATE(N)BOTH(N),PRICE(C);pds=6
;halton;pts=100$
b) WTP estimates(WALD Procedure in NLOGIT 5)
|-> WALD; labels=b1, b2,b3,b4,b5,b6,b7,sd_b1, sd_b2, sd_b3, sd_b4, sd_b5, sd_b6
Fix_b7:start=b;var=varb;Fn1=-1*(b1/b7);Fn2=-1*(b2/b7);Fn3=-1*(b3/b7);Fn4=-1*(b4/b7)
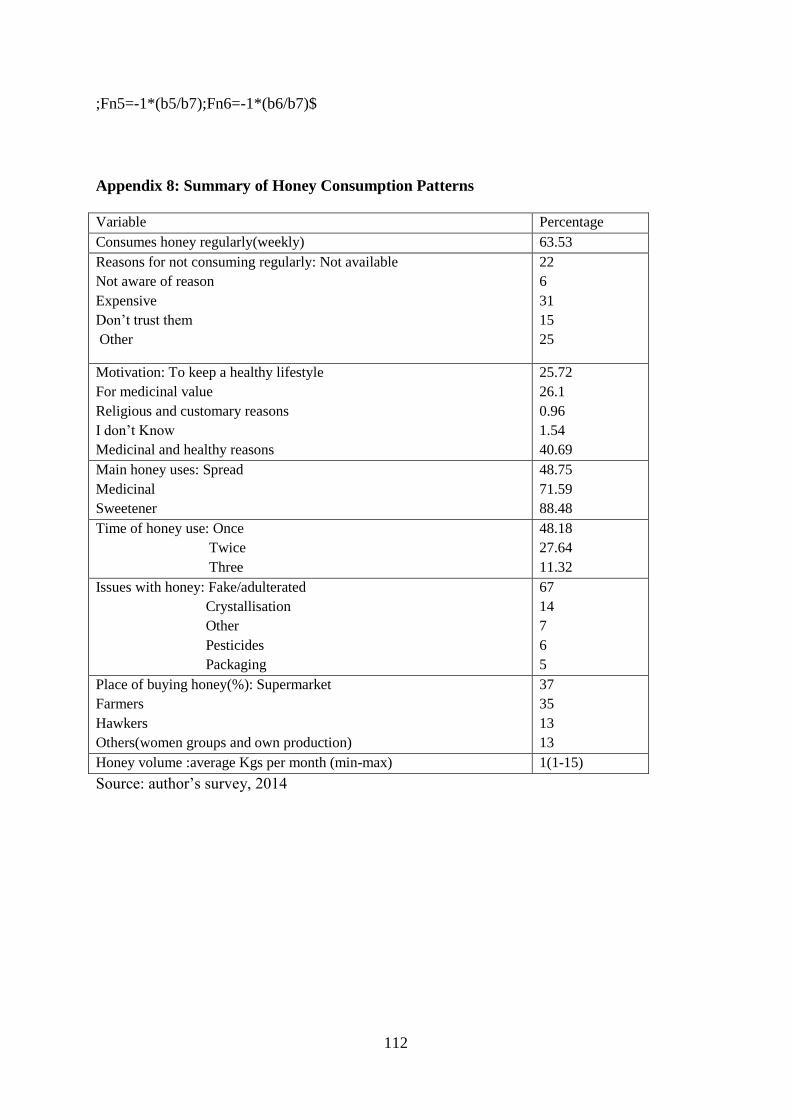
112
;Fn5=-1*(b5/b7);Fn6=-1*(b6/b7)$
Appendix 8: Summary of Honey Consumption Patterns
Variable Percentage
Consumes honey regularly(weekly) 63.53
Reasons for not consuming regularly: Not available
Not aware of reason
Expensive
Don’t trust them
Other
22
6
31
15
25
Motivation: To keep a healthy lifestyle
For medicinal value
Religious and customary reasons
I don’t Know
Medicinal and healthy reasons
25.72
26.1
0.96
1.54
40.69
Main honey uses: Spread
Medicinal
Sweetener
48.75
71.59
88.48
Time of honey use: Once
Twice
Three
48.18
27.64
11.32
Issues with honey: Fake/adulterated
Crystallisation
Other
Pesticides
Packaging
67
14
7
6
5
Place of buying honey(%): Supermarket
Farmers
Hawkers
Others(women groups and own production)
37
35
13
13
Honey volume :average Kgs per month (min-max) 1(1-15)
Source: author’s survey, 2014