factors influencing consumers' buying
TRANSCRIPT

FACTORS INFLUENCING CONSUMERS’ BUYING BEHAVIOR OF
REFRIGERATORS IN NAIROBI, KENYA
BY
JOEL KARUBIU
UNITED STATES INTERNATIONAL UNIVERSITY-AFRICA
SPRING 2019
FACTORS INFLUENCING CONSUMERS’ BUYING BEHAVIOR OF
REFRIGERATORS IN NAIROBI, KENYA
BY
JOEL KARUBIU
A Research Project Submitted to the Chandaria School of Business in
Partial Fulfillment of the Requirement for the Degree of Masters in
Business Administration (MBA)
UNITED STATES INTERNATIONAL UNIVERSITY – AFRICA
SPRING 2019
ii
STUDENT’S DECLARATION
I, the undersigned, declare this my original work and has not been submitted to any other
college, institution or university other than United States University in Nairobi for
academic credit.
Signed __________________________ Date: _________________________
Joel Karubiu (Id No: 258649)
This project report has been presented for examination with my approval as the appointed
supervisor.
Signed __________________________ Date: _________________________
Dr. Peter Kiriri
Signed: __________________________ Date: _____________________________
Dean Chandaria School of Business
iii
COPYRIGHT
© 2019 Joel Karubiu
ALL RIGHTS RESERVED. Any unauthorized reprint or use of this research report is
prohibited. No part of study may be reproduced or transmitted in any form or by any
means, electronic or mechanical, including photocopying, recording, or by any
information storage and retrieval system without express written permission from the
author and the university.
iv
ABSTRACT
The main objective of the study was to investigate factors influencing consumer buying
behavior of refrigerators in Nairobi, Kenya. Specifically, the study sought to investigate
cultural, social and personal factors influencing consumer buying behavior of
refrigerators in Nairobi, Kenya.
The study adopted a descriptive research design in order to fully describe the factors that
influence consumer buying behavior of refrigerators in Kenya. The total population for
the study was 985,016 households in Nairobi County. The sampling technique used in the
study was two-stage cluster sampling, whereby the first stage involved identifying
households in Nairobi that have a refrigerator and the second stage involved selecting a
random sample from the identified households. The sample size for the study was 230,
however a total of 233 questionnaires were filled correctly. The sample size was
distributed as follows: 60 interviews in Nairobi West, 83 in Nairobi East, 70 in Nairobi
North and 20 in Westland. The study mainly involved collection of quantitative data
using a simple household questionnaire. Once the questionnaire was developed, it was
uploaded onto a digital platform (Kobo collect) which enabled collection of data using
mobile phones instead of the “pen and paper” method. Interviewers were locally
identified, recruited and trained after which the questionnaire was pre-tested and fine-
tuned. Data collected was analyzed using SPSS. The data was analyzed using descriptive
statistics, mainly frequencies and measures of central tendency (mean, median and
mode).The data was presented in tables and figures.
The cultural factors investigated by the study were nationality; racial group; area of
residence; set of values, customs and traditions from the society; average monthly
income; highest education level and type of occupation. Majority of the respondents
disagreed that nationality, racial group, average monthly income and highest education
level influences their buying behavior of refrigerators whereas most respondents agreed
that area of residence, type of occupation and set of values, customs and traditions
obtained from the society influence their buying behavior of refrigerators.
Social factors investigated by the study were family members, friends, and colleagues,
position in workplace, society and family. Most respondents disagreed that family
members, colleagues, position in workplace, society and family influences their buying
v
behavior of refrigerators whereas most respondents agreed that friends influence their
buying behavior of refrigerators.
Personal factors investigated by the study were age group, lifestyle, current lifecycle,
personality, self-concept, values and economic status. Most respondents disagreed that
age group, current lifecycle, personality and economic status influence their buying
behavior of refrigerators whereas most respondents agreed that lifestyle, self-concept and
values influence their buying behavior of refrigerators.
The cultural factors influencing consumer buying behavior of refrigerators included area
of residence, type of occupation that one has and the set of values, customs and traditions
that were obtained from the society in which one grew up in. The study found that social
factors were not very influential when it comes to making a decision to purchase a
refrigerator. The only social factor influencing the buying behavior is friends of the
person intending to make a purchase. There are several personal factors that influence
consumer buying behavior of refrigerators. These are lifestyle of an individual, the self-
concept and values of a person.
On cultural factors influencing consumer buying behavior of refrigerators, the researcher
recommend marketing of refrigerators to be customized for each area. This is because,
people acquire values, customs and traditions from the areas they grew up in, then use the
same in the places they reside. Therefore marketers should market specific brands of
refrigerators in specific areas. Friends play a very big role when it comes to influencing
buying behavior. Therefore we recommend to the retailers to offer good service to
customers and provide them with adequate information about a product so that these
customers can tell their friends about them. We recommend to the manufacturers to
ensure that every product is custom made in order to meet the need of the customers.
These narrows down to the color, size and power consumption.

vi
ACKNOWLEDGEMENTS
I would like to acknowledge and appreciate the Almighty God for the gift of life and
strength granted to me throughout the period of this study. I would also like to sincerely
thank my supervisor Dr. Peter Kiriri for his intellectual contribution, support and
guidance in developing this research study. My gratitude also goes to the respondents for
giving me the valuable information needed to develop this study. Finally, my gratitude
goes to my family for allowing me the opportunity to study and for their support during
the tough academic times. God bless you all.

vii
DEDICATION
I dedicate this dissertation to God the Almighty for His enormous favor and grace. I also
dedicate this dissertation to my wife Purity Karubiu and children Wacera and Muriuki
Karubiu for their prayers, encouragement and unwavering support. Their love and support
have been invaluable.

viii
LIST OF ACRONYMS
SPSS Statistical Package for Social Scientist
PCA Principal Component Analysis
KES Kenyan Shillings
0C Degrees Centigrade
0F Degrees Fahrenheit
ix
TABLE OF CONTENTS
STUDENT’S DECLARATION ............................................................................................. ii
COPYRIGHT ......................................................................................................................... iii
ABSTRACT ............................................................................................................................ iv
ACKNOWLEDGEMENTS .................................................................................................. vi
DEDICATION....................................................................................................................... vii
LIST OF ACRONYMS ....................................................................................................... viii
TABLE OF CONTENTS ...................................................................................................... ix
LIST OF TABLES ................................................................................................................ xii
LIST OF FIGURES ............................................................................................................. xiii
CHAPTER ONE ..................................................................................................................... 1
1.0 INTRODUCTION........................................................................................................ 1
1.1 Background of the Problem ........................................................................................... 1
1.2 The Problem Statement .................................................................................................. 5
1.3 General Objective .......................................................................................................... 6
1.4 Specific Objective .......................................................................................................... 7
1.5 Importance of the Study ................................................................................................. 7
1.6 Scope of the Study ......................................................................................................... 8
1.7 Definition of Terms........................................................................................................ 8
1.8 Chapter Summary .......................................................................................................... 9
CHAPTER TWO .................................................................................................................. 11
2.0 LITERATURE REVIEW ......................................................................................... 11
2.1 Introduction .................................................................................................................. 11
2.2 Cultural Factors Influencing Consumer Buying Behavior .......................................... 11
2.3 Social Factors Influencing Consumer Buying Behavior ............................................. 16
2.4 Personal Factors Influencing Consumer Buying Behavior .......................................... 22
2.5 Chapter Summary ........................................................................................................ 29
x
CHAPTER THREE .............................................................................................................. 30
3.0 RESEARCH METHODOLOGY ............................................................................. 30
3.1 Introduction .................................................................................................................. 30
3.2 Research Design........................................................................................................... 30
3.3 Population and Sampling Design ................................................................................. 30
3.4 Data Collection Methods ............................................................................................. 33
3.5 Research Procedure ...................................................................................................... 33
3.6 Data Analysis Methods ................................................................................................ 34
3.7 Chapter Summary ........................................................................................................ 35
CHAPTER FOUR ................................................................................................................. 36
4.0 RESULTS AND FINDINGS ..................................................................................... 36
4.1 Introduction .................................................................................................................. 36
4.2 Demographic Characteristics and Main Sources of Income of the Respondents ........ 36
4.3 Ownership of Refrigerators.......................................................................................... 40
4.4 Cultural Factors Influencing Consumer Buying Behavior of Refrigerators ................ 42
4.5 Social Factors Influencing Buying Behavior of Refrigerators .................................... 48
4.6 Personal Factors Influencing Consumer Buying Behavior of Refrigerators ............... 53
4.7 Chapter Summary ........................................................................................................ 58
CHAPTER FIVE .................................................................................................................. 60
5.0 DISCUSSION, CONCLUSIONS AND RECOMMENDATIONS ........................ 60
5.1 Introduction .................................................................................................................. 60
5.2 Summary ...................................................................................................................... 60
5.3 Discussion .................................................................................................................... 61
5.4 Conclusions .................................................................................................................. 66
5.5 Recommendations ........................................................................................................ 67
REFERENCES ...................................................................................................................... 69
APPENDICES ....................................................................................................................... 73

xi
APPENDIX I: INTRODUCTORY LETTER .................................................................... 73
APPENDIX I1: QUESTIONNAIRE ................................................................................... 74
xii
LIST OF TABLES
Table 3.1: Population Distribution .......................................................................................... 31
Table 3.2: Sample Size ........................................................................................................... 33
Table 4.1: Number of Questionnaires Filled Correctly .......................................................... 36
Table 4.2: Frequency for the Age Respondents ...................................................................... 37
Table 4.3: Frequency for Nationality displaying the %responses .......................................... 42
Table 4.4: Racial Group .......................................................................................................... 43
Table 4.5: Area of Residence .................................................................................................. 43
Table 4.6: Set of Values, Customs and Traditions.................................................................. 44
Table 4.7: Average Monthly Income ...................................................................................... 44
Table 4.8: Highest Education Level ........................................................................................ 45
Table 4.9: Frequency for Type of Occupation ........................................................................ 45
Table 4.10: Family Members .................................................................................................. 49
Table 4.11: Friends Influence in Purchasing Refrigerators .................................................... 49
Table 4.12: Colleagues Influence in Refrigerator Purchase ................................................... 50
Table 4.13: Position in Workplace as an Influence in Purchasing Refrigerator ..................... 50
Table 4.14: Position in Society ............................................................................................... 51
Table 4.15: position in Family ................................................................................................ 51
Table 4.16: Age Group as a Determining Factor in Refrigerator Purchase ............................ 53
Table 4.17: Lifestyle Characteristic as an Influential Factor .................................................. 54
Table 4.18: Current Lifecycle as an Influential Characteristic for Refrigerator Purchase ..... 54
Table 4.19: Personality as an Influential Characteristic ......................................................... 55
Table 4.20: Self-Concept as an Influential Characteristic Refrigerator Purchase .................. 55
Table 4.21: Values as an Influence in Refrigerator Purchase ................................................. 56
Table 4.22: Economic Status as an Influence ......................................................................... 56
xiii
LIST OF FIGURES
Figure 4.1: Gender of the Respondents................................................................................... 37
Figure 4.2: Marital Status of the Respondents ........................................................................ 38
Figure 4.3: Highest Level of Education of the Respondents .................................................. 39
Figure 4.4: Main Sources of Income for the Respondents...................................................... 39
Figure 4.5: Average Monthly Income of the Respondents ..................................................... 40
Figure 4.6: Ownership of Refrigerators .................................................................................. 41
Figure 4.7: Brand of Refrigerator Owned ............................................................................... 41
Figure 4.8: Type of Refrigerator Owned ................................................................................ 42
CHAPTER ONE
1.0 INTRODUCTION
1.1 Background of the Problem
A consumer is a person engaged in evaluating, acquiring, and using goods and services to
satisfy his needs and wants. A consumer is a key figure in the market and all activities are
carried on around this person .The old close relation between production and consumption
has changed now. Consumers now depend on a complex industrial system to satisfy their
wants. Goods and services have multiplied and become more complicated, making it difficult
to choose wisely among them (James, 2012).
According to consumer buying behaviour report of 2017 it was described as a process where
by consumers select, buy, consume and dispose of products depending on their rate of
satisfaction. The consumer buying cycle used to be about the simple act of trading goods and
services with a neighbor (Conlon, 2016). Now there are ever-increasing touch points where
customers expect to be served and delighted. In-store, online, mobile, social, smart watches,
smart televisions, connected devices, in the car, in the air, and many more are already
available or coming quickly (Conlon, 2016). Consumers have many options and are much
better equipped with information to choose from these available options (Peighambari,
2016). The consumer now exhibits a totally different behavior than what they used to do in a
regulated market. The existence of any business is due to unfulfilled needs and wants of the
consumer (Peighambari, 2016). To fulfill needs of consumer, products/services are
introduced in the market by business organization. So, a thorough knowledge of consumers
and understanding of their behavior is must for a meaningful existence of any organization
(Peighambari, 2016).
The consumer’s buying patterns, according to researchers, is an area for in-depth study for
suggesting different useful marketing strategies (Peighambari, 2016). In the present era, the
information technology is growing at very fast rate. This has created tremendous competition
in the market. The enhanced importance of consumers' behavior, in the recent development
of information system, has provoked an interest in examining the buying/subscribing pattern
of two-wheelers by consumers (Peighambari, 2016).
2
In earlier times, marketers could understand consumers well through the daily experience of
selling to them (Peighambari, 2016). But as firms and marketers have grown in size, many
marketing decision makers lost direct contact with their customers and now have turned to
consumer research. The market stimuli consist of the four Ps, product, price, place and
promotion (Peighambari, 2016). Other stimuli include major forces and events in the buyers’
environment such as economic, technological, political and cultural. All these stimuli enter
the buyer's black box, where they are turned into a set of observable buyer responses such as
product choice, brand choice, dealer choice, purchase timing and purchase amount
(Peighambari, 2016).
Consumer behavior is affected by a host of variables, ranging from personal motivation,
needs, attributes and values, personality characteristics, socio-economic and cultural
background, age, sex, professional status to social influences of various kind exerted by
family, friends, colleagues and society as a whole (Peighambari, 2016). The combination of
these various factors produces a different impact on each one of us as manifested in our
different behaviors as consumers (Peighambari, 2016).
Cultural Factors are some of the strongest influences of consumer buyer behavior (Tunkkari,
2017). Cultural factors are the set of basic values, perceptions, wants and behaviors that are
"learned" by a consumer from their families and other important social institutions.
"Culture" is the most basic source of a consumer's wants and behavior (Tunkkari, 2017). It
lives at the foundation of a consumer's world view. Culture is mostly a learned behavior,
being constructed by the society a consumer grows up in. That society "teaches" the
consumer basic values, perceptions, wants and behaviors. Every cultural group has numerous
subcultures. Subcultures can be defined as groups of people with the same way of life
(Tunkkari, 2017). Subcultures can include different nationalities, religions, racial groups, and
geographic regions. Many of these sub cultural groups make up important customer
segments. Because of this, marketers are designing products and marketing campaigns that
are specifically tailored to their needs and wants (Tunkkari, 2017).
Human beings are social. They need people around them to interact with and to discuss
various issues in order to reach to better solutions and ideas (Agnita et al., 2017). We all live
3
in a society of some form, and it is very important for individuals to adhere to the "laws" and
social "regulations" of a community. These social factors typically consist of the consumer's
small groups, their family, and their social roles and social status. The reality is that a
consumer's behavior isn't influenced my just one group; it is influenced by many different
groups. We refer to these groups as reference groups. Reference groups influence the
consumer by serving as direct (face to face) or indirect points of comparison or "reference" in
building a consumer's behavior and attitudes (Agnita et al., 2017). In a reference group with
direct influence, several individuals may be a part of the consumer's purchase decision
(Agnita et al., 2017).
Personal factors are the individual factors to the consumers that strongly influence their
buying behaviors. These factors vary from person to person and they result in a different set
of perceptions, attitudes and behavior towards certain goods and services (Hemsley-Brown,
2016).
According to Hemsley-Brown (2016), age is important in determining the consumer
behavior, in that the different stages of human life cycles determines the products they buy
for example a child may be more into impulse buying than an older person who is seen to be
more responsible. Also the income determines the spending or buying patterns which also
changes with preferences that comes with aging of the consumer (Hemsley-Brown, 2016).
He also noted that occupation is an important aspect in consumer behaviour since most
consumers tend to purchase products that depict their status in the society. Lifestyle also is an
important aspect especiall ywhen one wants to lead a healthy life
Making a decision to buy any item is a rationale and conscious process in which the
consumer evaluates each of the available alternatives to select the best among them
(Peighambari, 2016). Each decision, one makes, involves an elaborate mental exercise and a
degree of active reasoning; though on the surface, it may not always seems to be so
(Peighambari, 2016). In making a purchase decision, the consumer usually goes through 5
stages.
4
The first stage is problem recognition. This is the when the consumer recognizes the need to
purchase something. This may include buying a new item or replacing an old one. The
second stage is pre-purchase information search. This involves both internal search and
external search. Internal search involves finding information stored in the memory whereas
external search involves finding information from the internet or the media regarding a
product, service or a brand. The third stage is evaluation of alternatives. After conducting an
information search, the consumer gets enough information about different brands, and is
therefore able to have a variety of products or services to choose from. The decision to
purchase is listed as stage number four. The consumer makes a purchase of the most ideal
product after considering all the alternatives available. The fifth stage is post-purchase
decision. After buying a product, the consumer may find that the product meets his/her
expectations. Thus, he/she develops a good attitude towards the product and the
manufacturing (Peighambari, 2016).
Refrigerator (colloquially fridge) is a popular household appliance that consists of a
thermally insulated compartment and a heat pump (mechanical, electronic or chemical) that
transfers heat from the inside of the fridge to its external environment so that the inside of the
fridge is cooled to a temperature below the ambient temperature of the room (Maurya, 2015).
Refrigeration is an essential in developed countries. The lower temperature lowers the
reproduction rate of bacteria, so the refrigerator reduces the rate of spoilage (Maurya, 2015).
A refrigerator maintains a temperature a few degrees above the freezing point of water.
Optimum temperature range for perishable food storage is 3 to 5 °C (37 to 41 °F). A similar
device that maintains a temperature below the freezing point of water is called a freezer. The
refrigerator replaced the icebox, which had been a common household appliance for almost a
century and a half. For this reason, a refrigerator is sometimes referred to as an icebox in
American usage (Jeffrey, 2013).
Refrigerators are used both commercially and domestically. Though they are essential in
developed countries, they have also become essential in developing countries. Refrigerators
vary in size, style and in energy consumption (Michael & Yunus, 2017). Therefore, as
consumers purchase refrigerators, they consider the size that is ideal for them, the style that
5
they like and the amount of money they are willing to spend on energy consumed by the
refrigerator; however, there are other factors that influence the buying behavior of consumers
while purchasing any item (Michael & Yunus, 2017).
1.2 The Problem Statement
Refrigerators, sometimes called as fridges, are considered to be one of the very crucial
equipment that can be present in anybody’s house these days (Gilson, 2017). Almost all
houses in the earth require something that is capable of storing or keeping foods safe in order
to avoid becoming spoilt (Gilson, 2017). Fridges are magical machines that are specially
designed to keep foods and anything you put inside stay cold. Without refrigerators, there
would be several amounts of spoilt food that would just be wasted on the garbage daily.
Undoubtedly, the invention of refrigerator is very useful and excellent that it provides great
impact to a lot of individuals in the world (Gilson, 2017). There are several brands of
refrigerators with the main ones being LG and Samsung.
Globally, the advent of tight working schedules and multitasking has heralded an era of
intelligent, and sometimes robotic, home appliances that are reclaiming time for
overstretched professionals (Standard Media Gropu, 2014). With a burgeoning middle class
living on the fast lane and working on a razor-thin schedule, the demand for time-saving
home appliances is on the rise. This demand is compelling electronics manufactures to
continuously innovate and keep up with emerging trends. They are now designing home
appliances that minimize the effort that goes into daily chores to give users more free time to
attend to priority tasks. The trend has ignited a race by manufacturers to increase their range
of intelligent product portfolio in the home appliances category. Consumers are now
increasingly keen on establishing appliance’s ability to minimize on effort and save time
before purchase (Furaji, Latuszyriska & Wawrzyniak, 2012).
South Korean home appliances titans LG and Samsung are seen to be at the fore front of this
transformation. They both believe that while appliances are all capable of functioning
independently, the more they are used together, the clearer their benefits become (Standard
Media Gropu, 2014).
6
LG’s smart refrigerator has several innovative, convenience-enhancing features such as
Smart View, Smart Power Saving and Smart Manager. Smart View employs the industry’s
first built-internal refrigerator camera to allow users to see the content of the refrigerator
using a smart-phone or tablet. Every time the fridge door is opened, the camera captures
images of the interior shelves. Users can check these images through Home Chat to quickly
assess what they need to buy while they’re at the supermarket, helping to save time and
preventing unnecessary purchases. Moreover, LG Smart Manager also transforms the
refrigerator into a complete food management system with a handy recipe search function
which presents the user with a variety of tasty meal options based on the items stored in the
refrigerator (Garga, 2016)). Samsung refrigerator helps users keep grocery lists, search
recipes, upload photos, check weather, read news updates and even check Twitter
(Haghshenas, Abedi, Ghorbani, Kamali & Harooni, 2013).
There is increased demand of electrical home appliances in Kenya (Standard Media Gropu,
2014). This demand is coming from a fast-growing and consumption-driven section of its
population; the middle class (Iwuoha, 2015). A 2010 report by McKinsey and another report
released by the Africa Development Bank (AfDB) in 2011 both agree that Africa’s middle
class, especially in Kenya has grown into a significant consumer pool. It’s also one of the
fastest growing middle class populations in the world. Another (more recent) report on the
middle class released by the Standard Bank Group shows that most middle class households
in Kenya spend between $15 and $115 a day. This is an indication that Kenyans who fall into
the ‘middle class’ category have more disposable or ‘extra’ income to spend (Iwuoha, 2015).
It’s no surprise that refrigerators which used to be owned solely by the upper class citizens
have now become a common feature for the middle class people.
With the rising demand for refrigerators in Kenya, it was of great importance to gain a deeper
understanding of the impact of different factors influencing consumer buying behaviour of
refrigerators in Kenya since no similar study has been done.
1.3 General Objective
The general objective of the study was to investigate the factors influencing the consumer
buying behavior of refrigerators in Nairobi County, Kenya.
7
1.4 Specific Objective
Specifically, this study aimed to:
1.4.1 To investigate the cultural factors influencing the consumer buying behavior
1.4.2 To investigate the social factors influencing the consumer buying behavior
1.4.3 To investigate the personal factors influencing the consumer buying behavior
1.5 Importance of the Study
1.5.1 Marketers
Mahatma Gandhi said “A customer is the most important visitor on our premises. He is not
dependent on us. We are dependent on him. He is not an interruption in our work. He is the
purpose of it. He is not an outsider on our business. He is a part of it. We are not doing him a
favor by serving him. He is doing a favor by giving us an opportunity to do so” (17 customer
service quotes every business should live by, 2014). Thus, this study is of great significance
to the marketers of refrigerators since they are able to understand how consumers think and
information on what leads to the satisfaction of the customers is at their disposal.
1.5.2 Retailers
This survey is of great importance to the retailers of refrigerators because they are able to
know which brands are most popular to the customers and why they love them. They also
have a greater understanding of the cultural, social and personal factors that influence the
consumer buying behavior of refrigerators.
1.5.3 Manufacturers
This study provides knowledge to the manufacturers of refrigerators on how to tailor these
products to meet the customers’ needs. They are able to factor in the things that consumers
consider important to them.
1.5.4 Researchers and Academicians
This study helps build knowledge and ensure effective learning of cultural, social and
personal factors influencing consumer buying behavior of refrigerators in Nairobi County,
8
Kenya. It also provides a basis for other researchers who would wish to conduct research on
factors influencing consumer buying behavior of refrigerators.
1.6 Scope of the Study
Among the many researched factors that can be pegged into influencing consumers’ buying
behavior like Social, economic, political just to name a few, however, this study only
investigated the cultural, social and personal factors that influence the consumer buying
behavior of refrigerators. The study was conducted in Nairobi County, Kenya targeting
households that own refrigerators, using cluster sampling; stage one and two. In the first
stage the researcher targeted the Nairobi households who own refrigerators and second stage
narrowed down to the sizeable and workable sampled group of 230 households who own
refrigerators arrived at using the Cochran’s Formula.
The study had a ranged time limit of data collection to the analysis. The researcher conducted
data collection process in December 2017 and conducted the analysis from January to April,
2018 in order to determine whether cultural, social and personal factors influence positively
consumer buying behavior of refrigerators in Nairobi County.
1.7 Definition of Terms
1.7.1 Refrigerator
A refrigerator is a storage system characterized by circular tracks located on shelving
throughout the refrigerator for receiving rotatable shelves for the selective storage of food
products. The arrangement affords versatility in food storage and the selection and
withdrawal of the food items in a convenient manner (Funke, 2012).
1.7.2 Consumer
Consumer is an individual who buys products or services for use and not for manufacture or
resale (Johar, 2015).
1.7.3 Consumer Buying Behavior
Consumer buying behavior is the sum total of a consumer's attitudes, preferences, intentions,
and decisions regarding the consumer's behavior in the marketplace when purchasing a
product or service (Solomon, 2013).
9
1.7.4 Cultural Factors
Culture encompasses the set of beliefs, moral values, traditions, language, and laws (or rules
of behavior) held in common by a nation, a community, or other defined group of people
(Veerakumar, 2017).
1.7.5 Social Factors
Social factors are things that affect lifestyle, such as religion, family or wealth. These can
change over time (Thangasamy & Pakitar, 2014).
1.7.6 Personal Factors
Personal Factors are the individual factors to the consumers that strongly influences their
buying behaviors. These factors vary from person to person that results in a different set of
perceptions, attitudes and behavior towards certain goods and services (Kotler & Armstrong,
2007).
1.7.7 Lifestyle
Person’s pattern of living in the world, expressed in the person’s Activities/ Interests/
Opinion (Srlvastava, 2012)
1.8 Chapter Summary
This chapter focused on the background of the study, objectives of the study, significance of
the study, scope of the study and definition of key terms that were used in the research
project report. The time scope to the study was December 2017 with a geographical scope of
the Nairobi households owning refrigerators with our general objective being to study
factors; cultural, social and personal factors that positively influenced consumer buying
behavior of refrigerators in Nairobi County. This aroused from the background of the study
about different brands refrigerators that has evolved over a long period of time, how they
operate, what we knew about them and what we didn’t know With the rising demand for
refrigerators in Kenya, it was of great importance to gain a deeper understanding of the
impact of different factors influencing consumer buying behavior of refrigerators in Kenya
since no similar study had been done.
The next chapter two outlined the literature review on cultural, social and personal factors
that influence the consumer buying behavior. It also outlined the conceptual framework of

10
the study. Chapter three was all about the methodology; that’s the whole organization of the
techniques of data collection, analysis and presentations as well as sampling techniques. How
we arrived at the sample size using the Cochran’s Formula .Chapter four was the findings,
result analysis then last but not least was Chapter five, that comprised of the discussions of
individual factors under study conclusions and recommendations.
11
CHAPTER TWO
2.0 LITERATURE REVIEW
2.1 Introduction
Consumer buying behavior is influenced by very many factors. These factors may be social,
economic, political, personal and cultural factors. This study point of focus is on Social
cultural and personal aspects that determine consumer buying behavior; hence, this chapter
elaborates previous surveys that have been done on cultural factors, social factors and
personal factors as key factors affecting the consumer buying behavior.
2.2 Cultural Factors Influencing Consumer Buying Behavior
Cultural factors are divided into three main groups: culture, sub-cultures and social class.
Culture is the fundamental determinant of a person's wants and behavior (Chaudhry, 2014).
Research shows that culture, sub-culture, and social classes are particularly important on
consumer buying behavior.
2.2.1 Cultures
Cultures differ in demographics, language, non-verbal communication, and values. Due to
these differences, consumer behavior changed dramatically across cultures. Mooij (2014)
defined culture as “the whole that includes knowledge, beliefs, morals, customs, and any
other capabilities and habits acquires by the humans as members of society.” Culture is a
comprehensive concept, and it includes almost everything that influences and individuals'
thought process and behaviors. It not only influences preferences, but also the way people
make decisions (Chaudhry, 2014), and how people perceive the world around them (Briley
2012). Culture is acquired and doesn’t include inherited responses and predispositions. Since
much of human behavior is learned than innate, culture doesn’t affect a wide range of
behavior (Chaudhry, 2014). Culture operates primarily by setting boundaries for individual
behaviors and by influencing the functioning of each institution as the family and mass
media. These boundaries set on behaviors are called norms, which are simply rules that
specify or prohibit certain behaviors in specific situations (Chaudhry, 2014). Norms are
12
derived from cultural values, or widely held beliefs that affirm what is not desirable.
Violation of cultural norms results in social disapproval to banishment from the group. Thus
cultural values give rise to the norms and associated sanctions, which in turn influence
consumption pattern (Chaudhry, 2014).
Culture sets restrictions within which most individuals think, act, and feel in a manner
consistent with that of other members of the same culture because it seems natural or right
thing to do so (Chaudhry, 2014). Cultural values are widely held beliefs that affirm what is
desirable. These values affect behavior through norms, which specify an acceptable, range of
responses to specific situations (Chaudhry, 2014). Consumer behavior differs because values
inherited by consumers differ from culture to culture. Research shows that consumers from
cultures that differ on values differ in their reaction to foreign products, advertising, and
preferred sources of information cultures are more youth-oriented than others (Barak, 2011)
hence are more liberal and individualistic, and are more likely to work harder and spend
more (Fattah, 2011). Furthermore, research shows that altitudes towards work and leisure
also differ from culture to culture (Chaudhry, 2014) which has important consequences for
lifestyle and demand for leisure activities. Another aspect that influences on consumer
behavior is the religious beliefs. For example, many Islamic cultures and some Catholic
cultures are much more religiously oriented as compared to Chinese culture where religion
plays a very small role (Chaudhry, 2014). This implies that in Islamic and some Catholic
cultures people
Research further shows that some cultures pay more emphasis on family bondage than
others. For example studies shows that in Mexico adolescents are more likely to seek
parental advice or respond positively to ads with parental figures in the purchase of items
ranging from candy to movies to fashion clothing than United States (Chaudhry, 2014). This
difference in consumer behavior is primarily because in the United States the family is
defined fairly narrowly, and is less important than in many other cultures. On the other hand,
the role of family in India is more important than in more individualistic societies (Chaudhry,
2014). Not only are the items of purchase decided with reference to the family needs
13
balancing individual and family requirements and resources, there is also often a pooling of
resources across family members that is not seen outside Indian culture (Chaudhry, 2014).
Another factor that affects the consumer behavior is the level of diversity and uniformity
within culture. A culture that values diversity not only will accept a wide array of personal
behaviors and attitudes, but is also likely to welcome variety in terms of consuming food,
dress, and other products and services. Collectivist cultures tend to place a strong value on
uniformity (Chaudhry, 2014); whereas more individualist cultures tend to value diversity. For
example, research shows that in Japan and China people tend to consume products and avail
services that everyone else is consuming, where as in United Kingdom and Unites States
people are more inclined to make their own individual decisions bases on personal
preferences and tastes (Chaudhry, 2014).
Some cultures place more value on cleanliness than others. For example, in the United States
a high value is placed on cleanliness, where germ-fighting liquid soaps alone are a $16
billion market (Chaudhry, 2014). People in United States expect their houses, offices, and
public places to be cleaned “beyond reasonable health requirements.” On the other hand, in
many poorer countries, cleanliness is not valued at a level sufficient to produce a healthy
environment. Research shows that even in rapidly developing countries, such as China and
India, a lack of basic hygiene still cause significant health problems because culture does not
place such a high value on cleanliness (Chaudhry, 2014).
2.2.2 Sub-Cultures
Courses on culture and behavior of individuals with similar values formed smaller groups are
called sub-culture (Durmaz, 2014). Sub-cultures are relevant units of analysis for market
research analysis of subculture enables the marketing manager to focus on sizable and natural
market segment (Durmaz, 2014). The marketer must determine whether the belief, values
and customs shared by member of a specific subgroup make them desirable candidates for
special marketing attention (Durmaz, 2014). Four types of subculture can be distinguished:
nationality groups, religious groups, racial groups and geographical areas. Durmaz (2014)
14
found that sub-cultures not only influences the buying patterns but can also influence the way
marketing messages are received.
While small societies tend to be culturally uniform, large industrial societies are culturally
diverse and involve numerous subcultures (Tomczyk, 2017). Subcultures are values and
norms distinct from those of the majority and are held by a group within a wider society. In
the United States, subcultures might include hippies, Goths, fans of hip hop or heavy metal
and even bikers - the examples are endless. One area of particular interest has to do with
deviant subcultures.
Richard, et al., (1966) proposed that deviance results from the various opportunity structures
that frame a person's life. A deviant subculture is a subculture which has values and norms
that differ substantially from the majority of people in a society (Tomczyk, 2017). When the
structure of a neighborhood or community favors criminal activity, a criminal subculture is
likely to develop, such as the Mafia in the 1930s or inner city gangs today. When people are
unable to find opportunities - either legally or illegally - two other subcultures that potentially
develop are conflict and retreats subcultures. Conflict subcultures develop partially as a result
of transient population and a lack of community. As a result, many turn to gang violence as a
result of frustration and anger. Another possible outcome is the development of a retreatist
subculture. An example of a retreatist subculture is one that's made up of high school
dropouts who may abuse alcohol or narcotics (Tomczyk, 2017). Walter Miller (1970) adds
that deviant subcultures don't arise from the inability of the members to achieve success.
2.2.3 Social Classes
According to (Clem, 2015)a major influence on one's purchasing habits and consumer
behavior is the social class in which one finds him or herself. Social class is considered an
external influence on consumer behavior because it is not a function of feelings or
knowledge. Social class is often hard to define; in fact, many people dispute the existence of
social classes in the United States. Usually, however, people are grouped in social classes
according to income, wealth, education, or type of occupation. Perhaps the simplest model to
define social class is a three-tiered approach that includes the rich, the middle class, and the
15
poor (Clem, 2015). Other models have as many as a dozen levels. People in the same social
class tend to have similar attitudes, live in similar neighborhoods, dress alike, and shop at.
Income refers to earnings from work or investments, while wealth refers to all of those assets
an individual owns, such as cash, savings and checking accounts, stocks, bonds, real estate,
etc. minus outstanding debts (DiMascio, 2017). Most people make money from work, but for
the wealthy, much of theirs is inherited. As a result, wealth is distributed much more
unevenly than income, because wealth is typically passed down from generation to
generation. In the United States, wealth is an important source of power. The small number
of people who control most of the wealth can more easily shape the agenda of society (Clem,
2015)
Work is considered an important dimension of social class as well. People commonly give
greater respect to those who have more prestigious occupations. In any society, those with
high-prestige occupations often belong to more privileged categories of people. When it
comes to occupational prestige, the highest-ranked occupations, such as physicians, dentists,
and engineers, are typically held by men. Women and people of color often dominate the less
prestigious occupations (Kotler & Armstrong, 2007).
Likewise, education is an important dimension of social class. In fact, education is one of the
strongest predictors of occupation, income, and wealth later in life. Most better-paying white
collar jobs require a college degree, while most blue collar jobs require less schooling, and
bring less income and prestige (Gizaw, & Thu Ha Nguyen, 2014).
Finally, it is argued that nothing affects social standing as much as being born into a
particular family. The family we are born into has a strong bearing on schooling, occupation,
and income (DiMascio, 2017). Social class has a profound effect on consumer spending
habits (Clem, 2015). The most obvious effect is the level of disposable income of each social
class. Generally, the rich have the ability to purchase more consumer goods than those with
less income, and those goods are of higher quality (Clem, 2015). There is also a distinction in
the type of goods purchased. For example, the upper class tends to be the primary buyers of
16
fine jewelry and often shop at exclusive retailers. The lower class, in contrast, is much more
concerned with simply getting by; they focus more on necessities (Clem, 2015).
2.3 Social Factors Influencing Consumer Buying Behavior
Social factors are the factors that are prevalent in the society where a consumer lives in.The
society is composed of several individuals that have different preferences and behaviors.
These varied behaviors influence the personal preferences of the other set of individuals as
they tend to perform those activities which are acceptable to the society (Knoop, Tershak &
Thieneman, 2017). Social factors are classified into three main groups: People bound by
blood, their social orientation, their role in society and the position they hold.
2.3.1 Reference Groups
A reference group is a group to which an individual or another group is compared.
Sociologists call any group that individuals use as a standard for evaluating themselves and
their own behavior a reference group (Study.Com, 2016).
Reference groups are used in order to evaluate and determine the nature of a given individual
or other group's characteristics and sociological attributes. It is the group to which the
individual relates or aspires to relate himself or herself psychologically. It becomes the
individual's frame of reference and source for ordering his or her experiences, perceptions,
cognition, and ideas of self. It is important for determining a person's self-identity, attitudes,
and social ties. It becomes the basis of reference in making comparisons or contrasts and in
evaluating one's appearance and performance (Study.Com, 2016).
Reference groups provide the benchmarks and contrast needed for comparison and
evaluation of group and personal characteristics. Individuals compare themselves with
reference groups of people who occupy the social role to which the individual aspires
(Knoop, Tershak & Thieneman, 2017).
Most reference groups are informal reference groups, which mean that they are based on the
group members' shared interests and goals. Informal groups are not structured with a specific
17
goal in mind. Group members interact on a very personal level. Examples of informal
reference groups include families, a group of local mothers and peer groups (Knoop, Tershak
& Thieneman, 2017).
According to Rani (2014) social groups are the same as membership groups in which a
person belongs to and its more likely to influence him and his decisions. The membership
groups are usually related to its social origin, age, place of residence, work, hobbies, leisure,
etc. Reference groups have potential in forming a person attitude or behavior (Rani,
2014).The impact of reference groups varies across products and brands. For example if the
product is visible such as dress, shoes, car etc. then the influence of reference groups will be
high. Reference groups also include opinion leader (a person who influences others because
of his special skill, knowledge or other characteristics) (Rani, 2014). More generally,
reference groups are defined as those that provide to the individual some points of
comparison more or less direct about his behavior, lifestyle, desires or consumer habits
(Rani, 2014). They influence the image that the individual has of himself as well as his
behavior whether it is a membership group or a non-membership group. Because the
individual can also be influenced by a group to which he doesn’t belong to yet but wishes to
be part of (Rani, 2014)? This is called an inspirational group. This group will have a direct
influence on the consumer who, wishing to belong to this group and look like its members,
will try to buy the same products. For example, even if he doesn’t need it yet, a surfing
beginner may want to buy advanced brands or products used by experienced surfers
(inspirational group) in order to get closer to this group. While a teen may want the shoe
model or smart phone used by the group of popular guys from his high school (inspirational
group) in order to be accepted by this group (Rani, 2014). Some brands have understood this
very well and communicate, implicitly or not, on the social benefit.
Within a reference group that influences the consumer buying behavior, several roles have
been identified (Rani, 2014). The initiator is the person who suggests buying a product or
service. The influencer is the person whose point of view or advice influences the buying
decision. It may be a person outside the group (singer, athlete, actor, etc.) but on which group
members rely on. The decision-maker is the person who will choose which product to buy. In
18
general, it’s the consumer but in some cases it may be another person. For example, the
leader of a soccer supporters group (membership group) that will define, for the whole group,
which supporters scarf buy and bear during the next game. The buyer is the person who will
buy the product. Generally, this will be the final consumer (Rani, 2014).
2.3.2 Family
A family is a group of two or more persons related by blood, marriage, or adoption who
reside together. The nuclear family is the immediate group of father, mother, and children
living together. The extended family is the nuclear family, plus other relatives, such as
grandparents, uncles and aunts, cousins, and parents-in-law. The family into which one is
born is called the family of orientation, whereas the one established by marriage is the family
of procreation. In a more dynamic sense, the individuals who constitute a family might be
described as members of the most basic social group who live together and interact to satisfy
their personal and mutual needs (Gizaw, & Thu Ha Nguyen, 2014).
The family is a major influence on the consumer behaviour of its members. There are many
examples of how the family influences the consumption behavior of its members. A child
learns how to enjoy candy by observing an older brother or sister; learns the use and
value of money by listening to and watching his or her parents. Decisions about a new car, a
vacation trip, or whether to go to a local or an out-of-town college are consumption decisions
usually made within the context of a family setting. As a major consumption unit, the family
is also a prime target for the marketing of many products and services (Rani, 2014).
The importance of the family or household unit in consumer behavior arises for two reasons:
many products are purchased by a family unit and individuals’ buying decisions may be
heavily influenced by other family members (Furaji, Latuszyriska & Wawrzyniak, 2012).
How families or households make purchase decisions depends on the roles of the various
family members in the purchase, consumption, and influence of products. Household
products like food and soaps may be purchased by a person but consumed by many, whereas
personal care items, such as cosmetics or shaving cream, might be purchased by an
individual family member for his or her own consumption. Homes and cars, on the other
19
hand, are often purchased by both spouses, perhaps with involvement from children or other
member of the extended family (Kumar, 2013). Visits to shopping malls often involve
multiple family members buying clothing and accessories, something with a heavy dose of
influence by family member’s children may buy clothing paid for and approved of by
parents, whereas teenagers may influence the clothing purchase of a parent. Regardless of
how many family members are present when items are being purchased, the other family
members play an important role in the purchase. Just because of being mother for two young
children, it is her responsibility for buying food for the family and act as an individual in the
market. It does not mean that her decisions are not influenced by the preferences and power
of other family members although marketing communications are usually directed to
individuals, marketers should consider the consumption circumstances and the family
structure before deciding on specific communication or advertising methods to attract their
segment (Chan, 2003).
Structural variables include the age of the head of household or family, marital status,
presence of children, and employment status. For example, consumer analysts have
enormous interest in whether families have children and how many they have. Children
increase family demand for clothing, food, furniture, homes, medical care, and education,
while they decrease demand for many discretionary items, including travel, higher-priced
restaurants, and adult clothing. Other structural changes affect the types of products that are
manufactured (Kumar, 2013). For example, in Japan, high-tech companies have formed a
consortium to standardize technology that has been developed to monitor and manage
households.
Marketers can understand family and household decisions better by examining the
sociological dimensions of how families make consumer decisions. Three sociological
variables that help explain how family’s function includes cohesion, adaptability, and
communication (Furaji, Latuszyriska & Wawrzyniak, 2012). Cohesion is the emotional
bonding between family members. It measures how close to each other family members feel
on an emotional level. Cohesion reflects a sense of connectedness to or separateness from
other family members. Adaptability measures the ability of a family to change its power
20
structure, role relationships, and relationship rules in response to situational and
developmental stress. The degree of adaptability shows how well a family can meet the
challenges presented by changing situations. Communication is a facilitating dimension,
critical to movement on the other two dimensions. Positive communication skills (such as
empathy, reflective listening, and supportive comments) enable family members to share
their changing needs as they relate to cohesion and adaptability. Negative communication
skills (such as double messages, double binds, criticism) minimize the ability to share
feelings, thereby restricting movement in the dimensions of cohesion and adaptability.
Understanding whether family members are satisfied with family purchase requires
communication within the family. To determine how the family makes its purchase decisions
and how the family affects the future purchase behavior of its members, it is useful to
understand the functions provided and the roles played by family members to fulfill their
consumption needs (Chan, 2003).
The family is maybe the most influencing factor for an individual (Rani, 2014). It forms an
environment of socialization in which an individual will evolve, shape his personality,
acquire values; and also develop attitudes and opinions on various subjects such as politics,
society, social relations or himself and his desires (Rani, 2014). Buyer behavior is strongly
influenced by the member of a family. Therefore marketers are trying to find the roles and
influence of the husband, wife and children. If the buying decision of a particular product is
influenced by wife then the marketers will try to target the women in their advertisement.
Here we should note that buying roles change with change in consumer lifestyles (Rani,
2014). For example, if you have never drunk Coke during your childhood and your parents
have described it as a product full of sugar and not good for health. There is far less chance
that you are going to buy it when you will grow up that someone who drinks Coke since
childhood (Rani, 2014).
2.3.3 Social Status
A social status of an individual usually comprises of an individual’s attitude, class and
prestige. It depends on the way he carries himself socially or the position at which he is in his
21
work or family or even in his group of friends. The social status of an individual influences
his consumption pattern (Solomon, 2013).
Status refers to the relative rank that an individual holds; this includes attendant rights,
duties, and lifestyle, in a social hierarchy based upon honor or prestige. Status has two
different types that come along with it: achieved, and ascribed. The word status refers to
social stratification on a vertical scale. In society, pariah status groups are regarded with
disdain or treated as outcasts by the majority of the population. The term derives from
the Paraiyar members of which are treated as outcasts in Hindu society (Sharma, 2015).
In modern societies, occupation is usually thought of as the main determinant of status, but
other memberships or affiliations (such as ethnic group, religion, gender, voluntary
associations, fandom, and hobby) can have an influence. Achieved status is when people are
placed in the stratification structure based on their individual merits or achievements. This
status can be achieved through education, occupation, and marital status. Their place within
the stratification structure is determined by society's bar, which often judges them on success,
success being financial, academic, and political. America most commonly uses this form of
status with jobs. The higher you are in rank the better off you are and the more control you
have over your co-workers (Sharma, 2015).
In pre-modern societies, status differentiation is widely varied. In some cases it can be quite
rigid and class based, such as with the Indian caste system. In other cases, status exists
without class and/or informally, as is true with some Hunter-Gatherer societies such as
the Khoisan, and some Indigenous Australian societies. In these cases, status is limited to
specific personal relationships. For example, a Khoisan man is expected to take his wife's
mother quite seriously (a non-joking relationship), although the mother-in-law has no special
"status" over anyone except her son-in-law—and only then in specific contexts. All societies
have a form of social status (Johar, 2015).
Status is an important idea in social stratification. Max Weber distinguishes status
from social class, though some contemporary empirical sociologists combine the two ideas to
create socioeconomic status or SES, usually operationalized as a simple index of income,
22
education and occupational prestige. The position of an individual within his family, his
work, his country club and his group of friends etc. can be defined in terms of role and social
status (Musyoki, 2012).
A social role is a set of attitudes and activities that an individual is supposed to have and do
to his profession and his position at work, his position in the family, his gender, etc. and
expectations of the people around him. In virtually all societies, there are visible and
significant differences in the availability and possession of valued items (Fisher, 2016).
Social class theory asserts that this unequal access to scarce resources and desired rewards is
by no means a random process (Fisher, 2016). There are mechanisms or social processes that
contribute to both the consistency and permanence of structured social inequality. One such
mechanism--the most crucial one is provided by the marketplace, defining as it does both
consumption possibilities (i.e., class variables) and actual consumption patterns (i.e., status
variables) (Johar, 2015).
2.4 Personal Factors Influencing Consumer Buying Behavior
Personal factors are the individual factors to the consumers that strongly influence their
buying behaviors (Hemsley-Brown, 2016). These factors vary from person to person and
they result in a different set of perceptions, attitudes and behavior towards certain goods and
services. They include age, income, and lifestyle among others.
2.4.1 Age of Consumers
The consumer buying behavior is greatly influenced by his age, i.e. the life cycle stage in
which he falls. The people buy different products in different stages of the life cycle. Such as
the purchase of confectionaries, chocolates are more when an individual is a child and as he
grows his preferences for the products also changes (Hemsley-Brown, 2016).
In two experiments younger and older adults performed decision-making tasks where reward
values available were either independent or dependent of the previous sequence of choices
made. The choice independent task involved learning and exploiting the options that gave the
highest rewards on each trial. In this task the stability of the expected rewards for each option
23
was not influenced by the choices participants made. The choice-dependent task involved
learning how each choice influenced the rewards available for both options on future trials
and making the best decisions based on that knowledge. Younger adults performed better
when rewards were choice-independent, while older adults performed better when rewards
were choice-dependent. This suggests a fundamental difference in the way in which younger
and older adults approach decision-making situations. We discuss the results within the
context of prominent decision-making theories, and offer possible explanations based on
neurobiological and behavioral changes associated with aging (Hemsley-Brown, 2016).
Decisions are a pervasive part of our lives. The importance and impact of our decisions may
only increase with age. Older adults often continue to work in prominent positions, and face
numerous important decisions such as which retirement options to select, how to spend their
life-savings, and how to best live out the remaining years of life. Likewise, younger adults
must choose which career path to take, which college to attend, and when to buy a house. It
is thus critical to understand how age affects decision-making strategies (Solomon, 2006).
Decisions rarely stand alone. Often the rewards available from each option depend on
previous choices. The current job prospects or retirement investments available are
Dependents on the current state that one has reached. One cannot apply for various teaching
jobs if one did not first decide to attend college. Likewise, one cannot decide where to buy a
retirement home if one did not first take steps to ensure a productive career that allowed
adequate accumulation of retirement savings. Thus, in many real world contexts our present
choices often determine our future possibilities (Solomon, 2006).
However, many previous studies that have examined how age affects decision-making have
focused on performance in tasks where the rewards available on a given trial
are independent of the sequence of previous choices. For example, the probabilities of
obtaining rewards of varying amounts on any given trial are often pre-determined by the
experimenter and do not change based on what decisions the participant makes (Harry,
1970).
24
Nonetheless, one should ponder why older adults, who have a vast reserve of decision-
making experience to draw upon, often perform worse, and rarely perform better than
younger adults in decision-making tasks. It may be the case that age-based neural declines
are so great in older adults that their advantage in decision-making experience, relative to
younger adults, cannot be compensated for. An alternative possibility is that the tasks often
used to assess age-based effects on decision-making are biased toward the strengths of
younger adults, and older adults’ abilities may be better suited for situations that require
higher-order processing of relational dependencies between the sequence of recent choices
and the rewards currently available in the environment. These situations, where reward
values are choice-dependent, may have greater ecological validity in that the options
available to us usually depend on the choices we have made previously (Jeffrey, 2013).
Recently, a distinction has emerged in the decision-making literature between model-
based and model-free reinforcement learning systems. The model-based system learns a
cognitive map of the environment that describes how different options and their associated
rewards are connected to one another. The system makes decisions by mentally simulating
how one decision will possibly impact future decisions similar to how a chess player decides
the best move based on how it will affect future possibilities. In contrast, the model-free
system learns the values associated with each choice directly without building an explicit
model of the environment (Peighambari, 2016)
These systems are neutrally dissociable. The model-based system is mediated by areas such
as the intraparietal sulcus and lateral prefrontal cortex, while the model-free system is
mediated by the ventral striatum. Interestingly, a recent study found that younger adults
recruit the ventral striatum more than older adults after reward expectancies have been
learned, while older adults recruit the dorsolateral prefrontal cortex more than younger
adults. One reasonable proposition stemming from this work is that increases in age are
associated with a shift in the neural areas that are recruited for decision-making purposes.
Older adults may recruit more frontal areas, and make decisions in a more model-based
manner, while younger adults may rely on striatal areas and engage in more model-free
decision-making (Peighambari, 2016)
25
The two systems may be better-suited for solving tasks based on whether the rewards
are choice-independent or choice-dependent. Younger adults may make better decisions
when rewards are choice-independent, where the rewards available are not influenced by
previous choices made, whereas older adults may make better decisions when rewards
are choice-dependent, where the rewards available are a function of the previous choices
made of course one could also predict that neural declines in prefrontal areas (West, 1996)
will cause older adults to perform worse on choice-dependent tasks which require
identification of the higher order relationship between choices and available future reward
values (Peighambari, 2016). Hence age plays a big role in influencing consumer decision
making.
2.4.2 Income of Consumers
The income of the person influences his buying patterns. The income decides the purchasing
power of an individual and thus, the more the personal income, the more will be the
expenditure on other items and vice-versa (Hemsley-Brown, 2016).
Researchers have tried to determine the impact of rising levels of inequality due to different
incomes on a wide array of indicators - among them economic growth, public spending,
financial stability, political representation, and average health and educational outcomes. But
this research has done little to demonstrate the effects of inequality (Blending, 2013). Some
researchers have found no effects at all, while others have identified opposite effects in
different situations.
"You'd think that with such a large change in our society, you'd see a definitive impact
somewhere," says Moss, (2013). "It's striking how much work has gone into examining this
question - including by many truly outstanding researchers - and how little we have to show
for it, at least so far."
In Inequality and Decision Making: Imagining a New Line of Inquiry, Moss and his
colleagues propose that rather than looking at the effects of inequality mainly on the macro
level, researchers should also look at the micro level, exploring how rising inequality might
26
affect the individual decisions people make across a wide range of areas, from risk-taking to
voting (Blending, 2013).
Moss (2013), offers a simple analogy: Imagine you want to test a theory that punches cause
stomachaches. If you examine the data and find that some people get punched without
getting stomachaches, and that others get stomachaches without getting punched, you might
mistakenly conclude that there is no causal relationship between the two. The problem, of
course, is that only certain types of punches-punches to the stomach-produce stomachaches.
"Without greater precision about mechanism, it would be easy to wrongly dismiss the
original hypothesis that punches cause stomachaches," Moss explains. "And the same may be
true about inequality and our inability at this point to say much about its effects. The problem
may be that we don't yet know enough about mechanism."
Moss (2013) followed the same logic working with colleagues at the Tobin Project, a
Cambridge-based independent, nonprofit research organization that he founded in 2005. As
he read the literature on inequality and spoke with numerous scholars in the field, Moss noted
the diversity of situations in which the phenomenon has been studied. Income inequality
might look very different-and exert very different effects in one country or one city as
opposed to another, due in part to differing institutional contexts. If so, then by aggregating
the data, it's possible that researchers have been lumping together dissimilar cases that
effectively cancel each other out.
If there was a way to tease out the mechanism by which inequality could affect this or that
economic indicator, he reasoned, then it might be possible to refine the large-sample studies
in productive ways-focusing only on punches aimed at the stomach, rather than all punches,
in examining the connection between punches and stomachaches, for example (Solomon,
2013).
One way to uncover the consequences of inequality, Moss and his colleagues propose, is to
set up experiments in a lab to look at possible effects on individual decision-making.
Behavioral psychologists have found that people often make decisions based on their frames
of reference. Some have argued that by changing that frame of reference, rising inequality
27
could change the way people make economic decisions. For example, economist Robert
Frank has suggested that inequality might induce higher spending as we try to "keep up with
the Joneses," creating "expenditure cascades" that could destabilize the economy as a whole.
In another example, researchers HBS Associate Professor Michael I. Norton and Columbia
Business School professor Ilyana Kuziemko have suggested that those close to the bottom of
the economic ladder may take greater risks than those above them in order to avoid tumbling
down any further. They call the behavior "last-place aversion" (Haghshenas, Abedi,
Ghorbani, Kamali & Harooni, 2013)
To test this theory in the lab, the pair teamed up with HBS Assistant Professor Ryan W.
Buell and Stanford PhD student/candidate Taly Reich set up a lottery where participants were
given varying amounts of money (some received larger amounts, others smaller) and then
had the option to buy a ticket that, were they to win, might allow them to move up
economically. The researchers found that the likelihood participants would choose the lottery
was essentially the same across all rungs of the ladder-except the bottom two rungs, where
participants opted for the riskier option more often (Blending, 2013).
Of course, it's possible that rising inequality simply doesn't exert any significant economic,
social, or political effects. This would explain the lack of findings, he says. But it's far from
the only explanation, and perhaps not the most likely one. In a recent working paper co-
written Anant Thaker (HBS MBA 2011) of the Boston Consulting Group and Howard
Rudnick of the Tobin Project, Moss offers an alternative perspective: Perhaps we've been
looking at the question the wrong way (Blending, 2013).
2.4.3 Lifestyle
Lifestyle can be broadly defined as the way a person lives. In sociology, a lifestyle typically
reflects an individual's attitudes, values, or world view. A lifestyle is a means of forging a
sense of self and to create cultural symbols that resonate with personal identity (Clem, 2015).
Not all aspects of a lifestyle are voluntary. However, in consumer marketing, lifestyle is
28
considered a psychological variable known to influence the buyer decision process of
consumers.
Lifestyle is also referred to as a buyer characteristic in the Black Box Model, which shows
the interaction of stimuli, consumer characteristics, decision process, and consumer
responses. The Black Box Model is related to the Black Box Theory of Behaviorism, where
the focus is set not on the processes inside a consumer, but the relation between the stimuli
and the response of the consumer (Clem, 2015)
In this theory, the marketing stimuli (product, price, place and promotion) are planned and
processed by companies, whereas the environmental stimuli are based on the economic,
political, and cultural circumstances of a society. The buyer's "black box" contains the buyer
characteristics (e.g., attitudes, motivation, perception, lifestyle, personality, and knowledge)
and the decision process (e.g. problem recognition, information research,
alternative evaluation, purchase decision, and post-purchase behavior) which determine the
buyer's response (e.g., product choice, brand choice, dealer choice, purchase timing, and
purchase amount) (Clem, 2015).
The Black Box Model considers the buyer's response as a result of a conscious, rational
decision process, in which it is assumed that the buyer has recognized the problem. However,
in reality, many decisions are not made in awareness of a determined problem by the
consumer.
A useful indicator of lifestyle is the groups of products, or product/consumption
constellations, used by consumers. This is just like one of the things that marketers will often
do. They look at the set of different brands that a consumer will use at the same time in their
life. These are called consumption constellations, which refers to the complementary set of
products and brands used by consumers that also help to indicate and execute particular
social roles. These consumption constellations were recently examined in the context of
young consumers and how they use these constellations in defining themselves and
others. By looking at these constellations, marketers can identify segments of consumers who
29
tend to use the same goods and services-an indication that they share a similar lifestyle (Rani,
2014).
In a purchase that requires a high level of involvement, such as a car, consumers will
consider various choices and develop beliefs about each choice; then they develop feelings
about the products (affect); and finally they act on the behavior and decide to purchase, or
not. Whereas with a behavioral influence, the customer will act first (purchase), then develop
beliefs about their purchase and that leads to developing feelings about the product or service
(Rani, 2014).
Everyone has two lifestyles-the one they are currently in and the one they want to be in,
which is always better than the current one. Marketers exploit this desire to move into a
better lifestyle by showcasing people who are better off than the intended target market in
their advertisements.
2.5 Chapter Summary
This chapter has looked at the previous surveys that have been done on factors influencing
the buying behaviour of consumers, specifically focusing on cultural factors, social factors
and personal factors. The next chapter outlines the methodology that was adopted in the
study. This includes the research design, the population and sampling design, data collection
methods, research procedures and the data analysis methods.
30
CHAPTER THREE
3.0 RESEARCH METHODOLOGY
3.1 Introduction
This chapter describes in detail the research methodology and approach that was adopted in
the study. It outlines the research design, population and sampling design, data collection
methods, research methods and the data analysis methods.
3.2 Research Design
A research design is the plan and structure of investigation so conceived as to obtain answers
to research questions (Cooper & Schindler, 2010). It expresses both the structure of the
research problem and the plan of investigation used to obtain empirical evidence on relations
of the problem. According to (Britt, 2010), a research design is a plan or structured
framework of how one intends to solve the research problem and to expand knowledge and
understanding. Through a clear and well-developed research plan, the reader can develop a
confidence in the methods used as the researcher maximizes validity and minimizes error.
The study adopted a descriptive research design. A descriptive research design is a study
design that is used to depict the participants in an accurate way. This design is all about
describing people who take part in a study. This design was used to fully describe the
cultural, social and personal factors influencing consumer buying behaviour of refrigerators
in Nairobi County. It made use of descriptive statistics such as the mean, median, mode and
standard deviation to outline the importance of each factor.
3.3 Population and Sampling Design
3.3.1 Population
Population is the entire pool from which a statistical sample is drawn. The total population
for this study was 985,016 households in Nairobi County according to the 2009 census
report. The population consisted of both male and female aged 18 years and above as shown
in Table 3.1 below.
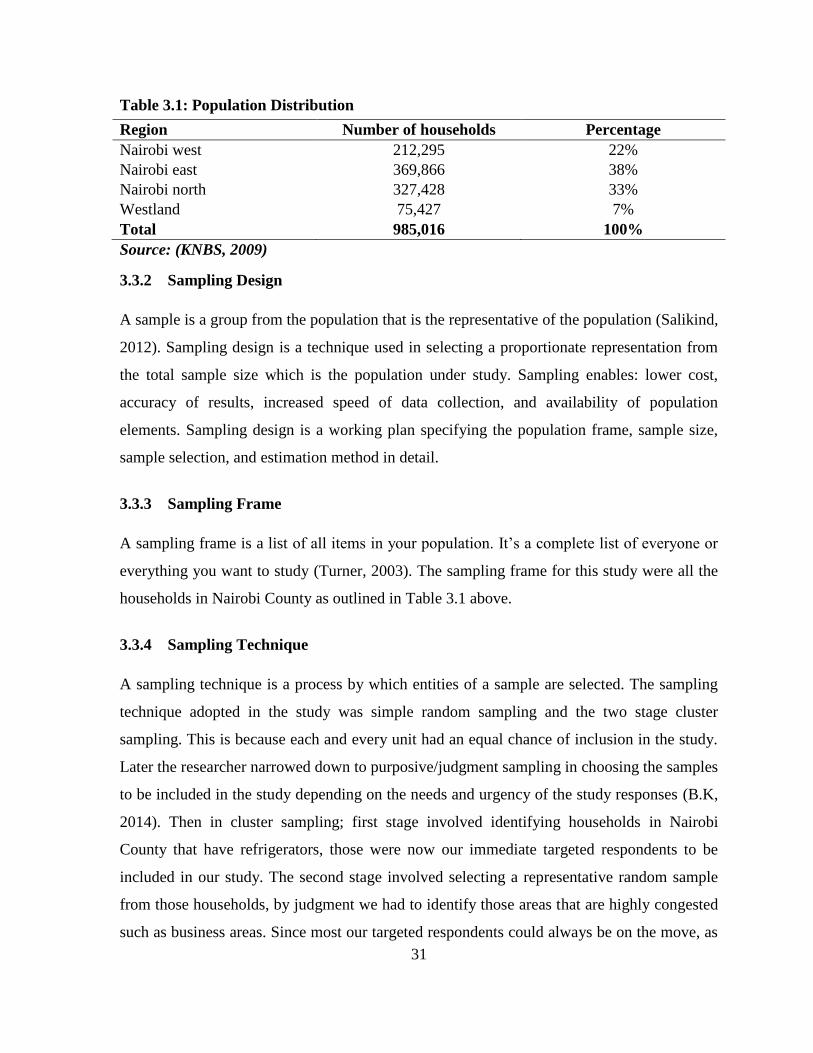
31
Table 3.1: Population Distribution
Region Number of households Percentage
Nairobi west 212,295 22%
Nairobi east 369,866 38%
Nairobi north 327,428 33%
Westland 75,427 7%
Total 985,016 100%
Source: (KNBS, 2009)
3.3.2 Sampling Design
A sample is a group from the population that is the representative of the population (Salikind,
2012). Sampling design is a technique used in selecting a proportionate representation from
the total sample size which is the population under study. Sampling enables: lower cost,
accuracy of results, increased speed of data collection, and availability of population
elements. Sampling design is a working plan specifying the population frame, sample size,
sample selection, and estimation method in detail.
3.3.3 Sampling Frame
A sampling frame is a list of all items in your population. It’s a complete list of everyone or
everything you want to study (Turner, 2003). The sampling frame for this study were all the
households in Nairobi County as outlined in Table 3.1 above.
3.3.4 Sampling Technique
A sampling technique is a process by which entities of a sample are selected. The sampling
technique adopted in the study was simple random sampling and the two stage cluster
sampling. This is because each and every unit had an equal chance of inclusion in the study.
Later the researcher narrowed down to purposive/judgment sampling in choosing the samples
to be included in the study depending on the needs and urgency of the study responses (B.K,
2014). Then in cluster sampling; first stage involved identifying households in Nairobi
County that have refrigerators, those were now our immediate targeted respondents to be
included in our study. The second stage involved selecting a representative random sample
from those households, by judgment we had to identify those areas that are highly congested
such as business areas. Since most our targeted respondents could always be on the move, as
32
Nairobi is a busy environment in nature. The two stage cluster sampling was the best to be
employed in sampling technique due to how distributed the population of Nairobi County is.
Hence we just had to narrow down so as to get our targeted samples in stages without biases
as to include all groups and classes of people to our study.
3.3.5 Sample Size
The sample size was calculated as shown below using the Cochran’s formula (Cochran,
1963). This is because our population of study was large therefore we opted for the
Cochran’s formula as it yields a good representative for proportion. Small sample size
increases the margin of error hence to be on the safe side we had to adjust our sample to a
reasonable size so as to minimize the errors using the fisher equation below (sample size
determination and sampling techniques, 2014)
no = [t2 *p*q]/d2 and n=no {1+no/N}-1
Where:
t = alpha value for a 90% confidence level
p*q= variance
d=margin of error (5%)
N=Total number of households in Nairobi County
no = Uncorrected sample size
n = sample size to be determined adjusted as per the Cochran’s correction formula
no = (1.645*1.645*0.5*0.5)/(0.05*0.05)
=230.60
We used 0.5, the maximum variability proportion to determine the more conservative sample
sized and t are the standardized level of precision and confidence level respectively. In our
case we used the default 5% level of precision at 90% confidence level depending on the
prediction of our respondents to determine the sample size.
With finite populations, correction to the proportions is necessary so as to slightly reduce the
sample size (B.K, 2014).
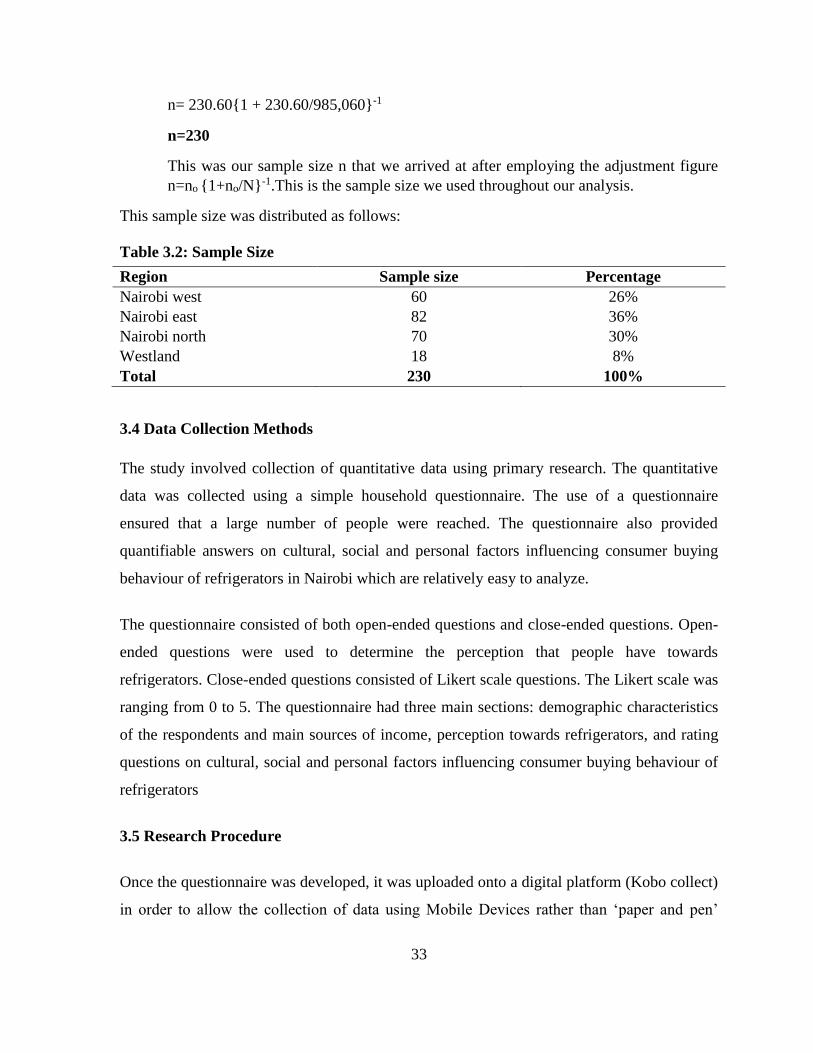
33
n= 230.60{1 + 230.60/985,060}-1
n=230
This was our sample size n that we arrived at after employing the adjustment figure
n=no {1+no/N}-1.This is the sample size we used throughout our analysis.
This sample size was distributed as follows:
Table 3.2: Sample Size
Region Sample size Percentage
Nairobi west 60 26%
Nairobi east 82 36%
Nairobi north 70 30%
Westland 18 8%
Total 230 100%
3.4 Data Collection Methods
The study involved collection of quantitative data using primary research. The quantitative
data was collected using a simple household questionnaire. The use of a questionnaire
ensured that a large number of people were reached. The questionnaire also provided
quantifiable answers on cultural, social and personal factors influencing consumer buying
behaviour of refrigerators in Nairobi which are relatively easy to analyze.
The questionnaire consisted of both open-ended questions and close-ended questions. Open-
ended questions were used to determine the perception that people have towards
refrigerators. Close-ended questions consisted of Likert scale questions. The Likert scale was
ranging from 0 to 5. The questionnaire had three main sections: demographic characteristics
of the respondents and main sources of income, perception towards refrigerators, and rating
questions on cultural, social and personal factors influencing consumer buying behaviour of
refrigerators
3.5 Research Procedure
Once the questionnaire was developed, it was uploaded onto a digital platform (Kobo collect)
in order to allow the collection of data using Mobile Devices rather than ‘paper and pen’
34
method. Qualified interviewers were locally identified, recruited and trained. The training
aimed at creating a common understanding of the questionnaire for purposes of uniformity
and quality in data collection.
The study tool (household questionnaire) was pre-tested with an aim of authenticating the
effectiveness and validity of the questionnaire. Outcomes from the pre-test process were used
to review and fine tune the data collection tool. Data was collected using mobile phones,
whereby the trained interviewers read the question to the respondents, then recorded the
response given using mobile phones. This ensured that the respondents were able to fully
understand the question and the responses were recorded in a uniform manner. Once the
responses were recorded in the digital platform and the entire form was filled, the responses
were automatically uploaded into the server.
Our high response rate was initiated by assuring the respondents on privacy of their
responses. Each and every person’s responses were treated with aloof privacy especially on
the issue of religion, age, occupation, education level etc.
We also had to ensure our respondents that the data obtained was basically for academic
purpose and nothing else and by so doing we had to present the data collection introduction
letter from USIU University to our respondents. This really boosted confidence among our
respondents as they responded to our questionnaires.
3.6 Data Analysis Methods
According to Cooper, Schneider (2008) data analysis is a research technique for the
objective, systematic and qualitative description of the manifest content of a communication.
In order for research quality in this study, quantitative method of data analysis was used.
According to Babbie and Mouton (2010) descriptive statistics involves a process of
transforming a mass of raw data into tables, charts, with frequency distribution and
percentages, which are a vital part of making sense of the data. The research data was
analyzed using Statistical Package for Social Sciences (SPSS) program and presented using
tables to give a clear picture of the research findings at a glance.
35
Key among the quantitative tools that were employed are descriptive statistics, which include
measures of central tendencies, such as means, median, Standard deviation, mode, cross-
tabulations, frequencies and percentages. These tools of analyses were used for instance to
determine views of commonality and deviations from commonality. Regression is another
useful statistic that described the degree of relationship between variables used. The study
also utilized measures of central tendency. These tests were done to assess factors
influencing consumer’s buying behaviour of refrigerators in Kenya.
Quantitative data was cleaned to ensure that the data was of good quality. The data was then
coded in order to prepare it for analysis. The data was analyzed using the Statistical Package
for Social Scientists (SPSS). It was analyzed using descriptive and inferential statistical
analysis which mainly included frequencies, measures of central tendency (mean, mode and
median), Correlation matrix tables as well as the P-values .The data is presented using tables
and figures.
3.7 Chapter Summary
This chapter discussed the research design, population and sampling design, data collection
methods, research procedures and the data analysis methods that the study adopted. The next
chapter outlines the results and findings of factors influencing consumer buying behavior of
refrigerators in Nairobi, Kenya. These results and findings include the demographic
characteristics of the respondents, their perception towards refrigerators and findings on the
cultural, social and personal factors influencing their buying behavior.
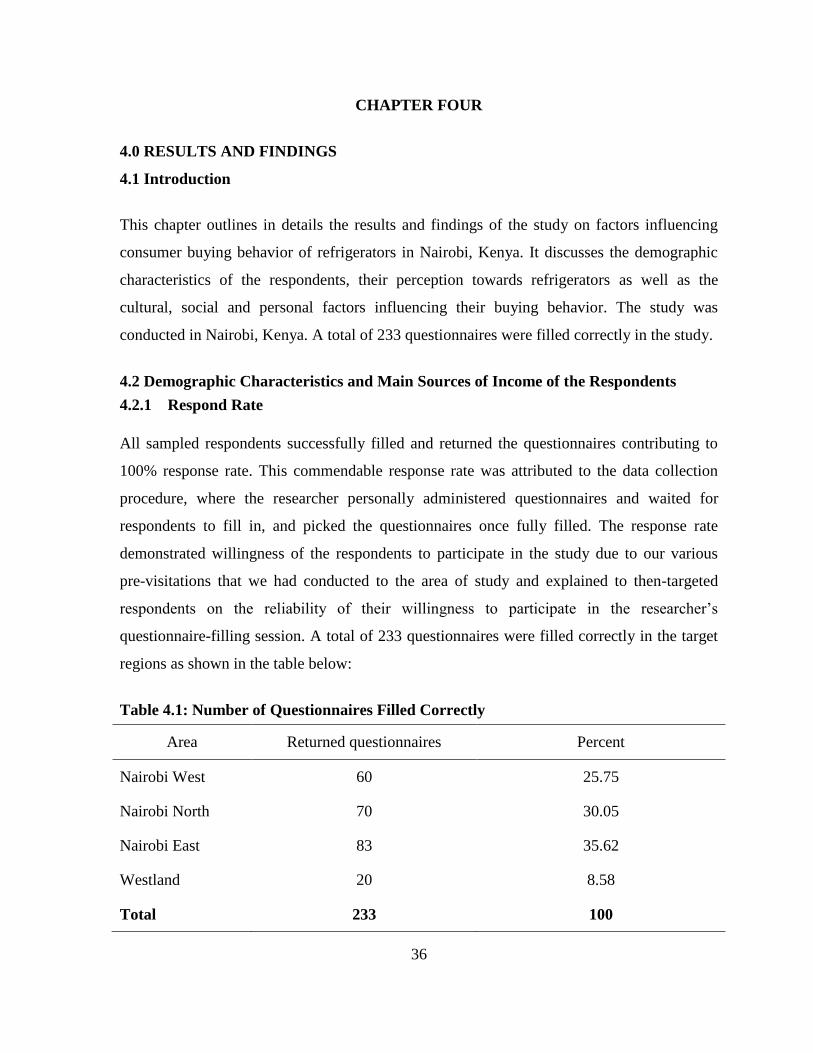
36
CHAPTER FOUR
4.0 RESULTS AND FINDINGS
4.1 Introduction
This chapter outlines in details the results and findings of the study on factors influencing
consumer buying behavior of refrigerators in Nairobi, Kenya. It discusses the demographic
characteristics of the respondents, their perception towards refrigerators as well as the
cultural, social and personal factors influencing their buying behavior. The study was
conducted in Nairobi, Kenya. A total of 233 questionnaires were filled correctly in the study.
4.2 Demographic Characteristics and Main Sources of Income of the Respondents
4.2.1 Respond Rate
All sampled respondents successfully filled and returned the questionnaires contributing to
100% response rate. This commendable response rate was attributed to the data collection
procedure, where the researcher personally administered questionnaires and waited for
respondents to fill in, and picked the questionnaires once fully filled. The response rate
demonstrated willingness of the respondents to participate in the study due to our various
pre-visitations that we had conducted to the area of study and explained to then-targeted
respondents on the reliability of their willingness to participate in the researcher’s
questionnaire-filling session. A total of 233 questionnaires were filled correctly in the target
regions as shown in the table below:
Table 4.1: Number of Questionnaires Filled Correctly
Area Returned questionnaires Percent
Nairobi West 60 25.75
Nairobi North 70 30.05
Nairobi East 83 35.62
Westland 20 8.58
Total 233 100
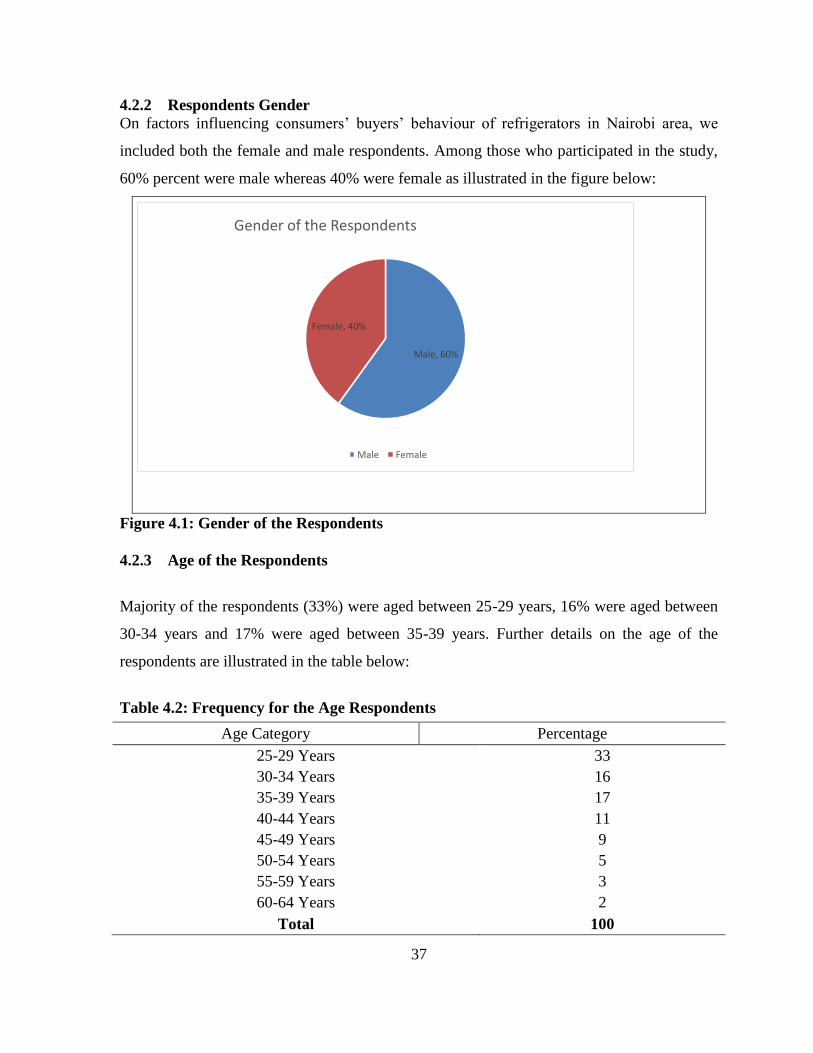
37
4.2.2 Respondents Gender
On factors influencing consumers’ buyers’ behaviour of refrigerators in Nairobi area, we
included both the female and male respondents. Among those who participated in the study,
60% percent were male whereas 40% were female as illustrated in the figure below:
Male, 60%
Female, 40%
Gender of the Respondents
Male Female
Figure 4.1: Gender of the Respondents
4.2.3 Age of the Respondents
Majority of the respondents (33%) were aged between 25-29 years, 16% were aged between
30-34 years and 17% were aged between 35-39 years. Further details on the age of the
respondents are illustrated in the table below:
Table 4.2: Frequency for the Age Respondents
Age Category Percentage
25-29 Years 33
30-34 Years 16
35-39 Years 17
40-44 Years 11
45-49 Years 9
50-54 Years 5
55-59 Years 3
60-64 Years 2
Total 100
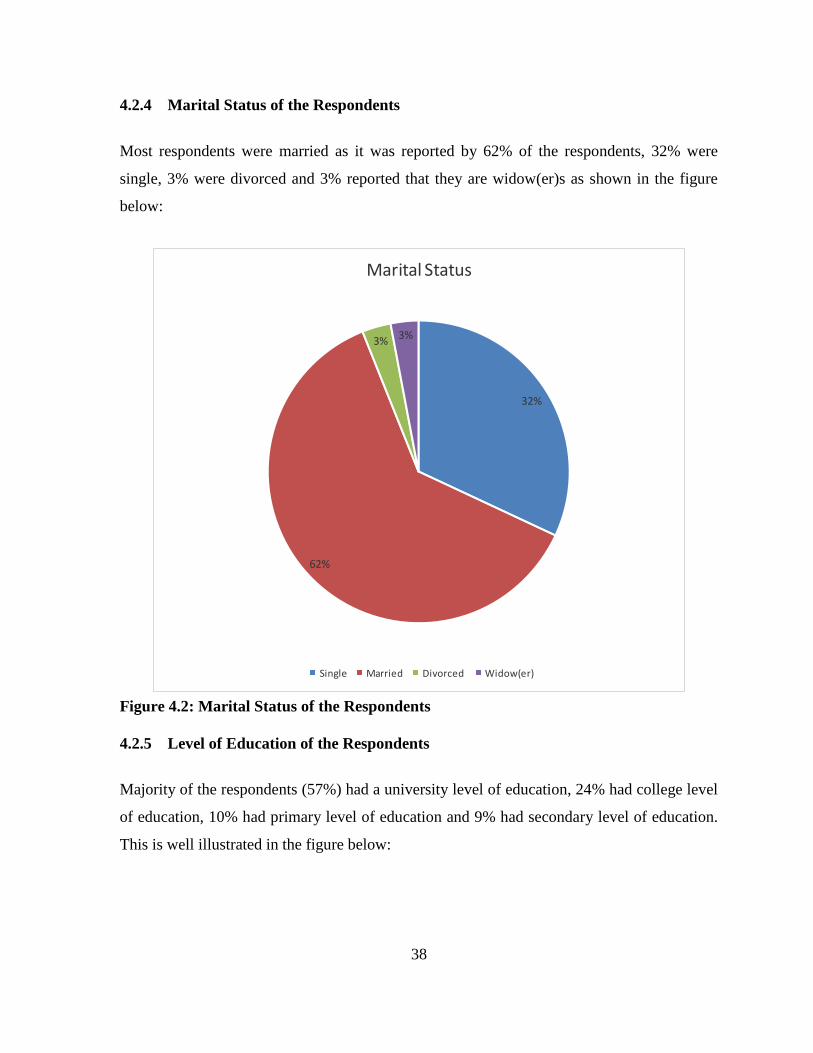
38
4.2.4 Marital Status of the Respondents
Most respondents were married as it was reported by 62% of the respondents, 32% were
single, 3% were divorced and 3% reported that they are widow(er)s as shown in the figure
below:
32%
62%
3% 3%
Marital Status
Single Married Divorced Widow(er)
Figure 4.2: Marital Status of the Respondents
4.2.5 Level of Education of the Respondents
Majority of the respondents (57%) had a university level of education, 24% had college level
of education, 10% had primary level of education and 9% had secondary level of education.
This is well illustrated in the figure below:
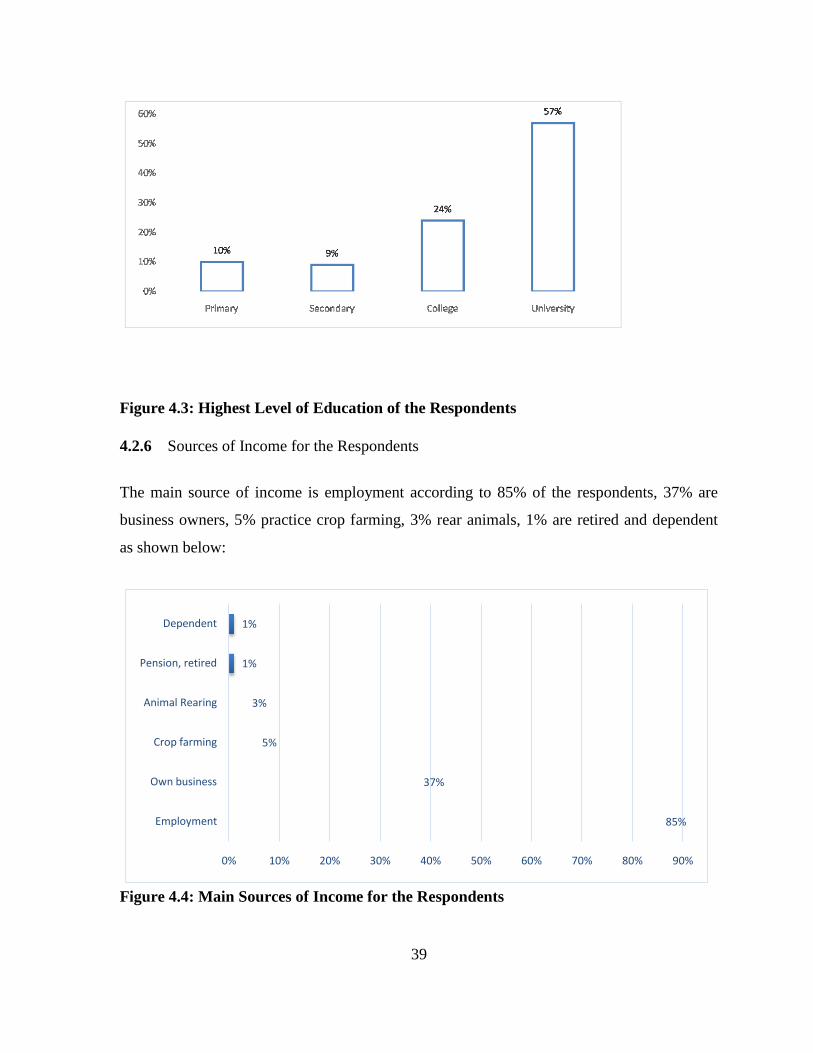
39
Figure 4.3: Highest Level of Education of the Respondents
4.2.6 Sources of Income for the Respondents
The main source of income is employment according to 85% of the respondents, 37% are
business owners, 5% practice crop farming, 3% rear animals, 1% are retired and dependent
as shown below:
85%
37%
5%
3%
1%
1%
0% 10% 20% 30% 40% 50% 60% 70% 80% 90%
Employment
Own business
Crop farming
Animal Rearing
Pension, retired
Dependent
Figure 4.4: Main Sources of Income for the Respondents
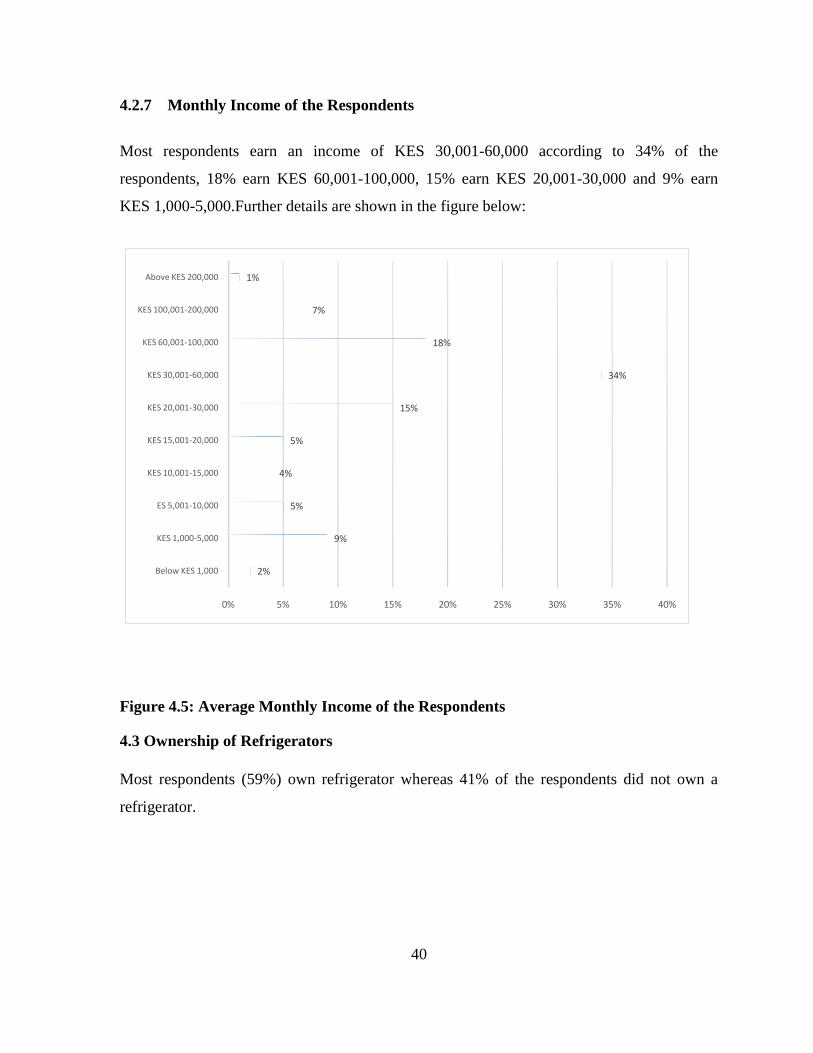
40
4.2.7 Monthly Income of the Respondents
Most respondents earn an income of KES 30,001-60,000 according to 34% of the
respondents, 18% earn KES 60,001-100,000, 15% earn KES 20,001-30,000 and 9% earn
KES 1,000-5,000.Further details are shown in the figure below:
2%
9%
5%
4%
5%
15%
34%
18%
7%
1%
0% 5% 10% 15% 20% 25% 30% 35% 40%
Below KES 1,000
KES 1,000-5,000
ES 5,001-10,000
KES 10,001-15,000
KES 15,001-20,000
KES 20,001-30,000
KES 30,001-60,000
KES 60,001-100,000
KES 100,001-200,000
Above KES 200,000
Figure 4.5: Average Monthly Income of the Respondents
4.3 Ownership of Refrigerators
Most respondents (59%) own refrigerator whereas 41% of the respondents did not own a
refrigerator.
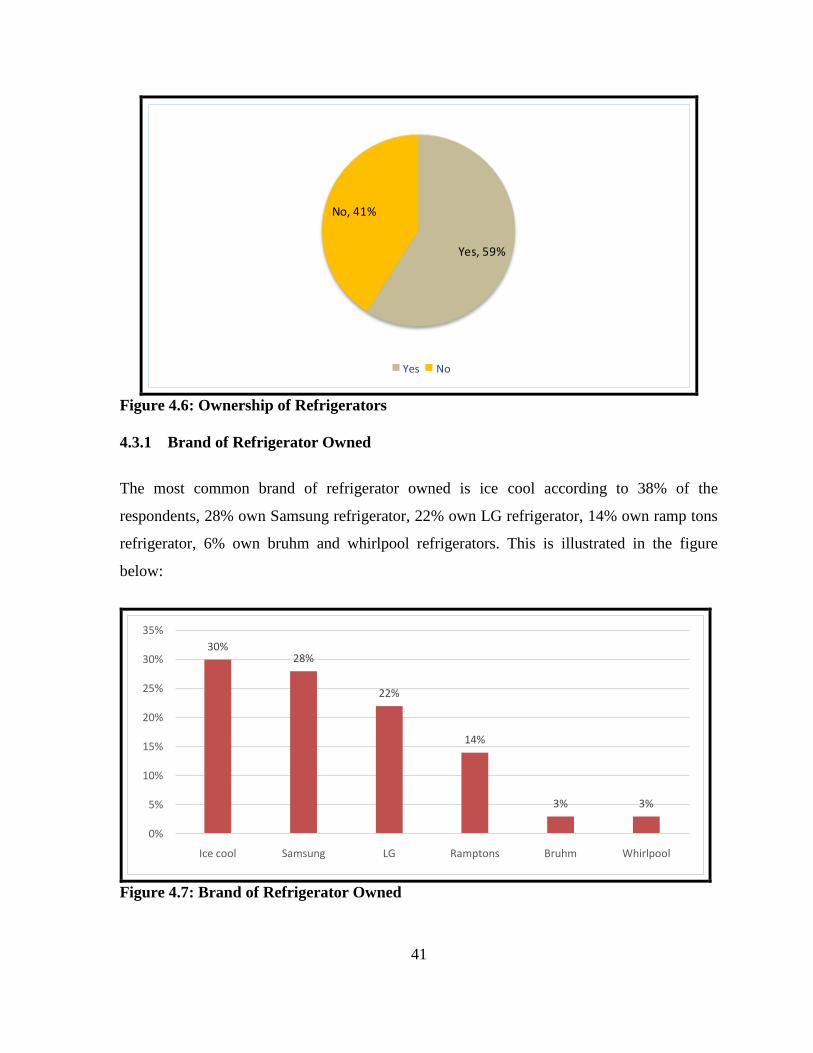
41
Yes, 59%
No, 41%
Yes No
Figure 4.6: Ownership of Refrigerators
4.3.1 Brand of Refrigerator Owned
The most common brand of refrigerator owned is ice cool according to 38% of the
respondents, 28% own Samsung refrigerator, 22% own LG refrigerator, 14% own ramp tons
refrigerator, 6% own bruhm and whirlpool refrigerators. This is illustrated in the figure
below:
30%28%
22%
14%
3% 3%
0%
5%
10%
15%
20%
25%
30%
35%
Ice cool Samsung LG Ramptons Bruhm Whirlpool
Figure 4.7: Brand of Refrigerator Owned
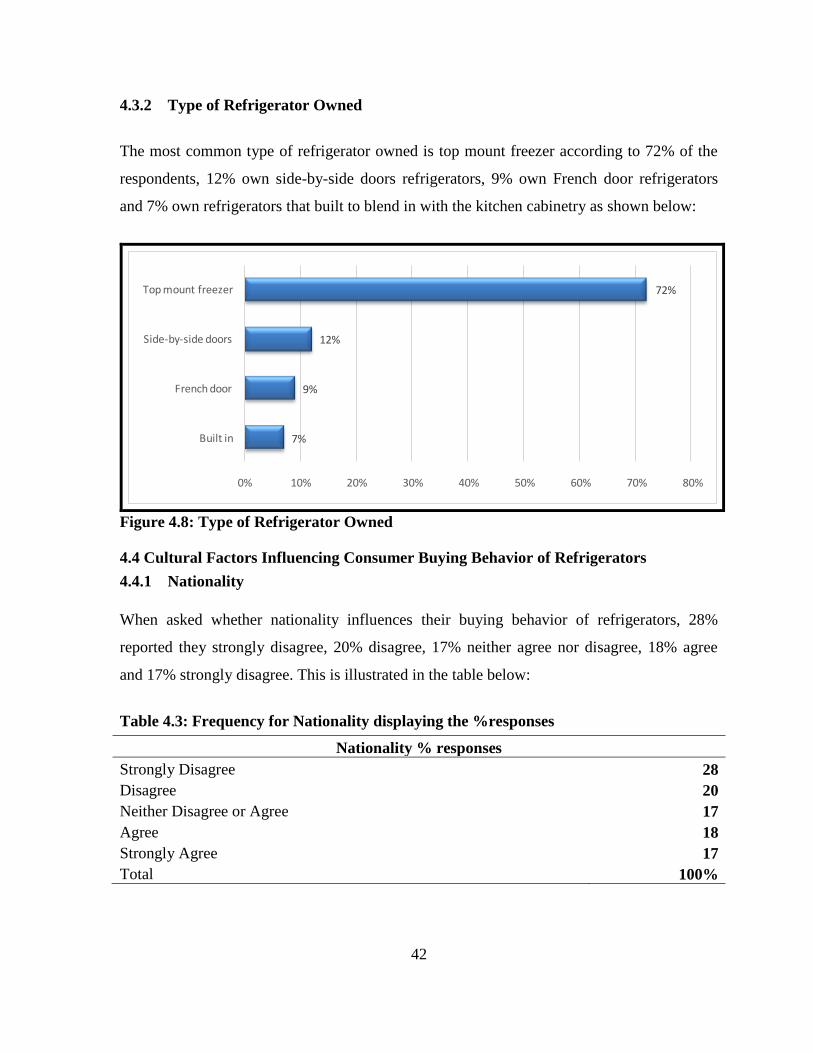
42
4.3.2 Type of Refrigerator Owned
The most common type of refrigerator owned is top mount freezer according to 72% of the
respondents, 12% own side-by-side doors refrigerators, 9% own French door refrigerators
and 7% own refrigerators that built to blend in with the kitchen cabinetry as shown below:
7%
9%
12%
72%
0% 10% 20% 30% 40% 50% 60% 70% 80%
Built in
French door
Side-by-side doors
Top mount freezer
Figure 4.8: Type of Refrigerator Owned
4.4 Cultural Factors Influencing Consumer Buying Behavior of Refrigerators
4.4.1 Nationality
When asked whether nationality influences their buying behavior of refrigerators, 28%
reported they strongly disagree, 20% disagree, 17% neither agree nor disagree, 18% agree
and 17% strongly disagree. This is illustrated in the table below:
Table 4.3: Frequency for Nationality displaying the %responses
Nationality % responses
Strongly Disagree 28
Disagree 20
Neither Disagree or Agree 17
Agree 18
Strongly Agree 17
Total 100%
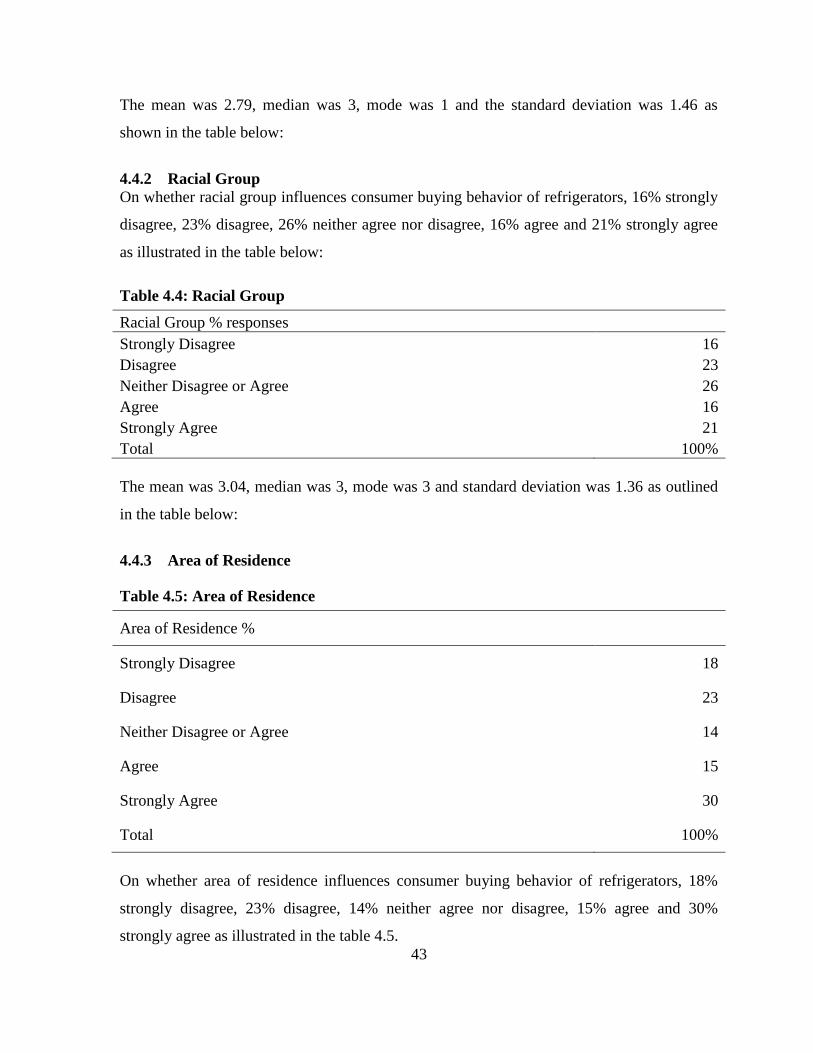
43
The mean was 2.79, median was 3, mode was 1 and the standard deviation was 1.46 as
shown in the table below:
4.4.2 Racial Group
On whether racial group influences consumer buying behavior of refrigerators, 16% strongly
disagree, 23% disagree, 26% neither agree nor disagree, 16% agree and 21% strongly agree
as illustrated in the table below:
Table 4.4: Racial Group
Racial Group % responses
Strongly Disagree 16
Disagree 23
Neither Disagree or Agree 26
Agree 16
Strongly Agree 21
Total 100%
The mean was 3.04, median was 3, mode was 3 and standard deviation was 1.36 as outlined
in the table below:
4.4.3 Area of Residence
Table 4.5: Area of Residence
Area of Residence %
Strongly Disagree 18
Disagree 23
Neither Disagree or Agree 14
Agree 15
Strongly Agree 30
Total 100%
On whether area of residence influences consumer buying behavior of refrigerators, 18%
strongly disagree, 23% disagree, 14% neither agree nor disagree, 15% agree and 30%
strongly agree as illustrated in the table 4.5.
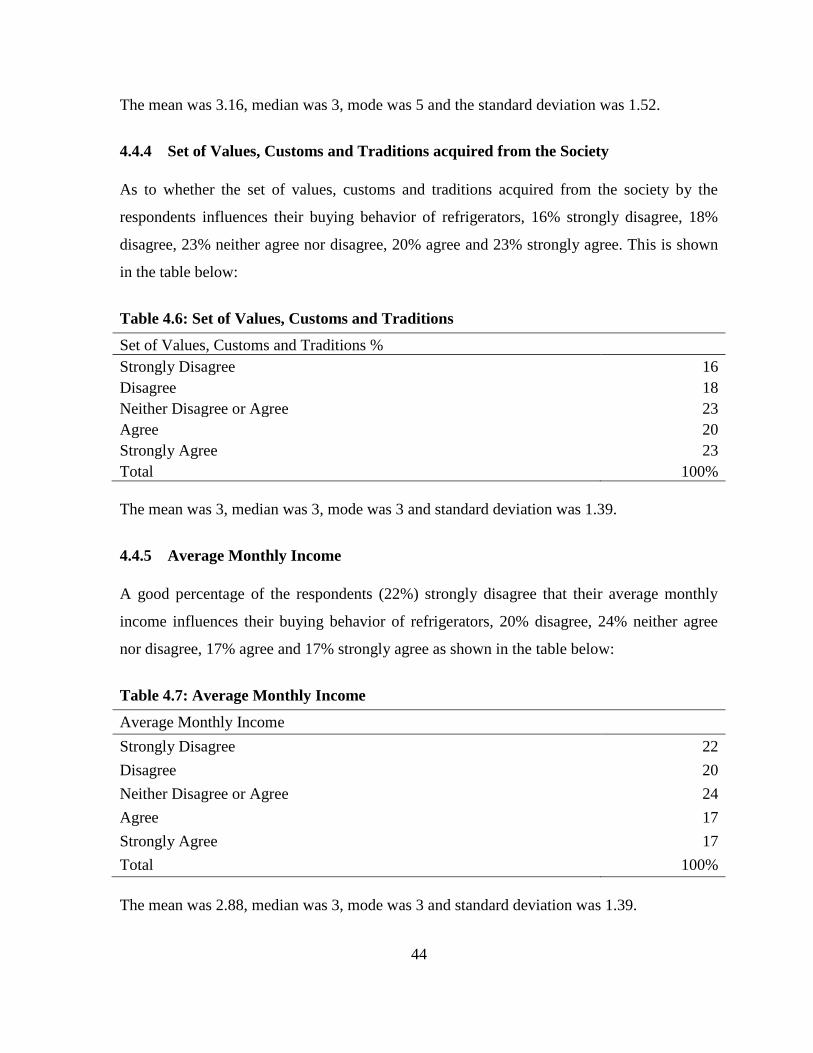
44
The mean was 3.16, median was 3, mode was 5 and the standard deviation was 1.52.
4.4.4 Set of Values, Customs and Traditions acquired from the Society
As to whether the set of values, customs and traditions acquired from the society by the
respondents influences their buying behavior of refrigerators, 16% strongly disagree, 18%
disagree, 23% neither agree nor disagree, 20% agree and 23% strongly agree. This is shown
in the table below:
Table 4.6: Set of Values, Customs and Traditions
Set of Values, Customs and Traditions %
Strongly Disagree 16
Disagree 18
Neither Disagree or Agree 23
Agree 20
Strongly Agree 23
Total 100%
The mean was 3, median was 3, mode was 3 and standard deviation was 1.39.
4.4.5 Average Monthly Income
A good percentage of the respondents (22%) strongly disagree that their average monthly
income influences their buying behavior of refrigerators, 20% disagree, 24% neither agree
nor disagree, 17% agree and 17% strongly agree as shown in the table below:
Table 4.7: Average Monthly Income
Average Monthly Income
Strongly Disagree 22
Disagree 20
Neither Disagree or Agree 24
Agree 17
Strongly Agree 17
Total 100%
The mean was 2.88, median was 3, mode was 3 and standard deviation was 1.39.
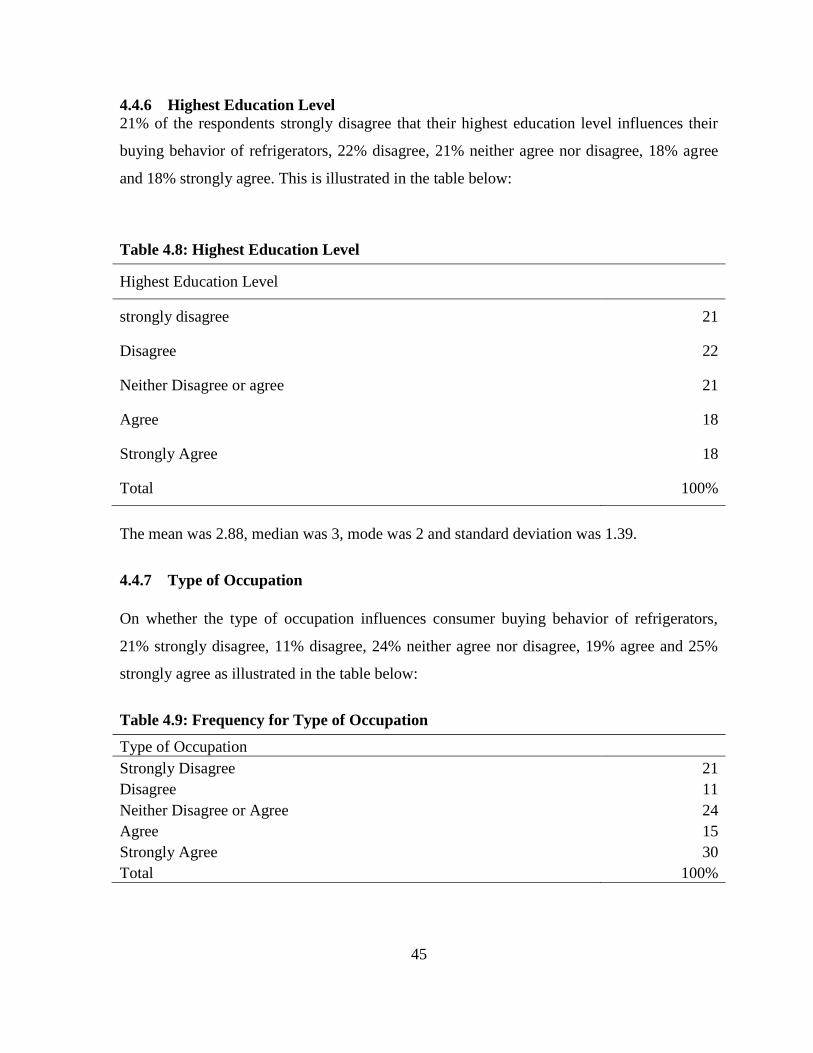
45
4.4.6 Highest Education Level
21% of the respondents strongly disagree that their highest education level influences their
buying behavior of refrigerators, 22% disagree, 21% neither agree nor disagree, 18% agree
and 18% strongly agree. This is illustrated in the table below:
Table 4.8: Highest Education Level
Highest Education Level
strongly disagree 21
Disagree 22
Neither Disagree or agree 21
Agree 18
Strongly Agree 18
Total 100%
The mean was 2.88, median was 3, mode was 2 and standard deviation was 1.39.
4.4.7 Type of Occupation
On whether the type of occupation influences consumer buying behavior of refrigerators,
21% strongly disagree, 11% disagree, 24% neither agree nor disagree, 19% agree and 25%
strongly agree as illustrated in the table below:
Table 4.9: Frequency for Type of Occupation
Type of Occupation
Strongly Disagree 21
Disagree 11
Neither Disagree or Agree 24
Agree 15
Strongly Agree 30
Total 100%
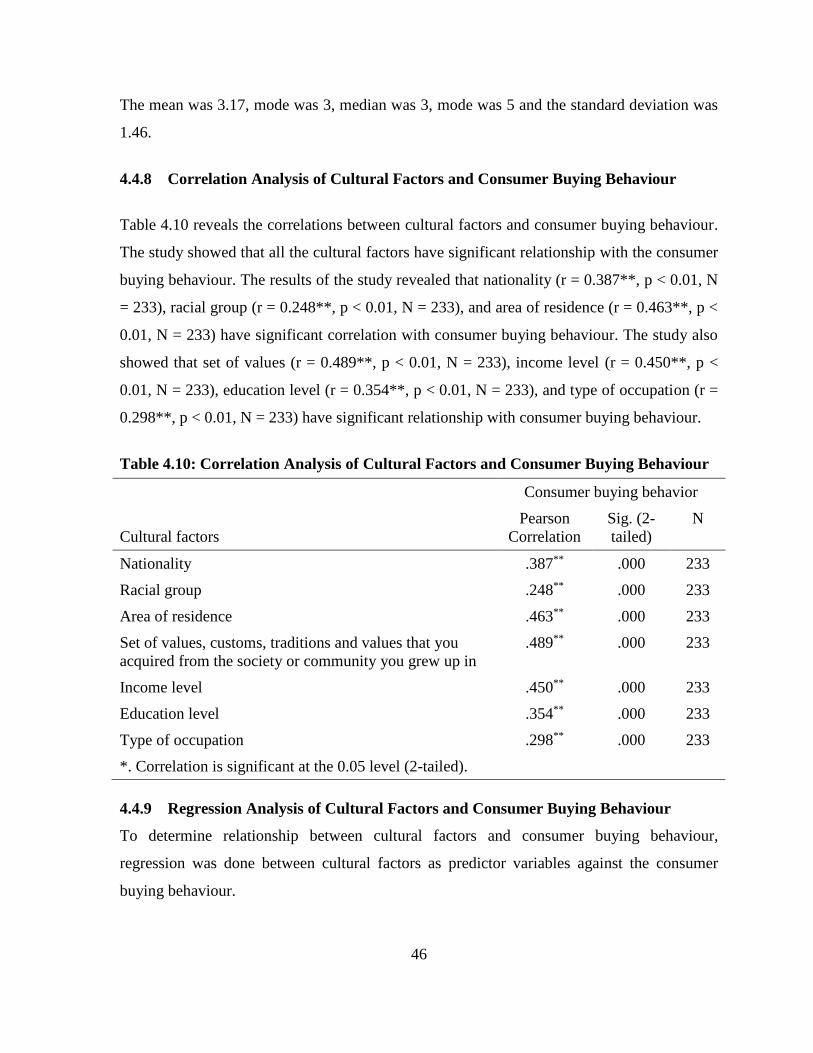
46
The mean was 3.17, mode was 3, median was 3, mode was 5 and the standard deviation was
1.46.
4.4.8 Correlation Analysis of Cultural Factors and Consumer Buying Behaviour
Table 4.10 reveals the correlations between cultural factors and consumer buying behaviour.
The study showed that all the cultural factors have significant relationship with the consumer
buying behaviour. The results of the study revealed that nationality (r = 0.387**, p < 0.01, N
= 233), racial group (r = 0.248**, p < 0.01, N = 233), and area of residence (r = 0.463**, p <
0.01, N = 233) have significant correlation with consumer buying behaviour. The study also
showed that set of values (r = 0.489**, p < 0.01, N = 233), income level (r = 0.450**, p <
0.01, N = 233), education level (r = 0.354**, p < 0.01, N = 233), and type of occupation (r =
0.298**, p < 0.01, N = 233) have significant relationship with consumer buying behaviour.
Table 4.10: Correlation Analysis of Cultural Factors and Consumer Buying Behaviour
Cultural factors
Consumer buying behavior
Pearson
Correlation
Sig. (2-
tailed)
N
Nationality .387** .000 233
Racial group .248** .000 233
Area of residence .463** .000 233
Set of values, customs, traditions and values that you
acquired from the society or community you grew up in
.489** .000 233
Income level .450** .000 233
Education level .354** .000 233
Type of occupation .298** .000 233
*. Correlation is significant at the 0.05 level (2-tailed).
4.4.9 Regression Analysis of Cultural Factors and Consumer Buying Behaviour
To determine relationship between cultural factors and consumer buying behaviour,
regression was done between cultural factors as predictor variables against the consumer
buying behaviour.
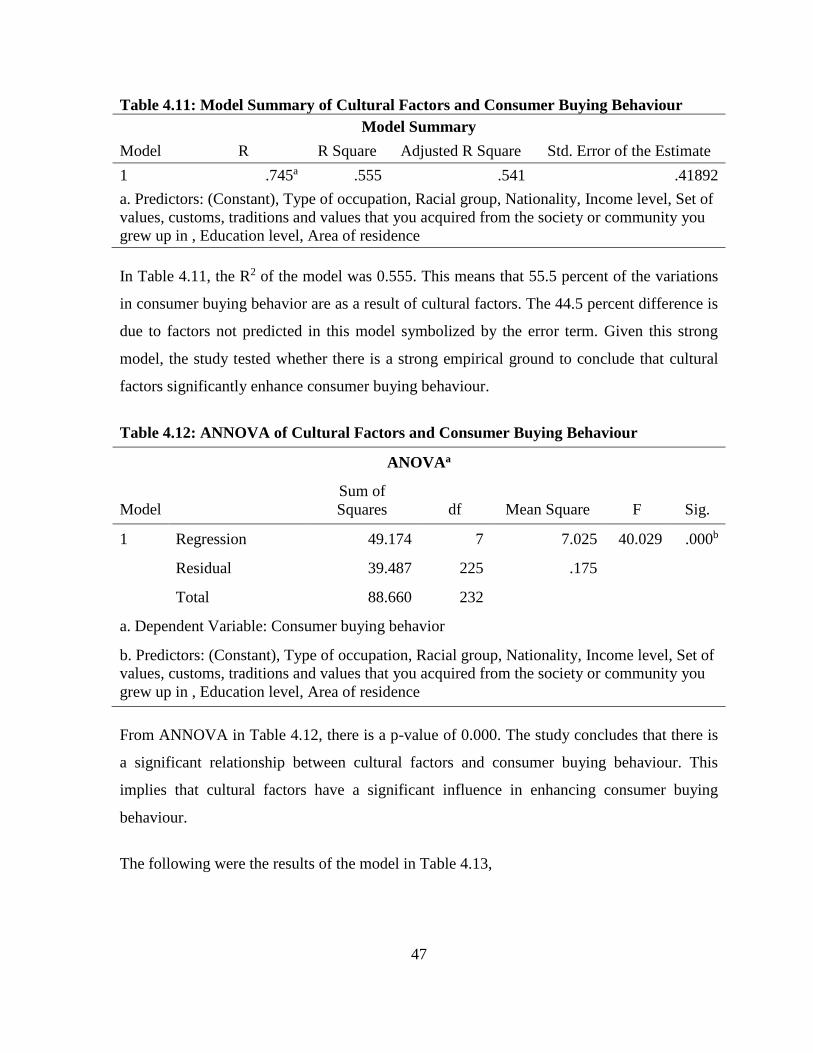
47
Table 4.11: Model Summary of Cultural Factors and Consumer Buying Behaviour
Model Summary
Model R R Square Adjusted R Square Std. Error of the Estimate
1 .745a .555 .541 .41892
a. Predictors: (Constant), Type of occupation, Racial group, Nationality, Income level, Set of
values, customs, traditions and values that you acquired from the society or community you
grew up in , Education level, Area of residence
In Table 4.11, the R2 of the model was 0.555. This means that 55.5 percent of the variations
in consumer buying behavior are as a result of cultural factors. The 44.5 percent difference is
due to factors not predicted in this model symbolized by the error term. Given this strong
model, the study tested whether there is a strong empirical ground to conclude that cultural
factors significantly enhance consumer buying behaviour.
Table 4.12: ANNOVA of Cultural Factors and Consumer Buying Behaviour
ANOVAa
Model
Sum of
Squares df Mean Square F Sig.
1 Regression 49.174 7 7.025 40.029 .000b
Residual 39.487 225 .175
Total 88.660 232
a. Dependent Variable: Consumer buying behavior
b. Predictors: (Constant), Type of occupation, Racial group, Nationality, Income level, Set of
values, customs, traditions and values that you acquired from the society or community you
grew up in , Education level, Area of residence
From ANNOVA in Table 4.12, there is a p-value of 0.000. The study concludes that there is
a significant relationship between cultural factors and consumer buying behaviour. This
implies that cultural factors have a significant influence in enhancing consumer buying
behaviour.
The following were the results of the model in Table 4.13,
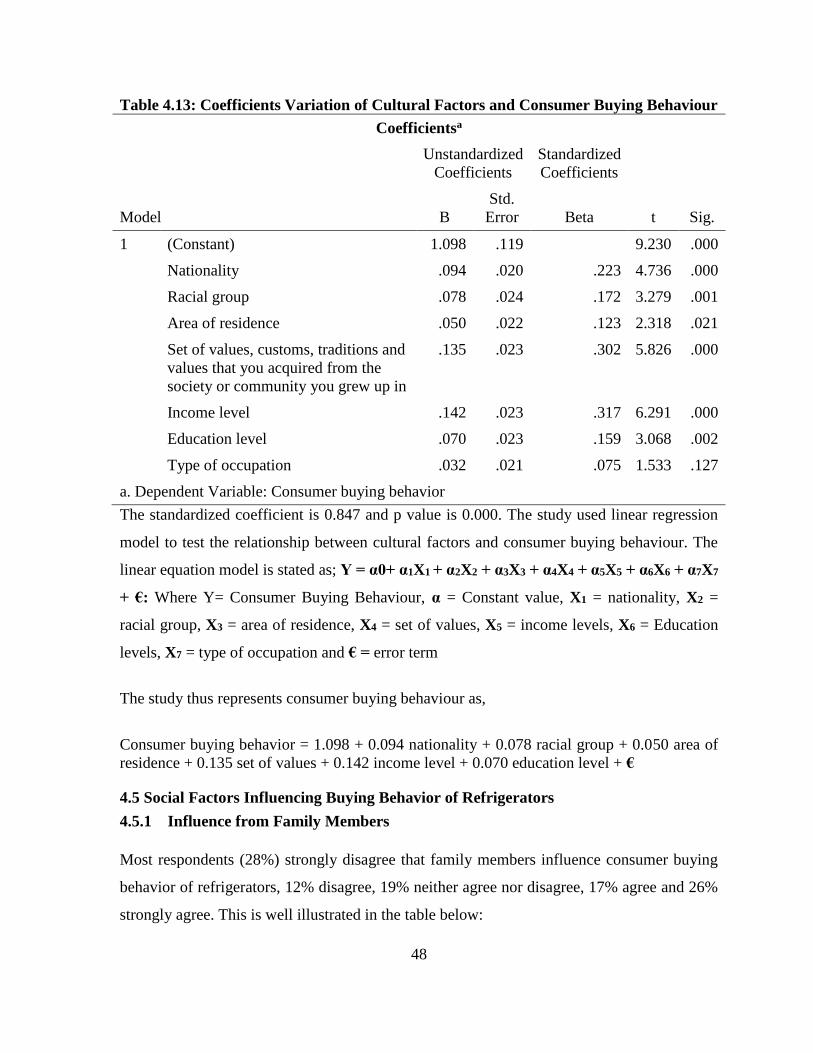
48
Table 4.13: Coefficients Variation of Cultural Factors and Consumer Buying Behaviour
Coefficientsa
Model
Unstandardized
Coefficients
Standardized
Coefficients
t Sig. B
Std.
Error Beta
1 (Constant) 1.098 .119 9.230 .000
Nationality .094 .020 .223 4.736 .000
Racial group .078 .024 .172 3.279 .001
Area of residence .050 .022 .123 2.318 .021
Set of values, customs, traditions and
values that you acquired from the
society or community you grew up in
.135 .023 .302 5.826 .000
Income level .142 .023 .317 6.291 .000
Education level .070 .023 .159 3.068 .002
Type of occupation .032 .021 .075 1.533 .127
a. Dependent Variable: Consumer buying behavior
The standardized coefficient is 0.847 and p value is 0.000. The study used linear regression
model to test the relationship between cultural factors and consumer buying behaviour. The
linear equation model is stated as; Y = α0+ α1X1 + α2X2 + α3X3 + α4X4 + α5X5 + α6X6 + α7X7
+ €: Where Y= Consumer Buying Behaviour, α = Constant value, X1 = nationality, X2 =
racial group, X3 = area of residence, X4 = set of values, X5 = income levels, X6 = Education
levels, X7 = type of occupation and € = error term
The study thus represents consumer buying behaviour as,
Consumer buying behavior = 1.098 + 0.094 nationality + 0.078 racial group + 0.050 area of
residence + 0.135 set of values + 0.142 income level + 0.070 education level + €
4.5 Social Factors Influencing Buying Behavior of Refrigerators
4.5.1 Influence from Family Members
Most respondents (28%) strongly disagree that family members influence consumer buying
behavior of refrigerators, 12% disagree, 19% neither agree nor disagree, 17% agree and 26%
strongly agree. This is well illustrated in the table below:
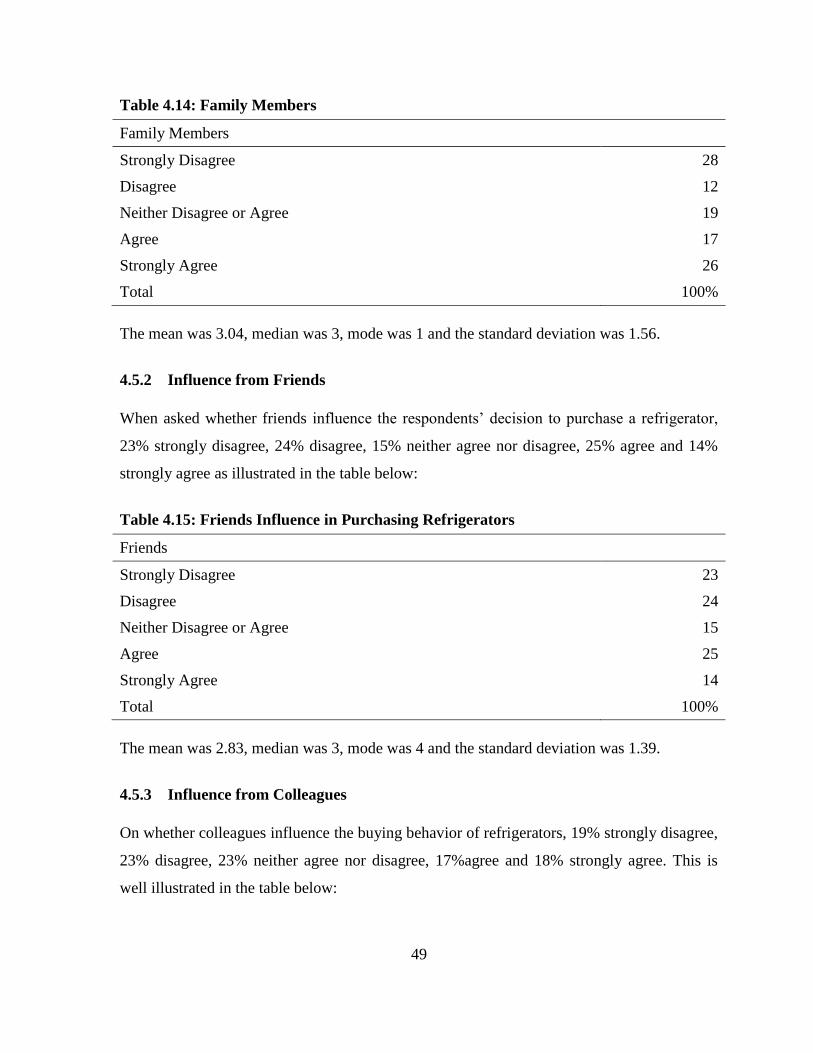
49
Table 4.14: Family Members
Family Members
Strongly Disagree 28
Disagree 12
Neither Disagree or Agree 19
Agree 17
Strongly Agree 26
Total 100%
The mean was 3.04, median was 3, mode was 1 and the standard deviation was 1.56.
4.5.2 Influence from Friends
When asked whether friends influence the respondents’ decision to purchase a refrigerator,
23% strongly disagree, 24% disagree, 15% neither agree nor disagree, 25% agree and 14%
strongly agree as illustrated in the table below:
Table 4.15: Friends Influence in Purchasing Refrigerators
Friends
Strongly Disagree 23
Disagree 24
Neither Disagree or Agree 15
Agree 25
Strongly Agree 14
Total 100%
The mean was 2.83, median was 3, mode was 4 and the standard deviation was 1.39.
4.5.3 Influence from Colleagues
On whether colleagues influence the buying behavior of refrigerators, 19% strongly disagree,
23% disagree, 23% neither agree nor disagree, 17%agree and 18% strongly agree. This is
well illustrated in the table below:
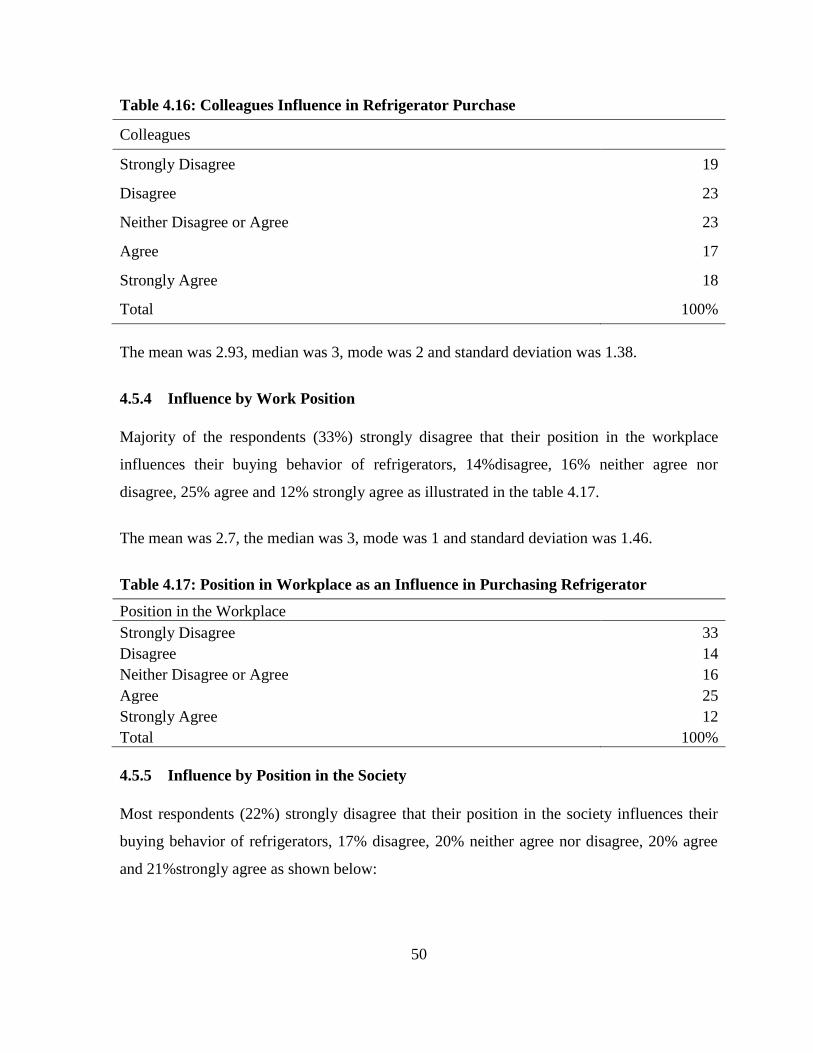
50
Table 4.16: Colleagues Influence in Refrigerator Purchase
Colleagues
Strongly Disagree 19
Disagree 23
Neither Disagree or Agree 23
Agree 17
Strongly Agree 18
Total 100%
The mean was 2.93, median was 3, mode was 2 and standard deviation was 1.38.
4.5.4 Influence by Work Position
Majority of the respondents (33%) strongly disagree that their position in the workplace
influences their buying behavior of refrigerators, 14%disagree, 16% neither agree nor
disagree, 25% agree and 12% strongly agree as illustrated in the table 4.17.
The mean was 2.7, the median was 3, mode was 1 and standard deviation was 1.46.
Table 4.17: Position in Workplace as an Influence in Purchasing Refrigerator
Position in the Workplace
Strongly Disagree 33
Disagree 14
Neither Disagree or Agree 16
Agree 25
Strongly Agree 12
Total 100%
4.5.5 Influence by Position in the Society
Most respondents (22%) strongly disagree that their position in the society influences their
buying behavior of refrigerators, 17% disagree, 20% neither agree nor disagree, 20% agree
and 21%strongly agree as shown below:
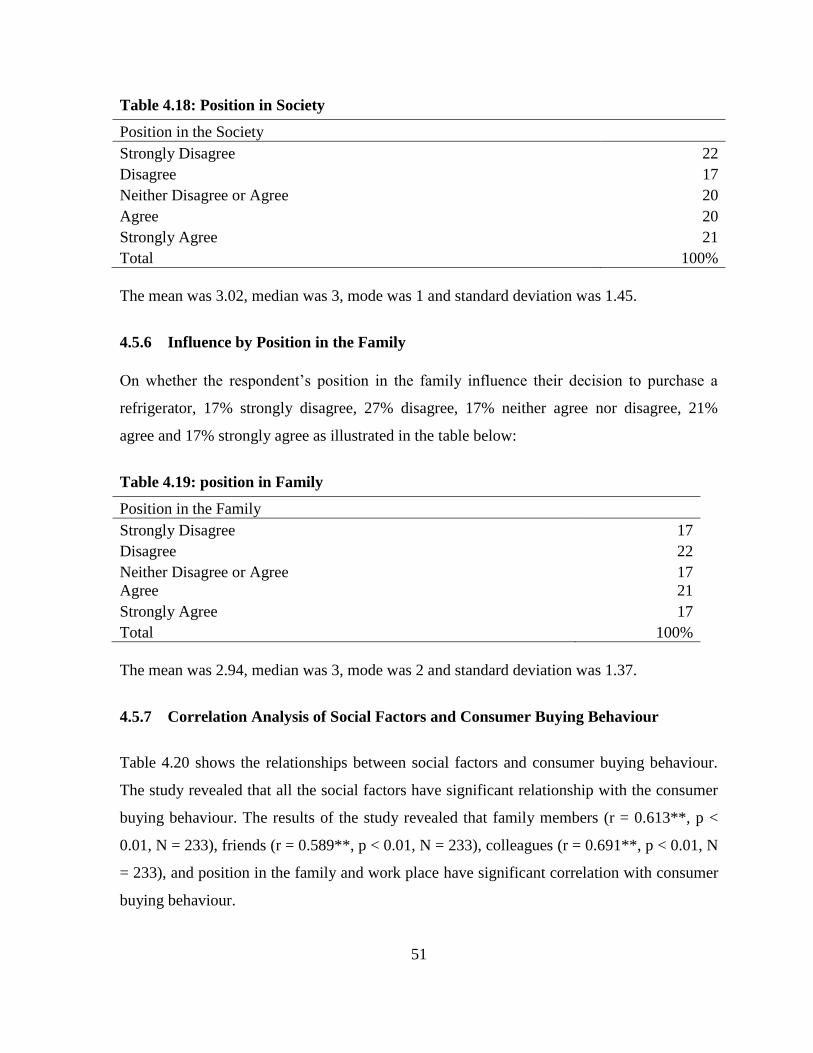
51
Table 4.18: Position in Society
Position in the Society
Strongly Disagree 22
Disagree 17
Neither Disagree or Agree 20
Agree 20
Strongly Agree 21
Total 100%
The mean was 3.02, median was 3, mode was 1 and standard deviation was 1.45.
4.5.6 Influence by Position in the Family
On whether the respondent’s position in the family influence their decision to purchase a
refrigerator, 17% strongly disagree, 27% disagree, 17% neither agree nor disagree, 21%
agree and 17% strongly agree as illustrated in the table below:
Table 4.19: position in Family
Position in the Family
Strongly Disagree 17
Disagree 22
Neither Disagree or Agree 17
Agree 21
Strongly Agree 17
Total 100%
The mean was 2.94, median was 3, mode was 2 and standard deviation was 1.37.
4.5.7 Correlation Analysis of Social Factors and Consumer Buying Behaviour
Table 4.20 shows the relationships between social factors and consumer buying behaviour.
The study revealed that all the social factors have significant relationship with the consumer
buying behaviour. The results of the study revealed that family members (r = 0.613**, p <
0.01, N = 233), friends (r = 0.589**, p < 0.01, N = 233), colleagues (r = 0.691**, p < 0.01, N
= 233), and position in the family and work place have significant correlation with consumer
buying behaviour.
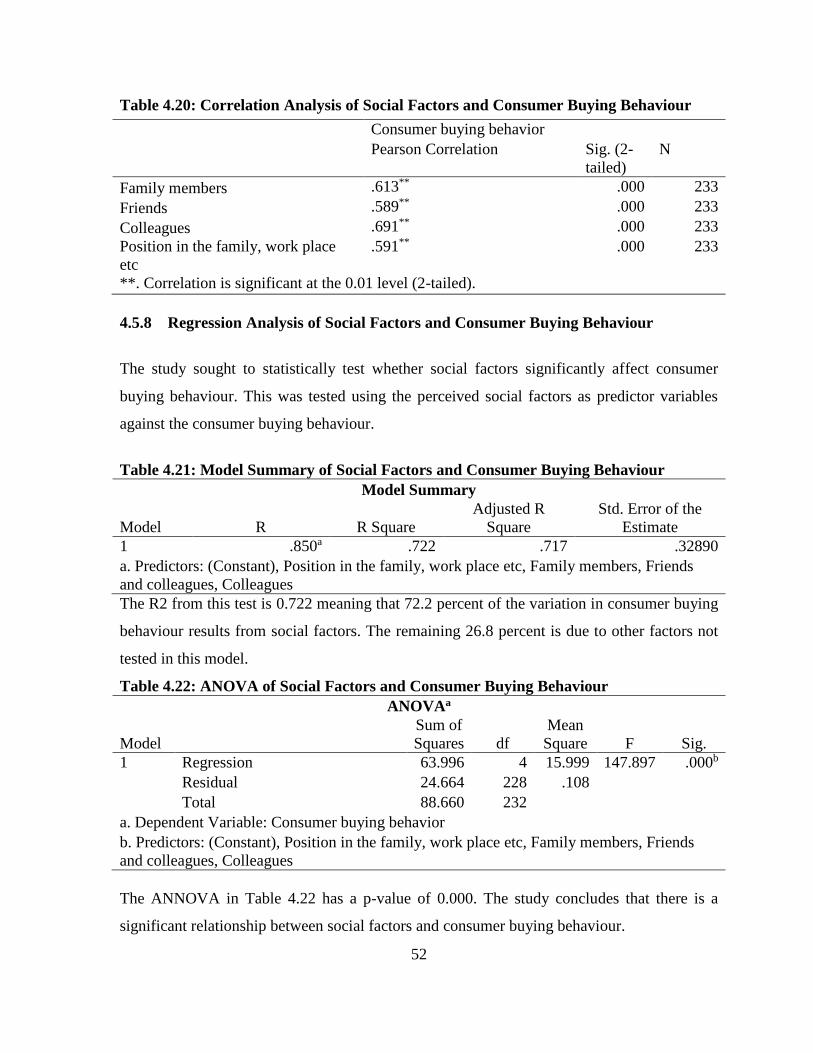
52
Table 4.20: Correlation Analysis of Social Factors and Consumer Buying Behaviour
Consumer buying behavior
Pearson Correlation Sig. (2-
tailed)
N
Family members .613** .000 233
Friends .589** .000 233
Colleagues .691** .000 233
Position in the family, work place
etc
.591** .000 233
**. Correlation is significant at the 0.01 level (2-tailed).
4.5.8 Regression Analysis of Social Factors and Consumer Buying Behaviour
The study sought to statistically test whether social factors significantly affect consumer
buying behaviour. This was tested using the perceived social factors as predictor variables
against the consumer buying behaviour.
Table 4.21: Model Summary of Social Factors and Consumer Buying Behaviour
Model Summary
Model R R Square
Adjusted R
Square
Std. Error of the
Estimate
1 .850a .722 .717 .32890
a. Predictors: (Constant), Position in the family, work place etc, Family members, Friends
and colleagues, Colleagues
The R2 from this test is 0.722 meaning that 72.2 percent of the variation in consumer buying
behaviour results from social factors. The remaining 26.8 percent is due to other factors not
tested in this model.
Table 4.22: ANOVA of Social Factors and Consumer Buying Behaviour
ANOVAa
Model
Sum of
Squares df
Mean
Square F Sig.
1 Regression 63.996 4 15.999 147.897 .000b
Residual 24.664 228 .108
Total 88.660 232
a. Dependent Variable: Consumer buying behavior
b. Predictors: (Constant), Position in the family, work place etc, Family members, Friends
and colleagues, Colleagues
The ANNOVA in Table 4.22 has a p-value of 0.000. The study concludes that there is a
significant relationship between social factors and consumer buying behaviour.
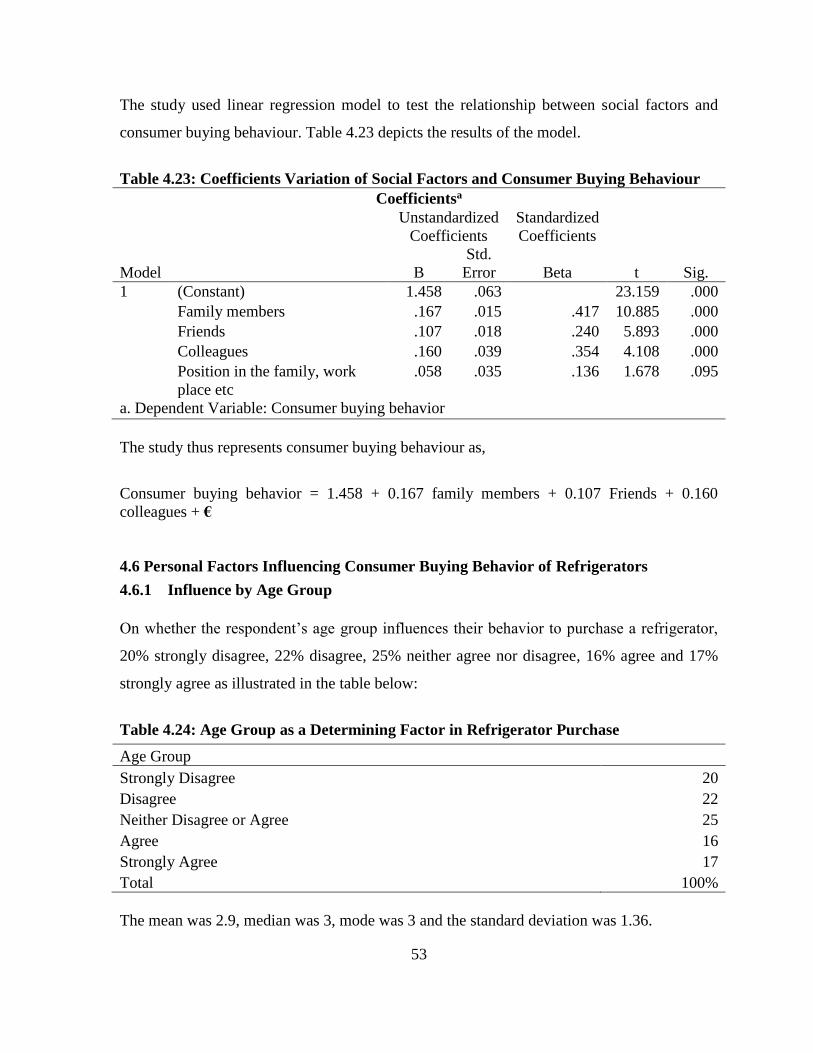
53
The study used linear regression model to test the relationship between social factors and
consumer buying behaviour. Table 4.23 depicts the results of the model.
Table 4.23: Coefficients Variation of Social Factors and Consumer Buying Behaviour
Coefficientsa
Model
Unstandardized
Coefficients
Standardized
Coefficients
t Sig. B
Std.
Error Beta
1 (Constant) 1.458 .063 23.159 .000
Family members .167 .015 .417 10.885 .000
Friends .107 .018 .240 5.893 .000
Colleagues .160 .039 .354 4.108 .000
Position in the family, work
place etc
.058 .035 .136 1.678 .095
a. Dependent Variable: Consumer buying behavior
The study thus represents consumer buying behaviour as,
Consumer buying behavior = 1.458 + 0.167 family members + 0.107 Friends + 0.160
colleagues + €
4.6 Personal Factors Influencing Consumer Buying Behavior of Refrigerators
4.6.1 Influence by Age Group
On whether the respondent’s age group influences their behavior to purchase a refrigerator,
20% strongly disagree, 22% disagree, 25% neither agree nor disagree, 16% agree and 17%
strongly agree as illustrated in the table below:
Table 4.24: Age Group as a Determining Factor in Refrigerator Purchase
Age Group
Strongly Disagree 20
Disagree 22
Neither Disagree or Agree 25
Agree 16
Strongly Agree 17
Total 100%
The mean was 2.9, median was 3, mode was 3 and the standard deviation was 1.36.
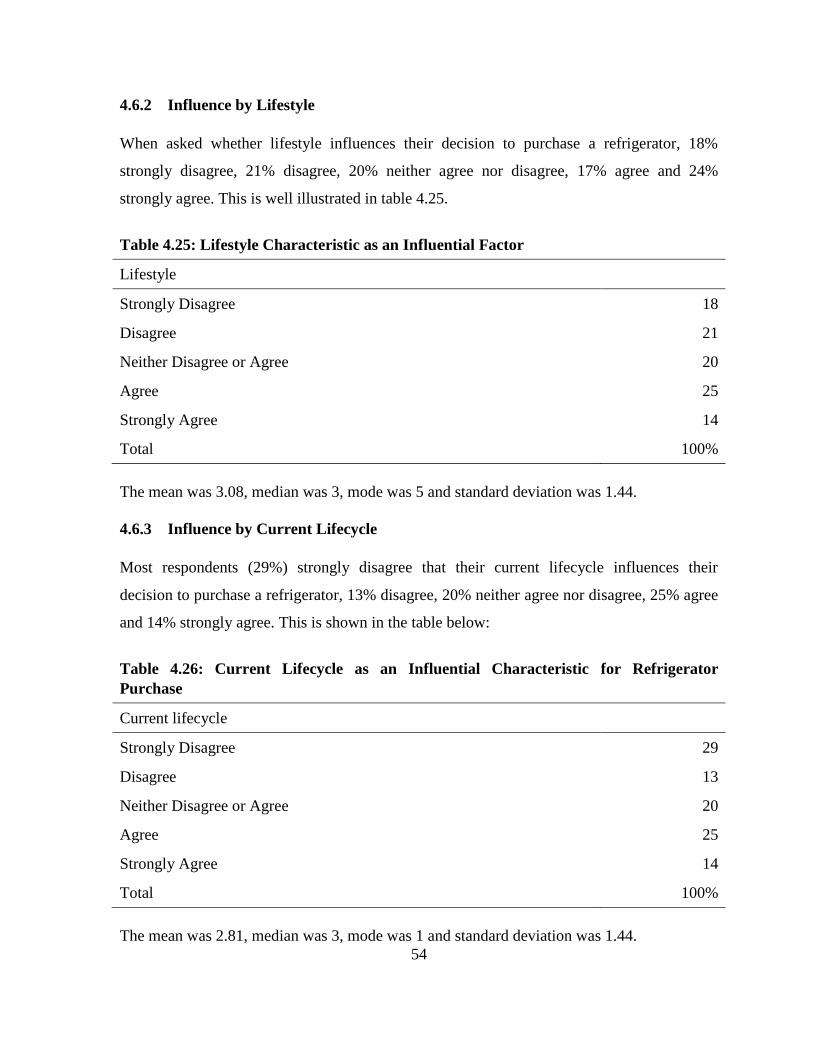
54
4.6.2 Influence by Lifestyle
When asked whether lifestyle influences their decision to purchase a refrigerator, 18%
strongly disagree, 21% disagree, 20% neither agree nor disagree, 17% agree and 24%
strongly agree. This is well illustrated in table 4.25.
Table 4.25: Lifestyle Characteristic as an Influential Factor
Lifestyle
Strongly Disagree 18
Disagree 21
Neither Disagree or Agree 20
Agree 25
Strongly Agree 14
Total 100%
The mean was 3.08, median was 3, mode was 5 and standard deviation was 1.44.
4.6.3 Influence by Current Lifecycle
Most respondents (29%) strongly disagree that their current lifecycle influences their
decision to purchase a refrigerator, 13% disagree, 20% neither agree nor disagree, 25% agree
and 14% strongly agree. This is shown in the table below:
Table 4.26: Current Lifecycle as an Influential Characteristic for Refrigerator
Purchase
Current lifecycle
Strongly Disagree 29
Disagree 13
Neither Disagree or Agree 20
Agree 25
Strongly Agree 14
Total 100%
The mean was 2.81, median was 3, mode was 1 and standard deviation was 1.44.
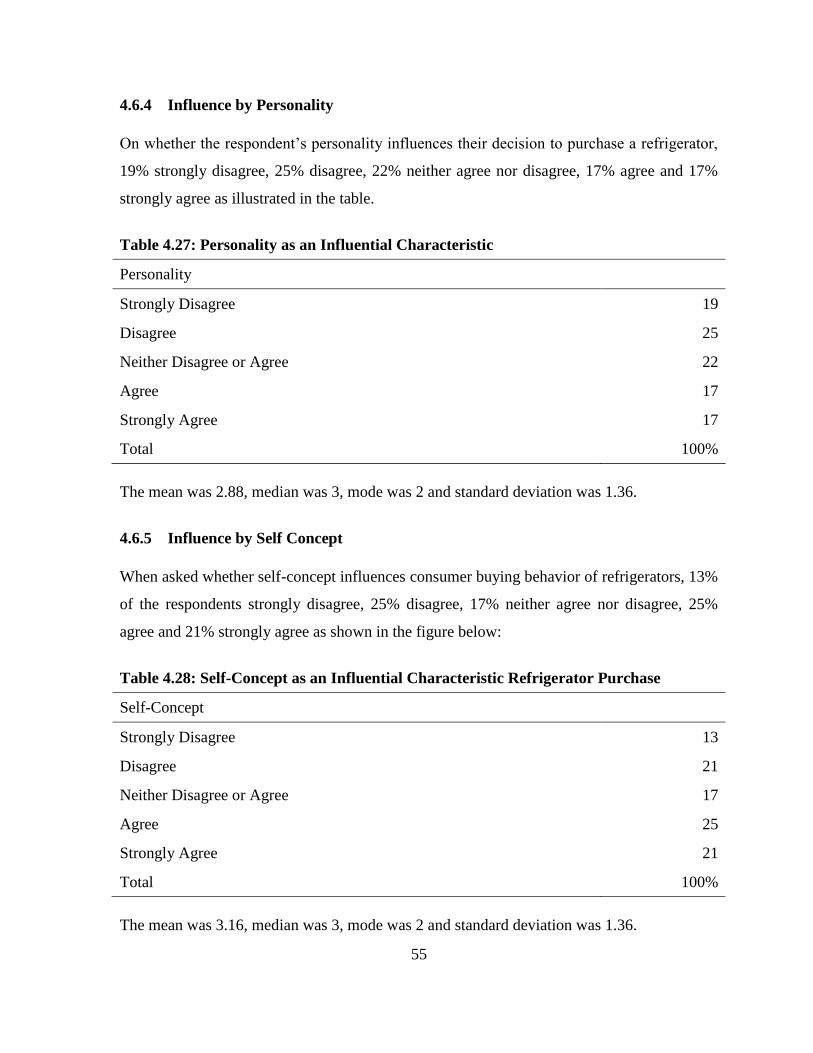
55
4.6.4 Influence by Personality
On whether the respondent’s personality influences their decision to purchase a refrigerator,
19% strongly disagree, 25% disagree, 22% neither agree nor disagree, 17% agree and 17%
strongly agree as illustrated in the table.
Table 4.27: Personality as an Influential Characteristic
Personality
Strongly Disagree 19
Disagree 25
Neither Disagree or Agree 22
Agree 17
Strongly Agree 17
Total 100%
The mean was 2.88, median was 3, mode was 2 and standard deviation was 1.36.
4.6.5 Influence by Self Concept
When asked whether self-concept influences consumer buying behavior of refrigerators, 13%
of the respondents strongly disagree, 25% disagree, 17% neither agree nor disagree, 25%
agree and 21% strongly agree as shown in the figure below:
Table 4.28: Self-Concept as an Influential Characteristic Refrigerator Purchase
Self-Concept
Strongly Disagree 13
Disagree 21
Neither Disagree or Agree 17
Agree 25
Strongly Agree 21
Total 100%
The mean was 3.16, median was 3, mode was 2 and standard deviation was 1.36.
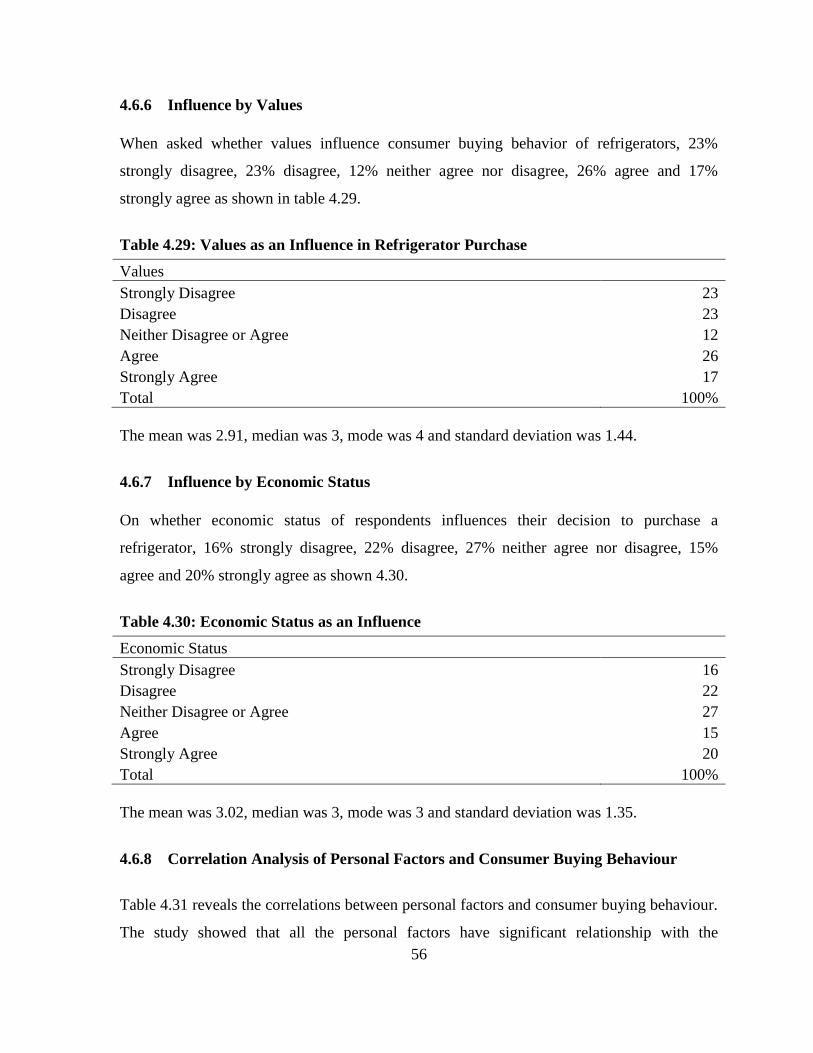
56
4.6.6 Influence by Values
When asked whether values influence consumer buying behavior of refrigerators, 23%
strongly disagree, 23% disagree, 12% neither agree nor disagree, 26% agree and 17%
strongly agree as shown in table 4.29.
Table 4.29: Values as an Influence in Refrigerator Purchase
Values
Strongly Disagree 23
Disagree 23
Neither Disagree or Agree 12
Agree 26
Strongly Agree 17
Total 100%
The mean was 2.91, median was 3, mode was 4 and standard deviation was 1.44.
4.6.7 Influence by Economic Status
On whether economic status of respondents influences their decision to purchase a
refrigerator, 16% strongly disagree, 22% disagree, 27% neither agree nor disagree, 15%
agree and 20% strongly agree as shown 4.30.
Table 4.30: Economic Status as an Influence
Economic Status
Strongly Disagree 16
Disagree 22
Neither Disagree or Agree 27
Agree 15
Strongly Agree 20
Total 100%
The mean was 3.02, median was 3, mode was 3 and standard deviation was 1.35.
4.6.8 Correlation Analysis of Personal Factors and Consumer Buying Behaviour
Table 4.31 reveals the correlations between personal factors and consumer buying behaviour.
The study showed that all the personal factors have significant relationship with the
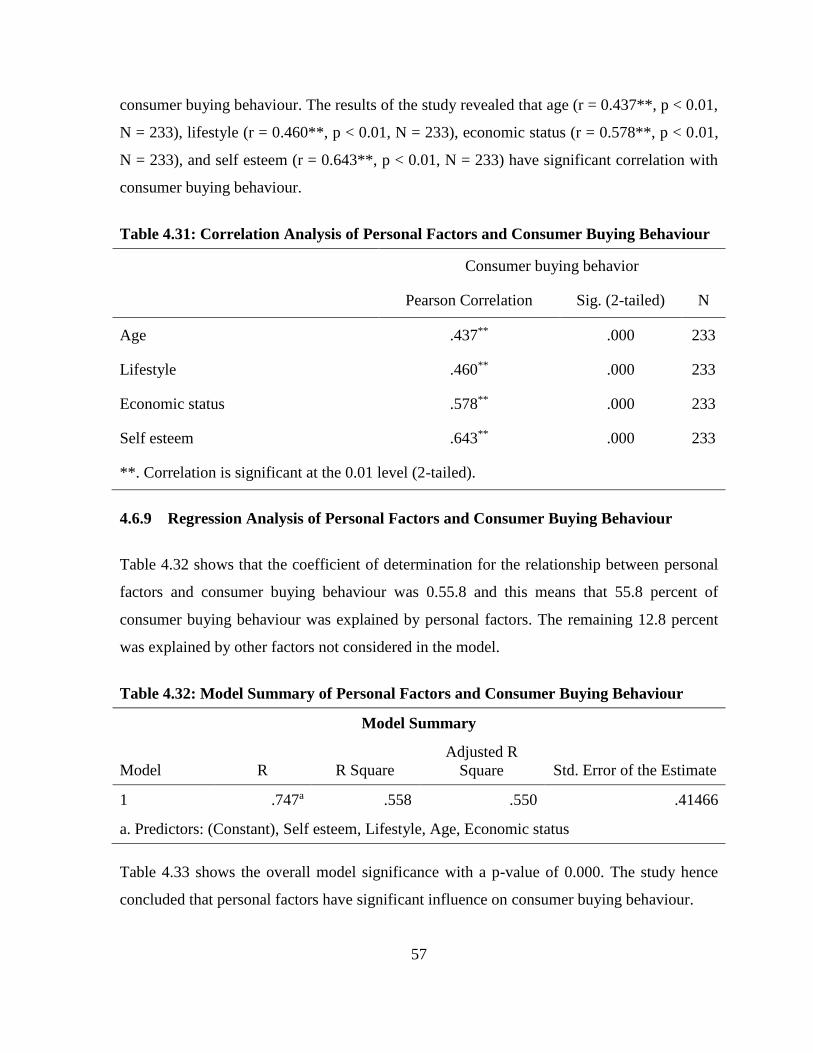
57
consumer buying behaviour. The results of the study revealed that age (r = 0.437**, p < 0.01,
N = 233), lifestyle (r = 0.460**, p < 0.01, N = 233), economic status (r = 0.578**, p < 0.01,
N = 233), and self esteem (r = 0.643**, p < 0.01, N = 233) have significant correlation with
consumer buying behaviour.
Table 4.31: Correlation Analysis of Personal Factors and Consumer Buying Behaviour
Consumer buying behavior
Pearson Correlation Sig. (2-tailed) N
Age .437** .000 233
Lifestyle .460** .000 233
Economic status .578** .000 233
Self esteem .643** .000 233
**. Correlation is significant at the 0.01 level (2-tailed).
4.6.9 Regression Analysis of Personal Factors and Consumer Buying Behaviour
Table 4.32 shows that the coefficient of determination for the relationship between personal
factors and consumer buying behaviour was 0.55.8 and this means that 55.8 percent of
consumer buying behaviour was explained by personal factors. The remaining 12.8 percent
was explained by other factors not considered in the model.
Table 4.32: Model Summary of Personal Factors and Consumer Buying Behaviour
Model Summary
Model R R Square
Adjusted R
Square Std. Error of the Estimate
1 .747a .558 .550 .41466
a. Predictors: (Constant), Self esteem, Lifestyle, Age, Economic status
Table 4.33 shows the overall model significance with a p-value of 0.000. The study hence
concluded that personal factors have significant influence on consumer buying behaviour.
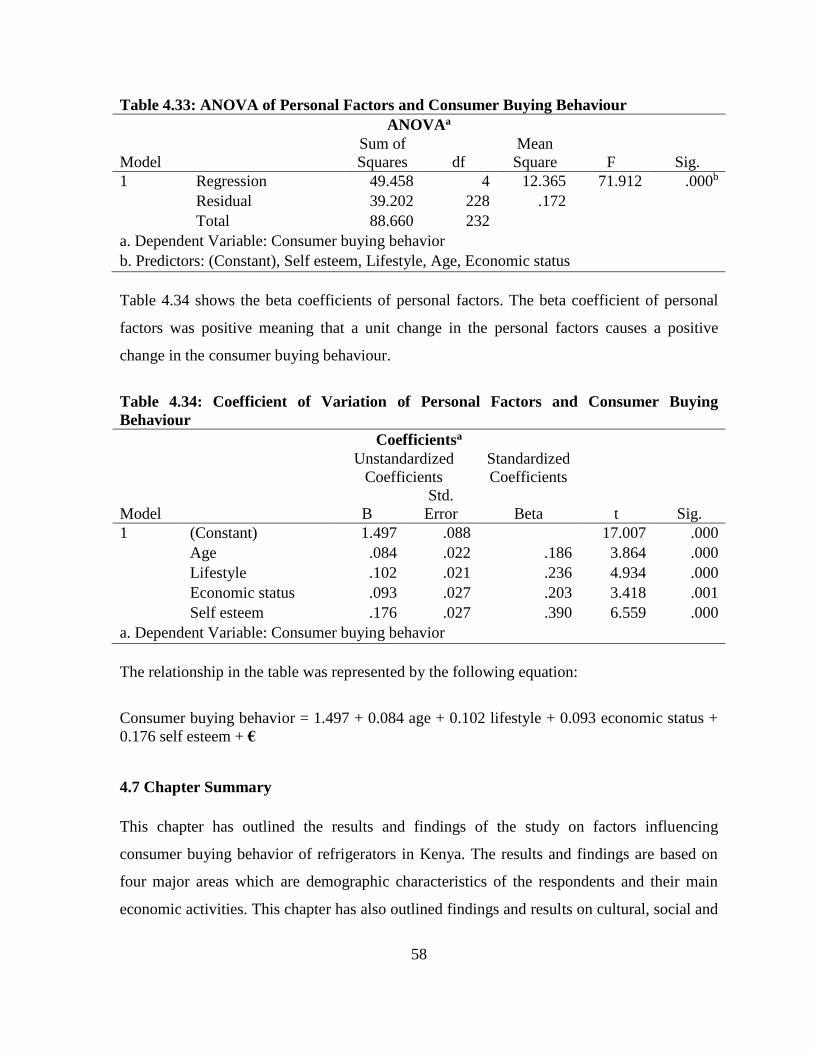
58
Table 4.33: ANOVA of Personal Factors and Consumer Buying Behaviour
ANOVAa
Model
Sum of
Squares df
Mean
Square F Sig.
1 Regression 49.458 4 12.365 71.912 .000b
Residual 39.202 228 .172
Total 88.660 232
a. Dependent Variable: Consumer buying behavior
b. Predictors: (Constant), Self esteem, Lifestyle, Age, Economic status
Table 4.34 shows the beta coefficients of personal factors. The beta coefficient of personal
factors was positive meaning that a unit change in the personal factors causes a positive
change in the consumer buying behaviour.
Table 4.34: Coefficient of Variation of Personal Factors and Consumer Buying
Behaviour
Coefficientsa
Model
Unstandardized
Coefficients
Standardized
Coefficients
t Sig. B
Std.
Error Beta
1 (Constant) 1.497 .088 17.007 .000
Age .084 .022 .186 3.864 .000
Lifestyle .102 .021 .236 4.934 .000
Economic status .093 .027 .203 3.418 .001
Self esteem .176 .027 .390 6.559 .000
a. Dependent Variable: Consumer buying behavior
The relationship in the table was represented by the following equation:
Consumer buying behavior = 1.497 + 0.084 age + 0.102 lifestyle + 0.093 economic status +
0.176 self esteem + €
4.7 Chapter Summary
This chapter has outlined the results and findings of the study on factors influencing
consumer buying behavior of refrigerators in Kenya. The results and findings are based on
four major areas which are demographic characteristics of the respondents and their main
economic activities. This chapter has also outlined findings and results on cultural, social and

59
personal factors influencing consumer buying behavior of refrigerators in Kenya. Chapter
five outlines a discussion focusing on major findings from the study and findings from the
literature review, conclusions and recommendations.
60
CHAPTER FIVE
5.0 DISCUSSION, CONCLUSIONS AND RECOMMENDATIONS
5.1 Introduction
This chapter outlines the purpose of the study, methodology used and a summary of the
major findings for each specific objective. It also outlines a discussion focusing on major
findings from the study and findings from the literature review, conclusions and
recommendations.
5.2 Summary
The main objective of the study was to investigate factors influencing consumer buying
behavior of refrigerators in Nairobi, Kenya. Specifically, the study sought to investigate
cultural, social and personal factors influencing consumer buying behavior of refrigerators in
Nairobi, Kenya.
The study adopted a descriptive research design in order to fully describe the factors that
influence consumer buying behavior of refrigerators in Kenya. The total population for the
study was 985,016 households in Nairobi County. The sampling technique used in the study
was two-stage cluster sampling, whereby the first stage involved identifying households in
Nairobi that have a refrigerator and the second stage involved selecting a random sample
from the identified households. The sample size for the study was 230, however a total of
233 questionnaires were filled correctly. The sample size was distributed as follows: 60
interviews in Nairobi West, 83 in Nairobi East, 70 in Nairobi North and 20 in Westland. The
study mainly involved collection of quantitative data using a simple household questionnaire.
Once the questionnaire was developed, it was uploaded onto a digital platform (Kobo collect)
which enabled collection of data using mobile phones instead of the “pen and paper” method.
Interviewers were locally identified, recruited and trained after which the questionnaire was
pre-tested and fine-tuned. Data collected was analyzed using SPSS. The data was analyzed
using descriptive statistics, mainly frequencies and measures of central tendency (mean,
median and mode).The data was presented in tables and figures.
61
The cultural factors investigated by the study were nationality; racial group; area of
residence; set of values, customs and traditions from the society; average monthly income;
highest education level and type of occupation. Majority of the respondents disagreed that
nationality, racial group, average monthly income and highest education level influences
their buying behavior of refrigerators whereas most respondents agreed that area of
residence, type of occupation and set of values, customs and traditions obtained from the
society influence their buying behavior of refrigerators.
Social factors investigated by the study were family members, friends, and colleagues,
position in workplace, society and family. Most respondents disagreed that family members,
colleagues, position in workplace, society and family influences their buying behavior of
refrigerators whereas most respondents agreed that friends influence their buying behavior of
refrigerators.
Personal factors investigated by the study were age group, lifestyle, current lifecycle,
personality, self-concept, values and economic status. Most respondents disagreed that age
group, current lifecycle, personality and economic status influence their buying behavior of
refrigerators whereas most respondents agreed that lifestyle, self-concept and values
influence their buying behavior of refrigerators.
5.3 Discussion
5.3.1 Cultural Factors Influencing Consumer Buying Behavior of Refrigerator
Consumer behavior differs because values inherited by consumers differ from culture to
culture. Research shows that consumers from cultures that differ on values differ in their
reaction to foreign products, advertising, and preferred sources of information (Chaudhry,
2014) that direct consumer behavior. Also, certain cultures are more youth-oriented than
others (Barak, 2011) hence are more liberal and individualistic, and are more likely to work
harder and spend more (Fattah, 2011). Furthermore, research shows that altitudes towards
work and leisure also differ from culture to culture (Chaudhry, 2014) which has important
consequences for lifestyle and demand for leisure activities. Another aspect that influences
on consumer behavior is the religious beliefs. For example, many Islamic cultures and some
62
Catholic cultures are much more religiously oriented as compared to Chinese culture where
religion plays a very small role (Chaudhry, 2014). This implies that in Islamic and some
Catholic cultures people are more inclined to buy and consume religious artifacts and related
material (Chaudhry, 2014).
Another factor that affects the consumer behavior is the level of diversity and uniformity
within culture. A culture that values diversity not only will accept a wide array of personal
behaviors and attitudes, but is also likely to welcome variety in terms of consuming food,
dress, and other products and services.
Social class is considered an external influence on consumer behavior because it is not a
function of feelings or knowledge. Social class is often hard to define; in fact, many people
dispute the existence of social classes in the United States. Usually, however, people are
grouped in social classes according to income, wealth, education, or type of occupation.
Perhaps the simplest model to define social class is a three-tiered approach that includes the
rich, the middle class, and the poor (Boundless, Marketers should understand that a person's
social class will have a major influence on the types and quantity of consumer goods
purchased, 2015). Other models have as many as a dozen levels. People in the same social
class tend to have similar attitudes, live in similar neighborhoods, dress alike, and shop at.
Income refers to earnings from work or investments, while wealth refers to all of those assets
an individual owns, such as cash, savings and checking accounts, stocks, bonds, real estate,
etc. minus outstanding debts (DiMascio, 2017). Most people make money from work, but for
the wealthy, much of theirs is inherited. As a result, wealth is distributed much more
unevenly than income, because wealth is typically passed down from generation to
generation. In the United States, wealth is an important source of power. The small number
of people who control most of the wealth can more easily shape the agenda of society
(Boundless, 2015)
Marketers should understand that a person's social class will have a major influence on the
types and quantity of consumer goods purchased, 2015).
63
Work is considered an important dimension of social class as well. People commonly give
greater respect to those who have more prestigious occupations. In any society, those with
high-prestige occupations often belong to more privileged categories of people. When it
comes to occupational prestige, the highest-ranked occupations, such as physicians, dentists,
and engineers, are typically held by men. Women and people of color often dominate the less
prestigious occupations.
Likewise, education is an important dimension of social class. In fact, education is one of the
strongest predictors of occupation, income, and wealth later in life. Most better-paying white
collar jobs require a college degree, while most blue collar jobs require less schooling, and
bring less income and prestige.
This study showed that the main cultural factors that influence consumer buying behavior of
refrigerators are area of residence, type of occupation and set of values, customs and
traditions inherited from the society in which they grew up in.
5.3.2 Social Factors Influencing Consumer Buying behavior of Refrigerators
The membership groups of an individual are social groups to which he belongs and which
will influence him (Rani, 2014). The membership groups are usually related to its social
origin, age, place of residence, work, hobbies, leisure, etc. Reference groups have potential in
forming a person attitude or behavior (Rani, 2014). The impact of reference groups varies
across products and brands. For example if the product is visible such as dress, shoes, car etc
then the influence of reference groups will be high. Reference groups also include opinion
leader (a person who influences others because of his special skill, knowledge or other
characteristics) (Rani, 2014). More generally, reference groups are defined as those that
provide to the individual some points of comparison more or less direct about his behavior,
lifestyle, desires or consumer habits (Rani, 2014). They influence the image that the
individual has of himself as well as his behavior whether it is a membership group or a non-
membership group. Because the individual can also be influenced by a group to which he
doesn’t belong to yet but wishes to be part of (Rani, 2014). This is called an inspirational
group. This group will have a direct influence on the consumer who, wishing to belong to
64
this group and look like its members, will try to buy the same products. For example, even if
he doesn’t need it yet, a surfing beginner may want to buy advanced brands or products used
by experienced surfers (inspirational group) in order to get closer to this group. While a teen
may want the shoe model or smart phone used by the group of popular guys from his high
school (inspirational group) in order to be accepted by this group (Rani, 2014). Some brands
have understood this very well and communicate, implicitly or not, on the social benefit.
The family is a major influence on the consumer behaviour of its members. There are many
examples of how the family influences the consumption behaviour of its members. A child
learns how to enjoy candy by observing an older brother or sister; learns the use and
value of money by listening to and watching his or her parents. Decisions about a new car, a
vacation trip, or whether to go to a local or an out-of-town college are consumption decisions
usually made within the context of a family setting. As a major consumption unit, the family
is also a prime target for the marketing of many products and services (Rani, 2014). The
importance of the family or household unit in consumer behavior arises for two reasons:
many products are purchased by a family unit and individuals’ buying decisions may be
heavily influenced by other family members (Yuvarani, 2016).
How families or households make purchase decisions depends on the roles of the various
family members in the purchase, consumption, and influence of products. Household
products like food and soaps may be purchased by a person but consumed by many, whereas
personal care items, such as cosmetics or shaving cream, might be purchased by an
individual family member for his or her own consumption. Homes and cars, on the other
hand, are often purchased by both spouses, perhaps with involvement from children or other
member of the extended family. Visits to shopping malls often involve multiple family
members buying clothing and accessories, something with a heavy dose of influence by
family member’s children may buy clothing paid for and approved of by parents, whereas
teenagers may influence the clothing purchase of a parent. Regardless of how many family
members are present when items are being purchased, the other family members play an
important role in the purchase. Just because of being mother for two young children, it is her
responsibility for buying food for the family and act as an individual in the market. It does
65
not mean that her decisions are not influenced by the preferences and power of other family
members. Although marketing communications are usually directed to individuals, marketers
should consider the consumption circumstances and the family structure before deciding on
specific communication or advertising methods to attract their segment.
The position of an individual within his family, his work, his country club and his group of
friends etc. can be defined in terms of role and social status (Musyoki, 2012). A social role is
a set of attitudes and activities that an individual is supposed to have and do to his profession
and his position at work, his position in the family, his gender, etc. and expectations of the
people around him. In virtually all societies, there are visible and significant differences in
the availability and possession of valued items (Fisher, 2016). Social class theory asserts that
this unequal access to scarce resources and desired rewards is by no means a random process
(Fisher, 2016). There are mechanisms or social processes that contribute to both the
consistency and permanence of structured social inequality. One such mechanism--the most
crucial one--is provided by the marketplace, defining as it does both consumption
possibilities (i.e., class variables) and actual consumption patterns (i.e., status variables)
(Rani, 2014). The study found that the social factor that influences consumer buying
behavior of refrigerators is friends.
5.3.3 Personal Factors Influencing Consumer Buying Behavior of Refrigerators
The consumer buying behavior is greatly influenced by his age, i.e. the life cycle stage in
which he falls. The people buy different products in different stages of the life cycle. Such as
the purchase of confectionaries, chocolates are more when an individual is a child and as he
grows his preferences for the products also changes (Hemsley-Brown, 2016). The income of
the person influences his buying patterns. The income decides the purchasing power of an
individual and thus, the more the personal income, the more will be the expenditure on other
items and vice-versa (Hemsley-Brown, 2016).
Researchers have tried to determine the impact of rising levels of inequality due to different
incomes on a wide array of indicators—among them economic growth, public spending,
financial stability, political representation, and average health and educational outcomes. But
66
this research has done little to demonstrate the effects of inequality (Blending, 2013). Some
researchers have found no effects at all, while others have identified opposite effects in
different situations.
A useful indicator of lifestyle is the groups of products, or product/consumption
constellations, used by consumers. This is just like one of the things that marketers will often
do. They look at the set of different brands that a consumer will use at the same time in their
life. These are called consumption constellations, which refers to the complementary set of
products and brands used by consumers that also help to indicate and execute particular
social roles. These consumption constellations were recently examined in the context of
young consumers and how they use these constellations in defining themselves and
others. By looking at these constellations, marketers can identify segments of consumers who
tend to use the same goods and services—an indication that they share a similar lifestyle.
In a purchase that requires a high level of involvement, such as a car, consumers will
consider various choices and develop beliefs about each choice; then they develop feelings
about the products (affect); and finally they act on the behavior and decide to purchase, or
not. Whereas with a behavioral influence, the customer will act first (purchase), then develop
beliefs about their purchase and that leads to developing feelings about the product or service
(Rani, 2014). Everyone has two lifestyles-the one they are currently in and the one they want
to be in, which is always better than the current one. Marketers exploit this desire to move
into a better lifestyle by showcasing people who are better off than the intended target market
in their advertisements.
This study found that the personal factors influencing consumer buying behavior of
refrigerators are lifestyle, self-concept and values of the respondents.
5.4 Conclusions
5.4.1 Cultural Factors Influencing Consumer Buying Behavior of Refrigerators
The study findings revealed that the cultural factors had significant effect on consumer
buying behaviour. The study thus rejected the null hypothesis that cultural factors have no
significant effect on consumer buying behaviour. The study concluded that it is imperative
67
for organizations selling refrigerators to factor in their marketing strategies the cultural
factors of consumers to influence their buying behaviour. The cultural factors are nationality,
racial group, area of residence, set of values, customs and traditions, education level and
income levels.
5.4.2 Social Factors Influencing Consumer Buying Behavior of Refrigerators
The study also established that social factors had significant effect on consumer buying
behaviour. Thus, the study rejected the null hypothesis that social factors have no significant
effect on consumer buying behaviour. Based on this finding, the study concluded that social
factors are very important determinant of consumer buying behaviour hence marketers
should consider them in the marketing strategies. Among the social factors that enhance
consumer buying behaviour are family members, friends, and colleagues.
5.4.3 Personal Factors Influencing Consumer Buying Behavior of Refrigerators
The study established that personal factors had significant effect on consumer buying
behaviour. Based on this finding, the study rejected the null hypothesis that the personal
factors have no significant effect on consumer buying behaviour. This led to the conclusion
that it was critical for refrigerator selling companies to consider personal factors as they draft
their marketing strategies to enhance consumer buying behaviour. These personal factors
age, lifestyle, economic status, and self esteem.
5.5 Recommendations
5.5.1 Recommendation for Improvement
5.5.1.1 Cultural Factors
The study established that cultural factors significantly affected consumer buying behaviour
of refrigerators in Nairobi, Kenya. Based on this finding, the study recommends that
refrigerator selling companies should consider nationalities, racial groups, area of residence,
set of values, income levels and education levels when strategizing on their markets. This is
because, people acquire values, customs and traditions from the areas they grew up in, then
68
use the same in the places they reside. Therefore marketers should market specific brands of
refrigerators in specific areas.
5.5.1.2 Social Factors
The study findings revealed that social factors had significant influence on consumer buying
behaviour. The study recommends the sellers of refrigerators to tailor their products to fit
into different social classes of consumers. They should look into area of residence, income
level, education level, values, norms and traditions of consumers, and nationality of
consumers.
5.5.1.3 Personal Factors
The study discovered that the personal factors of consumers significantly affected consumer
buying behaviour of refrigerators in Nairobi Kenya. Opinions from family members, friends,
and colleagues should be factored in the marketing strategies of refrigerators. The study
recommends to the manufacturers to ensure that every product is custom made in order to
meet the need of the customers. These narrow down to the color, size and power
consumption.
5.5.2 Recommendation for Further Research
The study recommends further studies to be conducted on economic, political and
psychological factors influencing consumer buying behavior of refrigerators since this study
only focused on cultural, social and personal factors.
69
REFERENCES
Agnita et al. (2017). social factors affecting consumer purchase behaviour . international
journal of scientific & technology research Volume, 6(06). Retrieved from The
market, media, life: http://marketmedialife.blogspot.co.ke/2012/10/marketing-101-
social-factors-affecting.html
Arora, R.C. (2017) Refrigeration and Air conditioning PHI Learning Private
Limited, New Delhi.
Blending, M. (2013). How income inequality affects individual decision making. Forbes
Magazine.
Business Dictionary (2017) Consumer buying behaviour. (2017, February 27). Retrieved
from Business Dictionary website:
http://www.businessdictionary.com/definition/consumer-buying-behavior.html
Chan, K. &. (2003). parent-child communication about consumption and advertising in
China. Journal of Consumer Marketing,20(4), 317-334.
Chaudhry, D. A. (2014). Does culture influence our consumer behaviour? If so, how?
Linkedin.
Christman, C. (2014). 17 customer service quotes every business should live by. (2014).
Retrieved from Main Street Host: http://www.mainstreethost.com/blog/17-customer-
service-quotes-every-business-live/
Clem,W.(2015). Marketers should understand that a person's social class will have a major
influence on the types and quantity of consumer goods purchased.
Cochran, J. (1963). cochrans formula. sample size, 75.
Conlon, G. (2016). What change in customer behavior will impact marketing most in 2016.
DMN.
DiMascio, M. (2017). "How your refrigerator has kept its cool over 40 years of efficiency
improvements." ACEEE Blog. Edited by American Council for an Energy-Efficient
Economy. September 11, 2017.
Durmaz, D. Y. (2014). The influence of cultural factors on consumer buying behaviour and
an application. Global journal of management and business research:E marketing.
Fisher, J. E. (2016). In Social class and consumer behaviour:the relevance of class and
status. 492-496.
70
Funke, L. (2012). U.S. Patent No. 4,191,437. Washington D.C.: U.S patent and Tademark
office.
Furaji, F; Latuszyriska, M and Wawrzyniak, A. (2012). An Empirical Study of the Factors
Influencing Consumer Behavior in the Electric Appliance Market. Vol 6-3.
Garga, E. (2016).Factors that influence consumer purchase decision of durable goods in
Kano Metropolis. Vol 2. Best Journals.
Gilson, L., (2017). Hospitality. (2017, February 10). Hospitality. Health Policy and Systems
Research Retrieved from HTML Helper: http://www.html-
helper.net/articles/importance-of-refrigerators/
Gizaw, A and Thu Ha Nguyen. (2014). Factors Influencing Consumer Purchasing Decision
of private Label. School of Business, Society and Engineering.
Haghshenas, L, Abedi, A, Ghorbani, E, Kamali, A. Harooni, A. (2013) Review Consumer
Behavior and Factors Affecting on Purchasing Decisions. Singaporean Journal of
Business Economics. Vol 1(10). P1
Harry Davis L., (1970). “Dimensions of Marital Roles in Consumer Decision Making”,
Journal of Marketing Research, Vol.VII, No.2, May 1970, pp.168-177.
Hemsley-Brown, J. (2016). Personal factors influencing consumer behavior. consumer
behaviour. Retrieved from Business jargons website:
http://businessjargons.com/personal-factors-influencing-consumer-behavior.html
Iwuoha, J.-P. (2015). Marketing experience. Global journal of management and business
research:E marketing
James C., (2012). “Feminine Role and Family Purchasing Decisions”, International Journal
of Management and Social Sciences Research, Vol.1, No.3, December, 2012,
pp.76-85.
Jeffrey, A. Barach., (2013). “Consumer Decision making and Self-confidence”, Indian
Journal of Marketing, Vol.2, No.3, p.18.
Johar, S. (2015).Consumer decision making behavior to purchase of durable goods.
International Journal of Applied and Pure Science and Agriculture. Vol 1-15
KNBS (2009). Kenya population and housing census. kenya population and housing census.
Knoop, D., A. Tershak, and M. Thieneman. (2017)."An Adaptive Demand Defrost and Two-
Zone Control and Monitor System for Refrigeration Products." IEEE Transactions on
Industry Applications 24, no. 2: 337-342.
71
Kotler, P & Armstrong, G. (2007). Principles of Marketing. Upper Saddle River, N.J Practice
hall.
Kumar, S. (2013). children influence in the process of family purchse decision for high,low
and chiold-centric products. journal of arts,science & commerce, 44.
Maurya, S. (2015). Mechanical vapour compression refrigeration. (n.d.). In R. C. Arora,
Refrigeration and Air conditioning (p. 3). New Delhi: PHI Learning.
Michael A. B. & Yunus A. C. (2017) Refrigerator ratings. (2017, August 31).
Retrieved from Consumer Reports:
https://www.consumerreports.org/cro/refrigerators.htm
Musyoki, N. M. (2012). Factors influencing consumer buying behavior of general motors
East Africa's saloon vehicles. Nairobi: Nairobi University.
OECD. (2017). Glossary of statistical terms. (2017). Retrieved from OECD:
https://stats.oecd.org/glossary/detail.asp?ID=2380
Peighambari, K. (2016, 04 26). Consumer Behavior. Personal Factors. (n.d.). Retrieved from
Business Jargons: http://businessjargons.com/personal-factors-influencing-consumer-
behavior.html
Rani, P. (2014). Factors influencing consumer behavior. Population. (2017, September 1).
Retrieved from Investopedia: http://www.investopedia.com/terms/p/population.asp
Richard C. et al. (1966). norms and culture. Samsung electrical appliances. (2018.).
Retrieved from Samsung: http://www.samsung.com
Sharma, A. (2015). international journal of Dharma Studies. Review of Pariah Problem, 3:8.
Solomon M., B. G. (2006). consumer behaviour. England: a European Perspective,pearson
Education Limited,Edinburgh Gate,Harlow Essex CM20 2JE.
Solomon, MR. (2013). Consumer Behavior: Buying, Having and Being 10th Ed. Pearson
Education.
Srlvastava, A. (2012). Personal factors affecting consumer behaviour.
Standard Media Gropu, (2014). The rise of intelligent home appliances. (2014, October 26).
Standard Newspaper.
Study.Com. (2016). Reference groups in Sociology. (2016). Retrieved from Study.com:
http://study.com/academy/lesson/reference-group-in-sociology-definition-examples-
types.html
72
Study.com. (2017). Descriptive research design. (2017, March 8). Retrieved from Study.com
website: http://study.com/academy/lesson/descriptive-research-design-definition-
examples-types.html
Thaker, A. (2011). working paper. HBS MBA. Retrieved from Super Professor Website:
http://www.superprofesseur.com/19.html
Thangasamy, E. & Pakitar, G. (2014). Factors Influencing Consumer Behavior: A Case
Study. Global Journal of Management and Business Research. Vol 14-5
Tomczyk, J. (2017). The Professor: Controlling Evaporator, Defrost Efficiency. April 1, 013.
http://www.achrnews.com/articles/122863-the-professor-controlling-evaporator-
defrost-efficiency.
Tunkkari, S. (2017, April 3). Marketing 101: Cultural factors affecting consumer purchases.
Retrieved from The market, media, life website:
http://marketmedialife.blogspot.co.ke/2012/09/marketing-101-cultural-factors.html
Turner, A. (2003, december 05). sampling frame. sampling framesand master samples.
Retrieved from Statistics How To: ww.statisticshowto.com/sampling-frame/
Veerakumar, K. (2017). Consumer behavior and factors influencing purchase decision in
durable goods. International journal of computational research & development.
WebFinance, (2017). Consumer Insight. Retrieved from Investor words website:
http://www.investorwords.com/1055/consumer.html
Yuvarani, R. (2016). Family influences & Decision making. (2016, September 2). Retrieved
from Miles Media: http://milesonmedia.com/family-influences-decision-making-
family-decision-making/

73
APPENDICES
APPENDIX I: INTRODUCTORY LETTER
Dear Sir/Madam,
RE: REQUEST TO PARTICIPATE IN A RESEARCH STUDY
I am a Graduate student at school of Business at United States International University-
Africa. I am carrying out a research project which is a partial requirement for the degree of
Masters in Business Administration (MBA). The objective of this research is to investigate
the Factors influencing the Consumer Buying Behaviour of Refrigerators in Nairobi
County, Kenya.
To complete my study I will need to collect relevant information from you. I am therefore
requesting for permission to collect and use your information which will be collected using
the attached questionnaire.
Kindly note that any information you give will be treated with confidentiality and at no
instance will it be used for any other purpose other than for academic purposes only. Your
assistance will be highly appreciated.
I look forward to your prompt response.
Regards
Joel Karubiu
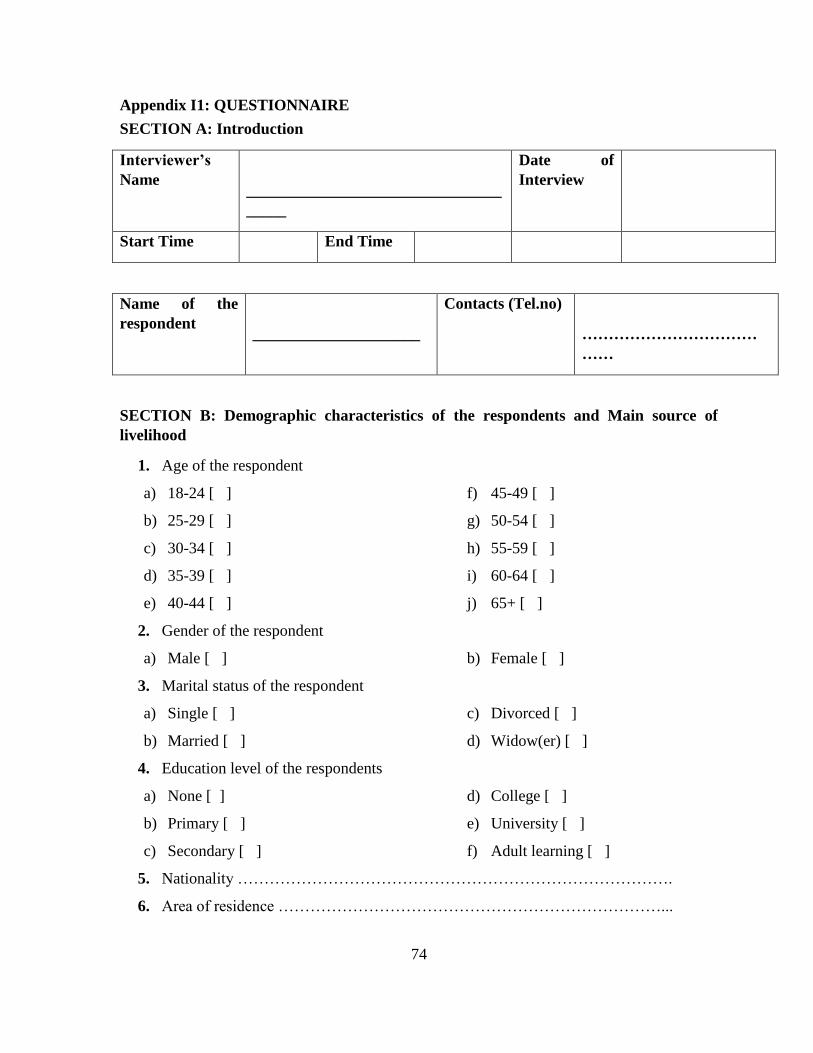
74
Appendix I1: QUESTIONNAIRE
SECTION A: Introduction
Interviewer’s
Name
________________________________
_____
Date of
Interview
Start Time End Time
Name of the
respondent
_____________________
Contacts (Tel.no)
……………………………
……
SECTION B: Demographic characteristics of the respondents and Main source of
livelihood
1. Age of the respondent
a) 18-24 [ ]
b) 25-29 [ ]
c) 30-34 [ ]
d) 35-39 [ ]
e) 40-44 [ ]
f) 45-49 [ ]
g) 50-54 [ ]
h) 55-59 [ ]
i) 60-64 [ ]
j) 65+ [ ]
2. Gender of the respondent
a) Male [ ] b) Female [ ]
3. Marital status of the respondent
a) Single [ ]
b) Married [ ]
c) Divorced [ ]
d) Widow(er) [ ]
4. Education level of the respondents
a) None [ ]
b) Primary [ ]
c) Secondary [ ]
d) College [ ]
e) University [ ]
f) Adult learning [ ]
5. Nationality ……………………………………………………………………….
6. Area of residence ………………………………………………………………...
76
7. Source of income
a) Employment [ ]
b) Crop farming [ ]
c) Animal rearing [ ]
d) Own business [ ]
e) Pension, retired [ ]
f) Dependent e.g. student [ ]
8. Income level of the respondent
a) Below 1000 [ ]
b) 1,000-5,000 [ ]
c) 5,001-10,000 [ ]
d) 10,001-15,000 [ ]
e) 15,001-20,000 [ ]
f) 20,001-30,000 [ ]
g) 30,001-60,000 [ ]
h) 60,001-100,000 [ ]
i) 100,001-200,000 [ ]
j) Above 200,000 [ ]
SECTION C: Perception towards refrigerators
9. Do you own a refrigerator(s)?
a) Yes [ ] (Go to Q 10) b) No [ ](Go to Q 17)
10. Which type of refrigerator do you own?
a) Bottom mount (bottom freezer) [ ]
b) Top mount (top freezer) [ ]
c) French door [ ]
d) Side-by-side doors [ ]
e) Built in (constructed to blend in with the rest of the kitchen cabinetry) [ ]
f) Others (Please specify)…………………………………………………….
11. What is the brand of your refrigerator?
a) LG [ ]
b) Samsung [ ]
c) Ramp tons [ ]
d) Von Hot point [ ]
e) Haier[ ]
f) Ice cool [ ]
g) Mika [ ]
h) Bruhm [ ]
i) Whirlpool [ ]
j) Others (Please specify)……
77
12. What do you like about your refrigerator?
----------------------------------------------------------------------------------------------------------------
13. What don’t you like about your refrigerator?
----------------------------------------------------------------------------------------------------------------
----------------------------------------------------------------------------------------------------------------
SECTION D: Cultural factors
14. On a scale of 0-10, 0 being not important at all and 10 being extremely important, how
important are the following cultural factors in influencing your decision to purchase a
refrigerator?
a) Nationality
0 1 2 3 4 5 6 7 8 9 10
b) Racial group
0 1 2 3 4 5 6 7 8 9 10
c) Area of residence
0 1 2 3 4 5 6 7 8 9 10
d) Set of values, customs, traditions and values that you acquired from the society or
community you grew up in
0 1 2 3 4 5 6 7 8 9 10
e) Income level
78
0 1 2 3 4 5 6 7 8 9 10
f) Education level
0 1 2 3 4 5 6 7 8 9 10
g) Type of occupation
0 1 2 3 4 5 6 7 8 9 10
SECTION E: Social factors
15. On a scale of 0-10, 0 being not important at all and 10 being extremely important, how
important are the following social factors in influencing your decision to purchase a
refrigerator?
a) Family members
0 1 2 3 4 5 6 7 8 9 10
b) Friends and colleagues
0 1 2 3 4 5 6 7 8 9 10
c) Position in the family, work place etc.
0 1 2 3 4 5 6 7 8 9 10
79
SECTION F: Personal factors
16. On a scale of 0-10, 0 being not important at all and 10 being extremely important, how
important are the following personal factors in influencing your decision to purchase a
refrigerator?
a) Age
0 1 2 3 4 5 6 7 8 9 10
b) Lifestyle
0 1 2 3 4 5 6 7 8 9 10
c) Economic Status
0 1 2 3 4 5 6 7 8 9 10
d) Self esteem
0 1 2 3 4 5 6 7 8 9 10
SECTION G: Recommendations
17. Why don’t you own a refrigerator?
…………………………………………………………………………………………………
………………………………………………………………………………………………….
18. Which factors do you think the manufacturers should consider when manufacturing
refrigerator?
---------------------------------------------------------------------------------------------------------------
----------------------------------------------------------------------------------------------------------------