construction safety management climate in kolkata, india
TRANSCRIPT
International Business Research; Vol. 6, No. 8; 2013 ISSN 1913-9004 E-ISSN 1913-9012
Published by Canadian Center of Science and Education
68
Construction Safety Management Climate in Kolkata, India
H. Guha1, B. Thakur2 & P. P. Biswas3 1 School of Management, West Bengal University of Technology, Kolkata, India 2 Department of Civil Engineering, Meghnad Saha Institute of Technology, Kolkata, India 3 Department of Construction Engineering, Jadavpur University, Kolkata, India
Correspondence: Himadri Guha, 7B, K. S. Roy Road, 5th Fl., Kolkata, India. Tel: 91-98-3103-5154. E-mail: [email protected]
Received: April 21, 2013 Accepted: July 1, 2013 Online Published: July 26, 2013
doi: 10.5539/ibr.v6n8p68 URL: http://dx.doi.org/10.5539/ibr.v6n8p68
Abstract A literature survey has revealed that workers in construction sites are subjected to hazardous conditions all over the world and more so in developing countries. Kolkata, India is no exception. Three surveys namely workers’ safety perceptions, managers’ safety practices and cultural attitudes towards safety for both the workers and the managers have been conducted in four construction sites in and around Kolkata. The responses have been studied with statistical techniques like factor analysis, correlations and multiple regressions. The cultural dimensions were based on Hofstede (1991). It has been found that the awareness and belief of the workers have no significant correlations with the cultural dimensions. The workers have no safety related cultural ties and would be logical in accepting safety prescriptions. It has been further noted that workers’ sensitivity to safety awareness is positively correlated with operational practices of managers. Therefore, enhanced safety training to managers which is comparatively easier would increase safety awareness among the managers which in turn would increase the safety awareness to workers.
Keywords: construction management, construction safety, safety culture, factor analysis, Kolkata, India
1. Introduction Construction sectors in developing countries could be a tool for effective growth. Despite such advantages for boosting economies higher risk level in construction sector is acknowledged worldwide. ILO (2005) estimated that more than 30% of worksite fatalities are in construction sector. Such higher risks are reported by other researchers (Murie, 2007). Construction sector contributes less than 10% to the gross domestic product, but take up more than 37% of all industrial accidents in Singapore (Teo, Ling & Chong, 2005). In developed economies, strong measures are adopted for reducing these risks to an acceptable level. For example, a code of practice for construction safety called CP 79 is mandatory for work value above US $ 5 million in Singapore (Teo et al., 2005). However, construction risks are often ignored in developing countries spanning from Asia to South America (Koehn et al., 1995; Suazo & Jaselskis, 1993). The situation is also not so different in the subcontinent. ILO (1995) reported that the occupational health and safety has not been developed in Bangladesh. The framework of existing occupational and health conditions of Pakistan’s construction industry is inadequate and fragmented (Tahua, 2006). Safety is generally ignored in Indian construction sites (Koehn & Reddy, 1999). A case study in Srilanka (Jayawardane & Gunawardena, 1998) concluded that the work force is generally dissatisfied with work security. It was estimated a decade earlier that construction fatalities were about 600 persons for hundred thousand workers in India compared to that of 70 in USA (Koehn & Reddy, 1999). These figures would indicate that a substantial section of the Indian workers in construction sites are compelled to work in a hazardous condition.
The scenarios are different in developed countries. For example, both the workers and supervisors in Finland felt that safe work habits improve production and accident prevention is the responsibility of everyone being a part of the skilful job performance (Niskanen, 1994). Glendona and Litherlande (2001) found high level of concern while investigating the safety climate of an Australian road construction firm. In Australia, safety steps are extensive enough so that a safety management index reflecting the intensity of safety activities is proposed (Mohammed, 2002). There are several reasons for such differences in safety climate in the two economic worlds. Teo, Ling and Chong (2005) identified four such factors namely policy, process, incentive and personnel. The

www.ccsenet.org/ibr International Business Research Vol. 6, No. 8; 2013
69
legislation or government policy that makes it obligatory to follow safe practice is the most important step. The management is then under the threat of punishment for flouting safety rules. It is however related to the government and is extraneous to a site safety plan (Rowlinson, 1997). Process factors refer to the production process of delivery. Sometimes safety principles might be breached in the process itself. (Dedobbeler & Beland, 1991). One of the examples is employment of a chain of subcontractors common worldwide. The actual work is ultimately carried over by relatively tiny firms under influence of intense competition, poor middle management and effective communications leading to safety breach (Debrah & Ofori, 2001). The factor is related to macro economy of construction sector and is extraneous to a site safety plan. Incentive factor refers to the introduction of financial incentives for safety. Several researchers found it effective only in a limited scale (McAfee & Winn, 1989).
The last one is the personnel factor. It refers to the attitude and commitments of both the workers and the management about the safety behaviour. This factor can be partially modified within a site setting with appropriate facility and effective training. It is a part of organizational culture where beliefs and values refer specifically to safety (Clarke, 1999). One of the ways to investigate the safety culture is through conducting employee perception surveys as a tool for detecting their attitudes to safety (Toole, 2002). The culture of a group has its influences on beliefs, attitude and perceptions.
A few of the studies in developing countries similar to India where safety perceptions were investigated through field interviews are summarized. Ngowi (1997) noted culture induced differences in construction management approach in Botswana. Sadullah and Kanten (2009) investigated the relationship between the safety climate and behaviors of the employees in a shipyard in Turkey. A five point Likert scale questionnaire survey of 125 individuals was studied. Factor analysis was used with the variables related to safety climate and the structural validity of the safety climate dimensions was tested. Multiple regression analysis was used for explaining the relationship between the dimensions of the safety climate and the safety behaviors of the employees. The study found empirical evidence supporting their hypothesis. Priyadarshini, Karunasena and Jayasuriya (2013) developed a construction safety assessment framework suitable for developing countries like Srilanka. A questionnaire survey in a five point Likert scale was administered to forty project professionals. A benchmark based on mean score was developed against which individual projects might be compared. It is a simple and direct tool for safety assessment. Okolie and Okoye (2012) evaluated the influence of national culture as defined by Hofstede (1991) on construction safety employing a survey of 180 participants in south east Nigeria. The study revealed that large power distance, weak uncertainty avoidance and short term orientation culture promote unsafe behaviors. Belel and Mahmud (2012) tried to identify the accident causes from a questionnaire survey in a five point Likert scale from fifty respondents in Yola, Nigeria. The main cause of accident has been found to be the absence of safety training. Moheeb, Khalid and Adnan (2012) conducted a questionnaire survey in a five point Likert scale from 209 crews about safety climate of construction sites in Gaza strip. Factor analysis was conducted. Factors like work environment, awareness, safety belief and supportive environment have been found to be the most important. James (2011) conducted semi structured interviews of 34 participants in a South African construction firm for finding the employees’ well being and found safety as an important concern to the workers. Yakubu and Bakr (2012) conducted a structured questionnaire survey in 5 different construction sites for investigating site safety status as recommended by construction industry development board in Malayasia. The study identified 22 basic components of workplace inspection. The results reveal that the compliance levels for safety at construction sites are only averagely implemented. A questionnaire survey comprising of 25 factors in a Likert 5 point scale was administered to twenty state owned companies in China (Zeng, Wang & Tam 2002) and the relative importance of each factor was estimated. Lack of attention, reckless actions and poor safety conscientiousness were found to be the top three reasons of accidents. The authors commented that China performs very badly in safety by international standards. Tahua (2006) found connections between culture and construction safety practices in Pakistan. Questionnaire surveys among stakeholders and thereafter factor analysis were conducted. The study demonstrated that workers have the relatively high degree of risk and safety awareness. The overall behavior seems to be best explained by workers’ attitudes towards the managements’ safety responsibilities. The study showed that workers are collective and opt for higher uncertainty avoidance in their attitudes.
2. Methods In the present research, the safety environment in the construction sector in Kolkata, India has been investigated through analysis of the responses of three different questionnaire surveys. The three surveys dealt with the safety perception of construction workers (worker’s survey), the safety practices employed by the construction managers (manager’s survey) and the prevailing safety culture (cultural survey) all in the context of the city of
www.ccsenet.org/ibr International Business Research Vol. 6, No. 8; 2013
70
Kolkata. The first two surveys reflects the attitude of two different groups, viz. construction workers and construction managers, which is a function of divergent factors like economic status, formal training and most importantly on its cultural backgrounds. Hofstede (1991) argues that culture of a society can be quantitatively distinguished by several dimensions. Therefore, the third survey has been conducted among the site personnel (both workers and managers) for estimating Hofstede’s dimensions of culture for the safety climate in the construction sector of Kolkata. Similar studies have been executed in construction sites in other developing countries stated earlier. Numbers of similar studies like Sadullah and Kanten (2009), Tahua (2006) and Belel and Mahmud (2012) have been consulted while developing the questions set in the surveys. These studies mostly used a 5 point Likert scale in questionnaires comprising of a set of questions related to site safety. The questions in this study are similar to that of others in a 5 point Likert scale. The questions were placed before the respondents and the responses were assigned 1 to 5 points for “strongly disagree” to “strongly agree” type replies. Surveys have been conducted among one hundred workers and fifty site supervisors and managers in four numbers building construction sites in or around Kolkata.
The survey responses are statistically analyzed using SPSS 17.0 (Statistical Package for Social Sciences). Firstly, underlying dimensions of worker’s safety perceptions, manager’s safety practices and safety culture are extracted through factor analysis (principal component analysis with varimax rotation). The analysis arranges different variables (i.e., questions) in a particular survey under reduced number of groups or factors. These reduced numbers of factors are considered as the underlying dimensions for that survey. The average score for any extracted dimension was then calculated by averaging the mean scores for each variable grouped under that factor. Section-3.1 elaborates the analysis method adopted during factor analysis.
Secondly, a multiple correlation analysis is carried out to see the interrelationship among the extracted dimensions from all the three surveys. The survey responses for all three surveys were stratified into six experience groups depending on the age of the respondents for stratifying the three different surveys on a common criterion. Details of the analysis procedure are presented in Section-3.2.
Finally, the dimensions of worker’s safety perceptions were regressed against the extracted dimensions of the remaining two surveys. Multiple regressions are performed to see the predictability of worker’s safety perceptions through manager’s safety practices and cultural dimensions of safety. The procedural details are provided in Section-3.3.
3. Results 3.1 Factor Analysis
The questionnaire surveys carried out for worker’s safety perceptions, manager’s safety practices and prevailing safety culture originally consisted of 24, 14 and 25 variables (questions) respectively. Factor analysis, a multivariate statistical technique has been used on the responses for identifying and extracting smaller number of underlying dimensions for all the three surveys. Prior to actual factor analysis a data screening was done for all of them to check the suitability for factor analysis.
A visual inspection of the correlation matrix for worker’s survey reveals good correlation among most of the variables. The anti-image correlation matrix reveals that the MSA (Measure of Sampling Adequacy) values for all the variables are above 0.50 (ranged from 0.701 to 0.946) which is satisfactory for further analysis. The variables also qualified Kaiser-Meyer-Olkin measure of sampling adequacy and Bartlett's test of sphericity as shown in Table 1. Therefore, final factor analysis was run with the selected twenty-four variables.
The correlation matrix for manager’s survey shows poor correlation (< 0.30) among most of the variables. Therefore, the factor analysis is likely to be inappropriate. The MSA values of QM4, QM7, QM11 and QM14 are below 0.50 (ranged from 0.344 to 0.494). Excluding these four variables another analysis was run and the MSA values of QM8 and QM10 were found to be 0.465 and 0.499 (i.e., < 0.50) and they were excluded from further analysis. In subsequent steps, QM13 and QM12 were also excluded based on the same criteria. The final analysis was run with the remaining six variables. The correlation matrix showed that more than 60% of correlations were more than 0.30 which was adequate for further analysis. The MSA values, ranged from 0.589 to 0.731, were also found to be satisfactory. The variables also qualified Kaiser-Meyer-Olkin measure of sampling adequacy and Bartlett's test of sphericity as shown in Table-1. These six variables were considered for final factor analysis.

www.ccsenet.org/ibr International Business Research Vol. 6, No. 8; 2013
71
Table 1. Summary of the factor analysis
Parameters Survey Type
Remarks Worker’s Manager’s Cultural
Initial Number of Variables 24 14 25
Number of Samples Surveyed 50 50 50
KMO (Kaiser-Meyer-Olkin) Statistic 0.860 0.665 0.853 Note 1
Bartlett's Test of Sphericity Chi-square 1964.879 100.470 928.967
Df 276 15 190
Ρ <0.001 <0.001 <0.001 Note 2
Number of Variables Qualifying for Final Factor Analysis 24 6 20
Number of Extracted Factors 4 2 3
Variables Retained in Extracted Factors 24 6 17 Note 3
Percent of Explained Variance by the Extracted Factors 87.92% 67.546% 79.92%
Notes: 1. Sampling adequacy is mediocre for Manager’s Survey and good for the remaining two. Factor analysis is appropriate in all the
cases.
2. The test is highly significant for all three surveys. Factor analysis is appropriate.
3. Only those variables having factor loading > 0.50 are retained.
A good correlation among most of the variable was observed from the correlation matrix of the cultural survey. However, QC4, QC15, QC20, QC21 and QC24 were observed to be poorly correlated with the others. The MSA values of QC15, QC21 and QC24 were also found to be below 0.50 (ranged from 0.330 to 0.457). Another analysis was run excluding these five variables and the MSA values for the twenty variables were ranged from 0.718 to 0.942 which was considered satisfactory. The variables also qualified Kaiser-Meyer-Olkin measure of sampling adequacy and Bartlett's test of sphericity as shown in Table 1. For final factor analysis these twenty variables were considered.
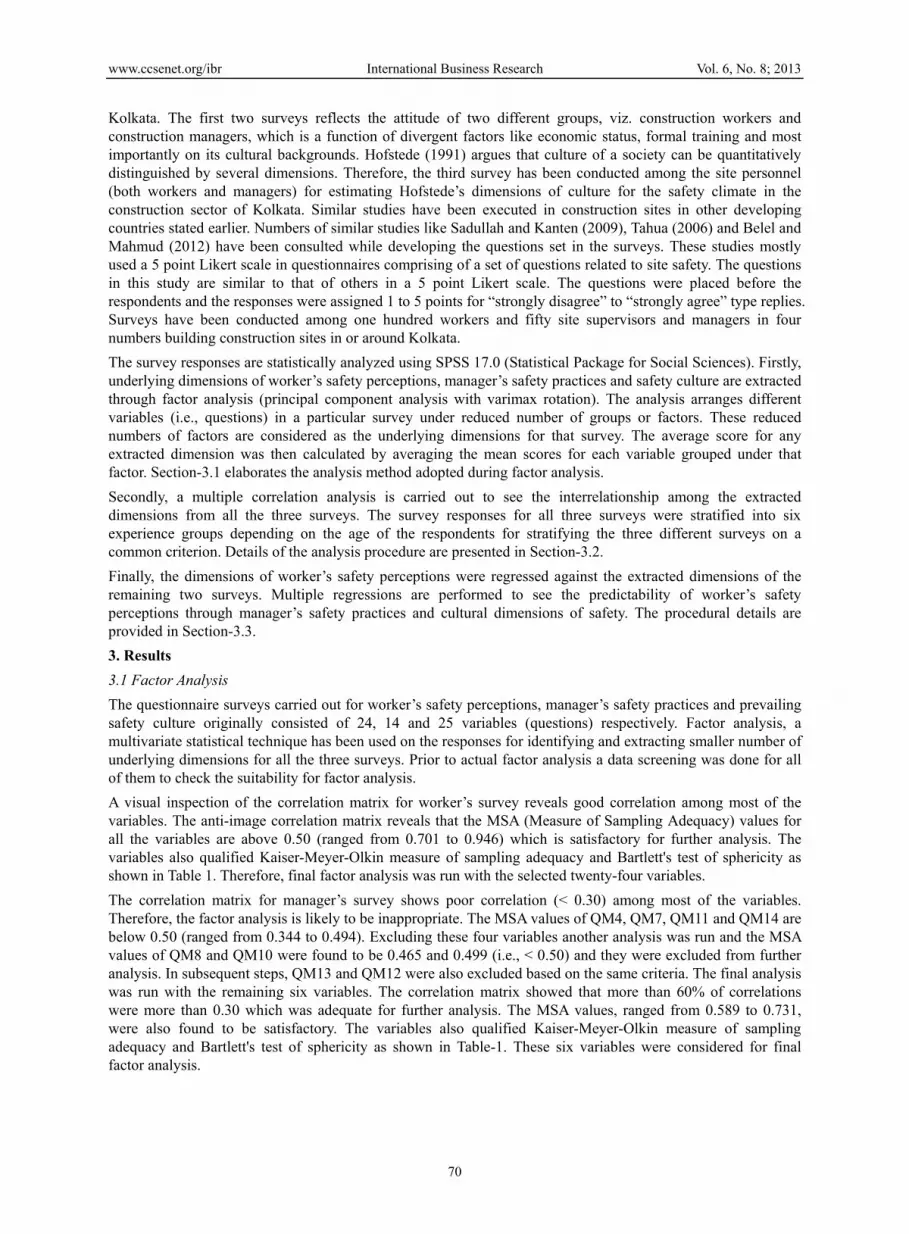
A principal component analysis with varimax rotation was performed for all the three surveys. Kaiser’s criterion of remaining components with eigen values greater than 1 was followed as the number of variables were less than 30. The Scree Plots are shown in Figure 1. Only those variables with factor loading greater than 0.5 after rotation were retained within the extracted components for result interpretation. Based on this criterion, QC5, QC23 and QC25 were eliminated for cultural survey as their factor loadings were below 0.50. For the other two surveys, all the variables qualifying for final factor analysis were retained after factor extraction. The results of factor analysis are presented in Table 2 through Table 4. The factor analysis differentiated the survey questions into four classifications. Each factor was subjectively labeled depending on the type of questions contained therein. Three classifications were found to be somewhat similar to that of Tahua (2006) and similar labels were retained. An additional label, work dynamism was used for questions for the fourth factor that tend to describe the variability of safety issues. The questions were stratified into two factors after analysis. The first was called strategic because it referred to the safety management plan. The second group was called operational because the questions referred to actions related to safety management.
www.ccsenet.org/ibr International Business Research Vol. 6, No. 8; 2013
72
Figure 1. Scree plots
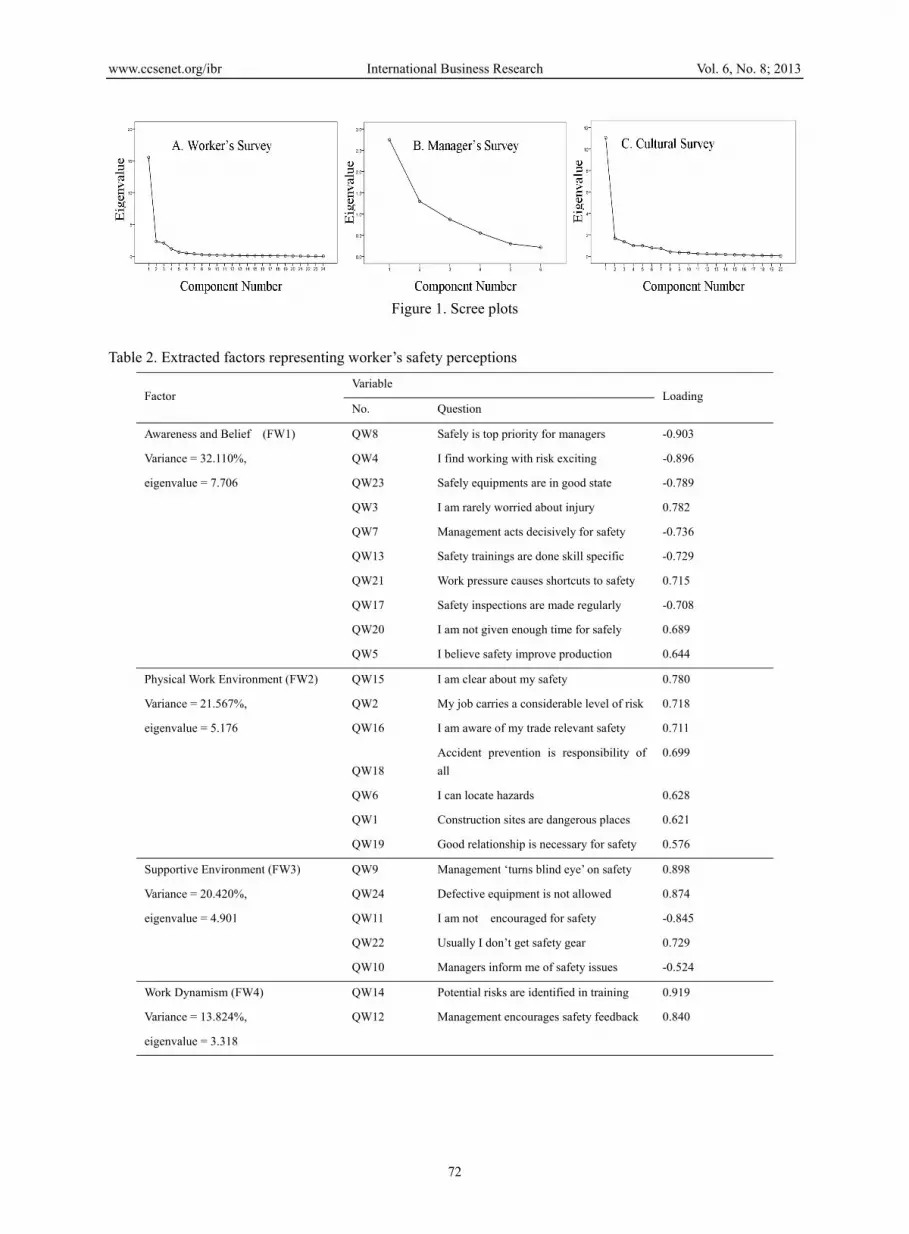
Table 2. Extracted factors representing worker’s safety perceptions
Factor Variable
Loading No. Question
Awareness and Belief (FW1)
Variance = 32.110%,
eigenvalue = 7.706
QW8 Safely is top priority for managers -0.903
QW4 I find working with risk exciting -0.896
QW23 Safely equipments are in good state -0.789
QW3 I am rarely worried about injury 0.782
QW7 Management acts decisively for safety -0.736
QW13 Safety trainings are done skill specific -0.729
QW21 Work pressure causes shortcuts to safety 0.715
QW17 Safety inspections are made regularly -0.708
QW20 I am not given enough time for safely 0.689
QW5 I believe safety improve production 0.644
Physical Work Environment (FW2)
Variance = 21.567%,
eigenvalue = 5.176
QW15 I am clear about my safety 0.780
QW2 My job carries a considerable level of risk 0.718
QW16 I am aware of my trade relevant safety 0.711
QW18
Accident prevention is responsibility of
all
0.699
QW6 I can locate hazards 0.628
QW1 Construction sites are dangerous places 0.621
QW19 Good relationship is necessary for safety 0.576
Supportive Environment (FW3)
Variance = 20.420%,
eigenvalue = 4.901
QW9 Management ‘turns blind eye’ on safety 0.898
QW24 Defective equipment is not allowed 0.874
QW11 I am not encouraged for safety -0.845
QW22 Usually I don’t get safety gear 0.729
QW10 Managers inform me of safety issues -0.524
Work Dynamism (FW4)
Variance = 13.824%,
eigenvalue = 3.318
QW14 Potential risks are identified in training 0.919
QW12
Management encourages safety feedback 0.840

www.ccsenet.org/ibr International Business Research Vol. 6, No. 8; 2013
73
Table 3. Extracted factors representing manager’s safety practices
Factor Variable
Loading No. Question
Strategic (FM1)
Variance = 39.129%,
eigenvalue = 2.348
QM1 Company has an effective safety plan 0.928
QM2 Company has a safety criteria for recruitment 0.878
QM3 Company has a safety criteria for Managers 0.764
Operational (FM2)
Variance = 28.417%,
eigenvalue = 1.705
QM6 Company has a training program for managers 0.854
QM9 Company has an incident and accident reporting system 0.687
QM5 Company has a training program for workers 0.597
Table 4. Extracted factors representing prevailing safety culture
Factor Variable
Loading No. Question
Power Distance(FC1)
Variance = 28.074%,
eigenvalue = 5.615
QC6 Generally workers follow safety rules without being told to do so 0.823
QC12
Many accidents just happen, there is little one can do to avoid
them
-0.822
QC11 Personally I enjoy the risk aspects associated with my job -0.793
QC19 Safety training can help me in improving my safety 0.732
QC16 Co-workers often give tips to each other on how to work safely 0.656
QC3 I am encouraged to raise safety concern 0.647
QC18 Safety would increase with co-workers' support 0.631
Collectivism (FC2)
Variance = 21.550%,
eigenvalue = 4.310
QC14 I often feel nervous or tense at work 0.831
QC22 I prefer places with less strict rules and working hours -0.721
QC10 Workers loose respect if their input is not taken 0.705
QC17 A safe place has a personal meaning to me and co-workers 0.695
QC7 I am allowed to act decisively for safety reasons 0.593
Uncertainty Avoidance (FC3)
Variance = 20.837%,
eigenvalue = 4.167
QC2 Managers encourage feedback from workers 0.827
QC13 I prefer to work with larger company because of better safety
practices
0.775
QC8 Safety rules should not be broken for production 0.746
QC9 Manager's safety decisions are more effective than workers 0.713
QC1 Decisions on site safety take place after consulting worker 0.584
The factor analysis for cultural survey differentiated the survey questions into three classifications. The groupings of questions were not identical but only similar to that of Tahua (2006). The labels based on Hofstede (1991) that were also used by Tahua (2006) were mostly retained. Hofstede (1991) defined power distance as the extent to which the less powerful members of the organizations expect and accept that power and decision making abilities are distributed unequally. The questions related to application of authority were found to be grouped together in FC1 which has been labeled as Power distance. Hofstede (1991) defined collectivism as the affinity to the cohesive groups in which members tend to view issues in the same line. Questions related to group thinking was found to be collated into FC2 and termed as collectivism. Uncertainty avoidance is the extent to which the members of a culture feel threatened by uncertain situations. The classification FC3 has similar questions and is labeled as uncertainty avoidance.
Radar diagrams as shown in Figure 2 are drawn for each of the surveys for showing the overall scores of the extracted dimensions defined on a scale from 0 to 100%. For any extracted dimension it was calculated based on

www.ccsenet.org/ibr International Business Research Vol. 6, No. 8; 2013
74
the mean scores for each variable related to that factor. For example, the overall score for the first factor for worker’s survey (FW1: Awareness and Belief) was calculated by the summation of mean scores for variables QW8, QW4, QW23, QW3, QW7, QW13, QW21, QW17, QW20 and QW5 divided by the total possible maximum score of these ten variables. The overall score for the said dimension (FW1) was thus found to be 57.48%.
Figure 2. Radar diagram
The Figure 2 reveals the mindsets of the surveyed sample. Workers survey shows higher FW2 that is physical work environment. The workers feel that they are well aware of the risk. They can identify the hazards effectively. The factor FW4 that is work dynamism is low among workers. It shows an inefficient communication channel with the management. Workers find training does not help and management does not encourage their feedback. However, FW1 that is awareness and belief is high. It shows that the workers are convinced about management’s commitments towards their safety. In mangers’ survey, a value of 55.47% has been found for strategic management plan. It signifies that little over half of the management team in the survey population are satisfied with the strategic safety plan of their company. Similarly the cultural survey reveals important nature about the site personnel. Higher FC1 indicates that workers respect power and authority of the managers. Higher FC2 indicates that workers tend to follow opinions of their peers and think cohesively as a group. Higher FC3 indicates that workers are uncomfortable with the new situation and would try to avoid uncertainty.
3.2 Interrelationship between the Extracted Dimensions
The dimension reduction through factor analysis of the three surveys yield four dimensions of worker safety perceptions, two dimensions of manager’s safety practices and three cultural dimensions of safety. An effort has been made for finding the interrelation through multiple correlation analysis. Responses from all three surveys were stratified into six experience groups depending on the age of the respondents for stratifying the three different surveys on a common criterion. Each of the responses was assigned an experience score ranging from 0 to 6 using Equation 1.
6
MinMax
MinR
AA
AAES (1)
Where,
ES = Experience Score of the Respondent for a Particular Survey
AR =Age of the Respondent for that Particular Survey
AMax =Maximum Respondent Age for that Survey
AMin =Minimum Respondent Age for that Survey
Once, ES are calculated for all the respondents of a survey, the responses are sorted into six different group viz. 0≤ES≤1), 1<ES≤2, 2<ES≤3, 3<ES≤4, 4<ES≤5 and 5<ES≤6. The mean score of each of the dimensions (e.g., FW1, FW2, FW3 and FW4 for worker perception) for that survey were calculated for each of the six experience
www.ccsenet.org/ibr International Business Research Vol. 6, No. 8; 2013
75
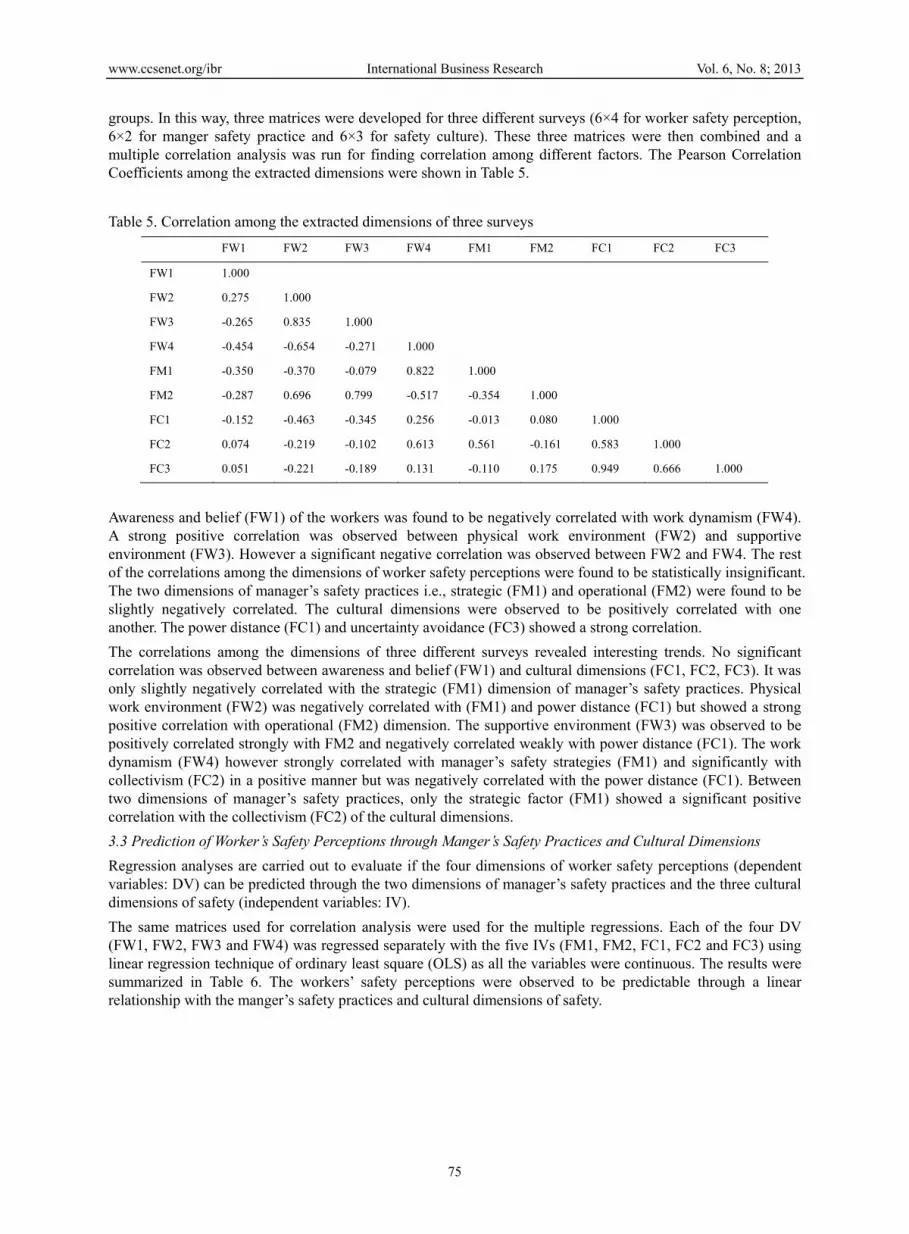
groups. In this way, three matrices were developed for three different surveys (6×4 for worker safety perception, 6×2 for manger safety practice and 6×3 for safety culture). These three matrices were then combined and a multiple correlation analysis was run for finding correlation among different factors. The Pearson Correlation Coefficients among the extracted dimensions were shown in Table 5.
Table 5. Correlation among the extracted dimensions of three surveys
FW1 FW2 FW3 FW4 FM1 FM2 FC1 FC2 FC3
FW1 1.000
FW2 0.275 1.000
FW3 -0.265 0.835 1.000
FW4 -0.454 -0.654 -0.271 1.000
FM1 -0.350 -0.370 -0.079 0.822 1.000
FM2 -0.287 0.696 0.799 -0.517 -0.354 1.000
FC1 -0.152 -0.463 -0.345 0.256 -0.013 0.080 1.000
FC2 0.074 -0.219 -0.102 0.613 0.561 -0.161 0.583 1.000
FC3 0.051 -0.221 -0.189 0.131 -0.110 0.175 0.949 0.666 1.000
Awareness and belief (FW1) of the workers was found to be negatively correlated with work dynamism (FW4). A strong positive correlation was observed between physical work environment (FW2) and supportive environment (FW3). However a significant negative correlation was observed between FW2 and FW4. The rest of the correlations among the dimensions of worker safety perceptions were found to be statistically insignificant. The two dimensions of manager’s safety practices i.e., strategic (FM1) and operational (FM2) were found to be slightly negatively correlated. The cultural dimensions were observed to be positively correlated with one another. The power distance (FC1) and uncertainty avoidance (FC3) showed a strong correlation.
The correlations among the dimensions of three different surveys revealed interesting trends. No significant correlation was observed between awareness and belief (FW1) and cultural dimensions (FC1, FC2, FC3). It was only slightly negatively correlated with the strategic (FM1) dimension of manager’s safety practices. Physical work environment (FW2) was negatively correlated with (FM1) and power distance (FC1) but showed a strong positive correlation with operational (FM2) dimension. The supportive environment (FW3) was observed to be positively correlated strongly with FM2 and negatively correlated weakly with power distance (FC1). The work dynamism (FW4) however strongly correlated with manager’s safety strategies (FM1) and significantly with collectivism (FC2) in a positive manner but was negatively correlated with the power distance (FC1). Between two dimensions of manager’s safety practices, only the strategic factor (FM1) showed a significant positive correlation with the collectivism (FC2) of the cultural dimensions.
3.3 Prediction of Worker’s Safety Perceptions through Manger’s Safety Practices and Cultural Dimensions
Regression analyses are carried out to evaluate if the four dimensions of worker safety perceptions (dependent variables: DV) can be predicted through the two dimensions of manager’s safety practices and the three cultural dimensions of safety (independent variables: IV).
The same matrices used for correlation analysis were used for the multiple regressions. Each of the four DV (FW1, FW2, FW3 and FW4) was regressed separately with the five IVs (FM1, FM2, FC1, FC2 and FC3) using linear regression technique of ordinary least square (OLS) as all the variables were continuous. The results were summarized in Table 6. The workers’ safety perceptions were observed to be predictable through a linear relationship with the manger’s safety practices and cultural dimensions of safety.

www.ccsenet.org/ibr International Business Research Vol. 6, No. 8; 2013
76
Table 6. Multiple regressions results
Independent
variables
Descriptions
Dependent Variables
Awareness and
Belief
Physical Work
Environment
Supportive
Environment
Work
Dynamism
Constant 21.768 39.034 -16.098 -72.091
Coefficient Unstand.
(B)
Standard
(Beta)
Unstand.
(B)
Standard
(Beta)
Unstand.
(B)
Standard
(Beta)
Unstand.
(B)
Standard
(Beta)
Manager Strategic 2.306 8.434 3.331 1.419 -2.788 1.419 -9.625 -6.885
Operational -0.819 -2.586 0.677 0.249 1.335 0.249 2.302 1.422
Cultural
Power Distance -8.498 -18.218 -18.667 -4.660 7.992 -4.660 33.972 14.243
Collectivism -3.528 -12.432 -4.951 -2.032 4.347 -2.032 15.598 10.751
Uncertainty
Avoidance
4.672
27.001 8.422
5.668 -4.969
5.668 -19.068
-21.553
4. Discussion and Conclusions Teo, Ling and Chong (2005) identified four factors affecting the safety climate in construction sites. Out of these, the personnel factor that is the attitude and commitments towards the safety climate were investigated in this study. Structured questionnaire surveys consisting of three sets of queries for worker’s safety perceptions, manager’s safety practices and prevailing safety culture were conducted among one hundred construction site workers and fifty site supervisors and managers. The questions were based on the similar studies conducted in other developing countries.
A screening of the observations was performed before factor analysis as shown in Table 1. Factor analyses were conducted for extracting smaller number of underlying dimensions for the three surveys shown in Tables 2, 3 and 4. The scree plots in Figure 1 would show that a few of the factors would account for most of the results which are common in factor analyses. The factors were given names in line with similar studies (Okolie & Okoye 2012; Tahua 2006). Hofstede’s (1991) cultural dimensions have been used for naming cultural factors. Pearson Correlation Coefficients have been presented in Table 5 for investigating the interrelation among extracted dimensions. Regression analyses were conducted in Table 6 to find if worker safety perceptions can be predicted through manager’s safety practices and cultural dimensions. The results have been presented in the following.
(1) It has been noted that awareness and belief of the workers have no significant correlations with the cultural dimensions in the surveyed site. It shows that the workers’ safety awareness is not influenced by any ideas embedded in culture which is expected in a contemporary society. It also means that workers would abide by reasonable logic for taking safety measures but would not be tied to any preconceived notion.
(2) Worker awareness is weakly related to manager’s strategic plan. It indicates that the workers pay some but not serious attention to the safety planning of the management. It is so expected because the workers would not have full information or training about the managers safety planning.
(3) Physical work environment is negatively correlated to power distance. As the power distance that is the respect to authority increases the workers’ sensitivity to safety hazards decreases. The workers tend to think less about safety aspects and expect that the managers would advise about these. Similarly, work dynamism is negatively correlated with power distance. It shows that as the respect to authority increases the workers’ sensitivity in reacting to managers’ safety feedback decreases. The workers seem to expect that the managers would advise them continuously for the safety actions.
(4) Work dynamism is positively correlated with collectivism. Work dynamism that is the safety training and feedback acceptance would increase with the cultural collectivism that is the tendency of group thinking. The training and feedback acceptance is also positively related to strategic safety plan. This is so expected because an increase in safety planning should also increase the receptivity of safety feedback.
(5) Physical work environment that is workers’ sensitivity to safety awareness is positively correlated with operational practices of managers. This is an important finding. It indicates that the safety practices adopted at site by managers would have a trickledown effect in increasing the workers’ safety perceptions.
www.ccsenet.org/ibr International Business Research Vol. 6, No. 8; 2013
77
(6) Strategic management is positively correlated with collectivism. It indicates that as the safety planning increases the collectivism that is group thinking about safety also increases. It signifies that the training involved with the safety planning has a positive impact on group thinking about safety perceptions.
The findings provided a road map for instituting an effective safety scheme in sites. Firstly, the workers have no preconceived cultural baggage about safety effectiveness. There would be no inbuilt cultural resistance from workers in imposing safety rules. Secondly, the training imparted on the managers would percolate through the workers’ safety perceptions. Since trainings to managers are logistically easier and comparatively economical focus of safety training on managers would result the desired effect of higher safety perceptions to the workers.
References Belel, Z. A., & Mahmud, H. (2012). Safety Culture of Nigerian Construction Workers—A Case Study of Yola.
International Journal of Scientific and Industrial Research, 3(9), 1-5.
Clarke, S. (1999). Perceptions of organizational safety: implications for the development of safety culture. J. Org. Behav., 20(2), 185-98. http://dx.doi.org/10.1002/(SICI)1099-1379(199903)20:2<185::AID-JOB892>3.0.CO;2-C
Dedobbeler, N., & Beland, F. (1991). Risk acceptance and safety performance on construction sites. J. Occup. Med., 29, 863-868.
Debrah, Y. A., & Ofori, G. (2001). Subcontracting, foreign workers and job safety in the Singapore construction industry. Asia Pac. Bus. Rev., 1(8), 145-66. http://dx.doi.org/10.1080/713999129
Glendona, A. I., & Litherlande, D. K. (2001). Safety climate factors, group differences and safety behaviour in road construction. Safety Science, 39(3), 157-188. http://dx.doi.org/10.1016/S0925-7535(01)00006-6
Hofstede, G. (1991). Cultures and Organizations: Software of the Mind. London: McGraw Hill.
International Labour Organization (ILO). (2005). Global estimates of fatal work related diseases and occupational accidents, World Bank Regions. Geneva. Programme on Safety and Health at Work and Environment (SafeWork).
International Labour Organization (ILO). (1995). Occupational Health and Safety. Directorate General of Health Services. Govt of the People's Republic of Bangladesh Dhaka. Retrieved March 25, 2012, from http://www.ilo.org/safework/countries/asia/bangladesh/WCMS_187745/lang--en/index.htm
Jayawardane, A. K. W., & Gunawardena, N. D. (1998). Construction workers in developing countries: A case study of Srilanka. Construction Management and Economics, 16, 521-530. http://dx.doi.org/10.1080/014461998372060
Koehn, E., Kothari, R. K., & Pan, C. S. (1995). Safety management in developing countries: Professional and bureaucratic problems. Journal of Construction Engineering and Management, 121(3), 261-265. http://dx.doi.org/10.1061/(ASCE)0733-9364(1995)121:3(261)
Koehn, E., & Reddy, S. (1999). Safety and Construction in India. In Singh, A., Hinze, J., & Coble, R. (Eds.), Implementation of Safety & Health on Construction Sites. Rotterdam Balkema.
Lopes, J. (1998). The construction industry and macroeconomy in Sub-Saharan Africa post 1970. Construction Management and Economics, 16, 637-649. http://dx.doi.org/10.1080/014461998371935
McAfee, R. B., & Winn, A. R. (1989). The use of incentives and feed-back to enhance work place safety: a critique of the literature. J Safety Res, 20, 7-19. http://dx.doi.org/10.1016/0022-4375(89)90003-0
Mohamed, S. (2002). Empirical investigation of construction safety management activities and performance in Australia. Safety Science, 33(3), 129-142. http://dx.doi.org/10.1016/S0925-7535(99)00028-4
Moheeb, E. I., Khalid, A. M., & Adnan, A. E. (2012). Safety Climate in Construction Industry: The case of Gaza strip. The 4th International Engineering Conference Towards engineering of 21st century. Retrieved March 25, 2013, from http://research.iugaza.edu.ps/files/2146.PDF
Murie, F. (2007). Building safety—An international perspective. International Journal of Occupational Environment and Health, 13, 5-11.
Niskanen, T. (1994). Safety Climate in the Road Administration. Safety Science, 17, 237-255. http://dx.doi.org/10.1016/0925-7535(94)90026-4
Ngowi, A. B. (1997). Impact of Culture on Construction Procurement. Journal of Construction Procurement, 3(1), 3-15.
www.ccsenet.org/ibr International Business Research Vol. 6, No. 8; 2013
78
Okolie, K. C., & Okoye, P. C. (2012). Assessment of National Culture Dimensions and Construction Health and Safety Climate in Nigeria. Science Journal of Environmental Engineering Research.
Priyadarshini, K., Karunasena, G., & Jayasuriya, S. (2013). Construction Safety Management Framework for Developing Countries: A case of Srilanka. J. of Construction management in Developing Countries (Early View). Retrieved March 25, 2013, from http://web.usm.my/jcdc/vol18_1_2013/Art 3_jcdc18-1_Early View.pdf
Rowlinson, S. (1997). Hong Kong construction—site safety management. Hong Kong: Sweet and Maxwell Asia
Sadullah, O., & Kanten, S. (2009). A research on the effect of Organizational Safety Climate Upon the Safe Behavors. Ege Academic Review, 9(3), 923-932.
Statistics Brain. (2013). Construction Industry Statistics. Retrieved April 11, 2012, from http://www.statisticbrain.com/construction-industry-statistics/
Suazo, G. A. R., & Jaselskis, E. J. (1993). Comparison of construction safety codes in United States and Honduras. Journal of Construction Engineering and Management, 119(3), 560-572. http://dx.doi.org/10.1061/(ASCE)0733-9364(1993)119:3(560)
Tahua, H. I. (2006). Influence of National Culture on Construction Safety Climate in Pakistan. Unpublished PhD Thesis. School of Engineering, Griffith University, Gold Coast Campus, Australia.
Teo, E. A., Ling, F. Y., & Chong, A. (2005). Framework for project managers to manage construction safety. Int. J. of Project Management, 23(4), 329-341. http://dx.doi.org/10.1016/j.ijproman.2004.09.001
Toole, M. (2002). The relationship between employees_ perceptions of safety and organisational culture. J Safety Res, 33, 231-243. http://dx.doi.org/10.1016/S0022-4375(02)00014-2
Yakubu, D. M., & Bakr, I. M. (2012). Investigation of safety and health compliance on the construction workers facilities. Prime Journal of Social Science, V1(7), 145-150.
World Bank. (1984). The Construction Industry: Issues and Strategies in Developing Countries. World Bank, Washington, D.C.
Zeng, S. X., Wang, H. C., & Tam, C. M. (2002). A Survey of Construction Safety in China. ICONDA database. Retrieved March 25, 2013, from http://www.baufachinformation.de/aufsatz.jsp?ul=2006111000049
Copyrights Copyright for this article is retained by the author(s), with first publication rights granted to the journal.
This is an open-access article distributed under the terms and conditions of the Creative Commons Attribution license (http://creativecommons.org/licenses/by/3.0/).
.