variable energy cyclotron centre kolkata
TRANSCRIPT
Government of India
Department of Atomic Energy
Variable Energy Cyclotron Centre Kolkata
Government of India
Department of Atomic Energy
Progress Report 2019-20
VARIABLE ENERGY CYCLOTRON CENTRE 1/AF, BIDHAN NAGAR, KOLKATA-700 064
Website: http://www.vecc.gov.in
Foreword
he K130 variable energy cyclotron has regularly been accelerating light ions like alpha, proton and heavy ions like nitrogen, oxygen and neon beams for performing research in various field of
physical sciences. During the above mentioned period, the K130 cyclotron has accelerated light ions produced from PIG ion source and delivered beams of various energies for the experiments. In the middle of March, 2020 cyclotron was shut-down for changing over to ECR ion source for heavy ion acceleration. In the period April, 2019 - March, 2020 the beam availability from K130 cyclotron was 3980 hours.
Phase-I commissioning of DAE 30MeV Medical cyclotron is an important milestone in India. Radionuclides and radio-pharmaceuticals are important diagnostic and nuclear imaging of tools of life. VECC is committed to produce radionuclides for the nation. The DAE Medical Cyclotron facility in Kolkata is under commissioning for the production of radioisotope production for medical use. Phase I commissioning of the cyclotron facility has been completed for the production of FDG. The supply of FDG to local hospital for the diagnosis of cancer has been started. The installation and beam transmission in the beamline # 1.3 (low dose beamline irradiation) has opened up a new proton irradiation facility for radiation damage studies. The beamline #1.1 designated for production of SPECT isotope has also been tested for the production of Gallium-67 isotope. The production of SPECT isotope using a cyclotron for commercial use will be carried out for the first time in India. This new advancement will lead to the development of many other important medical SPECT isotope which will cater the need of the nation.
This year the beam development effort in Radioactive Ion Beam Facilities Group has produced several stable-isotope ion beams as well as molecular ion beams for utilization in material science research. These beams have been used by in-house as well as external users from colleges and universities through the UGC-DAE-CSR centre Kolkata. The beam development R&D also focused on measuring the yield of radioactive isotope 43K and the scope of online ionization of the species in a surface ionization ion source. The fabrication, installation and tests of two 75.6 MHz rebunchers is another milestone reached this year. Among other activities, a new 2.4 GHz gas-jet coupled ECR ion source has been designed and fabricated and a low-level RF control system for the 37 MHz RF transmitters is also designed and developed. The design and development of a 2 kW, 37.8 MHz RF amplifier along with its instrumentation and monitoring system is ongoing. On the e-Linac front, the electron gun was operated at 100 kV and its trans-conductance has been measured. A new RF matching transformer and DC isolator for RF modulation of the gun has been installed and tested. The Injector Cryo-Module (ICM) has been assembled at VECC and vacuum tests have been completed after its arrival from TRIUMF, Canada as part of the collaboration between the two institutes. A liquid He plant of 500W capacity (at 4 K) has been installed and commissioned this year as part of the requirement for the ICM.
The energetic experimental nuclear physics group has carried novel research by measuring the collective enhancement in the NLD, gamma transition rates in 12C, increase of 7Be decay rate under compression, optimization of VECC penning trap at room temperature, lifetime measurement in neutron rich nuclei using VENTURE array and characterization of first beam from the K-500 cyclotron. An extensive experimental campaign of national gamma array with light ion beams was also carried out using digital data acquisition system. On the development front, non-magnetic multi-pin coaxial vacuum feed through for cryogenic applications, design and development of a dual CFD with variable delay and fraction and development of a low cost current integrator for use with SCC has been developed indigenously.
The fluctuations as well as diffusion coefficients of identified particles are studied in the energy regime of the BNL relativistic heavy ion collider. The propagation of heavy quarks inside QGP medium is also studied using the stochastic Langevin equation. The anisotropic flow of hadrons and its dependence on equation of state is investigated at FAIR energies. The effect of the anomalous
T
magnetic of quarks and the thermo-magnetic spectral properties of neutral mesons have been studied using the NJL model. The viscous coefficients and thermal conductivity of a hot gas of pions, kaons and nucleons has been studied using the kinetic theory approach. The relativistic FMT treatment of compressed atoms has been extended to treat magnetized matter in white dwarfs. In the lower energy domain, systematic study of the nuclear capture process has been done using the four dimensional Langevin dynamical model. In the intermediate energy regime the sensitivity of the evaporation residue observables on symmetry energy as well as the effect of liquid drop model parameters of nuclear phase transition has been studied. The exact relaxation dynamics and quantum information scrambling in multiply quenched harmonic chains has also been studied.
Computer & Informatics Group of VECC, which is primarily engaged in R & D activities in the field of Computer Control of Accelerators, Data Acquisition (DAQ) Systems and IT Infrastructure & Services, has marked this period by some successful indigenous developments such as Digital RF Power Meter for RIB project, enhanced and miniature version of digital Pico-ammeter. A significant progress is also made in its ASIC-based activities with the design & development of variety of front-end electronics (such as discriminator, peak detector, multi-channel read out system) required for detectors like CPDA, GMDA used in nuclear physics experiments. In addition to that, developmental activities related to hardware and software of various DAQ systems for physics experiment and medical imaging are also reported here. In the area of IT infrastructure and services, several developments and upgradations including implementation of Centralised Log Management System have also been successfully conducted. Research activities towards development of Unmanned Aerial Vehicle (UAV), Terrestrial Robots, Indian Sign Language Translation System and Network Intrusion Detection System using Machine Learning are also carried out.
The academic activities of Homi Bhabha National Institute (HBNI) at VECC have continued as usual with its Ph.D programme. Seventeen Ph.D degrees were awarded from HBNI. Several national and international conferences, schools, workshops, theme meetings, colloquiums lectures and outreach programmes were successfully organized.
Sumit Som
Director

PreFace
his report brings out the scientific and technical activities of Variable Energy Cyclotron Centre, Kolkata during April 2019 to March 2020. The format of this report has remained identical to the
previous one. Division of the chapters and distribution of the contents are also very similar. Division of the chapters is given in the contents. As the prime thrust of activities in the Centre was towards implementation of various projects undertaken by the Centre, the contributions related to the ongoing projects are given in a separate chapter (Chapter 5) of this volume.
Research activities of this centre are available in chapter 1. The Operational status and Research and Development activities of the K130 Room Temperature Cyclotron are reported in chapter 2. The activities related to Computer and Informatics Group is mentioned in chapter 3. Chapter 4 contains activities related to Instrumentation and Methods. The activities of the RRMC & Medical Section, VECC are available in chapter 6. Chapter 7 provides a comprehensive list of publications as well as colloquia, thesis, book/patents, awards/honours, events and other activities in this Centre.
The editorial board has tried utmost to make this volume as a complete sourcebook of information as possible about the research and developmental activities of this centre. We regret for the errors or omissions that might have taken place in spite of our best efforts. Editing of the contributions has been kept minimum. The affiliations of the authors of this centre are not mentioned in their respective contributions, but those of the collaborating authors are only mentioned. We acknowledge the co-operation extended by the board members and other colleagues of this Centre in bringing out this report in present form. Suggestions for future improvement of the quality of the progress report are welcome.
Surajit Pal
Convener, Editorial Board
EDITORIAL BOARD Surajit Pal Gargi Chaudhuri Gayathri N. Banerjee Pranab Bhattacharyya Sudeshna Seth Kaushik Datta Anand Kumar Dubey Shashi C L Srivastava Md. Sabir Ali Animesh Goswami Anirban De Deepak Pandit
T
Contents 1. Research 1
1.1. Nuclear Experiment 2 1.2. Nuclear Theory 49 1.3. Experimental High Energy Physics 61 1.4. Analytical Chemistry, Radio Chemistry & BRIT, Kolkata 63 1.5. Material Research 89 1.6. Health Physics 102
2. Cyclotron 106 2.1. Cyclotron Operation 107 2.2. Accelerator Research & Development 108
3. Computer and Informatics 111
4. Instrumentation and Methods 135
5. Ongoing Projects 151 5.1. Superconduction Cyclotron 152 5.2. Medical Cyclotron 159 5.3. Radioactive Ion Beam 162 5.4. Other Projects 200
6. RRMC and Medical 204
7. Publications Theses Events etc 207 7.1. Publication in Journals 208 7.2. Publication in Symposia, Conferences and Reports 218 7.3. Thesis 225 7.4. Books & Patents 227 7.5. Colloquium, Symposia, Events & Other Activities 228 7.6. Awards & Honours 233
8. Personnel 234

RESEARCH
Progress Report 2019-20
2
1.1 Nuclear Experiment
PUZZLE OF COLLECTIVE ENHANCEMENT IN THE NUCLEAR LEVEL DENSITY
Deepak Pandit, Balaram Dey1, Srijit Bhattacharya2, T. K. Rana, Debasish Mondal, S. Mukhopadhyay, Surajit Pal, A. De3, Pratap Roy, K. Banerjee, Samir Kundu , A. K. Sikdar,
C. Bhattacharya and S. R. Banerjee
1Bankura University, Bankura, West Bengal - 722155, India 2Department of Physics, Barasat Govt. College, Barasat, N24 Pgs, Kolkata 700124, INDIA
3Department of Physics, Raniganj Girls’ College, Raniganj 713347, WB, INDIA
he nucleus is a complex quantum many body system where single particle as well as collective degrees of freedom constitute elementary modes of excitation. Understanding the coexistence of
these two contrasting facets of nuclear dynamics has been a fundamental problem in nuclear science. The collective mode of excitation arises when the equilibrium shape of the nucleus deviates from spherical symmetry leading to ellipsoidal shapes. The key role of deformation is that it not only alters the spacing and order of the single particles states but also introduces rotational levels (collective degree of freedom) built on each intrinsic state resulting in an enhancement of the NLD. The manifestation of the collective rotational enhancement in the NLD still remains a puzzling topic due to lack of experimental evidence.
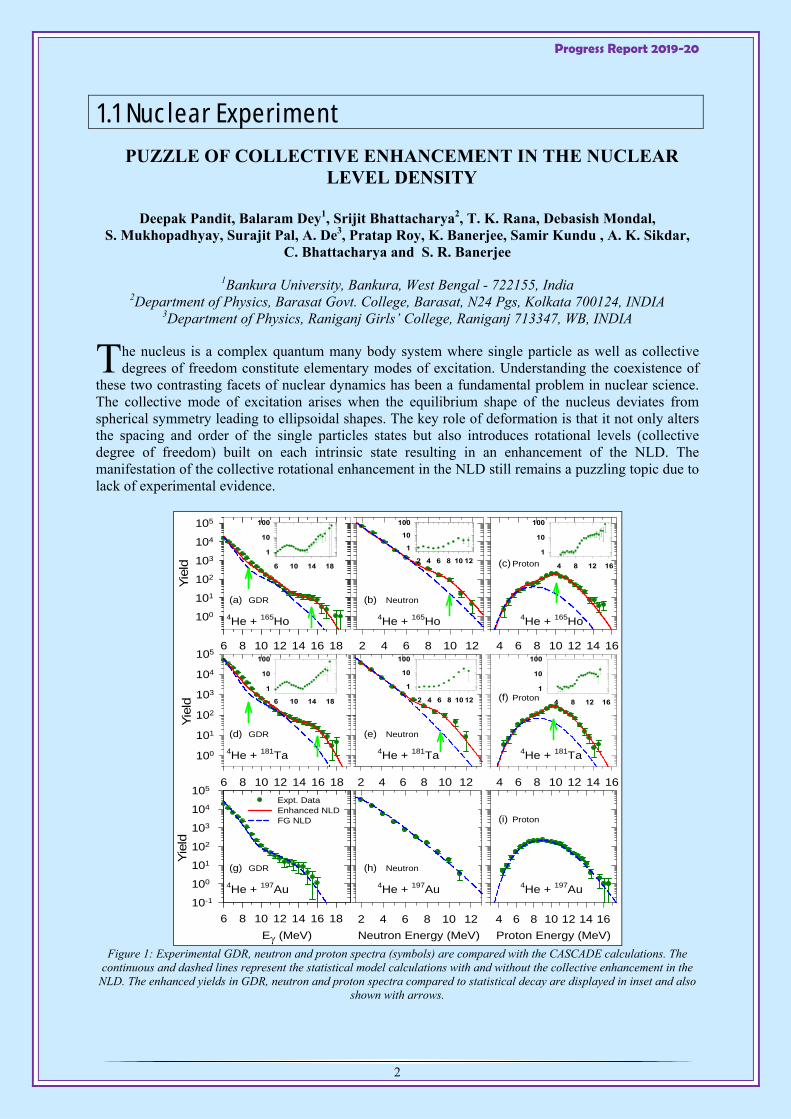
Figure 1: Experimental GDR, neutron and proton spectra (symbols) are compared with the CASCADE calculations. The
continuous and dashed lines represent the statistical model calculations with and without the collective enhancement in the NLD. The enhanced yields in GDR, neutron and proton spectra compared to statistical decay are displayed in inset and also
shown with arrows.
E (MeV)6 8 10 12 14 16 18
Yiel
d
10-1
100
101
102
103
104
1052 4 6 8 10 126 8 10 12 14 16 18
Yiel
d
100
101
102
103
104
1056 8 10 12 14 16 18
Yiel
d
100
101
102
103
104
105
2 4 6 8 10 12
Expt. DataEnhanced NLDFG NLD
4 6 8 10 12 14 16
4 6 8 10 12 14 16
Neutron Energy (MeV)2 4 6 8 10 12
Proton Energy (MeV)4 6 8 10 12 14 16
4He + 165Ho 4He + 165Ho 4He + 165Ho
4He + 181Ta
4He + 197Au
4He + 181Ta
4He + 197Au 4He + 197Au
4He + 181Ta
(a) (b)
(c)
(d) (e)
(f)
(g) (h)
(i)
GDR Neutron
Proton6 10 14 18
1
10
100
GDR
GDR
Neutron
Neutron
2 4 6 8 10 12
1
10
100
4 8 12 16
1
10
100
6 10 14 18
1
10
100
2 4 6 8 10 12
1
10
100
4 8 12 16
1
10
100
Proton
Proton
T

Progress Report 2019-20
3
Figure 2: (a) The enhancement factors extracted from GDR and particle spectra for different nuclei. (b) The variation of
nuclear deformation with excitation energy displaying the shape transtion (2 ~ 0). The green shaded region is the fadeout of the enhancement measured in the experiment. The experimental data have been compared with the predictions of (c)
microscopic model and (d) phenomenological calculation of collective rotational enhancement.
To address this open problem, angular momentum (J) gated neutron, proton and Giant Dipole Resonance -ray spectra have been measured from two deformed nuclei (169Tm and 185Re) and one near spherical nucleus (201Tl) by populating them around 26 MeV excitation energy using 28 MeV alpha beams from the K-130 Cyclotron . An enhanced yield compared to statistical decay is observed in all the three spectra (p, n, ) for both the deformed nuclei but only statistical decay for near spherical nucleus. Intriguingly, the relative enhancement factors determined independently from all the spectra are very similar (~10) for both the deformed nuclei. Moreover, the results indicate that the fadeout of the collective enhancement does not dependent strongly on the nuclear ground state deformation and occurs much before the nuclear shape phase transition from deformed to spherical which is in stark contrast to the expectations of the phenomenological as well as microscopic calculations.
MEASUREMENT AND SIMULATION OF NEUTRON RESPONSE FUNCTION IN PLASTIC SCINTILLATOR EJ-299-33A USING QUASI-
MONOENERGETIC NEUTRONS
Arup Singha Roy, K. Banerjee, Pratap Roy, C. Bhattacharya, T. K. Rana, Arijit Sen ,T. K. Ghosh, S. Kundu, G. Mukherjee, S. Manna, R. Pandey, R. Ravishankar, D. Paul, K. Atreya, S.
Basu, S. Mukhopadhyay, Deepak Pandit, Debasish Mondal, Surajit Pal
iquid organic scintillator are commonly used for fast neutrons spectroscopic studies for more than several decades. Liquid scintillator detectors have excellent pulse shape discrimination property
but generally suffer from potential problems like toxicity, chemical hazards, leakage and low flash points. Recently developed new type of plastic scintillators also known as PSD plastic are capable of discriminating -rays from neutrons however their properties are not up to the level of liquid scintillator. Pulse height response of liquid scintillator BC501A and plastic scintillator EJ-299-33A based detectors have been studied using quasi-monoenegetic neutrons generated from 7Li(p, n)7Be reaction.
0 20 40 60
2
0.0
0.1
0.2
0.3
0.4
0.5169Tm185Re
5 10 15 20
Enh
ance
men
t fac
tor
1
10
100169Tm168Tm168Er185Re184Re184W
(a) (b)
Excitation Energy (MeV)10 20 30 40
Enh
ance
men
t fac
tor
1
10
100150Sm (2= 0.20)152Sm (2= 0.24)154Sm (2= 0.27)
Excitation Energy (MeV)20 40 60 80 100
Enh
ance
men
t fac
tor
1
10
100169Tm185Re
(c) (d)
L

Progress Report 2019-20
4
Figure 1: Measured and calculated pulse height response of liquid BC 501A and plastic EJ 299 33A scintillator using quasi
mono-energetic neutrons.
Experiment was performed using proton beams from the K130 Cyclotron at VECC for four different beam energies in the range 7 to 13 MeV. Six liquid scintillator detectors and two plastic scintillator detector of dimension 5 5 were placed at angles in the range between 10 - 150 with respect to the beam direction and at a distance of 1.5 to 2 meters from the target centre. The energy of the neutrons were measured using time of flight (TOF) where as the discrimination of neutrons and -rays events were obtained using TOF and pulse shape discrimination using zero cross over (ZCO) technique.
Measured pulse height responses were compared with Geant4 simulations which reproduced the data resonably well as shown in the figure 1. A 80% reduction in the scintillation light is required for plastic scintillator in comparison to liquid scintillator to reproduced the measured data.
STUDY OF γ -TRANSITIONS OF RESONANCE STATE via 11B(p, 3α)γ REACTION
T. K. Rana, S. Manna, C. Bhattacharya, Samir Kundu, K. Banerjee, Pratap Roy, R. Pandey, A. Sen, T. K. Ghosh, G. Mukherjee, A. Dhal, S. Mukhopadhyay, Deepak Pandit, Debasish Mondal, Surajit Pal, J. K. Sahoo, J. K. Meena, A. K. Saha, R. M. Saha, S. R. Banerjee, S. Bhattacharya,
and Amit Roy
he study of γ-transitions of the state in a nucleus to various lower excited states is very interesting, which will provide the information both on the structure of these states as well as their coupling to
the γ-decay state. The GDR state of 12C at excitation energy of 22.6 MeV has a large width of 3.2 MeV and is dominated around that excitation energy. The γ-decay of the states below the proton decay threshold has been measured well [1]. However, the GDR state exits above the proton decay threshold and decay mostly via. particle emission (p, n, α) to the daughter nuclei. The γ-decay branching of a state above the particle decay threshold is very small and difficult to observe directly due to poor efficiency of the conventional γ-detectors but can be investigated through other indirect techniques. Here, the resonance state of 12C, at excitation energy of ~22.6 MeV, has been populated using the proton beams of 7.2 MeV from Variable Energy Cyclotron Centre, Kolkata, on 11B target. The decay α-particles emitted from the resonance state have been detected using the novel state of the art silicon strip detectors in complete kinematics to investigate the γ-delayed 3α decay of the resonance state. The γ-decay branching ratios of the populated state to various lower energy particle unstable states has been measured, using missing energy or indirect γ-detection technique [2]. Typical two dimensional plot between the excitation energy of the 12C and the center of mass energies of the emitted α-particles has been plotted for all events as shown in Fig. 1.
T
Progress Report 2019-20
5
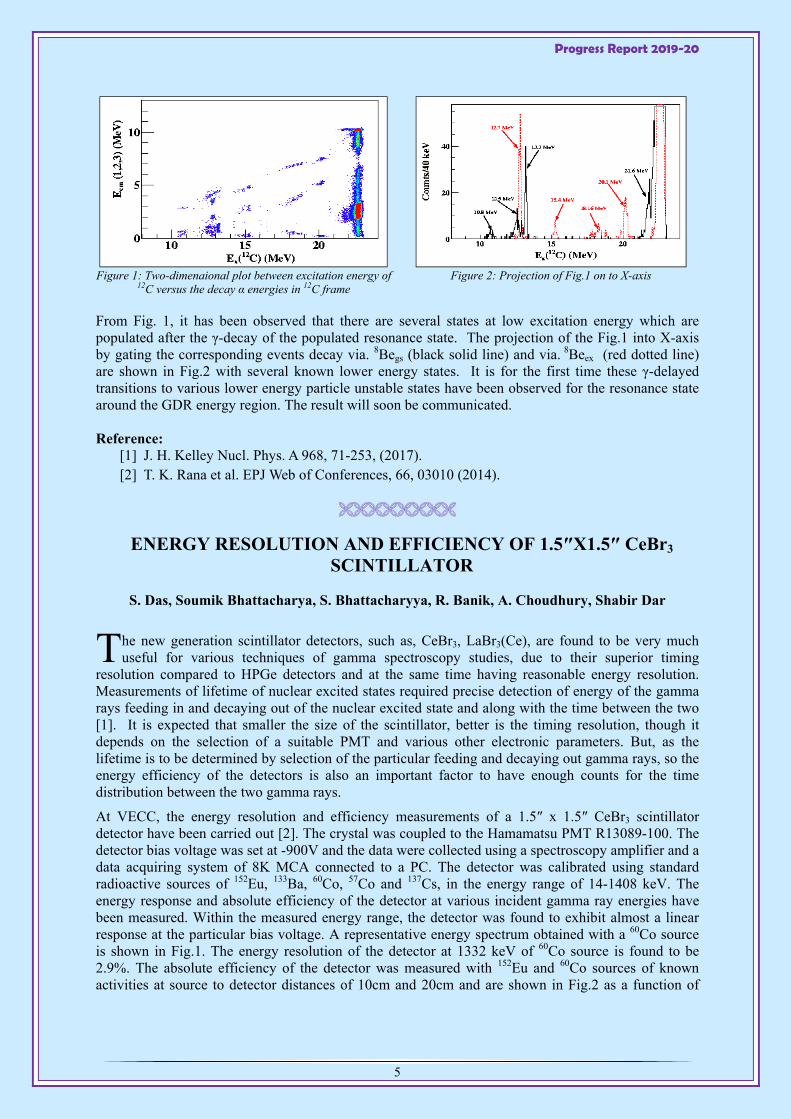
Figure 1: Two-dimenaional plot between excitation energy of 12C versus the decay α energies in 12C frame
Figure 2: Projection of Fig.1 on to X-axis
From Fig. 1, it has been observed that there are several states at low excitation energy which are populated after the γ-decay of the populated resonance state. The projection of the Fig.1 into X-axis by gating the corresponding events decay via. 8Begs (black solid line) and via. 8Beex (red dotted line) are shown in Fig.2 with several known lower energy states. It is for the first time these γ-delayed transitions to various lower energy particle unstable states have been observed for the resonance state around the GDR energy region. The result will soon be communicated. Reference:
[1] J. H. Kelley Nucl. Phys. A 968, 71-253, (2017). [2] T. K. Rana et al. EPJ Web of Conferences, 66, 03010 (2014).
ENERGY RESOLUTION AND EFFICIENCY OF 1.5″X1.5″ CeBr3 SCINTILLATOR
S. Das, Soumik Bhattacharya, S. Bhattacharyya, R. Banik, A. Choudhury, Shabir Dar
he new generation scintillator detectors, such as, CeBr3, LaBr3(Ce), are found to be very much useful for various techniques of gamma spectroscopy studies, due to their superior timing
resolution compared to HPGe detectors and at the same time having reasonable energy resolution. Measurements of lifetime of nuclear excited states required precise detection of energy of the gamma rays feeding in and decaying out of the nuclear excited state and along with the time between the two [1]. It is expected that smaller the size of the scintillator, better is the timing resolution, though it depends on the selection of a suitable PMT and various other electronic parameters. But, as the lifetime is to be determined by selection of the particular feeding and decaying out gamma rays, so the energy efficiency of the detectors is also an important factor to have enough counts for the time distribution between the two gamma rays.
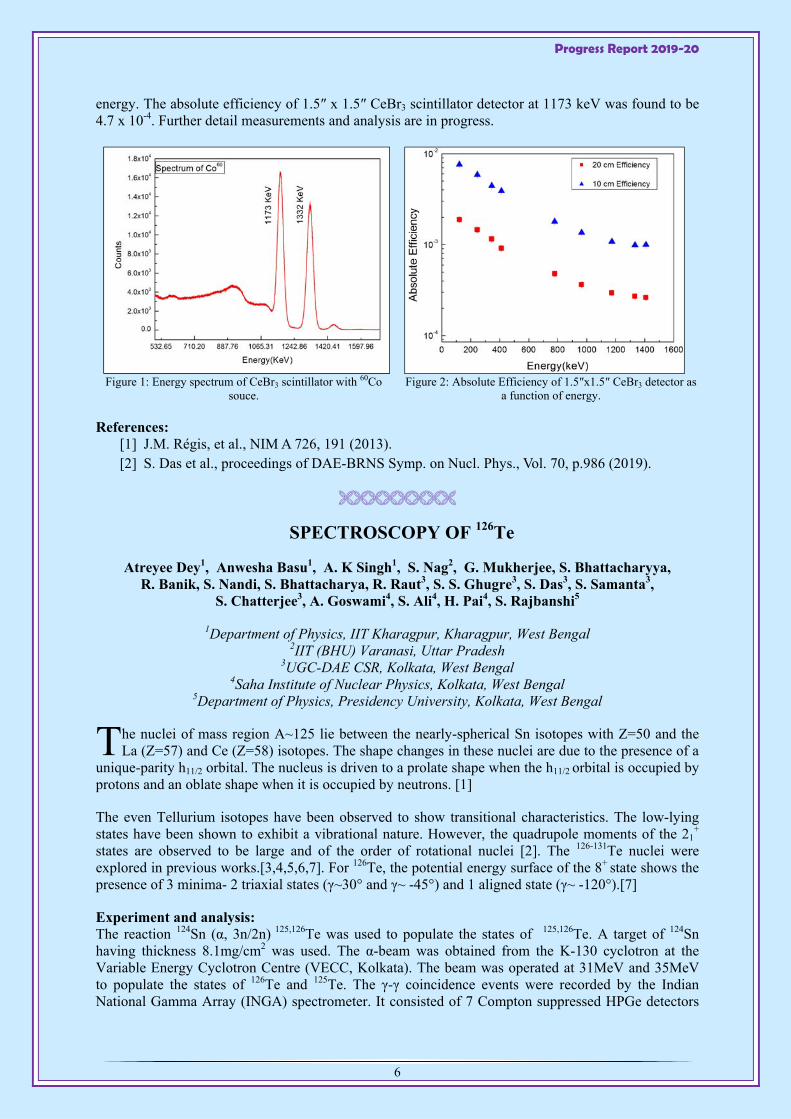
At VECC, the energy resolution and efficiency measurements of a 1.5″ x 1.5″ CeBr3 scintillator detector have been carried out [2]. The crystal was coupled to the Hamamatsu PMT R13089-100. The detector bias voltage was set at -900V and the data were collected using a spectroscopy amplifier and a data acquiring system of 8K MCA connected to a PC. The detector was calibrated using standard radioactive sources of 152Eu, 133Ba, 60Co, 57Co and 137Cs, in the energy range of 14-1408 keV. The energy response and absolute efficiency of the detector at various incident gamma ray energies have been measured. Within the measured energy range, the detector was found to exhibit almost a linear response at the particular bias voltage. A representative energy spectrum obtained with a 60Co source is shown in Fig.1. The energy resolution of the detector at 1332 keV of 60Co source is found to be 2.9%. The absolute efficiency of the detector was measured with 152Eu and 60Co sources of known activities at source to detector distances of 10cm and 20cm and are shown in Fig.2 as a function of
T
Progress Report 2019-20
6
energy. The absolute efficiency of 1.5″ x 1.5″ CeBr3 scintillator detector at 1173 keV was found to be 4.7 x 10⁻⁴. Further detail measurements and analysis are in progress.
Figure 1: Energy spectrum of CeBr3 scintillator with 60Co souce.
Figure 2: Absolute Efficiency of 1.5″x1.5″ CeBr3 detector as a function of energy.
References: [1] J.M. Régis, et al., NIM A 726, 191 (2013). [2] S. Das et al., proceedings of DAE-BRNS Symp. on Nucl. Phys., Vol. 70, p.986 (2019).
SPECTROSCOPY OF 126Te
Atreyee Dey1, Anwesha Basu1, A. K Singh1, S. Nag2, G. Mukherjee, S. Bhattacharyya, R. Banik, S. Nandi, S. Bhattacharya, R. Raut3, S. S. Ghugre3, S. Das3, S. Samanta3,
S. Chatterjee3, A. Goswami4, S. Ali4, H. Pai4, S. Rajbanshi5
1Department of Physics, IIT Kharagpur, Kharagpur, West Bengal 2IIT (BHU) Varanasi, Uttar Pradesh
3UGC-DAE CSR, Kolkata, West Bengal 4Saha Institute of Nuclear Physics, Kolkata, West Bengal
5Department of Physics, Presidency University, Kolkata, West Bengal
he nuclei of mass region A~125 lie between the nearly-spherical Sn isotopes with Z=50 and the La (Z=57) and Ce (Z=58) isotopes. The shape changes in these nuclei are due to the presence of a
unique-parity h11/2 orbital. The nucleus is driven to a prolate shape when the h11/2 orbital is occupied by protons and an oblate shape when it is occupied by neutrons. [1]
The even Tellurium isotopes have been observed to show transitional characteristics. The low-lying states have been shown to exhibit a vibrational nature. However, the quadrupole moments of the 21
+ states are observed to be large and of the order of rotational nuclei [2]. The 126-131Te nuclei were explored in previous works.[3,4,5,6,7]. For 126Te, the potential energy surface of the 8+ state shows the presence of 3 minima- 2 triaxial states (γ~30° and γ~ -45°) and 1 aligned state (γ~ -120°).[7]
Experiment and analysis: The reaction 124Sn (α, 3n/2n) 125,126Te was used to populate the states of 125,126Te. A target of 124Sn having thickness 8.1mg/cm2 was used. The α-beam was obtained from the K-130 cyclotron at the Variable Energy Cyclotron Centre (VECC, Kolkata). The beam was operated at 31MeV and 35MeV to populate the states of 126Te and 125Te. The γ-γ coincidence events were recorded by the Indian National Gamma Array (INGA) spectrometer. It consisted of 7 Compton suppressed HPGe detectors
T
Progress Report 2019-20
7
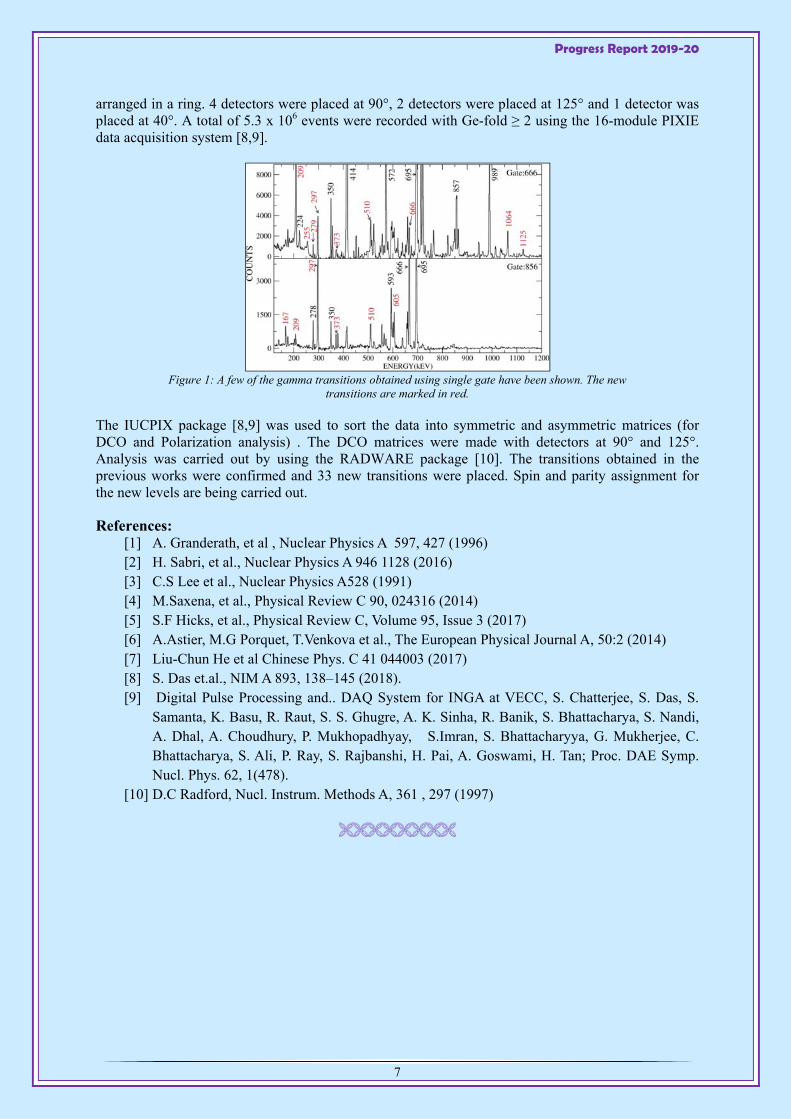
arranged in a ring. 4 detectors were placed at 90°, 2 detectors were placed at 125° and 1 detector was placed at 40°. A total of 5.3 x 10⁶ events were recorded with Ge-fold ≥ 2 using the 16-module PIXIE data acquisition system [8,9].
Figure 1: A few of the gamma transitions obtained using single gate have been shown. The new
transitions are marked in red.
The IUCPIX package [8,9] was used to sort the data into symmetric and asymmetric matrices (for DCO and Polarization analysis) . The DCO matrices were made with detectors at 90° and 125°. Analysis was carried out by using the RADWARE package [10]. The transitions obtained in the previous works were confirmed and 33 new transitions were placed. Spin and parity assignment for the new levels are being carried out.
References: [1] A. Granderath, et al , Nuclear Physics A 597, 427 (1996) [2] H. Sabri, et al., Nuclear Physics A 946 1128 (2016) [3] C.S Lee et al., Nuclear Physics A528 (1991) [4] M.Saxena, et al., Physical Review C 90, 024316 (2014) [5] S.F Hicks, et al., Physical Review C, Volume 95, Issue 3 (2017) [6] A.Astier, M.G Porquet, T.Venkova et al., The European Physical Journal A, 50:2 (2014) [7] Liu-Chun He et al Chinese Phys. C 41 044003 (2017) [8] S. Das et.al., NIM A 893, 138–145 (2018). [9] Digital Pulse Processing and.. DAQ System for INGA at VECC, S. Chatterjee, S. Das, S.
Samanta, K. Basu, R. Raut, S. S. Ghugre, A. K. Sinha, R. Banik, S. Bhattacharya, S. Nandi, A. Dhal, A. Choudhury, P. Mukhopadhyay, S.Imran, S. Bhattacharyya, G. Mukherjee, C. Bhattacharya, S. Ali, P. Ray, S. Rajbanshi, H. Pai, A. Goswami, H. Tan; Proc. DAE Symp. Nucl. Phys. 62, 1(478).
[10] D.C Radford, Nucl. Instrum. Methods A, 361 , 297 (1997)
Progress Report 2019-20
8
NEW PARTNER BANDS IN 199Hg
Soumik. Bhattacharya, S. Bhattachrayya, S. Das Gupta1 , R. Banik, G. Mukherjee, A. Dhal&, S. Nandi, Md. A. Asgar, T. Roy, R. Raut2, S. S. Ghugre2, S. K. Das2, S. Chatterjee2,
S.Samanta2, Shabir Dar, A. Goswami3,#, Sajad Ali3, S. Mukhopadhyay, Debasish Mondal, S. S. Alam, A. Saha$, T. Bhattacharjee, Deepak Pandit, Surajit Pal,
S. R. Banerjee and S. Rajbanshi
1Victoria Institution (College), Kolkata-700009, INDIA 2UGC-DAE CSR (Kolkata), INDIA
3Saha Institute of Nuclear Physics,Kolkata-700064, INDIA 4Presidency University, Kolkata, INDIA
& present address: IFIN-HH ELI-NP, Romania. # Deceased $ Present address: Department of Physics, Indian Institute of Technology Bombay, Powai, Mumbai.
arieties of band structures in nuclei close to 208Pb in mass 200 region are observed due to the coupling of odd valance particles with the core. In this region, the ground and first few excited
states are dominated by the pure single particle orbitals near Fermi level. Whereas, the available high-j intruder orbital both for proton and neutron brings deformations into the system and various exotic structural phenomena related to triaxiality. Chiral bands, which is one of the signatures of trixiality, have been reported in 194,195,198Tl [1,2,3]. The band structures in even Hg nuclei are observed involving the rotational aligned h9/2 and i13/2 orbitals [4]. For odd Hg nuclei around mass 200, the odd neutron in i13/2 orbital coupled to the slightly oblate neighbouring even Hg core and decoupled positive parity band structure built on (i-1
13/2) 13/2+ state has been observed in all of them [5,6]. At higher spin, negative parity structure based on 5- and 21/2- band head is described as semi decoupled band [7] in odd and even mass Hg nuclei respectively. The latest work on 199Hg and 197Hg, produced by heavy ion inelastic scattering [8], did not observe any structure in low spin except the already established i13/2 band. Though the yrast i13/2 band has been extended upto 49/2+ in 197Hg and in other lower odd mass Hg nuclei, which indicates pair breaking in all of them, the decoupled band in 199Hg is only known upto 25/2+ spin. The exotic structures (like triaxiality), apprearing as non-yrast states, are expected in this region with less deformation and the light ion induced reaction are the most favorable one to populate this type of near-yrast structures.
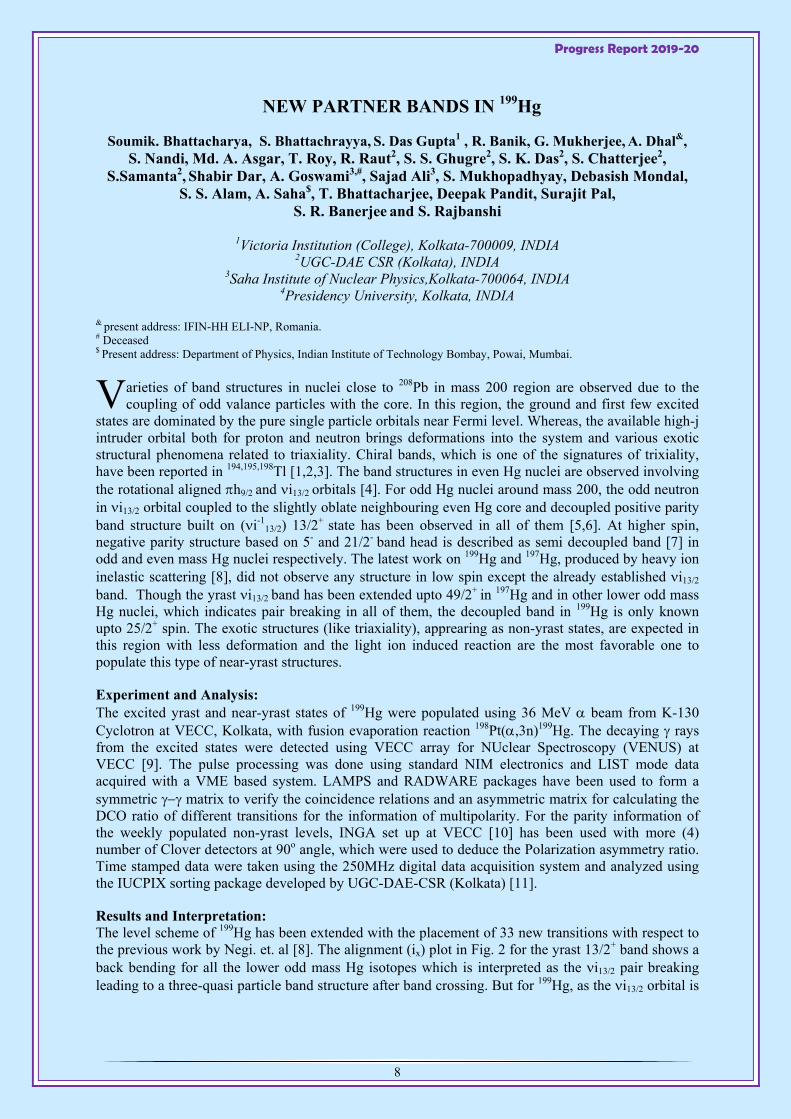
Experiment and Analysis: The excited yrast and near-yrast states of 199Hg were populated using 36 MeV beam from K-130 Cyclotron at VECC, Kolkata, with fusion evaporation reaction 198Pt(,3n)199Hg. The decaying rays from the excited states were detected using VECC array for NUclear Spectroscopy (VENUS) at VECC [9]. The pulse processing was done using standard NIM electronics and LIST mode data acquired with a VME based system. LAMPS and RADWARE packages have been used to form a symmetric matrix to verify the coincidence relations and an asymmetric matrix for calculating the DCO ratio of different transitions for the information of multipolarity. For the parity information of the weekly populated non-yrast levels, INGA set up at VECC [10] has been used with more (4) number of Clover detectors at 90o angle, which were used to deduce the Polarization asymmetry ratio. Time stamped data were taken using the 250MHz digital data acquisition system and analyzed using the IUCPIX sorting package developed by UGC-DAE-CSR (Kolkata) [11].
Results and Interpretation: The level scheme of 199Hg has been extended with the placement of 33 new transitions with respect to the previous work by Negi. et. al [8]. The alignment (ix) plot in Fig. 2 for the yrast 13/2+ band shows a back bending for all the lower odd mass Hg isotopes which is interpreted as the i13/2 pair breaking leading to a three-quasi particle band structure after band crossing. But for 199Hg, as the i13/2 orbital is
V
Progress Report 2019-20
9
almost full, a pair breaking in this orbital is blocked by the last odd neutron and the band become non-yrast, leading to the non-observation of the transitions beyond 25/2+ in heavy ion reaction.
Figure 1: Setup of Compton Suppressed Clover HPGe
detectors of the VENUS array at VECC K-130 Cyclotron beam line.
Figure 2: The alignment angular momentum (ix) for the yrast i13/2 band in 199Hg as well as the neighbouring odd Hg.
In the present work, two new E2 transitions, belongs to the i13/2 band, have been observed which extends the yrast band up to 31/2+ spin. In the present work, the signature partner band of i13/2 band has been identified for the first time which connects the main band with M1(+E2) transitions. Along with the signature partner band, another partner band with similar structure has been identified in 199Hg. The strongest connecting transition from the said band to the yrast band is found to be I=1, dominantly E2 nature with =78% mixing. The I=1, dominantly E2 (highly mixed) connecting transitions between rotational bands are the major experimental evidences of wobbling motion, generated in a triaxial nucleus. Being a potential candidate for the triaxial shape, this new rotational band 199Hg is predicted as a probable wobbling partner band. The determinations of the mixing ratios of all the connecting transitions as well as the theoretical calculations are necessary to confirm this conjecture.
Acknowledgement: The efforts of all the persons from VECC Cyclotron group are gratefully acknowledged for delivering the stable beam.
References: [1] P.L. Masiteng et al., PLB 719, 83 (1988). [2] T. Roy et al., PLB 782, 768 (2018). [3] E. A.Lawrie et al.,PRC 78, 021305(R) (2008). [4] C. Gunther et. al. PRC 15, 4, (1977) [5] R. M. Lieder et.al., NPA 248, 317 (1975) [6] D. Proetel et.al., NPA 226, 237 (1974) [7] K. Neergard et. al., NPA 238, 199 (1975) [8] D. Negi et. al., PRC 100, 014329 (2019) [9] Soumik Bhattacharya et. al. DAE Symp. on Nucl. Phys. Vol 61, p.98 ,(2016) [10] Soumik Bhattacharya et. al. DAE Symp. on Nucl. Phys. Vol 63, p.1156 (2018) [11] S. Das et.al, NIM A, 893, 138 (2018)
Progress Report 2019-20
10
COEXISTENCE OF SINGLE PARTICLE AND COLLECTIVE STRUCTURES IN 116Sb
Shabir Dar, Soumik Bhattacharya, S. Bhattacharyya, R. Banik, S. Nandi, G. Mukherjee, S. Das Gupta1, Sajad.Ali2, S. Chatterjee3, S. Das3, A. Dhal, S. S. Ghugre3, A. Goswami2, D. Mondal,
S. Mukhopadhyay, S. Pal, D. Pandit, R. Raut3, P. Ray2, S. Samanta3
1Victoria Institution (College), Kolkata-700009, India 2Saha Institute of Nuclear Physics, Kolkata - 700064, India 3UGC-DAE CSR, Kolkata Centre, Kolkata - 700098, India
he odd-odd Sb nuclei with only one valance proton above Z=50 closed shell and few neutrons above N=64 subshell exhibit both single particle as well as collective structures. The occupation
of h11/2 high-j negative parity orbital and also the promotion of a proton from g9/2 orbital to the g7/2 orbital leads the system towards the prolate deformation. The presence of Novel excitation modes, such as, magnetic rotational structures are also predicted for the Sb nuclei in this mass region [1]. Indication of the presence of coexistence of single particle and collective structures in the Sb isotopes of A~110 region has also made these nuclei interesting to study [2].
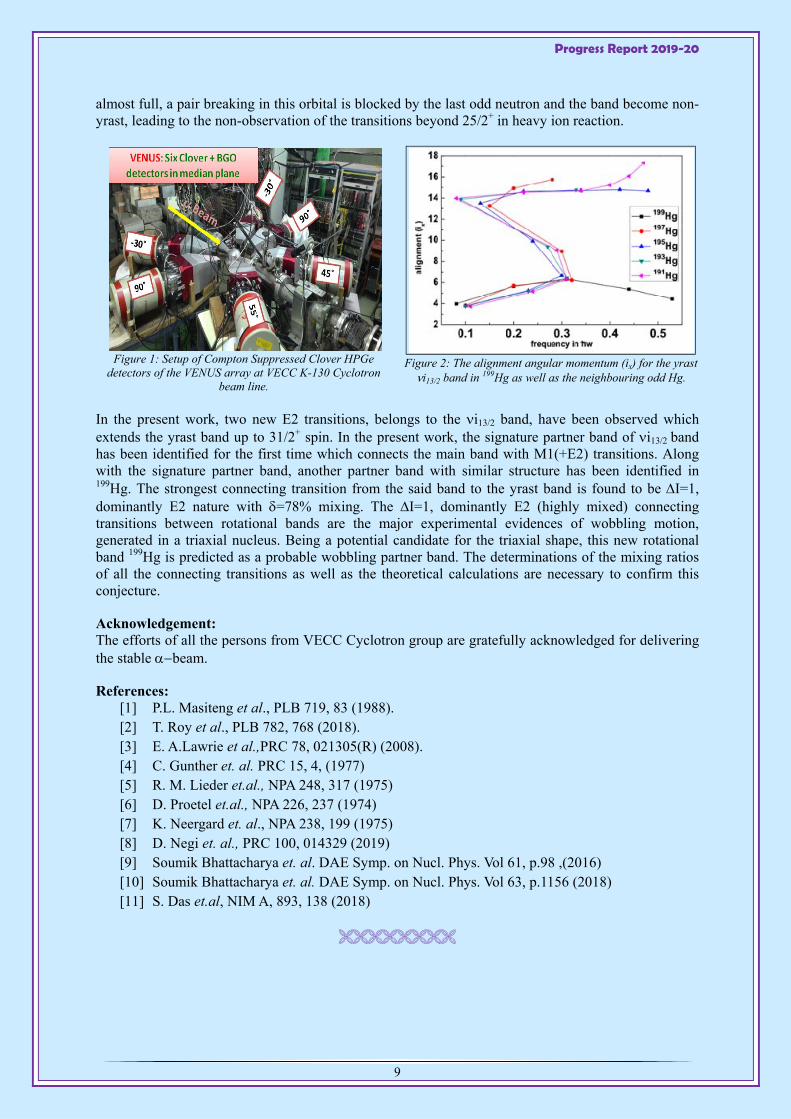
The excited states of 116Sb, with one valence proton and one valence neutron above Z=51 major shell and N=64 subshell respectively, are investigated at VECC, using the reaction 115In(, 3n)116Sb at a beam energy of 40 MeV from the K-130 Cyclotron at VECC, Kolkata. The decaying gamma rays from the excited states of 116Sb were detected using the setup of Indian National Gamma Array (INGA) at VECC, comprised of 7 Compton suppressed Clover HPGe detectors at the time of the present experiment. The target was placed 25 cm away from the front face of the Clover detectors. Pre-amplifier pulse has been processed using PIXIE-16 digitizer based pulse processing and data acquisition system [2]. The data were collected mostly with the trigger of two fold coincidence between two Compton suppressed Clover detectors and for some time collected with singles mode. A total of 200 million coincidence events were collected in the present experiment, which were sorted using the IUCPIX program, developed at UGC-DAE CSR, Kolkata Centre [2].
A symmetric coincidence matrix has been formed with the addback parameters of all the 7 Clover detectors. Asymmetric matrices were formed to measure the ratio of Directional Correlation from Oriented states (DCO) using the backward and 90° detectors. The polarization asymmetry of the decaying -rays have been determined from a matrix of parallel and perpendicular scattering of the -rays using the 90° Clover detectors.
Figure 1: Full projection of matrix showing the -rays detected in the current reaction.
100 200 300 400 500 600 7000.0
5.0x10⁵
1.0x10⁶
1.5x10⁶
2.0x10⁶
800 900 1000 1100 1200 1300 14000.0
5.0x10⁵
1.0x10⁶
1.5x10⁶
116Sb nuclei Other populated nuclei
624.
2
700.
266
9.0
480.
4
444.
0382.
837
4.4
337.
5
255.
5192.
7
93.0
226.
6
646.
3
527.
1
426.
1
596.
0
542.
5511.
046
7.0
411.
0
241.
0
352.
231
7.3
298.
6
215.
3
158.
213
5.9
Cou
nts
Energy (keV)
100.
4
116Sb nuclei Other populated nuclei
932.
1
1323
.8
1249
.2
1089
.4
1040
.810
21.2
886.
285
9.7
844.
1
795.
6
734.
2
1000
.1
1122
.211
60.1
968.
2
1399
.313
77.6
1293
.5
1184
.0
1072
.3
775.
5
972.
5
752.
4
Cou
nts
Energy (keV)
T
Progress Report 2019-20
11
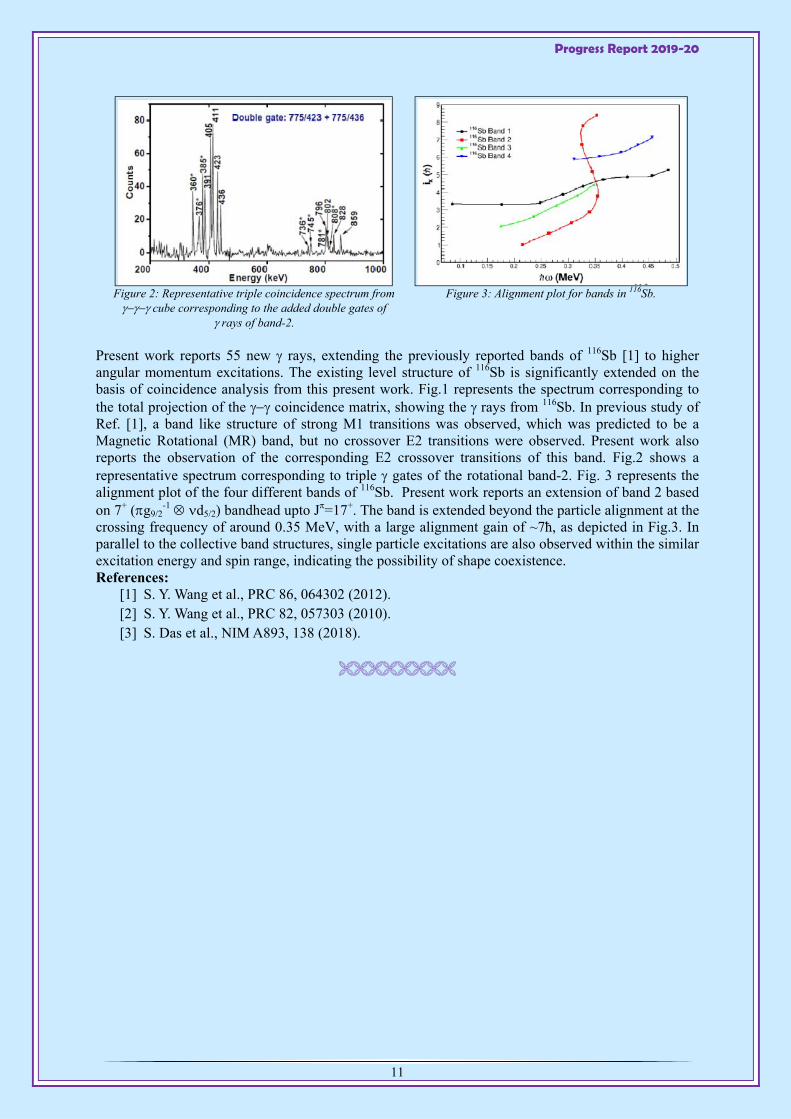
Figure 2: Representative triple coincidence spectrum from cube corresponding to the added double gates of
rays of band-2.
Figure 3: Alignment plot for bands in 116Sb.
Present work reports 55 new rays, extending the previously reported bands of 116Sb [1] to higher angular momentum excitations. The existing level structure of 116Sb is significantly extended on the basis of coincidence analysis from this present work. Fig.1 represents the spectrum corresponding to the total projection of the coincidence matrix, showing the rays from 116Sb. In previous study of Ref. [1], a band like structure of strong M1 transitions was observed, which was predicted to be a Magnetic Rotational (MR) band, but no crossover E2 transitions were observed. Present work also reports the observation of the corresponding E2 crossover transitions of this band. Fig.2 shows a representative spectrum corresponding to triple gates of the rotational band-2. Fig. 3 represents the alignment plot of the four different bands of 116Sb. Present work reports an extension of band 2 based on 7+ (g9/2
-1 d5/2) bandhead upto J=17+. The band is extended beyond the particle alignment at the crossing frequency of around 0.35 MeV, with a large alignment gain of ~7ħ, as depicted in Fig.3. In parallel to the collective band structures, single particle excitations are also observed within the similar excitation energy and spin range, indicating the possibility of shape coexistence. References:
[1] S. Y. Wang et al., PRC 86, 064302 (2012). [2] S. Y. Wang et al., PRC 82, 057303 (2010). [3] S. Das et al., NIM A893, 138 (2018).
Progress Report 2019-20
12
INVESTIGATION OF THE LEVEL STRUCTURE OF 78As AT MEDIUM SPINS
A. K. Mondal1, K. Mandal1, A. Chakraborty1#, A. Dey1#, U. S. Ghosh1, S. Biswas1, S. Rai1, B. Mukherjee1, Krishichayan2,3, S. Samanta4, S. K. Das4, S. Chatterjee4, R. Raut4, S. S. Ghugre4,
S. Rajbanshi5, R. Banik, S. Nandi, Soumik Bhattacharya, S. Bhattacharyya, G. Mukherjee, S. Ali6, A. Goswami6*, R. Chakrabarti7, S. Mukhopadhyay8, A. K. Sinha9,
A. Kumar10, V. Kumar10
1Department of Physics, Siksha-Bhavana, Visva-Bharati, Santiniketan 731 235 2Department of Physics, Duke University, Durham, North Carolina, 27708, USA
3Triangle Universities Nuclear Laboratory, Durham, North Carolina, 27708, USA 4UGC-DAE Consortium for Scientific Research, Kolkata 700 106 5Department of Physics, Presidency University, Kolkata 700 073
6Saha Institute of Nuclear Physics, Kolkata 700 064 7Department of Physics, Univesity of Mumbai, Mumbai 400 098
8Nuclear Physics Division, Bhabha Atomic Research Centre, Mumbai 400 085 9UGC-DAE Consortium for Scientific Research, Indore 452 017
10Department of Physics, Banaras Hindu University, Varanasi 221 005
#Financially assisted by the DAE-BRNS, Government of India (Project Sanction No.: 37(3)/14/17/2016-BRNS) *deceased
t appears that A~80 region provides a laboratory, particularly well suited to investigate the possibility of the occurrence of M1 band structures and their subsequent interpretations in terms of
“magnetic rotation” or “stapler mechanism” and the possible co-existence of the two [1,2,3]. Lying in the vicinity of N = 50 shell-closure, the 78As nucleus can be considered to be an ideal candidate in A~80 mass region for investigating the aforesaid novel mechanisms of angular momentum generation. The study of the level structure of odd-odd nuclei in this mass region also offers a scope to investigate the possible competition between single-particle and collective degrees of freedom. With these motivations, a detailed experimental investigation of the level structure of 78As has been carried out.
The excited states of 78As were populated through 76Ge(α,pn) fusion evaporation reaction at the incident beam energies of 30, 35, and 40 MeV. The beam was delivered by the K-130 Cyclotron machine at the Variable Energy Cyclotron Centre (VECC), Kolkata. The target was prepared at the target laboratory of VECC through the centrifuge process by depositing enriched 76Ge (94% enrichment) powder on mylar backing. The thickness of the target was 2 mg/cm2. Two such targets were stacked together in order to increase the yield of the residual nuclei. The de-exciting γ-rays were detected using Indian National Gamma Array (INGA). The array was comprised of six Compton-suppressed HPGe Clover detectors and one Low Energy Photon Spectrometer (LEPS) at the time of the experiment. Out of the six Clover detectors, four were placed at 90o with respect to the beam direction and the remaining two were at 125o. The single LEPS used in the experiment was placed at 40o. The pulse processing and data acquisition system was a digital one, consisting of 250 MHz 12-bit PIXIE-16 digitizers manufactured by XIA, LLC (USA) and running on a firmware conceptualized by the UGC-DAE CSR, Kolkata Centre [4]. The off-line data sorting process was carried out using the Linux based code ‘IUCPIX’, also developed at the UGC-DAE CSR, Kolkata Centre [4].
A representative - coincidence spectrum is shown in Fig. 1. In addition to the extension of the previously known yrast positive-parity band up to Ex ~2.7 MeV with J = 11ħ, an excited dipole band-like structure based on the 7(−), 1243-keV state has also newly been established. Several weak transitions feeding the low-lying non-yrast states have newly been identified and placed in the level scheme. The observed low-lying level scheme is found to be irregular in nature suggesting the dominance of single particle excitations. With an increase in the energy and angular momentum, regularity in the level scheme appears to develop. A positive-parity dipole band with the 6(+) band-head spin has been observed and assigned with a configuration of π(g9/2)
1 ν(g9/2)−1. A configuration
I

Progress Report 2019-20
13
of π[(f p)3] ν[(g9/2)−1] has been assigned to the observed negative-parity dipole band with a 7(−) band-
head spin. The TRS calculations suggest that both the positive and negative-parity dipole band has minima with prolate deformation of β2 0.18 (with γ 6) and 0.09 (with γ -11), respectively. Evidences for the possible persistence of stapler like mechanism in the observed dipole bands have been established.
Figure 1: (a,b): Representative coincidence spectra with the gate set on the ground state feeding 185-keV(3- 2-) transition
of 78As. Peaks labelled with their energy values (in keV) have been assigned to 78As. The newly observed transitions are marked with . The contaminant peaks marked with # belong to 77Se. The transition marked with $ belongs to the residual 18F nucleus produced from the oxidized target following the reaction,16O(,np). The spectrum has been generated using the set
of coincidence data collected with the incident beam energy of 40 MeV.
References: [1] H. Schnare et al., Phys. Rev. Lett. 82, 4408 (1999) [2] C.G. Li et al., Phys. Lett. B. 766, 107 (2017) [3] C.G. Li et al., Phys. Rev. C. 100, 044318 (2019) [4] S. Das et al., Nucl. Instrum. Methods Phys. Res. A893, 138 (2018)
Progress Report 2019-20
14
SPECTROSCOPIC STUDY OF 197Hg
S. Das Gupta1, P. Pallav1, Soumik Bhattacharya, S. Bhattachrayya, R. Banik*, G. Mukherjee, R. Raut2, S. Ghugre2, S. Das2, S. Samanta2, S. Chatterjee2, S. Rajbanshi3,
S. Nandi, Shabir Dar, Sneha Das, A. Goswami4,#, Sajad Ali4,$, Sudatta Ray5, Rupsa Banik1 and Sangeeta Majumdar1,&
1Victoria Institution (College), Kolkata-700009, INDIA 2UGC-DAE CSR (Kolkata), INDIA
3Presidency University, Kolkata, INDIA 4Saha Institute of Nuclear Physics, HBNI, Kolkata - 700064, INDIA
5Mody University of Science and Technology, Rajasthan, INDIA-332311
*Present Affiliation: Institute of Engineering and Management, Salt lake Sector V, Kolkata- 91, INDIA # Deceased $Present Affiliation: Government General Degree College at Pedong, Kalimpong -734311, INDIA &Present Affiliation: West Bengal State University, INDIA
uclear collective motion and its coupling with single particle excitation are manifested in various interesting modes of nuclear excitation in mass 190 region. Some of the common features of the
odd mass Hg isotopes are the existence of a 1
1 3 / 2( )i decoupled positive parity band built on an
isomeric 13/2+ level [1,2] and a negative parity semi decoupled band of ΔI=2 sequence [3]. 197Hg is of special interest as it manifests a blocking effect if the configuration of the corresponding core, 198Hg is considered to be 2
1 3 / 2( )i [4] which is not the case for the other odd mass Hg isotopes in mass 190
region. The bands built on 13/2+ and 21/2- states are extended in the latest work along with several other side bands [5], but many of the levels are assigned with tentative spin-parity. Thus, the aim of the present work is to enrich the spectroscopic data with a definite spin-parity assignment of the levels as it is a pre-requisite in understanding the shape driving effects caused by the intruder orbitals in the formation of different nuclear shape and the associated phenomena.
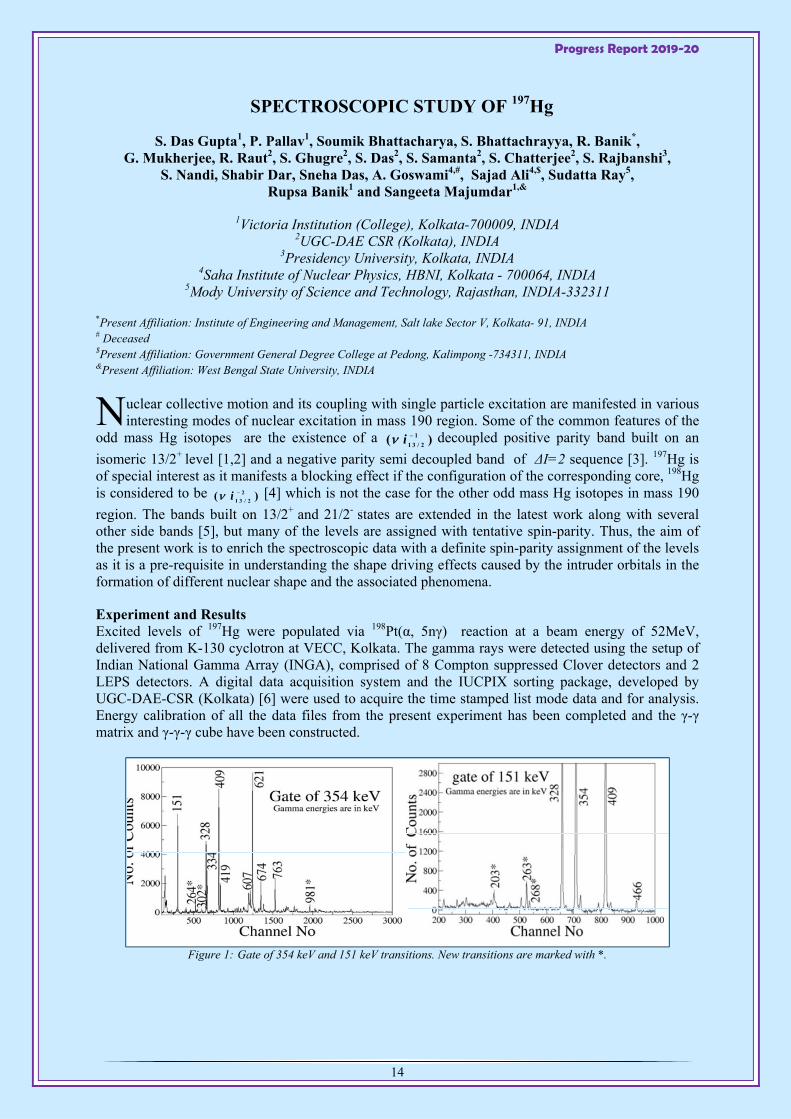
Experiment and Results Excited levels of 197Hg were populated via 198Pt(α, 5nγ) reaction at a beam energy of 52MeV, delivered from K-130 cyclotron at VECC, Kolkata. The gamma rays were detected using the setup of Indian National Gamma Array (INGA), comprised of 8 Compton suppressed Clover detectors and 2 LEPS detectors. A digital data acquisition system and the IUCPIX sorting package, developed by UGC-DAE-CSR (Kolkata) [6] were used to acquire the time stamped list mode data and for analysis. Energy calibration of all the data files from the present experiment has been completed and the γ-γ matrix and γ-γ-γ cube have been constructed.
Figure 1: Gate of 354 keV and 151 keV transitions. New transitions are marked with *.
N
Progress Report 2019-20
15
The representative coincidence spectra corresponding to the gates of 354 (transition just above the 13/2+ isomeric level) and 151 keV transitions of 197Hg are shown in Fig.1. The ‘*’ marked transitions are some of the new ones from the present work. Further analysis is in progress.
References: [1] R. M. Lieder et.al., NPA 248, 317 (1975) [2] D. Proetel et.al., NPA 226, 237 (1974) [3] K. Neergard et. al., NPA 238, 199 (1975) [4] D. Mertin et.al., NPA 301, 365 (1978) [5] D. Negi et. al., PRC 100, 014329 (2019) [6] S. Das et.al, NIM A, 893, 138 (2018)
Acknowledgement This work is the part of the project titled "Role of intruder orbitals for generation of high spin states in mass 190 region" supported by the UGC-DAE-CSR, Kolkata Centre, under Collaborative Research Scheme, 2019. We express our sincere gratitude towards them.
HIGH-K STATES AND BAND STRUCTURES IN YB ISOTOPES
Saket Suman1, S. K. Tandel1, S. G. Wahid1, Poulomi Roy1, A. Chakraborty2, K. Mandal2, A. K. Mondal2, G. Mukherjee, S. Bhattacharyya, Soumik Bhattacharya, R. Banik, S. Nandi, Shabir
Dar, A. Agar, S. Samanta3, S. Das3, S. Chatterjee3, R. Raut3, S. S. Ghugre3, A. Sharma4, Sajad Ali5 , P. Chowdhury6
1UM-DAE Centre for Excellence in Basic Sciences, University of Mumbai, Mumbai 2Department of Physics, Visva-Bharati, Santiniketan
3UGC-DAE Consortium for Scientific Research, Kolkata 4Department of Physics, Himachal Pradesh University, Shimla
5Saha Institute for Nuclear Physics, HBNI, Kolkata 6University of Massachusetts Lowell, Lowell, USA
uclei in the Yb region (A ≈ 170) represent some of the best known examples of normal-deformed axially symmetric rotors. Additionally, the region provides with large Ω valence neutron and
proton orbitals from the i13/2 and h11/2 subshell respectively. This allows for the study of the competition between rotational and quasiparticle degrees of freedom, and the Coriolis coupling between these excitation modes. The presence of high-j orbitals in this region allows for the realization of multiple band structures in addition to the ground state rotational band.
High-j orbitals can have relatively high components of angular momentum projection (Ω) along the symmetry axis. The presence of these orbitals originating from high-j proton and neutron sub-shells in this region suggest that high-K (K = Σ Ωi) states, some of which may be isomeric, are expected in Yb isotopes. K isomers have been observed in some Yb isotopes, however a few others have not yet been studied up to high spin using thick targets [1-5].
The aim of the experiment was to study high-K states, rotational and vibrational band structures and the evolution of collectivity along the Yb isotopic chain. Identification of the high-K states and associated bands and lifetime measurements for possible longer-lived isomers (T1/2 > 100 ns ) is one of the objectives. The band structures built on the high-K states and the branching ratios for the decay of the levels in these rotational bands would also allow for configuration assignments.
N

Progress Report 2019-20
16
Experiment and Analysis In the present work, excited states have been populated in Yb isotopes using alpha-induced reactions on a thick, natural erbium target. An alpha beam at 45 MeV was delivered by the K-130 cyclotron at the Variable Energy Cyclotron Centre (VECC), Kolkata. The INGA (Indian National Gamma Array) facility at VECC, consisting of 8 clover HPGe and 2 LEPS detectors were used to record two- and higher-fold gamma ray coincidence events. The PIXIE-16 digitizer-based data acquisition system along with the associated software package IUCPIX [6] of UGC-DAE CSR, Kolkata, was used to sort the data into different two- and three-dimensional histograms.
Results and Discussion Preliminary analysis of the data has allowed verification of the already established rotational bands and side bands in the Yb isotopes. Excited states in the strong rotational bands in the even Yb isotopes are observed up to spin 20 . The presence of known transitions from the decay of K isomers in 168,170,172Yb was also evident. The partial level schemes of 168,170,172Yb showing known K isomers [7-9] and their feeding and decaying transitions to the ground-state rotational bands have been shown in Fig. 1.
Figure 1: Partial level schemes of 168,170,172Yb with
known K isomers and their halflives. Figure 2: Spectra from the decay of K isomers
in 168,170,172Yb.
The spectra from gates on their respective decaying transitions in a two-dimensional energy histogram are also shown in Figure 2. Further analysis is in progress to determine the presence of other high-K states and their lifetimes in the 100 ns - few μs time range. It is also proposed to explore the evolution of collectivity in Yb isotopes at high spin with increasing neutron number
References: [1] D.E. Archer et al, Phys. Rev. C 57, 2924 (1998). [2] J.C. Bacelar et al, Nucl. Phys. A442, 509 (1985). [3] N. Roy et al, Nucl. Phys. A382, 125 (1982). [4] E.M. Beck et al, Nucl. Phys. A464, 472 (1987). [5] A.E. Stuchbery et al, Nucl. Phys. A669, 27 (2000). [6] S. Das et al, Nucl. Inst. and Meth. Phys. Res. A893, 138 (2018). [7] P.M. Walker et al, Nucl. Phys. A365, 61 (1981). [8] P.M. Walker et al, Nucl. Phys. A343, 45 (1980). [9] A. Charvet et al, Nucl. Phys. A213, 117 (1973).
Progress Report 2019-20
17
MEASUREMENT OF RELATIVE ISOTOPIC YIELD DISTRIBUTIONS OF NEUTRON-RICH FRAGMENT NUCLEI PRODUCED IN
INDUCED FISSION OF 232Th
Aniruddha Dey1,2#, S. Mukhopadhyay1, A. Chakraborty2#, D. C. Biswas1, B. N. Joshi1, A. K. Mondal2, K. Mondal2, S. Chatterjee3, S. Samanta3,
S. Das3, Soumik Bhattacharya, R. Banik, S. Nandi, R. Raut3, G. Mukherjee, S. Bhattacharyya, S. S. Ghugre3, and A. Goswami4*
1Nuclear Physics Division, Bhabha Atomic Research Centre, Mumbai 400 085 2Department of Physics, Visva-Bharati University, Shantiniketan, Birbhum, West Bengal 731 235
3UGC-DAE CSR, Kolkata Centre, Kolkata 700 106 4Saha Institute of Nuclear Physics, Kolkata 700 064
#financially assisted by the DAE-BRNS, Government of India (Project Sanction No.: 37(3)/14/17/2016-BRNS) *deceased
uclear fission is a very complex process which involves large scale collective rearrangement of nuclear matter in a short time scale. The dynamics of fission process continues to generate a lot
of research interest even after more than eighty years of its discovery. The fission fragment nuclei that are produced in a fission process are found to be exotic in nature due to their higher neutron-to-proton ratios. It is to be noted here that the relative production yields of the correlated fission fragment nuclei change from one system to another and also depend on the excitation of the fissioning nucleus. The extraction of relative fission fragment yield distribution of a particular fissioning system provides valuable information on the underlying dynamics of nuclear fission process. The relative yield distribution and spectroscopic studies of neutron-rich fission fragments were carried out earlier for fission of 236U, employing 235U(nth,f) reaction using thermal neutrons from CIRUS reactor at BARC [1]. In this context, we have carried out an experiment using the accelerated 30 MeV -beam from VECC machine and the fission fragment nuclei were produced following the 232Th(,f) fission reaction.
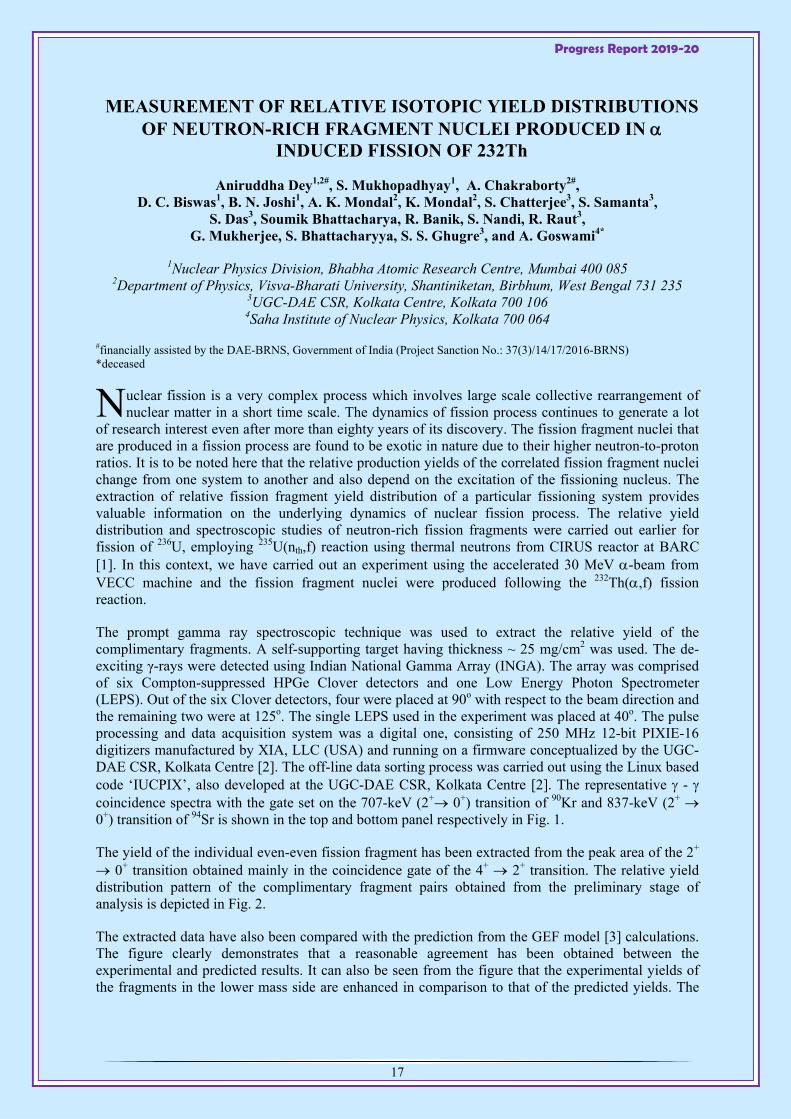
The prompt gamma ray spectroscopic technique was used to extract the relative yield of the complimentary fragments. A self-supporting target having thickness ~ 25 mg/cm2 was used. The de-exciting γ-rays were detected using Indian National Gamma Array (INGA). The array was comprised of six Compton-suppressed HPGe Clover detectors and one Low Energy Photon Spectrometer (LEPS). Out of the six Clover detectors, four were placed at 90o with respect to the beam direction and the remaining two were at 125o. The single LEPS used in the experiment was placed at 40o. The pulse processing and data acquisition system was a digital one, consisting of 250 MHz 12-bit PIXIE-16 digitizers manufactured by XIA, LLC (USA) and running on a firmware conceptualized by the UGC-DAE CSR, Kolkata Centre [2]. The off-line data sorting process was carried out using the Linux based code ‘IUCPIX’, also developed at the UGC-DAE CSR, Kolkata Centre [2]. The representative - coincidence spectra with the gate set on the 707-keV (2+ 0+) transition of 90Kr and 837-keV (2+ 0+) transition of 94Sr is shown in the top and bottom panel respectively in Fig. 1.
The yield of the individual even-even fission fragment has been extracted from the peak area of the 2+ 0+ transition obtained mainly in the coincidence gate of the 4+ 2+ transition. The relative yield distribution pattern of the complimentary fragment pairs obtained from the preliminary stage of analysis is depicted in Fig. 2.
The extracted data have also been compared with the prediction from the GEF model [3] calculations. The figure clearly demonstrates that a reasonable agreement has been obtained between the experimental and predicted results. It can also be seen from the figure that the experimental yields of the fragments in the lower mass side are enhanced in comparison to that of the predicted yields. The
N
Progress Report 2019-20
18
additional yields are possibly due to the feeding of beta-precursors. Detailed analysis of the acquired data is in progress.
Figure 1: Representative coincidence spectra of 94Sr (lower
panel) and 90Kr (upper panel). A few strong transitions belonging to 94Sr, 90Kr, and their complementary fragments
are labelled.
Figure 2: Comparison of the experimental relative
isotopic yield distribution of the complementary even-even fragment nuclei with the results obtained from the
theoretical GEF model [3] calculations.
References: [1] S. Mukhopadhyay et al., Phys. Rev. C 85, 064321 (2012) [2] S. Das et al., Nucl. Instrum. Methods Phys. Res. A893, 138 (2018) [3] K. H. Schmidt, B. Jurado, C. Amouroux, and C. Schmitt, Nucl. Data Sheets 131, 107 (2016)
DESIGN AND DEVELOPMENT OF A DUAL CFD WITH VARIABLE DELAY AND FRACTION
Somnath Dalal, Partha Bhaskar, Kaushik Banerjee, Chandana Bhattacharya
n demand of users from the Experimental Nuclear Physics Division of VECC, a Constant Fraction Discriminator, in NIM standard was designed and developed. Two unique features of
changing the fraction and the delay of the input pulse has been incorporated in this low cost double width NIM unit for optimizing signal characteristics and use with different types of detectors.
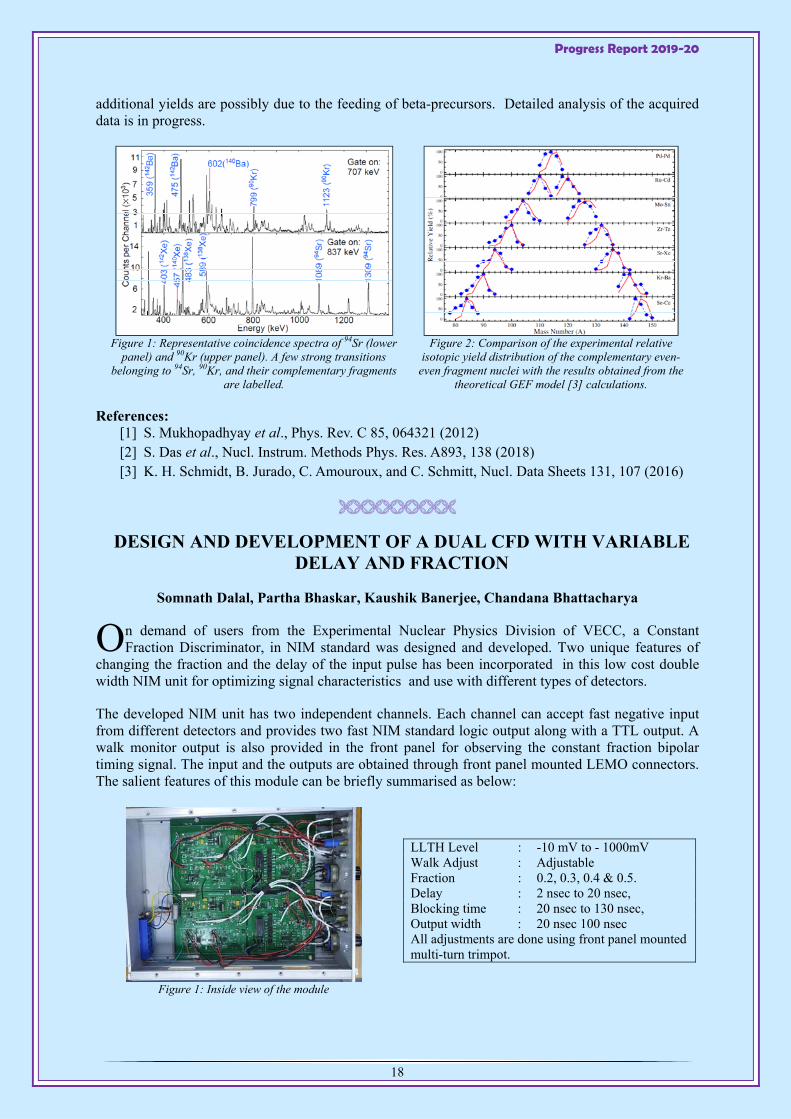
The developed NIM unit has two independent channels. Each channel can accept fast negative input from different detectors and provides two fast NIM standard logic output along with a TTL output. A walk monitor output is also provided in the front panel for observing the constant fraction bipolar timing signal. The input and the outputs are obtained through front panel mounted LEMO connectors. The salient features of this module can be briefly summarised as below:
Figure 1: Inside view of the module
LLTH Level : -10 mV to - 1000mV Walk Adjust : Adjustable Fraction : 0.2, 0.3, 0.4 & 0.5. Delay : 2 nsec to 20 nsec, Blocking time : 20 nsec to 130 nsec, Output width : 20 nsec 100 nsec All adjustments are done using front panel mounted multi-turn trimpot.
O
Progress Report 2019-20
19
The circuit has been designed using fast emitter coupled logic Integrated Circuits and state of the art SMD components realised on a double sided FR4 grade PCB using ground plane to reduce noise components .The schematic and PCB design has been done using Proteus8 computer aided software. Fast ECL comparator Integrated Circuit AD96687, is used in the circuit along with MC10EL05, which generates the constant fraction signal. Stable metal film resistors having tolerance of ± 1% are used for obtaining precision fractional value of the input pulse and high performance passive tap delay TZB12-5 (Rhombus make) in DIP package, has been used for setting different values of delay desired. The generated constant fraction signal is subsequently fed to two MC10EL31, a D type ECL flip flop, which are configured as a mono-stable, to generate the blocking time of the unit and to generate and adjust the width of the final outputs. Integrated circuit MC10ELT25 has been used to generate TTL output and finally, the output section uses a pair of high frequency transistor BFR92A to produce two fast negative NIM standard outputs per channel. One such unit has been extensively used by a student of Jadavpur University, Kolkata studying M.Sc. (Inst).
DEVELOPMENT OF ETHERNET BASED REMOTE CONTROL FOR MAJORITY LOGIC UNIT
Somnath Dalal, Partha Bhaskar, Kaushik Banerjee, Chandana Bhattacharya
he Majority Logic unit, which was developed last year, has been updated to be used remotely, besides locally, for changing its coincidence level, using LAN and a custom built webpage. This
novel feature, developed first of its kind in VECC, will help a user of this unit, to use it inside the experimental caves of the RTC, without stopping the beam, thereby reducing wastage of precious beam time and improve experimental techniques.
This newly developed low cost remote control system is based on Arduino Due platform and a firmware is developed to implement the technique which is tested with the Local Area Network. The remote control unit is connected to the threshold block of the logic unit’s each channel by four wires. The control part for selecting the coincidence level of the unit is connected to the internet using the Ethernet shield. The remote control unit, which is housed in a small aluminium box, is designed as a web based server and assigned with a unique internet protocol (IP) address. A user can access this logic unit using this IP address and change its coincidence level remotely. For the user interface purpose, a custom webpage is developed using Hyper Text Mark-up Language (HTML) in the control server. Detailed characteristics of the Majority logic unit, like time jitter, minimum coincidence time, maximum operating frequency, double pulse resolution, input to output delay etc. are evaluated using the selection of coincidence level using this remote control unit. The results are tabulated below.
Figure 1: Inside view of the Arduino
based Remote Control unit.
Output width (adj) 4 to 150 nsec Frequency (Max) ≥130 MHz
Time jitter <40 psec Double pulse
resolution <7.7 nsec
Coincidence time (Min)
440 psec Input to output
delay 10 nsec
T

Progress Report 2019-20
20
Validity of the developed Majority Logic Unit has been compared with Phillips Scientific 754 by performing a 1-fold and 2-fold coincidence experiment using 22Na γ-source. Measurement was performed using two BaF2 detectors placed opposite to each other at a distance of 10 cm apart with a 22Na γ-source in between and the final data was acquired using a Multi-Channel Analyser.
Figure 2: Gamma energy Spectrum of 22Na under 1-fold and
2-fold coincidence using VECC make module.
Figure 3: Gamma energy Spectrum of 22Na under 1-fold and
2-fold coincidence using PS 754.
It is clearly seen in Fig.2 and Fig.3, that performance of our module using the newly developed remote control coincidence level selection is at par with locally controlled Phillips Scientific module. Hence, it may be concluded that this low cost Arduino based remote controllable NIM MLU can be an upgradation of the commercially available similar NIM units. Possibilities of implementing such remote control units for other NIM’s are being explored.
DEVELOPMENT OF A LOW COST CURRENT INTEGRATOR FOR USE WITH SCC
Partha Bhaskar, Somnath Dalal, Chandana Bhattacharya
low cost, indigenously developed Current Integrator has been developed and dedicated to be used in control room of Super Conducting Cyclotron at VECC. The unit is a benchtop model,
working as a combined Ampere/Coulomb meter having measuring range from 1 nA/nC F.S. to 100nA/100nC F.S in 11 steps. The input current reading is displayed on the front panel by an analogue meter and the total counts are accumulated on a 6 digit electromechanical counter, which can also be reset. The polarity of the input current and the over range status are automatically displayed by front panel mounted light emitting diodes. The unit also has been provided an analog output of ± 1V F.S and a digital output of +5V, 10Hz F.S. In case the electro mechanical counter fails to operate, the digital output can be used to count using a Scaler unit.
Extreme care has been taken to minimize leakage current of the unit to enhance the measurement quality and accuracy especially in low ranges. The PCB has been designed using computer aided software Proteus 8 and realised on a FR4 grade laminate. The heart of the unit utilises LTC1051, a micro power Zero Drift Chopper Stabilised Op Amp and OP177, an ultra-precision Op Amp with ultra-low offset voltage combined with 50 ppm, 1% MF resistors in feedback section of the input stage. These components ensure a stable performance of the unit. The input section has over voltage and over current protection as a standard feature. The unit has been calibrated and extensively tested using Keithley Current Source, Model 6221, for each range. The unit has been packed in 19 inch rack mount 2U cabinet operating on 230VAC, 50Hz. Similar unit is used in RTC Control Room for the last many years.
A
Progress Report 2019-20
21
COMPARATIVE STUDY OF GAMMA RAY DETECTORS FOR PRECISION DECAY RATE MEASUREMENTS
S. Pathak#, P. Das, A. K. Sikdar, J. Nandi, S. Bhattacharyya, T. Bhattacharjee, Soumik Bhattacharya, S. S. Alam, A. Ray##
#Fnancially assisted by DAE, India ##Financially assisted by Science and Engineering Research Board, Government of India, Grant No. EMR/2016/001914
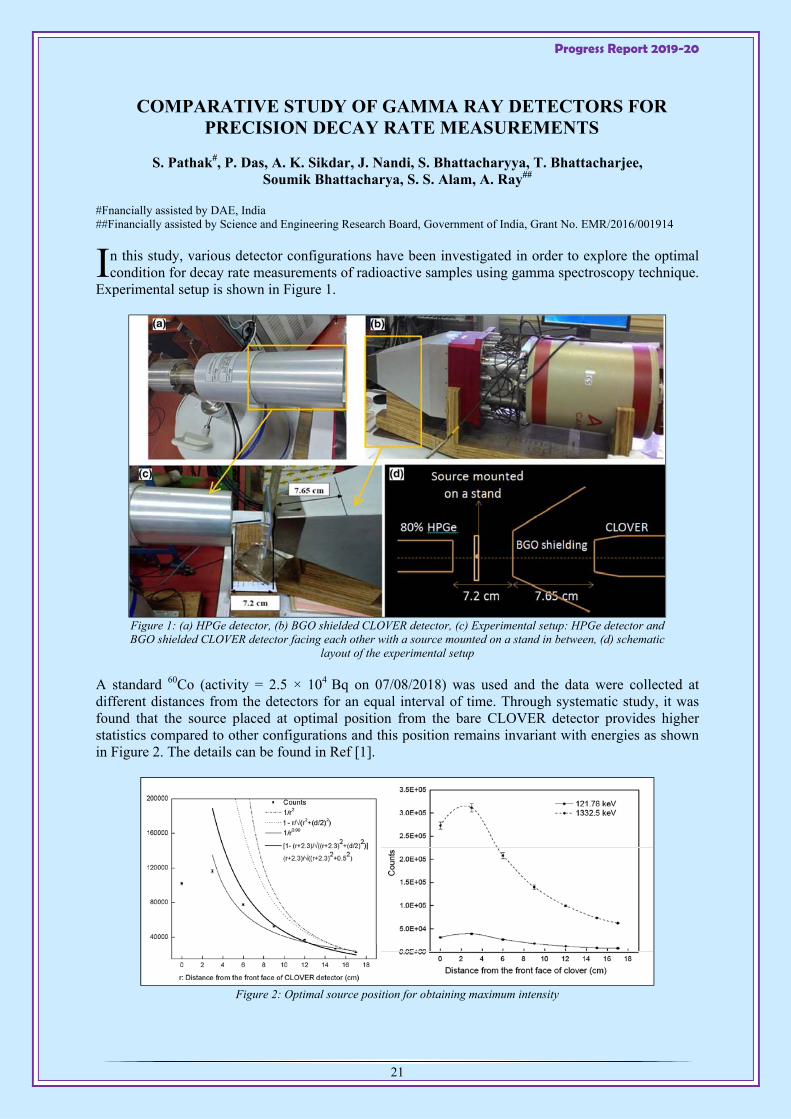
n this study, various detector configurations have been investigated in order to explore the optimal condition for decay rate measurements of radioactive samples using gamma spectroscopy technique.
Experimental setup is shown in Figure 1.
Figure 1: (a) HPGe detector, (b) BGO shielded CLOVER detector, (c) Experimental setup: HPGe detector and BGO shielded CLOVER detector facing each other with a source mounted on a stand in between, (d) schematic
layout of the experimental setup
A standard 60Co (activity = 2.5 × 10⁴ Bq on 07/08/2018) was used and the data were collected at different distances from the detectors for an equal interval of time. Through systematic study, it was found that the source placed at optimal position from the bare CLOVER detector provides higher statistics compared to other configurations and this position remains invariant with energies as shown in Figure 2. The details can be found in Ref [1].
Figure 2: Optimal source position for obtaining maximum intensity
I

Progress Report 2019-20
22
References: [1] S. Pathak, P. Das, A. K. Sikdar, J. Nandi, S. Bhattacharyya, T. Bhattacharjee, Soumik
Bhattacharya, S. S. Alam & A. Ray, Journal of Radioanlytical and Nucl. Chem. 323 (2020) 1353.
UNEXPECTED INCREASE OF 7Be DECAY RATE UNDER COMPRESSION
A. Ray##, A. K. Sikdar, P. Das, S. Pathak# and J, Datta
#Fnancially assisted by DAE, India ##Financially assisted by Science and Engineering Research Board, Government of India, Grant No. EMR/2016/001914
t is important to understand the effect of compression on the decay rate of 7Be because of its significance in calculating 7Be decay rate at the solar core and corresponding 8B neutrino flux. An
experimental study was conducted and we measured (0.82 ± 0.16)% increase of decay rate of 7Be in Pd lattice compared to that of 7Be in Pb lattice, whereas the corresponding increase predicted by density functional code is ∼0.2%. The increase of 7Be decay rate is similar to compressing 7BeO lattice with an external pressure of about 40 GPa. The details can be found in Ref [1].
References: [1] Ray, A. K. Sikdar, P. Das, S. Pathak and J, Datta, Phys. Rev C 101 (2020) 035801.
DOPING INDUCED PHASE TRANSFORMATION AND CHANGE IN THE PATH OF PRESSURE-INDUCED STRUCTURAL EVOLUTION
S. Pathak, P. Das, M. Sahu, K. L. Pandey1, G. Mandal2, G. R. Patkare1
1RCAD, BARC, Mumbai 2Centre for Rural and Cryogenic Technologies, Jadavpur University, Kolkata
#Fnancially assisted by DAE, India
systematic study of orthorhombic phase formation at ambient conditions beyond a critical concentration of dopant Tantalum (Ta) in HfO2 has been done. The formation of orthorhombic-I
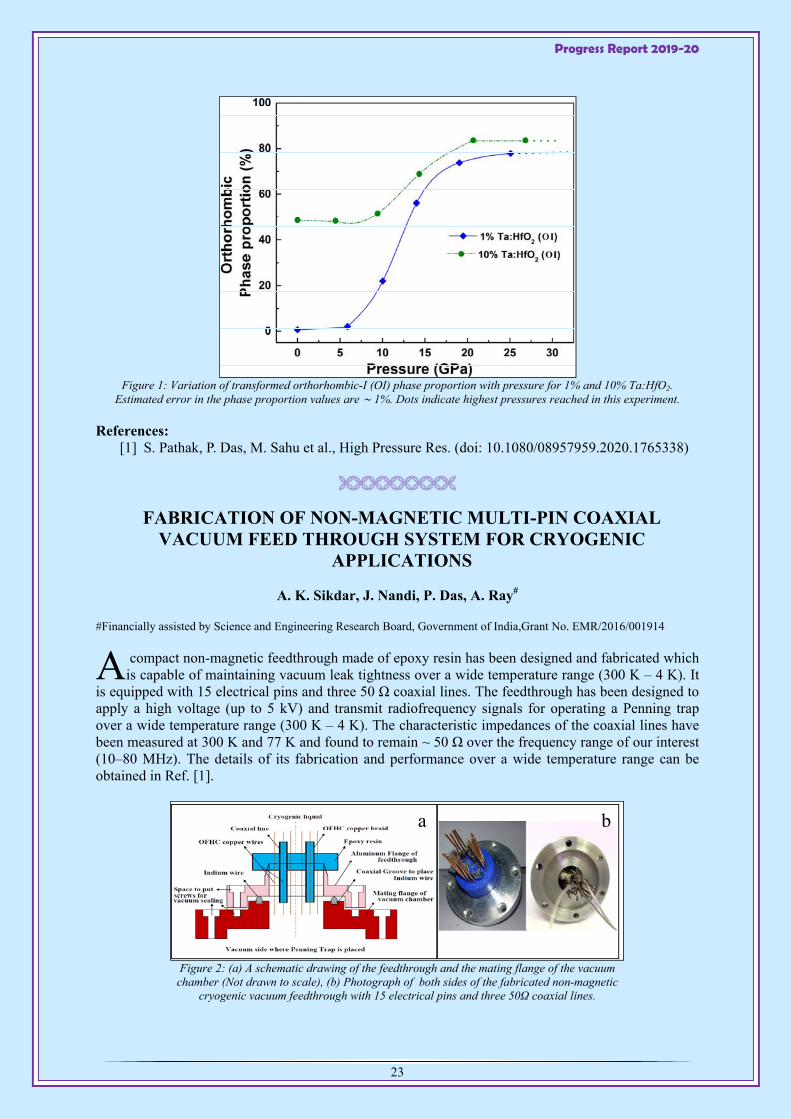
phase of HfO2 occurs at ambient condition for minimum 1 mol % or higher concentration of Ta doping and this phase formation increases with enhanced Ta doping up to 10 mol %. Further increase in the doping concentration (20% and 30%) results decrease in the orthorhombic-I phase formation.
The effect on the path of structural evolution due to Ta doping in HfO2 was also investigated. Though the proportion of orthorhombic-I phase for 10% Ta doped HfO2 sample (∼ 50%) is comparatively much higher than 1% doped sample (∼0.7%) at ambient condition, rate of conversion to orthorhombic-I phase with pressure is much faster for 1% doped sample as shown in Figure 1. Orthorhombic-I phase reaches to a saturation for both 1% and 10% doped samples ∼ 30 GPa pressure.
Studies on Ta-doped HfO2 samples and their path of structural evolution under compression have significant implications for materials undergoing β-decay. Due to radioactive decays the composition of the Earth would change; particularly in case of β-decay atomic number of the constituents would change by one unit. This study implies that structural evolution may take a different path deep inside the Earth where high pressure condition exists. The details can be found in Ref [1].
I
A
Progress Report 2019-20
23
Figure 1: Variation of transformed orthorhombic-I (OI) phase proportion with pressure for 1% and 10% Ta:HfO2.
Estimated error in the phase proportion values are ∼ 1%. Dots indicate highest pressures reached in this experiment.
References: [1] S. Pathak, P. Das, M. Sahu et al., High Pressure Res. (doi: 10.1080/08957959.2020.1765338)
FABRICATION OF NON-MAGNETIC MULTI-PIN COAXIAL VACUUM FEED THROUGH SYSTEM FOR CRYOGENIC
APPLICATIONS
A. K. Sikdar, J. Nandi, P. Das, A. Ray#
#Financially assisted by Science and Engineering Research Board, Government of India,Grant No. EMR/2016/001914
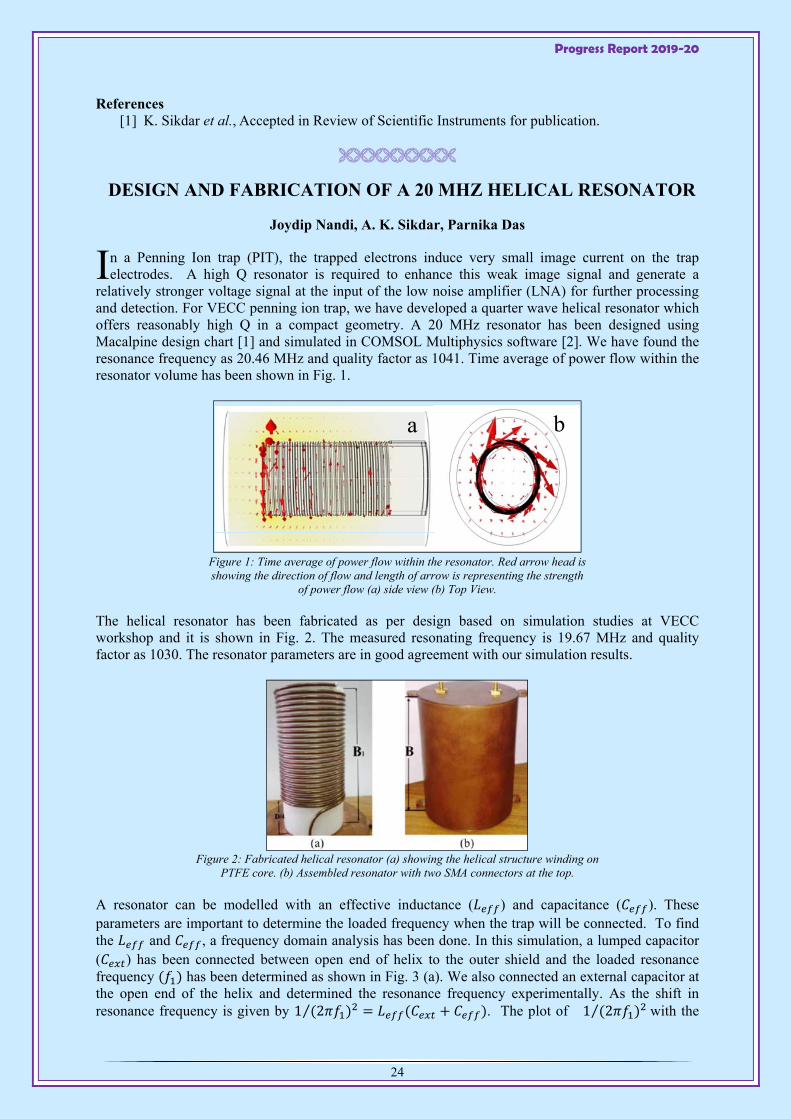
compact non-magnetic feedthrough made of epoxy resin has been designed and fabricated which is capable of maintaining vacuum leak tightness over a wide temperature range (300 K – 4 K). It
is equipped with 15 electrical pins and three 50 Ω coaxial lines. The feedthrough has been designed to apply a high voltage (up to 5 kV) and transmit radiofrequency signals for operating a Penning trap over a wide temperature range (300 K – 4 K). The characteristic impedances of the coaxial lines have been measured at 300 K and 77 K and found to remain ~ 50 Ω over the frequency range of our interest (10–80 MHz). The details of its fabrication and performance over a wide temperature range can be obtained in Ref. [1].
Figure 2: (a) A schematic drawing of the feedthrough and the mating flange of the vacuum
chamber (Not drawn to scale), (b) Photograph of both sides of the fabricated non-magnetic cryogenic vacuum feedthrough with 15 electrical pins and three 50Ω coaxial lines.
a b
A
Progress Report 2019-20
24
References [1] K. Sikdar et al., Accepted in Review of Scientific Instruments for publication.
DESIGN AND FABRICATION OF A 20 MHZ HELICAL RESONATOR
Joydip Nandi, A. K. Sikdar, Parnika Das
n a Penning Ion trap (PIT), the trapped electrons induce very small image current on the trap electrodes. A high Q resonator is required to enhance this weak image signal and generate a
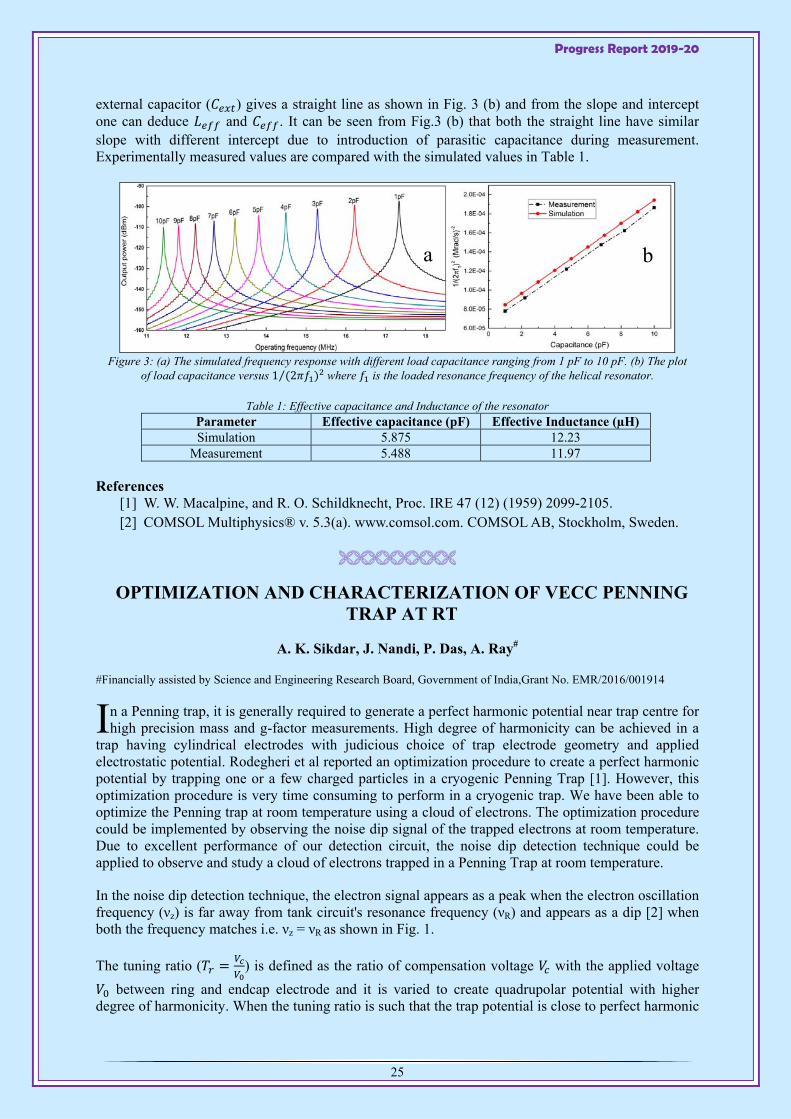
relatively stronger voltage signal at the input of the low noise amplifier (LNA) for further processing and detection. For VECC penning ion trap, we have developed a quarter wave helical resonator which offers reasonably high Q in a compact geometry. A 20 MHz resonator has been designed using Macalpine design chart [1] and simulated in COMSOL Multiphysics software [2]. We have found the resonance frequency as 20.46 MHz and quality factor as 1041. Time average of power flow within the resonator volume has been shown in Fig. 1.
Figure 1: Time average of power flow within the resonator. Red arrow head is showing the direction of flow and length of arrow is representing the strength
of power flow (a) side view (b) Top View.
The helical resonator has been fabricated as per design based on simulation studies at VECC workshop and it is shown in Fig. 2. The measured resonating frequency is 19.67 MHz and quality factor as 1030. The resonator parameters are in good agreement with our simulation results.
Figure 2: Fabricated helical resonator (a) showing the helical structure winding on
PTFE core. (b) Assembled resonator with two SMA connectors at the top.
A resonator can be modelled with an effective inductance ( ) and capacitance ( ). These parameters are important to determine the loaded frequency when the trap will be connected. To find the and , a frequency domain analysis has been done. In this simulation, a lumped capacitor ( ) has been connected between open end of helix to the outer shield and the loaded resonance frequency has been determined as shown in Fig. 3 (a). We also connected an external capacitor at the open end of the helix and determined the resonance frequency experimentally. As the shift in resonance frequency is given by 1 2⁄ . The plot of 1 2⁄ with the
a b
I
Progress Report 2019-20
25
external capacitor ( ) gives a straight line as shown in Fig. 3 (b) and from the slope and intercept one can deduce and . It can be seen from Fig.3 (b) that both the straight line have similar slope with different intercept due to introduction of parasitic capacitance during measurement. Experimentally measured values are compared with the simulated values in Table 1.
Figure 3: (a) The simulated frequency response with different load capacitance ranging from 1 pF to 10 pF. (b) The plot
of load capacitance versus 1 2⁄ where is the loaded resonance frequency of the helical resonator.
Table 1: Effective capacitance and Inductance of the resonator Parameter Effective capacitance (pF) Effective Inductance (µH) Simulation 5.875 12.23
Measurement 5.488 11.97
References [1] W. W. Macalpine, and R. O. Schildknecht, Proc. IRE 47 (12) (1959) 2099-2105. [2] COMSOL Multiphysics® v. 5.3(a). www.comsol.com. COMSOL AB, Stockholm, Sweden.
OPTIMIZATION AND CHARACTERIZATION OF VECC PENNING TRAP AT RT
A. K. Sikdar, J. Nandi, P. Das, A. Ray#
#Financially assisted by Science and Engineering Research Board, Government of India,Grant No. EMR/2016/001914
n a Penning trap, it is generally required to generate a perfect harmonic potential near trap centre for high precision mass and g-factor measurements. High degree of harmonicity can be achieved in a
trap having cylindrical electrodes with judicious choice of trap electrode geometry and applied electrostatic potential. Rodegheri et al reported an optimization procedure to create a perfect harmonic potential by trapping one or a few charged particles in a cryogenic Penning Trap [1]. However, this optimization procedure is very time consuming to perform in a cryogenic trap. We have been able to optimize the Penning trap at room temperature using a cloud of electrons. The optimization procedure could be implemented by observing the noise dip signal of the trapped electrons at room temperature. Due to excellent performance of our detection circuit, the noise dip detection technique could be applied to observe and study a cloud of electrons trapped in a Penning Trap at room temperature.
In the noise dip detection technique, the electron signal appears as a peak when the electron oscillation frequency (νz) is far away from tank circuit's resonance frequency (νR) and appears as a dip [2] when both the frequency matches i.e. νz = νR as shown in Fig. 1.
The tuning ratio ( ) is defined as the ratio of compensation voltage with the applied voltage
between ring and endcap electrode and it is varied to create quadrupolar potential with higher degree of harmonicity. When the tuning ratio is such that the trap potential is close to perfect harmonic
a b
I
Progress Report 2019-20
26
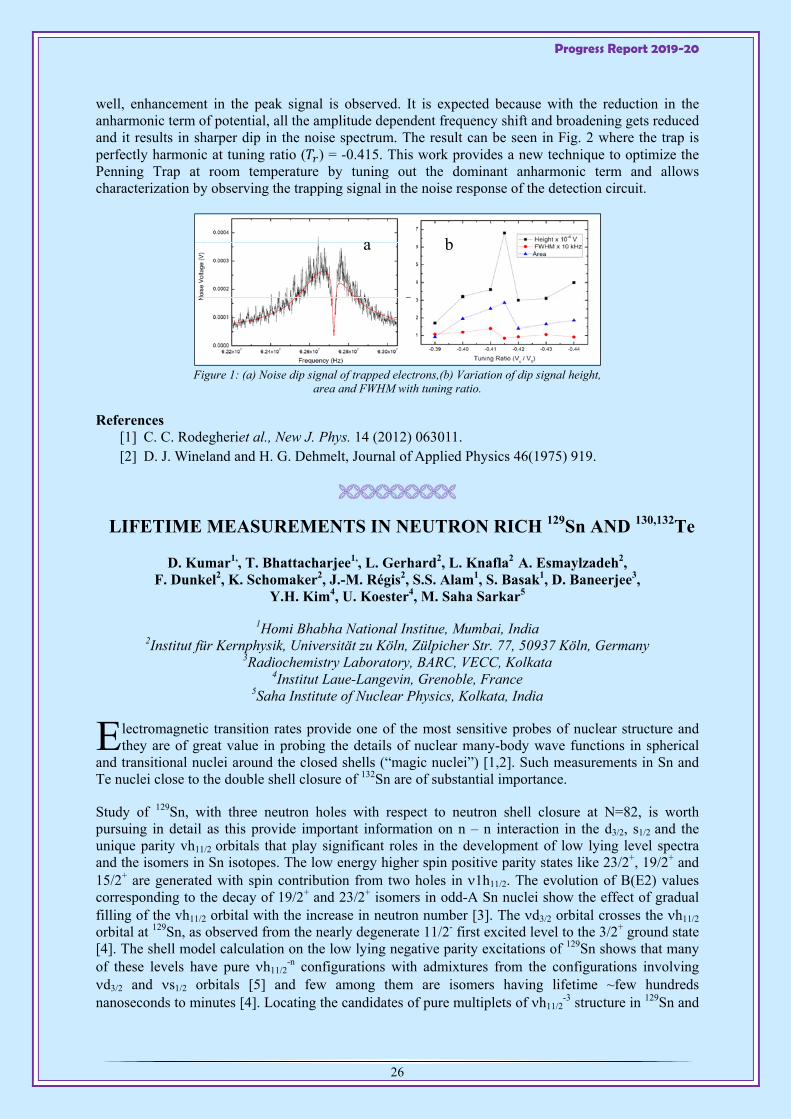
well, enhancement in the peak signal is observed. It is expected because with the reduction in the anharmonic term of potential, all the amplitude dependent frequency shift and broadening gets reduced and it results in sharper dip in the noise spectrum. The result can be seen in Fig. 2 where the trap is perfectly harmonic at tuning ratio ( ) = -0.415. This work provides a new technique to optimize the Penning Trap at room temperature by tuning out the dominant anharmonic term and allows characterization by observing the trapping signal in the noise response of the detection circuit.
Figure 1: (a) Noise dip signal of trapped electrons,(b) Variation of dip signal height,
area and FWHM with tuning ratio.
References [1] C. C. Rodegheriet al., New J. Phys. 14 (2012) 063011. [2] D. J. Wineland and H. G. Dehmelt, Journal of Applied Physics 46(1975) 919.
LIFETIME MEASUREMENTS IN NEUTRON RICH 129Sn AND 130,132Te
D. Kumar1,, T. Bhattacharjee1,, L. Gerhard2, L. Knafla2 A. Esmaylzadeh2, F. Dunkel2, K. Schomaker2, J.-M. Régis2, S.S. Alam1, S. Basak1, D. Baneerjee3,
Y.H. Kim4, U. Koester4, M. Saha Sarkar5
1Homi Bhabha National Institue, Mumbai, India 2Institut für Kernphysik, Universität zu Köln, Zülpicher Str. 77, 50937 Köln, Germany
3Radiochemistry Laboratory, BARC, VECC, Kolkata 4Institut Laue-Langevin, Grenoble, France
5Saha Institute of Nuclear Physics, Kolkata, India
lectromagnetic transition rates provide one of the most sensitive probes of nuclear structure and they are of great value in probing the details of nuclear many-body wave functions in spherical
and transitional nuclei around the closed shells (“magic nuclei”) [1,2]. Such measurements in Sn and Te nuclei close to the double shell closure of 132Sn are of substantial importance.
Study of 129Sn, with three neutron holes with respect to neutron shell closure at N=82, is worth pursuing in detail as this provide important information on n – n interaction in the d3/2, s1/2 and the unique parity vh11/2 orbitals that play significant roles in the development of low lying level spectra and the isomers in Sn isotopes. The low energy higher spin positive parity states like 23/2+, 19/2+ and 15/2+ are generated with spin contribution from two holes in 1h11/2. The evolution of B(E2) values corresponding to the decay of 19/2+ and 23/2+ isomers in odd-A Sn nuclei show the effect of gradual filling of the vh11/2 orbital with the increase in neutron number [3]. The d3/2 orbital crosses the h11/2 orbital at 129Sn, as observed from the nearly degenerate 11/2- first excited level to the 3/2+ ground state [4]. The shell model calculation on the low lying negative parity excitations of 129Sn shows that many of these levels have pure h11/2
-n configurations with admixtures from the configurations involving d3/2 and s1/2 orbitals [5] and few among them are isomers having lifetime ~few hundreds nanoseconds to minutes [4]. Locating the candidates of pure multiplets of h11/2
-3 structure in 129Sn and
a b
E
Progress Report 2019-20
27
to estimate the possible configuration mixing can be probed with measurements of lifetimes in this odd-A Sn nucleus close to N = 82 shell closure. The low lying excited levels (2+ to 10+ and 7-) in the N = 78-82 Te nuclei are generated due to the coupling of either of two proton particles and/or two to four neutron holes with the neighboring Sn core. The particle-hole configurations of these levels are similar among themselves, however, with the addition of two protons in comparison to Z = 50, more proton contribution is found for the low spin levels while the neutron part of angular momentum is dominant in the higher lying levels (e.g. 10+ and 8+). The B(E2) values for the 10+ to8+ decay in Te nuclei are observed to be anomalously and significantly high compared to those in both Sn and Xe nuclei [6] which was conjectured to be due to configuration mixing with increasing residual p-n interaction [6]. The same for the 0+ to 2+ excitation, however, was found to follow the expected behavior with increasing Z below N = 82 [7] but is of anomalous nature at or beyond N = 82 [8]. In order to probe the evolution of p-n interaction and configuration mixing, the lifetime measurements of all the low lying levels in N = 78, 82 Te would be of significance.
Experiment: The lifetime measurements in 129Sn and 130,132Te were performed through fast timing spectroscopy from the decay of microsecond isomers. The Te and Sn nuclei were produced from reaction 233U(nth,f) using the research reactor at Institute Laue Langevin, Grenoble, France. The fission products were separated for A and its kinetic energy (E) by using the Lohengrin mass spectrometer [10] associated with a gas ionization chamber (IC) at the focal plane of the spectrometer. Fast timing measurements were performed with separated fission product placed at the focal plane of the spectrometer surrounded by four LaBr3 scintillator detectors. In addition, two Clover HPGe detectors were also placed in the setup for high resolution detection of the gamma rays emitted from the isomeric decay. Generalized Centroid Difference method with multiplexing electronics [9] was used for gathering the fast timing data using NIM electronics and Digital Data Acquisition.
Results: Fig. 1 shows the Clover spectra for the A = 130 that clearly identify the gamma rays decaying from the isomers 130Te. The delayed and anti-delayed time distribution spectra obtained for different cascades in 129Sn and 130-132Te nuclei are shown in Fig. 2 to Fig. 3.
Figure 1: Total singles spectrum for A~130
Figure 2: Time difference projections for 130Te
Figure 3: Time difference projections for 132Te
References: [1] S. S. Alam et al., PRC 99, 014306 (2019). [2] S. Illieva et al., PRC 94, 034302 (2016). [3] J. Genevey et al., PRC 65, 034322 (2002). [4] www.nndc.bnl.gov/~ensdf
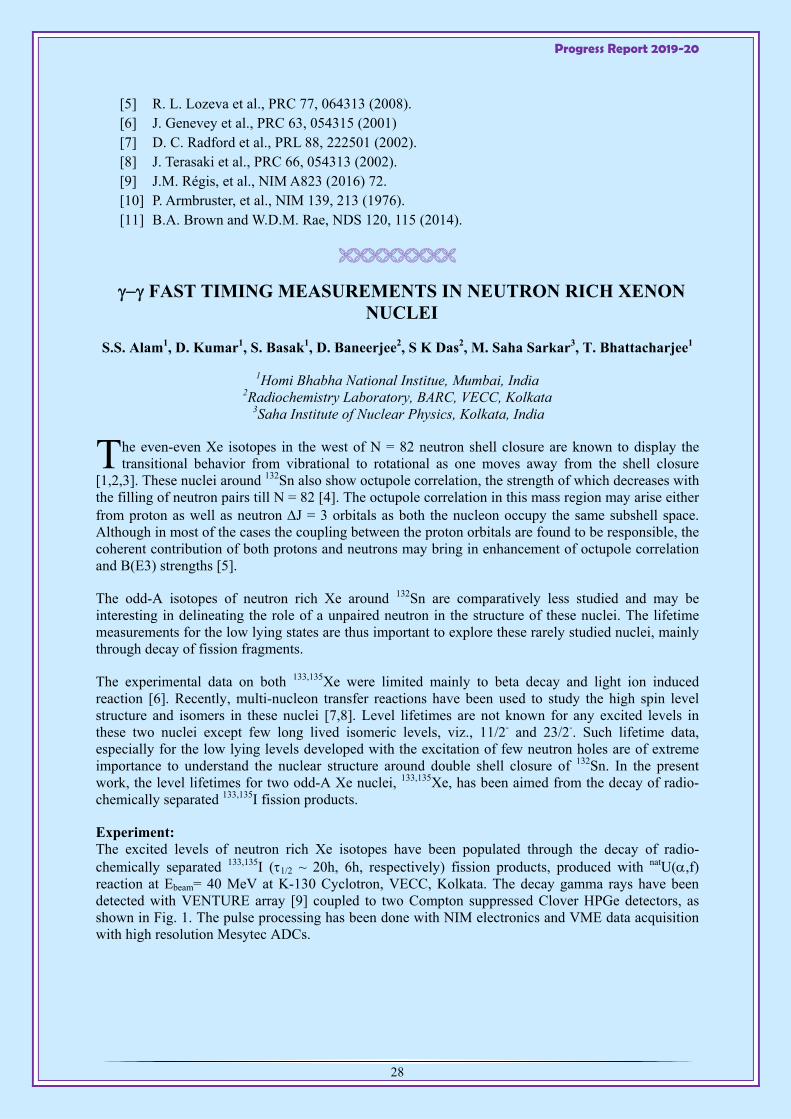
Progress Report 2019-20
28
[5] R. L. Lozeva et al., PRC 77, 064313 (2008). [6] J. Genevey et al., PRC 63, 054315 (2001) [7] D. C. Radford et al., PRL 88, 222501 (2002). [8] J. Terasaki et al., PRC 66, 054313 (2002). [9] J.M. Régis, et al., NIM A823 (2016) 72. [10] P. Armbruster, et al., NIM 139, 213 (1976). [11] B.A. Brown and W.D.M. Rae, NDS 120, 115 (2014).
FAST TIMING MEASUREMENTS IN NEUTRON RICH XENON NUCLEI
S.S. Alam1, D. Kumar1, S. Basak1, D. Baneerjee2, S K Das2, M. Saha Sarkar3, T. Bhattacharjee1
1Homi Bhabha National Institue, Mumbai, India 2Radiochemistry Laboratory, BARC, VECC, Kolkata
3Saha Institute of Nuclear Physics, Kolkata, India
he even-even Xe isotopes in the west of N = 82 neutron shell closure are known to display the transitional behavior from vibrational to rotational as one moves away from the shell closure
[1,2,3]. These nuclei around 132Sn also show octupole correlation, the strength of which decreases with the filling of neutron pairs till N = 82 [4]. The octupole correlation in this mass region may arise either from proton as well as neutron J = 3 orbitals as both the nucleon occupy the same subshell space. Although in most of the cases the coupling between the proton orbitals are found to be responsible, the coherent contribution of both protons and neutrons may bring in enhancement of octupole correlation and B(E3) strengths [5].
The odd-A isotopes of neutron rich Xe around 132Sn are comparatively less studied and may be interesting in delineating the role of a unpaired neutron in the structure of these nuclei. The lifetime measurements for the low lying states are thus important to explore these rarely studied nuclei, mainly through decay of fission fragments.
The experimental data on both 133,135Xe were limited mainly to beta decay and light ion induced reaction [6]. Recently, multi-nucleon transfer reactions have been used to study the high spin level structure and isomers in these nuclei [7,8]. Level lifetimes are not known for any excited levels in these two nuclei except few long lived isomeric levels, viz., 11/2- and 23/2-. Such lifetime data, especially for the low lying levels developed with the excitation of few neutron holes are of extreme importance to understand the nuclear structure around double shell closure of 132Sn. In the present work, the level lifetimes for two odd-A Xe nuclei, 133,135Xe, has been aimed from the decay of radio-chemically separated 133,135I fission products.
Experiment: The excited levels of neutron rich Xe isotopes have been populated through the decay of radio-chemically separated 133,135I (1/2 ~ 20h, 6h, respectively) fission products, produced with natU(,f) reaction at Ebeam= 40 MeV at K-130 Cyclotron, VECC, Kolkata. The decay gamma rays have been detected with VENTURE array [9] coupled to two Compton suppressed Clover HPGe detectors, as shown in Fig. 1. The pulse processing has been done with NIM electronics and VME data acquisition with high resolution Mesytec ADCs.
T
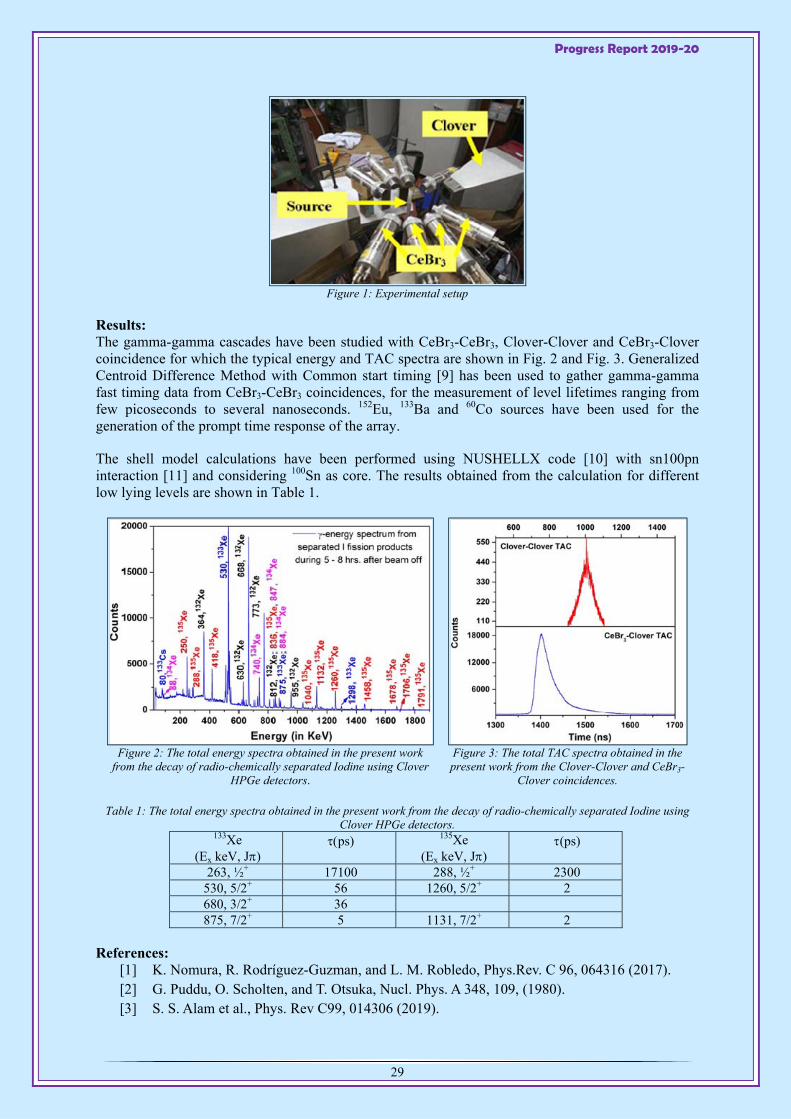
Progress Report 2019-20
29
Figure 1: Experimental setup
Results: The gamma-gamma cascades have been studied with CeBr3-CeBr3, Clover-Clover and CeBr3-Clover coincidence for which the typical energy and TAC spectra are shown in Fig. 2 and Fig. 3. Generalized Centroid Difference Method with Common start timing [9] has been used to gather gamma-gamma fast timing data from CeBr3-CeBr3 coincidences, for the measurement of level lifetimes ranging from few picoseconds to several nanoseconds. 152Eu, 133Ba and 60Co sources have been used for the generation of the prompt time response of the array.
The shell model calculations have been performed using NUSHELLX code [10] with sn100pn interaction [11] and considering 100Sn as core. The results obtained from the calculation for different low lying levels are shown in Table 1.
Figure 2: The total energy spectra obtained in the present work from the decay of radio-chemically separated Iodine using Clover
HPGe detectors.
Figure 3: The total TAC spectra obtained in the present work from the Clover-Clover and CeBr3-
Clover coincidences.
Table 1: The total energy spectra obtained in the present work from the decay of radio-chemically separated Iodine using Clover HPGe detectors.
133Xe (Ex keV, J)
ps) 135Xe (Ex keV, J)
(ps)
263, ½+ 17100 288, ½+ 2300 530, 5/2+ 56 1260, 5/2+ 2 680, 3/2+ 36 875, 7/2+ 5 1131, 7/2+ 2
References: [1] K. Nomura, R. Rodríguez-Guzman, and L. M. Robledo, Phys.Rev. C 96, 064316 (2017). [2] G. Puddu, O. Scholten, and T. Otsuka, Nucl. Phys. A 348, 109, (1980). [3] S. S. Alam et al., Phys. Rev C99, 014306 (2019).

Progress Report 2019-20
30
[4] W. F. Mueller et al., Phys. Rev C73, 014316 (2006). [5] G. de Angelis et al., Phys. Lett. B 535, 93 (2002). [6] www.nndc.bnl.gov/~ensdf [7] A. Vogt et al., Phys. Rev C95, 024316 (2017). [8] L. Kaya et al., Phys. Rev C98, 054312 (2018). [9] S. S. Alam et al., Nuclear Inst. and Methods in Physics Research A 874, 103 (2017). [10] B.A. Brown and W.D.M. Rae, NDS 120, 115 (2014). [11] B. A. Brown, et al., Phys. Rev. C71, 044317 (2005).
LIFETIME MEASUREMENT IN N = 88 SM USING VENTURE ARRAY
S. Basak1, S. S. Alam1, D. Kumar1, A. Saha1,# , D. Banerjee2 and T. Bhattacharjee1
1Homi Bhabha National Institue, Mumbai, India 2Radiochemistry Laboratory, BARC, VECC, Kolkata
# Presently at:The ICFAI University Tripura, Kamalghat, Agartala, Tripura-799210, India
he nuclei around N = 90 and with proton number close to the Z = 64 subshell closure are known to exhibit deformed structures. A rapid evolution of shapes and deformation are experimentally
identified in these nuclei [1,2]. The deformed band structures could be characterized with stable prolate deformation in the ground state along with the presence of octupole shapes at very low excitation [3,4]. The presence of deformation driving orbitals for the mid-shell neutrons along with the J = 3 orbitals for protons, gives rise to the possibility of different degree of deformation to the nuclear surface in this mass region. In addition, the vibrational structures are also observed in these nuclei around stable quadrupole [5] as well as octupole shapes [6].
Till date, the lifetimes have been measured in N = 88 Sm, mostly by using neutron excitation with Doppler Shift and Grid techniques. The measured lifetimes of the negative parity levels [7-9] strongly confirms the existence of octupole shapes and correlation in this nucleus as observed from other spectroscopic results. Another important aspect is the lifetime of the 03
+ level that has displayed interesting structure phenomenon in the neighboring Sm nuclei [10].
The literature survey of lifetime data in 150Sm indicates the need for lifetime measurements in several low lying levels to study the evolution of nuclear structure. In the present work, the lifetime measurement has been attempted in 150Sm using gamma-gamma fast timing spectroscopy with VENTURE array [11] at VECC, Kolkata. The obtained lifetimes and the corresponding transition probabilities have been systematically compared with those known in the neighboring nuclei..
Experiment: The excited levels of 150Sm have been populated through beta the decay of 150Pm produced with 150Nd(p,n) reaction using 8 MeV proton beam from K-130 cyclotron at VECC, Kolkata. The beta delayed gamma transitions were detected with VENTURE array [11], having eight CeBr3 detectors, coupled to VENUS array of six Compton suppressed Clover HPGe detectors. The lifetime measurement was performed by using Generalized Centroid Difference method with Common Start timing electronics. Further details on the pulse processing electronics and measurement techniques can be found in Ref. [11].
Results: The -energy spectrum of 150Sm obtained with the CeBr3 detectors compared to that obtained from the Clover HPGe detectors, are shown in Fig, 1. The lifetime analysis, using the method described in Ref [12], for the 334 keV, 2+ level is explained in Fig. 2.
T
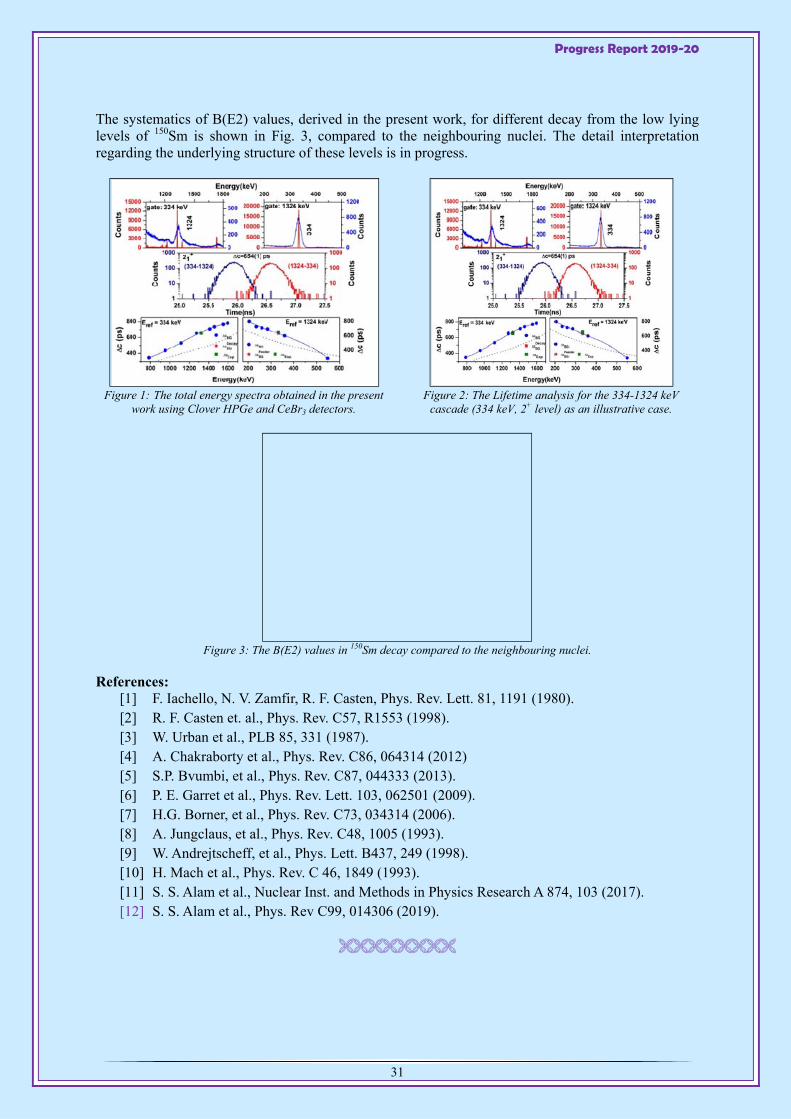
Progress Report 2019-20
31
The systematics of B(E2) values, derived in the present work, for different decay from the low lying levels of 150Sm is shown in Fig. 3, compared to the neighbouring nuclei. The detail interpretation regarding the underlying structure of these levels is in progress.
Figure 1: The total energy spectra obtained in the present
work using Clover HPGe and CeBr3 detectors.
Figure 2: The Lifetime analysis for the 334-1324 keV
cascade (334 keV, 2+ level) as an illustrative case.
Figure 3: The B(E2) values in 150Sm decay compared to the neighbouring nuclei.
References: [1] F. Iachello, N. V. Zamfir, R. F. Casten, Phys. Rev. Lett. 81, 1191 (1980). [2] R. F. Casten et. al., Phys. Rev. C57, R1553 (1998). [3] W. Urban et al., PLB 85, 331 (1987). [4] A. Chakraborty et al., Phys. Rev. C86, 064314 (2012) [5] S.P. Bvumbi, et al., Phys. Rev. C87, 044333 (2013). [6] P. E. Garret et al., Phys. Rev. Lett. 103, 062501 (2009). [7] H.G. Borner, et al., Phys. Rev. C73, 034314 (2006). [8] A. Jungclaus, et al., Phys. Rev. C48, 1005 (1993). [9] W. Andrejtscheff, et al., Phys. Lett. B437, 249 (1998). [10] H. Mach et al., Phys. Rev. C 46, 1849 (1993). [11] S. S. Alam et al., Nuclear Inst. and Methods in Physics Research A 874, 103 (2017). [12] S. S. Alam et al., Phys. Rev C99, 014306 (2019).
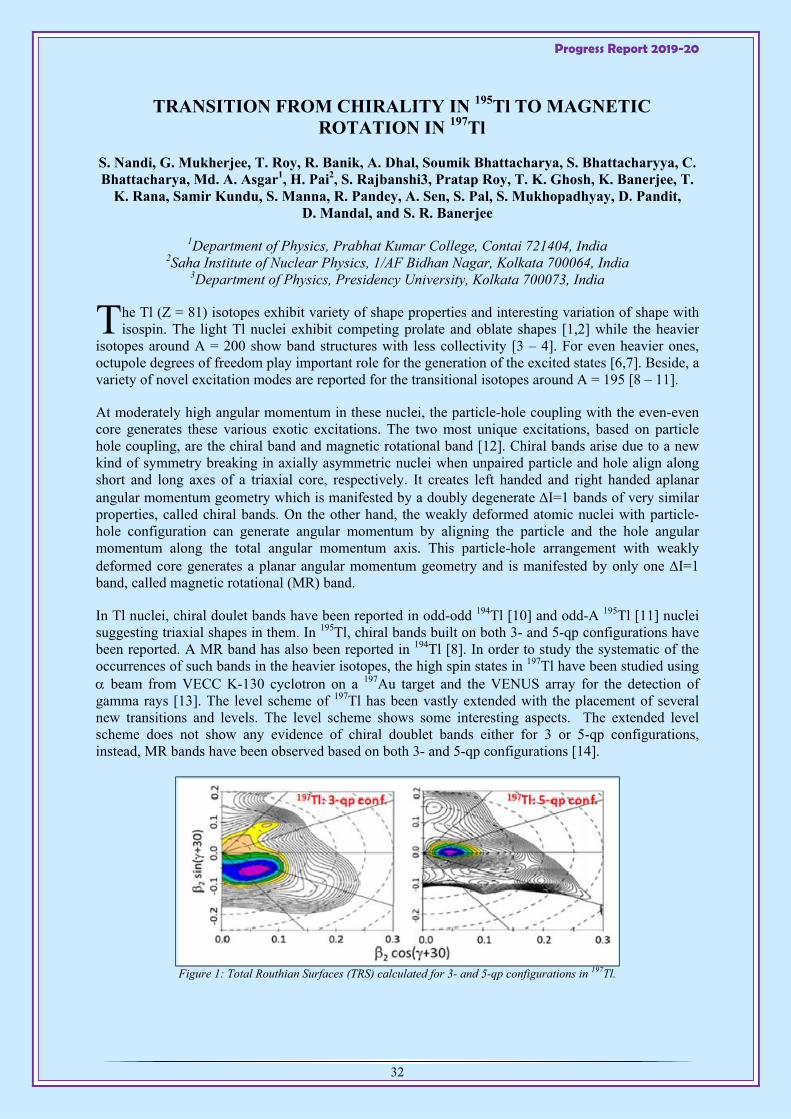
Progress Report 2019-20
32
TRANSITION FROM CHIRALITY IN 195Tl TO MAGNETIC ROTATION IN 197Tl
S. Nandi, G. Mukherjee, T. Roy, R. Banik, A. Dhal, Soumik Bhattacharya, S. Bhattacharyya, C. Bhattacharya, Md. A. Asgar1, H. Pai2, S. Rajbanshi3, Pratap Roy, T. K. Ghosh, K. Banerjee, T.
K. Rana, Samir Kundu, S. Manna, R. Pandey, A. Sen, S. Pal, S. Mukhopadhyay, D. Pandit, D. Mandal, and S. R. Banerjee
1Department of Physics, Prabhat Kumar College, Contai 721404, India 2Saha Institute of Nuclear Physics, 1/AF Bidhan Nagar, Kolkata 700064, India
3Department of Physics, Presidency University, Kolkata 700073, India
he Tl (Z = 81) isotopes exhibit variety of shape properties and interesting variation of shape with isospin. The light Tl nuclei exhibit competing prolate and oblate shapes [1,2] while the heavier
isotopes around A = 200 show band structures with less collectivity [3 – 4]. For even heavier ones, octupole degrees of freedom play important role for the generation of the excited states [6,7]. Beside, a variety of novel excitation modes are reported for the transitional isotopes around A = 195 [8 – 11].
At moderately high angular momentum in these nuclei, the particle-hole coupling with the even-even core generates these various exotic excitations. The two most unique excitations, based on particle hole coupling, are the chiral band and magnetic rotational band [12]. Chiral bands arise due to a new kind of symmetry breaking in axially asymmetric nuclei when unpaired particle and hole align along short and long axes of a triaxial core, respectively. It creates left handed and right handed aplanar angular momentum geometry which is manifested by a doubly degenerate I=1 bands of very similar properties, called chiral bands. On the other hand, the weakly deformed atomic nuclei with particle-hole configuration can generate angular momentum by aligning the particle and the hole angular momentum along the total angular momentum axis. This particle-hole arrangement with weakly deformed core generates a planar angular momentum geometry and is manifested by only one I=1 band, called magnetic rotational (MR) band.
In Tl nuclei, chiral doulet bands have been reported in odd-odd 194Tl [10] and odd-A 195Tl [11] nuclei suggesting triaxial shapes in them. In 195Tl, chiral bands built on both 3- and 5-qp configurations have been reported. A MR band has also been reported in 194Tl [8]. In order to study the systematic of the occurrences of such bands in the heavier isotopes, the high spin states in 197Tl have been studied using beam from VECC K-130 cyclotron on a 197Au target and the VENUS array for the detection of gamma rays [13]. The level scheme of 197Tl has been vastly extended with the placement of several new transitions and levels. The level scheme shows some interesting aspects. The extended level scheme does not show any evidence of chiral doublet bands either for 3 or 5-qp configurations, instead, MR bands have been observed based on both 3- and 5-qp configurations [14].
Figure 1: Total Routhian Surfaces (TRS) calculated for 3- and 5-qp configurations in 197Tl.
T

Progress Report 2019-20
33
The total Routhian surface (TRS) calculations have been performed to understand the contrasting behaviour of the two neighbouring nuclei 195Tl and 197Tl. In 195Tl, it was shown that the minima in the TRS occur at triaxial shapes for the above configurations [11] but in the present case of 197Tl, the minima for both 3-qp and 5-qp configurations appear at near spherical shapes (see Figure 1). Due to the low deformation, the core angular momentum contribution to the total angular momentum gets reduced in 197Tl. Thus the weakly deformed 197Tl cannot hold the aplanar geometry as in 195Tl. On the contrary, it helps the weakly deformed 197Tl to generate angular momentum by shears mechanism which resulted in magnetic rotational bands. Therefore, the aplanar configuration changes to a planar one for neutron number N = 116 in Tl isotopes. Hence, 197Tl is considered as a transitional nucleus in Tl isotopic chain where we observed a transition from chiral bands in 195Tl to magnetic rotational bands in 197Tl. It is worth noting that similar transition from chiral to shears mechanism was observed in Cs isotopes also [15] at N = 79.
References: [1] W. Reviol et al., Phys. Scr. T56, 167 (1995). [2] G. J. Lane et al., Nucl. Phys. A586, 316 (1995). [3] Soumik Bhattacharya et al., Phys. Rev. C 95, 014301 (2017). [4] S. Das Gupta et al., Phys. Rev. C88, 044328 (2013). [5] J.A. Becker et al., Phys. Rev. C29, 1268 (1984). [6] J. Wrzesinski et al., Eur. Phys. J A20, 57 (2004). [7] M. Rejmund et al., Eur. Phys. J. A8, 161 (2000). [8] H. Pai et al., Phys. Rev. C85, 064313 (2012). [9] H. Pai et al., Phys. Rev. C 88, 064302 (2013). [10] P.L. Mesiteng et al., Phys. Lett. B719, 83 (2013). [11] T. Roy et al., Phys. Lett. B 782, 768 (2018). [12] S. Frauendorf, J. Meng, Nucl. Phys. A617, 131 (1997). [13] S. Bhattacharya et al., DAE-BRNS Symp. Nucl. Phys. 61, 98 (2016). [14] S. Nandi et al., Phys. Rev. C 99, 054312 (2019). [15] H. Pai et al., Phys. Rev. C 84, 041301(R) (2011).
STUDY OF THE EXCITED STATES IN THE ODD-ODD 54Mn AND 58Co NUCLEI
S. Basu#, G. Mukherjee, S. Nandi, A. Dhal, C. Bhattacharya, S. Bhattacharyya, Soumik Bhattacharya, Samir Kundu, D. Paul, S. Samanta1, S. K. Das1, S. Chatterjee1, R. Raut1, S. S.
Ghugre1, A. Goswami2, H. Pai2, P. Ray2, R. Banik3, Md. Asgar4, S. Ali5, S. Rajbanshi6, S. Biswas7
1UGC-DAE CSR, Kolkata, India 2SINP, Kolkata, India 3IEM, Kolkata, India
4Prabhat Kumar College, Contai, India 5Government General Degree College, Pedong, Kalimpong, India
6Department of Physics, Presidency University, Kolkata-700073, India 7Grand Accélérateur National d’Ion Lourds, Blvd. Henri Becquerel, 14000, Caen, France
#Financially assisted by UGC-CSIR-CSR, India
he proton and neutron Fermi levels in the odd-odd 54Mn (Z=25, N=29) and 58Co (Z=27, N=31) nuclei lie below and above the N,Z = 28 shell gap and has complimentary particle-hole structure.
While 54Mn has 1-particle (neutron) and 3-holes (proton), 58Co has 3-particles and 1-hole configuration with respect to the doubly magic 56Ni core [1, 2]. The configuration spaces for both the
T

Progress Report 2019-20
34
nuclei contain 1f7/2, 2p3/2, 1f5/2, and 2p1/2 orbitals. However, the neutron g9/2 orbital and the core excitation also play important roles for the high-spin states. The low lying states of these two nuclei look similar with J = 2+, 3+, 4+ and 5+ states lie very close to the ground state, which are generated mostly by the proton and the neutron excitations to the above single particle, negative parity states. The ground state in 54Mn is 3+ while it is 2+ in 58Co. However, there are more important differences between the two nuclei. In 58Co, the first two excited states are long lived isomers of half lives ~ 9.1 h and 10.5 s, but in 54Mn (which is a candidate to be used as a cosmic ray chronometer [3]), there is no such known long lived isomer. Moreover, a tentatively assigned 7- state is reported in 54Mn at the excitation energy of 1925 keV [2], but no negative parity state is known in 58Co up to about 8 MeV of excitation energy reported in this nucleus. The J of several states are, however, not known in this nucleus [1]. Negative parity states occur with the involvement of g9/2 neutron orbital [4]. It is quite surprising to have negative parity state at such a low excitation in 54Mn but not in 58Co. On the contrary, a less-developed band-like collective structure has been observed in 58Co on top of the 4+ isomer. The softness of the N = Z = 28 core and the occurrences of the co-existent single particle and collective excitations is known in this region [5]. Hence, it is important to study the excited states in these nuclei in details for a better understanding of the single particle states and structure of nuclei around N, Z = 28.
Figure 1: (Left) The perpendicular and parallel scattered rays, for polarization asymmetry and (Right)
the angle dependent gated spectra for the DCO ratio measurements in 54Mn.
Figure 2: Same as Figure 1, but for 58Co nucleus. Clear lineshapes are also observed for the
spectra in the right corresponding to the backward (125o) detector data.
A gamma ray spectroscopy experiment was performed at VECC with α beam (36 and 38 MeV) from K-130 cyclotron using INGA array consisting of 7 clovers and 1 LEPS detector [6]. The PIXIE-16 based digitizer data acquisition system and IUCPIX package, developed by UGC-DAE CSR Kolkata
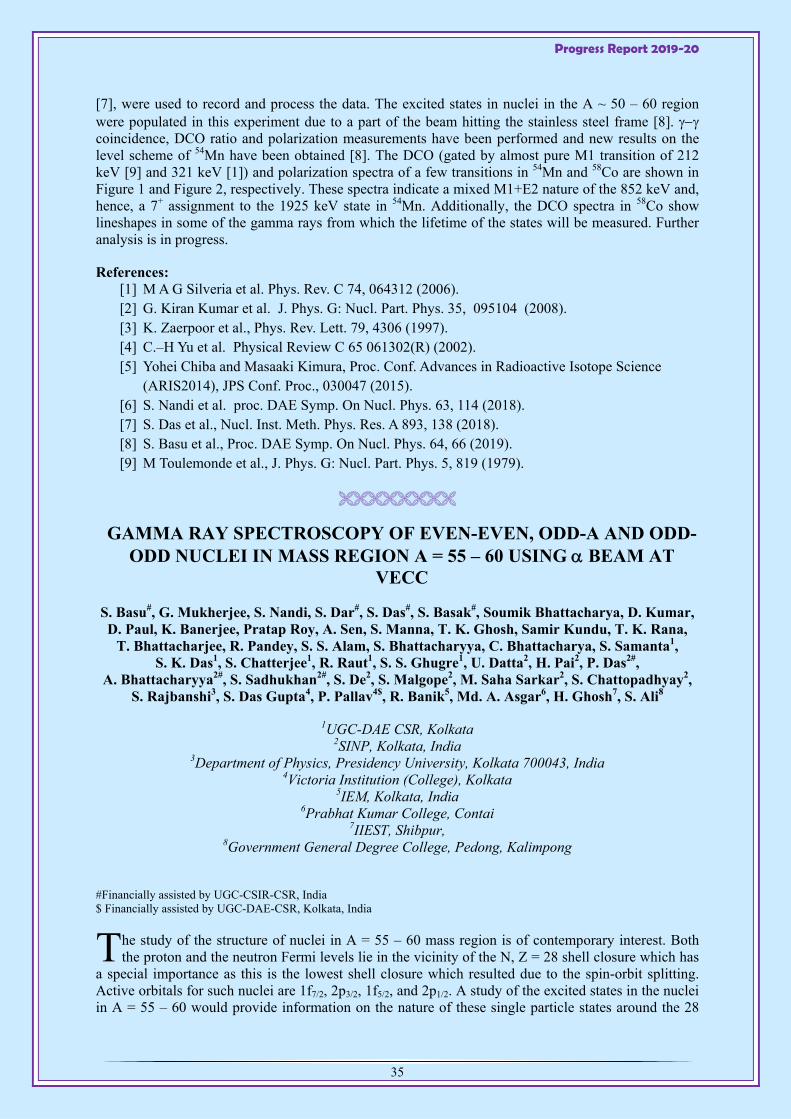
Progress Report 2019-20
35
[7], were used to record and process the data. The excited states in nuclei in the A ~ 50 – 60 region were populated in this experiment due to a part of the beam hitting the stainless steel frame [8]. coincidence, DCO ratio and polarization measurements have been performed and new results on the level scheme of 54Mn have been obtained [8]. The DCO (gated by almost pure M1 transition of 212 keV [9] and 321 keV [1]) and polarization spectra of a few transitions in 54Mn and 58Co are shown in Figure 1 and Figure 2, respectively. These spectra indicate a mixed M1+E2 nature of the 852 keV and, hence, a 7+ assignment to the 1925 keV state in 54Mn. Additionally, the DCO spectra in 58Co show lineshapes in some of the gamma rays from which the lifetime of the states will be measured. Further analysis is in progress.
References: [1] M A G Silveria et al. Phys. Rev. C 74, 064312 (2006). [2] G. Kiran Kumar et al. J. Phys. G: Nucl. Part. Phys. 35, 095104 (2008). [3] K. Zaerpoor et al., Phys. Rev. Lett. 79, 4306 (1997). [4] C.–H Yu et al. Physical Review C 65 061302(R) (2002). [5] Yohei Chiba and Masaaki Kimura, Proc. Conf. Advances in Radioactive Isotope Science (ARIS2014), JPS Conf. Proc., 030047 (2015). [6] S. Nandi et al. proc. DAE Symp. On Nucl. Phys. 63, 114 (2018). [7] S. Das et al., Nucl. Inst. Meth. Phys. Res. A 893, 138 (2018). [8] S. Basu et al., Proc. DAE Symp. On Nucl. Phys. 64, 66 (2019). [9] M Toulemonde et al., J. Phys. G: Nucl. Part. Phys. 5, 819 (1979).
GAMMA RAY SPECTROSCOPY OF EVEN-EVEN, ODD-A AND ODD-ODD NUCLEI IN MASS REGION A = 55 – 60 USING BEAM AT
VECC
S. Basu#, G. Mukherjee, S. Nandi, S. Dar#, S. Das#, S. Basak#, Soumik Bhattacharya, D. Kumar, D. Paul, K. Banerjee, Pratap Roy, A. Sen, S. Manna, T. K. Ghosh, Samir Kundu, T. K. Rana,
T. Bhattacharjee, R. Pandey, S. S. Alam, S. Bhattacharyya, C. Bhattacharya, S. Samanta1, S. K. Das1, S. Chatterjee1, R. Raut1, S. S. Ghugre1, U. Datta2, H. Pai2, P. Das2#,
A. Bhattacharyya2#, S. Sadhukhan2#, S. De2, S. Malgope2, M. Saha Sarkar2, S. Chattopadhyay2, S. Rajbanshi3, S. Das Gupta4, P. Pallav4$, R. Banik5, Md. A. Asgar6, H. Ghosh7, S. Ali8
1UGC-DAE CSR, Kolkata 2SINP, Kolkata, India
3Department of Physics, Presidency University, Kolkata 700043, India 4Victoria Institution (College), Kolkata
5IEM, Kolkata, India 6Prabhat Kumar College, Contai
7IIEST, Shibpur, 8Government General Degree College, Pedong, Kalimpong
#Financially assisted by UGC-CSIR-CSR, India $ Financially assisted by UGC-DAE-CSR, Kolkata, India
he study of the structure of nuclei in A = 55 – 60 mass region is of contemporary interest. Both the proton and the neutron Fermi levels lie in the vicinity of the N, Z = 28 shell closure which has
a special importance as this is the lowest shell closure which resulted due to the spin-orbit splitting. Active orbitals for such nuclei are 1f7/2, 2p3/2, 1f5/2, and 2p1/2. A study of the excited states in the nuclei in A = 55 – 60 would provide information on the nature of these single particle states around the 28
T
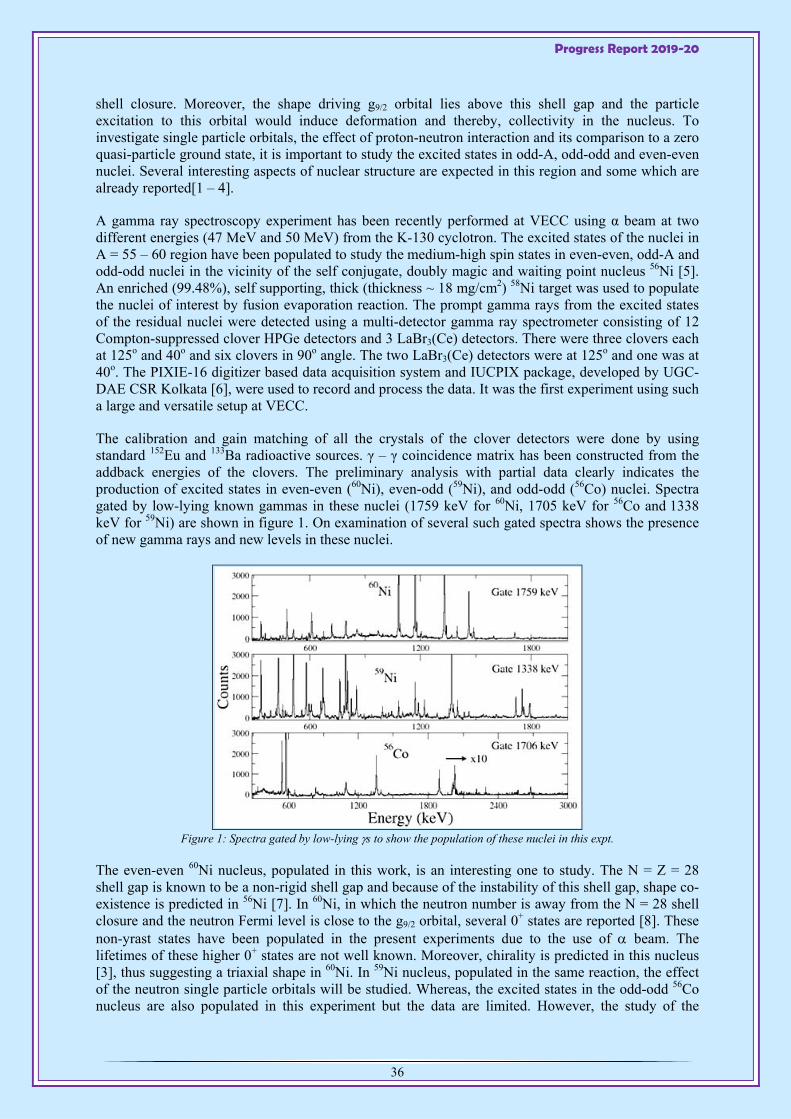
Progress Report 2019-20
36
shell closure. Moreover, the shape driving g9/2 orbital lies above this shell gap and the particle excitation to this orbital would induce deformation and thereby, collectivity in the nucleus. To investigate single particle orbitals, the effect of proton-neutron interaction and its comparison to a zero quasi-particle ground state, it is important to study the excited states in odd-A, odd-odd and even-even nuclei. Several interesting aspects of nuclear structure are expected in this region and some which are already reported[1 – 4].
A gamma ray spectroscopy experiment has been recently performed at VECC using α beam at two different energies (47 MeV and 50 MeV) from the K-130 cyclotron. The excited states of the nuclei in A = 55 – 60 region have been populated to study the medium-high spin states in even-even, odd-A and odd-odd nuclei in the vicinity of the self conjugate, doubly magic and waiting point nucleus 56Ni [5]. An enriched (99.48%), self supporting, thick (thickness ~ 18 mg/cm2) 58Ni target was used to populate the nuclei of interest by fusion evaporation reaction. The prompt gamma rays from the excited states of the residual nuclei were detected using a multi-detector gamma ray spectrometer consisting of 12 Compton-suppressed clover HPGe detectors and 3 LaBr3(Ce) detectors. There were three clovers each at 125o and 40o and six clovers in 90o angle. The two LaBr3(Ce) detectors were at 125o and one was at 40o. The PIXIE-16 digitizer based data acquisition system and IUCPIX package, developed by UGC-DAE CSR Kolkata [6], were used to record and process the data. It was the first experiment using such a large and versatile setup at VECC.
The calibration and gain matching of all the crystals of the clover detectors were done by using standard 152Eu and 133Ba radioactive sources. γ – γ coincidence matrix has been constructed from the addback energies of the clovers. The preliminary analysis with partial data clearly indicates the production of excited states in even-even (60Ni), even-odd (59Ni), and odd-odd (56Co) nuclei. Spectra gated by low-lying known gammas in these nuclei (1759 keV for 60Ni, 1705 keV for 56Co and 1338 keV for 59Ni) are shown in figure 1. On examination of several such gated spectra shows the presence of new gamma rays and new levels in these nuclei.
Figure 1: Spectra gated by low-lying s to show the population of these nuclei in this expt.
The even-even 60Ni nucleus, populated in this work, is an interesting one to study. The N = Z = 28 shell gap is known to be a non-rigid shell gap and because of the instability of this shell gap, shape co-existence is predicted in 56Ni [7]. In 60Ni, in which the neutron number is away from the N = 28 shell closure and the neutron Fermi level is close to the g9/2 orbital, several 0+ states are reported [8]. These non-yrast states have been populated in the present experiments due to the use of beam. The lifetimes of these higher 0+ states are not well known. Moreover, chirality is predicted in this nucleus [3], thus suggesting a triaxial shape in 60Ni. In 59Ni nucleus, populated in the same reaction, the effect of the neutron single particle orbitals will be studied. Whereas, the excited states in the odd-odd 56Co nucleus are also populated in this experiment but the data are limited. However, the study of the

Progress Report 2019-20
37
excited states in this nucleus is interesting as the proton and neutron Fermi levels in this nucleus are just below and just above the N, Z = 28 shell closure, respectively.
Contributions and help from MEG, VECC, accelerator operators, target lab staff and scientific assistants from VECC, SINP and UGC-DAE-CSR are gratefully acknowledged. We are also thankful to Head, Physics Group and Director, VECC, Director SINP and Director UGC-DAE-CSR for their support and encouragement. References:
[1] C.–H Yu et al., Physical Review C65, 061302(R) (2002) [2] N. Bendjaballah et al. Phys. Rev. Lett 36, 1536 (1976) [3] J. Peng and Q.B. Chen, Phys. Lett. B793, 303 (2019) [4] J. Peng and Q.B. Chen, Phys. Rev. C98, 024320 (2018) [5] D. Kahl et al., Phys. Lett. B 797 134803 (2019). [6] S. Das et al., Nucl. Inst. Meth. Phys. Res. A 893, 138 (2018) [7] Yohei Chiba and Masaaki Kimura, Proc. Conf. Advances in Radioactive Isotope Science
(ARIS2014), JPS Conf. Proc. , 030047 (2015). [8] D. A. Torres et al., Phys. Rev. C 78, 054318 (2008)
INCREASING WOBBLING ENERGY WITH SPIN: LONGITUDINAL OR TRANSVERSE?
G. Mukherjee and S. Nandi
he wobbling motion in classical object is realised with a spinning top having unequal moments of inertia along its three axes. In the microscopic world of an atomic nucleus, classical rotation is
realised through the observation of rotational bands in case of an axially deformed nucleus. Recent studies show that wobbling phenomenon is also realised in the odd-A nuclei [1]. In this case the precision of the odd particle (proton or neutron) and the rotation of the triaxial core having unequal moments of inertia, A1, A2 and A3 along the three principal axes generate the wobbling motion. Such novel excitation mode in a nucleus is realised through the observation of wobbling bands with certain characteristics i.e, the -ray transitions between the yrast and the wobbling band are I = 1, predominantly E2 type. The manifestation of wobbling motion in nuclei involves the coupling of single particle and collective motions in a microscopic object with non-axial mass distribution along three body-fixed axes with different moments of inertia.
Two types of wobbling in nuclei, longitudinal (LW) and transverse (TW), have been predicted from the theory [2] which represents different alignment of the particle angular momentum with respect to the medium, short and long axes of the triaxial core. The alignment of the particle depends on the involved single particle orbital. The wobbling phenomenon is known only in a few nuclei, however, experimental evidences of both TW and LW have been reported [1,3,4] recently. Experimentally, the LW and TW are distinguished from the variation of the wobbling energy (Ewobb) with the angular momentum or spin (I) of the nucleus. It is normally seen that the decrease (increase) of Ewobb with the increase of spin corresponds to TW (LW). However, according to the model prescribed by Frauendorf and Dönau [2], the Ewobb for a TW band would also show an initial increase with spin before it starts to decrease. The turning spin depends on the values of A1, A2, A3 and the single particle angular momentum j.
We have recently identified two wobbling bands in 183Au nucleus based on the h9/2 and i13/2 configurations with contrasting behaviour of Ewobb [5]. Ewobb found to decreases with I for h9/2 band
T
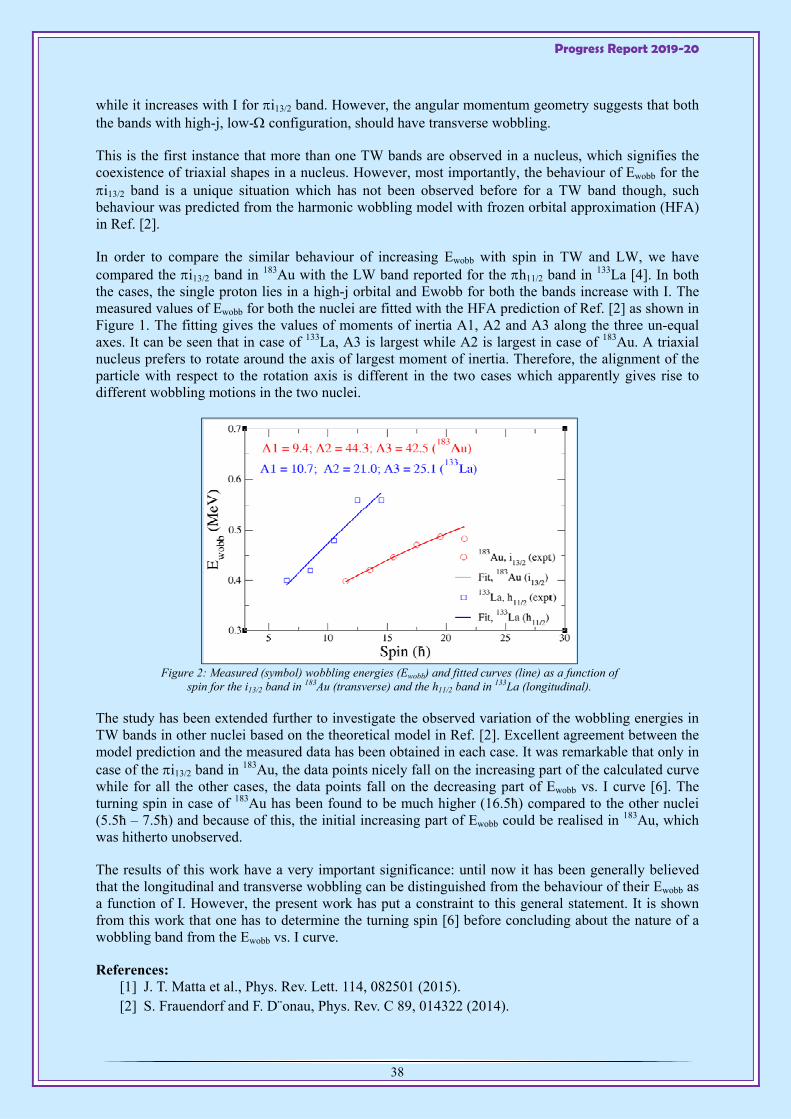
Progress Report 2019-20
38
while it increases with I for i13/2 band. However, the angular momentum geometry suggests that both the bands with high-j, low- configuration, should have transverse wobbling.
This is the first instance that more than one TW bands are observed in a nucleus, which signifies the coexistence of triaxial shapes in a nucleus. However, most importantly, the behaviour of Ewobb for the i13/2 band is a unique situation which has not been observed before for a TW band though, such behaviour was predicted from the harmonic wobbling model with frozen orbital approximation (HFA) in Ref. [2].
In order to compare the similar behaviour of increasing Ewobb with spin in TW and LW, we have compared the i13/2 band in 183Au with the LW band reported for the h11/2 band in 133La [4]. In both the cases, the single proton lies in a high-j orbital and Ewobb for both the bands increase with I. The measured values of Ewobb for both the nuclei are fitted with the HFA prediction of Ref. [2] as shown in Figure 1. The fitting gives the values of moments of inertia A1, A2 and A3 along the three un-equal axes. It can be seen that in case of 133La, A3 is largest while A2 is largest in case of 183Au. A triaxial nucleus prefers to rotate around the axis of largest moment of inertia. Therefore, the alignment of the particle with respect to the rotation axis is different in the two cases which apparently gives rise to different wobbling motions in the two nuclei.
Figure 2: Measured (symbol) wobbling energies (Ewobb) and fitted curves (line) as a function of
spin for the i13/2 band in 183Au (transverse) and the h11/2 band in 133La (longitudinal).
The study has been extended further to investigate the observed variation of the wobbling energies in TW bands in other nuclei based on the theoretical model in Ref. [2]. Excellent agreement between the model prediction and the measured data has been obtained in each case. It was remarkable that only in case of the i13/2 band in 183Au, the data points nicely fall on the increasing part of the calculated curve while for all the other cases, the data points fall on the decreasing part of Ewobb vs. I curve [6]. The turning spin in case of 183Au has been found to be much higher (16.5ħ) compared to the other nuclei (5.5ħ – 7.5ħ) and because of this, the initial increasing part of Ewobb could be realised in 183Au, which was hitherto unobserved.
The results of this work have a very important significance: until now it has been generally believed that the longitudinal and transverse wobbling can be distinguished from the behaviour of their Ewobb as a function of I. However, the present work has put a constraint to this general statement. It is shown from this work that one has to determine the turning spin [6] before concluding about the nature of a wobbling band from the Ewobb vs. I curve.
References: [1] J. T. Matta et al., Phys. Rev. Lett. 114, 082501 (2015). [2] S. Frauendorf and F. D¨onau, Phys. Rev. C 89, 014322 (2014).
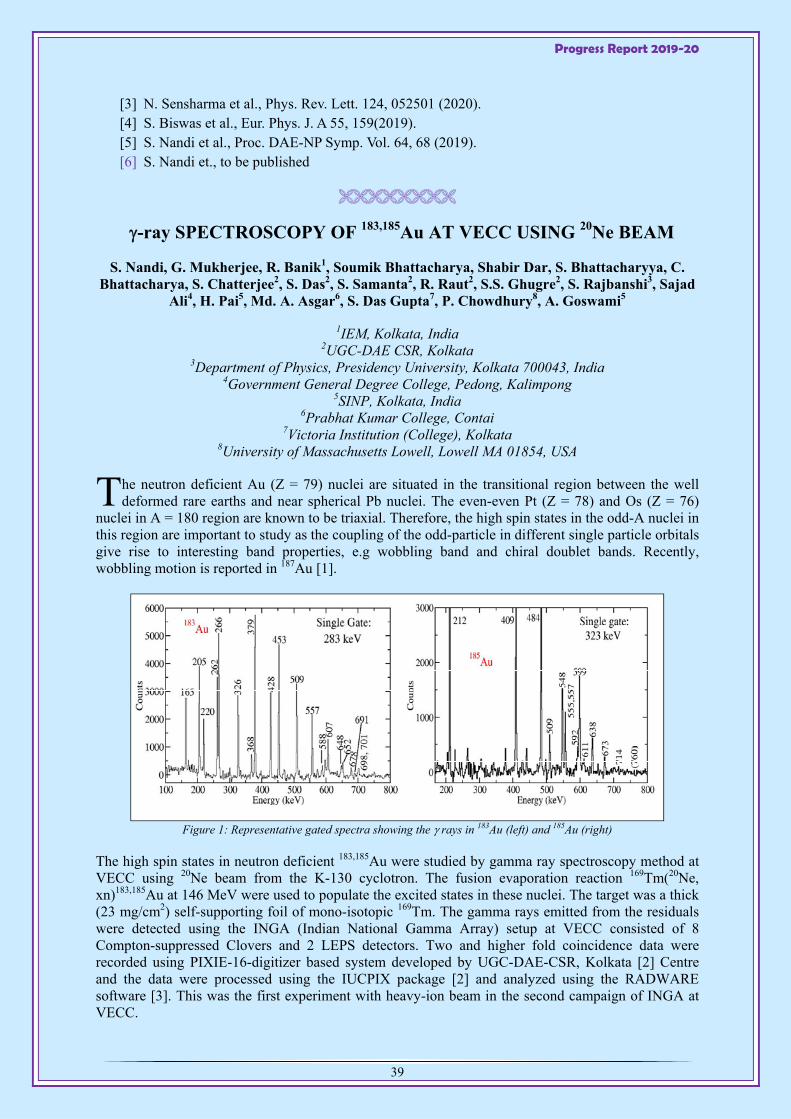
Progress Report 2019-20
39
[3] N. Sensharma et al., Phys. Rev. Lett. 124, 052501 (2020). [4] S. Biswas et al., Eur. Phys. J. A 55, 159(2019). [5] S. Nandi et al., Proc. DAE-NP Symp. Vol. 64, 68 (2019). [6] S. Nandi et., to be published
-ray SPECTROSCOPY OF 183,185Au AT VECC USING 20Ne BEAM
S. Nandi, G. Mukherjee, R. Banik1, Soumik Bhattacharya, Shabir Dar, S. Bhattacharyya, C. Bhattacharya, S. Chatterjee2, S. Das2, S. Samanta2, R. Raut2, S.S. Ghugre2, S. Rajbanshi3, Sajad
Ali4, H. Pai5, Md. A. Asgar6, S. Das Gupta7, P. Chowdhury8, A. Goswami5
1IEM, Kolkata, India 2UGC-DAE CSR, Kolkata
3Department of Physics, Presidency University, Kolkata 700043, India 4Government General Degree College, Pedong, Kalimpong
5SINP, Kolkata, India 6Prabhat Kumar College, Contai
7Victoria Institution (College), Kolkata 8University of Massachusetts Lowell, Lowell MA 01854, USA
he neutron deficient Au (Z = 79) nuclei are situated in the transitional region between the well deformed rare earths and near spherical Pb nuclei. The even-even Pt (Z = 78) and Os (Z = 76)
nuclei in A = 180 region are known to be triaxial. Therefore, the high spin states in the odd-A nuclei in this region are important to study as the coupling of the odd-particle in different single particle orbitals give rise to interesting band properties, e.g wobbling band and chiral doublet bands. Recently, wobbling motion is reported in 187Au [1].
Figure 1: Representative gated spectra showing the rays in 183Au (left) and 185Au (right)
The high spin states in neutron deficient 183,185Au were studied by gamma ray spectroscopy method at VECC using 20Ne beam from the K-130 cyclotron. The fusion evaporation reaction 169Tm(20Ne, xn)183,185Au at 146 MeV were used to populate the excited states in these nuclei. The target was a thick (23 mg/cm2) self-supporting foil of mono-isotopic 169Tm. The gamma rays emitted from the residuals were detected using the INGA (Indian National Gamma Array) setup at VECC consisted of 8 Compton-suppressed Clovers and 2 LEPS detectors. Two and higher fold coincidence data were recorded using PIXIE-16-digitizer based system developed by UGC-DAE-CSR, Kolkata [2] Centre and the data were processed using the IUCPIX package [2] and analyzed using the RADWARE software [3]. This was the first experiment with heavy-ion beam in the second campaign of INGA at VECC.
T

Progress Report 2019-20
40
In the analysis, matrix as well as cubes were constructed. Gamma ray spectra gated by the known low-lying transitions 183Au [4,5] and 185Au [6] nuclei are shown in Figure 1. The transitions are very clearly observed and it can be seen that the population of 183Au was more than that of 185Au in this experiment. Different band structures, based on the negative parity h9/2 and the positive parity i13/2 orbitals are known in both the isotopes. A new band structure has also been identified in 183Au. The nature of the bands (e.g signature partner or wobbling partner) can be distinguished from the mixing ratio () of the I = 1 connecting transitions between the bands. This has been done in the present work from the combined measurements of polarization (P) and DCO (directional correlation in oriented nuclei) ratio (RDCO) of the gamma rays and by comparing them with the calculated values. The measured and the calculated values of some of the connecting transitions in 183Au are shown in Figure 2. It clearly shows large mixing ratios for 495 and 498 keV transitions.
Figure 2: The measured (filled symbols) and calculated (line) values of polarization
and DCO ratio (RDCO) of some of the connecting transitions in 183Au.
References: [1] N. Sensharma et al., Phys. Rev. Lett. 124, 052501 (2020). [2] S. Das et al., Nucl. Inst. Meth. Phys. Res. A893, 138 (2018). [3] D. C. Radford, Nucl. Inst. Meth. Phys. Res. A361, 297 (1995). [4] W.F. Mueller et al., Phys. Rev. C59, 2009 (1999). [5] L. T. Song et al., Phys. Rev. C71, 017302 (2005). [6] A.J. Larabee, et al., Phys. Lett. B169, 21 (1986)
Progress Report 2019-20
41
MAGNETIC ROTATIONAL BAND IN THE TRANSITIONAL NUCLEUS 131Xe
R. Banik#, S. Bhattacharyya, S. Biswas2, Soumik Bhattacharya, G. Mukherjee, S. Rajbanshi3, S. Dar, S. Nandi, S. Ali4, S. Chatterjee5, S. Das5, S. Das Gupta6, S. S. Ghugre5, A. Goswami4, D. Mondal, S. Mukhopadhyay, H. Pai4, S. Pal, D. Pandit, R. Raut5, P. Ray4, and S. Samanta5
2GANIL, CEA/DRF-CNRS/IN2P3, Bd Henri Becquerel, BP 55027, F-14076 Caen Cedex 5, France. 3Department of Physics, Presidency University, Kolkata 700073, India.
4Saha Institute of Nuclear Physics, Kolkata 700064, India. 5UGC-DAE CSR, Kolkata Centre, Kolkata 700098, India.
6Victoria Institution (College), Kolkata 700009, India. #Present address: Institute of Engineering and Management, Saltlake Sector V, Kolkata 700091,
India.
he transitional mass region A~130 is known for exhibiting variety of nuclear structures as well as various exotic shapes arising from interplay between the available single particle orbitals and the
collective degrees of freedom. A comparison of the isotopic and isotonic chains reveals the transitional nature of the N = 77 nuclei in this mass region. The neutron Fermi levels of the Xe isotopes with neutron number N > 70 lie around the h11/2, d3/2, and s1/2 single particle orbitals, situated just below the N = 82 shell closure. The evolution of the excitation energies of the low-lying single-particle configurations in Xe isotopes are shown in Fig.1. It can be seen from this figure that the ground states of the lighter Xe isotopes changes from 1/2+ to 3/2+ at N = 77 (131Xe), whereas, the excitation energy of the 11/2− state is minimum for the N = 77, i.e., 131Xe isotope. This clearly shows a transitional nature of 131Xe. The presence of the shape driving high-j orbital πh11/2 and νh11/2 orbital in this mass region drags the nucleus towards various exotic shapes and structures. High spin band structures in 125Xe [1] and triaxial bands in 129Xe [2] have already been reported. Also Magnetic Rotational (MR) band is observed in 123Xe [3] at high spin with the tilted axis configuration involving πh11/2 and νh11/2. In this connection 131Xe (N=77) is also a possible candidate to look for such MR bands. In such MR band or shears mechanism, the observed angular momenta along a band are generated by the gradual closing of the quasi proton and quasi neutron angular momentum blades. This kind of alignment of angular momentum blades results into a band structure consisting of dipole transitions.
Experiment The excited states of 131Xe have been populated using the reaction 130Te (α, 3n) 131Xe, at a beam energy of 38 MeV, obtained from the K-130 Cyclotron at Variable Energy Cyclotron Centre (VECC), Kolkata, India. The Indian National Gamma Array (INGA) stationed at VECC [4] consisting of seven Compton suppressed Clover HPGe detectors were used to detect the γ-rays. The detectors are oriented in the following way: four detectors of the array were at 90o, two detectors were at 125o and one detector was at 40o with respect to the incident beam direction. PIXIE based digital data acquisition system was used to record the time stamped LIST mode data [5]. The symmetric and angle-dependent Eγ-Eγ matrices were constructed to obtain the coincidence information, determination of multipolarities of rays from DCO ratio analysis and polarization asymmetry measurements.
Results and discussion The existing level scheme of 131Xe is significantly extended with the placement of 72 new transitions from the current measurement [6]. The signature partner band of the main νh11/2 band is identified from this work. Other than that, one sequence of positive parity dipole transitions is observed above the 21/2+ (2249 keV) level which is extended upto 33/2(+) (5172 keV) level [6, 7]. This band consists of 1105, 295, 503, 119, 311 and 592 keV transitions. The upper part of this band is likely to have an extra pair of proton aligned in the g7/2/d5/2 orbital compared to the lower one. Therefore, a 5 quasiparticle configuration of π(d5/2g7/2)
3h11/21 x νh11/2
−1 is assigned to this band. This structure may possibly a MR band and thus discussed in the framework of Shears mechanism with the Principle Axis Cranking (SPAC) model. For the present case, the SPAC calculation is being carried out considering
T

Progress Report 2019-20
42
Jπ= 12 and Jν= 5.5. The level energies with respect to the band head energy as a function of level spin for the dipole band is plotted in the Fig. 2. Those experimental points are compared with the present calculation (solid line) and are found to be matching well. The calculated transition probabilities, B(M1), are also plotted as a function of level spin and shown in the inset of Fig. 2. It is clearly seen from the figure, that the B(M1) values go on decreasing with increasing spin, which is one of the signature of MR band. This calculation leads to an interaction strength of V2 = 1.90 MeV. This calculation also indicates that the 91% of the total angular momentum is generated via shears mechanism. Thus the present SPAC calculations describes the MR nature of the 5 quasiparticle band of 131Xe quite successfully.
Figure 1: Evolution of the low-lying 1-qp states in Xe
isotopes.
Figure 2: Level energy (Elevel) of the dipole band with respect to the band head energy (Ebandhead) as a function of level spin
which is compared with the SPAC calculation. The level sequence of the band with the transitions is also shown. The inset shows the calculated B(M1) values using SPAC model
as function of level spin.
The funding received from CEFIPRA (Project 5604-4) is also acknowledged. INGA is partially funded by DST, Government of India (No. IR/S2/PF-03/2003-II).
References: [1] A. Al-Khatib, G. B. Hagemann, G. Sletten et al., Phys. Rev. C 83, 024306 (2011). [2] Y. Huang, Z. G. Xiao, S. J. Zhu et al., Phys. Rev. C 93, 064315 (2016). [3] G. Rainovski, D. L. Balabanski, G. Roussev et al., Phys. Rev. C 66, 014308 (2002). [4] Soumik Bhattacharya, R. Banik, S. Nandi et al., DAE Symp. on Nucl. Phys. 63, 1156 (2018). [5] S. Das, S. Samanta, R. Banik et al., Nucl. Instrum. Meth. A, 893, 138 (2018). [6] R. Banik et. al., Phys. Rev. C 101, 044306 (2020). [7] R. Banik et.al., EPJ Web of Conferences 232, 04001 (2020).
SPECTROSCOPY OF 196Hg USING DIGITAL INGA AT VECC
S. Das1, S. Chatterjee1, S. Samanta1, R. Raut1, and S. S. Ghugre1, A. K. Sinha2, S. Bhattacharya, S. Nandi, R. Banik, G. Mukherjee, S. Bhattacharyya, S. Ali3, P. Ray3, H. Pai3,
A. Goswami3, R. Rajbanshi4, S. Das Gupta5
UGC-DAE Consortium for Scientific Research, Kolkata Centre, Kolkata 700098, India UGC-DAE Consortium for Scientific Research, Indore 452001, India
Nuclear Physics Division, Saha Institute of Nuclear Physics, Kolkata 700064, India Presidency University, 86, 1, College St, Kolkata, West Bengal 700073
Victoria Institution (College), Kolkata 70000, India
uclei around doubly magic core, such as Hg isotopes exhibit different interesting phenomena. The low and high spin states in Hg isotopes with A around 190-200 have been extensively N
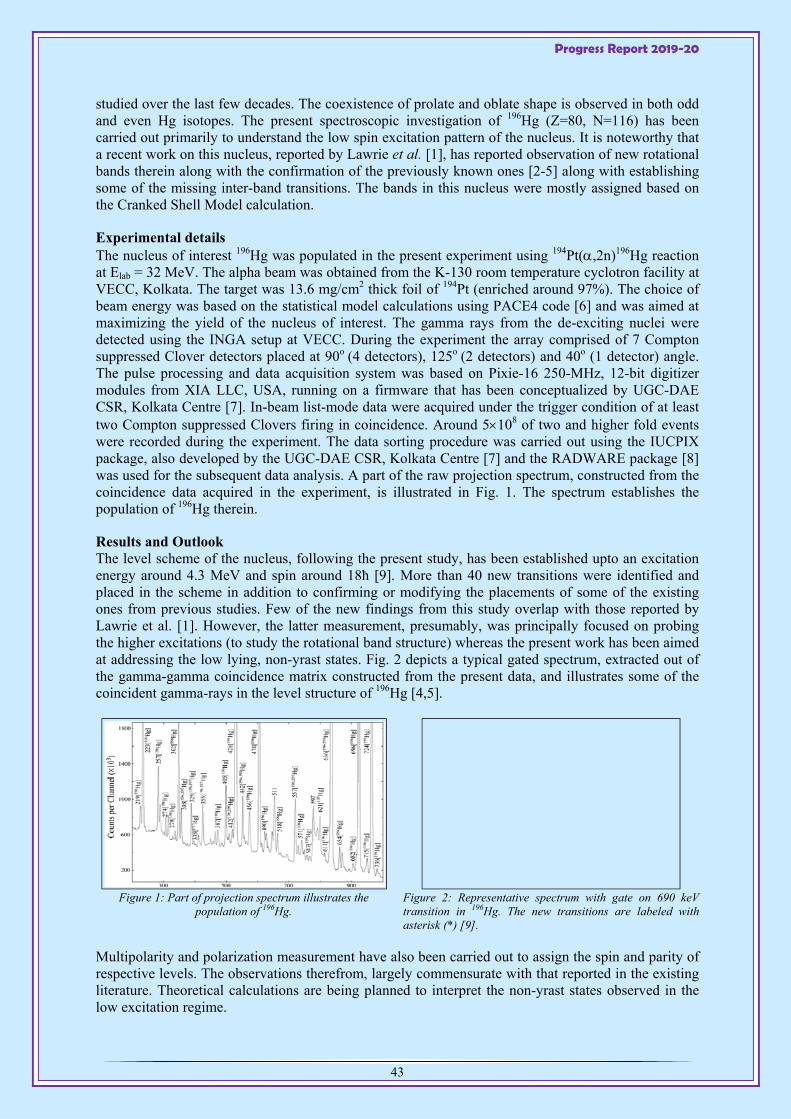
Progress Report 2019-20
43
studied over the last few decades. The coexistence of prolate and oblate shape is observed in both odd and even Hg isotopes. The present spectroscopic investigation of 196Hg (Z=80, N=116) has been carried out primarily to understand the low spin excitation pattern of the nucleus. It is noteworthy that a recent work on this nucleus, reported by Lawrie et al. [1], has reported observation of new rotational bands therein along with the confirmation of the previously known ones [2-5] along with establishing some of the missing inter-band transitions. The bands in this nucleus were mostly assigned based on the Cranked Shell Model calculation.
Experimental details The nucleus of interest 196Hg was populated in the present experiment using 194Pt(,2n)196Hg reaction at Elab = 32 MeV. The alpha beam was obtained from the K-130 room temperature cyclotron facility at VECC, Kolkata. The target was 13.6 mg/cm2 thick foil of 194Pt (enriched around 97%). The choice of beam energy was based on the statistical model calculations using PACE4 code [6] and was aimed at maximizing the yield of the nucleus of interest. The gamma rays from the de-exciting nuclei were detected using the INGA setup at VECC. During the experiment the array comprised of 7 Compton suppressed Clover detectors placed at 90o (4 detectors), 125o (2 detectors) and 40o (1 detector) angle. The pulse processing and data acquisition system was based on Pixie-16 250-MHz, 12-bit digitizer modules from XIA LLC, USA, running on a firmware that has been conceptualized by UGC-DAE CSR, Kolkata Centre [7]. In-beam list-mode data were acquired under the trigger condition of at least two Compton suppressed Clovers firing in coincidence. Around 5108 of two and higher fold events were recorded during the experiment. The data sorting procedure was carried out using the IUCPIX package, also developed by the UGC-DAE CSR, Kolkata Centre [7] and the RADWARE package [8] was used for the subsequent data analysis. A part of the raw projection spectrum, constructed from the coincidence data acquired in the experiment, is illustrated in Fig. 1. The spectrum establishes the population of 196Hg therein.
Results and Outlook The level scheme of the nucleus, following the present study, has been established upto an excitation energy around 4.3 MeV and spin around 18ħ [9]. More than 40 new transitions were identified and placed in the scheme in addition to confirming or modifying the placements of some of the existing ones from previous studies. Few of the new findings from this study overlap with those reported by Lawrie et al. [1]. However, the latter measurement, presumably, was principally focused on probing the higher excitations (to study the rotational band structure) whereas the present work has been aimed at addressing the low lying, non-yrast states. Fig. 2 depicts a typical gated spectrum, extracted out of the gamma-gamma coincidence matrix constructed from the present data, and illustrates some of the coincident gamma-rays in the level structure of 196Hg [4,5].
Figure 1: Part of projection spectrum illustrates the
population of 196Hg.
Figure 2: Representative spectrum with gate on 690 keV transition in 196Hg. The new transitions are labeled with asterisk (*) [9].
Multipolarity and polarization measurement have also been carried out to assign the spin and parity of respective levels. The observations therefrom, largely commensurate with that reported in the existing literature. Theoretical calculations are being planned to interpret the non-yrast states observed in the low excitation regime.
Progress Report 2019-20
44
Acknowledgements Help and support extended by the cyclotron staff and the Health Physics personnel at VECC, during the experiment, is gratefully appreciated. The efforts of the local INGA collaboration in setting up the facility is acknowledged.
References [1] J. J. Lawrie, E. A. Lawrie, B. Msezane, M. Benatar, M. Fedderke, G. K. Mabala, S.
Mukherjee, S. M. Mullins, K. P. Mutshena, N. J. Ncapayi, R. T. Newman, J. F. Sharpey-Schafer, F. D. Smit and P. Vymers, Phys. Rev. C 100, 064321 (2019).
[2] D. Proetel, R. M. Diamond, and F. S. Stephens, Nucl. Phy. A 231, 301 (1974). [3] R. M. Lieder, H. Beuscher, W. F. Davidson, A. Neskakis, and C. Mayer-Boricke, Nucl. Phy. A
248, 317 (1975). [4] H. Helppi, S. K. Saha, P. J. Daly, S. R. Faber, and T. L. Khoo, Phys. Rev. C 28, 3 (1983). [5] D. Mehta, Y. K. Agarwal, K. P. Blume, S. Heppner, H. Hubel, M. Murzel, K. Theine, and W.
Gast, Z. Phys. A 339, 317 (1991). [6] A. Gavron, Phys. Rev. C 21, 230 (1980). [7] S. Das, S. Samanta, R. Banik, R. Bhattacharjee, K. Basu, R. Raut, S. S. Ghugre, A. K. Sinha,
S. Bhattacharya, S. Imran, et al., Nucl. Instr. Meth. Phys. Res. A 893, 138 (2018); [8] URL www.radware.phy.ornl.gov. [9] S. Das et al. https://arxiv.org/abs/1912.03017v1; Proc. DAE Symp. Nucl. Phys. 64, 274(2019).
CHARACTERIZATION OF THE FIRST BEAM FROM K-500 CYCLOTRON
Samir Kundu, T. K. Rana, Santu Manna, R. Pandey, C. Bhattacharya, T. K. Ghosh, K. Banerjee, Pratap Roy, G. Mukherjee, A. Sen, J. K. Meena, J. K. Sahoo, A. K. Saha,
R. M. Saha, A. Sikdar
he first beam from K-500 cyclotron was transported at the segmented, horizontal axis, reaction chamber, SHARC [1] in SSC Cave-1 very recently. The cyclotron was operated in second
harmonic mode and nitrogen beam of energy 4.5 MeV/A was extracted. The aim of this study was to optimise the beam transportation as well as it’s characterization.
Optimization of beam spot on target position A large alumina with radius 5 cm was used to track the beam inside the chamber. The observed beam spot was quite large. To make the beam spot smaller, a remote controlled slit was used just before the entrance of the chamber. It was observed that the beam spot was reduced to ~5 mm diameter at the target position, as shown in Fig.1. It is expected that the beam would be scattered from the slit if it is single one. To avoid this scattering, the single slit was removed and then beam optimization was again performed to reduce the size of the beam spot. After optimization, the obtained diameter of the beam spot was less than 8 mm. The beam current was measured keeping a copper plate at the target position and it was found to be ~ 1nA. The current of the same beam was measured at the last Faraday cup and found to be reduced by a factor of two. This is due to defocussing of the beam beyond the target position, as the distance (more than 1.5 m) between the target holder to Faraday cup is quite large.
T
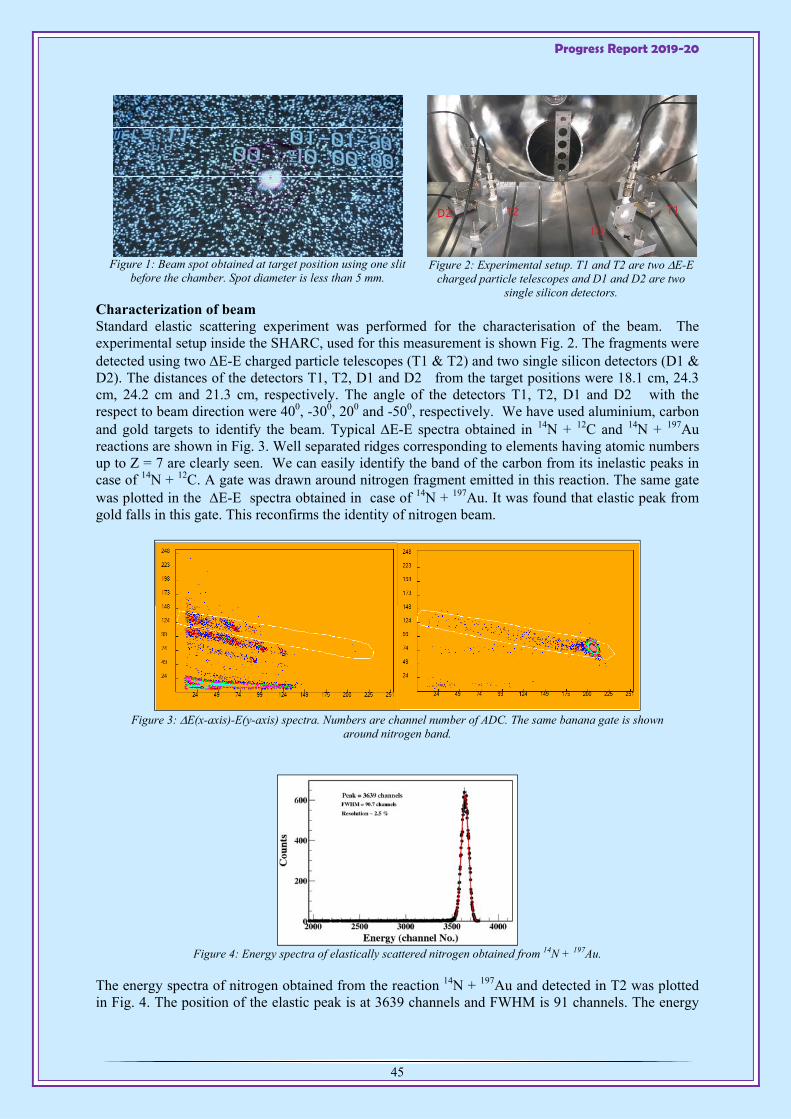
Progress Report 2019-20
45
Figure 1: Beam spot obtained at target position using one slit
before the chamber. Spot diameter is less than 5 mm. Figure 2: Experimental setup. T1 and T2 are two E-E
charged particle telescopes and D1 and D2 are two single silicon detectors.
Characterization of beam Standard elastic scattering experiment was performed for the characterisation of the beam. The experimental setup inside the SHARC, used for this measurement is shown Fig. 2. The fragments were detected using two E-E charged particle telescopes (T1 & T2) and two single silicon detectors (D1 & D2). The distances of the detectors T1, T2, D1 and D2 from the target positions were 18.1 cm, 24.3 cm, 24.2 cm and 21.3 cm, respectively. The angle of the detectors T1, T2, D1 and D2 with the respect to beam direction were 400, -300, 200 and -500, respectively. We have used aluminium, carbon and gold targets to identify the beam. Typical E-E spectra obtained in 14N + 12C and 14N + 197Au reactions are shown in Fig. 3. Well separated ridges corresponding to elements having atomic numbers up to Z = 7 are clearly seen. We can easily identify the band of the carbon from its inelastic peaks in case of 14N + 12C. A gate was drawn around nitrogen fragment emitted in this reaction. The same gate was plotted in the E-E spectra obtained in case of 14N + 197Au. It was found that elastic peak from gold falls in this gate. This reconfirms the identity of nitrogen beam.
Figure 3: E(x-axis)-E(y-axis) spectra. Numbers are channel number of ADC. The same banana gate is shown
around nitrogen band.
Figure 4: Energy spectra of elastically scattered nitrogen obtained from 14N + 197Au.
The energy spectra of nitrogen obtained from the reaction 14N + 197Au and detected in T2 was plotted in Fig. 4. The position of the elastic peak is at 3639 channels and FWHM is 91 channels. The energy

Progress Report 2019-20
46
resolution of the scattered beam (61 MeV at 300) is ~2.5% which is ~1.5 MeV. It may be mentioned here, the contribution of energy resolution of the detector in the beam energy resolution at this energy is negligibly small.
Conclusion The accelerated nitrogen beam from the superconducting cyclotron at VECC has been identified. The reduction of beam current from target position to faraday cup is due to defocussing of the beam because of large distance of more than 1.5m. Optimization of beam optics may solve this problem. The energy resolution of the beam is also found to be quite large to study the resonance reaction.
References: [1] S. Kundu et. al., J.Phys.Conf.Ser. 390, 012075 (2012).
AN ADVANCED GAMMA SPECTROSCOPIC ARRAY FOR IN-BEAM EXPERIMENTS WITH MULTIDETECTOR SYSTEM AND DIGITAL
DAQ AT VECC
In collaboration with 1SINP, Kolkata
2UGC-DAE CSR, Kolkata
he room temperature cyclotron at VECC provides high energy light (proton, alpha) and heavy ion beams for the users. The availability of high energy alpha beam and beams of inert gases, such as
20Ne, 40Ar, etc., are unique in the country. In order to utilize the unique accelerated ion beams, a high-efficiency multifaceted gamma detector array has been setup in channel-3 of cave-2 of K-130 cyclotron at VECC in multi-institutional collaboration for exploring the intricacies of the nuclear structure. The array consists of twelve Compton-suppressed clover HPGe detectors and three six inches long LaBr3(Ce) detectors. The clover detectors, placed at a distance of 25 cm from the target position, were at three angles, 40o (3 nos.), 90o (6 nos.) and 125o (3 nos.), while the LaBr3(Ce) detectors were placed at 125o (2 nos.) and at 40o (1 no.) angles at a distance of about 30 cm from the target position. In this collaborative setup, the detectors were contributed by SINP, UGC-DAE-CSR, and VECC, Kolkata. The mechanical structure of the array, originally designed and fabricated by SINP, Kolkata, has been augmented from the existing INGA support structure to accommodate the LaBr3(Ce) detectors and additional number of Clovers. The augmented structure, designed by VECC and SINP, has been fabricated by the Mechanical Engineering Group (MEG), VECC. In this design, additional Clovers could be mounted in the out of plane configuration in forward and backward angles along with the LaBr3(Ce) scintillators. The newly added mechanical structure is shown in Figure 1. This setup is one of the very few in the world which combines the power of high resolution in both energy and time in Clover and LaBr3(Ce), respectively and is the largest in the country that has been setup in multi- institutional collaboration. A picture of the setup is shown in Figure 2. The pulse processing and data acquisition system was a digital one that has been conceptualized and implemented by the UGC-DAE CSR, Kolkata Centre [1] and that is based on 250 MHz, 12 bit PIXIE-16 digitizer modules (XIA LLC, USA). The firmware of the digital DAQ was an updated one compared to the previous version that had been applied in the earlier use of this system during INGA@VECC. Time stamped listmode data from all the detectors were acquired with both singles (M≥ 1) and coincidence (M ≥ 2) modes, where Mis the multiplicity condition set on the Compton-suppressed clover detectors. Standard 133Ba and 152Eu radioactive sources, placed at the target position were used for energy and efficiency calibration of the setup. Initially, a facility test run was carried out to check the performance of the digital data acquisition coupled to the combined setup of Clover and LaBr3(Ce). After this test run, three collaborative experiments have been performed successfully with this setup using alpha beam from K-130 cyclotron. One more planned experiment will be performed soon.
T
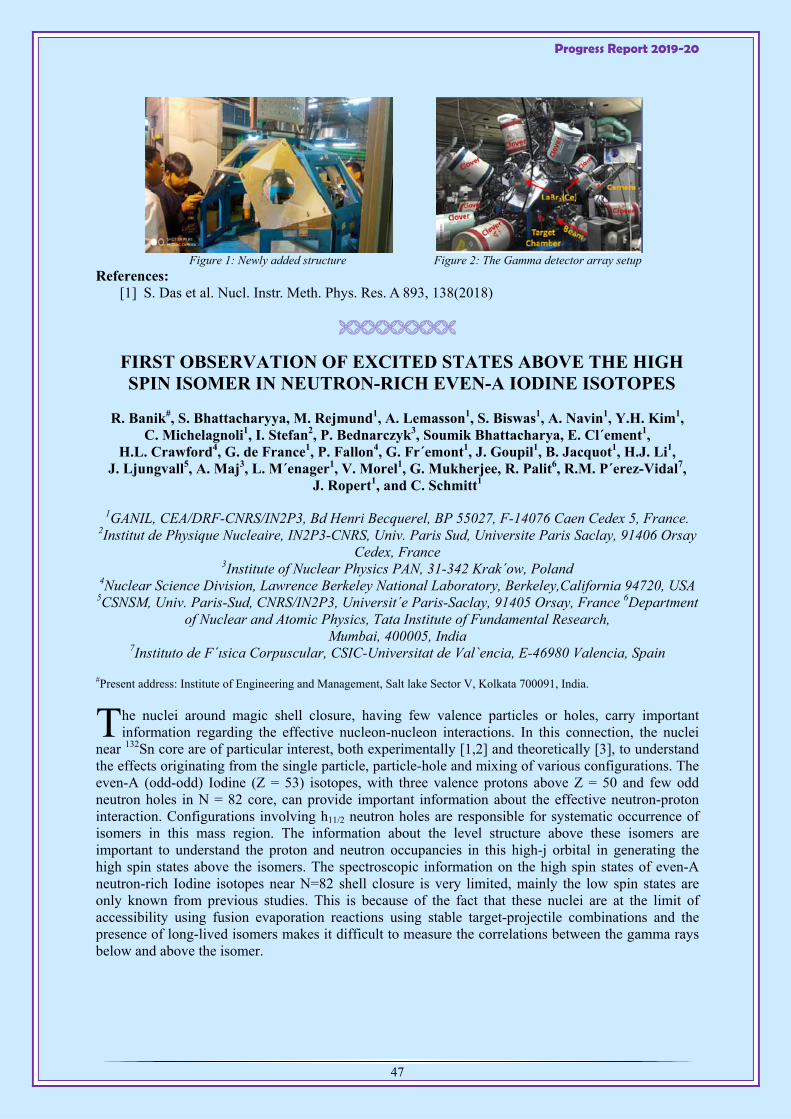
Progress Report 2019-20
47
Figure 1: Newly added structure
Figure 2: The Gamma detector array setup
References: [1] S. Das et al. Nucl. Instr. Meth. Phys. Res. A 893, 138(2018)
FIRST OBSERVATION OF EXCITED STATES ABOVE THE HIGH SPIN ISOMER IN NEUTRON-RICH EVEN-A IODINE ISOTOPES
R. Banik#, S. Bhattacharyya, M. Rejmund1, A. Lemasson1, S. Biswas1, A. Navin1, Y.H. Kim1, C. Michelagnoli1, I. Stefan2, P. Bednarczyk3, Soumik Bhattacharya, E. Cl´ement1,
H.L. Crawford4, G. de France1, P. Fallon4, G. Fr´emont1, J. Goupil1, B. Jacquot1, H.J. Li1, J. Ljungvall5, A. Maj3, L. M´enager1, V. Morel1, G. Mukherjee, R. Palit6, R.M. P´erez-Vidal7,
J. Ropert1, and C. Schmitt1
1GANIL, CEA/DRF-CNRS/IN2P3, Bd Henri Becquerel, BP 55027, F-14076 Caen Cedex 5, France. 2Institut de Physique Nucleaire, IN2P3-CNRS, Univ. Paris Sud, Universite Paris Saclay, 91406 Orsay
Cedex, France 3Institute of Nuclear Physics PAN, 31-342 Krak´ow, Poland
4Nuclear Science Division, Lawrence Berkeley National Laboratory, Berkeley,California 94720, USA 5CSNSM, Univ. Paris-Sud, CNRS/IN2P3, Universit´e Paris-Saclay, 91405 Orsay, France 6Department
of Nuclear and Atomic Physics, Tata Institute of Fundamental Research, Mumbai, 400005, India
7Instituto de F´ısica Corpuscular, CSIC-Universitat de Val`encia, E-46980 Valencia, Spain
#Present address: Institute of Engineering and Management, Salt lake Sector V, Kolkata 700091, India.
he nuclei around magic shell closure, having few valence particles or holes, carry important information regarding the effective nucleon-nucleon interactions. In this connection, the nuclei
near 132Sn core are of particular interest, both experimentally [1,2] and theoretically [3], to understand the effects originating from the single particle, particle-hole and mixing of various configurations. The even-A (odd-odd) Iodine (Z = 53) isotopes, with three valence protons above Z = 50 and few odd neutron holes in N = 82 core, can provide important information about the effective neutron-proton interaction. Configurations involving h11/2 neutron holes are responsible for systematic occurrence of isomers in this mass region. The information about the level structure above these isomers are important to understand the proton and neutron occupancies in this high-j orbital in generating the high spin states above the isomers. The spectroscopic information on the high spin states of even-A neutron-rich Iodine isotopes near N=82 shell closure is very limited, mainly the low spin states are only known from previous studies. This is because of the fact that these nuclei are at the limit of accessibility using fusion evaporation reactions using stable target-projectile combinations and the presence of long-lived isomers makes it difficult to measure the correlations between the gamma rays below and above the isomer.
T

Progress Report 2019-20
48
Experiment In the present work, the neutron rich Iodine isotopes 130,132I are produced as fission fragments from 9Be(238U,f) reaction at a beam energy of 6.2 MeV/u, performed at GANIL, France, and the transitions from the high spin excited states above the long-lived isomer have been studied after direct identification of the particular isotope [4]. The complete isotopic identification (A, Z) is obtained using the large acceptance magnetic spectrometer VAMOS++ [5]. The Z identification was obtained by E-E measurement using the ionization chamber placed at the focal plane of VAMOS++. Time of Flight of each fragment was measured using a Dual Position-Sensitive Multi-Wire Proportional Counter (DPS-MWPC), placed at the entrance of VAMOS++ and the MWPC placed at the focal plane. The AGATA -ray tracking array [6] is used to detect the prompt -rays while the delayed -rays from the isomeric states are identified by the EXOGAM segmented Clover detectors [7], placed at the end of the focal plane of the VAMOS++ spectrometer. In the present experiment, AGATA consisted of 32 crystals and was placed at 13.5 cm away from the target. The rays emitted in flight were Doppler corrected on an event-by-event basis, using the velocity vector of the recoiling ions (measured at VAMOS++) and the -ray emission angle measured by AGATA.
Results and discussion The present work reports, for the first time, the high spin excited states above the (8-) isomers in 130,132I. Fig. 1 shows the prompt singles -ray spectrum (P ) of 130I and 132I, after Doppler correction, in coincidence with the respective fragments identified at the VAMOS++ focal plane. It can be seen that all the transitions found to be in coincidence with the respective isotopes are new. No coincidences were observed between the previously known transitions and the newly observed - rays from the present work. As the fission process is likely to populate high angular momentum states, so, the new transitions are placed above the (8-) 315 ns isomer in 130I and (8-) 1.39 hr isomer in 132I respectively. A new high-spin isomer in 132I has also been identified using the prompt-delayed coincidence technique and the half-life has been measured as T1/2=342(12) ns. The new level structures are interpreted in terms of systematics and the large scale shell model calculations.
Figure 1: Doppler corrected prompt singles -ray spectrum (P) of 130I (left panel) and 132I (right panel), in coincidence with the fragments of respective isotopes. The new transitions observed are marked as ‘*’.
The contribution of AGATA collaboration is gratefully acknowledged. The funding received from CEFIPRA project No. 5604-4 and LIA France-India agreement is also acknowledged.
References:
[1] M. Rejmund, et al., Phys. Lett. B 753, 86 (2016). [2] S. Biswas et.al., Phys. Rev. C 93, 034324 (2016). [3] L. Coraggio et.al., Phys. Rev. C 66, 064311 (2002). [4] Y.H. Kim et al, Eur. Phys. J. A 53, 162 (2017). [5] M. Rejmund, et al., Nucl. Inst. Meth. A 646, 184 (2011). [6] S. Akkoyun, et al., Nucl. Inst. Meth. A 668, 26 (2012). [7] J. Simpson, et al., Act. Phys. Hung. Ser. Heavy Ion Phys. 11, 159 (2000).

Progress Report 2019-20
49
1.2 Nuclear Theory
SYSTEMATIC STUDY OF THE NUCLEAR CAPTURE PROCESS USING A FOUR-DIMENSIONAL LANGEVIN DYNAMICAL MODEL
Shabnam Mohsina and Jhilam Sadhukhan
eavy-ion induced fusion reaction provides the opportunity for synthesizing heavy and superheavy elements in laboratories. In general, the process can be divided in two successive dynamical
evolutions. First, a compact dinuclear configuration is formed through capture and then either it decays via quasifission or it equilibrates to a compound nucleus. We have performed a systematic study of nuclear capture process to disentangle the significances of collective angular momentum, target-projectile mass asymmetry, and dissipative forces. Partial contributions from different angular momenta have been analyzed for three different reaction channels with 16O, 48Ca, and 50Ti projectiles on the 208Pb target. A four-dimensional Langevin dynamical framework has been developed to simulate the time evolution of two colliding nuclei starting from a well separated configuration until a captured composite is formed. In this model, the driving potential and the dissipative forces are estimated using the double-folding procedure and the surface friction model, respectively.
Irrespective of target-projectile mass asymmetry, the dynamics has been found to be strongly influenced by the collective angular momentum when it reaches beyond a critical value depending on the beam energy. Effects are more prominent for 48Ca and 50Ti as these systems populate higher angular momenta. Nuclear dissipation has been found to be strongly correlated with the angular momentum. This study may provide a better guidance in designing fusion experiments.
References: [1] Shabnam Mohsina and Jhilam Sadhukhan, Phys. Rev. C 101, 044607 (2020).
RELATIVISTIC THOMAS-FERMI EQUATION OF STATE FOR MAGNETIZED WHITE DWARFS
Sujan Kumar Roy, Somnath Mukhopadhyay, Joydev Lahiri, D. N. Basu
he relativistic Feynman-Metropolis-Teller treatment of compressed atoms is extended to treat magnetized matter. Each atomic configuration is confined by a Wigner-Seitz cell and is
characterized by a positive electron Fermi energy which varies insignificantly with the magnetic field. In the relativistic treatment, the limiting configuration is reached when the Wigner-Seitz cell radius equals the radius of the nucleus with a maximum value of the electron Fermi energy which cannot be attained in the presence of magnetic field due to the effect of Landau quantization of electrons [1] within the Wigner-Seitz cell. This treatment is implemented to develop the equation of state for magnetized white dwarf stars [2] in the presence of Coulomb screening. The mass-radius relations for magnetized white dwarfs are obtained by solving the general relativistic hydrostatic equilibrium equations using Schwarzschild metric description suitable for non-rotating and slowly rotating stars. The explicit effects of the magnetic energy density and pressure contributed by a density-dependent magnetic field are included to find the stable configurations of magnetized super-Chandrasekhar white dwarfs.
References: [1] U. Das and B. Mukhopadhyay, Phys. Rev. Lett. 110, 071102 (2013). [2] Somnath Mukhopadhyay, Debasis Atta, D.N. Basu, Rom. Rep. Phys. 69, 101 (2017).
H
T
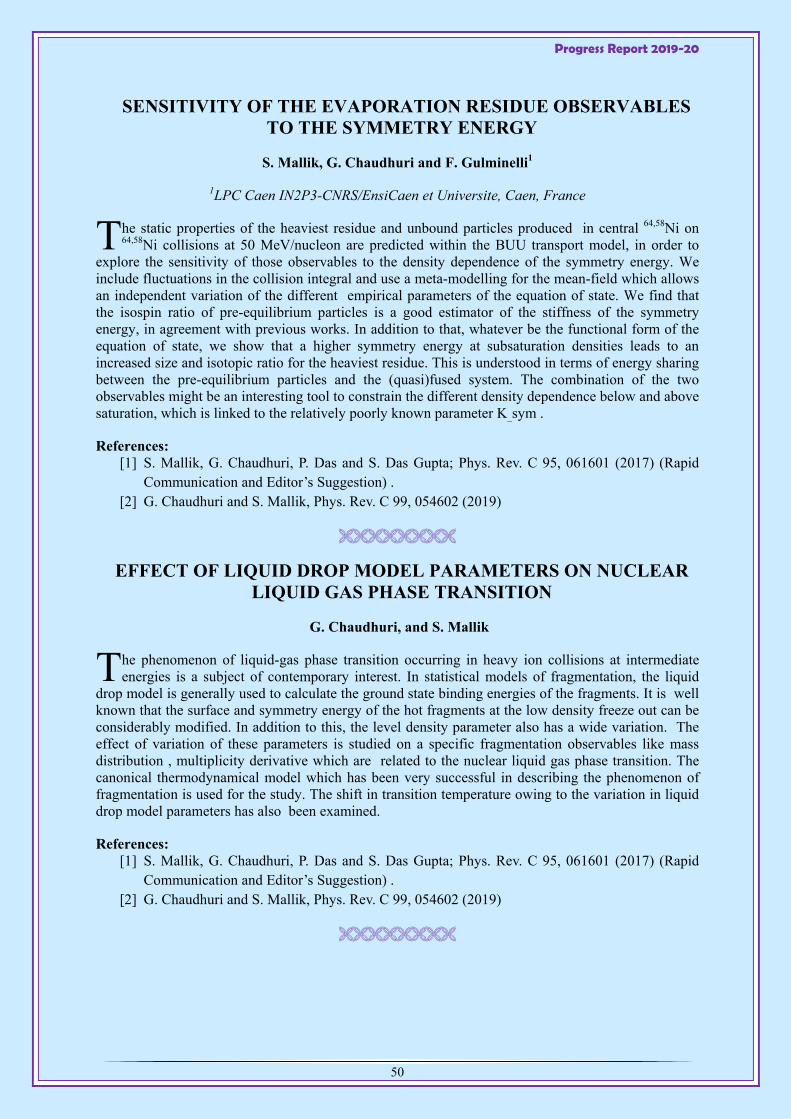
Progress Report 2019-20
50
SENSITIVITY OF THE EVAPORATION RESIDUE OBSERVABLES TO THE SYMMETRY ENERGY
S. Mallik, G. Chaudhuri and F. Gulminelli1
1LPC Caen IN2P3-CNRS/EnsiCaen et Universite, Caen, France
he static properties of the heaviest residue and unbound particles produced in central 64,58Ni on 64,58Ni collisions at 50 MeV/nucleon are predicted within the BUU transport model, in order to
explore the sensitivity of those observables to the density dependence of the symmetry energy. We include fluctuations in the collision integral and use a meta-modelling for the mean-field which allows an independent variation of the different empirical parameters of the equation of state. We find that the isospin ratio of pre-equilibrium particles is a good estimator of the stiffness of the symmetry energy, in agreement with previous works. In addition to that, whatever be the functional form of the equation of state, we show that a higher symmetry energy at subsaturation densities leads to an increased size and isotopic ratio for the heaviest residue. This is understood in terms of energy sharing between the pre-equilibrium particles and the (quasi)fused system. The combination of the two observables might be an interesting tool to constrain the different density dependence below and above saturation, which is linked to the relatively poorly known parameter K_sym .
References: [1] S. Mallik, G. Chaudhuri, P. Das and S. Das Gupta; Phys. Rev. C 95, 061601 (2017) (Rapid
Communication and Editor’s Suggestion) . [2] G. Chaudhuri and S. Mallik, Phys. Rev. C 99, 054602 (2019)
EFFECT OF LIQUID DROP MODEL PARAMETERS ON NUCLEAR LIQUID GAS PHASE TRANSITION
G. Chaudhuri, and S. Mallik
he phenomenon of liquid-gas phase transition occurring in heavy ion collisions at intermediate energies is a subject of contemporary interest. In statistical models of fragmentation, the liquid
drop model is generally used to calculate the ground state binding energies of the fragments. It is well known that the surface and symmetry energy of the hot fragments at the low density freeze out can be considerably modified. In addition to this, the level density parameter also has a wide variation. The effect of variation of these parameters is studied on a specific fragmentation observables like mass distribution , multiplicity derivative which are related to the nuclear liquid gas phase transition. The canonical thermodynamical model which has been very successful in describing the phenomenon of fragmentation is used for the study. The shift in transition temperature owing to the variation in liquid drop model parameters has also been examined.
References: [1] S. Mallik, G. Chaudhuri, P. Das and S. Das Gupta; Phys. Rev. C 95, 061601 (2017) (Rapid
Communication and Editor’s Suggestion) . [2] G. Chaudhuri and S. Mallik, Phys. Rev. C 99, 054602 (2019)
T
T

Progress Report 2019-20
51
EXACT RELAXATION DYNAMICS AND QUANTUM INFORMATION SCRAMBLING IN MULTIPLY QUENCHED HARMONIC CHAINS
S. Ghosh1, K. S. Gupta1, and Shashi C. L. Srivastava
1Theory Division, Saha Institute of Nuclear Physics, HBNI, 1/AF Bidhannagar, Kolkata 700064, India
he behavior of isolated quantum systems under nonequilibrium conditions is of great interest from both the theoretical as well as experimental point of view. A generic method to reach a
nonequilibrium regime is by a single or multiple quenches of the system parameters. The quantum dynamics of isolated systems under quench condition exhibits a variety of interesting features depending on the integrable/chaotic nature of system. For nonintegrable systems, the quench protocol often leads to thermalization, although there can be subtleties depending on the choice of initial states. For integrable systems, the situation is not as unequivocal. It is generally known that an isolated integrable system does not thermalize, but can be described by a generalized Gibbs ensemble (GGE). We have analyzed the relaxation dynamics and quantum information scrambling in an isolated harmonic chain under multiple quenches. The various physical quantities show remarkably different nonequilibrium behavior under the multiple quench protocol compared to a single quench. The reduced density matrix has been shown to assume a diagonal form exponentially fast compared to a single quench. The entanglement dynamics and the momentum distribution also show relaxation to a steady state. The exact analytical results obtained here are valid for arbitrary number of particles. These exact results involving infinite-dimensional Hilbert space are indicative of dynamical equilibration for a trivially integrable harmonic chain. For details see[1].
References: [1] S. Ghosh, K. S. Gupta, and Shashi C. L. Srivastava, Phys. Rev. E100, 012215 (2019).
EFFECT OF THE ANOMALOUS MAGNETIC MOMENT OF QUARKS ON THE PHASE STRUCTURE AND MESONIC PROPERTIES IN THE
NJL MODEL
Nilanjan Chaudhuri, Snigdha Ghosh1, Sourav Sarkar, and Pradip Roy1
1 SINP, Kolkata
mploying a field dependent three-momentum cutoff regularization technique, we study the phase structure and mesonic masses using the 2-flavor Nambu–Jona Lasinio model at finite temperature
and density in the presence of an arbitrary external magnetic field. This approach is then applied to incorporate the effects of the anomalous magnetic moment (AMM) of quarks on constituent quark mass and thermodynamic observables as a function of temperature/baryonic density. The critical temperature for transition from chiral symmetry broken to the restored phase is observed to decrease with the external magnetic field, which can be classified as inverse magnetic catalysis, while an opposite behavior is realized in the case of a vanishing magnetic moment, implying magnetic catalysis. These essential features are also reflected in the phase diagram. Furthermore, the properties of the low lying scalar and neutral pseudoscalar mesons are also studied in presence of a hot and dense magnetized medium including AMM of the quarks using random phase approximation. For nonzero values of magnetic field, we notice a sudden jump in the mass of the Goldstone mode at and above the Mott transition temperature which is found to decrease substantially with the increase in magnetic field when the AMM of the quarks are taken into consideration.
T
E
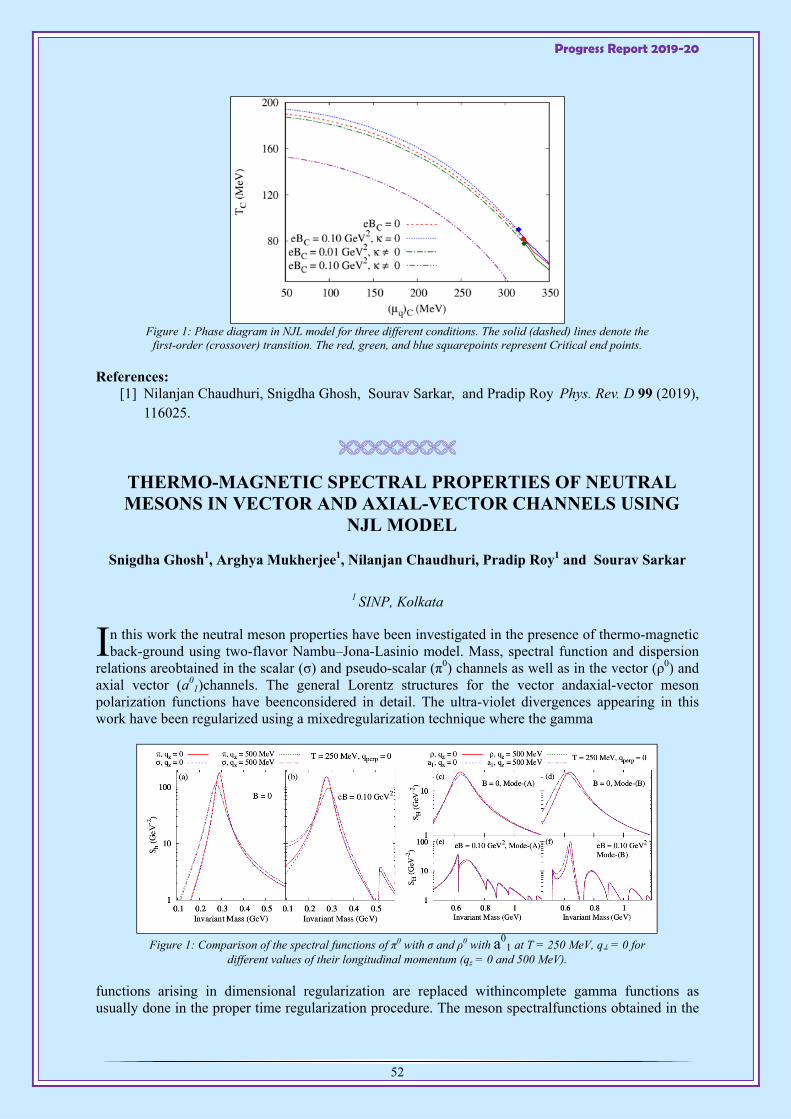
Progress Report 2019-20
52
Figure 1: Phase diagram in NJL model for three different conditions. The solid (dashed) lines denote the
first-order (crossover) transition. The red, green, and blue squarepoints represent Critical end points.
References: [1] Nilanjan Chaudhuri, Snigdha Ghosh, Sourav Sarkar, and Pradip Roy Phys. Rev. D 99 (2019),
116025.
THERMO-MAGNETIC SPECTRAL PROPERTIES OF NEUTRAL MESONS IN VECTOR AND AXIAL-VECTOR CHANNELS USING
NJL MODEL
Snigdha Ghosh1, Arghya Mukherjee1, Nilanjan Chaudhuri, Pradip Roy1 and Sourav Sarkar
1 SINP, Kolkata
n this work the neutral meson properties have been investigated in the presence of thermo-magnetic back-ground using two-flavor Nambu–Jona-Lasinio model. Mass, spectral function and dispersion
relations areobtained in the scalar (σ) and pseudo-scalar (π0) channels as well as in the vector (ρ0) and axial vector (a0
1)channels. The general Lorentz structures for the vector andaxial-vector meson polarization functions have beenconsidered in detail. The ultra-violet divergences appearing in this work have been regularized using a mixedregularization technique where the gamma
Figure 1: Comparison of the spectral functions of π0 with σ and ρ0 with a0
1 at T = 250 MeV, q = 0 for different values of their longitudinal momentum (qz = 0 and 500 MeV).
functions arising in dimensional regularization are replaced withincomplete gamma functions as usually done in the proper time regularization procedure. The meson spectralfunctions obtained in the
I

Progress Report 2019-20
53
presence of magnetic field possessnon-trivial oscillatory structure. Similar to thescalar and pseudo-scalar channel, the spectral functions for each of the modes of ρ0 are observed to overlap withthe corresponding modes of its chiral partner a0
1 mesons in the chiral symmetry restored phase. We observediscontinuities in the masses of all the mesonic excitations for non-zero external magnetic field.
References: [1] Snigdha Ghosh, Arghya Mukherjee, Nilanjan Chaudhuri, Pradip Roy and Sourav Sarkar, Phys.
Rev. D 101, 056023 (2020).
VISCOUS COEFFICIENTS AND THERMAL CONDUCTIVITY OF A Π K N GAS MIXTURE IN THE MEDIUM
Pallavi Kalikotay1, Nilanjan Chaudhuri, Snigdha Ghosh2, Utsab Gangopadhyaya and Sourav Sarkar
1Department of Physics, Kazi Nazrul University, Asansol, West Bengal 713340, India
2 SINP, Kolkata
he temperature and density dependence of the relaxation times, thermal conductivity, shear viscosity and bulk viscosity for a hot and dense gas consisting of pions, kaons and nucleons have
been evaluated in the kinetic theory approach. The in-medium cross-sections for π π , π K and π N scatterings were obtained by using complete propagators for the exchanged ρ, σ , K∗ and Delta excitations derived using thermal field theoretic techniques. Notable deviations can be observed in the temperature dependence of η, ζ and λ when compared with corresponding calculations using vacuum cross-sections usually employed in the literature. The value of the specific shear viscosity η/s is found to be in agreement with available estimates.
References: [1] Pallavi Kalikotay, Nilanjan Chaudhuri, Snigdha Ghosh, Utsab Gangopadyaya and Sourav
Sarkar, Eur. Phys. J A 56 (2020) 79.
T

Progress Report 2019-20
54
HEAVY FLAVOUR LANGEVIN DIFFUSION WITH THE CHROMO-ELECTROMAGNETIC FIELD FLUCTUATIONS IN THE QUARK-
GLUON PLASMA
A. I. Sheikh1 and Zubayer Ahammed1
1Variable Energy Cyclotron Centre, HBNI, 1/AF Bidhannagar, Kolkata 700 064, India
he diagnostics of quark-gluon plasma (QGP) produced at the laboratory is a field of immense interest in high energy heavy-ion research. Amongst many, heavy quarks are the crucial probes to
study QGP. Being heavy, heavy quarks are produced early in the collisions and as a result they might preserve a memory of their interaction history. The estimations of heavy quark energy losses in the QGP were obtained by considering the QGP medium in an average fashion, i.e., microscopic fluctuations were ignored. When an energetic heavy quark passes through the QGP medium, it encounters the fluctuations of the chromo-electromagnetic field generated by the moving partons in the medium that causes the propagating heavy quark to gain energy and the gained energy becomes substantial in lower momentum region [1].
Theoretical Formulation: The propagation of heavy quarks inside a QGP medium of light partons at a temperature, T<MQ, (MQ is the mass of heavy quark) can be studied by stochastic Langevin equation. In order to achieve equilibrium distribution feq = e-E/T with E = (p2+M2
Q) being the energy of the heavy quark, as the ultimate distribution one needs to adjust the drag coefficient (A(p)) and diffusion coefficient (D(E)) in accordance with the Einstein fluctuation-dissipation (FD) relation. We use the pre-point discretization scheme and the simple form of FD relation, D = ET, where and D are the drag and diffusion coefficient respectively, that govern the interaction between the heavy quark and the medium.
The hydrodynamic evolution of the bulk medoum is understood by (3+1)-dimensional relativistic viscous hydrodynamics, vHLLE[4]. We use optical Glauber initial state for this hydrodynamic evolution and obtained space-time history in performing the heavy flavour Langevin simulation.
Results and Discussions: In Fig. 1, we display the nuclear modification factor, RAA, of D0 mesons with the effect of fluctuations as a function of transverse momentum pT in Pb-Pb collisions at √sNN = 2.76 TeV for 0-10% centralities and B+ mesons in 0-100. The results are compared with the RAA measurements of D0 and B+ mesons by ALICE [5] and CMS[6] Collaborations. It is observed that both the results, with and without fluctuations describe the experimental measurements within their systematic uncertainties. However, at the momentum region ( pT < 8GeV), the results with the effect of fluctuations describe the experimental data well compared to the case of without fluctuations, i.e., the fluctuations have significant effects on RAA, of D0 mesons at the lower momentum region. Since, the fluctuations cause energy gain to the heavy quarks, which is significant at the lower momentum limit.
In Fig. 2, we show RAA, of D0 mesons as a function of pT for 0-10% (left), 10-40% (middle) and 40-80 (right) centrality classes in Au-Au collisions at √sNN = 200 GeV with the effect of field fluctuations included. The obtained results are compared with the RAA measurements of D0 mesons by STAR collaboration [8]. The obtained results, both with and without fluctuations, are close to the experimental data in all centrality bins. However the results with the effect of fluctuations show less suppression compared to the case of without fluctuations, In summary, the field fluctuations have considerable effects on the suppressions of D and B mesons at lower transverse momentum in LHC energies. The results without fluctuations are close enough to the ALICE and CMS experimental measurements within their uncertainties. But the measurements can be described well at the lower transverse momentum region when the effect of the fluctuations is taken into
T

Progress Report 2019-20
55
account. However, the effect of the fluctuations is less at RHIC energy. Nevertheless, the data can also be described with the effect of the fluctuations.
Figure 2: Left: RAA of D0 mesons as a function of pT for 0-10% centrality in Pb-Pb collisions at √sNN = 2.76 TeV, compared with the ALICE[5] and CMS[6] data. Right: Same for B+ mesons for 0-100% centrality in Pb-Pb collisions at
√sNN = 5.02 TeV.
Figure 3: RAA of D0 mesons with pT in Au-Au collisions at √sNN = 200GeV. The experimental data are
taken from STAR Collaboration [8].
References: [1] P. Chakraborty, M.G. Mustafa, M.H. Thoma, Phys. Rev. C, Phys. Rev. C 75 064908 (2007). [2] A.I. Sheikh, Z. Ahammed, Nucl.Phys. A 986 48 (2019) [3] A.I. Sheikh, Z. Ahammed, P. Shukla, M.G. Mustafa Phys. Rev. C 98 034915 (2018) [4] I. Karpenko, P. Huovinen, M. Bleicher, Comput. Phys. Commun. 185 3016 (2014) [5] J. Adam et al. (ALICE Collaboration), J. High Energy Phys. 03 081 (2016) [6] CMS Collaboration, CERN Report No. CMS-PAS-HIN-15-005, 2015 [7] CMS Collaboration, Phys. Rev. Lett. 119 152301 (2017) [8] L. Adamczyk, et al. (STAR Collaboration), Phys. Rev. Lett. 113 142301 (2014)

Progress Report 2019-20
56
STUDY OF DIFFUSION COEFFICIENTS OF IDENTIFIED PARTICLES AT ENERGIES AVAILABLE AT BNL RELATIVISTIC
HEAVY ION COLLIDER
V. K. Singh1, D. K. Mishra2, Z. Ahammed1
1Variable Energy Cyclotron Centre, HBNI, 1/AF Bidhannagar, Kolkata 700 064, India 2Nuclear Physics Division, Bhabha Atomic Research Center, Mumbai 400085, India
vent-by-event fluctuations of conserved quantities such as net-charge, net-baryon number etc. are widely studied in heavy ion collisions to understand the QCD phase transition. The variation of
collision centrality, total energy deposition, variation in number of participant nucleons and baryon stopping in each and every collision causes these fluctuations. The strength of the measured fluctuations depends upon the survival probability in the QGP medium. However the fluctuations created in the initial state in heavy-ion collisions may survive during the hadronization process as the fireball expands very quickly. The strength of such fluctuations differs from their equilibrium hadron gas state towards initial values, typical for QGP. If the relaxation time happens to be shorter than the lifetime of the hadronic stage of the collisions. The measured fluctuations may get diluted in the expanding medium due to the diffusion of the charged hadrons in the rapidity space. The dissipation of fluctuations occurs during the evolution of the system from hadronization to their kinetic freeze-out. Hence, the experimental measurements of not only the magnitudes of fluctuation quantities at a fixed ∆η but also their dependence on ∆η enable us to explore various aspect of the time evolution of the hot medium and the hadronization mechanism. A strong gradients in the chemical potential of conserved charges are expected at such energies. Hence, lower energy beam scan at RHIC can be useful to explore the properties of charge particle diffusion of nuclear matter which were out of reach in high energy collisions. It is proposed to study the fluctuations of identified particle species and estimate the rate of diffusion in different rapidity interval for the measured particles at various centre of mass energies (√sNN) available at BNL (RHIC). In this study we have calculated the diffusion coefficient parameter of identified charged particles, mainly for net-pion, net-kaon, and net-proton using a transport model UrQMD, and HIJING model which will serve as the baseline for experimental measurement.
Results: The diffusion coefficient as a function of ∆η window for net-charge, net-pion, net-kaon, and net-proton for (0-5%) centrality in Au+Au collisions at √sNN= 200 GeV is shown in the Fig.1.The σ values are obtained by fitting the <Nch> ν (±,dyn) up to different ∆η range with the error function Erf (∆η/√8σ ). In both the HIJING and UrQMD models, the diffusion coefficient for net-charge and net-pion are independent of ∆η window and match with each other. This is due to the fact that the majority of the produced particles in a collision are pions itself. In HIJING model, the diffusion coefficients of net-kaon and net-proton show small ∆η dependence. The σ values of net-proton are systematically above, whereas σ values of net-kaon are systematically below the net-charge and net-pion values at all ∆η windows. In case of UrQMD model, the σ values of net-kaon are higher than net-pion and net-charge. The difference in UrQMD with HIJING comes from the inclusion of multiple re-scattering in the former. The HIJING model does not include the secondary interactions. Due to the qualitatively different nature of curvature of <Nch>ν (±,dyn) as a function ∆η for net-proton in UrQMD model, it was not possible to extract the σ values. The extracted values of diffusion coefficient of net charged and identified particles as a function of √sNN are shown in Fig. 2. The resulting values of σ are obtained by fitting the <Nch>ν (±,dyn) values up to ∆ η = 3.5 for 7.7GeV, 4.5 for 19.6GeV, and 5.0 for 27–200GeV respectively with the Erf (∆η/√8σ ). It is found that, the σ values are independent of collision energies. The σ values of net-kaons and net-protons are systematically higher than net-pion at all the studied energies. The difference between HIJING and UrQMD is due to the fact that UrQMD, being a transport model, it includes multiple re-scattering before freezeout of the species which is absent in HIJING. This study emphasizes the particle species dependence of diffusion coefficient and provides a reference baseline for comparison with the experimental data
E
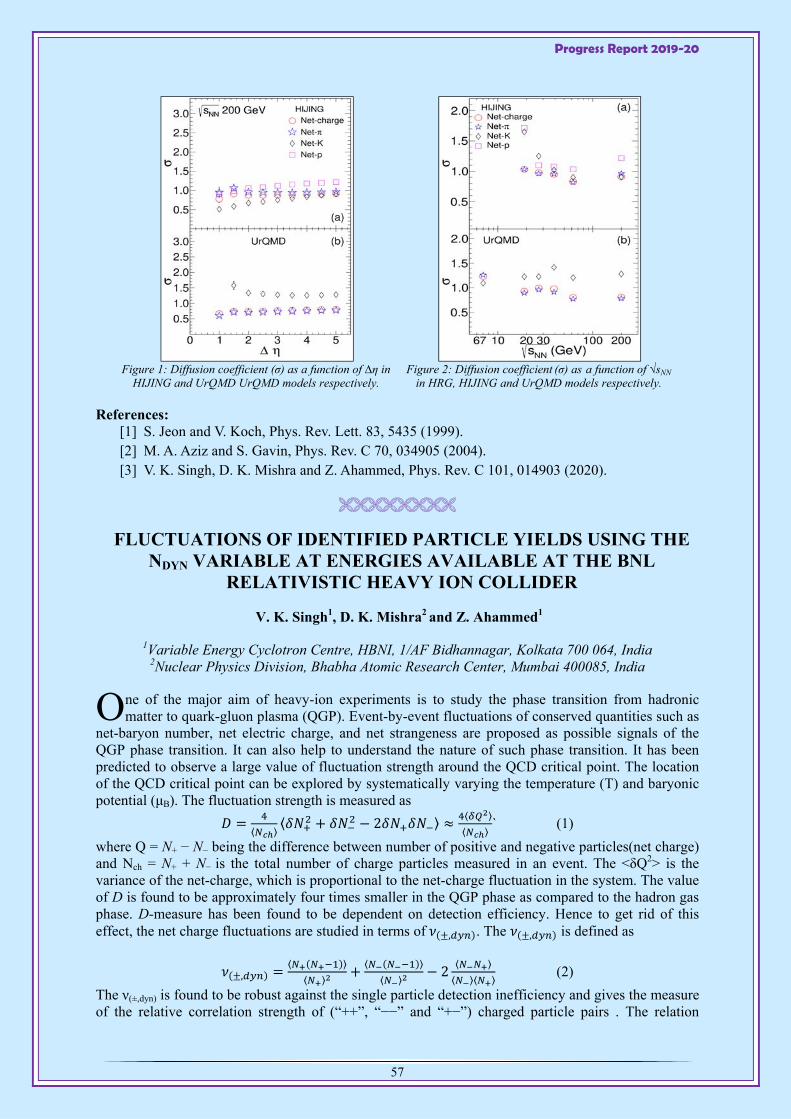
Progress Report 2019-20
57
Figure 1: Diffusion coefficient (σ) as a function of ∆η in
HIJING and UrQMD UrQMD models respectively.
Figure 2: Diffusion coefficient (σ) as a function of √sNN
in HRG, HIJING and UrQMD models respectively.
References: [1] S. Jeon and V. Koch, Phys. Rev. Lett. 83, 5435 (1999). [2] M. A. Aziz and S. Gavin, Phys. Rev. C 70, 034905 (2004). [3] V. K. Singh, D. K. Mishra and Z. Ahammed, Phys. Rev. C 101, 014903 (2020).
FLUCTUATIONS OF IDENTIFIED PARTICLE YIELDS USING THE ΝDYN VARIABLE AT ENERGIES AVAILABLE AT THE BNL
RELATIVISTIC HEAVY ION COLLIDER
V. K. Singh1, D. K. Mishra2 and Z. Ahammed1
1Variable Energy Cyclotron Centre, HBNI, 1/AF Bidhannagar, Kolkata 700 064, India 2Nuclear Physics Division, Bhabha Atomic Research Center, Mumbai 400085, India
ne of the major aim of heavy-ion experiments is to study the phase transition from hadronic matter to quark-gluon plasma (QGP). Event-by-event fluctuations of conserved quantities such as
net-baryon number, net electric charge, and net strangeness are proposed as possible signals of the QGP phase transition. It can also help to understand the nature of such phase transition. It has been predicted to observe a large value of fluctuation strength around the QCD critical point. The location of the QCD critical point can be explored by systematically varying the temperature (T) and baryonic potential (μB). The fluctuation strength is measured as
⟨ ⟩⟨ 2 ⟩ ⟨ ⟩
⟨ ⟩` (1)
where Q = N+ − N− being the difference between number of positive and negative particles(net charge) and Nch = N+ + N− is the total number of charge particles measured in an event. The <δQ2> is the variance of the net-charge, which is proportional to the net-charge fluctuation in the system. The value of D is found to be approximately four times smaller in the QGP phase as compared to the hadron gas phase. D-measure has been found to be dependent on detection efficiency. Hence to get rid of this effect, the net charge fluctuations are studied in terms of , . The , is defined as
,⟨ ⟩
⟨ ⟩
⟨ ⟩
⟨ ⟩2
⟨ ⟩
⟨ ⟩⟨ ⟩ (2)
The ν(±,dyn) is found to be robust against the single particle detection inefficiency and gives the measure of the relative correlation strength of (“++”, “−−” and “+−”) charged particle pairs . The relation
O

Progress Report 2019-20
58
between D and ν(±,dyn) is given as ⟨ ⟩ , 4 . We have used HIJING(v.1.37) and UrQMD(V.1.30) to study the fluctuation variables. The HIJING and UrQMD both are monte carlo event generators, which is used for nucleon-nucleon and nucleus-nucleus collisions in high energy physics simulations. These models provide the proper baseline to compare with the experimental data.
Results: We have studied the fluctuations of net-charge, net-pion, net-kaon, and net-proton using the ⟨ ⟩ , observable within the ambit of HRG, HIJING, and UrQMD models at different collision energies. The ⟨ ⟩ , values are estimated up to a higher ∆η window. The estimated values of ⟨ ⟩ , are found to be independent of ∆η in the case of the HRG model. However, there is a strong dependence of resonance decay effects observed for the identified particles. The calculation of ⟨ ⟩ , from the HRG model will provide a pure thermal baseline contribution as a function of ∆η. In the case of HIJING and UrQMD models a stronger dependence of the ⟨ ⟩ , value is observed for lower ∆η and the decreasing trend continues up to higher ∆η with the lower slope in both the models, except for the net proton case in the UrQMD model. In the case of net proton in the UrQMD model, the curvature of ⟨ ⟩ , values as a function of ∆η shows different behaviour as observed in HIJING model. The difference between HIJING and UrQMD is due to the fact that UrQMD, being a transport model, it includes multiple re-scattering before freezeout of the species which is absent in HIJING. The HIJING model does not include the secondary interactions.
Figure 1: Fluctuation parameter ⟨ ⟩ , as a
function of ∆η in HRG, HIJING and UrQMD models respectively.
Figure 2: Fluctuation parameter ⟨ ⟩ , as a
function of √sNN in HRG, HIJING and UrQMD models respectively.
The ⟨ ⟩ , values obtained from different model calculations are independent of collision energies but show particle species dependence. This study emphasizes the particle species dependence of fluctuation strength and provides are reference baseline for comparison with the experimental data.
References: [1] S. Jeon and V. Koch, Phys. Rev. Lett. 83, 5435 (1999). [2] X. N. Wang and M. Gyulassy, Phys. Rev. D 44, 3501 (1991). [3] M. Bleicher et al., J. Phys. G 25, 1859 (1999).

Progress Report 2019-20
59
ANISOTROPIC ESCAPE MECHANISM AND ELLIPTIC FLOW OF BOTTOMONIA
P. P. Bhaduri, N. Borghini1, A. Jaiswal2, M. Strickland3,
1Faculty of Physics, University of Bielefeld, Postfach 100131, D-33501 Bielefeld, Germany 2 School of Physical Sciences, National Institute of Science Education and Research, HBNI, Jatni-
752050, India 3Department of Physics, Kent State University, Kent, OH 44242 United States
eavy quarks, such as charm (c) and bottom (b) quarks, and their quarkonium bound states (cc-bar and bb-bar) are very useful internal probes of the hot and dense medium created in collisions of
heavy nuclei at high energies [1]. Heavy quarkonia created in high-energy collisions at the BNL Relativistic Heavy Ion Collider (RHIC) and the CERN Large Hadron Collider (LHC) have been found to be appreciably affected by the medium and thus carry information about the thermodynamic and transport properties of the medium.
Figure 1: Transverse momentum dependence of v2 of (1S) states including feed down contributions
from higher excited states for different centrality intervals in 2.76 TeV Pb + Pb collisions.
We have studied the role of anisotropic escape mechanism in generating the elliptic flow (v2) of bottomonia produced in ultra-relativistic heavy-ion collisions. The state-of-the-art temperature dependent decay widths for the various bottomonium states are implemented to calculate their survival probability while traversing through the anisotropic hot and dense medium formed in non-central collisions. We have employed the recently developed 3+1d quasi-particle anisotropic hydrodynamic model [2] to simulate the space-time evolution of the quark-gluon plasma. We provide quantitative prediction for transverse momentum dependence of bottomonium elliptic flow for 2.76 TeV Pb+Pb collisions at the Large Hadron Collider, as shown in Fig. 1. The predictions serve as an useful reference for the ongoing analysis of the measured v2 of the different bottomonia states by ALICE and CMS Collaborations at LHC. More details about the work can be found in Ref. [3].
References: [1] A. Andronic et al., Eur. Phys. J. C76 (2016), no. 3, 107. [2] M. Alqahtani, M. Nopoush and M. Strickland, Phys. Rev. C92 (2015) no. 5, 054910. [3] Partha P. Bhaduri, N.Borghini, A. Jaiswal, M.Strickland, Phys. Rev. (Rapp. Comm.) C100
(2019) no. 5, 051901.
H
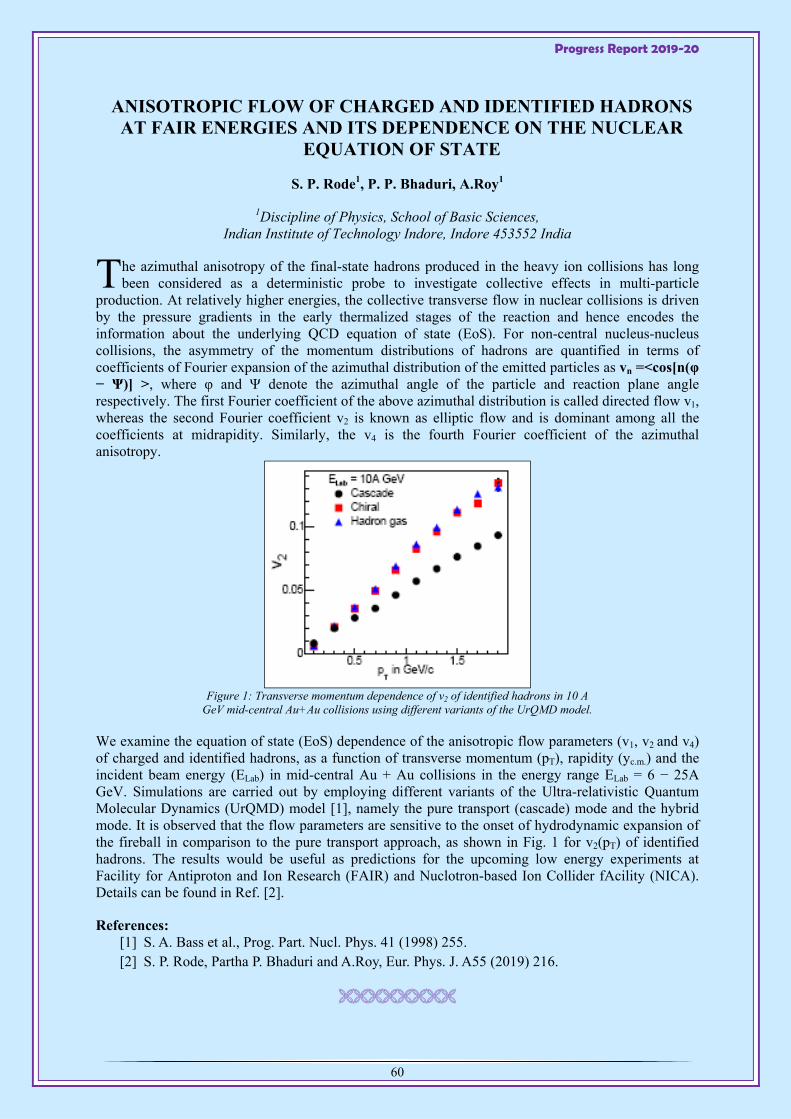
Progress Report 2019-20
60
ANISOTROPIC FLOW OF CHARGED AND IDENTIFIED HADRONS AT FAIR ENERGIES AND ITS DEPENDENCE ON THE NUCLEAR
EQUATION OF STATE
S. P. Rode1, P. P. Bhaduri, A.Roy1
1Discipline of Physics, School of Basic Sciences, Indian Institute of Technology Indore, Indore 453552 India
he azimuthal anisotropy of the final-state hadrons produced in the heavy ion collisions has long been considered as a deterministic probe to investigate collective effects in multi-particle
production. At relatively higher energies, the collective transverse flow in nuclear collisions is driven by the pressure gradients in the early thermalized stages of the reaction and hence encodes the information about the underlying QCD equation of state (EoS). For non-central nucleus-nucleus collisions, the asymmetry of the momentum distributions of hadrons are quantified in terms of coefficients of Fourier expansion of the azimuthal distribution of the emitted particles as vn =<cos[n(φ − Ψ)] >, where φ and Ψ denote the azimuthal angle of the particle and reaction plane angle respectively. The first Fourier coefficient of the above azimuthal distribution is called directed flow v1, whereas the second Fourier coefficient v2 is known as elliptic flow and is dominant among all the coefficients at midrapidity. Similarly, the v4 is the fourth Fourier coefficient of the azimuthal anisotropy.
Figure 1: Transverse momentum dependence of v2 of identified hadrons in 10 A
GeV mid-central Au+Au collisions using different variants of the UrQMD model.
We examine the equation of state (EoS) dependence of the anisotropic flow parameters (v1, v2 and v4) of charged and identified hadrons, as a function of transverse momentum (pT), rapidity (yc.m.) and the incident beam energy (ELab) in mid-central Au + Au collisions in the energy range ELab = 6 − 25A GeV. Simulations are carried out by employing different variants of the Ultra-relativistic Quantum Molecular Dynamics (UrQMD) model [1], namely the pure transport (cascade) mode and the hybrid mode. It is observed that the flow parameters are sensitive to the onset of hydrodynamic expansion of the fireball in comparison to the pure transport approach, as shown in Fig. 1 for v2(pT) of identified hadrons. The results would be useful as predictions for the upcoming low energy experiments at Facility for Antiproton and Ion Research (FAIR) and Nuclotron-based Ion Collider fAcility (NICA). Details can be found in Ref. [2].
References: [1] S. A. Bass et al., Prog. Part. Nucl. Phys. 41 (1998) 255. [2] S. P. Rode, Partha P. Bhaduri and A.Roy, Eur. Phys. J. A55 (2019) 216.
T
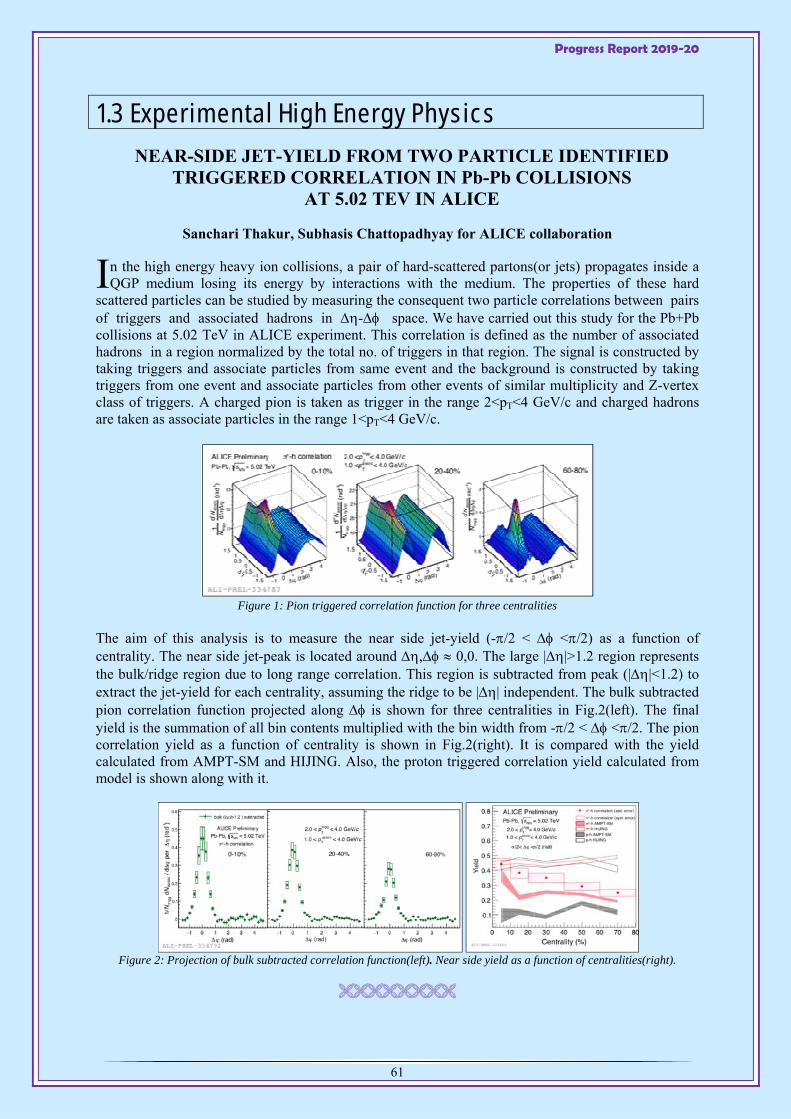
Progress Report 2019-20
61
1.3 Experimental High Energy Physics
NEAR-SIDE JET-YIELD FROM TWO PARTICLE IDENTIFIED TRIGGERED CORRELATION IN Pb-Pb COLLISIONS
AT 5.02 TEV IN ALICE
Sanchari Thakur, Subhasis Chattopadhyay for ALICE collaboration
n the high energy heavy ion collisions, a pair of hard-scattered partons(or jets) propagates inside a QGP medium losing its energy by interactions with the medium. The properties of these hard
scattered particles can be studied by measuring the consequent two particle correlations between pairs of triggers and associated hadrons in - space. We have carried out this study for the Pb+Pb collisions at 5.02 TeV in ALICE experiment. This correlation is defined as the number of associated hadrons in a region normalized by the total no. of triggers in that region. The signal is constructed by taking triggers and associate particles from same event and the background is constructed by taking triggers from one event and associate particles from other events of similar multiplicity and Z-vertex class of triggers. A charged pion is taken as trigger in the range 2<pT<4 GeV/c and charged hadrons are taken as associate particles in the range 1<pT<4 GeV/c.
Figure 1: Pion triggered correlation function for three centralities
The aim of this analysis is to measure the near side jet-yield (-/2 < </2) as a function of centrality. The near side jet-peak is located around , 0,0. The large ||>1.2 region represents the bulk/ridge region due to long range correlation. This region is subtracted from peak (||<1.2) to extract the jet-yield for each centrality, assuming the ridge to be || independent. The bulk subtracted pion correlation function projected along is shown for three centralities in Fig.2(left). The final yield is the summation of all bin contents multiplied with the bin width from -/2 < </2. The pion correlation yield as a function of centrality is shown in Fig.2(right). It is compared with the yield calculated from AMPT-SM and HIJING. Also, the proton triggered correlation yield calculated from model is shown along with it.
Figure 2: Projection of bulk subtracted correlation function(left). Near side yield as a function of centralities(right).
I
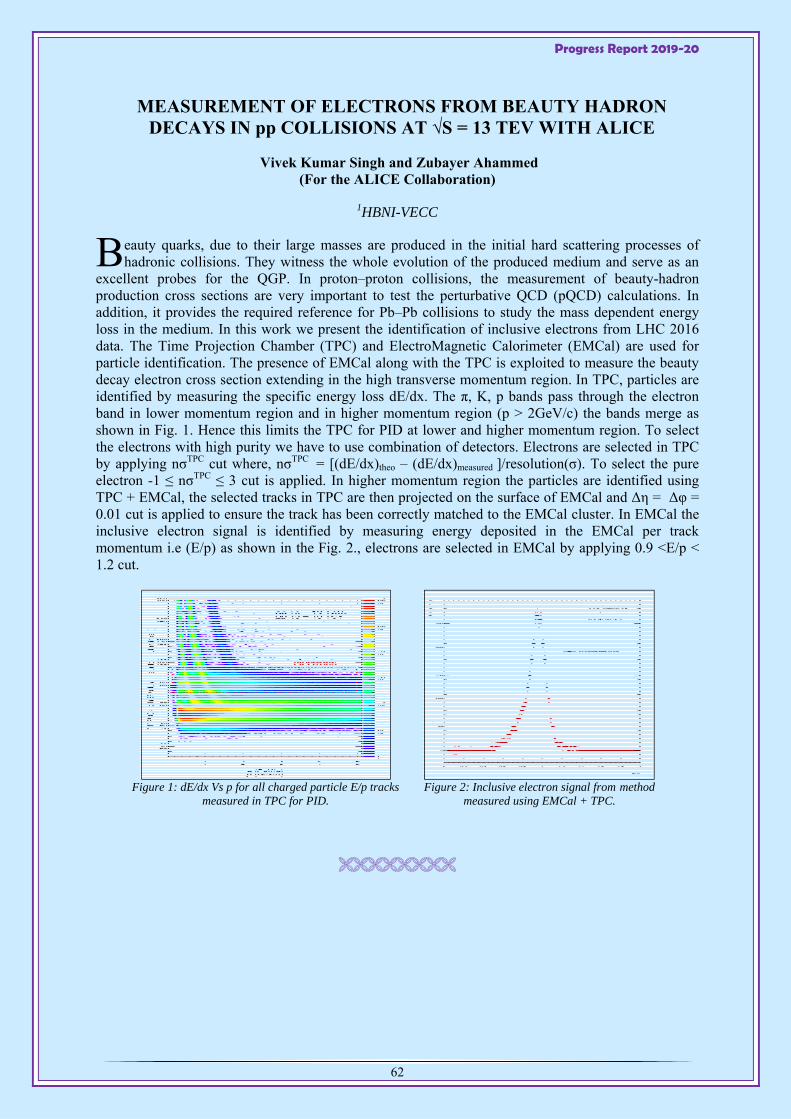
Progress Report 2019-20
62
MEASUREMENT OF ELECTRONS FROM BEAUTY HADRON DECAYS IN pp COLLISIONS AT √S = 13 TEV WITH ALICE
Vivek Kumar Singh and Zubayer Ahammed (For the ALICE Collaboration)
1HBNI-VECC
eauty quarks, due to their large masses are produced in the initial hard scattering processes of hadronic collisions. They witness the whole evolution of the produced medium and serve as an
excellent probes for the QGP. In proton–proton collisions, the measurement of beauty-hadron production cross sections are very important to test the perturbative QCD (pQCD) calculations. In addition, it provides the required reference for Pb–Pb collisions to study the mass dependent energy loss in the medium. In this work we present the identification of inclusive electrons from LHC 2016 data. The Time Projection Chamber (TPC) and ElectroMagnetic Calorimeter (EMCal) are used for particle identification. The presence of EMCal along with the TPC is exploited to measure the beauty decay electron cross section extending in the high transverse momentum region. In TPC, particles are identified by measuring the specific energy loss dE/dx. The π, K, p bands pass through the electron band in lower momentum region and in higher momentum region (p > 2GeV/c) the bands merge as shown in Fig. 1. Hence this limits the TPC for PID at lower and higher momentum region. To select the electrons with high purity we have to use combination of detectors. Electrons are selected in TPC by applying nσTPC cut where, nσTPC = [(dE/dx)theo – (dE/dx)measured ]/resolution(σ). To select the pure electron -1 ≤ nσTPC ≤ 3 cut is applied. In higher momentum region the particles are identified using TPC + EMCal, the selected tracks in TPC are then projected on the surface of EMCal and Δη = Δφ = 0.01 cut is applied to ensure the track has been correctly matched to the EMCal cluster. In EMCal the inclusive electron signal is identified by measuring energy deposited in the EMCal per track momentum i.e (E/p) as shown in the Fig. 2., electrons are selected in EMCal by applying 0.9 <E/p < 1.2 cut.
Figure 1: dE/dx Vs p for all charged particle E/p tracks
measured in TPC for PID.
Figure 2: Inclusive electron signal from method
measured using EMCal + TPC.
B
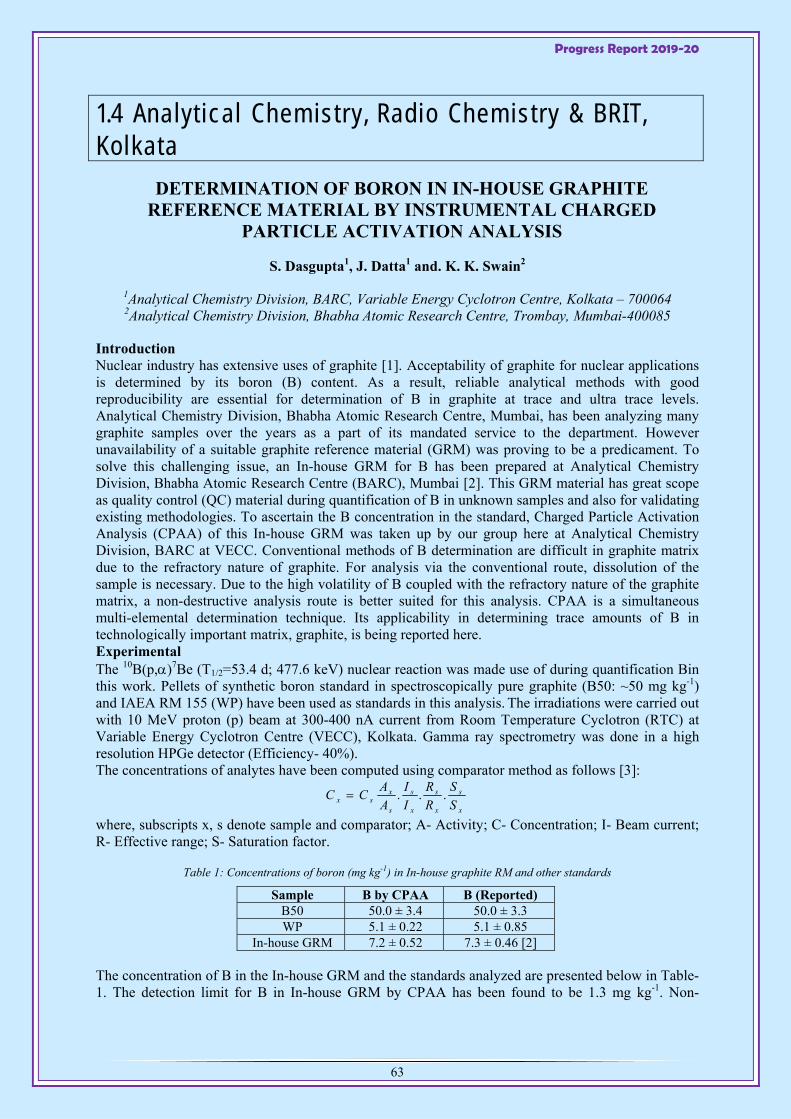
Progress Report 2019-20
63
1.4 Analytical Chemistry, Radio Chemistry & BRIT, Kolkata
DETERMINATION OF BORON IN IN-HOUSE GRAPHITE REFERENCE MATERIAL BY INSTRUMENTAL CHARGED
PARTICLE ACTIVATION ANALYSIS
S. Dasgupta1, J. Datta1 and. K. K. Swain2
1Analytical Chemistry Division, BARC, Variable Energy Cyclotron Centre, Kolkata – 700064 2Analytical Chemistry Division, Bhabha Atomic Research Centre, Trombay, Mumbai-400085
Introduction Nuclear industry has extensive uses of graphite [1]. Acceptability of graphite for nuclear applications is determined by its boron (B) content. As a result, reliable analytical methods with good reproducibility are essential for determination of B in graphite at trace and ultra trace levels. Analytical Chemistry Division, Bhabha Atomic Research Centre, Mumbai, has been analyzing many graphite samples over the years as a part of its mandated service to the department. However unavailability of a suitable graphite reference material (GRM) was proving to be a predicament. To solve this challenging issue, an In-house GRM for B has been prepared at Analytical Chemistry Division, Bhabha Atomic Research Centre (BARC), Mumbai [2]. This GRM material has great scope as quality control (QC) material during quantification of B in unknown samples and also for validating existing methodologies. To ascertain the B concentration in the standard, Charged Particle Activation Analysis (CPAA) of this In-house GRM was taken up by our group here at Analytical Chemistry Division, BARC at VECC. Conventional methods of B determination are difficult in graphite matrix due to the refractory nature of graphite. For analysis via the conventional route, dissolution of the sample is necessary. Due to the high volatility of B coupled with the refractory nature of the graphite matrix, a non-destructive analysis route is better suited for this analysis. CPAA is a simultaneous multi-elemental determination technique. Its applicability in determining trace amounts of B in technologically important matrix, graphite, is being reported here. Experimental The 10B(p,)7Be (T1/2=53.4 d; 477.6 keV) nuclear reaction was made use of during quantification Bin this work. Pellets of synthetic boron standard in spectroscopically pure graphite (B50: ~50 mg kg-1) and IAEA RM 155 (WP) have been used as standards in this analysis. The irradiations were carried out with 10 MeV proton (p) beam at 300-400 nA current from Room Temperature Cyclotron (RTC) at Variable Energy Cyclotron Centre (VECC), Kolkata. Gamma ray spectrometry was done in a high resolution HPGe detector (Efficiency- 40%). The concentrations of analytes have been computed using comparator method as follows [3]:
where, subscripts x, s denote sample and comparator; A- Activity; C- Concentration; I- Beam current; R- Effective range; S- Saturation factor.
Table 1: Concentrations of boron (mg kg-1) in In-house graphite RM and other standards
Sample B by CPAA B (Reported) B50 50.0 ± 3.4 50.0 ± 3.3 WP 5.1 ± 0.22 5.1 ± 0.85
In-house GRM 7.2 ± 0.52 7.3 ± 0.46 [2]
The concentration of B in the In-house GRM and the standards analyzed are presented below in Table-1. The detection limit for B in In-house GRM by CPAA has been found to be 1.3 mg kg-1. Non-
x
s
x
s
x
s
s
xsx S
S
R
R
I
I
A
ACC ...
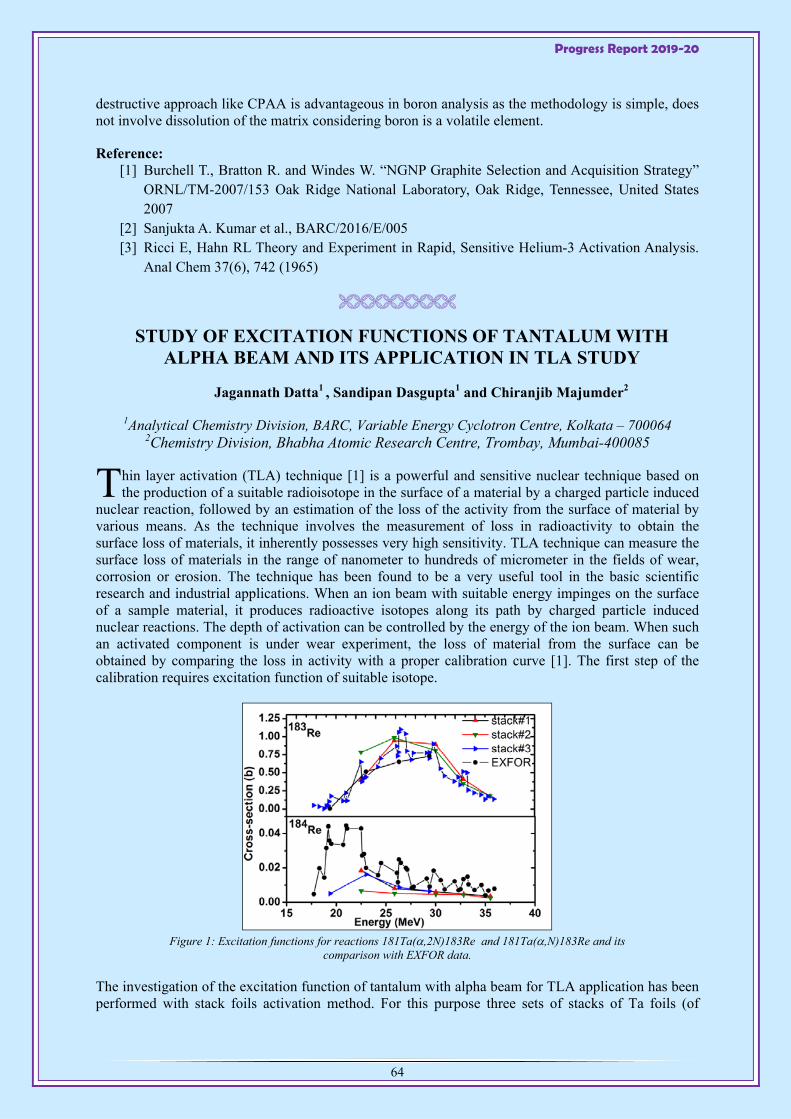
Progress Report 2019-20
64
destructive approach like CPAA is advantageous in boron analysis as the methodology is simple, does not involve dissolution of the matrix considering boron is a volatile element.
Reference: [1] Burchell T., Bratton R. and Windes W. “NGNP Graphite Selection and Acquisition Strategy”
ORNL/TM-2007/153 Oak Ridge National Laboratory, Oak Ridge, Tennessee, United States 2007
[2] Sanjukta A. Kumar et al., BARC/2016/E/005 [3] Ricci E, Hahn RL Theory and Experiment in Rapid, Sensitive Helium-3 Activation Analysis.
Anal Chem 37(6), 742 (1965)
STUDY OF EXCITATION FUNCTIONS OF TANTALUM WITH ALPHA BEAM AND ITS APPLICATION IN TLA STUDY
Jagannath Datta1 , Sandipan Dasgupta1 and Chiranjib Majumder2
1Analytical Chemistry Division, BARC, Variable Energy Cyclotron Centre, Kolkata – 700064 2Chemistry Division, Bhabha Atomic Research Centre, Trombay, Mumbai-400085
hin layer activation (TLA) technique [1] is a powerful and sensitive nuclear technique based on the production of a suitable radioisotope in the surface of a material by a charged particle induced
nuclear reaction, followed by an estimation of the loss of the activity from the surface of material by various means. As the technique involves the measurement of loss in radioactivity to obtain the surface loss of materials, it inherently possesses very high sensitivity. TLA technique can measure the surface loss of materials in the range of nanometer to hundreds of micrometer in the fields of wear, corrosion or erosion. The technique has been found to be a very useful tool in the basic scientific research and industrial applications. When an ion beam with suitable energy impinges on the surface of a sample material, it produces radioactive isotopes along its path by charged particle induced nuclear reactions. The depth of activation can be controlled by the energy of the ion beam. When such an activated component is under wear experiment, the loss of material from the surface can be obtained by comparing the loss in activity with a proper calibration curve [1]. The first step of the calibration requires excitation function of suitable isotope.
Figure 1: Excitation functions for reactions 181Ta(,2N)183Re and 181Ta(,N)183Re and its
comparison with EXFOR data.
The investigation of the excitation function of tantalum with alpha beam for TLA application has been performed with stack foils activation method. For this purpose three sets of stacks of Ta foils (of
T
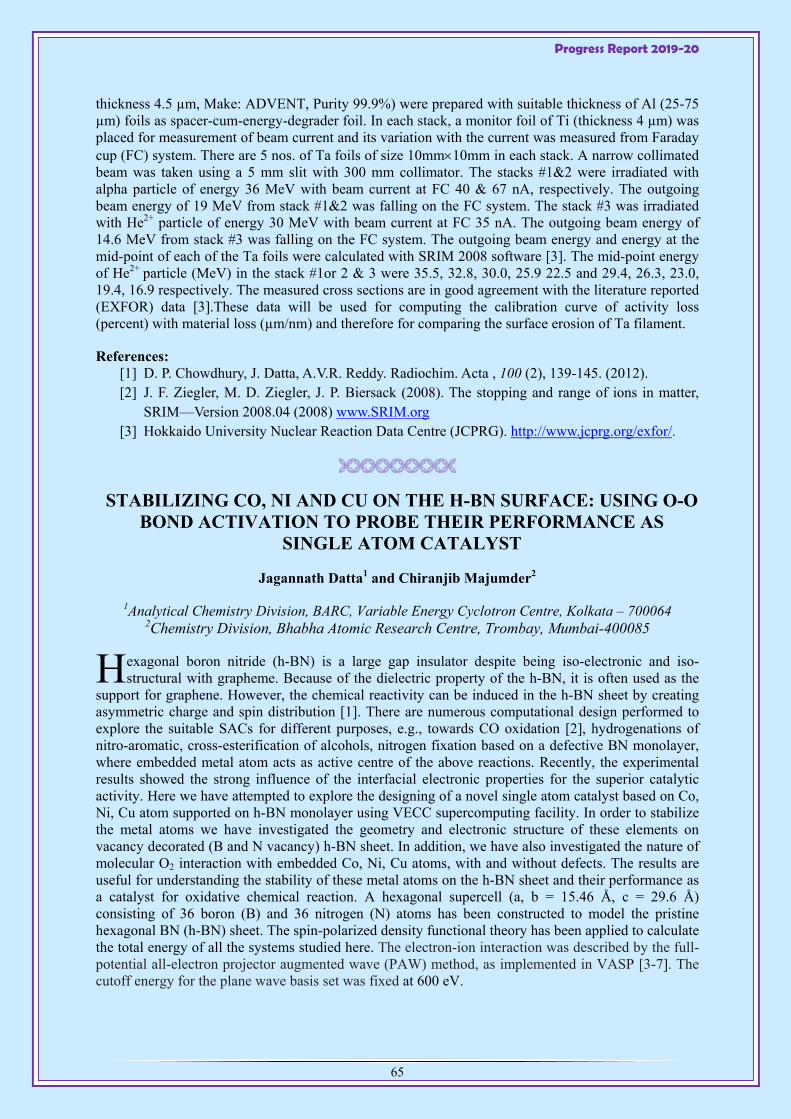
Progress Report 2019-20
65
thickness 4.5 µm, Make: ADVENT, Purity 99.9%) were prepared with suitable thickness of Al (25-75 µm) foils as spacer-cum-energy-degrader foil. In each stack, a monitor foil of Ti (thickness 4 µm) was placed for measurement of beam current and its variation with the current was measured from Faraday cup (FC) system. There are 5 nos. of Ta foils of size 10mm10mm in each stack. A narrow collimated beam was taken using a 5 mm slit with 300 mm collimator. The stacks #1&2 were irradiated with alpha particle of energy 36 MeV with beam current at FC 40 & 67 nA, respectively. The outgoing beam energy of 19 MeV from stack #1&2 was falling on the FC system. The stack #3 was irradiated with He2+ particle of energy 30 MeV with beam current at FC 35 nA. The outgoing beam energy of 14.6 MeV from stack #3 was falling on the FC system. The outgoing beam energy and energy at the mid-point of each of the Ta foils were calculated with SRIM 2008 software [3]. The mid-point energy of He2+ particle (MeV) in the stack #1or 2 & 3 were 35.5, 32.8, 30.0, 25.9 22.5 and 29.4, 26.3, 23.0, 19.4, 16.9 respectively. The measured cross sections are in good agreement with the literature reported (EXFOR) data [3].These data will be used for computing the calibration curve of activity loss (percent) with material loss (µm/nm) and therefore for comparing the surface erosion of Ta filament.
References: [1] D. P. Chowdhury, J. Datta, A.V.R. Reddy. Radiochim. Acta , 100 (2), 139-145. (2012). [2] J. F. Ziegler, M. D. Ziegler, J. P. Biersack (2008). The stopping and range of ions in matter,
SRIM—Version 2008.04 (2008) www.SRIM.org [3] Hokkaido University Nuclear Reaction Data Centre (JCPRG). http://www.jcprg.org/exfor/.
STABILIZING CO, NI AND CU ON THE H-BN SURFACE: USING O-O BOND ACTIVATION TO PROBE THEIR PERFORMANCE AS
SINGLE ATOM CATALYST
Jagannath Datta1 and Chiranjib Majumder2
1Analytical Chemistry Division, BARC, Variable Energy Cyclotron Centre, Kolkata – 700064 2Chemistry Division, Bhabha Atomic Research Centre, Trombay, Mumbai-400085
exagonal boron nitride (h-BN) is a large gap insulator despite being iso-electronic and iso-structural with grapheme. Because of the dielectric property of the h-BN, it is often used as the
support for graphene. However, the chemical reactivity can be induced in the h-BN sheet by creating asymmetric charge and spin distribution [1]. There are numerous computational design performed to explore the suitable SACs for different purposes, e.g., towards CO oxidation [2], hydrogenations of nitro-aromatic, cross-esterification of alcohols, nitrogen fixation based on a defective BN monolayer, where embedded metal atom acts as active centre of the above reactions. Recently, the experimental results showed the strong influence of the interfacial electronic properties for the superior catalytic activity. Here we have attempted to explore the designing of a novel single atom catalyst based on Co, Ni, Cu atom supported on h-BN monolayer using VECC supercomputing facility. In order to stabilize the metal atoms we have investigated the geometry and electronic structure of these elements on vacancy decorated (B and N vacancy) h-BN sheet. In addition, we have also investigated the nature of molecular O2 interaction with embedded Co, Ni, Cu atoms, with and without defects. The results are useful for understanding the stability of these metal atoms on the h-BN sheet and their performance as a catalyst for oxidative chemical reaction. A hexagonal supercell (a, b = 15.46 Å, c = 29.6 Å) consisting of 36 boron (B) and 36 nitrogen (N) atoms has been constructed to model the pristine hexagonal BN (h-BN) sheet. The spin-polarized density functional theory has been applied to calculate the total energy of all the systems studied here. The electron-ion interaction was described by the full-potential all-electron projector augmented wave (PAW) method, as implemented in VASP [3-7]. The cutoff energy for the plane wave basis set was fixed at 600 eV.
H

Progress Report 2019-20
66
Figure 1: Side and top view of the optimized structure of Co@BV and O2ǁCo@BV systems are shown here. The structure of
Ni and Cu are similar. The green, white and red atoms indicate B, N and O respectively.
Figure 2: Side and top view of the optimized structure of Co@NV and O2ǁCo@NV systems are shown here. The structure of
Ni and Cu are similar. The green, white and red atoms indicate B, N and O respectively.
The interaction of molecular oxygen with the metal atoms embedded on the h-BN has been investigated by placing the molecular at different orientations with respect to the plane. The results have been analyzed by the energetic, geometrical parameters, charge distribution and the electronic density of state analysis. The results revealed higher stability of metal atoms on the vacancy defects in comparison to the pristine surface. Moreover, the stability of metal atoms is more on the B vacancy defect than N vacancy. Bader charge analysis [8] showed that with M atoms on B vacancy, the h-BN acts as a lewis acid by accepting electrons. In sharp contrast for M atoms on N vacancy, the h-BN acts as lewis base by donating charge to the metal centers. The electronic density of state analysis suggests the upward move (less negative) of the Fermi energy levels due to incorporation of M atoms. From the chemical reactivity point of view embedded metal atoms promote (in comparison to bare metal atoms) the electronic charge transfer to the anti-bonding molecular orbital of the O2 molecule. The activation of the O-O bond has been illustrated through the change in the bond length, which is proportional to the charge transfer from the metal to the anti-bonding orbitals of the O2 molecule. The results show that the M atom embedded N vacancy defects elongate the O-O bond more than M atoms on B vacancy defects. Because of weaker interaction of metal atoms with N vacancy sites they have more free electrons and thereby are able to activate the O-O bond more efficiently. In fact the most stable isomer of O2 with Cu@NV, the O-O bond can be stretched upto 1.50 Å (which is considered as the peroxo state of the O2 molecule.) for Cu embedded in the N vacancy site of the h-BN. On the basis of
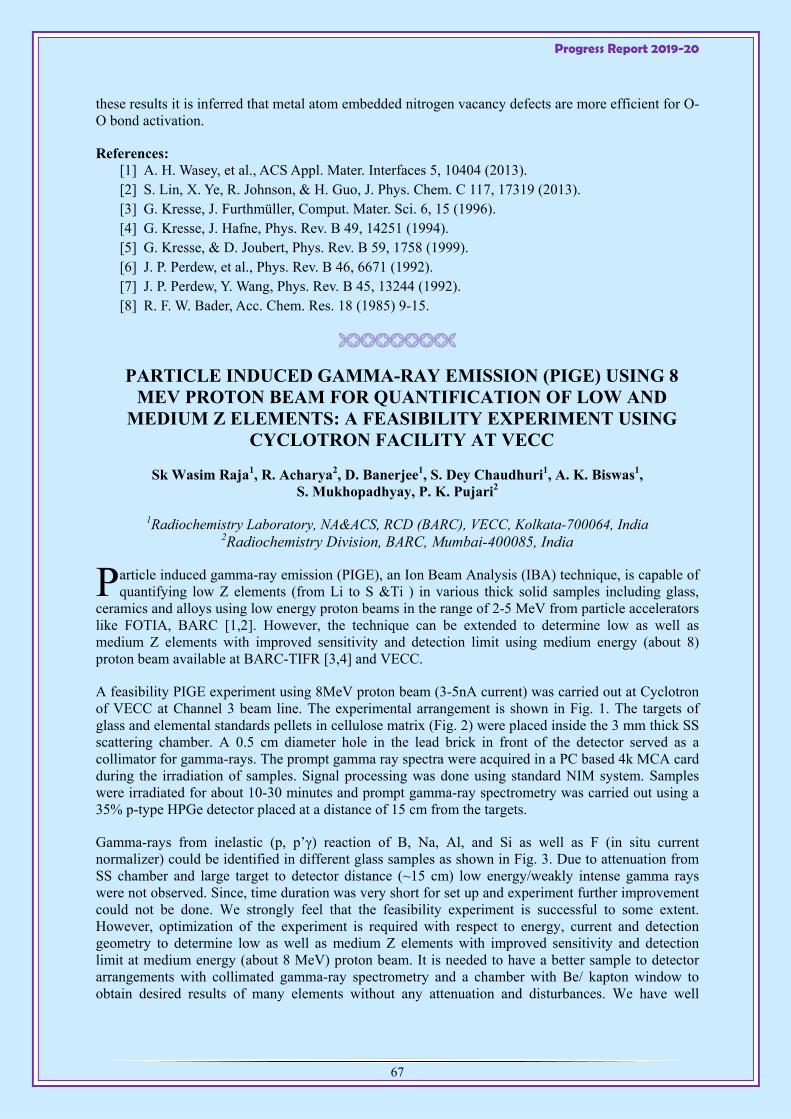
Progress Report 2019-20
67
these results it is inferred that metal atom embedded nitrogen vacancy defects are more efficient for O-O bond activation.
References: [1] A. H. Wasey, et al., ACS Appl. Mater. Interfaces 5, 10404 (2013). [2] S. Lin, X. Ye, R. Johnson, & H. Guo, J. Phys. Chem. C 117, 17319 (2013). [3] G. Kresse, J. Furthmüller, Comput. Mater. Sci. 6, 15 (1996). [4] G. Kresse, J. Hafne, Phys. Rev. B 49, 14251 (1994). [5] G. Kresse, & D. Joubert, Phys. Rev. B 59, 1758 (1999). [6] J. P. Perdew, et al., Phys. Rev. B 46, 6671 (1992). [7] J. P. Perdew, Y. Wang, Phys. Rev. B 45, 13244 (1992). [8] R. F. W. Bader, Acc. Chem. Res. 18 (1985) 9-15.
PARTICLE INDUCED GAMMA-RAY EMISSION (PIGE) USING 8 MEV PROTON BEAM FOR QUANTIFICATION OF LOW AND
MEDIUM Z ELEMENTS: A FEASIBILITY EXPERIMENT USING CYCLOTRON FACILITY AT VECC
Sk Wasim Raja1, R. Acharya2, D. Banerjee1, S. Dey Chaudhuri1, A. K. Biswas1, S. Mukhopadhyay, P. K. Pujari2
1Radiochemistry Laboratory, NA&ACS, RCD (BARC), VECC, Kolkata-700064, India 2Radiochemistry Division, BARC, Mumbai-400085, India
article induced gamma-ray emission (PIGE), an Ion Beam Analysis (IBA) technique, is capable of quantifying low Z elements (from Li to S &Ti ) in various thick solid samples including glass,
ceramics and alloys using low energy proton beams in the range of 2-5 MeV from particle accelerators like FOTIA, BARC [1,2]. However, the technique can be extended to determine low as well as medium Z elements with improved sensitivity and detection limit using medium energy (about 8) proton beam available at BARC-TIFR [3,4] and VECC.
A feasibility PIGE experiment using 8MeV proton beam (3-5nA current) was carried out at Cyclotron of VECC at Channel 3 beam line. The experimental arrangement is shown in Fig. 1. The targets of glass and elemental standards pellets in cellulose matrix (Fig. 2) were placed inside the 3 mm thick SS scattering chamber. A 0.5 cm diameter hole in the lead brick in front of the detector served as a collimator for gamma-rays. The prompt gamma ray spectra were acquired in a PC based 4k MCA card during the irradiation of samples. Signal processing was done using standard NIM system. Samples were irradiated for about 10-30 minutes and prompt gamma-ray spectrometry was carried out using a 35% p-type HPGe detector placed at a distance of 15 cm from the targets.
Gamma-rays from inelastic (p, p’γ) reaction of B, Na, Al, and Si as well as F (in situ current normalizer) could be identified in different glass samples as shown in Fig. 3. Due to attenuation from SS chamber and large target to detector distance (~15 cm) low energy/weakly intense gamma rays were not observed. Since, time duration was very short for set up and experiment further improvement could not be done. We strongly feel that the feasibility experiment is successful to some extent. However, optimization of the experiment is required with respect to energy, current and detection geometry to determine low as well as medium Z elements with improved sensitivity and detection limit at medium energy (about 8 MeV) proton beam. It is needed to have a better sample to detector arrangements with collimated gamma-ray spectrometry and a chamber with Be/ kapton window to obtain desired results of many elements without any attenuation and disturbances. We have well
P

Progress Report 2019-20
68
defined plan to measure thick target gamma-ray yields as well as varied applications useful for the Departmental Work program.
Figure 1: A temporary PIGE experimental set up at Channel
3 beam line of VECC cyclotron;
Figure 2: Target pellets (20mm diameter and 2 mm thick)
in the SS sample ladder
Figure 3: Typical PIGE spectra of borosilicate glass reference material and sample thick targets irradiated with 8 MeV
proton beam Acknowledgments: We are sincerely thankful to Dr. D. Sanyal of RIB Group, VECC for providing the HPGe detector for the experiment. We acknowledge the cooperation received from Dr. T. Bhattacharjee and Dr. Chandana Bhattacharyato perform this feasibility experiment
References: [1] S. Chhillar, R. Acharya, S. Sodaye, P. K. Pujari, Anal.Chem.,86(22), 11167 (2014). [2] R. Acharya, Sk Wasim Raja et al., J. Anal. At. Spectrom.,33 (5),784 (2018). [3] S. Chhillar, R. Acharya et al, J. Radioanal. Nucl. Chem., 305, 463 (2015). [4] J. Raisanen, T. Witting, J. Keinonen, Nucl. Instrum. Meth. B, 28, 199 (1987).
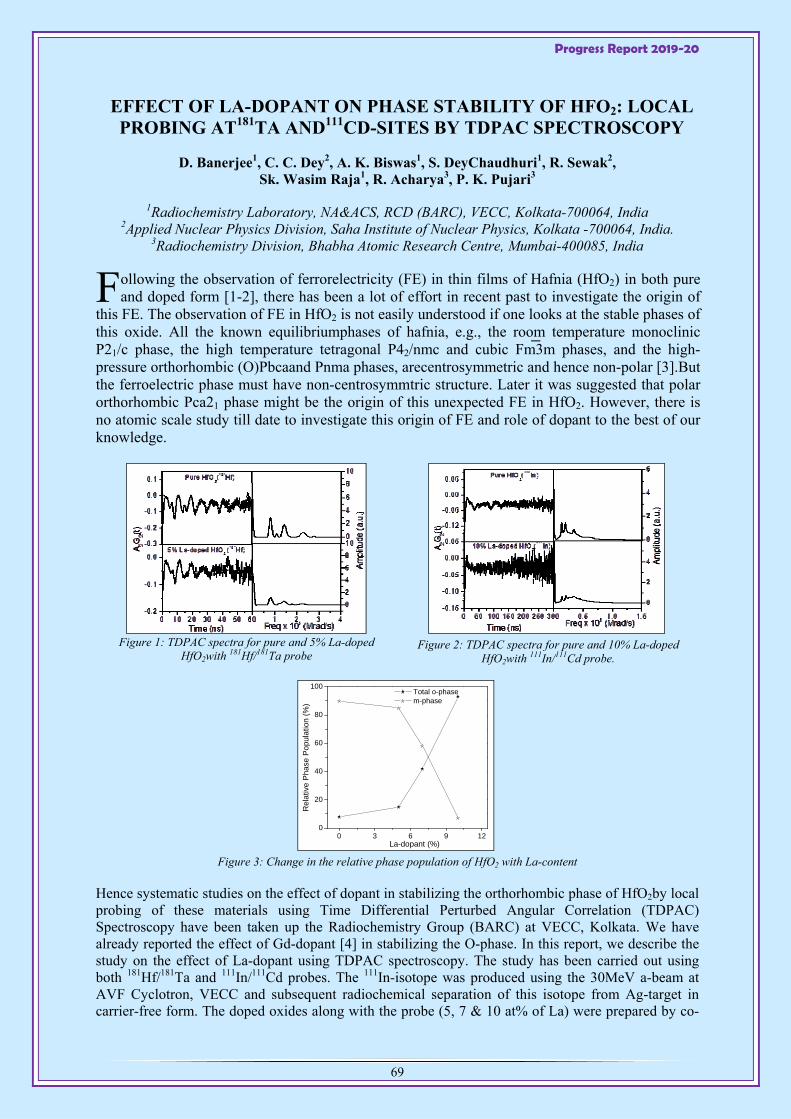
Progress Report 2019-20
69
EFFECT OF LA-DOPANT ON PHASE STABILITY OF HFO2: LOCAL PROBING AT181TA AND111CD-SITES BY TDPAC SPECTROSCOPY
D. Banerjee1, C. C. Dey2, A. K. Biswas1, S. DeyChaudhuri1, R. Sewak2, Sk. Wasim Raja1, R. Acharya3, P. K. Pujari3
1Radiochemistry Laboratory, NA&ACS, RCD (BARC), VECC, Kolkata-700064, India 2Applied Nuclear Physics Division, Saha Institute of Nuclear Physics, Kolkata -700064, India.
3Radiochemistry Division, Bhabha Atomic Research Centre, Mumbai-400085, India
ollowing the observation of ferrorelectricity (FE) in thin films of Hafnia (HfO2) in both pure and doped form [1-2], there has been a lot of effort in recent past to investigate the origin of
this FE. The observation of FE in HfO2 is not easily understood if one looks at the stable phases of this oxide. All the known equilibriumphases of hafnia, e.g., the room temperature monoclinic P21/c phase, the high temperature tetragonal P42/nmc and cubic Fm3m phases, and the high-pressure orthorhombic (O)Pbcaand Pnma phases, arecentrosymmetric and hence non-polar [3].But the ferroelectric phase must have non-centrosymmtric structure. Later it was suggested that polar orthorhombic Pca21 phase might be the origin of this unexpected FE in HfO2. However, there is no atomic scale study till date to investigate this origin of FE and role of dopant to the best of our knowledge.
Figure 1: TDPAC spectra for pure and 5% La-doped
HfO2with 181Hf/181Ta probe
Figure 2: TDPAC spectra for pure and 10% La-doped
HfO2with 111In/111Cd probe.
Figure 3: Change in the relative phase population of HfO2 with La-content
Hence systematic studies on the effect of dopant in stabilizing the orthorhombic phase of HfO2by local probing of these materials using Time Differential Perturbed Angular Correlation (TDPAC) Spectroscopy have been taken up the Radiochemistry Group (BARC) at VECC, Kolkata. We have already reported the effect of Gd-dopant [4] in stabilizing the O-phase. In this report, we describe the study on the effect of La-dopant using TDPAC spectroscopy. The study has been carried out using both 181Hf/181Ta and 111In/111Cd probes. The 111In-isotope was produced using the 30MeV a-beam at AVF Cyclotron, VECC and subsequent radiochemical separation of this isotope from Ag-target in carrier-free form. The doped oxides along with the probe (5, 7 & 10 at% of La) were prepared by co-
0 3 6 9 120
20
40
60
80
100
La-dopant (%)
Total o-phase m-phase
R
elat
ive
Pha
se P
opul
atio
n (%
)F
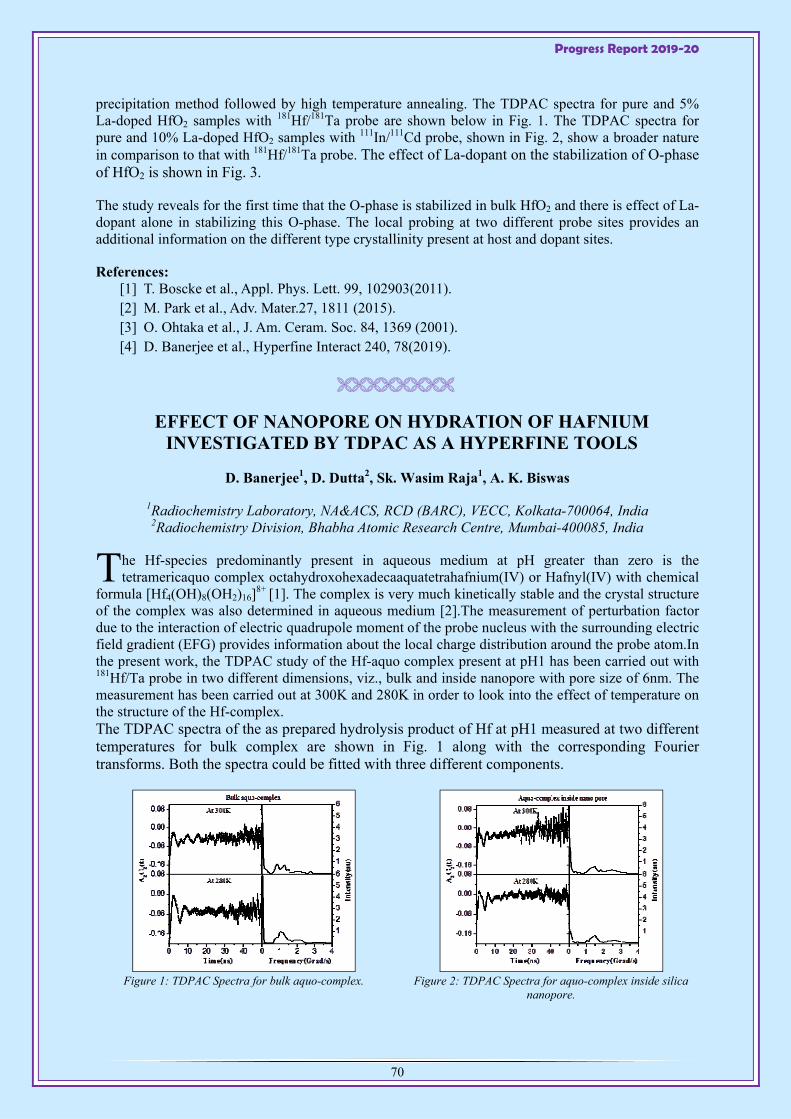
Progress Report 2019-20
70
precipitation method followed by high temperature annealing. The TDPAC spectra for pure and 5% La-doped HfO2 samples with 181Hf/181Ta probe are shown below in Fig. 1. The TDPAC spectra for pure and 10% La-doped HfO2 samples with 111In/111Cd probe, shown in Fig. 2, show a broader nature in comparison to that with 181Hf/181Ta probe. The effect of La-dopant on the stabilization of O-phase of HfO2 is shown in Fig. 3.
The study reveals for the first time that the O-phase is stabilized in bulk HfO2 and there is effect of La-dopant alone in stabilizing this O-phase. The local probing at two different probe sites provides an additional information on the different type crystallinity present at host and dopant sites.
References: [1] T. Boscke et al., Appl. Phys. Lett. 99, 102903(2011). [2] M. Park et al., Adv. Mater.27, 1811 (2015). [3] O. Ohtaka et al., J. Am. Ceram. Soc. 84, 1369 (2001). [4] D. Banerjee et al., Hyperfine Interact 240, 78(2019).
EFFECT OF NANOPORE ON HYDRATION OF HAFNIUM INVESTIGATED BY TDPAC AS A HYPERFINE TOOLS
D. Banerjee1, D. Dutta2, Sk. Wasim Raja1, A. K. Biswas
1Radiochemistry Laboratory, NA&ACS, RCD (BARC), VECC, Kolkata-700064, India 2Radiochemistry Division, Bhabha Atomic Research Centre, Mumbai-400085, India
he Hf-species predominantly present in aqueous medium at pH greater than zero is the tetramericaquo complex octahydroxohexadecaaquatetrahafnium(IV) or Hafnyl(IV) with chemical
formula [Hf4(OH)8(OH2)16]8+ [1]. The complex is very much kinetically stable and the crystal structure
of the complex was also determined in aqueous medium [2].The measurement of perturbation factor due to the interaction of electric quadrupole moment of the probe nucleus with the surrounding electric field gradient (EFG) provides information about the local charge distribution around the probe atom.In the present work, the TDPAC study of the Hf-aquo complex present at pH1 has been carried out with 181Hf/Ta probe in two different dimensions, viz., bulk and inside nanopore with pore size of 6nm. The measurement has been carried out at 300K and 280K in order to look into the effect of temperature on the structure of the Hf-complex. The TDPAC spectra of the as prepared hydrolysis product of Hf at pH1 measured at two different temperatures for bulk complex are shown in Fig. 1 along with the corresponding Fourier transforms. Both the spectra could be fitted with three different components.
Figure 1: TDPAC Spectra for bulk aquo-complex.
Figure 2: TDPAC Spectra for aquo-complex inside silica
nanopore.
T

Progress Report 2019-20
71
The major fraction at 300K has ωQ=105(1) Mrad/s, η = 0.61(1) and δ=9.4(7)%. At 280K, the major component has almost similar PAC parameters but its relative population decreases significantly. The PAC parameters for other two minor components appear to be completely different from that obtained at 300K.The TDPAC spectra for the complex inside silica nanopore, measured at 300K and 280K, are shown in Fig. 2.
The present TDPAC study reveals the fact that the hydrolysis product has not a unique or single configuration under the present condition. There could be three different structures around the Hf-atom when present in bulk and it becomes even four when kept inside the nanopore.From the value of asymmetry parameter, it can be realized that the major component inside the nanopore is more axially symmetric than that present in bulk. The quadrupole frequency values of the major components imply that Hf-O bond distance is shorter inside nanopore than outside. However, the relative population of the major component inside the pore does not change significantly with temperature in contrast to that happening for bulk complex. This fact may imply that the configuration present inside nanopore is more rigid with respect to temperature than that in bulk. The very different TDPAC spectra, as shown in Fig. 3, for the major component found in case of the bulk complex and complex inside nanopore may suggest that either the degree of polymerization is different inside the nanopore or the configuration of the major species present inside the pore is different if one considers even the same degree of polymerization in both the cases. In any case, the presence of Si-O-Si network inside the silica nanopore has a significant effect on the polymerization of hydrolysis product of Hf.
References: [1] C. Hagfeldt et al., Dalton Trans. 2004, 2142(2004). [2] G. M. Muha et al., J. Chem. Phys. 33, 194(1960).
PRECISE MEASUREMENT OF DECAY HALF LIVES OF N-RICH IODINE ISOTOPES AFTER RADIOCHEMICAL SEPARATION
D. Banerjee1, D. Kumar, A. K. Biswas1, S. Basak, S. S. Alam, T. Bhattacharjee
1Radiochemistry Laboratory, NA&ACS, RCD (BARC), VECC, Kolkata-700064, India
he half-life of a radionuclide is an indispensable parameter both for fundamental nuclear physics and the application of any particular radionuclide. Iodine (I)-isotopes have several application,
viz., 123-125I &131I are used in medicine and biology, 125I is important in nuclear reactor physics as its decay product 135Xe has a very high thermal n-absorption cross section etc., to name a few. Although there exists the half-lives of the above n-rich I-isotopes in the literature [1], there are several values reported for 130I [2-5].For other I-isotopes also, it is worth performing a precise measurement of half-life with radiochemically separated I-isotopes.The n-rich I-isotopes were produced by -induced fission of 238U followed by radiochemical separation. The -irradiation of 238U target was performed in K=130 AVF Cyclotron at VECC with 40MeV -beam.The U-target was electro-deposited on 1mil Al-backing and thickness was kept between 500-600μg/cm2. Two irradiations with different duration were performed. One irradiation was done for 1h to attempt shorter-lived I-isotopes and other was performed for 40h to address the longer-lived ones. The irradiated target and Al-catcher foils were dissolved and I-carrier was added to the reaction mixture. All iodide was oxidized to Iodine and extracted in CCl4 medium. The Iodine was then back-extracted from organic phase in the aqueous phase and used for subsequent counting with 50%HPGe detector. The -ray spectrum obtained after counting the radiochemically separated I-isotopes with 50% HPGedetector is shown in Fig. 1. The figure represents the -spectrum acquired immediately after the radiochemical separation performed for short-irradiation of 1h.
T
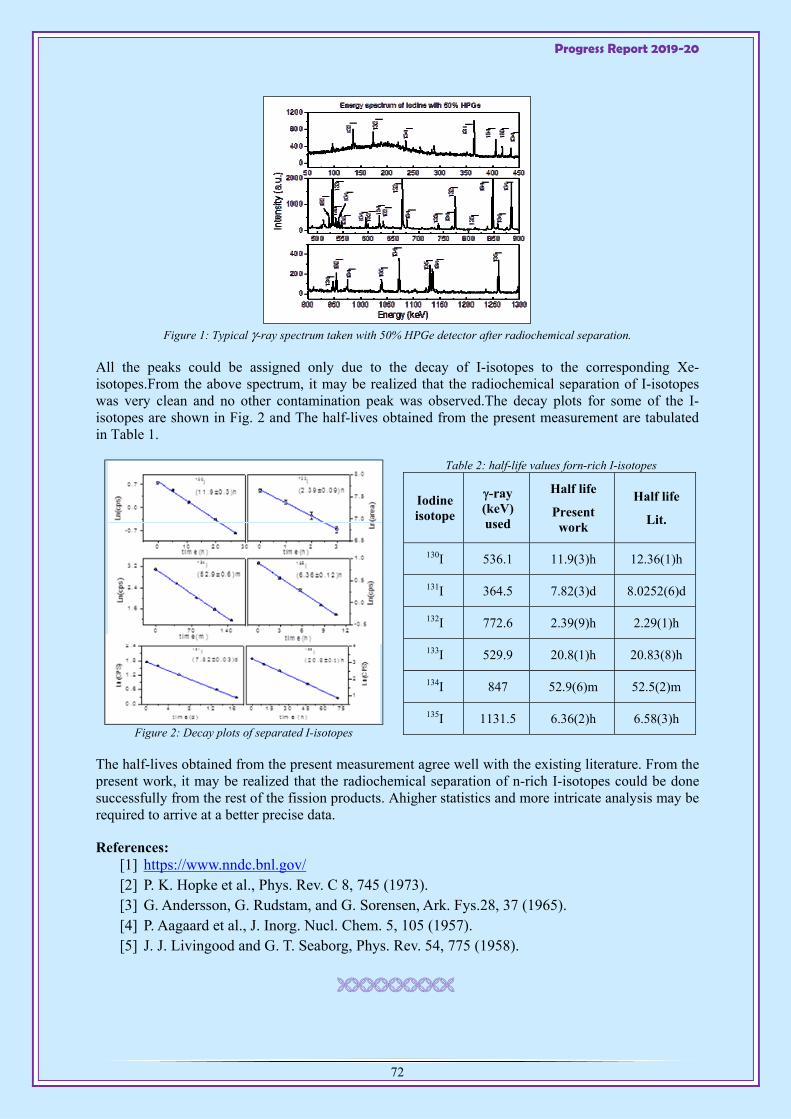
Progress Report 2019-20
72
Figure 1: Typical -ray spectrum taken with 50% HPGe detector after radiochemical separation.
All the peaks could be assigned only due to the decay of I-isotopes to the corresponding Xe-isotopes.From the above spectrum, it may be realized that the radiochemical separation of I-isotopes was very clean and no other contamination peak was observed.The decay plots for some of the I-isotopes are shown in Fig. 2 and The half-lives obtained from the present measurement are tabulated in Table 1.
Figure 2: Decay plots of separated I-isotopes
Table 2: half-life values forn-rich I-isotopes
Iodine isotope
-ray (keV) used
Half life
Present work
Half life
Lit.
130I 536.1 11.9(3)h 12.36(1)h
131I 364.5 7.82(3)d 8.0252(6)d
132I 772.6 2.39(9)h 2.29(1)h
133I 529.9 20.8(1)h 20.83(8)h
134I 847 52.9(6)m 52.5(2)m
135I 1131.5 6.36(2)h 6.58(3)h
The half-lives obtained from the present measurement agree well with the existing literature. From the present work, it may be realized that the radiochemical separation of n-rich I-isotopes could be done successfully from the rest of the fission products. Ahigher statistics and more intricate analysis may be required to arrive at a better precise data.
References: [1] https://www.nndc.bnl.gov/ [2] P. K. Hopke et al., Phys. Rev. C 8, 745 (1973). [3] G. Andersson, G. Rudstam, and G. Sorensen, Ark. Fys.28, 37 (1965). [4] P. Aagaard et al., J. Inorg. Nucl. Chem. 5, 105 (1957). [5] J. J. Livingood and G. T. Seaborg, Phys. Rev. 54, 775 (1958).
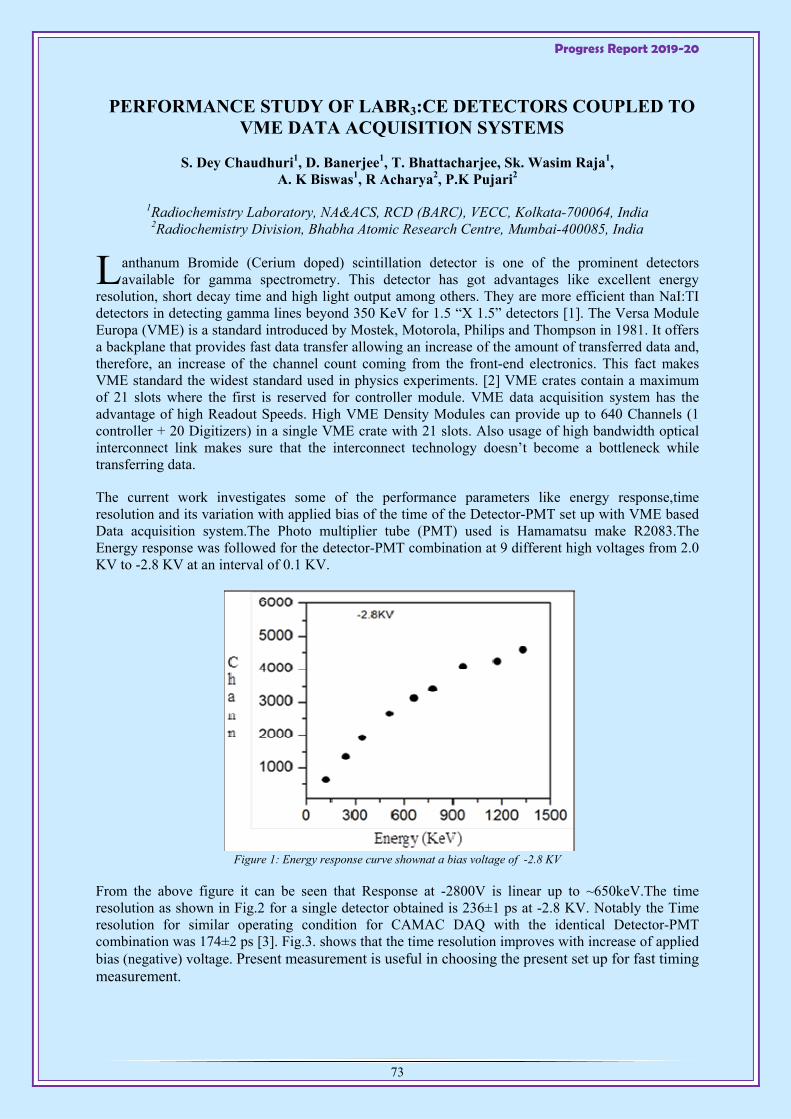
Progress Report 2019-20
73
PERFORMANCE STUDY OF LABR3:CE DETECTORS COUPLED TO VME DATA ACQUISITION SYSTEMS
S. Dey Chaudhuri1, D. Banerjee1, T. Bhattacharjee, Sk. Wasim Raja1, A. K Biswas1, R Acharya2, P.K Pujari2
1Radiochemistry Laboratory, NA&ACS, RCD (BARC), VECC, Kolkata-700064, India 2Radiochemistry Division, Bhabha Atomic Research Centre, Mumbai-400085, India
anthanum Bromide (Cerium doped) scintillation detector is one of the prominent detectors available for gamma spectrometry. This detector has got advantages like excellent energy
resolution, short decay time and high light output among others. They are more efficient than NaI:TI detectors in detecting gamma lines beyond 350 KeV for 1.5 “X 1.5” detectors [1]. The Versa Module Europa (VME) is a standard introduced by Mostek, Motorola, Philips and Thompson in 1981. It offers a backplane that provides fast data transfer allowing an increase of the amount of transferred data and, therefore, an increase of the channel count coming from the front-end electronics. This fact makes VME standard the widest standard used in physics experiments. [2] VME crates contain a maximum of 21 slots where the first is reserved for controller module. VME data acquisition system has the advantage of high Readout Speeds. High VME Density Modules can provide up to 640 Channels (1 controller + 20 Digitizers) in a single VME crate with 21 slots. Also usage of high bandwidth optical interconnect link makes sure that the interconnect technology doesn’t become a bottleneck while transferring data.
The current work investigates some of the performance parameters like energy response,time resolution and its variation with applied bias of the time of the Detector-PMT set up with VME based Data acquisition system.The Photo multiplier tube (PMT) used is Hamamatsu make R2083.The Energy response was followed for the detector-PMT combination at 9 different high voltages from 2.0 KV to -2.8 KV at an interval of 0.1 KV.
Figure 1: Energy response curve shownat a bias voltage of -2.8 KV
From the above figure it can be seen that Response at -2800V is linear up to ~650keV.The time resolution as shown in Fig.2 for a single detector obtained is 236±1 ps at -2.8 KV. Notably the Time resolution for similar operating condition for CAMAC DAQ with the identical Detector-PMT combination was 174±2 ps [3]. Fig.3. shows that the time resolution improves with increase of applied bias (negative) voltage. Present measurement is useful in choosing the present set up for fast timing measurement.
L

Progress Report 2019-20
74
Figure 2: Gated TAC for 511-511 cascade obtained with
present set up.
Figure 3: Variation of time resolution with applied negative
bias voltage.
References: [1] K Ciupek, Slawomir Jednorog, Marian Fujak, kamilszewczak, J. Radioanalytical Nucl. Chem.
299, 1345 (2014). [2] VITA Technologies (2011) VME Technology FAQ. Available:
http://www.vita.com/home/Learn/vmefaq/vmefaq.html. [3] S DeyChaudhuri, D Banetjee , T Bhattacharjee , Sk. Wasim Raj, R Acharya , P K Pujari,
J.Radioanalytical Nucl. Chem. 324, 829 (2020).
PRODUCTION OF 43+47SC VIA 40CA(Α, P)43SC AND 44CA(Α, P)47SC REACTIONS FOR PREPARATION OF CANCEROUS TUMOUR
SPECIFIC RADIOPHARMACEUTICALS
Rubel Chakravarty, 1Sudipta Chakraborty, 1D. Banerjee, 2SkWasim Raja, 2A. K. Biswas, 2Sayan DeyChaudhuri, 2R. Acharya, 3A. Dash, 1P. K. Pujari3
1Radiopharmaceuticals Division, Bhabha Atomic Research Centre, Mumbai-400085, India
2Radiochemistry Laboratory, NA&ACS, RCD (BARC), VECC, Kolkata-700064, India 3Radiochemistry Division, Bhabha Atomic Research Centre, Mumbai-400085, India
candium-43 (+ 88.1 %, T½ = 3.9 h) features ideal nuclear decay characteristics, such as high positron branching ratio, suitable half-life and has favourable chemistry which are suitable for
preparation of a wide variety of target specific radiopharmaceuticals for positron emission tomography (PET) imaging of cancer [1]. Another scandium radioisotope, i.e., 47Sc (T½ = 3.4 d, Eβ−(av) = 162 keV, main Eγ = 159.4 keV, I = 68.3 %) is a promising low-energy β− emitter for targeted radiotherapy [2]. Thus, the β+-emitting 43Sc with the β−-emitting 47Sc represent an ideal theranostic pair for preparation of target specific radiopharmaceuticals for personalized cancer care. Scandium-43 can be produced by 40Ca (, p) 43Sc reaction and 47Sc can be produced by 43Ca (, p) 47Sc reaction in a cyclotron. After irradiation of natural CaCO3 target, the 43Sc and 47Sc produced need to be separated in a form suitable for radiopharmaceutical preparation. Though there are reports on the production of 43+47Sc by this route [1], a facile approach for radiochemical separation of 43+47Sc from the irradiated target is yet to be developed and the utility of 43+47Sc in preparation of radiopharmaceuticals has to be demonstrated.
An irradiation of ~ 2 h at a current of 300 nA was performed to yield a total ~10 MBq of 43Sc-activity using 1 mm thick target. The radiochemical separation of Sc-isotopes was performed by selective precipitation of Sc over Ca in alkaline medium. The radioactive mixture was passed through a 0.22 m membrane filter where colloidal Sc radioisotopes were trapped and Ca solution passed through.
S
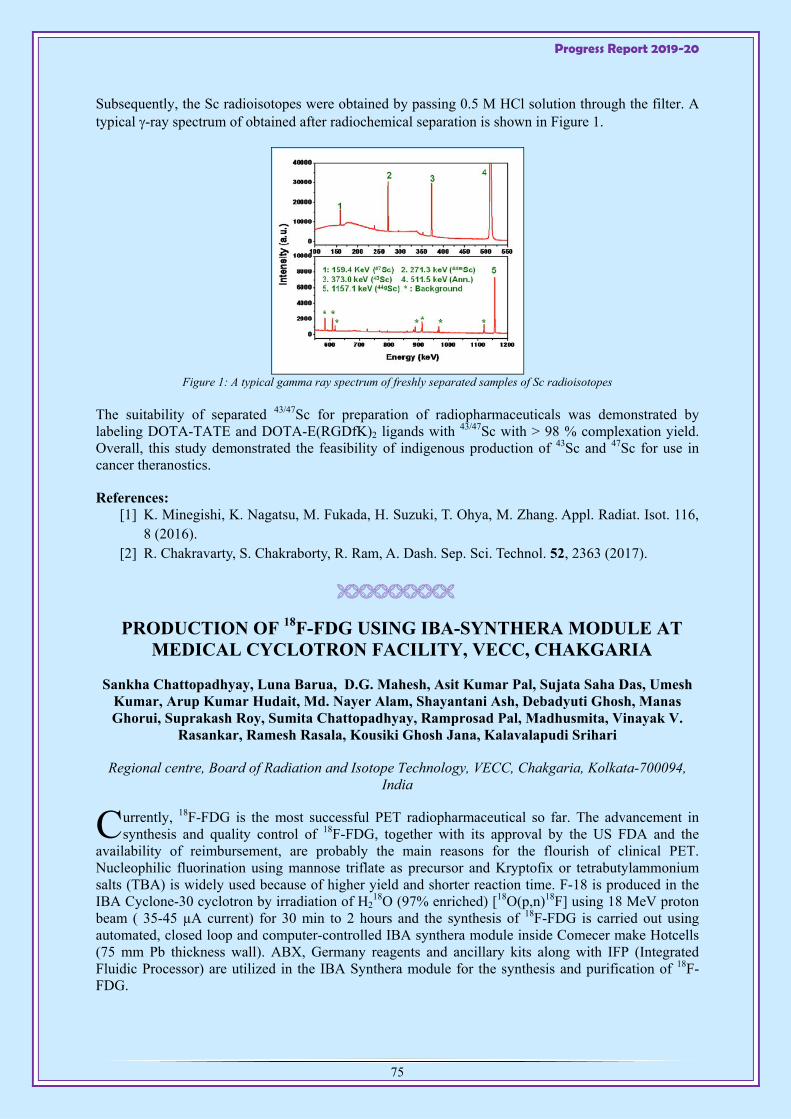
Progress Report 2019-20
75
Subsequently, the Sc radioisotopes were obtained by passing 0.5 M HCl solution through the filter. A typical -ray spectrum of obtained after radiochemical separation is shown in Figure 1.
Figure 1: A typical gamma ray spectrum of freshly separated samples of Sc radioisotopes
The suitability of separated 43/47Sc for preparation of radiopharmaceuticals was demonstrated by labeling DOTA-TATE and DOTA-E(RGDfK)2 ligands with 43/47Sc with > 98 % complexation yield. Overall, this study demonstrated the feasibility of indigenous production of 43Sc and 47Sc for use in cancer theranostics.
References: [1] K. Minegishi, K. Nagatsu, M. Fukada, H. Suzuki, T. Ohya, M. Zhang. Appl. Radiat. Isot. 116,
8 (2016). [2] R. Chakravarty, S. Chakraborty, R. Ram, A. Dash. Sep. Sci. Technol. 52, 2363 (2017).
PRODUCTION OF 18F-FDG USING IBA-SYNTHERA MODULE AT MEDICAL CYCLOTRON FACILITY, VECC, CHAKGARIA
Sankha Chattopadhyay, Luna Barua, D.G. Mahesh, Asit Kumar Pal, Sujata Saha Das, Umesh Kumar, Arup Kumar Hudait, Md. Nayer Alam, Shayantani Ash, Debadyuti Ghosh, Manas Ghorui, Suprakash Roy, Sumita Chattopadhyay, Ramprosad Pal, Madhusmita, Vinayak V.
Rasankar, Ramesh Rasala, Kousiki Ghosh Jana, Kalavalapudi Srihari
Regional centre, Board of Radiation and Isotope Technology, VECC, Chakgaria, Kolkata-700094, India
urrently, 18F-FDG is the most successful PET radiopharmaceutical so far. The advancement in synthesis and quality control of 18F-FDG, together with its approval by the US FDA and the
availability of reimbursement, are probably the main reasons for the flourish of clinical PET. Nucleophilic fluorination using mannose triflate as precursor and Kryptofix or tetrabutylammonium salts (TBA) is widely used because of higher yield and shorter reaction time. F-18 is produced in the IBA Cyclone-30 cyclotron by irradiation of H2
18O (97% enriched) [18O(p,n)18F] using 18 MeV proton beam ( 35-45 µA current) for 30 min to 2 hours and the synthesis of 18F-FDG is carried out using automated, closed loop and computer-controlled IBA synthera module inside Comecer make Hotcells (75 mm Pb thickness wall). ABX, Germany reagents and ancillary kits along with IFP (Integrated Fluidic Processor) are utilized in the IBA Synthera module for the synthesis and purification of 18F-FDG.
C
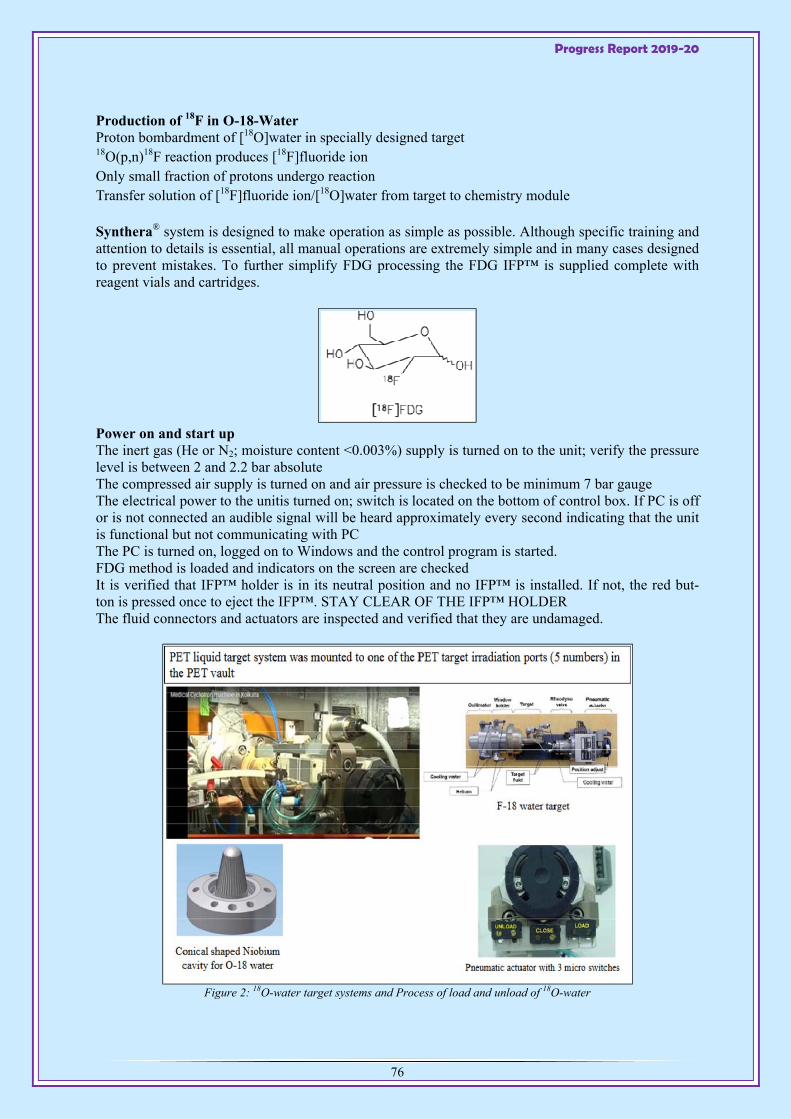
Progress Report 2019-20
76
Production of 18F in O-18-Water Proton bombardment of [18O]water in specially designed target 18O(p,n)18F reaction produces [18F]fluoride ion Only small fraction of protons undergo reaction Transfer solution of [18F]fluoride ion/[18O]water from target to chemistry module
Synthera® system is designed to make operation as simple as possible. Although specific training and attention to details is essential, all manual operations are extremely simple and in many cases designed to prevent mistakes. To further simplify FDG processing the FDG IFP™ is supplied complete with reagent vials and cartridges.
Power on and start up The inert gas (He or N2; moisture content <0.003%) supply is turned on to the unit; verify the pressure level is between 2 and 2.2 bar absolute The compressed air supply is turned on and air pressure is checked to be minimum 7 bar gauge The electrical power to the unitis turned on; switch is located on the bottom of control box. If PC is off or is not connected an audible signal will be heard approximately every second indicating that the unit is functional but not communicating with PC The PC is turned on, logged on to Windows and the control program is started. FDG method is loaded and indicators on the screen are checked It is verified that IFP™ holder is in its neutral position and no IFP™ is installed. If not, the red but- ton is pressed once to eject the IFP™. STAY CLEAR OF THE IFP™ HOLDER The fluid connectors and actuators are inspected and verified that they are undamaged.
Figure 2: 18O-water target systems and Process of load and unload of 18O-water
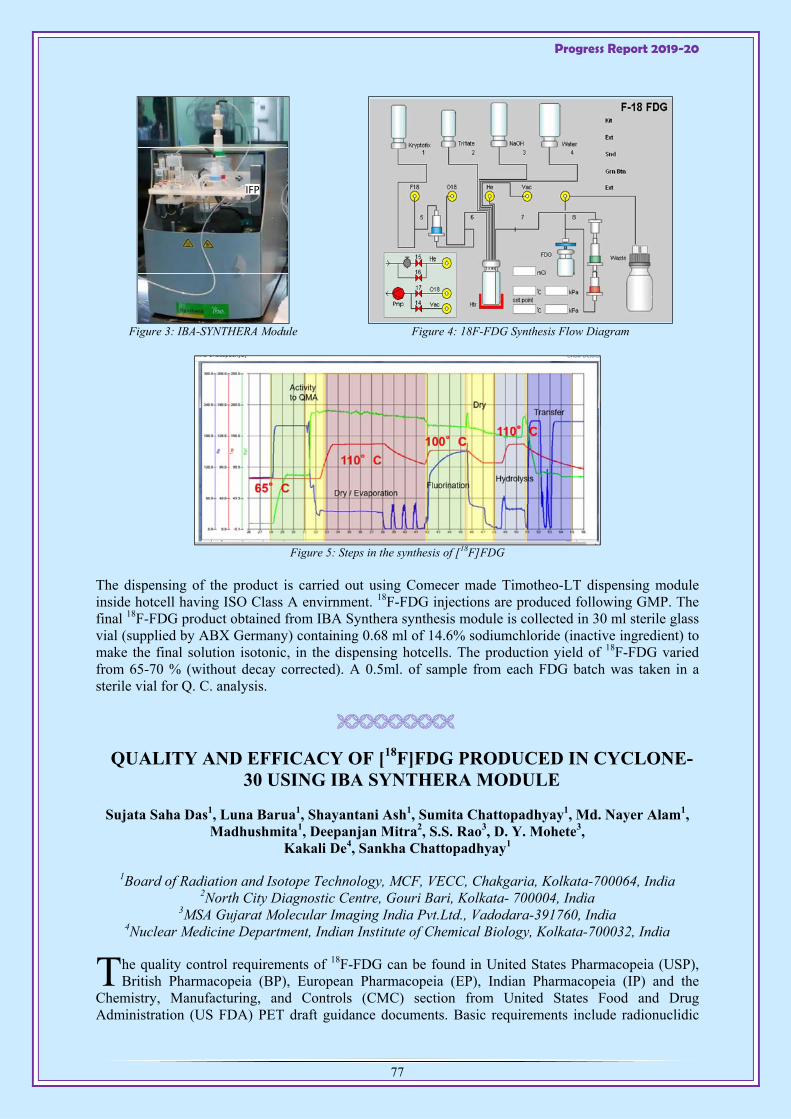
Progress Report 2019-20
77
Figure 3: IBA-SYNTHERA Module
Figure 4: 18F-FDG Synthesis Flow Diagram
Figure 5: Steps in the synthesis of [18F]FDG
The dispensing of the product is carried out using Comecer made Timotheo-LT dispensing module inside hotcell having ISO Class A envirnment. 18F-FDG injections are produced following GMP. The final 18F-FDG product obtained from IBA Synthera synthesis module is collected in 30 ml sterile glass vial (supplied by ABX Germany) containing 0.68 ml of 14.6% sodiumchloride (inactive ingredient) to make the final solution isotonic, in the dispensing hotcells. The production yield of 18F-FDG varied from 65-70 % (without decay corrected). A 0.5ml. of sample from each FDG batch was taken in a sterile vial for Q. C. analysis.
QUALITY AND EFFICACY OF [18F]FDG PRODUCED IN CYCLONE-30 USING IBA SYNTHERA MODULE
Sujata Saha Das1, Luna Barua1, Shayantani Ash1, Sumita Chattopadhyay1, Md. Nayer Alam1, Madhushmita1, Deepanjan Mitra2, S.S. Rao3, D. Y. Mohete3,
Kakali De4, Sankha Chattopadhyay1
1Board of Radiation and Isotope Technology, MCF, VECC, Chakgaria, Kolkata-700064, India 2North City Diagnostic Centre, Gouri Bari, Kolkata- 700004, India
3MSA Gujarat Molecular Imaging India Pvt.Ltd., Vadodara-391760, India 4Nuclear Medicine Department, Indian Institute of Chemical Biology, Kolkata-700032, India
he quality control requirements of 18F-FDG can be found in United States Pharmacopeia (USP), British Pharmacopeia (BP), European Pharmacopeia (EP), Indian Pharmacopeia (IP) and the
Chemistry, Manufacturing, and Controls (CMC) section from United States Food and Drug Administration (US FDA) PET draft guidance documents. Basic requirements include radionuclidic
IFP
T
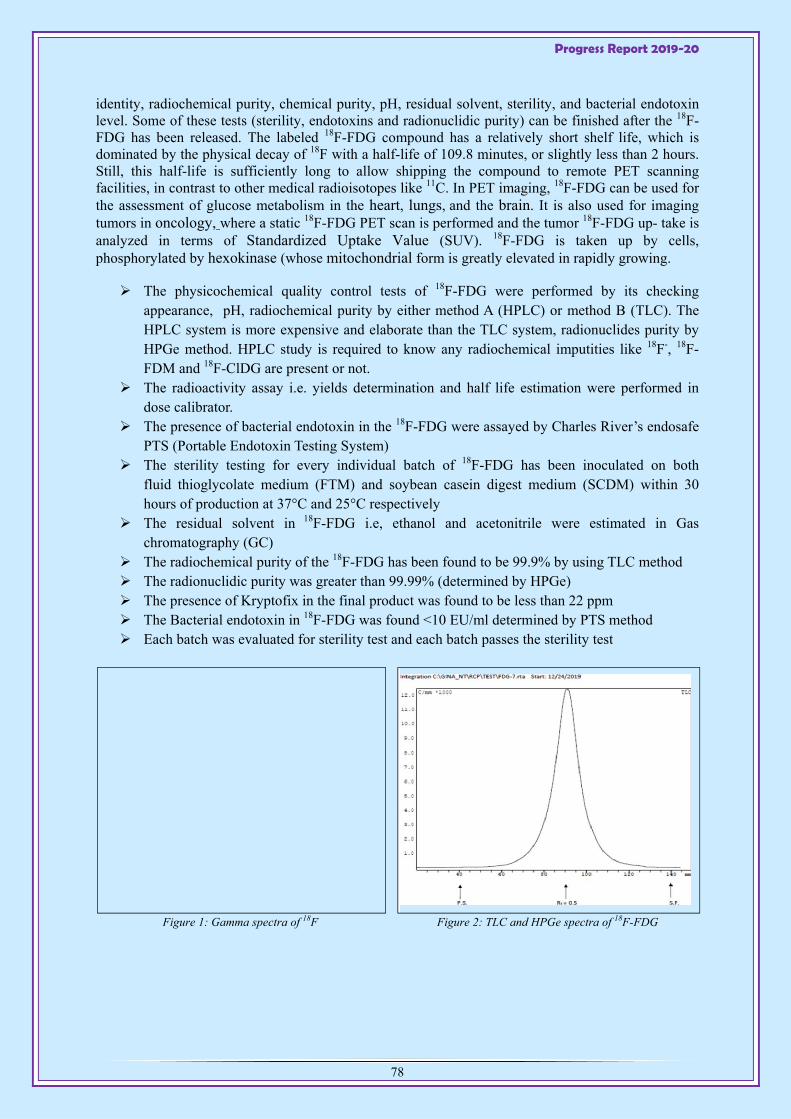
Progress Report 2019-20
78
identity, radiochemical purity, chemical purity, pH, residual solvent, sterility, and bacterial endotoxin level. Some of these tests (sterility, endotoxins and radionuclidic purity) can be finished after the 18F-FDG has been released. The labeled 18F-FDG compound has a relatively short shelf life, which is dominated by the physical decay of 18F with a half-life of 109.8 minutes, or slightly less than 2 hours. Still, this half-life is sufficiently long to allow shipping the compound to remote PET scanning facilities, in contrast to other medical radioisotopes like 11C. In PET imaging, 18F-FDG can be used for the assessment of glucose metabolism in the heart, lungs, and the brain. It is also used for imaging tumors in oncology, where a static 18F-FDG PET scan is performed and the tumor 18F-FDG up- take is analyzed in terms of Standardized Uptake Value (SUV). 18F-FDG is taken up by cells, phosphorylated by hexokinase (whose mitochondrial form is greatly elevated in rapidly growing.
The physicochemical quality control tests of 18F-FDG were performed by its checking appearance, pH, radiochemical purity by either method A (HPLC) or method B (TLC). The HPLC system is more expensive and elaborate than the TLC system, radionuclides purity by HPGe method. HPLC study is required to know any radiochemical imputities like 18F-, 18F-FDM and 18F-ClDG are present or not.
The radioactivity assay i.e. yields determination and half life estimation were performed in dose calibrator.
The presence of bacterial endotoxin in the 18F-FDG were assayed by Charles River’s endosafe PTS (Portable Endotoxin Testing System)
The sterility testing for every individual batch of 18F-FDG has been inoculated on both fluid thioglycolate medium (FTM) and soybean casein digest medium (SCDM) within 30 hours of production at 37°C and 25°C respectively
The residual solvent in 18F-FDG i.e, ethanol and acetonitrile were estimated in Gas chromatography (GC)
The radiochemical purity of the 18F-FDG has been found to be 99.9% by using TLC method The radionuclidic purity was greater than 99.99% (determined by HPGe) The presence of Kryptofix in the final product was found to be less than 22 ppm The Bacterial endotoxin in 18F-FDG was found <10 EU/ml determined by PTS method Each batch was evaluated for sterility test and each batch passes the sterility test
Figure 1: Gamma spectra of 18F Figure 2: TLC and HPGe spectra of 18F-FDG
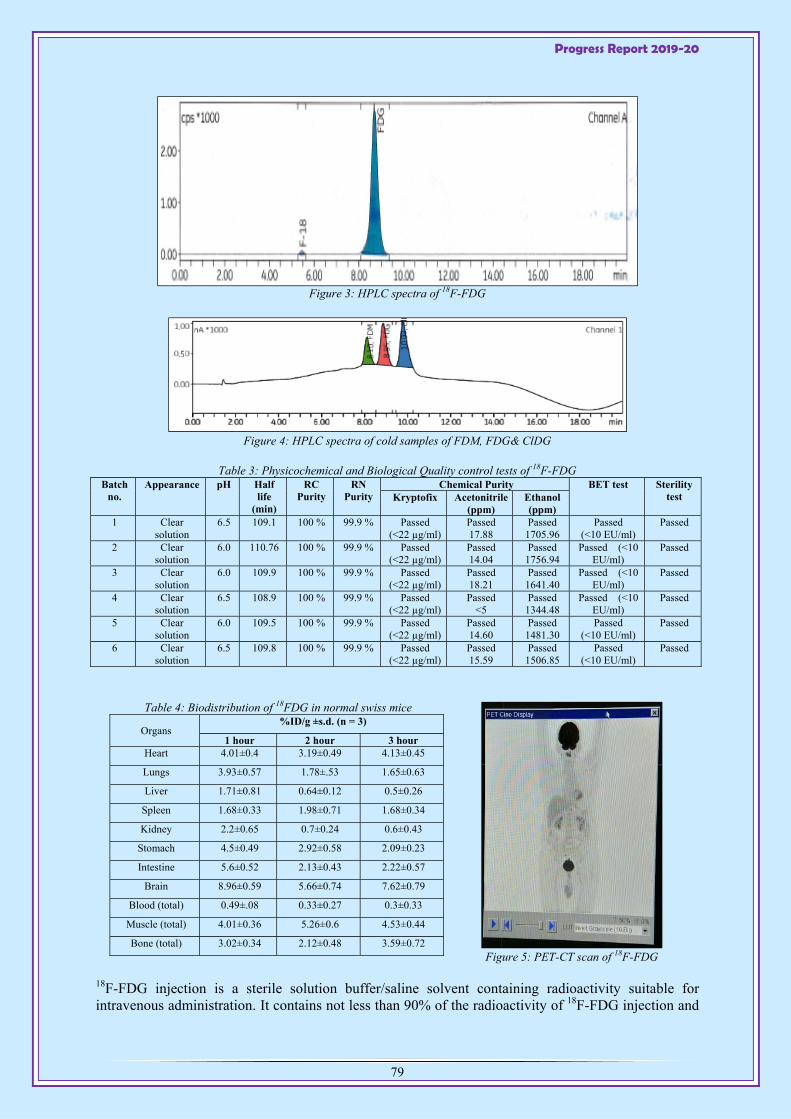
Progress Report 2019-20
79
Figure 3: HPLC spectra of 18F-FDG
Figure 4: HPLC spectra of cold samples of FDM, FDG& ClDG
Table 3: Physicochemical and Biological Quality control tests of 18F-FDG Batch
no. Appearance pH Half
life (min)
RC Purity
RN Purity
Chemical Purity BET test Sterility test Kryptofix Acetonitrile
(ppm) Ethanol (ppm)
1 Clear solution
6.5 109.1 100 % 99.9 % Passed (<22 µg/ml)
Passed 17.88
Passed 1705.96
Passed (<10 EU/ml)
Passed
2 Clear solution
6.0 110.76 100 % 99.9 % Passed (<22 µg/ml)
Passed 14.04
Passed 1756.94
Passed (<10 EU/ml)
Passed
3 Clear solution
6.0 109.9 100 % 99.9 % Passed (<22 µg/ml)
Passed 18.21
Passed 1641.40
Passed (<10 EU/ml)
Passed
4 Clear solution
6.5 108.9 100 % 99.9 % Passed (<22 µg/ml)
Passed <5
Passed 1344.48
Passed (<10 EU/ml)
Passed
5 Clear solution
6.0 109.5 100 % 99.9 % Passed (<22 µg/ml)
Passed 14.60
Passed 1481.30
Passed (<10 EU/ml)
Passed
6 Clear solution
6.5 109.8 100 % 99.9 % Passed (<22 µg/ml)
Passed 15.59
Passed 1506.85
Passed (<10 EU/ml)
Passed
Table 4: Biodistribution of 18FDG in normal swiss mice
Organs %ID/g ±s.d. (n = 3)
1 hour 2 hour 3 hourHeart 4.01±0.4 3.19±0.49 4.13±0.45
Lungs 3.93±0.57 1.78±.53 1.65±0.63
Liver 1.71±0.81 0.64±0.12 0.5±0.26
Spleen 1.68±0.33 1.98±0.71 1.68±0.34
Kidney 2.2±0.65 0.7±0.24 0.6±0.43
Stomach 4.5±0.49 2.92±0.58 2.09±0.23
Intestine 5.6±0.52 2.13±0.43 2.22±0.57
Brain 8.96±0.59 5.66±0.74 7.62±0.79
Blood (total) 0.49±.08 0.33±0.27 0.3±0.33
Muscle (total) 4.01±0.36 5.26±0.6 4.53±0.44
Bone (total) 3.02±0.34 2.12±0.48 3.59±0.72
Figure 5: PET-CT scan of 18F-FDG
18F-FDG injection is a sterile solution buffer/saline solvent containing radioactivity suitable for intravenous administration. It contains not less than 90% of the radioactivity of 18F-FDG injection and
Progress Report 2019-20
80
not more than 110% of the labeled amount of 18F-FDG expressed in MBq (or mCi) per mL at the time indicated in the label. Other chemical forms of radioactivity do not exceed 5% of the total radioactivity. The 18F-FDG was administered in normal swiss mice(male) and %ID /g in desired organs are given in Table 2. The 18F-FDG was administered in normal volunteer and PET-CT scan was successfully performed with requisite uptake in desired organs (Fig.4). The RPC has granted it’s permission for routine production and supply of Cyclone-30 produced 18F-FDG to hospitals seeing satisfactory quality control results of 18F-FDG.
A NEW DISPENSING SYSTEM FOR REMOTE DISPENSING OF 18F-FDG
Umesh Kumar1, D.G.Mahesh1, Asit Pal1, Mousumi Garai, Sabyasachi Pathak, Anirban De2, Sankha Chattopadhyay1
1 Radiopharmaceutical Lab., Regional Centre, Board of Radiation and Isotope Technology, VECC, 1/AF, Bidhan Nagar, Kolkata – 700064
2HBNI, Variable Energy Cyclotron Centre, 1/AF, Bidhan Nagar, Kolkata - 700064
he 18F-FDG synthesized in the PET hot cell of the DAE Medical Cycltron Facility using IBA synthera module is transfered asceptically with 10ml of sterile water in a capped sterile vial
(stock) with a required amount of sodium chloride (to make 0.9% sodium chloride) through a 0.22m millipore filter kept in the dispensing hot cell (Class A) through a interconnected 1/16 inch diameter teflon tube. The activity of 18F-FDG is measured in a dose calibrator, installed in dispensing hot cell and dispensed into the several dispensing vials. The standard procedure for dispensing of the 18F-FDG to the dispensing vials is to place an empty sterile vial on the M/s Comecer make weighing system for measuring the actual volume of activity dispensed and a preset volume of activity and saline are dispensed automatically from the stock 18F-FDG product vial by means of the peristaltic pump system (M/s Comecer make) which is controlled by the control program installed in the PC from outside of the dispensing hotcell. Thereafter the dispensed vial is removed by tele-manipulator and finally capped by means of M/s Comecer make capping system. Then the capped dispensed vials containing required amount of activity is autoclaved in M/s Comecer make autoclave system to get 18F-FDG in injectable form. This procedure is not only cumbersome and time consuming but also has a chance of compromising the sterility of the product. To overcome this, a dispensing system has been developed that not only made the procedure more user-friendly but also reduced the chance of contamination from bacteria. The newly developed dispensing system consisted of dose callibrator, peristaltic pump and an electromechanical module. Moreover, the dispensing system is a compact filling system which allows the dispensing of the radioactive liquid in a sealed glass vial. This system is PLC controlled and the HMI program installed in the PC will act as the operator’s interface. The system comprises of an activity vial placed inside the dose calibrator, a dilution saline vial and a dispensing vial where calculated amount of activity is dispensed. The peristaltic pump is operated from the computer terminal till the required activity is dispensed. Two pinch-valves allow the closing of the dilution tubes while the radioisotope is being pumped, and vice versa. The electromechanical module consists of a motor driven screw assembly to vertically move the dispensing needle in both the directions of the precaped sterile product vial. The vial for dispensing of 18F-FDG activity is kept in position by a grip arrangement mechanism from which the vial can be easily released by the tele-manipulator. Limit switches and relays are used to limit the vertical range of the movement of the product vial. The entire operation is carried out with electrical toggle switches installed outside the hot cell and manipulators.The requisite volume of 18F-FDG activity from the stock vial kept in the dose callibrator and requisite volume of saline were dispensed by means of a M/s Comecer make peristaltic pump through the respective sterile polypropelene tubes connected to the needle of the mechanical module to the precapped sterile vial. During dispensing, the motor was driven to move the needle down the capped vial, till the needle punctures its rubber stopper. Then the transfer of product as well as saline
T

Progress Report 2019-20
81
were carried out by peristaltic pump assembly. Since we have used sterilized capped vial for dispensing the product, there is a minimum chance of the product getting contaminated with respect to sterility point of view. Since the sealed vials are used to dispense the activity, capping and crimping operations are not required to be done.
Figure 1: Automated HMI Control program
Figure 2: Dispensing system inside Hotcell
Figure 3: Schematic diagram of the newly developed dispensing system
PRELIMINARY STUDY ON THE PREPARATION OF 67GA-CITRATE
IN MEDICAL CYCLOTRON FACILITY, VECC, CHAKGARIA, KOLKATA
Sankha Chattopadhyay, D. G. Mahesh, Asit K. Pal, Umesh Kumar, Arup K. Hudait, Sujata Saha Das, Luna Barua, Shayantani Ash, Sumita Chattopadhyay,
Ramprosad Pal, Md. Nayer Alam, Madusmita
Regional centre, Board of Radiation and Isotope Technology, MCF, VECC, Kolkata-700091, India
allium-67 isotope has a physical half-life of 78.3 hours and decays by electron capture emitting gamma radiation. It can be produced by a variety of reactions in a cyclotron. The principal
gamma photons from 67Ga are 93 keV (40%), 184 keV (24%), 296 keV (22%), and 388 keV (7%). Production of Ga-67-citrate: Zn-68 target has been prepared as per methodology given in the manual (Fig.1), VUB, Belgium . Gallium-67 has been produced by irradiating enriched Zinc-68 target electroplated on the copper base material in the solid target station in the beam line 1.1. The target was irradiated with energy of 28MeV proton beam, 10-30 A current for a total integrated current of 50 Ah. The irradiated target
G

Progress Report 2019-20
82
was transferred to the SPECT hotcell (100mm lead shield) by the rabbit transport system [Fig 2 & Fig 3]. The following steps are involved in production of 67Ga-citrate radiopharmaceutical
Step 1: Loading of the electroplated target to the receiving SPECT hotcell through loading/unloading window. Step 2: Fixing of the electroplated target to the solid target irradiation station (either solid target 1 or 2) located in SPECT vault by transferring the target through the pneumatic rabbit transfer facilities from the receiving SPECT hotcell by computer controlled software system. Step 3: Irradiation of the target to the respective target station as required for the production of a particular radioisotope (here Gallium-67). Step 4: Receiving of irradiated target to the receiving SPECT hotcell through the pneumatic rabbit transfer implanted inside the lead shielded trench. Step 5: Transfer of the irradiated target to the respective SPECT hotcell from the receiving SPECT hotcell through Pb shielded conveyor belt for production of the respective radioisotope by computer controlled automated chemistry module where separation of the desired radioisotope from the target matrix and formulation of the desired radio-chemical will take place. Step 6: Transferring of the radiochemical to the dispensing SPECT hotcell through conveyor belt, sterilization of the same for preparation of radiopharmaceutical, and dispensing of the product in vials (for quality control) through fully automated device. Step 7: Collection of the final product vials from SPECT dispensing hotcell in LP30 container by remote control operation and transfer of the product through the conveyor belt to the loading/unloading window. Step 8: Transfer of product for performing physio-chemical tests (Radionuclidic purity & Radio Chemical purity).The irradiated target was chemically processed in Ga-Chemistry hot cell [Fig 4] to get carrier-free gallium-67 citrate (Radio pharmaceutical). All the operations were carried out remotely using the computer based controller system [Fig 5], operated the IBA chemistry modules installed inside the Gallium processing hotcell [Fig 4]. The gallium-67 citrate was evaluated by performing physio-chemical tests (Radionuclidic purity [Fig 6], Radio Chemical purity [Fig 7] A 80 mCi of 67Ga-citrate has been successfully produced in Medical Cyclotron. The radionuclidic purity and radiochemical purity of 67Ga-citrate are 99.8% and 99.9%, respectively.
Figure 1: Electroplated Zinc-68 targets
Figure 2: Irradiated Target with rabbit system inside receiving Hotcell
Figure 3: Irradiated target system received in the receiving
hot cell
Figure 4: Gallium Chemistry Hotcell with Ga-chemisty
module
Rabbit
Irradiated target
Target holder
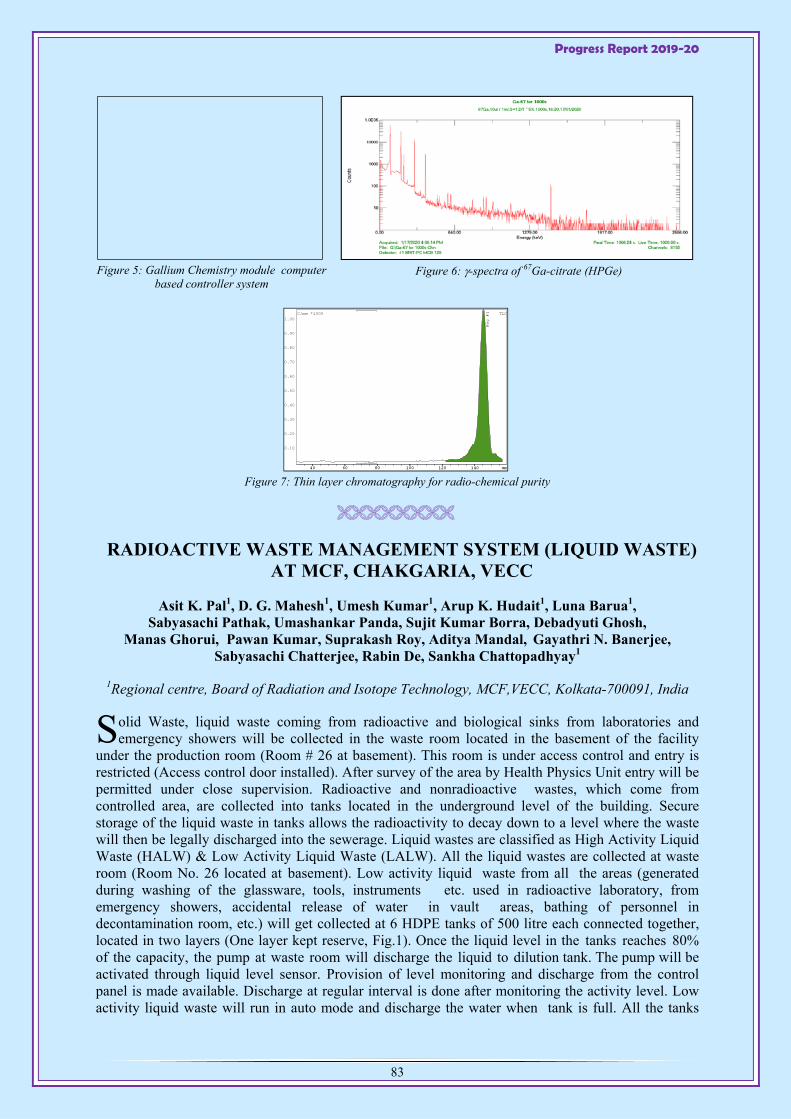
Progress Report 2019-20
83
Figure 5: Gallium Chemistry module computer
based controller system
Figure 6: -spectra of 67Ga-citrate (HPGe)
Figure 7: Thin layer chromatography for radio-chemical purity
RADIOACTIVE WASTE MANAGEMENT SYSTEM (LIQUID WASTE) AT MCF, CHAKGARIA, VECC
Asit K. Pal1, D. G. Mahesh1, Umesh Kumar1, Arup K. Hudait1, Luna Barua1, Sabyasachi Pathak, Umashankar Panda, Sujit Kumar Borra, Debadyuti Ghosh,
Manas Ghorui, Pawan Kumar, Suprakash Roy, Aditya Mandal, Gayathri N. Banerjee, Sabyasachi Chatterjee, Rabin De, Sankha Chattopadhyay1
1Regional centre, Board of Radiation and Isotope Technology, MCF,VECC, Kolkata-700091, India
olid Waste, liquid waste coming from radioactive and biological sinks from laboratories and emergency showers will be collected in the waste room located in the basement of the facility
under the production room (Room # 26 at basement). This room is under access control and entry is restricted (Access control door installed). After survey of the area by Health Physics Unit entry will be permitted under close supervision. Radioactive and nonradioactive wastes, which come from controlled area, are collected into tanks located in the underground level of the building. Secure storage of the liquid waste in tanks allows the radioactivity to decay down to a level where the waste will then be legally discharged into the sewerage. Liquid wastes are classified as High Activity Liquid Waste (HALW) & Low Activity Liquid Waste (LALW). All the liquid wastes are collected at waste room (Room No. 26 located at basement). Low activity liquid waste from all the areas (generated during washing of the glassware, tools, instruments etc. used in radioactive laboratory, from emergency showers, accidental release of water in vault areas, bathing of personnel in decontamination room, etc.) will get collected at 6 HDPE tanks of 500 litre each connected together, located in two layers (One layer kept reserve, Fig.1). Once the liquid level in the tanks reaches 80% of the capacity, the pump at waste room will discharge the liquid to dilution tank. The pump will be activated through liquid level sensor. Provision of level monitoring and discharge from the control panel is made available. Discharge at regular interval is done after monitoring the activity level. Low activity liquid waste will run in auto mode and discharge the water when tank is full. All the tanks
40 60 80 100 120 140 mm
TLC
40 60 80 100 120 140 mm
0.10
0.20
0.30
0.40
0.50
0.60
0.70
0.80
0.90
1.00C/mm *1000
Reg #1
S
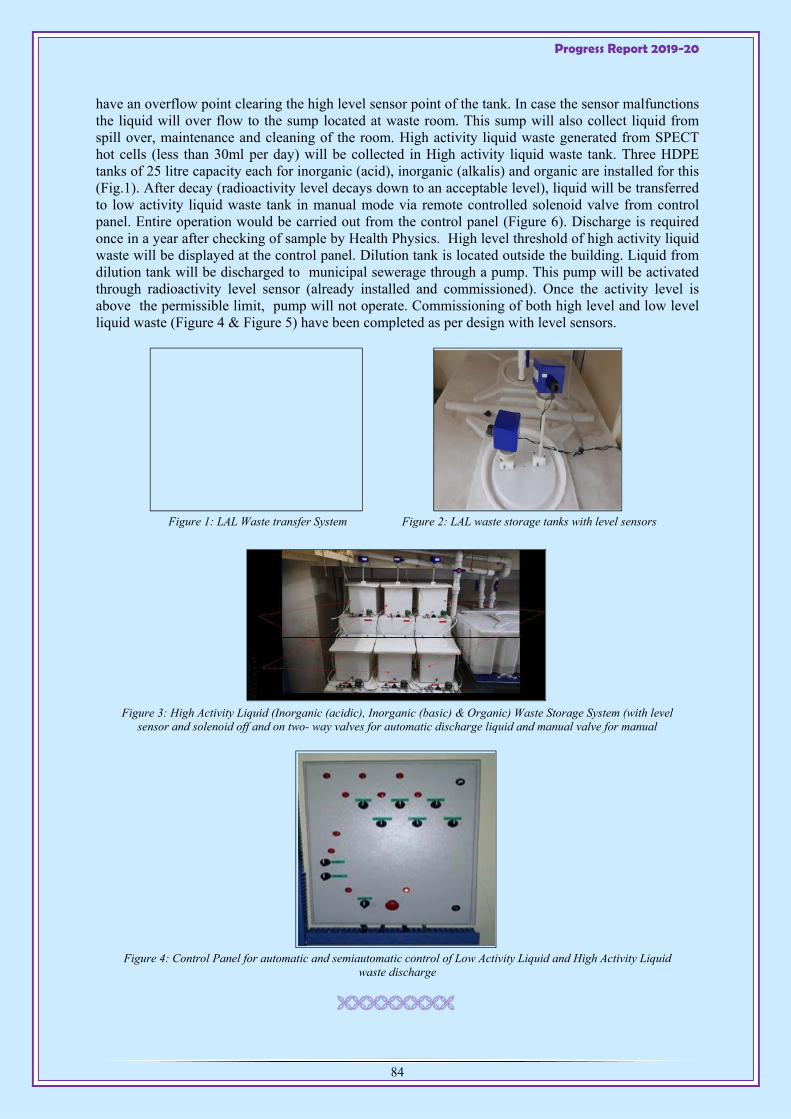
Progress Report 2019-20
84
have an overflow point clearing the high level sensor point of the tank. In case the sensor malfunctions the liquid will over flow to the sump located at waste room. This sump will also collect liquid from spill over, maintenance and cleaning of the room. High activity liquid waste generated from SPECT hot cells (less than 30ml per day) will be collected in High activity liquid waste tank. Three HDPE tanks of 25 litre capacity each for inorganic (acid), inorganic (alkalis) and organic are installed for this (Fig.1). After decay (radioactivity level decays down to an acceptable level), liquid will be transferred to low activity liquid waste tank in manual mode via remote controlled solenoid valve from control panel. Entire operation would be carried out from the control panel (Figure 6). Discharge is required once in a year after checking of sample by Health Physics. High level threshold of high activity liquid waste will be displayed at the control panel. Dilution tank is located outside the building. Liquid from dilution tank will be discharged to municipal sewerage through a pump. This pump will be activated through radioactivity level sensor (already installed and commissioned). Once the activity level is above the permissible limit, pump will not operate. Commissioning of both high level and low level liquid waste (Figure 4 & Figure 5) have been completed as per design with level sensors.
Figure 1: LAL Waste transfer System
Figure 2: LAL waste storage tanks with level sensors
Figure 3: High Activity Liquid (Inorganic (acidic), Inorganic (basic) & Organic) Waste Storage System (with level
sensor and solenoid off and on two- way valves for automatic discharge liquid and manual valve for manual
Figure 4: Control Panel for automatic and semiautomatic control of Low Activity Liquid and High Activity Liquid
waste discharge
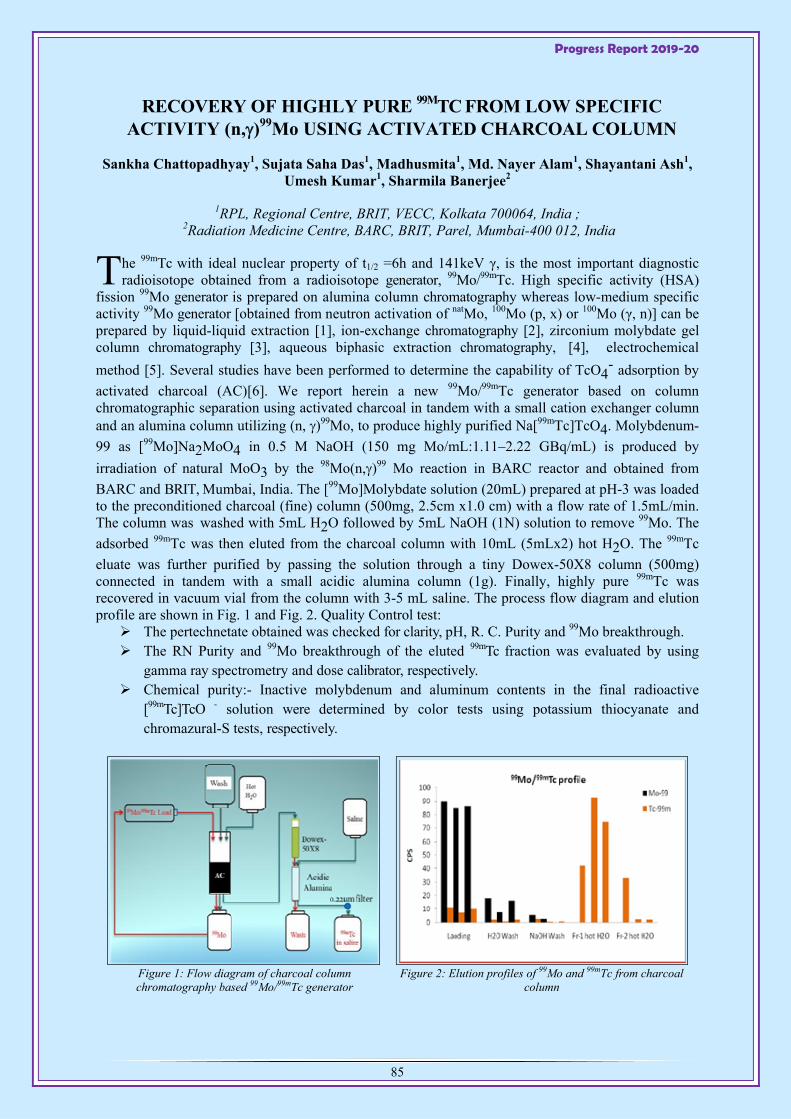
Progress Report 2019-20
85
RECOVERY OF HIGHLY PURE 99MTC FROM LOW SPECIFIC ACTIVITY (n,)99Mo USING ACTIVATED CHARCOAL COLUMN
Sankha Chattopadhyay1, Sujata Saha Das1, Madhusmita1, Md. Nayer Alam1, Shayantani Ash1, Umesh Kumar1, Sharmila Banerjee2
1RPL, Regional Centre, BRIT, VECC, Kolkata 700064, India ; 2Radiation Medicine Centre, BARC, BRIT, Parel, Mumbai-400 012, India
he 99mTc with ideal nuclear property of t1/2 =6h and 141keV γ, is the most important diagnostic radioisotope obtained from a radioisotope generator, 99Mo/99mTc. High specific activity (HSA)
fission 99Mo generator is prepared on alumina column chromatography whereas low-medium specific activity 99Mo generator [obtained from neutron activation of natMo, 100Mo (p, x) or 100Mo (γ, n)] can be prepared by liquid-liquid extraction [1], ion-exchange chromatography [2], zirconium molybdate gel column chromatography [3], aqueous biphasic extraction chromatography, [4], electrochemical
method [5]. Several studies have been performed to determine the capability of TcO4- adsorption by
activated charcoal (AC)[6]. We report herein a new 99Mo/99mTc generator based on column chromatographic separation using activated charcoal in tandem with a small cation exchanger column and an alumina column utilizing (n, )99Mo, to produce highly purified Na[99mTc]TcO4. Molybdenum-
99 as [99Mo]Na2MoO4 in 0.5 M NaOH (150 mg Mo/mL:1.11–2.22 GBq/mL) is produced by
irradiation of natural MoO3 by the 98Mo(n,)99 Mo reaction in BARC reactor and obtained from
BARC and BRIT, Mumbai, India. The [99Mo]Molybdate solution (20mL) prepared at pH-3 was loaded to the preconditioned charcoal (fine) column (500mg, 2.5cm x1.0 cm) with a flow rate of 1.5mL/min. The column was washed with 5mL H2O followed by 5mL NaOH (1N) solution to remove 99Mo. The
adsorbed 99mTc was then eluted from the charcoal column with 10mL (5mLx2) hot H2O. The 99mTc
eluate was further purified by passing the solution through a tiny Dowex-50X8 column (500mg) connected in tandem with a small acidic alumina column (1g). Finally, highly pure 99mTc was recovered in vacuum vial from the column with 3-5 mL saline. The process flow diagram and elution profile are shown in Fig. 1 and Fig. 2. Quality Control test: The pertechnetate obtained was checked for clarity, pH, R. C. Purity and 99Mo breakthrough. The RN Purity and 99Mo breakthrough of the eluted 99mTc fraction was evaluated by using
gamma ray spectrometry and dose calibrator, respectively. Chemical purity:- Inactive molybdenum and aluminum contents in the final radioactive
[99mTc]TcO - solution were determined by color tests using potassium thiocyanate and chromazural-S tests, respectively.
Figure 1: Flow diagram of charcoal column chromatography based 99Mo/99mTc generator
Figure 2: Elution profiles of 99Mo and 99mTc from charcoal column
T
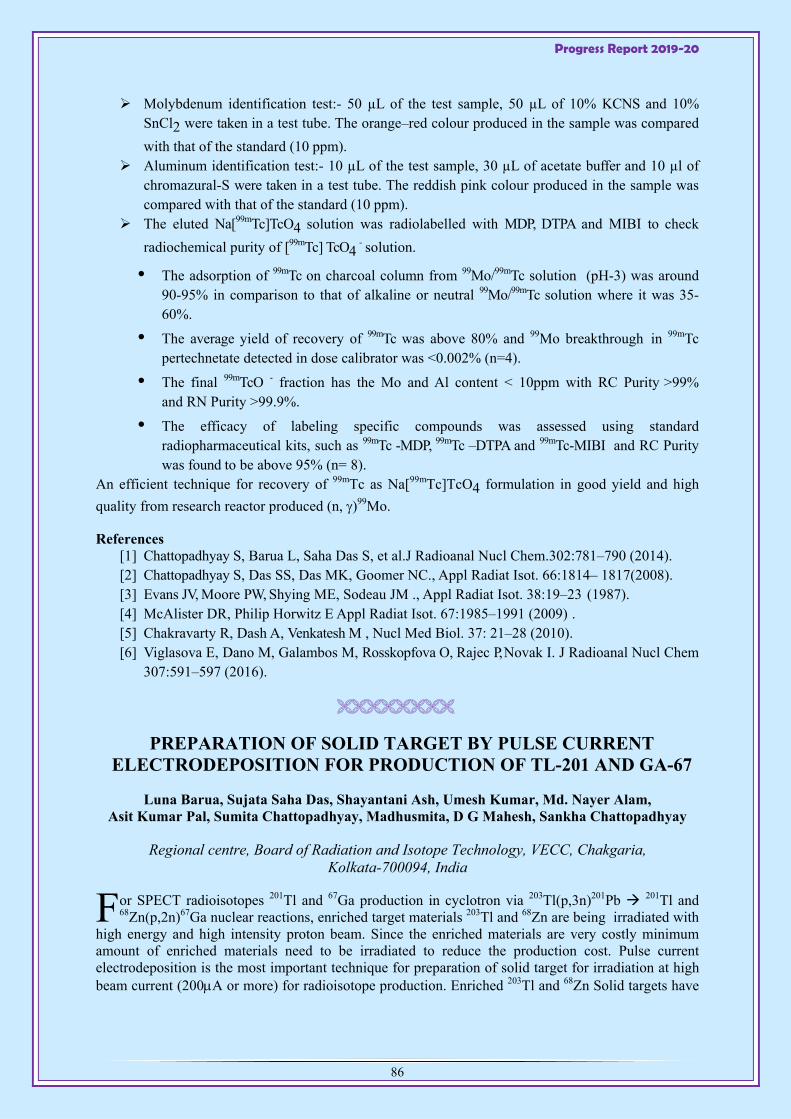
Progress Report 2019-20
86
Molybdenum identification test:- 50 µL of the test sample, 50 µL of 10% KCNS and 10% SnCl2 were taken in a test tube. The orange–red colour produced in the sample was compared
with that of the standard (10 ppm). Aluminum identification test:- 10 µL of the test sample, 30 µL of acetate buffer and 10 µl of
chromazural-S were taken in a test tube. The reddish pink colour produced in the sample was compared with that of the standard (10 ppm).
The eluted Na[99mTc]TcO4 solution was radiolabelled with MDP, DTPA and MIBI to check
radiochemical purity of [99mTc] TcO4 - solution.
• The adsorption of 99mTc on charcoal column from 99Mo/99mTc solution (pH-3) was around 90-95% in comparison to that of alkaline or neutral 99Mo/99mTc solution where it was 35-60%.
• The average yield of recovery of 99mTc was above 80% and 99Mo breakthrough in 99mTc pertechnetate detected in dose calibrator was <0.002% (n=4).
• The final 99mTcO - fraction has the Mo and Al content < 10ppm with RC Purity >99% and RN Purity >99.9%.
• The efficacy of labeling specific compounds was assessed using standard radiopharmaceutical kits, such as 99mTc -MDP, 99mTc –DTPA and 99mTc-MIBI and RC Purity was found to be above 95% (n= 8).
An efficient technique for recovery of 99mTc as Na[99mTc]TcO4 formulation in good yield and high
quality from research reactor produced (n, )99Mo.
References [1] Chattopadhyay S, Barua L, Saha Das S, et al.J Radioanal Nucl Chem.302:781–790 (2014). [2] Chattopadhyay S, Das SS, Das MK, Goomer NC., Appl Radiat Isot. 66:1814– 1817(2008). [3] Evans JV, Moore PW, Shying ME, Sodeau JM ., Appl Radiat Isot. 38:19–23 (1987). [4] McAlister DR, Philip Horwitz E Appl Radiat Isot. 67:1985–1991 (2009) . [5] Chakravarty R, Dash A, Venkatesh M , Nucl Med Biol. 37: 21–28 (2010). [6] Viglasova E, Dano M, Galambos M, Rosskopfova O, Rajec P, Novak I. J Radioanal Nucl Chem
307:591–597 (2016).
PREPARATION OF SOLID TARGET BY PULSE CURRENT ELECTRODEPOSITION FOR PRODUCTION OF TL-201 AND GA-67
Luna Barua, Sujata Saha Das, Shayantani Ash, Umesh Kumar, Md. Nayer Alam, Asit Kumar Pal, Sumita Chattopadhyay, Madhusmita, D G Mahesh, Sankha Chattopadhyay
Regional centre, Board of Radiation and Isotope Technology, VECC, Chakgaria, Kolkata-700094, India
or SPECT radioisotopes 201Tl and 67Ga production in cyclotron via 203Tl(p,3n)201Pb 201Tl and 68Zn(p,2n)67Ga nuclear reactions, enriched target materials 203Tl and 68Zn are being irradiated with
high energy and high intensity proton beam. Since the enriched materials are very costly minimum amount of enriched materials need to be irradiated to reduce the production cost. Pulse current electrodeposition is the most important technique for preparation of solid target for irradiation at high beam current (200A or more) for radioisotope production. Enriched 203Tl and 68Zn Solid targets have
F

Progress Report 2019-20
87
been prepared by pulse electrodeposition technique for production of 201Tl and 67Ga at Medical Cyclotron.
Procedure: The main purpose of the electrodeposition unit is to prepare simultaneously four electrodeposits of enriched material onto copper backings. The major physicochemical quality criteria of the electrodeposits may be summarized as follows:
a) The target layer should adhere strongly to the copper target carrier (generally copper) at a temperature about 50 0C below the melting point of the corresponding metal.
b) Target layer should be homogeneous all over the surface area (±5%) & show a well defined thickness that may vary from a few tens to several hundred microns.
c) Target layer should be smooth (not spongy), dense (no occlusions nor vacuoles) and stress-free d) The metal deposit & the carrier layer interface should be free of organic plating additives.
Pulsed current electroplating technology is required to get the desired quality of the electrodeposited target layer, where pulsed current and voltage waveform and its parameters are different for different materials which need to be optimized experimentally for individual metal. The electrodeposition vessel is a hollow Perspex cylinder fitted with a central Pt-anode, four slots for copper carriers for simultaneous production of four targets and a stirrer-motor combination.
Figure 1: Electrodeposition vessel
Thallium-203 Electrodeposition for Tl-201 production: The electrodeposition bath was prepared by dissolving an amount of 203Tl2O3 (corresponding to the Tl weight of 8 targets) in an aqueous alkaline solution containing a complexing agent (EDTA), an anodic depolarizer and a wetting agent. From this bath, four targets were prepared by constant current electrolysis (current efficiency > 99%) involving the application of a bipolar chopped saw-tooth voltage between a central grounded Pt anode wire and four cathodes, i.e.: four copper carriers, mounted vertically in appropriate windows of the electrodeposition vessel. Thereby after one electrodeposition cycle a 50 % 203Tl depletion is obtained i.e.: half of the 203TlEDTA- is reduced to 203Tl0 and deposited on the Cu backings. The control electronics involves a single generator, 4 voltage controlled current sources, and the stirrer-control.
Zinc-68 Electrodeposition for Ga-67 production :
The electrodeposition bath was prepared by dissolving an amount of Zn or ZnO (corresponding to the 68Zn weight of 8 targets) in a diluted acid aqueous solution containing an anodic depolarizer. The required amount of enriched Zn for 1 plating bath is 5g. Reuse of the plating bath up to 10 times is possible after addition of 2.5 gr. From this bath, four targets were prepared by constant current electrolysis (current efficiency > 99%) involving the application of a chopped sine wave voltage between a central Pt anode wire and four grounded cathodes, i.e. four grounded copper carriers,
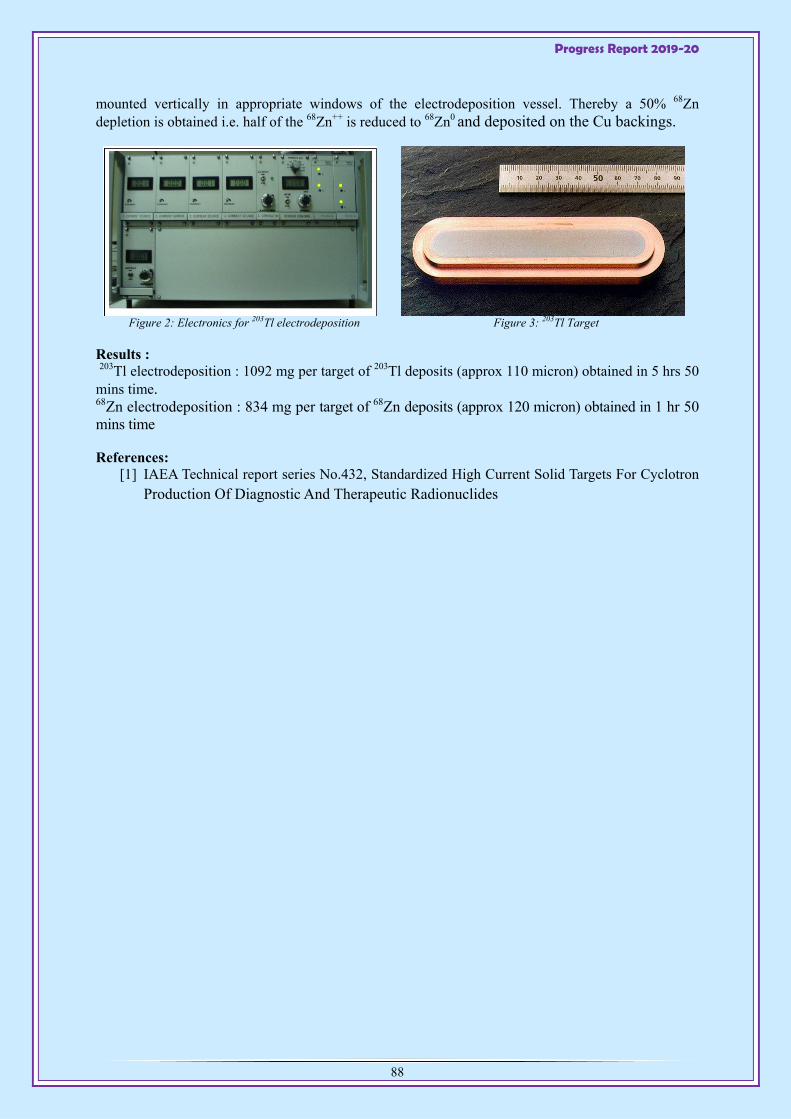
Progress Report 2019-20
88
mounted vertically in appropriate windows of the electrodeposition vessel. Thereby a 50% 68Zn depletion is obtained i.e. half of the 68Zn++ is reduced to 68Zn0 and deposited on the Cu backings.
Figure 2: Electronics for 203Tl electrodeposition
Figure 3: 203Tl Target
Results : 203Tl electrodeposition : 1092 mg per target of 203Tl deposits (approx 110 micron) obtained in 5 hrs 50 mins time. 68Zn electrodeposition : 834 mg per target of 68Zn deposits (approx 120 micron) obtained in 1 hr 50 mins time
References: [1] IAEA Technical report series No.432, Standardized High Current Solid Targets For Cyclotron
Production Of Diagnostic And Therapeutic Radionuclides

Progress Report 2019-20
89
1.5 Material Research
CHARACTERIZATION OF PROTON IRRADIATED V-4Cr-4Ti ALLOY SAMPLES
N. Gayathri, Sudipta Mandal,P.Mukherjee, Santu Dey, Tapatee Kundu Roy
he V-4Cr-4Ti alloy is being considered as one of the candidate structural materials for the advanced blankets of fusion reactors. This alloy is found to have suitable mechanical properties,
limited activation after neutron irradiation, and good stability under irradiation above 673 K, especially in terms of swelling resistance and ductility. It also shows less helium and hydrogen production rates and lower nuclear heating rates compared to stainless steel and FM steels. This potential application has given impetus to investigate its behaviourunder proton irradiation. Samples of V-4Cr-4Ti were irradiated using 6.5 MeV proton beam to doses of 6.2×10¹⁶ p/cm2, 1.0×10¹⁷ p/cm2, 4.3×10¹⁷ p/cm2 and 1.0×10¹⁸ p/cm2. The samples were characterized by X-ray diffraction. Fig 1 shows the dpa profile generated using SRIM for the irradiated doses. Fig 2 shows the XRD profile of the irradiated and unirradiated samples after the initial decrease in peak intensity, not much variation is seen as a function of dose.
Figure 1: dpa profile es generated using SRIM
Figure 2: XRD profile of the samples
Figure 3: W-H plot generated from the XRD
Figure 4: Dislocation density obtained from CMWP analysis
WH plot (Fig 3.) obtained from the single peak analysis of the XRD data indicates that the irradiated samples have a decreased domain size (larger intercept) and a small increase in the microstrain (increased slope) compared to the unirradiated sample. The dislocation density (Fig 4.) shows a sudden increase at the first dose of irradiation and thereafter remains almost unchanged with dose. However, the detailed analysis of the XRD data using the convoluted multiple whole profile fitting, gives an insight into the nature of the dislocations (denoted by ‘q’)that are formed due to irradiation. From Fig 6 it can be clearly seen that the q values systematically decrease with irradiation dose. The limiting values of the q have been calculated using the ANZIC program [2] for different types of
0 40 80 120 160 200
0.00
0.05
0.10
0.15
0.20
0.25
0.30
6.21016 p/cm2
1.01017 p/cm2
4.31017 p/cm2
1.01018 p/cm2
Dis
pla
cem
ent
per
Ato
m(d
pa)
Penetration Depth (in m)
4060
80100
120
0
1x10⁴
2x10⁴
3x10⁴
as received 6.21016p/cm2
1.01017p/cm2
4.31017p/cm2
11018p/cm2
Inte
nsi
ty (
counts
)
2 (in deg)
110
200
211
220
310
0.4 0.5 0.6 0.7 0.8 0.9 1.0
3.0x10⁻³
4.5x10⁻³
6.0x10⁻³
7.5x10⁻³ Unirradiated 6.2x10¹⁶ p/cm2
1x10¹⁷ p/cm2
4x10¹⁷ p/cm2
1.x1018 p/cm2
*/1
000
d*
0.0 2.5x10¹⁷ 5.0x10¹⁷ 7.5x10¹⁷ 1.0x10¹⁸
2x10¹⁵
3x10¹⁵
4x10¹⁵
5x10¹⁵
Dis
loc
ati
on
De
ns
ity
(m-2
)
Irradiation Dose (p/cm2)
T
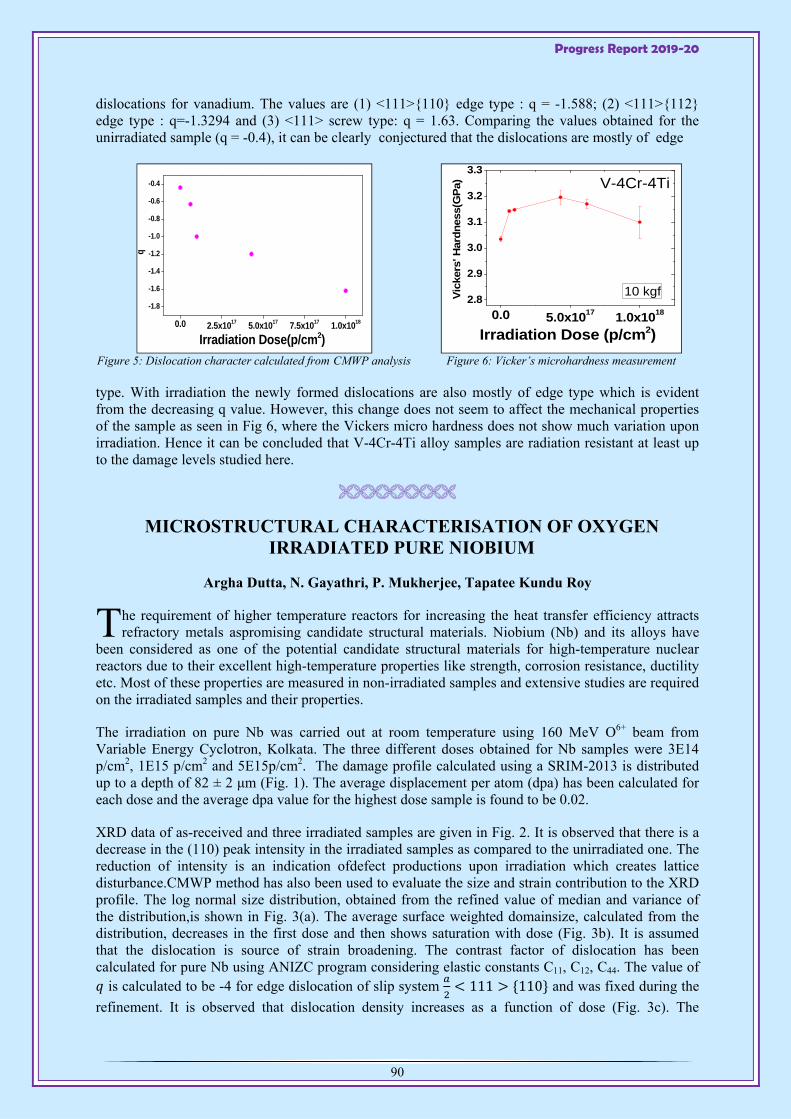
Progress Report 2019-20
90
dislocations for vanadium. The values are (1) <111>110 edge type : q = -1.588; (2) <111>112 edge type : q=-1.3294 and (3) <111> screw type: q = 1.63. Comparing the values obtained for the unirradiated sample (q = -0.4), it can be clearly conjectured that the dislocations are mostly of edge
Figure 5: Dislocation character calculated from CMWP analysis
Figure 6: Vicker’s microhardness measurement
type. With irradiation the newly formed dislocations are also mostly of edge type which is evident from the decreasing q value. However, this change does not seem to affect the mechanical properties of the sample as seen in Fig 6, where the Vickers micro hardness does not show much variation upon irradiation. Hence it can be concluded that V-4Cr-4Ti alloy samples are radiation resistant at least up to the damage levels studied here.
MICROSTRUCTURAL CHARACTERISATION OF OXYGEN IRRADIATED PURE NIOBIUM
Argha Dutta, N. Gayathri, P. Mukherjee, Tapatee Kundu Roy
he requirement of higher temperature reactors for increasing the heat transfer efficiency attracts refractory metals aspromising candidate structural materials. Niobium (Nb) and its alloys have
been considered as one of the potential candidate structural materials for high-temperature nuclear reactors due to their excellent high-temperature properties like strength, corrosion resistance, ductility etc. Most of these properties are measured in non-irradiated samples and extensive studies are required on the irradiated samples and their properties.
The irradiation on pure Nb was carried out at room temperature using 160 MeV O6+ beam from Variable Energy Cyclotron, Kolkata. The three different doses obtained for Nb samples were 3E14 p/cm2, 1E15 p/cm2 and 5E15p/cm2. The damage profile calculated using a SRIM-2013 is distributed up to a depth of 82 ± 2 μm (Fig. 1). The average displacement per atom (dpa) has been calculated for each dose and the average dpa value for the highest dose sample is found to be 0.02.
XRD data of as-received and three irradiated samples are given in Fig. 2. It is observed that there is a decrease in the (110) peak intensity in the irradiated samples as compared to the unirradiated one. The reduction of intensity is an indication ofdefect productions upon irradiation which creates lattice disturbance.CMWP method has also been used to evaluate the size and strain contribution to the XRD profile. The log normal size distribution, obtained from the refined value of median and variance of the distribution,is shown in Fig. 3(a). The average surface weighted domainsize, calculated from the distribution, decreases in the first dose and then shows saturation with dose (Fig. 3b). It is assumed that the dislocation is source of strain broadening. The contrast factor of dislocation has been calculated for pure Nb using ANIZC program considering elastic constants C11, C12, C44. The value of
is calculated to be -4 for edge dislocation of slip system 111 110 and was fixed during the
refinement. It is observed that dislocation density increases as a function of dose (Fig. 3c). The
0.0 2.5x10¹⁷ 5.0x10¹⁷ 7.5x10¹⁷ 1.0x10¹⁸
-1.8
-1.6
-1.4
-1.2
-1.0
-0.8
-0.6
-0.4
q
Irradiation Dose(p/cm2)
0.0 5.0x10¹⁷ 1.0x10¹⁸
2.8
2.9
3.0
3.1
3.2
3.3
Vic
kers
' Hard
ness(G
Pa)
Irradiation Dose (p/cm2)
10 kgf
V-4Cr-4Ti
T
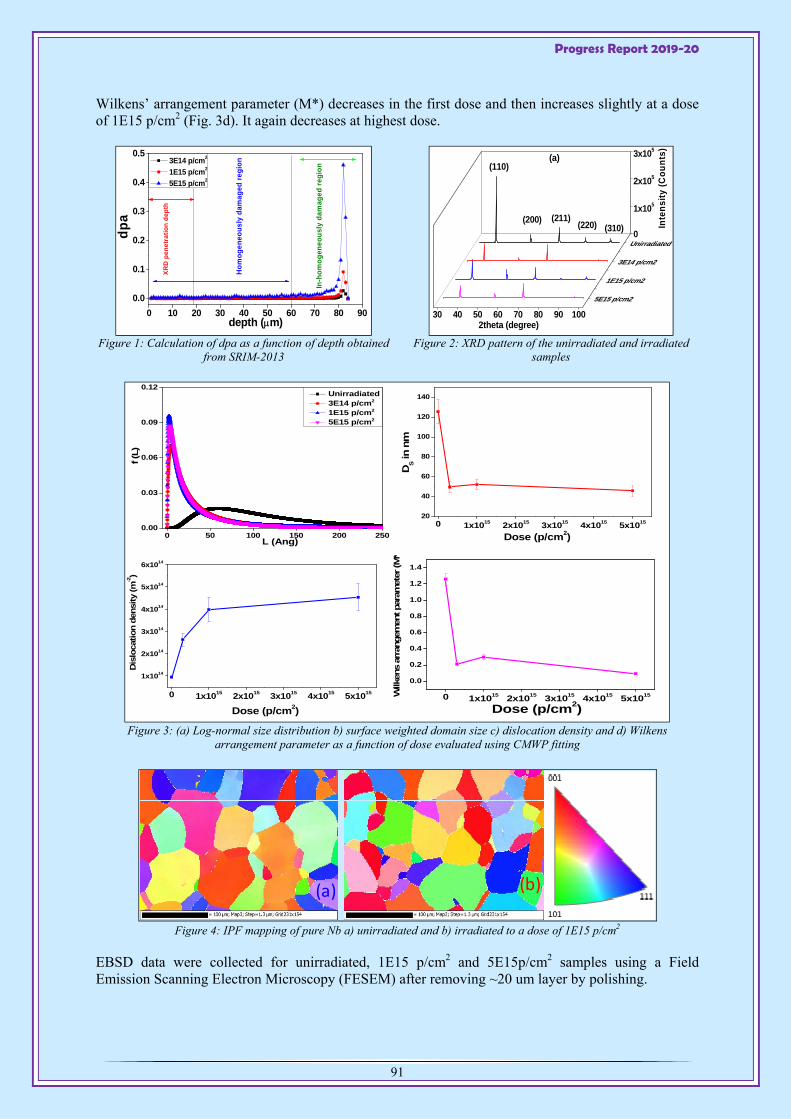
Progress Report 2019-20
91
Wilkens’ arrangement parameter (M*) decreases in the first dose and then increases slightly at a dose of 1E15 p/cm2 (Fig. 3d). It again decreases at highest dose.
Figure 1: Calculation of dpa as a function of depth obtained
from SRIM-2013
Figure 2: XRD pattern of the unirradiated and irradiated
samples
Figure 3: (a) Log-normal size distribution b) surface weighted domain size c) dislocation density and d) Wilkens
arrangement parameter as a function of dose evaluated using CMWP fitting
Figure 4: IPF mapping of pure Nb a) unirradiated and b) irradiated to a dose of 1E15 p/cm2
EBSD data were collected for unirradiated, 1E15 p/cm2 and 5E15p/cm2 samples using a Field Emission Scanning Electron Microscopy (FESEM) after removing ~20 um layer by polishing.
0 10 20 30 40 50 60 70 80 90
0.0
0.1
0.2
0.3
0.4
0.5
In-h
om
og
eneo
usl
y d
amag
ed r
egio
n
dp
a
depth (m)
3E14 p/cm2
1E15 p/cm2
5E15 p/cm2
XR
D p
ene
tra
tio
n d
epth
Ho
mo
gen
eou
sly
dam
aged
reg
ion
30 40 50 60 70 80 90 100
0
1x10⁵
2x10⁵
3x10⁵
Unirradiated
3E14 p/cm2
1E15 p/cm2
5E15 p/cm2
(310)(220)(211)(200)
In
ten
sit
y (
Co
un
ts)
2theta (degree)
(110)(a)
0 50 100 150 200 2500.00
0.03
0.06
0.09
0.12
f (L
)
L (Ang)
Unirradiated 3E14 p/cm2
1E15 p/cm2
5E15 p/cm2
0 1x10¹⁵ 2x10¹⁵ 3x10¹⁵ 4x10¹⁵ 5x101520
40
60
80
100
120
140
Dose (p/cm2)
DS in n
m
0 1x10¹⁵ 2x10¹⁵ 3x10¹⁵ 4x10¹⁵ 5x10¹⁵
1x10¹⁴
2x10¹⁴
3x10¹⁴
4x10¹⁴
5x10¹⁴
6x10¹⁴
Dose (p/cm2)
Dis
locat
ion d
ensity
(m-2)
0 1x10¹⁵ 2x10¹⁵ 3x10¹⁵ 4x10¹⁵ 5x10¹⁵
0.0
0.2
0.4
0.6
0.8
1.0
1.2
1.4
Dose (p/cm2)
Wilk
ens
arra
ngem
ent par
amet
er (M
*
(a) (b)
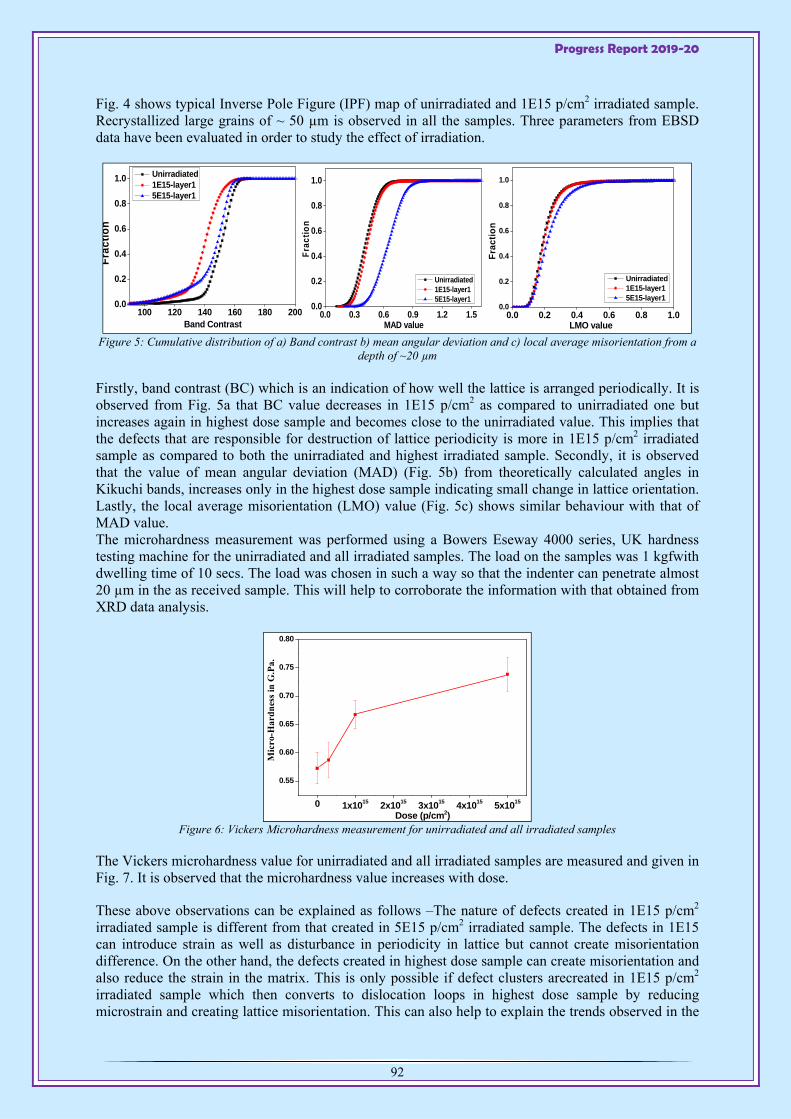
Progress Report 2019-20
92
Fig. 4 shows typical Inverse Pole Figure (IPF) map of unirradiated and 1E15 p/cm2 irradiated sample. Recrystallized large grains of ~ 50 µm is observed in all the samples. Three parameters from EBSD data have been evaluated in order to study the effect of irradiation.
Figure 5: Cumulative distribution of a) Band contrast b) mean angular deviation and c) local average misorientation from a
depth of ~20 µm Firstly, band contrast (BC) which is an indication of how well the lattice is arranged periodically. It is observed from Fig. 5a that BC value decreases in 1E15 p/cm2 as compared to unirradiated one but increases again in highest dose sample and becomes close to the unirradiated value. This implies that the defects that are responsible for destruction of lattice periodicity is more in 1E15 p/cm2 irradiated sample as compared to both the unirradiated and highest irradiated sample. Secondly, it is observed that the value of mean angular deviation (MAD) (Fig. 5b) from theoretically calculated angles in Kikuchi bands, increases only in the highest dose sample indicating small change in lattice orientation. Lastly, the local average misorientation (LMO) value (Fig. 5c) shows similar behaviour with that of MAD value. The microhardness measurement was performed using a Bowers Eseway 4000 series, UK hardness testing machine for the unirradiated and all irradiated samples. The load on the samples was 1 kgfwith dwelling time of 10 secs. The load was chosen in such a way so that the indenter can penetrate almost 20 µm in the as received sample. This will help to corroborate the information with that obtained from XRD data analysis.
Figure 6: Vickers Microhardness measurement for unirradiated and all irradiated samples
The Vickers microhardness value for unirradiated and all irradiated samples are measured and given in Fig. 7. It is observed that the microhardness value increases with dose.
These above observations can be explained as follows –The nature of defects created in 1E15 p/cm2 irradiated sample is different from that created in 5E15 p/cm2 irradiated sample. The defects in 1E15 can introduce strain as well as disturbance in periodicity in lattice but cannot create misorientation difference. On the other hand, the defects created in highest dose sample can create misorientation and also reduce the strain in the matrix. This is only possible if defect clusters arecreated in 1E15 p/cm2 irradiated sample which then converts to dislocation loops in highest dose sample by reducing microstrain and creating lattice misorientation. This can also help to explain the trends observed in the
100 120 140 160 180 2000.0
0.2
0.4
0.6
0.8
1.0
Fra
ctio
n
Band Contrast
Unirradiated 1E15-layer1 5E15-layer1
0.0 0.3 0.6 0.9 1.2 1.50.0
0.2
0.4
0.6
0.8
1.0
MAD value
Fra
ctio
n
Unirradiated 1E15-layer1 5E15-layer1
0.0 0.2 0.4 0.6 0.8 1.00.0
0.2
0.4
0.6
0.8
1.0
Fra
ctio
n
LMO value
Unirradiated 1E15-layer1 5E15-layer1
0 1x10¹⁵ 2x10¹⁵ 3x10¹⁵ 4x10¹⁵ 5x10¹⁵
0.55
0.60
0.65
0.70
0.75
0.80
Dose (p/cm2)
Mic
ro-H
ard
nes
s in
G.P
a.
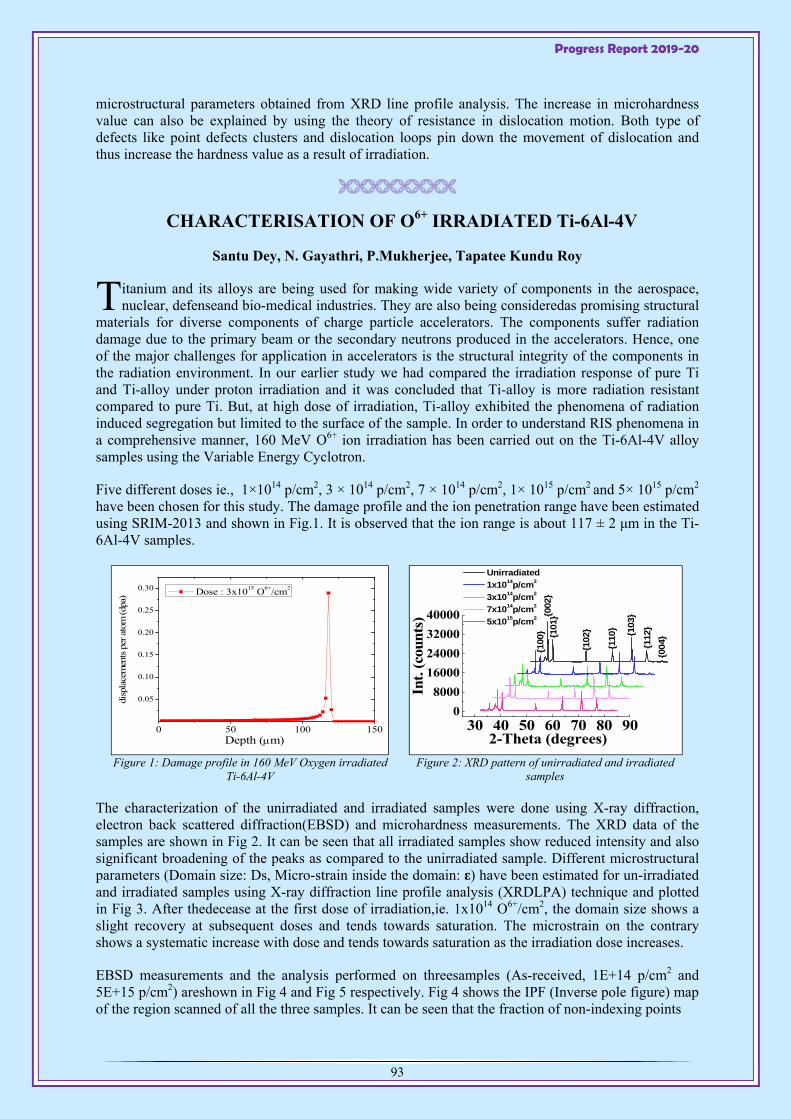
Progress Report 2019-20
93
microstructural parameters obtained from XRD line profile analysis. The increase in microhardness value can also be explained by using the theory of resistance in dislocation motion. Both type of defects like point defects clusters and dislocation loops pin down the movement of dislocation and thus increase the hardness value as a result of irradiation.
CHARACTERISATION OF O6+ IRRADIATED Ti-6Al-4V
Santu Dey, N. Gayathri, P.Mukherjee, Tapatee Kundu Roy
itanium and its alloys are being used for making wide variety of components in the aerospace, nuclear, defenseand bio-medical industries. They are also being consideredas promising structural
materials for diverse components of charge particle accelerators. The components suffer radiation damage due to the primary beam or the secondary neutrons produced in the accelerators. Hence, one of the major challenges for application in accelerators is the structural integrity of the components in the radiation environment. In our earlier study we had compared the irradiation response of pure Ti and Ti-alloy under proton irradiation and it was concluded that Ti-alloy is more radiation resistant compared to pure Ti. But, at high dose of irradiation, Ti-alloy exhibited the phenomena of radiation induced segregation but limited to the surface of the sample. In order to understand RIS phenomena in a comprehensive manner, 160 MeV O6+ ion irradiation has been carried out on the Ti-6Al-4V alloy samples using the Variable Energy Cyclotron.
Five different doses ie., 1×10¹⁴ p/cm2, 3 × 10¹⁴ p/cm2, 7 × 10¹⁴ p/cm2, 1× 10¹⁵ p/cm2 and 5× 10¹⁵ p/cm2 have been chosen for this study. The damage profile and the ion penetration range have been estimated using SRIM-2013 and shown in Fig.1. It is observed that the ion range is about 117 ± 2 μm in the Ti-6Al-4V samples.
Figure 1: Damage profile in 160 MeV Oxygen irradiated Ti-6Al-4V
Figure 2: XRD pattern of unirradiated and irradiated
samples
The characterization of the unirradiated and irradiated samples were done using X-ray diffraction, electron back scattered diffraction(EBSD) and microhardness measurements. The XRD data of the samples are shown in Fig 2. It can be seen that all irradiated samples show reduced intensity and also significant broadening of the peaks as compared to the unirradiated sample. Different microstructural parameters (Domain size: Ds, Micro-strain inside the domain: ε) have been estimated for un-irradiated and irradiated samples using X-ray diffraction line profile analysis (XRDLPA) technique and plotted in Fig 3. After thedecease at the first dose of irradiation,ie. 1x10¹⁴ O6+/cm2, the domain size shows a slight recovery at subsequent doses and tends towards saturation. The microstrain on the contrary shows a systematic increase with dose and tends towards saturation as the irradiation dose increases.
EBSD measurements and the analysis performed on threesamples (As-received, 1E+14 p/cm2 and 5E+15 p/cm2) areshown in Fig 4 and Fig 5 respectively. Fig 4 shows the IPF (Inverse pole figure) map of the region scanned of all the three samples. It can be seen that the fraction of non-indexing points
0 50 100 150
0.05
0.10
0.15
0.20
0.25
0.30
disp
lace
men
ts p
er a
tom
(dp
a)
Depth (m)
Dose : 3x10¹⁵ O6+/cm2
30 40 50 60 70 80 900
8000
16000
24000
32000
40000
004
112
103
110
102
101
002
Unirradiated
1x10¹⁴p/cm2
3x10¹⁴p/cm2
7x10¹⁴p/cm2
5x10¹⁵p/cm2
Int.
(co
unts
)
2-Theta (degrees)
100
T

Progress Report 2019-20
94
Figure 3: Domain Size (Ds) and Micro-strain (ε) as a function of dose.
Figure 4: IPF map of the unirradiated and the irradiated Ti-6Al-4V samples
Figure 5: (a) Misorientation angle distribution (b) Cumulative band contrast and (c) Cumulative pattern misfit
of the unirradiated and irradiated (1E14 p/cm2 and 5E15 p/cm2) of Ti-6Al-4V
(represented by the black colour points in the IPF maps) are increasing with dose indicating formation of more irregular regions with irradiation. However, the analysis of the EBSD data gives a clear indication of the effect of irradiation. Fig 5(a) shows the distribution of the misorientation angle between regions of the EBSD data. It can be seen that the fraction of regions with low misorientation (between 1-2 degree), increases at the first dose of irradiation and but shifts towards higher angles at highest dose of irradiation. The band contrast and the pattern misfit give indication regarding how well the periodicity of the lattice is maintained. If the periodicity of the lattice is disturbed due to the presence of dislocations this is manifested as a change in the band contrast (defined by the sharpness of the Kikuchi bands) and pattern misfit (defined by the small angular deviation of the observed Kikuchi pattern from the generated Kikuchi pattern for a particular orientation).It can be seen from Fig. 5(b) and Fig. 5(c), that at the 1st dose of irradiation studied here, theband contrast shifts towards low contrast values and the pattern misfit shifts towards higher angles indication a loss of the periodicity of the lattice as compared to the unirradiated sample. However, at the highest dose of irradiation, the band contrastshifts towards higher contrast values and the pattern misfit decreases towards lower angles indicating that there is a slight recovery of the initial defects that are created.
550
600
650
700
750
800
Domainsize
Dom
ain
Size
(Ang
s)
0.0 2.0x10¹⁵ 4.0x10¹⁵ 6.0x10150.0
5.0x10⁻⁴
1.0x10⁻³
1.5x10⁻³
Mic
rost
rain
Dose (O6+/cm2)
Microstrain
Unirradiated Dose: 1E+14 Dose: 5E+15
0.00.20.40.6
Unirradiated
0.0
0.20.40.6
Fre
qu
ency Dose: 1E+14
2 4 6 8 10 12 140.00.20.40.6 Dose: 5E+15
Misorientation (Deg.)
0 60 120 180 240 300
0.0
0.2
0.4
0.6
0.8
1.0
Unirradiated Dose:1E+14 Dose: 5E+15
Fre
qu
ency
Band Contrast0.0 0.5 1.0 1.5 2.0 2.5 3.0
0.0
0.2
0.4
0.6
0.8
1.0
Unirradiated Dose:1E+14 Dose: 5E+15
Fre
qu
en
cy
Pattern Misfit (Deg.)
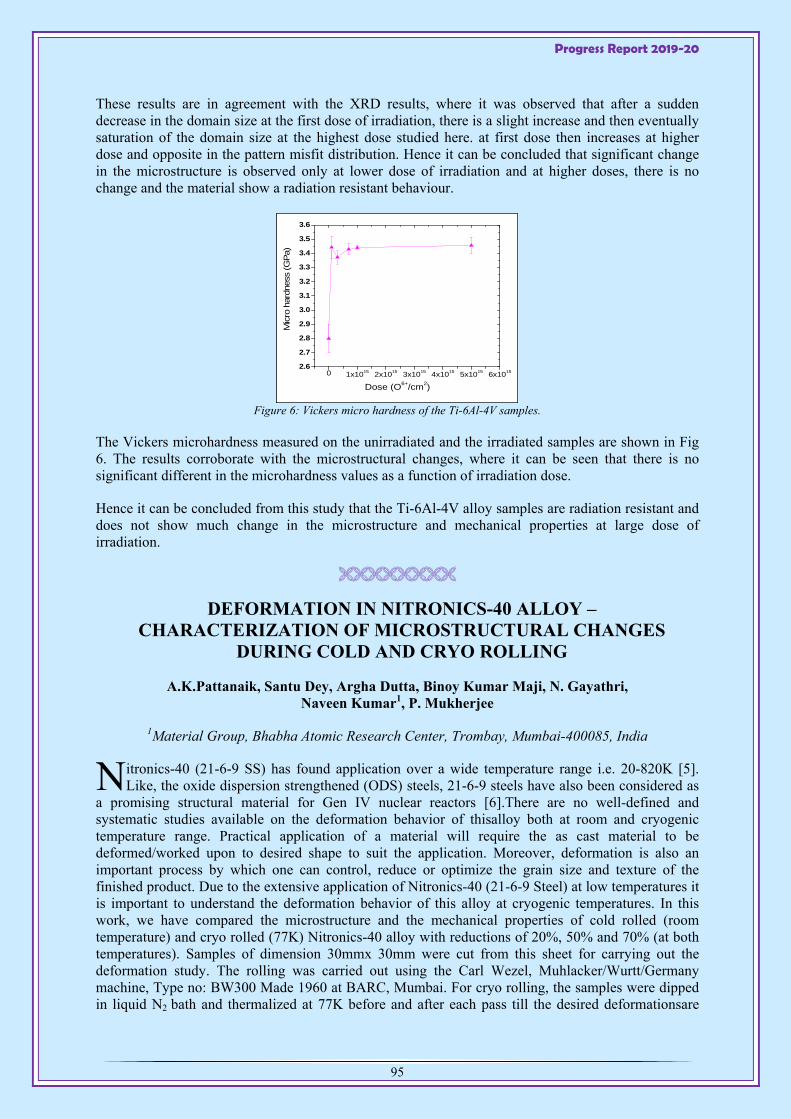
Progress Report 2019-20
95
These results are in agreement with the XRD results, where it was observed that after a sudden decrease in the domain size at the first dose of irradiation, there is a slight increase and then eventually saturation of the domain size at the highest dose studied here. at first dose then increases at higher dose and opposite in the pattern misfit distribution. Hence it can be concluded that significant change in the microstructure is observed only at lower dose of irradiation and at higher doses, there is no change and the material show a radiation resistant behaviour.
Figure 6: Vickers micro hardness of the Ti-6Al-4V samples.
The Vickers microhardness measured on the unirradiated and the irradiated samples are shown in Fig 6. The results corroborate with the microstructural changes, where it can be seen that there is no significant different in the microhardness values as a function of irradiation dose.
Hence it can be concluded from this study that the Ti-6Al-4V alloy samples are radiation resistant and does not show much change in the microstructure and mechanical properties at large dose of irradiation.
DEFORMATION IN NITRONICS-40 ALLOY – CHARACTERIZATION OF MICROSTRUCTURAL CHANGES
DURING COLD AND CRYO ROLLING
A.K.Pattanaik, Santu Dey, Argha Dutta, Binoy Kumar Maji, N. Gayathri, Naveen Kumar1, P. Mukherjee
1Material Group, Bhabha Atomic Research Center, Trombay, Mumbai-400085, India
itronics-40 (21-6-9 SS) has found application over a wide temperature range i.e. 20-820K [5]. Like, the oxide dispersion strengthened (ODS) steels, 21-6-9 steels have also been considered as
a promising structural material for Gen IV nuclear reactors [6].There are no well-defined and systematic studies available on the deformation behavior of thisalloy both at room and cryogenic temperature range. Practical application of a material will require the as cast material to be deformed/worked upon to desired shape to suit the application. Moreover, deformation is also an important process by which one can control, reduce or optimize the grain size and texture of the finished product. Due to the extensive application of Nitronics-40 (21-6-9 Steel) at low temperatures it is important to understand the deformation behavior of this alloy at cryogenic temperatures. In this work, we have compared the microstructure and the mechanical properties of cold rolled (room temperature) and cryo rolled (77K) Nitronics-40 alloy with reductions of 20%, 50% and 70% (at both temperatures). Samples of dimension 30mmx 30mm were cut from this sheet for carrying out the deformation study. The rolling was carried out using the Carl Wezel, Muhlacker/Wurtt/Germany machine, Type no: BW300 Made 1960 at BARC, Mumbai. For cryo rolling, the samples were dipped in liquid N2 bath and thermalized at 77K before and after each pass till the desired deformationsare
0 1x10¹⁵ 2x10¹⁵ 3x10¹⁵ 4x10¹⁵ 5x10¹⁵ 6x10152.6
2.7
2.8
2.9
3.0
3.1
3.2
3.3
3.4
3.5
3.6
Mic
ro h
ardn
ess
(GPa
)
Dose (O6+/cm2)
N
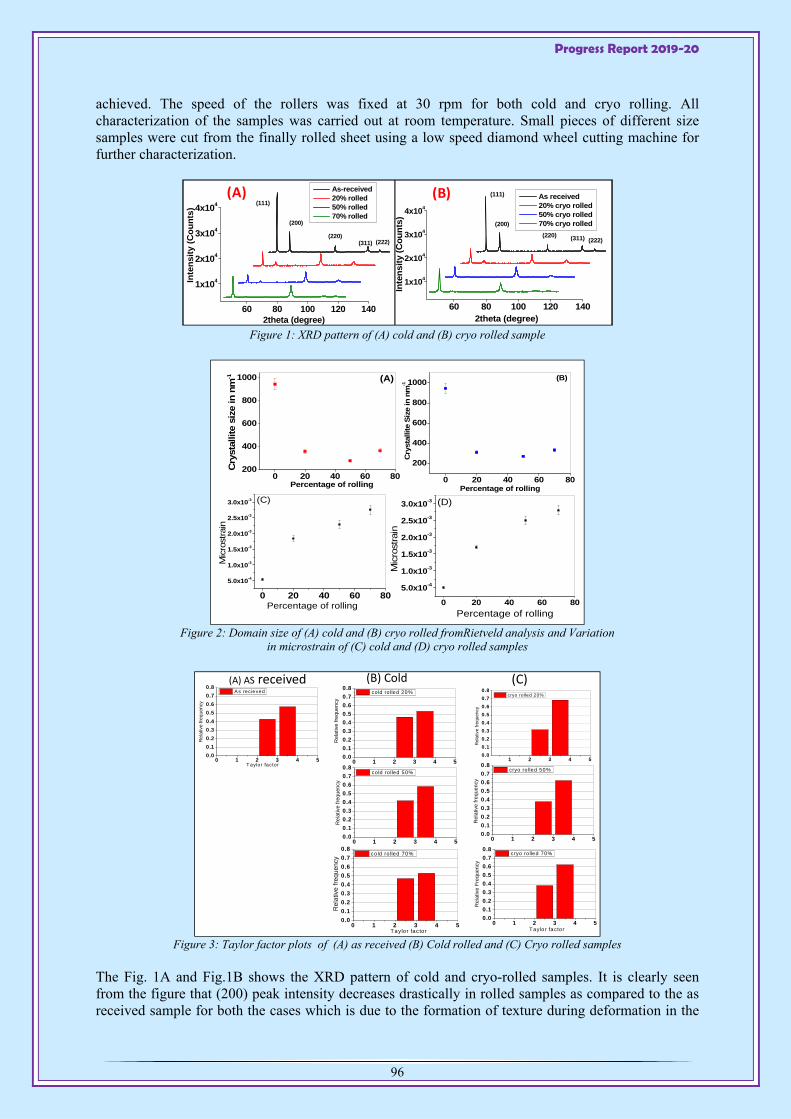
Progress Report 2019-20
96
achieved. The speed of the rollers was fixed at 30 rpm for both cold and cryo rolling. All characterization of the samples was carried out at room temperature. Small pieces of different size samples were cut from the finally rolled sheet using a low speed diamond wheel cutting machine for further characterization.
Figure 1: XRD pattern of (A) cold and (B) cryo rolled sample
Figure 2: Domain size of (A) cold and (B) cryo rolled fromRietveld analysis and Variation
in microstrain of (C) cold and (D) cryo rolled samples
Figure 3: Taylor factor plots of (A) as received (B) Cold rolled and (C) Cryo rolled samples
The Fig. 1A and Fig.1B shows the XRD pattern of cold and cryo-rolled samples. It is clearly seen from the figure that (200) peak intensity decreases drastically in rolled samples as compared to the as received sample for both the cases which is due to the formation of texture during deformation in the
60 80 100 120 140
1x10⁴
2x10⁴
3x10⁴
4x10⁴
(222)(311)(220)
(200)
As-received 20% rolled 50% rolled 70% rolled
Inte
nsi
ty (
Co
un
ts)
2theta (degree)
(111)
60 80 100 120 140
1x10⁴
2x10⁴
3x10⁴
4x10⁴
(222)(311)(220)
(200)
(111) As received 20% cryo rolled 50% cryo rolled 70% cryo rolled
2theta (degree)
Inte
nsit
y (
Co
un
ts)
(A) (B)
0 20 40 60 80
5.0x10⁻⁴
1.0x10⁻³
1.5x10⁻³
2.0x10⁻³
2.5x10⁻³
3.0x10⁻³
Mic
rost
rain
Percentage of rolling
(C)
0 20 40 60 80
5.0x10⁻⁴
1.0x10⁻³
1.5x10⁻³
2.0x10⁻³
2.5x10⁻³
3.0x10⁻³
Mic
rost
rain
Percentage of rolling
(D)
0 20 40 60 80200
400
600
800
1000
Cry
stal
lite s
ize
in n
m-1
Percentage of rolling
(A)
0 20 40 60 80
200
400
600
800
1000
Cry
stal
lite
Siz
e in
nm
-1
Percentage of rolling
(B)
0 1 2 3 4 50.0
0.1
0.2
0.3
0.4
0.5
0.6
0.7
0.8
Rel
ativ
e fre
quen
cy
A s recieved
Taylor factor 0 1 2 3 4 50.0
0.1
0.2
0.3
0.4
0.5
0.6
0.7
0.8
Rel
ativ
e fre
quen
cy
co ld ro lled 20%
0 1 2 3 4 50.0
0.1
0.2
0.3
0.4
0.5
0.6
0.7
0.8
Rel
ativ
e fre
quen
cy
co ld ro lled 50%
0 1 2 3 4 50.0
0.1
0.2
0.3
0.4
0.5
0.6
0.7
0.8
Rel
ativ
e fre
quen
cy
co ld rolled 70%
Taylor factor
1 2 3 4 50.0
0.1
0.2
0.3
0.4
0.5
0.6
0.7
0.8
Rel
ativ
e fre
quen
cy
c ryo rolled 20%
0 1 2 3 4 50.0
0.1
0.2
0.3
0.4
0.5
0.6
0.7
0.8
Rel
ativ
e fre
quen
cy
cryo ro lled 50%
0 1 2 3 4 50.0
0.1
0.2
0.3
0.4
0.5
0.6
0.7
0.8
Rel
ativ
e Fr
eque
ncy
c ryo ro lled 70%
Taylor factor
(A) AS received (B) Cold (C)
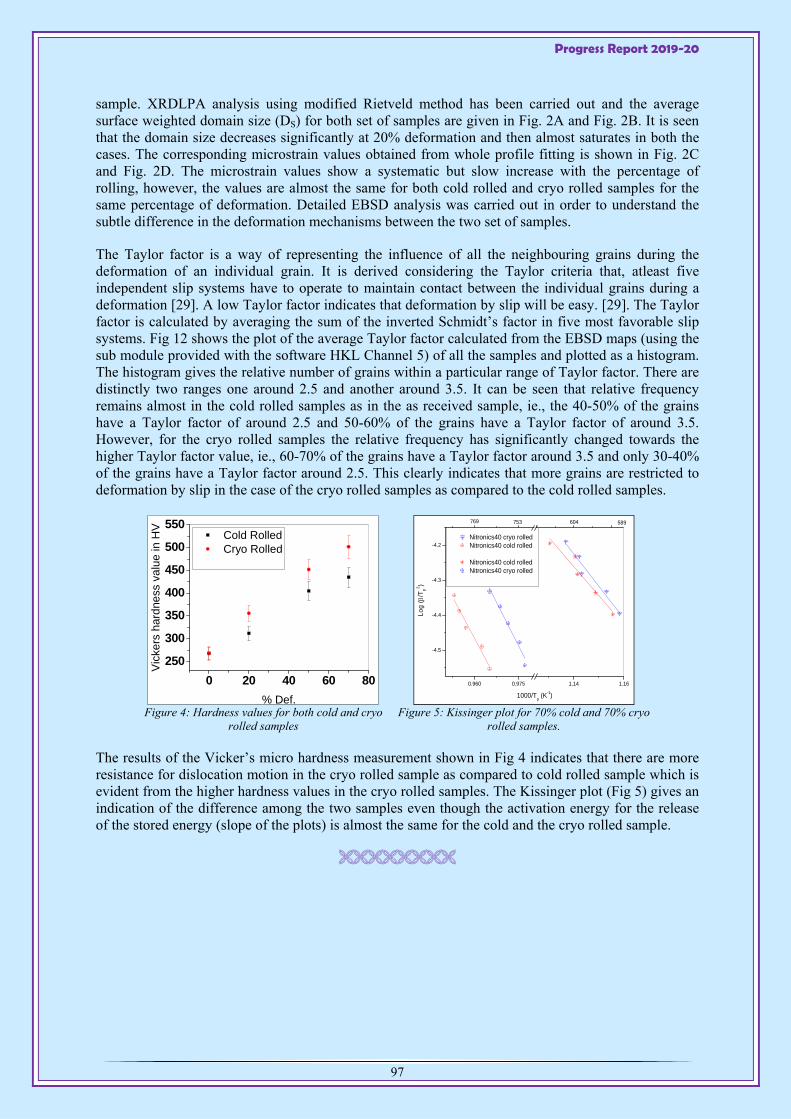
Progress Report 2019-20
97
sample. XRDLPA analysis using modified Rietveld method has been carried out and the average surface weighted domain size (DS) for both set of samples are given in Fig. 2A and Fig. 2B. It is seen that the domain size decreases significantly at 20% deformation and then almost saturates in both the cases. The corresponding microstrain values obtained from whole profile fitting is shown in Fig. 2C and Fig. 2D. The microstrain values show a systematic but slow increase with the percentage of rolling, however, the values are almost the same for both cold rolled and cryo rolled samples for the same percentage of deformation. Detailed EBSD analysis was carried out in order to understand the subtle difference in the deformation mechanisms between the two set of samples.
The Taylor factor is a way of representing the influence of all the neighbouring grains during the deformation of an individual grain. It is derived considering the Taylor criteria that, atleast five independent slip systems have to operate to maintain contact between the individual grains during a deformation [29]. A low Taylor factor indicates that deformation by slip will be easy. [29]. The Taylor factor is calculated by averaging the sum of the inverted Schmidt’s factor in five most favorable slip systems. Fig 12 shows the plot of the average Taylor factor calculated from the EBSD maps (using the sub module provided with the software HKL Channel 5) of all the samples and plotted as a histogram. The histogram gives the relative number of grains within a particular range of Taylor factor. There are distinctly two ranges one around 2.5 and another around 3.5. It can be seen that relative frequency remains almost in the cold rolled samples as in the as received sample, ie., the 40-50% of the grains have a Taylor factor of around 2.5 and 50-60% of the grains have a Taylor factor of around 3.5. However, for the cryo rolled samples the relative frequency has significantly changed towards the higher Taylor factor value, ie., 60-70% of the grains have a Taylor factor around 3.5 and only 30-40% of the grains have a Taylor factor around 2.5. This clearly indicates that more grains are restricted to deformation by slip in the case of the cryo rolled samples as compared to the cold rolled samples.
Figure 4: Hardness values for both cold and cryo
rolled samples
Figure 5: Kissinger plot for 70% cold and 70% cryo
rolled samples.
The results of the Vicker’s micro hardness measurement shown in Fig 4 indicates that there are more resistance for dislocation motion in the cryo rolled sample as compared to cold rolled sample which is evident from the higher hardness values in the cryo rolled samples. The Kissinger plot (Fig 5) gives an indication of the difference among the two samples even though the activation energy for the release of the stored energy (slope of the plots) is almost the same for the cold and the cryo rolled sample.
0 20 40 60 80
250
300
350
400
450
500
550 Cold Rolled Cryo Rolled
Vic
kers
har
dnes
s va
lue
in H
V
% Def.0.960 0.975 1.14 1.16
-4.5
-4.4
-4.3
-4.2Nitronics40 cryo rolledNitronics40 cold rolled
Nitronics40 cold rolledNitronics40 cryo rolled
Log
(/T
p2 )
1000/Tp (K-1)
589604753769

Progress Report 2019-20
98
ELECTROCHEMICAL BEHAVIOUR OF THE MARTENSITIC STAINLESS STEEL WITH BLOOD
Pintu Sen, Nibedita Saha1, Jisnu Basu2 and Gautam Majumdar1
1Department of Mechanical Engineering, Jadavpur University, Kolkata 2SINP, 1/AF Bidhan Nagar, Kolkata
artensitic stainless steels have some unique material properties due to which they are considered as asuitable candidate for the manufacturing of the medical instruments. As the amount of Ni is
negligible incommon commercial martensitic stainless steel, the corrosion resistivity especially in contact with bloodis less than austenitic stainless steel. In order to get rid of this problem, martensitic stainless steel hasgone under several modifications with respect to its composition. In the presentwork, three grades of martensiticstainless steel namely AISI 420, Custom 630 and Custom 455have been considered to study their electrochemicalbehavior in presence of the artificial blood plasma. In the linear potentiodynamic polarization experiment, it is observed thatthe Custom 455 has the lowest cathodic potential value (Ecorr = -0.364 V), but in long run, the Custom 630 seems to be considered as a promising material for manufacturing the medical instruments, as the break downpotential responsible for pitting corrosion in blood, is quite high for the Custom 630 (Eb = 0.275 V).An attempt has also been made to correlate the corrosion resistivitywith their magnetic properties. Magnetic measurements reveal that the saturation magnetic moment of the Custom 630 (~145 emu/g) is lower as compared to that of the AISI 420 (~200 emu/g), which supports the presence of lower fraction of martensite phase making it less vulnerable to corrosion.
Figure 1: Potentiodynamic polarization curves obtained after 24 h
immersion at opencircuit voltage.
HIERARCHICAL DESIGNED rGO-PEDOT- -MnO2 NANOCOMPOSITE FOR SUPERCAPACITORS
Pintu Sen and Amithabha De1
1Retired from SINP, 1/AF Bidhan Nagar, Kolkata
hierarchical strategy has been adopted for the development of the ternary composites, where a nanostructured -MnO2 has been fabricated sonochemically on a unique mesoporous binary
composite made of 3,4-ethylenedioxythiophene (EDOT)and reduced graphene oxide (rGO)(Fig.1) in order to achieve maximum loading of 89% Mn4+ oxidation state (Fig.2) essential for high capacitance value.
M
A
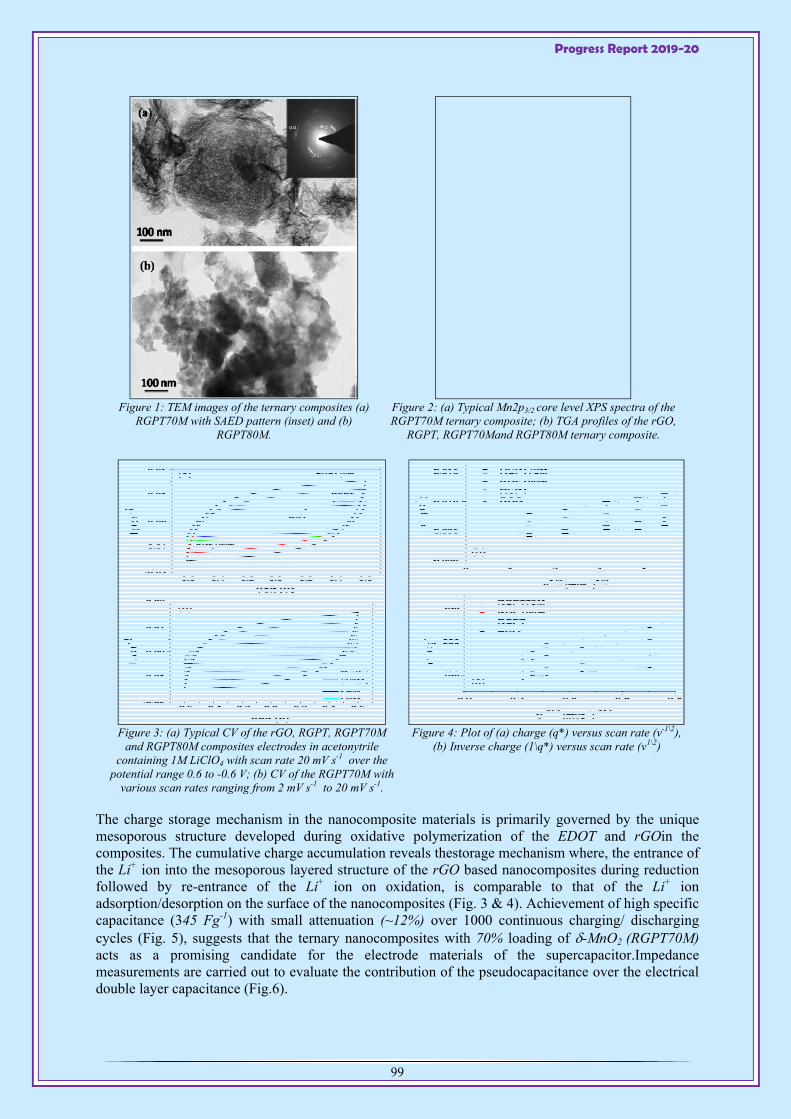
Progress Report 2019-20
99
Figure 1: TEM images of the ternary composites (a)
RGPT70M with SAED pattern (inset) and (b) RGPT80M.
Figure 2: (a) Typical Mn2p3/2 core level XPS spectra of the RGPT70M ternary composite; (b) TGA profiles of the rGO,
RGPT, RGPT70Mand RGPT80M ternary composite.
Figure 3: (a) Typical CV of the rGO, RGPT, RGPT70M
and RGPT80M composites electrodes in acetonytrile containing 1M LiClO4 with scan rate 20 mV s-1 over the
potential range 0.6 to -0.6 V; (b) CV of the RGPT70M with various scan rates ranging from 2 mV s-1 to 20 mV s-1.
Figure 4: Plot of (a) charge (q*) versus scan rate (v-1\2), (b) Inverse charge (1\q*) versus scan rate (v1\2)
The charge storage mechanism in the nanocomposite materials is primarily governed by the unique mesoporous structure developed during oxidative polymerization of the EDOT and rGOin the composites. The cumulative charge accumulation reveals thestorage mechanism where, the entrance of the Li+ ion into the mesoporous layered structure of the rGO based nanocomposites during reduction followed by re-entrance of the Li+ ion on oxidation, is comparable to that of the Li+ ion adsorption/desorption on the surface of the nanocomposites (Fig. 3 & 4). Achievement of high specific capacitance (345 Fg-1) with small attenuation (~12%) over 1000 continuous charging/ discharging cycles (Fig. 5), suggests that the ternary nanocomposites with 70% loading of -MnO2 (RGPT70M) acts as a promising candidate for the electrode materials of the supercapacitor.Impedance measurements are carried out to evaluate the contribution of the pseudocapacitance over the electrical double layer capacitance (Fig.6).

Progress Report 2019-20
100
Figure 5: (a) GCD over the potential range 0.6 to - 0.6 V of the rGO, RGPT, RGPT70M and RGPT80M electrodes with current densityof ± 1 mA cm-2 (b) Typical GCD of
the RGPT70M electrode with different current density (± 0.5 mA cm-2 to ± 10 mA cm_2).
Figure 6: Typical Nyquist plot of (a) rGO, (b) RGPT, (c)
RGPT70M and (d) RGPT80M electrode from 100 kHz to 10 mHz. The inset presents the Randles circuit
MAGNETO STRUCTURAL TRANSITION AND LARGE MAGNETOCALORIC EFFECT IN (Mn0.6Fe0.4) NiSi1-xAlx(x = 0.06 - 0.08)
INTER ALLOY SYSTEM
Pintu Sen, Subrata Ghosh1 and Kalyan Mandal1
1S.N. Bose Centre for Basic science, Kolkata
t is a critical task to couple both the magnetic and structural transition(MST)in order to achieve a large magnetocaloric effect in the inter metallic alloy system. At the present studies, tuning of
magneto structural transition and their magnetocaloric properties across their phase transition, have
Figure 1: XRD patterns of (Mn0.6Fe0.4) NiSi1-
xAlx(x = 0.06 to 0.08) alloys at 300 K and temperature dependent XRD patterns for the
alloy with x = 0.07.
Figure 2: (a) M-T curves for (Mn0.6Fe0.4) NiSi1-xAlx(x = 0.06 to 0.08) alloys in presence of 500 Oe magnetic field (b) M-T
curve for the alloy x = 0.07 under 500 Oe and 50 kOe magnetic field at a temperature interval of 1 K.
I
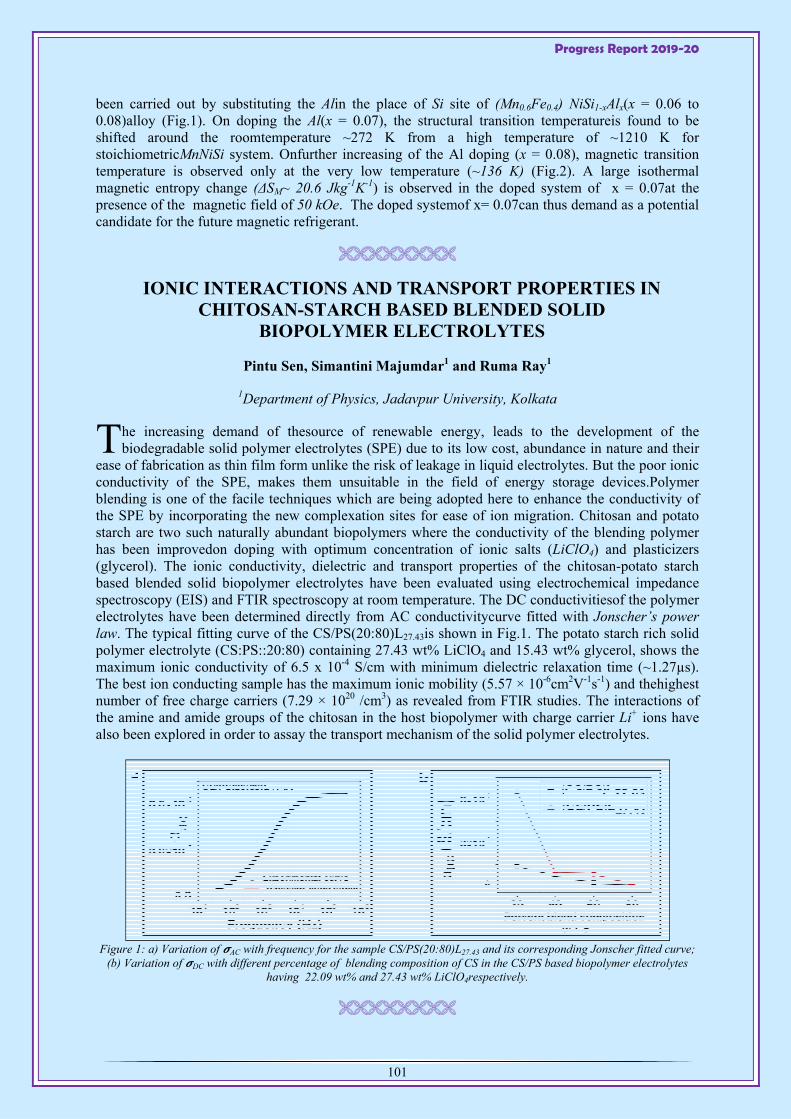
Progress Report 2019-20
101
been carried out by substituting the Alin the place of Si site of (Mn0.6Fe0.4) NiSi1-xAlx(x = 0.06 to 0.08)alloy (Fig.1). On doping the Al(x = 0.07), the structural transition temperatureis found to be shifted around the roomtemperature ~272 K from a high temperature of ~1210 K for stoichiometricMnNiSi system. Onfurther increasing of the Al doping (x = 0.08), magnetic transition temperature is observed only at the very low temperature (~136 K) (Fig.2). A large isothermal magnetic entropy change (ΔSM~ 20.6 Jkg-1K-1) is observed in the doped system of x = 0.07at the presence of the magnetic field of 50 kOe. The doped systemof x= 0.07can thus demand as a potential candidate for the future magnetic refrigerant.
IONIC INTERACTIONS AND TRANSPORT PROPERTIES IN CHITOSAN-STARCH BASED BLENDED SOLID
BIOPOLYMER ELECTROLYTES
Pintu Sen, Simantini Majumdar1 and Ruma Ray1
1Department of Physics, Jadavpur University, Kolkata
he increasing demand of thesource of renewable energy, leads to the development of the biodegradable solid polymer electrolytes (SPE) due to its low cost, abundance in nature and their
ease of fabrication as thin film form unlike the risk of leakage in liquid electrolytes. But the poor ionic conductivity of the SPE, makes them unsuitable in the field of energy storage devices.Polymer blending is one of the facile techniques which are being adopted here to enhance the conductivity of the SPE by incorporating the new complexation sites for ease of ion migration. Chitosan and potato starch are two such naturally abundant biopolymers where the conductivity of the blending polymer has been improvedon doping with optimum concentration of ionic salts (LiClO4) and plasticizers (glycerol). The ionic conductivity, dielectric and transport properties of the chitosan-potato starch based blended solid biopolymer electrolytes have been evaluated using electrochemical impedance spectroscopy (EIS) and FTIR spectroscopy at room temperature. The DC conductivitiesof the polymer electrolytes have been determined directly from AC conductivitycurve fitted with Jonscher’s power law. The typical fitting curve of the CS/PS(20:80)L27.43is shown in Fig.1. The potato starch rich solid polymer electrolyte (CS:PS::20:80) containing 27.43 wt% LiClO4 and 15.43 wt% glycerol, shows the maximum ionic conductivity of 6.5 x 10⁻⁴ S/cm with minimum dielectric relaxation time (~1.27µs). The best ion conducting sample has the maximum ionic mobility (5.57 × 10⁻⁶cm2V-1s-1) and thehighest number of free charge carriers (7.29 × 10²⁰ /cm3) as revealed from FTIR studies. The interactions of the amine and amide groups of the chitosan in the host biopolymer with charge carrier Li+ ions have also been explored in order to assay the transport mechanism of the solid polymer electrolytes.
Figure 1: a) Variation of AC with frequency for the sample CS/PS(20:80)L27.43 and its corresponding Jonscher fitted curve;
(b) Variation of DC with different percentage of blending composition of CS in the CS/PS based biopolymer electrolytes having 22.09 wt% and 27.43 wt% LiClO4respectively.
T

Progress Report 2019-20
102
1.6 Health Physics
ACTIVITIES OF HEALTH PHYSICS UNIT, KOLKATA
he Health Physics Unit of VECC is a part of Health Physics Division, BARC, Mumbai. It is providing radiological safety coverage during operation and maintenance of the cyclotrons. No
accidental radiation exposure was reported during the calendar year 2019-20. In addition, following are the activities of this Unit in 2019-20.
1. Analysis and Certification of export and import items: Several countries have imposed statutory requirements for the analysis of the radioactivity content (mainly Cs-137) in food and other items exported to those countries after Chernobyl Nuclear disaster. The imported milk and milk powder in India has to be tested for its radioactivity content. The permissible level in most of the food products has been set as 50 Bq/kg.
In India, three DAE laboratories, one each in Kolkata, Chennai and Mumbai have been authorized in India to carry out analysis and issue certificates to importers and exporters. Analysis of radioactivity content and certification of radioactivity in food and other consumable materials are being carried out at Health Physics Unit, VECC. This is a revenue earning activity.
A total of 479 samples have been analysed and the total revenue earning were Rs. 47,90,000 (Rupees forty seven lakh ninety thousand only) from April,2019 to March 31, 2020. Figures 1 and 2 show respectively, the number of samples analysed and revenue earned in each month during 2019-20.
Figure 1: Monthly breakup of samples in 2019-20
Figure 2: Revenue earned in 2019-20
2. Radiation Protection Training In accordance with the guidelines of AERB, radiation protection training (general and pertaining to VECC specifically) has been given in the form of lectures followed by tests for regular employees ( new entrants) and for other persons (including trainees, students etc.). Personnel monitoring devices have been issued to those who qualified in such tests. FOR CAT-I and CAT-II trainees’ Radiation Safety Training followed by evaluation was done.
3. Emergency Response Centre Radiation Emergency Response Centre, VECC is a designated unit by Crisis Management Group of DAE to handle Radiation Emergency in and around Kolkata. The unit is equipped with emergency
T
Progress Report 2019-20
103
handling kits & instruments. Director, VECC is the authority to take necessary measures. The unit is in operation with a standard operating procedure (SOP). This unit also involves in training first responders of radiation emergency of different government agencies.
DAE-ERC, Kolkata (at VECC) is one among the twenty four DAE Emergency Response Centre established in INDIA. In the National level Hypothetical Radiation Emergency and Communication Exercise organized by DAE-RERC & CMG, Mumbai during 6-13 December, 2019, DAE-ERC, Kolkata got RANK-1 among 24 DAE-ERCs.
ERC,Kolkata team has given a lecture cum practical Demo on “Detection and Recovery of Orphan Radioactive Sources” at Kolkata port trust on 20th Nov.2019 at Basic Training Course on CBRN Emergency Management for Sea Port Emergency handlers (SPEH)(Conducted by IPA,NDRF,INMAS and DRDO).
4. Campus & Environmental Survey Radiation survey has been carried out at 12 locations within the VECC compound once in every week. Air sampling analysis (daily), discharge sewerage water analyses have been carried out (once a week). Radiation survey at 26 locations up to a distance of 5KM from the VECC site has been conducted once monthly.
5. Radiation Safety Analysis for K-130, K-500 and Medical Cyclotron facilities: Radiation safety aspects, shielding & ventilation adequacy estimations, dose estimations, estimation of induce activity and other related safety analysis have been carried out time to time for K-130 & K-500 cyclotrons and the DAE Medical cyclotron facilities. HPU,VECC contributed in terms of RPP recommendations and ensuring the safety features at MCF which helped in getting AERB Clearances.
6. Extending Support: In Cryogenic section and RIB, to check the newly-welded pipes Radiography work has been outsourced;Ir-192 source(3.2Ci) was used for the purpose. Necessary cordoning and evacuation were done during the work so that radiation level outside the cordoning was kept below 1µSv/h.
Relative calibration check of Capintec Dose Calibrator (Model CRC-55tR) of RRMC, Kolkata and MCF, Kolkata have been carried out.
Radiation Survey Meter (MR 4515,S No. 218,ECIL make) belonging to Electronics Regional Test Laboratory, Kolkata and Radiation Survey Meter (RDS-31 S/R;SI. NO.2400591, MIRION make ) belonging to SINP, Kolkata were tested for functionality and calibration on request sent through Director, VECC and necessary reports were issued.
Two Lectures have been delivered on invitation at Bidhan Chandra Krishi Vishwavidyalaya, Kalyani on radiation protection aspects.
HEAVY ION INDUCED REACTIONS ON KCl TARGET: A NEW PRODUCTION ROUTE FOR 52Mn
Kousiki Ghosh1,2, Dibyasree Choudhury3, Susanta Lahiri3,2, R Ravishankar1,2
1Health Physics Division, Bhabha Atomic Research Centre, Trombay, Mumbai-400085, India 2Homi Bhabha National Institute, India
3Saha Institute of Nuclear Physics, 1/AF, Bidhan Nagar, Kolkata-700064
he 52Mn (T1/2=5.591 d) is an important radiotracer having applications in nuclear medicine [1, 2]. Heavy ion has been first time used to produce 52Mn via natK (16O,2pxn)52Mn. Along with 52Mn
some other radiotracers 48V, 48,49,51Cr and 43,44,44mSc were also produced which can be evaporation T

Progress Report 2019-20
104
residues produced from both cationic and anionic part. Metallic K cannot be used as target as it is highly active and may easily get oxidised. Hence KCl has been chosen as target. Theoretical code PACE4 has been used to compare experimental and theoretical results.
Description of work Four KCl targets were irradiated by conventional stacked foil technique with 16O beam from 45-73 MeV at Bhabha Atomic Research Centre -Tata Institute of Fundamental Research (BARC-TIFR) pelletron facility at Mumbai, India.Post irradiation, targets were cooled for 1.5 h to decay out all short-lived radionuclides. Radioisotopes were identified by gamma spectrometry. The fusion-evaporation code PACE4 was used to calculate the excitation function of residues expected to be produced in 16O-induced reactions on a KCl target.
Results and Discussion The non-destructive gamma spectra revealed the formation of 48,49,51Cr, 48V, 44,44mSc and 52Mn radioisotopes from KCl target. Irradiation details cross section and yield are mentioned in table 1.
Table 1: Irradiation details, cross section and yield of 52Mn Target Incident
energy (MeV)
Exit energy (MeV)
Projectile energy at mass
center, MeV
Irradiation time (h)
Integrated charge (µC)
Yield (kBq) Cross section (mb)
KCl (1) 45.0 27.0 36.0 5.58 1482 504±22 74.47±8 KCl (2) 52.5 36.0 44.0 6 2165 781±28 96.16±9 KCl (3) 66.5 52.0 59.0 5.58 1482 441±21 65.09±8 KCl (4) 73.0 59.0 66.0 6 2165 167±13 2.07±1.4
Conclusion A new production route for 52Mn using heavy ion on chloride target has been developed. Experimental cross sections were compared with results obtained from theoretical codes.
Reference [1] S. A Graves et al., Bioconjugatechem, 26-10(2015), 2118-2124. [2] W. Schima et al., Am J Roentgenol, 179-3(2002), 717-724.
COMPARISON OF EXPERIMENTAL AND FLUKA SIMULATED GAMMA SPECTRA FOR SHIELDED NaI(Tl) DETECTOR
Varshitha K.S., R. Ravishankar Health Physics Unit, VECC, Health Physics Division, BARC
or the estimation of low level radioactivity due to the presence of natural radio-nuclides, it requires an established gamma – spectrometric system with low background setup. We have considered a
5 × 4 NaI(Tl) crystal interfaced with suitable Photomultiplier Tube(PMT) and associated electronics setup. The detector is covered with a thick Iron shielding enclosure to reduce background.
Method: In this work, the response of the detector system was simulated using Monte Carlo simulation code FLUKA [1,2]. The detector system is modelled in FLUKA considering the actual dimensions of the detector system. Energy deposited in the NaI(Tl) crystal is estimated by the DETECT card. Statistical fluctuations, variations in charge collection efficiency and electronic noise which cause the broadening of the photo peak cannot be represented by the Monte Carlo technique. Therefore, to compare with the experimental data, Gaussian smearing of the output spectrum from FLUKA is carried out taking resolution of the detector into consideration. Gamma spectrum obtained experimentally with the setup using Cs-137 and Co-60 sources was compared with the simulation results for identical source conditions.
F
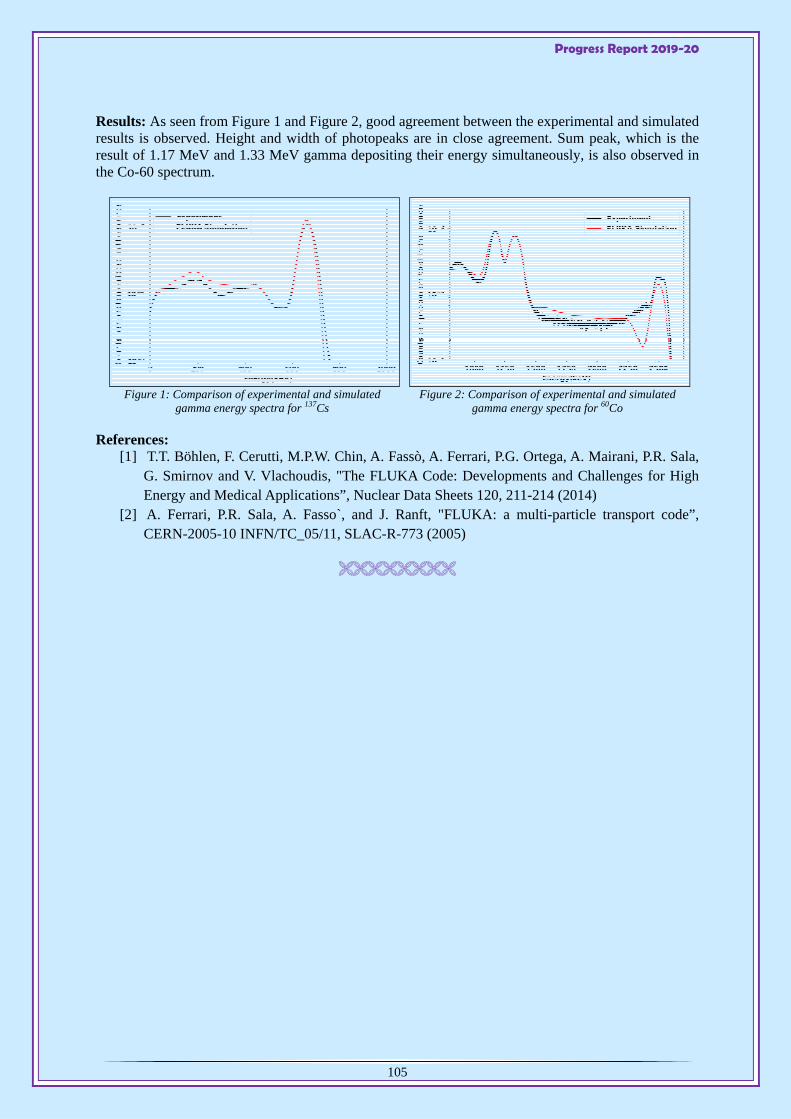
Progress Report 2019-20
105
Results: As seen from Figure 1 and Figure 2, good agreement between the experimental and simulated results is observed. Height and width of photopeaks are in close agreement. Sum peak, which is the result of 1.17 MeV and 1.33 MeV gamma depositing their energy simultaneously, is also observed in the Co-60 spectrum.
Figure 1: Comparison of experimental and simulated gamma energy spectra for 137Cs
Figure 2: Comparison of experimental and simulated gamma energy spectra for 60Co
References: [1] T.T. Böhlen, F. Cerutti, M.P.W. Chin, A. Fassò, A. Ferrari, P.G. Ortega, A. Mairani, P.R. Sala,
G. Smirnov and V. Vlachoudis, "The FLUKA Code: Developments and Challenges for High Energy and Medical Applications”, Nuclear Data Sheets 120, 211-214 (2014)
[2] A. Ferrari, P.R. Sala, A. Fasso`, and J. Ranft, "FLUKA: a multi-particle transport code”, CERN-2005-10 INFN/TC_05/11, SLAC-R-773 (2005)

CYCLOTRON
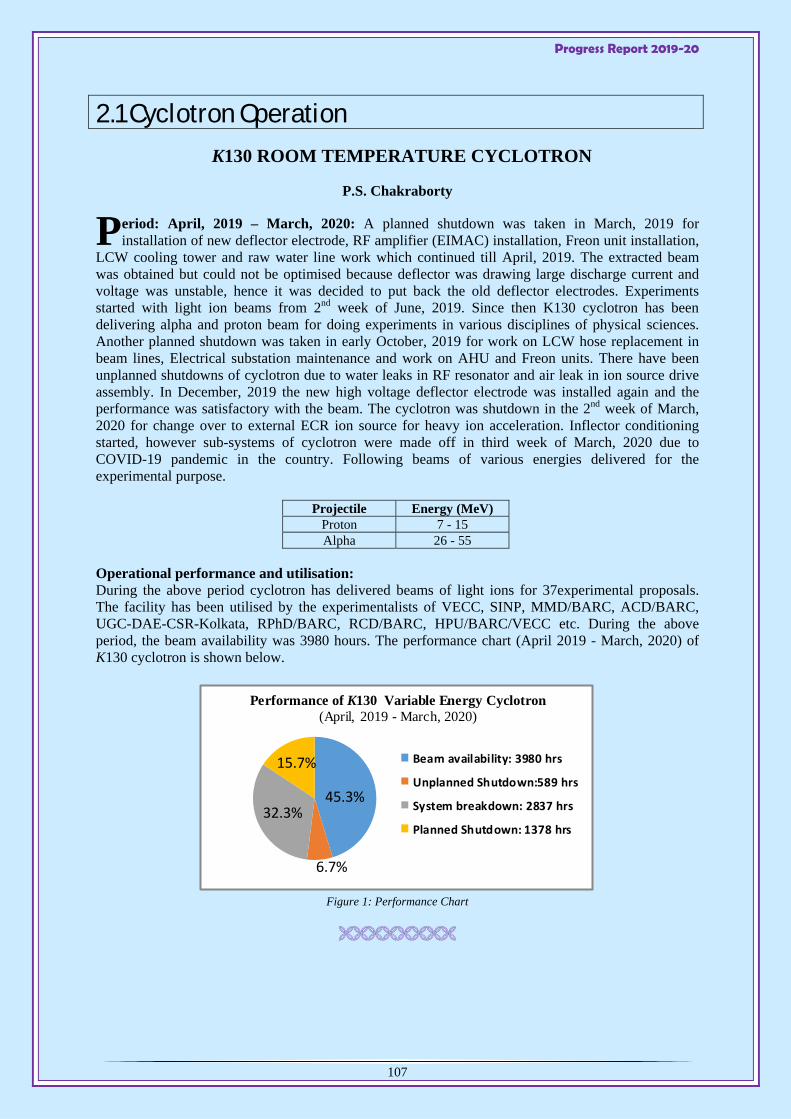
Progress Report 2019-20
107
2.1 Cyclotron Operation
K130 ROOM TEMPERATURE CYCLOTRON
P.S. Chakraborty
eriod: April, 2019 – March, 2020: A planned shutdown was taken in March, 2019 for installation of new deflector electrode, RF amplifier (EIMAC) installation, Freon unit installation,
LCW cooling tower and raw water line work which continued till April, 2019. The extracted beam was obtained but could not be optimised because deflector was drawing large discharge current and voltage was unstable, hence it was decided to put back the old deflector electrodes. Experiments started with light ion beams from 2nd week of June, 2019. Since then K130 cyclotron has been delivering alpha and proton beam for doing experiments in various disciplines of physical sciences. Another planned shutdown was taken in early October, 2019 for work on LCW hose replacement in beam lines, Electrical substation maintenance and work on AHU and Freon units. There have been unplanned shutdowns of cyclotron due to water leaks in RF resonator and air leak in ion source drive assembly. In December, 2019 the new high voltage deflector electrode was installed again and the performance was satisfactory with the beam. The cyclotron was shutdown in the 2nd week of March, 2020 for change over to external ECR ion source for heavy ion acceleration. Inflector conditioning started, however sub-systems of cyclotron were made off in third week of March, 2020 due to COVID-19 pandemic in the country. Following beams of various energies delivered for the experimental purpose.
Projectile Energy (MeV) Proton 7 - 15 Alpha 26 - 55
Operational performance and utilisation: During the above period cyclotron has delivered beams of light ions for 37experimental proposals. The facility has been utilised by the experimentalists of VECC, SINP, MMD/BARC, ACD/BARC, UGC-DAE-CSR-Kolkata, RPhD/BARC, RCD/BARC, HPU/BARC/VECC etc. During the above period, the beam availability was 3980 hours. The performance chart (April 2019 - March, 2020) of K130 cyclotron is shown below.
Figure 1: Performance Chart
45.3%32.3%
15.7%
6.7%
Performance of K130 Variable Energy Cyclotron(April, 2019 - March, 2020)
Beam availability: 3980 hrs
Unplanned Shutdown:589 hrs
System breakdown: 2837 hrs
Planned Shutdown: 1378 hrs
P
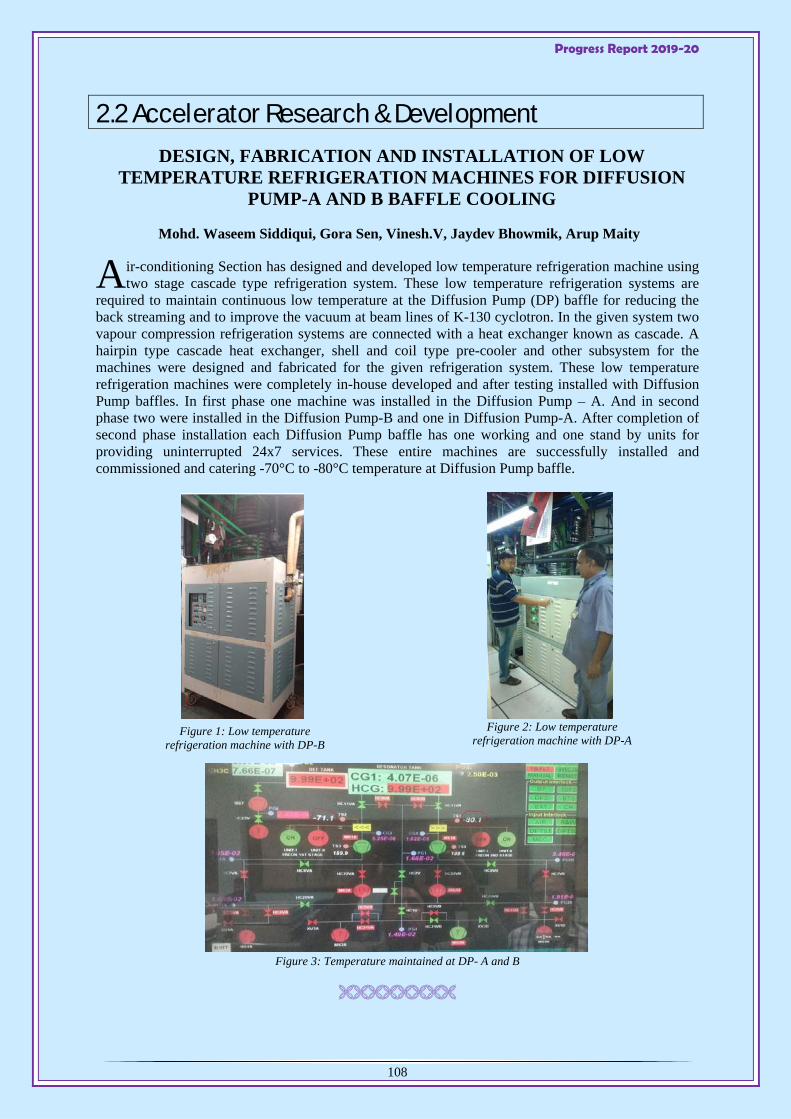
Progress Report 2019-20
108
2.2 Accelerator Research & Development
DESIGN, FABRICATION AND INSTALLATION OF LOW TEMPERATURE REFRIGERATION MACHINES FOR DIFFUSION
PUMP-A AND B BAFFLE COOLING
Mohd. Waseem Siddiqui, Gora Sen, Vinesh.V, Jaydev Bhowmik, Arup Maity
ir-conditioning Section has designed and developed low temperature refrigeration machine using two stage cascade type refrigeration system. These low temperature refrigeration systems are
required to maintain continuous low temperature at the Diffusion Pump (DP) baffle for reducing the back streaming and to improve the vacuum at beam lines of K-130 cyclotron. In the given system two vapour compression refrigeration systems are connected with a heat exchanger known as cascade. A hairpin type cascade heat exchanger, shell and coil type pre-cooler and other subsystem for the machines were designed and fabricated for the given refrigeration system. These low temperature refrigeration machines were completely in-house developed and after testing installed with Diffusion Pump baffles. In first phase one machine was installed in the Diffusion Pump – A. And in second phase two were installed in the Diffusion Pump-B and one in Diffusion Pump-A. After completion of second phase installation each Diffusion Pump baffle has one working and one stand by units for providing uninterrupted 24x7 services. These entire machines are successfully installed and commissioned and catering -70°C to -80°C temperature at Diffusion Pump baffle.
Figure 3: Temperature maintained at DP- A and B
A
Figure 1: Low temperature refrigeration machine with DP-B
Figure 2: Low temperature refrigeration machine with DP-A
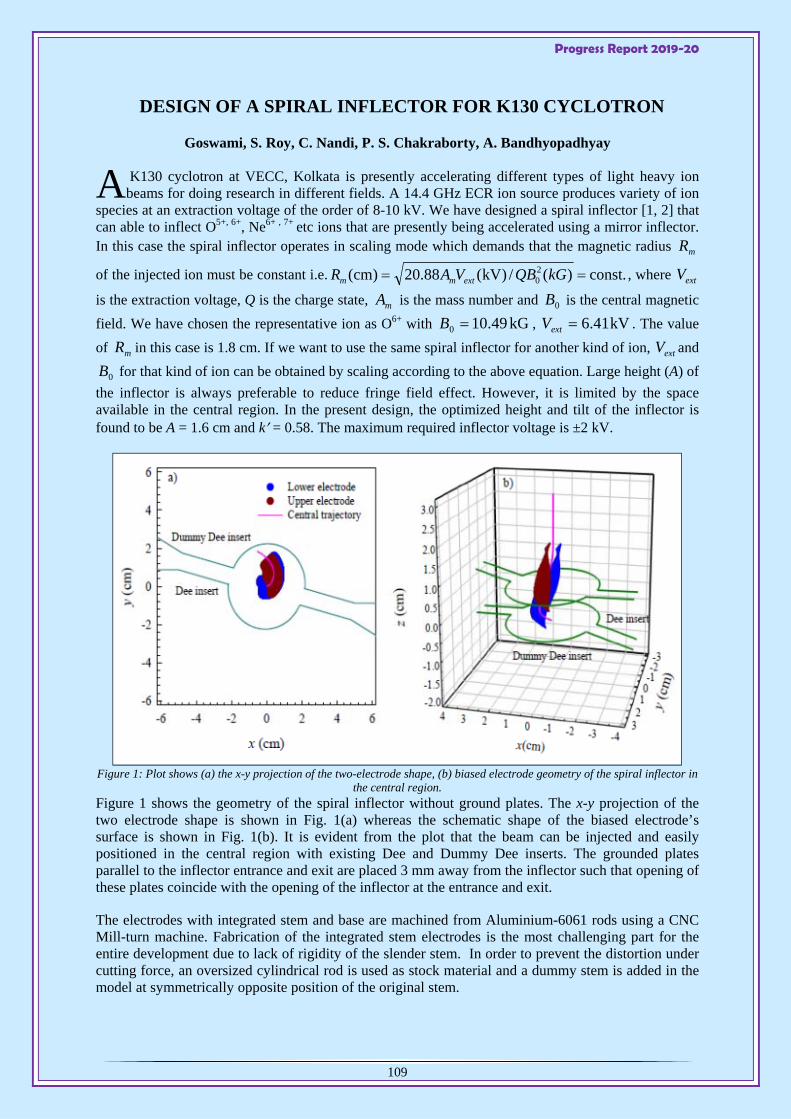
Progress Report 2019-20
109
DESIGN OF A SPIRAL INFLECTOR FOR K130 CYCLOTRON
Goswami, S. Roy, C. Nandi, P. S. Chakraborty, A. Bandhyopadhyay
K130 cyclotron at VECC, Kolkata is presently accelerating different types of light heavy ion beams for doing research in different fields. A 14.4 GHz ECR ion source produces variety of ion
species at an extraction voltage of the order of 8-10 kV. We have designed a spiral inflector [1, 2] that can able to inflect O5+, 6+, Ne6+ , 7+ etc ions that are presently being accelerated using a mirror inflector. In this case the spiral inflector operates in scaling mode which demands that the magnetic radius mR
of the injected ion must be constant i.e. .const)(/)kV(88.20)cm( 20 kGQBVAR extmm , where extV
is the extraction voltage, Q is the charge state, mA is the mass number and 0B is the central magnetic
field. We have chosen the representative ion as O6+ with kG49.100 B , kV41.6extV . The value
of mR in this case is 1.8 cm. If we want to use the same spiral inflector for another kind of ion, extV and
0B for that kind of ion can be obtained by scaling according to the above equation. Large height (A) of
the inflector is always preferable to reduce fringe field effect. However, it is limited by the space available in the central region. In the present design, the optimized height and tilt of the inflector is found to be A = 1.6 cm and k = 0.58. The maximum required inflector voltage is ±2 kV.
Figure 1: Plot shows (a) the x-y projection of the two-electrode shape, (b) biased electrode geometry of the spiral inflector in
the central region. Figure 1 shows the geometry of the spiral inflector without ground plates. The x-y projection of the two electrode shape is shown in Fig. 1(a) whereas the schematic shape of the biased electrode’s surface is shown in Fig. 1(b). It is evident from the plot that the beam can be injected and easily positioned in the central region with existing Dee and Dummy Dee inserts. The grounded plates parallel to the inflector entrance and exit are placed 3 mm away from the inflector such that opening of these plates coincide with the opening of the inflector at the entrance and exit.
The electrodes with integrated stem and base are machined from Aluminium-6061 rods using a CNC Mill-turn machine. Fabrication of the integrated stem electrodes is the most challenging part for the entire development due to lack of rigidity of the slender stem. In order to prevent the distortion under cutting force, an oversized cylindrical rod is used as stock material and a dummy stem is added in the model at symmetrically opposite position of the original stem.
A

Progress Report 2019-20
110
Figure 2: Spiral inflector assembly developed at VECC
The dummy stem is useful to minimize the distortion to a great extent and removed at the final stage of machining. The complicated 3D contoured spiral helical surface of the electrodes is machined with ball end milling cutter using a rotary drive as the 4th axis to impart The surface roughness of the functional surfaces of the electrodes is measured between 0.35µm to 0.6µm. The insulator base is made of macor and RF housing is made of ETP copper. RF housing is fabricated in three parts which are brazed together using a fixture. The spiral inflector assembly, shown in Fig. 2 is tested for vacuum leak test and high voltage. Global vacuum leak rate is found below 1x10⁻⁹mbar-l/sec and electrodes withstood upto 8.5kV potential difference without any breakdown when tested within a vacuum of 1.6x10⁻⁶ mbar.
References: [1] A Goswami, et. al. Nucl. Instrum.Methods A 693, 276 (2012). [2] A Goswami, et. al. Pramana – J. Phys. 93:15 (2019).

COMPUTER AND INFORMATICS

Progress Report 2019-20
112
DESIGN AND DEVELOPMENT OF DIGITAL RF POWER METER
Niraj Chaddha, Hemendra Kumar Pandey, Anindya Roy, Sarbajit Pal, Arup Bandopadhyay
digital RF power meter is developed in-house to meet requirement of RIB project. The meter is designed to monitor RF power over a wide dynamic range (1kW to 20kW) and over a wideband
(30-120 MHz). The meter comprises of a Dual Directional Coupler (DDC) and a dual channel digital RF power meter.
The Dual Directional Coupler (DDC) is designed using CST and it is fabricated using in-house facility. The DDC can be used over a frequency range of 30-115MHz. The sectional view of the DDC is shown in Figure 1.
Figure 1: The schematic of the DDC Direction coupler is measured using vector network analyzer for forward and reverse coupling with isolation. The forward coupling S31 and directivity S32 with rotation for different position of coupler from centre of the coaxial line are shown in Figure 2. The forward coupling and reflected coupling of the DDC are measured as 62.95 dB and 62.70 dB respectively with an isolation of 28 dB for the position of the coupler at 45 and around 54.7 mm from the centre of coaxial line. The developed DDC is tested along with RF Power meter after installation in RF line with amplifier at RIB facility, shown in Figure 3.
Figure 2: The plot of forward coupling S31 and directivity S32 with
rotation for different position of coupler from centre of the coaxial line.
Figure 3: The DDC installed in RF line with
amplifier at RIB facility.
The dual channel Digital RF Power Meter, shown in Figure 4, is designed and developed in-house for the measurement of forward and reflected power simultaneously. A RF power sensing chip with a dynamic range of 47 dB to measure RF power with input frequency range from dc to 6 GHz is selected to meet the power and frequency requirement of the instrument. The sensor output signal corresponding to RMS voltage of input RF is used for power measurement after calibration. A special module with required shielding is designed for the sensor chip. The output of sensor module is
A

Progress Report 2019-20
113
buffered and filtered before it is fed to data acquisition module of the meter. The PSoC based data acquisition module is designed to sample sensor output with high resolution built-in ADCs. The sampled data is then digitally filtered to reduce the measurement noise and it is then converted to RF power in dBm using logarithmic scale. The meter is designed to incorporate salient features like LCD display for forward and reflected powers in dBm and watt, multipurpose knob for selecting coupling factor and frequency range and RS-232/485 based communication interface.
Figure 4: The front view and the internal assembly of the RF Power Meter
The meter along with the DDC with a coupling factor around 60, is capable of measuring RF power up to 25 kW over a frequency range of 30 MHz-120MHz.
DESIGN AND CHARACTERIZATION OF A MONOLITHIC NON-DELAY LINE CONSTANT FRACTION DISCRIMINATOR FOR IN-
HOUSE NUCLEAR PHYSICS EXPERIMENTS WITH CPDA AT VECC
P. Bahre, M. K. Jha, T. Bhattacharjee, S. K. Pal
harged Particle Detector Array (CPDA) is a hybrid pixel detector developed at VECC for particle detection with high spatial resolution in high energy with SCC ion beam. Preamplifier and shaper
modules from Mesytec had been used as Front End Electronics (FEE) to carry out energy spectroscopy with CPDA. To reduce power consumption and cost, replacement of these modules in the form of ASIC was planned. A subsection of the complete ASIC for CPDA, non-delay line Constant Fraction Discriminator (CFD) using 0.18 μm CMOS technology has been designed and characterized.
Design of Monolithic CFD Circuit The block diagram of non-delay line CFD is shown in Figure 1.For monolithic implementation, the attenuator block was made using poly-resistors and a first order low pass RC filter for filter circuit [1]. The RC circuit was made using a poly-resistor and a mim-cap. The RC time constant was kept 1 ns as the circuit was designed for input pulses having minimum value of rise time of about 25 ns.
Figure 1: Block diagram of non-delay line CFD
C
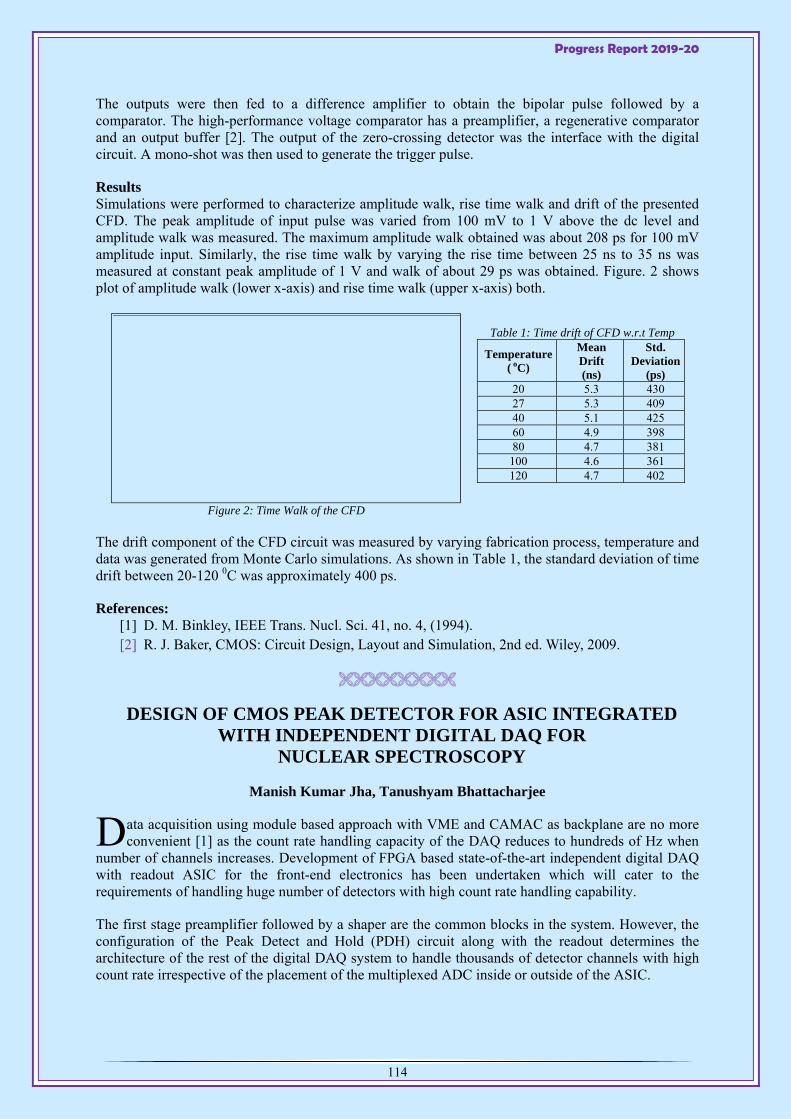
Progress Report 2019-20
114
The outputs were then fed to a difference amplifier to obtain the bipolar pulse followed by a comparator. The high-performance voltage comparator has a preamplifier, a regenerative comparator and an output buffer [2]. The output of the zero-crossing detector was the interface with the digital circuit. A mono-shot was then used to generate the trigger pulse.
Results Simulations were performed to characterize amplitude walk, rise time walk and drift of the presented CFD. The peak amplitude of input pulse was varied from 100 mV to 1 V above the dc level and amplitude walk was measured. The maximum amplitude walk obtained was about 208 ps for 100 mV amplitude input. Similarly, the rise time walk by varying the rise time between 25 ns to 35 ns was measured at constant peak amplitude of 1 V and walk of about 29 ps was obtained. Figure. 2 shows plot of amplitude walk (lower x-axis) and rise time walk (upper x-axis) both.
Figure 2: Time Walk of the CFD
Table 1: Time drift of CFD w.r.t Temp
Temperature( oC)
Mean Drift (ns)
Std. Deviation
(ps) 20 5.3 430 27 5.3 409 40 5.1 425 60 4.9 398 80 4.7 381
100 4.6 361 120 4.7 402
The drift component of the CFD circuit was measured by varying fabrication process, temperature and data was generated from Monte Carlo simulations. As shown in Table 1, the standard deviation of time drift between 20-120 0C was approximately 400 ps.
References: [1] D. M. Binkley, IEEE Trans. Nucl. Sci. 41, no. 4, (1994). [2] R. J. Baker, CMOS: Circuit Design, Layout and Simulation, 2nd ed. Wiley, 2009.
DESIGN OF CMOS PEAK DETECTOR FOR ASIC INTEGRATED WITH INDEPENDENT DIGITAL DAQ FOR
NUCLEAR SPECTROSCOPY
Manish Kumar Jha, Tanushyam Bhattacharjee
ata acquisition using module based approach with VME and CAMAC as backplane are no more convenient [1] as the count rate handling capacity of the DAQ reduces to hundreds of Hz when
number of channels increases. Development of FPGA based state-of-the-art independent digital DAQ with readout ASIC for the front-end electronics has been undertaken which will cater to the requirements of handling huge number of detectors with high count rate handling capability.
The first stage preamplifier followed by a shaper are the common blocks in the system. However, the configuration of the Peak Detect and Hold (PDH) circuit along with the readout determines the architecture of the rest of the digital DAQ system to handle thousands of detector channels with high count rate irrespective of the placement of the multiplexed ADC inside or outside of the ASIC.
D

Progress Report 2019-20
115
The design and characterization of the two-phase PDH in CMOS was carried out using 0.18µm CMOS technology of SCL foundry.
Design of the two-phase PDH The PDH was designed to be operated in two-phase [2] as shown in Figure 1. During the write phase switches S1_W and S2_W are closed and other switches are open. The input voltage, Vi was applied on the negative terminal, Vm of the amplifier. The charging capacitor C0 carries no charge initially and hence the voltage across it i.e. Vh, was zero. Vh was connected to the positive input terminal of the amplifier, therefore Vm > Vh resulted a sharp fall in the output voltage of the amplifier (Vg) which turned on the current mirror (M0-M1) to charge C0 to make Vh same as Vi. As Vi reached its peak voltage and stopped rising, output of the amplifier switched-off the current supply of the current mirror.
On the other hand, in the read phase S1_W and S2_W were switched off. S3_R, S4_R, and S5_R were kept ON to cut-off the input from the circuit. The peak value which was stored in C0 was read as the output voltage (Vout) across load (R1 and C1), as the amplifier acts as buffer. The core amplifier of the PDH is shown in Figure 2.
Figure 1: Schematic of a two-phase peak detector. Figure 2: Schematic of the core amplifier.
Results Figure 3 shows the read and write phase of the PDH circuit. The sharp fall of the output voltage of the amplifier was obtained during write phase. The value of Vh was slightly higher than the input peak due to offset of the amplifier. However, the same has been balanced out during read phase as shown in the Figure 3. The result was encouraging in respect of implementation of the PDH circuit using HV CMOS of SCL 0.18 µm CMOS technology.
Figure 3: Output of the designed PDH.
Conclusion The PDH circuit along with the readout will be implemented in ASIC for fabrication after the implementation of a proto-type independent digital DAQ for final testing.
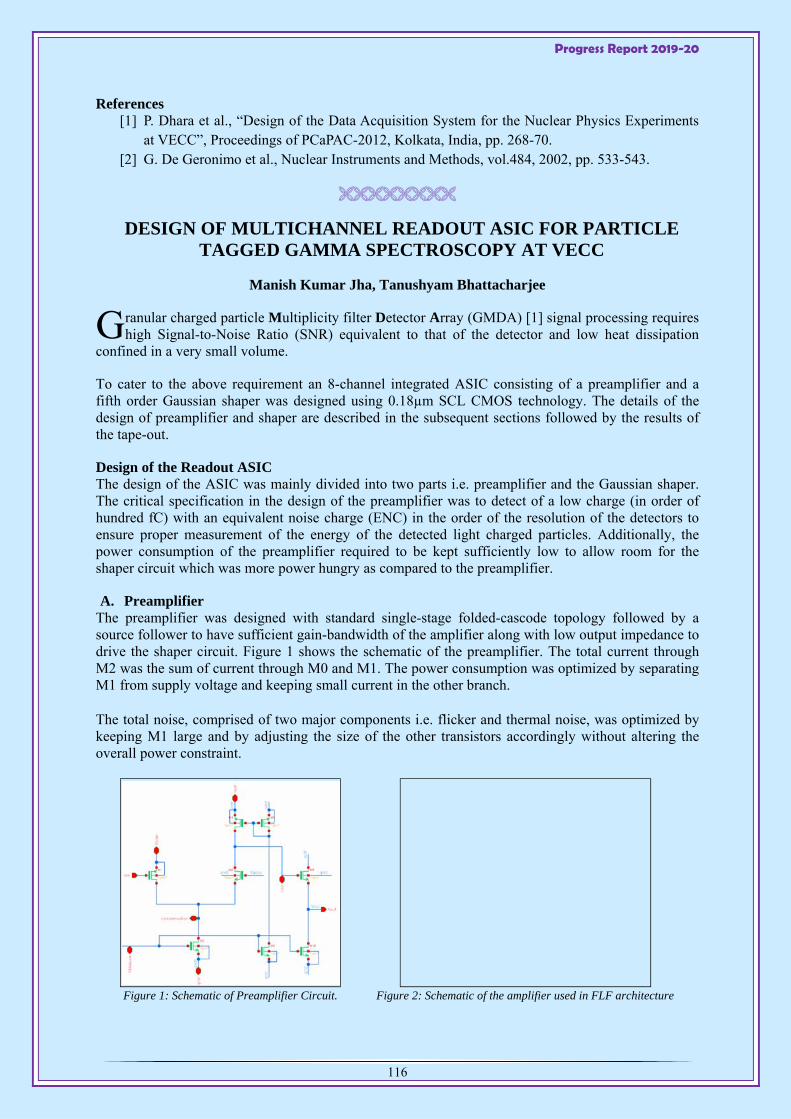
Progress Report 2019-20
116
References [1] P. Dhara et al., “Design of the Data Acquisition System for the Nuclear Physics Experiments
at VECC”, Proceedings of PCaPAC-2012, Kolkata, India, pp. 268-70. [2] G. De Geronimo et al., Nuclear Instruments and Methods, vol.484, 2002, pp. 533-543.
DESIGN OF MULTICHANNEL READOUT ASIC FOR PARTICLE TAGGED GAMMA SPECTROSCOPY AT VECC
Manish Kumar Jha, Tanushyam Bhattacharjee
ranular charged particle Multiplicity filter Detector Array (GMDA) [1] signal processing requires high Signal-to-Noise Ratio (SNR) equivalent to that of the detector and low heat dissipation
confined in a very small volume.
To cater to the above requirement an 8-channel integrated ASIC consisting of a preamplifier and a fifth order Gaussian shaper was designed using 0.18µm SCL CMOS technology. The details of the design of preamplifier and shaper are described in the subsequent sections followed by the results of the tape-out.
Design of the Readout ASIC The design of the ASIC was mainly divided into two parts i.e. preamplifier and the Gaussian shaper. The critical specification in the design of the preamplifier was to detect of a low charge (in order of hundred fC) with an equivalent noise charge (ENC) in the order of the resolution of the detectors to ensure proper measurement of the energy of the detected light charged particles. Additionally, the power consumption of the preamplifier required to be kept sufficiently low to allow room for the shaper circuit which was more power hungry as compared to the preamplifier.
A. Preamplifier The preamplifier was designed with standard single-stage folded-cascode topology followed by a source follower to have sufficient gain-bandwidth of the amplifier along with low output impedance to drive the shaper circuit. Figure 1 shows the schematic of the preamplifier. The total current through M2 was the sum of current through M0 and M1. The power consumption was optimized by separating M1 from supply voltage and keeping small current in the other branch.
The total noise, comprised of two major components i.e. flicker and thermal noise, was optimized by keeping M1 large and by adjusting the size of the other transistors accordingly without altering the overall power constraint.
Figure 1: Schematic of Preamplifier Circuit.
Figure 2: Schematic of the amplifier used in FLF architecture
G
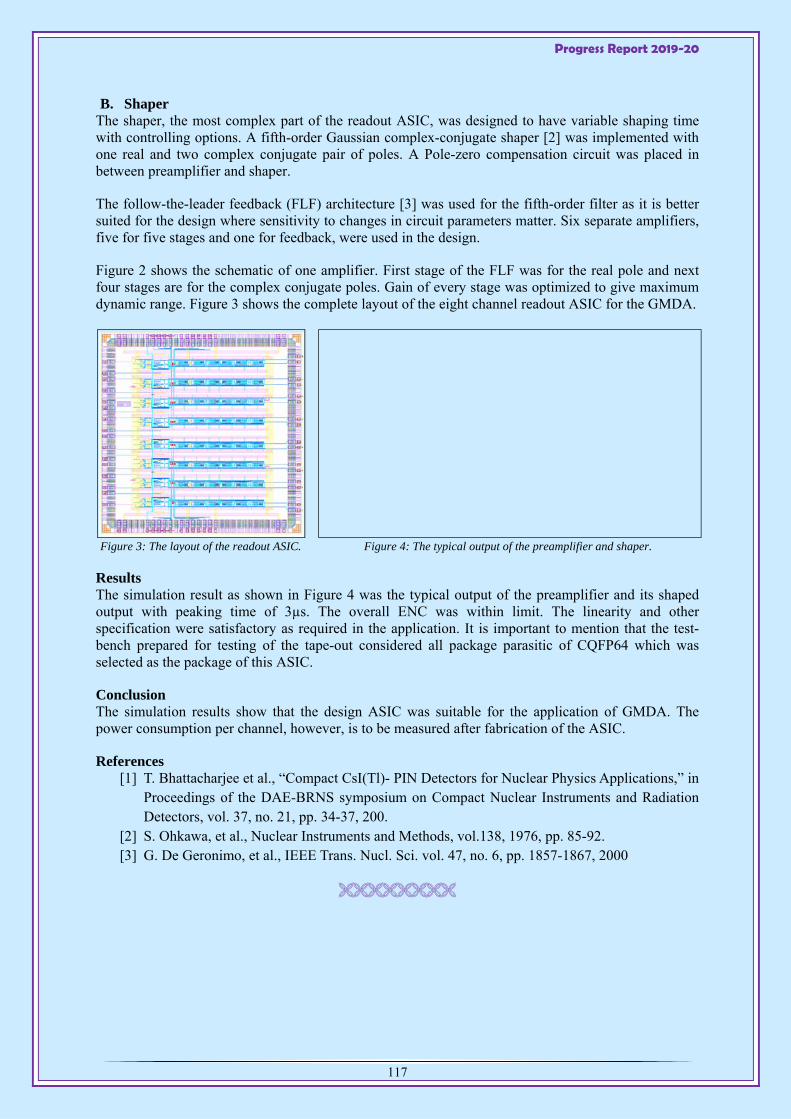
Progress Report 2019-20
117
B. Shaper The shaper, the most complex part of the readout ASIC, was designed to have variable shaping time with controlling options. A fifth-order Gaussian complex-conjugate shaper [2] was implemented with one real and two complex conjugate pair of poles. A Pole-zero compensation circuit was placed in between preamplifier and shaper.
The follow-the-leader feedback (FLF) architecture [3] was used for the fifth-order filter as it is better suited for the design where sensitivity to changes in circuit parameters matter. Six separate amplifiers, five for five stages and one for feedback, were used in the design.
Figure 2 shows the schematic of one amplifier. First stage of the FLF was for the real pole and next four stages are for the complex conjugate poles. Gain of every stage was optimized to give maximum dynamic range. Figure 3 shows the complete layout of the eight channel readout ASIC for the GMDA.
Figure 3: The layout of the readout ASIC. Figure 4: The typical output of the preamplifier and shaper.
Results The simulation result as shown in Figure 4 was the typical output of the preamplifier and its shaped output with peaking time of 3µs. The overall ENC was within limit. The linearity and other specification were satisfactory as required in the application. It is important to mention that the test-bench prepared for testing of the tape-out considered all package parasitic of CQFP64 which was selected as the package of this ASIC.
Conclusion The simulation results show that the design ASIC was suitable for the application of GMDA. The power consumption per channel, however, is to be measured after fabrication of the ASIC.
References [1] T. Bhattacharjee et al., “Compact CsI(Tl)- PIN Detectors for Nuclear Physics Applications,” in
Proceedings of the DAE-BRNS symposium on Compact Nuclear Instruments and Radiation Detectors, vol. 37, no. 21, pp. 34-37, 200.
[2] S. Ohkawa, et al., Nuclear Instruments and Methods, vol.138, 1976, pp. 85-92. [3] G. De Geronimo, et al., IEEE Trans. Nucl. Sci. vol. 47, no. 6, pp. 1857-1867, 2000
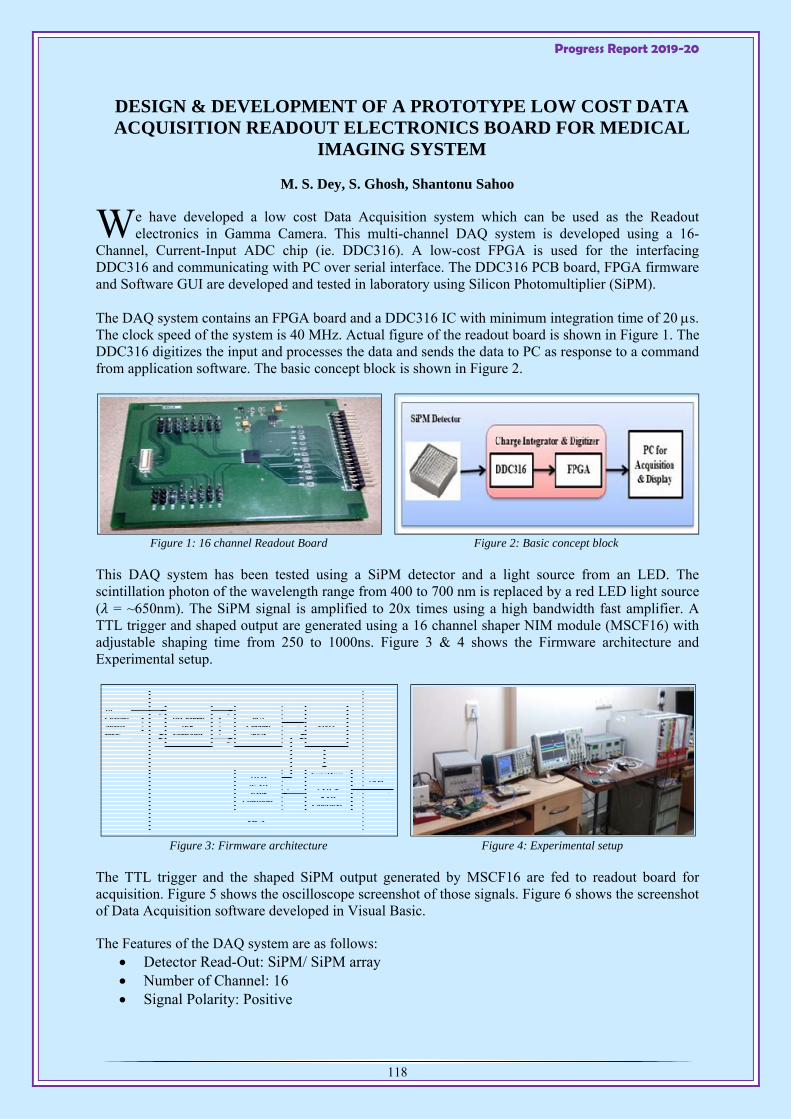
Progress Report 2019-20
118
DESIGN & DEVELOPMENT OF A PROTOTYPE LOW COST DATA ACQUISITION READOUT ELECTRONICS BOARD FOR MEDICAL
IMAGING SYSTEM
M. S. Dey, S. Ghosh, Shantonu Sahoo
e have developed a low cost Data Acquisition system which can be used as the Readout electronics in Gamma Camera. This multi-channel DAQ system is developed using a 16-
Channel, Current-Input ADC chip (ie. DDC316). A low-cost FPGA is used for the interfacing DDC316 and communicating with PC over serial interface. The DDC316 PCB board, FPGA firmware and Software GUI are developed and tested in laboratory using Silicon Photomultiplier (SiPM).
The DAQ system contains an FPGA board and a DDC316 IC with minimum integration time of 20 s. The clock speed of the system is 40 MHz. Actual figure of the readout board is shown in Figure 1. The DDC316 digitizes the input and processes the data and sends the data to PC as response to a command from application software. The basic concept block is shown in Figure 2.
Figure 1: 16 channel Readout Board Figure 2: Basic concept block
This DAQ system has been tested using a SiPM detector and a light source from an LED. The scintillation photon of the wavelength range from 400 to 700 nm is replaced by a red LED light source ( = ~650nm). The SiPM signal is amplified to 20x times using a high bandwidth fast amplifier. A TTL trigger and shaped output are generated using a 16 channel shaper NIM module (MSCF16) with adjustable shaping time from 250 to 1000ns. Figure 3 & 4 shows the Firmware architecture and Experimental setup.
Figure 3: Firmware architecture Figure 4: Experimental setup
The TTL trigger and the shaped SiPM output generated by MSCF16 are fed to readout board for acquisition. Figure 5 shows the oscilloscope screenshot of those signals. Figure 6 shows the screenshot of Data Acquisition software developed in Visual Basic.
The Features of the DAQ system are as follows: Detector Read-Out: SiPM/ SiPM array Number of Channel: 16 Signal Polarity: Positive
W

Progress Report 2019-20
119
Energy measurements by charge integration Power consumption: 32mW/Channel Dimension : 10x12 cm Dynamic Programmable Range 3-12pC
Figure 5: Oscilloscope Screenshot Figure 6: Spectrum
References: [1] www.ti.com, “DDC316” Datasheet.
DESIGN AND DEVELOPMENT MONSTER DAQ MASTER CONTROLLER
Ayan Banerjee, Partha Dhara, Tapas Samanta, Sarbajit Pal, Kaushik Banerjee, Pratap Roy, Chandana Bhattacharya
his article reports the progress of Monster (MOdular Neutron SpectromeTER) Data Acquisition software development. The software is being developed as three modules - networking, user
interface and storage. The networking part for both client and server has been developed. The queue management for handling multiple clients has been tested. The basic Master controller interface is partially developed.
Monster Master Controller and Monster Client There can be multiple Monster clients which can connect to Monster Master Controller through control socket. Then the clients can be configured to start the data acquisition centrally from the Master controller. The clients may send the experimental data through data socket which is stored by the Master Controller.
Figure 1: Monster Master Controller (left) and Monster Client (Right) established network connection.
T

Progress Report 2019-20
120
Monster Data Visualization The processed data generated by the Monster DAQ client can be visualized in the ROOT framework developed by CERN. The data is currently getting visualized offline and is yet to be integrated to the online data storage of the monster master controller.
Figure 2: Offline Visualization Histogram of Monster Data
PROTOTYPE DEVELOPMENT OF DIGITAL PULSE PROCESSING SYSTEM & ITS DATA ACQUISITION SYSTEM FOR NUCLEAR
PHYSICS EXPERIMENTS
Ayan Banerjee, Ram Kumar Paul, Partha Dhara, Pintu Maity, Tapas Samanta, Sarbajit Pal
he traditional nuclear spectrometry systems employ radiation detectors, analog front end electronics and a computer based data acquisition system. Front-end electronics are composed of a
chain of signal processing subsystems that filter, amplify, shape, and digitize the electrical signals to finally produce digital information for computer based data acquisition system.
The digital pulse processing approach replaces the traditional analog chain with equivalent digital algorithms. The digital pulse processing approach was started and results were reported from time to time. This will describe the use of CR-RC digital filtering algorithm and the detail plan for implementation of a multichannel digital data acquisition system as an augmentation of the existing VECC DAQ system.
Pulse Processing Electronics The complete electronics block schematic and processing hardware is given in below figure1.
Figure 1: DPP Block Schematic & Hardware
T
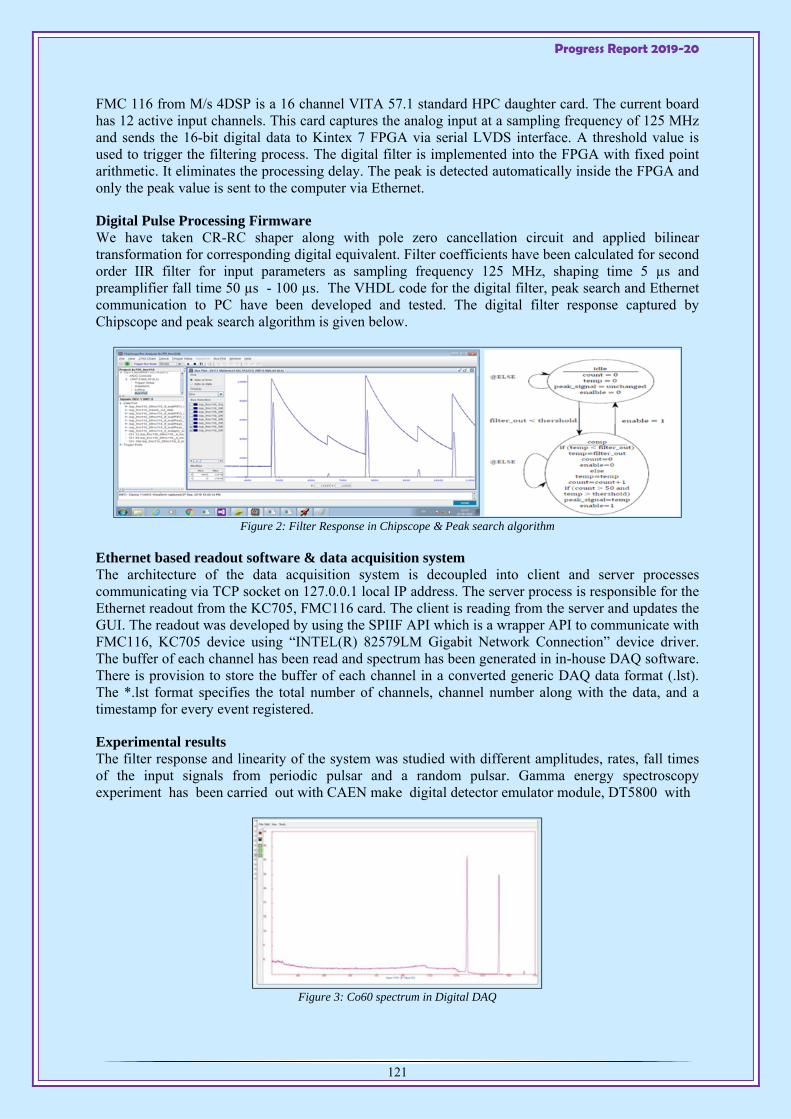
Progress Report 2019-20
121
FMC 116 from M/s 4DSP is a 16 channel VITA 57.1 standard HPC daughter card. The current board has 12 active input channels. This card captures the analog input at a sampling frequency of 125 MHz and sends the 16-bit digital data to Kintex 7 FPGA via serial LVDS interface. A threshold value is used to trigger the filtering process. The digital filter is implemented into the FPGA with fixed point arithmetic. It eliminates the processing delay. The peak is detected automatically inside the FPGA and only the peak value is sent to the computer via Ethernet.
Digital Pulse Processing Firmware We have taken CR-RC shaper along with pole zero cancellation circuit and applied bilinear transformation for corresponding digital equivalent. Filter coefficients have been calculated for second order IIR filter for input parameters as sampling frequency 125 MHz, shaping time 5 µs and preamplifier fall time 50 µs - 100 µs. The VHDL code for the digital filter, peak search and Ethernet communication to PC have been developed and tested. The digital filter response captured by Chipscope and peak search algorithm is given below.
Figure 2: Filter Response in Chipscope & Peak search algorithm
Ethernet based readout software & data acquisition system The architecture of the data acquisition system is decoupled into client and server processes communicating via TCP socket on 127.0.0.1 local IP address. The server process is responsible for the Ethernet readout from the KC705, FMC116 card. The client is reading from the server and updates the GUI. The readout was developed by using the SPIIF API which is a wrapper API to communicate with FMC116, KC705 device using “INTEL(R) 82579LM Gigabit Network Connection” device driver. The buffer of each channel has been read and spectrum has been generated in in-house DAQ software. There is provision to store the buffer of each channel in a converted generic DAQ data format (.lst). The *.lst format specifies the total number of channels, channel number along with the data, and a timestamp for every event registered.
Experimental results The filter response and linearity of the system was studied with different amplitudes, rates, fall times of the input signals from periodic pulsar and a random pulsar. Gamma energy spectroscopy experiment has been carried out with CAEN make digital detector emulator module, DT5800 with
Figure 3: Co60 spectrum in Digital DAQ
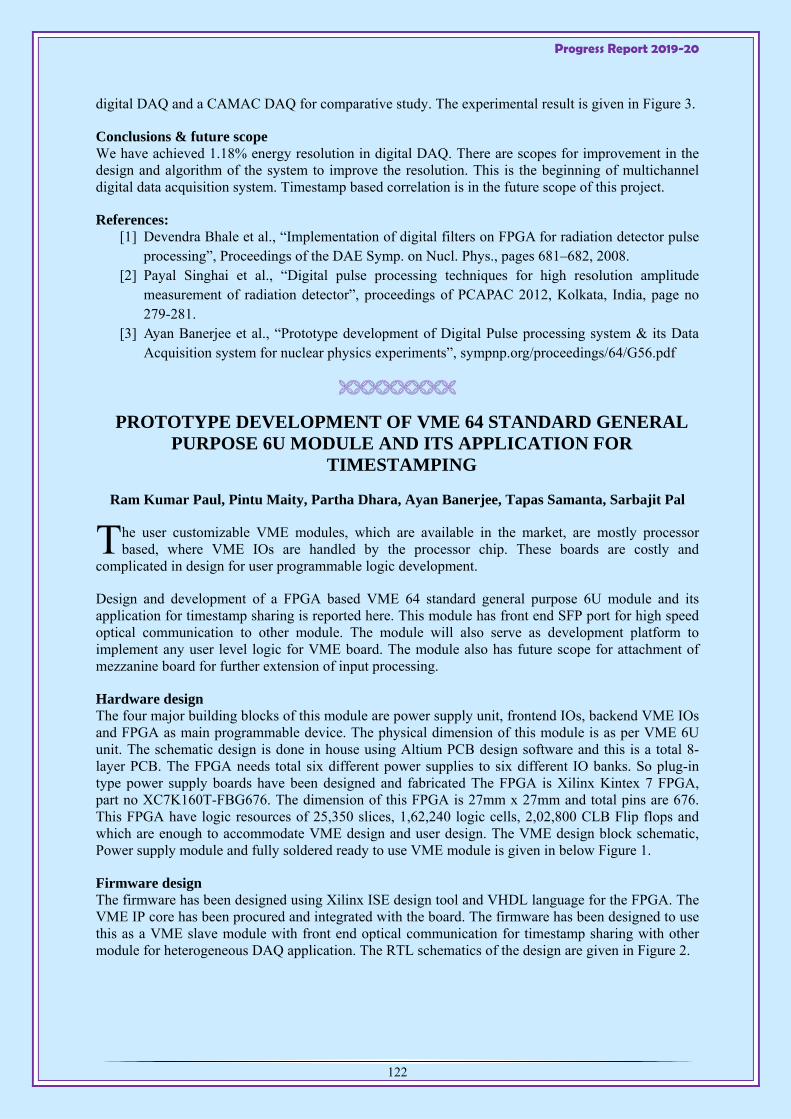
Progress Report 2019-20
122
digital DAQ and a CAMAC DAQ for comparative study. The experimental result is given in Figure 3.
Conclusions & future scope We have achieved 1.18% energy resolution in digital DAQ. There are scopes for improvement in the design and algorithm of the system to improve the resolution. This is the beginning of multichannel digital data acquisition system. Timestamp based correlation is in the future scope of this project.
References: [1] Devendra Bhale et al., “Implementation of digital filters on FPGA for radiation detector pulse
processing”, Proceedings of the DAE Symp. on Nucl. Phys., pages 681–682, 2008. [2] Payal Singhai et al., “Digital pulse processing techniques for high resolution amplitude
measurement of radiation detector”, proceedings of PCAPAC 2012, Kolkata, India, page no 279-281.
[3] Ayan Banerjee et al., “Prototype development of Digital Pulse processing system & its Data Acquisition system for nuclear physics experiments”, sympnp.org/proceedings/64/G56.pdf
PROTOTYPE DEVELOPMENT OF VME 64 STANDARD GENERAL PURPOSE 6U MODULE AND ITS APPLICATION FOR
TIMESTAMPING
Ram Kumar Paul, Pintu Maity, Partha Dhara, Ayan Banerjee, Tapas Samanta, Sarbajit Pal
he user customizable VME modules, which are available in the market, are mostly processor based, where VME IOs are handled by the processor chip. These boards are costly and
complicated in design for user programmable logic development.
Design and development of a FPGA based VME 64 standard general purpose 6U module and its application for timestamp sharing is reported here. This module has front end SFP port for high speed optical communication to other module. The module will also serve as development platform to implement any user level logic for VME board. The module also has future scope for attachment of mezzanine board for further extension of input processing.
Hardware design The four major building blocks of this module are power supply unit, frontend IOs, backend VME IOs and FPGA as main programmable device. The physical dimension of this module is as per VME 6U unit. The schematic design is done in house using Altium PCB design software and this is a total 8-layer PCB. The FPGA needs total six different power supplies to six different IO banks. So plug-in type power supply boards have been designed and fabricated The FPGA is Xilinx Kintex 7 FPGA, part no XC7K160T-FBG676. The dimension of this FPGA is 27mm x 27mm and total pins are 676. This FPGA have logic resources of 25,350 slices, 1,62,240 logic cells, 2,02,800 CLB Flip flops and which are enough to accommodate VME design and user design. The VME design block schematic, Power supply module and fully soldered ready to use VME module is given in below Figure 1.
Firmware design The firmware has been designed using Xilinx ISE design tool and VHDL language for the FPGA. The VME IP core has been procured and integrated with the board. The firmware has been designed to use this as a VME slave module with front end optical communication for timestamp sharing with other module for heterogeneous DAQ application. The RTL schematics of the design are given in Figure 2.
T
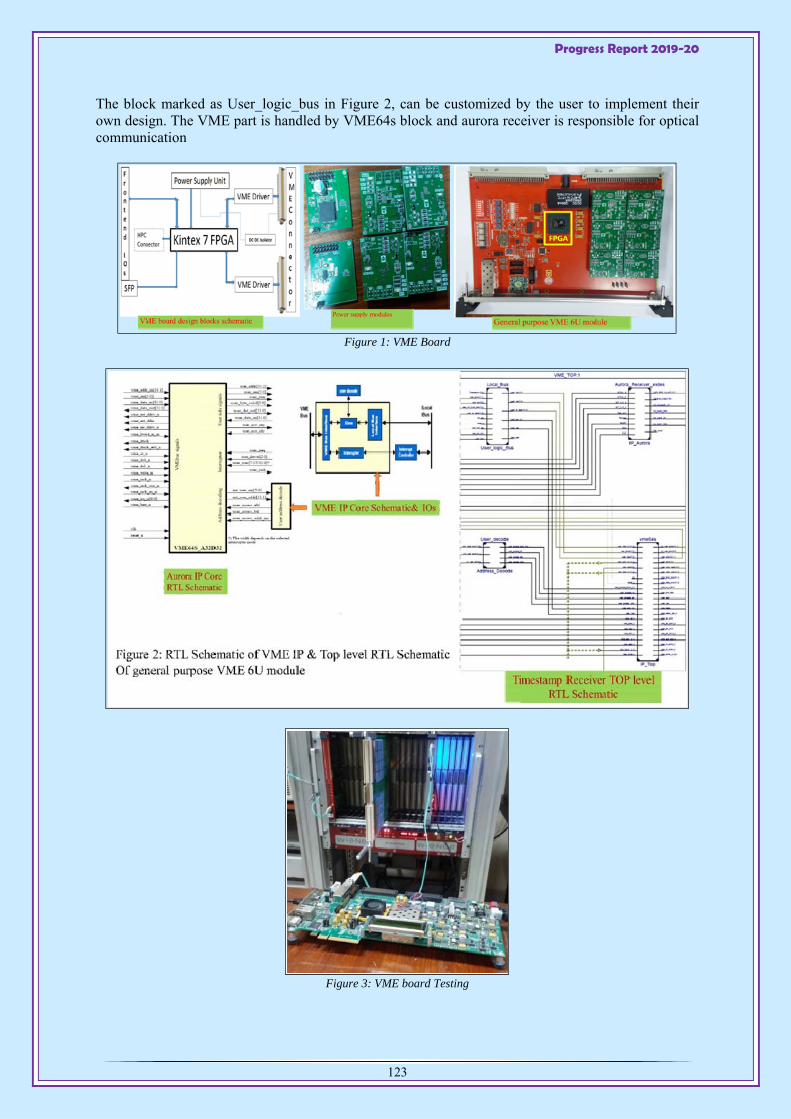
Progress Report 2019-20
123
The block marked as User_logic_bus in Figure 2, can be customized by the user to implement their own design. The VME part is handled by VME64s block and aurora receiver is responsible for optical communication
Figure 1: VME Board
Figure 3: VME board Testing

Progress Report 2019-20
124
Test experiment, conclusions & future scope VME read, Write access has been tested with this general purpose VME module. Front end optical communication for timestamp sharing with FPGA evaluation board has also been tested.
Timestamp scheme and correlation study with our previously developed CAMAC & VME timestamp receiver modules have been described in reference nos. [1] & [2]. This general purpose VME module is completely indigenous design and user customizable FPGA resources with frontend optical IO connectivity. This module also has future scope for HPC connector for attachment of VITA 57.1 standard mezzanine board for further extension of input processing. The testing photograph is given in Figure 3.
References: [1] Ram Kumar Paul et al., “Prototype VME & CAMAC form factor Timestamping module
development for Nuclear Physics experiment”, DAE-BRNS Symp. On Nucl. Phys. 60 (2015), p.922-923.
[2] Ram Kumar Paul et al., "Heterogeneous data acquisition system & time correlation," 2017 8th ICCCNT, Delhi, 2017, pp. 1-3. doi: 10.1109/ICCCNT.2017.820403.
[3] Ram Kumar Paul et al., “Prototype development of VME 64 standard general purpose 6U module and its application for Timestamping”, sympnp.org/proceedings/64/G57.pdf
DESIGN AND DEVELOPMENT OF ENHANCED VERSION OF DIGITAL PICO AMMETER
Subhabrata Mazumder, Tapas Samanta, Sarbajit Pal
n enhanced prototype version (Figure 1) of digital Pico ammeter has been designed, developed & tested successfully in VECC, Kolkata. The instrument is capable of measuring current up to
20µA which was previously 1.8µA only. It has 8 different internal ranges which need not to be selected manually as it has auto ranging facility. It has dual independent current input channels and 20x4 alphanumeric LCD display is used to show the current reading along with the other reading parameters of the instrument. The instrument has a RS-232 port which can be connected with a PC for remote control & monitoring.
Figure 1: Block Diagram
A
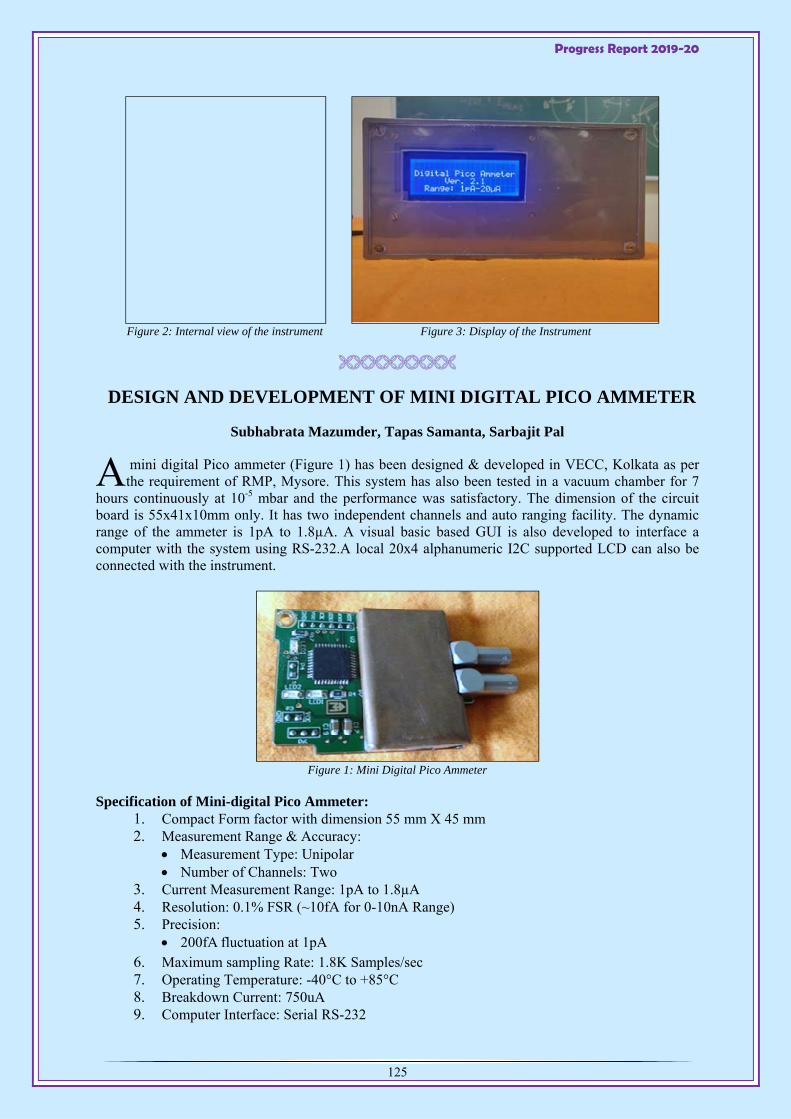
Progress Report 2019-20
125
Figure 2: Internal view of the instrument
Figure 3: Display of the Instrument
DESIGN AND DEVELOPMENT OF MINI DIGITAL PICO AMMETER
Subhabrata Mazumder, Tapas Samanta, Sarbajit Pal
mini digital Pico ammeter (Figure 1) has been designed & developed in VECC, Kolkata as per the requirement of RMP, Mysore. This system has also been tested in a vacuum chamber for 7
hours continuously at 10-5 mbar and the performance was satisfactory. The dimension of the circuit board is 55x41x10mm only. It has two independent channels and auto ranging facility. The dynamic range of the ammeter is 1pA to 1.8µA. A visual basic based GUI is also developed to interface a computer with the system using RS-232.A local 20x4 alphanumeric I2C supported LCD can also be connected with the instrument.
Figure 1: Mini Digital Pico Ammeter
Specification of Mini-digital Pico Ammeter: 1. Compact Form factor with dimension 55 mm X 45 mm 2. Measurement Range & Accuracy:
Measurement Type: Unipolar Number of Channels: Two
3. Current Measurement Range: 1pA to 1.8µA 4. Resolution: 0.1% FSR (~10fA for 0-10nA Range) 5. Precision:
200fA fluctuation at 1pA 6. Maximum sampling Rate: 1.8K Samples/sec 7. Operating Temperature: -40°C to +85°C 8. Breakdown Current: 750uA 9. Computer Interface: Serial RS-232
A
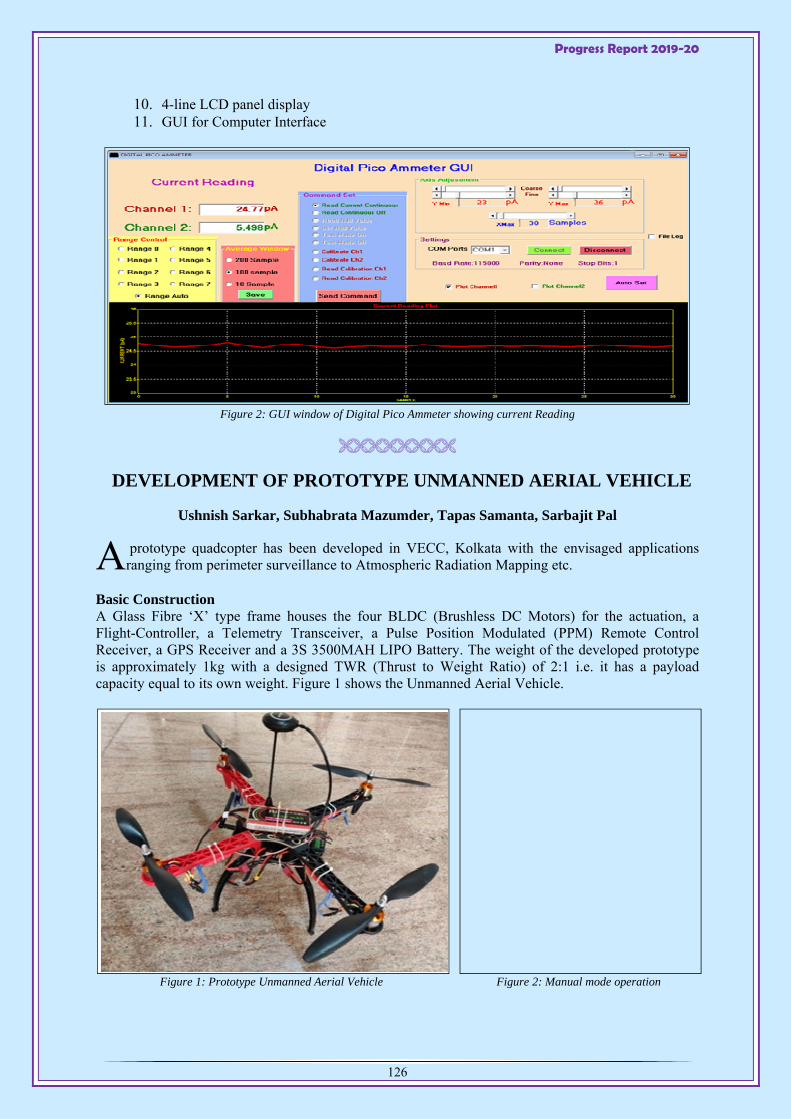
Progress Report 2019-20
126
10. 4-line LCD panel display 11. GUI for Computer Interface
Figure 2: GUI window of Digital Pico Ammeter showing current Reading
DEVELOPMENT OF PROTOTYPE UNMANNED AERIAL VEHICLE
Ushnish Sarkar, Subhabrata Mazumder, Tapas Samanta, Sarbajit Pal
prototype quadcopter has been developed in VECC, Kolkata with the envisaged applications ranging from perimeter surveillance to Atmospheric Radiation Mapping etc.
Basic Construction A Glass Fibre ‘X’ type frame houses the four BLDC (Brushless DC Motors) for the actuation, a Flight-Controller, a Telemetry Transceiver, a Pulse Position Modulated (PPM) Remote Control Receiver, a GPS Receiver and a 3S 3500MAH LIPO Battery. The weight of the developed prototype is approximately 1kg with a designed TWR (Thrust to Weight Ratio) of 2:1 i.e. it has a payload capacity equal to its own weight. Figure 1 shows the Unmanned Aerial Vehicle.
Figure 1: Prototype Unmanned Aerial Vehicle Figure 2: Manual mode operation
A

Progress Report 2019-20
127
Modes of Operation The prototype vehicle can operate in two mode - Manual and Autonomous.
Manual Mode In manual mode (Figure 2), the quadcopter is operated manually from a Remote Control through a 2.4 GHz communication link. As a subdivision of the manual mode, two further modes of operation have been developed and tested.
i. All the coordinates of quadcopter including altitude is controlled from the remote control ii. The altitude, once set from the remote control is held steady by Flight Controller with the help
of on-board barometer sensor and the remaining degrees of freedom controllable from the remote control.
Figure 3: Mission Programming of UAV for Autonomous Operation
Figure 4: Operation of UAV within VECC perimeter

Progress Report 2019-20
128
Autonomous Mode In Autonomous mode, the desired waypoints (including take-off point and landing point) are programmed into the Flight Controller in terms of Latitude and Longitude and the quadcopter thereafter completes the mission without any human intervention (Figure 3).
Safety of UAV In both Manual and Autonomous Modes, safety failsafe (e.g. loss of communication with Remote Control, loss of GPS signal, loss of battery power) has been configured, which commands the quadcopter to safe landing. The feature of Geo-Fencing is also available which restricts the operation of the UAV within a predefined perimeter. Figure 4 shows safe operation of UAV within VECC perimeter.
TERRESTRIAL ROBOTICS: INDOOR LOCALIZATION & NAVIGATION OF E-PUCK 2.0 ROBOT
Ushnish Sarkar, Subhabrata Mazumder, Pranab Singha Roy, Tapas Samanta, Sarbajit Pal
he E-puck 2.0 (Figure 1) is a differential wheeled mobile robot designed for education and is also used widely for swarm robotic research. It is open hardware and software. e-puck is powered by a
32-bit microcontroller and features a large number of sensors in its standard configuration.
The e-puck hardware and software is open source giving low-level access to every electronic device and offering unlimited extension possibilities.
Figure 1: E-puck 2.0
Objective of Work The objective of the present research was navigation within a known map of an indoor environment using monocular camera in replacement of GPS for localization. The broader aim is to approach the problem of Maximal Coverage of a given area. This finds application for perimeter security surveillance by robots.
Interfacing and configuration of on-board sensors of epuck-2.0 through RTOS In this work, interfacing of on board sensors (Inertial Measurement Unit, Time of Flight distance sensor, IR proximity sensor) through Real Time Operating System named ChibiOS has been done. Subsequently, Bluetooth communication link has been established between PC and the robot. A command structure has been developed to read the different onboard sensors of the robot and finally control its actuators from PC over Bluetooth.
T
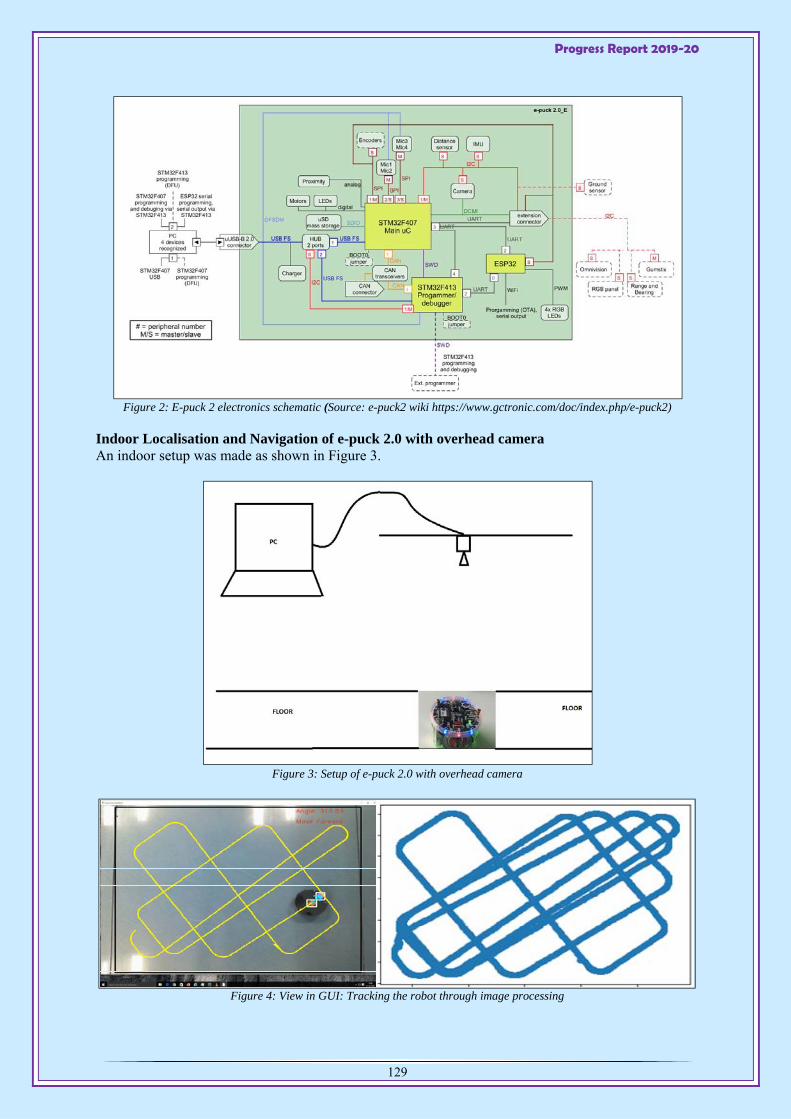
Progress Report 2019-20
129
Figure 2: E-puck 2 electronics schematic (Source: e-puck2 wiki https://www.gctronic.com/doc/index.php/e-puck2)
Indoor Localisation and Navigation of e-puck 2.0 with overhead camera An indoor setup was made as shown in Figure 3.
Figure 3: Setup of e-puck 2.0 with overhead camera
Figure 4: View in GUI: Tracking the robot through image processing
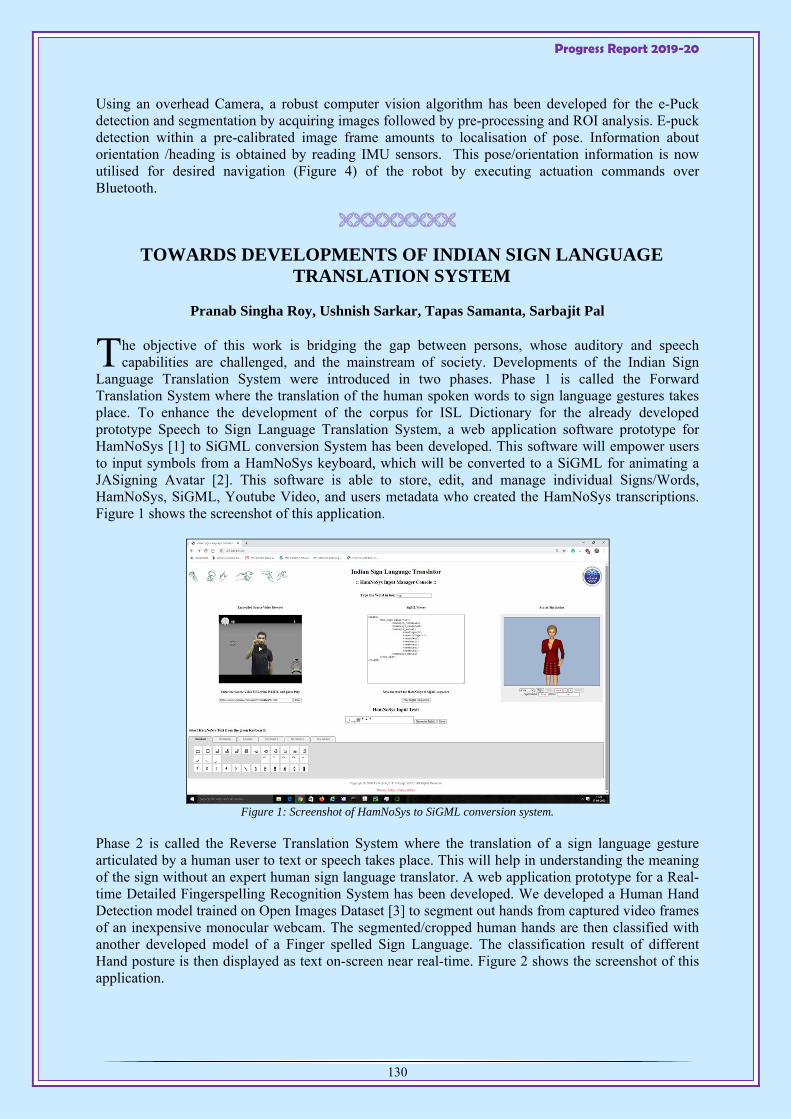
Progress Report 2019-20
130
Using an overhead Camera, a robust computer vision algorithm has been developed for the e-Puck detection and segmentation by acquiring images followed by pre-processing and ROI analysis. E-puck detection within a pre-calibrated image frame amounts to localisation of pose. Information about orientation /heading is obtained by reading IMU sensors. This pose/orientation information is now utilised for desired navigation (Figure 4) of the robot by executing actuation commands over Bluetooth.
TOWARDS DEVELOPMENTS OF INDIAN SIGN LANGUAGE TRANSLATION SYSTEM
Pranab Singha Roy, Ushnish Sarkar, Tapas Samanta, Sarbajit Pal
he objective of this work is bridging the gap between persons, whose auditory and speech capabilities are challenged, and the mainstream of society. Developments of the Indian Sign
Language Translation System were introduced in two phases. Phase 1 is called the Forward Translation System where the translation of the human spoken words to sign language gestures takes place. To enhance the development of the corpus for ISL Dictionary for the already developed prototype Speech to Sign Language Translation System, a web application software prototype for HamNoSys [1] to SiGML conversion System has been developed. This software will empower users to input symbols from a HamNoSys keyboard, which will be converted to a SiGML for animating a JASigning Avatar [2]. This software is able to store, edit, and manage individual Signs/Words, HamNoSys, SiGML, Youtube Video, and users metadata who created the HamNoSys transcriptions. Figure 1 shows the screenshot of this application.
Figure 1: Screenshot of HamNoSys to SiGML conversion system.
Phase 2 is called the Reverse Translation System where the translation of a sign language gesture articulated by a human user to text or speech takes place. This will help in understanding the meaning of the sign without an expert human sign language translator. A web application prototype for a Real-time Detailed Fingerspelling Recognition System has been developed. We developed a Human Hand Detection model trained on Open Images Dataset [3] to segment out hands from captured video frames of an inexpensive monocular webcam. The segmented/cropped human hands are then classified with another developed model of a Finger spelled Sign Language. The classification result of different Hand posture is then displayed as text on-screen near real-time. Figure 2 shows the screenshot of this application.
T
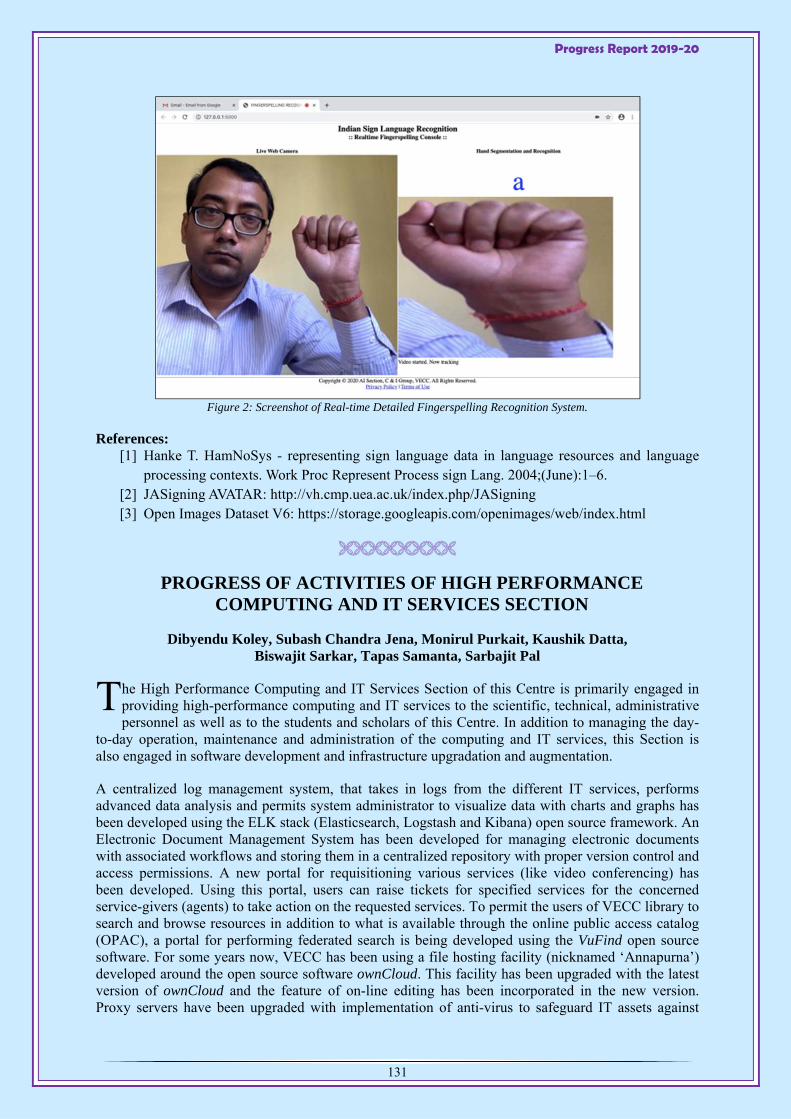
Progress Report 2019-20
131
Figure 2: Screenshot of Real-time Detailed Fingerspelling Recognition System.
References: [1] Hanke T. HamNoSys - representing sign language data in language resources and language
processing contexts. Work Proc Represent Process sign Lang. 2004;(June):1–6. [2] JASigning AVATAR: http://vh.cmp.uea.ac.uk/index.php/JASigning [3] Open Images Dataset V6: https://storage.googleapis.com/openimages/web/index.html
PROGRESS OF ACTIVITIES OF HIGH PERFORMANCE COMPUTING AND IT SERVICES SECTION
Dibyendu Koley, Subash Chandra Jena, Monirul Purkait, Kaushik Datta, Biswajit Sarkar, Tapas Samanta, Sarbajit Pal
he High Performance Computing and IT Services Section of this Centre is primarily engaged in providing high-performance computing and IT services to the scientific, technical, administrative personnel as well as to the students and scholars of this Centre. In addition to managing the day-
to-day operation, maintenance and administration of the computing and IT services, this Section is also engaged in software development and infrastructure upgradation and augmentation.
A centralized log management system, that takes in logs from the different IT services, performs advanced data analysis and permits system administrator to visualize data with charts and graphs has been developed using the ELK stack (Elasticsearch, Logstash and Kibana) open source framework. An Electronic Document Management System has been developed for managing electronic documents with associated workflows and storing them in a centralized repository with proper version control and access permissions. A new portal for requisitioning various services (like video conferencing) has been developed. Using this portal, users can raise tickets for specified services for the concerned service-givers (agents) to take action on the requested services. To permit the users of VECC library to search and browse resources in addition to what is available through the online public access catalog (OPAC), a portal for performing federated search is being developed using the VuFind open source software. For some years now, VECC has been using a file hosting facility (nicknamed ‘Annapurna’) developed around the open source software ownCloud. This facility has been upgraded with the latest version of ownCloud and the feature of on-line editing has been incorporated in the new version. Proxy servers have been upgraded with implementation of anti-virus to safeguard IT assets against
T

Progress Report 2019-20
132
virus/malware by blocking them at the gateway before they enter into internal network. Fail-over in DHCP has been implemented to ensure availability of secondary DHCP server during failure of the Primary DHCP. Various web servers hosted under the vecc.gov.in domain, which were earlier available through HTTP, are now being made available to the users through the secure HTTPS protocol using SSL certificates.
In addition to the above, regular operation and management of all important IT services such as Web, DNS, E-mail, Proxy, DHPC, Backup, Private Cloud, Helpdesk system, File server, Antivirus, Event management portal, APAR, IPR, Koha and RFID-based Integrated library management system, video conferencing etc. are carried out and user requirements regarding all these services are addressed. The high-performance computing cluster named Himalaya, having a theoretical peak performance of 92 TFLOPS, was made available to the user with availability of 99%. Besides operation, maintenance and system administration, user support for the cluster was also extended.
A study was conducted for evaluation of different machine learning techniques on contemporary datasets for development of Intelligent Network Intrusion Detection System (NIDS).
CENTRALISED LOG MANAGEMENT SYSTEM FOR VECC IT SERVICES
Dibyendu Koley, Kaushik Datta, Tapas Samanta, Sarbajit Pal
he IT infrastructure of VECC consists of various application servers and network devices. Application servers runs critical services such as DHCP, Proxy, DNS, Websites, E-mail etc. and
network devices include various switches, firewall, router etc. Centralised log management system of VECC caters to the need of collecting, storing, visualising and finally analysing logs of all its critical IT applications in order to investigate application/system faults, monitor application utilisation and address security related issues. Apart from tracing anomalous behaviour in the system/application, the log management system fulfills various security audit requirements in an organisation. A Centralised Log Management System (CLMS) has been developed using open-source software and deployed inside VECC premises. This system collects and stores all kinds of logs from various IT systems in a central log server and analyzes them for descriptive and diagnostic purposes. This system mainly consists of two components namely: [i] Central Log Server [ii] Log Analyser.
Figure 1; Basic architecture of Centralised Log Management System.
Filebeats(Data
Collection)
Logstash(Data
Processing)
Elasticsearch(Storage & Indexing)
Kibana(Visualisation)
Web Server
Rsyslogd
DNS Server
Rsyslogd
Proxy Server
Rsyslogd
Central Log Server
Rsyslogd
Log Server Log Analyser (using ELK Stack)
T
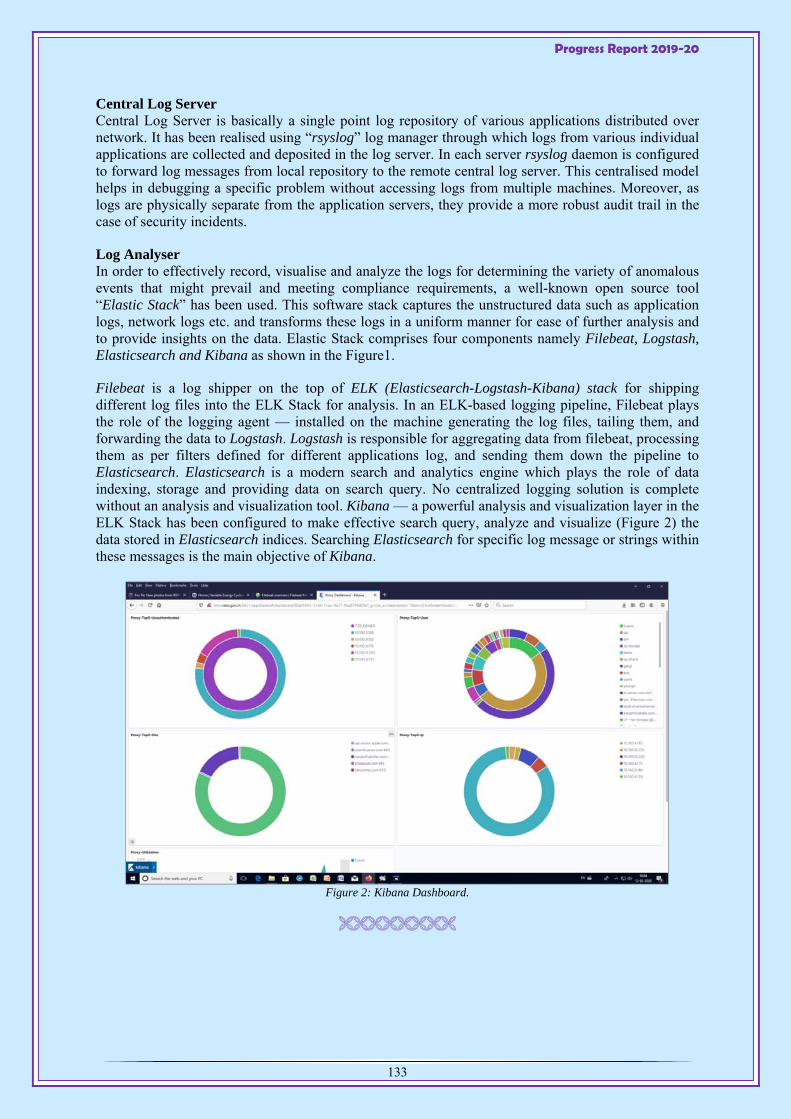
Progress Report 2019-20
133
Central Log Server Central Log Server is basically a single point log repository of various applications distributed over network. It has been realised using “rsyslog” log manager through which logs from various individual applications are collected and deposited in the log server. In each server rsyslog daemon is configured to forward log messages from local repository to the remote central log server. This centralised model helps in debugging a specific problem without accessing logs from multiple machines. Moreover, as logs are physically separate from the application servers, they provide a more robust audit trail in the case of security incidents.
Log Analyser In order to effectively record, visualise and analyze the logs for determining the variety of anomalous events that might prevail and meeting compliance requirements, a well-known open source tool “Elastic Stack” has been used. This software stack captures the unstructured data such as application logs, network logs etc. and transforms these logs in a uniform manner for ease of further analysis and to provide insights on the data. Elastic Stack comprises four components namely Filebeat, Logstash, Elasticsearch and Kibana as shown in the Figure1.
Filebeat is a log shipper on the top of ELK (Elasticsearch-Logstash-Kibana) stack for shipping different log files into the ELK Stack for analysis. In an ELK-based logging pipeline, Filebeat plays the role of the logging agent — installed on the machine generating the log files, tailing them, and forwarding the data to Logstash. Logstash is responsible for aggregating data from filebeat, processing them as per filters defined for different applications log, and sending them down the pipeline to Elasticsearch. Elasticsearch is a modern search and analytics engine which plays the role of data indexing, storage and providing data on search query. No centralized logging solution is complete without an analysis and visualization tool. Kibana — a powerful analysis and visualization layer in the ELK Stack has been configured to make effective search query, analyze and visualize (Figure 2) the data stored in Elasticsearch indices. Searching Elasticsearch for specific log message or strings within these messages is the main objective of Kibana.
Figure 2: Kibana Dashboard.

Progress Report 2019-20
134
STUDY ON MACHINE LEARNING/DEEP LEARNING METHODS FOR NETWORK INTRUSION DETECTION SYSTEM (NIDS)
Kaushik Datta, Tapas Samanta, Sarbajit Pal
ver growing landscape of cyber-attacks with the advent of information & communication technology (ICT) has motivated present day researchers to design and develop more accurate
intrusion detection system (IDS) using modern techniques involving machine learning (ML)/Deep Learning (DL). Development of intelligent IDS highly depends on a rich, up-to-date and contemporary dataset which consists of relevant attributes and real-world scenario of cyber-attacks. We have conducted literature survey on development of NIDS using Machine learning/ Deep Learning techniques and studied variety of available datasets including NSLKDD, ISCX2012, CICIDS2017, CICIDS2018 etc. which are most popular ones in recent times and represent real-world network traffic. For evaluation our models, we have primarily used NSLKDD [1], CICIDS2017 [2] and CICIDS2018 [3] datasets. NSLKDD contains four attack types namely DoS, Probe, R2L and U2R whereas CICIDS2017 and CICIDS2018 are relatively new ones and cover many contemporary attack types such as Bot, SQL Injection, DDoS, Infiltration, Web attack etc. CICIDS2017 and CICIDS2018 both are flow-based datasets; however CICIDS2018 is more voluminous in numbers of instances than CICIDS2017 and recorded over wider period of times.
Scikit-learn library has been used for developing machine learning algorithms and Keras neural network API has been used with Tensorflow as back-end computation engine for developing models based on artificial neural network or deep neural network. Google Co-laboratory platform has been utilised to develop and faster execution of program using GPU (Graphics Processing Unit) or TPU (Tensor Processing Unit). Multiple models have been developed using various machine learning (boosting) classifiers namely Random Forest, AdaBoost, XGBoost as well as using neural/deep neural network techniques such as ANN, LSTM, GRU to detect the attack data from the benign ones. These models are trained and tested with datasets mentioned above and their performances are evaluated on the basis of confusion matrix. It is observed that boosting classifiers are showing better accuracy (more than 98%) than the deep neural models in respect of datasets selected.
References: [1] https://www.unb.ca/cic/datasets/nsl.html [2] https://www.unb.ca/cic/datasets/ids-2017.html [3] https://www.unb.ca/cic/datasets/ids-2018.html
E

INSTRUMENTATION & METHODS
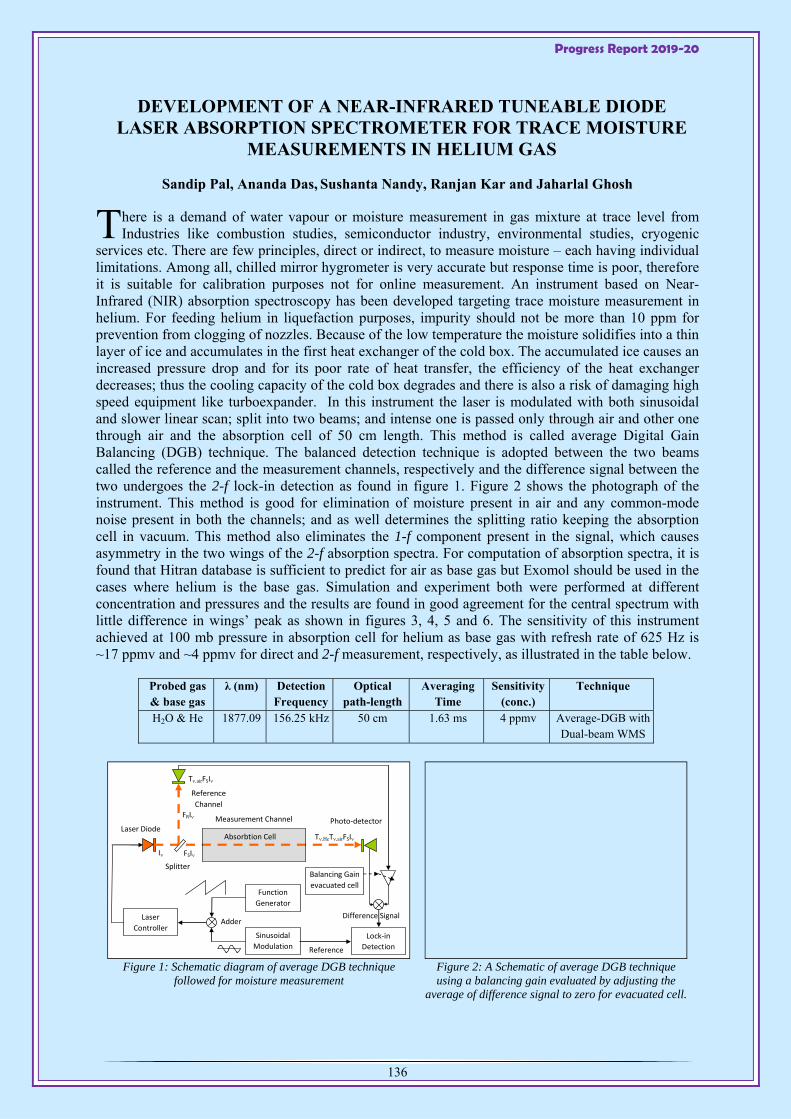
Progress Report 2019-20
136
DEVELOPMENT OF A NEAR-INFRARED TUNEABLE DIODE LASER ABSORPTION SPECTROMETER FOR TRACE MOISTURE
MEASUREMENTS IN HELIUM GAS
Sandip Pal, Ananda Das, Sushanta Nandy, Ranjan Kar and Jaharlal Ghosh
here is a demand of water vapour or moisture measurement in gas mixture at trace level from Industries like combustion studies, semiconductor industry, environmental studies, cryogenic
services etc. There are few principles, direct or indirect, to measure moisture – each having individual limitations. Among all, chilled mirror hygrometer is very accurate but response time is poor, therefore it is suitable for calibration purposes not for online measurement. An instrument based on Near-Infrared (NIR) absorption spectroscopy has been developed targeting trace moisture measurement in helium. For feeding helium in liquefaction purposes, impurity should not be more than 10 ppm for prevention from clogging of nozzles. Because of the low temperature the moisture solidifies into a thin layer of ice and accumulates in the first heat exchanger of the cold box. The accumulated ice causes an increased pressure drop and for its poor rate of heat transfer, the efficiency of the heat exchanger decreases; thus the cooling capacity of the cold box degrades and there is also a risk of damaging high speed equipment like turboexpander. In this instrument the laser is modulated with both sinusoidal and slower linear scan; split into two beams; and intense one is passed only through air and other one through air and the absorption cell of 50 cm length. This method is called average Digital Gain Balancing (DGB) technique. The balanced detection technique is adopted between the two beams called the reference and the measurement channels, respectively and the difference signal between the two undergoes the 2-f lock-in detection as found in figure 1. Figure 2 shows the photograph of the instrument. This method is good for elimination of moisture present in air and any common-mode noise present in both the channels; and as well determines the splitting ratio keeping the absorption cell in vacuum. This method also eliminates the 1-f component present in the signal, which causes asymmetry in the two wings of the 2-f absorption spectra. For computation of absorption spectra, it is found that Hitran database is sufficient to predict for air as base gas but Exomol should be used in the cases where helium is the base gas. Simulation and experiment both were performed at different concentration and pressures and the results are found in good agreement for the central spectrum with little difference in wings’ peak as shown in figures 3, 4, 5 and 6. The sensitivity of this instrument achieved at 100 mb pressure in absorption cell for helium as base gas with refresh rate of 625 Hz is ~17 ppmv and ~4 ppmv for direct and 2-f measurement, respectively, as illustrated in the table below.
Probed gas & base gas
λ (nm) Detection Frequency
Optical path-length
Averaging Time
Sensitivity (conc.)
Technique
H2O & He 1877.09 156.25 kHz 50 cm 1.63 ms 4 ppmv Average-DGB with Dual-beam WMS
Figure 1: Schematic diagram of average DGB technique followed for moisture measurement
Figure 2: A Schematic of average DGB technique using a balancing gain evaluated by adjusting the
average of difference signal to zero for evacuated cell.
Laser Diode Absorbtion Cell
I
THeTairFSI
Photo‐detector
Laser
Controller
Function
Generator
Reference
Channel
Splitter
Lock‐in
Detection
FSI
FRI
Sinusoidal
Modulation
AdderDifference Signal
Balancing Gain
evacuated cell
Reference
TairFSI
Measurement Channel
T
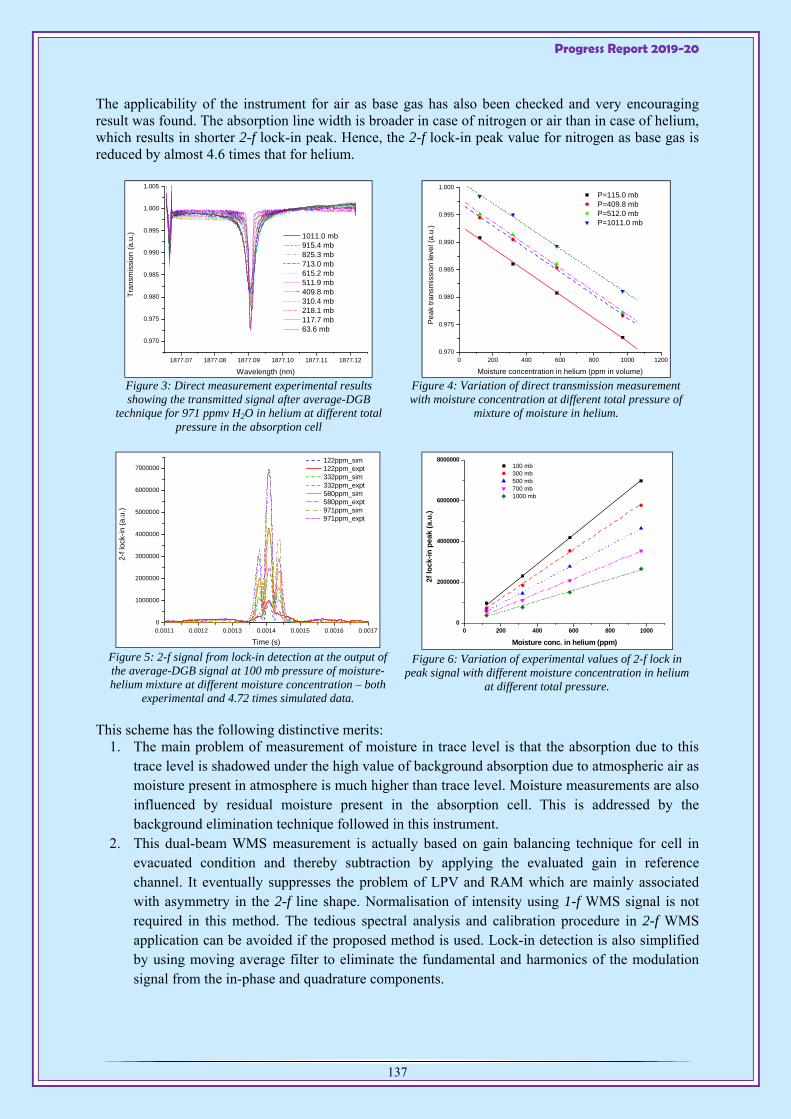
Progress Report 2019-20
137
The applicability of the instrument for air as base gas has also been checked and very encouraging result was found. The absorption line width is broader in case of nitrogen or air than in case of helium, which results in shorter 2-f lock-in peak. Hence, the 2-f lock-in peak value for nitrogen as base gas is reduced by almost 4.6 times that for helium.
Figure 3: Direct measurement experimental results showing the transmitted signal after average-DGB
technique for 971 ppmv H2O in helium at different total pressure in the absorption cell
Figure 4: Variation of direct transmission measurement with moisture concentration at different total pressure of
mixture of moisture in helium.
Figure 5: 2-f signal from lock-in detection at the output of the average-DGB signal at 100 mb pressure of moisture-helium mixture at different moisture concentration – both
experimental and 4.72 times simulated data.
Figure 6: Variation of experimental values of 2-f lock in
peak signal with different moisture concentration in helium at different total pressure.
This scheme has the following distinctive merits: 1. The main problem of measurement of moisture in trace level is that the absorption due to this
trace level is shadowed under the high value of background absorption due to atmospheric air as moisture present in atmosphere is much higher than trace level. Moisture measurements are also influenced by residual moisture present in the absorption cell. This is addressed by the background elimination technique followed in this instrument.
2. This dual-beam WMS measurement is actually based on gain balancing technique for cell in evacuated condition and thereby subtraction by applying the evaluated gain in reference channel. It eventually suppresses the problem of LPV and RAM which are mainly associated with asymmetry in the 2-f line shape. Normalisation of intensity using 1-f WMS signal is not required in this method. The tedious spectral analysis and calibration procedure in 2-f WMS application can be avoided if the proposed method is used. Lock-in detection is also simplified by using moving average filter to eliminate the fundamental and harmonics of the modulation signal from the in-phase and quadrature components.
1877.07 1877.08 1877.09 1877.10 1877.11 1877.12
0.970
0.975
0.980
0.985
0.990
0.995
1.000
1.005
1011.0 mb 915.4 mb 825.3 mb 713.0 mb 615.2 mb 511.9 mb 409.8 mb 310.4 mb 218.1 mb 117.7 mb 63.6 mb
Tran
smis
sion
(a.u
.)
Wavelength (nm)0 200 400 600 800 1000 1200
0.970
0.975
0.980
0.985
0.990
0.995
1.000 P=115.0 mb P=409.8 mb P=512.0 mb P=1011.0 mb
Peak
tran
smis
sion
leve
l (a.
u.)
Moisture concentration in helium (ppm in volume)
0.0011 0.0012 0.0013 0.0014 0.0015 0.0016 0.00170
1000000
2000000
3000000
4000000
5000000
6000000
7000000 122ppm_sim 122ppm_expt 332ppm_sim 332ppm_expt 580ppm_sim 580ppm_expt 971ppm_sim 971ppm_expt
2-f l
ock-
in (a
.u.)
Time (s)0 200 400 600 800 1000
0
2000000
4000000
6000000
8000000 100 mb 300 mb 500 mb 700 mb 1000 mb
2f lo
ck-
in p
eak
(a.
u.)
Moisture conc. in helium (ppm)
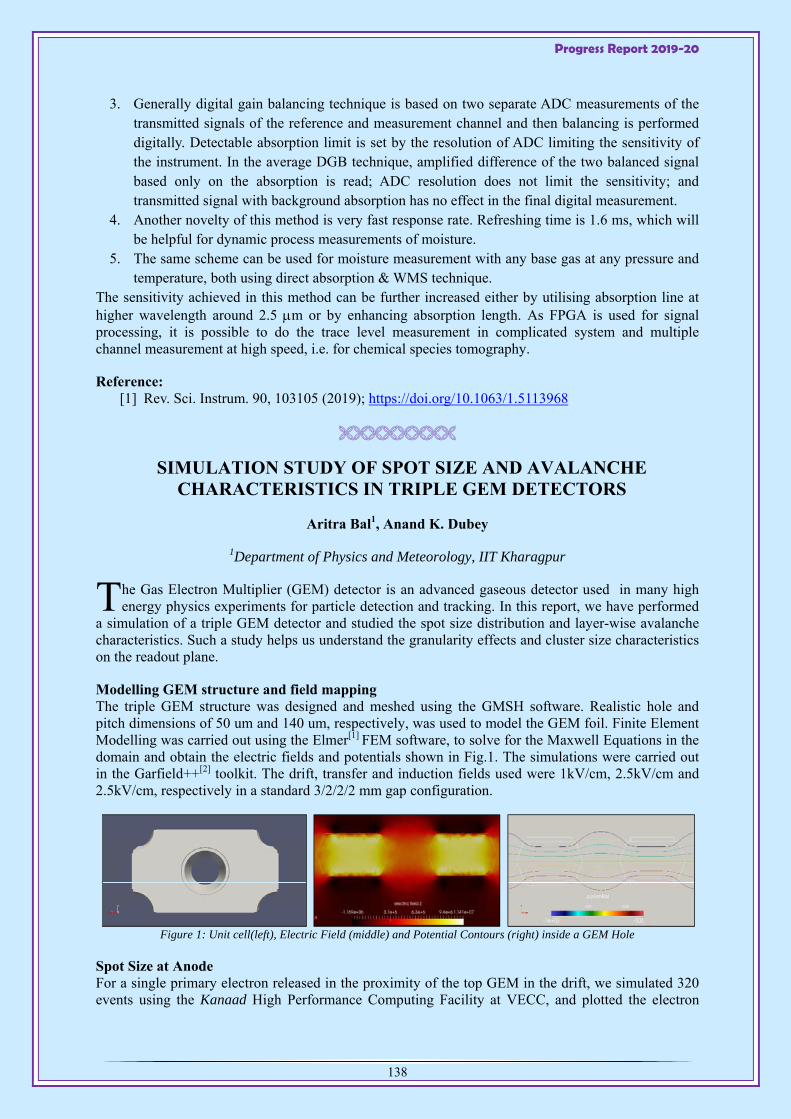
Progress Report 2019-20
138
3. Generally digital gain balancing technique is based on two separate ADC measurements of the transmitted signals of the reference and measurement channel and then balancing is performed digitally. Detectable absorption limit is set by the resolution of ADC limiting the sensitivity of the instrument. In the average DGB technique, amplified difference of the two balanced signal based only on the absorption is read; ADC resolution does not limit the sensitivity; and transmitted signal with background absorption has no effect in the final digital measurement.
4. Another novelty of this method is very fast response rate. Refreshing time is 1.6 ms, which will be helpful for dynamic process measurements of moisture.
5. The same scheme can be used for moisture measurement with any base gas at any pressure and temperature, both using direct absorption & WMS technique.
The sensitivity achieved in this method can be further increased either by utilising absorption line at higher wavelength around 2.5 m or by enhancing absorption length. As FPGA is used for signal processing, it is possible to do the trace level measurement in complicated system and multiple channel measurement at high speed, i.e. for chemical species tomography.
Reference: [1] Rev. Sci. Instrum. 90, 103105 (2019); https://doi.org/10.1063/1.5113968
SIMULATION STUDY OF SPOT SIZE AND AVALANCHE CHARACTERISTICS IN TRIPLE GEM DETECTORS
Aritra Bal1, Anand K. Dubey
1Department of Physics and Meteorology, IIT Kharagpur
he Gas Electron Multiplier (GEM) detector is an advanced gaseous detector used in many high energy physics experiments for particle detection and tracking. In this report, we have performed
a simulation of a triple GEM detector and studied the spot size distribution and layer-wise avalanche characteristics. Such a study helps us understand the granularity effects and cluster size characteristics on the readout plane.
Modelling GEM structure and field mapping The triple GEM structure was designed and meshed using the GMSH software. Realistic hole and pitch dimensions of 50 um and 140 um, respectively, was used to model the GEM foil. Finite Element Modelling was carried out using the Elmer[1] FEM software, to solve for the Maxwell Equations in the domain and obtain the electric fields and potentials shown in Fig.1. The simulations were carried out in the Garfield++[2] toolkit. The drift, transfer and induction fields used were 1kV/cm, 2.5kV/cm and 2.5kV/cm, respectively in a standard 3/2/2/2 mm gap configuration.
Figure 1: Unit cell(left), Electric Field (middle) and Potential Contours (right) inside a GEM Hole
Spot Size at Anode For a single primary electron released in the proximity of the top GEM in the drift, we simulated 320 events using the Kanaad High Performance Computing Facility at VECC, and plotted the electron
T
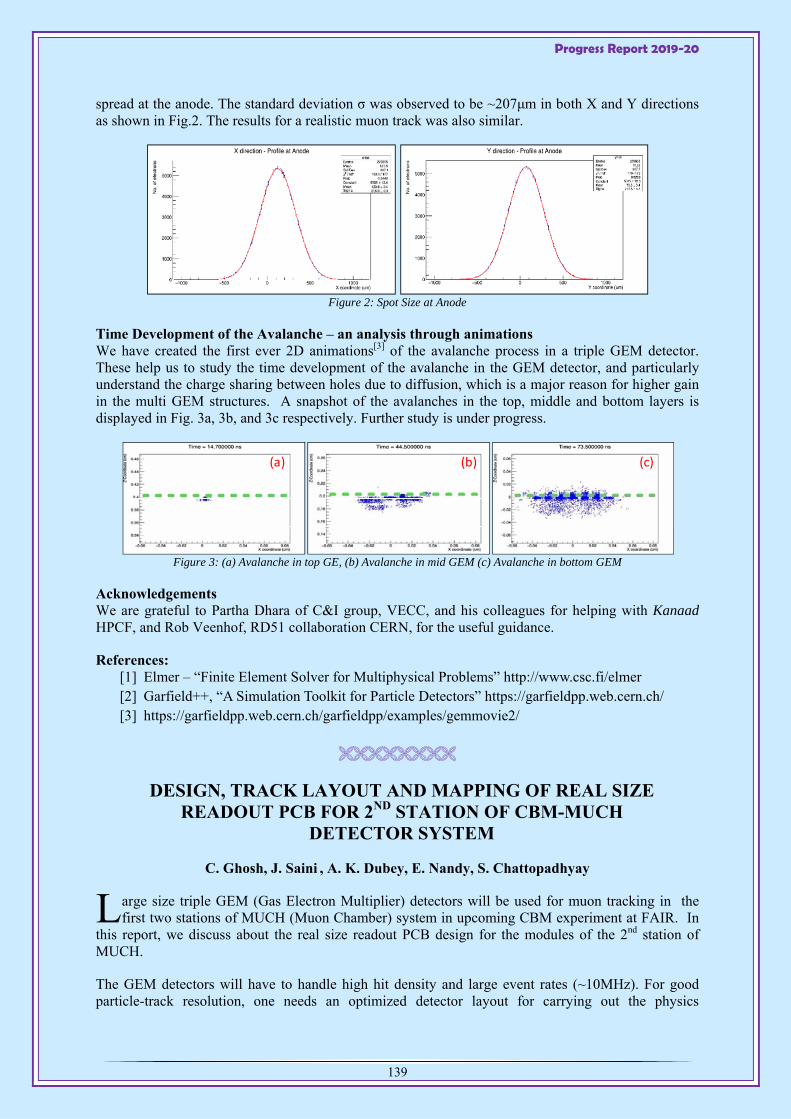
Progress Report 2019-20
139
spread at the anode. The standard deviation σ was observed to be ~207μm in both X and Y directions as shown in Fig.2. The results for a realistic muon track was also similar.
Figure 2: Spot Size at Anode
Time Development of the Avalanche – an analysis through animations We have created the first ever 2D animations[3] of the avalanche process in a triple GEM detector. These help us to study the time development of the avalanche in the GEM detector, and particularly understand the charge sharing between holes due to diffusion, which is a major reason for higher gain in the multi GEM structures. A snapshot of the avalanches in the top, middle and bottom layers is displayed in Fig. 3a, 3b, and 3c respectively. Further study is under progress.
Figure 3: (a) Avalanche in top GE, (b) Avalanche in mid GEM (c) Avalanche in bottom GEM
Acknowledgements We are grateful to Partha Dhara of C&I group, VECC, and his colleagues for helping with Kanaad HPCF, and Rob Veenhof, RD51 collaboration CERN, for the useful guidance.
References: [1] Elmer – “Finite Element Solver for Multiphysical Problems” http://www.csc.fi/elmer [2] Garfield++, “A Simulation Toolkit for Particle Detectors” https://garfieldpp.web.cern.ch/ [3] https://garfieldpp.web.cern.ch/garfieldpp/examples/gemmovie2/
DESIGN, TRACK LAYOUT AND MAPPING OF REAL SIZE READOUT PCB FOR 2ND STATION OF CBM-MUCH
DETECTOR SYSTEM
C. Ghosh, J. Saini , A. K. Dubey, E. Nandy, S. Chattopadhyay
arge size triple GEM (Gas Electron Multiplier) detectors will be used for muon tracking in the first two stations of MUCH (Muon Chamber) system in upcoming CBM experiment at FAIR. In
this report, we discuss about the real size readout PCB design for the modules of the 2nd station of MUCH.
The GEM detectors will have to handle high hit density and large event rates (~10MHz). For good particle-track resolution, one needs an optimized detector layout for carrying out the physics
(a) (b) (c)
L
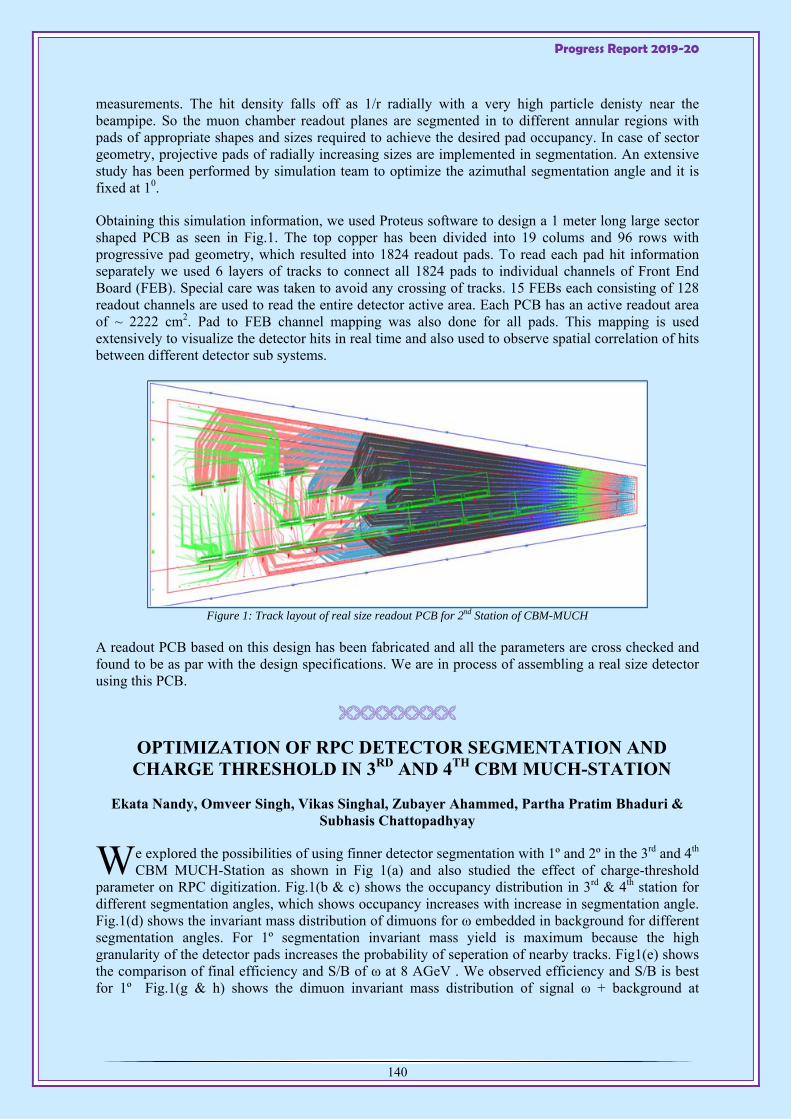
Progress Report 2019-20
140
measurements. The hit density falls off as 1/r radially with a very high particle denisty near the beampipe. So the muon chamber readout planes are segmented in to different annular regions with pads of appropriate shapes and sizes required to achieve the desired pad occupancy. In case of sector geometry, projective pads of radially increasing sizes are implemented in segmentation. An extensive study has been performed by simulation team to optimize the azimuthal segmentation angle and it is fixed at 10.
Obtaining this simulation information, we used Proteus software to design a 1 meter long large sector shaped PCB as seen in Fig.1. The top copper has been divided into 19 colums and 96 rows with progressive pad geometry, which resulted into 1824 readout pads. To read each pad hit information separately we used 6 layers of tracks to connect all 1824 pads to individual channels of Front End Board (FEB). Special care was taken to avoid any crossing of tracks. 15 FEBs each consisting of 128 readout channels are used to read the entire detector active area. Each PCB has an active readout area of ~ 2222 cm2. Pad to FEB channel mapping was also done for all pads. This mapping is used extensively to visualize the detector hits in real time and also used to observe spatial correlation of hits between different detector sub systems.
Figure 1: Track layout of real size readout PCB for 2nd Station of CBM-MUCH
A readout PCB based on this design has been fabricated and all the parameters are cross checked and found to be as par with the design specifications. We are in process of assembling a real size detector using this PCB.
OPTIMIZATION OF RPC DETECTOR SEGMENTATION AND CHARGE THRESHOLD IN 3RD AND 4TH CBM MUCH-STATION
Ekata Nandy, Omveer Singh, Vikas Singhal, Zubayer Ahammed, Partha Pratim Bhaduri & Subhasis Chattopadhyay
e explored the possibilities of using finner detector segmentation with 1º and 2º in the 3rd and 4th CBM MUCH-Station as shown in Fig 1(a) and also studied the effect of charge-threshold
parameter on RPC digitization. Fig.1(b & c) shows the occupancy distribution in 3rd & 4th station for different segmentation angles, which shows occupancy increases with increase in segmentation angle. Fig.1(d) shows the invariant mass distribution of dimuons for ω embedded in background for different segmentation angles. For 1º segmentation invariant mass yield is maximum because the high granularity of the detector pads increases the probability of seperation of nearby tracks. Fig1(e) shows the comparison of final efficiency and S/B of ω at 8 AGeV . We observed efficiency and S/B is best for 1º Fig.1(g & h) shows the dimuon invariant mass distribution of signal ω + background at
W
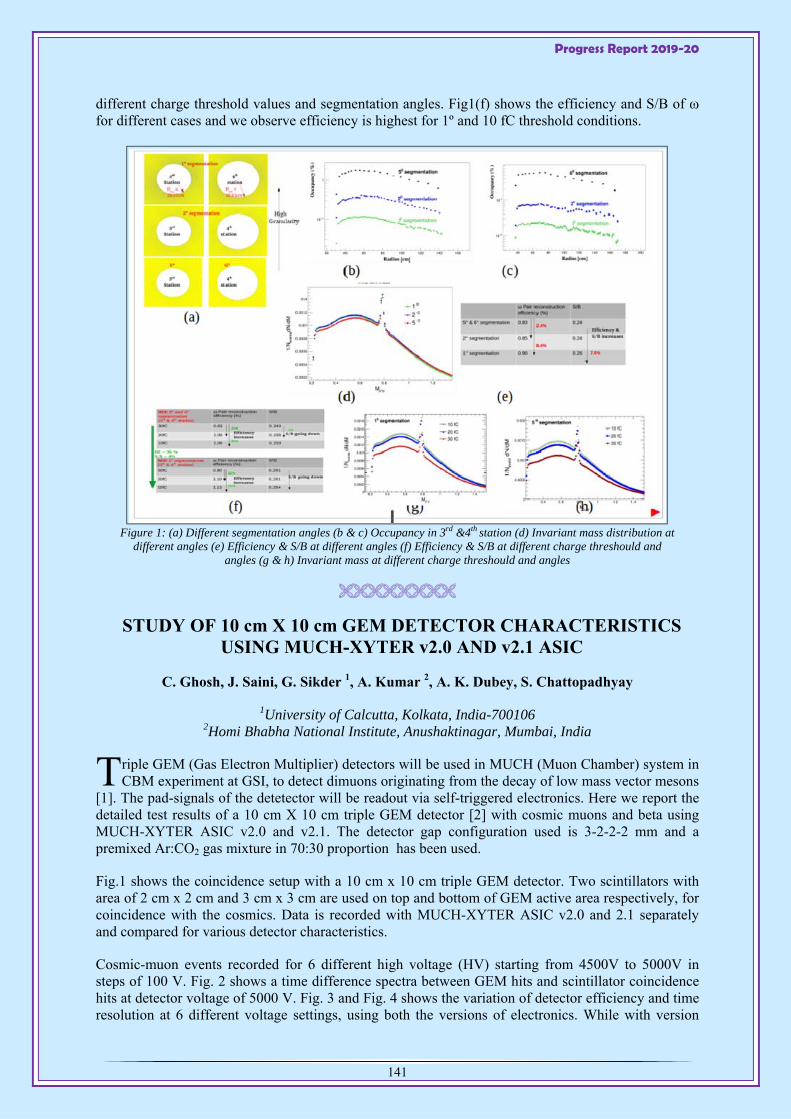
Progress Report 2019-20
141
different charge threshold values and segmentation angles. Fig1(f) shows the efficiency and S/B of ω for different cases and we observe efficiency is highest for 1º and 10 fC threshold conditions.
Figure 1: (a) Different segmentation angles (b & c) Occupancy in 3rd &4th station (d) Invariant mass distribution at
different angles (e) Efficiency & S/B at different angles (f) Efficiency & S/B at different charge threshould and angles (g & h) Invariant mass at different charge threshould and angles
STUDY OF 10 cm X 10 cm GEM DETECTOR CHARACTERISTICS USING MUCH-XYTER v2.0 AND v2.1 ASIC
C. Ghosh, J. Saini, G. Sikder 1, A. Kumar 2, A. K. Dubey, S. Chattopadhyay
1University of Calcutta, Kolkata, India-700106 2Homi Bhabha National Institute, Anushaktinagar, Mumbai, India
riple GEM (Gas Electron Multiplier) detectors will be used in MUCH (Muon Chamber) system in CBM experiment at GSI, to detect dimuons originating from the decay of low mass vector mesons
[1]. The pad-signals of the detetector will be readout via self-triggered electronics. Here we report the detailed test results of a 10 cm X 10 cm triple GEM detector [2] with cosmic muons and beta using MUCH-XYTER ASIC v2.0 and v2.1. The detector gap configuration used is 3-2-2-2 mm and a premixed Ar:CO2 gas mixture in 70:30 proportion has been used.
Fig.1 shows the coincidence setup with a 10 cm x 10 cm triple GEM detector. Two scintillators with area of 2 cm x 2 cm and 3 cm x 3 cm are used on top and bottom of GEM active area respectively, for coincidence with the cosmics. Data is recorded with MUCH-XYTER ASIC v2.0 and 2.1 separately and compared for various detector characteristics.
Cosmic-muon events recorded for 6 different high voltage (HV) starting from 4500V to 5000V in steps of 100 V. Fig. 2 shows a time difference spectra between GEM hits and scintillator coincidence hits at detector voltage of 5000 V. Fig. 3 and Fig. 4 shows the variation of detector efficiency and time resolution at 6 different voltage settings, using both the versions of electronics. While with version
T
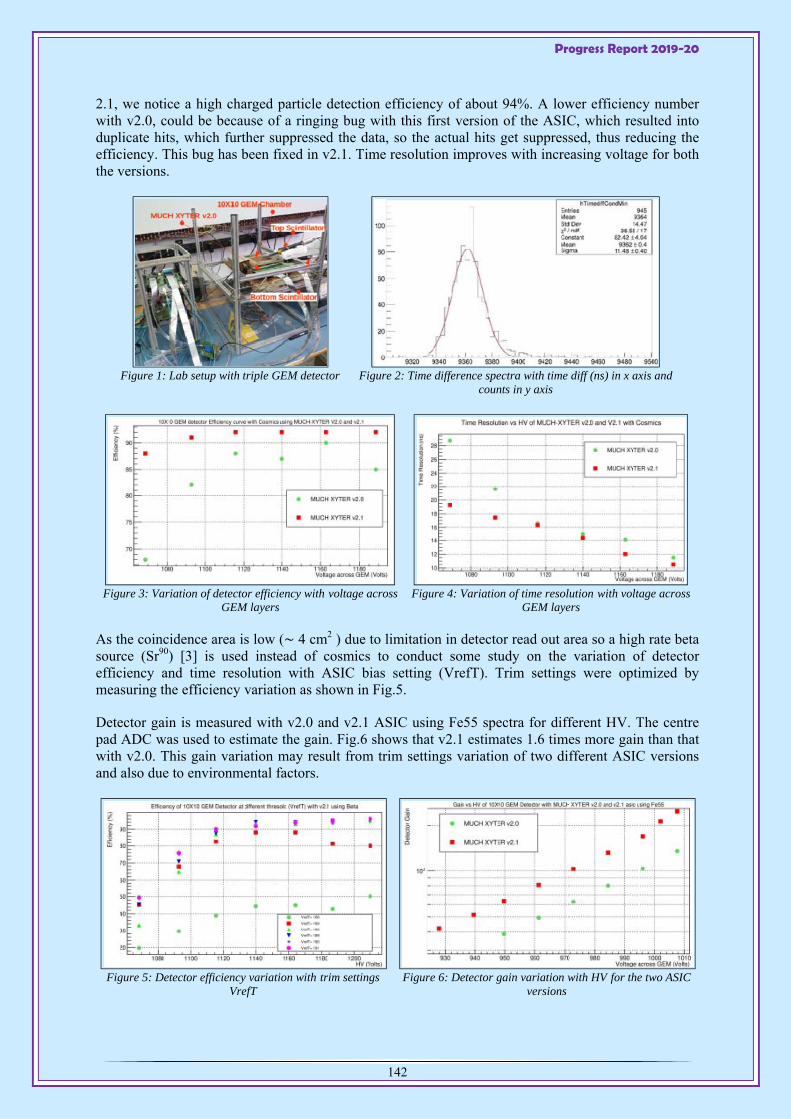
Progress Report 2019-20
142
2.1, we notice a high charged particle detection efficiency of about 94%. A lower efficiency number with v2.0, could be because of a ringing bug with this first version of the ASIC, which resulted into duplicate hits, which further suppressed the data, so the actual hits get suppressed, thus reducing the efficiency. This bug has been fixed in v2.1. Time resolution improves with increasing voltage for both the versions.
Figure 1: Lab setup with triple GEM detector
Figure 2: Time difference spectra with time diff (ns) in x axis and
counts in y axis
Figure 3: Variation of detector efficiency with voltage across GEM layers
Figure 4: Variation of time resolution with voltage across
GEM layers
As the coincidence area is low (∼ 4 cm2 ) due to limitation in detector read out area so a high rate beta source (Sr90) [3] is used instead of cosmics to conduct some study on the variation of detector efficiency and time resolution with ASIC bias setting (VrefT). Trim settings were optimized by measuring the efficiency variation as shown in Fig.5.
Detector gain is measured with v2.0 and v2.1 ASIC using Fe55 spectra for different HV. The centre pad ADC was used to estimate the gain. Fig.6 shows that v2.1 estimates 1.6 times more gain than that with v2.0. This gain variation may result from trim settings variation of two different ASIC versions and also due to environmental factors.
Figure 5: Detector efficiency variation with trim settings VrefT
Figure 6: Detector gain variation with HV for the two ASIC versions

Progress Report 2019-20
143
Further investigations are going on in this direction.
References: [1] Technical Design Report for the CBM, Muon Chambers, November, 2014. [2] A. K. Dubey et al., Nucl. Instr. Meth. A , 755 (2014) 62-68. [3] A. Kumar et al., Proceedings of the DAE Symp. on Nucl.Phys. 63 (2018)
CROSSTALK STUDY OF A LOW RESISTIVE BAKELITE RPC PROTOTYPE FOR THE 3RD AND 4TH STATIONS OF CBM-MUCH
M. Mondal 1, J. Saini , T. Dey1, R. Ganai 2, Z. Ahammed, and S. Chattopadhyay
1VECC-HBNI, 1/AF, Bidhan Nagar, Kolkata, 700064, India; 2 Calcutta University, Kolkata,
single gap (2 mm) bakelite RPC detector of bulk resistivity (4 × 10 10 Ω-cm) has been tested using a strip readout and STS-XYTER 2.0 readout at a cosmic ray setup at VECC and at the
GIF++ beam test at CERN to be used for the 3rd and 4th station of CBM-MuCh detector system. The test results at GIF++ showed a larger cluster size than expected indicating higher cross-talks to the neighbouring strips. We report a series of studies performed at VECC on reduction of cluster size thereby minimising the crosstalk.
Test Setup and Results: The RPC module was tested with two differnt gas mixture ratios of R134a: iC4H10 : SF6 , GasI, 95 : 4.5: 0.5 and Gas II, 90 : 5: 5 and three different types of PCB, (i) P1, 10 cm x 10 cm with 4 mm x 4 mm pads, (ii) P2 , 30 cm x 30 cm with 2.8 cm x 2.8 cm pads, (ii) P3, 30 cm x 30 cm rwith 2 mm thick long strips.
Figure 1: Cluster size of RPC at 9.6 KV with P1
PRC & Gas Mixture G1.
Figure 2: Variation of efficiency and cluster size with voltage for
Gas-I, P-1 readout panel (Threshold: 18fC, 0.5% SF6)
PCB & Gas Threshold HV Efficiency Cluster Size Spread P1, Gas-I 18 fC 9.6 kV 84 % 15 pads 2 cm x 2 cm P2, Gas-I 8 fC 9.4 kV 92.6% 14 Pads 14 cm x 14 cm
P3, Gas-I (1%SF6) 18 fC 10 kV 84.8% 15 strips 3 cm in X-axis P3, Gas-II 18 fC 11.2 kV 81% 20 strips 4 cm in X-axis
As the self-triggered electronics STS-XYTER is highly prone to noise, several efforts have been made to reduce the noise to operate the detector at lower threshold. Among them, most important changes were the introduction of a low pass filter in the high voltage line of the detector to block the AC noise, an EMI shielded copper box to put the detector inside, a common grounding scheme between the electronics and detector readout as well as the copper box, increasing the distance between the ground
A
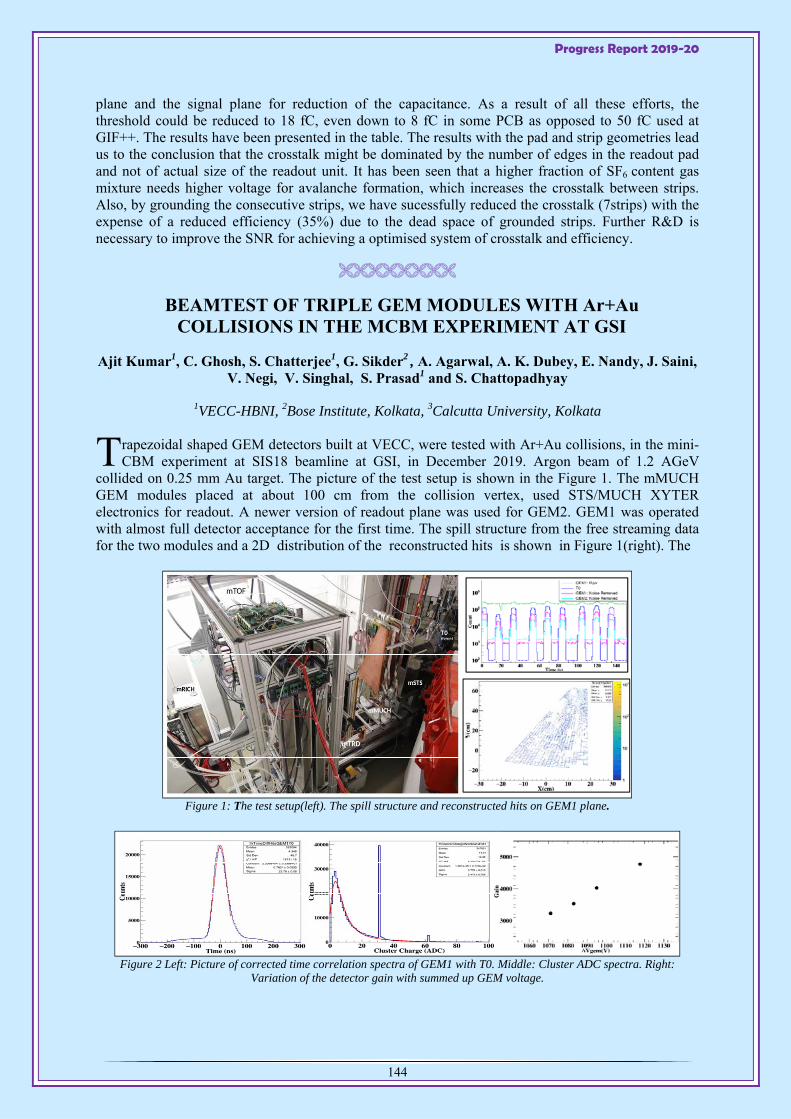
Progress Report 2019-20
144
plane and the signal plane for reduction of the capacitance. As a result of all these efforts, the threshold could be reduced to 18 fC, even down to 8 fC in some PCB as opposed to 50 fC used at GIF++. The results have been presented in the table. The results with the pad and strip geometries lead us to the conclusion that the crosstalk might be dominated by the number of edges in the readout pad and not of actual size of the readout unit. It has been seen that a higher fraction of SF6 content gas mixture needs higher voltage for avalanche formation, which increases the crosstalk between strips. Also, by grounding the consecutive strips, we have sucessfully reduced the crosstalk (7strips) with the expense of a reduced efficiency (35%) due to the dead space of grounded strips. Further R&D is necessary to improve the SNR for achieving a optimised system of crosstalk and efficiency.
BEAMTEST OF TRIPLE GEM MODULES WITH Ar+Au COLLISIONS IN THE MCBM EXPERIMENT AT GSI
Ajit Kumar1, C. Ghosh, S. Chatterjee1, G. Sikder2 , A. Agarwal, A. K. Dubey, E. Nandy, J. Saini, V. Negi, V. Singhal, S. Prasad1 and S. Chattopadhyay
1VECC-HBNI, 2Bose Institute, Kolkata, 3Calcutta University, Kolkata
rapezoidal shaped GEM detectors built at VECC, were tested with Ar+Au collisions, in the mini-CBM experiment at SIS18 beamline at GSI, in December 2019. Argon beam of 1.2 AGeV
collided on 0.25 mm Au target. The picture of the test setup is shown in the Figure 1. The mMUCH GEM modules placed at about 100 cm from the collision vertex, used STS/MUCH XYTER electronics for readout. A newer version of readout plane was used for GEM2. GEM1 was operated with almost full detector acceptance for the first time. The spill structure from the free streaming data for the two modules and a 2D distribution of the reconstructed hits is shown in Figure 1(right). The
Figure 1: The test setup(left). The spill structure and reconstructed hits on GEM1 plane.
Figure 2 Left: Picture of corrected time correlation spectra of GEM1 with T0. Middle: Cluster ADC spectra. Right:
Variation of the detector gain with summed up GEM voltage.
T
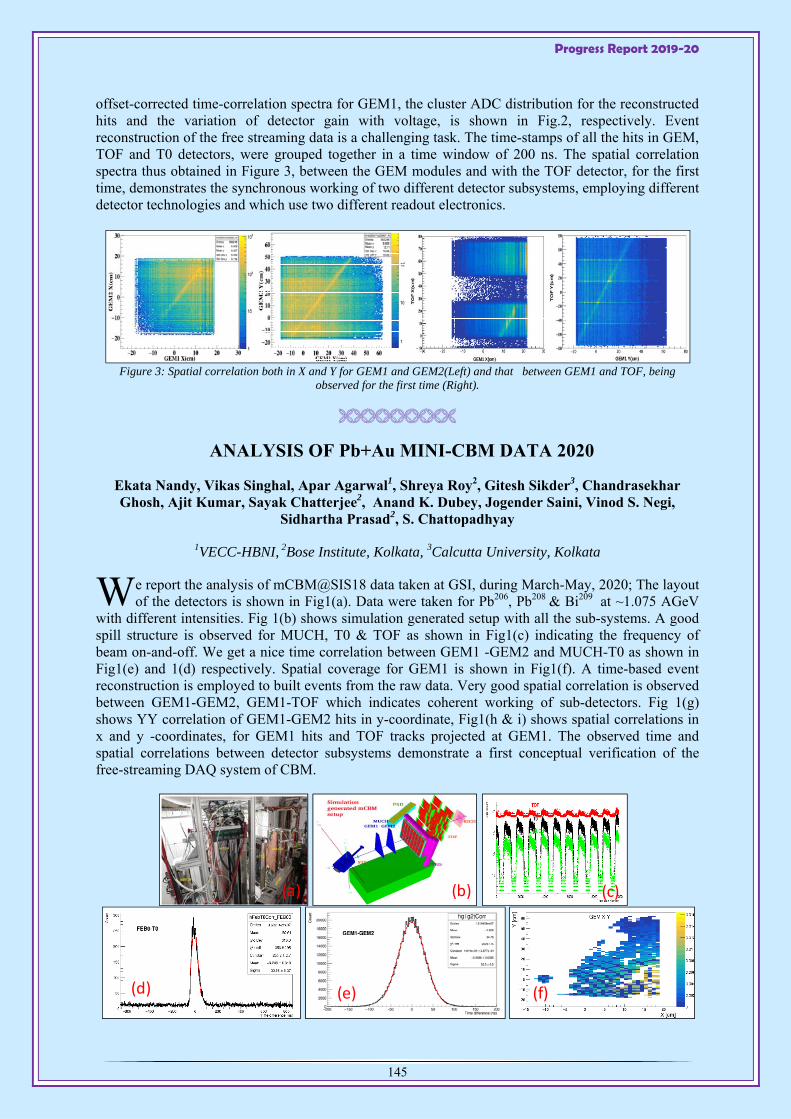
Progress Report 2019-20
145
offset-corrected time-correlation spectra for GEM1, the cluster ADC distribution for the reconstructed hits and the variation of detector gain with voltage, is shown in Fig.2, respectively. Event reconstruction of the free streaming data is a challenging task. The time-stamps of all the hits in GEM, TOF and T0 detectors, were grouped together in a time window of 200 ns. The spatial correlation spectra thus obtained in Figure 3, between the GEM modules and with the TOF detector, for the first time, demonstrates the synchronous working of two different detector subsystems, employing different detector technologies and which use two different readout electronics.
Figure 3: Spatial correlation both in X and Y for GEM1 and GEM2(Left) and that between GEM1 and TOF, being observed for the first time (Right).
ANALYSIS OF Pb+Au MINI-CBM DATA 2020
Ekata Nandy, Vikas Singhal, Apar Agarwal1, Shreya Roy2, Gitesh Sikder3, Chandrasekhar Ghosh, Ajit Kumar, Sayak Chatterjee2, Anand K. Dubey, Jogender Saini, Vinod S. Negi,
Sidhartha Prasad2, S. Chattopadhyay
1VECC-HBNI, 2Bose Institute, Kolkata, 3Calcutta University, Kolkata
e report the analysis of mCBM@SIS18 data taken at GSI, during March-May, 2020; The layout of the detectors is shown in Fig1(a). Data were taken for Pb206, Pb208 & Bi209 at ~1.075 AGeV
with different intensities. Fig 1(b) shows simulation generated setup with all the sub-systems. A good spill structure is observed for MUCH, T0 & TOF as shown in Fig1(c) indicating the frequency of beam on-and-off. We get a nice time correlation between GEM1 -GEM2 and MUCH-T0 as shown in Fig1(e) and 1(d) respectively. Spatial coverage for GEM1 is shown in Fig1(f). A time-based event reconstruction is employed to built events from the raw data. Very good spatial correlation is observed between GEM1-GEM2, GEM1-TOF which indicates coherent working of sub-detectors. Fig 1(g) shows YY correlation of GEM1-GEM2 hits in y-coordinate, Fig1(h & i) shows spatial correlations in x and y -coordinates, for GEM1 hits and TOF tracks projected at GEM1. The observed time and spatial correlations between detector subsystems demonstrate a first conceptual verification of the free-streaming DAQ system of CBM.
(a) (b) (c)
(f)(e)(d)
W
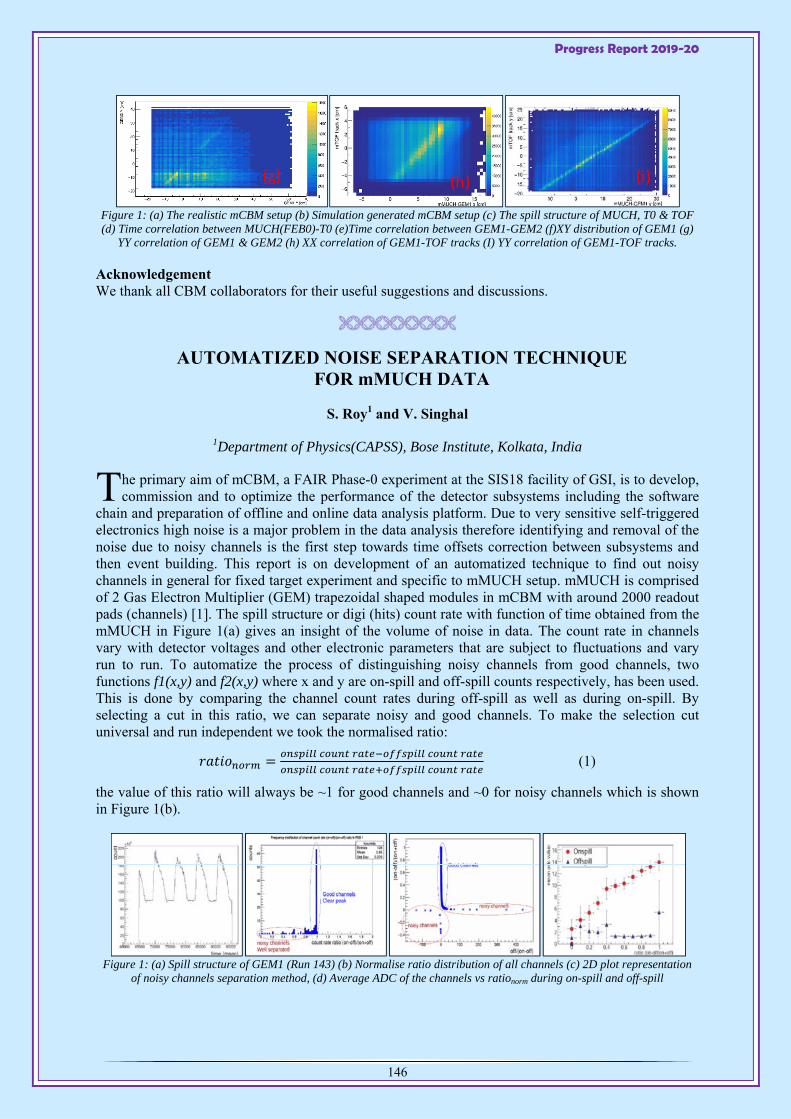
Progress Report 2019-20
146
Figure 1: (a) The realistic mCBM setup (b) Simulation generated mCBM setup (c) The spill structure of MUCH, T0 & TOF (d) Time correlation between MUCH(FEB0)-T0 (e)Time correlation between GEM1-GEM2 (f)XY distribution of GEM1 (g)
YY correlation of GEM1 & GEM2 (h) XX correlation of GEM1-TOF tracks (I) YY correlation of GEM1-TOF tracks.
Acknowledgement We thank all CBM collaborators for their useful suggestions and discussions.
AUTOMATIZED NOISE SEPARATION TECHNIQUE FOR mMUCH DATA
S. Roy1 and V. Singhal
1Department of Physics(CAPSS), Bose Institute, Kolkata, India
he primary aim of mCBM, a FAIR Phase-0 experiment at the SIS18 facility of GSI, is to develop, commission and to optimize the performance of the detector subsystems including the software
chain and preparation of offline and online data analysis platform. Due to very sensitive self-triggered electronics high noise is a major problem in the data analysis therefore identifying and removal of the noise due to noisy channels is the first step towards time offsets correction between subsystems and then event building. This report is on development of an automatized technique to find out noisy channels in general for fixed target experiment and specific to mMUCH setup. mMUCH is comprised of 2 Gas Electron Multiplier (GEM) trapezoidal shaped modules in mCBM with around 2000 readout pads (channels) [1]. The spill structure or digi (hits) count rate with function of time obtained from the mMUCH in Figure 1(a) gives an insight of the volume of noise in data. The count rate in channels vary with detector voltages and other electronic parameters that are subject to fluctuations and vary run to run. To automatize the process of distinguishing noisy channels from good channels, two functions f1(x,y) and f2(x,y) where x and y are on-spill and off-spill counts respectively, has been used. This is done by comparing the channel count rates during off-spill as well as during on-spill. By selecting a cut in this ratio, we can separate noisy and good channels. To make the selection cut universal and run independent we took the normalised ratio:
(1)
the value of this ratio will always be ~1 for good channels and ~0 for noisy channels which is shown in Figure 1(b).
Figure 1: (a) Spill structure of GEM1 (Run 143) (b) Normalise ratio distribution of all channels (c) 2D plot representation
of noisy channels separation method, (d) Average ADC of the channels vs rationorm during on-spill and off-spill
(g) (i)(h)
T
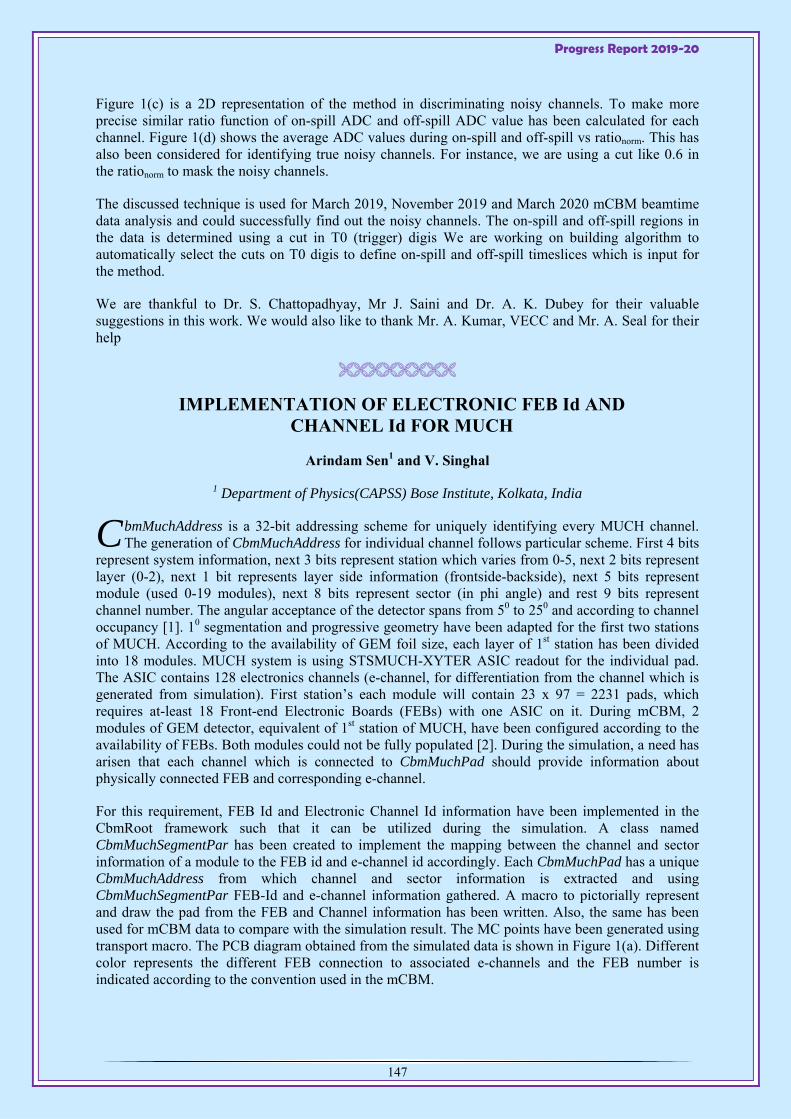
Progress Report 2019-20
147
Figure 1(c) is a 2D representation of the method in discriminating noisy channels. To make more precise similar ratio function of on-spill ADC and off-spill ADC value has been calculated for each channel. Figure 1(d) shows the average ADC values during on-spill and off-spill vs rationorm. This has also been considered for identifying true noisy channels. For instance, we are using a cut like 0.6 in the rationorm to mask the noisy channels.
The discussed technique is used for March 2019, November 2019 and March 2020 mCBM beamtime data analysis and could successfully find out the noisy channels. The on-spill and off-spill regions in the data is determined using a cut in T0 (trigger) digis We are working on building algorithm to automatically select the cuts on T0 digis to define on-spill and off-spill timeslices which is input for the method.
We are thankful to Dr. S. Chattopadhyay, Mr J. Saini and Dr. A. K. Dubey for their valuable suggestions in this work. We would also like to thank Mr. A. Kumar, VECC and Mr. A. Seal for their help
IMPLEMENTATION OF ELECTRONIC FEB Id AND CHANNEL Id FOR MUCH
Arindam Sen1 and V. Singhal
1 Department of Physics(CAPSS) Bose Institute, Kolkata, India
bmMuchAddress is a 32-bit addressing scheme for uniquely identifying every MUCH channel. The generation of CbmMuchAddress for individual channel follows particular scheme. First 4 bits
represent system information, next 3 bits represent station which varies from 0-5, next 2 bits represent layer (0-2), next 1 bit represents layer side information (frontside-backside), next 5 bits represent module (used 0-19 modules), next 8 bits represent sector (in phi angle) and rest 9 bits represent channel number. The angular acceptance of the detector spans from 50 to 250 and according to channel occupancy [1]. 10 segmentation and progressive geometry have been adapted for the first two stations of MUCH. According to the availability of GEM foil size, each layer of 1st station has been divided into 18 modules. MUCH system is using STSMUCH-XYTER ASIC readout for the individual pad. The ASIC contains 128 electronics channels (e-channel, for differentiation from the channel which is generated from simulation). First station’s each module will contain 23 x 97 = 2231 pads, which requires at-least 18 Front-end Electronic Boards (FEBs) with one ASIC on it. During mCBM, 2 modules of GEM detector, equivalent of 1st station of MUCH, have been configured according to the availability of FEBs. Both modules could not be fully populated [2]. During the simulation, a need has arisen that each channel which is connected to CbmMuchPad should provide information about physically connected FEB and corresponding e-channel.
For this requirement, FEB Id and Electronic Channel Id information have been implemented in the CbmRoot framework such that it can be utilized during the simulation. A class named CbmMuchSegmentPar has been created to implement the mapping between the channel and sector information of a module to the FEB id and e-channel id accordingly. Each CbmMuchPad has a unique CbmMuchAddress from which channel and sector information is extracted and using CbmMuchSegmentPar FEB-Id and e-channel information gathered. A macro to pictorially represent and draw the pad from the FEB and Channel information has been written. Also, the same has been used for mCBM data to compare with the simulation result. The MC points have been generated using transport macro. The PCB diagram obtained from the simulated data is shown in Figure 1(a). Different color represents the different FEB connection to associated e-channels and the FEB number is indicated according to the convention used in the mCBM.
C
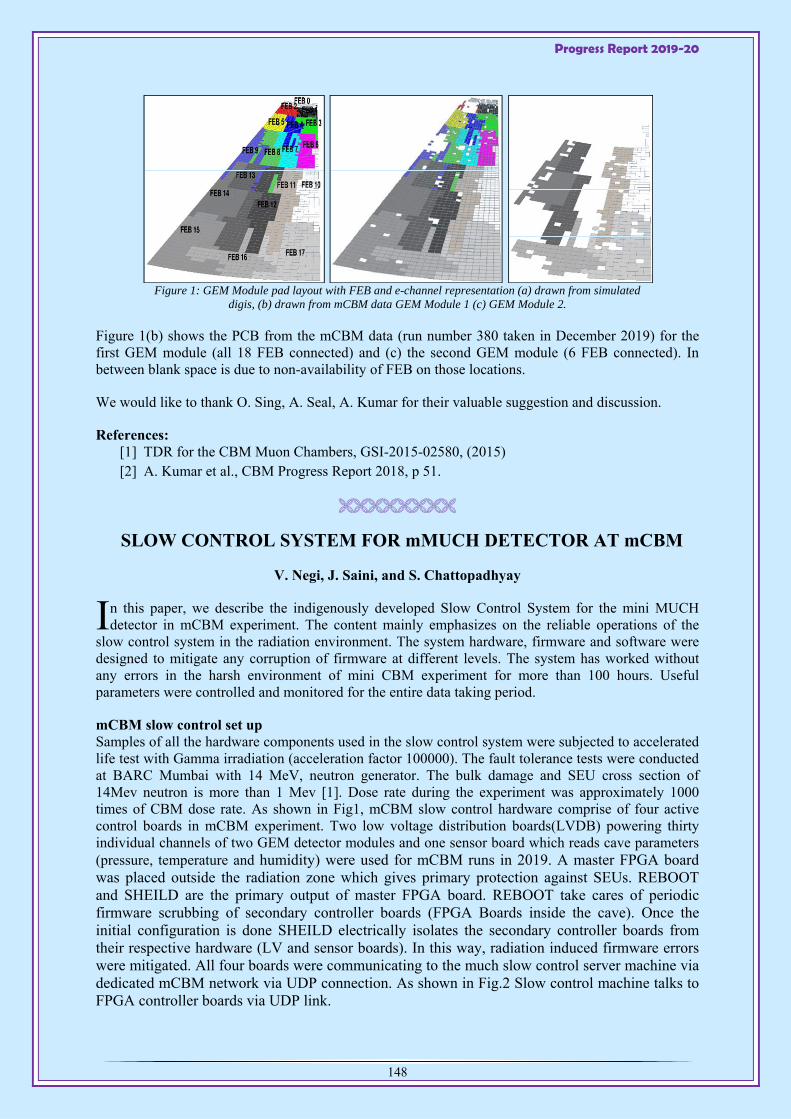
Progress Report 2019-20
148
Figure 1: GEM Module pad layout with FEB and e-channel representation (a) drawn from simulated
digis, (b) drawn from mCBM data GEM Module 1 (c) GEM Module 2.
Figure 1(b) shows the PCB from the mCBM data (run number 380 taken in December 2019) for the first GEM module (all 18 FEB connected) and (c) the second GEM module (6 FEB connected). In between blank space is due to non-availability of FEB on those locations.
We would like to thank O. Sing, A. Seal, A. Kumar for their valuable suggestion and discussion.
References: [1] TDR for the CBM Muon Chambers, GSI-2015-02580, (2015) [2] A. Kumar et al., CBM Progress Report 2018, p 51.
SLOW CONTROL SYSTEM FOR mMUCH DETECTOR AT mCBM
V. Negi, J. Saini, and S. Chattopadhyay
n this paper, we describe the indigenously developed Slow Control System for the mini MUCH detector in mCBM experiment. The content mainly emphasizes on the reliable operations of the
slow control system in the radiation environment. The system hardware, firmware and software were designed to mitigate any corruption of firmware at different levels. The system has worked without any errors in the harsh environment of mini CBM experiment for more than 100 hours. Useful parameters were controlled and monitored for the entire data taking period.
mCBM slow control set up Samples of all the hardware components used in the slow control system were subjected to accelerated life test with Gamma irradiation (acceleration factor 100000). The fault tolerance tests were conducted at BARC Mumbai with 14 MeV, neutron generator. The bulk damage and SEU cross section of 14Mev neutron is more than 1 Mev [1]. Dose rate during the experiment was approximately 1000 times of CBM dose rate. As shown in Fig1, mCBM slow control hardware comprise of four active control boards in mCBM experiment. Two low voltage distribution boards(LVDB) powering thirty individual channels of two GEM detector modules and one sensor board which reads cave parameters (pressure, temperature and humidity) were used for mCBM runs in 2019. A master FPGA board was placed outside the radiation zone which gives primary protection against SEUs. REBOOT and SHEILD are the primary output of master FPGA board. REBOOT take cares of periodic firmware scrubbing of secondary controller boards (FPGA Boards inside the cave). Once the initial configuration is done SHEILD electrically isolates the secondary controller boards from their respective hardware (LV and sensor boards). In this way, radiation induced firmware errors were mitigated. All four boards were communicating to the much slow control server machine via dedicated mCBM network via UDP connection. As shown in Fig.2 Slow control machine talks to FPGA controller boards via UDP link.
I
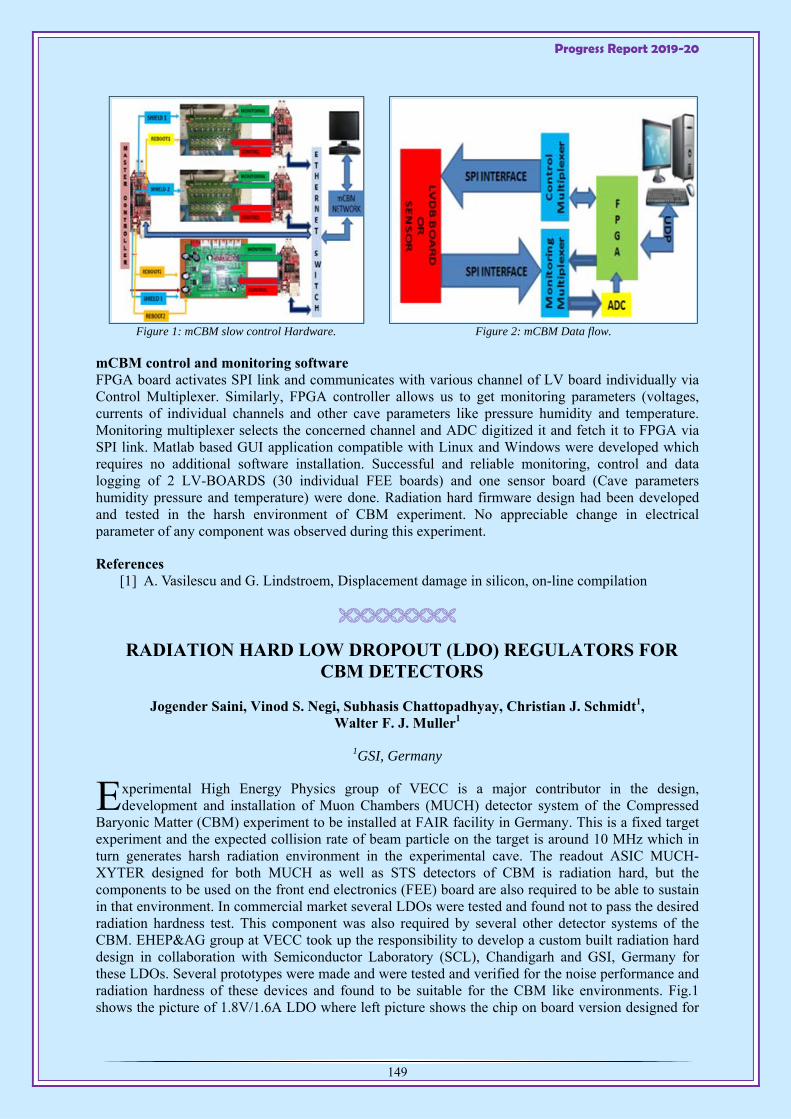
Progress Report 2019-20
149
Figure 1: mCBM slow control Hardware. Figure 2: mCBM Data flow.
mCBM control and monitoring software FPGA board activates SPI link and communicates with various channel of LV board individually via Control Multiplexer. Similarly, FPGA controller allows us to get monitoring parameters (voltages, currents of individual channels and other cave parameters like pressure humidity and temperature. Monitoring multiplexer selects the concerned channel and ADC digitized it and fetch it to FPGA via SPI link. Matlab based GUI application compatible with Linux and Windows were developed which requires no additional software installation. Successful and reliable monitoring, control and data logging of 2 LV-BOARDS (30 individual FEE boards) and one sensor board (Cave parameters humidity pressure and temperature) were done. Radiation hard firmware design had been developed and tested in the harsh environment of CBM experiment. No appreciable change in electrical parameter of any component was observed during this experiment.
References [1] A. Vasilescu and G. Lindstroem, Displacement damage in silicon, on-line compilation
RADIATION HARD LOW DROPOUT (LDO) REGULATORS FOR CBM DETECTORS
Jogender Saini, Vinod S. Negi, Subhasis Chattopadhyay, Christian J. Schmidt1, Walter F. J. Muller1
1GSI, Germany
xperimental High Energy Physics group of VECC is a major contributor in the design, development and installation of Muon Chambers (MUCH) detector system of the Compressed
Baryonic Matter (CBM) experiment to be installed at FAIR facility in Germany. This is a fixed target experiment and the expected collision rate of beam particle on the target is around 10 MHz which in turn generates harsh radiation environment in the experimental cave. The readout ASIC MUCH-XYTER designed for both MUCH as well as STS detectors of CBM is radiation hard, but the components to be used on the front end electronics (FEE) board are also required to be able to sustain in that environment. In commercial market several LDOs were tested and found not to pass the desired radiation hardness test. This component was also required by several other detector systems of the CBM. EHEP&AG group at VECC took up the responsibility to develop a custom built radiation hard design in collaboration with Semiconductor Laboratory (SCL), Chandigarh and GSI, Germany for these LDOs. Several prototypes were made and were tested and verified for the noise performance and radiation hardness of these devices and found to be suitable for the CBM like environments. Fig.1 shows the picture of 1.8V/1.6A LDO where left picture shows the chip on board version designed for
E
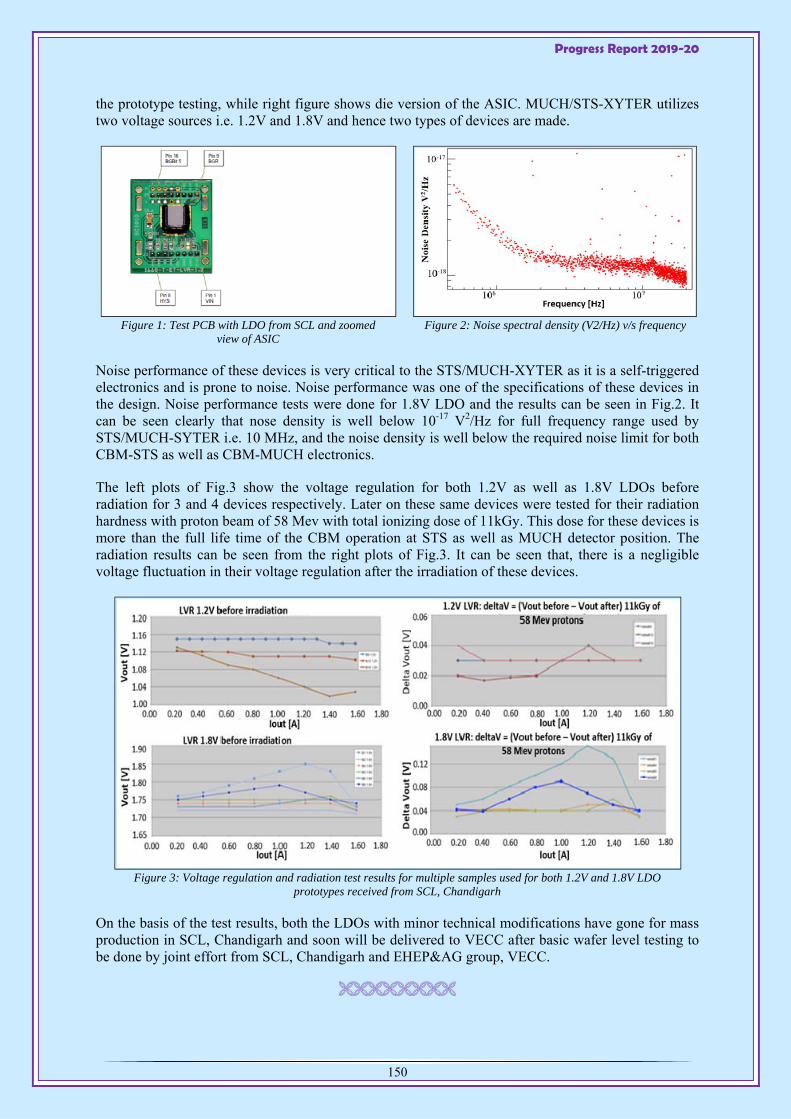
Progress Report 2019-20
150
the prototype testing, while right figure shows die version of the ASIC. MUCH/STS-XYTER utilizes two voltage sources i.e. 1.2V and 1.8V and hence two types of devices are made.
Figure 1: Test PCB with LDO from SCL and zoomed
view of ASIC Figure 2: Noise spectral density (V2/Hz) v/s frequency
Noise performance of these devices is very critical to the STS/MUCH-XYTER as it is a self-triggered electronics and is prone to noise. Noise performance was one of the specifications of these devices in the design. Noise performance tests were done for 1.8V LDO and the results can be seen in Fig.2. It can be seen clearly that nose density is well below 10-17 V2/Hz for full frequency range used by STS/MUCH-SYTER i.e. 10 MHz, and the noise density is well below the required noise limit for both CBM-STS as well as CBM-MUCH electronics.
The left plots of Fig.3 show the voltage regulation for both 1.2V as well as 1.8V LDOs before radiation for 3 and 4 devices respectively. Later on these same devices were tested for their radiation hardness with proton beam of 58 Mev with total ionizing dose of 11kGy. This dose for these devices is more than the full life time of the CBM operation at STS as well as MUCH detector position. The radiation results can be seen from the right plots of Fig.3. It can be seen that, there is a negligible voltage fluctuation in their voltage regulation after the irradiation of these devices.
Figure 3: Voltage regulation and radiation test results for multiple samples used for both 1.2V and 1.8V LDO prototypes received from SCL, Chandigarh
On the basis of the test results, both the LDOs with minor technical modifications have gone for mass production in SCL, Chandigarh and soon will be delivered to VECC after basic wafer level testing to be done by joint effort from SCL, Chandigarh and EHEP&AG group, VECC.

ONGOING PROJECTS
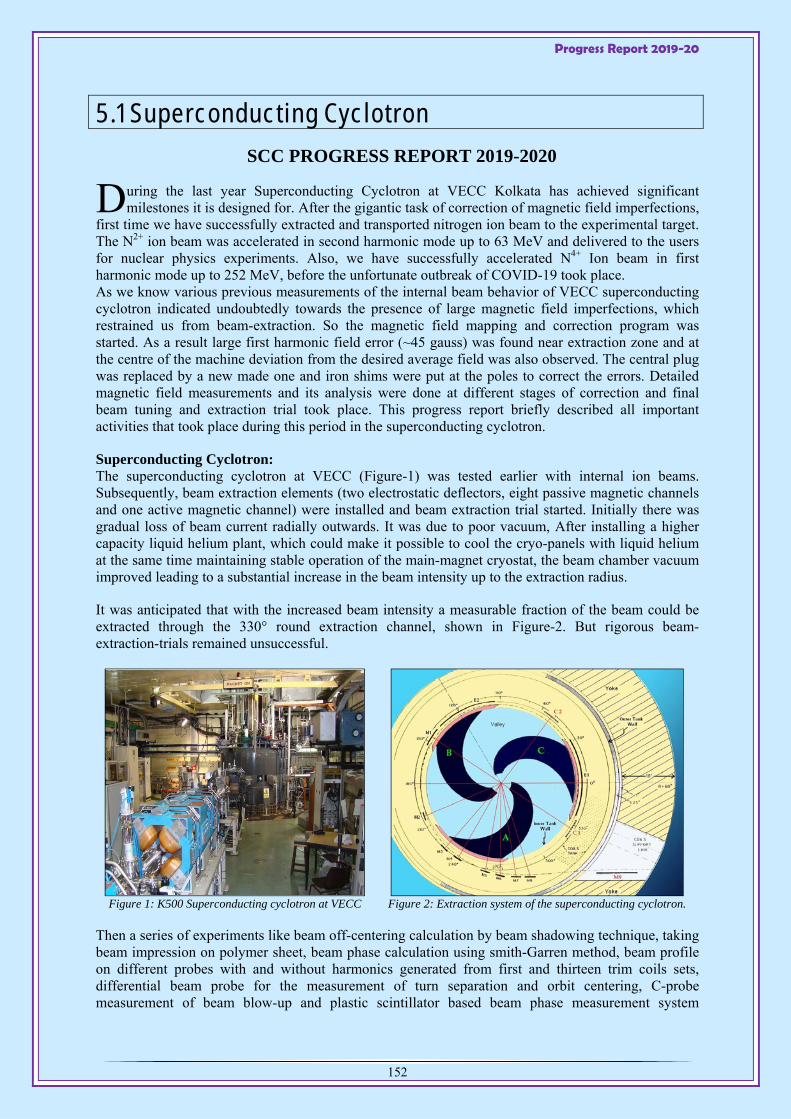
Progress Report 2019-20
152
5.1 Superconducting Cyclotron
SCC PROGRESS REPORT 2019-2020
uring the last year Superconducting Cyclotron at VECC Kolkata has achieved significant milestones it is designed for. After the gigantic task of correction of magnetic field imperfections,
first time we have successfully extracted and transported nitrogen ion beam to the experimental target. The N2+ ion beam was accelerated in second harmonic mode up to 63 MeV and delivered to the users for nuclear physics experiments. Also, we have successfully accelerated N4+ Ion beam in first harmonic mode up to 252 MeV, before the unfortunate outbreak of COVID-19 took place. As we know various previous measurements of the internal beam behavior of VECC superconducting cyclotron indicated undoubtedly towards the presence of large magnetic field imperfections, which restrained us from beam-extraction. So the magnetic field mapping and correction program was started. As a result large first harmonic field error (~45 gauss) was found near extraction zone and at the centre of the machine deviation from the desired average field was also observed. The central plug was replaced by a new made one and iron shims were put at the poles to correct the errors. Detailed magnetic field measurements and its analysis were done at different stages of correction and final beam tuning and extraction trial took place. This progress report briefly described all important activities that took place during this period in the superconducting cyclotron.
Superconducting Cyclotron: The superconducting cyclotron at VECC (Figure-1) was tested earlier with internal ion beams. Subsequently, beam extraction elements (two electrostatic deflectors, eight passive magnetic channels and one active magnetic channel) were installed and beam extraction trial started. Initially there was gradual loss of beam current radially outwards. It was due to poor vacuum, After installing a higher capacity liquid helium plant, which could make it possible to cool the cryo-panels with liquid helium at the same time maintaining stable operation of the main-magnet cryostat, the beam chamber vacuum improved leading to a substantial increase in the beam intensity up to the extraction radius.
It was anticipated that with the increased beam intensity a measurable fraction of the beam could be extracted through the 330° round extraction channel, shown in Figure-2. But rigorous beam-extraction-trials remained unsuccessful.
Figure 1: K500 Superconducting cyclotron at VECC
Figure 2: Extraction system of the superconducting cyclotron.
Then a series of experiments like beam off-centering calculation by beam shadowing technique, taking beam impression on polymer sheet, beam phase calculation using smith-Garren method, beam profile on different probes with and without harmonics generated from first and thirteen trim coils sets, differential beam probe for the measurement of turn separation and orbit centering, C-probe measurement of beam blow-up and plastic scintillator based beam phase measurement system
D
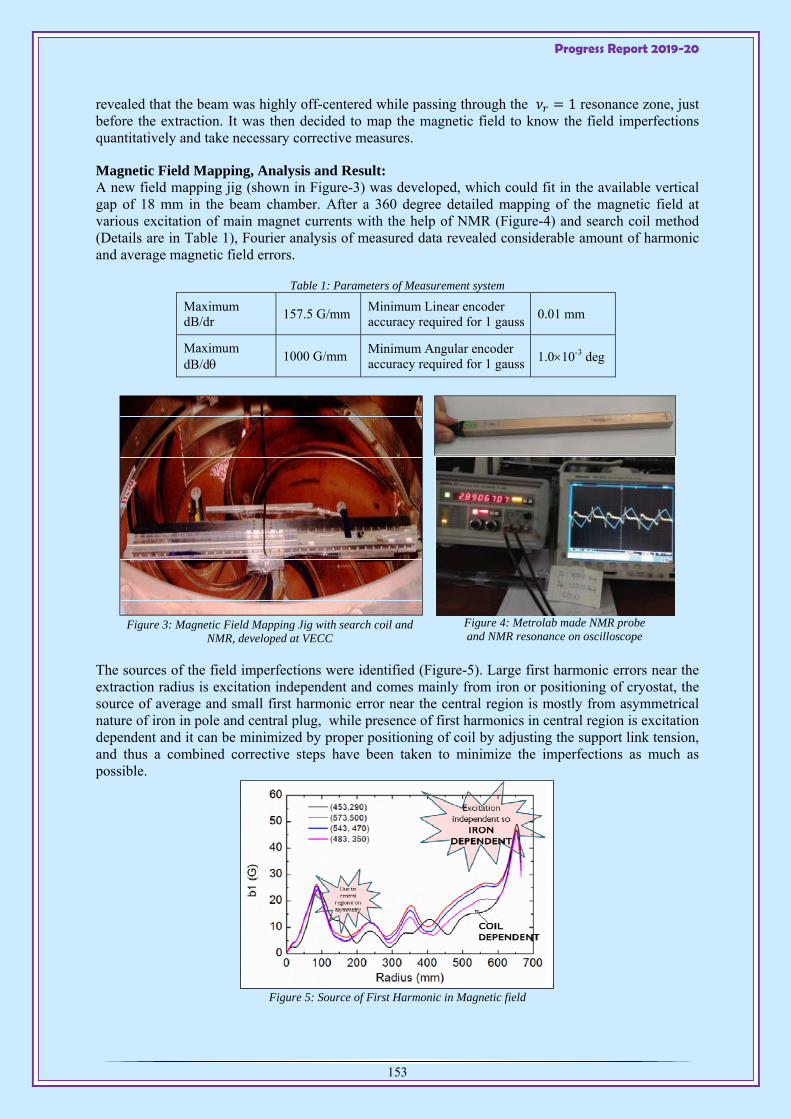
Progress Report 2019-20
153
revealed that the beam was highly off-centered while passing through the 1 resonance zone, just before the extraction. It was then decided to map the magnetic field to know the field imperfections quantitatively and take necessary corrective measures.
Magnetic Field Mapping, Analysis and Result: A new field mapping jig (shown in Figure-3) was developed, which could fit in the available vertical gap of 18 mm in the beam chamber. After a 360 degree detailed mapping of the magnetic field at various excitation of main magnet currents with the help of NMR (Figure-4) and search coil method (Details are in Table 1), Fourier analysis of measured data revealed considerable amount of harmonic and average magnetic field errors.
Table 1: Parameters of Measurement system
Maximum dB/dr
157.5 G/mm Minimum Linear encoder accuracy required for 1 gauss
0.01 mm
Maximum dB/d
1000 G/mm Minimum Angular encoder accuracy required for 1 gauss 1.010-3 deg
Figure 3: Magnetic Field Mapping Jig with search coil and NMR, developed at VECC
Figure 4: Metrolab made NMR probe and NMR resonance on oscilloscope
The sources of the field imperfections were identified (Figure-5). Large first harmonic errors near the extraction radius is excitation independent and comes mainly from iron or positioning of cryostat, the source of average and small first harmonic error near the central region is mostly from asymmetrical nature of iron in pole and central plug, while presence of first harmonics in central region is excitation dependent and it can be minimized by proper positioning of coil by adjusting the support link tension, and thus a combined corrective steps have been taken to minimize the imperfections as much as possible.
Figure 5: Source of First Harmonic in Magnetic field
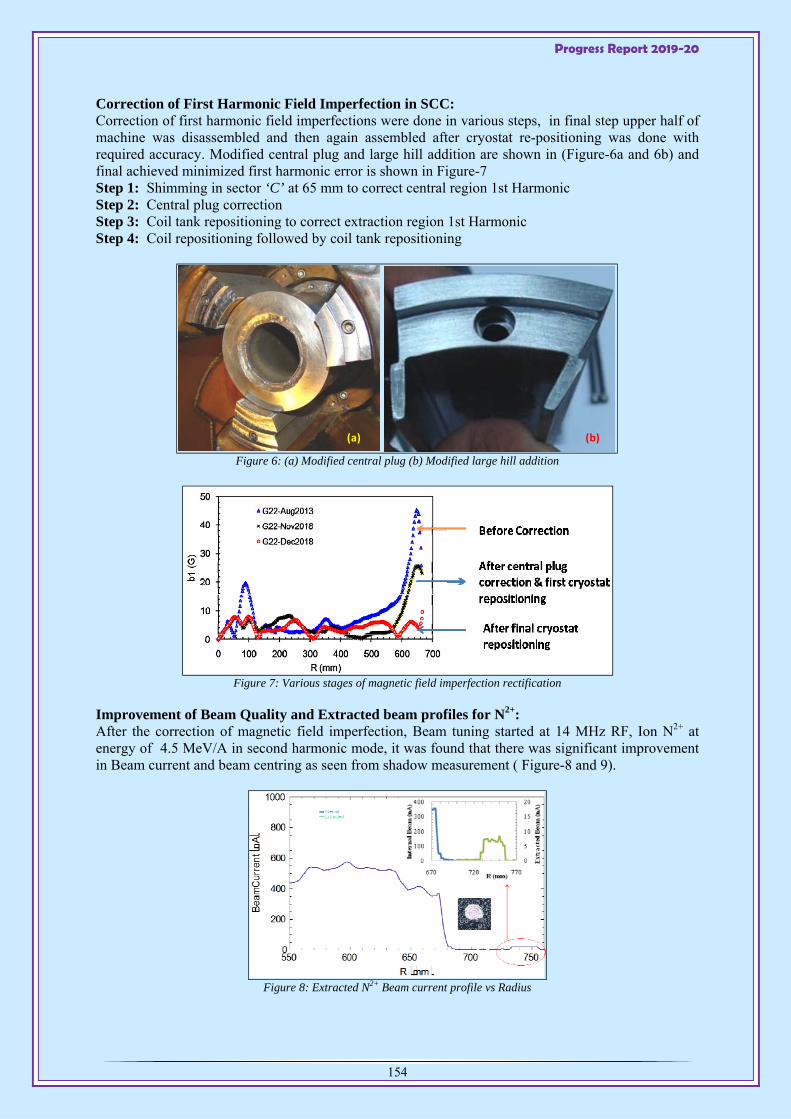
Progress Report 2019-20
154
Correction of First Harmonic Field Imperfection in SCC: Correction of first harmonic field imperfections were done in various steps, in final step upper half of machine was disassembled and then again assembled after cryostat re-positioning was done with required accuracy. Modified central plug and large hill addition are shown in (Figure-6a and 6b) and final achieved minimized first harmonic error is shown in Figure-7 Step 1: Shimming in sector ‘C’ at 65 mm to correct central region 1st Harmonic Step 2: Central plug correction Step 3: Coil tank repositioning to correct extraction region 1st Harmonic Step 4: Coil repositioning followed by coil tank repositioning
Figure 6: (a) Modified central plug (b) Modified large hill addition
Figure 7: Various stages of magnetic field imperfection rectification
Improvement of Beam Quality and Extracted beam profiles for N2+: After the correction of magnetic field imperfection, Beam tuning started at 14 MHz RF, Ion N2+ at energy of 4.5 MeV/A in second harmonic mode, it was found that there was significant improvement in Beam current and beam centring as seen from shadow measurement ( Figure-8 and 9).
Figure 8: Extracted N2+ Beam current profile vs Radius
(a) (b)
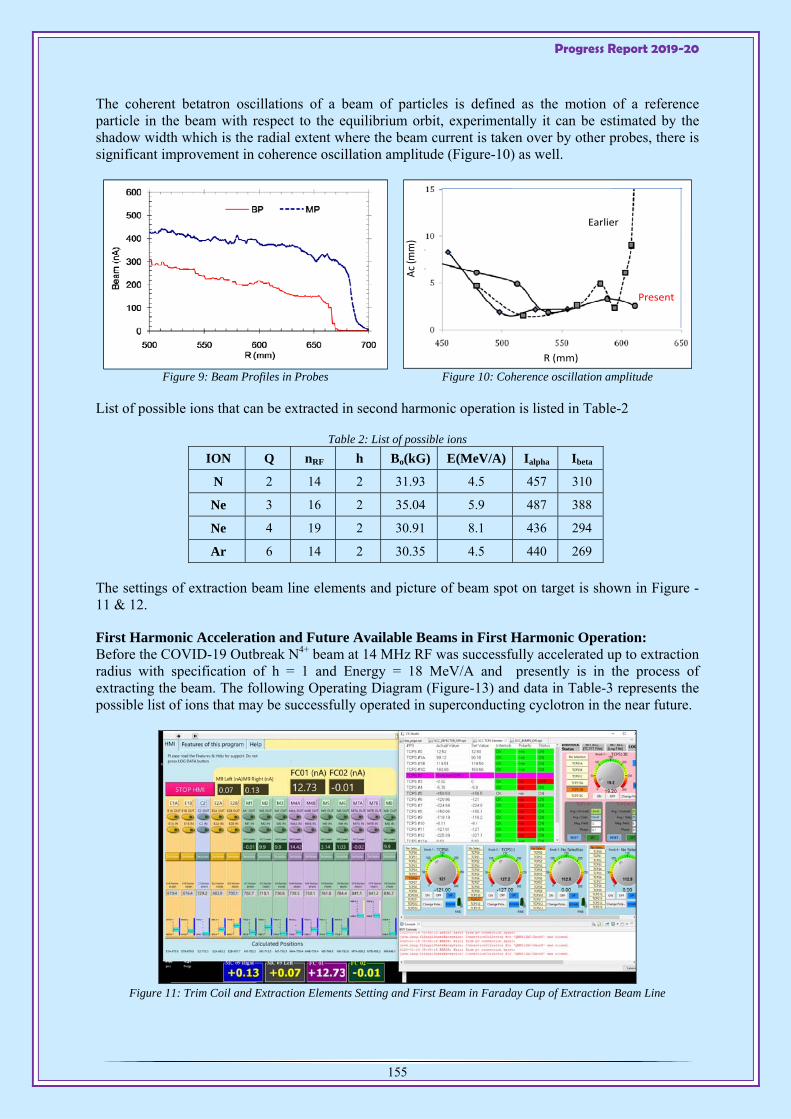
Progress Report 2019-20
155
The coherent betatron oscillations of a beam of particles is defined as the motion of a reference particle in the beam with respect to the equilibrium orbit, experimentally it can be estimated by the shadow width which is the radial extent where the beam current is taken over by other probes, there is significant improvement in coherence oscillation amplitude (Figure-10) as well.
Figure 9: Beam Profiles in Probes Figure 10: Coherence oscillation amplitude
List of possible ions that can be extracted in second harmonic operation is listed in Table-2
Table 2: List of possible ions
ION Q nRF h Bo(kG) E(MeV/A) Ialpha Ibeta
N 2 14 2 31.93 4.5 457 310
Ne 3 16 2 35.04 5.9 487 388
Ne 4 19 2 30.91 8.1 436 294
Ar 6 14 2 30.35 4.5 440 269
The settings of extraction beam line elements and picture of beam spot on target is shown in Figure -11 & 12.
First Harmonic Acceleration and Future Available Beams in First Harmonic Operation: Before the COVID-19 Outbreak N4+ beam at 14 MHz RF was successfully accelerated up to extraction radius with specification of h = 1 and Energy = 18 MeV/A and presently is in the process of extracting the beam. The following Operating Diagram (Figure-13) and data in Table-3 represents the possible list of ions that may be successfully operated in superconducting cyclotron in the near future.
Figure 11: Trim Coil and Extraction Elements Setting and First Beam in Faraday Cup of Extraction Beam Line
Earlier
Present
R (mm)
Ac (m
m)
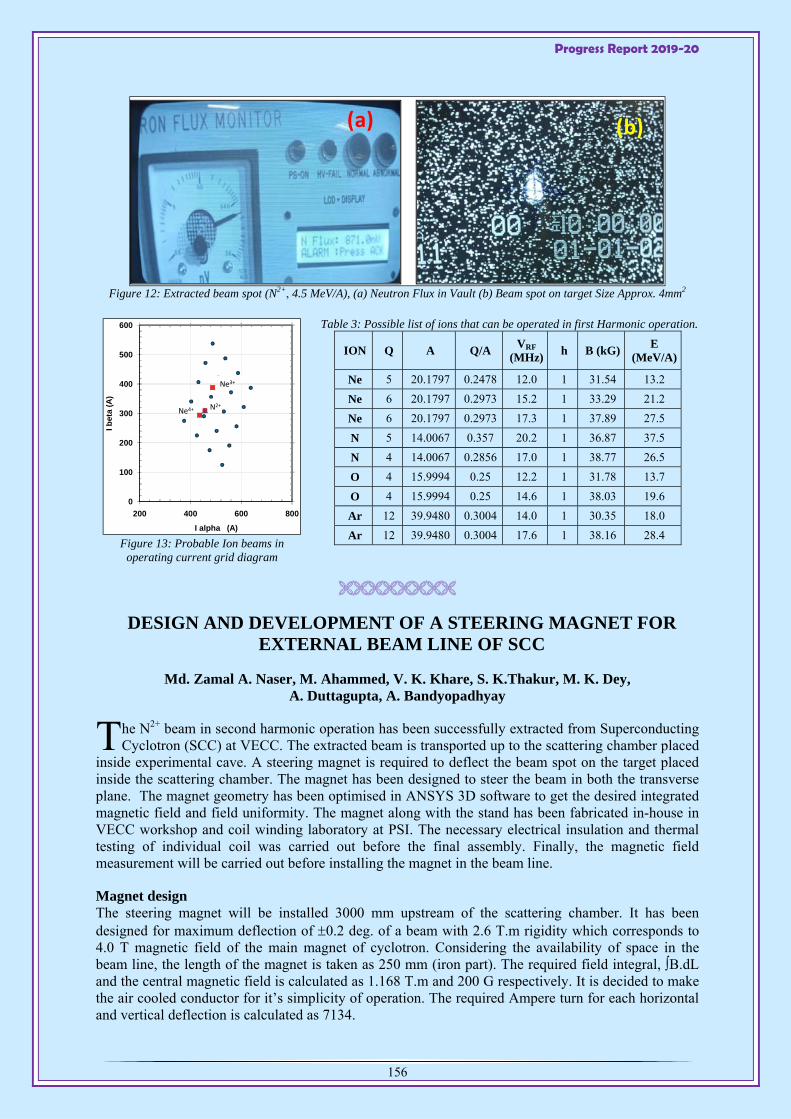
Progress Report 2019-20
156
Figure 12: Extracted beam spot (N2+, 4.5 MeV/A), (a) Neutron Flux in Vault (b) Beam spot on target Size Approx. 4mm2
Figure 13: Probable Ion beams in
operating current grid diagram
Table 3: Possible list of ions that can be operated in first Harmonic operation.
ION Q A Q/A VRF
(MHz)h B (kG)
E (MeV/A)
Ne 5 20.1797 0.2478 12.0 1 31.54 13.2
Ne 6 20.1797 0.2973 15.2 1 33.29 21.2
Ne 6 20.1797 0.2973 17.3 1 37.89 27.5
N 5 14.0067 0.357 20.2 1 36.87 37.5
N 4 14.0067 0.2856 17.0 1 38.77 26.5
O 4 15.9994 0.25 12.2 1 31.78 13.7
O 4 15.9994 0.25 14.6 1 38.03 19.6
Ar 12 39.9480 0.3004 14.0 1 30.35 18.0
Ar 12 39.9480 0.3004 17.6 1 38.16 28.4
DESIGN AND DEVELOPMENT OF A STEERING MAGNET FOR EXTERNAL BEAM LINE OF SCC
Md. Zamal A. Naser, M. Ahammed, V. K. Khare, S. K.Thakur, M. K. Dey, A. Duttagupta, A. Bandyopadhyay
he N2+ beam in second harmonic operation has been successfully extracted from Superconducting Cyclotron (SCC) at VECC. The extracted beam is transported up to the scattering chamber placed
inside experimental cave. A steering magnet is required to deflect the beam spot on the target placed inside the scattering chamber. The magnet has been designed to steer the beam in both the transverse plane. The magnet geometry has been optimised in ANSYS 3D software to get the desired integrated magnetic field and field uniformity. The magnet along with the stand has been fabricated in-house in VECC workshop and coil winding laboratory at PSI. The necessary electrical insulation and thermal testing of individual coil was carried out before the final assembly. Finally, the magnetic field measurement will be carried out before installing the magnet in the beam line.
Magnet design The steering magnet will be installed 3000 mm upstream of the scattering chamber. It has been designed for maximum deflection of 0.2 deg. of a beam with 2.6 T.m rigidity which corresponds to 4.0 T magnetic field of the main magnet of cyclotron. Considering the availability of space in the beam line, the length of the magnet is taken as 250 mm (iron part). The required field integral, ∫B.dL and the central magnetic field is calculated as 1.168 T.m and 200 G respectively. It is decided to make the air cooled conductor for it’s simplicity of operation. The required Ampere turn for each horizontal and vertical deflection is calculated as 7134.
(a) (b)
0
100
200
300
400
500
600
200 400 600 800
I beta
(A
)
I alpha (A)
Ne4+ N2+
Ne3+
T
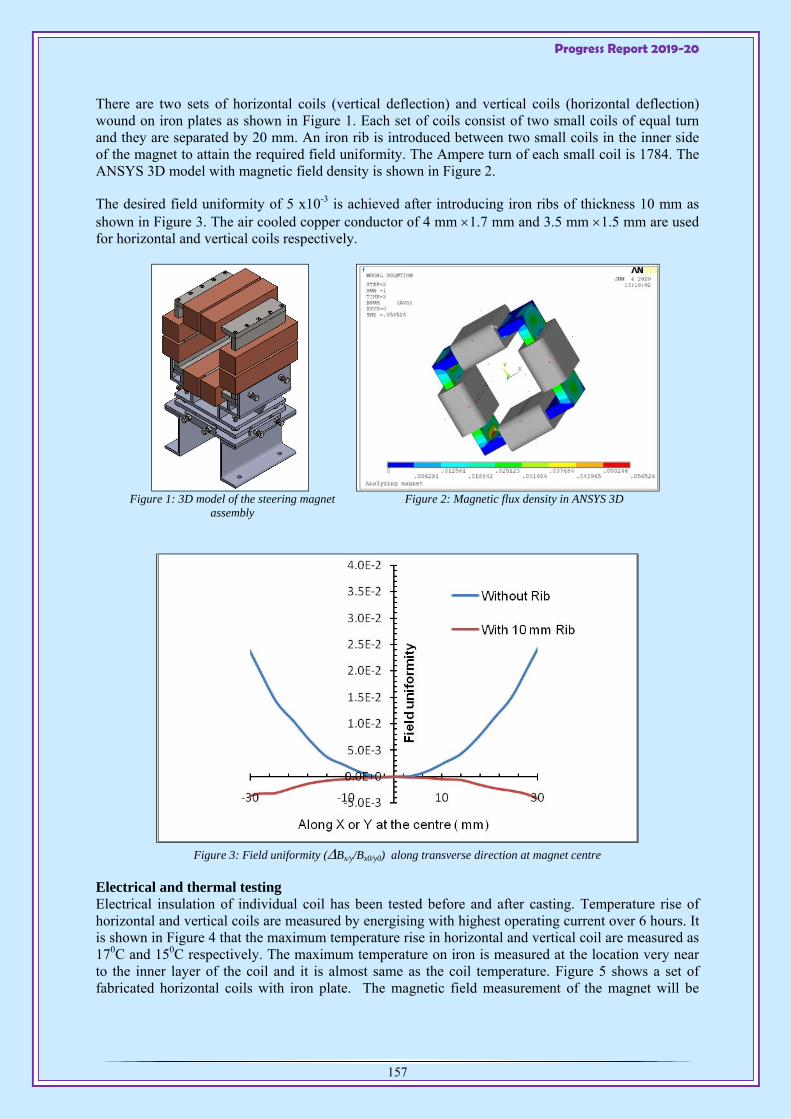
Progress Report 2019-20
157
There are two sets of horizontal coils (vertical deflection) and vertical coils (horizontal deflection) wound on iron plates as shown in Figure 1. Each set of coils consist of two small coils of equal turn and they are separated by 20 mm. An iron rib is introduced between two small coils in the inner side of the magnet to attain the required field uniformity. The Ampere turn of each small coil is 1784. The ANSYS 3D model with magnetic field density is shown in Figure 2.
The desired field uniformity of 5 x10⁻³ is achieved after introducing iron ribs of thickness 10 mm as shown in Figure 3. The air cooled copper conductor of 4 mm 1.7 mm and 3.5 mm 1.5 mm are used for horizontal and vertical coils respectively.
Figure 1: 3D model of the steering magnet
assembly
Figure 2: Magnetic flux density in ANSYS 3D
Figure 3: Field uniformity (Bx/y/Bx0/y0) along transverse direction at magnet centre
Electrical and thermal testing Electrical insulation of individual coil has been tested before and after casting. Temperature rise of horizontal and vertical coils are measured by energising with highest operating current over 6 hours. It is shown in Figure 4 that the maximum temperature rise in horizontal and vertical coil are measured as 170C and 150C respectively. The maximum temperature on iron is measured at the location very near to the inner layer of the coil and it is almost same as the coil temperature. Figure 5 shows a set of fabricated horizontal coils with iron plate. The magnetic field measurement of the magnet will be
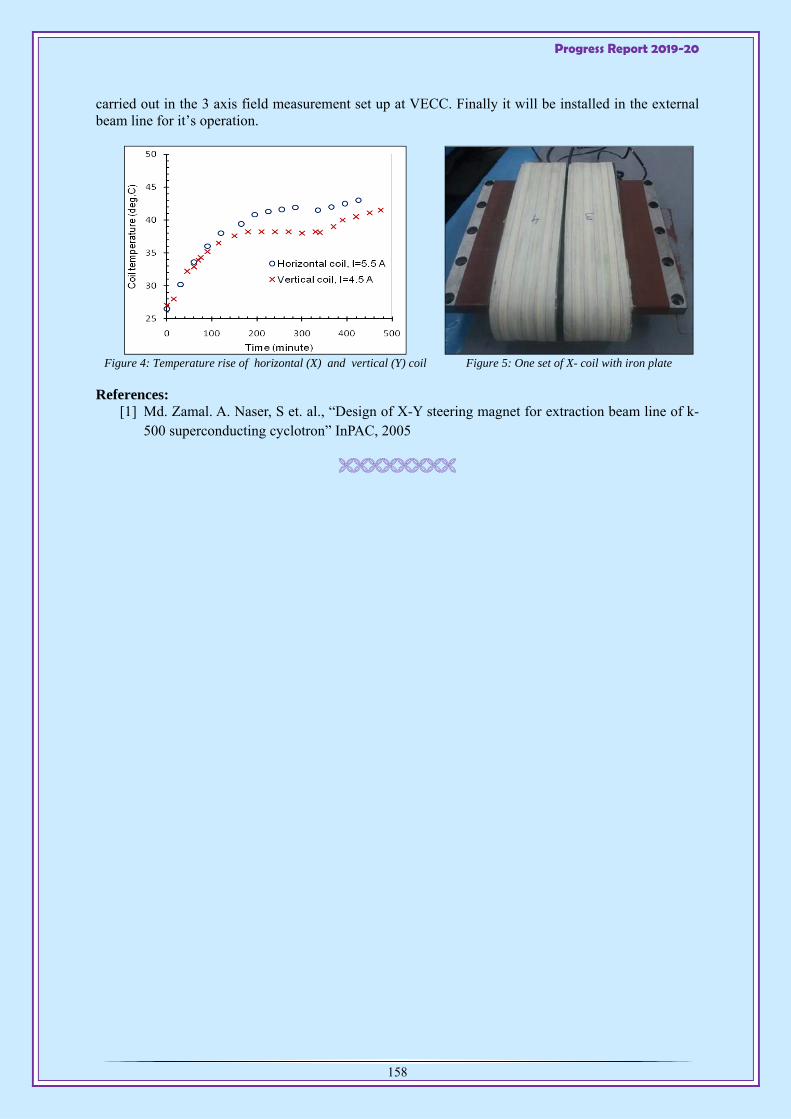
Progress Report 2019-20
158
carried out in the 3 axis field measurement set up at VECC. Finally it will be installed in the external beam line for it’s operation.
Figure 4: Temperature rise of horizontal (X) and vertical (Y) coil Figure 5: One set of X- coil with iron plate
References: [1] Md. Zamal. A. Naser, S et. al., “Design of X-Y steering magnet for extraction beam line of k-
500 superconducting cyclotron” InPAC, 2005

Progress Report 2019-20
159
5.2 Medical Cyclotron
MEDICAL CYCLOTRON FACILITY UNDER COMMISSIONING AT VECC
he Medical Cyclotron Facility under VECC, Kolkata has five beamlines, three exclusive for production of radioisotopes and two for material research activities. Among the three, one beamline is dedicated for Positron Emission Tomography (PET) for production of FDG which is a
short lived PET radioisotope of immense importance in the diagnosis of cancer. Two beam lines will be used for production of Single Photon Emission Computed Tomography (SPECT) isotope for medical imaging. Isotopes gallium-67, thallium-201 is planned in the initial phase, which will be subsequently extended for production of Iodine-123 and other useful isotopes. The machine is designed and build by M/s IBA, Belgium. The Cyclotron and 4 beam lines supplied by M/s IBA was mainly installed and pre-commissioned by VECC, Kolkata. M/s IBA also took active part in commissioning the machine and the beamlines. Among the two research beam lines, one is dedicated for performing radiation damage studies on nuclear structural materials and the other for testing of the LBE-loop for future ADSS applications. These two beam lines for research activities were supplied and installed by M/s Danfysik, Denmark.
Currently, the beamline for irradiation of liquid target for the production of FDG and the associated HOTCELL for the production of FDG has been commissioned. Since then production and supply of FDG to the hospitals for imaging purpose has started on a regular basis. Among the research beam lines, the low materials science beam line has been commissioned for material irradiation up to a maximum current of 10 microA. Due to the large beam power available from the cyclotron (maximum of 30 MeV and 200 microA over an area of 30 mm x 30mm), the design and development of a target station capable handling this power is a challenging task. Currently, a target flange with 300W heat removal capability has been developed and tested. This facility will complement the existing irradiation facility at Room temperature cyclotron at VECC.
Brief description of the Cyclotron: Cyclone 30 Ion source and axial beam injection line: The cyclotron is equipped with an external high output Hydrogen negative ion source. The beam will be axially injected into the cyclotron. The ion source will provide high beam intensity (at least 5mA-7mA) and is pumped with an oil diffusion pump or an equally efficient pump. The gas load to the cyclotron due to the ion source will be a minimum. The vertical injection line have one RF buncher working at fundamental cyclotron frequency and one magnetic focusing lens system.
R. F. System: High power Rf system comprising of room temperature copper lamda/2 cavity at frequency 65MHz driven by triode based amplifier. The RF voltage is 50kV achieved at Dee. The high power RF system feeding power to the accelerating electrodes. High dee voltage stability is achieved with precision digital low level control system.
Extraction system: The carbon foil stripping mechanism ensuring 100% extraction efficiency is adopted. The cyclotron have two beam extraction ports each with a switching magnet capable of directing the beam to one of the three external beam lines fitted to each port. The stripping probes is capable of moving in radial direction to vary the extraction energy from 18 to 30 MeV and azimuthally to centre the extracted beam in the port selection magnet. Each probe have an air lock and fitted with automatic stripper foil loading device, each containing quite a few stripper foils ready to be automatically loaded into the position remotely controlled by supervisory control system without venting the magnet. The extraction system is capable of delivering two proton beams simultaneously with different energies and different beam currents by means of partial interception and position adjustment of stripper foil subject to a beam current of 350 μA in total.
T
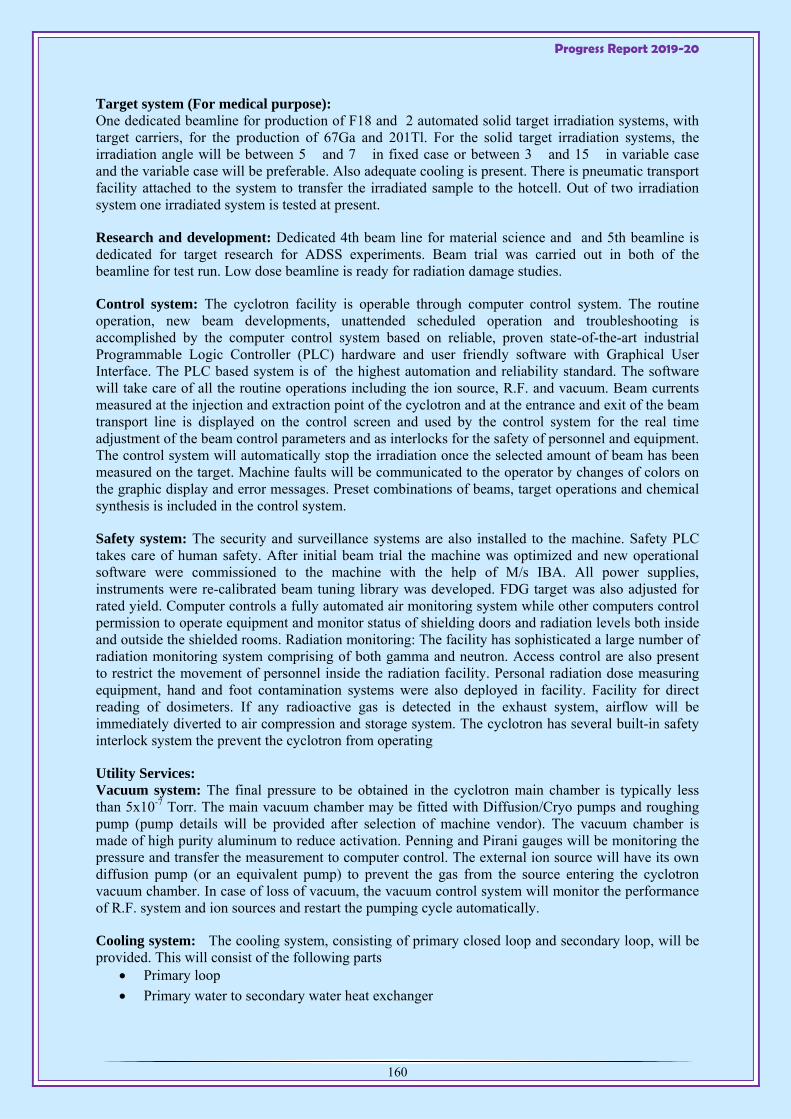
Progress Report 2019-20
160
Target system (For medical purpose): One dedicated beamline for production of F18 and 2 automated solid target irradiation systems, with target carriers, for the production of 67Ga and 201Tl. For the solid target irradiation systems, the irradiation angle will be between 5 and 7 in fixed case or between 3 and 15 in variable case and the variable case will be preferable. Also adequate cooling is present. There is pneumatic transport facility attached to the system to transfer the irradiated sample to the hotcell. Out of two irradiation system one irradiated system is tested at present.
Research and development: Dedicated 4th beam line for material science and and 5th beamline is dedicated for target research for ADSS experiments. Beam trial was carried out in both of the beamline for test run. Low dose beamline is ready for radiation damage studies.
Control system: The cyclotron facility is operable through computer control system. The routine operation, new beam developments, unattended scheduled operation and troubleshooting is accomplished by the computer control system based on reliable, proven state-of-the-art industrial Programmable Logic Controller (PLC) hardware and user friendly software with Graphical User Interface. The PLC based system is of the highest automation and reliability standard. The software will take care of all the routine operations including the ion source, R.F. and vacuum. Beam currents measured at the injection and extraction point of the cyclotron and at the entrance and exit of the beam transport line is displayed on the control screen and used by the control system for the real time adjustment of the beam control parameters and as interlocks for the safety of personnel and equipment. The control system will automatically stop the irradiation once the selected amount of beam has been measured on the target. Machine faults will be communicated to the operator by changes of colors on the graphic display and error messages. Preset combinations of beams, target operations and chemical synthesis is included in the control system.
Safety system: The security and surveillance systems are also installed to the machine. Safety PLC takes care of human safety. After initial beam trial the machine was optimized and new operational software were commissioned to the machine with the help of M/s IBA. All power supplies, instruments were re-calibrated beam tuning library was developed. FDG target was also adjusted for rated yield. Computer controls a fully automated air monitoring system while other computers control permission to operate equipment and monitor status of shielding doors and radiation levels both inside and outside the shielded rooms. Radiation monitoring: The facility has sophisticated a large number of radiation monitoring system comprising of both gamma and neutron. Access control are also present to restrict the movement of personnel inside the radiation facility. Personal radiation dose measuring equipment, hand and foot contamination systems were also deployed in facility. Facility for direct reading of dosimeters. If any radioactive gas is detected in the exhaust system, airflow will be immediately diverted to air compression and storage system. The cyclotron has several built-in safety interlock system the prevent the cyclotron from operating
Utility Services: Vacuum system: The final pressure to be obtained in the cyclotron main chamber is typically less than 5x10⁻⁷ Torr. The main vacuum chamber may be fitted with Diffusion/Cryo pumps and roughing pump (pump details will be provided after selection of machine vendor). The vacuum chamber is made of high purity aluminum to reduce activation. Penning and Pirani gauges will be monitoring the pressure and transfer the measurement to computer control. The external ion source will have its own diffusion pump (or an equivalent pump) to prevent the gas from the source entering the cyclotron vacuum chamber. In case of loss of vacuum, the vacuum control system will monitor the performance of R.F. system and ion sources and restart the pumping cycle automatically.
Cooling system: The cooling system, consisting of primary closed loop and secondary loop, will be provided. This will consist of the following parts
Primary loop
Primary water to secondary water heat exchanger

Progress Report 2019-20
161
De-ionization column
Resistivity meter
Temperature probe
Water pump including the motor
Water manifold.
Secondary cooling system (with an external chiller facility) Secondary water will be made available at the site.
Power supplies: All power supplies and electronic devices required for normal operation of the cyclotron system, including the beam lines, will be provided. They will all be equipped with appropriate computer interface cards/systems. Power at the site will be made available. Necessary safety provisions will be provided for the equipments to take care of occasional power failure. It is planned to have a captive power plant at the site to run the emergency systems like ventilation, vacuum, etc.
Interlocks: Computer controlled interlocks will be provided for safety of the personnel and the sub-systems, with manual over-ride capability.
Water and compressed air manifolds: Appropriate equipment with necessary safety feature for all the systems will be provided.
Compressed air: An air compressor with the following specifications will be installed in the building technical room.
Pressure: Between 7 and 10 bar
Quality: Dried and filtered, with water trap and oil filter
Average flow: < 1 ltr/min
Peak flow: < 250 ltr/min A reserve tank of at least 0.5 m³ will be provided to allow valves closing in case of power failure.
Water supply: LCW: Primary Loop including demineralising unit and heat exchanger will be provided with the cyclotron system. VECC will incorporate the same design in the building layout in consultation with the cyclotron system vendor and consultant. Consultant will design the secondary cooling system, including the chiller unit. At present secondary cooling system is designed and will be in place before installation. The requirement for secondary cooling system is as follows: Pressure 2 bar, flow 15 m3/hr, flow meter is required, temperature 15-20 C, power ~150kW, pressure drop in heat exchanger~ 2 bars.
Radio-isotopes: The following table shows the nuclear reactions involved in different radioisotope production and the required beam energy, current and irradiation time. Radioisotopes
to be produced
(T1/2)
Nuclear Reaction
Target Quantity per
Run
Proton Energy (MeV)
Max Beam Current (Amp)
Average Irradiation
Time
Max. Activity produced per
batch (Ci)
Ga-67 (78.3 h)
68Zn(p, 2n) 67Ga 1 g (98%
enriched)
28.5 200 * 8 h 8.4
Tl-201 (73.5 h)
203Tl(p, 3n) 201Pb(9.4 h) EC/+
201Pb 201Tl
1 g (98%
enriched)
28.5 200 * 8 h 30 (201Pb)
3.1 (201Tl) FDG
(1.8 h)
18O(p, n) 18F 2 g (95% enriched
H218O)
18 40 1 – 2 h 5

Progress Report 2019-20
162
5.3 Radioactive Ion Beam
RADIOACTIVE ION BEAM PROJECT – HIGHLIGHTS RIBFG team
ajor activities: During this year mainly stable isotope ion-beams of oxygen, nitrogen, argon, boron as well as molecular ion beams of NO+ were produced and utilized for materials science
studies. Radioactive ion beam development R&D focused on the yield measurement of 43K (half-life 22 hrs) and online ionization studies using surface ion-source. Apart from this fabrication, installation and test of two new 75 MHz re-bunchers was completed. These are installed in the beam-line connecting Linac-3 and Linac-4 modules in the RIB annex building. Also, a new 2.4 GHz gas-jet coupled ECR ion-source has been designed and fabricated. This will be used as 1+ ion-source in a new charge breeder. Other activities comprise design and development of low level rf (LLRF) control system for the 37 MHz rf transmitters in the RIB facility. Also design and development of a 2 kW, 37 MHz solid state rf amplifier and its instrumentation and monitoring system has been undertaken.
Figure 1: The beam-line between 3rd and 4th Linac module in RIB annex building
Utilization of ion-beams from the facility: Ion-beams accelerated in the facility were used for materials science studies by in-house researchers affiliated with VECC/HBNI and university users through the UGC-DAE-CSR centre, Kolkata. The external users comprised from St. Joseph’s College, Tirucirapalli, Tamil Nadu, M S University Baroda and Amity Institute of Nanotechnology, Noida.
Activities related to e-Linac project: The electron gun was operated at 100 kV and trans-conductance of the gun was measured. A new RF matching transformer and DC isolator for RF modulation of electron gun was installed and tested. The Injector Cryomodule (ICM) was shipped from TRIUMF, Canada and has been assembled and its vacuum tests have been completed in cryomodule test area. A liquid helium plant with the capacity of 500 W at 4 K temperature has been installed and commissioned.
Detailed reports on the above activities and some results from material science studies are discussed in the following sections.
M
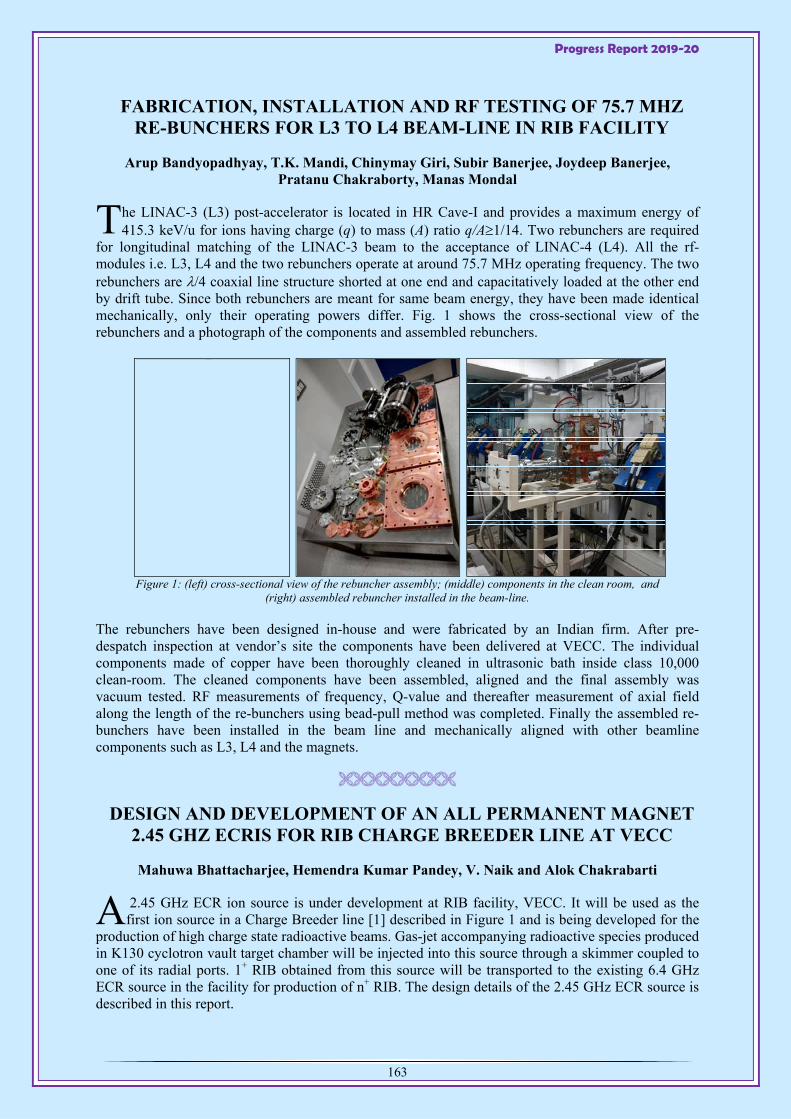
Progress Report 2019-20
163
FABRICATION, INSTALLATION AND RF TESTING OF 75.7 MHZ RE-BUNCHERS FOR L3 TO L4 BEAM-LINE IN RIB FACILITY
Arup Bandyopadhyay, T.K. Mandi, Chinymay Giri, Subir Banerjee, Joydeep Banerjee, Pratanu Chakraborty, Manas Mondal
he LINAC-3 (L3) post-accelerator is located in HR Cave-I and provides a maximum energy of 415.3 keV/u for ions having charge (q) to mass (A) ratio q/A1/14. Two rebunchers are required
for longitudinal matching of the LINAC-3 beam to the acceptance of LINAC-4 (L4). All the rf-modules i.e. L3, L4 and the two rebunchers operate at around 75.7 MHz operating frequency. The two rebunchers are /4 coaxial line structure shorted at one end and capacitatively loaded at the other end by drift tube. Since both rebunchers are meant for same beam energy, they have been made identical mechanically, only their operating powers differ. Fig. 1 shows the cross-sectional view of the rebunchers and a photograph of the components and assembled rebunchers.
Figure 1: (left) cross-sectional view of the rebuncher assembly; (middle) components in the clean room, and (right) assembled rebuncher installed in the beam-line.
The rebunchers have been designed in-house and were fabricated by an Indian firm. After pre-despatch inspection at vendor’s site the components have been delivered at VECC. The individual components made of copper have been thoroughly cleaned in ultrasonic bath inside class 10,000 clean-room. The cleaned components have been assembled, aligned and the final assembly was vacuum tested. RF measurements of frequency, Q-value and thereafter measurement of axial field along the length of the re-bunchers using bead-pull method was completed. Finally the assembled re-bunchers have been installed in the beam line and mechanically aligned with other beamline components such as L3, L4 and the magnets.
DESIGN AND DEVELOPMENT OF AN ALL PERMANENT MAGNET 2.45 GHZ ECRIS FOR RIB CHARGE BREEDER LINE AT VECC
Mahuwa Bhattacharjee, Hemendra Kumar Pandey, V. Naik and Alok Chakrabarti
2.45 GHz ECR ion source is under development at RIB facility, VECC. It will be used as the first ion source in a Charge Breeder line [1] described in Figure 1 and is being developed for the
production of high charge state radioactive beams. Gas-jet accompanying radioactive species produced in K130 cyclotron vault target chamber will be injected into this source through a skimmer coupled to one of its radial ports. 1+ RIB obtained from this source will be transported to the existing 6.4 GHz ECR source in the facility for production of n+ RIB. The design details of the 2.45 GHz ECR source is described in this report.
T
A
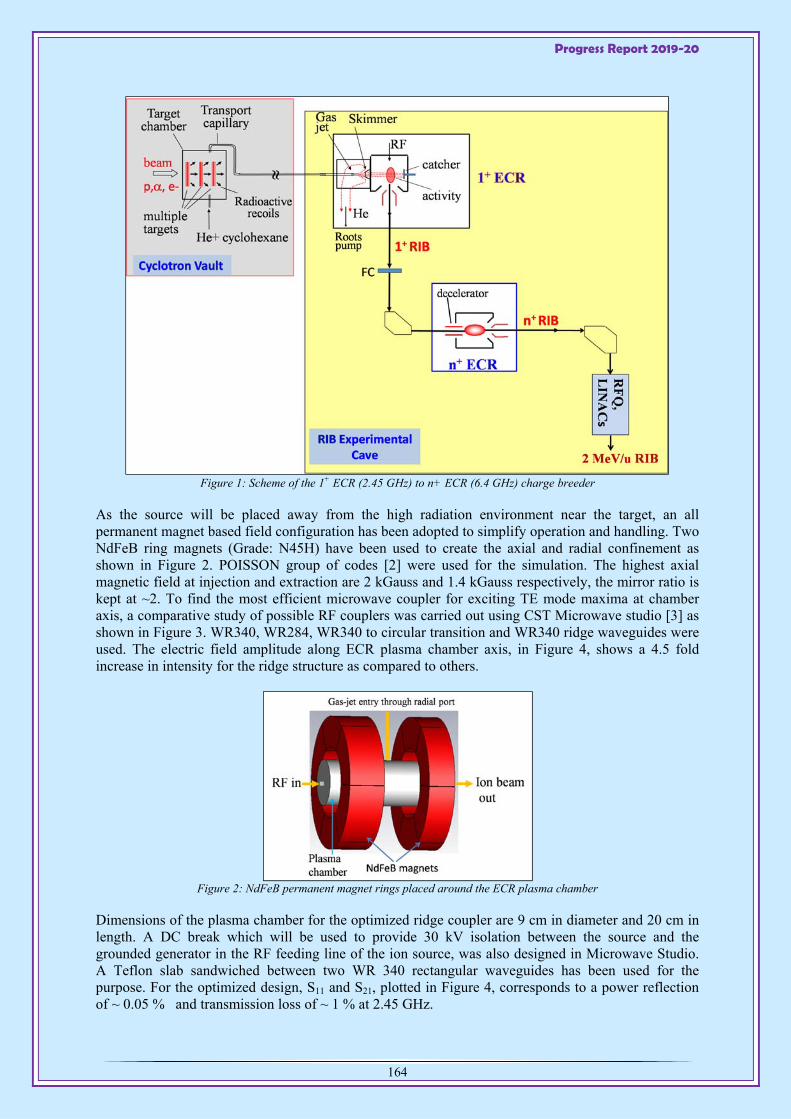
Progress Report 2019-20
164
Figure 1: Scheme of the 1+ ECR (2.45 GHz) to n+ ECR (6.4 GHz) charge breeder
As the source will be placed away from the high radiation environment near the target, an all permanent magnet based field configuration has been adopted to simplify operation and handling. Two NdFeB ring magnets (Grade: N45H) have been used to create the axial and radial confinement as shown in Figure 2. POISSON group of codes [2] were used for the simulation. The highest axial magnetic field at injection and extraction are 2 kGauss and 1.4 kGauss respectively, the mirror ratio is kept at ~2. To find the most efficient microwave coupler for exciting TE mode maxima at chamber axis, a comparative study of possible RF couplers was carried out using CST Microwave studio [3] as shown in Figure 3. WR340, WR284, WR340 to circular transition and WR340 ridge waveguides were used. The electric field amplitude along ECR plasma chamber axis, in Figure 4, shows a 4.5 fold increase in intensity for the ridge structure as compared to others.
Figure 2: NdFeB permanent magnet rings placed around the ECR plasma chamber
Dimensions of the plasma chamber for the optimized ridge coupler are 9 cm in diameter and 20 cm in length. A DC break which will be used to provide 30 kV isolation between the source and the grounded generator in the RF feeding line of the ion source, was also designed in Microwave Studio. A Teflon slab sandwiched between two WR 340 rectangular waveguides has been used for the purpose. For the optimized design, S11 and S21, plotted in Figure 4, corresponds to a power reflection of ~ 0.05 % and transmission loss of ~ 1 % at 2.45 GHz.

Progress Report 2019-20
165
Figure 3: Microwave studio simulation of various RF couplers and the electric field maxima obtained inside
plasma chamber
Figure 4: Electric field amplitude plotted along the axis
of chamber for different couplers
For beam extraction out of the ion source a two-electrode system has been used. The plasma chamber floats at a high potential and a grounded extractor electrode placed 25 mm away from the plasma electrode helps in efficient extraction of ions out of the plasma. The extractor forms the first electrode of the einzel lens system used to focus the beam. The inter-electrode distance as well as the geometry of the electrodes have been optimized through IGUN simulation [4]. As per the simulation, the beam emittance is 25 Pi mm-mrad at a distance of 70 mm from the plasma electrode. Fabrication/procurement for all the parts of the ion source has been completed. All parts of the ion source including mechanical parts, permanent magnets and RF feeding line has been assembled and installed at site as shown in Figure 5. Vacuum and RF testing of the assembly is presently underway.
Figure 5: Actual views of the ECR source installed at assembly area.
References: [1] M. Bhattacharjee et al, InPAC -2015, TIFR Mumbai, India [2] K. Halbach, R.F. Holsinger, Part. Accel. 7 (1976) 213. [3] Microwave Studio, CST GmBH 2011, www.cst-world.com [4] Reinard Becker, W. B. Herrmannsfeldt, Rev. Sci. Ins. 63(4), 2756, (1992).
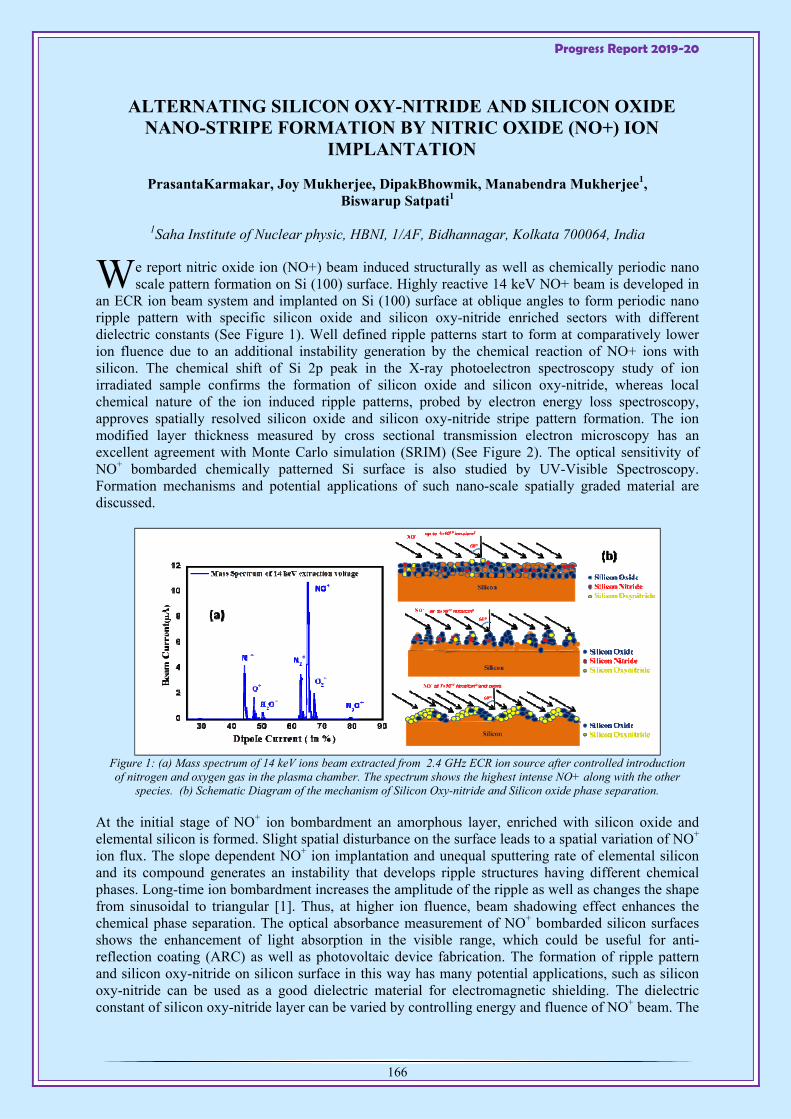
Progress Report 2019-20
166
ALTERNATING SILICON OXY-NITRIDE AND SILICON OXIDE NANO-STRIPE FORMATION BY NITRIC OXIDE (NO+) ION
IMPLANTATION
PrasantaKarmakar, Joy Mukherjee, DipakBhowmik, Manabendra Mukherjee1, Biswarup Satpati1
1Saha Institute of Nuclear physic, HBNI, 1/AF, Bidhannagar, Kolkata 700064, India
e report nitric oxide ion (NO+) beam induced structurally as well as chemically periodic nano scale pattern formation on Si (100) surface. Highly reactive 14 keV NO+ beam is developed in
an ECR ion beam system and implanted on Si (100) surface at oblique angles to form periodic nano ripple pattern with specific silicon oxide and silicon oxy-nitride enriched sectors with different dielectric constants (See Figure 1). Well defined ripple patterns start to form at comparatively lower ion fluence due to an additional instability generation by the chemical reaction of NO+ ions with silicon. The chemical shift of Si 2p peak in the X-ray photoelectron spectroscopy study of ion irradiated sample confirms the formation of silicon oxide and silicon oxy-nitride, whereas local chemical nature of the ion induced ripple patterns, probed by electron energy loss spectroscopy, approves spatially resolved silicon oxide and silicon oxy-nitride stripe pattern formation. The ion modified layer thickness measured by cross sectional transmission electron microscopy has an excellent agreement with Monte Carlo simulation (SRIM) (See Figure 2). The optical sensitivity of NO+ bombarded chemically patterned Si surface is also studied by UV-Visible Spectroscopy. Formation mechanisms and potential applications of such nano-scale spatially graded material are discussed.
Figure 1: (a) Mass spectrum of 14 keV ions beam extracted from 2.4 GHz ECR ion source after controlled introduction of nitrogen and oxygen gas in the plasma chamber. The spectrum shows the highest intense NO+ along with the other
species. (b) Schematic Diagram of the mechanism of Silicon Oxy-nitride and Silicon oxide phase separation.
At the initial stage of NO+ ion bombardment an amorphous layer, enriched with silicon oxide and elemental silicon is formed. Slight spatial disturbance on the surface leads to a spatial variation of NO+ ion flux. The slope dependent NO+ ion implantation and unequal sputtering rate of elemental silicon and its compound generates an instability that develops ripple structures having different chemical phases. Long-time ion bombardment increases the amplitude of the ripple as well as changes the shape from sinusoidal to triangular [1]. Thus, at higher ion fluence, beam shadowing effect enhances the chemical phase separation. The optical absorbance measurement of NO+ bombarded silicon surfaces shows the enhancement of light absorption in the visible range, which could be useful for anti-reflection coating (ARC) as well as photovoltaic device fabrication. The formation of ripple pattern and silicon oxy-nitride on silicon surface in this way has many potential applications, such as silicon oxy-nitride can be used as a good dielectric material for electromagnetic shielding. The dielectric constant of silicon oxy-nitride layer can be varied by controlling energy and fluence of NO+ beam. The
W
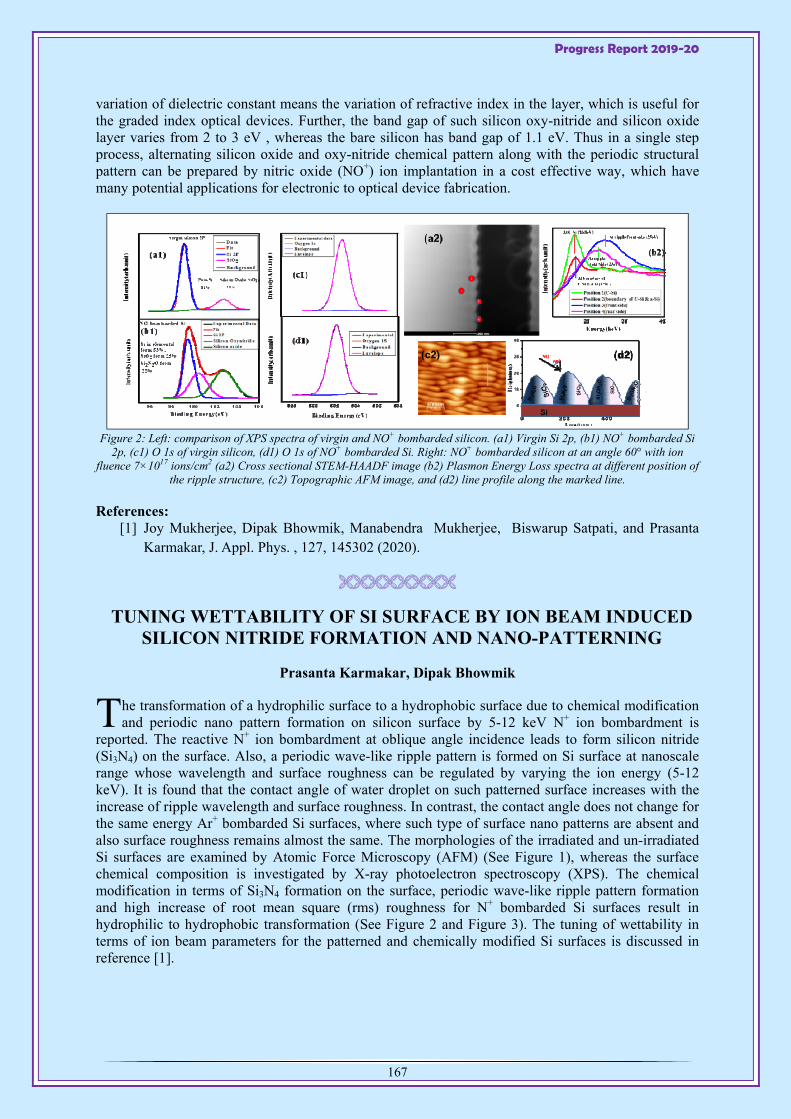
Progress Report 2019-20
167
variation of dielectric constant means the variation of refractive index in the layer, which is useful for the graded index optical devices. Further, the band gap of such silicon oxy-nitride and silicon oxide layer varies from 2 to 3 eV , whereas the bare silicon has band gap of 1.1 eV. Thus in a single step process, alternating silicon oxide and oxy-nitride chemical pattern along with the periodic structural pattern can be prepared by nitric oxide (NO+) ion implantation in a cost effective way, which have many potential applications for electronic to optical device fabrication.
Figure 2: Left: comparison of XPS spectra of virgin and NO+ bombarded silicon. (a1) Virgin Si 2p, (b1) NO+ bombarded Si
2p, (c1) O 1s of virgin silicon, (d1) O 1s of NO+ bombarded Si. Right: NO+ bombarded silicon at an angle 60° with ion fluence 7×10¹⁷ ions/cm2 (a2) Cross sectional STEM-HAADF image (b2) Plasmon Energy Loss spectra at different position of
the ripple structure, (c2) Topographic AFM image, and (d2) line profile along the marked line.
References: [1] Joy Mukherjee, Dipak Bhowmik, Manabendra Mukherjee, Biswarup Satpati, and Prasanta
Karmakar, J. Appl. Phys. , 127, 145302 (2020).
TUNING WETTABILITY OF SI SURFACE BY ION BEAM INDUCED SILICON NITRIDE FORMATION AND NANO-PATTERNING
Prasanta Karmakar, Dipak Bhowmik
he transformation of a hydrophilic surface to a hydrophobic surface due to chemical modification and periodic nano pattern formation on silicon surface by 5-12 keV N+ ion bombardment is
reported. The reactive N+ ion bombardment at oblique angle incidence leads to form silicon nitride (Si3N4) on the surface. Also, a periodic wave-like ripple pattern is formed on Si surface at nanoscale range whose wavelength and surface roughness can be regulated by varying the ion energy (5-12 keV). It is found that the contact angle of water droplet on such patterned surface increases with the increase of ripple wavelength and surface roughness. In contrast, the contact angle does not change for the same energy Ar+ bombarded Si surfaces, where such type of surface nano patterns are absent and also surface roughness remains almost the same. The morphologies of the irradiated and un-irradiated Si surfaces are examined by Atomic Force Microscopy (AFM) (See Figure 1), whereas the surface chemical composition is investigated by X-ray photoelectron spectroscopy (XPS). The chemical modification in terms of Si3N4 formation on the surface, periodic wave-like ripple pattern formation and high increase of root mean square (rms) roughness for N+ bombarded Si surfaces result in hydrophilic to hydrophobic transformation (See Figure 2 and Figure 3). The tuning of wettability in terms of ion beam parameters for the patterned and chemically modified Si surfaces is discussed in reference [1].
T
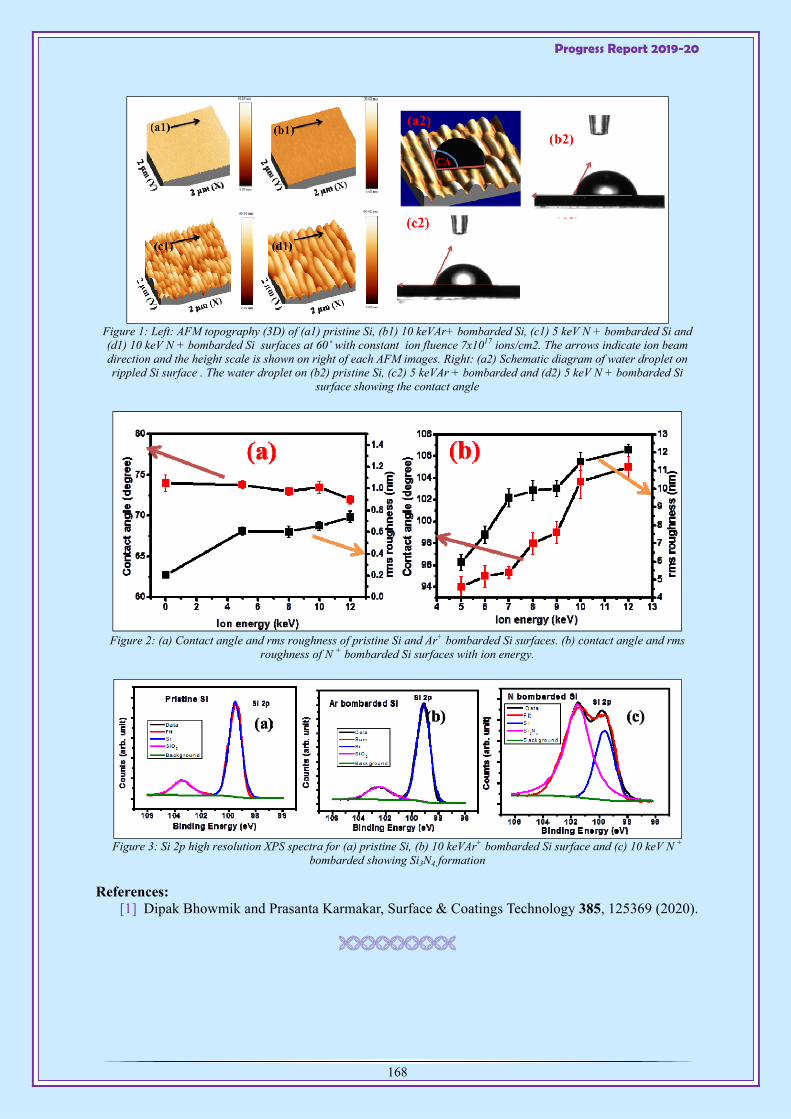
Progress Report 2019-20
168
Figure 1: Left: AFM topography (3D) of (a1) pristine Si, (b1) 10 keVAr+ bombarded Si, (c1) 5 keV N + bombarded Si and (d1) 10 keV N + bombarded Si surfaces at 60˚ with constant ion fluence 7x10¹⁷ ions/cm2. The arrows indicate ion beam direction and the height scale is shown on right of each AFM images. Right: (a2) Schematic diagram of water droplet on rippled Si surface . The water droplet on (b2) pristine Si, (c2) 5 keVAr + bombarded and (d2) 5 keV N + bombarded Si
surface showing the contact angle
Figure 2: (a) Contact angle and rms roughness of pristine Si and Ar+ bombarded Si surfaces. (b) contact angle and rms
roughness of N + bombarded Si surfaces with ion energy.
Figure 3: Si 2p high resolution XPS spectra for (a) pristine Si, (b) 10 keVAr+ bombarded Si surface and (c) 10 keV N +
bombarded showing Si3N4 formation
References: [1] Dipak Bhowmik and Prasanta Karmakar, Surface & Coatings Technology 385, 125369 (2020).

Progress Report 2019-20
169
EVOLUTION OF MAGNETIC ANISOTROPY IN COBALT FILM ON NANO-PATTERNED SILICON SUBSTRATE
Khushboo Bukharia1, Prasanta Karmakar, Dileep Kumar2, V.R. Reddy2, Ajay Gupta1
1Amity Centre for Spintronic Materials, Amity University, Noida 201313, India 2UGC-DAE CSR, University Campus, Khandwa Road, Indore 452001, India
volution of magnetization behaviour of cobalt film on nano patterned silicon (1 0 0) substrate, with film thickness, has been studied [1]. In situ magneto-optical Kerr effect measurements during
film deposition allowed us to study genuine thickness dependence of magnetization behaviour, all other parameters like surface topography, deposition conditions remaining invariant. The nano-patterned substrate had a 8 nm thick amorphous silicon nitride surface layer. Thus, induced magnetic anisotropy in the Co film is expected to be of purely topographical origin, excluding any effect of the single crystalline Si (1 0 0) surface on magnetic anisotropy film due to possible epitaxy or surface
Figure 1: AFM image (2×2 μm) of nano-rippled Si substrate used for deposition of Co film, and the corresponding line profile along the line. (b) AFM image (2×2 μm) of 40 nm thick Co film deposited on nano-patterned substrate,
and corresponding line profile
Figure 2: (a) Some representative magnetic hysteresis loops of Co film along i) the easy axis (continuous
line) and ii) hard axis direction (dotted line), (b) Polar plot of remnant magnetization as a function of azimuthal angle for Co film of thickness 60 nm.Contact angle and rms roughness of pristine Si and Ar+
bombarded Si surfaces. (b) contact angle and rms roughness of N + bombarded Si surfaces with ion energy.
step-induced anisotropy [1]. In conformity with earlier results, the film induces a uniaxial magnetic anisotropy in the film, with its magnitude decreasing with increasing thickness. A magnetically dead layer of 2.6 nm forms at the interface with the substrate. Analysis of the magnetic layer thickness dependence of anisotropy shows that it has contributions from both, i) exchange energy which is volume dependent and, ii) stray dipolar fields at the surface/interface (See Figure 2). This suggests that local magnetization follows only partially the topography of the rippled surface. As expected from energy considerations, for small film thickness, the local magnetization closely follows the surface contour of the ripples making the volume term as the dominant contribution. With increasing film thickness, the local magnetization gradually deviates from the local slope and approaches towards a
E

Progress Report 2019-20
170
uniform magnetization along the macroscopic film plane making the surface term as the dominant contribution (See Figure 3). Significant deviation of the observed stray dipolar field contribution from the anisotropy energy calculated on the basis of Schlomann’s theory is observed, which can be attributed to several factors like, deviation of surface topography from an ideal sinusoidal wave, breaks of continuity along the ripple direction, topological defects like, pattern dislocations, and small film thicknesses compared to the correlation length of surface corrugations.
Figure 3: Schematic diagram showing variation of local magnetization directionmarked
by arrows, relative to the surface/interface contour of the film
References: [1] Khushboo Bukharia, Prasanta Karmakar, Dileep Kumar, V.R. Reddy, Ajay Gupta, Journal of
Magnetism and Magnetic Materials 497, 165934 (2020).
NMR STUDY OF DEFECT INDUCED MAGNETISM IN METHYLAMMONIUM LEAD IODIDE PEROVSKITE
B. Bandyopadhyay1, H. Luitel, S. Sil2, J. Dhar2, M. Chakrabarti3, and Dirtha Sanyal
1Saha Institute of Nuclear Physics, 1/AF Bidhannagar, Kolkata-700064, India 2Department of Physics, Jadavpur University, Kolkata 700032, India
3Department of Physics, Basirhat College, Basirhat 743412, India
n the organic-inorganic photovoltaic semiconductor methylammonium lead iodide the occurrence of magnetism has been confirmed from magnetization and 1H nuclear magnetic resonance (NMR) measurements [1]. From room temperature down to 4 K, the magnetization is a combination of
weak ferromagnetism and paramagnetism. 1H nuclear magnetic resonance spectra at low temperatures also reveal two components, one with a small chemical shift characteristic of 1H resonance in non-metals, and the other with a much larger shift of ~100 ppm that is ascribed to the ferromagnetism of the material. The study of 1H spin-lattice relaxation rate (1/T1) indicates some kind of clustering of magnetic moments occurring at around 60 K in the paramagnetic component of the system. It is shown that ferromagnetism arises from the iodine vacancies present in the orthorhombic and cubic crystal phases of the material (See Figures 1, 2 and 3).
The samples used in this study were prepared by mechanochemical synthesis process. Figure 1 shows the magnetic field (H) dependence of magnetization (M) at various temperatures 4-300 K. The plots show that from room temperature down to 4 K, M is a combination of two components; a ferromagnetic (FM) one with a hysteresis and a certain value of saturation magnetization, and a linear paramagnetic component. Accordingly, the data of M vs. H at different temperatures have been analyzed. The results, given in Table I, show that the ferromagnetic saturation moment, MFM, is orders of magnitude stronger than the paramagnetic susceptibility, χpara. From room temperature down to 4 K, MFM shows a small and continuous increase, as expected in case of ferromagnetism. The coercive field is in the range of 100 Oe. On the other hand, χpara has a much larger variation over temperature. It
I

Progress Report 2019-20
171
shows a small increase in between 300 and 80 K, and a rapid increase at lower temperatures. This is reflected also in the temperature dependence of total susceptibility, χ, obtained from M vs. T measured at 500 Oe, shown in inset 'A' of Fig. 1. Interestingly, in the rapidly increasing part of χ below ~ 60 K there is a 'weak' maximum near 53 K which is shown expanded in inset 'B'. Such a behavior in the present case may arise from some kind of clustering of magnetic ions that will be investigated further.
Figure 1: (a) The bottom figure shows the full range of magnetic field (H) dependence of magnetization (M) at different temperatures as indicated.
The top figure shows the same plots expanded around the origin. The lower inset 'A' shows the temperature dependence of bulk magnetic susceptibility
(χ) measured at 500 Oe. The arrow indicates the region of a 'weak' maximum that is shown in expanded scale in upper inset 'B'.
Table 1: Ferromagnetic saturation magnetization (MFM) and linear susceptibility (χpara) of MAPbI3 obtained from the analysis of magnetization data at different temperatures.
Temp (K)
MFM (emu/mol)
χpara (emu/mol)
300 4.45 (5) 3.6 (5) ×10-5
80 6.15 (5) 4.6 (5) ×10-5
40 7.25 (5) 10.0 (5) ×10-5
4 13.25 (5) 4.7 (5) ×10-5
Figure 2: 1H NMR spectra of MAPbI3 at different temperatures and their simulation as described in
the text. The thin solid and broken lines indicate the two resonance components and the thick line
denotes their sum. The inset shows the variation of the total resonance linewidth (FWHM, full-width at half-maximum) with the magnetic susceptibility (χ)
with temperature as the intrinsic parameter.
Figure 3: Experimental data for measurement of 1H spin-lattice relaxation time (T1) in MAPbI3 at different temperatures as described
in the text. The solid lines are the results of fitting using Eq. 2. The temperature and the magnetic susceptibility (χpara) dependence of 1/T1l
T are shown in inset A and inset B, respectively.
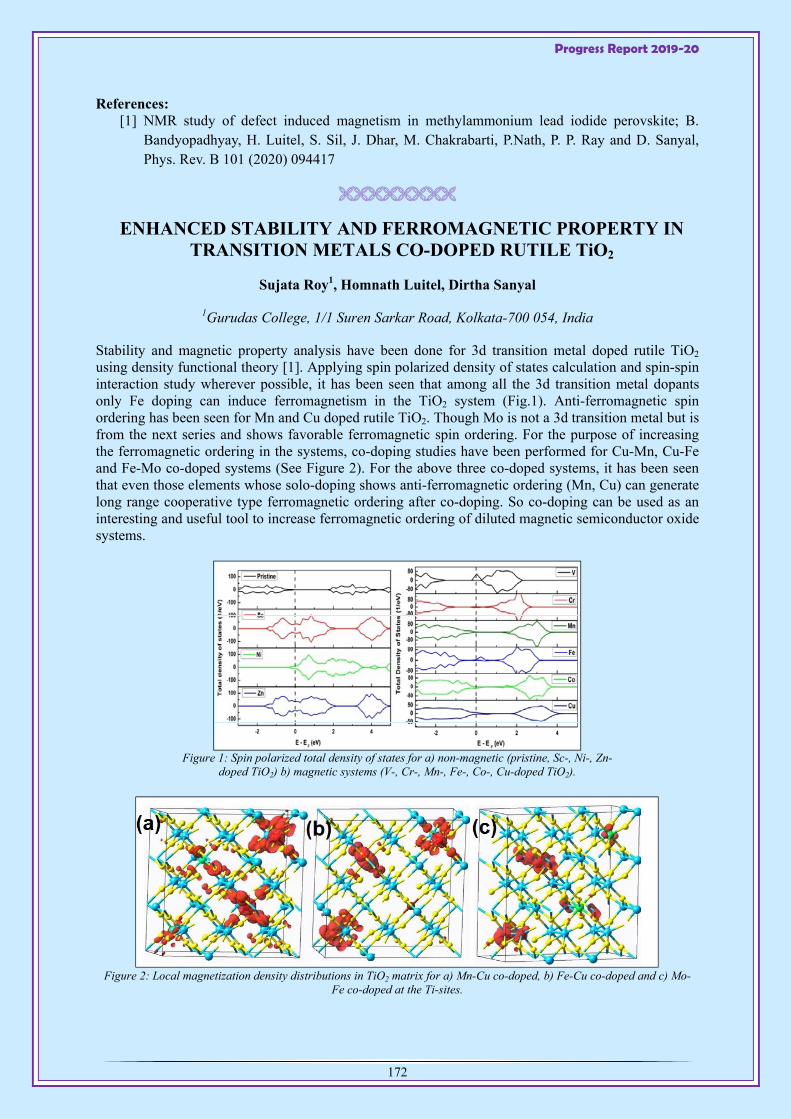
Progress Report 2019-20
172
References: [1] NMR study of defect induced magnetism in methylammonium lead iodide perovskite; B.
Bandyopadhyay, H. Luitel, S. Sil, J. Dhar, M. Chakrabarti, P.Nath, P. P. Ray and D. Sanyal, Phys. Rev. B 101 (2020) 094417
ENHANCED STABILITY AND FERROMAGNETIC PROPERTY IN TRANSITION METALS CO-DOPED RUTILE TiO2
Sujata Roy1, Homnath Luitel, Dirtha Sanyal
1Gurudas College, 1/1 Suren Sarkar Road, Kolkata-700 054, India
Stability and magnetic property analysis have been done for 3d transition metal doped rutile TiO2 using density functional theory [1]. Applying spin polarized density of states calculation and spin-spin interaction study wherever possible, it has been seen that among all the 3d transition metal dopants only Fe doping can induce ferromagnetism in the TiO2 system (Fig.1). Anti-ferromagnetic spin ordering has been seen for Mn and Cu doped rutile TiO2. Though Mo is not a 3d transition metal but is from the next series and shows favorable ferromagnetic spin ordering. For the purpose of increasing the ferromagnetic ordering in the systems, co-doping studies have been performed for Cu-Mn, Cu-Fe and Fe-Mo co-doped systems (See Figure 2). For the above three co-doped systems, it has been seen that even those elements whose solo-doping shows anti-ferromagnetic ordering (Mn, Cu) can generate long range cooperative type ferromagnetic ordering after co-doping. So co-doping can be used as an interesting and useful tool to increase ferromagnetic ordering of diluted magnetic semiconductor oxide systems.
Figure 1: Spin polarized total density of states for a) non-magnetic (pristine, Sc-, Ni-, Zn-
doped TiO2) b) magnetic systems (V-, Cr-, Mn-, Fe-, Co-, Cu-doped TiO2).
Figure 2: Local magnetization density distributions in TiO2 matrix for a) Mn-Cu co-doped, b) Fe-Cu co-doped and c) Mo-
Fe co-doped at the Ti-sites.
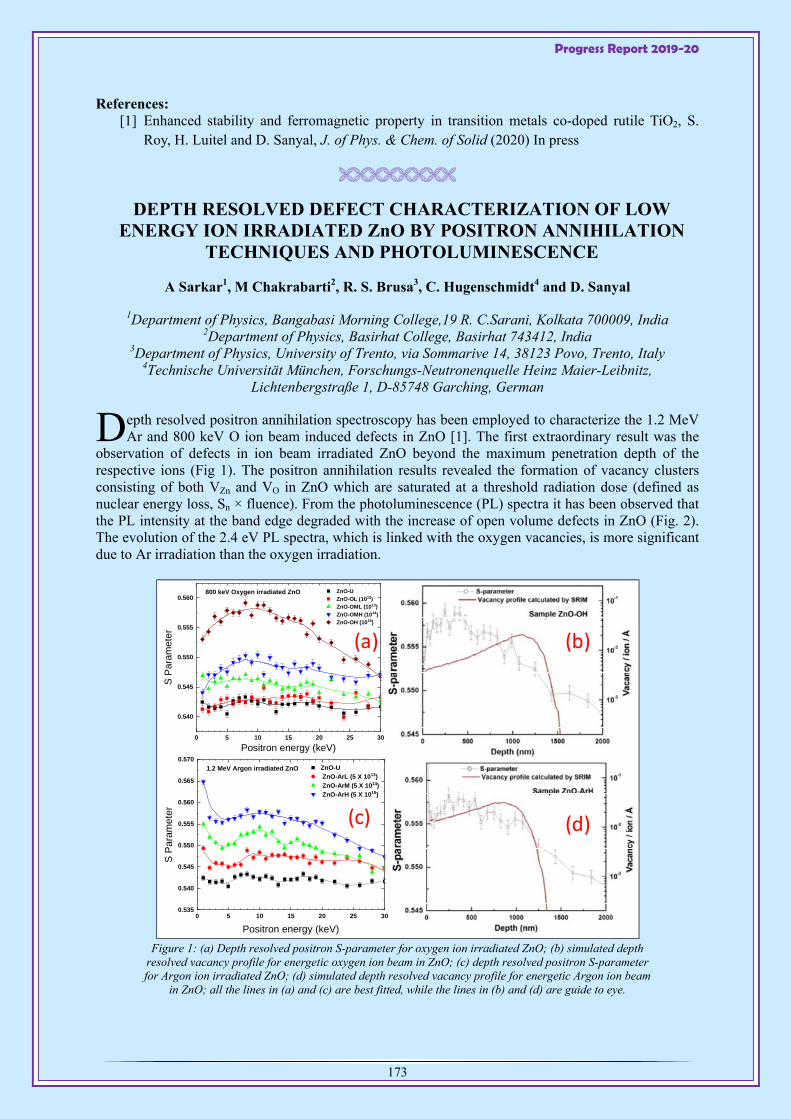
Progress Report 2019-20
173
References: [1] Enhanced stability and ferromagnetic property in transition metals co-doped rutile TiO2, S.
Roy, H. Luitel and D. Sanyal, J. of Phys. & Chem. of Solid (2020) In press
DEPTH RESOLVED DEFECT CHARACTERIZATION OF LOW ENERGY ION IRRADIATED ZnO BY POSITRON ANNIHILATION
TECHNIQUES AND PHOTOLUMINESCENCE
A Sarkar1, M Chakrabarti2, R. S. Brusa3, C. Hugenschmidt4 and D. Sanyal
1Department of Physics, Bangabasi Morning College,19 R. C.Sarani, Kolkata 700009, India 2Department of Physics, Basirhat College, Basirhat 743412, India
3Department of Physics, University of Trento, via Sommarive 14, 38123 Povo, Trento, Italy 4Technische Universität München, Forschungs-Neutronenquelle Heinz Maier-Leibnitz,
Lichtenbergstraße 1, D-85748 Garching, German
epth resolved positron annihilation spectroscopy has been employed to characterize the 1.2 MeV Ar and 800 keV O ion beam induced defects in ZnO [1]. The first extraordinary result was the
observation of defects in ion beam irradiated ZnO beyond the maximum penetration depth of the respective ions (Fig 1). The positron annihilation results revealed the formation of vacancy clusters consisting of both VZn and VO in ZnO which are saturated at a threshold radiation dose (defined as nuclear energy loss, Sn × fluence). From the photoluminescence (PL) spectra it has been observed that the PL intensity at the band edge degraded with the increase of open volume defects in ZnO (Fig. 2). The evolution of the 2.4 eV PL spectra, which is linked with the oxygen vacancies, is more significant due to Ar irradiation than the oxygen irradiation.
Figure 1: (a) Depth resolved positron S-parameter for oxygen ion irradiated ZnO; (b) simulated depth
resolved vacancy profile for energetic oxygen ion beam in ZnO; (c) depth resolved positron S-parameter for Argon ion irradiated ZnO; (d) simulated depth resolved vacancy profile for energetic Argon ion beam
in ZnO; all the lines in (a) and (c) are best fitted, while the lines in (b) and (d) are guide to eye.
0 5 10 15 20 25 30
0.540
0.545
0.550
0.555
0.560
S P
aram
eter
Positron energy (keV)
ZnO-U
ZnO-OL (1012) ZnO-OML (1013)
ZnO-OMH (1014) ZnO-OH (1016)
800 keV Oxygen irradiated ZnO
0 5 10 15 20 25 300.535
0.540
0.545
0.550
0.555
0.560
0.565
0.570
S P
aram
eter
Positron energy (keV)
ZnO-U
ZnO-ArL (5 X 10¹³)
ZnO-ArM (5 X 10¹⁴)
ZnO-ArH (5 X 10¹⁵)
1.2 MeV Argon irradiated ZnO
(a) (b)
(d)(c)
D

Progress Report 2019-20
174
Figure 2: (a) Photoluminescence spectra for differently irradiated ZnO samples.(b) Integrated PL
intensity as function of S parameter (above) and as damage dose (below)
References [1] Sarkar, M. Chakrabarti, D Sanyal, N. Gogurla, P. Kumar, R. S. Brusa and C. HugenschmidtJ
of Phys. Cond. Matt.32 (2019) 085703
ROOM TEMPERATURE FERROMAGNETISM IN BORON-DOPED OXIDES: A COMBINED FIRST PRINCIPLES AND
EXPERIMENTAL STUDY
Homnath Luitel, Sujata Roy1, Mahuya Chakrabarti2, V. Naik and D. Sanyal
1Gurudas College, 1/1 Suren Sarkar Road, Kolkata-700054, India 2Department of Physics, Bashirhat College,North 24 Parganas, West Bengal-743412, India
erromagnetic property of boron-doped oxides (viz., ZnO, MgO, CdO, SnO2 and TiO2) has been studied using first-principle calculations based on density functional theory [1]. Boron atom when
doped at anion site generates magnetic moment per dopant ranging from ~1 µB in TiO2 to ~ 3 µB in ZnO system. Source of magnetism in the boron-doped system is the 2p-orbital electrons of the dopant atom and a small contribution comes from the oxygen atoms surrounding the dopant (Fig. 1 and Fig. 2). However, the spin-spin interaction study reveals that only ZnO, MgO, CdO and TiO2 favors ferromagnetic spin coupling. Boron doped samples have been prepared by ion beam irradiation technique with 10 keV B+ beam (available from the RIB facility of VECC) implanting the pallet samples. Magnetic measurements have been carried out for 10keV B+ ions implanted oxide samples using SQUID magnetometer (Fig. 3). A stable room temperature ferromagnetic ordering is observed in boron ion irradiated ZnO, MgO, CdO and TiO2 samples.
103
104
2.0 2.4 2.8 3.2102
103
104
105
ZnO Ar L ZnO Ar M ZnO Ar H
PL
inte
nsi
ty (
arb
. un
it)
Photon Energy (eV)
ZnO U ZnO O L ZnO O ML ZnO O MH ZnO O H
10-3 10-2 10-1 100 101 102 103 104 1050
1x10⁵
2x10⁵
0.540 0.545 0.550 0.555
105
0.540 0.545 0.550 0.555104
105
Inte
grat
ed P
L in
ten
sity
(ar
b. u
nit)
Fluence × Sn (in 1012 ions/cm2 × eV/Å)
ZnO U Oxygen irradiated ZnO Argon irradiated ZnO
Integrated PL 3.00-3.45 eV
S parameter
Data2_C Data2_G ZnO Data2_K ZnO
@ 15 keV
Inte
grat
ed P
L in
ten
sity
(ar
b. u
nit
)
S parameter
(a) (b)
F
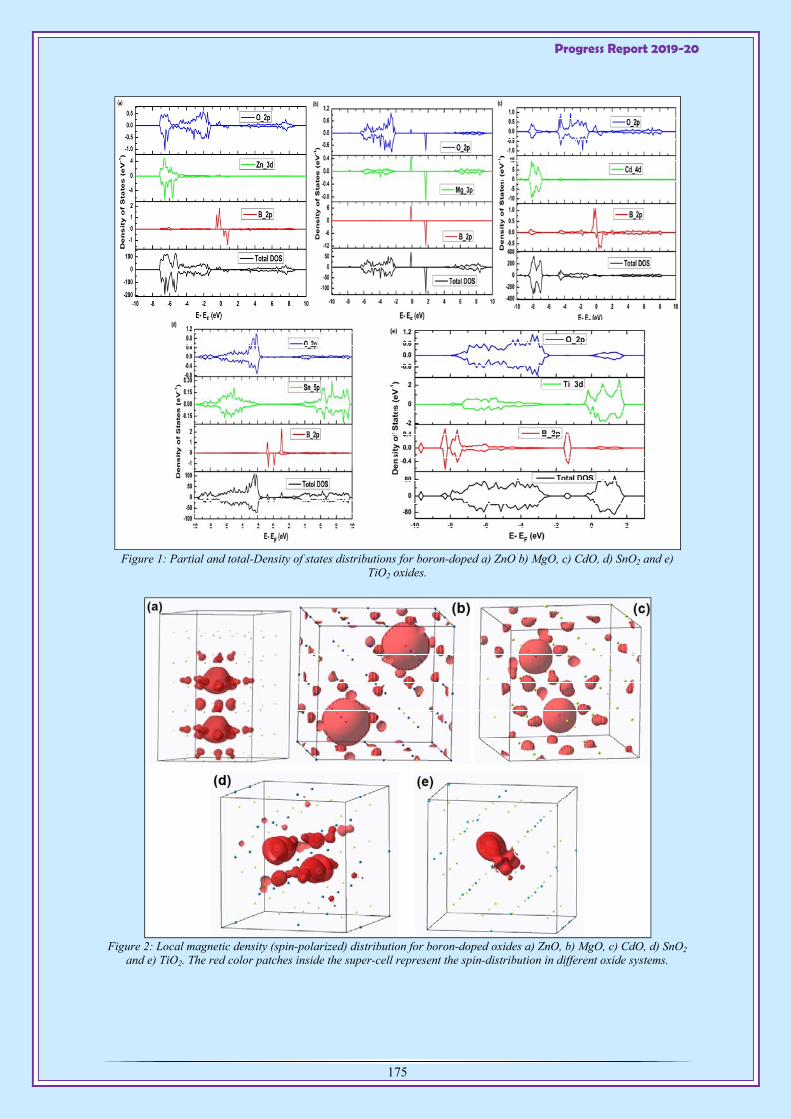
Progress Report 2019-20
175
Figure 1: Partial and total-Density of states distributions for boron-doped a) ZnO b) MgO, c) CdO, d) SnO2 and e) TiO2 oxides.
Figure 2: Local magnetic density (spin-polarized) distribution for boron-doped oxides a) ZnO, b) MgO, c) CdO, d) SnO2
and e) TiO2. The red color patches inside the super-cell represent the spin-distribution in different oxide systems.
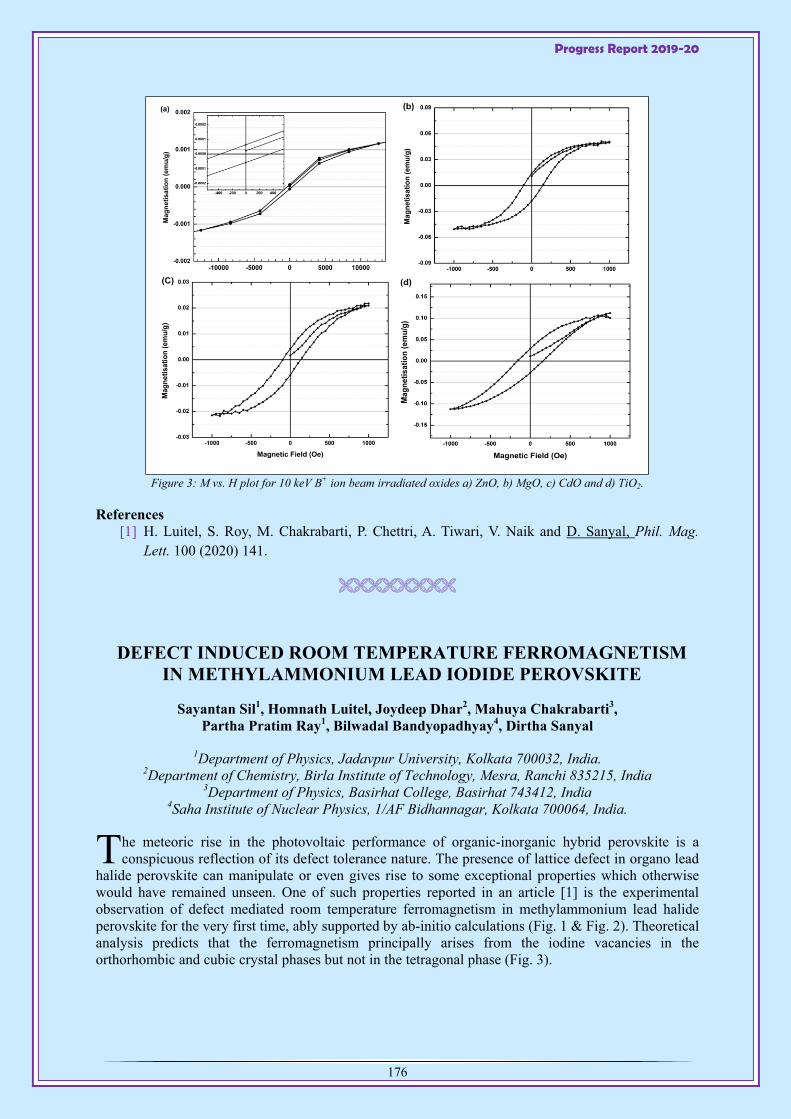
Progress Report 2019-20
176
Figure 3: M vs. H plot for 10 keV B+ ion beam irradiated oxides a) ZnO, b) MgO, c) CdO and d) TiO2.
References [1] H. Luitel, S. Roy, M. Chakrabarti, P. Chettri, A. Tiwari, V. Naik and D. Sanyal, Phil. Mag.
Lett. 100 (2020) 141.
DEFECT INDUCED ROOM TEMPERATURE FERROMAGNETISM IN METHYLAMMONIUM LEAD IODIDE PEROVSKITE
Sayantan Sil1, Homnath Luitel, Joydeep Dhar2, Mahuya Chakrabarti3, Partha Pratim Ray1, Bilwadal Bandyopadhyay4, Dirtha Sanyal
1Department of Physics, Jadavpur University, Kolkata 700032, India. 2Department of Chemistry, Birla Institute of Technology, Mesra, Ranchi 835215, India
3Department of Physics, Basirhat College, Basirhat 743412, India 4Saha Institute of Nuclear Physics, 1/AF Bidhannagar, Kolkata 700064, India.
he meteoric rise in the photovoltaic performance of organic-inorganic hybrid perovskite is a conspicuous reflection of its defect tolerance nature. The presence of lattice defect in organo lead
halide perovskite can manipulate or even gives rise to some exceptional properties which otherwise would have remained unseen. One of such properties reported in an article [1] is the experimental observation of defect mediated room temperature ferromagnetism in methylammonium lead halide perovskite for the very first time, ably supported by ab-initio calculations (Fig. 1 & Fig. 2). Theoretical analysis predicts that the ferromagnetism principally arises from the iodine vacancies in the orthorhombic and cubic crystal phases but not in the tetragonal phase (Fig. 3).
T

Progress Report 2019-20
177
Figure 1: The spin polarized total density of states for pristine MAPbI3 in three different crystal structures.
Figure 2: Spin polarized total density of states for MAPbI3 with V˙I in orthorhombic (a) and cubic (b) and V′′Pb in the
cubic (c) crystal structure carrying asymmetry in the total electron spin distribution. In inset, magnified region for each distribution has been shown for clarity. Total differential charge distribution for MAPbI3 with V˙I in orthorhombic (d) and cubic (e) and V′′Pb in the cubic (f) crystal structure. The region marked with green circle shows that there is an imbalance
in the total charge distribution density, due to presence of atomic vacancy.
Figure 3: The contribution of valence orbital of each element present in MAPbI3 on spin polarized partial density of states for V˙I in orthorhombic (a) and cubic (b) and V′′Pb in cubic (c) crystal structures.
References [1] S. Sil, H. Luitel, J. Dhar, M. Chakrabarti, P. P. Ray, B. Bandyopadhyay and D. Sanyal Phys.
Lett. A384 (2020) 126278.
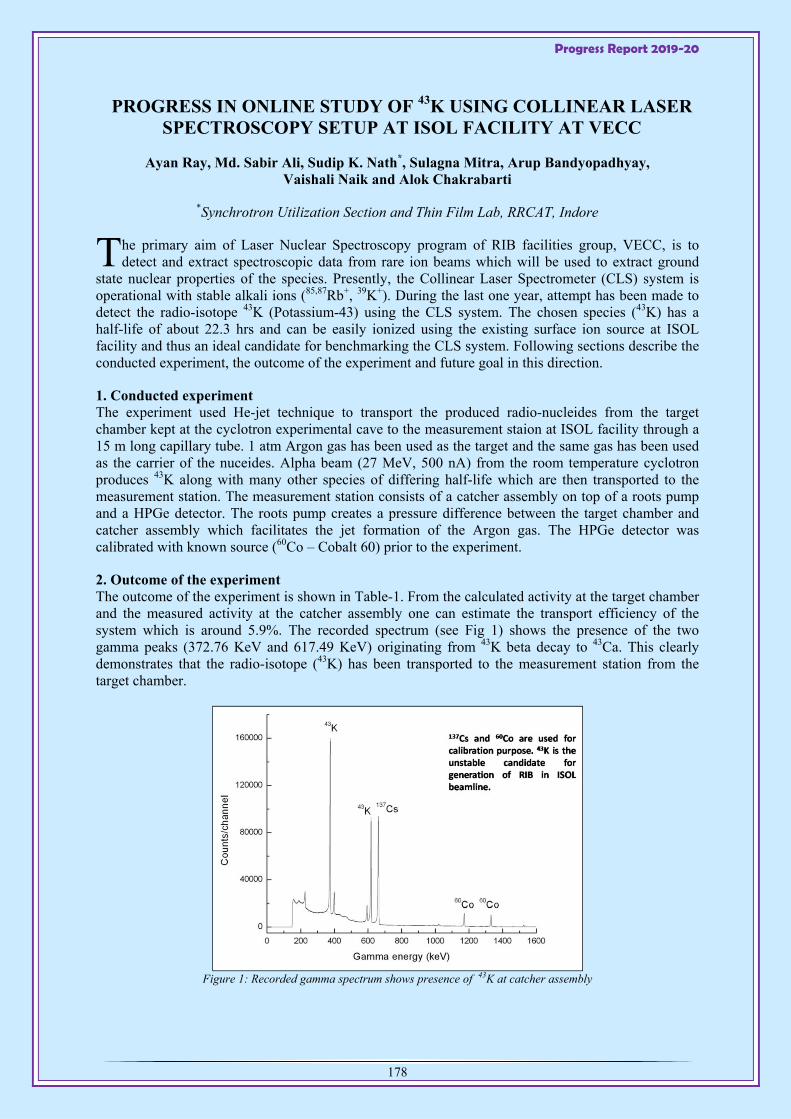
Progress Report 2019-20
178
PROGRESS IN ONLINE STUDY OF 43K USING COLLINEAR LASER SPECTROSCOPY SETUP AT ISOL FACILITY AT VECC
Ayan Ray, Md. Sabir Ali, Sudip K. Nath*, Sulagna Mitra, Arup Bandyopadhyay, Vaishali Naik and Alok Chakrabarti
*Synchrotron Utilization Section and Thin Film Lab, RRCAT, Indore
he primary aim of Laser Nuclear Spectroscopy program of RIB facilities group, VECC, is to detect and extract spectroscopic data from rare ion beams which will be used to extract ground
state nuclear properties of the species. Presently, the Collinear Laser Spectrometer (CLS) system is operational with stable alkali ions (85,87Rb+, 39K+). During the last one year, attempt has been made to detect the radio-isotope 43K (Potassium-43) using the CLS system. The chosen species (43K) has a half-life of about 22.3 hrs and can be easily ionized using the existing surface ion source at ISOL facility and thus an ideal candidate for benchmarking the CLS system. Following sections describe the conducted experiment, the outcome of the experiment and future goal in this direction.
1. Conducted experiment The experiment used He-jet technique to transport the produced radio-nucleides from the target chamber kept at the cyclotron experimental cave to the measurement staion at ISOL facility through a 15 m long capillary tube. 1 atm Argon gas has been used as the target and the same gas has been used as the carrier of the nuceides. Alpha beam (27 MeV, 500 nA) from the room temperature cyclotron produces 43K along with many other species of differing half-life which are then transported to the measurement station. The measurement station consists of a catcher assembly on top of a roots pump and a HPGe detector. The roots pump creates a pressure difference between the target chamber and catcher assembly which facilitates the jet formation of the Argon gas. The HPGe detector was calibrated with known source (60Co – Cobalt 60) prior to the experiment.
2. Outcome of the experiment The outcome of the experiment is shown in Table-1. From the calculated activity at the target chamber and the measured activity at the catcher assembly one can estimate the transport efficiency of the system which is around 5.9%. The recorded spectrum (see Fig 1) shows the presence of the two gamma peaks (372.76 KeV and 617.49 KeV) originating from 43K beta decay to 43Ca. This clearly demonstrates that the radio-isotope (43K) has been transported to the measurement station from the target chamber.
Figure 1: Recorded gamma spectrum shows presence of 43K at catcher assembly
T
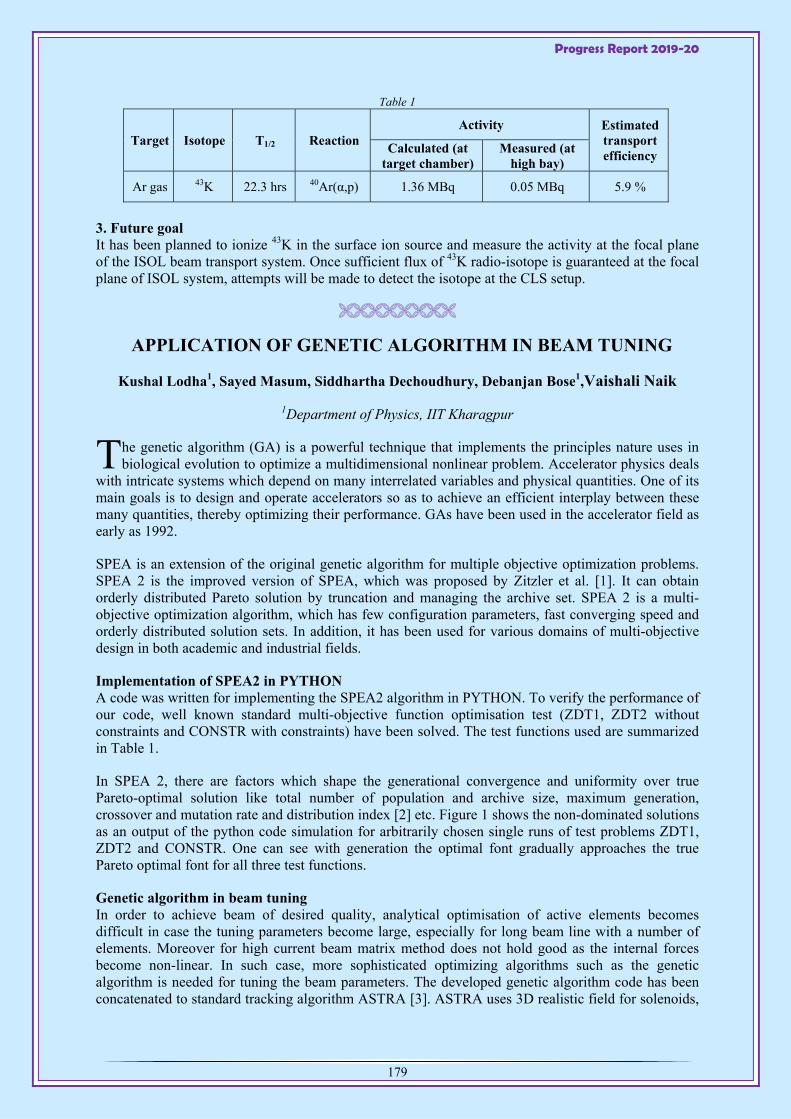
Progress Report 2019-20
179
Table 1
Target Isotope T1/2 Reaction Activity Estimated
transport efficiency
Calculated (at target chamber)
Measured (at high bay)
Ar gas 43K 22.3 hrs 40Ar(α,p) 1.36 MBq 0.05 MBq 5.9 %
3. Future goal It has been planned to ionize 43K in the surface ion source and measure the activity at the focal plane of the ISOL beam transport system. Once sufficient flux of 43K radio-isotope is guaranteed at the focal plane of ISOL system, attempts will be made to detect the isotope at the CLS setup.
APPLICATION OF GENETIC ALGORITHM IN BEAM TUNING
Kushal Lodha1, Sayed Masum, Siddhartha Dechoudhury, Debanjan Bose1,Vaishali Naik
1Department of Physics, IIT Kharagpur
he genetic algorithm (GA) is a powerful technique that implements the principles nature uses in biological evolution to optimize a multidimensional nonlinear problem. Accelerator physics deals
with intricate systems which depend on many interrelated variables and physical quantities. One of its main goals is to design and operate accelerators so as to achieve an efficient interplay between these many quantities, thereby optimizing their performance. GAs have been used in the accelerator field as early as 1992.
SPEA is an extension of the original genetic algorithm for multiple objective optimization problems. SPEA 2 is the improved version of SPEA, which was proposed by Zitzler et al. [1]. It can obtain orderly distributed Pareto solution by truncation and managing the archive set. SPEA 2 is a multi-objective optimization algorithm, which has few configuration parameters, fast converging speed and orderly distributed solution sets. In addition, it has been used for various domains of multi-objective design in both academic and industrial fields.
Implementation of SPEA2 in PYTHON A code was written for implementing the SPEA2 algorithm in PYTHON. To verify the performance of our code, well known standard multi-objective function optimisation test (ZDT1, ZDT2 without constraints and CONSTR with constraints) have been solved. The test functions used are summarized in Table 1.
In SPEA 2, there are factors which shape the generational convergence and uniformity over true Pareto-optimal solution like total number of population and archive size, maximum generation, crossover and mutation rate and distribution index [2] etc. Figure 1 shows the non-dominated solutions as an output of the python code simulation for arbitrarily chosen single runs of test problems ZDT1, ZDT2 and CONSTR. One can see with generation the optimal font gradually approaches the true Pareto optimal font for all three test functions.
Genetic algorithm in beam tuning In order to achieve beam of desired quality, analytical optimisation of active elements becomes difficult in case the tuning parameters become large, especially for long beam line with a number of elements. Moreover for high current beam matrix method does not hold good as the internal forces become non-linear. In such case, more sophisticated optimizing algorithms such as the genetic algorithm is needed for tuning the beam parameters. The developed genetic algorithm code has been concatenated to standard tracking algorithm ASTRA [3]. ASTRA uses 3D realistic field for solenoids,
T

Progress Report 2019-20
180
quadrupoles and accelerating cavities and track quite a large number of particles through the field with space charge contributions. The workflow of the developed code using ASTRA is shown in Figure 3.
Table 1: Test functions Test Function Minimize Constraints Limits of variables
ZDT1
1
1929
NIL 0 1 and 1 30
ZDT2
1
1929
NIL 0 1 and 1 30
CONSTR ,
,1
, 9 6, 9 1
0.1 1 and 0 5
Figure 1: Optimal font in objective space with generation (different symbols) and pareto optimal font (black
line) for ZDT1, ZDT2 and CONSTR test functions Genetic algorithm in beam tuning In order to achieve beam of desired quality, analytical optimisation of active elements becomes difficult in case the tuning parameters become large, especially for long beam line with a number of elements. Moreover for high current beam matrix method does not hold good as the internal forces become non-linear. In such case, more sophisticated optimizing algorithms such as the genetic algorithm is needed for tuning the beam parameters. The developed genetic algorithm code has been concatenated to standard tracking algorithm ASTRA [3]. ASTRA uses 3D realistic field for solenoids, quadrupoles and accelerating cavities and track quite a large number of particles through the field with space charge contributions. The workflow of the developed code using ASTRA is shown in Figure 2.
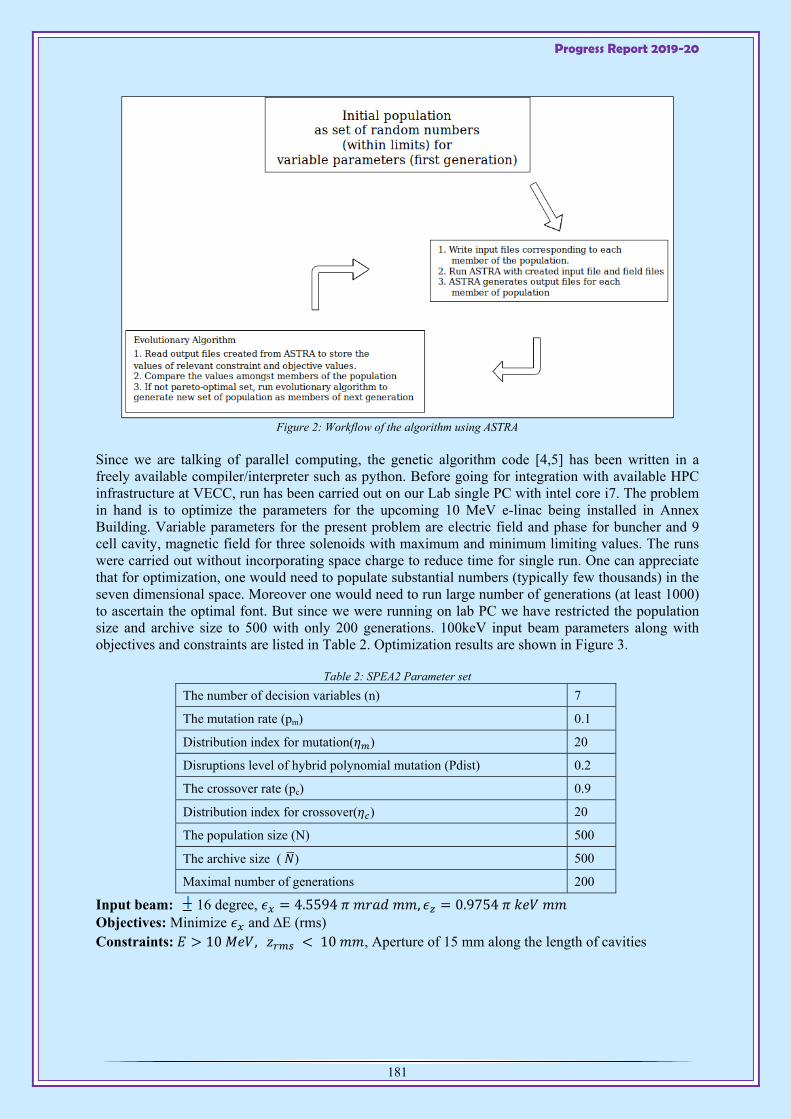
Progress Report 2019-20
181
Figure 2: Workflow of the algorithm using ASTRA
Since we are talking of parallel computing, the genetic algorithm code [4,5] has been written in a freely available compiler/interpreter such as python. Before going for integration with available HPC infrastructure at VECC, run has been carried out on our Lab single PC with intel core i7. The problem in hand is to optimize the parameters for the upcoming 10 MeV e-linac being installed in Annex Building. Variable parameters for the present problem are electric field and phase for buncher and 9 cell cavity, magnetic field for three solenoids with maximum and minimum limiting values. The runs were carried out without incorporating space charge to reduce time for single run. One can appreciate that for optimization, one would need to populate substantial numbers (typically few thousands) in the seven dimensional space. Moreover one would need to run large number of generations (at least 1000) to ascertain the optimal font. But since we were running on lab PC we have restricted the population size and archive size to 500 with only 200 generations. 100keV input beam parameters along with objectives and constraints are listed in Table 2. Optimization results are shown in Figure 3.
Table 2: SPEA2 Parameter set
The number of decision variables (n) 7
The mutation rate (pm) 0.1
Distribution index for mutation( ) 20
Disruptions level of hybrid polynomial mutation (Pdist) 0.2
The crossover rate (pc) 0.9
Distribution index for crossover( ) 20
The population size (N) 500
The archive size ( ) 500
Maximal number of generations 200
Input beam: 16 degree, 4.5594 , 0.9754 Objectives: Minimize and ∆E (rms) Constraints: 10 , 10 , Aperture of 15 mm along the length of cavities
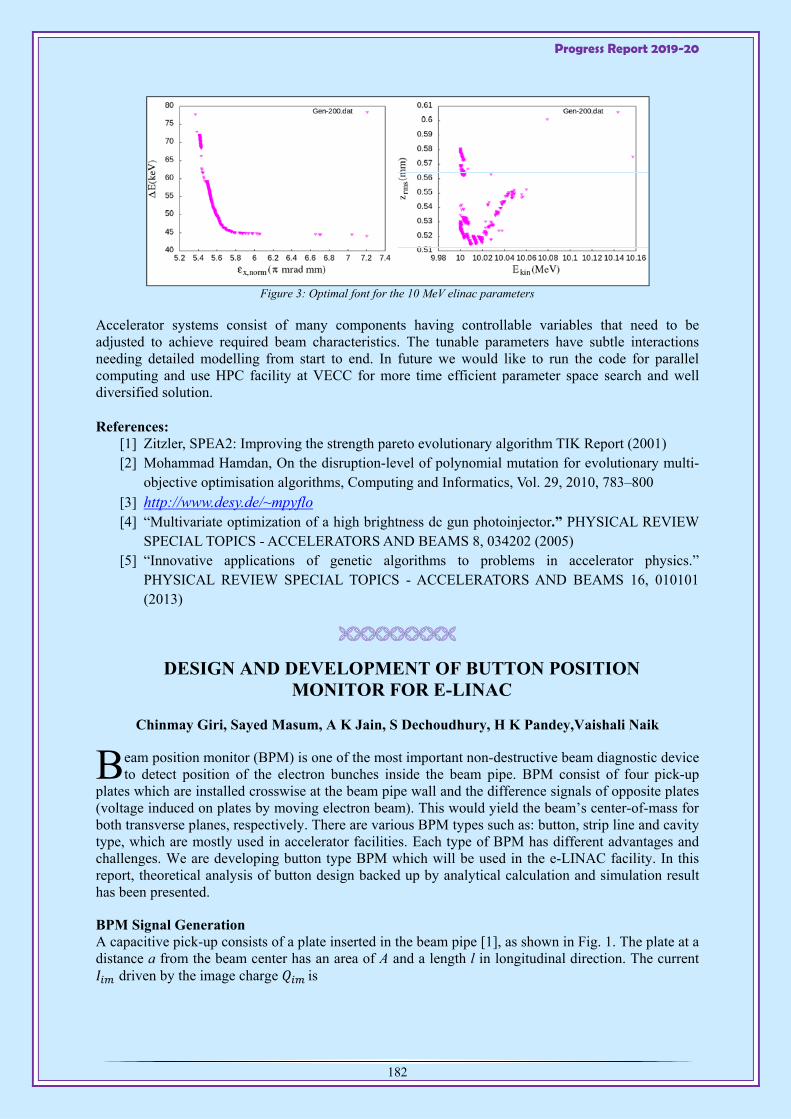
Progress Report 2019-20
182
Figure 3: Optimal font for the 10 MeV elinac parameters
Accelerator systems consist of many components having controllable variables that need to be adjusted to achieve required beam characteristics. The tunable parameters have subtle interactions needing detailed modelling from start to end. In future we would like to run the code for parallel computing and use HPC facility at VECC for more time efficient parameter space search and well diversified solution. References:
[1] Zitzler, SPEA2: Improving the strength pareto evolutionary algorithm TIK Report (2001) [2] Mohammad Hamdan, On the disruption-level of polynomial mutation for evolutionary multi-
objective optimisation algorithms, Computing and Informatics, Vol. 29, 2010, 783–800 [3] http://www.desy.de/~mpyflo [4] “Multivariate optimization of a high brightness dc gun photoinjector.” PHYSICAL REVIEW
SPECIAL TOPICS - ACCELERATORS AND BEAMS 8, 034202 (2005) [5] “Innovative applications of genetic algorithms to problems in accelerator physics.”
PHYSICAL REVIEW SPECIAL TOPICS - ACCELERATORS AND BEAMS 16, 010101 (2013)
DESIGN AND DEVELOPMENT OF BUTTON POSITION MONITOR FOR E-LINAC
Chinmay Giri, Sayed Masum, A K Jain, S Dechoudhury, H K Pandey,Vaishali Naik
eam position monitor (BPM) is one of the most important non-destructive beam diagnostic device to detect position of the electron bunches inside the beam pipe. BPM consist of four pick-up
plates which are installed crosswise at the beam pipe wall and the difference signals of opposite plates (voltage induced on plates by moving electron beam). This would yield the beam’s center-of-mass for both transverse planes, respectively. There are various BPM types such as: button, strip line and cavity type, which are mostly used in accelerator facilities. Each type of BPM has different advantages and challenges. We are developing button type BPM which will be used in the e-LINAC facility. In this report, theoretical analysis of button design backed up by analytical calculation and simulation result has been presented.
BPM Signal Generation A capacitive pick-up consists of a plate inserted in the beam pipe [1], as shown in Fig. 1. The plate at a distance a from the beam center has an area of A and a length l in longitudinal direction. The current
driven by the image charge is
B
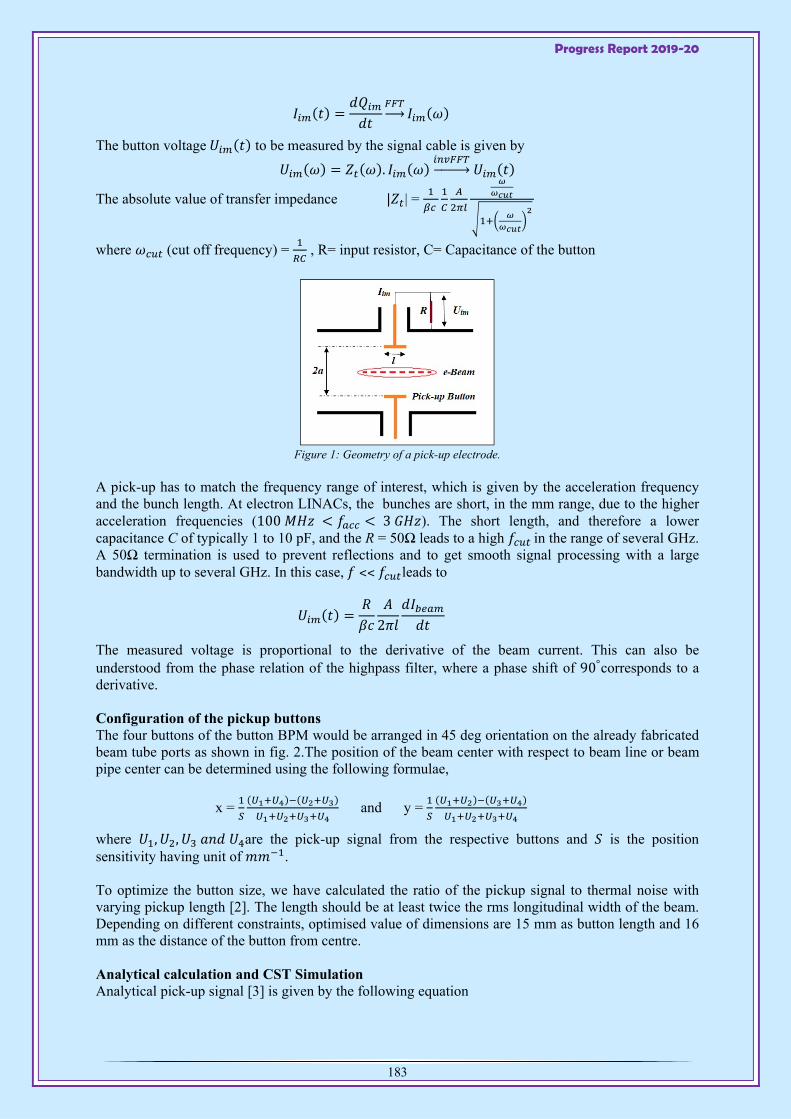
Progress Report 2019-20
183
The button voltage to be measured by the signal cable is given by
.
The absolute value of transfer impedance | | =
where (cut off frequency) = , R= input resistor, C= Capacitance of the button
Figure 1: Geometry of a pick-up electrode.
A pick-up has to match the frequency range of interest, which is given by the acceleration frequency and the bunch length. At electron LINACs, the bunches are short, in the mm range, due to the higher acceleration frequencies (100 3 ). The short length, and therefore a lower capacitance C of typically 1 to 10 pF, and the R = 50Ω leads to a high in the range of several GHz. A 50Ω termination is used to prevent reflections and to get smooth signal processing with a large bandwidth up to several GHz. In this case, ˂˂ leads to
2
The measured voltage is proportional to the derivative of the beam current. This can also be understood from the phase relation of the highpass filter, where a phase shift of 90°corresponds to a derivative. Configuration of the pickup buttons The four buttons of the button BPM would be arranged in 45 deg orientation on the already fabricated beam tube ports as shown in fig. 2.The position of the beam center with respect to beam line or beam pipe center can be determined using the following formulae,
x = and y =
where , , are the pick-up signal from the respective buttons and is the position sensitivity having unit of . To optimize the button size, we have calculated the ratio of the pickup signal to thermal noise with varying pickup length [2]. The length should be at least twice the rms longitudinal width of the beam. Depending on different constraints, optimised value of dimensions are 15 mm as button length and 16 mm as the distance of the button from centre. Analytical calculation and CST Simulation Analytical pick-up signal [3] is given by the following equation
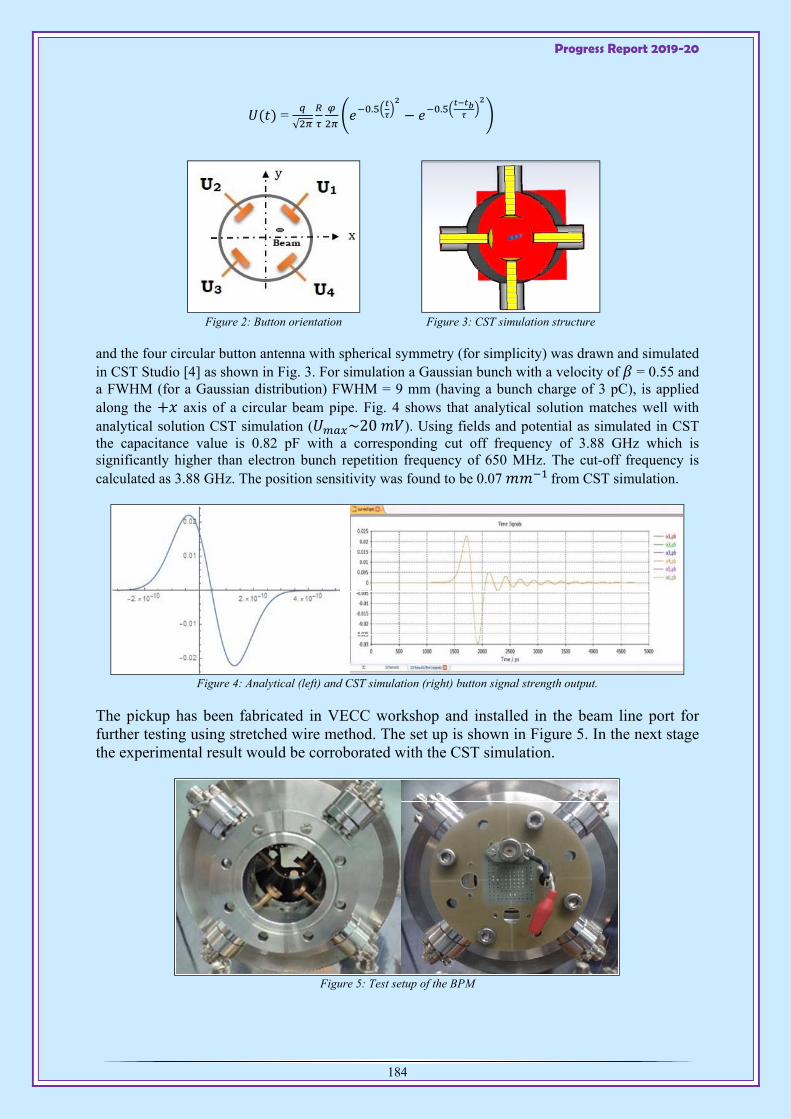
Progress Report 2019-20
184
= √
. .
Figure 2: Button orientation
Figure 3: CST simulation structure
and the four circular button antenna with spherical symmetry (for simplicity) was drawn and simulated in CST Studio [4] as shown in Fig. 3. For simulation a Gaussian bunch with a velocity of = 0.55 and a FWHM (for a Gaussian distribution) FWHM = 9 mm (having a bunch charge of 3 pC), is applied along the axis of a circular beam pipe. Fig. 4 shows that analytical solution matches well with analytical solution CST simulation ( ~20 ). Using fields and potential as simulated in CST the capacitance value is 0.82 pF with a corresponding cut off frequency of 3.88 GHz which is significantly higher than electron bunch repetition frequency of 650 MHz. The cut-off frequency is calculated as 3.88 GHz. The position sensitivity was found to be 0.07 from CST simulation.
Figure 4: Analytical (left) and CST simulation (right) button signal strength output.
The pickup has been fabricated in VECC workshop and installed in the beam line port for further testing using stretched wire method. The set up is shown in Figure 5. In the next stage the experimental result would be corroborated with the CST simulation.
Figure 5: Test setup of the BPM
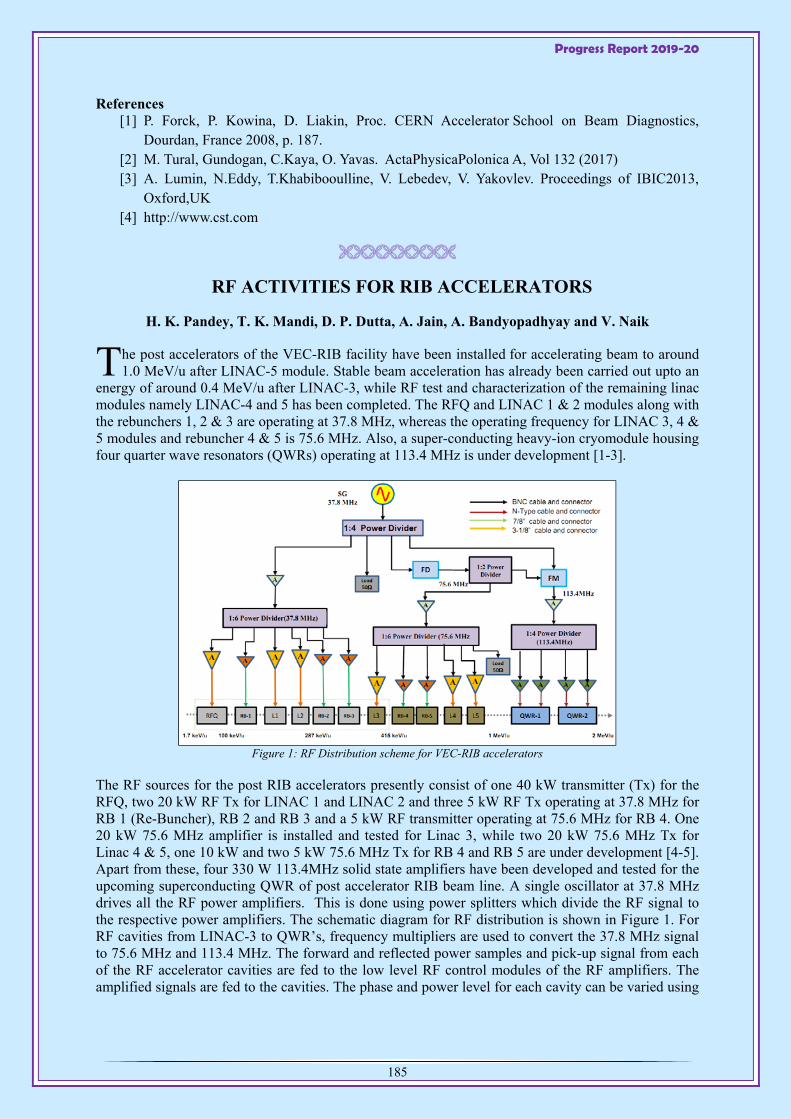
Progress Report 2019-20
185
References [1] P. Forck, P. Kowina, D. Liakin, Proc. CERN Accelerator School on Beam Diagnostics,
Dourdan, France 2008, p. 187. [2] M. Tural, Gundogan, C.Kaya, O. Yavas. ActaPhysicaPolonica A, Vol 132 (2017) [3] A. Lumin, N.Eddy, T.Khabibooulline, V. Lebedev, V. Yakovlev. Proceedings of IBIC2013,
Oxford,UK [4] http://www.cst.com
RF ACTIVITIES FOR RIB ACCELERATORS
H. K. Pandey, T. K. Mandi, D. P. Dutta, A. Jain, A. Bandyopadhyay and V. Naik
he post accelerators of the VEC-RIB facility have been installed for accelerating beam to around 1.0 MeV/u after LINAC-5 module. Stable beam acceleration has already been carried out upto an
energy of around 0.4 MeV/u after LINAC-3, while RF test and characterization of the remaining linac modules namely LINAC-4 and 5 has been completed. The RFQ and LINAC 1 & 2 modules along with the rebunchers 1, 2 & 3 are operating at 37.8 MHz, whereas the operating frequency for LINAC 3, 4 & 5 modules and rebuncher 4 & 5 is 75.6 MHz. Also, a super-conducting heavy-ion cryomodule housing four quarter wave resonators (QWRs) operating at 113.4 MHz is under development [1-3].
Figure 1: RF Distribution scheme for VEC-RIB accelerators
The RF sources for the post RIB accelerators presently consist of one 40 kW transmitter (Tx) for the RFQ, two 20 kW RF Tx for LINAC 1 and LINAC 2 and three 5 kW RF Tx operating at 37.8 MHz for RB 1 (Re-Buncher), RB 2 and RB 3 and a 5 kW RF transmitter operating at 75.6 MHz for RB 4. One 20 kW 75.6 MHz amplifier is installed and tested for Linac 3, while two 20 kW 75.6 MHz Tx for Linac 4 & 5, one 10 kW and two 5 kW 75.6 MHz Tx for RB 4 and RB 5 are under development [4-5]. Apart from these, four 330 W 113.4MHz solid state amplifiers have been developed and tested for the upcoming superconducting QWR of post accelerator RIB beam line. A single oscillator at 37.8 MHz drives all the RF power amplifiers. This is done using power splitters which divide the RF signal to the respective power amplifiers. The schematic diagram for RF distribution is shown in Figure 1. For RF cavities from LINAC-3 to QWR’s, frequency multipliers are used to convert the 37.8 MHz signal to 75.6 MHz and 113.4 MHz. The forward and reflected power samples and pick-up signal from each of the RF accelerator cavities are fed to the low level RF control modules of the RF amplifiers. The amplified signals are fed to the cavities. The phase and power level for each cavity can be varied using
T

Progress Report 2019-20
186
the respective phase and level controllers of the individual transmitters. The pick-up signals from all cavities are observed with oscilloscopes during operations.
Low Level RF Control The Low Level RF (LLRF) control system regulates the amplitude and phase of the RF cavity voltage through fast electronic feedback mechanism. The frequency of the cavity is regulated by the mechanical movement of a tuner loop in appropriate direction by sensing the frequency deviation. This control system is based on the conventional amplitude and phase loop method as shown in Figure 2(a). The important components in control system consists of the phase comparator (realized with double balanced mixer configured in phase comparator mode), amplitude detector (realized with Schottky diodes HP5082-2835), PI controller, voltage controlled phase shifter (realized with two 0-180˚ varactor diode based phase shifters in cascade) and voltage controlled attenuators (realized with pin diodes based π configuration circuitry). The phase detector senses the phase difference between the RF input signal and the cavity pick-up signal to produce an error signal which is fed to a PI controller to generate the control voltage. The control voltage is input to a phase shifter which brings the phase of the RF signal to the desired value. The measured phase stability is ± 0.5 and phase control range is 360. The amplitude detector senses the level of the cavity pick-up signal and it is compared with the reference level signal to produce the error signal which is fed to a PI controller. The measured amplitude stability of the control circuit is ± 0.5%.
Figure 2: (a) Low level RF control system (b) PLC based Remote control of RF system
Upgradation of Remote control of RF system RF transmitter control and monitoring systems are currently being upgraded. The existing system will be replaced by a PLC based system with provision for local as well as remote operation (Figure 2-b). The system consists of 75 digital IO and 20 analog IO. The low voltage analog signals will be processed through appropriate signal conditioning circuit to make them compatible with PLC input range. A “Distributed Data Acquisition and Control System (DDACS)” has also been developed and installed at VECC. The remote control system is designed to control and monitor all parameters for the RIB beam line components including the RF transmitters at RIB Facility. The data acquisition and control system has a 3 layered design, namely: a) Equipment Interface Layer b) Supervisory Layer and c) Operator Interface Layer. The Equipment Interface Layer consists of Remote Interface Modules (RIM) and Equipment Interface Modules (EIM). The RIM, realised using a 32-bit LPC 2478 ARM7TDMI, acts as the interface between the local controller of the RF Tx and the EIM. The RIM is interfaced to the EIM through RS232. Each EIM controls a specific RIM along with a specific section of beam line support subsystems. The Supervisory layer, realised using Embedded Controllers (EC1), interfaced with EIMs through fibre optic cables, performs supervisory task of continuously sending command and acquiring data from lower level EIMs and reporting to the operator interface layer as and when requested. Operator interface layer consists of operator console formed with another
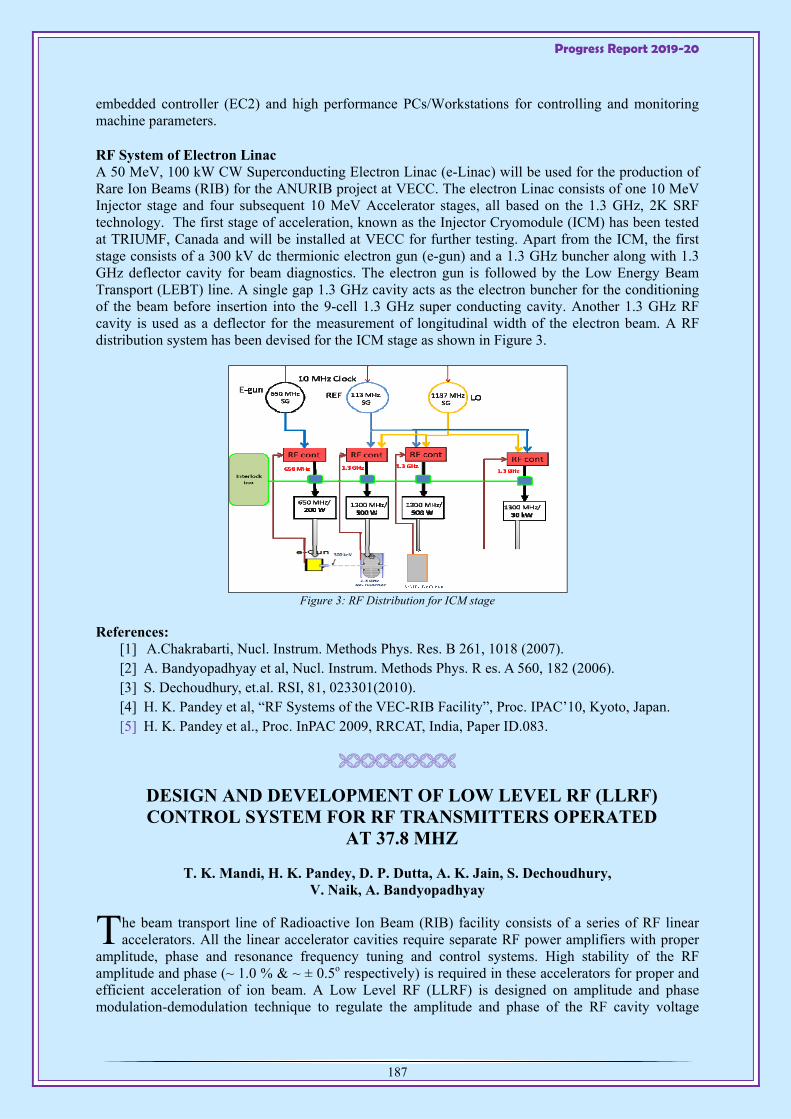
Progress Report 2019-20
187
embedded controller (EC2) and high performance PCs/Workstations for controlling and monitoring machine parameters. RF System of Electron Linac A 50 MeV, 100 kW CW Superconducting Electron Linac (e-Linac) will be used for the production of Rare Ion Beams (RIB) for the ANURIB project at VECC. The electron Linac consists of one 10 MeV Injector stage and four subsequent 10 MeV Accelerator stages, all based on the 1.3 GHz, 2K SRF technology. The first stage of acceleration, known as the Injector Cryomodule (ICM) has been tested at TRIUMF, Canada and will be installed at VECC for further testing. Apart from the ICM, the first stage consists of a 300 kV dc thermionic electron gun (e-gun) and a 1.3 GHz buncher along with 1.3 GHz deflector cavity for beam diagnostics. The electron gun is followed by the Low Energy Beam Transport (LEBT) line. A single gap 1.3 GHz cavity acts as the electron buncher for the conditioning of the beam before insertion into the 9-cell 1.3 GHz super conducting cavity. Another 1.3 GHz RF cavity is used as a deflector for the measurement of longitudinal width of the electron beam. A RF distribution system has been devised for the ICM stage as shown in Figure 3.
Figure 3: RF Distribution for ICM stage
References: [1] A.Chakrabarti, Nucl. Instrum. Methods Phys. Res. B 261, 1018 (2007). [2] A. Bandyopadhyay et al, Nucl. Instrum. Methods Phys. R es. A 560, 182 (2006). [3] S. Dechoudhury, et.al. RSI, 81, 023301(2010). [4] H. K. Pandey et al, “RF Systems of the VEC-RIB Facility”, Proc. IPAC’10, Kyoto, Japan. [5] H. K. Pandey et al., Proc. InPAC 2009, RRCAT, India, Paper ID.083.
DESIGN AND DEVELOPMENT OF LOW LEVEL RF (LLRF) CONTROL SYSTEM FOR RF TRANSMITTERS OPERATED
AT 37.8 MHZ
T. K. Mandi, H. K. Pandey, D. P. Dutta, A. K. Jain, S. Dechoudhury, V. Naik, A. Bandyopadhyay
he beam transport line of Radioactive Ion Beam (RIB) facility consists of a series of RF linear accelerators. All the linear accelerator cavities require separate RF power amplifiers with proper
amplitude, phase and resonance frequency tuning and control systems. High stability of the RF amplitude and phase (~ 1.0 % & ~ ± 0.5o respectively) is required in these accelerators for proper and efficient acceleration of ion beam. A Low Level RF (LLRF) is designed on amplitude and phase modulation-demodulation technique to regulate the amplitude and phase of the RF cavity voltage
T
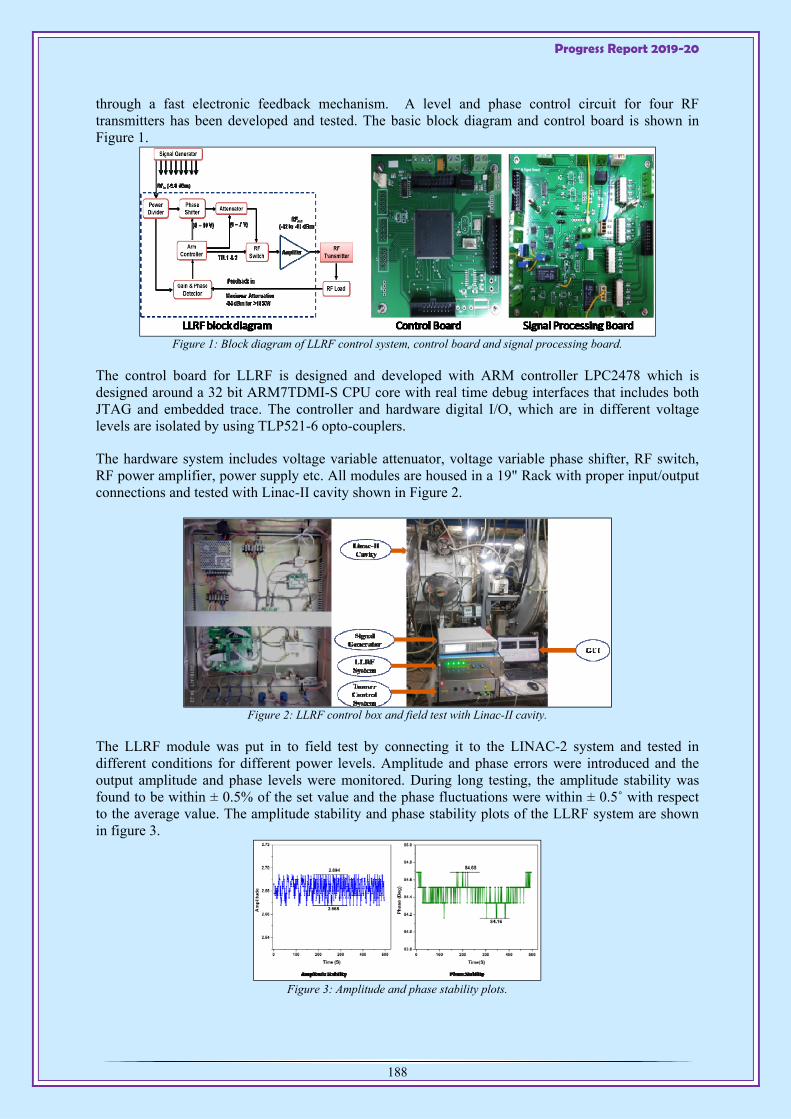
Progress Report 2019-20
188
through a fast electronic feedback mechanism. A level and phase control circuit for four RF transmitters has been developed and tested. The basic block diagram and control board is shown in Figure 1.
Figure 1: Block diagram of LLRF control system, control board and signal processing board.
The control board for LLRF is designed and developed with ARM controller LPC2478 which is designed around a 32 bit ARM7TDMI-S CPU core with real time debug interfaces that includes both JTAG and embedded trace. The controller and hardware digital I/O, which are in different voltage levels are isolated by using TLP521-6 opto-couplers.
The hardware system includes voltage variable attenuator, voltage variable phase shifter, RF switch, RF power amplifier, power supply etc. All modules are housed in a 19" Rack with proper input/output connections and tested with Linac-II cavity shown in Figure 2.
Figure 2: LLRF control box and field test with Linac-II cavity.
The LLRF module was put in to field test by connecting it to the LINAC-2 system and tested in different conditions for different power levels. Amplitude and phase errors were introduced and the output amplitude and phase levels were monitored. During long testing, the amplitude stability was found to be within ± 0.5% of the set value and the phase fluctuations were within ± 0.5˚ with respect to the average value. The amplitude stability and phase stability plots of the LLRF system are shown in figure 3.
Figure 3: Amplitude and phase stability plots.
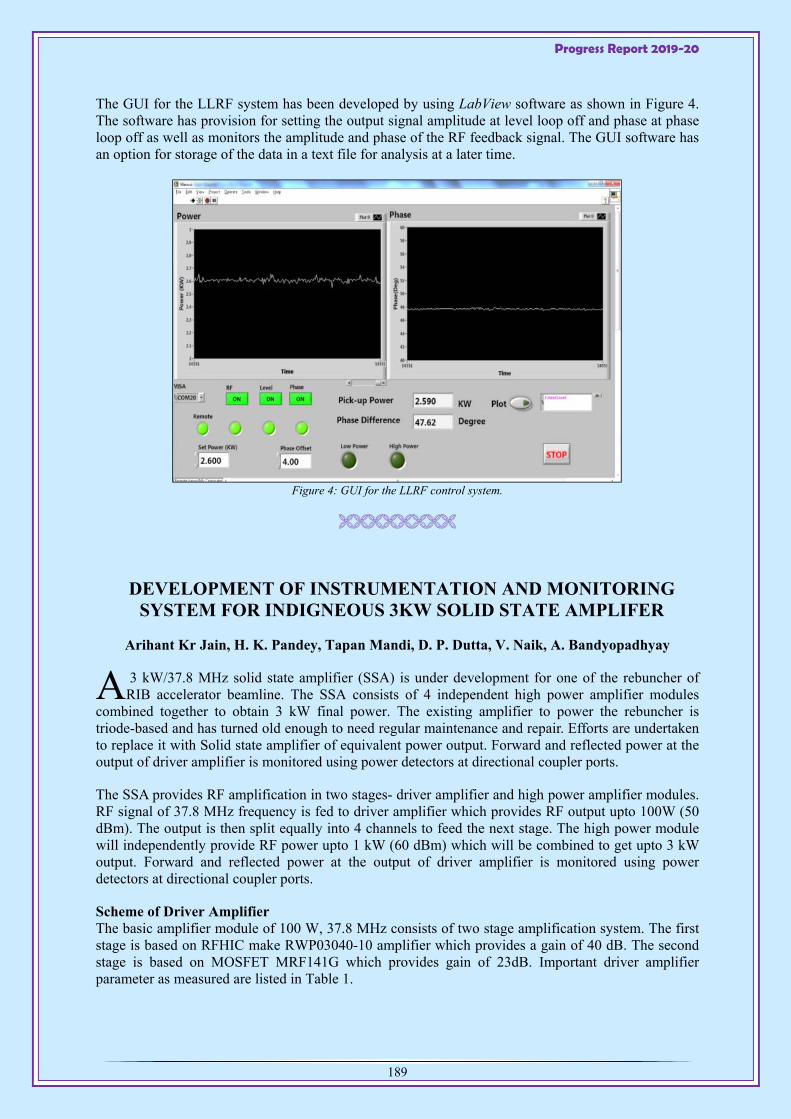
Progress Report 2019-20
189
The GUI for the LLRF system has been developed by using LabView software as shown in Figure 4. The software has provision for setting the output signal amplitude at level loop off and phase at phase loop off as well as monitors the amplitude and phase of the RF feedback signal. The GUI software has an option for storage of the data in a text file for analysis at a later time.
Figure 4: GUI for the LLRF control system.
DEVELOPMENT OF INSTRUMENTATION AND MONITORING SYSTEM FOR INDIGNEOUS 3KW SOLID STATE AMPLIFER
Arihant Kr Jain, H. K. Pandey, Tapan Mandi, D. P. Dutta, V. Naik, A. Bandyopadhyay
3 kW/37.8 MHz solid state amplifier (SSA) is under development for one of the rebuncher of RIB accelerator beamline. The SSA consists of 4 independent high power amplifier modules
combined together to obtain 3 kW final power. The existing amplifier to power the rebuncher is triode-based and has turned old enough to need regular maintenance and repair. Efforts are undertaken to replace it with Solid state amplifier of equivalent power output. Forward and reflected power at the output of driver amplifier is monitored using power detectors at directional coupler ports.
The SSA provides RF amplification in two stages- driver amplifier and high power amplifier modules. RF signal of 37.8 MHz frequency is fed to driver amplifier which provides RF output upto 100W (50 dBm). The output is then split equally into 4 channels to feed the next stage. The high power module will independently provide RF power upto 1 kW (60 dBm) which will be combined to get upto 3 kW output. Forward and reflected power at the output of driver amplifier is monitored using power detectors at directional coupler ports.
Scheme of Driver Amplifier The basic amplifier module of 100 W, 37.8 MHz consists of two stage amplification system. The first stage is based on RFHIC make RWP03040-10 amplifier which provides a gain of 40 dB. The second stage is based on MOSFET MRF141G which provides gain of 23dB. Important driver amplifier parameter as measured are listed in Table 1.
A
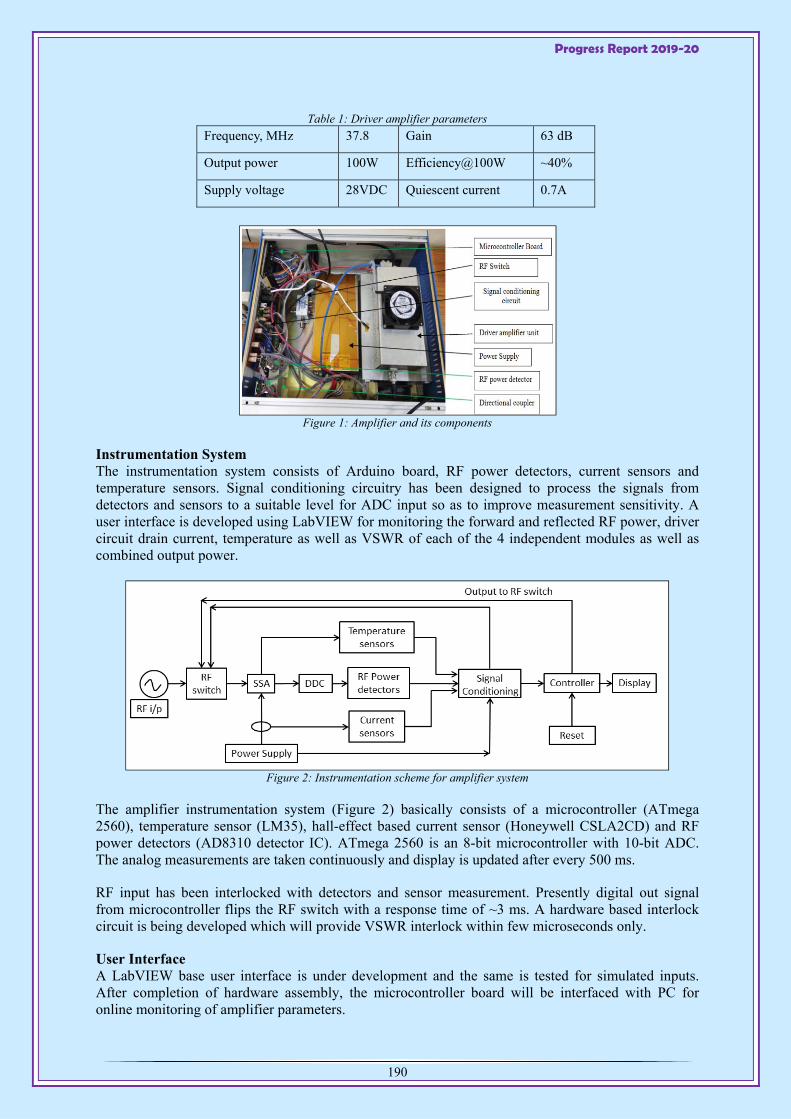
Progress Report 2019-20
190
Table 1: Driver amplifier parameters
Frequency, MHz 37.8 Gain 63 dB
Output power 100W Efficiency@100W ~40%
Supply voltage 28VDC Quiescent current 0.7A
Figure 1: Amplifier and its components
Instrumentation System The instrumentation system consists of Arduino board, RF power detectors, current sensors and temperature sensors. Signal conditioning circuitry has been designed to process the signals from detectors and sensors to a suitable level for ADC input so as to improve measurement sensitivity. A user interface is developed using LabVIEW for monitoring the forward and reflected RF power, driver circuit drain current, temperature as well as VSWR of each of the 4 independent modules as well as combined output power.
Figure 2: Instrumentation scheme for amplifier system
The amplifier instrumentation system (Figure 2) basically consists of a microcontroller (ATmega 2560), temperature sensor (LM35), hall-effect based current sensor (Honeywell CSLA2CD) and RF power detectors (AD8310 detector IC). ATmega 2560 is an 8-bit microcontroller with 10-bit ADC. The analog measurements are taken continuously and display is updated after every 500 ms.
RF input has been interlocked with detectors and sensor measurement. Presently digital out signal from microcontroller flips the RF switch with a response time of ~3 ms. A hardware based interlock circuit is being developed which will provide VSWR interlock within few microseconds only.
User Interface A LabVIEW base user interface is under development and the same is tested for simulated inputs. After completion of hardware assembly, the microcontroller board will be interfaced with PC for online monitoring of amplifier parameters.
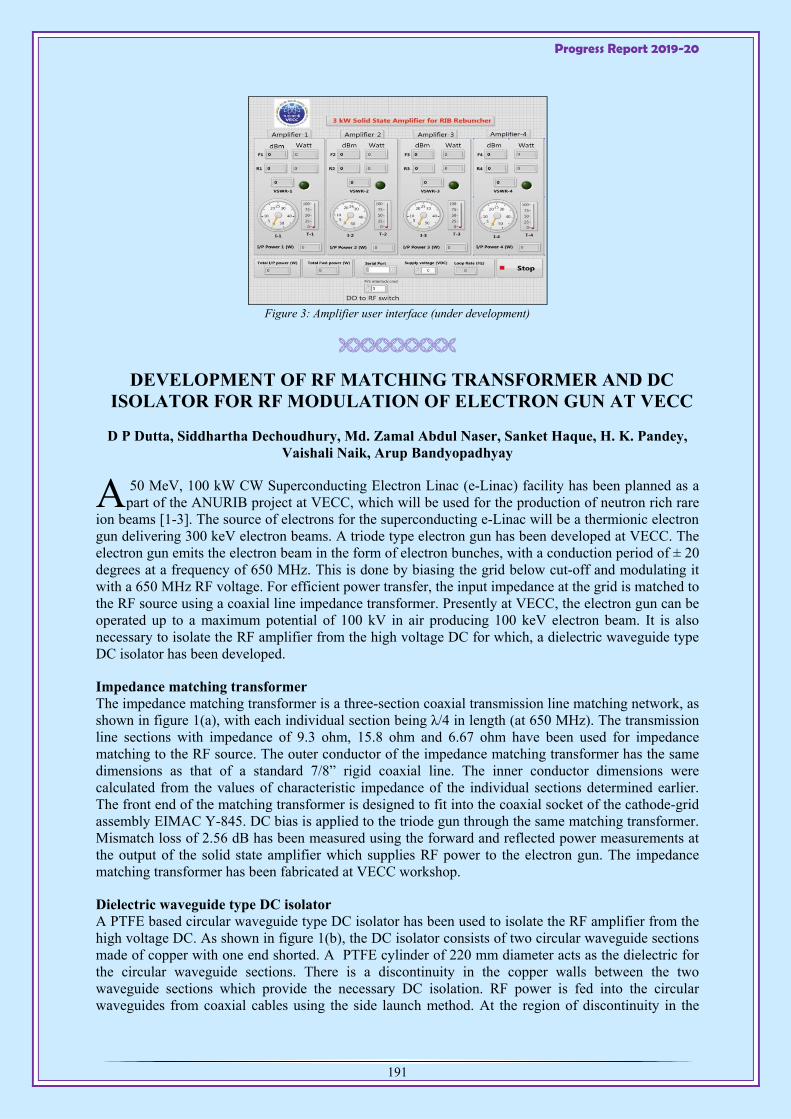
Progress Report 2019-20
191
Figure 3: Amplifier user interface (under development)
DEVELOPMENT OF RF MATCHING TRANSFORMER AND DC ISOLATOR FOR RF MODULATION OF ELECTRON GUN AT VECC
D P Dutta, Siddhartha Dechoudhury, Md. Zamal Abdul Naser, Sanket Haque, H. K. Pandey, Vaishali Naik, Arup Bandyopadhyay
50 MeV, 100 kW CW Superconducting Electron Linac (e-Linac) facility has been planned as a part of the ANURIB project at VECC, which will be used for the production of neutron rich rare
ion beams [1-3]. The source of electrons for the superconducting e-Linac will be a thermionic electron gun delivering 300 keV electron beams. A triode type electron gun has been developed at VECC. The electron gun emits the electron beam in the form of electron bunches, with a conduction period of ± 20 degrees at a frequency of 650 MHz. This is done by biasing the grid below cut-off and modulating it with a 650 MHz RF voltage. For efficient power transfer, the input impedance at the grid is matched to the RF source using a coaxial line impedance transformer. Presently at VECC, the electron gun can be operated up to a maximum potential of 100 kV in air producing 100 keV electron beam. It is also necessary to isolate the RF amplifier from the high voltage DC for which, a dielectric waveguide type DC isolator has been developed.
Impedance matching transformer The impedance matching transformer is a three-section coaxial transmission line matching network, as shown in figure 1(a), with each individual section being λ/4 in length (at 650 MHz). The transmission line sections with impedance of 9.3 ohm, 15.8 ohm and 6.67 ohm have been used for impedance matching to the RF source. The outer conductor of the impedance matching transformer has the same dimensions as that of a standard 7/8” rigid coaxial line. The inner conductor dimensions were calculated from the values of characteristic impedance of the individual sections determined earlier. The front end of the matching transformer is designed to fit into the coaxial socket of the cathode-grid assembly EIMAC Y-845. DC bias is applied to the triode gun through the same matching transformer. Mismatch loss of 2.56 dB has been measured using the forward and reflected power measurements at the output of the solid state amplifier which supplies RF power to the electron gun. The impedance matching transformer has been fabricated at VECC workshop.
Dielectric waveguide type DC isolator A PTFE based circular waveguide type DC isolator has been used to isolate the RF amplifier from the high voltage DC. As shown in figure 1(b), the DC isolator consists of two circular waveguide sections made of copper with one end shorted. A PTFE cylinder of 220 mm diameter acts as the dielectric for the circular waveguide sections. There is a discontinuity in the copper walls between the two waveguide sections which provide the necessary DC isolation. RF power is fed into the circular waveguides from coaxial cables using the side launch method. At the region of discontinuity in the
A
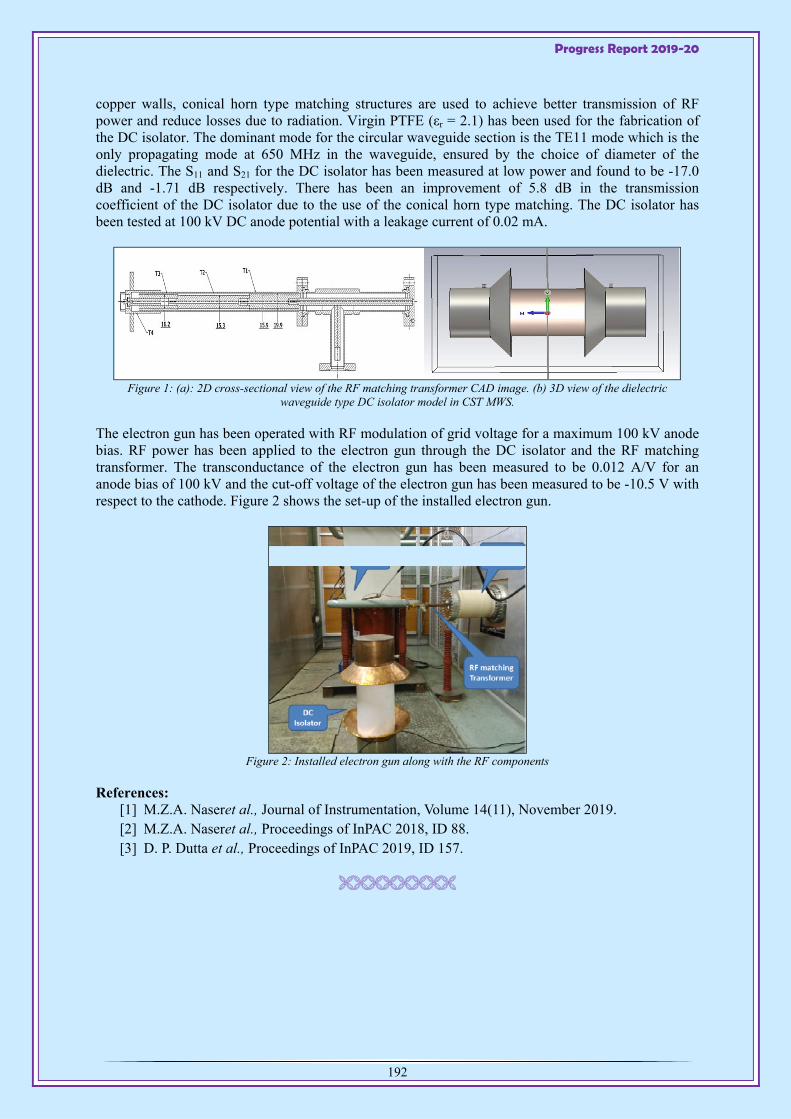
Progress Report 2019-20
192
copper walls, conical horn type matching structures are used to achieve better transmission of RF power and reduce losses due to radiation. Virgin PTFE (εr = 2.1) has been used for the fabrication of the DC isolator. The dominant mode for the circular waveguide section is the TE11 mode which is the only propagating mode at 650 MHz in the waveguide, ensured by the choice of diameter of the dielectric. The S11 and S21 for the DC isolator has been measured at low power and found to be -17.0 dB and -1.71 dB respectively. There has been an improvement of 5.8 dB in the transmission coefficient of the DC isolator due to the use of the conical horn type matching. The DC isolator has been tested at 100 kV DC anode potential with a leakage current of 0.02 mA.
Figure 1: (a): 2D cross-sectional view of the RF matching transformer CAD image. (b) 3D view of the dielectric waveguide type DC isolator model in CST MWS.
The electron gun has been operated with RF modulation of grid voltage for a maximum 100 kV anode bias. RF power has been applied to the electron gun through the DC isolator and the RF matching transformer. The transconductance of the electron gun has been measured to be 0.012 A/V for an anode bias of 100 kV and the cut-off voltage of the electron gun has been measured to be -10.5 V with respect to the cathode. Figure 2 shows the set-up of the installed electron gun.
Figure 2: Installed electron gun along with the RF components
References: [1] M.Z.A. Naseret al., Journal of Instrumentation, Volume 14(11), November 2019. [2] M.Z.A. Naseret al., Proceedings of InPAC 2018, ID 88. [3] D. P. Dutta et al., Proceedings of InPAC 2019, ID 157.
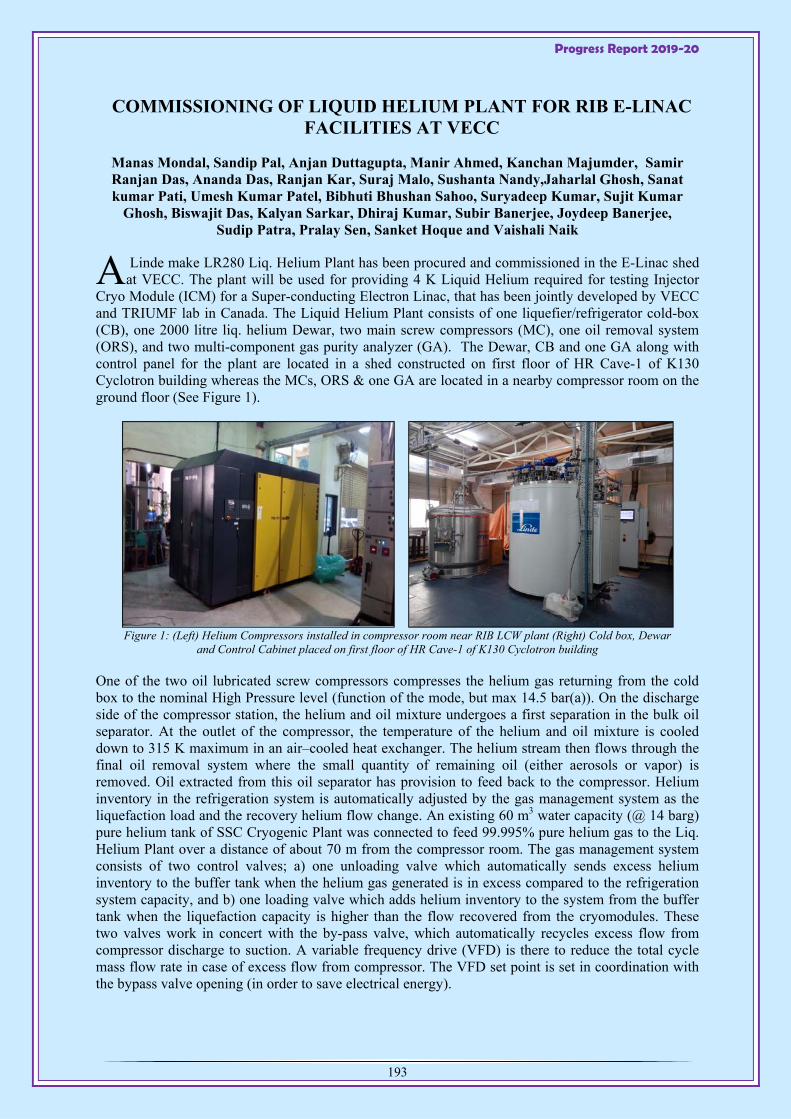
Progress Report 2019-20
193
COMMISSIONING OF LIQUID HELIUM PLANT FOR RIB E-LINAC FACILITIES AT VECC
Manas Mondal, Sandip Pal, Anjan Duttagupta, Manir Ahmed, Kanchan Majumder, Samir Ranjan Das, Ananda Das, Ranjan Kar, Suraj Malo, Sushanta Nandy,Jaharlal Ghosh, Sanat kumar Pati, Umesh Kumar Patel, Bibhuti Bhushan Sahoo, Suryadeep Kumar, Sujit Kumar
Ghosh, Biswajit Das, Kalyan Sarkar, Dhiraj Kumar, Subir Banerjee, Joydeep Banerjee, Sudip Patra, Pralay Sen, Sanket Hoque and Vaishali Naik
Linde make LR280 Liq. Helium Plant has been procured and commissioned in the E-Linac shed at VECC. The plant will be used for providing 4 K Liquid Helium required for testing Injector
Cryo Module (ICM) for a Super-conducting Electron Linac, that has been jointly developed by VECC and TRIUMF lab in Canada. The Liquid Helium Plant consists of one liquefier/refrigerator cold-box (CB), one 2000 litre liq. helium Dewar, two main screw compressors (MC), one oil removal system (ORS), and two multi-component gas purity analyzer (GA). The Dewar, CB and one GA along with control panel for the plant are located in a shed constructed on first floor of HR Cave-1 of K130 Cyclotron building whereas the MCs, ORS & one GA are located in a nearby compressor room on the ground floor (See Figure 1).
Figure 1: (Left) Helium Compressors installed in compressor room near RIB LCW plant (Right) Cold box, Dewar and Control Cabinet placed on first floor of HR Cave-1 of K130 Cyclotron building
One of the two oil lubricated screw compressors compresses the helium gas returning from the cold box to the nominal High Pressure level (function of the mode, but max 14.5 bar(a)). On the discharge side of the compressor station, the helium and oil mixture undergoes a first separation in the bulk oil separator. At the outlet of the compressor, the temperature of the helium and oil mixture is cooled down to 315 K maximum in an air–cooled heat exchanger. The helium stream then flows through the final oil removal system where the small quantity of remaining oil (either aerosols or vapor) is removed. Oil extracted from this oil separator has provision to feed back to the compressor. Helium inventory in the refrigeration system is automatically adjusted by the gas management system as the liquefaction load and the recovery helium flow change. An existing 60 m3 water capacity (@ 14 barg) pure helium tank of SSC Cryogenic Plant was connected to feed 99.995% pure helium gas to the Liq. Helium Plant over a distance of about 70 m from the compressor room. The gas management system consists of two control valves; a) one unloading valve which automatically sends excess helium inventory to the buffer tank when the helium gas generated is in excess compared to the refrigeration system capacity, and b) one loading valve which adds helium inventory to the system from the buffer tank when the liquefaction capacity is higher than the flow recovered from the cryomodules. These two valves work in concert with the by-pass valve, which automatically recycles excess flow from compressor discharge to suction. A variable frequency drive (VFD) is there to reduce the total cycle mass flow rate in case of excess flow from compressor. The VFD set point is set in coordination with the bypass valve opening (in order to save electrical energy).
A
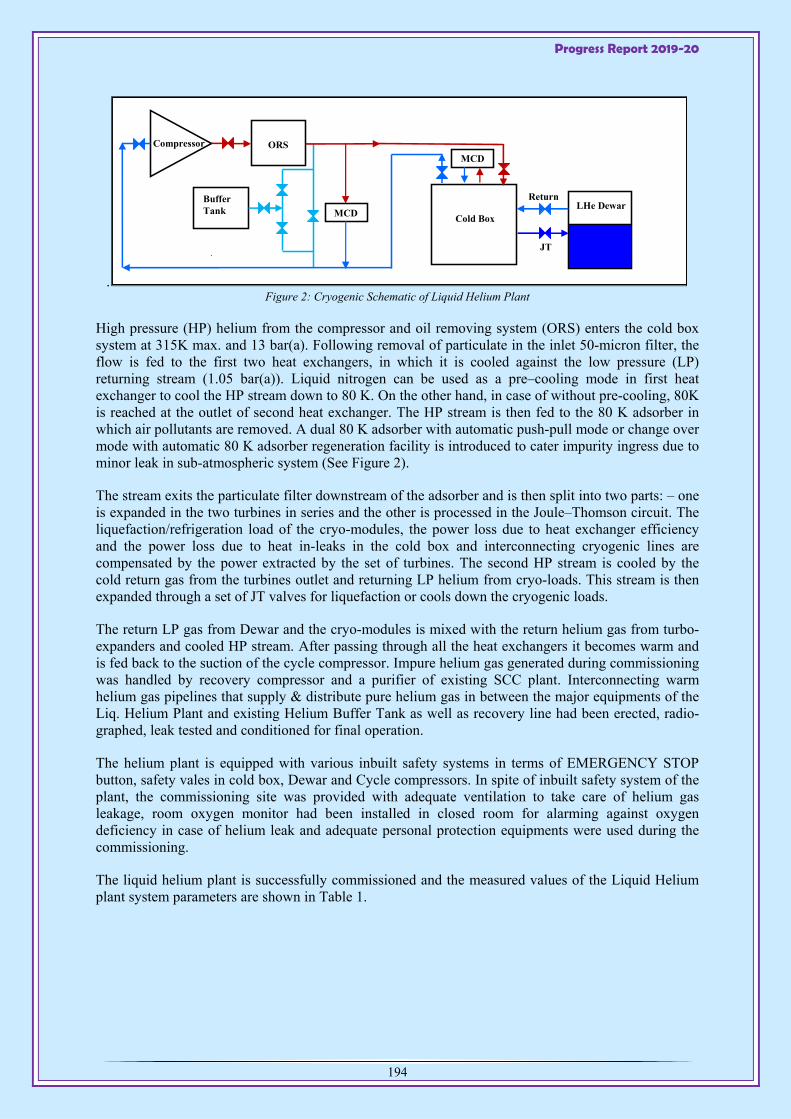
Progress Report 2019-20
194
. Figure 2: Cryogenic Schematic of Liquid Helium Plant
High pressure (HP) helium from the compressor and oil removing system (ORS) enters the cold box system at 315K max. and 13 bar(a). Following removal of particulate in the inlet 50-micron filter, the flow is fed to the first two heat exchangers, in which it is cooled against the low pressure (LP) returning stream (1.05 bar(a)). Liquid nitrogen can be used as a pre–cooling mode in first heat exchanger to cool the HP stream down to 80 K. On the other hand, in case of without pre-cooling, 80K is reached at the outlet of second heat exchanger. The HP stream is then fed to the 80 K adsorber in which air pollutants are removed. A dual 80 K adsorber with automatic push-pull mode or change over mode with automatic 80 K adsorber regeneration facility is introduced to cater impurity ingress due to minor leak in sub-atmospheric system (See Figure 2).
The stream exits the particulate filter downstream of the adsorber and is then split into two parts: – one is expanded in the two turbines in series and the other is processed in the Joule–Thomson circuit. The liquefaction/refrigeration load of the cryo-modules, the power loss due to heat exchanger efficiency and the power loss due to heat in-leaks in the cold box and interconnecting cryogenic lines are compensated by the power extracted by the set of turbines. The second HP stream is cooled by the cold return gas from the turbines outlet and returning LP helium from cryo-loads. This stream is then expanded through a set of JT valves for liquefaction or cools down the cryogenic loads.
The return LP gas from Dewar and the cryo-modules is mixed with the return helium gas from turbo-expanders and cooled HP stream. After passing through all the heat exchangers it becomes warm and is fed back to the suction of the cycle compressor. Impure helium gas generated during commissioning was handled by recovery compressor and a purifier of existing SCC plant. Interconnecting warm helium gas pipelines that supply & distribute pure helium gas in between the major equipments of the Liq. Helium Plant and existing Helium Buffer Tank as well as recovery line had been erected, radio-graphed, leak tested and conditioned for final operation.
The helium plant is equipped with various inbuilt safety systems in terms of EMERGENCY STOP button, safety vales in cold box, Dewar and Cycle compressors. In spite of inbuilt safety system of the plant, the commissioning site was provided with adequate ventilation to take care of helium gas leakage, room oxygen monitor had been installed in closed room for alarming against oxygen deficiency in case of helium leak and adequate personal protection equipments were used during the commissioning.
The liquid helium plant is successfully commissioned and the measured values of the Liquid Helium plant system parameters are shown in Table 1.
LHe Dewar Return
Cold Box
JT
Buffer Tank
ORS
MCD
Compressor
MCD
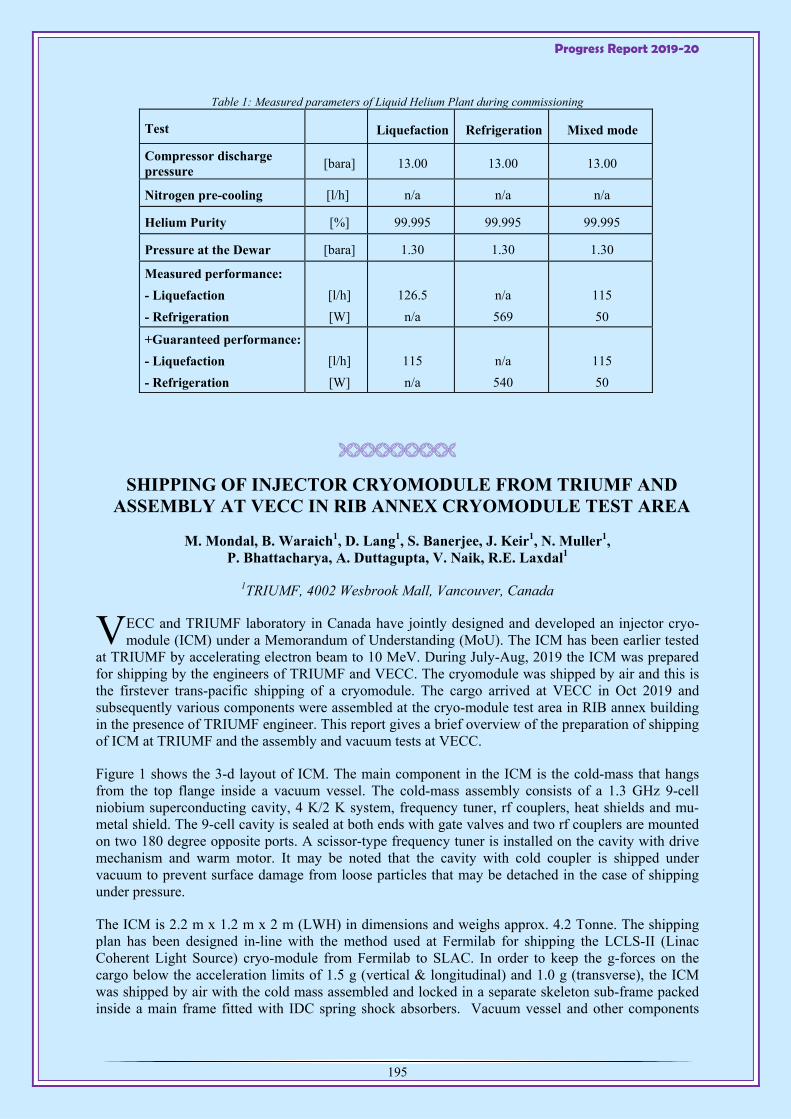
Progress Report 2019-20
195
Table 1: Measured parameters of Liquid Helium Plant during commissioning
Test Liquefaction Refrigeration Mixed mode
Compressor discharge pressure
[bara] 13.00 13.00 13.00
Nitrogen pre-cooling [l/h] n/a n/a n/a
Helium Purity [%] 99.995 99.995 99.995
Pressure at the Dewar [bara] 1.30 1.30 1.30
Measured performance:
- Liquefaction
- Refrigeration
[l/h]
[W]
126.5
n/a
n/a
569
115
50
+Guaranteed performance:
- Liquefaction
- Refrigeration
[l/h]
[W]
115
n/a
n/a
540
115
50
SHIPPING OF INJECTOR CRYOMODULE FROM TRIUMF AND ASSEMBLY AT VECC IN RIB ANNEX CRYOMODULE TEST AREA
M. Mondal, B. Waraich1, D. Lang1, S. Banerjee, J. Keir1, N. Muller1, P. Bhattacharya, A. Duttagupta, V. Naik, R.E. Laxdal1
1TRIUMF, 4002 Wesbrook Mall, Vancouver, Canada
ECC and TRIUMF laboratory in Canada have jointly designed and developed an injector cryo-module (ICM) under a Memorandum of Understanding (MoU). The ICM has been earlier tested
at TRIUMF by accelerating electron beam to 10 MeV. During July-Aug, 2019 the ICM was prepared for shipping by the engineers of TRIUMF and VECC. The cryomodule was shipped by air and this is the firstever trans-pacific shipping of a cryomodule. The cargo arrived at VECC in Oct 2019 and subsequently various components were assembled at the cryo-module test area in RIB annex building in the presence of TRIUMF engineer. This report gives a brief overview of the preparation of shipping of ICM at TRIUMF and the assembly and vacuum tests at VECC.
Figure 1 shows the 3-d layout of ICM. The main component in the ICM is the cold-mass that hangs from the top flange inside a vacuum vessel. The cold-mass assembly consists of a 1.3 GHz 9-cell niobium superconducting cavity, 4 K/2 K system, frequency tuner, rf couplers, heat shields and mu-metal shield. The 9-cell cavity is sealed at both ends with gate valves and two rf couplers are mounted on two 180 degree opposite ports. A scissor-type frequency tuner is installed on the cavity with drive mechanism and warm motor. It may be noted that the cavity with cold coupler is shipped under vacuum to prevent surface damage from loose particles that may be detached in the case of shipping under pressure.
The ICM is 2.2 m x 1.2 m x 2 m (LWH) in dimensions and weighs approx. 4.2 Tonne. The shipping plan has been designed in-line with the method used at Fermilab for shipping the LCLS-II (Linac Coherent Light Source) cryo-module from Fermilab to SLAC. In order to keep the g-forces on the cargo below the acceleration limits of 1.5 g (vertical & longitudinal) and 1.0 g (transverse), the ICM was shipped by air with the cold mass assembled and locked in a separate skeleton sub-frame packed inside a main frame fitted with IDC spring shock absorbers. Vacuum vessel and other components
V
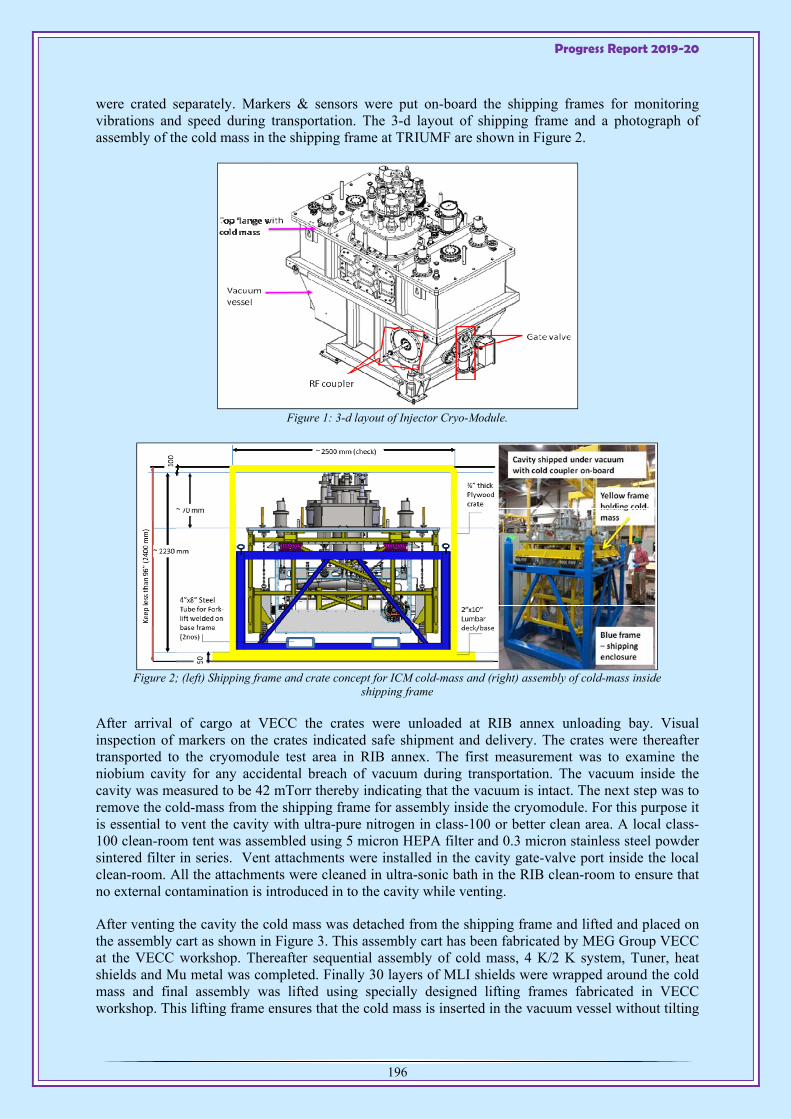
Progress Report 2019-20
196
were crated separately. Markers & sensors were put on-board the shipping frames for monitoring vibrations and speed during transportation. The 3-d layout of shipping frame and a photograph of assembly of the cold mass in the shipping frame at TRIUMF are shown in Figure 2.
Figure 1: 3-d layout of Injector Cryo-Module.
Figure 2; (left) Shipping frame and crate concept for ICM cold-mass and (right) assembly of cold-mass inside
shipping frame
After arrival of cargo at VECC the crates were unloaded at RIB annex unloading bay. Visual inspection of markers on the crates indicated safe shipment and delivery. The crates were thereafter transported to the cryomodule test area in RIB annex. The first measurement was to examine the niobium cavity for any accidental breach of vacuum during transportation. The vacuum inside the cavity was measured to be 42 mTorr thereby indicating that the vacuum is intact. The next step was to remove the cold-mass from the shipping frame for assembly inside the cryomodule. For this purpose it is essential to vent the cavity with ultra-pure nitrogen in class-100 or better clean area. A local class-100 clean-room tent was assembled using 5 micron HEPA filter and 0.3 micron stainless steel powder sintered filter in series. Vent attachments were installed in the cavity gate-valve port inside the local clean-room. All the attachments were cleaned in ultra-sonic bath in the RIB clean-room to ensure that no external contamination is introduced in to the cavity while venting.
After venting the cavity the cold mass was detached from the shipping frame and lifted and placed on the assembly cart as shown in Figure 3. This assembly cart has been fabricated by MEG Group VECC at the VECC workshop. Thereafter sequential assembly of cold mass, 4 K/2 K system, Tuner, heat shields and Mu metal was completed. Finally 30 layers of MLI shields were wrapped around the cold mass and final assembly was lifted using specially designed lifting frames fabricated in VECC workshop. This lifting frame ensures that the cold mass is inserted in the vacuum vessel without tilting
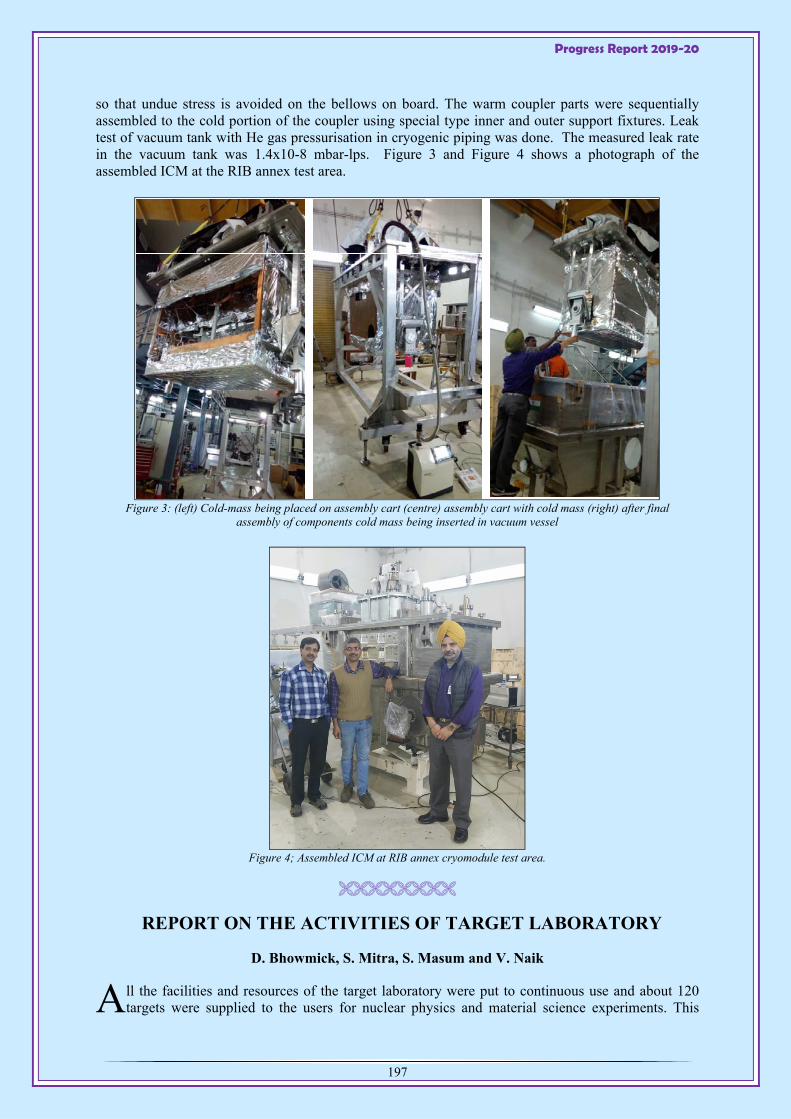
Progress Report 2019-20
197
so that undue stress is avoided on the bellows on board. The warm coupler parts were sequentially assembled to the cold portion of the coupler using special type inner and outer support fixtures. Leak test of vacuum tank with He gas pressurisation in cryogenic piping was done. The measured leak rate in the vacuum tank was 1.4x10⁻⁸ mbar-lps. Figure 3 and Figure 4 shows a photograph of the assembled ICM at the RIB annex test area.
Figure 3: (left) Cold-mass being placed on assembly cart (centre) assembly cart with cold mass (right) after final
assembly of components cold mass being inserted in vacuum vessel
Figure 4; Assembled ICM at RIB annex cryomodule test area.
REPORT ON THE ACTIVITIES OF TARGET LABORATORY
D. Bhowmick, S. Mitra, S. Masum and V. Naik
ll the facilities and resources of the target laboratory were put to continuous use and about 120 targets were supplied to the users for nuclear physics and material science experiments. This A
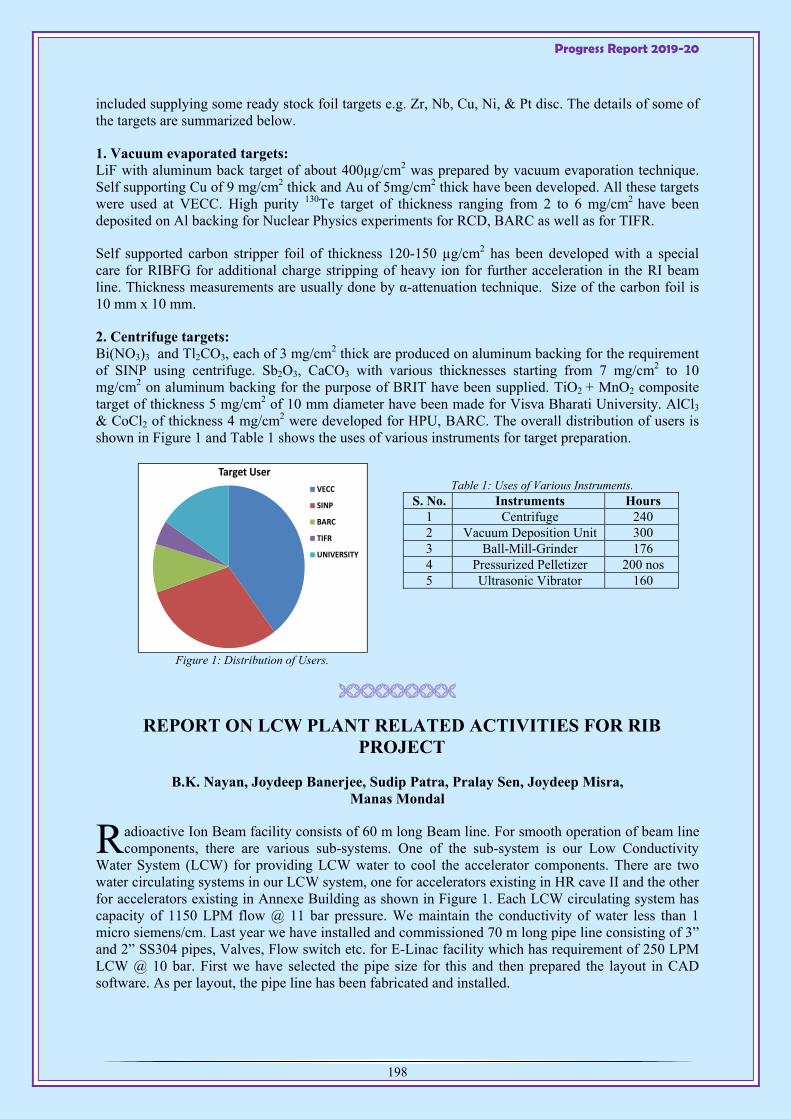
Progress Report 2019-20
198
included supplying some ready stock foil targets e.g. Zr, Nb, Cu, Ni, & Pt disc. The details of some of the targets are summarized below.
1. Vacuum evaporated targets: LiF with aluminum back target of about 400µg/cm2 was prepared by vacuum evaporation technique. Self supporting Cu of 9 mg/cm2 thick and Au of 5mg/cm2 thick have been developed. All these targets were used at VECC. High purity 130Te target of thickness ranging from 2 to 6 mg/cm2 have been deposited on Al backing for Nuclear Physics experiments for RCD, BARC as well as for TIFR.
Self supported carbon stripper foil of thickness 120-150 µg/cm2 has been developed with a special care for RIBFG for additional charge stripping of heavy ion for further acceleration in the RI beam line. Thickness measurements are usually done by α-attenuation technique. Size of the carbon foil is 10 mm x 10 mm.
2. Centrifuge targets: Bi(NO3)3 and Tl2CO3, each of 3 mg/cm2 thick are produced on aluminum backing for the requirement of SINP using centrifuge. Sb2O3, CaCO3 with various thicknesses starting from 7 mg/cm2 to 10 mg/cm2 on aluminum backing for the purpose of BRIT have been supplied. TiO2 + MnO2 composite target of thickness 5 mg/cm2 of 10 mm diameter have been made for Visva Bharati University. AlCl3 & CoCl2 of thickness 4 mg/cm2 were developed for HPU, BARC. The overall distribution of users is shown in Figure 1 and Table 1 shows the uses of various instruments for target preparation.
Figure 1: Distribution of Users.
Table 1: Uses of Various Instruments.
S. No. Instruments Hours 1 Centrifuge 240 2 Vacuum Deposition Unit 300 3 Ball-Mill-Grinder 176 4 Pressurized Pelletizer 200 nos 5 Ultrasonic Vibrator 160
REPORT ON LCW PLANT RELATED ACTIVITIES FOR RIB PROJECT
B.K. Nayan, Joydeep Banerjee, Sudip Patra, Pralay Sen, Joydeep Misra, Manas Mondal
adioactive Ion Beam facility consists of 60 m long Beam line. For smooth operation of beam line components, there are various sub-systems. One of the sub-system is our Low Conductivity
Water System (LCW) for providing LCW water to cool the accelerator components. There are two water circulating systems in our LCW system, one for accelerators existing in HR cave II and the other for accelerators existing in Annexe Building as shown in Figure 1. Each LCW circulating system has capacity of 1150 LPM flow @ 11 bar pressure. We maintain the conductivity of water less than 1 micro siemens/cm. Last year we have installed and commissioned 70 m long pipe line consisting of 3” and 2” SS304 pipes, Valves, Flow switch etc. for E-Linac facility which has requirement of 250 LPM LCW @ 10 bar. First we have selected the pipe size for this and then prepared the layout in CAD software. As per layout, the pipe line has been fabricated and installed.
Target User
VECC
SINP
BARC
TIFR
UNIVERSITY
R
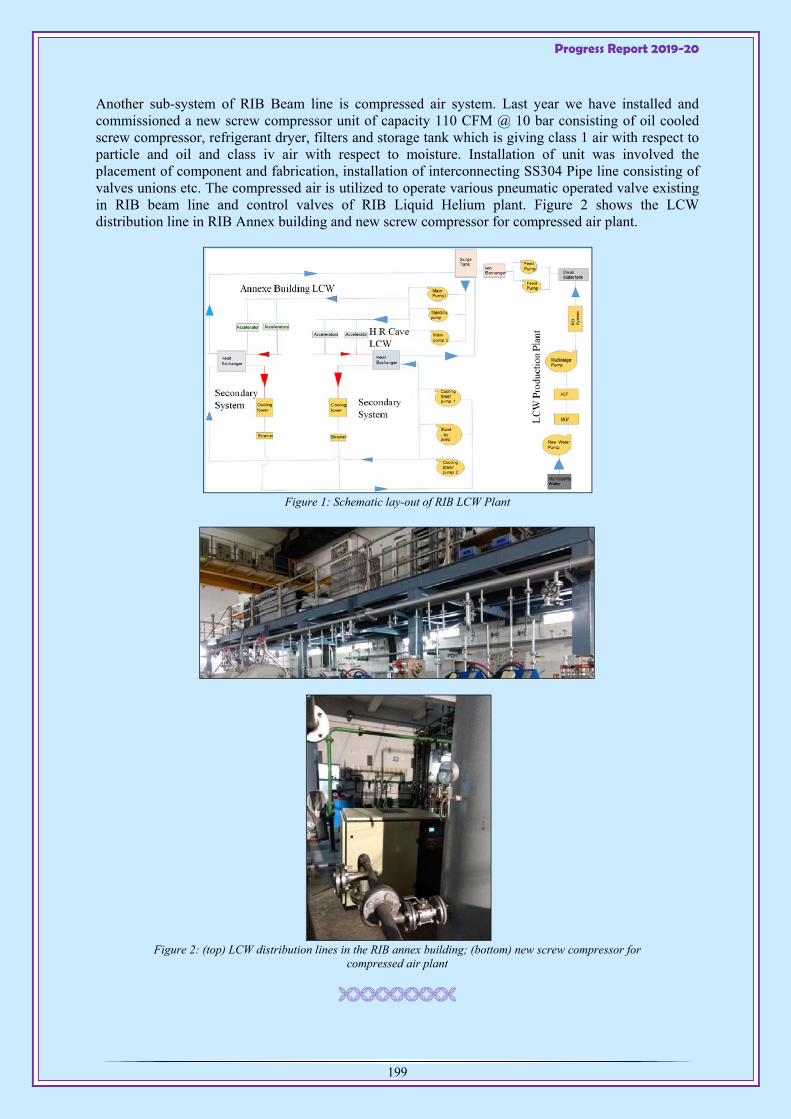
Progress Report 2019-20
199
Another sub-system of RIB Beam line is compressed air system. Last year we have installed and commissioned a new screw compressor unit of capacity 110 CFM @ 10 bar consisting of oil cooled screw compressor, refrigerant dryer, filters and storage tank which is giving class 1 air with respect to particle and oil and class iv air with respect to moisture. Installation of unit was involved the placement of component and fabrication, installation of interconnecting SS304 Pipe line consisting of valves unions etc. The compressed air is utilized to operate various pneumatic operated valve existing in RIB beam line and control valves of RIB Liquid Helium plant. Figure 2 shows the LCW distribution line in RIB Annex building and new screw compressor for compressed air plant.
Figure 1: Schematic lay-out of RIB LCW Plant
Figure 2: (top) LCW distribution lines in the RIB annex building; (bottom) new screw compressor for
compressed air plant
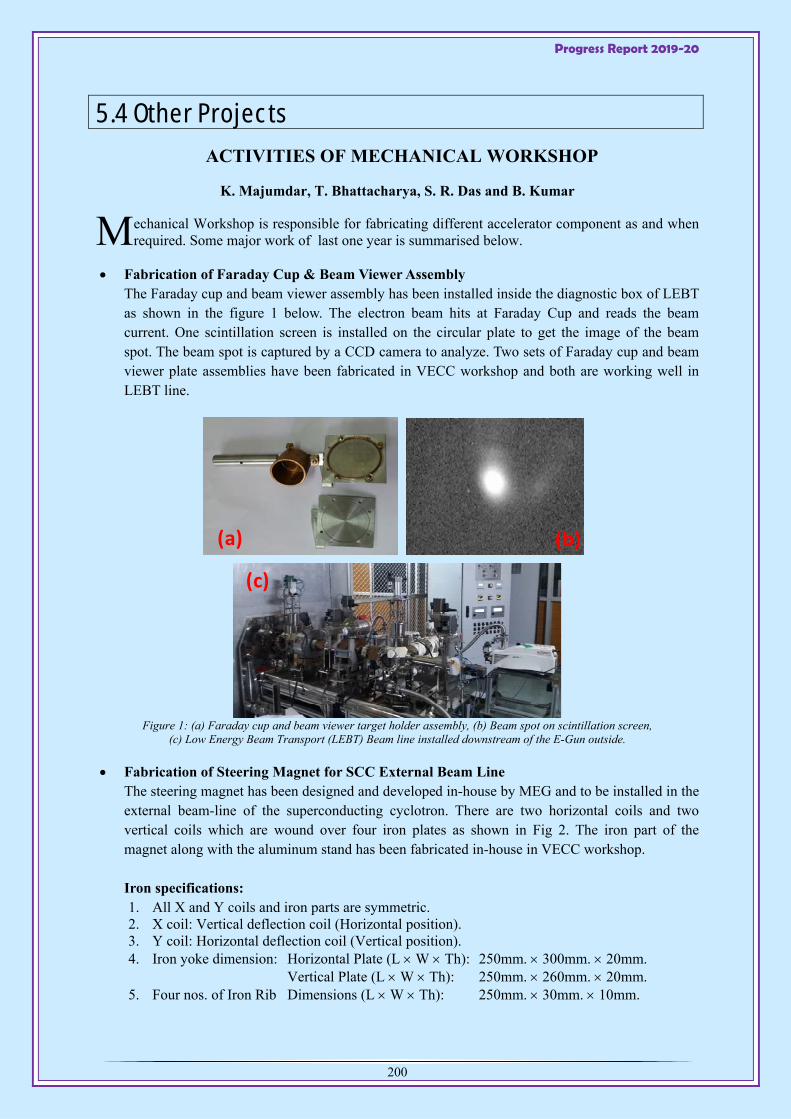
Progress Report 2019-20
200
5.4 Other Projects
ACTIVITIES OF MECHANICAL WORKSHOP
K. Majumdar, T. Bhattacharya, S. R. Das and B. Kumar
echanical Workshop is responsible for fabricating different accelerator component as and when required. Some major work of last one year is summarised below.
Fabrication of Faraday Cup & Beam Viewer Assembly The Faraday cup and beam viewer assembly has been installed inside the diagnostic box of LEBT as shown in the figure 1 below. The electron beam hits at Faraday Cup and reads the beam current. One scintillation screen is installed on the circular plate to get the image of the beam spot. The beam spot is captured by a CCD camera to analyze. Two sets of Faraday cup and beam viewer plate assemblies have been fabricated in VECC workshop and both are working well in LEBT line.
Figure 1: (a) Faraday cup and beam viewer target holder assembly, (b) Beam spot on scintillation screen,
(c) Low Energy Beam Transport (LEBT) Beam line installed downstream of the E-Gun outside.
Fabrication of Steering Magnet for SCC External Beam Line The steering magnet has been designed and developed in-house by MEG and to be installed in the external beam-line of the superconducting cyclotron. There are two horizontal coils and two vertical coils which are wound over four iron plates as shown in Fig 2. The iron part of the magnet along with the aluminum stand has been fabricated in-house in VECC workshop. Iron specifications: 1. All X and Y coils and iron parts are symmetric. 2. X coil: Vertical deflection coil (Horizontal position). 3. Y coil: Horizontal deflection coil (Vertical position). 4. Iron yoke dimension: Horizontal Plate (L W Th): 250mm. 300mm. 20mm.
Vertical Plate (L W Th): 250mm. 260mm. 20mm. 5. Four nos. of Iron Rib Dimensions (L W Th): 250mm. 30mm. 10mm.
(a) (b)
(c)
M

Progress Report 2019-20
201
Figure 2: Steering magnet on the stand.
Fabrication of 20mm. thick Aluminum Plate Grade 6061-T6 for SCC K500 Cyclotron A base plate is an important component of a vacuum scattering chamber as it holds the detectors used in the Nuclear experiments. It requires provision for detector mounting at precise point so that the distance from the target and the angle with the beam direction can be easily calculated. Also the surface of the plate should be uniform so that the reaction plane becomes well defined. These are the main characteristics of a baseplate. One base plate Material: Aluminum, grade 6061-T6 was required for the SCC K500 Cyclotron scattering chamber. The job was assigned to the workshop, VECC. The required dimensions were 500mm x 780mm x 20mm. Through holes (φ 12.0mm, 209 nos.) to be done along a particular line maintaining a fixed angular difference (10) between each line. Hole to hole distance is 25.0mm. The plate’s surface finishing is compatible for 10-7 mbar order vacuum. The job was completed within stipulated time frame and the finishing was satisfactory.
Fabrication of SS Target Ladder for K130 Cyclotron Scattering chamber To reduce the dead area of detector system, a thin target ladder is always preferred for nuclear physics experiment. A 1.4mm thick target ladder was required for the K130 cyclotron general purpose scattering chamber. The job was assigned to VECC, workshop. Its material is stainless steel and size 32.0mm x 165.0mm with 1.4mm thickness. 4 target samples can be fixed on ladder at a time with φ25.0mm circular window. To fix the target sample 4 nos. M3 threaded holes are provided. The job was completed within stipulated time frame and the finishing was satisfactory.
DESIGN AND DEVELOPMENT OF 650 MHz, β=0.61, 5-cell ELLIPTICAL SHAPE SUPERCONDUCTING RF LINAC CAVITY
UNDER IIFC COLLABORATION
Sudeshna Seth, Aditya Mandal, Surajit Ghosh, Samares Kumar Manna,P.R. Raj, Pranab Bhattacharyya, Sundeep Ghosh, Samir Ranjan Das, Anjan Dutta Gupta, Sumit Som
n India, DAE laboratories are now actively involved in research and development activities on SRF cavities and associated technologies for high current, high energy proton linear accelerators, which
is essential for development of ADSS and Spallation Neutron Source by DAE and also for the FERMILAB PIP-II Project. These activities are being carried out under Indian institutions- Fermilab collaboration (IIFC). As part of these activities, VECC, Kolkata, has been involved in the design and development of 650 MHz, β=0.61, 5-cell elliptical shape Superconducting RF linac cavity. The design of this cavity is required to satisfy a functional requirement specification(FRS) consisting of specified values of Electro magnetic parameters and operational parameters. Also this specification
I
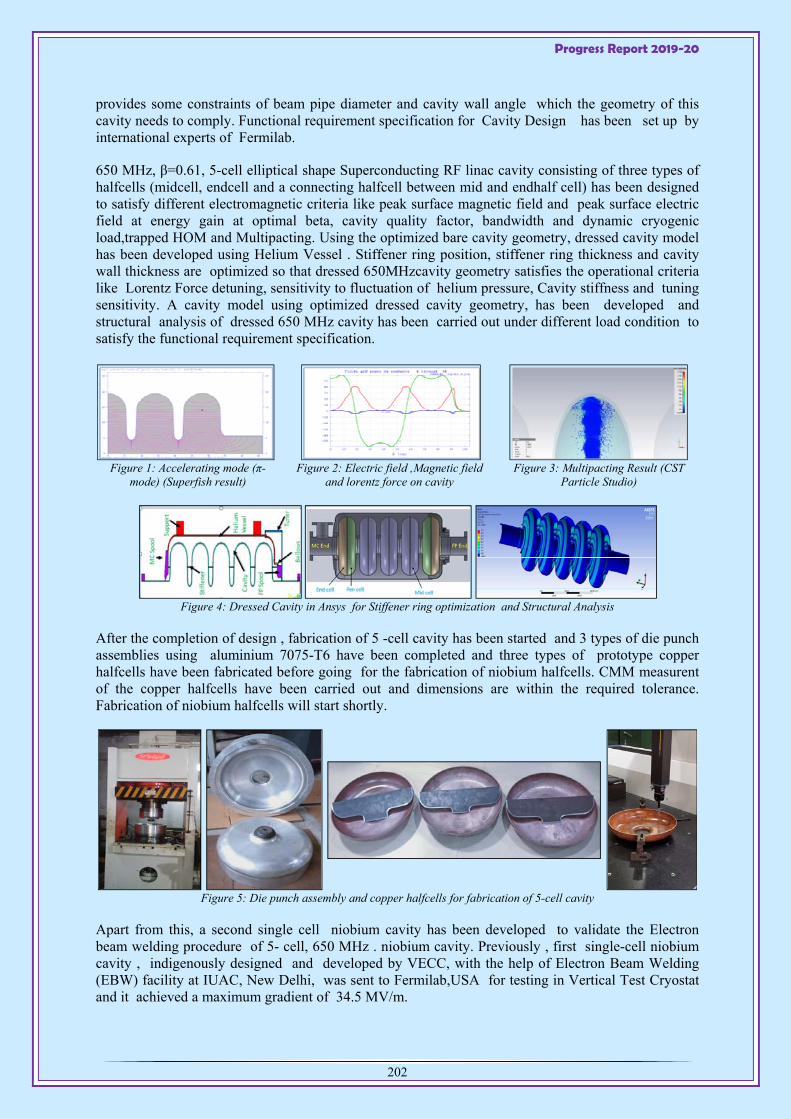
Progress Report 2019-20
202
provides some constraints of beam pipe diameter and cavity wall angle which the geometry of this cavity needs to comply. Functional requirement specification for Cavity Design has been set up by international experts of Fermilab.
650 MHz, β=0.61, 5-cell elliptical shape Superconducting RF linac cavity consisting of three types of halfcells (midcell, endcell and a connecting halfcell between mid and endhalf cell) has been designed to satisfy different electromagnetic criteria like peak surface magnetic field and peak surface electric field at energy gain at optimal beta, cavity quality factor, bandwidth and dynamic cryogenic load,trapped HOM and Multipacting. Using the optimized bare cavity geometry, dressed cavity model has been developed using Helium Vessel . Stiffener ring position, stiffener ring thickness and cavity wall thickness are optimized so that dressed 650MHzcavity geometry satisfies the operational criteria like Lorentz Force detuning, sensitivity to fluctuation of helium pressure, Cavity stiffness and tuning sensitivity. A cavity model using optimized dressed cavity geometry, has been developed and structural analysis of dressed 650 MHz cavity has been carried out under different load condition to satisfy the functional requirement specification.
Figure 1: Accelerating mode (π-
mode) (Superfish result)
Figure 2: Electric field ,Magnetic field
and lorentz force on cavity
Figure 3: Multipacting Result (CST
Particle Studio)
Figure 4: Dressed Cavity in Ansys for Stiffener ring optimization and Structural Analysis
After the completion of design , fabrication of 5 -cell cavity has been started and 3 types of die punch assemblies using aluminium 7075-T6 have been completed and three types of prototype copper halfcells have been fabricated before going for the fabrication of niobium halfcells. CMM measurent of the copper halfcells have been carried out and dimensions are within the required tolerance. Fabrication of niobium halfcells will start shortly.
Figure 5: Die punch assembly and copper halfcells for fabrication of 5-cell cavity
Apart from this, a second single cell niobium cavity has been developed to validate the Electron beam welding procedure of 5- cell, 650 MHz . niobium cavity. Previously , first single-cell niobium cavity , indigenously designed and developed by VECC, with the help of Electron Beam Welding (EBW) facility at IUAC, New Delhi, was sent to Fermilab,USA for testing in Vertical Test Cryostat and it achieved a maximum gradient of 34.5 MV/m.
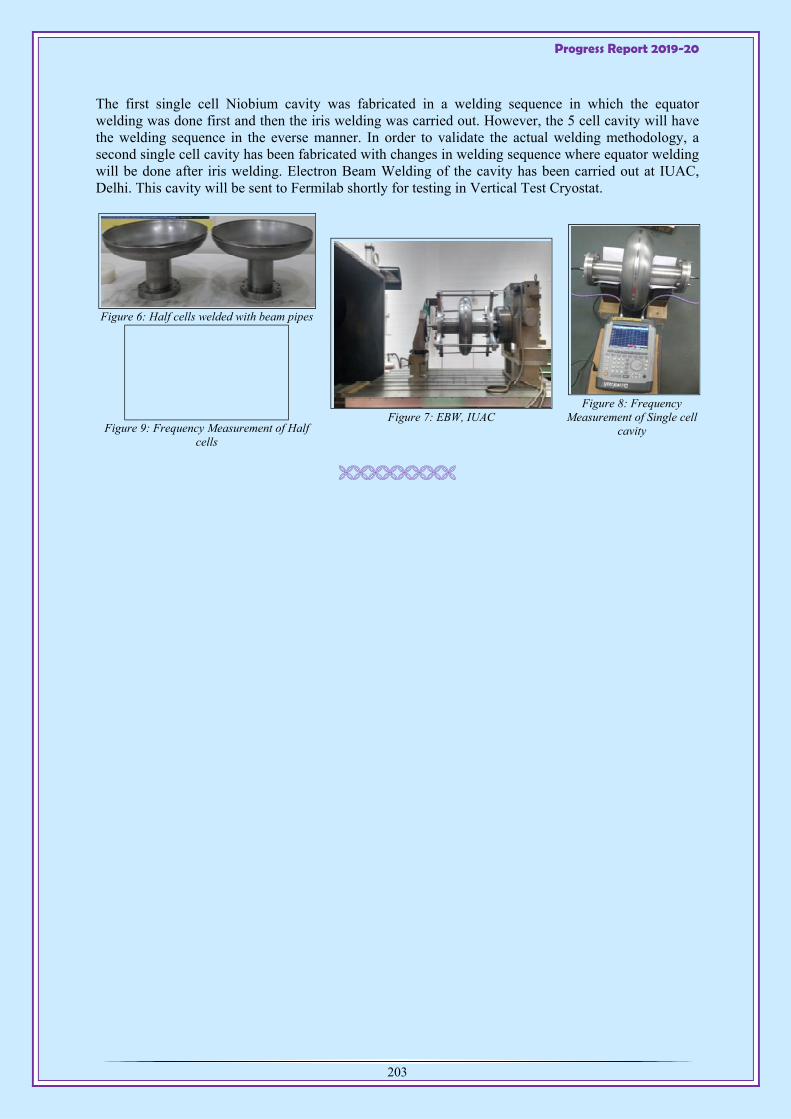
Progress Report 2019-20
203
The first single cell Niobium cavity was fabricated in a welding sequence in which the equator welding was done first and then the iris welding was carried out. However, the 5 cell cavity will have the welding sequence in the everse manner. In order to validate the actual welding methodology, a second single cell cavity has been fabricated with changes in welding sequence where equator welding will be done after iris welding. Electron Beam Welding of the cavity has been carried out at IUAC, Delhi. This cavity will be sent to Fermilab shortly for testing in Vertical Test Cryostat.
Figure 6: Half cells welded with beam pipes
Figure 7: EBW, IUAC Figure 8: Frequency
Measurement of Single cell cavity
Figure 9: Frequency Measurement of Half
cells

RRMC AND MEDICAL
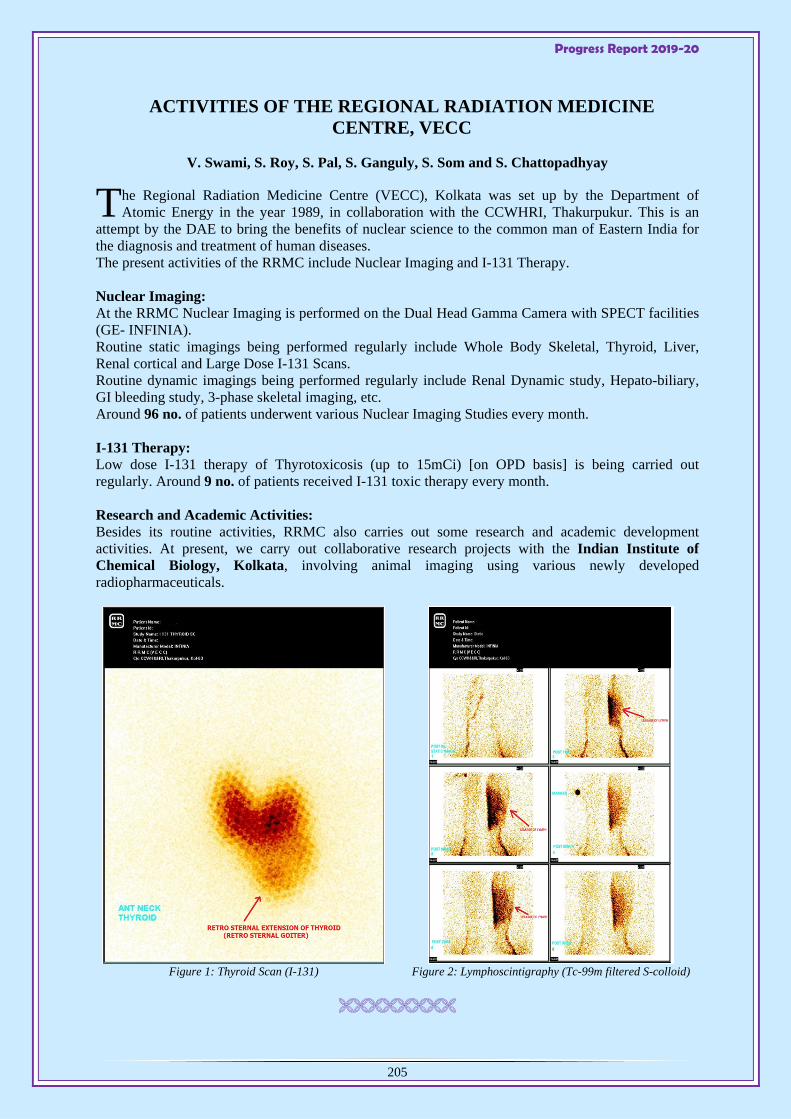
Progress Report 2019-20
205
ACTIVITIES OF THE REGIONAL RADIATION MEDICINE CENTRE, VECC
V. Swami, S. Roy, S. Pal, S. Ganguly, S. Som and S. Chattopadhyay
he Regional Radiation Medicine Centre (VECC), Kolkata was set up by the Department of Atomic Energy in the year 1989, in collaboration with the CCWHRI, Thakurpukur. This is an
attempt by the DAE to bring the benefits of nuclear science to the common man of Eastern India for the diagnosis and treatment of human diseases. The present activities of the RRMC include Nuclear Imaging and I-131 Therapy. Nuclear Imaging: At the RRMC Nuclear Imaging is performed on the Dual Head Gamma Camera with SPECT facilities (GE- INFINIA). Routine static imagings being performed regularly include Whole Body Skeletal, Thyroid, Liver, Renal cortical and Large Dose I-131 Scans. Routine dynamic imagings being performed regularly include Renal Dynamic study, Hepato-biliary, GI bleeding study, 3-phase skeletal imaging, etc. Around 96 no. of patients underwent various Nuclear Imaging Studies every month. I-131 Therapy: Low dose I-131 therapy of Thyrotoxicosis (up to 15mCi) [on OPD basis] is being carried out regularly. Around 9 no. of patients received I-131 toxic therapy every month. Research and Academic Activities: Besides its routine activities, RRMC also carries out some research and academic development activities. At present, we carry out collaborative research projects with the Indian Institute of Chemical Biology, Kolkata, involving animal imaging using various newly developed radiopharmaceuticals.
Figure 1: Thyroid Scan (I-131)
Figure 2: Lymphoscintigraphy (Tc-99m filtered S-colloid)
T

Progress Report 2019-20
206
ACTIVITIES OF VECC MEDICAL FACILITY
Achintya Bhattacharyya
part from attending day to day patients, The medical team is actively engaged with different camps organized by, such as blood donation camp, awareness regarding organ donation is
escalated by arranging a seminar by renowned physician. Several free diabetic camps are also arranged by medical teams. Different disease awareness programme, such as hypertension, diabetes, cancers, viral disease etc. for the people working in VECC. Our doctors are also actively involving in research in epidemic with students, even after the stipulated time of work. The preventive measurements taken in VECC to control the spread of current epidemic CoVID-19, is also suggested by this medical team. The public awareness programme was also conducted several times before and after the lockdown either via offline or via webinar. Moreover, the doctors were also available at home for the whole day during the lockdown period, for providing medical consultancy over phone for those urgent patients. So, in a nutshell the medical teams are highly active and they are dedicated for arbitrating the problems of the patients. In this pandemic situation doctors are also advice to use sanitizer (alcohol based) to keep away from germs and sanitize properly the material which is used regularly. Safe distance is also taking a special part of medical treatment, which is necessary for every people in this CoVID situation, Spacing in sitting arrangements has been executed efficiently in patient waiting area. Using of mask is compulsory for all the people in VECC advised by the medical officers. Not only that they have also suggested about how to handling regular lifestyle, take precautions to avoid this pandemic situation. 2 original research article in the context of CoVID 19 has been published in journal of repute. One study report has been archived as internal report in VECC library.
A

PUBLICATIONS THESES EVENTS ETC.
Progress Report 2019-20
208
7.1 Publications in Journals
1. A. R. Abraham, B. Raneesh, D. Sanyal, S. Thomas, N. Kalarikkal and P. M. G. Nambissan, “Defects-focused analysis of calcium-substitution-induced structural transformation of magnesium ferrite nanocrystals”, New J. of Chem. 44 (2020) 1556
2. A. R. Abraham, B. Raneesh, P. M. G. Nambissan, D. Sanyal, S. Thomas and N Kalarikkal, “Defects characterisation and studies of structural properties of sol–gel synthesized MgFe2O4
nanocrystals through positron annihilation and supportive spectroscopic methods”, Phil. Mag. 100 (2020) 32
3. Sajad Ali, S. Rajbanshi, R. Raut, H. Pai, Y.Y. Wang, G. Gangopadhyay, J. Meng, R. Palit, Somnath Nag, Abhijit Bisoi, S. Saha, J. Sethig, S. Bhattacharyya, S. Chattopadhyay, G. Mukherjee, A.K. Singh, T. Trivedi, A. Goswami, “Evidence of the octupole correlation between the shears bands in 142Eu”, Phys. Lett. B 798, (2019) 134960.
4. ALICE Collaboration, “Measurements of inclusive jet spectra in pp and central Pb-Pb collisions at sqrt(sNN) = 5.02 TeV”, Phys. Rev. C 101, 034911.
5. ALICE Collaboration, “Scattering studies with low-energy kaon-proton femtoscopy in proton-proton collisions at the LHC”, Phys. Rev. Lett. 124 (2020) 092301.
6. ALICE Collaboration, “Multiplicity dependence of (multi-)strange hadron production in proton-proton collisions at sqrt(s) = 13 TeV”, The European Physical Journal C 80, Article number: 167 (2020).
7. ALICE Collaboration, “Studies of J/ψ production at forward rapidity in Pb-Pb collisions at sqrt(sNN) = 5.02 TeV”, JHEP 02 (2020) 041.
8. ALICE Collaboration, “Measurement of electrons from heavy-flavour hadron decays as a function of multiplicity in p-Pb collisions at sqrt(sNN) = 5.02 TeV”, JHEP02 (2020) 077.
9. ALICE Collaboration, “Exploration of jet substructure using iterative declustering in pp and Pb-Pb collisions at LHC energies”, Physics Letters B, Volume 802, 10 March 2020, 135227.
10. ALICE Collaboration, “Evidence of rescattering effect in Pb-Pb collisions at the LHC through production of K∗(892)0 and φ(1020) mesons”, Physics Letters B, Volume 802, 10 March 2020, 135225.
11. ALICE Collaboration, “Measurement of p Λ bar⊕p bar Λ and ΛΛ bar interactions with femtoscopic correlations in Pb−Pb collisions at sqrt(sNN)=2.76 TeV and sqrt(sNN)=5.02 TeV”, Physics Letters B, Volume 802, 10 March 2020, 135223.
12. ALICE Collaboration, “Measurement of prompt D0, D+, D∗+, and D+s production in p−Pb collisions at sqrt(sNN) = 5.02 TeV”, JHEP 2019 (2019) 92.
13. ALICE Collaboration, “Multiplicity dependence of light (anti-)nuclei production in p-Pb collisions at sqrt(sNN) = 5.02 TeV”, Phys.Lett. B800 (2020) 135043.
14. ALICE Collaboration, “Measurement of charged jet cross section in pp collisions at sqrt(s)=5.02 TeV”, Phys. Rev. D 100, 092004.
Progress Report 2019-20
209
15. ALICE Collaboration, “Measurement of the inclusive isolated photon production cross section in pp collisions at sqrt(s) = 7 TeV”, Eur. Phys. J. C (2019) 79: 896.
16. ALICE Collaboration, “Measurement of Υ(1S) elliptic flow at forward rapidity in Pb-Pb collisions at sqrt(sNN)=5.02 TeV”, Phys. Rev. Lett. 123, 192301.
17. ALICE Collaboration, “Charged-particle production as a function of multiplicity and transverse spherocity in pp collisions at sqrt(s)= 5.02 and 13 TeV”, The European Physical Journal C 79, Article number: 857 (2019)
18. ALICE Collaboration, “Study of the Λ-Λ interaction with femtoscopy correlations in pp and p-Pb collisions at the LHC”, Phys. Lett. B 797 (2019) 134822.
19. ALICE Collaboration, “3ΛH and 3Λ¯H¯ lifetime measurement in Pb-Pb collisions at sqrt(sNN)= 5.02 TeV via two-body decay”, Phys. Lett. B797 (2019) 134905
20. ALICE Collaboration, “Two particle differential transverse momentum and number density correlations in p-Pb and Pb-Pb at the LHC”, Phys. Rev. C 100, 044903 – Published 10 October 2019
21. ALICE Collaboration, “Inclusive J/ψ production at mid-rapidity in pp collisions at sqrt(s) = 5.02 TeV”, JHEP 10 (2019) 084.
22. ALICE Collaboration, “Event-shape and multiplicity dependence of freeze-out radii in pp collisions at sqrt(s)=7 TeV”, Journal of High Energy Physics 2019, Article number: 108.
23. ALICE Collaboration, “Investigations of anisotropic flow using multi-particle azimuthal correlations in pp, p-Pb, Xe-Xe, and Pb-Pb collisions at the LHC”, Phys. Rev. Lett. 123, (2019) 142301.
24. ALICE Collaboration, “Coherent J/ψ photoproduction at forward rapidity in ultra-peripheral Pb-Pb collisions at sqrt(sNN)=5.02 TeV”, Phys.Lett. B798 (2019) 134926.
25. ALICE Collaboration, “First observation of an attractive interaction between a proton and a multi-strange baryon”, Phys. Rev. Lett. 123, 112002 – Published 13 September 2019.
26. ALICE Collaboration, “Measurement of jet radial profiles in Pb−Pb collisions at sqrt(sNN) = 2.76 TeV”, Phys. Lett. B 796 (2019) 204-219.
27. ALICE Collaboration, “Measurement of the production of charm jets tagged with D0 mesons in pp collisions at sqrt(s)= 7 TeV”, J. High Energ. Phys. (2019) 2019: 133.
28. ALICE Collaboration, “Production of muons from heavy-flavour hadron decays in pp collisions at sqrt(s) = 5.02 TeV”, JHEP (2019) 2019: 8.
29. ALICE Collaboration, “Multiplicity dependence of (anti-)deuteron production in pp collisions at sqrt(s) = 7 TeV”, Phys. Lett. B 794 (2019) 50-63.
30. ALICE Collaboration, “Λ+c production in Pb-Pb collisions at sqrt(sNN)=5.02 TeV”, Phys.Lett. B793 (2019) 212-223.
31. ALICE Collaboration, “Analysis of the apparent nuclear modification in peripheral Pb-Pb collisions at 5.02 TeV”, Phys.Lett. B793 (2019) 420-432.

Progress Report 2019-20
210
32. ALICE Collaboration, “Energy dependence of exclusive J/ψ photoproduction off protons in ultra-peripheral p-Pb collisions at sqrt(sNN) = 5.02 TeV”, Eur. Phys. J. C (2019) 79: 402.
33. ALICE Collaboration, “Measurement of D0, D+, D∗+ and D+s production in pp collisions at sqrt(s) = 5.02 TeV with ALICE”, Eur.Phys.J. C79 (2019) no.5, 388.
34. ALICE Collaboration, “Relative particle yield fluctuations in Pb-Pb collisions at sqrt(sNN)=2.76 TeV”, Eur. Phys. J. C (2019) 79: 236.
35. ALICE Collaboration, “Charged-particle pseudorapidity density at mid-rapidity in p-Pb collisions at sqrt(sNN) = 8.16 TeV”, Eur. Phys. J. C (2019) 79: 307.
36. ALICE Collaboration, “Jet fragmentation transverse momentum measurements from di-hadron correlations in sqrt(s) = 7 TeV pp and sqrt(sNN) = 5.02 TeV p-Pb collisions”, J. High Energ. Phys. (2019) 2019: 169.
37. Md. A. Asgar, G. Mukherjee, T. Roy, S. Nandi, G.H. Bhatt, J.A. Sheikh, R. Palit, S. Bhattacharyya, Soumik Bhattacharya, C. Bhattacharya, A. Dhal, T.K. Ghosh, A. Chaudhuri, K. Banerjee, Samir Kundu, T. K. Rana, Pratap Roy, R. Pandey, S. Manna, J. K. Meena, S. Saha, S. Biswas, J. Sethi, P. Singh, and D. Choudhury, “Band structures in 169Tm and the structures of Tm isotopes around N = 98”, Eur. Phys. J. A (2019) 55: 175
38. A. Banerjee, S. Mandal, Pratap Roy, S. Mukhopadhyay, G. Mukherjee, M. Kumar, A. Jhingan, R. Palit: “A compact scintillator based position sensitive detector system for gamma ray tracking applications”, Nucl. Inst. and Meth Phys. Res. A930, (2019) 100
39. Debashis Banerjee, Chandi Charan Dey, Sk. Wasim Raja, Ram Sewak, S. V. Thakare, Raghunath Acharya, Pradeep Kumar Pujari, “Stability of monoclinic phase in pure and Gd-doped HfO2: A hyperfine interaction study”, Hyperfine Interact 240 (2019) 78.
40. Debashis Banerjee, Dhanadeep Dutta, Sk. Wasim Raja, S. V. Thakare, “Effect of nanopore on hydration of hafnium investigated by TDPAC as a hyperfine tool”, Hyperfine Interact 240 (2019) 68.
41. I. Banerjee, M. De, G. Dey, R. Bharti, S. Chattopadhyay, N. Ali, P. Chakrabarti, “A peptide-modified solid lipid nanoparticle formulation of paclitaxel modulates immunity and outperforms dacarbazine in a murine melanoma model”, Biomaterials Science 7 (3) (2019) 1161-1178.
42. K. Banerjee, D. J. Hinde, M. Dasgupta, E. C. Simpson, D. Y. Jeung, C. Simenel, B. M. A. Swinton-Bland, E. Williams, P. Carter, K. J. Cook, H. M. David, Ch. E. Düllmann, J. Khuyagbaatar, B. Kindler, B. Lommel, E. Prasad, C. Sengupta, J. F. Smith, K. Vo-Phuoc, J. Walshe, and A. Yakushev, “Mechanisms Suppressing Superheavy Element Yields in Cold Fusion Reactions”, Phys. Rev. Lett 122, (2019) 232503
43. R. Banik, S. Bhattacharyya, Soumik Bhattacharya, G. Mukherjee, R. Goswami, D. Choudhury, S. Das, S. Samanta, S. S. Ghugre, R. Raut, and A. Goswami, “Observation of signature partner bands in 117Sb”, Phys. Rev. C 101, (2020) 014322
44. Partha Pratim Bhaduri, Nicolas Borghini, Amaresh Jaiswal and Michael Strickland, “Anisotropic escape mechanism and elliptic flow of bottomonia”, Phys. Rev. C 100 (2019) 5, 051901 (Rapid Communication).
45. M. Bhattacharjee, H. K. Pandey, V. Naik and A. Chakrabarti, “Design of a gas-jet coupled
Progress Report 2019-20
211
ECR ion-source for ISOL type RIB facility”, Nucl. Inst. & Method. A, 959 (2020) 163572
46. S. Bhattacharya & C. Bhattacharya, “Nuclear reaction studies using the cyclotron at VECC: A Review”, Indian Journal of Pure & Applied Physics Vol. 57, September (2019) 690-695.
47. D. Bhowmik, M. Mukherjee and P. Karmakar, “Presence of reactive impurities in Ar+ ion beam plays a key role for Si ripple formation”, Nucl. Inst. & Method B 444 (2019) 54
48. D. Bhowmik and P. Karmakar, “Tailoring and investigation of surface chemical nature of virgin and ion beam modified muscovite mica”, Surf. & Inter. Analysis 51 (2019) 667
49. D. Bhowmik and P. Karmakar, “Tuning wettability of Si surface by ion beam induced silicon nitride formation and nanopatterning”, Surf. & Coat. Tech. 385 (2020) 125369
50. S. Biswas, A. Lemasson, M. Rejmund, A. Navin, Y. H. Kim, C. Michelagnoli, I. Stefan, R. Banik, P. Bednarczyk, S. Bhattacharya, S. Bhattacharyya et al., “Effects of one valence proton on seniority and angular momentum of neutrons in neutron-rich 122-13151Sb isotopes”, Phys.Rev. C 99, (2019) 064302
51. K. Bukharia, P. Karmakar, D. Kumar, V. R. Reddy and A. Gupta, “Evolution of magnetic anisotropy in cobalt film on nanopatterned silicon substrate studied in situ using MOKE”, J of Mag. & Mag. Mat. 497 (2020) 165934
52. A. Chakrabarti, S. Dechoudhury, D. Bhwomick, V. Naik, “Signature of Bi-modal fission in Uranium Nuclei”, Journal of Physics - G, Nuclear and Particle Physics 46 (2019) 125105
53. Sankha Chattopadhyay, Sujata Das, Madhusmita, Md. Nayer Alam, Sharmila Banerjee, “Purification of 99Mo and 99mTc from radioactive traces of Nb, Zr, and Y impurities: method applicable in the purification of the spent 100/99Mo–99mTc generator”, J. Radioanal. Nucl. Chem. 322 (2019) 809–815.
54. G. Chaudhuri and S. Mallik, “Effect of liquid drop model parameters on nuclear liquid- gas phase transition”, Phys. Rev. C 99 (2019), 054602 .
55. Nilanjan Chaudhuri, Snigdha Ghosh, Sourav Sarkar and Pradip Roy, “Effect of the anomalous magnetic moment of quarks on the phase structure and mesonic properties in the NJL model”, Phys. Rev. D 99 (2019) 116025.
56. Chowdhury Aminul Islam, Aritra Bandyopadhyay, Pradip K. Roy, Sourav Sarkar, “Spectral function and dilepton rate from a strongly magnetized hot and dense medium in light of mean field models”, Phys. Rev. D 99 (2019), 094028.
57. C. Das, S. Dechoudhury, T. Mandi, S. Roy, H. K. Pandey, V. Naik, A. Chakraborty, “Measurement of quadrupolar assymetry in prototype rod type radio frequency quadrupole linac for protons”, Review of Scientific Instruments 91 (2020) 033306.
58. Kalipada Das, Pintu Sen,“Magnetic and magnetocaloric properties of polycrystalline Pr0.55(Ca 0.75 Sr 0.25)0.45MnO3 compound: Observation of large inverse magnetocaloric effect”, Journal of Magnetism and Magnetic Materials, 485 (2019) 224-227.
59. S. Das, A. De, B. Dey, S. Sharma, A. Adhikari, S. S. Alam, A. Gupta, Y. Sapkota, A. Das, A. Saha, D. Pramanik, T. Bhattacharjee, A. Bisoi, S. Sarkar and M. Saha Sarkara, “Study of radioactivity built-up and decay with singles time-stamped data”, Journal of Instrumentation 14, (2019) T09006

Progress Report 2019-20
212
60. Sandip Kumar De, Subrata Mondal, Abhijit Roy, Sourabh Kumar, Manabendra Mukherjee, Sudeshna Das Chakraborty, Pintu Sen, Biswarup Pathak, Biswarup Satpati, Mrinmay Kumar Mukhopadhyay and Dulal Senapati, “Zone Specific Crystallization and Porosity Directed Scaling Marker for the Catalytic Efficacy of Au-Ag Alloy Nanoparticles”, ACS Applied Nano Materials, 12 (2019) 7669–7685.
61. S. Dey Chaudhuri, D. Banerjee, T. Bhattacharjee, Sk Wasim Raja, R. Acharya and P. K. Pujari, “Performance study of LaBr3:Ce detectors coupled to R2083 PM tube for energy and timing characteristics”, Journal of Radioanalytical and Nuclear Chemistry 324, (2020) 829
62. S. Dey, A. Dutta, P. Mukherjee, N. Gayathri, A. Dutta Gupta and T. Kundu Roy, “Characterization of ion induced damage as a function of depth in proton irradiated pure Ti and Ti–6Al–4V”, J. of Alloys & Comp. 821 (2020) 153441
63. Sourav Kumar Dey, Chandi Charan Dey, Satyajit Saha, Debashis Banerjee, Drogan Toprek, “Local structure study of 181Hf dopants in Zr7Ni10 by perturbed angular correlation spectroscopy and first principles calculations”, Hyperfine Interact 240 (2019) 25.
64. R. Ganai, M. Mondal, M. K. Shiroya, Z. Ahammed and S. Chattopadhyay, “Performance Studies of Bakelite Multi-gap Resistive Plate Chamber with Cosmic Rays” Journal of Instrumentation, (2019 JINST 14 C06010).
65. R. Ganai, M. Mondal, Z. Ahammed and S. Chattopadhyay, “Timing Studies of Bakelite Multi-gap Resistive Plate Chamber”, Nuclear Inst. and Methods in Physics Research, A. 936, (2019), 505-506.
66. Utsab Gangopadhyaya, Snigdha Ghosh, Sourav Sarkar, “In-medium thermal conductivity and diffusion coefficients of a hot hadronic gas mixture”, Int. J. Mod. Phys. E 28 (2019) 1950035.
67. N. Gayathri, Kalipada Das, P. Mukherjee, Ranjini Menon and P. Y. Nabhiraj, “Observation of radiation enhanced phase formation and subsequent dissolution at very high doses in Ar9+ ion irradiated Ti-modified stainless steel”, Radiation Physics and Chemistry, On line 24th June 2019, Volume 165, December 2019, 108379
68. S. Ghosal, H. Luitel, S. K. Mandal, D. Sanyal and D Jana, “Half metallic ferromagnetic and optical properties of ruthenium-doped zinc blende ZnS: A first principles study”, J. of Phys. and Chem. of Solids 136 (2020) 109175
69. S. Ghosh, K. S. Gupta, and Shashi C. L. Srivastava, “Exact relaxation dynamics and quantum information scrambling in multiply quenched harmonic chains”, Phys. Rev. E100 (2019) 012215.
70. Snigdha Ghosh, Arghya Mukherjee, Nilanjan Chaudhuri, Pradip Roy, and Sourav Sarkar, “Thermo-magnetic spectral properties of neutral mesons in vector and axial-vector channels using NJL model”, Phys. Rev. D 101 (2020), 056023.
71. Snigdha Ghosh, Arghya Mukherjee, Pradip Roy, Sourav Sarkar, “General structure of the neutral ρ meson self-energy and its spectral properties in a hot and dense magnetized medium”, Phys. Rev. D 99 (2019), 096004.
72. Tilak Kumar Ghosh, “Into the fission valley of ‘magic nucleus’ polonium”, Current Science 116, 12, (2019) 25
73. A Goswami, Atanu Dutta, Santanu Paul, “Design of a spiral inflector and transverse beam matching for K130 cyclotron at the Variable Energy Cyclotron Centre”, Pramana - J Phys 93
Progress Report 2019-20
213
(2019) 15
74. Pallavi Kalikotay, Nilanjan Chaudhuri, Snigdha Ghosh, Utsab Gangopadhyaya, Sourav Sarkar, “Viscous coefficients and thermal conductivity of a πKN gas mixture in the medium”, Eur. Phys. J. A 56 (2020) 79.
75. Kavita, K. S. Golda, T. K. Ghosh, A. Jhingan, P. Sugathan, A. Chatterjee, B. R. Behera, Ashok Kumar, Rakesh Kumar, N. Saneesh, M. Kumar, Abhishek Yadav, C. Yadav, Neeraj Kumar, Akashrup Banerjee, A. Rani, S. K Duggi, Rakesh Dubey, et al, “Fusion-fission dynamics of 188,190Pt through fission fragment mass distribution measurements”, Phys. Rev. C 100, (2019) 024626
76. Shuaib Ahmad Khan, et.al. "Optimization of multi-gigabit transceivers for high speed data communication links in HEP Experiments", Nuclear Instruments and Methods in Physics Research A: Accelerators, Spectrometers, Detectors and Associated Equipment. (2019) Volume 927, 21 May 2019, Pages 14-23.
77. Ajit Kumar, A. K. Dubey, J. Saini, V. Negi and S. Chattopadhyay, "Operating large size GEM detectors using a novel optocoupler based biasing scheme for the Muon Chamber system of CBM experiment", NIMA, Volume 958, 162905.
78. Nishant Kumar, D. C. Biswas, T. K. Ghosh, J. Sadhukhan, B. N. Joshi, Y. K. Gupta, R. P. Vind, G. K. Prajapati, Shradha Dubey, L. S. Danu, S. Mukhopadhyay, K. Mahata, B. V. John and S. Sodaye, “Role of quasi-fission in fission fragment mass distributions for the 28Si + 197Au reaction”, Phys. Rev. C 99, (2019) 041602 (R)
79. Samir Kundu, T. K. Rana, C. Bhattacharya, K. Banerjee, R. Pandey, Santu Manna, J. K. Meena, A. K. Saha, J. K. Sahoo , P. Dhara, A. Dey, D. Gupta, T. K. Ghosh, Pratap Roy, G. Mukherjee, R. Mandal Saha, S. Roy, S.R. Bajirao, A. Sen, S. Bhattacharya, “ChAKRA : The high resolution charged particle detector array at VECC”, Nuclear Inst. and Methods in Physics Research, A 943 (2019) 162411
80. H. Luitel, S. Roy, M. Chakrabarti, P. Chettri, A. Tiwari, V. Naik, D. Sanyal, “Room temperature ferromagnetism in boron-doped oxides: A combined first principle and experimental study”, Phil. Mag. Lett. (2020) in press
81. H. Luitel, S. Moshat and D. Sanyal, “Ferromagnetic ordering in cobalt doped methylammonium lead bromide: An ab-initio study”, Comp. Cond. Matt. 22 (2020) e00444
82. H. Luitel and D. Sanyal, “Ferromagnetism in p-block-element doped ZnO: An ab-initio approach”, Comp. Cond. Matt. 21 (2019) e00393
83. Simantini Majumdar, Pintu Sen, Ruma Ray, “Ionic interactions and transport properties in chitosan-starch based blend solid biopolymer electrolytes”, Materials Today: Proceedings, 18 2019, pp 4913-4920.
84. S. Mallik, G. Chaudhuri and F. Gulminelli, “Sensitivity of the evaporation residue observables to the symmetry energy”, Phys. Rev. C 100 (2019) 024611.
85. Md. Zamal Abdul Naser, S. Dechoudhury, D. P. Dutta, S. K. Thakur, S. Haque, V. Naik and A. Bandyopadhyay, “Development and Testing of Radio Frequency Modulated Electron Gun at VECC Kolkata”, Journal of Instrumentation 14 (2019) 11
86. Aradhya Mishra, Ganesh Bera, Priyanath Mal, G. Padmaja, Pintu Sen, Pradip Das, Brahmananda Chakraborty, G.R. Turpu,“Comparative electrochemical analysis of rGO-
Progress Report 2019-20
214
FeVO4 nanocomposite and FeVO4 for supercapacitor application”, Applied Surface Science, 488 (2019) 221-227.
87. Arpit Mitra, Sankha Chattopadhyay, Ashok Chandak, Sangita Lad, Luna Barua, Anirban De, Umesh Kumar, Rajesh Chinagandham,Trupti Upadhye, Kamaldeep Koundal, Sharmila Banerjee, Ramakrishna, “Clinical Efficacy of Sodium [99mTc] Pertechnetate from Low Specific Activity 99Mo/99mTc Autosolex Generator in Hospital Radiopharmacy Centre”. Nucl. Med. Rev. 23(1) (2020) 1-14.
88. Rituparna Mondal, Koyel Sarkar, Subhrajyoti Dey, Dipanwita Majumdar, Swapan Kumar Bhattacharya, Pintu Sen, and Sanjay Kumar,“Magnetic, Pseudocapacitive, and H2O2 Electrosensing Properties of Self-Assembled Superparamagnetic Co0.3Zn0.7Fe2O4 with Enhanced Saturation Magnetization”, ACS Omega 4 (2019) 12632-12640.
89. S. Muhuri et al, “Fabrication and beam test of a silicon-tungsten electromagnetic calorimeter”, 2020 JINST 15 P03015.
90. S. Nandi, G. Mukherjee, T. Roy, R. Banik, A. Dhal, Soumik Bhattacharya, S. Bhattacharyya, C. Bhattacharya, Md. A. Asgar, H. Pai, S. Rajbanshi, Pratap Roy, T. K. Ghosh, K. Banerjee, T. K. Rana, Samir Kundu, S. Manna, R. Pandey, A. Sen, S. Pal, S. Mukhopadhyay, D. Pandit, D. Mandal, and S. R. Banerjee, “Effect of neutron alignments on the structure of 197Tl”,Phys. Rev. C 99, (2019) 054312
91. Md. Z. A. Naser, S. Dechoudhury, D. P. Dutta, S. K. Thakur, S. Haque, V. Naik, A. Bandyopadhyay, “Development and testing of radio frequency modulated electron gun at VECC, Kolkata”, JINST 14 P (2019) 11027
92. S. Nath, V. Naik, A. Chakrabarti and A. Ray, “Discriminating electromagnetically induced transparency from Autler–Townes splitting in a Ξ system”, J. of the Optical Society of America B 36 (2019) 2610
93. A. K. Nayek, H. Luitel, B. Haldar, D. Sanyal, M. Chakrabarti, “Ferromagnetic property of copper doped ZnO: a first-principles study”, Comp. Cond. Matt. 23 (2020) e00455
94. A. Ono, J. Xu, M. Colonna, P. Danielewicz, C. M. Ko, M. B. Tsang, Y. J. Wang, H. Wolter, Y. X. Zhang, L. W.Chen, D. Cozma, H. Elfner, Z. Q. Feng, N. Ikeno, Bao An Li, S. Mallik, Y. Nara, T. Ogawa, A. Ohnishi, D. Oliinychenko, J. Su, T. Song, F. S. Zhang and Z. Zhang, “Comparison of heavy-ion transport simulations: Collision integral with pions and Δ resonances in a box”, Phys. Rev. C 100 (2019) 434617 .
95. S. Pathak, P. Das, A. K. Sikdar, J. Nandi, S. Bhattacharyya, T. Bhattacharjee, Soumik Bhattacharya, S. S. Alam & A. Ray, “Single crystal HPGe (80%) versus BGO shielded CLOVER detector for high precision decay rate measurements: a comparative study”, Journal of Radioanlytical and Nuclear Chemistry 323 (2020) 1353
96. J. J. Pulikkottil, A. Lakshminarayan, Shashi C. L. Srivastava, A. Bäcker, and S. Tomsovic, “Entanglement production by interaction quenches of quantum chaotic subsystems”, Phys. Rev. E101 (2020) 032212.
97. N. K. Rai, A. Gandhi, Ajay Kumar, N. Saneesh, M. Kumar, G. Kaur, A. Parihari, D. Arora, K. S. Golda, A. Jhingan, P. Sugathan, T. K. Ghosh, Jhilam Sadhukhan, B. K. Nayak, Nabendu K. Deb, S. Biswas and A. Chakraborty, “Measurement of neutron multiplicity to investigate the role of entrance channel parameters on the nuclear dissipation”, Phys. Rev. C 100, (2019) 014614
Progress Report 2019-20
215
98. T. K. Rana, S. Bhattacharya, C. Bhattacharya, S. Manna, Samir Kundu, K. Banerjee, R. Pandey, Pratap Roy, A. Dhal, G. Mukherjee, V. Srivastava, A. Dey, A. Chaudhuri, T. K. Ghosh, A. Sen, Md. A. Asgar, T. Roy, J. K. Sahoo, J. K. Meena, A. K. Saha, R. M. Saha, M. Sinha, Amit Roy, “New high precision study on the decay width of the Hoyle state in 12C”, Physics Letters B 793, (2019) 130
99. A. Ray, A. K. Sikdar, P. Das, S. Pathak, J. Datta, “Unexpected increase of 7Be decay rate under compression”, Physical Review C 101 (2020) 035801
100. Sudhir P. Rode, Partha Pratim Bhaduri and Ankhi Roy, “Anisotropic flow of charged and identified hadrons at FAIR energies and its dependence on the nuclear equation of state”, Eur. Phys. J. A 55, (2019) 216
101. S Roy, H Luitel and D Sanyal, “Magnetic properties of transition metal doped SnO2: A detailed theoretical study”, Comp. Cond. Matt. 19 (2019) e00376
102. S. Roy, T. Kundu Roy, D. Das, “Grain growth kinetics of Er2O3 doped ZnO-V2O5 based varistor ceramics”, Ceram. International 45 (2019) 24835.
103. S. Roy, D. Das, and T. Kundu Roy, “Nonlinear Electrical Properties of ZnO-V2O5 Based Rare Earth (Er2O3) Added Varistors”, Journal of Electronic Materials 48 (2019) 5650
104. S. Roy, H. Luitel and D. Sanyal, “First-principles analysis of ferromagnetic properties of molybdenum-doped wide-band-gap oxides”, Phil. Mag. Lett. 99 (2019) 326
105. Sujan Kumar Roy, Somnath Mukhopadhyay, Joydev Lahiri, D. N. Basu, “Relativistic Thomas-Fermi equation of state for magnetized white dwarfs’’, Phys. Rev. D100 (2019) 063008.
106. Sujan Kumar Roy, Somnath Mukhopadhyay, Joydev Lahiri, Debasis Atta, Partha Roy Chowdhury, D. N. Basu, “Gravitational waves from non-radial perturbations in neutron stars’’, Annals of Physics 415 (2020) 168121.
107. S. Saha, R. Palit, J. Sethi, S. Biswas, P. Singh, S. Nag, A. K. Singh, I. Ragnarsson, F. S. Babra, U. Garg, A. Goswami, E. Ideguchi, H. C. Jain, S. Kumar, Md. S. R. Laskar, G. Mukherjee, Z. Naik, and C. S. Palshetkar, “Observation of rotation about the longest principal axis in 89Zr”, Phys. Rev. C 99, (2019) 054301
108. S. Saini, N.Gayathri, S. K. Sharma, Aruna Devi, A. P. Srivastava, S. Neogy, P. Mukherjee, P. K. Pujari, “Microstructural investigation of irradiation damage behavior of proton irradiated Zr-1 wt.% Nb fuel cladding alloy”, Journal of Nuclear Materials, Available online 13 November 2019, 151894, Volume 528, January 2020, 151894,
109. A. Sarkar, M. Chakrabarti, D. Sanyal, N. Gogurla, P. Kumar, R. S. Brusa and C. Hugenschmidt, “Depth resolved defect characterization of energetic ion irradiated ZnO by positron annihilation techniques and photoluminescence”, J of Phys. Cond. Matt. 32 (2019) 085703
110. Pintu Sen, Subhashis Rana and Amitabha De,“Hierarchical designed of rGO-PEDOT- -MnO2 nanocomposite for supercapacitor”, Journal of Electronic materials, 49 (2020) 763–772.
111. A. I. Sheikh and Zubayer Ahammed, “Estimation of shear viscosity to entropy density ratio of the QGP including the effects of chromo-electromagnetic field fluctuations”, Nucl. Phys.
Progress Report 2019-20
216
A986 (2019) 48.
112. M. Shiroya, R. Ganai, Z. Ahammed and S. Chattopadhyay “Charge measurement of oil-free single gap Bakelite Resistive Plate Chamber”, Journal of Instrumentation, (2019 JINST 14 P08007).
113. S. Sil, H. Luitel, J. Dhar, M. Chakrabarti, P. P. Ray, B. Bandyopadhyay and D. Sanyal, “Defect induced room temperature ferromagnetism in methylammonium lead iodide perovskite”, Phys. Lett. A (2020) 126278
114. Vinay Singh, Debasis Atta, Md. A. Khan, D. N. Basu, “Astrophysical S-factor for deep sub-barrier fusion reactions of light nuclei”, Nucl. Phys. A986 (2019) 98.
115. Vinay Singh, Joydev Lahiri, D. N. Basu, “Theoretical exploration of S-factors for nuclear reactions of astrophysical importance”, Nucl. Phys. A987 (2019) 260.
116. Vivek K. Singh, D. K. Mishra and Zubayer Ahammed, “Calculation of particle species dependence of net charge fluctuation”, Phys. Rev. C101 (2020) no. 1, 014903.
117. V. Singhal, S. Chattopadhyay and V. Friese, “Investigation of heterogeneous computing platforms for real-time data analysis in the CBM experiment”, Computer Physics Communications Volume 253, August 2020, 107190.
118. A. P. Srivastava, N. Gayathri, S. Saini, Priya Maheshwari, S. Neogy, S. K. Sharma, P. S. Ghosh, P. Mukherjee, P. K. Pujari, “Proton irradiation of Ni–Cr alloy: Understanding the evolution of the damage microstructure”, Journal of Alloys and Compounds Available online 25 September 2019, 152408, Volume 815, 30 January 2020, 152408,
119. STAR Collaboration, “The STAR Event Plane Detector”, Nucl. Instrum. Meth. A 968 (2020) 163970.
120. STAR Collaboration, “Underlying event measurements in p+p collisions at sqrt(s)=200 GeV at RHIC”, Phys. Rev. D 101 (2020) 52004.
121. STAR Collaboration, “Bulk Properties of the System Formed in Au+Au Collisions at sqrt(sNN) = 14.5 GeV”, Phys. Rev. C 101 (2020) 24905.
122. STAR Collaboration, “Beam-energy dependence of identified two-particle angular correlations in Au+Au collisions at RHIC”, Phys. Rev. C 101 (2020) 14916.
123. STAR Collaboration, “Charge-dependent pair correlations relative to a third particle in p+Au and d+Au collisions at RHIC”, Phys. Lett. B 798 (2019) 134975.
124. STAR Collaboration, “Longitudinal double-spin asymmetry for inclusive jet and dijet production in pp collisions at sqrt(s)=510 GeV”, Phys. Rev. D 100 (2019) 52005.
125. STAR Collaboration, “Measurement of inclusive J/psi suppression in Au+Au collisions at sqrt(sNN) = 200 GeV through the dimuon channel at STAR”, Phys. Lett. B 797 (2019) 134917.
126. STAR Collaboration, “Polarization of Lambda (anti-Lambda) hyperons along the beam direction in Au+Au collisions at sqrt(sNN) = 200 GeV”, Phys. Rev. Lett. 123 (2019) 132301.
127. STAR Collaboration, “Measurements of the transverse-momentum-dependent cross sections of $J/\psi$ production at mid-rapidity in proton+proton collisions at $\sqrts = 510 and 500
Progress Report 2019-20
217
GeV with the STAR detector”, Phys. Rev. D 100 (2019) 52009.
128. STAR Collaboration, “First observation of the directed flow of D0 and D0bar in Au+Au collisions at sqrt(sNN) = 200 GeV”, Phys. Rev. Lett. 123 (2019) 162301.
129. STAR Collaboration, “Observation of excess J/psi yield at very low transverse momenta in Au+Au collisions at sqrt(sNN) = 200 GeV and U+U collisions at sqrt(sNN) = 193 GeV”, Phys. Rev. Lett. 123 (2019) 132302.
130. STAR Collaboration, “Precise measurement of the mass difference and the binding energy of hypertriton and antihypertriton”, Nature Physics 16 (2020) 409.
131. STAR Collaboration, “Beam energy dependence of (anti-)deuteron production in Au+Au collisions at RHIC”, Phys. Rev. C 99 (2019) 64905.
132. STAR Collaboration, “Collision energy dependence of second-order off-diagonal and diagonal cumulants of net-charge, net-proton and net-kaon multiplicity distributions in Au+Au collisions”, Phys. Rev. C 100 (2019) 14902.
133. STAR Collaboration, “Azimuthal harmonics in small and large collision systems at RHIC top energies”, Phys. Rev. Lett. 122 (2019) 172301.
134. STAR Collaboration, “Collision Energy Dependence of pT Correlations in Au+Au Collisions at RHIC”, Phys. Rev. C 99 (2019) 44918.
135. Sk Wasim Raja, R. Acharya, P. K. Pujari, “Application of PIGE method for quantification of total boron in neutron absorbers and shielding materials and isotopic composition in in-house prepared enriched boron carbide samples”, J. Radioanal. Nucl. Chem. 323 (2020) 1359.
Progress Report 2019-20
218
7.2 Publications in Symposia, Conferences and Reports
1. R. Acharya, V. Sharma, S. K. Samanta, P. S. Girkar, Sk Wasim Raja, Mala N. Rao, S. M. Yusuf, P. K. Pujari, “A Prompt Gamma-ray Neutron Activation Analysis (PGNAA) Facility at Dhruva Reactor for Analytical Applications”, MTAA-15, Mumbai, November 17-22, 2019.
2. R. Acharya, A. Agarwal, S. K. Samanta, V. Sharma, Sk Wasim Raja, Priya S. Girkar, N. B. V. Subrahmanyam, S. Krishnagopal, P. K. Pujari, “Setting up of an External (in-air) PIGE Facility at FOTIA for Non-destructive and Rapid Detection of Low Z Elements in Diverse Samples”, MTAA-15, Mumbai, November 17-22, 2019.
3. Ankur Agrawal, Atanu Dutta, Animesh Goswami and Arup Bandyopadhyay, “Design of Dipole Magnet For High Resolution Separator”, Indian Particle Accelerator Conference (InPAC-2019), IUAC, New Delhi
4. S. S. Alam, Devesh Kumar, Shefali Basak, D. Banerjee, S. K. Das, M. SahaSarkar, T. Bhattacharjee, “fast timing measurements in neutron rich Xenon nuclei”, Proceedings of the DAE Symp. on Nucl. Phys. 64 (2019) 278.
5. K. Atreya, T. K. Ghosh, A. Sen, Md. Moin Shaikh, D. Paul, C. Bhattacharya, Samir Kundu, S. Manna, G. Mukherjee, S. Nandi, R. Pandey, T. K. Rana, Pratap Roy, S. Mukhopadhyay, Raj Kumar Santra, “Fission fragment mass distribution of 225Pa”, DAE Symp Nucl Phys, 64, (2019) 399.
6. D. Atta, S. Mukhopadhyay, D. N. Basu, “R-Mode Instability of Neutron Stars Using Nuclear EoS from DDM3Y”, Recent Progress in Few-Body Physics, Chapter 39 Springer Proceedings in Physics 238 (2020) 223.
7. P. S. Babu, Siddhartha Dechoudhury, Vaishali Naik, “Analytical Study of buffer gas cooling of ion beams using viscous drag model”, Indian Particle Accelerator Conference (2019)
8. P. Bahre, M. K. Jha, T. Bhattacharjee, S. K. Pal, “Design and characterization of a Monolithic Non-delay Line Constant Fraction Discriminator for in-house nuclear physics experiments with CPDA at VECC”, 64th DAE-BRNS Symposium on Nuclear Physics, December 23-27, 2019.
9. D. Banerjee, D. Kumar, T. Bhattacharjee, S. Basak, S. S. Alam, “Precise measurement of decay half lives of n-rich iodine isotopes after radiochemical separation”, Proceedings of the DAE Symp. on Nucl. Phys. 64 (2019) 286.
10. D. Banerjee, T. N. Nag, R. Tripathi, Sk Wasim Raja, S. Sodaye, P. K. Pujari, A. Chakrabarti, M. Bhattacharjee, M. K. Doddi, V. Naik, “Determination of fission product mass distribution in + 232Th reaction from short irradiation using He-Gas jet transport system”, Proceedings of the DAE Symp. onNucl. Phys. 64 (2019) 537.
11. K. Banerjee, “Fusion fission dynamics in Super Heavy Element synthesis”, DAE Symp Nucl Phys, 64, (2019) 25.
12. Shefali Basak, S. S. Alam, D. Kumar, A. Saha, D. Banerjee, T. Bhattacharjee, “Lifetime measurement in N = 88 Sm using VENTURE array”, DAE Symp. on Nucl. Phys. 64 (2019)
Progress Report 2019-20
219
282.
13. S. Basu, G. Mukherjee, S. Nandi, A. Dhal, R. Banik, S. Bhattacharya, S. Bhattacharyya, C. Bhattacharya, S. Kundu, D. Paul, Sajad Ali, S. Rajbanshi, H. Pai, P. Ray, S. Chatterjee, S. Das, S. Samanta, A. Goswami, R. Raut, S.S. Ghugre, S. Biswas, “Revisiting the high-spin states in 54Mn reveals its new structure”, DAE Symp Nucl Phys, 64, (2019) 66.
14. C. Bhattacharya, “Accelerators & experimental nuclear physics facilities at VECC”, DAE Symp Nucl Phys, 64, (2019) 1066.
15. Soumik Bhattacharya, S. Bhattacharyya, S. Das Gupta, R. Banik, G. Mukherjee, A. Dhal, S. Nandi, Md. A. Asgar, T. Roy, R. Raut, S. S. Ghugre, S. K. Das, S. Chatterjee, S. Samanta, Shabir Dar, A. Goswami, Sajad Ali, S. Mukhopadhyay, Debasish Mondal, S. S. Alam, T. Bhattacharjee, A. Saha, Deepak Pandit, Surajit Pal, S. R. Banerjee, S. Rajbanshi, “Near-yrast exotic structure in 197Hg”, DAE Symp. on Nucl. Phys. 64 (2019) 276.
16. Dipak Bhowmik, Joy Mukherjee, and Prasanta Karmakar, “Nano patterning and band gap tailoring of muscovite mica by low energy O2
+, NO+, N2+, and C+ ion beam irradiation”,
International Conference on Nanostructuring by Ion Beams (ICNIB 2019)” at IGCAR, Kalpakkam, during November 06 - 08, 2019.
17. Niraj Chaddha, Hemendra Kumar Pandey, Anindya Roy, “Design and development of a digital RF power meter”, Indian Particle Accelerator Conference, IUAC, New Delhi (2019)
18. P. S. Chakraborty et. al., “Operational Status of K130 Variable Energy Cyclotron”, Indian Particle Accelerator Conference (InPAC-2019), IUAC, New Delhi, Nov 18-21, 2019
19. Sankha Chattopadhyay, Sujata Saha Das, Madhusmita, Md. Nayer Alam, Shayantani Ash, Umesh Kumar, Sharmila Banerjee, “Recovery of highly pure 99mTc from low specific activity (n,)99Mo using activated charcoal column”. Presented in International Symposium on Trends in Radiopharmaceuticals (ISTR2019), 28th October–1st November 2019, Vienna, Austria. Organized by International Atomic Energy Agency (IAEA). Published in ISTR2019 - UGD Repository, pp. 282-283. http://eprints.ugd.edu.mk/22967/1/ISTR2019ProgrammeandAbstracts.pdf.
20. Gargi Chaudhuri and Swagata Mallik, “Liquid Gas Phase transition; Effect of surface energy”, Proceedings of the DAE-BRNS Symposium on Nuclear Physics, 64 (2019) 323.
21. Nilanjan Chaudhuri, Snigdha Ghosh, Sourav Sarkar, Pradip Roy, “Effect of anomalous magnetic moment of quarks on chiral and de-confinement transition in pNJL model”, DAE Symp. Nucl. Phys. 64 (2019) 722-723.
22. B Das, Md. S. R. Laskar, S Rajbanshi, R Palit, F. S. Babra, S Biswas, C Palshetkar, P. Dey, L. P. Singh, Biswajit Das, R. Donthi, S. Jadhav, Abraham. T. Vazhappilly, S. Nandi, G. Mukherjee, S. Bhattacharya, T. Trivedi, E. Ideguchi, M. Kumar Raju Santra, “Lifetime measurement for the high spin states of Sr nucleus”, DAE Symp Nucl Phys, 64, (2019) 150.
23. Chiranjib Das, Tapan Kr Mandi, Suvadeep Roy, S. Dechoudhury, H. K. Pandey, V. Naik, A. Chakrabarti, “Cold model testing of scaled prototype of proton RFQ for ANURIB”, Indian Particle Accelerator Conference (2019)
24. S. Das Gupta, Soumik Bhattachraya, S. Bhattacharyya, R. Banik, G. Mukherjee, R. Raut, S. Ghugre, S. Das, S. Samanta, S. Chatterjee, S. Rajbanshi, S. Nandi, Shabir Dar, Sneha Das, A. Goswami, Sajad Ali, Sudatta Ray, Rupsa Banik, Sangeeta Majumdar, “Spectroscopic study of
Progress Report 2019-20
220
197Hg”, DAE Symp Nucl Phys, 64, (2019) 182.
25. S. Dasgupta, J. Datta, “The study of Excitation functions of heavy ion induced nuclear reactions between 20Ne beam and natural Copper for analytical application”, Proceedings of Fourteenth Biennial DAE-BRNS Symposium on Nuclear and Radiochemistry (NUCAR-2019) held at Mumbai, India, during Jan 15-19, p 226 (2019).
26. S. Dasgupta, J. Datta and. K. K. Swain, “Determination of boron concentration in In-house graphite reference material by instrumental charged particle activation analysis”, In 15th International Conference on Modern Trends in Activation Analysis (MTAA-15), organized by DAE-BRNS, ICAA & IANCAS during November 17-22, (2019)
27. S. Dasgupta, J. Datta, “Evaluation of excitation functions in heavy ion activation of natural copper with 20Ne beam for analytical application”, In 15th International Conference on Modern Trends in Activation Analysis (MTAA-15), organized by DAE-BRNS, ICAA & IANCAS during November 17-22 (2019)
28. J Datta, S. Dasgupta, “The development of analytical methodology for the determination of boron by heavy ion activation analysis”, Proceedings of Fourteenth Biennial DAE-BRNS Symposium on Nuclear and Radiochemistry (NUCAR-2019) held at Mumbai, India, during Jan 15-19, p 227 (2019)
29. J. Datta, S. Dasgupta, “The development of analytical methodology for the determination of boron by heavy ion activation analysis”, In 15th International Conference on Modern Trends in Activation Analysis (MTAA-15), organized by DAE-BRNS, ICAA & IANCAS during November 17-22, (2019)
30. J. Datta, S. Dasgupta, “Utilization of Charged Particle Activation Analysis using ion beams from Cyclotron for analytical applications”, In 15th International Conference on Modern Trends in Activation Analysis (MTAA-15), organized by DAE-BRNS, ICAA & IANCAS during November 17-22 (2019)
31. J. Datta, C. Majumder, “Adsorption behavior of noble metal atom on the monovacancy defected hexagonal boron nitride monolayer”, in Second Indian Materials Conclave and 31st AGM at Kolkata during February 11 to 14, 2020 at CSIR – Central Glass & Ceramic Research Institute (2020)
32. A. De, Deepak Pandit, Balaram Dey, Debasish Mondal, S. Mukhopadhyay, Surajit Pal, S. R. Banerjee, Srijit Bhattacharya, “A study on nuclear binding energy based on neural network”, DAE Symp Nucl Phys, 64, (2019) 142.
33. A. De, Debakinandan Majee, Srijit Bhattacharya, S. R. Banerjee, Deepak Pandit, S. Mukhopadhyay, Surajit Pal, Debasish Mondal, Balaram Dey, “Three-body force effects in proton induced break-up of deuterons”, DAE Symp Nucl Phys, 64, (2019) 351.
34. Atreyee Dey, Anwesha Basu, A. K Singh, S. Nag, G. Mukherjee, S. Bhattacharyya, R. Banik, S. Nandi, S. Bhattacharya, R. Raut, S. S. Ghugre, S. Das, S. Samanta, S. Chatterjee, A. Goswami, S. Ali, H.Pai, S.Rajbanshi, “Spectroscopy of 126Te”, DAE Symp Nucl Phys, 64, (2019) 248.
35. Balaram Dey, Deepak Pandit, Subinit Roy, P. Y. Nabhiraj, “Simulation and prototype design of window-less gas-jet target”, DAE Symp Nucl Phys, 64, (2019) 894.
36. Dipta Pratim Dutta, Siddhartha Dechoudhury, Md. Zamal Naser, Sanket Haque, Sajjan Kumar Thakur, Tapan Kumar Mandi, Hemendra Kumar Pandey, Vaishali Naik, Arup
Progress Report 2019-20
221
Bandyopadhyay, “Design, installation and testing of a dielectric waveguide type DC isolator for electron gun at VECC”, Indian Particle Accelerator Conference (2019)
37. Antara Ghosh, A. K. Sikdar, Joydip Nandi, P. Das, A. Ray, “Optimization and characterization of Penning Trap at room temperature”, DAE Symp Nucl Phys, 64, (2019) 934.
38. Santu Ghosh, Shantonu Sahoo, Madhusudan Dey, “Design and Development of a Prototype Low-cost Data Acquisition Readout Electronics Board for Medical Imaging System”, Proc. of 64th DAE-BRNS Symposium on Nuclear Physics, Vol. 64 (2019), 962.
39. Animesh Goswami, Suvadeep Roy, C. Nandi, Prodyut Sankar Chakraborty and Arup Bandhopadhyay, et. al., “Design and Modelling of a Spiral Inflector for K130 Cyclotron at VECC”, Indian Particle Accelerator Conference (InPAC-2019), IUAC, New Delhi
40. Animesh Goswami, Santanu Paul, Ankur Agrawal, Md. Zamal Abdul Naser and Arup Bandyopadhyay, et. al., “Beam Optics Design of a High Resolution Separator for ANURIB Project”, Indian Particle Accelerator Conference (InPAC-2019), IUAC, New Delhi
41. Aarushi Jain and Vikas Singhal, “Investigations of High Throughput Computing for Event Selection Process of MuCh@CBM”, International Conference on Recent Advances in Interdisciplinary Trends in Engineering & Applications (RAITEA-2019).
42. M. K. Jha, et al., “Design of Multichannel Readout ASIC for particle tagged gamma spectroscopy at VECC”, in the Proceedings of DAE-BRNS Symp. on Nucl. Phys 2019.
43. M. K. Jha, et al., “Design of CMOS peak detector for ASIC integrated with independent digital DAQ for nuclear spectroscopy”, in the Proceedings of DAE-BRNS Symp. on Nucl. Phys. 2019.
44. Prasanta Karmakar, “Tailoring of near surface chemistry and nano pattern development on Si and mica by ion beam”, International Conference on Electron Microscopy & Allied Analytical Techniques, EMAAT 2019 at Shimla during June 07-09, 2019.
45. Prasanta Karmakar, “Surface and buried nanostructuring by keV ion beams”, International Conference on Nanostructuring by Ion Beams (ICNIB 2019)” at IGCAR, Kalpakkam, during November 06 - 08, 2019.
46. Prasanta Karmakar, “Nanopatterning and chemical alteration at surface and interfaces by low energy ion beam”, 2nd Materials Conclave and 31st AGM of Material Research Society of India, CGCRI, Kolkata during Feb 11-14, 2020.
47. F. Khan, Shuaib Ahmad Khan et. Al, “Unfolding design strategies and the critical aspects for development of DAQ at the HEP experiments”, 2019 International Conference on Cutting-edge Technologies in Engineering (ICon-CuTE), Uttar Pradesh, India, pp. 113-116, IEEE Conference Record No. 47290, Published in IEEE. (Feb 2020).
48. Shuaib Ahmad Khan and Subhasis Chattopadhyay,“Optimization methodology of high speed transceivers for interfaces in HEP Experiments”, Proceedings of the DAE-BRNS Symp. on Nucl. Phys. 64 (Dec 2019) page (1000-1001).
49. Devesh Kumar, T. Bhattacharjee, L. Gerhard, L. Knafla, A. Esmaylzadeh, F. Dunkel, K. Schonaker, J. -M. Regis, S.S. Alam, S. Basak, D. Banerjee, Y.H. Kim, U. Koster, M. Saha Sarkar, “Lifetime measurements in neutron rich 129Sn and 130,132Te”, DAE Symp. on Nucl.
Progress Report 2019-20
222
Phys. 64 (2019) 280.
50. Nishant Kumar, B. N. Joshi, G. K. Prajapati, B. V. John, L. S. Danu, Y. K. Gupta, T. K. Ghosh, S. Mukhopadhyay, D. C. Biswas, “Fission fragment mass distribution studies in Be + U system”, DAE Symp Nucl Phys, 64, (2019) 349.
51. Tapan Kumar Mandi, Hemendra Kumar Pandey, Dipta Pratim Dutta, Arihant Kumar Jain, Siddhartha Dechoudhury, A. Bandyopadyay, V. Naik, “Design and development of LLRF control system for RF transmitters operated at 37.8 MHz”, Indian Particle Accelerator Conference (2019)
52. Anuraag Mishra, ..., Prodyut Sankar Chakraborty, “Time structure measurement of Alpha Ion Beam Extracted from K-130 Cyclotron using a Indigenously Developed Capacitive Pick up and Fast Faraday Cup”, Indian Particle Accelerator Conference (InPAC-2019), IUAC, New Delhi, Nov 18-21, 2019
53. Debasish Mondal, Deepak Pandit, S. Mukhopadhyay, Surajit Pal, Balaram Dey, A. De, Srijit Bhattacharya, Pratap Roy, K. Banerjee, Soumik Bhattacharya, S. R. Banerjee, “Onset of exotic shape in 31P”, DAE Symp Nucl Phys, 64, (2019) 58.
54. Joy Mukherjee, Dipak Bhowmik, Prasanta Karmakar, “Chemically periodicnano ripple formation on silicon surface by NO+ ion irradiation”, International Conference on Nanostructuring by Ion Beams (ICNIB 2019)” at IGCAR, Kalpakkam, during November 06 - 08, 2019.
55. Joy Mukherjee, Dipak Bhowmik, Prasanta Karmakar, “Band gap engineering and nano patterning of muscovite mica by various projectile ion bombardments”, 2nd Materials Conclave and 31st AGM of Material Research Society of India, CGCRI, Kolkata during Feb. 11-14, 2020.
56. S. Mukhopadhyay, “Nuclear collective excitations in hot and fast rotating nuclei”, DAE Symp Nucl Phys, 64, (2019) 49.
57. S. Nandi, G. Mukherjee, Q. B. Chen, R. Banik, S. Bhattacharya, Shabir Dar, S. Bhattacharyya, C. Bhattacharya, S. Rajbanshi, Sajad Ali, H. Pai, S. Chatterjee, S. Das, S. Samanta, R. Raut, S.S. Ghugre, P. Chowdhury, S. Das Gupta, “Presence of transverse and longitudinal wobbling in 183Au”, DAE Symp Nucl Phys, 64, (2019) 68
58. E. Nandy et.al, “Implementation of RPC geometry and digitization in the 3rd and 4th MUCH station”, CBM Progress Report 2018, published on Oct,2019 page (163-164)
59. E. Nandy et.al, “A systematic investigation of di-muon combinatorial background for CBM-MUCH”, CBM Progress Report 2018, published on Oct,2019 , page (176-177)
60. Ekata Nandy, Partha Pratim Bhaduri and Subhasis Chattopadhyay, "Thermal dimuon signal extraction with the Muon Detector setup of CBM experiment FAIR at 8 AGeV", Proceedings of the DAE-BRNS Symp. on Nucl. Phys. 64 (Dec 2019) page (828-829).
61. Md. Zamal Abdul Naser, D. P. Dutta, Sanket Haque, Siddhartha Dechoudhury, Manas Mondal, S. K.Thakur, Arup Bandyopadhyay, Vaishali Naik, Alok Chakrabarti, “In-house beam profile measurement set-up for measuring electron beam emittance using solenoid scan technique”, Indian Particle Accelerator Conference-2019 (InPAC-2019), November 18-21, 2019, IUAC, New Delhi.

Progress Report 2019-20
223
62. Umashankar Panda, Aditya Mandal, Sabyasachi Pathak, Suprakash Roy, Niraj Chaddha, Sudeshna Seth, Surajit Ghosh, Anirban De, Anindya Roy, Malay Kanti Dey, Sumit Som, Umesh Kumar, Sankha Chattopadhyay, “Control system for first trial run of FDG production at DAE medical cyclotron facility Kolkata”. Presented in the 9th Indian Particle Accelerator Conference, INPAC 2019 at IUAC, New Delhi, 18th – 21st November 2019.
63. Deepak Pandit, “Understanding of the collective enhancement in the nuclear level density”, DAE Symp Nucl Phys, 64, (2019) 27.
64. Pooja Pareek,”Energy and system-size dependence of neutral mesons production at the Large Hadron Collider with ALICE", Proceedings of the DAE-BRNS Symp. on Nucl. Phys. 64 (Dec 2019) page (710-711).
65. S. Pathak, T. Das, J. Nandi, P. Das, “Electronic Structure Calculation of HfO2 with mBJ Potential using Precise Experimental Structure”, 64th DAE Solid State Physics Symposium (2019) IIT Jodhpur, India.
66. Santanu Paul, Animesh Goswami, Uttam Bhunia, Chiranjib Das, and Arup Bandyopadhyay, et. al., “Beam Injection Studies in a Separated Sector Cyclotron for ANURIB Project”, Indian Particle Accelerator Conference (InPAC-2019), IUAC, New Delhi.
67. A. Ray, A. K. Sikdar, P. Das, S. Pathak, J. Datta, “Large Increase of Be Decay Rate Under Compression”,DAE Symp Nucl Phys, 64, (2019) 580.
68. Anindya Roy, Shantonu Sahoo, Sarbajit Pal, “Application of EPICS control system studio in VECC”, Indian Particle Accelerator Conference, IUAC, New Delhi (2019)
69. Pratap Roy, K. Banerjee, S. Kundu, T. K. Rana, A. Sen, S. Manna, T. K. Ghosh, G. Mukherjee, R. Pandey, J. Sadhukhan, D. Mondal, S. Mukhopadhyay, Deepak Pandit, S. Pal, A. K. Saha, J. K. Meena, J. K. Sahoo, D. Paul, K. Atreya, C. Bhattacharya, “Nuclear Level Density of Sn from neutron evaporation”, DAE Symp Nucl Phys, 64, (2019) 325.
70. Sujan Kumar Roy, Somnath Mukhopadhyay, Joydev Lahiri, D. N. Basu, “Relativistic Thomas-Fermi EoS of magnetic White Dwarfs”, Proc. of DAE-BRNS Symposium on Nuclear Physics, 64, (2019) 760.
71. Sujata Saha Das, Luna Barua, Ash Shayantani, Asit Kumar Pal, D Mahesh. G., Hudait Arup Kumar, Umesh Kumar, Madhusmita, Sumita Chattopadhyay, Md. Nayer Alam, Sankha Chattopadhyay, “DAE Medical Cyclone-30, Kolkata : Production of 18F-FDG using IBA-Synthera module”. Presented in the 51st SNMICON 2019, Annual Conference of Society of Nuclear Medicine India, 12th to 15th December, 2019 held at Mumbai, Abstract Id : RP 45.
72. Shantonu Sahoo, Arihant Jain, Anindya Roy, “EPICS based embedded control system architecture for electron gun of e-LINAC”, Indian Particle Accelerator Conference, IUAC, New Delhi (2019)
73. A. Sen, T. K. Ghosh, A. Chaudhuri, S. Bhattacharya, C. Bhattacharya, T. K. Rana, S. Manna, D. Paul, K. Atreya, Moin Shaikh, J. K. Meena, K. Banerjee, Pratap Roy, S. Kundu, G. Mukherjee, E.M. Kozulin, I.V. Pchelintsev, I.M. Harca, P. Sugathan, K. S. Golda, N. Saneesh, K. Chauhan, R. Bhukal, “Study of fusion fission dynamics in the reaction 19F + 205Tl”, DAE Symp Nucl Phys, 64, (2019) 395.
74. Md. Moin Shaikh, T. K. Ghosh, A. Sen, D. Paul, K. Atreya, C. Bhattacharya, S. Kundu, T. K. Rana, S. Nandi, G. Mukherjee, J. K. Meena, S. Manna, Pratap Roy, R. Pandey, S. Mukhopadhyay, RajKumar Santra, “Fission dynamics at energies far above the Coulomb
Progress Report 2019-20
224
barrier”, DAE Symp Nucl Phys, 64, (2019) 321.
75. A. K. Sikdar, Joydip Nandi, P. Das, A. Ray, “A new technique to measure the number of trapped particles in a Penning Trap”, DAE Symp Nucl Phys, 64, (2019) 858.
76. Vinay Singh, Debasis Atta, Md. A. Khan, D. N. Basu, “Deep sub-barrier fusion of p+6,7Li, p+D and S-function”, Proc. of DAE-BRNS Symposium on Nuclear Physics, 64, (2019) 768.
77. Vinay Singh, Joydev Lahiri, D. N. Basu, “Thermonuclear 6Li(n,)7Li reaction rate: A revisit ”, Proc. of DAE-BRNS Symposium on Nuclear Physics, 64, (2019) 600.
78. Arup Singha Roy, K Banerjee, Pratap Roy, C. Bhattacharya, T. K Rana, Arijit Sen, T. K. Ghosh, .S Kundu, G. Mukherjee, S. Mukhopadhyay, R. Ravishankar, S Manna, R. Pandey, D. Paul, K Atreya, S. Basu, V. Suman, S. Saha, M. Das, Deepak Pandit, Debasish Mondal, Surajit Pal, G. Mohanto, M. S. Kulkarni, S. Bhattacharya, “Measurement of neutron response function using quasi mono-energetic neutrons produced in the Li(p, n) Be reaction”, DAE Symp Nucl Phys 64 (2019) 469.
79. Saket Suman, S. K. Tandel, S. G. Wahid, Poulomi Roy, A. Chakraborty, K. Mandal, A. K. Mondal, G. Mukherjee, S. Bhattacharyya, Soumik Bhattacharya, R. Banik, S. Nandi, Shabir Dar, A. Asgar, S. Samanta, S. Das, S. Chatterjee, R. Raut, S. S. Ghugre, A. Sharma, Sajad Ali and P. Chowdhary, “High-K states and band structures in Yb isotopes”, DAE Symp Nucl Phys, 64, (2019) 226.
80. A. F. Usmani, Shuaib Ahmad Khan et. Al, “Design of FPGA based phase reconfiguration technique”, 3rd International Conference on Electronics, Materials Engineering & Nano-Technology (IEMENTech), Kolkata, India, August 2019, pp. 1-5.", Published in IEEE.
81. Sk Wasim Raja, V. Sharma, S. K. Samanta, R. Acharya, P. K. Pujari, “Quantification of 10B and Total B Concentrations in Boron Based Ceramic Neutron Absorbers by PGNAA using Thermal Neutron Beam at Dhruva Reactor and its Comparison with PIGE”, MTAA-15, Mumbai, November 17-22,2019.
Progress Report 2019-20
225
7.3 Thesis 1. Somnath Mukhopadhyay, “Equations of states for white dwarfs and neutron stars”, Doctor
of Philosophy in Science 2019, Homi Bhabha National Institute (HBNI). Supervisor: Dr. D. N. Basu, VECC, Kolkata.
2. Sk. Noor Alam, “Charge correlation using balance function of identified particles in heavy-ion collisions at LHC”, Doctor of Philosophy in Science 2019, Homi Bhabha National Institute (HBNI). Supervisor: Prof. Subhasis Chattopadhyay, VECC, Kolkata.
3. Md. Ali Asgar, “Study of high spin states in nuclei near spherical and deformed shell gaps”, Doctor of Philosophy in Science 2019, Homi Bhabha National Institute (HBNI). Supervisor: Prof. Gopal Mukherjee, VECC, Kolkata.
4. Dipak Bhowmik, “Surface and interface modification by low energy ion beams”, Doctor of Philosophy in Science 2019, Homi Bhabha National Institute (HBNI). Supervisor: Prof. Prasanta Karmakar, VECC, Kolkata.
5. Arghya Chatterjee, “Study of conserved quantities and their correlations in the RHIC beam energy scan program”, Doctor of Philosophy in Science 2019, Homi Bhabha National Institute (HBNI). Supervisor: Prof. Tapan Kumar Nayak, VECC, Kolkata.
6. Abhirup Chaudhuri, “Dynamics of fusion-reaction near the coulomb barrier”, Doctor of Philosophy in Science 2019, Homi Bhabha National Institute (HBNI). Supervisor: Prof. Tilak Kumar Ghosh, VECC, Kolkata.
7. Prabrisa Das, “Theoretical studies on fragmentation of nuclei at intermediate energies”, Doctor of Philosophy in Science 2020, Homi Bhabha National Institute (HBNI). Supervisor: Prof. Gargi Chaudhuri, VECC, Kolkata.
8. Pingal Dasgupta, “Study of direct photon production relativistic heavy ion collisions”, Doctor of Philosophy in Science 2019, Homi Bhabha National Institute (HBNI). Supervisor: Prof. D. K. Srivastava, VECC, Kolkata.
9. Utsab Gangopadhyaya, “Transport coefficients of hot hadronic matter”, Doctor of Philosophy in Science 2020, Homi Bhabha National Institute (HBNI). Supervisor: Prof. Sourav Sarkar, VECC, Kolkata.
10. Shuaib Ahmad Khan, “Optimization and performance analysis of the Common Readout Unit for the ALICE experiment at CERN”, Doctor of Philosophy in Engineering Sciences 2019, Homi Bhabha National Institute (HBNI). Supervisor: Prof. Tapan Kumar Nayak, VECC, Kolkata.
11. Homnath Luitel, “Defect induced room temperature ferromagnetism in non magnetic semiconducting oxides”, Doctor of Philosophy in Science 2019, Homi Bhabha National Institute (HBNI). Supervisor: Prof. Dirtha Sanyal, VECC, Kolkata.

Progress Report 2019-20
226
12. Sanjib Muhuri, “Forwarded calorimetry in ALICE and high Multip physics in proton-proton collisions at the large hadron collider”, Doctor of Philosophy in Science 2020, Homi Bhabha National Institute (HBNI). Supervisor: Prof. Tapan Kumar Nayak, VECC, Kolkata.
13. Rajendra Nath Patra, “Development of GEM detectors for the ALICE TPC upgrade and study of particle production at LHC energies”, Doctor of Philosophy in Science 2019, Homi Bhabha National Institute (HBNI). Supervisor: Prof. Tapan Kumar Nayak, VECC, Kolkata.
14. Samrangy Sadhu, “Measurement of azimuthal correlations between D-mesons and charged particles in pp collisions at √S = 13 TeV with ALICE at the LHC”, Doctor of Philosophy in Science 2019, Homi Bhabha National Institute (HBNI). Supervisor: Prof. Premomoy Ghosh, VECC, Kolkata.
15. Golam Sarwar, “Evolution of perturbation in a hydromynamically expanding system formed in relativistic heavy ion collision”, Doctor of Philosophy in Science 2019, Homi Bhabha National Institute (HBNI). Supervisor: Prof. Jane Alam, VECC, Kolkata.
16. Ashik Ikbal Sheikh, “Study of inclusive B-JET production in ALICE experiment at LHC”, Doctor of Philosophy in Science 2019, Homi Bhabha National Institute (HBNI). Supervisor: Prof. Zubayer Ahammed, VECC, Kolkata.
17. Vinay Singh, “Astrophysical S-factors for fusion reactions and nucleosynthesis”, Doctor of Philosophy in Science 2019, Homi Bhabha National Institute (HBNI). Supervisor: Dr. D. N. Basu, VECC, Kolkata.

Progress Report 2019-20
227
7.4 Books & Patents 1. S. Das Gupta, S. Mallik and G. Chaudhuri, “Heavy ion collisions at Intermediate Energy”,
Publisher: World Scientific Publishers (August, 2019)

Progress Report 2019-20
228
7.5 Colloquium, Symposia, Events & Other Activities
Colloquium
1. Prof. Shouvik Mukherjee, Department of History, University of Calcutta, “Dialogue between a Poet and a Saint: Perspectives on Nationalism”, September 27, 2019.
2. Professor Dimiter L. Balabanski, ELI-NP, Horia Hulubei National R&D Institute in Physics and Nuclear Engineering, Bucharest – Magurele, Romania, “Extreme Light: A New Tool in Nuclear Physics”, October 21, 2019.
3. Shri G. Nageswara Rao, Chairman, Atomic Energy Regulatory Board (AERB), “Pursuit of AERB for SAFE use of Radiation for Societal Benefit”, November 08, 2019.
4. Prof. Pijushpani Bhattacharjee, Saha Institute of Nuclear Physics, Kolkata, “The Nobel Prize in Physics: 2019”, November 28, 2019.
5. Prof. Saibal Basu, Raja Ramanna Fellow and Associate Dean, HBNI Former, Head Solid State Physics Division, BARC¸ “Neutron Scattering, a Unique tool for condensed matter”, January 07, 2020.
6. Shri A. K. Sinha, Former Associate Director (Maintenance), Nuclear Power Corporation of Indian Ltd. (NPCIL), “Maintenance Strategy to avoid force shutdown of plant”, March 04, 2020.
Symposis
1. Thematic Workshop on Science and Engineering of Materials using Ion Beams and Gamma Radiation, organised jointly by UGC-DAE Consortium for Scientific Research, Kolkata Centre & Variable Energy Cyclotron Centre, May 28-29, 2019
2. DAE-BRNS symposium on "Contemporary and Emerging Topics in High Energy Nuclear Physics (CETHENP 2019)", November 25-27, 2019
3. मौिलक िवजञान और उसक सामािजक आयाम, November 29, 2019
4. Indo Japan Accelerator School cum Workshop IJAS - 2020, January 28-31, 2020
Events & Other Activities
1. National Science Day - 2019 Celebration National Science Day 2019 was celebrated by VECC, Kolkata, on March 12, 2019. The main theme of the celebration was “Science for Swachhata and Swachhata for Science”. This year, the students of class X to 1st year college, in particular from schools from remote rural areas were invited, with an emphasis to reach students of schools far away from the city. Dr. Arunabha Majumdar, emeritus professor, school of water resources engineering, Jadavpur University delivered a lecture on "Swachh Bharat Abhiyan/ Mission". A total of 13 schools participated (70 student and 18 teachers) in the National Science Day 2019 celebration at VECC. The programme consisted of visits to various research facilities and laboratories at VECC followed by various programmes (quiz and debate) at Ajay Dewatia Lecture hall. The students left VECC with great joy and inspiration. Their enthusiasms were electrifying and all volunteers VECC were touched by it. Some photographs of the event are attached in below.
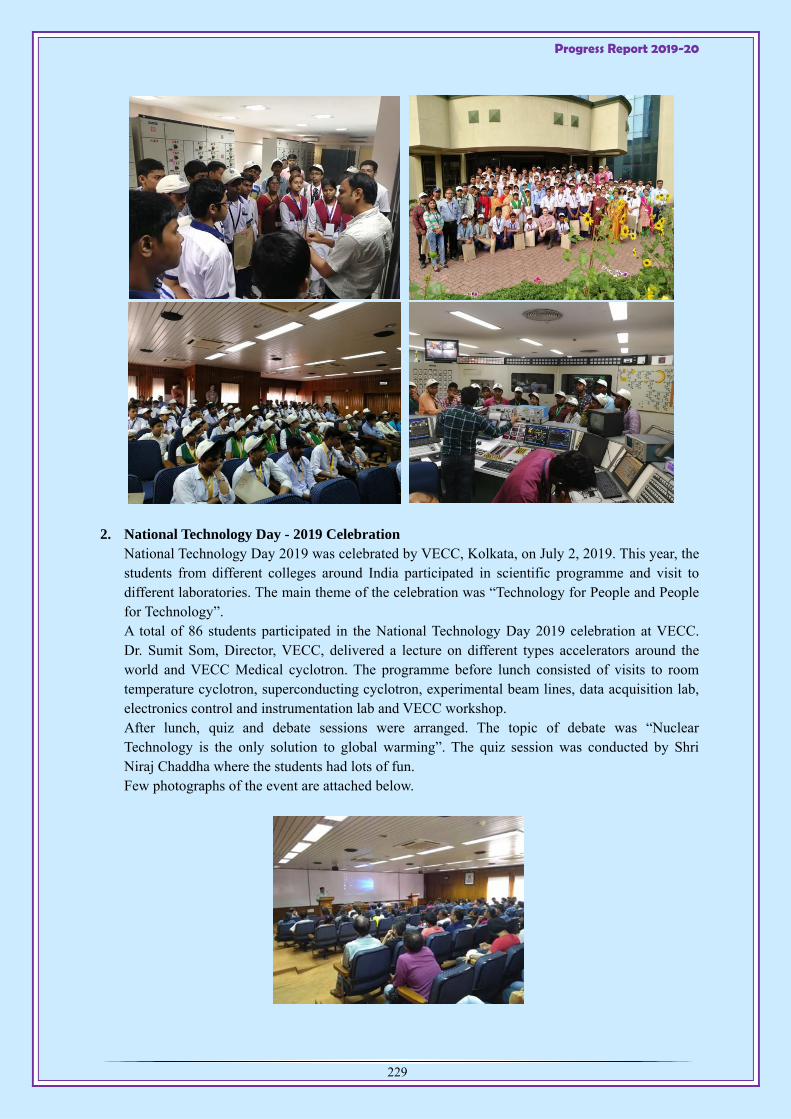
Progress Report 2019-20
229
2. National Technology Day - 2019 Celebration
National Technology Day 2019 was celebrated by VECC, Kolkata, on July 2, 2019. This year, the students from different colleges around India participated in scientific programme and visit to different laboratories. The main theme of the celebration was “Technology for People and People for Technology”. A total of 86 students participated in the National Technology Day 2019 celebration at VECC. Dr. Sumit Som, Director, VECC, delivered a lecture on different types accelerators around the world and VECC Medical cyclotron. The programme before lunch consisted of visits to room temperature cyclotron, superconducting cyclotron, experimental beam lines, data acquisition lab, electronics control and instrumentation lab and VECC workshop. After lunch, quiz and debate sessions were arranged. The topic of debate was “Nuclear Technology is the only solution to global warming”. The quiz session was conducted by Shri Niraj Chaddha where the students had lots of fun. Few photographs of the event are attached below.
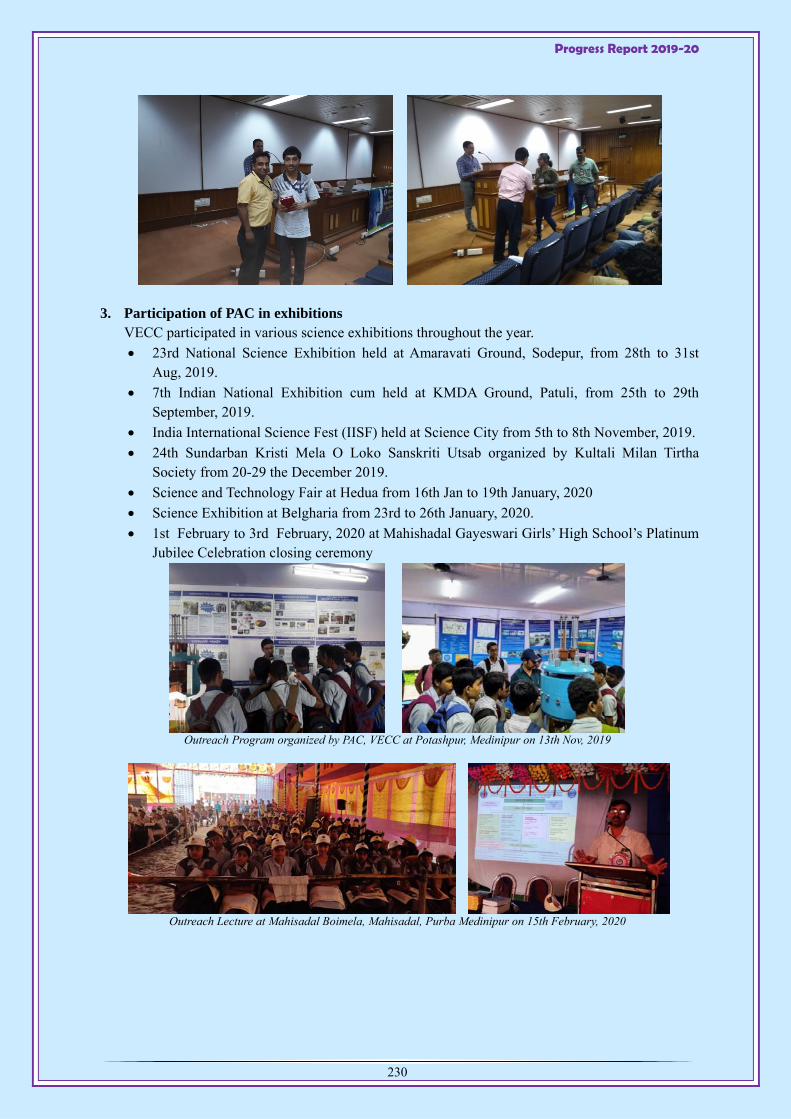
Progress Report 2019-20
230
3. Participation of PAC in exhibitions
VECC participated in various science exhibitions throughout the year.
23rd National Science Exhibition held at Amaravati Ground, Sodepur, from 28th to 31st Aug, 2019.
7th Indian National Exhibition cum held at KMDA Ground, Patuli, from 25th to 29th September, 2019.
India International Science Fest (IISF) held at Science City from 5th to 8th November, 2019.
24th Sundarban Kristi Mela O Loko Sanskriti Utsab organized by Kultali Milan Tirtha Society from 20-29 the December 2019.
Science and Technology Fair at Hedua from 16th Jan to 19th January, 2020
Science Exhibition at Belgharia from 23rd to 26th January, 2020.
1st February to 3rd February, 2020 at Mahishadal Gayeswari Girls’ High School’s Platinum Jubilee Celebration closing ceremony
Outreach Program organized by PAC, VECC at Potashpur, Medinipur on 13th Nov, 2019
Outreach Lecture at Mahisadal Boimela, Mahisadal, Purba Medinipur on 15th February, 2020
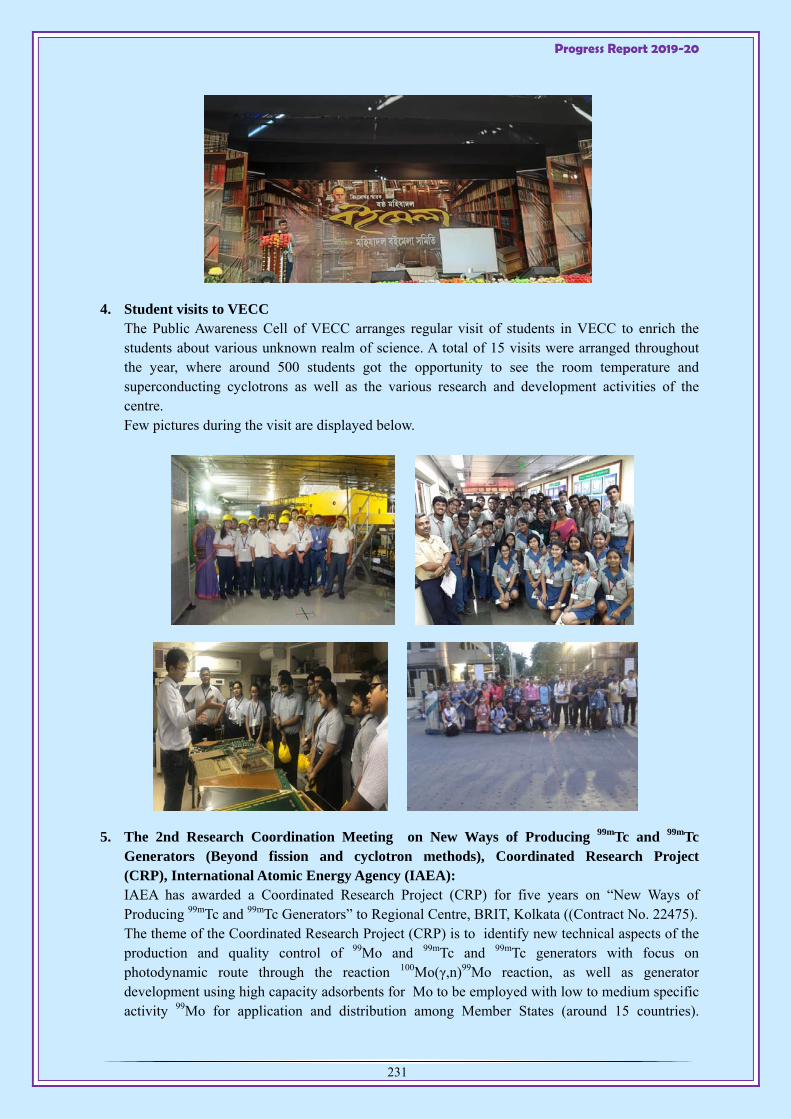
Progress Report 2019-20
231
4. Student visits to VECC
The Public Awareness Cell of VECC arranges regular visit of students in VECC to enrich the students about various unknown realm of science. A total of 15 visits were arranged throughout the year, where around 500 students got the opportunity to see the room temperature and superconducting cyclotrons as well as the various research and development activities of the centre. Few pictures during the visit are displayed below.
5. The 2nd Research Coordination Meeting on New Ways of Producing 99mTc and 99mTc
Generators (Beyond fission and cyclotron methods), Coordinated Research Project (CRP), International Atomic Energy Agency (IAEA): IAEA has awarded a Coordinated Research Project (CRP) for five years on “New Ways of Producing 99mTc and 99mTc Generators” to Regional Centre, BRIT, Kolkata ((Contract No. 22475). The theme of the Coordinated Research Project (CRP) is to identify new technical aspects of the production and quality control of 99Mo and 99mTc and 99mTc generators with focus on photodynamic route through the reaction 100Mo(γ,n)99Mo reaction, as well as generator development using high capacity adsorbents for Mo to be employed with low to medium specific activity 99Mo for application and distribution among Member States (around 15 countries).

Progress Report 2019-20
232
Although the fission based Mo-99 remains the major source for 99Mo/99mTc generators, in recent years Mo-99 supply crisis was raised by different factors such as the extension of planned outage, the prolonged or unplanned shutdown of many research reactors around the world. These unplanned events, combined with other planned outages created a worldwide Mo-99 supply crisis. In response to the crisis, producers increased the production of Mo-99 to the maximum extent possible and also alternative production routes were suggested for availability of Mo-99 and/or Tc-99m radionuclides. Dr. Sankha Chattopadhyay, Officer-In-Charge, Regional Centre, BRIT has represented the 2nd Reasearch Co-ordination Meeting and presented the progress and future plan of the project at the National Centre for Nuclear Research, Radioisotope Centre POLATOM, Otwock-Swierk, Poland, 13-17 May 2019.
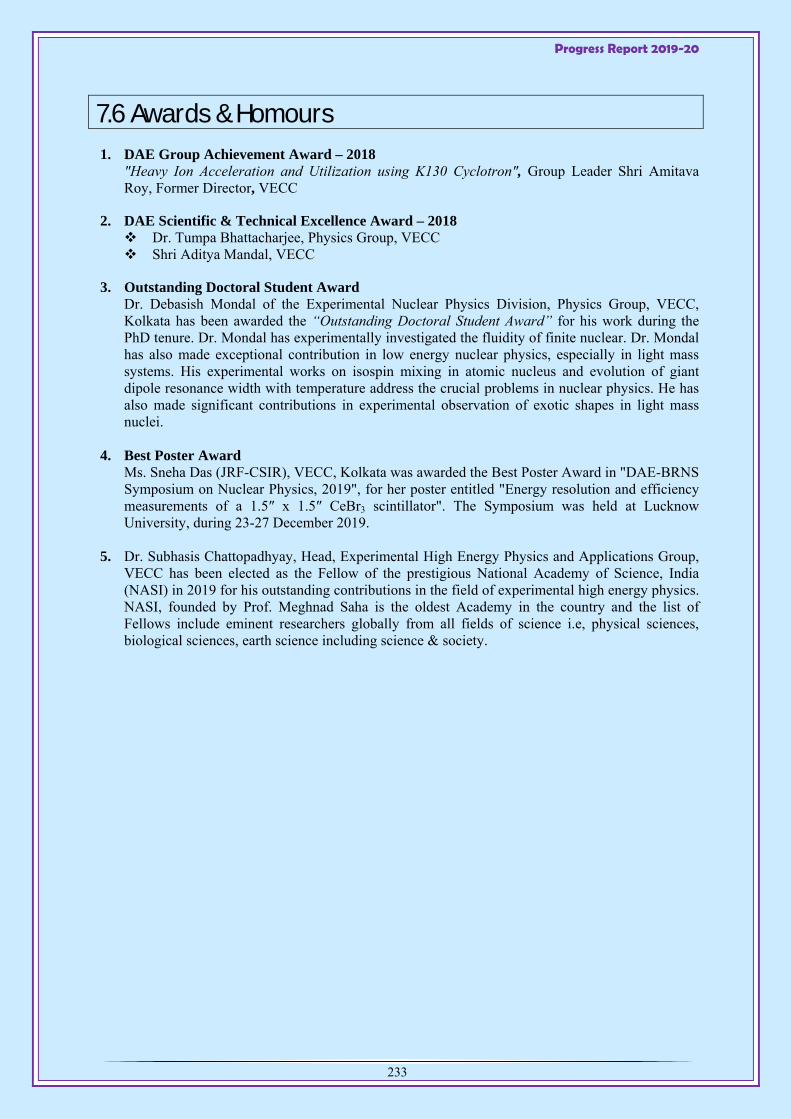
Progress Report 2019-20
233
7.6 Awards & Homours
1. DAE Group Achievement Award – 2018 "Heavy Ion Acceleration and Utilization using K130 Cyclotron", Group Leader Shri Amitava Roy, Former Director, VECC
2. DAE Scientific & Technical Excellence Award – 2018 Dr. Tumpa Bhattacharjee, Physics Group, VECC Shri Aditya Mandal, VECC
3. Outstanding Doctoral Student Award Dr. Debasish Mondal of the Experimental Nuclear Physics Division, Physics Group, VECC, Kolkata has been awarded the “Outstanding Doctoral Student Award” for his work during the PhD tenure. Dr. Mondal has experimentally investigated the fluidity of finite nuclear. Dr. Mondal has also made exceptional contribution in low energy nuclear physics, especially in light mass systems. His experimental works on isospin mixing in atomic nucleus and evolution of giant dipole resonance width with temperature address the crucial problems in nuclear physics. He has also made significant contributions in experimental observation of exotic shapes in light mass nuclei.
4. Best Poster Award
Ms. Sneha Das (JRF-CSIR), VECC, Kolkata was awarded the Best Poster Award in "DAE-BRNS Symposium on Nuclear Physics, 2019", for her poster entitled "Energy resolution and efficiency measurements of a 1.5″ x 1.5″ CeBr3 scintillator". The Symposium was held at Lucknow University, during 23-27 December 2019.
5. Dr. Subhasis Chattopadhyay, Head, Experimental High Energy Physics and Applications Group, VECC has been elected as the Fellow of the prestigious National Academy of Science, India (NASI) in 2019 for his outstanding contributions in the field of experimental high energy physics. NASI, founded by Prof. Meghnad Saha is the oldest Academy in the country and the list of Fellows include eminent researchers globally from all fields of science i.e, physical sciences, biological sciences, earth science including science & society.

PERSONNEL
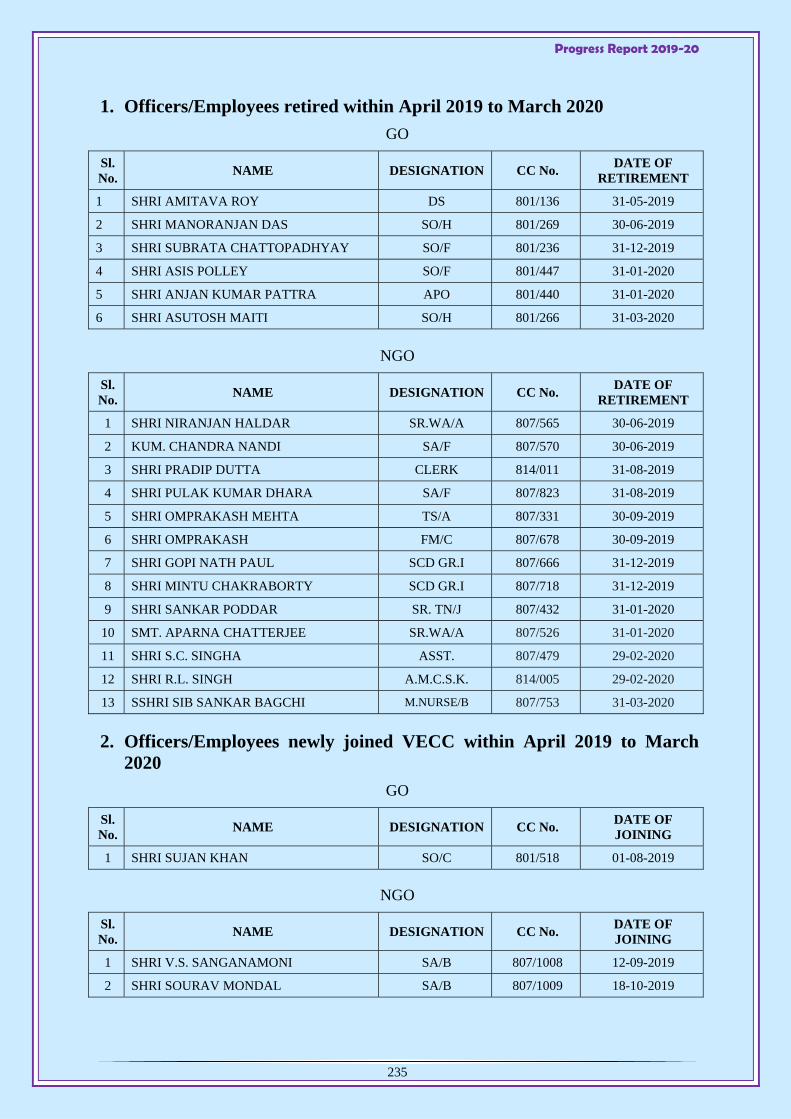
Progress Report 2019-20
235
1. Officers/Employees retired within April 2019 to March 2020
GO
Sl. No.
NAME DESIGNATION CC No. DATE OF
RETIREMENT
1 SHRI AMITAVA ROY DS 801/136 31-05-2019
2 SHRI MANORANJAN DAS SO/H 801/269 30-06-2019
3 SHRI SUBRATA CHATTOPADHYAY SO/F 801/236 31-12-2019
4 SHRI ASIS POLLEY SO/F 801/447 31-01-2020
5 SHRI ANJAN KUMAR PATTRA APO 801/440 31-01-2020
6 SHRI ASUTOSH MAITI SO/H 801/266 31-03-2020
NGO
Sl. No.
NAME DESIGNATION CC No. DATE OF
RETIREMENT
1 SHRI NIRANJAN HALDAR SR.WA/A 807/565 30-06-2019
2 KUM. CHANDRA NANDI SA/F 807/570 30-06-2019
3 SHRI PRADIP DUTTA CLERK 814/011 31-08-2019
4 SHRI PULAK KUMAR DHARA SA/F 807/823 31-08-2019
5 SHRI OMPRAKASH MEHTA TS/A 807/331 30-09-2019
6 SHRI OMPRAKASH FM/C 807/678 30-09-2019
7 SHRI GOPI NATH PAUL SCD GR.I 807/666 31-12-2019
8 SHRI MINTU CHAKRABORTY SCD GR.I 807/718 31-12-2019
9 SHRI SANKAR PODDAR SR. TN/J 807/432 31-01-2020
10 SMT. APARNA CHATTERJEE SR.WA/A 807/526 31-01-2020
11 SHRI S.C. SINGHA ASST. 807/479 29-02-2020
12 SHRI R.L. SINGH A.M.C.S.K. 814/005 29-02-2020
13 SSHRI SIB SANKAR BAGCHI M.NURSE/B 807/753 31-03-2020
2. Officers/Employees newly joined VECC within April 2019 to March 2020
GO
Sl. No.
NAME DESIGNATION CC No. DATE OF JOINING
1 SHRI SUJAN KHAN SO/C 801/518 01-08-2019
NGO
Sl. No.
NAME DESIGNATION CC No. DATE OF JOINING
1 SHRI V.S. SANGANAMONI SA/B 807/1008 12-09-2019
2 SHRI SOURAV MONDAL SA/B 807/1009 18-10-2019

Progress Report 2019-20
236
3. Officers/Employees joined VECC on transfer within April 2019 to March 2020
GO
Sl. No.
NAME DESIGNATION CC No. DATE OF JOINING
TRANSFER FROM
1 SHRI DEBASIS SINHAMAPATRA SO/D 801/517 01-07-2019 RRCAT
2 SHRI PRASENJIT DHANG SO/D 801/519 26-08-2019 BARCF
3 SHRI V.A. BHOITE APO 801/520 17-09-2019 BARC
4 SHRI TANUMAY BHATTACHARYA SO/D 801/521 25-11-2019 BARC
5 SMT. RAJI S. NAIR APO 801/522 03-03-2020 DPS
NGO
Sl. No.
NAME DESIGNATION CC No. DATE OF JOINING
TRANSFER FROM
1 SHRI DIPANKAR KARMAKAR TN/D 807/1007 10-06-2019 RRCAT
2 SHRI ROHAN RAMAN SA/C 807/1010 19-11-2019 NFC
3 SHRI GOUTAM PAUL TN/F 807/1012 09-03-2020 BARC
4. Officers/Employees transferred to other unit from VECC within April 2019 to March 2020
GO
Sl. No.
NAME DESIGNATION CC No. DATE OF
TRANSFER TRANSFER
TO
1 SHRI BHASKARANAND JHA AD(OL) 801/442 05-04-2019 AERB
2 SHRI J. BALU NAIK TO/D 801/439 26-08-2019 BARCF
NGO
Sl. No.
NAME DESIGNATION CC No. DATE OF
TRANSFER TRANSFER
TO
1 SHRI KHEMRAJ MEENA TN/D 807/894 14-06-2019 RRCAT
2 SHRI A ARUN UDC 807/948 30-09-2019 IGCAR
3 SHRI LAVANYA K. DODDI SA/D 807/857 15-11-2019 NFC
4 SHRI SANJAY G. KARANJKAR TN/F 807/804 28-02-2020 BARCF