construction of an improved linkage map of diploid alfalfa ( medicago sativa )
TRANSCRIPT
Abstract An improved genetic map of diploid (2n=2x=16)alfalfa has been developed by analyzing the inheritanceof more than 800 genetic markers on the F2 populationof 137 plant individuals. The F2 segregating populationderived from a self-pollinated F1 hybrid individual of thecross Medicago sativa ssp. quasifalcata × Medicago sat-iva ssp. coerulea. This mapping population was the sameone which had been used for the construction of our pre-vious alfalfa genetic map. The genetic analyses wereperformed by using maximum-likelihood equations andrelated computer programs. The improved genetic mapof alfalfa in its present form contains 868 markers (fourmorphological, 12 isozyme, 26 seed protein, 216 RFLP,608 RAPD and two specific PCR markers) in eight link-age groups. Of the markers 80 are known genes, includ-ing 2 previously cytologically localized genes, the rDNAand the β-tubulin loci. The genetic map covers 754 cen-timorgans (cM) with an average marker density of0.8/cM. The correlation between the physical and genet-ic distances is about 1000–1300 kilobase pairs per centi-Morgan. In this map, the linkage relationships of somemarkers on linkage groups 6, 7, and 8 are different fromthe previously published one. The cause of this discrep-ancy was that the genetic linkage of markers displayingdistorted segregation (characterized by an overwhelmingnumber of heterozygous individuals) had artificiallylinked genetic regions that turned out to be unlinked. Toovercome the disadvantageous influence of the excessnumber of heterozygous genotypes on the recombinationfractions, we used recently described maximum-likeli-hood formulas and colormapping, which allowed us to
exclude the misleading linkages and to estimate the ge-netic distances more precisely.
Key words Medicago sativa · Linkage map · Distortedsegregation
Introduction
Alfalfa (Medicago sativa L.) is a very important foragecrop species in many countries throughout the world. Itis widely adaptable to diverse environmental conditionspartly because of its deeply penetrable root system andits ability to fix atmospheric nitrogen in symbiosis withRhizobium meliloti. These obvious soil-improving prop-erties make it an important member of the crop rotation.The cultivated alfalfa is a tetraploid, cross-pollinatedplant for which homozygous, inbred lines can not be es-tablished (Hanson et al. 1988). As a consequence, theunderstanding of its genetic system, which would be ex-tremely beneficial for both basic and applied science, isin its infancy. Because of the complex segregation pat-tern of the tetraploid inheritance geneticists often studythe diploid alfalfa species and subspecies belonging tothe Medicago sativa complex (Quiros and Bauchan1988; Echt et al. 1992; Kiss et al. 1993; Endre et al.1996). As these diploid alfalfa plants are crossable withthe cultivated, tetraploid counterpart, genetic systems de-veloped for the diploids can be adaptable for the tetra-ploid ones as well.
Preliminary genetic mapping studies on diploid alfalfaspecies demonstrated that the genotypes of some markersin the F2 segregating populations originating from self-pollinated F1 hybrids had significant distorted segregation(Brummer et al. 1993; Kiss et al. 1993). In these mappingpopulations, the dominant (3:1) or the codominant (1:2:1)segregation ratios deviated significantly from the theoret-ical values in several regions in which heterozygous ge-notypes dominated. Heterozygote excesses have been ob-served for a few markers in the mapping populations ofother plant species, such as lettuce (Landry et al. 1987;
Communicated by G. Wenzel
G. B. Kiss (✉) · P. Kaló · G. Endre · G. CsanádiInstitute of Genetics, Biological Research Center of the HungarianAcademy of Sciences, P.O. Box 521, Szeged, H-6701, Hungarye-mail:[email protected]
L. ZimányiInstitute of Biophysics, Biological Research Centerof the Hungarian Academy of Sciences, P.O. Box 521,Szeged, H-6701, Hungary
Theor Appl Genet (2000) 100:641–657 © Springer-Verlag 2000
P. Kaló · G. Endre · L. Zimányi · G. CsanádiG.B. Kiss
Construction of an improved linkage map of diploid alfalfa(Medicago sativa)
Received: 19 October 1998 / Accepted: 15 April 1999
Kesseli et al. 1994), tomato (Bernatzky and Tanksley1986; Helentjaris et al. 1986); maize (Helentjaris et al.1986), and pepper (Prince et al. 1993), but in none ofthese was the segregation distortion as severe as that seenin alfalfa. Deviations in the segregation ratio result fromthe reduced viability of the parental gametes (gametic se-lection) or the zygotes (zygotic selection). The type of theselection can be identified numerically from the segrega-tion ratio by two succesive χ2-tests (Pham et al. 1990;Lorieux et al. 1995). In extreme cases the homozygotesfor one allele can be completely absent, therefore thepresence of a lethal allele is suggested, such as that re-ported in sugar beet by Pillen et al. (1993). In many seg-regating populations, higher proportions of one or bothhomozygous allele configurations have also been foundfor some markers, e.g., tomato (Bernatzky and Tanksley1986), lettuce (Landry et al. 1987), oilseed rape (Landryet al.1991), and pepper (Prince et al. 1993), which may beexplained by the inbred nature of the parents.
Several investigations have been performed to revealthe effect of the distorted segregation ratio on the estima-tion of the recombination fractions (RFs). Bailey (1949)analyzed the linkage relationships between dominantmarkers in the case of zygotic selection, and Heun andGregorius (1987) also investigated dominant markers un-der gametic and zygotic selections. Lorieux et al. (1995)developed “special” maximum-likelihood (ML) formulasto estimate the viability factors and recombination frac-tions for both codominant and dominant markers in thecase of both gametic and zygotic selections. These inves-tigations indicated that the distorted segregation ratiohad a strong effect on the estimation of the recombina-tion fractions, which linked marker(s) and, consequently,unlinked genetic regions together.
During our mapping work we have come to the con-clusion that markers with extreme segregation distortionbehave confusingly when linkage is calculated. The in-creased numbers of heterozygous genotypes influencethe linkage values on such a way that genetically un-linked regions are artifically linked together. To over-come this obstacle, we calculated recombination frac-tions by the “special” maximum-likelihood formulas de-veloped by Lorieux et al. (1995) by which false linkagevalues can be distinguished from genuine ones for thosechromosomal regions where the number of individualswith a heterozygous allele configuration overwhelminglyexceed the homozygotes. The fidelity of this approach issustained by an independent, non-mathematical methodcalled colormapping, described by Kiss et al. (1998). Bythe combined use of these two methods an improved ge-netic map of alfalfa was constructed and is presented inthis paper.
Materials and methods
Plant material
The 137 individual plants of the F2 segregating population – usedpreviously for genetic analysis of alfalfa by Kiss et al. (1993) –
were the progeny of a self-mated F1 hybrid plant deriving from across between a diploid (2n=2x=16), yellow-flowered Medicagosativa ssp. quasifalcata (Mqk93) as a female parent and a dip-
loid (2n=2x=16), blue-flowered Medicago sativa ssp. coerulea(Mcw2) as a male parent. The conditions for growing the plantswere the same as described by Kiss et al. (1993).
DNA isolation and hybridization
Total DNA was isolated from young leaves according to theslightly modified method described by Dellaporta et al. (1983).Aliquots of 10–15 µg of total DNA were digested with four differ-ent restriction enzymes (EcoRI, EcoRV, HindIII, and DraI;Amersham and Promega) according to the suppliers’ instructions.The DNA fragments were separated on 1.1% agarose gels andtransferred by the capillarity method (Southern 1975) onto nylonmembranes (Hybond-N, Amersham). The DNA fragments used asprobes were isolated from agarose gels using the QIAEX Gel Ex-traction Kit (Qiagen GmbH, Germany) and were labelled with α-[32P]dCTP by the random priming method (Feinberg and Vogel-stein 1983). The hybridizations were performed at 55–60°C andthe washings were carried out according to Kiss et al. (1993).
DNA amplification
The PCR amplifications with random amplified polymorphicDNA (RAPD) primers were based on the optimized method ofWilliams et al. (1990). The reaction mix consisted of 5 pmol 10-mer primer, 1 U Taq polymerase enzyme (Promega), 2.4 mMMgCl2,, 200 mM of each dNTP, and 25 ng total DNA of the indi-viduals in 1× Taq polymerase buffer in a final volume of 25 µl.The reactions were overlayed with 20 µl mineral oil (Sigma). Thepolymerase chain reactions (PCRs) for RAPD markers were car-ried out in 40 cycles with the following steps: 5 s at 94°C; 1 minat 37°C, and 1 min at 72°C in a PREM III thermocycler (LEP Sci-entific) or in a Programmable Thermal Controller (MJ Research).
The specific PCR amplifications were carried out with 16- to27-base-long oligonucleotides in the same mix as for RAPDs ex-cept that the MgCl2 concentration was 1.5 mM. The reactions werecarried out in 35 cycles of 30 s at 94°C; 1 min at 55°, 60° or 65°Cdepending on the primers, 1 or 2 min at 72°C, the reactions wereterminated with a final extension at 72°C for 4 min.
Amplified products were separated on 2.0% agarose gel andphotographed after staining with ethidium bromide.
Cloning and sequencing of PCR fragments
After separation, the PCR products were reisolated and purified byQIAEX Gel Extraction Kit (Qiagen GmbH, Germany). The PCRfragments were treated with the Klenow fragment of DNA poly-merase I in order to create blunt ends. The fragments were ligatedinto HincII-digested M13mp19 phage vector, and the sequencingreactions were carried out by the chain termination method de-scribed originally by Sanger et al. (1977).
Other DNA manipulations (restriction digestion of DNA, liga-tion, transformation, isolation of plasmid DNA, etc.) were carriedout according to Maniatis et al. (1982).
Isozyme analysis
The phosphoglucoseisomerase (PGI, E.C.5.3.1.9.) [=glucose-6-phosphate isomerase (GPI)] isoenzyme assay was performed oncellulose acetate plates following the method described by Hebertand Beaton (1989). Double-concentrated staining mixture – pre-pared according to the procedure described by Wendel andWeeden (1989) – was mixed with an equal volume of melted agarand poured over the plate to stain the gels for enzyme activity.Other isozyme analyses were performed with the method de-scribed by Kiss et al. (1993).
642

Source and nomenclature of the markers
Morphological markers
The sticky leaves (Stl, formerly marked as STLF), the dwarf phe-notypes and the colors of the flowers [the presence of anthocyan(Ant) and xanthophyll (Xant) pigments] were the same as de-scribed before (Kiss et al. 1993).
Restriction fragment length polymorphism (RFLP) markers
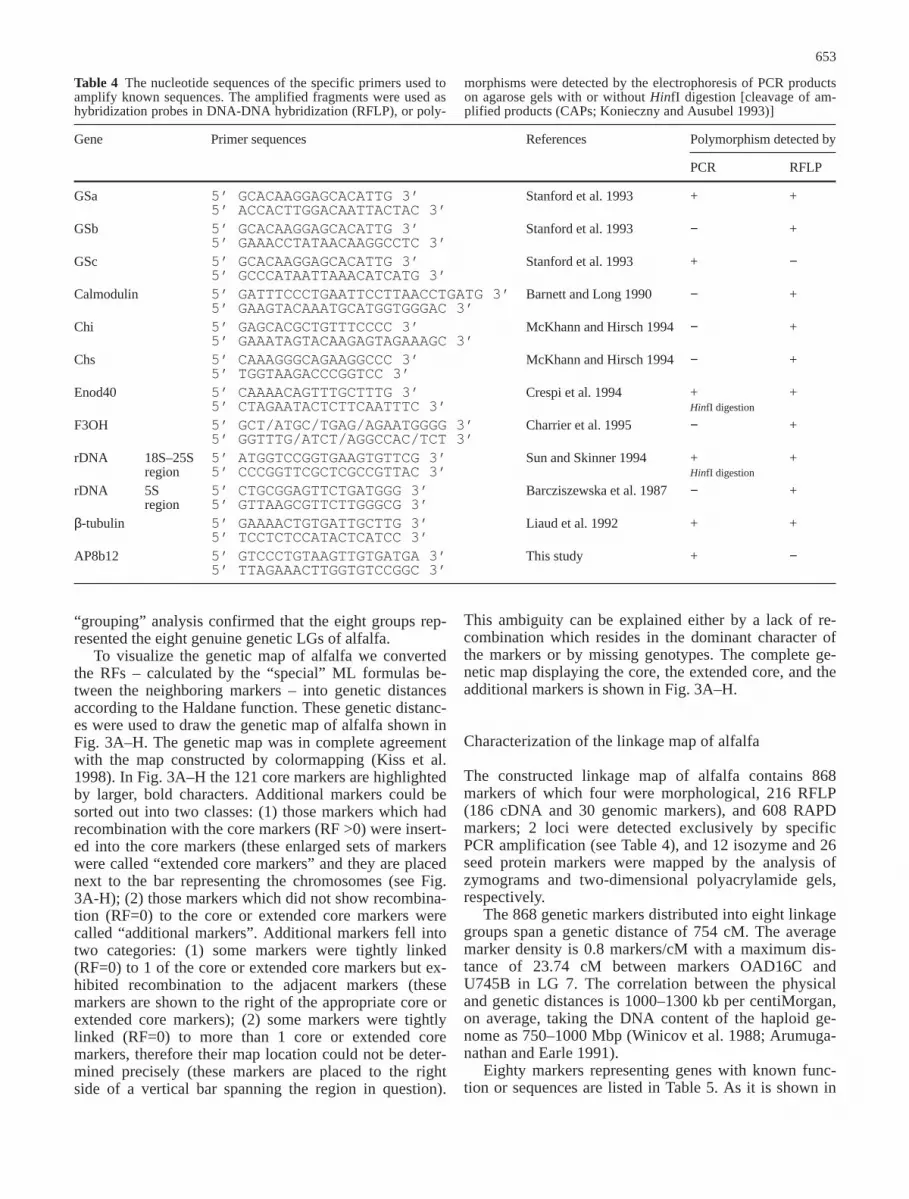
To determine the genotype of RFLP markers, we hybridizedcDNA and genomic probes to restriction enzyme-digested totalDNA of the individuals of the segregation population. cDNAclones with prefixes U and L originated from libraries describedby Brummer et al. (1991) and Györgyey et al. (1991), respectively.W prefixes indicate clones that originated from a genomic librarydescribed by Echt et al. (1994). Clones denoted by CG are genom-ic clones from a PstI library of Medicago sativa cv ‘Nagyszénási’(Kiss et al. 1993). Several genes with known function weremapped by RFLP using specific amplified fragments as probes(Table 4).
The rDNA locus was mapped by dominant evaluation afterHinfI digestion of the amplified 858-bp length region containingthe 5.8S sequence (Table 4) and with RFLP (also with dominantevaluation) using an isolated fragment containing the 17S se-quence of the rDNA unit as a probe (G. Endre, PhD thesis, 1997).
Two previously mapped leghemoglobin loci, LbMs1 andLbMs3 (Kiss et al. 1993), were renamed LbMsI and LbMsII to beconsistent with the nomenclature of leghemoglobin genes (Löblerand Hirsch 1992). Using a cDNA fragment as hybridization probe(Table 5), we identified a third leghemoglobin locus, LbMsIII.
Dominant RFLP markers inherited from either the maternal orpaternal parent are labelled with 5 or 4, respectively, in superscriptafter the marker names in Fig. 3A–H.
Markers detected by PCR using specific primers
To identify specific DNA fragments 16- to 27-base oligonucle-otide primers were synthesized (Biological Research Center,Szeged) for polymerase chain reactions. They are listed in Table 4.
RAPD markers
Random amplified polymorphic DNA (RAPD markers) fragments(Williams et al. 1990) were generated using 203 different 10-base-long oligonucleotide primers. The names of the markers whichwere detected by these primers (purchased from Operon Technolo-gies, Alameda, Calif.) start with O. Other RAPD markers wereproduced with the AP8b (5’-TCGTCACT GA-3’) and AP8e (5’-TGGTGACTGA-3’) primers. Although in most cases the RAPDfragments were dominant, 17 (2.6% of the mapped RAPD mark-ers) of them showed codominant segregation. These markers areindicated with asterisks in Fig. 3A–H. The AP8b12 RAPD frag-ment was sequenced and based on its sequence, 20-base-longprimer-pairs were synthesized (Table 4) and used in specific PCRreactions to detect a sequence-characterized amplified (SCAR)marker (Paran and Michelmore 1993).
Seed protein markers
Seed protein markers (indicated by 2D prefixes) were produced byseparating seed proteins by means of two-dimensional polyacryla-mide gel electrophoresis (K. Felföldi manuscript in preparation).
Data analysis
The genotypes of the loci were scored as numerical characters asdescribed by Kiss et al. (1993). The female and male homozygous
genotypes, the heterozygous, and maternal and paternal dominantgenotypes were marked with 1, 3, 2, 5 and 4, respectively. Missingdata were designated with 0.
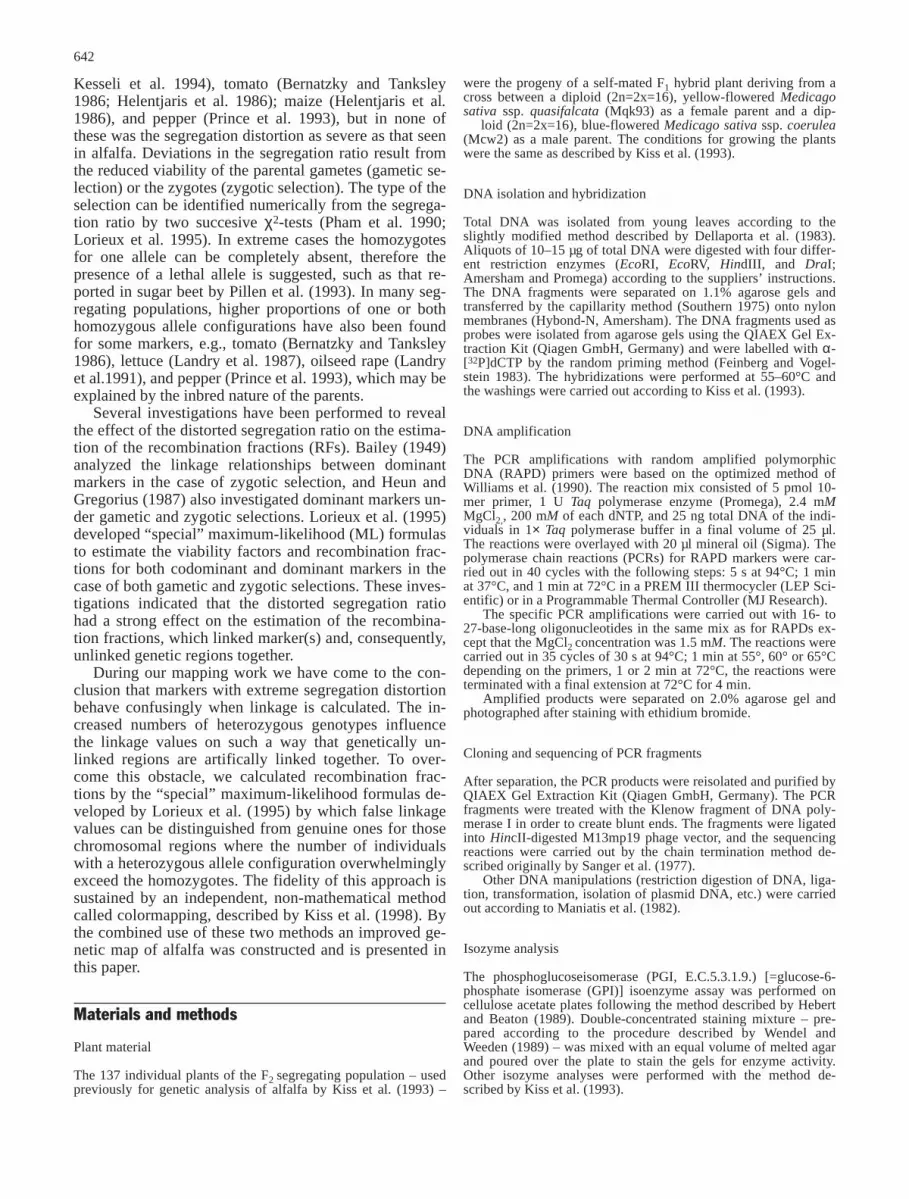
Deviation of the segregation ratio of the core markers from theexpected 1:2:1 ratio were tested by χ2 analysis (Table 1.). The typeof selection acting at a given locus was determined by two succes-sive χ2-tests (Pham et al. 1990); where the first tested the 1:1 ratioof the allelic frequencies (gametic selection), and the second test-ed the random assortment of the alleles according to the p2:2pq:q2
distributions (zygotic selection).The recombination fractions were calculated by two methods:
in one case RFs were calculated by the so-called “classical” maxi-mum-likelihood method using MAPMAKER/EXP 3.0 (Lander et al.1987; Lincoln et al. 1992). In the second case RFs were deter-mined by the recently described “special” formulas by Lorieux etal. (1995) in which segregation distortion is taken into consider-ation. The “special” maximum-likelihood formulas were devel-oped only for those loci which were affected by the same type ofselection or for markers with a normal segregation ratio (Lorieuxet al. 1995). Therefore, the RFs were calculated by the “special”formulas only for the marker pairs under normal-normal, zygotic-normal, zygotic-zygotic, normal-gametic, and gametic-gametic se-lection. In those cases when 2 markers were affected by a differenttype of selection (zygotic-gametic) no RFs could be determinedusing the “special” maximum-likelihood method.
For the determination of the RFs by the “special” maximum-likelihood equations of Lorieux et al. (1995), first the viability val-ues for each marker were determined by comparing the actual seg-regation ratio with the expected ones with no selection. These vi-abilities were then used as parameters in the search for the RFswhich maximized the corresponding log-likelihood functions.First an initial estimate for RF was obtained by a grid search overpossible RF values. Using this initial estimate we computed thetrue maximum iteratively by the Nelder-Mead (simplex) algo-rithm. The programs were written in Matlab (The MathWorks, Na-tick, Mass.). The RFs were converted to map distances accordingto the Haldane function.
Results and discussion
Selection of the core markers and preliminary grouping
A genetic map with eight linkage groups (LGs) had beenconstructed earlier for diploid alfalfa using 89 molecular,isozyme, and morphological markers (Kiss et al. 1993).More genetic markers have been mapped during the last 5years, and as the number of the mapped markers increasedsome showed spurious and ambiguous linkages to the ex-isting eight linkage groups (LGs) using MAPMAKER/EXP
3.0 (Lander et al. 1987; Lincoln et al. 1992) as a mappingprogram. Because of these discrepancies, we have restartedthe construction of the genetic map of alfalfa from the be-ginning. As a first step, 121 so-called core markers wereselected to identify the number of genetic linkage groupsand to establish a frame map. The core markers represent-ed all those codominant markers which showed recombi-nation to each other, that is, only one of those codominantmarkers was included which showed 100% linkage. Co-dominant markers were selected as core markers, sincethey reveal more recombination events than dominantmarkers; consequently, they ensure more reliable linkagedata. The resulting “frame map” was used afterwards tomap more than 700 additional, mostly dominant, markers.
The genetic analysis of the 121 core markers (see Ta-ble 1) was started with the help of the MAPMAKER/EXP
643

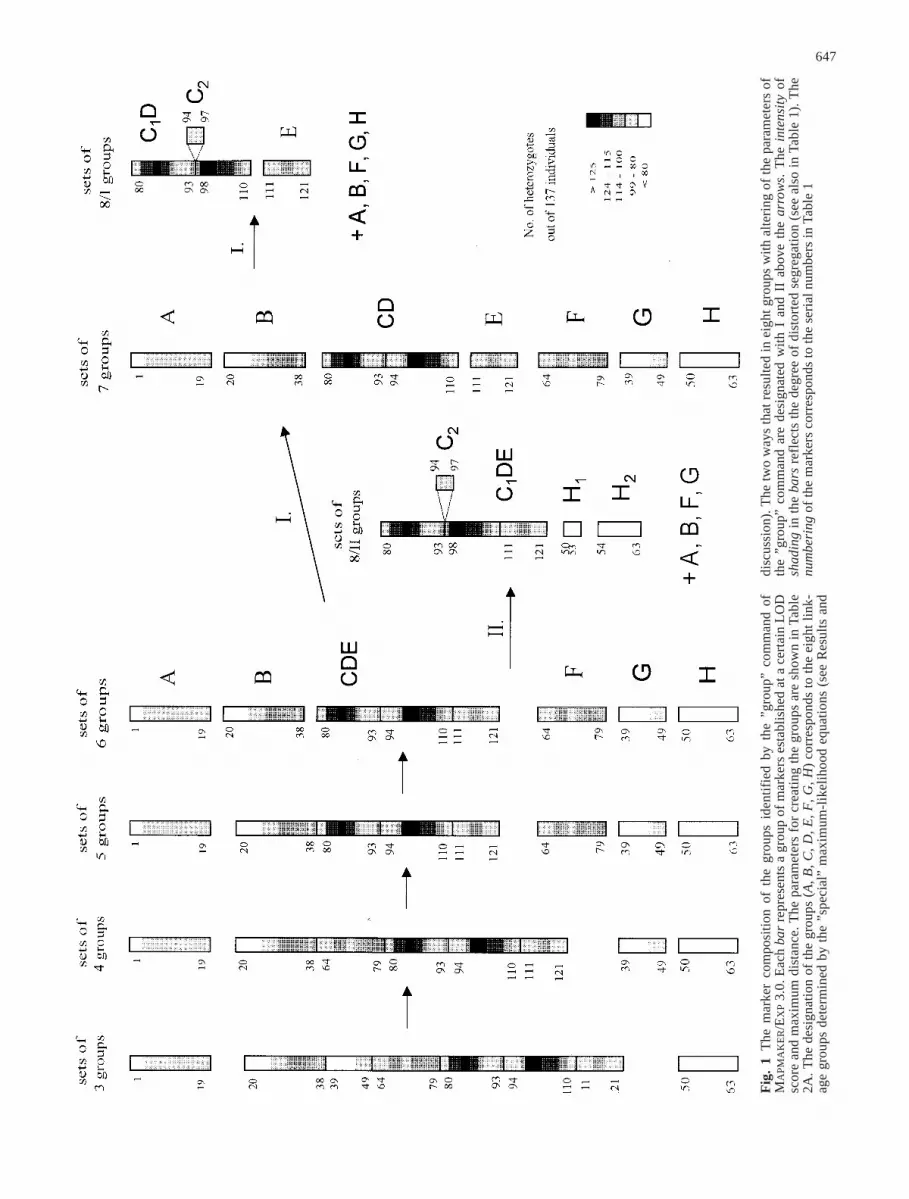
3.0 computer program which was used previously. To tryto establish the number of linkage groups, we performeda “classical” “two-point” or pair-wise linkage analysis ofthe 121 core markers which generated 7260 RFs andLOD scores. These data were then used to identifygroups of the markers by the “group” command of theprogram by altering systematically the LOD scores from3 to 17 and the maximum distances between 10 and40 cM. The number of groups generated by this analysisvaried from 3 to 20 as shown in the matrix of Table 2A.
Since the haploid chromosome number of diploid al-falfa is eight, our attention focussed on those elements ofthe matrix which contained eight groups. Such elementsappeared in two blocks: the first block (Block 8/I) was inthe column of LOD score 13 between 20 and 30 cM
(light-gray area of Table 2A); the second block (Block8/II) was in the row of 15 cM from LOD score 3 to 10(dark-gray area of Table 2A). Block 8/I and Block 8/IIare formed by three (8α–γ) and eight (8a–h) elements ofthe matrix, respectively. The marker compositions of thegroups in each element of Block 8/I were identical, thatis, element 8α was equal to element 8β and 8γ. Similarly,the markers in the groups of any element of Block 8/IIwere identical with the markers of the correspondinggroups in any other element of Block 8/II; that is, ele-ment 8a was equal to element 8b, 8c 8d, 8e, 8f, 8g, and 8h,respectively. Comparing the eight groups of the elementsin Block 8/I and Block 8/II showed that the marker con-stitution of some groups in the elements of Block 8/I andBlock 8/II were identical, but some were different (see
644
Table 1 The observed segregation ratio of the 121 core markers.The markers are aligned according to their established order in thelinkage groups (see Results and discussion). The LG 1, LG 2, LG3, LG 4, LG 5, LG 6, LG 7, and LG 8 correspond to groups A, B,
G, H, F, C, D and E in Fig. 1, respectively. The genotypes are asfollows: a1a1, maternal homozygotes; a1a2, heterozygotes; a2a2,paternal homozygotes
LG 1 (group A) LG 2 (group B)
Serial Name of Segregation ratio χ2zyg
a χ2gam
b χ2segrc Serial Name of Segregation ratio χ2
zyga χ2
gamb χ2
segrc
number the locus a1a1:a1a2:a2a2 number the locus a1a1:a1a2:a2a2
1 AAT2 24:74:39 1.20 3.28 4.17 20 U212D 28:47:42 4.00 3.35 7.872 LbMsII 23:65:37 0.35 3.14 3.34 21 EST3 23:50:43 1.44 6.90 9.103 U237 22:61:37 0.44 2.09 2.40 22 AP8B12 23:68:46 0.06 7.72 7.734 U80 24:61:33 0.19 1.37 1.51 23 U73 23:68:45 0.10 7.12 7.125 W151 25:66:30 1.04 0.41 1.41 24 U68A 20:66:40 0.70 6.35 6.636 U779 28:82:27 5.32 0.01 5.34 25 PRX 20:77:40 3.02 5.84 7.957 CG5 28:79:25 5.15 0.14 5.26 26 L591 15:81:32 10.64 4.52 13.55*8 CG8 28:81:23 6.92 0.38 7.20 27 W170 12:58:35 2.70 10.08* 11.239 CG1 32:74:20 4.33 2.29 6.13 28 U107 10:75:35 11.29 10.42* 17.92*
10 U502 35:71:20 2.58 3.57 5.60 29 U212A 7:87:34 22.87* 11.39* 27.92*11 Med1 30:80:21 6.76 1.24 7.66 30 U305 4:87:26 34.33* 8.27 36.04*12 Enod2 28:82:21 8.55 0.75 9.06 31 L408BD 3:109:24 56.07* 6.49 55.93*13 OQ5B 29:74:22 4.41 0.78 5.02 32 NOD22A 11:96:19 35.39* 1.02 35.59*14 L234 29:82:19 9.41 1.54 10.43 33 PEPC 11:99:21 35.46* 1.53 35.79*15 NOD14 32:78:20 5.75 2.22 7.42 34 U599 12:81:21 21.08* 1.42 21.63*16 L391 32:86:19 9.76 2.47 11.41* 35 CG6 16:95:18 28.89* 0.06 28.91*17 CAD5A 31:79:15 10.16 4.10 12.81* 36 U189A 17:84:19 19.24* 0.07 19.27*18 L56 32:89:16 13.79* 3.74 16.01* 37 CAD5B 17:87:21 19.35* 0.26 19.46*19 Chi 32:86:17 11.35* 3.33 13.47* 38 L295 18:94:19 24.81* 0.02 24.82*
LG 3 (group G) LG 4 (group H)
Serial Name of Segregation ratio χ2zyg
a χ2gam
b χ2segr
c Serial Name of Segregation ratio χ2zyg
a χ2gam
b χ2segr
c
number the locus a1a1:a1a2:a2a2 number the locus a1a1:a1a2:a2a2
39 U515A 29:45:44 6.13 2.6 9.51 50 NOD22B 40:63:24 0.01 4.03 4.0440 L313 29:47:45 5.47 3.4 9.26 51 L408AC 45:68:24 0.04 6.44 6.4541 U28 30:66:44 0.35 2.6 2.51 52 β−tubulin 48:58:23 0.56 9.69* 11.0042 LAP2 27:69:41 0.04 2.6 2.87 53 NOD1G 46:61:22 0.05 8.93 9.3143 CG11 26:71:40 0.31 2.6 3.04 54 U466 47:68:18 0.72 12.65* 12.71*44 OD3E 25:78:34 2.83 1.8 3.82 55 U131 48:63:19 0.05 12.94* 13.06*45 U587 24:63:35 0.21 1.8 2.11 56 W157A 49:58:19 0.07 14.29* 15.08*46 GSb 25:60:35 0.01 1.7 1.67 57 L23 54:70:13 2.05 24.54* 24.61*47 OR5I 26:77:31 3.05 0.7 3.36 58 OA17A 55:67:11 2.29 29.11* 29.12*48 NMs25 23:80:27 6.99 0.5 7.17 59 SKDH1 47:78:12 6.52 17.88* 20.52*49 LAP1 23:89:25 12.29* 0.6 12.33* 60 U84 45:68:14 2.44 15.13* 15.77*
61 OQ3B 45:73:14 3.84 14.56* 16.05*62 U40A 44:78:15 5.06 12.28* 14.91*63 U68B 44:73:14 4.07 13.74* 15.46*
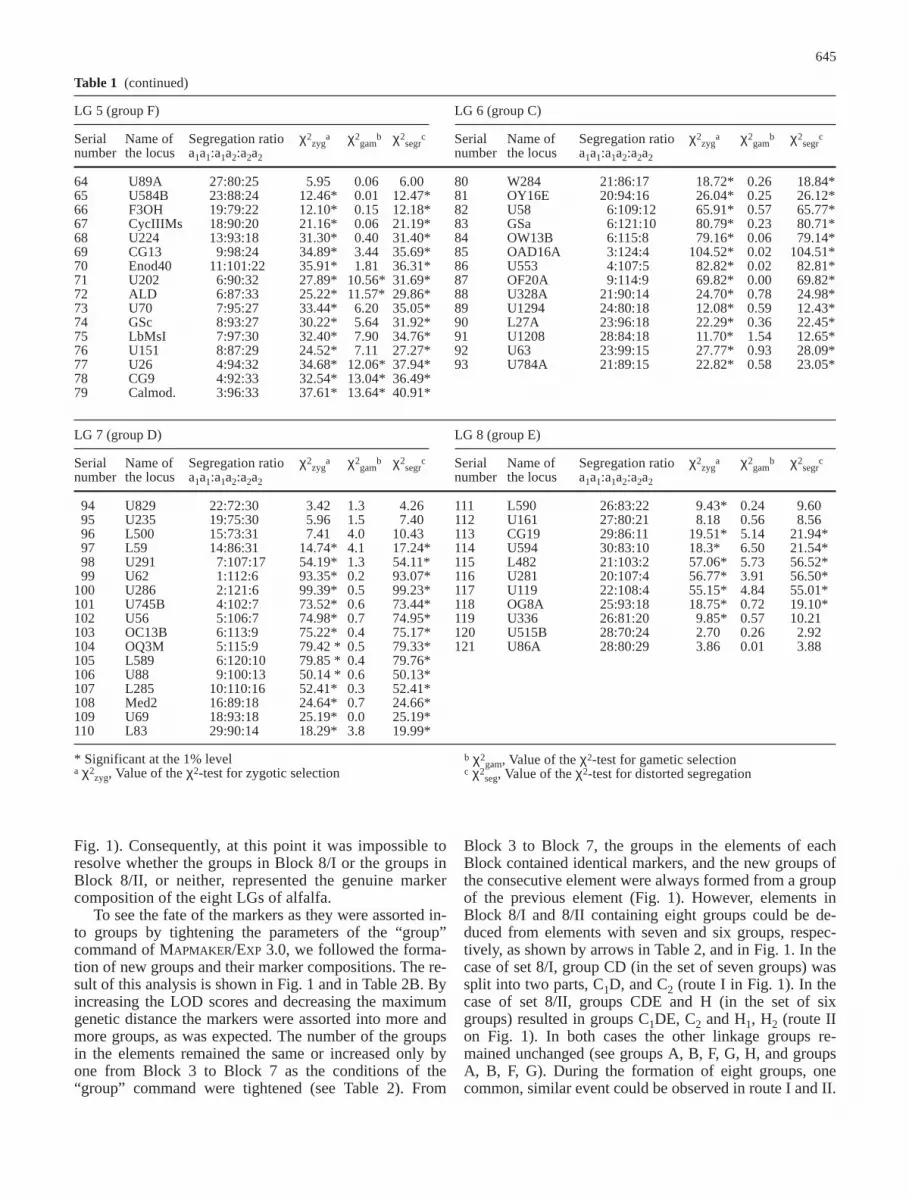
Fig. 1). Consequently, at this point it was impossible toresolve whether the groups in Block 8/I or the groups inBlock 8/II, or neither, represented the genuine markercomposition of the eight LGs of alfalfa.
To see the fate of the markers as they were assorted in-to groups by tightening the parameters of the “group”command of MAPMAKER/EXP 3.0, we followed the forma-tion of new groups and their marker compositions. The re-sult of this analysis is shown in Fig. 1 and in Table 2B. Byincreasing the LOD scores and decreasing the maximumgenetic distance the markers were assorted into more andmore groups, as was expected. The number of the groupsin the elements remained the same or increased only byone from Block 3 to Block 7 as the conditions of the“group” command were tightened (see Table 2). From
Block 3 to Block 7, the groups in the elements of eachBlock contained identical markers, and the new groups ofthe consecutive element were always formed from a groupof the previous element (Fig. 1). However, elements inBlock 8/I and 8/II containing eight groups could be de-duced from elements with seven and six groups, respec-tively, as shown by arrows in Table 2, and in Fig. 1. In thecase of set 8/I, group CD (in the set of seven groups) wassplit into two parts, C1D, and C2 (route I in Fig. 1). In thecase of set 8/II, groups CDE and H (in the set of sixgroups) resulted in groups C1DE, C2 and H1, H2 (route IIon Fig. 1). In both cases the other linkage groups re-mained unchanged (see groups A, B, F, G, H, and groupsA, B, F, G). During the formation of eight groups, onecommon, similar event could be observed in route I and II.
645
LG 5 (group F) LG 6 (group C)
Serial Name of Segregation ratio χ2zyg
a χ2gam
b χ2segr
c Serial Name of Segregation ratio χ2zyg
a χ2gam
b χ2segr
c
number the locus a1a1:a1a2:a2a2 number the locus a1a1:a1a2:a2a2
64 U89A 27:80:25 5.95 0.06 6.00 80 W284 21:86:17 18.72* 0.26 18.84*65 U584B 23:88:24 12.46* 0.01 12.47* 81 OY16E 20:94:16 26.04* 0.25 26.12*66 F3OH 19:79:22 12.10* 0.15 12.18* 82 U58 6:109:12 65.91* 0.57 65.77*67 CycIIIMs 18:90:20 21.16* 0.06 21.19* 83 GSa 6:121:10 80.79* 0.23 80.71*68 U224 13:93:18 31.30* 0.40 31.40* 84 OW13B 6:115:8 79.16* 0.06 79.14*69 CG13 9:98:24 34.89* 3.44 35.69* 85 OAD16A 3:124:4 104.52* 0.02 104.51*70 Enod40 11:101:22 35.91* 1.81 36.31* 86 U553 4:107:5 82.82* 0.02 82.81*71 U202 6:90:32 27.89* 10.56* 31.69* 87 OF20A 9:114:9 69.82* 0.00 69.82*72 ALD 6:87:33 25.22* 11.57* 29.86* 88 U328A 21:90:14 24.70* 0.78 24.98*73 U70 7:95:27 33.44* 6.20 35.05* 89 U1294 24:80:18 12.08* 0.59 12.43*74 GSc 8:93:27 30.22* 5.64 31.92* 90 L27A 23:96:18 22.29* 0.36 22.45*75 LbMsI 7:97:30 32.40* 7.90 34.76* 91 U1208 28:84:18 11.70* 1.54 12.65*76 U151 8:87:29 24.52* 7.11 27.27* 92 U63 23:99:15 27.77* 0.93 28.09*77 U26 4:94:32 34.68* 12.06* 37.94* 93 U784A 21:89:15 22.82* 0.58 23.05*78 CG9 4:92:33 32.54* 13.04* 36.49*79 Calmod. 3:96:33 37.61* 13.64* 40.91*
LG 7 (group D) LG 8 (group E)
Serial Name of Segregation ratio χ2zyg
a χ2gam
b χ2segr
c Serial Name of Segregation ratio χ2zyg
a χ2gam
b χ2segr
c
number the locus a1a1:a1a2:a2a2 number the locus a1a1:a1a2:a2a2
94 U829 22:72:30 3.42 1.3 4.26 111 L590 26:83:22 9.43* 0.24 9.6095 U235 19:75:30 5.96 1.5 7.40 112 U161 27:80:21 8.18 0.56 8.5696 L500 15:73:31 7.41 4.0 10.43 113 CG19 29:86:11 19.51* 5.14 21.94*97 L59 14:86:31 14.74* 4.1 17.24* 114 U594 30:83:10 18.3* 6.50 21.54*98 U291 7:107:17 54.19* 1.3 54.11* 115 L482 21:103:2 57.06* 5.73 56.52*99 U62 1:112:6 93.35* 0.2 93.07* 116 U281 20:107:4 56.77* 3.91 56.50*
100 U286 2:121:6 99.39* 0.5 99.23* 117 U119 22:108:4 55.15* 4.84 55.01*101 U745B 4:102:7 73.52* 0.6 73.44* 118 OG8A 25:93:18 18.75* 0.72 19.10*102 U56 5:106:7 74.98* 0.7 74.95* 119 U336 26:81:20 9.85* 0.57 10.21103 OC13B 6:113:9 75.22* 0.4 75.17* 120 U515B 28:70:24 2.70 0.26 2.92104 OQ3M 5:115:9 79.42 * 0.5 79.33* 121 U86A 28:80:29 3.86 0.01 3.88105 L589 6:120:10 79.85 * 0.4 79.76*106 U88 9:100:13 50.14 * 0.6 50.13*107 L285 10:110:16 52.41* 0.3 52.41*108 Med2 16:89:18 24.64* 0.7 24.66*109 U69 18:93:18 25.19* 0.0 25.19*110 L83 29:90:14 18.29* 3.8 19.99*
Table 1 (continued)
* Significant at the 1% levela χ2
zyg, Value of the χ2-test for zygotic selectionb χ2
gam, Value of the χ2-test for gametic selectionc χ2
seg, Value of the χ2-test for distorted segregation
In both cases group C2 was separated from group CD orCDE, respectively, without the disjunction of group C1Dor C1DE (the group C1DE was split into group C1D andgroup E at a LOD score of 11, 12, and 13 at 15 cM, butgroup C1D remained in its entirety).
Subsequent genetic mapping revealed that unambigu-ous marker order could be established for groups A, B,E, F, G, and H, but under no circumstances could themarker order for groups C1DE or C1D be determinedwith MAPMAKER/EXP 3.0 or with any other mapping pro-grams. This is surprising since markers in group C1D be-haved as they would have belonged to one group be-cause they remained together even at a very high thresh-old using the “group” command (LOD 15, maximumdistance 20 cM). The inconsistency between the failureto set the gene order and the apparent one-group attributemust reside in the nature of the markers in group C1D.
The influence of segregation distortion on linkage
As the core markers were sorted into groups by the“group” command, we realized that most of the markerswith severe distorted segregation ratios accumulated ingroups C1DE or C1D (see black regions in Fig. 1). We
therefore suspected that markers displaying extreme dis-torted segregation may be responsible for the failure ofproper grouping and setting the gene order in groupsC1D or C1DE.
As it can be seen in Fig. 1 and is documented by num-bers in Table 1, many of the core markers showed signifi-cant deviations from the expected 1:2:1 segregation ratio.Most of these distortions were the consequences of zygot-ic selections (individuals with heterozygous configurationwere dominating in the mapping population). Only someof the markers in group H were of gametic selection. Themost extreme zygotic selection was detected for themarkers in group CDE (Fig. 1), where nearly all of themarkers displayed distorted segregation with an over-whelming number of heterozygous genotypes.
It was demonstrated earlier (Lorieux et al. 1995) that inthe case of zygotic selection the calculation of RF valuesby the “classical” maximum likelihood (ML) estimation(Allard 1956) resulted in significantly lower RFs if the vi-ability (number) of the individuals with heterozygous con-figuration exceeded by tenfold the viability of the individ-uals with homozygous configuration. It is demonstrated inFig. 1 that such an extreme distortion occurred only ingroup CDE. The lower RF values calculated by the “clas-sical” maximum likelihood estimation were supposed to
646
Table 2. A Formation of groups established by the ”group” com-mand of the MAPMAKER/EXP 3.0 program. To establish linkagegroups of the markers we altered the LOD scores and maximumdistances [in centiMorgans (cM) by Haldane function) step bystep. The eight groups which formed at different parameters are
shaded in light and dark gray (Block 8/I and Block 8/II). Thesmall arrows indicate the development of the groups from the pre-vious ones. B The simplified schema of the formation of thegroups shown in part A
647
Fig
. 1
The
mar
ker
com
posi
tion
of
the
grou
ps i
dent
ifie
d by
the
”gr
oup”
com
man
d of
MA
PM
AK
ER
/EX
P3.
0. E
ach
bar
repr
esen
ts a
gro
up o
f m
arke
rs e
stab
lish
ed a
t a c
erta
in L
OD
scor
e an
d m
axim
um d
ista
nce.
The
par
amet
ers
for
crea
ting
the
gro
ups
are
show
n in
Tab
le2A
. The
des
igna
tion
of
the
grou
ps (
A, B
, C, D
,E, F
, G, H
) co
rres
pond
s to
the
eig
ht l
ink-
age
grou
ps d
eter
min
ed b
y th
e ”s
peci
al”
max
imum
-lik
elih
ood
equa
tion
s (s
ee R
esul
ts a
nd
disc
ussi
on).
The
two
way
s th
at r
esul
ted
in e
ight
gro
ups
wit
h al
teri
ng o
f th
e pa
ram
eter
s of
the
”gro
up”
com
man
d ar
e de
sign
ated
wit
h I
and
II a
bove
the
arr
ows.
The
int
ensi
tyof
shad
ing
in t
he b
ars
refl
ects
the
deg
ree
of d
isto
rted
seg
rega
tion
(se
e al
so i
n Ta
ble
1). T
henu
mbe
ring
of th
e m
arke
rs c
orre
spon
ds to
the
seri
al n
umbe
rs in
Tab
le 1
648
Tab
le 3
The
cal
cula
ted
link
age
valu
es o
f th
e co
re m
arke
rs i
n gr
oup
CD
E (
see
Fig
. 1)
.T
he r
ecom
bina
tion
fra
ctio
ns (
RF
s; u
pper
fig
ures
) w
ith
the
pert
aini
ng L
OD
sco
res
(bot
-to
m f
igur
es)
calc
ulat
ed b
y th
e M
AP
MA
KE
R/E
XP
3.0
prog
ram
are
pre
sent
ed in
the
uppe
r tr
i-an
gle
of t
he L
OD
tab
les.
RF
s m
ore
than
0.3
and
LO
D s
core
s le
ss t
han
3 ar
e no
t sh
own
(dou
ble
dash
es).
RF
s ge
nera
ted
by t
he “
spec
ial”
max
imum
-lik
elih
ood
form
ula
deve
lope
dby
Lor
ieux
et
al.
(199
5) f
or z
ygot
ic s
elec
tion
are
lis
ted
in t
he l
ower
lef
t tr
iang
le,
RF
sm
ore
than
0.3
are
als
o no
t sh
own.
The
mar
kers
are
lis
ted
acco
rdin
g to
the
det
erm
ined
or-
der
of th
e m
arke
rs (
see
Res
ults
and
dis
cuss
ion)

649
Fig
. 2.
Col
orm
appi
ng o
f m
arke
rs (
Kis
s et
al.
1998
) sh
owin
g th
e m
ost
extr
eme
dist
orte
dse
greg
atio
n ra
tio.
The
col
ors
in t
he m
atri
x di
spla
ys t
he g
enot
ypes
of
the
core
mar
kers
in
LG
6 a
nd L
G 7
of
the
map
ping
pop
ulat
ion
cons
isti
ng o
f 13
7 in
divi
dual
s. T
he y
ello
w,
gree
n, a
nd p
urpl
eco
lors
rep
rese
nt t
he m
ater
nal
hom
ozyg
ous,
het
eroz
ygou
s, a
nd p
ater
nal
hom
ozyg
ous
geno
type
s, r
espe
ctiv
ely.
The
num
bers
at
the
top
of t
he m
atri
x ar
e th
e se
rial
num
bers
of
the
indi
vidu
als
in t
he p
opul
atio
n. T
he v
alue
s to
the
rig
htof
the
col
orm
ap r
e-pr
esen
t th
e nu
mbe
r of
the
ind
ivid
uals
wit
h th
e sa
me
hom
ozyg
ous
geno
type
s be
twee
n th
em
arke
rs (
”hom
ozyg
ous
link
s”).
The
int
erpr
etat
ion
of t
his
figu
re i
s de
scri
bed
in t
he R
e-su
lts
and
disc
ussi
on s
ecti
on
cross-link markers which otherwise would belong to dif-ferent linkage groups and, thus, proper grouping and geneorder determination has been baffled.
Establishment of the eight linkage groups
In order to compare the linkage relation between markersin group CDE, we calculated RF values by the “classi-
650
6265
60595858575654
53.5
50
464442
3937
31
26
23
29
2018
15
131286532
14
17
25
10
cM
Chi
L56CAD5A
L391NOD14L234
OQ5B*ENOD2
MED1
U502
CG1
CG8
CG5U779
W151U80
U237
AAT2LbMsII
OC15C
OC7KAP8e1, OAF15E
OH5A
OB20D, OD18E, OR16A
AP8b2, OL20A, OAG5B
U181, CHMT1, OA12C, OB9B
U163, U85, OB8C
OB4F, OB6H, OD18B, OAF6E
OA8G, OB14F, OI7A
Chs-A U52B
OL19E2D45-46, U457B
EST2
OB13DOW13D NOD6G
2D14-16L280 OD11B, OT20B
OAG11B U212B , SKDH2, OP16H5
XantENOD8, Msk-1
OAG2C
OR5G
CD32A, CD40
OC7C
OR5B
U96, OB1F, OC1C, OC15COA7F, OD8M, OE7C, OE12EOQ3H, OU18C, OW13A
OAC4A
OA6B, OA19B, OD18DOP16J, OV12F
TRS1 , W44, 0B6B, OS12A4
OE12K, ON12F
OA8H OA7E, OZ6C, OAA12C
OR5A OB11F, OG5D, OR12AGogat, 2D43-44
ANT
OB5B, OC9C*, OG11C, OL8A
DFR, U742A
LG 1
A
B
0
104107
103102100999695
89
86
68
50
41
36343232302926232119171511
765
1098
2
cM
U212DEST3
L408BD
NOD22A
PEPCU599
L295CAD5BU189ACG6
U305
U212AU107W170
L591
PRXU68A
U73AP8b12OA2E
OAB19EU212C
OD20D
OA7HOA14AOF20G
OH7C
AP8b6L27B
5OA11FOA18B
U52A
OB4A
OD13C
LG 2
U65
U4524
OC7E, OF20H
W157, OP16L, OQ5KOT9C, OW13E
W169
OX17C
U86B, TMs6 , OB17F, OI11C*OD20L, OL6B, OP6A
4
Cdc2A
OA10C, OA11C, OA17L, OB10AOD20K, OJ5B, OK16B, ON16DOQ4F, OX17F, OY18B
OQ3G
OAF19C
OA2D, OAH18BOB8D, OE4A, OP16I
OA7K, OA14D, OA14E, OA17EOC9E, OD2E, OD12C, OH5DOK16C, OR1E, OY19A, OY16BOAD16D, OAF6C, OAG2H,
OA16C, OD18F, OH20BON10B, OP16G
U157A, U246, Wip, TMs7-8OB10D, OB18A, OD10B, OT6B
OD8E
Dwarf, MNR1
MsRab1, U40B4
C
0
54
1
24
60
64
5957
54
4645
423837333231
22
2528
201816
1286
3
cM
U515AL313
ENOD125
LAP1
NMs25
NOD32/34OR5I*
GSb
U587OD3E*
CG11LAP2U28
OA12BAP8e4OC13E
OG9HOAG2E
AP8b7OAF6D
OA7LOE12COI10A
OA8D
OD8D
OB4I
OG17C
OG11B
U72, U601, OA18E,OK18D, OQ3K, OAD10B, OAF19E
LG 3
TMs15
U83, OAF14F, OAG5A
U671
ENOD10 OC13A, OD13/1, OJ10D, OQ12DOR1F, OT9A, OAG11C
U457A, OA17M, OB12C, OB14D. OC9AOC9F, OL4F, OL18B, OR5F, OX11C, OAE1A
OB14H, OD5B, OD13L, OJ10B, OU18B, OAF15D
OD18C, OJ20E, OAH15D
OC15A, OC19D, OD4A, OD15A, OD20G, OE7E, OK19AOS3A, OS12B, OT15E, OU8E, OX9B, OX11D, OAG5F
OA10, OA16B, OB3B, OD8K, OK4D
CD32B, U449B, L276, OA6C, OB5E, 0B14EOC7A, OD7C, OD8A, OM15C, OP19B, OS8AOY16C, OAD16E
AAT1, OB7B, OD8L, OD12A, OD20C, OF1EOL7B, ON16C, OQ4D, OR4B, OR5H
D
60
56
5348474543424140
383534
39
6667
656463
32
21
1814121110985
10
cM
U68BU40A
OQ3B*U84SKDH1
OA17A*
L23
W157AU131U466
NOD1G
b -tubulin
L408AC
NOD22B
OQ4EU36B, U53, U93, 5S rDNA, OB20G, OD10AOD13B, OI10E, OQ5G, OT20C, OY14D
2D47-48
W275, OB2A, OD13K, OK6A
U225
Mtst1, Annexin, U584A , Msk-2, OA8A, OB4D, OB4Q, OC7OOL20B, OO16E, OR5B, OR18B, OU10A, OU14A, OAG11F
5
Cdc2B, EST1, MMK1, 2D36-39, 2D38-40, OD3C, OG11DOG17E, OJ11C, OK8A, OM2E, OR6C, OR17B, OAB11A, OAE7E*
OB13C
OC15DOB8A*
OF20F OB18B, OY4B, OL4D
OK10CU760 OA1D, OA8F, OB12D, OB16A, OD15K, OE12L, OG17BOD7BOA12A2D80-81OG8B
OA8B, OA19A, OF5A, OG5A, OM2B, OO15A, OQ3FOY17A, OAC7D, OAD10C, OAD11B, OAF6B, OAG5C
OU8H2D76, 2D77, OB4C, OB14G, OB20E, OD6AOD19A, OY7H, OAB11B
AP8e5
U44, U782, OC2A, OE7D, OI17A, OQ3A, OS7A
OB15AU157B
4
OL8B
OC4A
LG 4
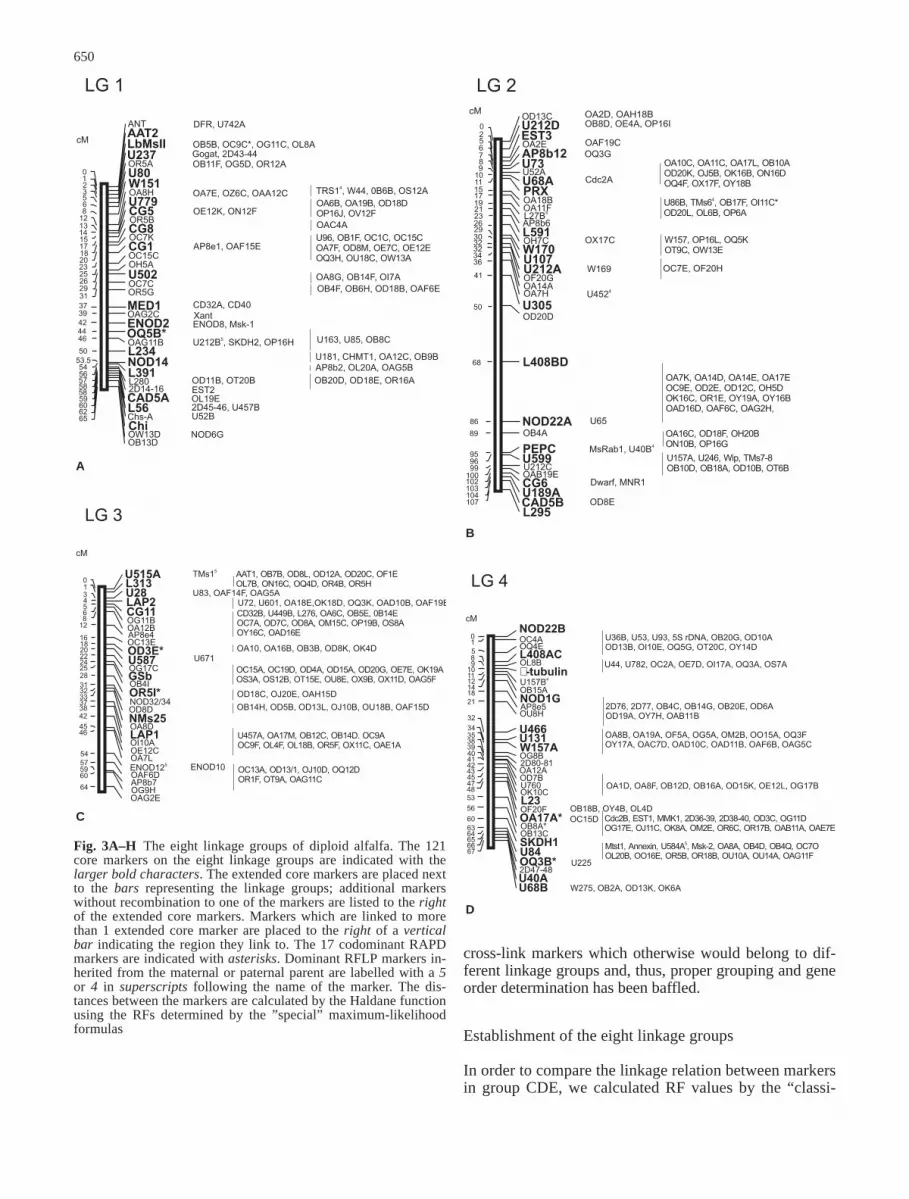
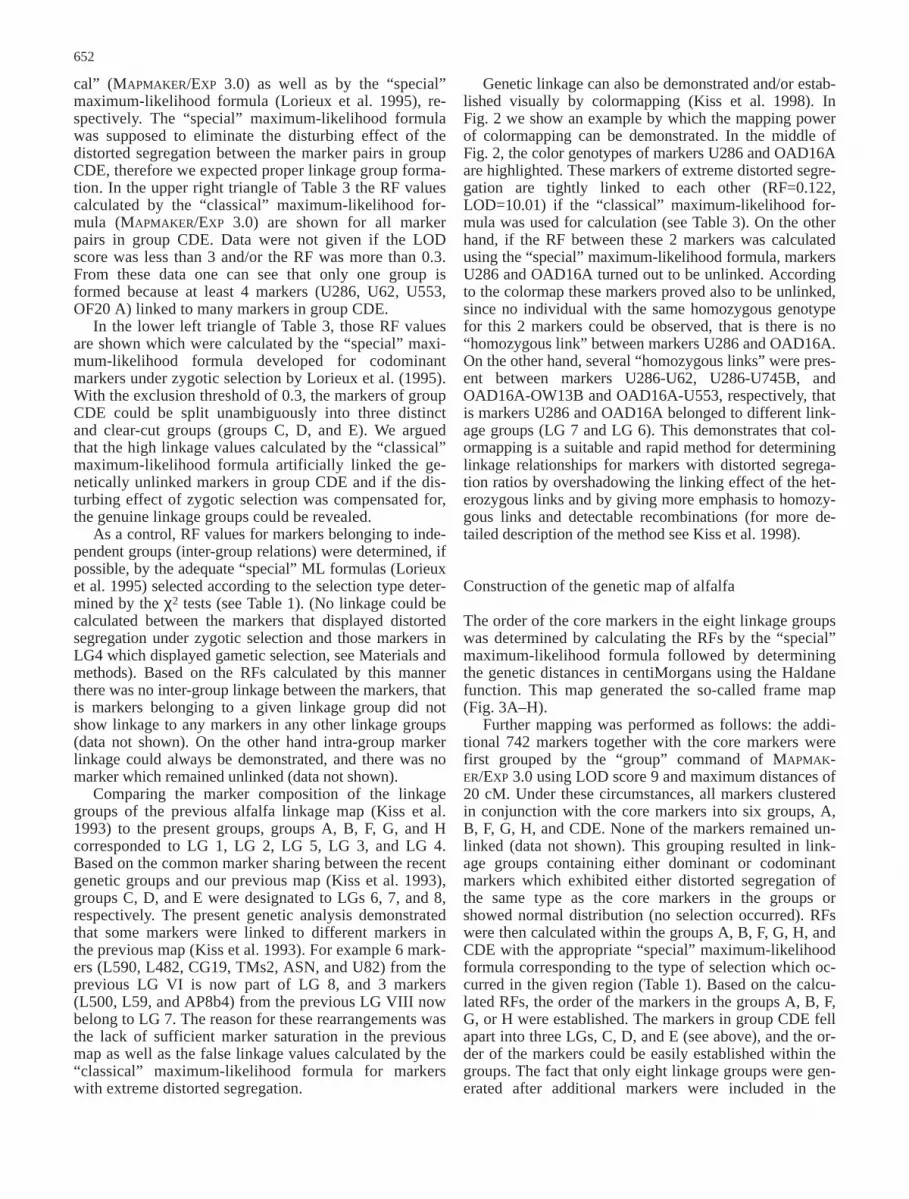
Fig. 3A–H The eight linkage groups of diploid alfalfa. The 121core markers on the eight linkage groups are indicated with thelarger bold characters. The extended core markers are placed nextto the bars representing the linkage groups; additional markerswithout recombination to one of the markers are listed to the rightof the extended core markers. Markers which are linked to morethan 1 extended core marker are placed to the right of a verticalbar indicating the region they link to. The 17 codominant RAPDmarkers are indicated with asterisks. Dominant RFLP markers in-herited from the maternal or paternal parent are labelled with a 5or 4 in superscripts following the name of the marker. The dis-tances between the markers are calculated by the Haldane functionusing the RFs determined by the ”special” maximum-likelihoodformulas

E
0
20
13
54
63
72
75
686764
616059
484641
39.539383736
322927
1211
86531
U89AOB6E
LG 5
cM
Chs-KL, U149, OL19COH18B, OAG4C, OAG10C
OA17C
OP16KU584BOQ3DOC7IF3OHCycIIIMsU224OQ5E
OQ5A
OL20E
AP8b3OG9D
CG13
U202ALD
U70GScLbMsIU151
CalmodulinCG9U26
U36A5
ENOD40
W35OX11B
OD3GOA17B
U540
2D27-28U122
2D2-3
OD16A
U121A, ENOD52D30-31, 2D49-50, 2D64-65
U9, U477, U602
2D51
OQ4G, OT15D
LbMsIII, OB1D, OB4K, OB7A, OB9A, OB13AOD5A, OD16E, OE4D, OE8F, OF2B, OG9GOO16B, OP16D, OQ12A, OR13D, OAA10COAA12A, OAF15B, OAG2A, OAG10E
U492, OAG5E
U71, OA18G, OD13Z, OQ5E, OV14A
F
11
0
119120
118
113110109108
104103
99979593
848381797674737271
70.5
67
56
51
4342403736343328272624222120
1412.5
cM
W284
OY16E*
U784AU63
U1208
L27A
U1294
U328A
OF20A*
U553OAD16A*
OW13B*
GSaU58
OAG2F
OA2C
OJ10A
2D1ABOL19A
OU8G
OE3A
OM6BPGI1
OL6AOG17A
OK10AOI9A
OE12AOJ20AOG9ArDNA
OP14BOR12BOI10FOO16A
OQ4A
U55
OD15E1OAG6B
OK18C
OC15BOL19F
U584C4
OB6C
OL20C
OB11A, OD13H, OG11A, OJ5A, OK16A, OM2C, ON5A, ON16AOQ3E, OR17C, OS13A, OS16B, OV2C, OV3A, OX2A, OY7BOY16A, OY18E, OAB18B, OAD11D, OAE1C, OAF2A, OAF15AOAG2G, OAH15C
OA6A, OB4B, OB11D, OC8A, OE4B, OH7A, OK4BOL6C, OO16H, OU18A, OY17B, OV1A, OV12BOAA12B, OAB19B, OAE1B, OAE7D, OAG11D, OAH15A
OB3A, OP16B, OX2B, OAH18A
OD8B, OF1B, OG17B
W106, OB17L, OF20C, OL4A, OL11A, OP2A, OP11A, OP14AOP16C, OP19C, OQ5C, OR5E, OR13A, OT20A, OU8C, OU10BOV2A, OX17A, OY18C, OAB18A, OAD8A, OAG6A, OAG11AOAF19D, OAH10A, OAH16A
Stl
U482AOJ20B, OL20D, OM6B, OAG2B, OR12C
OD3D, OD13X, OAF15F, OAG4A, OU8F
U522A, U564, U745C , TMs3 , 2D42, OB17E, OB20A, OG9COL4C, OM15B, OQ12C, OT1A, OX9A, OX14A, OAA10B, OAF8A
5 4
OG9F, OT19C
LG 6
G
L59
L500
U829U235
U291
OF20E, OQ5F
U380, U393, U328B, U522BD, U584D , 2D69, OC1AOC7D, OD1A, ON10A, ON13A, OP19A, OR6BOR16C, OT9E, OV14B, OAA8B, OAF6A, OAG4F
5
Chs-B
OA8C, OA16D, OA20BOL4E, OP3D, OAG11G
U94A, U906, OK20AOO16G, OAB19D, OAF15C
U62
U56U745B
OC13B*OQ3M*
U88CD43BL589
Med2
U69
U744, W245
OAH11A, OAC7C
OU8A, OU19B, OY19B
VR
Ati18
TRS22D29, 2D52
4
CD43A
Msk-3
U34, OR3C, OS16AU745A, OC4B
OH7B, OO16F
OS8B, OV12E, OX17E, OAG4B
OC19A, OD13F, OEX7HOE12F, OF20I, OQ5DOX17D, OY14D
L83
L285
LG 7
OP16A2 OB4E
OPQ4C
OD13A
OB2B
OA14GOE12GOG17BOK10BOL19BAP8b4
OF1COH7E
U286
OAD16C
OAD11A
U1130OD11A
OH17BOB1A
OC7G
OG8DOAC7A
0
8
cM
161920
24
26
30
37383940414245
5760
65
75
90
147150
146144141139137134132130129127124123122121119117114
H
L590U161
CG19U594
L482
U281
U119
OG8A*
U336
U515BU86A
U67
Ubcp
OAF20A, OD2F, 2D10-11, 2D53-542D70-71, TMs2 , OB12D, OD12FOK19E, OV2B, OY4A, 2D55-56
4
OC13F, OD7A, OD16F, OK4E, OZ6A*OAC7B, OAF6F
U82, W36, OA18FOB12E, OC8B, OD5COH8B, OAB19A, OAH10C
OA7A, OB5C, OD8H, ON16BOX17B, OAC7E, OAD11C, OAG5D
W135, OD8G, OI10BOV12H, OW13F, OY19D
MMK2, U141OM15A, OY18A
U182, OC19C, ON20AOAG2D, OAG4D
LG 8
3
6.5
111314
22
30
4748
65
103105
102
98
95
90
85848180
6966
495152
39
27
910
7
5
0
cM
OG5C
OI10DOO16DOD2CASNU505
OA20AOB6D
OG8C
OF20D
OE12DOA8E
OC13DOU8DOL19G
OC19BOB11EOD20E
OD3A
OD7DOC19C
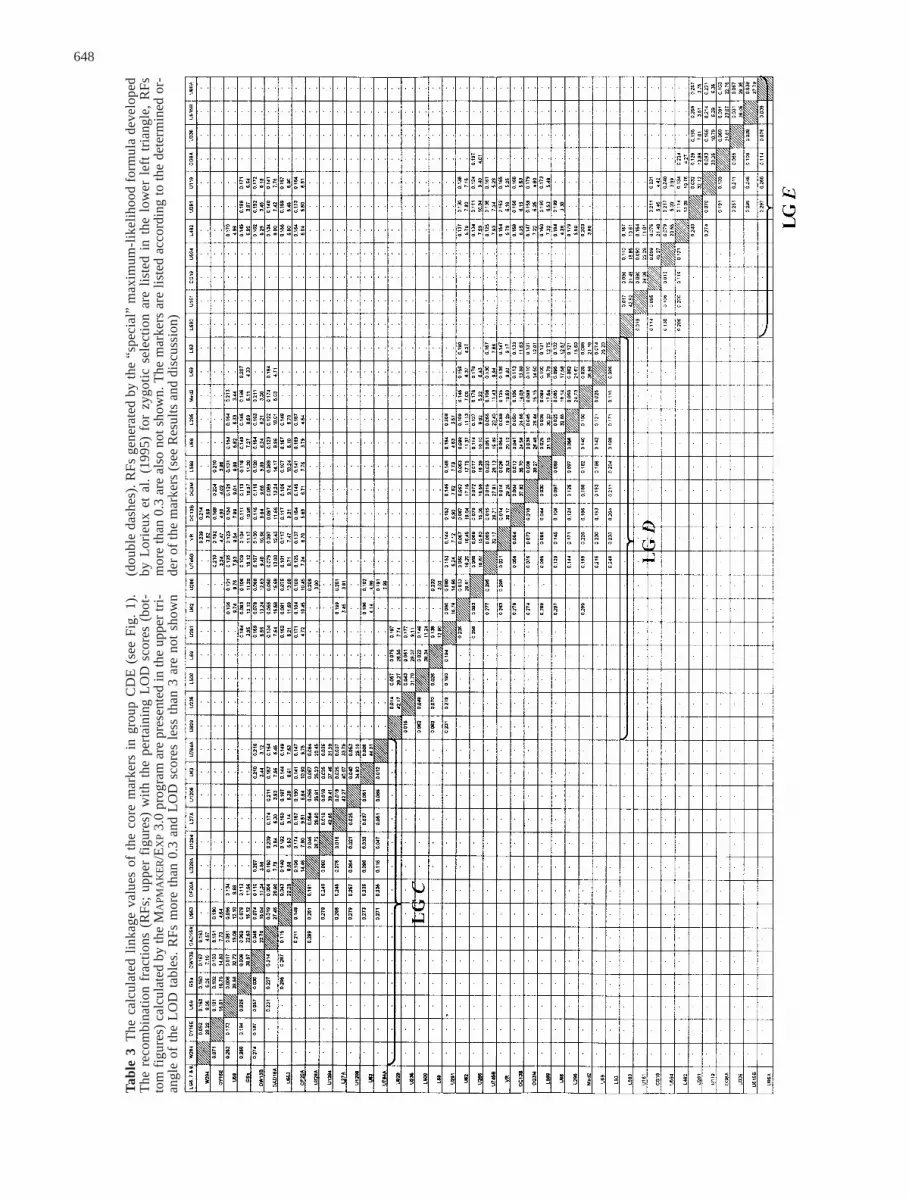
cal” (MAPMAKER/EXP 3.0) as well as by the “special”maximum-likelihood formula (Lorieux et al. 1995), re-spectively. The “special” maximum-likelihood formulawas supposed to eliminate the disturbing effect of thedistorted segregation between the marker pairs in groupCDE, therefore we expected proper linkage group forma-tion. In the upper right triangle of Table 3 the RF valuescalculated by the “classical” maximum-likelihood for-mula (MAPMAKER/EXP 3.0) are shown for all markerpairs in group CDE. Data were not given if the LODscore was less than 3 and/or the RF was more than 0.3.From these data one can see that only one group isformed because at least 4 markers (U286, U62, U553,OF20 A) linked to many markers in group CDE.
In the lower left triangle of Table 3, those RF valuesare shown which were calculated by the “special” maxi-mum-likelihood formula developed for codominantmarkers under zygotic selection by Lorieux et al. (1995).With the exclusion threshold of 0.3, the markers of groupCDE could be split unambiguously into three distinctand clear-cut groups (groups C, D, and E). We arguedthat the high linkage values calculated by the “classical”maximum-likelihood formula artificially linked the ge-netically unlinked markers in group CDE and if the dis-turbing effect of zygotic selection was compensated for,the genuine linkage groups could be revealed.
As a control, RF values for markers belonging to inde-pendent groups (inter-group relations) were determined, ifpossible, by the adequate “special” ML formulas (Lorieuxet al. 1995) selected according to the selection type deter-mined by the χ2 tests (see Table 1). (No linkage could becalculated between the markers that displayed distortedsegregation under zygotic selection and those markers inLG4 which displayed gametic selection, see Materials andmethods). Based on the RFs calculated by this mannerthere was no inter-group linkage between the markers, thatis markers belonging to a given linkage group did notshow linkage to any markers in any other linkage groups(data not shown). On the other hand intra-group markerlinkage could always be demonstrated, and there was nomarker which remained unlinked (data not shown).
Comparing the marker composition of the linkagegroups of the previous alfalfa linkage map (Kiss et al.1993) to the present groups, groups A, B, F, G, and Hcorresponded to LG 1, LG 2, LG 5, LG 3, and LG 4.Based on the common marker sharing between the recentgenetic groups and our previous map (Kiss et al. 1993),groups C, D, and E were designated to LGs 6, 7, and 8,respectively. The present genetic analysis demonstratedthat some markers were linked to different markers inthe previous map (Kiss et al. 1993). For example 6 mark-ers (L590, L482, CG19, TMs2, ASN, and U82) from theprevious LG VI is now part of LG 8, and 3 markers(L500, L59, and AP8b4) from the previous LG VIII nowbelong to LG 7. The reason for these rearrangements wasthe lack of sufficient marker saturation in the previousmap as well as the false linkage values calculated by the“classical” maximum-likelihood formula for markerswith extreme distorted segregation.
Genetic linkage can also be demonstrated and/or estab-lished visually by colormapping (Kiss et al. 1998). InFig. 2 we show an example by which the mapping powerof colormapping can be demonstrated. In the middle ofFig. 2, the color genotypes of markers U286 and OAD16Aare highlighted. These markers of extreme distorted segre-gation are tightly linked to each other (RF=0.122,LOD=10.01) if the “classical” maximum-likelihood for-mula was used for calculation (see Table 3). On the otherhand, if the RF between these 2 markers was calculatedusing the “special” maximum-likelihood formula, markersU286 and OAD16A turned out to be unlinked. Accordingto the colormap these markers proved also to be unlinked,since no individual with the same homozygous genotypefor this 2 markers could be observed, that is there is no“homozygous link” between markers U286 and OAD16A.On the other hand, several “homozygous links” were pres-ent between markers U286-U62, U286-U745B, andOAD16A-OW13B and OAD16A-U553, respectively, thatis markers U286 and OAD16A belonged to different link-age groups (LG 7 and LG 6). This demonstrates that col-ormapping is a suitable and rapid method for determininglinkage relationships for markers with distorted segrega-tion ratios by overshadowing the linking effect of the het-erozygous links and by giving more emphasis to homozy-gous links and detectable recombinations (for more de-tailed description of the method see Kiss et al. 1998).
Construction of the genetic map of alfalfa
The order of the core markers in the eight linkage groupswas determined by calculating the RFs by the “special”maximum-likelihood formula followed by determiningthe genetic distances in centiMorgans using the Haldanefunction. This map generated the so-called frame map(Fig. 3A–H).
Further mapping was performed as follows: the addi-tional 742 markers together with the core markers werefirst grouped by the “group” command of MAPMAK-ER/EXP 3.0 using LOD score 9 and maximum distances of20 cM. Under these circumstances, all markers clusteredin conjunction with the core markers into six groups, A,B, F, G, H, and CDE. None of the markers remained un-linked (data not shown). This grouping resulted in link-age groups containing either dominant or codominantmarkers which exhibited either distorted segregation ofthe same type as the core markers in the groups orshowed normal distribution (no selection occurred). RFswere then calculated within the groups A, B, F, G, H, andCDE with the appropriate “special” maximum-likelihoodformula corresponding to the type of selection which oc-curred in the given region (Table 1). Based on the calcu-lated RFs, the order of the markers in the groups A, B, F,G, or H were established. The markers in group CDE fellapart into three LGs, C, D, and E (see above), and the or-der of the markers could be easily established within thegroups. The fact that only eight linkage groups were gen-erated after additional markers were included in the
652
“grouping” analysis confirmed that the eight groups rep-resented the eight genuine genetic LGs of alfalfa.
To visualize the genetic map of alfalfa we convertedthe RFs – calculated by the “special” ML formulas be-tween the neighboring markers – into genetic distancesaccording to the Haldane function. These genetic distanc-es were used to draw the genetic map of alfalfa shown inFig. 3A–H. The genetic map was in complete agreementwith the map constructed by colormapping (Kiss et al.1998). In Fig. 3A–H the 121 core markers are highlightedby larger, bold characters. Additional markers could besorted out into two classes: (1) those markers which hadrecombination with the core markers (RF >0) were insert-ed into the core markers (these enlarged sets of markerswere called “extended core markers” and they are placednext to the bar representing the chromosomes (see Fig.3A-H); (2) those markers which did not show recombina-tion (RF=0) to the core or extended core markers werecalled “additional markers”. Additional markers fell intotwo categories: (1) some markers were tightly linked(RF=0) to 1 of the core or extended core markers but ex-hibited recombination to the adjacent markers (thesemarkers are shown to the right of the appropriate core orextended core markers); (2) some markers were tightlylinked (RF=0) to more than 1 core or extended coremarkers, therefore their map location could not be deter-mined precisely (these markers are placed to the rightside of a vertical bar spanning the region in question).
This ambiguity can be explained either by a lack of re-combination which resides in the dominant character ofthe markers or by missing genotypes. The complete ge-netic map displaying the core, the extended core, and theadditional markers is shown in Fig. 3A–H.
Characterization of the linkage map of alfalfa
The constructed linkage map of alfalfa contains 868markers of which four were morphological, 216 RFLP(186 cDNA and 30 genomic markers), and 608 RAPDmarkers; 2 loci were detected exclusively by specificPCR amplification (see Table 4), and 12 isozyme and 26seed protein markers were mapped by the analysis ofzymograms and two-dimensional polyacrylamide gels,respectively.
The 868 genetic markers distributed into eight linkagegroups span a genetic distance of 754 cM. The averagemarker density is 0.8 markers/cM with a maximum dis-tance of 23.74 cM between markers OAD16C andU745B in LG 7. The correlation between the physicaland genetic distances is 1000–1300 kb per centiMorgan,on average, taking the DNA content of the haploid ge-nome as 750–1000 Mbp (Winicov et al. 1988; Arumuga-nathan and Earle 1991).
Eighty markers representing genes with known func-tion or sequences are listed in Table 5. As it is shown in
653
Table 4 The nucleotide sequences of the specific primers used toamplify known sequences. The amplified fragments were used ashybridization probes in DNA-DNA hybridization (RFLP), or poly-
morphisms were detected by the electrophoresis of PCR productson agarose gels with or without HinfI digestion [cleavage of am-plified products (CAPs; Konieczny and Ausubel 1993)]
Gene Primer sequences References Polymorphism detected by
PCR RFLP
GSa 5’ GCACAAGGAGCACATTG 3’ Stanford et al. 1993 + +5’ ACCACTTGGACAATTACTAC 3’
GSb 5’ GCACAAGGAGCACATTG 3’ Stanford et al. 1993 − +5’ GAAACCTATAACAAGGCCTC 3’
GSc 5’ GCACAAGGAGCACATTG 3’ Stanford et al. 1993 + −5’ GCCCATAATTAAACATCATG 3’
Calmodulin 5’ GATTTCCCTGAATTCCTTAACCTGATG 3’ Barnett and Long 1990 − +5’ GAAGTACAAATGCATGGTGGGAC 3’
Chi 5’ GAGCACGCTGTTTCCCC 3’ McKhann and Hirsch 1994 − +5’ GAAATAGTACAAGAGTAGAAAGC 3’
Chs 5’ CAAAGGGCAGAAGGCCC 3’ McKhann and Hirsch 1994 − +5’ TGGTAAGACCCGGTCC 3’
Enod40 5’ CAAAACAGTTTGCTTTG 3’ Crespi et al. 1994 + +5’ CTAGAATACTCTTCAATTTC 3’ HinfI digestion
F3OH 5’ GCT/ATGC/TGAG/AGAATGGGG 3’ Charrier et al. 1995 − +5’ GGTTTG/ATCT/AGGCCAC/TCT 3’
rDNA 18S–25S 5’ ATGGTCCGGTGAAGTGTTCG 3’ Sun and Skinner 1994 + +region 5’ CCCGGTTCGCTCGCCGTTAC 3’ HinfI digestion
rDNA 5S 5’ CTGCGGAGTTCTGATGGG 3’ Barcziszewska et al. 1987 − +region 5’ GTTAAGCGTTCTTGGGCG 3’
β-tubulin 5’ GAAAACTGTGATTGCTTG 3’ Liaud et al. 1992 + +5’ TCCTCTCCATACTCATCC 3’
AP8b12 5’ GTCCCTGTAAGTTGTGATGA 3’ This study + −5’ TTAGAAACTTGGTGTCCGGC 3’
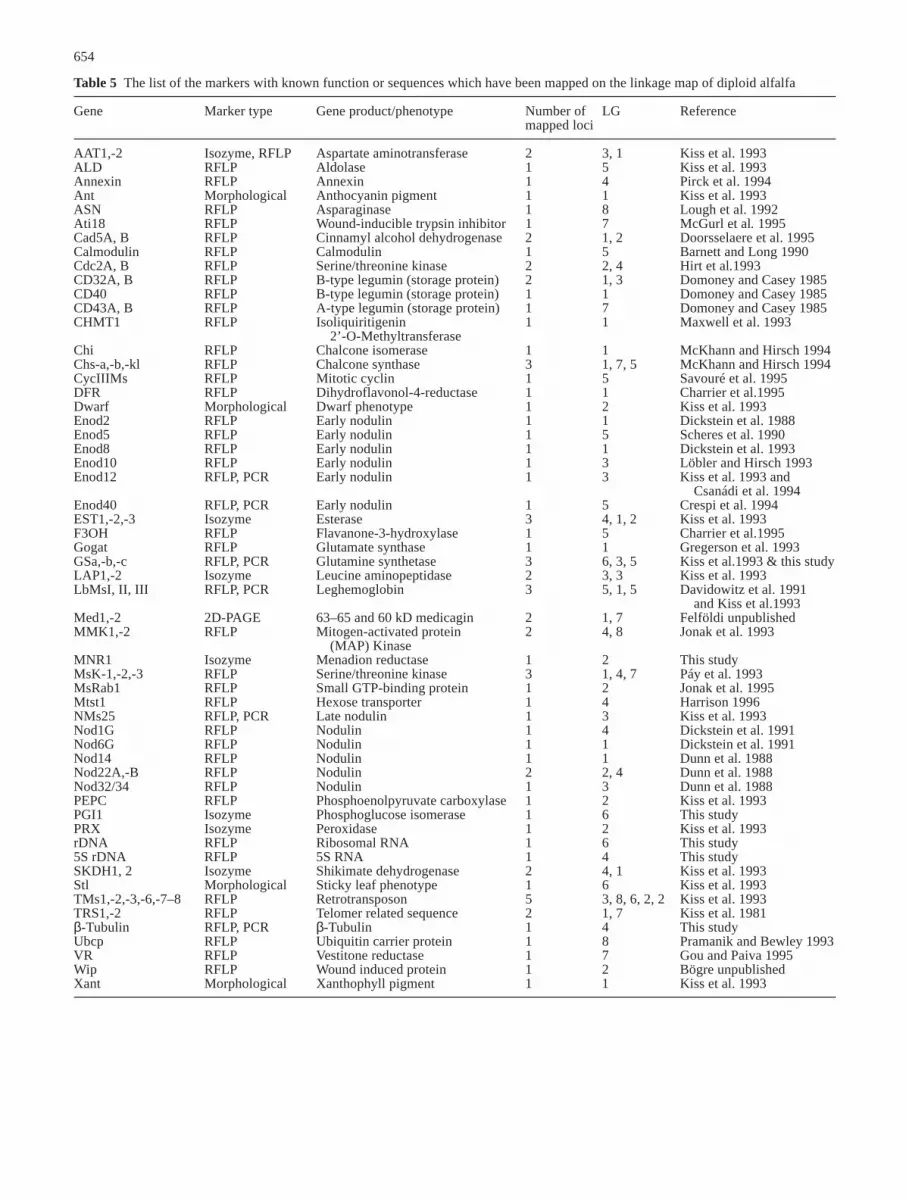
654
Table 5 The list of the markers with known function or sequences which have been mapped on the linkage map of diploid alfalfa
Gene Marker type Gene product/phenotype Number of LG Referencemapped loci
AAT1,-2 Isozyme, RFLP Aspartate aminotransferase 2 3, 1 Kiss et al. 1993ALD RFLP Aldolase 1 5 Kiss et al. 1993Annexin RFLP Annexin 1 4 Pirck et al. 1994Ant Morphological Anthocyanin pigment 1 1 Kiss et al. 1993ASN RFLP Asparaginase 1 8 Lough et al. 1992Ati18 RFLP Wound-inducible trypsin inhibitor 1 7 McGurl et al. 1995Cad5A, B RFLP Cinnamyl alcohol dehydrogenase 2 1, 2 Doorsselaere et al. 1995Calmodulin RFLP Calmodulin 1 5 Barnett and Long 1990Cdc2A, B RFLP Serine/threonine kinase 2 2, 4 Hirt et al.1993CD32A, B RFLP B-type legumin (storage protein) 2 1, 3 Domoney and Casey 1985CD40 RFLP B-type legumin (storage protein) 1 1 Domoney and Casey 1985CD43A, B RFLP A-type legumin (storage protein) 1 7 Domoney and Casey 1985CHMT1 RFLP Isoliquiritigenin 1 1 Maxwell et al. 1993
2’-O-Methyltransferase Chi RFLP Chalcone isomerase 1 1 McKhann and Hirsch 1994Chs-a,-b,-kl RFLP Chalcone synthase 3 1, 7, 5 McKhann and Hirsch 1994CycIIIMs RFLP Mitotic cyclin 1 5 Savouré et al. 1995DFR RFLP Dihydroflavonol-4-reductase 1 1 Charrier et al.1995Dwarf Morphological Dwarf phenotype 1 2 Kiss et al. 1993Enod2 RFLP Early nodulin 1 1 Dickstein et al. 1988Enod5 RFLP Early nodulin 1 5 Scheres et al. 1990Enod8 RFLP Early nodulin 1 1 Dickstein et al. 1993Enod10 RFLP Early nodulin 1 3 Löbler and Hirsch 1993Enod12 RFLP, PCR Early nodulin 1 3 Kiss et al. 1993 and
Csanádi et al. 1994Enod40 RFLP, PCR Early nodulin 1 5 Crespi et al. 1994EST1,-2,-3 Isozyme Esterase 3 4, 1, 2 Kiss et al. 1993F3OH RFLP Flavanone-3-hydroxylase 1 5 Charrier et al.1995Gogat RFLP Glutamate synthase 1 1 Gregerson et al. 1993GSa,-b,-c RFLP, PCR Glutamine synthetase 3 6, 3, 5 Kiss et al.1993 & this studyLAP1,-2 Isozyme Leucine aminopeptidase 2 3, 3 Kiss et al. 1993LbMsI, II, III RFLP, PCR Leghemoglobin 3 5, 1, 5 Davidowitz et al. 1991
and Kiss et al.1993Med1,-2 2D-PAGE 63–65 and 60 kD medicagin 2 1, 7 Felföldi unpublished MMK1,-2 RFLP Mitogen-activated protein 2 4, 8 Jonak et al. 1993
(MAP) KinaseMNR1 Isozyme Menadion reductase 1 2 This studyMsK-1,-2,-3 RFLP Serine/threonine kinase 3 1, 4, 7 Páy et al. 1993MsRab1 RFLP Small GTP-binding protein 1 2 Jonak et al. 1995Mtst1 RFLP Hexose transporter 1 4 Harrison 1996NMs25 RFLP, PCR Late nodulin 1 3 Kiss et al. 1993Nod1G RFLP Nodulin 1 4 Dickstein et al. 1991Nod6G RFLP Nodulin 1 1 Dickstein et al. 1991Nod14 RFLP Nodulin 1 1 Dunn et al. 1988Nod22A,-B RFLP Nodulin 2 2, 4 Dunn et al. 1988Nod32/34 RFLP Nodulin 1 3 Dunn et al. 1988PEPC RFLP Phosphoenolpyruvate carboxylase 1 2 Kiss et al. 1993PGI1 Isozyme Phosphoglucose isomerase 1 6 This studyPRX Isozyme Peroxidase 1 2 Kiss et al. 1993rDNA RFLP Ribosomal RNA 1 6 This study5S rDNA RFLP 5S RNA 1 4 This studySKDH1, 2 Isozyme Shikimate dehydrogenase 2 4, 1 Kiss et al. 1993Stl Morphological Sticky leaf phenotype 1 6 Kiss et al. 1993TMs1,-2,-3,-6,-7–8 RFLP Retrotransposon 5 3, 8, 6, 2, 2 Kiss et al. 1993TRS1,-2 RFLP Telomer related sequence 2 1, 7 Kiss et al. 1981β-Tubulin RFLP, PCR β-Tubulin 1 4 This studyUbcp RFLP Ubiquitin carrier protein 1 8 Pramanik and Bewley 1993VR RFLP Vestitone reductase 1 7 Gou and Paiva 1995Wip RFLP Wound induced protein 1 2 Bögre unpublishedXant Morphological Xanthophyll pigment 1 1 Kiss et al. 1993

the fourth column of Table 5 some genes were detected tobe present in one, two, three, or more loci in the genome.Considering only the RFLP markers, isozyme markersand 2 loci detected by specific PCR amplification, 63 outof the 230 loci (27%) were duplicated or multiplied. Thir-teen cDNA clones (CAD5, CD32, L27, L408, NOD22,U36, U40, U52, U68, U157, U328, U457, U515), 1 ge-nomic clone (W157) and 3 isozyme markers (AAT, LAP,SKDH) were mapped to 2 loci, while 7 genes (Chs, GS,EST, leghemoglobin, Msk, U522 and U745) are presentat least in three copies. Two cDNA clones could be locat-ed at 4 loci (U584 and U212).
Two multicopy genes received special interest sinceboth had been localized by cytological experiments earlier(Schaff et al. 1990; McCoy and Bingham 1988; Bauchanand Campbell 1994). These are: (1) the ribosomal RNAgenes (rDNA) at one genomic region in LG 6 and (2) theβ-tubulin genes in LG 4. The genetic mapping of thesegenes allowed us to correlate these two LGs with the ap-propriate chromosomes detected by cytology. Accordingly,LG 6 on which the ribosomal genes were mapped could becorrelated with chromosome no. 8 carrying the nucleolusorganizing region (McCoy and Bingham 1988; Bauchanand Campbell 1994; Falistocco et al. 1995). LG 4 carryingthe β-tubulin genes could be correlated with the smallmetacentric or another submetacentric chromosome towhich these genes hybridized in situ (Schaff et al. 1990).
Perspectives
The improved genetic map of alfalfa presented in thisstudy is suitable for comparative mapping studies. The de-termination of the degree of synteny between the geneticmaps of Medicago sativa and Medicago truncatula, Pisumsativum, and Arabidopsis thaliana is in progress. Since thediploid and the cultivated tetraploid alfalfa are crossableand belong to the Medicago sativa complex (Quiros andBauchan 1988; Endre et al. 1996), the detailed genetic mapof diploid Medicago sativa facilitates mapping and taggingagronomically important traits in different alfalfa popula-tions. In addition, this map can be used in map-based clon-ing approaches for isolating genes conditioning importantagronomic traits like symbiotic nitrogen fixation.
Acknowledgements The authors thank P. Somkúti, K. Katona, S.Jenei, K. Molnár, Z. Liptay, and M. Tóth for skillful technical as-sistance, L. Bögre for the Cdc2A, Cdc2B and Wip cDNA clones;M. Deák for the calmodulin primers; K. Felföldi for the seed pro-tein analysis; K. Felföldi and J. Shore for helping in GPI isozymeanalysis; P. Ratet for the F3OH primers and for the DHFR cDNAclone; T. Jávorfi for helping in the mathematical analysis; A.Kereszt and P. Kiss for their help during the mapping work; Z.Kevei for helping in mapping the β-tubulin locus. This study wassupported partly by the Grants OTKA (Hungarian Scientific Re-search Fund) T016935, OTKA T025467, OTKA T020470, AKP96-360/62, CIPA-CT93-0156, AKP96-360/62, OMFB (NationalCommittee for Technical Development, Hungary), Dr. JánosBástyai Holczer Foundation, Volkswagen Stiftung grant no. I/72244, INCO COPERNICUS/BIOTECH grant no. PL962170, andby the C.N.R.S. Hungarian Academy of Sciences collaborativeprogram.
References
Allard RW (1956) Formulas and tables to facilitate the calculationof recombination values in heredity. Hilgardia 24:235–278
Arumuganathan K, Earle ED (1991) Nuclear DNA content ofsome important plant species. Plant Mol Biol Rep 9:208–219
Bailey NTJ (1949) The estimation of linkage with differential via-bility, II and III. Heredity 3:220–228
Barcziszewska MZ, Nalaskowska M, Mashkova TD, Kisselev LL,Barcziszewski J (1987) Heterogenity in the 3’-portion of Pa-pilionaceae 5S rRNAs. The primary structure of alfalfa 5SrRNA. Nucleic Acids Res 15:362
Barnett MJ, Long SR (1990) Nucleotide sequence of an alfalfacalmodulin cDNA. Nucleic Acids Res 18:3395
Bauchan GR, Campbell TA (1994) Use of an image analysissystem to karyotype diploid alfalfa (Medicago sativa L.). JHered 85:18–22
Bentolila S, Hardy T, Guitton C, Freyssinet G (1992) Comparativegenetic analyses of F2 plants and anther culture derived plantsof maize. Genome 35:575–582
Bernatzky R, Tanksley SD (1986) Majority of random cDNAclones correspond to single loci in the tomato genome. MolGen Genet 203:8–14
Brummer EC, Kochert G, Bouton JH (1991) RFLP variation indiploid and tetraploid alfalfa. Theor Appl Genet 83:89–96
Brummer EC, Bouton JH, Kochert G (1993) Development of anRFLP map in alfalfa. Theor Appl Genet 86:329–332
Charrier B, Coronado C, Kondorosi Á, Ratet P (1995) Molecularcharacterization and expression of alfalfa (Medicago sativa L.)flavanone-3-hydroxylase and dihydroflavonol-4-reductase en-coding genes. Plant Mol Biol 29:773–786
Crespi MD, Jurkevitch E, Poiret M, d’Aubenton Carafa Y, Petro-vics G, Kondorosi É, Kondorosi Á (1994) enod40, a gene ex-pressed during nodule organogenesis, codes for a non-translat-able RNA involved in plant growth. EMBO J 13:5099–5112
Csanádi G, Szécsi J, Kaló P, Kiss P, Endre G, Kondorosi Á,Kondorosi É, Kiss GB (1994) ENOD12, an early nodulingene, is not required for nodule formation and efficient nitro-gen fixation in alfalfa. Plant Cell 6:201–213
Davidowitz EJ, Creissen G, Vincze É, Kiss GB, Lang-Unnasch N(1991) Sequence analysis of alfalfa (Medicago sativa) leghemo-globin cDNA and genomic clones. Plant Mol Biol 16:161–165
Dellaporta SL, Wood J, Hicks JB (1983) A plant DNA miniprepa-ration: Version II. Plant Mol Biol Rep 1:19–21
Dickstein R, Bisseling T, Reinhold VN, Ausubel FM (1988) Ex-pression of nodule-specific genes in alfalfa root nodulesblocked at an early stage of development. Genes Dev2:677–687
Dickstein R, Scheirer DC, Fowle WH, Ausubel FM (1991) Nod-ules elicited by Rhizobium meliloti heme mutants are arrestedat an early stage of development. Mol Gen Genet 230:423–432
Dickstein R, Prusty R, Peng T, Ngo W, Smith ME (1993) Enod8, anovel early nodule-specific gene, is expressed in empty alfalfanodules. Mol Plant-Microbe Interaction 6:715–721
Domoney C, Casey R (1985) Measurement of gene number forseed storage proteins in Pisum. Nucleic Acids Res 13:687–699
Doorsselaere JV, Baucher M, Feuillet C, Boudet AM, Van Mon-tagu M, Inzé D (1995) Isolation of cinnamyl alcohol dehydro-genase cDNAs from two important economic species:alfalfaand poplar. Demonstration of a high homology of the genewithin angiosperms. Plant Physiol Biochem 33:105–109
Dunn K, Dickstein R, Feinbaum R, Burnett BK, Petermann TK,Thoidis G, Goodman HM, Ausubel FM (1988) Developmentalregulation of nodule-specific genes in alfalfa root nodules.Mol Plant-Microbe Interaction 1:66–74
Echt CS, Erdahl LA, McCoy TJ (1992) Genetic segregation ofrandom amplified polymorphic DNA in diploid cultivated al-falfa. Genome 35:84–87
Echt CS, Kidwell KK, Knapp SJ, Osborn TC, McCoy TJ (1994)Linkage mapping in diploid alfalfa (Medicago sativa). Ge-nome 37:61–71
655
Endre G, Kaló P, Hangyel Tárczy M, Csanádi G, Kiss GB (1996)Reducing the tetraploid non-nodulating alfalfa (Medicago sat-iva) MnNC-1008(NN) germ plasm to the diploid level. TheorAppl Genet 93:1061–1065
Falistocco E, Falcinelli M, Veronesi F (1995) Karyotype and C-banding pattern of mitotic chromosomes in alfalfa, Medicagosativa L. Plant Breed 114:451–453
Feinberg AP, Vogelstein B (1983) A technique for radiolabelingDNA restriction endonuclease fragments to high specific ac-tivity. Anal Biochem 132:6–13
Gou L, Paiva NL (1995) Molecular cloning and expression of al-falfa (Medicago sativa L.) vestitone reductase, the penultimateenzyme on medicarpin biosynthesis. Arch Biochem Biophys320:353–360
Gregerson RG, Miller SS, Twary SN, Gantt JS, Vance C (1993)Molecular characterization of NADH-dependent glutamatesynthase from alfalfa nodules. Plant Cell 5:215–226
Györgyey J, Gartner A, Németh K, Magyar Z, Hirt H, Heberle-Bors E. Dudits D (1991) Alfalfa heat shock genes are differen-tially expressed during somatic embryogenesis. Plant Mol Biol16:999–1007
Hanson AA, Barnes DK, Hill RR (eds) (1988) Alfalfa and alfalfaimprovement. American Society of Agronomy, Crop ScienceSociety of America, Soil Science of America, Madison, Wis
Harrison MJ (1996) A sugar transporter from Medicago tru-ncatula: altered expression in roots during vesicular-arbuscular (VA) mycorrhizal associations. Plant J 9:491–503
Hebert PDN, Beaton MJ (1989) Methodologies for allozyme anal-ysis using cellulose acetate electrophoresis. Helena Laborato-ries, Beaumont, Tex
Helentjaris T, Slocum M, Wright S, Schaefer A, Nienhuis J (1986)Construction of genetic linkage maps in maize and tomato us-ing resctriction fragment length polymorphisms. Theor ApplGenet 72:761–769
Heun M, Gregorius HR (1987) A theoretical model for estimatinglinkage in F2 populations with distorted single gene segrega-tion. Biom J 4:397–406
Hirt H, Páy A, Bögre L, Meskiene I, Heberle-Bors E (1993)cdc2MsB, a cognate cdc2 gene from alfalfa, complements theG1/S but not the G2/M transition of budding yeast cdc28 mu-tants. Plant J 4:61–69
Jonak C, Páy A, Bögre L, Hirt H, Heberle-Bors E (1993) Theplant homologue of MAP kinase is expressed in a cell cycle-dependent and organ specific manner. Plant J 3:611–617
Jonak C, Heberle-Bors E, Hirt H (1995) A cDNA from Medicagosativa encodes a protein homologous to small GTP-bindingproteins. Plant Physiol 107:263–264
Kesseli RV, Paran I, Michelmore RW (1994) Analysis of a de-tailed genetic linkage map of Lactuca sativa (Lettuce) con-structed from RFLP and RAPD markers. Genetics 136:1435–1446
Kiss GB, Amin AA, Pearlman RE (1981) Two separate regions ofthe extrachromosomal ribosomal deoxyribonucleic acid of Tet-rahymena thermophila enable autonomous replication of plasm-ids in Saccharomyces cerevisiae. Mol Cell Biol 1:535–543
Kiss GB, Csanádi G, Kálmán K, Kaló P, Ökrész L (1993) Con-struction of a basic genetic map for alfalfa using RFLP,RAPD, isozyme and morphological markers. Mol Gen Genet238:129–137
Kiss GB, Kereszt A, Kiss P, Endre G (1998) Colormapping: a non-mathematical procedure for genetic mapping. Acta Biol Hun49:125–142
Konieczny A, Ausubel FM (1993) A procedure for mapping Arab-idopsis mutations using co-dominant ecotype-specific PCR-based markers. Plant J 4:403–410
Lander ES, Green P, Abrahamson J, Barlow A, Daly MJ, LincolnSE, Newburg L (1987) MAPMAKER: an interactive computerpackage for constructing primary genetic linkage maps of ex-perimental and natural populations. Genomics 1:174–181
Landry BS, Kesseli RV, Farrara B, Michelmore RW (1987) A ge-netic map of lettuce (Lactuca sativa L.) with restriction frag-ment length polymorphism, isozyme, disease resistance andmorphological markers. Genetics 116:331–337
Landry BS, Hubert N, Etoh T, Harada JJ, Lincoln SE (1991) A ge-netic map for Brassica napus based on restriction fragmentlength polymorphisms detected with expressed DNA sequenc-es. Genome 34:543–552
Liaud MF, Brinkmann H, Cerff R (1992) The β-tubulin gene fami-ly of pea: primary structures, genomic organization and introndependant evolution of genes. Plant Mol Biol 18:639–651
Lincoln S, Daly M, Lander E (1992) Constructing genetic mapswith MAPMAKER/EXP 3.0 Whitehead Institute Technical Re-port, 3rd edn.
Lorieux M, Perrier X, Goffinet B, Lanaud C, González de Leon D(1995) Maximum-likelihood models for mapping geneticmarkers showing segregation distortion. 2. F2 populations.Theor Appl Genet 90:81–89
Lough TJ, Reddington BD, Grant MR, Hill DF, Reynolds PHS,Farnden KJF (1992) The isolation and characterization of acDNA clone encoding L-asparaginase from developing seedsof lupin (Lupinus arboreus). Plant Mol Biol 19:391–399
Löbler M, Hirsch AM (1992) An alfalfa (Medicago sativa L.)cDNA encoding an acidic leghemoglobin (MsLb3). Plant MolBiol 20:733–736
Löbler M, Hirsch AM (1993) A gene that encodes a proline-richnodulin with limited homology to PsENOD12 is expressed inthe invasion zone of Rhizobium meliloti-induced alfalfa rootnodules. Plant Physiol 103:21–30
Maniatis T, Fritsch EF, Sambrook J (1982) Molecular cloning: alaboratory manual. Cold Spring Laboratory Press, New York
Maxwell CA, Harrison MJ, Dixon RA (1993) Molecular charac-terization and expression of alfalfa isoliquiritigenin 2’-O-methyltransferase, an enzyme specifically involved in the bio-synthesis of an inducer of Rhizobium meliloti nodulationgenes. Plant J 4:971–981
McCoy TJ, Bingham ET (1988) Cytology and cytogenetics of al-falfa. In: Hanson AA, Barnes DK, Hill RR (eds) Alfalfa andalfalfa improvement. American Society of Agronomy, CropScience Society of America, Soil Science of America, Madi-son, Wis., pp 737–776
McGurl B, Swarup M, Kahn M, Ryan CA (1995) Characterizationof two proteinase inhibitor (ATI) cDNAs from alfalfa leaves(Medicago sativa var. Vernema): the expression of ATI genesin response to wounding and soil microorganisms. Plant MolBiol 27:995–1001
McKhann HI, Hirsch AM (1994) Isolation of chalcone synthaseand chalcone isomerase cDNAs from alfalfa (Medicago sativaL.): highest transcript levels occur in young roots and roottips. Plant Mol Biol 24:767–777
Paran I, Michelmore RW (1993) Development of reliable PCR-based markers linked to downy mildew resistance genes in let-tuce. Theor Appl Genet 85:985–993
Páy A, Jonak C, Bögre L, Meskiene I, Mairinger T, Szalay A, He-berle-Bors E, Hirt H (1993) The MsK family of alfalfa proteinkinase genes encodes homologues of shaggy/glycogen syn-thase kinase-3 and shows differential expression pattrens inplant organs and development. Plant J 3:847–856
Pham JL, Glaszmann JC, Sano R, Barbier P, Ghesquiére A, Sec-ond G (1990) Isozyme markers in rice: genetic analysis andlinkage relationships. Genome 33:348–359
Pillen K, Steinrücken G, Herrmann RG, Jung C (1993) An extend-ed linkage map of sugar beet (Beta vulgaris L.) including nineputative lethal genes and the restorter gene. X. Plant Breed111:265–272
Pirck M, Hirt H, Heberle-Bors E (1994) The cDNA sequence en-coding an annexin from Medicago sativa. Plant Physiol104:1463–1464
Pramanik SK, Bewley JD (1993) A ubiquitin carrier preotein cDNAfrom developing alfalfa embryos. Plant Physiol 102:1049–1050
Prince JP, Pochard E, Tanksley SD (1993) Construction of a mole-cular linkage map of pepper and a comparison of synteny withtomato. Genome 36:404–417
Quiros FC, Bauchan GR (1988) The genus Medicago and the ori-gin of the Medicago sativa complex. In: Hanson AA, BarnesDK, Hill RR (eds) Alfalfa and alfalfa improvement. American
656

Society of Agronomy, Crop Science Society of America, SoilScience of America, Madison, Wis., pp 93–124
Sanger F, Nicklen S, Coulson AR (1977) DNA sequencing withthe chain terminating inhibitors. Proc Natl Acad Sci USA74:5463–5467
Savouré A, Fehér A, Kaló P, Petrovics G, Csanádi G, Szécsi J,Kiss G, Brown S, Kondorosi Á, Kondorosi É (1995) Isolationof a full-length mitotic cyclin cDNA clone CycIIIMs fromMedicago sativa: Chromosomal mapping and expression.Plant Mol Biol 27:1059–1070
Schaff DA, Koehler SM, Matthews BF, Bauchan GR (1990) Insitu hybridization of β-tubulin to alfalfa chromosomes. JHered 81:479–483
Scheres DA, Van Engelen F, Van Der Knaap E, Van De Wiel C,Van Kammen A, Bisseling T (1990) Sequential induction ofnodulin gene expression in the developing pea nodule. PlantCell 2:687–700
Southern EM (1975) Detection of specific sequences among DNAfragments separated by gel electrophoresis. J Mol Biol98:503–517
Stanford AC, Larsen K, Barker DG, Cullimore JV (1993) Differ-ential expression within the glutamine synthetase gene familyof the model legume Medicago truncatula. Plant Physiol103:73–81
Sun Y, Skinner DZ (1994) A phylogeny of Medicago speciesbased on ribosomal DNA sequences. In: Michaud R, Elgin JH(eds), Rep 34th N Am Alfalfa Improve Conf. Guelph, Ont,Canada, p 65
Wendel JF, Weeden NF (1989) Visualization and interpretation ofplant isozymes. In: Soltis DE, Soltis PS (eds) Isozymes inplant biology. Dioscorides Press, Portland, Oreg, pp 5–45
Williams JGK, Kubelik AR, Livak KJ, Rafalski JA, Tingey SV(1990) DNA polymorphisms amplified by arbitrary primers areuseful as genetic markers. Nucleic Acids Res 18:6531–6535
Winicov I, Maki DH, Waterborg JH, Riehm MR, Harrington RE(1988) Characterization of the alfalfa (Medicago sativa) ge-nome by DNA reassociation. Plant Mol Biol 10:369–371
657
Note added in Proof An agreement was made on the 2nd
Medicago truncatula Workshop (Amsterdam, July 22–23, 1999)about the uniform designation of the linkage groups as well as thecorresponding chromosomes of all Medicago species. Accordingto the agreement, the nomenclature of the linkage groupsdescribed in this paper will be used based on the common geneticmarkers mapped in both Medicago sativa and Medicagotruncatula. The corresponding chromosomes will be identified byin situ hybridization using the common genetic markers or thecorresponding Medicago truncatula BAC clones.