construction & infrastructure21jan15
TRANSCRIPT
TRACKCONSTRUCTION & INFRASTRUCTURE
InfraTrack December 16, 2015
Nitin Arora Research [email protected] +91 22 66242491
Kushan ParikhResearch [email protected] +91 22 66121431
Emkay Research is also available on www.emkayglobal.com, Bloomberg EMKAY<GO>, Reuters and DOWJONES. Emkay Global Financial Services Ltd.
©
Your success is our success
Emkay
Callout Key trends observed during the month with respect to project tenders, awards,
port traffic, NHAI and PGCIL awards.
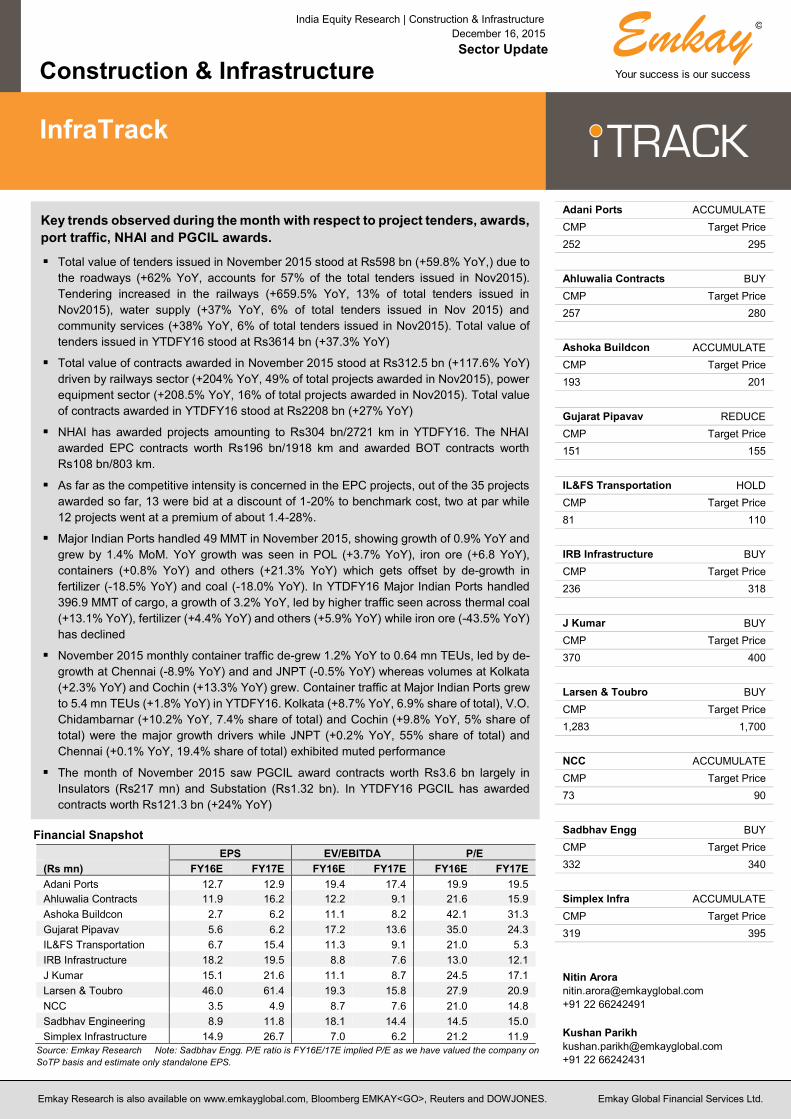
Total value of tenders issued in November 2015 stood at Rs598 bn (+59.8% YoY,) due to
the roadways (+62% YoY, accounts for 57% of the total tenders issued in Nov2015).
Tendering increased in the railways (+659.5% YoY, 13% of total tenders issued in
Nov2015), water supply (+37% YoY, 6% of total tenders issued in Nov 2015) and
community services (+38% YoY, 6% of total tenders issued in Nov2015). Total value of
tenders issued in YTDFY16 stood at Rs3614 bn (+37.3% YoY)
Total value of contracts awarded in November 2015 stood at Rs312.5 bn (+117.6% YoY)
driven by railways sector (+204% YoY, 49% of total projects awarded in Nov2015), power
equipment sector (+208.5% YoY, 16% of total projects awarded in Nov2015). Total value
of contracts awarded in YTDFY16 stood at Rs2208 bn (+27% YoY)
NHAI has awarded projects amounting to Rs304 bn/2721 km in YTDFY16. The NHAI
awarded EPC contracts worth Rs196 bn/1918 km and awarded BOT contracts worth
Rs108 bn/803 km.
As far as the competitive intensity is concerned in the EPC projects, out of the 35 projects
awarded so far, 13 were bid at a discount of 1-20% to benchmark cost, two at par while
12 projects went at a premium of about 1.4-28%.
Major Indian Ports handled 49 MMT in November 2015, showing growth of 0.9% YoY and
grew by 1.4% MoM. YoY growth was seen in POL (+3.7% YoY), iron ore (+6.8 YoY),
containers (+0.8% YoY) and others (+21.3% YoY) which gets offset by de-growth in
fertilizer (-18.5% YoY) and coal (-18.0% YoY). In YTDFY16 Major Indian Ports handled
396.9 MMT of cargo, a growth of 3.2% YoY, led by higher traffic seen across thermal coal
(+13.1% YoY), fertilizer (+4.4% YoY) and others (+5.9% YoY) while iron ore (-43.5% YoY)
has declined
November 2015 monthly container traffic de-grew 1.2% YoY to 0.64 mn TEUs, led by de-
growth at Chennai (-8.9% YoY) and and JNPT (-0.5% YoY) whereas volumes at Kolkata
(+2.3% YoY) and Cochin (+13.3% YoY) grew. Container traffic at Major Indian Ports grew
to 5.4 mn TEUs (+1.8% YoY) in YTDFY16. Kolkata (+8.7% YoY, 6.9% share of total), V.O.
Chidambarnar (+10.2% YoY, 7.4% share of total) and Cochin (+9.8% YoY, 5% share of
total) were the major growth drivers while JNPT (+0.2% YoY, 55% share of total) and
Chennai (+0.1% YoY, 19.4% share of total) exhibited muted performance
The month of November 2015 saw PGCIL award contracts worth Rs3.6 bn largely in
Insulators (Rs217 mn) and Substation (Rs1.32 bn). In YTDFY16 PGCIL has awarded
contracts worth Rs121.3 bn (+24% YoY)
India Equity Research | Construction & Infrastructure
December 16, 2015
Sector Update
Construction & Infrastructure
InfraTrack
TRACK
Financial Snapshot
EPS EV/EBITDA P/E
(Rs mn) FY16E FY17E FY16E FY17E FY16E FY17E
Adani Ports 12.7 12.9 19.4 17.4 19.9 19.5
Ahluwalia Contracts 11.9 16.2 12.2 9.1 21.6 15.9
Ashoka Buildcon 2.7 6.2 11.1 8.2 42.1 31.3
Gujarat Pipavav 5.6 6.2 17.2 13.6 35.0 24.3
IL&FS Transportation 6.7 15.4 11.3 9.1 21.0 5.3
IRB Infrastructure 18.2 19.5 8.8 7.6 13.0 12.1
J Kumar 15.1 21.6 11.1 8.7 24.5 17.1
Larsen & Toubro 46.0 61.4 19.3 15.8 27.9 20.9
NCC 3.5 4.9 8.7 7.6 21.0 14.8
Sadbhav Engineering 8.9 11.8 18.1 14.4 14.5 15.0
Simplex Infrastructure 14.9 26.7 7.0 6.2 21.2 11.9
Source: Emkay Research Note: Sadbhav Engg. P/E ratio is FY16E/17E implied P/E as we have valued the company on
SoTP basis and estimate only standalone EPS.
Adani Ports ACCUMULATE
CMP Target Price
252 295
Ahluwalia Contracts BUY
CMP Target Price
257 280
Ashoka Buildcon ACCUMULATE
CMP Target Price
193 201
Gujarat Pipavav REDUCE
CMP Target Price
151 155
IL&FS Transportation HOLD
CMP Target Price
81 110
IRB Infrastructure BUY
CMP Target Price
236 318
J Kumar BUY
CMP Target Price
370 400
Larsen & Toubro BUY
CMP Target Price
1,283 1,700
NCC ACCUMULATE
CMP Target Price
73 90
Sadbhav Engg BUY
CMP Target Price
332 340
Simplex Infra ACCUMULATE
CMP Target Price
319 395
Nitin Arora
+91 22 66242491
Kushan Parikh
+91 22 66242431

Construction & Infrastructure India Equity Research | Sector Update
Emkay Research | December 16, 2015 3
Tenders Issued
Total value of tenders issued in November 2015 stood at Rs598 bn (+59.8% YoY,) due to
the roadways (+62% YoY, accounts for 57% of the total tenders issued in
Nov2015).Tendering increased in the railways (+659.5% YoY, 13% of total tenders issued
in Nov2015), water supply (+37% YoY, 6% of total tenders issued in Nov 2015) and
community services (+38% YoY, 6% of total tenders issued in Nov2015). We witnessed
total number of tenders decreased 6.7% on a YoY basis.
Out of Rs77.5 bn worth tenders, Rs38.1 bn are three orders coming from Ircon
International Ltd. for constructing various tunnel sections, bridges and a station yard of the
Katra-Banihal stretch of the Udhampur-Srinagar-Baramulla new broad gauge railway line
in Jammu & Kashmir.
Water tenders included three tenders worth Rs16.4 bn combined coming from Telangana
state for it Drinking Water Supply project.
Total value of tenders issued in YTDFY16 stood at Rs3614 bn (+37.3% YoY). We
witnessed strong tendering in roadways, railways, community services, hospitals and
water supply projects.
In November 2015, State govt tenders rose to Rs301.6 bn (+51% YoY), while Central govt
tenders were up at Rs296.4 bn (+71% YoY) and private tenders stood at Rs290 mn.
State govt tenders in YTDFY16 increased to Rs2053 bn (+39% YoY), Central govt tenders
increased to Rs1551 bn (+47% YoY) and private domestic tenders increased to Rs9.1 bn.
Exhibit 1: Tenders Published 78.3% MoM in November 2015
Source: Projects Today, Emkay Research
Exhibit 2: Number of tenders decreased by 2.1% MoM to 2178
Source: Projects Today, Emkay Research
Exhibit 3: Tenders Published 59.8% YoY in November 2015
Source: Projects Today, Emkay Research
Exhibit 4: Number of tenders decreased by 6.7% YoY to 2178
Source: Projects Today, Emkay Research
Exhibit 5: YTDFY16, Value of tenders increased by 37.3%
Source: Projects Today, Emkay Research
Exhibit 6: YTDFY16, Number of tenders increased 3.8% to 19960
Source: Projects Today, Emkay Research
-200
-100
0
100
200
0
200000
400000
600000
800000
Nov-13 Mar-14 Jul-14 Nov-14 Mar-15 Jul-15 Nov-15
MoM
Gro
wth
(%
)
Rs M
illio
n
State Government Central Government
Growth Rate MoM
-100
-50
0
50
100
0
1000
2000
3000
4000
5000
Nov-13 Mar-14 Jul-14 Nov-14 Mar-15 Jul-15 Nov-15
MoM
Gro
wth
(%
)
No. of T
enders
State Government Central Government
Growth Rate MoM
-200
-100
0
100
200
300
400
500
Nov-13 Mar-14 Jul-14 Nov-14 Mar-15 Jul-15 Nov-15
YoY
Gro
wth
(%
)
-90
-60
-30
0
30
60
90
120
150
Nov-13 Mar-14 Jul-14 Nov-14 Mar-15 Jul-15 Nov-15YoY
Gro
wth
(%
)
0
500
1000
1500
2000
2500
3000
3500
4000
YT
DF
Y1
1
YT
DF
Y1
2
YT
DF
Y1
3
YT
DF
Y1
4
YT
DF
Y1
5
YT
DF
Y1
6
In R
s b
n
0
5000
10000
15000
20000
25000
30000
YT
DF
Y1
1
YT
DF
Y1
2
YT
DF
Y1
3
YT
DF
Y1
4
YT
DF
Y1
5
YT
DF
Y1
6
No. of T
enders
Construction & Infrastructure India Equity Research | Sector Update
Emkay Research | December 16, 2015 4
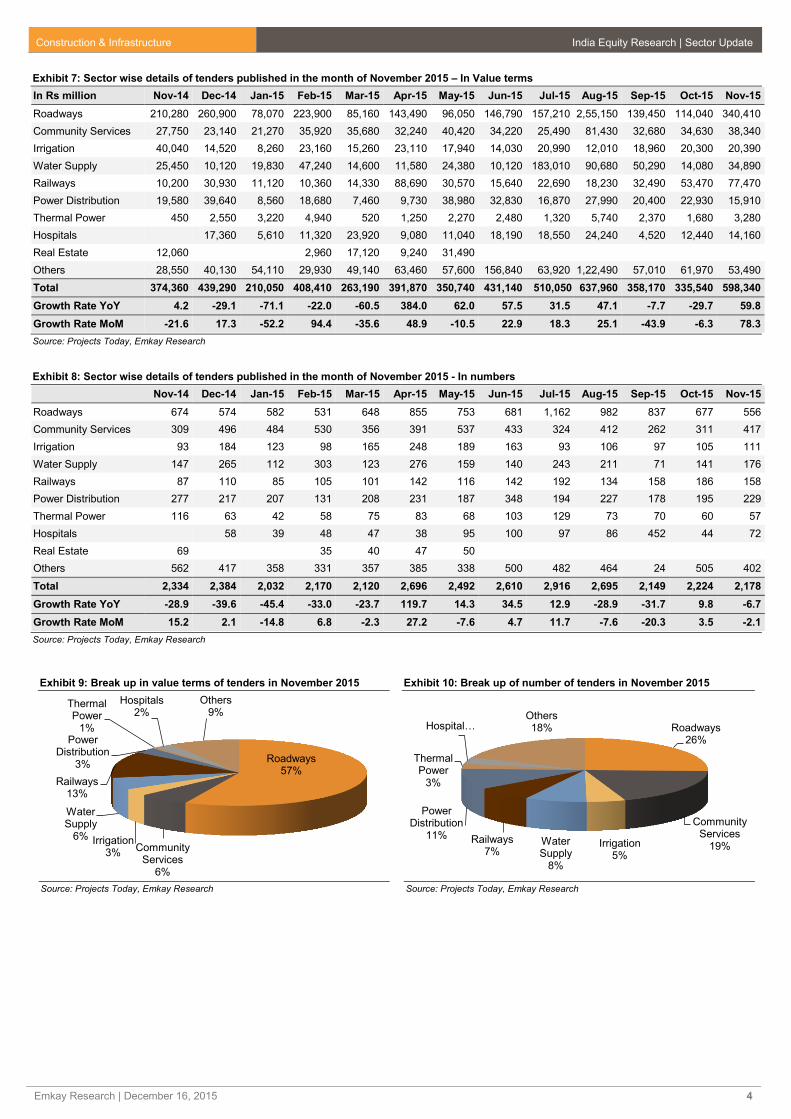
Exhibit 7: Sector wise details of tenders published in the month of November 2015 – In Value terms
In Rs million Nov-14 Dec-14 Jan-15 Feb-15 Mar-15 Apr-15 May-15 Jun-15 Jul-15 Aug-15 Sep-15 Oct-15 Nov-15
Roadways 210,280 260,900 78,070 223,900 85,160 143,490 96,050 146,790 157,210 2,55,150 139,450 114,040 340,410
Community Services 27,750 23,140 21,270 35,920 35,680 32,240 40,420 34,220 25,490 81,430 32,680 34,630 38,340
Irrigation 40,040 14,520 8,260 23,160 15,260 23,110 17,940 14,030 20,990 12,010 18,960 20,300 20,390
Water Supply 25,450 10,120 19,830 47,240 14,600 11,580 24,380 10,120 183,010 90,680 50,290 14,080 34,890
Railways 10,200 30,930 11,120 10,360 14,330 88,690 30,570 15,640 22,690 18,230 32,490 53,470 77,470
Power Distribution 19,580 39,640 8,560 18,680 7,460 9,730 38,980 32,830 16,870 27,990 20,400 22,930 15,910
Thermal Power 450 2,550 3,220 4,940 520 1,250 2,270 2,480 1,320 5,740 2,370 1,680 3,280
Hospitals 17,360 5,610 11,320 23,920 9,080 11,040 18,190 18,550 24,240 4,520 12,440 14,160
Real Estate 12,060 2,960 17,120 9,240 31,490
Others 28,550 40,130 54,110 29,930 49,140 63,460 57,600 156,840 63,920 1,22,490 57,010 61,970 53,490
Total 374,360 439,290 210,050 408,410 263,190 391,870 350,740 431,140 510,050 637,960 358,170 335,540 598,340
Growth Rate YoY 4.2 -29.1 -71.1 -22.0 -60.5 384.0 62.0 57.5 31.5 47.1 -7.7 -29.7 59.8
Growth Rate MoM -21.6 17.3 -52.2 94.4 -35.6 48.9 -10.5 22.9 18.3 25.1 -43.9 -6.3 78.3
Source: Projects Today, Emkay Research
Exhibit 8: Sector wise details of tenders published in the month of November 2015 - In numbers
Nov-14 Dec-14 Jan-15 Feb-15 Mar-15 Apr-15 May-15 Jun-15 Jul-15 Aug-15 Sep-15 Oct-15 Nov-15
Roadways 674 574 582 531 648 855 753 681 1,162 982 837 677 556
Community Services 309 496 484 530 356 391 537 433 324 412 262 311 417
Irrigation 93 184 123 98 165 248 189 163 93 106 97 105 111
Water Supply 147 265 112 303 123 276 159 140 243 211 71 141 176
Railways 87 110 85 105 101 142 116 142 192 134 158 186 158
Power Distribution 277 217 207 131 208 231 187 348 194 227 178 195 229
Thermal Power 116 63 42 58 75 83 68 103 129 73 70 60 57
Hospitals 58 39 48 47 38 95 100 97 86 452 44 72
Real Estate 69 35 40 47 50
Others 562 417 358 331 357 385 338 500 482 464 24 505 402
Total 2,334 2,384 2,032 2,170 2,120 2,696 2,492 2,610 2,916 2,695 2,149 2,224 2,178
Growth Rate YoY -28.9 -39.6 -45.4 -33.0 -23.7 119.7 14.3 34.5 12.9 -28.9 -31.7 9.8 -6.7
Growth Rate MoM 15.2 2.1 -14.8 6.8 -2.3 27.2 -7.6 4.7 11.7 -7.6 -20.3 3.5 -2.1
Source: Projects Today, Emkay Research
Exhibit 9: Break up in value terms of tenders in November 2015
Source: Projects Today, Emkay Research
Exhibit 10: Break up of number of tenders in November 2015
Source: Projects Today, Emkay Research
Roadways57%
Community Services
6%
Irrigation3%
Water Supply
6%
Railways13%
Power Distribution
3%
Thermal Power
1%
Hospitals2%
Others9%
Roadways26%
Community Services
19%Irrigation5%
Water Supply
8%
Railways7%
Power Distribution
11%
Thermal Power
3%
Hospital…Others18%

Construction & Infrastructure India Equity Research | Sector Update
Emkay Research | December 16, 2015 5
Exhibit 11: YTDFY16, improvement seen in most segments (Value terms)
Source: Projects Today, Emkay Research
Exhibit 12: YTDFY16, improvement seen in most segments (No. of Contracts)
Source: Projects Today, Emkay Research
Exhibit 13: Tenders in numbers terms down 17.5% YoY
Source: Projects Today, Emkay Research
Exhibit 14: Road tenders in value terms +61.9% YoY
Source: Projects Today, Emkay Research
Exhibit 15: Tenders in Number terms +19.4% YoY
Source: Projects Today, Emkay Research
Exhibit 16: Irrigation tenders in value terms -49.1% YoY
Source: Projects Today, Emkay Research
Exhibit 17: Tenders in number terms +19.7% YoY
Source: Projects Today, Emkay Research
Exhibit 18: Water supply tenders in value terms up 37.1% YoY
Source: Projects Today, Emkay Research
0 500000 1000000 1500000
Roadways
Community Services
Irrigation
Water Supply
Railways
Power Distribution
Thermal Power
Hospitals
Real Estate
OthersRs Million
YTDFY15 YTDFY16
0 2000 4000 6000 8000
Roadways
Community Services
Irrigation
Water Supply
Railways
Power Distribution
Thermal Power
Hospitals
Real Estate
Others Number of Contacts
YTDFY15 YTDFY16
-100
-50
0
50
100
150
200
0
1000
2000
Nov-13 Mar-14 Jul-14 Nov-14 Mar-15 Jul-15 Nov-15
YoY
Gro
wth
(%
)
No. of T
enders
Roadways YOY - Growth
-200
-100
0
100
200
300
400
500
600
700
0
100000
200000
300000
400000
Nov-13 Mar-14 Jul-14 Nov-14 Mar-15 Jul-15 Nov-15
YoY
Gro
wth
(%
)
In R
s M
n
Roadways YOY - Growth
-150
-100
-50
0
50
100
150
0
50
100
150
200
250
300
Nov-13 Mar-14 Jul-14 Nov-14 Mar-15 Jul-15 Nov-15
YoY
Gro
wth
(%
)
No. of T
enders
Irrigation YOY - Growth
-150
-100
-50
0
50
100
150
200
0
10000
20000
30000
40000
50000
60000
70000
Nov-13 Mar-14 Jul-14 Nov-14 Mar-15 Jul-15 Nov-15
YoY
Gro
wth
(%
)
In R
s M
n
Irrigation YOY - Growth
-150
-100
-50
0
50
100
0
50
100
150
200
250
300
350
Nov-13 Mar-14 Jul-14 Nov-14 Mar-15 Jul-15 Nov-15
YoY
Gro
wth
(%
)
No. of T
enders
Water Supply YOY - Growth
-200
0
200
400
600
800
0
50000
100000
150000
200000
Nov-13 Mar-14 Jul-14 Nov-14 Mar-15 Jul-15 Nov-15
YoY
Gro
wth
(%
)
In R
s M
n
Water Supply YOY - Growth
Construction & Infrastructure India Equity Research | Sector Update
Emkay Research | December 16, 2015 6
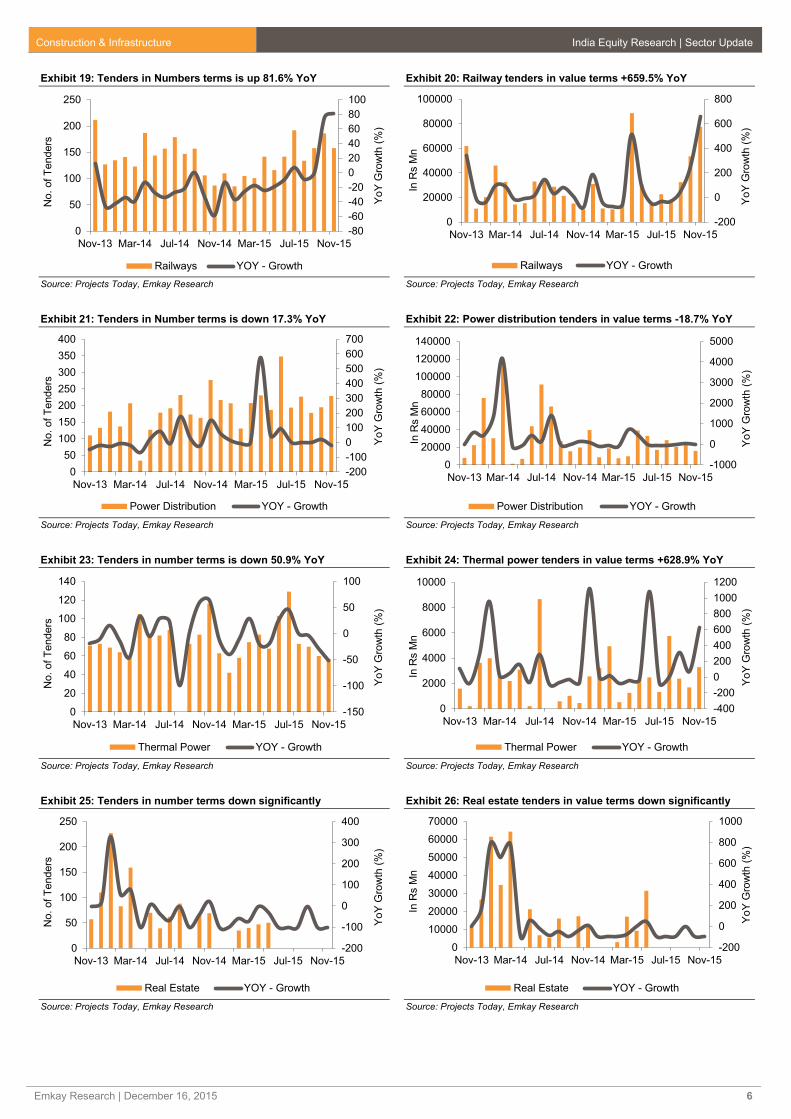
Exhibit 19: Tenders in Numbers terms is up 81.6% YoY
Source: Projects Today, Emkay Research
Exhibit 20: Railway tenders in value terms +659.5% YoY
Source: Projects Today, Emkay Research
Exhibit 21: Tenders in Number terms is down 17.3% YoY
Source: Projects Today, Emkay Research
Exhibit 22: Power distribution tenders in value terms -18.7% YoY
Source: Projects Today, Emkay Research
Exhibit 23: Tenders in number terms is down 50.9% YoY
Source: Projects Today, Emkay Research
Exhibit 24: Thermal power tenders in value terms +628.9% YoY
Source: Projects Today, Emkay Research
Exhibit 25: Tenders in number terms down significantly
Source: Projects Today, Emkay Research
Exhibit 26: Real estate tenders in value terms down significantly
Source: Projects Today, Emkay Research
-80
-60
-40
-20
0
20
40
60
80
100
0
50
100
150
200
250
Nov-13 Mar-14 Jul-14 Nov-14 Mar-15 Jul-15 Nov-15
YoY
Gro
wth
(%
)
No. of T
enders
Railways YOY - Growth
-200
0
200
400
600
800
0
20000
40000
60000
80000
100000
Nov-13 Mar-14 Jul-14 Nov-14 Mar-15 Jul-15 Nov-15
YoY
Gro
wth
(%
)
In R
s M
n
Railways YOY - Growth
-200
-100
0
100
200
300
400
500
600
700
0
50
100
150
200
250
300
350
400
Nov-13 Mar-14 Jul-14 Nov-14 Mar-15 Jul-15 Nov-15
YoY
Gro
wth
(%
)
No. of T
enders
Power Distribution YOY - Growth
-1000
0
1000
2000
3000
4000
5000
0
20000
40000
60000
80000
100000
120000
140000
Nov-13 Mar-14 Jul-14 Nov-14 Mar-15 Jul-15 Nov-15
YoY
Gro
wth
(%
)
In R
s M
n
Power Distribution YOY - Growth
-150
-100
-50
0
50
100
0
20
40
60
80
100
120
140
Nov-13 Mar-14 Jul-14 Nov-14 Mar-15 Jul-15 Nov-15
YoY
Gro
wth
(%
)
No. of T
enders
Thermal Power YOY - Growth
-400
-200
0
200
400
600
800
1000
1200
0
2000
4000
6000
8000
10000
Nov-13 Mar-14 Jul-14 Nov-14 Mar-15 Jul-15 Nov-15
YoY
Gro
wth
(%
)
In R
s M
n
Thermal Power YOY - Growth
-200
-100
0
100
200
300
400
0
50
100
150
200
250
Nov-13 Mar-14 Jul-14 Nov-14 Mar-15 Jul-15 Nov-15
YoY
Gro
wth
(%
)
No. of T
enders
Real Estate YOY - Growth
-200
0
200
400
600
800
1000
0
10000
20000
30000
40000
50000
60000
70000
Nov-13 Mar-14 Jul-14 Nov-14 Mar-15 Jul-15 Nov-15
YoY
Gro
wth
(%
)
In R
s M
n
Real Estate YOY - Growth
Construction & Infrastructure India Equity Research | Sector Update
Emkay Research | December 16, 2015 7
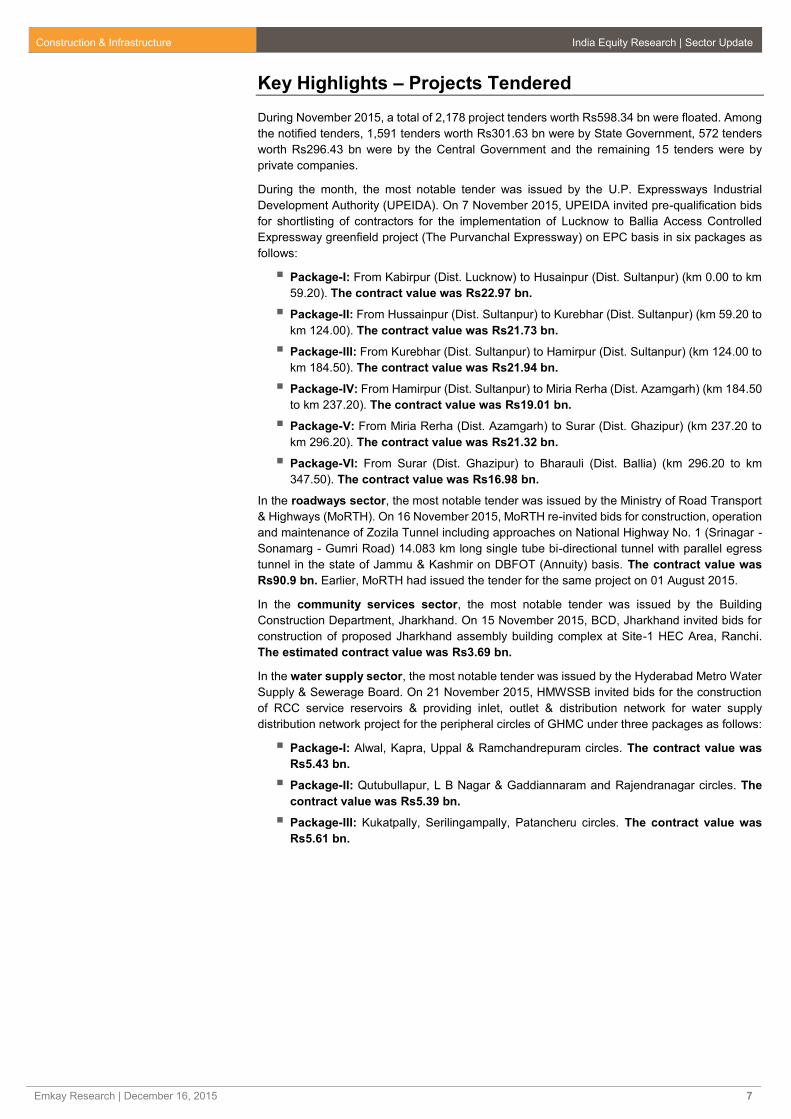
Key Highlights – Projects Tendered
During November 2015, a total of 2,178 project tenders worth Rs598.34 bn were floated. Among
the notified tenders, 1,591 tenders worth Rs301.63 bn were by State Government, 572 tenders
worth Rs296.43 bn were by the Central Government and the remaining 15 tenders were by
private companies.
During the month, the most notable tender was issued by the U.P. Expressways Industrial
Development Authority (UPEIDA). On 7 November 2015, UPEIDA invited pre-qualification bids
for shortlisting of contractors for the implementation of Lucknow to Ballia Access Controlled
Expressway greenfield project (The Purvanchal Expressway) on EPC basis in six packages as
follows:
Package-I: From Kabirpur (Dist. Lucknow) to Husainpur (Dist. Sultanpur) (km 0.00 to km
59.20). The contract value was Rs22.97 bn.
Package-II: From Hussainpur (Dist. Sultanpur) to Kurebhar (Dist. Sultanpur) (km 59.20 to
km 124.00). The contract value was Rs21.73 bn.
Package-III: From Kurebhar (Dist. Sultanpur) to Hamirpur (Dist. Sultanpur) (km 124.00 to
km 184.50). The contract value was Rs21.94 bn.
Package-IV: From Hamirpur (Dist. Sultanpur) to Miria Rerha (Dist. Azamgarh) (km 184.50
to km 237.20). The contract value was Rs19.01 bn.
Package-V: From Miria Rerha (Dist. Azamgarh) to Surar (Dist. Ghazipur) (km 237.20 to
km 296.20). The contract value was Rs21.32 bn.
Package-VI: From Surar (Dist. Ghazipur) to Bharauli (Dist. Ballia) (km 296.20 to km
347.50). The contract value was Rs16.98 bn.
In the roadways sector, the most notable tender was issued by the Ministry of Road Transport
& Highways (MoRTH). On 16 November 2015, MoRTH re-invited bids for construction, operation
and maintenance of Zozila Tunnel including approaches on National Highway No. 1 (Srinagar -
Sonamarg - Gumri Road) 14.083 km long single tube bi-directional tunnel with parallel egress
tunnel in the state of Jammu & Kashmir on DBFOT (Annuity) basis. The contract value was
Rs90.9 bn. Earlier, MoRTH had issued the tender for the same project on 01 August 2015.
In the community services sector, the most notable tender was issued by the Building
Construction Department, Jharkhand. On 15 November 2015, BCD, Jharkhand invited bids for
construction of proposed Jharkhand assembly building complex at Site-1 HEC Area, Ranchi.
The estimated contract value was Rs3.69 bn.
In the water supply sector, the most notable tender was issued by the Hyderabad Metro Water
Supply & Sewerage Board. On 21 November 2015, HMWSSB invited bids for the construction
of RCC service reservoirs & providing inlet, outlet & distribution network for water supply
distribution network project for the peripheral circles of GHMC under three packages as follows:
Package-I: Alwal, Kapra, Uppal & Ramchandrepuram circles. The contract value was
Rs5.43 bn.
Package-II: Qutubullapur, L B Nagar & Gaddiannaram and Rajendranagar circles. The
contract value was Rs5.39 bn.
Package-III: Kukatpally, Serilingampally, Patancheru circles. The contract value was
Rs5.61 bn.

Construction & Infrastructure India Equity Research | Sector Update
Emkay Research | December 16, 2015 8
Projects Awarded
Total value of contracts awarded in November 2015 stood at Rs312.5 bn (+117.6% YoY)
driven by railways sector (+204% YoY, 49% of total projects awarded in Nov2015), power
equipment sector (+208.5% YoY, 16% of total projects awarded in Nov2015). GE Global
Sourcing India Pvt. Ltd was awarded Rs146.6 bn project by Indian Railways for setting up
a diesel locomotive factory in Bihar.
Total value of contracts awarded in YTDFY16 stood at Rs2208 bn (+27% YoY). We
witnessed growth in awarding in roadways (+152.5% YoY), railways (79.2% YoY), water
(+78.8% YoY) and power distribution (30% YoY).
In November 2015, domestic awards increased to Rs284.4 bn (+111.7% YoY,) and
international awards during the month increased to Rs28.1 bn (204.1% YoY).
Domestic awards on YTDFY16 basis stood at Rs1819.5 bn (+45.8% YoY) while
international awards stood at Rs388.7 bn (-20.8% YoY).
Exhibit 27: Nov 2015, projects awarded in value terms +29.3% MoM
Source: Projects Today, Emkay Research
Exhibit 28: Nov 2015, projects awarded in number terms +17.5% MoM
Source: Projects Today, Emkay Research
Exhibit 29: Nov 2015, projects awarded up 117.6% YoY
Source: Projects Today, Emkay Research
Exhibit 30: Nov 2015, projects awarded number terms +53.4% YoY
Source: Projects Today, Emkay Research
Exhibit 31: YTDFY16 projects awarded up 27% YoY
Source: Projects Today, Emkay Research
Exhibit 32: In YTDFY16 projects awarded in number terms +6.4% YoY
Source: Projects Today, Emkay Research
-100
-50
0
50
100
150
200
250
300
0
100000
200000
300000
400000
500000
Nov-13 Mar-14 Jul-14 Nov-14 Mar-15 Jul-15 Nov-15
In %
Te
rms
Rs M
illio
n
Indian Overseas Growth Rate MoM
-100
-50
0
50
100
150
0
50
100
150
200
250
300
Nov-13 Mar-14 Jul-14 Nov-14 Mar-15 Jul-15 Nov-15
In %
Term
s
No. of A
ward
s
Indian Overseas Growth Rate MoM
-100
0
100
200
300
400
Nov-13 Mar-14 Jul-14 Nov-14 Mar-15 Jul-15 Nov-15
YoY
Gro
wth
(%
)
-100
0
100
200
300
400
500
Nov-13 Mar-14 Jul-14 Nov-14 Mar-15 Jul-15 Nov-15
YoY
Gro
wth
(%
)
0
500
1000
1500
2000
2500
YT
DF
Y1
1
YT
DF
Y1
2
YT
DF
Y1
3
YT
DF
Y1
4
YT
DF
Y1
5
YT
DF
Y1
6
In R
s b
n
0
200
400
600
800
1000
1200
1400
1600
YT
DF
Y1
1
YT
DF
Y1
2
YT
DF
Y1
3
YT
DF
Y1
4
YT
DF
Y1
5
YT
DF
Y1
6
In N
um
bers
Construction & Infrastructure India Equity Research | Sector Update
Emkay Research | December 16, 2015 9
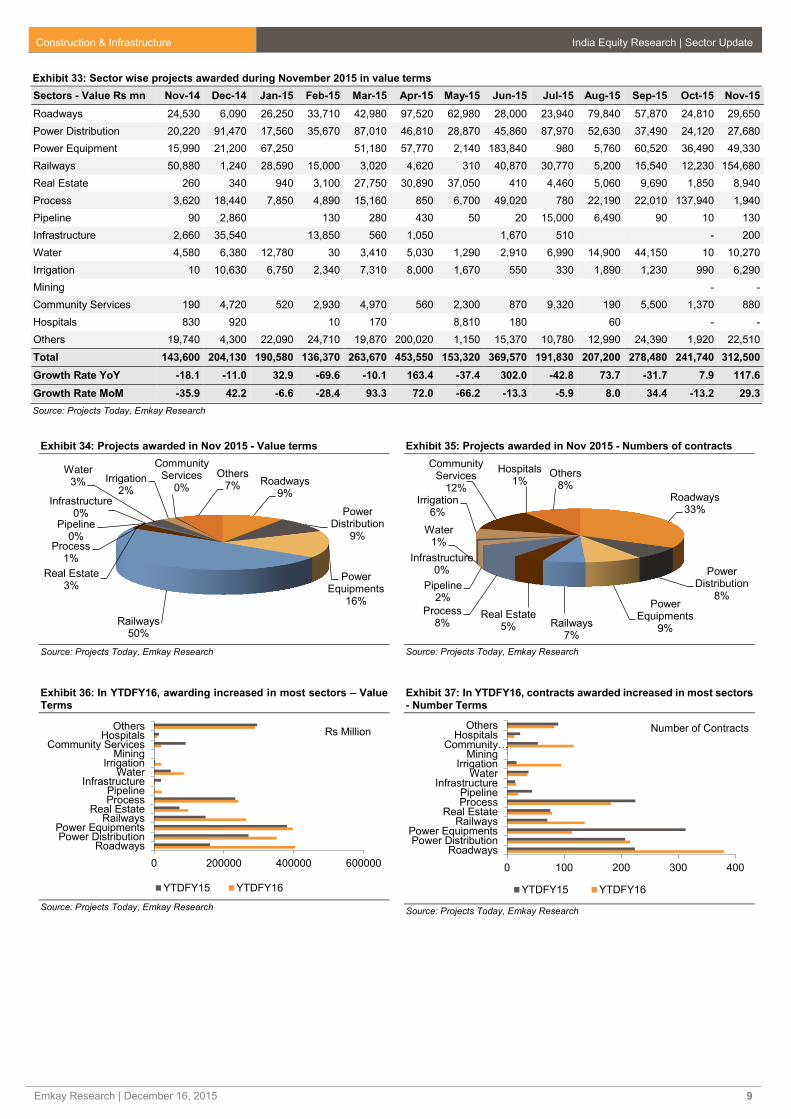
Exhibit 33: Sector wise projects awarded during November 2015 in value terms
Sectors - Value Rs mn Nov-14 Dec-14 Jan-15 Feb-15 Mar-15 Apr-15 May-15 Jun-15 Jul-15 Aug-15 Sep-15 Oct-15 Nov-15
Roadways 24,530 6,090 26,250 33,710 42,980 97,520 62,980 28,000 23,940 79,840 57,870 24,810 29,650
Power Distribution 20,220 91,470 17,560 35,670 87,010 46,810 28,870 45,860 87,970 52,630 37,490 24,120 27,680
Power Equipment 15,990 21,200 67,250 51,180 57,770 2,140 183,840 980 5,760 60,520 36,490 49,330
Railways 50,880 1,240 28,590 15,000 3,020 4,620 310 40,870 30,770 5,200 15,540 12,230 154,680
Real Estate 260 340 940 3,100 27,750 30,890 37,050 410 4,460 5,060 9,690 1,850 8,940
Process 3,620 18,440 7,850 4,890 15,160 850 6,700 49,020 780 22,190 22,010 137,940 1,940
Pipeline 90 2,860 130 280 430 50 20 15,000 6,490 90 10 130
Infrastructure 2,660 35,540 13,850 560 1,050 1,670 510 - 200
Water 4,580 6,380 12,780 30 3,410 5,030 1,290 2,910 6,990 14,900 44,150 10 10,270
Irrigation 10 10,630 6,750 2,340 7,310 8,000 1,670 550 330 1,890 1,230 990 6,290
Mining - -
Community Services 190 4,720 520 2,930 4,970 560 2,300 870 9,320 190 5,500 1,370 880
Hospitals 830 920 10 170 8,810 180 60 - -
Others 19,740 4,300 22,090 24,710 19,870 200,020 1,150 15,370 10,780 12,990 24,390 1,920 22,510
Total 143,600 204,130 190,580 136,370 263,670 453,550 153,320 369,570 191,830 207,200 278,480 241,740 312,500
Growth Rate YoY -18.1 -11.0 32.9 -69.6 -10.1 163.4 -37.4 302.0 -42.8 73.7 -31.7 7.9 117.6
Growth Rate MoM -35.9 42.2 -6.6 -28.4 93.3 72.0 -66.2 -13.3 -5.9 8.0 34.4 -13.2 29.3
Source: Projects Today, Emkay Research
Exhibit 34: Projects awarded in Nov 2015 - Value terms
Source: Projects Today, Emkay Research
Exhibit 35: Projects awarded in Nov 2015 - Numbers of contracts
Source: Projects Today, Emkay Research
Exhibit 36: In YTDFY16, awarding increased in most sectors – Value Terms
Source: Projects Today, Emkay Research
Exhibit 37: In YTDFY16, contracts awarded increased in most sectors - Number Terms
Source: Projects Today, Emkay Research
Roadways9%
Power Distribution
9%
Power Equipments
16%
Railways50%
Real Estate3%
Process1%
Pipeline0%
Infrastructure0%
Water3% Irrigation
2%
Community Services
0%
Others7%
Roadways33%
Power Distribution
8%Power
Equipments9%
Railways7%
Real Estate5%
Process8%
Pipeline2%
Infrastructure0%
Water1%
Irrigation6%
Community Services
12%
Hospitals1%
Others8%
0 200000 400000 600000
RoadwaysPower DistributionPower Equipments
RailwaysReal Estate
ProcessPipeline
InfrastructureWater
IrrigationMining
Community ServicesHospitals
OthersRs Million
YTDFY15 YTDFY16
0 100 200 300 400
RoadwaysPower Distribution
Power EquipmentsRailways
Real EstateProcessPipeline
InfrastructureWater
IrrigationMining
Community…Hospitals
Others Number of Contracts
YTDFY15 YTDFY16

Construction & Infrastructure India Equity Research | Sector Update
Emkay Research | December 16, 2015 10
Exhibit 38: Projects awarded November 2015 up 20.9% YoY
Source: Projects Today, Emkay Research
Exhibit 39: Projects awarded in November 2015 up significantly YoY
Source: Projects Today, Emkay Research
Exhibit 40: Projects awarded November 2015 +124.2% YoY
Source: Projects Today, Emkay Research
Exhibit 41: Projects awarded November 2015 up 2044% YoY
Source: Projects Today, Emkay Research
Exhibit 42: Projects awarded November 2015 up 36.9% YoY
Source: Projects Today, Emkay Research
Exhibit 43: Projects awarded November 2015 up 208.5% YoY
Source: Projects Today, Emkay Research
Exhibit 44: Projects awarded November 2015 up significantly YoY
Source: Projects Today, Emkay Research
Exhibit 45: Projects awarded November 2015 down 13.7% YoY
Source: Projects Today, Emkay Research
-500
0
500
1000
1500
0
20000
40000
60000
80000
100000
120000
Nov-13 Mar-14 Jul-14 Nov-14 Mar-15 Jul-15 Nov-15
YoY
Gro
wth
(%
)
In R
s M
n
Roadways
Roadways YoY - Growth
-20000
0
20000
40000
60000
80000
0
10000
20000
30000
40000
50000
Nov-13 Mar-14 Jul-14 Nov-14 Mar-15 Jul-15 Nov-15
YoY
Gro
wth
(%
)
In R
s M
n
Irrigation
Irrigation YoY - Growth
-5000
0
5000
10000
15000
0
10000
20000
30000
40000
50000
Nov-13 Mar-14 Jul-14 Nov-14 Mar-15 Jul-15 Nov-15
YoY
Gro
wth
(%
)
In R
s M
n
Water
Water YoY - Growth
-500
0
500
1000
1500
2000
2500
0
50000
100000
150000
200000
Nov-13
Mar-14 Jul-14 Nov-14
Mar-15 Jul-15 Nov-15
YoY
Gro
wth
(%
)
In R
s M
n
Railways
Railways YoY - Growth
-2000
0
2000
4000
6000
0
20000
40000
60000
80000
100000
Nov-13 Mar-14 Jul-14 Nov-14 Mar-15 Jul-15 Nov-15
YoY
Gro
wth
(%
)
In R
s M
n
Power Distribution
Power Distribution YoY - Growth
-500
0
500
1000
1500
2000
0
50,000
100,000
150,000
200,000
250,000
Nov-13 Mar-14 Jul-14 Nov-14 Mar-15 Jul-15 Nov-15
YoY
Gro
wth
(%
)
In R
s M
n
Power Equipments
Power Equipments YoY - Growth
-1000
0
1000
2000
3000
4000
0
10000
20000
30000
40000
Nov-13 Mar-14 Jul-14 Nov-14 Mar-15 Jul-15 Nov-15
YoY
Gro
wth
(%
)
In R
s M
n
Real Estate
Real Estate YoY - Growth
-2000
0
2000
4000
6000
8000
10000
0
10000
20000
30000
40000
50000
Nov-13 Mar-14 Jul-14 Nov-14 Mar-15 Jul-15 Nov-15
YoY
Gro
wth
(%
)
In R
s M
n
Community Services + Hospitals
Community Services + Hospitals YoY - Growth

Construction & Infrastructure India Equity Research | Sector Update
Emkay Research | December 16, 2015 11
Key Highlights – Projects Awarded
During November 2015, a total of 135 contracts with order value totaling Rs303.01 bn were
awarded. These orders (domestic as well as overseas) were bagged by 102 companies across
various sectors. Further, of the 135 finalized contracts, 5 were bagged by Indian companies to
execute job work overseas.
Indian Railways issued Letter of Award (LoA) for setting up of the Diesel Locomotive Factory at
Marhowra in Saran district of Bihar to USA-based company M/s. GE Global Sourcing India. A
joint venture company between the Ministry of Railways and GE Global Sourcing India will be
created to build and run the factory. The factory to manufacture and supply Modern Diesel
Electric Locomotives of 4500 HP and 6000 HP to Indian Railways. These locos, in combination
can operate as 9000 HP and 12000 HP multiple units (1000 locos to be manufactured in a period
of ten years).
Bharat Heavy Electricals Limited (BHEL) secured the second largest project orders worth
Rs46.14 bn for setting up two Supercritical Thermal Power projects involving one unit each of
800 MW sets, in Andhra Pradesh. The projects are 1x800 MW Dr. Narla Tata Rao Thermal
Power Station (Dr NTTPS) Stage-V of Andhra Pradesh Power Generation Corporation
(APGENCO) and 1x800 MW Sri Damodaram Sanjeevaiah Thermal Power Station (SDSTPS)
Stage-II, popularly known as Krishnapatnam Supercritical Thermal Power Project, of Andhra
Pradesh Power Development Company (APPDCL). The scope of work in the projects includes
supply, erection and commissioning of boilers, turbines, generators and associated auxiliaries.
The third largest contract, valued at Rs10.24 bn, was bagged by Pratibha Industries from
Government of Telangana, Rural Water Supply & Sanitation Department, TWPS., Circle,
Karimnagar (Water Supply Project) for providing drinking water to habitations in LMD-
Karimnagar, Ramadugu Segment & LMD-Manakondur, Husnabad, Huzurabad Segment in
Telangana including operation and maintenance for 10 years. The project was scheduled for
completion in 30 months.
The roadways sector saw the finalization of 40 new contracts worth Rs26.5 bn. The largest
contract in the sector was finalized by National Highways Authority of India (NHAI), for a Rs6.44
bn job to PNC Infratech for improvement / augmentation of Aligarh-Moradabad section of NH-
93 to two lane with paved shoulders from km 85.650 to km 232.020 in Uttar Pradesh under NHDP
Phase-IV on EPC basis. The project is scheduled for completion in 30 months.
During November 2015, fourteen contracts worth Rs27.69 bn were awarded in the power
distribution sector. Power Grid Corporation of India (PGCIL) owned 11 of the 14 contracts
finalized in the month. However, the largest contract in this sector was finalized by the Saudi
Electricity Company. The company awarded a Rs7.18 bn job to Larsen & Toubro (L&T) for
construction of five 132 kV substations at Hail in Saudi Arabia. The scope involves detailed
design, engineering, construction, testing and commissioning of 132 kV gas insulated
switchgear, 132/13.8 kV, 50/67 MVA power transformers, 132/33 kV, 80/100 MVA power
transformers, 13.8 kV switchgears, 33 kV switchgear, control and protection systems, substation
automation systems, HVAC, Novec firefighting system, along with associated auxiliary system
and civil works.
Overseas Contract
In November 2015, Indian companies bagged five overseas contracts worth Rs28.1 bn in
Heavy/Light Commercial Vehicles, Power Distribution, Crude Oil/POL Pipeline & Solar based
Power sectors from countries like the South Africa, Saudi Arabia, USA & Philippines.
The largest overseas contract, valued at Rs13.34 bn was bagged by Ashok Leyland from
Government of Cote D’Ivoire for supply of 3600 vehicles. This contract is being funded by EXIM
Bank of India and the company has to supply the trucks and buses over the next 12 months.
Construction & Infrastructure India Equity Research | Sector Update
Emkay Research | December 16, 2015 12
Other Developments
The last date for submission of bids for the construction of six lane elevated road from
Basaveshwara Circle to Hebbal Flyover via Le-Meridien Hotel and Mekhri Circle in Bengaluru
was extended up to 26 December 2015.
National Highways Authority of India has cancelled its tender issued on 30 October 2014 for four-
laning of Aunta-Simaria (Ganga Bridge with approach road) section of NH 31 from km 197.900
to 206.050 (design chainage) and (existing chainage km 204.741 to km 209.945 of NH-31) [total
design length - 8.150 km] in the state of Bihar on EPC basis due to change in contract model.
The project is now proposed to be taken up on Hybrid Annuity mode instead of EPC mode.
Lack of participation forced tender issuing authorities to extend the last date of submission of
504 project tenders and cancellation of around four tenders during November 2015.
Construction & Infrastructure India Equity Research | Sector Update
Emkay Research | December 16, 2015 13
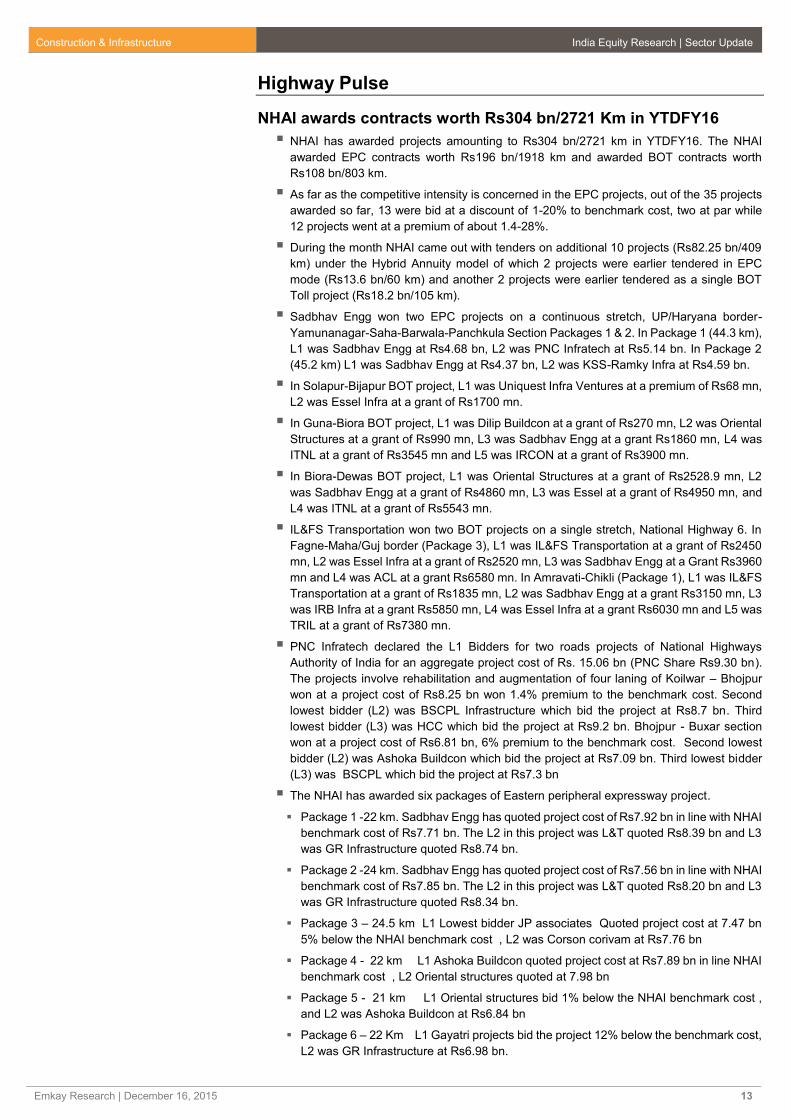
Highway Pulse
NHAI awards contracts worth Rs304 bn/2721 Km in YTDFY16
NHAI has awarded projects amounting to Rs304 bn/2721 km in YTDFY16. The NHAI
awarded EPC contracts worth Rs196 bn/1918 km and awarded BOT contracts worth
Rs108 bn/803 km.
As far as the competitive intensity is concerned in the EPC projects, out of the 35 projects
awarded so far, 13 were bid at a discount of 1-20% to benchmark cost, two at par while
12 projects went at a premium of about 1.4-28%.
During the month NHAI came out with tenders on additional 10 projects (Rs82.25 bn/409
km) under the Hybrid Annuity model of which 2 projects were earlier tendered in EPC
mode (Rs13.6 bn/60 km) and another 2 projects were earlier tendered as a single BOT
Toll project (Rs18.2 bn/105 km).
Sadbhav Engg won two EPC projects on a continuous stretch, UP/Haryana border-
Yamunanagar-Saha-Barwala-Panchkula Section Packages 1 & 2. In Package 1 (44.3 km),
L1 was Sadbhav Engg at Rs4.68 bn, L2 was PNC Infratech at Rs5.14 bn. In Package 2
(45.2 km) L1 was Sadbhav Engg at Rs4.37 bn, L2 was KSS-Ramky Infra at Rs4.59 bn.
In Solapur-Bijapur BOT project, L1 was Uniquest Infra Ventures at a premium of Rs68 mn,
L2 was Essel Infra at a grant of Rs1700 mn.
In Guna-Biora BOT project, L1 was Dilip Buildcon at a grant of Rs270 mn, L2 was Oriental
Structures at a grant of Rs990 mn, L3 was Sadbhav Engg at a grant Rs1860 mn, L4 was
ITNL at a grant of Rs3545 mn and L5 was IRCON at a grant of Rs3900 mn.
In Biora-Dewas BOT project, L1 was Oriental Structures at a grant of Rs2528.9 mn, L2
was Sadbhav Engg at a grant of Rs4860 mn, L3 was Essel at a grant of Rs4950 mn, and
L4 was ITNL at a grant of Rs5543 mn.
IL&FS Transportation won two BOT projects on a single stretch, National Highway 6. In
Fagne-Maha/Guj border (Package 3), L1 was IL&FS Transportation at a grant of Rs2450
mn, L2 was Essel Infra at a grant of Rs2520 mn, L3 was Sadbhav Engg at a Grant Rs3960
mn and L4 was ACL at a grant Rs6580 mn. In Amravati-Chikli (Package 1), L1 was IL&FS
Transportation at a grant of Rs1835 mn, L2 was Sadbhav Engg at a grant Rs3150 mn, L3
was IRB Infra at a grant Rs5850 mn, L4 was Essel Infra at a grant Rs6030 mn and L5 was
TRIL at a grant of Rs7380 mn.
PNC Infratech declared the L1 Bidders for two roads projects of National Highways
Authority of India for an aggregate project cost of Rs. 15.06 bn (PNC Share Rs9.30 bn).
The projects involve rehabilitation and augmentation of four laning of Koilwar – Bhojpur
won at a project cost of Rs8.25 bn won 1.4% premium to the benchmark cost. Second
lowest bidder (L2) was BSCPL Infrastructure which bid the project at Rs8.7 bn. Third
lowest bidder (L3) was HCC which bid the project at Rs9.2 bn. Bhojpur - Buxar section
won at a project cost of Rs6.81 bn, 6% premium to the benchmark cost. Second lowest
bidder (L2) was Ashoka Buildcon which bid the project at Rs7.09 bn. Third lowest bidder
(L3) was BSCPL which bid the project at Rs7.3 bn
The NHAI has awarded six packages of Eastern peripheral expressway project.
Package 1 -22 km. Sadbhav Engg has quoted project cost of Rs7.92 bn in line with NHAI
benchmark cost of Rs7.71 bn. The L2 in this project was L&T quoted Rs8.39 bn and L3
was GR Infrastructure quoted Rs8.74 bn.
Package 2 -24 km. Sadbhav Engg has quoted project cost of Rs7.56 bn in line with NHAI
benchmark cost of Rs7.85 bn. The L2 in this project was L&T quoted Rs8.20 bn and L3
was GR Infrastructure quoted Rs8.34 bn.
Package 3 – 24.5 km L1 Lowest bidder JP associates Quoted project cost at 7.47 bn
5% below the NHAI benchmark cost , L2 was Corson corivam at Rs7.76 bn
Package 4 - 22 km L1 Ashoka Buildcon quoted project cost at Rs7.89 bn in line NHAI
benchmark cost , L2 Oriental structures quoted at 7.98 bn
Package 5 - 21 km L1 Oriental structures bid 1% below the NHAI benchmark cost ,
and L2 was Ashoka Buildcon at Rs6.84 bn
Package 6 – 22 Km L1 Gayatri projects bid the project 12% below the benchmark cost,
L2 was GR Infrastructure at Rs6.98 bn.
Construction & Infrastructure India Equity Research | Sector Update
Emkay Research | December 16, 2015 14
Gayatri Projects won another 4 EPC projects in the state of West Bengal, 2 projects on
the contiguous stretch of NH-233, 4 laning Ghaghra Bridge to Varanasi section, package
1, 60 kms at a premium of 11.1% and package 2, 59 kms at a premium of 14.3%.
L&T won its second NHAI project for the year, in EPC mode, 4 laning of Baharagora to
Singhara section of NH-6 at adiscount of 18.2%.
In September 2015, NHAI awarded the 4 packages of JNPT roads (57 kms) in EPC mode,
of which one package was won by Ashoka Buildcon (10.6 kms, awarded cost Rs4.14 bn)
at a premium of 4.7% while the other three packages were won by a JV of J. Kumar
Infraprojects and J.M. Mhatre Infra (46.3 kms, awarded cost Rs16.34 bn) where J. Kumar
Infra’s share is Rs10.65 bn.
PNC Infratech was declared L1 in the Aligarh Moradabad Road Project (146.4 kms),
awarded at Rs6.45 bn (+28% premium to benchmark), L2 was NCC at Rs7 bn.
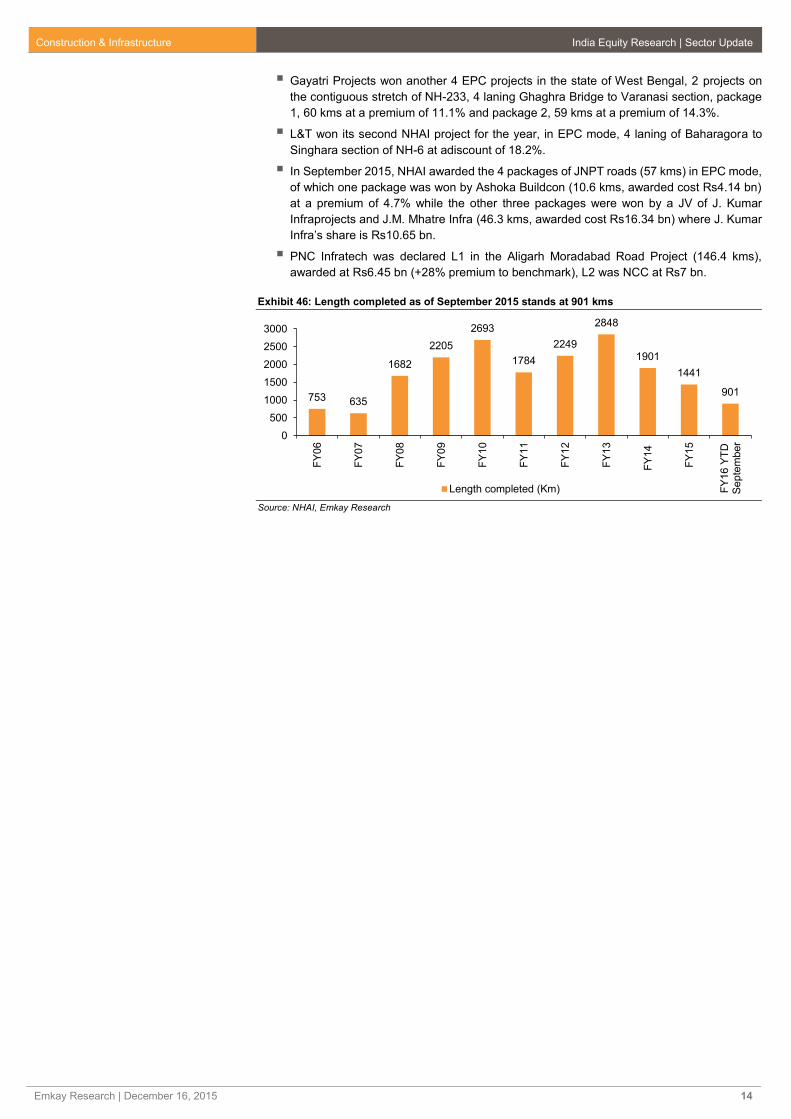
Exhibit 46: Length completed as of September 2015 stands at 901 kms
Source: NHAI, Emkay Research
753 635
1682
2205
2693
1784
2249
2848
1901
1441
901
0
500
1000
1500
2000
2500
3000
FY
06
FY
07
FY
08
FY
09
FY
10
FY
11
FY
12
FY
13
FY
14
FY
15
FY
16 Y
TD
Se
pte
mber
Length completed (Km)
Construction & Infrastructure India Equity Research | Sector Update
Emkay Research | December 16, 2015 15
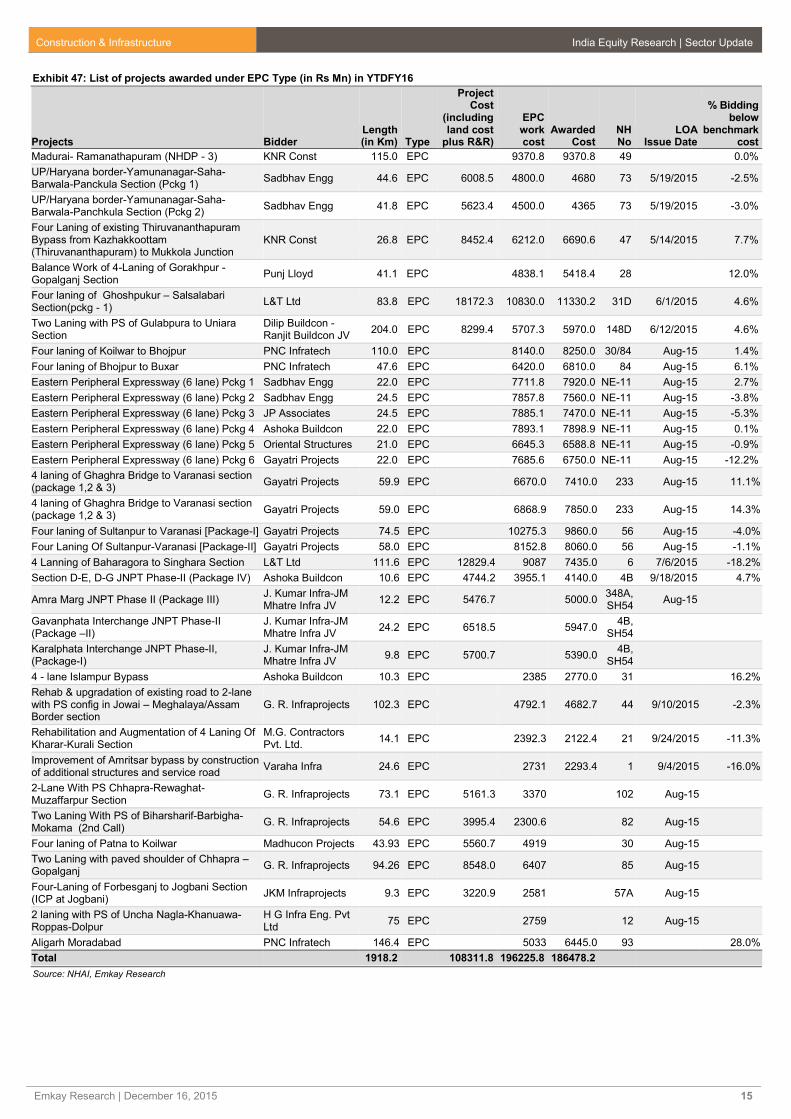
Exhibit 47: List of projects awarded under EPC Type (in Rs Mn) in YTDFY16
Projects Bidder Length (in Km) Type
Project Cost
(including land cost
plus R&R)
EPC work cost
Awarded Cost
NH No
LOA Issue Date
% Bidding below
benchmark cost
Madurai- Ramanathapuram (NHDP - 3) KNR Const 115.0 EPC 9370.8 9370.8 49 0.0%
UP/Haryana border-Yamunanagar-Saha-Barwala-Panckula Section (Pckg 1)
Sadbhav Engg 44.6 EPC 6008.5 4800.0 4680 73 5/19/2015 -2.5%
UP/Haryana border-Yamunanagar-Saha-Barwala-Panchkula Section (Pckg 2)
Sadbhav Engg 41.8 EPC 5623.4 4500.0 4365 73 5/19/2015 -3.0%
Four Laning of existing Thiruvananthapuram Bypass from Kazhakkoottam (Thiruvananthapuram) to Mukkola Junction
KNR Const 26.8 EPC 8452.4 6212.0 6690.6 47 5/14/2015 7.7%
Balance Work of 4-Laning of Gorakhpur - Gopalganj Section
Punj Lloyd 41.1 EPC 4838.1 5418.4 28 12.0%
Four laning of Ghoshpukur – Salsalabari Section(pckg - 1)
L&T Ltd 83.8 EPC 18172.3 10830.0 11330.2 31D 6/1/2015 4.6%
Two Laning with PS of Gulabpura to Uniara Section
Dilip Buildcon - Ranjit Buildcon JV
204.0 EPC 8299.4 5707.3 5970.0 148D 6/12/2015 4.6%
Four laning of Koilwar to Bhojpur PNC Infratech 110.0 EPC 8140.0 8250.0 30/84 Aug-15 1.4%
Four laning of Bhojpur to Buxar PNC Infratech 47.6 EPC 6420.0 6810.0 84 Aug-15 6.1%
Eastern Peripheral Expressway (6 lane) Pckg 1 Sadbhav Engg 22.0 EPC 7711.8 7920.0 NE-11 Aug-15 2.7%
Eastern Peripheral Expressway (6 lane) Pckg 2 Sadbhav Engg 24.5 EPC 7857.8 7560.0 NE-11 Aug-15 -3.8%
Eastern Peripheral Expressway (6 lane) Pckg 3 JP Associates 24.5 EPC 7885.1 7470.0 NE-11 Aug-15 -5.3%
Eastern Peripheral Expressway (6 lane) Pckg 4 Ashoka Buildcon 22.0 EPC 7893.1 7898.9 NE-11 Aug-15 0.1%
Eastern Peripheral Expressway (6 lane) Pckg 5 Oriental Structures 21.0 EPC 6645.3 6588.8 NE-11 Aug-15 -0.9%
Eastern Peripheral Expressway (6 lane) Pckg 6 Gayatri Projects 22.0 EPC 7685.6 6750.0 NE-11 Aug-15 -12.2%
4 laning of Ghaghra Bridge to Varanasi section (package 1,2 & 3)
Gayatri Projects 59.9 EPC 6670.0 7410.0 233 Aug-15 11.1%
4 laning of Ghaghra Bridge to Varanasi section (package 1,2 & 3)
Gayatri Projects 59.0 EPC 6868.9 7850.0 233 Aug-15 14.3%
Four laning of Sultanpur to Varanasi [Package-I] Gayatri Projects 74.5 EPC 10275.3 9860.0 56 Aug-15 -4.0%
Four Laning Of Sultanpur-Varanasi [Package-II] Gayatri Projects 58.0 EPC 8152.8 8060.0 56 Aug-15 -1.1%
4 Lanning of Baharagora to Singhara Section L&T Ltd 111.6 EPC 12829.4 9087 7435.0 6 7/6/2015 -18.2%
Section D-E, D-G JNPT Phase-II (Package IV) Ashoka Buildcon 10.6 EPC 4744.2 3955.1 4140.0 4B 9/18/2015 4.7%
Amra Marg JNPT Phase II (Package III) J. Kumar Infra-JM Mhatre Infra JV
12.2 EPC 5476.7 5000.0 348A, SH54
Aug-15
Gavanphata Interchange JNPT Phase-II (Package –II)
J. Kumar Infra-JM Mhatre Infra JV
24.2 EPC 6518.5 5947.0 4B,
SH54
Karalphata Interchange JNPT Phase-II, (Package-I)
J. Kumar Infra-JM Mhatre Infra JV
9.8 EPC 5700.7 5390.0 4B,
SH54
4 - lane Islampur Bypass Ashoka Buildcon 10.3 EPC 2385 2770.0 31 16.2%
Rehab & upgradation of existing road to 2-lane with PS config in Jowai – Meghalaya/Assam Border section
G. R. Infraprojects 102.3 EPC 4792.1 4682.7 44 9/10/2015 -2.3%
Rehabilitation and Augmentation of 4 Laning Of Kharar-Kurali Section
M.G. Contractors Pvt. Ltd.
14.1 EPC 2392.3 2122.4 21 9/24/2015 -11.3%
Improvement of Amritsar bypass by construction of additional structures and service road
Varaha Infra 24.6 EPC 2731 2293.4 1 9/4/2015 -16.0%
2-Lane With PS Chhapra-Rewaghat-Muzaffarpur Section
G. R. Infraprojects 73.1 EPC 5161.3 3370 102 Aug-15
Two Laning With PS of Biharsharif-Barbigha-Mokama (2nd Call)
G. R. Infraprojects 54.6 EPC 3995.4 2300.6 82 Aug-15
Four laning of Patna to Koilwar Madhucon Projects 43.93 EPC 5560.7 4919 30 Aug-15
Two Laning with paved shoulder of Chhapra – Gopalganj
G. R. Infraprojects 94.26 EPC 8548.0 6407 85 Aug-15
Four-Laning of Forbesganj to Jogbani Section (ICP at Jogbani)
JKM Infraprojects 9.3 EPC 3220.9 2581 57A Aug-15
2 laning with PS of Uncha Nagla-Khanuawa-Roppas-Dolpur
H G Infra Eng. Pvt Ltd
75 EPC 2759 12 Aug-15
Aligarh Moradabad PNC Infratech 146.4 EPC 5033 6445.0 93 28.0%
Total 1918.2 108311.8 196225.8 186478.2
Source: NHAI, Emkay Research
Construction & Infrastructure India Equity Research | Sector Update
Emkay Research | December 16, 2015 16
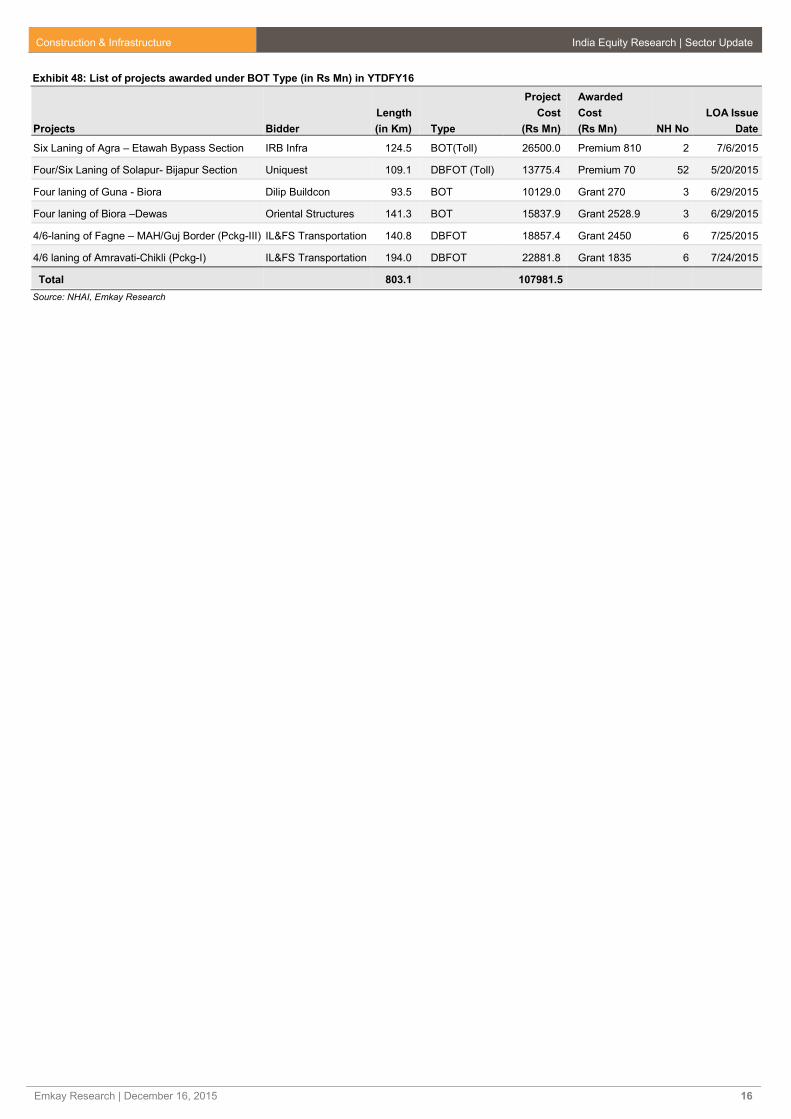
Exhibit 48: List of projects awarded under BOT Type (in Rs Mn) in YTDFY16
Projects Bidder
Length
(in Km) Type
Project
Cost
(Rs Mn)
Awarded
Cost
(Rs Mn) NH No
LOA Issue
Date
Six Laning of Agra – Etawah Bypass Section IRB Infra 124.5 BOT(Toll) 26500.0 Premium 810 2 7/6/2015
Four/Six Laning of Solapur- Bijapur Section Uniquest 109.1 DBFOT (Toll) 13775.4 Premium 70 52 5/20/2015
Four laning of Guna - Biora Dilip Buildcon 93.5 BOT 10129.0 Grant 270 3 6/29/2015
Four laning of Biora –Dewas Oriental Structures 141.3 BOT 15837.9 Grant 2528.9 3 6/29/2015
4/6-laning of Fagne – MAH/Guj Border (Pckg-III) IL&FS Transportation 140.8 DBFOT 18857.4 Grant 2450 6 7/25/2015
4/6 laning of Amravati-Chikli (Pckg-I) IL&FS Transportation 194.0 DBFOT 22881.8 Grant 1835 6 7/24/2015
Total 803.1 107981.5
Source: NHAI, Emkay Research

Construction & Infrastructure India Equity Research | Sector Update
Emkay Research | December 16, 2015 17
Exhibit 49: List of tenders issued under EPC mode
Road Stretch (EPC Route) State NH No. Length
Project
Cost Rsmn
Completion
yrs
Main-
tenance
4-laning of Varanasi Gorakhpur section [Package-III Birnon
Village To Amilla Village] Uttar Pradesh 29 60.0 8523.2 2.5 4
4-laning of Varanasi Gorakhpur section [Package-IV Amilla
Village to Gorakhpur] Uttar Pradesh 29 60.3 10381.5 2.5 4
Four laning of Ghoshpukur – Salsalabari Section (pckg - 2) West Bengal 31D 71.1 9720.0
Two Laning with paved shoulder of Chhapra – Gopalganj Bihar 85 94.3 6406.8
Four laning of Yadgiri- Warangal Section Telangana 163 99.1 11410.0
Four laning of Bakhtiyarpur – Mokama section Bihar 31 44.6 9861.4
Four laning of Simaria- Khagaria Bihar 31 60.2 6072.5
Four laning of Aunta – Simaria (Ganga bridge with approach rd) Bihar 31 8.2 4898.9 2.5 4
Four Laning of Nerchowk-Kullu stretch [Aut-Takoli Section
(Tunnel), Package-V] Himachal Pradesh 21 6.7 5561.1 2.5 4
Four laning of Nerchowk - Kullu stretch [Rehukaldhar - Aut
Section (Tunnel), Package-IV] Himachal Pradesh 21 4.6 5751.4 2.5 4
Nerchowk-Kullu stretch [Bata-Rehukaldhar Section (Tunnel),
Package-III] Himachal Pradesh 21 2.6 3774.3 2.5 4
Four laning of Nerchowk-Kullu stretch [Pandoh-Bata Section
(Tunnel), Package-II] Himachal Pradesh 21 13.0 6907.8 2.5 4
Dalkhola Bypass section from Design Chainage West Bengal 34 5.4 809.3 2 4
4-laning of Varanasi Gorakhpur [package-II from Sandah to
Birnon] Uttar Pradesh 29 76.0 8566.4 2.5 4
Service Road and RCC Drain incld. Storage Lane at Chat
Junction on Ambala-Chandigarh Punjab
22
(new NH-152) 2.8 240.6
Upgradation of Kullu-Manali section from Km 272.00 to Km
309.345 (Designed Chainage) Himachal Pradesh
NH-21
(now NH-3) 37.3 2184.7 2 4
Rehabilitation and upgradation of Birmitrapur – Barkote section
by Two/Four laning of NH – 23 Odisha 23 126.0 8600.5 2.5 4
Four Laning With PS From Chichra To Kharagpur West Bengal 6 50.8 7696.3 2.5 4
Six laning of Kamrej - Chalthan Section Gujarat 8 16.3 2994.4 2 3
Flyover at (km 544/650), including ROB incld Services Roads,
Footpath for RCC drains on Urban link to Nagpur-Raipur road Maharashtra 6 4086 3 4
Four laning of Chandigarh-Kharar section from Sector-39
(Round about) at Chandigarh to Kharar Punjab 21 & 95 10.2 4473 2.5 4
Rehab & Upgradation of Four Laning with PS of Talibani to
Sambalpur Section Odisha 6 50.7 5228 2.5 4
4 Laning of Sargaon- Bilaspuraa (Package III) Chhattisgarh 200
(new NH130) 35.5 4132 2 4
4 Laning of Simga - Sargaon (Package II) Chhattisgarh
200 (new
NH130) 42.4 4784 2 4
4/6 laning of Raipur- Simga (Package I) Chhattisgarh
200 (new
NH130) 48.6 5867 2 4
4- Laning of Vijayawada – Machilipatnam Andhra Pradesh 9 64.6 8711 2 4
Rehab & upgrade of Jharpokharia Baripada Baleshwar section Odisha 5 80.6 8571 2.5 4
Four laning of Haridwar Nagina section Uttarakhand/UP 74 73.0 9895 2.5 4
Four Laning of Nagina-Kashipur section Uttarakhand/UP 74 102.0 12908 2.5 4
Six laning of Kamrej - Chalthan Section Gujarat 8 16.3 2994 2 3
New 4 lane Bridge across Varsova Creek & its approaches with
Interchange on NH-8 (New NH-48) between Surat –Dahisar
section
Maharashtra 8 (New NH-
48) 1651 2 4
Four Laning of Mahulia-Baharagora- JH/WB Border Section of
NH-33 & NH-6 Jharkhand 33 & 6 71.6 8233 2.5 4
ROB cum Flyover at Ranichak upto Haldia Dock Complex West Bengal 41 1889.8 2.5 4
New 4 lane Bridge across Varsova Creek & its approaches with
Interchange on NH-8 (New NH-48) between Surat –Dahisar Maharashtra
8 (New NH-
48) 1651 2 4
Four Laning of Mahulia-Baharagora- JH/WB Border Section of
NH-33 & NH-6 Jharkhand 33 & 6 71.6 8233 2.5 4
Source: NHAI, Emkay Research
Construction & Infrastructure India Equity Research | Sector Update
Emkay Research | December 16, 2015 18
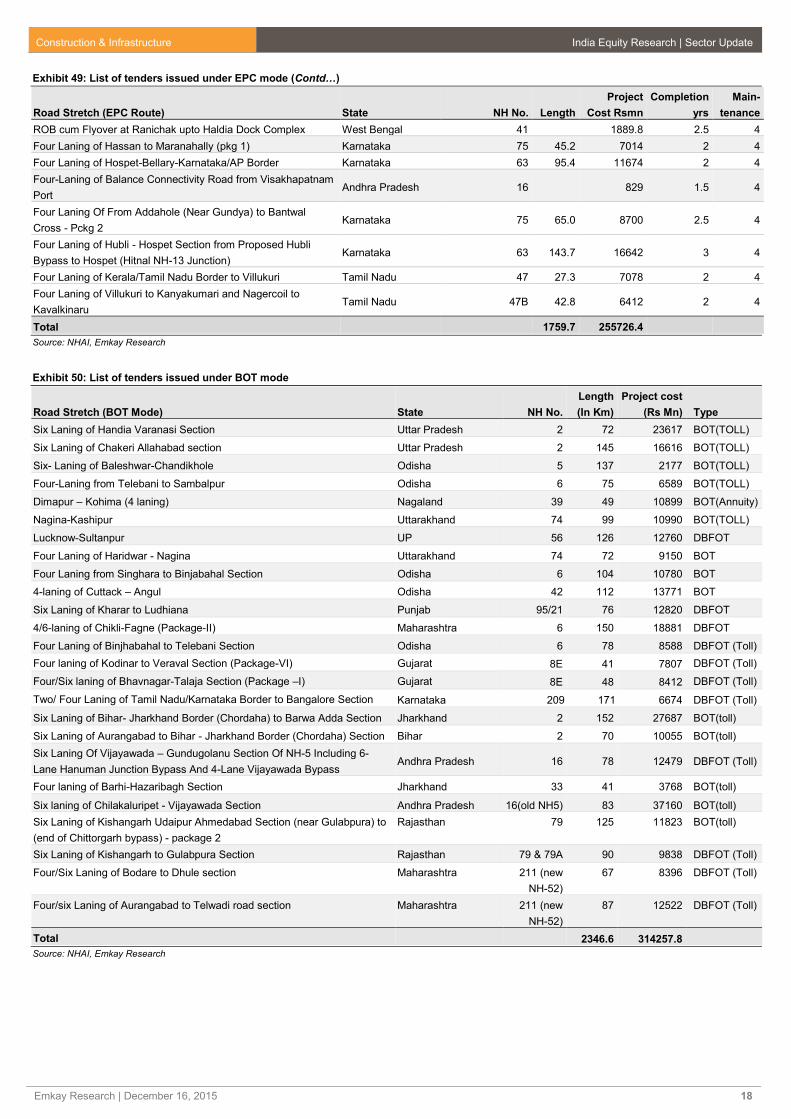
Exhibit 49: List of tenders issued under EPC mode (Contd…)
Road Stretch (EPC Route) State NH No. Length
Project
Cost Rsmn
Completion
yrs
Main-
tenance
ROB cum Flyover at Ranichak upto Haldia Dock Complex West Bengal 41 1889.8 2.5 4
Four Laning of Hassan to Maranahally (pkg 1) Karnataka 75 45.2 7014 2 4
Four Laning of Hospet-Bellary-Karnataka/AP Border Karnataka 63 95.4 11674 2 4
Four-Laning of Balance Connectivity Road from Visakhapatnam
Port Andhra Pradesh 16 829 1.5 4
Four Laning Of From Addahole (Near Gundya) to Bantwal
Cross - Pckg 2 Karnataka 75 65.0 8700 2.5 4
Four Laning of Hubli - Hospet Section from Proposed Hubli
Bypass to Hospet (Hitnal NH-13 Junction) Karnataka 63 143.7 16642 3 4
Four Laning of Kerala/Tamil Nadu Border to Villukuri Tamil Nadu 47 27.3 7078 2 4
Four Laning of Villukuri to Kanyakumari and Nagercoil to
Kavalkinaru Tamil Nadu 47B 42.8 6412 2 4
Total 1759.7 255726.4
Source: NHAI, Emkay Research
Exhibit 50: List of tenders issued under BOT mode
Road Stretch (BOT Mode) State NH No.
Length
(In Km)
Project cost
(Rs Mn) Type
Six Laning of Handia Varanasi Section Uttar Pradesh 2 72 23617 BOT(TOLL)
Six Laning of Chakeri Allahabad section Uttar Pradesh 2 145 16616 BOT(TOLL)
Six- Laning of Baleshwar-Chandikhole Odisha 5 137 2177 BOT(TOLL)
Four-Laning from Telebani to Sambalpur Odisha 6 75 6589 BOT(TOLL)
Dimapur – Kohima (4 laning) Nagaland 39 49 10899 BOT(Annuity)
Nagina-Kashipur Uttarakhand 74 99 10990 BOT(TOLL)
Lucknow-Sultanpur UP 56 126 12760 DBFOT
Four Laning of Haridwar - Nagina Uttarakhand 74 72 9150 BOT
Four Laning from Singhara to Binjabahal Section Odisha 6 104 10780 BOT
4-laning of Cuttack – Angul Odisha 42 112 13771 BOT
Six Laning of Kharar to Ludhiana Punjab 95/21 76 12820 DBFOT
4/6-laning of Chikli-Fagne (Package-II) Maharashtra 6 150 18881 DBFOT
Four Laning of Binjhabahal to Telebani Section Odisha 6 78 8588 DBFOT (Toll)
Four laning of Kodinar to Veraval Section (Package-VI) Gujarat 8E 41 7807 DBFOT (Toll)
Four/Six laning of Bhavnagar-Talaja Section (Package –I) Gujarat 8E 48 8412 DBFOT (Toll)
Two/ Four Laning of Tamil Nadu/Karnataka Border to Bangalore Section Karnataka 209 171 6674 DBFOT (Toll)
Six Laning of Bihar- Jharkhand Border (Chordaha) to Barwa Adda Section Jharkhand 2 152 27687 BOT(toll)
Six Laning of Aurangabad to Bihar - Jharkhand Border (Chordaha) Section Bihar 2 70 10055 BOT(toll)
Six Laning Of Vijayawada – Gundugolanu Section Of NH-5 Including 6-
Lane Hanuman Junction Bypass And 4-Lane Vijayawada Bypass Andhra Pradesh 16 78 12479 DBFOT (Toll)
Four laning of Barhi-Hazaribagh Section Jharkhand 33 41 3768 BOT(toll)
Six laning of Chilakaluripet - Vijayawada Section Andhra Pradesh 16(old NH5) 83 37160 BOT(toll)
Six Laning of Kishangarh Udaipur Ahmedabad Section (near Gulabpura) to
(end of Chittorgarh bypass) - package 2
Rajasthan 79 125 11823 BOT(toll)
Six Laning of Kishangarh to Gulabpura Section Rajasthan 79 & 79A 90 9838 DBFOT (Toll)
Four/Six Laning of Bodare to Dhule section Maharashtra 211 (new
NH-52)
67 8396 DBFOT (Toll)
Four/six Laning of Aurangabad to Telwadi road section Maharashtra 211 (new
NH-52)
87 12522 DBFOT (Toll)
Total 2346.6 314257.8
Source: NHAI, Emkay Research
Construction & Infrastructure India Equity Research | Sector Update
Emkay Research | December 16, 2015 19
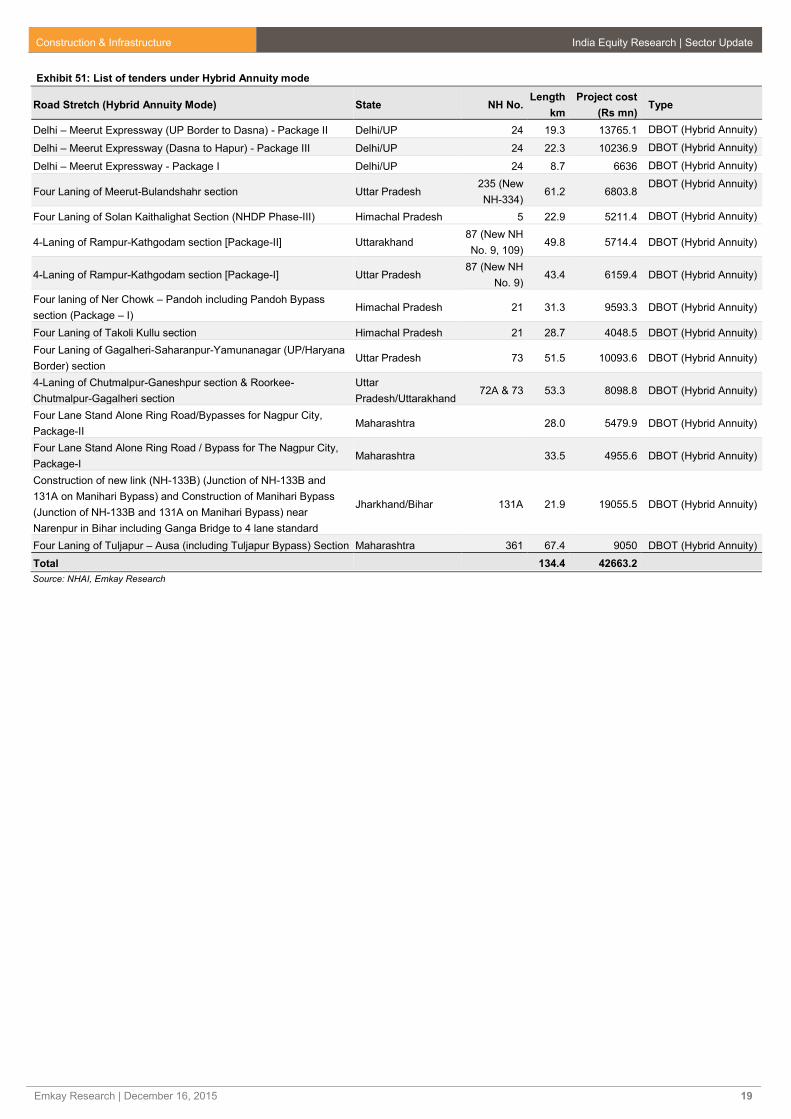
Exhibit 51: List of tenders under Hybrid Annuity mode
Road Stretch (Hybrid Annuity Mode) State NH No. Length
km
Project cost
(Rs mn) Type
Delhi – Meerut Expressway (UP Border to Dasna) - Package II Delhi/UP 24 19.3 13765.1 DBOT (Hybrid Annuity)
Delhi – Meerut Expressway (Dasna to Hapur) - Package III Delhi/UP 24 22.3 10236.9 DBOT (Hybrid Annuity)
Delhi – Meerut Expressway - Package I Delhi/UP 24 8.7 6636 DBOT (Hybrid Annuity)
Four Laning of Meerut-Bulandshahr section Uttar Pradesh 235 (New
NH-334) 61.2 6803.8
DBOT (Hybrid Annuity)
Four Laning of Solan Kaithalighat Section (NHDP Phase-III) Himachal Pradesh 5 22.9 5211.4 DBOT (Hybrid Annuity)
4-Laning of Rampur-Kathgodam section [Package-II] Uttarakhand 87 (New NH
No. 9, 109) 49.8 5714.4 DBOT (Hybrid Annuity)
4-Laning of Rampur-Kathgodam section [Package-I] Uttar Pradesh 87 (New NH
No. 9) 43.4 6159.4 DBOT (Hybrid Annuity)
Four laning of Ner Chowk – Pandoh including Pandoh Bypass
section (Package – I) Himachal Pradesh 21 31.3 9593.3 DBOT (Hybrid Annuity)
Four Laning of Takoli Kullu section Himachal Pradesh 21 28.7 4048.5 DBOT (Hybrid Annuity)
Four Laning of Gagalheri-Saharanpur-Yamunanagar (UP/Haryana
Border) section Uttar Pradesh 73 51.5 10093.6 DBOT (Hybrid Annuity)
4-Laning of Chutmalpur-Ganeshpur section & Roorkee-
Chutmalpur-Gagalheri section
Uttar
Pradesh/Uttarakhand 72A & 73 53.3 8098.8 DBOT (Hybrid Annuity)
Four Lane Stand Alone Ring Road/Bypasses for Nagpur City,
Package-II Maharashtra 28.0 5479.9 DBOT (Hybrid Annuity)
Four Lane Stand Alone Ring Road / Bypass for The Nagpur City,
Package-I Maharashtra 33.5 4955.6 DBOT (Hybrid Annuity)
Construction of new link (NH-133B) (Junction of NH-133B and
131A on Manihari Bypass) and Construction of Manihari Bypass
(Junction of NH-133B and 131A on Manihari Bypass) near
Narenpur in Bihar including Ganga Bridge to 4 lane standard
Jharkhand/Bihar 131A 21.9 19055.5 DBOT (Hybrid Annuity)
Four Laning of Tuljapur – Ausa (including Tuljapur Bypass) Section Maharashtra 361 67.4 9050 DBOT (Hybrid Annuity)
Total 134.4 42663.2
Source: NHAI, Emkay Research
Construction & Infrastructure India Equity Research | Sector Update
Emkay Research | December 16, 2015 20
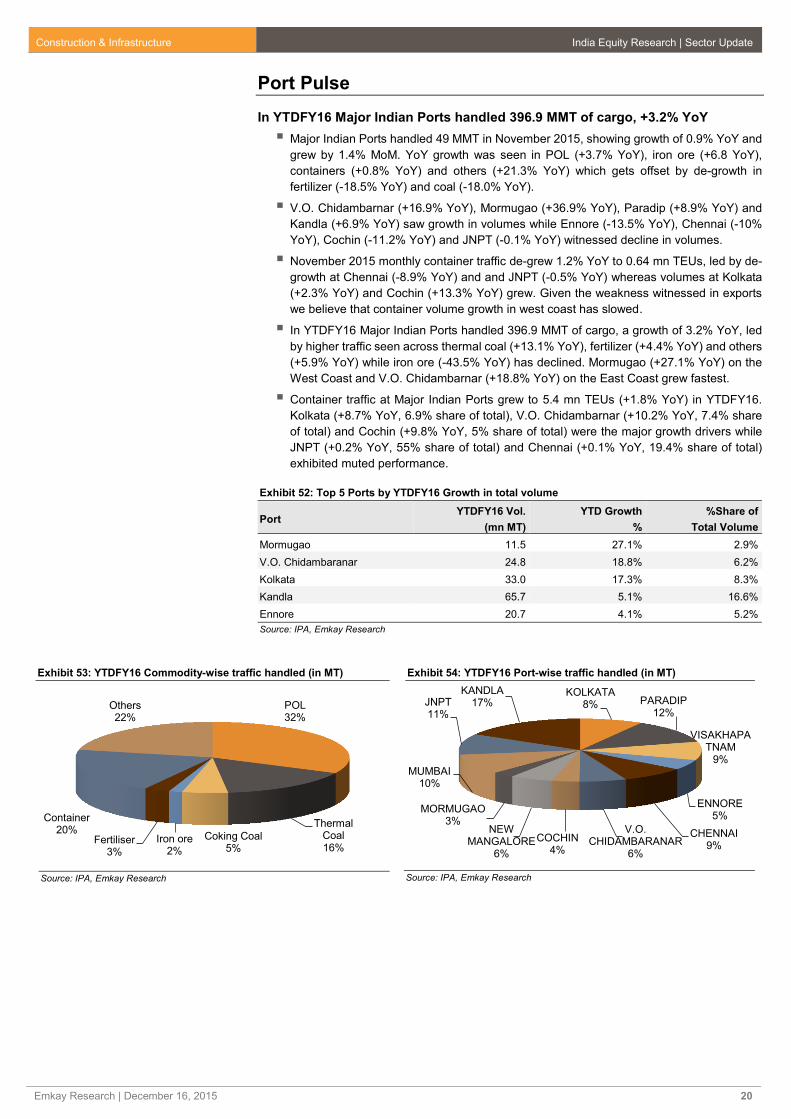
Port Pulse
In YTDFY16 Major Indian Ports handled 396.9 MMT of cargo, +3.2% YoY
Major Indian Ports handled 49 MMT in November 2015, showing growth of 0.9% YoY and
grew by 1.4% MoM. YoY growth was seen in POL (+3.7% YoY), iron ore (+6.8 YoY),
containers (+0.8% YoY) and others (+21.3% YoY) which gets offset by de-growth in
fertilizer (-18.5% YoY) and coal (-18.0% YoY).
V.O. Chidambarnar (+16.9% YoY), Mormugao (+36.9% YoY), Paradip (+8.9% YoY) and
Kandla (+6.9% YoY) saw growth in volumes while Ennore (-13.5% YoY), Chennai (-10%
YoY), Cochin (-11.2% YoY) and JNPT (-0.1% YoY) witnessed decline in volumes.
November 2015 monthly container traffic de-grew 1.2% YoY to 0.64 mn TEUs, led by de-
growth at Chennai (-8.9% YoY) and and JNPT (-0.5% YoY) whereas volumes at Kolkata
(+2.3% YoY) and Cochin (+13.3% YoY) grew. Given the weakness witnessed in exports
we believe that container volume growth in west coast has slowed.
In YTDFY16 Major Indian Ports handled 396.9 MMT of cargo, a growth of 3.2% YoY, led
by higher traffic seen across thermal coal (+13.1% YoY), fertilizer (+4.4% YoY) and others
(+5.9% YoY) while iron ore (-43.5% YoY) has declined. Mormugao (+27.1% YoY) on the
West Coast and V.O. Chidambarnar (+18.8% YoY) on the East Coast grew fastest.
Container traffic at Major Indian Ports grew to 5.4 mn TEUs (+1.8% YoY) in YTDFY16.
Kolkata (+8.7% YoY, 6.9% share of total), V.O. Chidambarnar (+10.2% YoY, 7.4% share
of total) and Cochin (+9.8% YoY, 5% share of total) were the major growth drivers while
JNPT (+0.2% YoY, 55% share of total) and Chennai (+0.1% YoY, 19.4% share of total)
exhibited muted performance.
Exhibit 52: Top 5 Ports by YTDFY16 Growth in total volume
Port YTDFY16 Vol.
(mn MT)
YTD Growth
%
%Share of
Total Volume
Mormugao 11.5 27.1% 2.9%
V.O. Chidambaranar 24.8 18.8% 6.2%
Kolkata 33.0 17.3% 8.3%
Kandla 65.7 5.1% 16.6%
Ennore 20.7 4.1% 5.2%
Source: IPA, Emkay Research
Exhibit 53: YTDFY16 Commodity-wise traffic handled (in MT)
Source: IPA, Emkay Research
Exhibit 54: YTDFY16 Port-wise traffic handled (in MT)
Source: IPA, Emkay Research
POL32%
Thermal Coal16%
Coking Coal5%
Iron ore2%
Fertiliser3%
Container20%
Others22%
KOLKATA8% PARADIP
12%
VISAKHAPATNAM
9%
ENNORE5%
CHENNAI9%
V.O. CHIDAMBARANAR
6%
COCHIN4%
NEW MANGALORE
6%
MORMUGAO3%
MUMBAI10%
JNPT11%
KANDLA17%
Construction & Infrastructure India Equity Research | Sector Update
Emkay Research | December 16, 2015 21
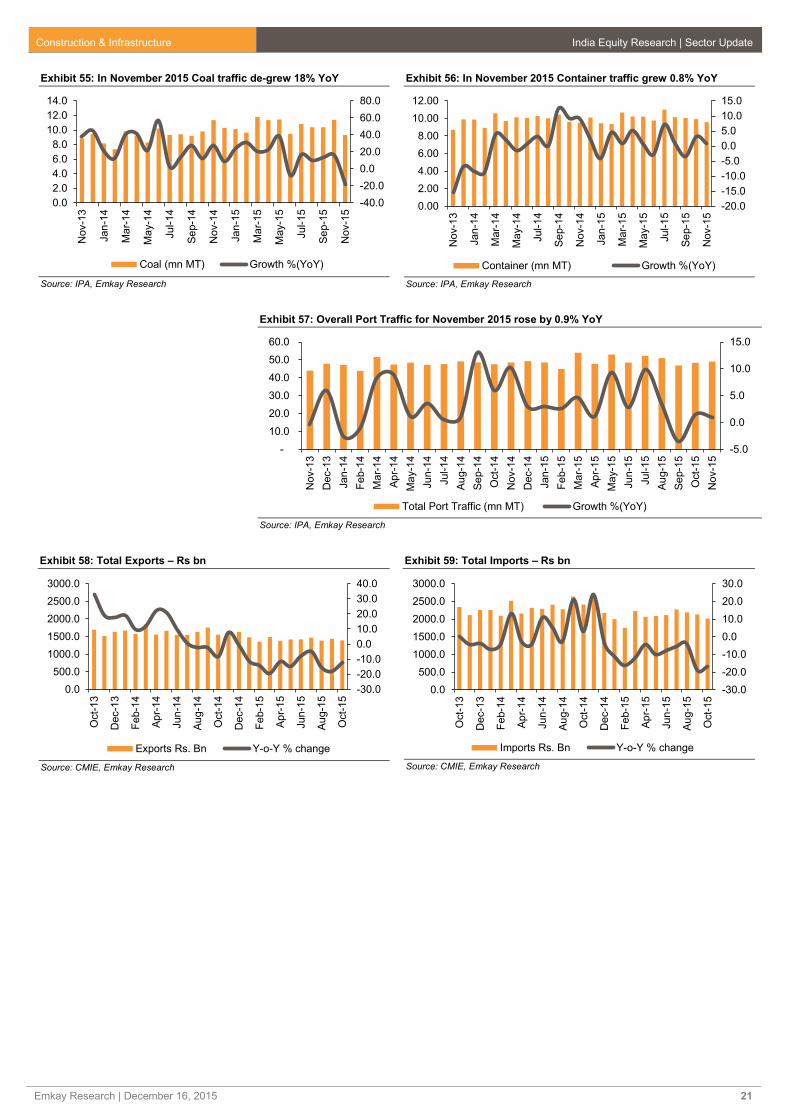
Exhibit 55: In November 2015 Coal traffic de-grew 18% YoY
Source: IPA, Emkay Research
Exhibit 56: In November 2015 Container traffic grew 0.8% YoY
Source: IPA, Emkay Research
Exhibit 57: Overall Port Traffic for November 2015 rose by 0.9% YoY
Source: IPA, Emkay Research
Exhibit 58: Total Exports – Rs bn
Source: CMIE, Emkay Research
Exhibit 59: Total Imports – Rs bn
Source: CMIE, Emkay Research
-40.0
-20.0
0.0
20.0
40.0
60.0
80.0
0.0
2.0
4.0
6.0
8.0
10.0
12.0
14.0
Nov-1
3
Jan
-14
Ma
r-14
Ma
y-1
4
Jul-1
4
Se
p-1
4
Nov-1
4
Jan
-15
Ma
r-15
May-1
5
Jul-1
5
Se
p-1
5
Nov-1
5
Coal (mn MT) Growth %(YoY)
-20.0
-15.0
-10.0
-5.0
0.0
5.0
10.0
15.0
0.00
2.00
4.00
6.00
8.00
10.00
12.00
Nov-1
3
Jan
-14
Mar-
14
Ma
y-1
4
Jul-1
4
Se
p-1
4
Nov-1
4
Jan
-15
Ma
r-15
Ma
y-1
5
Jul-1
5
Se
p-1
5
Nov-1
5
Container (mn MT) Growth %(YoY)
-5.0
0.0
5.0
10.0
15.0
-
10.0
20.0
30.0
40.0
50.0
60.0
Nov-1
3
Dec-1
3
Jan
-14
Fe
b-1
4
Mar-
14
Ap
r-14
Ma
y-1
4
Jun
-14
Jul-1
4
Au
g-1
4
Se
p-1
4
Oct-
14
Nov-1
4
Dec-1
4
Jan
-15
Fe
b-1
5
Ma
r-15
Ap
r-15
Ma
y-1
5
Jun
-15
Jul-1
5
Au
g-1
5
Se
p-1
5
Oct-
15
Nov-1
5
Total Port Traffic (mn MT) Growth %(YoY)
-30.0
-20.0
-10.0
0.0
10.0
20.0
30.0
40.0
0.0
500.0
1000.0
1500.0
2000.0
2500.0
3000.0
Oct-
13
Dec-1
3
Fe
b-1
4
Ap
r-14
Jun
-14
Au
g-1
4
Oct-
14
Dec-1
4
Fe
b-1
5
Ap
r-15
Jun
-15
Au
g-1
5
Oct-
15
Exports Rs. Bn Y-o-Y % change
-30.0
-20.0
-10.0
0.0
10.0
20.0
30.0
0.0
500.0
1000.0
1500.0
2000.0
2500.0
3000.0
Oct-
13
Dec-1
3
Feb-1
4
Ap
r-14
Jun
-14
Au
g-1
4
Oct-
14
Dec-1
4
Fe
b-1
5
Ap
r-15
Jun
-15
Au
g-1
5
Oct-
15
Imports Rs. Bn Y-o-Y % change
Construction & Infrastructure India Equity Research | Sector Update
Emkay Research | December 16, 2015 22
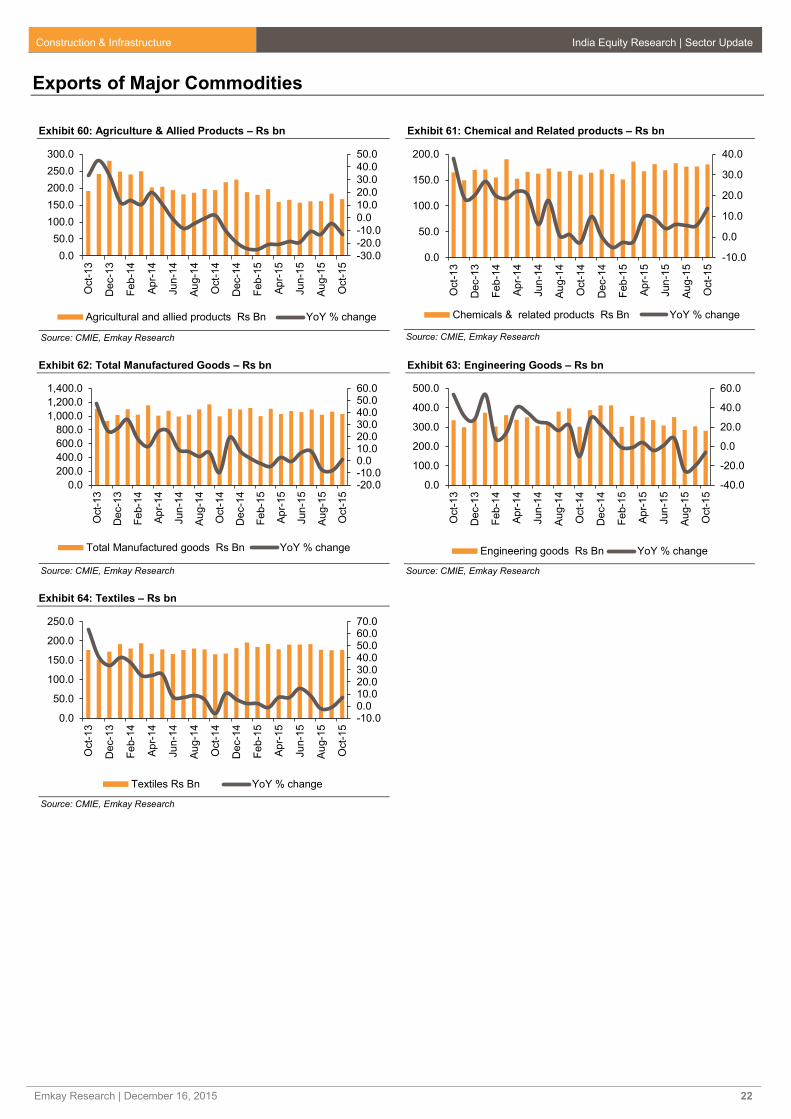
Exports of Major Commodities
Exhibit 60: Agriculture & Allied Products – Rs bn
Source: CMIE, Emkay Research
Exhibit 61: Chemical and Related products – Rs bn
Source: CMIE, Emkay Research
Exhibit 62: Total Manufactured Goods – Rs bn
Source: CMIE, Emkay Research
Exhibit 63: Engineering Goods – Rs bn
Source: CMIE, Emkay Research
Exhibit 64: Textiles – Rs bn
Source: CMIE, Emkay Research
-30.0
-20.0
-10.0
0.0
10.0
20.0
30.0
40.0
50.0
0.0
50.0
100.0
150.0
200.0
250.0
300.0
Oct-
13
Dec-1
3
Fe
b-1
4
Ap
r-14
Jun
-14
Au
g-1
4
Oct-
14
Dec-1
4
Fe
b-1
5
Ap
r-15
Jun
-15
Au
g-1
5
Oct-
15
Agricultural and allied products Rs Bn YoY % change
-10.0
0.0
10.0
20.0
30.0
40.0
0.0
50.0
100.0
150.0
200.0
Oct-
13
Dec-1
3
Fe
b-1
4
Ap
r-14
Jun
-14
Au
g-1
4
Oct-
14
Dec-1
4
Fe
b-1
5
Ap
r-15
Jun
-15
Au
g-1
5
Oct-
15
Chemicals & related products Rs Bn YoY % change
-20.0-10.00.010.020.030.040.050.060.0
0.0
200.0
400.0
600.0
800.0
1,000.0
1,200.0
1,400.0
Oct-
13
Dec-1
3
Fe
b-1
4
Ap
r-14
Jun
-14
Au
g-1
4
Oct-
14
Dec-1
4
Fe
b-1
5
Ap
r-15
Jun
-15
Au
g-1
5
Oct-
15
Total Manufactured goods Rs Bn YoY % change
-40.0
-20.0
0.0
20.0
40.0
60.0
0.0
100.0
200.0
300.0
400.0
500.0
Oct-
13
Dec-1
3
Fe
b-1
4
Ap
r-14
Jun
-14
Au
g-1
4
Oct-
14
Dec-1
4
Fe
b-1
5
Ap
r-15
Jun
-15
Au
g-1
5
Oct-
15
Engineering goods Rs Bn YoY % change
-10.00.010.020.030.040.050.060.070.0
0.0
50.0
100.0
150.0
200.0
250.0
Oct-
13
Dec-1
3
Fe
b-1
4
Ap
r-14
Jun
-14
Au
g-1
4
Oct-
14
Dec-1
4
Fe
b-1
5
Ap
r-15
Jun
-15
Au
g-1
5
Oct-
15
Textiles Rs Bn YoY % change

Construction & Infrastructure India Equity Research | Sector Update
Emkay Research | December 16, 2015 23
Imports of Major Commodities
Exhibit 65: Agriculture & Allied Products – Rs bn
Source: CMIE, Emkay Research
Exhibit 66: Chemicals & Related Products – Rs bn
Source: CMIE, Emkay Research
Exhibit 67: Total Manufactured Goods – Rs bn
Source: CMIE, Emkay Research
Exhibit 68: Engineering Goods – Rs bn
Source: CMIE, Emkay Research
Exhibit 69: Electronic Goods – Rs bn
Source: CMIE, Emkay Research
Exhibit 70: Coking & Non-Coking Coal – mn MT
Source: CMIE, Emkay Research
-20.0
0.0
20.0
40.0
60.0
80.0
0.020.040.060.080.0
100.0120.0140.0160.0
Oct-
13
Dec-1
3
Fe
b-1
4
Ap
r-14
Jun
-14
Au
g-1
4
Oct-
14
Dec-1
4
Fe
b-1
5
Ap
r-15
Jun
-15
Au
g-1
5
Oct-
15
Agricultural and allied products Rs Bn YoY % change
-20.0
-10.0
0.0
10.0
20.0
30.0
40.0
0.0
50.0
100.0
150.0
200.0
250.0
300.0
Oct-
13
Dec-1
3
Fe
b-1
4
Ap
r-14
Jun
-14
Au
g-1
4
Oct-
14
Dec-1
4
Fe
b-1
5
Ap
r-15
Jun
-15
Au
g-1
5
Oct-
15
Chemicals & related products Rs Bn YoY % change
-30.0-20.0-10.00.010.020.030.040.050.060.0
0.0
500.0
1,000.0
1,500.0
2,000.0
Oct-
13
Dec-1
3
Fe
b-1
4
Ap
r-14
Jun
-14
Au
g-1
4
Oct-
14
Dec-1
4
Fe
b-1
5
Ap
r-15
Jun
-15
Au
g-1
5
Oct-
15
Total Manufactured goods Rs Bn YoY % change
-30.0
-20.0
-10.0
0.0
10.0
20.0
30.0
0.0
100.0
200.0
300.0
400.0
500.0
Oct-
13
Dec-1
3
Fe
b-1
4
Ap
r-14
Jun
-14
Au
g-1
4
Oct-
14
Dec-1
4
Fe
b-1
5
Ap
r-15
Jun
-15
Au
g-1
5
Oct-
15
Engineering goods Rs Bn YoY % change
0.0
10.0
20.0
30.0
40.0
50.0
0.0
50.0
100.0
150.0
200.0
250.0
300.0
350.0
Oct-
13
Dec-1
3
Fe
b-1
4
Ap
r-14
Jun
-14
Au
g-1
4
Oct-
14
Dec-1
4
Fe
b-1
5
Ap
r-15
Jun
-15
Au
g-1
5
Oct-
15
Electronic goods Rs Bn YoY % change
-
5.0
10.0
15.0
20.0
25.0
Ap
r-14
Ma
y-1
4
Jun
-14
Jul-1
4
Au
g-1
4
Se
p-1
4
Oct-
14
Nov-1
4
Dec-1
4
Jan
-15
Fe
b-1
5
Ma
r-15
Ap
r-15
Ma
y-1
5
Jun
-15
Jul-1
5
Au
g-1
5
Se
p-1
5
Oct-
15
Nov-1
5
Coking & Non-Coking Coal - mn MT
Construction & Infrastructure India Equity Research | Sector Update
Emkay Research | December 16, 2015 24
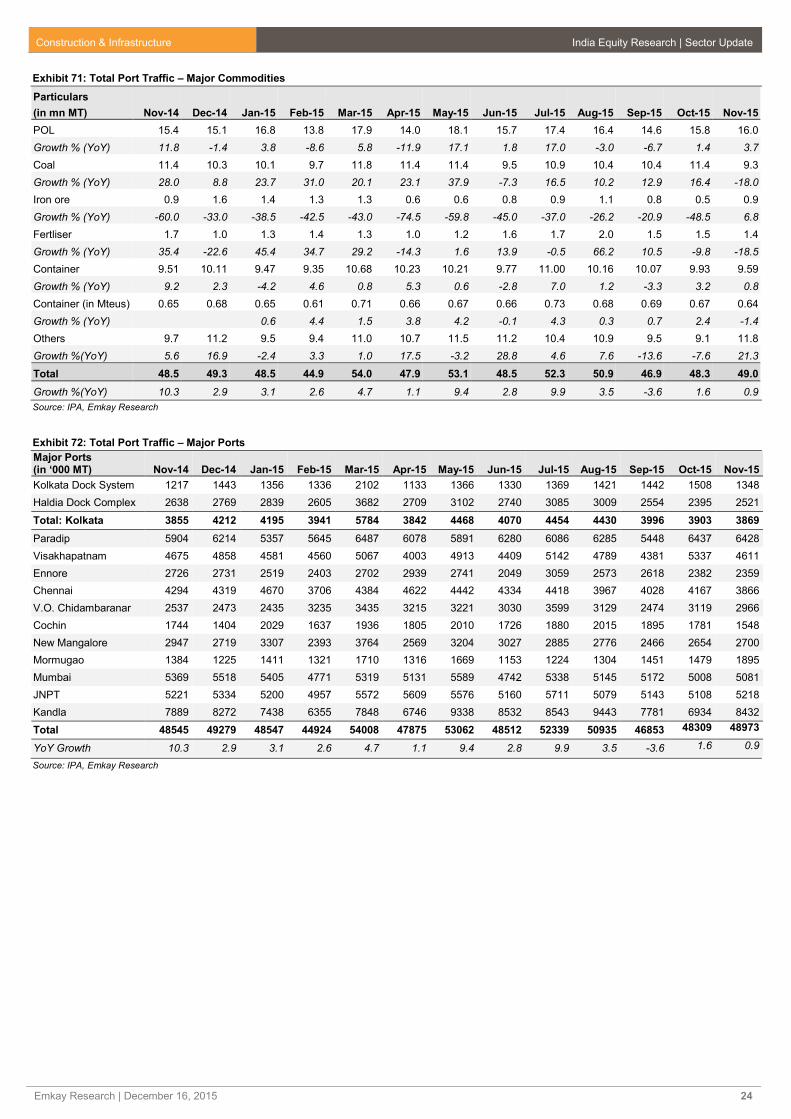
Exhibit 71: Total Port Traffic – Major Commodities
Particulars
(in mn MT) Nov-14 Dec-14 Jan-15 Feb-15 Mar-15 Apr-15 May-15 Jun-15 Jul-15 Aug-15 Sep-15 Oct-15 Nov-15
POL 15.4 15.1 16.8 13.8 17.9 14.0 18.1 15.7 17.4 16.4 14.6 15.8 16.0
Growth % (YoY) 11.8 -1.4 3.8 -8.6 5.8 -11.9 17.1 1.8 17.0 -3.0 -6.7 1.4 3.7
Coal 11.4 10.3 10.1 9.7 11.8 11.4 11.4 9.5 10.9 10.4 10.4 11.4 9.3
Growth % (YoY) 28.0 8.8 23.7 31.0 20.1 23.1 37.9 -7.3 16.5 10.2 12.9 16.4 -18.0
Iron ore 0.9 1.6 1.4 1.3 1.3 0.6 0.6 0.8 0.9 1.1 0.8 0.5 0.9
Growth % (YoY) -60.0 -33.0 -38.5 -42.5 -43.0 -74.5 -59.8 -45.0 -37.0 -26.2 -20.9 -48.5 6.8
Fertliser 1.7 1.0 1.3 1.4 1.3 1.0 1.2 1.6 1.7 2.0 1.5 1.5 1.4
Growth % (YoY) 35.4 -22.6 45.4 34.7 29.2 -14.3 1.6 13.9 -0.5 66.2 10.5 -9.8 -18.5
Container 9.51 10.11 9.47 9.35 10.68 10.23 10.21 9.77 11.00 10.16 10.07 9.93 9.59
Growth % (YoY) 9.2 2.3 -4.2 4.6 0.8 5.3 0.6 -2.8 7.0 1.2 -3.3 3.2 0.8
Container (in Mteus) 0.65 0.68 0.65 0.61 0.71 0.66 0.67 0.66 0.73 0.68 0.69 0.67 0.64
Growth % (YoY) 0.6 4.4 1.5 3.8 4.2 -0.1 4.3 0.3 0.7 2.4 -1.4
Others 9.7 11.2 9.5 9.4 11.0 10.7 11.5 11.2 10.4 10.9 9.5 9.1 11.8
Growth %(YoY) 5.6 16.9 -2.4 3.3 1.0 17.5 -3.2 28.8 4.6 7.6 -13.6 -7.6 21.3
Total 48.5 49.3 48.5 44.9 54.0 47.9 53.1 48.5 52.3 50.9 46.9 48.3 49.0
Growth %(YoY) 10.3 2.9 3.1 2.6 4.7 1.1 9.4 2.8 9.9 3.5 -3.6 1.6 0.9
Source: IPA, Emkay Research
Exhibit 72: Total Port Traffic – Major Ports
Major Ports (in ‘000 MT) Nov-14 Dec-14 Jan-15 Feb-15 Mar-15 Apr-15 May-15 Jun-15 Jul-15 Aug-15 Sep-15 Oct-15 Nov-15
Kolkata Dock System 1217 1443 1356 1336 2102 1133 1366 1330 1369 1421 1442 1508 1348
Haldia Dock Complex 2638 2769 2839 2605 3682 2709 3102 2740 3085 3009 2554 2395 2521
Total: Kolkata 3855 4212 4195 3941 5784 3842 4468 4070 4454 4430 3996 3903 3869
Paradip 5904 6214 5357 5645 6487 6078 5891 6280 6086 6285 5448 6437 6428
Visakhapatnam 4675 4858 4581 4560 5067 4003 4913 4409 5142 4789 4381 5337 4611
Ennore 2726 2731 2519 2403 2702 2939 2741 2049 3059 2573 2618 2382 2359
Chennai 4294 4319 4670 3706 4384 4622 4442 4334 4418 3967 4028 4167 3866
V.O. Chidambaranar 2537 2473 2435 3235 3435 3215 3221 3030 3599 3129 2474 3119 2966
Cochin 1744 1404 2029 1637 1936 1805 2010 1726 1880 2015 1895 1781 1548
New Mangalore 2947 2719 3307 2393 3764 2569 3204 3027 2885 2776 2466 2654 2700
Mormugao 1384 1225 1411 1321 1710 1316 1669 1153 1224 1304 1451 1479 1895
Mumbai 5369 5518 5405 4771 5319 5131 5589 4742 5338 5145 5172 5008 5081
JNPT 5221 5334 5200 4957 5572 5609 5576 5160 5711 5079 5143 5108 5218
Kandla 7889 8272 7438 6355 7848 6746 9338 8532 8543 9443 7781 6934 8432
Total 48545 49279 48547 44924 54008 47875 53062 48512 52339 50935 46853 48309 48973
YoY Growth 10.3 2.9 3.1 2.6 4.7 1.1 9.4 2.8 9.9 3.5 -3.6 1.6 0.9
Source: IPA, Emkay Research

Construction & Infrastructure India Equity Research | Sector Update
Emkay Research | December 16, 2015 25
Power T&D Pulse
For YTDFY16 PGCIL awarding up 24% YoY at Rs121.3 bn
The month of November 2015 saw PGCIL award contracts worth Rs3.6 bn largely in
Insulators (Rs217 mn) and Substation (Rs1.32 bn).
In YTDFY16 PGCIL has awarded contracts worth Rs121.3 bn (+24% YoY).
Substations category saw orders worth Rs34.7 bn (+125% YoY) in YTDFY16 with Chinese
players dominating the market at 65% market share (Hyosung Corp. – 30%, New
Northeast Electric Group High Voltage Switchgear Co. Ltd. – 15%, Rongxin Power
Electronic Co. Ltd. – 14%, Xian XD Switchgear Electric Co. Ltd. – 6%).
Towers category saw orders worth Rs31.6 bn (-2.8% YoY) in YTDFY16 with KEC Intl.
leading the pack at 33% mkt share followed by EMC (17% mkt share), Kalpataru Power
Transmission (16% mkt share), L&T (11% mkt share) and Skipper Ltd. (9% mkt share).
Exhibit 73: YTDFY16, PGCIL orders are up 24% YoY
Source: PGCIL, Emkay Research
Exhibit 74: PGCIL monthly awarding trend
Source: PGCIL, Emkay Research
Exhibit 75: Product-wise ordering activity
Source: PGCIL, Emkay Research
-50%
0%
50%
100%
150%
200%
0
20,000
40,000
60,000
80,000
100,000
120,000
140,000Y
TD
FY
09
YT
DF
Y1
0
YT
DF
Y1
1
YT
DF
Y1
2
YT
DF
Y1
3
YT
DF
Y1
4
YT
DF
Y1
5
YT
DF
Y1
6
in R
s m
n
PGCIL Orders Growth YoY
0
10,000
20,000
30,000
40,000
50,000
60,000
Ap
ril
Ma
y
Jun
e
July
Au
gust
Se
pte
mb
er
Octo
ber
Novem
ber
Decem
ber
Jan
uary
Fe
bru
ary
Ma
rch
in R
s m
n
FY14 FY15 YTDFY16
0
20,000
40,000
60,000
80,000
100,000
To
wer
Tra
nsfo
rme
rs
Su
bsta
tio
n
Conducto
rs
Insula
tors
Reacto
rs
Cable
s
Pile
Fo
undatio
n
Rura
lE
lectr
ific
ation
Oth
ers
in R
s m
n
FY14 FY15 YTDFY16

Construction & Infrastructure India Equity Research | Sector Update
Emkay Research | December 16, 2015 26
Exhibit 76: YTDFY16, Sub-Stations orders up 124.8% YoY
Source: PGCIL, Emkay Research
Exhibit 77: YTDFY16, Towers orders down 2.8% YoY
Source: PGCIL, Emkay Research
Exhibit 78: YTDFY16 Towers Award Share – Company-wise
Source: PGCIL, Emkay Research
Exhibit 79: YTDFY16 Sub-stations Award Share – Company-wise
Source: PGCIL, Emkay Research
-50%
0%
50%
100%
150%
05,000
10,00015,00020,00025,00030,00035,00040,000
YT
DF
Y0
9
YT
DF
Y1
0
YT
DF
Y1
1
YT
DF
Y1
2
YT
DF
Y1
3
YT
DF
Y1
4
YT
DF
Y1
5
YT
DF
Y1
6
in R
s m
n
Sub-Stations Growth YoY
-100%-50%0%50%100%150%200%250%
0
10,000
20,000
30,000
40,000
50,000
YT
DF
Y0
9
YT
DF
Y1
0
YT
DF
Y1
1
YT
DF
Y1
2
YT
DF
Y1
3
YT
DF
Y1
4
YT
DF
Y1
5
YT
DF
Y1
6
in R
s m
n
Towers Growth YoY
33%
17%
16%
11%
9%9%
5% 1%
KEC INTERNATIONAL LTD
ELECTRICAL MANUFACTURING COMPANY LTD(EMC)
KALPTARU POWER TRANSMISSION LTD (KPTL)
LARSEN & TOUBRO (L&T)
Skipper Limited
Karamtara Engineering Pvt. Ltd.
JV of Associated Power Structures Pvt. Ltd. & KetanConstruction Limited
K Ramachandra Rao Transmission & Projects PvtLtd
30%
15%
14%
10%
9%7%
6%
5% 2%
2%
HYOSUNG CORPORATION
New Northeast Electric Group High Voltage SwitchgearCo. Ltd.
Rongxin Power Electronic Co. Ltd.
Alstom T&D India Limited
Techno Electric & Engg. Company Ltd
BHARAT HEAVY ELECTRICALS LIMITED (BHEL)
Xian XD Switchgear Electric Co. Ltd.
JV of ABB INDIA and ABB SWITZERLAND
Blue Star Limited
Megha Engineering & Infrastructures Ltd.
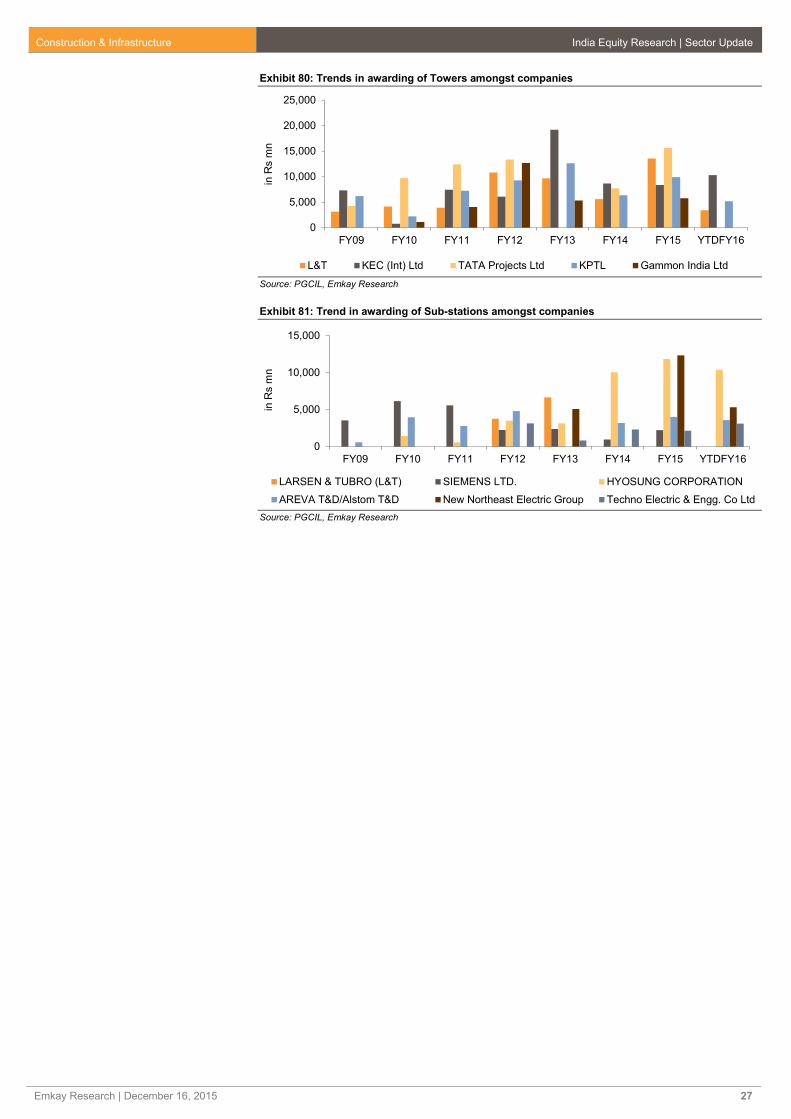
Construction & Infrastructure India Equity Research | Sector Update
Emkay Research | December 16, 2015 27
Exhibit 80: Trends in awarding of Towers amongst companies
Source: PGCIL, Emkay Research
Exhibit 81: Trend in awarding of Sub-stations amongst companies
Source: PGCIL, Emkay Research
0
5,000
10,000
15,000
20,000
25,000
FY09 FY10 FY11 FY12 FY13 FY14 FY15 YTDFY16
in R
s m
nL&T KEC (Int) Ltd TATA Projects Ltd KPTL Gammon India Ltd
0
5,000
10,000
15,000
FY09 FY10 FY11 FY12 FY13 FY14 FY15 YTDFY16
in R
s m
n
LARSEN & TUBRO (L&T) SIEMENS LTD. HYOSUNG CORPORATION
AREVA T&D/Alstom T&D New Northeast Electric Group Techno Electric & Engg. Co Ltd

Construction & Infrastructure India Equity Research | Sector Update
Emkay Research | December 16, 2015 28
Exhibit 82: List of PGCIL Orders in November 2015
Order Awardee Value (Rs mn)
Insulator Pkg Is01 And Insulator Package Is02 For 765kv D/C Wardha-Hyderabad Link Yuzhnouraisky Insulators and
Fittings Plant 217
Insulators Total 217
Substation Package-GIS-S1 For Extension Of 400/220kv Bongaigaon S/S, Extension Of 220kv Salakati
S/S, Extension Of 220/132kv Khuppi S/S(Neepco), Augmentation Of 220/132kv Balipara S/S And
Stringing Of 2nd Ckt Of 220kv Bongaigaon-Salakati D/C Line Associated With NERSS-III
Alstom T&D India Limited 1319
Substation Total 1319
SDH Telecom Equipment Package (Package-S) Under Telecommunication Backbone And Access
Network Augmentation Project Tejas Networks Limited 161
Fibre Optic Cabling Packages 1a, 1b, 1d And 1e For Establishment Of Fibre Optic Based Communication
Network On Transmission Lines Of WBSETCL Under Consultancy Works In The State Of West Bengal ZTT India Private Limited 190
Fibre Optic Cabling Packages 1a, 1b, 1d And 1e For Establishment Of Fibre Optic Based Communication
Network On Transmission Lines Of WBSETCL Under Consultancy Works In The State Of West Bengal ZTT India Private Limited 215
Fibre Optic Cabling Packages 1a, 1b, 1d And 1e For Establishment Of Fibre Optic Based Communication
Network On Transmission Lines Of WBSETCL Under Consultancy Works In The State Of West Bengal ZTT India Private Limited 225
Fibre Optic Cabling Packages 1a, 1b, 1d And 1e For Establishment Of Fibre Optic Based Communication
Network On Transmission Lines Of WBSETCL Under Consultancy Works In The State Of West Bengal ZTT India Private Limited 186
Ap-01 Aerial Patrolling Of Transmission Lineslines In Northern Region JV of AAM Pty Ltd Australia &
Pinnacle Air Pvt Ltd 164
DWDM Telecom Equipment Package-R Under Augmentation Of Telecommunication Backbone And
Access Network
Fiberhome Telecom.
Technologies Co. Ltd 839
Package-II (B) Communication Equipment Package (Pdh Eqpt) Under Implementation Of Communication
Systems In West Bengal And Jharkhand Associated With Consultancy Services To Jharkhand Urja
Sancharan Nigam Limited (JUSNL) And West Bengal State Electricity Transmission Company Limited
(WBSETCL)
Valiant Communications
Limited 75
Others Total 2055
Grand Total 3592
Source: PGCIL, Emkay Research

Construction & Infrastructure India Equity Research | Sector Update
Emkay Research | December 16, 2015 29
DISCLAIMERS AND DISCLOSURES: Emkay Global Financial Services Limited (CIN-L67120MH1995PLC084899) and its affiliates are a full-service, brokerage, investment banking, investment
management and financing group. Emkay Global Financial Services Limited (EGFSL) along with its affiliates are participants in virtually all securities trading markets in India. EGFSL was established in
1995 and is one of India's leading brokerage and distribution house.EGFSL is a corporate trading member of Bombay Stock Exchange Limited (BSE), National Stock Exchange of India Limited(NSE),
MCX Stock Exchange Limited (MCX-SX).EGFSL along with its subsidiaries offers the most comprehensive avenues for investments and is engaged in the businesses including stock broking (Institutional
and retail), merchant banking, commodity broking, depository participant, portfolio management, insurance broking and services rendered in connection with distr ibution of primary market issues and
financial products like mutual funds, fixed deposits. Details of associates are available on our website i.e. www.emkayglobal.com
EGFSL is registered as Research Analyst with SEBI bearing registration Number INH000000354 as per SEBI (Research Analysts) Regulations, 2014. EGFSL hereby declares that it has not defaulted
with any stock exchange nor its activities were suspended by any stock exchange with whom it is registered in last five years, except that NSE had disabled EGFSL from trading on October 05, October
08 and October 09, 2012 for a manifest error resulting into a bonafide erroneous trade on October 05, 2012. However, SEBI and Stock Exchanges have conducted the routine inspection and based on
their observations have issued advice letters or levied minor penalty on EGFSL for certain operational deviations in ordinary/routine course of business. EGFSL has not been debarred from doing business
by any Stock Exchange / SEBI or any other authorities; nor has its certificate of registration been cancelled by SEBI at any point of time.
EGFSL offers research services to clients as well as prospects. The analyst for this report certifies that all of the views expressed in this report accurately reflect his or her personal views about the subject
company or companies and its or their securities, and no part of his or her compensation was, is or will be, directly or indirectly related to specific recommendations or views expressed in this report.
Other disclosures by Emkay Global Financial Services Limited (Research Entity) and its Research Analyst under SEBI (Research Analyst) Regulations, 2014 with reference to the subject
company(s) covered in this report-:
EGFSL or its associates may have financial interest in the subject company.
Research Analyst or his/her relative’s financial interest in the subject company. (NO)
EGFSL or its associates and Research Analyst or his/her relative’s does not have any material conflict of interest in the subject company. The research Analyst or research entity (EGFSL) have not been
engaged in market making activity for the subject company.
EGFSL or its associates may have actual/beneficial ownership of 1% or more securities of the subject company at the end of the month immediately preceding the date of publication of Research Report.
Research Analyst or his/her relatives have actual/beneficial ownership of 1% or more securities of the subject company at the end of the month immediately preceding the date of publication of Research
Report: (NO)
EGFSL or its associates may have received any compensation including for investment banking or merchant banking or brokerage services from the subject company in the past 12 months. EGFSL or its
associates may have received compensation for products or services other than investment banking or merchant banking or brokerage services from the subject company in the past 12 months. EGFSL
or its associates may have received any compensation or other benefits from the Subject Company or third party in connection with the research report. Subject Company may have been client of EGFSL
or its associates during twelve months preceding the date of distribution of the research report and EGFSL may have co-managed public offering of securities for the subject company in the past twelve
months.
The research Analyst has served as officer, director or employee of the subject company: (NO)
EGFSL and/or its affiliates may seek investment banking or other business from the company or companies that are the subject of this material. Our salespeople, traders, and other professionals may
provide oral or written market commentary or trading strategies to our clients that reflect opinions that are contrary to the opinions expressed herein, and our proprietary trading and investing businesses
may make investment decisions that may be inconsistent with the recommendations expressed herein. In reviewing these materials, you should be aware that any or all of the foregoing, among other
things, may give rise to real or potential conflicts of interest including but not limited to those stated herein. Additionally, other important information regarding our relationships with the company or
companies that are the subject of this material is provided herein. This report is not directed to, or intended for distribution to or use by, any person or entity who is a citizen or resident of or located in any
locality, state, country or other jurisdiction where such distribution, publication, availability or use would be contrary to law or regulation or which would subject EGFSL or its group companies to any
registration or licensing requirement within such jurisdiction. Specifically, this document does not constitute an offer to or solicitation to any U.S. person for the purchase or sale of any financial instrument
or as an official confirmation of any transaction to any U.S. person. Unless otherwise stated, this message should not be construed as official confirmation of any transaction. No part of this document may
be distributed in Canada or used by private customers in United Kingdom. All material presented in this report, unless specifically indicated otherwise, is under copyright to Emkay. None of the material,
nor its content, nor any copy of it, may be altered in any way, transmitted to, copied or distributed to any other party, without the prior express written permission of EGFSL . All trademarks, service marks
and logos used in this report are trademarks or registered trademarks of EGFSL or its Group Companies. The information contained herein is not intended for publication or distribution or circulation in
any manner whatsoever and any unauthorized reading, dissemination, distribution or copying of this communication is prohibited unless otherwise expressly authorized. Please ensure that you have read
“Risk Disclosure Document for Capital Market and Derivatives Segments” as prescribed by Securities and Exchange Board of India before investing in Indian Securities Market. In so far as this report
includes current or historic information, it is believed to be reliable, although its accuracy and completeness cannot be guaranteed.
www.emkayglobal.com
Emkay Global Financial Services Ltd.
CIN - L67120MH1995PLC084899
7th Floor, The Ruby, Senapati Bapat Marg, Dadar - West, Mumbai - 400028. India
Tel: +91 22 66121212 Fax: +91 22 66121299 Web: www.emkayglobal.com
Emkay Rating Distribution
BUY Expected total return (%) (Stock price appreciation and dividend yield) of over 25% within the next 12-18 months.
ACCUMULATE Expected total return (%) (Stock price appreciation and dividend yield) of over 10% within the next 12-18 months.
HOLD Expected total return (%) (Stock price appreciation and dividend yield) of upto 10% within the next 12-18 months.
REDUCE Expected total return (%) (Stock price depreciation) of upto (-) 10% within the next 12-18 months.
SELL The stock is believed to underperform the broad market indices or its related universe within the next 12-18 months.