computational analyses of synergism in small molecular network motifs
TRANSCRIPT
Computational Analyses of Synergism in Small MolecularNetwork MotifsYili Zhang, Paul Smolen, Douglas A. Baxter, John H. Byrne*
Department of Neurobiology and Anatomy, The University of Texas Medical School at Houston, Houston, Texas, United States of America
Abstract
Cellular functions and responses to stimuli are controlled by complex regulatory networks that comprise a large diversity ofmolecular components and their interactions. However, achieving an intuitive understanding of the dynamical propertiesand responses to stimuli of these networks is hampered by their large scale and complexity. To address this issue, analysesof regulatory networks often focus on reduced models that depict distinct, reoccurring connectivity patterns referred to asmotifs. Previous modeling studies have begun to characterize the dynamics of small motifs, and to describe ways in whichvariations in parameters affect their responses to stimuli. The present study investigates how variations in pairs ofparameters affect responses in a series of ten common network motifs, identifying concurrent variations that actsynergistically (or antagonistically) to alter the responses of the motifs to stimuli. Synergism (or antagonism) was quantifiedusing degrees of nonlinear blending and additive synergism. Simulations identified concurrent variations that maximizedsynergism, and examined the ways in which it was affected by stimulus protocols and the architecture of a motif. Only asubset of architectures exhibited synergism following paired changes in parameters. The approach was then applied to amodel describing interlocked feedback loops governing the synthesis of the CREB1 and CREB2 transcription factors. Theeffects of motifs on synergism for this biologically realistic model were consistent with those for the abstract models ofsingle motifs. These results have implications for the rational design of combination drug therapies with the potential forsynergistic interactions.
Citation: Zhang Y, Smolen P, Baxter DA, Byrne JH (2014) Computational Analyses of Synergism in Small Molecular Network Motifs. PLoS Comput Biol 10(3):e1003524. doi:10.1371/journal.pcbi.1003524
Editor: Lilia M. Iakoucheva, University of California San Diego, United States of America
Received October 18, 2013; Accepted February 6, 2014; Published March 20, 2014
Copyright: � 2014 Zhang et al. This is an open-access article distributed under the terms of the Creative Commons Attribution License, which permitsunrestricted use, distribution, and reproduction in any medium, provided the original author and source are credited.
Funding: This study was supported by the National Institute of Health grant number NS073974 (www.nih.gov). The funders had no role in study design, datacollection and analysis, decision to publish, or preparation of the manuscript.
Competing Interests: The authors have declared that no competing interests exist.
* E-mail: [email protected]
Introduction
Cellular functions are regulated by complex biochemical
networks that incorporate large numbers of diverse molecular
components and their interactions. The large scale and complexity
of these regulatory networks impedes achieving an intuitive
understanding of their overall function and responses to stimuli
and/or drugs. Consequently, when analyzing a complex system, it
is often useful to develop and analyze reduced models that capture
the key dynamical properties of the system. In analyses of
biochemical networks, these reduced models are referred to as
motifs [1]. Motifs depict distinct connectivity patterns that occur
more frequently in a given network than in random networks of
the same size. Motifs can be comprised of as few as three
molecules (referred to as nodes or vertices) and their interactions
(referred to as edges). Motifs are present in gene regulatory
networks, protein-protein interactions, and metabolic networks of
species as diverse as bacteria [1–2], yeast [2–3], and humans [2,4–
12]. Structurally distinct motifs appear to manifest specific
dynamical features [10,13–17] and modeling studies describe
how the responses of distinct motifs and the robustness of these
responses vary with parameters [18–20]. These studies are
beginning to elucidate ways in which motif dynamics contribute
to the functions and response properties of larger, more complex
regulatory networks. Moreover, as is investigated here, small
network motifs can be used to examine the ways in which
combinations of parameter changes act synergistically (or antag-
onistically) to alter the response to stimuli. This later strategy may
ultimately help guide the development of drug combination
therapies that target disease-related dysfunction of a network
motif.
Here, models of ten three-node motifs (Fig. 1) were developed
and synergistic interactions within these motifs were investigated.
These motifs are ubiquitous and are included within gene and
protein networks that are associated with specific diseases [1–2,4–
6,9,11,13,15,21–24]. The mechanisms of disease are usually
associated with large networks of molecular pathways. However,
in many clinical studies in which combination drug therapy is used
for treatment of diseases, two-drug combinations are considered
[25]. Therefore, for models of simple motifs or of complex
pathways, simulation of concurrent paired parameter changes is of
value for understanding the synergistic or antagonistic properties
of many current or possible combination therapies. In the simu-
lations, pairs of parameters were simultaneously varied, and the
extent to which these ten motifs manifest synergism (or antago-
nism) was examined. First, a canonical model was developed. This
motif constitutes a minimal representation of two convergent
pathways. Element A and element B both respond to a common
stimulus (S), and converge to activate a common target (T)
(Fig. 1A1). Activation (e.g., increased phosphorylation, or
enhanced synthesis) of T was assumed to be the output of the
PLOS Computational Biology | www.ploscompbiol.org 1 March 2014 | Volume 10 | Issue 3 | e1003524
motif, and the target for examining the effects of combinations of
parameter variations. Variations of parameter pairs in elements
A and B represent combination therapies in which two drugs
target two different sites of the same pathway or two pathways
converging at a downstream process. Such convergence is
commonly used in designing therapies. For example, Paclitaxel
synergizes with Tubacin in enhancing tubulin acetylation, with
the former directly increasing acetylation and the later
decreasing the deacetylation of a-tubulin [25]. Aplidin and
Cytarabine are synergistic in killing cancer cells because they
induce apoptosis via two convergent signaling cascades [25]. In
this study, synergism (or antagonism) was quantified using
degrees of nonlinear blending and additive synergism (see
Model Development). Then the canonical motif was modified to
generate a set of similar three-node motifs that incorporated
different patterns of interaction among the nodes. These
interactions included a variety of positive and negative feedback
loops, and autoregulatory loops. These motifs were found to
greatly modify the existence and amount of synergism. For
specific parameter pairs, only a subset of motif architectures
exhibited synergism.
To substantiate these conclusions, the approach was applied to
a model representing interlocked feedback loops that govern the
synthesis of two transcription factors, cAMP-response element
binding proteins (CREBs), specifically CREB1 and CREB2 [26].
CREB1 is a transcription activator and CREB2 is a transcription
repressor. CREB1 and CREB2 regulate their own expression, viabinding to the CRE elements in or near their genes. The
feedback loops involving CREB1 and CREB2 modulate long-
term memory [27]. Three of the network motifs that were
simulated are included in this model: a positive auto-regulatory
loop governing CREB1 synthesis; a negative auto-regulatory loop
governing CREB2 synthesis; and negative feedback in which
CREB2 inhibits the synthesis of CREB1. The effects of these
motifs on synergism in this more biologically realistic model were
consistent with the results from the more abstract three-node
models.
Methods
A canonical model of converging pathways that regulatea downstream targetElements A and B converge onto a target (T) (Fig. 1A1). Both A
and B are activated by stimulus S. The activities of A and B are
dynamic variables that follow first-order ordinary differential
equations (ODEs). kbasal_A and kbasal_B are basal activation rates
of A and B. The deactivation of A and B follows Michaelis–
Menten kinetics. These assumptions yield the following ODEs:
dA
dt~ksASzkbasal A{kdA
A
AzKA
ð1Þ
dB
dt~ksBSzkbasal B{kdB
B
BzKB
ð2Þ
Two variants of this simple converging model were analyzed. In
Variant M, the activation rate of T is proportional to the product
of the effects of A and B. Deactivation of T follows Michaelis-
Menten kinetics. The following ODE for T results:
dT
dt~kST (
A
AzKTA
)(B
BzKTB
)zkbasal T{kdTT
TzKT
ð3Þ
In Variant A, the activation rate of T is proportional to the sum
of the effects of A and B, yielding the following ODE:
dT
dt~kST ½( A
AzKTA
)z(B
BzKTB
)�zkbasal T{kdTT
TzKT
ð4Þ
Concentrations are non-dimensional. Standard parameter
values are used in all simulations unless noted. These values are:
KsA=0.1, kbasal_A=0.1, kdA=0.2, KA=1, KsB=0.1, kba-sal_B=0.1, kdB=0.2, KB=1, kbasal_T=0.0001, kST=0.01,
KTA=2.5, KTB=2.5, kdT=0.01, KT=0.5.
The parameters were adjusted by trial and error so that the
dynamics of A, B and T display properties of common
biochemical responses; e.g., 1) the activation of A and B was
rapid, whereas their deactivation was relatively slow; 2) the peak
level of T was well below saturation when stimuli were weak; and
3) the basal activation rate of T, kbasal_T, was much smaller than
the activation rate induced by A and B, kST. For simplicity, the
strengths of both pathways were initially balanced. Therefore, the
parameters of dynamics of A and B shared the same values. The
extent to which the synergism is dependent on these values is
discussed in the Results.
Expanding the canonical model to represent additionalthree-node motifsIn the three-node model, it was assumed that 1) both A and B
have excitatory effects on T; and 2) the standard parameter values
governing A and B dynamics are identical. There are then nine
biochemical variations of the canonical motif that involve adding a
single feedback or feedforward interaction, or autoregulation,
involving A or B. These nine motifs were represented by
extensions of the canonical model. For simplicity and consistency,
these extensions were all constructed by adding regulation, within
the motif, of a given pair of parameters, kdA and kdB. After
Author Summary
Cellular responses to stimuli are controlled by complexregulatory networks that comprise many molecular com-ponents. Understanding such networks is critical forunderstanding normal cellular functions and pathologicalconditions. Because the complexity of these networksoften precludes intuitive insights, a useful approach is tostudy mathematical models of small network motifshaving reduced complexity yet consisting of key regula-tory components of the more complex networks. Compu-tational studies have analyzed the behavior of small motifs,and have begun to describe the ways in which variationsin parameters affect their functional properties. Here, weinvestigated how variations in pairs of parameters actsynergistically (or antagonistically) to alter responses of tencommon network motifs. Simulations identified parametervariations that maximized synergism, and examined theways in which synergism was affected by stimulusprotocols and motif architecture. The results have impli-cations for the rational design of combination drugtherapies where a goal is to identify drugs that whenadministered together have a greater effect than would bepredicted by simple addition of single-drug effects (i.e.,super-additive effects), thereby allowing for lower drugdoses, minimizing undesirable effects.
Simulating Synergism in Network Motifs
PLOS Computational Biology | www.ploscompbiol.org 2 March 2014 | Volume 10 | Issue 3 | e1003524
construction, synergism was examined with paired parameter
variations for each of these motifs.
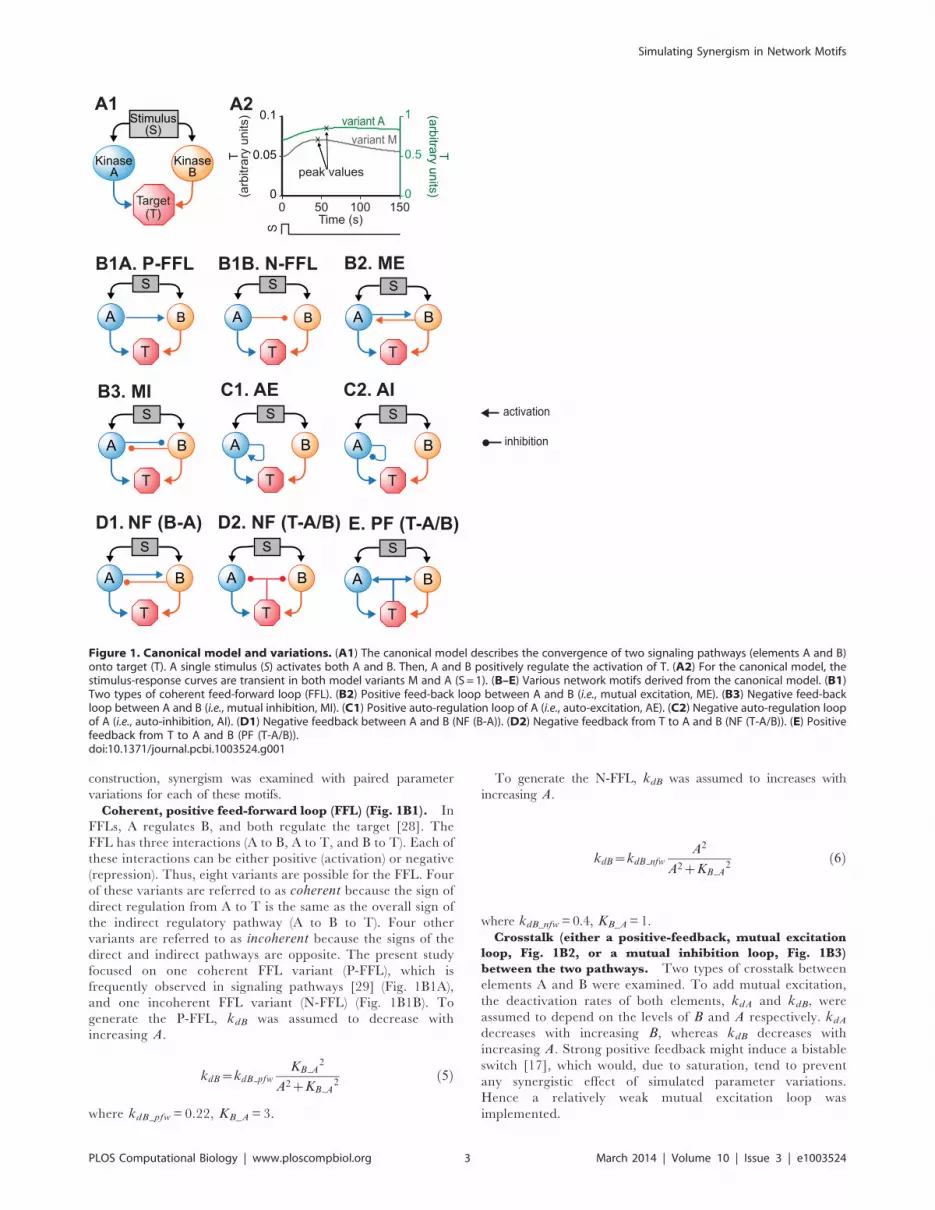
Coherent, positive feed-forward loop (FFL) (Fig. 1B1). In
FFLs, A regulates B, and both regulate the target [28]. The
FFL has three interactions (A to B, A to T, and B to T). Each of
these interactions can be either positive (activation) or negative
(repression). Thus, eight variants are possible for the FFL. Four
of these variants are referred to as coherent because the sign of
direct regulation from A to T is the same as the overall sign of
the indirect regulatory pathway (A to B to T). Four other
variants are referred to as incoherent because the signs of the
direct and indirect pathways are opposite. The present study
focused on one coherent FFL variant (P-FFL), which is
frequently observed in signaling pathways [29] (Fig. 1B1A),
and one incoherent FFL variant (N-FFL) (Fig. 1B1B). To
generate the P-FFL, kdB was assumed to decrease with
increasing A.
kdB~kdB pfwKB A
2
A2zKB A2
ð5Þ
where kdB_pfw= 0.22, KB_A= 3.
To generate the N-FFL, kdB was assumed to increases with
increasing A.
kdB~kdB nfwA2
A2zKB A2
ð6Þ
where kdB_nfw=0.4, KB_A=1.
Crosstalk (either a positive-feedback, mutual excitation
loop, Fig. 1B2, or a mutual inhibition loop, Fig. 1B3)
between the two pathways. Two types of crosstalk between
elements A and B were examined. To add mutual excitation,
the deactivation rates of both elements, kdA and kdB, were
assumed to depend on the levels of B and A respectively. kdAdecreases with increasing B, whereas kdB decreases with
increasing A. Strong positive feedback might induce a bistable
switch [17], which would, due to saturation, tend to prevent
any synergistic effect of simulated parameter variations.
Hence a relatively weak mutual excitation loop was
implemented.
Figure 1. Canonical model and variations. (A1) The canonical model describes the convergence of two signaling pathways (elements A and B)onto target (T). A single stimulus (S) activates both A and B. Then, A and B positively regulate the activation of T. (A2) For the canonical model, thestimulus-response curves are transient in both model variants M and A (S = 1). (B–E) Various network motifs derived from the canonical model. (B1)Two types of coherent feed-forward loop (FFL). (B2) Positive feed-back loop between A and B (i.e., mutual excitation, ME). (B3) Negative feed-backloop between A and B (i.e., mutual inhibition, MI). (C1) Positive auto-regulation loop of A (i.e., auto-excitation, AE). (C2) Negative auto-regulation loopof A (i.e., auto-inhibition, AI). (D1) Negative feedback between A and B (NF (B-A)). (D2) Negative feedback from T to A and B (NF (T-A/B)). (E) Positivefeedback from T to A and B (PF (T-A/B)).doi:10.1371/journal.pcbi.1003524.g001
Simulating Synergism in Network Motifs
PLOS Computational Biology | www.ploscompbiol.org 3 March 2014 | Volume 10 | Issue 3 | e1003524

kdA~kdA pfKB A
2
B2zKB A2
kdB~kdB pfKB A
2
A2zKB A2
ð7Þ
where kdA_pf= 0.22, kdB_pf= 0.22, KB_A= 3.
To add mutual inhibition to the canonical model, kdA and kdBwere assumed to increase with increasing B and A, respectively.Mutual inhibition constitutes a form of positive feedback, and
strong feedback could induce bistability. Hence a relatively weak
mutual inhibition loop was implemented.
kdA~kdA nfB2
B2zKB A2
kdB~kdB nfA2
A2zKB A2
ð8Þ
where kdA_nf=0.4, kdB_nf=0.4, KB_A=1.
Auto-regulatory loop(s) (Figs. 1C1 and 1C2). In an auto-
regulatory loop, a node directly influences its own function.
Common examples of auto-regulation include autophosphory-
lation of kinases and transcriptional regulation [27,30–31]. To add
positive auto-regulation, kdA was assumed to decrease with
increasing A.
kdA~kdA paKA A
2
A2zKA A2
ð9Þ
where kdA_pa=0.22, KA_A=3
To add negative auto-regulation, kdA was assumed to increase
with increasing A.
kdA~kdA naA2
A2zKA A2
ð10Þ
where kdA_na=0.4, KA_A=1.
Negative feedback between A and B (Fig. 1D1) or from T
to A and B (Fig. 1D2). We considered a negative feedback loop
in which activation of A inhibits de-activation of B, with activation
of B then accelerating de-activation of A. kdA was assumed to
increase with increasing B and kdB was assumed to decrease with
increasing A.
kdA~kdA nfB2
B2zKB A2
kdB~kdB nfKA B
2
A2zKA B2
ð11Þ
where kdA_nf=0.4, kdB_nf=0.22, KB_A=1, KA_B=3.
A negative feedback loop was also implemented in which
activation of the target accelerates de-activation of the upstream
elements A and B. kdA and kdB were assumed to increase with
increasing T.
kdA~kdA TA
T2
T2zKT A2
kdB~kdB TBT2
T2zKT B2
ð12Þ
where kdA_TA=0.4, kdB_TB=0.4, KT_A=0.05, KT_B=0.05.
Positive feedback from T to A and B (Fig. 1E). Here kdAand kdB were assumed to decrease with increasing T, inhibiting
de-activation of the upstream elements A and B.
kdA~kdA TAKT A
2
T2zKT A2
kdB~kdB TBKT B
2
T2zKT B2
ð13Þ
where kdA_TA=0.22, kdB_TB=0.22, KT_A=0.15, KT_B=0.15.
The model of Song et al. [26]CREB1 is assumed to bind to cAMP response elements (CREs)
near the promoters of both the creb1 and creb2 genes, activating
expression of both genes. CREB2 is assumed to bind competitively
to the same CREs and to repress transcription of both genes. In
this minimal model, differential equations for mRNAs are not
included. Thus the model consists of two ODEs, for the levels of
CREB1 and CREB2, with gene regulation represented by
activation and repression of CREB1 and CREB2 formation.
d½CREB1�dt
~VX½CREB1�2=KX
1z½CREB1�2=KXz½CREB2�2=KY
" #
{kdX ½CREB1�zrbas,X
ð14Þ
d½CREB2�dt
~VY½CREB1�2=KX
1z½CREB1�2=KXz½CREB2�2=KY
" #
{kdY ½CREB2�zrbas,Y
ð15Þ
Concentrations are non-dimensional. Standard parameter values
from Song et al. [26] are used. These values are:
Vx=0.4 min21, Vy=0.01 min21, Kx=5, Ky=10,
kdx=0.04 min21, kdy=0.01 min21, rbas,x=0.003 min21, and
rbas,y=0.002 min21
The parameters involved in the positive auto-regulatory loop in
which CREB1 enhances its own synthesis are Vx (the maximum
induced synthesis rate of CREB1) and Kx (the dissociation
constant of CREB1 from a CRE). The parameters involved in
the negative auto-regulatory loop in which CREB2 represses its
own synthesis are Vy (the maximum induced synthesis rate of
CREB2) and Ky (the dissociation constant of CREB2 from a
CRE). All four parameters are involved in the negative feedback
loop in which CREB2 represses the synthesis of CREB1, because
in this loop, CREB1 first activates CREB2 synthesis (parameters
Vy, Kx) and CREB2 then represses CREB1 synthesis (parameters
Vx, Ky).
Quantification of nonlinear blending synergism andadditive synergismMeasures to assess synergistic drug actions are diverse and
include additive synergism [32–34], Bliss independence [32,35–
37], the Chou-Talalay Combination Index [37], the isobolo-
graphic approach [32], Loewe additivity [33–35], and nonlinear
blending [38], but there is no agreement on which is preferable.
Given the diversity of methods for measuring synergism, it is useful
to adopt more than one method in studies of combination drug
treatments. In the present study nonlinear blending synergism
and additive synergism were selected to assess the effects of
Simulating Synergism in Network Motifs
PLOS Computational Biology | www.ploscompbiol.org 4 March 2014 | Volume 10 | Issue 3 | e1003524

combinations of parameter variations on the output of the motifs.
These methods were chosen because: 1) Additive synergism is a
straightforward way to calculate synergism and can be easily
conceptualized, and 2) Nonlinear blending allows for synergism to
be assessed by considering the shape of a curve constructed over a
range of concurrent drug dosages, as opposed to assessing at a
single dose. In this way, nonlinear blending is closely related to
several of the more complex methods for calculating synergism,
such as isobolograms.
In nonlinear blending [38], a fixed total amount of drug 1 is
selected, which gives a substantial, but not saturated, response.
Then the response is quantified for mixtures of drugs 1 and 2,
holding the total drug amount the same as with drug 1 alone, but
varying the percentage of drug 1 in the mixture from 0 to 100%.
The resulting dose-effect curve, with percentage of drug 1 on the xaxis, will be concave up if antagonism is present between the
drugs and concave down if synergism is present. Weak nonlinear
blending synergism is present if the curve is concave down, but still
has its maximum at an end point [38]. Weak nonlinear blending
may not be useful, however, because the maximal response is still
obtained at one endpoint, using only one parameter change.
However a stronger, more useful form of synergism may be seen,
termed strong nonlinear blending synergism [38]. In this case, the
curve is concave down with the maximum response at a point
removed from either end point (Fig. 2A). Thus, for a given total
drug amount, the best response is obtained for a mixture of drugs
1 and 2.
For each nonlinear blending (NB) curve, a corresponding
additive effect (AE) curve can be constructed. The same
combination of drugs is used as for the NB curve. However, the
additive effect is simply calculated as the sum of the response from
with the altered value of drug 1 alone and the response with drug 2
alone (Fig. 2B). Additive synergism is then present if the response
to the combination of drugs 1 and 2, shown by the NB curve, is
greater than the sum of the responses to the individual drugs,
shown by the AE curve.
In the simulations, the effects of pairs of drugs were mimicked
by varying pairs of parameters. In the canonical model, 14
parameters in Eq. 1–4 determine the dynamics of A, B and T. Thepeak level of T was considered to represent the response to the
stimulus S (Fig. 1A2). The peak level of T in the absence of
parameter changes was regarded as the control peak level. The
percentage increase of the peak level with parameter changes over
the control peak level was taken as the simulated response to the
parameter changes. Individual parameters were varied in the
direction that increased the peak level of T. For 14 parameters, 91
distinct combinations of two parameters are possible. To simulate
a reasonable range of drug effect strengths, each individual
parameter was varied within the range bounded by 90% changes
of its standard value, either increased (0%–+90%) or decreased
(0%–290%), according to which direction increased the peak level
of T. When two parameters were modified simultaneously, the
sum of absolute values of individual parameter percent changes
was maintained at 90%. The value of 90% was chosen so that the
maximal degree of reduction, or inhibition, of biochemical
processes governed by these parameters – synthesis, degradation,
or activation/deactivation of A, B, or T – was 90%. For example,
kdA/kST is one pair that was selected. For simulations with this
pair, kdA was decreased, because a decrease in the degradation
rate of A tends to increase the peak level of the target T, and kSTwas increased, because an increase in the maximum induced
synthesis rate of T also increases the peak level of T. In a series of
Figure 2. A schematic of NB synergism (A) and additive synergism (B). Response for AE curve = effect of drug 1 alone+effect of drug 2 alone.The maximal difference between peak value and endpoints of NB curves determines the maximum NB synergism. The maximal difference betweenNB and AE curves determines maximum additive synergism.doi:10.1371/journal.pcbi.1003524.g002
Simulating Synergism in Network Motifs
PLOS Computational Biology | www.ploscompbiol.org 5 March 2014 | Volume 10 | Issue 3 | e1003524
combined parameter changes, the decrease in kdA varied from 0%
to 90% of its standard value, and the increase in kST concurrently
varied from 90% to 0% of its standard value, such that |%
decrease in kdA|+|% increase in kST|= 90%. To simulate dose-
effect curves for individual parameters, as well as to construct NB
curves, 30 points were used, evenly spaced between 0 and 90%
parameter variations from standard values, evenly spaced between
0 and 90% parameter variations from standard values.
Synergism was quantified by defining the degrees of NB and
additive synergism. The left end point of an NB curve corresponds
to a 90% change in parameter 2 (i.e., 0% change in parameter 1).
The right end point corresponds to a 90% change of parameter 1.
The greater value of these two endpoints was considered as the
maximal single-parameter effect (Fig. 2A). Then:
Degree of NB synergism~
(peakvalue ofNB curve - maximal single parameter effect
maximal single parameter effect)
|100%
ð16Þ
Based on Eq. 16, the degree of weak NB synergism (i.e., NBcurve is concave down and the peak response is obtained from
either end point of NB curve) is always zero. Therefore, this degree
was only calculated for parameter pairs that exhibit strong NB
synergism, with degree .0. All other pairs that exhibit weak NB
synergism were assigned a degree of 0. A negative degree
corresponds to antagonism (i.e., NB curve is concave up).
The degree of additive synergism was calculated using the
maximal difference between the NB curve and AE curve, as
follows (see also Fig. 2B).
Degree of AE synergism~
max value of (NB curve - AE curve)
maximal single parameter effect|100%
ð17Þ
A positive degree.1 corresponds to additive synergism, whereas a
negative degree corresponds to antagonism.
Fourth-order Runge-Kutta integration was used for integration
of ODEs, with a time step of 3 s. The model was programmed in
XPP-Aut version 6.1 (http://www.math.pitt.edu/,bard/xpp/xpp.
html). The XPP-Aut code is provided as Supplemental Material.
Results
Perhaps the simplest model for studying synergism is a three-
node model of two pathways that converge onto a single target.
Here, each pathway represents stimulus-induced activation of an
enzyme, which in turn modifies the activity or level of a target
effector molecule. For generality, the activity of each pathway is
simply represented as the level of an element (A or B). A and B
converge to induce activation of the target, T (Fig. 1A1). To
characterize the responses of this motif (and the additional motifs
described below), a stimulus (S) is modeled as a brief (10 min)
square-wave pulse, rising from a basal value of zero to an elevated
value. To examine whether the strength of S affects synergism, the
latter value is varied from weak (1) to strong (40) (non-dimensional
units). After the pulse, S returns to zero. S concurrently activates A
and B. The activities of A and B are dynamic variables A and Bthat follow first-order ODEs (see Model Development). Two
variants of this model were analyzed. In Variant M, the effect of
the two pathways on the expression of T is multiplicative. The
activation rate of T is proportional to the product of the effects of
A and B. Thus, Variant M is equivalent to a logical AND gate. In
Variant A, the activation rate of T is proportional to the sum of the
effects of A and B. Each element is thus able to separately activate
T. Thus, Variant A is similar to a logical OR gate.
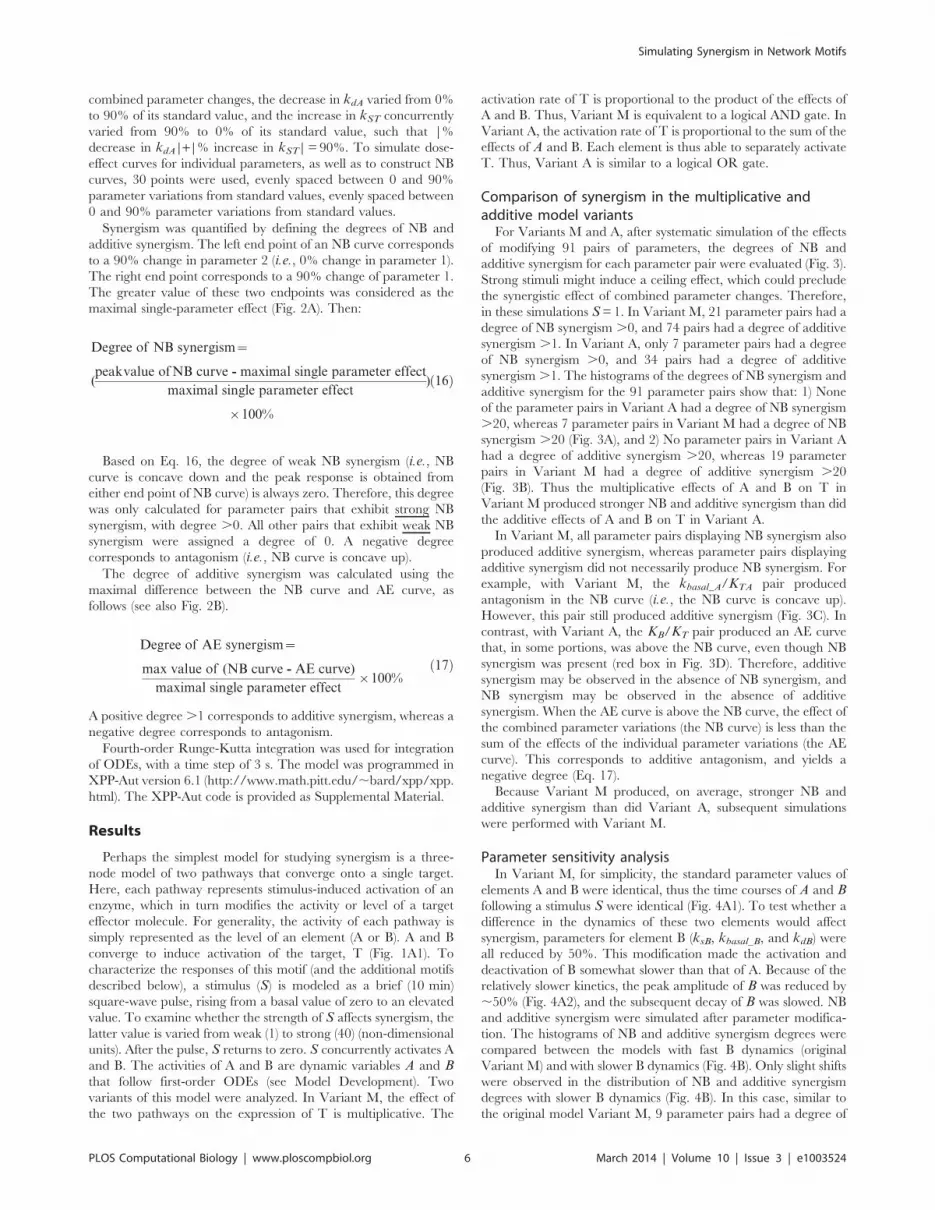
Comparison of synergism in the multiplicative andadditive model variantsFor Variants M and A, after systematic simulation of the effects
of modifying 91 pairs of parameters, the degrees of NB and
additive synergism for each parameter pair were evaluated (Fig. 3).
Strong stimuli might induce a ceiling effect, which could preclude
the synergistic effect of combined parameter changes. Therefore,
in these simulations S=1. In Variant M, 21 parameter pairs had a
degree of NB synergism .0, and 74 pairs had a degree of additive
synergism .1. In Variant A, only 7 parameter pairs had a degree
of NB synergism .0, and 34 pairs had a degree of additive
synergism.1. The histograms of the degrees of NB synergism and
additive synergism for the 91 parameter pairs show that: 1) None
of the parameter pairs in Variant A had a degree of NB synergism
.20, whereas 7 parameter pairs in Variant M had a degree of NB
synergism .20 (Fig. 3A), and 2) No parameter pairs in Variant A
had a degree of additive synergism .20, whereas 19 parameter
pairs in Variant M had a degree of additive synergism .20
(Fig. 3B). Thus the multiplicative effects of A and B on T in
Variant M produced stronger NB and additive synergism than did
the additive effects of A and B on T in Variant A.
In Variant M, all parameter pairs displaying NB synergism also
produced additive synergism, whereas parameter pairs displaying
additive synergism did not necessarily produce NB synergism. For
example, with Variant M, the kbasal_A/KTA pair produced
antagonism in the NB curve (i.e., the NB curve is concave up).
However, this pair still produced additive synergism (Fig. 3C). In
contrast, with Variant A, the KB/KT pair produced an AE curve
that, in some portions, was above the NB curve, even though NB
synergism was present (red box in Fig. 3D). Therefore, additive
synergism may be observed in the absence of NB synergism, and
NB synergism may be observed in the absence of additive
synergism. When the AE curve is above the NB curve, the effect of
the combined parameter variations (the NB curve) is less than the
sum of the effects of the individual parameter variations (the AE
curve). This corresponds to additive antagonism, and yields a
negative degree (Eq. 17).
Because Variant M produced, on average, stronger NB and
additive synergism than did Variant A, subsequent simulations
were performed with Variant M.
Parameter sensitivity analysisIn Variant M, for simplicity, the standard parameter values of
elements A and B were identical, thus the time courses of A and Bfollowing a stimulus S were identical (Fig. 4A1). To test whether a
difference in the dynamics of these two elements would affect
synergism, parameters for element B (ksB, kbasal_B, and kdB) wereall reduced by 50%. This modification made the activation and
deactivation of B somewhat slower than that of A. Because of the
relatively slower kinetics, the peak amplitude of B was reduced by
,50% (Fig. 4A2), and the subsequent decay of B was slowed. NB
and additive synergism were simulated after parameter modifica-
tion. The histograms of NB and additive synergism degrees were
compared between the models with fast B dynamics (original
Variant M) and with slower B dynamics (Fig. 4B). Only slight shifts
were observed in the distribution of NB and additive synergism
degrees with slower B dynamics (Fig. 4B). In this case, similar to
the original model Variant M, 9 parameter pairs had a degree of
Simulating Synergism in Network Motifs
PLOS Computational Biology | www.ploscompbiol.org 6 March 2014 | Volume 10 | Issue 3 | e1003524

NB synergism .10, and 36 pairs had a degree of additive
synergism .10 (Fig. 4B). In another test, the activation of B by S
was delayed by 60 min compared to activation of A (Fig. 4A2),
and the effect on synergism was assessed. With delayed B
activation, 7 parameter pairs still had a degree of NB synergism
.10, and 29 pairs had a degree of additive synergism .10
(Fig. 4B). Therefore, NB and additive synergism in Variant M
were robust to moderate variations in dynamics.
In further simulations, the percent reduction of ksB, kbasal_B,
and kdB was increased to 70% and then to 90%, which made the
activation and deactivation of B much slower than A. These
changes led to a decrease in the number of parameter pairs
showing synergism. When parameters for B were reduced by 70%,
7 parameter pairs had a degree of NB synergism .10 and none
had a degree .40. 33 pairs had a degree of additive synergism .10 but none had a degree .40. When parameters for B were
reduced by 90%, only 3 parameter pairs had a degree of NB
synergism .10 and none had a degree .20. 28 pairs had a degree
of additive synergism .10 but none had a degree .40. Although
50%, 70% and 90% were arbitrarily selected, they effectively
represent the range of substantial variation of kinetics of B. These
results suggest that the use of combined parameter changes might
be less effective in inducing synergy if two converging pathways
have very different dynamics. In the simulations, the highest
degrees of synergism were produced when the basal parameter
values governing the dynamics of both pathways were identical.
Therefore, further analyses of effects of stimulus strength and
network motifs on synergism were performed for the optimal
initial condition (identical basal dynamics of elements A and B).
To further test the robustness of Variant M, parameter
sensitivity analysis was performed for the dynamics of T. Six
parameters that affect the dynamics of T (Eq. 3) were altered by
either 225% or +25% from their standard values. NB and
additive synergism for the 91 parameter pairs were simulated after
each of these 12 parameter modifications. The histograms of NB
and additive synergism degrees were compared for the cases of
standard and varied parameters. Both NB and additive synergism
were robust to these moderate variations in T dynamics. For
example, after reducing or increasing kST by 25% or reducing KT
by 25%, 9 parameter pairs exhibited a degree of NB synergism .10, and 36 parameter pairs had a degree of additive synergism .10 (Figs. 4C–D). These pair numbers were the same as with
standard parameter values. After increasing KT by 25%, 7
parameter pairs exhibited a degree of NB synergism .10, and
38 parameter pairs had a degree of additive synergism .10
(Fig. 4D).
Initially, the effects of stimulus strength and network motifs on
synergism for all 91 parameter pairs were examined. However, the
most dramatic changes in the dynamics of the motifs were related
to alterations in the deactivation rate constants of elements A and
B, kdA and kdB. Therefore, the detailed analyses of effects of
stimulus strength and network motifs on synergism concentrated
on variations to the three parameter pairs (kdA, kdB), (kdA, kST),
and (kdA, KT), each of which includes at least one of these
Figure 3. Histograms of NB synergism (A) and additive synergism (B) degrees from 91 parameter pairs for Variant M (grey bars) andVariant A (green bars) (S=1). (C) Variation of the parameter pair KTA/kbasal_A in Variant M shows that additive synergism can exist in the absence ofNB synergism. kbasal_A increases from 0 to 90% as KTA concurrently decreases from 90 to 0%. (D) Variation of KB/KT in Variant A shows that NBsynergism can exist in the absence of additive synergism (red box, concave-down NB curve is below AE curve).doi:10.1371/journal.pcbi.1003524.g003
Simulating Synergism in Network Motifs
PLOS Computational Biology | www.ploscompbiol.org 7 March 2014 | Volume 10 | Issue 3 | e1003524
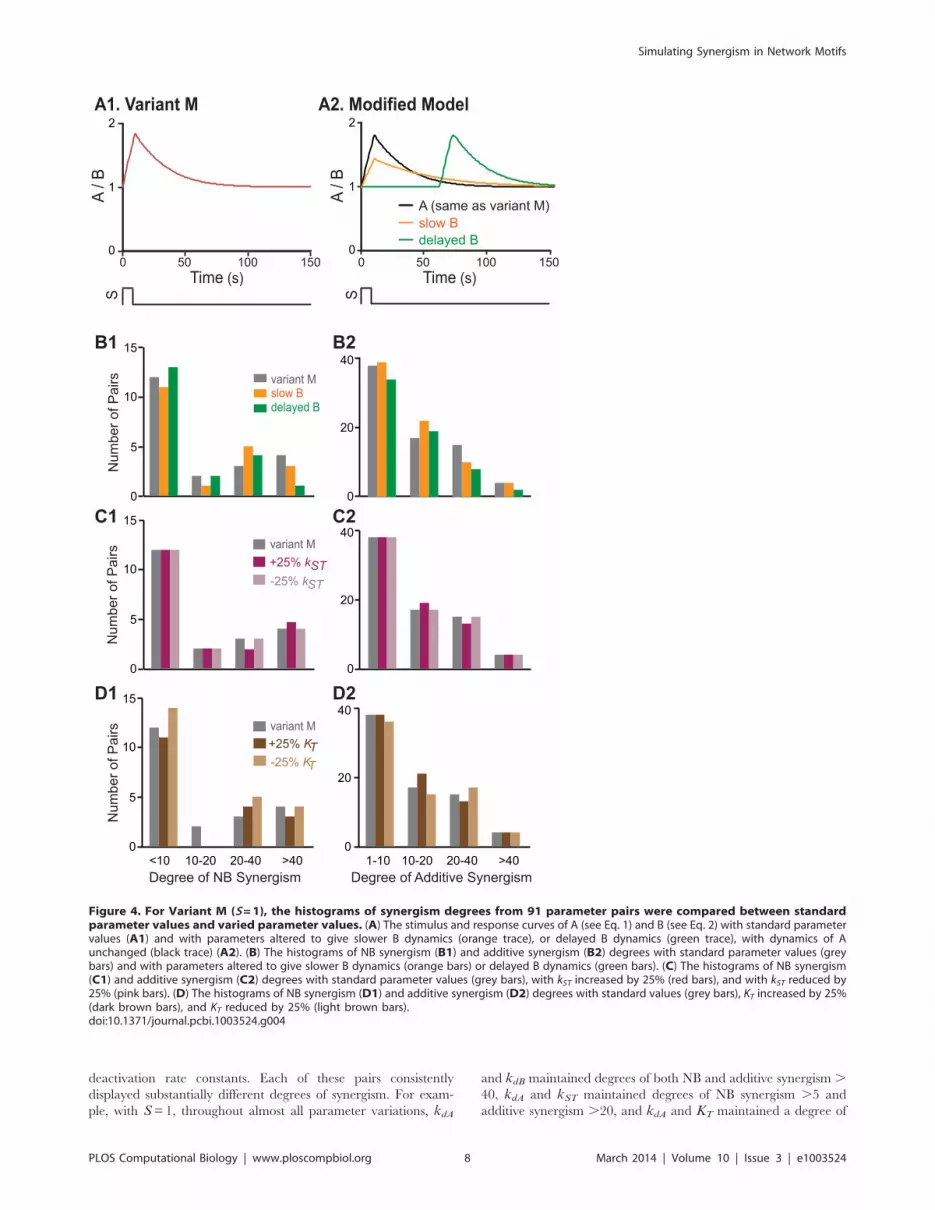
deactivation rate constants. Each of these pairs consistently
displayed substantially different degrees of synergism. For exam-
ple, with S=1, throughout almost all parameter variations, kdA
and kdB maintained degrees of both NB and additive synergism .40, kdA and kST maintained degrees of NB synergism .5 and
additive synergism .20, and kdA and KT maintained a degree of
Figure 4. For Variant M (S=1), the histograms of synergism degrees from 91 parameter pairs were compared between standardparameter values and varied parameter values. (A) The stimulus and response curves of A (see Eq. 1) and B (see Eq. 2) with standard parametervalues (A1) and with parameters altered to give slower B dynamics (orange trace), or delayed B dynamics (green trace), with dynamics of Aunchanged (black trace) (A2). (B) The histograms of NB synergism (B1) and additive synergism (B2) degrees with standard parameter values (greybars) and with parameters altered to give slower B dynamics (orange bars) or delayed B dynamics (green bars). (C) The histograms of NB synergism(C1) and additive synergism (C2) degrees with standard parameter values (grey bars), with kST increased by 25% (red bars), and with kST reduced by25% (pink bars). (D) The histograms of NB synergism (D1) and additive synergism (D2) degrees with standard values (grey bars), KT increased by 25%(dark brown bars), and KT reduced by 25% (light brown bars).doi:10.1371/journal.pcbi.1003524.g004
Simulating Synergism in Network Motifs
PLOS Computational Biology | www.ploscompbiol.org 8 March 2014 | Volume 10 | Issue 3 | e1003524
additive synergism.10 and a degree of NB synergism= 0. For the
kdA/KT pair the NB curve remained concave down with a
maximal at an endpoint (weak nonlinear blending).
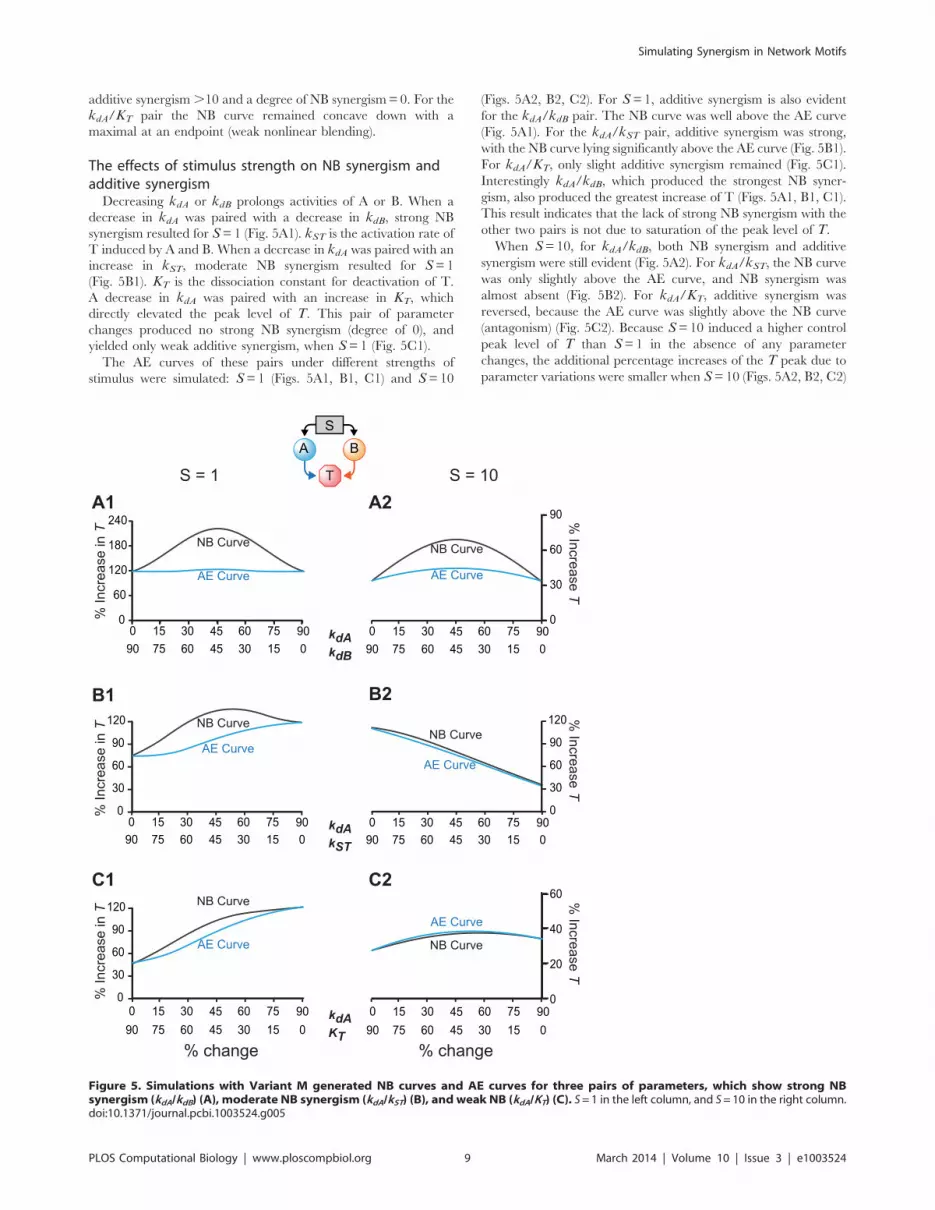
The effects of stimulus strength on NB synergism andadditive synergismDecreasing kdA or kdB prolongs activities of A or B. When a
decrease in kdA was paired with a decrease in kdB, strong NB
synergism resulted for S=1 (Fig. 5A1). kST is the activation rate of
T induced by A and B. When a decrease in kdA was paired with an
increase in kST, moderate NB synergism resulted for S=1
(Fig. 5B1). KT is the dissociation constant for deactivation of T.
A decrease in kdA was paired with an increase in KT, which
directly elevated the peak level of T. This pair of parameter
changes produced no strong NB synergism (degree of 0), and
yielded only weak additive synergism, when S=1 (Fig. 5C1).
The AE curves of these pairs under different strengths of
stimulus were simulated: S=1 (Figs. 5A1, B1, C1) and S=10
(Figs. 5A2, B2, C2). For S=1, additive synergism is also evident
for the kdA/kdB pair. The NB curve was well above the AE curve
(Fig. 5A1). For the kdA/kST pair, additive synergism was strong,
with the NB curve lying significantly above the AE curve (Fig. 5B1).
For kdA/KT, only slight additive synergism remained (Fig. 5C1).
Interestingly kdA/kdB, which produced the strongest NB syner-
gism, also produced the greatest increase of T (Figs. 5A1, B1, C1).
This result indicates that the lack of strong NB synergism with the
other two pairs is not due to saturation of the peak level of T.
When S=10, for kdA/kdB, both NB synergism and additive
synergism were still evident (Fig. 5A2). For kdA/kST, the NB curve
was only slightly above the AE curve, and NB synergism was
almost absent (Fig. 5B2). For kdA/KT, additive synergism was
reversed, because the AE curve was slightly above the NB curve
(antagonism) (Fig. 5C2). Because S=10 induced a higher control
peak level of T than S=1 in the absence of any parameter
changes, the additional percentage increases of the T peak due to
parameter variations were smaller when S=10 (Figs. 5A2, B2, C2)
Figure 5. Simulations with Variant M generated NB curves and AE curves for three pairs of parameters, which show strong NBsynergism (kdA/kdB) (A), moderate NB synergism (kdA/kST) (B), and weak NB (kdA/KT) (C). S=1 in the left column, and S=10 in the right column.doi:10.1371/journal.pcbi.1003524.g005
Simulating Synergism in Network Motifs
PLOS Computational Biology | www.ploscompbiol.org 9 March 2014 | Volume 10 | Issue 3 | e1003524

than when S=1 (Figs. 5A1, B1, C1), which indicated some
saturation of the peak level of T for the higher stimulus, S=10.
However the kdA/kdB pair, which produced the strongest NB
synergism, yielded a greater increase of T than did kdA/KT
(Figs. 5A2, C2). This result indicates that the saturation of peak T
is not the only reason for reduction of synergism.
The results of Fig. 5 indicate that increasing the strength of the
stimulus tends to reduce NB synergism and additive synergism. To
further test this hypothesis, the degrees of NB synergism and
additive synergism were measured under a series of stimuli ranging
from S=1 to S=40. Fig. 6 illustrates dose-effect curves of
synergism vs. stimulus strength. Although, for all three pairs of
parameters, NB synergism and additive synergism gradually
decreased with increasing S when S.10, the dose-effect curves
were not monotonic, displaying a type of inverted U-shaped curve.
Each pair required a different stimulus strength to maximize each
type of synergism. For each pair, maximal NB synergism and
additive synergism could occur at distinct stimulus strengths.
The effects of network motifs on NB synergism andadditive synergism
Mutual excitation loop between A and B. The effects of
mutual excitation on NB synergism and additive synergism
(Fig. 1B2) were simulated with the same three parameter pairs
as above in the presence of positive feedback, when S=1 (Fig. S1,
panels A1, B1, C1) or S=10 (Fig. S1, panels A2, B2, C2). No
strong NB synergism, or strong additive synergism, was exhibited
for any of the pairs. For kdA/kdB, the AE curve was well above the
NB curve, and the NB curve was concave up, illustrating
antagonism (Fig. S1A1). For kdA/kST (Fig. S1B1), and kdA/KT
(Fig. S1C1), the NB and AE curves were close or intertwined.
Compared to the corresponding AE and NB curves in the original
Variant M (Fig. 5), it appears that NB synergism and additive
synergism are both greatly reduced, for all three pairs, by the
presence of this form of positive feedback. Indeed, the degrees of
NB and additive synergism were ,5 for all three pairs, whereas
without excitation the degrees of NB synergism and additive
synergism for kdA/kdB and kdA/kST were .10, and the degree of
additive synergism for kdA/KT was also .10.
When S=10, the NB and AE curves were also close for all three
pairs. Additive antagonism was nearly eliminated when S=10.
Mutual excitation also increased the peak level of T. This effectwas particularly significant when S=10, because the additional
percentage increases of the T peak due to parameter variations
were much smaller when S=10 than when S=1, which indicated
saturation of the peak level of T. Therefore, with mutual
excitation, increasing stimulus strength tends to eliminate both
synergism and antagonism, apparently due to a ceiling effect
caused by the combination of mutual excitation and strong
stimulation.
Positive feedback from T to A and B. The effects of
positive feedback from T to A and B (Fig. 1E) on NB synergism
and additive synergism were similar to the effects of a mutual
excitation loop between A and B (Fig. S5). Reduced synergism, or
even antagonism, was evident when S=1. Increasing the stimulus
strength eliminated antagonism, possibly due to a ceiling effect.
Mutual inhibition loop between A and B. The effects of a
mutual inhibition loop on NB synergism and additive synergism
(Fig. 1B3) were simulated with the same three parameter pairs
when S=1 (Fig. S2, panels A1, B1, C1) or S=10 (Fig. S2, panels
A2, B2, C2). When S=1, for kdA/kdB, both NB synergism and
additive synergism were greatly enhanced by the inhibition
(compare Figs. 5A1 and S2A1). The degrees of both forms of
synergism were enhanced at least four-fold. In contrast, for kdA/kST and kdA/KT, the NB and AE curves were intertwined.
Compared to the corresponding AE and NB curves in the original
Variant M (Fig. 5), NB synergism and additive synergism were
greatly reduced.
The differential effects of mutual inhibition on synergism for
different parameter pairs may be due to the fact that mutual
inhibition and kdA/kdB are both involved in the deactivation of A
and B, whereas kST and KT are involved in the activation of T.
Mutual inhibition enhanced NB synergism and additive synergism
if both parameters were chosen from the reactions regulated by the
inhibition. In contrast, mutual inhibition reduced both forms of
synergism if at least one of the parameters was chosen from a
different reaction or interaction, even if that reaction was
downstream and indirectly regulated by the inhibition.
When S=10, for kdA/kdB, both NB synergism and additive
synergism remained strong. The NB curve was well above the AE
curve (Fig. S2A2). The degrees of NB synergism and additive
synergism decreased by ,40% as compared to the degrees when
S=1. However, the presence of mutual inhibition still increased
the values of both degrees by .100%. For kdA/kST and kdA/KT,
the NB and AE curves were no longer intertwined. The AE curves
were slightly below the NB curves. In addition, kdA/KT shows
substantial NB synergism when S=10 (degree of NB syner-
gism=23). Thus for these two parameter pairs, with mutual
inhibition, both forms of synergism are enhanced with increasing
stimulus strength.
Positive auto-regulation of A. The effects of a positive auto-
regulation loop on NB synergism and additive synergism (Fig. 1C1)
were simulated with the same three parameter pairs when S=1
(Fig. S3, panels A1, B1, C1) or S=10 (Fig. S3, panels A2, B2, C2).
When S=1, for kdA/kdB, both NB synergism and additive
Figure 6. Simulations of three parameter pairs with Variant Mgenerated dose-effect curves that describe the relationshipsbetween NB synergism and stimulus strength (A), and betweenadditive synergism and stimulus strength (B). The strength ofstimulus (S) was varied from 1 to 40.doi:10.1371/journal.pcbi.1003524.g006
Simulating Synergism in Network Motifs
PLOS Computational Biology | www.ploscompbiol.org 10 March 2014 | Volume 10 | Issue 3 | e1003524
synergism were strong. The NB curve was well above the AE curve
(Fig. S3A1) and the degrees of both types of synergism were
increased by at least 40% by positive auto-regulation. Indeed
NB synergism was enhanced for all three pairs (compare Fig. 5,
A1–C1 with Fig. S3, A1–C1). For kdA/kST and kdA/KT, NB
synergism was evident. Surprisingly, however, for these two pairs
the AE curves were above the NB curves (additive antagonism).
Additive synergism was reversed for kdA/KST (Fig. S3B1) and
kdA/KT (Fig. S3C1). Therefore for a weak stimulus (S = 1), positive
auto-regulation enhances NB synergism for all pairs, but has
diverse, parameter-specific effects on additive synergism. When
S=10, the NB and AE curves were close for all three pairs and no
substantial NB synergism or additive synergism was observed. The
positive auto-regulation eliminates NB synergism and additive
synergism for a strong stimulus. Similarly to the mutual excitation
loop discussed previously, this elimination of synergism for a
strong stimulus might be due to an enhanced ceiling effect.
Negative auto-regulation of A. The effects of a negative
auto-regulation loop on NB synergism and additive synergism
(Fig. 1C2) were simulated in the presence of negative auto-
regulation for the same parameter pairs. When S=1, the degrees
of NB synergism and additive synergism for all three pairs were at
least 25% lower than the corresponding synergism degrees in the
absence of the negative auto-regulation loop (the original Variant
M). Therefore, negative auto-regulation reduces NB synergism
and additive synergism when the stimulus is weak. For S= 10,
negative auto-regulation enhanced NB synergism and additive
synergism for kdA/kST, and additive synergism for kdA/KT,
compared to the corresponding degrees without negative auto-
regulation. However, negative auto-regulation reduced NB
synergism and additive synergism for kdA/kdB, and NB synergism
for kdA/KT. The negative auto-regulation loop has a complicated,
parameter-specific and stimulus-dependent effect on both forms of
synergism.
Coherent positive feed-forward loop, or negative feed-
forward loop, from A to B. For the same three parameter
pairs, in the presence of a positive feed forward loop (P-FFL)
(Fig. 1B1A), the degrees of additive synergism were negative or,1
when S=10. When S=1, for all pairs, these degrees of additive
synergism were .50% less than the corresponding degrees in the
absence of the feed-forward loop. The degrees of NB synergism for
all three pairs were always 0, except for kdA/kST when S=10
(degree = 4). The feed forward loop reduces NB synergism and
additive synergism.
The negative feed forward loop (N-FFL) (Fig. 1B1B) had similar
effects as did the P-FFL. For the same three parameter pairs, the
degrees of NB and additive synergism for all pairs were reduced
regardless of stimuli.
Negative feedback between A and B, or from T to A and
B. The effects of a negative feedback loop between A and B
(Fig. 1D1) were simulated for the same parameter pairs when
S=1 and when S=10. With this negative feedback, the degrees of
NB synergism for all pairs were zero regardless of stimuli. When
S=1, for all pairs, the degrees of additive synergism were .50%
less than the corresponding degrees in the absence of negative
feedback. When S=10, for kdA/kdB, the degree of additive
synergism was ,0.9. In contrast, the degree of additive synergism
for kdA/kST was ,26, whereas the degree was ,4 in the absence
of negative feedback. The degree of additive synergism for kdA/KT
was ,7, whereas the degree was negative without negative
feedback. This type of negative feedback reduces NB synergism
and exhibits a parameter-specific and stimulus-dependent effect on
additive synergism.
Finally, the effects of a negative feedback loop in which
increased T accelerates deactivation of A and B (Fig. 1D2) were
simulated when S=1 (Fig. S4, panels A1, B1, C1) or S=10 (Fig.
S4, panels A2, B2, C2). When S=1, the degrees of NB and
additive synergism for kdA/kdB were ,20% greater than in the
absence of negative feedback, whereas the degrees of additive and
NB synergism for kdA/kST were, respectively, ,40% and ,5%
lower. The degree of additive synergism for kdA/KT was reduced
by ,25%. In contrast, the degree of NB synergism for kdA/KT
was small but positive (,4), whereas the degree was 0 in the
absence of negative feedback. Negative feedback from T to A and
B has a diverse, parameter-specific effect on both forms of
synergism.
When S=10, NB and additive synergism was enhanced for all
three pairs. For kdA/kdB the degrees of NB and additive synergism
were at least 100% greater than in the absence of negative
feedback from T to A and B. For kdA/kST the degree of NB
synergism was small (,1) but positive and the degree of additive
synergism was ,11, both increased above the degrees without
feedback (NB synergism: 0; additive synergism: ,4). For kdA/KT
the degree of NB synergism was ,22, more than 100% greater
than without negative feedback (,10). Additive synergism was also
present (degree ,11), in contrast to the antagonism seen without
negative feedback (degree ,24) (Fig. 5B2). Negative feedback
from T to A and B can enhance both NB and additive synergism
when the stimulus is sufficiently strong.
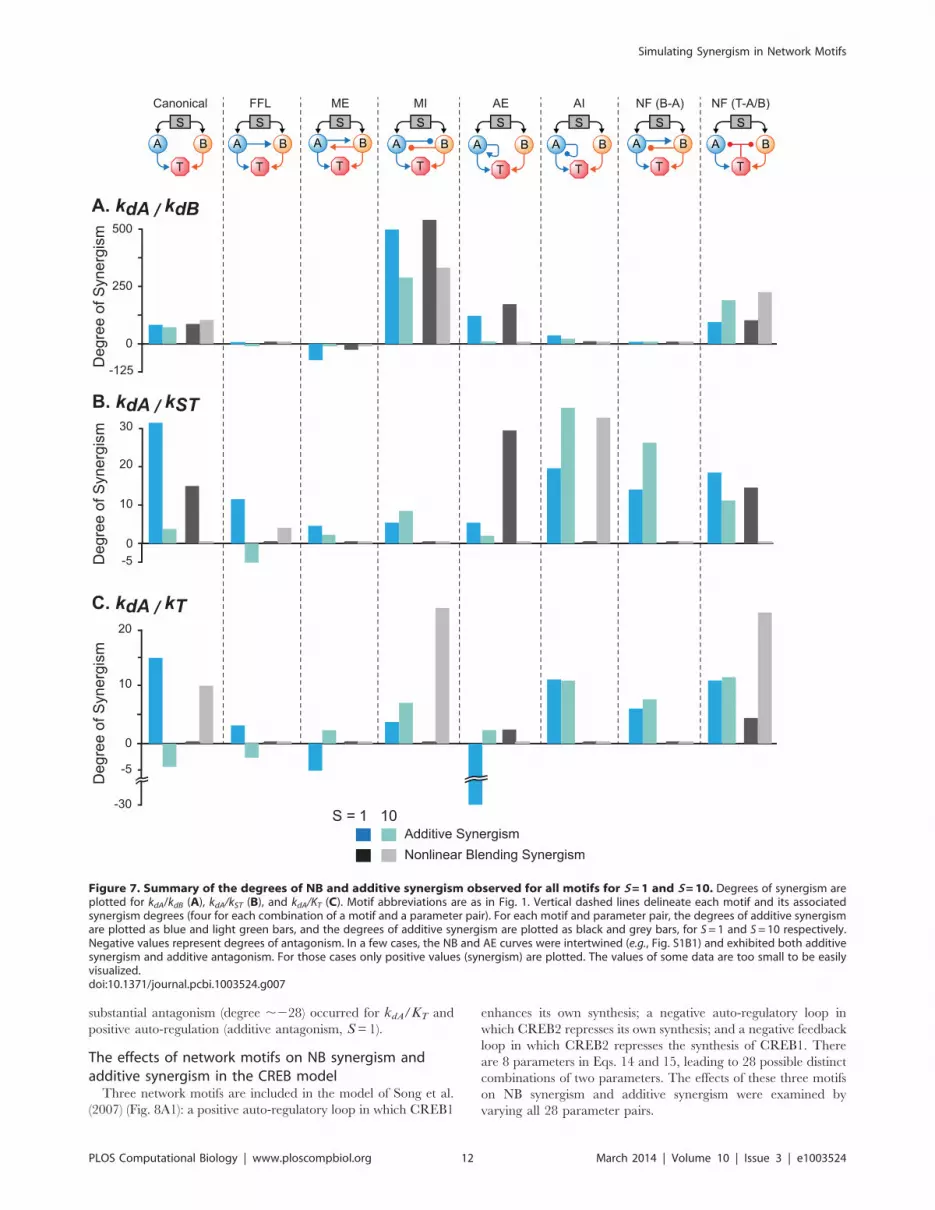
Substantial enhancement of synergism was only seen for
a subset of motifs. Fig. 7 summarizes the degrees of NB and
additive synergism simulated for the canonical model and seven
other motifs, for S=1 and 10. Positive feedback from T to A and
B, and the negative feed forward loop, were not included in Fig. 7,
because their effects on synergism and antagonism were respec-
tively similar to mutual excitation and to the positive feed forward
loop. Variations of kdA/kdB in the mutual inhibition loop
produced the greatest enhancement of synergism when compared
to the canonical model. NB and additive synergism were greatly
enhanced, and degrees in excess of 250 were simulated. However,
with the other parameter pairs in the mutual inhibition loop, only
kdA/KT showed an evident synergism increase, and only for NB
synergism for S=10. Negative feedback from T to A and B
yielded a similar pattern. Substantial enhancement of all forms of
synergism was again seen for kdA/kdB, especially for S=10.
Again, with the other parameter pairs, only kdA/KT exhibited
substantially enhanced synergism, and only for NB synergism for
S= 10. In both motifs, kdA/kST and kdA/KT showed an evident
but modest synergism increase for additive synergism for S=10,
although some degrees did not exceed 10 or were only slightly
above 10.
For kdA/kdB in other motifs, positive auto-regulation was also
seen to substantially enhance both forms of synergism, but only for
S=1, whereas for S=10, both forms were abolished. For kdA/
kST, three other instances of substantial synergism enhancement
(degrees .10) were seen in Fig. 7. Positive auto-regulation
increased the NB synergism degree to 29 for S=1. Negative
auto-regulation enhanced both forms of synergism for kdA/kST,
but only for S=10, and a negative feedback loop between A and B
enhanced additive synergism for kdA/kST for S=10. The two
remaining motifs, the mutual excitation loop and the positive feed
forward loop, did not exhibit significant synergism for any
conditions simulated.
Indeed, kdA/kdB in the mutual excitation loop exhibited evident
NB and additive antagonism. A degree as negative as 270 for
additive synergism was simulated for S=1. One other instance of
Simulating Synergism in Network Motifs
PLOS Computational Biology | www.ploscompbiol.org 11 March 2014 | Volume 10 | Issue 3 | e1003524
substantial antagonism (degree ,228) occurred for kdA/KT and
positive auto-regulation (additive antagonism, S=1).
The effects of network motifs on NB synergism andadditive synergism in the CREB modelThree network motifs are included in the model of Song et al.
(2007) (Fig. 8A1): a positive auto-regulatory loop in which CREB1
enhances its own synthesis; a negative auto-regulatory loop in
which CREB2 represses its own synthesis; and a negative feedback
loop in which CREB2 represses the synthesis of CREB1. There
are 8 parameters in Eqs. 14 and 15, leading to 28 possible distinct
combinations of two parameters. The effects of these three motifs
on NB synergism and additive synergism were examined by
varying all 28 parameter pairs.
Figure 7. Summary of the degrees of NB and additive synergism observed for all motifs for S=1 and S=10. Degrees of synergism areplotted for kdA/kdB (A), kdA/kST (B), and kdA/KT (C). Motif abbreviations are as in Fig. 1. Vertical dashed lines delineate each motif and its associatedsynergism degrees (four for each combination of a motif and a parameter pair). For each motif and parameter pair, the degrees of additive synergismare plotted as blue and light green bars, and the degrees of additive synergism are plotted as black and grey bars, for S= 1 and S= 10 respectively.Negative values represent degrees of antagonism. In a few cases, the NB and AE curves were intertwined (e.g., Fig. S1B1) and exhibited both additivesynergism and additive antagonism. For those cases only positive values (synergism) are plotted. The values of some data are too small to be easilyvisualized.doi:10.1371/journal.pcbi.1003524.g007
Simulating Synergism in Network Motifs
PLOS Computational Biology | www.ploscompbiol.org 12 March 2014 | Volume 10 | Issue 3 | e1003524

In Song et al. [26], when the standard parameter values are
used, the model has two stable steady states: LOW and HIGH
states. Vx is transiently increased from 0.4 min21 to 3.7 min21 to
simulate the application of a neurotransmitter, 5-HT [26]. A
standard 5-HT protocol that is widely used to induce long-term
synaptic facilitation (LTF) (5 pulses of 5 min 5-HT with
interstimulus interval of 20 min) [39] is simulated, by increasing
Vx for 5 min for each of the 5 pulses. After the 5-HT stimulus,
CREB1 and CREB2 were switched from the LOW state to the
HIGH state (Fig. 8A2). The ratio of [CREB1]/[CREB2] after
they converge to the HIGH state was considered to represent the
response to 5-HT. An increase in this ratio corresponds to an
increase in the level of the transcription activator CREB1 and/or
a decrease in the level of the transcription repressor CREB2.
Therefore an increase in this ratio corresponds to increased
induction of genes necessary for LTF. LTF is a cellular correlate of
long-term memory (LTM), and an increase of [CREB1]/[CREB2]
corresponds qualitatively to improved formation of some forms of
LTM. The [CREB1]/[CREB2] ratio in the absence of parameter
changes was regarded as the control, and the percentage increase of
the ratio over the control was taken as the simulated response to
each of the 28 variations in parameter pairs. As was done previously
for the three-node motifs (Methods), for each parameter pair,
individual parameters were varied in the direction that acted to
increase the response, i.e., the [CREB1]/[CREB2] ratio.
After systematic, concurrent variation of each of the 28 pairs of
parameters, only one pair of parameters, Vx/Kdy, was found to
exhibit degrees of NB and additive synergism that exceeded 20
(Fig. 8B). Vx is the maximum induced synthesis rate of CREB1,
whereas Kdy is the degradation rate of CREB2. In these
simulations, Vx and Kdy were both increased, because for both
parameters, an increase acts to elevate [CREB1]/[CREB2].
Increasing Vx enhances the strength of the positive auto-regulatory
loop of CREB1. Increasing Kdy suppresses the negative feedback
between CREB1 and CREB2 and suppresses the negative auto-
regulatory loop of CREB2 by accelerating the degradation of
CREB2. Thus increasing positive auto-regulation while simulta-
neously suppressing negative auto-regulation was found to be the
only way to obtain substantial NB synergism and additive
synergism. These simulation results are consistent with the earlier
results from the three-node motifs, that positive auto-regulation
acts to enhance NB synergism, and that negative auto-regulation
acts to suppress synergism.
Discussion
The effects of varying parameter combinations in the context of
common motifs in biochemical pathways were simulated, and for
each motif, parameter combinations were identified that have a
relatively greater likelihood of exhibiting synergism. For every
motif (Fig. 1), simulations quantified degrees of NB synergism and
of additive synergism for an extensive set of 91 parameter pairs.
Three of these pairs, which each exhibited substantially different
amounts of synergism, were then used to analyze parameter
combination effects in detail. By concurrent simulation of NB and
AE curves, we were able to visualize which pairs produced
synergism (e.g., Fig. 5A), and which produced antagonism (e.g.,Fig. 3C). Simulations demonstrated that NB synergism can exist
without additive synergism, and vice versa (Figs. 3C, 3D).
A canonical model that exhibits synergismFor the basic motif of two converging signaling pathways
(Fig. 1A1), the model variant with a multiplicative effect of the
pathways on the regulation of a target (Variant M) produced
stronger synergism than did the model with a simply additive effect
of the two pathways (Variant A). Thus, combined parameter
variations may be less efficacious if they occur within signaling
pathways that have additive effects on a downstream target.
However, and as discussed below, a multiplicative mechanism
does not guarantee synergistic effects in other motifs.
The synergism produced by Variant M was robust to modest
variations of parameters governing the dynamics of signal
pathways. In contrast, synergism was much more sensitive to the
strength of stimulus and to the presence of feedback or feed
forward interactions between elements and their target. NB and
additive synergism were decreased when the stimulus became
strong (Fig. 6). These results are not surprising, because increasing
stimulus intensity will saturate the signaling cascade. This ceiling
effect will prevent the combined parameter changes from further
enhancing the activation of their target. However, the relation-
ships between synergism and stimulus strength were non-
monotonic (Fig. 6). Each parameter pair exhibited maximal
synergism at a different stimulus strength. For example, kdA/kdBproduced maximal NB synergism when S=4, but kdA/kSTproduced maximal NB synergism when S=2 (Fig. 6). When
S=8, a simulated parameter combination was still effective (i.e.,synergism was observed) for kdA/kdB, but not for kdA/kST (Fig. 6).
These simulations suggest that empirically, if the physiological
stimulus strength activating a given pathway varies, the optimal
choice of combined drug therapy to target that pathway might also
change.
The effectiveness of paired parameter variations dependson the network motifsMutual excitation and mutual inhibition feedback loops are two
motifs commonly observed in signaling pathways [29]. Variation
of a pair of parameters yields synergistic effects in mutual
inhibition motifs (Figs. 1B3, 7, S2), but has opposite effects on
Figure 8. The model of Song et al. [26] and simulations. (A1) Thefeedback loops described by the model. (A2) After 5 pulses of 5-HTtreatment, CREB1 and CREB2 switch from a LOW state to a HIGH state.(B) The NB curve and AE curve for the parameter pair Vx/kdy. This pairshows strong NB synergism, and additive synergism.doi:10.1371/journal.pcbi.1003524.g008
Simulating Synergism in Network Motifs
PLOS Computational Biology | www.ploscompbiol.org 13 March 2014 | Volume 10 | Issue 3 | e1003524

motifs with a mutual excitation loop (Fig. 1B2), where both NB
and additive synergism (Figs. 7, S1) were eliminated. This
elimination may be due to the self-reinforcing effect of the positive
feedback, enhancing the ability of combined parameter changes to
saturate the response. Similar results were obtained for paired
parameter changes in a positive feed forward motif (Fig. 1B1).
These results suggest that it may not be advantageous to design a
combined drug therapy for which both drugs activate a positive
feedback loop similar to that of Fig. 1B2, or a feed forward loop
similar to Fig. 1B1. In contrast, mutual inhibition tends to prevent
activation of the target from saturating, and this effect may explain
the enhanced synergism. Thus, a promising strategy for combi-
nation therapy might be to target drugs to elements of mutual
inhibition loops.
The effects of other network motifs on synergism were also
examined. A positive auto-regulation loop (Fig. 1C1) enhanced NB
synergism only if: 1) the upstream stimulus activating the signaling
pathway was weak, and 2) one or both of the parameters were part
of the positive auto-regulation loop (Figs. 7, S3). Although positive
auto-regulation surprisingly reversed additive synergism for some
parameter pairs (Fig. S3), these simulations nevertheless suggest
that given conditions 1) and 2), a positive auto-regulation loop may
be a worthwhile target of a combination drug therapy. In contrast,
a negative auto-regulation loop had a diverse, pair-specific effect
on synergism (Fig. 7). When the upstream stimulus was weak, this
auto-regulation tended to reduce synergism. Only for kdA/kST and
for a strong upstream stimulus was a substantial enhancement
(degree.10) seen. These simulations suggest that a signal pathway
with negative auto-regulation may not be a good target for
combined drug therapies that affect pathway parameters in a
similar manner to that modeled here. Simulations with the more
biologically realistic model of [26], which contains multiple motifs,
supported the above suggestions. With this model, the only way to
obtain substantial NB synergism and additive synergism was to
suppress negative auto-regulation while substantially enhancing
positive auto-regulation.
The effects of a negative feedback loop between the target and
an upstream element were similar to those of a mutual inhibition
loop between elements (Figs. 7, S2, S4). In the negative feedback
and the mutual inhibition loops:
N For kdA/kdB, both NB synergism and additive synergism were
enhanced regardless of stimulus strength, compared to the
model without feedback or inhibition.
N For kdA/kST, additive synergism was enhanced when the
stimulus was sufficiently strong (S=10).
N For kdA/KT, both forms of synergism were enhanced when the
stimulus was sufficiently strong (S=10).
These results further support the suggestion that some pathways
with negative interactions, either mutual inhibition between
elements, or inhibition between a downstream target and an
upstream element, may be good targets for combined drug
therapy, especially when both drugs target the parameters
involved in the negative interactions. However, a simple negative
feedback loop between A and B (Fig. 1D1) may not be a good
target for combined drug therapies that alter parameters in a way
similar to that modeled here, because with this negative feedback,
the degrees of NB synergism for all three parameter pairs were
zero regardless of stimuli (Fig. 7).
Although elements A and B are representative of enzymes
acting on a common target (T), the motifs of Figs. 1A1–1D2
are found in signaling pathways that also include regulation
of gene expression [1,29,40]. Thus A, B, and/or T could
alternatively refer to genes, or A and B could refer to
transcription factors inducing gene T. Drug combinations
targeting elements of motifs with such elements might include
antisense RNA or siRNA to affect translation of a regulatory
protein, or compounds that affect the activity of transcription
factors.
Indeed, numerous feedback loops and feed-forward motifs have
been identified in signaling pathways that include gene regulation
and that are associated with cancer and other disorders. Cui et al.[4] mapped interactions among ,1,600 genes associated with
oncogenesis. Over 850 three-node FFLs similar to that in Fig. 1B1
were identified, and ,200 feedback loops similar to those in
Figs. 1B2 and 1B3 were found. One well-known example is the
p53-mdm2 negative feedback loop [41]. Aberrant activation of the
RasRRafRMAP kinase pathway is also commonly implicated in
cancer [42], and a strong negative feedback loop within which
activation of MAP kinase leads to inhibition of upstream Raf
kinase has been identified [43]. Considerable effort is also being
directed toward developing pharmacotherapies to improve learn-
ing and memory in individuals with cognitive deficits due to
molecular lesions (e.g., Rubinstein-Taybi syndrome [44]; or
neurofibromatosis type 1 [45]). Long-term synaptic potentiation
(LTP) is a correlate of learning and memory, and within signaling
pathways important for LTP, numerous three-node FFLs and
feedback loops have been identified [46]. Interestingly, over the
entire human gene network, three-node FFLs are the most
common regulatory motif [5].
Sensitivity of synergism to initial parameter valuesA series of sensitivity analyses were performed. The results
indicated that although synergism and antagonism could be
dependent on initial setting of individual parameter space,
synergism may be less likely if parameters are concurrently
changed in two converging pathways with substantially different
dynamics. In the simulations, the highest degrees of synergism
were produced when the basal parameter values governing the
dynamics of two converging pathways were identical. This finding
that choosing two target pathways with similar dynamics tends to
favor synergism might be useful in designing some combination
drug therapies.
Implications for combination drug therapiesCombination drug therapies are commonly used for complex
diseases and neurological disorders such as Alzheimer’s disease,
depression, traumatic brain injury, cancer, type 2 diabetes, and
infections [47–54]. A potential benefit of combination therapies is
synergism [50,55–56]. With synergism, drugs administered
together have a greater effect than would be predicted by simple
addition of single-drug effects (i.e., super-additive effects). Thus
synergism allows for lower drug doses, minimizing undesirable
effects. However, the molecular mechanisms underlying the
synergism produced by combined drugs are not well understood
for many combination drug therapies. In Axelrod et al. [57], 420
drug combinations were screened in 14 different cell lines. 84
combinations were found to generate synergism in multiple cell
lines. The mechanistic analysis did help to suggest possible
mechanisms involved in the induction of synergism. For example,
the analysis implied that a combination of Ro31-8220 and
lapatinib might produce synergism by their compensatory cross-
talk between the p70S6 kinase and EGF receptor pathways [57].
However, none of the 84 combinations were synergistic in more
than half of the 14 cell lines, and no pattern of lineage specificity
was observed. Moreover, the authors found that even compounds
from the same family or with similar structures cannot substitute
Simulating Synergism in Network Motifs
PLOS Computational Biology | www.ploscompbiol.org 14 March 2014 | Volume 10 | Issue 3 | e1003524

for each other to induce synergism, which reflects the diversity of
complex signaling networks.
In the current study, concurrent variation of parameter pairs to
increase a response can represent the effect of a pair of drugs
targeted to affect the corresponding interactions in a specific
pathway motif. Therefore, alterations in parameter pairs that
result in both NB synergism and additive synergism, and for which
both types of synergism are robust to moderate variations in other
parameters, may help to suggest, or to prioritize, drug combina-
tions for empirical investigation.
This study did not focus on examining how motifs affect a
parameter pair for varying initial values of all model parameters.
Instead, the aim was to investigate how network motifs affect the
degrees of synergism associated with variation of different types of
parameter pairs, when the initial values of model parameters favor
the induction of synergism. In the analysis of effects of stimulus
strength and network motifs on synergism, we examined whether
the motifs enhanced or eliminated the synergism for the parameter
pairs that already exhibited synergism in the canonical model
(kdA/kdB and kdA/kST), and whether the motifs helped to generate
synergism for the parameter pair that did not exhibit synergism in
the canonical model (kdA/KT).
The network motifs examined in the present study are obvious
simplifications of the processes taking place in realistic biological
networks and the analysis of these motifs is not expected to yield a
complete understanding of these networks and the ways in which
combined parameter variations affect them. However, models of
simplified motifs have their own advantages. They have relatively
few parameters and a relatively simple mathematical structure, so
it is possible to simulate and analyze the dynamics characteristic of
a specific motif, which can be otherwise obscured within a
complex network. Moreover, once the key dynamical elements of
basic motifs are characterized, it is easier to incorporate these
elements into more complicated and biologically realistic models.
Under some circumstances, the dynamics characteristic of a single
motif may dominate a local biological network [29,58]. Indeed,
Tyson and Novak [58] review several cases for which a single
motif appears to dominate the dynamics of a cellular response. In
these circumstances, the analysis presented here could be
particularly useful for understanding cellular responses to pairs
of drugs affecting that motif.
In summary, models such as those studied here provide insights
into the dynamical properties of network motifs. Moreover, the
stimulus protocols and parameter manipulations used here may
help to predict the extent of synergism and consequently may
prove useful in prioritizing empirical investigations of combination
therapies. If combined drugs target signaling pathways that
contain mutual excitation or positive feed forward interactions, a
single drug might be as efficient as combined drugs. Whereas, if
combined drugs target signaling pathways that contain a negative
feedback loop between the target and an upstream element, or a
mutual inhibition loop between elements, the combination may be
more likely to exhibit empirical synergism. The usefulness of this
approach is dependent on knowledge of the motifs that participate
in signaling pathways affected by specific disorders. Often this
information is currently limited. However, as progress is made in
understanding motifs affected by diseases, the use of such
computational models in the initial stage of designing combination
drug therapies may become a common and efficient methodology.
Supporting Information
Code S1 This file contains code written for the free, publicly
available software package XPPAut. This code served as the basis
for all the simulations in the manuscript.
(TXT)
Figure S1 Simulations in the model with a mutual excitation
loop between A and B generated NB curves and AE curves for
kdA/kdB (A), kdA/kST (B) and kdA/KT (C). Stimulus was weak in
the left column (S=1), and strong in the right column (S=10).
(EPS)
Figure S2 Simulations in the model with a mutual inhibition
loop between A and B generated NB curves and AE curves for
kdA/kdB (A), kdA/kST (B) and kdA/KT (C). Stimulus was weak in
the left column (S=1), and strong in the right column (S=10).
(EPS)
Figure S3 Simulations in the model with a positive auto-
regulation loop of A generated NB curves and AE curves for kdA/
kdB (A), kdA/kST (B) and kdA/KT (C). Stimulus was weak in the
left column (S=1), and strong in the right column (S=10).
(EPS)
Figure S4 Simulations in the model with negative feedback from
T to A and B generated NB curves and AE curves for kdA/kdB (A),kdA/kST (B) and kdA/KT (C). Stimulus was weak in the left
column (S=1), and strong in the right column (S=10).
(EPS)
Figure S5 Simulations in the model with positive feedback from
T to A and B generated NB curves and AE curves for kdA/kdB (A),kdA/kST (B) and kdA/KT (C). Stimulus was weak in the left
column (S=1), and strong in the right column (S=10).
(EPS)
Author Contributions
Conceived and designed the experiments: YZ PS JHB. Performed the
experiments: YZ. Analyzed the data: YZ PS DAB. Contributed reagents/
materials/analysis tools: YZ PS DAB. Wrote the paper: YZ PS DAB JHB.
References
1. Milo R, Shen-Orr S, Itzkovitz S, Kashtan N, Chkiovskii D, et al. (2002) Net-
work motifs: simple building blocks of complex networks. Science 298:824–
827.
2. Goemann B, Wingender E, Potapov AP (2009) An approach to evaluate
the topological s igni f icance of moti f s and other patterns in
regulatory networks. BMC Syst Biol 3:53, doi: 10.1186/1752-0509-3-
53.
3. Kaizu K, Ghosh S, Matsuoka Y, Moriya H, Shimizu-Yoshida Y, et al. (2010) A
comprehensive molecular interaction map of the yeast cell cycle. Mol Syst Biol
6:415, doi: 10.1038/msb.2010.73.
4. Cui Q, Ma Y, Jaramillo M, Bari H, Awan A, et al. (2007) A map of human
cancer signaling. Mol Syst Biol 3:152, doi: 10.103/msb4100200.
5. Gerstein MB, Kundaje A, Hariharan M, Landt SG, Yan KK, et al. (2012)
Architecture of the human regulatory network derived from ENCODE data.
Nature 489:91–100.
6. Boyer LA, Lee TI, Cole MF, Johnstone SE, Levine SS, et al. (2005) Core
transcription regulatory circuitry in human embryonic stem cells. Cell 122:947–
956.
7. Cloutier M, Wang E (2011) Dynamic modeling and analysis of cancer cellular
network motifs. Integr Biolo (Camb) 3:724–732.
8. Lim WA, Lee CM, Tang C (2013) Design principles of regulatory networks:
searching for the molecular algorithms of the cell. Cell 49:202–212.
9. Odom DT, Zizlsperger N, Gordon DB, Bell GW, Rinaldi NJ, et al. (2004)
Control of pancreas and liver gene expression by HNF transcription factors.
Science 303:1378–1381.
10. Ratushny AV, Saleem RA, Sitko K, Ramsey SA, Aitchison JD (2012)
Asymmetric positive feedback loops reliably control biological responses. Mol
Syst Biol 8:577.
11. Shellman ER, Burant CF, Schnell S (2013) Network motifs provide signatures
that characterize metabolism. Mol Biosyst 9:352–360.
Simulating Synergism in Network Motifs
PLOS Computational Biology | www.ploscompbiol.org 15 March 2014 | Volume 10 | Issue 3 | e1003524
12. Wu SF, Qian WY, Zhang JW, Yang YB, Liu Y, et al. (2013) Network motifs in
the transcriptional regulation network of cervical carcinoma cells respond to
EGF. Arch Gynecol Obstet 287:771–777.
13. Alon U (2007) Networks motifs: theory and experimental approaches. Nat Rev
Genet 8:450–461.
14. Fioravanti F, Helmer-Citterich M, Nardelli E (2012) Modeling gene regulatory
network motifs using Statecharts. BMC Bioinformatic 13 (Suppl 4):S20,
doi:10.1186/1471-2105-13-S4-S20.
15. Han Z, Voldriska TM, Yang L, MacLellan WR, Weiss JN, Qu Z (2007) Signal
transduction network motifs and biological memory. J Theor Biol 246:755–761.
16. Mangan S, Itzkovitz S, Zaslaver A, Alon U (2005) The incoherent feed-forward
loop accelerates the response-time of the gal system of Escherichia coli. J Mol
Biol 356:1073–1081.
17. Smolen P, Baxter DA, Byrne JH (2000) Mathematical modeling of gene
networks. Neuron 26:567–580.
18. Kaplan S, Bren A, Dekel E, Alon U (2008) The incoherent feed-forward loop
can generate non-monotonic input functions for genes. Mol Syst Biol 4:203–210.
19. Madar D, Dekel E, Bren A, Alon U (2011) Negative auto-regulation increases
the input dynamic-range of the arabinose system of Escherichia coli. BMC Syst
Biol 5:111.
20. Tian XJ, Zhang XP, Liu F, Wang W (2009) Interlinking positive and negative
feedback loops create a tunable motif in gene regulatory networks. Phys
Rev E Stat Nonlin Soft Matter Phys 80:011926.
21. Zhang S, Jin G, Zhang XS, Chen L (2007) Discovering functions and revealing
mechanisms at molecular level from biological networks. Proteomics 7:2856–
2869.
22. Awan A, Bari H, Yan F, Moksong S, Yang S, et al. (2007) Regulatory network
motifs and hotspots of cancer genes in mammalian cellular signaling network.
IET Syst Biol 1:292–297.
23. Liu ZP, Wang Y, Zhang XS, Chen L (2012) Network-based analysis of complex
diseases. IET Syst Biol 6:22–33.
24. Liu R-Y, Zhang Y, Baxter DA, Smolen P, Cleary LJ, et al. (2013) Deficit in long-
term synaptic plasticity is rescued by a computationally predicted stimulus
protocol. J Neurosci 33:6944–6949.
25. Jia J, Zhu F, Ma X, Cao Z, Li Y, et al. (2009) Mechanisms of drug combinations:
interaction and network perspectives. Nat Rev Drug Discov 8:111–128.
26. Song H, Smolen P, Av-Ron E, Baxter DA, Byrne JH (2007) Dynamics of a
minimal model of interlocked positive and negative feedback loops of
transcriptional regulation by cAMP-response element binding proteins.
Biophys J 92: 3407–3424.
27. Mohamed HA, Yao W, Fioravante D, Smolen PD, Byrne JH (2005) cAMP-
response elements in Aplysia creb1, creb2, and Ap-uch promoters: implications
for feedback loops modulating long term memory. J Biol Chem 280:27035–
27043.
28. Mangan S, Alon U (2003) Structure and function of the feed-forward loop
network motif. Proc Natl Acad Sci USA 100:11980–11985.
29. Yeger-Lotem E, Sattath S, Kashtan N, Itzkovitz S, Milo R, et al. (2004) Network
motifs in integrated cellular networks of transcription-regulation and protein-
protein interaction. Proc Natl Acad Sci USA 101:5934–5939.
30. Coultrap SJ, Bayer KU (2012) CaMKII regulation in information processing
and storage. Trends Neurosci 35:607–618.
31. Pickin KA, Chaudhury S, Dancy BC, Gray JJ, Cole PA (2008) Analysis of
protein kinase autophosphorylation using expressed protein ligation and
computational modeling. J Am Chem Soc 130:5667–5669.
32. Goldoni M, Taqliaferri S (2011) Dose-response or dose-effect curves in in vitroexperiments and their use to study effect of neurotoxicants. Methods Mol Biol
785:415–434.
33. Loewe S (1953) The problem of synergism and antagonism of combined drugs.
Arzneim-Forsch 3:285–290.
34. Novick SJ (2013) A simple test for synergy for small number of combinations.
Stat Med Aug 13: 5145–55. doi: 10.1002/sim.5905.
35. Bliss CL (1939) The toxicity of poisons applied jointly. Ann Appl Biol 26:585–
615.
36. Yan H, Zhang B, Li S, Zhao Q (2010) A formal model for analyzing drug
combination effects and its application in TNF-a-induced NFkB pathway. BMCSyst Biol 4:50, doi: 10.1186/1752-0509-4-50.
37. Chou T-C, Talalay P (1983) Analysis of combined drug effects: a new look at a
very old problem. Trends Pharmacol Sci, 4:450–454.38. Peterson JJ, Novick SJ (2007) Nonlinear blending: a useful general concept for
the assessment of combination drug synergy. J Recept Signal Transduct Res,27:125–146.
39. Montarolo PG, Goelet P, Castellucci VF, Morgan J, Kandel ER, Schacher S
(1986) A critical period for macromolecular synthesis in long-term hetero-synaptic facilitation in Aplysia. Science 234:1249–1254.
40. Prill RJ, Iglesias PA, Levchenko A (2005) Dynamic properties of network motifscontribute to biological network organization. PLoS Biol, 3(11):e343.
41. Lahav G, Rosenfeld N, Sigal A, Geva-Zatorsky N, Levine A, et al. (2004)Dynamics of the p53-Mdm2 feedback loop in individual cells. Nature Gen,
36:147–150.
42. Pratilas CA, Solit DB (2010) Targeting the mitogen-activated protein kinasepathway: physiological feedback and drug response. Clin Cancer Res, 16:3329–
3334.43. Fritsche-Guenther R, Witzel F, Sieber A, Herr R, Schmidt N, et al. (2011)
Strong negative feedback from Erk to Raf confers robustness to MAPK
signaling. Mol Systems Biol, 7:489–502.44. Alarcon JM, Malleret G, Touzani K, Vronskaya S, Ishii S, et al. (2004)
Chromatin acetylation, memory, and LTP are impaired in CBP+/2 mice: amodel for the cognitive deficit in Rubinstein-Taybi syndrome and its
amelioration. Neuron, 42:947–959.45. Guilding C, McNair K, Stone TW, Morris BJ (2007) Restored plasticity in a
mouse model of neurofibromatosis type 1 via inhibition of hyperactive ERK and
CREB. Eur J Neurosci, 25:99–105.46. Ma’ayan A, Jenkins SL, Neves S, Hasseldine A, Grace E, et al. (2005) Formation
of regulatory patterns during signal propagation in a mammalian cellularnetwork. Science, 309:1078–1083.
47. Alvarez XA, Cacabelos R, Sampedro C, Couceiro V, Aleixandre M, et al. (2011)
Combinational treatment in Alzheimer’s disease: results of a randomized,controlled trail with cerebroysin and donepezil. Curr Alzheimer Res, 8:583–591.
48. Bijnsdorp IV, Giovannetti E, Peters GJ (2011) Analysis of drug interactions.Methods Mol Biol, 731:421–434.
49. Chauhan NB, Gatto R (2010) Synergistic benefits of erythropoietin andsimvastatin after traumatic brain injury. Brain Res, 1360:177–192.
50. Chou TC (2006) Theoretical basis, experimental design, and computerized
simulation of synergism and antagonism in drug combination studies. PharmacolRev, 56:621–668.
51. Marchetti C, Tafi E, Middei S, Rubinacci MA, Restivo L, et al. (2010) Synapticadaptations of CA1 pyramidal neurons induced by highly effective combination
antidepressant therapy. Biol Psychiatry, 67:146–154.
52. Marcus MM, Jardemark K, Malmerfelt A, Gertow J, Kondradsson-Geuden A,et al. (2012) Augmentation by escitalopram, but not citalopram or R-
citalopream, of the effects of low-dose risperidone: behavioral, biochemical,and electrophysiological evidence. Synapse, 66:277–290.
53. Stiborova M, Eckschlager T, Poljakova J, Hrabeta J, Adam V, et al. (2012) Thesynergistic effects of DNA-targeted chemotherapeautics and histone deacetylase
inhibitors as therapeutic strategies for cancer treatment. Curr Med Chem,
19:4218–4238.54. Tamma PD, Cosgrove SE, Maragakis LL (2012) Combination therapy for
treatment of infections with gram-negative bacteria. Clin Microbiol Rev,25:450–470.
55. Geary N (2013) Understanding synergy. Am J Physiol Endocrinol Metab,
304:E237–E253.56. Tallarida RJ (2012) Revisiting the isobole and related quantitative methods for
assessing drug synergism. J Pharmacol Exp Ther, 342:2–8.57. Axelrod M, Gordon VL, Conaway M, Tarcsafalvi A, Neitzke DJ, et al. (2009)
Combinatorial drug screening identifies compensatory pathway interactions and
adaptive resistance mechanisms. Oncotarget, 4:622–635.58. Tyson JJ, Novak B (2010) Functional motifs in biochemical reaction networks.
Annu Rev Phys Chem, 61:219–240.
Simulating Synergism in Network Motifs
PLOS Computational Biology | www.ploscompbiol.org 16 March 2014 | Volume 10 | Issue 3 | e1003524