competition and efficiency in banking
TRANSCRIPT
103
Competition and Efficiency in Banking: International Comparisons Jacob A. Bikker 1 Central Bank of the Netherlands Jaap W.B. Bos Utrecht School of Economics 1. Introduction Over the past decade, liberalisation and harmonisation in the European Union have strongly affected the financial environment in which European banks operate. The creation of large and transparent euro capital markets has promoted competition within the European banking world. Comparative advantages in the management of equity and debt issues or investment mediation, which banks used to enjoy in their domestic markets, were sharply reduced after the euro replaced the national currencies. These contributions to international integration, together with the entry of novel types of competitors, have reinforced banks’ competitiveness within the EMU area, as it forced them to become more efficient and led to consolidation and rationalisation of the entire banking industry. Competition in the banking market and the efficiency of banks are major factors that have an impact both on the performance and financial health of banks and on the wealth of consumers and businesses. As regards efficiency, this impact is both strong and clear-cut, since inefficiency is tantamount to wastefulness, which leads to lower profits or higher bank tariffs or both. The role of competition is less obvious (for a summary discussion, see Canoy et al., 2001, and Bikker and Wesseling, 2003). For bank customers, competition is good because it keeps bank tariffs low and service levels high, while it also forces banks to become
1 Views expressed in this article are those of the authors and do not necessarily represent the opinion of De Nederlandsche Bank.
Abstract: This article discusses the nature and degree of competition in the European banking markets and the levels of efficiency of the banks that operate in those markets. Nearly all banking markets in the industrialised world are relatively competitive. Estimates of cost efficiencies suggest that on average, there is still room for further cost-saving. Calculations of profit efficiencies show that possibilities for improvement exist in that area as well, which might in part be realised through relatively minor cost reductions. The efficiency of European banks has improved significantly over the past decade.
Jacob A. Bikker and Jaap W.B. Bos .
Autumn 2005 • Economic & Financial Modelling 104
more efficient and stable. Indeed, Beck et al. (2003), analysing data from a large number of countries over a period of many years, find that crises are less likely to occur in countries where there are fewer restrictions on competition and more effective arrangements to promote competition. Also, the Group of Ten (2001) concludes that whether a change in the level of competition or concentration is accompanied by stronger or weaker stability depends on individual cases and conditions. A (sudden) increase in competition, however, can drive individual banks closer to the edge of insolvency, thereby threatening financial stability. Some studies have compared both viewpoints and, the general answers seems to be that the risks posed to financial stability by consolidated, less competitive markets may be worse than strong competition (Carletti and Hartmann, 2002; Caminal and Matutes, 2002). This article focuses on what we know about comparing bank performance by studying the competition and efficiency of banks. Acquiring such knowledge is not a trivial matter, because competition and efficiency cannot be measured directly. The following presents the results of research based on the most successful measuring techniques available in the field. Yet it should be stressed that the results are subject to a degree of uncertainty. Section 2 introduces competition measures and presents world-wide empirical results. Section 3 presents alternatives for market power in explaining bank performance. Sections 4 and 5 develop measures to explain performance from efficiency. Section 6 details what we know about cost efficiency across European countries, and compares the cost and profit efficiencies of large international banks in Europe and the US. This section also discusses the influence of various market conditions on the efficiency of banks in Europe and analyses the development in time of competition and efficiency. The final section presents concluding remarks.
Competition and Efficiency in Banking
Economic & Financial Modelling • Autumn 2005 105
2. Market Power 2.1. The Structure-Conduct-Performance Hypothesis A method often used in the economic literature to acquire knowledge about market power is the theory known as the structure-conduct-performance (SCP) hypothesis (see Molyneux Altunbas, and Gardener 1997; Punt and Van Rooij, 2003). According to this hypothesis, the structure of the banking market (e.g. the number of banks, their level of concentration and the opportunities for market entry) determines to a considerable degree the conduct of banks (e.g. mutual pricing agreements), which in turn explains banks’ performance (monopoly rents then lead to excessive profitability). Therefore, in empirical tests of the SCP hypothesis by means of a regression model, banks’ profits (P) are explained from one or more characteristics of the market structure (M), such as a concentration index, demand variables (D) and bank-specific control variables (C), such as cost variables, the type of bank, its risk profile and its size. Hence, the basic SCP model can be formulated as: Pi,t = f (Mj,t, Di,t, Ci,t) (1) where i refers to banks, j to the market where bank i operates and t to time. If a significant positive effect of market-structural variables on profits is found, this indicates the presence of market power. An alternative explanation of such a positive effect is given by the so-called efficiency hypothesis. Under this hypothesis, existing differences in bank efficiency leads to differences in both market share (implying a change in market structure) and performance, so that market power is not the cause but the result of profitability. In order to prevent erroneous interpretations, both hypotheses should be tested simultaneously. To this purpose, efficiency measures are also included in the regression model (Berger and Hannan, 1993; Bos, 2004). The regression model testing the SCP hypothesis has been applied in numerous ways. In many cases, market power has been demonstrated by the fact that profit increases with the level of concentration, so that perfect competition is rejected. Of course,
Jacob A. Bikker and Jaap W.B. Bos .
Autumn 2005 • Economic & Financial Modelling 106
every method has both strong and weak points, and the SCP hypothesis is no exception. One advantage of the test applied to the SCP hypothesis is the fact that market prices need not be known for the regression model to be estimated. The fact that the practical measurement of market prices is especially difficult in the case of banks makes the SCP test an attractive alternative, which explains the continuing popularity of the regression model for this test. A drawback of the SCP hypothesis is the fact that it does not permit quantification of the market power it finds. For this reason it makes sense to use other sources of information on competition as well. 2.2. The Panzar-Rosse Model An alternative method to measure market power is provided by the Panzar-Rosse model, based on a bank’s reduced-form revenue equation (Bikker and Groeneveld, 2000; Bikker, 2004). In the empirical analysis, the following operationalisation is used:
eOIlnBSFlnPCElnPPElnAFRlnINTRln j jj ++++++= ∑ ηζδγβα (2) where INTR is the ratio of total interest revenue to the total balance sheet, AFR is the ratio of annual interest expenses to total funds, or the Average Funding Rate, PPE is the ratio of personnel expenses to the total balance sheet, or the (approximated) Price of Personnel Expenses, PCE is the ratio of physical capital expenditure and other expenses to fixed assets, or the (approximated) Price of Capital Expenditure, BSF are Bank-Specific exogenous Factors (without explicit reference to their origin from the cost or revenue function), OI is the ratio of Other Income to the total balance sheet, and e is a stochastic error term. AFR, PPE and PCE are the unit prices of the inputs of the banks: funds, labour and capital, or proxies of these prices. In the notation of Equation (2), a so-called H-statistic is defined by
δγβ ++ , representing the sum of all input price elasticities. H permits various types of market structure to be distinguished. The first of these is perfect competition (H = 1), a market type in
Competition and Efficiency in Banking
Economic & Financial Modelling • Autumn 2005 107
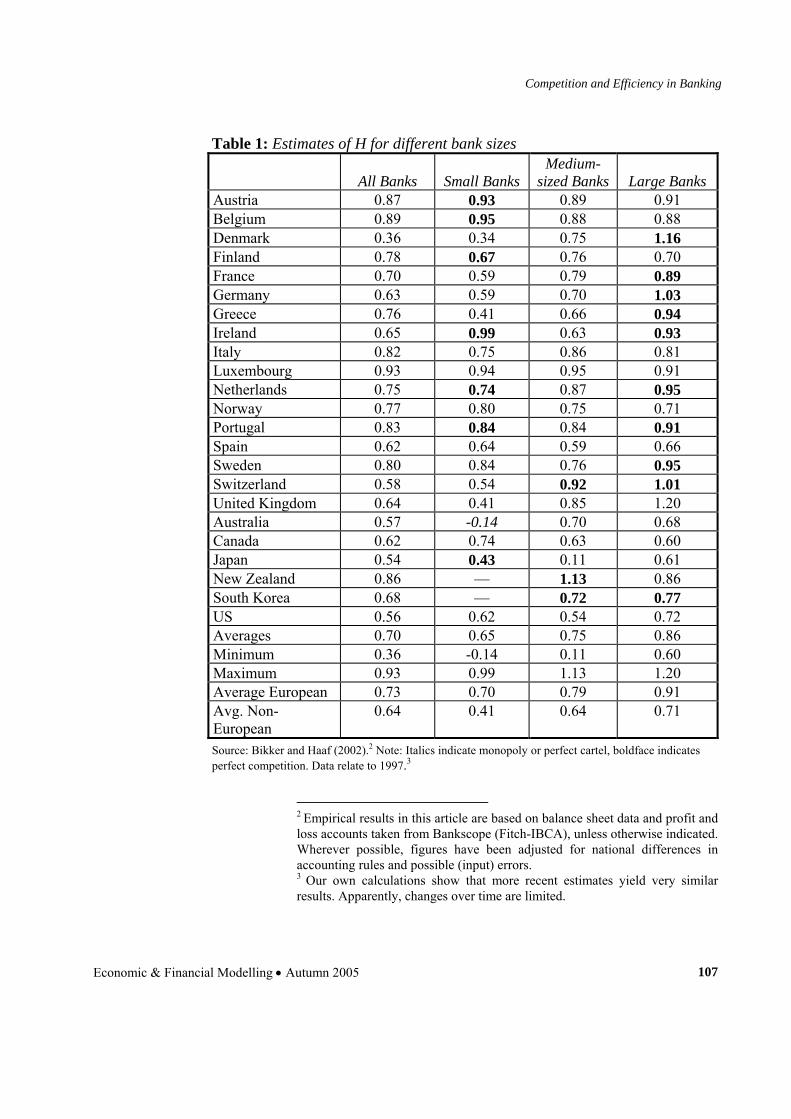
Table 1: Estimates of H for different bank sizes
All Banks
Small Banks Medium-
sized Banks
Large Banks Austria 0.87 0.93 0.89 0.91 Belgium 0.89 0.95 0.88 0.88 Denmark 0.36 0.34 0.75 1.16 Finland 0.78 0.67 0.76 0.70 France 0.70 0.59 0.79 0.89 Germany 0.63 0.59 0.70 1.03 Greece 0.76 0.41 0.66 0.94 Ireland 0.65 0.99 0.63 0.93 Italy 0.82 0.75 0.86 0.81 Luxembourg 0.93 0.94 0.95 0.91 Netherlands 0.75 0.74 0.87 0.95 Norway 0.77 0.80 0.75 0.71 Portugal 0.83 0.84 0.84 0.91 Spain 0.62 0.64 0.59 0.66 Sweden 0.80 0.84 0.76 0.95 Switzerland 0.58 0.54 0.92 1.01 United Kingdom 0.64 0.41 0.85 1.20 Australia 0.57 -0.14 0.70 0.68 Canada 0.62 0.74 0.63 0.60 Japan 0.54 0.43 0.11 0.61 New Zealand 0.86 — 1.13 0.86 South Korea 0.68 — 0.72 0.77 US 0.56 0.62 0.54 0.72 Averages 0.70 0.65 0.75 0.86 Minimum 0.36 -0.14 0.11 0.60 Maximum 0.93 0.99 1.13 1.20 Average European 0.73 0.70 0.79 0.91 Avg. Non-European
0.64 0.41 0.64 0.71
Source: Bikker and Haaf (2002).2 Note: Italics indicate monopoly or perfect cartel, boldface indicates perfect competition. Data relate to 1997.3
2 Empirical results in this article are based on balance sheet data and profit and loss accounts taken from Bankscope (Fitch-IBCA), unless otherwise indicated. Wherever possible, figures have been adjusted for national differences in accounting rules and possible (input) errors. 3 Our own calculations show that more recent estimates yield very similar results. Apparently, changes over time are limited.
Jacob A. Bikker and Jaap W.B. Bos .
Autumn 2005 • Economic & Financial Modelling 108
which interest income moves up and down in proportion to input prices. Perfect competition will prevent excessive profits, so that banks must on-charge any rise in input prices in order to prevent losses, while they must match any fall in input prices by a decrease in output prices, because competitors will do likewise. The second market type is monopoly or perfect collusion, in which the bank or the cartel chooses prices that yield maximum profits. Under perfect collusion, the relation between output and input process is absent or negative (so that H ≤ 0): any input price rise will eat into the monopoly’s profits and vice versa. The third market type, monopolist competition, is found especially frequently in the financial sector. Competition may be eased to some extent as products and services differ from those of other banks, at least in (minor) details. Under monopolist competition, or oligopoly, there is some correlation between input and output prices, but it is less than proportional (0 < H < 1). Thus H, in this model, is a measure of competition. Table 1 presents estimates of H for a number of European and non-European countries based on three input prices: funding rate, personnel expenses and other expenses. It also shows the average of H for 23 OECD countries. The first column provides estimates for all banks. Notably, of the 23 national banking markets taken as a whole, none is a pure monopoly or cartel, nor is any one of them characterised by perfect competition. Apparently, all national banking markets considered are either characterised by oligopoly or monopolist competition. This result tallies with those of the SCP analysis, which in most cases also point to a degree of market power (Bos, 2004). Competition turns out to be more pronounced in Europe (0.73) than elsewhere (0.64). Notably, Germany and the Anglo-Saxon countries appear to be lagging behind in this respect. Germany and the US have unconsolidated banking markets with large numbers of small banks targeting local markets where they meet limited competition. This is reflected by low average competition estimates: 0.63 and 0.56, respectively. The banking market breaks down into several partial markets, distinguished by customer (private consumers; small and medium-sized businesses; large, international concerns), by product (savings; mortgage loans; business credit; capital market
Competition and Efficiency in Banking
Economic & Financial Modelling • Autumn 2005 109
services), and by service area (local; national; international). Table 1 takes a first step towards segmentation of the banking market by size, distinguishing small banks, operating mostly locally and targeting the retail market; large banks operation internationally and mostly targeting large companies; and medium-sized banks taking up an intermediate position (columns 2–4). Obviously, this distinction provides only an approximate understanding of competitive conditions in the submarkets. As expected, small banks generally face milder than average competition: apparently, the retail segment of local markets is competed for less energetically (with H values averaging 0.65). In only seven countries is perfect competition probable (boldface in Table 1). Only for Australia, do the results for small banks point to monopoly or perfect cartel (italics in Table 1). Large banks operate in a markedly more competitive environment, in which counterparties are more powerful and foreign banks participate as well (with H values averaging 0.86). In this sector, the results for many more countries point to perfect competition. Values of H greater than 1 – as found for large banks in Denmark and the UK – are an indication that banks co-operate and apply strategic pricing methods, taking into account the manner in which they expect competitors to respond to their prices. Medium-sized banks again take up an intermediate position. 3. From Market Power to Alternative Explanations for Bank Performance The shareholders of a bank are claimants for its profits and it is thereby in their interest to maximise these profits.4 They can achieve this by maximising revenue and by minimising costs. Also, depending on the market power of the bank in the input- and output-market respectively, they may be able to increase output prices or decrease input prices. Abstracting from speculative motives, shareholders are indifferent to the distribution of profits, receiving a return on their investment in the bank either through an increase in the bank’s share price or through dividends received.
4 Here profits are net earnings minus any retained earnings.
Jacob A. Bikker and Jaap W.B. Bos .
Autumn 2005 • Economic & Financial Modelling 110
Economic theory tells us that in a perfectly competitive situation, profit maximisation is equivalent to cost minimisation. In practice however, maximisation of profits and/or minimisation of costs is not necessarily observed. Of course, exogenous factors such as regulation or (economic) shocks can cause suboptimal performance. To the extent that such factors do not have a similar impact on both cost minimisation and profit maximisation, they can drive a wedge between the two. Possible other explanations for deviations from profit maximisation fall into two categories. The first category is a rallying point for all deviations that can be attributed to incentive problems. These problems cause banks to no longer solely minimise costs and/or maximise profits. The second category harbours all deviations that can be attributed to inefficiency. Inefficiency is defined here as the suboptimal use of inputs given outputs and vice versa. 3.1. Incentive Problems Imperfect competition causes a situation where profits are maximised at an output level where average costs are no longer minimised. Theoretically, a second and related reason why shareholders may abstain from maximising expected profits and minimising costs depends on their degree of risk preference. If shareholders are highly risk-averse and not well diversified, they want to ensure a bank to perform counter-cyclically and thus make decisions that may be suboptimal for the bank.5 Aside from the questionable assumption that shareholders know precisely the correlation between the economic cycle and the banks’ performance, the prerequisite that shareholders are not well diversified is impossible to uphold in practice. Incentive problems that more easily translate to banking practice hinge on the separation of ownership and control and are - ceteris
5 See also Tirole (1993), p. 35. The same reasoning, but to a far lesser extent of course holds for risk-neutral shareholders.
Competition and Efficiency in Banking
Economic & Financial Modelling • Autumn 2005 111
paribus - independent of market structure.6 In the absence of complete information, principal-agent theory states that the inability of shareholders to adequately monitor bank management and the resulting managerial discretion may induce non-optimal behaviour, i.e. profits are not maximised and/or costs are not minimised. As long as shareholders can not insure themselves against this possible suboptimal behaviour, bank management may show expense-preference behaviour or - if it is highly risk-averse - any other strategy that reduces profits.7 This means that the asymmetric information between principal and agent that was once used by Diamond (1984) to explain that banks exist because they reduce audit costs for lenders to non-financial firms, now helps explain why banks themselves may also suffer from moral hazard and other incentive problems. Dewatripoint and Tirole (1994) note that principal-agent problems are of particular importance in banking, where debt is highly dispersed among a bank’s deposit holders. The high leverage of banks should negatively affect incentives of management to spend much on perks and reduce managerial slack. Individual deposit holders, however, are too small and free riding stands in the way of monitoring coalitions. This problem is especially pressing in bad times, when the concave return structure of risk-averse deposit holders should ensure sufficient pressure on a bank’s management to avoid excessive risk-taking and stimulate a high level of efficiency. A vast amount of literature exists on ways to minimise the negative effects of these principal-agent problems. A detailed discussion is beyond the scope of this article. Pecuniary and non-pecuniary incentives and yardstick competition are ways to reduce managerial slack while keeping managerial discretion
6 This section borrows from Tirole (1993, Chapters 0, 1, 6, 7 and 9, from Dewatripoint and Tirole (1994), Chapters 2, 5-8 and 12, and from Freixas and Rochet (1997), Chapters 2 and 3. 7 For an excellent introduction into principal-agent theory, we refer to Arrow (1985). Seminal references for banking are Edwards and Heggestad (1973) and Edwards (1977).
Jacob A. Bikker and Jaap W.B. Bos .
Autumn 2005 • Economic & Financial Modelling 112
intact.8 Discretion itself is affected by for instance external control mechanisms, supervisory institutions, collateralised debt and takeover bids.9 Price and non-price competition, the substitutability of a bank’s products and the contestability of its markets may also serve to ensure a bank’s optimal performance by putting competitive pressure on its management, provided management compensation is performance-based.10 A similar role may be played by signalling devices such as ratings. Finally, it is important to note that although we emphasise incentive problems between bank management and debt holders, the same type of problems - if to a lesser extent - also exist for shareholders. Whether incentive problems are important in European banking is questionable. First, few studies have attempted to empirically test the impact of principal-agent conflicts on the performance of European banks. Translations of the above-described situations where hidden action by or hidden knowledge of bank management results in suboptimal performance into empirical tests are rare.11 Second, to the extent that the principal-agent relationship results in moral hazard conflicts, it is only problematic as long as the principal (i.e. the shareholder) can not insure himself against excessive risk-taking by the agent (cf. Tirole (1993), Paragraph 2.1). Third, although incentive problems may lead to suboptimal performance of a bank, the extent to which this affects European banking dynamics is unclear. There is little reason to suspect that the incentive problems that can cause a bank to make less profits or above-minimum average costs are significantly different from bank to bank, or from country to country. The separation between ownership and control is highly similar for commercial banks in Europe, even if institutional supervision is not.12
8 See Tirole (1993), pp. 35-55. In addition, regulators have considered creating deposit insurance schemes conditional on the banks’ performance (Dewatripoint and Tirole (1994), p. 129). 9 See again Tirole (1993), pp. 35-55, as well as Chapters 6 and 8 of Dewatripoint and Tirole (1994). 10 For examples, see Chapter 3 of Freixas and Rochet (1997). 11 See Molyneux et al. (1997), pp. 82-83 for a short overview. 12 Cf. Chapter 3 of Molyneux et al. (1997), especially Table 3.20, where standard deviations for the EU area are small for all banks, and mean
Competition and Efficiency in Banking
Economic & Financial Modelling • Autumn 2005 113
Summing up, even if incentive problems can help explain bank performance, empirically testing whether they can explain differences in bank performance is difficult and until now far from conclusive. 3.2. Inefficiency Problems An approach that may prove more rewarding is to explain bank performance through inefficiency. A bank may produce at lower costs and with a higher profit than other banks if it makes better use of its inputs and transforms them into outputs in the cheapest possible way. In the long run, every bank has to produce efficiently in order to survive.13 Molyneux et al. (1997) underscore the importance of efficiency in European banking and point out that higher efficiency can be expected to “lead to improved financial products and services, a higher volume of funds intermediated, greater and more appropriate innovations, a generally more responsive financial system, and improved risk-taking capabilities if efficiency profit gains are channelled into improved capital adequacy positions” (p. 9). In short, bank efficiency is highly important in explaining and interpreting bank performance. An important example is given by Berger and Humphrey (1992) and Avkiran (1999), who argue that the only way consumers can potentially benefit from large bank mergers is through enhanced efficiency, resulting in lower prices and an increased service level. Likewise, Rose (1995), Altunbas, Molyneux, and Thornton (1997) and Akhavein, Berger, and Humphrey (1997) have examined whether merged banks are more efficient than similar non-merged banks that are of the same size. Baker and Bresnahan (1985) examine whether stepped-up product differentiation may contribute positively to an increase in efficiency after a merger. Haynes and Thompson (1999) more specifically ask the same question for British
ownership (capital/assets) of private and co-operative banks is remarkably similar. 13 Cf. Hanweck and Rhoades (1984).
Jacob A. Bikker and Jaap W.B. Bos .
Autumn 2005 • Economic & Financial Modelling 114
building societies.14 The importance of questioning whether inefficiency can explain bank performance is underlined by the outcomes of these studies. Only in the last case is there some evidence of efficiency benefits from mergers. In the other studies, there is either no evidence (e.g. Rose, 1987) or even evidence against efficiency benefits from mergers (e.g. Altunbas et al., 1997). The renewed attention for efficiency as an explanatory factor in bank performance as well as its potential role in policy-making sufficed for the European Commission (Economic Research Ltd., 1997) to engage in its own all-encompassing study of market power and efficiency in European banking. The commission hypothesises that the single market integration program (SMP) “has allowed the (increased) realisation of [efficiency gains] in European banking markets” (p. 187). Results show that the impact of the SMP on bank efficiency varied across different countries. Importantly, although not concluded by the European Commission itself, this impact is itself not related to the explanatory power of the applied models for different countries. The results are strong and robust enough however, for the commission to conclude that “there does appear to have been a trend for European banks, on average, to move closer to the EU cost efficiency frontier” (p. 195). Summing up, efficiency plays an important role in explaining the forces behind European bank performance. Furthermore, it can aid in measuring and interpreting the sources driving bank performance. And it serves as a crucial policy-making tool in reacting to the dynamics of the single market for financial services. In the next sections, we will therefore build an analytical framework that allows for accurate measurement and interpretation of the (relative) efficiency of European banks.
14 Zardkoohi, Kolari, and Dahm (1995) do the same for US commercial banks, without the explicit focus on mergers.
Competition and Efficiency in Banking
Economic & Financial Modelling • Autumn 2005 115
4. From Economic Rationality to Production Functions Our framework starts with the identification and description of why banks pursue efficiency. In order to do so, we must first define bank production and show why and how production is optimised.15 4.1. Bank Production Before specifying the cost minimisation model and the profit maximisation model respectively, we first give a short overview of the inputs and outputs that typically find their way into these models. The specification of inputs to and outputs of bank production is part of an ongoing debate. On the one hand, the production approach distinguishes labour and physical capital as inputs and numbers of processed documents or transactions as output. In the literature, consensus exists that it is mostly appropriate for bank branches with low autonomy in loan policy (see also Ferrier and Lovell, 1990). On the other hand, the intermediation approach starts from the traditional core function of financial institutions and takes deposits as inputs and defines loans and investments as output.16 Both approaches have their disadvantages. In the production approach, output may be better specified as the yield to maturity plus notional amounts. Equivalently, some authors have argued that in the intermediation approach deposits may included as outputs rather than inputs.17 However, the main motivation for this seems to be that banks create revenue from deposits. This would suggest including the interest margin, which does not conform with what can be considered an output. Rather, it is a performance measure in itself. Concluding, we consider the
15 This paragraph relies on and refers to Beattie and Taylor (1985), Coelli et al. (1998) and Molyneux et al. (1997). 16 We refer to Freixas and Rochet (1997), Ferrier and Lovell (1990) and Berger and Mester (1997) for an overview of the debate. 17 See Molyneux et al. (1997) for a discussion.
Jacob A. Bikker and Jaap W.B. Bos .
Autumn 2005 • Economic & Financial Modelling 116
inclusion of loans as outputs a reason in itself to include deposits as inputs (hence the term intermediation approach). Both approaches also fail to incorporate the management of risk, information processing and the solution of agency problems arising due to the differences between loans and deposits and the separation between management and ownership. Potential solutions to these shortcomings may be a different formulation of the constraint under which banks solve their minimisation and maximisation problems, respectively. An example of the incorporation of risk management is the inclusion of the level of equity in bank production.18 In funding loans, equity may be used as an alternative instead of deposits. Clearly, this would have an impact on both costs and profits. Furthermore, Mester (1996) argues that the inclusion of equity in the analysis may account for differing risk attitudes of bank managers, since higher levels of equity reduce the risk of default all else being equal. Finally, Berger and Humphrey (1997) mention the larger dependence of huge banks on debt financing as a reason to include equity. We will therefore include equity (or a close proxy for equity as a risk variable) as an additional explanatory control variable in our empirical models. 4.2. Bank Behaviour We introduce banks as rational economic agents. This concept merits some explanation. To start with, we assume banks act rationally. That is, the bank operates in such a way that it pursues its own goals in what is – ceteris paribus – the best conceivable, optimal way. Of course, this means banks are assumed to know the mechanics of their own production and have the ability and will to use it to reach their goals. Second, banks are agents, interacting with other agents, such as consumers and governments. Therefore in pursuing their goals, banks have to take into account exogenous factors. Finally, banks are economic agents, in that these goals are defined from now on in economic terms. In reference to the previous section, this means that we
18 See Hughes and Mester (1993), and Mester (1991, 1992).
Competition and Efficiency in Banking
Economic & Financial Modelling • Autumn 2005 117
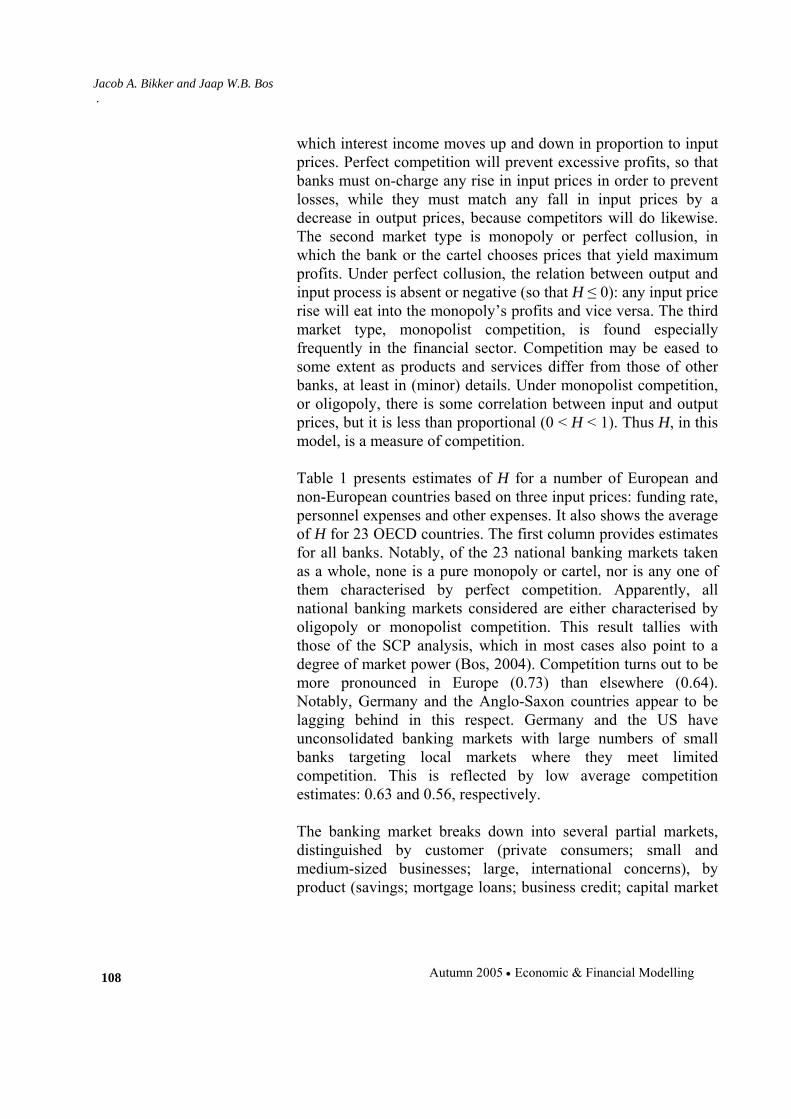
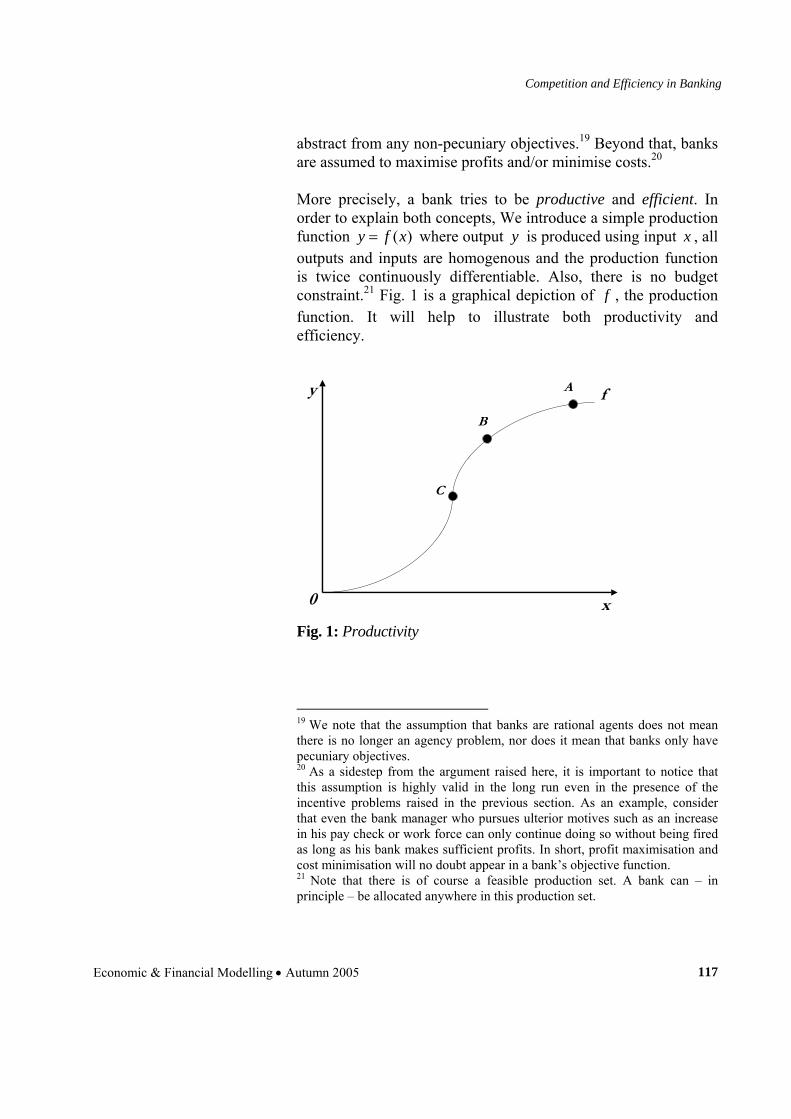
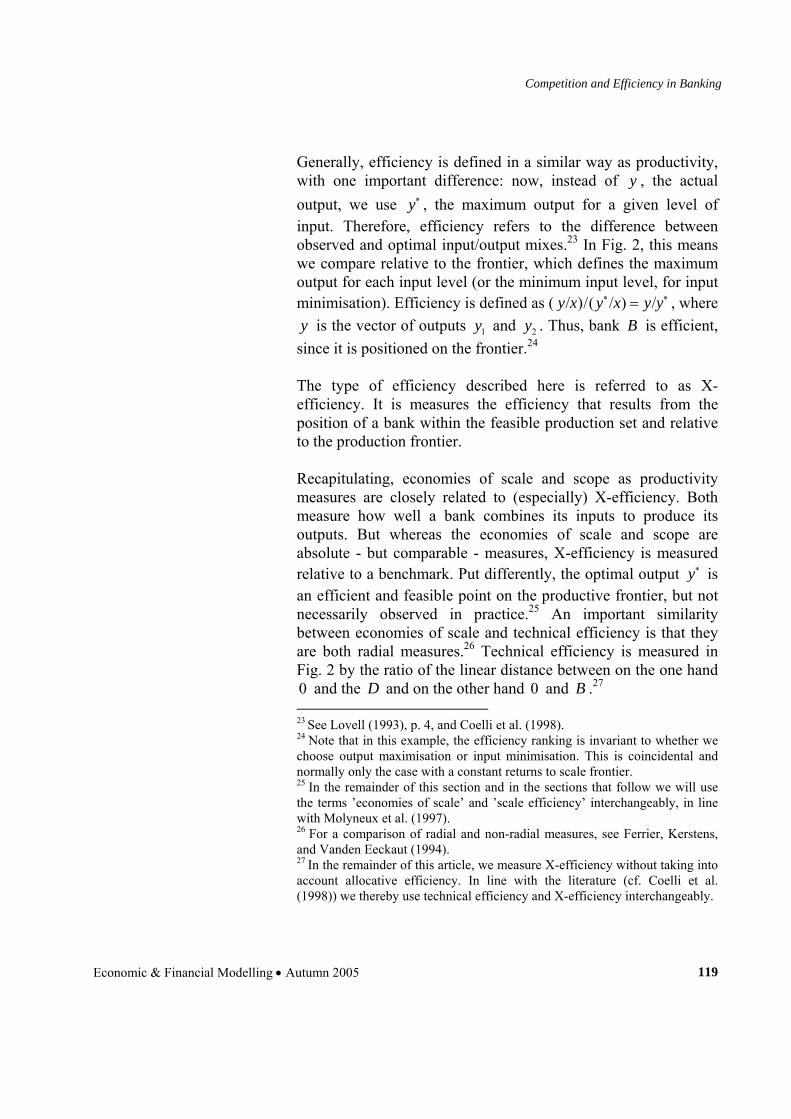
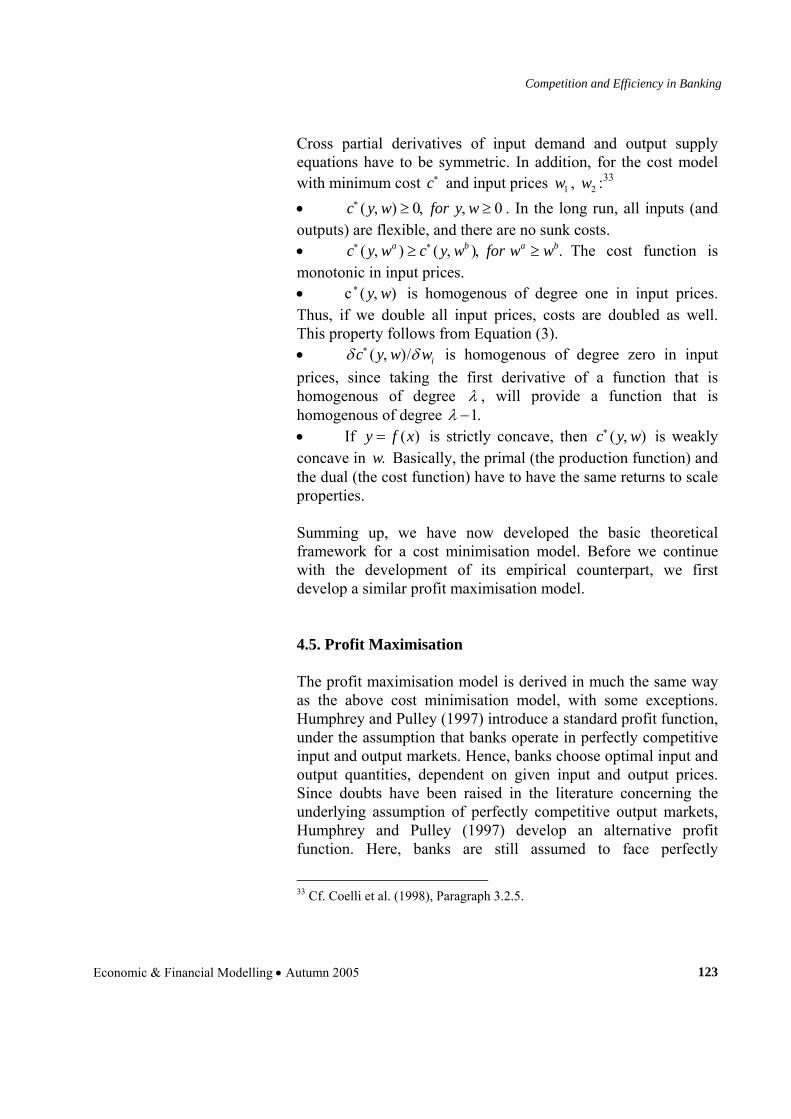
abstract from any non-pecuniary objectives.19 Beyond that, banks are assumed to maximise profits and/or minimise costs.20 More precisely, a bank tries to be productive and efficient. In order to explain both concepts, We introduce a simple production function ( )y f x= where output y is produced using input x , all outputs and inputs are homogenous and the production function is twice continuously differentiable. Also, there is no budget constraint.21 Fig. 1 is a graphical depiction of f , the production function. It will help to illustrate both productivity and efficiency.
y
x
C
f
B
A
0
Fig. 1: Productivity
19 We note that the assumption that banks are rational agents does not mean there is no longer an agency problem, nor does it mean that banks only have pecuniary objectives. 20 As a sidestep from the argument raised here, it is important to notice that this assumption is highly valid in the long run even in the presence of the incentive problems raised in the previous section. As an example, consider that even the bank manager who pursues ulterior motives such as an increase in his pay check or work force can only continue doing so without being fired as long as his bank makes sufficient profits. In short, profit maximisation and cost minimisation will no doubt appear in a bank’s objective function. 21 Note that there is of course a feasible production set. A bank can – in principle – be allocated anywhere in this production set.
Jacob A. Bikker and Jaap W.B. Bos .
Autumn 2005 • Economic & Financial Modelling 118
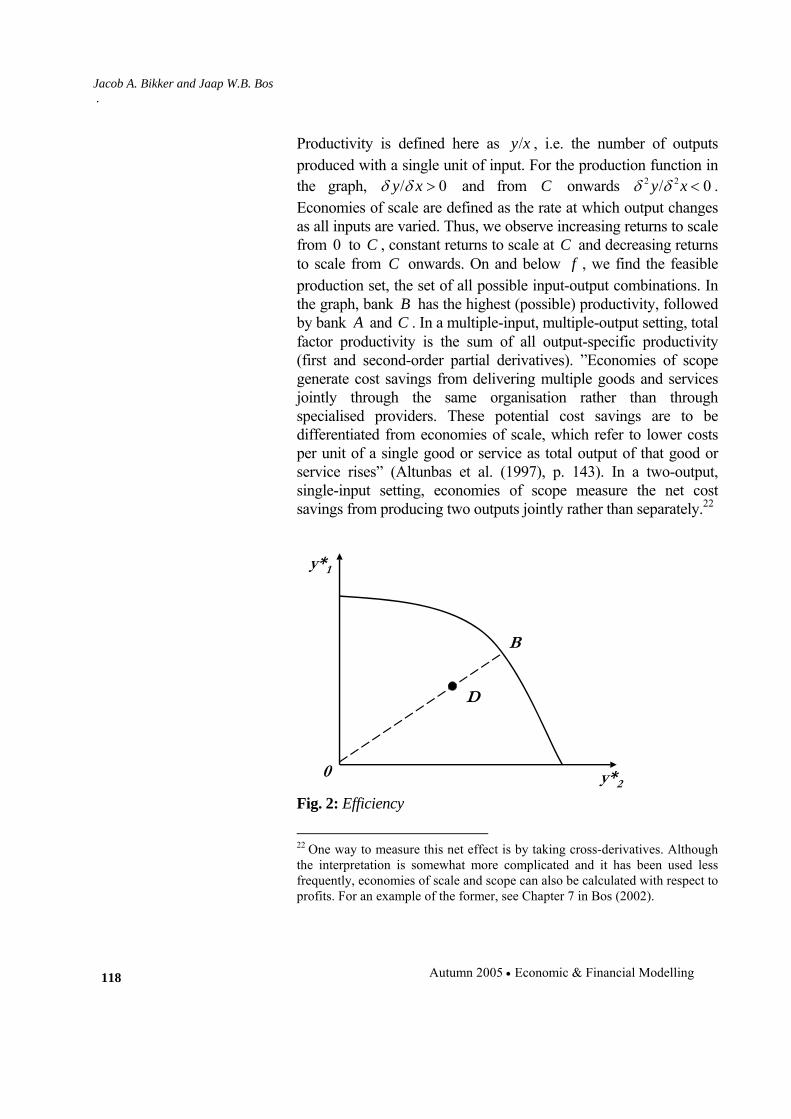
Productivity is defined here as y x/ , i.e. the number of outputs produced with a single unit of input. For the production function in the graph, 0y xδ δ/ > and from C onwards 2 2 0y xδ δ/ < . Economies of scale are defined as the rate at which output changes as all inputs are varied. Thus, we observe increasing returns to scale from 0 to C , constant returns to scale at C and decreasing returns to scale from C onwards. On and below f , we find the feasible production set, the set of all possible input-output combinations. In the graph, bank B has the highest (possible) productivity, followed by bank A and C . In a multiple-input, multiple-output setting, total factor productivity is the sum of all output-specific productivity (first and second-order partial derivatives). ”Economies of scope generate cost savings from delivering multiple goods and services jointly through the same organisation rather than through specialised providers. These potential cost savings are to be differentiated from economies of scale, which refer to lower costs per unit of a single good or service as total output of that good or service rises” (Altunbas et al. (1997), p. 143). In a two-output, single-input setting, economies of scope measure the net cost savings from producing two outputs jointly rather than separately.22
y*1
y*20
D
B
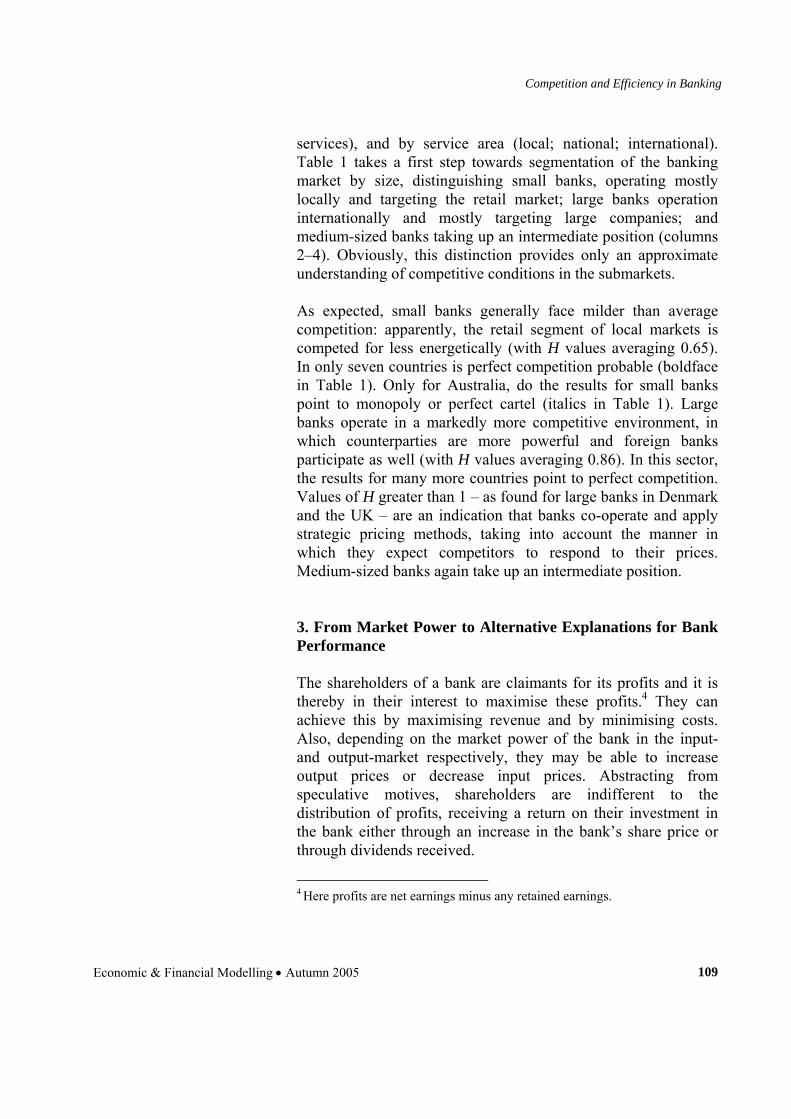
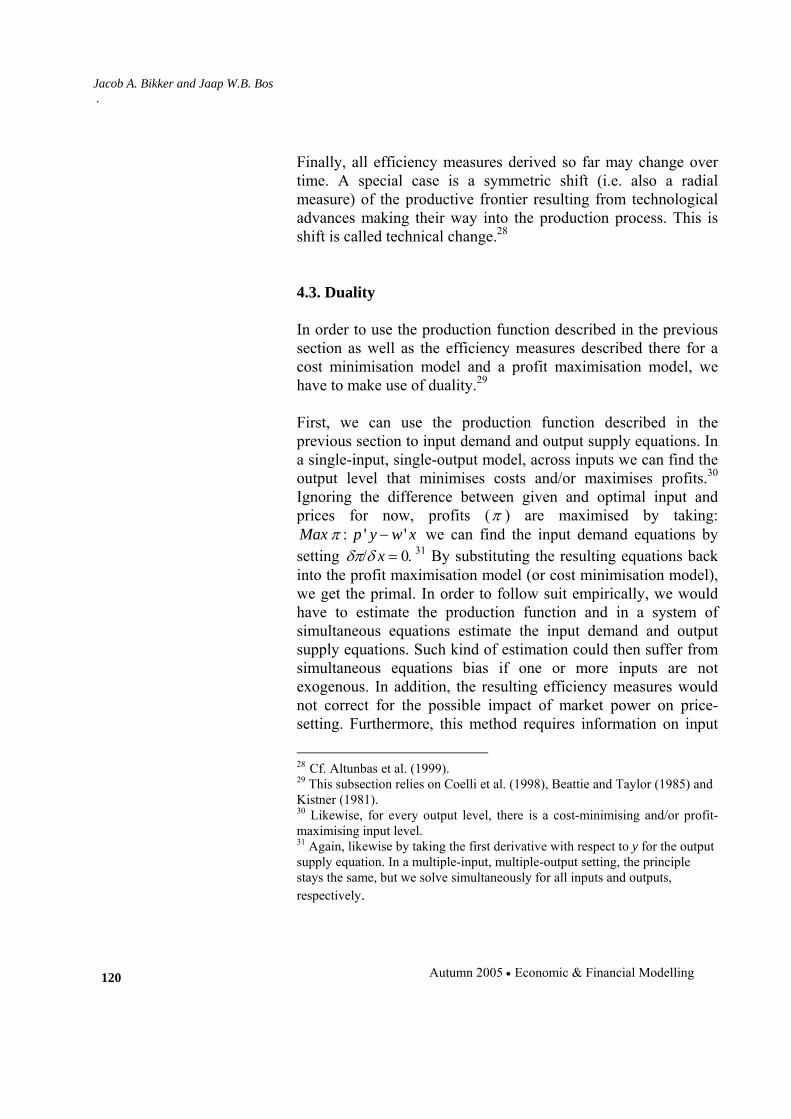
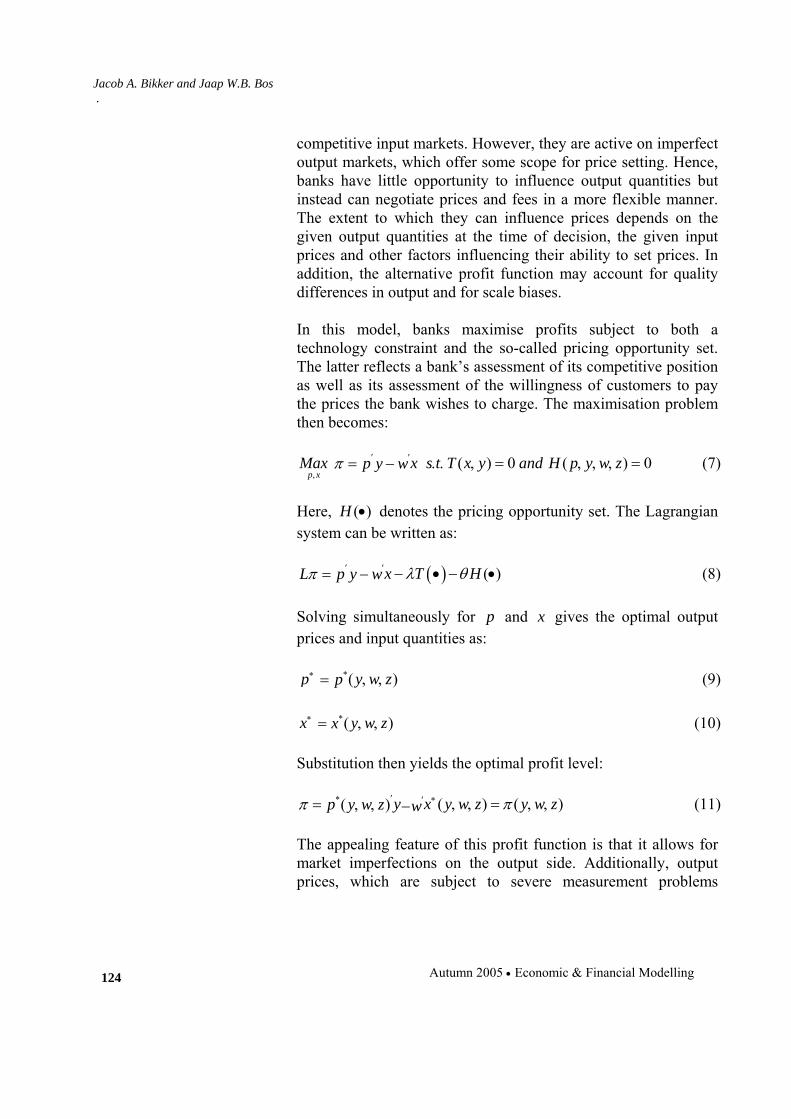
Fig. 2: Efficiency
22 One way to measure this net effect is by taking cross-derivatives. Although the interpretation is somewhat more complicated and it has been used less frequently, economies of scale and scope can also be calculated with respect to profits. For an example of the former, see Chapter 7 in Bos (2002).
Competition and Efficiency in Banking
Economic & Financial Modelling • Autumn 2005 119
Generally, efficiency is defined in a similar way as productivity, with one important difference: now, instead of y , the actual output, we use y∗ , the maximum output for a given level of input. Therefore, efficiency refers to the difference between observed and optimal input/output mixes.23 In Fig. 2, this means we compare relative to the frontier, which defines the maximum output for each input level (or the minimum input level, for input minimisation). Efficiency is defined as ( ) ( )y x y x y y∗ ∗/ / / = / , where y is the vector of outputs 1y and 2y . Thus, bank B is efficient, since it is positioned on the frontier.24 The type of efficiency described here is referred to as X-efficiency. It is measures the efficiency that results from the position of a bank within the feasible production set and relative to the production frontier. Recapitulating, economies of scale and scope as productivity measures are closely related to (especially) X-efficiency. Both measure how well a bank combines its inputs to produce its outputs. But whereas the economies of scale and scope are absolute - but comparable - measures, X-efficiency is measured relative to a benchmark. Put differently, the optimal output y∗ is an efficient and feasible point on the productive frontier, but not necessarily observed in practice.25 An important similarity between economies of scale and technical efficiency is that they are both radial measures.26 Technical efficiency is measured in Fig. 2 by the ratio of the linear distance between on the one hand 0 and the D and on the other hand 0 and B .27 23 See Lovell (1993), p. 4, and Coelli et al. (1998). 24 Note that in this example, the efficiency ranking is invariant to whether we choose output maximisation or input minimisation. This is coincidental and normally only the case with a constant returns to scale frontier. 25 In the remainder of this section and in the sections that follow we will use the terms ’economies of scale’ and ’scale efficiency’ interchangeably, in line with Molyneux et al. (1997). 26 For a comparison of radial and non-radial measures, see Ferrier, Kerstens, and Vanden Eeckaut (1994). 27 In the remainder of this article, we measure X-efficiency without taking into account allocative efficiency. In line with the literature (cf. Coelli et al. (1998)) we thereby use technical efficiency and X-efficiency interchangeably.
Jacob A. Bikker and Jaap W.B. Bos .
Autumn 2005 • Economic & Financial Modelling 120
Finally, all efficiency measures derived so far may change over time. A special case is a symmetric shift (i.e. also a radial measure) of the productive frontier resulting from technological advances making their way into the production process. This is shift is called technical change.28 4.3. Duality In order to use the production function described in the previous section as well as the efficiency measures described there for a cost minimisation model and a profit maximisation model, we have to make use of duality.29 First, we can use the production function described in the previous section to input demand and output supply equations. In a single-input, single-output model, across inputs we can find the output level that minimises costs and/or maximises profits.30 Ignoring the difference between given and optimal input and prices for now, profits (π ) are maximised by taking:
' 'Max p y w xπ : − we can find the input demand equations by setting 0xδπ δ/ = . 31 By substituting the resulting equations back into the profit maximisation model (or cost minimisation model), we get the primal. In order to follow suit empirically, we would have to estimate the production function and in a system of simultaneous equations estimate the input demand and output supply equations. Such kind of estimation could then suffer from simultaneous equations bias if one or more inputs are not exogenous. In addition, the resulting efficiency measures would not correct for the possible impact of market power on price-setting. Furthermore, this method requires information on input
28 Cf. Altunbas et al. (1999). 29 This subsection relies on Coelli et al. (1998), Beattie and Taylor (1985) and Kistner (1981). 30 Likewise, for every output level, there is a cost-minimising and/or profit-maximising input level. 31 Again, likewise by taking the first derivative with respect to y for the output supply equation. In a multiple-input, multiple-output setting, the principle stays the same, but we solve simultaneously for all inputs and outputs, respectively.
Competition and Efficiency in Banking
Economic & Financial Modelling • Autumn 2005 121
and output quantities. For banks this is not always straightforward. For example, a loan can be described by its outstanding value or the interest that is earned on it. With the help of the envelope theorem the derivation of the dual is much easier. For a profit maximisation model, Hotelling’s Lemma (Beattie and Taylor (1985), p. 227) tells us that the negative of input demand and output supply equations can be derived by taking the first order partial derivatives from a profit function. Likewise, for a cost minimisation model, Shephard’s Lemma states that the first partial derivative of the cost function with respect to each of the input prices defines the conditional input demand functions (i.e. conditional upon the output level, y ). For both models, Young’s Theorem states that a second-order partial derivative is invariant to the order of differentiation, and the cross partial derivatives are symmetric (cf. Chiang, 1984). Now, there is no simultaneous equations bias, and we can easily use the resulting cost minimisation model and profit maximisation model to interpret the role of market dynamics for bank efficiency. Summing up, we have defined a simple production function and introduced a number of efficiency measures. In the context of the banking industry it is important to note the particular problems arising from the ambiguity of bank’s underlying production technology. This ambiguity is one of the major reasons to model efficiency analyses on the basis of cost and/or profit functions. In the next sections, we further elaborate on the use of these efficiency measures to explain (relative) bank performance. 4.4. Cost Minimisation We now introduce a cost minimisation model. The minimisation problem is set up as follows32. Let a cost function C consist of the costs incurred due to buying input quantities x at price w .
32 Estimating cost functions in order to determine the efficiency of financial institutions is the traditional approach in the literature. Applications of this concept to European banking data are Altunbas and Chakravarty (1998) and Battese et al. (1998)
Jacob A. Bikker and Jaap W.B. Bos .
Autumn 2005 • Economic & Financial Modelling 122
Assuming that banks are price takers in possibly imperfectly competitive input markets, factor prices w are exogenous. All costs are treated as variable costs. Banks minimise their objective function under the restrictions imposed by the transformation function:
( ) 0x
Min x s t T x y zw′ . , , == (3)
where w and x are vectors, ( )T x y z, , is a so-called transformation function and z denotes equity, which is exogenously given. The corresponding Lagrangian function can be formulated as:
( )x TLC w λ′ − •= (4) Taking first derivatives and solving yields the conditional factor demand equations, or, in terms of Hughes and Mester (1994), the restricted input requirement set:
( )i ix y w zx∗∗ , ,= (5) The minimum cost level is obtained by substituting into the cost function:
( ) ( )iTC x y w z c y w zw′∗ ∗ , , = , ,= (6) The conditional demand for inputs depends on the amount of output sold at prevailing prices, the given factor prices in input markets and the level of equity in the production period. The cost minimisation model developed here, as well as the profit maximisation model developed later, are purely static. The models represent long-run relationships between costs (or profits) inputs, outputs and prices. We therefore take care when estimating these models in selecting time periods that are marked by (relative) stability. In both this cost minimisation model and in the profit maximisation model that follows we have to ensure symmetry.
Competition and Efficiency in Banking
Economic & Financial Modelling • Autumn 2005 123
Cross partial derivatives of input demand and output supply equations have to be symmetric. In addition, for the cost model with minimum cost c∗ and input prices 1w , 2w :33 • ( ) 0 0c y w for y w∗ , ≥ , , ≥ . In the long run, all inputs (and outputs) are flexible, and there are no sunk costs. • ( ) ( )a b a bc y w c y w for w w∗ ∗, ≥ , , ≥ . The cost function is monotonic in input prices. • c ( )y w∗ , is homogenous of degree one in input prices. Thus, if we double all input prices, costs are doubled as well. This property follows from Equation (3). • ( ) ic y w wδ δ∗ , / is homogenous of degree zero in input prices, since taking the first derivative of a function that is homogenous of degree λ , will provide a function that is homogenous of degree 1λ − . • If ( )y f x= is strictly concave, then ( )c y w∗ , is weakly concave in w. Basically, the primal (the production function) and the dual (the cost function) have to have the same returns to scale properties. Summing up, we have now developed the basic theoretical framework for a cost minimisation model. Before we continue with the development of its empirical counterpart, we first develop a similar profit maximisation model. 4.5. Profit Maximisation The profit maximisation model is derived in much the same way as the above cost minimisation model, with some exceptions. Humphrey and Pulley (1997) introduce a standard profit function, under the assumption that banks operate in perfectly competitive input and output markets. Hence, banks choose optimal input and output quantities, dependent on given input and output prices. Since doubts have been raised in the literature concerning the underlying assumption of perfectly competitive output markets, Humphrey and Pulley (1997) develop an alternative profit function. Here, banks are still assumed to face perfectly
33 Cf. Coelli et al. (1998), Paragraph 3.2.5.
Jacob A. Bikker and Jaap W.B. Bos .
Autumn 2005 • Economic & Financial Modelling 124
competitive input markets. However, they are active on imperfect output markets, which offer some scope for price setting. Hence, banks have little opportunity to influence output quantities but instead can negotiate prices and fees in a more flexible manner. The extent to which they can influence prices depends on the given output quantities at the time of decision, the given input prices and other factors influencing their ability to set prices. In addition, the alternative profit function may account for quality differences in output and for scale biases. In this model, banks maximise profits subject to both a technology constraint and the so-called pricing opportunity set. The latter reflects a bank’s assessment of its competitive position as well as its assessment of the willingness of customers to pay the prices the bank wishes to charge. The maximisation problem then becomes:
( ) 0 ( ) 0p x
Max x s t T x y and H p y w zp y wπ ′ ′
,. . , = , , , == − (7)
Here, ( )H • denotes the pricing opportunity set. The Lagrangian system can be written as:
( ) ( )x T HL p y w λ θπ ′ ′ − • − •= − (8) Solving simultaneously for p and x gives the optimal output prices and input quantities as:
( )p y w zp∗∗ , ,= (9)
( )x y w zx∗∗ , ,= (10) Substitution then yields the optimal profit level:
( ) ( )( ) y x y w z y w zp y w z w ππ ∗ ′ ∗′ , , = , ,= , , − (11) The appealing feature of this profit function is that it allows for market imperfections on the output side. Additionally, output prices, which are subject to severe measurement problems
Competition and Efficiency in Banking
Economic & Financial Modelling • Autumn 2005 125
according to Berger and Humphrey (1997) and Vander Vennet (1998), are not required for the empirical analysis. For this profit model, with optimal profit π ∗ and input prices 1w ,
2w , properties are similar to those of the cost model:34 • ( ) 0 0p w for p wπ ∗ , ≥ , , ≥ . In the long run, all inputs (and outputs) are flexible, and there are no sunk costs. • ( ) ( )bp w p w forαπ π∗ ∗, ≥ , , a bp p≥ . The profit function is monotonic in output prices. • ( ) ( )a bp w p w forπ π∗ ∗, ≥ , , a bw w≤ . The profit function is monotonic in input prices. • ( )p wπ ∗ , is homogenous of degree one in all prices. Thus, if we double all input prices, profits are doubled as well. This property follows from Equation (7). • ( )p w pδπ δ∗ , / and ( )p w wδπ δ∗ , / are now both homogenous of degree zero in output and input prices, respectively. • The production function and the profit function also share the same returns to scale properties. So a strictly concave production function requires a profit function that is concave in prices. We have now introduced a theoretical framework for a cost minimisation model and a profit maximisation model. In the next section we further develop these models to measure bank efficiency. 5. Efficiency and Bank Performance The previous section argued that in a perfect competition setting a bank will be a price-taker that maximises profits by minimising costs.35 It increases output up to the point where marginal costs equal marginal revenue and average costs are minimised.
34 Coelli et al. (1998), Paragraph 3.2.5. 35 For an elaborate overview and deeper discussion see Freixas and Rochet (1997).
Jacob A. Bikker and Jaap W.B. Bos .
Autumn 2005 • Economic & Financial Modelling 126
There are a number of reasons why banks may not be price takers and may not operate in a perfectly competitive market. As a first example, in the presence of increasing returns to scale a single bank should theoretically serve the market.36 Second, price discrimination can give rise to monopsony powers, for instance through switching costs, search costs and product differentiation.37 Third, cross-subsidisation may cause spill-over effects from one concentrated banking market to another.38 A fourth example depends on the existence of regulatory barriers such as the ban on interstate branching in the US following the enactment of the Glass-Steagal act or the existence of interest rate regulation (in the form of maximum rates) in France and Spain in the early 1990s. We therefore need an analytical framework that can incorporate behavioural assumptions about banks. Consider that both the bank operating in the perfectly competitive market and the bank that has a natural monopoly maximise outputs, possibly using the same production technology. Hence, they have the same production function. Therefore, we explicitly distinguish between cost minimisation and profit maximisation. In a perfectly competitive market, for any single bank the two approaches should yield identical results. However, in the case of imperfect competition, the existence of market power (for whatever reason) might lead to a bank that maximises profits without minimising costs or vice versa. The combined use of both cost and profit optimisation is therefore a good – albeit indirect – way to incorporate bank behaviour in response to its competitive environment.
36 This is the case for instance in the original Diamond model, cf. Diamond (1984), Diamond and Dybvig (1986) and Freixas and Rochet (1997). 37 Seminal references are Tirole (1993) and Bain (1956), and for banking markets Milgrom and Roberts (1982a, 1982b) and Freixas and Rochet (1997). Product differentiation in banking has been studied in for instance Berg and Kim (1994, 1998). The opposite effect (channel discrimination) has been studied in Barefoot (2000). 38 See e.g. Ali and Greenbaum (1977), Caprio and Wilson (1997) and Chiappori, Perez-Castrilo, and Verdier (1995).
Competition and Efficiency in Banking
Economic & Financial Modelling • Autumn 2005 127
5.1. A Focus on X-Efficiency A number of concepts are widely employed in the empirical literature. Scale economies refer to the optimal size of production, that is, it concerns the point on the production curve where productivity is maximised. X-efficiency was defined earlier as a comparison between observed and optimal values of output and input. An efficient frontier is then made up of a continuous series of scale efficient points for different input- and output-mixes. Berger, Hunter, and Timme (1993) argue that in translog production models scale efficiency refers to that size of a banking firm at which average costs are minimised by moving along the production frontier. The issue of scope economies deals with answering the question of whether the joint or the single production of an output bundle is optimal. This kind of inefficiency source is also referred to as product mix economies. The combination of scale and scope economies concepts is subject to some qualifications. Remember that efficient banks are assumed to operate on the frontier. Indeed, both concepts focus on an optimal production plan in terms of input and output quantities. Consequently, inefficient banks operating above the cost-minimising frontier can be the result of a suboptimal production size, a suboptimal product mix, or both. Berger, Hunter, and Timme (1993) in a seminal reference sum up the major problems associated with measuring economies of scale and scope using translog functions. Measuring economies of scope is particularly problematic given the possible existence of zero outputs. Related, there is often an extrapolation problem: in a sample with universal banks as well as other banks, universal banks are often the only banks truly offering the full range of services. As a result the economies of scope derived from the cost (or profit) function tend to overestimate the true economies of scope present among most banks in the sample. In addition measuring average economies of scope results in scope measures that are highly biased due to the fact that they also include X-(in)efficiency.
Jacob A. Bikker and Jaap W.B. Bos .
Autumn 2005 • Economic & Financial Modelling 128
The crucial difference between X-efficiency and scale-/scope-efficiency is the perception of the bank’s position relative to the best-practice frontier and the assumptions regarding behaviour. X-inefficiency indicates the ability of management to convert inputs efficiently into outputs given prevailing prices. Beyond formulating a production plan, it also evaluates how well this plan is achieved and is therefore also referred to as managerial efficiency. Berger, Hunter, and Timme (1993) identify several problems with measuring economies of scale.39 First and foremost, research has time and again brought evidence in favour of U-shaped cost curves in banking. Economies of scale increase up to a relatively modest size, sometimes estimated to be as low as USD 100 million or less, after which they tend to increase (albeit slowly). Thus, when using a translog function to measure economies of scale for a sample of small and large banks it is not very well possible to identify the cost curve and find reliable economies of scale for banks in different size classes. A second problem concerns the fact that risk variables are often excluded when measuring economies of scale. Thirdly, Berger, Hunter, and Timme (1993) observe that many studies base their scale measures on observations that are not on or close to the efficient frontier. As a result, these studies cannot separate economies of scale (i.e. the marginal effects of outputs on profits or costs) from X-efficiency (the distance from the efficient frontier). So economies of scale will be biased the further the banks lie from the efficient frontier. Berger, Hunter, and Timme (1993) and Berger and Humphrey (1991) state that scale and scope inefficiencies (amounting to 5 percent) are less important in the banking industry than X-inefficiencies (20-25 percent). A similar finding is reported in a study carried out for the European Commission by European Commission (1997) for Europe’s banking markets. Henceforth, we concentrate on X-efficiency not only because it appears to be quantitatively more important in the banking industry, but also
39 In particular, they discuss the use of translog functions. However, their arguments apply to other flexible forms as well (and to Cobb-Douglas models, with the exception of the first argument).
Competition and Efficiency in Banking
Economic & Financial Modelling • Autumn 2005 129
because the conceptual notion is more appealing. In addition, X-efficiency bears the decisive advantage of allowing the bank to react to price changes, see Berger and Humphrey (1997) and Lovell (1993). It allows for sub-optimal (beneath-frontier) operations and incorporates relative prices into the analysis. 6. X-efficiency and bank performance 6.1. X-efficiency ranks Bikker (2002) estimates X-efficiency for banks in European countries, determining their cost efficiencies.40 This study compared European banks to their best-practice banks – an exercise of crucial importance for cross-border comparisons. Many studies in this area have been single-country studies, comparing banks to their national champion performers only. As these national champions lag farther and farther behind the European champions, however, the local (lagging) banking sector will continue to compare itself favourably with ever less justification. The present multi-country study lacks this problem. A banking market may therefore be characterised by measuring the performances of the banks in that market. Performance, here meaning the relative ability of a bank to minimise costs or maximise profits, is measured by comparing the costs or profits of a bank to those of the best performing bank of the same size (eliminating scale effects), taking into account any differences in input prices and product range. These differences in performance are expressed in terms of ‘X efficiency’ and may be attributed to the quality of banks’ management. One of the various methods to estimate X-efficiency is the stochastic frontier approach, which assumes that the error term is composed of the sum of a specification error and an inefficiency term:41 40 Partly because of the high requirements imposed on data and of conceptual problems, relatively little research has been done in the field of international comparisons. Exceptions are Pastor et al. (1997), Altunbas et al. (2001), Bikker (2001) and Maudos et al. (1999, 2001 and 2002). 41 A number of techniques exist to measure a production unit’s efficiency relative to some kind of ‘best-practice-frontier’. A first distinction is between
Jacob A. Bikker and Jaap W.B. Bos .
Autumn 2005 • Economic & Financial Modelling 130
cit = α + ∑j βj xijt + ∑j ∑k γjk xijt xikt + vit + uit (12)
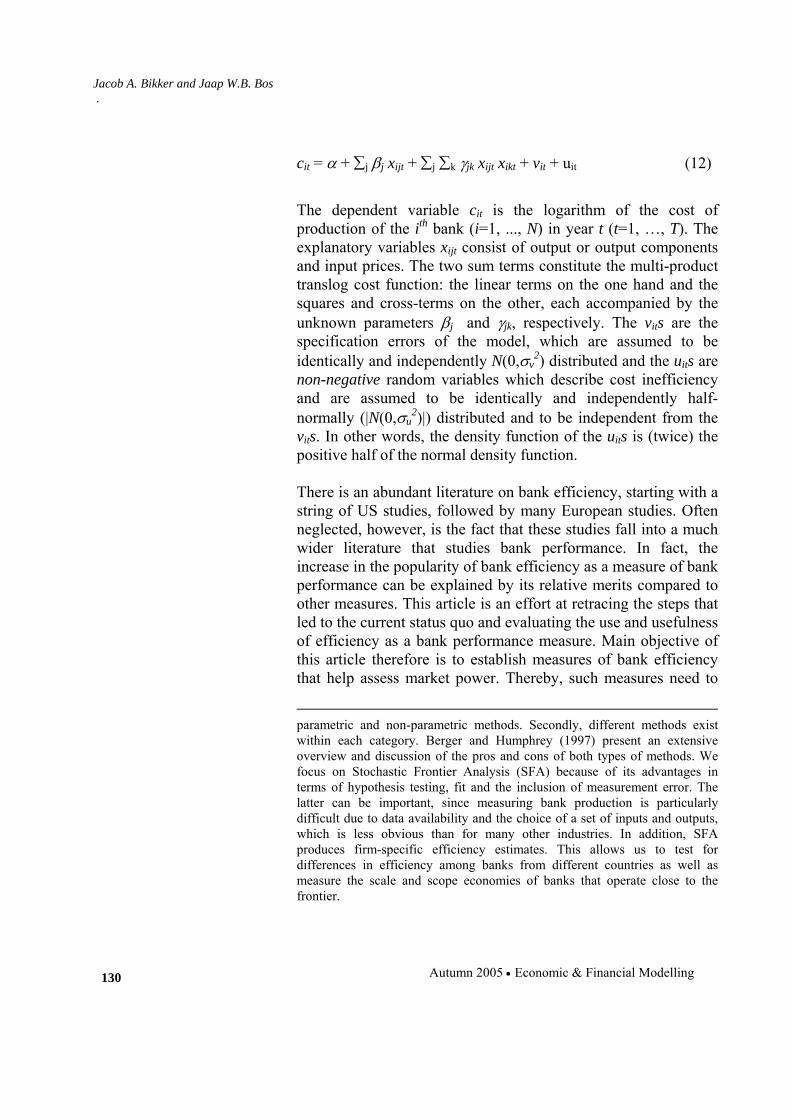
The dependent variable cit is the logarithm of the cost of production of the ith bank (i=1, ..., N) in year t (t=1, …, T). The explanatory variables xijt consist of output or output components and input prices. The two sum terms constitute the multi-product translog cost function: the linear terms on the one hand and the squares and cross-terms on the other, each accompanied by the unknown parameters βj and γjk, respectively. The vits are the specification errors of the model, which are assumed to be identically and independently N(0,σv
2) distributed and the uits are non-negative random variables which describe cost inefficiency and are assumed to be identically and independently half-normally (|N(0,σu
2)|) distributed and to be independent from the vits. In other words, the density function of the uits is (twice) the positive half of the normal density function. There is an abundant literature on bank efficiency, starting with a string of US studies, followed by many European studies. Often neglected, however, is the fact that these studies fall into a much wider literature that studies bank performance. In fact, the increase in the popularity of bank efficiency as a measure of bank performance can be explained by its relative merits compared to other measures. This article is an effort at retracing the steps that led to the current status quo and evaluating the use and usefulness of efficiency as a bank performance measure. Main objective of this article therefore is to establish measures of bank efficiency that help assess market power. Thereby, such measures need to
parametric and non-parametric methods. Secondly, different methods exist within each category. Berger and Humphrey (1997) present an extensive overview and discussion of the pros and cons of both types of methods. We focus on Stochastic Frontier Analysis (SFA) because of its advantages in terms of hypothesis testing, fit and the inclusion of measurement error. The latter can be important, since measuring bank production is particularly difficult due to data availability and the choice of a set of inputs and outputs, which is less obvious than for many other industries. In addition, SFA produces firm-specific efficiency estimates. This allows us to test for differences in efficiency among banks from different countries as well as measure the scale and scope economies of banks that operate close to the frontier.
Competition and Efficiency in Banking
Economic & Financial Modelling • Autumn 2005 131
meet two requirements. First, they have to be able to contribute significantly to the explanation of bank performance. Second, if possible they should provide additional and perhaps more accurate information on the existence of market power.
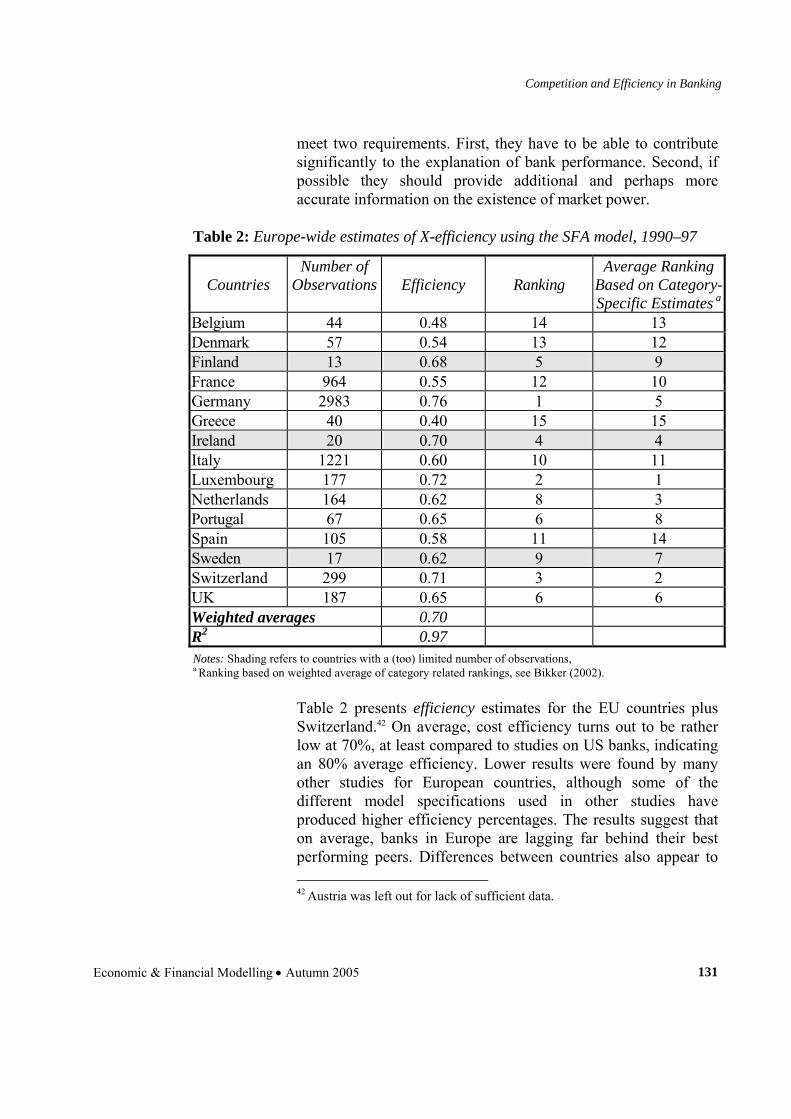
Table 2: Europe-wide estimates of X-efficiency using the SFA model, 1990–97
Countries
Number of Observations
Efficiency
Ranking
Average Ranking Based on Category-Specific Estimates a
Belgium 44 0.48 14 13 Denmark 57 0.54 13 12 Finland 13 0.68 5 9 France 964 0.55 12 10 Germany 2983 0.76 1 5 Greece 40 0.40 15 15 Ireland 20 0.70 4 4 Italy 1221 0.60 10 11 Luxembourg 177 0.72 2 1 Netherlands 164 0.62 8 3 Portugal 67 0.65 6 8 Spain 105 0.58 11 14 Sweden 17 0.62 9 7 Switzerland 299 0.71 3 2 UK 187 0.65 6 6 Weighted averages 0.70 R2 0.97 Notes: Shading refers to countries with a (too) limited number of observations, a Ranking based on weighted average of category related rankings, see Bikker (2002).
Table 2 presents efficiency estimates for the EU countries plus Switzerland.42 On average, cost efficiency turns out to be rather low at 70%, at least compared to studies on US banks, indicating an 80% average efficiency. Lower results were found by many other studies for European countries, although some of the different model specifications used in other studies have produced higher efficiency percentages. The results suggest that on average, banks in Europe are lagging far behind their best performing peers. Differences between countries also appear to 42 Austria was left out for lack of sufficient data.
Jacob A. Bikker and Jaap W.B. Bos .
Autumn 2005 • Economic & Financial Modelling 132
be rather large. Banks in Germany, Luxembourg and Switzerland, with efficiencies averaging 70%, lead the European pack, while banks in Spain, Belgium and Greece trail behind with average efficiencies below 55%. Higher efficiency estimates for banks in Luxembourg and Switzerland are somewhat misleading, as they do not necessarily reflect higher managerial performance but are produced by special circumstances including bank secrecy, zero tax rates for foreigners and stable local currencies, which make it easier to attract (foreign) investment cheaply. The efficiency ranking of national markets does not always correspond to expectations. Germany, with its low level of banking market consolidation and high level of government interference, is often regarded as a less efficient banking market. Similar reasons, in combination with economic developments that lag behind in certain respects, have led to lower a priori estimates of efficiency with regard to France and Southern European countries, as well. In this respect, the ranking of Belgium in Table 2 is lower than expected, while those of Italy and Portugal are higher than expected. The UK, too, turns out to be less competitive than some observers think. On further analysis, however, rankings turn out differently as more factors are taken into consideration, especially if the distribution of a country’s banks across each banking category is taken into account. Then it becomes clear that on account of their simplified structures, savings and co-operative banks tend to be relatively inefficient. The effects of differences in managerial competence on cost differences turn out to be less strong. On the other hand, universal banks tend to be less efficient as a result of their more complex structures and concomitant management problems. The last column of Table 2 presents averages of country rankings based on efficiency estimates per banking category, with e.g. savings banks being compared only to best-practice savings banks etc. This leads to a dramatic shift in position for Germany, where more than 90 per cent of the banks are of the co-operative and savings bank type: plain banking institutions, whose inefficiency is limited. This strong concentration of relatively efficient co-operative and savings banks in Germany results in a high average level of efficiency. However, within these categories – and among the other categories – German banks are
Competition and Efficiency in Banking
Economic & Financial Modelling • Autumn 2005 133
not the most efficient ones. After adjustment for this category effect, German efficiency turns out to be just slightly above average (5th in stead of 1st, see the last column of Table 2). A similar bias appears to have crept in the case of Italy and Spain where, respectively, 73 per cent and 64 per cent of banks are co-operative and savings banks. For the Dutch banks, 78 per cent of which are commercial banks, we see a landslide ranking shift in the opposite direction. Commercial banks have, on average, high inefficiencies but in relative terms the Dutch commercial banks are among the most efficient. After adjustment, Dutch banks rank 3rd instead of 8th. 6.2. Efficiency of Large Banks Compared Internationally The interest of researchers has concentrated mostly on the largest banks, both because they are economic heavyweights and because international competition makes them easier to compare with one another. The present section therefore shifts its attention to an international comparison of large banks in Europe and the US. Also, profit efficiency is considered in addition to cost efficiency. A result often found is that differences in cost efficiency (measured in percentages) tend to be significantly smaller than differences in profit efficiency (Berger, Hunter, and Timme, 1993; Berger and Humphrey, 1997). Note, however, that a relatively small reduction in costs may take away a large share of profit inefficiency. The difference between cost and profit efficiency may also be explained in part by the fact that profit efficiency is determined to a much larger extent than cost efficiency by conditions of the market in which a bank operates, because the pricing levels a bank can afford to use have an immediate effect on profit maximisation. Also, profit is more volatile than costs, so that percentage differences between profit and profit efficiencies of banks are larger than in the case of costs. In sum, examining profit efficiency can result in additional evidence on the nature of the competition in a banking market.
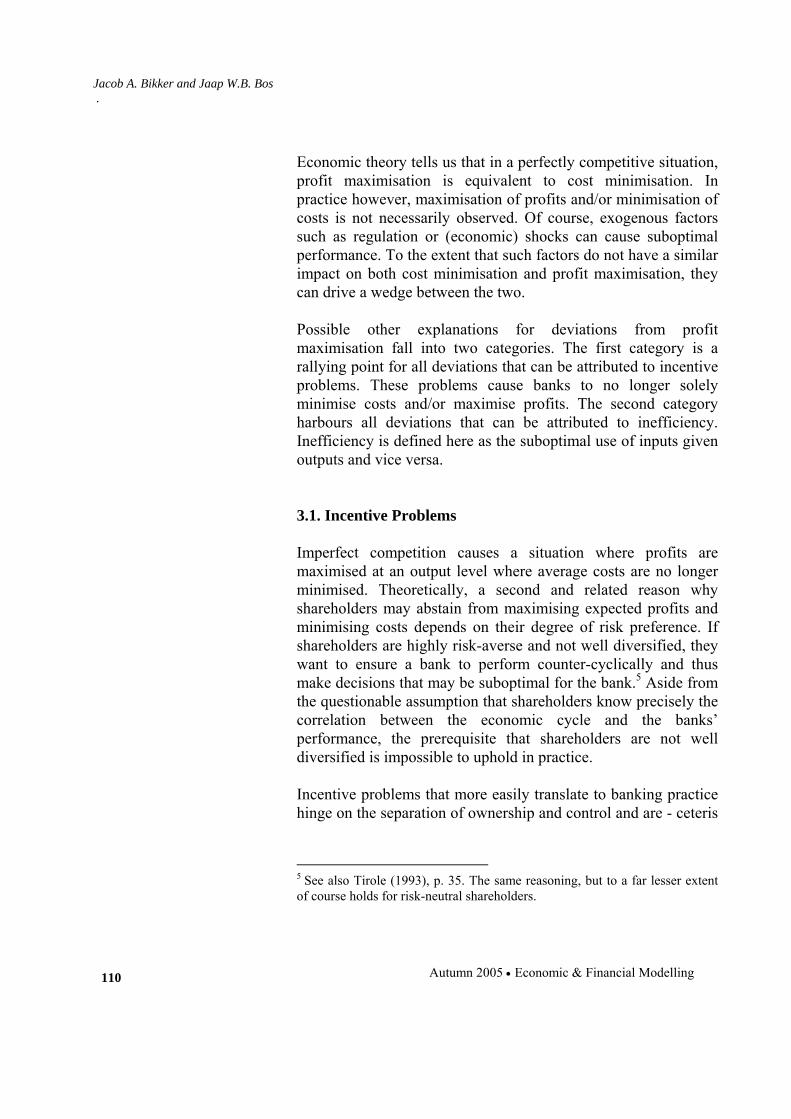
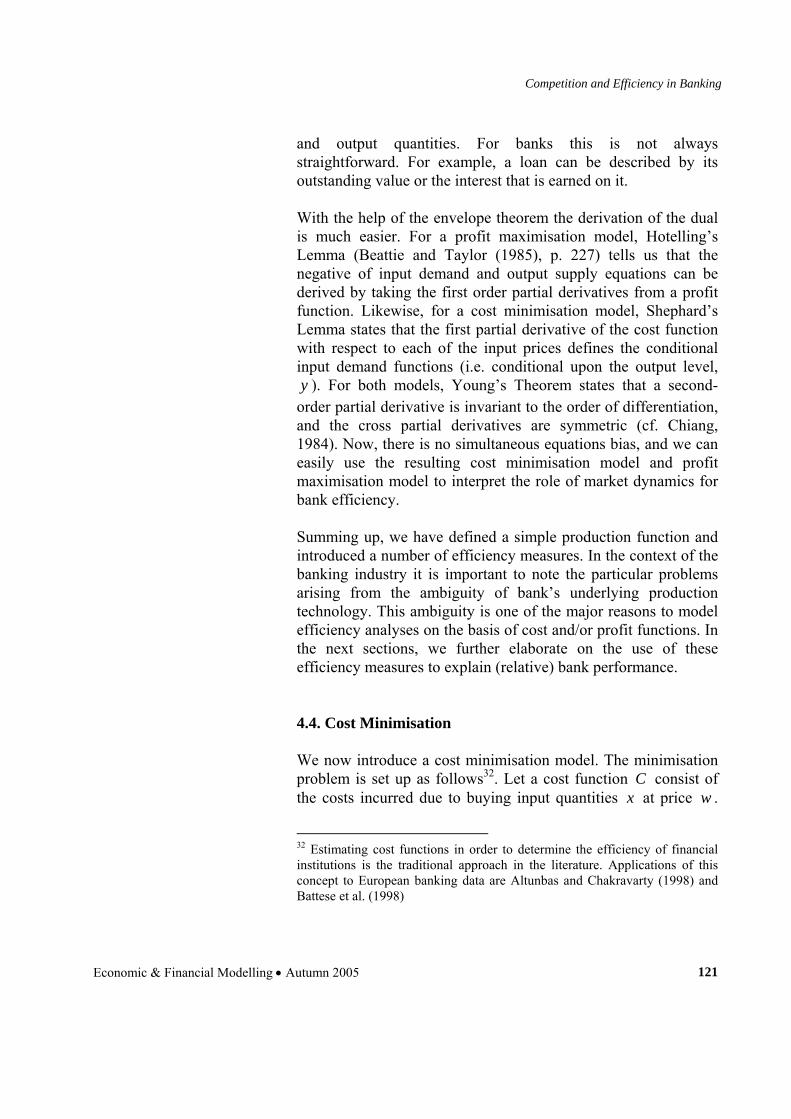
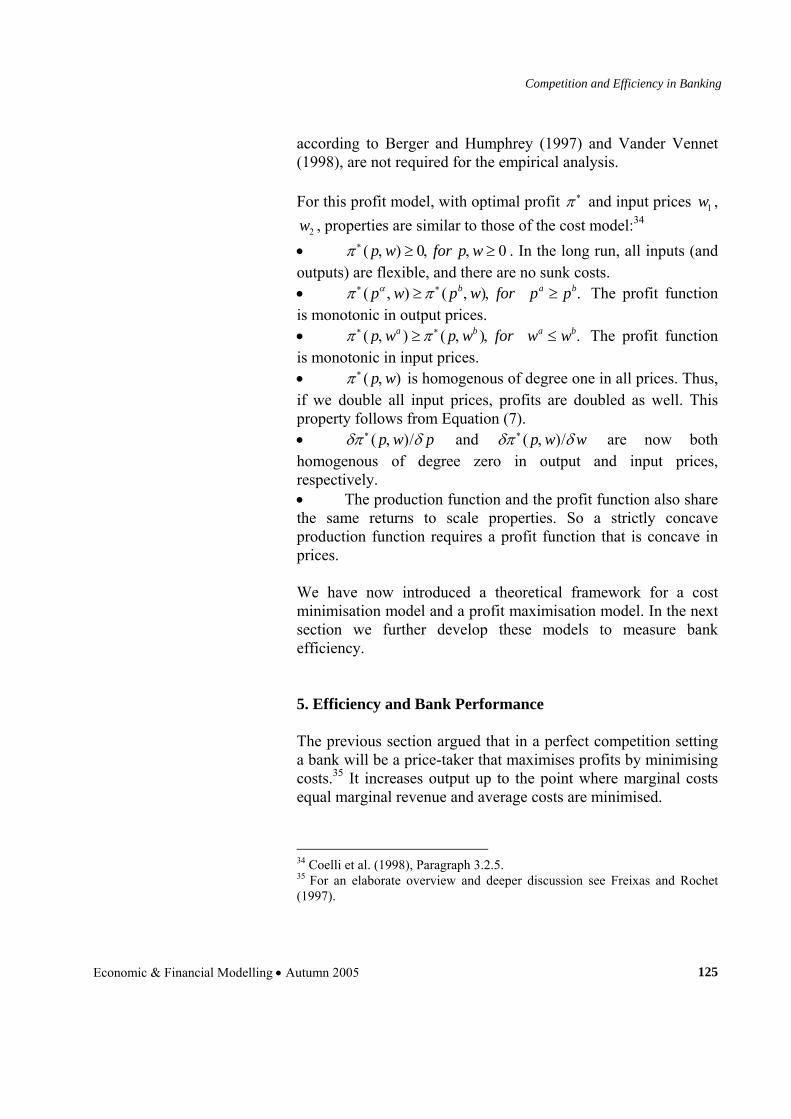
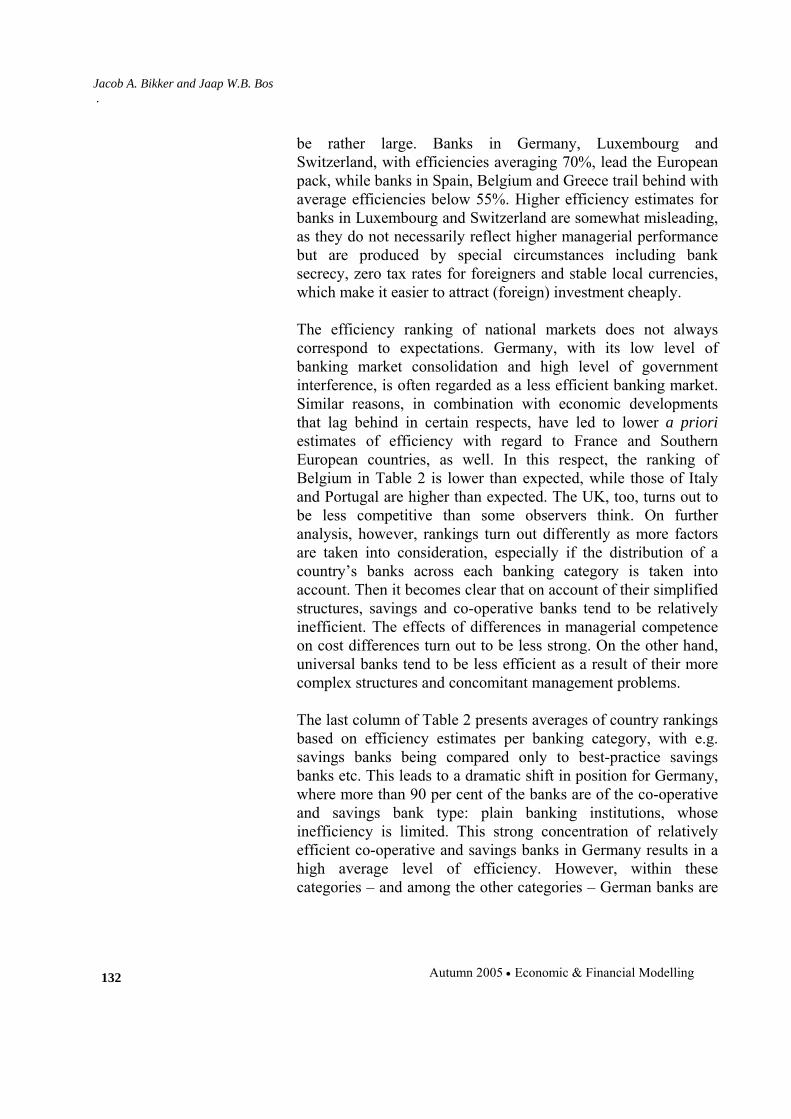
Fig. 3: Profit and Cost Efficiency of Large Banks in Europe and the US
Jacob A. Bikker and Jaap W.B. Bos .
Autumn 2005 • Economic & Financial Modelling 134
Austria
Belgium
SwitzerlandGermany
Denmark
Spain
FinlandFrance
Great Britain
Greece
Ireland
Italy
Luxembourg
Netherlands
Norway
Portugal
Sweden
U.S.
.5.6
.7.8
.9P
rofit
Effi
cien
cy
.88 .9 .92 .94 .96 .98Cost Efficiency
Source: Bos and Kolari (2005).43
Fig. 3 shows average efficiencies of large banks with world-wide operations, by country and weighted for banks’ total assets. The absolute champions turn out to be banks in Ireland, the Netherlands and the US, in terms of both cost and profit efficiency. The surprisingly low marks scored by Luxembourg and Austria may be less reliable, because the number of large banks in these countries is so small. Profit efficiency, varying between 0.52 and 0.87, is much more widely spread than cost efficiency (0.88–0.98).44 The difference in spread is caused in large part by national differences in market conditions. To the extent that profit efficiency is determined by local market conditions, such as the existence of market power or institutional conditions, the same efficiency is unlikely to be ‘exported’ entirely when banks spread their wings across national borders. 43 Data on independent institutions over the 1995–99 period. Source of data on US banks: Federal Reserve Call Reports. 44 Cost efficiency is much higher here than it is in the estimates of Section 6.1. This is because only large, international banks are considered, as appears also from the calculations underlying Fig. 4 in the next section. Also, a different model specification is used here.
Competition and Efficiency in Banking
Economic & Financial Modelling • Autumn 2005 135
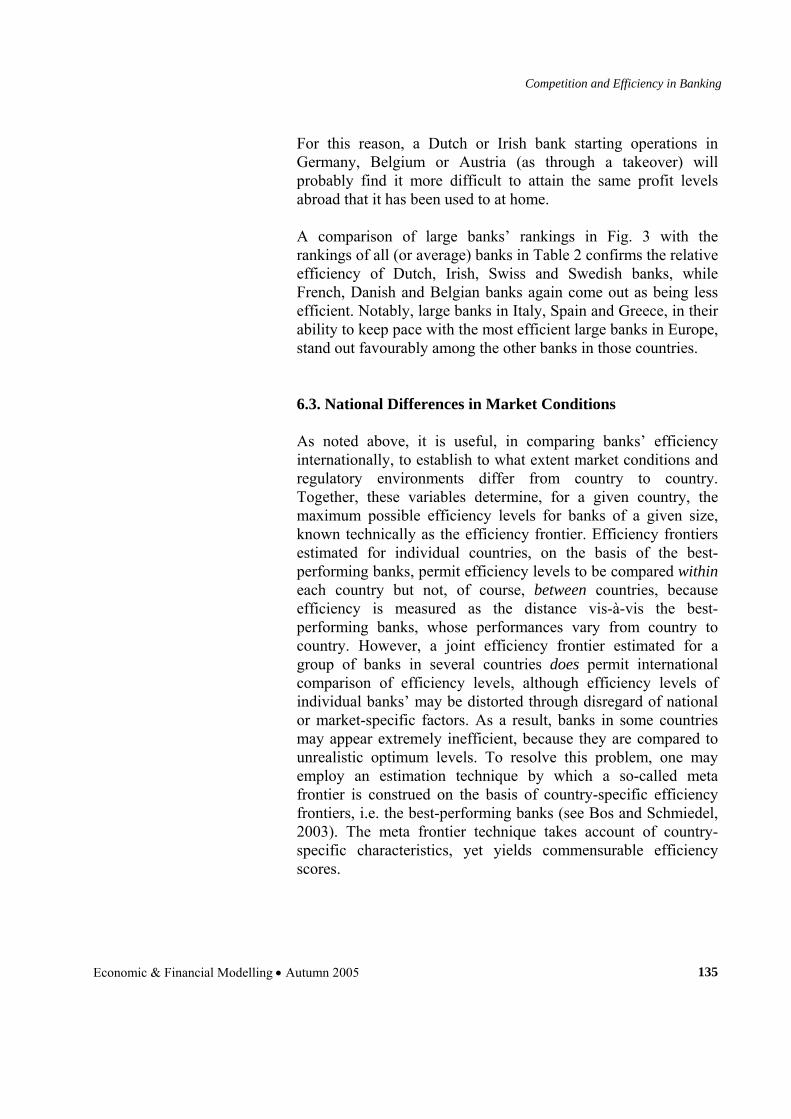
For this reason, a Dutch or Irish bank starting operations in Germany, Belgium or Austria (as through a takeover) will probably find it more difficult to attain the same profit levels abroad that it has been used to at home. A comparison of large banks’ rankings in Fig. 3 with the rankings of all (or average) banks in Table 2 confirms the relative efficiency of Dutch, Irish, Swiss and Swedish banks, while French, Danish and Belgian banks again come out as being less efficient. Notably, large banks in Italy, Spain and Greece, in their ability to keep pace with the most efficient large banks in Europe, stand out favourably among the other banks in those countries. 6.3. National Differences in Market Conditions As noted above, it is useful, in comparing banks’ efficiency internationally, to establish to what extent market conditions and regulatory environments differ from country to country. Together, these variables determine, for a given country, the maximum possible efficiency levels for banks of a given size, known technically as the efficiency frontier. Efficiency frontiers estimated for individual countries, on the basis of the best-performing banks, permit efficiency levels to be compared within each country but not, of course, between countries, because efficiency is measured as the distance vis-à-vis the best-performing banks, whose performances vary from country to country. However, a joint efficiency frontier estimated for a group of banks in several countries does permit international comparison of efficiency levels, although efficiency levels of individual banks’ may be distorted through disregard of national or market-specific factors. As a result, banks in some countries may appear extremely inefficient, because they are compared to unrealistic optimum levels. To resolve this problem, one may employ an estimation technique by which a so-called meta frontier is construed on the basis of country-specific efficiency frontiers, i.e. the best-performing banks (see Bos and Schmiedel, 2003). The meta frontier technique takes account of country-specific characteristics, yet yields commensurable efficiency scores.
Jacob A. Bikker and Jaap W.B. Bos .
Autumn 2005 • Economic & Financial Modelling 136
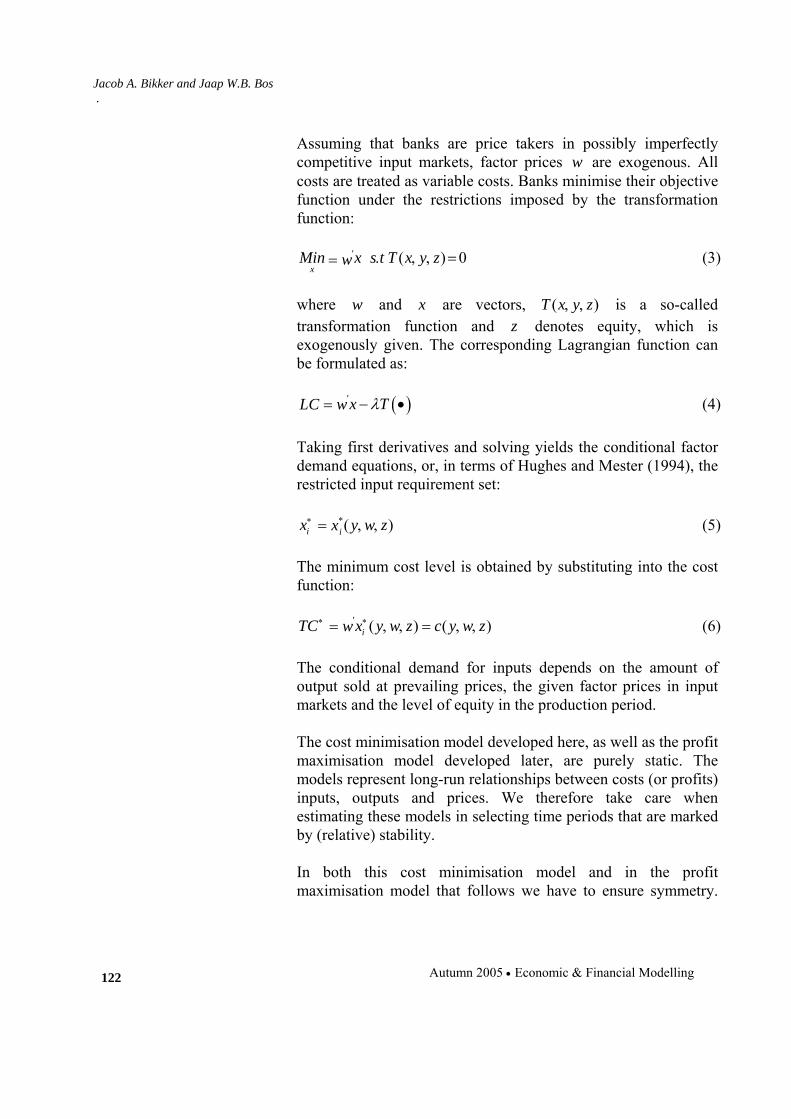
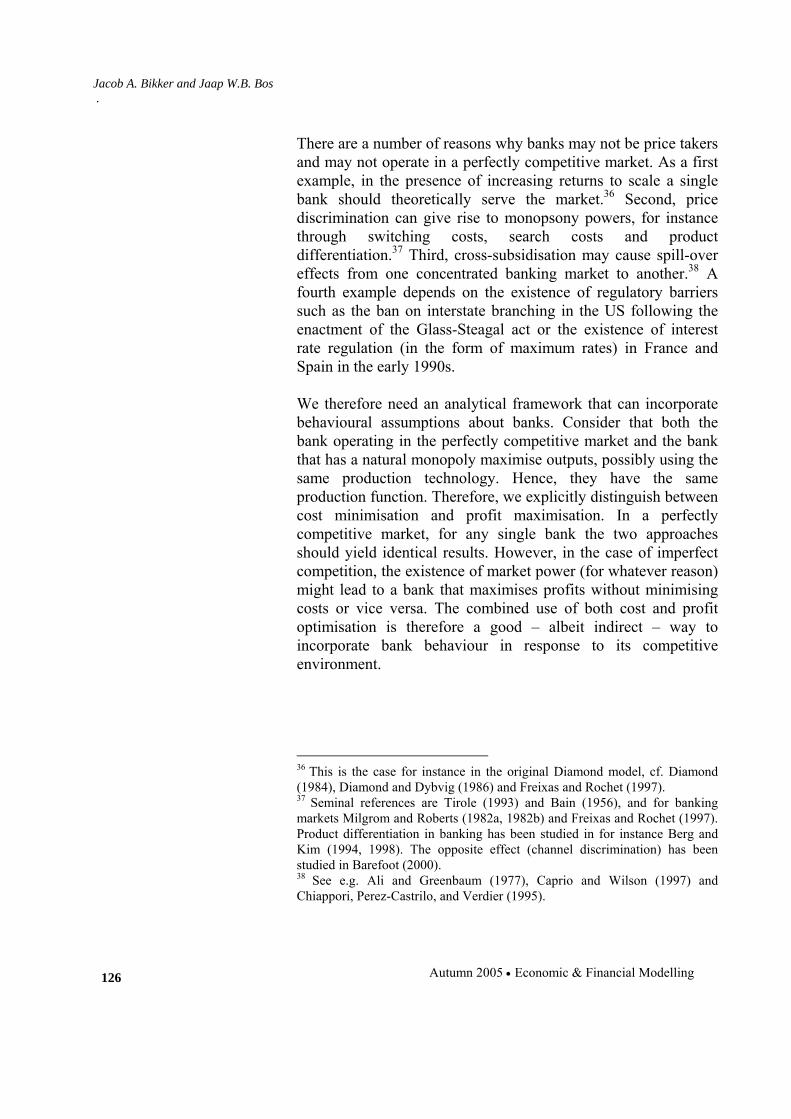
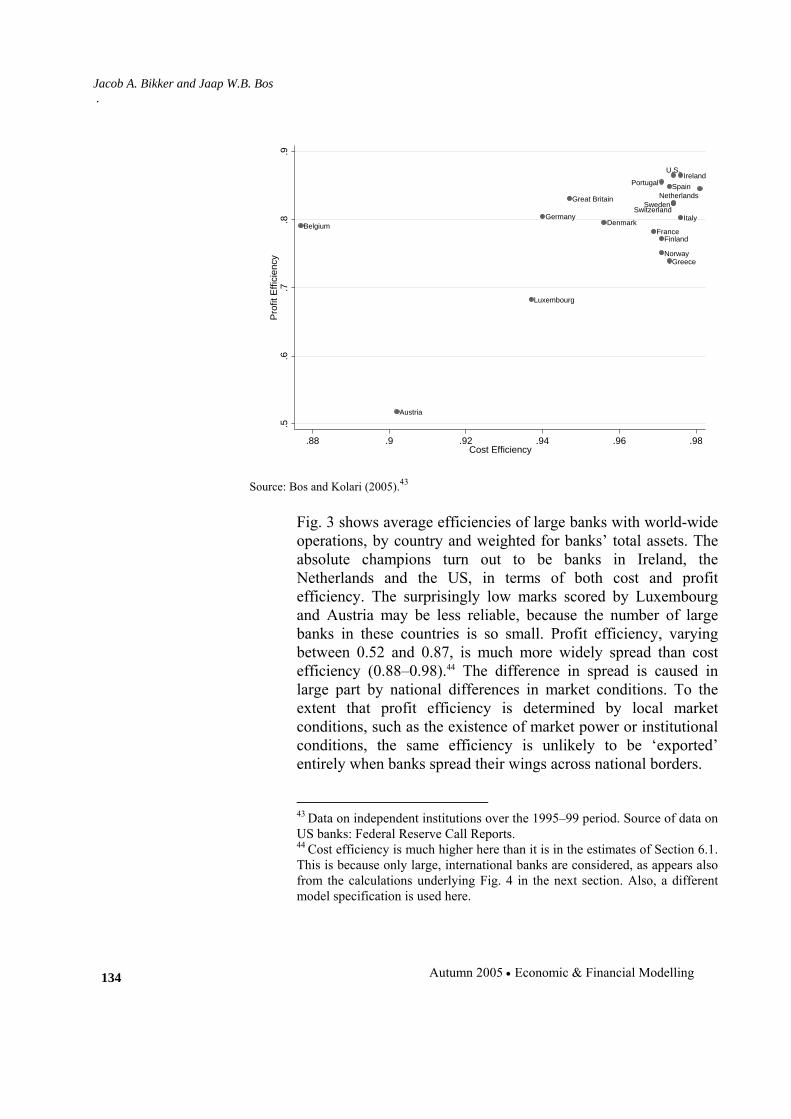
Fig. 4: From a Pooled Frontier to a Meta Frontier
0.3
0.4
0.5
0.6
0.7
0.7 0.8 0.9 1.0
Meta Pooled
Germany
France
Spain
Switzerland
Netherlands
Belgium
United Kingdom
Italy
Cost efficiency
Profit efficiency
Source: Bos and Schmiedel (2003), asset-weighted averages for 1993-2000.
Fig. 4 also compares banks in several countries. In contrast to Fig. 3, which only looks at large banks (including US banks), this figure represents all banks, illustrating how relative cost and profit efficiencies change if a meta frontier is estimated instead of the one-size-fits-all used in Fig. 3. The most notable change is the increase, for almost every country, of average cost and profit efficiencies, owing to the apparent divergence of national efficiency frontiers. The odd one out amid this pattern of increasing efficiencies is Germany, where both cost and profit efficiencies decline. This is all the more notable because both types of efficiency, but especially profit efficiency were already low to begin with. Indeed, the analysis shows that even the most efficient German banks are relatively inefficient compared to other European banks. These low efficiency levels also play a part, of course, in the recently rekindled debate on the efficiency of the German banking system. Another remarkable result is the particularly strong increase in
Competition and Efficiency in Banking
Economic & Financial Modelling • Autumn 2005 137
both cost and profit efficiencies of banks in Belgium, Italy and the Netherlands. This result demonstrates that the national efficiency frontiers for banks in these countries are still considerably higher than for banks in other European countries. By consequence, the efficiency of banks in these countries is probably underestimated (more strongly than elsewhere) when compared to a pooled frontier in stead of a meta frontier. The shifts observed in Fig. 4 also explain the almost complete lack of cross-border bank mergers and takeovers within the EU. Apparently, successes realised domestically are difficult to repeat abroad. Another notable point is that successful cost management does not lead automatically to greater profit efficiency and, by consequence, to higher profits. Belgian banks, for instance, although they have the highest average cost efficiency, are relatively less efficient in turning this into profits than e.g. their Dutch or British competitors. It is unclear what causes these differences. Perhaps average managerial capabilities differ significantly from country to country; another possibility is that further integration is impeded by national differences in market and regulatory conditions. 6.4. Rising Competition and Efficiency Levels over Time A commonly held view holds that deregulation, liberalisation and technological innovation have strengthened national and international competition. For the EU, this process was reinforced by progressive financial and monetary integration. The resulting increased competition forces banks to become ever more efficient. The question arises whether these changes are expressed in competition and efficiency estimates. This section discusses two ways to measure these differences. First, 1997 H indices (see the discussion of Table 1) are compared to H indices for an earlier period, around 1991. Given the dramatic changes in the banking market over the past decade, one would expect to see competition levels increase significantly. Yet in fact while the level of competition did increase in many countries and in various subsectors, the differences as expressed by the H statistic remain limited. Possibly, this is because banks
Jacob A. Bikker and Jaap W.B. Bos .
Autumn 2005 • Economic & Financial Modelling 138
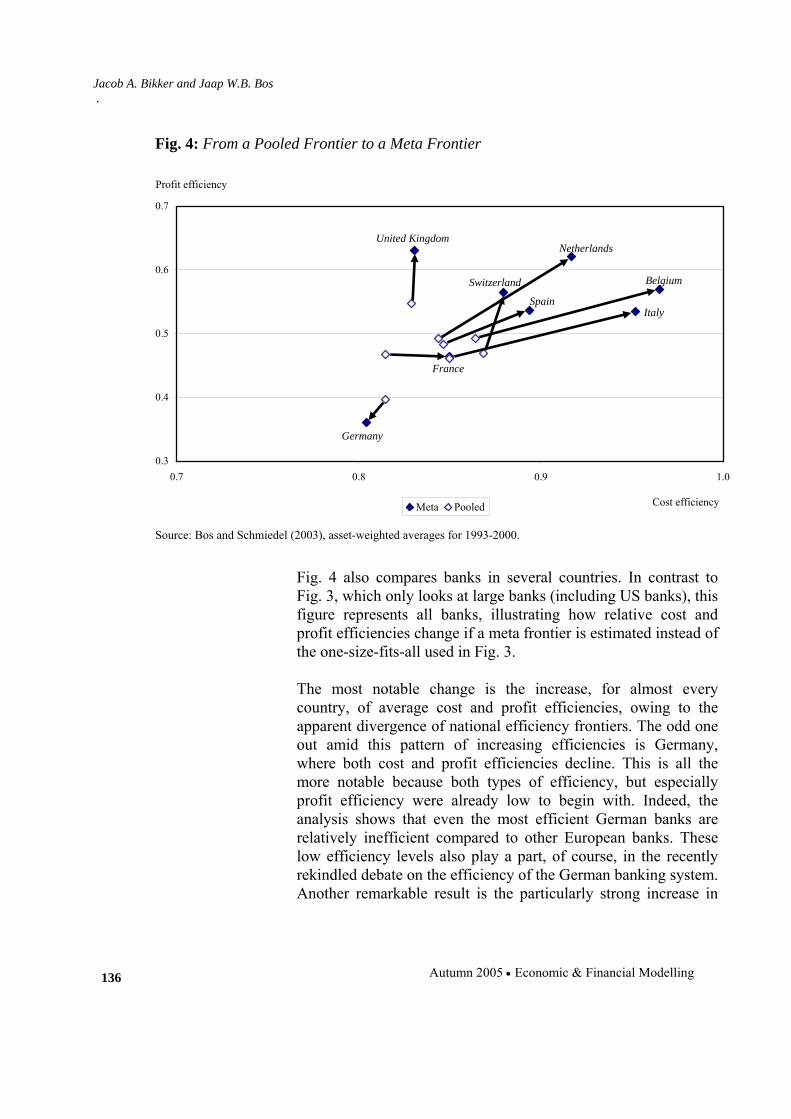
manage to mitigate increasing competitive pressures to some extent, as by product differentiation, which would be consistent with the monopolistic competition observed for most countries in Table 1. Table 3: Changes in Efficiency over Time
Year Number of Banks Efficiency 1990 31 0.563 1991 52 0.543 1992 220 0.563 1993 364 0.564 1994 515 0.590 1995 1 126 0.653 1996 2 135 0.733 1997 1 907 0.739 Source: Bikker (2002). Next, we look at annual cost efficiency changes over the 1990–97 period. Amid growing competition awareness in banks, caused in part by rising levels of competition, one would expect to see cost efficiency increase over time. Table 3 shows that this is indeed the case, as indicated by a consistent year-on-year rise in efficiency levels of EU banks over the 1991–1997 period. Whereas in 1990, average efficiency lagged considerably behind that of US banks, seven years on, inefficiency levels had fallen by as much as 45 per cent, significantly reducing the efficiency lag. This suggests major contributions made by deregulation and economic and financial integration within Europe to the wealth of both customers and owners of banks. As demonstrable increases in competition levels are limited, it follows that competition was not the impelling force driving efficiency improvements. Therefore, other factors must have contributed as well, as, for instance, increased concern for profitability or shareholder value. 7. Conclusions Banks’ activities and products are undergoing dramatic changes as a result of technological progress in ICT and developments in financial techniques, while banks feel the pressures caused by
Competition and Efficiency in Banking
Economic & Financial Modelling • Autumn 2005 139
global changes in the economic and financial environment. Information technology has contributed to internationalisation of money and capital markets, the developments of new risk management techniques and the rise of novel, complex financial products and new sales channels. Institutional conditions in Europe have changed dramatically as a result of measures such as the second EU banking directive (the single EU banking ‘passport’) or the creation of EMU and its single currency. All of these factors have worked to increase competition on both national and international levels, forcing banks to become ever more efficient. This article has outlined the levels of competition prevailing on European banking markets and the profit and cost efficiency levels of banks in Europe. The reader is warned, meanwhile, that the competition and efficiency estimates are surrounded by considerable uncertainties. The structure-conduct-performance hypothesis assumes that banks possess and use a certain degree of market power. In line with this, the Panzar-Rosse method indicates monopolist competition or oligopoly. Relatively strong though less than perfect competition is found to exist in almost all banking markets – less strong in local, retail oriented markets and much stronger in international, wholesale oriented markets. Efficiency estimates for banks in the EU suggest that on average, they lag far behind their best performing peers. Differences between national banking markets are also rather large. A relevant factor to take into account appears to be the distribution of banks across different banking categories in each country. Efficiency estimates for large, internationally active banks may diverge considerably from those for average banks. Profit efficiency calculations show that there is still room for relatively strong progress with respect to profits, which might be partly realised through comparatively small cost reductions. Furthermore, results appear sensitive to country-specific market and regulatory conditions. Efficiency levels of EU banks have improved significantly over the past decade, probably owing to increasing competition and enhanced focus on profitability. Presumably, deregulation and financial and monetary integration within the EU have made major contributions to the resulting competitive improvements and efficiency gains.
Jacob A. Bikker and Jaap W.B. Bos .
Autumn 2005 • Economic & Financial Modelling 140
References Akhavein, J.D., A.N. Berger, and D.B. Humphrey (1997), “The Effects of Mega mergers on Efficiency and Prices: Evidence from a Bank Profit Function,” Review of Industrial Organization, 12, pp. 95-139. Ali, M., and S. Greenbaum (1977), “A Spatial Model of the Banking Industry,” The Journal of Finance, XXXII, pp. 1283-1303. Altunbas, Y., and S. Chakravarty (1998): “Efficiency Measures and the Banking Structure in Europe,” Economics Letters, 60 (2), 205—208. Altunbas, Y., J. Goddard, and P. Molyneux (1999), “Technical Change in Banking,” Economics Letters, 64, pp. 215-221. Altunbas, Y., P. Molyneux, and J. Thornton (1997), “Big-Bank Mergers in Europe: An Analysis of the Cost Implications,” Economica, 64, pp. 317-329. Altunbas, Y., E.P.M. Gardener, P. Molyneux, and B. Moore (2001), “Efficiency in European Banking”, European Economic Review, 45, pp. 1931-1955. Arrow, K. (1985), “The Economics of Agency,” in: Principals and Agents: The Structure of Business, ed. by J. Pratt and R. Zeckhauser, Harvard Business School Press, Cambridge, Massachussets. Avkiran, N.K. (1999), “The Evidence on Efficiency Gains: The Role of Mergers and the Benefits to the Public,” Journal of Banking & Finance, 23, pp. 991-1013.
Competition and Efficiency in Banking
Economic & Financial Modelling • Autumn 2005 141
Bain, J. (1956), Industrial Organization, Wiley, New York. Baker, K., and T. Bresnahan (1985), “The Gains from Merger and Collusion in Product Differentiated Industries,” Journal of Industrial Economics, 33, pp. 427-444. Barefoot, J. (2000), “How Can Banks Avoid ‘Channel Discrimination’?,” American Bankers Association Banking Journal, 92, pp. 33-38. Battese, G., A. Heshmati, and L. Hjalmarsson (1998): “Efficiency of Labour Use in the Swedish Banking Industry: A Stochastic Frontier Approach,” CEPA Working Papers, 6/98. Beattie, B., and C. Taylor (1985), The Economics of Production, John Wiley and Sons, New York. Beck, T., A. Demirgüç-Kunt, and R. Levine (2003), “Bank concentration and crises”, NBER Working Paper Series, no. 9921, National Bureau of Economic Research, Cambridge, Massachusetts (http://www.nber.org/papers/w9921). Berg, S.A., and M. Kim (1994), “Oligopolistic Interdependence and the Structure of Production in Banking: An Empirical Evaluation,” Journal of Money, Credit and Banking, 26, pp. 309-322. Berg, S.A., and M. Kim (1998), “Banks as Multioutput Oligopolies: An Empirical Evaluation of the Retail and Corporate Banking Markets,” Journal of Money, Credit and Banking, 30, pp. 135-153. Berger, A.N., and T.H. Hannan, (1993), “Using Efficacy Measures to Distinguish Among Alternative Explanations of the Structure-Performance Relationship in Banking”, Board of Government of the Federal Reserve System Finance and Discussion Series, 93-18. Berger, A.N., and D.B. Humphrey (1991), “The Dominance of Inefficiencies over Scale and Product Mix Economies in Banking,” Journal of Monetary Economics, 28, pp. 117-148.
Jacob A. Bikker and Jaap W.B. Bos .
Autumn 2005 • Economic & Financial Modelling 142
Berger, A.N., and D.B. Humphrey (1992), “Mega Mergers in Banking and the Use of Cost Efficiency as an Antitrust Defense,” Antitrust Bulletin, 37, pp. 541-600. Berger, A.N., and D.B. Humphrey (1997), “Efficiency of Financial Institutions: International Survey and Directions for Future Research”, European Journal of Operations Research, 98, pp. 175-212. Berger, A.N., W.C. Hunter, and S.G. Timme (1993), “The Efficiency of Financial Institutions: A Review and Preview of Research Past, Present, and Future,” Journal of Banking & Finance, 17, pp. 221-249. Berger, A.N., and L.J. Mester (1997), “Inside the Black Box: What Explains Differences in the Efficiencies of Financial Institutions,” Journal of Banking & Finance, 21, pp. 895-947. Bikker, J.A., and J.M. Groeneveld (2000), “Competition and Concentration in the EU Banking Industry”, Kredit und Kapital, 33, pp. 62-98. Bikker, J.A. (2001), “Efficiency in the European Banking Industry: An Exploratory Analysis to Rank Countries”, Cahiers Economiques de Bruxelles, 172, pp. 3-28. Bikker, J.A. (2002), “Efficiency and Cost Differences across Countries in a Unified European Banking Market”, Kredit und Kapital, 35, pp. 344-380. Bikker, J.A. (2004), Competition and Efficiency in a Unified European Banking Market, Edward Elgar. Bikker, J.A., and K. Haaf (2002), “Competition, Concentration and their Relationship: An Empirical Analysis of the Banking Industry”, Journal of Banking & Finance, 26, pp. 2191-2214. Bikker, J.A., and A.A.T. Wesseling (2003), “Intermediation, Integration and Internationalisation: A Survey on Banking in
Competition and Efficiency in Banking
Economic & Financial Modelling • Autumn 2005 143
Europe”, DNB Occasional Paper, vol. 1, no 3, De Nederlandsche Bank, Amsterdam (www.dnb.nl). Bos, J.W.B. (2002), European Banking: Market Power and Efficiency, University Press Maastricht (PhD thesis). Bos, J.W.B. (2004), “Does Market Power Affect Performance in the Dutch Banking Market? A Comparison of Reduced Form Market Structure Models”, De Economist, 152, pp. 491-512. Bos, J.W.B., and H. Schmiedel (2003), “Comparing Efficiency in European Banking: A Meta-Frontier Approach”, Research Series Supervision 57, De Nederlandsche Bank, Amsterdam (www.dnb.nl). Bos, J.W.B., and J.W. Kolari (2005), “Large Bank Efficiency in Europe and the United States: Are There Economic Motivations for Geographic Expansion in Financial Services?”, Journal of Business, 78, pp. 1-39. Broek, J.V.D., F. Førsund, L. Hjalmarsson, and W. Meeusen (1980), “On the Estimation of Deterministic and Stochastic Frontier Production Functions: A Comparison,” Journal of Econometrics, 13, pp. 117-138. Caminal, R., and C. Matutes (2002), “Market Power and Banking Failures”, International Journal of Industrial Organization, 20, pp. 1341-1361. Canoy, M., M. van Dijk, J. Lemmen, R. de Mooij, and J. Weigand (2001), “Competition and Stability in Banking”, CPB Document, no. 15, Central Planning Bureau, The Hague (www.cpb.nl). Caprio, G., and B. Wilson (1997), “On Not Putting All Your Eggs in One Basket,” World Bank Working Paper. Carletti, E., and P. Hartmann (2002), “Competition and Stability: What is Special About Banking?”, ECB Working paper, 146, European Central Bank, Frankfurt am Main.
Jacob A. Bikker and Jaap W.B. Bos .
Autumn 2005 • Economic & Financial Modelling 144
Chiang, A. C. (1984): Fundamental Methods of Mathematical Economics. McGraw-Hill, Singapore. Chiappori, P.A., D. Perez-Castrilo, and T. Verdier (1995), “Spatial Competition in the Banking System: Localization, Cross-Subsidies and the Regulation of Deposit Rates,” European Economic Review, 39, pp. 889-918. Coelli, T., D. Prasada Rao, and G. Battese (1998), An Introduction to Efficiency and Productivity Analysis, Kluwer Academic Publishers, Boston. Dewatripoint, M., and J. Tirole (1994), The Prudential Regulation of Banks, MIT Press, Cambridge, Massachusetts. Diamond, D.W. (1984), “Financial Intermediation and Delegated Monitoring,” Review of Economic Studies, 51, pp. 393-414. Diamond, D.W., and P.H. Dybvig (1986), “Banking Theory, Deposit Insurance, and Bank Regulation,” Journal of Business, 59, pp. 55-68. Economic Research Ltd. (1997), “Single Market Integration and X-Inefficiency,” in The Single Market Review - Subseries II: Impact on Services, vol. 3: Credit Institutions and Banking, ed. by European Commission, Office for Official Publications of the European Communities, Luxembourg. Edwards, F. (1977), “Managerial Objectives in Regulated Industries: Expense-Preference Behavior in Banking,” Journal of Political Economy, 85, pp. 147-162. Edwards, F., and A. Heggestad (1973), “Uncertainty, Market Structure and Performance: The Galbraith Caves Hypothesis and Managerial Motives in Banking,” Quarterly Journal of Economics, 87, pp. 455-473. Ferrier, G.D., K. Kerstens, and P. Vanden Eeckaut (1994), “Radial and Nonradial Technical Efficiency Measures on a DEA Reference Technology: A Comparison Using US Banking Data,”
Competition and Efficiency in Banking
Economic & Financial Modelling • Autumn 2005 145
CORE Discussion Paper, 94-23, Université Catholique de Louvain. Ferrier, G.D., and C.A.K. Lovell (1990), “Measuring Cost Efficiency in Banking: Econometric and Linear Programming Evidence,” Journal of Econometrics, 46, pp. 229-245. Freixas, X., and J.-C. Rochet (1997), Microeconomics of Banking, MIT Press, Massachusetts. Group of Ten (2001), Report on Consolidation in the Financial Sector, Working Party on Financial Sector Consolidation, BIS, IMF and OECD (www.bis.org, www.imf.org and www.oecd.org). Hanweck, G.A., and S.A. Rhoades (1984), “Dominant Firms, Deep Pockets and Local Market Competition in Banking,” Journal of Economics and Business, 36, pp. 391-402. Haynes, M., and S. Thompson (1999), “The Productivity Effects of Bank Mergers: Evidence from the UK Building Societies,” Journal of Banking & Finance, 23, pp. 825-846. Hughes, J., and L. Mester (1993), “Accounting for the Demand for Financial Capital and Risk-Taking in Bank-Cost Functions,” Economic Research Division Paper, 93-17, Federal Reserve Bank of Philadelphia, Humphrey, D., and L. Pulley (1997), “Banks’ Response to Deregulation: Profits, Technology and Efficiency,” Journal of Money, Credit and Banking, 29, pp. 73-93. Kistner, K.P. (1981), Produktions- und Kostentheorie. Physica Verlag, Würzburg, Wien. Lovell, C.A.K. (1993), “Production Frontiers and Productive Efficiency,” in: The Measurement of Productive Efficiency: Techniques and Applications, ed. by H. Fried, C.A.K. Lovell, and S. Schmidt, New York. Oxford University Press, pp. 3-67.
Jacob A. Bikker and Jaap W.B. Bos .
Autumn 2005 • Economic & Financial Modelling 146
Maudos, J., J.M. Pastor, and L. Seranno (1999), “Economic Integration, Efficiency and Economic Growth: The European Union Experience”, Applied Economic Letters, 6, pp. 389–392. Maudos, J., and J.M. Pastor (2001), “Cost and Profit Efficiency in Banking: An International Comparison of Europe, Japan and the USA”, Applied Economic Letters, 8, pp. 383–387. Maudos, J., J.M. Pastor, F. Pérez, and J. Quesada (2002), “Cost and Profit Efficiency in European Banks”, Journal of International Financial Markets, Institutions & Money, 12, pp. 33–58. Meeusen, W., and J. Van Den Broeck (1977), “Efficiency Estimation from Cobb-Douglas Production Functions with Composed Error,” International Economic Review, 18, pp. 435-444. Mester, L. (1991), “Agency Costs Among Savings and Loans,” Journal of Financial Intermediation, 1, pp. 257-278. Mester, L. (1992), “Traditional and Non-traditional Banking: An Information Theoretic Approach,” Journal of Banking & Finance, 16, pp. 545-566. Mester, L. (1996), “Measuring Efficiency at US Banks: Accounting for Heterogeneity is Important,” Federal Reserve Bank of Philadelphia Research Working Paper, 96-11. Milgrom, P., and J. Roberts (1982a), “Limit Pricing and Entry Under Incomplete Information: An Equilibrium Analysis,” Econometrica, 50, pp. 443-460. Milgrom, P., and J. Roberts (1982b), “Predation, Reputation and Entry Deterrence,” Journal of Economic Theory, 27, pp. 280-312. Molyneux, P., Y. Altunbas, and E. Gardener (1997), Efficiency in European Banking, John Wiley and Sons, New York.
Competition and Efficiency in Banking
Economic & Financial Modelling • Autumn 2005 147
Pastor, J., F. Perez, and J. Quesada (1997), “Efficiency Analysis in Banking Firms: An International Comparison”, European Journal of Operational Research, 98, pp. 175–212. Punt, L.W., and M.C.J. van Rooij (2003), “The Profit-Structure Relationship and Mergers in the European Banking Industry: An Empirical Assessment”, Kredit und Kapital, 36, pp. 1–29. Resti, A. (1997), “Evaluating the Cost-Efficiency of the Italian Banking System: What Can Be Learned from the Joint Application of Parametric and Non-Parametric Techniques,” Journal of Banking & Finance, 21, pp. 221-250. Rose, P.S. (1987), “The Impact of Mergers in Banking: Evidence From a Nationwide Sample of Federally Chartered Banks,” Journal of Economics and Business, 39, pp. 289-312. Rose, P.S. (1995), “The Distribution of Outcomes from Corporate Mergers: The Case of Commercial Banking,” Journal of Accounting, Auditing, and Finance, X (2). Schmidt, P., and C.A.K. Lovell (1979), “Estimation Technique and Allocative Inefficiency Relative to Stochastic Production and Cost Functions,” Journal of Econometrics, 9, pp. 343-366. Stevenson, R.E. (1980), “Likelihood Functions for Generalised Stochastic Frontier Estimation,” Journal of Econometrics, 13, pp. 57-66. Swank, J. (1996), “How Stable is the Multi-Product Translog Cost Function? Evidence from the Dutch Banking Industry,” Kredit und Kapital, 29, pp. 153-172. Tirole, J. (1993), The Theory of Industrial Organization, MIT Press, Cambridge, Massachusetts. Vennet, Vander, R. (1998): “Determinants of EU Bank Takeovers: A Logit Analysis,” The Changing European Financial Landscape - A CEPR/ESI Conference, Brussels, September 24/26, 1—21.
Jacob A. Bikker and Jaap W.B. Bos .
Autumn 2005 • Economic & Financial Modelling 148
Waldman, D.M. (1982), “A Stationary Point for the Stochastic Frontier Likelihood,” Journal of Econometrics, 18, pp. 275-279. Zardkoohi, A., J. Kolari, and F. Dahm (1995), “Economies of Scale and Scope in Commercial Banks with Different Output Mixes,” Texas A&M Working Paper.