branching and competition in the european banking industry
TRANSCRIPT

Branching and Competitionin the European Banking Industry
Vittoria Cerasi Universita' degli Studi di Milano-Bicocca
Barbara Chizzolini
Universita' Bocconi, Milano
Marc Ivaldi GREMAQ-EHESS and Institut D’Economie Industrielle, Toulouse
January 2001
Abstract: In this paper we measure branching costs and competitiveness of European banks byfitting a monopolistic competition model to a representative sample drawn from nine EECbanking industries in the period from 1990 to 1996. In the theoretical model, banks decidestrategically the size of their branching network anticipating the degree of competition faced oninterest rates. From the structural equations of the model we derive an econometric test inorder to measure branching costs and degree of competition in banking services. The empiricalanalysis captures their changing over time together with the impact of various Europeandirectives aiming at deregulating the banking industry. Furthermore the paper showspersistence of segmentation across EEC banking industries. JEL classification: G21; L13; L59.
Keywords: Banking; Market structure and oligopoly; Deregulation.
Corresponding author: Marc Ivaldi - Institut D'Economie Industrielle - Université des SciencesSociales - Manufacture des Tabacs - 21, Allée de Brienne - 31000 Toulouse. E-mail: [email protected]
Acknowledgments: A previous version of this paper was circulated under the title "Sunk costs andcompetitiveness of European Banks after deregulation" (FMG DP.290, London School of Economics).We would like to thank Bruno Biais, Giovanni Ferri, Jean-Charles Rochet, John Sutton and Jean Tirolefor helpful comments and seminar participants at International Conference in Game Theory andApplications in Milan, EEA’97 in Toulouse, ASSET in Lisbon, Bank of England, IDEI and Ecole deGestion in Toulouse, CIDE in Bologna. We thank Andrea Balzarini and Elena Carletti for extremelyvaluable research assistance. Financial support from Fondation Banque de France is gratefullyacknowledged.
2
1. Introduction
In the last two decades, European banking industries have undergone deregulation
processes whose effects on their structures and competitive behavior have neither faded nor
been entirely understood yet. Deregulation has led in a relatively short time to mergers
among banks and more concentrated industries, characterized by a smaller number of larger
banks that seem to offer a wider set of services to (selected) clients.1 Whether in the
meantime competition among banks has become more or less fierce is a debatable and
debated issue; moreover, given the complexity of the banking activity, competition in
banking takes on many dimensions, as Gual (1999) and references therein very clearly
outline, and each contribution in the existing literature tackles a different side of the
question.
This paper addresses the joint issues of toughness of competition2 and branching
behavior by banks3. In Gual’s terms, branching in non regulated markets is a competitive
strategy banks use to “improve access to the bank by clients”, hence reduce their transaction
costs and increase banks market shares4. The theoretical model (Cerasi, (1995) and (1996))
that we test in this paper accepts this definition, but it enlarges and strengthens it by
modeling how entry and branching decisions by banks are linked to the type and strength of
competition that is played in banking markets, along lines that are in the same class as
Sutton’s (1991) game theoretic model of market structure in manufacturing industries.
The main contribution of this paper is the econometric test we derived from Cerasi’s
theoretical model, that we use to measure and interpret the actual impact of deregulation on
the banking industries of nine European countries in the years 1990 – 1996. Those were the
starting years of the deregulation process in most of the countries under analysis, when they
1 See Gual and Neven (1992), Economic Research Europe (ERE) Summary Report (1996), Cerasi(1996) and European Central Bank (ECB) (1999) for evidence that the degree of concentration in theEuropean banking industry has increased since the process of deregulation has started.2 Sutton, (1991, page 9),defines toughness of competition as a “function linking concentration to pricesor unit margins. This function will be affected by such featurs of the market as the physical nature ofthe product (..) and the climate of competition policy (a strict or acquiescent approach to pricecoordination by firms).”3 See, among others that deal with branching in the banking industry, Chiappori, Perez-Castrillo andVerdier (1995), De Palma and Uctum (1992), Molyneux, Lloyd-Williams and Thornton (1994), Nevenand Roller (1999), Cabral and Majure (1993), Barros (1995) and Kim and Vale (1999)4 See also Neven (1989) and Cerasi (1996) for implications of deregulation on the size of branchingnetworks.
3
at last implemented at national level the Banking Directives, in particular the Second
European Directive, issued in the eighties by the European Community in the belief that
more competitive banking markets would eventually lead to more efficiency on the supply
side as well as to reductions in the price of financial services for customers. The changes in
regulation, by influencing either the conduct or the structure of banking markets, were also
meant to provoke the removal of barriers across financial markets of EEC countries and
induce a complete integration of markets both on the demand and on the supply side, a
necessary occurrence in view of the adoption of the single European currency by the new
millennium. Controls on interest rates have been lifted and cartels among the largest banks
have been fought more fiercely, hence the power to complete on interest rates has increased
for the overall banking system. Costs and legal constraints attached to entry by EEC banks
into another EEC country have been reduced or altogether removed; capital controls have
also been lifted, thus potentially affecting the decision to enter or open new branches across
borders, altogether allowing the strategic interaction of banks rather than the regulatory
framework to determine the structure of the banking industry.
Still, as said before, the effect of deregulation in Europe, (and in the US of A as well5)
has been to decrease the number of banks and change their average dimension as well as
branching network size in each banking industry, while the number of banks that opened ex-
novo branches in other European countries or underwent cross-border Merger or
Acquisition operations is as yet very small. This may limit the expected benefits of
deregulation on allocative efficiency, if the monopoly power of each bank has not
decreased.
The econometric test in this paper gives some hints on how to unravel this puzzle, and
on how to quantify the effects of deregulation on competition as well as on bank size.
Disregarding ex-novo entry into a market (an empirically irrelevant occurrence in Europe in
the years under analysis), the test is able to predict branching decisions in each of the nine
European banking industries, by computing and comparing costs and benefits of opening
branches by bank. In our specification, changes in costs are a direct function of some of the
regulatory innovations listed above; benefits are also a function of deregulation through the
effects that it had on toughness of competition on interest rates in the deposits markets. In
5 See Volume 23, 1999 of the Journal of Banking and Finance for an overview of the debate on theeffects of deregulation in the U.S.A.

4
addition to deregulation indicators, both costs and benefits are functions of some bank and
market specific variables.
It results that, after deregulation, the fierceness of competition in the EEC banking
industries has risen, while the likelihood of opening new branches is on average smaller,
with however quite significant differences in behavior across countries that suggest that
convergence and complete integration are still quite far ahead. Furthermore the estimated
trends in competition and branching sizes can only marginally be directly linked to the actual
implementation of a specific EEC directive. We find that only capital flows liberalization
had a significant impact, in particular it has increased competitiveness, while the Second
European Directive had a minor impact on branching costs.
The theoretical model and the econometric test are presented in the next section.
Section 3 describes sample data and the observable variables used in the econometric test.
In section 4 the results are presented together with an evaluation of the goodness of the fit
of the estimated model. Finally, section 5 concludes the paper.
2. Bank branching behavior
In the banking industry, as in many other industries, there are two relevant segments: the
retail and the wholesale market.6 In the retail segment, banks mainly collect deposits and lend
funds to households and firms. Incumbent banks compete for clients either by expanding their
branching networks or by setting interest rates on financial services.
In the wholesale segment, banks may in addition supply a large variety of financial
services, as for example underwriting of new issues, intermediation of different financial
activities, etc. In the two segments, banks might differ also with respect to their size. In
particular, large banks do tend to operate in the wholesale segment, where it is unlikely to find
small banks. Here we focus on the retail segment where the vast majority of banks operate,
irrespective of their size, and where it is easier to model strategic interactions among banks.
Notice however that this segmentation in the banking industry has been changing over time and
6 Bröker (1989) and Kaufman (1992) provide detailed pictures of structures and relevant strategicissues of the European banking industry.

5
it is not so sharp nowadays as a result of the implementation of the Second European Directive
that has redefined the functions of banks.
Banks, in the retail market, compete for clients by topping their rivals interest rates on
deposits and by locating their branches closer to their clients. In other words, banks can exploit
the fact that their clients have preferences over locations, in order to mitigate interest rates
competition and earn some market power by enlarging their branching network. These two
dimensions of competition are not independent: on the one hand, the larger the number of
branches in a market, the tougher the competition on interest rates will be; on the other hand,
the degree of competition on interest rates affects the incentive to expand the branching
network through bank profits. The relation between competition on interest rates and
branching must be modeled together. The solution proposed in this paper is a static non-
cooperative two-stage game where branching decisions are taken in the first stage, while
interest rates are set in the second stage according to monopolistic competition rules.
Given the number of banks in the market, the decision of an incumbent to open branches
depends on the effect that opening new branches has on its own clientele and on rivals'
response to it. Opening new branches augments the demand for services to the bank (expansive
effect), but it may also cause a relocation of clients either from branches of rivals, or from
preexistent branches of the same bank (competitive effect). The benefits of opening new
branches on profits of the bank depend very much on the relative strength of the expansive and
the competitive effect.
However, opening new branches has a fixed cost, independently of the size of their
operations, as for example the cost of hiring personnel, the cost of renting or buying facilities
in that particular region, etc. A tougher price competition in the region reduces the expected
profits of the new branch and therefore, the ability to recover the fixed costs. Then the bank, in
the first stage of the game, will likely decide not to open new branches.
In the next paragraph, a formalized model of bank branching behavior, as briefly described
above, is presented. To be able to derive bank specific functions of branching benefits and
costs that can be then estimated using micro level data, an explicit functional form for the
banks profits will be used. We wish to anticipate that no accounting data will be needed during
estimation because the second stage equilibrium solution for interest rates7, hence for profits,
7 See Cerasi 1995 for this result that derives from a model of monopolistic competition in which bothstages are solved explicitely.

6
ultimately only depends on market size, number of competitors and number of branches by
bank
2.1. The model Let us analyze the two-stage game where branching decisions are taken in the first stage,
and then interest rates are set in the second stage. Solving backwards, we postulate that there
exists a non-cooperative symmetric solution to the second stage of the game, namely the
competition in interest rates, and that in equilibrium the profits of each bank can be
characterized by a reduced-form which satisfies some regularity conditions8.
In order to understand the shape of this reduced-form for profits, remember that the
decision to open branches results from a cost benefits trade-off. On one hand, opening new
branches might attract new clients in the market (expansive effect). On the other hand, a new
branch steals business to old branches, either by attracting new clients from competitors or
from preexistent branches of the same bank (competitive effect). Not taking costs into account,
the benefits of opening new branches result from the balance between expansive and
competitive effect. This intuition is translated into setting that, given the outcome of the
interest rate competition, overall bank profits are (i) increasing, although (ii) at a decreasing
rate, in the number of branches of the bank; (iii) further, the benefits of opening a new branch
in a market crowded by competitors is smaller. In other words, overall bank profits is
decreasing in the number of branches of other competitors.
Given the second-stage game equilibrium profits, in the first stage of the game each bank
sets optimally the size of its network equating the benefit of an additional branch to the cost of
opening it. The marginal benefit of opening an additional branch is the profits gain of an
additional branch, while the cost of an additional branch captures the opportunity cost, that is
the cost of hiring personnel, the rent of spaces for the activities of the branch and all sorts of
investment opportunities which are forgone by deciding to open a new branch.
Assume that in a market of size S, there are n banks with ki branches each, where i=1,…,n.
Define the total number of branches operating in the market N. Let εi be the cost of an
additional branch which, for simplicity, we assume to be constant and independent upon the
8 See Cerasi (1995) for the regularity conditions that must be satisfied by the profit function forequilibrium to obtain.

7
size of the network. The marginal benefit of an additional branch, MB(ki), is obtained by taking
the first order derivative of the equilibrium profits with respect to ki.
The optimal size is given by the number of branches ki*>1 such that MB(ki*) = εi. This
condition defines the optimal size for multi-branch banks. It could happen however that MB(ki)
< εi for any ki >1. In this case bank i will open only its headquarters and we define it as a unit
bank.
Let
( )ci
i
Skk
Nπ = (1)
be a special case of the reduced-form for the profits satisfying all required conditions,
namely it is (i) increasing in ki, (ii) concave in ki and (iii) decreasing in N. Furthermore this
function is increasing in S, that is the larger the market size the higher the profits for each bank
in the market. Notice that for large N, the parameter c is approximately equal to the elasticity
of profits to own branching size. This parameter c, which is a measure of the profitability of an
additional branch, can be more interestingly interpreted as the inverse of the degree of
toughness of interest rates competition in the market. In other words, each additional branch
delivers lower profits if competition in interest rates gets tougher, thus a smaller c indicates
higher degrees of competition.9
The marginal benefit of opening a new branch, given our specific reduced-form, is the
derivative of the profit function in equation (1) with respect to ki:
( )1
2
ci i
i
Sk kMB k c
NN
− = −
(2)
The first order condition (FOC) for branching is given by, either
( )i iMB k ε= (3a)
thus the optimal number of branches is greater than 1 and bank i is a multi-branch bank, or
( )i iMB k ε< (3b)
therefore bank i operates with only its headquarters and thus is a unit bank.
9 The parameter c may as well capture other factors affecting the elasticity of profits to branching,as for instance shifts in demand and supply of banking services. Although some of them are captured byother variables, as for instance by the market size S, our interpretation can actually be restrictive. Still,
8
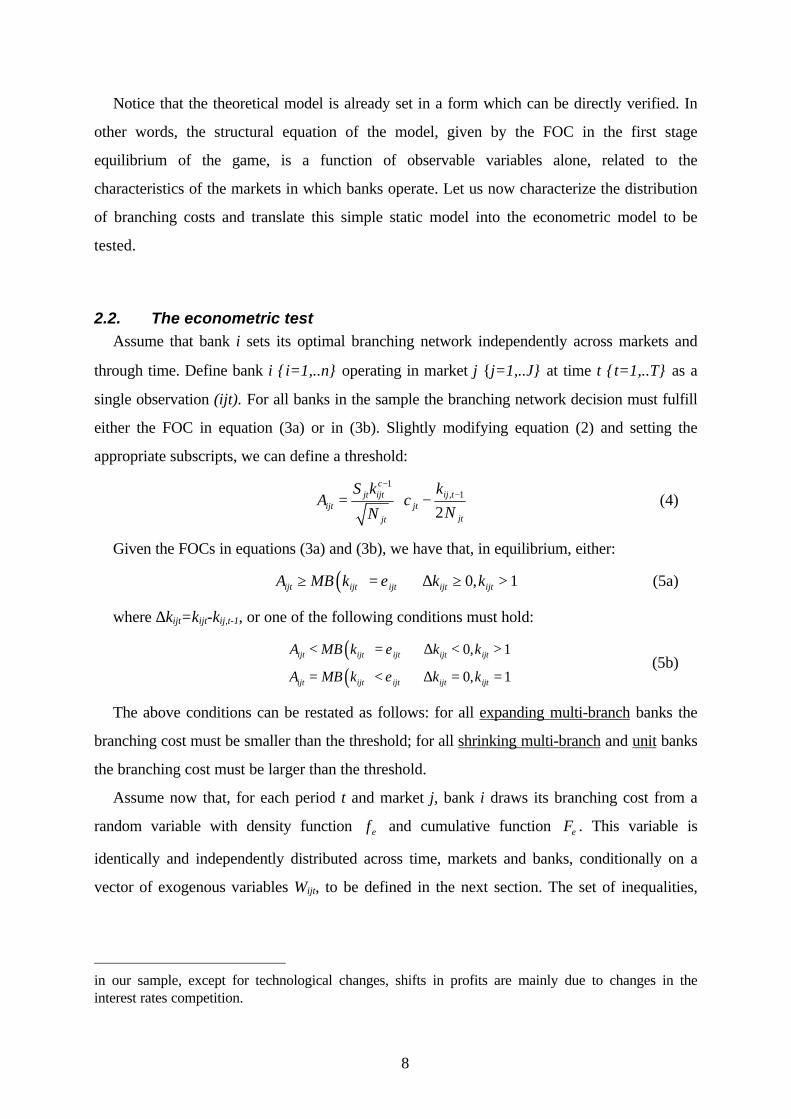
Notice that the theoretical model is already set in a form which can be directly verified. In
other words, the structural equation of the model, given by the FOC in the first stage
equilibrium of the game, is a function of observable variables alone, related to the
characteristics of the markets in which banks operate. Let us now characterize the distribution
of branching costs and translate this simple static model into the econometric model to be
tested.
2.2. The econometric test Assume that bank i sets its optimal branching network independently across markets and
through time. Define bank i {i=1,..n} operating in market j {j=1,..J} at time t {t=1,..T} as a
single observation (ijt). For all banks in the sample the branching network decision must fulfill
either the FOC in equation (3a) or in (3b). Slightly modifying equation (2) and setting the
appropriate subscripts, we can define a threshold:
1
, 1
2
cjt ijt ij t
ijt jtjtjt
S k kA c
NN
−−
= −
(4)
Given the FOCs in equations (3a) and (3b), we have that, in equilibrium, either:
( ) 0, 1ijt ijt ijt ijt ijtA MB k k kε≥ = ⇔ ∆ ≥ > (5a)
where ∆kijt=kijt-kij,t-1, or one of the following conditions must hold:
( )( )
0, 1
0, 1
ijt ijt ijt ijt ijt
ijt ijt ijt ijt ijt
A MB k k k
A MB k k k
ε
ε
< = ⇔ ∆ < >
= < ⇔ ∆ = =(5b)
The above conditions can be restated as follows: for all expanding multi-branch banks the
branching cost must be smaller than the threshold; for all shrinking multi-branch and unit banks
the branching cost must be larger than the threshold.
Assume now that, for each period t and market j, bank i draws its branching cost from a
random variable with density function f ε and cumulative function Fε . This variable is
identically and independently distributed across time, markets and banks, conditionally on a
vector of exogenous variables Wijt, to be defined in the next section. The set of inequalities,
in our sample, except for technological changes, shifts in profits are mainly due to changes in theinterest rates competition.
9
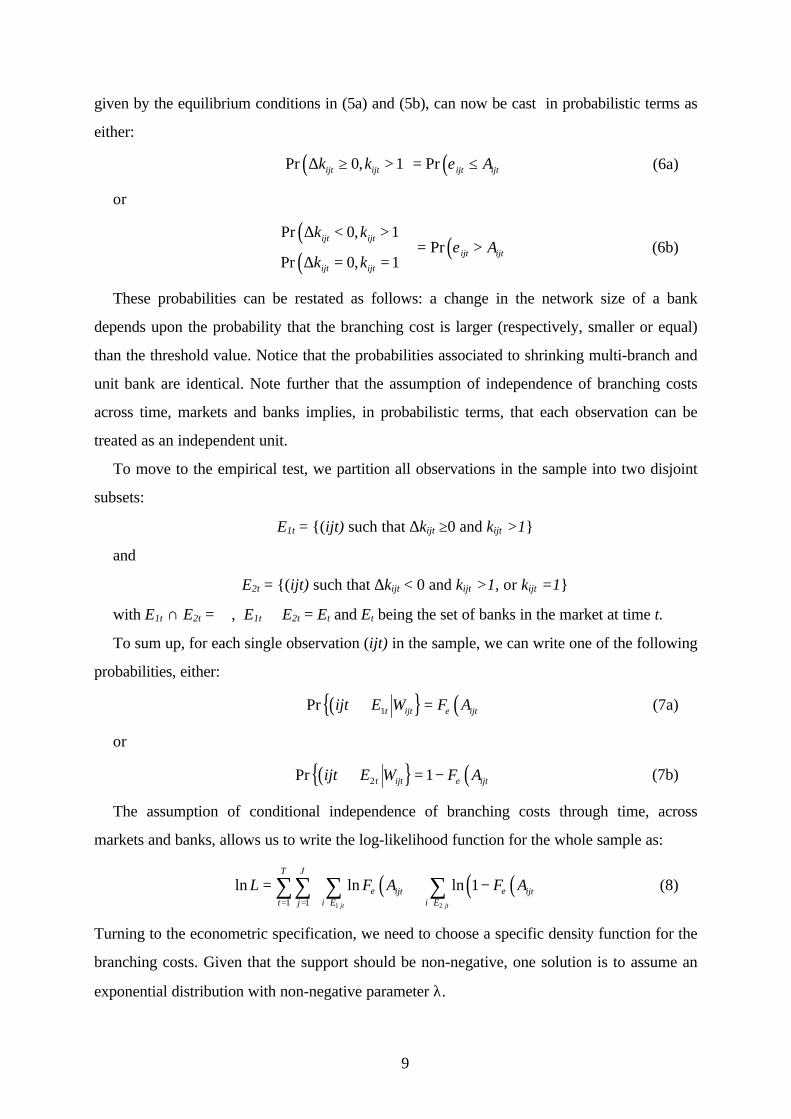
given by the equilibrium conditions in (5a) and (5b), can now be cast in probabilistic terms as
either:
( ) ( )Pr 0, 1 Prijt ijt ijt ijtk k Aε∆ ≥ > = ≤ (6a)
or
( )( )
( )Pr 0, 1
PrPr 0, 1
ijt ijt
ijt ijt
ijt ijt
k kA
k kε
∆ < > = >∆ = =
(6b)
These probabilities can be restated as follows: a change in the network size of a bank
depends upon the probability that the branching cost is larger (respectively, smaller or equal)
than the threshold value. Notice that the probabilities associated to shrinking multi-branch and
unit bank are identical. Note further that the assumption of independence of branching costs
across time, markets and banks implies, in probabilistic terms, that each observation can be
treated as an independent unit.
To move to the empirical test, we partition all observations in the sample into two disjoint
subsets:
E1t = {(ijt) such that ∆kijt ≥0 and kijt >1}
and
E2t = {(ijt) such that ∆kijt < 0 and kijt >1, or kijt =1}
with E1t ∩ E2t = ∅, E1t ∪ E2t = Et and Et being the set of banks in the market at time t.
To sum up, for each single observation (ijt) in the sample, we can write one of the following
probabilities, either:
( ){ } ( )1Pr t ijt ijtijt E W F Aε∈ = (7a)
or
( ){ } ( )2Pr 1t ijt ijtijt E W F Aε∈ = − (7b)
The assumption of conditional independence of branching costs through time, across
markets and banks, allows us to write the log-likelihood function for the whole sample as:
( ) ( )( )1 21 1
ln ln ln 1jt jt
T J
ijt ijtt j i E i E
L F A F Aε ε= = ∈ ∈
= + −
∑∑ ∑ ∑ (8)
Turning to the econometric specification, we need to choose a specific density function for the
branching costs. Given that the support should be non-negative, one solution is to assume an
exponential distribution with non-negative parameter λ.

10
The objective of the econometric analysis is to estimate the parameters c and λ,
conditionally on the set of observable variables Wijt. Furthermore, let us split the set of
exogenous variables Wijt into two subsets, namely Wijt={xijt , zjt}. We posit that the distribution
of branching costs depends upon the vector of exogenous variables xijt according to the
following pdf:
( )βλ 'exp ijtijt x= (9)
while the inverse degree of competition in each market depends upon the vector zjt according
to the pdf:
( )exp 'jt jtc z δ= (10)
To conclude, the objective of the econometric test, is to recover the mean of the distribution
of branching costs together with the measure of the degree of competition given the set of
observable variables Wijt={xijt , zjt}.
3. European banks in the sample
The econometric test allows to separately estimate factors affecting the toughness of
competition in each country from factors affecting branching costs. We have however to make
a priori assumptions with little help from the theory or the empirical literature, on whether and
how each of the limited set of available explanatory variables, affects competitiveness rather
than branching costs. We spend the rest of the section describing the sample and the set of
observable variables used in the implementation of the econometric test.
3.1 The sample
Our sample consists of annual data on banks in nine EEC countries, namely Belgium,
Denmark, France, Germany, Greece, Italy, Netherlands, Portugal and Spain. The economic
unit on which we focus is the single bank and not its single branch, because we believe that
strategic decisions about the size of the branching network are taken at the bank level.
Therefore, banks that have been operating for at least two consecutive years between 1990 and
1996 in the nine countries are retained from the Bank Base, a database supplied by the
Bankers' Almanac, containing detailed information on each bank for all countries.
11
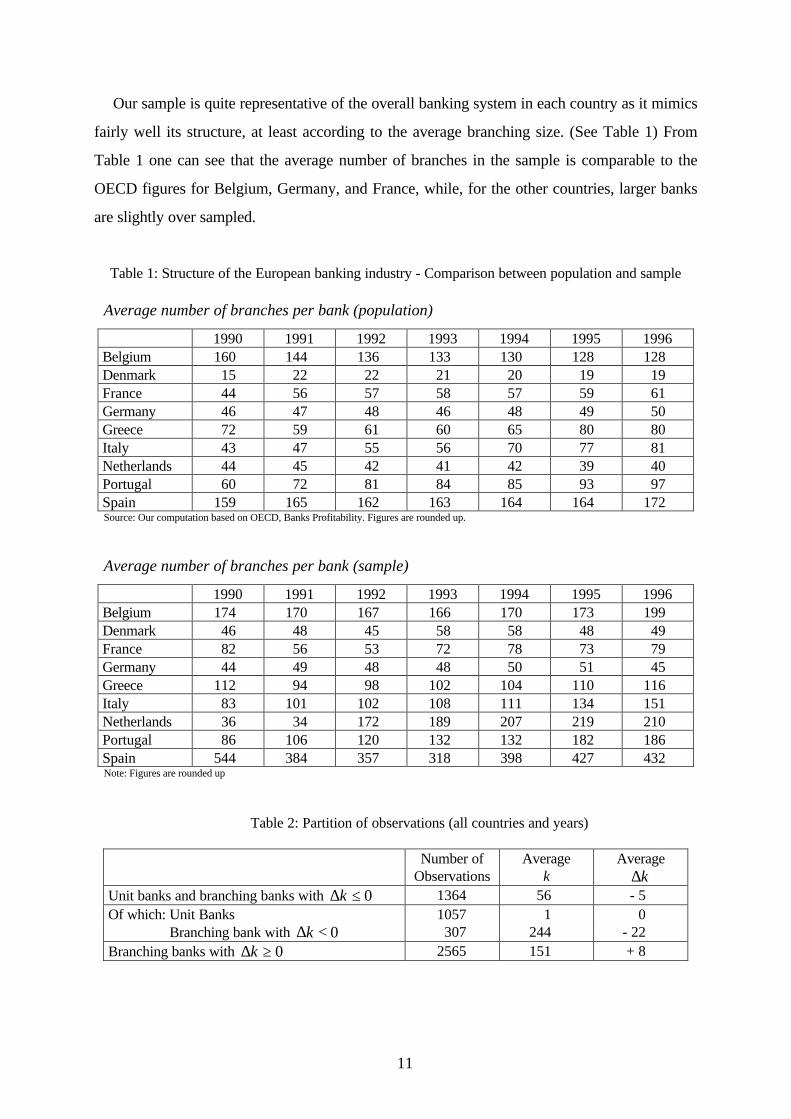
Our sample is quite representative of the overall banking system in each country as it mimics
fairly well its structure, at least according to the average branching size. (See Table 1) From
Table 1 one can see that the average number of branches in the sample is comparable to the
OECD figures for Belgium, Germany, and France, while, for the other countries, larger banks
are slightly over sampled.
Table 1: Structure of the European banking industry - Comparison between population and sample
Average number of branches per bank (population)
1990 1991 1992 1993 1994 1995 1996Belgium 160 144 136 133 130 128 128Denmark 15 22 22 21 20 19 19France 44 56 57 58 57 59 61Germany 46 47 48 46 48 49 50Greece 72 59 61 60 65 80 80Italy 43 47 55 56 70 77 81Netherlands 44 45 42 41 42 39 40Portugal 60 72 81 84 85 93 97Spain 159 165 162 163 164 164 172Source: Our computation based on OECD, Banks Profitability. Figures are rounded up.
Average number of branches per bank (sample)
1990 1991 1992 1993 1994 1995 1996Belgium 174 170 167 166 170 173 199Denmark 46 48 45 58 58 48 49France 82 56 53 72 78 73 79Germany 44 49 48 48 50 51 45Greece 112 94 98 102 104 110 116Italy 83 101 102 108 111 134 151Netherlands 36 34 172 189 207 219 210Portugal 86 106 120 132 132 182 186Spain 544 384 357 318 398 427 432Note: Figures are rounded up
Table 2: Partition of observations (all countries and years)
Number ofObservations
Averagek
Averagek∆
Unit banks and branching banks with 0k∆ ≤ 1364 56 - 5Of which: Unit Banks 1057 1 0 Branching bank with 0k∆ < 307 244 - 22Branching banks with 0k∆ ≥ 2565 151 + 8
12
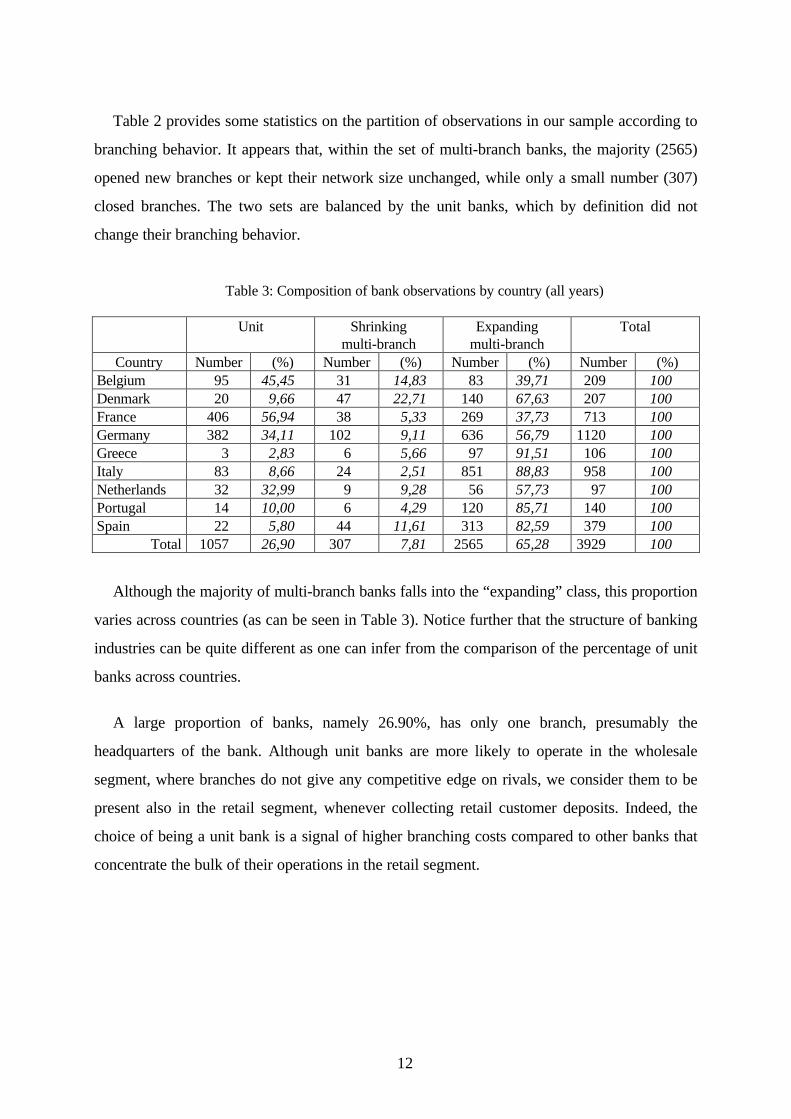
Table 2 provides some statistics on the partition of observations in our sample according to
branching behavior. It appears that, within the set of multi-branch banks, the majority (2565)
opened new branches or kept their network size unchanged, while only a small number (307)
closed branches. The two sets are balanced by the unit banks, which by definition did not
change their branching behavior.
Table 3: Composition of bank observations by country (all years)
Unit Shrinkingmulti-branch
Expandingmulti-branch
Total
Country Number (%) Number (%) Number (%) Number (%)Belgium 95 45,45 31 14,83 83 39,71 209 100Denmark 20 9,66 47 22,71 140 67,63 207 100France 406 56,94 38 5,33 269 37,73 713 100Germany 382 34,11 102 9,11 636 56,79 1120 100Greece 3 2,83 6 5,66 97 91,51 106 100Italy 83 8,66 24 2,51 851 88,83 958 100Netherlands 32 32,99 9 9,28 56 57,73 97 100Portugal 14 10,00 6 4,29 120 85,71 140 100Spain 22 5,80 44 11,61 313 82,59 379 100
Total 1057 26,90 307 7,81 2565 65,28 3929 100
Although the majority of multi-branch banks falls into the “expanding” class, this proportion
varies across countries (as can be seen in Table 3). Notice further that the structure of banking
industries can be quite different as one can infer from the comparison of the percentage of unit
banks across countries.
A large proportion of banks, namely 26.90%, has only one branch, presumably the
headquarters of the bank. Although unit banks are more likely to operate in the wholesale
segment, where branches do not give any competitive edge on rivals, we consider them to be
present also in the retail segment, whenever collecting retail customer deposits. Indeed, the
choice of being a unit bank is a signal of higher branching costs compared to other banks that
concentrate the bulk of their operations in the retail segment.

13
3.2 Mergers and acquisitions
There have been several Merger and Acquisition (M&A) deals in Europe over the sample
period, some of them performed across national borders.10 While collecting data on banks and
their branching networks by country, however we were not able to recover all M&A deals that
involved banks in our data set: the reason being that except for large public banks, it is difficult
to gather the names of the banks involved in any deal.11 In the sample there are 95 banks
involved in M&A deals, 4 cases are cross-borders. (See Table 4 for the distribution of deals
across countries). In 37 cases the bank was involved in a merger, while in 58 in an acquisition
deal. Among the acquisitions, in 45 cases (2 cross-borders) the bank was active in the deal,
while in 13 cases (2 cross-borders) it was passive.
Table 4: Banks involved in M&As in the sample
Country NumberBelgium 5Denmark 6France 11Germany 13Greece 0Italy 47Netherlands 3Portugal 0Spain 10Total 95
All acquisitions recorded in our sample refer to cases where the acquiring bank gained
majority control over the acquired bank. Furthermore, only major mergers were taken into
account, that is mergers involving two or more medium to big banks. Finally we do not have
any information on deals done in Greece and Portugal.
Even though our list of M&A is not exhaustive, there still is a large enough number of deals
to test the impact of M&A on branching costs. Notice that in the model there is no difference
between opening (or closing) a new branch or acquiring (or selling) a branch through a M&A
10 See Gual and Neven (1992), ERE Summary Report (1996) for detailed figures on cross-borders andinside borders M&As in the last years. We refer to Danthine et al. (1999) instead for the economicanalysis of cross-borders M&As of European banks.11 Among the foreign Central Banks, we must acknolwedge a report by the Bundesbank concerninggerman banks, which allowed us to include in our dataset the names of many banks involved in M&Adeals.
14
deal. We hence included in our data set a dummy variable that indicates if an observation is
involved in a M&A deal.
3.3 Deregulation variables
In the eighties, the institutional framework in which banks were operating has changed
drastically, as a consequence of the deregulation process that has affected both banking
competition and the structure of markets, through the relaxation of entry barriers within and
across markets. A description of the legal framework in which banks operate is out of the
scope of this paper.12
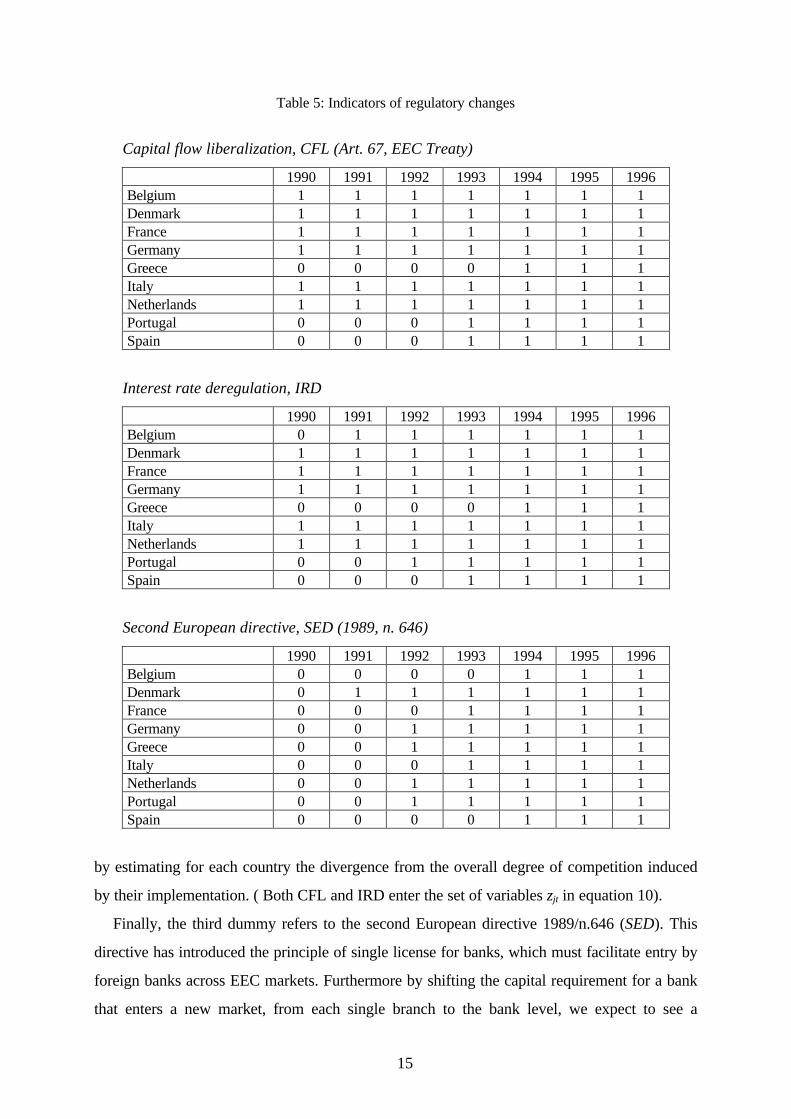
Our objective is to pin down how the changes in banking regulation influenced the degree of
competition and the decision to open or close branches. Therefore we have constructed a set
of dummy variables that indicate when particular regulatory rules, which should affect banks’
conduct and branching decisions, have been implemented in each different country. (See Table
5) There is often a lag between the time in which a particular regulation is passed at the EEC
level and the moment of its implementation at the national level. Each regulation dummy will
then take on value 1 in and after the year of implementation in a specific country, rather than in
the year the policy was approved at the European level.13 We focus on three important
measures.
The first one, capital flow liberalization (CFL), is the set of policies whose target was to
ease the flow of financial services across the European countries and, as a consequence, to
stimulate banking business across countries. (See Art.67, EEC Treaty) We expect an increase
in the demand for banking services all over the EEC and more mobility of banks as a
consequence of higher capital mobility. This may affect the degree of competition, as banks
envisage entry by new competitors in the market.
The second rule, interest rate deregulation (IRD), is the set of laws and policies, at the
national level, aimed at increasing interest rate competition among banks. We expect to see an
increase in the degree of competition. However IRD policies were enforced in six out nine
countries by 1990, the starting year in our data set (with the exception of Belgium in 1991,
Portugal in 1992 and Greece in 1993). Therefore their effect on competition must be checked
12 See Gual and Neven (1992), ERE Summary Report (1996) and Danthine et al. (1999) for extremelyhelpful and complete guides on the changing banking regulatory environment.13 We took this information from the ERE Summary Report (1996).
15
Table 5: Indicators of regulatory changes
Capital flow liberalization, CFL (Art. 67, EEC Treaty)
1990 1991 1992 1993 1994 1995 1996Belgium 1 1 1 1 1 1 1Denmark 1 1 1 1 1 1 1France 1 1 1 1 1 1 1Germany 1 1 1 1 1 1 1Greece 0 0 0 0 1 1 1Italy 1 1 1 1 1 1 1Netherlands 1 1 1 1 1 1 1Portugal 0 0 0 1 1 1 1Spain 0 0 0 1 1 1 1
Interest rate deregulation, IRD
1990 1991 1992 1993 1994 1995 1996Belgium 0 1 1 1 1 1 1Denmark 1 1 1 1 1 1 1France 1 1 1 1 1 1 1Germany 1 1 1 1 1 1 1Greece 0 0 0 0 1 1 1Italy 1 1 1 1 1 1 1Netherlands 1 1 1 1 1 1 1Portugal 0 0 1 1 1 1 1Spain 0 0 0 1 1 1 1
Second European directive, SED (1989, n. 646)
1990 1991 1992 1993 1994 1995 1996Belgium 0 0 0 0 1 1 1Denmark 0 1 1 1 1 1 1France 0 0 0 1 1 1 1Germany 0 0 1 1 1 1 1Greece 0 0 1 1 1 1 1Italy 0 0 0 1 1 1 1Netherlands 0 0 1 1 1 1 1Portugal 0 0 1 1 1 1 1Spain 0 0 0 0 1 1 1
by estimating for each country the divergence from the overall degree of competition induced
by their implementation. ( Both CFL and IRD enter the set of variables zjt in equation 10).
Finally, the third dummy refers to the second European directive 1989/n.646 (SED). This
directive has introduced the principle of single license for banks, which must facilitate entry by
foreign banks across EEC markets. Furthermore by shifting the capital requirement for a bank
that enters a new market, from each single branch to the bank level, we expect to see a

16
reduction in the cost of opening new branches across countries, and we include SED into the
set of explanatory variables xijt in equation 9. Notice that the second European directive has
also eliminated the classification of banks by function, in favor of universal banks, that is
multifunctional banking both within and across borders.
3.4 Inputs costs and market variables
Costs, in particular the cost of labor and the interest rate on real capital, may affect the
choice of opening a new branch, as they represent the fixed factors for branch operations.
Labor cost is an important component of fixed costs in branching, as personnel is needed to
run a branch and must be paid independently of the level of activity of that particular branch.
More specifically, the unit labor cost in a particular region (country) must affect the decision as
to whether open a new branch in that region. Therefore, we look at the way in which the real
wage in the banking sector (Wage) affects the average cost of branching (equation 9),
expecting a positive relationship.
Opening a branch also involves renting or buying facilities in a particular location, i.e.
investing in fixed capital. The average cost of branching should increase if the real interest rates
(Rirate), as a proxy for the opportunity cost of investing in fixed capital, increases.
Unfortunately this proxy may pin down also other effects, as for example the costs of interbank
funds or more generally an indicator of the level of economic activity linked to monetary
policy, and therefore the results should be carefully interpreted. If, on the one hand, the real
interest rate were to capture the cost of funds in the interbank market, we should expect a
negative correlation with the cost of branching, as a rise in the interbank rate increases the
convenience of collecting funds through branches. On the other hand, since real interest rates
are directly related to monetary policy, when economic activity grows we expect interest rates
to be low and competition for clients among banks to be softer, hence a positive relation
between real rates and degree of competition. Only the results of estimation will tell which of
the two effects, the one on competition or the one on branching costs is the most relevant.
Finally in computing the threshold variable Aijt, (4), for each country, we use total deposits
as a proxy for market size, S, while N is the total number of branches in the country. For each
bank in the sample, we have the number of branches, k. Table 6 provides the average values for
the exogenous variables included in the econometric model.
17
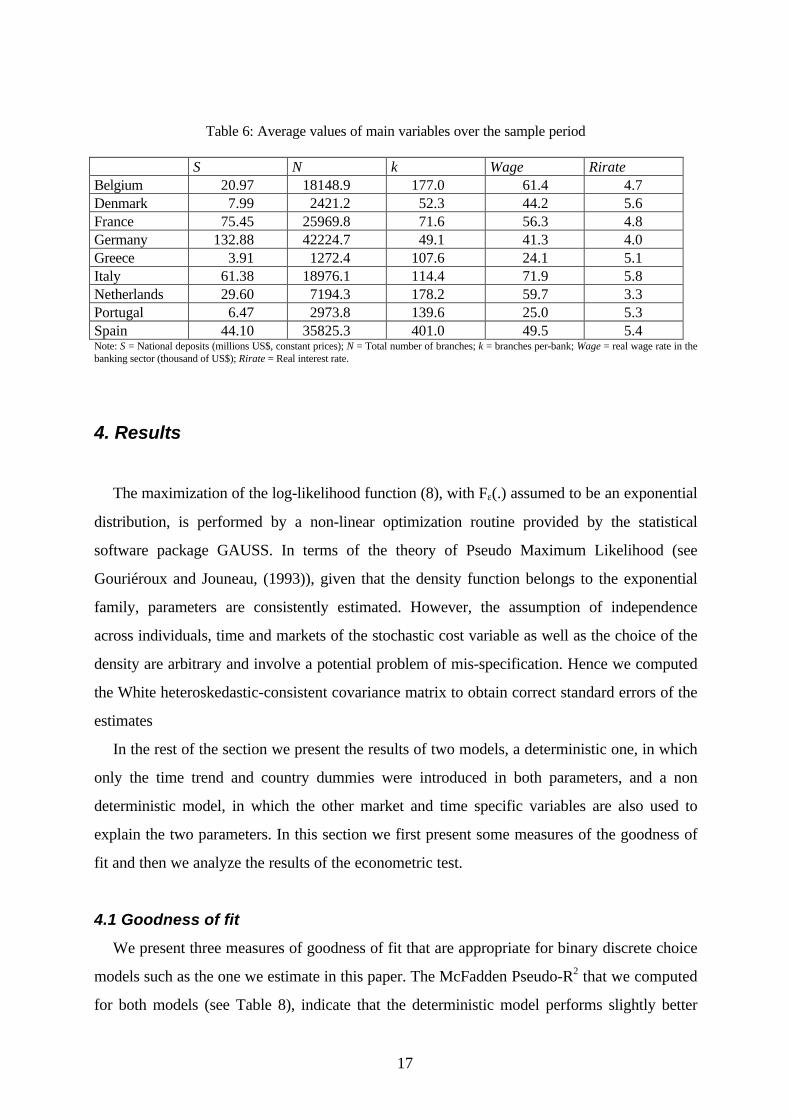
Table 6: Average values of main variables over the sample period
S N k Wage RirateBelgium 20.97 18148.9 177.0 61.4 4.7Denmark 7.99 2421.2 52.3 44.2 5.6France 75.45 25969.8 71.6 56.3 4.8Germany 132.88 42224.7 49.1 41.3 4.0Greece 3.91 1272.4 107.6 24.1 5.1Italy 61.38 18976.1 114.4 71.9 5.8Netherlands 29.60 7194.3 178.2 59.7 3.3Portugal 6.47 2973.8 139.6 25.0 5.3Spain 44.10 35825.3 401.0 49.5 5.4Note: S = National deposits (millions US$, constant prices); N = Total number of branches; k = branches per-bank; Wage = real wage rate in thebanking sector (thousand of US$); Rirate = Real interest rate.
4. Results
The maximization of the log-likelihood function (8), with Fε(.) assumed to be an exponential
distribution, is performed by a non-linear optimization routine provided by the statistical
software package GAUSS. In terms of the theory of Pseudo Maximum Likelihood (see
Gouriéroux and Jouneau, (1993)), given that the density function belongs to the exponential
family, parameters are consistently estimated. However, the assumption of independence
across individuals, time and markets of the stochastic cost variable as well as the choice of the
density are arbitrary and involve a potential problem of mis-specification. Hence we computed
the White heteroskedastic-consistent covariance matrix to obtain correct standard errors of the
estimates
In the rest of the section we present the results of two models, a deterministic one, in which
only the time trend and country dummies were introduced in both parameters, and a non
deterministic model, in which the other market and time specific variables are also used to
explain the two parameters. In this section we first present some measures of the goodness of
fit and then we analyze the results of the econometric test.
4.1 Goodness of fit
We present three measures of goodness of fit that are appropriate for binary discrete choice
models such as the one we estimate in this paper. The McFadden Pseudo-R2 that we computed
for both models (see Table 8), indicate that the deterministic model performs slightly better
18
than the non deterministic one. It also shows that the included regressors significantly improve
(by approximately 36%) the explanatory power of both models relative to the restricted model
where the probability of falling into one of the two classes of banks only depends on a
constant.
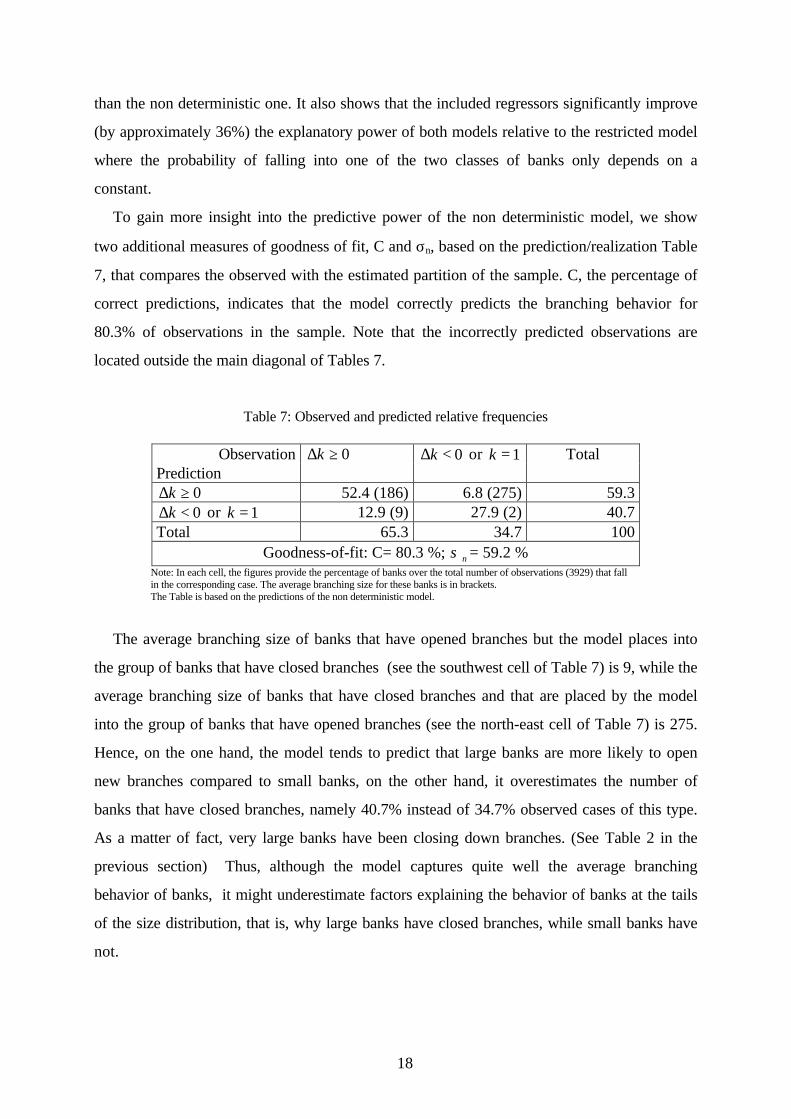
To gain more insight into the predictive power of the non deterministic model, we show
two additional measures of goodness of fit, C and σn, based on the prediction/realization Table
7, that compares the observed with the estimated partition of the sample. C, the percentage of
correct predictions, indicates that the model correctly predicts the branching behavior for
80.3% of observations in the sample. Note that the incorrectly predicted observations are
located outside the main diagonal of Tables 7.
Table 7: Observed and predicted relative frequencies
Observation 0k∆ ≥ 0k∆ < or 1k = TotalPrediction
0k∆ ≥ 52.4 (186) 6.8 (275) 59.30k∆ < or 1k = 12.9 (9) 27.9 (2) 40.7
Total 65.3 34.7 100Goodness-of-fit: C= 80.3 %; nσ = 59.2 %
Note: In each cell, the figures provide the percentage of banks over the total number of observations (3929) that fallin the corresponding case. The average branching size for these banks is in brackets.The Table is based on the predictions of the non deterministic model.
The average branching size of banks that have opened branches but the model places into
the group of banks that have closed branches (see the southwest cell of Table 7) is 9, while the
average branching size of banks that have closed branches and that are placed by the model
into the group of banks that have opened branches (see the north-east cell of Table 7) is 275.
Hence, on the one hand, the model tends to predict that large banks are more likely to open
new branches compared to small banks, on the other hand, it overestimates the number of
banks that have closed branches, namely 40.7% instead of 34.7% observed cases of this type.
As a matter of fact, very large banks have been closing down branches. (See Table 2 in the
previous section) Thus, although the model captures quite well the average branching
behavior of banks, it might underestimate factors explaining the behavior of banks at the tails
of the size distribution, that is, why large banks have closed branches, while small banks have
not.

19
For completeness and because C may be misleading14, we also computed σn, which can be
interpreted, similarly to a R2, as the percentage of the variability of the phenomenon that the
model explains. This measure takes on a value of almost 60%15 for our non deterministic
model.
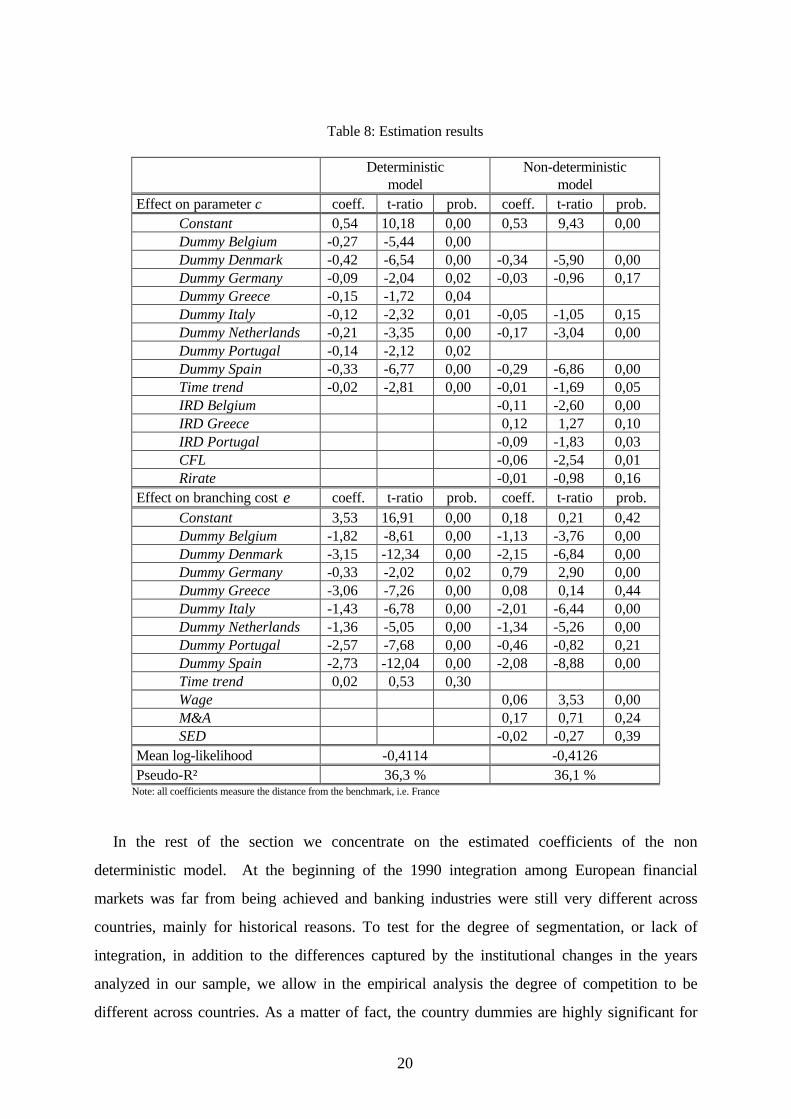
4.2 Results of the estimation
Parameter estimates as well as t-ratios are gathered in Table 8, in which we present the
results of two estimations. The first column refers to a completely deterministic model, while in
the second column we report the results of the best, according to a cautious selection process,
combination among the variables that explain the levels of the two parameters of the model,
the degree of competition and the mean of branching costs.
The coefficients in the upper part of Table 8 measure the impact of exogenous variables on
c , the elasticity of profits to branching, or, alternatively, the inverse of the degree of toughness
of competition. A negative sign implies an increase in the degree of competition. We can also
interpret a negative sign as inducing a lower probability that banks open new branches, namely
a shrinking in the average size of branching networks. The reason is that a smaller c , implies a
reduction in the quantity Ait , which is the upper bound of the area defining the probability of
opening new branches according to equations (6a) and (6b).
As for the parameter ε , a coefficient associated with the branching cost, measures the
magnitude of the effect of the explanatory variable on the average cost of branching and, as a
consequence, its indirect impact on the probability of opening new branches.
14 See Veall et al., 1996 for a discussion of how C may be misleading.15 σn is an R2- type measure for binary prediction/realization tables that varies between 0 and 1.(SeeVeall et al. (1996), p.254)
20
Table 8: Estimation results
Deterministicmodel
Non-deterministicmodel
Effect on parameter c coeff. t-ratio prob. coeff. t-ratio prob.Constant 0,54 10,18 0,00 0,53 9,43 0,00Dummy Belgium -0,27 -5,44 0,00Dummy Denmark -0,42 -6,54 0,00 -0,34 -5,90 0,00Dummy Germany -0,09 -2,04 0,02 -0,03 -0,96 0,17Dummy Greece -0,15 -1,72 0,04Dummy Italy -0,12 -2,32 0,01 -0,05 -1,05 0,15Dummy Netherlands -0,21 -3,35 0,00 -0,17 -3,04 0,00Dummy Portugal -0,14 -2,12 0,02Dummy Spain -0,33 -6,77 0,00 -0,29 -6,86 0,00Time trend -0,02 -2,81 0,00 -0,01 -1,69 0,05IRD Belgium -0,11 -2,60 0,00IRD Greece 0,12 1,27 0,10IRD Portugal -0,09 -1,83 0,03CFL -0,06 -2,54 0,01Rirate -0,01 -0,98 0,16
Effect on branching cost ε coeff. t-ratio prob. coeff. t-ratio prob.Constant 3,53 16,91 0,00 0,18 0,21 0,42Dummy Belgium -1,82 -8,61 0,00 -1,13 -3,76 0,00Dummy Denmark -3,15 -12,34 0,00 -2,15 -6,84 0,00Dummy Germany -0,33 -2,02 0,02 0,79 2,90 0,00Dummy Greece -3,06 -7,26 0,00 0,08 0,14 0,44Dummy Italy -1,43 -6,78 0,00 -2,01 -6,44 0,00Dummy Netherlands -1,36 -5,05 0,00 -1,34 -5,26 0,00Dummy Portugal -2,57 -7,68 0,00 -0,46 -0,82 0,21Dummy Spain -2,73 -12,04 0,00 -2,08 -8,88 0,00Time trend 0,02 0,53 0,30Wage 0,06 3,53 0,00M&A 0,17 0,71 0,24SED -0,02 -0,27 0,39
Mean log-likelihood -0,4114 -0,4126Pseudo-R² 36,3 % 36,1 %
Note: all coefficients measure the distance from the benchmark, i.e. France
In the rest of the section we concentrate on the estimated coefficients of the non
deterministic model. At the beginning of the 1990 integration among European financial
markets was far from being achieved and banking industries were still very different across
countries, mainly for historical reasons. To test for the degree of segmentation, or lack of
integration, in addition to the differences captured by the institutional changes in the years
analyzed in our sample, we allow in the empirical analysis the degree of competition to be
different across countries. As a matter of fact, the country dummies are highly significant for
21
the parameter measuring interest rate competition. Thus, we take this as evidence that starting
conditions of price competition across countries were significantly different in 1990 and must
be taken into consideration. Notice further that we have set France as the benchmark country
to which other countries have to be compared. It follows that competitive conditions in Italy
and Germany are not significantly different from France.
The time trend for the parameter c is negative, so that competition becomes fiercer with
time. Note that this implies that the efficient size of branching networks decreases. This cannot
be seen directly from descriptive statistics as the average number of branches per bank would
indicate a positive trend, at least in some countries. (Compare to Table 1)
The effect of increasing toughness of interest rate competition does seem to be induced
partly by other national deregulation policies, captured by the time trend, and partly by the
capital flow liberalization (dummy CFL). On one hand, the time trend probably captures the
effect of changes in regulation at the country level more than those at the European
Community level. On the other hand, capital flow liberalization has certainly increased
competition, by increasing integration between markets, and therefore fostering rivalry among
banks.
For interest rate deregulation (IRD) we have included a dummy only for three out of nine
countries since this set of policies has been implemented after 1990 only in these three
countries (namely in 1991 in Belgium, in 1992 in Portugal and in 1993 in Greece). For the
other countries instead the impact of IRD is absorbed by the constant. Therefore we can
measure only the differential impact of IRD for the three latest countries compared to the
others. The negative coefficients for Belgium and Portugal indicates that IRD has increased
competition, while this has not happened yet in Greece.
Finally higher real interest rates (Rirate) induce a rise in the toughness of interest rates
competition. That is competition among banks is tougher, when real interest rates are high,
which is an indicator of restrictive monetary policies and thus of a low level of economic
activity.
Consider now the determinants of average values of branching costs by country. The
coefficient for the real wage (Wage) has a positive sign, indicating that salaries are an
important determinant of branching costs.
Here, the effects of changes in the regulatory environment are weaker. The dummy
indicating the effectiveness of the second European directive (SED) has a negative sign,

22
although not significant, indicating that this directive has decreased the cost of opening new
branches.
Finally the positive coefficient of M&A, although not significant, indicates that for those
banks branching costs are higher. This could be evidence that for banks involved in M&As
branching networks need to be restructured, due to duplication of networks, or that there are
other economic reasons other than economies of scale in branching for M&As.
4.3 Costs and competitiveness across countries
The econometric results have implications for the degree of competition and for the choice
of branching in the different countries. Together with the values of c , figures on profits,
marginal benefits of branching, estimated branching costs by country are shown in Table 9.
While the absolute values of these estimated variables may not be entirely realistic, the ordering
of the countries in terms of degree of competition and branching behavior they imply is
informative and close to observed facts.
Table 9: Estimated values of competitiveness and branching costs
Averagevalue of c
Averagevalue of ε
Marginalbenefit
Averageprofit
Belgium 1.33 12.24 6.89 3059Denmark 1.04 1.66 1.89 106France 1.47 28.48 22.68 10023Germany 1.43 26.88 31.13 3883Greece 1.63 4.98 28.82 4017Italy 1.39 9.32 31.96 4855Netherlands 1.24 9.65 9.03 3515Portugal 1.41 3.06 10.93 1476Spain 1.12 2.43 4.54 2141Mean 1.37 16.56 23.08 4732
Note: All values are millions of US$. The values are estimated using the non-deterministic model.
Concerning the strategic interactions among banks in the retail banking industry, note that
the average estimated value for the parameter c is 1.37. So the expansive effect of branching is
quite important and thus, we would overestimate the competitive effect in choosing a model of
pure spatial competition to analyze the branching decision. A model of monopolistic
competition turns out to be a better modeling choice at least for our sample. In addition, a
value of c larger than one indicates that the response of profits to branching is considerable and
thus, that branching still gives banks in the retail segment an edge over competitors. This is

23
also confirmed by the fact that, on average, the estimated average marginal benefit of opening
an additional branch is 0.48 percent of the overall profits of a bank.16
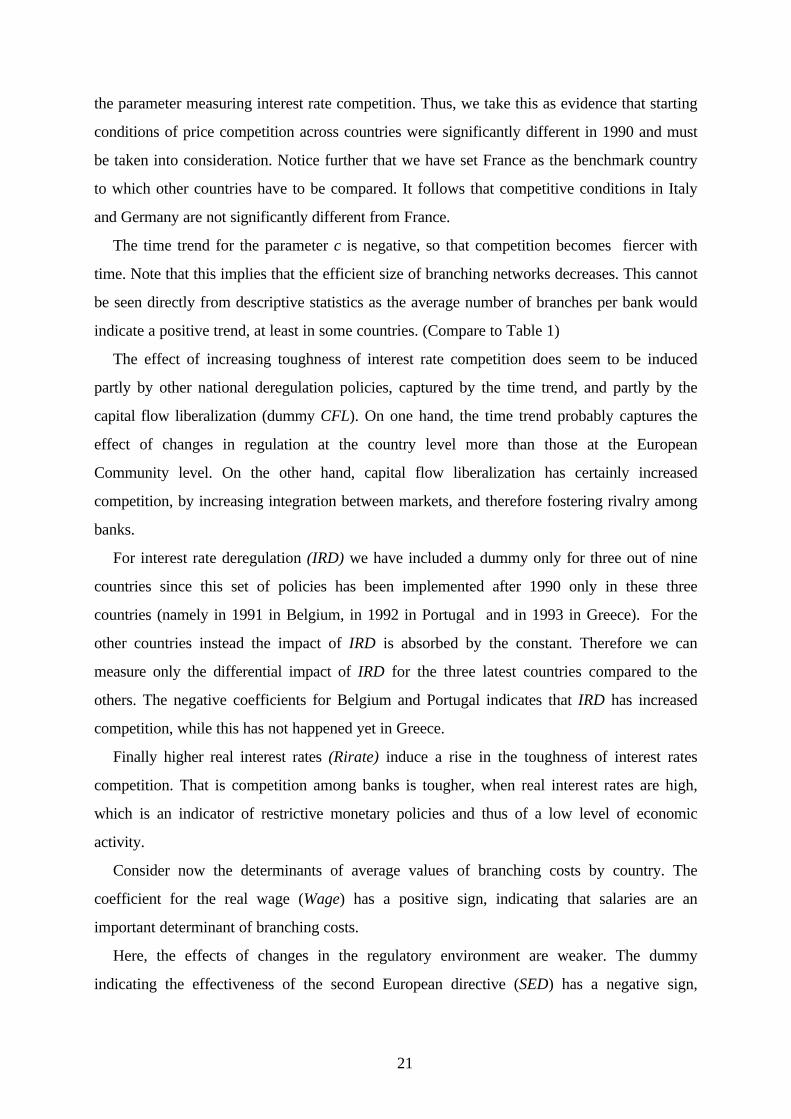
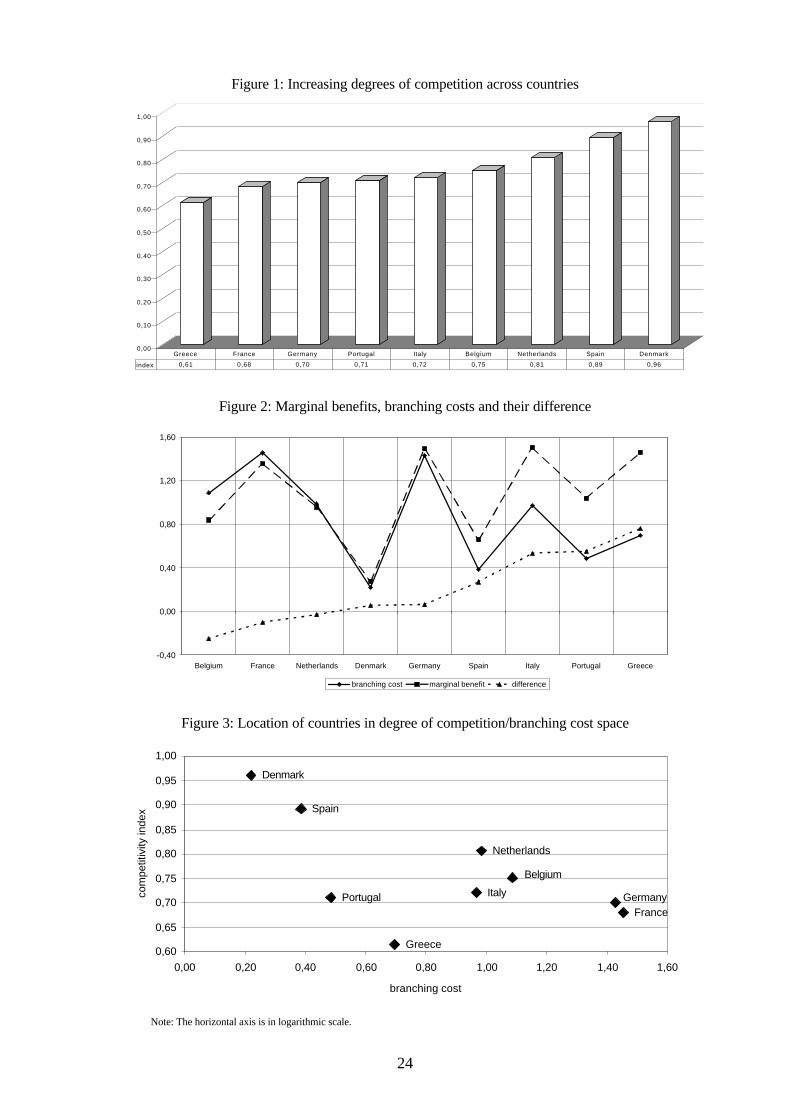
Countries can be ordered according to the degree of competition from the estimated
average values of c . Figure 1 shows that Greece is still behind all other countries for the low
level of price competition. Germany, France, Portugal and Italy have almost similar
competitive conditions, while Belgium, Netherlands, Spain and Denmark show rather high
levels of competition .
The estimated average branching costs are quite different across countries. (See Figure 2)
Portugal, Spain and Denmark have relatively low costs of branching, whereas they are high in
Netherlands, Belgium, Germany and France, with Italy in the middle. As for incentives to open
new branches in these countries, we have to look at the difference between marginal benefits of
branching and marginal costs. In Figure 2 we show that there is scope for opening new
branches in the southern countries, Spain, Portugal, Italy and Greece, while it is not convenient
in the northern countries as Belgium, France, Netherlands, Denmark and Germany.
Finally, if we were to decide where to open new branches according to our theoretical
suggested model, one should look for countries where branching costs are small and toughness
of competition low. In Figure 3 we have allocated countries in the branching costs-degree of
competition space. The closer a country to the origin, the higher the incentives to branch in
that country. So for instance, Portugal and Greece should be a better choice than Netherlands
and Belgium. Further one should be indifferent between opening new branches in Spain or
Denmark compared to Germany or France: it would trade off higher branching costs for lower
level of competition.
16 This result can be compared to Kim and Vale (1999) results for Norway. By estimating a model withconjectural variations, they show that a 1% increase in own branches bring about a 0.5% increase inmarket share. However they conclude that a model of pure spatial competition fits better their dataset.
24
Figure 1: Increasing degrees of competition across countries
Figure 2: Marginal benefits, branching costs and their difference
Figure 3: Location of countries in degree of competition/branching cost space
Greece
FranceGermanyItaly
Belgium
Portugal
Netherlands
Spain
Denmark
0,60
0,65
0,70
0,75
0,80
0,85
0,90
0,95
1,00
0,00 0,20 0,40 0,60 0,80 1,00 1,20 1,40 1,60
branching cost
com
petit
ivity
inde
x
Note: The horizontal axis is in logarithmic scale.
0,00
0,10
0,20
0,30
0,40
0,50
0,60
0,70
0,80
0,90
1,00
index 0,61 0,68 0,70 0,71 0,72 0,75 0,81 0,89 0,96
Greece France Germany Portugal Italy Belgium Netherlands Spain Denmark
-0,40
0,00
0,40
0,80
1,20
1,60
Belgium France Netherlands Denmark Germany Spain Italy Portugal Greece
branching cost marginal benefit difference

25
5. Conclusions
The main feature of our simple econometric analysis is to treat branching costs as a latent
variable. Based on this idea, a model of monopolistic competition, fitted on microeconomic
data, provides a fair approximation of the conduct of European banks. The analysis also
produces a series of useful measures as for instance the degree of competition, the level of
economic profits and marginal benefits of opening branches.
The results of the paper can be summarized as follows. First, deregulation has certainly
increased the degree of competition within the European retail banking industry. In particular
capital flow liberalization has contributed to foster interest rates competition. However the
overall impact of deregulation is better captured by the time trend, that indicates increasing
competition in interest rates. We interpret this as evidence that the deregulatory environment is
more complex than the sum of rules passed at the European Community level. While, on one
hand, these rules have pushed for an effective change of the working of the market, on the
other hand, idiosyncrasies in the deregulation process at the country level play a prominent
role. Second, regardless of convergence towards higher level of competitiveness there are still
differences across banking industries.
Provided that data are available on entry to and exit from the industry, the level of entry
costs could be estimated together with branching costs. Furthermore, with a more dynamic
setting, we might be able to improve our results in this line of investigation. These extensions
are part of our research agenda.
26
6. Appendix
Sources of data
IBCA database: Name of operating banks in each year. The Bankers Almanac, Bank Base, several years: Number of branches for each single bank, k. Information about the history of each bank (for instance on M&A). OECD, Bank Profitability, last issue: Total number of branches for each country (overall banking industry), N, Labor costs in the banking sector, Wage. IFS Yearbook, several years: Total deposits (demand and time deposits) for each country, S, Real interest rates, Rirate. ERE Summary Report: Dummy for implementation of interest rate deregulation, IRD, Dummy for implementation of capital control lifting, CFL, Dummy for implementation of Second EEC Directive, SED.
7. References
Barros, P.P., 1995, Post-entry expansion in banking: The case of Portugal, InternationalJournal of Industrial Organization, 13, 593-611.
Bröker, G., 1989, Competition in Banking (OECD, Paris).
Cabral, L. and R. Majure, 1994, An Empirical Analysis of Bank Branching: Portugal 1989-1991, in: Neven, D. and Roller L., eds., The Empirical Analysis of Industrial Organization,(CEPR, London) 111-136.
Cerasi, V., 1995, A model of retail banking competition, mimeo (London School ofEconomics, London).
Cerasi, V., 1996, An empirical analysis of banking concentration, Quaderni del Centro Baffi,January No105 (Bocconi University, Milano).
Chiappori, P.A., D. Perez-Castrillo and T. Verdier, 1995, Spatial competition in the bankingsystem: Localization, cross subsidies and the regulation of deposit rates, EuropeanEconomic Review, 39, 889-918.
Danthine, J. P., F. Giavazzi, X. Vives and E.L. Von Thadden, 1999, The Future of EuropeanBanking, Monitoring European Integration report N.9 (CEPR, London).
De Palma, A. and M. Uctum, 1992, Financial intermediation under financial integration andderegulation, NER 19 (Banque de France, Paris).
Economic Research Europe Ltd., 1996, A study of the effectiveness and impact of InternalMarket Integration on the banking and credit sector: A Summary Report.
27
European Central Bank, 1999, Possible Effects of EMU on the EU Banking Systems in theMedium to Long Term (ECB, Frankfurt am Main).
Gouriéroux, C. and F. Jouneau, 1993, Pseudo Likelihood Methods, in: G.S. Maddala, C.R.Rao and H.Vinod, eds., Handbook of statistics (North-Holland, Amsterdam), 335-362.
Gual J., 1999, Deregulation, Integration and Market Structure in European Banking, CEPR,Discussion Paper No. 2288, (CEPR, London).
Gual, J. and D. Neven, 1992, Deregulation of the European Banking Industry (1980-1991),CEPR Discussion Papers, No 703 (CEPR, London).
Kaufman, G., ed., 1992, Banking Structures in Major Countries (Kluwer Academic Publishers,Boston).
Kim, M. and B. Vale, 1999, Non-price strategic behaviour: the case of bank branches, mimeo(Norges Bank, Oslo)
Molyneux, P., D.M. Lloyd-Williams and J. Thornton, 1994, Competitive conditions inEuropean Banking, Journal of Banking and Finance, 18, 445-459.
Neven, D., 1989, Structural adjustment in European retail banking. Some views from industrialorganization, CEPR Discussion Papers, No 311 (CEPR, London).
Neven, D. and L.H. Roller, 1999, Competition in the European Banking Industry: AnAggregate Structural Model of Competition, International Journal of IndustrialOrganization, 17 (7), 1059-1074.
Sutton J, 1991, Sunk Costs and Market Structure, (The MIT Press, Cambridge Mass.,London, U.K.).
Veall M.R. and K.F. Zimmermann, 1996, Pseudo- R2 Measures for some common limiteddependent variable models, Journal of Economic Surveys, 10 (3), 241-259.