collegiate education in karnataka state
TRANSCRIPT
COLLEGIATE EDUCATION IN KARNATAKA STATE
By:
Dr M R NARAYANProfessor of Economics
Institute for Social & Economic Change Bangalore.
EDUCATION DEPARTMENTGovernment of Karnataka
Bangalore 2002
NIEPA DC
D11891I
U B R A K Y ft o y c v a iifr A T H M i e t m a i^aCi«ifl«i la s » !tu « of KdvcftCioaal Plac jk I AdLcBinittr&tien. j17* Ik tt-i Aueohm4e M«rf, IN .» >.Ih.-UM.16 3 ) _ l , g ^ |n ? t t - . - z - ^ - d z : ^ o o 3
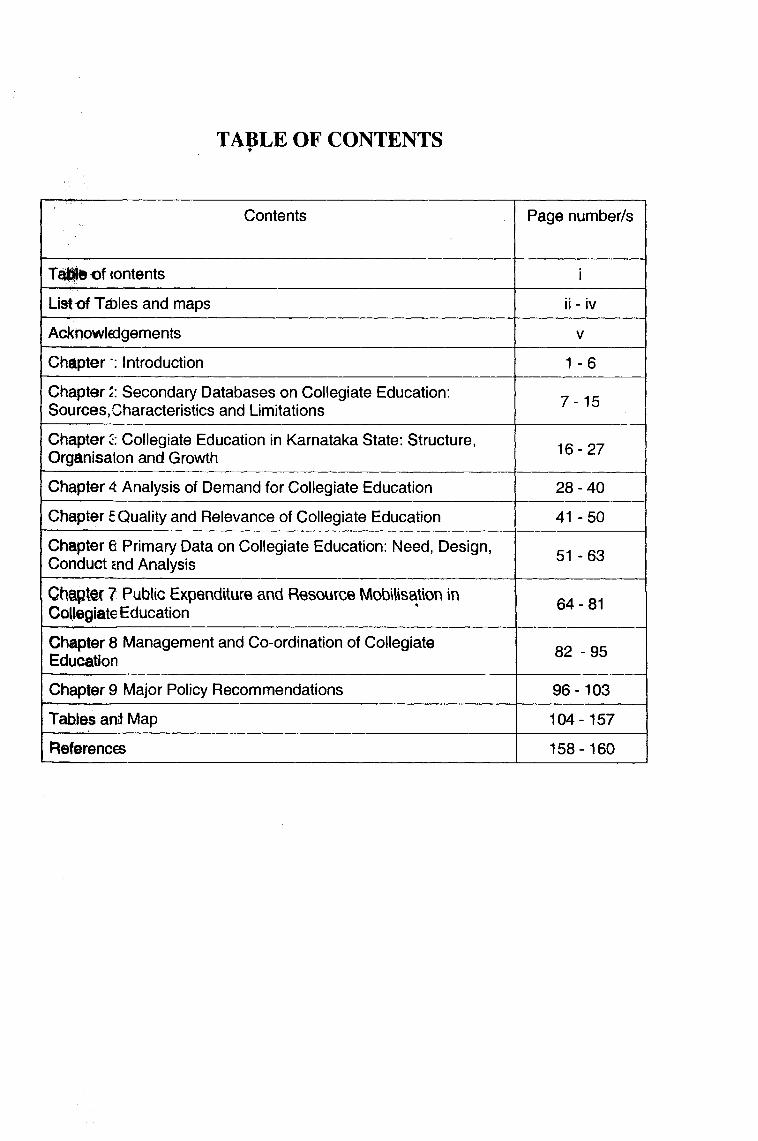
TABLE OF CONTENTS
Contents Page number/s
of {ontents i
List of T^les and maps ii - iv
Acknowledgements V
ChapterIntroduction 1 -6
Chapter Secondary Databases on Collegiate Education: Sources,Characteristics and Limitations 7 - 1 5
Chapter C: Collegiate Education in Karnataka State: Structure, Organisaion and Growth 16 -27
Chapter 4 Analysis of Demand for Collegiate Education 28 -4 0
Chapter 5 Quality and Relevance of Collegiate Education 41 -50
Chapter e Primary Data on Collegiate Education: Need, Design, Conduct £nd Analysis 51 -63
Chaptif 7 Public Expenditure and Resource Mobilisation in Coltegiate Education 64-81
Chapter 8 Management and Co-ordination of Collegiate Education 82 -95
Chapter 9 Major Policy Recommendations 96-103
Tables and Map 104-157
References 158-160
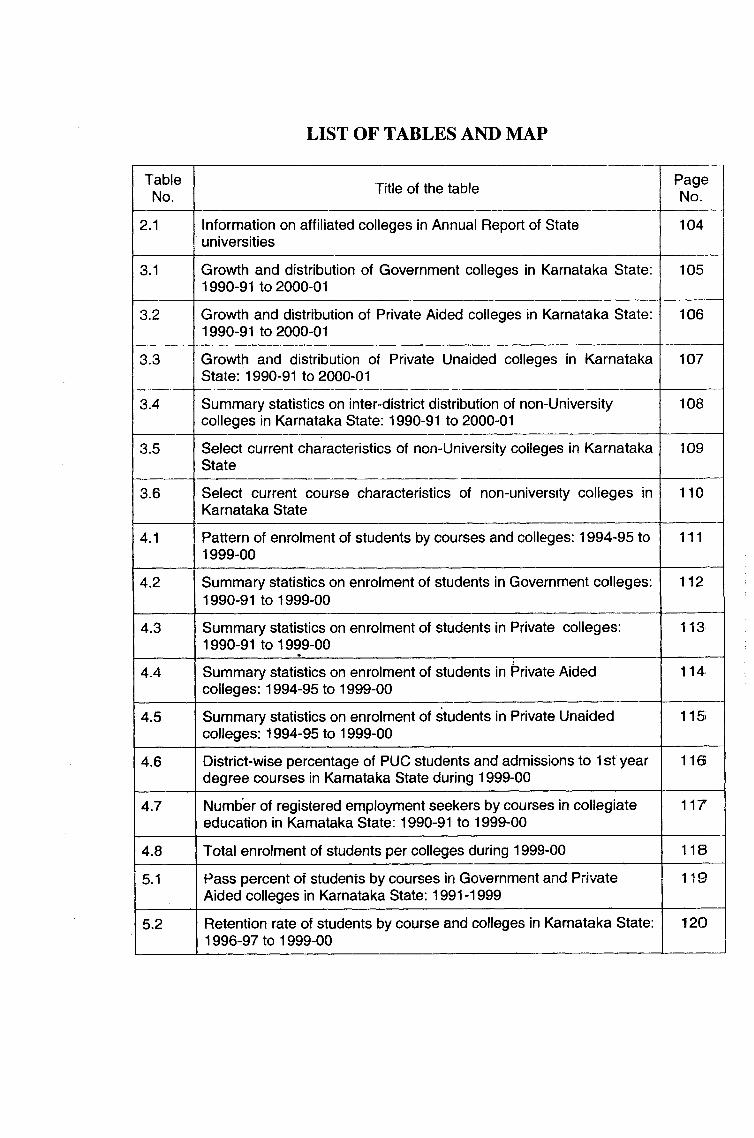
LIST OF TABLES AND MAP
TableNo. Title of the table Page
No.
2.1 Information on affiliated colleges in Annual Report of State universities
104
3.1 Growth and distribution of Governnnent colleges in Karnataka State: 1990-91 to 2000-01
105
3.2 Growth and distribution of Private Aided colleges in Karnataka State: 1990-91 to 2000-01
106
3.3 Growth and distribution of Private Unaided colleges in Karnataka State: 1990-91 to 2000-01
107
3.4 Summary statistics on inter-district distribution of non-University colleges in Karnataka State: 1990-91 to 2000-01
108
3.5 Select current characteristics of non-University colleges in Karnataka State
109
3.6 Select current course characteristics of non-university colleges in Karnataka State
110
4.1 Pattern of enrolment of students by courses and colleges: 1994-95 to 1999-00
111
4.2 Summary statistics on enrolment of students in Government colleges: 1990-91 to 1999-00
112
4.3 Summary statistics on enrolment of students in Private colleges: 1990-91 to 1999-00
113
4.4 Summary statistics on enrolment of students in Private Aided colleges: 1994-95 to 1999-00
114
4.5 Summary statistics on enrolment of students in Private Unaided colleges: 1994-95 to 1999-00
115)
4.6 District-wise percentage of PUC students and admissions to 1st year degree courses in Karnataka State during 1999-00
116
4.7 Number of registered employment seekers by courses in collegiate education in Karnataka State: 1990-91 to 1999-00
117
4.8 Total enrolment of students per colleges during 1999-00 118
5.1 Pass percent of students by courses in Government and Private Aided colleges in Karnataka State: 1991-1999
119
5.2 Retention rate of students by course and colleges in Karnataka State: 1996-97 to 1999-00
120
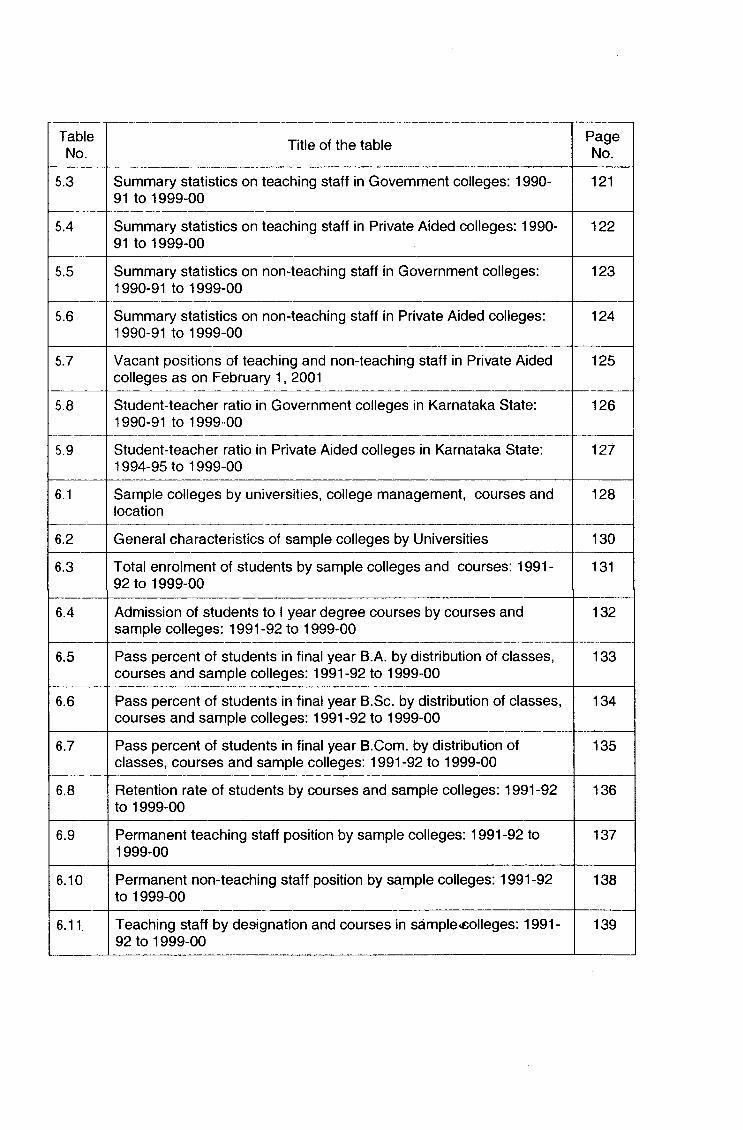
TableNo. Title of the table Page
No.
5.3 Summary statistics on teaching staff in Govemment colleges: 1990- 91 to 1999-00
121
5.4 Summary statistics on teaching staff in Private Aided colleges: 1990- 91 to 1999-00
122
5.5 Summary statistics on non-teaching staff in Government colleges: 1990-91 to 1999-00
123
6.6 Summary statistics on non-teaching staff in Private Aided colleges: 1990-91 to 1999-00
124
5.7 Vacant positions of teaching and non-teaching staff in Private Aided colleges as on February 1, 2001
125
5.8 Student-teacher ratio in Government colleges in Karnataka State: 1990-91 to 1999 00
126
5.9 Student-teacher ratio in Private Aided colleges in Karnataka State: 1994-95 to 1999-00
127
6.1 Sample colleges by universities, college management, courses and location
128
6.2 General characteristics of sample colleges by Universities 130
6.3 Total enrolment of students by sample colleges and courses: 1991- 92 to 1999-00
131
6.4 Admission of students to 1 year degree courses by courses and sample colleges: 1991 -92 to 1999-00
132
6.5 Pass percent of students in final year B.A. by distribution of classes, courses and sample colleges: 1991-92 to 1999-00
133
6.6 Pass percent of students in final year B.Sc. by distribution of classes, courses and sample colleges: 1991-92 to 1999-00
134
6.7 Pass percent of students in final year B.Gom. by distribution of classes, courses and sample colleges: 1991-92 to 1999-00
135
6.8 Retention rate of students by courses and sample colleges: 1991-92 to 1999-00
136
6.9 Permanent teaching staff position by sample colleges: 1991-92 to 1999-00
137
6.10 Permanent non-teaching staff position by sample colleges: 1991-92 to 1999-00
138
6.11 Teaching staff by designation and courses in sample^eolleges: 1991- 92 to 1999-00
139
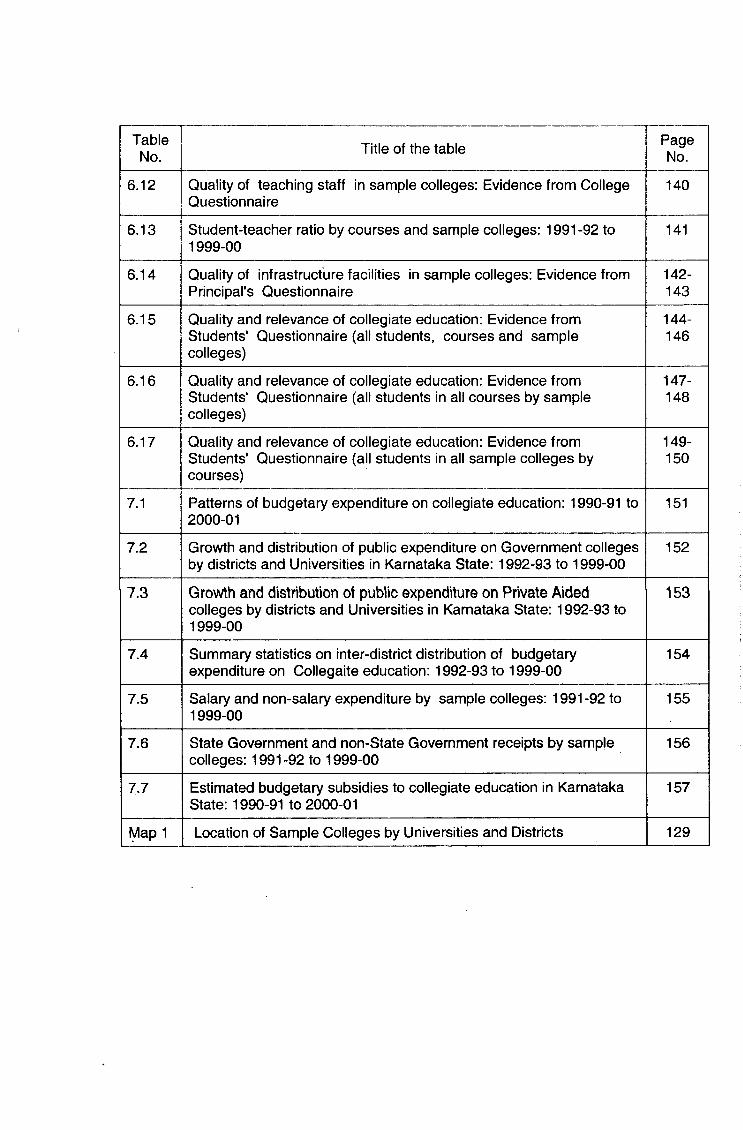
TableNo. Title of the table Page
No.
6.12 Quality of teaching staff in sample colleges: Evidence from College Questionnaire
140
6.13 Student-teacher ratio by courses and sample colleges: 1991-92 to 1999-00
141
6.14 Quality of infrastructure facilities in sample colleges: Evidence from Principal's Questionnaire
142-143
6.15 Quality and relevance of collegiate education: Evidence from Students' Questionnaire (all students, courses and sample colleges)
144-146
6.16 Quality and relevance of collegiate education: Evidence from Students' Questionnaire (all students in all courses by sample colleges)
147-148
6.17 Quality and relevance of collegiate education: Evidence from Students' Questionnaire (all students in all sample colleges by courses)
149-150
7.1 Patterns of budgetary expenditure on collegiate education: 1990-91 to 2000-01
151
7.2 Growth and distribution of public expenditure on Government colleges by districts and Universities in Karnataka State: 1992-93 to 1999-00
152
7.3 Growth and distribution of public expenditure on Private Aided colleges by districts and Universities in Karnataka State: 1992-93 to 1999-00
153
7.4 Summary statistics on inter-district distribution of budgetary expenditure on Collegaite education: 1992-93 to 1999-00
154
7.5 Salary and non-salary expenditure by sample colleges: 1991-92 to 1999-00
155
7.6 State Government and non-State Government receipts by sample colleges: 1991 -92 to 1999-00
156
7.7 Estimated budgetary subsidies to collegiate education in Karnataka State: 1990-91 to 2000-01
157
Map 1 Location of Sample Colleges by Universities and Districts 129
ACKNOWLEDGMENTS
This book is the revised and updated version of the Final Report of the Subsector Study on Collegiate Education, sponsored by the Education Department, Qoverrment of Karnataka, Bangalore, and submitted to the Government of Karnataka in August 2001.
The entire initiative to bring out the edited version of the Report in the form of the presenlbook is taken by the Review Committee of the Sub-Sector Studies. I am grateful to 5 f 'Nalati Das, Chairperson of the Committee, and Principal Secretary, Education Departnent, Government of Karnataka; Sri Lukose Vallatharai, Member-Secretary of the Sub-Se:tor Studies, and Commissioner of Collegiate Education, Government of Karnat^a; and all other members of the Review Committee, for their kind help and encouregement.
h addition, my grateful thanks are due to Dr M.Govinda Rao, Director, Institute for SockI & Economic Change (ISEC), Bangalore, for encouraging me to work on this study.
Finally, I am thankful to Sri Shantha Raju, Programme Officer, DPEP, Governnent of Karnataka, for his co-operation in all official matters and patience in getting tiings done at my convenience; and to Dr M. Jaya Krishna in ISEC for technical assistarce.
June 6, 2002 M.R. NarayanaBangaloe
CHAPTER 1
Introduction
Collegiate education is an important component of higher education in Karnataka State. The higher education in the State comprises general education, technical education, medical education and agricultural education. The general higher education comprises the university education and collegiate education. Up to 1976, education was in the list of State subjects under the Constitution of India. However, since the 42"'* amendment to the constitution in 1976, education has been placed under the concurrent list. Thus, both Union Government and State Governments can formulate policies and programmes for development of education including higher education in the country. This is clearly evident in the recent policy document of Government of India (2000) and Government of Karnataka (2002).
The Report of the Karnataka Universities Review Commission or, in brief, the Review Commission, (1993: pp.29-30) has neatly outlined four important roles of higher education in the State. First, to move into new frontiers of knowledge by fundamental and applied research while aiming at absorbing the changing nature of society in its various aspects to continuously pass on the traditions through knowledge, skill and values to upcoming generations. Second, to provide basic knowledge to the students through teaching and research. Third, to develop skilled personnel to meet ever-growing and complex needs of modern society. Fourth, to provide the basis for continuing education for updating the knowledge by providing extension services. Thus, higher education has the basic objectives of producing qualified manpower, training for research career and efficient management of teaching profession.
This book aims at describing the progress and analysing the major policy issues in the collegiate education in Karnataka State. The main purpose of this analysis is to derive implications for (a) formulation of current and future policies and (b) integrated planning for improving the collegiate education in the State, especially from the viewpoint of the State Government's policies and programmes.
1.1. Scope of collegiate education
Throughout, by collegiate education we mean that education which leads to the award to first undergraduate degree in general education, such as, B.A., B.Sc., B.Com., B.B.M., B.C.A., and B.H.M. Thus, the scope of collegiate education in this book does not include degree courses in (a) law colleges, (b) colleges of education, (c) fine arts colleges and (d) physical education colleges and post-graduate degree courses in the degree colleges.
Broadly speaking, collegiate education is of two types. First, regular education. Second, distance education. The scope of this study covers the collegiate education in regular and distance education within the State.
Regular education ;s college-based or provided through Government colleges (GCs) , Private Aided colleges (PACs), Private Unaided colleges (PUACs) and University colleges (UCs) which are affiliated with the State universities. The State universities are the University of Mysore, Bangalore University, Karnatak University,
Mangalore University, Gulbarga University and Kuvempu University. The PACs and PUACs, which come under SC/ST colleges, Minority colleges and General (i.e. neither SC/ST nor Minority) colleges are covered in this study.
Distance education is university-based and provided in the form of correspondence courses, external examination system and open university system. At present, Bangalore University, Karnatak University and Karnataka State Open University offer distance education within the State. It should be emphasised that the admission to the distance education by these universities is open to all persons anywhere in the country. In the same way, distance education offered by universities outside the State (e.g. Indira Gandhi National Open University) is also open to students within the State. However, the scope of distance education in this study is limited to the universities within the State.
1.2. Major policy issues focused
In general, there are nine aspects in the study of collegiate education in the State. These aspects are related to structure, organisation, management, co-ordination, supply, demand, quality, relevance and financing of collegiate education. This book deals with a description of these aspects, as they are related to 1990’s. In particular, this book focuses on the analysis of the following four major policy issues for the purpose of deriving useful policy implications.
(i) Unlike the supply of college graduates from the colleges, the demand for collegiate education is not directly observed as it originates in activities from within the education sector (e.g. annual pass percent of students from PUC courses) as well as from outside the general education system (e.g. job absorption in trade and industry in public and private sectors). Thus, it is essential to identify the major sources of demand for collegiate education as it helps in assessing the nature, magnitude, determinants and impact of the demand for collegiate education by sources (especially, by select courses) in the State. In a spatial context (e.g. at the district level), the supply and demand analysis helps in identifying areas with excess or deficient demand. Accordingly, the need for and feasibility of a policy, for instance, for consolidating small sized colleges and facilities as a measure of cost reduction strategies in the system may be justifiable.
(ii) In general, scoring minimum marks for a pass in the qualifying examinations leads to the award of a degree to students, although students above the minimum marks may have varying marks. This fact suggests that, in addition to the analysis of pass percent of students, it is pertinent to analyse the distribution of number of students with a first class, a second class and a third class. Further, it is important to understand the student performance in examinations by broad student categories (boys, girls, SC/ST etc.) and by broad institution type (district, management type, medium of instruction, university). This understanding shall be of immense policy use, as many of these factors may be influenced by the State Government's policy changes, either directly or indirectly.
(iii) In the recent past, fiscal reforms at the State level include expenditure reduction as well as expenditure switching policies, as they are related to collegiate education. For instance, the State Government had announced a 15% cut in allocation of resources to higher education sector, including collegiate education, in the budget 2000-2001. Consequently, the collegiate education system has to explore options (e.g. seeking additional funds from non-governmental sources) to cope with this reduced finance from the State Government without, of course, compromising on the quality of education.
(iv) The affiliated colleges (hence, their staff, students and management) are under specific guidelines and regulations of the State Government, the University in question and the University Grants Commission. It is important to know in what ways and to what extent the changes over the years in the specific guidelines and regulations of the university and the State Government have implications, for instance, on removing courses for which there is little demand and adding those for which there is demand, enabling institutions to change curriculum, hire faculty etc.
1.3. Review of previous studies
Studies on collegiate education in Karnataka are few and focus only on the description of current status of collegiate education and nature and impact of Grants-in- Aid (GIA) on students performance in final year degree courses in the private aided colleges. These studies include Narayana (2001a), Narayana (2000a), Narayana (2000b), Narayana (2000c) and Narayana (1999a). \n lact, these studies are the extensions and refinements of the earliest study on grants-in-aid to private degree colleges in the State by Narayana (1999b).
In Narayana (1999a), a description of trends in size, growth and distribution of GIA during 1990’s is given. And, the characteristics of colleges on GIA are elaborated (e.g. staff and students strength in colleges). Further, the study raises several current policy issues in GIA, such as, whether or not the GIA should be permanent? Should GIA be conditional on the professional performance criteria, such as, pass percentage anc| academic achievements of students? Can “all grants for ever” be replaceable by “all grants for the year” or “no grants are for ever?" Should all the aided colleges be given a uniform cut in the size of GIA? If so, by what percentage? If not, can different colleges be given different cut in the size of their current GIA ? And, by what objective criteria can such differential cut be effected ? How should the management fill in the resource gap due to reduction in the GIA ? Will they be given total flexibility in charging fee, collecting donations and any other non-institutional sources of revenues? If so, what are the possible implications of such unregulated pricing of collegiate education on students from poorer sections of society, in both rural and urban areas? However, the'study did not answer any of these policy questions.
The determinants of pass percent of students in private aided colleges are empirically modeled and tested in Narayana (2000a). In particular, cross-section, pooled regression and fixed effects model for panel data are formulated and estimated using the data from 1991-92 to 1997-98 from 31 sample aided degree colleges by three types of private management in Bangalore-urban and rural districts. The study models the impact of GIA on pass percent of students through student-teacher ratio. The study
finds, among others, that the nature and magnitude of determinants of students’ performance in aided colleges of Bangalore districts are different between types of college management. Thus, pooling of colleges between management is not plausible on empirical grounds. Second, of the three empirical frameworks, the fixed effect model is empirically preferable to cross-section model and pooled regression model. Thus, a priori, specification of the estimation model in terms of a cross section model or a pooled regression model may lead to misleading conclusions and implications. Third, regardless of the nature of estimation models, the impact of student-teacher ratio on the pass percent of student in colleges by all management is statistically insignificant. This implies that, other things being equal, the impact of GIA on the pass percent of students in the aided colleges is not significantly different from zero.
On the other hand, in Narayana (2000b), the empirical models in Narayana (2000a) are estimated using the data from 1991-92 to 1997-98 on 113 sample aided colleges in the entire Karnataka State excluding Bangalore districts. Most surprisingly, the empirical evidence shows that regardless of the nature of estimation in terms of cross-section regression, pooled regression and fixed effects model, the influence of student-teacher ratio on the pass percent of students in colleges by all management is statistically insignificant and negligible in magnitude. This implies that, other things being equal, the impact of GIA (indirectly, however) on the pass percent of student is zero on empirical grounds. This results suggests that there is a need to reconsider the current and future objectives of the GIA policy from the viewpoint of determining and improving the students’ performance in the private aided colleges.
In Narayana (2000c), a simple empirical framework for estimation of determinants of pgiss percent of students by courses is developed. The available databases on collegiate education in terms of their sources, characteristics and limitations are explored, and the role of primary data in supplementing the secondary data is justified. Most importantly, the nature and limitations of data on college finances (i.e. receipt and expenditure) from primary sources are highlighted. Using the primary data from 1991-92 to 1997-98 on 31 sample private aided colleges by types of management from Bangalore districts as in Narayana (2000a), a pooled regression model is estimated by alternative specifications of explanatory variable, viz., retention rate of students and GIA. The estimation results show that, of the variables, retention rate and GIA are the common determinants of student performance in colleges of all management, although the nature and magnitude of these variables are remarkably different between Minority colleges, SC/ST colleges and Other colleges (i.e. colleges which do not belong to Minority or SC/ST management). However, regardless of the nature of management, the impact of GIA is smallest in magnitude but statistically highly significant.
More recently, Narayana (2001a) has estimated the impact of grants-in-aid on students' performance (in terms of pass percentages) in aided private degree colleges, using panel data from sample colleges in Bangalore district of Karnataka State from 1991-92 to 1997-98. The specification of GIA variable (i.e. in the standardised form) is distinct from the specification in the above studies. In addition, sensitivity of a reduction in GIA on the estimated pass percent of students in the individual colleges and feasibility of financing a reduction in GIA through proposed changes in students' fee during 1997- 98 are analysed. The results show that (a) the impact of GIA is positive and significant in all estimations; (b) the estimated pass percentage of students do vary remarkably,
especially if GIA is reduced by 50 per cent or more; and (c) the proposed fee revisions can finance a reduction in GIA to all colleges by about 12 percent.
All the above studies have a narrow focus on analysing the nature and impact of GIA on PAGs in the State with alternative empirical modeling, databases and techniques of estimation. However, PAGs are only a part of the collegiate education system, and GIA is one of the aspects of the working of the collegiate education in the State.
The present book is wider in coverage as it includes government colleges, private aided colleges, private unaided colleges and university colleges, and universities in distance collegiate education. The issues to be discussed are related to entire aspects of collegiate education. Thus, the book is contributory to the empirical and policy literature on collegiate education in the State and is the basis for comparative study of collegiate education between Karnataka and other States in India.
1.4. Main Objectives
In the context of the issues raised and research gaps identified in the previous studies above, the main objectives of the study are as follows.
(a) Describe the major changes in the size, dispersion, composition, finances, sources of funding, organisation and structure of the collegiate education system in Karnataka State during the 1990’s.
(b) Analyse the performance of collegiate education system in terms of student outcomes (especially, in final year examinations) in the State.
(c) Determine the effect of the limitation on State Government grants to the collegiate education in the State. And, assess how the collegiate education may cope with such limitations, at present and in future.
(d) Suggest measures to enable the institutions on both supply side and demand side to be more responsive to student needs, to improve efficiency and to mobilise more funds for collegiate education in the State.
(e) Suggest specific measures in government and university regulations to reduce the mismatch between supply and demand, increase responsiveness of institutions to add or delete courses depending on the demand for courses, provide flexibility to colleges to change curriculum, hire faculty, raise and use resources, etc.
(f) Identification of good practices and lessons that can be learnt from well performing institutions in collegiate education within and outside the State, and discuss the feasibility of introducing reforms.
1.5. Method of analysis
This study uses both secondary and primary data and employs simple descriptive methods for analysis of these data. The methods include statistical measures of central tendency and dispersion, as well as simple ratios and percentage analysis. Throughout, primary data is used as a supplementary information for analysis
based on secondary data. For clarity of exposition, secondary data and primary data is separately analysed.
1.6. Organisation of the boolc
This book is organised into 9 chapters including this Chapter. In Chapter 2, secondary databases on collegiate education, which form the bases for Chapter 3, 4, 5 and 7* are elaborated. Chapter 3 focuses on the description of the structure, organisation and growth of collegiate education. Chapter 4 analyses the patterns, determinants and impact of changes in demand for collegiate education by major courses and types of colleges. In Chapter 5, quality and relevance of collegiate education are discussed with few measurable indicators. Chapter 6 presents the design and conduct of primary data collection, and derives implications for demand, quality and relevance for collegiate education. Chapter 7 analyses the public expenditure and resource mobilisation with special reference to implicit budgetary subsidy of the State Government to collegiate education. The management and co-ordination aspects of collegiate education are discussed in Chapter 8. Chapter 9 summarises the major policy recommendations of the study.
To keep the continuity of text, all tables are given at the end of the report after the Chapter 9. All tables are numbered sequentially by chapters (e.g., table 1 of chapter 1 is numbered Table 1.1 and so on). The list of references of the study follows the tables.
In addition, abbreviations used throughout the book include the following :
BA Bachelor of ArtsB.B.M Bachelor of Business ManagementB.C.A Bachelor of Computer ApplicationsB.Com. Bachelor of CommerceB.F.A Bachelor of Fine ArtsB.H.M Bachelor of Hotel ManagementB.Sc. Bachelor of ScienceB.S.W Bachelor of Social WorkG.Cs Government CollegesGIA Government-in-AidKSOU Karnataka State Open UniversityNAAC National Accreditiation and Assessment CouncilNIMHANS National Institute of Mental Health and Neuro-SciencesPACs Private Aided CollegesPUACs Private Un-Aided CollegesPUC Pre-University CourseS C /S T Scheduled Castes and Scheduled TribesSTR Student-Teacher RatioUCs University CollegesUGC Ufiiversity Grants Commission
Secondary Databases on Collegiate Education: Sources, Characteristics and Limitations
The main objective of this Chapter is to explore the sources, characteristics and limitations of secondary databases on collegiate education in the State. This exploration helps in consolidating the available data in both published and unpublished forms, avoids duplication of data collection and provides a justification for collection of primary data to supplement and substantiate the analysis based on secondary data.
2.1. Sources
Secondary data on collegiate education are available from different sources in published and unpublished forms. The major characteristics and limitations of these data by sources and for years during 1990's are described below.
2.1.1. Office of the Commissioner or Director of Collegiate Education
The statistical cell in the Directorate of Collegiate Education maintains the records of the data or information on degree colleges (i.e. general degree and law degree cojieges). In regard to general degree colleges, detailed data are collected from the Government and PACs in prescribed formats. However, the Directorate processes and maintains data only on the following variables with their characteristics and limitations. It is Important to emphasise that many of the limitations of the available data are not accountable for non-collection. Rather, the limitations may be due to nonprocessing of the collected information by the Directorate and/or non-reporting of the relevant data by the colleges. These points are discussed by variables below.
(i) Number of colleges and their general characteristics (unpublished but processed)
District-wise and university-wise data on the nature and number of general degree and law colleges are available for 1997-98, 1999-00 and 2000-01. Data on the characteristics of the colleges include: distribution of colleges by Government, private aided and unaided colleges; distribution of private colleges by minority, SC/ST and general management (i.e. colleges which do not belong to SC/ST management or minorities' management); Location of colleges in or away from district headquarters; courses offered by general and professional courses; year of establishment of colleges; year of brining the aided colleges under GIA; distinction of colleges by evening and day colleges, urban and rural colleges, composite or bifurcated colleges and men's or women's colleges. From these data, annual distribution of number of colleges and colleges by various characteristics can be determined. However, non- availability of data on medium of instruction in colleges is a major missing information on the characteristics of the colleges.
(ii) Enrolment of students (unpublished and unprocessed)
Data on students in colleges may be generated on many aspects, such as, intake, admission, enrolment, examination, pass percent and graduation. At present, all data in the Department are related only to the enrolment of students in the II year and III year of the degree courses. In case of I year degree students, the distinction between number of students admitted and enrolled is not clear. Nevertheless, this study presumes that the number of student in I year degree courses is equivalent to number of students enrolled in I year degree courses for a given year.
Data on enrolment of students are available by: districts; Government, aided and unaided colleges; B.A., B.Sc., and B.Com. courses; I year, if year and ill year; and by male and female students. In addition, total number of students (i.e. sum of students in I year, II year and Ml year of the degree courses) by SG/ST and non-SG/ST students is available for select years in Government and private colleges.
Major limitations of this data are as follows. First, from 1990-91 to 1993-94, the data are combined for aided and unaided colleges. Thus, no separation of enrolment of students between private aided and unaided colleges is possible. Second, no distinction is made in the data on private colleges by minority, SG/ST and general colleges. However, this distinction can be easily made because the identity of colleges by management is available and obtainable from the Directorate.
(iii) Number of staff (unpublished and unprocessed)
Staff in colleges includes teaching and non-teaching staff.
District-wise data on teaching staff are available on the number of teachers by designation and by SG/ST and non-SG/ST categories. These data are available only for GGs and PACsfrom 1990-91 through 1999-00.
In the same way, district-wise data on non-teaching staff are available on the number of non-teaching persons by group G and D categories, and by SG/ST and non- SG/ST categories from 1990-91 through 1999-00.
Major limitations of the data on the staff are due to its non-availability on: private unaided colleges; qualification of teachers and completion of job-related programmes (e.g. refresher and orientation programmes); distinction between part-time and temporary staff; private colleges by Minority, SG/ST and General colleges; and on distinction between sanctioned, working and vacant staff. In addition, the data does not distinguish between teachers (a) in aided colleges who are paid out of government's GIA or paid out of college management, and (b) in different courses in colleges. However, information on sanctioned, working and vacant positions must be available with other sections (e.g. budget section of the Directorate, as such information is vital for release of GIA to colleges). Hence, some of these limitations may be overcome.
(iv) Pass percent of students (unpublished and unprocessed)
The ratio (expressed in percent) of number of students passing in a final year examination to total number of students appearing for final year examination in a course is called pass percent of students in a course. Availability of data on pass percent is limited to total number of students, and by SG/ST and non-SG/ST categories, who have appeared and passed in B.A., B.Sc., and B.Gom. degree final examination in GGs and
PACs from 1990-91 through 1999-00. Thus, pass percent of students may be classified by courses, by SC/ST and non-SC/ST categories and by Government and aided colleges during these years. However, the major limitations of the available data are due to its non-availability on distribution by I Class, II Class and III Class; distinction between male and female students and on entire unaided colleges.
(v) Public expenditure on colleges (processed and unpublished)
The budget section of the Directorate maintains the college level data on the provision and release of budgetary expenditure (Rs. in lakh at current prices) for GCs and on GIA to aided private degree colleges. The data is tabulated by universities and by districts from 1992-93 through 1999-00.
The 6 Joint Directorate of Collegiate Education maintains the college level data on the provision and release of budgetary expenditure on Governmeftt and GIA to the aided private degree colleges which falls within their jurisdiction. From this data, expenditure by different characteristics of colleges may be classified.
(vi) Major limitations of non-GIA data
A major limitation of the non-GIA data above is non-reporting of information by many colleges to the Directorate for different years. For instance, the number of reporting PACs as a percentage of total number of PACs with B.A. and other courses as well as B.Com. and other courses was highest in 1992-92 with 99.58 percent and lowest during 1995-96 with 72.66 percent. However, in case of colleges with B.Sc. and other courses, the highest reporting was evident during 1998-99 and lowest during 1995-96. In case of GCs, the number of reporting colleges as a percentage of total number of colleges with B.A. and other courses was highest during '<996-97 with 99.25 percent and lowest during 1990-91 with 68.54 percent. In case o- GCs with B.Sc. and other courses (or B.Com. and other courses), the highest reporting is evident during 1998-99 (or 1997-98) and lowest during 1990-91. Thus, in all the years, non-reporting private and GCs did exist and vary between the years.
Non-reported information constitutes the missing information for the respective colleges during the years. This has two implications. First, in any statistical analysis, missing information cannot be valued by zero. Second, while taking the average values of the respective variables, (e.g. average enrollment for a government or a private aided college), the denominator should refer to total number of reported government or aided colleges rather than total number of government or aided colleges in a year.
It should be emphasised that the Directorate has no way to fill in data gap, arising out of non-reporting by colleges, except to write back to the respective nonreported colleges. The fact that such data gaps still persist (e.g. data on pass percent of student) is a clear indication that no follow up is strongly initiated by the Directorate to get the data reported from the non reported colleges.
Interestingly, the Directorate has attempted to fill in the missing information in the following way. For total number of teaching staff and enrolment of student by courses, information of the preceding year (as reported by the colleges) are repeated for the current year (non-reported by colleges). However, for pass percent of students by courses, this method of filling in missing information is not adopted. Thus, missing (i.e.
non-reported) information is clearly evident for data on pass percent of students in colleges.
It is important to note that the name of non-reporting colleges can be known from the Directorate. Hence, two alternatives to fill in the missing information are as follows. First, write to individual colleges to supply the relevant information. This is time- consuming and the reply may not be guaranteed. Or, visit the colleges personally to obtain the missing information, provided the colleges are co-operative. However, this is both time-consuming and costly. Second, collect the missing information from the universities, wherein select information on all their affiliated (i.e. government, private aided and private un-aided) colleges are maintained.
2.1.2. Publications of Education Department
2.1.2.1. Annual Report
Select data in the Office of the Director of Collegiate Education are consolidated under the Department of Collegiate Education in the Annual Report of the Education Department. In particular, the Report includes information on administration, important characteristics (including courses offered) and geographical distribution of colleges by management, districts and universities.
2.1.2.2. Performance Budget
Under the Department of Collegiate Education, the performance budget document of the Education Department provides data on the intra-departmental plan and non-plan allocation of resources on revenue and capital account in the format of Budget Paper of the State Government. This information is useful to single out the budgetary allocation to collegiate education on capital account.
2.1.3. Publications of the Department of Finance
Data on public or State Government expenditure on collegiate education are available from the following two published sources.
2.1.3.1. Budget papers
The Budget Papers of the Government of Karnataka provide State level data on plan and non-plan revenue expenditure on collegiate education under the budget head; 2202-03-103 for GCs and under 2202-03-104 for non-GCs. These data are reported in terms of budget estimates for current year, revised estimates for the last year and accounts/actuals for the year before last.
2.1.3.2. Finance Accounts
The Finance Accounts contain audited expenditure and receipts by major budget heads under revenue expenditure, capital expenditure and loans and advances for a given year. First, in case of capital expenditure, audited expenditure by plan, non-plan and total are reported, and cumulative total expenditure at the end of the financial year (e.g. at the end of March) are separately reported. Thus, by subtracting the capital expenditure during the year from the cumulative total expenditure at the end of the year.
the total capital expenditure at the beginning of the year (i.e. as on April 1®*) or total capital stock may be obtained. Second, in case of loans and advances, balance at the beginning of a year, amount advanced during a year, amount repaid during the year, balance at the end of the year, and interest received and credited to revenue are separately reported.
2.1.4. Other sources of data
Other sources of secondary data on collegiate education are available from the(a) universities with which the colleges are affiliated; (b) report of committees on education, human development and other public documents; and (c) from the concerned colleges.
2.1.4.1. Collegiate data in the universities
College level information from the universities is available by four sources. First, published data are obtainable from the Annual Reports, as they are reported on their affiliated colleges. Second, examination and convocation data which are maintained by the examination/evaluation branch of the universities. Third, maintained records in the statistical cells (or Directorate of College Development Councils) of the universities. Since college level data in the universities are not categorised by government, private aided and unaided colleges, identification of types of colleges by management is essential before the data are obtained from the universities. Fourth, report of the Local Inquiry Committees (LIC) for granting fresh/renewal/permanent affiliation to the colleges by the universities. In general, the LIC reports are treated confidential and, hence, data are not published and accessible. Thus, the major characteristics of the university data from annual reports, examination branch and statistical cells are described below.
2.1.4.1.1. Annual Report of the universities (published data)
Annual Report provides information on the objectives, performance and working of the university. In case of Karnataka State Open University (KSOU), the annual report is yet to be brought out. Thus, information relating to KSOU is to be collected from the maintained records in the university and from printed documents, such as. Vice Chancellor's Report for the first convocation of the University held on March 3, 2001.
Within the annual report, a section is exclusively devoted for select details on the affiliated colleges and distance education. Unfortunately, information provided on affiliated colleges lacks uniformity between universities. And, at times, there is inconsistency in' not reporting the same information between years by the same university. These points are clearly evident in the Table 2.1 where the items of reported information are compared between two points in time.
Few remarks deserve special mention here. First, the Annual Report of the Kuvempu University does not report information on affiliated colleges, enrolment of students, number of teachers, pass percentage of students, courses offered etc. Second, receipt and expenditure of colleges is a special item of information, which is currently reported, only in the annual report of Mangalore University. Third, pass percentage of students is not reported in annual report of Karnatak University and Mangalore University. Fourth, data on total number of students are related to number of students who are enrolled in, but not admitted to, different courses by types of colleges.
The data is the aggregate enrolment of student in I year, II year and III year of the respective degree courses in all the subjects. For instance, total enrolment in B.A. course in, GCs during 1991-92 is equal to total enrolment of students in I, II and III year B.A. in all subjects (e.g. history, economics, political science, sociology etc).
Thus, from the annual report of universities, no data can ha generated on any variable for all the universities and for all the years, such as, enrolment of students by courses, number of teaching staff and pass percent of students by courses and classes. Consequently, annua! report of universities is of limited use in supplementing the non- available information with the Department of Collegiate Education.
2.1 4.1.2. Examination/evaSuation branch of the universities (processed data)
The universities wiih which the colleges are affiliated conduct all works relating to the examination/evaluation of the students in all the courses. And, the college-wise results of the examinations are announced and maintained in the examination section of the universities. In particular, three types of college-wise data are maintained.
(i) Announced results
First, after the examination is conducted and evaluation is completed, the universities prepare the results and announce through the colleges. The announced results include information of the register number of students who have passed the examination with a first class, second class and a pass class in the respective colleges. Thus, distribution of total number of students who have passed the examination by courses by 1,11 and Pass class may be determined in a college.
In general, the announced results are in the form of a notification/circular issued from the university to a college. Hence, the college-wise results of the university level examinations are to be accessed only from the circulars, maintained either in the examination branch of the universities or from the concerned colleges.
Two important limitations of this data are as follows. First, the data do not give any information on the number of students who have failed in the examination by colleges. Of course, the announced results include 'to be announced later' (TAL) category. However, TAL is not related to number of failed candidates, if any, in a college. Thus, total number of candidates who appeared for the examination in a course at a college may not be known from the announced results. Second, the announced results are related for the examination in question. Since the successful completion of all courses in the previous year is not a pre-condition for taking up the examination in the current year (this is popularly called 'carry over system'), the announced results of the final year examination cannot be equated with total number of students graduating from a course in a college during a year.
(ii) Convocation data (processed data)
Convocation data are available in two forms. For instance, Bangalore University has processed information on (a) list of candidates admitted to the degrees in several faculties [Bangalore University (2000a)]; and (b) list of candidates eligible to the degrees in the several faculties [Bangalore University (2000b)]. The first list includes the serial number, name and eligible register number of the candidates who have applied to
receive the degrees during the convocation in question. The second list includes the list of candidates who are eligible to receive the degrees during the convocation in question. This list provides course-wise, year-wise and college-wise information on the eligibility number, name of the graduates, register number in the final year examination and class obtained. Those candidates who are eligible by passing the supplementary examination, only pass class is reported.
Thus, convocation data has two merits as compared to the examination data. First, convocation data (i.e. list of candidates eligible) is an important source of consolidated information on announced results of those students who have successfully passed all the prescribed examination in a course in a college. Thus, the number of students graduating from a course in colleges may be determined. Second, convocation data gives the distribution of graduates by 1, II and Pass class by courses or faculty and by colleges in a university.
Nevertheless, e^xamination data of final year students in a course and convocation data of students in a cowrse of a college during a year cannot be considered equivalent in any sense of the term. And, a mere access to examination or convocation daia may not help in determining the pass percent of students, as these data do not contain any information on the number of students appearing for an examination in a college. There are two vyays to dealing with this problem.
First, within the universities, records of hail tickets or register numbers issued by the universities to the students, who take up examination in different colleges, are maintained in the administration branch, if these data are accessible, then total number of candidates who appear for the examination may be obtained and, hence, pass percentage of students may be determined for the colleges within the universities. However, this data suffers from the basic limitation that it includes students who are fresher and repeaters in the April examinations. The results of the repeaters are only announced if they have completed all the examinations of the course and no class is declared for them. Thus, any attempt to find the pass percentage by taking the total number of students passing the examination among the enrolled students as a percentage of total (fresh and repeater) students who appeared for the examination would give misleading results.
Second, information on number of candidates appearing for an examination by courses is also available with the concerned colleges. Since colleges have data on both number of students appearing and passing the examinations, pass percentage of students by courses are also obtainable from the colleges. Unlike the pass percentage data from within the universities, pass percentage data from within the colleges have several other advantages. For instance, at the college level, pass percentage of students is distinguishable between male and female student, and between SC/ST and non-SC/ST students. It is perhaps for this reasons, the Statistical Cells of the universities have attempted to collect information, including pass percentage of student, directly from the affiliated colleges. The details of this source of college level data are given below.
2.1.4.1.3. Statistical cells of the universities
Data on affiliated colleges in the Annual Report of the universities are generated in the statistical cells of the universities. These cells collect information from the
affiliated colleges in the prescribed format. For instance, Bangalore University has a format, which seeks detailed annual information on college, students' strength by courses, examination results, faculty strength, research, sports and games activities of the teachers.
As compared to the information on affiliated colleges from the annual reports of the Bangalore University in Table 2.1, the information collected through the format above has many differences. First, information collected through the format is annual, but publication of report on affiliated colleges, in the form of statistical appendices, is not every year. The last statistical appendices were published during 1995-96 and the work for 1999-00 is reported to be on-going. Second, there exists a vast gap between the information collected in the prescribed format above and the information published in Annual Report of the Bangalore University. This is mainly attributable to shortage of staff to handle the work in the statistical cell. Third, all the information is physically processed. There is a need to computerise the working of this cell in order to quickly input and process the information. Otherwise, much of the vital information collected from the colleges will continue to remain unprocessed and unused, as they have been over the years.
Consequently, information other than what is published in the Annual Report must be extracted from the unpublished and unprocessed data, maintained in the statistical cells of the universities. Inevitably, this data has to be collected only in person with due official permissions, subject to the availability and proper maintenance of records.
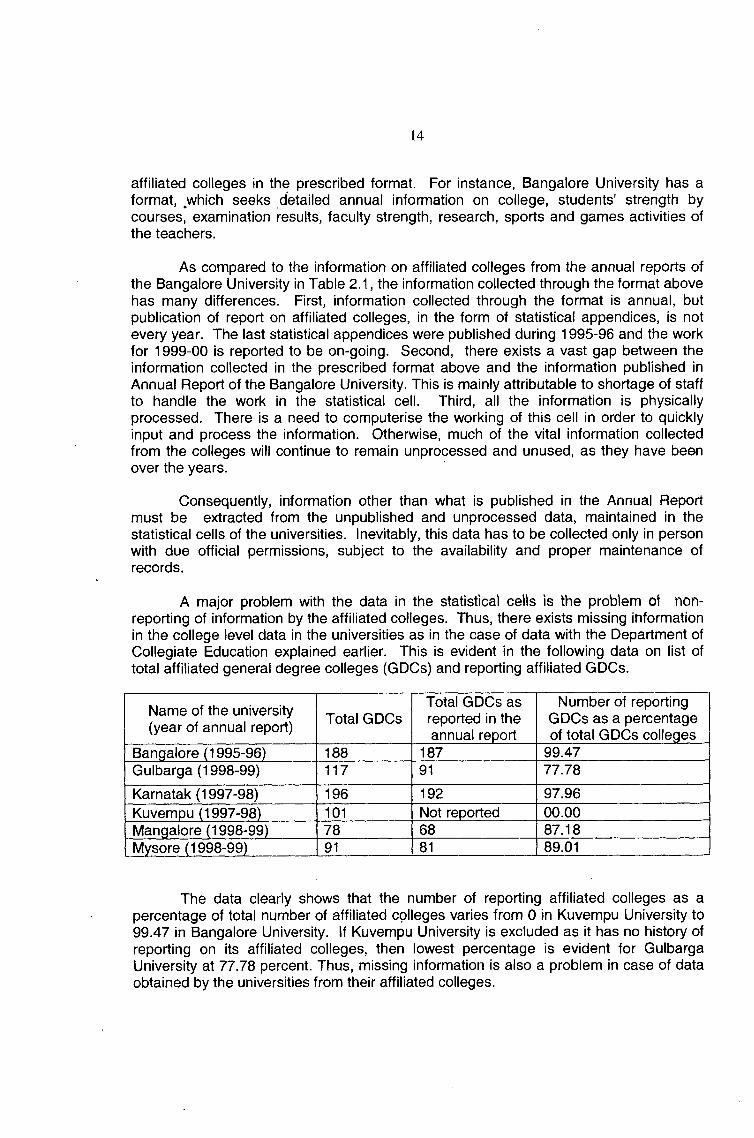
A major problem with the data in the statistical cells is the problem of nonreporting of information by the affiliated colleges. Thus, there exists missing information in the college level data in the universities as in the case of data with the Department of Collegiate Education explained earlier. This is evident in the following data on list of total affiliated general degree colleges (GDCs) and reporting affiliated GDCs.
Name of the university (year of annual report) Total GDCs
Total GDCs as reported in the annual report
Number of reporting GDCs as a percentage of total GDCs colleges
Bangalore (1995-96) 188 187 99.47Gulbarga (1998-99) 117 91 77.78
Karnatak (1997-98) 196 192 97.96Kuvempu (1997-98) 101 Not reported 00.00Mangalore (1998-99) 78 68 87.18Mysore (1998-99) 91 81 89.01
The data clearly shows that the number of reporting affiliated colleges as a percentage of total number of affiliated cpileges varies from 0 in Kuvempu University to 99.47 in Bangalore University. If Kuvempu University is excluded as it has no history of reporting on its affiliated colleges, then lowest percentage is evident for Gulbarga University at 77.78 percent. Thus, missing information is also a problem in case of data obtained by the universities from their affiliated colleges.
2.1.4.2. Report of committees on education and human development
Two important reports during 1990’s are relevant for the study of collegiate education in the State. First, the Report of the Karnataka Universities Review Commission (RKURC) [Government of Karnataka (1993)]. Second, Report on the Human Development in Karnataka (HDK) 1999 [Government of Karnataka (1999)].
Data on collegiate education in RKURC include the following, (a) Number of government and private colleges in different universities by courses during 1991-92; (b) total number of government and private degree colleges during 1960,1965, 1970, 1975, 1980, 1985, 1990 and 1991-92; and (c) enrolment of male and female students in universities by courses; (d) total number of teaching staff in government and private colleges by courses; (e) total number of teaching staff by designation in government and private colleges by universities; and (f) average number of students per teacher in universities by courses, during 1965, 1975, 1985 and 1991-92.
The report of the HDK contains data on select variables in collegiate education by districts in the State. These variables include the following, (i) Total number of colleges by universities and districts during 1991-92 and 1996-97; (ii) enrolment of students by universities and districts during 1996-97; (iii) total number of government and private colleges during 1965, 1975 and 1985, 1991-92 and 1996-97; and (iv) enrolment of male and female students by districts by universities by courses dunng 1965, 1975 and 1985, 1991-92 and 1996-97. In a way, the report of the HDK updates the information in RKURC on variables in (iii) and (iv) for the year 1996-97.
Data in RKURC and HDK have lew eommon limitations. First, they do not contain information on pass percent of student. Second, private colleges are not distinguished between aided and unaided categories. In particular, these limitations underline their limited use in filling up gaps in pass percentage data with the Directorate of Collegiate Education.
On the whole, . available secondary data are particularly inadequate for identification of key (a) problems in students (e.g. motivation in joining the course) and for analysis of future plans of students passing out of colleges; (b) problem in curriculum (e.g. quality and availability of textbooks, and impact of accreditation requirements); laboratory equipment and consumables (e.g. quality, quantity, availability and funding), and facilities (for faculty in terms of appropriateness of class size, staff room and recruitment/retention of qualified faculty, and for support staff in terms of their numbers, skills, etc); (c) non-governmental sources of revenue and non-salary expenditure in private degree colleges (e.g. payment of salary for staff, purchase of land and building,, expenditure on library and equipment). These gaps in the available secondary data must be filled up only through collection of primary data from the individual colleges. A design, conduct and analysis of primary data collection for the present study will be presented in Chapter 6.
CHAPTER 3
Collegiate Education in Karnataka State; Structure, Organisation and Growth
The main objectives of this Chapter are to provide with an overview of the structure, organisation and quantitative growth of collegiate education in the Karnataka State.
3.1. Structure and organisation of collegiate education
The structure of collegiate education has evolved over the years. The major historical developments in the evolution of collegiate education in the State are briefly documented in Government of Karnataka (1993). Thus, the current structure and organisational aspects of collegiate education are focused below.
The structure of collegiate education in the Karnataka State may be defined in terms of institutions and agents. The institutions are the affiliated colleges, viz., government colleges (GCs), private aided colleges (PACs), private unaided colleges (PUACs), university colleges (DCs) and universities that impart distance education.
A private college, which receives (does not receive) GIA from the State Government is called an aided (unaided) private college. Over the years, the GIA is given in the form of maintenance or teaching grant to meet the annual recurring cost on account of salary expenditure of aided teaching and non-teaching staff in the PACs and, hence, the amount of GIA varies between the aided colleges. However, the entire salary on teaching and non-teaching staff is not covered by the GIA in any of the PACs.
Both PACs and PUACs are broadly divided under three types of management, viz., (a) colleges which are managed by minorities (i.e. linguistic or religious) or Minority colleges, (b) colleges which are managed by Scheduled Castes and Tribes (SC/ST) or SC/ST colleges, and (c) colleges which are managed by non-minorities and non-SC/ST or General colleges. The essential distinctions between these management are as follows.
In principle, the SC/ST colleges should have all members of their management belonging to SC/ST and 50 percent of their students belonging to the SC/ST. In addition, these colleges are free from roaster system in recruitment of their staff. However, it is mandatory for these colleges to obtain permission to fill up any vacancy and to be bound by Government’s directions on the constitution of the selection committee including the appointment of Government’s nominee.and subject-expert. The Minority colleges are characterised by majority of the persons on their management belonging to minorities. They are free from the roaster system and all other official rules and regulation in regard to staff recruitment. Thus, Minority colleges are free to formulate their own recruitment policy in regard to their staff. Unlike SC/ST and Minority colleges, General colleges are characterised by no specific conditions on the composition of management, but subject to various rules and regulations in regard to recruitment of staff including the roaster system. For instance, as in the case of SC/ST colleges, it is mandatory for General colleges to obtain permission to fill up any vacancy and to be
bound by Government’s directions on the constitution of the selection committee including the appointment of Government’s nominee and subject-expert.
The major agents in collegiate education are those who contribute to the functioning of the colleges. These agents include the university, State Government, college management, teaching and non-teaching staff and students enrolled in various courses. In fact, each agent may be identified with one or more specific function/s. However, the basic functions of different agents may be common or different between the types of colleges. These commonalties and differences are highlighted below by specifying the role of different agents in collegiate education.
3.2. Role of University Grants Commission (UGC)
The role of UGC in collegiate education may be distinguished in terms of the following functions, (a) Formulation of guidelines for recruitment and promotion and workload for teaching staff, (b) Provision of financial assistance for developmental purposes for colleges on permanent affiliation, autonomous colleges, and eligible vocational courses in degree colleges and faculty improvement programmes (e.g. to pursue research towards Ph.d degree), (c) Approval of autonomy for colleges, (d) Assist universities in establishment of College Development Council, SC/ST Cell and Academic Staff Colleges, and (e) Assessment and accreditation of colleges through National Assessment and Accreditation Council (NAAC).
3.3. Role of University
University is the most important institution for promotion and regulation of academic matter in regard to collegiate education. In particular, the role of a University may be identified as follows. First, establishment, organisation, financing, promotion, regulation and management of UCs. Second, constitution of Affiliation/Local Inquiry Committee for recommending affiliation (new/renewal/permanent) for colleges and courses and fix intake of students by courses. Third, fixation of course combinations in colleges; number of working days for colleges; minimum attendance of students in colleges; and workload for staff. Fourth, constitution of subject-wise Board of Studies (Undergraduate) for framing of uniform curriculum for all subjects taught in the affiliated colleges. Fifth, conduct of uniform examination and valuation of students in all affiliated courses, and award degree for successful students. Sixth, recommend autonomy for colleges.
The framework of functioning of the universities in regard to their affiliated colleges are stated in the Karnataka State Universities Act 1976 and statues and resolutions within the bodies of the university (e.g. Senate, Syndicate and Academic Council). A comprehensive amendment to the Act 1976 has come into effect in 2001 under The Karnataka State Universities Act 2000. On the other hand, in case of Karnataka State Open University, the Karnataka State Open University Act 1992 is applicable.
In addition, the State universities have established the College Development Council, SC/ST Cell and Academic Staff College with the assistance of UGC. The major functions of the Council are to facilitate the grant of affiliation and autonomy for affiliated colleges; NAAC's working within the university; approval of appointment of teachers and principals of affiliated private colleges; facilitate UGC assistance to colleges and
teachers; and academic and adnninistrative improvements of college education. The SC/ST Ceil has the objective of improving the welfare of students and staff who belong to SC/ST communities through monitoring the implementation of various programmes for the communities including admission of students and recruitment of staff in colleges. The Academic Staff College is established to offer refresher courses for in-service teaching staff and orientation programmes for newly appointed teaching staff. At present, all the State universities have College Development Council and SC/ST Cell. The Academic Staff College is established in University of Mysore, Karnatak University and Banglaore University. And, Mangalore University has established Staff Development College.
3.4. Role of State Government
The State Government has both regulatory and promotional functions in collegiate education. These functions include the following, (i) Establishment, organisation, financing, promotion, regulation and management of GCs. (ii) Promotion (e.g. through GIA policy) and regulation (e.g. fixing student fee, periodic inspection, implementation of reservation and roaster system in recruitment and promotion of staff) of PACs. (iii) Grant recognition through approval of affiliation or autonomy for all colleges and, thereby, permit the start of a new affiliated college or autonomous college.
To carry on the functions above, among others, the State Government has a four-tier administrative set up. First, the Secretariat with the Principal Secretary (Higher Education) to deal with all policy matters in higher general and technical education. Second, the Commissioner of Collegiate Education since 1997 to co-ordinate between the Secretariat and Directorate of Collegiate Education. Third, establishment of Directorate of CoHegiate Education in 1960. Historically, the Directorate ot Collegiate Education is responsible to administer the GCs and PACs. To start with, all colleges except teachers' colleges, university colleges and professional colleges came under its administrative control. At present, the Directorate has three major functions, (i) Promotion and administration of GCs (i.e. general degree colleges and law degree colleges), (ii) Promotion and regulation of PACs. (iii) Co-ordinate between the State Government and universities in regard to collegiate education at the State level. Fourth, establishment of 6 Joint Directorate of Collegiate Education to cover the GCs and PACs that come under the jurisdiction of 6 State universities to facilitate local level coordination between the State Government, universities and colleges and for disbursement of GIA to PACs.
3.5. Role of management in private colleges
As per the guidelines of the State Government, affiliated university and UGC, the management of private colleges has the following major functions, (a) Apply for affiliation, recognition and/or autonomy, (b) Establish, organise, finance, promote, regulate and manage their colleges, (c) Recruit staff and admit students to courses, (d) Facilitate the conduct of examination and valuation by the affiliated university, (e) Appointment of principal for day-to-day college administration, (f) Take disciplinary action on erring staff and students. Thus, management plays a very important role in the growth of private colleges in the State.
3.6. Role of Staff and students
Teaching and non-teaching staff and students comprise the non-institutional agents of collegiate education.
Teaching staff has the basic function of promoting the curricular and extracurricular activities of students through teaching prescribed syllabus in courses offered within the colleges. The non-teaching staff has the basic functions of supporting the teaching staff in conducting all academic programmes, and in assisting the smooth administration and management of the colleges.
Staff may be directly recruited or internally promoted. The nature of staff includes permanent, temporary and part-time. In general, qualification and experience for teaching staff are guided by the UGC norms and approved by the State Government. The number of teachers to be appointed is based on workload and minimum enrolment of students, rather than student-teacher ratio.
Students, who are enrolled in courses offered within the colleges, have the basic function of learning the prescribed contents of the courses from the teaching and nonteaching sources (e.g. by referencing books in the college library) within the colleges and to successfully graduate from the courses.
Admission criteria for students are college-specific. Thus, quality of intake of students varies between colleges. In addition, infrastructure (e.g. library, laboratory, sports facilities and classroom facilities), opportunities for interaction vary between colleges, subjects and syllabus lor the course vary between the universities and, hence, in colleges. Most importantly, students and colleges have no freedom to choosing the combination of subjects in a course, as the university fixes all combinations of subjects.
In short, the institutions in collegiate education include university, government and private colleges. The agents include both institutional agents (i.e. the State Government, State universities, and private management of colleges) and non- institutional agents (i.e. staff and students of colleges). These institutions and agents constitute the structure of collegiate education, and interactions between all institutions and agents constitute the organised system of collegiate education in the State. In essence, the organised system specifies the functions and responsibilities that each institution and agent should do, as per the rules and regulations framed within the institutions as well as for all the institutions in the State.
The analysis on the structure and organisation of collegiate education in the State above clearly indicates the following. First, colleges, courses and admission of students are different within and between the universities. Second, establishment, functions, administration and management of GCs, PACs, PUACs and DCs are different in the State. Third, universities have important roles in collegiate education mainly in affiliation, curriculum and examination matters. Fourth, State Government has the vast powers in effecting the establishment, organisation, management, promotion, regulation and financing of collegiate education. Thus, State Government policies and programmes are of critical importance in explaining past and current development and in influencing/determining future developments of collegiate education in the State
3.7. Growth of collegiate education
Broadly speaking, the growth of collegiate education is the culmination of all interactions between all the institutions and their agents. Over the years, this culmination of interactions has resulted in many changes or outcomes in the collegiate education. The changes may be observed (e.g. changes in the number of colleges or enrolment of students) and/or unobserved (e.g. dedication and commitment of teaching staff towards improving the quality of education in their colleges). However, for paucity of data, the analysis of growth of collegiate education is limited to observed changes.
In reality, observed changes in collegiate education are many and diversified, since the changes refer to all the elements in the structure and organisation of the collegiate education explained above. To simplify the growth analysis, first of all, the observed changes shall have to be summarised by a set of broad indicators of growth of collegiate education. Second, the spatial unit of analysis shall have to be specified, as the indicators can be analysed at different levels (e.g. State level, district level and college level).
(i) Choice of growth indicators
This study considers the following broad indicators of growth of collegiate education in Karnataka State during 1990’s.
♦ Growth and distribution of number of colleges by management.
♦ Growth and distribution ot enrolment ot male and female students by courses and by SC/ST and non-SC/ST students in colleges by management.
♦ Growth and distribution of teaching staff who belong to SC/ST and non SC/ST categories in colleges by management.
♦ Growth and distribution of non-teaching staff who belong to SO/ST and non SC/ST categories in colleges by management.
(ii) Choice of level indicators
Select current characteristics and distribution of courses in colleges by management are separately analysed. This analysis is intended to indicate the current levels of various qualitative and quantitative indicators of the collegiate education in the State.
(iii) Unit of analysis
The growth indicators may be analysed at the State level, district level, university level and/or at the college level. However, first of all, an analysis at the State level will not capture the spatial distribution of the growth of collegiate education. Second, the number of colleges is many and an analysis based on all colleges is highly demanding in terms of time and other resources. Third, in view of the reorganisation of districts and the resultant creation of 7 new districts in the State, a district-wise analysis will pose the problem of comparison of indicators between pre-reorganisation (i.e. before 1997-98)
and post reorganisation (i.e. from 1997-98) during 1990's. Fourth, the number of State universities in this study has remained the same during 1990's. In the same way, the nature of districts within the jurisdiction of these universities has also remained the same, although the number of districts has changed due to reorganisation of districts in the recent past.
In view of the above, the analysis of growth indicators will be done by universities and by 20 districts. Since district is a unit of planning in the State, a district wise analysis will be helpful for both district level and inter-district planning. However, all analysis of current level indicators will be done by types of colleges at the State level.
3.7.1. Description of growth of collegiate education
The indicator (b) will be described in detail Chapter 4 as part of the demand for collegiate education. Indicator (c) and (d) will be described in Chapter 5 as part of the quality and relevance of collegiate education. Thus, indicator (a) is described below along with current characteristics of colleges.
3.7.1.1. Growth and distribution of number of colleges
The number, annual growth, university-wise and district-wise distribution of colleges by GCs, PACs and PUACs during 1990's are given in Table 3.1, Table 3.2. and Table 3.3 respectively. In all the tables, for each year, the number of colleges and its share in the State's total (as shown in the parentheses) are given in the first column. In the second column, annual growth (%) of the number of colleges and share of each district in the University's total number of colleges ( as shown in the flower brackets) are given.
Inter-district distribution is not relevant for UCs. Hence, the growth of DCs is not clubbed with non-UCs below. In the same way, growth of distance education is separately analysed.
3.7.1.1.1. Government colleges
In Table 3.1, it is apparent that the total number of GCs has increased from 99 in1990-91 to 138 in 1993-94 and to 148 in 1996-97. However, from 1997-98 to 2000-01, only 2 new GCs have been established in the State. Thus, the annual growth of total GCs in the State was 16.16 percent in 1991-92, 13.91 percent in 1992-93, 5.34 percent in 1993-94 and 6.47 percent in 1996-97. For the remaining years, the annual growth has been less than one percent.
Of the universities in the State, Bangalore (Mangalore) University has the highest (lowest) share of GCs, but the share has declined (increased) over the years. For instance, the share of Bangalore (Mangalore) university in the State's total was 31.31(5.05) percent in 1990-91, but has declined (increased) to 25.83 (9.93) in 2000-01. The declining share of Bangalore University is due to increasing number of GCs in other universities. For instance, during 1990-91 to 2000-01, 52 new GCs have been established in the State and of which only 8 have been established within the jurisdiction of the Bangalore University.
Of the districts in the State, the share of Bangalore Urban, Tumkar, Kolar, Mysore, Shimoga, Dakshina Kannada and Gulbarga has been relatively higher than other districts. For instance, the combined share of these 7 districts in the total number of colleges in the State was 54.54 percent in 1990-91, 51.77 percent in 1995-96 and 51.66 percent in 2000-01.
3.7.1.1.2. Private aided colleges
Table 3.2 presents the number and growth of PACs. The total number of PACs has remained the same at 290 during 1990-91 to 1998-99. Consequently, (a) the annual growth of total number of colleges by universities and districts is zero in these years and(b) the share of PACs does not vary between universities in a year and for each university over the years. Thus, there exists uniformity in the distribution of number of PACs by universities and districts in the State during 1990-91 to 1998-99.
From the list of colleges on GIA in Government of Karnataka (2001a), it is observed that only 2 new PACs have been brought under the GIA in Kuvempu and Karnatak University and 2 PACs are reduced in Gulbarga University, in 2000-01. Thus, the net addition to the number of PACs in the State is only 2 colleges, resulting in the total number of PACs in the State to 292 in 2000-01.
Of the universities in the State, Karnatak University has the highest share of PACs and is followed by Bangalore University, Gulbarga University, Mangalore University, University of Mysore and/or Kuvempu University. In 1990-91 (2000-01), the share of these universities in the total PACs in the State is 33.79 (34.25) percent, 21.03 (20.89) percent, 14.14 (13.36) percent, 12.07 (11.99) percent, 9.66 (9.59) percent and 9.31 (9.93) percent respectively.
Of the districts in the State, the share of Bangalore Urban, Dakshina Kannada, Dharwad, Belgaum and Bijapur has been relatively higher than other districts. For instance, the combined share of these 5 districts in the total number of PACs in the State is 55.52 percent in 1990-91, 55.52 percent in 1995-96 and 55.82 percent in 2000-01. The stagnation in the percent share of these districts is due to the stagnation in the growth of number of PACs in the State as whole during these years.
3.7.1.1.3. Private unaided colleges
Table 3.3 presents the number and growth of PUACs, which show remarkable patterns and differences as compared to the number and growth of GCs and PACs.
First, there has been a phenomenal increase in the total number of PUACs in the State over the years. For instance, the total number of PUACs colleges in the State has increased from 42 in 1990-91 to 95 in 1991-92, and from 150 in 1992-93 to 259 in 1994- 95 and to 473 in 2000-01. The highest annual growth of 126.19 percent is evident in1991-92 and is followed by 57.89 percent in 1992-93, 8.24 percent in 2000-01 and so on.
Of the universities, Bangalore University has highest percent share in the State's total PUACs and is followed by Gulbarga University (26.19%), Mangalore University (16.07%), Kuvempu University (14.29%), Karnatak University (9.52%) and University of Mysore (4.76%) in 1990-91. However, in 2000-01, the highest share in the total PUACs
in the State is evident for Bangalore University (37.84%) and is followed by Karnatak University (22.41%), Kuvempu University (12.05%) and Gulbarga University (12.05%), University of Mysore (8.88%) and Mangalore University (6.77%) in 2000-01.
The annual growth of the number of PUACs shows that all the universities have registered a positive growth for all the years, although the highest annual growth is evident for most of the universities in 1991-92 and 1992-93. For instance, the annual growth of number of colleges in 1991-92 (2000-01) was 90.91 (17.76) percent in Bangalore University, 200 (0.00) percent in University of Mysore, 200 (5.56) percent in Kuvempu University, 42.86 (0.00) percent in Mangalore University, 250 (6.00) percent in Karnatak University and 116.67 (0.00) percent in Gulbarga University. Thus, the number and annual growth of PUACs vary not only between universities in a year but for each university over the years.
Of the districts in the State, the share of Bangalore Urban, Chitradurga Dakshina Kannada and Raichur has been relatively higher than other districts. For instance, the combined share of these 4 districts in the total number of PUACs in the State was 72.97 percent in 1990-91, 41.84 percent in 1995-96 and 45.88 percent in 2000-01. The changes in percent share of these districts are due to the increase in the growth of number of PUACs in other districts (e.g. Tumkur) in these years.
3.7.1.1.4. University colleges
University (or constituent) colleges have been established by University of Mysore, Mangalore University, Karnatak University and Kuvempu University. The University of Mysore has 3 colleges (Maharaja's coHege, Yuvaraja's college and University Evening college at Mysore), Mangalore University has 2 colleges (University college at Mangalore and F.M.K.M. Cariappa College at Madikeri), Karnatak University has one college (Karnatak Science College at Darwad) and Kuvempu University has two colleges (Sahyadri Arts and Science College and Sahyadri Science College at Shimoga).
Thus, the total number of UCs is equal to 8 colleges. This has remained the same during the entire 1990s. Further except F.K.K.M. Colleges, no other university college is located outside the university headquarters.
3.7.1.1.5. Summary statistics on the number of colleges in the State
Table 3.4 presents the summary statistics on the number of GCs, PACs and PUACs for 20 districts in the State. The summary statistics is related to the mean, standard deviation and coeffieient of variation. The mean values show the average number of colleges per district in a year. Since the number of districts is the same throughout the 1990's, the changes in the mean values are the consequences of the changes in the number of colleges in a year. The standard deviation measures the absolute deviation about the mean in inter-district distribution of colleges. The coefficient of variation is a measure of relative variation. It is computed by dividing standard deviation by mean of a variable and is expressed in percentage.
Since the number of PACs has been constant from 1990-91 to 1999-00, all the summary statistics have remained the same. Nevertheless, some interesting trends are observable between GCs, PACs and PUACs.
First, since 1992-93, the mean number of GCs (i.e. number of GCs per district) has been lower than in case of PACs and PUACs. Between FACs and PUACs, the mean number of PUACs has been higher than PACs since 1996-97. This indicates the phenomenal increase in the growth of PUACs in the State during last five years.
Second, lack of wide variations in inter-district distribution is evident in case of GCs, as the values of standard deviation and coefficient of variations do not show marked annual changes in their magnitude. In the same way, the variations are the least as compared to the PACs and PUACs throughout 1990's. However, between PACs and PUACs, both absolute and relative variations in inter-district distribution of colleges are the largest in case of PUACs since 1994-95.
In short, slowness in growth of GCs, stagnation in growth of PACs and UCs and phenomenal growth of PUACs marks the trends in the growth of collegiate education during 1990's in the State.
3.7.1.2. Current select characteristics of colleges
For expositional clarity, the characteristics of colleges are presented under general and course characteristics.
3.7.1.2.1. General characteristics
Table 3.5 presents the select current (i.e. as observed in 2000-01) characteristics of all PACs, PUACs and GCs, in the State.
First, the number of Mens' (Womens') colleges is relatively higher within the GCs (PUACs). However, co-education colleges (i.e. total number of colleges less Mens' and Womens' colleges) are the highest among the GCs, PACs and PUACs.
Second, composite colleges (i.e. degree colleges with pre-university education) are highest in aided colleges than in GCs and PUACs.
Third, while there are no evening GCs, the share of evening colleges in the total PACs (PUACs) is about 4.11 (2.54) percent. Thus, day colleges dominate the collegiate education in the State.
Fourth, of the three types of private colleges (i.e. General, SC/ST and Minority colleges), the share of Minority colleges (SC/ST) colleges is relatively higher in PACs (PUACs). However, the share of General colleges (i.e. total colleges less Minority and SC/ST colleges) is highest in the total PACs (about 81.51 percent) and PUACs (^ o u t 72.94 percent).
Fifth, the location pattern shows that most of the colleges are concentrated either at the district or taluk headquarters. Since these headquarters constitute urban areas, the location of colleges is predominantly urban in character. Thus, 75.49 percent of GCs, 81.16 percent of PACs and 74.21 percent of PUACs are urban colleges in the State. Or, 76.63 percent of all colleges in the State are urban colleges.
‘ At present, degree education is bifurcated from pre-university education in all GCs and PACs. Hence, the concept of composite colleges is relevant only for PUACs.
In case of DCs, the following important characteristics are evident. First, of the 8 DCs, 7 colleges are day colleges. Second, no university college is a composite college. Third, all DCs are located in urban areas and district headquarters. Fourth, all DCs are co-education colleges.
3.7.1.2.2. Course characteristics
An important characteristic of collegiate education is the courses offered. Broadly speaking, courses offered in degree colleges may be divided into (excluding preuniversity courses in composite colleges) undergraduate degree courses and postgraduate degree courses. The undergraduate courses may be divided into traditional courses (i.e. B.A., B.Sc., and B.Com.) and professional courses (i.e. BCA, BBM, BFA, BHM and BSW). The traditional or professional courses may include vocational subjects (e.g. Industrial Chemistry, Industhal Microbiology, Foreign Trade and Practice and Functional English/Communicative English). The post-graduate courses include traditional courses (e.g. M.A., M.Sc., M.Com) and professional courses (e.g. MBA and MCA).
Table 3.6 presents the nature and combination of different courses offered by GCs, PACs and PUACs in 2000-01.
First, the number of colleges offering traditional degree courses (i.e. B.A., B.Sc. and B.Com.) is highest among the PACs (42.12 percent) and is followed by GCs (17.22 percent) and PUACs (5.29 percent).
Second, the number of GCs and PACs offering only professional courses is less than one percent, as compared to 21.99 percent of total PUACs.
Third, the combination of traditional courses and professional courses show very interesting patterns. For instance, of the three traditional courses, the combination of B.A. and professional courses is observed to be most popular in case of GCs (23.84 percent) and PUACs (28.12 percent) as compared to the combination of B.Sc. or B.Com. and professional courses.
Fourth, B.A., B.Com. and professional courses are the most popular combination of courses in GCs (46.36 percent), PACs (33.22 percent) and PUACs (19.66 percent) than the combination of either (a) B.A., B.Sc. and professional courses or (b) B.Sc., B.Com. and professional courses.
Fifth, the number of degree colleges which offers post-graduate courses is relatively more in private colleges (in particular, in PACs) than in GCs.
Thus, GCs, PACs and PUACs exhibit unique characteristics and differences in the nature and combination of courses offered in 2000-01.
On the whole, the growth of collegiate education is characterised by variations in the number and annual growth at the State level, between districts, between universities and between years in GCs, PACs and PUACs. The variations in the current characteristics indicate the heterogeneity of the colleges in the State. These variations provide a factual basis for a disaggregate study of colleges by management and courses in the following chapters of this study.
It might be added here that in case of DCs, 3 colleges provide science education and the rest 5 colleges provide arts and/or commerce education including BBM course (e.g. in Maharaja's college at Mysore).
3.7.1.3. Growth and characteristics of distance education
The Report of the Karnataka Universities Review Commission in 1993 clearly noted the following. "There is a need for starting an Open University in the State of Karnataka, which will open up better avenues for higher education to the needy at an affordable cost. Hence it is recommended that an Open University in the State (TheKarnataka State Open University) be started without loss of time........ The coursesprepared can be offered in Kannada and English for the benefit of the students" (p.193).
Accordingly, the Karnataka State Open University (KSOU) has come into being by taking over the administration and working of the Institute of Correspondence Courses and Continuing Education of the University of Mysore on June 1, 1996.
Before the establishment of KSOU on June 1, 1996, distance education was imparted by three State universities, viz., University of Mysore, Karnatak University and Bangalore University. While University of Mysore focused on correspondence courses (CC) and open university system (OUS), Karnatak University focused on external scheme (ES), and Bangalore University included CC, OUS and ES. At present, distance education within the State is imparted by KSOU, Karnatak University (only ES) and Bangalore University (no ES).
Since admission to CC and OUS by the universities outside the State (e,g, Annamalai University or Indira Gandhi National Open University) is open to students in Karnataka State as well, access to distance education for students in Karnataka State is not limited to distance education, provided by universities within the State. Thus, supply of and demand for distance collegiate education cannot be assessed from within the State only.
The essential differences between CC, OUS and ES are as follows. First, for admission to the CC and ES, the students should have obtained the basic qualification, as prescribed by the university (e.g. a pass in PUC for admission to traditional degree courses). For admission to OUS, a student should have completed 18 years for undergraduate courses and 21 years for post-graduate courses. Second, the study materials are provided to students under CC and OUS, but not under ES. Third, the syllabus and evaluation for CC, OUS, ES and regular education within the university is the same. And, no discrimination in degree certificates is made. However, between the universities the syllabus and evaluation are different. Fourth, between national and state open universities, the nature of language as medium of instruction (to be opted by the students voluntarily, however) plays an important role. For instance, Hindi and English are the medium of instruction in case of IGNOU, and Kannada and English in case of KSOU.
Various undergraduate, post-graduate, diploma and certificate courses are offered by distance education mode. For instance, in Bangalore University, Directorate of Correspondence Courses & Distance Education offers undergraduate courses In B.A., BBM., B.Com., B.Ed. and B.C.A. In Karnatak University, External Examination wing offers undergraduate coursf;6 in B.A. and B.Com. The KSOU offers undergraduate
degree courses in B.A. B.Com., B.Ed. and B.L.I.Sc. Thus, undergraduate courses in distance education belong to non-science degree courses, and non-experimental professional subjects. As in the case of regular education, teaching, course structure and contents and evaluation of distance education are not directly comparable between the universities in the State.
In the context of collegiate education in the State, distance education adds to the total supply of and demand for collegiate education in the State, except in case of science degree courses, and, hence, is complementary to regular education.
It should be emphasised that regular education and distance education is not directly comparable in terms of admission requirements, enrolment of students, learning performance of students and cost of education. In view of these differences, analysis of distance education should be treated separate from the regular collegiate education. Thus, all analysis of regular education is separated from distance education in this book.
CHAPTER 4
Analysis of Demand for Collegiate Education
This chapter examines the student demand for different courses and explores reasons for the excess demand/lack of demand for specific courses in the collegiate education. In addition, possible impact of changes in demand for collegiate education on lower and higher levels of education is analysed.
4.1. Demand for collegiate education
In general, students are considered to be the demanders (consumers or buyers) of collegiate education. However, all those who buy the services of students, after their graduation, for various jobs in the society are the ultimate demanders of the collegiate education. Accordingly, demand for collegiate education may be analysed with respect to student demand for collegiate education and/or with respect to demand for college graduates.
In the absence of gross or net enrolment ratio for collegiate education, student demand for collegiate education may be related to demand for courses (and, of course, for different subjects within the courses) offered in colleges or for the colleges wherein the courses are offered. In either of the cases, the ultimate student demand for collegiate education is the demand for courses offered in colleges.
On the other hand, demand for college graduates comes from various economic activities in primary, secondary and tertiary sectors. These activities include trade, manufacturing, business, teaching, government and agriculture. In essence, the demand for college graduates in these activities is the demand for collegiate education. Hence, employment changes in these activities signify changes in the demand for collegiate education.
In reality, demand for college graduates may influence the student demand for college courses. For instance, students may plan to join a course of study in a college depending on whether or not a course has employment prospects after their graduation. Thus, for determination of student demand for collegiate education, an understanding of demand for collegiate education is essential.
In what follows, the focus of the analysis will be on student demand for collegiate education in terms of their demand for degree courses.
4.2. Generation of demand for collegiate education by courses
Student demand for collegiate education is expressed in the form of application for admission to courses. In general, courses which are in high (low) demand receive more (less) number of applications than the availability of seats (or intake capacity or limit as fixed by the universities with which the colleges are affiliated) in the courses. Thus, the colleges have to devise specific ways of increasing (reducing) the demand for low (high) demand courses in order to balance the supply of and demand for courses. For instance, in the context of reducing the excess demand for a course, a college may
rise the eligibility criteria for application to courses in terms of higher percent of marks scored in the qualifying examination, or conduct an entrance examination, to select the required quantity and quality of students for the courses.
It should be emphasised that there exists no centralised (either at the State level or university level) entrance examination to courses in general collegiate education inthe State. This is in contrast, for instance, with professional education (i.e. allengineering courses, medical and dental courses) where the State Governmentconducts a Common Entrance Test, allocates students under and fix fee for free seats and payment seats. In the same way, universities conduct entrance examination for management (e.g. MBA) and computer (e.g. MCA) courses and allocate students under free seat and payment seat, although the student fee under both free and payment category is fixed by the State Government.
Thus, a detailed analysis of the generation of student demand for collegiate education by courses above requires information, at the college level, on the number of applications received, intake capacity in different courses, eligibility criteria foradmissions to courses in excess or deficient demand, and the actual number of admission of students in the courses. Unfortunately, these information are not available from the secondary sources, either in published or unpublished forms. Hence, the following alternative is tried in terms of enrolment data.
4.3. Demand for collegiate education based on enrolment data
Enrolment of students (i.e. sum of students in the I, II and III year of the courses) is an important indicator of demand for collegiate education by courses. Analysis of growth and distribution of enrolment of students helps in understanding of what students demand in collegiate education. The purpose of this description is to single out the essential differences and/or similarities in the nature and patterns of students' enrolment by courses in the colleges. It should be emphasised that these descriptions are limited to certain years and characteristics for GCs, PACs and PUACs for lack of data for all years, characteristics and colleges.
Further, summary statistics on the number and annual growth of enrolment of male and female students are presented and described separately for Government colleges (GCs), Private aided colleges (PACs) and Private unaided colleges (PUACs). This description is intended to understand the nature and extent of inter-district variations in the demand for collegiate education through 1990’s.
In addition, enrolment of student in UCs and distance education is described by courses. This description is useful to understand the distribution of enrolment by GCs, PACs, PUACs, UCs and distance education in the State.
4.3.1. Enrolment by courses by non-university colleges
Table 4.1. summahses the trends in and patterns of enrolment of students at the State level by B.A., B.Sc. and B.Com. degree courses in GCs, PACs and PUACs as well as in all colleges.
First, total enrolment in GCs has declined in all the courses since 1996-97. For instance, the enrolment in B.A. B.Sc. and B.Com. course has declined from 50936,
11301 and 9342 students in 1996-97 to 43717, 6137 and 7366 students in 1999-00. Thus, total enrolment in all courses has declined from 71579 student in 1996-97 to 57220 students in 1999-00. Of the total decline in enrolment in all courses, the largest decline is evident for B.Sc. course and is followed by B.Com. For instance, the share of B.Sc. (B.Com.) students in the total enrolment in all courses has declined from 15.79(13.05) percent in 1996-97 to 10.73 (12.87) percent in 1999-00. Consequently, the relative share of B.A. students in total enrolment has increased from 71.16 percent to 76.40 percent in this period.
Second, as in the case of GCs, total enrolment in PACs has declined in all the courses since 1996-97. For instance, the enrolment in B.A. B.Sc. and B.Com. course has declined from 133840, 48243 and 56612 students in 1996-97 to 85735, 32264 and 54671 students in 1999-00. Thus, total enrolment in all courses has declined from 56612 student in 1996-97 to 54671 students in 1999-00. Of the total decline in enrolment in all courses, the largest decline is evident for B.A. course and is followed by B.Sc. course. For instance, the share of B.A. (B.Sc.) students in the total enrolment in all courses has declined from 56.07 (20.21) percent in 1996-97 to 49.60 (18.66) percent in 1999-00. Consequently, the relative share of B.Com. students in total enrolment has increased from 23.72 percent to 31.74 percent in this period.
Third, in contrast with GCs and PACs, total enrolment in PUACs has increased in all the courses since 1996-97. For instance, the enrolment in B.A., B.Sc. and B.Com. course has increased from 26628, 3354, and 10212 students in 1996-97 to 30628, 5375 and 14590 students in 1999-00 respectively. Thus, total enrolment in all courses has increased from 40194 students in 1996-97 to 50592 students in 1999-00. Of the total increase in enrolment in all courses, the largest increase Is evident for B.Com. course and is followed by B.Sc. course. For instance, the share of B.Com. (B.Sc.) students in the total enrolment in ail courses has increased from 25.41 (8.34) percent in 1996-97 to 28.84 (10.62) percent in 1999-00. However, the relative share of B.A. students in total enrolment has declined from 66.25 percent to 60.54 percent in this period.
Fourth, total enrolment in all colleges by courses shows similar patterns of enrolment in GCs and PACs, since the enrolment of students in these colleges constitutes the largest share among all colleges in the State.
The above trends and patterns have the following major implications. First, total demand (i.e. demand for all courses) has declined in colleges under all management except PUACs. Second, of the courses, greater decline in demand is evident for B.Sc. and B.Com. course in GCs; and B.A. and B.Sc. course in PACs. Third, in contrast to GCs and PACs, total demand has increased in PUACs, especially for B.Sc. and B.Com. courses. Thus, the nature and magnitude of changes in demand for collegiate education are distinct between courses and colleges in the State.
4.3.2. inter-district distribution and variations in enroiment of students by courses and by non-university coiieges: A summary
A simple way of summarising the inter-district distribution and variations in enrolment is to look at the summary statistics. The summary statistics is related to the mean, standard deviation and coefficient of variation. The mean values show the average number of students per district in a year.' Since the number of districts is fixed
at 20 throughout, the changes in the mean values imply changes in the number of total enrolment of students in a year. The standard deviation measures the absolute deviation about the mean in inter-district distribution of enrolment of students. The coefficient of variation is a measure of relative variation. It is computed by dividing standard deviation by mean of a variable and is expressed in percentage.^
Table 4.2 presents the summary statistics for GCs from 1990-91 through 1999- 00. First, enrolment of male (or female) students is higher than female (or male) students in all the years in B.A. and B.Com courses (or B.Sc. course). Second, the mean enrolment of male and female, or mean enrolment of all students, has increased in all the courses up to 1995-96. This increase is accompanied by an increase in absolute variation in terms of standard deviation. Subsequently, the mean enrolment has declined in all the courses and, at the same time, the value of standard deviation has fluctuated. Third, throughout the period, the magnitude of standard deviation of male is generally larger than that of female enrolment in all the courses. Fourth, the value of coefficient of variation does not show a consistent trend. However, in general, the coefficient of variation is larger for male enrolment than for female enrolment in all the courses except in B.Com. Thus, marked inter-district variations are observed in the distribution of enrolment of male and female students, or all students, in the State.
As noted in Chapter 2, data on enrolment of students in private aided and unaided colleges are combined (or bifurcated) up to (or after) 1993-94. Accordingly, summary statistics on student enrolment in private colleges are presented and despribed separately below.
Table 4.3 presents the summary statistics on enrolment of students in private colleges from 1990-91 to 1993-94. Qualitatively, the patterns are comparable with GCs in Table 4.2. For instance, mean enrolment of male and female students, or all students, has increased in all the years and in all the courses; enrolment of male (or female) students is higher than female (or male) students in all the years in B.A. and B.Com courses (or B.Sc. course), accompanied by an increase in absolute variation in terms of standard deviation; throughout the period, the magnitude of standard deviation of male is generally larger than that of female enrolment in all the courses; the value of coefficient of variation does not show a consistent trend and the coefficient of variation is larger for male enrolment than for female enrolment in all the courses except in B.Com.
Table 4.4 presents the summary statistics on enrolment of students in PACs from1994-95 through 1999-00. First, unlike in QCs, enrolment of male students is higher than female students in all the years and in all the courses. Second, unlike in GCs, the mean enrolment of male and female, or mean enrolment of all students, has increased in all the courses up to 1996-97. This increase is accompanied by an increase in absolute variation in terms of standard deviation. Subsequently, the mean enrolment has declined in all the courses and, at the same time, the value of standard deviation has fluctuated. Third, throughout the period, the magnitude of standard deviation of male is generally larger than that of female enrolment in all the courses except in B.Com. This result is different from enrolment of student in GCs. Fourth, the value of coefficient of variation does show a consistent decline only in case of enrolment of male students or all students in B.A. course. However, unlike in GCs, the coefficient of variation is larger for
For a detailed description of the trends and patterns in enrolment of students by districts and universities in the I990’s, see Chapter 3 in Narayana (2001b).
male (or female) enrolment than for female (or male) enrolment in B.A. (or B.Sc. and B.Com.). Thus, marked inter-district variations are observed in the distribution of enrolment of male and female students, or all students, in PACs. These variations are in contrast with variations in GCs.
Table 4.5 presents the summary statistics on enrolment of students in PUACs from 1994-95 through 1999-00. First, as in case of PACs, enrolment of male students is higher than female students in all the years and in all the courses. Second, unlike in PACs, the mean enrolment of male and female, or mean enrolment of all students, has increased in all courses and in all years except in case of B.A. course. Most importantly, this trend is accompanied by highly fluctuating annual changes in absolute variation in terms of standard deviation. Third, throughout the period, the magnitude of standard deviation of male is generally larger than that of female enrolment in all the courses except in B.Com. This result is comparable to enrolment of student in GCs. Fourth, the value of coefficient of variation does not show a consistent trend in any course. However, unlike in GCs and PACs, the coefficient of variation is larger for male enrolment than for female enrolment only in B.A.. Thus, marked inter-district variations are observed in the distribution of enrolment of male and female students, or all students, in PACs. These variations are in contrast with variations in GCs and PACs.
4.3.3. Enrolment of students in University Colleges
In the Annual Report of the Mangalore University, data on enrolment of students by courses in affiliated colleges, including DCs, is not reported. On the other hand, data on enrolment of students is not reported in the Annual Report of the Kuvempu University. However, for the year 1999-00, total enrolment of students by colleges is prepared for submission to the UGC. Thus, only total enrolment of students in UCs for 1999-00 is described below.
In 1999-00, total enrolment of students in UCs is equal to 7608 students. Of this total enrolment, the share of University of Mysore is 51.46 percent, Mangalore University is 22.95 percent, Kuvempu University is 19.36 percent and Karnatak University is 6.23 percent.
4.3.4. Enrolment of students by courses in distance education
Total enrolment of students in B.A. (B.Com.) course has increased in KSOU. That is, from 4342 (1647) students in 1997-98 to 7263 (2345) students in 1998-99 and to 6883 (3455) students in 1999-00.
In 1999-00, total enrolment of students in distance education in Bangalore University is 3272 students in B.A. course, 1523 students in B.Com. course and 452 students in other subjects, in Karnatak University, 2641 students are enrolled in B=A. course and 3455 students in B.Com. course.
In 1999-00, the total enrolment of students in distance education in Bangalore, Karnatak and KSOU is equal to 12796 students in B.A. course and 5178 students in B.Com. course and 452 students in other subjects. Of the total enrolment in B.A. course, the share of Bangalore University is 25.57 percent, Karnatak University is 20.64 percent and KSOU is 53.79 percent. In the same way, of the total enrolment in B.Com. course, the share of Bangalore University is 29.41 percent, Karnatak University is 3.86 percent
and KSOU is 66.72 percent. In regard to enrolment to other subjects, the share of Bangalore University is 100 percent.
The increasing enrolment in B.A. course in KSOU is in contrast with declining enrolment in regular education in 1997-98 to 1999-00. As noted in Chapter 3, admission to distance education in the State is not restricted only for students from within the State. Thus, a direct comparison of enrolment of students between regular education and distance education may not be plausible.
4.3.5. Aggregate enrolment and distribution of enrolment by types of collegiate education and colleges in the State
Aggregate enrolment of students in collegiate education in the State is the sum of students in all colleges in regular education and in universities in distance education.
In 1999-00, aggregate enrolment in collegiate education is equal to 306265 students. Of this total, the share of GCs is 18.68 percent, PACs is 56.44 percent, PUACs is 16.52 percent, UCs is 2.48 percent and distance education is 5.87 percent. Thus, regular education constitutes 94.13 percent of total enrolment in collegiate education in the State.
4.4. Reasons for changing demand for collegiate education
In general, the description of patterns of enrolment of students indicates that, in recent years, there has been a decline in enrolment of male and female students in traditional courses for all universities in regular education in the state. This indicates a general decline in the student demand for collegiate education in traditional courses in the State.
Two points emerge in the context of declining enrolment in traditional degree courses. First, what are the probable reasons for declining enrolment of student in the courses? Second, what are the implications of declining enrolment of students in the courses?
4.4.1. Probable reasons for decline in demand for collegiate education
Over the years, the decline in demand for collegiate education may have been contributed by factors from within and outside the system of collegiate education.
4.4.1.1. Factors from outside the system of collegiate education
The important factors, which may have corvtributed for decline in demand for collegiate education from outside the system of collegiate education in the State, are as follows.
(i) A rise in the enrolment of student in vocational education.
(ii) A fall in pass percent of students in PUC courses.
(iii) A rise in enrolment of non-general education, especially in technical education.
(iv) A rise in unemployment of college graduates in traditional courses with special reference to the problem of decline in organised public sector employment opportunities.
(v) Demographic factors, especially a decline in population of the college- going age groups.
4.4.1.2. Factors from within the system of collegiate education
Some of the important factors, which may have contributed for the decline in demand from within the system of collegiate education, are as follows.
(a) A rise in dropout of students in traditional courses.
(b) A rise in demand for non-traditional courses (i.e. for professional and vocational courses and subjects) within collegiate education.
(c) Lack of quality and relevance in collegiate education.
A thorough examination of the factors, which influence on all the demands for collegiate education is certainly beyond the scope of this Chapter. Thus, the empirical validity of a few of the factors, which influence the demand for collegiate education, is examined below. Analysis of (a) and (c) above will be taken up in next chapter as part of analysis on quality and relevance of collegiate education in the State
4.4.1.3. Factors which influence the demand for collegiate education: An empirical examination of select factors
4.4.1.3.1. Vocational education and demand for collegiate education
Vocational education is of two types in the State. First, vocational education as a part of non-higher education which is jointly sponsored by the Central and State governments. Second, vocational education as a part of collegiate education, which is sponsored by the UGC.
Vocational education? as a part of non-higher education, is organised and administered by the Directorate of Vocational Education, established in 1977. The Directorate maintains, among others, district-wise distribution of number of courses and number of colleges in 2000-01; number of students approved/ admitted at the State level from 1994-95 to 2000-01; and number of students appeared at the State level from1994-95 to 2000-01.
Five major sectors have been identified for vocational education in the State. These sectors are (1) agricultural related courses (e.g. agricultural economics and farm management, agricultural chemicals, co-operation, dairying, fisheries, horticulture etc),(2) commerce and business courses (e.g. accountancy and auditing, accountancy and costing, accountancy and taxation, banking etc), (3) technical related courses (e.g. automobile servicing, civil construction technology, clock and watch repairs etc), (4) home science and para-medical courses (e.g. pre-school education and health and beauty care), and (5) job-linked courses in polytechnic and engineering colleges (e.g. automobile servicing, garment making and embroidery, office automation etc).
JIS IIA H Y ft O y c y M tfN T A T IW I UfcHflK.(astittiic of 14«€»tieQal
PlauM *i *md A dm in istratisn .17-1 tti Ai»oWinde M«ti«New Uelhi-ll§©16 Ts I I
35 DOC, No.
From the available information with the Directorate, the following features of vocational education may be noted. First, the minimum qualification for admission to vocational courses is secondary school leaving certificate, or a fail in I! PUC examination. However, if a student has passed the languages in II PUC examination, he/she is given exemption of study in language subjects in vocational education courses. Second, at present, 1055 courses are conducted under vocational education in the 642 Pre-university colleges in the State. In each district, the Deputy Director of Pre-university Education looks after the supervision of these vocational courses. The Directorate conducts the common examination for the second and fourth semesters of the courses and awards the certificates of course completion. Successfully completed candidates undergo one year apprenticeship training in their certified courses.
The total number of approved admission of students (i.e. boys and girls) to the I year has declined during 1990's. For instance, the total approved admissions have declined from 33250 students in 1994-95 to 31924 students in 1997-98 and to 23054 students in 1999-00. However, the total number of approved admission of students (i.e. boys and girls) to the II year has increased from 22621 students in 1994-95 to 24690 students in 1997-98 and to 19246 students in 1999-00. These numbers have two implications. First, they clearly indicate the decline in the number of admissions approved. Second, the difference between the approved admission in I and II year clearly show the dropout of students. The rate of dropout (i.e. ratio of number of students admitted to II year as a percentage of number of approved admission of students to the I year in the previous year) was 18.08 percent in 1995-96 and 49.30 percent in 1999-00. In view of this, the presumption that increasing enrolment in vocational courses, before pre-university education, as a reason for declining demand for collegiate education cannot be empirically confirmed.
On the other hand, vocational education in collegiate education is related to the introduction of vocational subjects in general degree colleges. For instance, the University Grants Commission provides financial assistance (to t*^e tune of about Rs.9 lakh to Rs.17 lakh per subject) in general degree colleges, which possess requisite physical infrastructure and capability for introduction of vocational subjects, identified by the UGC. These vocational subjects include Industrial Microbiology, Industrial Chemistry, Foreign Trade and Practice. In 1998-99, for instance, about 7 degree colleges in Gulbarga University have benefited from this scheme of the UGC.
Unfortunately, enrolment of students to these subjects is not separated since they are a part of the existing B.Sc. or B.Com. courses. Thus, changing enrolment to vocational subjects as a reason for declining demand for traditional subjects may not be ascertained on empirical grounds.
4.4.1.3.2. Professional education and demand for collegiate education
Professional higher education in Karnataka comprises technical education, medical education and agricultural education. However, in what follows, the relationship between enrolment in technical education and demand for collegiate education (i.e. for science education, as admission to the professional courses requires students with science background) is focused at the State level. This is because of the fact that admission to and allocation of students to engineering courses are centralised at the State level, except for seats under management quota.
Technical education comprises degree education (i.e. offered by engineering colleges) and diploma education (i.e. offered by the polytechnic colleges). The total number of engineering colleges (i.e. Government, private aided and unaided colleges) has increased from 51 in 1990-91, 53 in 1994-95, 70 in 1997-98 and to 82 in 2000-01. And, total intake of students in engineering colleges has increased from 16536 students in 1990-91, 19331 students in 1994-95, 24384 students in 1998-99 and to 29779 students in 2000-01.
In the same way, the number of polytechnics (i.e. Government, private aided and unaided polytechnics) has increased from 163 in 1990-91 to 173 in 1995-96 and to 196 in 1997-98. And, total in-take of students in polytechnic colleges has increased from 22652 students in 1990-91 to 28455 students in 1994-95, 32568 students in 1998-99 and to 35458 student in 2000-01.
Thus, there has been an increase in in-take of students in technical education in the State. If this intake is added to the growing intake of students in other types of professional education, the resultant total intake of students in professional education does offer an immediate support for the decline in demand for B.Sc. degree education in colleges due to increase in intake in professional education during 1990's in the State.
4.4.1.3.3. Pass percent in PUC courses and demand for collegiate education
The Directorate of Pre-university Education maintains, among others, examination data (electronically processed but unpublished) on II PUC examination by districts trom 1991 to 2000. The data are related to April (tor fresh and repeat students) and October (for repeat students) examination. In addition, available information is related to number of students (boys/girls and SC/ST and backward groups) appeared for the examinations; number of student (boys/ girls and SC/ST and backward groups) who have passed the examination; pass percent of students (boys/girls and SC/ST and backward groups), all by languages opted by the students and by arts, science and commerce subjects.
In order to test the presumption that the observed decline in demand for collegiate education by courses is contributed by a decline in pass percent in PUG by courses, first of all, data on total pass percent of students in arts, science and commerce subjects from 1991 to 2000 were collected. Total pass percent includes pass percent of fresh and repeat students in April examination of the respective years. In brief, the main features of these data are as follows.
The total pass percent of students in arts subjects in the State as a whole has increased from 31.6 percent in 1991 to 40.94 percent in 1995 but has declined to 28.76 percent in 1998 or to 36.16 percent in 2000. The number of districts below the total pass percent of students at the State level has fluctuated from 11 districts in 1991 to 14 districts in 1995 and remained at 8 districts in 1999.
The total pass percent of students in science subjects in the State as a whole has increased from 37.73 percent in 1991 to 43.21 percent in 1995 and to 53.13 percent in 1999, but has declined to 43.2 percent in 2000. The number of districts below the total pass percent of students at the State level has remained around 12 districts during these years.
The total pass percent of students in commerce subjects in the State as a whole has increased from 43.03 percent in 1991 to 53.98 percent in 1995 and to 62.02 percent in 1999, but has declined to 58.10 percent in 2000. The number of districts below the total pass percent of students at the State level has fluctuated from 14 districts in 1994 to 15 districts in 1995 and 11 districts in 1999.
Most importantly, since 1996, total pass percent of students has been fluctuating in arts, science and commerce courses, both at the State level and at the individual district level. Given this fact, it is not possible to directly associate changes in total pass percent in PUC courses with the decline in enrolment to a l traditional courses in GGs, PACs and PUACs in section 4.3.
It should be mentioned that a direct comparison of total pass percent in PUG courses and enrolment in degree courses suffers from two major drawbacks.
First, pass percent in PUG courses is an annual but, where the enrolment in degree courses is the sum of annual data of three years (i.e. sum of enrolment in I, II and 111 year). In view of this limitation, pass percent in PUC courses may be more appropriate to understand the demand for admission to degree courses in the respective years rather than a determinant of changing demand for enrolment of students in degree courses. Second, admission to arts courses in degree colleges is open to students who pass in arts, science and commerce subjects in PUG. This is in contrast with admission to science courses in degree colleges which is open to student who passes in science subject in PUG. Thus, demand for admission to arts courses in degree colleges may be underestimated if only the pass percent of students in PUC arts subjects is taken into account. This is clearly evident in Table 4.6, where the number of students passing the PUG is related to the number of admissions to, or enrolment in, I year degree by courses in GGs, PACs and PUACs by districts in 1999-00. The ratio of admission 1 year degree courses to PUG pass clearly indicates that, except for Ghickmagalur districts under Kuvempu University and all districts under Mangalore University, the ratio is more than 1 in all other districts for arts and commerce courses. And, in case of science subjects, the ratio is less than 1 for all districts. However, this analysis ignores the mobility of students who pass PUG in one district and get admitted In a degree course in another district within the State.
4.4.1.3.4. Unemployment problem and demand for collegiate education
Data on employment and unemployment are collected, organised and presented by the Directorate of Employment and Training of the Government of Karnataka. These data include employment in the organised public and private sectors, and in primary, secondary and tertiary sectors, district-wise number of vacancies notified and placements made, district-wise registrants on the live registers of employment exchanges by post graduates, graduates diploma holder etc. These data are reproduced in the annual, pre-budget Economic Survey of the Government of Karnataka, and in the recently started Manpower Profile Karnataka by the Manpower and Employment Division of the Department of Planning of the Government of Karnataka. Unfortunately, none of the data on employment and unemployment in these documents are presented by college graduates in arts, science and commerce.
Thus, the Directorate of Employment and Training was approached to get the required data on employment and unemployment of college graduate by arts, science
and commerce courses, if available in the maintained records. And, the Directorate was helpful in getting the required data on unemployment by districts from 1990-91 to 1999- GO, as the required data on employment was not available.
Table 4.7 summarises the State level trends in total number of registered job seekers, and the number of registered job seekers by arts, science and commerce degrees in the State, from 1990-91 to 1999-00. All these data refer to live registrations. That is, all registrants are required to renew the registration once in 3 years. If a registrant fails to renew his/her registration, his/her name is automatically deleted. Thus, live registrants include new job seekers who have registered during last three years and old registrants who have renewed their registrations.
Over the years, the size of total job seekers in the State has increased. This is evident in the positive annual growth (%) of total number of job seekers over the years. However, the annual growth has fluctuated from 8.73 percent in 1991-92 to 2.37 percent in 1996-97 and to 3.99 percent in 1999-00.
Of the total number of graduates, the share of arts graduates has been higher than the share of science or commerce graduates in all the years. However, between science and commerce graduates, unemployment is observed to be higher among commerce gradates than among science graduates. In 1997-98, the annual growth of unemployment is negative for all the three types of graduates, and negative annual growth has continued in 1998-99 in case of science and commerce graduates.
On the whole, the share of all college graduates in the total job seekers in the State has been less than 4 percent throughout the 1990‘s. In addition, the share of unemployed arts, science and commerce graduates in the total uneniployed persons in the State has remained about 2.5 percent, 1.2 percent and 1.5 percent respectively. Thus, the observed changes in unemployment of college graduates by courses may not help in offering a categorical evidence for the declining demand for collegiate education since 1997-98.
It is important to mention few important limitations of employment exchange data. First, all registration is voluntary. Second, all job recruitment does not need a registration with an employment exchange. Consequently, many graduates might not register with employment exchanges and, thereby, unemployment problem is underestimated.
Several important reasons may explain the increase in graduate unemployment in the State.
First, there has been a decline in the job opportunities in the organised sector, especially in the public sector. This is evident in the figures published by the Government of Karnataka (2000). For instance, employment in the organised public (private) sectors has changed in the 1990's. In 1990-91, the total employment in the organised sector was 14.47 lakh and the share of public sector employment was 70.29 percent. In the same way, in 1994-95 (1998-99), the total employment in the organised sector was 15.78 (18.49) lakh with the share of public sector at 66.57 (59.06) percent. Historically, organised public sector (ipcluding government sector) has been the main user of general degree graduates. Most recently, efforts towards down-sizing the State Government and public sector undertakings by abolishing various posts in general
administration has lead to further reduction in organised public sector jobs in the State. Thus, with the decline in the public sector employment, the unemployment problem seems to have increased during the period.
Second, the employment requirements in private sector have changed in the 1990's with emphasis on technical skills and knowledge (e.g. computer literacy). In the absence of these requirements to be met by the education system, the outturn of graduates has remained largely unabsorbed in the changing labour markets. Thus, at the bottom, much of the problems may be associated with the relevance of our general education system.
4.4.1.3.5. Demographic factors
Changes in college-going age distribution (e.g. 19-24 years) between years is an important demographic indicator of changing admission/enrolment in colleges. This can be judged by determining whether or not the growth of colleges is higher than the student population. Unfortunately, age distribution of population is available only from decinial population census. The latest data is available for 1991 census, as the age- distribution tables for 2001 census are not yet published. Thus, for lack of data, the role of demographic factors is left unexplored in this study.
4.4.1.3.6. Rise in demand for non-traditional courses within collegiate education
In the 1990's, the non-traditional courses in collegiate education in the State have been introduced. These non-traditional courses are called professional courses, such as, BBM, BHM and BCA. In addition, various vocational subjects have been introduced, as part of UGC-sponsored programme on vocationalisation of degree education. These subjects include, for instance, industrial chemistry, computer science, seed technology, and geo-exploration and drilling technology. In fact, these subjects are introduced as one of the optional subjects, along with traditional subjects (e.g. Physics, Chemistry and Industrial Chemistry) under the B.Sc. course. It is for this reason, admission to and enrolment in vocational subjects are reported under the B.Sc. course in the colleges. Thus, in general, non-traditional courses within collegiate education are represented by professional courses (e.g. BBM, BHM and BCA) but not by vocational subjects.
To ascertain the changing patterns of enrolment in traditional and non-traditional courses, all the 6 State universities (i.e. Registrar or Director of College Development Council) were requested to provide information in a prescribed format from 1995-96 through 1999-00. The University of Mysore responded with complete details which show the following features. Of the total enrolment of students in affiliated colleges in the University of Mysore in 1995-96 (1999-00), 1.24 (1.29) percent of students wereenrolled in non-traditional courses in GCs, 5.74 (7.08) percent in PACs, 3.88 (15.28) percent in PUACs and 0.80 (6.64) percent in UCs. Thus, except in GCs, enrolment in non-traditional have increased between the years. The highest enrolment in non- traditional courses in 1999-00 is evident for PUACs and is followed by PACs and UCs.
Thus, there exists an empirical evidence for a decline in enrolment in traditional courses as a consequence of a rise in enrolment in non-traditional courses within the collegiate education in the State.
4.5. Probable impact of declining demand for collegiate education
The impact of declining demand for collegiate education may have several implications, both at present (short run) and in future (long run).
The short-term impact is the decline in the number of students per college or per course. This raises a fundamental question on the viability of a college or course in terms of a desired number of students, or a minimum number of students to sustain a college or course, given the investment already made in the college/course. For instance, the State Government has been considering to fix 40 students as a minimum enrolment in an aided course for that course to exist or continue in a PACs. Thus, an analysis of number of students per colleges by courses is essential.
Table 4.8 gives the districts-wise give total enrolment of students by B.A., B.Sc., and B.Com. course per GCs, PACs and PUACs in 1999-00. It is clearly evident that all courses in both PACs and PUACs, and B.A. course in GCs, have more than 40 enrolled students per college. However, in case of both B.Sc. and B.Com. courses in GCs, there exist many districts in which total enrolment per college in less than 40. These districts include Dharwad, Raichur and Bidar in B.Sc. course, and Mandya, Hassan, Dhan/vad, Belgaum, Gulbarga, Raichur and Bidar in B.Com. course. However, if college-wise enrolment per course in these districts is computed, a more insightful evidence may be found on the nature and number of colleges and courses for which enrolments have declined below 40 students within the districts.
The long-term impact includes the following, (i) Decline in the demand for postgraduate general education in tlr e universities, and its attendant impact on the reduction in the supply of post-graduates for teaching jobs and research In universities and colleges, (ii) Decline in the supply of graduates for general regional and national economic development, (iii) Adverse impact on the existing number and future quantitative expansion of collegiate education, (iv) Adverse impact on studies and research in humanities and social sciences and, hence, on societal and cultural studies in future.
Two points deserve special remarks here. First, each factor, which influences the changes in demand for collegiate education, is analysed separately. Thus, the impact of all factors together is not captured on the changes in demand for collegiate education. To do this, a simple empirical modeling of demand for collegiate education is required. Second, a systematic analysis of long impact of declining demand for collegiate education requires a detailed examination of the inter-relationships between collegiate education, university education and economic and non-economic objectives or socio-economic objectives of regional and national economic development. These are the areas of future policy research in Karnataka's collegiate education.
CHAPTER 5
Quality and Relevance of Collegiate Education
The main objective of this chapter is to analyse the quality and relevance of collegiate education in the State.
5.1. Quality of collegiate education
Quality of collegiate education may be related to the quality of three agents within the colleges. First, quality of students who are admitted or enrolled in courses. Second, quality of teaching and non-teaching staff who are appointed and work in the colleges. Third, quality of physical infrastructure which are conducive for curricular and extracurricular development of students in the colleges. In the context of this study, however, quality of these three agents is considered to be inter-related for overall development of collegiate education. Thus, indicators of quality are not listed by agents separately.
Three important frameworks for determining the quality and relevance of collegiate education may be mentioned. First, statutes of State universities relating to grant of fresh affiliation or renewal (continuation) of temporary affiliation to colleges and institutions, and withdrawal of such affiliation/permission for bifurcation/shifting of the location of the affiliated colleges and institutions. Second, manual for self-study for affiliated/constituent colleges, or methodology of assessment and accreditation by the National Assessment and Accreditation Council (NAAC). Third, a report of the "Seminar on Assessment of Quality in Higher Education: Parameters and Indicators" at NIEPA (2000). These frameworks provide with a comprehensive set of parameters and variables for assessment of quality and/relevance in higher education. However, the choice of the indicators below is mainly governed by their measurability, using the available data in the State.
5.1.1. Indicators of quality
The quality of students in a college may be related to the quality of students admitted by courses (e.g. students with high percent of marks in the qualifying examination with high motivation and commitment to studies) and to the quality of students turned out of, or graduated from, the colleges. Note that within the graduated students, there exists heterogeneity in terms of passing the degree examination with a I Class or II Class or 111 Class. Although class distinctions are not essential to obtain a degree, heterogeneity in pass percentage of students in terms of I Class, II Class and Pass Class is important to understand the distribution of quality of student performance in the final year examinations.
It should be emphasised that pass percent of student in a course/college may be influenced by various factors, such as, retention rate (or low dropout rate) of good students, number and quality of teaching and non-teaching staff, and infrastructure facilities. Thus, a college with high retention rate (or low dropout rate) may be presumed, other things being equal, to have high pass percent of its students. Thus, the following broad indicators are used to measure the quality of collegiate education in the State.
(i) Pass percent of students
The pass percent of student in a course in a year is computed by taking total nunnber of students passing the final year examination as a percentage of total number of student who appeared for the final year examination in the same course in a year. As the number of student who have passed the examination is less than or equal to the number of student who have appeared for the examination, the pass percent is less than or equal to 100.
(ii) Retention rate of students
The retention rate is defined as the number of students enrolled in the final year of a course as a percentage of total number of students admitted/enrolled when they were in the first year of the course. For instance, retention rate in B.A. course in a college in 1995-96 is equal to; [(total number of final year students in B.A. course in1995-96) divided by (total number of first year students in B.A. course in 1993-94)]*100.
(iii) Growth of teaching and non-teaching staff
Growth and availability of teaching and non-teaching staff, absence of vacant posts of staff and quality of staff (i.e. persons beyond the minimum qualification, experienced, trained, committed, dedicated staff) are important indicators for contribution of staff in the development of collegiate education. At the same time, it is important to know the familiar student-teacher ratio in colleges, as it has implications on the quality of education in colleges.
(iv) Infrastructure facilities
Availability of adequate water for drinking and non-drinking purposes, electricity, sanitation, library, laboratory, building, class room, playground and sport materials, transport facilities to reach the colleges, class room furniture and teaching materials (including text books) etc are important infrastructure facilities in the colleges. These facilities do contribute to the functioning and quality of students, teaching staff and nonteaching staff in colleges. Further, they have important implications for explaining the differences in private cost of education for students between colleges.
5.2. Analysis of indictors of quality of collegiate education
Based on secondary data, various indicators of quality and relevance are described below by courses, male/female students, SC/ST students, universities and districts.
5.2.1. Pass percent of students
As noted in Chapter 2, secondary data on pass percent of students are available only for GCs and PACs in the State. Using this data, an attempt is made below to describe the broad trends in pass percent of students in GCs and PACs by courses at the State level. The entire data is related to pass percent of fresh student in April
examination of the respective years. No attempt is made to present and analyse the data at the district level due to data gaps.^
Table 5.1 summarises the annual pass percent of students by courses and colleges (i.e. GCs and PACs) from 1991 to 1999. Pass percent of students is presented by total students and SC/ST students.
5.2.1.1. Pass percent of students in Government colleges
First of all, changes in pass percent of students (total or SC/ST) do not show any consistent trend in any of the three courses. For instance, in final year B.A. the highest pass percent for total (or SC/ST) student is observed in 1999 (or 1999) at 45.37 (Or 35.25) percent and the lowest is observed in 1994 (or 1991) at 36.32 (or 25.57) percent. In final year B.Sc. the highest pass percent for total (or SC/ST) student is observed in 1999 (or 1999) at 42.62 (or 28.85) percent and the lowest is observed in 1992 (or 1991) at 21.02 (or 14.17) percent. In final year B.Com. the highest pass percent for total (or SC/ST) student is observed in 1999 (or 1998) at 35.68 (or 22.67) percent and the lowest is observed in 1991 (or 1992) at 20.17 (or 10.26) percent.
Second, in all the courses and for all the years, the pass percent of total students has been higher than the pass percent of SC/ST students. Thus, total pass percent of students would exaggerate the pass percent of SC/ST students in all courses.
Third, pass percent of students including SC/ST student is relatively high in final year B.A. than in final year B.Sc. or B.Com. However, pass percent of students is re\aVively bv\; in final B.Com. than in other courses.
5.2.1.2. Pass percent of students in Private Aided colleges
First, as in the case of GCs, changes in pass percent of students (total or SC/ST) do not show any consistent trend in any of ttie three courses. For instance, in final year B.A. the highest pass percent for total (or SC/ST) student is observed in 1998 (or 1998) at 78.04 (or 65.52) percent and the lowest is observed in 1992 (or 1992) at 34.06 (or 25.34) percent. In final year B.Sc. the highest pass percent for total (or SC/ST) student is observed in 1998 (or 1998) at 53.85 (or 40) percent and the lowest is observed in 1993 (or 1991) at 45 (or 20.75) percent. In final year B.Com. the highest pass percent for total (or SC/ST) student is observed in 1999 (or 1995) at 56.75 (or 87.20) percent and the lowest is observed in 1998 (or 1998) at 40.20 (or 14.29) percent.
Second, in all the courses and for all the years, the pass percent of total students has been higher than the pass percent of SC/ST students, except in 1995 for final year B.Com. students. Thus, total pass percent of students would exaggerate the pass percent of SC/ST students in all courses.
' These gaps in secondary data are filled in by primary data in Chapter 6 in two ways. First, in analysing the pass percent of students in GCs, PACs, PUACs and UCs by courses, male/female students, SC/ST male/female students and by universities. Second, in analysing the distribution of pass percent of students by I Class, II Class and Pass Class by courses, male/female students, SC/ST male/female students and by universities.
Third, unlike in GCs, the pass percent of students including SC/ST student in PACs is not consistently higher or lower between courses in all the years. For instance, pass percent in final year B.A. (B.Sc.) was higher than in final year B.Sc. (B.A.) in 1993 (1992).
Fourth, as compared to GCs, pass percent in PACs is higher in all the courses and for most of the years during 1990's. This suggests that the quantity of outturn of graduates in PACs is relatively higher than in GCs.
5.2.2. Retention rate of students
Table 5.2 presents the retention rates for male and female students in GCs, PACs and PUACs by B.A., B.Sc. and B.Com. courses from 1996-97 to 1999-00.
First, the retention rates for all students in GCs show an increase between 1997- 98 and 1999-00 in all courses, except in B.Sc. However, there exists annual variation in the rate between the years, courses and between male and female students. For instance, the retention rate in B.A. was 45.94 (56.34) percent and 43.47 (54.47) percent for male (female) student in 1996-97 and 1997-98 respectively; 51.72 (69.79) percent and 48.22 (62.40) percent for male (female) students respectively in B.Sc; and 60.35 (80.20) percent and 56.05 (70.96) percent for male (female) respectively in B.Com. Second, interestingly, in ail the years and in all courses, the retention rate for female students has been higher than that of male students. Third, of all the courses, the retention rate is highest (or lowest) in B.Com. (or B.A.) in all the years.
Qualitatively, the pattern ot retention rates in PACs are comparable with the GCs, except for the following. Of all the courses in PACs, the retention rate for all students is highest (or lowest) in B.Com (or B.Sc). This implies that dropout of students in PACs is highest in case of B.A. course. In addition, a comparison of retention rates between GCs and PACs show that the rates are higher in PACs for both male and female students in all courses and for all years. *
As in the case of PACs, the retention rates in PUACs are comparable with GCs. For instance, as compared to the retention rates of B.A. and B.Sc., the retention rates in PUACs are higher in B.Com. for both male and female students. However, between B.A. and B.Sc., the retention rates are generally higher in B.Sc. than in B.A. course. This indicates that dropout of students in PUACs is highest in case of B.A. course. On the other hand, a comparison of retention rates between GCs, PACs and PUACs, show interesting differenced. First, the nature of retention rates is comparable between GCs and PUACs than between PACs and PUACs. Second, the retention rates are generally higher in PACs than in GCs and PUACs for both male and female students.
5.2.3. Growth and distribution of teaciiing staff
The number, annual growth and inter-district distribution of teaching staff for GCs and PACs are presented below from 1990-91 through 1999-00. In addition, the number and distribution of SC/ST staff is separately given. The entire analysis is done at the State level.^
‘ For a detailed analysis of the growth and distribution of teaching staff in GCs and PACs by districts and universities, see Chapter 4 in Narayana (2001b).
5.2.3.1. Growth and distribution of teaching staff in Government colleges
Table 5.3 presents the summary statistics on growth and distribution of teaching staff in GCs with special to SC/ST staff.
The total number of teaching staff in the State has increased from 1812 persons in 1990-91 to 2213 persons in 1995-96 and to 2501 persons in 1999-00. However, the increase in total staff is not consistent over the years. This is evident in the fluctuations in the annual growth of total teaching staff, which was 27.48 percent in 1991-92, -4.13 percent in 1993-94, 1.98 percent in 1995-96 and 0.00 percent in 1999-00. On the other hand, the growth and distribution of teaching staff who belong to SC/ST show that the share of SC/ST staff in the total teaching staff of the State has varied between the years. It was 9.94 percent in 1990-91, 15.09 percent in 1995-96 and 13.31 percent in 1999-00.
On the whole, two trends are striking in case of GCs. First, the annual growth had both negative and positive rates between 1990-91 and 1994-95, but has been positive for years since 1995-96, except in 1998-99. Second, the annual growth of SC/ST teaching staff has remained around 15 percent since 1995-96. And, in 1999-00, the growth of teaching staff is zero.
The summary statistics for district-wise distribution of all and SC/ST teaching staff in GCs show that, although the mean values and value of standard deviation are higher for total teaching staff than for SC/ST teaching staff for all the years, the relative variations have been higher for SC/ST teaching staff than for total teaching staff since1996-97.
5.2.5.2. Growth and distribution of teaching staff in Private Aided colleges
Table 5.4. represents the summary statistics on growth and distribution of teaching staff in PACs with special reference to SC/ST staff.
The total number of teaching staff in the State has increased from 7701 persons in 1990-91 to 7923 persons in 1995-96 and to 7845 persons in 1999-00. However, the increase in total staff is not consistent over the years. This is evident in the fluctuations in the annual growth of total teaching staff, which was 5.73 percent in 1991-92, 1.67 percent in 1993-94, -0.26 percent in 1995-96 and 1.13 percent in 1999-00. In the same way, the share of SC/ST staff in the total teaching staff of the State has varied between the years. It was 4.58 percent in 1990-91, 5.68 percent in 1995-96 and 5.16 percent in 1999-00.
On the whole, two trends are striking in case of PACs. First, unlike the GCs, the annual growth had both negative and positive rates between 1990-91 and 1994-95, as well as between 1995-96 and 1999-00. Second, the annual growth of total teaching staff has been very low, i.e. less than 2 percent throughout.
As compared to the GCs, the number of teaching staff has been higher in PACs for all the years. However, the annual growth of the total staff in PACs has been lower than in GCs, especially since 1995-96. In addition, since 1995-96, the number of SC/ST staff has been higher in GCs than in PACs.
The summary statistics for district-wise distribution of all and SC/ST teaching staff in PACs show that, although the mean number of teaching staff and value of standard deviation are higher for total staff than for SC/ST staff for all the years, the relative variations have been higher for SC/ST than for total staff for all the years. Interestingly, as compared to the summary statistics for GCs, the summary statistics for PACs show higher mean values and higher standard deviation for total and SC/ST teaching staff, but lower coefficient of variation.
5.2.4. Growth and distribution of non-teaching staff
The number, distribution and annual growth of non-teaching staff for GCs and PACs are presented below from 1990-91 through 1999-00. In addition, the number and distribution of SC/ST staff is separately given. As in the case of teaching staff, the entire analysis is done at the State level.^
5.2.4.1. Growth and distribution of non-teaching staff in Government colleges
Table 5.5 presents the growth and distribution of non-teaching staff in GCs with special reference to SC/ST staff.
The total number of non-teaching staff in the State has varied from 2294 persons in 1990-91 to 1725 persons in 1995-96 and to 1927 persons in 1999-00. Thus, the annual growth has fluctuated between years. That is, -0.96 percent in 1991 -92, 0.97 percent in 1993-94, 8.76 percent in 1995-96 and 2.77 percent in 1999-00. In the same way, the share of SC/ST staff in the total teaching staff of the State has varied between the years. It v as 20.79 percent in 1990-91, 26.14 percent in 1995-96 and 26.26 percent in 1999-00.
Two trends are striking in case of GCs. First, the number of non-teaching staff has been higher than the teaching staff. Second, unlike the positive annual growth of teaching staff, the growth of non-teaching staff shows both positive and negative rates since 1995-96. Thus, there is no stagnation in the growth of non-teaching staff in the GCs.
The summary statistics for district-wise distribution of all and SC/ST non-teaching staff in GCs show that, although the mean number of non-teaching staff and value of standard deviation are higher for total non-teaching staff than SC/ST non-teaching staff for all the years, the relative variations have been higher for SC/ST than for total nonteaching staff for all the years.
5.2.4.2. Growth and distribution of non-teaching staff in Private Aided colleges
Table 5.6 presents the growth and distribution of non-teaching staff in PACs with special reference to SC/ST staff.
The total number of non-teaching staff in the State had varied from 6265 persons in 1990-91 to 5886 persons in 1995-96 and to 5638 persons in 1999-00. Thus, the annual growth has fluctuated between years. That is, -3 percent in 1991-92, -3.97
' For a detailed analysis of the growth and distributiorvof non-teaching staff in GCs and PACs by districts and universities, see Chapter 4 in Narayana (2001b).
percent in 1993-94, 1.33 percent in 1995-96 and -2.36 percent in 1999-00. As in the case of GCs, the share of SC/ST staff in the total teaching staff of the State has varied between the years. It was 15.87 percent in 1990-91, 13 percent in 1995-96 and 16.09 percent in 1999-00.
Two trends are striking in case of non-teaching staff of PACs. First, the number of non-teaching staff has been higher than the teaching staff. Second, qualitatively, the trends in the growth of teaching and non-teaching staff are comparable in PACs.
The summary statistics for district-wise distribution of all and SC/ST non-teaching staff in PACs show that the mean values, standard deviation and coefficient of variation for total non-teaching staff have been higher than for SC/ST non-teaching staff for all the years. As compared to the summary statistics for non-teaching staff in GCs in Table 5.5, ail the statistics in Table 5.6 are higher except the values of coefficient of variation.
5.2.5. Reasons for slow growth of teaching and non-teaching staff
The description of groyvth of teaching and non-teaching staff in GCs and PACs above has been based on the observed number of teaching and non-teaching staff in different years. Thus, the analysis did not capture the importance of vacant (i.e. difference between the sanctioned and working) staff positions in the colleges.
In GCs, the State Government conducts the recruitment of staff fills the vacant positions through the Karnataka Public Service Commission. Thus, in the GCs, the Government itself is responsible for the vacancies to be sanctioned and filled up. And, the existence o1 vacant positions wouid only indicate the lack of recruitment for the posts and/or for a ban on the recruitment for the posts.
In case of PACs, Government's prior permission is essential to fill up a sanctioned post as per the rules of recruitment specified by the State Government. However, no permission from the Government is necessary if PACs make appointments for the posts to be financed by the college management.
Table 5.7 presents the details of vacant positions of teaching and non-teaching staff under plan and noh-plan expenditure in PACs in the State as on February 1, 2001. This secondary data are given by the regional offices of the Directorate of Collegiate Education.
Of the sanctioned teaching positions, the highest (or lowest) share is evident for Karnatak (or Mangalore) University at 30.48 (or 10.78) percent. In regard to sanctioned non-teaching staff positions, the highest (or lowest) share is evident for Karnatak University (or University of Mysore) at 29.10 (or 10.37) percent.
Of the working teaching positions, the highest (or lowest) share is evident for Karnatak (or Kuvempu) University at 31.50 (or 9.02) percent. In regard to working non- teaching staff positions, the highest (or lowest) share is evident for Karnatak University (or University of Mysore) at 30.73 (or 10.9) percent. In the same way, these universities have the highest (or lowest) share in the total working positions in the State.
Most importantly, the working teaching positions as a percentage of sanctioned teaching positions is highest (or lowest) for Karnatak (or Gulbarga) University. In the
same way, the working non-teaching positions as a percentage of sanctioned nonteaching positions are highest (or lowest) for Bangalore (or Kuvempu) University.
The results of PACs above have two implications. First, in ail the universities, there exist vacant teaching and non-teaching positions. In regard to teaching (nonteaching) staff, the highest vacant positions are evident for Gulbarga (Kuvempu) University. Second, if there is a ban on the recruitment of these vacant positions, It will have differential impact on the quality of collegiate education in universities in the State.
5.2.6. Student-teacher ratio (STR)
The STR is one of the traditional indicators of quality of collegiate education. This is evident in the international survey article by Hanushek (1996). It measures the number of students per teacher in a college or university or district. In the analysis below, the STR in a district is arrived by dividing the total number of students enrolled in all traditional courses in all GCs or PACs by the total number of permanent teaching staff in all GCs or PACs in the district in a year. This STR suffers from two limitations. It is an underestimate if the colleges in a districts have large number of students enrolled in non- traditional courses. Second, it is an overestimate, if the colleges in a district have large number of non-permanent teachers.
Table 5.8 presents the STR for GCs from 1990-91 through 1999-00. First, the STR has gradually increased in the State from 1991-92 to 1995-96. That is, from 23.15 in 1991-92 to 29.61 in 1993-94 and to 33.71 in 1995-96. On the other hand, from1995-96 to 1999-00, the STR has gradually declined from 28.23 in 1996-97 to 22.88 in 1999-00. 01 the districts, the STR had been higher in districts of northern Karnatal^a, such as, Gulbarga, Raichur, Bellary, Bidar and Bijapur. And, districts, such as, Mysore, Mandya, Bangalore Urban and Kodagu have relatively lower STR.
Table 5.9 presents the STR for PACs from 1994-95 through 1999-00. As in the case of the GCs, the STR has gradually increased in the State since 1995-96. However, unlike in the case of GCs, there are no remarkable differences in the STR between districts in different years.
In general, the STR in PACs is relatively lower than in GCs. Two important reasons for this result are as follows. First, existence of large number of vacant posts or non-permanent staff who are not included in the STR in the PACs. Second, total number of students in a college is inclusive of traditional and non-traditional courses. In PACs, non-traditional courses are more than in GCs. Thus, although total students and staff are low in GCs than in PACs, the STR is higher in GCs than in PACs.
5.3. Relevance of collegiate education
Relevance of collegiate education is related to the relevance of courses offered in collegiate education to the students and to society. The relevance to the students may be related to (a) giving the most update and deep knowledge in the areas, voluntarily chosen by themselves and (b) giving them knowledge and training which are needed for employment in the process of regional and national economic development.
An important determinant of relevance of collegiate education is the prescription of curricula for courses. At present, the respective universities through their Board of
Undergraduate Studies fix the curricula. Such curricula are uniformly innplennented throughout the university. While such uniformity are justifiable for the purpose of holding common examination and uniform evaluation of all students in the universities, it lacks autonomy for the colleges to design their own curricula according to the particular needs of students and areas within the universities. Thus, at present, colleges can only take initiative for introducing new courses, but the affiliating University takes all academic decisions on the introduction of new courses and their curricula.
In the 1990’s two important steps have been taken to increase the relevance of collegiate education in the State. First, introduction of UGC-sponsored, vocational subjects in degree colleges. Second, introduction of various professional courses, including degree courses in computer science and computer applications, in degree colleges.
Interestingly, at the university level, computer applications have been introduced in two alternative ways. First, as in the case of Bangalore University, computer applications are introduced as one of the compulsory subjects of study for all Master’s degree students in humanities and social science students. Second, as in the case of Mangalore University, computer applications are introduced for all university students as a voluntary training programme, outside the curricula of the university.
While college management (or universities) may take initiatives to introducing new courses in their private colleges (or universities), the State Government has to take similar initiative to bring relevance in courses offered in GCs. In this regard, an important lesson for Government of Karnataka is evident in the following experience of Government of Tamil Nadu in introducing computer literacy programme for arts and science students in GCs.
5.3.1. Experience of Tamil Nadu
Recently, the Government of Tamil Nadu has decided to introduce the Computer Literacy /Education Programme to impart knowledge in computer applications and use of internet, from the academic year 2000-01, for about 30000 non-computer science students who are studying in their second year degree course in 60 Government Arts and Science Colleges. The cost of the programme is estimated to be Rs.30 for a period of 5 years. The duration of the programme is one academic year, but outside the purview of the university curriculum and system. The structure of the course is inclusive of theory classes and practical sessions. Participation in the programme is voluntary for both undergraduate and post-graduate students. The college teachers are the trainers of the student-trainees. Thus, the programme includes free of cost and annual training of 10 college teachers including the principal for 30 hours in computer applications. The Director of Collegiate Education conducts the examination and certifies the proficiency of students in computer applications. A sum of Rs.2000 is collected (in four installments) as course fee from each student for the entire course. The course fee is considered to be very minimal as compared to fee charged by a private computer training institute (anywhere between Rs. 15000 and Rs.25000 per student) for a similar course.
Thus, the experience of Tamil Nadu is important for other States including Karnataka State in increasing the relevance of collegiate education with low cost for students in GCs.
5.3.2. Medium of instruction, and quality and relevance of education
Kannada has emerged as an alternative medium of instruction to English in many colleges in the State. In fact, instruction in Kannada language is most popular among students in social sciences in rural colleges. Most surprisingly, in many of the rural colleges, more than half of the instruction in English medium classes in social sciences are also taught in Kannada language. In general, instruction in Kannada should be most welcome in Karnataka, as Kannada is the mother-tongue for most of the college students.
Two important problems associated with instruction in Kannada are as follows. First, in general, teachers may not have studied their subjects in Kannada language. Second, there is a terrible dearth of standard textbooks in Kannada in social sciences. Consequently, the instructor has to prepare his/her own teaching materials by translating them into Kannada from the available textbooks in English language. For this reason, the quality and content of teaching in social science has been heavily dependent upon the ability of translation of teachers and availability of English language textbooks. Consequently, low ability of translation and non-availability of English language textbooks have become one of the major reasons for low quality of classroom teaching in colleges in the State. Third, books on computer education, and computer manuals, are not available in Kannada language or not translated into Kannada language. Thus, students are handicapped in self-learning computer applications in one’s own area of subject and beyond their basic training in computer literacy. This is in contrast with Japanese system where the state-of-art computer education and manuals are available in Japanese language. Thus, self-learning of computer applications is the most predominant feature in Japanese education system.
On the whole, the analysis of quality and relevance of collegiate education has several policy issues in GCs and non-GCs to be newly tackled through current and future policy interventions. In this regard, the lessons from the best practices from within and outside the State, as highlighted in this chapter, deserve serious consideration from the policy makers in the State.
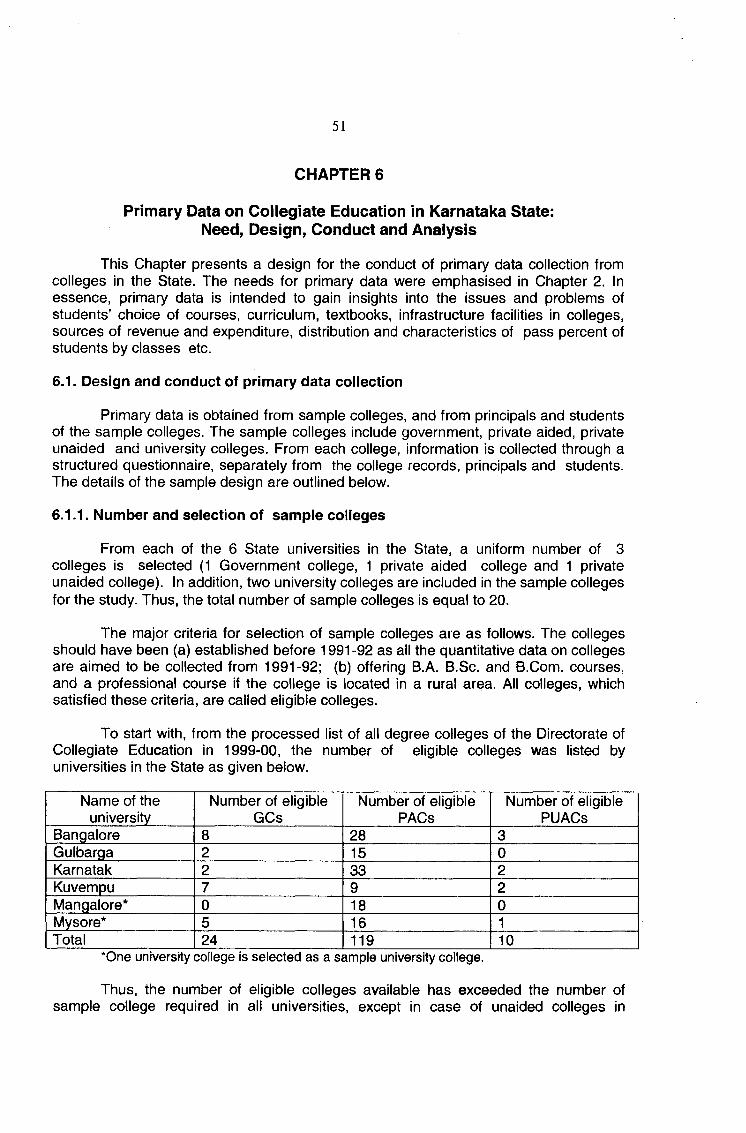
Primary Data on Collegiate Education in Karnataka State: Need, Design, Conduct and Analysis
This Chapter presents a design for the conduct of prinnary data collection fronn colleges in the State. The needs for primary data were emphasised in Chapter 2. In essence, primary data is intended to gain insights into the issues and problems of students’ choice of courses, curriculum, textbooks, infrastructure facilities in colleges, sources of revenue and expenditure, distribution and characteristics of pass percent of students by classes etc.
6.1. Design and conduct of primary data collection
Primary data is obtained from sample colleges, and from principals and students of the sample colleges. The sample colleges include government, private aided, private unaided and university colleges. From each college, information is collected through a structured questionnaire, separately from the college records, principals and students. The details of the sample design are outlined below.
6.1.1. Number and selection of sample colleges
From each of the 6 State universities in the State, a uniform number of 3 colleges is selected (1 Government college, 1 private aided college and 1 private unaided college). In addition, two university colleges are included in the sample colleges for the study. Thus, the total number of sample colleges is equal to 20.
The major criteria for selection of sample colleges are as follows. The colleges should have been (a) established before 1991-92 as all the quantitative data on colleges are aimed to be collected from 1991-92; (b) offering B.A. B.Sc. and B.Com. courses, and a professional course if the college is located in a rural area. All colleges, which satisfied these criteria, are called eligible colleges.
To start with, from the processed list of all degree colleges of the Directorate of Collegiate Education in 1999-00, the number of eligible colleges was listed by universities in the State as given below.
Name of the university
Number of eligible GCs
Number of eligible PACs
Number of eligible PUACs
Bangalore 8 28 3Gulbarga 2 15 0Karnatak 2 33 2Kuvempu 7 9 2Mangalore* 0 18 0Mysore* 5 16 1Total 24 119 10
One university college is selected as a sample university college
Thus, the number of eligible colleges available has exceeded the number of sample college required in all universities, except in case of unaided colleges in
Gulbarga university, and government and PUACs in Mangalore University. For these special cases, the eligible criterion (b) above is modified in terms of reducing the number of courses offered in a college. Accordingly, colleges which offered any two of the B.A., B.Sc., and B.Com. courses are listed and the sample colleges are randomly selected.
In Table 6.1, the sample colleges by universities, college management, courses and location are given. The geographical location of the sample colleges is shown on Map 1.
6.1.2. Type of data collected and instrument of data collection
From each of the 20 colleges above, data were collected by developing 3 types of structured questionnaires, viz., College questionnaire. Principal’s questionnaire and Students’ questionnaire. The contents and canvassing of these questionnaires are briefly described below.
6.1.2.1. College questionnaire
This questionnaire is divided into 6 sections. The specific quantitative and qualitative information sought in the questionnaire was as follows.
In section 1, general information on the colleges was sought including the year of establishment, year in which the private college was brought under GIA, type of college management, number of sections and medium of instrument by courses. In section 2, information on (a) enrolment of students in I, II and ill year of the degree courses offered; (b) number of students appeared and passed (in I, 11 and Pass class) in final year examination by courses, male/female students, SC/ST and other students were sought. In section 3, teaching and non-teaching staff position in terms of sanctioned, filled up and vacant and teaching staff positions by designation were sought. In section 4 (5), information on receipts (expenditure) by sources to the colleges was sought. The sources of receipts included grants from the State Government, college management, UGC, the University, tuition and non-tuition fee, student donations at the time and after the admission. The sources of expenditure included payment of salary for staff, purchase of land and building, expenditure on library and equipment. In section 6, other information on the colleges including organisation of seminars in the colleges, attendance of staff in conference or seminars and refresher courses, and number of books added to the library were sought.
To begin with, all the information in section 2 through section 5 was planned to be collected from 1990-91 through 1999-00. However, supply of all information for over a period of 10 years was highly demanding in terms of time and availability of records with the colleges. Consequently, the time period was reduced to three years, viz., 1991- 92, 1995-96 and 1999-00. In the same way, information in section 6 was reduced to last 3 years (i.e. 1998-99 to 1999-00).
6.1.2.3. Principal's questionnaire
For identification of key current problem in curriculum; laboratory equipment and consumables and infrastructure facilities, staff turnover and recruitment problems, participatKDn of alumni association and local people in the development of the college,
and recent changes in the grants-in-aid policy of the State Government, this structured questionnaire was prepared to be responded by the college principals (entitled Principals' Questionnaire).
6.1.2.4. Students' questionnaire
First, for identification of the socio-economic background, mother tongue and medium of instruction, academic preparation of final examinations including through private tuition and borrowing reference books from the college library, interest/motivation in joining the course, future plans of students passing out of colleges, awareness of vocational education of the State Government, reading habits of newspapers and cost of studying away from parents, a total of 30 final year students comprising 10 arts students, 10 science students and 10 commerce students was initially planned. The instrument of data collection was direct personal interview with the students. For comparability of information to be collected across courses, all questions were uniformly framed for all students.
However, during the fieldwork, several problems were confronted to carry on the fieldwork as planned above. The first problem was the non-availability of courses in the colleges. For instance, B.Sc. course was closed during the academic year 2000-01 in three sample GOs, viz., (a) Government First Grade College, Channapatna, Bangalore rural district, (b) Government First Grade College, Rona, Dharwad district, and (d) Government First Grade College, Channapatna, Bangalore rural district, and in one sample private unaided college, viz., SM Boomareddy First Grade College, Gajendragada, Dharwad district. In the same way, total enrolment in few courses in few sample colleges was less than 10, i.e. lor linal B.Com. in SSM College, Shahabad, Gulbarga district and Government First Grade College, Rona, Dharwad district. The second problem was the non-availability of students in courses and in colleges. For instance, in the Government First Grade College at Channapatna, the number of students enrolled in the final year B.Sc. was less than 5. These students were not available at the college or at their residence on the day of the field staffs' visit to the college. Thus, the number of students interviewed in B.Sc. course was zero for this college in Table 6.1. Further, in few colleges, no admissions were made for courses in1998-99, i.e. for B.Sc. course in Government First Grade College, Shikaripura; and for B.Sc. and B.Com. courses in Sri Tipperudra Swamy First Grade College, Nayakanahatti. Moreover, in view of the preparations for the forthcoming examination, students' attendance during the first week of March was very low in colleges, especially in Gulbarga University. Hence, many of the students in sample colleges had to be interviewed at their residence under the guidance of the college principal.
Consequently, the number of sample students was reduced to 5 students in each of the available courses in all the colleges. In addition, to gain a wider perspective of students' issues, two sets of new students were interviewed. First, to understand the special problems of professional courses in degree colleges (e.g. students in BBM course), it was decided to interview 5 BBM students in all colleges where BBM courses was conducted. Second, the university coHeges in the University of Mysore are located adjacent to each other. Although Maharaja's College was a sample college with arts and commerce courses, 5 science students were interviewed in Yuvaraja's College.
The final number of students interviewed in each college by courses is given below the courses offered in Table 6.1. In total, 248 students were interviewed from all courses in all sample colleges.
6.2. Description of primary data from college questionnaire
6.2.1. Characteristics of sample colleges
Table 6.2 surhmarises the general characteristics of 20 sample colleges. First, the year of establishment of colleges varies from the oldest college established in 1944 to the newest colleges established in 1991. Second, the year of bringing in colleges under GIA is relevant only for aided colleges. The earliest college that was brought under GIA is in the year 1949 and latest college is in 1987. Third, all the sample colleges are day colleges. Fourth, except for 3 colleges, all other colleges are coeducation colleges. Fifth, medium of instruction varies between the colleges. While Kannada (or English) is the sole medium of instruction in 2 (or 5) colleges, other colleges provide instruction in both Kannada and English languages. Sixth, of the 20 sample colleges, 8 (= 40 percent of) colleges are composite and the rest are non-composite colleges. Seventh, the nature of courses offered in the sample colleges, as given in Table 6.1 shows that in 16 (= 80 percent of) colleges, all the 3 traditional courses are offered. And, of these 16 colleges, 5 colleges offer BBM as a non-traditional course. Thus, sample colleges exhibit wide variations in their basic characteristics.
6.2.2. Enrolment of students
W is interesting to understand the trends in and patterns ot enrolment ot students by courses and colleges from the sample survey data as presented in Table 6.3. First, in all the colleges, enrolment in B.A. course is the highest among all courses and in all the years. Second, total enrolment had increased in all the courses from 1991-92 to 1994-95, but declined from 1994-95 to 1999-00 except in case of B.Com. in PACs. Third, of the courses, enrolment in B.A. course has declined in all colleges except in PUACs. In regard to B.Sc. course, the decline is evident only for GCs and PUACs. On the other hand, enrolment in B.Com.. and in other courses has declined only in case of GCs. Fourth, of the colleges, the decline in enrolment is evident in all courses for GCs. In case of PACs and DCs (or PUACs), the decline is evident for B.A. (or B.Sc.) course.
Except for GCs, the sample survey results do not offer consistent results for trends and patterns in enrolment by courses and colleges as compared to the secondary data, summarised in Chapter 4. This indicates that results from secondary data and primary data on colleges would lead to divergent conclusions on the trends and patterns of enrolment by courses and by colleges in the State.
6.2.3. Admission of students
It is interesting to analyse the survey data on the patterns of admission of students in colleges here. Table 6.4 presents admission data of students to 1 year degree c6urse by male/female, SC/ST, courses and by colleges under different management for three years, viz., 1991-§2, 1994-95 and 1999-00. In general, admission to courses shows an increase from 1991-92 to 1994-95, but a decline from 1994-95 to 1999-00. The patterns and characteristics of this decline are highlighted below.
First, total admission to B.A. and B.Sc. courses in all colleges has declined from 1994-95 to 1999-00, except in case of female students in all non-GCs and female SC/ST students in PUACs. However, in case of non-traditional courses, admission has increased over the years along with admission to B.Com. courses. This result offers supporting evidence for the declining enrolment, especially in B.Sc. courses, as observed from secondary data in Chapter 4, and underlines that the decline in enrolment is due to decline in the admission itself.
Second, of all the courses, B.A. degree course attracts the largest number of admission of all male and female students as well as all SC/ST male and female students in all colleges and in all years. Other than B.A. course, B.Com. course attracts the largest admission of students and is followed by B.Sc. and other courses.
Third, in all the colleges, admission of total male students is higher than the admission of total female students, except in case of B.Com. course in PUACs. This pattern is relevant for SC/ST students as well, except in 1991-92.
Fourth, of all the courses, admission of SC/ST students among the total male and female students is higher in B.A. than in non-B.A. courses in all the years. Thus, a decline in enrolment in B.A., as a consequence of decline in admission, has important implications for SC/ST students in collegiate education in the State.
Fifth, in case of B.Sc. course, the decline is evident for all students in GCs, for all students except non-SC/ST male students in PACs and for only non-SC/ST male students in PUACs.
The above insights from the sample survey data clearly indicate that the decline in enrolment in colleges is different not only in different courses, but also between male and female students, and between SC/ST and non-SC/ST male and female students, in different years. This implies that a policy to deal with the problem of declining enrolment in degree colleges needs to be specific towards particular group of students by courses.
6.2.4. Pass percent and distribution of pass percent of students
Table 6.5 through Table 6.7. presents the pass percent and distribution of pass percent of final year sample students in B.A., B.Sc. and B.Com. degree course in 1991- 92, 1994-95 and 1999-00 for respectively.
6.2.4.1. Pass percent and distribution of pass percent of students in B.A. course
In Table 6.5, distribution of number of passes and total pass percent of students in B.A. is presented. In 1991-92, total pass percent of students was highest in GCs as compared to PACs and PUACs. The total pass percent of female students was higher than total pass percent of male students in all colleges except in the GCs. Further, of the total number of passes, the proportion of number of SC/ST and non-SC/ST male students with a Pass Class was higher than female students in all the colleges.
Total pass percent shows wide fluctuations from 1991-92 through 1999-00. However, as compared to 1994-95, total pass percent shows marked improvement in all colleges, except for female students in GCs, in 1999-00. In the same way, the number
of pass class students has come down in all colleges with an appreciable increase in I Class students in 1999-00.
6.2.4.2. Pass percent and distribution of pass percent of students in B.Sc. course
In Table 6.6 pass percent and distribution of pass percent of students in B.Sc. is presented.
The DCs and PUACs have not reported data for the year 1991-92 and, hence, the analysis is restricted below only for GCs and PACs. First, total pass percent of students was highest in GCs as compared to PACs, except for female SC/ST students. Second, unlike in B.A. course, the number of I Class and II Class students are relatively higher in all category of students. Most surprisingly, unlike in PACs, total pass percent of SC/ST students is higher than non SC/ST students in GCs. And, total pass percent of female students is higher than male students.
Total pass percent shows wide fluctuations from 1991-92 through 1999-00. For Instance, in 1999-00, the following patterns are evident. First, the highest total pass percent for male (or SC/ST male) students are evident in PACs (or GCs). Second, the highest total pass percent for SC/ST and non-SC/ST female students is evident in GCs. Third, the proportion of students who pass with a Pass (or First) Class is highest among SC/ST male (or non-SC/ST female) students in PUACs (DCs). Fourth, total pass percent of students shows improvements among all students in all colleges except in case of all female students and SC/ST male students in GCs.
6.2.4.3. Pass percent and distribution of pass percent of students in B.Com. course
In Table 6.7, distribution of number of passes and total pass percent of students in B.Com. course is presented. In 1991-92, of the colleges, total pass percent of students was highest for SC/ST female students and non-SC/ST male students in PUACs. The total pass percent of female students was higher than total pass percent of male students in GCs. Further, of the total number of passes, the proportion of students passing with a Pass Class was relatively higher in GCs and PACs than in PUACs.
Total pass percent shows wide fluctuations from 1991-92 through 1999-00. However, as compared to 1994-95, total pass percent shows marked improvement in all colleges, except for SC/ST female students in GCs and UCs and for SC/ST male students in PUACs in 1999-00. In the same way, the number of I class students has increased in all colleges in 1999-00.
6.2.5. Retention rate of students in sample colleges
Table 6.8 presents the retention rates in sample colleges by courses, male/female students and male/female SC/ST students in 1991-92, 1994-95 and 1999-00.
Since primary data in this study is not collected for all year during 1990's, the methodology of computing the retention rate needs to be changed, as compared to the methodology of computing the retention rate, using the secondary data, given under section 5.1.1. (ii) in Chapter 5. That is, the retention rate is defined as the number of
students enrolled in the final year of a course as a percentage of total number of student's admitted/enrolled in the first year of the course during the same year. Thus, for instance, retention rate in B.A. course in a college in 1995-96 is equal to: [(total number of final year students in B.A. course in 1995-96) divided by (total number of first year students in B.A. course in 1995-96)]*100. Consequently, the retention rate cannot be constrained to be strictly less than 100 percent. In view of this difference in methodology in computing the retention rates between primary and secondary data, the results of retention rates based on primary and secondary data are not directly comparable. Nevertheless, some insights from the primary data analysis are given below.
First, in case of GCs, the retention rates are higher for male and female SC/ST students than for non-SC/ST students, except in B.Com. course. Over the years, the total retention rates have fluctuated. As predicted, the rietention rates are more than 100 percent. For instance, the retention rate for female students was 241.33 percent in B.Sc. course and 241.77 percent for B.Com. students in 1999-00.
Second, in case of PACs, the retention rates are higher for female students than for male students, except in B.Com. course. Further, retention rates are equal or higher for non-SC/ST male and female students than for SC/ST students, except in B.A., and B.Com. courses in 1999-00. Over the years, the retention rates have fluctuated, but have declined from 1994-95 to 1999-00 in B.Sc. and B.Com. courses.
Third, in case of PUACs, the total retention rates are higher for female students than for male students in all years except in 1999-00. Further, retention rates are higher for non-SC/ST female students than for SC/ST male students in all the years. Over the years, the total retention rates have fluctuated, but have declined from 1994-95 to 1999-00 except for female students. Of the courses, the retention rates have declined in all courses except in B.Sc. course.
Fourth, in case of UCs, the patterns of retention of students are mixed between years. For instance, between 1994-95 and 1999-00, total retention rates have declined except in case of non-SC/ST male students. And, of the courses, retention rate has declined in B.Sc. and B.Com. courses.
An important implication of the analysis of retention rates by courses and by colleges is that it provides a supporting evidence for decline in enrolment in traditional courses, especially in B.Sc. courses. Given the results in Chapter 4 in regard to decline in admission to traditional courses, it is plausible explain the decline in enrolment in collegiate as a combination of decline in admission and retention of students in traditional courses.
6.2.6. Teaching and non-teaching staff position
In what follows, the nature and distribution of teaching and non-teaching staff positions are analysed.
Table 6.9 presents the sanctioned, filled up and vacant position of permanent teaching staff in sample colleges in 1991-92, 1994-95 and 1999-00. In GCs, the vacant posts constitute about 50 percent or more for both SC/ST and non-SC/ST posts. In case of PACs, the vacant posts of SC/ST have come down over the years. For non-SC/ST staff, the vacant posts have fluctuated from 37.72 percent in 1991-92 to 20.10 percent in
292-9
1994-95 and to 37.9 percent in 1999-00. In the same way, vacant posts for SC/ST and non-SC/ST fluctuate between years for PUACs. In case of UCs, vacant posts have been prevalent only since 1991 -92. Thus, vacant posts exist in all colleges in the State.
Table 6.10 presents the sanctioned, filled up and vacant position of permanent non-teaching staff in sample colleges in 1991-92, 1994-95 and 1999-00. In both GCs and PACs, the number of vacant posts of SC/ST is higher than the total vacant posts. However, the vacant posts are higher in GCs than in PACs. In case of PUACs, vacant posts have been reduced from 87 percent in 1991-92 to 61 percent in 1999-00. In case of UCs, vacant posts are evident in 1994-95 and 1999-00.
6.2.7. Composition and quality of teaching staff
In what follows, a summary of the qualitative aspects of teaching staff by colleges is presented.
Table 6.11 presents the composition of total teaching staff between lecturers and non-lecturers (i.e. professors and readers) in colleges by courses in 1991-92, 1994-95 and 1999-00. In all the years and courses, the number of lecturers dominate the nonlecturers in the total teaching staff of the colleges and teaching staff in arts subjects dominate over other subjects. Most surprisingly, there are no professors and readers in PUACs. On the other hand, in UCs, the number of professors and readers has declined over the years from 53 in 1991 -92 to 24 in 1994-95 and to 2 in 1999-00.
Table 6.12 presents select details of qualification, training and professional interactions ot the teaching staff in colleges. In addition, library facility in terms of books purchased or donated to colleges per total teaching staff and students is highlighted.
First, the number of faculty members who have attended the refresher and/or orientation programmes as a percentage of total number of staff in 1999-00 indicates that faculty in PUACs have attended the least number of programmes as compared to faculty in other colleges. While the faculty in science, commerce and other subjects of PACs have attended the highest number of programmes, the faculty of GCs have attended the highest number of programmes in arts subjects. It should be noted that the percentage of faculty who attended the programmes in other subjects in PACs is reported at 250 percent. This has happened since the faculty who attended the programme from the PACs is reported for all years, whereas the total number of staff is reported for 1999-00.
Second, the number of faculty members who have obtained or doing M.Phil or Ph.D degree as a percentage of total number of staff in 1999-00 shows that, in general, the UCs are relatively better placed in terms of these higher qualification for faculty than other colleges.
Third, attendance in and organisation of professional seminars, workshops and guest lectures in the colleges as a percentage of total number of faculty members shows that the PACs and PUACs perform better than GCs and UCs. As these opportunities for faculty and students to interact and access recent knowledge, they need to be encouraged in GCs and UCs.
Fourth, the number of professional books purchased to college library per total teachers and students shows that GCs have the highest number in all subjects except in other subjects. However, the number of professional books donated to college library per total teachers and students is negligible in all subjects and colleges.
6.2.8. Student-teacher ratio
Table 6.13 presents the STR for the sample colleges in 1991-92, 1994-94 and1999-00 by courses. In all the colleges, STR has increased from 1991-92 to 1994-95. For all the courses, STR in GCs was relatively higher than in all non-GCs. However, from 1994-95 to 1999-00, STR has declined in all the courses in GCs, in B.A. and B.Com. courses in PACs, in all traditional courses in PUACs and in B.A. course in DCs. In 1999-00, STR is lowest in B.Sc. in GCs, PACs and DCs, and in other course in PUACs.
6.3. Description of primary data from Principal’s Questionnaire
Table 6.14 summarises the responses of the principals in 20 sample colleges in regard to quality and adequacy of college infrastructure and other aspects.
First, about 37 percent of the sample colleges have problems in obtaining books for their libraries and all the problems are related to lack of money to buy the books. Thus, lack of financial resources is a serious constraint for the improvement of library collections in the colleges. Surprisingly, except two colleges, there seem to be no problems in obtaining laboratory equipment and consumables. And, lack of resources is reported to be the major reason tor it.
Second, about 95 percent of sample colleges have their own buildings. Over 73 percent of colleges have adequate classrooms. Over 85 percent of colleges have adequate students' desk, blackboard, teachers' chairs and desks regular maintenance of classroom walls and roof, adequate sanitation facilities including separate toilet for boys and girls and playground and sport facilities.
Third, only about 37 percent of colleges have students' hostel facilities and only about 11 percent of colleges have employment guidance/placement cell for students. In the same way, only about 37 percent of colleges have alumni association and local people are contributory for college development. However, only 3 out of 20 sample colleges have NAAC's recognition.
Fourth, regarding the staff position, especially in PACs, 4 (3) out of 6 sample colleges have reported the existence of vacant teaching (non-teaching) staff in their colleges. The most important reason for the existence of vacant positions is lack of permission from the State Government to fill up the positions. This is perfectly consistent with the recent decision of the State Government to ban the recruitment of non-teaching staff in both Government and PACs, and freeze the recruitment of teaching staff in PACs, to reduce the expenditure on collegiate education. It should be emphasised that over 66 percent of the existing posts are due to retirement of staff in the colleges. In fact, over 63 percent of principals are aware of the recent debates on the reduction in GIA to the PACs in the State.
Fifth, on the demand for courses in colleges, the largest decline is reported (over 68 percent) in B.Sc. course and is followed by B.Com., B.A. and BBM courses.
6.4. Description of primary data from Students’ Questionnaire
Perceptions of the students on the quality and relevance of collegiate education in the State is summarised below in Table 6.15 through 6.17.
6.4.1. Sample survey results of all students in all courses and colleges
Sample survey results of all students in all courses and colleges are presented in Table 6.15. In total, 248 final year students [i.e. comprising students in B.A. (40%), B.Sc. (25%), B.Com. (29%) and BBM (6%) courses] are interviewed. A description of these results Is given below.
6.4.1.1. Socio-economic background of students
About 24 percent of sample students belonged to SC/ST. Kannada is the mother-tongue for about 76 percent of student. Only about 28 percent of students come from families whose fathers' occupation is agriculture. The parental income distribution of students show that over 57 percent belong to families whose parents' monthly income is over Rs.1001 per month.
The performance of students in previous examinations show that about 23 (40) percent and 32 (41) percent had passed the I and II year course with a first (second) Glass respectively. However, over 93 percent of students expect a first class in the final year examination of their courses.
6.4.1.2. Motivation for study
Who and what motivated the students to pursue the course of their present enrolment are important factors in understanding the demand for collegiate education at the students' level. Interestingly, about 44 percent of student have been self-motivated to join the courses, while parents, brother/sisters and friends and relatives are the next largest motivators for the students to join the course of their study.
Of the motivations for the study, over 64 (67) percent of students have responded to pursue higher education and only about 23 (23) percent to find a job at the time of joining (completing) the course. Thus, the purpose of their study is consistent and stable over the years.
6.4.1.3. Reading habits of students
It is glad to know that the students have positively responded to reading newspaper. The proportion of students who read both Kannada and English language newspapers is about 54 percent. While 22 (19) percent read the newspaper at home (college), other students read the newspapers both at home and college. The most important news item that the students read is related to job advertisements.
Over 93 percent of students have borrowed books from the college libraries, but at the same time about 81 percent have purchased the reference books. The amount of
money spent on books during last 3 years shows wide variations. For instance, 38 percent of students have spent less than Rs.500 and about 24 percent of students have spent between Rs.510 and Rs.1000. Interestingly, about 18 percent of students have spent nnore than Rs.1001 on purchase of books. And, availability of books in the college library, rather than lack of money, is the most important reason for not buying books for about 15 percent of students.
6.4.1.4. Cost of private tuition
Private tuition seems to be less popular as only 22 percent of students are taking private tuition in the colleges. And, over 97 percent of students spend less than Rs.500 per year on private tuition.
6.4.1.5. Cost of boarding, lodging and commuting
For students who stay away from their parents and close relatives for college education, cost of boarding, lodging and commuting is an important element of private costs of collegiate education. However, the proportion of students who stay with friends and hostels is only about 5.2 percent and 17.3 percent respectively.
Of the total students, about 10.9 percent have spent less than Rs.500, about 9 percent have spent between Rs.501 and Rs.1000 towards boarding and lodging expenses per month.
Distance and mode of transport are the major determinants of cost of commuting for students. About 69 percent ot students stay in less than 2 Km distance Irom their colleges, and about 15 percent of students stay in less than 6 Kms but more than 2 Km distance from their colleges. Thus, short distance students dominate the long distance students in the sample colleges.
If walking and cycling are costless modes of commuting, then about 31 percent of students do not incur any cost of commuting to reaching their colleges. Among the others, about 10.1 (22.2) percent of students spend less (more) than Rs.50 towards commuting cost per month.
6.4.1.6. Knowledge and awareness of vocational education
The Directorate of Training and Employment (DTE) of the Government of Karnataka has been spreading knowledge on the vocational education and job market information to students in State universities and their affiliated colleges. For this purpose, in every State University, employment and guidance bureau is set up, manned by the deputed persons from the DTE. The officials of the bureau are expected to visit the colleges and provide information and education on vocational courses and programmes.
Of the total sample students, only about 38 percent are aware of the vocational education in the State. Much less of them (about 21 percent), know about the courses offered under vocational education, although about 29 percent of students know the eligibility criteria for admission to vocational education. Unfortunately, only about 16 percent of students know the job prospects of joining the vocational courses in the State.

6.4.2. Sample survey results of all student In all courses by colleges
The sample survey results of all students in all courses by colleges are presented in Table 6.16. The highlight of these results are as follows.
❖ Proportion of total students who belong to SC/ST is higher in UCs than in other colleges.
❖ Number of students, whose mother-tongue is Kannada, is highest in GCs.
❖ Number of students whose parents have monthly income of more than Rs.1000 is higher in non-GCs than in GCs.
❖ Number of students having III class in I Year and II Year course is higher in GCs.
❖ Pursuance of higher education rather than finding a job is the motivation for joining a degree course, both at the time of admission and completion of a course, for the highest number of students in all the colleges.
❖ Newspaper reading habits of students is 100 percent in all the colleges.
❖ Students’ dependence on college library for reference books is highest in GCs.
❖ Proportion of students who bought reference books is highest in GCs with 68 percent of students spending less than or equal to Rs.1000 on books.
❖ Proportion of students who go for private tuition is relatively less in PUACs.
❖ Proportion of students staying in hostels is highest in UCs and is lowest in PUACs.
❖ Proportion of students who spend between Rs.501 and Rs.1000 per month on boarding and lodging is highest in UCs.
❖ About 80 percent of students travel less than 2 km to reach their GCs. This is in contrast with UCs where about 23 percent of students travel more than 9 km to reach their college.
❖ Knowledge and awareness of vocational education is widespread among the students in UCs than in other colleges. This is for the main reason that University Employment Bureau and Vocational Guidance is located, in general, within the campus of university colleges (e.g. within the campus of Maharaja's College in the University of Mysore).
6.4.3. Sample survey results of all students in all colleges by courses/
The sample survey results by courses are presented in Table 6.17. The highlight of these results are as follows.
♦ Proportion of total students who belong to SC/ST is higher in B.A. course than in other courses.
♦ Number of students, whose mother-tongue is Kannada, is highest in B.A. course.
♦ Number of students whose parents have monthly income of more than Rs.5000 is higher in B.Sc. course than in other courses.
♦ Number of students having III class in I Year and II Year course is higher in B.A. course.
♦ Pursuance of higher education rather than finding a job is the motivation for joining a degree course, both at the time of admission and completion of a course, for the highest number of students in all the courses.
♦ Newspaper reading habits of students is 100 percent in all the courses
♦ Students' dependence on college library for reference books is highest in BBM course and lowest in case of B.A. course.
♦ Proportion of students who bought reference books is also highest in B.Com. course with about 73 percent of students spending less than or equal to Rs.1000 on books.
♦ Proportion of students who go for private tuition is more in non-B.A. courses, especially in B.Sc. course.
♦ Proportion of students staying in hostels is highest in other course and is lowest in B.A. course.
♦ Proportion of students who spend between Rs.501 and Rs.1000 per month on boarding and lodging is highest in BBM course.
♦ Knowledge and awareness of vocational education is widespread among the students in B.Sc. course and is followed by B.Com. course, B.A. course and in other course.
On the whole, the analysis of primary data from sample colleges, college principals and college students have offered new insights into the reasons for declining enrolment in traditional courses; wide difference in the distribution of pass percent by I Class, II Class and Pass Class; and remarkable variability in the quality of college infrastructure and teaching staff; and appreciably differences in the perception of students on quality and relevance of collegiate education in different colleges and courses.
Public Expenditures and Resource IVIobilisation in Collegiate Education
This chapter analyses the trends in public expenditure on collegiate education and the effects of changes in the level and composition of government expenditure on Government and private aided degree colleges. In addition, per student expenditure by colleges is analysed based on sample survey data on colleges.
7.1. Nature of public financing of collegiate education
In a federal economy like India, public (i.e. budgetary) financing of collegiate education may be analysed at different levels of the government, such as, at the federal or Union Government's level and/or at the State Governments' level. However, the focus of this chapter is on financing of collegiate education by the State Government, viz., the Government of Karnataka. For this reason, throughout this chapter, the two terms, public financing of collegiate education and financing of collegiate education by the State Government, will be used interchangeably.
The nature of public financing of collegiate education is different between the GCs and private colleges. For instance, in case of GCs, all expenditure (i.e. net of students fee to the State Government, however) are met by the State Government. In case of private colleges, the State Government provides with maintenance or teaching grants in the form of cent percent reimbursement of salary payments of working teaching and non-teaching staff. These grants are called grants-in-aid (or GIA). A college, which receives (does not receive) the GIA is called an aided (unaided) college.
Aided colleges need not have only those courses, which are aided. In fact, many of the aided college do have many unaided courses (e.g. professional courses, such as, BBM and BHM) and subjects (e.g. electronics). Thus, what distinguishes an aided college from an unaided college is the following. In an aided college there exists at least one course, which is aided, whereas in an unaided college there exists no courses, which are aided.
The policy framework for brining the new colleges under GIA and to continue the GIA for the currently aided colleges are outlined in the GIA Code of the Karnataka Collegiate Education (for details, see Chapter 5 in Murthy (1993)]. Recently, Narayana (1999b) has examined in detail the current status and future policy alternatives in Karnataka's' GIA, especially in terms of examining the financing of a reduction in GIA by students' fee revisions and the impact of such financing of reduction of GIA on the pass percent of students in final year examinations in aided colleges. Nevertheless, the GIA code is briefly explained below.
The GIA code is a set of rules and regulations for payment of the GIA to eligible colleges in Karnataka State. These rules and regulations are formulated and implemented by the State government. The GIA code comprises: (a) a set of definitions including for a college, institution and management; (b) general conditions for payments and non-payment of GIA including the affiliation requirements and nature of courses; (c) explanation of different types of GIA payable, including teaching (or
maintenance) grant, grant towards loss of fee income, building grants and equipment grants; (d) guidelines and application format for different types of GIA.
In principle, the GIA may be given in different forms, such as, teaching (maintenance) grant, building grant and equipment grant. However, in practice and at present, the nature of GIA is limited to teaching grant in the form of cent percent direct reimbursement of salary for the staff in the aided colleges.
The GIA is limited to privately managed degree and law colleges, affiliated to recognised Universities within the State. And, within the affiliated private degree colleges, courses leading to B.A., B.Sc., and B.Com. degrees and affiliated with the University are eligible for the GIA. In case of law colleges, the three-year course leading to the award of a law degree (e.g. LLB) is eligible for the GIA. However, a college is eligible for the GIA only upon completing five years of working, and a course (existing or new) in such a college is eligible only upon completing five years from the year of its introduction. In addition, an aided college should satisfy that the average daily attendance of students and the minimum number of working days in its college shall not be less than what is fixed by the University with which the college is affiliated.
It should be emphasised that the GIA is a discretionary grant as the State government has all rights reserved in it with regard to changing and interpreting the rules, and hence refusing or withdrawing the grant. Thus, the GIA cannot be claimed as a matter of right. Further, an important pre-condition for the GIA is the availability of funds under the concerned heads of expenditure in the State budget. That is, funds must be available under the State budget-head i.e. [2202-03-104-1-01] for teaching/ maintenance grant under non-plan expenditure and [2202-03-104-1-02] for bringing new colleges under GIA under plan expenditure.
The GIA policy has both promotional and regulatory objectives. First, the GIA policy aims at encouraging private enterprise/management in higher education, In such a way that both public and private financing are ensured. Second, through the GIA policy, the Government can regulate the activities (e.g. in staff recruitment and fixation of student fees) in PACs. Third, the GIA policy aims at reducing the total cost of providing collegiate education for the State government, especially as compared to a hypothetical situation where all the aided colleges are to be totally established and run as GCs. In the same way, it reduces the cost of production of education by the private colleges as the expenditure on the aided teachers is entirely reimbursed by the Government. Fourth, because of the GIA, the teaching and non-teaching staff are paid on par with the staff in GCs, apart from equal service conditions (e.g. job security) and benefits (including retirement benefits). Thus, the private management can attract the best of qualified and experienced staff for their colleges, which, in the ultimate analysis, is a critical input for improving the quality of education in the colleges. Fifth, the GIA policy aims at reducing the cost of obtaining collegiate education by students, as compared to a situation when the GIA is absent and the private colleges work on the basis of full cost recovery from the students. Thus, the objectives of the GIA policy have relevance for all major agents involved in the collegiate education, viz., the State government, management, and teachers and students in the private degree colleges.
7.2. Nature of public expenditure on collegiate education
In the State budget, expenditure on collegiate education is a part of university and higher education, which, in turn, is a part of general education. In principle, the budgetary allocation is divided under revenue expenditure, capital expenditure and loans and advances.
7.2.1. Revenue expenditure
First, budgetary allocation is made for general education sector (budget head: 2202) under allocation for social services. Second, within the general education sector, among others, allocation is made for University and Higher Education (2202-03). Next, within the University and Higher Education, plan and non-plan allocation are made separately for Government and non-GCs under the Department of Collegiate Education. For instance, allocation for GCs come under the budget head: 2202-03-103-2 and Assistance to Non-GCs come under the budget head: 2202-03-104-1. The non-plan assistance to non-GCs is given as teaching/maintenance grants (2202-03-104-1-01) and plan assistance is for bringing new colleges under GIA (2202-03-104-1-02).
7.2.2. Capital expenditure
The capital expenditure ( budget head 4202-01-203) is divided under plan and non-plan expenditure. The plan expenditure includes works (e.g. construction of buildings), equipment grants and library grants (for purchase of books and journals). The items of expenditure tor construction of buildings under State Plan Schemes (4202-01- 203-1-01) include establishment changes transferred from Public Works Department (budget head: 2059) under construction (2059-80-051) and machinery and equipment (2059-80-052) and grants for library and equipment are called development grants. These expenditure, however, are not distinguished for collegiate education.
7.2.3. Loans and advances
The loan and advances for University and Higher Education (budget head: 6202- 203) are under plan and non-plan schemes. The items of expenditure under this head include (a) loans to Universities for sanction of house building and other advances to their staff (6202-203-1) by Universities (e.g. for University of Mysore under 6202-203-1-01 and so on), (b) special loans for maintenance expenditure to private colleges (6202- 01-203-2-01) and scheme of National Loan Scholarship (6202-01-203-3-001) and (c) loans for construction of buildings to University Colleges (6202-01-203-4-01). As in the case of capital outlay, the items under loans and advances are not distinguished for collegiate education.
7.3. Patterns of budgetary expenditure on collegiate education
The patterns of public financing of collegiate education may be described at different levels. In what follows, the descriptions are focused at the State and sub-State levels.
7.3.1. Patterns of budgetary expenditure on collegiate education at State level
Table 7.1. presents the patterns of budgetary expenditure on collegiate education at the State level of aggregation.
Over the years, both plan and non-plan expenditure have been incurred on the collegiate education. Unlike the total non-plan expenditure, the total plan expenditure on collegiate education shows fluctuating trends in 1990's. First, for all the years, non-plan expenditure on PACs has been higher than on GCs. In regard to plan expenditure, up to the year 1994-95, plan expenditure on PACs was more than on the GCs. Since then, however, plan expenditure on GCs has been higher than on PACs.
The total plan (non-plan) expenditure on collegiate education as a percentage of total plan (non-plan) revenue expenditure on general education in the State shows wide fluctuations. It was 7.15 (9.77) percent in 1990-91 but declined (increased) to 0.47 (10.66) percent in 1998-99, but has increased to 1.97 (17.07) percent in 2000-01. In the same way, total plan (non-plan) expenditure on collegiate education as a percentage of total plan (non-plan) revenue expenditure on University and Higher Education in the State shows fluctuations. It was 52.76 (65.67) percent in 1990-91 but declined (increased) to 10.49 (75.86) percent in 1998-99, but has increased to 58.89 (80.88) percent in 2000-01. This implies that a large amount of non-plan University and Higher Education expenditure is incurred on collegiate education in the State.
7.3.2. Patterns of budgetary expenditure on collegiate education at tiie sub- State level
State level description of the revenue expenditure does only reveal the allocation of budgetary resources to collegiate education as one of the sectors in higher education. However, to gain insights into the patterns of spatial allocation of expenditure to collegiate education, a description of expenditure allocation to GCs and aided colleges by universities and districts is given in Table 7.2 and Table 7.3.
In both the tables, for each year, the absolute amount of expenditure (Rs. in Lakh at current prices) and its share in the State's total ( as shown in the parentheses) are given in the first column. In the second column, annual growth of expenditure (%) and share of each district in the University's total (as shown in the flower brackets) are given.
All the data in both the tables refer to budgetary provision of expenditure by the Department of Collegiate Education to 6 Joint Directorate of Collegiate Education in the State. In fact, data on actual release of expenditure or grants-in-aid by colleges is maintained only in the office of this Joint Directorate. Thus, there may exist a difference between the expenditure data on collegiate education in the budget papers, budgetary provision by the Directorate of Collegiate Education and the actual release of expenditure by the Joint Directorate of Collegiate Education.
7.3.2.1. Expenditure on Government colleges
Table 7.2 presents the allocation of expenditure to GCs by universities and districts from 1992-93 to 1999-00.
First of all, there exist annual variations in the absolute amount of expenditure between districts and universities in all the years. For instance, the amount of expenditure for colleges under Bangalore (or Mangalore) university has increased from Rs.571.61 (or Rs.225.63) lakh in 1992-93 to Rs. 1035.35 (or Rs.408.70) lakh in 1995-96 to Rs.1834.64 (or Rs.724.20) lakh in 1999-00. In the same way, the increasing amount of expenditure is evident for all the remaining universities in the State. Further, total expenditure for all universities or districts has also increased over the years from Rs.2241.30 lakh in 1992-93 to Rs.4059.69 lakh in 1995-96 to Rs.7139.58 lakh in1999-00.
Most surprisingly, there exist several uniformities in the spatial distribution of expenditure in Table 7.2. In particular, the uniformities are evident for the following variables, (a) Uniformity in the share of each district in the State's total expenditure for all the years. For instance, the share of expenditure of the Bangalore Urban district in the State's total expenditure was 7.38 percent in 1992-93 and has remained the same throughout, (b) Uniformity in the share of each university in the State's total. For instance, the share of expenditure of the Bangalore University in the State's total expenditure was 25.50 percent in 1992-93 and has remained the same throughout, (c) Uniformity in the share of expenditure of each district in the total expenditure under each university. For instance, the share of expenditure of Bangalore Urban district in the University's total expenditure was 28.95 percent in 1990-91 and has remained the same throughout.
The presence of the above uniformities indicates a simple formula for spatial allocation of expenditure for GCs. That is, a proportionate rise (in percent terms) in the total expenditure for all districts or universities in the State.
7.S.2.2. Expenditure on Private Aided colleges
Table 7.3 presents the allocation of expenditure to private aided degree colleges by universities and districts from 1992-93 to 1999-00. Qualitatively, the allocation patterns in Table 7.3 are comparable with the patterns in Table 7.2.
First of all, there exist annual variations in the absolute amount of expenditure on the GIA between districts and universities in all the years. For instance, the amount of expenditure for colleges under Bangalore (or Mangalore) university has increased from Rs.1494.71 (or Rs.857.62) lakh in 1992-93 to Rs.2274.88 (or Rs.1305.26) lakh in 1995- 96 to Rs.3781.50 (or Rs.2172.50) lakh in 1999-00. In the same way, the increasing amount of expenditure is evident for all the remaining universities in the State. Further, total expenditure for all universities or districts has also increased over the years from Rs.7106 lakh in 1992-93 to Rs.10815 lakh in 1995-96 to Rs. 17947.43 lakh in 1999-00.
Most surprisingly, there exist several uniformities in the spatial distribution of GIA in Table 7.3. In particular, the uniformities are evident for the following variables, (a) Uniformity in the share of each district in the State's total expenditure for all the years. For instance, the share of expenditure of the Bangalore Urban district in the State's total expenditure was 15.17 percent in 1992-93 and has remained the same throughout, (b) Uniformity in the share of each university in the State's total. For instance, the share of expenditure of the Bangalore University in the State's total expenditure was 21.03 percent in 1992-93 and has remained the same throughout, (c) Uniformity in the share of expenditure of each district in the total expenditure under each university. For
instance, the share of expenditure of Bangalore Urban district in the University's total expenditure was 72.13 percent in 1990-91 and has remained the same throughout.
As in the case of GCs, the presence of the above uniformities indicates a simple formula for spatial allocation of expenditure for aided colleges. That is, a proportionate rise (in percent terms) in the expenditure for all districts or universities in the State.
7.3.2.S. Summary statistics
Table 7.4 gives the summary statistics of inter-district distribution of expenditure for GCs and aided colleges separately. These statistics confirm the patterns described above. That is, as the total allocation for districts have increased over the years, and given the same number of districts, the mean allocation has increased for both Government and aided colleges. Second, because of variations in the absolute size of allocation between districts in each year, the standard deviation has increased over the years. Third, the relative variations have remained the same at about 51 percent in case of GCs and at about 79 percent in case of aided colleges. This confirms the presence of uniformity in the patterns of allocations for districts or universities over the years.
7.4. Analysis of per student expenditure by colleges
Data on expenditure in colleges are not available from secondary sources. Thus, as a part of college questionnaire in the sample survey of colleges in Chapter 6, data on different items of expenditure and receipts from colleges were collected. This data is helpful to compare per student expenditure by types of colleges at different points in time.
Table 7.5 presents expenditure data by GCs, PACs, PUACs and UCs in 1991-92, 1995-96 and 1999-00. The major features of the expenditure data are as follows.
First, salary for teaching and non-teaching staff constitutes the largest expenditure in all colleges except in PUACs. For instance, in GCs, salary expenditure has been over 96 percent of total expenditure in all the years. In case of PACs (or UCs), over 80 (or 90) percent of total expenditure is towards staff salary. However, in case of PUACs, salary expenditure varies between years. It is about 33 percent in 1991-92, about 85 percent in 1995-96 and about 65 percent in 1999-00. Consequently, expenditure on non-salary items has been negligible, especially on land and buildings for the colleges. In 1999-00, expenditure on laboratory (or library) has been highest in PACs (or PUACs).
Second, per student expenditure shows an increase in all colleges except PUACs. For instance, per student expenditure in GCs has increased from about Rs.713 in 1991-92 to about Rs.1140 in 1995-96 and to about Rs3791 in 1999-00.
As in the case of GCs, per student expenditure shows an upward trend in PACs and UCs. For instance, per student expenditure in PACs (or UCs) has increased from about Rs.7352 (or Rs. 6533) in 1995-96 to about Rs.13600 (Rs.Rs.10690) in 1999-00.
On the other hand, in case of PUACs, there exists a wide variation in per student expenditure between years. For instance, per student expenditure has reduced from
about Rs.291?. in 1991-92 to about Rs.1399 in 1995-96, but has increased to about Rs.2881 in 1999-00.
Of all the colleges, per student expenditure is the lowest in GCs and highest in case of PACs in the State.
it is interesting to examine the sources of and trends in receipts to colleges, especially in relation to the expenditure patterns above. Table 7.6 presents the sources and amount of receipts of sample GCs, PACs, PUACs and UCs in 1991-92, 1995-96 and 1999-00. The important insights from this data are as follows.
First, for GCs, the State Government is the single most important source of total receipts. Except for the assistance from UGC in 1999-00, the State Government constituted the only source of receipt for the GCs. In addition, total receipts and per student receipts have increased over the years. For instance, per student receipts has increased from about Rs.322 in 1991-92 to about Rs.392 in 1995-96 and to about Rs.1325 in 1999-00.
Second, for PACs, the State Government is one of the most important reported sources (i.e. about 86 percent) of total receipts. The other important sources include college management, tuition fee from students and UGC. For instance, in 1999-00, the share of tuition fee (or UGC) is about 3.55 (or 3.10) percent in the total receipts. In addition, total receipts and per student receipts have increased over the years. For instance, per student receipts has increased from about Rs.4385 in 1991-92 to about Rs.5817 in 1995-96 and to about Rs.9848 in 1999-00.
Third, for PUACs, the college management is single most important reported source (i.e. more than 90 percent) of total receipts. The other important sources include other sources of receipts whose composition is not made explicit. For instance, in1999-00, the share of other sources is about 7 percent in the total receipts. In addition, total receipts, but not per student receipts, have increased over the years. For instance, per student receipts has declined from about Rs.597 in 1991-92 to about Rs.272 in1995-96 and has increased to about Rs.446 in 1999-00.
Fourth, for UCs, the affiliating university and the UGC are the major sources of receipts. For instance, in 1999-00, the share of University (UGC) is about 91 (or 9) percent in the total receipts of UCs.
It should be emphasised that a comparison of total or per student receipts may not be plausible since, for instance, no data on receipts from the tuition fee fronn students are reported in GCs in 1991-92 and 1995-96. In the same way, no data on tuition fee from students are reported in PUACs and UCs for any of the study years. Hence, due to incompleteness of data on all sources of receipts, a comparison of total or per capita receipts between colleges, and between total receipts and total expenditure is not plausible.
7.5. Current issues in public financing of collegiate education in ttie State
The important current policy issues in public financing of collegiate education include the following. First, can we consider GIA as a form of budgetary subsidies to private aided colleges? Second, is there no subsidy in GCs? Third, if subsidies exist,
what are their composition and volume? Fourth, how can subsidies be reduced in its volume and composition, and by which instruments, without compromising, of course, on the quality of and equity in collegiate education? These policy issues are addressed in the analysis below.
7.5.1. Background for current policy issues
The Economic Survey 1999-00 of the Government of Karnataka (2000a) outlines the policy and performance of education sector (i.e. in primary, secondary, mass and vocational education) under social infrastructure. However, surprisingly, the Survey does not make any reference to policies and performance of higher education including collegiate education in the State. Nevertheless, the increasing recognition of the importance of higher education in general, and concern with present and future public financing and subsidies to higher education in particular, are evident in the following recent policy studies and reports of the Government of Karnataka.
The Report of the Karnataka Universities Review Commission [Government of Karnataka (1993)], under the chairmanship of Professor T. Navaneetha Rao, has examined in detail, among other, the State financing and financial management of university education in the State. Listing the perspectives in 2001 AD, the Report notes two important points.
First, the Report argues that "higher education in universities has beensubsidised to a great extent..........It is our considered view that higher education beyond,say, high school level, becomes a private property. People who choose to go for graduate, post-graduate and professional courses decide to invest their money anticipating relevant returns from future employment which will be based on such higher education. Higher education cannot be treated as a basic need or social good as muchas elementary education.......... Therefore, higher education has to be treated as aprivate good constituting private wealth" (p.230).
Second, on financing of higher education, the Report clearly noted that: " public money has come to be allocated for the benefit of even those who can afford higher education in terms of their ability to pay for it. Against this background the fee structure should be rationalised with a view to augmenting resources for higher education and also to recover, on equity grounds, part of the total cost of education, from beneficiaries of whom large sections belong to higher income groups. While the cost of education has been increasing for different reasons, fees have remained more or less static even though the returns due to higher education in the form of individual earnings have also increased. Therefore, pricing of education at higher levels will have to be reconsidered and quantum and nature of subsidisation will have to be related either to merit or the dictates of social justice" (p.231).
Implicitly, the Report brings in the relationship between public support of universities, cost of university education and students' fee structure. That is, given the students' fees and other things being same, cost of education can be reduced by increasing public support. Or, given the cost of production and other things being same, increasing the students' fees can reduce public support to higher education.
Although the Report makes a reference to subsidies to higher education and the need to reduce it, no attempt has been made within the report to define (except, perhaps
loosely understood in terms of cost recovery from students' fees) and quantify subsidies to general higher education in the State.
A study on An Approach to Subsidies in Karnataka ( in brief, the Approach Paper) by the Government of Karnataka (1997) has attempted to estimate, among others, the nature and volume of budgetary subsidies to different sectors in the State for 1984-85 and from 1989-90 through 1995-96 (B.E). To start with, the need for reviewing the structure and extent of subsidies are justified for many reasons. First, to re-examine the justification for subsidies in the light of enormous growth of the quantum of subsidies and its associated problem of misuse or lack of proper targeting. Second, for exploring the possibilities of reducing large revenue deficits by reducing subsidies. Third, for monitoring and evaluation of subsidies in terms of its objective. In regard to education sector, the study makes the following two important points.
First, "it appears that the subsidies are introduced by conscious efforts after finding justification in individual cases with specific objectives and not according to a general policy. As such, it is not practical to think of a general policy or approach towards subsidies as a whole" (p.1).
Second, the non-plan subsidies by the State Government (i.e. to organisations other than Zilla Panchayats) to general education are estimated at Rs.48.99 lakh in 1984-85. These subsidies are in the form of payment to Mysore Sales International Limited (MSIL) on account of differential cost between concessional rate of Lekhak Note Books and increased cost of printing papers. However, no subsidies, either on plan or non-plan basis, are estimated for any of the years in the study period. This is evident in Table 4 on page 16 and in Statement-4 on page 44 of the Approach Paper. Thus, in essence, the study does not identify any other expenditure as a form of budgetary subsidy to any level of general education in the State in the study period.
Nevertheless, the Approach Paper recognises that there exists a relationship between budgetary expenditure and subsidies to different levels of general education in the States. For instance, the Approach Paper notes:
"While provision of Primary and Secondary education facilities may be considered as provision for basic minimum needs to the population and therefore the expenditure on them cannot be considered as subsidy, there is no reason why the entire expenditure or even a major part of it on technical/ higher education should be borne by the State Government. In other words, the Higher Education involved considerable subsidisation by Government in our country. This is not justified because the benefits accrued to an insignificant proportion of the population irrespective of whether the beneficiaries have the capacity to pay for the services or not. It is therefore highly inequitable. Further, Higher Education is both costly and improves the skills and employability and income earning capacity of the beneficiaries. Therefore, the beneficiaries should pay for such higher education. However, in case of poor students availing the facility, open subsidies by way of freeships, scholarships etc may be provided. It is estimated that hardly 1/5** of the Government expenditure on Higher/University Education in the country is recovered by way of fees etc. This means 80 per cent of the cost of the Higher Education is subsidised. It should be possible to reduce the extent of subsidy in Higher education without affecting the services. It is therefore necessary to aim at revising upwards the fees and other payments for higher
education in such a way that at least 75 to 80% of the cost of services are recovered in the long run which can be attempted in phases" (p.26-27)
The Human Development Report for Karnataka State [Government of Karnataka (1999)] (a) makes an elaborate description of the quantitative developments, increase in student enrolments and patterns of public expenditure of general and technical higher education; and (b) updates the data and analysis of the Report of the Karnataka Universities Review Commission on higher education for the year 1996-97. At the same time, it lists two important concerns (p.67). First, few students opt for science and humanities streams. Second, poor physical infrastructure in colleges including poorly maintained buildings and ill equipped laboratories.
The Report sets out two agenda for future action. First, in regard to technical education, ban opening of new engineering colleges and close down courses with no demand and replace them with courses with potential, such as in the area of information technology. Second, in regard to general education, ban starting of new colleges, make colleges more self-financing by enhancing fees, provide basic physical infrastructure for the colleges, enhance state funding of doctoral and post-doctoral research in both physical and social sciences and provide opportunities to merited students to pursue research by providing monetary incentives.
The budget speech of the Chief Minister (also the Finance Minister) of the State on March 27, 2000 announced (in para 32 and 33) a cut in grants-in-aid to higher education by 15% for 2000-2001, as most of the aided institutions in higher education are strong enough to mobilise their own resources. The budgetary resources thus mobiUsed or saved are proposed to be utilised for expansion of primary education in regions, which are educationally backward within the State. In addition, the budget speech noted the need for raising tuition fee for students in GCs in the State, as it is lower than in other States. For instance, the annual tuition fee for a B.Com. student in Karnataka is Rs.180 as compared to Rs.BOO in Maharashtra and Rs.360 in Andhra Pradesh. However, if the revised fees are going to be beyond the reach of students who are poor but deserving, such students are proposed to be helped through educational loans from banks and financial institutions. Most recently, in the budget speech of the Chief Minister (also the Finance Minister) of the State on March 26, 2001 announced (in para 67) that "the grants-in-aid code will be reviewed to enable the state government to deploy more funds for primary education. ^
On the whole, the policy studies, reports and statements above make reference to the presence of subsidies in higher education, and the need to reduce them for different reasons and by students' fee revisions, both at present and in future. Notwithstanding the policy concern with and need for reduction in budgetary subsidies, nowhere in the budget heads for higher education in the State, the term subsidy is explicitly used. Or, if at all subsidies exist, they should exist only in an indirect or implicit form and subject to interpretation as subsidies. Thus, identification of subsidies to collegiate education is a policy imperative in the State. At the national level, such a policy imperative is evident in NIEPA (2000b).
‘ In addition, the Medium Term Fiscal Plan for Karnataka, 2000-01 to 2004-05 [Government of Karnataka (2001b)] has clearly stated that the targeted reduction in fiscal and revenue deficit of the State Government is dependent, among other, on a reduction in Grants-in-aid to higher education by 5 percent every year from 2002-03.
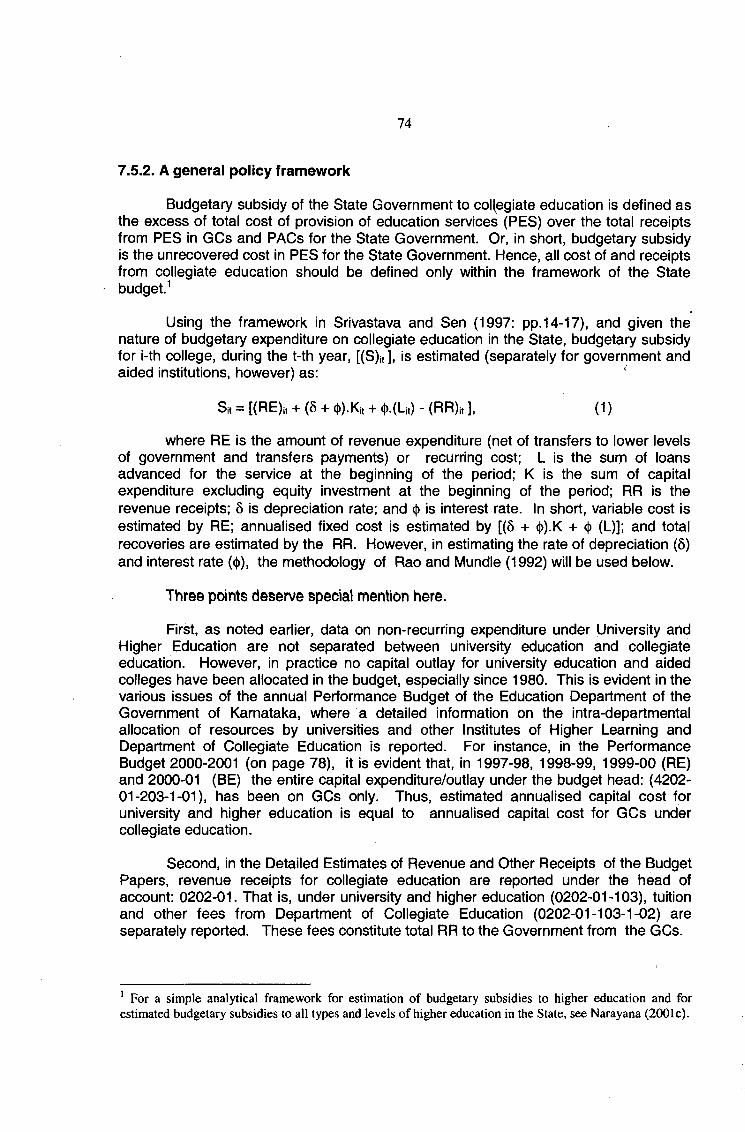
7.5.2. A general policy framework
Budgetary subsidy of the State Government to col(egiate education is defined as the excess of total cost of provision of education services (PES) over the total receipts from PES in GCs and PACs for the State Government. Or, in short, budgetary subsidy is the unrecovered cost in PES for the State Government. Hence, all cost of and receipts from collegiate education should be defined only within the framework of the State budget.^
Using the framework in Srivastava and Sen (1997: pp.14-17), and given the nature of budgetary expenditure on collegiate education in the State, budgetary subsidy for i-th college, during the t-th year, [(S)it], is estimated (separately for government and aided institutions, however) as:
Sit = [(RE)i, + (6 + (|)).Kit + (j).(U) - (RR)it ]. (1)
where RE is the amount of revenue expenditure (net of transfers to lower levels of government and transfers payments) or recurring cost; L is the sum of loans advanced for the service at the beginning of the period; K is the sum of capital expenditure excluding equity investment at the beginning of the period; RR is the revenue receipts; 8 is depreciation rate; and (|) is interest rate. In short, variable cost is estimated by RE; annualised fixed cost is estimated by [(5 + ({)).K + ((> (L)]; and total recoveries are estimated by the RR. However, in estimating the rate of depreciation (5) and interest rate (<|)), the methodology of Rao and Mundle (1992) will be used below.
Three points deserve special mention here.
First, as noted earlier, data on non-recurring expenditure under University and Higher Education are not separated between university education and collegiate education. However, in practice no capital outlay for university education and aided colleges have been allocated in the budget, especially since 1980. This is evident in the various issues of the annual Performance Budget of the Education Department of the Government of Karnataka, where a detailed information on the intra-departmental allocation of resources by universities and other Institutes of Higher Learning and Department of Collegiate Education is reported. For instance, in the Performance Budget 2000-2001 (on page 78), it is evident that, in 1997-98, 1998-99, 1999-00 (RE) and 2000-01 (BE) the entire capital expenditure/outlay under the budget head: (4202- 01-203-1-01), has been on GCs only. Thus, estimated annualised capital cost for university and higher education is equal to annualised capital cost for GCs under collegiate education.
Second, in the Detailed Estimates of Revenue and Other Receipts of the Budget Papers, revenue receipts for collegiate education are reported under the head of account: 0202-01. That is, under university and higher education (0202-01-103), tuition and other fees from Department of Collegiate Education (0202-01-103-1-02) are separately reported. These fees constitute total RR to the Government from the GCs.
* For a simple analytical framework for estimation of budgetary subsidies to higher education and for estimated budgetary subsidies to all types and levels o f higher education in the State, see Narayana (2001c).
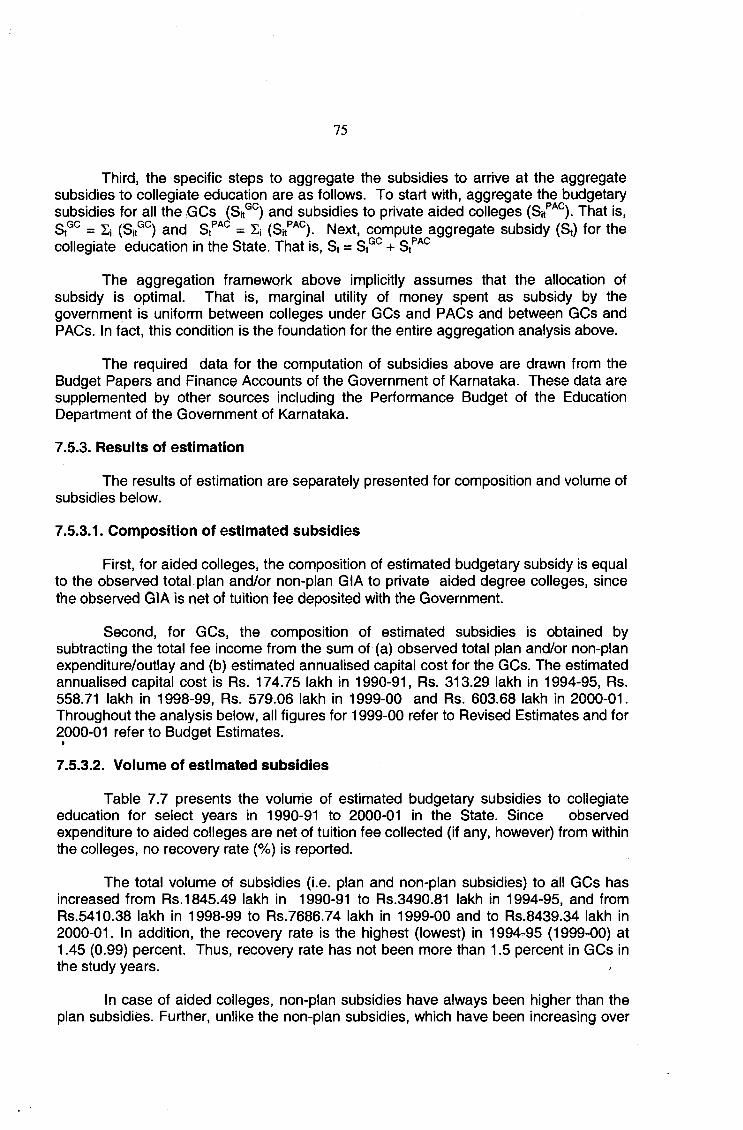
Third, the specific steps to aggregate the subsidies to arrive at the aggregate subsidies to collegiate education are as follows. To start with, aggregate the budgetary subsidies for all the ,GCs (Sj®^) and subsidies to private aided colleges That is,
= Ej and = Ej Next, compute aggregate subsidy (St) for thecollegiate education in the State. That is, St = St°^ + St^^^
The aggregation framework above implicitly assumes that the allocation of subsidy is optimal. That is, marginal utility of money spent as subsidy by the government is uniform between colleges under GCs and PACs and between GCs and PACs. In fact, this condition is the foundation for the entire aggregation analysis above.
The required data for the computation of subsidies above are drawn from the Budget Papers and Finance Accounts of the Government of Karnataka. These data are supplemented by other sources including the Performance Budget of the Education Department of the Government of Karnataka.
7.5.3. Results of estimation
The results of estimation are separately presented for composition and volume of subsidies below.
7.5.3.1. Composition of estimated subsidies
First, for aided colleges, the composition of estimated budgetary subsidy is equal to the observed total.plan and/or non-plan GIA to private aided degree colleges, since the observed GIA is net of tuition fee deposited with the Government.
Second, for GCs, the composition of estimated subsidies is obtained by subtracting the total fee income from the sum of (a) observed total plan and/or non-plan expenditure/outlay and (b) estimated annualised capital cost for the GCs. The estimated annualised capital cost is Rs. 174.75 lakh in 1990-91, Rs. 313.29 lakh in 1994-95, Rs. 558.71 lakh in 1998-99, Rs. 579.06 lakh in 1999-00 and Rs. 603.68 lakh in 2000-01. Throughout the analysis below, all figures for 1999-00 refer to Revised Estimates and for2000-01 refer to Budget Estimates.
7.5.3.2. Volume of estimated subsidies
Table 7.7 presents the volurrie of estimated budgetary subsidies to collegiate education for select years in 1990-91 to 2000-01 in the State. Since observed expenditure to aided colleges are net of tuition fee collected (if any, however) from within the colleges, no recovery rate (%) is reported.
The total volume of subsidies (i.e. plan and non-plan subsidies) to all GCs has increased from Rs. 1845.49 lakh in 1990-91 to Rs.3490.81 lakh in 1994-95, and from Rs.5410.38 lakh in 1998-99 to Rs.7686.74 lakh in 1999-00 and to Rs.8439.34 lakh in2000-01. In addition, the recovery rate is the highest (lowest) in 1994-95 (1999-00) at 1.45 (0.99) percent. Thus, recovery rate has not been more than 1.5 percent in GCs in the study years.
In case of aided colleges, non-plan subsidies have always been higher than the plan subsidies. Further, unlike the non-plan subsidies, which have been increasing over
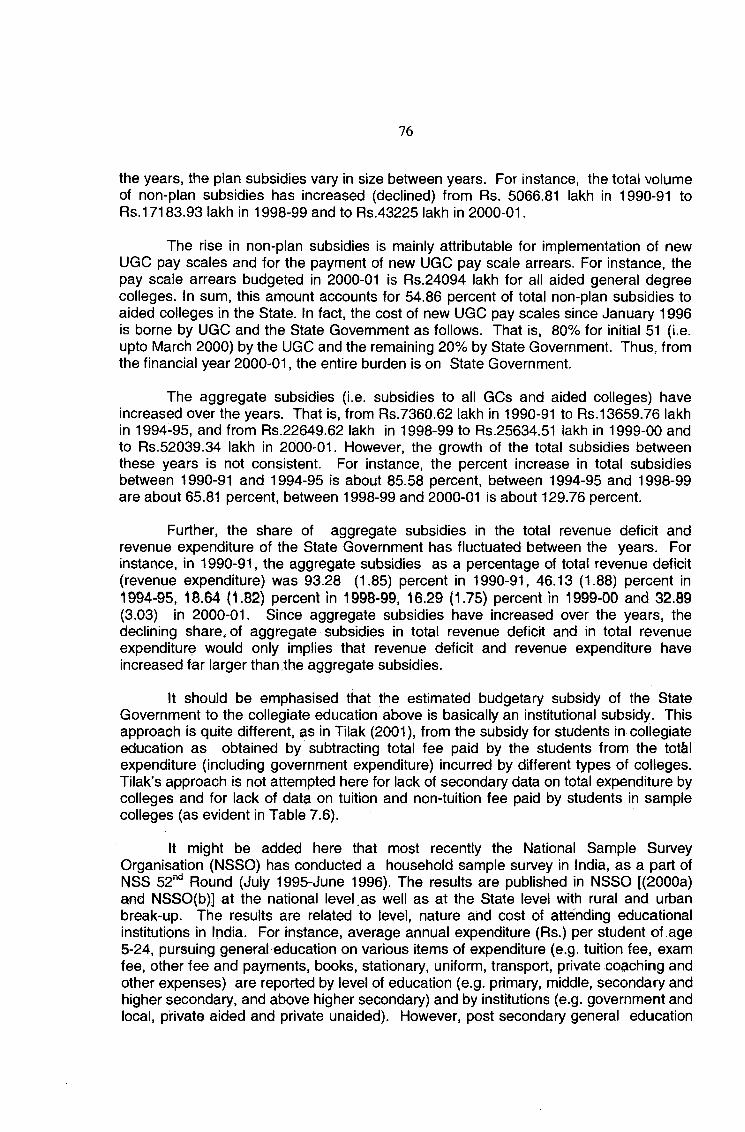
the years, the plan subsidies vary in size between years. For instance, the total volume of non-plan subsidies has increased (declined) from Rs. 5066.81 lakh in 1990-91 to Rs. 17183.93 lakh in 1998-99 and to Rs.43225 lakh in 2000-01.
The rise in non-plan subsidies is mainly attributable for implementation of new UGC pay scales and for the payment of new UGC pay scale arrears. For instance, the pay scale arrears budgeted in 2000-01 is Rs.24094 lakh for all aided general degree colleges. In sum, this amount accounts for 54.86 percent of total non-plan subsidies to aided colleges in the State. In fact, the cost of new UGC pay scales since January 1996 is borne by UGC and the State Government as follows. That is, 80% for initial 51 (i.e. upto March 2000) by the UGC and the remaining 20% by State Government. Thus, from the financial year 2000-01, the entire burden is on State Government.
The aggregate subsidies (i.e. subsidies to all GCs and aided colleges) have increased over the years. That is, from Rs.7360.62 lakh in 1990-91 to Rs. 13659.76 lakh in 1994-95, and from Rs.22649.62 lakh in 1998-99 to Rs.25634.51 lakh in 1999-00 and to Rs.52039.34 lakh in 2000-01. However, the growth of the total subsidies between these years is not consistent. For instance, the percent increase in total subsidies between 1990-91 and 1994-95 is about 85.58 percent, between 1994-95 and 1998-99 are about 65.81 percent, between 1998-99 and 2000-01 is about 129.76 percent.
Further, the share of aggregate subsidies in the total revenue deficit and revenue expenditure of the State Government has fluctuated between the years. For instance, in 1990-91, the aggregate subsidies as a percentage of total revenue deficit (revenue expenditure) was 93.28 (1.85) percent in 1990-91, 46.13 (1.88) percent in 1994-95, 18.64 (1.82) percent in 1998-99, 16.29 (1.75) percent in 1999-00 and 32.89 (3.03) in 2000-01. Since aggregate subsidies have increased over the years, the declining share, of aggregate subsidies in total revenue deficit and in total revenue expenditure would only implies that revenue deficit and revenue expenditure have increased far larger than the aggregate subsidies.
It should be emphasised that the estimated budgetary subsidy of the State Government to the collegiate education above is basically an institutional subsidy. This approach is quite different, as in Tilak (2001), from the subsidy for students in collegiate education as obtained by subtracting total fee paid by the students from the tot&l expenditure (including government expenditure) incurred by different types of colleges. Tilak’s approach is not attempted here for lack of secondary data on total expenditure by colleges and for lack of data on tuition and non-tuition fee paid by students in sample colleges (as evident in Table 7.6).
It might be added here that most recently the National Sample Survey Organisation (NSSO) has conducted a household sample survey in India, as a part of NSS 52”' Round (July 1995-June 1996). The results are published in NSSO [(2000a) and NSSO(b)] at the national level ,as well as at the State level with rural and urban break-up. The results are related to level, nature and cost of attending educational institutions in India. For instance, average annual expenditure (Rs.) per student of age 5-24, pursuing general education on various items of expenditure (e.g. tuition fee, exam fee, other fee and payments, books, stationary, uniform, transport, private coaching and other expenses) are reported by level of education (e.g. primary, middle, secondary and higher secondary, and above higher secondary) and by institutions (e.g. government and local, private aided and private unaided). However, post secondary general education
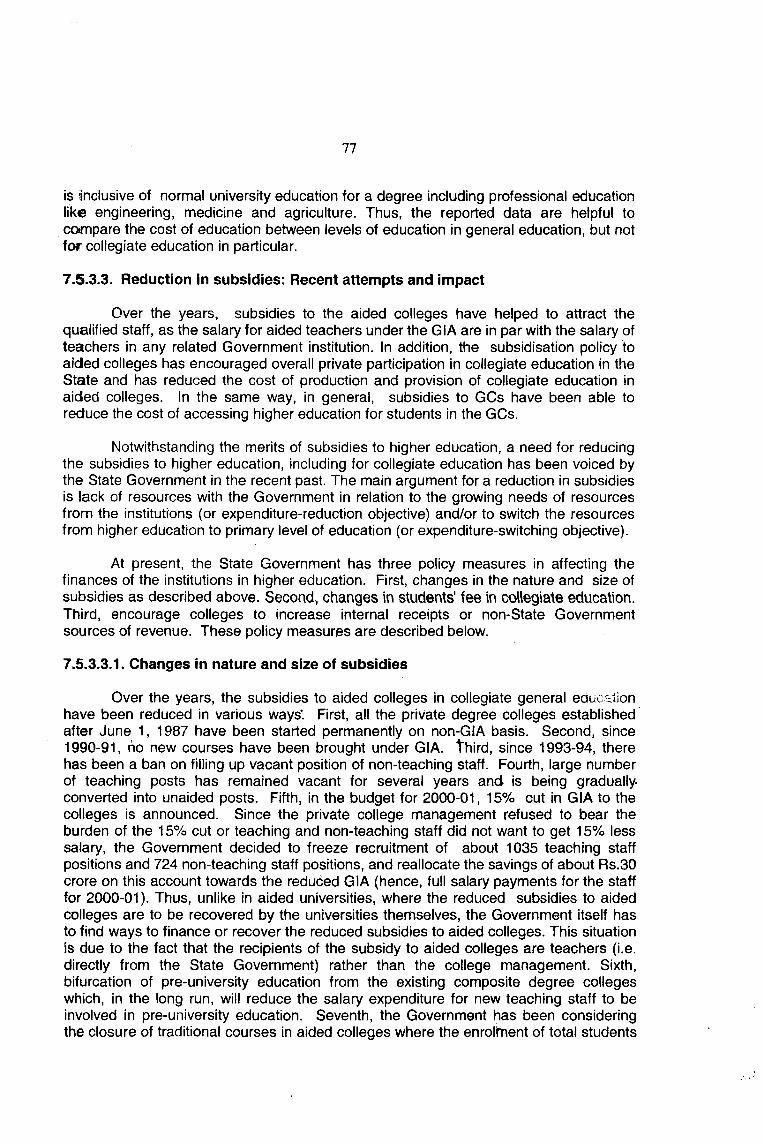
is inclusive of normal university education for a degree including professional education like engineering, medicine and agriculture. Thus, the reported data are helpful to co«npare the cost of education between levels of education in general education, but not for collegiate education in particular.
7.S.3.3. Reduction in subsidies: Recent attempts and impact
Over the years, subsidies to the aided colleges have helped to attract the qualified staff, as the salary for aided teachers under the GIA are in par with the salary of teachers in any related Government institution. In addition, the subsidisation policy to aided colleges has encouraged overall private participation in collegiate education in the State and has reduced the cost of production and provision of collegiate education in aided colleges. In the same way, in general, subsidies to GCs have been able to reduce the cost of accessing higher education for students in the GCs.
Notwithstanding the merits of subsidies to higher education, a need for reducing the subsidies to higher education, including for collegiate education has been voiced by the State Government in the recent past. The main argument for a reduction in subsidies is lack of resources with the Government in relation to the growing needs of resources from the institutions (or expenditure-reduction objective) and/or to switch the resources from higher education to primary level of education (or expenditure-switching objective).
At present, the State Government has three policy measures in affecting the finances of the institutions in higher education. First, changes in the nature and size of subsidies as described above. Second, changes in students' fee in collegiate education. Third, encourage colleges to increase internal receipts or non-State Government sources of revenue. These policy measures are described below.
7.5.3.3.1. Changes in nature and size of subsidies
Over the years, the subsidies to aided colleges in collegiate general education have been reduced in various ways*. First, all the private degree colleges established after June 1, 1987 have been started permanently on non-GIA basis. Second, since 1990-91, ho new courses have been brought under GIA. third, since 1993-94, there has been a ban on filling up vacant position of non-teaching staff. Fourth, large number of teaching posts has remained vacant for several years and is being gradually converted into unaided posts. Fifth, in the budget for 2000-01, 15% cut in GIA to the colleges is announced. Since the private college management refused to bear the burden of the 15% cut or teaching and non-teaching staff did not want to get 15% less salary, the Government decided to freeze recruitment of about 1035 teaching staff positions and 724 non-teaching staff positions, and reallocate the savings of about Rs.30 crore on this account towards the reduced GIA (hence, full salary payments for the staff for 2000-01). Thus, unlike in aided universities, where the reduced subsidies to aided colleges are to be recovered by the universities themselves, the Government itself has to find ways to finance or recover the reduced subsidies to aided colleges. This situation is due to the fact that the recipients of the subsidy to aided colleges are teachers (i.e. directly from the State Government) rather than the college management. Sixth, bifurcation of pre-university education from the existing composite degree colleges which, in the long run, will reduce the salary expenditure for new teaching staff to be involved in pre-university education. Seventh, the Government has been considering the closure of traditional courses in aided colleges where the enrolhient of total students
for a course is less than 40 students and/or where the workload for the teaching staff is not full (e.g. 16 hours of teaching for non-science teaching staff). The staff of such closed courses is to be transferred to other aided colleges where the workload exists.
The above gradual approach to reducing subsidies to aided colleges in Karnataka State is in contrast with the experience of Madhya Pradesh. For instance, the Madhya Pradesh Government decided to stop financial aid to 100 private colleges from 1998-99. The aid had cost the State Government to the tune of about Rs.30 crore per annum. The Government’s decision was defended on the following grounds. First, literary and primary education but not higher education are the priorities for the State. Second, the poor are not deprived of opportunities for collegiate education as the State has 450 GCs. Third, if the removal of aid would lead to enhanced fee structure in private colleges, and make collegiate education costly for poor students, such students could enroll for courses offered by the open universities.
7.5.3.S.2. Changes in student fees
An increase in students' fee may be motivated by two reasons. First, to offset the increasing total cost of provision of educational services in collegiate education, given the nature and amount of subsidies and other things being equal. Second, to reduce the subsidies to collegiate education, especially with changes in tuition fee which is generally shared between the college and State Government, given the cost of provision of educational services and other things being equal.
Regardless ot the motivations above, the State Government fixes the students' fee in collegiate education, which is applicable, in general, to GCs, private aided and unaided colleges in the State. Over the years, the students' fees have remained both low and constant. For instance, in the recent past, the students' fee was revised in 1993 and was implemented from 1993-94. In total, a degree college student in B.A. course was charged Rs.355 (including Rs.80 towards the laboratory fee). The SC/ST students were exempt from paying the tuition fee. In 1997, this fee structure was proposed to be changed. The total fee chargeable was proposed to be Rs.1530 (with Rs. 600 for as tuition fee and Rs.400 as laboratory fee), an increase of about 331 percent over the 1993-94 fees. However, this fee structure was never implemented. For the current academic year, the fee structure is revised with a total fee payable by a degree college student at Rs.865 (tuition fee Rs.500 and laboratory fee Rs.160), an increase of about 135 percent over the 1993-94 fees. Originally, this fee structure was applicable for all the degree students studying I year, II year and III year courses. Subsequently, it was modified to be applicable only for the I year degree students in 2000-01. The modified fee structure has reduced the tuition fee and laboratory fee to Rs.400 and Rs.110 respectively.
A study done by Narayana (1999b) on the impact of the proposed total fee revision of 1997 on financing of GIA in 31 sample aided degree colleges in Bangalore districts of Karnataka State found the following evidence. The sum of total fee collectable from all non-SC/ST students by all sample colleges in 1997-98 equaled to about Rs.12 lakh according the 1993-94 rates; Rs.114 lakh jinde r the 1997-98 (or proposed) rates; Rs.167 lakh under the proposed rates if only the tuition fee is doubled; Rs.178 lakh under the proposed rates if only the tuition fee and laboratory fee are doubled. As a ratio to total GIA to all sample colleges (=Rs.1624 lakh), the total fee collectable above accounted for 0.74 percent, 7.02 percent, 10.28 percent and 10.96 respectively. Thus,
only about 10 percent of the size of GIA in 1997-98 could be financed through the proposed total fee revision. Since the fee revision in 2000-01 is far less than the proposed revision in 1997, and other things being equal, students' fee revision may not contribute to financing a reduction in GIA beyond 10 percent per annum.
It must be admitted that the fee structure in collegiate education is relatively lower and uniform between Government and private colleges and between all courses [i.e. between professional courses (e.g. management related courses), vocational courses (e.g. Industrial Microbiology) and non-professional and non-vocational courses (e.g. traditional courses in B.A. B.A. and B.Com. degree)]. In contrast, the fee structure in the collegiate education under other types of higher education in the State is both higher and diversified. For instance, in teachers' education under general education in2000-01, tuition fee was Rs.3000 in GCs, Rs.3000 (Rs.8000) for Government seat (management seat) in private aided colleges and Rs.6000 (Rs.30000) for Government seat (management seat) in private unaided college.
Thus, there is a need for both increasing and diversifying the fee structure between Government, aided and unaided colleges in the State. In this connection, several major policy issues arise, such as, how much of which fees is to be raised and when, and whether or not the rise in fees should be uniform between students in different colleges located in rural and urban areas?
In fact, some of the issues above have already been focused in public reports on higher education in the country in the 1990s. These reports include Punnayya committee Report on UGC Funding of Institutions of Higher Education in 1993; Pylee committee Report on the Recommendation of the Punnayya Committee relating to the unit cost of higher education and other related issues in 1997; Anandkrishnan committee to Review the Maintenance Grants Norms for Delhi Colleges in 1999; and Mahmood-ur Rahman committee to Formulate Revised Fee Structure in the Central and Deemed Universities in 2000. While these reports make a case for upward revision in fees, the recommended nature and extent of revisions vary between the committees. For instance, the Punnayya committee argued for upward revision of tuition fees with immediate effect and for its periodical adjustment, keeping in view the rate of inflation. The Anandakrishna committee noted that the fee structure be reviewed at the end of each plan period and increased by 20% to account for increasing cost of education. The Mahmood-ur Rahman committee argued that 3% of the unit cost worked out by Punnayya committee should be the basis of fee structure which may be increased every year to the extent of 2%. In addition, a Report of Consultative Committee Meeting on Funding of Higher Education & Fee Regulation by NIEPA (2000b) recommended, among others, a differential fee for students coming from different economic background. That is, 15% additional fee for students whose parental income is between Rs.2 lakh and Rs.2.5 lakh; 20% additional fee if the parental income is between Rs.2.5 lakh and Rs.3 lakh and 35% additional fee if the parental income is above Rs.3 lakh. Notwithstanding these diversities, the recommendations of the committees do serve important guidelines for designing of a revised fee structure for general education in general, and for collegiate education under general education in particular in the State.
However, there will be a need to help the poor students as a consequence of any upward revision of fees. In this connection, following two alternatives may be considered.
First, students may be provided with loan facilities and, thereby, make the students to pay for their own higher education. In an interesting study of loan financing higher education of 308 students by a commercial bank in Bangalore districts, Seetharamu (1997) described that 306 or about 99 percent of sample students belonged to technical, medical management and other professional courses. And, about 302 students took loans for payment of tuition fee in their courses. However, the study revealed that loan financing is not popular among the students in general education.
Most recently, Narayana (2003) offers evidence on the impact of student loan on reducing budgetary subsidies to collegiate education in the State. He assumes that the number and pattern of enrolment of students by courses in all GCs and PACs in 2000-01 are the same as they were in 1999-00. Next, assuming that all students would pay the tuition and non-tuition fee, according to their enrolment in science or non-science courses, he found that the maximum total fee (or laboratory and tuition fee) collectable was equal to Rs.352.93 (or Rs.235.63) lakh in GCs and Rs.1081.35 (or Rs.726.97) lakh in PACs. As a percentage of total estimated budgetary subsidies, the fee collections account for 4.18 (or 2.79) percent in GCs and 2.48 (or 1.67) percent in PACs.
The negligible share of fee income in the aggregate subsidy to collegiate education clearly indicates that the size of per capita subsidy and per student fee contribution is incomparable. This is evident in the estimated subsidy per student which is equal to Rs.14748.93 in GCs and Rs.25221.66 in PACs. Hence, the maximum fee collectable from a science student as a percentage of estimated subsidy per student in GCs (or PACs) is only 4.85 (or 2.83) percent.
The evidence above clearly implies that tee revisions effected so far do not contribute to a sizable share of total subsidy to collegiate education in the State. Alternatively, if the budgetary subsidy is to be entirely financed by student fees, the amount of fee revision shall have to be gigantic. Consequently, student fee revision as a single instrument may not be an appropriate instrument for total reduction of the budgetary subsidy to collegiate general education in the State.
Second, distance education (through correspondence courses or Open University scheme) is often suggested as an important way of reducing the cost of higher education for students. Here, care should be taken in defining the cost of education for students. One way is to define it only in terms of payment of fees for the colleges, and then comparing the cost of education between regular and distance education. The other way of defining the cost of education for students is to take into all expenditure on college fees, commuting cost, boarding and lodging, books etc. In this regard, obviously, out of station students in regular education may find the distance educaffon less costly.
7.5.3.3.S. Other measures
Other measures include increase in internal receipts of the colleges through charging differential fee for unaided and professional courses, endowments, charity, philanthropy, and alumni association (i.e. donations after graduation) and consultancy. In the same way, cross-subsidisation of students between professional and nonprofessional courses, and between aided and un-aided courses may be considered.
It is important to single out the role of charity by the tennples for the development of colleges in the State. For instance, the temples, which come under the Endowment Act, are entitled to set apart a certain portion of the,total receipts for purposes of charity including for running educational institutions. In fact, Shri Durgaparameshwari Temple First Grade College in Mangalore University, which is one of the unaided sample colleges of this report, is under the administration and charity of Shri Durgaparameshwari Temple at Kateel. The charity includes free lunch for all college students in the working days.
Unfortunately, in general, the details of other receipts of the colleges above are not published (or not reported, as that is evident from the reported sources of receipts in Table 7.6) by the colleges. This is mainly due to two reasons. First, these receipts go to the management account rather than for college accounts. Hence, college finances do not report these receipts. Second, additional resource mobilisation through donations, either during or after the admission to new professional courses, (e.g. in the form of building and library funds) are not disclosed, as they are prohibited under the provisions of the Karnataka Educational Institutions (Prohibition of Capitation Fees) Act, 1984. Hence, no impact analysis of other receipts on the development of the colleges is possible.
Management and Co-ordination of Collegiate Education
The main objectives of this chapter are to describe the existing management and regulatory structure of collegiate education and to discuss some important measures that may be required to improve efficiency, quality and additional resource mobilisation by colleges in the State.
8.1. Policy frameworks for management and coordination
In Chapter 3, the structure and organisation of collegiate education in the State was described in detail. The structure was defined in terms of different institutional and non-institutional agents and their associated functions/roles in the collegiate education. The institutional agents included the university, UGC, State Government, and management of private colleges. The non-institutional agents included the staff and students in the colleges. The interactions between all these agents constituted the organisation, or organised system of the collegiate education in the State.
Further, as noted in Chapter 3, the management, regulation, promotion and coordination of activities in collegiate education are spread across institutions and agents. For instance, the State Government controls the permission to be given to establish a new college: amount of GIA to be allocated to the private aided colleges; recruitment of staff on GIA in private aided colleges; fixation of students' fee in all colleges under collegiate education; fixation of staff salary in colleges and monitors the implementation of reservation and roaster systems in private aided colleges.
The University deals with all academic aspects of the colleges through granting affiliation to courses and colleges, fixing the curricula, conduct examination and evaluation, award degrees and provide financial assistance to affiliating colleges. The UGC sets standards for recruitment and promotion of teaching staff, provides financial assistance to (a) colleges for development purposes; (b) for vocationalisation at the first-degree level and (c) autonomous colleges. The private college management plays a significant role in taking all the initiatives to establish the colleges, recruit staff, provide infrastructure facilities, mobilise funds for college development etc.
In view of the above, the development of collegiate education is a consequence of the regulatory and promotional activities of the State Government, the University, UGC and the private college management (in case a college is not 9 Government college). Since the activities of different institutions and agents are inter-related, it is necessary to deal with the issues under common policy frameworks.
As noted in Chapter 5, quality of collegiate education refers to the quality of outturn of students, which in turn depends on the quality of teaching staff and infrastructure in the colleges. Interestingly, measures to improve the quality of these inputs in the State, either directly or indirectly, are also a part of the promotional policies and programmes for collegiate education.
The important policy frameworks for regulation and promotion of collegiate education in the State are as follows.
8.1.1. Karnataka State Universities Act 1976
The most important policy framework for the management, regulation and coordination of affiliated colleges in the State is the Karnataka State Universities Act 1976 (or, in brief the Act). The specific provisions of the Act are highlighted below in regard to different aspects of working of collegiate education in the State. The most important sections in the Act to be considered below are (a) section 20 through section 34A on Authorities of the University; (b) section 29 on Board of Studies; (c) section 53 through 56A on Affiliation of Colleges and Recognition of Institutions; (d) section 61B on Karnataka State Inter University Board; and (e) section 66 on Relations of Affiliated Colleges with the University.^
8.1.2. State Government Orders
The Department of Collegiate Education under the Education Department of the State Government can issue orders on various aspects of the working of the collegiate education in the State. The Department is mainly responsible for the administration of all Government colleges and private aided colleges in the State. The orders may be related to service conditions (e.g. salary, allowances, increment, promotion and transfer) of the staff, fixation of student fee (except those fees which are fixed by the universities) in degree colleges, grants-in-aid for private aided degree colleges, and reorganisation of collegiate education (e.g. bifurcation of pre-university education from composite colleges).
8.1.3. UGC regulations
The UGC is a national and statutory body (established in 1956) for (a) coordination, determination and maintenance of minimum standards of instruction and qualifications of teachers; (b) providing with universities and colleges the financial grants for research and development activities; and (c) promoting excellence and enhancing standards for institutions in higher education through national assessment and accreditation programmes.
The regulations and promotions of the UGC are clearly evident in six importantareas.
First, in specifying the qualification and experience for recruitment of teaching staff through direct recruitment and through internal promotion. These specifications are given in the “UGC Regulations, 2000 Regarding Minimum Qualifications for Appointment and Career Advancement of Teachers in Universities and Colleges”. The Regulation, for instance, specifies the qualification for Principal (Professor's Grade), Principals (Reader's Grade), Professor, Reader and Lecturer by direct recruitment. Under career
‘ The Act 1976 has been comprehensively amended and replaced by the Karnataka State Universities Act 2000, which has come into effect from September 13, 2001. However, for the period covered in this study, the Act 1976 is applicable. For this reason, the Act 2000 is not outlined, and no comparison of provisions between the Act 1976 and the Act 2000 is attempted, in the text. Nevertheless, it may be pointed out that, except in regard to few new conditions for affiliation of colleges and recognition o f institutions under section 59 in the Act 2000, the provisions between the Act 1976 and the Act 2000 are comparable. For details o f the Act 2000, see Government of Karnataka (2001c).
advancement, qualifications for Lecturer, Lecturer (Senior Scale), Lecturer (Selection Grade), Reader (Promotion) and Professor (Promotion) are specified.
Second, in stipulating higher qualifications and training for teaching staff. For instance, under career advancement, for movement into grades of Reader and above, the minimum eligibility criterion is a Ph.D degree. Those without Ph.D can go up to the level of Lecturer (Selection Grade) with participation in required number of Refresher Courses and/or Orientation Programmes. In the same way, National Eligibility Test (NET), conducted since 1989, or State Level Eligibility Test (SLET), is a compulsory requirement for appointment as Lecturer even for candidates having Ph.D degree, except for those who have completed M.Phil degree or have submitted Ph.D thesis up to March 31, 1993.
Third, in providing opportunity for pursuing research for college teachers under the UGC Scheme of Teacher Fellowship for Professional Development.
Fourth, in introducing new UGC pay scales for colleges teachers with effect from January 1, 1996 as a measure of attracting and encouraging the talented and competitive teachers in colleges.
Fifth, in providing financial assistance in the form of development grants for colleges which are having permanent affiliation with state universities, including for vocationalisation at the First Degree Level since 1994-95, and for autonomous colleges. For instance, the ceiling of assistance provided under the autonomous colleges scheme (depending on the location and courses offered in the colleges, however) is Rs.4 lakh or Rs.6 lakh for Arts/Science/ Commerce colleges with undergraduate courses only» and Rs.8 lakh for colleges with both undergraduate and post-graduate courses.
Sixth, establishment of National Assessment and Accreditation Council (NAAC) in 1994 with the main objective of helping them to work continuously to improve the quality of education. The NAAC approaches evaluation of institutions for the purposes of accreditation and grading in three stages. First, submission of self study report by the unit of assessment. Second, on-site visit of the peer team for validation of the report. Third, final decision by the Council to star-grade the institution from one star to 5 stars. The criteria for NAAC’s assessment include curricular aspects; teaching-learning and evaluation; research, consultancy and extension; infrastructure and learning resources; student support and progression; organisation and management; and healthy practices. In fact, the detailed methodology of NAAC is outlined in its publication entitled: “Manual for Self-study for Affiliated/Constituent Colleges”.
Up to the end of March 2000, only 2 State Universities and 3 affiliated colleges were accredited by the NAAC. However, during 2000-2001, 2 State Universities and 14 affiliated general degree colleges did obtain NAAC’s accreditation in the State with varying number of stars. Thus, up to the end of March 2001, only about 1.84 percent of total affiliated general degree colleges in the State is accredited by the NAAC.
It is gratifying to note that in a recent Workshop on Accreditation and Assessment of Distance Education (June 20-21, 2001: Bangalore), NAAC’s recognition is made mandatory for institutions in distance education in the country. Accordingly, for instance, the Karnataka State Open University should seek NAAC’s recognition before December 2003.
8.2. Select regulatory and promotional policies
8.2.1. Establishment of a college
Under section 53 (or u/s 53, in brief) of the Act, colleges within the University area may be affiliated to the University by the University on the recommendations of the State Government.
To start with, a college shall apply for affiliation to the University with a justification on the need for establishing a new college in the locality, "having regard to the type of education intended to be provided by the college, the existing provision for the same type of education made by other colleges in the neighborhood and the suitability of the locality where the college is to be established" [u/s 53 (2 (a)]. In addition, the management shall have to satisfy the appropriate authorities of the University in regard to various requirements for starting a new college, such as, teaching staff, buildings, library, laboratory, hostel and student fees. In general, these requirements are made explicit as per the statutes framed by the University from time to time. This is evident, for instance, in the “Draft statutes relating to grant of fresh affiliation/renewal (continuation) of temporary affiliation to colleges and institution and withdrawal of such affiliation/permission for the bifurcation/shifting of the locations of the affiliated colleges and institutions” of the University of Mysore.
Upon receiving the application from the college for new affiliation, the University shall send a Local Inquiry Committee (LIC) to inquire into whether affiliation for the college is recommendable or not. However, the recommendations of the LIC are placed before the appropriate bodies ot the University and recommendations on affiliation to the colleges are sent to the State Government for approval. If approved by the State Government, the University shall notify the affiliation to the college.
Thus, for starting of a new college, application has to be given by the college, permission is granted by the State Government and affiliation is granted by the University.
It might be added here that once a college is affiliated, it has to renew (or, continue) its affiliation every year. In the same way, all new courses to be started in affiliated colleges must be affiliated to the University. Such affiliation to be renewed every year is called temporary affiliation. However, an affiliated college may apply for and be grated permanent affiliation by the University, on the recommendation of the State Government. In this case, affiliation should be renewed once in five year. Thus, State Government’s permission is essential for fresh affiliation as well as for permanent affiliation to the universities in the State. As a passing reference, it should be noted that permanent affiliation is an essential condition for seeking UGC assistance by the colleges in the State.
In addition, u/s 56 of the Act, there exists a provision for withdrawal of affiliation of a college to the university. For instance, under sub-section (1) (i.e. u/s 56 (1)), “the rights conferred on a college by affiliation may be withdrawn in whole or in part or modified if the college has failed to comply with any of the provisions of section 53 or the colleges has failed to observe any of the conditions of the affiliation or the college is conducted in a manner which is prejudicial to the interests of education”. However, there exists a detailed procedure to withdraw affiliation as outlined from sub-section (2)
through sub-section (7) of section 56 of the Act. In particular, the State Government’s recommendation (or permission/approval) is essential before the University issues an order for withdrawal of affiliation to the college.
It should be emphasised that when affiliation is newly or permanently granted or renewed/continued, the University also fixes the following for the colleges. First, the intake of students in a class or course. Second, subjects that the college can offer. In addition, the University prescribes the combination of subjects in a course (e.g. History, Economics and Political Science for B.A. degree course) and syllabus for all subjects, which are applicable for all affiliated colleges.
However, in general, the University does not involve in admission of students to colleges. Thus, criteria for admission of students are college-specific in the State.
8.2.2. Reorganisation of coilegiate education
An important policy for reorganisation of collegiate education in the recent past is evident in the bifurcation of composite colleges or bifurcation of Pre-university (or, in brief, PU) education from degree colleges. This policy is elaborated below.
Three types of colleges have imparted PU education in the State. First, composite junior colleges which combined PUC and high school education and coming under the administrative control of Commissioner of Public Instruction. Second, junior colleges which impart only PU education and coming under the administrative control of Director of PU Education. Third, composite degree colleges which include PU and degree education and coming under \\\b administrative control ot Commissioner/Director of Collegiate Education.
Bifurcation of PU education from degree education was started in 1997 (as per GO No.ED 313 UPC 92, dated 17-06-97) and is being completed ( as per the GO No.ED 140 DCE 2000, Bangalore, dated: 09 May 2001). The major provisions of the latest Government Order are as follows.
❖ The Government has considered that teaching PU and degree courses in the same college is inappropriate. This consideration is also in line with the recommendation of the UGC for implementation of revised pay scales for university and college teachers. Otherwise, PU teachers in composite degree colleges are paid higher salary than PU teachers in junior colleges. To remove this anomaly, the junior college teachers should be given the UGC pay scales. Otherwise, bifurcation is the only alternative to deal with the problem.
❖ Total number of composite GCs (PACs) to be bifurcated is equal to 17 (164) out of 151 (292). However, bifurcation is exempted for VHD Home Science composite degree college in Bangalore, as it is the only college of its type in the State.
❖ The bifurcated PU education would come under the administrative control of Directorate of PU Education with immediate effect.
❖ Minimum enrolment in science/arts/commerce faculty or courses is fixed at 120 (80) students in degree (PU) colleges.
❖ Workload for full time lecturer is fixed at 16 (20) hours in non-experimental (experimental) subjects. After fulfilling this workload, if extra-workload exists at 12 (16) hours in non-experimental (experimental) subjects, then such extra-workload may be considered as workload for a full-time lecturer in the college.
❖ While allocating the teaching staff between PU and degree education, experienced and highly qualified (e.g. Ph.D., M.Phil, SLET or NET) staff may be retained in the degree colleges.
❖ Redeployment of excess staff between colleges run by the same management.
❖ Bifurcated college teachers in PU courses are guaranteed salary protection and same designation as they were in degree colleges. Such PU teachers would come under the administrative control of the PU Directorate. However, whenever vacant positions arise in degree colleges, such PU teachers may be employed back in degree colleges, provided they satisfy the qualification and experience as per UGC guidelines and on seniority basis. In case there exists a shortage of teaching staff for new PU colleges, the staff of degree colleges may be deputed for two years, or less if the vacancy is filled up.
❖ All library and physical education facilities of degree colleges would be continued to be provided to bifurcated PU colleges.
❖ Except for current working teaching and non-teaching staff positions, all other vacant positions are to be treated as unaided in the degree and PU colleges.
❖ Until the Government makes alternative arrangements, the salary and allowance of bifurcated PU staff shall be paid by the Department of Collegiate Education.
❖ PU education in aided composite evening colleges would be closed from this academic year, 2001-2002. And, the staff shall be redeployed in places where the workload exists.
❖ After bifurcation, if the number of students enrolled in science and commerce courses are too less, such courses may be closed. And, admission of students to such closed courses may be facilitated in nearby colleges.
❖ If a place has many composite colleges and after bifurcation takes place, the bifurcated PU colleges may be merged depending upon the student strength.
In short, the major provisions of the bifurcation of composite colleges are related to consolidation of resources, transfer of staff, closure of courses and/or colleges, merger of colleges and abolition of staff positions. These provisions are made to offset the decline in the enrolment of students as a consequence of bifurcation of composite degree colleges.
8.2.3. Curriculum
Under section 29 of the Act, “there shall be a Board of Studies for every subject or group of subjects as may be prescribed by the ordinances. (Provided that separate Board of Studies for Under Graduate studies and for Post Graduate studies in any subject or group of subjects may be constituted by the Syndicate where felt necessary)” [u/s 29(1)]. Further, “the constitution, functions and powers of the Board of Studies shall be prescribed by the Statutes” [u/s 29(2)]. For instance, the Bangalore University has constituted Board of Under Graduate Studies including in Economics. The Chairman of the Department of Economics of the Bangalore University is also the Chairman of the Board. The members of the Board include 4 nominated members from the affiliated colleges within the University and two nominated members from the colleges outside the University. The most important functions of the Board are to recommend new subjects and courses, prepare and recommend the syllabus and to recommend textbooks for all papers in different subjects, which are taught, or to be taught, in the respective discipline.
Thus, affiliated colleges are involved in the preparation of curriculum, but colleges themselves cannot introduce new courses and prescribe syllabus for the courses.
8.2.4. Examination system
In the present system of collegiate education, performance of students are determined by the percentage of marks obtained in the annual examination, conducted and evaluated by the concerned university for the purpose o1 awarding degree and diploma certificates. Thus, the university decides all aspects of the examination including the examination fee for all students in the affiliated colleges.
There are two key issues in regard to reforming the existing examination system in the collegiate education.
First, the annual examination system lacks specific mechanism for continuous monitoring of students’ learning performance. However, colleges may conduct the midterm examination and/or periodic class tests only to train students to do well in final examinations, since marks obtained in mid-term and class tests do not add to marks obtained in final examinations. Consequently, there is less seriousness on the part of the students to prepare for and pass in the mid-term and class tests. Further, the present system is often said to be heavily dependent on memorisation and involves examination- centred teaching-learning process.
Second, the nature and number of subjects of study in the present degree courses are decided (if only, there exists few combinations of subjects) at the beginning of the study. Students do not have options to choose subjects according their levels (i.e. from elementary to advanced levels through an intermediate level).
Thus, there is a need to introduce a system wherein students have flexibility of choosing subjects and their levels in a degree course with scope for continuous monitoring of their learning performance. This need calls for a change in the examination from the present annual examination system to a credit-based, semester scheme. It might be recalled that the University of Mysore did introduce marks-based.
semester scheme in post-graduate courses in the late 1970’s through 1980’s. Subsequently, however, the semester scheme was replaced by the earlier annual examination system. At present, credit-based, semester scheme of education is not prevalent in the collegiate education under general education in the State.
Over the years, the University of Agricultural Sciences (UAS) in the State have been successfully practicing the credit-based, semester system in its undergraduate and post-graduate courses. Thus, the experience of UAS is of vital importance for introducing credit-based, semester scheme in colleges of general education in the State.
8.2.5. Policy and mechanism for co-ordination
The development of collegiate education is contributed by different government and non-government institutions. Thus, co-ordination between institutions is essential for orderly growth of the collegiate education, such as, between universities in the State; between students, parents and colleges administration and management; between affiliated colleges and State Government; between affiliated college and the university; between affiliated college, the university and the State Government; and between universities and State Government in the Sta^.
The Karnataka State Universities Act 1976 makes provision for co-ordination between the university, affiliated colleges and State Government by giving representation to affiliated colleges (i.e. principals of affiliated colleges) and State Government (i.e. Director of Collegiate Education) in various authorities of the university, such as. Academic Council, Senate and Syndicate. In the same way, co-ordination in curricular aspects between affiliated colleges and the university is ensured by giving membership to professors of affiliated colleges in Board of Under-graduate Studies. Further, the Act makes provision for Karnataka State Inter University Board for coordination between universities and the State Government in regard to (a) development of academic facilities, specilisation and standards; (b) matters affecting students, such as, eligibility for admission, mobility and examinations; and (c) compliance with reservation and roaster system in the universities. Since Vice Chancellors of all the State universities including the Karnataka State Open University are members of the Board, the Board is also a co-ordinating body between regular education and distance education In the State.
Outside the Act, co-ordination in the collegiate education is ensured between college administration and State Government (through meetings organised in the Department of Collegiate Education with the college principals); between college management and administration (e.g. by giving representation to college principal and staff in the management committee); and between parents and colleges administration and/or management (e.g. by organising meetings with parents).
8.3. Need for alternative systems of colleges
The present system of affiliating colleges has many promoters and regulators with multiplicity of rules and regulations over every aspect of the working of colleges in the State. Thus, colleges lack autonomy in their functioriing for achieving their academic goals. Over the years, lack of autonomy has resulted in colleges being less innovative and responsive to the changing needs of the society, polrty and economy. Thus, there is a need for alternative systems of colleges to the existing type of affiliating colleges. In
what follows, these alternative systems are argued for introducing autonomous colleges and community colleges in the State.
8.3.1. A case for autonomous colleges
The concept of autonomous college is not new. As UGC (2001) notes; "the Education Commission 1964-66 had recommended the concept of Autonomous Colleges with a view to providing academic freedom for potential colleges, specially designing their curricula, evolving new methods of teaching, research and learning, framing own rules for admission, prescribing own courses of study and conduct of examination. Under the autonomous colleges scheme of the UGC, a college declared autonomous by its affiliating university is fully accountable for the content and quality of education it imparts. Such a college is also responsible for setting its own examination papers and for the conduct of examinations. The College evaluates the students for the award of degree which will be accepted by the parent university".
8.3.1.1. Experience of Tamil Nadu
Tamil Nadu is one of the S ta t^ , which has implemented the concept of autonomous college as back as 1978-79. The Tamil Nadu experience is aptly summarised by Victor (2000) in the following words.
“By granting autonomy, the colleges are enabled to frame their own syllabus according to the current needs, set question papers and conduct examinations. These autonomous colleges have their own academic councils and Board of Studies. This academic freedom given to the colleges facilitate them to revise and modernize the syllabus and curriculum whenever required without approaching the University concerned for approval. Autonomous Colleges offer a large number of Diploma and Certificate Courses in addition to conventional degree courses. But however the degrees are awarded by the University concerned. By getting autonomous status the colleges become eligible for more quantum of University Grants Commission’s assistance. The University Grants Commission has also inspected the present autonomous colleges and they have recommended for continuation of their autonomous status for 5 more years. There are 44 Autonomous Colleges in Tamil Nadu which is more than those in any other State in India” (p.4).
it might be added here that by the end of March 2001, 25 out of 44 or 57 percent of autonomous colleges in Tamil Nadu are accredited by the NAAC.
Further, Victor notes the following.
“Autonomy has enabled the Colleges not only to be innovative, socially relevant and accountable but also play a key role in supplementing the efforts of the Government by way of participation and contribution to the social welfare programmes. The variety of courses offered by the college, the inter-disciplinary accessibility to the students for courses of their choices, the credit-based evaluation system which provides opportunities for individual achievement/attainment on differential mental capabilities - all these are point in favor. Th'e variety of courses and subjects offered by the various autonomous colleges spread throughout the State in urban, semi-urban and rural areas attempt to cater to the aspiration and achievements of the people” (p2 ).
Thus, the experience of Tamil Nadu State in regard to introducing the autonomous colleges is positive and, hence, is encouraging for Karnataka State to introducing the concept of autonomous colleges.
8.3.1.2. Experience of Karnataka
The Karnataka State Universities Act 1976 has a provision for autonomous college under section 56A. For instance, “notwithstanding anything contained in this Act, or the Statutes, Ordinances and Regulations made thereunder, the University may with the prior concurrence of the State Government and the University Grants Commission, designate for such period as may be specified, an affiliated college, department or unit as an Autonomous College for any course of study, after following the procedure and subject to such conditions as may be prescribed in the statutes made in this behalf and with a view to improve the quality of education and to introduce new and relevant courses of study" [u/s 56A(1)],
Nevertheless, to date, Karnataka State has no autonomous college in its collegiate education. Thus, autonomy to the colleges is a new concept and experience to be tried in the Karnataka State.
8.3.1.2.1. Recent proposals to granting autonomy to colleges in Karnataka
It is gratifying to note that the State Universities, such as, University of Mysore, Kuvempu University and Mangalore University, have drafted statutes relating to grant of autonomy to their affiliated colleges.
For instance, the University of Mysore has prepared the Statutes relating to the Grant of Autonomy to the Colleges of Mysore University in 1999. The preamble clearly recognises the need for the autonomous colleges in the following words. "The archaic system of affiliation has provided little or no scope for college to innovate, experiment and standardize the activities related to learning, examination and training. Therefore, it is time that some, if not all, colleges are given the statues of autonomy to accept the new challenges in terms of quality and excellence of a new century".
The Statutes of the University of Mysore are related to many aspects including application for grant for autonomy; procedures for grant of autonomy; relationship of autonomous colleges with the Mysore University; composition, powers and functions of Governing Body, Academic Council, Board of Studies and the Board of Examiners; composition, powers and functions of Governing Body in autonomous Government College, University maintained colleges, Minority colleges and in other colleges; review and evaluation; rights and privileges of college which has been granted autonomy; award of degrees through the Mysore University; and withdrawal of autonomy.
The rights and privileges of an autonomous college include (a) prescribing syllabus, courses of study, providing new courses and subjects of study; (b) arranging for instructions of students; (c) devising methods of evaluation, examination and tests leading to award of degrees (and Diplomas) by the University; (d) admission of students to courses of study; (e) framing of rules, byelaws and regulations; and (f) starting of Diploma (undergraduate or postgraduate) and certificate courses. While the Diplomas and Certificates shall be issued under the seal of the college, the University alone has
the right to award degree to students evaluated and recommended by autonomous colleges with explicit mention of the name of the college on the degree certificate.
Thus, autonomous colleges are the new hopes of bringing in innovations, dynamism, and for improving quality and relevance of collegiate education in the State.
8.3.1.2.2. Some limitations on the proposed autonomy to colleges
Three important limitations of proposed autonomy to colleges by University of Mysore are as follows.
First, all aspects of proposed autonomy by the University of Mysore are related to academic matters within the purview of the University. However, collegiate education in the State is not only regulated and promoted by the Universities, but also by the State Government, among others. Thus, autonomy to colleges does not mean that colleges are free from all regulatory and promotional functions of all regulators and promoters of collegiate education in the State.
Second, the cost of autonomy may have to be borne by the colleges and students within the colleges. This is because of the fact that any new subject or course of study, or evaluation of students (through examination reforms), to be introduced involves additional financial resources for the colleges. If the additional cost are to be met by resources within the colleges (i.e. through student fees and/or non-student sources), the colleges would need autonomy and flexibility in raising and spending additional resources. At present, the proposals for autonomy to colleges do not cover aspects of financial autonomy to colleges in the State.
Third, autonomy entails a lot of additional responsibility, work, accountability on the staff, students and management of colleges, and high standards in conduct of examination especially if a credit-based, semester system of education is introduced. If colleges do not like to take up additional works and responsibility and ensure accountability, there may not be many colleges to become autonomous ever although its University may offer autonomy.
8.3.1.2.3. Need for further autonomy to colleges
In order to improve efficiency, quality and additional resource mobilisation within the framework of proposed autonomy to the colleges, there is a need to consider financial autonomy in three specific areas.
(i) Fixation of student fees at the college level
There is a need to fix the student fee at the college level. At present, student fees in collegiate education are fixed by three institutions, (i) State Government fixes the tuition, laboratory, admission, reading room, sports, library fee including binding and mid-term examination fees, and for student welfare and staff welfare funds, (ii) The University f'xes the examination, sports development and registration fees, (iii) The college management fixes fees in respect of student union, cultural activities, college magazine and identity card. However, the largest of all the fees are fixed by the State Government, viz., tuition and laboratory fees.
The main problem with the above fixation of fees is that they have been uniform for all Government, Private Aided and Private Unaided colleges in the State. However, in the Government Order No.ED 123 DEC 97, Bangalore, dated 7th August 2000, the fee revisions, to be introduced during 2000-01, have been restricted to be applicable only for Government and Private Aided colleges. Further, in this Government Order, a provision is made for an annual increase in the fee by 10 percent. Thus, if autonomy is granted to a Government college and to a Private Aided College, they are subject to charging their students the same fee at the fixed rates.
Since the cost of autonomy may vary between colleges, there is a need to fix the student fee in the colleges. This does not mean that colleges can fix any fees and at any level. Rather, it only implies that colleges need autonomy in fixing level of fees according to the cost of providing the educational services in their colleges.
It is important to recapitulate here that, way back in 1999, an attempt was made by the State Government in giving flexibility to fixation of tuition fee for recognised private unaided institutions. That is, ‘luition fee in respect of Private Unaided Educational Institution shall be fixed taking into consideration the Salary Expenditure Plus 30% of the salary expenditure towards contingency and maintenance equipments divide by total number of students” (Ref; GO No.ED 39 Vivida 99, Bangalore dated 9* August 1999). This approach is welcome and should be implemented by the colleges themselves, as it takes into account the cost differential between institutions in fixing tuition fee for students.
(ii) Payment of salary to staff and other service conditions to be monitored
The colleges should strictly implement payment of salary to staff as per the State Government guidelines. The State Government should closely monitor this implementation. At present, there is a problem in regard to payment of low salary and poor service conditions for staff in unaided courses in aided colleges and in all courses in unaided colleges, as most of the staff are appointed only on temporary basis. Consequently, these colleges have not been above to attract qualified and experience staff and, hence, quality of education has suffered in the colleges.
It is important to remember here that there exists a regulatory framework to implement the above monitoring process in private colleges. That is, the Karnataka Private Educational Institutions (Discipline and Control) Act, 1975. Notwithstanding the provisions of this Act, the service conditions in unaided collegiate education sector continues to be grim for reasons including lack of knowledge on these provisions for the staff members. This underlines the need for guidance for staff members on their rights and privileges within the framework of the Act.
(iii) Accountability in all receipts and expenditure of colleges
All colleges must be accountable for all receipts and expenditure in them. At present, there is a mismatch in the reported amount of receipts and expenditure in colleges. Such a mismatch creates a suspicion on the college finances for all noncollege agents in collegiate education. Thus, transparency and accountability are a must for the colleges.
8.3.2. A case for community colleges
The concept of community colleges is virtually unknown in the system of collegiate education in Kamataka. Surprisingly, even in countries like United States of America (USA) where the community colleges have been established long before 1980, the concept is relatively little known. As Kane and Rouse (1999) put it: “Community colleges have assumed an increasingly central role in the nation’s education and training. Between 1980 and 1994, the proportion of 18 to 24 year-olds enrolled in college grew by more than one-third, from 26 to 36 percent. Nearly half of this increase in enrolment was absorbed at community colleges. Yet despite the increasing interest in community colleges among both students and policy- makers as a potential source of education for workers seeking to upgrade their skills, relatively little is known about them” (p.63).
In what follows, the experience of USA in regard to community colleges is briefly described and lessons for Karnataka’s collegiate education are explored. The description of USA’s experiences draws heavily from the paper by Kane and Rouse (1999) and all page numbers quoted below refer to this paper.
8.3.2.1. Experience of USA
Historically, the community colleges in USA have been started with a focus on ‘Iransfer function”. That is, “students would complete two years of a general undergraduate educatipn and earn an associate’s degree (AA) at the two-year college, and those who wanted and were capable would transfer to a four-year college to complete a bachelor’s degree. Since then, two-year colleges have broadened their mission to include vocational degree programs, continuing adult education programs, and workforce, economic and community development programs” (p.64).
There are three merits of community colleges as compared to regular (or full time) education. First, most community college students attend part time. Second, cost of education in community colleges is relatively low. Third, a significant fraction of students enrolls in terminal (usually) vocational programs.
Over the years, community colleges have transformed from an academic curriculum delivered in a traditional manner into providing education services in non- traditional ways. These non-traditional ways include the following, (i) Providing contract training, i.e. classes offered to employees of a business, industry, labour union, or public agency, often at a site designated by the contracting agency. The focus of the contract training is on teaching job-specific skills needed to perform a job, to improve current performance, or to prepare for advancement, (ii) Providing contract courses in basic reading, writing, or maths skills.
Available empirical evidence for USA suggest that community colleges increase aggregate educational attainment, and are associated with higher wages, even for those not completing degrees.
8.3.2.2. Lessons for Karnataka State
First, as explained in Chapter 4 under section 4.4.1.3.1, the Directorate of Vocational Education (DVE) imparts training in various vocational courses for students
passing out of secondary education. These courses are college-based, (i.e. in junior colleges) and non-terminal (since students with vocational education certificates can enter degree courses). Thus, the current vocational education, imparted by the State’s DVE, is comparable with some of the functions of the community colleges in the USA.
The experience of USA in community colleges (e.g. contract training programmes) clearly implies that colleges go to the students, rather than students come to the colleges as in the case of Karnataka state. This is an important lesson for diversifying the activities and approaches to vocational education by the DVE in the State, such as, contract-training programmes for small-scale industries in local areas. Thus, DVE seems to have the potential to provide education services under the new concept of community colleges. This potential may be utilised by giving further encouragement and support to the DVE by the State Government.
CHAPTER 9
Major policy recommendations
This study has made an in-depth analysis of the structure, organisation, supply of and demand for, quality and relevance, public financing, management and coordination of collegiate education in Karnataka State during 1990's. The analysis has been carried out, subject to the availability of secondary data and collection of primary data at the State level, university level, district level, college level and student level. Thus, the study's results have important implications for goals and strategies for collegiate education at different levels of planning, policy formulation and policy implementation in the State, both at present and in future. The major policy recommendations, which originate from within the analysis of this study, are presented below.
9.1. For improving the database on collegiate education
9.1.1. Data on collegiate education can be made complete without incurring any additional cost. First, collection of all data on colleges should be left only to the universities, as they have already got the initial infrastructure, manpower and experience. The data thus collected by the universities for their own purposes (e.g. for publication in their Annual Report) should be consolidated with the help 6 Regional Directorate of Collegiate Education and organised by the Department, This has three positive implications. First, the duplication in cost of collection of data by the Department and universities is avoided. Second, the consolidated data will be broad-based as it would naturally include PUACs. Third, the consolidated data will go a long way in building a data bank on collegiate education by the Department.
To accomplish the task above, the Statistical Cell of the Department must be reorganised. First, the available records on colleges must be properly reorganised and systematically maintained by years. Second, the future data organisation and consolidation must be computerised. Otherwise, speedy processing, communication and sharing of data may not be possible. In this regard, the Statistical Cell of the universities may also initiate steps to computerise their data on affiliated colleges. For this purpose, the State Government may help universities by way of specific financial assistance. Third, the Department must depute/appoint, a computer-literate person to head the Statistical Cell who shall not only electronically organise and consolidate the data from the universities but also train the persons to be deputed/appointed into the Cell in future.
9.1.2. Annual Report of the State Universities should be made to include an exclusive report on the affiliated colleges. This has been regularly practiced in universities, such as. University of Mysore, Mangalore University, Gulbarga University, and Karnatak University, irregularly practiced in Bangalore University and never practiced in Kuvempu University. In addition, basic data on affiliated colleges should be made common for all universities, such as, enrolment of students, strength of teaching and non-teaching staff and pass percent of students by courses, social categories and by sex.
9.2. On controlling the quantitative expansion of colleges, promotion of private sector participation, and need for area-based planning and utilisation of resources
9.2.1. The decline in enrolment of students in GCs and PACs is often attributed, among others, to rapid quantitative expansion of PUAC in the 1990’s. However, for this reason alone, the quantitative expansion of PUACs should not be contained, both at present and in future, especially given the fact that there has been a stagnation of growth of PACs and UCs in the recent past. In fact, PUACs should be encouraged as they aim at meeting the diversified (e.g. for professional courses) and competitive (e.g. for traditional courses) demand for collegiate education without burdening the public finances in the State, if the quality of education provided by them is comparable with GCs and PACs.
9.2.2. The future planning for the quantitative growth of collegiate education should not be based on mere permission to start a large number of PUACs. Rather, the planning may also aim at making all-out efforts by all stakeholders (i.e. the State Government, affiliating University, and college-management) for inter-institutional collaboration (e.g. between GCs and PACs, or between colleges and university, located within the same area) to avoid creating parallel facilities and, thereby, promoting net work of personnel and institutions for long run reduction in total social cost of providing collegiate education in an area. Thus, consolidation and co-operative sharing of facilities rather than a numerical expansion of colleges should guide the future quantitative expansion of collegiate education in the State. In essence, this strategy calls (a) for an area-based rather than college-specific planning and utilisation of resources and (b) helps in assessing the unmet demand for collegiate education.
9.2.3. In future planning for regular collegiate education, the complementary role of distance education should be considered. In fact, only that unmet aggregate demand by the existing regular and distance education should form the basis for future expansion of either regular or distance education in the State.
9.3. For improving the quality of education
At present, quality of infrastructure in all types of colleges, payment of salary of staff and amount of fee charged to students in unaided colleges and in unaided courses of aided colleges, and quality of students admitted are questionable in many colleges. In fact, the persistence of these problems indicates the failure on the part of colleges to complying with the Government/university rules and guidelines. Thus, new ways to deal with the improvement and regulation of quality are essential.
9.3.1. For improving the quality of student in-take
9.3.1.1. Select urban colleges have attempted to improve the quality of student in-take by admitting students with higher marks in the qualifying examination. In few professional courses, admission tests are introduced by colleges. In all these cases, there exists more number of applications than the student in-take capacity in colleges, and colleges get the merited students. Obviously, those who do not succeed in these competitive processes, seek admission in other colleges where such admissions tests are not practiced. Accordingly, colleges get students of different levels of quality. This problem is severe in rural colleges, especially in rural GCs, where a large number of
student get admitted with a pass class in their qualifying examinations. Very often, these students are not sure of their objectives for and options in pursuing collegiate education. Thus, there is a strong need to counseling students on vocational education and distance education, before they start their collegiate education, and get only the most motivated and interested students to pursue collegiate education. This shall also go a long way in increasing retention rate or enrolment of students in colleges.
It is gratifying to note that the Department of Collegiate Education and NIMHANS in Bangalore have joined together in giving training to college teachers in student counseling. The services such trained teachers are most useful in offering student counseling in their respective and nearby colleges.
9.3.1.2. Medium of instruction in Kannada is often said to be a major obstacle for occupational and spatial mobility of college graduates outside the State. To overcome this problem, Kannada medium students should be provided with a short-term training in communicative skills in English language. It should be acknowledged that Gulbarga University has such an innovative programme for rural and Kannada medium students who are admitted to post-graduate education in the University.
9.3.1.3. For improving quality of teacliers
9.3.1.3.1. At present, college teachers do not require a formal teacher’s training certificate or degree to get a teaching job. However, quality of teaching depends not only on the substance but also on the method of teaching. Thus, a short term training is essential for all college teachers in the methods and art of teaching. To be professional, such a training programme should be organised and conducted by the Government teacher training colleges for all pre-job and on-job teachers. The programme should be intensive and for a duration of 4 weeks. Alternatively, the universities and institutes of higher learning may organise such training programme with inputs from relevant experts, either on self-financing*basis or grants from the State Government. In the meanwhile, the contents of the UGC-sponsored Refresher Courses and Orientation Programmes may be redesigned to accommodate more lectures on the teaching methods in the respective subjects.
9.3.1.3.2.' In-class teaching performance of teachers should be periodically evaluated in all colleges, either by the college management or administration or by students. This shall go a long way in improving the monitoring the quality of class-room teaching and in recognising the good teachers for special incentive purposes on objective basis (e.g. for best Lecturer awards by the Government).
9.3.1.3.3. The qualification and experience for appointment of teachers in all colleges, either by direct recruitment or promotion, should strictly follow as per the standing guidelines of the UGC.
9.3.1.3.4. The revised UGC-pay scale for college teachers have been implemented in the State with effect from January 1, 1996. At present, as per the decision of the State Government, the direct beneficiaries of this revised pay scale are the teachers in the GCs and in aided courses of the PACs. The unaided teachers in PACs and teachers in PUACs are often said to be the non-beneficiaries of the revised pay scale, especially for lack of resources with the college management. However, pay differentials for equal work within the same college is a source of discouragement and
disincentive for qualified staff, resulting in high turnover and adverse impact on quality of teaching. Thus, equal pay for equal work in all colleges should be implemented and monitored, either by the University or by the State Government.
9.3.1.3.5. The existence of retired college teachers constitutes a large pool of experienced teachers in the State. There is a suggestion that the services of such retired persons may be utilised for teaching purposes on part-time or temporary basis in both Government and private colleges. This suggestion should be considered only as a special case but not as a general policy since it would further worsen the job prospects of young post-graduates.
9.3.1.3.6. In a globalising economy, the biggest beneficiaries are those whose skills are transformable and those who are mobile. Unfortunately, at present, the collegiate education in traditional courses is not transformed in tune with the requirements of digilitisation of the economy. Thus, introduction of digitilisation is most desired in the collegiate education. In this regard, the experience of Bangalore University, Mangalore University, and the Government of Tamil Nadu, in introducing and financing the computer training programme in colleges, especially in Government colleges, deserve special consideration by the Government.
9.3.1.3.7. In the process of providing computer-training facilities to students, colleges can also directly access the most update knowledge and information through Internet services for both teachers and students. The access to knowledge has the immediate impact on reducing physical investment (i.e. on building and printed books) on library in colleges. For instance, the literature on World Trade Organisation, WTO, (continuously updated, however) is available on free website; www.wto.org. In the same way, innumerable free websites are now available for science and commerce subjects. Thus, the benefits of information technology should be utilitsed for improving the quality of teaching and learning in the colleges.
9.3.1.3.8. In many of the rural colleges, courses are taught in Kannada language. In addition, more than half of the Instruction in English medium classes is said to be in Kannada language. However, there is a terrible dearth of standard textbooks in Kannada language in social sciences. Consequently, the instructor has to prepare his/her own teaching materials by translating into Kannada from the available textbooks in English language. For this reason, the quality and content of teaching in social science has been heavily dependent upon the ability of translation of teachers and availability of English language textbooks. Consequently, low ability of translation and non-availability of English language tektbooks have become the major reasons for low quality of classroom teaching. In addition, books on computer education, and computer manuals, are not available in Kannada language or not translated into Kannada language. Thus, students are handicapped in self-learning computer applications in one’s own area of subject and beyond their basic training in computer literacy. To overcome this problem on long term basis, the State Government or the Universities should take early initiatives in commissioning the writing of text books in Kananda language in all miiajor courses in collegiate education. For this purpose, the services of retired professors from university and collegiate education may be considered. The procurement of such books should be made mandatory in all college libraries.
9.3.1.4. For improving college infrastructure
9.3.1.4.1. In recent years, salary expenditure on staff comprises the entire maintenance expenditure and the largest component of total expenditure of all colleges. This pattern of expenditure leaves little resources for non-salary recurring expenditure and for investment on college buildings, student hostel, library facilities, computer facilities and other infrastructure facilities. Thus, expenditure on non-salary items should be increased with immediate effect, especially in GCs.
9.3.1.4.2. National Assessment and Accreditation Council (NAAC) has the main objective of helping universities and colleges to work continuously to improve the quality of education. The NAAC approaches evaluation of colleges for purposes of accreditation and grading in the most professional manner and star-grade the institution from one star to 5 stars. The criteria for NAAC’s assessment include curricular aspects; teaching- learning and evaluation; research, consultancy and extension; infrastructure and learning resources; student support and progression; organisation and management; and healthy practices. Up to the end of March 2001, only about 1.84 percent of total affiliated general degree colleges in the State is accredited by the NAAC. In the interest of overall improvement of quality of education in colleges, NAAC’s accreditation should be made mandatory for all colleges in the State within a period of next 3 to 5 years. It might be noted here that NAAC’s recognition Is made mandatory for institutions in distance education in the country including the Karnataka State Open University, before December 2003.
9.4. For improving the relevance of education through autonomous colleges
An important determinant of relevance of collegiate education is the prescription of curricula for courses. At present, the universities fix the curriculum for their colleges. And, colleges lack autonomy in designing of their own curricula according to the particular needs of students and areas within the universities. To bring in innovations, dynamism, and for improving quality and relevance in collegiate education, autonomy to colleges is offered by the University of Mysore, among other Universities in the State. And, all aspects of proposed autonomy by the University of Mysore are related to academic matters within the purview of the University. However, in order to improve efficiency, quality and additional resource mobilisation within the framework of proposed autonomy to the colleges, there is a need to consider financial autonomy in fixation of college-specific student fee and in raising resources through non-fee sources. Nevertheless, autonomous colleges should be monitored in regard to payment of salary to and other service conditions of their staff by, and should be made accountable for all receipts and expenditure of their colleges to the State Government.
It should be emphasised that improvement in the relevance of education along with quality of education is also the most important ways of increasing the demand for collegiate education by halting the declining enrolment of students in the colleges.
9.5. For diversifying vocational education through community colleges
The experience of USA in community colleges (e.g. contract training programmes) clearly implies that colleges go to the students, rather than students come to the colleges as in the case of Karnataka state. This is an important lesson for diversifying the activities and approaches to vocational education in degree colleges and
by the Directorate of Vocational Education (DVE) in the State, such as, contract-training programmes for small-scale industries in local areas. In particular, DVE seems to have the potential to provide education services under the new concept of community colleges. This potential should be utilised by giving further encouragement and support to the DVE by the State Government. In addition, the lessons from the experience of USA may be considered as useful guidelines in realising this potential of DVE.
9.6. On post-graduate education through degree colleges
Post-graduate education through degree colleges is imparted in two ways. First, post-graduate centers of the universities located in degree colleges. Second, postgraduate courses run by degree colleges. For instance, during a field visit to a postgraduate centre of a university revealed that it is located in a Government degree college without adequate and experienced staff, classroom facilities, water and sanitation facilities, housing facilities for staff, library facilities for staff and students etc. The situation is more deplorable in case of a science faculty by the absence of laboratory facilities. On the other hand, in a Government degree college with postgraduate courses, there exists no teaching staff who are appointed specially for postgraduate courses. In view of these problems, post-graduate centres and education in degree colleges should not be encouraged in future. And, the continuation of postgraduate courses in the present degree colleges should be reconsidered at the earliest.
9.7. For Improving the examination system
At present, the annual examination system in affiliated colleges lacks specific mechanism tor continuous monitoring o1 students’ learning performance and is heavily dependent on memorisation and involves examination-centred teaching-learning process. Further, the nature and number of subjects chosen for study in the present degree courses are decided (if only, there exists few combinations of subjects) only at the beginning of the study. Students do not have options to choose subjects according their levels (i.e. from elementary to advanced levels through an intermediate level). Thus, there is a need to introduce a system wherein students have flexibility of choosing subjects and their levels in a degree course with scope for continuous monitoring of their learning performance. This need calls for a change in the examination system from the present annual examination system to a credit-based or marks-based semester scheme. Over the years, the University of Agricultural Sciences (UAS) in the State has been successfully practicing the credit-based, semester system in its undergraduate and postgraduate courses. In the 1980’s, the University of Mysore had introduced marks-based semester scheme for post-graduate courses. Thus, the current experience of UAS and past experience of University of Mysore are of vital guidance for introducing credit- based, semester scheme in degree colleges in the State.
9.8. For reducing budgetary subsidies to collegiate education and Improving self- finances of colleges
9.8.1. There is a need for both increasing and diversifying the fee structure between courses and colleges within the collegiate education. At present, this can be done only by the State Government (or university in case of UCs), as colleges do not have powers to prescribe their own fee for students. However, the fee revisions should be periodic with built in safeguards for poor students in terms of providing education loan
facilities and access to distance education. To start with, tiie recommendations of Punnayya committee, Pylee committee, Ananadakrishnan committee and Mahmood-ur Rahman committee may be considered as scientific guidelines for fee revisions.
9.8.2. At least in the short run, and other things being the same, it is feared that a reduction in the volume of budgetary subsidies (or, subsidies, in brief) to collegiate education may lead to a reduction in provision of teaching and non-teaching staff services of collegiate education. To avoid such a situation, a policy of reduction in subsidies may be announced well in advance (e.g. about 3 years in advance) such that the colleges may prepare themselves to cope with the new situation.
9.8.3. If select traditional courses are looked from the viewpoint of preserving and fostering the culture, encouraging learning, and teaching and researching in subjects of culture and civilisation of the society, one may get a broader perspective on a need for continuing subsidies to collegiate education. Such viewpoints are essential for prioritisation and targeting of reduction in budgetary subsidy to collegiate education. Thus, subsidies should not be cut for courses, which have least or no market/employment orientation or which aim at preserving and fostering the culture, encouraging learning, and teaching and researching in subjects of culture and civilisation of the society.
9.8.4. Given the diversities of collegiate education, a policy of reduction in subsidies may not be realistic if formulated and implemented uniformly across types of colleges and places in the State. This underlines a need for evolving the management- specific and/or area-specific policies and instruments for reduction in subsidies to collegiate education. In the meanwhile, subsidies should not be cut to colleges, which are located in backward and rural areas and in which large number of students come from poor families.
9.8.5. There is a problem of lack of active involvement of local people, industry and old students in the development of the colleges. In fact, these are the potential sources for mobilising financial resources for future development of the colleges through endowments, philanthropy, and alumni association (i.e. donations after graduation). To tap these sources of resources, effective mechanism to participation of and co-ordination with industry, old students and local people must be developed by the colleges.
9.8.6. Role of charity from religious institutions (e.g. temples that under the Endowment Act) should be recognised. If permissible the limits to charity under the Endowment Act may be increased, subject to the condition that increased charity must be spent only on improving educational institutions, which are financially maintained or supported by the temples.
9.9. On bifurcation of composite colleges
The Government Order on bifurcation of composite colleges is related only to the GCs and PACs. This is most surprising since the objective of bifurcation is professional improvement of PU education by separating it from the degree or secondary education in the entire State. Since professional improvement in collegiate education Is accomplished through GCs, PACs and PUACs, the Government Order should be extended to all colleges (except DCs, as there are no composite UCs in the State).
9.10. For improving the Government Colleges
There is a misconception that under the economic reforms in India, the role of the government is reduced including in collegiate education. However, the correct perception is that the role of the government is redefined in collegiate education. The redefined role is to (a) increase private finances in Government colleges and to reduce public finances to private colleges; and (b) improve the quality and relevance of education in Government colleges, and (c) make GCs competitive in the changing environment of liberalisaton and globalisation of educational services. In addition. Government colleges are generally composed of students (especially, SC/ST students) with low performance in qualifying examinations and poor economic background. Thus, over the years, students in GCs are provided with various forms of fee concessions, scholarships, national loan scheme and special benefits under Special Component Plan and Tribal Sub-plan. Nevertheless, the real challenge for the Government colleges is to train their students such that they become competitive in University level. State level and national level selections (e.g. through Union Public Service Commission or Karnataka Public Service Commission), examinations (e.g. UGC’s NET or Government of Karnataka’s SLET, and admission to post-graduate courses) and in employment markets (i.e. number of placements in government and private sector jobs).
9.11. Other policy recommendations of the study
9.11.1. This study has demonstrated that there exists wide disparities in all variables of growth and distribution of collegiate education by sex of students, by social categories of students, by types of colleges, by districts and by universities, and by male and female students and stall in all coHeges, in the State. Thus, the results of this study are useful for State policy makers in designing a scientific policy for achieving interregional balance in the growth of collegiate education in the State.
9.11.2. This study has demonstrated that collegiate education has close links with Pre-university education, Vocational education. Teachers’ education. Technical, Medical and Agricultural education and University education and research. These links should be considered for integrated planning and development of collegiate education, both at present and in future.
9.11.3. There are several long run impact of recent decline in demand for collegiate education on (a) demand for post-graduate general education in the universities, and its attendant impact on the reduction in the supply of post-graduates for teaching jobs and research in universities and colleges; (b) current and future number and investment in collegiate education; and (c) supply of teachers for school education in the State. A systematic analysis of these impacts is an area of future policy study on collegiate education in the State.
9.11.4. India is a founder-member of WTO. Education services from primary to tertiary levels come under General Agreement on Trade in Services. (WTO (1998)]. Under the provisions of the agreement, collegiate education services are bound to be exposed to international competition, especially through distance modes of learning, such as, on line degree programme. Virtual University, local branch campuses and twinning arrangements. Can our college-based, regular education withstand such global competition? If not, can we think of a competition policy for higher education in general, and collegiate education in particular, in the near future? At present, this is an open question for all stakeholders in the collegiate education in the State.
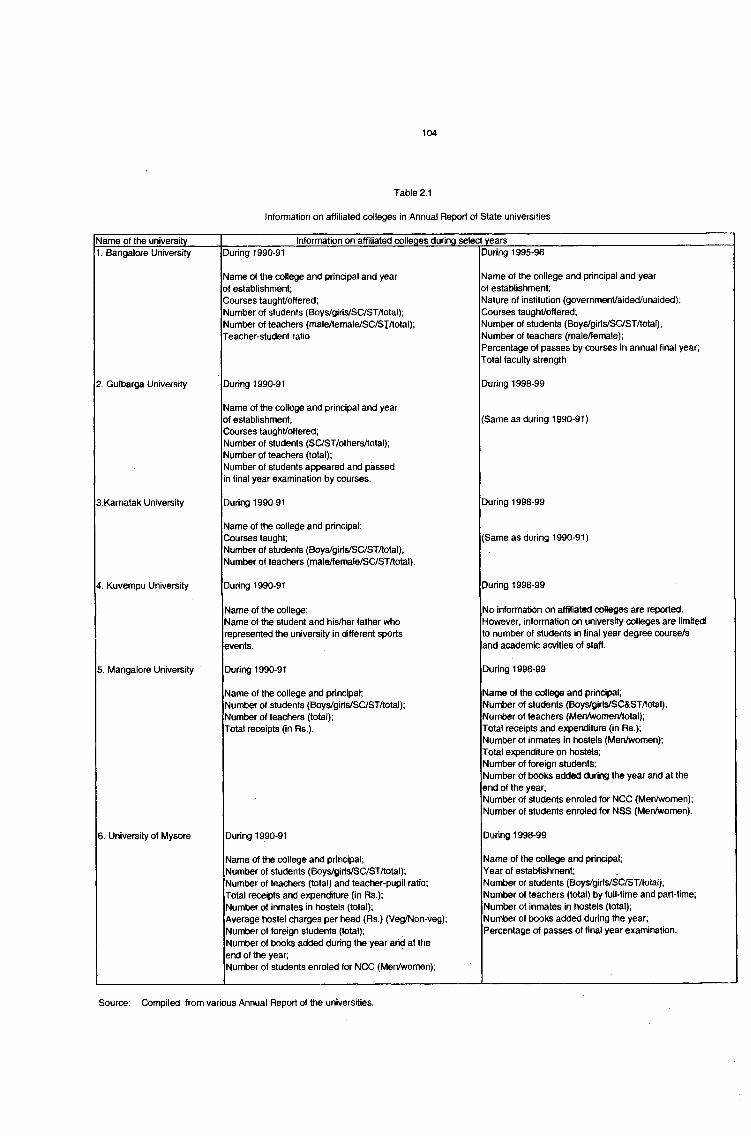
Table 2.1
Information on affiliated colleges in Annual Report of State universities
Name of the university Information on affiliated colleges during select years1. Bangalore University During 1990-91 During 1995-96
Name of the college and principal and year of establishment;Courses taught/offered;Number of students (Boys/giris/SC/ST/total); Number of teachers (male/female/SC/SXAotal); Teacher-student ratio
Name of the college and principal and year of establishment;Nature of institution (government/aided/unaided); Courses taught/offered;Number of students (Boys/giris/SC/ST/total);Numljer of teachers (male/female);Percentage of passes by courses in annual final year; Total faculty strength
2. Gulbarga University During 1990-91 During 1998-99
Name of the college and principal and year of establishment;Courses taught/offered;Number of students (SC/ST/others/total); Number of teachers (total);Number of students appeared and passed in final year examination by courses.
(Same as during 1990-91)
3.Kamatak University During 1990-91 During 1998-99
Name of the college and principal:Courses taught;Number of students (Boys/giris/SC/ST/total); Number of teachers (male/female/SC/ST/total).
(Same as during 1990-91)
4. Kuvempu University During 1990-91 During 1998-99
Name of the college;Name of the student and his/her father who represented the university in different sports events.
No informatton on affiliated colleges are reported. However, information on university colleges are limited to number of students in final year degree course/s and academk: acvities of staff.
5. Mangalore University During 1990-91 During 1998-99
Name of the college and principal;Number of students (Boys/giri^SC/ST/total); Number of teachers (total);Total receipts (in Rs ).
Name of the college and princ^al;Number of students (Boys/girls/SC&ST/total); Number of teachers (Men/women/total);Total receipts and expenditure (in Rs.);Number of inmates in hostels (Men/women);Total expenditure on hostels;Numt>er of foreign students;Number of books added during the year and at the end of the year;Numfc>er of students enroled for NCC (Men/women); Number of students enroled for NSS (Men/women).
6. University of Mysore During 1990-91 During 1998-99
Name of the college and principal;Number of students (Boys/giris/SC/ST/total);Number of teachers (total) and teacher-pupil ratio; Total receipts and expenditure (in Rs );Number of inmates in hostels (total);Average hostel charges per head (Rs.) (Veg/Non-veg); Number of foreign students (total);Number of books added during the year arid at the end of the year;Number of students enroled for NCC (Men/women);
Name of the college and principal;Year of establishment;Number of students (Boys/giris/SC/ST/total), NumlDer of teachers (total) by full-time and part-time; Number of inmates in hostels (total);Number of books added during the year;Percentage of passes of final year examination.
Source: Compiled from various Annual Report of the universities.
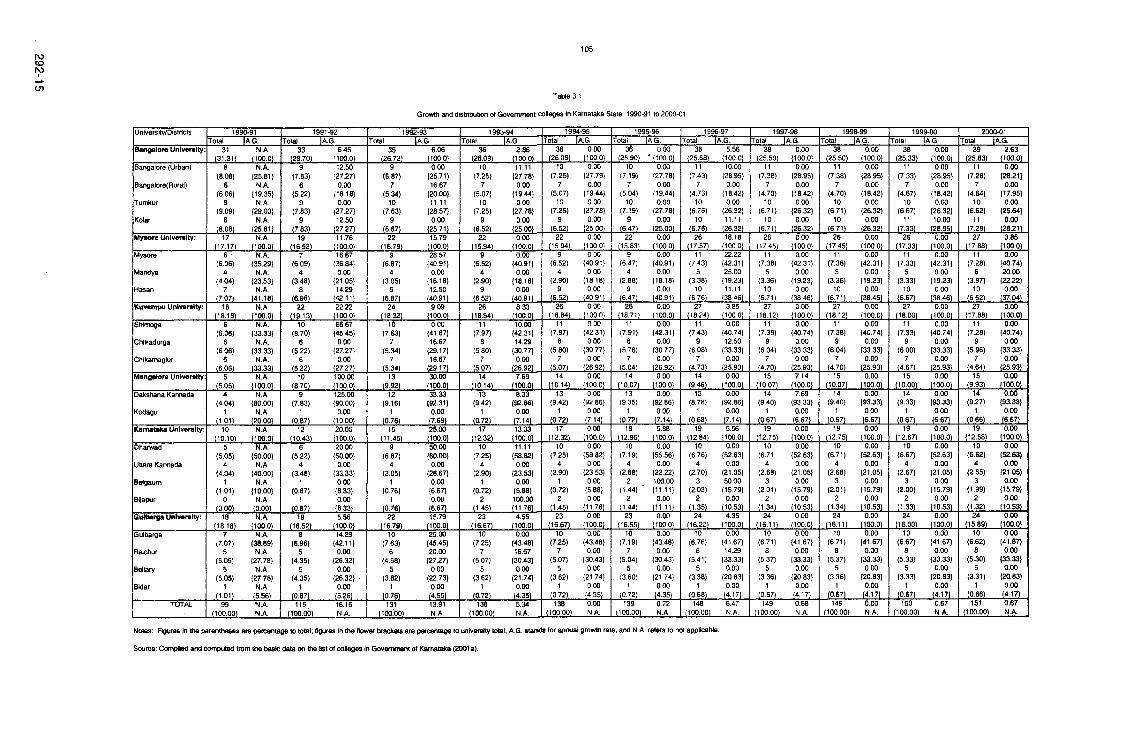
roCOM
cn
Growth and distribution of Government coneges in Karnataka State: 1990-91 to 2000-01
University/Distrtcts
Bangalore University:
Bangalore (Urban)
Bangalore(Rurai)
Tuml<ur
Koiar
Mysore University:
Mysore
Mandya
Hasan
Kuvempu University:
SNmoga
Chitradurga
Chlkamagiur
Mangalore University:
Dakshana Kannada
Kodagu
Karnataka University:
Dharwad
Uttara Kannada
Belgaum
Bijapur
Gulliarga University:
Quibarga
Raichur
Bellary
Bidar
TOTAL
31(31.31)
N.A.( 100.01
(8.08)6
(6.06)9
(9.09)8
(8.08)17
N.A.(25.81}
N.A,(19.35)
N.A.(29.03)N.A.
J2511L
6(6.06)
(4.04)7
(7.07)
N.A.( 100.0)
N.A.(35.29)
N.A.(23.53)
N.A.(41.18)
18(18.18)
6(6.06)
6(6.06)
6(6.06)
N.A.(100.0)
5■1§,05L
N.A.(33.33)
N.A.(33.33)
N.A.(33.33)
4(4.04)
1
N.A.( 100 .0)
10(10.10)
N.A(80.00)
N.A.(20.00)
5(5.05)
4(4.04)
1(1.01)
0
N.A.(100.0)
N.A.(50.00)
N.A.(40.00)
N.A.( 10.00)
N.A.(0.00) (0.00)
18(18.18)
7(7.07)
5(5.05)
5(5.05)
1(1.01)
N.A.( 100.0)
99( 100.00 )
N.A.(3&89)
N.A.(27.78)
N.A.(27.78)
N.A...11561,.
N.A.N.A.
33(28.70)
6.45(100.0)
9(7.83)
6(5.22)
9(7.83)
9(7.83)
19(16.52)
12.50 ■:27,27)
0.00i'18.18)
0.00(27.27)12.50
(27.27)
7(6.09)
4(3.48)
8(6.96)
11.76( 100.0)16.67
(36.84)0.00
(21.05)14.29
(42.11)22
(19.13)22.22
( 100.0)10
(8.70)6
(5.22)6
(5-22J_10
(8-70)
66.67(45.45)
0.00(27.27)
0.00(27.27)100.00( 100.0)
(7.83)1
(0.87)12
(10.43)
125.00(90.00)
0.00(10.00)
6(5.22)
4(3.48)
1(0.87)
(0:6ZL
20.001100.0)20.00
(50.00)0.00
(33.33) 0.00
(8.33) 0.00
(8.33)19
(16.52)5.56
(100.0)8
(6.96)5
(4.35)5
(4.35) 1
(0.87)115
( 100.00)
14.29(42.11)0.00
(26.32) 0.00
(26.32) 0.00
(5.26)16.16N.A.
35(26.72)
1992-93JEK
6.06(100.0)
9(6.87)
7(5.34)
10 (7.63)
9
22(16.79)
0.00(25.71) 16.67
(20.00)11.11
(28.57)0.00
(25.71)
9(6.87)
4(3.05)
9(6.87)
15.79(100.0)28.57
(40.91) 0.00
(18.18)12.50
(40.91)24
,,(18.32110
(7.63)7
(5.34)7
-(5;34j..
9.09( 100.0)
13(9.92)
0.00(4167)16.67
(29.17)16.67
(29.17)
12(9.16)
1,.iq.-76}.
30.00( 100.0 )
15-L1145L
33.33(92.31)
0.00(7.69)
9(6.87)
4(3.05)
1(0.76)
1(0 76),
25.00(100.0)
22(16.79)
50.00(60.00)
0.00(26.67)
0.00(6.67) 0.00
(6.67)15.79
(100.0)10
(7.63)6
(4.58)5
(3.82)1
(076)131
( 100.00)
25.00 (45.45)20.00
(27.27)0.00
(22.73)0.00
(4.55)13.91N.A.
1993-94
36(26.09)
2.86(100.0)
10(7.25)
7(5.07)
10(7.25)
9(6.52)
22
11.11{27,78}000
(19.44)0.00
(27.78)0.00
(25.00)
9(6.52)
4(2.90)
9(6.52)
0.00(100.0)0.00
(40.91) 0.00
(18.18)0.00
(40.91)26
(18.84)11
(7.97)8
(5.80)7
(5.07)
8.33(100.0)
14(10.14)
10.00(42.31)14.29
(30.77)0.00
(26.92)
13(9.42)
1(0.72)
7,f ( 100.0)
17(12.32)
8.33(^.86)
0,00(7.14)13,33
(100.0)10
(7.25)4
(2.90)1
(0.72)2
(1.45)
T1.11(58.82)
0.00(23.53)
0.00(5.88)100.00(11.76)
23(16.67)
4.55(100.0)
10(7.25)
7(5.07)
5(3.62)
1(0.72)
0.00(43.48)16.67
(30.43)0.00
(21.74)0.00
(4.35)138
( 100.00)
5.34N.A.
1994-95|a .g
36(26.09)
0.00( 100.0 )
10(7.25)
7(5.07)
10(7.25)
9(6.52)
0.00(27.78)
0.00(19.44)
0.00(27.78)
0.00(25.00)
22(15,94)
0.00( 100.01
9(6.52)
4(2.90)
9(6 52)
26<18.84)
0.00(40.91)
0.00(18.18)
0.00(40.911
0,00(100.0)
11(7.97)
8(5.80)
7(5,07)
000(42.31)
0,00(30,77)
0,00(26.92)
14(10,14)
0.00(100.0)
13(9.42)
1(0.72)
0.00(92.86)
0.00(7,14)
17(12.32)
0,00( 100.0 )
10(7.25)
4(2.90)
1(0.72)
2(1.45)
0.00(58.82)
0.00(23.53)
0,00(5,88)0,00
(11.76)23
(16.67)10
(7.25)7
(5.07)5
(3,62)1
(0.72)
0.00(100.0 )0.00
(43.48)0,00
(30.43)0.00
(21.74)0.00
(4,35)138
( 100,00)0.00N.A-
1 a g '36
(25.90)000
* ( 100,0110
1,7.19)7
(5,04)10
(7.19)9
(6.47)
0.00(27.78)
0.00(19.44)
0,00(27.78)
0.00(25.00)
22(15.83)
0.00( 100.0 )
9(6.47)
4(2.88)
9(6.47)
26(18.71)
0.00(40.91}
0.00(18.18)
0.00(40.91)
0.00( 100.0)
11(7.91)
8(5.76)
7(5.04)
0.00(42.31)
0.00(30.77)
0.00(26.92)
14(10.07)
0.00(100.0)
13(9.35)
1(0.72)
0.00(92.86)
0.00(7.141
18(12.95)
5.88(100,0)
10(7,19)
4(2.88)
2(1.44)
2(1.44)
0.00(55.56)
0.00(22.22)100.00( 11.11)0.00
( 11 .1 1 )23
(16.55)10
(7.19)7
(5.04)5
(3.60)1
(0.72)
0.00(100,0)
139(100.00)
0.00(43.48)0.00
(30.43)0.00
(21.74)0.00
( ■35)0.72N.A,
1996-97|a .g .
38(25.68)
5.56( 100,01
11(7,43)
7(4.73)
10(6.76)
10(6.76)
10.00(28,95)
0.00(18.42)
0.00(26.32) 11.11
(26.32)26
(17.57)18,18
(100.0)11
(7.43)5
(3.38)10
(6,76)27
(18.24)
22.22(42.31)25.00
(19.23)11.11
(38,46)3.S5
(100.0)11
(7.43)9
(6.08)7
(4.73)
0.00(40.74)12.50
(33.33)0.00
(25.93)14
(9,46)0.00
(100,0)13
(8.78)1
(0,68)
0.00(92.86)
0.00(7.14)
19(12,84)
5.56(100,0)
10(6.76)
4(2.70)
3(2,03)
2(1.35)
0.00(52.63)0.00
(21.05)50.00
(15.79)0,00
(10.53)24
(16.22)4.35
(100,0)10
(6.76)6
(5,41)5
(3.38)1
(0.68)
0.00(41.67)14.29
(33.33)0.00
(20.83)0,00
(4.17)148
(100.00)
6.47N.A,
38(25,50)
0.00( 100.01
11(7.38)
7(4.70)
10(6.71)
10(6.71)
26(17.45)
0.00(28.95)
0.00(18.42)
0.00(26.32)
0.00(26.32)0.00
(100,0)11
(7.38)5
(3.36)10
(6'71)27
(18 12)
0.00(42.31)0.00
(19.23)0,00
(38,46)
11(7.38)
9(6.04)
7(4.70)
0.00(100,0)0.00
(40.74)0,00
(33,33)0.00
(25.93)15
(10.07)7 14
(100.0)14
(9.40)1
(0.67)
7.69(93.33)0.00
(6.67)19
(12.75)0.00
(100.0)10
(6.714
(2.68)3
(2.01)2
(1.34)
0.00(52.63)
0.00(21.05)0.00
(15.79)0.00
(10.53)24
i i m10
(6.71)8
(5.37)5
(3.36)1
(0.67)
0.00(100.0)
149( 100.00)
0.00(41.67)
0.00(33.33)0.00
(20.83}0.00
(4.17)0.68N.A,
38(25.50)
0.00(100.0)
11(7.38)
7(4.70)
10(671)
10(6.71)
0.00{28.95}
0.00{18.42}
0.00(26.32)
0.00(26.32)
26(17.45)
0.00(100.0)
11(7.38)
5(3.36)
10t6-.71),
27(18.12)
0,00(42.31)0,00
{19,23}0,00
(38.46)0.00
(100.0)11
(7,38)9
(6,04)7
(4.70)
0,00(40,74)0.00
{33.33}0.00
(25.93)15
(10.07)0.00
(100.0)14
(9,40)1
(0,67)
0,00{93,33}0.00
(6.67)19
(12.75)0.00
(100.0)10
(6.71)4
(2.68)3
(2.01)2
(1.34)
0.00{52.63}
0.00{21.05}0.00
(15.79)0.00
(10.53)24
(16.11)0.00
(100.0)10
(6,71)8
(5.37)5
(3.36)1
(0-67).149
( 100.00 )
0.00{41.67}0.00
(33.33)0.00
{20.83}0.00
F -17L0,00N,A.
I X gT38 0.00
(25.33) (100.0)11
(7.33) 7
(4.67) 10
(6.67) 11
(7.33)26
(17,33)
0.00{28.95}
0,00{18.42}
0,00{26,32}10,00
(28,95)0,00
( 100,0 )11
(7.33) 5
(3.33) 10
(6.67)27
(18,00)
0.00(42,31)
000(19.23)
0,00(38.46)
11(7.33)
9(6.00)
7(4.67)
0.00( 100.0)
0.00(40.74)
0.00{33.33}
0.00(25.93)
15( 10.00 )
0.00(100.0)
14(9.33)
1(0.67)
0.00{93.33}
0.00(6.67)
19(12.67)
0.00(100.0)
10(6.67)
4(2.67)
3(2.00)
2(1.33)
0.00{52.63}
0.00(21.05)
0,00(15.79)
0,00(10.53)
24(16.00)
0,00( 100.0)
10(6.67)
8(5.33)
5(3.33)
1
150( 100.00)
0,00(41.67)
0.00{33.33}
0.00{20.83}
0,00JUZL
0,67 N A.
39(25.83)
IA.G.
11(7.28)
7(4.64)
10(6.62)
11(7.28)
27(17.88)
11(7.28)
6(3.97)
10J M 2 L
27(17.88)
11(7.28)
9(5.96)
7(4.64)
15(9.93)
14(9.27)
1(0.66)
19(12.58)
10(6.62)
4(2.65)
3(1.99)
2(1.32)
24(15.89)
10(6.62)
8(5.30)
5(3.31)
1(0.66)
2.63( 100.0)0.00
{28.21}0.00
{17.95}0.00
(25.64)0.00
(28.21)3.85
(100.0)0.00
{40.74}20.00
{22.22}0.00
,..(3L041,0.00
(100.0)0.00
{40.74}0.00
(33.33)0.00
(25.93)0,00
( 100.0 )
0.00(93.33)
0.00(6.67)0.00
(100.0)0.00
(52.63)0.00
(21.05)0.00
(15.79}0.00
(10.5310.00
(100.0)0.00
(41.67)0.00
(33.33)0.00
(20.83)0,00(4.17)
151(100.00)
0.67N.A.
Notes; Inures in the parentheses are percentage to total; figures in the flower brackets are percentage to university total; A G. starads for annual growth rate; and N.A. refers to not appltoaWe.
Source: Complied and computed from the basic data on the list of colleges In Government of Karnataka (2001a).
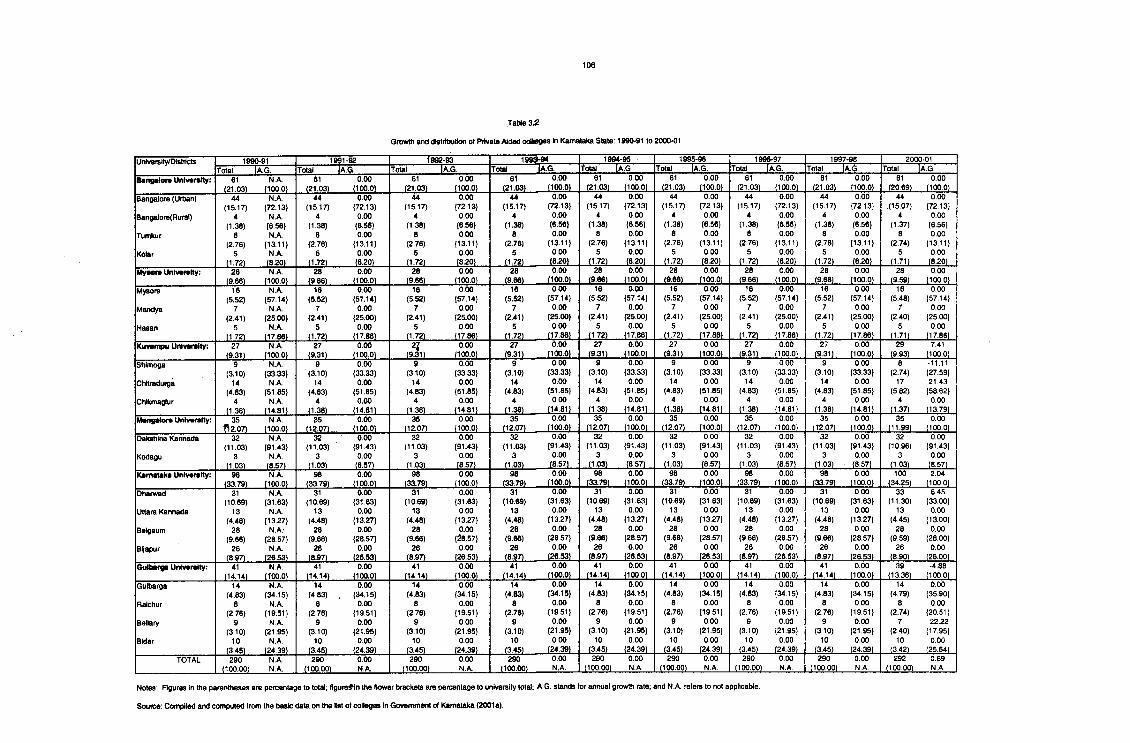
Growth and distrttiution of Private Aided colleges in Karnataka State; 1990-91 to 2000-01
Umverslty/Distrfcts 1990-91 1991 92 1992-93Ia .g .
1W 3-9t~Ta g ~
1994-95Ia .g .
1995-96IA.G.
1996-97Ia .g .
1997-98Total Total Total Total Total Total
61 0.00(21.03) (100.0)
TotalBangalore University: 61
(21.03)N.A.
(100.0)61
(21.03)0.00
(100.0)61
(21.03)0.00
(100.0)61
(21.03)0.00
(100.0)61
(21.03)0.00(100.0)
61(21.03)
0.00(100.0) 61
(21.03)0.00(100.0) 61
(20.69)0.00
(100.01Bangalore (Urt»n)
Bangalore(Rural)
Tumkur
Kolar
44(15.17)
4(1.38)
8(2.76)
5(1.72)
N.A.{72.13}
N .A(6.56)N .A
{13.11}N .A
{820)
44(15.17)
4(1.38)
8(2.76)
5(1-72)
0.00{72.13}
0.00(6.56)0.00
{13.11}0.00
(8.20)
44(15.17)
4(1.38)
8(2.76)
5(1.72)
0.00{72.13}0.00
{6.56}0.00
{13.11}0.00
(8.20)
44(15.17)
4(1.38)
8(2.76)
5„ ,0,7.?)
0.00{72.13}
0.00{6.56}0.00
{13.11}0.00
(8.20)
44(15.17)
4(1.38)
8(2.76)
5(t.72)
0.00{72.13)
0.00{6.56}0.00
{13.11)0.00(8.20)
44(15.17)
4(1.38)
8(2.76)
5(1.72)
0.00{72.13}
0.00{6.56}0.00
(13.11)0.00
(8.20)
44(15.17)
4(1.38)
8(2.76)
5(1.72)
0.00(72.13)
0.00{6.56}0.00
{13.11}0.00
(8 .20)
44(15.17)
4(1.38)
8(2.76)
5(1.72)
0.00{72.13}
0.00{6.56}0.00
(13.11)0.00
■J.B2QI
44(15.07)
4(1-37)
8(2.74)
5..Q71)
0.00{72.13)
0.00(6.56)0.00
{13.11)0.00
-L8J.P1-Myeere Unlwralty: 28
(9.66)N .A
(100.0)28
(9.66)0.00
(100.0)28 0.00(100.0) 28
(9.66)0.00(100.0) 28
.<9-66)0.00(100.0) 28
(868},0.00
(100.0)28
(9.66)0.00
(100.0)28
-(9-.66L0.00
(100.0)28
(959)0.00
(100.0)Mysore
Mandya
H a s a n
16(5.52)
7(2.41)
5(1.72)
N .A{57.14}
N .A{25.00}
N.A.{17.86}
16(5.52)
7(2.41)
5(1.72)
0.00{57.14}
0.00{25.00}
0.00(17.86)
16(5.52)
7(2.41)
5(1.72)
0.00{57.14}
0.00{25.00}
0.00(17.86)
16(5.52)
7(2.41)
5(1.72)
000{57.14}
0.00{25.00}
0.00(17.86)
16(5.52)
7(2.41)
5■11??).
0.00{57.14}
0.00{25.00}
0.00(17.86)
16(5.52)
7(2.41)
5■11-.72},.,
0.00{57.14}
0.00{25.00}
0.00J1 7 J6 L
16(5.52)
7(2.41)
5J 1 Z 2 L
0.00{57.14}
0.00{25.00}
0.00(17.86)
16(5.52)
7(2.41)
5
0.00{57.14}
0.00(25.00}
0.00(17.86)
16(5.48)
7(2.40)
5(1-71)
0.00{57.14}
0.00{25.00}
0.00(17.86}
Kuvwnpu Univaraity: 27(9.31)
N.A.(100.0)
27(9.31)
0.00(100.0) 2 i
(9.31)0.00(100.0)
27(9.31)
0.00(100.0)
27(9.31)
0.00(100.0)
27(9.31)
0.00(100.0)27
(9.31)0.00
(100.0)27 0.00
(100.0)29
■ (9-93)7.41
(100.0)
Shimoga
Chttradurga
CNkmaglur
(3.10)14
(4.83)4
(1.38)
N.A.{33.33}
N.A{51.85}
N.A.(14.81)
9(3.10)
14(4.83)
4(1.38)
0.00{33.33}
0.00{51.85}
0.00(14.81)
9(3.10)
14(4.83)
4(1.38)
0.00{33.33}
0.00{51.85}
0.00(14.81)
9(3.10)
14(4.83)
4(1.38)
0.00{33.33}
0,00{51.85}
0.00(14.81)
9(3.10)
14(4.83)
4(1.38)
0.00{33.33}
0.00{51.85}
0.00(14.81)
(3.10)14
(4.83)4
(1.38)
0.00(33.33)
0.00(51.85)
0.00(14.81)
9(3.10)
14(4.83)
4(1.38)
OOO(33.33)
0.00(51.85)
0.00(14.81)
9(3.10)
14(4.83)
4(1.38)
0.00{33.33}
0.00(51.85)
0.00(14.81)
8(2.74)
17(5.82)
4(137)
-11.11{27.59}21.43
{58.62}0.00
(13.79)Mwigirtare Unlv««lty: 35
fl2.07)N.A.
( 100.0)
35(12.07):
0.00(100.0)
35(12.07)
0.00(100.0)
35(12.07)
0.00(100.0)
35(12.07)
0.00(100.0)
35(12.07)
0.00( 100.0)
35(12.07)
0.00( 100 .0 )
35(12.07)
0.00(100.0)
35(11.99)
0.00(100.0)
Dakstiina Kannada
Kodagu
32(11.03)
3(1.03)
N.A.{91.43}
N.A.(8.57)
32(11.03)
3(1.03)
0.00{91.43}0.00
_1157L
32(11.03)
3(1.03)
0.00{91.43}
0.00(8.57)
32(11.03)
3
0.00{91.43)
0.00(8.57)
32(11.03)
3(1.03)
0.00{91.43}
0.00(8.57)
32(11.03)
3(1.03)
0.00(91.43)
0.00(8.57)
32(11.03)
3(1.03)
0.00(91.43)
0.00(8.57)
32(11.03)
3(1.03)
0.00 32 0.00(91.43) (10.96) (91.43)
0.00 3 0.00(8.57) (103) (8.571
Karnataka Unlveralty: 98(33.79)
N.A.(100.0) (33.79)
0.00(100.0) (33.79)
0.00(100.0)
98(33.79)
0.00(100.0) 98(33.79)
0.00(100.0) (33.79)0.00
(100.0) 98(33.79)
0.00(100.0)
98(33.79)
0.00(100.0) 100
(34.25)2.04
(100.0)Dhanwad
Uttdra Kannada
Belgaum
Bl]apur
31(10.69)
13(4.48)
28(9.66)
26(8.97)
N.A.{31.63}
N.A{13.27}
N.A.-{28.57}
N.A.(26.53)
31(10.69)
13(4.48)
28(9.66)
26(8.97)
0.00(31.63)
0.00{13.27}
0.00{28.57}
0.00(26.53)
31(10.69)
13(4.48)
28(9.66)
26(8.97)
0.00(31.63)
0.00{13.27}
0.00(28.57)
0.00(26.53)
31(10.69)
13(4.48)
28(9.66)
26(8.97)
0.00{31.63}
0.00{13.27}
0.00{28.57}
0.00(26.53)
31(10.69)
13(4.48)
28(9.66)
26(8.97)
0.00{31.63}
0.00{13.27}
0.00{28.57}
0.00(26.53)
31(10.69)
13(4.48)
28(9.66)
26(8.97)
0.00(31.63)
0.00{13.27}
0.00(28.57)
0.00(26.53)
31(10.69)
13(4.48)
28(9.66)
26(8.97)
0.00{31.63}
0.00{13.27}
0.00(28.57)
0.00(26.53)
31(10.69)
13(4.48)
28(9.66)
26(8.97)
0.00{31.63}
0.00{13.27}
0.00{28.57}
0.00(26.53)
33(11.30)
13(4.45)
28(9.59)
26(8.90)
6.45(33.00)
0.00(13.00) 0.00
(28.00) 0.00
(26.00)GkiHMrga University: 41
(14.14)N.A.
(TOO.O)41
(14.14)0.00
(100.0)41
(14.14)0.00
(100.0)41
(14.14)0,00
( 100.0)41 0,00
{100,0}41 0.00
(100.0)41
(14,14)0.00
(100,0 )41
(14.14)0.00
(100.0 )
39(13.36)
-4.88(100.0)
Gulbarga
Raichur
BeMary
BIdar
14(4.83)
8(2,76)
9(3.10)
10 (3.45)
N.A.(34.15)
N .A{19.51}
N .A{21.95}
N.A.(24.39)
14(4.83)
8(2.76)
9(3,10)
10 (3.45)
0.00{34.15}
0.00{19.51}
0.00(21.95)
0.00(24.39)
14(4.83)
8(2.76)
9(3.10)
10 (3.45)
0.00{34.15}
0.00{19.51}
0.00{21.95}
0.00(24.39)
14(4.83)
8(2.76)
9(3.10)
10 (3.45)
0.00{34.15}
0.00{19.51}
0.00(21.95)
0.00(24.39)
14(4.83)
8(2,76)
9(3.10)
10 (3.45)
0.00(34,15)
0.00{19.51}
0.00{21.95}
0.00(24.39)
14(4.83)
8(2.76)
9(3.10)
10■ (3.^5J„
0.00{34.15}
0.00{19.51}
0.00(21.95}
0.00(24.39)
14(4.83)
8(2.76)
9(3.10)
10 .,(3-45j
0.00(34.15)
0.00(19.51)
0.00{21.95}
0.00(24.39)
14(4,83)
8(2.76)
9(3.10)
10 (3.45)
0,00{34,15}
0.00(19.51)
0.00{21.95}
0.00(24.39)
14(4.79)
8(2.74)
7(2.40)
10(342)
0.00 (35.90)
0.00 {20.51) -22.22 (17.95} 0.00
(25.64)TOTAL 290(100.00)
N .AN.A.
290(100.00)0.00N.A.
290(100.00)
0.00N .A
290(100.00)0.00N.A.
290(100.00)
0.00N.A.
290(100.00) 0.00
N.A.290
(100.00) 0.00N.A.
290(100.00) 0.00N.A.
292(100.00) 0.69N.A.
Notes: Rgures in the parentheses are percentage to total; flgure#ln the (lower brackets are percentage to university total: A.G. stands for annual growth rate; and N.A. refers to not applicable.
Source; Compiled and computed from the bask: data on the list of colleges In (3ovemment of Karnataka (2(X)1a).
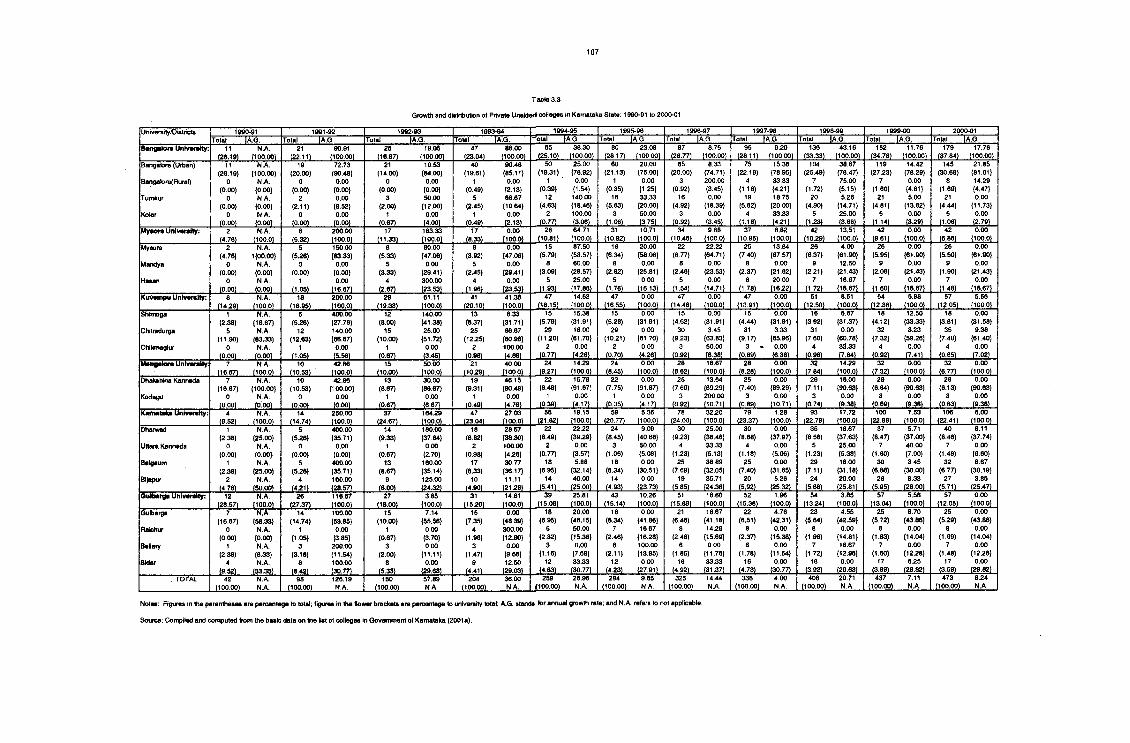
Table 3.3
Growth and diatribulion <rf Private UnaWed colleges in Karnataka Stale: 1990-91 to 2000-01
University/Districts 1992-93 1993-94|A.Q.
1994-95lAG.fotal
es 3B.30 (25.10) (100.00)
1995-96 1996-97IA.G.Total______
87 8.75(26.77) (100.00)
1997-98IA.G.
1998-99IA.G.
1999-00IA.G.
2000)1IA.G.IA.G. IA.G Total IA.G.
80 23.08(28.17) (100.00)
Total_______95 9.20
(28.11) (100.00)Bangeiora UniveraHy: 11
J 2 6 J 9 LN A
(100.00)21 90.91
(100.00)25
(16.67)19.05
(100.00)88.00
(100.00)136
(33.33)43.16
(100.00)152 11.76
(34.78) (100.00)179
(37.84)17.76
(100.00)Bangalore (Utban)
Bangalore(Rural)
Tumkur
Kolar
(26.19)0
(0.00)0
(0.00)0
(0.00)
N A(100.00)
N.A.(0.00)N.A.
(0.00)N.A.
p o o l
19(20.00)
0(0.00)
2(2.11)
0
72.73{90.48}
0.00(0.00)0.00
{9.52)0.00
21(14.00)
0(0.00)
3(2.00)
1(0.67)
10.53{84.00)
0.00(0.00)50.00(12.00)
0.00(4.00)
40(19.61)
1(0.49)
5(2.45)
1(0.49)
90.48(85.11)
0.00{2.13)66.67
{10.64)0.00
(2.13)
50(19.31)
1(0.39)
12(4.63)
25.00 (76.92)0.00
(1.54)140.00 {18.46}100.00 (3.08)
60(21.13)
1(0.35)
16(5.63)
3(1.06)
20.00(75.00)0.00
(1.25)33.33{20.00}50.00(3.75)
65(20.00)
3(0.92)
16(4.92)
8.33(74.71)200.00(3.45) 0.00
{18.39)0.00
(3.45)
75(22.19)
(1 18) 19
(5.62)
15.38(78.95)33.33 (4.21) 18.75
(20.00)33.33
104(25.49)
(1.72)20
(4.90)
(123)
38.67(76.47)75.00 (5.15) 5.26
{14.71}25.00 (368)
119(27.23)
7(1.60)
21(4.81)
5(H '* )
14.42(78.29)
0.00{4.61}5.00
{13.82}0.00
(3.291
145(30.66)
(1.69)21
(4.44)5
(1.08)
21.85{81.01}14.29(4.47)0.00
(11.73)0.00
(2.79)Mysore Univwsfty:
« 76 )N.A.
(100.0)200.00(100.0)
17J 1 1 3 3 L
183.33(100.0)
17(8.33)
0.00(100.0)
28(10.81)
64.71(100.0)
31(10.92)
10.71(100.0)
34(10.46)
9.68(100.0)
37(10.95)
8.82(100.0)
42(10.29)
13.51(100.0)
42(9.61)
0.00(100.0)
42(6.88)
0.00(100.0)
Mysore
Mandya
Hasan
2(4.76)
0(0.00)
0i m i .
N.A.1(00.00}
N.A.{0.00}N.A.
(0.00)
5(5.26)
(0.00)1
(1.05)
150.00(83.33)
0.00{0.00}0.00
(16.67)
(5.33) 5
(3.33) 4
(2.87)
60.00{47.06}
0.00{29.41}300.00(23.53)
(3.92)5
(2.45)4
(1.96)
0.00(47.06)
0.00(29.41)
0.00(23.53)
(5.79)8
(3.09)5
(1.93)
87.50{53.57}60.00
(28.57)25.00
(17.86)
(6.34)a
(2.82)5
(1.76)
20.00{58.06}
0.00{25.81}
0.00(16.13)
22(6.77)
8(2.46)
5(1.54)
22.22(64.71)
0.00(23.53)
0.00(14.71)
25(7.40)
(2.37)6
(1.78)
13.64(67.57)0.00
{21.62}20.00
(16.22)
(6.37)9
(2.21)7
(1.72)
4.00{61.90}12,50
{21.43}16.67
(16.67)
26(5.95)
9(2.06)
7(1.60)
0.00(61.90)
0.00(21.43)
0.00(16.67)
(5.50)9
(1.90)7
(1.48)
0:00(61.90)0.00
{21.43}0.00
(16.67)Kuiiwmpu Univsrsiiy:
(14.29)N.A.
(100.0)18
(18.95)200.00(100.0) 29
(19.33)61.11(100.0)
41(20.10)
41.38(100.0)
47(18.15)
14.63(100.0)
47(16.55)
0.00(100.0)
47(14.46)
0.00(100.0)
47(13.91)
0.00(100.0)
51(12.50)
8.51(100.0)
54(12.36)
5.88(100.0)
57(12.05)
5.56(100.0)
Shlmoga
CHtradurga
Chikmagluf
Mangalors UnKrarsity:
1 N.A.(2.38) (16.67}
5 N.A.(11.90) (83.33)
0 N.A.(0.00) (0.00)
7 N.A.
5(5.26)
12(12.63)
1(1.05)
400.00 {27.78}140.00 {66.67}
0.00(5.56)
12(8.00)
15(10.00)
1(0.67)
140.00 {41.38}25.00
(51.72)0.00
(3.45)
13(6.37)
25(12.25)
2(0.98)
8.33{31.71}66.67
{60.98}100.00(4.68)
15(5.79)
29(11.20)
2(0.77)
15.38(31.91)16.00
(61.70)0.00
(4.26)
15(5.28)
29(10.21)
2(0.70)
0.00 (31.91)
0.00 {61.70)
0.00 (4.26)
(4.62)30
(9.23)
(0.92)
0.00(31.91)3.45
{63.83}50.00(6.38)
(4.44)31
(9.17)
(0.89)
0.00(31.91)
3.33{65.96}
0.00(6.38)
16(3.92)
31(7.60)
4(0.98)
6.67{31.37}
0.00{60.78}33.33(7.84)
18(4.12)
32(7.32)
4(0.92)
12.50{33.33}
3.23{59.26}
0.00(7.41)
18(3.81)
35(7.40)
4(0.85)
0.00 {31.58}
9.38 {61.40}
0.00 (7.02)
(16.67) (100.0)10
(10.53)42.86(100.0)
15(10.00)
50.00(100.0)
21(10.29)
40.00(100.0)
24(9.27)
14.29(100.0)
24(8.45)
0.00(100.0)
28(8.62)
16.67(100.0)
28(8.28)
0.00(100.0)
32(7.84)
14.29(100.0)
32(7.32)
0.00(100.0)
32(6.77)
0.00(100.0)
Dhakshlna Kannada
Kodogu(16.67)
0(0.00)
N.A.{100.00}
N.A.(o:oo)
10(10.53)
(0.00)
42.86(100.00)
0.00(0.00)
13(8.67)
(0.67)
30.00{86.67}
0.00(6.67)
19(9.31)
(0.49)
46.15(90.48)
0.00(8.49)
1(0.39)
15.79(91.67)
0.00(4.17)
(7.75)0.00
(91.87)0.00
(4.17)
(7.69)3
(0.92)
13.64(89.29)200.00(10.71)
(7.40)3
(0.89)
0.00(89.29)
0.00(10.71)
(7.11)3
(0.74)
16.00{90.63}
0.00(9.38)
(6.64)3
(0.69)
0.00(90.63)0.00
(9.38)
(6.13)3
(0.63)
0.00(90.63)0.00
(9.38)Karnataka University:
Dharwed
N.A.(100.0) (14.74)
250.00(100.0) (24.67)
16429(100.0)
47(23.04)
27.03(100.0)
56(21.62)
19.15(100.0)
59(20.77)
5.36(100.0)
32.20(100.0)
1.28(100.0) (22.79)
17.72(100.0)
100(22.88)
7.53(100,0)
106(22.41)
6.00(100.0)
Uttara Kannada
Belgaum
Bljapur
Qutbarga University:
(2.38) 0
(0.00)1
(2.38) 2
(*■76)
N.A.(25.00)
N.A. {0.00} N.A.
(25.00) N.A.
(50.00)
5(5.28)
0(0.00)
5(5.26)
41 * 2 1 L
400.00 {35.71}
0.00(0.00)
400.00 (35.71)100.00 (28.57)
(9.33)1
(0.67)13
(8.67)9
(6.00)
180.00(37.84)
0.00(2.70)160.00(35.14)125.00(24.32)
18(8.82)
2(0.98)
17(8.33)
10(4.90)
28.57{38.30}100.00{4.26}30.77
(M.17)11.11
,121:281,
22(8.49)
2(0.77)
18(6.95)
14(5.41)
22.22(39.29)
0.00(3.57)5.88
{32.14}40.00
(25.00)
24(8.45)
3(1.06)
18(6.34)
14(4.93)
(40.68)50.00(5.08)0.00
(30.51)0.00
(23.73)
30(9.23)
(1.23)25
19(5.85)
25.00(38.46)33.33(5.13)38.89
(32.05)35.71
(24.36)
30(8.88)
4(1.18)
25(7.40)
20(5.92)
0.00 (37.97)
0.00 (5.06) 0.00
(31.65} 5.26
(25.32)
35(8.58)
5(1.23)
29(7.11)
24(5.88)
16.67{37:63}25.00 {5.38}16.00
{31.18} 20.00
(25.81)
37(8.47)
7(1.60)
30(6.86)
26(5.95)
5.71(37.00) 40.00(7.00) 3.45
(30.00) 8.33
(26.00)
40(8.46)
7(1.48)
32(6.77)
27(5.71)
8.11(37.74)0.00
{6.60}6.67
{30.19}3.85
(25.47)12
..(28,52,N.A.
(100.0)26
(27.37)116.67(100.0)
27(18.00)
3.85(100.0)
31(15.20)
14.81(100.0)
39(15.06)
25.81(100.0)
43(15.14)
10.26(100.0)
51(15.69)
18.60(100.0)
52(15.38)
1.96(100.0)
54(13.24)
3.85(100.0)
57(13.04)
5.56(100.0) (12.05)
0.00(100.0)
Gubarga
RaiciHjr
Betary
SMar
7(16.67)
0(0.00)
1(2.38)
4(9 52)
N.A. {58.33} N.A.
{0.00} , N.A.
(8.33) N.A.
(33.33)
14(14.74)
1(1.05)
3(3.16)
8(a.'” )
100.00(53.85)
0.00(3.85}200.00(11.54)100.00(30.77)
15(10.00)
1(0.67)
3(2.00)
8(5.33)
7.14{55.56}
0.00(3.70)0.00
(11.11)0.00
(29!63)
15(7.35)
4(1.96)
3(1.47)
9(4.41)
0.00(48.39)300.00(12.90)
0.00(9.68)12.50
(29.03)
18(6.95)
6(2.32)
3(1.16)
12(4.63)
20.00{46.15}50.00
(15.38)0.00
(7.69)33.33
(30.77)
18(6.34)
7(2.46)
6(2.11)
12(4.23)
0.00{41.86}16.67
(16.28)100.00(13.95)
0.00(27.91)
21(6.46)
(2.46)6
(1.85)
(4.92)
16.67{41.18}14.29
(15.69)0.00
(11.76)33.33
(31.37)
22(6.51)
8(2.37)
6(1.78)
16(4.73)
4.76(42.31)
0.00(15.38)
0.00{11.54}
0.00(30.77)
23(5.64)
(1.96)7
(1.72)
(3.92)
4.55{42.59}
0.00(14.81)16.67
(12.96)0.00
(29.63)
25(5.72)
8(1.83)
7(1.60)
17(3.89)
8.70(43.86)
0.00(14.04)
0.00(12.28)
6.25(29.82)
25(5.29)
(1.69)7
(1.48)17
(3.59)
0.00{43.86}
0.00(14.04)
0.00(12.28)
0.00(29.82)
(100.00)N.A.N.A. (100.00)
126.19N.A.
150(100.00)
57.89N.A.
204(100.00)
36.00N.A.
259jdOO.OO)
26.96N.A.
284(100.00)
9.65N.A.
325(100.00)
14.44N.A.
338(100.00)
4.00N.A.
408(100.00)
20.71N.A.
437(100.00)
7.11N.A.
473(100.00)
8.24N.A.
Notes: Rgures In the parentheses are percentage to total; figures in the flower brackets are percentage to university total; A.G. stsnds for annual growth rate; and N.A. refers to not applicable.
Source: Ck>mpiled and computed from the basic data on the list ol colleges in Qoverrenent of Karnataka (2001a).
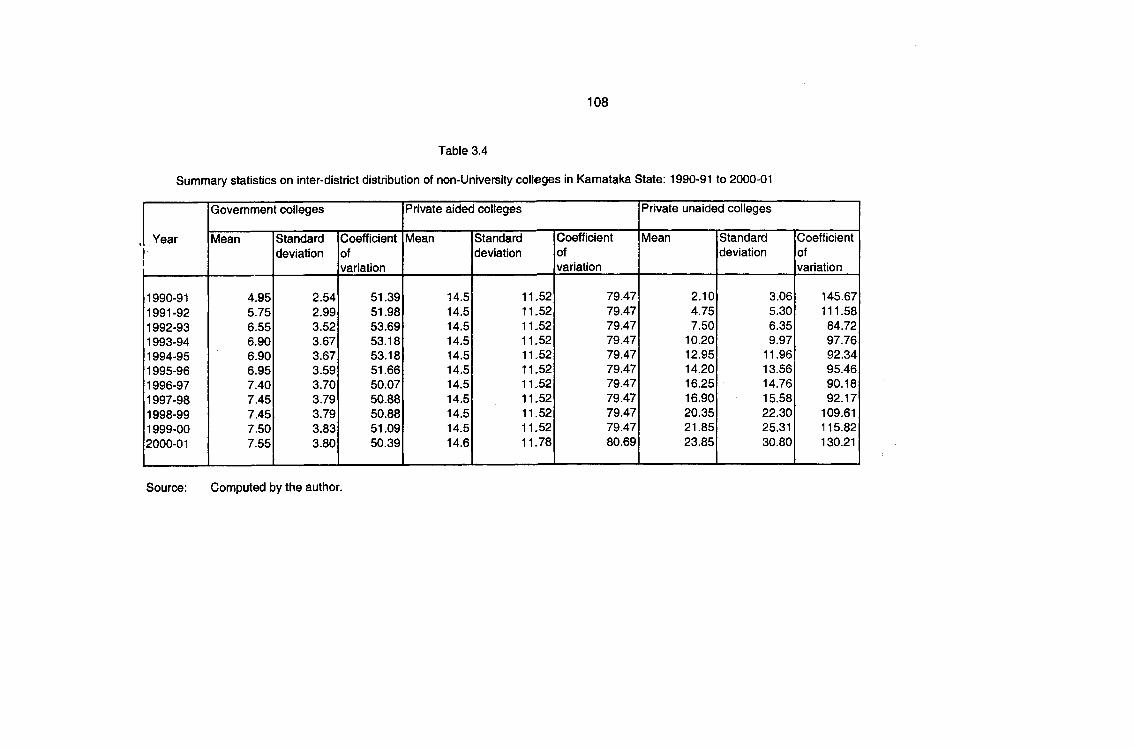
Summary statistics on inter-district distribution of non-University colleges in Karnataka State: 1990-91 to 2000-01
Government colleges Private aided colleges Private unaided colleges
Year Mean Standarddeviation
Coefficientofvariation
Mean Standarddeviation
Coefficientofvariation
Mean Standarddeviation
Coefficientofvariation
1990-911991-921992-931993-941994-951995-961996-971997-981998-991999-002000-01
4.95 5.756.556.906.906.95 7.407.457.45 7.507.55
2.542.993.523.673.67 3.59 3.703.793.79 3.833.80
51.39 51.98 53.6953.1853.18 51.66 50.0750.8850.88 51.0950.39
14.514.514.514.514.514.514.514.514.514.514.6
11.5211.5211.5211.5211.5211.5211.5211.5211.5211.52 11.78
79.4779.4779.4779.4779.4779.4779.4779.4779.4779.47 80.69
2.104.757.50
10.2012.9514.2016.2516.9020.3521.8523.85
3.065.306.359.97
11.9613.5614.7615.5822.3025.31 30.80
145.67111.5884.7297.7692.3495.4690.1892.17
109.61115.82130.21
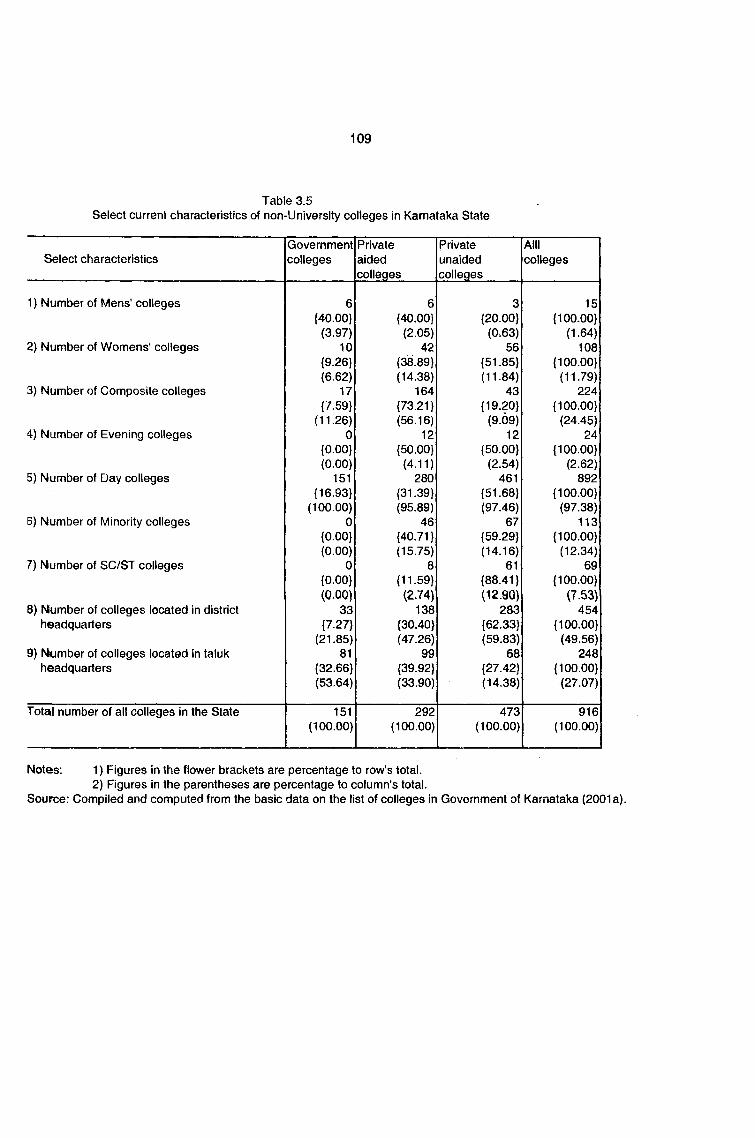
Table 3.5Select current characteristics of non-Universlty colleges in Karnataka State
Select characteristicsGovernmentcolleges
Privateaidedcolleges
Privateunaidedcolleges
Alllcolleges
1) Number of Mens' colleges 6 6 3 15{40.00} {40.00} {20.00} {100.00}
(3.97) (2.05) (0.63) (1.64)2) Number of Womens' colleges 10 42 56 108
{9.26} {38.89} {51.85} {100.00}(6.62) (14.38) (11.84) (11.79)
3) Number of Composite colleges 17 164 43 224{7.59} {73.21} {19.20} {100.00}
(11.26) (56.16) (9.09) (24.45)4) Number of Evening colleges 0 12 12 24
{0.00} {50.00} {50.00} {100.00}(0.00) (4.11) (2.54) (2.62)
5) Number of Day colleges 151 280 461 892{16.93} {31.39} {51.68} {100.00}
(100.00) (95.89) (97.46) (97.38)B) Number of Minority colleges 0 46 67 113
{0.00} {40.71} {59.29} {100.00}(0.00) (15.75) (14.16) (12.34)
7) Number of SC/ST colleges 0 8 61 69{0.00} {11.59} {88.41} {100.00}(O..QQ) (2J4) (12.90) (7.53)
8) Number of colleges located in district 33 138 283 454headquarters {7.27} {30.40} {62.33} {100.00}
(21.85) (47.26) (59.83) (49.56)9) hkjmber of colleges located in taluk 81 99 68 248
headquarters {32.66} {39.92} {27.42} {100.00}(53.64) (33.90) (14.38) (27.07)
Total number of all colleges in the State 151 292 473 916(100.00) (100.00) (100.00) (100.00)
Notes; 1) Figures in the flower brackets are percentage to row's total.2) Figures in the parentheses are percentage to column's total.
Source: Compiled and computed from the basic data on the list of colleges in Government of Karnataka (2001a).
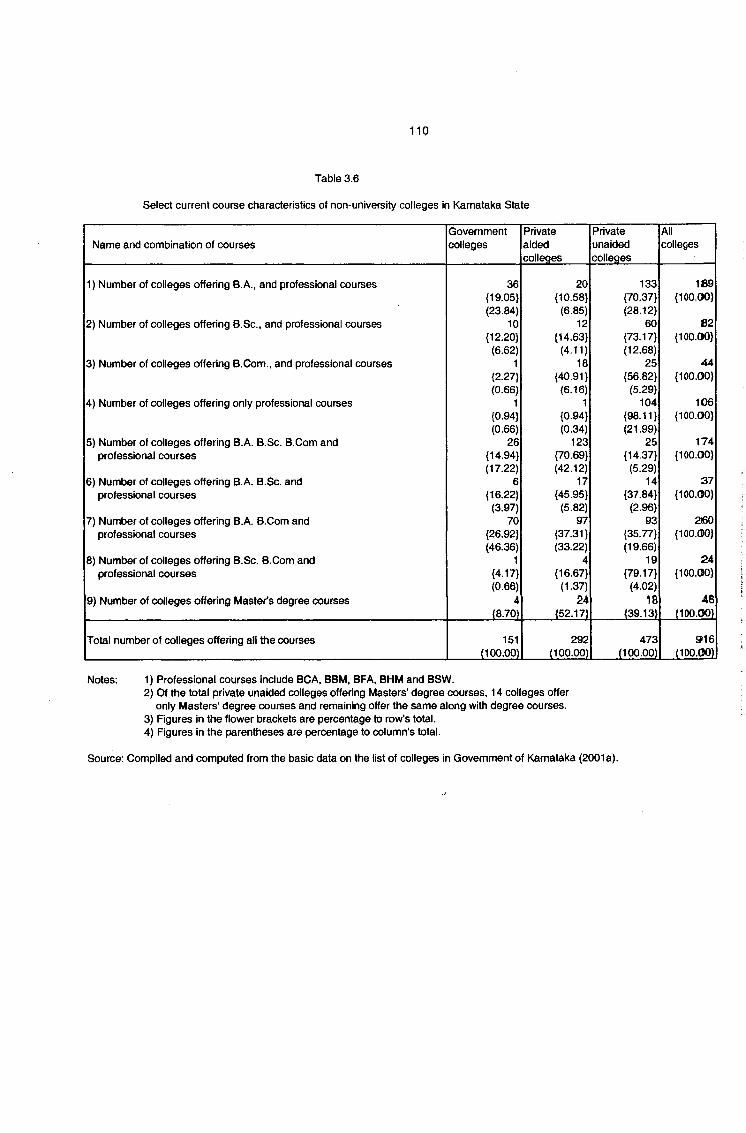
Select current course characteristics of non-university colleges in Karnataka State
Name and combination of coursesGovernmentcolleges
Privateaidedcolleges
Privateunaidedcolleges
Allcolleges
1) Number of colleges offering B.A., and professional courses 36 20 133 189{19.05} {10.58} {70.37} {100.00}(23.84) (6.85) (28.12)
2) Number of colleges offering B.Sc., and professional courses 10 12 60 82{12.20} {14.63} {73.17} {100.00}
(6.62) (4.11) (12.68)3) Number of colleges offering B.Com., and professional courses 1 18 25 44
{2.27} {40.91} {56.82} {100.00}(0.66) (6.16) (5.29)
4) Number of colleges offering only professional courses 1 1 104 106{0.94} {0.94} {98.11} {100.00}(0.66) (0.34) (21.99)
5) Number of colleges offering B.A. B.Sc. B.Com and 26 123 25 174professional courses {14.94} {70.69} {14.37} {100.00}
(17.22) (42.12) (5.29)6) Number of colleges offering B.A. B.Sc. and 6 17 14 37
professional courses {16.22} {45.95} {37.84} {100.00}(3.97) (5.82) (2.96)
7) Number of colleges offering B.A. B.Com and 70 97 93 260professional courses {26.92} {37.31} {35.77} {100.00}
(46.36) (33.22) (19.66)8) Number of colleges offering B.Sc. B.Com and 1 4 19 24
professional courses {4.17} {16.67} {79.17} {100.00}(0.66) (1.37) (4.02)
9) Number of colleges offering Master's degree courses 4 24 18 46{8.70} {52.17} {39.13} {100.00}
Total numt)er of colleges offering all the courses 151 292 473 9»16(100.00) (100.00) (100.00) (100.00)
Notes: 1) Professional courses include BCA, BBM, BFA, BHM and BSW.2) Of the total private unaided colleges offering Masters' degree courses, 14 colleges offer
only Masters' degree courses and remaining offer the same along with degree courses.3) Figures in the flower brackets are percentage to row's total.4) Figures in the parentheses are percentage to column's total.
Source; Compiled and computed from the basic data on the list of colleges in Government of Karnataka (2001a).
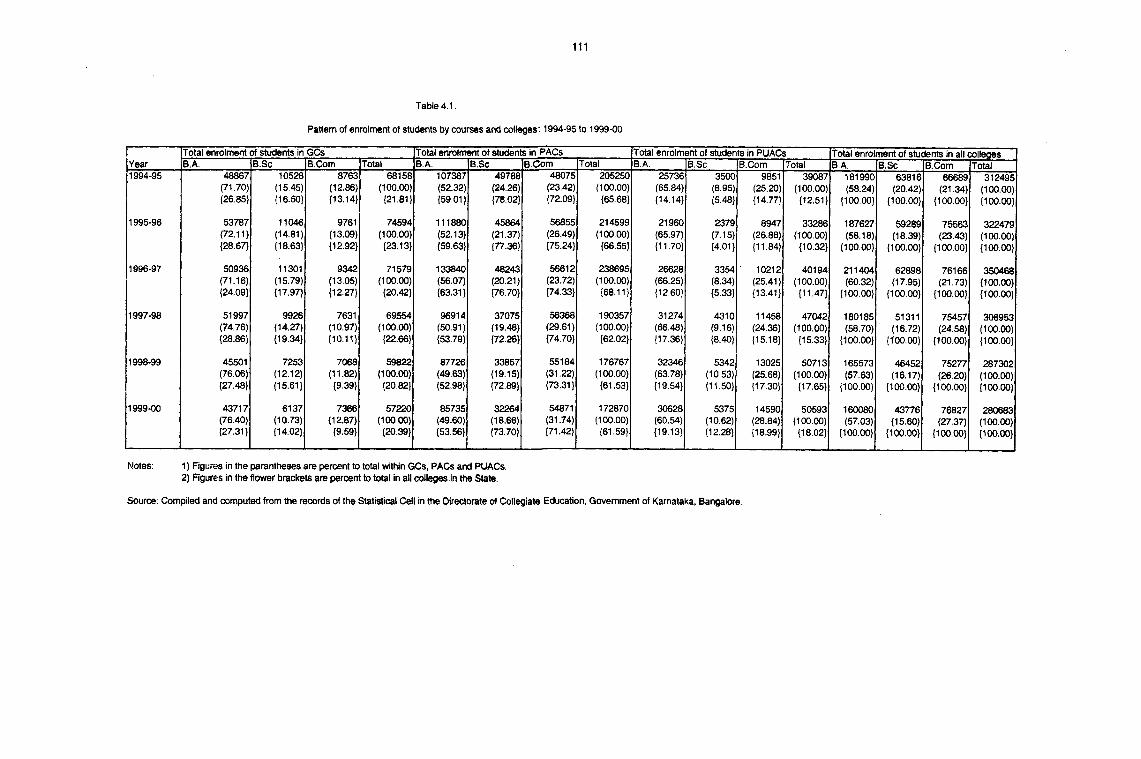
Pattern of enrolment of students by courses and colleges; 1994-95 to 1999-00
Total enrolment of students in GCs Total enrolment of students in PACs Total enrolment of students in PUACs Total enrolment of students in all colleaesYear B.A. B.Sc B.Com Total B.A. B.Sc B.Com Total B.A. B.Sc B.Com Total B,A. B.Sc B.Com Total1994-95 48867 10528 8763 68158 107387 49788 48075 205250 25736 3500 9851 39087 181990 63816 66689 312495
(71.70) (15.45) (12.86) (100.00) (52.32) (24.26) (23.42) (100.00) (65.84) (8.95) (25.20) (100.00) (58.24) (20.42) (21.34) (100.00){26.85} {16.50} {13.14} {21.81} {59.01} {78.02} {72.09} {65.68} {14.14} {5.48} {14,77} {12.51} {100.00} {100,00} {100.00} {100.00}
1995-96 53787 11046 9761 74594 111880 45864 56855 214599 21960 2379 8947 33286 187627 59289 75563 322479(72.11) (14.81) (13.09) (100.00) (52.13) (21.37) (26.49) (100.00) (65.97) (7.15) (26.88) (100.00) (58.18) (18,39) (23.43) (100.00){28.67} {18.63} {12.92} {23.13} {59.63} {77.36} {75.24} {66.55} {11.70} {4.01} {11.84} {10.32} {100.00} {100,00} {100.00} {100.00}
1996-97 50936 11301 9342 71579 133840 48243 56612 238695 26628 3354 10212 40194 211404 62898 76166 350468(71.16) (15.79) (13.05) (100.00) (56.07) (20.21) (23.72) (100.00) (66.25) (8.34) (25.41) (100.00) (60.32) (17.95) (21.73) (100.00){24.09} {17,97} {12.27} {20.42} {63.31} {76.70} {74.33} {68.11} {12.60} {5.33} {13,41} {11.47} {100.00} {100.00} {100.00} {100.00}
1997-98 51997 9926 7631 69554 96914 37075 56368 190357 31274 4310 11458 47042 180185 51311 75457 306953(74.76) (14.27) (10.97) (100.00) (50.91) (19.48) (29.61) (100.00) (66.48) (9.16) (24.36) (100.00) (58.70) (16.72) (24.58) (100.00){28.86} {19.34} {10.11} {22.66} {53.79} {72.26} {74.70} {62.02} {17.36} {8.40} {15.18} {15.33} {100.00} {100.00} {100.00} {100.00}
1998-99 45501 7253 7068 59622 87726 33857 55184 176767 32346 5342 13025 50713 165573 46452 75277 287302(76.06) (12.12) (11.82) (100.00) (49.63) (19.15) (31.22) (100.00) (63.78) (10.53) (25.68) (100.00) (57.63) (16.17) (26.20) (100.00){27.48} {15.61} {9.39} {20.82} {52.98} {72.89} {73.31} {61.53} {19.54} {11.50} {17.30} {17.65} {100.00} {100.00} {100.00} {100.00}
1999-00 43717 6137 7366 57220 85735 32264 54871 172870 30628 5375 14590 50593 160080 43776 76827 280683(76.40) (10.73) (12.87) (100.00) (49.60) (18.66) (31.74) (100.00) (60.54) (10.62) (28.84) (100,00) (57.03) (15.60) (27.37) (100.00){27.31} {14.02} {9.59} {20.39} {53.56} {73.70} {71.42} {61.59} {19.13} {12.28} {18.99} {18,02} {100.00} {100.00} {100.00} {100.00}
Notes: 1) Figures in the parentheses are percent to total within GCs, PACs and PUACs.2) Figures in the flower brackets are percent to total in all colleges in the State.
Source. Compiled and computed from the records of the Statistical Cell in the Directorate of Collegiate Education, Government of Karnataka. Bangalore.
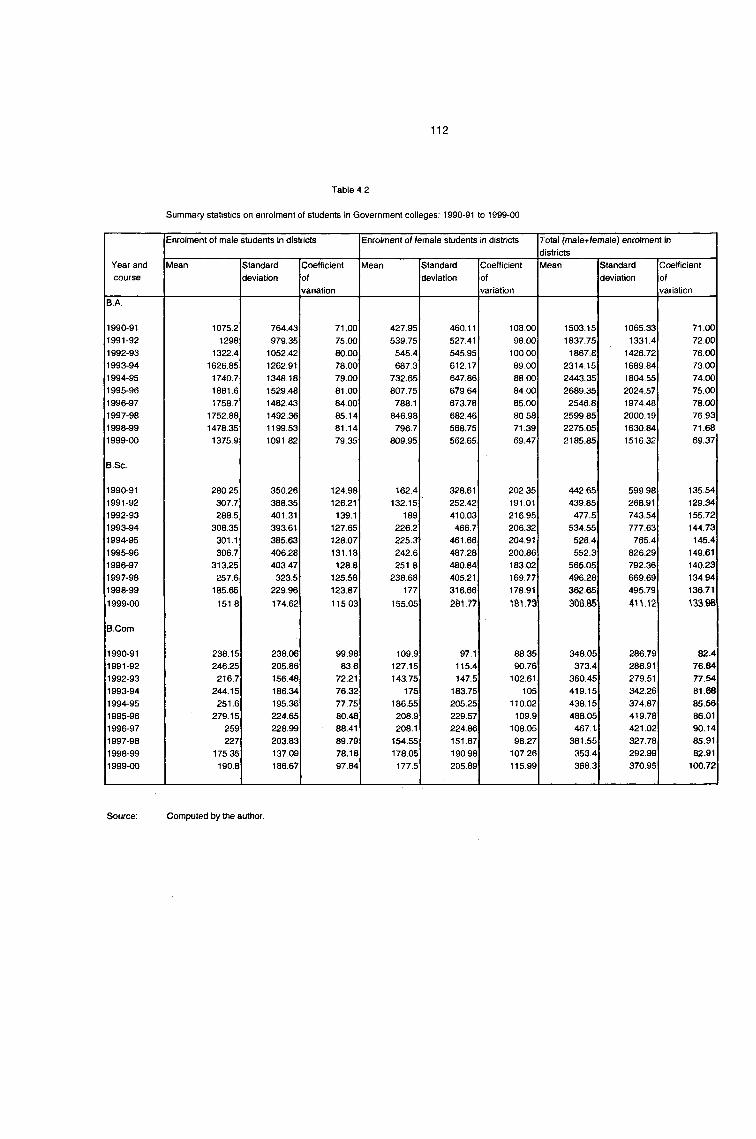
Summary statistics on enrolment of students in Government colleges: 1990-91 to 1999-00
Enrolment of male students in districts Enrolment of female students in districts Total (male+female) enrolment in districts
Year and Mean Standard Coefficient Mean Standard Coefficient Mean Standard Coefficientcourse deviation of deviation of deviation of
variation variation variationB.A.
1990-91 1075.2 764.43 71.00 427.95 460.11 108.00 1503.15 1065.33 71.001991-92 1298 979.35 75.00 539.75 527.41 98.00 1837.75 1331.4 72.001992-93 1322.4 1052.42 80.00 545.4 545.95 100.00 1867.8 1426.72 76.001993-94 1626.85 1262.91 78.00 687.3 612.17 89.00 2314.15 1689.84 73.001994-95 1740.7 1348.18 79.00 732.65 647.86 88.00 2443.35 1804.55 74.001995-96 1881.6 1529.48 81 00 807.75 679.64 84.00 2689.35 2024.57 75.001996-97 1758.7 1482.43 84.00 788.1 673.78 85.00 2546.8 1974.48 78.001997-98 1752.88 1492.36 85.14 846.98 682.46 80.58 2599.85 2000.19 76.931998-99 1478.35 1199.53 81.14 796.7 568.75 71.39 2275.05 1630.84 71.681999-00 1375.9 1091.82 79.35 809.95 562.65 69.47 2185.85 1516.32 69.37
B.Sc.
1990-91 280.25 350.26 124.98 162.4 328.61 202.35 442.65 599.98 135.541991-92 307.7 388.35 126.21 132.15 252.42 191 01 439.85 268.91 129.341992-93 288.5 401.31 139.1 189 410.03 216.95 477.5 743.54 155.721993-94 308.35 393.61 127.65 226.2 466.7 206.32 534.55 777.63 144.731994-95 301.1 385.63 128.07 225.3 461.66 204.91 526.4 765.4 145.41995-96 306.7 406.28 131.18 242.6 487.28 200.86 552.3 826.29 149.611996-97 313.25 403.47 128.8 251.8 480.84 183.02 565.05 792.36 140.231997-98 257.6 323.5 125.58 238.68 405.21 169 77 496.28 669.69 134.941998-99 185.65 229.96 123.87 177 316.66 178.91 362.65 495.79 136.711999-00 151.8 174.62 115 03 155.05 281.77 181.73 308.85 41V12 ^3,98
B.Com
1990-91 238.15 238.06 99.98 109.9 97.1 88.35 348.05 286.79 82.41991-92 246.25 205.86 83.6 127.15 115.4 90.76 373.4 286.91 76.841992-93 216.7 156.48 72.21 143.75 147.5 102.61 360.45 279.51 77.541993-94 244.15 186.34 76.32 175 183.75 105 419.15 342.26 81.681994-95 251.6 195.36 77.75 186.55 205.25 110.02 438.15 374.87 85.561995-96 279.15 224.65 80.48 208.9 229.57 109.9 488.05 419.78 86.011996-97 259 228.99 88.41 208.1 224.86 108.05 467.1. 421.02 90.141997-98 227 203.83 89.79 154.55 151.87 98.27 381.55 327.78 85.911998-99 175.35 137.09 78.18 178.05 190.98 107.26 353.4 292.99 82.911999-00 190.8 186.67 97.84 177.5 205.89 115.99 368.3 370.95 100.72
Source: Computed by the author.
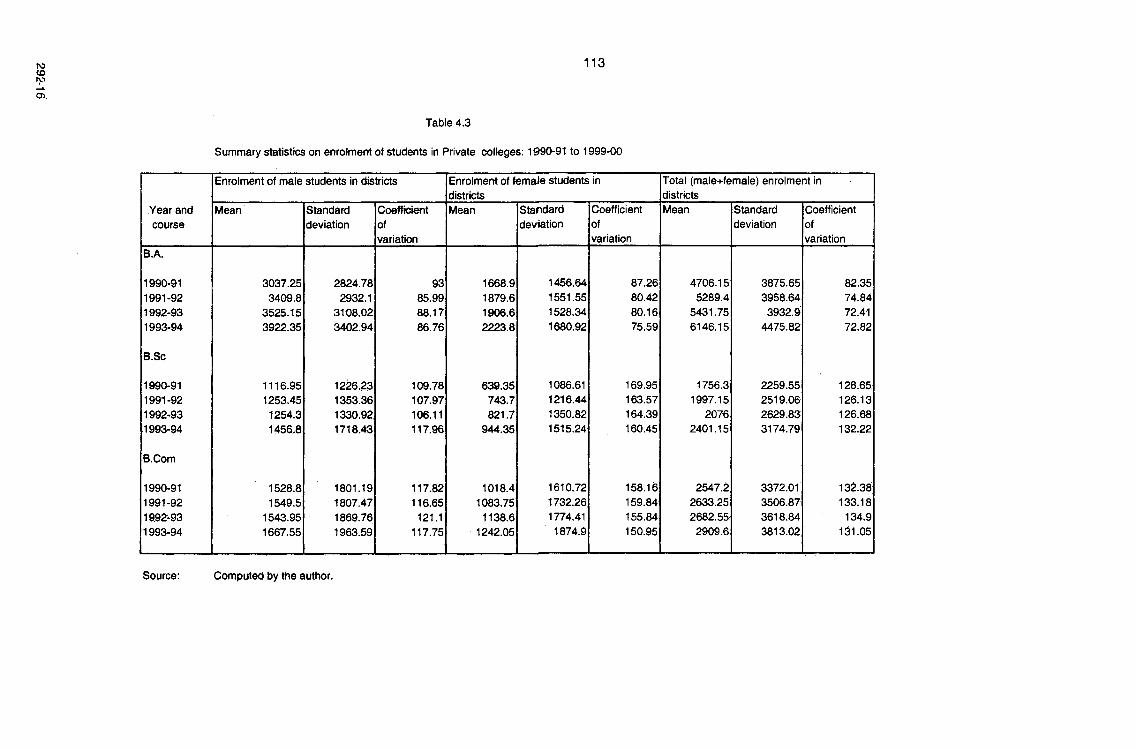
roCOrpCD.
Table 4.3
Summary statistics on enrolment of students in Private colleges: 1990-91 to 1999-00
Enrolment of male students in districts Enrolment of femaJe students in districts
Total (male+female) enrolment in districts
Year and course
Mean Standarddeviation
Coeffteientofvariation
Mean Standarddeviation
Coefficientofvariation
Mean Standarddeviation
Coefficientofvariation
B.A.
1990-911991-921992-931993-94
3037.253409.8
3525.153922.35
2824.782932.1
3108.023402.94
9385.9988.1786.76
1668.91879.61906.6 2223.8
1456.641551.551528.341680.92
87.2680.4280.1675.59
4706.15 5289.4
5431.756146.15
3875.653958.643932.9
4475.82
82.3574.8472.4172.82
B.Sc
1990-911991-921992-931993-94
1116.951253.45
1254.31456.8
1226.231353.361330.921718.43
109.78107.97106.11117.96
639.35743.7821.7
944.35
1086.611216.441350.821515.24
169.95163.57164.39160.45
1756.31997.15
20762401.15
2259.552519.062629.833174.79
128.65126.13126.68132.22
B.Com
1990-911991-921992-931993-94
1528.81549.5
1543.951667.55
1801.191807.471869.761963.59
117.82116.65121.1
117.75
1018.41083.75
1138.61242.05
1610.721732.261774.411874.9
158.16159.84155.84 150.95
2547.22633.252682.55
2909.6
3372.01 3506.87 3618.843813.02
132.38133.18
134.9131.05
Source: Computed by the author.
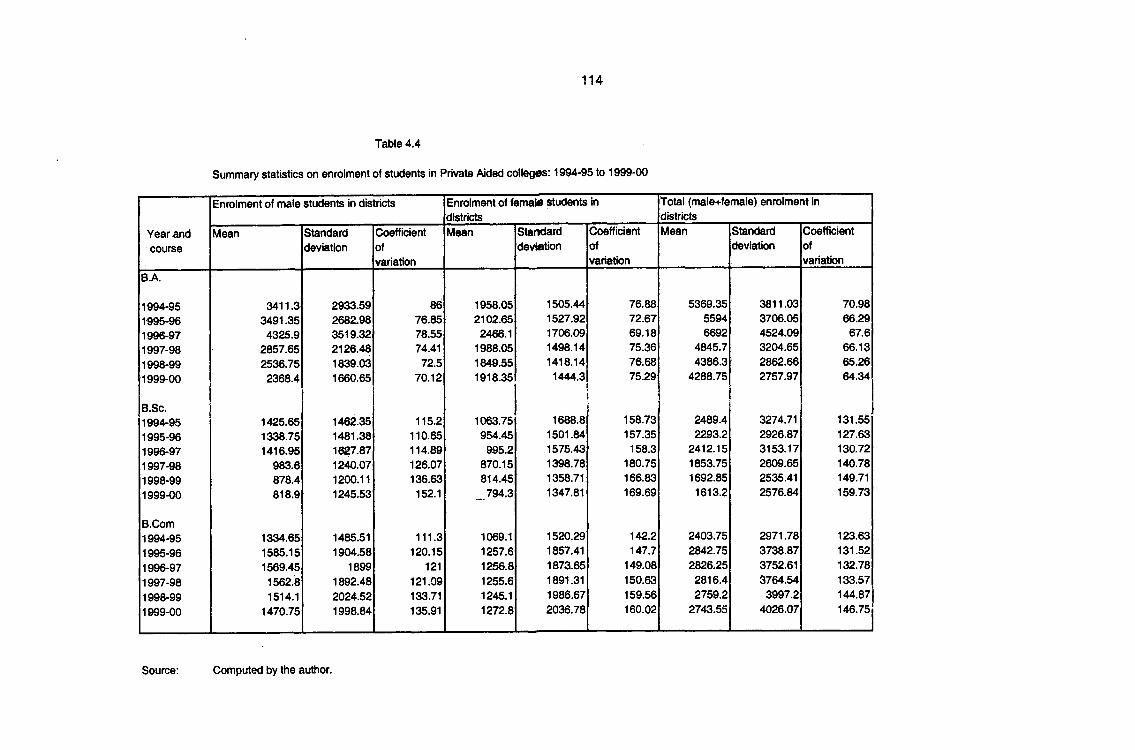
Summar)' statistics on enrolment of students in Private ^ded colleges: 1994-95 to 1999-00
Enrolment of male students in districts Enrolment of female students in districts
total (male+fe districts
male) enrolmeint in
Year and Mean Standard Coefficient Mean Standard Coefficient Mean Standard Coefficientcourse deviation of devBBtion of deviation of
variation variation variationB.A.
1994-95 3411.3 2933.59 86 1958.05 1505.44 76.88 5369.35 3811.03 70.981995-96 3491.35 2682.98 76.85 2102.65 1527.92 72.67 5594 3706.05 66.291996-97 4325.9 3519.32 78.55 2466.1 1706.09 69.18 6692 4524.09 67.61997-98 2857.65 2126.48 74.41 1988.05 1498.14 75.36 4845.7 3204.65 66.131998-99 2536.75 1839.03 72.5 1849.55 1418.14 76.68 4386.3 2862.66 65.261999-00 2368.4 1660.65 70.12 1918.35 1444.3 75.29 4288.75 2757.97 64.34
B.Sc.1994-95 1425.65 1462.35 115.2 1063.75 1688.8 158.73 2489.4 3274.71 131.551995-96 1338.75 1481.38 110.65 954.45 1501.84 157.35 2293.2 2926.87 127.631996-97 1416.95 1627.87 114.89 995.2 1575.43 158.3 2412.15 3153.17 130.721997-98 983.6 1240.07 126.07 870.15 1398.78 180.75 1853.75 2609.65 140.781998-99 878.4 1200.11 136.63 814.45 1358.71 166.83 1692.85 2535.41 149.711999-00 818.9 1245.53 152.1 ..794.3 1347.81 169.69 1613.2 2576.84 159.73
B.Com1994-95 1334.65 1485.51 111.3 1069.1 1520.29 142.2 2403.75 2971.78 123.631995-96 1585.15 1904.58 120.15 1257.6 1857.41 147.7 2842.75 3738.87 131.521996-97 1569.45 1899 121 1256.8 1873.65 149.08 2826.25 3752.61 132.781997-98 1562.8 1892.48 121.09 1255.6 1891.31 150.63 2816.4 3764.54 133.571998-99 1514.1 2024.52 133.71 1245.1 1986.67 159.56 2759.2 3997.2 144.871999-00 1470.75 1998.84 135.91 1272.8 2036.78 160.02 2743.55 4026.07 146.75
Source: Computed by the author.
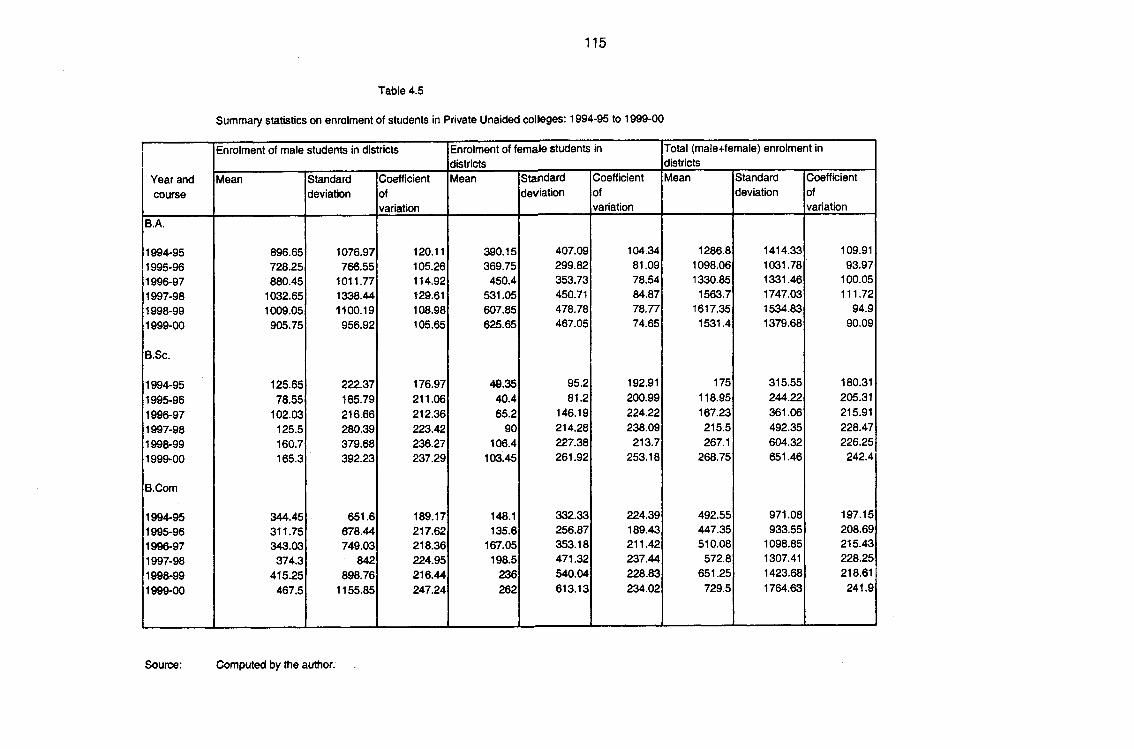
Summary statistics on enrolment of students in Private Unaided colleges: 1994-95 to 1999-00
Enrolment of male students in districts Enrolment of female students in districts
Total (male+female) enrolment in districts
Year and course
Mean Standarddeviation
Coefficientofvariation
Mean Standarddeviation
Coefficientofvariation
Mean Standarddeviation
Coefficientofvariation
B A
1994-951995-961996-971997-981998-991999-00
B.Sc.
1994-951995-961996-971997-981998-991999-00
B.Com
1994-951995-961996-971997-981998-991999-00
896.65728.25880.45
1032.651009.05905.75
125.6578.55
102.03125.5160.7165.3
344.45311.75343.03
374.3415.25
467.5
1076.97766.55
1011.771338.441100.19956.92
222.37165.79216.66280.39379.68392.23
651.6678.44749.03
842898.76
1155.85
120.11105.26114.92129.61108.98105.65
176.97211.06212.36223.42236.27237.29
189.17217.62218.36224.95216.44247.24
390.15369.75
450.4531.05607.85625.65
49.3540.465.2
90106.4
103.45
148.1135.6
167.05198.5
236262
407.09299.82353.73450.71478.78467.05
95.281.2
146.19 214.28 227.38 261.92
332.33256.87353.18471.32540.04613.13
104.34 81.09 78.54 84.87 78.77 74.65
192.91200.99224.22238.09213.7
253.18
224.39189.43 211.42237.44 228.83 234.02
1286.8 1098.06 1330.85
1563.7 1617.35
1531.4
175118.95167.23215.5267.1
268.75
492.55447.35510.08
572.8651.25729.5
1414.331031.781331.461747.031534.831379.68
315.55244.22361.06492.35604.32651.46
971.08933.55
1098.851307.411423.681764.63
109.9193.97
100.05111.72
94.990.09
180.31205.31 215.91 228.47 226.25
242.4
197.15208.69215.43228.25218.61241.9
Source: Computed by the author.
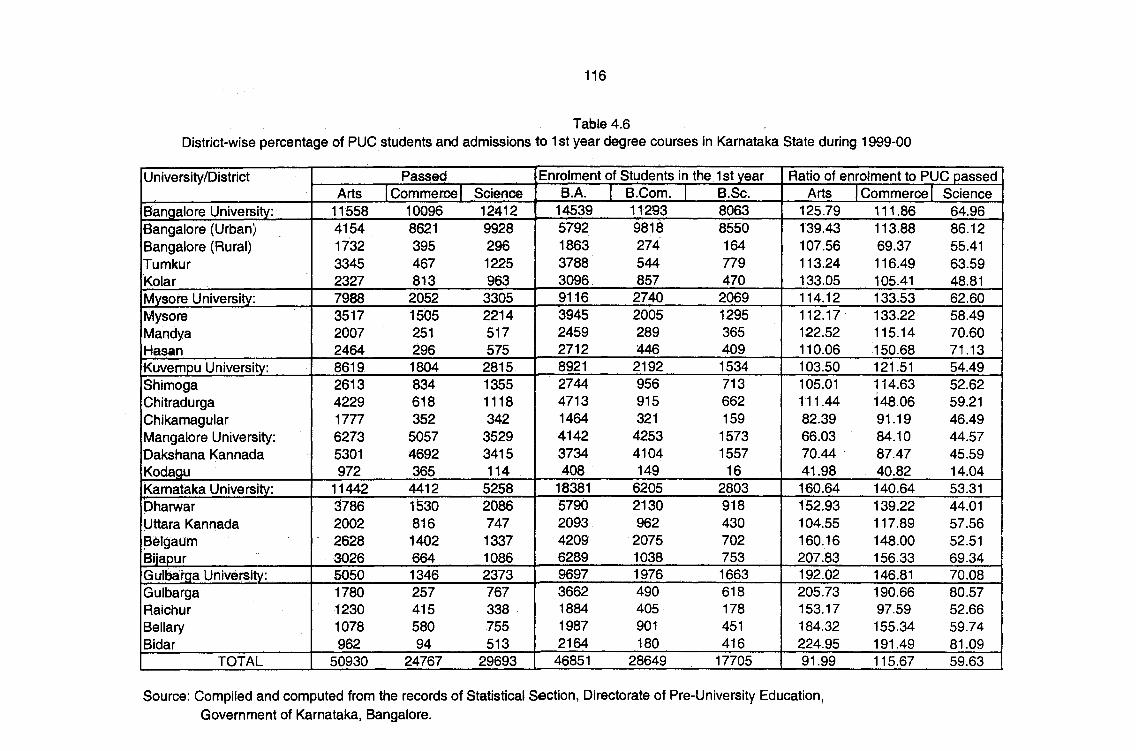
District-wise percentage of PUC students and admissions to 1st year degree courses in Karnataka State during 1909-00
University/District Passed Enrolment of Students in the 1st year Ratio of enrolment to PUC passedArts Commence 1 Science B.A. 1 B.Com. B.Sc. Arts Commerce Science
Bangalore University: 11558 10096 12412 14539 11293 8063 125.79 111.86 64.96Bangalore (Urban) 4154 8621 9928 5792 9818 8550 139.43 113.88 86.12Bangalore (Rural) 1732 395 296 1863 274 164 107.56 69.37 55.41Tumkur 3345 467 1225 3788 544 779 113.24 116.49 63.59Kolar 2327 813 963 3096 857 470 133.05 105.41 48.81Mysore University: 7988 2052 3305 9116 2740 2069 114.12 133.53 62.60Mysore 3517 1505 2214 3945 2005 1295 112.17 133.22 58.49Mandya 2007 251 517 2459 289 365 122.52 115.14 70.60Hasan 2464 296 575 2712 446 409 110.06 150.68 71.13Kuvempu University: 8619 1804 2815 8921 2192 1534 103.50 121.51 54.49Shimoga 2613 834 1355 2744 956 713 105.01 114.63 52.62Chitradurga 4229 618 1118 4713 915 662 111.44 148.06 59.21Chikamagular 1 / / / 352 342 1464 321 159 82.39 91.19 46.49Mangalore University: 6273 5057 3529 4142 4253 1573 66.03 84.10 44.57Dakshana Kannada 5301 4692 3415 3734 4104 1557 70.44 87.47 45.59Kodagy 972 365 114 408 149 16 41.98 40.82 14.04Karnataka University: 11442 4412 5258 18381 6205 2803 160.64 140.64 53.31phanwar 3786 1530 2086 5790 2130 918 152.93 139.22 44.01Uttara Kannada 2002 816 747 2093 962 430 104.55 117.89 57.56Belgaurri 2628 1402 1337 4209 2075 702 160.16 148.00 52.51Biiapur 3026 664 1086 6289 1038 753 207.83 156.33 69.34Gulbatga University: 5050 1346 2373 9697 1976 1663 192.02 146.81 70.08Gulbarga 1780 257 767 3662 490 618 205.73 190.66 80.57Raichur 1230 415 338 1884 405 178 153.17 97.59 52.66Bellary 1078 580 755 1987 901 451 184.32 155.34 59.74Bidar 962 94 513 2164 180 416 224.95 191.49 81.09
TOTAL 50930 24767 29693 46851 28649 17705 91.99 115.67 59.63
Source: Compiled and computed from the records of Statistical Section, Directorate of Pre-University Education, Government of Karnataka, Bangalore.
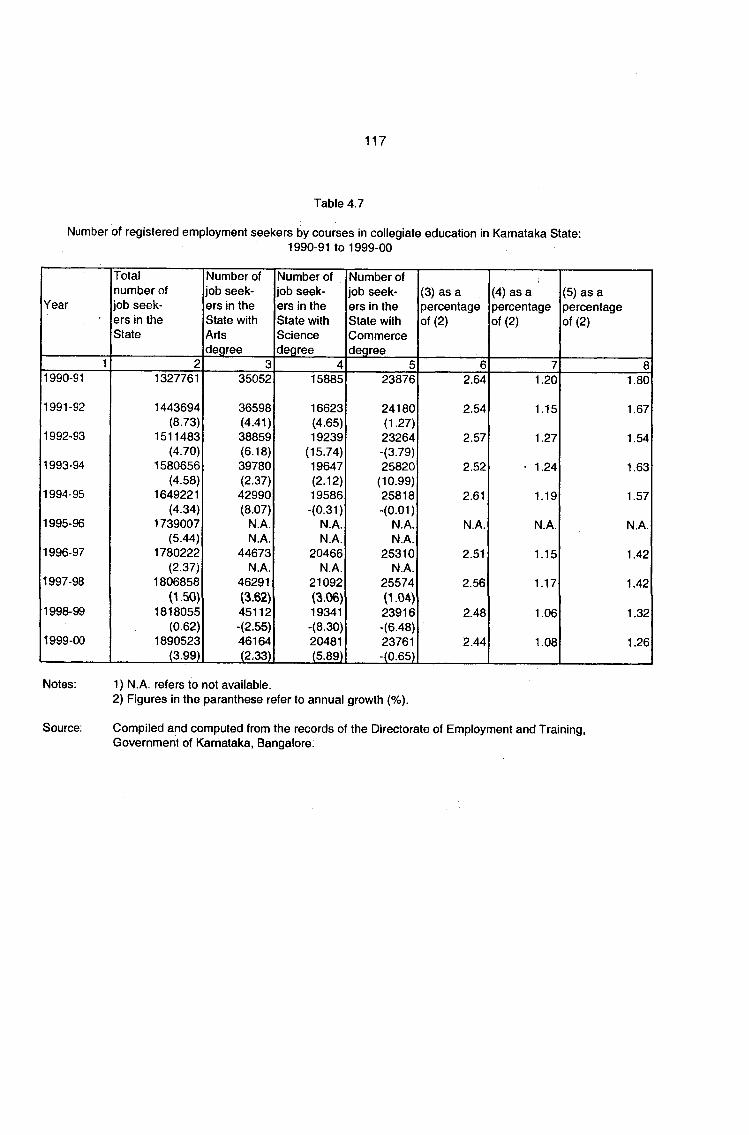
Number of registered employment seekers by courses In collegiate education in Karnataka State:1990-91 to 1999-00
Year
Totalnumber of job seekers in the State
Number of job seekers in the State with Arts degree
Number of job seekers in the State with Science degree
Number of job seekers in the State with Commerce degree
(3) as a percentage of (2)
(4) as a percentage of (2)
(5) as a percentage of (2)
81990-91
1991-92
1992-93
1993-S4
1994-95
1995-96
1996-97
1997-98
1998-99
1999-00
1327761
1443694(8.73)
1511483(4.70)
1580656(4.58)
1649221(4.34)
1739007(5.44)
1780222(2.37)
1806858(1.50)
1818055(0.62)
1890523(3.99)
35052
36598(4.41)38859(6.18)39780(2.37)42990(8.07)
N.A.N.A.
44673N.A.
46291(3.62)45112-(2.55)46164(2.33)
15885
16623(4.65)19239
(15.74)19647(2.12)19586-(0.31)
N.A.N.A.
20466N.A.
21092(3.06)19341-(8.30)20481(5.89)
23876
24180(1.27)23264-(3.79)25820
(10.99)25818-(0.01)
N.A.N.A.
25310N.A.
25574(1.04)23916-(6.48)23761-(0.65)
2.64
2.54
2.57
2.52
2.61
N.A.
2.51
2.56
2.48
2.44
1.20
1.15
1.27
1.24
1.19
N.A.
1.15
1.17
1.06
1.08
1.80
1.67
1.54
1.63
1.57
N.A.
1.42
1.42
1.32
1.26
Notes: 1) N.A. refers to not available.2) Figures in the paranthese refer to annual growth (%).
Source: Compiled and computed from the records of the Directorate of Employment and Training,Government of Karnataka, Bangalore;
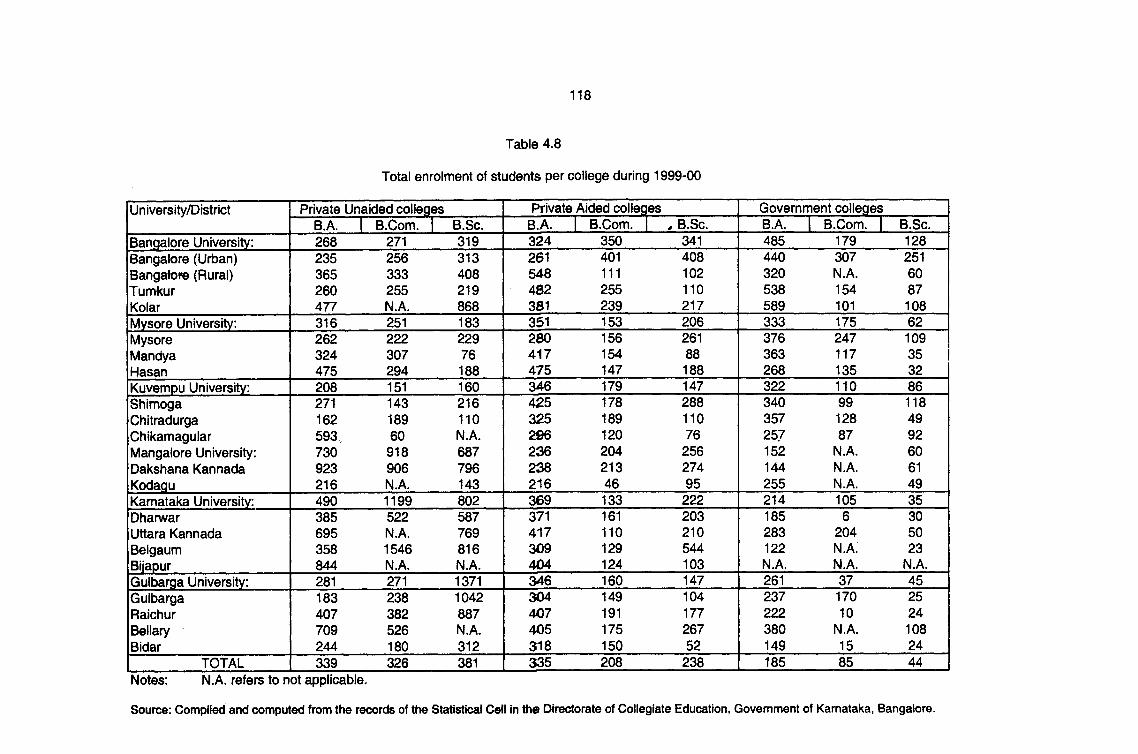
Total enrolment of students per college during 1999-00
University/District Private Unaided colleges Private Aided collec]es Government collegesB.A. 1 B.Com. B.Sc. B.A. B.Com. t B.Sc. B.A. B.Com. B.Sc.
Bangalore University: 268 271 319 324 350 341 485 179 128Bangalore (Urban) 235 256 313 261 401 408 440 307 251Bangalore (Rural) 365 333 408 548 111 102 320 N.A. 60Tumkur 260 255 219 482 255 110 538 154 87Kolar 477 N.A. 868 381 239 217 589 101 108Mysore University: 316 251 183 351 153 206 333 175 62Mysore 262 222 229 280 156 261 376 247 109Mandya 324 307 76 417 154 88 363 117 35Hasan 475 294 188 475 147 188 268 135 32Kuvennpu University: 208 151 160 346 179 147 322 110 86Shimoga 271 143 216 425 178 288 340 99 118Chitradurga 162 189 110 325 189 110 357 128 49Chikamagular 593 60 N.A. 296 120 76 257 87 92Mangalore University: 730 918 687 236 204 256 152 N.A. 60Dakshana Kannada 923 906 796 238 213 274 144 N.A. 61Kodagu 216 N.A. 143 216 46 95 255 N.A. 49Karnataka University: 490 1199 802 369 133 222 214 105 35Dharwar 385 522 587 371 161 203 185 6 30Uttara Kannada 695 N.A. 769 417 110 210 283 204 50Belgaum 358 1546 816 309 129 544 122 N.A. 23Bijapur 844 N.A. N.A. 404 124 103 N.A. N.A. N.A.Guibarga University: 281 271 1371 346 160 147 261 37 45Gulbarga 183 238 1042 304 149 104 237 170 25Raichur 407 382 887 407 191 177 222 10 24Bellary 709 526 N.A. 405 175 267 380 N.A. 108BIdar 244 180 312 318 150 52 149 15 24
TOTAL 339 326 381 335 208 238 185 85 44Notes: N.A. refers to not applicable.
Source: Compiled and computed from the records of the Statistical Cell in the Directorate of Collegiate Education, Govemment of Karnataka, Bangalore.
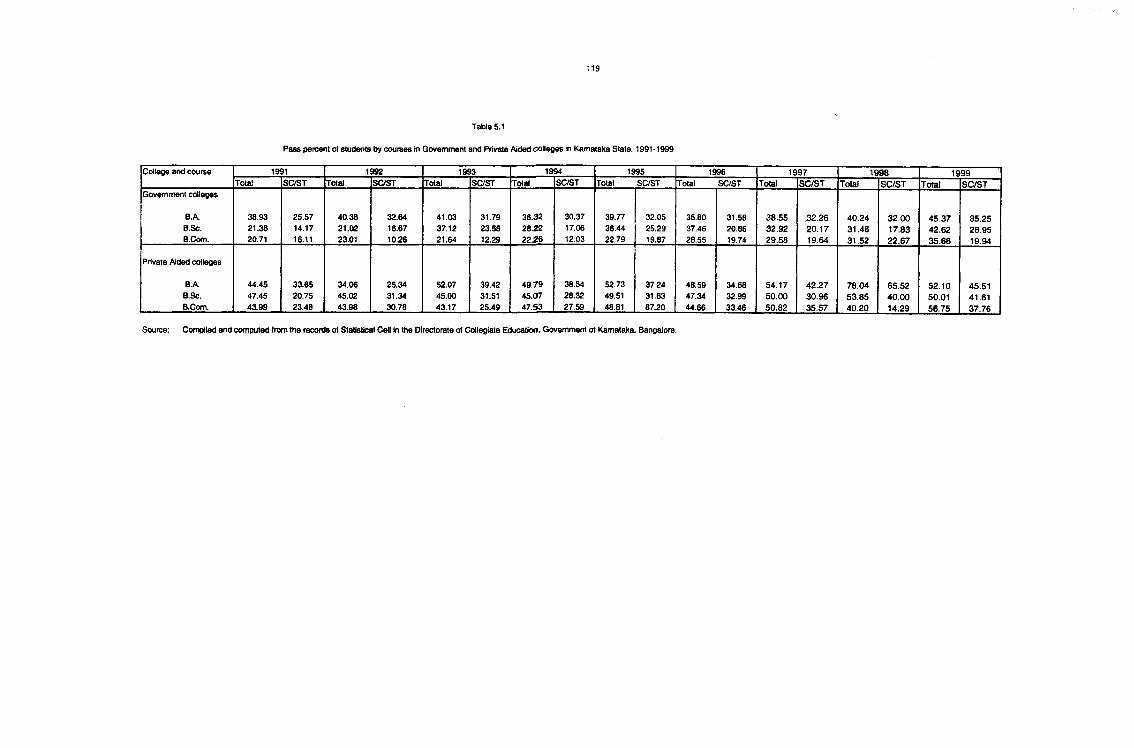
Table 5.1
Pass percent of students by courses in Government and Private Aided colleges in Karnataka State: 1991-1999
College and course 1991 1992 1993 1994 1995 1996 1997 1998 1999Total SC/ST Total SC/ST Total SC/ST Total SC/ST Total SC/ST Total SC/ST Total SC/ST Total SC/ST Total SC/ST
Government colleges
B.A.B.Sc.B.Com.
38.9321.3620.71
25.5714.1716.11
40.3821.0223.01
32.6416.6710.26
41.0337.1221.64
31.7923.5812.29
36.3228.2222.26
30.3717.0612.03
39.7736.4422.79
32.0525.2919.87
35.8037.4628.55
31.5820.8619.74
38.5532.9229.58
;32.2620.1719.64
40.2431.4631.52
32.0017.8322.67
45.3742.6235.68
35.2528.9519.94
Private Aided colleges
B.A.B.Sc.B.Com.
44.4547.45 43.99
33.6520.7523.46
34.0645.0243.98
25.3431.34 30.78
52.0745.0043.17
39.4231.5125.49
49.7945.0747.53
38.5428.3227.59
52.7349.5148.81
37,2431.6387.20
48.5947.3444.66
34.6832.9933.46
54.1750.0050.82
42.2730.9635.57
78.0453.8540.20
65.5240.0014.29
52.1050.0156.75
45.5141.6137.76
Source: Compiled and computed from the records of Statistical Cell in the Directorate of Collegiate Education, Government of Karnataka, Bangalore.
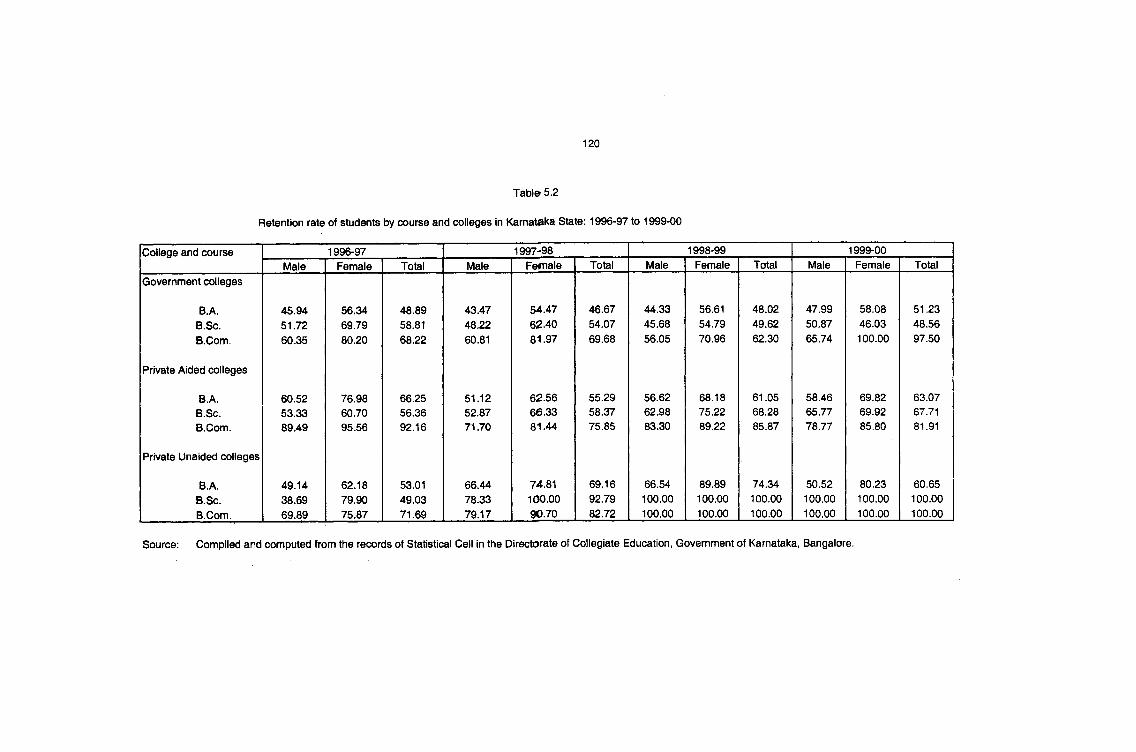
Retention rate of students by course and colleges In Karnataka State: 1996-97 to 1999-00
College and course 1996-97 1997-98 1998-99 1999-00Male Female Total Male Female Total Male Female Total Male Female Total
Government colleges
B.A. 45.94 56.34 48.89 43.47 54.47 46.67 44.33 56.61 48.02 47.99 58.08 51.23B.Sc. 51.72 69.79 58.81 48.22 62.40 54.07 45.68 54.79 49.62 50.87 46.03 48.56B.Com. 60.35 80.20 68.22 60.81 81.97 69.68 56.05 70.96 62.30 65.74 100.00 97.50
Private Aided colleges
B.A. 60.52 76.98 66.25 51.12 62.56 55.29 56.62 68.18 61.05 58.46 69.82 63.07B.Sc. 53.33 60.70 56.36 52.87 66.33 58.37 62.98 75.22 68.28 65.77 69.92 67.71B.Com. 89.49 95.56 92.16 71.70 81.44 75.85 83.30 89.22 85.87 78.77 85.80 81.91
Private Unaided colleges
B.A. 49.14 62.18 53.01 66.44 74.81 69.16 66.54 89.89 74.34 50.52 80.23 60.65B.Sc. 38.69 79.90 49.03 78.33 100.00 92.79 100.00 100.00 100.00 100.00 100.00 100.00B.Com. 69.89 75.87 71.69 79.17 90.70 82.72 100.00 100.00 100.00 100.00 100.00 100.00
Source: Compiled and computed from the records of Statistical Cell in the Directorate of Collegiate Education, Government of Karnataka, Bangalore.
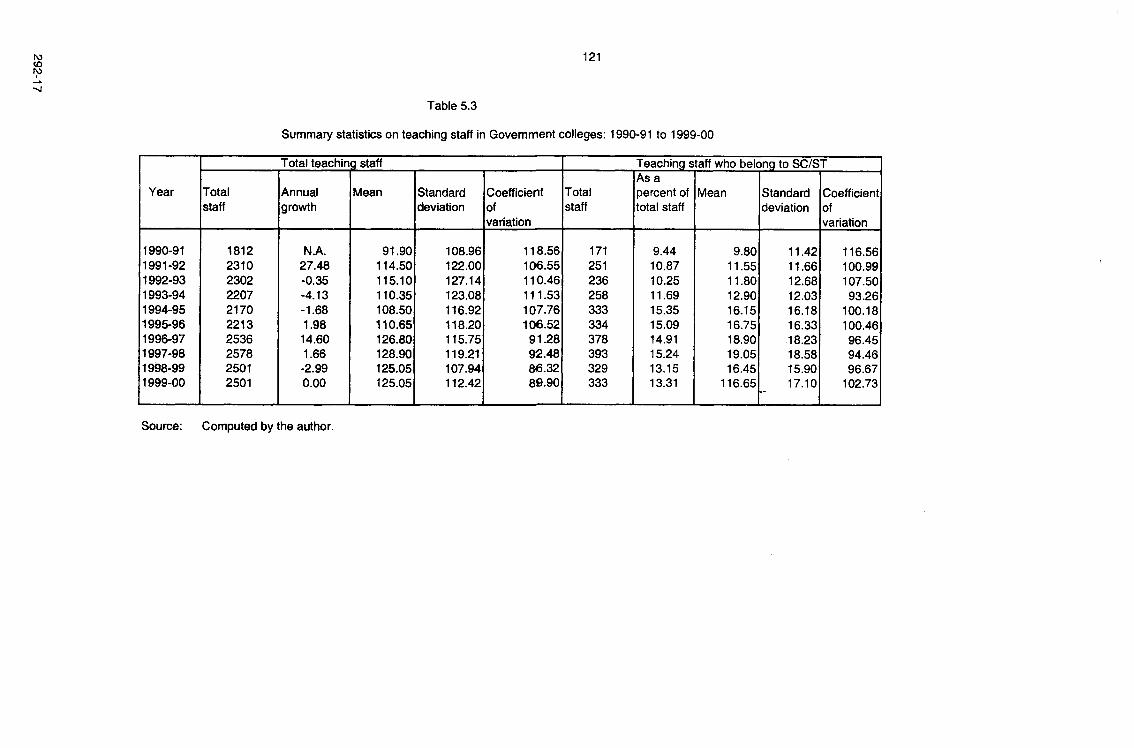
roCO
Summary statistics on teaching staff in Govemment colleges: 1990-91 to 1999-00
Total teaching staff Teaching staff who belong to SC/ST
Year Totalstaff
Annualgrowth
Mean Standarddeviation
Coefficientofvariation
Totalstaff
As a percent of total staff
Mean Standarddeviation
Coefficient ofvariation
1990-911991-921992-931993-941994-951995-961996-971997-981998-991999-00
1812231023022207217022132536257825012501
N.A.27.48-0.35-4.13-1.681.98
14.601.66-2.990.00
91.90114.50 115.10 110.35108.50 110.65 126.80 128.90125.05125.05
108.96122.00127.14123.08116.92118.20115.75119.21107.94112.42
118.56106.55110.46111.53107.76106.52
91.2892.4886.3289.90
171251236258333334 378 393 329 333
9.4410.8710.2511.6915.3515.0914.9115.2413.1513.31
9.8011.5511.8012.90 16.15 16.7518.90 19.05 16.45
116.65
11.4211.6612.6812.0316.1816.3318.2318.5815.9017.10
116.56100.99107.5093.26
100.18100.4696.4594.46 96.67
102.73
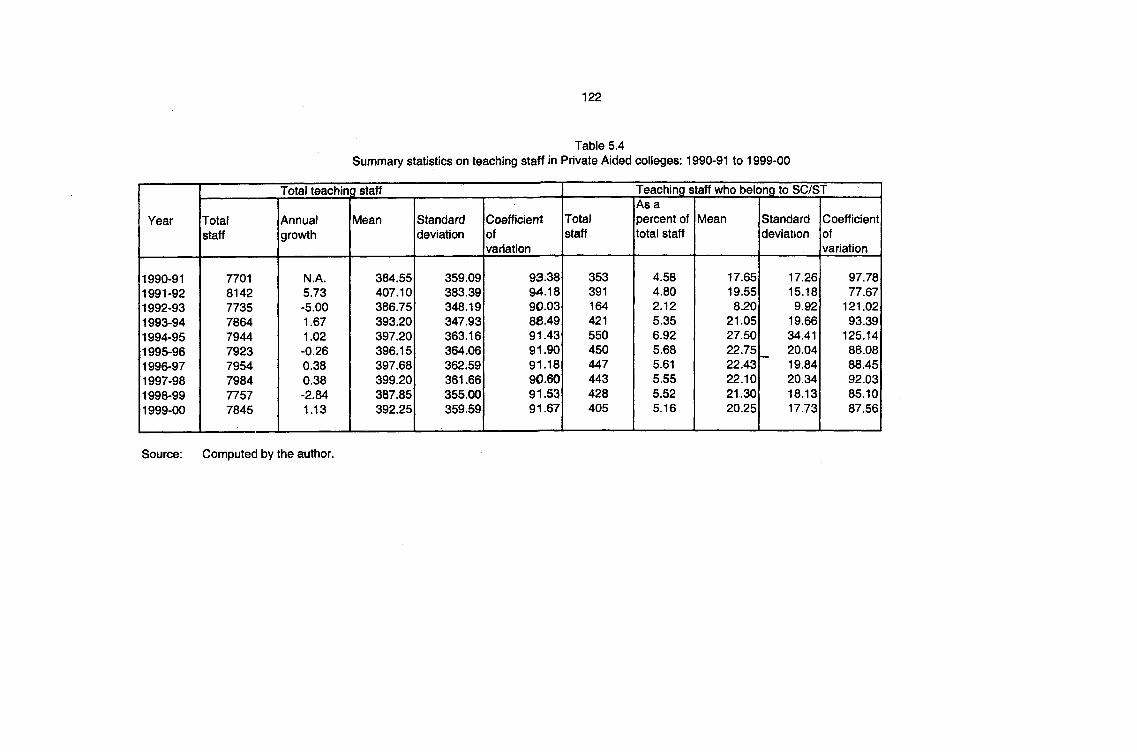
Table 5.4Summary statistics on teaching staff in Private Aided colleges: 1990-91 to 1999-00
Total teaching staff Teaching staff who belong to SC/ST
Year Totalstaff
Annualgrowth
Mean Standarddeviation
Coefficientofvariation
Totalstaff
As a percent of total staff
Mean Standarddeviation
Coefficientofvariation
1990-911991-921992-931993-941994-951995-961996-971997-981998-991999-00
7701814277357664794479237954798477577845
N.A.5.73-5.001.671.02-0.260.380.38-2.841.13
384.55407.10386.75393.20397.20 396.15 397.68399.20 387.85 392.25
359.09383.39348.19347.93363.16364.06362.59 361.66 355.00359.59
93.3894.18 90.03 88.49 91.43 91.9091.18 90.60 91.53 91.67
353391164421550450447443428405
4.584.802.125.356.925.685.615.555.525.16
17.6519.558.20
21.0527.5022.7522.4322.1021.3020.25
17.2615.18
9.9219.6634.4120.0419.8420.3418.1317.73
97.7877.67
121.0293.39
125.1488.0888.4592.0385.1087.56
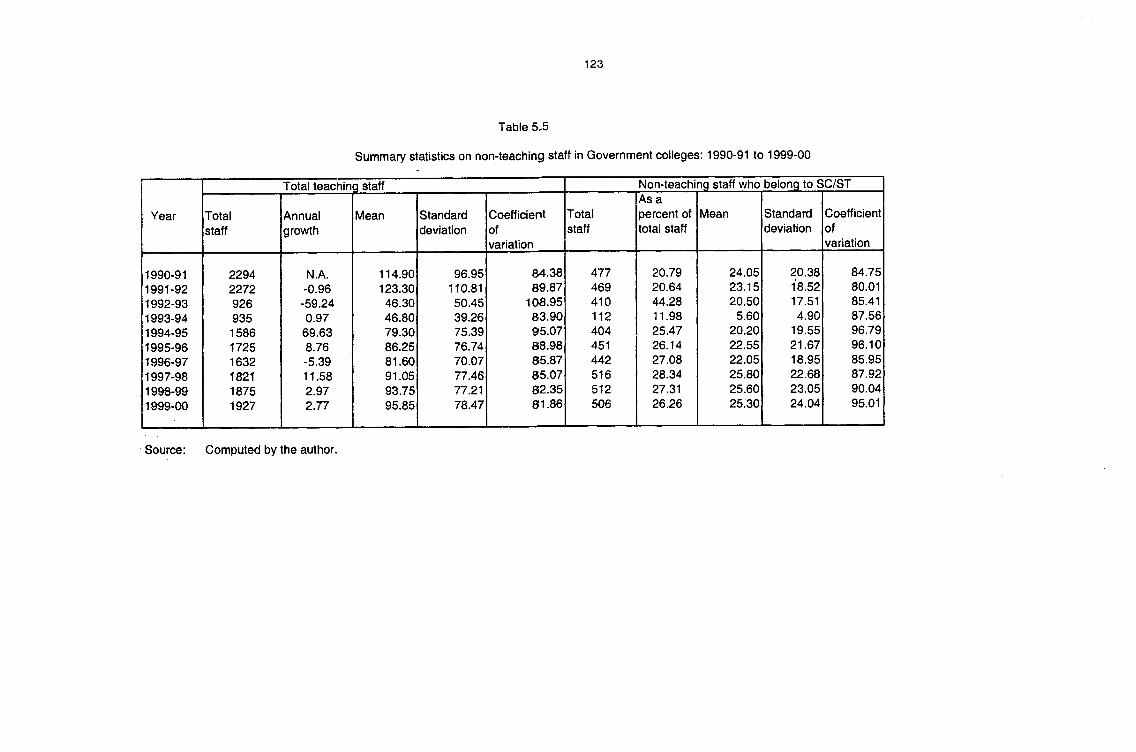
Summary statistics on non-teaching staff in Govemment colleges: 1990-91 to 1999-00
Total teaching staff Non-teaching staff who belong to SC/ST
Year Totalstaff
Annualgrowth
Mean Standarddeviation
Coefficientofvariation
Totalstaff
As apercent of total staff
Mean Standarddeviation
Coefficientofvariation
1990-911991-921992-931993-941994-951995-961996-97 1997^981998-991999-00
22942272926935158617251632182118751927
N.A.-0.96
-59.240.97
69.638.76 -5.39 11.58 2.972.77
114.90123.30
46.30 46.8079.30 86.25 81.60 91.05 93.75 95.85
96.95110.81
50.45 39.26 75.39 76.74 70.0777.46 77.2178.47
84.3889.87
108.9583.9095.07 88.9885.8785.07 82.35 81.86
477469410112404451442516512506
20.7920.6444.2811.9825.4726.1427.0828.3427.3126.26
24.05 23.15 20.50
5.6020.2022.5522.05 25.80 25.60 25.30
20.3818.5217.514.90
19.5521.67 18.9522.68 23.05 24.04
84.7580.0185.4187.5696.7996.1085.9587.9290.0495.01
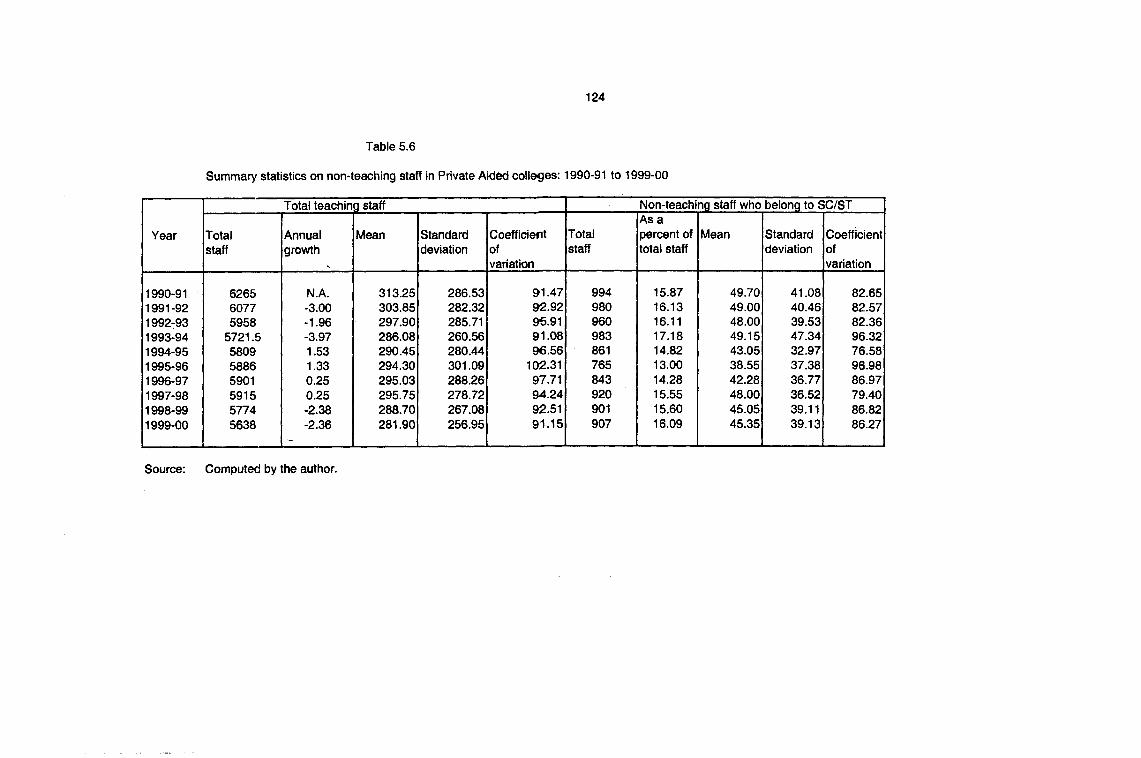
Summary statistics on non-teacliing staff in Private Aided collesges: 1990-91 to 1999-00
Total teaching staff Non-teaching staff who belong to SC/ST
Year Totalstaff
Annualgrowth
Mean Standarddeviation
Coefficientofvariation
Totalstaff
As a percent of total staff
Mean Standarddeviation
Coefficient ofvariation
1990-911991-921992-931993-941994-951995-961996-971997-981998-991999-00
626560775958
5721.5580958865901591557745638
N.A.-3.00-1.96-3.971.531.330.250.25-2.38-2.36
313.25303.85297.90 286.08 290.45 294.30 295.03 295.75 288.70281.90
286.53282.32285.71 260.56 280.44 301.09 288.26278.72 267.08 256.95
91.4792.9296.9191.0896.56
102.3197.7194.2492.5191.15
994980960983861765843920901907
15.8716.1316.1117.1814.8213.0014.2815.5515.6016.09
49.7049.0048.00 49.1543.05 38.55 42.2848.0045.05 45.35
41.0840.4639.5347.3432.9737.3836.7736.5239.1139.13
82.6582.57 82.36 96.3276.58 96.98 86.97 79.40 86.82 86.27
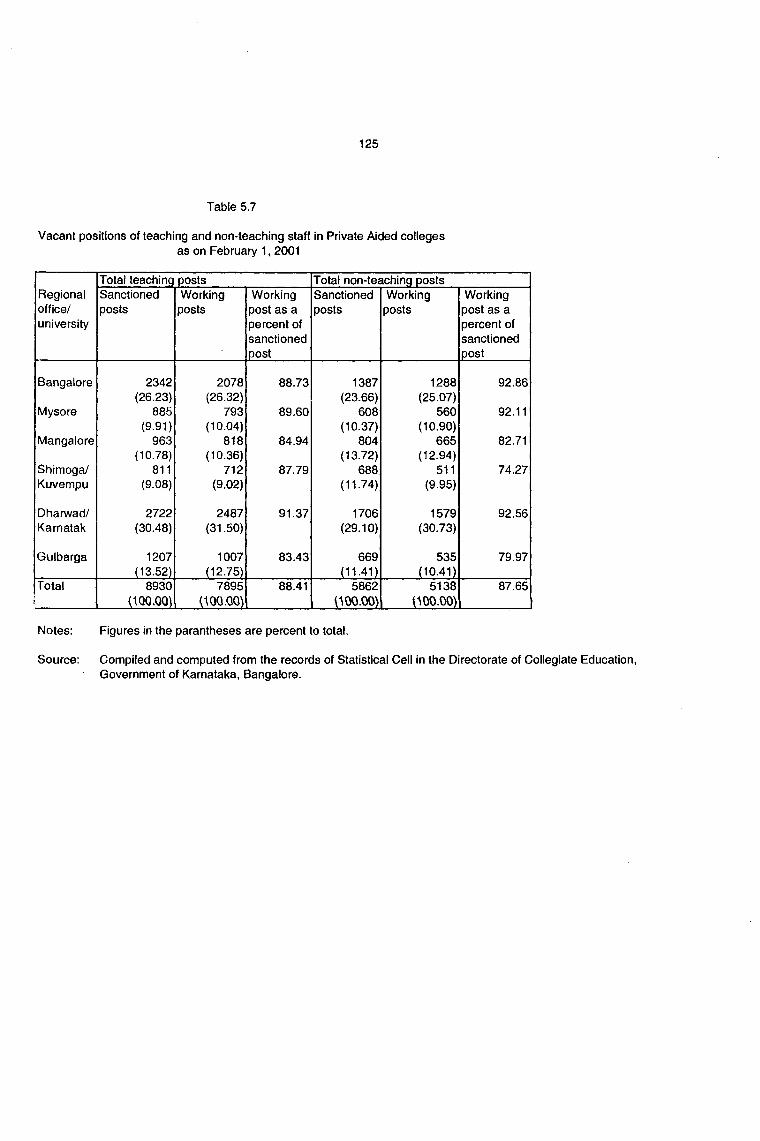
Vacant positions of teaching and non-teaching staff in Private Aided colleges as on February 1, 2001
Total teaching posts Total non-teaching postsRegional Sanctioned Working Working Sanctioned Working Workingoffice/ posts posts post as a posts posts post as auniversity percent of percent of
sanctioned sanctionedpost post
Bangalore 2342 2078 88.73 1387 1288 92.86(26.23) (26.32) (23.66) (25.07)
Mysore 885 793 89.60 608 560 92.11(9.91) (10.04) (10.37) (10.90)
Mangalore 963 818 84.94 804 665 82.71(10.78) (10.36) (13.72) (12.94)
Shimoga/ 811 712 87.79 688 511 74.27Kuvempu (9.08) (9.02) (11.74) (9.95)
Dhanwad/ 2722 2487 91.37 1706 1579 92.56Karnatak (30.48) (31.50) (29.10) (30.73)
Gulbarga 1207 1007 83.43 669 535 79.97(13.52) (12.75) (11.41) (10.41)
Total 8930 7895 88.41 5862 5138 87.65i! (IQQ-.OO (100.00\ (100.00^ (100.00)
Notes: Figures in the parantheses are percent to total.
Source: Compiled and computed from the records of Statistical Cell in the Directorate of Collegiate Education,Government of Karnataka, Bangalore.
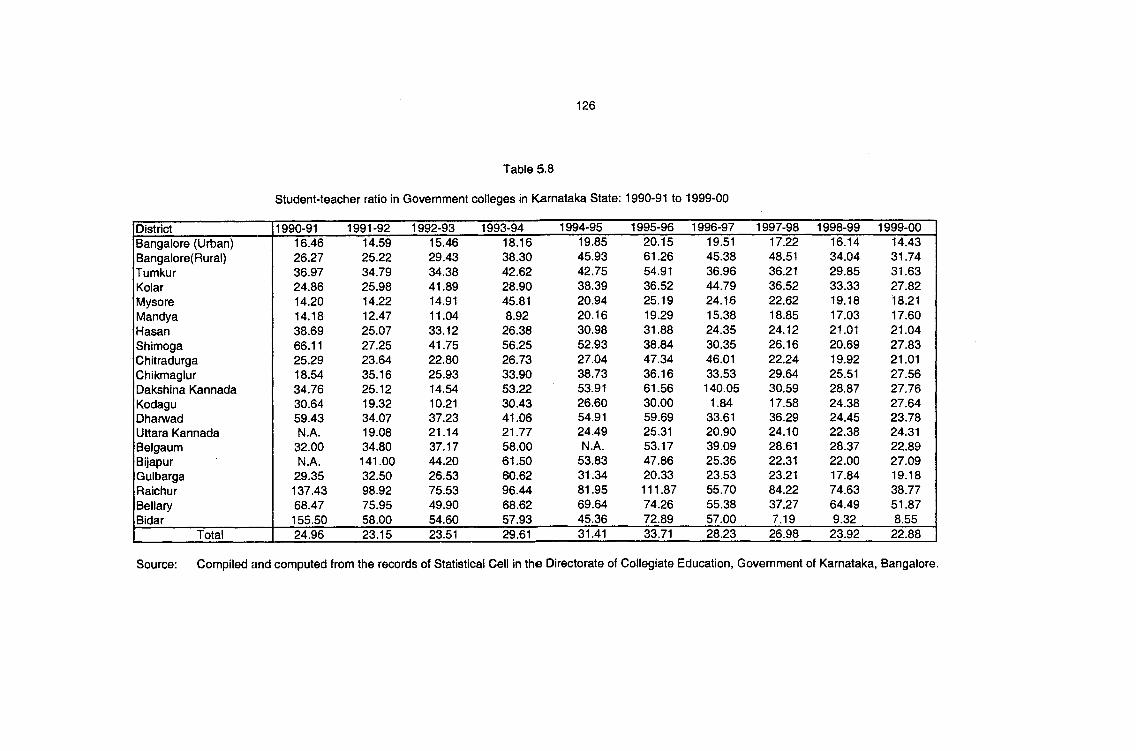
Student-teacher ratio in Government colleges in Karnataka State: 1990-91 to 1999-00
District 1990-91 1991-92 1992-93 1993-94 1994-95 1995-96 1996-97 1997-98 1998-99 1999-00Bangalore (Urban)Bangalore(Rural)TumkurKolarMysoreMandyaHasanShimogaChitradurgaChikmaglurDakshina KannadaKodaguDharwadUttara KannadaBelgaumBijapurGulbargaRaichurBellaryBidar
16.46 26.27 36.97 24.86 14.20 14.18 38.69 66.11 25.29 18.54 34.76 30.6459.43 N.A.
32.00 N.A.
29.35137.4368.47 155.50
14.5925.2234.79 25.9814.22 12.4725.07 27.25 23.64 35.16 25.12 19.3234.0719.0834.80141.00 32.50 98.92 75.9558.00
15.4629.4334.3841.89 14.91 11.04 33.12 41.75 22.80 25.93 14.54 10.21 37.23 21.14 37.17 44.2026.5375.5349.90 54.60
18.1638.3042.6228.90 45.81 8.92
26.38 56.25 26.7333.90 53.2230.43 41.06 21.77 58.00 61.5060.6296.44 68.62 57.93
19.8545.93 42.75 38.3920.94 20.16 30.98 52.93 27.04 38.7353.91 26.6054.91 24.49 N.A.
53.83 31.3481.95 69.64 45.36
20.15 61.26 54.91 36.52 25.19 19.2931.88 38.84 47.3436.16 61.56 30.00 59.69 25.3153.17 47.86 20.33 111.87 74.2672.89
19.5145.38 36.96 44.79 24.1615.3824.3530.35 46.0133.53 140.05
1.8433.6120.9039.0925.3623.53 55.7055.38 57.00
17.2248.5136.2136.52 22.62 18.85 24.12 26.16 22.24 29.64 30.59 17.58 36.29 24.10 28.61 22.3123.2184.22 37.27 7.19
16.1434.0429.8533.3319.1817.0321.0120.6919.9225.5128.8724.38 24.4522.38 28.37 22.00 17.84 74.63 64.49 9.32
14.4331.7431.6327.82 18.21 17.60 21.0427.83 21.01 27.5627.7627.64 23.78 24.31 22.89 27.09 19.1838.77 51.87 8.55
Total 24.96 23.15 23.51 29.61 31.41 33.71 28.23 26.98 23.92 22.88
Source: Compiled and computed from the records of Statistical Cell in the Directorate of Collegiate Education, Government of Karnataka, Bangalore.
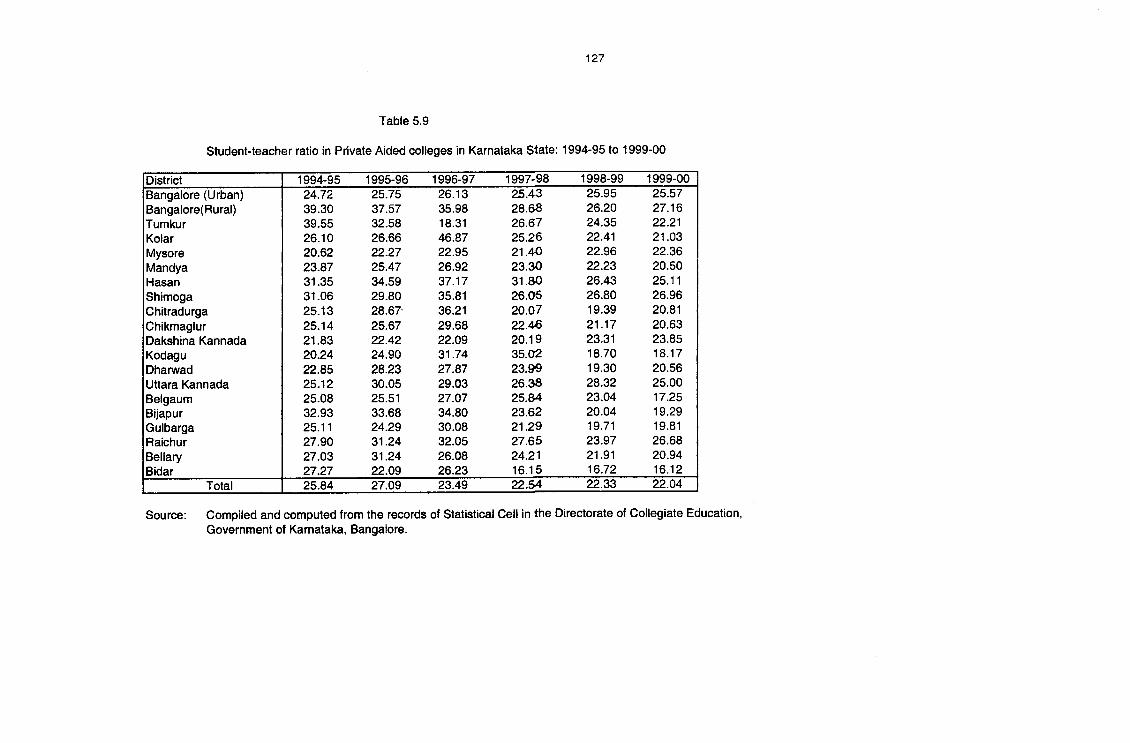
Student-teacher ratio in Private Aided colleges in Karnataka State: 1994-95 to 1999-00
District 1994-95 1995-96 1996-97 1997-98 1998-99 1999-00Bangalore (Urban)Bangalore(Rural)TumkurKolarMysoreMandyaHasanShimogaChitradurgaChikmaglurDakshina KannadaKodaguDharwadUttara KannadaBelgaumBijapurGulbargaRaichurBellaryBidar
24.7239.3039.5526.1020.6223.8731.3531.0625.1325.14 21.83 20.24 22.85 25.12 25.08 32.93 25.11 27.90 27.03 27.27
25.7537.5732.58 26.66 22.27 25.4734.59 29.80 28.67-25.67 22.42 24.9028.23 30.05 25.5133.68 24.2931.2431.24 22.09
26.1335.9818.3146.87 22.95 26.92 37.17 35.81 36.21 29.68 22.09 31.7427.87 29.0327.07 34.8030.08 32.0526.08 26.23
25.43 28.68 26.67 25.26 21.40 23.30 31 .SO 26.06 20.07 22.46 20.19 35.02 23.99 26.38 25.84 23.62 21.29 27.65 24.21 16.15
25.95 26.20 24.35 22.4122.96 22.23 26.43 26.80 19.39 21.1723.3118.70 19.3028.3223.0420.0419.7123.97 21.9116.72
25.5727.16 22.21 21.03 22.36 20.5025.11 26.96 20.81 20.63 23.8518.17 20.56 25.00 17.25 19.29 19.81 26.68 20.9416.12
Total 25.84 27.09 23.49 22.54 22.33 22.04
Source: Compiled and computed from the records of Statistical Cell in the Directorate of Collegiate Education,Government of Karnataka, Bangalore.
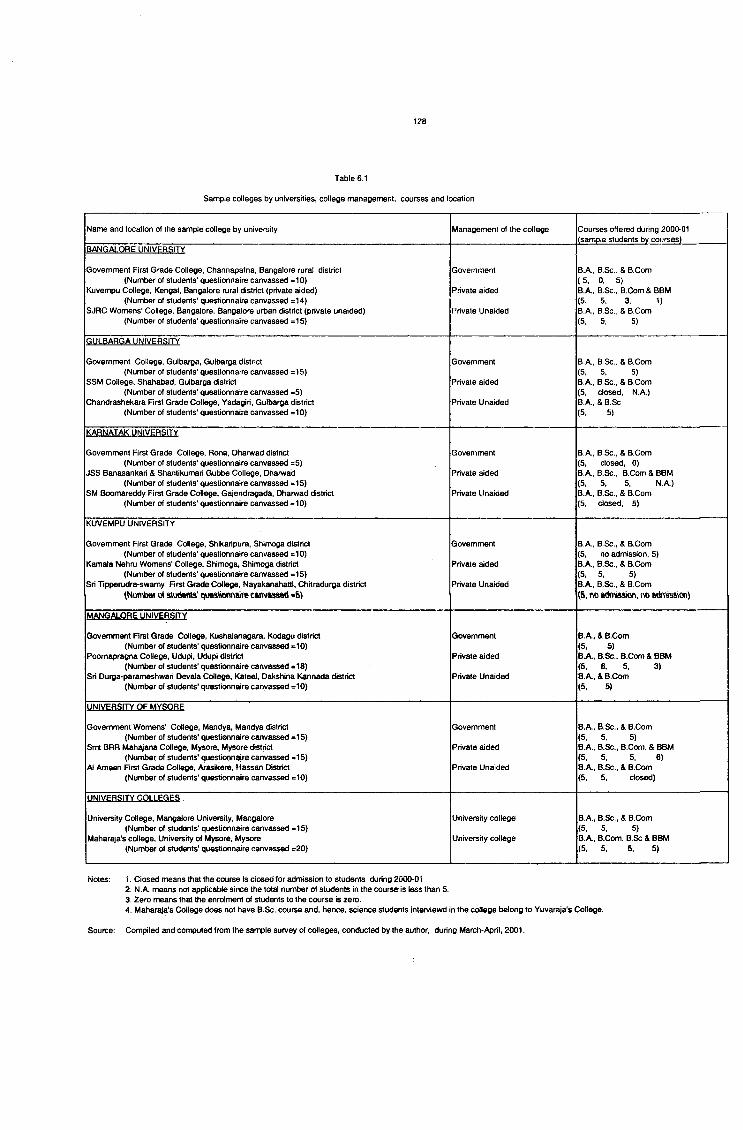
Sample colleges by universities, college management, courses and location
Name and location of the sample college by university Management of the college Courses offered during 2000-01 (sample students by courses)
BANGALORE UNIVERSITY
Govemment
Private aided
Private Unaided
B.A., B.Sc., & B.Com ( 5, 0, 5)B.A., B.Sc., B.Com & BBM (5, 5, 3, 1) B.A., B.Sc., & B.Com (5, 5, 5)
Government First Grade College, Channapatna, Bangalore rural district (Number of students' questionnaire canvassed =10)
Kuvempu College, Kengal, Bangalore rural district (private aided)(Number of students' questionnaire canvassed =14)
SJRC Womens' College, Bangalore, Bangalore urban district (private unaided) (Number of students' questionnaire canvassed =15)
GULBARGA UNIVERSITY
Govemment
Private aided
Private Unaided
B.A., B.Sc., & B.Com (5, 5, 5) B.A., B.Sc., & B.Com (5, closed, N.A.) B.A., & B.Sc (5, 5)
Government College, Gulbarga, Gulbarga district(Number of students' questionnaire canvassed =15)
SSM College, Shahabad, Gulbarga district(Number of students' questionnaire canvassed =5)
Chandrashekara First Grade College, Yadagiri, Gulbarga district (Numtier of students' questionnaire canvassed =10)
KARNATAK UNIVERSITY
Govemment
Private aided
Private l.lnaided
B.A., B.Sc., & B.Com (5, closed, 0)B.A, B.Sc., B.Com & BBM (5. 5, 5, N.A.) B.A., B.Sc., & B.Com (5, closed, 5)
Government First Grade College, Rona, Dharwad district(Number of students' questionnaire canvassed =5)
JSS Banasankari & Shantikumari Gubbe College, Dhanwad(Number of students' questionnaire canvassed =15)
SM Boomareddy First Grade College, Gajendragada, Dhanwad district (Number of students' questionnaire canvassed =10)
KUVEMPU UNIVERSITY
Government First Grade College, Shikaripura, Shimoga district (Number of students' questionnaire canvassed =10)
Kamala Nehm Womens' College, Shimoga, Shimoga district (Number of students' questionnaire canvassed =15)
Sri Tipperudra-swamy First Grade CoHege, Nayakanahatti, Chitradurga district(Numbef o< stvKtents' canvasaeti »&)
Govemment
Private aided
Private Unaided
B.A., B.Sc., & B.Com (5, no admission, 5)B.A., B.Sc., & B.Com (5. 5. 5)B.A, B.Sc., & B.Com(5. fw> na adnMssion)
MANGALORE UNIVERSITY
Govemment
Private aided
Private Unaided
B.A, & B.Com (5. 5)B.A.,B.Sc., B.Com & BBM (5, 6, 5, 3) B.A., & B.Com (5. 5)
Government First Grade College, Kushalanagara, Kodagu district (Number of students' questionnaire canvassed =10)
Poomapragna College, Udupi, Udupi district(Number of students’ questionnaire canvassed =18)
Sri Durga-parameshwari Devala C^lege, Kateel, Dakshina Kannada district (Number of students' questionnaire canvassed =10)
UNIVERSITY OF MYSORE
Govemment
Private aided
Private Unaided
B.A., B.Sc., & B.Com (5, 5, 5)B.A., B.Sc., B.Com. & BBM (5, 5, 5, 6) B.A., B.Sc., & B.Com (5. 5, closed)
Govemment Womens' College, Mandya, Mandya district(Number of students' questionnaire canvassed =15)
Smt BRR Mahajana College, Mysore, Mysore district(Number of students' questionn^re canvassed =15)
A1 Ameen First Grade College, Arasikere, Hassan District(Number of students' questionnaire canvassed =10)
UNIVERSITY COLLEGES
University college
University college
B.A., B.Sc., & B.Ck)m (5. 5. 5)B.A., B.Com. B.Sc & BBM (5, 5, 5, 5)
University College, Mangalore University, Mangalore(Number of students' questionnaire canvassed =15)
Maharaja's college. University of Mysore, Mysore(Number of students' questionnaire canvassed =20)
Notes: 1. Closed means that the course Is closed for admission to students during 2000-0i2. N.A. means not applicable since the total number of students in the course is less than 5.3. Zero means that the enrolment of students to the course is zero.4. Maharaja's College does not have B.Sc. course and, hence, lienee students interviewd in the college belong to Yuvaraja's College.
Source: Compiled and computed from the sample sun/ey of colleges, conducted by the author, during March-April, 2001.
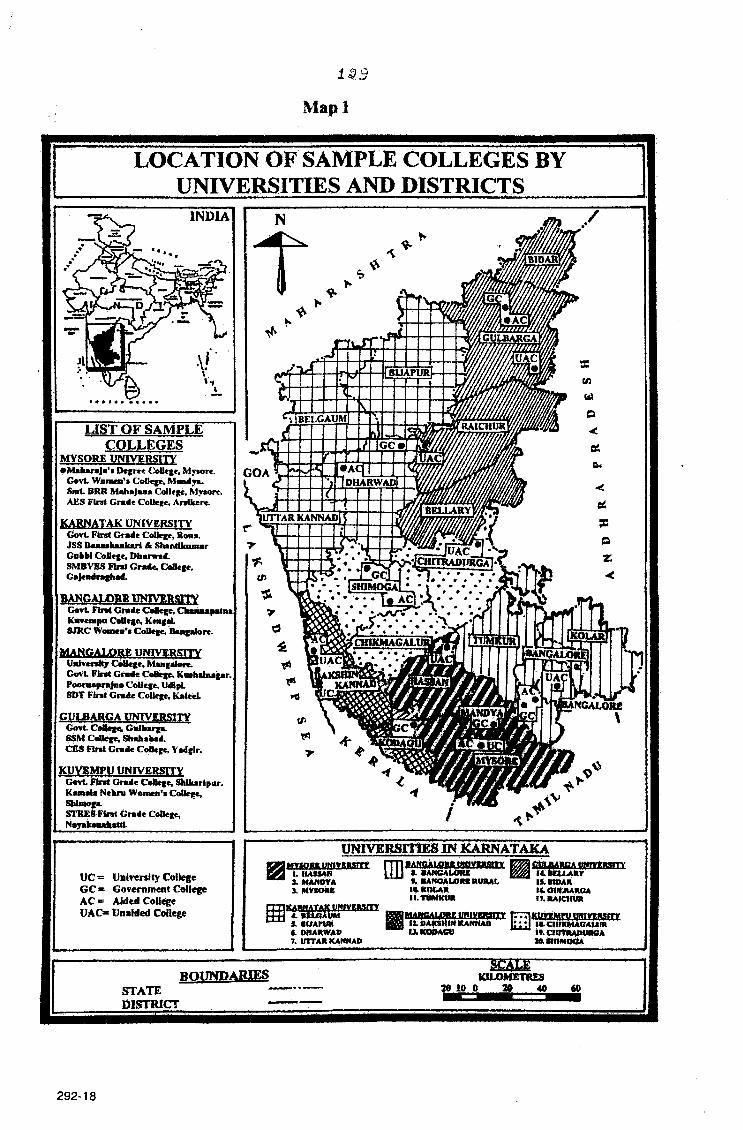
1 ^ 9
M a p l
L O C A T I O N O F S A M P L E C O L L E G E S B Y
U N I V E R S I T I E S A N D D I S T R I C T S
INDIA
U STO F SAMPLE COLLEGES
MYSORE UNIVERSITYOegret Collect My*ore.
Govt Wonim'* Collcfe Mmidjra.Smt BRR Matiajftiia Coii«f> Mi ore. AES FIrrt Crade CoUent«, Anllure.
KMNATAICiff?iVEfiS|TYGovt First GnMie Conete* Ron*.JSS BaiMsluuikari & Shanttknniar CabM Coll«ce, Dkanrsd.SMBVES 1 ^ GnMl CoOege, GsJ«ndnigh«l.
BmM^ilDNW^RsyrYGovt Fii»l Grade Caiege, €rini«apBln» Knvcniia CoBque. KengaL 8JRC Wmucb's Coltefe, Bainipdore.
MANGALORE UNIVERSITY Unfverifllf CMi e, Mioigal0re.Govt FInt Grade kuhiybiagar.P«omapr«|na Coikfe, UdipL SDT Firat Grade Colk| . K«^
GULBARGA UNIVERSITY G«vt CdQi Gttibarlea.SSM CaOege, Shaltakad.CBS FInl Grade Coiege, Yadglr.
KtlVEMPUUMlVEIlSlTY G«vt Grade Ct foge, Slbtkaripur. Kamata Nelmi Women's C<ege,STRE8 First Grade C<«tege, NayafcaiMrtiaWt
UC= Unlverilty College GG* Government College AC< Aided CdU<«e UAO Unaided CoUege
im tvERsrrtES in k a r n a t a k arn ii^ i^ jg iy g iw ro
X H A K O tA X Mvsone
s, iutAruRC. OHARWAD7. irrriUtKANNAD
% SANCALORB RUItAt IttMltAlt li.TfMkimKMgwrvffnymmf••.CIHXItlAOAUnRiv.ctnimAiHnraAMMnMocU
BCStEKfLOMETIRES
Sk 3 h h ^x i :^ h i i£STATE DISTRICT
BQIJNDARIES
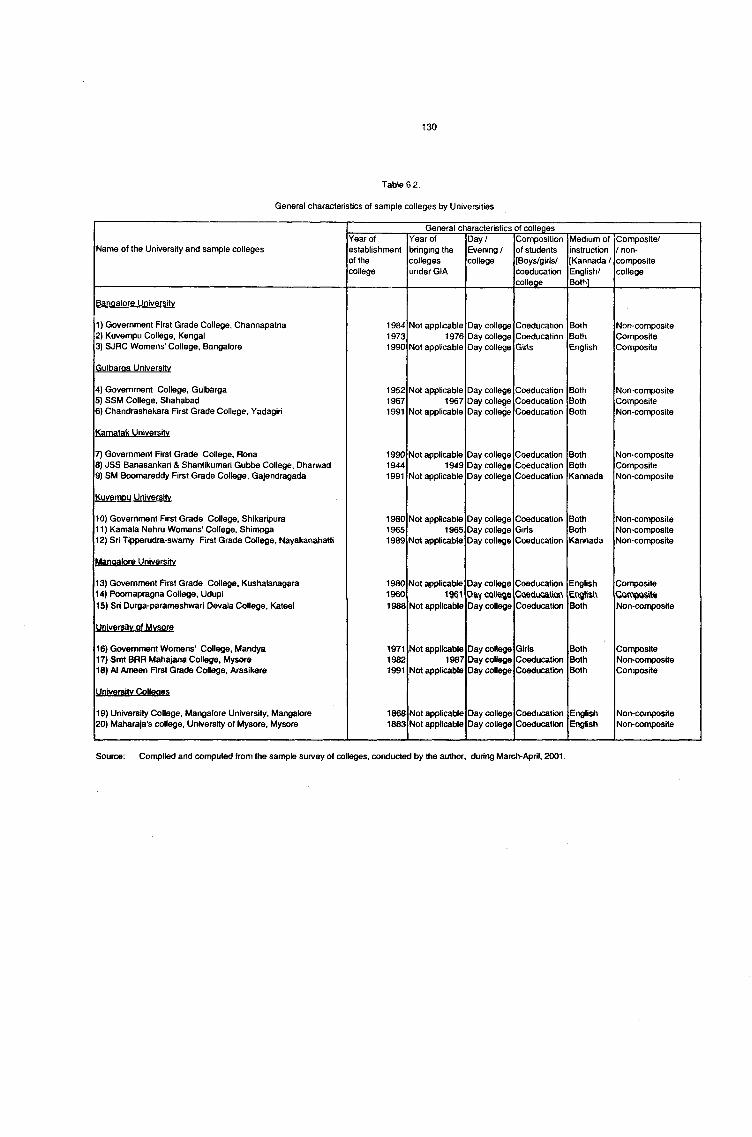
General characteristics of sample colleges by Universities
General characteristics of colleges
Name of the University and sample collegesYear of establishment of the college
Year of bringing the colleges under GIA
Day/ Evening / college
Composition of students [Boys/girls/ coeducation college
Medium of instruction [Kannada/ English/ Both]
Composite/ / noncomposite college
Banaalore Universitv
1) Government First Grade College, Channapatna2) Kuvempu College, Kengal3) SJRC Womens' College, Bangalore
198419731990
Not applicable 1976
Not applicable
Day college Day college Day college
CoeducationCoeducationGirls
BothBothEnglish
Non-compositeCompositeComposite
4) Government College, Gulbarga5) SSM College, Shahabad6) Chandrashekara First Grade College, Yadagiri
195219671991
Not applicable 1967
Not applicable
Day college Day college Day college
CoeducationCoeducationCoeducation
BothBothBoth
Non-compositeCompositeNon-composite
Kamatak Universitv
7) Government First Grade College, Rona8) JSS Banasankari & Shantikumari Gubbe College, Dharwad9) SM Boomareddy First Grade College, Gajendragada
1990 19441991
Not applicable 1949
Not applicable
Day college Day college Day college
CoeducationCoeducationCoeducation
BothBothKannada
Non-compositeCompositeNon-composite
Kuy^trpg Univgrgity
10) Govemment First Grade College, Shikaripura11) Kamala Nehru Womens' College, Shimoga12) Sri Tipperudra-swamy First Grade College, Nayakanahatti
198019651989
Not applicable 1965
Not applicable
Day college Day college Day college
CoeducationGirlsCoeducation
BothBothKannada
Non-compositeNon-compositeNon-composite
13) Govemment First Grade College, Kushalanagara14) Poomapragna College, Udupi15) Sri Durga-parameshwari Devala College, Kateel
198019601988
Not applicable 1961
Not applicable
Day college DayDay college
CoeducationQoedu<^tlQ(\CoeducatkHi
English
Both
Composite
Non-composite
Universitv of Mvsore
16) Govemment Womens' College, Mandya17) Smt BRR Mahajana College, Mysore18) Al Ameen First Grade College, Arasikere
197119821991
Not applicable 1987
Not applicable
Day college Day college Day college
GirlsCoeducationCoeducation
BothBothBoth
CompositeNon-compositeComposite
Universitv Colleaes
19) University College, Mangalore University, Mangalore20) Maharaja's college, Urwersity of Mysore, Mysore
18681883
Not applicable Not applicable
Day college Day college
CoeducationCoeducation
EnglishEnglish
Non-compositeNon-composite
Source: Confipiled and computed from the sample survey of colleges, conducted by the author, during March-Aprll, 2001.
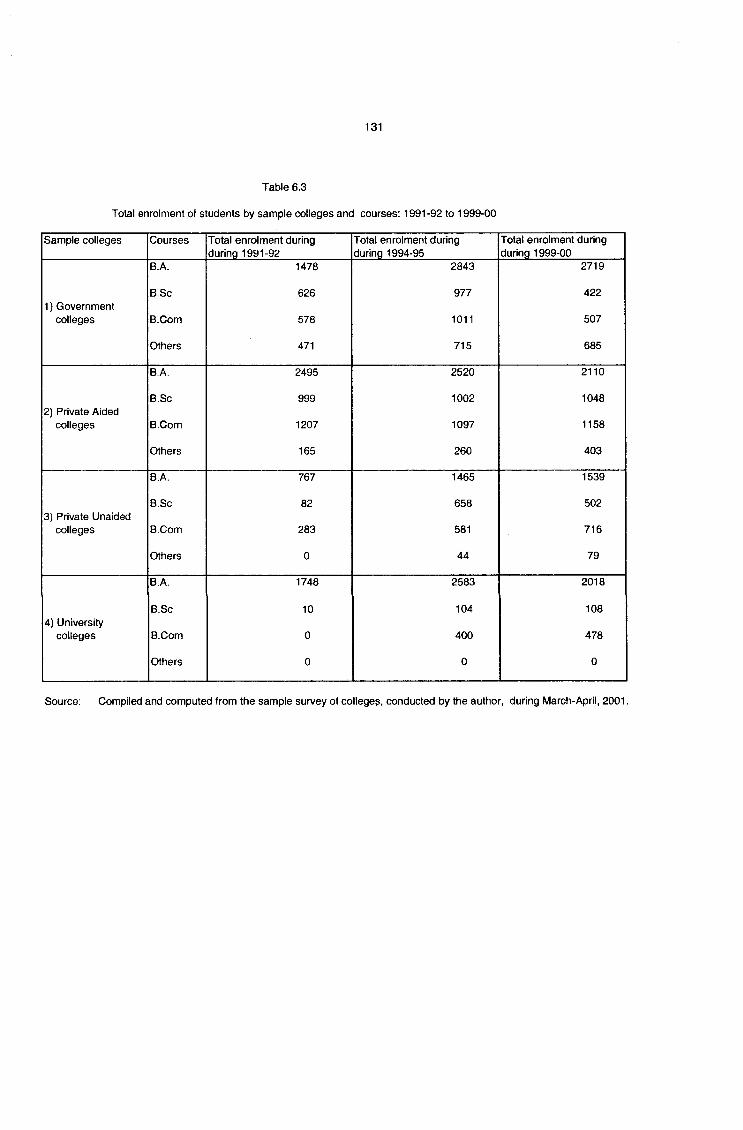
Total enrolment of students by sample colleges and courses: 1991-92 to 1999-00
Sample colleges Courses Total enrolment during during 1991-92
Total enrolment during during 1994-95
Total enrolment during during 1999-00
B.A. 1478 2843 2719
B.Sc 626 977 4221) Government
colleges B.Com 578 1011 507
Others 471 715 685
B.A. 2495 2520 2110
B.Sc 999 1002 10482) Private Aided
colleges B.Com 1207 1097 1158
Others 165 260 403
B.A. 767 1465 1539
B.Sc 82 658 5023) Private Unaided
colleges B.Com 283 581 716
Others 0 44 79
B.A. 1748 2583 2018
B.Sc 10 104 1084) University
colleges B.Com 0 400 478
Others 0 0 0
Source: Compiled and computed from the sample survey of colleges, conducted by the author, during March-April, 2001.
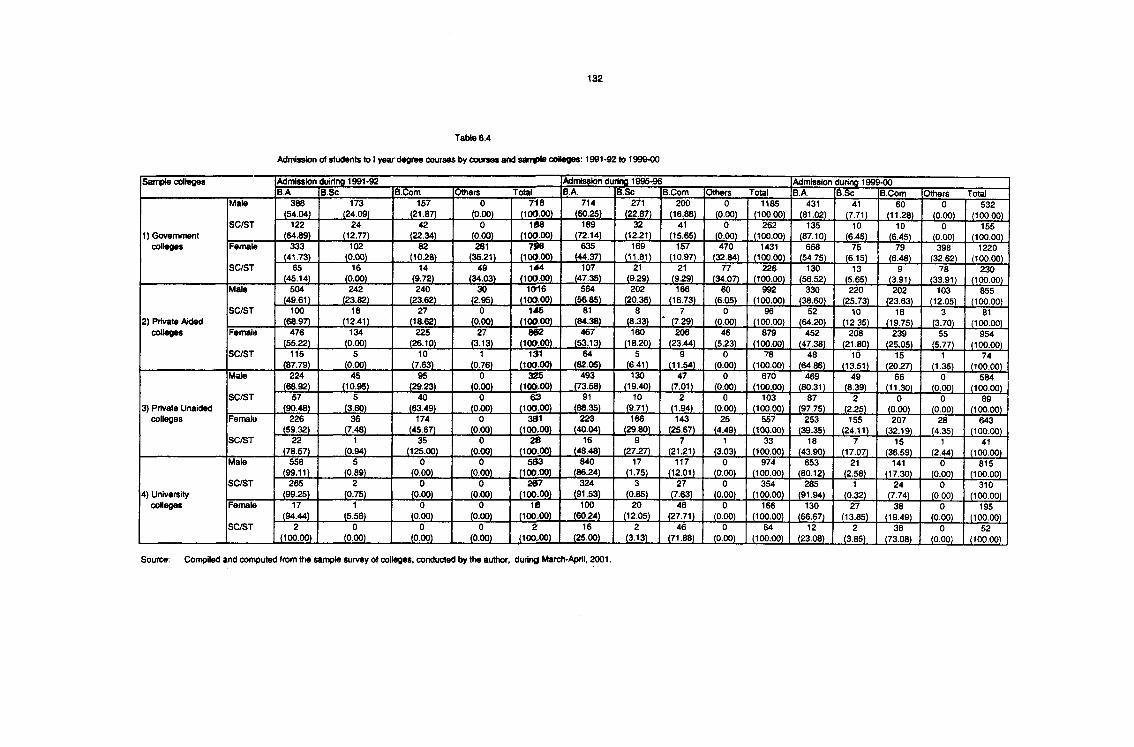
Sample colleges Admission duiring 1991-92 Admission during 1995-96 Admission during 1999-00B.A. B.Sc B.Com Others Total B.A. B.Sc B.Com Others Total B.A. B.Sc B.Com Others Total
Male 388 173 157 0 718 714 271 200 0 1185 431 41 60 0 532(54.04) (24,09) (21.87) (0.00) (100.00) (60.25) (22.87) (16.88) (0.00) (100.00) (81.02) (7.71) (11.28) (0.00) (100.00)
SC/ST 122 24 42 0 188 189 32 41 0 262 135 10 10 0 1551) Government (64.89) (12.77) (22.34) (0.00) (100.00) (72.14) (12.21) (15.65) (0.00) (100.00) (87.10) (6.45) (6.45) (0.00) (100.00)
colleges Female 333(41.73)
102(0.00)
82(10.28)
281(35.21)
798(100.00)
635(44.37)
169m - a j )
157(10.97)
470(32.84)
1431(100.00)
668(54.75)
75(6.15)
79(6.48)
398(32.62)
1220(100.00)
SC/ST 65 16 14 49 144 107 21 21 77 226 130 13 9 78 230(45.14) (0.00) (9.72) (34.03) (100.00) (47.35) (9.29) (9.29) (34.07) (100.00) (56.52) (5.65) (3.91) (33.91) (100.00)
Male 504(49.61)
242(23.82)
240(23.62)
30(2.95)
1016(100.00)
564(56.85)
202(20.36)
166(16.73)
60(6.05)
992(100.00)
330(38.60)
220(25.73)
202(23.63)
103(12.05)
855(100.00)
SC/ST 100 18 27 0 145 81 8 7 0 96 52 10 16 3 812) Private Aided (68.97) (12.41) (18.62) (0.00) (100.00) (84.38) (8.33) ' (7.29) (0.00) (100.00) (64.20) (12.35) (19.75) (3.70) (100.00)
colleges Female 476 134 225 27 802 467 160 206 46 879 452 208 239 55 954(55.22) (0.00) (26.10) (3.13) (100.00) (53.13) (18.20) (23.44) .(5 .2 3 ) (100.00) (47.38) (21.80) (25.05) (5.77) (100.00)
SC/ST 115 5 10 1 131 64 5 9 0 78 48 10 15 1 74(87.79) (0.00) (7.63) (0.76) (100.00) (82.(S) M n (11.54) (0.00) (100.00) (64.86) (13.51) (20.27) (1.35) (100.00)
Male 224(68.92)
45(10.95)
95(29.23)
0(0.00)
325(10000)
493(73.58)
130(19.40)
47(7.01)
0(0.00)
670(100.00)
469(80.31)
49(8.39)
66(11.30)
0(0.00)
584(100.00)
SC/ST 57 5 40 0 63 91 10 2 0 103 87 2 0 0 893) Private Unaided (90.48) (3.60) (63.49) (0.00) (100.00) (88.35) (9.71) (1.94) (0.00) (100.00) (97.75) (2.25) (0.00) (0.00) (100.00)
colleges Female 226(59.32)
36(7.48)
174(45.67)
0(0.00)
391(100.00)
223(40.04)
166(29.80)
143(25.67)
25 . (4.49)
557(100.00)
253(39.35)
155(24.11)
207(32.19)
28(4.35)
643(100.00)
SC/ST 22 1 35 0 28 16 9 7 1 33 18 7 15 1 41(78.57) (0.94) (125.00) (0.00) (100.00) (48.48) (27.27) (21.21) (3.03) (100.00) (43.90) (17.07) (36.59) (2.44) (100.00)
Male 558 5 0 0 5S3 840 17 117 0 974 653 21 141 0 815(99.11) (0.89) (0.00) (0.00) (100.00) (86.24) L1J5) , (12.01) (0.00) (100.00) (80.12) (2.58) (17.30) (0.00) (100.00)
SC/ST 265 2 0 0 267 324 3 27 0 354 285 1 24 0 3104) University (99.25) (0.75) (0.00) (0.00) (100-00) (91.53) (0.85) (7.63) (0.00) (100.00) (91.94) (0.32) (7,74) (0.00) (100.00)
colleges Female 17(94.44)
1(5.56)
0(0.00)
0(0.00)
18(100.00)
100(60.24)
20(12.05)
46(27.71)
0(0.00)
166(100.00)
130(66.67)
27(13.85)
38(19.49)
0(0.00)
195(100.00)
SC/ST 2 0 0 0 2 16 2 46 0 64 12 2 38 0 52(100.00) (0.00) (0.00) . .. (0 00) (100,00) (25.00) (3.13) (71.88) (0.00) (100.00) (23.08) (3.85) (73.08) (0.00) (100,00)
Source; Compiled and computed from the sample survey of colleges, conducted by the author, during March-Aprll, 2001.
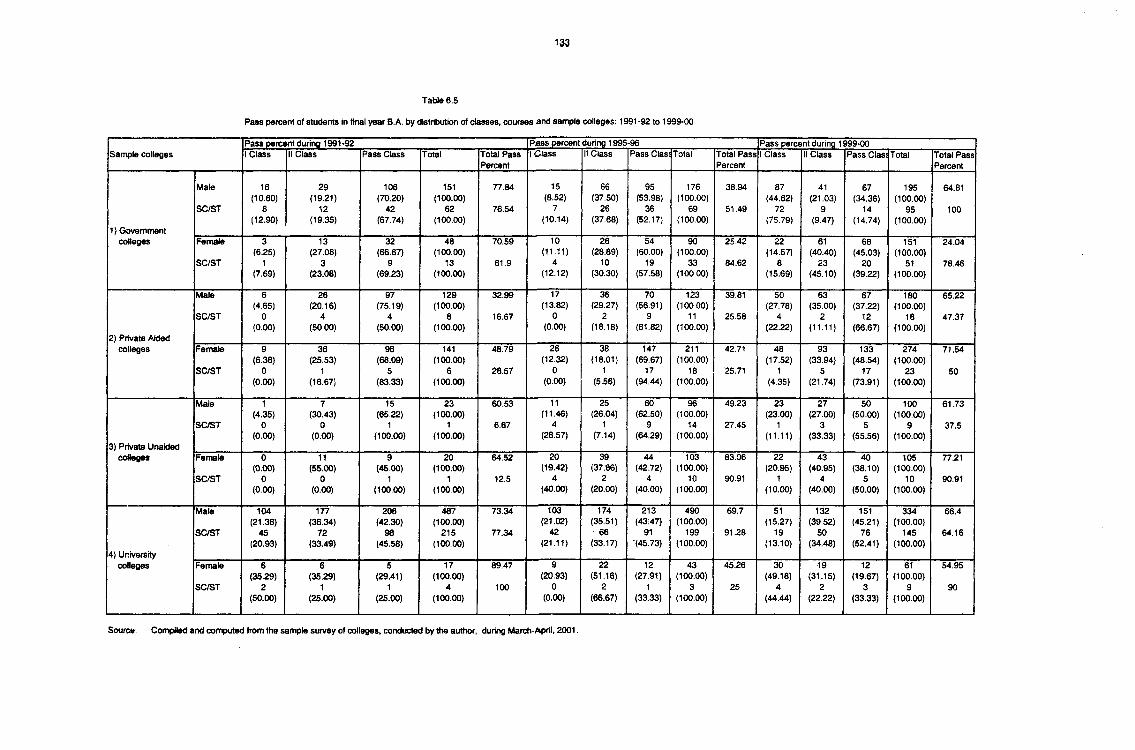
Sample collegesPass percent during 1991-92 Pass percent during 1995-96 Pass percent during 1999-001 Class II Class Pass Class Total Total Pass
Percent1 Class II Class Pass Class Total Total Pass
Percent1 Class II Class Pass Class Total Total Pass
Percent
Male 16 29 106 151 77.84 15 66 95 176 38.94 87 41 67 195 64.81(10.60) (19.21) (70.20) (100.00) (8.52) (37.50) (53.98) (100.00) (44.62) (21.03) (34.36) (100.00)
SC/ST 8 12 42 62 76.54 7 26 36 69 51.49 72 9 14 95 100(12.90) (19.35) (67.74) (100.00) (10.14) (37.68) (52.17) (100.00) (75.79) (9.47) (14.74) (100.00)
1) Governmentcolleges Female 3 13 32 48 70.59 10 26 54 90 25.42 22 61 68 151 24.04
(6.25) (27.08) (66.67) (100.00) (11.11) (28.89) (60.00) (100.00) (14.57) (40.40) (45.03) (100.00)SC/ST 1 3 9 13 61.9 4 10 19 33 84.62 8 23 20 51 78.46
(7.69) (23.08) (69.23) (100.00) (12.12) (30.30) (57.58) (100.00) (15.69) (45.10) (39.22) (100.00)
Male 6 26 97 129 32.99 17 36 70 123 39.81 50 63 67 180 65.22(4.65) (20.16) (75.19) (100.00) (13.82) (29.27) (56.91) (100,00) (27.78) (35.00) (37.22) (100.00)
SC/ST 0 4 4 8 16.67 0 2 9 11 25.58 4 2 12 18 47.37(0.00) (50.00) (50.00) (100.00) (0.00) (18.18) (81.82) (100.00) (22.22) (11.11) (66.67) (100.00)
2) Private Aidedcolleges Female 9 36 96 141 48.79 26 38 147 211 42.71 48 93 133 274 71.54
(6.38) (25.53) (68.09) (100.00) (12.32) (18.01) (69.67) (100.00) (17.52) (33.94) (48.54) (100.00)SC/ST 0 1 5 6 28.57 0 1 17 18 25.71 1 5 17 23 50
(0.00) (16.67) (83.33) (100.00) (0.00) (5.56) (94.44) (100.00) (4.35) (21.74) (73.91) (100.00)
Male 1 7 15 23 60.53 11 25 60 96 49.23 23 27 50 100 61.73(4.35) (30.43) (65.22) (100.00) (11.46) (26.04) (62.50) (100.00) (23.00) (27.00) (50.00) (100.00)
SC/ST 0 0 1 1 6.67 4 1 9 14 27.45 1 3 5 9 37.5(0.00) (0.00) (100.00) (100.00) (28.57) (7.14) (64.29) (100.00) (11.11) (33.33) (55.56) (100.00)
3) Private Unaidedcotteges Female 0 11 9 20 64.52 20 39 44 103 83.06 22 43 40 105 77.21
(0.00) (55.00) (45.00) (100.00) (19.42) (37.86) (42.72) (100.00) (20.95) (40.95) (38.10) (100.00)SC/ST 0 0 1 1 12.5 4 2 4 10 90.91 1 4 5 10 90.91
(0.00) (0.00) (100.00) (100.00) (40.00) (20.00) (40.00) (100.00) (10.00) (40.00) (50.00) (100.00)
Male 104 177 206 487 73.34 103 174 213 490 69.7 51 132 151 334 66.4(21.36) (36.34) (42.30) (100.00) (21.02) (35.51) (43:47) (100.00) (15.27) (39.52) (45.21) (100.00)
SC/ST 45 72 98 215 77.34 42 66 91 199 91.28 19 50 76 145 64.16(20.93) (33.49) (45.58) (100.00) (21.11) (33.17) (45.73) (100.00) (13.10) (34.48) (52.41) (100.00)
4) Universitycolleges Female 6 6 5 17 89.47 9 22 12 43 45.26 30 19 12 61 54.95
(35.29) (35.29) (29.41) (100.00) (20.93) (51.16) (27.91) (100.00) (49.18) (31.15) (19.67) (100.00)SC/ST 2 1 1 4 100 0 2 1 3 25 4 2 3 9 90
(50.00) (25.00) (25.00) (100.00) (0.00) (66.67) (33.33) (100.00) (44.44) (22.22) (33.33) (100.00)
Source: Compiled and computed from the sample survey of colleges, conducted by the author, during March-April, 2001.
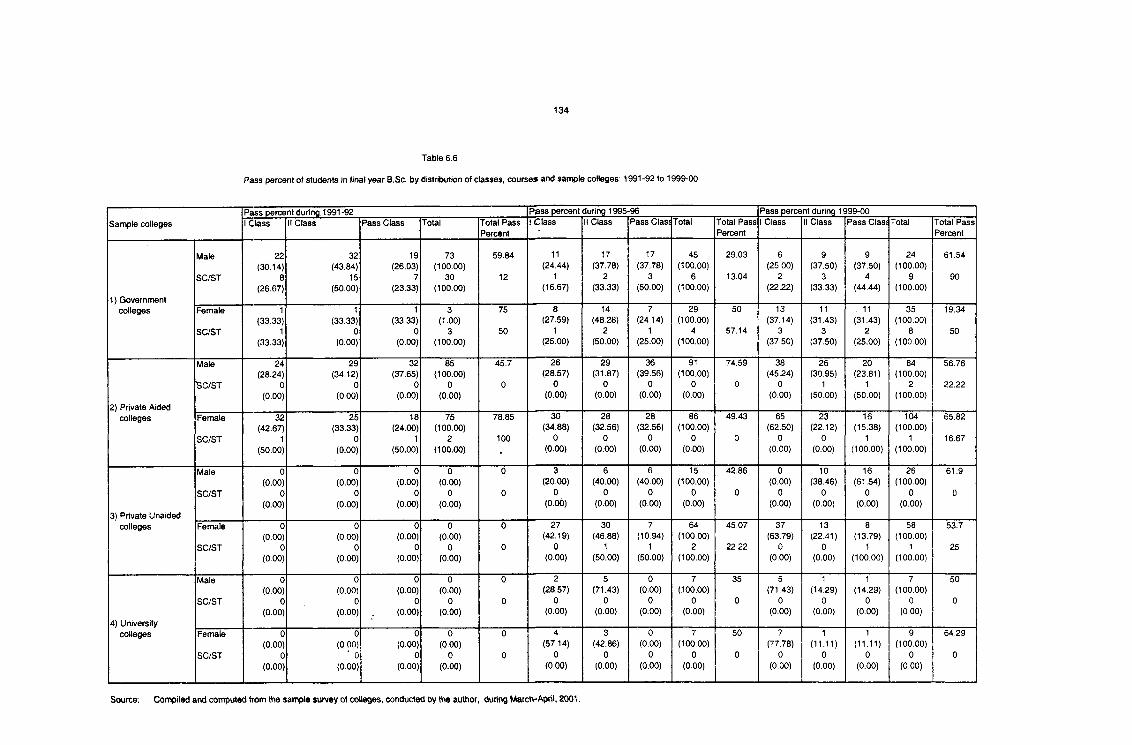
Sample collegesPass percent during 1991 -92 Pass percent during 1995'■96 Pass percent during 1999-001 Class II Class Pass Class Total Total Pass
Percent1 Class II Class Pass Class Total Total Pass
Percent1 Class II Class Pass Clas: Total Total Pass
Percent
Male 22 32 19 73 59.84 11 17 17 45 29,03 6 9 9 24 61,54(30.14) (43.84) (26.03) (100.00) (24.44) (37.78) (37.78) (100.00) (25.00) (37.50) (37.50) (100.00)
SC/ST 8 15 7 30 12 1 2 3 6 13.04 2 3 4 9 90(26.67) (50.00) (23.33) (100.00) (16.67) (33.33) (50.00) (100.00) (22.22) (33.33) (44.44) (100.00)
1) Governmentcolleges Female 1 1 1 3 75 8 14 7 29 50 13 11 11 35 19.34
(33.33) (33.33) (33.33) (1.00) (27.59) (48.28) (24.14) (100.00) (37,14) (31.43) (31.43) (100.00)SC/ST 1 0 0 3 50 1 2 1 4 57.14 3 3 2 8 50
(33.33) (0.00) (0.00) (100.00) (25.00) (50.00) (25.00) (100.00) (37.50) (37.50) (25.00) (100,00)
Male 24 29 32 85 45.7 26 29 36 91 74.59 38 26 20 84 56,76(28.24) (34.12) (37.65) (100.00) (28.57) (31.87) (39.56) (100.00) (45.24) (30.95) (23.81) (100.00)
SC/ST 0 0 0 0 0 0 0 0 0 0 0 1 1 2 22.22(0.00) (0.00) (0.00) (0.00) (0.00) (0.00) (0.00) (0.00) (0.00) (50.00) (50.00) (100.00)
2) Private Aidedcolleges Female 32 25 18 75 78.85 30 28 28 86 49.43 65 23 16 104 65.82
(42.67) (33.33) (24.00) (100.00) (34.88) (32.56) (32.56) (100.00) (62.50) (22.12) (15.38) (100.00)SC/ST 1 0 1 2 100 0 0 0 0 0 0 0 1 1 16.67
(50.00) (0.00) (50.00) (100.00) (0.00) (0.00) (0.00) (0.00) (0.00) (0.00) (100.00) (100.00)
Male 0 0 0 0 0 3 6 6 15 42.86 0 10 16 26 61.9(0.00) (0.00) (0.00) (0.00) (20.00) (40.00) (40.00) (100.00) (0.00) (38.46) (61.54) (100.00)
SC/ST 0 0 0 0 0 0 0 0 0 0 0 0 0 0 0(0.00) (0.00) (0.00) (0.00) (0.00) (0.00) (0.00) (0.00) (0.00) (0.00) (0.00) (0.00)
3) Private Unaidedcolleges Female 0 0 0 0 0 27 30 7 64 45.07 37 13 8 58 53.7
(0.00) (0.00) (0.00) (0.00) (42.19) (46.88) (10.94) (100.00) (63.79) (22.41) (13.79) (100.00)SC/ST 0 0 0 0 0 0 1 1 2 22.22 0 0 1 1 25
(0.00) (0.00) (0.00) (0.00) (0.00) (50.00) (50.00) (100.00) (0.00) (0.00) (100.00) (100.00)
Male 0 0 0 0 0 2 5 0 7 35 5 1 1 7 50(0.00) (0.00) (0.00) (0.00) (28.57) (71.43) (0.00) (100.00) (71,43) (14.29) (14.29) (100.00)
SC/ST 0 0 0 0 0 0 0 0 0 0 0 0 0 0 0(0.00) (0.00) (0.00) (0.00) (0.00) (0.00) (0.00) (0.00) (0.00) (0.00) (0,00) (0,00)
4) Universitycolleges Female 0 0 0 0 0 4 3 0 7 50 7 1 1 9 64.29
(0.00) (0 00) (0.00) (0.00) (57.14) (42.86) (0.00) (100.00) (77.78) (11.11) (11.11) (100,00)SC/ST 0 ■ 0 0 0 0 0 0 0 0 0 0 0 0 0 0
(0.00) (0.00) (0.00) (0.00) (0.00) (0.00) (0.00) (0.00) (0.00) (0.00) (0.00) (0,00)
Source; Compiled and computed from the sample survey of colleges, conducted by the author, during March-April, 2001.
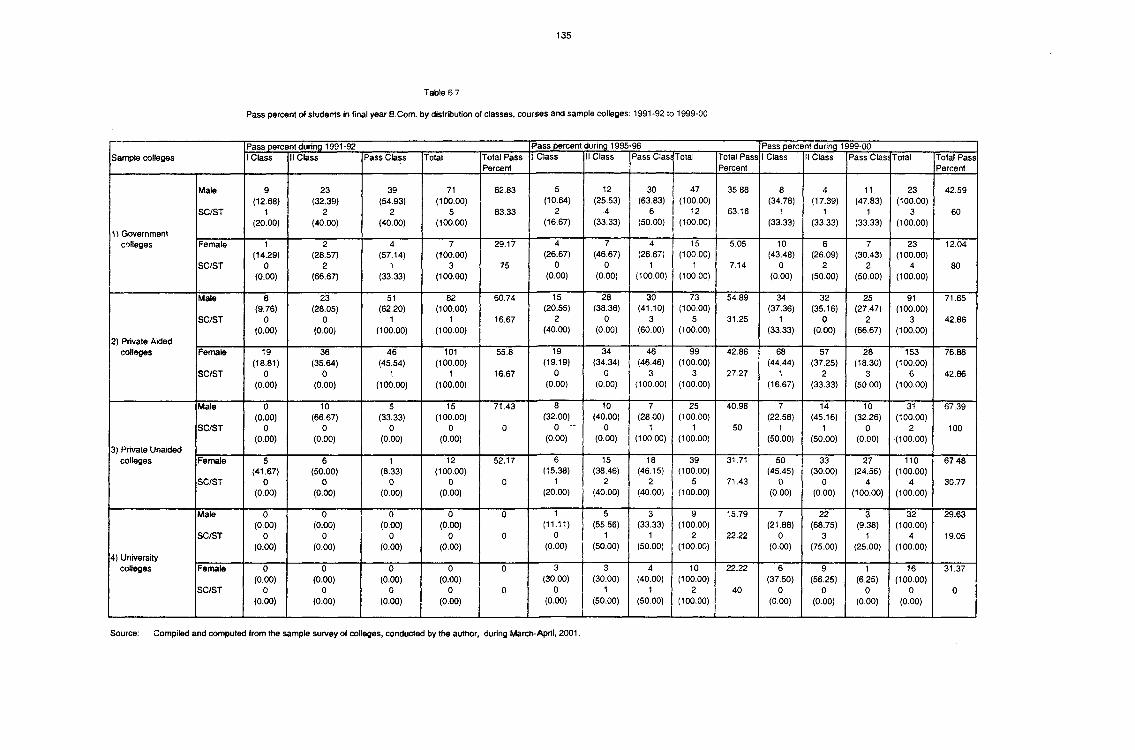
Pass percent during 1991-92 F*ass percent during 1995-96 Pass percent during 1999-00Sample colleges 1 Class II Class Pass Class Total Total Pass
Percent1 Class II Class Pass Class Total Total Pass
Percent1 Class II Class Pass Class Total Total Pass
Percent
Maie 9(12.68)
23(32.39)
39(54.93)
71(100.00)
62.83 5(10.64)
12(25.53)
30(63,83)
47(100,00)
35,88 8(34.78)
4(17.39)
11(47,83)
23(100.00)
42.59
SC/ST 1(20.00)
2(40.00)
2(40.00)
5(100.00)
83.33 2(16,67)
4(33,33)
6(50,00)
12(100,00)
63,16 1(33.33)
1(33.33)
1(33,33)
3(100.00)
60
1) Governmentcolleges Female 1
(14.29)2
(28.57)4
(57.14)7
(100.00)29.17 4
(26.67)7
(46.67)4
(26,67)15
(100.00)5,05 10
(43.48)6
(26.09)7
(30.43)23
(100.00)12.04
SC/ST 0(0.00)
2(66.67)
1(33.33)
3(100.00)
75 0(0.00)
0(0,00)
1(100,00)
1(100,00)
7,14 0(0.00)
2(50.00)
2(50.00)
4(100.00)
80
Male 8(9.76)
23(28.05)
51(62.20)
82(100.00)
60.74 15(20.55)
28(38,36)
30(41.10)
73(100,00)
54.89 34(37,36)
32(35.16)
25(27.47)
91(100.00)
71.65
SC/ST 0(0.00)
0(0,00}
1(100.00)
1(100.00)
16.67 2(40.00)
0(0,00)
3(60,00)
5(100,00)
31,25 1(33,33)
0(0.00)
2(66.67)
3(100.00)
42.86
2) Private Aidedcolleges Female 19
(18.81)36
(35.64)46
(45.54)101
(100.00)55.8 19
(19.19)34
(34,34)46
(46.46)99
(100.00)42,86 68
(44.44)57
(37.25)28
(18.30)153
(100.00)76.88
SC/ST 0(0.00)
0(0.00)
1(100.00)
1(100.00)
16.67 0(0.00)
0(0,00)
3(100,00)
3(100,00)
27.27 1(16.67)
2(33.33)
3(50.00)
6(100.00)
42.86
Male 0(0.00)
10(66.67)
5(33.33)
15(100.00)
71.43 8(32.00)
10(40,00)
7(28,00)
25(100,00)
40,98 7(22.58)
14(45.16)
10(32.26)
31(100.00)
67.39
SC/ST 0(0.00)
0(0.00)
0(0.00)
0(0.00)
0 0 - (0.00)
0(0,00)
1(100,00)
1(100,00)
50 1(50.00)
1(50.00)
0(0.00)
2(100.00)
100
3) Private Unaidedcolleges Female 5
(41.67)6
(50.00)1
(8.33)12
(100.00)52.17 6
(15.38)15
(38,46)18
(46,15)39
(100,00)31,71 50
(45.45)33
(30.00)27
(24.55)110
(100.00)67,48
SC/ST 0(0.00)
0(0.00)
0(0.00)
0(0.00)
0 1(20.00)
2(40,00)
2(40,00)
5(100,00)
71,43 0(0.00)
0(0.00)
4(100.00)
4(100.00)
30,77
Male 0(0.00)
0(0.00)
0(0.00)
0(0.00)
0 1(11.11)
5(55,56)
3(33,33)
9(100.00)
15.79 7(21.88)
22(68.75)
3(9,38)
32(100.00)
29.63
SC/ST 0(0.00)
0(0.00)
0(0.00)
0(0.00)
0 0(0.00)
1(50,00)
1(50.00)
2(100,00)
22,22 0(0.00)
3(75.00)
1(25.00)
4(100.00)
19.05
4) Universitycolleges Femaie 0
(0.00)0
(0.00)0
(0.00)0
(0.00)0 3
(30.00)3
(30,00)4
(40,00)10
(100,00)22.22 6
(37.50)9
(56,25)1
(6.25)16
(100.00)31.37
SC/ST 0(0.00)
0(0.00)
0(0.00)
0(0.00)
0 0(0.00)
1(50,00)
1(50,00)
2(100,00)
40 0(0.00)
0(0,00)
0(0.00)
0(0.00)
0
Source: Compiled and computed from the sample survey of colleges, conducted by the author, during March-Aprii, 2001.
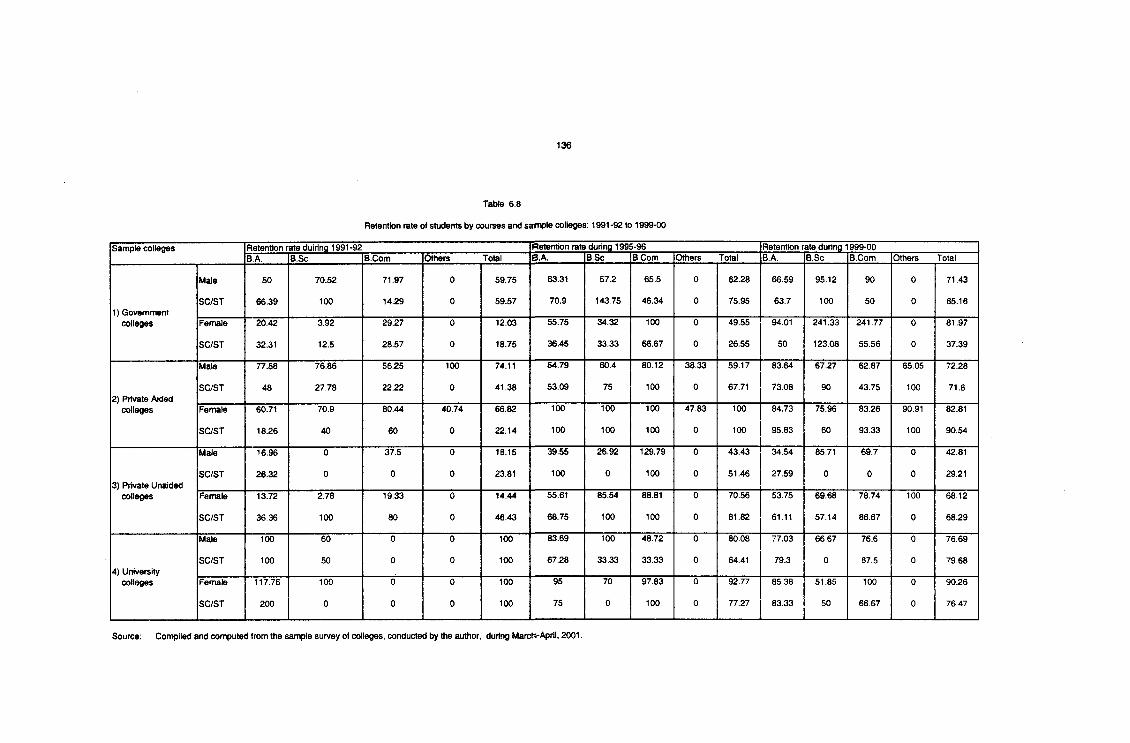
Retention rate of students by courses and sample colleges: 1991-92 to 1999-00
Sample colleges Retention rate duiring 1991-92 Retention rate during 1995-96 Retention rate during 1999-00BA. B.Sc B.Com Others Total B.A. B.Sc B.Com Others Total B.A. B.Sc B.Com Others Total
Male 50 70.52 71.97 0 59.75 63.31 572 65.5 0 62.28 66.59 95.12 90 0 71.43
1) GovernmentSC/ST 66.39 100 14.29 0 59.57 70.9 143.75 46.34 0 75.95 63.7 100 50 0 65.16
colleges Female 20.42 3.92 29.27 0 12.03 55.75 34.32 100 0 49.55 94.01 241.33 241.77 0 81.97
SC/ST 32.31 12.5 28.57 0 18.75 36.45 33.33 66.67 0 26.55 50 123.08 55.56 0 37.39
Male 77.58 76.86 56.25 100 74.11 54.79 60.4 80.12 38.33 59.17 83.64 67.27 62.87 65.05 72.28
2) Private AidedSC/ST 48 27.78 22.22 0 41.38 53.09 75 100 0 67.71 73.08 90 43.75 100 71.6
colleges Female 60.71 70.9 80.44 40.74 66.82 100 100 100 47,83 100 84.73 75.96 83.26 90.91 82.81
SC/ST 18.26 40 60 0 22.14 100 100 100 0 100 95.83 60 93.33 100 90.54
Male 16.96 0 37.5 0 18.15 39.55 26.92 129.79 0 43.43 34.54 85,71 69.7 0 42.81
3) Private UnaidedSC/ST 26.32 0 0 0 23.81 100 0 100 0 51.46 27,59 0 0 0 29.21
colleges Female 13.72 2.78 19.33 0 14.44 55.61 85.54 88.81 0 70.56 53.75 69.68 78.74 100 68.12
SC/ST 36.36 100 80 0 46.43 68.75 100 100 0 81.82 61.11 57.14 86.67 0 68.29
Male 100 60 0 0 100 83.69 100 48.72 0 80.08 77.03 66.67 76.6 0 76.69
4) UniversitySC/ST 100 50 0 0 100 67.28 33.33 33.33 0 64.41 79.3 0 87.5 0 79,68
colleges Female 117.76 100 0 0 100 95 70 97.83 0 92.77 85.38 51.85 100 0 90.26
SC/ST 200 0 0 0 100 75 0 100 0 77.27 83.33 50 66.67 0 76.47
Source: Connpited and computed from the sample survey of colleges, conducted by the author, during March-April, 2001.
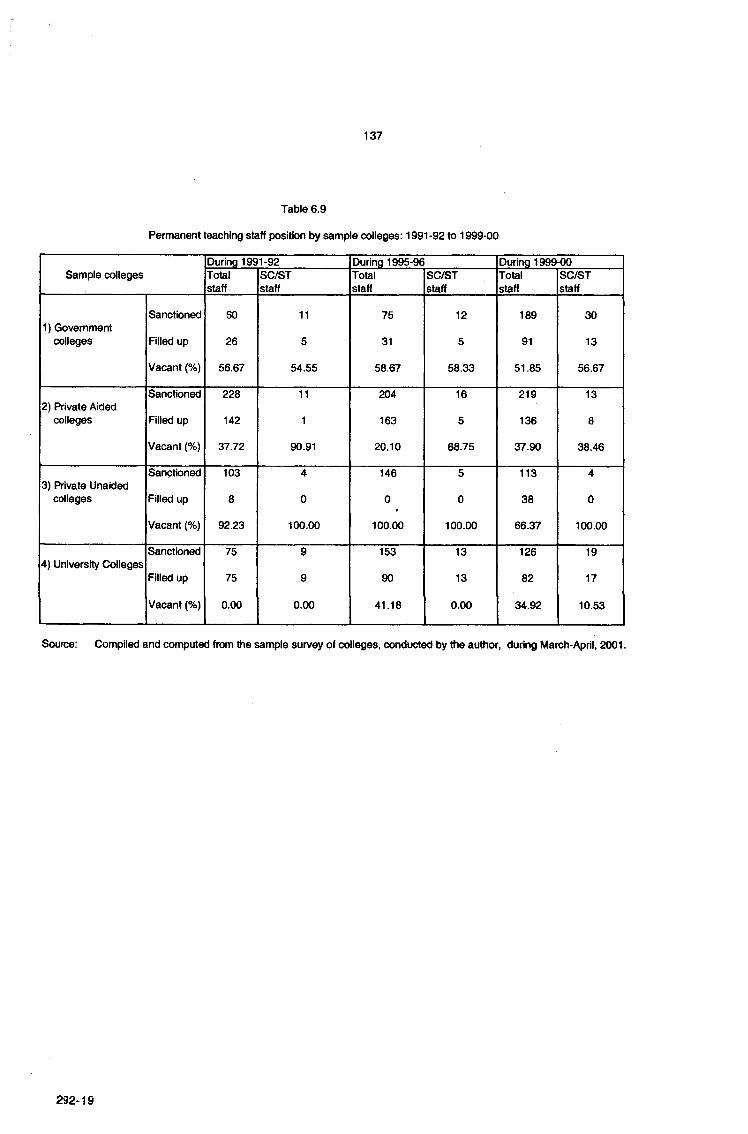
Permanent teaching staff position by sample colleges: 1991-92 to 1999-00
Sample collegesDuring 1991-92 During 1995-96 During 1999-00Totalstaff
SC/STstaff
Totalstaff
SC/STStaff
Totalstaff
SC/STStaff
Sanctioned 60 11 75 12 189 301) Government
colleges Filled up 26 5 31 5 91 13
Vacant (%) 56.67 54.55 58.67 58.33 51.85 56.67
Sanctioned 228 11 204 16 219 132) Private Aided
colleges Filled up 142 1 163 5 136 8
Vacant (%) 37.72 90.91 20.10 68.75 37.90 38.46
Sanctioned 103 4 146 5 113 43) Private Unaided
colleges Filled up 8 0 0 0 38 0
Vacant (%) 92.23 100.00 100.00 100.00 66.37 100.00
Sanctioned 75 9 153 13 126 194) University Colleges
Filled up 75 9 90 13 82 17
Vacant (%) 0.00 0.00 41.18 0.00 34.92 10.53
Source: Compiled and computed from the sample survey of colleges, conducted by tfie author, during March-April, 2001.
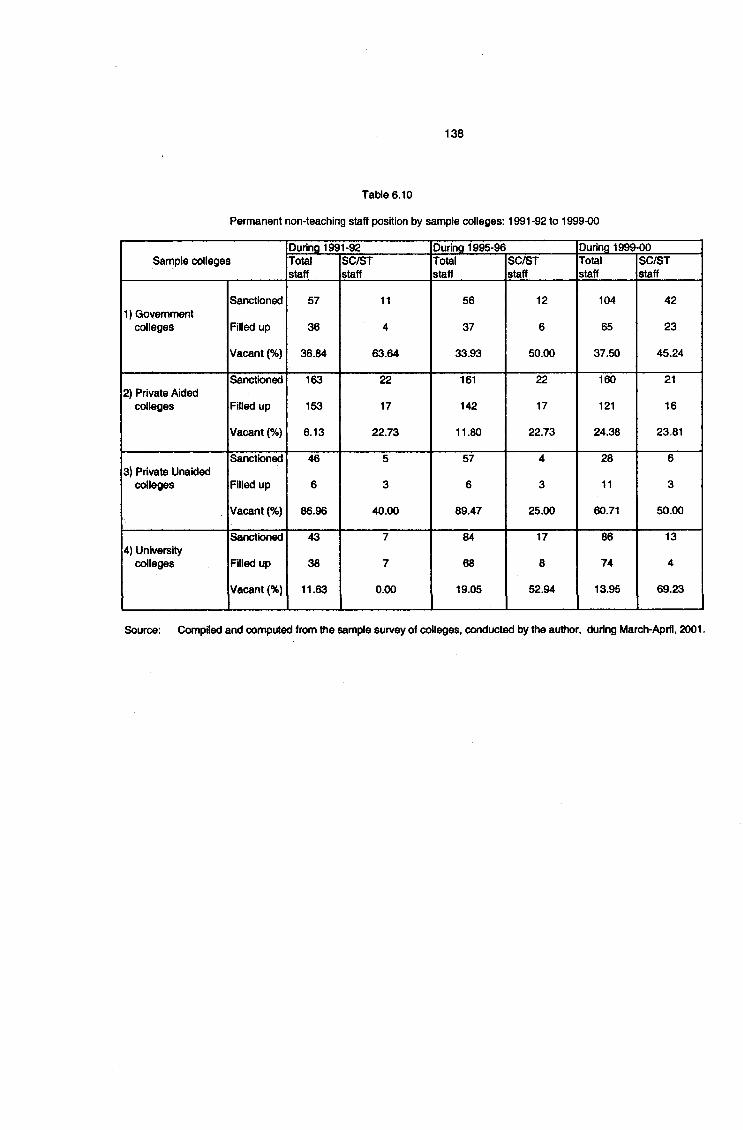
Permanent non-teaching staff position by sample colleges: 1991-92 to 1999-00
Sample collegesDuring 1991-92 During 1995-96 During 1999-00Totalstaff
SC/STStaff
Totalstaff
SC/STStaff
TotalStaff
SC/STStaff
Sanctioned 57 11 56 12 104 421) Government
colleges Filled up 36 4 37 6 65 23
Vacant (%) 36.84 63.64 33.93 50.00 37.50 45.24
Sanctioned 163 22 161 22 160 212) Private Aided
colleges Filled up 153 17 142 17 121 16
Vacant (%) 6.13 22.73 11.80 22.73 24.38 23.81
Sanctioned 46 5 57 4 28 63) Private Unaided
colleges Filled up 6 3 6 3 11 3
Vacant (%) 86.96 40.00 89.47 25.00 60.71 50.00
Sanctioned 43 7 84 17 86 134) University
colleges Filled up 38 7 68 8 74 4
Vacant (%) 11.63 0.00 19.05 52.94 13.95 69.23
Source: Compiled and connputed from the sample survey of colleges, conducted by the author, during March-April, 2001.
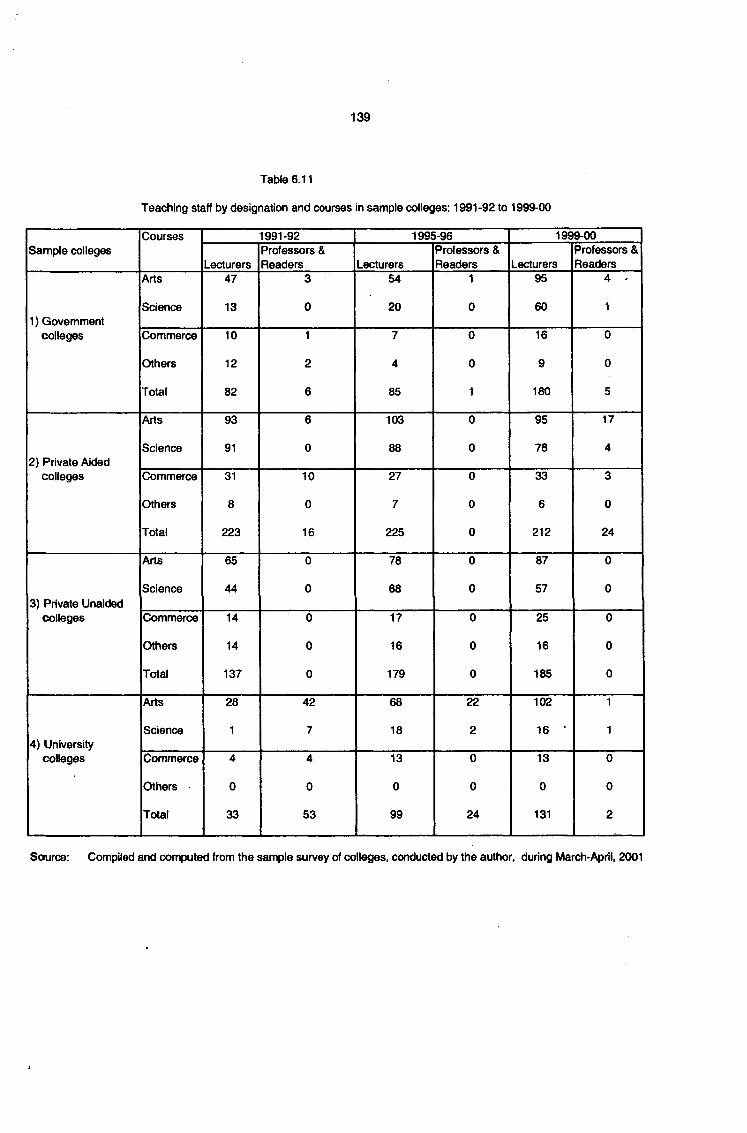
Teaching staff by designation and courses in sample colleges: 1991-92 to 1999-00
Courses 1991-92 1995-96 1999-00Sample colleges
LecturersProfessors & Readers Lecturers
Professors & Readers Lecturers
Professors & Readers
Arts 47 3 54 1 95 4 .
1) GovernmentScience 13 0 20 0 60 1
colleges Commerce 10 1 7 0 16 0
Others 12 2 4 0 9 0
Total 82 6 85 1 180 5
Arts 93 6 103 0 95 17
2) Private AidedScience 91 0 88 0 78 4
colleges Commerce 31 10 27 0 33 3
Others 8 0 7 0 6 0
Total 223 16 225 0 212 24
Arts 65 0 78 0 87 0
3) Private UnaidedScience 44 0 68 0 57 0
colleges Commerce 14 0 17 0 25 0
Others 14 0 16 0 16 0
Total 137 0 179 0 185 0
Arts 28 42 68 22 102 1
4) UniversityScience 1 7 18 2 16 ' 1
colleges Commerce 4 4 13 0 13 0
Others 0 0 0 0 0 0
Total 33 53 99 24 131 2
Source: Compiled and computed from the sample survey of colleges, conducted by the author, during March-April, 2001
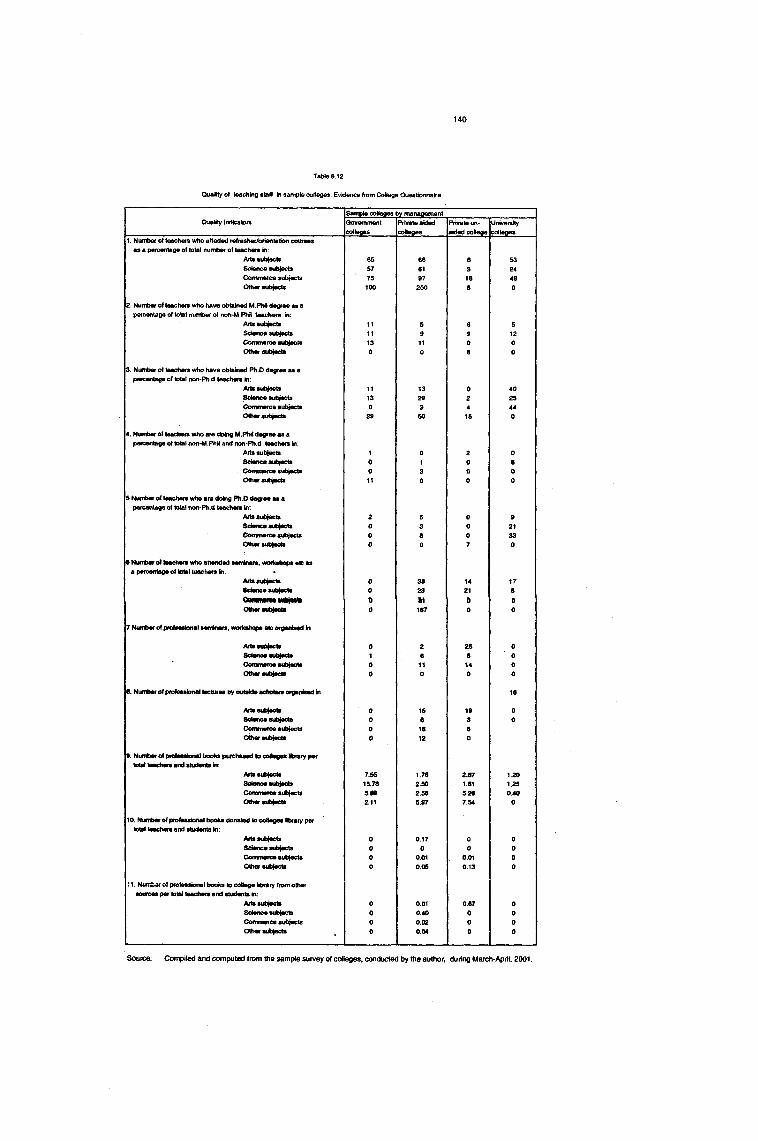
Quality of leaching »tatl In sample colleges: Evidence from CoHege Questionnaire
Sample colleges t>y managementQuaKty bidicalors Qovemment
collegesPrivate aided colleges
Private un- aUed college
Uruversitycolleges
1. Nuinber of teachara who atteded refresher/orientation courses as a percentage of total number of teacher* In:
Arts subjects 65 68 8 53Science subfects 57 61 3 24Comnerce subiects 75 97 18 48Other subjects 100 250 8 0
2. f^m berof teachers who have obtained M.PhU degree as apercentage of total number of non-M.Pha teachers In;
Alts subjects 11 5 6 5Sciance subjects 11 9 9 12Commerce subjects 13 11 0 0Other subject*
3. Number of teachers wfio have obtained Ph.O degree as a
0 0 8 0
percentage of total non-Ph.d teachers in;Arts subjects 11 13 0 40Science suijjects 13 29 2 25Commerce sutqects 0 3 4 44Other sutijact* 29 50 15 0
4. Nurrtwr of teachers w in are doing M.Pfd degree as a percentage of total non-IM.Phil and non-Ph.d teactiers In:
ArtssuMects 1 0 2 0Scianca subjects 0 1 0 8Commerce sut^ects 0 3 0 0Other subjects 11 0 0 0
5 Number of leacftar* wfio are doing Ph.O degree as a percmtdge of total non-Ph.d teachan In;
Aitssubjaet* 2 5 0 9Scienee subject* 0 3 0 21Commerce subjects 0 8 0 33Other sut^ect* 0 0 7 0
8 Number at Isachet* who attended sembiar*. wotfc*hep( etc as a percentage of total teachers in: '
Artsaubjeds 0 38 14 17Sdanee sid^ects 0
02381
210
80
Other aubjads 0 187 0 0
7 Nurrber of professional seminars, workshope ale organised In
Afts*ubjecl* 0 2 25 0Sciano«subi«:to 1 6 8 0Commaroa sutqect* 0 11 14 0Other aubjecto 0 0 0 0
18
Arts subjects 0 15 19 0Sdance subjects 0 8 3 0Commerce sulqscts 0 18 8Other wA^ects 0 12 0
9. Number of protetslonal books purchased to ooOeges Nbraiy per total taachers and students in:
Arts subjects 7.55 1.78 2.87 1.20Sciance subjects 15.78 2.S0 1.81 1.25Commerce subjects 5.89 2.58 5.26 0.40Other subjects 2.11 5.97 7.54 0
10. NurriMr of professional books donated to college* Mxary per total teacfiers and students In:
Artsaubjects 0 0.17 0 0Sdance subjects 0 0 0 0Commerce subjects 0 0.01 0.01 0Other subject* 0 0.05 0.13 0
11. Nui^ber of proiinskinal books to colege tbtary from other source* per total teachers and student* kt:
Art**ubject* 0 0.01 0.87 0Science *ut4ects 0 0.40 0 0Commerce subjects 0 0.02 0 0Other subjects 0 0.04 0 0
Source; Compiled and computed from the sample survey o( colleges, conducted Ijy the author, during March-April, 2001.
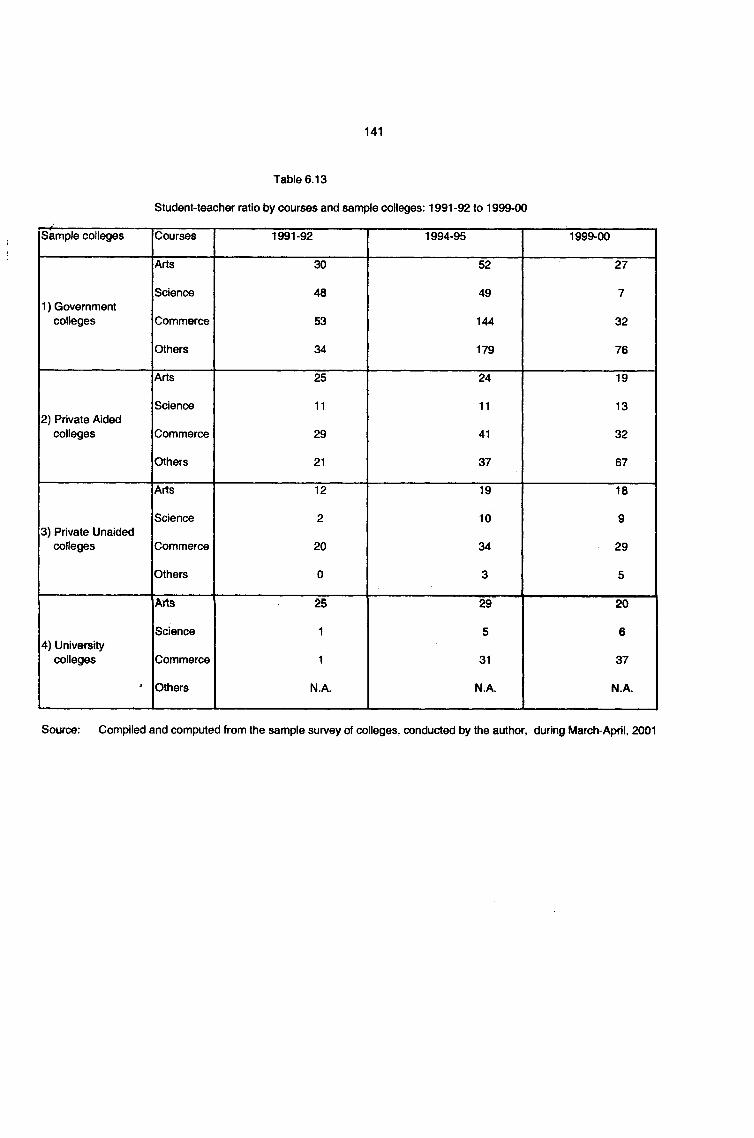
Student-teacher ratio by courses and sample colleges: 1991-92 to 1999-00
Sample colleges Courses 1991-92 1994-95 1999-00
Arts 30 52 27
Science 48 49 71) Government
colleges Commerce 53 144 32
Others 34 179 76
Arts 25 24 19
Science 11 11 132) Private Aided
colleges Commerce 29 41 32
Others 21 37 67
Arts 12 19 18
Science 2 10 93) Private Unaided
colleges Commerce 20 34 29
Others 0 3 5
Arts 25 29 20
Science 1 5 64) University
colleges Commerce 1 31 37
Others N.A. N.A. N.A.
Source: Compiled and computed from the sample survey of colleges, conducted by the author, during March-April, 2001
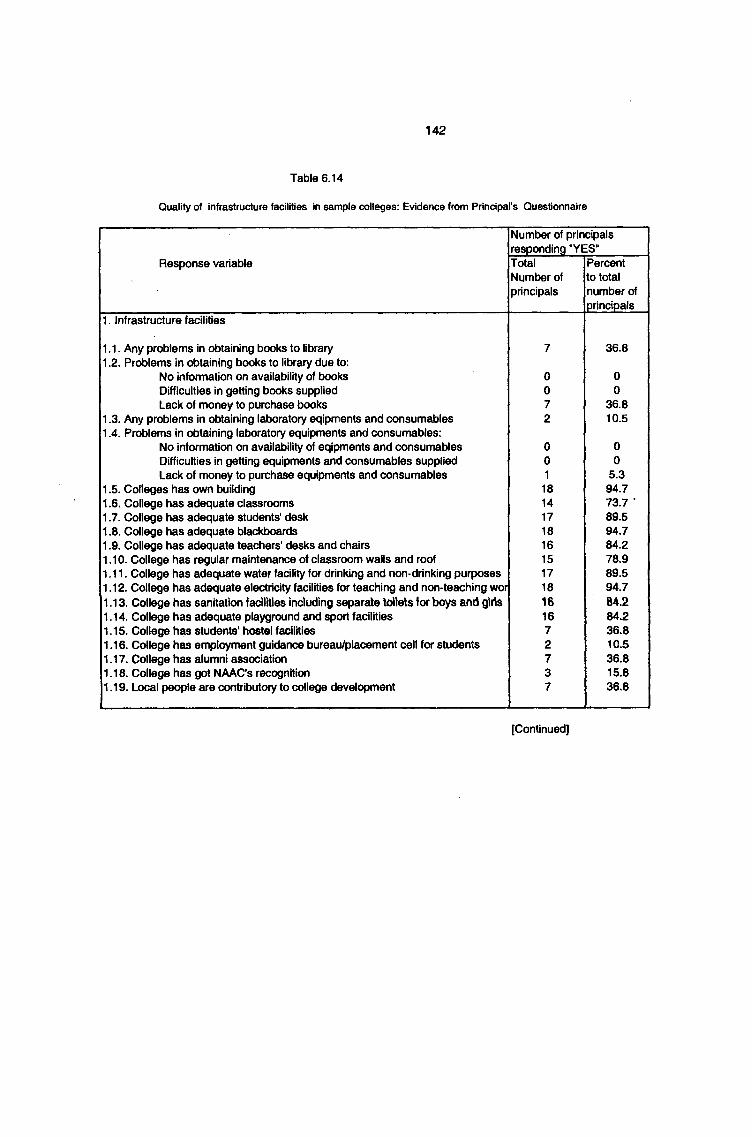
Quality of infrastructure facilities in sample colleges: Evidence from Principal's Questionnaire
Response variable
Number of principals responding ”YES“Total Number of principals
Percent to total number of principals
1. Infrastructure facilities
1.1. Any problems in obtaining books to library1.2. Problems in obtaining books to library due to:
No information on availability of books Difficulties in getting books supplied Lack of money to purchase books
1.3. Any problems in obtaining laboratory eqipments and consumables1.4. Problems in obtaining laboratory equipments and consumables:
No information on availability of eqipments and consumables Difficulties in getting equipments and consumables supplied Lack of money to purchase equipments and consumables
1.5. Colleges has own building1.6. College has adequate classrooms1.7. College has adequate students' desk1.8. College has adequate blackboards1.9. College has adequate teachers' desks and chairs1.10. College has regular maintenance of classroom walls and roof1.11. College has adequate water facility for drinking and non-drinking purposes1.12. College has adequate electricity facilities for teaching and non-teaching wor1.13. College has sanitation facilities induding separate toilets tor boys and girts1.14. College has adequate playground and sport facilities1.15. College has students' hostel facilities1.16. College has employment guidance bureau/placement cell for students1.17. College has alumni association1.18. College has got NAAC's recognition1.19. Local people are contributory to college development
0072
00118141718 1615171816 16 7 2 7 3 7
36.8
00
36.810.5
00
5.394.773.789.594.784.278.989.594.784.284.236.810.536.815.836.8
[Continued]
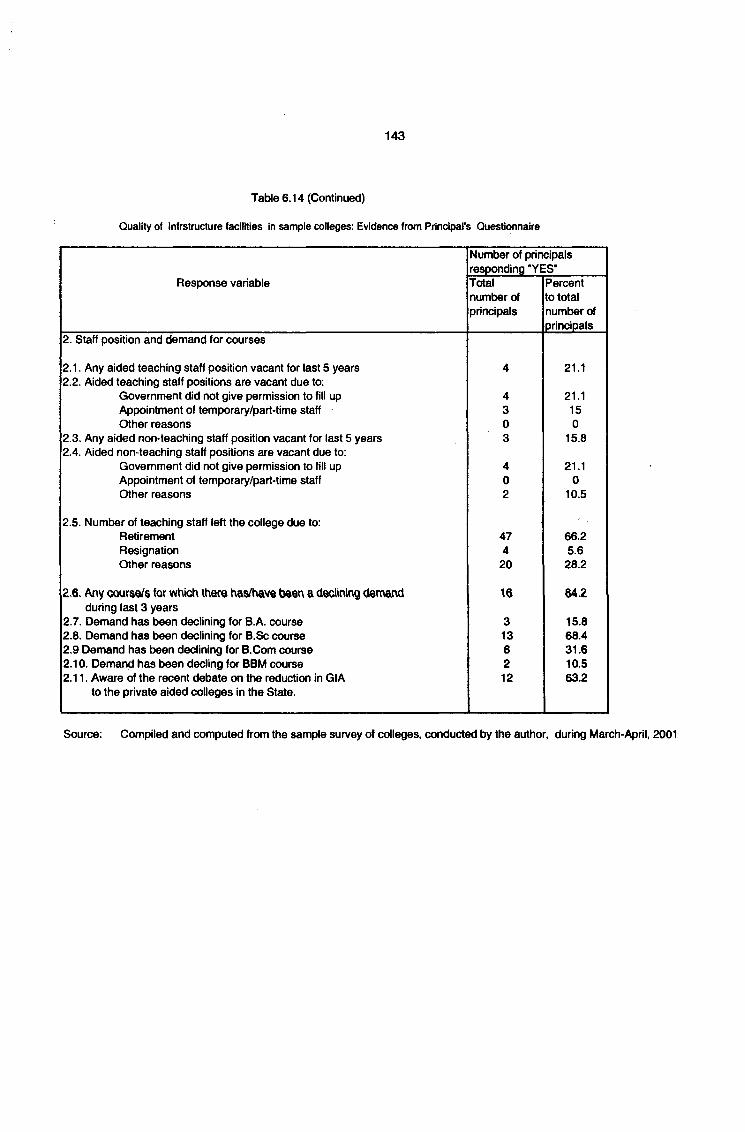
Quality of infrstructure facilities in sample colleges: Evidence from Principal's Questionnaire
Number of principals responding "YES"
Response variable Totalnumber of principals
Percent to total number of principals
2. Staff position and demand for courses
2.1. Any aided teaching staff position vacant for last 5 years 4 21.12.2. Aided teaching staff positions are vacant due to;
Government did not give permission to fill up 4 21.1Appointment of temporary/part-time staff 3 15Other reasons 0 0
2.3. Any aided non-teaching staff position vacant for last 5 years 3 15.82.4. Aided non-teaching staff positions are vacant due to:
Government did not give permission to fill up 4 21.1Appointment of temporary/part-time staff 0 0Other reasons 2 10.5
2.5. Number of teaching staff left the college due to: Retirement 47 66.2Resignation 4 5.6Other reasons 20 28.2
2.6. Any courso/s for which there has/have been a declining demand 16 84.2during last 3 years
2.7. Demand has been declining for B.A. course 3 15.82.8. Demand has been declining for B.Sc course 13 68.42.9 Demand has been declining for B.Com course 6 31.62.10. Demand has been decling for BBM course 2 10.52.11. Aware of the recent debate on the reduction in GIA 12 63.2
to the private aided colleges in the State.
Source: Compiled and computed from the sample survey of colleges, conducted by the author, during March-April, 2001
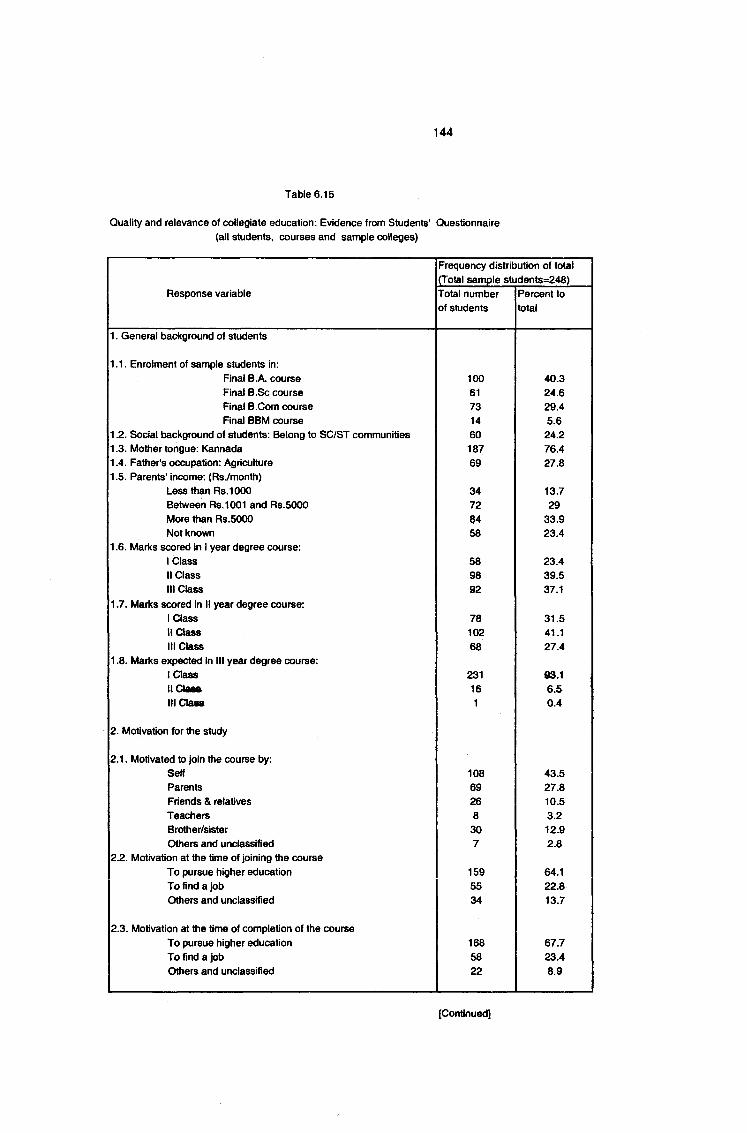
Frequency distribution of total (Total sample students=248)
Response variable Total number of students
Percent to total
1. General background of students
1.1. Enrolment of sample students in:Final B.A. course 100 40.3Final B.Sc course 61 24.6Final B.Com course 73 29.4Final BBM course 14 5.6
1.2. Social background of students; Belong to SC/ST communities 60 24.21.3. Mother tongue: Kannada 187 76.41.4. Father's occupation; Agriculture 69 27.81.5. Parents' income: (RsVmonth)
Less than Rs.1000 34 13.7Between Rs.1001 and Rs.5000 72 29More than Rs.5000 84 33.9Not known 58 23.4
1.6. Marks scored irv 1 year degree course:1 Class 58 23.4II Class 98 39.5III Class 92 37.1
1.7. Marks scored in II year degree course;1 Class 78 31.511 Class 102 41.1III Class 68 27.4
1.8. Marks expected in III year degree course:1 Class 231 S3.111 Ctasft 16 6.5III Ctasa 1 0.4
2. Motivation for the study
2.1. Motivated to join the course by:Self 108 43.5Parents 69 27.8Friends & relatives 26 10.5Teachers 8 3.2Brother/sister 30 12.9Others and unclassified 7 2.8
2.2. Motivation at the time of joining the courseTo pursue higher education 159 64.1To find a job 55 22.8Others and unclassified 34 13.7
2.3. Motivation at the time of completion of the courseTo pursue higher education 168 67.7To find a Job 58 23.4Others and unclassified 22 8.9
[Continued]
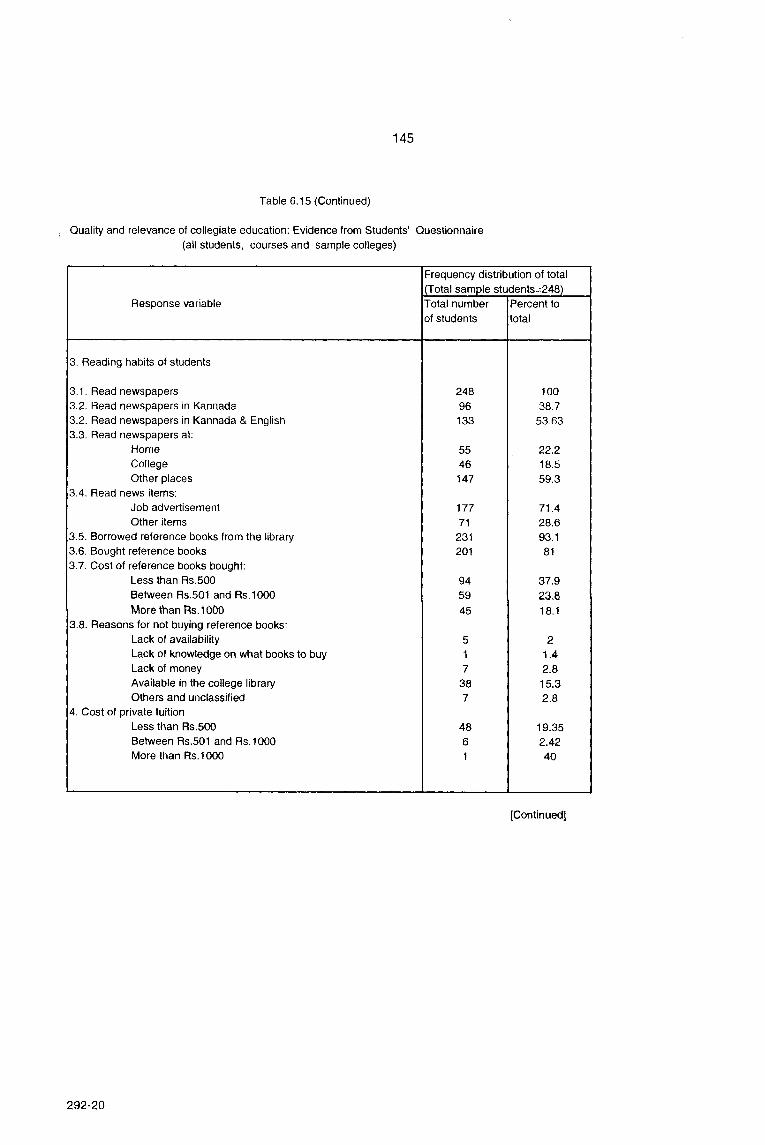
Frequency distribution of total (Total sample students=248)
Response variable Total number of students
Percent to total
3. Reading habits of students
3.1. Read newspapers 248 1003.2. Read newspapers in Kannada 96 38.73.2. Read newspapers in Kannada & English 133 53.633.3. Read newspapers at;
Home 55 22.2College 46 18.5Other places 147 59.3
3.4. Read news items;Job advertisement 177 71.4Other items 71 28.6
3.5. Borrowed reference books from the library 231 93.13.6. Bought reference books 201 813.7. Cost of reference books bought;
Less than Rs.500 94 37.9Between Rs.501 and Rs.1000 59 23,8More than Rs.1000 45 18.1
3.8. Reasons for not buying reference books;Lack of availability 5 2Lack of knowledge on what books to buy 1 1.4Lack of money 7 2.8Available in the college library 38 15.3Others and unclassified 7 2.8
4. Cost of private tuitionLess than Rs.500 48 19.35Between Rs.501 and Rs.1000 6 2.42More than Rs.1000 1 40
[Continued]
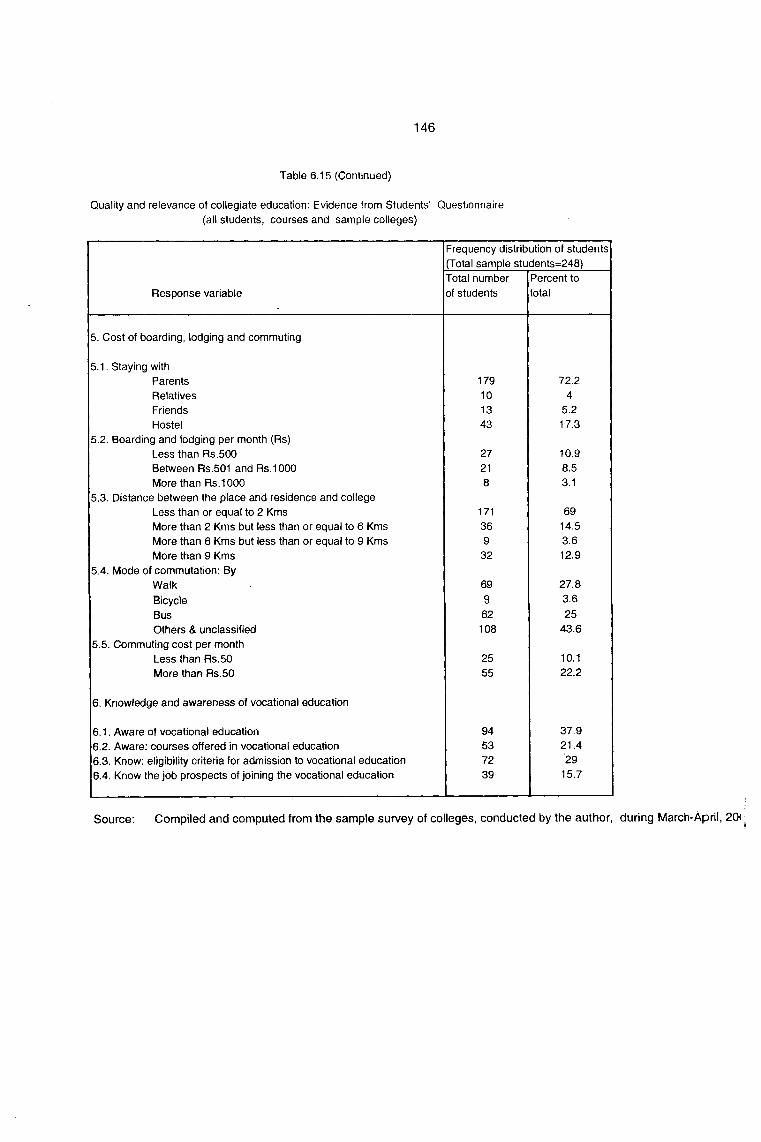
Frequency distribution of students (Total sample students=248)
Response variableTotal number of students
Percent to total
5. Cost of boarding, lodging and commuting
5.1. Staying withParents 179 72.2Relatives 10 4Friends 13 5.2Hostel 43 17.3
5.2. Boarding and lodging per month (Rs)Less than Rs.500 27 10.9Between Rs.501 and Rs.1000 21 8.5More than Rs.1000 8 3.1
5.3. Distance between the place and residence and collegeLess than or equal to 2 Kms 171 69More than 2 Kms but less than or equal to 6 Kms 36 14.5More than 6 Kms but less than or equal to 9 Kms 9 3.6More than 9 Kms 32 12.9
5.4. Mode of commutation: ByWalk 69 27.8Bicycle 9 3,6Bus 62 25Others & unclassified 108 43.6
5.5. Commuting cost per monthLess than Rs.50 25 10.1More than Rs.50 55 22.2
6. Knowledge and awareness of vocational education
6.1. Aware of vocational education 94 37.96.2. Aware; courses offered in vocational education 53 21.46.3. Know; eligibility criteria for admission to vocational education 72 296.4. Know the job prospects of joining the vocational education 39 15.7
Source; Compiled and computed from the sample survey of colleges, conducted by the author, during March-April, 20<:
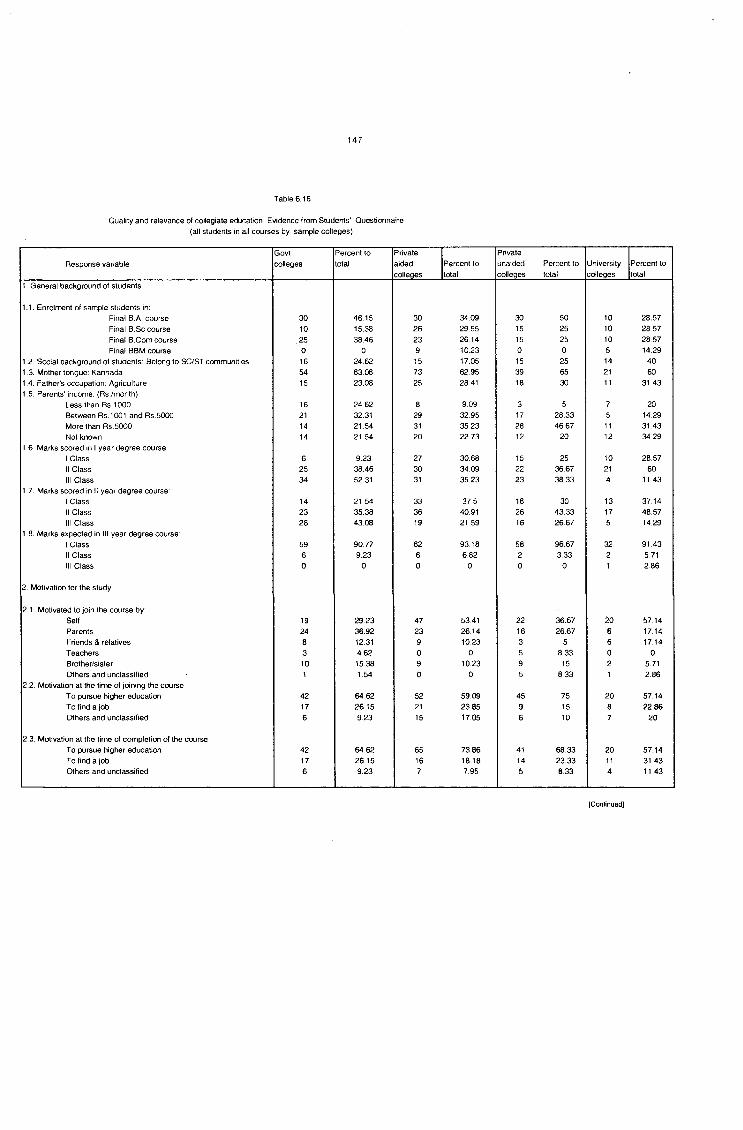
Response variableGovtcolleges
Percent to total
Privateaidedcolleges
Percent to total
Privateunaidedcolleges
Percent to total
Universitycolleges
Percent to total
1. General background of students
1.1. Enrolment of sample students in:Final B.A. course 30 46.15 30 34.09 30 50 10 28.57Final B.Sc course 10 15.38 26 29.55 15 25 10 28.57Final B.Com course .25 38.46 23 26.14 15 25 10 28.57Final BBI^ course 0 0 9 10.23 0 0 5 14.29
1.2. Social background of students: Belong to SC/ST communities 16 24 62 15 17.05 15 25 14 401.3. Mother tongue: Kannada 54 83.08 73 62 95 39 65 21 601 4. Father's occupation: Agriculture 15 23.08 25 28.41 18 30 11 31.431.5. Parents' income: (Rs./month)
Less than Rs 1000 16 24.62 8 9.09 3 5 7 20Between Rs.1001 and Rs.5000 21 32.31 29 32.95 17 28.33 5 14.29More than Rs.5000 14 21 54 31 35 23 28 4667 11 31 43Not known 14 21.54 20 22 73 12 20 12 34.29
1 6 Marks scored in 1 year degree course:1 Class 6 923 27 30 68 15 25 10 28.57II Class 25 38.46 30 34.09 22 36.67 21 60III Class 34 52.31 31 35.23 23 38 33 4 11.43
1.7. Marks scored in II year degree course:1 Class 14 21 54 33 37 5 18 30 13 37.14II Class 23 35.38 36 40.91 26 43.33 17 48.57III Class 28 43.08 19 21 59 16 26.67 5 14.29
1.8. Marks expected in III year degree course:1 Class 59 90.77 82 93.18 58 96,67 32 91 43II Class 6 9.23 6 6 82 2 3.33 2 5 71III Class 0 0 0 0 0 0 1 2.86
2 Motivation for the study
2.1. Motivated to join the course by: Self 19 29.23 47 5341 22 36.67 20 57.14Parents 24 36.92 23 26 14 16 26.67 6 17.14Friends & relatives 8 12.31 9 1023 3 5 6 17.14Teachers 3 4.62 0 0 5 8.33 0 0Brother/sister 10 15.38 9 10.23 9 15 2 5.71Others and unclassified 1 1 54 0 0 5 8.33 1 2.86
2.2. Motivation at the time of joining the courseTo pursue higher education 42 64.62 52 59.09 45 75 20 57.14To find a job 17 26.15 21 23.85 9 15 8 22.86Others and unclassified 6 9.23 15 17 05 6 10 7 20
2.3. Motivation at the time of completion of the courseTo pursue higher education 42 64.62 65 73.86 41 68.33 20 57.14To find a job 17 26.15 16 18.18 14 23.33 11 31.43Others and unclassified 6 9.23 7 7.95 5 8.33 4 11.43
[Continuedl

Tatile 6,16 (Continued)
Response variableGovt.colleges
Percent to total
Privateaidedcolleges
Percent to total
Privateunaidedcolleges
Percent to total
Universitycolleges
Percent to total
3. Reading habits of students
3.1. Read newspapers 65 100 88 100 60 100 35 1003.2 Read newspapers in Kannada 26 40 27 30.68 32 53,33 11 31.433.2. Read newspapers in Kannada & English 33 50.77 53 60.23 25 41 67 22 62 863.3 Read newspapers at:
Home 16 24.62 20 22.73 15 25 4 11 43College 8 12,31 14 15.91 13 21.67 11 31.43Other places
3.4. Read news items:41 63.08 54 61.36 32 53 33 20 57,14
Job advertisement 50 76.92 59 67 05 42 70 26 74,29Other items 15 23.08 29 -32.95 18 30 9 25,71
3.5. Borrowed reference books from the library 56 86.15 87 98.86 57 95 31 88573.6, Bought reference books 56 86.15 66 75 50 83 33 29 82 863.7, Cost of reference books bought:
Less than Rs 500 25 38,46 32 36.36 26 43 33 11 31,43Between Rs,501 and Rs.1000 20 30,77 21 23.86 9 15 9 25,71More than Rs 1000 9 13.85 13 14.77 14 23.33 9 25,71
3.8. Reasons for not buying reference tx)0ks:Lack of availability 2 3,08 2 2.27 0 0 1 2 86Lack of knowledge on what books to buy 1 1.54 0 0 0 0 0 0Lack of money 3 4.62 4 4.55 0 0 0 0Available in the college library 6 9.23 18 20.45 8 13.33 6 17,14Others and unclassified 1 1.54 3 3.41 2 3.33 1 2 86
4. Cost of private tuitionLess than Rs.500 10 15.38 29 32.14 4 6.6 5 14.29Between Rs.501 and Rs.1000 0 0 0 0 5 8 34 1 2 85More than Rs.1000 0 0 1 1.14 0 0 0 0
5. Cost of boarding, lodging and commuting 5.1. Staying with
Parents 47 72.31 68 77.27 50 83.33 14 404 3 341 1 VS7 2 S>7’i
Friends 2 3.08 2 2.27 8 13 33 1 2 86Hostel 11 16.92 13 14.77 1 1 67 18 51 43
5.2. Boarding and lodging per month (Rs)Less than Rs.500 7 10.77 13 14.77 7 11 67 0 0Between Rs.501 and Rs.1000 1 1.54 2 2.27 0 0 18 51 43More than Rs.1000 5 7.69 0 0 2 3.33 1 2 86
5.3. Distance between the place and residence and collegeLess than or equal to 2 Kms 52 80 48 54.55 51 85 20 57,14More than 2 Knrts but less than or equal to 6 Kms 5 7.69 24 27 27 2 333 5 14,29More than 6 Kms but less than or equal to 9 Kms 0 0 6 6.82 1 1 67 2 5.71More than 9 Kms 8 12.31 10 11 36 6 10 8 22 86
5.4. Mode of commutation: ByWalk 14 21.54 24 27.27 12 20 19 54 29Bicycle 4 6,15 2 2.27 2 3.33 1 2 86Bus 9 13.85 33 37.5 8 13.33 12 34 29Others & unclassified 38 58.46 29 32.95 38 63.33 3 857
5.5. Commuting cost per monthLess than Rs.50 6 9.23 12 13.64 0 0 7 20More than Rs.50 5 7.69 33 37.5 9 15 8 22.86
6. Knowledge and awareness of vocational education6.1. Aware of vocational education 21 32,31 34 38.64 26 43.33 13 37 146.2. Aware: courses offered in vocational education 15 23,08 16 18.18 11 18.33 11 31.436.3. Know: eligibility criteria for admission to vocational education 18 27.69 22 25 19 31.67 13 37.146.4. Know the job prospects of joining the vocational education 8 12.31 8 9.09 11 18.33 12 34 29
Source: Compiled and computed from tlie sample survey of colleges, conducted by ttie autlior, during March-April, 2001.
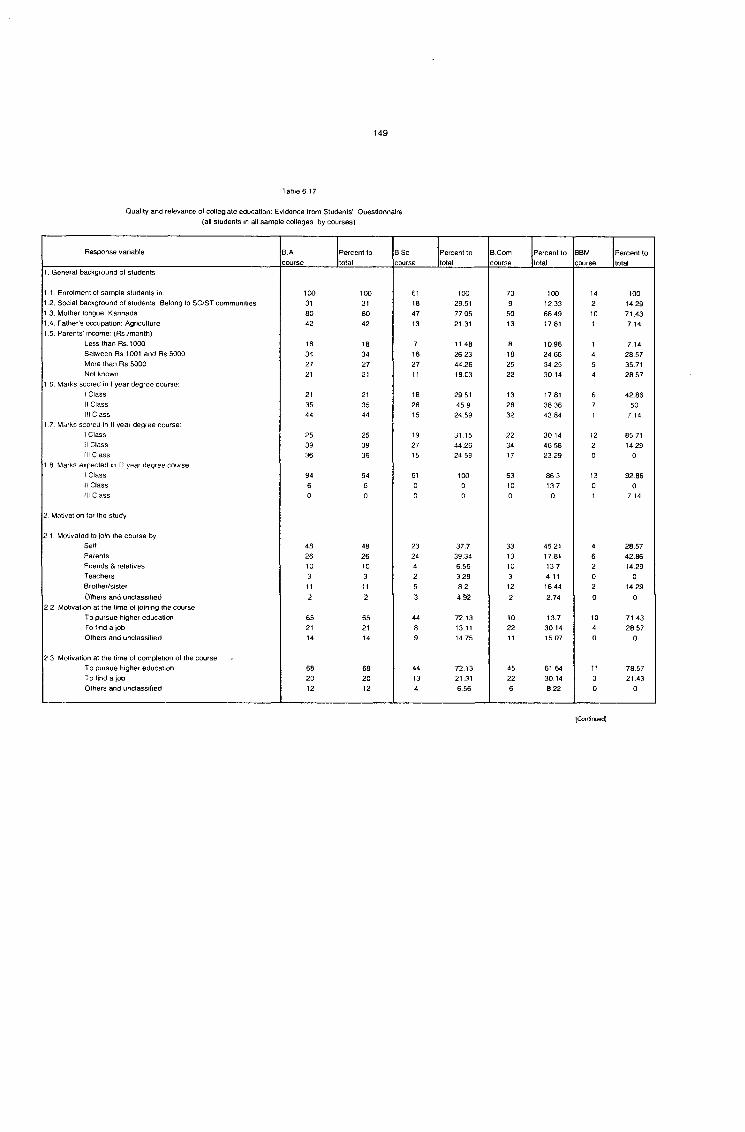
Response variable B.Acourse
Percent to total
B.Sccourse
Percent to total
B Com course
Percent to total
BBMcourse
Percent to total
1. General background of students
1.1. Enrolment of sample students in: 100 100 61 100 73 100 14 1001.2. Social background of students: Belong to SC/ST communities 31 31 18 29.51 9 12.33 2 14.291.3. Mother tongue: Kannada 80 80 47 77.05 50 68.49 10 71.431.4. Father's occupation: Agriculture 42 42 13 21.31 13 17.81 1 7.141.5. Parents' income: (Rs./month)
Less than Rs.1000 18 18 7 11.48 8 10 96 1 7.14Between Rs.1001 and Rs.5000 34 34 16 26 23 18 24 66 4 28.57More than Rs.5000 27 27 27 44.26 25 34.25 5 35,71Not known 21 21 11 18.03 22 30.14 4 2857
1 -6. Marks scored in 1 year degree course:1 Class 21 21 18 29.51 13 17 81 6 42,86II Class 35 35 28 45.9 28 38 36 7 50III Class 44 44 15 24,59 32 43.84 1 7,14
1.7. Marks scored in II year degree course:1 Class 25 25 19 31.15 22 30 14 12 85 7111 Class 39 39 27 44.26 34 46 58 2 14 29III Class 36 36 15 24.59 17 23 29 0 0
1.8 Marks expected in lit year degree course:1 Class 94 94 61 100 63 86 3 13 92,86II Class 6 6 0 0 10 13.7 0 0III Class 0 0 0 0 0 0 1 7 14
2. Motivation for the study
2,1. Motivated to join the course by:Self 48 48 23 37.7 33 45.21 4 28 57Parents 26 26 24 39.34 13 17 81 6 42.86Friends & relatives 10 10 4 6.56 10 13 7 2 14 29Teachers 3 3 2 3.28 3 4.11 0 0Brother/sister 11 11 5 82 12 16.44 2 14 29Others and unclassffied 2 2 3 4,92 2 2 74 0 0
2.2 Motivation at the time of joining the courseTo pursue higher education 65 65 44 72.13 10 13,7 10 71 43To find a job 21 21 8 13.11 22 30 14 4 28.57Others and unclassified 14 14 9 14.75 11 15.07 0 0
2.3 Motivation at the time of completion of the courseTo pursue higher education 68 68 44 72.13 45 61 64 11 7857To find a job 20 20 13 21.31 22 30.14 3 21,43Others and unclassified 12 12 4 6.56 6 8.22 0 0
(Continued)
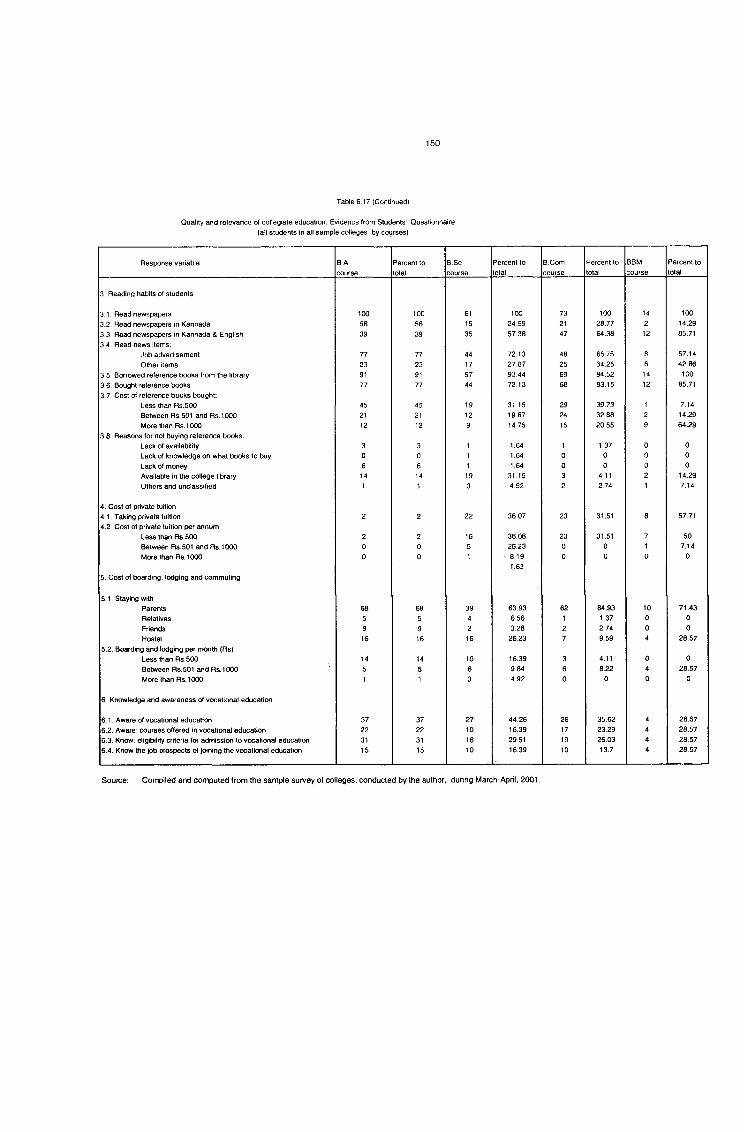
Response variable BAcourse
Percent to total
B,Sccourse
Percent to total
B.Comcourse
Percent to total
BBMcourse
Percent to total
3. Reading habits of students
3,1. Read newspapers 100 100 61 100 73 100 14 1003.2. Read newspapers in Kannada 58 58 15 24.59 21 28.77 2 14.293.3. Read newspapers in Kannada & English 39 39 35 57.38 47 64,38 12 85.713.4 Read news items:
Job advertisement 77 77 44 72.13 48 65,75 8 57,14Other items 23 23 17 27 87 25 34,25 6 42,86
3.5. Borrowed reference tx)oks from the library 91 91 57 93.44 69 94,52 14 1003 6 Bought reference books 77 77 44 72.13 68 93,15 12 85,713.7 Cost of reference books bought;
Less than Rs.500 45 45 19 31 15 29 39,73 1 7,14Between Rs.501 and Rs.1000 21 21 12 19 67 24 32,88 2 14,29fvtore than Rs.1000 12 12 9 14 75 15 20,55 9 64.29
3.8. Reasons for not buying reference tX K jks ;
Lack of availability 3 3 1 1.64 1 1.37 0 0Lack of knowledge on what txx>ks to buy 0 0 1 1.64 0 0 0 0Lack of money 6 6 1 1.64 0 0 0 0Available in the college library 14 14 19 31.15 3 4.11 2 14.29Others and unclassified 1 1 3 4.92 2 2.74 1 7.14
4. Cost of private tuition4.1. Taking private tuition 2 2 22 36.07 23 31.51 8 57.714.2. Cost of private tuition per annum
Less than Rs.500 2 2 16 36.06 23 31.51 7 50Between Rs.501 and Rs.1000 0 0 5 26.23 0 0 1 7.14Ikflore than Rs.1000 0 0 1 8.19
1.630 0 0 0
5. Cost of boarding, lodging and commuting
5.1. Staying withParents 68 68 39 63,93 62 84.93 10 71.43Relatives 5 5 4 6,56 1 1.37 0 0Friends 9 9 2 3,28 2 2.74 0 0Hostel 16 16 16 26.23 7 9.59 4 28.57
5.2. Boarding and lodging per month (Rs)Less than Rs.500 14 14 10 16.39 3 4.11 0 0Between Rs.501 and Rs.1000 5 5 6 9.84 6 8.22 4 28.57More than Rs.1000 1 1 3 4.92 0 0 0 0
6. Knowledge and awareness of vocationeil education
6.1. Aware of vocational education 37 37 27 44.26 26 35.62 4 28.576.2. Aware: courses offered In vocational education 22 22 10 16,39 17 23.29 4 28.576.3, Know; eligit3ility criteria for admission to vocational education 31 31 18 29.51 19 26.03 4 28.576.4. Know the job prospects of joining the vocational education 15 15 10 16.39 10 13.7 4 28.57
Source: Compiled and computed from the sample survey of colleges, conducted by the author, during March-April, 2001.
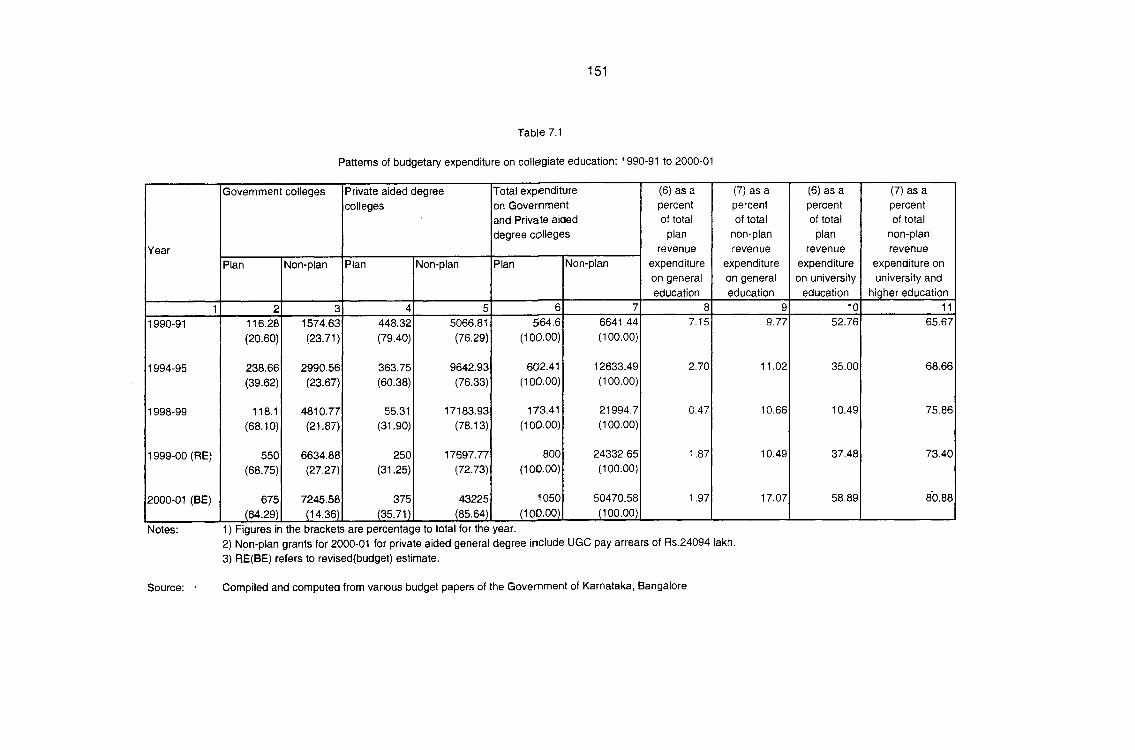
Patterns of budgetary expenditure on collegiate education: 1990-91 to 2000-01
Year
Government colleges Private aided degree colleges
Total expenditure on Government and Private aided degree colleges
(6) as a percent of total
plan revenue
(7) as a percent of total
non-plan revenue
(6) as a percent of total
plan revenue
(7) as a percent of total
non-plan revenue
Plan Non-plan Plan Non-plan Plan Non-plan expenditure on general education
expenditure on general education
expenditure on university
education
expenditure on university and
higher education1 2 3 4 5 6 7 8 9 10 11
1990-91 116.28(20.60)
1574.63(23.71)
448.32(79.40)
5066.81(76.29)
564.6(100.00)
6641.44(100.00)
7.15 9.77 52.76 65.67
1994-95 238.66(39.62)
2990.56(23.67)
363.75(60.38)
9642.93(76.33)
602.41(100.00)
12633.49(100.00)
2.70 11,02 35.00 68.66
1998-99 118.1(68.10)
4810.77 (21.87)
55.31(31.90)
17183.93(78.13)
173.41(100.00)
21994.7(100.00)
0.47 10.66 10.49 75.86
1999-00 (RE) 550(68.75)
6634.88(27.27)
250 (31.25)
17697.77(72.73)
800(100.00)
24332.65(100.00)
1.87 10.49 37.48 73.40
2000-01 (BE) 675(64.29)
7245.58(14.36)
375(35.71)
43225(85.64)
1050(100.00)
50470.58(100.00)
1.97 17.07 58.89 80.88
Notes: 1) Figures in the braci<ets are percentage to total for the year.2) Non-plan grants for 2000-01 for private aided general degree imclude UGC pay arrears of Rs,24094 lakh.3) RE(BE) refers to revised(budget) estimate.
Source: Compiled and computed from various budget papers of the Government of Karnataka, Bangalore
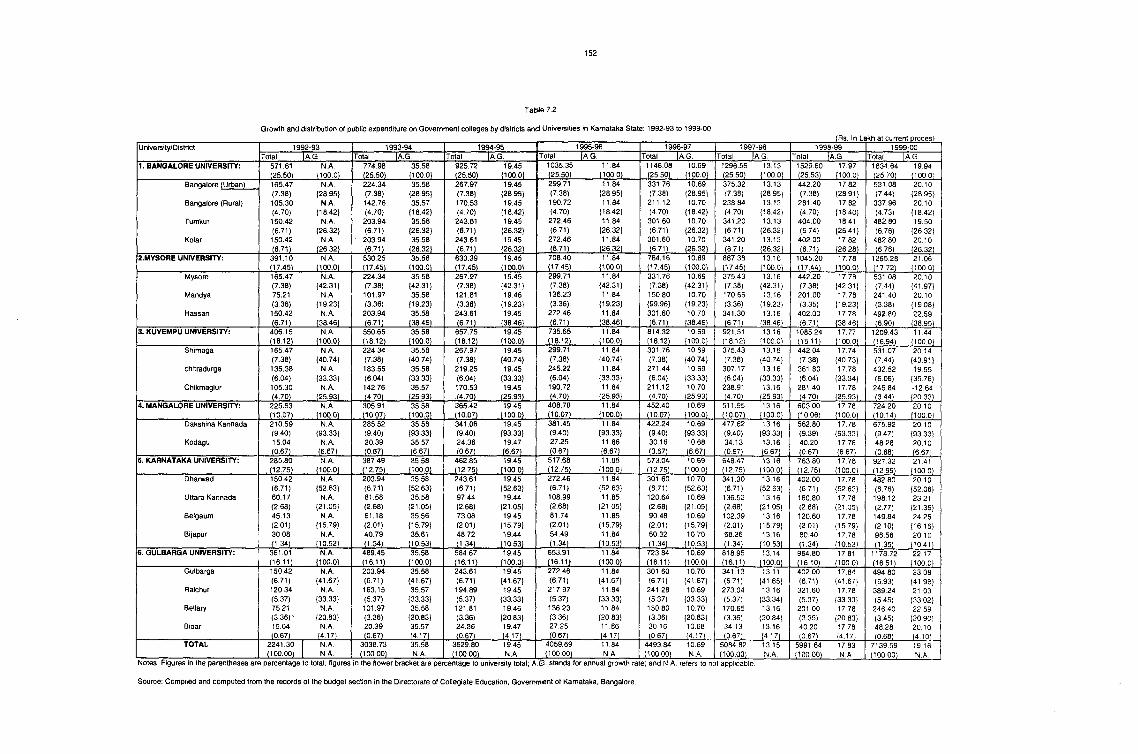
Tal3le 7.2
Growth and distribution of public expenditure on Government colleges by districts and Universities in Karnataka State: 1992-93 to 1999-00(Rs. In Lal<h at current proces)
University/District 1992-93 1993-94Total JEK
1994-95Total
1995-96[A.G.
1996-97Total Total Ia .G. Total Ia .G.
1. BANGALORE UNIVERSITY: 571.61(25.50)
N.A.(100.0 )
774.98(25.50)
35.58(100.0 )
925.72(25.50)
19.45(100.0 )
1035.35(25.50)
11.84( 100.01
1146.08(25.50)
10.69(100.0) 1296.56(25.50)
13.13( 100.0 )
1529.60(25.53)
17.97( 100 .0 )
1834.64(25.70)
19.94(100.0}
Bangalore (Urban)
Bangalore (Rural)
Tumkur
Kolar
165.47(7.38)105.30(4.70)150.42(6.71)150.42(6.71)
N.A.(28.95)
N.A.(18.42)
N.A.(26.32)
N.A.(26.32)
224.34(7.38)142.76(4.70)203.94(6.71)
203.94(6.71)
35.58{28.95)35.57
(18.42)35.58
(26.32)35.58
(26.32)
267.97(7.38)170.53(4.70)243.61(6.71)243.61(6.71)
19.45 {28.95119.45
{18.42}19.45
(26.32119.45
(26.32)
299.71 (7.38)190.72(4.70)272.46(6.71)
272.46 (6-71)
11.84 {28.95)11.84
(18.42)11.84
(26.32)11.84
(26.32)
331.76(7.38)
211.12(4.70)301.60(6.71)301.60i iZ lL
10.69 {28.95)10.70
(18.42)10.70
(26.32)10.70
(26.32)
375,32(7.38)238,84(4.70)341.20(6.71)341.20igZlL
13.13 {28,95)13.13
(18,42)13.13
{26.32)13.13
(26.32)
442.20(7.38)281-40(4.70)404.00 (6,74)402.00(6.71)
17.82 {28,91)17.82
(18.40) 18,41
(26.41)17.82
(26,28)
531,08(7,44)337,96(4,73)482.80 (6.76)
482.80 _(676L
20.10{28,95}20,10
(18,42)19,50
(26.32) 20,10(26.32)
2.MYSORE UNIVERSITY: 391.10.(17.45)
N.A.{100.0 )
530.25...07.45),,.
35.58( 100.01
633.39J17-45)_
19.45{100.0)
708.40(17.45)
11.84{ 100.0}
784.16(17.45)
10.69(100.0)
887.38(17.45)
13.16(100.0)
1045.20(17.44)
17.78(100 .0 )
1265.28(17.72)
21.06(100,0)
Mysore
Mandya
Hassan
165.47 (7.38) 75.21 (3.36) 150.42
. (671J,
N.A.(42.31)
N.A.(19.23)
N.A.(38.46)
224.34(7.38)101.97(3,36)
203.94J67U_
35.58 {42.31}35.58
{19.23}35.58
(38.46)
267.97(7.38)121.81(3.36)
243,61(6-71)
19.45 (42,31}19.46
(19,23) 19,45
(38,46)
299,71(7,38)136,23(3,36)
272,46(6-71)
11.84 (42.31)11.84
(19.23)11.84
(38.46)
331.76 (7.38) 150.80 {99.96} 301.60 ..(6.71),
10.69 {42.31}10.70
{19.23}10.70
(38.46)
375.43(7.38)170.65(3.36)
341.30J 6 ^
13.16 (42.31)13.16
{19.23}13.16
(38,46)
442,20(7,38)201,00(3,35)
402,00(6,71)
17.78 (42,31)17.78
(19,23)17.78
(38,46)
531,08(7,44)241,40(3,38)
492,80(6.90)
20,10{41,97}20,10
(19,08)22,59
{38,95}3. KUVEMPU UNIVERSITY: 406,15
(18,12)N,A,
(100.0}550.65(18.12)
35.58(100.0)
657.75(18.12)
19.45{100.0}
735.65(18.12)
11.84{100.0}
814.32(18.12)
10.69( 100 ,0 )
921,51(18,12)
13,16{100,0}
1085.24 17.77(100.0)
1209.43(16.94)
11,44( 100 ,0 )
Shimoga
chitradurga
Chikmaglur
165,47(7,38)135.38(6,04)105.30(4_70)
N.A.{40,74}
N.A.(33,33)
N.A,(25.93)
224,34(7.38)183.55(6.04)142.76(4.70)
35.58 (40.74)35.58
(33.33) 35.57
(25.93)
267.97(7,38)219,25(6.04)170.53(4.70)
19.45 (40.74)19.45
{33.33}19.45
(25.93)
299.71 (7.38) 245.22 (6.04)190.72 (4.70)
11.84 (40.74)11.84
(33.33)11.84
(25.93)
331.76 (7,38)
271,44 (6,04)
211,12 (4,70)
10.69 {40,74}10.69
(33,33)10.70
(25,931
375,43(7,38)307,17(6,04)238,91
13.16 {40,74}13.16
{33,33}13.16
{25.93}
442.04 (7,38) 361,80 (6,04) 281,40 (4,70)
17,74(40,73)17.78
(33.34)17.78
(25.93)
531.07(7,44)432,52(6,06)245,84.■(3.44],
20,14{43,91}19,55
{35,76}-12,64(20,33)
4. MANGALORE UNIVERSITY: 225.63(10.07)
N.A.(100.0)
305.91(10.07)
35.58(100.0 )
365.42(10.07)
19.45( 100.0 )
408.70(10.07)
11.84(100 .0)
452.40(10.07)
10.69{100.0}
511.95(10.07)
13,16( 100 ,0 )
603,00(10,06)
17,78( 100,0 )
724,20(10,14)
20.10(1000)Dakshina Kannada
Kodagu
210.59(9.40)15.04
J067L
N.A,{93.33}
N,A,_ i i6 7 ]_
285,52(9.40)20.39
..(9-671..
35.58{93.33}35.57
J167L
341.06 (9.40) 24.36
J067L
19.45(93.33)19.47{6-671
381.45(9.40)27.25(0.67)
11.84(93.33)11.86(6.67)
422.24(9.40)30.16
..(0-67)
10.69(93.33}1068
477.82(9.40)34.13(067)
13.16 (93.33}13.161§:.67}
562.80(9.39)40.20
J M Z L
17.78 {93.33}17.78 (6.67}
675.92(9.47)48,28(0,68)
20,10{93,33}20,10
J6 ,67 ]_5. KARNATAKA UNIVERSITY: 285,80
. (12.75)N.A.
( 100.0 )387,49(12.75)
35.58( 100.0 )
462.8502-75)
19.45{100.0}
517.6802.75)
11.85 (100 0)
573.04 10.69(100.0)
648.47(12.75)
13.16( 100.0 )
763.80(12.75J
17.78(100,0)
927,32(12,99)
21,41(100,01
DInarwad
Uttara Kannada
Belgaum
BIjapur
150,42(6.71)60.17(2.68)45.13(2.01)30.08(1.34)
N.A.(52,63)
N.A.{21,05}
N,A,{15,79}
N,A.(10.52)
203.94(6.71)81.58(2.68)61.18(2.01)40.79(1.34)
35.58 {52.63)35.58
{21,05} 35,56
(15,79) 35,61
(10,53)
243,61(6,71)97.44(2.68)73.08(2.01)48.72
J121L
19.45{52.63}19.44
(21.05119.45
{15.79} 19.44
(10.53)
272.46(6.71)108.99(2.68)81.74(2.01)54.49(1.34)
11.84 {52.63}11.85
(21.05)11.85
(15.79) 11.84
(10.53)
301.60(6.71)120.64(2.68)90.48(2.01)60.32(1.34)
10.70(52.63)10.69
{21.05}10.69
{15.79}10.70
(10,53)
341,30(6,71)136,52(2 ,68)
102,39(2 ,01 )68,26-11341,
13.16 (52,63)13.16
{21,05}13.16
{15,79}13.16
(10,53)
402,00(6,71)160,80(2 ,6 8 )
120,60(2 ,01)
80,40iL34L
17.78 {52.63}17.78
(21.05)17.78
{15.79}17.78
(10.53)
482 80(6.76) 198,12(2.77) 149,84 (2 ,10 )
96,56 (1.35)
20,10{52,06}23,21
{21,36}24,25
{16,16}20,10
(10,41)i. GULBARGA UNIVERSITY: 361,01
(16,11)N,A,
( 100.0 )
489.45(16.11)
35.58(100.0)
584.67(16.11)
19.45(100.0)
653.91(16.11)
11.84(100.0)
723.84(16.11)
10.69(100.0 )
818.95(16.11)
13.14{100.0} 964.80
(16.10)17.81
( 100 .0 )
1178.72,,,(16.51]
22,17(100,0}
Gulbarga
Raichur
Bellary
Bldar
150.42(6.71)120.34(5.37)75.21(3.36)'15.04(0.67)
N.A.{41.67}
N.A.(33.33)
N.A.(20.83)
N.A.(4.17)
203.94(6.71)163.15(5.37)101.97(3.36)20.39
j o-67}..
35.58(41.67)35.57
(33.33)35.58
(20.83) 35.57 (4.17)
243.61(6.71)194.89(5.37)121.81(3.36)24.36
.,(0-67)
19.45 {41.67}19.45
{33.33}19.46
(2083)19.47
-14,17]_
272.46(6.71)217.97(5.37)136.23(3,36)27,25(067)
11.84 {41,67}11.84
(33,33)11.84
{20,83}11,86
_i4J7
301,60 (6,71) 241,28 (5,37) 150,80 (3,36) 30 16 (0.67)
10,70(41,67)10.69
(33,33)10.70
(20.83) 10,68
- l i iZ i .
341.13 (6,71) 273,04 (5,37) 170,65 (3,36)34.13
10 671,
13,11{41,65}13.16
(33,34)13.16
(20,84)13.16 14 17]
402 00 (6,71) 321,60 (5,37) 201,00 (3,35) 40,20 (0.67)
17,84{41,67}17.78
(33,33)17.78
(20,83)17.78 (4,171
494,80(6,93)389,24(5.45) 246,40(3.45) 48.28 (0 .6 8 )
23.08{41.98}21.03
(33,02)22,59
(20,90)20,10(4,101
TOTAL 2241.30(100.00)
N.A.N.A.
3038.73(100.00)
35.58N.A,
3629.80( 100.00 )
19.45N.A.
4059.69( 100.00)
11.84N.A.
4493.84(100,00)
10,69N,A,
5084,82( 100,00 )
13,15N,A,
5991.64(100.00)
17.83N.A,
7139,59(100,00)
19,16N,A,
Notes: Figures in the parentheses are percentage to total; figures in the flower bracket are percentage to university total; KG. stands for annual growth rate; and N,A, refers to not applicable.
Source: Compiled and computed from the records of the budget section in the Directorate of Collegiate Education, Government of Karnataka, Bangalore,
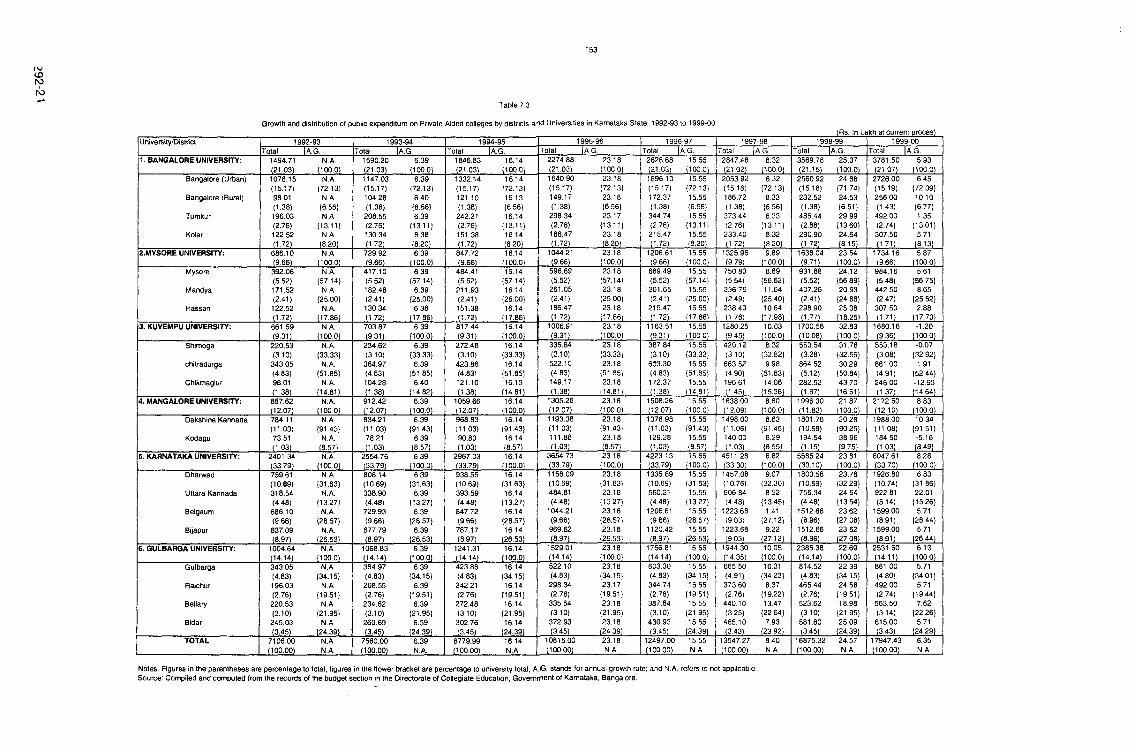
CDN)
Growth and distribution of public expenditure on Private Aided colleges by districts aind Universities in Karnataka State: 1992-93 to 1999-00(Rs. In Lakh at current proces)
University/District 1992-93Total I K K
1993-94Total
1994-95 1995-96Ha H
1996-97Total Total Ia .g
1999-00Total Ia .g .
1. BANGALORE UNtVERSITY; 1494.71(21.03)
N.A.(100.01
1590.20(21.031
6.39( 100.01
1846.83(21.031
16.14(100.01
2274.88(21.03)
23,18(100.01
2628.68 15.55(21.03) (100,01
2847.48(21 .02)
8.32(100.01
3569.78 25.37(21.15) (100.01
3781.50(21.07)
5.931100.01
Bangalore (Urban)
Bangalore (Rural)
Tumkur
Kolar
1078.15(15.17)98.01(1.38)196.03(2.76)122.52(1-72)
N.A.(72.13)
N.A.(6.56)N.A
(13.11)N.A.
(8.201
1147,03(15.17)104.28(1.38)
208.55(2,76)130.34(1-72)
6.39 (72.13)
6.40 (6.56) 6.39
(13.1116,38(8,20)
1332,14(15,17)121,10(1,38)242,21(2,76)151.38(1-72)
16.14(72.13)16.13 (6.56)16.14
(13.11116.14 (8-201
1640.90(15.17)149.17(1.38)
298,34(2.76)186.47,,n -721
23.18 (72.13)23.18 (6.56)23.17 (13,11123.18ig.20J .
1896.10(15.17)172.37(1.38)344.74(2.76)215.47
15.55 (72.13)15.55 (6.56)15.55
(13.11}15.55 (8.201
2053.92(15.16)186.72(1.38)373.44(2.76)233.40(172)
8.32 (72.13)
8.33 (6.5618.33
(13.1118.32(8.20)
2560.92(15.18)232.52(1.38)
485.44(2.88)290.90(1.72)
24.68(71.74)24.53(6.51)29.99
(13.60}24.64(8.151
2726.00 (15.19)256.00 (1.43)
492.00 (2,74) 307,50 (1.71)
6.45(72.09)10.10(6.77)1.35
(13.01}5.7118.131
2.MYS0RE UNIVERSITY: 686.10(9.66)
N.A.( 100.01
729.92(9,66)
i,39( 100,0 )
847,72-(9.66)
16,14(100,0)
1044,21(9.66)
23,18(100,01
1206,61(9..6.6]
15,55(100,01
1325,96_(979j_
9,891100,01
1638,04(9.71).
23,54(100,01
1734,16,(9.661.
5,87( 100,01
Mysore
IVIandya
Hassan
392,06(5,52)171.52 (2,41)122.52 (112},,
N,A.(57,14}
N.A.(25.00)
N.A.(17.861
417.10(5.52)182.48(2.41)130.34.0.72)
),39(57.14)
6.39(25.001
6.38(17.86)
484.41(5,52)211,93(2,41)151,38(1.72)
16.14 (57.14)16.14
(25.00)16.14
(17.861
596.69(5,52)261,05(2.41)186,47(1.72)
23 18 (57,14) 23 18
(25,00) 23,18 (17,861
689,49(5,52)301,65(2,41)
215,47(1.72)
15.55 (57,14)15 55
(25,00)15.55
(17,86)
750,80(5,54)336,76(2.49)238.40_Q76L
8.89(56.62)11.64
(25.40110.64
J I L
931.88(5.52)407.26(2.41)298.90i lZ Z L
24.12(56.89)20.93
(24.86)25.38
■118.25}.
984.16(5.48)442.50 (2.47)307.50 I V71L
5.61(56.75)
8.65(25.52)
2.88(17.731
3. KUVEMPU UNIVERSITY; 661.59(9_31L
N.A.( 100.01
703.87 6.39( 100.01
817.44(9.31)
16.14( 100.0 )
1006.91(9.31)
23.18( 100.0 )
1163.51(9.31)
15.55(100.0)
1280.25iMSL
10.03(100.01
1700.58(10.08)
32.83(100.0)
1680.16Jg,36I.
■1.20( 100.0 )
Shimoga
chitradurga
Chikmaglur
220.53(3.10)343.05(4.83)98.010-38J,
N.A.(33.33}
N.A.(51.85}
N.A.(14.811
234.62(3.10)
364.97(4,83)104.28(1.38)
6.39 (33.33)
6.39 (51,85)
6.40 (14.82)
272,48(3.10)
423.86(4.83)121,10(1.38)
16.14 (33,33)16.14
(51,85}16,13
(U,81)
335,64(3,10)522,10(4,83)149,17
-11-38L
23.18 (33,33)23.18 (51,85)23.18 (14.811
387,84(3,10)
603,30(4,83)172,37(1.38)
15.55 {33.33}15.55
(51.85115.55 (14.811
420.12(3,10)663.52(4.90)196.61(1.45)
8.32(32,82)9,98
(51,83114,06
(15.361
553,54(3,28)864.52 (5.12)282.52 (1.67)
31.76(32.55)30.29
(50.84)43.70
(16.611
553.16 (3.08)
881.00 (4.91) 246.00 ■ (1.371.
-0.07(32.92)
1.91(52.44)-12,93(1464)
4. MANGALORE UNIVERSITY: 857,62,(1g^7]„,
N,A,(100,0)
912,42(12.07)
6.39( 100.0 )
1059,66(12,07)
16,14(100,0)
1305,26(12,07)
23,18(100,0)
1508,26(12,07)
15,55(100,0 )
1638,00(12,09)
8,60( 100,0 )
1996,30(11,83)
21,87(100.0)
2172,50(12,10)
8,83( 100,0 )
Dakshina Kannada
Kodagu
784,11(11,03)73,51(103}
N,A,(91,43)
N,A,-18:571.
834.21 (11,03)78.210-03}
i,39(91,43}
639,18.571.,,
968.83(11.03)90.83(1.03)
16.14 (91.43)16.14 (8.57)
1193.38(11.03) 111.88(1.03)
23.18 (91.43)23.18 (8.57)
1378 98(11.03) 129.28(1.03)
15.55 (91.43)15.55 (8.57)
1498.00 (11,06)140.00 (1.03)
8,63(91.45)
8,29(8,55)
1801,76(10,68)194,54(1.15)
20,28(90,25)38.96(9.751
1988.00(11.08)184.50(1.031,
10.34(91.51)-5.1618-49]
5. KARNATAKA UNIVERSITY: 2401.34(33.79)
N.A.(100.0)
2554.76(33.79)
6.39( 100.0 )
2967.03(33.79)
16.14(100.0 )
3654.73(33.79)
23.18( 100.0 )
4223 13 (33.79)
15.55(100,0)
4511,28(33,30)
6,82( 100,0 )
5585,24(33,10)
23,81( 100,01
6047,61(33,70)
8,28(100,0)
Dharwad
Uttara Kannada
Belgaum
Bijapur
759,61(10.69)318,54(4,48)686,10(9,66)637,09(8,97)
N,A,(31.63)
N,A,(13,27)
N,A,(28,57)
N,A,(26.531
808.14(10.69)338.90(4.48)729.93(9.66)677.79(8.97)
6.39 (31.63}
6.39 (13.27)
6.39 (28.57)
6.39 (26.53)
938.55(10.69)393.59(4.48)847.72(9.66)787.17J8...97}
16.14 (31.63}16.14
(13.27)16.14
(28,57)16.14
(26,531
1156,09 (10,69) 484,81 (4,48)
1044.21 (9,66) 969 62(8.97)
23.18 (31,63)23.18
(13,27)23.18
(28,57)23.18
(26,53)
1335.89(10.69)560.21(4.48)
1206.61(9.66)
1120.42(8.97)
15.55 (31.63)15.55
{13.27}15.55
(28.57)15.55
(26.53)
1457,08(10,76)606,84(4,48)
1223.68(9.03)
1223.68(9.03)
9,07(32,30)
8,32(13,45)
1,41(27.12)
9,22(27.12)
1803,58(10,69)756.34(4.48)
1512.66(8.96)
1512.66(8.96)
23.78(32.29)24.64
(13.54)23.62 (27.08)23.62
(27.08}
1926.80 (10.74) 922.81 (5.14)
1599 00(8.91)
1599.00(8.91)
6.83(31.86)22.01
(15.26)5.71
(26.4415.71
(26.4416. GULBARGA UNIVERSITY: 1004.64
(14.14)N.A.
(100.0)1068.83(14.14)
6.39(100.0)
1241.31(1414)
16.14(100.0 )
1529.01(14.14)
23.18(100.0)
1766.81(14,14)
15,55( 100,0 )
1944,30(1435)
10,05(100,0 )
2385,38(1414)
22,69(100,0)
2531.50(14.11)
6.13( 100.0 )
Gulbarga
Raichur
Bellary
Bidar
343.05(4.83)196.03 (2.76)
220.53 (3.10)
245.03(3^5}
N.A.(34.15}
N.A.(19.51)
N.A.(21.95)
N.A.(24.39)
364.97(4,83)208,55(2,76)234,62(3,10)
260,69(3.45)
6.39 (34,15)
6.39 (19,51)6.39
(21,95}6.39
(24.39)
423.86(4,83)242,21(2,76)272,48(3,10)302,76(3.45)
16.14 (34,15)16.14
{19.51}16.14
(21,95)16.14
(24.39)
522.10(4.83)
298,34(2,76)335.64(3.10)372.93
- i^ 5 ) _
23.18(34.15)23.17
(19.51)23.18 (21,95)23.18
(24,39)
603.30 (4.83) 344.74 (2.76) 387.84 (3.10) 430.93 ■ 13d5j_
15.55 (34.15)15.55
(19.51)15.55
(21,95)15.55
(24.39)
665,50(4,91)373,60(2,76)
440.10 (3,25)465.10 (3,43)
10,31(34,23)
8,37(19,22)13,47
(22,64)7,93
(23,92)
814,52(4,83)465,44(2,76)523,62(3,10)581,80,(M5},.
22,39(34,15}24,58
{19,51}18.98
(21.95)25.09
(24.39)
861.00 (4.80)492.00 (2.74) 563.50 (3.14)615.00-(.3.,43L
5.71 (34.01)
5.71 {19.44}
7.62(22.26)
5.71 (24.29)
TOTAL 7106.00(100.00)
N.A.N.A.
7560.00( 100.00)
6.39N.A.
8779.99( 100.00 )
16.14N.A.
10815.00(100.00)
23.18N.A.
12497.00(100.00)
15.55N.A.
13547.27(100.00)
8,40N,A,
16875,32(100,00)
24.57 N A,
17947.43(100.00)
6.35N.A.
Notes; Figures in the parentheses are percentage to total; figures in the flower bracket are percentage to university total; A iG. stands for annual growth rate; and N.A. refers to not applicable. Source: Compiled and computed from the records of the budget section in the Directorate of Collegiate Education, Govemn^ent of Karnataka, Bangalore.
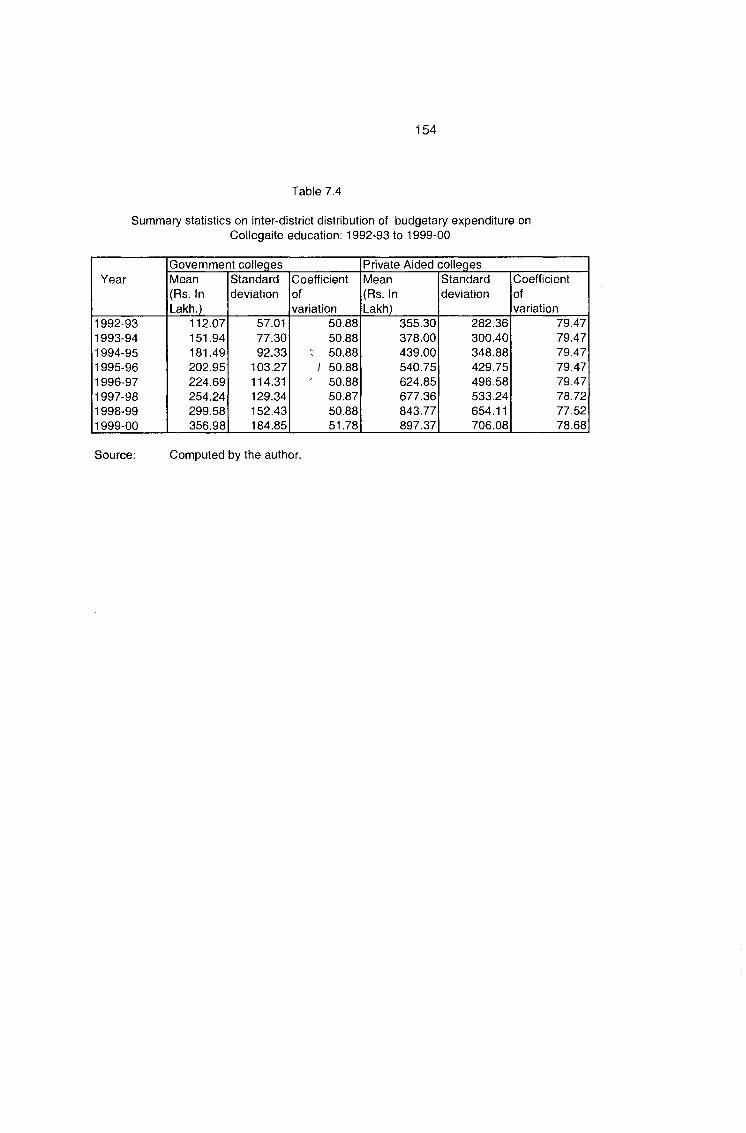
Summary statistics on inter-district distribution of budgetary expenditure on Collegaite education: 1992-93 to 1999-00
YearGovernment colleges Private Aided collegesMean (Rs. In Lakh.)
Standarddeviation
Coefficientofvariation
Mean (Rs. In Lakh)
Standarddeviation
Coefficientofvariation
1992-93 112.07 57.01 50.88 355.30 282.36 79.471993-94 151.94 77.30 50.88 378.00 300.40 79.471994-95 181.49 92.33 50.88 439.00 348.88 79.471995-96 202.95 103.27 1 50.88 540.75 429.75 79.471996-97 224.69 114.31 ' 50.88 624.85 496.58 79.471997-98 254.24 129.34 50.87 677.36 533.24 78.721998-99 299.58 152.43 50.88 843.77 654.11 77.521999-00 . 356.98 184.85 51.78 897.37 706.08 78.68
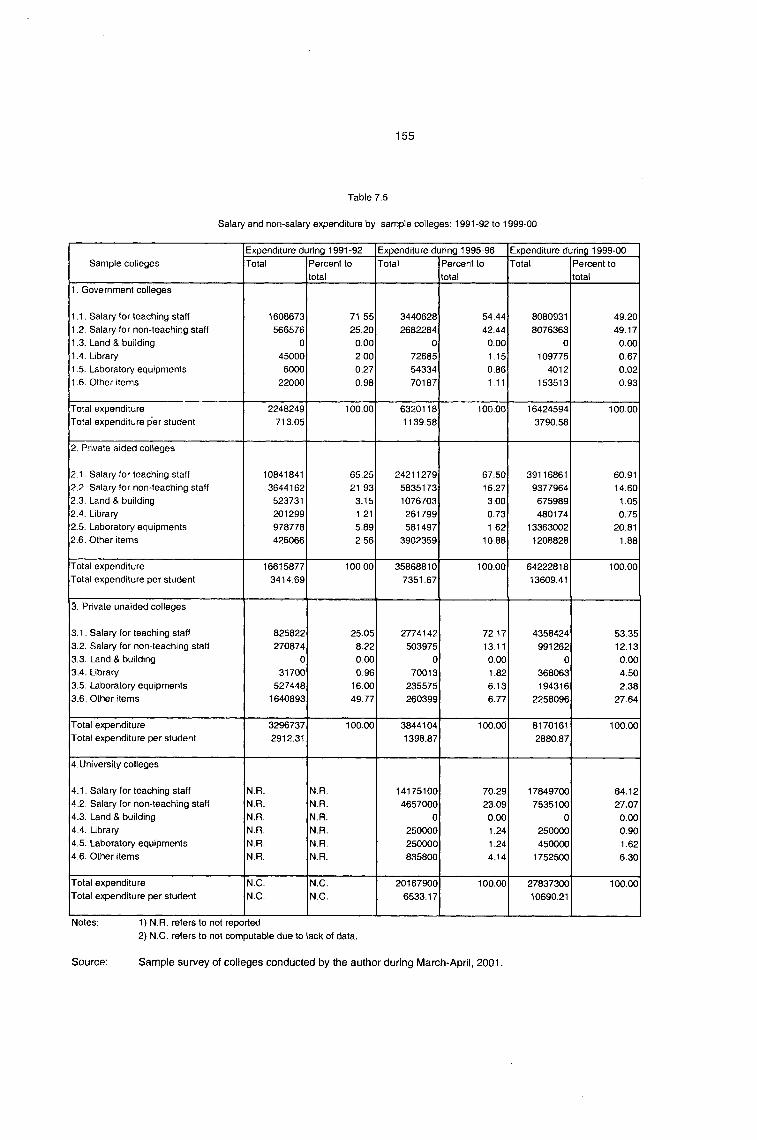
Salary and non-salary expenditure by sample colleges: 1991 -92 to 1999-00
Sample collegesExpenditure during 1991-92Total Percent to
total
Expenditure during 1995-96Total Percent to
total
Expenditure during 1999-00Total Percent to
total1. Government colleges
1.1. Salary for teaching staff1.2. Salary for non-teaching staff1.3. Land & building1.4. Library1.5. Laboratory equipments1.6. Other items
1608673566576
045000
600022000
71.5525.200.002.000.270.98
34406282682284
0
726855433470187
54.4442.44
0.00 1.15 0.86 1.11
80809318076363
0109775
4012153513
49.2049.17
0.000.670.020.93
Total expenditureTotal expenditure per student
2248249713.05
100.00 63201181139.58
100.00 164245943790.58
100.00
2. Private aided colleges
2.1. Salary for teaching staff2.2. Salary for non-teaching staff2.3. Land & building2.4. Library2.5. Laboratory equipments2.6. Other items
108418413644162
523731201299978778426066
65.2521.93
3.151.215.892.56
2421127958351731076703
261799581497
3902359
67.5016.27
3.000.731.62
10.88
39116861 9377964
675989 480174
13363002 1208828
60.91 14.60
1.05 0.75
20 81 1.88
Total expenditureTotal expenditure per student
166158773414.69
100.00 358688107351.67
100.00 6422281813609.41
100.00
3. Private unaided colleges
3.1. Salary for teaching staff3.2. Salary for non-teaching staff3.3. Land & building3.4. Library3.5. Laboratory equipments3.6. Other items
825822270874
031700
5274481640893
25.058.220.000.96
16.0049.77
2774142503975
070013
235575260399
72.1713.110.001.826.136.77
4358424991262
0
368063194316
2258096
53.3512.130.004.502.38
27.64
Total expenditureTotal expenditure per student
32967372912.31
100.00 38441041398.87
100.00 81701612880.87
100.00
4 .University colleges
4.1. Salary for teaching staff4 .2. Salary for non-teaching staff4.3. Land & building4.4. Library4.5. Laboratory equipments4.6. Other items
N.R.N .R .
N.R.N.R.N.R.N.R.
N.R.N.R.N.R.N.R.N.R.N.R.
141751004657000
0250000250000835800
70.2923.090.001.241.24 4.14
178497007535100
0250000450000
1752500
64.1227.07
0.000.901.626.30
Total expenditureTotal expenditure per student
N.C.N.C.
N.C.N.C.
201679006533.17
100.00 2783730010690.21
100.00
Notes; 1) N.R. refers to not reported2) N.C. refers to not computable due to lack of data.
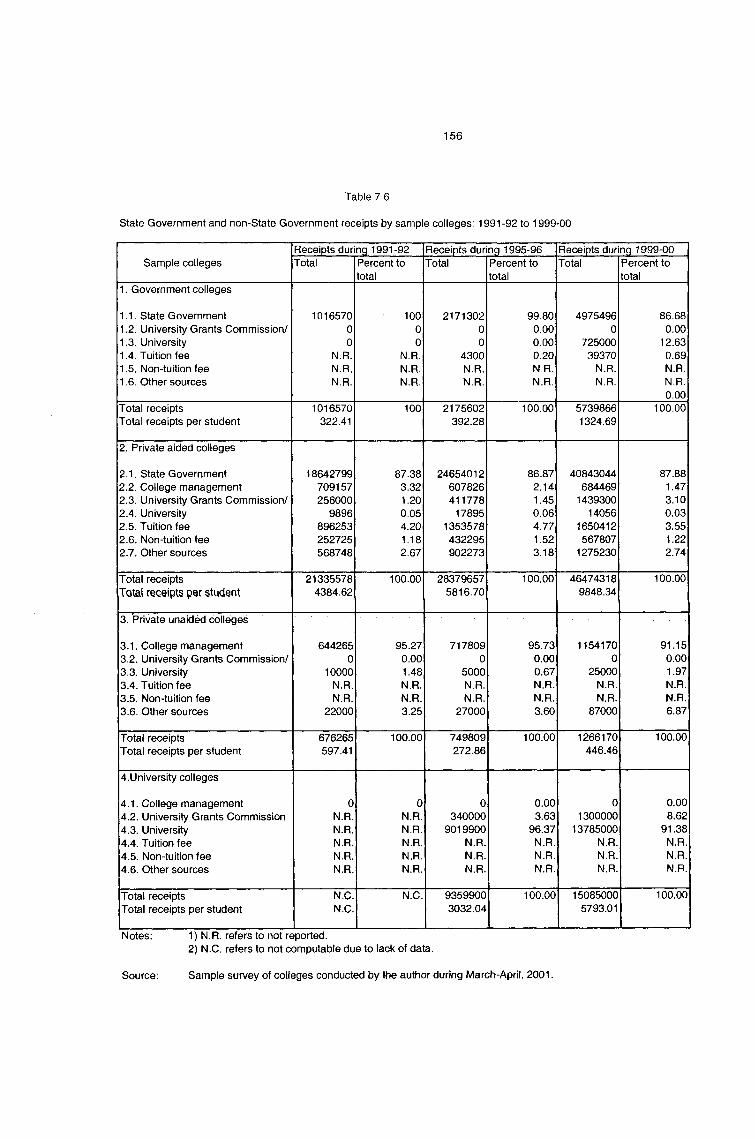
State Government and non-State Government receipts by sample colleges: 1991-92 to 1999-00
Sample colleges TotalReceipts during 1991-92
Percent to total
Receipts during 1995-96Total Percent to
totalTotalReceipts during 1999-00
Percent to total
1. Government colleges
1.1. State Government1.2. University Grants Commission/1.3. University1.4. Tuition fee1.5. Non-tuition fee1.6. Other sources
101657000
N.R.N.R.N.R.
10000
N.R.N.R.N.R.
217130200
4300N.R.N.R.
99.800.000.000.20N.R.N.R.
49754960
72500039370
N.R.N.R.
86.680.00
12.630.69N.R.N.R.0.00
Total receiptsTotal receipts per student
1016570322.41
100 2175602392.28
100.00 57398661324.69
100.00
2. Private aided colleges
2.1. State Government2.2. College management2.3. University Grants Commission/2.4. University2.5. Tuition fee2.6. Non-tuition fee2.7. Other sources
18642799709157256000
9896896253252725568748
87.383.321.200.054.201.182.67
24654012607826411778
178951353578432295902273
86.872.141.450.064.771.523.18
40843044684469
143930014056
1650412567807
1275230
87.881.473.100.033.551.222.74
Total receiptsTotal receipts per student
213355784384.62
100.00 283796575816.70
100.00 464743189848.34
100.00
3. Private unaided colleges
3.1. College management3.2. University Grants Commission/3.3. University3.4. Tuition fee3.5. Non-tuition fee3.6. Other sources
6442650
10000N.R.N.R.
22000
95.270.001.48N.R.N.R.3.25
7178090
5000N.R.N.R.
27000
95.730.000.67N.R.N.R.3.60
11541700
25000N.R.N.R.
87000
91.150.001.97N.R.N.R.6.87
Total receiptsTotal receipts per student
676265597.41
100.00 749809272.86
100.00 1266170446.46
100.00
4.University colleges
4.1. College management4.2. University Grants Commission4.3. University4.4. Tuition fee4.5. Non-tuition fee4.6. Other sources
0N.R.N.R.N.R.N.R.N.R.
0N.R.N.RN.R.N.R.N.R.
0340000
9019900N.R.N.R.N.R.
0.003.63
96.37N.R.N.R.N.R.
01300000
13785000N.R.N.R.N.R.
0.008.62
91.38N.R.N.R.N.R.
Total receiptsTotal receipts per student
N.C.N.C.
N.C 93599003032.04
100.00 150850005793.01
100.00
Notes: 1) N.R. refers to not reported.2) N.C, refers to not computable due to lack of data.
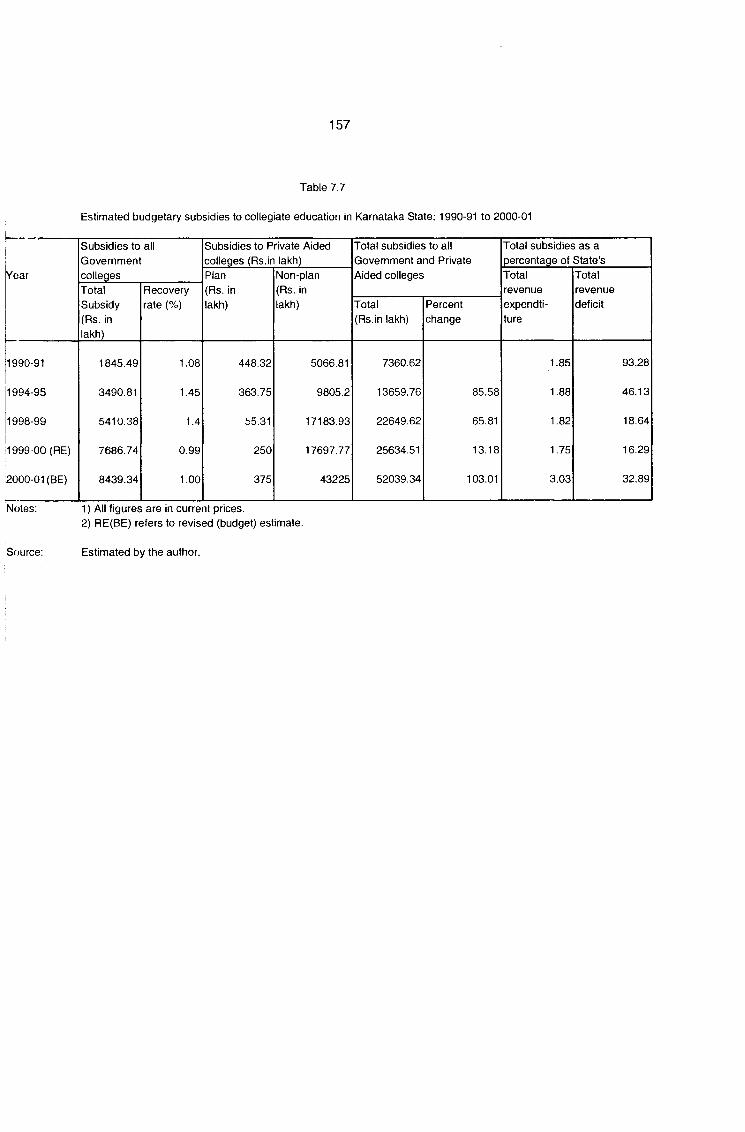
j-------Estimated budgetary subsidies to collegiate education in Karnataka State: 1990-91 to 2000-01
Year
Subsidies to all Government collegesTotal Subsidy (Rs. in lakh)
Recovery rate (%)
Subsidies to Private Aided colleges (Rs.in lakh)_____Plan (Rs. in lakh)
Non-plan (Rs. in lakh)
Total subsidies to all Government and Private Aided colleges
Total(Rs.in lakh)
Percentchange
Total subsidies as a percentage of State'sTotalrevenueexpendti-ture
Totalrevenuedeficit
1990-91
1994-95
1998-99
1999-00 (RE)
I2OOO-OI (BE)
1845.49
3490.81
5410.38
7686.74
8439.34
1.08
1.45
1.4
0.99
1.00
448.32
363.75
55.31
250
375
5066.81
9805.2
17183.93
17697.77
43225
7360.62
13659.76
22649.62
25634.51
52039.34
85.58
65.81
13.18
103.01
1.85
1.88
1.82
1.75
3.03
93.28
46.13
18.64
16.29
32.89
jNotes: 1) All figures are in current prices.2) RE(BE) refers to revised (budget) estimate.
Source; Estimated by the author.
REFERENCES
Bangalore University (2000a). List of Candidates Admitted to the Degrees in the Several Faculties, 35^ Annual Convocation, Bangalore University Press (Bangalore).
Bangalore University (2000b). List of Candidates Eligible to the Degrees in the Several Faculties, 35^ Annual Convocation, Bangalore University Press (Bangalore).
Government of India. (2000). Report on A Policy Framework for Reforms in Education, Prime Minister's Council on Trade and Industry, Government of India (New Delhi).
Government of Karnataka. (2002). Shaping Education in Karnataka: Goals and Strategies, Education Department (Bangalore).
Government of Karnataka. (2001a). District-wise and University-wise list of Government, Private Aided and Private Unaided General Degree and Law Degree Colleges in Karnataka State, Department of Collegiate Education (Bangalore).
Government of Karnataka. (2001b). Medium Term Fiscal Plan for Karnataka: 2000-01 to 2004-05, Finance Department (Bangalore).
Government of Karnataka. (2001c). The Karnataka State Universities Act 2000 (Karnataka Act 29 of 2001), Department of Parliamentary Affairs and Legislation (Bangalore).
Government of Karnataka. (2000a). Economic Survey 1999-2000, Department of Planning, Institutional Finance and Statistics and Science and Technology (Bangalore).
Government of Karnataka. (2000b). Karnataka Act 1 of 1995: The Karnataka Education Act, 1983 and Rules under the Karnataka Education Act, Department of Parliamentary Affairs and Legislation, Government Sub-Urban Press (Bangalore).
Government of Karnataka. (1999). Human Development in Karnataka 1999, Department of Planning (Bangalore).
Government of Karnataka. (1998). Finance Accounts 1996-97, Government Press (Bangalore).
Government of Karnataka. (1997). An Approach to Subsidies in Karnataka, Plan Finance & Resource Division, Planning Department, State Planning Board, (Bangalore).
Government of Karnataka. (1993). Report of the Karnataka Universities Review Commission (Chairman: Professor T.Navaneeth Rao), Karnataka University Press (Dharwad).
Guibarga University. (2000). Annual Report, 1998-99, Gulbarga University (Gulbarga)
Hanushek, E.A. (1996). "iVleasuring Investment in Education", Journal of Economic Perspectives, 10, 9030.
Kane, T.J. and Rouse, G.E. (1999). “The Community College: Educating Students at the Margin Between College and W ork” , Journal of Economic Perspectives, 13, 63-84.
Narayana, M.R. (2003). “Student loans by commercial banks: A way to reduce State Government financial support to higher education in India” , Journal of Higher Education Policy and Management, forthcoming.
Narayana, M.R. (2001a). "Impact of Grants-in-aid on Collegiate Education: Evidence and Implications of a Regional Study in India", Education Policy Analysis Archives, 9, pp.31. [htpp://epaa.asu.edu/epaa/v9n21/]
Narayana, M.R. (2001b). Final Report of the Sub-sector Study on Collegiate Education, Education Department, Government of Karnataka, Bangalore.
Narayana, M.R. (2001c). "Budgetary Subsidies of the State Government to Higher Education: Evidence from Karnataka State”, Journal of Indian School of Political Economy, XIII, 443-470.
Narayana, M.R. (2000a). "Determinants of Pass Percent of Students in Aided Private Degree Colleges: Evidence for Karnataka State (India), Artha Vijnana, XLII, 60-75.
Narayana, M.R. (2000b). "Determinants of Students' performance in Private Aided Degree Colleges: Evidence and Implications for Karnataka State", Journal of Educational Planning and Administration, XIV, 133-154.
Narayana, M.R. (2000c). "College Resources and Student Performance: Databases, Recent Trends and Implications for Private Aided Degree Colleges in Karnataka State (India)", Review of Development and Change, V, 209-247.
Narayana, M.R. (1999a). "Grants-in Aid to Collegiate Education in Karnataka: Current status and policy issues", Journal of Indian School of Political Economy, XI, 295-319.
Narayana, M.R. (1999b). Grants-in-aid to Private Degree Colleges in Karnataka State: Current Status and Future Policy Alternatives, Education Department, Government of Karnataka (Bangalore).
NSSO (2000a). “A Note on Attending an Educational Institution in India: Its Level, Nature and Cost”, Sarvekshana, XXIII, 1-39.
«R W Y 8 wcy«WT»T»»i
m r t - » i • ■ • B ' o . t t i K i M * . 1
DOC, No •• .......--------------
NSSO (2000b). “Results on Attending an Education Institution in India: Its Level, Nature and Cost” , Sarvekshana, XXlii, S1-S159.
NIEPA (National Institute of Educational Planning and Administration). (20C0a). Towards Assessment of Quality of Higher Education, a report of the sem inar on Assessment of Quality in Higher Education: Parameters and Indicators (held on January 18-19, 2000), Higher Education Unit, NIEPA (New Delhi).
NIEPA (National Institute of Educational Planning and Administration). (2000b). Policy Recommendations on Financing of Higher Education, a Report of Consultative Committee Meeting on Funding of Higher Education and Fee Regulation (held on April 10, 2000), Higher Education Unit, NIEPA (New Delhi).
Rao, M. Govinda and Mundle, Sudipto. (1992). "An Analysis of Changes in State Government Subsidies: 1977-87", in Amaresh Bagchi, J.L. Bajaj and William A. Bird, (eds). State Finances in India, Vikas Publications (New Delhi): 107-143.
Seetharamu, A.S. (1997). Loan Financing Higher Education, Institute for Social and Economic Change (Bangalore). Processed.
Srivastava, D.K. and Sen, Tapas K. (1997). Government Subsidies in India, National Institute of Public Finance and Policy (New Delhi).
Tilak, J.B.G. (2001). "Public Subsidies in the Education Sector in India", a paper presented for the conference: India: Fiscal Policies to Accelerate Economic Growth, May 21-22: (New Delhi).
UCG (University Grants Commission) (2001). W W W .UGC.AC.IN, accessed as on January 31, 2001.
University of Mysore. (2001). Statutes Relating to Autonomous Colleges And Institutions of Mysore University, 1999, Office of Registrar (Notification No.CDC/Autonomy/99- 2000, dt February 23, 2001), University of Mysore (Mysore).
University of Mysore, (undated). Draft statutes relating to grant of fresh affiliation/renewal (continuation) of temporary affiliation to colleges and institutions and withdrawal of such affiliation/permission for the bifurcation/ shifting of the location of the affiliated colleges and institutions, College Development Council (Mysore).
Victor, D. (2000). “Autonomy - The point of view of the University and of the Government of Tamil Nadu” , paper presented for UGC-sponsored W orkshop at St.Xaviers College (Calcutta): April 29.
WTO. (1998). Education Services, Background Note by the Secretariat #S/C/W/49, C ouncitfo r Trade in Services (Geneva). Available on www.wto.org
292 - 300 a : 26-02-2003.
N IEPA DC
IIID11891

The government of Karnataka has initiated
an exercise to evolve a broad policy frame
work on Education. As part of this effort,
a series of studies have been undertaken on
various sub-sectors in a bid to have an
indepth analysis of the situation and of the
needs of the entire spectrum of Education
in Karnataka. The various sub sectors
covered relate to Education & Child
development, Education & Equity,
Teacher Education, & Sec & P. U Education,
Collegiate Education, the Role of private
sector in Education, Technical Education,Etc.
The available reports are being printed
hereby in an attempt to share the same with
the readers at large so that they can draw as
much benefit from them as possible.
Printed a t : Government Press, Bangalore