collegiate aviation review international - ejournals
TRANSCRIPT
Collegiate Aviation Review
International
Volume 38 | Issue 1 Spring 2020
The Peer Reviewed Journal
of the University Aviation
Association
ISSN: 1523-5955
COLLEGIATE AVIATION REVIEW
INTERNATIONAL
A PEER REVIEWED JOURNAL OF THE
UNIVERSITY AVIATION ASSOCIATION
EDITOR
Ryan J. Wallace Embry-Riddle Aeronautical University
ASSOCIATE EDITOR John M. Robbins
Embry-Riddle Aeronautical University
EDITORIAL BOARD
Erik R. Baker Lewis University
Wendy Beckman Middle Tennessee State
University
Elizabeth Bjerke University of North
Dakota
Timm Bliss Oklahoma State
University
Thomas Carney Purdue University
Patti Clark Embry-Riddle
Aeronautical University
Randal DeMik Lewis University
Chad Depperschmidt Oklahoma State
University
Yi Gao Purdue University
Christina Hiers Middle Tennessee State
University
Mary Johnson Purdue University
Suzanne Kearns University of Waterloo
Jacqueline Luedtke Embry-Riddle
Aeronautical University
John H. Mott Purdue University
Jason Newcomer Embry-Riddle
Aeronautical University
Matt Romero Southern Illinois
University
Lorelei Ruiz Southern Illinois
University
James Simmons Metropolitan State
University of Denver
Scott Winter Embry-Riddle
Aeronautical University
Gail Zlotky Middle Tennessee State
University
COLLEGIATE AVIATION REVIEW INTERNATIONAL
2020 VOLUME 38 ISSUE 1
Ryan J. Wallace, Editor
Copyright © 2020 University Aviation Association
ISSN: 1523-5955
Correspondence and inquiries:
University Aviation Association
2787 N. 2nd St
Memphis, TN 38127
(901) 563-0505
OBJECTIVES
The University Aviation Association publishes the Collegiate Aviation Review International
throughout each calendar year. Papers published in each volume and issue are selected
from submissions that were subjected to a double-blind peer review process.
The University Aviation Association is the only professional organization representing all
levels of the non-engineering/technology element in collegiate aviation education and
research. Working through its officers, trustees, committees, and professional staff, the
University Aviation Association plays a vital role in collegiate aviation and in the aerospace
industry. The University Aviation Association accomplishes its goals through a number of
objectives:
• To encourage and promote the attainment of the highest standards in aviation
education at the college level
• To provide a means of developing a cadre of aviation experts who make themselves
available for such activities as consultation, aviation program evaluation, speaking
assignment, and other professional contributions that stimulate and develop aviation
education
• To furnish an international vehicle for the dissemination of knowledge relative to
aviation among institutions of higher learning and governmental and industrial
organizations in the aviation/aerospace field
• To foster the interchange of information among institutions that offer non-
engineering oriented aviation programs including business technology,
transportation, and education
• To actively support aviation/aerospace oriented teacher education with particular
emphasis on the presentation of educational workshops and the development of
educational materials covering all disciplines within the aviation and aerospace field
REVIEWER ACKNOWLEDGEMENT Thank you to all of the individuals who served as reviewers for the scholarly works published in this issue!
Kwasi Adjekum
University of North Dakota
Wendy Beckman
Middle Tennessee State University
Timm Bliss
Oklahoma State University
Michael Canders
Farmingdale State College
Cody Christensen
South Dakota State University
Patti Clark
Embry-Riddle Aeronautical University
Paul Craig
Middle Tennessee State University
David Cross
Embry-Riddle Aeronautical University
Jake Durham
Southeastern Oklahoma State University
Mark Dusenbury
University of North Dakota
Yi Gao
Purdue University
Andrea Georgiou
Middle Tennessee State University
Todd Hubbard
University of Oklahoma
Joseph Hupy
Purdue University
Mary Johnson
Purdue University
Julius Keller
Purdue University
Kristine Kiernan
Embry-Riddle Aeronautical University
Andrew Leonard
University of North Dakota
Chien-tsung Lu
Purdue University
Becky Lutte
University of Nebraska-Omaha
Caroline Marete
Purdue University
Rian Mehta
Florida Institute of Technology
Flavio Mendonca
Purdue University
Peter Neff
Middle Tennessee State University
Mary Niemczyk
Arizona State University
C. Daniel Prather
California Baptist University
Stephen Rice
Embry-Riddle Aeronautical University
Mike Robertson
Southern Illinois University
Matthew Romero
Southern Illinois University
Susan Sharp
Embry-Riddle Aeronautical University
Gajapriya Tamilselvan
Saint Louis University
Dothang Truong
Embry-Riddle Aeronautical University
Gary Ullrich
University of North Dakota
Matt Vance
Oklahoma State University
Jonathan Velazquez
Inter American University of Puerto Rico
Linda Weiland
Embry-Riddle Aeronautical University
Nick Wilson
University of North Dakota
Scott Winter
Embry-Riddle Aeronautical University
TABLE OF CONTENTS
Peer-Reviewed Articles
Training Capacity of the Fixed Wing FAA Part 141 Flight Schools in the United
States
Robert L. Thomas & Nicola M. O’Toole ........................................................................... 1
Fatigue in Collegiate Flight Training
Matthew J. Romero, Michael F. Robertson & Steven C. Goetz ......................................... 12
Developing a Taxonomy for Success in Commercial Pilot Behaviors
Kristine Kiernan, David Cross & Mark Scharf ................................................................ 30
Depression, Anxiety, and Stress in Collegiate Aviators
Destry Jacobs, Mary Niemczyk, Robert Nullmeyer, Nancy Cooke & Paul Cline ................... 46
How Weather, Distance, Flight Time, and Geography Affect Consumer Willingness
to Fly in Autonomous Air Taxis
Nadine K. Ragbir, Stephen Rice, Scott R. Winter, Elaine C. Choy & Mattie N. Milner .......... 69
Further Improving General Aviation Flight Safety: Analysis of Aircraft Accidents
During Takeoff
Chenyu Huang ......................................................................................................... 88
Assessing an Aviation Out-of-School Time Program: A Collective Case Study
Stephen M. Belt & Nithil K. Bollock ........................................................................... 106
Assessing Cultural Drivers of Safety Resilience in a Collegiate Aviation Program
Daniel Kwasi Adjekum & Marcos Fernandez Tous ........................................................ 122
An Analysis of Self-Reported Sleepiness and Fatigue Measures from Collegiate
Aviation Pilots
Julius Keller, Flavio A.C. Mendonca, Thomas Laub & Sarah Wolfe ................................. 148
A publication of the University Aviation Association, © 2020, ISSN: 1523-5955 1
Collegiate Aviation Review
International
Volume 38 | Issue 1 Peer-Reviewed Article #1
1-7-2020
Training Capacity of the Fixed Wing
FAA Part 141 Flight Schools within the
United States
Robert L. Thomas
Embry-Riddle Aeronautical University
Nicola M. O’Toole
Embry-Riddle Aeronautical University
Discussions have been held in classrooms, industry forums and in the media about the looming pilot shortage.
Discussion to date has primarily focused on causal factors, and forecasting industry need for pilots; there is little
research on where those pilots are going to come from. A study was conducted in the Fall of 2018 to quantify the
pilot training capacity in the United States, focusing on FAA Part 141 certified flight schools associated with
University degree programs. This information will be used to help the FAA and industry members make informed
decisions and plan for the future. In total, 33 schools participated in a survey, ranging in size from 1,700 students to
11. Findings indicated that a lack of CFI’s was the most common limiting factor, followed by lack of aircraft. 14 of
the 33 schools were at or above 100 percent capacity. Several other metrics were surveyed, including costs, total
pilot output, training duration, and CFI attrition, in order to build a broad picture of the state of pilot training within
the United States.
Recommended Citation:
Thomas, R.M. & O’Toole, N.M. (2020). Training Capacity of the Fixed Wing FAA Part 141 Flight Schools within
the United States. Collegiate Aviation Review International, 38(1), 1-11. Retrieved from
http://ojs.library.okstate.edu/osu/index.php/CARI/article/view/7957/7343
Collegiate Aviation Review International
A publication of the University Aviation Association, © 2020 2
Discussions have been held in classrooms, industry forums, and in the media about the
looming pilot shortage. The impact of the 1,500-hour rule, the cost of training, and increasing
retirements are just a few of reasons leading to the cause for the shortfall. A report released at the
Paris Airshow by C.A.E. (2017), a worldwide training organization, forecasts that the industry
worldwide will need an additional 255,000 pilots by 2027 to sustain its growth. The report adds
that more than half of these pilots have not yet begun training. The RAND Corporation published
a study that supports the hiring and industry growth trend (McGee, 2015). The RAND study has
a broader scope and maps the supply chain that should be providing a steady stream of pilots to
fulfill the demand.
The Airline Safety and Federal Aviation Administration Extension Act of 2010 (PL 111-
216) was a significant change to the airline hiring practices and prompted a body of research to
look at various impacts of the law. Smith, NewMyer, Bjerke, Niemczyk and Hamilton (2010)
studied the backgrounds and training records of more than 2,100 regional airline pilots in order
to identify characteristics of a successful first officer candidate. Flight programs associated with
university degree programs were identified as the primary source of pilots for airlines in the
United States. Smith et al. (2010) showed that: 1) pilots graduating from an Aviation
Accreditation Board International (AABI) accredited program, 2) with a bachelor's degree were
two of the five criteria for determining a high success rate through pilot training. Therefore, this
study chose to focus primarily on those Part 141 certificated flight schools that were associated
with a university degree program. An expansion of the research by Smith et al. (2017) looked at
numerous other factors including the number of hours of dual flight instruction an applicant
logged. These hours were compared before and after implementation of PL 111-216. Overall the
amount of dual given has increased since the law passed. In maintaining a constant pipeline of
pilots, attracting and maintaining a core of flight instructors is critically important. A study
looking at the effects of Public Law 111-216 on collegiate aviation provided a good overview of
what aviation program administrators are expecting and experiencing as a result of the law
(Depperschmidt, 2013). Of the schools surveyed, 41% were AABI accredited and an additional
22 schools were looking at AABI accreditation in response to PL 111-216. Additionally, PL
111-216 was seen as detrimental to collegiate aviation programs by 67% of the survey
respondents; and, 41% perceived the law to be detrimental to program enrollments
(Depperschmidt, 2013). While the current study does not directly address the effects of PL 111-
216, it would appear that student enrollment has not been adversely affected. In an additional
study, Casebolt (2015) assessed student perceptions of PL 111-216, providing insight as to the
career aspirations of students enrolled in public and private collegiate aviation programs. Of the
283 students surveyed, 65% of them aspired to be commercial pilots, 8% wanted to fly for the
military, 16% corporate, and 11% selected “other.” Based on the results of this survey, only 76%
of the pilots training in collegiate aviation programs would funnel directly into the industry to
resolve the shortage.
The question remains: where will these future pilots come from? The United States is the
world leader in training pilots but does the country have the training capacity to fulfill pilot
demand? The Federal Aviation Administration (FAA) (2018) issued 7,019 commercial airplane
Thomas & O’Toole: Training Capacity of the Fixed Wing FAA Part 141 Flight Schools within the U.S.
http://ojs.library.okstate.edu/osu/index.php/cari 3
single-engine land certificates; 6,615 commercial multi-engine land certificates; and 2,024
certificated flight instructor certificates in 2018. Are all those pilots destined for the airlines?
The goal of this survey was to create a clearer picture of the flight training environment and it is
associated limitations. It aimed to quantify the training capacity at FAA-approved Part 141 Pilot
Schools associated with university degree programs. Along with the current capacity of these
schools, the survey also gathered information regarding the current output of training schools,
the duration of the training, the cost of training, and an exploration of factors that limit training
capacity.
Methodology
An online survey was sent out in the Fall of 2018 to 108 schools identified from the
Federal Aviation Administration’s website listing of 14 Code of Federal Regulations (CFR) Part
141 Pilot Schools. These schools provide flight training in support of a university degree
program. Participants identified from the FAA’s website listing of pilot schools were called to
obtain an email address for the appropriate personnel to complete the survey. Thirty-three of the
108 schools completed the survey, yielding a response rate of 31%. Each school participant was
given a weblink to an online survey and presented with an electronic consent form. The
participants were then presented with the online survey to gather information and provided with
an opportunity to add additional comments. The researchers followed up with a phone call to the
participants to ensure there were no technical glitches in the administration of the survey and
increase response rate. A list of the survey questions is in Appendix A.
Results
The survey responses were divided into two groups: 1) programs with fewer than 250
students; and, 2) programs with more than 250 students. After reviewing the data there was a
natural separation between larger schools and smaller school size. The division at 250 students
was a decision made by the authors aimed at separating schools into two groups by size—large
and small—to make better comparisons across the different flight school sizes. Eleven of the
schools had more than two hundred and fifty students enrolled in the flight program and twenty-
two had fewer than two hundred and fifty students enrolled in the flight program. Twenty-five
of the 33 schools (76%) had minimum entry requirements for flight students. Those
requirements were not defined in this survey. Eighteen of the schools (55%) had programs that
were accredited by the Aviation Accreditation Board International.
The average student load for schools with more than 250 student enrollments was 589
(SD = 486.53). The average for schools with less than 250 student enrollments was 83 students
(SD = 41.48) (see Table 1). Cumulatively, the schools surveyed were at an average of 97% of
their maximum capacity. Fourteen of the 33 schools have enrollments at or above one hundred
percent capacity (see Table 2). Eighty percent of these students on average were focused on the
airlines as their career goal.
Collegiate Aviation Review International
A publication of the University Aviation Association, © 2020 4
Table 1
Current Student Load
School Size M SD Total
All 252 365.98 8,303
250+ Students 589 486.53 6,484
<250 Students 83 41.18 1,819
Table 2
Maximum Student Capacity
School Size M SD Total % Max Capacity
All 259 364.29 8,547 97%
250+ Students 579 500.72 6,365 102%
<250 Students 99 50.60 2,182 83%
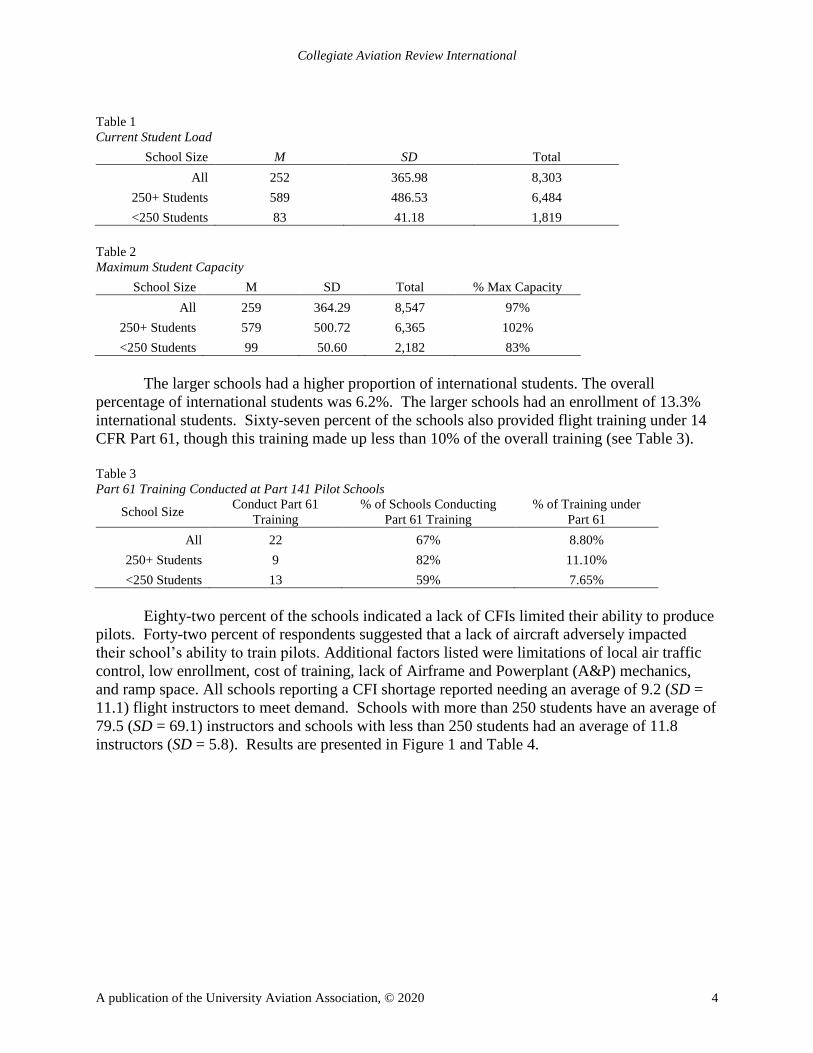
The larger schools had a higher proportion of international students. The overall
percentage of international students was 6.2%. The larger schools had an enrollment of 13.3%
international students. Sixty-seven percent of the schools also provided flight training under 14
CFR Part 61, though this training made up less than 10% of the overall training (see Table 3).
Table 3
Part 61 Training Conducted at Part 141 Pilot Schools
School Size Conduct Part 61
Training
% of Schools Conducting
Part 61 Training
% of Training under
Part 61
All 22 67% 8.80%
250+ Students 9 82% 11.10%
<250 Students 13 59% 7.65%
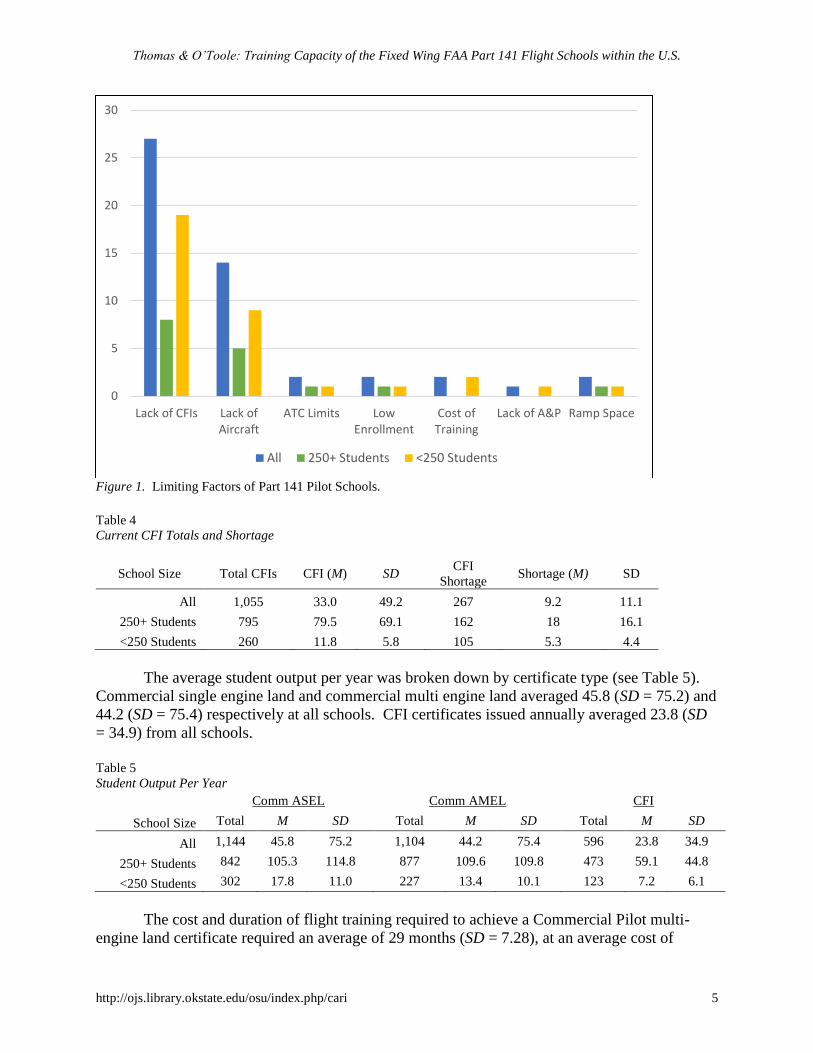
Eighty-two percent of the schools indicated a lack of CFIs limited their ability to produce
pilots. Forty-two percent of respondents suggested that a lack of aircraft adversely impacted
their school’s ability to train pilots. Additional factors listed were limitations of local air traffic
control, low enrollment, cost of training, lack of Airframe and Powerplant (A&P) mechanics,
and ramp space. All schools reporting a CFI shortage reported needing an average of 9.2 (SD =
11.1) flight instructors to meet demand. Schools with more than 250 students have an average of
79.5 (SD = 69.1) instructors and schools with less than 250 students had an average of 11.8
instructors (SD = 5.8). Results are presented in Figure 1 and Table 4.
Thomas & O’Toole: Training Capacity of the Fixed Wing FAA Part 141 Flight Schools within the U.S.
http://ojs.library.okstate.edu/osu/index.php/cari 5
Figure 1. Limiting Factors of Part 141 Pilot Schools.
Table 4
Current CFI Totals and Shortage
School Size Total CFIs CFI (M) SD CFI
Shortage Shortage (M) SD
All 1,055 33.0 49.2 267 9.2 11.1
250+ Students 795 79.5 69.1 162 18 16.1
<250 Students 260 11.8 5.8 105 5.3 4.4
The average student output per year was broken down by certificate type (see Table 5).
Commercial single engine land and commercial multi engine land averaged 45.8 (SD = 75.2) and
44.2 (SD = 75.4) respectively at all schools. CFI certificates issued annually averaged 23.8 (SD
= 34.9) from all schools.
Table 5
Student Output Per Year
Comm ASEL Comm AMEL CFI
School Size Total M SD Total M SD Total M SD
All 1,144 45.8 75.2 1,104 44.2 75.4 596 23.8 34.9
250+ Students 842 105.3 114.8 877 109.6 109.8 473 59.1 44.8
<250 Students 302 17.8 11.0 227 13.4 10.1 123 7.2 6.1
The cost and duration of flight training required to achieve a Commercial Pilot multi-
engine land certificate required an average of 29 months (SD = 7.28), at an average cost of
0
5
10
15
20
25
30
Lack of CFIs Lack ofAircraft
ATC Limits LowEnrollment
Cost ofTraining
Lack of A&P Ramp Space
All 250+ Students <250 Students
Collegiate Aviation Review International
A publication of the University Aviation Association, © 2020 6
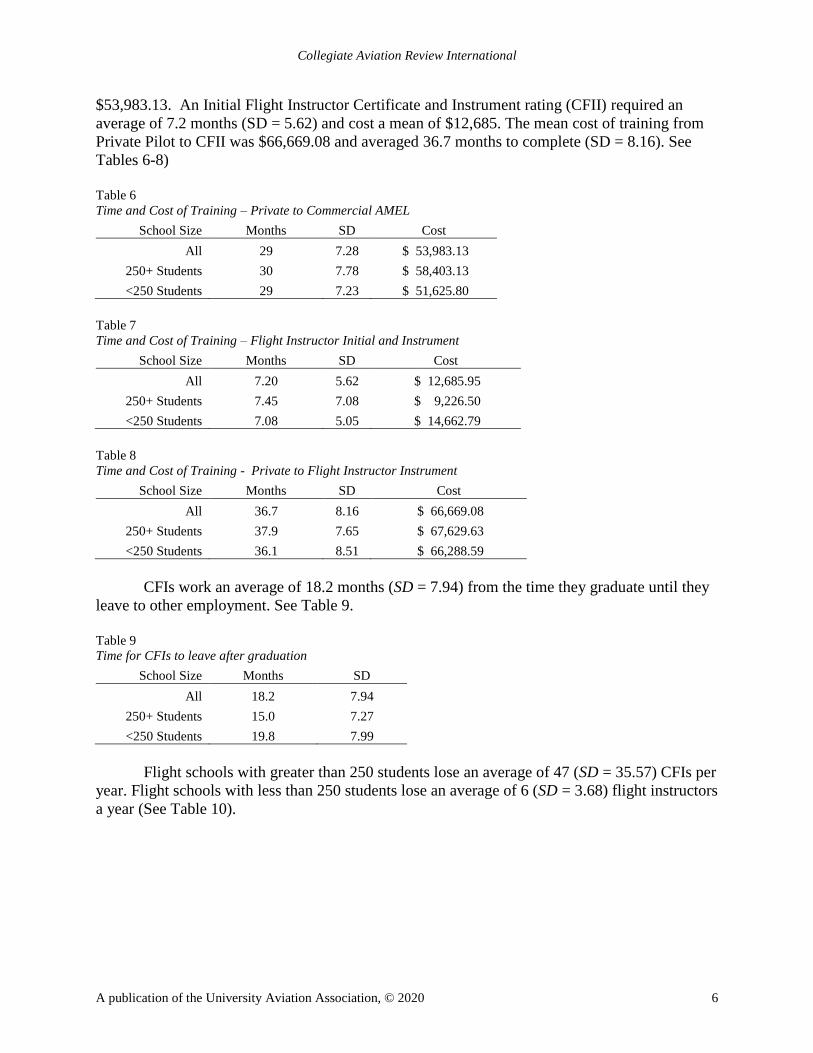
$53,983.13. An Initial Flight Instructor Certificate and Instrument rating (CFII) required an
average of 7.2 months (SD = 5.62) and cost a mean of $12,685. The mean cost of training from
Private Pilot to CFII was $66,669.08 and averaged 36.7 months to complete (SD = 8.16). See
Tables 6-8)
Table 6
Time and Cost of Training – Private to Commercial AMEL
School Size Months SD Cost
All 29 7.28 $ 53,983.13
250+ Students 30 7.78 $ 58,403.13
<250 Students 29 7.23 $ 51,625.80
Table 7
Time and Cost of Training – Flight Instructor Initial and Instrument
School Size Months SD Cost
All 7.20 5.62 $ 12,685.95
250+ Students 7.45 7.08 $ 9,226.50
<250 Students 7.08 5.05 $ 14,662.79
Table 8
Time and Cost of Training - Private to Flight Instructor Instrument
School Size Months SD Cost
All 36.7 8.16 $ 66,669.08
250+ Students 37.9 7.65 $ 67,629.63
<250 Students 36.1 8.51 $ 66,288.59
CFIs work an average of 18.2 months (SD = 7.94) from the time they graduate until they
leave to other employment. See Table 9.
Table 9
Time for CFIs to leave after graduation
School Size Months SD
All 18.2 7.94
250+ Students 15.0 7.27
<250 Students 19.8 7.99
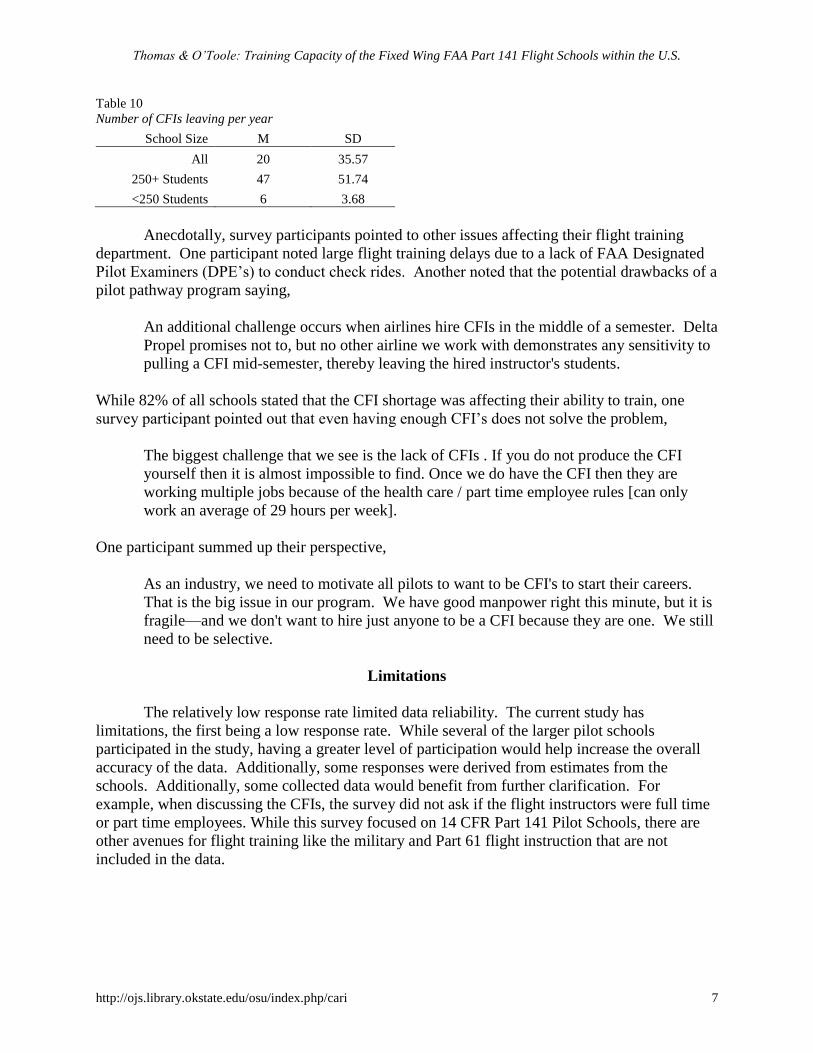
Flight schools with greater than 250 students lose an average of 47 (SD = 35.57) CFIs per
year. Flight schools with less than 250 students lose an average of 6 (SD = 3.68) flight instructors
a year (See Table 10).
Thomas & O’Toole: Training Capacity of the Fixed Wing FAA Part 141 Flight Schools within the U.S.
http://ojs.library.okstate.edu/osu/index.php/cari 7
Table 10
Number of CFIs leaving per year
School Size M SD
All 20 35.57
250+ Students 47 51.74
<250 Students 6 3.68
Anecdotally, survey participants pointed to other issues affecting their flight training
department. One participant noted large flight training delays due to a lack of FAA Designated
Pilot Examiners (DPE’s) to conduct check rides. Another noted that the potential drawbacks of a
pilot pathway program saying,
An additional challenge occurs when airlines hire CFIs in the middle of a semester. Delta
Propel promises not to, but no other airline we work with demonstrates any sensitivity to
pulling a CFI mid-semester, thereby leaving the hired instructor's students.
While 82% of all schools stated that the CFI shortage was affecting their ability to train, one
survey participant pointed out that even having enough CFI’s does not solve the problem,
The biggest challenge that we see is the lack of CFIs . If you do not produce the CFI
yourself then it is almost impossible to find. Once we do have the CFI then they are
working multiple jobs because of the health care / part time employee rules [can only
work an average of 29 hours per week].
One participant summed up their perspective,
As an industry, we need to motivate all pilots to want to be CFI's to start their careers.
That is the big issue in our program. We have good manpower right this minute, but it is
fragile—and we don't want to hire just anyone to be a CFI because they are one. We still
need to be selective.
Limitations
The relatively low response rate limited data reliability. The current study has
limitations, the first being a low response rate. While several of the larger pilot schools
participated in the study, having a greater level of participation would help increase the overall
accuracy of the data. Additionally, some responses were derived from estimates from the
schools. Additionally, some collected data would benefit from further clarification. For
example, when discussing the CFIs, the survey did not ask if the flight instructors were full time
or part time employees. While this survey focused on 14 CFR Part 141 Pilot Schools, there are
other avenues for flight training like the military and Part 61 flight instruction that are not
included in the data.
Collegiate Aviation Review International
A publication of the University Aviation Association, © 2020 8
Conclusion
The 33 schools that completed the survey trained a total of 1,144 commercial single
engine pilots and 1,104 commercial multi engine pilots. These certificate issuances represent
16% and 17% of all of these respective airmen class certifications issued in 2018. The
participating schools trained 596 certificated flight instructors this is 29% of the total number of
flight instructor certificates issued to pilots between the ages of 18 and 25 in 2018. While flight
schools are training a significant percentage of the total number of flight instructors, these pilots
are averaging 18 months of service as a flight instructor. The average total cost of flight training
for a new student to earn a CFII certificate was $66,669.08, with an average completion time of
36.7 months. The survey results confirm what is already known by many flight school
administrators. Airline hiring is generating a lot of interest in aviation careers. Flight schools
are at or over capacity. Primary factors limiting the ability to train more pilots is the lack of
available CFIs and training aircraft.
Recommendations for Future Research
Future research could repeat and expand on this survey in an effort to analyze trends in
the training industry and gather data from more participants. It is hoped this information will be
used to help the FAA, flight school administrators, and industry members make informed
decisions and plan for the future.
Thomas & O’Toole: Training Capacity of the Fixed Wing FAA Part 141 Flight Schools within the U.S.
http://ojs.library.okstate.edu/osu/index.php/cari 9
References
Airline Safety and Federal Aviation Administration Extension Act of 2010, Pub. L. 111-216, 117
Stat. 2518 (2010).
CAE. (2017). CAE’s Airline Pilot Demand Outlook, a 10-year view. Retrieved from
https://www.cae.com/media/documents/Civil_Aviation/CAE__Airline_Pilot_Demand_O
utlook_a_10-year_view_2017.pdf
Casebolt, M. K. (2015). Impact of Public Law 111-216: Perceptions of US Collegiate Flight
Students (Doctoral dissertation, Oklahoma State University).
Depperschmidt, C. L. (2013). Public Law 111-216: Effects of new legislation on collegiate
aviation flight training programs. The Collegiate Aviation Review International, 31(1).
http://dx.doi.org/10.22488/okstate.18.100434
Federal Aviation Administration (FAA). (2018). U.S. Civil Airman Statistics: 2018 Active Civil
Airman Statistics 2018. Retrieved from: https://www.faa.gov/data_research/
aviation_data_statistics/civil_airmen_statistics/
McGee, M. (2015). Air Transport Pilot Supply and Demand: Current State and Effects of Recent
Legislation. Rand Corporation. Retrieved from https://www.rand.org/pubs/
rgs_dissertations/RGSD351.html.
Smith, M.O., Smith, G.M., Bjerke, E., Christiansen, C., Carney, T.W., Craig, P.A., & Niemczyk,
M. (2017). Pilot Source Study 2015: A Comparison of Performance at Part 121 Regional
Airlines Between Pilots Hired Before the U.S. Congress Passed Public Law 111-216 and
Pilots Hired After the Law’s Effective Date, Journal of Aviation Technology and
Engineering: 6(2). https://doi.org/10.7771/2159-6670.1151
Smith, G. M., NewMyer, D. A., Bjerke, E., Niemczyk, M., & Hamilton, R. A. (2010). Pilot
source study: An analysis of pilot backgrounds and subsequent success in US regional
airline training programs. International Journal of Applied Aviation Studies, 10(1), 73.
Retrieved from https://commons.erau.edu/dbapplied-aviation/3
Collegiate Aviation Review International
A publication of the University Aviation Association, © 2020 10
Appendix A Research Questions
1. Name of Pilot School
2. If yes, please specify the college or university Name of point of contact
3. Email address for point of contact
4. Phone number for point of contact
Note that items 1, 2, 3, and 4 will only be used for follow-up questions and will not be used in
any report or presentation of the data.
5. Is your flight program affiliated with an accredited college or university?
a. Yes
b. No
6. Does your college or university aviation/flight degree program possess AABI
accreditation?
a. Yes
b. No
7. Do you have any screening or minimum requirements for pilot school applicants?
a. Yes
b. No
8. What is the current number of flight students enrolled in your FAA approved 141 pilot
school?
9. What percentage of your flight students are international students?
10. Do you complete any flight training under Part 61?
a. Yes
b. No
11. If yes, what percentage of your training is completed under Part 61
12. What is the maximum number of flight students you able to train concurrently at your
FAA approved 141 pilot school?
13. What is the limiting resource/factor(s) that limit your ability to reach maximum student
output (select all that apply)?
a. Lack of CFIs
b. Lack of Aircraft Availability
c. Low student enrollment
d. ATC/Airspace saturation
e. Other (please specify)
14. How many CFIs do you currently employ?
15. If you are short of CFIs, how many more would you need?
16. What is your current annual output of Commercial ASEL students?
17. What is your current annual output of Commercial AMEL students?
18. What is your current annual output of Flight Instructor -Initial students?
19. What is the mean time (in months) to complete your program from Private through
Commercial ASEL & AMEL)
20. What is the mean cost (flight cost only, not tuition or fees) to complete your program
(from Private through Commerical ASEL & AMEL?
21. What is the mean time (in months) to complete your program’s Flight Instructor ASE and
Flight Instructor Instrument-Airplane?
Thomas & O’Toole: Training Capacity of the Fixed Wing FAA Part 141 Flight Schools within the U.S.
http://ojs.library.okstate.edu/osu/index.php/cari 11
22. What is the mean cost (flight cost only, not tuition or fees) to complete your program’s
Flight Instructor ASE and Flight Instructor Instrument-Airplane?
23. What is the mean time (in months) your graduates stay employed at your flight school
before leaving for an airline first officer job?
24. Do you have any flow through programs or airline hiring agreements?
a. Yes
b. No
25. How many airlines do you have agreements with?
26. How many of your students are enrolled in flow through programs?
27. What percentage of your graduates are focused on an airline career path?
28. On average, how many flight instructors leave your flight school for an airline first
officer position per year?
29. Open Comments:
A publication of the University Aviation Association, © 2020, ISSN: 1523-5955 12
Collegiate Aviation Review
International
Volume 38 | Issue 1 Peer-Reviewed Article #2
1-8-2020
Fatigue in Collegiate Flight Training
Matthew J. Romero
Southern Illinois University
Michael F. Robertson
Southern Illinois University
Steven C. Goetz
Southern Illinois University
Fatigue-related problems are not new in the aviation industry and have been a contributing factor to more than one-
fifth of all aviation accidents. Using an online survey instrument, this exploratory study investigated how 138
collegiate flight students interact with fatigue during their flight training. Overall, students recognize they are
fatigued and that it has a negative impact on their flight training. Many of the students identify the proper strategic
adjustments that they need to make to manage fatigue, such as reducing workload, getting more sleep, and keeping a
regular sleep schedule. However, they do not seem to be making those adjustments. They indicate that they lack
enough quality sleep, have high workloads, and do not keep a regular sleep schedule. Findings from this study are
consistent with recent flight training studies and can assist the collegiate flight training community in the
management of student fatigue.
Recommended Citation:
Romero, M.J. & Robertson, M.F. & Goetz, S.C. (2020). Fatigue in Collegiate Flight Training. Collegiate Aviation
Review International, 38(1), 12-29. Retrieved from
http://ojs.library.okstate.edu/osu/index.php/CARI/article/view/7912/7344
Collegiate Aviation Review International
A publication of the University Aviation Association, © 2020 13
Everyone experiences fatigue from time to time, but fatigue in high-risk industries such
as transportation is an especially-dangerous risk factor. Fatigue-related problems are not new in
the aviation industry. Fatigue contributed to a substantial number of aviation accidents from the
mid-1970s to the early-1990s (Caldwell, 2005), and the National Transportation Safety Board
(NTSB) made over 50 fatigue-related recommendations between 1972 and 2018 (NSTB, 2018).
Fatigue was a contributing factor to 20.3% of all investigations by the NTSB conducted between
2001 and 2012; and of those, fatigue was a contributing factor in 23% of aviation-related
transportation accidents during the same period (Marcus & Rosekind, 2017).
The effects of fatigue can manifest in subtler ways than aircraft accidents or incidents.
Fatigue insidiously infiltrates the lives of pilots long before they become the subject of NTSB
investigations, and the long-term effects of fatigue can have lasting impacts on pilots. Fatigue is
a precursor that may be uncovered during accident investigations; and, it has been established
that the long-term effects of fatigue on pilot performance is a critical safety issue that warrants
mitigations (International Air Transport Association [IATA], International Civil Aviation
Organization [ICAO], & International Federation of Air Line Pilots’ Associations [IFALPA],
2011). Human factors training introduces new pilots to fatigue, its effects, and methods to avoid
fatigue. This study provides educators a chance to see the prevalence of fatigue within a
collegiate flight training environment.
Purpose of the Research
There has been very little research conducted regarding fatigue in flight training (Levin,
Mendonca, Keller, & Teo, 2019) This research aims to expand our understanding of the impact
fatigue has on students in a collegiate flight training environment. McDale and Ma (2008)
investigated the effects fatigue had on a group of flight instructors at part 141 flight schools.
This research investigates the same issues related to flight students at a collegiate Part 141 flight
school.
The role of the university within a person’s life is debatable, but behavioral changes are
often the result of education. The behavioral changes that occur can be positive or negative,
depending on social and structural determinants of health. The social determinants of health
“consist of policies and environments that support access to education, provide relevant
resources for health (e.g., contraception), and create opportunities to enhance young people’s
autonomy, decision-making capacities, employment, and human rights” (U.S. Department of
Transportation, 2012, p. 1634). Collegiate flight programs act as a structural means to provide
opportunities for young adults to interact with positive social determinants of health by educating
them about how their behaviors affect their flight performance and long-term well-being. This
research will help clarify how flight students interact with fatigue to help shape human factors
training into a relevant curriculum that incorporates the needs of students.
Collegiate aviation students will be members of the professional pilot workforce and play
a vital role in fatigue risk management systems. Collegiate flight programs have the opportunity
to shape students’ attitudes and knowledge about fatigue, which will help inexperienced pilots
effectively managing their own fatigue.
Romero, Robertson, & Goetz: Fatigue in Collegiate Flight Training
http://ojs.library.okstate.edu/osu/index.php/cari 14
Aside from educating new pilots about professional standards and norms, flight schools
certified under Part 141 also operate full flight schedules that carry their own inherent safety
risks. We can also improve operational safety in collegiate flight training courses by teaching
college student-pilots to manage their own fatigue during flight training. Improving fatigue-
related human factors training also has the added benefit of improving the safety within
collegiate flight training environments.
Three primary research questions provided the focus for this research:
1. How do students evaluate their fatigue and how do they believe it impacts their flight
training?
2. What do students perceive to be the causes of their fatigue?
3. What lifestyle adjustments do the students believe are necessary to manage their fatigue?
Literature Review
An industry-wide strategy has been developed to combat the risks associated with fatigue
in aviation. Fatigue management (FM) “generally refers to the identification of fatigue risk and
the implementation of strategic controls” (Avers, Hauck, Blackwell, & Nesthus, 2010, p. 52).
Avers, Hauck, Blackwell, and Nesthus (2010) describe three distinct stakeholder groups that are
necessary for effective FM: (1) regulatory agencies; (2) operating organizations; and (3) the
pilots. A fourth stakeholder group--the research community--also contributes to FM strategies.
The regulator mandates maximum duty time and rest requirements for flight crews in
operational environments. The operator, or airline, influences the fatigue culture in two ways.
First, the airline schedules its pilots and must, at a minimum, follow duty limitations regulations.
Second, airlines may implement Fatigue Risk Management Systems (FRMS) to identify and
mitigate risks associated with fatigue. The pilot is responsible for managing their own fatigue
and for being fit for duty (U.S. Department of Transportation, 2012). Fitness for duty means a
pilot is “physiologically and mentally prepared and capable of performing duties assigned” (U.S.
Department of Transportation, 2012, 2012, p.1). The research community is the fourth
stakeholder group involved in FM. The research community should inform and educate other
FM stakeholders to find ways to reduce the risks associated with operating aircraft in fatigued
states. Their research also contributes to the body of literature used by other stakeholder groups
to address fatigue-related issues.
Definition of Fatigue
In their thorough review of FAA fatigue research, Avers and Johnson (2011) correctly
describe fatigue as a “complex state” (p. 88). Understanding fatigue requires a definition that
reflects the complex nature of the construct of fatigue. Literature provides many definitions of
fatigue that lack comprehensiveness and consistency (Avers & Johnson, 2011; Lee & Kim, 2018;
Noy et al., 2011; Phillips, 2015). Using a common definition for fatigue will help the aviation
research community develop comprehensive research agendas covering all aspects of fatigue.
Collegiate Aviation Review International
A publication of the University Aviation Association, © 2020 15
A complete definition of fatigue adequately describes the complex nature of the condition
of fatigue, the causes of fatigue, and the consequences of fatigue (Phillips, 2015). A multi-
dimensional construct with such immediate safety risks deserves a definition that reflects the
complex nature of fatigue, its antecedents, and its outcomes (Avers & Johnson, 2011; Noy et al.,
2011). A consistent, comprehensive definition of fatigue will allow the research community to
strategically investigate these different aspects.
A unified definition of fatigue provides transportation researchers with a theoretical
framework to guide future fatigue-related research. Because previous definitions of fatigue in
transportation research are too divergent to be useful, Phillips (2015) proposes a new definition
of fatigue and “claims that by delimiting the origins, state, and consequences of fatigue, a
‘whole’ definition would help make explicit for different transport researchers, aspects of fatigue
that different studies do not measure, as well as those that they do measure” (p. 49). A common,
unified definition of fatigue in transportation research allows the research community to monitor
and categorize fatigue research into different aspects of the complex construct of fatigue.
According to Phillips (2015):
Fatigue is a suboptimal psychophysiological condition caused by exertion. The degree
and dimensional character of the condition depends on the form, dynamics, and context
of exertion. The context of exertion is described by the value and meaning of
performance to the individual; rest and sleep history; circadian effects; psychosocial
factors spanning work and home life; individual traits; diet; health, fitness and other
individual states; and environmental conditions. The fatigue condition results in changes
in strategies or resource use such that original levels of mental processing or physical
activity are maintained or reduced (p. 53).
This definition of fatigue has three basic parts: origin, state, and consequences. First,
origins refer to the sources of fatigue, which can be mental or physical exertion and varies along
with working conditions. Next, state refers to the psycho-physiological condition, characterized
by objective and subjective measures of fatigue. The fatigued condition is directly dependent on
the type and degree of exertion (physical or mental effort). Lastly, consequences refer to the
behavioral changes that result from fatigue (Phillips, 2015). The results of this research follow
this three-part framework.
College Students in Aviation
College students engaged in flight training are different than other members of the
piloting workforce because they are typically younger and less experienced than counterparts.
Persons of all ages need quality sleep to maintain their physical and phycological health, but
college-age students who are in their late adolescence are more susceptible to the effect of
fatigue and face greater safety risks when operating airplanes for flight training because their
physiological needs differ (Pink, 2018).
Collegiate aviation is a rare intersection in the aviation industry because its members are
young college students, a unique population in the industry. Pilots in this age group interact with
fatigue differently than older pilots. Aside from their novice status among the piloting
Romero, Robertson, & Goetz: Fatigue in Collegiate Flight Training
http://ojs.library.okstate.edu/osu/index.php/cari 16
community, collegiate aviation students are unique because most are still in the developmental
process of adolescence, albeit in the latter stages (American Psychological Association, 2002;
Curtis, 2015; Sawyer et al., 2012). They are known for impulsivity and peer pressure (Sawyer et
al., 2012). As adolescents, they possess different behavioral characteristics, such as staying up
late, sleeping in on weekends, and have different sleep needs than fully-developed adults.
The sleep patterns of college students are notorious, and their lack of sleep creates
conditions conducive to chronic and acute fatigue and their related symptoms (Lund, Reider,
Whiting, & Prichard, 2010). College is a “a time of minimal adult supervision, erratic schedules,
and easy access to over-the-counter (OTC), prescription, and recreational drugs” (Lund, et al.,
2010, p. 125). The academic demands of school and the social demands of college life relegate
sleep to a tertiary status. According to Lund et al. (2010), only 29.4% of college students report
getting enough sleep. They noted that average sleep time for college student (N=5,401) was 7.02
hours (SD=1.15) (Lund et al., 2010, p. 125).
Levin, Mendonca, Keller, and Teo (2019) through a mixed methods exploratory study
investigated how pilots in the collegiate flight training environment mitigate fatigue through
lifestyle factors and how they rank those solutions for fatigue management. The most effective
solutions that the participants identified for fatigue mitigation were obtaining more sleep,
reduced workload, and time management of their flight and class workloads. Several themes
through qualitative inquiry were found, including; socializing and late night electronic use
delayed student’s bed times, excessive noise and light in the dorm environment led to sleep
disturbances, and school workload time spent working frequently left participants sleepless.
Research Methodology
This study used a survey methodology to understand how students at Part 141 pilot
schools feel they were impacted by fatigue. This study replicates the questionnaire of McDale
and Ma (2008) who assessed the impacts of fatigue on flight instructors at Part 141 pilot schools
in the U.S. The instrument used was not validated and some questions were altered to suit the
new population. The internet-based questionnaire, data collection methodology, and the
informed consent notification were approved by the university institutional review board to
ensure high ethical standards in the research process. All participation in the study was
voluntary.
Sampling
This study used a convenient, non-probability sample to identify participants for the
survey. A department student listserve was used to email a survey link to all students enrolled in
the flight program. The researchers acknowledge that the convenient sampling technique limits
the generalizability of the results (Cohen, Manion, & Morrison, 2011). This exploratory study
shows the prevalence of fatigue-related issues within the study sample and possibly other flight
training environments.
Collegiate Aviation Review International
A publication of the University Aviation Association, © 2020 17
Participants
The participants in the study were undergraduate students engaged in flight training at a
certified Part 141 pilot school at a state university in the U.S. The students were enrolled in a
two-year flight degree and a four-year aviation management degree. All participation in the study
was anonymous and voluntary.
Data Collection and Analysis
Data were collected over two different periods. The first data collection period was from
November 9, 2017 until December 8, 2017, and the second data collection period was from April
8, 2019 until April 17, 2019. Both of these time periods had a high number of operational
activities.
The researchers added an additional question to the second questionnaire to ensure that
each participant only contributed one set of responses. The first question on the second
questionnaire asked respondents if they had taken the survey during the first data collection
period. Respondents who indicated they previously participated in the first survey were removed
from the second group of respondents. The nature of the variables used in the survey limit the
analysis for the current project to descriptive statistics.
Results
The results are divided into three major section based on the different elements of
Phillips’ (2015) definition of fatigue: (1) the psychophysiological state; (2) the exertion
expended and the context in which it occurred; and (3) the strategic behavioral adjustments that
are made as a result of fatigue. A demographics section provides a general picture of the
respondent population.
Response Rate
The number of students enrolled at the time the of data collection determined the
population for this study. A total of 132 students were enrolled in the flight program, and a total
of 60 students responded to the questionnaire, yielding a 45% response rate for the first data
collection period. The enrollment during the second data collection period was 153 students,
with 68 students responding, resulting in a 44% response rate during the second data collection
period (Institutional Research and Studies, 2019).
Demographics
The respondents were students enrolled in a collegiate flight training program at a flight
school certified under 14 C.F.R. §141. A large majority (80.47%) of the 128 respondents were
between the ages of 18-24, and the remaining respondents were older. Survey respondents
reported enrollment in the range of aviation flight-related courses offered in the curriculum, with
the largest concentration of students training for instrument rating (26.78%). The curriculum at
the institution where the data were collected offers private pilot, instrument rating, commercial
Romero, Robertson, & Goetz: Fatigue in Collegiate Flight Training
http://ojs.library.okstate.edu/osu/index.php/cari 18
pilot, multi-engine, and flight instructor courses. Nearly two-thirds (66.33%) of the 98
respondents had only a private pilot certificate while the remaining one-third of respondents had
an instrument rating, or other flight certifications and ratings. Most of the respondents (60.71%)
had less than 200 hours of total flight time
A Sub-optimal Psychophysiological State
Phillips (2015) explains that fatigue is both a subjective (psychological) and objective
(physiological) condition. This research does not address the objective, physiological state of
fatigue. Rather, the survey questions asked the respondents for their perceptions of fatigue, a
subjective rating.
Respondents indicated awareness of their fatigue and believed it impacted their flight
training. Using a ten-point Likert-type scale, respondents rated the degree to which they were
aware of their own fatigue, with 1 being the least aware and 10 being the most aware of their
own fatigue. A weighted average of the responses was 7.40, with a median and mode of 7 (30%
of respondents). In addition, 95% of respondents (n =121) indicated that fatigue effects the
quality of their flight training.
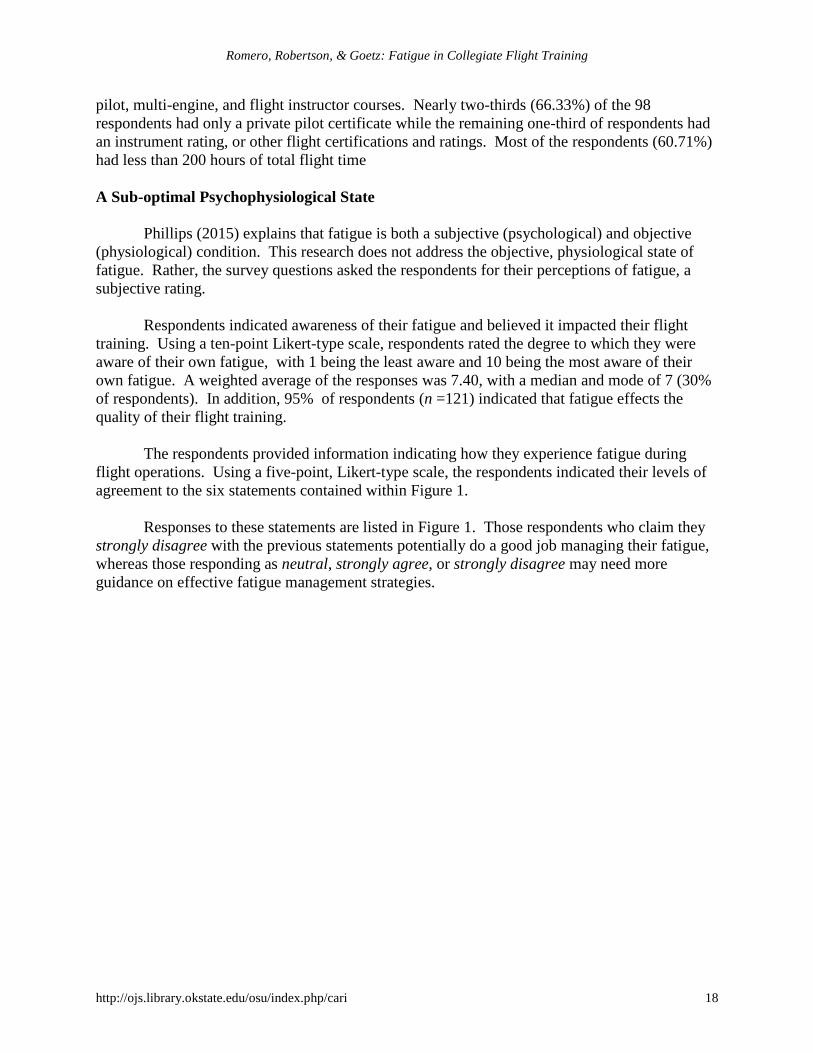
The respondents provided information indicating how they experience fatigue during
flight operations. Using a five-point, Likert-type scale, the respondents indicated their levels of
agreement to the six statements contained within Figure 1.
Responses to these statements are listed in Figure 1. Those respondents who claim they
strongly disagree with the previous statements potentially do a good job managing their fatigue,
whereas those responding as neutral, strongly agree, or strongly disagree may need more
guidance on effective fatigue management strategies.
Collegiate Aviation Review International
A publication of the University Aviation Association, © 2020 19
Figure 1. Impacts of Fatigue on Flight Training.
Exertion
Fatigue is caused by exertion, which occurs in different contexts. This section provides
information on the context of fatigue like weekly workloads, sleep habits, and other lifestyle
factors. Respondents also ranked factors that contributed to their fatigue.
Academic workload. The primary workload of a student enrolled in a collegiate flight
program is the effort related to the university’s core curriculum and courses required by for the
aviation-related major, including flight courses. Respondents reported being in school for most
of the week. Nearly 66% of the 128 respondents answering this question indicated that they
attend class five days a week. Three-quarters of respondents (n = 96) indicated they attend class
between 3-5 hours each day. Most of the respondents (76.56%) reported a full-time academic
schedule, of 12 or more credit-hours per semester. Respondents most commonly reported being
enrolled in 15-18 credit hours, which is 1-2 courses over the standard, full-time workload.
Sleep habits. Respondents reported information about their sleep habits. This section
reports results of the respondents’ quantity and quality of their sleep. Quantity of sleep refers to
the number of hours respondents slept per day, either through regular, nightly sleep or by
napping. Quality of sleep refers to the number of times respondents’ sleep was interrupted per
night and whether their sleep made them feel rested.
53
13
10
22
19
20
47
28
35
45
16
29
11
16
22
17
14
29
14
62
57
35
66
42
3
9
4
9
13
8
0% 20% 40% 60% 80% 100%
I have fallen asleep or struggled to stay awake during a
training flight.
I have remarked (out loud or to myself) about how
tired I was, but went on the flight anyway.
I have overlooked mistakes I have made during a
training flight because of reduced awareness or
judgement due to fatigue.
I have felt heightened irritation toward my instructor
because I was tired.
I have felt a disinterest in flight training because I was
tired.
I have decided to fly a dual flight when, if I was solo, I
would not have flown due to fatigue.
Impacts of Fatigue on Flight Training
Strongly Disagree Disagree Neutral Agree Strongly Agree
Romero, Robertson, & Goetz: Fatigue in Collegiate Flight Training
http://ojs.library.okstate.edu/osu/index.php/cari 20
Quantity of sleep. Respondents showed different sleeping habits on the weekdays than
on the weekends. Overall, the respondents reported an average of 7.89 hours of sleep per night
during the week and an average of 9.04 hours of sleep per night during the weekend.
Respondent sleep and rise times also differed from weekday to weekend.
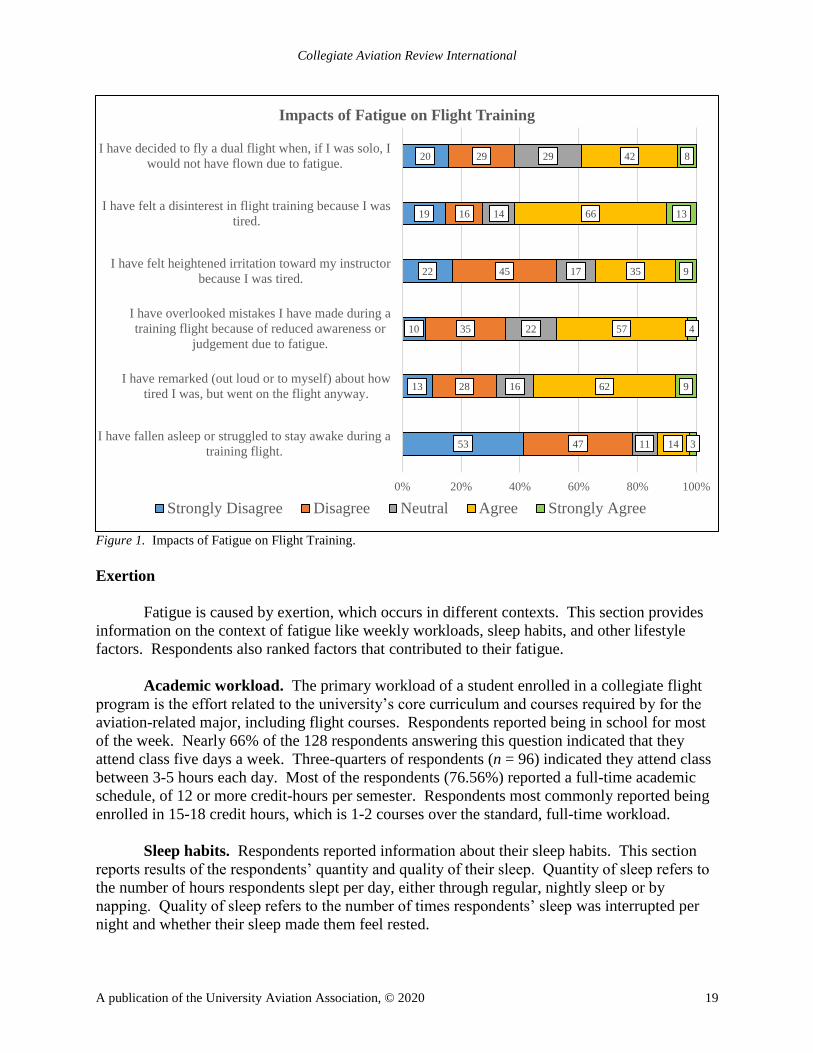
Respondents reported sleep patterns on school nights and non-school nights. Half of
respondents (n = 64) reported going to bed between 11:00 pm and 12:00 am on nights when they
have school the next day. An additional 29 respondents (22.66%) go to bed sometime after
midnight on school nights. The remaining results are displayed in Figure 2 which shows a
pattern that shifts toward later bedtimes on non-school.
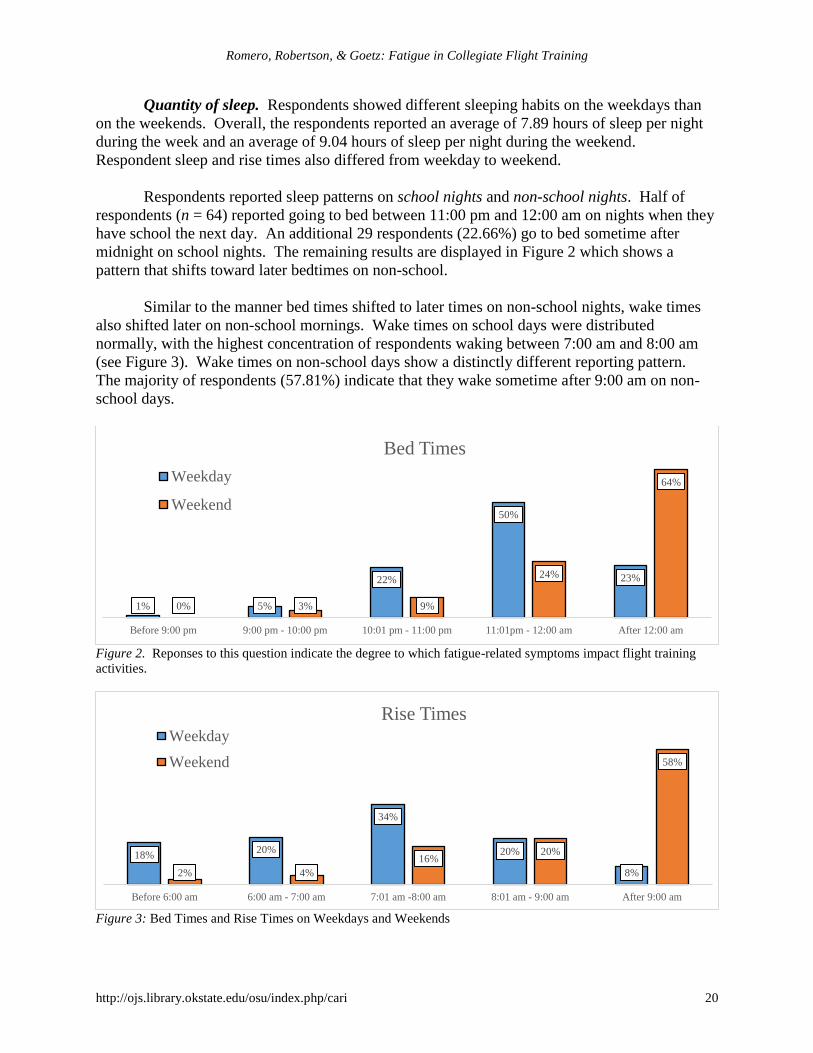
Similar to the manner bed times shifted to later times on non-school nights, wake times
also shifted later on non-school mornings. Wake times on school days were distributed
normally, with the highest concentration of respondents waking between 7:00 am and 8:00 am
(see Figure 3). Wake times on non-school days show a distinctly different reporting pattern.
The majority of respondents (57.81%) indicate that they wake sometime after 9:00 am on non-
school days.
Figure 2. Reponses to this question indicate the degree to which fatigue-related symptoms impact flight training
activities.
Figure 3: Bed Times and Rise Times on Weekdays and Weekends
1% 5%
22%
50%
23%
0% 3% 9%
24%
64%
Before 9:00 pm 9:00 pm - 10:00 pm 10:01 pm - 11:00 pm 11:01pm - 12:00 am After 12:00 am
Bed Times
Weekday
Weekend
18%20%
34%
20%
8%2% 4%
16%20%
58%
Before 6:00 am 6:00 am - 7:00 am 7:01 am -8:00 am 8:01 am - 9:00 am After 9:00 am
Rise TimesWeekday
Weekend
Collegiate Aviation Review International
A publication of the University Aviation Association, © 2020 21
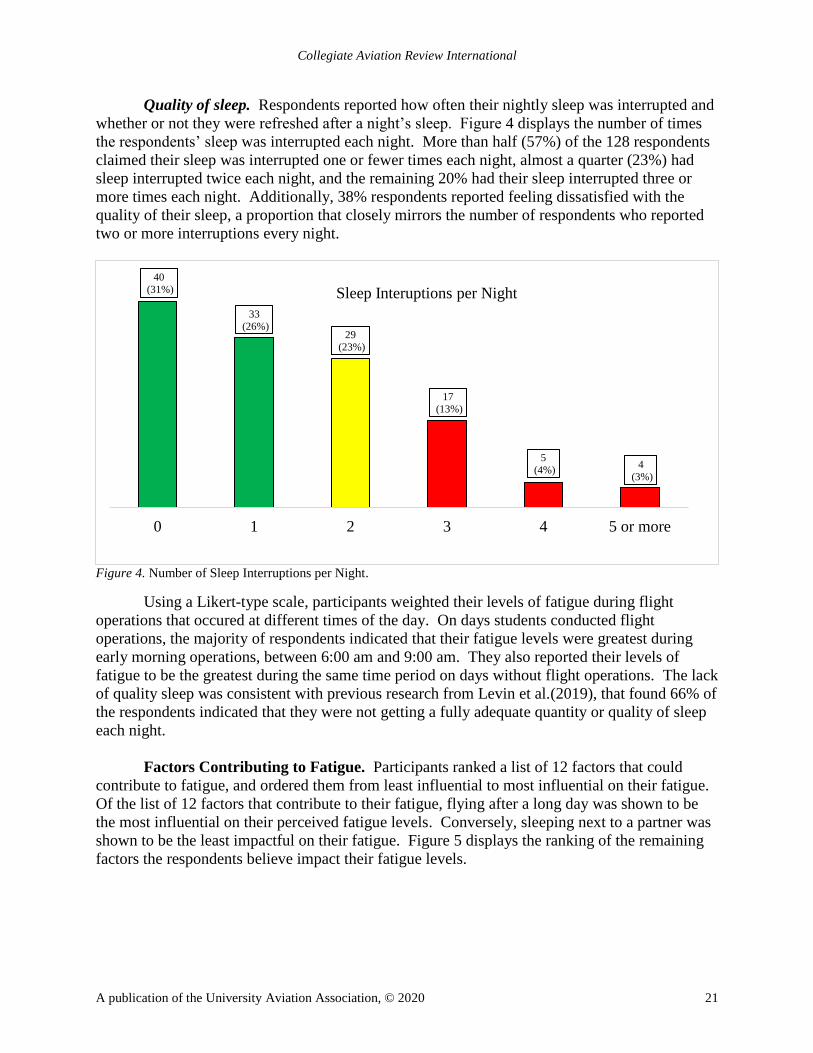
Quality of sleep. Respondents reported how often their nightly sleep was interrupted and
whether or not they were refreshed after a night’s sleep. Figure 4 displays the number of times
the respondents’ sleep was interrupted each night. More than half (57%) of the 128 respondents
claimed their sleep was interrupted one or fewer times each night, almost a quarter (23%) had
sleep interrupted twice each night, and the remaining 20% had their sleep interrupted three or
more times each night. Additionally, 38% respondents reported feeling dissatisfied with the
quality of their sleep, a proportion that closely mirrors the number of respondents who reported
two or more interruptions every night.
Figure 4. Number of Sleep Interruptions per Night.
Using a Likert-type scale, participants weighted their levels of fatigue during flight
operations that occured at different times of the day. On days students conducted flight
operations, the majority of respondents indicated that their fatigue levels were greatest during
early morning operations, between 6:00 am and 9:00 am. They also reported their levels of
fatigue to be the greatest during the same time period on days without flight operations. The lack
of quality sleep was consistent with previous research from Levin et al.(2019), that found 66% of
the respondents indicated that they were not getting a fully adequate quantity or quality of sleep
each night.
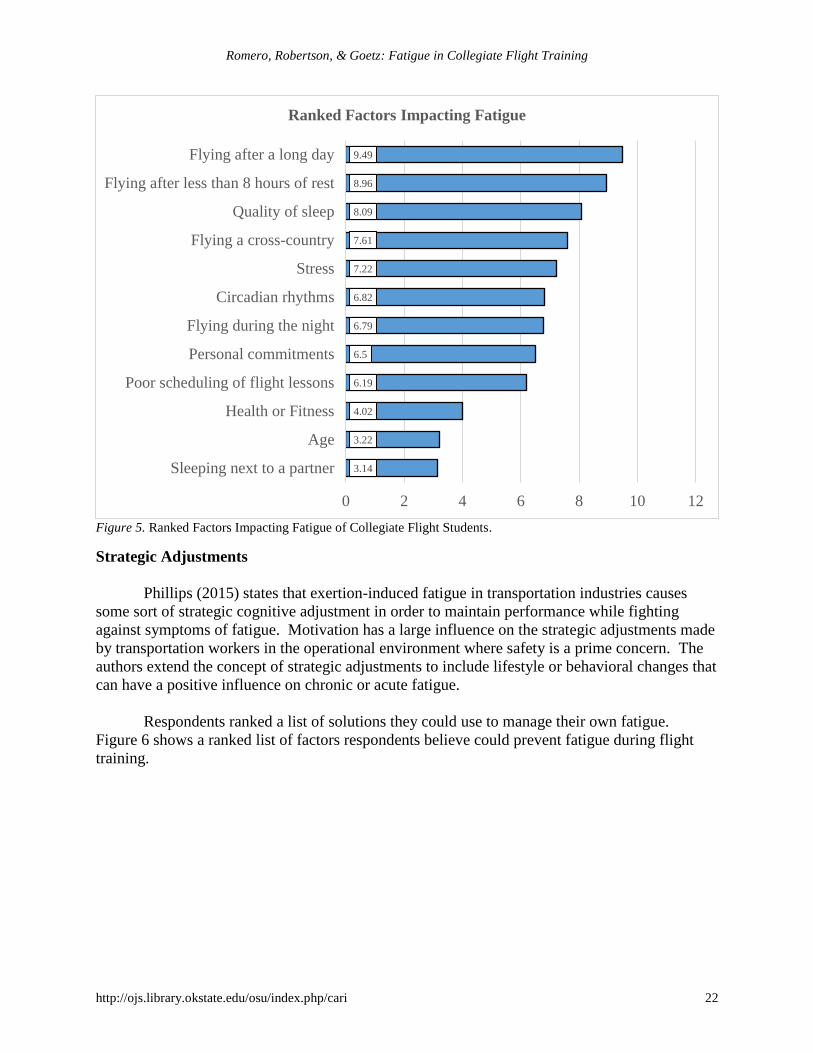
Factors Contributing to Fatigue. Participants ranked a list of 12 factors that could
contribute to fatigue, and ordered them from least influential to most influential on their fatigue.
Of the list of 12 factors that contribute to their fatigue, flying after a long day was shown to be
the most influential on their perceived fatigue levels. Conversely, sleeping next to a partner was
shown to be the least impactful on their fatigue. Figure 5 displays the ranking of the remaining
factors the respondents believe impact their fatigue levels.
40
(31%)
33
(26%)29
(23%)
17
(13%)
5
(4%)4
(3%)
0 1 2 3 4 5 or more
Sleep Interuptions per Night
Romero, Robertson, & Goetz: Fatigue in Collegiate Flight Training
http://ojs.library.okstate.edu/osu/index.php/cari 22
Figure 5. Ranked Factors Impacting Fatigue of Collegiate Flight Students.
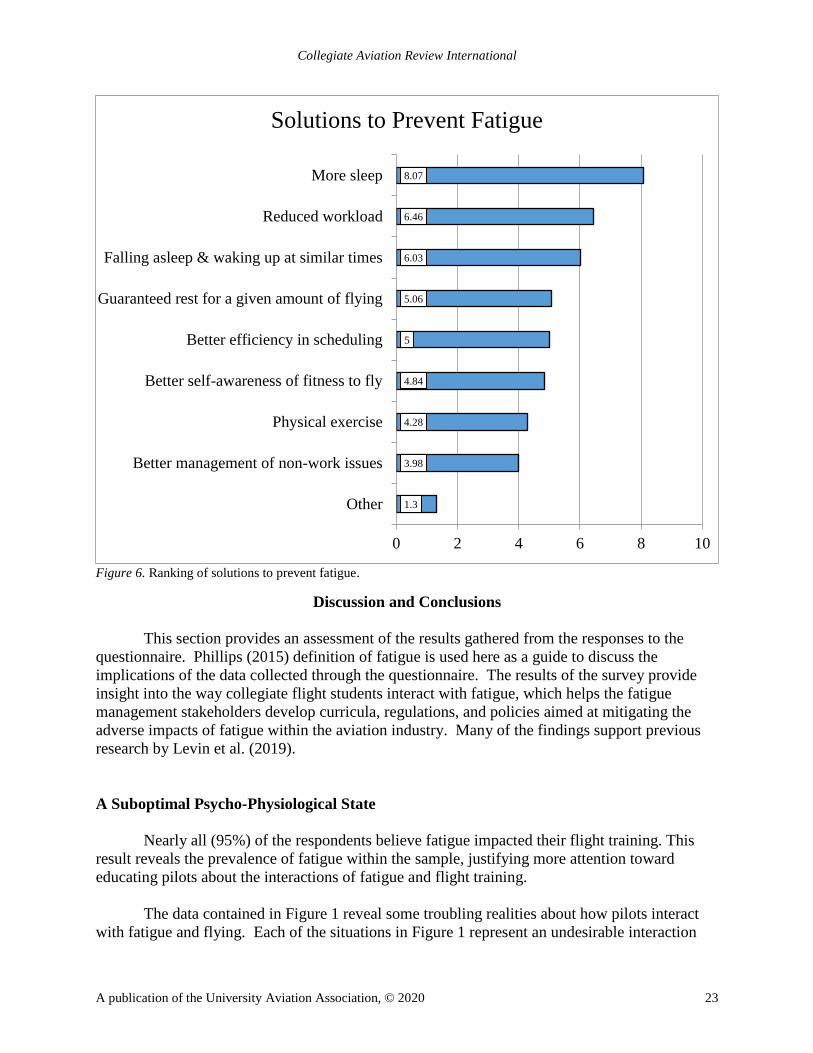
Strategic Adjustments
Phillips (2015) states that exertion-induced fatigue in transportation industries causes
some sort of strategic cognitive adjustment in order to maintain performance while fighting
against symptoms of fatigue. Motivation has a large influence on the strategic adjustments made
by transportation workers in the operational environment where safety is a prime concern. The
authors extend the concept of strategic adjustments to include lifestyle or behavioral changes that
can have a positive influence on chronic or acute fatigue.
Respondents ranked a list of solutions they could use to manage their own fatigue.
Figure 6 shows a ranked list of factors respondents believe could prevent fatigue during flight
training.
3.14
3.22
4.02
6.19
6.5
6.79
6.82
7.22
7.61
8.09
8.96
9.49
0 2 4 6 8 10 12
Sleeping next to a partner
Age
Health or Fitness
Poor scheduling of flight lessons
Personal commitments
Flying during the night
Circadian rhythms
Stress
Flying a cross-country
Quality of sleep
Flying after less than 8 hours of rest
Flying after a long day
Ranked Factors Impacting Fatigue
Collegiate Aviation Review International
A publication of the University Aviation Association, © 2020 23
Figure 6. Ranking of solutions to prevent fatigue.
Discussion and Conclusions
This section provides an assessment of the results gathered from the responses to the
questionnaire. Phillips (2015) definition of fatigue is used here as a guide to discuss the
implications of the data collected through the questionnaire. The results of the survey provide
insight into the way collegiate flight students interact with fatigue, which helps the fatigue
management stakeholders develop curricula, regulations, and policies aimed at mitigating the
adverse impacts of fatigue within the aviation industry. Many of the findings support previous
research by Levin et al. (2019).
A Suboptimal Psycho-Physiological State
Nearly all (95%) of the respondents believe fatigue impacted their flight training. This
result reveals the prevalence of fatigue within the sample, justifying more attention toward
educating pilots about the interactions of fatigue and flight training.
The data contained in Figure 1 reveal some troubling realities about how pilots interact
with fatigue and flying. Each of the situations in Figure 1 represent an undesirable interaction
1.3
3.98
4.28
4.84
5
5.06
6.03
6.46
8.07
Other
Better management of non-work issues
Physical exercise
Better self-awareness of fitness to fly
Better efficiency in scheduling
Guaranteed rest for a given amount of flying
Falling asleep & waking up at similar times
Reduced workload
More sleep
0 2 4 6 8 10
Solutions to Prevent Fatigue
Romero, Robertson, & Goetz: Fatigue in Collegiate Flight Training
http://ojs.library.okstate.edu/osu/index.php/cari 24
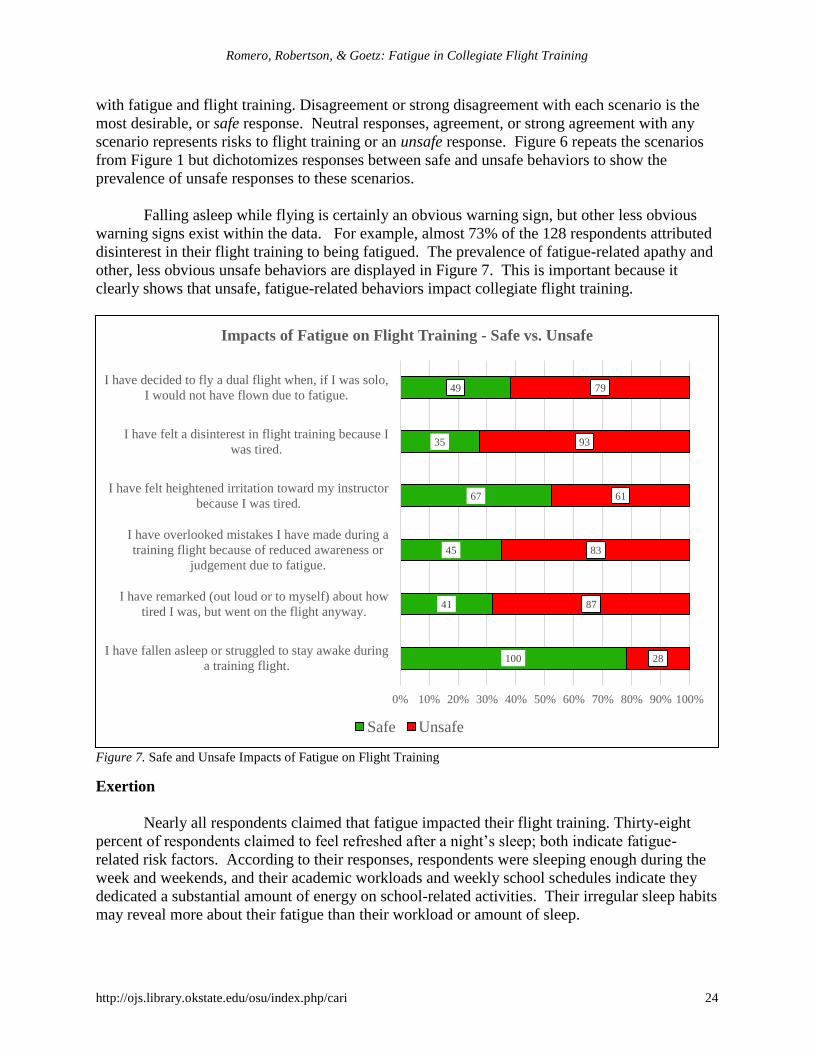
with fatigue and flight training. Disagreement or strong disagreement with each scenario is the
most desirable, or safe response. Neutral responses, agreement, or strong agreement with any
scenario represents risks to flight training or an unsafe response. Figure 6 repeats the scenarios
from Figure 1 but dichotomizes responses between safe and unsafe behaviors to show the
prevalence of unsafe responses to these scenarios.
Falling asleep while flying is certainly an obvious warning sign, but other less obvious
warning signs exist within the data. For example, almost 73% of the 128 respondents attributed
disinterest in their flight training to being fatigued. The prevalence of fatigue-related apathy and
other, less obvious unsafe behaviors are displayed in Figure 7. This is important because it
clearly shows that unsafe, fatigue-related behaviors impact collegiate flight training.
Figure 7. Safe and Unsafe Impacts of Fatigue on Flight Training
Exertion
Nearly all respondents claimed that fatigue impacted their flight training. Thirty-eight
percent of respondents claimed to feel refreshed after a night’s sleep; both indicate fatigue-
related risk factors. According to their responses, respondents were sleeping enough during the
week and weekends, and their academic workloads and weekly school schedules indicate they
dedicated a substantial amount of energy on school-related activities. Their irregular sleep habits
may reveal more about their fatigue than their workload or amount of sleep.
100
41
45
67
35
49
28
87
83
61
93
79
0% 10% 20% 30% 40% 50% 60% 70% 80% 90% 100%
I have fallen asleep or struggled to stay awake during
a training flight.
I have remarked (out loud or to myself) about how
tired I was, but went on the flight anyway.
I have overlooked mistakes I have made during a
training flight because of reduced awareness or
judgement due to fatigue.
I have felt heightened irritation toward my instructor
because I was tired.
I have felt a disinterest in flight training because I
was tired.
I have decided to fly a dual flight when, if I was solo,
I would not have flown due to fatigue.
Impacts of Fatigue on Flight Training - Safe vs. Unsafe
Safe Unsafe
Collegiate Aviation Review International
A publication of the University Aviation Association, © 2020 25
The times the respondents reported going to sleep and waking both shifted at least one
hour later on the weekends compared to the weekdays. It would appear that most of the
participants within this study had sleep patterns that were consistent with other studies
investigating the sleep habits of college students. The late bed times and early wake times are
consistent with other studies that have investigated the sleep quality and quantity of college
students (Eliasson, Lettieri, & Eliasson, 2010; Buboltz, Brown, & Soper, 2001). Although the
respondents may get adequate sleep, their shifting bed and wake times from the weekdays to the
weekends may contribute to the prevalence of fatigue with in the study sample.
Interrupted sleep is low quality sleep. Waking one or two times per night may not impact
the overall quality of sleep, but havingsleep interrupted more than twice each night can reduce
the overall quality of sleep and lead to fatigued conditions. Twenty percent of the respondents
reported having their sleep interrupted more than two times each night, which is certainly
impactful on their ability to recharge.
Some students managed their fatigue by supplementing their nightly sleep with naps.
Napping provides the opportunity to increase the daily quantity of sleep or make-up for poor
sleep caused by excessive interruptions. Previous research indicated that naps improve
physiological and psychological performance (Pink, 2018). The results indicated that many
students do not nap to help manage their sleep debt. Nearly 33% of respondents indicated they
napped to manage their fatigue. Most of the students who reported napping indicated that they
usually took a nap in the early afternoon or evening, which fortunately are the best times of the
day to nap based on normal circadian rhythms (Pink, 2018).
Strategic Adjustments
Lifestyle choices are integral to proper fatigue management. Strategic lifestyle
adjustments are necessary to react to various demands that affect fatigue. Students identified that
the best strategies for managing their fatigue were to sleep more, reduce workload, and keep a
regular schedule. Many students did not rank exercise high in importance for managing fatigue.
This is similar to the findings by Levin et al., (2019). Research has shown that physical exercise
has a tremendous benefit for lowering stress and increasing the quality of sleep (Pilcher, Ginter,
& Sadowsky, 1997; Trockel, Barnes, & Egget, 2017).
Overall, the students recognize they are fatigued and that it has a negative impact on their
flight training. Many of the students identify the proper strategic adjustments they need to make
to manage fatigue (reduce workload, more sleep, and keep a regular sleep schedule). However,
they do not seem to be making those adjustments. They indicate that they lack enough quality
sleep and have high workloads and do not keep a regular sleep schedule.
Threats and Limitations
A lack of face validity is a one major threat to the results of this study because of
insufficient operationalization of the construct of fatigue (Drost, 2011). Although Phillips (2015)
provided a framework for communicating and discussing the results of the survey, it was not
used to shape an operational definition for the survey respondents to use as a guide for the
Romero, Robertson, & Goetz: Fatigue in Collegiate Flight Training
http://ojs.library.okstate.edu/osu/index.php/cari 26
questionnaire. Because each participant used their own, independent, subjective definition of
fatigue, the authors cannot be sure the responses to the questionnaire that related to the construct
of fatigue were similarly understood by all respondents.
The non-probability sampling technique used in this study limits the generalizability of
the data generated from the questionnaire. Because the convenient sample is not representative
of the entire collegiate flight student population, the results of this research can only be
generalized to the students who responded to the survey. These students, however, are not unlike
other collegiate flight students, and the results can be considered to help develop a complete
picture of the interaction between collegiate flight students and fatigue.
This research replicated a survey used in previous research. The instrument used was not
a validated instrument. The categorical nature of the questions adapted from previous research
limited the analysis to descriptive statistics rather than more sophisticated inferential analysis.
Future research in this area should focus on using questions that yield data that generate more
meaning than a simple descriptive analysis.
Recommendations
The results indicate that collegiate aviation education may have a problem with fatigue
similar to other parts of the aviation industry. While the results are not generalizable, it is not
hard to imagine that the conditions at institutions similar to the study institution may yield
similar findings. This needs to be studied so that we can help the future aviation professionals
recognize and combat fatigue.
Several recommendations for further research come from the findings of this study. First,
expanding the sampling frame of this study to a regional or national sample to improve
generalizability of the study. .Second, broadening the scope of the research to include all aspects
of collegiate aviation education rather than just flight training may indicate if fatigue is endemic
to aviation education as a whole or limited to flight training. Third, numerous respondents in this
study indicated interrupted and ineffective sleep patterns. Studying collegiate aviation student
sleep patterns may shed light on how the sleep habits of aviation students differ from those of the
general collegiate student population. Finally, if this study were replicated or expanded upon,
the survey instrument should be updated to reflect current survey best practices that would be
conducive to a greater depth of analysis.
Collegiate Aviation Review International
A publication of the University Aviation Association, © 2020 27
References
American Psychological Association. (2002). Developing adolescents: A reference for
professionals. Retrieved from https://www.apa.org/pi/families/resources/develop.pdf
Avers, K., Hauck, E. L., Blackwell, L. V., Nesthus, T. E., (2010). A qualitative and quantitative
analysis of fatigue countermeasures training in the aviation industry. International
Journal of Applied Aviation Studies, 10(2), 51-65. Retrieved from
https://www.academy.jccbi.gov/ama-800/Winter_2010.pdf
Avers, K., & Johnson, B., (2011). A review of Federal Aviation Administration fatigue research.
Aviation Psychology and Applied Human Factors, 1(2), 87-98. doi:10.1027/2192-
0923/a000016
Buboltz, W.C., Brown, F., & Soper, B. (2001). Sleep habits and patterns of college students: A
preliminary study. Journal of American College Health, 50, 131-135.
Caldwell, J.A. (2005). Fatigue in aviation. Travel Medicine and Infectious Disease, 3, 85-96. doi:
10.1016/j.tmaid.2004.07.008
Cohen, L., Manion, L., & Morrison, K. (2011). Sampling. Research Methods in Education (pp.
143-163). New York: Routledge, 2011.
Curtis, A.C. (2015). Defining adolescence. Journal of Adolescent and Family Health 7(2),
Retrieved from: https://scholar.utc.edu/cgi/viewcontent.cgi?article=1035&context=jafh
Drost, E. A. (2011). Validity and reliability in social science research. Education Research and
perspectives, 38(1), 105.
Eliasson, A. H., Lettieri, C. J., & Eliasson, A. H. (2010). Early to bed, early to rise! Sleep habits
and academic performance in college students. Sleep and Breathing, 14(1), 71-75.
Institutional Research and Studies. (2019). Interactive Factbook, Program Enrollments.
https://irs.siu.edu/interactive-factbook/students/program-enrollments.php
International Air Transport Association [IATA], International Civil Aviation Organization
[ICAO], & International Federation of Air Line Pilots’ Associations [IFALPA]. (2011).
Fatigue Risk Management Systems: Implementation Guide for Operators (1st ed.).
Retrieved from https://www.icao.int/safety/fatiguemanagement/FRMS%20Tools/
FRMS%20Implementation%20Guide%20for%20Operators%20July%202011.pdf
Lee, S., Kim, J. K., (2018). Factors contributing to the risk of airline pilot fatigue. Journal of Air
Transport Management 67, 197-207. doi.org/10.1016/j.jairtraman.2017.12.009
Romero, Robertson, & Goetz: Fatigue in Collegiate Flight Training
http://ojs.library.okstate.edu/osu/index.php/cari 28
Levin, E., Mendonca, F. C., Keller, J., & Teo, A. (2019). Fatigue in Collegiate Aviation.
International Journal of Aviation, Aeronautics, and Aerospace,
6(4).https://doi.org/10.15394/ijaaa.2019.1351
Lund, H. G., Reider, B. D., Whiting, A. B., & Prichard, J. R. (2010). Original article: Sleep
patterns and predictors of disturbed sleep in a large population of college
students. Journal of Adolescent Health, 46, 124–132.
https://doi.org/10.1016/j.jadohealth.2009.06.016
Marcus, J. H., & Rosekind, M. R. (2017). Fatigue in transportation: NTSB investigations and
safety recommendations. Injury Prevention: Journal of The International Society For
Child And Adolescent Injury Prevention, 23(4), 232-238. doi:10.1136/injuryprev-2015-
041791
McDale, S., Ma, J., (2008). Effects of fatigue on flight training: A survey of U.S. part 141 flight
schools. International Journal of Applied Aviation Studies, 8(2), 311-336. Retrieved from
https://www.academy.jccbi.gov/ama-800/Winter_2008.pdf
Noy, Y.I., Horrey, W.J., Popkin, S.M., Folkard, S., Howarth, H.D., Courtney, T.K. (2011).
Future directions in fatigue and safety research. Accident Analysis and Prevention, 43,
495-497. doi:10.1016/j.aap.2009.12.017
National Transportation Safety Board. (2018). 2019-2020 Most wanted list of transportation
improvements. Retrieved from https://www.ntsb.gov/safety/mwl/Pages/default.aspx
Phillips, R.O. (2015). A review of definitions of fatigue – And a step towards a whole definition.
Transportation Research Part F: Psychology and Behavior, 29, 48–56.
doi.org/10.1016/j.trf.2015.01.003
Pilcher, J. J., Ginter, D. R., & Sadowsky, B. (1997). Sleep quality versus sleep quantity:
Relationships between sleep and measures of health, well-being and sleepiness in college
students. Journal of Psychosomatic Research, 42(6), 583-596.
Pink, D. H. (2018) When: The scientific secrets of perfect timing. New York: Riverhead Books.
Sawyer, S. M., Afifi, R. A., Bearinger, L. H., Blakemore, S., Dick, B., Ezeh, A. C., Patton, G. C.
(2012). Adolescence: A foundation for future health. Lancet, 379(9826), 1630-1640.
doi:10.1016/S0140-6736(12)60072-5
Trockel, M. T., Barnes, M. D., & Egget, D. L. (2000). Health-related variables and academic
performance among first-year college students: implications for sleep and other
behaviors. Journal of American College Health, 49(3), 125-131. DOI:
10.1080/07448480009596294
Collegiate Aviation Review International
A publication of the University Aviation Association, © 2020 29
U.S. Department of Transportation, Federal Aviation Administration. (2012). Advisory Circular
117-3, Fitness for duty. Retrieved from https://www.faa.gov/regulations_policies/
advisory_circulars/index.cfm/go/document.information/documentID/1020389
A publication of the University Aviation Association, © 2020, ISSN: 1523-5955 30
Collegiate Aviation Review
International
Volume 38 | Issue 1 Peer-Reviewed Article #3
1-8-2020
Developing a Taxonomy for Success in
Commercial Pilot Behaviors
Kristine Kiernan
Embry-Riddle Aeronautical University
David Cross
Embry-Riddle Aeronautical University
Mark Scharf
Embry-Riddle Aeronautical University
Human error has been well studied in aviation. However, less is known about the ways in which human performance
maintains and contributes to aviation safety. The lack of data on positive human performance prevents consideration
of the full range of human behaviors when making safety and risk management decisions. The concept of resilient
performance provides a framework to understand and classify positive human behaviors. Through interviews with
commercial airline pilots, this study examined routine airline operations to evaluate the concept of resilient
performance and to develop a taxonomy for success. The four enablers of resilient performance, anticipation,
learning, responding, and monitoring, were found to be exhaustive but not mutually exclusive. The tenets of
resilience theory apply in airline pilot behavior, but operationalizing a taxonomy will require more work.
Recommended Citation:
Kiernan, K. & Cross, D., & Scharf, M. (2020). Developing a Taxonomy for Success in Commercial Pilot Behaviors.
Collegiate Aviation Review International, 38(1), 30-45. Retrieved from
http://ojs.library.okstate.edu/osu/index.php/CARI/article/view/7959/7345
Kiernan, Cross, & Scharf: Developing a Taxonomy for Success in Commercial Pilot Behaviors
http://ojs.library.okstate.edu/osu/index.php/cari 31
Human error is thought to account for 80% of aviation mishaps (Shappell & Wiegmann,
2001). As a result, human error has been well studied in aviation (Helmreich, 1997;
Kontogiannis & Malakis, 2009; Wiegmann & Shappell, 1999). Researchers and practitioners are
able to speak a common language due to the development of a well-accepted taxonomy, the
Human Factors Analysis and Classification System (HFACS) (Wiegmann & Shappell, 2017).
The widespread acceptance of models such as Threat and Error Management (TEM) have helped
valuable concepts of human error move into operational settings as diverse as aviation, medicine,
and nuclear power. (Boy & Schmitt, 2013; Helmreich & Musson, 2000). Most data sources in
aviation, such as the Aviation Safety Reporting System (ASRS), the Aviation Safety Action
Program (ASAP), and Line Operations Safety Assessments (LOSA), are event or error driven,
which enables and reinforces the study of error.
However, much less is known about how human performance actively builds and enables
system safety and efficiency (Holbrook et al., 2019). In complex, high reliability systems such as
aviation, resilience has emerged as a key factor in safe and efficient operations. Resilient
performance occurs when a system can “adjust its functioning prior to, during, or following
changes and disturbances, so that it can sustain required operations under both expected and
unexpected conditions.” (Hollnagel, 2011, p. xxxvi). Studying how human performance
contributes to system resilience can offer a new perspective on how to improve system
performance and safety, and will offer a more complete picture of the role humans currently play
in complex systems. As Holbrook et al. (2019) point out, understanding the full range of human
contributions to system performance is critical at a time when the role of the human in the
aviation system is changing.
Background
Safety I and Safety II
In its earliest days, aviation safety was reactive, with most safety improvements driven by
mishap investigations. With the introduction of incident reporting systems and the development
of hazard identification and risk mitigation strategies, aviation safety entered a period of
proactive safety management, in which mishap precursors could be identified and mitigated prior
to mishaps occurring. This approach, known as Safety I, concentrates on identifying, trapping,
and mitigating error in order to reduce the number of negative outcomes to as low as reasonably
practicable (Hollnagel, 2018; ICAO, 2009).
A number of challenges emerge with the Safety I approach as systems become safer.
First, data is only systematically collected on operations with error or negative outcomes, so as
operations become safer, a smaller and smaller proportion of actual operations are analyzed
(Holbrook et al., 2019). Therefore, opportunities to learn and improve become increasingly
limited. Second, the focus on prediction and prevention of negative outcomes does not
accommodate unknown or unknowable threats. Third, if safety is measured by the absence of
Collegiate Aviation Review International
A publication of the University Aviation Association, © 2020 32
events that are extremely rare, it becomes increasingly difficult to assess the impact of system
changes (Holbrook et al., 2019). Finally, it is intuitively obvious that studying failure when you
are trying to ensure success tells only part of the story. In a comment first attributed to Marit de
Vos of Leiden University, it is as if we are trying to learn about marriage by studying divorce (de
Vos, 2018).
Data Sources
A key tenet of Safety Management Systems is the collection and analysis of safety data,
so that the impact of changes to the system can be measured and monitored (ICAO, 2009).
Aviation has a rich variety of data sources that drive safety decision making. The Aviation Safety
and Reporting System allows anonymous reporting of incidents from private and commercial
pilots, air traffic controllers, mechanics, dispatchers, and cabin crew (NASA, 2019). The
Aviation Safety Action Program fulfills a similar function among air carriers and repair stations
(FAA, 2002). The Flight Operational Quality Assurance (FOQA) program collects vast amounts
of data on routine flights that is analyzed by individual operators for exceedances and trends.
Finally, the Line Operations Safety Assessment program uses expert observation of routine
flights to identify threats and errors, based on the Threat and Error Management model (FAA,
2014). Finally, the National Transportation Safety Board (NTSB) and the Federal Aviation
Administration (FAA) collect data on aircraft mishaps and publish detailed accident reports and
analyses.
These data sources primarily focus on errors or incidents, and therefore do not represent
the population of routine and ordinary flights. Robust data sources on successful flights are
lacking. Therefore, most safety recommendations derive from a non-representative data set, and
the routine and successful operations that make up the vast majority of commercial aviation
operations are not documented.
Human Error
The abundance and quality of data concerning human error has made it possible to create
a taxonomy of human error that has been widely accepted. The Human Factors Analysis and
Classification System was derived from extensive analysis of aviation mishaps and incidents,
and has been applied to diverse industries outside aviation (Wiegmann & Shappell, 2017).
HFACS has enabled a common language to be used in government, academia, and industry, and
among researchers as well as practitioners. The ubiquity of HFACS has made it a powerful tool
in identifying and addressing problems in human performance. Similarly, ASRS categorizes
incidents using a taxonomy that focuses on outcomes and failures in human performance, which
has resulted in a body of rich and consistent information about adverse events and errors (NASA,
2019).
However, no such common vocabulary exists for discussing successful behaviors that
actively contribute to system safety. The lack of a taxonomy to categorize and classify positive
behaviors adds to the difficulty of studying successful performance.
Kiernan, Cross, & Scharf: Developing a Taxonomy for Success in Commercial Pilot Behaviors
http://ojs.library.okstate.edu/osu/index.php/cari 33
Resilience Theory
Safety II depends not only upon reliable data sources and a common vocabulary, but also
on a theoretical underpinning. Just as models of human error are anchored by theories of human
information processing and cognition, so models of successful behaviors must be anchored by
theories of human and system performance. Accident causation models have typically been
linear, leading to the approach that preventing bad outcomes involves preventing or mitigating
precursors. However, some mishaps cannot be explained by linear models. Rather, they are the
result of a complex interplay of events that affect each other (Woods, 2017). In this model of
accident causation, safety results from the ability of a system to accommodate these events.
Resilience theory concentrates not on the response to the specific disturbance, but on the system
capabilities that allow it to accommodate the disturbance.
Resilient performance is thought to be enabled by four key system attributes, specifically,
the ability to:
● Anticipate future events or situations
● Monitor both its own performance and environmental factors
● Respond to expected and unexpected events
● Learn from experience
These four abilities form a model of resilient performance based on the underlying theory
of resilience (Hollnagel, 2011).
Problem
The study of error has been instrumental in achieving the safety improvements that
commercial aviation has enjoyed. However, the reduction in negative outcomes creates problems
for using the Safety I approach to further improve safety. As negative outcomes decline, the
proportion of flights studied becomes smaller and less representative. Further, the impact of
safety interventions becomes very difficult to assess. Also, a system that concentrates on
identifying and mitigating threats may become vulnerable to threats that cannot be predicted.
Instead, a Safety II approach is needed that supplements Safety I by examining the qualities that
allow a system to respond flexibly in response to threats and disturbances, both anticipated and
unexpected.
The Safety I approach has been successful in improving commercial aviation safety, but
further safety advances cannot depend only on reducing the occurrence of negative outcomes.
Safety in complex systems depends on the ability of a system to accommodate disturbances.
System resilience depends upon behaviors that reflect the key attributes of anticipation,
monitoring, responding, and learning. However, the error and event-based reporting approach
common in commercial aviation does not fully capture the range of pilot behaviors
corresponding to the key attributes of system resilience. As a result, much of the pilot’s
contribution to system resilience is not measured, and therefore not studied systematically.
In order to understand how system resilience is built and maintained, data must be
collected on routine successful operations. Currently, aviation has rich data sources and robust
taxonomies to study error, but insufficient ways to identify and categorize success.
Collegiate Aviation Review International
A publication of the University Aviation Association, © 2020 34
Purpose
The purpose of this study is to identify behaviors that increase system resilience in
routine commercial airline operations, and to begin to articulate a taxonomy for behaviors that
contribute to system resilience. Data on successful routine performance in commercial aviation is
not systematically collected or analyzed in a way that allows for exploration of the qualities and
attributes that enable system resilience. LOSA assesses routine flights, but focuses on error
management. FOQA records information on routine flights, but the data analysis focuses on
exceedances, rather than the data that might correspond to corrections that prevent exceedances.
These data sources are tremendously valuable, but incomplete in the effort to study the
contribution of routine pilot performance to system resilience. This study aims to fill a small part
of that gap by studying specific events that involve unexpected or unplanned events and
exploring pilot behaviors that contributed to successful conclusion of these flights.
Significance of the Study
The Safety I approach of reducing negative outcomes has natural limits as systems
become safer. Further improvements in safety and efficiency must come from expanding data
sets to include analysis of successful outcomes in order to understand the antecedents of
successful performance as well as the antecedents of unsuccessful performance. Safety II is still
in its early stages of acceptance. This study adds to the growing body of literature that uses a
Safety II approach to understand the full range of human performance contributions to system
resilience. Learning more about successful human behaviors that contribute to system resilience
can help training organizations cultivate and enhance resilient performance. Further, with the
increase in interest in autonomous systems in aviation, it is vital to understand the human
contribution to system performance so this ability can be accounted for in any new system
design.
Research Questions
Can commercial airline pilot behaviors be classified according to the four key attributes
of resilient performance?
Can a taxonomy of resilient performance be articulated from investigating airline pilot
behaviors in routine operations?
Methodology
This project used a qualitative, case study approach based on incident debrief interviews
with commercial airline pilots. The study was designed to utilize purposeful sampling of the
participants’ viewpoints and expert opinions regarding their decision-making processes in
aviation. Qualitative research is the traditional method for discovering a deeper understanding of
a subject in a way that quantitative-only data cannot give us.
The interviews were based on the critical incident approach in which a participant was
asked to recall a particular type of event (Hobbs, Cardoza, & Null, 2016). The interview protocol
contained a greeting, description of the purpose of the research, event prompt, follow-up
questions, and space for reflective notes. Using research questions developed by NASA, the
Kiernan, Cross, & Scharf: Developing a Taxonomy for Success in Commercial Pilot Behaviors
http://ojs.library.okstate.edu/osu/index.php/cari 35
researchers developed an open-ended question with follow up questions to probe for deeper
meaning (Holbrook et al, 2019). The interview questions are presented in Appendix A.
Institutional Review Board permission was obtained from the sponsoring university prior
to any participant recruiting or data collection. To maintain the confidentiality of the participants,
all identifying information was redacted from the transcripts.
A case study methodology was employed to examine the various aspects of the pilots’
thought processes within the theory of resilient performance. This case study was designed to
bring the researchers to a deeper understanding of this issue, adding depth to what is already
known about this phenomenon. As a result, 16 unique perspectives were obtained, analyzed, and
placed into specific themes for the purpose of addressing the research questions.
Participants
Sixteen pilots from major U.S. airlines were recruited for participation in this study.
Fourteen pilots were actively flying for a major airline (including eight captains and eight first
officers); and, two were actively flying for a regional carrier (one captain and one first officer).
Saturation of the data was met through this sample by ensuring that adequate quality data was
collected to support the study; no new information was expected to be added to the emerging
patterns that would enhance or change the findings of this study.
The 16 purposely-selected participants were pilots from different airlines, which allowed
for different perspectives from a cross section of cultures, experiences, and situations. In the data
collection and analysis process, each participant read and signed a confidentiality consent form,
was assigned a code to ensure confidentiality and privacy was maintained.
A high degree of validity was designed into the research process. The first step to ensure
validity consisted of inter-rater reliability (IRR) training. Interviewers discussed potential biases
and then met to create mock interviews, thereby ensuring consistency of questions and follow up
techniques. Next, the researchers ensured that an appropriate sample was selected, by
interviewing both captains and first officers from different airlines. Finally, triangulation was
also used to ensure validity. Interviews were conducted by three IRR-trained researchers in
different locations. Once the interviews were complete, the researchers individually analyzed the
data before meeting to compare and integrate their individual results.
Procedures
As an initial study, this data is intended to support a foundational understanding of pilots’
thought processes and behaviors within resilient performance. As in any research, ancillary
findings (which are not the primary target of the planned procedures) can greatly contribute to
the results of this study. Further, understanding the thought processes in real-world situations
was envisioned as a secondary function of this research.
The researchers voice-recorded each participant’s discussion throughout the interview. A
written transcript was developed for each participant after de-identifying each participant’s
information. Each of the participants’ responses offered insight into their perceptions, opinions,
and personal recommendations of airline operations. The MAXQDA qualitative analysis
software was used to organize and analyze the data. The participants were assigned a sequential
Collegiate Aviation Review International
A publication of the University Aviation Association, © 2020 36
identification number (i.e. Participant 1 [P1]). Using the inductive approach to data analysis, the
researchers then extracted key statements and phrases while organizing them into broad patterns
that corresponded with the research questions and finally summarized what was communicated
within each statement. From this extraction, the researchers identified primary themes.
While the researchers had specific interview questions that were asked during each of the
semi-structured interview sessions, the interviewers also permitted the free flow of dialogue.
This approach provided a broader set of information, yielding richer overall data than is
presented in this discussion.
Through the data collection process, the researchers were able to freely engage with the
participants, which yielded additional unexpected findings. While not initially planned, the
additional dialogue provided a wealth of interpretive data to support the findings from the
original structured research questions.
The data reduction process was helpful in further identifying patterns and alignment to
the research questions. In the review of themes, the above connections were drawn based on
similar participant responses and the interpretation of this data. It is important to be mindful that
qualitative data analysis is ongoing, fluid, and sheds light on the broader study questions.
Limitations and Delimitations
This study included only pilots employed full-time with airlines based in the United
States. Additionally, participants were limited to those who were available and willing to be
interviewed. Purposive sampling allowed for the representation of a variety of airlines, but may
have introduced other biases.
Results and Discussion
As an initial study, this data is intended to investigate the practical application of
resilience theory in real-world setting. Holbrook et al. (2019) categorized behaviors in terms of
strategies for resilient behavior, such as “Anticipate resource gaps” and “Anticipate procedure
limits”. The authors focused on observable behaviors rather than underlying strategies, since the
research objective was to develop a taxonomy of behaviors that an expert observer could use in
safety audit setting. However, the theoretical framework and major categories were the same.
Our intent was to begin a discussion among researchers and practitioners, rather than to prescribe
an exact taxonomy. The model for the taxonomy is shown in Figure 1.
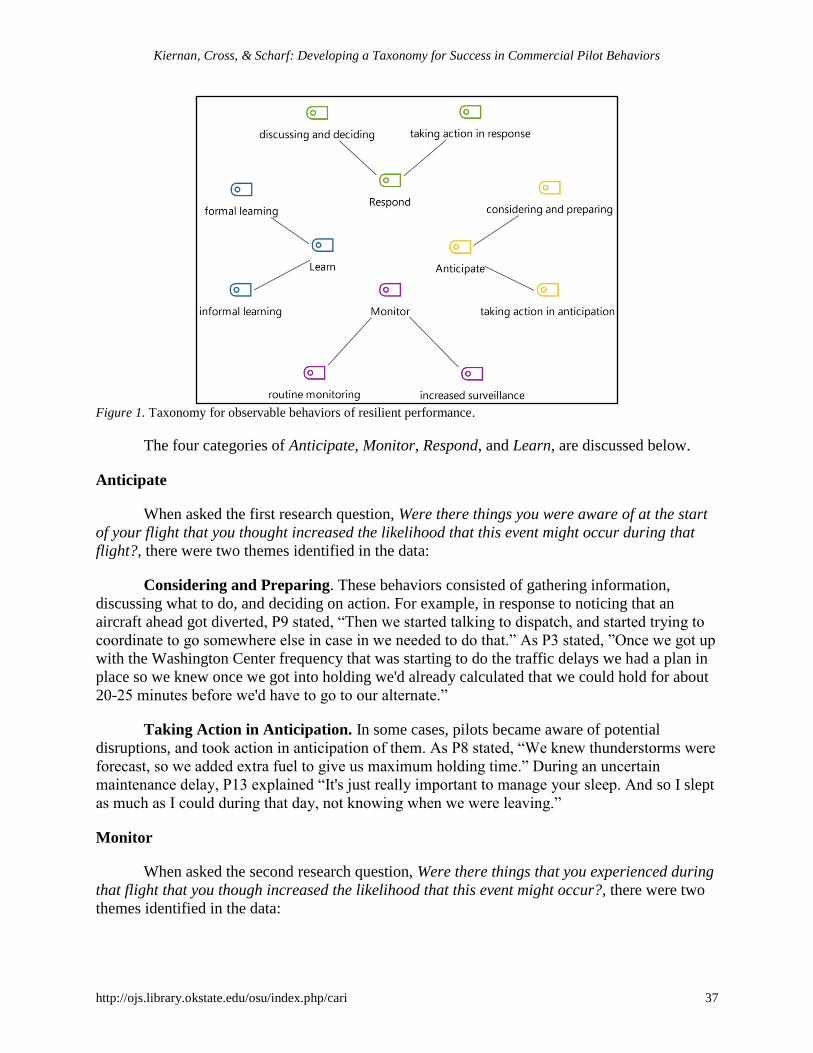
Kiernan, Cross, & Scharf: Developing a Taxonomy for Success in Commercial Pilot Behaviors
http://ojs.library.okstate.edu/osu/index.php/cari 37
Figure 1. Taxonomy for observable behaviors of resilient performance.
The four categories of Anticipate, Monitor, Respond, and Learn, are discussed below.
Anticipate
When asked the first research question, Were there things you were aware of at the start
of your flight that you thought increased the likelihood that this event might occur during that
flight?, there were two themes identified in the data:
Considering and Preparing. These behaviors consisted of gathering information,
discussing what to do, and deciding on action. For example, in response to noticing that an
aircraft ahead got diverted, P9 stated, “Then we started talking to dispatch, and started trying to
coordinate to go somewhere else in case in we needed to do that.” As P3 stated, ”Once we got up
with the Washington Center frequency that was starting to do the traffic delays we had a plan in
place so we knew once we got into holding we'd already calculated that we could hold for about
20-25 minutes before we'd have to go to our alternate.”
Taking Action in Anticipation. In some cases, pilots became aware of potential
disruptions, and took action in anticipation of them. As P8 stated, “We knew thunderstorms were
forecast, so we added extra fuel to give us maximum holding time.” During an uncertain
maintenance delay, P13 explained “It's just really important to manage your sleep. And so I slept
as much as I could during that day, not knowing when we were leaving.”
Monitor
When asked the second research question, Were there things that you experienced during
that flight that you though increased the likelihood that this event might occur?, there were two
themes identified in the data:
Collegiate Aviation Review International
A publication of the University Aviation Association, © 2020 38
Routine Monitoring. Responses from pilots indicated there are known factors they
routinely monitor on every flight, for example weather, crew rest, the aircraft interphone system,
or traffic in the area. P4 stated “Just for myself, usually anytime I'm on a more than like an hour
long flight pretty much as soon as I get up to cruise I update and monitor all my weather
information. Just to have like the earliest heads up if something is starting to change. And that's
when we first got up to cruise, I got an updated ATIS for Baltimore and it was already showing
thunderstorms at the field.”
As another example, P9 stated “I was just flying from Charlotte to San Francisco, and I'd
say probably almost, a little over halfway into the flight, I actually monitor the flight attendant
conversations over the interphones. I'm sure like you guys have, we have a way to monitor their
intercom conversation. So, I keep that available. I started noticing they were calling about a
passenger that was having some kind of medical distress. So I became aware of something that
could potentially be developing with a medical issue. And I typically just wait and let it play out
and then eventually they're going to contact me and let me know. But at least now I have an idea
that at least something's transpiring or beginning to transpire so I can start to... It lessens the
startle effect later.”
Increased Surveillance. In addition, there were factors that pilots paid more attention to
due to certain circumstances, for example holding and diversion of aircraft ahead on the flight
path in areas of bad weather, fuel state when other aircraft were diverting for weather, and traffic
in the area when conditions made VFR traffic likely. P6 stated “You know it was August in
Miami. So, you always have to be aware of the potential for the airfield getting soft in the
thunderstorms. Typically, in Florida they move through fairly quickly and we do have holding
fuel for that contingency. And then sometimes there's a little extra. So, we look at the fuel more
carefully based on experience with the weather and actual weather.”
P2 explained, “You know that busy airport on a VFR day you're going to have VFR
traffic in addition to traffic that are filed with the FAA or you know… you've got guys that are
not filing. So just more of an awareness that this trip I needed to be on my A game, you kind of
keep an eye out for this basically.”
Respond
When asked the third question, How did you respond to this event?, there were two themes
identified in the data:
Discussing and Deciding. This included gathering information, discussing alternatives,
and deciding on action to take. For example, P8 stated “Between the two or three of us with
dispatch, we continually monitored the weather and tried to make the best possible decision. Like
I said, I was more for going to Dulles, which was open at the time, and they were both like,
‘Yeah, but Dulles, they've got that thunderstorm there, close by, and they're predicting it's going
to move in. I think BWI is clear and a million, and we're going to be pretty safe going in there’. .
. It was actually a little bit closer than Dulles, although either one of them were super close.
Between the three of us, we gathered the information, made a decision we were all comfortable
with. I was comfortable going with Baltimore.”
Kiernan, Cross, & Scharf: Developing a Taxonomy for Success in Commercial Pilot Behaviors
http://ojs.library.okstate.edu/osu/index.php/cari 39
Taking Action in Response. This category included all actions taken in response to
unexpected events or situations, for example following a checklist, initiating a divert or
complying with a collision avoidance procedure. Pilot explanations of this were typically simple
and direct. P4 stated “And then you break out the checklist. And do the normal things declare an
emergency break out the checklist. Go ahead start running the checklists.”
Learn
When asked the fourth question, What did you learn from this event?, every participant
stated that learning from previous experience increases the safe operation of a flight. Every pilot
specifically mentioned learning from previous events. This was the most discussed aspect of
resilient performance for these pilots. Pilots stated that both formal and informal learning guided
their actions.
Formal Learning. P16 stated “Training. . . So, any pilot that experiences any non-
normal situation relies on their training methodology to solve the problem, resolve it.” In
addition, P15 included “Every year we train in the simulator for all kinds of different problems”.
Moreover, P1 included “I think there is pattern matching that goes on. I think I find in other
emergency situations I have handled in my career there's pattern matching. It seems to me that,
have I seen this kind of scenario before and it goes all the way back to my primary training we
did simulated engine failures unexpectedly. So pattern matching to me can be helpful. Pattern
matching can also retrieve some skills, some primal skills, positive primal skills that might help
you deal with it.”
Informal Learning. As P10 stated, “They may be able to trigger in their mind oh you
know I talked to somebody about this once and I think that's really a huge hugely important thing
in aviation is that is those little things that you have in your mind of past experiences and past
stories that you've heard so that when symptoms of a problem do present themselves to you, you
can kind of reach back to those tidbits of information and maybe use that to analyze and figure
out what's going on in your situation.”
Moreover, airlines have robust safety feedback programs. As P2 stated, “Well, we have a
very robust ASAP, where we have access to a lot of information de-identified of incidents and
events that occur. I think with a strong safety management system, through our FOQA program,
our ASAP system and LOSA. I think there is power in learning and when you read these things
you can be very arrogant and say well that would never happen to me. I look at it and say I could
see that happening to me and... So I think learning about lessons learned from other people are
very powerful.”
In addition, P13 added “There's our debriefing afterwards. We talked about what had
happened. Like I told my first officer, I said he did a fantastic job at coordinating with the flight
attendants. Especially at the end when I was doing a lot of the flying, doing the diverting and
talking to ATC, he did a lot of the behind-the-scenes stuff, which really helped. We debriefed
what things could have gone better, what went well, and then how would we do things
differently.”
Collegiate Aviation Review International
A publication of the University Aviation Association, © 2020 40
Ancillary Findings
As in any research, often the data collected yields information, ideas, or additional
themes that were not anticipated. When this occurs, a rich and detailed set of findings can
support the gap in the literature and further support the research questions. In this case, there
were two major unintended findings that were common throughout the interviews. While this
later theme may not be directly aligned to the original research question, it is related to the
perceptions and opinions of the participants.
Enablers of Resilient Performance
Training. Training was a topic that was discussed in 12 of the 16 interview sessions.
Every participant complimented the quality of training received from the respective airline. As
P5 stated, “Yeah I lost an engine on takeoff a couple of years ago. And it was just sort of fall
back on your training. . . Because you're trained for it all the time you know to lose an engine on
takeoff.” P12 stated, “You see you start falling back on what you've been taught to do.” As P7
added, “yeah, simulator training. We had seen it before in the simulator. . . I followed the
emergency procedures we were trained to do.”
Experience. In addition to training, experience was mentioned by 14 of the 16 every
participants as a huge factor in how they responded to an event. As P1 stated, “On my last trip to
Dulles, I mentioned it to the co-pilot what had happened, and if we were offered that again on an
afternoon flight, that we would probably end up doing the same thing, or at least considering it.”
P11 included “Experience because many airports that have construction anywhere near the end
of the runway, have frequently had their instrument or glide slope and localizer antennas
interfered with construction or vehicles driving right in front of them… Personal experience,
since I was a private pilot, you just land the airplane.”
P4 handled an emergency by recognizing that something just wasn’t right, stating, “I
guess I mean just from flying this aircraft for the past several years knowing what the speed
schedule would be upon reaching the thrust reduction altitude it'll start commanding a nose down
pitch attitude and the speed bug would switch up to two hundred and fifty. And just witnessing
that not happening is something very different occurring. That was just outside of the normal
pattern that you're accustomed to seeing.”
As P9 stated, “As experienced dictates, you try and avoid surprises, anything with startle
effects, so I always anticipate or try to become cognizant of any potential threats to a flight. And
like I said, the longer flights I'm aware that options could be limited to divert. A lot of
international experience like yourself. So you realize there are areas where you have really
limited options. You try and think ahead, "what would I do in this case?" Because you don't want
to be caught behind the power curve and have a surprise and have to play catch up.”
Despite the importance of informal learning, pilots did not generally share these lessons
through any established process. Rather, pilots reported sharing their lessons with others in one-
on-one conversations, but generally they regarded what they learned as not significant enough to
share through the more formal mechanisms available at their airlines. As Holbrook et al (2019)
point out, “no methods exist to systematically report or capture this information. This is a missed
Kiernan, Cross, & Scharf: Developing a Taxonomy for Success in Commercial Pilot Behaviors
http://ojs.library.okstate.edu/osu/index.php/cari 41
opportunity for developing training, data systems, and procedures whereby operators could
systematically benefit from others’ lived experiences, not just their own” (p. 17). Further, several
pilots noted that their airline experience differed from their previous military experience in this
regard, with more opportunities to share informal lessons in their military flying background.
Crew Climate
Most participants discussed crew climate and crew coordination as major factors in their
decision making, hence resilience. For example, as P14 stated, “But then you could almost call it
if anything like a sort of like team building type thing. Because at that point we had kind of like
faced, nothing major, but we faced an abnormal situation and worked through the issue and come
to a conclusion there.” As P7 stated,” I learned that the people that I worked with during the
emergency were awesome. The controllers were very helpful in getting us back around.
Everything went very, very easily just because of the training, and the working together from the
airline perspective.” P8 added “The most important thing is having a crew that can work
together. That can say, Hey, we're gonna check all the other stuff when we come to work, and
just work together the best we can to handle any kind of a situation."
The contribution of the crew concept to resilience is an especially important topic to
explore in future research, as the idea of single pilot operations gains more traction. Any changes
to accommodate single pilot operations must also be able to incorporate the resilience that is an
emergent property of team performance in the cockpit.
Categories Are Not Mutually Exclusive
It became apparent early in the interviews that often a response could be used in more
than one category. For example, P9 stated “As experienced dictates, you try and avoid surprises,
anything with startle effects, so I always anticipate or try to become cognizant of any potential
threats to a flight. And like I said, the longer flights I'm aware that options could be limited to
divert. A lot of international experience like yourself. So, you realize there are areas where you
have really limited options. You try and think ahead, "what would I do in this case?" Because
you don't want to be caught behind the power curve and have a surprise and have to play catch
up.” This example could easily fit into the categories of Anticipate, Monitor, or Learn.
Conclusion
Resilient performance, as a theory, appears to have practical application in aviation.
Purposeful sampling of 16 airline pilots show resilient performance does occur on flights. The
categories of Anticipate, Monitor, Respond, and Learn were exhaustive, but not mutually
exclusive. Thus, the tenets of resilience theory are initially validated, but operationalizing a
taxonomy will require more work.
Recommendations for the Instructional Environment
As noted previously, the highest response was in the category of Learning. Although each
category is important in the decision-making process, opportunities to create better learning
environments will continue to enhance safety. This gives great opportunities to enhance student
learning with the incorporation of resilience theory.
Collegiate Aviation Review International
A publication of the University Aviation Association, © 2020 42
As both formal and informal training were highlighted by the participants, three areas to
create better learning for students:
Flight line Operations: as part of the brief/debrief time, instructors should build in
scenarios where students need to think through a situation. Situations could include abnormal
engine indications, unexpected weather, equipment malfunction, etc. This gives the student the
opportunity to chair fly (practice on the ground) the thought process and resources available.
Curriculum Developers: a similar process can be used in any classroom setting (air
traffic control, maintenance, UAV operations, etc.). Curriculum developers/instructors can build
in “what would you do if” scenarios into lectures. This helps reinforce the law of primacy (learn
it correctly the first time) for situations that may be encountered later in more stressful
environments.
Capturing Positive Performance/Resilience: this gives opportunities to reinforce
correct thought processes. Often times, people critique negative/incorrect application, yet fail to
reinforce the overwhelming part the process that was done correctly. This is a great opportunity
to correct faulty thoughts, but also praise and reinforce correct thought processes.
Future Research
Future research is suggested with a larger sample size, across numerous airlines,
worldwide. Also, future research should include less-experienced pilots, to see if the theory holds
at different levels of experience. Further, research should include different operational domains,
such as flight instruction. Holbrook et al. (2019) discussed the need to be able to correlate safety
data, such as FOQA data with crew behaviors. Future research should attempt to connect
disparate data sources to develop a more robust and complete picture of resilient behaviors.
Finally, carefully-scripted follow up questions should be introduced to include crew dynamics
with resilient performance.
Kiernan, Cross, & Scharf: Developing a Taxonomy for Success in Commercial Pilot Behaviors
http://ojs.library.okstate.edu/osu/index.php/cari 43
References
Boy, G. A., & Schmitt, K. A. (2013). Design for safety: A cognitive engineering approach to the
control and management of nuclear power plants. Annals of Nuclear Energy, 52, 125-
136.
de Vos, M. (2018). Healthcare improvement based on learning from adverse outcomes. Ph. D.
Dissertation, The Netherlands: Leiden University.
Federal Aviation Administration [FAA]. (2002). Aviation safety action program. Advisory
circular 120-66B. Retrieved from https://www.faa.gov/documentLibrary/media/
Advisory_Circular/AC120-66B.pdf
Federal Aviation Administration [FAA]. (2014). LOSA characteristics. Retrieved from
https://www.faa.gov/about/initiatives/maintenance_hf/losa/media/LOSA_Brochure_Augu
st_2014_v6.pdf
Helmreich, R. L. (1997). Managing human error in aviation. Scientific American, 276(5), 62-67.
Helmreich, R. L., & Musson, D. M. (2000). Threat and error management model: Components
and examples. British Medical Journal, 9, 1-23.
Hobbs, A., Cardoza, C., & Null, C. (2016). Pilot critical incident reports as a means to identify
human factors of remotely piloted aircraft. DoD Human Factors Engineering Technical
Advisory Group (DoD HFE TAG) Meeting 70; May 09, 2016 - May 13, 2016; Hampton,
VA; United States.
Holbrook, J., Stewart, M., Smith, B., Prinzel, L., Matthews, B., Avrekh, I., Null, C. (2019).
Human performance contributions to safety in commercial aviation. NASA Langley
Research Center. NASA/TM2019-220417
Hollnagel, E. (2011). RAG – The resilience analysis grid. In: E. Hollnagel, J. Pariès, D. D.
Woods & J. Wreathall (Eds), Resilience Engineering in Practice. A Guidebook. Farnham,
UK: Ashgate.
Hollnagel, E. (2018). Safety-I and safety-II: The past and future of safety management. Boca
Raton, FL: CRC press.
International Civil Aviation Organization [ICAO]. (2009). Safety Management Manual (ICAO
Doc 9859). Retrieved from https://www.icao.int/safety/fsix/Library/
DOC_9859_FULL_EN.pdf
Kontogiannis, T., & Malakis, S. (2009). A proactive approach to human error detection and
identification in aviation and air traffic control. Safety Science, 47(5), 693-706.
Collegiate Aviation Review International
A publication of the University Aviation Association, © 2020 44
National Aeronautics and Space Administration. (2019). Aviation safety reporting system
program briefing. Retrieved from https://asrs.arc.nasa.gov/docs/
ASRS_ProgramBriefing.pdf
Shappell, S. A., & Wiegmann, D. A. (2001). Applying reason: The human factors analysis and
classification system (HFACS). Human Factors and Aerospace Safety, 1(1), 59-86.
Wiegmann, D. A., & Shappell, S. A. (1999). Human error and crew resource management
failures in Naval aviation mishaps: A review of US Naval Safety Center data, 1990-
96. Aviation, Space, and Environmental Medicine, 70(12), 1147-1151.
Wiegmann, D. A., & Shappell, S. A. (2017). A human error approach to aviation accident
analysis: The human factors analysis and classification system. London: Routledge.
Woods, D. D. (2017). Resilience engineering: concepts and precepts. Boca Raton, FL: CRC
Press.
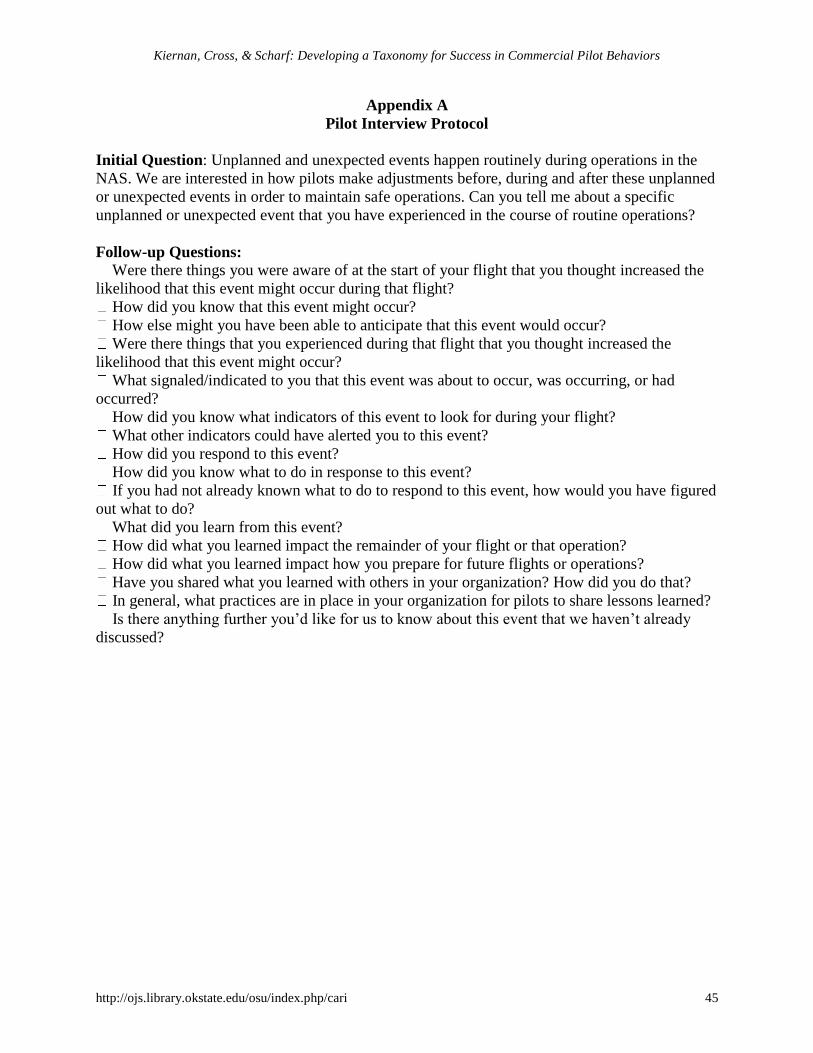
Kiernan, Cross, & Scharf: Developing a Taxonomy for Success in Commercial Pilot Behaviors
http://ojs.library.okstate.edu/osu/index.php/cari 45
Appendix A
Pilot Interview Protocol
Initial Question: Unplanned and unexpected events happen routinely during operations in the
NAS. We are interested in how pilots make adjustments before, during and after these unplanned
or unexpected events in order to maintain safe operations. Can you tell me about a specific
unplanned or unexpected event that you have experienced in the course of routine operations?
Follow-up Questions:
Were there things you were aware of at the start of your flight that you thought increased the
likelihood that this event might occur during that flight?
How did you know that this event might occur?
How else might you have been able to anticipate that this event would occur?
Were there things that you experienced during that flight that you thought increased the
likelihood that this event might occur?
What signaled/indicated to you that this event was about to occur, was occurring, or had
occurred?
How did you know what indicators of this event to look for during your flight?
What other indicators could have alerted you to this event?
How did you respond to this event?
How did you know what to do in response to this event?
If you had not already known what to do to respond to this event, how would you have figured
out what to do?
What did you learn from this event?
How did what you learned impact the remainder of your flight or that operation?
How did what you learned impact how you prepare for future flights or operations?
Have you shared what you learned with others in your organization? How did you do that?
In general, what practices are in place in your organization for pilots to share lessons learned?
Is there anything further you’d like for us to know about this event that we haven’t already
discussed?
A publication of the University Aviation Association, © 2020, ISSN: 1523-5955 46
Collegiate Aviation Review
International
Volume 38 | Issue 1 Peer-Reviewed Article #4
2-18-2020
Depression, Anxiety, and Stress in
Collegiate Aviators
Destry Jacobs
Arizona State University
Mary Niemczyk
Arizona State University
Robert Nullmeyer
Arizona State University
Nancy Cooke
Arizona State University
Paul Cline
Arizona State University
The purpose of this mixed-method research was to determine if students who are enrolled in a collegiate flight
program exhibit significantly higher rates of depression, stress, and anxiety. This study compared collegiate flight
students to non-professional flight students to determine whether collegiate flight students have higher rates of
depression, anxiety or stress. In addition, this study sought to determine if there were higher depression, anxiety, and
stress levels in upperclassmen (juniors and seniors) than in lowerclassmen (freshman and sophomore). These groups
were compared to each other by using results from the DASS-21, a survey that measures depression, anxiety, and
stress. There were no statistically significant results indicating no singular group is more or less prone to depression,
anxiety, or stress.
Recommended Citation:
Jacobs, D., Niemczyk, M., Nullmeyer, R., Cooke, N., & Cline, P. (2020). Depression, Anxiety, and Stress in
Collegiate Aviators. Collegiate Aviation Review International, 38(1), 46-68. Retrieved from
http://ojs.library.okstate.edu/osu/index.php/CARI/article/view/7956/7349
Collegiate Aviation Review International
A publication of the University Aviation Association, © 2020 47
College can be a turbulent time for students as many of them are confronting new and
complex experiences without the immediate and direct support from their parents, family, and
friends. Some students may also be embarking on this new phase of life without the maturity or
experience to handle many demanding events. Even for those who make the transition well it can
be difficult to manage everyday responsibilities, academia, and adulthood (Pedrelli, Nyer,
Yueng, Zulauf, & Wilson 2015). In general, this can be a challenging time but can become more
so when an individual is dealing with mental illness.
More and more college students are dealing with mental illnesses, specifically depression
and anxiety (Center of Collegiate Mental Health [CCMH], 2017 & 2018). Rates for students
seeking counseling are increasing dramatically, yet some still attempt to handle things on their
own. A recent study reported that rate of college students seeking treatment increased from 19%
in 2007 to 34% in 2017 (Lipson, Lattie, & Eisenberg, 2019). The Center of Collegiate Mental
Health, noted that anxiety and depression have had a clear growth trend over the past five years
(CCMH, 2018).
Generally, while it appears college students are dealing with increasing levels of stress
and mental illness, specifically depression, anxiety and stress, there may be some students
pursuing academic majors which may cause even higher levels of stress due to the demands of
highly-complicated course material and requirements of frequent skill demonstrations. One such
major is professional flight where students are required to master not only the concepts of many
complex courses such as meteorology, and aircraft systems but must also be able to demonstrate
various flight maneuvers in varying types of environmental conditions. Studying to become a
collegiate pilot may cause students to experience higher levels of stress (Blouin, Deaton,
Richard, & Buza, 2014).
Mental health concerns can be a sensitive subject in everyday life and even more so in
aviation. Even a suspicion of a mental health disorder can ground a pilot; and, if a diagnosis is
made where the FAA deems the pilot is unable to meet requirements the pilot’s certificate may
be temporarily or permanently revoked (Morse & Bor, 2006). Therefore, it is an important topic
to investigate as collegiate aviators will be entering into various flight roles upon their
graduation, and a mental health disorder can cause a certified pilot to lose flight privileges.
Research Questions & Hypotheses
The researchers posed the following research questions:
1: Are students who are enrolled in a professional flight degree program more prone to exhibit
significantly higher levels of depression, anxiety, and stress?
H0: The null hypothesis proposed would be such that there are no specific group of
students who are more depressed, stressed, or anxious than the others.
Jacobs et al.: Depression, Anxiety, and Stress in Collegiate Aviators
http://ojs.library.okstate.edu/osu/index.php/cari 48
HA: Alternative hypothesis proposed that students enrolled in a collegiate flight program
would have significantly higher levels of depression, anxiety, and stress than non-
professional flight students.
2: Do upperclassmen (juniors and senior) students exhibit more depression, anxiety, and stress
than underclassmen (freshman and sophomore) students?
H0: The null hypothesis proposed would be such that upperclassmen do not exhibit
significantly higher levels of depression, anxiety, and stress than underclassmen.
HA: Alternative hypothesis proposed that upperclassmen would exhibit significantly
higher levels of depression, anxiety and stress than underclassmen.
3: Is there an interaction between enrollment and academic stage (i.e., underclassmen vs.
upperclassmen) such that differences between professional flight and non-professional flight
students are greater for upperclassmen than underclassmen?
H0: The null hypothesis proposed that there is not an interaction between
upper/underclassmen in the collegiate aviation flight program regarding depression, anxiety, and
stress.
HA: Alternative hypothesis proposed that there is an interaction between
upper/underclassmen in the collegiate aviation flight program regarding depression, anxiety, and
stress.
Literature Review
Background
In 2016, more than 70% of high school students enrolled in a post-secondary institution
(McFarland et al., 2018). In addition to attending classes, many students also need to establish
independence, self-sufficiency, and how to manage new tasks, (Meadows, Brown & Elder,
2006). These new factors can lead to stress, anxiety, and depression—especially for students who
have poor coping skills or those who are predisposed to mental illness.
For some college students, mental health issues may not be a new concern, as mental
illness usually develops during adolescence and presents itself by age 24 (Andrews &Wilding,
2004; Hunt & Eisenberg, 2010; Mahmoud, Staten, Hall & Lennie, 2012). As an example,
approximately 75% of young adults who are diagnosed with an anxiety disorder have their first
episode by age 22 (Kessler et al., 2007).
Anxiety and depression disorders are the most common mental illnesses among adults
(CCMH, 2017 & 2018). Approximately 18% of the United States population suffers from some
type of anxiety disorder, with 6.7% suffering from Major Depressive Disorder (MDD) (National
Institute of Mental Health [NIMH], 2017). Anxiety and mood disorders often co-occur and
Collegiate Aviation Review International
A publication of the University Aviation Association, © 2020 49
nearly half of those diagnosed with depression are also diagnosed with an anxiety disorder
(NIMH, 2017; Sanderson, Di Nardo, Rapee, & Barlow, 1990).
Mental illness can plague college students in their everyday life causing ordinary
activities to become difficult. Untreated mental illness in students can impact academic success,
productivity, and incite substance abuse (Hunt & Eisenberg, 2010).
Mental Health Definitions
The Diagnostic and Statistical Manual of Mental Disorders, Fifth Edition (DSM-5)
published by the American Psychiatric Association (2013) is the authoritative guide used by
health care practioners to provide a diagnosis for individuals dealing with mental disorders. The
DSM-5 has been developed over time and is updated regularly to maintain currency with new
research and breakthroughs in the mental health community. It is important to note, however,
that not all practitioners utilize or rely solely on the DSM-5, but instead use it as part of their
practice. Some mental disorders are clearly defined with clear boundaries and symptom clusters,
yet many appear on a spectrum and can appearing with some or all symptoms. Many disorders
are closely-related with shared symptoms with similar genetic and environmental factors
(American Psychiatric Association, 2013). Some mental health disorders can be fleeting and
solved with time, while others can be more pervasive and take years of care and help to address.
Depression and anxiety disorders can be in both of those categories.
Depressive disorders. The most common feature of depressive disorders is a sad, empty,
and irritable mood. Depressive disorders also include body changes and cognitive impacts that
affect the individual’s ability to function for more than two weeks. Depression tends to impact
the sufferer in everyday life making it difficult to complete daily activities and even get out of
bed (NIMH, 2017). Specifically, in academia, depression can impact the student’s ability to learn
and retain information (NIMH, 2017; Prince, 2015). Difficulty concentrating, social isolation,
and feelings of hopelessness are also common and impactful (Johns Hopkins Student Assistance
Program, 2019). The individual can experience feelings of guilt, worthlessness, hopelessness,
pessimism and have difficulty finding happiness in previously enjoyable activities (NIMH,
2017). Other symptoms include slow talking, moving, and decision making, or in extreme cases
thoughts of death, suicidal ideation or even suicide attempts. Depressive disorders differ in
duration, timing and like many other health concerns depression and how the symptoms manifest
is unique to the individual (American Psychiatric Association, 2013; Johns Hopkins Student
Assistance Program, 2019; NIMH, 2017).
Major Depressive Disorder (MDD), a recurrent disorder, is characterized by discrete
episodes of at least two weeks of clear cognitive and neurovegetative affects that impact
function. These episodes may also have inter-episode remissions through the depressive period
disorder (American Psychiatric Association, 2013).
Anxiety disorders. Anxiety disorders present in many forms but are mostly characterized
by excessive fear and anxiety and related behavioral disturbances (American Psychiatric
Association, 2013). Most anxiety disorders are developed in childhood and if not addressed by a
medical professional through treatment, can worsen as the individual ages (American Psychiatric
Jacobs et al.: Depression, Anxiety, and Stress in Collegiate Aviators
http://ojs.library.okstate.edu/osu/index.php/cari 50
Association, 2013). More females are impacted by anxiety than males by a 2:1 ratio (NIMH,
2017).
General Anxiety Disorder (GAD) is one of the most common anxiety disorders
(American Psychiatric Association, 2013). GAD is persistent and excessive anxiety exhibiting
worry across domains such as work, education, and social relationships, to name a few. GAD is
also accompanied by physical symptoms such as restlessness, becoming easily fatigued,
consistently on edge, muscle tension, sleep disturbance, irritability, and difficulty concentrating
(American Psychiatric Association, 2013).
Explanations to Rising Mental Illness in College-Aged Young Adults
There are many factors that may explain these increases such as a lack of social support,
relationship stressors, or other life challenges (Hunt & Eisenberg, 2010).
Stigma towards mental health. It appears there is a decreased stigma towards mental
health issues for current college students as attitudes towards receiving help for mental health are
much more favorable in younger adults than in older adults (American Psychiatric Association,
2018; Mojtabai, 2007). Thus, the reports of increasing mental health concerns in college students
could be due to the increase of those getting help. However, some other studies suggest that less
than half of students who are suffering with a mental health disorder are receiving treatment
(Zivin, Eisenberg, Gollust, & Golberstein, 2009).
If less stigma is causing more college students to reach out for help, this may be a cause
of increased reporting. Yet, this may also indicate more college students are suffering with
mental illness than previously thought. If less stigma is not causing college students to reach for
help, then there may be a genuine increase of students impacted by mental illness.
Most people develop mental health disorders as children but tend to not be treated until
later. More commonly, it takes years for the patient to seek help, if they search for help at all
(Pedrelli et. al., 2015; Prince, 2015). More colleges and universities are providing counseling
services and other support systems for students. Some universities are reporting a staggering
increase of students now utilizing the student mental health centers (Beiter et. al., 2015).
Traditional College Students and Collegiate Aviation Students
Traditional and non-traditional college students. Traditional college students tend to
be around 18-24 years of age. Most enroll directly into a postsecondary institution after
completing high school at 18 or 19 years of age (McFarland et. al., 2018; Pedrelli et. al., 2015).
Most commonly, these students enroll in 12 or more credit hours of classes and are considered
full-time students. Many of these students rely on their parents or other family members for
financial support and may also hold a job to supplement the cost of living or their education
(Pedrelli et. al., 2015). Many of these students can feel stressed by trying to balance their
academics in addition to the new demands of college (Pedrelli et al., 2015).
Collegiate Aviation Review International
A publication of the University Aviation Association, © 2020 51
Non-traditional students are older (above 24 years of age), are usually employed full-
time, and may have spouses or dependents (Pedrelli et al., 2015). While these students need to
balance their academics with work, and family, they may find more stress in coming back to
school and adjusting to the role and expectations of being a student again (Pedrelli et al., 2015).
Collegiate aviation flight students. Collegiate aviation flight students usually maintain
the typical college student role while also progressing through the flight portion of their degree
program. Aviation flight students are typically full-time students, may maintain full-time or part-
time jobs, and are required to spend many hours flying to earn their various flight certificates and
ratings. These students may be traditional or non-traditional students.
Flying an aircraft is an inherently stressful activity (Martinussen & Hunter, 2010;
Matthews, 2001; Morse & Bor, 2006; Telfer & Biggs, 1988). The pilot’s responsibilities include
safely operating the plane in a variety of environments, completing periodic check rides, and
more. Pilots may experience consistent low-level stress by just being in the airplane. While
flying, pilots are constantly monitoring their aircraft and surroundings, which can lead to subtle
chronic tension (Suedfeld & Steel, 2000). Additional stress can arise from the requirement to
persist in increasing their knowledge and skills as they achieve the designated certificates and
ratings for their flight program (Katz, 1997; Matthews, 2001; Salas, Driskell, & Hughes, 1996).
A reduction in performance may result in increased number of errors (Martinussen & Hunter,
2010) and accident rates (Loewenthal et al., 2000), as well as the increased financial
requirement. Collegiate aviation students are continuously confronted with all these stressors
along with those from their academics and everyday life.
Possible Triggers of Mental Health Disorders in College Students
The most common reason found to trigger depression in students are financial issues
(Andrews & Wilding, 2004). Financial issues are universal for students, as a post-secondary
education has become more expensive possibly leading to a considerable financial burden on the
student and their family (Callender & Kemp, 2000). With 70% of high school graduates
enrolling in postsecondary education (McFarland et al., 2018), financial burdens on students and
families are becoming all the more common (Andrews & Wilding, 2004).
Both anxiety and depression can impact daily life but, depression tends to impact
academic performance more than anxiety disorders as the nature of anxiety can motivate students
to use compensatory strategies that can increase performance effectiveness (Andrews & Wilding,
2004; Eysenck & Calvo, 1992). Though this sounds like it may be beneficial, often it is not as
this can set students up for a lifetime of stress and impact their long-term health and well-being
(Stewart-Brown et al., 2000).
Mental Health in Aviation
Mental health in aviation is a sensitive topic and comes with many challenges. Pilots and
other flight crew may have a deep aversion to the admittance of a mental health issue as it can
put their flight careers in jeopardy. Pilots who are diagnosed with a psychiatric disorder must be
grounded until recovered, therefore many may not reach out for help (Bor & Hubbard, 2006;
Jacobs et al.: Depression, Anxiety, and Stress in Collegiate Aviators
http://ojs.library.okstate.edu/osu/index.php/cari 52
Morse & Bor, 2006). Additionally, mental health is not a singular topic, as it is diverse, ranges in
degree and severity, and can change over time. According to Bor and Hubbard (2006), there are
five main sources of mental health problems associated with aviation employees:
(a) stresses associated with coping, safety, and survival,
(b) stress that emanates from workload, how work is organized and organizational
climate (e.g. rostering, frequency of flights, jet lag, pensions and financial changes),
(c) personal problems that stem from disruption to personal relationships, which clinical
research suggests should act as a buffer to work stress,
(d) ever-present concerns about loss of license as a consequence of the onset of a
disqualifying medical condition, and
(e) normal psychological problems that occur naturally in the everyday life of the
population at large. (p. 2)
Elevated levels of stress can have significant impacts on cognitive processes and decision
making. In combination, work and personal stress can impact performance (Blouin et al., 2014).
In a survey conducted by Sexton, Thomas, and Helmreich (2000), 74% of pilots reported that
stress and fatigue do impact their performance, and 47% reported that personal problems also
impact them while flying. If these issues are affecting experienced pilots, there may be similar
issues confronting student pilots.
The Federal Aviation Administration (FAA) has specific physical and mental health
standards. To receive a First Class Medical, which is required to fly for airlines, pilots must
undergo a physical and psychological evaluation (Federal Aviation Administration, 2018a). A
First-Class Medical Certificate cannot be issued if the pilot has been diagnosed with a
personality disorder, experienced psychosis (hallucinations, delusions, bizarre behavior), bipolar
personality disorder, or substance dependence (Federal Aviation Administration, 2018c).
Additionally, there are many medications that disqualify or may revoke a pilot’s medical due to
the potential side effects. Most of the medications used to treat depression and anxiety are
included and can cause the pilot to be grounded. Updated in 2010, the FAA has allowed for
Special Issuance or Special Consideration to be given to pilots who have been diagnosed with
MDD (mild to moderate), Dysthymic Disorder, Adjustment Disorder with depressed mood, and
any non-depression related condition where an SSRI (selective serotonin reuptake inhibitor) is
used to treat the disorder. There are four medications that can be taken by pilots but are approved
on a case by case basis by the FAA (Federal Aviation Administration [FAA], 2018a).
The FAA lists all medications that pilots are and are not able to use while flying. There
are two lists: Do Not Issue (DNI) and Do Not Fly (DNF). Any pilot taking any medication on the
DNI list will not be issued their flight medical certificate or be able to renew their certificate
(FAA, 2018a). Pilots who are taking any medications on the DNF list are highly discouraged to
not fly. This list tends to apply more to over-the-counter medications. Pilots are able to return to
flying after the medication has been stopped and sufficient time has elapsed allowing the drug to
leave the pilot’s system.
Pilots are still prone to mental health concerns in spite of extensive medical screening
(Morse & Bor, 2006). When the pilot is examined by an Aviation Medical Examiner (AME) the
Collegiate Aviation Review International
A publication of the University Aviation Association, © 2020 53
decision to certify the pilot fit for service is up to the AME. AMEs do not diagnose or perform
psychiatric exams but make the final decision based on the information provided by the applicant
(FAA, 2018a). If the AME cannot make the decision based on the information provided by the
applicant, the application is then sent to a FAA certified psychiatrist and all of the pilot’s medical
records are then reviewed by the FAA (FAA, 2018a).
The ambiguity of the FAA on mental health make it a pain point for many pilots. After
physical disorders, psychological disorders, at 12.5% (Pombal, R., Peixoto, H., Lima, M. &
Jorge, A., 2005), are the most common reason for pilots to lose their license (Bor & Hubbard,
2006). The loss of a license or even a temporary hold can cause legal, social, and personal
consequences.
These rules, regulations, and stigmas do not only apply to the US airline industry, but
also includes international pilots. Collegiate aviators may already be in a turbulent and
transitional phase of life and with the added stigma and possible consequences of being
diagnosed with a mental disorder, these students may be much less likely to reach out for help if
it is needed. Even if the student’s mental health issue is transient, the student can still be
grounded from flight operations impacting the speed at which he/she completes their education.
This interruption in training can incite financial concerns as well as complicating other aspects of
daily life.
Mental Health and Collegiate Aviation Students
Changes in domestic life, social life, and work may produce stress and other adverse
reactions. Internal biological changes can also result in psychiatric disturbances (Morse & Bor,
2006). Academics and personal stresses can create large amounts of stress for students. One of
the biggest challenges faced by collegiate aviation students is the cost of flight time. Depending
on the certificates and ratings included in the academic program, collegiate flight costs can climb
to well above $80,000, for flight time, examiner fees, and supplies (ATP Flight School, 2018).
Financial issues are a contributing factor causing student depression; therefore, the
intense costs of an aviation program may put students at a higher risk. Results from a previous
study found that 70% of college students are stressed about finances (McDaniel, A., Montalto,
C., Ashton, B., Duckett, K., & Croft, A. (2014). This stress can precipitate the onset of mood and
anxiety disorders in students (Robinson, Bond & Rosier, 2015). Additionally, previous research
focusing on the stress levels of collegiate aviators found that FAA practical tests are the most
stressful, followed by financial concerns, written exams, flight course workload, checkride
scheduling, and time management (Robertson & Ruiz, 2010).
Pilot Profile
When people think of pilots they may think of a confident and level-headed individual.
Some studies even support that there are specific personality types that are drawn to being
aviators. The pilot personality as studied by Fitzgibbons, Davis, and Schutte (2004) is quite
common. The most common pilot profile is someone who is emotionally stable, has low anxiety,
low vulnerability (being able to handle difficult situations), difficult to anger, not impulsive, and
Jacobs et al.: Depression, Anxiety, and Stress in Collegiate Aviators
http://ojs.library.okstate.edu/osu/index.php/cari 54
low on depression. Pilots are also very contentious, goal-orientated, deliberate, competent and
dutiful. Most pilots also are trusting, straightforward, and assertive which helps with crew
resource management. Because of this profile and the commonality, a majority of pilots may not
have a personality that is prone to mental health problems. This could mean that collegiate
aviators could have less anxiety and depression rates.
Purpose of the Study
The purpose of this study was to determine and compare the rates of depression, anxiety,
and stress among collegiate flight students and non-professional flight students.
Methodology
This study utilized the DASS-21 (Lovibond & Lovibond, 1995) survey which is
comprised of three scales (depression, stress, and anxiety), each with seven Likert-type items
utilizing a four-point scale, ranging from Never to Almost Always. The reliability of DASS-21
was confirmed by Antony, Cox, Enns, Bieling and Swinson (1998). Generic, non-identifying
demographic questions were also included. The survey used in this study can be found in the
Appendix.
The DASS measures features specific to depression, anxiety, and stress. The three
sections DASS- D (depression), DASS-S (stress), DASS-A (anxiety) address specific conditions
within the DASS. The DASS is a reliable, valid method in both clinical and non-clinical groups
(Antony et al., 1998).
This study utilized the DASS-21 for brevity. DASS-21, has fewer items, a cleaner factor
structure and a smaller inter-factor correlation. For the purpose of this study the DASS-21 is
shorter for students to take, encompasses all of the mental disorders pertinent to the study, and
can be compared to previous studies. Additionally, the issue of self-reporting should also be
addressed. Respondents were asked to report to the best of their ability. Self-reporting, though
beneficial in many cases, can also have issues with over-exaggerated answers, unwillingness of
response honestly, and various other biases that may skew reporting reliability. Yet, self-
reporting is the main way that clinicians diagnose their patients. The main purpose of this survey
is to address whether or not depression, anxiety, or stress, though possibly not diagnosed, is
perceived pervasive enough in a respondent’s life that could impact the ability to effectively
perform duties asked of them.
After receiving Institutional Review Board approval, the survey was disseminated using
convenience sampling. Both paper copies and electronic versions were available for the
respondent. The survey was distributed to University Aviation Association (UAA) members via
email and at the Women in Aviation (WAI) Conference via iPad. Additionally, the survey was
also accessible through a URL with solicitation on social media (Facebook), and in-person
requests in college courses with enrollments that included both aviation flight students and non-
aviation degree seeking students. Prior to the start of the survey, participants completed a consent
form. An additional statement was included to note that due to the nature of the study
participants experiencing any discomfort or distress could stop the survey at any time. There was
no compensation or class credit available for this study.
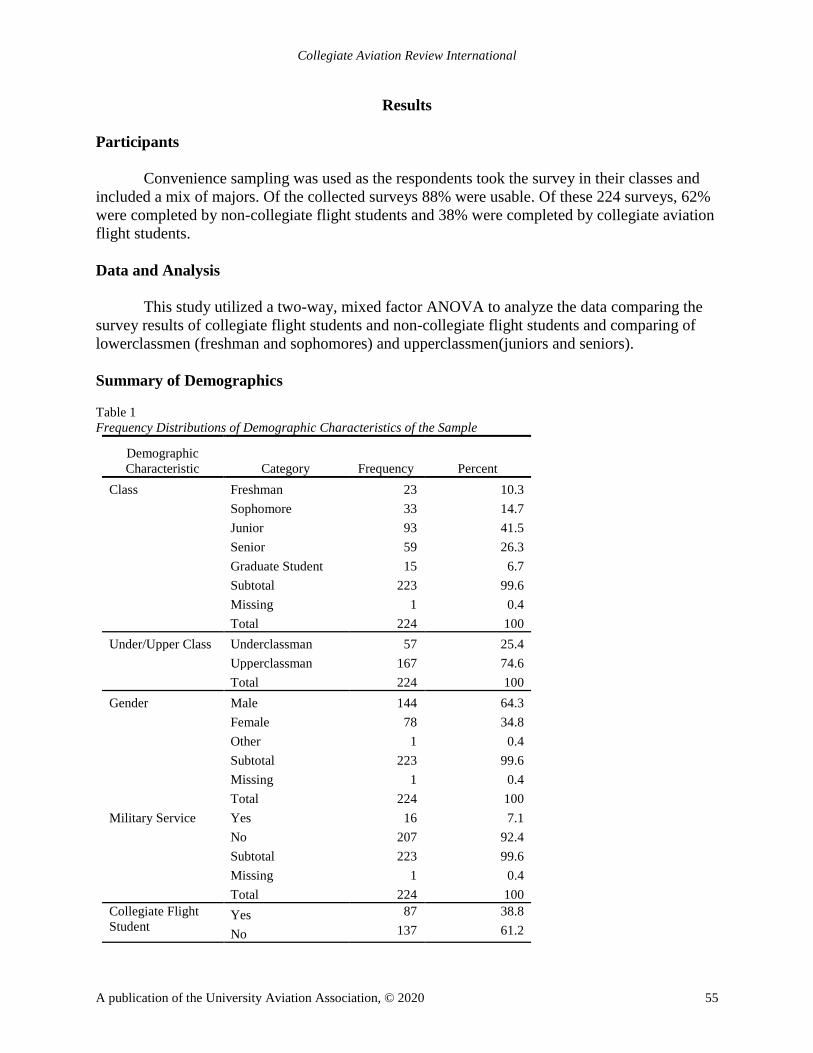
Collegiate Aviation Review International
A publication of the University Aviation Association, © 2020 55
Results
Participants
Convenience sampling was used as the respondents took the survey in their classes and
included a mix of majors. Of the collected surveys 88% were usable. Of these 224 surveys, 62%
were completed by non-collegiate flight students and 38% were completed by collegiate aviation
flight students.
Data and Analysis
This study utilized a two-way, mixed factor ANOVA to analyze the data comparing the
survey results of collegiate flight students and non-collegiate flight students and comparing of
lowerclassmen (freshman and sophomores) and upperclassmen(juniors and seniors).
Summary of Demographics
Table 1
Frequency Distributions of Demographic Characteristics of the Sample
Demographic
Characteristic Category Frequency Percent
Class Freshman 23 10.3
Sophomore 33 14.7
Junior 93 41.5
Senior 59 26.3
Graduate Student 15 6.7
Subtotal 223 99.6
Missing 1 0.4
Total 224 100
Under/Upper Class Underclassman 57 25.4
Upperclassman 167 74.6
Total 224 100
Gender Male 144 64.3
Female 78 34.8
Other 1 0.4
Subtotal 223 99.6
Missing 1 0.4
Total 224 100
Military Service Yes 16 7.1
No 207 92.4
Subtotal 223 99.6
Missing 1 0.4
Total 224 100
Collegiate Flight
Student Yes 87 38.8
No 137 61.2
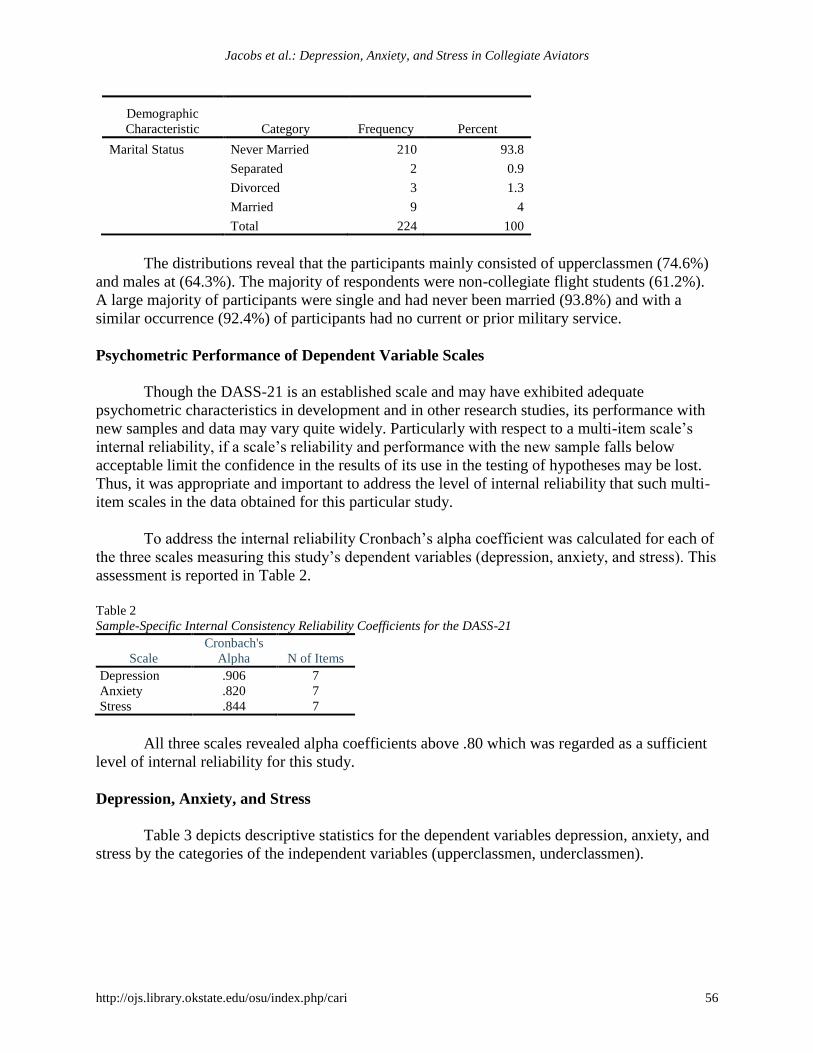
Jacobs et al.: Depression, Anxiety, and Stress in Collegiate Aviators
http://ojs.library.okstate.edu/osu/index.php/cari 56
Demographic
Characteristic Category Frequency Percent
Marital Status Never Married 210 93.8
Separated 2 0.9
Divorced 3 1.3
Married 9 4
Total 224 100
The distributions reveal that the participants mainly consisted of upperclassmen (74.6%)
and males at (64.3%). The majority of respondents were non-collegiate flight students (61.2%).
A large majority of participants were single and had never been married (93.8%) and with a
similar occurrence (92.4%) of participants had no current or prior military service.
Psychometric Performance of Dependent Variable Scales
Though the DASS-21 is an established scale and may have exhibited adequate
psychometric characteristics in development and in other research studies, its performance with
new samples and data may vary quite widely. Particularly with respect to a multi-item scale’s
internal reliability, if a scale’s reliability and performance with the new sample falls below
acceptable limit the confidence in the results of its use in the testing of hypotheses may be lost.
Thus, it was appropriate and important to address the level of internal reliability that such multi-
item scales in the data obtained for this particular study.
To address the internal reliability Cronbach’s alpha coefficient was calculated for each of
the three scales measuring this study’s dependent variables (depression, anxiety, and stress). This
assessment is reported in Table 2.
Table 2
Sample-Specific Internal Consistency Reliability Coefficients for the DASS-21
Scale
Cronbach's
Alpha N of Items
Depression .906 7
Anxiety .820 7
Stress .844 7
All three scales revealed alpha coefficients above .80 which was regarded as a sufficient
level of internal reliability for this study.
Depression, Anxiety, and Stress
Table 3 depicts descriptive statistics for the dependent variables depression, anxiety, and
stress by the categories of the independent variables (upperclassmen, underclassmen).
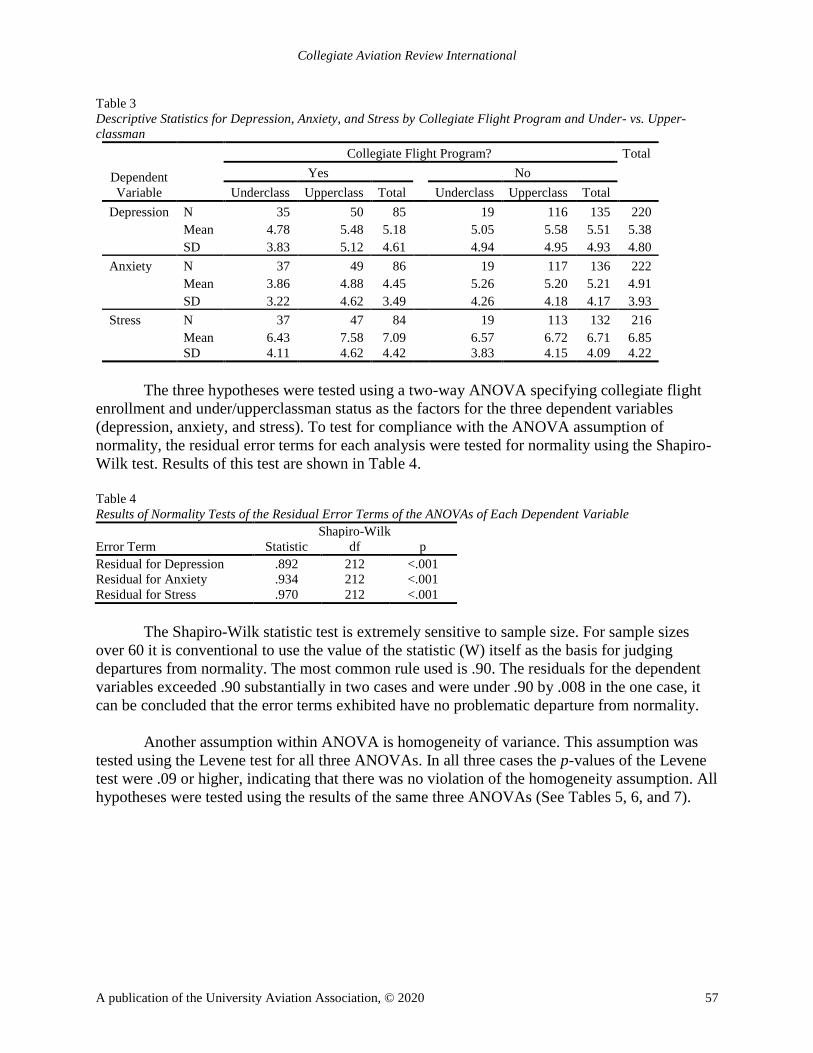
Collegiate Aviation Review International
A publication of the University Aviation Association, © 2020 57
Table 3
Descriptive Statistics for Depression, Anxiety, and Stress by Collegiate Flight Program and Under- vs. Upper-
classman
Dependent
Variable
Collegiate Flight Program? Total
Yes
No
Underclass Upperclass Total Underclass Upperclass Total
Depression N 35 50 85
19 116 135 220
Mean 4.78 5.48 5.18 5.05 5.58 5.51 5.38
SD 3.83 5.12 4.61 4.94 4.95 4.93 4.80
Anxiety N 37 49 86
19 117 136 222
Mean 3.86 4.88 4.45 5.26 5.20 5.21 4.91
SD 3.22 4.62 3.49 4.26 4.18 4.17 3.93
Stress N 37 47 84
19 113 132 216
Mean 6.43 7.58 7.09 6.57 6.72 6.71 6.85
SD 4.11 4.62 4.42 3.83 4.15 4.09 4.22
The three hypotheses were tested using a two-way ANOVA specifying collegiate flight
enrollment and under/upperclassman status as the factors for the three dependent variables
(depression, anxiety, and stress). To test for compliance with the ANOVA assumption of
normality, the residual error terms for each analysis were tested for normality using the Shapiro-
Wilk test. Results of this test are shown in Table 4.
Table 4
Results of Normality Tests of the Residual Error Terms of the ANOVAs of Each Dependent Variable
Error Term
Shapiro-Wilk
Statistic df p
Residual for Depression .892 212 <.001
Residual for Anxiety .934 212 <.001
Residual for Stress .970 212 <.001
The Shapiro-Wilk statistic test is extremely sensitive to sample size. For sample sizes
over 60 it is conventional to use the value of the statistic (W) itself as the basis for judging
departures from normality. The most common rule used is .90. The residuals for the dependent
variables exceeded .90 substantially in two cases and were under .90 by .008 in the one case, it
can be concluded that the error terms exhibited have no problematic departure from normality.
Another assumption within ANOVA is homogeneity of variance. This assumption was
tested using the Levene test for all three ANOVAs. In all three cases the p-values of the Levene
test were .09 or higher, indicating that there was no violation of the homogeneity assumption. All
hypotheses were tested using the results of the same three ANOVAs (See Tables 5, 6, and 7).
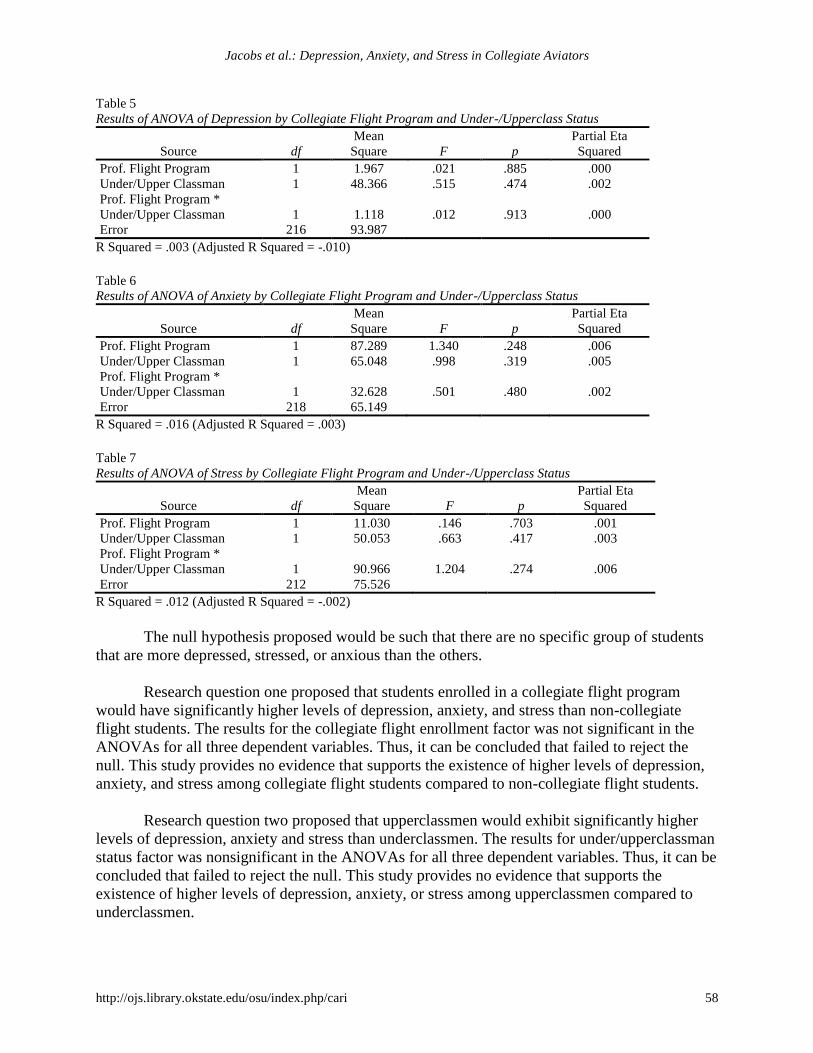
Jacobs et al.: Depression, Anxiety, and Stress in Collegiate Aviators
http://ojs.library.okstate.edu/osu/index.php/cari 58
Table 5
Results of ANOVA of Depression by Collegiate Flight Program and Under-/Upperclass Status
Source df
Mean
Square F p
Partial Eta
Squared
Prof. Flight Program 1 1.967 .021 .885 .000
Under/Upper Classman 1 48.366 .515 .474 .002
Prof. Flight Program *
Under/Upper Classman 1 1.118 .012 .913 .000
Error 216 93.987
R Squared = .003 (Adjusted R Squared = -.010)
Table 6
Results of ANOVA of Anxiety by Collegiate Flight Program and Under-/Upperclass Status
Source df
Mean
Square F p
Partial Eta
Squared
Prof. Flight Program 1 87.289 1.340 .248 .006
Under/Upper Classman 1 65.048 .998 .319 .005
Prof. Flight Program *
Under/Upper Classman 1 32.628 .501 .480 .002
Error 218 65.149
R Squared = .016 (Adjusted R Squared = .003)
Table 7
Results of ANOVA of Stress by Collegiate Flight Program and Under-/Upperclass Status
Source df
Mean
Square F p
Partial Eta
Squared
Prof. Flight Program 1 11.030 .146 .703 .001
Under/Upper Classman 1 50.053 .663 .417 .003
Prof. Flight Program *
Under/Upper Classman 1 90.966 1.204 .274 .006
Error 212 75.526
R Squared = .012 (Adjusted R Squared = -.002)
The null hypothesis proposed would be such that there are no specific group of students
that are more depressed, stressed, or anxious than the others.
Research question one proposed that students enrolled in a collegiate flight program
would have significantly higher levels of depression, anxiety, and stress than non-collegiate
flight students. The results for the collegiate flight enrollment factor was not significant in the
ANOVAs for all three dependent variables. Thus, it can be concluded that failed to reject the
null. This study provides no evidence that supports the existence of higher levels of depression,
anxiety, and stress among collegiate flight students compared to non-collegiate flight students.
Research question two proposed that upperclassmen would exhibit significantly higher
levels of depression, anxiety and stress than underclassmen. The results for under/upperclassman
status factor was nonsignificant in the ANOVAs for all three dependent variables. Thus, it can be
concluded that failed to reject the null. This study provides no evidence that supports the
existence of higher levels of depression, anxiety, or stress among upperclassmen compared to
underclassmen.
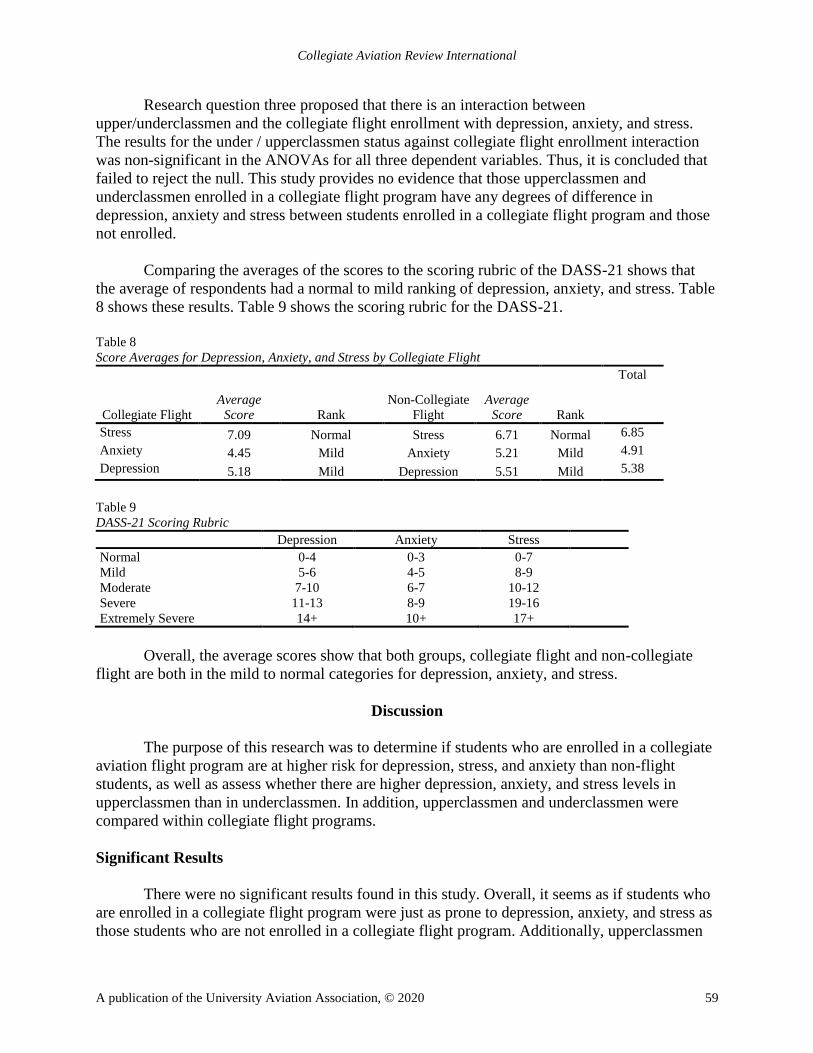
Collegiate Aviation Review International
A publication of the University Aviation Association, © 2020 59
Research question three proposed that there is an interaction between
upper/underclassmen and the collegiate flight enrollment with depression, anxiety, and stress.
The results for the under / upperclassmen status against collegiate flight enrollment interaction
was non-significant in the ANOVAs for all three dependent variables. Thus, it is concluded that
failed to reject the null. This study provides no evidence that those upperclassmen and
underclassmen enrolled in a collegiate flight program have any degrees of difference in
depression, anxiety and stress between students enrolled in a collegiate flight program and those
not enrolled.
Comparing the averages of the scores to the scoring rubric of the DASS-21 shows that
the average of respondents had a normal to mild ranking of depression, anxiety, and stress. Table
8 shows these results. Table 9 shows the scoring rubric for the DASS-21.
Table 8
Score Averages for Depression, Anxiety, and Stress by Collegiate Flight
Collegiate Flight
Average
Score Rank
Non-Collegiate
Flight
Average
Score Rank
Total
Stress 7.09 Normal Stress 6.71 Normal 6.85
Anxiety 4.45 Mild Anxiety 5.21 Mild 4.91
Depression 5.18 Mild Depression 5.51 Mild 5.38
Table 9
DASS-21 Scoring Rubric
Depression Anxiety Stress
Normal 0-4 0-3 0-7
Mild 5-6 4-5 8-9
Moderate 7-10 6-7 10-12
Severe 11-13 8-9 19-16
Extremely Severe 14+ 10+ 17+
Overall, the average scores show that both groups, collegiate flight and non-collegiate
flight are both in the mild to normal categories for depression, anxiety, and stress.
Discussion
The purpose of this research was to determine if students who are enrolled in a collegiate
aviation flight program are at higher risk for depression, stress, and anxiety than non-flight
students, as well as assess whether there are higher depression, anxiety, and stress levels in
upperclassmen than in underclassmen. In addition, upperclassmen and underclassmen were
compared within collegiate flight programs.
Significant Results
There were no significant results found in this study. Overall, it seems as if students who
are enrolled in a collegiate flight program were just as prone to depression, anxiety, and stress as
those students who are not enrolled in a collegiate flight program. Additionally, upperclassmen
Jacobs et al.: Depression, Anxiety, and Stress in Collegiate Aviators
http://ojs.library.okstate.edu/osu/index.php/cari 60
were not more prone to depression, anxiety, or stress compared to underclassmen. An identical
result was found when comparing upperclassmen and lowerclassmen enrolled in a collegiate
flight program.
A possible explanation for these results is that collegiate flight students are just that;
students. Though they incur more academic obligations than non-flight students there are equal
opportunities for non-flight students to have equal amounts of responsibilities and additional
requirements.
Additionally, as addressed previously, those who are drawn to becoming pilots may have
a pilot personality. This personality or at least some personality traits may mean those who are
attracted to becoming a pilot may be more resilient and less likely to develop depression,
anxiety, or high levels of stress.
Implications
Though there were no significant differences among participant groups, there are still
some important findings. Based on this study, no specific group, pilot, non-pilot, upperclassmen,
or lower classmen, were more prone to depression, anxiety, or stress than another group. Yet, to
assure students are aware of the services available to them, all students still need to be provided
education about mental health and have mental health services available to them. Student mental
health is a national issue as increases in depression, anxiety, and stress among college have been
reported by various organizations.
Collegiate aviation flight students still need to be educated about the impacts that mental
health can have on them and their careers. Knowing the signs of common mental health disorders
may help them in aiding themselves or others. Positive coping methods and stress relief is an
important topic to address for all students.
Overall, this study has shown that there are no specific groups within a collegiate flight
program that are more likely to exhibit high statistical levels of depression, anxiety, or stress.
Conclusively, students enrolled in a professional flight program are not more or less stressed
than those not enrolled in a flight program.
Since these results are positive and the results do not show that either of these student
groups are more stressed, depressed, or anxious than others (and actually show a fairly low rate
of these traits), it is important to not be lulled into a false sense of security. Though these results
are something to be comforted about at these universities and member organizations it is still
important to educate all students on the importance of mental health and ways to effectively take
care of themselves and produce positive coping mechanisms and self-care strategies.
Limitations & Future Research
This survey was disseminated through email to University Aviation Association
institutions, Women in Aviation Conference volunteers, administered during classroom visits,
and social media. While a large number of prospective participants had access to the survey, data
Collegiate Aviation Review International
A publication of the University Aviation Association, © 2020 61
collection was conducted for three weeks. A longer collection window may have been
advantageous to secure more responses from a more diverse sample pool.
Future studies should also take into account other student responsibilities in and outside
of the classroom for example, employment status, involvement in student organizations, class
credit load, home environment, and other factors. Both collegiate flight and non-flight students
have the equal opportunity to incur additional responsibilities in and outside of the classroom.
An analysis of pilot personality at the collegiate level may also be a point of interest to future
studies. Finally, the same study can be repeated and add a test/re-test aspect. Addressing these
limitations may add to a better understanding of collegiate flight students and what is needed to
support them.
Jacobs et al.: Depression, Anxiety, and Stress in Collegiate Aviators
http://ojs.library.okstate.edu/osu/index.php/cari 62
References
American Psychiatric Association. (2013). Diagnostic and statistical manual of mental disorders
(5th ed.). Arlington, VA: American Psychiatric Publishing.
American Psychiatric Association. (2018). Stress in America: Generation Z, (October).
https://doi.org/10.1016/j.fuel.2013.07.110
Andrews, B. & Wilding, J.M. (2004). The relation of depression and anxiety to life-stress and
achievement in students. British Journal of Psychology, 95, 509–521.
Antony, M.M., Cox, B. J., Enns, M.W., Bieling, P.J. & Swinson, R. P. (1998). Psychometric
properties of the 42-item and 21-item versions of the Depression Anxiety Stress Scales in
clinical groups and a community sample. Psychological Assessment, 10(2), 176–181.
https://doi.org/10.1037/1040-3590.10.2.176
ATP Flight School. (2018). Pilot Training Cost. Retrieved from
https://atpflightschool.com/faqs/pilot-training-cost.html
Beiter, R., Nash, R., McCrady, M., Rhoades, D., Linscomb, M., Clarahan, M. & Sammut, S.
(2015). The prevalence and correlates of depression, anxiety, and stress in a sample of
college students. Journal of Affective Disorders, 173, 90–96.
https://doi.org/10.1016/j.jad.2014.10.054
Blouin, N., Deaton, J., Richard, E., & Buza, P. (2014). Effects of Stress on Perceived
Performance of Collegiate Aviators. Aviation Psychology and Applied Human Factors,
4(1), 40–49. https://doi.org/10.1027/2192-0923/a000054
Bor, R., & Hubbard, T. (2006). Aviation Mental Health. Aldershot: Ashgate.
Callender C. & Kemp, M. (2000). Changing Student Finances: Income, Expenditure and Take-
up of Student Loans Among Full- and Part-time Higher Education Students in 1998/9.
Center for Collegiate Mental Health [CCMH]. (2017). 2017 Annual Report. Retrieved from
https://sites.psu.edu/ccmh/files/2018/01/2017_CCMH_Report-1r3iri4.pdf
Center for Collegiate Mental Health [CCMH]. (2018). 2018 Annual Report. Retrieved from
https://ccmh.psu.edu/files/2018/02/2017_CCMH_Report-1r4m88x.pdf
Eysenck, M. W., & Calvo, M. G. (1992). Anxiety and performance: The processing
efficiency theory. Cognition and Emotion, 6, 409–434
Federal Aviation Administration [FAA]. (2018a). Guide for Aviation Medical Examiners 2018.
Retrieved from https://www.faa.gov/about/office_org/headquarters_offices/avs/offices/
aam/ame/guide/media/guide.pdf
Collegiate Aviation Review International
A publication of the University Aviation Association, © 2020 63
Federal Aviation Administration [FAA]. (2018b). Specifications for Psychiatric and
Psychological Evaluations. Medical Evaluation Guide. Retrieved from
http://www.faa.org
Federal Aviation Administration [FAA]. (2018c). Title 14: Aeronautics and Space PART 67—
MEDICAL STANDARDS AND CERTIFICATION Subpart B—First-Class Airman
Medical Certificate.
Fitzgibbons, A., Davis, D, & Schutte, P. (2004). Pilot personality profile using the NEO-PI-R.
https://doi.org/10.1016/j.scs.2017.04.017
Hunt, J. & Eisenberg, D. (2010). Mental Health Problems and Help-Seeking Behavior Among
College Students. Journal of Adolescent Health, 46(1), 3–10.
https://doi.org/10.1016/j.jadohealth.2009.08.008
Johns Hopkins Student Assistance Program. (2019). Depression, Anxiety & Emotional
Distress. Retrieved from http://jhsap.org/self_help_resources/depression_anxiety_
emotional_distress/index.html%0A1/2
Katz, L.C. (1997). Stress, coping, belief systems, and symptoms (USAARL Report No.
97-37). Fort Rucker, AL: US Army Aeromedical Research Center.
Kessler, R., Amminger, P., Aguilar-Gaxiola, S., Alonso, J., Lee, S. & Ustun, B. (2007). Age of
onset of mental disorders: A review of recent literature Ronald. Curr Opin Psychiatry,
20(4), 359–364. Retrieved from https://www.ncbi.nlm.nih.gov/pmc/articles/
PMC1925038/pdf/nihms25081.pdf
Lipson, S.K., Lattie, E.G. & Eisenberg, D. (2019). Increased Rates of Mental Health Service
Utilization by U.S. College Students: 10-Year Population-Level Trends (2007–2017).
Psychiatric Services, 70(1), 60–63.
Loewenthal, K. M., Eysenck, M., Harris, D., Lubitsh, G., Gorton, T. & Bicknell, H.
(2000). Stress, distress and air traffic incidents: Job dysfunction and distress in
airline pilots in relation to contextually-assessed stress. Stress Medicine, 16, 179-
183.
Lovibond, S. H., Lovibond, P. F. (1995). The structure of negative emotional states: Comparison
of the depression anxiety stress scales (DASS) with the beck depression and anxiety
inventories. Behavioural Research and Therapy, 33, 335–343.
Mahmoud, J., Staten, R., Hall, L., & Lennie, T. (2012). The relationship among young adult
college students’ depression, anxiety, stress, demographics, life satisfaction, and coping
styles. Issues in Mental Health Nursing, 33(3), 149–156.
https://doi.org/10.3109/01612840.2011.632708
Jacobs et al.: Depression, Anxiety, and Stress in Collegiate Aviators
http://ojs.library.okstate.edu/osu/index.php/cari 64
Matthews, G. (2001). A transactional model of driver stress. In P. A. Hancock & P. A.
Desmond (Eds.), Stress, workload, and fatigue (pp. 133 – 163). Mahwah, NJ: Lawrence
Erlbaum Associates.
Martinussen, M., & Hunter, D. (2010). Aviation psychology and human factors. Boca
Raton: CRC Press.
McFarland, J., Hussar, B., Wang, X., Wang, K., Zhang, J., Rathbun, A., Barmer, A., Cataldi, E.,
Nachazel, T., Smith, W., & Ossolinski, M. (2018). The Condition of Education - 2018.
U.S. Department of Education. https://doi.org/NCES 2018144
Meadows, S. O., Brown, J. S., & Elder, G. S. (2006). Depressive symptoms, stress, and support:
Gendered trajectories from adolescence to young adult-hood. Journal of Youth and
Adolescence, 35(1), 89–99.
Mojtabai, R. (2007) Americans' Attitudes toward Mental Health Treatment Seeking: 1990-2003.
Psychiatric Services (Washington, D.C.), 5(58), pp. 642–651.,
doi:10.1176/ps.2007.58.5.642.
Morse, J.S. & Bor, R. (2006). Psychiatric disorders and syndromes among pilots. In R. Bor, & T.
Huddard, (Eds.), Aviation mental health (pp. 107–125). Burlington, VT: Ashgate
National Institute of Mental Health [NIMH]. (2017). Major Depression. Retrieved from
https://www.nimh.nih.gov/health/statistics/major-depression.shtml
McDaniel, A., Montalto, C., Ashton, B., Duckett, K., & Croft, A. (2014). National Student
Financial Wellness Study, Key Findings Report . Ohio State University . Pedrelli, P.,
Nyer, M., Yeung, A., Zulauf, C. & Wilens, T. (2015). College Students: Mental Health
Problems and Treatment Considerations. Academic Psychiatry, 39(5), 503–511.
https://doi.org/10.1007/s40596-014-0205-9.
Prince, J. P. (2015). University student counseling and mental health in the United States: Trends
and challenges. Mental Health and Prevention, 3(1–2), 5–10.
https://doi.org/10.1016/j.mhp.2015.03.001
Pombal, R., Peixoto, H., Lima, M. & Jorge, A. (2005). Permanent medical
disqualification in airline cabin crew: causes in 136 cases, 1993-2002. Aviation, Space
and Environmental Medicine, 76, 10, 981-984.
Robertson, M. F. & Ruiz, L. E. (2010). Perceptions of Stress among Collegiate Aviation
Flight Students Michael F. Robertson and Lorelei E. Ruiz Southern Illinois
University Carbondale. Collegiate Aviation Review, 28(1), 115–127.
Collegiate Aviation Review International
A publication of the University Aviation Association, © 2020 65
Robinson, O., Bond, R. & Rosier, J. (2015). The impact of stress on financial decision-making
varies as a function of depression and anxiety symptoms. Journal of Life and
Environmental Sciences, 12(3).
Sanderson, W., Di Nardo, P., Rapee, R. & Barlow, D. (1990). Syndrome comorbidity in patients
diagnosed with a DSM-III-R anxiety disorder. Journal of Abnormal Psychology, 99, 308–
312.
Salas, E., Driskell, J. E., & Hughes, S. (1996). Introduction: The study of stress and
human performance. In J. E. Driskell & E. Salas (Eds.), Stress and human
performance (pp. 1 – 45). Mahwah, NJ: Lawrence Erlbaum Associates.
Sexton, J. B., Thomas, E. J. & Helmreich, R. L. (2000). Error, stress, and teamwork in
medicine and aviation: cross sectional surveys. British Medical Journal,
320(7237), 745–749.
Stewart-Brown, S., Evans, J., Patterson, J., Peterson, S., Doll, H., Balding, J. & Regis, D.
(2000). The health of students in institutes of higher education: An important and
neglected public health problem? Journal of Public Health Medicine, 22, 492–499
Suedfeld, P. & Steel, G. D. (2000). The Environmental Psychology Of Capsule Habitats. Annual
Review of Psychology, 51, 227–253.
Telfer, R. & Biggs, J. (1988). The psychology of flight training. Ames, IA: Iowa State
University.
Zivin, K., Eisenberg, D., Gollust, S. E. & Golberstein, E. (2009). Persistence of mental health
problems and needs in a college student population. Journal of Affective Disorders,
117(3), 180–185. https://doi.org/10.1016/j.jad.2009.01.001
Jacobs et al.: Depression, Anxiety, and Stress in Collegiate Aviators
http://ojs.library.okstate.edu/osu/index.php/cari 66
APPENDIX
SURVEY INSTRUMENT
Q1 Please be advised: All responses to this survey are ANONYMOUS. There will be no way to
identify you. These results will be used strictly for research purposes. Please fill out the
questions below to the best of your ability. If at any time you do not wish to answer a question or
wish to discontinue taking the survey you have the right to do so. Thank you for your time.
Q2 Degree Program
Q3 Estimated date of graduation (Semester, Year):
Q4 Class Standing
Freshman (1), Sophomore (2), Junior (3), Senior (4), Graduate Student (5)
Q5 Are you a transfer student?
Yes (1), No (2)
Q6 Gender
Male (1), Female (2), Other (3)
Q7 Age
Q8 Have you or are you currently serving in the US Armed Forces?
Yes (1), No (2)
Q9 Relationship Status
Never Married (1), Separated (2), Divorced (3), Widowed (4), Married (5)
Q10 Do you have any children?
Yes (1), No (2)
Q11 Are you enrolled in a Collegiate Flight degree program?
Yes (1), No (2)
Skip To: Q13 If Are you enrolled in a Collegiate Flight degree program? = Yes
Skip To: Q16 If Are you enrolled in a Collegiate Flight degree program? = No
Q12 How many flight hours PER WEEK do you have?
Q13 What flight certificates/ratings do you have?
Private Pilot (27), Commercial (28), Instrument (29), Multi-engine (30), CFI (31), CFI-I (32)
Collegiate Aviation Review International
A publication of the University Aviation Association, © 2020 67
Q14 How many total flight hours do you have?
Q15 Are you a pilot (ie: hold any FAA airman certificate or rating)?
Yes (1), No (2)
Q16 If you are not enrolled in a Collegiate Flight major, are you currently taking flight lessons
with an FBO or any other type of flight training program?
Yes (1), No (2)
Please read each statement and circle a number 0, 1, 2 or 3 which indicates how much the
statement applied to you over the past week. There are no right or wrong answers. Do not spend
too much time on any statement.
The rating scale is as follows:
0 Did not apply to me at all
1 Applied to me to some degree, or some of the time
2 Applied to me to a considerable degree or a good part of the time
3 Applied to me very much or most of the time
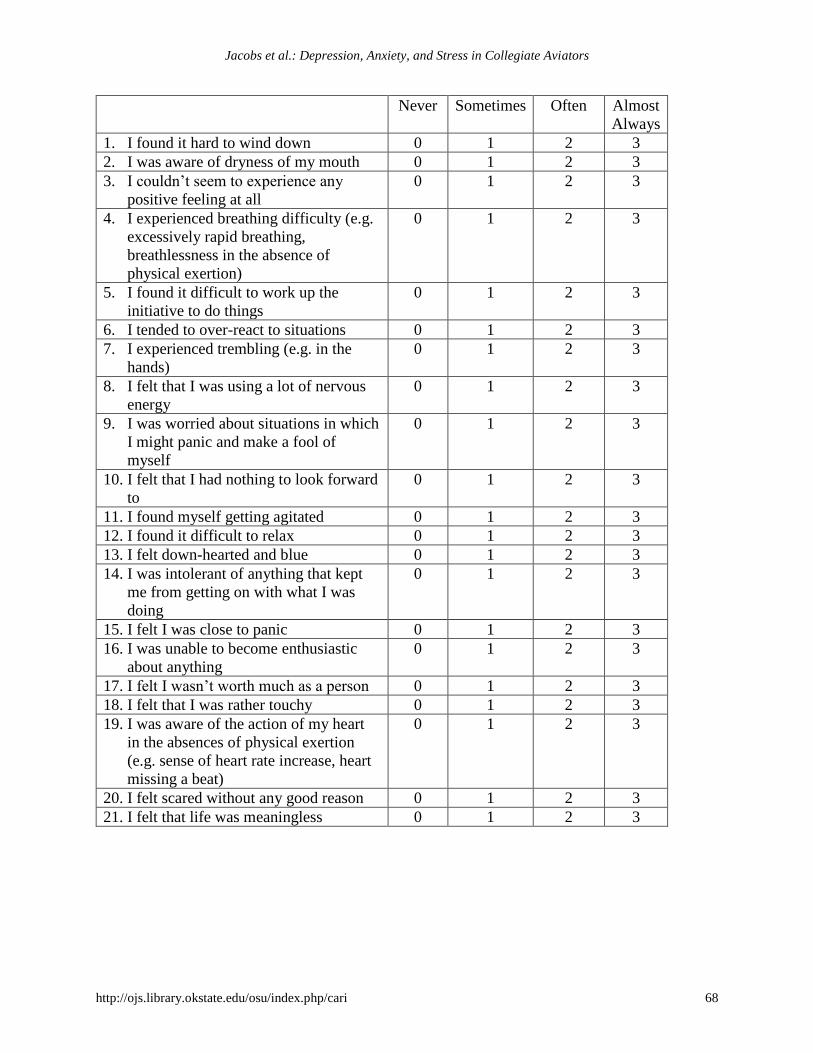
Jacobs et al.: Depression, Anxiety, and Stress in Collegiate Aviators
http://ojs.library.okstate.edu/osu/index.php/cari 68
Never Sometimes Often Almost
Always
1. I found it hard to wind down 0 1 2 3
2. I was aware of dryness of my mouth 0 1 2 3
3. I couldn’t seem to experience any
positive feeling at all
0 1 2 3
4. I experienced breathing difficulty (e.g.
excessively rapid breathing,
breathlessness in the absence of
physical exertion)
0 1 2 3
5. I found it difficult to work up the
initiative to do things
0 1 2 3
6. I tended to over-react to situations 0 1 2 3
7. I experienced trembling (e.g. in the
hands)
0 1 2 3
8. I felt that I was using a lot of nervous
energy
0 1 2 3
9. I was worried about situations in which
I might panic and make a fool of
myself
0 1 2 3
10. I felt that I had nothing to look forward
to
0 1 2 3
11. I found myself getting agitated 0 1 2 3
12. I found it difficult to relax 0 1 2 3
13. I felt down-hearted and blue 0 1 2 3
14. I was intolerant of anything that kept
me from getting on with what I was
doing
0 1 2 3
15. I felt I was close to panic 0 1 2 3
16. I was unable to become enthusiastic
about anything
0 1 2 3
17. I felt I wasn’t worth much as a person 0 1 2 3
18. I felt that I was rather touchy 0 1 2 3
19. I was aware of the action of my heart
in the absences of physical exertion
(e.g. sense of heart rate increase, heart
missing a beat)
0 1 2 3
20. I felt scared without any good reason 0 1 2 3
21. I felt that life was meaningless 0 1 2 3
A publication of the University Aviation Association, © 2020, ISSN: 1523-5955 69
Collegiate Aviation Review
International
Volume 38 | Issue 1 Peer-Reviewed Article #5
2-18-2020
How Weather, Terrain, Flight Time, and
Population Density Affect Consumer
Willingness to Fly in Autonomous Air
Taxis
Nadine K. Ragbir Elaine C. Choy
Embry-Riddle Aeronautical University Embry-Riddle Aeronautical University
Stephen Rice Mattie N. Milner
Embry-Riddle Aeronautical University Embry-Riddle Aeronautical University
Scott R. Winter
Embry-Riddle Aeronautical University
Background: Many studies have investigated passengers’ willingness to fly (WTF) or ride in autonomous aircraft
and vehicles. With the emergence of urban air mobility, it is important to consider consumer perceptions of
autonomous air taxis and passengers’ willingness to fly in various conditions. Therefore, the purpose of this study
was to determine what external factors may influence consumers’ willingness to fly on autonomous air taxis in
various weather conditions, terrain, flight time, and population densities. Methods: Across two studies, 782
participants were presented with a definition of autonomous air taxis. Then a hypothetical scenario involving an air
taxi that included four variables: rain versus no rain (Weather), 5-minute flight versus 30-minute flight (Flight
Time), over land or water (Terrain), and over urban or rural areas (Population Density). Results: The data from the
study suggest that both United States and Indian passengers were more willing to fly in good weather conditions
versus rainy weather, over land versus over water, and on short flights versus longer flights. Conclusions: As urban
air mobility becomes more well-known, it is important to understand consumer opinions and educate them on
emerging technology. This, in turn, can aid industries in developing marketing strategies to help increase awareness
of new technologies in the future.
Recommended Citation: Ragbir, N.K., Rice, S., Winter, S.R., Choy, E.C., & Milner, M.N. (2020). How Weather, Terrain, Flight Time, and
Population Density Affect Consumer Willingness to Fly in Autonomous Air Taxis. Collegiate Aviation
Review International, 38(1), 69-87. Retrieved from
http://ojs.library.okstate.edu/osu/index.php/CARI/article/view/7962/7350
Collegiate Aviation Review International
A publication of the University Aviation Association, © 2020 70
Prior research has extensively examined consumers’ perceptions and how certain
perceptions can influence their willingness to fly in autonomous vehicles (Asgari & Jin, 2019;
Haddad, Chaniotakis, Straubinger, Plötner, & Antoniou, 2020; Hughes, Rice, Trafimow, &
Clayton, 2009; Mehta, Rice, & Winter, 2014; Mehta, Rice, Winter, & Eudy, 2017; Ragbir,
Baugh, Rice, & Winter, 2018; Rice, Kraemer,Winter, Mehta, & Dunbar, 2014; Rice, Winter,
Mehta, & Ragbir, 2019; Rice & Winter, 2015). However, research on external factors and their
impact on the adoption of autonomous vehicles for urban air mobility (UAM) is limited. Traffic
congestion on the ground can be extremely high in many urban areas, and there is a lot of
airspaces available to alleviate this congestion. Since transportation is most effective when it can
assist the masses, it is important to know in what conditions consumers are most likely to adopt
and use UAM. Thus, the purpose of this study aims to determine consumers’ willingness to fly in
autonomous air taxis in varying weather, flight time, terrain, and population density conditions.
This study will also consider consumers’ cultural differences between India and the United
States and how that may affect individual responses to the adoption and use of UAM in varying
conditions.
Urban Air Mobility
Urban air mobility (UAM) refers to transportation systems, mainly within urban areas,
that move people by air (Thipphavong et al., 2018). This system is intended to reduce traffic
congestion by creating more avenues for public transportation. There are various barriers to the
successful implementation of UAM. First, the technology and infrastructure need to be reliable
and accessible to the public (Risen, 2018). For example, for an electric vehicle with vertical
takeoff and landing (VTOL), like a helicopter, to provide transportation in urban areas, it needs
to have a robust battery and designated landing pads. Another important barrier is the expense as
emerging technology and infrastructure are quite costly throughout the developmental process
(Risen, 2018). Therefore, it is imperative to optimize costs while upholding safety to create a
transportation system that can truly assist the public and reduce congestion.
Another important barrier to consider is the public’s likelihood of adoption of UAM.
Haddad et al. (2020) studied factors that can affect adoption, like the 1989 Technology
Acceptance Model by Davis, Bagozzi, and Warshaw. The results indicated that the key factors
associated with the adoption are safety, trip cost, trip duration, and service reliability. Analyses
of socio-demographic factors indicated that females were much less interested in UAM adoption
by expressing lower trust, lower perceived usefulness, and greater concerns for safety and
security (Haddad et al., 2020). Tackling these barriers is key for future researchers and designers,
as resolving them could lead to a higher potential for UAM adoption. While technology is
advancing for all autonomous vehicles, it is ideal that autonomous cars are available to the
masses first as this adoption and growing familiarity will assist with autonomous aircraft in the
future.
Ragbir et al.: How Weather, Terrain, Flight Time, & Population Density Affect Willingness to Fly in Autonomous Air Taxis
http://ojs.library.okstate.edu/osu/index.php/cari 71
Moreover, Unmanned Aerial Systems, or better known as drones, also play a role in
understanding the public’s adoption of autonomous technology. Drones do not have a human
pilot onboard; however, a pilot is operating the aircraft by remote control (Clothier, Greer, Greer,
& Mehta, 2015). As drones began to gain popularity, some citizens expressed apprehensions
regarding drone operations. One study explored a predictive approach to understand what factors
predicted an individual’s privacy concerns of drones (Marte et al., 2018). The results of the study
suggested that seven factors predicted these concerns, some of which was the importance of
privacy, attitudes towards drones, and safety in the neighborhood (Marte et al., 2018). The
Federal Aviation Administration issued new regulations beginning in 2020 regarding recreational
drone flying in the U.S. Some regulations include flying below 400 feet, not flying in controlled
airspaces such as around airports, and no flying in airspaces where a flight is prohibited (Federal
Aviation Administration [FAA], 2020).
Cultural Considerations
The study of human behavior is complex because there are so many variables and
influences involved. This study strives to further understand human behavior and decision-
making by accounting for nationality and perceptions of various flight conditions. Determining
how nationality can play a role typically involves cultural influences. Culture is difficult to
define because its influences on society and individuals are mostly invisible (Hofstede, 1984).
Helmreich defines culture as “shared norms, values, and practices associated with a nation,
organization, or profession” (2000, p. 134). It is extremely important to consider cultural
differences across nations because of the limits to generalizability. What may be common
practice or belief in one culture may even be unheard of in another culture. For example, an
individual’s willingness to trust others may be influenced by cultural background, and therefore,
cannot be generalized to individuals that do not share a similar culture (Hofstede, 1980).
In this study, the participants were either from the United States or Indian. Participants
from both countries are important to the aviation market because millions fly each year in India
and close to a billion fly in the United States (Carrerio, n.d.; Bureau of Transportation Statistics,
2019). One key cultural difference between these nations is the value of individualism in the
United States versus collectivism in India. Markus and Kitayama (1991) concluded that
collectivist cultures have an interdependent view of the self. Individuals are taught to trust
without question and to take others’ interests into higher regard than their own (Wu & Jang,
2008; Rice et al., 2014). Collectivist cultures also have a preference for a closely-knit social
framework, where individuals can rely on nurturing from relatives and others within the in-group
in exchange for unquestioning loyalty (Hofstede, 1980).
Conversely, individualistic cultures place preference for a more relaxed social
framework, where individuals care for themselves and their immediate families only (Hofstede,
1980, 1984). Those of individualistic cultures are also more autonomous and independent from
their in-groups, as they prioritize personal goals over group goals (Triandis, 2002). It is common
for individualists to behave based on their attitudes, as opposed to aligning behaviors to mimic
those of the in-groups.
Collegiate Aviation Review International
A publication of the University Aviation Association, © 2020 72
To further solidify the cultural differences between India and the United States, on
Hofstede’s Cultural Values by Nation Index comparing individualistic and collectivist
dimensions, India scored a 48 out of 100. This score indicates that culture is mainly collectivist
with some individualistic characteristics (Hofstede, 1980, 1984). The United States scored the
highest value at 91 out of 100, which suggests a strong individualistic culture. For this study, the
differences in cultures will play a role in the participant’s willingness to fly in autonomous
vehicles.
Willingness to Fly on Autonomous Aircraft
Automation is the capability for technology to select data, transform information, make
decisions, and control processes (Hughes et al., 2009). To improve human performance,
automation is commonly utilized in the field of aviation, which includes aircraft take off,
piloting, and landing. An autonomous aircraft does not require a pilot and can fulfill all operation
procedures required to fly an aircraft safely such as interaction with air traffic controllers and
national airspace (Ragbir et al., 2018). On the other hand, drones or unmanned aerial systems are
operated by a pilot who is controlling the aircraft through a remote control device, though one
similarity between autonomous aircrafts and drones is there is no human pilot directly onboard
the aircraft.
However, the successful adoption of automation in commercial aircraft relies heavily on
consumer opinions. These opinions pertained to risk, knowledge, price, trust, and reliability
(Hughes et al., 2009). Pilots must be comfortable working with associated risks and be
knowledgeable with more complex technologies should problems arise. Passengers prefer that
the price is affordable, but not so inexpensive that quality is compromised. Lastly, both pilots
and passengers need to be able to trust the automation to work reliably. While these opinions
may seem reasonable and workable, it is not uncommon for individuals to exercise the affect
heuristic, which is unconsciously and immediately assessing an object as good or bad based on
feeling, regardless of actual risk or benefit (Hughes et al., 2009). In a 2009 study by Hughes and
colleagues, participants almost always preferred the human pilot over the automated pilot, both
functioning at 99% reliability when accounting for the price, trust, confidence and emergency.
Therefore, it is likely that automation technology needs to overachieve in commonly used areas
to combat negative affect heuristic and improve consumer opinions.
In addition to ensuring overachievement, it is important to develop familiarity either by
interactions, experiences, or pure learning because trust is developed “within the set of
familiarity” (Mehta, Rice, & Winter, 2014). For example, consumers are very trusting in the use
of cruise control because they are familiar with the functional parameters from experience. In a
2014 study by Mehta and colleagues, participants, varying from novice to expert in aviation,
ranked their familiarity and reliability with numerous automated aircraft devices (e.g., airspeed
indicator, autopilot, anti-ice controls, etc.). The results indicated a strong correlation between
familiarity with device and perceived reliability (Mehta et al., 2014). Even though the average
consumer will have minimal aviation experience, it is worth developing familiarity through in-
flight pamphlets and other learning materials. Repeated exposure will help consumers develop
more trust in automation.
Ragbir et al.: How Weather, Terrain, Flight Time, & Population Density Affect Willingness to Fly in Autonomous Air Taxis
http://ojs.library.okstate.edu/osu/index.php/cari 73
When striving towards more exposure and familiarity, it is important to know the
consumer, as well, and be able to account for cultural norms. In a 2014 study by Rice and
colleagues, results indicated that Indians and participants from the U.S. were more comfortable,
trusting, and willing to fly with a human pilot than an automated aircraft. However, Indian
participants were more forgiving when it came to automated and remote-controlled (RC)
aircrafts in comfort, trust, and willingness than American participants (Rice et al., 2014). These
results are further supported in a study by Ragbir et al. (2018) where willingness to fly in an
autonomous aircraft accounted for nationality, weather, wind, and distance. Across the board,
Indians were much more willing to fly in an autonomous aircraft, as almost every American
participant responded negatively across all conditions. These results are likely due to differences
in societal norms rooted in collectivism or individualism of Indians and Americans, respectively.
It is uncommon within collective cultures, like Indians, to challenge the status quo or push
boundaries. Therefore, to conform with others, Indian participants are likely to be moderates, as
opposed to extremists.
Winter et al. (2015) expanded on the research by focusing on cockpit configurations (e.g.,
one or two pilots onboard and/or one or two pilots in a remote-control ground station with no
autonomy). Both Indian and participants from the U.S preferred having a traditional cockpit,
where both pilots are onboard. However, both groups of participants were slightly more in favor
of the aircraft that were operated by remote-control to delivered cargo, as opposed to passengers
(Winter et al., 2015). While the preference was not significant, this could be a starting point to
teach the usefulness and reliability of automation in aviation. In 2017, a study by Mehta and
colleagues expanded on cockpit configurations to account for gender. Indian male participants
were less willing to fly when two female pilots were onboard, but still preferred all human pilot
configurations over autopilot. Even though Indian participants are generally more in favor of
automation in aviation than Americans, it is still important to properly familiarize Indians and
Americans with the technology, likely with different learning methodologies, so that they are
informed consumers.
While there may be cultural perspective differences in the use of automation in aviation,
there are emotions that are more congruent across all individuals and less dependent on culture.
In 2015, Rice and Winter conducted a study utilizing emotions as a mediator for pilot
configurations and the willingness to fly. All participants in the study experienced more
negatively associated emotions when presented with autopilot configurations, including anger,
disgust, fear, sadness, and surprise. The only clear positive emotion, happiness, was expressed
significantly in favor of human pilots. There was also a correlation between emotions and the
willingness to fly. Participants that expressed a negative affect for autopilot were not willing to
fly, whereas participants that had expressed a positive affect for human pilots were also more
willing to fly (Rice & Winter, 2015). These correlated emotions are also consistent with Rice,
Winter, Deaton, and Cremer (2016) regarding system-wide trust (SWT) loss. Participants that
were more likely to feel negative about aircraft automation failures (e.g., unnecessary deployed
oxygen masks) also lost trust in the other automated systems that did not fail (e.g., autopilot
system, landing gear, seat video monitor). While SWT loss and negative perceptions are likely to
be consistently correlated, it is important to address and reassure consumers that not all
components within the aircraft are entirely linked or interconnected. As mentioned previously,
Collegiate Aviation Review International
A publication of the University Aviation Association, © 2020 74
familiarity and experience with autonomous aviation and its processes can assist with building
and earning trust.
While there may be disparities in willingness to fly in autonomous aircraft, consumers do
acknowledge the advantages, as well. In the qualitative portion of Ragbir and colleague’s (2018)
study, participants mentioned that autonomous aircrafts would have less human error as there are
no emotions involved. Participants also mentioned that the autopilot would not fatigue like a
human pilot, and there may be cheaper flight costs (Ragbir et al., 2018). Individuals who buy
into the advantages of autonomous aircrafts would likely be more willing to fly in the future.
Rice et al. (2019) conducted a study to determine if there are predictors of individuals who are
more willing to fly and may be early adopters to the technology. The seven significant predictors
were familiarity, fun factor, wariness of new technology, fear, happiness, age, and education
level. It is reasonable that individuals with more knowledge in aviation and autonomous
technology are more willing to fly as the opportunities become available. Those same individuals
may feel happiness or perceive emerging technology as fun since they have a better idea of how
aircraft worked traditionally (Rice et al., 2019). It is important not only to identify these
individuals that are more likely to support and be willing to fly in autonomous aircraft but also to
consider their input on improvements to better the technology for the masses.
Willingness to Ride in Autonomous Cars
Similar to aviation, autonomous technology intends to reduce human error and fatigue
when in an automotive vehicle. However, differing media portrayals can have an impact on the
potential consumers’ perspectives on willingness to ride. Anania et al. (2018) conducted a study
determining the effects of information regarding driverless vehicles and whether nationality or
gender can affect the consumer’s willingness to ride. Firstly, there were correlations where
individuals were more willing to ride after hearing positive information and less willing to ride
after hearing negative information. These results made clear the importance of seeking
information from various sources to get a better understanding of the technology and a more
accurate perspective of advantages and disadvantages to autonomous cars. Similar to findings
within autonomous aircraft, Indian participants were also more willing to ride in driverless cars
than American participants. Gender had less consistent correlations as Indian females reported
the highest willingness to ride scores, but American females reported the lowest willingness to
ride scores (Anania et al., 2018).
Further research by Rice and Winter (2019) demonstrated that females were less willing
to ride compared to males, and that effect was mostly mediated by fear and anger. These
emotional responses may be due to perceptions of complexity in the technology, a lack of fun
factor, and less familiarity with technology. The study results also demonstrated a significant
effect for age, where older participants were less willing to ride compared to younger
participants. These results supported previous findings by Winter and colleagues in 2018. They
had applied an affective perspective to consumer use of driverless ambulances. Both genders
preferred having a human as the driver of an emergency medical service vehicle (Winter et al.,
2018). Similar to results by Rice and Winter (2019), females were less willing to ride in
driverless ambulances, and this result was mostly mediated by anger.
Ragbir et al.: How Weather, Terrain, Flight Time, & Population Density Affect Willingness to Fly in Autonomous Air Taxis
http://ojs.library.okstate.edu/osu/index.php/cari 75
Similar to literature from autonomous aircraft, there will always be consumers that are
not willing to ride in driverless cars. However, as technology continues to advance and become
more accessible, it is important to identify those who are willing to ride and become early
adopters. A study by Asgari and Jin (2019) utilized attitudinal factors as mediators for consumers
who are willing to adopt or pay for autonomous vehicles. The four most prominent factors were
the joy of driving, mode choice reasoning, trust, and technology savviness (Asgari & Jin, 2019).
Participants that enjoyed driving were less willing to adopt and pay for autonomous vehicles.
However, participants that were technologically savvy were much more willing to adopt the use
of autonomous vehicles. Mode choice reasoning referred to individuals that factored in the costs
and benefits of a driverless vehicle, and were only willing to pay for automated features if it
would save time and cost, be more convenient, reduce stress, improve quality of life, or produce
some other benefit (Asgari & Jin, 2019). Lastly, individuals with low trust were more likely to
pay for automated features as they would provide more privacy and protection compared to
public transit or other shared mobility options (Asgari & Jin, 2019). Knowing where consumers
are hesitant or excited about autonomous vehicles is one of the best courses of action toward
developing technology that can be utilized by the masses.
Current Study
Prior research has shown that consumers are more willing to fly in vehicles that are
manned by humans versus fully autonomous vehicles (Anania et al., 2018; Hughes et al., 2009;
Mehta et al., 2014; Rice et al., 2014; Rice et al., 2019; Rice & Winter, 2015; Winter et al., 2015).
However, there are emerging consumers that are willing to be early adopters of autonomous
vehicles, and they share similar interests and factors. Indian consumers tend to be more willing
to fly or ride on autonomous vehicles than American consumers (Rice et al., 2014). Familiarity
with technology and emotions are also mediators for consumers interested and willing to fly or
ride in autonomous aircraft or vehicles (Mehta et al., 2014; Rice & Winter, 2015; Rice & Winter,
2019). This study will expand on previous research by determining which external factors may
affect consumers in their willingness to fly in an autonomous aircraft designed for UAM in
various weather, flight time, and environmental conditions. The following research question
drove this study:
RQ: Do weather, terrain, flight time, and population density affect consumer willingness
to fly in autonomous air taxis?
We hypothesized the following:
Ha1: Participants would be more willing to fly in an air taxi in good weather versus rainy
weather.
Ha2: Participants would be more willing to fly in an air taxi over dry land versus over
water.
Ha3: Participants would be more willing to fly in an air taxi for shorter flights versus
longer flights.
Ha4: Participants would be more willing to fly in an air taxi over rural areas versus urban
areas.
Collegiate Aviation Review International
A publication of the University Aviation Association, © 2020 76
Study 1 – Methods
Study 1 investigated which external factors may affect consumers in their willingness to
fly in an autonomous aircraft designed for UAM in various weather, flight time, and
environmental conditions. Study 1 used American participants only. Both studies utilized a
within-participants experimental design where all participants were responding to all conditions.
Each participant was presented with a randomly ordered set of scenarios to avoid order effects.
Participants
Four hundred and ninety-six (261 females) people took part in the study. All participants
were located in the United States. The mean age was 37.77 years old (SD = 11.54). Participants
were recruited from Amazon’s Mechanical Turk, which is an online portal where participants
receive monetary compensation for completing human intelligence tasks. Data from this site
have been shown to have high reliability, similar to what is found in experimental labs
(Buhrmester, Kwang, & Gosling, 2011; Germine et al., 2012; Rice, Winter, Doherty & Milner,
2017).
Materials and Stimuli and Procedure
Participants first read and signed an electronic informed consent, and then, they were
given instructions. Participants were presented with a definition of autonomous air taxis, and
followed by a hypothetical scenario involving an air taxi. Specifically, they were told:
Imagine a situation where you have no other option of getting across a major city except
to ride in an autonomous air taxi. This aircraft has no human pilot and is fully
automated. There are no flight controls, and no way for anyone inside to take over
control.
Afterward, they were asked how willing or unwilling they would be to ride in the air taxi
under a variety of conditions that were divided into four experimental independent variables: rain
versus no rain (Weather), 5-minute flight versus 30-minute flight (Flight Time), over land or
water (Terrain), and over urban or rural terrain (Population Density). Each of these conditions
was crossed with all other conditions for a total of 16 conditions. Participants responded to the
willingness to fly scale (WTF) (Rice et al., 2020) with seven possible responses from extremely
unwilling to fly (-3) to extremely willing to fly (+3) with a zero neutral option. A description of
the scale can be found in Appendix A.
They were then asked basic demographics questions and allowed to elaborate, if they
wished, with open-ended questions. Finally, participants were debriefed, compensated, and
dismissed.
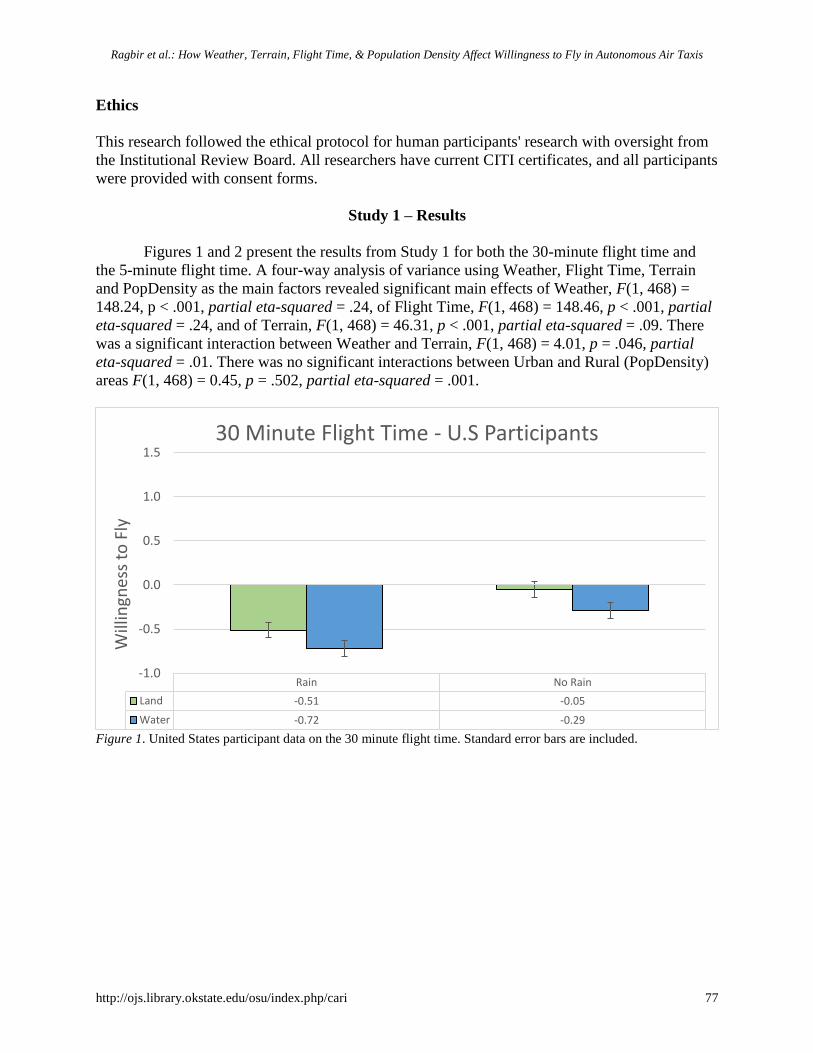
Ragbir et al.: How Weather, Terrain, Flight Time, & Population Density Affect Willingness to Fly in Autonomous Air Taxis
http://ojs.library.okstate.edu/osu/index.php/cari 77
Ethics
This research followed the ethical protocol for human participants' research with oversight from
the Institutional Review Board. All researchers have current CITI certificates, and all participants
were provided with consent forms.
Study 1 – Results
Figures 1 and 2 present the results from Study 1 for both the 30-minute flight time and
the 5-minute flight time. A four-way analysis of variance using Weather, Flight Time, Terrain
and PopDensity as the main factors revealed significant main effects of Weather, F(1, 468) =
148.24, p < .001, partial eta-squared = .24, of Flight Time, F(1, 468) = 148.46, p < .001, partial
eta-squared = .24, and of Terrain, F(1, 468) = 46.31, p < .001, partial eta-squared = .09. There
was a significant interaction between Weather and Terrain, F(1, 468) = 4.01, p = .046, partial
eta-squared = .01. There was no significant interactions between Urban and Rural (PopDensity)
areas F(1, 468) = 0.45, p = .502, partial eta-squared = .001.
Figure 1. United States participant data on the 30 minute flight time. Standard error bars are included.
Rain No Rain
Land -0.51 -0.05
Water -0.72 -0.29
-1.0
-0.5
0.0
0.5
1.0
1.5
Will
ingn
ess
to F
ly
30 Minute Flight Time - U.S Participants
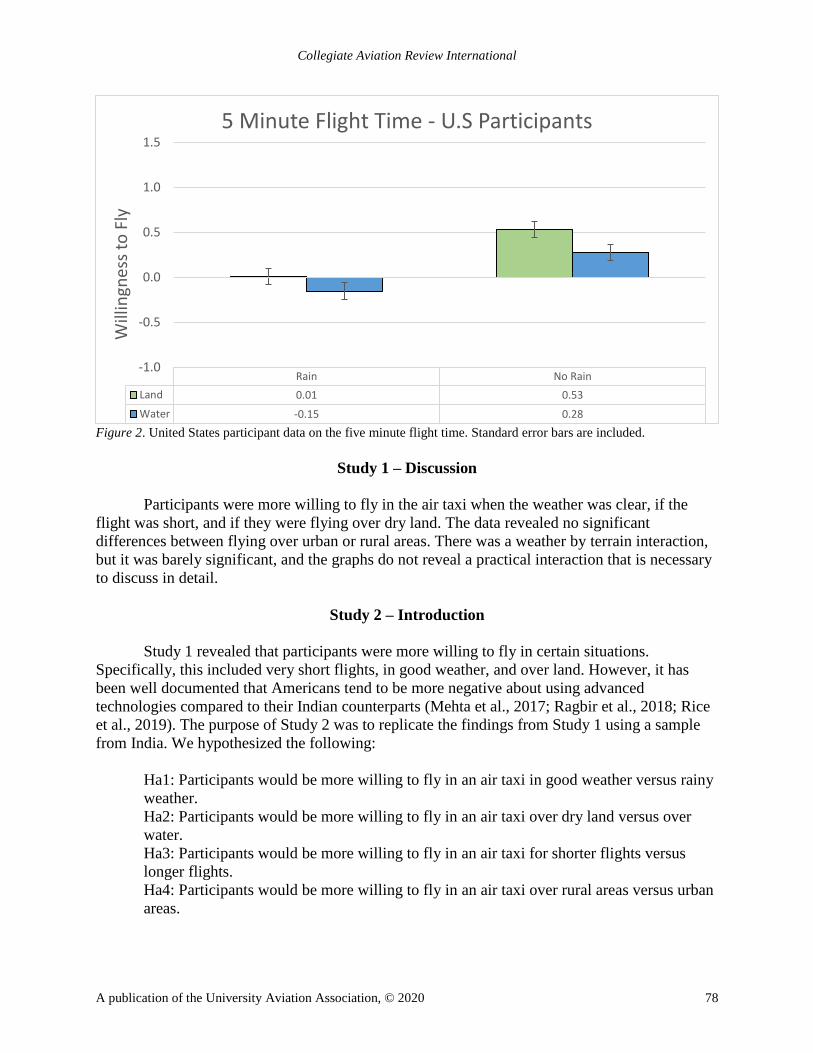
Collegiate Aviation Review International
A publication of the University Aviation Association, © 2020 78
Figure 2. United States participant data on the five minute flight time. Standard error bars are included.
Study 1 – Discussion
Participants were more willing to fly in the air taxi when the weather was clear, if the
flight was short, and if they were flying over dry land. The data revealed no significant
differences between flying over urban or rural areas. There was a weather by terrain interaction,
but it was barely significant, and the graphs do not reveal a practical interaction that is necessary
to discuss in detail.
Study 2 – Introduction
Study 1 revealed that participants were more willing to fly in certain situations.
Specifically, this included very short flights, in good weather, and over land. However, it has
been well documented that Americans tend to be more negative about using advanced
technologies compared to their Indian counterparts (Mehta et al., 2017; Ragbir et al., 2018; Rice
et al., 2019). The purpose of Study 2 was to replicate the findings from Study 1 using a sample
from India. We hypothesized the following:
Ha1: Participants would be more willing to fly in an air taxi in good weather versus rainy
weather.
Ha2: Participants would be more willing to fly in an air taxi over dry land versus over
water.
Ha3: Participants would be more willing to fly in an air taxi for shorter flights versus
longer flights.
Ha4: Participants would be more willing to fly in an air taxi over rural areas versus urban
areas.
Rain No Rain
Land 0.01 0.53
Water -0.15 0.28
-1.0
-0.5
0.0
0.5
1.0
1.5
Will
ingn
ess
to F
ly5 Minute Flight Time - U.S Participants
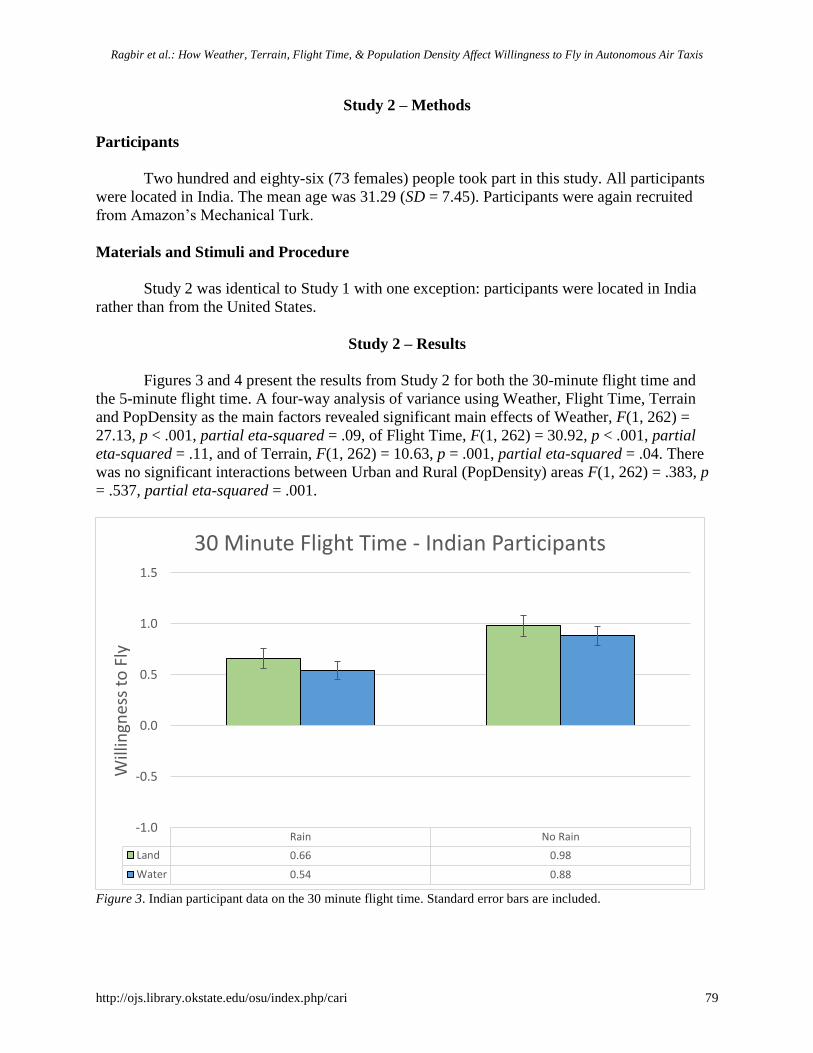
Ragbir et al.: How Weather, Terrain, Flight Time, & Population Density Affect Willingness to Fly in Autonomous Air Taxis
http://ojs.library.okstate.edu/osu/index.php/cari 79
Study 2 – Methods
Participants
Two hundred and eighty-six (73 females) people took part in this study. All participants
were located in India. The mean age was 31.29 (SD = 7.45). Participants were again recruited
from Amazon’s Mechanical Turk.
Materials and Stimuli and Procedure
Study 2 was identical to Study 1 with one exception: participants were located in India
rather than from the United States.
Study 2 – Results
Figures 3 and 4 present the results from Study 2 for both the 30-minute flight time and
the 5-minute flight time. A four-way analysis of variance using Weather, Flight Time, Terrain
and PopDensity as the main factors revealed significant main effects of Weather, F(1, 262) =
27.13, p < .001, partial eta-squared = .09, of Flight Time, F(1, 262) = 30.92, p < .001, partial
eta-squared = .11, and of Terrain, F(1, 262) = 10.63, p = .001, partial eta-squared = .04. There
was no significant interactions between Urban and Rural (PopDensity) areas F(1, 262) = .383, p
= .537, partial eta-squared = .001.
Figure 3. Indian participant data on the 30 minute flight time. Standard error bars are included.
Rain No Rain
Land 0.66 0.98
Water 0.54 0.88
-1.0
-0.5
0.0
0.5
1.0
1.5
Will
ingn
ess
to F
ly
30 Minute Flight Time - Indian Participants
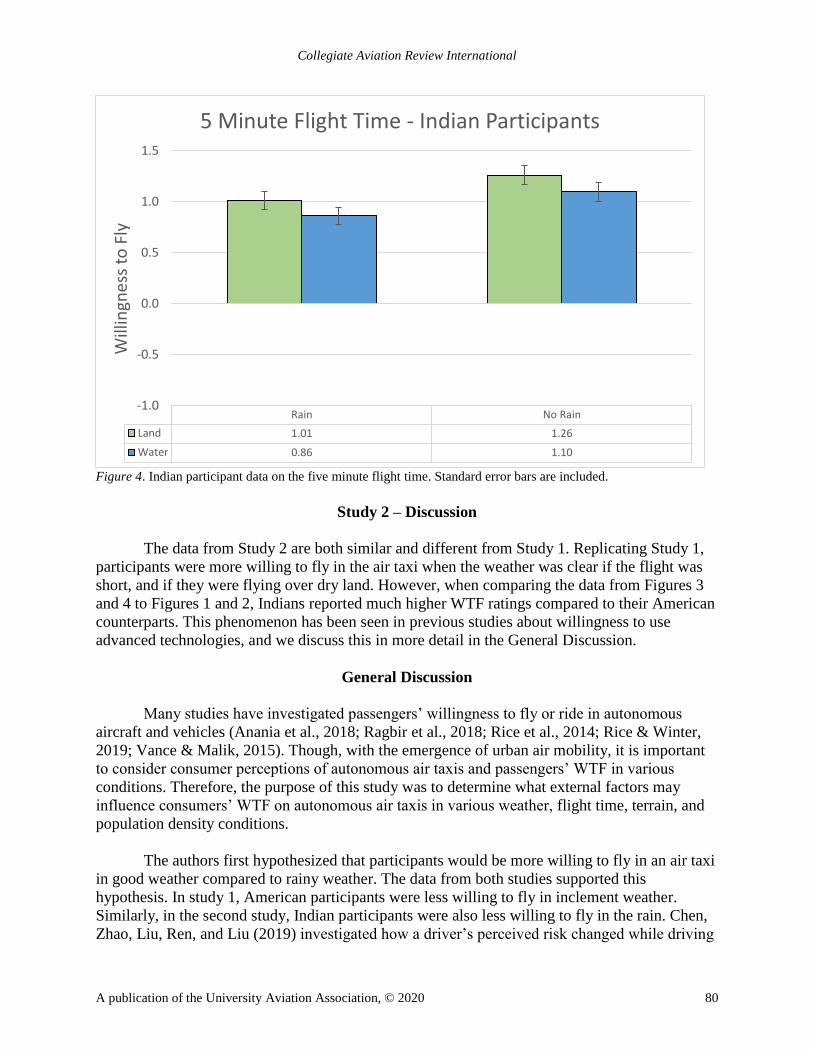
Collegiate Aviation Review International
A publication of the University Aviation Association, © 2020 80
Figure 4. Indian participant data on the five minute flight time. Standard error bars are included.
Study 2 – Discussion
The data from Study 2 are both similar and different from Study 1. Replicating Study 1,
participants were more willing to fly in the air taxi when the weather was clear if the flight was
short, and if they were flying over dry land. However, when comparing the data from Figures 3
and 4 to Figures 1 and 2, Indians reported much higher WTF ratings compared to their American
counterparts. This phenomenon has been seen in previous studies about willingness to use
advanced technologies, and we discuss this in more detail in the General Discussion.
General Discussion
Many studies have investigated passengers’ willingness to fly or ride in autonomous
aircraft and vehicles (Anania et al., 2018; Ragbir et al., 2018; Rice et al., 2014; Rice & Winter,
2019; Vance & Malik, 2015). Though, with the emergence of urban air mobility, it is important
to consider consumer perceptions of autonomous air taxis and passengers’ WTF in various
conditions. Therefore, the purpose of this study was to determine what external factors may
influence consumers’ WTF on autonomous air taxis in various weather, flight time, terrain, and
population density conditions.
The authors first hypothesized that participants would be more willing to fly in an air taxi
in good weather compared to rainy weather. The data from both studies supported this
hypothesis. In study 1, American participants were less willing to fly in inclement weather.
Similarly, in the second study, Indian participants were also less willing to fly in the rain. Chen,
Zhao, Liu, Ren, and Liu (2019) investigated how a driver’s perceived risk changed while driving
Rain No Rain
Land 1.01 1.26
Water 0.86 1.10
-1.0
-0.5
0.0
0.5
1.0
1.5
Will
ingn
ess
to F
ly5 Minute Flight Time - Indian Participants
Ragbir et al.: How Weather, Terrain, Flight Time, & Population Density Affect Willingness to Fly in Autonomous Air Taxis
http://ojs.library.okstate.edu/osu/index.php/cari 81
a car under different adverse weather conditions by using a driving simulation. The authors
highlighted that a driver’s perceived risk was highest during rainy and heavy fog conditions. This
uncertainty of risk could potentially transfer to aircraft, as well as autonomous systems. Another
recent study found that both participants from the U.S and India were less willing to fly in
autonomous aircraft if it was raining. The results also showed a significant difference in Indian
participants displaying a more willingness to fly in autonomous aircrafts overall (Ragbir et al.,
2018).
The second hypothesis stated that participants would be more willing to fly in an air taxi
for short amounts of time compared to long amounts of time. The data from both studies
supported the hypothesis. In study 1, Americans participants were more willing to fly in the
autonomous air taxi for five minutes as opposed to 30 minutes. In study 2, Indian participants
displayed analogous results, illustrating more positivity towards flying for five minutes in the air
taxi rather than 30 minutes. One possibility for these results could be the consumers’ familiarity
with the development of urban air mobility, and in turn, autonomous air taxis. Passengers can
have the perception that the longer lengths of time traveling in new modes of transportation
could offer more possibilities for issues.
The third hypothesis stated that participants would be more willing to fly in an air taxi
over dry land compared to over water. The data from both studies supported this hypothesis. In
study 1, American participants were more willing to fly over land than water. In study 2, Indian
participants reflected the same attitudes. Perhaps, participants felt flying over water would result
in the additional danger of drowning if the vehicle was unable to land safely. Another possible
reason for these results could be access to emergency response resources if a vehicle were to go
down on land as opposed to water.
The final hypothesis stated that participants would be more willing to fly in an air taxi
over rural areas compared to over urban areas. The data from both studies showed that
population density was not a factor. In study 1, there was no significant difference between
flying over rural or urban areas for American participates. Similarly, in study 2, there was no
significant difference in population densities for Indian participants.
Lastly, we note that there may be some differences between Indians and Americans. Prior
research has shown that Indians tend to be more accepting of new technologies compared to their
American counterparts, and this data certainly does not dispel that notion. However, the authors
did not conduct statistical analyses on these differences because they are not confident that they
have captured identical samples from each country that would be conducive to making this
comparison. The participants from the United States are probably closer to the average
American, while the participants from India are probably more educated and wealthy than the
average Indian. Having access to the internet and being able to work online via MTurk is
probably more of a luxury reserved for the higher class in India. Thus, we worry that we might
be comparing a smaller subset of the Indian population to a more general subset of United States
participants.
Collegiate Aviation Review International
A publication of the University Aviation Association, © 2020 82
Practical Applications
The findings from the study provide some meaningful, practical applications, especially
as aerial taxi manufacturers and companies continue extensive development of vehicles
intending to deploy urban air mobility devices within the next few years. First, the data indicate
that passengers are more willing to fly when the weather is good. This finding is important, but it
also presents some challenges. While the finding that passengers are more willing to fly in good
weather is perhaps intuitive, for air taxi operations to be successful, there will likely need to
maintain a level of reliability equal to or better than traditional ground-based vehicle, such as a
car. If aerial taxi flights have to cancel frequently for the weather, this could deter passengers
from seeking to use this service.
Another practical outcome of the study relates to the routing of flights. Passengers
indicated greater willingness to be over dry land as opposed to water. This factor could present
some challenges, as some initial discussions related to urban air mobility routings have
considered taking flights over waterways to avoid the congestion of downtown metropolitan
areas as well as noise abatement concerns. While passengers may be willing to fly over lakes or
ponds, flights over extended waterways may be a deterrent to some passengers. As a result,
operators should give consideration not only to the most logical flight path routings of these
initial flights, but also the concerns of the passengers who will be flying onboard.
Limitations
Some limitations bound the current studies. First, a convenience sample was used, which
provides restrictions on the generalizability of the findings. The sample was drawn from an
online repository of participants, Amazon’s MTurk, and it was limited to only two countries.
Data for the study was conducted cross-sectionally so the findings indicate consumer preference
at one point in time. As additional testing continues and becomes more common, it is possible,
and likely, that consumers’ views will shift based on the outcomes of these trials.
Conclusion
The purpose of this study was to determine what external factors may influence
consumers’ WTF on autonomous air taxis in various weather, flight time, terrain, and population
density conditions. The data from the study suggested that both American and Indian passengers
were more willing to fly in good weather conditions (i.e., no rain, no wind), over land, and on
short flights consisting of about five minutes. The results of the study also suggest that Indian
and American participants were not concerned if they were flying over rural or urban areas. As
urban air mobility becomes more well-known, with several years of a solid safety record, it could
be possible that passengers may become more willing to fly in adverse conditions. These results
are valuable in understanding how to reach consumers and educate them on emerging
technology. This, in turn, can aid industries in developing marketing strategies to help increase
awareness of new technologies in the future.
Ragbir et al.: How Weather, Terrain, Flight Time, & Population Density Affect Willingness to Fly in Autonomous Air Taxis
http://ojs.library.okstate.edu/osu/index.php/cari 83
Future Research
As revealed, several studies have explored differences between participants from the
United States and India and their willingness to fly in autonomous aircraft. Prior research has
also captured their attitudes regarding new technology. Future studies should identify whether
these differences are reflected in autonomous air taxis as well. Other studies could potentially
investigate whether age, income, and residence influence the results from participants in the U.S.
Also, many countries have expressed an interest or are actively engaging in urban air mobility
testing, future research should expand the sample from this study to see if the findings replicate
across broader populations. Therefore, conducting frequent replication studies over time will
provide valuable insights into the trends of consumer willingness to fly onboard urban air
mobility devices.
Collegiate Aviation Review International
A publication of the University Aviation Association, © 2020 84
References
Anania, E. C., Rice, S., Walters, N. W., Pierce, M., Winter, S. R., & Milner, M. N. (2018). The
effects of positive and negative information on consumers’ willingness to ride in a
driverless vehicle. Transport Policy, 72, (218-224).
Asgari, H., & Jin, X. (2019). Incorporating attitudinal factors to examine adoption of and
willingness to pay for autonomous vehicles. Transportation Research Record, 2673(8),
418-429.
Buhrmester, M., Kwang, T., & Gosling, S. D. (2011). Amazon's Mechanical Turk: A new source
of inexpensive, yet high-quality data? Perspectives on Psychological Science, 6(3), 3-5.
Bureau of Transportation Statistics. (2019). 2018 traffic data for U.S. airlines and foreign airlines
U.S. flights: Passengers on U.S. and foreign airlines. Retrieved from
https://www.bts.dot.gov/newsroom/2018-traffic-data-us-airlines-and-foreign-airlines-us-
flights
Carrerio, H., (n.d.). About airlines in India. Retrieved from: http://traveltips.usatoday.
com/airlines-india-17997.html.
Chen, C., Zhao, X., Liu, H., Ren, G., & Liu, X. (2019). Influence of adverse weather on drivers’
perceived risk during car following based on driving simulations. Journal of Modern
Transportation, 27(4), 282-292. doi:10.1007/s40534-019-00197-4
Clothier, R. A., Greer, D. A., Greer, D. G., & Mehta, A. M. (2015). Risk perception and the
public acceptance of drones. Risk analysis, 35(6), 1167-1183.
Davis, F. D., Bagozzi, R. P., & Warshaw, P. R. (1989). User acceptance of computer technology:
A comparison of two theoretical models. Management Science, 35(8), 903-1028.
Federal Aviation Administration (FAA). (2020). Unmanned aircraft systems: recreational flyers
& modeler community-based organizations. Retrieved from
https://www.faa.gov/uas/recreational_fliers/
Germine, L., Nakayama, K., Duchaine, B.C., Chabris, C.F., Chatterjee, G., & Wilmer, J.B.
(2012). Is the web as good as the lab? Comparable performance from web and lab in
cognitive/perceptual experiments. Psychonomic Bulletin & Review, 19(5), 847-857.
Haddad, C. A., Chaniotakis, E., Straubinger, A., Plötner, K., & Antoniou, C. (2020). Factors
affecting the adoption and use of urban air mobility. Transportation Research, 132, 696-
712.
Helmreich, R. L. (2000). Culture and error in space: Implications from analog environments.
Aviation, Space, and Environmental Medicine, 71(9-11), 133-139.
Ragbir et al.: How Weather, Terrain, Flight Time, & Population Density Affect Willingness to Fly in Autonomous Air Taxis
http://ojs.library.okstate.edu/osu/index.php/cari 85
Hofstede, G. (1980). Motivation, leadership, and organization: Do American theories apply
abroad? Organizational Dynamics, 9(1), 42-63.
Hofstede, G. (1984). Culture’s consequences. Newbury Park, CA: SAGE.
Hughes, J. S., Rice, S., Trafimow, D., & Clayton, K. (2009). The automated cockpit: A
comparison of attitudes towards human and automated pilots. Transportation Research,
12, 428-439.
Markus, H. R., & Kitayama, S. (1991). Culture and the self: Implications for cognition, emotion,
and motivation. Psychological Review, 98, 224–253.
Marte, D. A., Anania, E. C., Rice, S., Mehta, R., Milner, M. N., Winter, S. R., Walters, N.,
Capps, J., & Ragbir, N. (2018). What type of person supports 24/7 police drones over
neighborhoods? A regression analysis. Journal of Unmanned Aerial Systems, 4(1), 61-70.
Mehta, R., Rice, S., & Winter, S. R. (2014). Examining the relationship between familiarity and
reliability of automation in the cockpit. Collegiate Aviation Review, 32(2). Retrieved
from https://commons.erau.edu/publication/1070
Mehta, R., Rice, S., Winter, S. R., & Eudy, M. (2017). Perceptions of cockpit configurations: A
culture and gender analysis. The International Journal of Aerospace Psychology, 27(1-2),
57-63.
Ragbir, N. K., Baugh, B. S., Rice, S., & Winter, S. R. (2018). How nationality, weather, wind,
and distance affect consumer willingness to fly in autonomous airplanes. Journal of
Aviation Technology and Engineering, 8(1), 2-10.
Rice, S., Kraemer, K., Winter, S. R., Mehta, R., & Dunbar, V. (2014). Passengers from India and
the United States have differential opinions about autonomous auto-pilots for commercial
flights. International Journal of Aviation, Aeronautics, and Aerospace, 1(1), 1-13.
Rice, S., Mehta, R., Dunbar, V., Oyman, K., Ghosal, S., Oni, M. D., & Oni, M. A. (2015,
January). A valid and reliable scale for consumer willingness to fly. In Proceedings of the
2015 Aviation, Aeronautics, and Aerospace International Research Conference (pp. 15-
18).
Rice, S., & Winter, S. R. (2015). Which passenger emotions mediate the relationship between
type of pilot configuration and willingness to fly in commercial aviation? Aviation
Psychology and Applied Human Factors, 5(2), 83-92.
Rice, S., Winter, S. R., Deaton, J. E., & Cremer, I. (2016). What are predictors of system-wide
trust loss in transportation automation? Journal of Aviation Technology and Engineering,
6(1), 1-8.
Collegiate Aviation Review International
A publication of the University Aviation Association, © 2020 86
Rice, S., Winter, S. R., Doherty, S., & Milner, M. N. (2017). Advantages and disadvantages of
using internet-based survey methods in aviation-related research. Journal of Aviation
Technology and Engineering, 7(1), 58-65. DOI: https://doi.org/10.15394/ijaaa.2014.1004
Rice, S., & Winter, S. R. (2019). Do gender and age affect willingness to ride in driverless
vehicles: If so, then why? Technology in Society, 58, 101145.
doi:10.1016/j.techsoc.2019.101145
Rice, S., Winter, S. R., Mehta, R., & Ragbir, N. K. (2019). What factors predict the type of
person who is willing to fly in an autonomous commercial airplane? Journal of Air
Transport Management, 75, 131-138.
Rice, S., Winter, S. R., Capps, J., Trombley, J., Robbins, J., Milner, M., & Lamb, T. L. (2020).
Creation of two valid scales: Willingness to fly in an aircraft and willingness to pilot an
aircraft. International Journal of Aviation, Aeronautics, and Aerospace, 7(1). Retrieved
from https://commons.erau.edu/ijaaa/vol7/iss1/5
Risen, T. (2018). Mainstreaming urban air mobility. Aerospace America, 56(2), 12.
Thipphavong, D. P., Apaza, R., Barmore, B., Battiste, V., Burian, B., Dao, Q., … Verma, S. A.
(2018). Urban air mobility airspace integration concepts and considerations. Aviation
Technology, Integration, and Operations, 10. doi:10.2514/6.2018-3676
Triandis, H. C. (2002). Individualism-collectivism and personality. Journal of Personality, 69(6),
907-924.
Vance, S. M., & Malik, A. S. (2015). Analysis of factors that may be essential in the decision to
fly on fully autonomous passenger airliners. Journal of Advanced Transportation, 49(7),
829-854. doi:10.1002/atr.1308
Winter, S. R., Keebler, J. R., Rice, S., Mehta, R., & Baugh, B. S. (2018). Patient perceptions on
the use of driverless ambulances: An affective perspective. Transportation Research, 58,
431-441.
Winter, S. R., Rice, S., Mehta, R., Cremer, I., Reid, K. M., Rosser, T. G., & Moore, J. C. (2015).
Indian and American consumer perceptions of cockpit configuration policy. Journal of
Air Transport Management, 42, 226-231.
Wu, C., & Jang, L. (2008). The moderating role of referent of focus on purchase intent for
consumers with varying levels of allocentric tendency in a collectivist culture. Journal of
International Consumer Marketing, 20(3–4), 5–22. doi:10.1080/08961530802129128
Ragbir et al.: How Weather, Terrain, Flight Time, & Population Density Affect Willingness to Fly in Autonomous Air Taxis
http://ojs.library.okstate.edu/osu/index.php/cari 87
Appendix A – Willingness to Fly Scale (Rice et al., 2015; Rice et al., 2020)
1) I would be happy to fly in this situation
Strongly Disagree Disagree NeutralAgree Strongly Agree
2) I would be willing to fly in this situation
Strongly Disagree Disagree NeutralAgree Strongly Agree
3) I have no fears of flying in this situation
Strongly Disagree Disagree NeutralAgree Strongly Agree
4) I would be comfortable flying in this situation
Strongly Disagree Disagree NeutralAgree Strongly Agree
5) I would have no problem flying in this situation
Strongly Disagree Disagree NeutralAgree Strongly Agree
6) I feel confident flying in this situation
Strongly Disagree Disagree NeutralAgree Strongly Agree
7) I would feel safe flying in this situation
Strongly Disagree Disagree NeutralAgree Strongly Agree
A publication of the University Aviation Association, © 2020, ISSN: 1523-5955 88
Collegiate Aviation Review
International
Volume 38 | Issue 1 Peer-Reviewed Article #6
4-5-2020
Further Improving General Aviation
Flight Safety: Analysis of Aircraft
Accidents During Takeoff
Chenyu Huang
University of Nebraska at Omaha
Data from the National Transportation Safety Board (NTSB) reveal that general aviation (GA) accounted for 76% of
total air transport related accidents and incidents in the U.S. between 2014 and 2019. The identification of causes is
one of the most important tasks in aircraft accident investigation and a critical strategy for proactive aircraft accident
prevention. Aircraft and flight crew perform differently in each phase of flight given the changes of aircraft
configuration, flight operation environment and flight crew workload, therefore, the causes of aircraft accident may
vary by phase of flight. Most accidents occur in the phases of final approach and landing have been investigated by
many researchers from various perspectives. Few studies, however, have been published on flight safety for the
phase of takeoff, which has the second-highest number of GA aircraft accidents and incidents. A good
understanding of the causes of GA aircraft accidents during takeoff is crucial to develop more effective
countermeasures for aircraft takeoff risk mitigation and accident prevention. The objective of this study is to
understand the causes of GA aircraft takeoff accidents by analyzing aircraft accident investigation reports published
by the NTSB. To better understand the causes of GA aircraft takeoff accidents, the following research design has
been implemented. First, comparative analysis was applied to depict the statistical features of GA takeoff accidents
compared to other air transport categories. Temporal change of GA takeoff accidents was analyzed using a linear-
by-linear association test. Secondly, primary accident causes were identified by analyzing the NTSB investigation
reports. Text mining techniques were applied to further explore contributing factors associated with the identified
causes to enrich discovered knowledge. Finally, logistic regression analysis was applied to explore risk factors for
fatal GA aircraft takeoff accidents. Lists of key causal and contributing factors were revealed and discussed from the
analytical results. The identification of causal factors, contributing factors and risk factors for GA aircraft takeoff
accidents are expected to be a valuable supplement to existing knowledge for aircraft accident prevention.
Recommended Citation: Huang, C. (2020). Further Improving General Aviation Flight Safety: Analysis of Aircraft Accidents During
Takeoff. Collegiate Aviation Review International, 38(1), 88-105. Retrieved from
http://ojs.library.okstate.edu/osu/index.php/CARI/article/view/7965/7382
Huang: Further Improving General Aviation Flight Safety: Analysis of Aircraft Accidents During Takeoff
http://ojs.library.okstate.edu/osu/index.php/cari 89
Flight safety improvement has been one of the fundamental objectives for all aviation
stakeholders for decades. A variety of flight safety enhancement measures have been undertaken
globally to mitigate aviation risks. With continuous effort and collaboration among aviation
stakeholders, the total number of aviation fatalities and the accident rate have decreased over the
last decades. However, according to the General Aviation Manufacturers Association (GAMA),
in the year of 2017 alone, the general aviation (GA) community operated more than 446,000
aircraft flying worldwide with 1,233 accidents in the U.S., which was around 5.67 accident per
million flight hours (General Aviation Manufacturers Association [GAMA], 2018). National
Transportation Safety Board’s (NTSB) statistics show GA was accountable for around 76
percent of total air transport related accidents and incidents in the U.S. between 2014 and 2019
(National Transportation Safety Board [NTSB], 2019). Aircraft accident investigation is “a
process conducted for the purpose of accident prevention which includes the gathering and
analysis of information, the drawing of conclusions, including the determination of causes and,
when appropriate, making of safety recommendations” (International Civil Aviation
Organization [ICAO], 2016, p.13). With the purpose of preventing future accidents, aircraft
accident investigation seeks to answer how and why accidents take place. Accurately identifying
and understanding of the causes of aircraft accidents are critical for the development of practical
safety recommendations for future accident prevention. Approximately 80 percent of aircraft
accidents are due to human errors and the other 20 percent are caused by machine failures
(Rankin, 2007). Reviewing aircraft accident statistics, investigation reports, and published
aviation safety studies, a number of causal factors and occurrence categories were revealed in
various accident scenarios for different types of operations. Loss of Control In-Flight (LOC-I),
runway excursion, and Controlled Flight into Terrain (CFIT) are the three most common fatal
accident categories in scheduled commercial jet airplanes, with primary contributing factors of
safety management failure, adverse weather conditions, and flight crew errors of standard
operating procedure (SOP) adherence during the years of 2014-2018 (Boeing, 2018;
International Air Transport Association [IATA], 2019). For the GA operations – in addition to
the CFIT and the LOC-I, system component failure – powerplant and unintended flight in
Instrument Meteorological Conditions (IMC) are among top ten leading causes of fatal GA
accidents during 2001 - 2016 identified by the Federal Aviation Administration (FAA) (2018).
Given the high accident rate and the diversity of the GA fleet and pilots, the FAA made
the goal of reducing the general aviation accident rate one of its top priorities; and, set a goal of
“no more than 1 fatal accident per 100,000 hours of flight by 2018” (FAA, n.d., p. 4). A number
of studies on GA aircraft accident analysis and prevention have been published from a variety of
important perspectives. The primary causal factors for GA aircraft accidents vary depending on
the perspectives of the studies. Based on the GA accident and incident data between 1984 and
2004, the FAA (2005) published a high-level analysis of the major causal factors of GA
accidents for various categories of aircraft. The study presented causal factors based on aircraft
categories, which could be valuable for aircraft manufacturers for aircraft safety design
improvement. However, the growing age of the GA fleet and slow replacement of aging GA
aircraft make this study subject to validation using more recent data. Specifically considering the
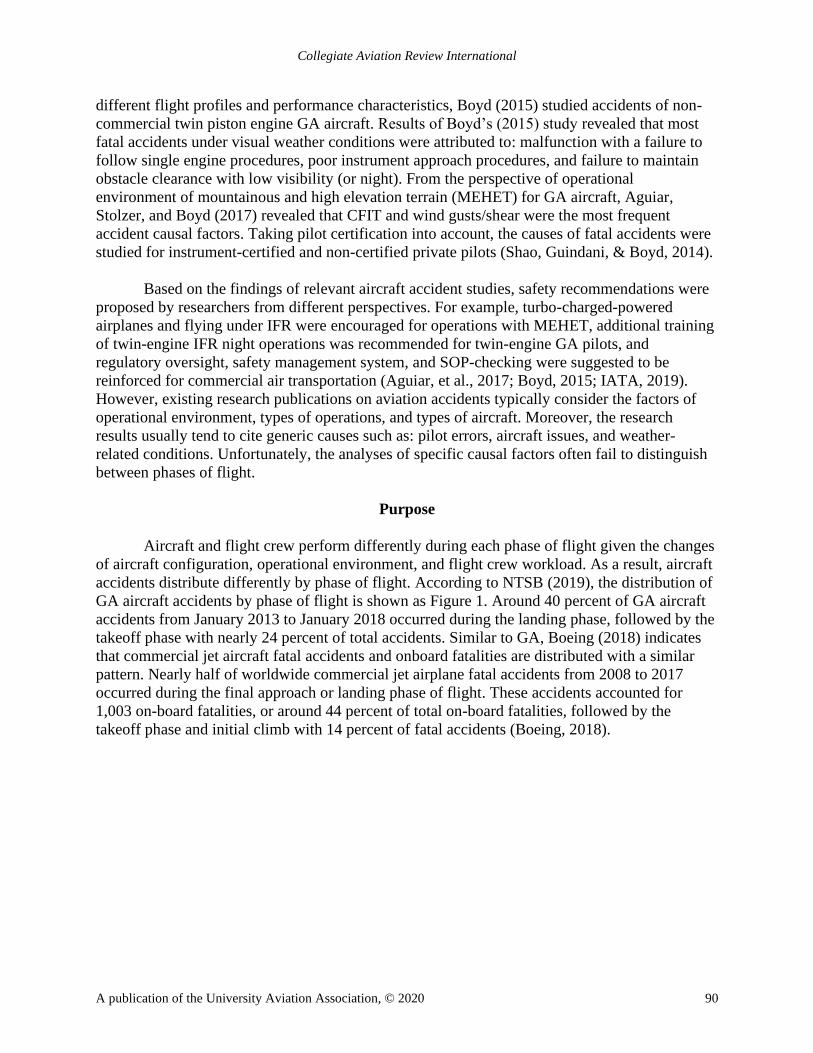
Collegiate Aviation Review International
A publication of the University Aviation Association, © 2020 90
different flight profiles and performance characteristics, Boyd (2015) studied accidents of non-
commercial twin piston engine GA aircraft. Results of Boyd’s (2015) study revealed that most
fatal accidents under visual weather conditions were attributed to: malfunction with a failure to
follow single engine procedures, poor instrument approach procedures, and failure to maintain
obstacle clearance with low visibility (or night). From the perspective of operational
environment of mountainous and high elevation terrain (MEHET) for GA aircraft, Aguiar,
Stolzer, and Boyd (2017) revealed that CFIT and wind gusts/shear were the most frequent
accident causal factors. Taking pilot certification into account, the causes of fatal accidents were
studied for instrument-certified and non-certified private pilots (Shao, Guindani, & Boyd, 2014).
Based on the findings of relevant aircraft accident studies, safety recommendations were
proposed by researchers from different perspectives. For example, turbo-charged-powered
airplanes and flying under IFR were encouraged for operations with MEHET, additional training
of twin-engine IFR night operations was recommended for twin-engine GA pilots, and
regulatory oversight, safety management system, and SOP-checking were suggested to be
reinforced for commercial air transportation (Aguiar, et al., 2017; Boyd, 2015; IATA, 2019).
However, existing research publications on aviation accidents typically consider the factors of
operational environment, types of operations, and types of aircraft. Moreover, the research
results usually tend to cite generic causes such as: pilot errors, aircraft issues, and weather-
related conditions. Unfortunately, the analyses of specific causal factors often fail to distinguish
between phases of flight.
Purpose
Aircraft and flight crew perform differently during each phase of flight given the changes
of aircraft configuration, operational environment, and flight crew workload. As a result, aircraft
accidents distribute differently by phase of flight. According to NTSB (2019), the distribution of
GA aircraft accidents by phase of flight is shown as Figure 1. Around 40 percent of GA aircraft
accidents from January 2013 to January 2018 occurred during the landing phase, followed by the
takeoff phase with nearly 24 percent of total accidents. Similar to GA, Boeing (2018) indicates
that commercial jet aircraft fatal accidents and onboard fatalities are distributed with a similar
pattern. Nearly half of worldwide commercial jet airplane fatal accidents from 2008 to 2017
occurred during the final approach or landing phase of flight. These accidents accounted for
1,003 on-board fatalities, or around 44 percent of total on-board fatalities, followed by the
takeoff phase and initial climb with 14 percent of fatal accidents (Boeing, 2018).
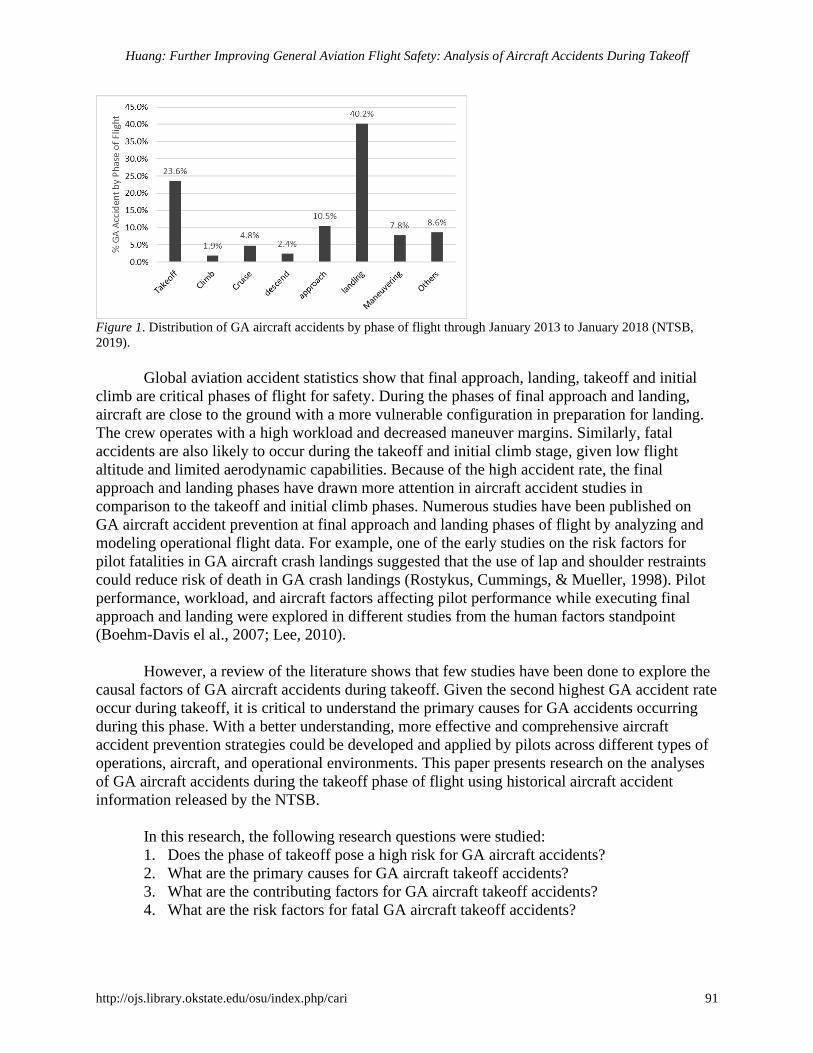
Huang: Further Improving General Aviation Flight Safety: Analysis of Aircraft Accidents During Takeoff
http://ojs.library.okstate.edu/osu/index.php/cari 91
Figure 1. Distribution of GA aircraft accidents by phase of flight through January 2013 to January 2018 (NTSB,
2019).
Global aviation accident statistics show that final approach, landing, takeoff and initial
climb are critical phases of flight for safety. During the phases of final approach and landing,
aircraft are close to the ground with a more vulnerable configuration in preparation for landing.
The crew operates with a high workload and decreased maneuver margins. Similarly, fatal
accidents are also likely to occur during the takeoff and initial climb stage, given low flight
altitude and limited aerodynamic capabilities. Because of the high accident rate, the final
approach and landing phases have drawn more attention in aircraft accident studies in
comparison to the takeoff and initial climb phases. Numerous studies have been published on
GA aircraft accident prevention at final approach and landing phases of flight by analyzing and
modeling operational flight data. For example, one of the early studies on the risk factors for
pilot fatalities in GA aircraft crash landings suggested that the use of lap and shoulder restraints
could reduce risk of death in GA crash landings (Rostykus, Cummings, & Mueller, 1998). Pilot
performance, workload, and aircraft factors affecting pilot performance while executing final
approach and landing were explored in different studies from the human factors standpoint
(Boehm-Davis el al., 2007; Lee, 2010).
However, a review of the literature shows that few studies have been done to explore the
causal factors of GA aircraft accidents during takeoff. Given the second highest GA accident rate
occur during takeoff, it is critical to understand the primary causes for GA accidents occurring
during this phase. With a better understanding, more effective and comprehensive aircraft
accident prevention strategies could be developed and applied by pilots across different types of
operations, aircraft, and operational environments. This paper presents research on the analyses
of GA aircraft accidents during the takeoff phase of flight using historical aircraft accident
information released by the NTSB.
In this research, the following research questions were studied:
1. Does the phase of takeoff pose a high risk for GA aircraft accidents?
2. What are the primary causes for GA aircraft takeoff accidents?
3. What are the contributing factors for GA aircraft takeoff accidents?
4. What are the risk factors for fatal GA aircraft takeoff accidents?
Collegiate Aviation Review International
A publication of the University Aviation Association, © 2020 92
Methods
Data Collection
For this study, GA aircraft accident information was retrieved from the NTSB Aviation
Accident Database & Synopses and Summary of U.S. Civil Aviation Accident updated in
January 2018 (NTSB, 2019). Aircraft accident records for operations under Title 14 of the Code
of Federal Regulation (CFR) Part 91 – General Aviation, occurring between January 2013 and
January 2018, were queried. Additional accident data for 14 CFR Part 121 – Air Carrier and
worldwide non-U.S. commercial aircraft and 14 CFR Part 135 – Air Taxi & Commuter during
the same time span were also collected for comparative analysis. Because no fatal accidents were
recorded from 14 CFR Part 121 operations in the U.S., data on worldwide, non-U.S. commercial
operations were collected to reflect the features of Commercial Air Carriers’ takeoff accidents.
Considering different flight characteristics due to the diverse aircraft categories and purposes of
flight, 14 CFR Part 91 aircraft accidents were limited to personal, business/corporate, and
instructional flights; and, only non-amateur built airplanes were included in the data query. In
addition, available final accident investigation reports were retrieved to supplement causal and
contributing factor information. Fatal outcome, causes, and contributing factors were determined
per the NTSB reports (NTSB, 2019). The total annual flight hours for the 14 CFR Part 91
operations for the selected flight purposes were obtained from the FAA survey to determine
accident rate (FAA, 2019). Given above criteria, 3,939 14 CFR Part 91 aircraft accidents
comprised of 826 takeoff accidents and 3,113 non-takeoff accidents were collected in this
analysis. Given the NTSB preliminary accident reports do not present causal factors, 721 final
reports for GA takeoff accidents were retrieved from the NTSB database for causal factor
analysis. Each phase of flight was defined by ICAO Common Taxonomy (ICAO, 2013). The
phase of flight for each accident was determined by the NTSB. Accident causes and causal factor
categories used in analysis were identical to the NTSB final reports.
Analytical Procedure
Focusing on analyzing the causes, contributing factors, and risk factors of GA aircraft
takeoff accidents, the following analytical work was conducted:
1. A comparative study of aircraft takeoff accidents in 14 CFR Part 91, 14 CFR Part 135,
and 14 CFR Part 121 operations was presented employing descriptive statistics and Chi-
square tests.
2. Focusing on Part 91 operation, the Chi-square linear-by-linear association output was
used for trend assessment of GA aircraft takeoff accidents.
3. A list of primary causes for fatal GA accidents during takeoff was developed from the
NTSB final accident investigation reports.
4. Based on the identified primary causes, the associated contributing factors were explored
employing text mining techniques.
5. Logistic regression analysis was employed to identify risk factors for fatal GA takeoff
accident based on 95% confidence intervals.
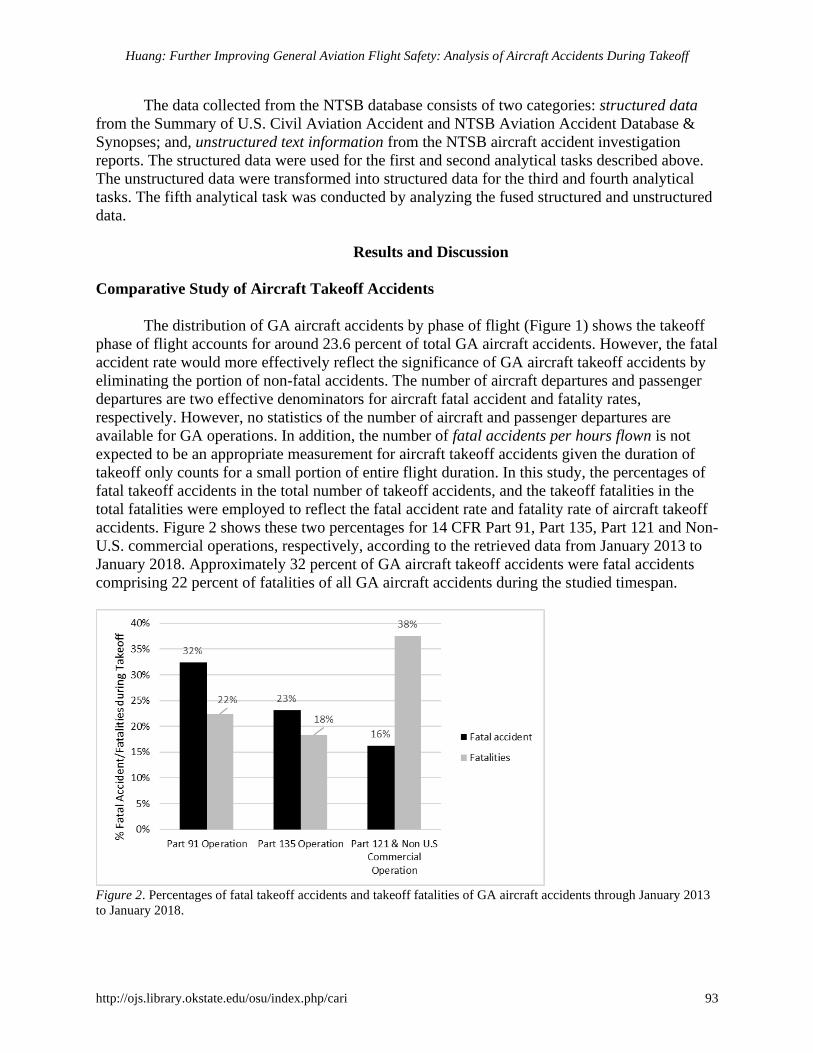
Huang: Further Improving General Aviation Flight Safety: Analysis of Aircraft Accidents During Takeoff
http://ojs.library.okstate.edu/osu/index.php/cari 93
The data collected from the NTSB database consists of two categories: structured data
from the Summary of U.S. Civil Aviation Accident and NTSB Aviation Accident Database &
Synopses; and, unstructured text information from the NTSB aircraft accident investigation
reports. The structured data were used for the first and second analytical tasks described above.
The unstructured data were transformed into structured data for the third and fourth analytical
tasks. The fifth analytical task was conducted by analyzing the fused structured and unstructured
data.
Results and Discussion
Comparative Study of Aircraft Takeoff Accidents
The distribution of GA aircraft accidents by phase of flight (Figure 1) shows the takeoff
phase of flight accounts for around 23.6 percent of total GA aircraft accidents. However, the fatal
accident rate would more effectively reflect the significance of GA aircraft takeoff accidents by
eliminating the portion of non-fatal accidents. The number of aircraft departures and passenger
departures are two effective denominators for aircraft fatal accident and fatality rates,
respectively. However, no statistics of the number of aircraft and passenger departures are
available for GA operations. In addition, the number of fatal accidents per hours flown is not
expected to be an appropriate measurement for aircraft takeoff accidents given the duration of
takeoff only counts for a small portion of entire flight duration. In this study, the percentages of
fatal takeoff accidents in the total number of takeoff accidents, and the takeoff fatalities in the
total fatalities were employed to reflect the fatal accident rate and fatality rate of aircraft takeoff
accidents. Figure 2 shows these two percentages for 14 CFR Part 91, Part 135, Part 121 and Non-
U.S. commercial operations, respectively, according to the retrieved data from January 2013 to
January 2018. Approximately 32 percent of GA aircraft takeoff accidents were fatal accidents
comprising 22 percent of fatalities of all GA aircraft accidents during the studied timespan.
Figure 2. Percentages of fatal takeoff accidents and takeoff fatalities of GA aircraft accidents through January 2013
to January 2018.
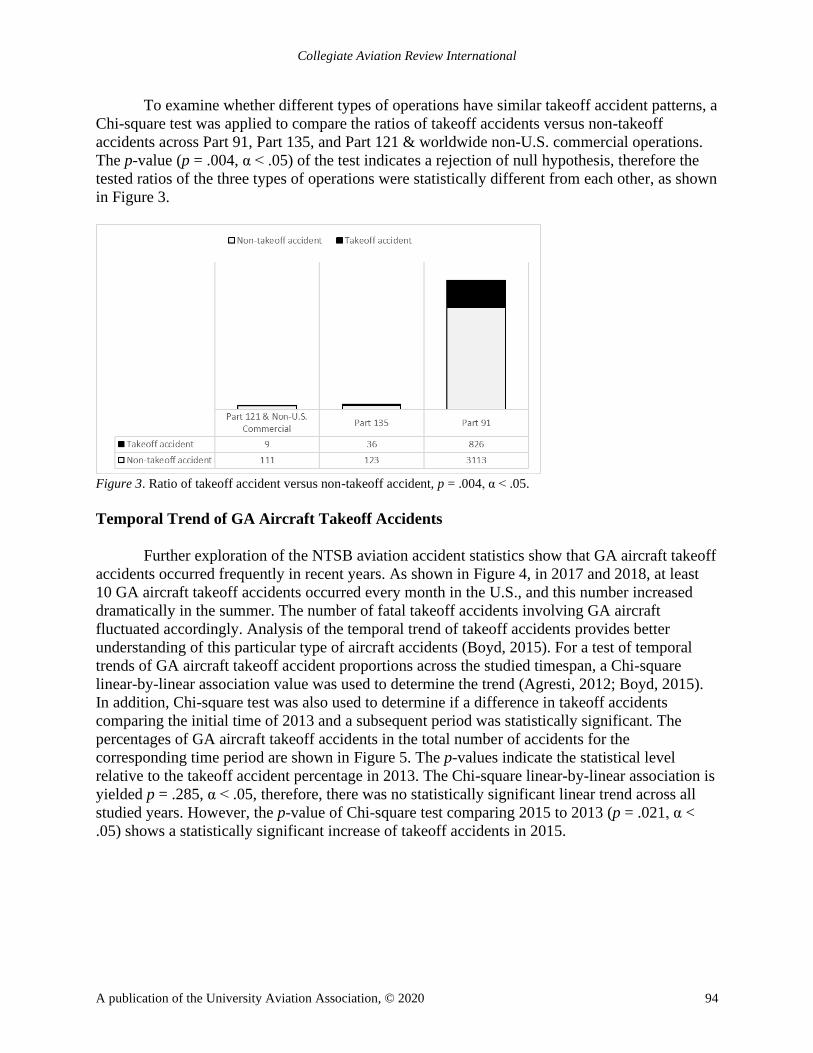
Collegiate Aviation Review International
A publication of the University Aviation Association, © 2020 94
To examine whether different types of operations have similar takeoff accident patterns, a
Chi-square test was applied to compare the ratios of takeoff accidents versus non-takeoff
accidents across Part 91, Part 135, and Part 121 & worldwide non-U.S. commercial operations.
The p-value (p = .004, α < .05) of the test indicates a rejection of null hypothesis, therefore the
tested ratios of the three types of operations were statistically different from each other, as shown
in Figure 3.
Figure 3. Ratio of takeoff accident versus non-takeoff accident, p = .004, α < .05.
Temporal Trend of GA Aircraft Takeoff Accidents
Further exploration of the NTSB aviation accident statistics show that GA aircraft takeoff
accidents occurred frequently in recent years. As shown in Figure 4, in 2017 and 2018, at least
10 GA aircraft takeoff accidents occurred every month in the U.S., and this number increased
dramatically in the summer. The number of fatal takeoff accidents involving GA aircraft
fluctuated accordingly. Analysis of the temporal trend of takeoff accidents provides better
understanding of this particular type of aircraft accidents (Boyd, 2015). For a test of temporal
trends of GA aircraft takeoff accident proportions across the studied timespan, a Chi-square
linear-by-linear association value was used to determine the trend (Agresti, 2012; Boyd, 2015).
In addition, Chi-square test was also used to determine if a difference in takeoff accidents
comparing the initial time of 2013 and a subsequent period was statistically significant. The
percentages of GA aircraft takeoff accidents in the total number of accidents for the
corresponding time period are shown in Figure 5. The p-values indicate the statistical level
relative to the takeoff accident percentage in 2013. The Chi-square linear-by-linear association is
yielded p = .285, α < .05, therefore, there was no statistically significant linear trend across all
studied years. However, the p-value of Chi-square test comparing 2015 to 2013 (p = .021, α <
.05) shows a statistically significant increase of takeoff accidents in 2015.
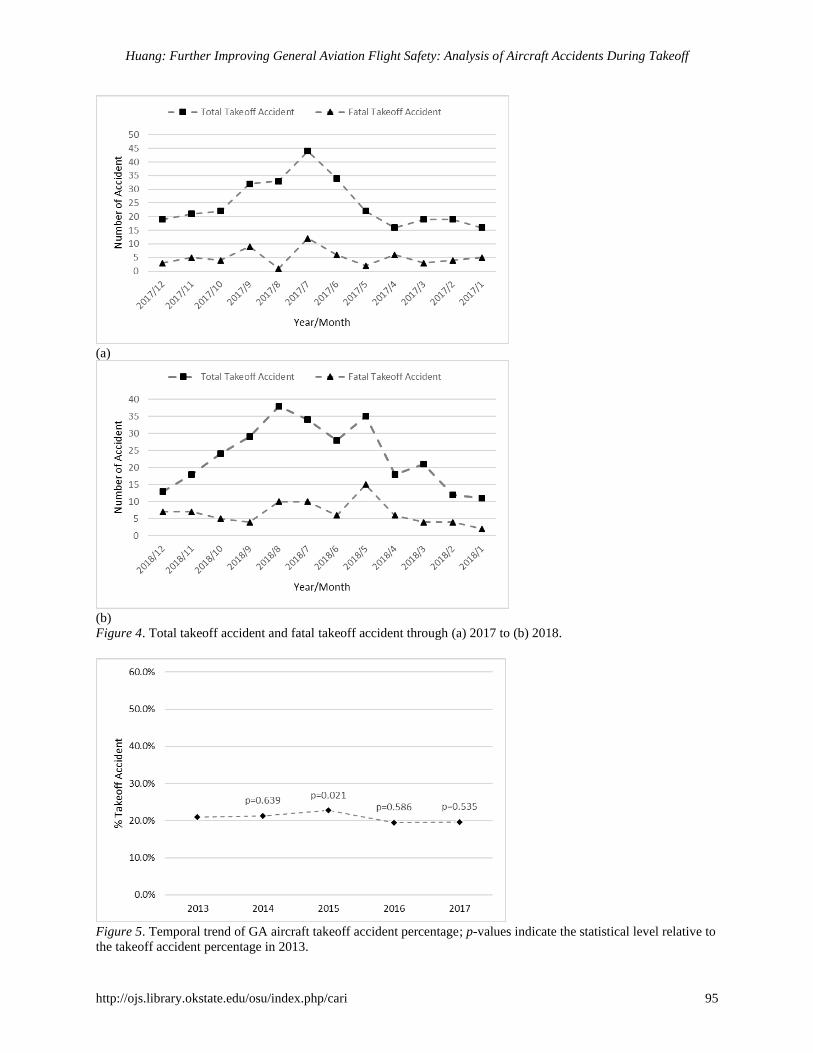
Huang: Further Improving General Aviation Flight Safety: Analysis of Aircraft Accidents During Takeoff
http://ojs.library.okstate.edu/osu/index.php/cari 95
(a)
(b)
Figure 4. Total takeoff accident and fatal takeoff accident through (a) 2017 to (b) 2018.
Figure 5. Temporal trend of GA aircraft takeoff accident percentage; p-values indicate the statistical level relative to
the takeoff accident percentage in 2013.
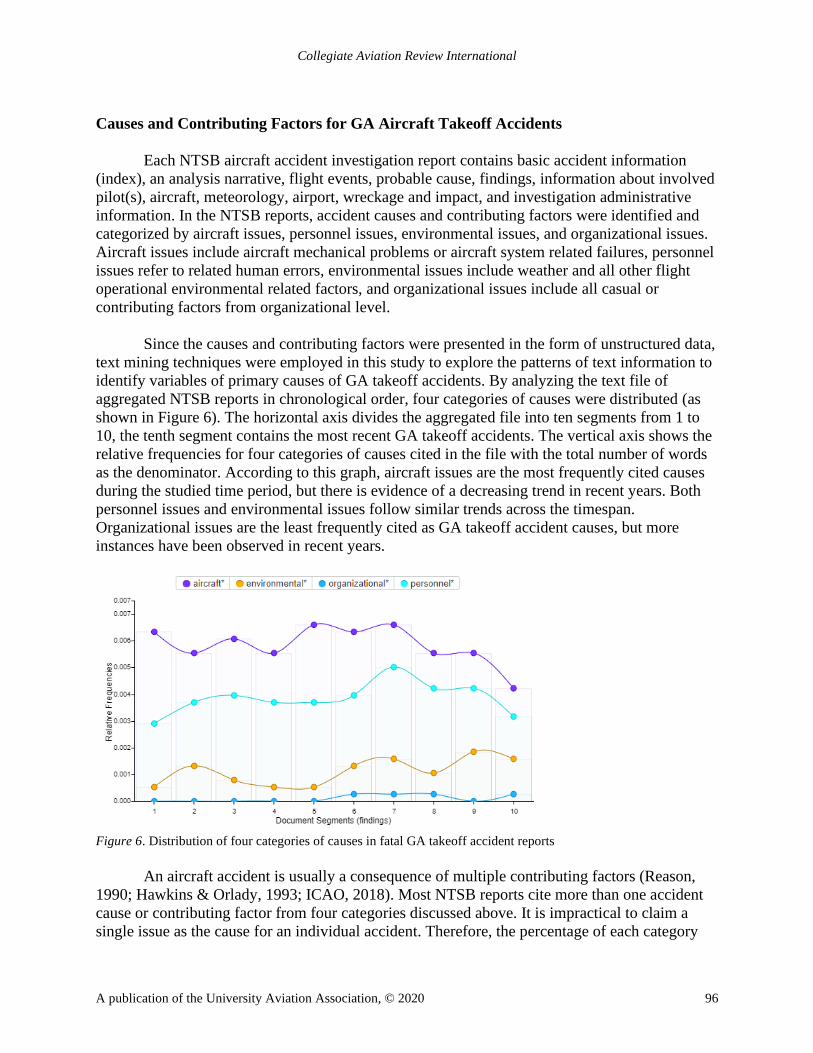
Collegiate Aviation Review International
A publication of the University Aviation Association, © 2020 96
Causes and Contributing Factors for GA Aircraft Takeoff Accidents
Each NTSB aircraft accident investigation report contains basic accident information
(index), an analysis narrative, flight events, probable cause, findings, information about involved
pilot(s), aircraft, meteorology, airport, wreckage and impact, and investigation administrative
information. In the NTSB reports, accident causes and contributing factors were identified and
categorized by aircraft issues, personnel issues, environmental issues, and organizational issues.
Aircraft issues include aircraft mechanical problems or aircraft system related failures, personnel
issues refer to related human errors, environmental issues include weather and all other flight
operational environmental related factors, and organizational issues include all casual or
contributing factors from organizational level.
Since the causes and contributing factors were presented in the form of unstructured data,
text mining techniques were employed in this study to explore the patterns of text information to
identify variables of primary causes of GA takeoff accidents. By analyzing the text file of
aggregated NTSB reports in chronological order, four categories of causes were distributed (as
shown in Figure 6). The horizontal axis divides the aggregated file into ten segments from 1 to
10, the tenth segment contains the most recent GA takeoff accidents. The vertical axis shows the
relative frequencies for four categories of causes cited in the file with the total number of words
as the denominator. According to this graph, aircraft issues are the most frequently cited causes
during the studied time period, but there is evidence of a decreasing trend in recent years. Both
personnel issues and environmental issues follow similar trends across the timespan.
Organizational issues are the least frequently cited as GA takeoff accident causes, but more
instances have been observed in recent years.
Figure 6. Distribution of four categories of causes in fatal GA takeoff accident reports
An aircraft accident is usually a consequence of multiple contributing factors (Reason,
1990; Hawkins & Orlady, 1993; ICAO, 2018). Most NTSB reports cite more than one accident
cause or contributing factor from four categories discussed above. It is impractical to claim a
single issue as the cause for an individual accident. Therefore, the percentage of each category
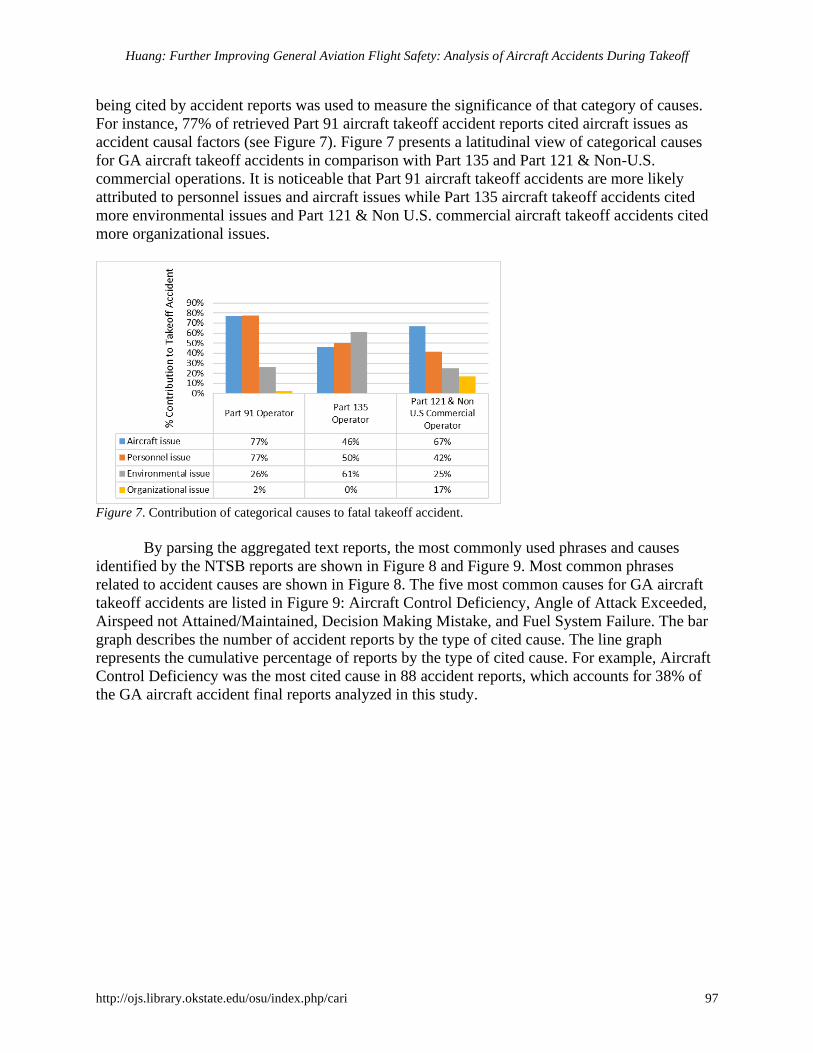
Huang: Further Improving General Aviation Flight Safety: Analysis of Aircraft Accidents During Takeoff
http://ojs.library.okstate.edu/osu/index.php/cari 97
being cited by accident reports was used to measure the significance of that category of causes.
For instance, 77% of retrieved Part 91 aircraft takeoff accident reports cited aircraft issues as
accident causal factors (see Figure 7). Figure 7 presents a latitudinal view of categorical causes
for GA aircraft takeoff accidents in comparison with Part 135 and Part 121 & Non-U.S.
commercial operations. It is noticeable that Part 91 aircraft takeoff accidents are more likely
attributed to personnel issues and aircraft issues while Part 135 aircraft takeoff accidents cited
more environmental issues and Part 121 & Non U.S. commercial aircraft takeoff accidents cited
more organizational issues.
Figure 7. Contribution of categorical causes to fatal takeoff accident.
By parsing the aggregated text reports, the most commonly used phrases and causes
identified by the NTSB reports are shown in Figure 8 and Figure 9. Most common phrases
related to accident causes are shown in Figure 8. The five most common causes for GA aircraft
takeoff accidents are listed in Figure 9: Aircraft Control Deficiency, Angle of Attack Exceeded,
Airspeed not Attained/Maintained, Decision Making Mistake, and Fuel System Failure. The bar
graph describes the number of accident reports by the type of cited cause. The line graph
represents the cumulative percentage of reports by the type of cited cause. For example, Aircraft
Control Deficiency was the most cited cause in 88 accident reports, which accounts for 38% of
the GA aircraft accident final reports analyzed in this study.
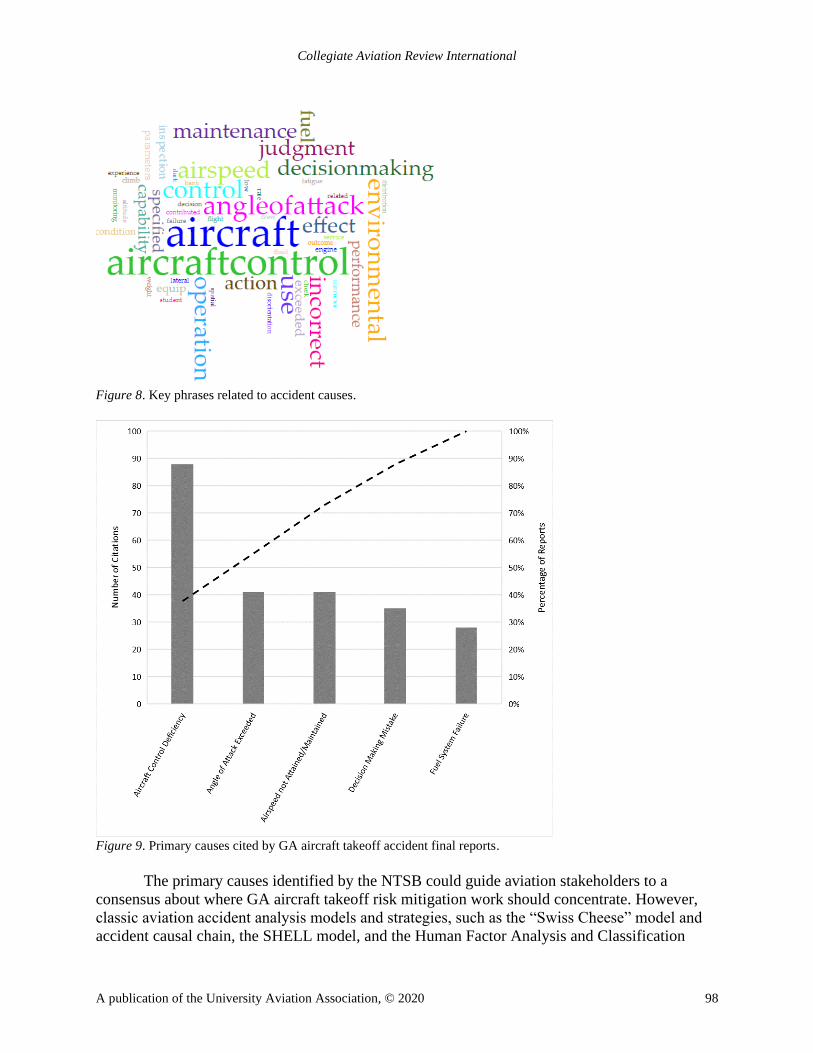
Collegiate Aviation Review International
A publication of the University Aviation Association, © 2020 98
Figure 8. Key phrases related to accident causes.
Figure 9. Primary causes cited by GA aircraft takeoff accident final reports.
The primary causes identified by the NTSB could guide aviation stakeholders to a
consensus about where GA aircraft takeoff risk mitigation work should concentrate. However,
classic aviation accident analysis models and strategies, such as the “Swiss Cheese” model and
accident causal chain, the SHELL model, and the Human Factor Analysis and Classification
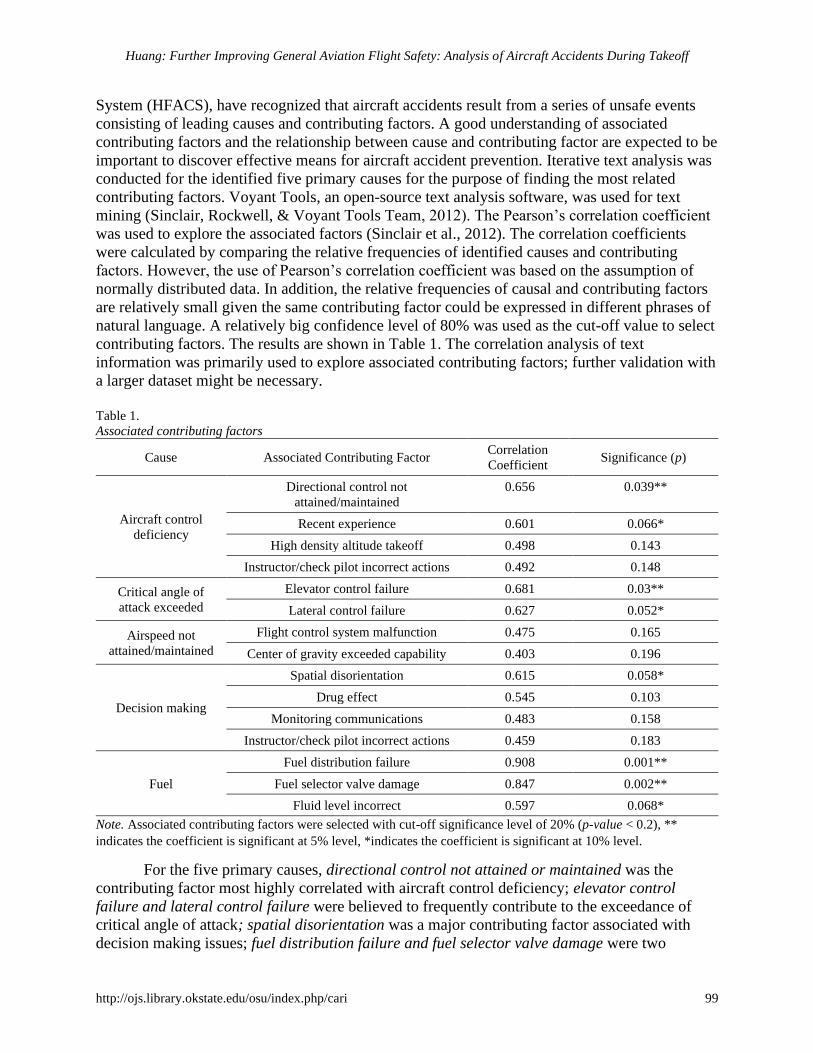
Huang: Further Improving General Aviation Flight Safety: Analysis of Aircraft Accidents During Takeoff
http://ojs.library.okstate.edu/osu/index.php/cari 99
System (HFACS), have recognized that aircraft accidents result from a series of unsafe events
consisting of leading causes and contributing factors. A good understanding of associated
contributing factors and the relationship between cause and contributing factor are expected to be
important to discover effective means for aircraft accident prevention. Iterative text analysis was
conducted for the identified five primary causes for the purpose of finding the most related
contributing factors. Voyant Tools, an open-source text analysis software, was used for text
mining (Sinclair, Rockwell, & Voyant Tools Team, 2012). The Pearson’s correlation coefficient
was used to explore the associated factors (Sinclair et al., 2012). The correlation coefficients
were calculated by comparing the relative frequencies of identified causes and contributing
factors. However, the use of Pearson’s correlation coefficient was based on the assumption of
normally distributed data. In addition, the relative frequencies of causal and contributing factors
are relatively small given the same contributing factor could be expressed in different phrases of
natural language. A relatively big confidence level of 80% was used as the cut-off value to select
contributing factors. The results are shown in Table 1. The correlation analysis of text
information was primarily used to explore associated contributing factors; further validation with
a larger dataset might be necessary.
Table 1.
Associated contributing factors
Cause Associated Contributing Factor Correlation
Coefficient Significance (p)
Aircraft control
deficiency
Directional control not
attained/maintained
0.656 0.039**
Recent experience 0.601 0.066*
High density altitude takeoff 0.498 0.143
Instructor/check pilot incorrect actions 0.492 0.148
Critical angle of
attack exceeded
Elevator control failure 0.681 0.03**
Lateral control failure 0.627 0.052*
Airspeed not
attained/maintained
Flight control system malfunction 0.475 0.165
Center of gravity exceeded capability 0.403 0.196
Decision making
Spatial disorientation 0.615 0.058*
Drug effect 0.545 0.103
Monitoring communications 0.483 0.158
Instructor/check pilot incorrect actions 0.459 0.183
Fuel
Fuel distribution failure 0.908 0.001**
Fuel selector valve damage 0.847 0.002**
Fluid level incorrect 0.597 0.068*
Note. Associated contributing factors were selected with cut-off significance level of 20% (p-value < 0.2), **
indicates the coefficient is significant at 5% level, *indicates the coefficient is significant at 10% level.
For the five primary causes, directional control not attained or maintained was the
contributing factor most highly correlated with aircraft control deficiency; elevator control
failure and lateral control failure were believed to frequently contribute to the exceedance of
critical angle of attack; spatial disorientation was a major contributing factor associated with
decision making issues; fuel distribution failure and fuel selector valve damage were two
Collegiate Aviation Review International
A publication of the University Aviation Association, © 2020 100
significant factors resulting in fuel system related accidents. In addition, it is noticeable that
some identified contributing factors are identical to other related publications, but some of them
are unexpected. One of the unexpected results is that drug effect was recognized as a
contributing factor for GA aircraft takeoff accidents, though the Federal Aviation Regulations
(FARs) preclude flying while having a condition or taking a medication that might affect flight
safety (14 C.F.R. § 91.17, 2006).
Risk Factors for Fatal Takeoff Accidents
Logistic regression analysis using 95% confidence intervals was adopted to identify risk
factors for fatal GA aircraft accidents during takeoff, given its advantages over discriminant
analysis. For instance, it is robust in the case of a violation of the normality assumption and does
not require equal variances within independent variable group (Tabachnick & Fidell, 1996).
According to the distribution of categorical causes to fatal takeoff accident (Figure 7) and
findings from the literature review, pilot age (Bazargan & Guzhva, 2007), flight experience (Li
& Baker, 1999; Bazargan & Guzhva, 2007), pilot certificate (Groff & Price, 2006), instrument
rating (Bazargan & Guzhva, 2007; Boyd, 2015), weather condition (Li & Baker, 1999; Groff &
Price, 2006; Bazargan & Guzhva, 2007; Boyd, 2015), number of engine (Bazargan & Guzhva,
2007), type of engine, and season of the year were selected as independent variables for logistic
regression analysis. Table 2 presents selected variables with corresponding coding descriptions.
Table 2.
Variables for logistic regression analysis
Variable Coding Description
Type of Accident 0 Non-fatal takeoff accident
1 Fatal takeoff accident
Pilot Age Log(age) Log transformation
Flight Experience by Hours Flown Log(hours) Log transformation
Pilot Certificate
0 Student pilot certificate
1 Private pilot certificate
2 Commercial pilot certificate
3 Airline Transport Pilot certificate
Instrument Rating 0 No
1 Yes
Weather Condition 0 Visual Meteorological Conditions (VMC)
1 Instrumental Meteorological Conditions (IMC)
Number of Engine 0 Single engine
1 Twin engine
Type of Engine
0 Reciprocating
1 Turbo Prop
2 Turbo Fan
Season of the Year
0 Spring (March to May)
1 Summer (June to August)
2 Fall (September to November)
3 Winter (December to February)
Huang: Further Improving General Aviation Flight Safety: Analysis of Aircraft Accidents During Takeoff
http://ojs.library.okstate.edu/osu/index.php/cari 101
The model is expressed as Equation (1).
𝐹𝑎𝑡𝑎𝑙𝑖 = 𝑎1𝑙𝑜𝑔(𝑎𝑔𝑒) + 𝑎2 log(𝑒𝑥𝑝𝑒𝑟𝑖𝑒𝑛𝑐𝑒) + 𝑎3𝐶𝑒𝑟𝑡𝑖𝑓𝑖𝑐𝑎𝑡𝑒𝑖 + 𝑎4𝑅𝑎𝑡𝑖𝑛𝑔𝑖 + 𝑎5𝑊𝑒𝑎𝑡ℎ𝑒𝑟𝑖 +𝑎6𝐸𝑛𝑔𝑖𝑛𝑒𝑁𝑢𝑚𝑖 + 𝑎7𝐸𝑛𝑔𝑖𝑛𝑒𝑇𝑦𝑝𝑒𝑖 + 𝑎8𝑆𝑒𝑎𝑠𝑜𝑛𝑖 + 𝑏 + 𝑒𝑖
Table 3 presents the parameter estimates from the logistic regression model. Wald
Statistics is used to test the statistical significance of each coefficient in the model. Odds ratios
are the probability of occurring over the probability of not occurring for an event. The regression
results indicate that the model is able to correctly classify 80.1% of the cases into fatal or non-
fatal takeoff accident with statistical reliability at 10% significance level (Chi Square p = 0.098).
In addition, three coefficients are statistically significant at the 5% level: weather condition (IMC
vs. VMC), number of engines (single engine vs. twin engine), and season of the year (spring,
summer, fall, vs. winter). More specifically, IMC, twin engine, and season of the year were
identified as risk factors for fatal GA aircraft takeoff accidents.
Table 3.
Logistic regression parameter estimates and odd ratios
Variable Coefficient Wald Sig. Odds ratio 95% CI in odds
Lower Upper
Pilot Age 0.003 0.715 1.003 0.989 1.017
Flight Experience 0.000 0.272 1.000 1.000 1.000
Pilot Certificate 0.291 0.144 1.338 0.905 1.977
Instrument Rating -0.122 0.666 0.885 0.509 1.539
Weather Condition 2.344 0.000* 0.096 0.034 0.269
Number of Engines 1.053 0.004* 2.969 1.417 6.219
Type of Engine 0.585 0.153 1.795 0.804 4.008
Season of the Year -0.258 0.019* 0.772 0.622 0.959
Constant 0.717 0.309 2.047
Note, * indicates statistical significance at the level of 5%; CI – Confidence Intervals.
Conclusion
Despite accounting for the second most number of fatal GA accidents, the literature
largely ignores accidents occurring during the takeoff phase of flight. In response, this study
verified the assumption of high risk of GA flight operations during the phase of takeoff, analyzed
the causes and contributing factors for GA aircraft takeoff accidents, and explored risk factors
for fatal GA takeoff accidents using available aircraft accident information from the NTSB
database from January 2013 to January 2018.
In comparison with aircraft accident in Part 121 and Part 135 operations, GA operations
show higher ratios of takeoff accidents vs. non-takeoff accidents and fatal takeoff accidents vs.
non-fatal takeoff accidents. The results indicate that takeoff accidents are statistically more
frequent and risky for GA compared to Part 135 and Part 121 operations, and no temporal
change of GA takeoff accidents was observed statistically across the studied years. The findings
of descriptive analyses of aircraft accident data support the author’s assumption and motivation
on this study topic: GA operations face significant risk during the takeoff phase of flight which
may result in fatal accidents.
Collegiate Aviation Review International
A publication of the University Aviation Association, © 2020 102
Unlike Part 135 and Part 121 operations, aircraft and personnel related issues were more
often cited as causes by accident reports for GA takeoff accidents. The difference might be
explained by the limited resources that GA operators allocate to aircraft maintenance, the large
number of old GA aircraft, and the diverse background and experience of GA pilots. In general,
aircraft control deficiency, angle of attack exceeded, airspeed not attained/maintained, decision
making mistake, and fuel system failure were identified as primary leading causes for GA
aircraft takeoff accidents.
In addition, a list of 15 contributing factors associated with the primary causes was
identified by text mining the final accident investigation reports. Due to the characteristics of
natural language used in the NTSB accident reports, a confidence level of 80% was employed as
the cut-off value to explore a bigger scope of associated contributing factors for each leading
cause. Directional control deficiency, elevator control failure, fuel distribution failure, and fuel
selector value damage were identified as contributing factors at 5% significant level; recent
experience, lateral control failure, spatial disorientation, and incorrect fluid level were identified
at 10% significant level. Surprisingly, drug effect was marginally significant at 10% level though
FARs prohibit flying while having a condition or taking a medication that might affect flight
safety. However, other identified contributing factors at lower confidence level might also be
considered in GA aircraft takeoff accident prevention.
The results of logistic regression analysis present weather conditions, number of engines,
and the season of the year as risk factors for fatal GA aircraft takeoff accident. In addition, the
analysis results show that IMC and twin engine aircraft increase the likelihood of a GA aircraft
takeoff accident to be fatal. GA aircraft takeoff accidents happening in spring and summer are
more likely to be fatal than those happening in fall and winter. The weather condition of IMC
means that the aircraft was taking off in low visibility or an adverse operational environment,
which intuitively explains the high likelihood of fatal takeoff accidents. The finding that twin
engine aircraft takeoff accidents are more likely to be fatal stays in line with the narratives in
corresponding NTSB accident reports. Pilots encounter serious directional control difficulties
while having engine failure of twin engine aircraft during takeoff. There could be many other
reasons making the season of year a possible risk factor, but generally, the relatively lower air
density and higher air temperature in summer and spring could reduce the aircraft takeoff
performance during takeoff.
In conclusion, this study emphasizes the importance and necessity of additional accident
prevention strategies for takeoff phase of flight in GA operations. The findings of this study
inform GA operators as to the causes of takeoff accidents and where the training should be
focused on. For example, improvement of aircraft control proficiency during takeoff in spring
and summer, as well as in an adverse weather condition is expected to be beneficial, proficient
execution of twin engine aircraft takeoff procedures upon loss of power in one engine should be
reinforced in an adverse weather condition. Additionally, findings of this study could be helpful
for better identifying possible gaps between current flight training techniques and pilot
proficiency standards. In this study, the available aircraft takeoff accident data from the NTSB
were categorized by broad phases of flight: Standing, Taxiing, Takeoff, Climb, Cruise, Descend,
Approach, Landing, Go-around, Maneuvering, and Others. There was no information explaining
Huang: Further Improving General Aviation Flight Safety: Analysis of Aircraft Accidents During Takeoff
http://ojs.library.okstate.edu/osu/index.php/cari 103
whether the aircraft accidents during the phase of climb-out were categorized as part of takeoff
accidents or climb accidents. Further research is necessary to verify the accuracy of this study by
eliminating data errors because of above reasons.
Collegiate Aviation Review International
A publication of the University Aviation Association, © 2020 104
References
Alcohol or drugs, 14 C.F.R. § 91.17 (2006).
Agresti, A. (2012). Categorical data analysis (3rd ed). Wiley Third.
Aguiar, M., Stolzer, A., & Boyd, D. D. (2017). Rates and causes of accidents for general aviation
aircraft operating in a mountainous and high elevation terrain environment. Accident
Analysis and Prevention, 107(2017), 195-201.
Bazargan, M. & Guzhva, V. S. (2007). Factors contributing to fatalities in general aviation
accidents. World Review of Intermodal Transportation Research, 1(2), 170-182
Boeing. (2018). Statistical Summary of Commercial Jet Airplane Accident, Worldwide
Operations, 1959-2017. Retrieved from http://www.boeing.com/resources/boeingdotcom/
company/about_bca/pdf/statsum.pdf
Boehm-Davis, D. A., Casali, J. G., Kleiner, B. M., Lancaster, J. A., Saleem, J. J., & Wochinger,
K. (2007). Pilot performance, strategy, and workload while executing approaches at steep
angles and with lower landing minima. Human Factors, 49(5), 759-772. (LR)
Boyd, D. D. (2015). Causes and risk factors for fatal accidents in non-commercial twin engine
piston general aviation aircraft. Accident Analysis and Prevention, 77(2015), 113-119.
Federal Aviation Administration. (2019). General aviation and Part 135 activity surveys (CY
2017). Retrieved from https://www.faa.gov/data_research/aviation_data_statistics/
general_aviation/
Federal Aviation Administration. (2018). Fact sheet – General aviation safety [Online].
Retrieved from https://www.faa.gov/news/fact_sheets/news_story.cfm?newsId=21274
Federal Aviation Administration. (2005). Causal factors for general aviation accidents/incidents
between January 1984 and October 2004. Retrieved from https://www.faa.gov/aircraft/
air_cert/design_approvals/small_airplanes/cos/media/Causal%20Factors%20-
%20Final%20Report.pdf
Federal Aviation Administration. (n.d.). Destination 2025. Washington, DC: Retrieved from
https://www.faa.gov/about/plans_reports/media/Destination2025.pdf
General Aviation Manufacturers Association (2018). 2018 annual report. Retrieved from
https://gama.aero/wp-content/uploads/GAMA-2018-Annual-Report-FINAL.pdf
Groff, L. S. & Price, J. M. (2006). General aviation accidents in degraded visibility: a case
control study of 72 accidents. Aviation, Space, and Environment Medicine, 77, 1062-
1067.
Huang: Further Improving General Aviation Flight Safety: Analysis of Aircraft Accidents During Takeoff
http://ojs.library.okstate.edu/osu/index.php/cari 105
Hawkins, F. H., & Orlady, H. W. (1993). Human factors in flight. England: Avebury Technical.
International Air Transport Association. (2019). Safety report 2018 (55th ed.). Montreal, Canada:
Author.
International Civil Aviation Organization. (2018). Safety management manual (Doc 9859, 4th
ed.). Montreal, Canada: Author.
International Civil Aviation Organization. (2016). Annex 13 to the convention on international
civil aviation, aircraft accident and incident investigation (11th ed., pp.13). Montreal,
Canada: Author.
International Civil Aviation Organization. (2013). Phase of flight – definitions and usage notes.
Retrieved from https://www.ntsb.gov/investigations/data/Documents/datafiles/
PhaseofFlightDefinitions.pdf
Lee, K. (2010). Effects of flight factors on pilot performance workload, and stress at final
approach to landing phase of flight. Electronic Theses and Dissertation 1628. Retrieved
from https://stars.library.ucf.edu/etd/1628?utm_source=stars.library.ucf.edu
%2Fetd%2F1628&utm_medium=PDF&utm_campaign=PDFCoverPages
Li & Baker (1999). Correlates of pilot fatality in general aviation crashes. Aviation Space and
Environmental Medicine, 70(4), 305-309.
National Transportation Safety Board. (2019). Aviation accident database & synopses. Retrieved
from https://www.ntsb.gov/_layouts/ntsb.aviation/index.aspx
Rankin, W. (2007). MEDA investigation process. Boeing Aeromagazine, 2(26). Retrieved from
https://www.boeing.com/commercial/aeromagazine/articles/qtr_2_07/AERO_Q207.pdf
Reason, J. (1990). Human error. New York, NY: Cambridge University Press.
Rostykus, P. S., Cummings, P., & Mueller, B. A. (1998). Risk factors for pilot fatalities in
general aviation airplanes crash landings. Journal of the American Medical Association,
280(11), 997-999. (LR)
Shao, B. S., Guindani, M., & Boyd, D. D. (2014). Causes of fatal accidents for instrument-
certified and non-certified private pilots. Accident Analysis and Prevention, 72(2014),
370-375.
Sinclair, S., Rockwell, G., & Voyant Tools Team. (2012). Voyant tools (web application).
Accessible: https://voyant-tools.org/
Tabachnick, B. C. & Fidell, L. S. (1996). Using multivariate statistics. HarperCollins, New York.
A publication of the University Aviation Association, © 2020, ISSN: 1523-5955 106
Collegiate Aviation Review
International
Volume 38 | Issue 1 Peer-Reviewed Article #7
4-12-2020
Assessing an Aviation Out-of-School
Time Program: A Collective Case Study
Stephen M. Belt
Saint Louis University
Nithil K. Bollock
Saint Louis University
Recent hiring trends fueled by a growing shortage of qualified pilots and aircraft mechanics serve to increase the
pressure on the aviation community to attract young people to the profession. Given the historical reality that the
industry is predominantly white and male, this dynamic supports efforts to increase access to underrepresented
populations, including women and people of color. This collective instrumental case study sought to contribute
insights and outcomes from providing an aviation module during an Out-of-School Time (OST) program in an
underserved, primarily African American neighborhood. Thirty-one youth campers and 12 adult camp counselors
participated. Thematic analysis and descriptive statistics were conducted to explore data collected via surveys,
worksheets, reflections, and observations. The perspectives and attitudes of the youth and counselors who
participated in the program were decidedly positive. The results suggested that the campers were connected,
engaged, and motivated, even as they seemed at times to be distracted in the program. Games, worksheets, age-
appropriate challenges, and one-on-one supervision were effective in supporting lecture and simulator activities. The
outcomes recommend the development of aviation programs with activities closely tailored to age-appropriate
academic objectives. Additionally, studies to further understand their value may provide insight into the long-term
benefits of youth engaged in such programs.
Recommended Citation: Belt, S.M. & Bollock, N.K. (2020). Assessing an Aviation Out-of-School Time Program: A Collective Case Study.
Collegiate Aviation Review International, 38(1), 106-121. Retrieved from
http://ojs.library.okstate.edu/osu/index.php/CARI/article/view/7961/7384
Belt & Bollock: Assessing an Aviation Out-of-School Time Program: A Collective Case Study
http://ojs.library.okstate.edu/osu/index.php/cari 107
Recent hiring trends fueled by a growing shortage of qualified pilots and aircraft
mechanics serve to increase the pressure on the aviation community to attract young people to
the profession (Boeing, 2019; Brinkmann, 2019). Given the historical reality that the industry is
predominantly white and male (Hansen, Oster, & National Research Council, 1997; Ison,
Herron, & Weiland, 2016), this dynamic supports efforts to increase access to underrepresented
populations, including women and people of color. This paper seeks to contribute insights and
outcomes from providing an aviation module during an Out-of-School Time (OST) program in
an underserved neighborhood to children of color. Specifically, it seeks to better understand the
effects of aviation OST programming from the perspective of the participants.
Background
There are several factors that challenge greater diversity in aviation for African American
populations, most notably precedent and access. According to Ison et al. (2016), in 2011, 2.9%
of employed professional pilots were African American. Furthermore, between 2004 and 2014,
while non-White participation in collegiate aviation programs increased from 17.1% to 22.2%,
African American participation increased an insignificant .29% (p. 29). The financial and
academic requirements of attaining the requisite qualifications for entry into the aviation
workforce likely serve to limit access by such underrepresented groups. As of 2017 (Annie E.
Casey Foundation, 2019), African American children made up 33% of children in poverty
(highest).
Additionally, 41% of children whose parents lacked secure employment (second highest),
and 45% of children living in households with a high housing cost burden (highest) were African
American. Regarding academic ability, the data is no less stark. African American youth
accounted for 81% of fourth-graders not proficient in reading (highest), 87% of eighth-graders
not proficient in math (highest), and 22% of high school students who did not graduate on time
(second highest). By comparison, for each of these categories, White children were consistently
below the average at the lowest or second-lowest rates. The issue is framed by the sheer lack of a
legitimate idea of becoming a pilot or aircraft mechanic (Turner & Lapan, 2003).
In contrast, there is a long-standing tradition to share one’s passion for flight with the
younger generations that goes back to the very beginning of the aviation community, and
outreach programs remain a popular means for attempting to generate interest (Lutte, 2018).
There are a myriad of initiatives designed to introduce young people to the world of aviation and
a multitude of lesson plans and programs available for those who wish to provide encounters
within the field. Such efforts are supported by research related to OST programs in general and
STEM disciplines in particular (Carrick, Miller, Hagedorn, Smith-Konter, & Velasco, 2016;
McCombs, Whitaker, & Yoo, 2017; Molina, Borror, & Desir, 2016; National Commission on
Mathematics and Science Teaching for the 21st Century, 2000).
Collegiate Aviation Review International
A publication of the University Aviation Association, © 2020 108
OST interventions are shown to address academic performance as well as social behavior
(Jenson et al., 2018). For example, Carrick et al. (2016), concluded that a summer high school
geoscience program was “a very effective strategy for inspiring interest in and recruitment into
the geosciences among Hispanic American high school students” (p. 95). Durlak, Pachan, and
Weissberg (2010) explained that in the U.S., the focus on OSTs had increased in recent years and
that such interventions were implemented with an expectation of increased personal and social
growth.
Methodology
Consistent with the goal of understanding the effects of an aviation OST program from the
perspective of underserved African American youth, the researchers adopted a qualitative collective
instrumental case study approach (Yin, 2003). An aviation module conducted as part of a month-
long summer camp within a neighborhood plagued by low income and high crime was purposefully
selected (Creswell & Poth, 2018). Data was collected from two sessions of the camp, offered in July
of 2018 and 2019. Six of the initial 11 participants returned for the second year. The age of the
campers ranged from 7 to 16 years old, all of whom were African American. The ratio between
female and male participants was roughly balanced, with 17 females and 14 males. Twelve camp
counselors participated in the camps. The counselors’ age ranged from 16 to 23 years old, with
seven female counselors and five male counselors. Two counselors were collegiate aviation
(flight) students. Participation rates fluctuated weekly for each group as not all campers or
counselors were able to participate every week.
The researchers were engaged in the summer camp activities as camp counselors and
functioned as participant observers (Ravitch & Carl, 2016). Given their presence as additional
counselors, the researchers were able to move from the roles of complete participant, participant
as an observer, and nonparticipant observer as needed (Creswell & Poth, 2018). The researchers
sought to limit observation bias and disruptions of the activities by collecting observation data by
way of hand-written field notes. As circumstances allowed, they would quietly withdraw from
activity to make notes. During times when they were in a more active role, they would wait until
the end of the activity to collect their observations. Permission to conduct the study was obtained
from the Saint Louis University Institutional Review Board (IRB #29032). The applicable
consent was obtained from all participants prior to collecting data.
The aviation program occurred twice weekly during each of the four weeks of the camp.
Data was collected via surveys, worksheets, reflections, and observations. Weekly satisfaction
surveys were conducted at the end of each week for both campers and counselors. Campers also
completed an end of the camp survey while the aviation counselors were asked to provide a final
reflection. The questions in the surveys were developed based on a number of out of the school
time research studies (Harvard Family Research Project, 2004; Kittur, Shaw, & Herrera, 2017;
Rudd, Aguilera, Elliott, & Chambers, 2017). Questions for the youth attempted to elicit their
attitudes regarding the activities within the aviation module of the camp, while questions for the
counselors were developed to understand their perspectives towards youth participation. The
surveys included a Likert scale, open-ended, and dichotomous questions. Worksheets included
short answer and fill in the blank questions related to the session material. Observations were
collected using field notes and included informal assessments and discussions with the campers
and counselors.
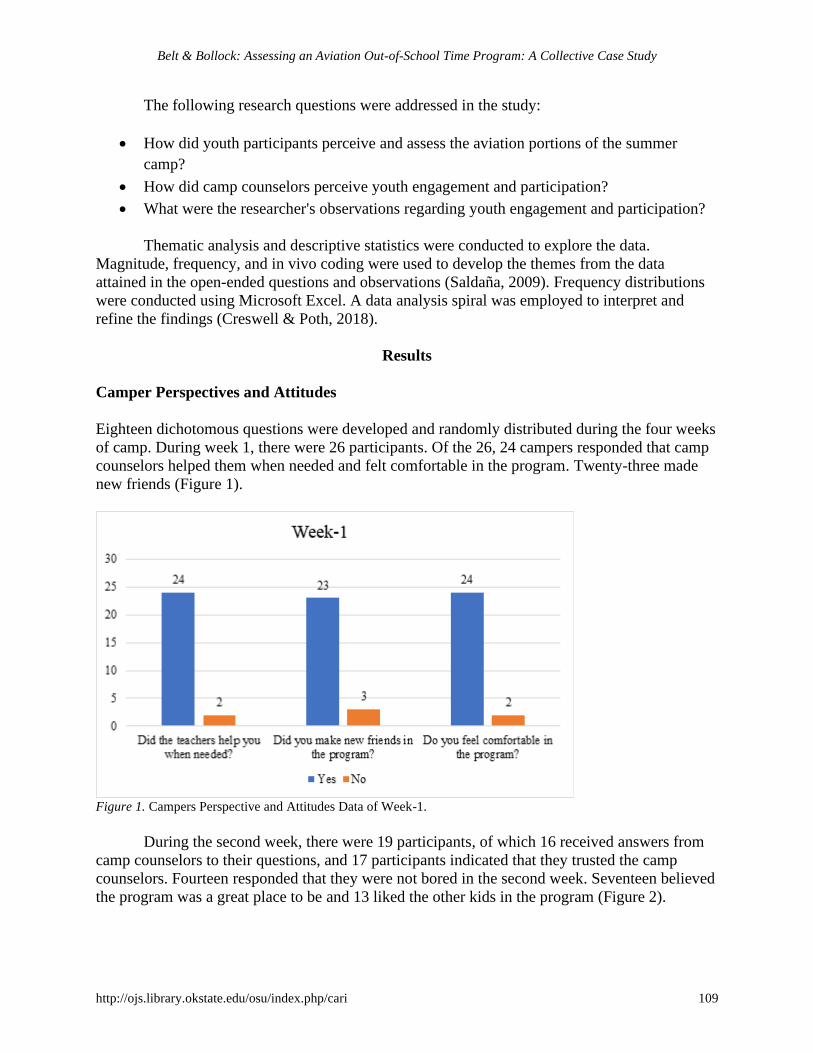
Belt & Bollock: Assessing an Aviation Out-of-School Time Program: A Collective Case Study
http://ojs.library.okstate.edu/osu/index.php/cari 109
The following research questions were addressed in the study:
• How did youth participants perceive and assess the aviation portions of the summer
camp?
• How did camp counselors perceive youth engagement and participation?
• What were the researcher's observations regarding youth engagement and participation?
Thematic analysis and descriptive statistics were conducted to explore the data.
Magnitude, frequency, and in vivo coding were used to develop the themes from the data
attained in the open-ended questions and observations (Saldaña, 2009). Frequency distributions
were conducted using Microsoft Excel. A data analysis spiral was employed to interpret and
refine the findings (Creswell & Poth, 2018).
Results
Camper Perspectives and Attitudes
Eighteen dichotomous questions were developed and randomly distributed during the four weeks
of camp. During week 1, there were 26 participants. Of the 26, 24 campers responded that camp
counselors helped them when needed and felt comfortable in the program. Twenty-three made
new friends (Figure 1).
Figure 1. Campers Perspective and Attitudes Data of Week-1.
During the second week, there were 19 participants, of which 16 received answers from
camp counselors to their questions, and 17 participants indicated that they trusted the camp
counselors. Fourteen responded that they were not bored in the second week. Seventeen believed
the program was a great place to be and 13 liked the other kids in the program (Figure 2).
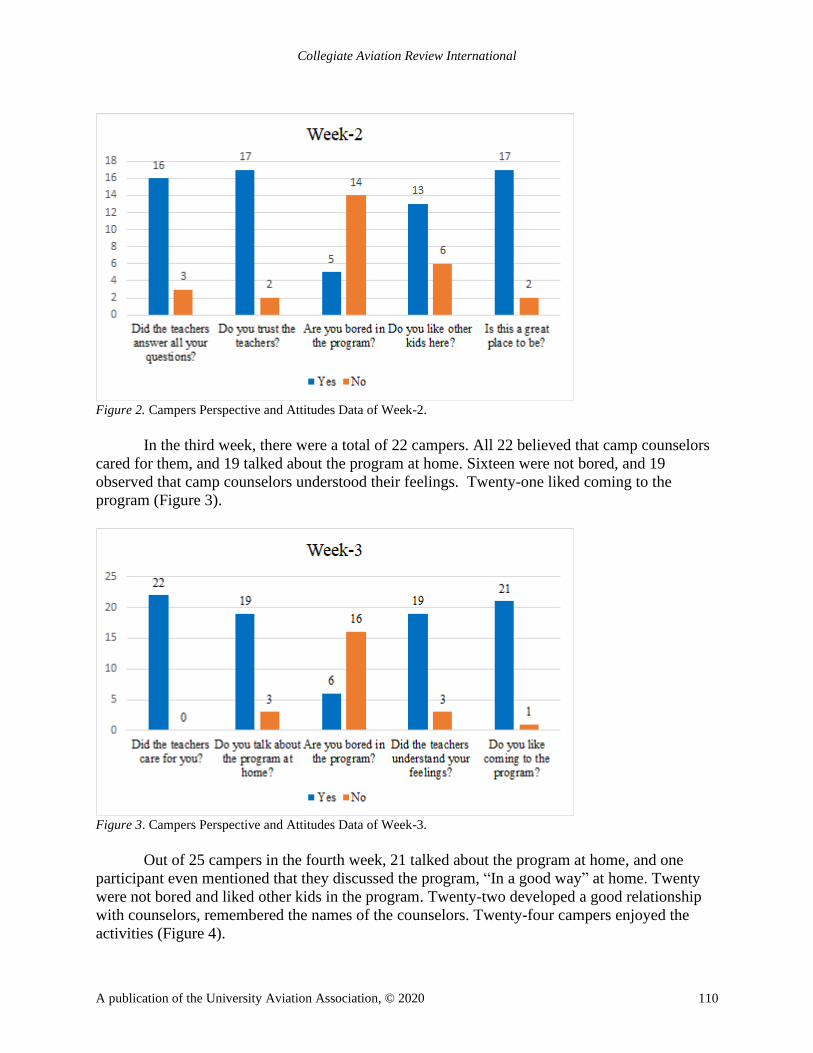
Collegiate Aviation Review International
A publication of the University Aviation Association, © 2020 110
Figure 2. Campers Perspective and Attitudes Data of Week-2.
In the third week, there were a total of 22 campers. All 22 believed that camp counselors
cared for them, and 19 talked about the program at home. Sixteen were not bored, and 19
observed that camp counselors understood their feelings. Twenty-one liked coming to the
program (Figure 3).
Figure 3. Campers Perspective and Attitudes Data of Week-3.
Out of 25 campers in the fourth week, 21 talked about the program at home, and one
participant even mentioned that they discussed the program, “In a good way” at home. Twenty
were not bored and liked other kids in the program. Twenty-two developed a good relationship
with counselors, remembered the names of the counselors. Twenty-four campers enjoyed the
activities (Figure 4).
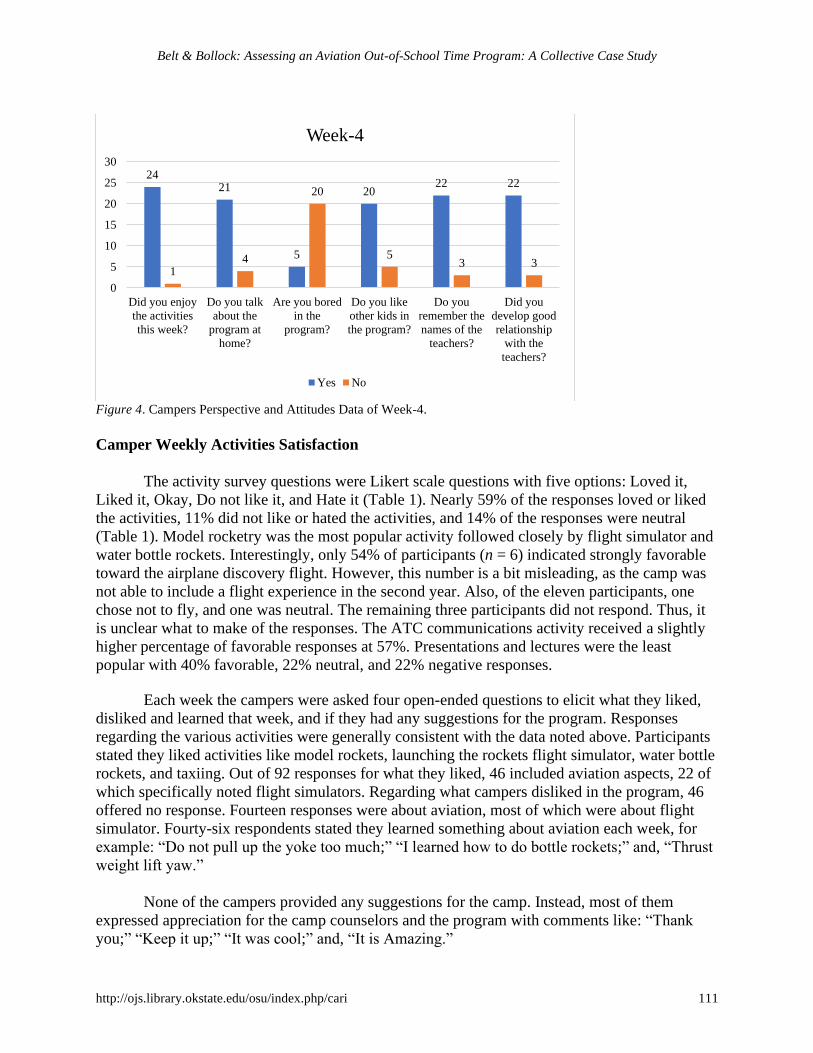
Belt & Bollock: Assessing an Aviation Out-of-School Time Program: A Collective Case Study
http://ojs.library.okstate.edu/osu/index.php/cari 111
Figure 4. Campers Perspective and Attitudes Data of Week-4.
Camper Weekly Activities Satisfaction
The activity survey questions were Likert scale questions with five options: Loved it,
Liked it, Okay, Do not like it, and Hate it (Table 1). Nearly 59% of the responses loved or liked
the activities, 11% did not like or hated the activities, and 14% of the responses were neutral
(Table 1). Model rocketry was the most popular activity followed closely by flight simulator and
water bottle rockets. Interestingly, only 54% of participants (n = 6) indicated strongly favorable
toward the airplane discovery flight. However, this number is a bit misleading, as the camp was
not able to include a flight experience in the second year. Also, of the eleven participants, one
chose not to fly, and one was neutral. The remaining three participants did not respond. Thus, it
is unclear what to make of the responses. The ATC communications activity received a slightly
higher percentage of favorable responses at 57%. Presentations and lectures were the least
popular with 40% favorable, 22% neutral, and 22% negative responses.
Each week the campers were asked four open-ended questions to elicit what they liked,
disliked and learned that week, and if they had any suggestions for the program. Responses
regarding the various activities were generally consistent with the data noted above. Participants
stated they liked activities like model rockets, launching the rockets flight simulator, water bottle
rockets, and taxiing. Out of 92 responses for what they liked, 46 included aviation aspects, 22 of
which specifically noted flight simulators. Regarding what campers disliked in the program, 46
offered no response. Fourteen responses were about aviation, most of which were about flight
simulator. Fourty-six respondents stated they learned something about aviation each week, for
example: “Do not pull up the yoke too much;” “I learned how to do bottle rockets;” and, “Thrust
weight lift yaw.”
None of the campers provided any suggestions for the camp. Instead, most of them
expressed appreciation for the camp counselors and the program with comments like: “Thank
you;” “Keep it up;” “It was cool;” and, “It is Amazing.”
2421
5
2022 22
14
20
53 3
0
5
10
15
20
25
30
Did you enjoy
the activities
this week?
Do you talk
about the
program at
home?
Are you bored
in the
program?
Do you like
other kids in
the program?
Do you
remember the
names of the
teachers?
Did you
develop good
relationship
with the
teachers?
Week-4
Yes No
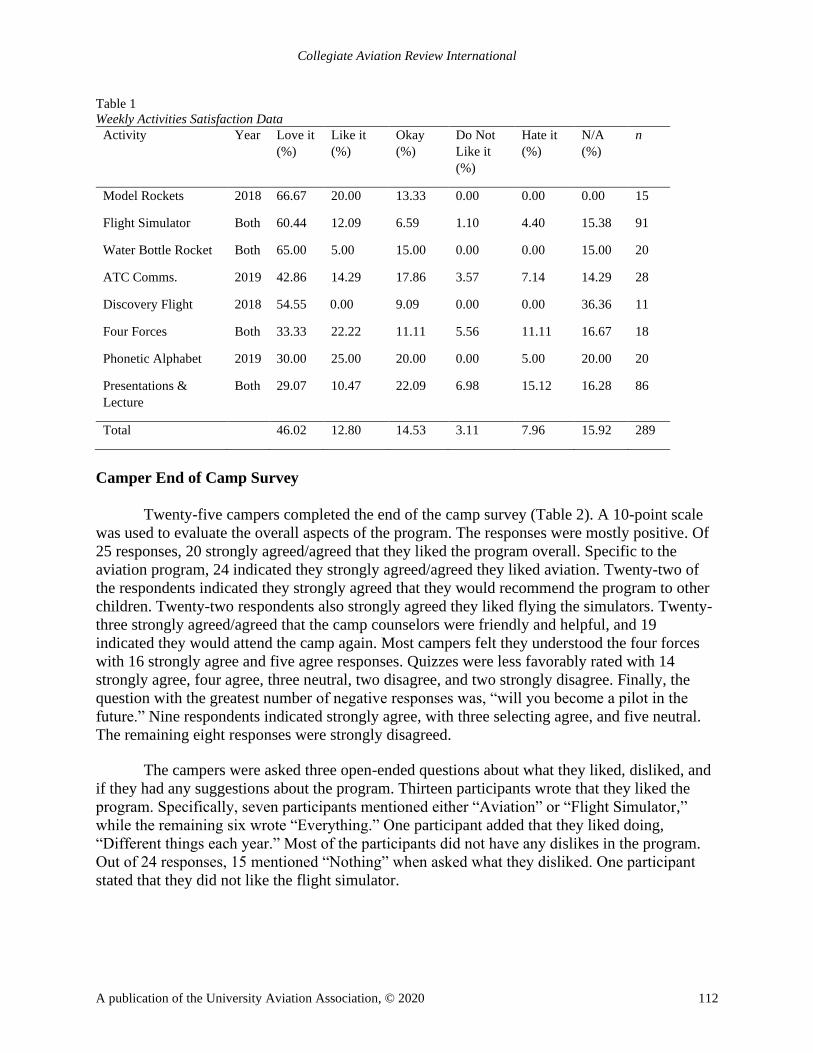
Collegiate Aviation Review International
A publication of the University Aviation Association, © 2020 112
Table 1
Weekly Activities Satisfaction Data
Activity Year Love it
(%)
Like it
(%)
Okay
(%)
Do Not
Like it
(%)
Hate it
(%)
N/A
(%)
n
Model Rockets 2018 66.67 20.00 13.33 0.00 0.00 0.00 15
Flight Simulator Both 60.44 12.09 6.59 1.10 4.40 15.38 91
Water Bottle Rocket Both 65.00 5.00 15.00 0.00 0.00 15.00 20
ATC Comms. 2019 42.86 14.29 17.86 3.57 7.14 14.29 28
Discovery Flight 2018 54.55 0.00 9.09 0.00 0.00 36.36 11
Four Forces Both 33.33 22.22 11.11 5.56 11.11 16.67 18
Phonetic Alphabet 2019 30.00 25.00 20.00 0.00 5.00 20.00 20
Presentations &
Lecture
Both 29.07 10.47 22.09 6.98 15.12 16.28 86
Total 46.02 12.80 14.53 3.11 7.96 15.92 289
Camper End of Camp Survey
Twenty-five campers completed the end of the camp survey (Table 2). A 10-point scale
was used to evaluate the overall aspects of the program. The responses were mostly positive. Of
25 responses, 20 strongly agreed/agreed that they liked the program overall. Specific to the
aviation program, 24 indicated they strongly agreed/agreed they liked aviation. Twenty-two of
the respondents indicated they strongly agreed that they would recommend the program to other
children. Twenty-two respondents also strongly agreed they liked flying the simulators. Twenty-
three strongly agreed/agreed that the camp counselors were friendly and helpful, and 19
indicated they would attend the camp again. Most campers felt they understood the four forces
with 16 strongly agree and five agree responses. Quizzes were less favorably rated with 14
strongly agree, four agree, three neutral, two disagree, and two strongly disagree. Finally, the
question with the greatest number of negative responses was, “will you become a pilot in the
future.” Nine respondents indicated strongly agree, with three selecting agree, and five neutral.
The remaining eight responses were strongly disagreed.
The campers were asked three open-ended questions about what they liked, disliked, and
if they had any suggestions about the program. Thirteen participants wrote that they liked the
program. Specifically, seven participants mentioned either “Aviation” or “Flight Simulator,”
while the remaining six wrote “Everything.” One participant added that they liked doing,
“Different things each year.” Most of the participants did not have any dislikes in the program.
Out of 24 responses, 15 mentioned “Nothing” when asked what they disliked. One participant
stated that they did not like the flight simulator.
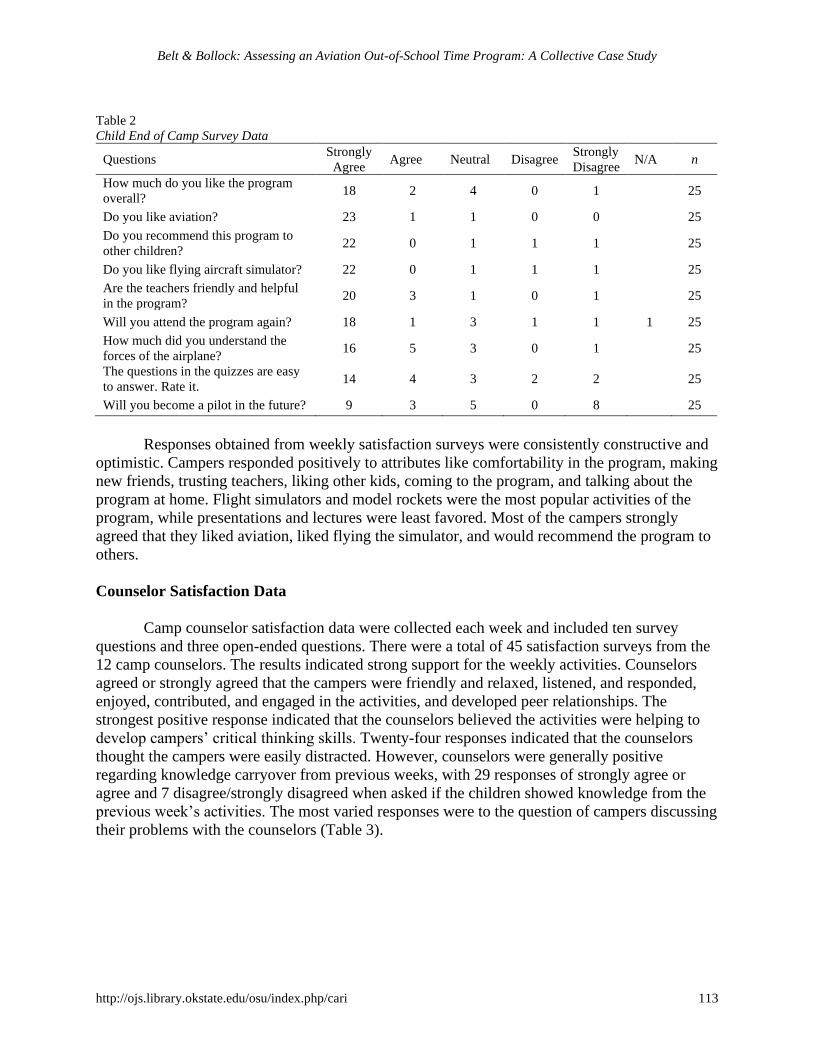
Belt & Bollock: Assessing an Aviation Out-of-School Time Program: A Collective Case Study
http://ojs.library.okstate.edu/osu/index.php/cari 113
Table 2
Child End of Camp Survey Data
Questions Strongly
Agree Agree Neutral Disagree
Strongly
Disagree N/A n
How much do you like the program
overall? 18 2 4 0 1
25
Do you like aviation? 23 1 1 0 0
25
Do you recommend this program to
other children? 22 0 1 1 1 25
Do you like flying aircraft simulator? 22 0 1 1 1 25
Are the teachers friendly and helpful
in the program? 20 3 1 0 1 25
Will you attend the program again? 18 1 3 1 1 1 25
How much did you understand the
forces of the airplane? 16 5 3 0 1 25
The questions in the quizzes are easy
to answer. Rate it. 14 4 3 2 2 25
Will you become a pilot in the future? 9 3 5 0 8 25
Responses obtained from weekly satisfaction surveys were consistently constructive and
optimistic. Campers responded positively to attributes like comfortability in the program, making
new friends, trusting teachers, liking other kids, coming to the program, and talking about the
program at home. Flight simulators and model rockets were the most popular activities of the
program, while presentations and lectures were least favored. Most of the campers strongly
agreed that they liked aviation, liked flying the simulator, and would recommend the program to
others.
Counselor Satisfaction Data
Camp counselor satisfaction data were collected each week and included ten survey
questions and three open-ended questions. There were a total of 45 satisfaction surveys from the
12 camp counselors. The results indicated strong support for the weekly activities. Counselors
agreed or strongly agreed that the campers were friendly and relaxed, listened, and responded,
enjoyed, contributed, and engaged in the activities, and developed peer relationships. The
strongest positive response indicated that the counselors believed the activities were helping to
develop campers’ critical thinking skills. Twenty-four responses indicated that the counselors
thought the campers were easily distracted. However, counselors were generally positive
regarding knowledge carryover from previous weeks, with 29 responses of strongly agree or
agree and 7 disagree/strongly disagreed when asked if the children showed knowledge from the
previous week’s activities. The most varied responses were to the question of campers discussing
their problems with the counselors (Table 3).
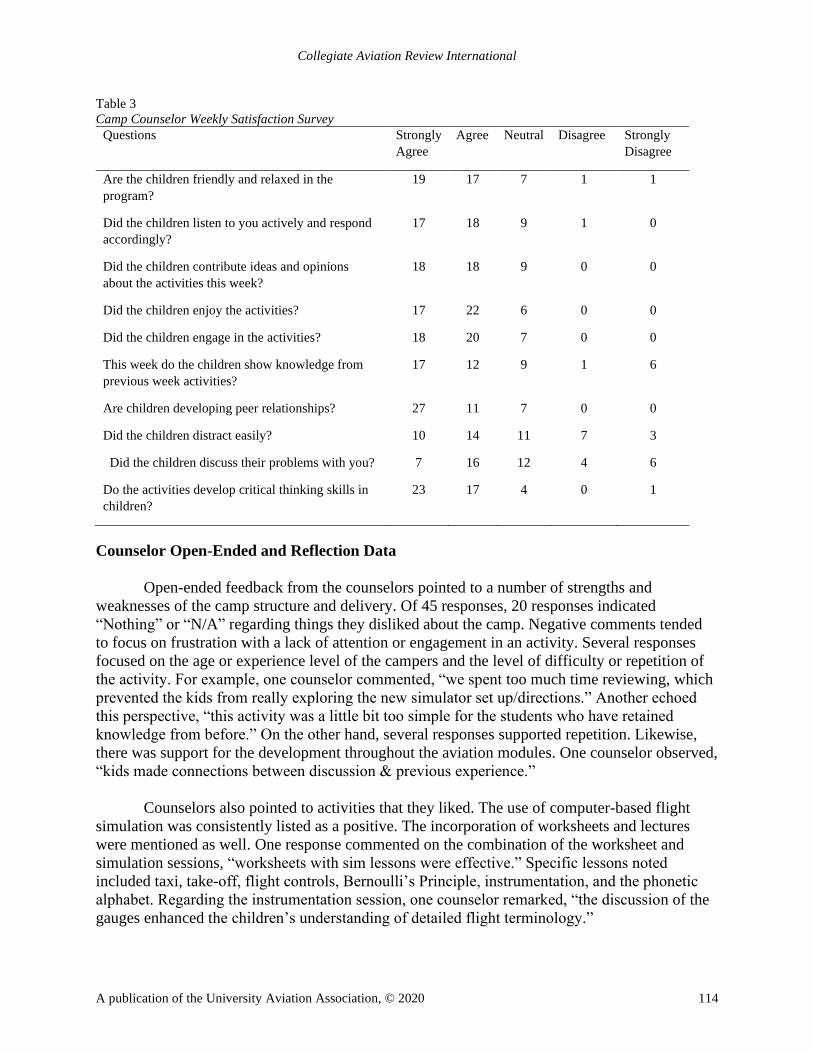
Collegiate Aviation Review International
A publication of the University Aviation Association, © 2020 114
Table 3
Camp Counselor Weekly Satisfaction Survey
Questions Strongly
Agree
Agree Neutral Disagree Strongly
Disagree
Are the children friendly and relaxed in the
program?
19 17 7 1 1
Did the children listen to you actively and respond
accordingly?
17 18 9 1 0
Did the children contribute ideas and opinions
about the activities this week?
18 18 9 0 0
Did the children enjoy the activities? 17 22 6 0 0
Did the children engage in the activities? 18 20 7 0 0
This week do the children show knowledge from
previous week activities?
17 12 9 1 6
Are children developing peer relationships? 27 11 7 0 0
Did the children distract easily? 10 14 11 7 3
Did the children discuss their problems with you? 7 16 12 4 6
Do the activities develop critical thinking skills in
children?
23 17 4 0 1
Counselor Open-Ended and Reflection Data
Open-ended feedback from the counselors pointed to a number of strengths and
weaknesses of the camp structure and delivery. Of 45 responses, 20 responses indicated
“Nothing” or “N/A” regarding things they disliked about the camp. Negative comments tended
to focus on frustration with a lack of attention or engagement in an activity. Several responses
focused on the age or experience level of the campers and the level of difficulty or repetition of
the activity. For example, one counselor commented, “we spent too much time reviewing, which
prevented the kids from really exploring the new simulator set up/directions.” Another echoed
this perspective, “this activity was a little bit too simple for the students who have retained
knowledge from before.” On the other hand, several responses supported repetition. Likewise,
there was support for the development throughout the aviation modules. One counselor observed,
“kids made connections between discussion & previous experience.”
Counselors also pointed to activities that they liked. The use of computer-based flight
simulation was consistently listed as a positive. The incorporation of worksheets and lectures
were mentioned as well. One response commented on the combination of the worksheet and
simulation sessions, “worksheets with sim lessons were effective.” Specific lessons noted
included taxi, take-off, flight controls, Bernoulli’s Principle, instrumentation, and the phonetic
alphabet. Regarding the instrumentation session, one counselor remarked, “the discussion of the
gauges enhanced the children’s understanding of detailed flight terminology.”
Belt & Bollock: Assessing an Aviation Out-of-School Time Program: A Collective Case Study
http://ojs.library.okstate.edu/osu/index.php/cari 115
Comparable to simulator activities, rocket building and launching were frequently
mentioned. As one counselor remarked, “rocket building helped with reading instructions and
motor skills and children liked this activity.” Likewise, the incorporation of air traffic control-
style communications was explicitly mentioned as a positive aspect of simulation sessions. This
was a feature that was introduced during the third week of the second summer camp. One
counselor stated, “Once they got involved with Air Traffic Control (ATC), they seemed more
focused and less inclined to fly off or intentionally crash.” Similarly, games were mentioned as
something the counselors liked. Suggestions for improving the program included developing
challenges of increasing complexity, additional worksheets, lessons, and the use of more
children’s games.
The two aviation undergraduate counselors were asked to complete an additional
reflection on aviation activities. Both commented that, in addition to the simulators, worksheets
were the most compelling aspect of the aviation camp modules:
The simulators paired with the worksheets were the most effective in teaching the basics
of flight.
The most effective aspect of the aviation module was worksheets. Without the
worksheets, planning out sims and finding a universal way to teach the kids would be
more difficult.
When asked about the value of the aviation component of the summer camp, the aviation
counselors offered complementary, yet distinct reflections. One spoke to the developmental
knowledge, skills, and abilities provided. For this person, the aviation program, “Improves
listening and motor skills. Children also learn basic physics and other subjects while having fun.
They also came up with creative solutions, and it engaged their imagination.” The other
counselor spoke to the broader impact such an encounter provided the children, “The value of the
aviation module is indescribable. It showed the kids a new world with various possibilities for
them.”
Regarding what they learned about themselves as a result of their participation, both
wrote about the need for patience when working with children. Both counselors reflected on
connecting with the children. One focused on the need to develop a varied teaching style to
connect with different children, “I learned how to adapt to each child’s learning pace and find
creative visuals to teach the kids.” The other spoke to the challenge of maintaining focus during
difficult times with the children, “they also liked learning but tried to act as if they did not.” This
person concluded, “It was neat how the children grasped new concepts and knowledge and how
behaviors changed during the progression of camp.”
Observations
The researchers shared and reflected upon their individual observations within the
broader context of the data collected from each group of participants. A number of themes
emerged that appeared to expand and further nuance the results achieved through analysis of
Collegiate Aviation Review International
A publication of the University Aviation Association, © 2020 116
participant provided data. These observations are discussed below in terms of active learning,
simulator use, and one-on-one interactions.
Active learning. Lecture and other, more passive activities were a challenging aspect of the
program. The youth showed more interest in events that were higher energy. For example, the
youth seemed more interested in launching rockets than building them. Even with hot
temperatures outside, the patience and interest of the youth were consistently greater during the
rocket launch activities. Moreover, many appeared to be enthusiastic to see how the rocket they
built flew.
It was somewhat surprising that some campers shunned the rocket building activity. At
the extreme, two campers initially refused to participate in building a water bottle rocket. These
campers were given a choice to move to an adjacent room and sit or read quietly. One camper
observed the others working on their rockets and soon decided to rejoin the activity. The other
camper maintained that they thought the activity was childish and did not participate. However,
once they saw the rockets fly, they became quite engaged with the launching process. A few days
later, when the group began to build Estes model rockets, that camper was attentive and engaged.
In each case, the campers did not appear to have an adequate perception of how the activity
would unfold. By allowing them the option to observe but not participate resulted in their re-
engagement of the activity.
Understandably, the least favorite activities were presentations and worksheets. In 2018,
rewards in the form of candy were offered as an incentive to participate and pay attention. The
campers were told they would get candy if they answered questions correctly. Not surprisingly,
even those who did not appear to be paying attention raised their hands to answer the questions
and frequently answered correctly. In 2019, there were no such rewards, and most of the time,
the campers did not volunteer to answer the counselor’s questions. However, when called on,
most of the campers were able to answer correctly, even without the added incentive. Thus, in
either case, it appeared to be a misconception that the campers were not paying attention to the
lectures. Furthermore, over-reliance on gimmicks to increase participation may not yield the
desired results. Understanding the attention span of the age group as well as the current
techniques employed at the particular age level may have a more satisfactory outcome. A
number of such approaches were observed during the study.
One such technique was limiting lectures in terms of length and material. Keeping
lectures short and focused on a few key points appeared to be helpful in maintaining interest.
Also, understanding that the campers may be paying attention even when it did not appear so
seemed to bolster the counselors’ confidence with an activity. Another strategy that helped to
maintain engagement was the addition of various games designed to help introduce a topic and
reinforce learning. Two such games were Thumbs Up and Simon Says. Thumbs Up was
developed to review the four forces of flight. The counselor called out one of the four forces: lift,
weight, thrust, drag. The campers would respond to the counselor’s call-out by putting their
thumbs up for lift, turn them down for weight, backward for drag, and point with their forefinger
for thrust. If a camper indicated the wrong vector, they would sit down for the remainder of the
round. Similarly, the counselors adapted Simon Says to help the campers practice the three
degrees of freedom: pitch, roll, and yaw. A counselor would play Simon and direct the campers
Belt & Bollock: Assessing an Aviation Out-of-School Time Program: A Collective Case Study
http://ojs.library.okstate.edu/osu/index.php/cari 117
to perform an action on the control yoke, for example, “Simon says roll left” or “Pitch up.” If the
camper performed the function without hearing, “Simon says,” they were out of that round of the
game.
Implementing worksheets was a third strategy for maintaining direction, particularly
when used in conjunction with simulator activities. Worksheets were developed by the collegiate
flight training camp counselors and required campers to use the simulators to in various ways in
order to complete tasks or answer questions. Campers would have to identify basic aerodynamic
principles, operate control surfaces, recognize and interpret flight instruments, and the like. The
worksheets were developed to be age-appropriate and to aid in the development of problem-
solving and critical thinking skills. From the first effort, it was clear that when presented with a
worksheet, the campers engaged the simulation activity with greater attention.
Simulator Use. It was not surprising that a great deal of interest and excitement surrounded
opportunities to work with the flight simulators. Campers would ask to use them on days when
aviation was not part of the camp schedule. However, similar to other activities in the program, it
became apparent that simulator sessions were more effective when they were more closely
tailored to the interests and abilities of the campers and had objectives they could achieve within
a session. Activities that did not account adequately for the age group quickly lost interest and
resulted in campers wandering off task. In addition to those noted above, a variety of techniques
were implemented to maintain focus by providing age-appropriate challenges and goals for the
campers to achieve. For example, basic aircraft control during taxi was introduced while
concurrently working on airport markings and the phonetic alphabet and supplemented with
games that reinforced the requisite knowledge for the activity.
During 2019, this gave way to a challenge for the campers to follow a set of instructions
and taxi from one point on the airport to another. The activity did not include a flight component,
and yet the campers maintained a fairly high degree of concentration as they worked to complete
the task. Toward the latter stages of the camp, this was further supplemented by networking the
simulators with an ATC station in a separate room. The campers used internet-enabled headsets
to communicate with ATC. A counselor provided taxi and take-off clearances as well as radar
vectors and other supporting instructions to help the participants navigate to a nearby landmark
while utilizing proper communication techniques. The addition of “radios” to the simulation
increased interest and maintained focus throughout the activity.
Working One-on-One. When able, campers and counselors were paired one-on-one.
With the added attention, the campers developed a greater rapport and were more likely to listen
to camp counselors, even outside of those sessions. During some sessions, not enough camp
counselors were available to provide such focused attention. This was particularly detrimental
during flight simulator activities where the shortage of counselors meant that the campers had to
wait for direction and support. At times, this resulted in distraction and impatience. The on-line
ATC activity alleviated this to some degree. The counselor in the other room performing the
ATC role could monitor and provide direction almost simultaneously to multiple campers. This
freed the in-room counselors to focus on campers who needed more attention. Additionally, the
novelty of communicating via the headsets served to help maintain focus as the campers
appeared to be more interested in following the directions provided over the radio.
Collegiate Aviation Review International
A publication of the University Aviation Association, © 2020 118
Limitations
The results of this study are limited. The study was purposefully focused on providing an
aviation experience to an underrepresented group. As a collective case study, the findings are
inherently limited in terms of generalizability. It is hoped that the perspectives will be useful for
the development of similar activities and will encourage additional research (Merriam, 2009).
The results obtained would benefit from further research across other disciplines and
populations. Questions that attempted to elicit camper preferences did not always provide
enough specificity, even when coupled with counselor feedback and observations. Future studies
may wish to consider follow-up questions to clarify what the campers liked or did not like.
Additionally, some of the responses to various survey questions appeared to be in
response to other activities of the summer camp. Because there were a variety of topics presented
during the camp, it is possible that some responses were referencing aspects of the camp other
than the aviation modules. This is particularly true where questions did not explicitly refer back
to aviation. Finally, while the results identified a number of strategies, evaluating best practices
was not a focus of the study. It did not address the question of how such programs might support
interest and academic performance in STEM-related subjects, nor can it predict the effect such a
program might have on youth development.
Conclusions
The data collected from the campers and the camp counselors, and the observations of the
researchers, all indicate that the perspectives and attitudes of the youth and counselors who
participated in the program were decidedly positive. Twenty-three out of 25 youth participants
responded that they liked aviation, and 22 would recommend the program to others. They found
the camp to be a supportive environment and felt cared for. The children were engaged and
motivated, even as they seemed at times to be distracted. The results suggest that the campers
were connected to and engaged in the program.
Likewise, it appeared to the adults that the youth developed critical thinking skills and
peer relationships; however, as this was not a primary focus of the study, additional research into
critical thinking and OST programs may provide additional insight. Games, worksheets, age-
appropriate challenges, and one-on-one supervision were effective in supporting lecture and
simulator activities. The addition of on-line ATC was particularly effective at drawing focus on
the planned activity. Overreliance on rewards did not appear to be as effective as identifying and
implementing strategies that were more closely suited to the age and experiences of the
participants. Given these outcomes, additional research into the educational benefits of the
strategies identified would serve to advance understanding of their value. In particular, further
investigation is needed to better understand the extent to which aviation programs may serve the
development of critical thinking skills.
Given the outcomes of the study, the development of aviation programs with activities
closely tailored to age-appropriate academic objectives is recommended. Almost half of the
respondents indicated they would consider becoming pilots in the future, nine strongly so. The
remaining were either not interested or were neutral. It was interesting that the responses of those
Belt & Bollock: Assessing an Aviation Out-of-School Time Program: A Collective Case Study
http://ojs.library.okstate.edu/osu/index.php/cari 119
who did not want to become a pilot in the future were strongly so. While this outcome appears to
be consistent with the age of the campers and a normal diversity of interests, there may be
additional explanations for the response rate. Questions surrounding access to the idea of such a
career track as well as financial, educational, and other barriers remain. Additional research into
this area would provide a greater understanding of the motivations this population of young
people carries and the barriers they face. Regardless of career aspirations, longitudinal studies
that follow the progression of youth engaged in such programs may provide insight into long-
term benefits, including how such programs may support and encourage involvement and
persistence in educational pursuits, particularly as they relate to STEM disciplines.
Collegiate Aviation Review International
A publication of the University Aviation Association, © 2020 120
References
Annie E. Casey Foundation. (2019). 2019 Kids Count Data Book: State trends in child well-being.
Retrieved from: www.aecf.org
Boeing. (2019). The 2019 Boeing Pilot and Technician Outlook. Retrieved from:
https://www.boeing.com/commercial/market/pilot-technician-outlook/#/overview
Brinkmann, P. (2019). Looming pilot shortage lifts aviation schools. UPI. Retrieved from
https://www.upi.com/Top_News/US/2019/10/29/Looming-pilot-shortage-lifts-aviation-
schools/2021571945946/
Carrick, T. L., Miller, K. C., Hagedorn, E. A., Smith-Konter, B. R., & Velasco, A. A. (2016). Pathways to
the Geosciences Summer High School Program: A Ten-Year Evaluation. Journal of Geoscience
Education, 64(1), 87-97.
Creswell, J. W., & Poth, C. N. (2018). Qualitative inquiry & research design choosing among five
approaches. Thousand Oaks, CA: Sage.
Durlak, J. A., Pachan, M., & Weissberg, R. P. (2010). A Meta-Analysis of After-School Programs That
Seek to Promote Personal and Social Skills in Children and Adolescents. American Journal of
Community Psychology, 45(3-4), 294-309. doi:10.1007/s10464-010-9300-6
Hansen, J. S., Oster, C. V., & National Research Council. (1997). Taking flight: education and training
for aviation careers. Washington, D.C.: National Academy Press.
Harvard Family Research Project. (2004). Performance Measures in Out-of-School Time Evaluation.
Out-of-School Time Evaluation Snapshot, Number 3. Harvard University. Retrieved from:
https://eric.ed.gov/?id=ED483278
Ison, D. C., Herron, R., & Weiland, L. (2016). Two Decades of Progress for Minorities in Aviation.
Journal of Aviation Technology & Engineering, 6(1), 25-33. doi:10.7771/2159-6670.1141
Jenson, J. M., Veeh, C., Anyon, Y., St. Mary, J., Calhoun, M., Tejada, J., & Lechuga-Peña, S. (2018).
Effects of an afterschool program on the academic outcomes of children and youth residing in
public housing neighborhoods: A quasi-experimental study. Children and Youth Services Review,
88, 211-217. doi:10.1016/j.childyouth.2018.03.014
Kittur, H., Shaw, L., & Herrera, W. (2017). A New Model for a Multi-Disciplinary Engineering Summer
Research Program for High School Seniors: Program Overview, Effectiveness, and Outcomes.
Journal of STEM Education: Innovations & Research, 18(4), 25-31.
Lutte, R. K. (2018). Aviation Outreach Model and Gap Analysis: Examining Solutions to Address
Workforce Shortages. Collegiate Aviation Review, 36(1), 13-33.
McCombs, J. S., Whitaker, A. A., & Yoo, P. Y. (2017). The Value of Out-of-School Time Programs.
Rand Corporation. Retrieved from: https://www.rand.org/pubs/perspectives/PE267.html.
Merriam, S.B., Qualitative research. 2009, San Francisco: Jossey-Bass.
Belt & Bollock: Assessing an Aviation Out-of-School Time Program: A Collective Case Study
http://ojs.library.okstate.edu/osu/index.php/cari 121
Molina, R., Borror, J., & Desir, C. (2016). Supporting STEM Success With Elementary Students of Color
in a Low-Income Community. Distance Learning, 13(2), 19.
National Commission on Mathematics and Science Teaching for the 21st Century. (2000). Before it's too
late: a report to the nation from the National Commission on Mathematics and Science Teaching
for the 21st Century. U.S. Dept. of Education. Retrieved from: https://eric.ed.gov/?id=ED441705
Ravitch, S. M., & Carl, N. M. (2016). Qualitative Research: Bridging the Conceptual, Theoretical, and
Methodological. Thousand Oaks, CA: Sage.
Rudd, P., Aguilera, A. B. V., Elliott, L., Chambers, B., Education Endowment, F., & Institute for
Effective, E. (2017). MathsFlip: Flipped Learning. Evaluation Report and Executive Summary.
Retrieved from https://eric.ed.gov/?id=ED581151.
Saldaña, J. (2009). The coding manual for qualitative researchers. Thousand Oaks, CA: Sage.
Turner, S. L., & Lapan, R. T. (2003). The Measurement of Career Interests Among At-Risk Inner-City
and Middle-Class Suburban Adolescents. Journal of Career Assessment, 11(4), 405.
Yin, R. K. (2003). Case study research: design and methods (3rd ed. ed.): Sage Publications.
A publication of the University Aviation Association, © 2020, ISSN: 1523-5955 122
Collegiate Aviation Review
International
Volume 38 | Issue 1 Peer-Reviewed Article #8
4-23-2020
Assessing Cultural Drivers of Safety
Resilience in a Collegiate Aviation
Program
Daniel Kwasi Adjekum
University of North Dakota
Marcos Fernandez-Tous
University of North Dakota
Organizational safety resilience is a key factor in sustaining an effective safety management system (SMS) in high-
reliability organizations (HROs) such as aviation. Extant research advocates for monitoring, assessing and
continuously improving safety in an organization that has a fully-functional SMS. Safety resilience provides a buffer
against vulnerabilities. Extant research also suggests a paucity in terms of a measurement framework for
organizational safety resilience in collegiate aviation operations. A quantitative approach using Reason’s safety
resilience concept (Reason, 2011) is used to assess organizational safety resilience in a collegiate aviation program
with an active conformance SMS accepted by the FAA. A sample of 516 research participants responded to an
online survey instrument derived from Reason (2011). Structural Equation Model (SEM)/Path Analysis (PA)
techniques are used to assess models that measure the strength of relationships between three cultural drivers
(Commitment, Cognizance, Competence) of safety and safety resilience. There were strong significant relationships
between these cultural drivers and safety resilience. Path analysis suggests that Commitment significantly mediates
the path between Cognizance and Competence and highlights its important role in sustaining safety competencies.
There were significant differences in the perceptions of safety resilience among top-level leadership, flight
operations and ground operations. Flight operations and ground operations had higher mean scores on safety
resilience than top-level leadership. Study provides a validated model of safety resilience that is essential for SMS
improvements in collegiate aviation programs. Future studies will utilize this safety resilience model to assess other
collegiate aviation programs in various phases of SMS implementation, airlines, and air traffic control operations.
Recommended Citation: Adjekum, D. K. & Fernandez-Tous, M. (2020). Assessing Cultural Drivers of Safety Resilience in a Collegiate
Aviation Program. Collegiate Aviation Review International, 38(1), 122-147. Retrieved from
http://ojs.library.okstate.edu/osu/index.php/CARI/article/view/8012/7386
Adjekum & Fernandez-Tous: Assessing Cultural Drivers of Safety Resilience in a Collegiate Aviation Program
http://ojs.library.okstate.edu/osu/index.php/cari 123
A rapidly changing technological workspace and corresponding requirements for
acceptable-levels of safety in the aviation operational environment should be complemented by a
proactive safety culture and organizational resilience. Safety resilience is a characteristic of an
organization that has good safety procedures and practices which enable it to have greater
resistance to incidents and accidents, as well as being able to cope better when they occur
(Hollnagel, Paries, Woods, & Wreathall, 2011).
Proactive safety culture and safety resilience are key enablers for effective safety
management systems (SMS) implementation and continuous improvement. Under normal
conditions a positive safety culture is known to be reflected in proactive behavior and to serve as
indirect indicator of organizational resilience (Schwarz, Wolfgang, & Gaisbachgrabner, 2016).
This acceptable–level of safety requirements has necessitated a global advocacy for a shift from
prescription-based safety management among aviation certificate holders to a performance based
one to enhance operational flexibility and resilience (ICAO, 2013a; ICAO, 2013b).
Improving operational capabilities while ensuring a commensurate level of acceptable
safety within a resilient culture is one of the key attributes of a Safety Management System
(SMS). SMS is a formal, top-down, organization-wide approach to managing safety risk and
assuring the effectiveness of safety risk controls. It includes systematic procedures, practices,
and policies for the management of safety risk (FAA, 2015a). Collegiate aviation programs are
not under regulatory mandate by the Federal Aviation Administration (FAA) to have an SMS.
However, SMS is required by certificate holders such as Part 121 airlines (Electronic Code of
Federal Register. Part 5, 2015). Some collegiate aviation programs have adopted the voluntary
SMS initiative promoted by the FAA due to the immense benefit derived in terms of proactive
risk management and building of a resilient safety culture in their operations (Adjekum, 2014).
Despite strenuous efforts to ensure an acceptable-level of safety in operations, there are
still un-anticipated safety risk in high reliability organizations (HROs) which are hazardous
organizations that operate almost error-free over long periods of time (Roberts, 1990). HROs are
entities that efficiently perceive changes in its environment and responds appropriately to them
and where accidents can be prevented through good organizational design and management (La
Porte, 1996; Weick & Sutcliffe, 2007). Examples of HROs are nuclear industry, oil and gas
industry and aviation. Programs that provide aviation training at the collegiate level can be
classified under generic aviation HROs. With the challenges of controlling these un-anticipated
safety risks, HROs should make every effort to build a safety resilient culture to sustain a
proactive safety system and prevent undesired safety events from re-occurring (Hollnagel,
Woods & Leveson, 2006).
Safety resilience ensures that HRO’s that operate in high risk environment such as
aviation training have robust safety defenses and controls to minimize their vulnerability to
adverse safety events. The topic of safety resilience within the aviation operational environment
Collegiate Aviation Review International
A publication of the University Aviation Association, © 2020 124
has been researched in extant literature (Akselsson, Koorneef, Stewart & Ward, 2009; Heese,
2012; Hollnagel, 2009; Hollnagel, 2014; Reason, 2011). The findings of these studies advocate
for robust and resilient safety systems as the next level in an organizational that has a fully
functional SMS program in place.
Reason (2011) provides a conceptual model of a safety resilience engine that drives an
organization’s safety program within a cultural context. Reason hypothesizes that these safety
cultural drivers (3Cs - commitment, competence and cognizance) are related to resilience in an
SMS program. An SMS that has reached the highest level of functionality and has all the various
components established, validated and effective needs to be continuously monitored and
improved due to changes in the operational environment (Schwarz & Kallus, 2015; Adjekum,
2017). Under the voluntary SMS program adopted by some collegiate aviation programs in the
U.S., the level of active conformance is attained when the Federal Aviation Administration
(FAA) acknowledges full implementation of the certificate holder’s SMS. The certificate holder
is expected to use organizational factors to build a strong safety resilience culture aimed at
reducing vulnerabilities (FAA, 2015b).
Changes such as financial status, national policies, quality of human resources, leadership
attrition and high–tempo operational activities may induce safety vulnerabilities (reductions in
the margins of safety that the safety controls can tolerate) (FAA, 2015a; Adjekum, 2017). Safety
resilience ensures that operational vulnerabilities due to increased activities are consistently
identified and managed. In the unfortunate scenario of an adverse safety event, an organization
that is resilient may still recover and operate effectively.
Research Problem
Extant studies on safety resilience in aviation have been mostly limited to commercial
aviation operations and air-traffic control management (Akselsson et al., 2009; Heese, 2012;
Hollnagel, 2009; Hollnagel, 2014; Reason, 2011). Specific studies on safety resilience in general
aviation such as collegiate flight training seems limited if not completely missing in the United
States. A search in extant literature suggests paucity in studies that assess the relationships
between the cultural drivers of safety (3Cs) and organizational safety resilience in a collegiate
aviation program with an active conformance SMS in the United States.
Research Objectives
Studies identifying areas of safety weaknesses and improvements in SMS of collegiate
aviation programs have been highly recommended (Adjekum, 2017). Determining the levels of
organizational safety resilience in an SMS accepted by the Federal Aviation Administration
(FAA) as being in the active conformance status can be beneficial to a collegiate aviation
program. This study aimed at determining survey instrument items that loaded strongly on
cultural drivers of safety using Confirmatory Factor Analysis (CFA). Measurement models that
links these cultural drivers of safety and their underlying measured items were assessed for
goodness-of-fit.
Adjekum & Fernandez-Tous: Assessing Cultural Drivers of Safety Resilience in a Collegiate Aviation Program
http://ojs.library.okstate.edu/osu/index.php/cari 125
Another objective was to assess the strength of relationships between the cultural drivers
of safety and organizational safety resilience in a collegiate aviation program using Structural
Equation Model (SEM) techniques. A full structural model that showed the relationships
between the 3Cs and organizational safety resilience was proposed. Reason (2011) suggested
that there were also intrinsic relationships among the 3Cs. Mediation/ Path analysis (PA) was
used to explore these relationships. Finally, variations in perceptions of organizational safety
resilience in the collegiate aviation program among demographic variables such as age,
functional groups and gender were analyzed.
Research Questions
1. What is the effectiveness of measurement models of Reason’s cultural drivers of
safety resilience “Commitment, Cognizance and Competence” in a collegiate aviation
program with an active conformance SMS?
2. What is the strength of relationships between the variables Commitment, Cognizance
and Competence and the latent construct organizational safety resilience in a
collegiate aviation program with an active conformance SMS?
3. What is the strength of relationships between variables Cognizance and Competence
when mediated by Commitment in a collegiate aviation with active conformance
SMS program?
4. What is the variation in perceptions among demographic variables Age, Functional
Groups and Gender on the three cultural drivers of safety in a collegiate aviation
program with an active conformance SMS?
Literature Review
Vulnerabilities in safety defenses of any organization can precipitate errors and failures
which can have adverse effects on the functional capabilities of such organizations. These
vulnerabilities can cause tragic accidents, destroy value, waste resources, and damage reputations
(Coombs, 2007; Yu, Sengul & Lester, 2008). Many organizations systematically strive to avoid
failure, particularly when the consequences are severe, and some HRO’s are able to achieve
remarkably error-free operations even in the face of challenging conditions (Weick & Sutcliffe,
2007).
Extant research in safety science suggests that accident rates in “ultra-safe” systems (such
as commercial aviation and nuclear power) seem to be asymptotic at around five disastrous
accidents per 10−7 safety units of the system (Amalberti, 2001). These findings suggest that even
for safety-conscious and safety-critical organizations, there may be challenges to eliminate all
failures. This supports the assertions that accidents are inevitable in complex, tightly coupled
systems (Leveson, Dulac, Marais & Carroll, 2009; Perrow, 1984). That is why the interlink
between safety resilience and safety management becomes very relevant to be able to proactively
identify vulnerabilities and veritable management practices that shapes the cultural drivers of
safety in such organizations (Reason, 2011).
Reason (2011) posits that the engine that drives any safety initiative in an organization is
primed by the cultural core of an organization. Within the core are three driving forces namely;
commitment, competence and cognizance. Commitment has two components: motivation and
Collegiate Aviation Review International
A publication of the University Aviation Association, © 2020 126
resources. Motivation hinges on whether an organization strives to be a domain model for good
safety practices, or whether it is content merely to keep one step ahead of regulatory sanctions.
Resources on the other hand deals with the financial and human capital (caliber and status of
those people assigned to direct the management of system safety) in the organization.
A highly resilient safety program in an organization requires the technical competence
necessary to achieve enhanced safety. Paries, Valot and Deharvenght (2018) using a generic
taxonomy of safety management modes, within the French Air Navigation Service Provider
(ANSP), found out that formal SMS implementation did not include many of the HROs features.
However, the researchers also found out that in the real “life” of the organization, particularly at
operational levels (control rooms and maintenance units), most of the HROs features could be
observed as informal work or skills. Paries et al. (2018) further suggests some defining technical
competencies of HROs as follows:
a. Identification of hazards and safety-critical activities.
b. Preparations and contingencies for crises and linking of crisis plans closely to
business-recovery plans.
c. Ensuring the defenses, barriers and safeguards possess adequate diversity and
redundancy.
d. Creating a structure of the organization that is sufficiently flexible and adaptive.
e. Ensuring the right kind of safety-related information is being collected and
analyzed appropriately.
f. Getting this information disseminated and making sure it is acted upon.
Cognizance is the final driver within the cultural core that determines the need for an
organization to be adequately conscious of the dangers that threaten its activities and understand
the true nature of the struggle for enhanced resilience. An organization must always be in state of
intelligent wariness even in the absence of bad outcomes (Reason, 2011; Hollnagel, 2014). This
is the very essence of a proactive safety culture. Cognizance ensures that the primary goal of
safety management which is, maintaining a region of the safety space associated with the
maximally attainable level of intrinsic resistance, is achieved (ICAO, 2013a).
In their research on resilience within the healthcare industry, Smith and Plunkett (2019)
posits a link between cognizance and competence. Their study analyzes the distinction between
‘work as imagined’ and ‘work as done’ as originally suggested by Hollnagel (2009). ‘Work as
imagined’ assumes that if the correct standard procedures are known, understood and followed,
safety will follow as a matter of course. However, staff at the ‘sharp end’ of organizations know
that to create safety in their work, variability is not only desirable but essential. This positive
adaptability within systems that allows good outcomes in the presence of both favorable and
adverse conditions is termed resilience. They further argue that clinical and organizational work
can be made safer, not only by addressing negative outcomes, but also by fostering excellence
and promoting resilience through non-punitive safety reporting.
Even within industries where there are formally established safety practices such as
aviation and the offshore oil industry; practical skills, support from colleagues, the creation of
‘performance spaces’ and flexibility in problem‐solving (all rooted in the informal elements of
work) are important in maintaining safety (Hollnagel, 2009). Oliver, Calvard, and Potočnik
Adjekum & Fernandez-Tous: Assessing Cultural Drivers of Safety Resilience in a Collegiate Aviation Program
http://ojs.library.okstate.edu/osu/index.php/cari 127
(2017) in a study on cognition, technology, and organizational limits suggest that HRO’s may
hold important lessons for other organizations as they tread a path between developing
capabilities for safety resilience aimed at avoiding errors and subsequent failures.
They also suggest that controllers of complex systems, whether they are pilots or
executives, run the risk of becoming insulated from the systems that they oversee. For top-level
management executives, this might result in separation from front-line operations, such as when
responsibilities are delegated to units who largely follow established protocols, resulting in
organizational mindlessness (Sutcliffe, Vogus & Dane, 2016). This is where commitment needs
to mediate the relationship between cognizance and competence at all levels.
Oliver et al. (2017) further found out that vulnerabilities in highly complex systems are
sometimes not matched by the organization’s ability to organize and control them in the face of
most conceivable conditions, let alone unpredictable ones. As organizations and systems grow in
scale and complexity, the issue of how to develop an organization to handle unexpected and
extreme events grows ever more challenging.
The implication is that top-management executives should continuously monitor and
develop improvement strategies to respond appropriately to unusual conditions. The cultural
drivers, namely; competence by top-level management and cognizance at all levels within the
organization is paramount for ensuring the organizational safety goal of resilience. Finally, the
assessment of the strength of relationships among the cultural drivers of safety is suggested by
Reason (2011) as the SMS becomes fully-functional and there is a constant shift in safety space
between vulnerabilities and resilience.
Methodology
Research Design
A quantitative research design involving an online and anonymous survey was used to
elicit the perceptions of respondent on scale items related to safety resilience in a collegiate
aviation program. Likert scaled items (1= strongly disagree to 5 = strongly agree) were adapted
from Reason’s attributes of a proactive safety resilient organization (Reason, 2011) and a face
/content validity review was done by two SMS subject -matter experts (SME) with combined
working experience of almost 40 years as SMS training facilitators, researchers and collegiate
aviation faculty members. Based on recommendations from the review, some minor changes in
survey items sequencing were done.
The cultural driver Commitment has 9 items with “Personnel proactively discuss safety-
related issues whenever the need arises” being an example of construct item. Competence has 7
items and an example of construct item is “There are standard operating procedures for recovery
from errors recognized which are reinforced by training.” The third cultural driver Cognizance
has 7 items and an example of construct item is “There are comparable procedures in place to
ensure safe transitions from the normal to emergency status.” Details of survey items used for
analysis is shown in Appendix A. A sample size greater than 300 was recommended as expedient
Collegiate Aviation Review International
A publication of the University Aviation Association, © 2020 128
to obtain meaningful fit of the measurement models based on Kline (2005) SEM
recommendations using model parameters.
Sampling and Survey Dissemination
A population of about 1850 comprised of students, faculty and supporting staff of a
collegiate aviation program in a large university located in the North-Western part of the U.S.
was sampled in this study. A convenience sampling approach was used to send an anonymous
online survey link via email to participants (aviation students, certified flight instructors, faculty,
maintenance, dispatch and top-level management) in the aviation program that also has an active
conformance level SMS accepted by the FAA.
The introduction of the survey had the research purpose, objectives and contact
information about the researchers. It also had a digital consent which provided the option to
accept or decline participation. For those who consented to participate, a hyperlink was provided
on completion of survey directing them to another site where participants could submit their
emails to win a $20 gift card in a random draw. The online survey was open for a three-week
period in the Fall semester of September 2019.
Data Collection and Preliminary Data Analysis
Relevant demographic data to assist in understanding the population was collected and
highlighted in this paper and will also be used in another study aimed solely at demographic
variations on safety resilience. At the end of the survey response period, the data was transferred
from the Qualtrics® survey site into IBM SPSS® version 26 software for preliminary screening.
The data was screened for multivariate normality using a combination of visual means such as
normality plots of histogram, kurtosis/skewness values and N-N plots (Fields, 2018). There were
no severe indications of non-normality or outliers in data that warranted transformations. IBM
SPSS® 26 analysis function for “pair-wise deletion of missing data” was used for the missing
data analysis. The full-information maximum likelihood approach using the IBM AMOS® V25
was used for model assessments, strength of relationships between measurement scale variables
(items), and the cultural drivers of safety (Enders & Bandalos, 2001).
Instrument Reliability, Construct Validity, and Goodness-Of- Fit Indices Criteria
The reliability of scale items underlying factors representing the cultural drivers that
generated acceptable fit for CFA models was determined. The outcomes from CFA models were
used to assess the reliability, convergent validity, and discriminant validity. A Cronbach’s alpha
(α) value of 0.7 or higher indicates good reliability of measured items (Nunnally, 1978) and
SPSS 26 was used to determine the reliability. Commitment (α = .85 for 7 items) and
Competence (α = .80 for 6 items) had good reliability. The factor Cognizance had a fair
reliability after the first analysis (α =. 54 for 5 items) and the reliability improvement function of
SPSS was used to delete the items cog 6 and cog 7. The next iteration improved the reliability (α
= .70 for 3 items) to an acceptable level.
Adjekum & Fernandez-Tous: Assessing Cultural Drivers of Safety Resilience in a Collegiate Aviation Program
http://ojs.library.okstate.edu/osu/index.php/cari 129
The average variance extracted (AVE) method was used to assess the convergent validity
(Fornell and Larcker, 1981). The AVE for commitment (.43), cognizance (.42) and competence
(.42) were all below the criteria suggested by Fornell and Larcker (AVE > .50). This result
suggests weak evidence of convergent validity. Using the Chin (2010) and Henseler & Sarstedt
(2015) recommendations of checking for cross-loading in the correlation matrix, some evidence
of discriminant validity also called “item-level discriminant validity” was observed. The
correlation matrix did not show any form of cross-loading of items among the constructs.
According to Gefen and Straub (2005), an item should be highly correlated with its own
construct, but have low correlations with other constructs in order to establish discriminant
validity at the item level. Hair, Ringle & Sarstedt (2011) recommends that the cut-off values of
factor loadings should be higher than .70.in that case. The evidence of weak convergence
validity should be taken into consideration when interpreting the results despite the evidence of
discriminant validity.
The items in each factor were summed up and used as indicator variables to assess the
relationship between cultural drivers and the over-arching concept of safety resilience. A model
containing all the individual measurement models was assessed for fit. Finally, the strength of
relationships and levels of interaction among the three cultural drivers were also assessed using
causal path analysis and Hayes Process V.3.4 in SPSS (Fields, 2018). A full structural model
showing relationships between cultural drivers of safety and safety resilience was proposed.
Annex A has all the measurement items retained after the reliability and validity assessment.
Annex B has details of correlation matrix highlighting lack of cross-loading among construct
items.
A large class of omnibus tests exists for assessing how well measurement models
matches observed data. The chi-squared (χ2) is a classic goodness-of-fit measure to determine
overall model fit. However, the chi-squared is sensitive to sample size, and it becomes difficult
to retain the null hypothesis as the number of cases increases (Kline, 2005). The χ2 test may also
be invalid when distributional assumptions are violated, leading to the rejection of good models
or the retention of bad ones (Steven, 2002; Brown, 2006; 2015).
Another commonly reported statistic is the Root Mean Square Error of Approximation
(RMSEA). A recommended value of 0.05 or less indicates a close fit of the model in relation to
the degrees of freedom (Brown, 2006; 2015). Another test statistic is the Comparative Fit Index
(CFI) that evaluates the fit of a user-specified solution in relation to a more restricted, nested
baseline model, in which the covariance among all input indicators are fixed to zero or no
relationship among variables is posited (Brown, 2006).
The fit index CFI ranges from 0, for a poor fit, to 1 for a good fit. Finally, the Tucker-
Lewis Index (TLI) is another index for comparative fit that “includes a penalty function for
adding freely estimated parameters” (Brown, 2006, p. 85). Other indices are the Normed Fit
Index (NFI) and Incremental Fit Index (IFI). Hu and Bentler (1999) provided rules of thumb for
deciding which statistics to report and choosing cut-off values for declaring significance. When
RMSEA values are .06 or below, and CFI and TLI are .95 or greater, the model may have a
reasonably good fit. In this study, the TLI, χ2, RMSEA, CFI, NFI and IFI were reported for
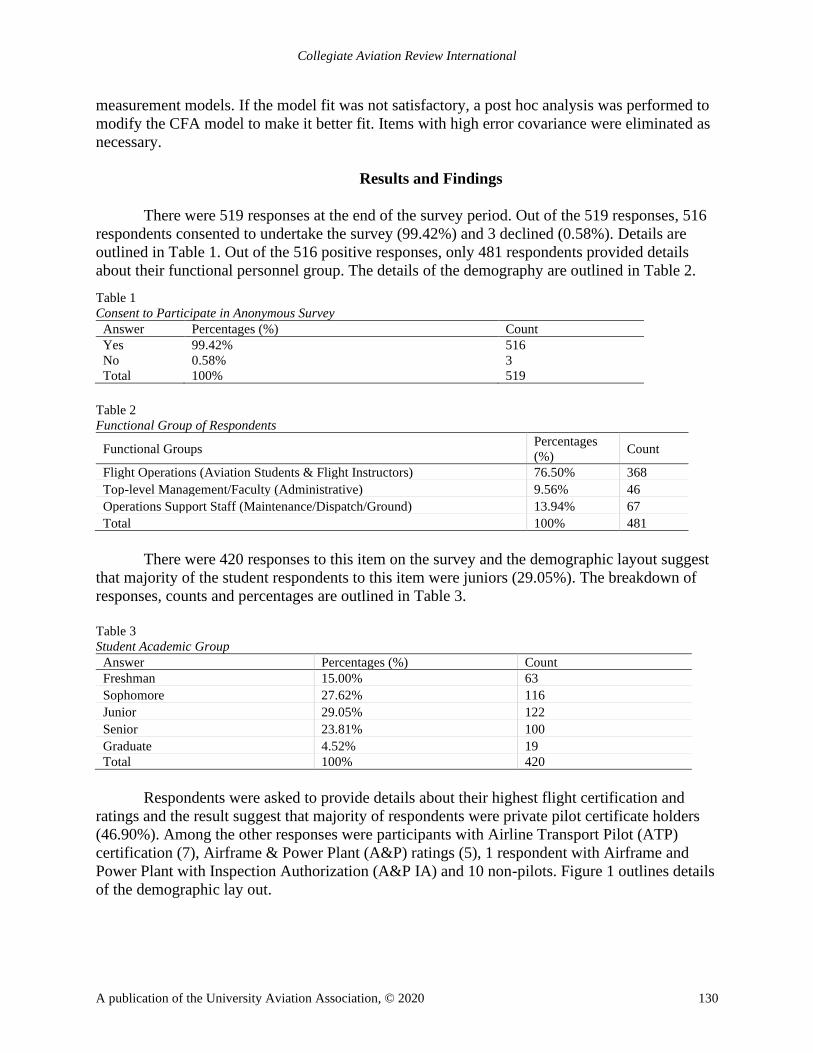
Collegiate Aviation Review International
A publication of the University Aviation Association, © 2020 130
measurement models. If the model fit was not satisfactory, a post hoc analysis was performed to
modify the CFA model to make it better fit. Items with high error covariance were eliminated as
necessary.
Results and Findings
There were 519 responses at the end of the survey period. Out of the 519 responses, 516
respondents consented to undertake the survey (99.42%) and 3 declined (0.58%). Details are
outlined in Table 1. Out of the 516 positive responses, only 481 respondents provided details
about their functional personnel group. The details of the demography are outlined in Table 2.
Table 1
Consent to Participate in Anonymous Survey
Answer Percentages (%) Count
Yes 99.42% 516
No 0.58% 3
Total 100% 519
Table 2
Functional Group of Respondents
Functional Groups Percentages
(%) Count
Flight Operations (Aviation Students & Flight Instructors) 76.50% 368
Top-level Management/Faculty (Administrative) 9.56% 46
Operations Support Staff (Maintenance/Dispatch/Ground) 13.94% 67
Total 100% 481
There were 420 responses to this item on the survey and the demographic layout suggest
that majority of the student respondents to this item were juniors (29.05%). The breakdown of
responses, counts and percentages are outlined in Table 3.
Table 3
Student Academic Group
Answer Percentages (%) Count
Freshman 15.00% 63
Sophomore 27.62% 116
Junior 29.05% 122
Senior 23.81% 100
Graduate 4.52% 19
Total 100% 420
Respondents were asked to provide details about their highest flight certification and
ratings and the result suggest that majority of respondents were private pilot certificate holders
(46.90%). Among the other responses were participants with Airline Transport Pilot (ATP)
certification (7), Airframe & Power Plant (A&P) ratings (5), 1 respondent with Airframe and
Power Plant with Inspection Authorization (A&P IA) and 10 non-pilots. Figure 1 outlines details
of the demographic lay out.
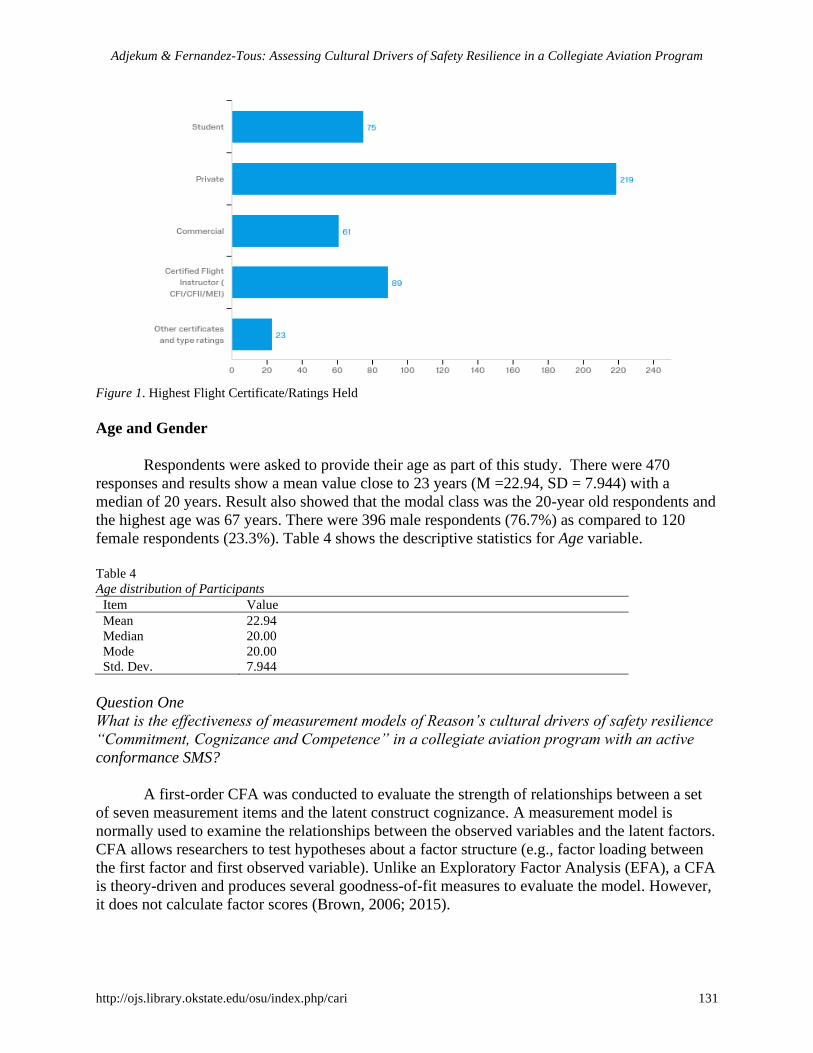
Adjekum & Fernandez-Tous: Assessing Cultural Drivers of Safety Resilience in a Collegiate Aviation Program
http://ojs.library.okstate.edu/osu/index.php/cari 131
Figure 1. Highest Flight Certificate/Ratings Held
Age and Gender
Respondents were asked to provide their age as part of this study. There were 470
responses and results show a mean value close to 23 years (M =22.94, SD = 7.944) with a
median of 20 years. Result also showed that the modal class was the 20-year old respondents and
the highest age was 67 years. There were 396 male respondents (76.7%) as compared to 120
female respondents (23.3%). Table 4 shows the descriptive statistics for Age variable.
Table 4
Age distribution of Participants
Item Value
Mean 22.94
Median 20.00
Mode 20.00
Std. Dev. 7.944
Question One
What is the effectiveness of measurement models of Reason’s cultural drivers of safety resilience
“Commitment, Cognizance and Competence” in a collegiate aviation program with an active
conformance SMS?
A first-order CFA was conducted to evaluate the strength of relationships between a set
of seven measurement items and the latent construct cognizance. A measurement model is
normally used to examine the relationships between the observed variables and the latent factors.
CFA allows researchers to test hypotheses about a factor structure (e.g., factor loading between
the first factor and first observed variable). Unlike an Exploratory Factor Analysis (EFA), a CFA
is theory-driven and produces several goodness-of-fit measures to evaluate the model. However,
it does not calculate factor scores (Brown, 2006; 2015).
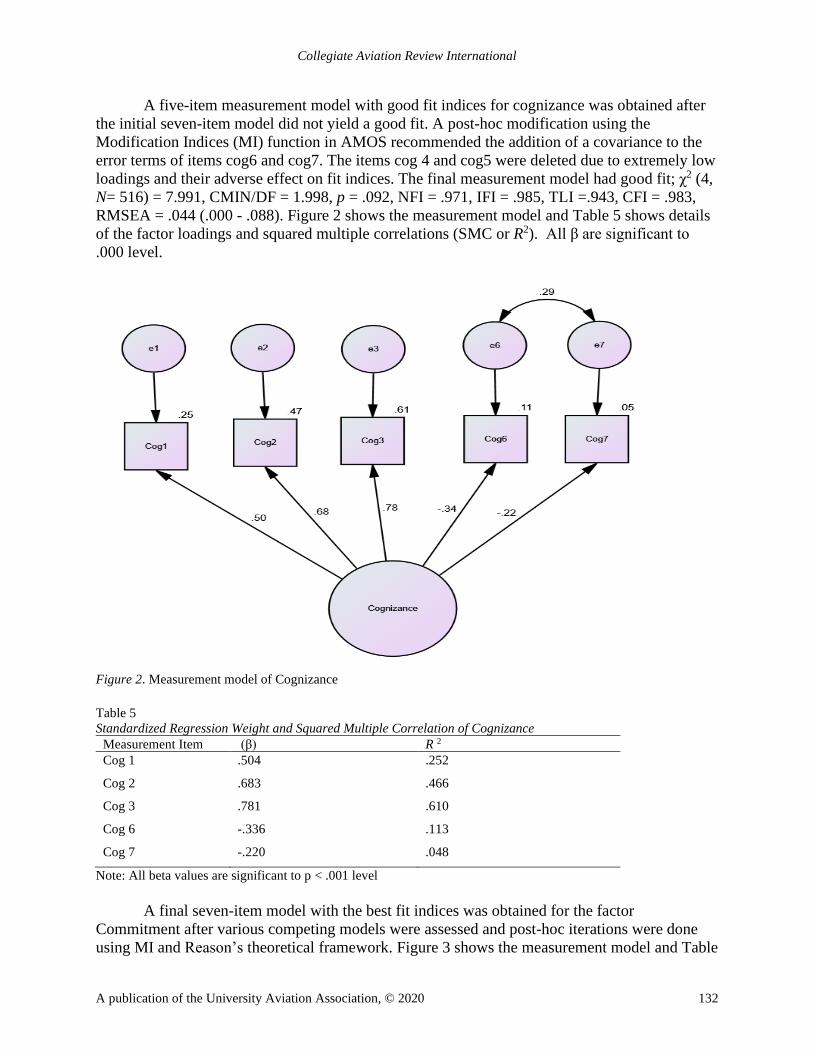
Collegiate Aviation Review International
A publication of the University Aviation Association, © 2020 132
A five-item measurement model with good fit indices for cognizance was obtained after
the initial seven-item model did not yield a good fit. A post-hoc modification using the
Modification Indices (MI) function in AMOS recommended the addition of a covariance to the
error terms of items cog6 and cog7. The items cog 4 and cog5 were deleted due to extremely low
loadings and their adverse effect on fit indices. The final measurement model had good fit; χ2 (4,
N= 516) = 7.991, CMIN/DF = 1.998, p = .092, NFI = .971, IFI = .985, TLI =.943, CFI = .983,
RMSEA = .044 (.000 - .088). Figure 2 shows the measurement model and Table 5 shows details
of the factor loadings and squared multiple correlations (SMC or R2). All β are significant to
.000 level.
Figure 2. Measurement model of Cognizance
Table 5
Standardized Regression Weight and Squared Multiple Correlation of Cognizance
Measurement Item (β) R 2
Cog 1 .504 .252
Cog 2 .683 .466
Cog 3 .781 .610
Cog 6 -.336 .113
Cog 7 -.220 .048
Note: All beta values are significant to p < .001 level
A final seven-item model with the best fit indices was obtained for the factor
Commitment after various competing models were assessed and post-hoc iterations were done
using MI and Reason’s theoretical framework. Figure 3 shows the measurement model and Table
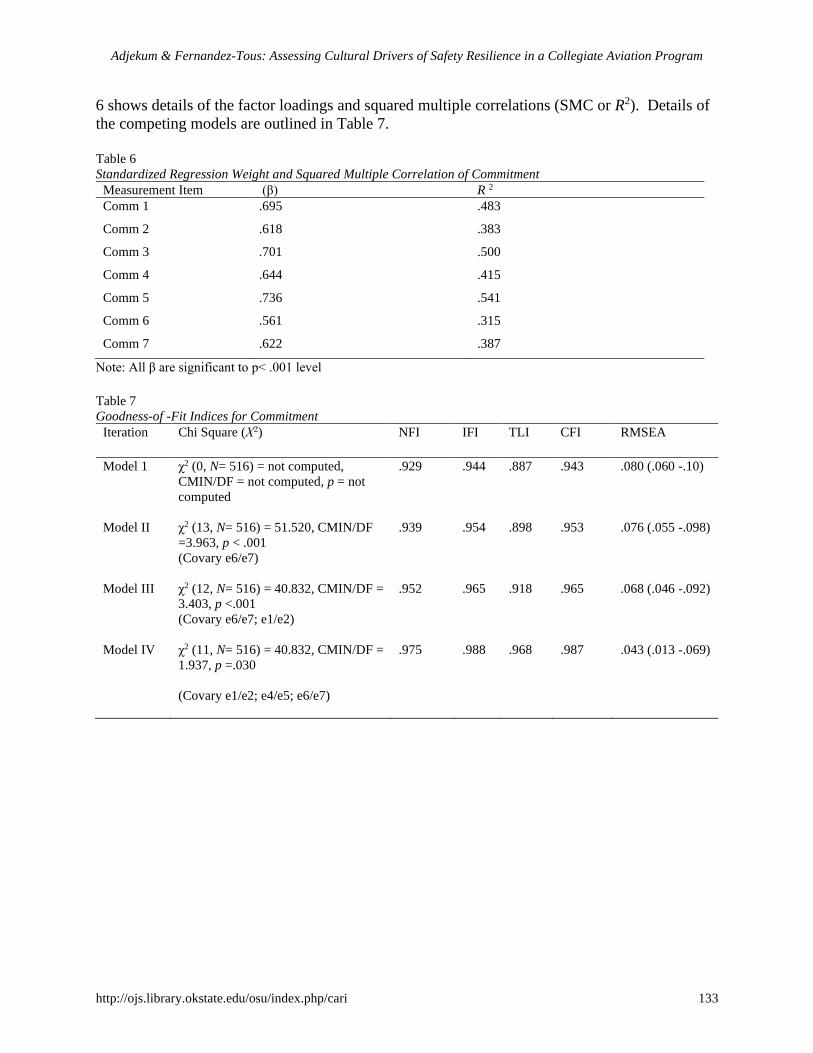
Adjekum & Fernandez-Tous: Assessing Cultural Drivers of Safety Resilience in a Collegiate Aviation Program
http://ojs.library.okstate.edu/osu/index.php/cari 133
6 shows details of the factor loadings and squared multiple correlations (SMC or R2). Details of
the competing models are outlined in Table 7.
Table 6
Standardized Regression Weight and Squared Multiple Correlation of Commitment
Measurement Item (β) R 2
Comm 1 .695 .483
Comm 2 .618 .383
Comm 3 .701 .500
Comm 4 .644 .415
Comm 5 .736 .541
Comm 6 .561 .315
Comm 7 .622 .387
Note: All β are significant to p< .001 level
Table 7
Goodness-of -Fit Indices for Commitment
Iteration Chi Square (Χ2)
NFI IFI TLI CFI RMSEA
Model 1 χ2 (0, N= 516) = not computed,
CMIN/DF = not computed, p = not
computed
.929 .944 .887 .943 .080 (.060 -.10)
Model II
χ2 (13, N= 516) = 51.520, CMIN/DF
=3.963, p < .001
(Covary e6/e7)
.939 .954 .898 .953 .076 (.055 -.098)
Model III
χ2 (12, N= 516) = 40.832, CMIN/DF =
3.403, p <.001
(Covary e6/e7; e1/e2)
.952 .965 .918 .965 .068 (.046 -.092)
Model IV
χ2 (11, N= 516) = 40.832, CMIN/DF =
1.937, p =.030
(Covary e1/e2; e4/e5; e6/e7)
.975 .988 .968 .987 .043 (.013 -.069)
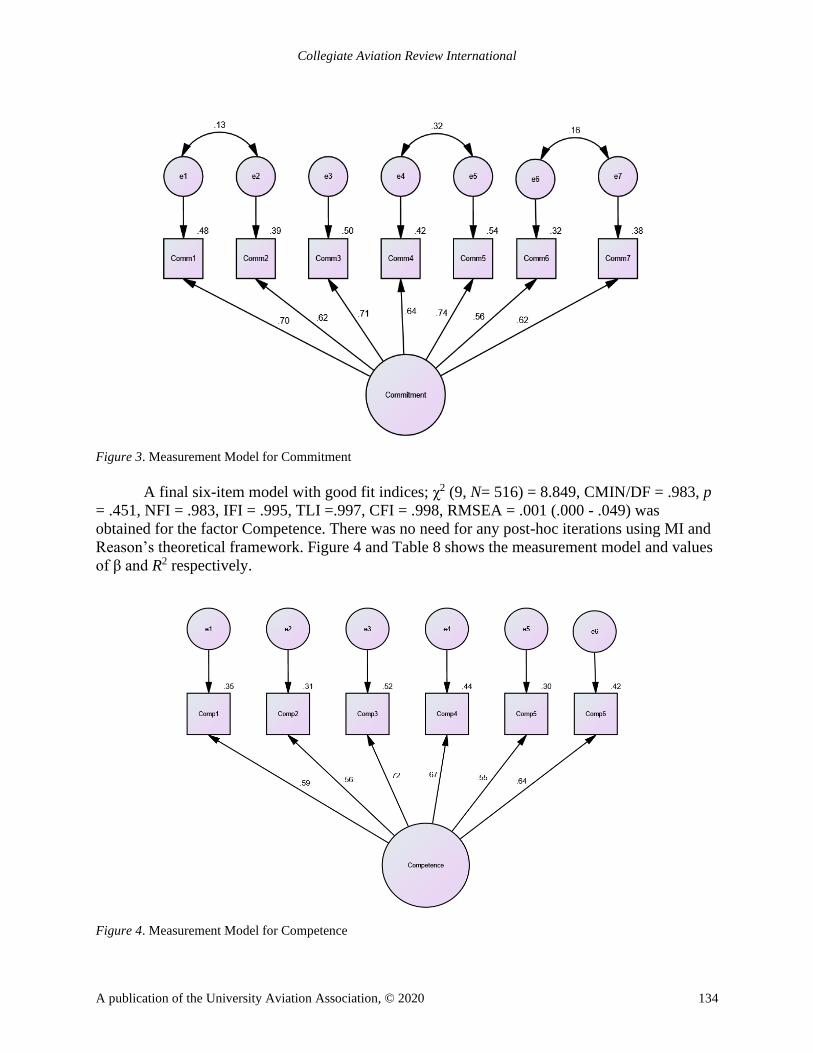
Collegiate Aviation Review International
A publication of the University Aviation Association, © 2020 134
Figure 3. Measurement Model for Commitment
A final six-item model with good fit indices; χ2 (9, N= 516) = 8.849, CMIN/DF = .983, p
= .451, NFI = .983, IFI = .995, TLI =.997, CFI = .998, RMSEA = .001 (.000 - .049) was
obtained for the factor Competence. There was no need for any post-hoc iterations using MI and
Reason’s theoretical framework. Figure 4 and Table 8 shows the measurement model and values
of β and R2 respectively.
Figure 4. Measurement Model for Competence
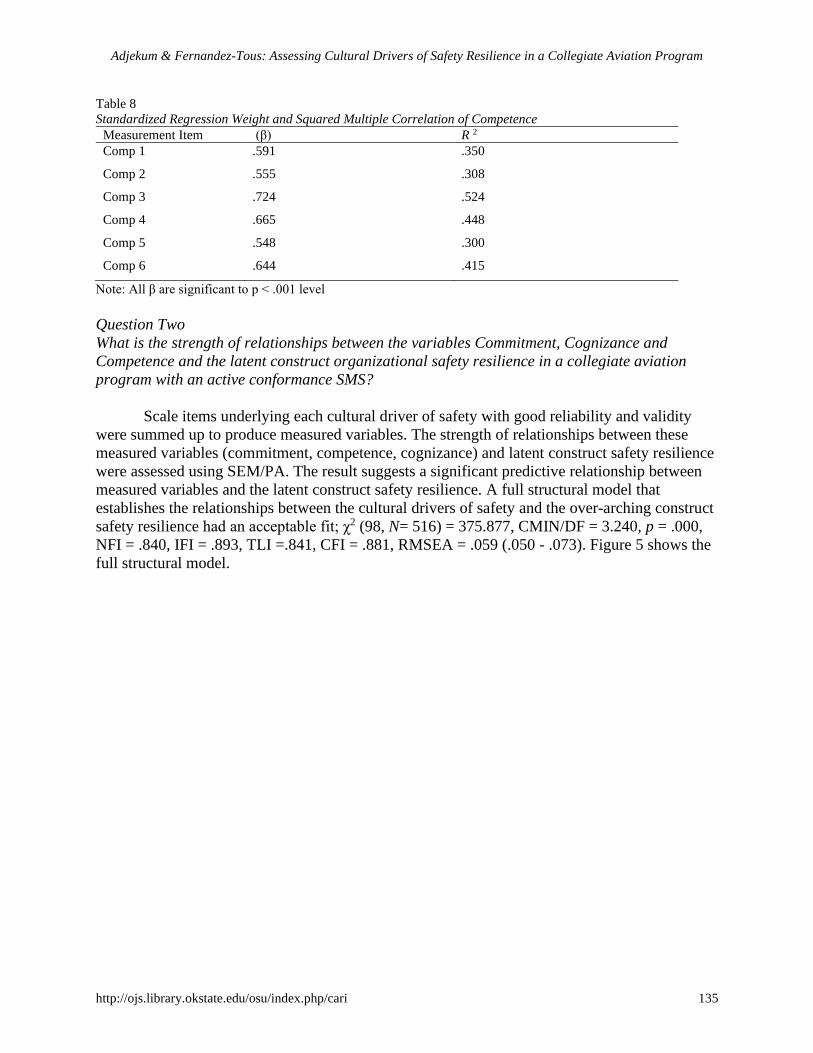
Adjekum & Fernandez-Tous: Assessing Cultural Drivers of Safety Resilience in a Collegiate Aviation Program
http://ojs.library.okstate.edu/osu/index.php/cari 135
Table 8
Standardized Regression Weight and Squared Multiple Correlation of Competence
Measurement Item (β) R 2
Comp 1 .591 .350
Comp 2 .555 .308
Comp 3 .724 .524
Comp 4 .665 .448
Comp 5 .548 .300
Comp 6 .644 .415
Note: All β are significant to p < .001 level
Question Two
What is the strength of relationships between the variables Commitment, Cognizance and
Competence and the latent construct organizational safety resilience in a collegiate aviation
program with an active conformance SMS?
Scale items underlying each cultural driver of safety with good reliability and validity
were summed up to produce measured variables. The strength of relationships between these
measured variables (commitment, competence, cognizance) and latent construct safety resilience
were assessed using SEM/PA. The result suggests a significant predictive relationship between
measured variables and the latent construct safety resilience. A full structural model that
establishes the relationships between the cultural drivers of safety and the over-arching construct
safety resilience had an acceptable fit; χ2 (98, N= 516) = 375.877, CMIN/DF = 3.240, p = .000,
NFI = .840, IFI = .893, TLI =.841, CFI = .881, RMSEA = .059 (.050 - .073). Figure 5 shows the
full structural model.
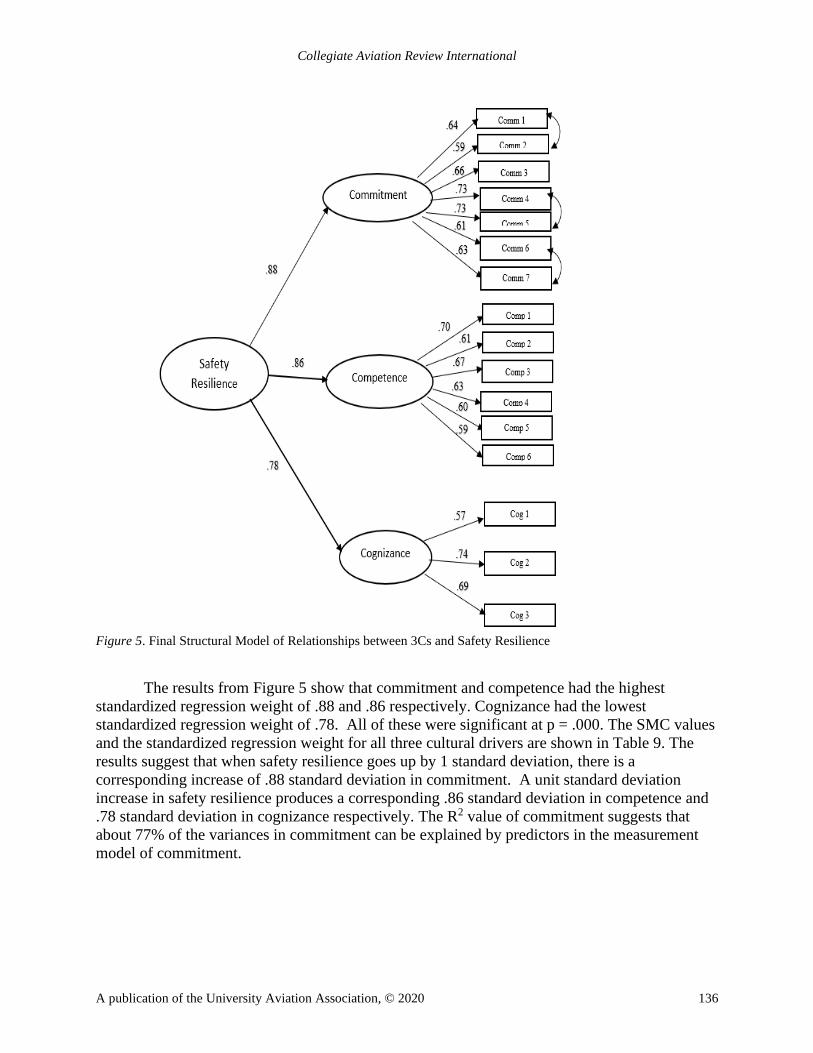
Collegiate Aviation Review International
A publication of the University Aviation Association, © 2020 136
Figure 5. Final Structural Model of Relationships between 3Cs and Safety Resilience
The results from Figure 5 show that commitment and competence had the highest
standardized regression weight of .88 and .86 respectively. Cognizance had the lowest
standardized regression weight of .78. All of these were significant at p = .000. The SMC values
and the standardized regression weight for all three cultural drivers are shown in Table 9. The
results suggest that when safety resilience goes up by 1 standard deviation, there is a
corresponding increase of .88 standard deviation in commitment. A unit standard deviation
increase in safety resilience produces a corresponding .86 standard deviation in competence and
.78 standard deviation in cognizance respectively. The R2 value of commitment suggests that
about 77% of the variances in commitment can be explained by predictors in the measurement
model of commitment.
.
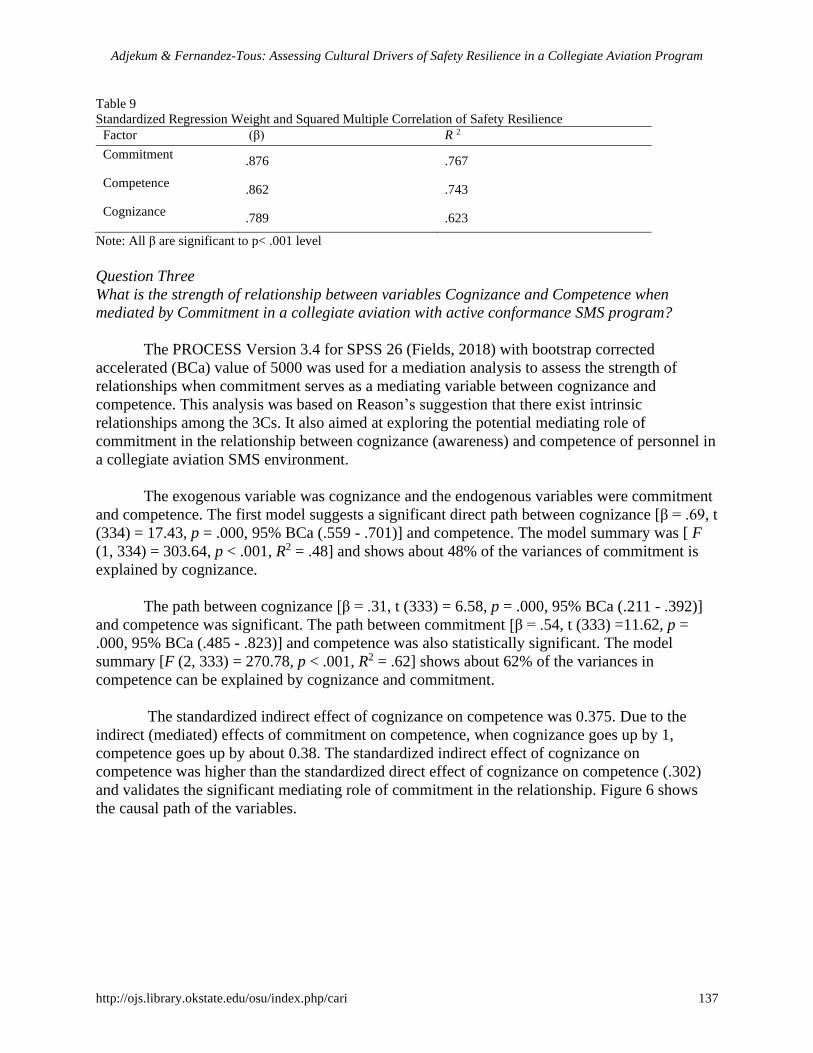
Adjekum & Fernandez-Tous: Assessing Cultural Drivers of Safety Resilience in a Collegiate Aviation Program
http://ojs.library.okstate.edu/osu/index.php/cari 137
Table 9
Standardized Regression Weight and Squared Multiple Correlation of Safety Resilience
Factor (β) R 2
Commitment .876 .767
Competence .862 .743
Cognizance .789 .623
Note: All β are significant to p< .001 level
Question Three
What is the strength of relationship between variables Cognizance and Competence when
mediated by Commitment in a collegiate aviation with active conformance SMS program?
The PROCESS Version 3.4 for SPSS 26 (Fields, 2018) with bootstrap corrected
accelerated (BCa) value of 5000 was used for a mediation analysis to assess the strength of
relationships when commitment serves as a mediating variable between cognizance and
competence. This analysis was based on Reason’s suggestion that there exist intrinsic
relationships among the 3Cs. It also aimed at exploring the potential mediating role of
commitment in the relationship between cognizance (awareness) and competence of personnel in
a collegiate aviation SMS environment.
The exogenous variable was cognizance and the endogenous variables were commitment
and competence. The first model suggests a significant direct path between cognizance [β = .69, t
(334) = 17.43, p = .000, 95% BCa (.559 - .701)] and competence. The model summary was [ F
(1, 334) = 303.64, p < .001, R2 = .48] and shows about 48% of the variances of commitment is
explained by cognizance.
The path between cognizance [β = .31, t (333) = 6.58, p = .000, 95% BCa (.211 - .392)]
and competence was significant. The path between commitment [β = .54, t (333) =11.62, p =
.000, 95% BCa (.485 - .823)] and competence was also statistically significant. The model
summary [F (2, 333) = 270.78, p < .001, R2 = .62] shows about 62% of the variances in
competence can be explained by cognizance and commitment.
The standardized indirect effect of cognizance on competence was 0.375. Due to the
indirect (mediated) effects of commitment on competence, when cognizance goes up by 1,
competence goes up by about 0.38. The standardized indirect effect of cognizance on
competence was higher than the standardized direct effect of cognizance on competence (.302)
and validates the significant mediating role of commitment in the relationship. Figure 6 shows
the causal path of the variables.
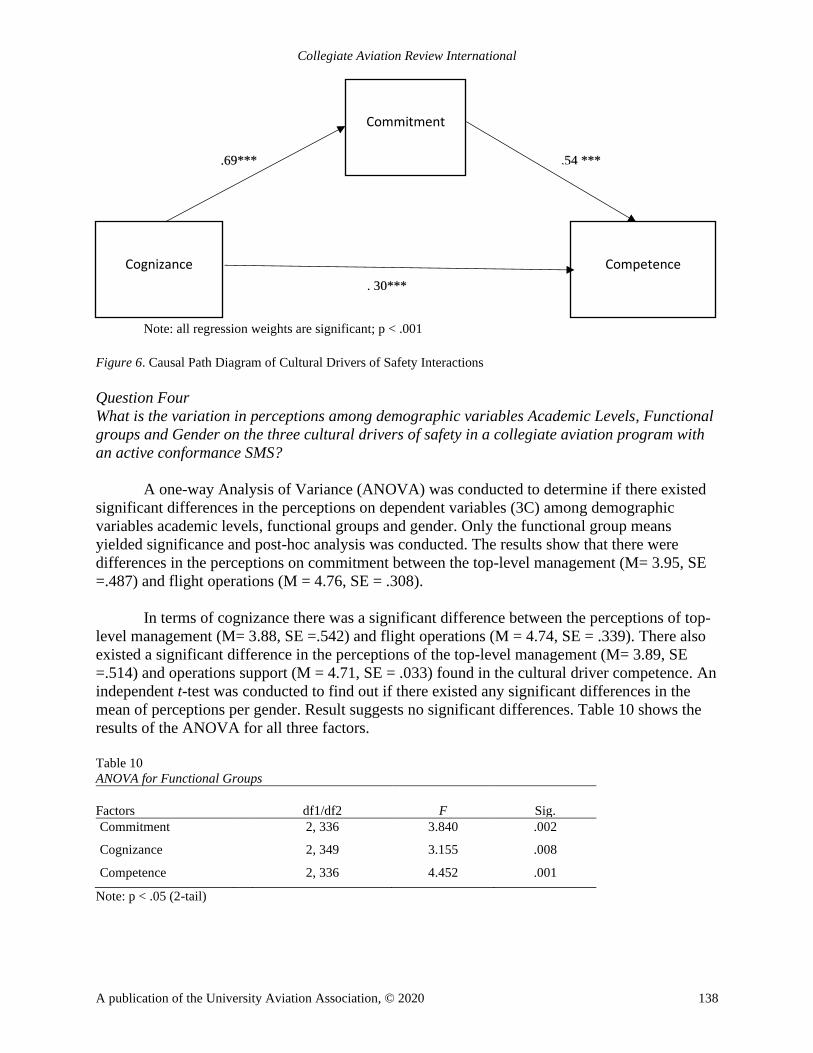
Collegiate Aviation Review International
A publication of the University Aviation Association, © 2020 138
Note: all regression weights are significant; p < .001
Figure 6. Causal Path Diagram of Cultural Drivers of Safety Interactions
Question Four
What is the variation in perceptions among demographic variables Academic Levels, Functional
groups and Gender on the three cultural drivers of safety in a collegiate aviation program with
an active conformance SMS?
A one-way Analysis of Variance (ANOVA) was conducted to determine if there existed
significant differences in the perceptions on dependent variables (3C) among demographic
variables academic levels, functional groups and gender. Only the functional group means
yielded significance and post-hoc analysis was conducted. The results show that there were
differences in the perceptions on commitment between the top-level management (M= 3.95, SE
=.487) and flight operations (M = 4.76, SE = .308).
In terms of cognizance there was a significant difference between the perceptions of top-
level management (M= 3.88, SE =.542) and flight operations (M = 4.74, SE = .339). There also
existed a significant difference in the perceptions of the top-level management (M= 3.89, SE
=.514) and operations support (M = 4.71, SE = .033) found in the cultural driver competence. An
independent t-test was conducted to find out if there existed any significant differences in the
mean of perceptions per gender. Result suggests no significant differences. Table 10 shows the
results of the ANOVA for all three factors.
Table 10
ANOVA for Functional Groups
Factors df1/df2 F Sig.
Commitment 2, 336 3.840 .002
Cognizance 2, 349 3.155 .008
Competence 2, 336 4.452 .001
Note: p < .05 (2-tail)
Competence
Commitment
Cognizance
.69*** .54 ***
. 30***
Adjekum & Fernandez-Tous: Assessing Cultural Drivers of Safety Resilience in a Collegiate Aviation Program
http://ojs.library.okstate.edu/osu/index.php/cari 139
Discussion and Conclusions
A structural model that assesses the strength of relationship between the cultural drivers
of safety and the overall construct of safety resilience showed a good fit to the data. The results
suggest that all the 3 cultural drivers have significant predictive relationship with safety
resilience with almost 88% of the proportion of variances in commitment explained by safety
resilience. About 86% of the variances in competence can be accounted for by safety resilience
and about 78 % of the variances in cognizance accounted for by safety resilience. The results
validate Reason (2011) concept of safety resilience and its relationship with cultural drivers of
safety. The findings of this study corroborate Hollnagel (2014) and Akselsson et al. (2009)
suggestions that safety resilience is an important element in the continuous monitoring and
improvements of SMS in aviation.
Results also suggest that it is very important for collegiate aviation programs to
constantly ensure that the mechanisms underlying resilience are assessed and improved. Cultural
drivers such as competence, cognizance and commitment should have metrics that needs to be
reviewed periodically during safety audits and SMS assessments to identify gaps and
misalignments with desired outcomes. Competence requires effective training and mentoring and
that leads to building the capacity of all personnel in the organization to be prepared and have
contingencies for situations that has adverse impact on organizational missions and goals as
posited by Adjekum (2017) and Stolzer & Goglia (2015).
The fact that cultural driver commitment significantly mediates the path between
cognizance and competence is also intuitive. It shows that even though a robust awareness or
educational program can be inherent in the SMS of a collegiate aviation, it may be inadequate as
a stand-alone to ensure competence of personnel in safety resilience. It will require motivation
from top-level management personnel, immediate supervisors and sometimes peers to enhance
competence. The provision of adequate material, financial and moral support also enhances
commitment to resilient practices.
Reciprocity in commitment is also required for personnel. Top-level management can
provide time and money for personnel training and development to build knowledge and skills.
These capacity-building resources ensures a safe working environment. Unfortunately, learning
and application cannot be forced and personnel must be self-committed to learning and
application of concepts to ensure competencies. Top-level management should provide
empowered accountability that allows personnel to recognize hazards and the authority to
mitigate the hazards. Such commitments also allow for work stoppage or deference to higher
supervision when risk mitigation is above competencies.
The results show that the mean perceptions of top-level management were relatively
lower for all three cultural drivers as compared to that of operations support and flight operations
(aviation students and flight instructors). However, it was only the difference between the top-
level management and operations support that was significant. This was quite surprising
considering that in a previous study that assessed perceptual gaps in a collegiate aviation safety
culture, top-level management had a better score than front-line personnel (Adjekum, 2017). The
findings of the Adjekum (2017) study suggested that top-level management as resource
Collegiate Aviation Review International
A publication of the University Aviation Association, © 2020 140
providers, deemed their efforts at sustaining safety culture adequate which was not reflected by
the perceptions of front-line personnel. In the present study, the assumption is that top-level
management may be privy to resource constraints and prospective strategic initiatives that can
pre-dispose aviation operations in their organization vulnerable, hence their seeming wariness as
compared to front-line personnel.
An example could be un-anticipated financial disruptions and aviation industry market
upheavals that can introduce vulnerabilities in aviation operations. To bridge the perceptual gaps
related to the cultural drivers of safety resilience and SMS, transparency in information flow and
periodic interaction between top-level management and front-line personnel is important.
Overall, the perceptions on all three factors that underly safety resilience namely; commitment,
cognizance and competence were good in the collegiate aviation program. It is highly
recommended that periodic assessments of safety resilience are performed to make operations
robust to such adversities.
Limitations and Generalizability of Findings
The findings of this study are based on perceptions of research participants from a single
collegiate aviation program. Also, majority of the respondents to the survey were collegiate
flight students and instructors who have relatively lower exposure to high tempo resilient
practices experienced in commercial airline or military flight operations. They may also have
minimal experiences with high impact safety occurrences that require higher levels of safety
resilience to ensure business continuity. Therefore, results from this study should not be
generalized across the aviation industry even though it can be relevant to other collegiate
aviation programs of scope and complexity.
The weak evidence of convergence validity should be taken into consideration when
making inferences on the findings in this study. It is recommended that future studies re-evaluate
survey items for convergent validity. The uneven sample size of the functional groups should be
considered when making inferences from the results of the ANOVA analysis. The majority of
the respondents were young aviation students and flight instructors (M=23 years) and their
perceptions on safety resilience and risk tolerability could have be shaped by psycho-social
factors such as exuberance, peer-pressure and high self-efficacy (Thomson, Önkal, Avcioğlu &
Goodwin, 2004; Adjekum, 2017; Wang, Zhang, Sun & Ren, 2018).
Implications of Study Findings for Research and Policies
This current study provides a veritable structural model with an acceptable fit and
provides a framework for future studies on organizational safety resilience in aviation. These
future studies recommended may include a comparative analysis of organizational safety
resilience in collegiate programs with active conformance SMS status, those going through the
voluntary process (active applicant and active participant) and those who are non-conformant
(without an accepted SMS program).
Such a study could also provide a plethora of literature and additional assessment tools
for organizational safety resilience in other certificate holders such as Airline Part 121, Air
Adjekum & Fernandez-Tous: Assessing Cultural Drivers of Safety Resilience in a Collegiate Aviation Program
http://ojs.library.okstate.edu/osu/index.php/cari 141
Traffic Management, Airports and Unmanned Aerial Systems operations. Another significant
benefit of this study is the capacity to assess operational vulnerabilities and strengthen safety
resilience in collegiate aviation programs as part of continuous monitoring and improvements of
SMS.
Funding: This work was supported by the John D. Odegard School of Aerospace Sciences,
University of North Dakota Seed Grant [# 21267-2205].
Collegiate Aviation Review International
A publication of the University Aviation Association, © 2020 142
References
Adjekum, D. K. (2014). Safety culture perceptions in a collegiate aviation program: A
systematic assessment. Journal of Aviation Technology and Engineering, 3 (2),8. http://dx.doi.org/10.7771/2159-6670.1086
Adjekum, D. K. (2017). An evaluation of the relationships between collegiate aviation Safety
Management Systems initiative, self-efficacy, transformational safety leadership and
safety behavior mediated by safety motivation. International Journal of Aviation,
Aeronautics, and Aerospace, 4(2). https://doi.org/10.15394/ijaa.2017.1169
Akselsson, R., Koorneef, F., Stewart, S. & Ward, M. (2009). Resilience safety culture in aviation
organizations. Retrieved from http://resolver.tudelft.nl/uuid:361fe48d-9390-4a4f-8dba-
8a6cf8ec4b64
Amalberti, R. (2001). The paradoxes of almost totally safe transportation systems. Safety
Sci.37, p. 2–3: p.109–126. https://doi.org/10.1016/S0925-7535(00)00045-X
Brown, T. A. (2006). Confirmatory factor analysis for applied research. New York, NY:
Guilford Publishing.
Brown, T. A. (2015). Confirmatory factor analysis for applied research. (2nd ed.). New York,
NY: Guilford Publishing.
Coombs, W. T. (2007). Protecting organization reputations during a crisis: The development and
application of situational crisis communication theory. Corporate Reputation Review, 10
(3):163–176. https://doi.org/10.1057/palgrave.crr.1550049
Chin, W. W. (2010). How to write up and report PLS analyses. In V. Esposito Vinzi, W. W.
Chin, J. Henseler, & H. Wang (Eds.), Handbook of partial least squares: concepts,
methods and applications in marketing and related fields (pp. 655–690). Berlin: Springer.
Electronic Code of Federal Register. Part 5. (2015). Safety Management Systems for Part 121
operators. Retrieved (04/02/2019) from: https://www.ecfr.gov/cgi-bin/text-
idx?SID=31a1ff34c5fb23bfab62b105fa038ceb&mc=true&node=pt14.1.5&rgn=div5
Enders, C. K., & Bandalos, D. L. (2001). The relative performance of full information maximum
likelihood estimation for missing data in structural equation models. Structural Equation
Modeling, 8(3), 430–457. https://doi.org/10.1207/S15328007SEM0803_5
Federal Aviation Administration (2015a). AC 190-92B - Safety Management Systems for
aviation service providers. Retrieved (02/02/2020) from
https://www.faa.gov/regulations_policies/advisory_circulars/index.cfm/go/document.info
rmation/documentID/1026670
Adjekum & Fernandez-Tous: Assessing Cultural Drivers of Safety Resilience in a Collegiate Aviation Program
http://ojs.library.okstate.edu/osu/index.php/cari 143
Federal Aviation Administration. (2015b, March 9). Safety Management Systems voluntary
program guide (AFS-900-002-G201) [PDF]. Washington D.C.: Federal Aviation
Administration. Accessed (04/02/2019) from: University of North Dakota Aviation
Safety Department.
Field, A. (2018). Discovering statistics using SPSS (5th ed.). London, England: SAGE
Publications, Ltd.
Fornell, C. G., & Larcker, D. F. (1981). Evaluating structural equation models with unobservable
variables and measurement error. Journal of Marketing Research, 18 (1), 39–50. https://doi.org/10.1177/002224378101800104
Gefen, D., & Straub, D. W. (2005). A practical guide to factorial validity using PLS-Graph:
tutorial and annotated example. Communications of the AIS, 16, 91–109. https://doi.org/10.17705/1CAIS.01605
Hair, J. F., Ringle, C. M., & Sarstedt, M. (2011). "PLS-SEM: Indeed, a Silver Bullet." Journal of
Marketing Theory and Practice, 19 (2), 139-51. DOI: 10.2753/MTP1069-6679190202
Heese, M. (2012). Got the results, now what do you do? Safety culture transformation from
theory into practice. Aviation Psychology and Applied Human Factors, 2 (1), 25–33. doi:
10.1027/2192-0923/a000020
Henseler, J., Ringle. C. M., & Sarstedt. M. (2015). A new criterion for assessing discriminant
validity in variance-based structural equation modeling. Journal of the Academy of
Marketing Science, 43, 115–135 DOI 10.1007/s11747-014-0403-8
Hollnagel, E., Woods, D. D. & Leveson, N. C. (Eds.) (2006). Resilience engineering: Concepts
and precepts. Aldershot, UK: Ashgate Publishing Limited.
Hollnagel, E. (2009). The ETTO-Principle: Efficiency and Thoroughness Trade-Off. Farnham:
Ashgate Publishing Limited
Hollnagel, E. (2014). Safety-I and safety-II. The past and future of safety management. Farnham,
UK: Ashgate Publishing Limited.
Hollnagel, E., Paries, J., Woods, D. D., & Wreathall, J. (2011). Resilience engineering in
practice- A guidebook. Farnham: Ashgate. Publishing Limited
Hu, L.-t., & Bentler, P. M. (1999). Cutoff criteria for fit indexes in covariance structure analysis:
Conventional criteria versus new alternatives. Structural Equation Modeling, 6(1), 1–
55. https://doi.org/10.1080/10705519909540118
International Civil Aviation Organization. (2013a). Safety management manual (Doc. 9859, 3rd
ed). Retrieved from https://www.skybrary.aero/bookshelf/books/644.pdf
Collegiate Aviation Review International
A publication of the University Aviation Association, © 2020 144
International Civil Aviation Organization. (2013b). Annex 19: Integrated safety management.
Retrieved from https://www.skybrary.aero/index.php/
ICAO_Annex_19,_Safety_Management
Kline, R. B. (2005). Principles and practice of structural equation modeling. New York, NY:
The Guilford Press.
La Porte, T. R. (1996). High reliability organizations: Unlikely, demanding and at risk.
Journal of Contingencies and Crisis Management, https://doi.org/10.1111/j.1468-
5973.1996.tb00078.x
Leveson, N., Dulac, N., Marais, K., & Carroll, J. (2009). Moving beyond normal accidents and
high reliability organizations: A systems approach to safety in complex systems.
Organizational Studies, 30 (2–3), 227–249. https://doi.org/10.1177/0170840608101478
Nunnally, J.C. (1978). Psychometric theory (2nd ed.). New York, NY: McGraw-Hill.
Oliver, N., Calvard, T., Potočnik, K. (2017). Cognition, technology, and organizational limits:
Lessons from the Air France 447 Disaster. Organization Science, pp.1–15 https://doi.org/10.1287/orsc.2017.1138
Paries, J., Macchi, L., Valot, C., & Deharvenght, S. (2018). Comparing HROs and RE in the
light of Safety Management Systems, Safety Science, 117, 501–511,
https://doi.org/10.1016/j.ssci.2018.02.026
Perrow, C. (1984). Normal Accidents: Living with high-risk technologies.
New York, NY. Basic Books.
Reason, J. (2011). The human contribution – Unsafe acts, accidents and heroic recoveries.
Farnham: Ashgate Publishing Limited.
Roberts, K. H. (1990). Managing high reliability organizations. California Management
Review, 32 (4), 101–113. https://doi.org/10.2307/41166631
Schwarz, M., & Wolfgang Kallus, K. (2015). Safety culture and safety-relevant behavior in air
traffic management: Validation of the CANSO safety culture development concept.
Aviation Psychology and Applied Human Factors, 5 (1), 3–17. https://doi.org/10.1027/2192-0923/a000068
Schwarz, M., Wolfgang, K. K., & Gaisbachgrabner, K. (2016). Safety culture, resilient
behavior, and stress in air traffic management. Aviation Psychology and Applied Human
Factors, 6, 12-23. https://doi.org/10.1027/2192-0923/a000091
Smith, A. F., & Plunkett, E. (2019). People, Systems and Safety: Resilience and excellence in
healthcare practice. Anaesthesia, 74 (4), 508–17. https://doi.org/10.1111/anae.14519.
Adjekum & Fernandez-Tous: Assessing Cultural Drivers of Safety Resilience in a Collegiate Aviation Program
http://ojs.library.okstate.edu/osu/index.php/cari 145
Stevens, J. (2002). Applied multivariate statistics for the social sciences (4th ed.).
Hillsdale, NJ: Erlbaum.
Stolzer, A. J., & Goglia, J.J. (2015). Safety Management Systems in Aviation (2nd ed.).
Burlington, VT: Ashgate Publishing,
Sutcliffe, K. M., Vogus, T. J., & Dane, E. (2016). Mindfulness in organizations: A cross-level
review. Annual Review of Organizational Psychology: Organizational Behavior, 3, 55–
58. https://doi.org/10.1146/annurev-orgpsych-041015-062531
Thomson, M. E., Önkal, D., Avcioğlu, A., & Goodwin, P. (2004). Aviation risk perception: A
comparison between experts and novices. Risk Analysis, 24, 6.
https://doi.org/10.1111/j.0272-4332.2004.00552.x
Wang, L., Zhang, J., Sun, H., & Ren, Y. (2018). Risk cognition variables and flight
exceedance behaviors of airline transport pilots. In: Harris D. (eds) Engineering
psychology and cognitive ergonomics. EPCE 2018.58. https://doi.org/10.1007/978-3-319-
91122-9_57
Weick, K. E., & Sutcliffe, K. M. (2007). Managing the unexpected: Resilient performance in an
age of uncertainty. San Francisco, CA: Jossey-Bass.
Yu, T., Sengul, M., & Lester, R. H. (2008). Misery loves company: The spread of negative
impacts resulting from an organizational crisis. Academic Management, Rev.33(2):452–
472. DOI: 10.5465/AMR.2008.31193499
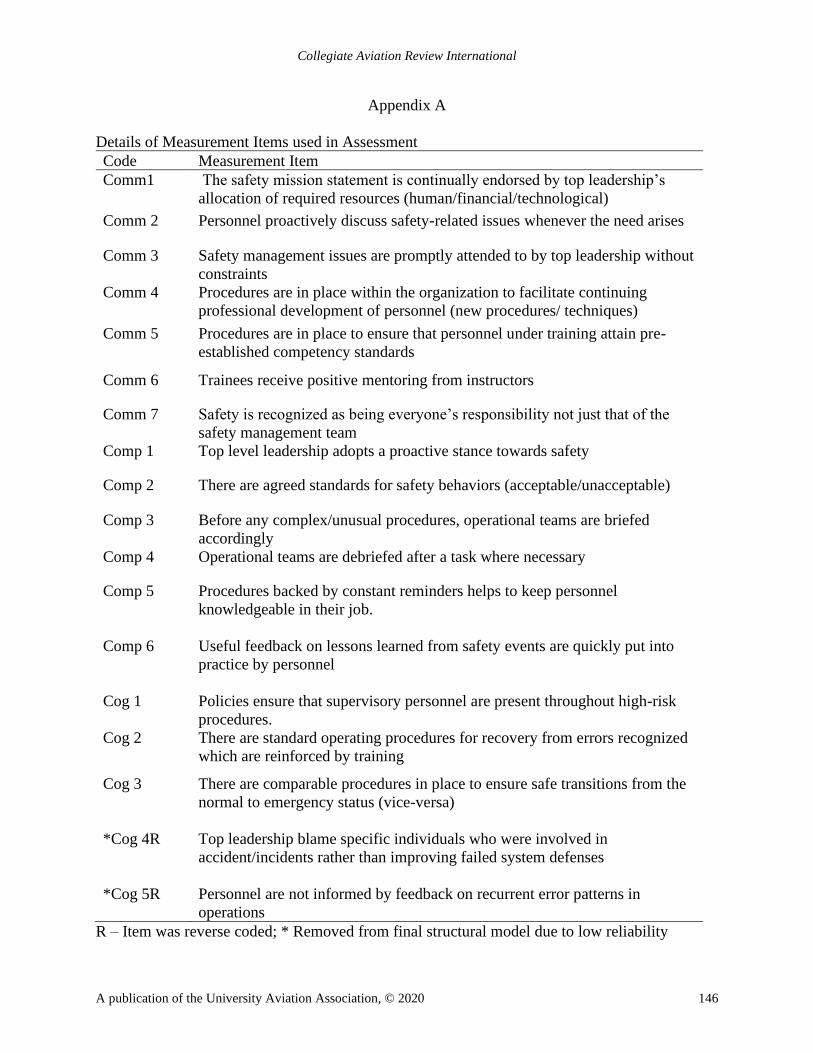
Collegiate Aviation Review International
A publication of the University Aviation Association, © 2020 146
Appendix A
Details of Measurement Items used in Assessment
Code Measurement Item
Comm1 The safety mission statement is continually endorsed by top leadership’s
allocation of required resources (human/financial/technological)
Comm 2 Personnel proactively discuss safety-related issues whenever the need arises
Comm 3 Safety management issues are promptly attended to by top leadership without
constraints
Comm 4 Procedures are in place within the organization to facilitate continuing
professional development of personnel (new procedures/ techniques)
Comm 5 Procedures are in place to ensure that personnel under training attain pre-
established competency standards
Comm 6 Trainees receive positive mentoring from instructors
Comm 7 Safety is recognized as being everyone’s responsibility not just that of the
safety management team
Comp 1 Top level leadership adopts a proactive stance towards safety
Comp 2 There are agreed standards for safety behaviors (acceptable/unacceptable)
Comp 3 Before any complex/unusual procedures, operational teams are briefed
accordingly
Comp 4 Operational teams are debriefed after a task where necessary
Comp 5 Procedures backed by constant reminders helps to keep personnel
knowledgeable in their job.
Comp 6 Useful feedback on lessons learned from safety events are quickly put into
practice by personnel
Cog 1 Policies ensure that supervisory personnel are present throughout high-risk
procedures.
Cog 2 There are standard operating procedures for recovery from errors recognized
which are reinforced by training
Cog 3 There are comparable procedures in place to ensure safe transitions from the
normal to emergency status (vice-versa)
*Cog 4R Top leadership blame specific individuals who were involved in
accident/incidents rather than improving failed system defenses
*Cog 5R Personnel are not informed by feedback on recurrent error patterns in
operations
R – Item was reverse coded; * Removed from final structural model due to low reliability
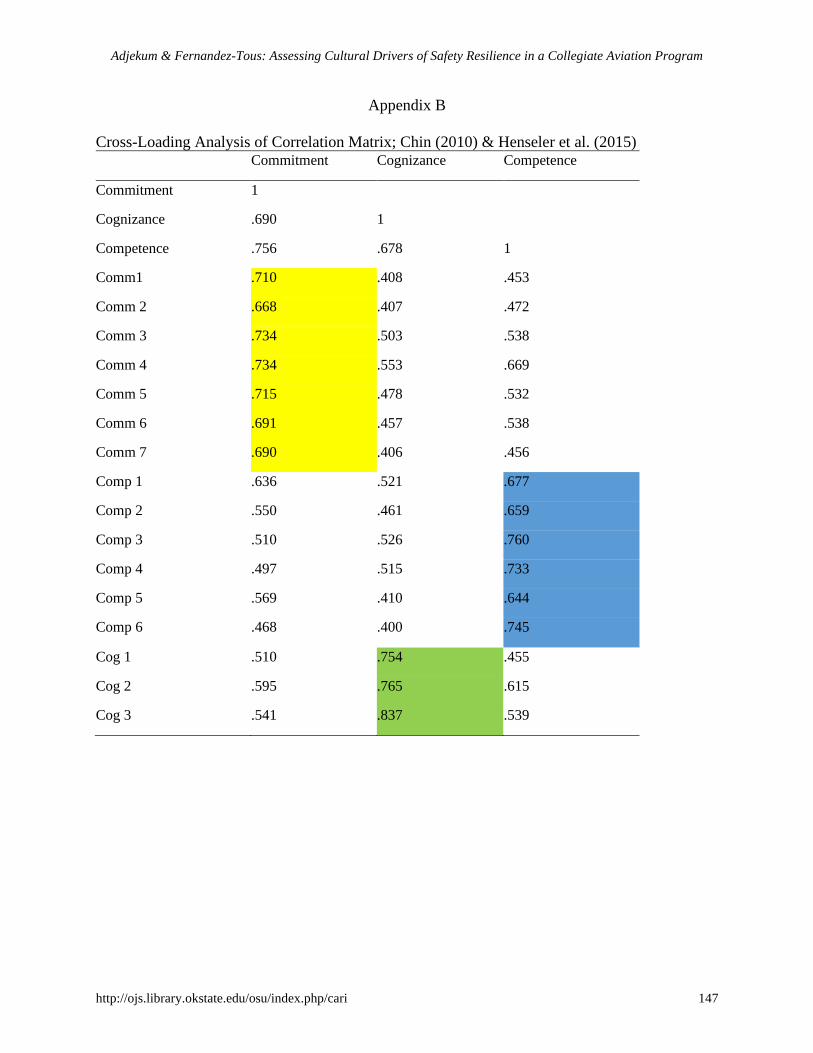
Adjekum & Fernandez-Tous: Assessing Cultural Drivers of Safety Resilience in a Collegiate Aviation Program
http://ojs.library.okstate.edu/osu/index.php/cari 147
Appendix B
Cross-Loading Analysis of Correlation Matrix; Chin (2010) & Henseler et al. (2015) Commitment Cognizance Competence
Commitment 1
Cognizance .690 1
Competence .756 .678 1
Comm1 .710 .408 .453
Comm 2 .668 .407 .472
Comm 3 .734 .503 .538
Comm 4 .734 .553 .669
Comm 5 .715 .478 .532
Comm 6 .691 .457 .538
Comm 7 .690 .406 .456
Comp 1 .636 .521 .677
Comp 2 .550 .461 .659
Comp 3 .510 .526 .760
Comp 4 .497 .515 .733
Comp 5 .569 .410 .644
Comp 6 .468 .400 .745
Cog 1 .510 .754 .455
Cog 2 .595 .765 .615
Cog 3 .541 .837 .539
A publication of the University Aviation Association, © 2020, ISSN: 1523-5955 148
Collegiate Aviation Review
International
Volume 38 | Issue 1 Peer-Reviewed Article #9
5-20-2020
An Analysis of Self-Reported Sleepiness
and Fatigue Measures from Collegiate
Aviation Pilots
Julius Keller Sarah Wolfe
Purdue University Purdue University
Flavio A. C. Mendonca
Purdue University
Thomas Laub
Purdue University
Fatigue can be deleterious to pilot performance. The National Transportation Safety Board has called on the
aviation community to reduce fatigue related accidents. Currently, there are few studies and guidance specific to
collegiate aviation pilots. The current study is part of a larger effort by the authors to gain a clearer understanding of
fatigue within the collegiate aviation environment. Collegiate aviation pilots are a unique group with different
schedules, lifestyles, and demands when compared to airline, military, and on-demand pilots. The purpose of this
study was to examine self-reported fatigue and sleepiness measures. Research instruments included the Karolinska
Sleepiness Scale and the Samn-Perelli Fatigue Scale. The research team recruited thirty-two collegiate aviation
pilots from a large Midwestern university. Participants were asked to record their sleepiness and fatigue ratings four
times a day, at intervals, for a total of four weeks over four months. Approximately 5,000 total data points were
collected. Results indicated a significant difference between the times of day. The 8:00 a.m. recording time had the
highest median fatigue and sleepiness score. There were no significant differences between the days of the week.
However, overall median fatigue and sleepiness scores indicated participants were slightly fatigued and sleepy
throughout the data collection period.
Recommended Citation: Keller, J., Mendonca, F. A. C., Laub, T., & Wolfe, S. (2020). An Analysis of Self-Reported Sleepiness and
Fatigue Measures from Collegiate Aviation Pilots. Collegiate Aviation Review International, 38(1), 148-
164. Retrieved from http://ojs.library.okstate.edu/osu/index.php/CARI/article/view/8016/7388
Keller et al.: An Analysis of Self-Reported Sleepiness and Fatigue Measures from Collegiate Aviation Pilots
http://ojs.library.okstate.edu/osu/index.php/cari 149
According to the National Transportation Safety Board (NTSB) (2018), fatigue is a
“pervasive problem in transportation that degrades a person’s ability to stay awake, alert, and
attentive to the demands of safely controlling a vehicle, vessel, aircraft, or train” (p. 1). The
International Civil Aviation Organization (ICAO) (2020) defines fatigue as:
a physiological state of reduced mental or physical performance capability resulting from
sleep loss or extended wakefulness, circadian phase, or workload (mental and/or physical
activity) that can impair a crew member’s alertness and ability to safely operate an
aircraft or perform safety-related duties. (p. 1)
Fatigue related accidents have become a concern for safety professionals. Consequently,
reducing fatigue related accidents has been listed on the National Transportation Safety Board’s
top ten most wanted list since 2016 (NTSB, 2020). The NTSB is calling for a comprehensive
approach to reducing the risks of fatigue in all sectors of transportation. Recommendations for
combatting fatigue in the aviation sector include research, education, and training. The NTSB,
the Federal Aviation Administration (FAA), aviation stakeholders, and the research community
have worked extensively to address the issue, however, there seems to be a gap in these efforts.
For instance, the FAA’s existing policies and training are specific to maintenance technicians,
scheduled services, and on-demand flight operations (FAA, 2010, 2012, 2014). Furthermore, the
only FAA regulation for duty time during flight training is the Federal Aviation Regulation
(FAR) 61.195. This regulation restricts flight instruction duties, which in the collegiate aviation
environment often consists of upper-level college students. Specifically, the regulation restricts
flight instruction hours to a maximum of eight per twenty-four hours (Electronic Code of Federal
Regulations, 2020a).
Although this is a positive mitigation tool, the regulation does not consider all the tasks
undertaken by the collegiate aviation pilots including instructions. Collegiate aviation pilots are a
unique population. In addition to flying, these pilots face rigorous course loads, expectations to
participate in student organizations, social activities, and often have part time jobs (Keller,
Mendonca, & Cutter, 2019; Levin, Mendonca, Keller, & Teo, 2019; Mendonca, Keller, & Lu,
2019). According to Beattie, Laliberté, Michaud-Leclerc, and Oreopoulos (2019), students who
thrive in the academic environment spend on average 30 hours a week studying. Many collegiate
aviation pilots are in the 18-22 age range. Moreover, this is frequently their first time living away
from home. Therefore, these individuals may be the least prepared group of pilots, as they are
just beginning to develop their time management and coping skills while learning how to safely
and effectively fly. Previous studies have indicated that a holistic approach to mitigate fatigue,
which includes conducting research utilizing multiple methodologies, evidence-based training
and education programs is vital (Mendonca et al., 2019; Signal, Ratieta, & Gander, 2006).
Collegiate Aviation Review International
A publication of the University Aviation Association, © 2020 150
Purpose
The purpose of this study was to investigate the role of day of the week and time of the
day on reported levels of sleepiness and fatigue by collegiate aviation pilots at a large
Midwestern professional flight program. The research team utilized the 10-point Karolinska
Sleepiness Scale (KSS) and the seven-point Samn-Parelli Fatigue Scale (SPS) to identify patterns
in sleepiness and fatigue, respectively, throughout the day and longitudinally (ICAO, 2012).
ICAO (2012) suggests using these scales to obtain a large data set efficiently. However, there are
biases with self-reported measures. Findings of this study will contribute to the larger project
which is intended to improve fatigue awareness, mitigation and management, training, and
education for collegiate aviation pilots (Keller et al., 2019; Mendonca et al., 2019; Romero,
Robertson, & Goetz, 2020). The following sections will discuss fatigue and the relationship to
safety as well as previous research pertaining to self-reported sleep measures.
Literature Review
Time of Day, Fatigue, and Errors
An examination of the literature indicates fatigue awareness and mitigation are directed
towards military and airline pilots (French & Garrick, 2005; Hamsal & Zein, 2019; Roach,
Darwent, Sletten, & Dawson, 2011). There seems to be only a few studies that are specific to
collegiate aviation pilots. The effects of sleep deprivation and physical fatigue are a continual
focal point in transportation safety research. From 2016 to 2020, “Reduce Fatigue-Related
Accidents” has been on the NTSB Most Wanted List as a primary safety focus (NTSB, 2018, p.
1). Many studies have been conducted with commercial airline and military flight crews (Gander
et al., 2013; Powell, Spencer, Holland, Broadbent, & Petrie, 2007; Sieberichs & Kluge, 2016).
Commercial flight crews are limited in duty time and flight time per day, while also subject to
minimum rest requirements per 14 Code of Federal Regulations (CFR) Parts 117, 121, and 135
(Electronic Code of Federal Regulations, 2020b). Despite the importance for aviation safety, a
prescriptive approach to mitigate fatigue in flight operations does not always consider other
factors contributing to fatigue other that work duration (Signal et al., 2006). Even with regulatory
rest protections, Mallis, Banks, and Dinges (2010) found only 50 to 75% of a normal rest period
appears to account for sleep.
ICAO (2016) suggests that sleep loss may affect a pilot's ability to "anticipating events,
planning and determining relevant courses of action ‐ particularly under novel situations" (pp. 2-
14). Pilots are required to plan and anticipate future actions and make split-second decisions,
especially when critical life-threatening situations arise. According to Williamson and Feyrer
(2000), 17 to 19 hours of wakefulness is equivalent to having a Blood Alcohol Content (BAC) of
.10. The NTSB labels the hours of wakefulness as the Time Since Awakening (TSA) (NTSB,
1994). TSA measures the number of hours when the pilot first rises from bed to the time of the
accident (NTSB, 1994). Flight crews with high TSA were recorded to have as much as 40%
more mistakes overall as compared to low TSA counterparts (NTSB, 1994). NTSB data also
indicate that errors of omission made by crews with high TSA rose by 75% (NTSB, 1994).
Similarly, errors with monitoring automation rose by around 136% in pilots with high TSA flight
Keller et al.: An Analysis of Self-Reported Sleepiness and Fatigue Measures from Collegiate Aviation Pilots
http://ojs.library.okstate.edu/osu/index.php/cari 151
crews (NTSB, 1994). As fatigue increases, errors made by an individual become more difficult
to detect and correct (ICAO, 2016).
According to O’Hagan, Issartel, McGinley, and Warrington (2018), seven pilots
participated in two 24-hour training sessions, one including an 8-hour rest period, and one
without the rest period. The participants were prompted to complete tasks measuring cognitive
flexibility, working memory, situational awareness, and hand-eye coordination every eight hours
throughout each session. Results indicated the participant instrument scan and hand eye
coordination suffered as well as pilot judgement due to fatigue. After 24 hours of continuous
wakefulness the pilots reported significant levels of fatigue. Lopez, Previc, Fischer, Heitz, and
Engle (2012) studied performance of Air Force pilots after 35 hours of sleep deprivation.
Significant effects of fatigue began to show after 19 hours of wakefulness. Slight increases in
performance were observed in the morning hours of the following day. This was possibly due to
peaks in the circadian rhythm cycle, yet performance was still significantly lowered when
compared to the beginning of the testing session. This finding may directly relate to collegiate
student pilots who may not have the best sleep practices. The human body needs a consistent
sleep cycle to be able to function at best performance. Students who have varying sleep
schedules, late nights, and early mornings are highly subject to decreases in performance (Lopez
et al., 2012).
The period in the day a flight occurs also has a significant effect on pilot performance due
to circadian cycles. Early morning flights between the hours of midnight and 6:00 a.m. have
shown decreases in performance regardless of the amount of rest received prior to duty. Mello et
al. (2008) analyzed Brazilian airline pilot errors in relationship to the time of day. The data
showed 9.5 errors per 100 flight hours during the early morning hours while later times of day
averaged 6.7 errors per 100 flight hours. Previc et al. (2009) also noted the effect of circadian
cycle in performance of pilots. Fatigue significantly increased and performance decreased at
midnight. A slight decrease in fatigue and sleepiness did not occur until after 9:30 a.m.
These articles provided evidence that relationships exist between time of day, fatigue
levels, and errors. Additionally, the methodologies provide an adequate framework for collegiate
aviation pilots. Though there have not been many studies specific to collegiate aviation pilots,
there has been a recent emerging effort by scholars.
Fatigue within the Collegiate Aviation Flight Environment
Mendonca, Keller, and Lu (2019) validated and distributed the Collegiate Aviation
Fatigue Inventory (CAFI) to a Midwestern collegiate aviation flight program. One hundred and
twenty-two pilots responded to the survey. Results indicated that 92% reported to have never
fallen asleep or struggled to stay awake during a flight. However, 51% indicated they proceeded
with a flight despite being extremely tired. Additionally, respondents reported cognitive
dysfunction during flight activities. Moreover, their responses suggested that lack of sleep was a
primary cause to their fatigue. In another study, researchers surveyed collegiate aviation pilots.
Results indicated flying after a long day, flying after less than eight hours of rest, and insufficient
quality of sleep were the top three causes of fatigue (Romero et al., 2020).
Collegiate Aviation Review International
A publication of the University Aviation Association, © 2020 152
Keller et al. (2019) utilized fatigue-related scenarios to understand pilot decision-making.
Results indicated participants did not always express desirable decision-making processes.
Additionally, findings indicated participants had insufficient knowledge about the effects of
fatigue as well as effective mitigation strategies. Pilots reported external factors such as
organizational pressures as a key aspect towards undesirable decisions. Levin, Mendonca, Keller,
and Teo (2019) reported that 86% (n = 141) of the surveyed participants believed that fatigue had
a negative impact on the safety of a flight operation. Additionally, approximately 85% of
respondents indicated they had not been formally trained on fatigue topics. It is important to
mention that Keller et al., (2019), Mendonca, Levin, Keller and Teo (2019), and Romero et al.
(2020) have clearly argued that further fatigue research within a collegiate aviation environment
is fundamental for aviation safety and efficiency. The previous studies pertaining to fatigue
within the collegiate aviation environment did not use self-reported measures. Therefore,
examining fatigue with a different methodology will add to the body of knowledge.
Measuring Fatigue Through Self-Reporting Measures
According to ICAO (2016), there are five methods for proactive fatigue identification.
These five are self-reporting measures, surveys, performance data, research studies, and the
analysis of time worked. Benefits to utilizing rating scales such as the Karolinska Sleepiness
Scale (KSS) and Samn-Parelli Scale (SPS) include the simplicity, cost-effectiveness, and ability
to collect a large amount of data (ICAO, 2012). However, self-reported scales are subject to
biases. These biases may come in two primary ways. First, a respondent may not want to tell the
truth about their fatigue state. Secondly, a person may not always be able to accurately detect the
true level of fatigue because of its insidious nature and or the individual’s emotional status
(Garwon, 2016). There has yet to be a study in the collegiate aviation environment utilizing self-
reported measures. However, robust studies using both the KSS and the SPS have been published
from the airline environment (Gander et al., 2013; Gawron, 2016; Powel et al., 2007; Van den
Berg et al., 2015).
Van den Berg et al. (2015) measured flight crew members fatigue and sleepiness to
evaluate the effectiveness of fatigue management strategies during ultra and non-ultra-long-range
flights. Participants were asked to provide their responses before and after a sleep break during
the flight. Additionally, the participants were asked to rate their workload and complete a five-
minute Psychomotor Vigilance Test (PVT). Results indicated the fatigue and sleepiness ratings
were higher on the non-ultra-long-range flights. This provided evidence that longer flights do not
always constitute more fatigue. This was attributed to better management of sleep recovery
periods between ultra-long-range flights. It was recommended that airlines should further
investigate workload patterns for shorter flights. In another study, the KSS and SPS were used to
evaluate pilots operating long-range and ultra-long-range flights. It was found that total sleep
time was a significant predictor for both the KSS an SPS ratings (Cosgrave, Wu, van den Berg,
Signal, & Gander, 2018). Levo (2016) utilized the KSS to measure pilot sleepiness over the
course of five flights. Results indicated a higher fatigue rating after the fourth flight during the
week that was recorded. This study contributed to understanding workload management and
fatigue risk management efforts. Previous studies (Gander et al., 2013; Honn, Satterfield,
Mccauley, Caldwell, & Van-Dongen, 2016; Shahid, Shen, & Shapiro, 2010) have demonstrated
Keller et al.: An Analysis of Self-Reported Sleepiness and Fatigue Measures from Collegiate Aviation Pilots
http://ojs.library.okstate.edu/osu/index.php/cari 153
that both the KSS and SPS are valid tools to assess subjective measures of sleepiness and fatigue,
respectively.
Pilot fatigue is a serious detriment to aviation safety. As pilots become more fatigued
performance decreases while accepted standards of performance and safety decreases (Caldwell,
2012). The review of literature indicated there are few fatigue studies pertaining to collegiate
aviation pilots and there may be a gap in fatigue training and education; however, there is an
emerging effort in that direction (Keller et al., 2019; Levin et al., 2019; Mendonca & Keller,
2020; Romero et al., 2020). Once again, this study is part of a larger effort to gain a clearer
understanding of fatigue specific to the collegiate aviation pilots. Previous phases of the research
project utilized surveys and fatigue-related decision-making scenarios (Keller et al., 2019; Levin
et al., 2019; Levin & Teo, 2019; Mendonca, Keller, Lu, 2019). When combining the results of
the different studies, the collegiate aviation community may have a clearer understanding of the
issue and could then develop more efficient holistic strategies to mitigate fatigue during flight
training activities. In order to understand fatigue and sleepiness among collegiate aviation pilots,
the following research questions were addressed:
1. Is there a significant difference between the time of day (8:00 a.m., 12:00 p.m., 4:00 p.m.,
and 9:00 p.m.) and the median KSS scores?
2. Is there a significant difference between the time of day (8:00 a.m., 12:00 p.m., 4:00 p.m.,
and 9:00 p.m.) and the median SPS scores?
3. Is there a significant difference between days of the week and the median KSS scores?
4. Is there a significant difference between days of the week and the median SPS scores?
Methodology
Sample
The participants in this study were undergraduate students enrolled in a Midwest Part 141
four-year collegiate aviation flight program. All participation was in accordance to Institution
Review Board (IRB) guidelines. Researchers sought collegiate aviation pilots, aged 18 years or
older, who had previously flown in the last six months, and were currently enrolled in a Part 141
flight training program.
Recruitment and Procedures
After obtaining IRB approval, the research team sent an email asking for participation.
Two information sessions were conducted to accommodate student schedules. During the
information sessions, the prospective participants were informed about the research project, their
rights as participants, the procedures, and then given consent forms to sign. The participants who
agreed to continue were re-informed of the procedures, asked to provide demographic
information, and to sign the consent form. A presentation was given to describe the scales and
their purpose.
The researchers asked students to document their fatigue and sleepiness levels at 8:00 a.m.,
12:00 p.m., 4:00 p.m., and 9:00 p.m. each day, using the SPS and KSS, respectively. The data
collection process occurred during four weeks spread in four consecutive months.
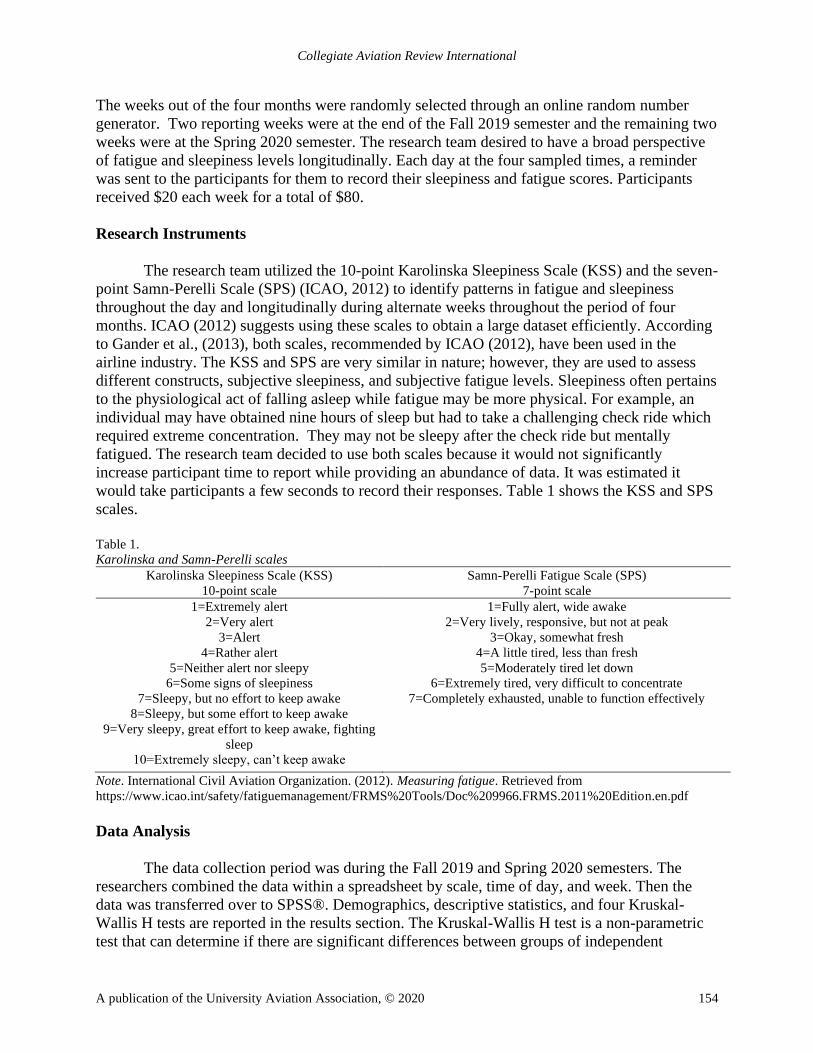
Collegiate Aviation Review International
A publication of the University Aviation Association, © 2020 154
The weeks out of the four months were randomly selected through an online random number
generator. Two reporting weeks were at the end of the Fall 2019 semester and the remaining two
weeks were at the Spring 2020 semester. The research team desired to have a broad perspective
of fatigue and sleepiness levels longitudinally. Each day at the four sampled times, a reminder
was sent to the participants for them to record their sleepiness and fatigue scores. Participants
received $20 each week for a total of $80.
Research Instruments
The research team utilized the 10-point Karolinska Sleepiness Scale (KSS) and the seven-
point Samn-Perelli Scale (SPS) (ICAO, 2012) to identify patterns in fatigue and sleepiness
throughout the day and longitudinally during alternate weeks throughout the period of four
months. ICAO (2012) suggests using these scales to obtain a large dataset efficiently. According
to Gander et al., (2013), both scales, recommended by ICAO (2012), have been used in the
airline industry. The KSS and SPS are very similar in nature; however, they are used to assess
different constructs, subjective sleepiness, and subjective fatigue levels. Sleepiness often pertains
to the physiological act of falling asleep while fatigue may be more physical. For example, an
individual may have obtained nine hours of sleep but had to take a challenging check ride which
required extreme concentration. They may not be sleepy after the check ride but mentally
fatigued. The research team decided to use both scales because it would not significantly
increase participant time to report while providing an abundance of data. It was estimated it
would take participants a few seconds to record their responses. Table 1 shows the KSS and SPS
scales.
Table 1.
Karolinska and Samn-Perelli scales
Karolinska Sleepiness Scale (KSS)
10-point scale
Samn-Perelli Fatigue Scale (SPS)
7-point scale
1=Extremely alert 1=Fully alert, wide awake
2=Very alert 2=Very lively, responsive, but not at peak
3=Alert 3=Okay, somewhat fresh
4=Rather alert 4=A little tired, less than fresh
5=Neither alert nor sleepy 5=Moderately tired let down
6=Some signs of sleepiness 6=Extremely tired, very difficult to concentrate
7=Sleepy, but no effort to keep awake 7=Completely exhausted, unable to function effectively
8=Sleepy, but some effort to keep awake
9=Very sleepy, great effort to keep awake, fighting
sleep
10=Extremely sleepy, can’t keep awake
Note. International Civil Aviation Organization. (2012). Measuring fatigue. Retrieved from
https://www.icao.int/safety/fatiguemanagement/FRMS%20Tools/Doc%209966.FRMS.2011%20Edition.en.pdf
Data Analysis
The data collection period was during the Fall 2019 and Spring 2020 semesters. The
researchers combined the data within a spreadsheet by scale, time of day, and week. Then the
data was transferred over to SPSS®. Demographics, descriptive statistics, and four Kruskal-
Wallis H tests are reported in the results section. The Kruskal-Wallis H test is a non-parametric
test that can determine if there are significant differences between groups of independent
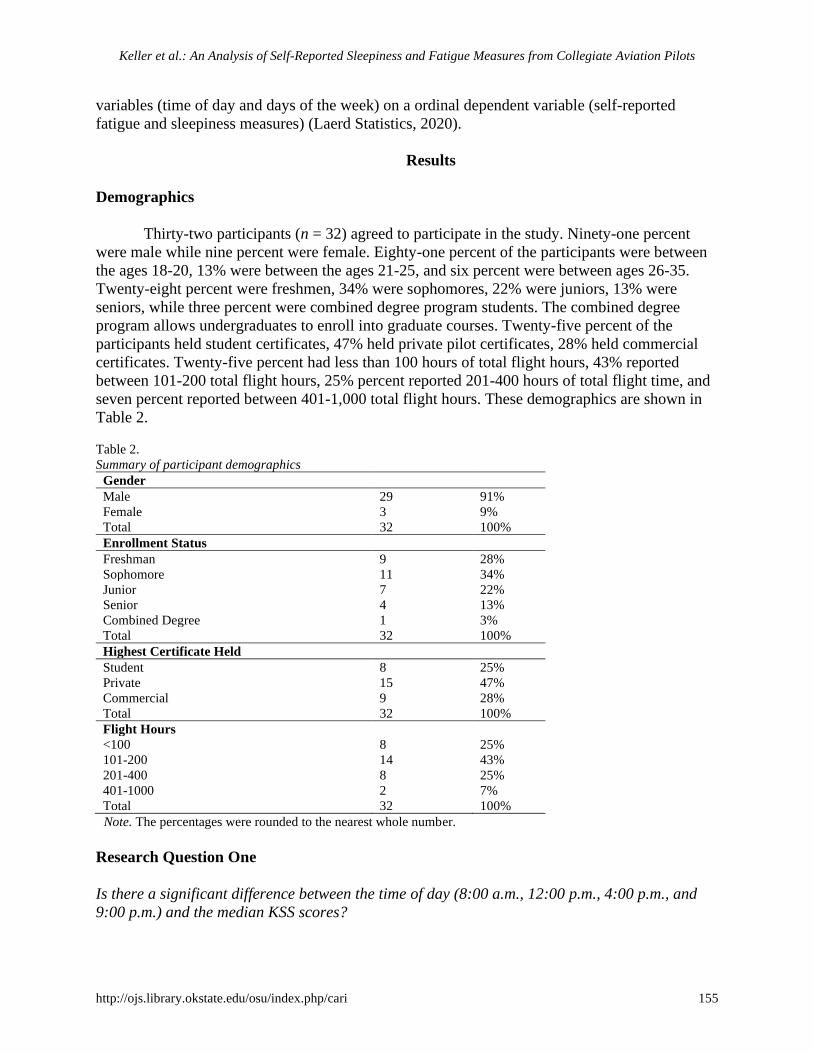
Keller et al.: An Analysis of Self-Reported Sleepiness and Fatigue Measures from Collegiate Aviation Pilots
http://ojs.library.okstate.edu/osu/index.php/cari 155
variables (time of day and days of the week) on a ordinal dependent variable (self-reported
fatigue and sleepiness measures) (Laerd Statistics, 2020).
Results
Demographics
Thirty-two participants (n = 32) agreed to participate in the study. Ninety-one percent
were male while nine percent were female. Eighty-one percent of the participants were between
the ages 18-20, 13% were between the ages 21-25, and six percent were between ages 26-35.
Twenty-eight percent were freshmen, 34% were sophomores, 22% were juniors, 13% were
seniors, while three percent were combined degree program students. The combined degree
program allows undergraduates to enroll into graduate courses. Twenty-five percent of the
participants held student certificates, 47% held private pilot certificates, 28% held commercial
certificates. Twenty-five percent had less than 100 hours of total flight hours, 43% reported
between 101-200 total flight hours, 25% percent reported 201-400 hours of total flight time, and
seven percent reported between 401-1,000 total flight hours. These demographics are shown in
Table 2.
Table 2.
Summary of participant demographics
Gender Male 29 91%
Female 3 9%
Total 32 100%
Enrollment Status Freshman 9 28%
Sophomore 11 34%
Junior 7 22%
Senior 4 13%
Combined Degree 1 3%
Total 32 100%
Highest Certificate Held Student 8 25%
Private 15 47%
Commercial 9 28%
Total 32 100%
Flight Hours
<100 8 25%
101-200 14 43%
201-400 8 25%
401-1000 2 7%
Total 32 100%
Note. The percentages were rounded to the nearest whole number.
Research Question One
Is there a significant difference between the time of day (8:00 a.m., 12:00 p.m., 4:00 p.m., and
9:00 p.m.) and the median KSS scores?
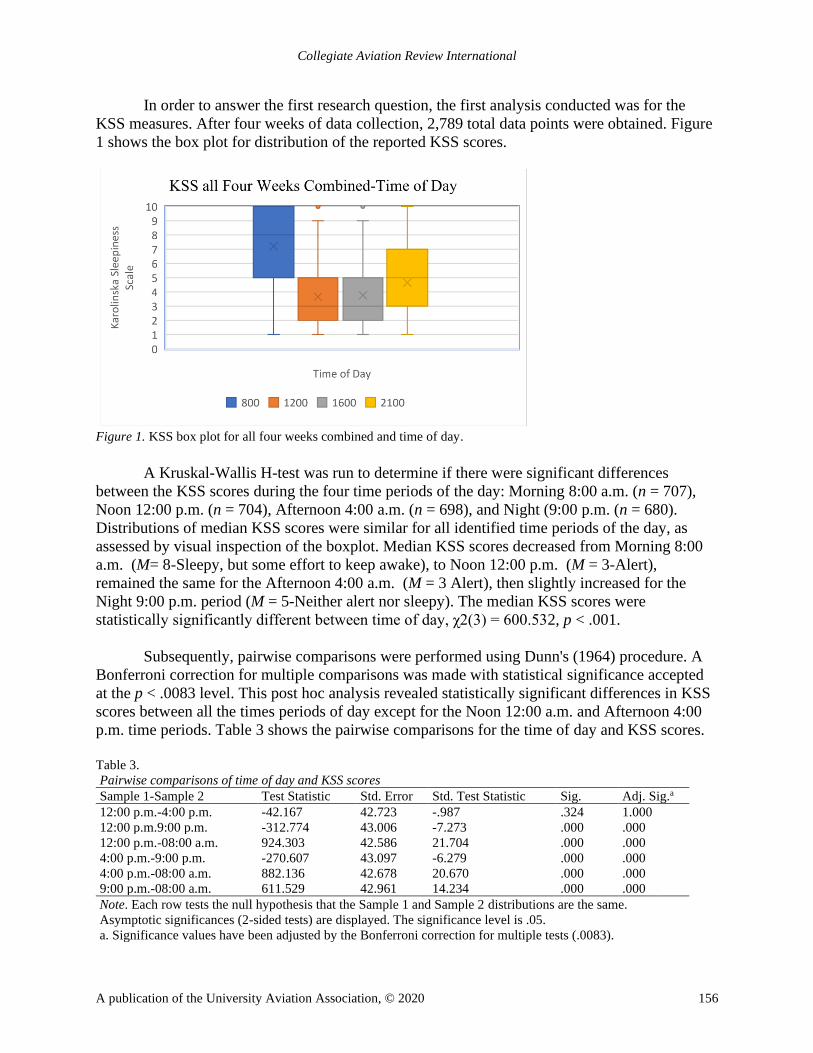
Collegiate Aviation Review International
A publication of the University Aviation Association, © 2020 156
In order to answer the first research question, the first analysis conducted was for the
KSS measures. After four weeks of data collection, 2,789 total data points were obtained. Figure
1 shows the box plot for distribution of the reported KSS scores.
Figure 1. KSS box plot for all four weeks combined and time of day.
A Kruskal-Wallis H-test was run to determine if there were significant differences
between the KSS scores during the four time periods of the day: Morning 8:00 a.m. (n = 707),
Noon 12:00 p.m. (n = 704), Afternoon 4:00 a.m. (n = 698), and Night (9:00 p.m. (n = 680).
Distributions of median KSS scores were similar for all identified time periods of the day, as
assessed by visual inspection of the boxplot. Median KSS scores decreased from Morning 8:00
a.m. (M= 8-Sleepy, but some effort to keep awake), to Noon 12:00 p.m. (M = 3-Alert),
remained the same for the Afternoon 4:00 a.m. (M = 3 Alert), then slightly increased for the
Night 9:00 p.m. period (M = 5-Neither alert nor sleepy). The median KSS scores were
statistically significantly different between time of day, χ2(3) = 600.532, p < .001.
Subsequently, pairwise comparisons were performed using Dunn's (1964) procedure. A
Bonferroni correction for multiple comparisons was made with statistical significance accepted
at the p < .0083 level. This post hoc analysis revealed statistically significant differences in KSS
scores between all the times periods of day except for the Noon 12:00 a.m. and Afternoon 4:00
p.m. time periods. Table 3 shows the pairwise comparisons for the time of day and KSS scores.
Table 3.
Pairwise comparisons of time of day and KSS scores
Sample 1-Sample 2 Test Statistic Std. Error Std. Test Statistic Sig. Adj. Sig.a
12:00 p.m.-4:00 p.m. -42.167 42.723 -.987 .324 1.000
12:00 p.m.9:00 p.m. -312.774 43.006 -7.273 .000 .000
12:00 p.m.-08:00 a.m. 924.303 42.586 21.704 .000 .000
4:00 p.m.-9:00 p.m. -270.607 43.097 -6.279 .000 .000
4:00 p.m.-08:00 a.m. 882.136 42.678 20.670 .000 .000
9:00 p.m.-08:00 a.m. 611.529 42.961 14.234 .000 .000
Note. Each row tests the null hypothesis that the Sample 1 and Sample 2 distributions are the same.
Asymptotic significances (2-sided tests) are displayed. The significance level is .05.
a. Significance values have been adjusted by the Bonferroni correction for multiple tests (.0083).
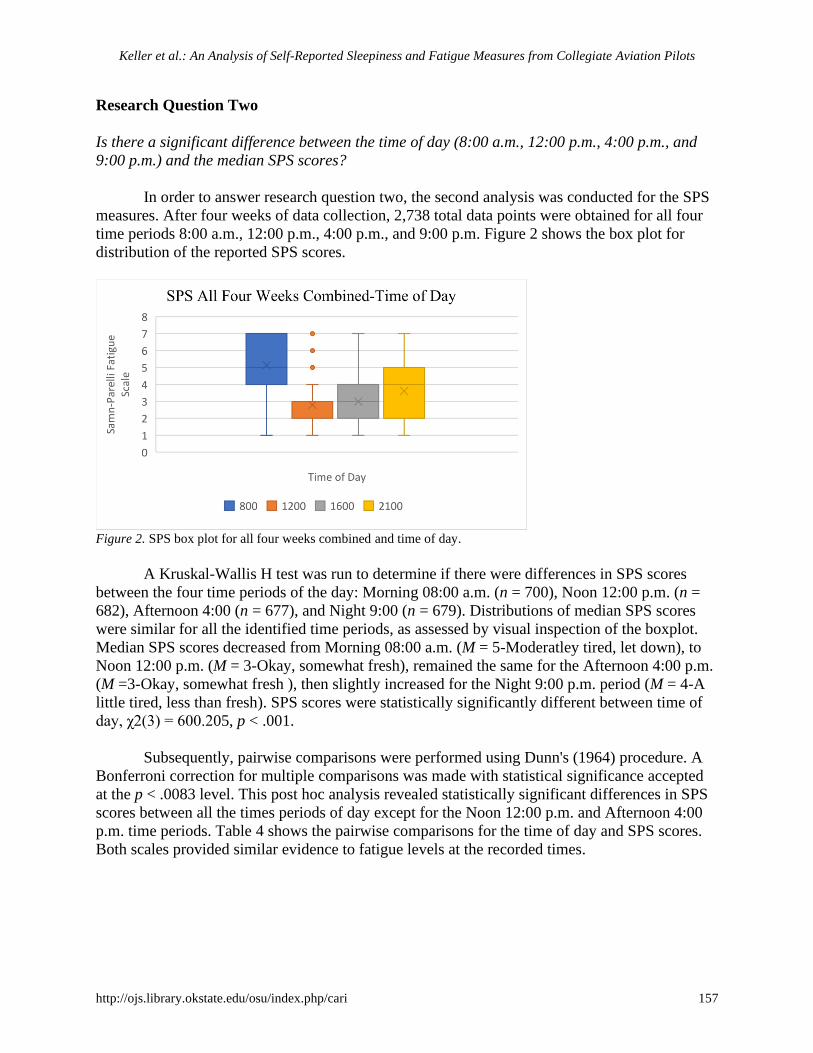
Keller et al.: An Analysis of Self-Reported Sleepiness and Fatigue Measures from Collegiate Aviation Pilots
http://ojs.library.okstate.edu/osu/index.php/cari 157
Research Question Two
Is there a significant difference between the time of day (8:00 a.m., 12:00 p.m., 4:00 p.m., and
9:00 p.m.) and the median SPS scores?
In order to answer research question two, the second analysis was conducted for the SPS
measures. After four weeks of data collection, 2,738 total data points were obtained for all four
time periods 8:00 a.m., 12:00 p.m., 4:00 p.m., and 9:00 p.m. Figure 2 shows the box plot for
distribution of the reported SPS scores.
Figure 2. SPS box plot for all four weeks combined and time of day.
A Kruskal-Wallis H test was run to determine if there were differences in SPS scores
between the four time periods of the day: Morning 08:00 a.m. (n = 700), Noon 12:00 p.m. (n =
682), Afternoon 4:00 (n = 677), and Night 9:00 (n = 679). Distributions of median SPS scores
were similar for all the identified time periods, as assessed by visual inspection of the boxplot.
Median SPS scores decreased from Morning 08:00 a.m. (M = 5-Moderatley tired, let down), to
Noon 12:00 p.m. (M = 3-Okay, somewhat fresh), remained the same for the Afternoon 4:00 p.m.
(M =3-Okay, somewhat fresh ), then slightly increased for the Night 9:00 p.m. period (M = 4-A
little tired, less than fresh). SPS scores were statistically significantly different between time of
day, χ2(3) = 600.205, p < .001.
Subsequently, pairwise comparisons were performed using Dunn's (1964) procedure. A
Bonferroni correction for multiple comparisons was made with statistical significance accepted
at the p < .0083 level. This post hoc analysis revealed statistically significant differences in SPS
scores between all the times periods of day except for the Noon 12:00 p.m. and Afternoon 4:00
p.m. time periods. Table 4 shows the pairwise comparisons for the time of day and SPS scores.
Both scales provided similar evidence to fatigue levels at the recorded times.
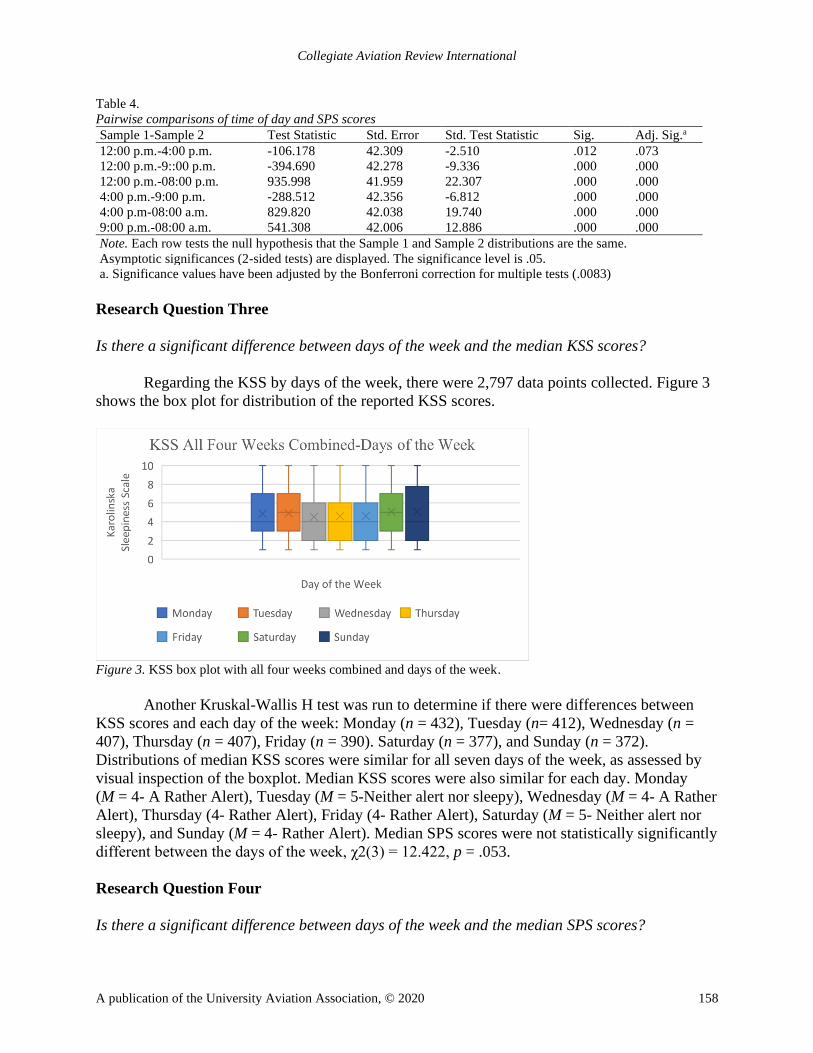
Collegiate Aviation Review International
A publication of the University Aviation Association, © 2020 158
Table 4.
Pairwise comparisons of time of day and SPS scores
Sample 1-Sample 2 Test Statistic Std. Error Std. Test Statistic Sig. Adj. Sig.a
12:00 p.m.-4:00 p.m. -106.178 42.309 -2.510 .012 .073
12:00 p.m.-9::00 p.m. -394.690 42.278 -9.336 .000 .000
12:00 p.m.-08:00 p.m. 935.998 41.959 22.307 .000 .000
4:00 p.m.-9:00 p.m. -288.512 42.356 -6.812 .000 .000
4:00 p.m-08:00 a.m. 829.820 42.038 19.740 .000 .000
9:00 p.m.-08:00 a.m. 541.308 42.006 12.886 .000 .000
Note. Each row tests the null hypothesis that the Sample 1 and Sample 2 distributions are the same.
Asymptotic significances (2-sided tests) are displayed. The significance level is .05.
a. Significance values have been adjusted by the Bonferroni correction for multiple tests (.0083)
Research Question Three
Is there a significant difference between days of the week and the median KSS scores?
Regarding the KSS by days of the week, there were 2,797 data points collected. Figure 3
shows the box plot for distribution of the reported KSS scores.
Figure 3. KSS box plot with all four weeks combined and days of the week.
Another Kruskal-Wallis H test was run to determine if there were differences between
KSS scores and each day of the week: Monday (n = 432), Tuesday (n= 412), Wednesday (n =
407), Thursday (n = 407), Friday (n = 390). Saturday (n = 377), and Sunday (n = 372).
Distributions of median KSS scores were similar for all seven days of the week, as assessed by
visual inspection of the boxplot. Median KSS scores were also similar for each day. Monday
(M = 4- A Rather Alert), Tuesday (M = 5-Neither alert nor sleepy), Wednesday (M = 4- A Rather
Alert), Thursday (4- Rather Alert), Friday (4- Rather Alert), Saturday (M = 5- Neither alert nor
sleepy), and Sunday (M = 4- Rather Alert). Median SPS scores were not statistically significantly
different between the days of the week, χ2(3) = 12.422, p = .053.
Research Question Four
Is there a significant difference between days of the week and the median SPS scores?
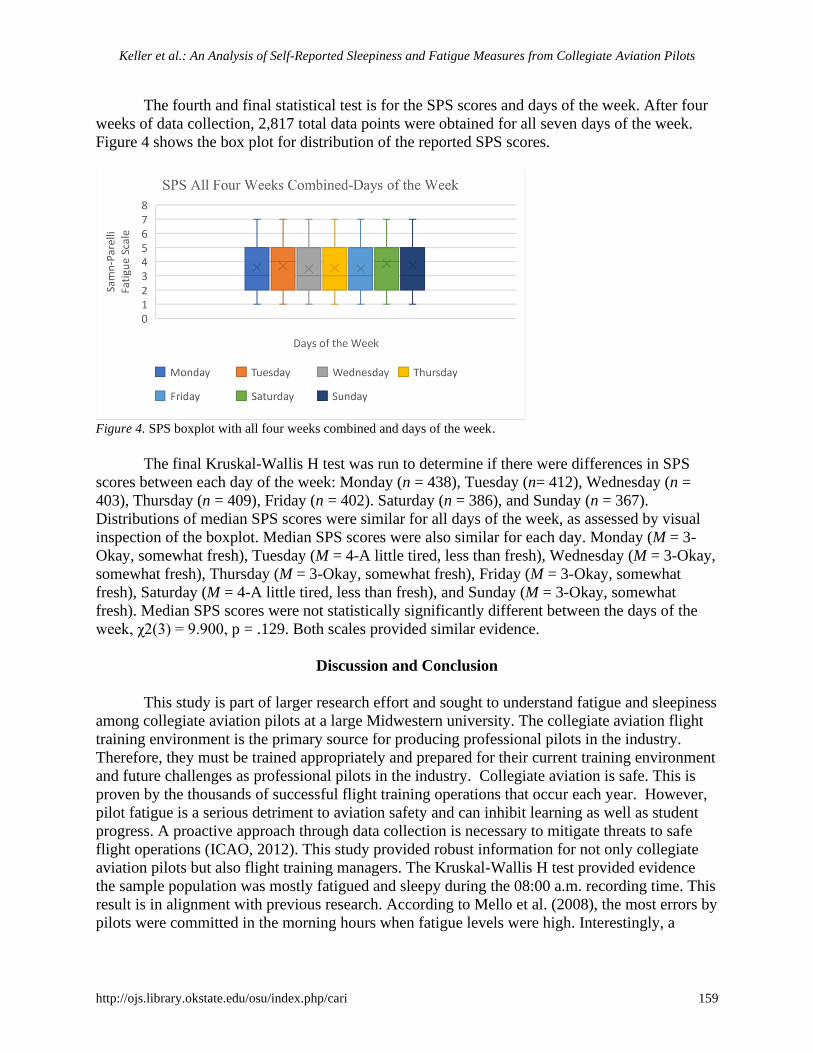
Keller et al.: An Analysis of Self-Reported Sleepiness and Fatigue Measures from Collegiate Aviation Pilots
http://ojs.library.okstate.edu/osu/index.php/cari 159
The fourth and final statistical test is for the SPS scores and days of the week. After four
weeks of data collection, 2,817 total data points were obtained for all seven days of the week.
Figure 4 shows the box plot for distribution of the reported SPS scores.
Figure 4. SPS boxplot with all four weeks combined and days of the week.
The final Kruskal-Wallis H test was run to determine if there were differences in SPS
scores between each day of the week: Monday (n = 438), Tuesday (n= 412), Wednesday (n =
403), Thursday (n = 409), Friday (n = 402). Saturday (n = 386), and Sunday (n = 367).
Distributions of median SPS scores were similar for all days of the week, as assessed by visual
inspection of the boxplot. Median SPS scores were also similar for each day. Monday (M = 3-
Okay, somewhat fresh), Tuesday (M = 4-A little tired, less than fresh), Wednesday (M = 3-Okay,
somewhat fresh), Thursday (M = 3-Okay, somewhat fresh), Friday (M = 3-Okay, somewhat
fresh), Saturday (M = 4-A little tired, less than fresh), and Sunday (M = 3-Okay, somewhat
fresh). Median SPS scores were not statistically significantly different between the days of the
week, χ2(3) = 9.900, p = .129. Both scales provided similar evidence.
Discussion and Conclusion
This study is part of larger research effort and sought to understand fatigue and sleepiness
among collegiate aviation pilots at a large Midwestern university. The collegiate aviation flight
training environment is the primary source for producing professional pilots in the industry.
Therefore, they must be trained appropriately and prepared for their current training environment
and future challenges as professional pilots in the industry. Collegiate aviation is safe. This is
proven by the thousands of successful flight training operations that occur each year. However,
pilot fatigue is a serious detriment to aviation safety and can inhibit learning as well as student
progress. A proactive approach through data collection is necessary to mitigate threats to safe
flight operations (ICAO, 2012). This study provided robust information for not only collegiate
aviation pilots but also flight training managers. The Kruskal-Wallis H test provided evidence
the sample population was mostly fatigued and sleepy during the 08:00 a.m. recording time. This
result is in alignment with previous research. According to Mello et al. (2008), the most errors by
pilots were committed in the morning hours when fatigue levels were high. Interestingly, a
Collegiate Aviation Review International
A publication of the University Aviation Association, © 2020 160
previous study by Mendonca et al. (2019) suggested that collegiate aviation pilots are more
fatigued during the early hours of the day (6:00am to 9:00am).
There were no significant differences found between the days of the week for both the
KSS and SPS scales. Interestingly, the participants median SPS score for each day of the week
ranged from 3-Okay, somewhat fresh to 4-A little tired, less than fresh while the KSS median
score ranged from 4-Rather alert to 5-Neither alert nor sleepy. This may indicate the participants
were slightly sleepy and fatigued while making it through each day. Desirably, students should
feel alert, fresh, and lively throughout the day. It is not new knowledge that best method to
prevent fatigue is getting enough rest (Caldwell, 2012; ICAO, 2016). According to Romero et
al., (2020), collegiate aviation pilots have struggled to get adequate sleep in both quantity and
quality. This may be due to inadequate sleep preparation including preparing a proper sleeping
environment i.e. temperature, putting away electronic devices, noisy dorm rooms, and planning
for 7-9 hours of sleep. Additionally, Mendonca, Keller, and Lu (2019) found that students battle
with having healthy lifestyles. Therefore, future research can further examine the barriers to
effective sleep and lifestyle habits. This can be accomplished through focus groups and
interviews. Though it is impossible to control student behavior outside of the classroom, it is
possible that proper research-based training and education can promote desirable behaviors.
The authors acknowledge this study had several limitations. It was conducted at one
collegiate aviation program and resources were limited. Additionally, there is potential bias in
self-reporting data such as reluctance to be truthful and reporting the true nature of the fatigue
level. Moreover, the researchers utilized a convenience sampling method, which unfortunately,
did not include flight instructors. Caution should be given towards generalizing the results of this
study to all collegiate aviation pilots. Furthermore, the researchers did not ask participants to
report what they were doing prior to and the moment of reporting or the quality of their sleep.
Nonetheless, results can still provide the foundation for safety efforts and research strategies to
mitigate fatigue during flight training.
Practical applications may be derived from this study. Management and faculty can
require formal fatigue mitigation and management training to all flight students. Program leaders
can continue to develop and implement fatigue risk management systems, as suggested by ICAO
(2012). In addition, the use of self-reported measures in conjunction with student workload
management should be encouraged. Lastly, it is recommended that a robust assessment of fatigue
be conducted prior to adding early morning and or later flight slots for the purpose of increasing
capacity. Specific attention should be given to existing early morning and late flight slots as well
as student-to-instructor ratio.
Keller et al.: An Analysis of Self-Reported Sleepiness and Fatigue Measures from Collegiate Aviation Pilots
http://ojs.library.okstate.edu/osu/index.php/cari 161
References
Beattie, G., Laliberté, J. W. P., Michaud-Leclerc, C., & Oreopoulos, P. (2019). What sets college
thrivers and divers apart? A contrast in study habits, attitudes, and mental
health. Economics letters, 178, 50-53. https://doi.org/10.1016/j.econlet.2018.12.026
Caldwell, J. A. (2012). Crew schedules, sleep deprivation, and aviation performance. Current
Directions in Psychological Science,21(2), 85-89.
https://doi.org/10.1177/0963721411435842
Cosgrave, J., Wu, L. J., van den Berg, M., Signal, T. L., & Gander, P. H. (2018). Sleep on long
haul layovers and pilot fatigue at the start of the next duty period. Aerospace medicine
and human performance, 89(1), 19-25. https://doi.org/10.3357/AMHP.4965.2018
Dunn, O. J. (1964). Multiple comparisons using rank sums. Technometrics, 6, 241-252.
https://doi.org/10.1080/00401706.1964.10490181
Electronic Code of Federal Regulations. (2020a). Title 14, chapter I, subchapter D, part 61,
subpart H, 61.195. Retrieved from https://gov.ecfr.io/cgi-
bin/retrieveECFR?gp=1&SID=cc48e562bfb79d04a4fc01b0714d7675&ty=HTML&h=L
&mc=true&r=SECTION&n=se14.2.61_1195
Electronic Code of Federal Regulations. (2020b). Title 14, chapter I, subchapter G, part 117.
Retrieved from https://gov.ecfr.io/cgi-bin/text-
idx?SID=cc48e562bfb79d04a4fc01b0714d7675&mc=true&node=pt14.3.117&rgn=div5#
se14.3.117_111
Federal Aviation Administration. (2010). Fact sheet-pilot fatigue. Retrieved from
https://www.faa.gov/news/fact_sheets/news_story.cfm?newsId=11857
Federal Aviation Administration. (2012). Fatigue education and awareness training program.
Retrieved from https://www.faa.gov/regulations_policies/advisory_circulars/
index.cfm/go/document.information/documentid/1020388
Federal Aviation Administration. (2014). Fatigue risk management. Retrieved from
https://www.faa.gov/about/initiatives/maintenance_hf/fatigue/
French, J., & Garrick, K. (2005). Estimating pilot fatigue in commercial flight operations.
Proceedings of the Human Factors and Ergonomics Society Annual Meeting, 49(1), 136–
139. https://doi.org/10.1177/154193120504900130
Gander, P. H., Signal, T. L., Berg, M. J. V. D., Mulrine, H. M., Jay, S. M., & Mangie, J. (2013).
In-flight sleep, pilot fatigue and psychomotor vigilance task performance on ultra-long
range versus long range flights. Journal of Sleep Research, 22(2), 697-
706. https://doi.org/10.1111/jsr.12071
Collegiate Aviation Review International
A publication of the University Aviation Association, © 2020 162
Gawron, V. J. (2016). Overview of self-reported measures of fatigue. The International Journal
of Aviation Psychology, 26(3-4), 120-131.
https://doi.org/10.1080/10508414.2017.1329627
Hamsal, M., & Zein, F. A. (2019). Pilot fatigue risk analysis: conceptual study at flight operation
of Garuda Indonesia’s Boeing 737 pilots. IOP Conference Series: Materials Science and
Engineering, 598, 012040. https://doi.org/10.1088/1757-899X/598/1/012040
Honn, A. K., Satterfield, B. C., Mccauley, P., Caldwell, J. L., & Van-Dongen, H. P. A. (2016).
Fatiguing effect of multiple take-offs and landings in regional airline operations. Accident
Analysis and Prevention, 86, 199-208. https://doi.org/10.1016/j.aap.2015.10.005
International Civil Aviation Organization. (2012). Measuring fatigue. Retrieved from
https://www.icao.int/safety/fatiguemanagement/FRMSBangkok/4.%20Measuring%20Fat
igue.pdf
International Civil Aviation Organization. (2016). Manual for the oversight of fatigue
management approaches. Retrieved from https://www.icao.int/safety/
fatiguemanagement/FRMS%20Tools/Doc%209966.FRMS.2016%20Edition.en.pdf
International Civil Aviation Organization. (2020). Cabin crew fatigue management. Retrieved
from https://www.icao.int/safety/airnavigation/OPS/CabinSafety/Pages/Cabin-Crew-
Fatigue-Management.aspx
Keller, J., Mendonca, F., & Cutter, J. E. (2019). Collegiate aviation pilots: Analyses of fatigue
related decision-making scenarios. International Journal of Aviation, Aeronautics, and
Aerospace, 6(4). https://doi.org/10.15394/ijaaa.2019.1360
Laerd Statistics (2020). Kruskal-Wallis H test using SPSS statistics. Statistical tutorials and
software guides. Retrieved from https://statistics.laerd.com/
Levin, E., Mendonca, F. A. C., Keller, J., & Teo, A. (2019). Fatigue in collegiate aviation.
International Journal of Aviation, Aeronautics, and Aerospace, 6(4).
https://doi.org/10.15394/ijaaa.2019.1351
Levin, E., & Teo, A. (2019). Lifestyle and solutions: An investigation of fatigue in collegiate
aviation. Journal of Purdue Undergraduate Research,9. Retrieved from
https://docs.lib.purdue.edu/cgi/viewcontent.cgi?article=1394&context=jpur
Levo, A. (2016). Predicting pilot fatigue in commercial transportation. Retrieved from
https://aaltodoc.aalto.fi/handle/123456789/19921
Lopez, N., Previc, F. H., Fischer, J., Heitz, R. P., & Engle, R. W. (2012). Effects of sleep
deprivation on cognitive performance by United States Air Force pilots. Journal of
Applied Research in Memory and Cognition,1(1), 27-33.
https://doi.org/10.1016/j.jarmac.2011.10.002
Keller et al.: An Analysis of Self-Reported Sleepiness and Fatigue Measures from Collegiate Aviation Pilots
http://ojs.library.okstate.edu/osu/index.php/cari 163
Mallis, M. M., Banks, S., & Dinges, D. F. (2010). Aircrew fatigue, sleep need and circadian
rhythmicity. In Human Factors in Aviation (2nd ed., pp. 401-436). Burlington, MA:
Elsevier. https://doi.org/10.1016/B978-0-12-374518-7.00013-4
Mello, M. D., Esteves, A., Pires, M., Santos, D., Bittencourt, L., Silva, R., & Tufik, S. (2008).
Relationship between Brazilian airline pilot errors and time of day. Brazilian Journal of
Medical and Biological Research, 41(12), 1129-1131. https://doi.org/10.1590/S0100-
879X2008001200014
Mendonca, F. A. C., & Keller, J. (2020, March). Fatigue in collegiate aviation. Proceedings of
the National Training Aircraft Symposium, Daytona Beach, FL. Retrieved from
https://commons.erau.edu/ntas/2020/presentations/11/
Mendonca, F. A. C., Keller J., Levin, E., & Teo, A. (2019). Understanding fatigue within a
collegiate aviation program. Manuscript submitted for publication.
Mendonca, F., Keller, J., & Lu, C. T. (2019). Fatigue identification and management in flight
training: An investigation of collegiate aviation pilots. International Journal of Aviation,
Aeronautics, and Aerospace, 6(5), 13. https://commons.erau.edu/ijaaa/vol6/iss5/13
National Transportation Safety Board. (1994). A review of flight crew-involved, major accidents
of U.S. air carriers, 1978 through 1990. Retrieved from
https://apps.dtic.mil/dtic/tr/fulltext/u2/a532150.pdf
National Transportation Safety Board (NTSB). (2018). Most wanted list archive. Retrieved
from https://www.ntsb.gov/safety/mwl/Pages/mwl_archive.aspx
National Transportation Safety Board (NTSB). (2020). Reduce fatigue related accidents-
aviation. Retrieved from https://ntsb.gov/safety/mwl/Pages/mwlfs-19-20/mwl2-fsa.aspx
O’Hagan, A., Issartel, J., Mcginley, E., & Warrington, G. (2018). 0232 Has your pilot had
enough sleep to fly? The effects of sleep deprivation on mood, fatigue and
competencies of commercial airline pilots. Sleep,41, 90-92.
https://doi:10.1093/sleep/zsy061.231
Powell, D., Spencer, M., Holland, D., Broadbent, E., & Petrie, K. (2007). Pilot fatigue in short-
haul operations: Effects of number of sectors, duty length, and time of day. Aviation,
Space, and Environmental Medicine, 78(7), 698-701. Retrieved from
https://www.ingentaconnect.com/content/asma/asem/2007/00000078/00000007/art00009
Previc, F. H., Lopez, N., Ercoline, W. R., Daluz, C. M., Workman, A. J., Evans, R. H., & Dillon,
N. A. (2009). The effects of sleep deprivation on flight performance, instrument
scanning, and physiological arousal in pilots. The International Journal of Aviation
Psychology,19(4), 326-346. https://doi:10.1080/10508410903187562
Collegiate Aviation Review International
A publication of the University Aviation Association, © 2020 164
Roach, G. D., Darwent, D., Sletten, T. L., & Dawson, D. (2011). Long-haul pilots use in-flight
napping as a countermeasure to fatigue. Applied Ergonomics, 42(2), 214–218.
https://doi.org/10.1016/J.APERGO.2010.06.016
Romero, M.J. & Robertson, M.F. & Goetz, S.C. (2020). Fatigue in collegiate flight training.
Collegiate Aviation Review International, 38(1), 12-29. Retrieved from
http://ojs.library.okstate.edu/osu/index.php/CARI/article/view/7912/7344
Shahid, A., Shen, J., & Shapiro, C. M. (2010). Measurements of sleepiness and fatigue. Journal
of Psychosomatic Research, 69(1), 81-89.
https://doi.org/10.1016/j.jpsychores.2010.04.001
Sieberichs, S., & Kluge, A. (2016). Good sleep quality and ways to control fatigue risks in
aviation—An empirical study with commercial airline pilots. In Advances in Physical
Ergonomics and Human Factors (pp. 191-201). Springer, Cham.
https://doi.org/10.1007/978-3-319-41694-6_20
Signal, L., Ratieta, D., & Gander, P. (2006). Fatigue management in the New Zealand aviation
industry. Retrieved from http://citeseerx.ist.psu.edu/viewdoc/
download?doi=10.1.1.72.7549&rep=rep1&type=pdf
van den Berg, M. J., Signal, T. L., Mulrine, H. M., Smith, A. A., Gander, P. H., & Serfontein, W.
(2015). Monitoring and managing cabin crew sleep and fatigue during an ultra-long-
range trip. Aerospace medicine and human performance, 86(8), 705-713.
https://doi.org/10.3357/AMHP.4268.2015
Williamson, A. M., & Feyer, A. M. (2000). Moderate sleep deprivation produces impairments in
cognitive and motor performance equivalent to legally prescribed levels of alcohol
intoxication. Occupational Environment Medical, 57, 649-655.
http://dx.doi.org/10.1136/oem.57.10.649