collegiate education
TRANSCRIPT
FINAL REPORT
OF
THE SUB-SECTOR STUDY ON:
COLLEGIATE EDUCATION
B \
Dr M.R Narayana Professor of Economics
Institute for Social & Economic Change Bangalore 560 072
SPONSORED BY AND SUBMITTED TO:
EDUCATION DEPARTMENT GOVERNMENT OF KARNATAKA
BANGALORE
August 13,2001
NIEPA DC
D11422
5 if
. f
idHAfiY & !lU(;U(v>liM IA f UM UtNfil^KCitu of Kd»c«tiM«i
iitam iu i v«k AdixiiQ!ftri!eti»».17-S. Au*oVm<io Niiirl,PI*W ( elhl-130^i6 r tv \ \ l± .o *1%oc, No 0
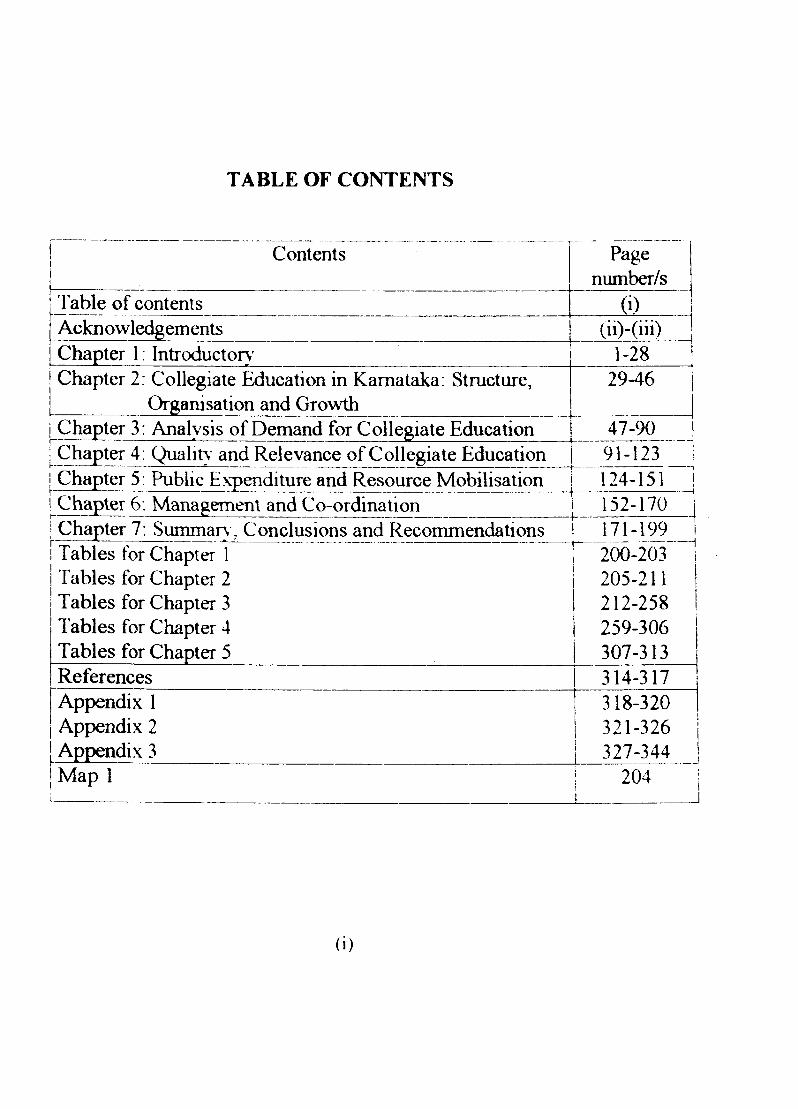
TABLE OF CONTENTS
Contents[
Pagenumber/s
Table of contents (i)Acknowledgements Cii)-(iii)Chapter 1; Introducton^ 1-28Chapter 2: Collegiate Education in Karnataka: Structure,
Organisation and Growth29-46
Chapter 3: Analysis of Demand for Collegiate Education 47-90 1Chapter 4: Qualm' and Relevance of Collegiate Educationh - - - - - - - . ' . . . . . . . . . . . . . . . . — - - - - - - - ■ 91-123 i
1 Chapter 5: Public Expenditure and Resource Mobilisation | 124-151 !i Chapter 6: Management and Co-ordination i 152-170IChapter 7: Summarw Conclusions and Recommendations 1 171-199 1
i i1 Tables for Chapter 1 200-203 i1 Tables for Chapter 2 205-2111 Tables for Chapter 3 212-258Tables for Chapter 4 259-306Tables for Chapter 5 307-313References 314-317 1Appendix 1 318-320Appendix 2 321-326Appendix 3 I 327-344Map 1
i.i 20411
(i)
ACKNOWLEDGMENTS
Grateful thanks are due to all persons who have directly and indirectly helped me to complete this final report. In particular, my thanks go to:
Education Department, Government of Karnataka, Bangalore, for sponsoring this study with fuU financial assistance;
Smt Vatsala Watsa, IAS, for giving me the opportunity’ and all encouragement to work on this study;
Dr Malati Das, Principal Secretary, Education Department and Chairperson of the Review Committee for the Sub-sector Studies, for helpful suggestions and all official help;
All distinguished members of the Review Committee for the Sub-sector Studies for constructive comments and guidance throughout;
Dr M.Govinda Rao, Director, Institute for Social & Economic Change (ISEC), Bangalore, for permitting and encouraging me to work on this study;
Sri T.R. Satishchandran, Chairman, Board of Governors of ISEC; Dr Sajitha Bashir, Education Economist, The World Bank; Professor M.V. Nadkami, Vice Chancellor, Gulbarga University; Professor N.S. Ramegowda, Vice Chancellor, Karnataka State Open University; Professor S. Gopal, Vice Chancellor, Mangalore University; the Director (Assistant Director) of College Development Council of University of Mysore (Kuvempu University); Dr Radhakrishna, Principal, Sheshadripuram First Grade College; Professor A.S. Seetharamu and Dr M. Venkata Reddy at ISEC; and Sri M.S. Nanjundaiah, Member, Task Force on Education of the Government of Karnataka for constructive discussions and/or comments and suggestions on the draft report;
The Chairperson, discussant and participants of the session on “Collegiate Education” in the national Workshop on Sub-sector studies during May 24-26, 2001 at Bangalore for helpfiil comments and suggestions.
(n)
Sri K.A*Belliappa, Commissioner of Collegiate Education; Sri Srinivas Rao Hejib. Director of Collegiate Education; Sri S.M. Vijayaraghavachar, Director (I/C), Bureau of Economics and Statistics; Sri S. Nagaraju, Under Secretary (University), and Sri Srikanteshware, Under Secretary (Planning), Education Department; Sri B,S. Sridhararaje Urs, Director of Vocational Education; Sri C.T. Kittur, Joint Director, Department of Employment and Training; Sri K. Shankar Rao, Director (Manpower and Employment Division), Planning Department, and late Sri M.G. Dayananda, Asst. Statistical Officer, Directorate of Collegiate Education, for useful discussions, and official help and co-operation in obtaining data from their respective departments in Government of Karnataka;
Sri K.V.Kodanda Ramaiah, Joint Director of Collegiate Education, for his excellent co-operation, help and discussions throughout the preparation of this report;
The Registrars of all the State universities in Karnataka, the principals and students in all sample colleges of this study, for their help and cooperation during the collection of primary and secondary data in their universities and colleges;
Participants of the Brain Storming Session on “Re-Orientation of Collegiate Education in Karnataka”, organised by the Education Department, Government of Karnataka, Bangalore, on July 13, 2001,
Sri Lukose Vallatharai, State Project Director, DPEP, and Sri Shantha Raju, Programme Officer, for all their help and co-operation throughout; and
The Research Officer, field investigators and data entr\' operators for their respective work for this study.
August 13, 2001 M.R. Narav'anaBangalore
(iii)
CHAPTER 1
Introductory
The main objectives of this Chapter are to provide with a broad introduction to the nature, objectives and approach of the study. In addition, this Chapter describes the data needs for the study, specifies the availability of databases in terms of their sources, characteristics and limitations, and justifies the need for collecting primary data from a random sample survey of colleges. These descriptions and specifications form the inferential foundations for the results and conclusions of this study.
1.1. Nature and Scope
1.1.1. General objectives of higher education
Collegiate education is an important component of higher education in Karnataka State. The higher education in the State comprises general education, technical education, medical education and agricultural education. The higher general education comprises the university education and collegiate education. Up to 1976, education was in the list of State subjects under the Constitution of India. However, since the 42“* amendment to the constitution in 1976, education has been placed under ^ e concurrent list. Thus, both Union Government and State Governments can formulate policies and programmes for development of education including higher education in the country.
The Report of the Karnataka Universities Review Commission or, in brie£ the Review Conmiission, (1993; pp.29-30) has neatly outlined four important roles of higher education in the State. First, to move into new firontiers of knowledge by ^ndamental and apfriied research while aiming at absorbing the changing nature of society in its various aspects to continuously pass on the traditions through knowledge, skill and values to upcoming generations. Second, to provide basic knowledge to the students through teaching and research. Third, to develop skilled personnel to meet ever-growing and complex needs of modem society. Fourth, to jMTOvide the basis for continuing education for updating the knowledge by providing extension services. Thus, higher education has the basic objectives of
producing qualified manpower, training for research career and efficient management of teaching profession.
1.1.2. Collegiate education in Karnataka
Throughout this study, by collegiate education we mean that education which leads to the award to first undergraduate degrees in general education, such as, B.A., B.Sc., B.Com., B.B.M., B.C.A., and B.H.M. Thus, the scope of collegiate education in this study does not include degree courses in (a) law colleges, (b) colleges of education, (c) fine arts colleges and (d) postgraduate degree courses within the general degree colleges.
Broadly speaking, collegiate education is of two types. First, regular education. Second, distance education. The scope of this study covers the collegiate education in regular education as well as distance education as described below.
Regular education is college-based or provided through Government colleges (GCs) , Private aided colleges (PACs), Private unaided colleges (PUACs) and University colleges (UCs) which are afiSliated with the State universities under section 53 of the Karnataka State Universities Act, 1976. The State universities to be covered in the study are the University of Mysore, Bangalore University, Kamatak University, Mangalore University, Gulbarga University and Kuvempu University. The private aided and unaided colleges, which come under three types of management, viz., SC/ST colleges. Minority colleges and General (i.e. neither SC/ST nor Minority) colleges, would be covered.
Distance education is university-based and provided in the form of correspondence courses, external examination system and open university system. At present. Bangalore University, Kamatak University and Karnataka State Open University offer distance education within the State. It should be emphasised tiiat the admission to the distance education by these universities is open to all persons anywhere in the country. In the same way, distance education offered by universities outside the State (e.g. Indian Gandhi National Open University) is also open to students within the State. However, the scope of distance education in this study is limited to the universities within the State.
1.2. Major policy issues focused
This sti^y aims at describing the progress and analysing the major policy issues in the collegiate education in Karnataka State. The main purpose of this analysis is to derive implications for (a) formulation of current and future policies and (b) planning for improving the collegiate education in the State, especially from the viewpoint of the State Government's policies and programmes.
The study focuses on the analysis of the following four major policy issues.
(i) Over the years, there have been several quantitative changes in the general higher education of the State. These changes include the number and type of colleges, nature and number of courses, students, teachers, physical infrastructure, amount and sources of financing of colleges. Consequent upon these changes, among others, the total number of graduates from the colleges has increased over the years. This has contributed to a large increase in the aggregate supply of graduates from the system of collegiate education in the State.
A pertinent issue in this regard is whether or not the supply of graduates (in aggregate or in individual courses) has been in relation to the demand for graduates in the State? If so, the system of collegiate education should have been matching its supply of graduates with the demand for graduates, from within and outside tiie system. Otherwise, there must have been a mismatch, resulting in either excess supply of or demand for graduates. An answer to these questions calls for reexamining the objectives of collegiate education as well as understanding the factors (i.e. both policy and nonpolicy factors) of supply of and demand for the collegiate education (especially, by select courses) in the State.
While the supply of college graduates are directly observed from the basic data on the outturn of students from universities or colleges, the demand for collegiate education is not directly observed as it originates in activities of both within the education sector (e.g. annual pass percent of students from PUC courses) and outside the general education system (e.g. job absorption in trade and industry in public and private sectors). Thus, it is essential to identify the major sources of demand for collegiate education as
it helps in assessing the nature and magnitude of the demand for collegiate education in the State.
In a spatial context (e.g. at the district level), the supply and demand analysis above helps in identifying areas wi^ excess or deficient demand . Accordingly, the need for and feasibility of a policy, for instance, for consolidating small sized colleges and facilities as a measure of cost reduction strategies in the system may be justifiable.
(ii) Along the path of quantitative expansion of the collegiate education, the learning performance of students (e.g. in terms of passing all relevant examinations and, hence, obtaining a degree) has not been uniform between students within a class, between subjects in a course, between the courses in a college and between colleges within the university and between the universities in the State. While scoring the minimum marks for a pass in the qualifying examinations leads to the award of degree, such a single indicator approach to measuring student performance may not be plausible, as students above the minimum marks may have varying marks. Thus, in addition to the analysis of pass percent of students by courses in the colleges or universities, it is pertinent to analyse the distribution of number of students with a first class, a second class and a third class among the total students who have passed in a course within a college or the university.
Further, it is important to understand the student performance in examinations by broad student categories (boys, girls, SC/ST etc.), by broad institution type (district, management type, medium of instruction, university) and by selection criteria of colleges (e.g. cut off marks for admission). This understanding shall be of immense policy use since many of these factors may be influenced by the State Government’s policy changes, either directly or indirectly.
(iii) Public financing of collegiate education has increased over the years. For instance, the State Government's financial assistance to private aided colleges has been in the form of grants-in>aid (GIA), i.e. in the form of teaching/ maintenance grant. Three important factors have contributed to increasing GIA to private degree colleges in the recent years. First, for bringing new degree colleges as plan expenditure under the GIA. Second, for continuing all colleges on the GIA which were brought under the GIA in the previous plans, as non-plan expenditure. Thus, as and when the pay revisions and allowances (e.g. dearness allowance as it is indexed with
inflation) take place, the GIA amount to the colleges has been increased. Third, the student fees (e.g. tuition fee, since GIA to a private aided college college is net of tuition fee collected within the college) have remained a negligible source of fmancing of collegiate education system, while the nonpublic sources of financing of private colleges (e.g. student donations at the time of admission to professional courses in private colleges) have remained widely undisclosed.
In the recent past, fiscal reforms at the State level have focused on expenditure reduction as well as expenditure switching policies, as they are related to budgetary subsidies to collegiate education. For instance, the State Government had announced a 15% cut in allocation of resources to higher education sector, including collegiate education, in the budget 2000-2001 and the resources thus saved would be allocated to primary and secondary education in educationally backward areas. And, in the budget 2001-02, the need for continuing with the diversion of money fi-om subsidised higher education to primary education has been reemphasised. Consequently, the collegiate education system has to explore options (e.g. seeking additional tunds from non-governmental sources) to cope with this reduced finance fi-om the State Government without, of course, compromising on the quality of education.
(iv) On the supply side, the system of collegiate education includes three major institutional agents, viz., the State Government, universities and affiliated colleges. And, within a university or a college, the major agents comprise staff (teaching and non-teaching), students and the management (in case of private colleges). For instance, the universities decide, among others, the continuation of affiliation, recognition of the courses to be taught, prescribe common syllabus for all courses and conduct uniform examination and valuations, prescribe minimum attendance for students, number of students in a course, number of working days for colleges and certain fee for students (e.g. examination fee) in their affiliated colleges. In the same way, colleges are dependent on the State Government for seeking permission to start, to receive financial assistance in the form of GIA and to fix certain fee, such as, tuition fee and laborator> fee, for their students.
In short the affiliated colleges (hence, their staffs students and management) are under specific guidelines and regulations of both the State Government and the University in question. Tlius, it is important to know in what ways and to what extent the changes over the years in the specific
guidelines and regulations of the university and the State Government in regard to the affiliated colleges have implications on the issues mentioned above, viz., reducing the mismatch between supply and demand, increasing responsiveness of institutions to removing courses for which there is little demand and addmg those for which there is demand, enabling institutions to change curriculum, hire faculty' etc. and enabling institutions to raise resources and use them for improving qualitv.
1.3. Review of key findings of earlier studies
Studies on collegiate education in Karnataka are few and focus only on the description of current status of collegiate education and nature and impact of GIA on students performance in final year degree courses in the private aided colleges. These studies include Narayana (2001a), Narayana (2000a), Narayana (2000b), Narayana (2000c) and Narayana (1999a). In fact these studies are the extensions and refinements of the earliest study on grants-in-aid to private degree colleges in the State by Narayana (1999b). In addition to these studies, there exist few popular write-ups on the current issues in collegiate education in the State. These write-ups include Narayana (1999c) on the impact of fee revision on the finances of private aided colleges and Narayana (2001 b) on the impact of 15% reduction in GIA on collegiate education during 2000-01.
In Narayana (1999a). a description of trends in size, growth and distribution of GIA during 1990's is given. And, the characteristics of colleges on GIA are elaborated (e.g. staff and students strength in colleges). Further, the study raises several current policy issues in GIA, such as, whether or not the GIA should be permanent? Should GIA be conditional on the professional performance criteria, such as, pass percentage and academic achievements of students? Can “all grants for ever” be replaceable by “all grants for the year” or “no grants are for ever? In addition, on the question of a reduction in GIA, the important policy issues raised include: Should all the aided colleges be given a uniform cut in the size of GIA? If so, by what percentage? If not, can different colleges be given ditYerent cut in the size of their current GIA ? And, by what objective criteria can such differential cut be effected ? How should the management fill in the resource gap due to reduction in the GIA ? Will they be given total flexibility in charging fee, collecting donations and any other non- institutional sources of revenues? If so, what are the possible implications of such unregulated pricing of collegiate education on students from poorer
sections of society, in both rural and urban areas? However, the study does not answer any of these policy questions.
The determinants of pass percent of students in private aided colleges are empirically modeled and tested in Narayana (2000a). In particular, cross- section, pooled regression and fixed effects model for panel data are formulated and tested using the data from 1991-92 to 1997-98 from 31 sample aided degree colleges by three types of private management in Bangalore urban and rural districts. The study models the impact of GIA on pass percent of students through student-teacher ratio. The study finds, among others, that the nature and magnitude of determinants of students' performance in aided colleges of Bangalore districts are different between types of college management. Thus, pooling of colleges between management is not plausible on empirical grounds. Second, of the three empincal firameworks, the fixed efl'ect model is empirically preferable to cross-section model and pooled regression model. Thus, a priori, specification of the estimation model in terms of a cross section model or a pooled regression model may lead to misleading conclusions and implications. Third, regardless of the nature of esfimation models, the impact of student-teacher ratio on the pass percent of student in colleges b>- all management is statistically insignificant. This implies that, other things being equal, the impact of GIA on the pass percent of students in the aided colleges is not significantly different from zero.
On the other hand, in Narayana (2000b), the empirical models in Narayana (2000a) are tested using the data firom 1991-92 to 1997-98 on 113 sample aided colleges in the entire Karnataka State excluding Bangalore districts. Most surprisingly, the empirical evidence show that regardless of the nature of estimation in terms of cross-section regression, pooled regression and fixed effects model, the influence of student-teacher ratio on the pass percent of students in colleges by all management is statistically insignificant and negligible in magnitude. This implies that, other things being equal, the impact of GIA (indirectly, however) on the pass percent of student is zero on empirical grounds. This results suggests that there is a need to reconsider the current and future objectives of the GIA policy fi'om the viewpoint of determining and improving the students' performance in the private aided colleges.
In Narayana (2000c), a simple empirical fi’amework for estimation of determinants of pass percent of students by courses is developed. The
available databases on collegiate education in terms of their sources, characteristics and limitations are explored, and the role of primary data in supplementing the secondary data is justified. Most importantly, the nature and limitations of data on college finances (i.e. receipt and expenditure) fi-om primary sources are highUghted. Using the primary data firom 1991-92 to 1997-98 on 31 sample private aided colleges by types of management fi-om Bangalore districts as in Narayana (2000a), a pooled regression model is estimated by ahemative specifications of explanatory variable, viz., retention rate of students and GIA. The estimation results show that, of the variables, retention rate and GIA as the common determinants of student performance in colleges of all management although the nature and magnitude of these variables are remarkably different between Minority colleges, SC/ST colleges and Other colleges (i.e. colleges which do not belong to Minority or SC/ST management). However, regardless of the nature of management, the impact of GIA is smallest in magnitude but statistically highly significant.
More recently, Narayana (2001a) has estimated the impact of grants-in- aid on students' performance (in terms of pass percentages) in aided private degree colleges, using panel data fi'om sample colleges in Bangalore district of Karnataka State (India) fi*om 1991-92 to 1997-98. The specification of GIA variable (i.e. in the standardised form) is distmct fi-om the specification in the above studies. In addition, sensitivity of a reduction in GIA on the estimated pass percent of students in the individual colleges and feasibility of financmg a reduction m GIA through proposed changes in students' fee during 1997-98 are analysed. The results show that (a) the impact of GIA is positive and significant in all estimations; (b) the estimated pass percentage of students do vary remarkably, especially if GIA is reduced by 50 per cent or more; and (c) the proposed fee revisions can finance a reduction in GIA to all colleges by about 12 percent.
All the above studies have a narrow focus on analysing the nature and impact of GIA on private aided colleges in the State with alternative empirical modeling, databases and techniques of estimation. However, aided private colleges are only a part of the cdlegiate education system, and GIA is one of the aspects of the working of the private aided colleges.
The present study is wider in coverage as it includes government colleges, private aided colleges, private unaided colleges and university colleges, and universities in distance collegiate education. The issues to be discussed are
related to supply side, demand side, quality and relevance, finance and management and co-ordination of the entire collegiate education. Thus, the present study is new, comprehensive and contributory to the empirical and policy literature on collegiate education in the State.
1.4. Main Objectives
In the context of the issues raised above, the main objectives of the study are as follows.
(a) Describe the major changes in the size, dispersion, composition, finances, sources of funding, organisation and structure of the collegiate education system in Karnataka State the during 1990's.
(b) Analyse the pert'ormancc of collegiate education system in terms of student outcomes (especially, in final year examinations) in the State.
(c) Determine the effect of the limitation on State Government grants to the collegiate education in the State. And, assess how the collegiate education may cope with such limitations, at present and in future.
(d) Suggest measures to enable the institutions on both supply side and demand side to be more responsive to student needs, to improve efficiency and to mobilise more funds for collegiate education in the State.
(e) Suggest specific measures in government and university regulations to reduce the mismatch between supply and demand, increase responsiveness of institutions to add or delete courses depending on the demand for courses, provide flexibility to colleges to change curriculum, hire faculty, raise and use resources, etc.
(f) Identification of good practices and lessons that can be learnt from well performing institutions in collegiate education within and outside the State, and discuss the feasibility of introducing reforms.
To accomplish the objectives above, both secondary and primary data are needed. The secondary data are needed in the study, among others, (a) to provide a description of the growth of collegiate education system, in terms of the organisation and management, enrolment of students, number of teachers, infrastructure facilities, size of colleges, medium of instruction, private/public provision, new courses ofifered, nature and amount of student fees, grants from State Government, etc; (ii) to analyse the trends in admissions for major disciplines and student performance in learning by discipline, region, social group, etc; and (iv) to analyse the nature and magnitude of employment or demand for graduates from collegiate education. In addition, secondary data in the form of information on government rules, orders, notifications and guidelines regarding infrastructure, fees, teachers' qualifications, reservation policy and roaster system, etc are needed.
On the other hand, exploration of options to finance a reduction in GIA to collegiate education requires detailed secondary data on the revenue and expenditure of colleges, such as, growth in public expenditures for government and aided institutions: composition of these expenditures by salary' and non-salary components for government and private aided colleges: specific new “self-tmancing” courses introduced in government and aided institutions and revenues generated by them; additional resource generation measures (consultancy, research projects): and fee levels bycourse and comparison with per student expenditure.
Fhe primary data (i.e. data to be newly and directly collected from the colleges, if secondary' data are not available w, if available, are inadequate) are required for different purposes, as detailed below. First, for identification of the key problems in students (i.e. academic preparation of final examinations, interest/motivation in joining the course) and for analysis of future plans of students passing out of colleges. Second, for identification of key current problem in curriculum (e.g. quality and availability of textbooks, and impact of accreditation requirements); laboratory equipment and consumables (e.g. quality, quantity, availability and funding), and facilities (for faculty in terms of appropriateness of class size, staff room and recruitment/retention of qualified faculty, and for support staff in tenns of their numbers, skills, etc), retention rate of students, especially in the context of the most motivated and able choosing technical
1.5. Data needs
to
education, reasons for course choices, if any. Third, data on nongovernmental sources of revenue and non-salary expenditure for private degree colleges are not available from secondary sources. However, such data are required for analysis of issues on public expenditure and resource mobilisation in the State (e.g. comparison of costs borne by students and per student expenditure in government aided and unaided colleges and by courses). The sources of revenue include grants from the State Government college management UGC, the University, tuition and non-tuition fee, student donations at the time and after the admission. The data on expenditure includes payment of salary for stafl purchase of land and building, expenditure on library and equipment.
1.6. Available databases on collegiate education: Sources, Charactenstjcs and limitations
Databases on collegiate education in Karnataka State may be explored under secondary databases and primary databases, as detailed below.
1 -6.1. Secondary databases
Secondary data on collegiate education are available from different sources in published and unpublished forms. The major characteristics and limitations of these data by sources and for years during 1990's are described below.
1.6.1.1. QfSce of the Commissioner or Director of Collegiate Education
The statistical cell of this Office maintains the records of the data or information on degree colleges (i.e. general degree and law degree colleges). In regard to general degree colleges, the data are collected from the Government and private aided colleges in the 5 forms/formats. A copy of these formats, as applicable during 2000-01, is given in the Appendix I.
From the formats above, the Directorate processes and maintains data on the following variables with their characteristics and limitations. These data are called available data with the Directorate. It is important to emphasise that many of the limitations of the available data are not accountable for non-collection. Rather, the limitations may be due to non-processing of the collected information by the Directorate and/or non-reporting of the relevant data by the colleges. These points are discussed by variables below.
11
(i) Number of colleges and their general characteristics (unpublished butprocessed)
District-wise and university-wise data on the nature and number of general degree and law colleges are available for 1997-98, 1999-00 and 2000-01. Data on the characteristics of the colleges include: distribution of colleges by Government, private aided and unaided colleges; distribution of private colleges by minorit>', SC/ST and general management (i.e. colleges which do not belong to SC/ST management or minorities' management); Location of colleges in or away from district headquarters; courses offered by general and professional courses; year of establishment of colleges; year of brining the aided colleges under GIA; distinction of colleges by evening and day colleges, urban and rural colleges, composite or bifurcated colleges and men’s or women’s colleges. From these data, annual distribution of number of colleges and colleges by various characteristics can be determined. However, non- availability of data on medium of instruction in colleges is a major missing information on the characteristics of the colleges.
(ii) Enrolment of students (unpublished and unprocessed)
Data on students in colleges may be generated on many aspects, such as, intake, admission, enrolment, examination, pass percent and graduation. At present, all data in the Department are related only to the enrolment of students in the II year and III year of the degree courses. In case of I year degree students, the distinction between number of students admitted and enrolled is not clear. Nevertheless, this study presumes that the number of student in I year degree courses is equivalent to number of students enrolled in I year degree courses for a given year.
Data on enrolment of students are available by: districts; Government, aided and unaided colleges; B.A., B.Sc., and B.Com. courses; I year, II year and III year, and by male and female students. In addition, total number of students (i.e. sum of students in I year, II year and III year of the degree courses) by SC/ST and non-SC/ST students is available for select years in Government and private colleges.
Major limitations of this data are as follows. First, from 1990-91 to 1993-94, the data are combined for aided and unaided colleges. Thus, no separation of enrolment of students between private aided and unaided
12
colleges is possible. Second, no distinction is made in the data on private colleges by minority, SC/ST and general colleges. However, this distinction can be easily made since the identity of colleges by management is available and obtainable from the Directorate.
(iii) Number of staff (unpublished and unprocessed)
Staff in colleges includes teaching and non-teaching staff.
District-wise data on teaching staff are available on the number of teachers by designation and by SC/ST and non-SC/ST categories. These data are available only for Government and private aided colleges from1990-91 through 1999-00.
In the same way, district-wise data on non-teaching staff are available on the number of non-teaching persons by group C and D categories, and by SC/ST and non-SC/ST categories from 1990-91 through 1999-00.
Major limitations of the data on the staff are due to its non-availabilitv' on: private unaided colleges; qualification of teachers and completion of job-related programmes (e.g. refresher and orientation programmes); distinction between part-time and temporary staff; private colleges by Minority, SC/ST and General colleges; and on distinction between sanctioned, working and vacant staff. In addition, the data does not distinguish between teachers (a) in aided colleges who are paid out of government’s grants-in-aid or paid out of college management, and (b) in different courses in colleges. However, since the information on sanctioned, working and vacant positions may be available with other sections (e.g. budget section, since such information is vital for release of GIA to colleges), some of these limitations may be overcome.
(iv) Pass percent of students (unpublished and unprocessed)
The ratio (expressed in percent) of number of students passing in a final year examination to total number of students appearing for final year examination in a course is called pass percent of students in a course. Availability of data on pass percent is limited to total number of students, and by SC/ST and non-SC/ST categories, who have appeared and passed in B.A., B.Sc., and B.Com. degree final examination in Government colleges and private aided colleges from 1990-91 through 1999-00. Thus, pass
13
percent of students may be classified by courses, by SC/ST and non-SC/ST categories and by Government and aided colleges during these years. However, the major limitations of the available data are due to its nonavailability on distribution by I Class, II Class and III Class; distinction between male and female students and on entire unaided colleges.
(v) Public expenditure on colleges
The budget section of the Directorate maintains the college level data on the provision and release of budgetary expenditure (Rs. in lakh at current prices) for Government colleges and on GIA to aided private degree colleges. The data is tabulated by universities and by districts from 1992-93 through 1999-00.
The 6 Joint Directorate of Collegiate Education maintains the college level data on the provision and release of budgetary expenditure on Government and GIA to the aided private degree colleges which falls within their jurisdiction. From this data, expenditure by different characteristics of colleges may be classified.
(vi) Major limitations of non-GIA data
A major limitation of the all the non-GIA data above is non-reporting of information by many colleges to the Directorate for different years.
Non-reported information constitutes the missing information for the respective colleges during the years. This has two implications. First in any statistical analysis, missing information cannot be valued by zero. Second, while taking the average values of the respective variables, (e.g. average enrollment for a government or a private aided college), the denominator should refer to total number of reported government or aided colleges rather than total number of government or aided colleges in a year.
It should be emphasised that the Directorate has no way to fill in data gap, arising out of non-reporting by colleges, except to write back to the respective non-reported colleges. The fact that such data gaps still persist (e.g. data on pass percent of student) is a clear indication that no follow up is strongly initiated by the Directorate to get the data reported from the non- reported colleges.
14
Interestingly, the Directorate has attempted to fill in the missing information in the following way for select variables. For instance, for total number of teaching staff and enrollment of student by courses, information of the preceding year (as reported by the colleges) are repeated for the current year (non-reported by colleges). However, for pass percent of students by courses, this method of filling in missing information is not adopted. Thus, missing (i.e. non-reported) information is clearly evident for data on pass percent of students in colleges.
For instance, of the private aided colleges in different years, the number of reporting colleges is given in Table 1.1. It is apparent that number of reporting private aided colleges as a percentage of total number of private aided colleges with B.A. and other courses as well as B.Com. and other courses was highest in 1992-92 with 99.58 percent and lowest during 1995- 96 with 72.66 percent. However, in case of colleges with B.Sc. and other courses, the highest reporting was evident during 1998-99 and lowest during1995-96. Thus, in all the years, non-reporting private aided colleges did exist and varied between the years.
The problem of non-reporting of information is not a special feature of private aided colleges. Rather, it is common for Government colleges also. This is evident in Table 1.2 where the data on the number of reporting Government colleges are presented from 1990-91 through 1999-<K). For instance, the number of reporting Cjovemment colleges as a percentage of total number of Government colleges with B.A. and other courses was highest during 1996-97 with 99.25 percent and lowest during 1990-91 with 68.54 percent. In case of Government colleges with B.Sc. and other courses (or B.Com. and other courses), the highest reporting is evid«it during 1998- 99 (or 1997-98) and lowest during 1990-91. Thus, in all the years, non- reporting government colleges did exist and varied between the years.
It is important to note that the name of non-reporting colleges can be known from the Directorate. Hence, two alternatives to fill in the missing information are as follows. First, write to individual colleges to supply the relevant information. This is time-consuming and the reply may not be guaranteed. Or, visit the colleges personally to obtain the missing information, provided the colleges are co-operative. However, this is both time-consuming and costly. Second, collect the missing information from the universities, wherein select information on all their a£[lliated (i.e. government, private aided and private un-aided) colleges are maintained.
15
1.6.1.2. Pubiications of Education Department
1.6.1.2.1. Annual Revort
Select data in the Office of the Director of Collegiate Education are consolidated under the Department of Collegiate Education in the Annual Report of the Education Department. In particular, the Report includes information on administration, important characteristics (including courses offered) and geographical distribution of colleges by management, districts and universities.
1.6.12 2 . Performance Budget
Under the Department of Collegiate Education, the performance budget document of the Education Department provides data on the intra- departmental plan and non-plan allocation of resources on revenue and capital account in the format of Budget Paper of the State Government. This information is useful to single out the budgetary allocation to collegiate education on capital account.
1.6.1.3. Publications of the Department of Finance
Data on public or State Government expenditure on collegiate education are available from the following two published sources.
1.6.1.3.1. Budget papers of the Government of Karnataka
The Budget Papers of the Government of Karnataka provide State level data on plan and non-plan revenue expenditure on collegiate education under the budget head: 2202-03-103 for Government colleges and under 2202-03- 104 for non-Govemment colleges. These data are reported in terms of budget estimates for current year, revised estimates for the last year and accounts/actuals for the year before last.
1.6.1.3.2. Finance Accounts of the Government of Karnataka
The Finance Accounts contain audited expenditure and receipts by major budget heads under revenue expenditure, capital expenditure and loans and advances for a given year. First, in case of capital expenditure, audited expenditure by plan, non-plan and total are reported, and cumulative total
16
expenditure at the end of the financial year (e.g. at the end of March) are separately reported. Thus, by subtracting the capital expenditure during the year from the cumulative total expenditure at the end of the year, the total capital expenditure at the beginning of the year (i.e. as on April 1**) or total capital stock may be obtained. Second, in case of loans and advances, balance at the beginning of a year, amount advanced during a year, amount repaid during the year, balance at the end of the year, and interest received and credited to revenue are separately reported.
1.6.1.4. Other sources of data
Other sources of secondary data on collegiate education are available from the (a) universities with which the colleges are affiliated; (b) report of committees on education, human development and other public documents; and (c) from the concerned colleges.
(a) Collegiate data in the universities
College level information from the universities is available by four sources. First, published data are obtainable from the Annual Reports, as they are reported on their affiliated colleges. Second, examination and convocation data maintained by the examination/evaluation branch of the universities. Third, maintained records in the statistical cells (or Directorate of College Development Councils) of the universities. Since college level data in the universities are not categorised by government, private aided and unaided colleges, identification of types of colleges by management is essential before the data are obtained from the universities. Fourth, report of the Local Inquiry Committees (LIC) for granting fresh/renewal/permanent affiliation to the colleges by the universities. In general, the LIC reports are treated confidential and, hence, data are not published and accessible. Thus, the major characteristics of the university data from annual reports, examination branch and statistical cells are described below.
(a. 1) Annual Report of the universities (published data)
Annual Report provides information on the objectives, performance and working of the university. In case of Karnataka State Open University' (KSOU), the annual report is yet to be brought out. Thus, information relating to KSOU is to be collected from the maintained records in the
17
university and from printed documents, such as. Vice Chancellor’s Report for the first convocation of the University held on March 3, 2001.
Within the annual report, a section is exclusively devoted for select details on the affiliated colleges and distance education. Unfortunately, information provided on affiliated colleges lacks uniformity between universities. And, at times, there is inconsistency in not reporting the same information between years by the same university. These points are cleariy evident the Table 1.3 where the items of information reported for two points in time.
Few remarks deserve special mention here. First, the Annual Report of the Kuvempu University does not report information on affiliated colleges, enrolment of students, number of teachers, pass percentage of students, courses offered etc. Second, receipt and expenditure of colleges is a special Item of information, which is currently reported, only in the annual report of Mangalore University. Third, pass percentage of students is not reported in annual report of Kamatak University and Mangalore University. Fourth, data on total number of students are related to number of students who are enrolled in, but not admitted to, different courses by types of colleges. The data is the aggregate enrollment of student in I year, II year and III year of the respective degree courses in all the subjects. For instance, total enrollment in B.A. course in Government colleges during 1991-92 is equal to total enrollment of students in I, II and III year B.A. in all subjects (e.g. history, economics, political science, sociology etc).
Thus, from the annual report of universities, no data can be generated on any variable for all the universities and for all the years, such as, enrolment of students by courses, number of teaching staff and pass percent of students by courses and classes. Consequently, annual report of universities is of limited use in supplementing the non-available intbrmation with the Department of Collegiate Education.
(a.2) Examination/evaluation branch of the universities (processed data)
The universities with which the colleges are affiliated conduct all works relating to the examination/evaluation of the students in all the courses. And, the college-wise results of the examinations are announced and maintained in the examination section of the universities. In particular, tliree types of college-wise data are maintained.
18
(a.2.1) Announced results
First, after the examination is conducted and evaluation is completed, the universities prepare the results and announce through the colleges. The announced results include information of the register number of students who have passed the examination with a first class, second class and a pass class in the respective colleges. Thus, distribution of total number of students who have passed the examination by courses by I, II and Pass class may be determined in a college.
In general, the announced results are in the form of a notification/circular issued from the university to a college. Hence, the college-wise results of the university level examinations are to be accessed only from the circulars, maintained either in the examination branch of the universities or from the concerned colleges.
Two important limitations of this data are as follows. First, the data do not give any information on the number of students who have failed in the examination by colleges. Of course, the announced results include *to be announced later' (TAL) category. However, TAL is not related to number of failed candidates, if any, in a college. Thus, total number of candidates who appeared for the examination in a course at a college may not be known from the announced results. Second, the announced results are related for the examination in question. Since the successful completion of all courses in the previous year is not a pre-condition for taking up the examination in the current year (this is popularly called 'carry over system*), the announced results of the final year examination cannot be equated with total number of students graduating from a course in a college during a year.
(a.2.2) Convocation data (processed data)
Convocation data are available in two forms. For instance. Bangalore University has processed information on (a) list of candidates admitted to the degrees in several faculties [Bangalore University (2000a)]; and (b) list of candidates eligible to the degrees in the several faculties [Bangalore University (2000b)]. The first Hst includes the serial number, name and eligible register number of the candidates who have applied to receive the degrees during the convocation in question. Fhe second list includes the list of candidates who are eligible to receive the degrees during the convocation in question. This list provides course-wise, year-wise and college-wise
19
information on the eligibility number, name of the graduates, register number in the final year examination and class obtained. Those candidates who are eligible by passing the supplementary examination, only pass class is reported.
Thus, convocation data has two merits as compared to the examination data. First, convocation data (i.e. list of candidates eligible) is an important source of consolidated information on announced results of those students who have successfully passed all the prescribed examination in a course in a college. Thus, the number of students graduating from a course in colleges may be determined. Second, convocation data gives the distribution of graduates by I, II and Pass class by courses or faculty and by colleges in a university.
Nevertheless, examination data of final year students in a course and convocation data of students in a course of a college during a year cannot be considered equivalent in any sense of the term. And, a mere access to examination or convocation data may not help in determining the pass percent of students, as these data do not contain any information on the number of students appearing for an examination in a college. There are two ways to dealing with this problem.
First, within the universities, records of hall tickets or register numbers issued by the universities to the students, who take up examination in different colleges, are maintained in the administration branch. If these data are accessible, then total number of candidates who appear for the examination may be obtained and, hence, pass percentage of students may be determined for the colleges within the universities. However, this data suffers from the basic limitation that it includes students who are fresher and repeaters in Ae April examinations. The results of the repeaters are only announced if they have completed all the examinations of the course and no class is declared for them. Thus, any attempt to find the pass percentage by taking the total number of students passing the examination among the enrolled students as a percentage of total (fresh and repeater) students who appeared for the examination would give misleading results.
Second, information on number of candidates appearing for an examination by courses is also available with the concerned colleges. Since colleges have data on both number of students appearing and passing the examinations, pass percentage of students by courses are also obtainable
20
from the colleges. Unlike the pass percentage data from within the universities, pass percentage data from within the colleges have several other advantages. For instance, at the college level, pass percentage of students is distinguishable between male and female student, and between SC/ST and non-SC/ST students. It is perhaps for this reasons, the Statistical Cells of the universities have attempted to collect information, including pass percentage of student, directly from the affiliated colleges. The details of this source of college level data are given below.
(a.3) Statistical cells of the universities
Data on affiliated colleges in the Annual Report of the universities are generated in the statistical cells of the universities. These cells collect information from the affiliated colleges in the prescribed format. For instance. Bangalore University has a format, which seeks detailed annual information on college, students’ strength by courses, examination results, feculty strength, research, sports and games activities of the teachers. A copy of this format (i.e. Proforma-II), circulated to affiliated colleges during 1999-00, is given in Appendix 2.
As compared to the information on affiliated colleges from the annual reports of the Bangalore University in Table 3, the information collected through the format above has many differences. First, information collected through the format is annual, but publication of report on affiliated colleges, in the form of statistical appendices, in not every year. The last statistical appendices were published during 1995-96 and the work for 1999-00 is reported to be on-going. Second, there exists a vast gap between the information collected in the prescribed format above and the information published in Annual Report of the Bangalore University . This is mainly attributable to shortage of staff to handle the work in the statistical cell. Third, all the information is physically processed. There is a need to computerise the working of this cell in order to quickly input and process the information. Otherwise, much of the vital information collected from the colleges will continue to remain unprocessed and unused, as they have been over the years.
Consequently, information other than what is pubHshed in tiie Annual Report must be extracted from the unpublished and unprocessed data, maintained in the statistical cells of the universities. Inevitably, this data has
21
to be done only in person with due official permissions, subject to the availability and proper maintenance of records.
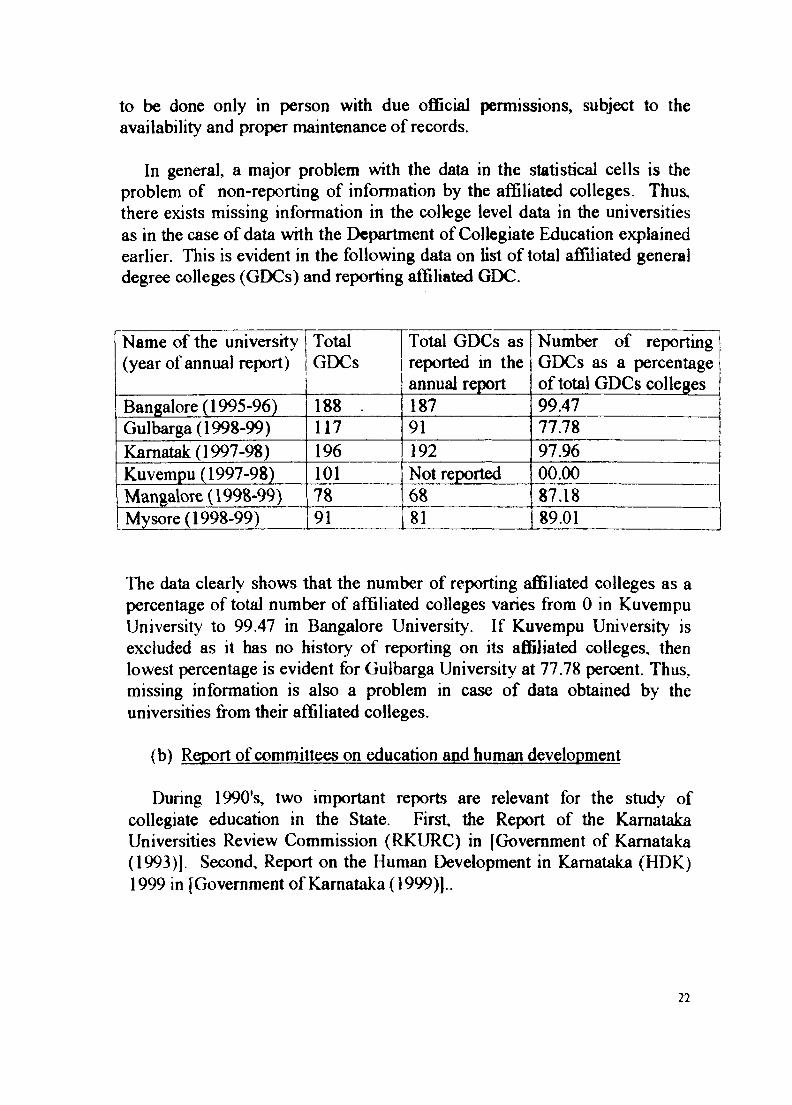
In general, a major problem with the data in the statistical cells is the problem of non-reporting of information by the affiliated colleges. Thus, there exists missing information in the college level data in the universities as in the case of data with the Department of Collegiate Education explained earlier. This is evident in the following data on list of total affiliated general degree colleges (GDCs) and reporting affiliated GEK3.
Name of the university (year of annual report)
TotalGDCs
Total GDCs as reported in the annual report
Number of reporting GDCs as a percentage of total GDCs colleges
Bangalore (1995-96) 188 . 187 99.47Gulbarga (1998-99) 117 91 77.78Kamatak (1997-98) 196 192 97.96Kuvempu (1997-98) 101 Not reported 00.00Mangalore (1998-99) 78 68 87.18Mysore (1998-99) 91 81 89.01
The data clearly shows that the number of reporting affiliated colleges as a percentage of total number of affiliated colleges varies from 0 in Kuvempu University to 99.47 in Bangalore University. If Kuvempu University is excluded as it has no history of reporting on its affiliated colleges, then lowest percentage is evident for Gulbarga University at 77.78 percent. Thus, missing information is also a problem in case of data obtained by the universities from their affiliated colleges.
(b) Report of committees on education and human development
During 1990’s, two important reports are relevant for the study of collegiate education in the State. First, the Report of the Karnataka Universities Review Commission (RKURC) in [Government of Karnataka (1993)]. Second, Report on the Human Development in Karnataka (HDK) 1999 in [Government of Karnataka (1999)]..
22
Data on collegiate education in RJCURC include the tbllowing. (a) Number of government and private colleges in different universities by courses during 1991-92; (b) total number of government and pnvate degree colleges during 1960, 1965, 1970, 1975, 1980, 1985, 1990 and 1991-92; and (c) enrolment of male and female students in universities by courses; (d) total number of teaching staff in government and private colleges by courses; (e) total number of teaching staff by designation in government and private colleges by universities, and (f) average number of students per teacher in universities by courses, during l%5, 1975, 1985 and 1991-92.
The report of the HDK contains data on select variables in collegiate education by districts in the State. These variables include the following, (i) Total number of colleges by universities and distncts during 1991-92 and1996-97; (ii) enrolment of students bv' universities and districts during 1996- 97; (iii) total number of government and pnvate colleges during 1%5, 1975 and 1985, 1991-92 and 1996-97; and (iv) enrolment of male and female students by districts by universities by courses during 1965, 1975 and 1985, 1991-92 and 1996-97. In a way, the report of the HDK updates the information in RKURC on variables in (iii) and (iv) for the year 1996-97.
On the whole, the data in RKURC and HDK have few common limitations. First, they do not contain information on pass percent of student. Second, private colleges are not distinguished between aided and unaided categories. In particular, these limitations underline their limited use in filling up gaps in pass percentage data with the Directorate of Collegiate Education.
Thus, the data gaps in the available data with the Directorate on Collegiate Education need to be filled up only through collection of primary' data from the individual colleges.
[c] Data fi'om the colleges: A fi-amework for primary data collection
Primary data is designed to be obtained from sample colleges in the State. The sample colleges include government, private aided, private unaided and universitv' colleges. From each college, information is sought through a structured questionnaire from the college records, principal and students. The details of the sample design are outlined below
23
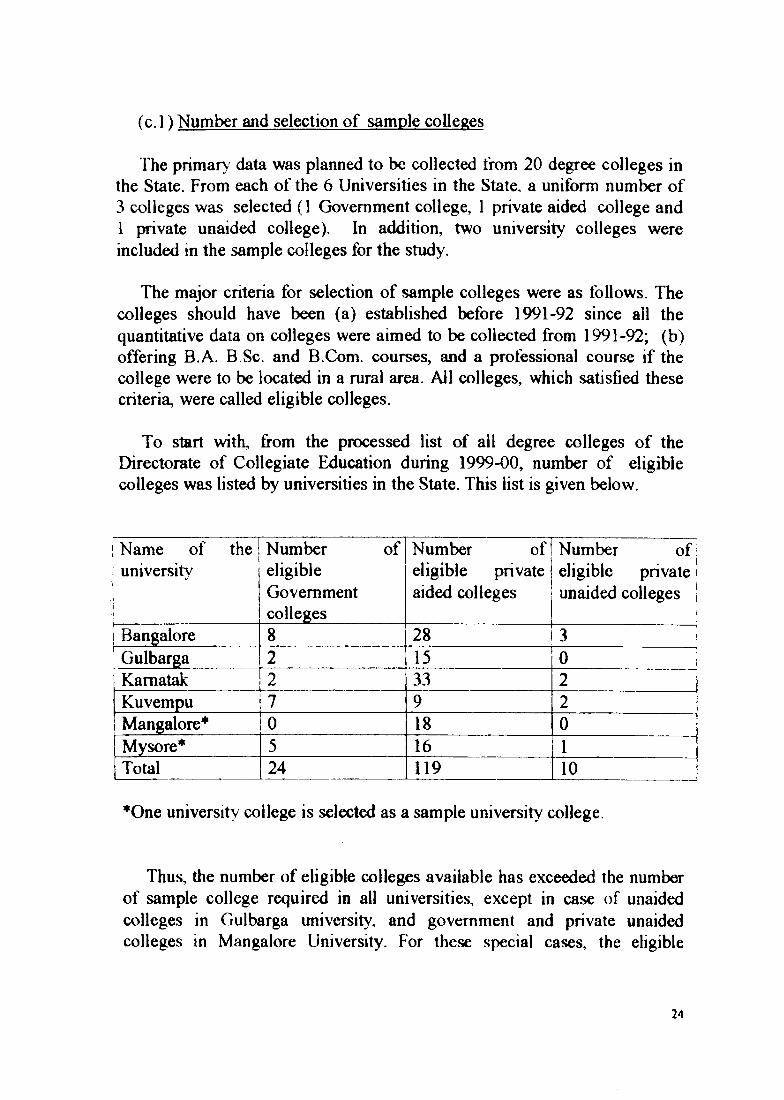
(c .l)Number and selection of sample colleges
The primarv' data was planned to be collected from 20 degree colleges in the State. From each of the 6 Universities in the State, a uniform number of 3 colleges was selected (1 Government college, 1 private aided college and 1 private unaided college). In addition, two university colleges were included in the sample colleges for the study.
The major criteria for selection of sample colleges were as follows. The colleges should have been (a) established before 1991-92 since all the quantitative data on colleges were aimed to be collected from 1991-92; (b) offering B.A. B.Sc. and B.Com. courses, and a professional course if the college were to be located in a rural area. Ail colleges, which satisfied these criteria, were called eligible colleges.
To start with, from the processed list of all degree colleges of the Directorate of Collegiate Education during 1999-00, number of eligible colleges was listed by universities in the State. This list is given below.
1 Name of the1 university1I1
Number of eligible Government colleges
Number of eligible private aided colleges
Number o f! eligible private 1 unaided colleges
I
i Bangalore 8 28 ^3 iGulbarga 2 15 !0 i
1 Kamatak 2 33 2Kuvempu 7 9 2
i Mangalore*^ 0 18 0Mysore* 5 16 1Total 24 119 10
’ One university college is selected as a sample university college.
Thus, the number of eligible colleges available has exceeded the number of sample college required in all universities, except in case of unaided colleges in Gulbarga university, and government and private unaided colleges in Mangalore University. For these special cases, the eligible
24
criterion (b) above was modified in terms of reducing the number of courses offered in a college. Accordingly, colleges which oft'ered any two of the B.A., B.Sc., and B.Com. courses were listed and the sample college was randomly selected.
In Table 1.4, the name, type of management and courses ottered in the sample colleges by universities are given. These details are the same as reported by the Department of Collegiate Education in its list of colleges during 2000-01. The geographical location of the sample colleges is shown on Map I, after Table 1.4.
(c.2) Type of data to be collected
From each of the 20 colleges above, the following types of data were planned to be collected by developing 3 types of structured questionnaires, viz.. College questionnaire. Principal’s questionnaire and Students’ questionnaire. Appendix 3 gives a blank copy of these questionnaires. The construction, contents and canvassing of these questionnaires are briefly described below.
(c.2T) College questionnaire
This questionnaire is designed to obtain the quantitative and qualitative information on the sample colleges. The questionnaire is divided into 6 sections. The specific information sought from the colleges under each section is as follows.
In section 1, general information on the colleges is sought including the year of establishment and brought under GIA, ty pe of management number of sections and medium of instrument by courses. In section 2, information on (a) enrolment of students in I, II and III year of the degree courses offered; (b) number of students appeared and passed (in 1, II and Pass class) in final year examination by courses, male/female students, SC/ST and other students are sought. In section 3, teaching and non-teaching staff position in terms of sanctioned, filled up and vacant and teaching staff positions by designation are sought. In section 4 (5X information on receipts(expenditure) by sources to the colleges is sought. The sources of receipts include grants fi-om the State Government, college management UGC, the University, tuition and non-tuition fee, student donations at the time and after the admission. The sources of expenditure include payment of salary
25
for stafit purchase of land and building, expenditure on library and equipment. In section 6, other information on the colleges including organisation of seminars in the colleges, attendance of staff in conference or seminars and refresher courses, and number of books added to the library are sought.
To begin with, all the information in section 2 through section 5 was planned to be collected from 1990-91 through 1999-00. However, supply of all information for over a period of 10 years was highly demanding in terms of time and availability of records with the colleges. Consequently, the time period was reduced to three years, viz., 1991-92, 1995-96 and 1999- 00. In the same way, information in section 6 was reduced to last 3 years (i.e. during 1998-99 to 1999-00).
The entire design of College Questionnaire was motivated to collect as much new, supplementary or additional information as possible from the colleges, which are otherwise not available (or, not easily accessible, if available) from the secondary sources. For instance, all information sought in section 6 are new as they are not available from secondary sources.
(c.2.2) Principal’s questionnaire
For identification of key current problem in curriculum; laborator> equipment and consumables and infrastructure facilities, staff turnover and recruitment problems, participation of alumni association and local people in the development of the college, and recent changes in the grants-in-aid policy of the State Government, this structured questionnaire was prepared to be responded by the college principals (entitled Principals' Questionnaire).
(c.2.3) Students* questionnaire
First, for identification of the socio-economic background, mother tongue and medium of instruction, academic preparation of final examinations including through private tuition and borrowing reference books from the college library, interest/motivation in joining the course, future plans of students passing out of colleges, awareness of vocational education of the State Government, reading habits of newspapers and cost of studying away from parents, a total of 30 final year students in arts (10 studentsX science (10 students) and commerce (10 students) courses was initially planned. The instrument of data collection was planned to be personal interview with
20
the students. For uniformity of information to be collected, all questions were framed in the Students' Questionnaire.
However, during the fieldwork, several problems were confronted to carr\' on the fieldwork as plamied above. The first problem was the nonavailability of courses in the colleges. For instance, B.Sc. course has been closed during the current academic year (i.e. during 2000-01) in three government colleges, viz., (a) Government First Grade College, Channapatna, Bangalore rural district, (b) Government First Grade College. Rona, Dharwad district and (d) Government First Grade College, Channapatna, Bangalore rural district, and in one private unaided college, viz., SM Boomareddy First Grade College, Gajendragada, Dharwad district. In the same way, total enrolment in few courses in few sample colleges was less than 10, i.e. for final B.Com. in SSM College, Shahabad, Gulbarga district and Government First Grade College. Rona, Dharwad district. The second problem was the non-availability of students in courses and in colleges. For instance, in the Government First Grade College at Channapatna in Bangalore University, the number of students enrolled in the final year B.Sc. was less than 5. These students were not available at the college or at their residence on the day of the field stafis' visit to the college. Thus, the number of students interviewed in B.Sc. course was zero for this college in Table 1.4. Further, in few colleges, no admissions were made for courses during 1998-99. This is evident in Government First Grade College, Shikaripura, for B.Sc. course and in Sri Tipperudra Swamy First Grade College, Nayakanahatti, for B.Sc. and B.Com. courses in Kuvempu University. Moreover, in view of the preparations for the forthcoming examination, students' attendance during the first week of March was ver>' low in colleges, especially in Gulbarga University. Hence, many of the students in sample colleges had to be interviewed at their residence under the guidance of the college principal.
Consequently, the number of sample students was reduced to 5 students in each of the available courses in all the colleges. In addition, to gain a wider perspective of students' issues, two sets of new students were interviewed. First, to understand the special problems of professional courses in degree colleges (e.g. students in BBM course), it was decided to interview 5 BBM students in all colleges where BBM courses was conducted. Second, the university colleges in the University of Mysore are located adjacent to each other. Although Maharaja's College is a sample college with arts and commerce courses, 5 science students were interviewed
27
in Yuvaraja's College. Thus, the final number of students interviewed in each college by courses is given below the courses ofifered in Table 1.4. In total, 248 students are intervened from all courses in all sample colleges.
It IS apparent that information collected from the Student Questionnaire and Principal’s/Teachers' Questionnaire should be seen only as a means of offering insights and perception of students and principals in the colleges.
1.7. Method of analysis
This study employs simple descriptive methods for analysis of primar> and secondary data. The methods include statistical measures of central tendency and dispersion, as well as simple ratios and percentage analysis.
Throughout pnmary data is used as a supplementary information (e.g. information on university colleges) for all analysis based on secondary data. Thus, secondarv’ data and primary data analysis is done together. This approach avoids the duplication of analysis of the same issues under secondary and priniarv' data separately.
1.8. Organisation of the report
The resi of the materials in this report is organised as follows.
Chapter 2 focuses on the de.scription of the structure, organisation and growth of collegiate education. Chapter 3 analyses the patterns, determinants and impact of changing demand for collegiate education by major courses and tvpes of colleges, hi Chapter 4, quality and relevance of collegiate education are discussed with few' measurable indicators, using both secondary and primar> data. Chapter 5 analyses the public expenditure and resource mobilisation with special reference to budgetary subsidies. The management and co-ordination aspects of collegiate education are discussed in Chapter 6. Chapter 7 summarises the main results, conclusions and policy implications of the study.
To keep the continuity of text, all tables are given at the end of the report after the Chapter 7. All tables are numbered sequentially by chapters (e.g. table I of chapter 1 is numbered fable 1.1 and so on). The list of references of the study follows the tables. All appendices are given after the list of references.
28
CHAPTER 2
Collegiate Education in Karnataka State: Structure, Organisation and Growth
The main objectives of this Chapter are to provide with an overview of the structure, organisation and growth of collegiate education in the Karnataka State. In fact, a study of the structure, organisation and growth of collegiate education is a study of how the colleges are structured, organised and have grown over the years.
2.1. Structure and organisation of collegiate education
The structure of collegiate education has evolved over the years. The major historical developments in the evolution of coll^iate education in the State are briefly documented in Government of Karnataka (1993). Thus, the current structure and organisational aspects of collegiate education are focused below.
The structure of collegiate education in the Karnataka State may be defined in terms of institutions and agents. The institutions are the afiQliated colleges, viz., government colleges (GCs), private aided colleges (PACs), private unaided colleges (PUACs), university colleges (UCs) and universities that impart distance education.
A private college, which receives (does not receive) GIA iGrom the State Government is called an aided (unaided) private college. Over the years, the GIA is given in the form of maintenance or teaching grant to meet the annual recurring cost on account of salary expenditure of teaching and nonteaching staff in the PACs and, hence, the amount of GIA varies between the aided colleges. However, the entire salary on teaching and non-teaching staff is covered by the GIA in any of the PACs.
«
Both PACs and PUACs are broadly divided under three types of management, viz., (a) colleges which are managed by minorities (i.e. linguistic or religious) to be called Minority colleges, (b) colleges which are managed by Scheduled Castes and Tribes (SC/ST) to be called SC/ST colleges, and (c) colleges which are managed by non-minorities and non-
29
SC/ST to be called General colleges. The essential distinctions between these management are as follows.
In principle, the SC/ST colleges should have all members of their management belonging to SC/ST and 50 percent of their students belonging to the SC/ST. In addition, these colleges are free from roaster system in recruitment of their stafif. However, it is mandatory for these colleges to obtain permission to fill up any vacancy and to be bound by Government’s directions on the constitution of the selection committee including the appointment of Government’s nominee and subject-expert. The Minority colleges are characterised by majority of the persons on their management belonging to minorities. They are free from the roaster system and all other official rules and regulation in regard to staff recruitment. Thus, Minority colleges are free to formulate their own recruitment policy in regard to their staff. Unlike SC/ST and Minority colleges. General colleges are characterised by no specific conditions on the composition of management, but subject to various rules and regulations in regard to recruitment of staff including the roaster system. For instance, as in the case of SC/ST colleges, it is mandatory for General colleges to obtain permission to fill up any vacancy and to be bound by Government’s directions on the constitution of the selection committee including the appointment of Government’s nominee and subject-expert.
The major agents in collegiate education are those who contribute to the functioning of the colleges. These agents include the university. State Government, college management, teaching and non-teaching staff and students enrolled in various courses. In fact, each agent may be identified with one or more specific fiinction/s. However, the basic fiinctions of different agents may be common or different between the types of colleges. These commonalties and differences in major fiinctions are highlighted below by specifying the role of agent in collegiate education, since they have implications for analysis of supply o t demand for, quality, relevance and financing of collegiate education in subsequent phapters of this report. The management and co-ordination of these agents will be discussed in Chapter 6 of this report.
2.1.1. Role of University Grants Commission in collegiate education
(a) Formulate guidelines for recruitment and promotion of teaching staff; and workload for teaching staff.
30
(b) Offer financial assistance for developmental purposes for colleges on permanent affiliation, autonomous colleges, and eligible vocational courses in degree colleges and faculty improvement programmes (e.g. to pursue research towards Ph.d degree).
(c) Approval of autonomy for colleges.
(d) Assist universities in establishment of College Development Council, SC/ST Cell and Academic Staff Colleges for improvement of collegiate education, (e.g. conduct of refresher and orientation programmes, and
(e) Assessment and Accreditation of colleges through National Assessment and Accreditation Council (NAAC).
2.1.2. Role of University in collegiate education
(a) Establishment, organisation, financing, promotion, regulation and management of UCs.
(b) Constitution of Affiliation/Local Inquiry Committee for recommending afUliation (new/renewal/permanent) for colleges and courses and fix intake of students by courses.
(c) Fix course combinations in colleges; number of working days for colleges; minimum attendance of students in colleges; and workload for staff.
(d) Constitution of subject-wise Board of Studies (Undergraduate) for framing of uniform curriculum for all subjects taught in the affiliated colleges.
(e) Conduct of uniform examination and valuation of students in all affiliated courses, and award degree for successful students.
(f) Recommend autonomy for colleges
31
The framework of functioning of the universities in regard to their affiliated colleges are stated in the Karnataka State Universities Act 1976 and statues and resolutions within the bodies of the university (e.g. Senate, Syndicate and Academic Council). A comprehensive amendment to the Act 1976 is proposed under The Karnataka State Universities Bill 2000. Since the Bill is yet to become an Act, no provisions of the Bill 2000 are discussed in this report. On the other hand, in case of Karnataka State Open University, the Karnataka State Open University Act 1992 is applicable.
In addition, the State universities have established the College Development Council, SC/ST Cell and Academic Staff College with the assistance of UGC. The major functions of the Council are to facilitate the grant of affiliation and autonomy for affiliated colleges; NAAC's working within the university; approval of appointment of teachers and principals of affiliated private colleges; facilitate UGC assistance to colleges and teachers; and academic and administrative improvements of college education. The SC/ST Cell has the objective of improving the welfare of students and staff who belong to SC/ST communities through monitoring the implementation of various programmes for the communities including admission of students and recruitment of stoff in colleges. The Academic Staff College is established to offer refresher courses for in-service teaching staff and orientation programmes for newly appointed teaching staff. At present, all the State universities have College Development Council and SC/ST Cell. The Academic Staff College is established in University of Mysore, Kamatak University and Banglaore University. And, Mangalore University has established Staff Development College.
2.1.3. Role of State Government in collegiate education
(a) Establishment, organisation, financing, promotion, regulation and management of GCs.
(b) Promotion (e.g. through GIA policy) and regulation (e.g. fixing student fee, periodic inspection, implementation of reservation and roaster system in recruitment and promotion of staff ) of PACs.
(c) Grant recognition through approval of affiliation or autonomy for all colleges and, thereby, permit the start of a new affiliated college or autonomous college.
32
To carry oo the functions above, among others, the State Government a four-tier administrative set up.
First, the Secretariat with the Principal Secretary (Higher Education) to deal with all policy matters in higher general and technical education.
Second, the Commissioner of Collegiate Education since 1997 to coordinate between the Secretariat and Directorate of Collegiate Education.
Third, establishment of Directorate of Collegiate Education in 1960. Historically, the Directorate of Collegiate Education is responsible to administer the GCs and PACs. To start with, all colleges except teachers' colleges, university colleges and professional colleges came under its administrative control. At present, the Directorate has three major fiinctions. (i) Promotion and administration of GCs (i.e. general degree colleges and law degree colleges), (ii) Promotion and regulation of PACs. (iii) Coordinate between the State Government and universities in regard to collegiate education at the State level.
Fourth, establishment of 6 Joint Directorate of Collegiate Education to cover the GCs and PACs that come under the jurisdiction of 6 State universities to facilitate local level co-ordination between the State Government, universities and colleges and for disbursement of GIA to PACs.
2.1.4. Role of management in private colleges
As per the guidelines of the State Government, affiliated university and UGC, the management of private colleges has the following major functions.
(a) Apply for affiliation, recognition and/or autonomy.
(b) Establish, organise, finance, promote, regulate and managetheir colleges.
(c) Recruit staff and admit students to courses.
(d) Facilitate the conduct of examination and valuation by theaffiliated university.
33
(e) Appointment of principal for day-to-day college administration.
(f) Take disciplinary action on erring stafif and students.
Thus, management plays a veiy important role in the growth of private colleges in the State.
2.1.5. Staff and students
Teaching and non-teaching staff and students comprise the non- institutional agents of collegiate education.
Teaching staff has the basic function of promoting the curricular and extra-curricular activities of students through teaching prescribed syllabus in courses offered within the colleges. The non-teaching staff has the basic functions of supporting the teaching staff in conducting all academic programmes, and in assisting the smooth administration and management of the colleges.
Staff may be directly recruited or internally promoted. The nature of staff includes permanent temporary and part-time. In general, qualification and experience for teaching staff are guided by the UGC norms and approved by the State Government. The number of teachers to be appointed is based on workload and minimum enrolment of students, rather than student-teacher ratio.
Students, who are enrolled in courses offered within the colleges have the basic function of learning the prescribed contents of the courses fh)m the teaching and non-teaching sources (e.g. by referencing books in the college library) within the colleges and to successfully graduate from the courses.
Admission criteria for students are college-specific. Thus, quality of intake of students varies between colleges. In addition, infrastructure (e.g. library, laboratory, sports facilities and classroom facilities), opportunities for interaction vary between colleges, subjects and syllabus for the course vary between the universities and, hence, in colleges. Students and colleges
34
have no choosing the combination of subjects in a course, as the university fixes all combinations of subjects.
In short, the institutions in collegiate education include university, government and private colleges. The agents include both institutional agents (i.e. the State Government, State universities, and private management of colleges) and non-institutional agents (i.e. staff and students of colleges). These institutions and agents constitute the structure of collegiate education, and interactions between all institutions and agents constitute the organised system of collegiate education in the State. In essence, the organised system specifies the functions and responsibilities that each institution and agent should do, as per the rules and regulations framed within the institutions as well as for all the institutions in the State.
The analysis on the structure and organisation of collegiate education in the State above clearly indicates the following. First, colleges, courses and admission of students are different within and between the universities. Second, establishment, functions, administration and management of GCs, PACs, PUACs and UCs are different in the State. Third, universities have important roles in collegiate education mainly in affiliation, curriculum and examination matters. Fourth, State Government has the vast powers in effecting the establishment, organisation, management, promotion, regulation and fmancing of collegiate education. Thus, State Government policies and programmes are of critical importance in explaining past and current development and in influencing/determining future developments in collegiate education in the State
2.2. Growth of collegiate education
Broadly speaking, the growth of collegiate education is the culmination of all interactions between all the institutions and their agents. Over the years, this culmination of interactions has resulted in many changes or outcomes in the collegiate education. The changes may be observed (e.g. changes in the number of colleges or enrolment of students) and/or unobserved (e.g. dedication and commitment of teaching staff towards improving the quality of education in their colleges). However, for paucity of data, the analysis of growth of collegiate education in this chapter is limited to observed changes.
(JBflAey » BOCUMiMTATlON C fiR Tik
17 ,;i. Jh V > M»ri,
"I* ^ 3) - 11^22.................. .
In reality, observed changes in collegiate education are many and diversified, since the changes refer to all the elements in the structure and organisation of the collegiate education e>q3lained above. To simplify the growth analysis, first of all, the observed changes shall have to be summarised by a set of broad indicators of growth of collegiate education. Second, the spatial unit of analysis shall have to be specified, as the indicators can be analysed at different levels (e.g. State level, district level and college level).
(i) Choice of growth indicators
This study considers the following broad indicators of growth of collegiate education in Karnataka State during 1990’s.
♦ Growth and distribution of number of colleges by GCs, PACs, PUACs, UCs and distance education.
♦ Growth and distribution of enrolment of male and female students by B.A., B.Sc., and B.Com. courses and by SC/ST and non-SC/ST students in GCs, PACs, UCs and in distance education.
♦ Growth and distribution of teaching stafif who belong to SC/ST and non SC/ST categories in GCs, PACs, PUACs, UCs and distance education.
♦ Growth and distribution of non-teaching stafif who belong to SC/ST and non SC/ST categories in GCs, PACs, PUACs, UCs and in distance education.
(ii) Choice of level indicatorsL
Select current characteristics of the GCs, PACs, PUACs and UCs, and current distribution of courses by these colleges are separately analysed. This analysis is intended to indicate the current levels of various qualitative and quantitative indicators of the collegiate education in the State.
(iii) Unit of analysis
The above indicators may be analysed at the State level, district level, university level and/or at the college level. However, first of all, an analysis
36
at the State level will not capture the spatial distribution of the growth of collegiate education. Second, the number of colleges is many and an analysis based on all colleges is highly demanding in terms time and other resources. Third, in view of the reorganisation of districts and the resultant creation of 7 new districts in the State, a district-wise analysis will pose the problem of comparison of indicators between pre-reorganisation (i.e. before1997-98) and post reorganisation (i.e. from 1997-98) during 1990’s. Fourth, the number of State universities in this study has remained the same during 1990's. In the same way, the nature of districts within the jurisdiction of these universities has also remained the same, although the number of districts has changed due to reorganisation of districts in the recent past.
In view of the above, the entire analysis of growth indicators below will be done below by universities and by 20 districts. Since district is a unit of planning in the State, a district wise analysis will be helpful for both district level and inter-district planning. However, all analysis of current level indicators will be done by types of colleges at the State level.
2.3. A description of indicators of growth of collegiate education
The indicator (b) will be described in detail Chapter 3 as part of the demand for collegiate education. Indicator (c) and (d) will be described in Chapter 4 as part of the quality and relevance of collegiate education. Thus, indicator (a) is described below based on observed secondary data. In addition, current characteristics of colleges will be analysed below including the sample colleges of this report.
2.3.1. Growth and distribution of number of colleges
The number, annual growth, university-wise and district-wise distribution of colleges by GCs, PACs and PUACs during 1990's are given in Table 2.1, Table 2.2. and Table 2.3 respectively. In air the tables, for each year, the number of colleges and its share in the State’s total (as shown in the parentheses) are given in the first column. In the second column, annual growth (%) of the number of colleges and share of each district in the University's total number of colleges ( as shown in the flower brackets) are given.
Since inter-district distribution is not relevant for UCs, the growth of UCs is not clubbed with non-UCs below. In the same way, as growth of distance
37
education cannot be clubbed with regular education, it is separately described at the end of this chapter.
2.3.1.1. Government colleges
In Table 2.1, it is apparent that the total number of GCs has increased from 99 during 1990-91 to 138 during 1993-94 and to 148 during 1996-97. However, from 1997-98 to 2000-01, only 2 new GCs have been established in the State. Thus, tiie annual growth of total GCs in the State was 16.16 percent during 1991-92, 13.91 percent during 1992-93, 5.34 percent during 1993-94 and 6.47 percent during 1996-97. For the remaining years, the< annual growth has been less than one percent.
Of the universities in the State, Bangalore (Mangalore) University has the highest (lowest) share of GCs, but the share has declined (increased) over the years. For instance, the share of Bangalore (Mangalore) university in the State's total was 31.31 (5.05) percent during 1990-91, but has declined (increased) to 25.83 (9.93) during 2000-01. The declining share of Bangalore University is due to increasing number of GCs in other universities. For instance, during 1990-91 to 20001-01, 52 new GCs have been established in the State and of which only 8 have been established within the jurisdiction of the Bangalore University.
Of the districts in the State, the share of Bangalore Urban, Tumkar, Kolar, Mysore, Shimoga, Dakshina Kannada and Gulbarga have been relatively higher than other districts. For instance, the combined share of these 7 districts in the total number of colleges in the State was 54.54 percent during 1990-91, 51.77 percent during 1995-96 and 51.66 percent during 2000-01.
2.3.1.2. Private aided colleges
Table 2.2 presents the number and growth of PACs. The total number of PACs has remained the same at 290 during 1990-91 to 1998-99. Consequently, (a) the annual growth of total number of colleges by universities and districts is zero during these years and (b) the share of PACs does not vary between universities during a year and for each university over the years. Thus, there exists uniformity in the distribution of number of PACs by universities and districts in the State during 1990-91 to 1998-99.
38
From the list of colleges on GIA in Government of Karnataka (2001), it is observed that only 2 new PACs have been brought under the GIA in Kuvempu and Kamatak University and 2 PACs are reduced in Gulbarga University, during 2000-01. Thus, the net addition to the number of PACs in the State is only 2 colleges, resulting in the total number of PACs in the State to 292 during 2000-01.
Of the universities in the State, Kamatak University has the highest share of PACs and is followed by Bangalore University, Gulbarga University, Mangalore University, University of Mysore and/or Kuvempu University. During 1990-91 (2000-01), the share of these universities in the total PACs in the State was 33.79 (34.25) percent, 21.03 (20.89) percent, 14.14 (13.36) percent, 12.07 (11.99) percent, 9.66 (9.59) percent and 9.31 (9.93) percent respectively.
Of the districts in the State, the share of Bangalore Urban, Dakshina Kannada, Dharwad, Belgaum and Bijapur has been relatively higher than other districts. For instance, the combined share of these 5 districts in the total number of PACs in the State was 55.52 percent during 1990-91, 55.52 percent during 1995-96 and 55.82 percent during 2000-01. The stagnation in the percent share of these districts is due to the stagnation in the growth of number of PACs in the State as whole during these years.
2.3.1.3. Private unaided colleges
Table 2.3 presents the number and growth of PUACs, which show remarkable patterns and differences as compared to the number and growth of GCs and PACs.
First, there has been a phenomenal increase in the total number of PUACs in the State over the years. For instance, the total number of PUACs colleges in the State has increased from 42 during 1990-91 to 95 during 1991-92, and fix>m 150 during 1992-93 to 259 during 1994-95 and to 473 during 20(X)-01. The highest annual growth of 126.19 percent is evident during 1991-92 and is followed by 57.89 percent during 1992-93, 8.24 percent during 2000-01 and so on.
Of the universities. Bangalore University has highest percent share in the State’s total PUACs and is followed by Gulbarga University (26.19%),
39
Mangalore University (16.07%), Kuvempu University (14.29%), Kamatak University (9.52%) and University of Mysore (4.76%) during 1990-91. However, during 2000-01, the highest share in the total PUACs in the State is evident for Bangalore University (37.84%) and is followed by Kamatak University (22.41%X Kuvempu University (12.05%) and Gulbarga University (12.05%), University of Mysore (8.88%) and Mangalore University (6.77%) during 20(X)-01.
The annual growth of the number of PUACs shows that all the universities have registered a positive growth for all the years, although the highest annual growth is evident for most of the universities during 1991-92 and 1992-93. For instance, the annual growth of number of colleges during1991-92 (20(X)-01) was 90.91 (17.76) percent in Bangalore University, 200 (0.00) percent in University of Mysore, 200 (5.56) percent in Kuvempu University, 42.86 (0.00) percent in Mangalore University, 250 (6.00) percent in Knmatai: University and 116.67 (0.00) percent in GuUxirga University, l iius, the number and annual growth of PUACs vary not only between universities during a year but for each university over the years.
Of the districts in the State, the share of Bangalore Urban, Chitradurga Dakshina Kannada and Raichur has been relatively higher than other districts. For instance, the combined share of these 4 districts in the total number of PUACs in the State was 72.97 percent during 1990-91, 41.84 percent during 1995-96 and 45.88 percent during 20(X)-01. The changes in percent share of these districts arc due to the increase in the growth of number of PUACs in other districts (e.g. Tumkur) during these years.
2.3.1.4. University colleges
University (or constituent) colleges have been established by University of Mysore, Mangalore University, Kamatak University and Kuvempu University. The University of Mysore has 3 colleges (Maharaja’s college, Yuvaraja’s college and University Evening college at Mysore), Mangalore University has 2 colleges (University college at Mangalore and F.M.K.M. Cariappa College at Madikeri), Kamatak University has one college (Kamatak Science College at Darwad) and Kuvempu University has two colleges (Sahyadri Arts and Science College and Sahyadri Science College at Shimoga).
40
Thus, the total number of UCs is equal to 8 colleges. This has remained the same during the entire 1990s. Further except F.K.K.M. Colleges, no other university college is located outside the university headquarters.
2.3.I.5. Summary statistics on the number of colleges in the State
Table 2.4 presents the summary statistics on the number of GCs, PACs and PUACs for 20 districts in the State. The summary statistics is related to the mean, standard deviation and coefficient of variation. The mean values show the average number of colleges per district during the year. Since the number of districts is the same throughout the 1990’s, the changes in the mean values are the consequences of the changes in the number of colleges during the year. The standard deviation measures the absolute deviation about the mean in inter-district distribution of colleges. The coefficient of variation is a measure of relative variation. It is computed by dividing standard deviation by mean of a variable and is expressed in percentage.
Since the number of PACs has been constant from 1990-91 to 1999-00, all the summary statistics have remained the same. Nevertheless, some interesting trends are observable between GCs, PACs and PUACs.
First, since 1992-93, the mean number of GCs (i.e. per district (i.e. number of GCs per district) has been lower than in case of PACs and PUACs. Between PACs and PUACs, the mean number of PUACs has been higher than PACs since 1996-97. This indicates the phenomenal increase in the growth of PUACs in the State during last five years.
Second, lack of wide variations in inter-district distribution is evident in case of GCs, as the values of standard deviation and coefficient of variations do not show marked annual changes in their magnitude. In the same way, the variations are the least as compared to the PACs and PUACs throughout 1990's. However, between PACs and PUACs, both absolute and relative
c
variations in inter-district distribution of colleges are the largest in case of PUACs since 1994-95.
In short, slowness in growth of GCs, stagnation in growth of PACs and UCs and phenomenal growth of PUACs marks the trends in the growth of collegiate education during 1990's in the State.
41
2.3.2. Current select characteristics of colleges
For expositional clarity, the characteristics of colleges are presented under general and course characteristics.
2.3.2.!. General characteristics
Table 2.5 presents the select current (i.e. as observed during 2000-01) characteristics of all PACs, PUACs and GCs, in the State.
First, the number of Mens’ (Womens’) colleges is relatively higher within the GCs (PUACs). However, co-education colleges (i.e. total number of colleges less Mens’ and Womens' colleges) are the highest among tlie GCs, PACs and PUACs.
Second, composite colleges (i.e. degree colleges with pre-university education) are highest in aided colleges than in GCs and PUACs.
Third, while there are no evening GCs, the share of evening a)lleges in the total PACs (PUACs) is about 4.11 (2.54) percent. Thus, day colleges dominate the collegiate education in the State.
Fourth, of the three types of private colleges (i.e. General, SC/ST and Minority colleges), the share of Minority colleges (SC/ST) colleges is relatively higher in PACs (PUACs). However, the share of General colleges (i.e. total colleges less Minority and SC/ST colleges) is highest in the total PACs (about 81.51 percent) and PUACs (about 72.94 percent).
Fifth, the location pattern shows that most of the colleges are concentrated either at the district or taluk headquarters. Since theseheadquarters constitute urban areas, the location of colleges is predominantly urban in character. Thus, 75.49 percent of GCs, 81.16 percent of PACs and 74.21 percent of PUACs are urban colleges in the State. Or, 76.63 percent of all colleges in the State are urban colleges.
In case of UCs, the following important characteristics are evident. First, of the 8 UCs, 7 colleges are day colleges. Second, no university college is a composite college. Third, all UCs are located in urban areas and district headquarters. Fourth, all UCs are co-education colleges.
42
2.3.22. Course characteristics
An important characteristic of collegiate education is the courses offered. Broadly speaking, courses offered in degree colleges may be divided into (excluding pre-university courses in composite colleges) undergraduate degree courses and post-graduate degree courses. The undergraduate courses may be divided into traditional courses (i.e. B.A., B.Sc^ and B.Com.) and professional courses (i.e. BCA, BBM, BFA, BHM and BSW). The traditional or professional courses may include vocational subjects (e.g. Industrial Chemistry, Industrial Microbiology, Foreign Trade and Practice and Functional English/Communicative English). The post-graduate courses include traditional courses (e.g. M.A., M.Sc., M.Com) and professional courses (e.g. MBA and MCA).
Table 2.6 presents the nature and combination of different courses offered by GCs, PACs and PUACs during 2000-01.
First, the number of colleges offering traditional degree courses (i.e. B.A., B.Sc. and B.Com.) is highest among the PACs (42.12 percent) and is followed by GCs (17.22 percent) and PUACs (5.29 percent).
Second, the number of GCs and PACs offering only professional courses is less than one percent, as compared to 21.99 percent of total PUACs.
Third, the combination of traditional courses and professional courses show very interesting patterns. For instance, of the three traditional courses, the combination of B.A. and professional courses is observed to be most popular in case of GCs (23.84 percent) and PUACs (28.12 percent) as compared to the combination of B.Sc. or B.Com. and professional courses.
Fourth, B.A., B.Com. and professional courses are the most popular combination of courses in GCs (46.36 percent), PACs (33.22 percent) and PUACs (19.66 percent) than the combination of either (a) B.A., B.Sc. and professional courses or (b) B.Sc., B.Com. and professional courses.
Fifth, the number of degree colleges which offers post-graduate courses is relatively more in private colleges (in particular, in PACs) than in GCs.
Thus, GCs, PACs and PUACs exhibit unique characteristics and differences in the nature and combination of courses offered during 2000-01.
43
On the whole, the growth of collegiate education is characterised by variations in the number and annual growth at the State level, between districts, between universities and between years in GCs, PACs and PUACs. The variations in the current characteristics indicate the heterogeneity of the colleges in the State. These variations provide a factual basis for a disaggregate study of colleges by management and courses in the following chapters of this study.
It might be added here that in case of UCs, 3 colleges provide science education and the rest 5 colleges provide arts and/or commerce education including BBM course (e.g. in Maharaja's college at Mysore).
2.3.3. Growth and characteristics of distance education
The Report of the Karnataka Universities Review Commission in 1993 clearly noted the following. ”There is a need for starting an Open University in the State of Karnataka, which will open up better avenues for higher education to the needy at an affordable cost. Hence it is recommended that an Open University in the State (The Karnataka State Open University) bestarted without loss of time.........The courses prepared can be offered inKannada and English for the benefit of the students" (p. 193).
Accordingly, the Karnataka State Open University (KSOU) has come into being by taking over the administration and working of the Institute of Correspondence Courses and Continuing Education of the University of Mysore on June 1, 1996.
Before the establishment of (KSOU) on June 1, 19%, distance education was imparted by three State universities, viz.. University of Mysore, Kamatak University and Bangalore University. While University of Mysore focused on correspondence courses (CC) and open university system (OUS), Kamatak University focused on external scheme (ES), and Bangalore University included CC, OUS and ES. At present, distance education within the State is imparted by KSOU, Kamatak University (only ES) and Bangalore University (no ES).
Since admission to CC and OUS by the universities outside the State (e.g. Annamalai University or Indira Grandhi National Open University) is open to students in Karnataka State as well, access to distance education for
44
students in Karnataka State is not limited to distance education, provided by universities within the State. Thus, supply of and demand for distance collegiate education cannot be assessed from within the State only.
The essential differences between CC, OUS and ES are as follows. First, for admission to the CC and ES, the students should have obtained the basic qualification, as prescribed by the university (e.g. a pass in PUC for admission to traditional degree courses). For admission to OUS, student should have completed 18 years for undergraduate courses and 21 years for post-graduate courses. Second, the study materials are provided to students under CC and OUS, but not under ES. Third, the syllabus and evaluation for CC, OUS, ES and regular within the university is the same. And, no discrimination in degree certificates is made. However, between the universities the syllabus and evaluation are different. Fourth, between national and state open universities, the nature of language as medium of instruction (to be opted by the students voluntarily, however) plays an important role. For instance, Hindi and English are the medium of instruction in case of IGNOU, and Kannada and English in case of KSOU.
Various undergraduate, post-graduate, diploma and certificate courses are offered by distance education mode. For instance, in Bangalore University, Directorate of Correspondence Courses & Distance Education offers undergraduate courses in B.A., BBM., B.Com., B.Ed. and B.C.A. In Kamatak University, External Examination wing offers undergraduate courses in B.A. and B.Com. The KSOU offers undergraduate degree courses in B.A. B.Com., B.Ed. and B.L.I.Sc. Thus, undergraduate courses in distance education belong to non-science degree courses, and non- experimental professional subjects. As in the case of regular education, teaching, course structure and contents and evaluation of distance education are not directly comparable between the universities in the State.
In the context of collegiate education in the State, distance education adds to the total supply of and demand for collegiate education in the State, except in case of science degree courses, and, hence, is complementary to regular education.
2.3.4. Characteristics of sample colleges
Table 2.7 summarises the main characteristics of sample colleges. First, the year of establishment of colleges varies from the oldest college
45
established in 1944 to the newest colleges established in 1991. Second, the year of bringing in colleges under GIA is relevant only for aided colleges. The earliest college that was brought under GIA is in the year 1949 and latest college is in 1987. Third, all the sample colleges are day colleges. Fourth, except for 3 colleges,^all other colleges are co-education colleges. Fifth, medium of instruction varies between the colleges. While Kannada (or English) is the sole medium of instruction in 2 (or 5) colleges, other colleges provide instruction in both Kannada and English languages. Sixth, of the 20 sample colleges, 8 (40 percent o f ) colleges are composite and the rest are non-composite colleges. Seventh, the nature of courses offered in the sample colleges, as given in Table 1.4. shows that in 16 (or 80 percent of) colleges, all the 3 traditional courses are offered. And, of these 16 colleges, 5 colleges offer BBM as a non-traditional course. Thus, sample colleges exhibit wide variations in their basic characteristics.
CHAPTER 3
Analysis of Demand for Collegiate Education
This chapter examines the student demand tor dilYerent courses and explores reasons for the excess demand lack of demand for specific courses in the collegiate education. Tliis analysis helps in answering questions, such as, who are the demanders of collegiate education? How do students demand collegiate education? What do students demand in collegiate education? Why do they demand collegiate education? And, what arc the determinants of demand for collegiate education?
3.1. Demand for collegiate education
hi general, students are considered to be the demanders (consumers or bu> ers) of collegiate education. Howev er, all those who buy the sen ices of students, after their graduation, for various jobs in the societv are the ultimate demanders of the collegiate education. Accordingly, demand for collegiate education may be analysed with respect to student demand for collegiate education and/or with respect to demand for college graduates.
Student demand for collegiate education may be related to demand for courses (and, of course, for different subjects within the courses) oft'ered in colleges or for the colleges wherein the courses are offered. In either of the cases, the ultimate student demand for collegiate education is the demand for courses offered in colleges.
On the other hand, demand for college graduates comes from various economic activities in primary, secondary and tertiary sectors. These activities include trade, manufacturing, business, teaching, government and agriculture. In essence, the demand for college graduates in these activities is the demand for collegiate education. Hence, employment changes in these activities signify changes in the demand for collegiate education.
In realit} demand for college graduates may influence the stiident demand for college courses. For instance, students may plan to join a course of study in a college depending on whether or not a course has employment prospects after their graduation. Thus, for determination of
47
student demand for collegiate education, an understanding o f dem and for collegiate education is essential.
In what follows, the focus of the analysis will be on student demand for collegiate education in terms of their demand for degree courses.
3.2. Generation o f student demand for collegiate education
Student demand I'or collegiate education is expressed in the form of application for admission to courses, hi general, courses which are in high (low) demand receive more (less) number o f applications than the availability of seats (or intake capacity or limit as fixed by the universities with which the colleges are affiliated) in the courses. Thus, the colleges have to devise specific ways of increasing (reducing) the demand for low (high) demand courses in order to balance the supply of and demand for courses. For instance, m the context of reducing the excess dem and for a course, a college may nse the eligibility criteria for application to courses in terms of higher percent of marks scored in the qualifying examination, or conduct an entrance examination, to select the required quantity' and quality o f students for the courses.
It should be emphasised that there exists no centrahsed (either at the Slate le\el or universin level) entrance examination to courses in general collegiate education in the State. This is in contrast, for in.stance, with professional education (i.e. all engineering courses, medical and dental courses) where the State Government conducts a Common Entrance Test, allocates students under and fix fee for free seats and payment seats. In the same way. universities conduct entrance examination for management (e.g. MBA) and computer (e.g. MCA) courses and allocate students under free seat and pa> ment seat, although the student fee under both free and payment category is fixed by the State (K>vernment.
rhus. a detailed analysis of the generation o f students demand for collegiate education b\ courses alx>\e requires information, at the college level, on the number o f applications received, intake capacity in dilTerent courses, eligibility criteria for admis.sions to courses in excess or deficient demand, and the actual number of admission o f students in the courses IJnfortunateK, these information are not available from the published or unpublished secondar> sources And, the attempts made for this study to get
48
the information from the sample colleges were not successful. Hence, the following alternative is tried in terms of enrolment data.
3.3. Demand for collegiate education based on enrolment data
Enrolment of students (i.e. sum of students in the 1, II and III year of the courses) is an important indicator of demand for collegiate education by courses. Analysis of growth and distribution of enrolment of students helps in understanding of what student’s demand in collegiate education in the State. Thus, the number and annual growth of enrolment of male and female students by universities and districts are presented and described separately for Government colleges (GCs), Private aided colleges (PACs) and Pn\ate unaided colleges (PUACs) below. In addition, the enrolment of SC ST students is highlighted. The purpose of this description is to single out the essential differences and/or similanties in the nature and patterns of students' enrolment by courses in the colleges. It should be emphasised that these descriptions are limited to certain years and characteristics for GCs, PACs and PUACs for lack of data for all years, characteristics and colleges.
In addition, enrolment of student in UCs and distance education will be described by courses. This description is useful to understand the distribution of enrolment by GCs, PACs, PUACs, UCs and distance education in the State.
3.3.1. Enrolment in Government colleges
Table 3.1 through Table 3.7 present the nature and pattern of students enrolment in traditional degree courses in GCs, from 1990-91 through 1999- GO, in terms of the (a) number of male, female and total enrolment of students by universities and districts, (b) share of male, female and total enrolment of students in universities and districts in the respective State’s total, and (c) annual growth (AG) of enrohnent of total students (in %) by universities and districts. Figures in the flower brackets below the annual growth represent the share of a district in the university's total.
49
3.3.1.1. Enrolment in B.A. course in Government colleges
3.3.1.1.1. Total enrolment in the State
Table 3.1 shows that total enrolment in B.A. course had increased from 30063 students during 1990-91, 37356 student during 1992-93, 48867 students during 1994-95 and to 53787 students during 1995-96. However, during 19%-97, total enrolment had decline to 50936 students and to 45501 students during 1998-99 and 43717 students during 1999-00. Thus, in the recent past, there has been a decline in the enrolment of students in B.A. degree course in GCs.
The annual growth of total enrolment shows wide fluctuations between 1990-91 and 1995-%, and between 1996-97 and 1999-2000. For instance, between 1990-91 and 1995-96, the annual growth of total enrolment was positive for all the years, but the highest (lowest) rate was observed during1993-94 (1992-93) at 23.90 (1.64) percent. On the other hand, between 1996-97 and 1999-(X), the annual growth rate was positive at 2.03 percent during 1997-98 and negative during the rest of the years. In fact, the biggest decline is evident during 1998-99 at -12.49 percent.
The composition of total enrolment between male and female students shows that for all the years, the number of male students has been higher than the number of female students.
3.3.1.1.2. Enrolment by universities
The university-wise enrolment of students shows that Bangalore University has the largest enrolment and is followed by the Universit> of Mysore, Kuvempu University, Gulbarga University, Kamatak University and Mangalore University. For instance, the share of Bangalore (Mangalore) University’ was 37.47 (4.59) percent during 1990-91, 38.37 (3.29) percent during 1993-94 and 39.59 (3.52) percent during 1995-96, and 37.72 (4.87) percent during 1999-00.
The annual growth of total enrolment shows that Bangalore University has the highest (lowest) growth during 1991-92 (1998-99) at 26.86 (-14.58) percent. University of Mysore during 1993-94 (1998-99) at 38.8 (-18.55) percent, and Kuvempu University during 1995-96 (1996-97) at 22.98 (- 26.34) percent.
50
During 1990-91 to 1999-00, the increase in total enrolment of student in the universities is contributed by enrolment of both male and female students. However, the share of male and female students in the total enrolment differs both within and between the universities. For instance, the share of male students in the total enrolment of students in Bangalore (Kuvempu) University was 67.78 (79.01) percent during 1990-91, 68.74 (74.42) percent during 1993-94, 69.73 (73.66) percent during 1995-96 and 67.84 (61.53) percent during 1999-00. In tlie same way, the share of male students of Bangalore (Kuvempu) university in the State's total was 35.51 (20.40) percent during 1990-91, 37.52 (18.78) percent during 1993-94, 39.45 (21.12) percent during 1995-96 and 40.65 (17.28) percent during 1999-00.
It must be emphasised that between 1990-91 to 1995-96. all universities have experienced a positive growth of total enrolment except Kuvempu and Mangalore universities during 1992-93. However, during 1996-97, all the universities have experience a negative growth except Kamatak and Gulbarga universities. And, during 1998-99, aU universities, excepl Gulbarga University, have experienced a negative growth m total enrolment of students.
3.3.1.1.3. Enrolment by districts
Inter-district variations in the enrolment of students may be described in three ways. First, by the changes in share of district’s enrolment in the State’s total. Second, by the changes in share of district’s enrolment in the university's total. Third, by the changes in each district's share in State's and university’s total over a period of time.
It is apparent that Bangalore Urban, Tumkur, Kolar, Mysore, Chitradurga and Gulbarga have the largest combined share in the male, female and total enrolment of students. For instance, the combined share of these 6 districts in the total enrolment of the State was 56.46 percent during 1990-91, 56.37 percent during 1995-96 and 53.98 percent during 1999-00. Of these 6 districts, the relative share of Bangalore Urban, Tumkur and Kolar have been higher than other districts in the State. In the same way, these three districts constitute about 90 percent of total enrolment in Bangalore University over the years.
51
A simple way of summarising the inter-district distribution and variations in enrolment is to look at the summary statistics, as given in Table 3.2. Since the total number of districts is fixed at 20 throughout the increasing average enrolment of male, female and total students are evident up to 1995-%. However, unlike male and total enrolment, which show a declining mean value since 1996-97, the mean female enrolment shows a fluctuating trend. Further, while the absolute variation in terms of standard deviation has been higher for male enrolment as compared to female enrolment, the coefficient of variation is clearly smaller in case of female enrolment as compared to male enrolment since 1997-98.
3.3.1.2. Enrolment in B.Sc. course in Government colleges
3.3.1.2.1. Total enrolment in the State
Table 3.3. shows that total enrolment in B.Sc. course had increased from 8853 students during 1990-91, 9550 student during 1992-93, 10528 students during 1994-95 and to 11301 students during 1996-97. However, this increase is not consistent as the total enrolment had decline to 8797 students during 1991-92 and 10528 during 1994-95. Further, fi*om 1997-98, total enrolment has continuously declined to 9925 students and to 7253 students during 1998-99 and 6137 students during 1999'00. Thus, since 1997-98 there has been a steady decline in the total enrolment of students in B.Sc. degree course in the GCs.
The annual growth of total enrolment shows wide fluctuations between 1990-91 and 1996-97, and between 1997-98 and 1999-2000. For instance, between 1990-91 and 1996-97, the annual growth of total enrolment was positive for all the years except during 1991-92 and 1994-95. And, the highest (lowest) rate was observed during 1993-94 (1994-95) at 11.95 (- 1.52) percent. On the other hand, between 1997-98 and 1999-00, the annual growth rate was negative at -12.17 percent during 1997-98, -26.93 during1998-99 and -15.39 per cent during 1999-00. Thus, the biggest decline in total enrolment is evident during 1998-99.
The composition of total enrolment between male and female students shows that for all the years except during 1999-00, the number of male students has been higher than the number of female students.
52
The university-wise enrolment of students shows that Bangalore University has the largest enrolment and is followed by the University of Mysore, Kuvempu University, Gulbarga University, Kamatak Universitv' and Mangalore University. The most striking feature of this distribution is that while Bangalore University has more than 50 percent of total enrolment in the State, the Mangalore University' is observed to have zero enrolment of students in B.Sc. course since 1992-93. For instance, the share of Bangalore (Mangalore) University was 50.25 (1.52) percent during 1990-91, 51.05 (0.00) percent during 1993-94 and 54.82 (0.00) percent during 1995-%, and 46.59 (0.00) percent during 1999-00.
The annual growth of total enrolment shows that Bangalore University has the highest (lowest) growth during 1992-93 (1998-99) at 21.58 (-31.17) percent. University of Mysore during 1993-94 (1999-(X)) at 34.24 (-18.56) percent, and Kuvempu University during 1996-97 (1998-99) at 35.18 (- 30.38) percent.
During 1990-91 to 1999-00, the increase in total enrolment of student in the universities is contributed by enrolment of both male and female students. However, the share of male and female students in the total enrolment differs both within and between the universities. For instance, the share of male students in the total enrolment of students in Bangalore (Kuvempu) University was 62.76 (75.08) percent during 1990-91, 56.05 (70.71) percent during 1993-94, 55.05 (69.34) percent during 1995-96 and 47.6 (67.03) percent during 1999-00. In the same way, the share of male students of Bangalore (Kuvempu) university in the State’s total was 49.81 (21.23) percent during 1990-91,49.60 (15.89) percent during 1993-94, 53.81 (15.34) percent during 1995-% and 44.83 (24.24) percent during 1999-00.
It must be emphasised that between 1990-91 to 19%-97, and excluding Mangalore University, few universities (e.g. Bangalore, Mysore, Kuvempu and Kamatak universities during 1991-92, Kuvempu and Gulbarga universities during 1992-93, and Bangalore and Gulbarga universities during1994-95) have experienced a negative annual growth of total enrolment. However, dunng 1997-98 to 1999-00, all the universities, except Kamatak University during 1999-(X), have experienced a negative growth.
3.3.1.2.2. Enrolment by universities
53
3.3.1.2.3. Enrolment by districts
It is apparent tiiat Bangalore Urban, Tumkur, Kolar, Shimoga, Chitradurga and Gulbarga have the largest but declining combined share in the male, female and total enrolment of students. For instance, the combined share of these 6 districts in the total enrolment of the State was 71.65 percent during 1990-91, 68.56 percent during 1995-% and 63.00 percent during1999-00. Of these 6 districts, the relative share of Bangalore Urban, Tumkur and Kolar has been higher than other districts in the State. In the same way, these three districts constitute about 100 percent of total enrolment in Bangalore University over the years.
The summary statistics on the inter-district distribution and variations in enrolment in Table 3.4 shows (a) a fluctuation (decline) in the mean enrolment of male, female and total students up to 1996-97 ( since 1997- 98); and (b) while the absolute variation in terms of standard deviation has been higher for male than for female enrolment up to 1991-92, the coefficient of variation is clearly higher in case of female enrolment as compared to male enrolment throughout-
3.3.1.3. Enrolment in B.Com. course in Government colleges
3.3.1.3.1. Total enrolment in the State
Table 3.5. shows that total enrolment in B.Com. course had increased from 6961 smdents during 1990-91, 7209 student during 1992-93, 8763 students during 1994-95 and to 9761 students during 1995-%. However, this increase is not consistent as the total enrolment had declined to 7209 students during 1992-93. Further, from 1996-97 total enrolment has continuously declined except during 1999-00. That is, from 9342 students during 19%-97 and to 7631 students during 1997-98 and 7068 students during 1998-99. Thus, in general, since 1996-97 there has been a steady decline in the total enrolment of students in B.Com. degree course in the GCs.
The annual grov^h of total enrolment shows wide fluctuations between 1990-91 and 1995-%, and between 1996-97 and 1999-2000. For instance, between 1990-91 and 1995-96, the annual growth of total enrolment was positive for all the years except during 1992-93. And, the highest (lowest) rate was observed during 1995-96 (1992-93) at 11.39 (-3.47) percent. On
54
the other hand, between 19%-97 and 1999-00, the annual growth rate was negative at -4.29 percent during 1996-97, -18.32 percent during 1997-98 and -7.38 percent during 1998-99. Thus, the biggest decline in total enrolment was evident during 1997-98.
The composition of total enrolment between male and female students shows that, for all the years, except during 1998-99, the number of male students have been higher than the number of female students.
3.3.1.3.2. Enrolment by universities
The university-wise enrolment of students shows that Bangalore University has the largest enrolment and is followed by the University of Mysore, Kuvempu University, Mangalore University, Gulbarga University and Kamatak Universit>'. For instance, the share of Bangalore (Kamatak) University was 39.64 (5.95) percent dunng 1990-91, 38.18 (5.76) percent during 1993-94 and 39.13 (6.54) percent during 1995-96, and 43.31 (5.67) percent during 1999-00.
The annual growth of total enrolment shows that Bangalore Universit\ has the highest (lowest) growth during 1999-00 (1997-98) at 26.74 (-20.65) percent. University of Mysore during 1992-93 (1997-98) at 12.74 (-16.85) percent, and Kuvempu University during 1993-94 (1997-98) at 18.68 (-9.76) percent.
During 1990-91 to 1999-00, the increase in total enrolment of student in the universities is contributed by enrolment of both male and female students. However, the share of male and female students in the total enrolment differs both within and between the universities. For instance, the share of male students in the total enrolment of students in Bangalore (Kuvempu) University was 72.74 (66.50) percent during 1990-91, 57.76 (61.16) percent during 1993-94, 57.05 (58.74) percent during 1995-% and 53.70 (54.33) percent during 1999-00. In the same way, the share of male students of Bangalore (Kuvempu) university in the State's total was 42.14 (13.79) percent during 1990-91,37.87 (14.64) percent during 1993-94, 39.03 (13.31) percent during 1995-96 and 44.89 (17.11) percent during 1999-00.
It must be emphasised that between 1990-91 to 1995-96, all universities (except Kuvempu University during 1991-92; Bangalore, Mangalore and Gulbarga universities during 1992-93; and Mysore, Kuvempu and Gulbarga
55
university during 1994-95) have experienced a positive annual growth of total enrolment. However, during 1996-97 to 1999-00, all the universities have experience a negative growth, except Gulbarga University during1998-99, and Bangalore University and Kuvempu University during 1999-GO.
3.3.13.3. Enrolment by districts
It is evident that Bangalore Urban, Tumkur, Kolar and Dakshina Kannada have the largest combined share in the male, female and total enrolment of students. For instance, the combined share of these 4 districts in the total enrolment of the State was 45.22 percent during 1990-91, 46.14 percent during 1995-96 and 49.97 percent during 1999-00. Of these 6 districts, the relative share of Bangalore Urban and Dakshina Kannada has been higher than other districts in the State. In the same way. Bangalore Urban, Tumkur and Kolar districts constitute more than 95% percent of total enrolment in Bangalore University over the years.
The summary statistics on the inter-district distribution and variations in enrolment in Table 3.6 shows (a) an increase (wide fluctuations) in average enrolment of male, female and total students up to 1995-96 except during1992-93 (since 1997-98); and (b) the absolute variation in terms of standard deviation has been higher for male than for female enrolment up to 1998-99, while the coefficient of variation is clearly higher in case of female enrolment as compared to male enrolment throughout except during 1990- 91.
3.3.1.4. Enrolment of SC/ST students in all course in Government colleges
Table 3.7 presents the total number of students in all courses in GCs during 1990-91 and 1991-92, since the data are available only for these years. Further, total number of SC/ST students is inclusive of students in all the degree courses and in the PUC courses, in case a college had offered non-traditional courses and was a composite college.
In Table 3.7, the number of male, female and total students enrolled and their share in State’s total in the parentheses are given. And, the share of SC/ST students in the total degree students enrolled is given in the last column under each year.
56
The share of SC/ST students in the total enrolment of degree students was about 50 percent in Bangalore University and was followed by Kuvempu University, Gulbarga University, University of Mysore, , Mangalore University and Kamatak University. Interestingly, the share of male SC/ST students in Kuvempu and Gulbarga University, and tiie female SC/ST students in the rest of the universities, was higher in the total enrolment. Finally, of the total enrolment, the share of SC/ST students was highest in Gulbarga University and was followed by Bangalore University, Kuvempu University, University of Mysore, Mangalore University and Kamatak University.
3.3.2. Enrolment in Private colleges
As noted in Chapter 1, data on enrolment of students in private colleges are available in two forms. First, data on combined enrolment of students in private aided and unaided colleges up to 1993-94. Second, data on enrolment of students in aided and unaided colleges separately since 1994- 95. Thus, all description of enrolment data in private colleges will be done separately for combined data and non-combined data.
A description of combined and non-combined data has their own merits. First, a description of combined data shall help in comparing the nature and patterns of enrolment of students between Government colleges and private colleges for the years for which data are available. On the other hand, a description of non-combined data shall help in comparing the nature and patterns of enrolment between Government colleges and private aided and unaided colleges, as well as between private aided and unaided colleges. However, since the emphasis is on the recent changes in the demand for collegiate education, the description of combined data will be briefly done.
Table 3.8 through Table 3.12 present the nature and pattern of students enrolment in traditional degree courses, from 1990-91 through 1993-94, in terms of the (a) number of male, female and total enrolment by universities and districts, (b) share of number of male, female and total enrolment of students in universities and districts in the respective State’s total, and (c) annual growth (AG) of total students enrolment (in %) by universities and districts in the private colleges (combined data) in the State. Figures in the flower brackets below the annual growth represent the share of a district in the universities’ total. The summar>' statistics by courses are given in Table 3.11.
57
Table 3.8 shows that total enrolment in the State had increased from 94123 students during 1990-91 to 122923 student during 1993-94, registering an annual growth of 12.39 percent during 1991-92 and 13.15 percent during 1993-94. The composition of students shows that in all the years, the number of male students was higher than female students in all universities except in case of Mangalore University. However, for the State as a whole, the number of male students had been higher than the female students.
Of the universities, the largest share was evident for Kamatak University and was followed by Bangalore University, Gulbarga University, Mangalore University, Kuvempu University and University of Mysore.
Of the districts, the largest share was evident for Dharwad, Belgaum, Bijapur and Bangalore Urban. For instance, the combined share of these 4 districts in the total enrolment was 48 percent during 1990-91 and 43.23 percent during 1993-94, and in the enrolment of male (female) students was 51.19 (42.19) percent during 1990-91 and 45.97 (38.41) percent during1993-94.
3.3.2.2. Enrolment of students in B.Sc. course in private colleges
Table 3.9 shows that total enrolment of students in B.Sc. course in the State had increased from 35126 students during 1990-91 to 48023 student during 1993-94, registering an annual growth of 13.71 percent during 1991- 92 and 15.66 percent during 1993-94. The composition of students shows that in all the years, the number of male students was higher than female students in all universities except in case of Mangalore University. However, for the State as a whole, the number of male students had been higher than the female students.
Of the universities, the largest share was evident for Bangalore University and was followed by Kamatak University, Gulbarga University, Kuvempu University, Mangalore University and University of Mysore.
33 .2 .1 . Enrolment o f students in B.A.course in private colleges
58
Of the districts, the largest share was evident for Bangalore Urban, Dakshina Kannada and Bijapur districts. For instance, the combined share of these 3 districts in the total enrolment was 46.63 percent during 1990-91 and 46.07 percent during 1993-94, and in the enrolment of male (female) students was 41.63 (55.37) percent during 1990-91 and 42.03 (52.28) percent during 1993-94.
3.3.2.3. Enrolment of students in B.Com. course in private colleges
Table 3.10 shows that total enrolment of students in B.Com. course had increased from 50944 students during 1990-91 to 58192 student during1993-94, registering an annual growth of 3,38 percent during 1991-92 and 8.46 percent during 1993-94. The composition of students shows that in all the years, the number of male students was higher than female students in all universities and in the State as a whole.
Of the universities, the largest share was evident for Bangalore University and was followed by Karnatak University, Mangalore University, University of Mysore, Gulbarga Universit>' and Kuvempu Universit\’.
Of the districts, the largest share was evident for Bangalore Urban, Dakshina Kannada, Mysore and Dharwad districts. For instance, the combined share of these 4 districts in the total enrolment was 61.84 percent during 1990-91 and 59.50 percent during 1993-94, and in the enrolment of male (female) students was 58.82 (66.39) percent during 1990-91 and 56.06 (64.12) percent during 1993-94.
3.3.2.4. Summary statistics on enrolment in private colleges by courses
Table 3.11 gives the summary statistics on male, female and total enrolment in private colleges by B.A., B.Sc. and B.Com. courses from 1990- 91 to 1993-94.
The mean enrolment of male, female and total students in private colleges was the highest in B.A. and was followed by B.Com. and B.Sc. courses. In addition, the inter-district variations in total enrolment were the largest in B.A. course and for males in all courses. However, the coefficient of variation was higher for males in B.A. courses and for females in both B.Sc. and B.Com. courses. Thus, inter-distiict variations were observed in enrolment of male, female and total students in private colleges.
59
Table 3.12 presents the total number of students in all courses in private colleges during 1990-91 to 1993-94. The number of male, female and total students enrolled and their share in State's total in the parentheses are given. And, the share of SC/ST students in the total degree college students enrolled is given in the last column under each year.
The total number of SC/ST students had increased from 18840 students during 1990-91 to 29850 students during 1991-92, but had declined from 32527 students during 1992-93 to 30160 students during 1993-94. Thus, the share of SC ST students in the total students enrolled in all courses had fluctuated from 6.48 percent during 1990-91 to 10.04 percent during 1992- 93.
The share of SC/ST students in the total enrolment of degree colleges was highest in Kamatak University and was followed by Gulbarga University, Bangalore University, University of Mysore, Kuvempu University and Mangalore University.
Of the total enrolment the share of SC/ST students was highest in Gulbarga Universit> and was followed by University of Mysore, Kuvempu Universit>’. Bangalore University, Kamatak University and Mangalore Universitv'. Interestingly, the share of male SC/ST students in all universities was higher than the share of female SC/ST students in all the years.
Of the districts, enrolment of SC/ST students was relatively higher in Kolar, Belgaum, Bijapur and Bidar districts. The combined share of these 4 districts in the total SC/ST enrolment in the State was 38.48 percent during1990-91 and 27.09 percent during 1993-94.
3.3.3. Enrolment in private aided colleges
Enrolment in private aided colleges by courses is described below. This description is based on the data in Table 3.13 through Table 3.19. The tables present the nature and pattern of students enrolment to traditional degree courses, from 1994-95 through 1999-00, in terms of the (a) number of male, female and total enrolment by universities and districts, (b) share of number of male, female and total enrolment of students in universities and
3.3.2.5. Enrolment of SC/ST students in all course in private colleges
60
districts in the respective State’s total, and (c) annual growth (AG) of total students enrolment (in %) by universities and districts in the private colleges (combined data) in the State. Enrolment of SC/ST students in degree colleges is analysed separately in all courses from 1994-95.
33.3.1. Enrolment in B.A. course in private aided colleges (PACs)
3.3.3.1.1. Total enrolment in the State
Table 3.13 shows that total enrolment in B.A. course had increased from 107387 students 1994-95 to 111880 students during 1995-96 and to 133840 students during 1996-97. However, since 1997-98, the total enrolment has continuously declined from 96914 students during 1997-98 to 87726 students during 1998-99 and to 85735 students during 1999-00. Thus, in the recent past, there has been a decline in the enrolment of students to B.A. degree course in PACs.
The annual growth of total enrolment shows wide fluctuations between 1994-95 and 1996-97, and between 1997-98 and 1999-2000. For instance, between 1994-95 and 1996-97, the annual growth of total enrolment was positive for all the years, but the highest (lowest) rate is observed during1996-97 (1995-96) at 19.63 (4.18) percent. On the other hand, between1997-98 and 1999-00, the annual growth rate has been negative with the lowest rate at -27.59 percent during 1997-98.
The composition of total enrolment between male and female students shows that for all the years, the number of male students have been higher than the number of female students in the State
3.3.3.12. Enrolment by universities
The university-wise enrolment of students shows that Karnataka University' has the largest enrolment and is followed by the Bangalore University, Gulbarga University, Kuvempu University, University of Mysore and Mangalore University. For instance, the share of Kamatak (Mangalore) University in total enrolment of students was 37.14 (8.01) percent during 1994-95, 35.75 (6.94) percent during 1996-97 and 34.86 (9.36) percent during 1999-00.
61
The annual growth of total enrolment shows that Kamatak University has the highest (lowest) growth during 1996-97 (1997-98) at 1820 (-24.71) percent University of Mysore during 1996-97 (1997-98) at 15.31 (-17.81) percent, and Kuvempu University during 19%-97 (1997-98) at 37.90 (-51.76) percent.
During 1990-91 to 1999-00, the increase in total enrolment of student in the universities is contributed by enrolment of both male and female students. However, the share of male and female students in the total enrolment differs both within and between the universities. For instance, the share of male students in the total enrolment of students in Bangalore (Kuvempu) University was 55.22 (59.14)) during 1994-95 and 51.50 (51.21) during 1999-00. In the same way, the share of male students of Bangalore (Kuvempu) university in the State's total was 15.53 (10.73) percent during 1994-95 and 18.34 (10.11) percent during 1999-00. And, the number of male students has remained higher than female student in all the years and in all universities except Mangalore University.
It must be emphasised that between 1994-95 to 19%-97, all universities have experienced a positive growth of total enrolment except Gulbarga and Mangalore universities during 1995-96. However, during 1997-98 to 1999- 00, all the universities have experienced a negative growth except Mangalore Universit>’ during 1998-99 and Kuvempu and Mangalore universities during 1999-00.
3.3.3.1.3. Enrolment by districts
As in the case of Government colleges, inter-district variations in the enrolment of students may be described in three ways. First, by the changes in share of district’s enrolment in the State's total. Second, by the changes in share of district’s enrolment in the university’s total. Third, by the changes in each districf s share in State’s and university’s total over a period of time.
It is apparent that Bangalore Urban, Dakshina Kannada, Dharwad, Belgaum and Bijapur districts have the largest combined share in the male, female and total enrolment of students. For instance, the combined share of these 5 districts in the total enrolment of the State was 49.72 percent during 1994-95, 50.56 percent during 1997-98 and 49.58 percent during 1999-00. Of these 5 districts, the relative share of Bangalore Urban and Bijapur have been higher than other districts in the State. In the same way, Dharwad,
62
A simple way of summarising the inter-district distribution and variations in enrolment is to look at the summary statistics, as given in Table 3.14. Since the total number of districts is fixed at 20 throughout, the increasing average enrolment of male, female and total students are evident up to 1996- 97. However, unlike male and total enrolment, which show a declining mean value since 1996-97, the mean female enrolment shows a fluctuating trend. Further, while the absolute variation in terms of standard deviation has been higher for male enrolment as compared to female enrolment, the coefficient of variation is clearly smaller in case of female enrolment as compared to male enrolment since 1997-98.
3.3.3.2. Enrolment in B.Sc. course in private aided colleges
3.3.32.1. Total enrolment in the State
Table 3.15 shows that total enrolment in B.Sc. course had declined from 49788 students 1994-95 to 45864 students during 1995-96 but had increased to 48243 students during 1996-97. However, since 1997-98, the total enrolment has continuously declined from 37075 students during 1997-98 to 33857 students during 1998-99 and to 32264 students during 1999-00. Thus, over the years, there has been a decline in the enrolment of students to B.Sc. degree course in PACs.
The annual growth of total enrolment shows wide fluctuations between 1994-95 and 1999-2000. For instance, the annual growth of total enrolment was -7.88 percent during 1995-%, -23.15 percent during 1997-98 and -4.71 percent during 1999-00.
The composition of total enrolment between male and female students shows that for all the years, the number of male students have been higher than the number of female students in the State.
3.3.32.2. Enrolment by universities
The universit>'-wise enrolment of students shows that Bangalore University has the largest enrolment and is followed by Kamatak University, Gulbarga University, Mangalore University, University of Mysore and
Belgaum and Bijapur districts constitute about 94 percent o f total enrolmentin Kamatak University over the years.
63
Kuvempu University. For instance, the share of Bangalore (Kuvempu) University in total enrolment of students in the State was 38.72 (6.23) percent during 1994-95, 39.39 (7.05) percent during 1996-97 and 44.49(6.10) percent during 1999-00.
The annual growth of total enrolment shows that Bangalore University has the highest (lowest) growth during 1996-97 (1997-98) at 6.38 (-18.23) percent, Kamatak University during 1996-97 (1997-98) at 2.35 (-30.57) percent, and Kuvempu University during 1995-96 (1997-98) at 5 (-35.71) percent.
During 1990-91 to 1999-00, the increase in total enrolment of student in the universities is contributed by enrolment of both male and female students. However, the share of male and female students in the total enrolment differs both within and between the universities. For instance, the share of male students in the total enrolment of students in Bangalore (Kuvempu) University was 5224 (60.14)) during 1994-95 and 49.79 (50.10) during 1999-00. In tiie same way, Ae share of male students of Bangalore (Kuvempu) University in the State's total was 35.52 (6.54) percent during1994-95 and 43.64 (6.02) percent during 1999-00. And, the number of male students has remained higher than female student in all the years and in all the universities except Mangalore University.
It must be emphasised that between 1994-95 to 1999-00, except during 19%-97, there exists no year in which all universities have experienced a positive growth of total enrolment. Most importantly, from 1997-98, all universities have experienced a negative growth in all the years.
3.3.3.2.3. Enrolment by districts
As in the case of enrolment in B.A. course, it is apparent that Bangalore Urban, Dakshina Kannada, Dharwad, Belgaum and Bijapur districts have the largest combined share in the male, female and total enrolment of students. For instance, the combined share of these 5 districts in the total enrolment of the State was 62.82 percent during 1994-95, 61.98 percent during 1997-98 and 64.37 percent during 1999-00. Of these 5 districts, the relative share of Bangalore Urban and Bijapur has been higher than other districts in the State. In the same way, Dharwad, Belgaum and Bijapur districts constitute about 97percent of total enrolment in Kamatak University over the years.
64
A simple way of summarising the inter-district distribution and variations in enrolment is to look at the summary statistics, as given in Table 3.16. First, the fluctuations in the enrolment are evident throughout in average enrolment of male, female and total students. Further, while the absolute variation in terms of standard deviation has been higher for male enrolment as compared to female enrolment, the coefficient of variation has been clearly smaller in case of female enrolment as compared to male enrolment for all the years.
3.3.3.3. Enrolment in B.Com. course in private aided colleges
3.3.3.3.1. Total enrolment in the State
Unlike the data on enrolment in B.A. and B.Sc. courses, which are available for all years, enrolment data on B.Com. is reported except for 19%-97. To maintain the continuity of analysis, average enrolment between1995-96 and 1997-98 is used as a proxy data for the enrolment during 1996- 97.
Table 3.17 shows that total enrolment in B.Sc. course had increased from 48075 students 1994-95 to 56855 students during 1995-96 and to 56612 students in 19%-97. As in the case of total enrolment in B.A. and B.Sc. courses, since 1997-98, the total enrolment in B.Com. course has continuously declined from 56368 students during 1997-98 to 55184 students during 1998-99 and to 54871 students during 1999-00. Thus, in the recent past, there has been a decline in the enrolment of students to B.Sc. degree course in PACs.
The annual growth of total enrolment shows wide fluctuations between1994-95 and 1999-2000. For instance, the annual growth of total enrolment was 18J26 percent during 1995-96, -0.43 percent during 1997-98 and -0.57 percent during 1999-00.
The composition of total enrolment between male and female students shows that for all the years, the number of male students has been higher than the number of female students in the State.
And, Bangalore Urban district itself constitutes about 80 percent of totalenrolment in Bangalore University.
65
The university-wise enrolment of students shows that Bangalore University has the largest enrolment and is followed by Kamatak University, Mangalore University, Gulbarga University, University of Mysore and Kuvempu University. For instance, the share of Bangalore (Kuvempu) University in total enrolment of students in the State was 32.75 (9.48) percent during 1994-95, 32.64 (6.83) percent during 1996-97 and 35.47(6.70) percent during 1999-00,
The annual growth of total enrolment shows that Bangalore University has the highest (lowest) growth during 1995-96 (1997-98) at 18.11 (-0.94) percent, K araa^ during 1995-96 (1998-99) at 12.92 (-8.10) percent, and Kuvempu University during 1999-00 (1995-96) at 3.64 (-13.69) percent.
During 1990-91 to 1999-00, the increase in total enrolment of student in the universities is contributed by enrolment of both male and female students. However, the share of male and female students in the total enrolment differs both within and between the universities. For instance, the share of male students in the total enrolment of students in Bangalore (Kuvempu) University was 50.01 (55.99) during 1994-95 and 50.16 (52.15) during 1999-00. In the same way, the share of male students of Bangalore (Kuvempu) University in the State's total was 29.50 (9.56) percent during1994-95 and 33.19 (6.52) percent during 1999-00. And, the number of male students has remained higher than female student in all the years and in all the universities except Mangalore University.
3.3.3.3.3. Enrolment bv districts
Of the districts in the State, Bangalore Urban, Mysore, Dakshina Kannada, Dharwad and Belgaum have the largest combined share in the male, female and total enrolment of students. For instance, the combined share of these 5 districts in the total enrolment of the State was 62.93 percent during 1994-95, 69.09 percent during 1997-98 and 71.67 percent during 1999-00. Of these 5 districts, the relative share of Bangalore Urban and Bijapur has been higher than other districts in the State. In the same way, Dharwad, Belgaum and Bijapur districts constitute more than 94 percent of total enrolment in Kamatak University over the years. And, Bangalore Urban district itself constitutes more than 85 percent of total enrolment in Bangalore University.
3.3.3.3.2. Enrolment bv universities
66
Table 3.18 gives the summary statistics on districts' average and interdistrict variations in enrolment of students. First the tluctuations in the enrolment are evident throughout in average enrolment of male, female and total students. Further, while the absolute variation in terms of standard deviation has been higher for male enrolment as compared to female enrolment, the coefficient of variation is clearly smaller in case of female enrolment as compared to male enrolment for all the years.
3.33.4. Enrolment of SC/ST students in all course in private aided colleges
Table 3.19 presents the total number of SC/ST students in all private aided colleges during 1994-95 to 1997-98. The number of male, female and total students enrolled and their share in State’s total in the parentheses are given. And, the share of SC/ST students in the total degree students enrolled is given in the last column under each year.
The total number of SC/ST students in the State has increased from 31105 students during 1994-95 to 33254 students during 1995-%, but has declined from 32372 students during 1996-97 to 31490 students during 1997-98. Thus, the share of SC/ST students in the total students enrolled in all degree colleges has fluctuated from 9.68 percent during 1994-95 to 10.63 percent during 1997-98.
The share of SC/ST students in the total enrolment of PACs is highest in Kamatak University, and is followed by Bangalore University, Gulbarga University, University of Mysore, Kuvempu University and Mangalore University. Interestingly, the share of male SC/ST students in all universities including Mangalore University has been higher than the share of female SC/ST students in all the years.
Of the districts, enrolment of SC/ST students is relatively high in Bangalore Urban, Mysore, Dharwad, Belgaum and Bijapur districts. The combined share of these 5 districts in the total SC/ST enrolment in all PACs in the State was 49.05 percent during 1994-95 and 53.63 percent during 1997-98.
67
Enrolment in pnvate unaided colleges by courses is described below. This description is based on the data in Table 3.20 through Table 3.26. The tables present the nature and pattern of students enrolment to traditional degree courses, from 1994-95 through 1999-00, in terms of the (a) number of male, female and total enrolment by universities and districts, (b) share of number of male, female and total enrolment of students in universities and districts in the respective State’s total, and (c) annual growth (AG) (in %) of total students enrolment by universities and districts in the private colleges (combined data) in the State. Enrolment of SC/ST students in degree colleges is analysed separately in all courses from 1994-95.
3.3.4.1. Enrolment in B.A. course in private unaided colleges
3.3.4.1.1. Total enrolment in the State
Table 3.20 shows that total enrolment in B.A. course has increased from1995-% to 1998-99. That is, from 25736 students 1995-96 to 26628 students during 1996-97 and from 31274 students during 1997-98 to 32346 students during 1998-99. However, between 1994-95 and 1995-96, and between 1998-99 and 1999-00, total enrolment has declined mainly due to a decline in male enrolment. Thus, unlike in GCs and PACs, there has been a decline in the enrolment of students in B.A. degree course in PUACs only during last one-year.
However, the annual growth of total enrolment shows wide fluctuations between 1994-95 and 1999-00. For instance, the highest (lowest) annual growth of total enrolment is observed during 1996-97 (1995-96) at 21.26 (- 14.67) percent. On the other hand, between 1998-99 and 1999-00, the annual growth rate is negative at -5.31 percent.
The composition of total enrolment between male and female students shows that for all the years, the number of male students has been higher than the number of female students in the State.
3.3.4.1.2. Enrolment by universities
The universit>'-wise enrolment of students shows that Karnatak University has the largest enrolment and is followed by the Gulbarga
3.3.4. Enrolment in private unaided colleges (PUACs)
68
lJniversit>, Kuvempu University, Bangalore University, University of Mysore and Mangalore University. For instance, the share of Kamatak University (University of Mysore) in total enrolment of students was 45.71(3.83) percent during 1994-95, 42.73 (7.20) percent during 1996-97 and40.85 (9.25) percent during 1999-00.
The annual growth of total enrolment shows that Kamatak University has the highest (lowest) growth 1996-97 (1995-%) at 54.47 (-37.38) percent. University of Mysore during 1995-96 (1999-00) at 71.91 (-1.63) percent, and Mangalore University during 1998-99 (1995-96) at 42.88 (-10.58) percent.
During 1994-95 to 1999-00, the increase in total enrolment of student in the universities is contributed by enrolment of both male and female students. However, the share of male and female students in the total enrolment differs both within and between the universities. For instance, the share of male students in the total enrolment of students in Kamatak University (University of Mysore) was 75.18 (69.57) during 1994-95 and(67.10) during 1999-00. In the same way, the share of male students of Kamatak University (University- of Mysore) in the State's total was 49.31(3.83) percent during 1994-95 and 46.35 (9.14) percent during 1999-00. Except Mangalore University, in all other universities, the number of male students has remained higher than female student in all the years.
It must be emphasised that during 1995-96, Bangalore, Mangalore, Kamatak and Gulbarga universities have experienced a negative growth of total enrolment. In the same way, during 1999-00, except Bangalore University, all other universities have experienced a negative annual growth of total enrolment of students.
3.3.4.1.3. Enrolment by districts
As in the case of GCs and PACs, the inter-district variations in the enrolment of students in PUACs may be described in three ways. First, by the changes in share of district’s enrolment in the State's total. Second, by the changes in share of district's enrolment in the university’s total. Third, by the changes in each district's share in State's and university's total over a period of time.
69
It is apparent that Bangalore Urban, Dharwad, Belgaum, Bijapur and Gulbarga districts have the largest combined share in the male, female and total enrolment of students. For instance, the combined share of these 5 districts in the total enrolment of the State was 61.87 percent during 1994- 95, 64.72 percent during 1997-98 and 57.82 percent during 1999-00. Of these 5 districts, the relative share of Dharwad and Bijapur has been higher than other districts in the State. In the same way, Dharwad, Belgaum and Bijapur districts constitute about 98 percent of total enrolment in Kamatak University over the years.
As a simple way of summarising the inter-district distribution and variations in enrolment, the summary statistics on enrolment are given in Table 3.21. Interestingly, the average enrolment of female students has increased over the years, and that of male and total enrolment of students shows wide variations between years. Further, both standard deviation and coefficient of variation show lower values for female enrolment than for male or total enrolment of students. Thus, inter-district variations are observed to be smaller in enrolment of female students than in enrolment of male student in B.A. course in PUACs.
3.3.4.2. Enrolment in B.Sc. course in private unaided colleges
3.3.4.2.1. Total enrolment
Table 3.22 shows that total enrolment in B.Sc. course has increased from1995-96 to 1999-00. That is, from 2379 students during 1995-96 to 3354 students during 1996-97,4310 students during 1997-98 and to 5375 students during 1999-00. The rise in total enrolment has been contributed by a rise in both male and female enrolments.
However, the annual growth of total enrolment shows wide fluctuations between the years. For instance, annual growth of total enrolment is -32.03 percent during 1995-96, 28.50 percent during 1998-99 and 0.62 percent during 1999-00.
The composition of total enrolment between male and female students shows that for all the years, the number of male students have been higher than the number of female students in the State.
70
The university-wise enrolment of students shows that Bangalore University has the largest enrolment and is followed (not for all years, however) by the Kamatak University, Mangalore University, University of Mysore, Gulbarga University and Kuvempu University. For instance, the share of Bangalore (Gulbarga) University in total enrolment of students was36.86 (8.46) percent during 1994-95, 51.65 (6.24) percent during 1997-98 and 55.61 (5.88) percent during 1999-00.
The annual growth of total enrolment shows that Bangalore University has the highest (lowest) growth 1996-97 (1995-96) at 47.85 (-11.71) percent, Kuvempu University during 1995-96 (19%-97) at 250.69 (-30.10) percent, and Gulbarga University during 1999-00 (1997-98) at 19.70 (-12.38) percent.
During 1994-95 to 1999-00, the increase in total enrolment of student in the universities is contributed by enrolment of both male and female students. However, the share of male and female students in the total enrolment differs both within and between the universities. For instance, the share of male students in the total enrolment of students in Bangalore (Gulbarga) University was 69.22 (82.77) during 1994-95 and 60.22 (75.32) percent during 1999-00. In the same way, the share of male students of Bangalore (Gullmrga) University in the State’s total was 35.54 (9.75) percent during 1994-95 and 54.45 (7.20) percent during 1999-00.
It must be emphasised that during 1995-96, all universities, except Mysore and Gulbarga universities, have experienced a negative growth of total enrolment.
3.3.4.2.3. Enrolment by districts
It is apparent that Bangalore Urban, Dakshina Kannada and Dharwad districts have the largest combined share in the male, female and total enrolment of students. For instance, the combined share of these 3 districts in the total enrolment of the State was 69.29 percent during 1994-95, 54.46 percent during 1997-98 and 57.40 percent during 1999-00. Of these 3 districts, the relative share of Bangalore Urban has been higher than other districts in the State. In the same way. Bangalore Urban district constitutes
3 3.4.2.2. Enrolment by universities
71
more than 95 percent of total enrolment in Bangalore University over the years.
As a simple way of summarising the inter-district distribution and variations in enrolment, the summar\ statistics on enrolment are given in Table 3.23. Interestingly, the average enrolment of female, male and total enrolment of students shows wide variations between years. Further, both standard deviation and coefficient of variation show variations between years and between male and female students. Thus, inter-district variations are observed to be mixed for male and female students in B.Sc. course in PUACs.
3.3.4.3. Enrolment in B.Com. course in private unaided colleges
3.3.4.3.I. Total enrolment in the State
Qualitatively, the patterns of enrolment of students in B.Com. course is similar to enrolment of students in B.Sc. course in PUACs. This is evident in the following descriptions.
Table 3.24 shows that total enrolment in B.Com. course has increased from 1995-% to 1999-00. That is, from 8947 students during 1995-96 to 10212 students during 1996-97. 11458 students during 1997-98 and to 14590 students during 1999-00. The rise in total enrolment over the years has been contributed by a rise in both male and female enrolment.
Thus, the annual growth of total enrolment shows wide fluctuations between the years. For instance, annual growth of total enrolment is -9.18 percent during 1995-96, 12.20 percent during 1997-98 and 12.02 percent during 1999-00.
The composition of total enrolment between male and female students shows that for all the years, the number of male students has been higher than the number of female students in the State,
3.3.4 3.2. Enrolment by universities
The universit>-wise enrolment of students shows that Bangalore University has the largest enrolment and is followed by the Mangalore University, Kamatak University, Kuvempu University, University of
72
Mysore and Gulbarga University. For instance, the share of Bangalore University (Gulbarga) in total enrolment of students in the State was 41.51(2.47) percent during 1994-95, 44.15 (3.01) percent during 19%-97 and 55.89 (3.11) percent during 1999-00.
The annual growth of total enrolment shows that Bangalore University has the highest (lowest) growth during 1995-96 (1996-97) at -17.34 (33.40) percent, Kuvempu University during 1998-99 (1997-98) at 69.69 (-60.28) percent, and Gulbarga University during 1997-98 (1995-96) at 38.44 (- 23.46) percent.
During 1994-95 to 1999-00, the increase in total enrolment of student in the universities is contributed by enrolment of both male and female students. However, the share of male and female students in the total enrolment differs both within and between the universities. For instance, the share of male students in the total enrolment of students in Bangalore Universitv' (Gulbarga University) was 63.73 (83.54) during 1994-95 and 64.25 (86.78) percent during 1999-00. In the same way, the share of male students in Bangalore University (Gulbarga Universit\) in the State’s total was 37.83 (2.95) percent during 1994-95 and 56.03 (4.21) percent during 1999-00.
It must be emphasised that during 1995-96, all universities except University of Mysore, Kuvempu University and Mangalore University have experienced a negative growth of total enrolment.
3.3.4.3.3. Enrolment by districts
It is observed that Bangalore Urban, Dakshina Kannada and Dharwad districts have the largest combined share in the male, female and total enrolment of students. For instance, the combined share of these 3 districts in the total enrolment of the State was 70.% percent during 1994-95, 78.38 pCTcent during 1997-98 and 75.37 percent during 1999-00. Of these 3 districts, the relative share of Bangalore Urban has been higher than other districts in the State. In the same way. Bangalore Urban district constitutes about 95 percent of total enrolment in Bangalore University over the years.
As a simple way of summarising the inter-district distribution and vanations in enrolment, the summary statistics on enrolment are given in Table 3.25. Interestingly, the average enrolment of female, male and total
73
enrolment of students shows wide variations between years. Further, both standard deviation and coefficient of variation show variations between years and between male and female students. Thus, inter-district variations are observed to be mixed for male and female students in B.Com. course, as in the case of enrolment of student in B .Sc. course, in the PUACs.
3.3.4.4. Enrolment of SC/ST students in all course in private unaided colleges
Table 3.26 presents the total number of SC/ST students in all private unaided colleges dunng 1994-95 and 1997-98. The number of male, female and total students enrolled and their share in State’s total in the parentheses are given. And, the share of SC/ST students in the total degree students enrolled is given in the last column under each year.
The total number of SC/ST students has increased from 6262 students dunng 1994-95, 6308 students during 1995-96, 6381 students during 1996- 97 but has declined to 6442 students during 1997-98 Thus, the share of SC ST students in the total students enrolled in all unaided degree colleges has fluctuated from 13.34 percent during 1994-95 to 11.62 percent during1997-98.
The share of SC ST students in the total enrolment of PUACs is highest in Kamatak University, and is followed by Gulbarga University', Bangalore University, Kuvempu University, University of Mysore and Mangalore University. Interestingly, the share of male SC/ST students in all universities is higher than the share of female SC ST students in all the years, except in case of Mangalore University' where the enrolment of male and female students is equal except during 1994-95.
Of the districts, enrolment of SC S'f students is relatively high in Bangalore Urban, Chitradurga, Dharwad. Gulbarga, Bijapur and Bidar distncts. The combined share of these 6 districts in the total SC/ST enrolment in all PUACs in the State was 72.45 percent during 1994-95 and73.35 percent during 1997-98.
74
Table 3.27 summarises the trends in enrolment of students at the State level by B.A.. B.Sc. and B.Com. degree courses in GCs, PACs and PUACs as well as for all colleges.
First, total enrolment in GCs has declined in all the courses since 1996- 97. For instance, the enrolment in B.A. B.Sc. and B.Com. course has declmed from 50936, 11301 and 9342 students during 1996-97 to 43717. 6137 and 7366 students during 1999-00. Thus, total enrolment in all courses has declined from 71579 student during 1996-97 to 57220 students during 1999-00. Of the total decline in enrolment in all courses, the largest declme is evident for B.Sc. course and is followed by B.Com. For instance, the share of B.Sc. (B.Com.) students in the total enrolment in all courses has declined from 15.79 (13.05) percent dunng 1996-97 to 10.73 (12.87) percent during 1999-00. Consequently, the relative share of B.A. students in total enrolment has increased from 71.16 percent to 76.40 percent during this period.
Second, as in the case of GCs. total enrolment in PACs has declined in all the courses since 1996-97. For instance, the enrolment in B.A. B.Sc. and B.Com. course has declined from 133840, 48243 and 56612 students during 1996-97 to 85735. 32264 and 54671 .students during 1999-00. Thus, total enrolment in all courses has declined from 56612 student during 1996- 97 to 54671 students during 1999-00. Of the total decline in enrolment in all courses, the largest decHne is evident for B.A. course and is followed by B.Sc, course. For instance, the share of B.A. (B.Sc.) students in the total enrolment in all courses has declined from 56.07 (20.21) percent during1996-97 to 49.60 (18.66) percent during 1999-00. Consequently, the relative share of B.Com. students in total enrolment has increased from 23.72 percent to 31.74 percent during this period.
Third, in contrast with GCs and PACs, total enrolment in PUACs has increased in all the courses since 1996-97. For instance, the enrolment in B.A., B.Sc. and B.Com. course has increased from 26628, 3354, and 10212 students during 1996-97 to 30628. 5375 and 14590 students during 1999-00 respectively. Thus, total enrolment in all courses has mcreased from 40194 students during 1996-97 to 50592 students during 1999-00. Of the total increase in enrolment in all courses, the largest increase is evident for B.Com. course and is followed bv B.Sc. course. For mstance, the share
3.3.5. Summary o f the trends in enrolment bv courses
of B.Com. (B.Sc.) students in tlie total enrolment in all courses has increased from 25.41 (8.34) percent during 1996-97 to 28.84 (10.62) percent during 1999-00. However, the relative share of B.A. students in total enrolment has declined from 66.25 percent to 60.54 percent during this period.
Fourth, total enrolment in all colleges by courses shows similar patterns of enrolment in GCs and PACs, since the enrolment of students in these colleges constitutes the largest share among all colleges in the State. Nevertheless, the trends in enrolment are not uniform by courses and by colleges in the State.
3.3.6. Enrolment of students by courses in sample colleges
It is interesting to understand the trends in and patterns of enrolment of students by courses and colleges from the sample survey data as presented in Table 3.28.
First, in all the colleges, enrolment in B.A. course in the highest among all subjects and in all the years.
Second, total enrolment had increased in all the courses from 1991-92 to 1994-95, but declined from 1994-95 to 1999-00 except in case of B.Com. in PACs.
Third, of the courses, enrolment in B.A. course has declined in all colleges except in PUACs. In regard to B.Sc. course, the decline is evident only for GCs and PUACs. On the other hand, enrolment in B.Com.. and in other courses has declined only in case of GCs.
Fourth, of the colleges, the decline in enrolment is evident in all courses for GCs. In case of PACs and UCs (or PUACs), the decline is evident for B.A. (or B.Sc.) course.
Except for GCs, the sample survey results do not otYer consistent results for trends and patterns in enrolment by courses and colleges as compared to the secondary data, summarised in section 3.3.5. above. This indicates that results from secondary data and primary data on colleges would lead to divergent conclusions on the trends and patterns of enrolment by courses and by colleges in the State.
76
3.3.7. Enrolment of students in University Colleges
In the Annual Report of the Mangalore University, data on enrolment of students by courses in affiliated colleges, including UCs, is not reported. On the other hand, data on enrolment of students is not reported in the Annual Report of the Kuvempu University. However, for the year 1999-00, total enrolment of students by colleges is prepared for submission to the UGC. Thus, only total enrolment of students in UCs for 1999-00 is described below.
During 1999-00, total enrolment of students in UCs is equal to 7608 students. Of this total enrolment, the share of University of Mysore is 51.46 percent, Mangalore University is 22.95 percent, Kuvempu University is19.36 percent and Kamatak University is 6.23 percent.
3.3.8. Enrolment of students by courses in distance education
Total enrolment of students in B.A. (B.Com.) course has increased in KSOU. That is, from 4342 (1647) students during 1997-98 to 7263 (2345) students during 1998-99 and to 6883 (3455) students during 1999-(X).
During 1999-00, total enrolment of students in distance education in Bangalore University is 3272 students in B.A. course, 1523 students in B.Com. course and 452 students in other subjects. In Kamatak University, 2641 students are enrolled in B.A. course and 3455 students in B.Com. course.
During 1999-00, the total enrolment of students in distance education in Bangalore, Kamatak and KSOU is equal to 12796 students in B.A. course and 5178 students in B.Com. course and 452 students in other subjects. Of the total enrolment in B.A. course, the share of Bangalore University is 25.57 percent, Kamatak University is 20.64 percent and KSOU is 53.79 percent. In the same way, of the total enrolment in B.Com. course, the share of Bangalore University is 29.41 percent, Kamatak University is 3.86 percent and KSOU is 66.72 percent. In regard to enrolment to other subjects, the share of Bangalore University is 100 percent.
The increasing enrolment in B.A. course in KSOU is in contrast with declining enrolment in regular education during 1997-98 to 1999-00. As noted in Chapter 2, admission to distance education in the State is not
77
restricted only for students from within the State. Thus, a direct comparison of enrolment of students between regular education and distance education may not be plausible.
3.3.9. Aggregate enrolment and distribution of enrolment by types of collegiate education and colleges in the State
Aggregate enrolment of students in collegiate education in the State is the sum of students in all colleges in regular education and in universities in distance education.
During 1999-00, aggregate enrolment in collegiate education is equal to 306265 students. Of this total the share of GCs is 18.68 percent, PACs is 56.44 percent, PUACs is 16.52 percent, UCs is 2.48 percent and distance education is 5.87 percent. Thus, regular education constitutes 94.13 percent of total enrolment in collegiate education in the State.
3.4. Analysis of changing demand for collegiate education
In general, the description of patterns of enrolment of students indicates that in recent years, there has been a decline in enrolment of male and female students in traditional courses for all universities in regular education in the state. This indicates a general decline in the student demand for collegiate education in traditional courses in the State.
Tw'o points emerge in the context of declining enrolment in traditional degree courses. First, what are the probable reasons for declining enrolment of student in the courses? Second, what are the implications of declining enrolment of students in courses?
c
3.4.1. Probable reasons for decline in demand for collegiate education
Over the years, the decline in demand for collegiate education may have been contributed by factors from within and outside the system of collegiate education.
78
3.4.1.1. Factors from outside the system of collegiate education
The important factors, which may have contributed for decline in demand for collegiate education from outside the system of collegiate education in the State, are as follows.
(i) A rise in the enrolment of student in vocational education.
(ii) A fall in pass percent of students in PUC courses.
(iii) A rise in enrolment of non-general education, especially intechnical education.
(iv) A rise in unemployment of college graduates in traditional courses with special reference to the problem of decline in organised public sector employment opportunities.
(v) Demographic factors, especially a decline in population of thecollege-going age groups.
3.4.1.2. Factors from within the system of collegiate education
Some of the important factors, which may have contributed for the decline in demand from within the system of collegiate education, are as follows.
(a) A rise in dropout of students in traditional courses.
(b) A rise in demand for non-traditional courses (i.e. for professional and vocational courses and subjects) within collegiate education.
(c) Lack of quality and relevance in collegiate education.
Two points deserve special emphasis here. First, the above factors, which influence the changing demand for collegiate education, are related to both student demand for courses and societal demand for college graduates. Second, the above factors which influence the changing demand for collegiate education arc only the presumed factors since, to my knowledge,
79
there exists no study which have examined the vah'dity of these presumptions in Karnataka State. Nevertheless, a thorough examination of the factors, which influence on all the demands for collegiate education is certainly beyond the scope of this Chapter.
Thus, the empirical validity of a few of the factors, which influence the demand for collegiate education, is examined below. Analysis of (a) and (c) above will be taken up in next chapter as part of analysis on quality and relevance of collegiate education in the State
3.4.1.3. Factors which influence the demand for collegiate education: An empirical examination of select factors
3.4.I.3.I. Vocational education and demand for collegiate education
Vocational education is of two types in the State. First, vocational education as a part of non-higher education which is jointly sponsored by the Central and State governments. Second, vocational education as a part of collegiate education, which is sponsored by the UGC.
Vocational education as a part of non-higher education is organised and administered by the Directorate of Vocational Education, established in 1977. The Directorate maintains, among others, district-wise distribution of number of courses and number of colleges during 2000-01; number of students approved/ admitted at the State level from 1994-95 to 2000-01; and number of students appeared at the State level from 1994-95 to 2000-01.
Five major sectors have been identified for vocational education in the State. These sectors are (1) agricultural related courses (e.g. agricultural economics and farm management, agricultural chemicals, co-operation, dairying, fisheries, horticulture etc), (2) commerce and business courses (e.g. accountancy and auditing, accountancy and costing, accountancy and taxation, banking etc), (3) technical related courses (e.g. automobile servicing, civil construction technology, clock and watch repairs etc), (4) home science and para-medical courses (e.g. pre-school education and health and beauty care), and (5) job-linked courses in polytechnic and engineering colleges (e.g. automobile servicing, garment making and embroidery, office automation etc).
80
From the available information with the Directorate, the following features of vocational education may be noted. First the minimum qualification for admission to vocational courses is secondary' school leaving certificate, or a fail in II PUC examination. However, if a student has passed the languages in II PUC examination, he/she is given exemption of study in language subjects in vocational education courses. Second, at present, 1055 courses are conducted under vocational education in the 642 Pre-university colleges in the State. In each district, the Deputy' Director of Pre-university Education looks alter the supervision of these vocational courses. The Directorate conducts the common examination for the second and fourth semesters of the courses and awards the certificates of course completion. Successfully completed candidates undergo one year apprenticeship training in their certified courses.
The total number of approved admission of students (i.e. boys and girls) to the I year has declined during 1990’s. For instance, the total approved admissions have declined from 33250 students during 1994-95 to 31924 students during 1997-98 and to 23054 students during 1999-00. However, the total number of approved admission of students (i.e. boys and girls) to the II year has increased from 22621 students during 1994-95 to 24690 students during 1997-98 and to 19246 students during 1999-00, These numbers have two implications. First, they clearly indicate the decline in the number of admissions approved. Second, the difference between the approved admission in I and II year clearly show the dropout of students. The rate of dropout (i.e. ratio of number of students admitted in II year as a percent of number of students approved admission in the I year during the previous year) was 18.08 percent during 1995-96, 49.30 percent during 1999-00. In view of this, the presumption that increasing enrolment in vocational courses, before pre-university education, as a reason for declining demand for collegiate education cannot be empirically confirmed.
On the other hand, vocational education in collegiate education is related to the introduction of vocational subjects in general degree colleges. For instance, the University Grants Commission provides financial assistance (to the tune of about Rs.9 lakh to Rs.l7 lakh per subject) in general degree colleges, which possess requisite physical infrastructure and capability for introduction of vocational subjects, identified by the UGC itself These vocational subjects include Industrial Microbiology, Industrial Chemistr>', Foreign Trade and Practice. During 1998-99, about 7 degree colleges in Gulbarga University have benefited from this scheme of the UGC.
81
Unfortunately, enrolment of students to these subjects is not separated since they are a part of the existing B.Sc. or B.Com. courses. Thus, changing enrolment to vocational subjects as a reason for declining demand for traditional subjects may not be ascertained on empirical grounds.
3.4.1.3.2. Professional education and demand for collegiate education
Professional higher education in Karnataka comprises technical education, medical education and agricultural education. However, in what follows, the relationship between enrolment in technical education and demand for collegiate education (i.e. for science education, since admission to the professional courses requires students with science background) is focused at the State level (since admission to and allocation of students to engineering courses are centralised at the State level, except for seats under management quota).
Technical education comprises degree education (i.e. offered by engineering colleges) and diploma education (i.e. offered by the polytechnic colleges). The total number of engineering colleges (i.e. Government, private aided and unaided colleges) has increased from 51 in 1990-91, 53 in 1994-95, 70 in 1997-98 and to 82 in 2000-01. And, total intake of students in engineering colleges has increased from 16536 students during 1990-91, 19331 students during 1994-95, 24384 students during 1998-99 and to 29779 students during 2000-01.
In the same way, the number of polytechnics (i.e. Government, private aided and unaided polytechnics) has increased from 163 during 1990-91 to 173 during 1995-96 and to 196 during 1997-98. And, total in-take of students in polytechnic colleges has increased from 22652 students during1990-91 to 28455 students during 1994-95, 32568 students during 1998-99 and to 35458 student during 2000-01.
Thus, there has been an increase in in-take of students in technical education in the State. If this intake is added to the growing intake of students in other types of professional education, the resultant total intake of students in professional education does offer an immediate support for the decline in demand B.Sc. degree education in colleges due to increase in intake in professional education during 1990’s in the State.
82
3.4.1.3.3. Pass percent in PUC courses and demand for collegiate education
The Directorate of Pre-university Education maintains, among others, examination data (electronically processed but unpublished) on II PUC examination by districts from 1991 to 2000. The data are related to April (for fresh and repeat students) and October (for repeat students) examination. In addition, available information is related to number of students (boys/girls and SC/ST and backward groups) appeared for the examinations; number of student (boys/ girls and SC/ST and backward groups) who have passed the examination; pass percent of students (boys/girls and SC/ST and backward groups), all by languages opted by the students and by arts, science and commerce subjects.
In order to test the presumption that the observed decline in demand for collegiate education by courses is contributed by a decline in pass percent in PUC by courses, first of all, data on total pass percent of students in arts, science and commerce subjects from 1991 to 2000 were collected. Total pass percent includes pass percent of fresh and repeat students in April examination of the respective years.
Table 3.29 presents the total pass percent of students in Arts subjects. The total pass percent in the State as a whole has increased from 31.6 percent in 1991 to 40.94 percent in 1995 but has declined to 28.76 in 1998 or to 36.16 percent in 2000. The number of districts below the total pass percent of students at the State level has declined from 11 districts in 1991 to 14 districts in 1995 and remained at 8 districts in 1999.
Table 3.30 presents the total pass percent of students in science subjects. The total pass percent in the State as a whole has increased from 37.73 percent in 1991 to 43.21 percent in 1995 and to 53.13 in 1999, but has declined to 43.2 percent in 2000. The number of districts below the total pass percent of students at the State level has remained around 12 districts during these years.
Table 3.31 presents the total pass percent of students in commerce subjects. The total pass percent in the State as a whole has increased from 43.03 percent in 1991 to 53.98 percent in 1995 and to 62.02 in 1999, but has declined to 58.10 percent in 2000. The number of districts below the total
83
pass percent of students at the State level has fluctuated from 14 districts in 1994 to 15 districts in 1995 and 11 districts in 1999.
Most importantly, since 1996, total pass percent of students has been fluctuating in arts, science and commerce courses, both at the State level and at the individual district level. Given this fact, it is not possible to directly associate changes in total pass percent in PUC courses with the decline in enrolment to all traditional courses in GCs, PACs and PUACs in section 3.3.
It should be mentioned that a direct comparison of total pass percent in PUC courses and enrolment in degree courses suffers fit>m two major drawbacks.
First, pass percent in PUC courses is an aimual data, where the enrolment in degree courses is the sum of three annual data (i.e. sum of enrolment in I, II and III year). In view of this limitation, pass percent in PUC courses may be more appropriate to understand the demand for admission to degree courses in the respective years rather than a determinant of changing demand for enrolment of students in degree courses. Second, admission to arts courses in degree colleges is open to students who pass in arts, science and commerce subjects in PUC. This is in contrast with admission to science courses in degree ’colleges which is open to student who passes in science subject in PUC. Thus, demand for admission to arts courses in degree colleges may be underestimated if only the pass percent of students in PUC arts subjects is taken into account. This is clearly evident in Table 3.32, where the number of students passing the PUC is related to the number of admissions to, or enrolment in, I year degree by courses in GCs, PACs and PUACs by districts during 1999-00. The ratio of admission I year degree courses to PUC pass clearly indicates that, except for Chickmagalur districts under Kuvempu University and all districts under Mangalore University, the ratio is more than 1 in all other districts for arts and commerce courses. And, in case of science subjects, the ratio is less than 1 for all districts. However, this analysis ignores the mobility of students who pass PUC in one district and get admitted in a degree course in another district within the State.
It is interesting to analyse the insights from sample survey data on the patterns of admission of students in colleges here. Table 3.33 presents admission data of students to I year degree course by male/female, SC/ST, courses and by colleges under different management for three years, viz..
84
1991-92, 1994-95 and 1999-00. In general, admission to courses shows an increase from 1991-92 to 1994-95, but a decline from 1994-95 to 1999-00. The patterns and characteristics of this decline are highlighted below.
First, total admission to B.A. and B.Sc. courses in all colleges has declined from 1994-95 to 1999-00, except in case of female students in all non-GCs and female SC/ST students in PUACs. However, in case of non- traditional courses, admission has increased over the years along with admission to B.Com. courses. This result ofYers supporting evidence for the declining enrolment, especially in B.Sc. courses, as observed from secondary data in Chapter 3, and underlines that the decline in enrolment is due to decline in the admission itself.
Second, of all the courses, B.A. degree course attracts the largest number of admission of all male and female students as well as all SC/ST male and female students in all colleges and in all years. Other than B.A. course, B.Com. course attracts the largest admission of students and is followed by B.Sc. and other courses.
Third, in all the colleges, admission of total male students is higher than the admission of total female students, except in case of B.Com. course in PUACs. This pattern is relevant for SC/ST students as well except during1991-92.
Fourth, of all the courses, admission of SC/ST students among the total male and female students is higher in B.A. than in non-B.A. courses in all the years. Thus, a decline in enrolment in B.A., as a consequence of decline in admission, has important implications for SC/ST students in collegiate education in the State.
Fifth, in case of B.Sc. course, the decline is evident for all students in GCs, for all students except non-SC/ST male students in FACs and for only non-SC/ST male students in PUACs.
The above insights from the sample survey data clearly indicate that the decline in enrolment in colleges is different not only in different courses, but also between male and female students, and between SC/ST and non-SC/ST male and female students, in different years. This implies that a policy to deal with the problem of declining enrolment in degree colleges needs to be specific towards particular group of students by courses.
85

Data on employment and unemployment are collected, organised and presented by the Directorate of Employment and Training of the Government of Karnataka. These data include employment in the organised public and private sectors, and in primary, secondary and tertiary sectors, district-wise number of vacancies notified and placements made, district- wise registrants on the live registers of employment exchanges by post graduates, graduates diploma holder etc. These data are reproduced in the annual, pre-budget Economic Survey of the Government of Karnataka, and in the recently started Manpower Profile Karnataka by the Manpower and Employment Division of the Department of Planning of the Government of Karnataka. Unfortunately, none of the data on employment and unemployment in these documents are presented by college graduates in arts, science and commerce.
Thus, the Directorate of Employment and Training was approached to get the required data on employment and unemployment of college graduate by arts, science and commerce courses, if available in the maintained records. And, the Directorate was helpful in getting the required data on unemployment by districts from 1990-91 to 1999-00, as the required data on employment was not available.
Table 3.34 summarises the State level trends in total number of registered job .seekers, and the number of registered job seekers by art.s, science and commerce degrees in the State, from 1990-91 to 1999-00. All these data refer to live registrations. That is, all registrants are required to renew the registration once in 3 years. If a registrant fails to renew his/1ier registration, his/her name is automatically deleted. Thus, live registrants include new job seekers who have registered during last three years and old registrants who have renewed their registrations.
Over the years, the size of total job seekers in the State has increased. This is evident in the positive annual growth (%) of total number of job seekers over the years. However, the annual growth has fluctuated from 8.73 percent during 1991-92 to 2.37 percent during 1996-97 and to 3.99 percent during 1999-00.
Of the total number of graduates, the share of arts graduates has been higher than the share of science or commerce graduates in all the years.
3.4 .13 .4 . Unemployment problem and demand for collegiate education
86
However, between science and commerce graduates, unemployment is observed to be higher among commerce gradates tlian among science graduates. During 1997-98, the annual growth of unemployment is negative for all the three types of graduates, and negative annual growth has continued during 1998-99 in case of science and commerce graduates.
On the whole, the share of all college graduates in the total job seekers in the State has been less than 4 percent throughout the 1990's. In addition, the share of unemployed arts, sciencc and commerce graduates in the total unemployed persons in the State has remained about 2.5 percent 1.2 percent and 1.5 percent respectively. Thus, the observed changes in unemployment of college graduates by courses may not help in offering a categorical evidence for the declining demand for collegiate education since 1997-98.
It is important to mention few important limitations of employment exchange data. First, all registration is voluntary. Second, all job recruitment does not need a registration with an employment exchange. Consequently, many graduates might not register with employment exchanges and, thereby, unemployment problem is underestimated.
Several important reasons may explain the increase in graduate unemployment in the State.
First, there has been a decline in the job opportunities in the organised sector, especially in the public sector. This is evident in the figures published by the Government of Karnataka (2000). For instance, employment in the organised public (private) sectors has changed in tiie 1990’s. During 1990- 91, the total employment in the organised sector was 14.47 lakh and the share of public sector employment was 70.29 percent. In the same way, during 1994-95 (1998-99), the total employment in the organised sector was15.78 (18.49) lakh with the share of public sector at 66.57 (59.06) percent. Historically, organised public sector (including government sector) has been the main user of general degree graduates. Most recently, efforts towards down-sizing the State Government and public sector undertakings by abolishing various posts in general administration has lead to further reduction in organised public sector jobs in the State. Thus, with the decline in the public sector employment, the unemployment problem seems to have increased during the period.
87
Second, the employment requirements in private sector have changed in the 1990’s with emphasis on technical skills and knowledge (e.g. computer literacy). In the absence of these requirements to be met by the education system, the outturn of graduates has remained largely unabsorbed in the changing labour markets. Thus, at the bottom, much of the problems may be associated with the relevance of our general education system.
3.4.1.3.5. Demographic factors
Changes in college-going age distribution (e.g. 19-24 years) between years is an important demographic indicator of changing admission/enrolment in colleges. This can be judged by determining whether or not the growth of colleges is higher than the student population. Unfortunately, age distribution of population is available only from decinial population census. The latest data is available for 1991 census, as the age- distribution tables for 2001 census are not yet published. Thus, for lack of data, the role of demographic factors is left unexplored in this report.
3 4.1.3.6. Rise in demand for non-traditional courses within collegiate education
In the 1990's, the non-traditional courses in collegiate education in the State have been introduced. These non-traditional courses are called professional courses, such as, BBM, BHM and BCA. In addition, various vocational subjects have been introduced, as part of UGC-sponsored programme on vocationalisation of degree education. These subjects include, for instance, industrial chemistry, computer science, seed technology, and geo-exploration and drilling technology. In fact, these subjects are introduced as one of the optional subjects, along with traditional subjects (e.g. Physics, Chemistr>' and Industrial Chemistry) under the B.Sc. course. It is for this reason, admission to and enrolment in vocational subjects are reported under the B.Sc. course in the colleges. Thus, in general, non-traditional courses within collegiate education are represented by proiessional courses (e.g. BBM, BUM and BCA) but not by vocational subjects.
To ascertain the changing patterns of enrolment in traditional and non- traditional courses, all the 6 State universities (i.e. Registrar or Director of College Development Council) were requested to provide information in a prescribed format from 1995-96 through 1999-00. The University of
88
Mysore responded with complete details. The Mangalore University sent the Ibrniat to all its affiliated colleges to send the information directly to us. However, only 3 colleges responded, viz., Vivekananda College at Puttur, Government First Grade College at Byndoor and Vijaya College at Mulki. Of these 3 colleges, Vivekananda College reported enrolment in non- traditional courses. Thus, the following analysis is limited only to the data obtained from the University' of Mysore.
Of the total enrolment of students in affiliated colleges in the University of Mysore during 1995-96 (1999-00), 1.24 (1.29) percent of students were enrolled in non-traditional courses in GCs, 5.74 (7.08) percent in PACs, 3.88 (15.28) percent in PUACs and 0.80 (6.64) percent in UCs. Thus, except in GCs, enrolment in non-traditional have increased between the years. The highest enrolment in non-traditional courses during 1999-00 is evident for PUACs and is followed by PACs and UCs.
Thus, there exists an empirical evidence for a decline in enrolment in traditional courses as a consequence of a rise in enrolment in non-traditional courses within the collegiate education in the State.
3.5. Probable impact of declining demand for collegiate education
The impact of declining demand for collegiate education may have several implications, both at present (short run) and in future (long run). These impacts may include short-term impact and long term impact.
The short-term impact is the decline in the number of students per college or per course. This raises a fundamental question on the viability of a college or course in terms of a desired number of students, or a minimum number of students to sustain a college or course, given the investment already made in the college/course. For instance, of late, the State Government is considering setting 40 students as a minimum enrolment in an aided course for that course to exist or continue in a PACs. Thus, an analysis of number of students per colleges by courses is essential.
In Table 3.35, districts-wise give total enrolment of students by B.A., B.Sc., and B.Com. course per GCs, PACs and PUACs during 1999-00. It is clearly evident that all courses in both PACs and PUACs, and B.A. course in GCs, have more than 40 enrolled students per college. However, in case of both B.Sc. and B.Com. courses in GCs, there exist many districts in which
89
total enrolment per college in less than 40. These districts include Dharwad, Raichur and Bidar in B.Sc. course, and Mandya, Hassan, Dharwad, Belgaum, Gulbarga, Raichur and Bidar in B.Com. course. However, if college-wise enrolment per courses in these districts is done, a more insightful evidence may be found on the nature and number of colleges and courses for which enrolments have declined below 40 students within the districts.
The long-term impact includes the following, (i) Decline in the demand for post-graduate general education in the universities, and its attendant impact on the reduction in the supply of post-graduates for teaching jobs and research in universities and colleges, (ii) Decline in the supply of graduates for general regional and national economic development, (iii) Adverse impact on the existing number and future quantitative expansion of collegiate education, (iv) Adverse impact on studies and research in humanities and social sciences and, hence, on societal and cultural studies in future.
A systematic analysis of the above long impact of declining demand for collegiate education requires a detailed examination of the interrelationships between collegiate education, university education and economic and non-economic objectives of socio-economic objectives of regional and national economic development. This is an area of future policy research in Karnataka's collegiate education.
CHAPTER 4
Quality and Relevance of Collegiate Education
The main objective of this chapter is to analyse the quality and relevance of collegiate education in the State, using select indicators. The analysis shall be based on both secondary and primary data. Primary data will be drawn from colleges, principals and students in sample colleges of this study. Secondary data is useful for inter-university, inter-district and State level macro analysis. Primary data analysis has the advantages of providing micro insights into quality and relevance issues from the viewpoint of colleges, students and principals.
4.1. Quality of collegiate education
Quality of collegiate education may be related to the quality of three agents within the colleges. First, quality of students who are admitted or enrolled in courses. Second, quality of teaching and non-teaching staff who are appointed and work in the colleges. Third, quality of physical infrastructure which are conducive for curricular and extra-curricular development of students in the colleges. In the context of this study, however, quality of these three agents is considered to be inter-related for overall improvement of collegiate education. Thus, indicators of quality are not listed by agents separately.
Three important frameworks for determining the quality and relevance of collegiate education may be mentioned. First, statutes of State universities relating to grant of fresh afiSliation or renewal (continuation) of temporary affiliation to colleges and institutions, and withdrawal of such affiliation/permission for bifiircation/shifting of the location of the affiliated colleges and institutions. Second, manual for self-study for affiliated/constituent colleges, or methodology of assessment and accreditation by the National Assessment and Accreditation Council (NAAC). Third, a report of the ’’Seminar on Assessment of Quality in Higher Education: Parameters and Indicators” at NIEPA (2000). These frameworks provide with a comprehensive set of parameters and variables for assessment of quality and/relevance in higher education. However, the choice of the indicators below is mainly governed by their measurability, using the available secondary data and primary data collected for this report.
91
4.1.1. Indicators of quality
The quality of students in a college may be related to the quality of students admitted by courses (e.g. students with high percent of marks in the qualifying examination with high motivation and commitment to studies) and to the quality of students turned out o^ or graduated from, the colleges. Note that within the graduated students, there exists heterogeneity in terms of passing the degree examination with a I Class or II Class or III Class. Although class distinctions are not essentia] to obtain a degree. Heterogeneity in pass percentage of students in terms of I Class, II Class and Pass Class is important to understand the distribution of quality of student performance in the final year examinations.
It should be emphasised that pass percent of student in a course/college may be influenced by various factors, such as, retention rate (or low dropout rate) of good students, number and quality of teaching and non-teaching stafC and infrastructure fiicilities. Thus, a college with high retention rate (or low dropout rate) may be presumed, other things being equal, to have high pass percent of its students. Thus, the following broad indicators are used to measure tiie quality of collegiate education in the State.
(i) Pass percent of students
The pass percent of student in a course during a year is computed by taking total number of students passing the final year examination as a percentage of total number of student who appeared for the final year examination in the same course during a year. Since the number of student who have passed the examination is less than or equal to the number of student who have appeared for the examination, the pass percent is less than or equal to 100.
(ii) Retention rate of students
The retention rate is defined as the number of students enrolled in the final year of a course as a percentage of total number of students admitted/enrolled when they were in the first year of the course. Thus, for instance, retention rate in B.A. course in a college during 1995-96 is equal to: [(total number of final year students in B.A. course during 1995-96) divided by (total number of first year students in B.A. course during 1993- 94)]*100.
92
(iii) Quality of teaching and non-teaching staff
Quality of teaching and non-teaching staff may be indicated by the availability and growth of the number of highly qualified (i.e. persons beyond the minimum qualification), experienced, trained, committed, dedicated teaching stafC ^ student-teacher ratio in colleges. In the same way, fair representation for SC/ST staff is an indication for the colleges to comply with the Government rules regarding reservation and roaster system in staff recruitment. In addition, absence of any vacant position may indicate that the recruitment of staff is complete in relation to the sanctioned posts and in relation to the student strength in the colleges.
(iv) Infrastructure facilities
Availability of adequate water for drinking and non-drinking purposes, electricity, sanitation, library, laboratory, building, class room, playground and sport materials, transport facilities to reach the colleges, class room furniture and teaching materials (including text books) eto are important infrastructure facilities in the colleges. These ^cilities do contribute to the functioning and quality of students, teaching staff and non-teaching staff in colleges. Further, they have important implications for e?q)laining the differences in private cost of education for students between colleges. Thus, the role of infi^tructure facilities is essential to the study of quality and relevance of collegiate education.
4.2. Analysis of indictors of quality of collegiate education
Based on secondary and primary data, various indicators of quality and relevance are described below by courses, male/female students, SC/ST students, universities and districts.
4.2.1. Pass percent of students
As noted in Chapter 1, secondary data on pass percent of students are available only for GCs and PACs in the State. Using this data, an attempt is made below to describe the broad trends in pass percent of students in CjC s and PACs by courses. The entire data is related to pass percent of fresh student in April examination of the respective years. No attempt is made to analyse the data at the district level, although the district level data is presented for the sake of highlighting the kind of pass percent data that one
93
may generate from the available incomplete records of the Directorate of Collegiate Education.
The gaps in secondary data above are filled in by primary data in two ways. First, in analysing the pass percent of students in GCs, PACs, PUACs and UCs by courses, male/female students, SC/ST male/female students and by universities. Second, in analysing the distribution of pass percent of students by I Class, II Class and Pass Class by courses, male/female students, SC/ST male/female students and by universities.
4.2.1.1. Pass percent of students in Government colleges (secondary data)
Pass percent of all students and SC/ST students in GCs by districts is presented below for final year B.A., B.Sc. and B.Com. students in Table 4.1 through Table 4.3 respectively.
First of all, changes in pass percent of students (total or SC/ST) do not show any consistent trend in any of the three courses. For instance, in final year B.A. the highest pass percent for total (SC/ST) student is observed during 1999 (1999) at 45.37 (3525) percent and the lowest is observed during 1994 (1991) at 36.32 (25.57) percent. In final year B.Sc. the highest pass percent for total (SC/ST) student is observed during 1999 (1999) at 42.62 (28.85) percent and the lowest is observed during 1992 (1991) at 21.02 (14.17) percent. In final year B.Com. the highest pass percent for total (SC/ST) student is observed during 1999 (1998) at 35.68 (22.67) percent and the lowest is observed during 1991 (1992) at 20.17 (1026) percent.
Second, in all the courses and for all the years, the pass perccnt of total students has been higher than the pass percent of SC/ST students. Thus, total pass percent of students would exaggerate the pass percent of SC/ST students in all courses.
Third, pass percent of students including SC/ST student is relatively high in final year B.A. than in final year B.Sc. or B.Com. However, pass percent of students is relatively low in final B.Com. than in other courses.
94
4.2.12. Pass percent of students in private aided colleges (secondary data)
Pass percent of all students and SC/ST students in PACs by districts is presented for final year B.A. B.Sc. and B.Com. students in Table 4.4 through Table 4.6 re^>ectively.
First, as in the case of GCs, changes in pass percent of students (total or SC/ST) do not show any consistent trend in any of the three courses. For instance, in final year B.A. the highest pass percent for total (SC/ST) student is observed during 1998 (1998) at 78.04 (65.52) percent and the lowest is observed during 1992 (19%) at 34.06 (25.34) percent. In final year B.Sc. the highest pass percent for total (SC/ST) student is observed during 1998 (1998) at 53.85 (40) percent and the lowest is observed during 1993 (1991) at 45 (20.75) percent. In final year B.Com. the highest pass percent for total (SC/ST) student is observed during 1999 (1995) at 56.75 (8720) percent and the lowest is observed during 1998 (1998) at 4020 (1429) percent.
Second, in all the courses and for all the years, the pass percent of total students has been higher tiian the pass percent of SC/ST students, except during 1995 for final year B.Com. students. Thus, total pass percent of students would exaggerate the pass percent of SC/ST students in all courses.
Third, unlike in GCs, the pass percent of students including SC/ST student in PACs is not consistently higher or lower between courses in all the years. For instance, pass percent in final year B.A. (B.Sc.) was higher than in final year B.Sc. (B.A) in 1993 (1992).
Fourth, as compared to GCs, pass percent in PACs is higher in all the courses and for most of the years during 1990’s. This suggests that the quantity of outturri of graduates in private aided colleges is relatively higher than in GCs.
4.2.1.3. Pass percent and distribution of pass percent of students (primary data)
Table 4.7 through Table 4.9 presents the pass percent and distribution of pass percent of final year sample students in B.A., B.Sc. and B.Com. degree course during 1991-92, 1994-95 and 1999-00 for respectively.
95
4.2.1.3.1. Pass percent and distribution of pass percent of students in B.A. course
In Table 4.7, distribution of number of passes and total pass percent of students in B.A. is presented. During 1991-92, total p ^ s percent of students was highest in GCs as compared to PACs and PUACs. The total pass percent of female students was higher than total pass percent of male students in all colleges except in the GCs. Further, of the total number of passes, the proportion of number of SC/ST and non-SC/ST male students with a Pass Class was higher than female students in all the colleges.
Total pass percent shows wide fluctuations from 1991-92 through 1999- 00. However, as compared to 1994-95, total pass percent shows marked improvement in all colleges, except for female students in GCs, during 1999-00. In the same way, the number of pass class students has come down in all colleges with an appreciable increase in I Class students during 1999-00.
4.2.1.3.2. Pass percent and distribution of pass percent of students in B.Sc. course
In Table 4.8, pass percent and distribution of pass percent of students in B.Sc. is presented.
The UCs and PUACs have not reported data for tiie year 1991-92 and, hence, the analysis is restricted below only for GCs and PACs. First, total pass percent of students was highest in GCs as compared to PACs, except for female SC/ST students. Second, unlike in B.A. course, the number of I Class and II Class students are relatively higher in all category of students. Most surprisingly, unUke in PACs, total pass percent of SC/ST students is higher than non SC/ST students in GCs. And, total pass percent of female students is higher than male students.
Total pass percent shows wide fluctuations from 1991-92 through 1999- 00. For instance, during 1999-00, the following patterns are evident. First, the highest total pass percent for male (or SC/ST male) students are evident in PACs (or GCs). Second, the highest total pass percent for SC/ST and non-SC/ST female students is evident in GCs. Third, the proportion of students who pass with a Pass (or First) Class is highest among SC/ST male (or non-SC/ST female) students in PUACs (UCs). Fourth, total pass percent
96
of students shows improvements among all students in all colleges except in case of all female students and SC/ST male students in OCs.
4.2.1.33. Pass percent and distribution of pass percent of students in B.Com. course
In Table 4.9, distribution of number of passes and total pass percent of students in B.Com. course is presented. During 1991-92, of the colleges, total pass percent of students was highest for SC/ST female students and non-SC/ST male students in PUACs. The total pass percent of female students was higher than total pass percent of male students in GCs. Further, of the total number of passes, the proportion of students passing with a Pass Class was relatively higher in GCs and PACs than in PUACs.
Total pass percent s^ows wide fluctuations from 1991-92 through 1999- 00. However, as compared to 1994-95, total pass percent shows marked improvement in ail colleges, except for SC/ST female students in GCs and UCs and for SC/ST male students in PUACs during 1999-00. In the same way, the number of I class students has increased in all colleges during 1999-00.
4.2.2. Retention rate of students
District-wise retention rates are presented below for male and female students in GCs, PACs and PUACs by B.A., B.Sc. and B.Com. courses. For comparability of rates between colleges and courses, retention rates are computed from 1996-97 through 1999-00. In all the tables below, retention rates exceeding 100 percent is equated to 100 percent. A zero retention rate indicates the non-applicability of the rate as the course does not exist in the districts or data are not reported to the Department of Collegiate Education.
4.2.2.1. Retention rate of students in Government colleges
4.2.2.1.1. Retention rate of students in B.A. course
Table 4.10 presents the district-wise retention rate of male, female and total students in B.A. course in GCs.
First, the retention rates at the State level show an increase from 1997-98 to 1999-00. However, there exists annual variation in the rate between the
97
years. For instance, the retention rate was 45.94 (56.34) pcrcent and 43.47(54.47) percent for male (female) student during 1996-97 and 1997-98 respectively. Interestingly, in all the years, the retention rate for female students has been higher than the male students.
Second, the retention rate at the district level shows wide inter-district variations within and between years. For instance, the districts, such as, Bidar, Chitradurga, Chikmagalur and Hassan show relatively low retention rates as compared to other districts. In additi<Hi, female retention rate has been higher than male retention rate in all the districts and for all the years.
4.2.2.1.2. Retention rate of students in B.Sc. course
Table 4.11 presents the district-wise retention rate of male, female and total students in B.Sc. course in GCs.
First, the retention rales at tiae State level show a decline from 19%-97 to 1999-00. However, there exists annual variation in the rate between the years. For instance, the retention rate was 51.72 (69.79) percent and 48.22(62.40) percent for male (female) student during 1996-97 and 1997-98 respectively. Interestingly, in all the years, the retention rate for female students has been higher than the male students.
Second, the retention rate at the district level shows wide inter-district variations within and between years. For instance, the districts, such as, Bidar, Hassan and Gulbarga show relatively low retention rates as compared to other districts. In addition, female retention rate has been higher than male retention rate in all the districts and for all the years.
4.2.2.1.3. Retention rate of students in B.Com. coursec
Table 4.12 presents the district-wise retention rate of male, female and total students in B.Com. course in GCs.
First, the retention rates at the State level show an increase from 1996-97 to 1999-00, except during 1998-99. However, there exists annual variation in the rate between the years. For instance, the retention rate was 60.35 (80.20) percent and 56.05 (70.%) percent for male (female) student during 19%-97 and 1998-99 respectively. Interestingly, in all the years, the retention rate for female students has been higher than the male students.
98
Second, the retention rate at the district level shows wide inter-district variations within and between years. For instance, the districts, such as, Bidar, Chitradurga, Bijapur, Mandya and Hassan show relatively low retention rates as compared to other districts. In addition, female retention rate has been higher than male retention rate in all the districts and for all the years.
As compared to the retention rates of B.A. and B.Sc., the retention rates are high in B.Com. for both male and female students. However, between B.A. and B.Sc., the retention rates are higher in B.Sc. than in B.A. course. This indicates that dropout of students in GCs is highest in case of B.A. course.
4.2.22. Retention rate of students in private aided colleges
4.2.2.2.I. Retention rate of students in B.A. course
Table 4.13 presents the district-wise retention rate of male, female and total students in B.A. coursc in PACs.
First, the retention rates at the State level show a marked fluctuations between years. For instajnce, the retention rate was 60.52 (76.98) percent and 58.48 (69.82) percent for male (female) student during 1996-97 and 1999-00 respectively. Interestingly, in all the years, the retention rate for female students has been higher than for the male students.
Second, the retention rate at the district level shows wide inter-district variations within and between years. For instance, the districts, such as, Chitradurga and Hassan shows relatively low retention rates as compared to other districts. In addition, female retention rate has been higher than male retention rate in all the districts and for all the years.
A2.222. Retention rate of students in B.Sc. course
Table 4.14 presents the district-wise retention rate of male, female and total students in B.Sc. coursc in PACs.
First, as in the case of retention rate for B.A. course, the retention rates in B.Sc. course at the State level show a marked fluctuations between years. For instance, the retention rate was 53.33 (60.70) percent and 65.77 (69.92)
99
percent for male (female) student during 1996-97 and 1999-00 respectively. Interestingly, in all the years, the retention rate for female students has been higher than for the male students.
Second, the retention rate at the district level shows wide inter-district variations within and between years. For instance, the districts, such as, Kodagu and Raichur show relatively low retention rates as compared to other districts. In addition, female retention rate has been higher than male retention rate in all the districts and for all the years.
4.2.22.3. Retention rate of students in B.Com. course
Table 4.15 presents the district-wise retention rate of male, female and total students in B.Com. course in PACs
First, as in the case of retention rate for B A and B.Sc. courses, the retention rates in B.Com. course at the State level show a marked fluctuations between years. For instance, the retention rate was 89.49 (95.58) percent and 78.77 (85.80) percent for male (female) student during1996-97 and 1999-00 respectively. Interestingly, in all the years, the retention rate for female students has been higher than for the male students.
Second, the retention rate at the district level shows wide inter-district variations within and between years. For instance, the districts, such as, Chitradurga and Bijapur show relatively low retention rates as compared to other districts. In addition, female retention rate has been higher than male retention rate in all the districts and for all the years.
As compared to the retention rates of B.A. and B.Sc., the retention rates are high in B.Com. for both male and female students. However, between B.A. and B.Sc., the retention rates are generally higher in B.Sc. than in B.A. course. This indicates that dropout of students in PACs is highest in case of B.A. course.
A comparison of retention rates between GCs and PACs show interesting differences. First, the retention rates are higher in PACs for both male and female students in all courses and for all years. Second, the retention rates are generally higher in PACs than in GCs for all districts. For instance, the retention rate for Bidar district is higher in all courses and years in PACs
100
than in GCs. Third, the nature of districts with low retention rates differs between GCs and PACs by courses.
4.2.23. Retention rate of students in private unaided colleges
4.2.2.3.I. Retention rate of students in B.A. course
Table 4.16 presents the district-wise retention rate of male, female knd total students in B.A. course in PUACs.
First, the retention rates at the State level show a marked fluctuations between years. For instance, the retention rate was 49.14 (62.18) percent and 50.52 (80.23) percent for male (female) student during 1996-97 and 1999-00 respectively. Interestingly, in all the years, the retention rate for female students has been higher than for the male students.
Second, the retention rate at the district level shows wide inter-district variations within and between years. For instance, the districts, such as, Mysore, Banglore Rural and Bidar show relatively low retention rates as compared to other districts during 1996-97. In addition, female retention rate has been higher than male retention rate in all the districts and for all the years.
4.2.2.32. Retention rate of students in B.Sc. course
Table 4.17 presents the district-wise retention rate of male, female and total students in B.Sc. course in PUACs.
First, as in the case of retention rate for B.A. course, the retention rates in B.Sc. course at the State level show a marked fluctuations between years. For instance, the retention rate was 38.69 (79.90) percent and 100 (100) percent for male (female) student during 1996-97 and 1999-00 respectively. Interestingly, in all the years, the retention rate for female students has been higher than or equal to the male students.
Second, the retention rate at the district level shows wide inter-district variations within and between years. For instance, the districts, such as, Chitradurga, Dharwar, Bijapur show relatively low retention rates as compared to other districts. In addition, female retention rate has been higher than male retention rate in all the distncts and for all the years.
101
4.2.233. Retention rate of students ip B.Com. coursc
Table 4.18 presents the district-wise retention rate of male, female and total students in B.Com. course in PUACs
First, as in the case of retention rate for B.A. and B.Sc. courses, the retention rates in B.Com. course at the State level show a marked fluctuations between years. For instance, the detention rate was 69.89 (75.87) percent and 100 (100) percent for male (female) student during1996-97 and 1999-00 respectively. Interestingly, in all the years, the retention rate for female students has been higher than or equal to the male students.
Second, the retention rate at Ae district level shows wide inter-district variations within and between years. For instance, the districts, such as, Gulbarga, Hassan and Belgaum show relatively low retention rate as compared to other districts. In addition, female retention rate has been higher than male retention rate in all the districts and for all the years.
As compared to the retention rates of B.A. and B.Sc., the retention rates in PUACs are higher in B.Com. for both male and female students. However, between B.A. and B.Sc., the retention rates are generally higher in B.Sc. than in B.A. course. This indicates that dropout of students in PUACs is highest in case of B.A. course.
A comparison of retention rates between GCs, PACs and PUACs, show interesting differences. First, the nature of retention rates is comparable between GCs and PUACs than between PACs and PUACs. Second, the retention rates are generally higher in PACs than in GCs and PUACs for both male and female students and in all districts.
4.2.2.4. Retention rate of students in sample colleges
Table 4.19 presents the retention rates in sample colleges by courses, male/female students and male/female SC/ST students during 1991-92,1994-95 and 1999-00.
Since primary data in this study is not collected on annual basis, the methodology of computing the retention rate needs to be changed, as compared to the methodology of computing the retention rate, using the
102
secondary data, given under section 4.1.1. (ii) above. That is, the retention rate is defined as the number of students enrolled in the final year of a course as a percentage of total number of student’s admitted/enrolled in the first year of the course during the same year. Thus, for instance, retention rate in B.A. course in a college during 1995-96 is equal to: [(total number of final year students in B.A. course during 1995-96) divided by (total number of first year students in B.A. course during 1995-96)]’*'100. Consequently, the retention rate cannot be constrained to be strictly less then 100 percent. In view of this difference in methodology in computing the retention rates between primary and secondary data, the results of retention rates based on primary and secondary data are not directly comparable. Nevertheless, some insights fi-om the primary data analysis are given below.
First, in case of GCs, the retention rates are higher for male and female SC/ST students than for non-SC7ST students, except in B.Com. course. Over the years, the total retention rates have fluctuated. As predicted, the retention rates are more then 100 percent. For instance, the retention rate for female students was 241.33 percent in B.Sc. course and 241.77 percent for B.Com. students during 1999-00.
Second, in case of PACs, the retention rates are higher for female students than for male students, except in B.Com. course. Further, retention rates are equal or higher for non-SC/ST male and female students than for SC/ST students, except in B.A., and B.Com. courses during 1999-00. Over the years, the retention rates have fluctuated, but have declined from 1994-95 to 1999-00 in B.Sc. and B.Com. courses.
Third, in case of PUACs, the total retention rates are higher for female students than for male students in all years except during 1999-00. Further, retention rates are higher for non-SC/ST fem^e students than for SC/ST male students in all the years. Over the years, the total retention rates have fluctuated, but have declined fi*om 1994-95 to 1999-00 except for female students. Of the courses, the retention rates have declined in all courses except in B.Sc. course.
Fourth, in case of UCs, the patterns of retention of students are mixed between years. For instance, between 1994-95 and 1999-00, total retention rates have declined except in case of non-SC/ST male students. And, of the courses, retention rate has declined in B.Sc. and B.Com. courses.
103
An important implication of the analysis of retention rates by courses and by colleges is that it provides a supporting evidence for decline in enrolment in traditional courses, especially in B.Sc. courses. Given the results in Chapter 3 of this report in regard to decline in admission to traditional courses, it is plausible e?q)lain the decline in enrolment in collegiate as a combination of decline in admission and retention of students in traditional courses.
4.2.3. Growth and distribution of teaching staff
The number, distribution and annual growth of teaching staff by universities and districts for GCs and PACs are presented below from 1990- 91 through 1999-00. In addition, the number and distribution of SC/ST staff is separately given.
4.2.3.1. Growth and distribution of teaching staff in Government colleges
Table 4.20 presents the growth and distribution of teaching staff in GCs with special to SC/ST staff.
The total number of teaching staff in the State has increased from 1812 persons during 1990-91 to 2213 persons during 1995-96 and to 2501 persons during 1999-00. However, the increase in total staff* is not consistent over the years. This is evident in the fluctuations in the annual growth of total teaching stafl which was 27.48 percent during 1991-92, -4.13 percent during 1993-94, 1.98 percent during 1995-96 and 0.00 percent during 1999- 00.
Of the universities in the State, the share of Bangalore University has been the highest over the years. Tliis is followed by University of Mysore, Kuvempu University, Gulbarga University, Kamatak University and Mangalore University. For instance, the share of Bangalore (Mangalore) University in the total teaching staff in the State was 44.81 (4.14) percent during 1990-91, 42.79 (2.58) percent during 1995-96 and 39.66 (4.28) percent during 1999-00. In the same way, the annual growth of teaching staff in the universities differs both within and between years. For instance, the annual growth of Bangalore (Mangalore) university was 21.92 (68.00) percent during 1991-92, 3.84 (-8.06) percent during 1995-96 and 323 (9.18) during 1999-00.
104
Of the districts in the Slate, tlie share of Bangalore Urban, Tumkur, Kolar, Mysore and Chitradurga has been relatively higher than other districts. For instance, the combined share of these 5 districts in the State’s total was 64.85 percent during 1990-92, 58.93 percent during 1995-96 and 56.16 percent during 1999-00. It is important to emphasise that, of these 5 districts, three districts are located within the Bangalore University.
The growth and distribution of teaching staff who belong to SC/ST show interesting patterns over the years. First, the share of SC/ST staff in the total teaching staff of the State has varied between the years. It was 9.94 percent during 1990-91, 15.09 percent during 1995-96 and 13.31 percent during 1999-00. Second, of the universities in the State, the share of SC/ST staff in the State's total has been higher (lower) in Bangalore (Mangalore) University. For instance, the share of these universities was 53.80 (2.92) percent during 1990-91, 44.01 (2.10) percent during 1995-96 and 36.64(2.70) percent during 1999-00. Third, the share of SC/ST within the total staff of the Bangalore (Mangalore) university was 11.33 (6.67) percent during 1990-91, 15.52 (12.28) percent during 1995-96 and 12.30 (8.41) percent during 1999-00. However, the SC/ST staff in the total teaching staff within the district shows a higher share in districts, such as, Kolar, Kodagu, Raichur and Utter Kannada.
On the whole, two trends are striking in case of GCs. First, the annual growth had both negative and positive rates between 1990-91 and 1994-95, but has been positive for years since 1995-96, except during 1998-99. Second, the annual growth of SC/ST teaching staff has remained around 15 percent since 1995-96. And, during 1999-00, the growth of teaching staff is zero.
The summary statistics for district-wise distribution of all and SC/ST teaching staff in GCs are given in Table 4.21. Although the mean values and value of standard deviation are higher for total teaching staff than for SC/ST teaching staff for all the years, the relative variations have been higher for SC/ST teaching staff than for total teaching staff since 1996-97.
42.3.2. Growth and distribution of teaching staff in private aided colleges
Table 4.22 represents the growth and distribution of teaching staff in PACs with special reference to SC/ST staff.
105
The total number of teaching staff in the State has increased from 7701 persons during 1990-91 to 7923 persons during 1995-96 and to 7845 persons during 1999-00. However, the increase in total staff is not consistent over the years’ This is evident in the fluctuations in the annual growth of total teaching staffs which was 5.73 percent during 1991-92, 1.67 percent during1993-94, -0.26 percent during 1995-96 and 1.13 percent during 1999-00.
Of the universities in the State, the share of Karnatak University has been the highest over the years. This is followed by Bangalore University, Gulbarga University, Mangalore University’, University' of Mysore and Kuvempu University. For instance, the share of Karnatak (Kuvempu) University in the total teaching staff in the State was 29.80 (9.27) percent during 1990-91, 29.29 (9.13) percent during 1995-96 and 32.48 (8.44) percent during 1999-00. In the same way, the annual growth of teaching staff in the universities differs both within and between years. For instance, the annual growth of Karnatak (Kuvempu) university 9.85 (2.38) percent during 1991-92, -5.61 (-2.17) percent during 1995-% and 4.55 (-0.60) percent during 1999-00.
Of the districts in the State, the share of Bangalore Urban, Dakshina Kannada, Dharwad, Belgaum and Bijapur has been relatively higher than other districts. For instance, the combined share of these 5 districts in the State's total was 53.58 percent during 1990-92, 52.60 percent during 1995-96 and 53.62 percent during 1999-00. It is important to emphasise that, of these 5 districts, three districts are located within the Karnatak University .
The growth and distribution of teaching staff who belong to SC/ST show interesting patterns over the years. First, the share of SC/ST staff in the total teaching staff of the State has varied between the years. It was 4.58 percent during 1990-91, 5.68 percent during 1995-96 and 5.16 percent during 1999-00. Second, of the universities in the State, the share of SC/ST staff in the State’s total has been higher (lower) in Bangalore (Mangalore) University. For instance, the share of these universities was 36.26 (2.27) percent during 1990-91, 32 (2.44) percent during 1995-96 and 31.85 (2.47) percent during 1999-00. Third, the share of SC/ST within the total staff of the Bangalore (Mangalore) university was 6.06 (0.94) percent during 1990- 91, 6.73 (1.2) percent during 1995-96 and 6.34 (1.18) percent during 1999- GO. However, the SC/ST staff in the total teaching staff within the district shows a higher share in districts, such as, Bangalore Urban, Chitradurga. 13eluaum and Dharwad.
105
On the whole, two trends are striking in case of PACs. First, unlike the GCs, the annual growth had both negative and positive rates between 1990- 91 and 1994-95, as well as between 1995-96 and 1999-00. Second, the annual growth of total teaching staff has been very low, i.e. less than 2 percent throughout.
As compared to the GCs, the number of teaching staff has been higher in PACs for all the years. However, the annual growth of the total staff in PACs has been lower than in GCs, especially since 1995-96. In addition, since 1995-96, the number of SC/ST staff has been higher in GCs than in PACs.
The summary statistics for district-wise distribution of all and SC/ST teaching staff in PACs are given in Table 4.23. Although the mean number of teaching staff and value of standard deviation are higher for total staff than for SC/ST staff for all the years, the relative variations have been higher for SC/ST than for total staff for all the years. Interestingly, as compared to the summary statistics for GCs in Table 4.23, the summary statistics for PACs show higher mean values and higher standard deviation for total and SC/ST teaching staffs but lower coefficient of variation.
4.2.33. Qualitative aspects of teaching staff: Evidence from sample colleges
In what follows, a summary of the qualitative aspects of teaching staff by colleges is presented.
Table 4.24 presents the distribution of total teaching staff between lecturers and non-lecturers (i.e. professors and readers) in colleges by courses during 1991-92, 1994-95 and 1999-99. In all the years and courses, the number of lecturers dominate the non-lecturers in the total teaching staff 3f the colleges and teaching staff in arts subjects dominate over other subjects. Most surprisingly, there are no professors and readers in PUACs. Dn the other hand, in UCs, the number of professors and readers has Jeclined over the years from 53 in 1991-92 to 24 in 1994-95 and to 2 in1999-00.
Table 4.25 presents select details of qualification, training, professional nteractions of the teaching staff in colleges. In addition, library facility in
10'
terms of books purchased or donated to colleges per total staff and students is highlighted.
First, the number of faculty members who have attended the refresher and/or orientation programmes as a percentage of total number of staff during 1999-00 indicates that faculty in PUACs have attended the least number of programmes as compared to faculty in other colleges. While the faculty in science, commerce and other subjects of PACs have attended the highest number of programmes, the faculty of GCs have attended the highest number of programmes in arts subjects. It should be noted that the percentage of faculty who attended the programmes in other subjects in PACs is reported at 250 percent. This has happened since the faculty who attended the programme from the PACs is reported for all years, whereas the total number of staff is reported for 1999-00.
Second, the number of faculty members who have obtained or doing M.Phil or Ph.D degree as a percentage of total number of staff during 1999- 00 shows that, in general, the UCs are relatively better placed in terms of these higher qualification for faculty than other colleges.
Third, in terms of attendance in and organisation of professional seminars, workshops and guest lectures in the colleges as a percentage of total number of faculty members, the PACs and PUACs perform relatively better than GCs and UCs. Since these professional arrangements are the opportunities for faculty and students to interact and access recent knowledge, these need to be strongly encouraged in GCs and UCs.
Fourth, the number of professional books purchased to college library per total teachers and students shows that GCs have the highest number in all subjects except in other subjects. However, the number of professional books donated to college library per total teachers and students is negligible in all subjects and colleges.
4.2.4. Growth and distribution of non-teaching staff
The number, distribution and annual growth of non-teaching staff by universities and districts for GCs and PACs are presented below from 1990- 91 through 1999-00. In addition, the number and distribution of SC/ST staff is separately given.
108
4.2.4.I. Growth and distribution of non-teaching staff in Government colleges
Table 4.26 presents the growth and distribution of non-teaching staff in GCs with special reference to SC/ST staff.
The total number of non-teaching staff in the State has varied fix)m 2294 persons during 1990-91 to 1725 persons during 1995-% and to 1927 persons during 1999-00. ,Thus, the annual growth has fluctuated between years. That is, -0.96 percent during 1991-92, 0.97 percent during 1993-94, 8.76 percent during 1995-96 and 2.77 percent during 1999-00.
Of the universities in the State, the share of Bangalore University has been the highest over the years. This is followed by University of Mysore, Kuvempu University, Gulbarga University, Kamatak University and Mangalore University. For instance, the share of Bangalore (Mangalore) University in the total non-teaching staff in the State was 39.63 (6.76) percent during 1990-91, 40.17 (3.88) percent during 1995-96 and 39.54 (4.15) percent during 1999-00. In the same way, the annual growth of teaching staff in the universities differs both within and between years. For instance, the annual growth of Bangalore (Mangalore) University 0.33 (1.94) percent during 1991-92, -.0,43 (13.56) percent during 1995-96 and 2.56(19.40) percent during 1999-00.
Of the districts in the State, the share of Bangalore Urban, Tumkur, Kolar, Mysore and Chitradurga has been relatively higher than other districts. For instance, the combined share of these 5 districts in the State's total was 54.06 percent during 1990-91, 56.18 percent during 1995-96 and 54.34 percent during 1999-00. It is important to emphasise that, of these 5 districts, three districts are located within the Bangalore University.
The growth and distribution of non-teaching staff who belong to SC/ST show interesting patterns over the years. First, the share of SC/ST staff in the total teaching staff of the State has varied between the years. It was20.79 percent during 1990-91, 26.14 percent during 1995-96 and 2626 percent during 1999-00. Second, of the universities in the State, the share of SC/ST staff in the State’s total has been higher (lower) in Bangalore (Mangalore) University. For instance, the share of these universities was 37.32 (7.97) percent during 1990-91, 37.25 (3.10) percent during 1995-96 and 38.54. (4.15) percent during 1999-00. Third, the share of SC/ST within
109
the total staff of the Bangalore (Mangalore) University was 19.58 (24.52) percent during 1990-91, 24.24 (20.90) percent during 1995-96 and 25.72 (26.25) percent during 1999-00. However, the SC/ST staff in the total nonteaching staff within the district shows a higher share in districts, such as. Bangalore Urban, Kolar, Tumkar, Mysore and Chitradurga.
On the whole, two trends are striking in case of GCs. First, the number non-teaching staff has been higher than the teaching staff. Second, unlike the positive annual growth of teaching stafi the growth of non-teaching staff shows both positive and negative rates since 1995-%. Thus, there is no stagnation in the growth of non-teaching staff in the GCs.
The summary statistics for district-wise distribution of all and SC/ST non-teaching staff in GCs are given in Table 4.27. Although the mean number of non-teaching staff and value of standard deviation are higher for total non-teaching staff than SC/ST non-teaching staff for all the years, the relative variations have been higher for SC/ST than for total non-teaching staff for all the years.
4.2.42. Growth and distribution of non-teaching staff in private aided colleges
Table 4.28 presents the growth and distribution of non-teaching staff in PACs with special reference to SC/ST staff.
The total number of non-teaching staff in the State had varied from 6265 persons during 1990-91 to 5886 persons during 1995-96 and to 5638 persons during 1999-00. Thus, the annual growth has fluctuated between years. That is, -3 percent during 1991-92, -3.97 percent during 1993-94, 1.33 percent during 1995-96 and -2.36 perce|it during 1999-00.
Of the universities in the State, the share of Bangalore University has been the highest over the years. This is followed by Kamatak University, Mangalore University, Gulbarga Kuvempu University and University Mysore. For instance, the share of Bangalore University (University of Mysore) in the total non-teaching staff in the State was 28.57 (9.61) percent during 1990-91, 31.97 (9.87) percent during 1995-96 and 27.08 (9.38) percent during 1999-00. In the same way, the annual growth of nonteaching staff in tlie universities differs both within and between years. For instance, the annual growth of Bangalore University (University of Mysore)
110
-11.06 (10.47) percent during 1991-92, 13.85 (9.21) percent during 1995-96 and -5.57 (-1.49) percent during 1999-00.
Of the districts in the State, the share of Bangalore Urban, Tumlcur, Kolar, Mysore and Chitradurga has been relatively higher than other districts. For instance, the combined share of these 5 districts in the State's total was 37.14 percent during 1990-91, 40.68 percent during 1995-96 and35.80 percent during 1999-00. It is important to emphasise that, of these 5 ’districts, three districts are located within the Kamatak University.
The growth and distribution of non-teaching staff who belong to SC/ST show interesting patterns over the years. First, the share of SC/ST staff in the total teaching staff of the State has varied between the years. It was15.87 percent during 1990-91, 13 percent during 1995-96 and 16.09 percent during 1999-00. Second, of the universities in the State, the share of SC/ST staff in the State's total has been higher (lower) in Bangalore University (University of Mysore). For instance, the share of these universities was 31.09 (9.05) percent during 1990-91, 34.12 (10.2) percent during 1995-96 and 30.10 (8.93) percent during 1999-00. Third, the share of SC/ST within the total staff of the Bangalore University (University of Mysore) was 17.26 (14.95) percent during 1990-91, 13.87 (13.43) percent during 1995-96 and 17.88 (15.31) percent during 1999-00. However, the SC/ST staff in the total non-teaching staff within the district shows a higher share in districts, such as. Bangalore Urban, Dakshina Kannada, Dharwad, Belgaum and Utter Kannada.
On the whole, two trends are striking in case of non-teaching staff of PACs. First, the number of non-teaching staff has been higher than the teaching staff. Second, qualitatively, the trends in the growth of teaching and non-teaching staff are comparable in PACs.
The summary statistics for district-wise distribution of all and SC/ST non-teaching staff in PACs are given in Table 4.29. The mean values, standard deviation and coefficient of variation for total non-teaching staff have been higher than for SC/ST non-teaching staff for all the years. As compared to the summary statistics for non-teaching staff in GCs in Table 4.27, all the statistics in Table 4.29 are higher except the values of coefficient of variation.
I l l
4.2.5. Reasons for slow growth of teaching and non-teaching staff
The description of growth of teaching and non-teaching staff in GCs and PACs above has been based on the observed number of teaching and nonteaching staff during different years. Thus, the analysis did not capture the importance of vacant (i.e. difference between the sanctioned and working) staff positions in the colleges.
In Government colleges, the State Government through the recruitment of staff fills the vacant positions by the Karnataka Public Service Commission. Thus, in the GCs, the Government itself is responsible for the vacancies to be sanctioned and filled up. And, tfie existence of vacant positions would only indicate the lack of recruitment for the posts and/or for a ban on the recruitment for the posts.
In case of PACs, Government's prior permission is essential to fill up a sanctioned post as per the rules of recruitment specified by the State Government. However, no permission fi*om the Government is necessary if PACs make appointments for the posts to be financed by the college management.
In what follows, the nature and distribution of current vacant staff positions are analysed.
Table 4.30 presents the sanctioned, filled up and vacant position of teaching staff in sample colleges during 1991-92, 1994-95 and 1999-00. In GCs, the vacant posts constitute about 50 percent or more for both SC/ST and non-SC/ST posts. In case of PACs, the vacant posts of SC/ST have come down over the years. For non-SC/ST stafiC the vacant posts have fluctuated fi'om 37.72 percent in 199L-92 to 20.10 percent in 1994-95 and to 37.9 percent in 1999-00. In the same way, vacant posts for SC/ST and non- SC/ST fluctuate between years for PUACs. In case of UCs, vacant posts have been prevalent only since 1991-92. Thus, vacant posts exist in all colleges in the State.
Table 4.31 presents the sanctioned, filled up and vacant position of nonteaching staff in sample colleges during 1991-92, 1994-95 and 1999-00. In both GCs and PACs, the number of vacant posts of SC/ST is higher than the total vacant posts. However, the vacant posts are higher in GCs than in PACs. In case of PUACs, vacant posts have been reduced from 87 percent
112
in 1991-92 to 61 percent in 1999-00. In case of UCs, vacant posts are evident in 1994-95 and 1999-00.
Further, Table 4.32 presents the details of vacant positions of teaching and non-teaching staff under plan and non-plan expenditure in PACs in the State as on February 1, 2001. This secondary data are given by the regional otTices of the Directorate of Collegiate Education.
Of the sanctioned teaching positions, the highest (lowest) share is evident for Kamatak (Mangalore) University at 30.48 (10.78) percent. In regard to sanctioned non-teaching staff positions, the highest (lowest) share is evident for Kamatak University (University of Mysore) at 29.10 (10.37) percent.
Of the working teaching positions, the highest (lowest) share is evident for Kamatak (Kuvempu) University at 31.50 (9.02) percent. In regard to working non-teaching staff positions, the highest (lowest) share is evident for Kamatak University (University of Mysore) at 30.73 (10.9) percent. In the same way, these universities have the highest (lowest) share in the total working positions in the State.
Most importantly, the working teaching positions as a percentage of sanctioned teaching positions is highest (lowest) for Kamatak (Gulbarga) University. In the same way, the working non-teaching positions as a percentage of sanctioned non-teaching positions are highest (lowest) for Bangalore (Kuvempu) University.
The results of PACs above have two implications. First, in all the universities, there exist vacant teaching and non-teaching positions. In regard to teaching (non-teaching) stafi the highest vacant positions are evident for Gulbarga (Kuvempu) University. Second, if there is a ban on the recruitment of these vacant positions, it will have differential impact on the quality of collegiate education in universities in the State.
4.2.6. Student-tcacher ratio (STR)
The STR is one of the traditional indicators of quality of collegiate education. This is evident in the intemational survey article by Hanushek (1996). It measures the number of students per teacher in a college or university or district. In the analysis below, the STR in a district is arrived by dividing the total number of students enrolled in all traditional courses in
113
all GCs or PACs by the total number of permanent teaching stafif in all GCs or PACs in the district during a year. This STR suffers firom two limitations. It is an underestimate if the colleges in a districts have large number of students enrolled in non>traditional courses. Second, it is an overestimate, if the colleges in a district have large number of non-permanent teachers.
Table 4.33 presents the STR for GCs from 1990-91 ^ o u g h 1999-00. First, the STR has gradually increased in the State from 1991-92 to 1995-%. That is, from 23.15 during 1991-92 to 29.61 during 1993-94 and to 33.71 during 1995-96. On the other hand, from 1995-96 to 1999-00, the STR has gradually declined from 28.23 during 1996-97 to 22.88 during 1999-00. Of the districts, the STR had been higher in districts of northern Karnataka, such as, Gulbarga, Raichur, BeUary, Bidar and Bijapur. And, districts, such as, Mysore, Mandya, Bangalore Urban and Kodagu have relatively lower STR.
Table 4.34 presents the STR for PACs from 1994-95 tiirough 1999-00. As in the case of the GCs, the STR has gradually increased in the State since 1995-96. However, unlike in the case of GCs, there are no remaiicable differences in the STR between districts in different years.
In general, the STR in PACs is relatively lower than in GCs. Two important reasons for this result are as follows. First, existence of large number of vacant posts or non-permanent stafif who are not included in the STR in the PACs. Second, total number of students in a college is inclusive of traditional and non-traditional courses. In PACs, non-traditional courses are more than in GCs. Thus, although total students and staff are low in GCs than in PACs, the STR is higher in GCs than in PACs.
Table 4.35 present the STR for the sample colleges during 1991-92,1994-94 and 1999-00 by courses. In all the colleges, STR has increased from 1991-92 to 1994-95. For all the courses, STR in GCs was relatively higher than in all non-GCs. However, from 1994-95 to 1999-00, STR has declined in all the courses in GCs, in B.A. and B.Com. courses in PACs, in all traditional courses in PUACs and in B.A. course in UCs. During 1999- 00, STR is lowest in B.Sc. in GCs, PACs and UCs, and in other course in PUACs
114
Table 4.36 summarises the responses of the principals in 20 sample colleges (i.e. as recorded in filled in Principals' Questionnaire) in regard to college infrastructure and other aspects.
First about 37 percent of the sample colleges have problems in obtaining books for their libraries and all the problems are related to lack of money to buy the books. Thus, lack of financial resources is a serious constraint tor the improvement of library collections in the colleges. Surprisingly, except two colleges, there seem to be no problems in obtaining laboratory equipment and consumables. And, lack of resources is reported to be the major reason for it.
Second, about 95 percent of sample colleges have their own buildings. Over 73 percent of colleges have adequate classrooms. Over 85 percent of colleges have adequate students' desk, blackboard, teachers' chairs and desks, regular maintenance of classroom walls and roof adequate sanitation facilities including separate toilet for boys and girls and playground and sport facilities.
Third, only about 37 percent of colleges have students' hostel facilities and only about 11 percent of colleges have employment guidance/placement cell for students. In the same way, only about 37 percent of colleges have alumni association and local people are contributory for college development. However, only 3 out of 20 sample colleges have NAAC’s recognition.
Fourth, regarding the staff position, especially in private aided colleges, 4 (3) out of 6 sample colleges have reported the existence of vacant teaching (non-teaching) staff in their colleges. The most important reason for the existence of vacant positions is lack of permission from the State Government to fill up the positions. This is perfectly consistent with the recent decision of the State Government to ban the recruitment of nonteaching staff in both Government and private aided colleges, and freeze the recruitment of teaching staff in private aided colleges, to reduce the expenditure on collegiate education. It should be emphasised that over 66 percent of the existing posts are due to retirement of staff in the colleges. In fact over 63 percent of principals are aware of the recent debates on the reduction in GIA to the PACs in the State.
4.2.7. Infrastructure facilities: Evidence from sample colleges
115
Fifth, on the demand for courses in colleges, the largest decline is reported (over 68 percent) in B.Sc. course and is followed B.Com., B.A. and BBB courses.
4.3. Relevance of collegiate education
Relevance of collegiate education is related to the relevance of courses offered in collegiate education to the students and to society. The relevance to the students may be related to (a) giving the most update and deep knowledge in the areas, voluntarily chosen by themselves and (b) giving them knowledge and training which are needed for employment in the process of regional and national economic development.
An important determinant of relevance of collegiate education is the prescription of curricula for courses. At present, the respective universities through their Board of Undergraduate Studies fix the curricula. Such curricula are uniformly implemented throughout the university. While such uniformity are justifiable for the purpose of holding common examination and uniform evaluation of all students in the universities, it lacks autonomy for the colleges to design their own curricula according to the particular needs of students and areas within the universities. Thus, at present, colleges can only taken initiative for introducing new courses, but the afiiliating University takes all academic decisions on the introduction of new courses and their curricula.
In the 1990’s two important steps have been taken to increase the relevance of collegiate education in the State. First, introduction of UGC- sponsored, vocational subjects in degree colleges. Second, introduction of various professional courses, including degree courses in computer science and computer applications, in degree colleges.
Interestingly, at the universit> level, computer applications have been introduced in two alternative ways. First, as in the case of Bangalore University, computer applications are introduced as one of the compulsory subjects of study for all Master’s degree students in humanities and social science students. Second, as in the case of Mangalore University, computer applications are introduced for all university students as a voluntary training programme, outside the outside the curricula of the university.
116
While college management (or universities) may taken initiatives to introducing new courses in their private colleges (or universities), the State Government has to take similar initiative to bring in relevant in courses otTered in Government colleges. In this regard, an important lesson for Government of Karnataka is evident in the following experience of Government of Tamil Nadu in introducing computer literacy programme for arts and science students in Government colleges.
4.3.1. Experience of Tamil Nadu
Recently, the Government of Tamil Nadu has decided to introduce the Computer Literacy /Education Programme to impart knowledge in computer applications and use of internet, from the academic year 20(X)-01, for about 30(X)0 non-computer science students who are studying in their second year degree course in 60 Government Arts and Science Colleges. The cost of the programme is estimated to be Rs.30 for a penod of 5 years. The duration of the programme is one academic year, but outside the purview of the university curriculum and system. The structure of the course is inclusive of theory classes and practical sessions. Participation in the programme is voluntar>’ for both undergraduate and post-graduate students. The college teachers are the trainers of the student-trainees. Thus, the programme includes free of cost and aimual training of 10 college teachers including the principal for 30 hours in computer applications. The Director of Collegiate education conducts the examination and certifies the proficiency of students in computer applications. A sum of Rs.2000 is collected (in four installments) as course fee from each student for the entire course. The course fee is considered to be very minimal as compared to fee charged by a private computer training institute (anywhere between Rs. 15000 and Rs.25000 per student) for a similar course.
Thus, the experience of Tamil Nadu is important for other States including Karnataka State in increasing the relevance of collegiate education with low cost for students in Government colleges.
4.3.2. Medium of instruction, and quality and relevance of education
Kannada has emerged as an alternative medium of instruction to English in many colleges in the State. In tact, instruction in Kannada language is most popular among students in social sciences in rural colleges. Most surprisingly, in many of the rural colleges, more than half of the instruction
117
in English medium classes in social sciences are also taught in Kannada language.
In general, instruction in Kannada should be most welcome in Karnataka, as Kannada is the mother-tongue for most of the college students. For instance, Kannada is the mother-tongue for over 76 percent of 248 sample students, and about 70 percent of sample colleges have both Kannada and English as the medium of instruction, in this Report.
Two important problems associated with instruction in Kannada are as follows. First m general, teachers may not have studied their subjects in Kannada language. Second, there is a terrible dearth of standard textbooks in Kannada in social sciences. Consequently, the instructor has to prepare his/her own teaching materials by translating into Kannada from the available textbooks in English language. For this reason, the quality and content of teaching m social science has been heavily dependent upon the abilit>’ of translation of teachers and availability of English language textbooks. Consequently; low ability of translation and non-availabilit\ of English language textbooks have become one of the major reasons for low qualit\' of classroom teaching in colleges in the State. Third, books on computer education, and computer manuals, are not available in Kannada language or not translated into Kannada language. Thus, students are handicapped in self-learning computer applications in one’s own area of subject and be\ond their basic training in computer literacy. This is in contrast with Japanese system where the on computer education and manuals are ready available in Japanese language. Thus, self-learning of computer applications are most predominant features in Japanese education system.
4.4. Quality and relevance of collegiate education: Evidence from sample survey of colleges
Perceptions of the students on the quality and relevance of collegiate education in the Slate is summarised below in Table 4.37 through 4.39.
4.4.1. Sample sun e\ results of all students and in all courses
Sample sur\e\ resuhs for all .students and in all courses are presented in fable 4.37. In total. 248 final year students (i.e. comprising students in B.A.
118
(40%), B.Sc. (25%), B.Com. (29%) aiid BBM (6%) courses were interviewed. A description of these results is given below.
4.4.1.1. Socio-economic background of students
About 24 percent of sample students belonged to SC/ST. Kannada is the mother-tongue for about 76 percent of student. Only about 28 percent of students come from families whose fathers' occupation is agriculture. The parental income distribution of students show that over (34) 13 percent belong to families whose parents’ monthly income is over (less than) Rs.lOOl per month.
The performance of students in previous examinations show that about 23 (40) percent and 32 (41) percent had passed the I and II year course with a first (second) class respectively. However, over 93 percent of students expect a first class \n tlie final year examination of their courses.
4.4.1.2. Motivation for study
Who and what motivated the students to pursue the course of their present enrolment are important factors in understanding the demand for collegiate education at the students’ level. Interestingly, about 44 percent of student have been self-motivated to join the courses, while parents, brother/sisters and friends and relatives are the next largest motivators for the students to join the course of their study.
Of the motivations for the study, over 64 (67) percents of students have responded to pursue higher education and only about 23 (23) percent to find a job at the time of joining (completing) the course. Thus, the purpose of their study is consistent and stable over the years.
4.4.1.3. Reading habits of students
It is glad to know that the students have positively responded to reading newspaper. The proportion of students who read both Kannada and English language newspapers is about 54 percent. While 22 (19) percent read the newspaper at home (college), other students read the newspapers both at home and college. The most important news item that the students read is related to job advertisements.
119
Over 93 percent of students have borrowed books from the college libraries, but at the same time about 81 percent have purchased the reference books. The amount of money spent on. books during last 3 years show s wide vanations. For instance, 38 percent of students have spent less than Rs.500 and about 24 percent of students have spent between Rs.510 and Rs.lOOO. Interestingly, about 18 percent of students have spent more than Rs.lOOl on purchase of books. And, availability of books in the college librar>, rather than lack of money, is the most important reason for not buying books for about 15 percent of students.
4.4.1.4. Cost of private tuition
Private tuition seems to be less popular as only 22 percent of students are taking private tuition in the colleges. And, over 97 percent of students spend less than Rs.500 per year on private tuition.
4.4.1.5. Cost of boardins, lodging and commuting.
For students who stay away from their parents and close relatives for college education, cost of boarding, lodging and commuting is an important element of private costs of collegiate education. However, the proportion of students who stay with friends and hostels is only about 5.2 percent and 17.3 percent respectively.
Of the total students, about 10.9 percent have spent less than Rs.500, about 9 percent have spent between Rs.501 and Rs.lOOO towards boarding and lodging expenses per month.
Distance and mode of transport are the major determinants of cost of commuting for students. About 69 percent of students stay in less than 2 Km distance from their colleges, and about 15 percent of students stay in less than 6 Kms but more than 2 Km distance from their colleges. Thus, short distance students dominate the long distance students in the sample colleges.
If walking and cycling are costless modes of commuting, then about 31 percent of students do not incur any cost of commuting to reaching their colleges. Among the others, about 10.1 (22.2) percent of students spend less (more) than Rs.50 towards commuting cost per month.
120
The Directorate of Training and Employnnent (DTE) of the Government of Karnataka has been spreading knowledge on the vocational education and job market information to students in State universities and their affiliated colleges. For this purpose, in every State University, employment and guidance bureau is set up, manned by the deputed persons from the DTE. The officials of the bureau are expected to visit the colleges and provide information and education on vocational courses and programmes.
Of the total sample students, only about 38 percent are aware of the vocational education in the State. Much less of them (about 21 percent), know about the courses offered under vocational education, although about 29 percent of students know the eligibility criteria for admission to vocational education. Unfortunately, only about 16 percent of students know the job prospects of joining the vocational courses in the State.
4.4.2. Sample survey results by colleges and in all courses
The sample survey results by colleges are presented in Table 4.38. The highlight of these results are as follows.
❖ Proportion of total students who belong to SC/ST is higher in UCs than in other colleges.
❖ Number of students, whose mother-tongue is Kannada, is highest in GCs.
❖ Number of students whose parents have monthly income of more than Rs.lOOO is higher in non-GCs than in GCs.
❖ Number of students having III class in I Year and II Year course is higher in GCs.
<♦ Pursuance of higher education rather than finding a job is the motivation for joining a degree course, both at the time of admission and completion of a course, for the highest number of students in all the colleges.
❖ Newspaper reading habits of students is 100 percent in all the colleges.
4.4.1.6. Knowledge and awareness o f vocational education
121
<♦ Students’ dependence on college library for reference books is highest in GCs.
❖ Proportion of students who bought reference books is highest in GCs with 68 percent of students spending less than or equal to Rs.lOOO on books.
❖ Proportion of students who go for private tuition is relatively less in PUACs.
❖ Proportion of students staying in hostels is highest in UCs and is lowest in PUACs.
❖ Proportion of students who spend between Rs.501 and Rs.lOOO per month on boarding and lodging is highest in UCs.
❖ About 80 percent of students travel less than 2 km to reach their GCs. This is in contrast with UCs where about 23 percent of students travel more than 9 km to reach their college.
<* Knowledge and awareness of vocational education is widespread among the students in UCs than in other colleges. This is for the main reason that Universit>' Employment Bureau and Vocational Guidance is located, in general within the campus of university colleges (e.g. within the campus of Maharaja's College in the University of Mysore).
4.4.3. Sample survey results by courses and in all colleges
The sample sur\ey results by courses are presented in Table 4.39. Thehighlight of these results are as follows.
❖ Proportion of total students who belong to SC/ST is higher in B. A. course than in other courses.
❖ Number of students, whose mother-tongue is Kannada, is highest in B.A. course.
❖ Number of students whose parents have monthly income of more than Rs.5000 is higher in B.Sc. course than in other courses.
122
♦ Number of students having III class in 1 Year and II Year course is higher in B.A. course.
♦ Pursuance of higher education rather than finding a job is the motivation for joining a degree course, both at the time of admission and completion of a course, for the highest number of students in all the courses.
♦ Newspaper reading habits of students is 100 percent in all the courses
♦ Students’ dependence on college library for reference books is highest in BBM course and lowest in case of B.A. course.
♦ Proportion of students who bought reference books is also highest in B.Com. course with about 73 percent of students spending less than or equal to Rs. 1000 on books.
♦ Proportion of students who go for private tuition is more in non-B.A. courses, especially in B.Sc. course.
♦ Proportion of students staying in hostels is highest in other course and is lowest in B.A. course.
♦ Proportion of students who spend between Rs.501 and Rs.lOOO per month on boarding and lodging is highest in BBM course.
♦ Knowledge and awareness of vocational education is widespread among the students in B.Sc. course and is followed by B.Com. course, B.A. course and in other course.
On the whole, the analysis of quality and relevance of collegiate education in this ch^ter brings out several problems in GCs and non-GCs as well as raises many issues to be newly tackled through current and future policy interventions. In this regard, the lessons from the best practices from within and outside the State, as highlighted in this chapter, deserve serious consideration from the policy makers in the State.
123
CHAPTER 5
Public Expenditures and Resource Mobilisarion
This chapter analyses the trends in piibhc expenditure on collegiate education and the effects of changes in the level and composition of goveniment expenditure on Government and private aided degree colleges. In addition, per student expenditure by colleges is analysed based on sample survey data of colleges.
5.1. Nature of public tlnancing of collegiate education
In a federal economy like India, public (i.e. budgetary) financing of collegiate education may be analysed at different levels of the government, such as, at the federal or Union Government’s level and/or at the State Governments' level. However, the focus of this chapter is on fmancing of collegiate education by the State Government, viz., the Government of Karnataka. For this reason, throughout this chapter, the two terms, public fmancing of collegiate education and financing of collegiate education by the State Government, will be used interchangeably.
The nature of public financing of collegiate education is different between the Government colleges and private colleges. For instance, in case of Government colleges, all expenditure (i.e. net of students fee to the State Government, however) are met by the State Government. In case of private colleges, the State Government provides with maintenance or teaching grants in the form of cent percent reimbursement of salary payments of working teaching and non-teaching staff. These grants are called grants-in- aid (or GIA). A college, which receives (does not receive) the GIA is called an aided (unaided) college.
Aided colleges need not have only those courses, which are aided. In fact, many of the aided college do have many unaided courses (e.g. professional courses, such as, BBM and BHM) and subjects (e.g. electronics). Thus, what distinguishes an aided college from an unaided college is the following. In an aided college there exists at least one course, which is aided, whereas in an unaided college there exists no courses, v 'hich are aided.
124
The policy framework for brining the new colleges under GIA and to continue the GIA for the currently aided colleges are outlined in the GIA Code of the Karnataka Collegiate Education (for details, see Chapter 5 in Murthy (1993)]. Recently, Narayana (1999b) has examined in detail the current status and future policy alternatives in Karnataka’s GIA, especially in terms of examining the financing of a reduction in GIA by students’ fee revisions and the impact of such financing of reduction of GIA on the pass percent of students in final year examinations in aided colleges. Nevertheless, the GIA code is briefly explained below.
The GIA code is a set of rules and regulations for payment of the GIA to eligible colleges in Karnataka State. These rules and regulations are formulated and implemented by the State government. The GIA code comprises: (a) a set of definitions including for a college, institution and management; (b) general conditions for payments and non-payment of GIA including the affiliation requirements and nature of courses; (c) explanation of different types of GIA payable, including teaching (or maintenance) grant, graiit towards loss of fee income, building grants and equipment grants; (d) guidelines and application format for different types of GIA.
In principle, the GIA may be given in different forms, such as, teaching (maintenance) grant, building grant and equipment grant. However, in practice and at present, the nature of GIA is limited to teaching grant in the form of cent percent direct reimbursement of salary for the statT in the aided colleges.
The GIA is limited to privately managed degree and law colleges, alilliated to recognised Universities within the State. And, within the affiliated private degree colleges, courses leading to B.A., B.Sc., and B.Com. degrees and affiliated with the University are eligible for the GIA. In case of law colleges, the three-year course leading to the award of a law degree (e.g. LLB) is eligible for the GIA. However, a college is eligible for the GIA only upon completing five years of working, and a course (existing or new) in such a college is eligible only upon completing five years from the year of its intnxiuction. In addition, an aided collcge should satisfy that the average daily attendance in its college and the minimum number of working days in its colleges shall not be less than what is fixed by the University with which the college is alfiliated.
125
It should be emphasised that tlie GIA is a discrctionar>' grant as tlie State goveninient has all rights reserv'ed in it with regard to changing and interpreting the rules, and hence refusing or withdrawing the grant. I'hus. the GIA cannot be claimed as a matter of right. Further, an important precondition for the GIA is the availability of funds under the concerned heads of expenditure in the State budget. Fhat is, funds must be available under the State budget-hcad i.e. [2202-03-104-1-011 for teaching/' maintenance grant under non-plan expenditure and [2202-03-104-1-02] for bringing new c< llegcs under GIA under plan expenditure.
The GIA policy has both promotional and regulatorv' objectives. First, the GIA p< licy aims at encouraging private enterprise/management in higher education, in such a way that botli pubic and private fmancing are ensured. Second, through the GIA policy, the Government can regulate the activities (e.g. in statY recruitment and fixation of student fees) in private aided colleges. Third, the GIA policy aims at reducing the total cost of providing collegiate education for the State government, especially as compared to a hypothetical situation where all the aided colleges are to be totally established and run as government colleges. In the same way, it reduces the cost of production of education by the private colleges as the expenditure on the aided teachers is entirely reimbursed by the Government. Fourth, because of the GIA, the teaching and non-teaching staff are paid on par with the staff in Government colleges, apart from equal service conditions (e.g. job security) and benefits (including retirement benefits). Thus, the private management can attract the best of qualified and experienced staff for their colleges, which, in the ultimate analysis, is a critical input for improving the quality of education in the colleges. Fifth, the GIA policy aims at reducing the cost of obtaining collegiate education by students, as compared to a situation when the GIA is absent and the private colleges work on the basis of fiill cost recovery from the students. Thus, the objectives of the GIA pc licy have relevance for all major agents involves in the collegiate education, viz., the State government, management, and teachers and students in, the private degree colleges.
5.2. Nature of public expenditure on collegiate education
In the State budget, expenditure on collegiate education is a part of university and higher education, which in turn is a part of general education. In principle, the budgetary allocation is divided under revenue expenditure, capital expenditure and loans and advances.
120
5.2.1. Revenue expenditure
First, budgetarv’ allocation is made tor general education sector (budget head; 2202) under allocation for social services. Second, within the general education sector, among others, allocation is made for Universit>' and Higher Education (2202-03). Next, within the Universitv’ and Higher Education, plan and non-plan allocation are made separately for Government and non-Government colleges under the Department o f Collegiate Education. For instance, allocation for Government colleges come under the budget head: 2202-03-103-2) and Assistance to Non-government Colleges come under the budget head: 2202-03-104-1. The non-plan assistance to non-government colleges is given as teaching/maintenance grants (2202-03- 104-1-01) and plan assistance is for bringing new colleges under GIA (2202- 03-104-1-02).
5.2.2. Capital expenditure
The capital expenditure ( budget head 4202-01-203) is divided under plan and non-plan expenditure. The plan expenditure includes works (e.g. construction o f buildings), equipment grants and library grants (for purchase o f bcx)ks and journals). The items o f expenditure for construction o f buildings under State Plan Schemes (4202-01-203-1-01) include establishment changes transferred from Public W orks Department (budget head: 2059) under constniction (2059-80-051) and machiner>' and equipment (2059-80-052) and grants for library and equipment are called development grants. These expenditure, however, are not distinguished for collegiate education.
5.2.3. L.oans and advances
The loan and advances for University and Higher Education (budget head; 6202-203) are under plan and non-plan schemes. Hence, all loans and advances refer to non-plan only. The items of expenditure under this head include (a) loans to Universities for sanction o f house building and other advances to their staff (6202-203-1) by Universities (e.g. for University o f Mysore under 6202-203-1-01 and so onX (b) special loans for maintenance expenditure to private colleges (6202-01-203-2-01) and scheme o f National I>oan Scholarship (6202-01-203-3-001) and (c) loans for construction of buildings to University Colleges (6202-01-203-4-01). As in the case of
127
capital outlay, the items under loans and advances are not distinguished for collegiate education.
5.3. Patterns of public financing of collegiate education
The patterns of public financing of collegiate education may be described at different levels. In what follows, the descriptions are focused at the State and sub-State levels.
5.3.1. Patterns of public financing of collegiate education at State level
Table 5.1. presents the patterns of public financing of collegiate education at the State level of aggregation.
Over the years, both plan and non-plan expenditure have been incurred on the collegiate education. Unlike the total non-plan expenditure, the total plan expenditure on collegiate education shows fluctuating trends during I990’s. First, for all the years, non-plan expenditure on FACs has been higher than on GCs. In regard to plan expenditure, up to the year 1994-95, plan expenditure on PACs was more than on the GCs. Since then, however, plan expenditure on GCs has been higher than on PACs.
The total plan (non-plan) expenditure on collegiate education as a percentage of total plan (non-plan) revenue expenditure on general education in the State shows wide fluctuations. It was 7.15 (9.77) percent during 1990-91 but declined (increased) to 0.47 (10.66) percent during 1998-99, but has increased to 1.97 (17.07) percent during 2000-01. In the same way, total plan (non-plan) expenditure on collegiate education as a percentage of total plan (non-plan) revenue expenditure on university and higher education in the State shows fluctuations. It was 52.76 (65.67) percent during 1990-91 but declined (increased) to 10.49 (75.86) percent during1998-99, but has increased to 58.89 (80.88) percent during 2000-01. This implies that a large amount of non-plan university and higher education expenditure is incurred on collegiate education in the State.
5.3.2. Patterns of public financing of collegiate education at the sub- State level
State level description of the revenue expenditure does only reveal the allocation of budgetary resources to collegiate education as one of the
128
sectors in higher education. However, to gain insights into the patterns of spatial allocation of expenditure to collegiate education, a description of expenditure allocation to Government colleges and aided colleges by universities and districts is given in Table 5.2 and in Table 5.3.
In both the tables, for each year, the absolute amount of expenditure and its share in the State's total ( as shown in the parentheses) are given in the first column. In the second column, annual growth of expenditure (%) and share of each district in the University’s total (as shown in the flower brackets) are given.
All the data in both the tables refer to budgetary provision of expenditure by the Department of Collegiate Education to 6 Joint Directorate of Collegiate Education in the State. In fact, data on actual release of expenditure or grants-in-aid by colleges is maintained only in the office of this Joint Directorate. Thus, there may exist a difference between the expenditure data on collegiate education in the budget papers, budgetary provision by the Directorate of Collegiate Education and the actual release of expenditure by the Joint Directorate of Collegiate Education.
5.3.2.1. Expenditure on Government colleges
1 able 5.2 presents the allocation of expenditure to Government degree by universities and districts from 1992-93 to 1999-00.
First of all, there exist annual variations in the absolute amount of expenditure between districts and universities during all the years. For instance, the amount of expenditure for colleges under Bangalore (Mangalore) university has increased from Rs.571.61 (225.63) lakh during 1992-93 to Rs. 1035.35 (408.70 lakh during 1995-96 to Rs. 1834.64 (724.20) lakh during 1999-00. In the same way, the increasing amount of expenditure is evident for all the remaining universities in the State. F'urther, total expenditure for all universities or districts have also increased over the years from Rs.2241.30 lakh during 1992-93 to Rs.4059.69 during 1995-96 to Rs.7139.58 during 1999-00.
Most surprisingly, there exist several uniformities in the spatial distribution of expenditure in Tale 5.2. In particular, the uniformities are evident for the following variables, (a) Uniformity in the share of each district in the State's total expenditure for all the years. For instance, the
129
share of expenditure of the Bangalore Urban district in the State’s total expenditure was 7.38 percent during 1992-93 and has remained the same throughout, (b) Uniformity in the share of each university in the State's total. For instance, the share of expenditure of the Bangalore University in the State’s total expenditure was 25.50 percent during 1992-93 and has remained the same throughout, (c) Uniformity in the share of expenditure of each district in the total expenditure under each university. For instance, the share of expenditure of Bangalore Urban district in the University’s total expenditure was 28.95 percent during 1990-91 and has remained the same throughout.
The presence of the above uniformities indicates a simple formula for spatial allocation of expenditure for Government colleges. That is, a proportionate rise (in percent terms) in the total expenditure for all districts or universities in the State.
5 3 2 2 . Expenditure on aided colleges
Table 5.3 presents the allocation of expenditure to private aided degree colleges by universities and districts from 1992-93 to 1999-00. Qualitatively, the allocation patterns in Table 5.3 are comparable with the patterns in Table 5.2.
First of all, there exist annual variations in the absolute amount of expenditure on the GIA between districts and universities during all the years. For instance, the amount of expenditure for colleges under Bangalore (Mangalore) universit>' has increased from Rs. 1494.71 (857.62) lakh during 1992-93 to Rs.2274.88 (1305.26) lakh during 1995-96 to Rs.378l.50 (2172.50) lakh during 1999-00. In the same way, the increasing amount of expenditure is evident for all the remaining universities in the State. Further, total expenditure for all universities or districts has also increased over the years from Rs.7106 lakli during 1992-93 to Rs.l0815 during 1995-96 to Rs. 17947.43 during 1999-00.
Most surprisingly, there exist several uniformities in the spatial distribution of GIA in Tale 5.3. In particular, the uniformities are evident for the following variables, (a) Uniformity in the share of each district in the State's total expenditure for all the years. For instance, the share of expenditure of the Bangalore Urban district in the State's total expenditure was 15.17 percent during 19 )2-93 and has remained the same throughout.
130
(b) Uniformit>' in the share of each university in the State’s total. For instance, the share of expenditure of the Bangalore University in the State's total expenditure was 21.03 percent during 1992-93 and has remained the same throughout, (c) Uniformity in the share of expenditure of each district in the total expenditure under each university. For instance, the share of expenditure of Bangalore Urban district in the University's total expenditure was 72.13 percent during 1990-91 and has remained the same throughout.
As in the case of Government colleges, the presence of the above uniformities indicates a simple formula for spatial allocation of expenditure for aided colleges. That is, a proportionate rise (in percent terms) in the expenditure for all districts or universities in the State.
5.3.2.3. Summary statistics
Table 5.4 gives the summary statistics of the district-wise expenditure for Government colleges and aided colleges separately. These statistics confirm the patterns described above. That is, as the total allocation for districts have increased over the years, and given the same number of districts, the mean allocation has increased for both Government and aided colleges. Second, because of variations in the absolute size of allocation between districts in each year, the standard deviation has increased over the years. Third, the relative variations have remained the same at about 51 in case of Government colleges and at about 79 in case of aided colleges. This confirms the pre.sence of uniformity in the patterns of allocations for districts or universities over the years.
5 .4. Analysis of per student expenditure by colleges
Data on expenditure in colleges are not available trom secondar>' sources. Thus, as a part of college questionnaire in the sample survey of colleges for the Report, data on different items of expenditure andTeceipts from colleges were collected. This data is helpful to compare per sludent expenditure by types of colleges at dilYerent points in time.
Table 5.5 presents expenditure data by GCs, PACs, PUACs and UCs during 1991-92, 1995-96 and 1999-00. The major features of the expenditure data arc as follows.
131
First, salary for teaching and non-teaching staff constitutes the largest expenditure in all colleges except in PUACs. For instance, in GCs, salary expenditure has been over 96 percent of total expenditure in all the years. In case of PACs (or UCs), over 80 (or 90) percent of total expenditure is towards staff salary. However, in case of PUACs, salary expenditure varies between years. It is about 33 percent during 1991-92, about 85 percent during 1995-96 and about 65 percent during 1999-00. Consequently, expenditure on non-salary items has been negligible, especially on land and buildings for the colleges. During 1999-00, expenditure on laboratory (or library) has been highest in PACs (PUACs).
Second, the per student expenditure show an increase in all colleges except PUACs. For instance, per student expenditure in GCs has increased from about Rs.713 during 1991-92 to about Rs.l 140 during 1995-96 and to about Rs3791 during 1999-00.
As in the case of GCs, per student expenditure show an upward trend in PACs and UCs. For instance, per student expenditure in PACs (or UCs) has increased from about Rs.7352 (or Rs. 6533) during 1995-96 to about Rs.l3609 (Rs.Rs. 10690) during 1999-00.
On the other hand, in case of PUACs, there exists a wide variation in per student expenditure between years. For instance, per student expenditure has reduced from about Rs.2912 during 1991-92 to about Rs.l399 during1995-96, but has increased to about Rs.2881 during 1999-00.
Of all the colleges, per student expenditure is the lowest in GCs and highest in case of PACs in the State.
It is interesting to examine the sources of and trends in receipts to colleges, especially in relation to the expenditure patterns above. Table 5.6 presents the sources and amount of receipts of sample GCs, PACs, PUACs and UCs during 1991-92, 1995-96 and 1999-00. The important insights from this data are as follows.
First, for GCs, the State Government is the single most important source of total receipts. Except for the assistance from UGC during 1999-00, the State Government constituted the only source of receipt for the GCs. In addition, total receipts and per student receipts have increased over the years. For instance, per student receipts have increased from about Rs.322
132
during 1991-92 to about Rs.392 during 1995-96 and to about Rs.l325 during1999-00.
Second, for PACs, the State Government is one of the most important reported sources (i.e. about 86 percent) of total receipts. The other important sources include college management, tuition fee from students and UGC. For instance, during 1999-00, the share of tuition fee (or UGC) is about 3.55 (or 3.10) percent in the total receipts. In addition, total receipts and per student receipts have increased over the years. For instance, per student receipts have increased from about Rs.4385 during 1991-92 to about Rs.5817 during 1995-96 and to about Rs.9848 during 1999-00.
Third, for PUACs, the college management is single most important reported source (i.e. more than 90 percent) of total receipts. The other important sources include other sources of receipts whose composition is not made explicit. For instance, during 1999-00, the share of other sources is about 7 percent in the total receipts. In addition, total receipts, but not per student receipts, have increased over the years. For instance, per student receipts have declined from about Rs.597 during 1991-92 to about Rs.272 during 1995-96 and has increased to about Rs.446 during 1999-00.
Fourth, for UCs, the atTiHating university and the UGC are the major sources of receipts. For instance, during 1999-00, the share of University (UGC) is about 91 (or 9) percent in the total receipts of UCs.
It should be emphasised that a comparison of total or per student receipts may not plausible since, for instance, no data on receipts from the tuition fee from students are reported in GCs during 1991-92 and 1995-96. In the same way, no data on tuition fee from students are reported in PUACs and UCs for any of the study years. Hence, due to incompleteness of data on all sources of receipts, comparison of total or per capita receipts between colleges, and between total receipts and total expenditure are not plausible.
5.5. Current issues in public financing of collegiate education in the State
llie important current policy issues in public financing of collegiate education include the following. First can we consider GIA as a form of budgetary subsidies to private aided colleges? Second, is there no subsidy in Government colleges? fhird. if subsidies exist, what are their composition and volume? Fourth, how can subsidies be reduced in its volume and
133
composition, and by which instruments, without compromising, of course, on the quality of and equity in collegiate education? These policy issues are addressed in the analysis below.
5.5.1. Background for current policy issues
Surprisingly, the Economic Survey 1999-00 of the Government of Karnataka (2000a) outlines the policy and performance of education sector (i.e. in primary, secondary, mass and vocational education) undef social infrastructure. However, the Survey does not make any reference to policies and performance of higher education including collegiate education in the State. Nevertheless, the increasing recognition of the importance of higher education in general, and concern with present and future public financing and subsidies to higher education in particular, are evident in the following recent policy studies and reports of the Government of Karnataka.
The Report of the Karnataka Universities Review Commission [Government of Karnataka (1993)], under the chairmanship of Professor T. Navaneetha Rao, has examined in detail, among other, the State financing and financial management of university education in the State. Listing the perspectives in 2001 AD, the Report notes two important points.
First, the Report argues that "higher education in universities has beensubsidised to a great extent........... It is our considered view that highereducation beyond, say, high school level, becomes a private property. People who choose to go for graduate, post-graduate and professional courses decide to invest their money anticipating relevant returns from future employment which will be based on such higher education. Higher educafion cannot be treated as a basic need or social good as much aselementary education...............Therefore, higher education has to be treated asa private good constituting private wealth" (p.230).
Second, on financing of higher education, the Report clearly noted that; " public money has come to be allocated for the benefit of even those who can afford higher education in terms of their abilit>' to pay for it. Against this background the fee structure should be rationalised with a view toaugmenting resources tor higher education and also to recover, on equitygrounds, part of the total cost of education, irom beneficiarics of whom large sections belong to higher mconie groups. While the cost of education has been increasing for ditTerent reasons, fees have remained more or less static
134
even though the returns due to higher education in the form of individual earnings have also increased. Therefore, pricing of education at higher levels will have to be reconsidered and quantum and nature of subsidisation will have to be related either to merit or the dictates of social justice" (p.231).
Implicitly, the Report brings in the relationship between public support of universities, cost of university education and students’ fee structure. That is, given the students’ fees and other things being same, cost of education can be reduced by increasing public support. Or, given the cost of production and other things being same, increasing the students' fees can reduce public support to higher education.
Although the Report makes a reference to subsidies to higher education and the need to reduce it, no attempt has been made within the report to define (except, perhaps loosely understood in terms of cost recovery from students’ fees) and quantify subsidies to general higher education in the State.
A study on An Approach to Subsidies in Karnataka ( in brief; the Approach Pap)er) by the Government of Karnataka (1997) has attempted to estimate, among others, the nature and volume of budgetary subsidies to different sectors in the State for 1984-85 and from 1989-90 through 1995-96 (B.E). To start with, the need for reviewing the structure and extent of subsidies are justified for many reasons. First, to reexamine the justification for subsidies in the light of enormous growth of the quantum of subsidies and its associated problem of misuse or lack of proper targeting. Second, for exploring the possibilities of reducing large revenue deficits by reducing subsidies. Third, for monitoring and evaluation of subsidies in terms of its objective. In regard to education sector, the study makes the following two important points.
First, ”it appears that the subsidies are introduced by conscious efforts after finding justification in individual cases with specific objectives and not according to a general policy. As such, it is not practical to think of a general policy or approach towards subsidies as a whole” (p.l).
Second, the non-plan subsidies by the State Government (i.e. to organisations other than Zilla Panchayats) to general education are estimated at Rs.48.99 lakh during 1984-85. These subsidies are in the form of
135
payment to Mysore Sales International Limited (MSIL) on account of differential cost between concessional rate of Lekhak Note Books and increased cost of printing papers. However, no subsidies, either on plan or non-plan basis, are estimated for any of the years during the study period. This is evident in Table 4 on page 16 and in Statement-4 on page 44 of the Approach Paper. Thus, in essence, the study does not identity any other expenditure as a form of budgetary subsidy to any level of general education in the State during the study period.
Nevertheless, the Approach Paper recognises that there exists a relationship between budgetary expenditure and subsidies to different levels of general education in the States. For instance, the Approach Paper notes;
"While provision of Primary and Secondary education facilities may be considered as provision for basic minimum needs to the population and therefore the expenditure on them cannot be considered as subsidy, there is no reason why the entire expenditure or even a major part of it on technical/ higher education should be borne by the State Government. In other words, the Higher Education involved considerable subsidisation by Government in our country. This is not justified because the benelSts accrued to an insignificant proportion of the population irrespective of whether the beneficiaries have the capacity to pay for the services or not. It is therefore highly inequitable. Further, Higher Education is both costly and improves the skills and employability and income earning capacity of the beneficiaries. Therefore, the beneficiaries should pay for such higher education. However, in case of poor students availing the facility, open subsidies by way of freeships, scholarships etc may be provided. It is estimated that hardly 1/5^ of the Government expenditure on Higher/University Education in the country is recovered by way of fees etc. This means 80 per cent of the cost of the Higher Education is subsidised. It should be possible to reduce the extent of subsidy in Higher education without affecting the services. It is therefore necessary to aim at revising upwards the fees and other payments for higher education in such a way that at least 75 to 80% of the cost of services are recovered in the long run which can be attempted in phases" (p.26-27)
The Human Development Report for Karnataka State [Government of Kimiataka (1999)] (a) makes an elaborate description of the quantitative developments, increase in student enrolments and patterns of public expenditure of general and technical higher education; and (b) updates the
13o
data and analysis of the Report of the Karnataka Universities Review Commission on higher education for the year 19%-97. At the same time, it lists two important concerns (p.67). First, few students opt for science and humanities streams. Second, poor physical infrastructure in colleges including poorly maintained buildings and ill equipped laboratories.
The Report sets out two agenda for future action. First, in regard to technical education, ban opening of new engineering colleges and close down courses with no demand and replace them with courses with potential, such as in the area of information technology. Second, in regard to general education, ban starting of new colleges, make colleges more self-fmancing by enhancing fees, provide basic physical infrastructure for the colleges, enhance state funding of doctoral and post-doctoral research in both physical and social sciences and provide opportunities to merited students to pursue research by providing monetary incentives.
The budget speech of the Chief Minister (also the Finance Minister) of the State on March 27, 2000 announced (in para 32 and 33) a cut in grants- in-aid to higher education by 15% for 2000-2001, as most of the aided institutions in higher education are strong enough to mobilise their own resources. The budgetary resources thus mobilised or saved are proposed to be utilised for expansion of primary education in regions, which are educationally backward within the State. In addition, the budget speech noted the need for raising tuition fee for students in government colleges in the State, as it is lower than in other States. For instance, the annual tuition fee for a B.Com. student in Karnataka is Rs.180 as compared to Rs.800 in Maharashtra and Rs.360 in Andhra Pradesh. However, if the revised fees are going to be beyond the reach of students who are poor but deserving, such students are proposed to be helped through educational loans from banks and financial institutions.
Most recently, in the budget speech of the Chief Minister (also the Finance Minister) of the State on March 26, 2001 announced (in para 67) that "the grants-in-aid code will be reviewed to enable the state government to deploy more funds for primary education. ....... Last year’s budget made abeginning to divert money from subsidised higher education to primary education. Once again, I appeal to the privileged sections of our society to make some sacrifices so that we may bring light into the lives of those more disadvantaged and deprived than us” (p.21-22).
137
On the whole, the policy studies, reports and statements above make reference to the presence of subsidies in higher education, and the need to reduce them for dilTerent reasons and by students' fee revisions, both at present and in future. Notwithstanding the policy concern with and need for reduction in budgetary subsidies, nowhere in the budget heads for higher education in the State, the term subsidy is explicitly used. Or, if at all subsidies exist, they should exist only in an indirect or implicit form and subject to interpretation as subsidies. Thus, identification of subsidies to collegiate education is a policy imperative in the State. At the national level, such a policy imperative is evident in NIEPA (2000b).
5.5.2. A general policy framework
A simple framework to explain the nature, composition and volume of budgetary subsidy to collegiate education in the State is developed below.
5.5.2.1. Nature and cost of educational services
Let us consider a college whose main objective is to provide for educational services to students’ admitted/enrolled in all courses offered within the college. Provision of educational services (PES) is used in the broad sense of the term to include all the services to students from the time of their admission to a course to the time of their graduation from a course. The PES is presumed to be strictly available and utilised by students within a college, or inter-college spillovers of services, either within an area or between areas, are assumed away throughout.
Let the total cost of PES is assumed to be divided between annualised fixed (non-recurring) cost (PC) and variable (recurring) cost (VC). Fixed cost includes expenditure on purchase of land, construction of building (including student hostel), purchase of furniture for staff and students, purchase of books for library, purchase of vehicles, purchase of equipment and machines (e.g. personal computers). Variable cost includes expenditure on (a) salary for teaching and non-teaching staff, (b) maintenance of buildings, furniture and vehicles, (c) payment of charges for water and electricity charges and property taxes, and (d) purchase of laboratory' materials, stationary and sports materials. Thus, the total cost (TC) of PES in a college is equal to:
138
TC - FC + VC - I (FC) + S (VCX (1)
It is presumed that PES in a college is financed from three sources, viz., governmental sources (GS), students' sources (SS) and college sources (CS). The GS is divided into State Government sources (SGS) and non-State Government sources (NSGS). The students’ sources include tuition and nontuition fees, which go to the State Government [(SS)sg], university [(SS)u], and the college [(SS)c]. The college sources include internal receipts [(CS)ir] and external (i.e. non-governmental) receipts [(CS)er].
It should be emphasised that the nature and sources of receipts depends on the types of colleges. However, the following analysis will be limited only to Government Colleges (GCs) and Private Aided Colleges (PACs), since State budgetary assistance to collegiate education is limited only to these two types of colleges.
In GCs, both recurring and non-recurring expenditure are entirely met by the State Government. In case of PACs, State Government expenditure is limited to meeting the recurring expenditure (i.e. staff salary) in aided courses. Thus, only the State Government meets a part of total cost of PES in PACs. Since select fees (e.g. tuition fee) paid by the students in GCs and
GfOPACs go to the Government, total receipts in a government college (TR ) and in a private aided college (TR^^) may be detlned respectively as follows.
= {(SGS)+ (SS)c + (SS)so - (SSX,}. (2)
TR^‘= ={(SGS)+(NSGS)+(CS),r + (CS)er + (SS)c }-{(SS)sc, + (SS)u} (3)
Thus, other things being equal, if tuition fee is increased (reduced), it shall result in lesser (larger) total costs to all GCs and PACs. Or, if nontuition fee of the State Government is increased (reduced), it shall result in lesser (lar£»er) total cost only to GCs.
139
Further, it is assumed that TC is less than or equal to TR in all colleges.
TC<TR (4)
Using the analysis of total cost and tinances above, a framework for estimation of subsidies is presented below.
5.5.2.2. Budgetary subsidies to collegiate education
Budgetary subsidy of the Stale Government to collegiate education is defined as the excess of total cost of PES over the total receipts from PES in GCs and PACs for the State Government. Or, in short, budgetarv subsidy is the unrecovered cost in PES for the State Government. Hence, all cost of and receipts from collegiate education should be defined only within the framework of the State budget.
Given the structure of total cost, receipts and financing of PES above, budgetary subsidy of the State Government to a government college (S ^) and private aided college (S^^^) may be defined respectively as follows.
goc j^Gc _ ^53^^ 5
= {(SGS) - (SS)sG} < TC (6)
where SGS represents the total cost of PES and SS represents the total receipts for the State Government in assisting the PES by the respective categories of aided institutions. However, most importantly, in all the categories of institutions, budgetary subsidy is less than the total cost of PES for the colleges.
5.5.2.3. Estimation strategy
Using the framework in Srivastava and Sen (1997: pp.14-17), and given the nature of budgetar>' expenditure on collegiate education, budgetary
140
subsidy for i-lh college, during the t-tli year, [(S)it ], may be estimated (separately for government and aided institutions, however) as:
where RE is the amount of revenue expenditure (net of transfers to lower levels of government and transfers payments) or recurring cost; L is the sum of loans advanced for the service at the beginning of the period; K is the sum of capital expenditure excluding equity investment at the beginning of the penod; RR is the revenue receipts: 6 is depreciation rate; and (j) is interest rate.
In short, variable cost is estimated by RE; annualised fixed cost is estimated by [(6 + (|)).K + <t> (L)]; and total recoveries are estimated by the RR. However, in estimating the rate of depreciation (6) and interest rate (4)), the methodology of Rao and Mundle (1992) will be used below.
Two points deserve special mention here.
First, as noted earlier, data on non-recurring expenditure under University' and Higher Education are not separated between universit\' education and collegiate education. However, in practice no capital outlay for university education and aided colleges have been allocated in the budget especially since 1980. This is evident in the various issues of the annual Performance Budget of the Education Department of the Government of Karnataka where a detailed information on the intra-departmental allocation of resources by universities and other Institutes of Higher Learning and [department of Collegiate Education is reported. For instance, in the Performance Budget 2000-2001 (on page 78), it is evident that during1997-98. 1998-99, 1999-00 (RE) and 2000-01 (BE) the entire capital expenditure/outlay under the budget head: (4202-01-203-1-01), has been on Government colleges only. Thus, estimated annualised capital cost for university and higher education is equal to annualised capital cost for Govenuiient colleges under collegiate education.
Sccond, in the Detailed Estimates of Revenue and Other Receipts of the F udget Papers, revenue receipts for collegiate education are reported under
141
the head of account: 0202-01. That is, under university and higher education (0202-01-103), tuition and other fees from Department of Collegiate Education (0202-01-103-1-02) are separately reported. These fees constitute total RR to the Government from the Government colleges.
5.5.2.4. Aggregation of budgetary subsidies
The specific steps to aggregate the subsidies to arrive at the aggregate subsidies to collegiate education are outlined below.
First, aggregate the budgetary subsidies for all the Government colleges (Sii^) and subsidies to private aided colleges
= V. ( s ,^ ) (8)
. = Si (9)
Second, compute aggregate subsidy (St) for the collegiate education in the State.
The aggregation framework above implicitly assumes that tlie allocation of subsidy is optimal. That is. marginal utility of money spent as subsidy by the government is uniform between colleges under GCs and PACs and between GCs and PACs. In fact this condition is the foundation for the entire aggregation analysis alxwe.
The required data for the computation of subsidies above will be drawn from the Budget Papers and Finance Accounts of the Government of Karnataka. These data will be supplemented by other sources including the Performance Budget of the Education ITepartment of the Government of Karnataka.
142
The results of estimation are separately presented for composition and volume of subsidies below.
5.5.2.5. Results o f estimation
5.5.2.5.1. Composition of estimated subsidies
First, for aided colleges, the composition of estimated budgetary subsidy is equal to the observed total plan and/or non-plan GIA to private aided degree colleges, since the observed GIA is net of tuition fee deposited with the Government.
Second, for Government colleges, the composition of estimated subsidies is obtained by subtracting the total fee income from the sum of (a) observed total plan and/or non-plan expenditure/outlay and (b) estimated annualised capital cost for the Government colleges. The estimated annualised cost is Rs. 174.75 lakh during 1990-91, Rs. 313.29 lakh during 1994-95, Rs. 558.71 lakh during 1998-99, Rs. 579.06 lakh during 1999-00 and Rs. 6()3.68 lakh during 2000-01. Throughout the analysis below, all figures for 1999-00 refer to Revised Estimates and for 2000-01 refer to Budget Estimates.
5.5.2.5.2. Volume of estimated subsidies
Table 5.7 presents the volume of budgetary subsidies to collegiate education for select years during 1990-91 to 2000-01 in the State. Since observed expenditure to aided colleges are net of tuition fee collected (if any, however) from within the colleges, no recovery rate (%) is reported.
The total volume of subsidies (i.e. plan and non-plan subsidies) to all Government colleges has increased from Rs. 1845.49 lakh during 1990-91 to Rs.3490.81 lakh during 1994-95, andirom Rs.5410.38 lakh during 1998-99 to Rs.7686.74 lakh during 1999-00 and to Rs.8439.34 lakh during 2000-01. In addition, the recovery rate is the highest (lowest) during 1994-95 (1999- 00) at 1.45 (0.99) percent. Thus, recovery rate has not been more than 1.5 percent in Government colleges during the study years.
In case of aided colleges, non-plan subsidies have always been higher than the plan subsidies. Further, unlike the non-plan subsidies, w'hich have been increasing over the years, the plan subsidies var\' in size between years.
143
For instance, the total volume of non-plan subsidies has increased (declined) from Rs. 5066.81 lakh during 1990-91 to Rs. 17183.93 lakh during 1998-99 and to Rs.43225 lakh during 2000-01.
The rise in non-plan is mainly attributable for implementation of new UGC pay scales and for the payment of new UGC pay scale arrears. For instance, the pay scale arrears budgeted during 2000-01 is Rs.24094 lakh for all aided general degree colleges. In sum, account for 54.86 percent of total non-plan subsidies to aided colleges in the State. In fact, the cost of new UGC pay scales since January 1996 is borne by UGC and the State Government as follows. That is, 80% for initial 51 (i.e. upto March 2000) by the UGC and the remaining 20% by State Government. Thus, from the financial year 2000-01, the entire burden is on the State Government.
The aggregate subsidies (i.e. subsidies to all Government colleges and aided colleges) have increased over the years. That is, from Rs.7360.62 lakh during 1990-91 to Rs.13659.76 lakh during 1994-95, and from Rs.22649.62 lakh dunng 1998-99 to Rs.25634.51 lakh during 1999-00 and to Rs.52039.34 lakh during 2000-01. However, the growth of the total subsidies between these years is not consistent. For instance, the percent increase in total subsidies between 1990-91 and 1994-95 is about 85.58 percent between 1994-95 and 1998-99 are about 65.81 percent between1998-99 and 2000-01 is about 129.76 percent.
Further, the share of aggregate subsidies in the total revenue deficit and revenue expenditure of the State Government has fluctuated between the years. For instance, during 1990-91, the aggregate subsidies as a percentage of total revenue deficit (revenue expenditure) was 93.28 (1.85) percent during 1990-91, 46.13 (1.88) percent during 1994-95, 18.64 (1.82) percent during 1998-99, 16.29 (1.75) percent during 1999-00 and 32.89 (3.03) during 2000-01. Since aggregate subsidies have increased over the years, the declining share of aggregate subsidies in total revenue deficit and in total revenue expenditure would only implies that revenue deficit and revenue expenditure have increased far larger than the aggregate subsidies.
It should be emphasised that the estimated budgetar>- subsidy of the State Government to the collegiate education above is basically an institutional iubsidy. This approach is quite different, as in Tilak (2001), from the >ubsidy for students in collegiate education as obtained by subtracting total ee paid by the students fi-om the total expenditure (including government
144
expenditure) incurred by different types of colleges. Tilak’s approach is not attempted here for lack of secondar>’ data on total expenditure by colleges and for lack of data on tuition and non-tuition fee paid by students in sample colleges (as evident in Table 5.10 above).
It might be added here that most recently the National Sample Survey Organisation (NSSO) has conducted a household sample survey in India, as a part of NSS 52” Round (July 1995-June 1996). The results are published in NSSO [(2000a) and NSSO(b)] at the national level as well as at the State level with rural and urban break-up. The results are related to level, nature and cost of attending educational institutions in India. For instance, average annual expenditure (Rs.) per student of age 5-24, pursuing general education on various items of exp>enditure (e.g. tuition fee, exam fee, other fee and payments, books, stationary, uniform, transport, private coaching and other expenses) are reported by level of education (e.g. primary, middle, secondary and higher secondary, and above higher secondary) and by institutions (e.g. government and \oca\, private aided and private unaided). However, post secondary general education is inclusive of normal university education for a degree including professional education like engineering, medicine and agriculture. Thus, the reported are helpful to compare the cost of education between levels of education in general education, but not for collegiate education in particular.
5.5.2.6. Reduction in subsidies: Recent attempts and impact
Over the years, subsidies to the aided colleges have helped to attract the qualified stafi as the salary for aided teachers under the GIA are in par with the salary of teachers in any related Government institution. In addition, the subsidisation policy to aided colleges has encouraged overall private participation in collegiate education in the State and has reduced the cost of production and provision of collegiate education in aided colleges. In the same way, in general, subsidies to government colleges have been able to reduce cost of buying higher education for students in the government colleges.
Notwithstanding the merits of subsidies to higher education, a need for reducing the subsidies to higher education, including for collegiate education has been voiced by the State Government in the recent past. The main argument for a reduction in subsidies is lack of resources with the Government in relation to the growing needs of resources from the
145
institutions (or expenditure-reduction objective) and/or to switch the resources from higher education to primary level of education (or expenditure-switching objective).
At present, the State Government has three policy measures in affecting the finances of the institutions in higher education. First, changes in the nature and size of subsidies as described above. Second, changes in students' fee in collegiate education. Third, encourage colleges to increase internal receipts or non-State Government sources of revenue. These policy measures are described below.
5.5.2.6.1. Changes in nature and size of subsidies
Over the years, the subsidies to aided colleges in collegiate general education have been reduced in various ways. First, all the private degree colleges established after June 1, 1987 have been started permanently on non-GIA basis. Second, since 1990-91, no new courses have been brought under GIA. Third, since 1993-94, there has been a ban on filling up vacant position of non-teaching staff Fourth, large number of teaching posts has remained vacant for several years and is being gradually converted into unaided posts. Fifth, in the budget for 2000-01, 15% cut in GIA to the colleges is announced. Sixth, since the private college management refused to bear the burden of the 15% cut or teaching and non-teaching staff did not want to get 15% less salary, the Government decided to freeze recruitment of about 1035 teaching staff positions and 724 non-teaching stafT positions, and reallocate the savings of about Rs.30 crore on this account towards the reduced GIA (hence, full salary payments for the staff for 2000-01). Thus, unlike in aided universities, where the reduced subsidies to aided colleges are to be recovered by the universities themselves, the Government itself has to fmd ways to finance or recover the reduced subsidies to aided colleges. This situation is due to the fact that the recipients of the subsidy to aided colleges are teachers (i.e. directly from the'^State Government) rather than the college management. Seventh, bifurcation of pre-university education from the existing composite degree colleges which, in the long run, will reduce the salar>' expenditure for new teaching staff to be involved in pre- universitv' education. Eighth, most recently, the Government has been considering the closure of traditional courses in aided colleges where the enrolment of total students for a course is less than 40 students and/or where the workioad for the teaching statf is not full (e.^. 16 hours of teaching for
non-science teaching staff). The staff of such closed courses is to be transferred to other aided colleges where the workload exists.
The above gradual approach to reducing subsidies to aided colleges in Karnataka State is in contrast with the experience of Madhya Pradesh. For instance, the Madhya Pradesh Government decided to stop financial aid to 100 private colleges from 1998-99. The aid had cost the State Government to the tune of about Rs.30 crore per annum. The Government’s decision was defended on the following grounds. First, literary and primary education but not higher education is priorities for the State. Second, the fX)or are not deprived of opportunities for collegiate education as the State has 450 Government colleges. Third, if the removal of aid would lead to enhanced fee structure in private colleges, and make collegiate education costly for poor students, such students could enroll for courses offered by the open universities.
5.5.2.62. Changes in student fees
An increase in students’ fee may be motivated by two reasons. First, to offset the increasing total cost of provision of educational services in collegiate education, given the nature and amount of subsidies and other things being equal. Second, to reduce the subsidies to collegiate education, especially with changes in tuition fee which is generally shared between the college and State Government, given the cost of provision of educational services and other things being equal.
Regardless of the motivations above, the State Government fixes the students’ fee in collegiate education, which is applicable, in general, to Government colleges, private aided and unaided colleges in the State. Over the years, the students' fees have remained both low and constant. For instance, in the recent past, the students’ fee was revised in 1993 and was implemented from 1993-94. In total, a degree college student in B.A. coitrse was charged Rs.355 (including Rs.80 towards the laboratory fee). The SC/ST students were exempt from paying the tuition fee. In 1997, this fee structure was proposed to be changed. The total fee chargeable was proposed to be Rs.l530 (with Rs. 600 for as tuition fee and Rs.400 as laboratory fee), an increase of about 331 percent over the 1993-94 fees. However, this fee structure was never implemented. For the current academic year, the fee stnicture is revised with a total fee payable by a degree college student at Rs.835 (tuition fee Rs.500 and laboratory fee
14'
Rs.l60), an increase of about 135 percent over the 1993-94 fees. Onginallv, this fee structure was applicable for all the degree students studying I year. II year and III year courses. Subsequently, it was mcxliried to be applicable only for the I year degree students during 2000-01. The modified lee structure has reduced the tuition fee and laboratoiy fee to Rs.400 and Rs.l 10 respectively.
A study done by Narayana (1999b) on the impact of the proposed total fee revision of 1997 on financing of GIA in 31 sample aided degree colleges in Bangalore districts of Karnataka State found the following evidence. The sum of total fee collectable by all sample colleges (if all non-SC/ST students were to pay all the fees which are reimbursable by the colleges themselves) during 1997-98 equaled to about Rs.l2 lakh according the 1993-94 rates: Rs.l 14 lakh under the 1997-98 (or proposed) rates; Rs.l67 lakh under the proposed rates if only the tuition fee is doubled: Rs.l78 lakh under the proposed rates if only the tuition fee and laboratory fee are doubled. As a ratio to total GIA to all sample colleges (=Rs.l624 lakh), the total fee collectable above accounted for 0.74 percent. 7.02 percent. 10.28 percent and 10.96 respectively. Thus, only about 10 percent of the current size of GIA could be financed through the proposed total fee revision. Since the fee revision during 2000-01 is far less than the proposed revision in 1997. and other things being equal, students' fee revision may not contribute to financing a reduction in GIA beyond 10 percent per annum.
It must be admitted that the fee structure in collegiate education is relatively lower and uniform between government and private colleges and between all courses [i.e. between professional courses (e.g. management related courses), vocational courses (e.g. Industrial Microbiology) and nonprofessional and non-vocational courses (e.g. traditional courses in B.A. B.A. and B.Com. degree)]. In contrast, the fee structure in the collegiate education under other types of higher education in the State is both higher and diversified. This is evident below in regard to annual tuition fee for the academic year 2000-01.
In teachers’ education under general education, tuition fee is Rs 3000 in government colleges, Rs.3000 (Rs.8000) for government seat (management seat) in private aided colleges and Rs.6000 (Rs.30000) for government seat (management seat) in pri\ate unaided college.
148
In technical education,, the tuition fee for a non-SC/ST student (a SC/ST student) is Rs.l600 (Rs.400 ) in Government poMechnics: Rs.3000 (Rs.800) \n aided poKtechnic colleges, and Rs.6500 (Rs.10,500) for students from Karnataka (outside Karnataka) State in unaided private polytechnics. In engmeering education, Rs.6000 (Rs.36000) is the tuition fee for free seats in government and aided colleges (for payment seats in private aided and unaided colleges), and USS4000 for NRI seats in private aided and unaided colleges.
In medical education (allopathic), for B.Sc. nursing, Rs.lOOO for free seat in Government college. Rs.2000 for free seat in private colleges and Rs.35000 for payment seats in private colleges. For B.Pharma and B.Sc. in physiotherapy, Rs.2(X)0 (Rs.4000) for free seats in Government (private) colleges and Rs.40000 for pavment seats in private colleges. For medical (dental) colleges, tuition fees for free seat is Rs.8000 (Rs.6000) and payment seats var\’ between Rs.80000 to Rs. 100000 (Rs.70000). In medical colleges (non-allopathic). tuition fee is Rs.3000 in government, private aided and private unaided colleges.
Thus, there is a need for both increasing and diversifying the fee structure between government, aided and unaided colleges in the State. In this connection, several major policy issues arise, such as. how much of which fees is to be raised and when, and whether or not the rise in fees should be uniform between students in ditYerent colleges located in rural and urban areas?
In fact, some of the issues above have already been focused in public reports on higher education m the country in the 1990s. These reports include Punnayya committee Report on UGC Funding of Institutions of Higher Education in 1993; P\lee committee Report on the Recommendation of the Punnayya Committee relating to the unit cost of higher education and other related issues in 1997, Anandkrishnan committee to Review the Maintenance Grants Nomis for Delhi Colleges in 1999; and Mahmood-ur Rahman committee to Formulate Revised Fee Structure in the Central and Deemed Universities in 2000 While these reports make a case for upward revision in fees, the recommended nature and extent of revisions varv' between the committees, l or instance, the Punnayya committee argued tor upward revision of tuition lees with immediate effect and for its pericxiical adjustment, keeping in view the rate of inllation. The Anandakrishna committee noted that the tee structure be reviewed at the end of each plan
W9
period and increased by 20% to account for increasing cost of education. The Mahmood-ur Rahman committee argued that 3% of the unit cost worked out by Punnayya committee should be the basis of fee structure which may be increased every year to the extent of In addition, aReport of Consultative Committee Meeting on Funding of Higher Education& Fee Regulation by NIEPA (2000b) recommended, among others, a differential fee for students coming from different economic background. That is, 15% additional fee for students whose parental income is between Rs.2 lakh and Rs2.5 lakh; 20% additional fee if the parental income is between Rs.2.5 lakh and Rs.3 lakh and 35% additional fee if the parental income is above Rs.3 lakh. Notwithstanding these diversities, the recommendations of the committees do serve important guidelines for designing of a revised fee structure for general education in general, and for collegiate education under general education in particular in the State.
However, there will be a need to help the poor students as a consequence of any upward revision of fees. In this connection, following two alternatives may be considered.
First, students may be provided with loan facilities and, thereby, make the students to pay for their own higher education. In an interesting study of loan financing higher education of 308 students by a commercial bank in Bangalore districts, Seetharamu (1997) described that 306 or about 99 percent of sample students belonged to technical, medical management and other professional courses. And, about 302 students took loans for payment of tuition fee in their courses. However, the study revealed that loan financing is not popular among the students in general education.
Second, distance education (through correspondence courses or Open University scheme) is often suggested as an important way of reducing the cost of higher education for students. Here, care should be taken in defining the cost of education for students. One way is define it only in terms of payment of fees for the colleges, and then comparing the cost of education between regular and distance education. The other way of defining the cost of education for students is to take into all expenditure on college fees, commuting cost, boarding and lodging, books etc. In this regard, obviously, out of station students in regular education may find the distance education less costly.
150
Other measures include increase in internal receipts of the colleges through charging differential fee for unaided and professional courses, endowments, charity, philanthropy, and alumni association (i.e. donations after graduation) and consultancy. In the same way, cross-subsidisation of students between professional and non-professional courses, and between aided and un-aided courses may be considered.
It is important to single out the role of charity by the temples for he development of colleges in the State. For instance, the temples, which cone under the Endowment Act, are entitled to set apart a certain portion of he total receipts for purposes of charity including for running educatioaal institutions. In fact, Shri Durgaparameshwari Temple First Grade College in Mangalore University, which is one of the unaided sample colleges of tiis report, is under the administration and charity of Shri Durgaparameshwari Temple at Kateel. The charity includes free lunch for all college studeits during the working days.
Unfortunately, in general, the details of other receipts of the colleges above are not published (or not reported, as that is evident from the reported sources of receipts in Table 5.11 above) by the colleges. This is mainly die to two reasons. First, these receipts go to the management account ratler than for college accounts. Hence, college finances do not report th<se receipts. Second, additional resource mobilisation through donations, eitler during or after the admission to new professional courses, (e.g. in the fom of building and library funds) are not disclosed, as they are prohibited un(er the provisions of the Karnataka Educational Institutions (Prohibition of Capitation Fees) Act, 1984. Hence, no impact analysis of other receipts )n the development of the colleges is possible in this report.
5.5 .2 .63. Other measures
CHAPTER 6
Management and C o-ordination
The main objectives o f this chapter are to describe the existing management and regulator\' structure of collegiate education and to discuss sone important measures that may be required to improve etTiciency, quality anc additional resource mobilisation by colleges m the State.
6.1 Policy framework for manaRcment and coordination o f collegiate education
n Chapter 2 o f this report, the structure and organisation of collegiate edication in the State was described in detail. The stnicture was defmed in terns of different institutional and non-institutional agents and their associated functions/roles in the collegiate cducalion. The \nsti\utiona\ ageits included the university, UCj C. State Government, and management o f private colleges. The non-institutional agents included the stafl' and students in tie colleges. The interactions between all these agents constituted tlie orginisation, or organised system o f the collegiate education in the State.
further, as noted in Chapter 2, the management, regulation, promotion and co-ordination o f activities in collegiate education are spread across insttutions and agents. For instance, tlie State Government controls the pemission to be given to establish a new college: amount o f GIA to be allocated to the private aided colleges: recruitment o f staff on GIA in private aidei colleges; fixation o f students' fee in all colleges under collegiate eduiation: fixation o f staff salarv in colleges and monitors the impementation o f reservation and roaster systems m pnvate aided colleges. The University deals with all academic aspects o f the colleges through grarting aflQliation to courses and colleges, fixing the curricula, conduct exanination and evaluation, award degrees and provide financial assistance to dfiliating colleges. The UGC sets standards for recruitment and pronotion o f teaching stafit provides financial assistance to (a) colleges for development purposes; (b) for vocationalisation at the first-degree level and <c) autonomous colleges. The pnvate college management pla>s a signtkant role in taking all the initiatives to establish the colleges, recruit stali provide infrastructure facilities, mobilise funds for college deveopm ent etc.
152
In view o f the above, the development of collegiate education is a consequence o f the regulatory and promotional activities o f the State Government, the University, UGC and the pnvate college m anagem ent (in case a college is not a Government college). Since the activities o f different institutions and agents are inter-related, it is necessar\' to deal with the issues under common policy frameworks.
As noted in Chapter 3 o f this Report, qualitv' o f collegiate education refers to the quality o f outturn o f students, which in turn depends on the qualit> o f teaching s ta ll and infrastructure in the colleges. Interestingly, measures to improve the quality o f these inputs in the State, either directh or indirectly, are also a part o f the promotional policies and program.mes for collegiate education.
The important policy frameworks for regulation and promotion o f collegiate education in the State are as follows.
6.1.1. Karnataka State Universities Act 1976
llie most important policy framework for the management, regulation and co-ordination o f atTiliated colleges in the State is the Karnataka State U nnersities Act 1976 (or. in brief the Act). The specitic provisions o f the Act are highlighted below in regard to ditlerent aspects o f working o f collegiate education in the State. The most important sections in the Act to be considered below are (a) .section 20 through section 34A on Authonties o f the Universit>” (b) section 29 on Board o f Studies: (c) section 53 through 56A on AtTiliation of Colleges and Recognition o f Institutions; (d) section 61B on Karnataka State Inter Universit\' Board: and (e) section 66 on Relations o f Affiliated Colleges with the Universit>.
6.1.2. State Government Orders
rhe Department of Collegiate Education under the Education Department of the State Government can issue orders on various aspects o f the working o f the collegiate education in the State. The Department is mainly respi'jnsible for the administration o f all Government colleges and private aided colleges in the Stale, fhe orders may be related to service conditions (e.g. salarv’, allowance.s. increment, promotion and transfer) o f the s ta ll fixation o f student fee (except those fees which are fixed by the universities) in degree colleges, grants-in-aid for private aided degree colleges, and
153
reorganisation of collegiate education (e.g. bifurcation of pre-university education from composite colleges).
6.1.3. UGC regulations
The U(jC is a national and stalutorv’ body (established in 1956) for (a) co-ordination, determination and maintenance of minimum standards of instruction and qualitl cations of teachers: (b) pro\iding with universities and colleges the financial grants for research and development activities: and (c) promoting excellence and enhancing standards for institutions in higher education through national assessment aiid accreditation programmes.
The regulations and promotions of the IJGC are clearly evident in six important areas.
First, m specifying the qualification and experience for recruitment of teaching stafl' through direct recruitment and through internal promotion. These specifications are given in the "UGC Regulations. 2000 Regarding Minimum Qualifications for Appointment and Career Advancement of Teachers in Universities and Colleges". The Regulation, for instance, specifies the qualification for Principal (Professor's Grade), Principals (Reader’s Grade), Professor, Reader and Lecturer by direct recruitment. Under career advancement qualifications for Lecturer, Lecturer (Senior Scale). Lecturer (Selection Grade), Reader (Promotion) and Professor (Promotion) are specified.
Second, in stipulating higher qualifications and training for teaching staff. For instance, under career advancement, for movement into grades of Reader and above, the minimum eligibility criterion is a Ph.D degree. Those without Ph.D can go up to the level of Lecturer (Selection Grade) with participation in required number of Refresher Courses andor Orientation Programmes. In the same way. National Eligibility Test (NET), conducted since 1989, or State Level Eligibility’ Test (SLET), is a compulsory' requirement for appointment as Lecturer e\en for candidates having Ph.D degree, except for those who have completed M.Phil degree or have submitted Ph.D thesis up to March 31, 1993. Third.
Third, in providing opportunity for pursumg research for college teachers under the UGC Scheme of Teacher Fellowship for Professional Development.
154
Fourth, in introducing new UGC pay scales for colleges teachers with effect from Januar>' 1. 1996 as a measure of attracting and encouraging the talented and competitive teachers m colleges.
Fitth, m providing financial assistance m the form of development grants for colleges which are having permanent affiliation with state universities, includmg for vocationalisation at the First Degree Level since 1994-95, and for autonomous colleges. For instance, the ceiling of assistance provided under the autonomous colleges scheme (depending on the location and courses offered in the colleges, however) is Rs.4 lakh or Rs.6 lakh for Arts Science/ Commerce colleges with undergraduate courses only, and Rs.8 iakh for colleges with both undergraduate and post-graduate courses.
Sixth, establishment of National Assessment and Accreditation Council (NAAC) in 1994 with the main objective of helping them to work continuously to improve the qualit>' of education. The NAAC approaches evaluation of institutions for the purposes of accreditation and grading in three stages. First, submission of self study report by the unit of assessment. Second, on-site visit of the peer team for validation of the report. Third, final decision by the Council to star-grade the institution from one star to 5 stars The cnteria for NAAC s assessment include curricular aspects: teaching-leaniing and evaluation: research, consultancy and extension; infrastructure and learning resources: student support and progression: organisation and management: and healthy practices. In fact, the detailed methodology of NAAC is outlined in its publication entitled: “Manual for Self-study for Affiliated/Constituent Colleges”.
Up to the end of March 2000. only 2 State Universities and 3 affiliated colleges were accredited by the NAAC. However, during 2000-2001, 2 State Universities and 14 affiliated general degree colleges did obtain NAAC's accreditation in the State with varv ing number of stars. Thus, up to the end of March 2001, only about 1.84 percent of total affiliated general degree colleges in the State is accredited by the NAAC.
It is gratifying to note that in a recent Workshop on Accreditation and Assessment of Distance Education (June 20-21, 2001: Bangalore), NAAC’s recognition is made mandatory tor institutions in distance education in the country'. Accordingly, for instance, the Karnataka State Open University should seek NAAC’s recognition before December 2003.
155
6.2.1. Establishment of a college
Under section 53 (or u/s 53, in briet) of the Act, colleges within the University area may be affiliated to the University by the University’ on the recommendations of the State Government.
To start with, a college shall apply for atTiliation to the University with a justification on the need for establishing a new college in the locality, "having regard to the type of education intended to be provided by the college, the existing provision for the same type of education made by other colleges in the neighborhood and the suitability of the locality where the college is to be established" [u;'s 53 (2 (a)]. In addition, the management shall have to satisfy the appropriate authorities of the University in regard to various requirements for starting a new colleges, such as, teaching staft buildings, library, laboratory; hostel and student fees. In general these requirements are made explicit as per the statutes framed by the University' from time to time. This is evident, for instance, in the ‘'Draft statutes relating to grant of fresh affiliation/renewal (continuation) of temporary affiliation to colleges and institution and withdrawal of such affiliation/permission for the bifurcation; shifting of the locations of the affiliated colleges and institutions” of the University’ of Mysore.
Upon receiving the application from the college for new affiliation, the University’ shall send a Local Inquiry Committee (LlC) to inquire into whether affiliation for the college is recommendable or not. However, the recommendations of the LIC are placed before the appropriate bodies of the University and recommendations on affiliation to the colleges are sent to the State Government for approval. If approved by the State Government, the University' shall notify the atfiliation to the college.
Thus, for starting of a new college, application has to be given by the college, permission is granted by the State Government and affiliation is granted by the University.
It might be added here that once a college is affiliated, it has to renew (or, continue) its affiliation every year. In the same way', all new courses to be started in affiliated colleges must be affiliated to the University. Such atTiliation to be renewed every year is called temporary' affiliation. However,
6.2. Select regulatory and promotional policies for collegiate education
156
an affiliated college may appl> for and be grated permanent affiliation by the University, on the recommendation of the State Government. In this case, affiliation should be renewed once in tlve year. Thus, State Government's permission is essential for fresh affiliation as well as for permanent affiliation to the universities in the State. As a passing reference, it should be noted that permanent affiliation is an essential condition for seeking UGC assistance to colleges in the State.
In addition, u/s 56 of the Act, there exists a provision for withdrawal of affiliation of a college to the university’. For instance, under sub-section ( I ) (i.e. u s 56 (1)), ‘‘the rights conferred on a college by affiliation may be withdrawn in whole or in part or modified if the college has failed to comply with any of the provisions of section 53 or the colleges has failed to observe any of the conditions of the affiliation or the college is conducted in a manner which is prejudicial to the interests of education”. However, there exists a detailed procedure to withdraw affiliation as outlined from subsection (2) through sub-section (7) of section 56 of the Act. In particular, the State Government's recommendation (or permission/approval) is essential before the University issue an order for withdrawal of affiliation to the college.
It should be emphasised that when affiliation is newly or pennanently granted or renewed/continued, the University also fixes the following for the colleges. First, the intake of students in a class or course. Second, subjects that the college can offer. In addition, the University' prescribed the combination of subjects in a course (e.g. Historv’. Economics and Political Science for B.A. degree course) and syllabus for all subjects, which are applicable for all atTiliated colleges.
However, in general, the University' does not involve in admission of students to colleges. Thus, criteria for admission of students are college- specific in the State.
6.2.2. Reorganisation of collegiate education
An important policy for Reorganisation of collegiate education in the recent past is evident in the bifurcation of composite colleges or bifurcation of Pre-university (or, in brief, PU) education from degree colleges. This pt licy is elaborated below.
\>i
Three t> pes of colleges have imparted PU education in the State. First, composite junior colleges which combined PUC and high school education and coming under the administrative control of Commissioner of Public Instruction. Second, junior colleges which impart only PU education and coming under the administrative control of Director of PU Education. Third, composite degree college which includes PU and degree education, and coming under the administrative control of Commissioner Director of Collegiate Education.
At present bifurcation of PU education from secondary education is completed. Thus, bifurcation of PU education from degree education was started in 1997 (as per GO No.ED 313 UPC 92, dated 17-06-97) and is being completed ( as per the GO No.ED 140 DCE 2000, Bangalore, dated: 09 Ma\ 2001). The mUjor provisions of the latest Government Order are as follows.
♦> The Government has considered that teaching PU and degree courses in the same college as inappropriate. This consideration is also in line with the recommendation of the UGC for implementation of revised pay scales for universit> and college teachers. Otherwise, PU teachers in composite degree colleges are paid higher salar>' than PU teachers in junior colleges. To remove this anomaly, the junior college teachers should be given the UGC pay scales. Otherwise, bifurcation is the only alternative to deal with the problem.
♦♦♦ Total number of composite GCs (PACs) to be bifurcated is equal to 17 (164) out of 151 (292). However, bifurcation is exempted for VHD Home Science composite degree college in Bangalore, as it is the only college of its type in the State.
The bifurcated PU education would come under the administrative control of Directorate of PU Education with immediate effect.
Minimum enrolment in science/arts/commerce faculty or courses is fixed at 120 (80) students in degree (PU) colleges.
Workload for full time lecturer is fixed at 16 (20) hours in non- experimental (experimental) subjects. After fulfilling this workload, if extra-workload exists at 12 (16) hours in non-experi mental(experimental) subjects, then such extra-workload may be considered as workload for a full-time lecturer in the college
158
While allocating the teaching statY between PU and degree education, experience and additional qualifications (e.g. Ph.D., M.Phil, SLET or NET) staff may be retained in the degree colleges.
Redeployment of excess staft’ between colleges run by the same management.
Bifurcated college teachers in PU courses are guaranteed salarv' protection and same designation as they were in degree colleges. Such PU teachers would come under the administrative control of the PU Directorate. However, whenever vacant positions arise in degree colleges, such PU teachers may be employed back in degree colleges, provided they satisfy the qualification and experience as per UGC guidelines and on seniority basis. In case there exists a shortage of teaching staff for new PU colleges, the staff of degree colleges may be deputed for tw’o years or less if the vacancy is filled up.
All library and physical education facilities of degree colleges would be continued to be provided to bifurcated PU colleges.
Except for current working teaching and non-teaching stall' positions, all other vacant positions are to be treated as unaided in the degree and PU colleges.
Until the Government makes alternative arrangements, the salar> and allow'ance of bifurcated PU staff shall be paid by the Department of Collegiate Education.
PU education in aided composite evening colleges would be closed from this academic year, 2001-2002. And. the staff shall be redeployed in places where the workload exists.
► At^er bifurcation, if the number of students enrolled in science and commerce courses are loo less, such courses may be closed. And, admission of students to such closed courses may be facilitated in nearbv colleges.
159
♦> If a place has many composite colleges and after bifurcation takes place,the bifurcated PU colleges may be merged depending upon the studentstrength.
In short, the major provisions of the bifurcation of composite colleges are related to consolidation of resources, transfer of staftl closure of courses and;br colleges, merger of colleges and abolition of stalY positions. These provisions are made to offset the decline in the enrolment of students as a consequence of bifurcation of composite degree colleges.
6.2.3. Curriculum
Under section 29 of the Act, “there shall be a Board of Studies for ever> subject or group of subjects as may be prescribed by the ordinances (Provided that separate Board of Studies for Under Graduate studies and for Post Graduate studies in an> subject or group of subjects may be constituted by the Syndicate where felt necessar>)” [u/s 29(1)). Further, ‘‘the constitution, functions and powers of the Board of Studies shall be prescribed by the Statutes" [u/s 29(2)]. For instance, the Bangalore University has constituted Board of Under Graduate Studies including in Economics. The Chairman of the Department of Economics of the Bangalore Universitv is also the Chairman of the Board. The members of the Board include 4 nominated members from the affiliated colleges within the University and two nominated members from the colleges outside the University. The most important functions of the Board are to recommend new subjects and courses, prepare and recommend the syllabus and to recommend textbooks for all papers in different subjects, which are taught or to be taught, in the respective discipline.
Thus, affiliated colleges are involved in the preparation of curriculum, but colleges themselves cannot introduce new courses and prescribe syllabus for the courses.
6.2.4. Examination system
In the present system of collegiate education, performance of students are determined by the percentage of marks obtained in the annual examination, conducted and evaluated b> the concerned university for the purpose of aw'arding degree and diploma certificates. Thus, the university decides all
160
aspects of the examination including the examination fee for all students in the affiliated colleges.
There are tvvo key issues in regard to reforming the existing examination system in the collegiate education.
First, the annual examination system lacks specific mechanism for continuous monitoring of students’ learning performance. However, colleges may conduct the mid-term examination and/or periodic class tests only to train students to do well in iinal examinations, since marks obtained in midterm and class tests do not add to marks obtained in final examinations. Consequently, there is less seriousness on the part of the students to prepare for and pass in the mid-term and class tests. Further, the present system is often said to be heavily dependent on memorisation and involves examination-centred teaching-learning process.
Second, the nature and number of subjects of study in the present degree courses are decided (if only, there exists few combinations of subjects) at the beginnmg of the study. Students do not have options to choose subjects according their levels (i.e. from elementary to advanced levels through an intermediate level).
Thus, there is a need to introduce a system wherein students have flexibility' of choosing subjects and their levels in a degree course with scope for continuous monitoring of their learning performance. This need calls for a change in the examination fi-om the present annual examination system to a credit-based, semester scheme. It might be recalled that the University of Mysore did introduce marks-based, semester scheme in post-graduate courses in the late 1970's through 1980's. Subsequently, however, the semester scheme was replaced by the earlier annual examination system. At present, credit-based, semester scheme of education is not prevalent in the collegiate education under general in the State.
Over the vears, the University of Agricultural Sciences (UAS) in the State have been successfully practicing the credit-based, semester system in its undergraduate and post-graduate courses. Thus, the experience of UAS IS of vital importance for introducing credit-based, semester scheme in colleges of general education in the State.
161
The development o f collegiate education is contributed by difterent government and non-govcniment institutions. Thus, co-i^rdination between institutions is essential for orderly growth of the collegiate education, such as. between universities in the Stale; between students, parents and colleges administration and management: between atliliated colleges and StateGovernment; between affiliated college and the university: between affiliated college, the university and the State Government: and between universities and State Government m the Stale.
The Karnataka State Universities Act 1976 makes provision for coordination of between the universit>, affiliated colleges and State Government b> giving representation to affiliated colleges (i.e. principals of affiliated colleges) and State Government (i.e. Director o f Collegiate l\ducation) in various autlionties o f the university, such as. Academic Council, Senate and Syndicate, hi the same way. co-ordination in curricular aspects between affiliated colleges and the university is ensured b> giving membership to professors of affiliated colleges in Board o f Under-graduate Studies. Further, the Act makes pro\ision for Karnataka State Inter University Board for co-ordination between universities and the State Government in regard to (a) development o f academic facilities, specilisation and standards; (b) matters atfecting students, such as, eligibility for admission, mobility and examinations: and (c) compliance withreservation and roaster system in the universities. Since Vice Chancellors o f all the Universities including the Karnataka State Open Universitv. the Board is also a co-ordinating body between regular education and distance education in the State.
Outside the A ct co-ordination in the collegiate education is ensured between college administration and State Government (through meetings organised in the Department o f Collegiate Education with the college principals); between college management and administration (e.g. by giving representation to college pnncipal and staff in the management committee): and between parents and colleges administration and or management (e.g. by organising meetings with parents).
6.2.5. Policy and mechanism lor co-ordination
162
The present system of atTiliating colleges has many promoters and regulators with multiplicit> o f rules and regulations over ever>' aspect o f the working o f colleges in the State. Thus, colleges lack autonom y in their fiinctioning for achieving their academic goals. O ver the years, lack o f autonom> has resulted in colleges being less innovative and responsive to the changing needs o f the societv; politv' and economy. Thus, there is a need for alternative systems o f colleges to the existing t \p e o f affiliating colleges, hi what follows, these alternative .systems are argued for introducing autonomous colleges and communitv colleges in the State.
6.3.1. A case for autonomous colleges
The concept o f autonomous college is not new. As UGC (2001) notes: "the Education Commission 1964-66 had recommended the concept o f Autonomous Colleges with a view’ to providing academic freedom for potential colleges, specially designing their curricula, evolving new methods o f teaching, research and learning, framing own rules for admission, prescribing own courses of study and conduct o f examination. Under the autonomous colleges scheme o f the UGC. a college declared autonomous b> its affiliating universit\ is fully accountable for the content and quality o f education it imparts. Such a college is also responsible for setting its own examination papers and for the conduct o f examinations. The College evaluates the students for the award of degree which will be accepted by the parent universitv".
6.3.1.1. Iixpenence o f Tamil Nadu
lamil Nadu is one of the States, which has implemented the concept o f autonomous college as back as 1978-79. The Tamil N adu experience is aptlv summarised b> Victor (2000) in the following words.
“By granting autonomy, the colleges are enabled to frame their own syllabus according to the current needs, set question papers and conduct examinations Fhese autonomous colleges have their own academic councils and Board of Studies. This academic freedom given to the colleges facilitate them to revise and moderni/e the syllabus and curriculum whenever required without approaching the University concerned for approval Autonomous Colleges otVer a large num ber o f Diploma and
6.3. Need for alternative systems o f colleges
l o 3
Certificate Courses in addition to conventional degree courses. But however the degrees are awarded by the University concerned. By getting autonomous status the colleges become eligible for more quantum ot' University' Grants Commission’s assistance. The University Grants Commission has also inspected the present autonomous colleges and they have recommended for continuation of their autonomous status for 5 more years. There are 44 Autonomous Colleges in Tamil Nadu which is more than those in any other State in India” (p.4).
It might be added here that by the end of March 2001. 25 out of 44 or 57 percent of autonomous colleges in Tamil Nadu are accredited by the NAAC.
Further Victor notes the follow ing.
‘"Autonomy has enabled the Colleges not only to be mnovative, socially relevant and accountable but also play a key role in supplementing the efforts of the Goverametit by way of participation and contribution to the social welfare programmes. I he vanety of courses offered by the college, the inter-disciplinarv' accessibility' to the students for courses of their choices, the credit-based evaluation system which provides opportunities for individual achievement/attainment on differential mental capabilities - all these are point in favor. The variet>’ of courses and subjects offered by the various autonomous colleges spread throughout the State in urban, semi- urban and rural areas attempt to cater to the aspiration and achievements of the people” (p2).
Thus, the experience of Tamil Nadu State in regard to introducing the autonomous colleges is positive and, hence, is encouraging for Karnataka State to introducing the concept of autonomous colleges.
6.3.1.2. Experience of Karnataka
The Karnataka State Universities Act 1976 has a provision for autonomous college under section 56A. For instance, “notwithstanding anything contained in this Act or the Statutes, Ordinances and Regulations made thereunder, the University' may with the prior concurrence of the State Government and the University' Grants Commission, designate for such period as may be specified, an affiliated college, department or unit as an Autonomous College for any course of study, after following the procedure and subject to such conditions as may be prescribed in the statutes made in
164
this behalf and with a view to improve the quality of education and to introduce new and relevant courses of study" [u s 56A( 1)],
Nevertheless, to date, Karnataka State has no autonomous college in :ts collegiate education. Thus, autonomy to the colleges is a new concept and experience to be tried in the Karnataka State.
6.3.1.2.1. Recent proposals to granting autonomy to colleges in Karnataka
It is gratifying to note that the State Universities, such as. University of M>'sore, Kuvempu Universits and Mangalore University; have drafted statutes relating to grant of autonomy to their affiliated colleges.
For instance, the University of Mysore has prepared the Statutes relating to the Grant of Autonomy to the Colleges of Mysore University' in 1999. Tlie preamble clearly recognises the need for the autonomous colleges in the following words. "The archaic system of affiliation has provided little or no scope for college to innovate, experiment and standardize the activities related to learning, examination and traming. Therefore, it is time that some, if not all colleges are given the statues of autonomy to accept the new challenges in terms of quality and excellence of a new century".
I'he Statutes of the University of Mysore are related to many aspects including application for grant for autonom y, procedures for grant of autonomy ; relationship of autonomous colleges with the Mysore University; composition, powers and functions of Governing Body, Academic Council, Board of Studies and the Board of Examiners; composition, pt^wers and functions of Governing Body in autonomous Government College, University maintained colleges. Minority colleges and in other colleges; review and evaluation; rights and privileges of college which has been granted autonomy; award of degrees through the Mysore University; and withdrawal of autonomy.
Ihe rights and privileges of an autonomous colleges include (a) prescribing syllabus, courses of study, providing new courses and subjects of study; (b) arranging for instructions of students; (c) devising methods of evaluation, examination and tests leading to award of degrees (and Diplomas) by the University; (d) admission of students to courses of study; (e) framing of mles, byelaws and regulations; and (t) starting of Diploma (undergraduate or postgraduate) and certificate courses. While the Diplomas
165
and Certificates shall be issued under the seal of the college, the University alone has the right to award degree to students evaluated and recommended by autonomous colleges with explicit mention of the name o f the college on the degree certitlcate.
I hus, autonomous colleges are the new hopes of brining in innovations, dynamism, and for improving quality and relevance o f collegiate education in the State.
Three important limitation of proposed autonom\ to colleges by University o f Mysore is as follows.
6.3.1.2.2. Some limitations on the proposed autonomy to colleges
First, all aspects of proposed autonom> by the University o f Mysore are related to academic matters within the pun iew o f the Universitv. However, collegiate education in the State is not onl> regulated and promoted by the Universities, but also b\' the Slate Go\em m ent. among others. Thus, autonomy to colleges does not mean that colleges are free from all regulator>' and promotional functions of all regulators and promoters of collegiate education in the State.
Second, the cost of autonomy may ha\ e to be borne by the colleges and students within the colleges. This is because of the fact that any new' subject or course o f study, or evaluation of students (through examination reforms), to be introduced involves additional financial resources for the colleges. If the additional cost were to be met by resources within the colleges (i.e. through student fees and-or non-student sources), the colleges would need autonom y and flexibilit> in raising and spending additional resources. At present, the proposals for autonomy to colleges do not cover aspects o f financial autonomy to colleges in the State.
Third, autonomy entails a lot of additional responsibility, work, accountability on the s ta ll students and management o f colleges, and high standards in conduct of examination especially if a credit-based, semester system o f education is introduced. If colleges do not like to take up additional works and responsibilit\ and ensure accountability, there may not be man>' colleges to become autonomous ever although its University ma> otYer autonomv.
166
In order to improve etilciency, qualit\ and additional resource mobilisation within the framework of proposed autonomy to the colleges, there is a need to consider financial autonomy in three specific areas.
(i) Fixation of student fees at the college level
There is a need to fix the student fee at the college level. At present, student fees in collegiate education are fixed by three insfitutions. (i) State Government fixes the tuition, laboratory, admission, reading room, sports, library fee including binding and mid-term examination fees, and for student welfare and staff welfare funds, (ii) The University fixes the examination, sports development and registration fees, (iii) The college management fixes fees in respect of student union, cultural activities, college magazine and identity card. However, the largest of all the fees are fixed by the State Government viz., tuition and laboratory fees.
The main problem with the above fixation of fees is that they have been uniform for all Government, Private Aided and Private Unaided colleges in the State. However, in the Government Order No.ED 123 UEC 97, Bangalore, dated 7th August 2000, the fee revisions, to be introduced during2000-01, have been restricted to be applicable only for Government and Private Aided colleges. Further, in this Government Order, a provision is made for an annual increase in the fee by 10 percent. Thus, if autonomy is granted to a Government college and to a Private Aided College, they are subject to charging their students the same fee at the fixed rates.
Since the cost of autonomy may vary between colleges, there is a need to fix the student fee in the colleges. This does not mean that colleges can fix any fees and at any level. Rather, it only implies that colleges need autonomy in fixing level of fees according to the cost of providing the educational services in their colleges.
It is important to recapitulate here that, way back in 1999, an attempt was made by the State Government in giving tlexibilit>' to fi?cation of tuition fee for recognised private unaided institutions. That is, ‘"tuition fee in respect of Private Unaided Educational Institution shall be fixed taking into consideration the Salar>’ Expenditure Plus 30®"o of the salary expenditure towards contingency and maintenance equipments divide by total number of
6 .3 .1 .2 .3 . Need for further autonomy to colleges
167
students” (Ref; GO No.ED 39 Vivida 99. Bangalore dated 9* August 1999). This approach is welcome and should be implemented by the colleges themselves, as it takes into account the cost ditferential between institutions in fixing tuition fee for students.
(ii) Payment of salary to staff and other service conditions to be monitored
The colleges should strictly implement payment of salary to staff as per the State Government guidelines. The State Government should closeK monitor this implementation. At present there is a problem in regard to payment of low salary and jxx>r service conditions for staff in unaided courses in aided colleges and in all courses in unaided colleges, as most of the staff are appointed only on temporar\’ basis. Consequently, these colleges have not been above to attract qualified and experience staff and. hence, quality' of education has suffered in the colleges.
It is important to remember here that there exists a regulatory framework to implement the above monitoring process in private colleges. That is, the Karnataka Private Educational Institutions (Discipline and Control) Act 1975. Notwithstanding the provisions of this Act, the service conditions in unaided collegiate education sector continues to be grim for reasons including lack of knowledge on these provisions for the staff members. This underlines the need for guidance for staff members on their rights and privileges within the framework of the Act.
(iii) Accountability in all receipts and expenditure of colleges
All colleges must be accountable for all receipts and expenditure in them. At present, there is a mismatch in the reported amount of receipts and expenditure in colleges. Such a mismatch creates a suspicion on the college finances for all non-college agents in collegiate education. Thus, transparency and accountability are a must for the colleges.
6.3.2. A case for communitv colleges
The concept of community colleges is virtually unknown in the system of collegiate education in Karnataka. Surprisingly, even in countries like United States of America (USA) where the communitv' colleges have been established long before 1980, the concept is relatively little known. Kane
168
and Rouse (1999) put it: “Conimunit>' colleges have assumed anincreasingly central role in the nation's education and training. Betw'een 1980 and 1994, the proportion of 18 to 24 year-olds enrolled in college grew by more than one-third, from 26 to 36 percent. Nearly half of this increase in enrollment was absorbed at communit>' colleges. Yet despite the increasing interest in community colleges among both students and policymakers as a potential source of education for workers seeking to upgrade their skills, relatively little is known about them” (p.63).
In what follows, the experience of USA in regard to communit>' colleges is briefly described and lessons for Karnataka’s collegiate education are explored. The description of USA's experiences draws heavily from the paper by Kane and Rouse (1999) and all page numbers quoted below refer to this paper.
6.3.2.1. Expencnce o f USA
Historically, the community colleges in USA have been started with a focus on "transfer function'". That is, 'students would complete two \ ears of a general undergraduate education and earn an associate's degree (AA) at the two-year college, and those who wanted and were capable would transfer to a four-year college to complete a bachelor's degree. Since then, two-year colleges have broadened their mission to include vocational degree programs, continuing adult education programs, and workforce, economic and community’ development programs" (p.64).
There are two merits of community colleges as compared to regular (or full time) education. First most community college students attend par time. Second, cost of education in community colleges is relatively low' I'hird, a significant fraction of students enrolls in terminal (usually vocational programs.
Over the years, community’ colleges have transformed from an academic curriculum delivered in a traditional manner into providing education services in non-traditional ways. These non-traditional ways include the following, (i) Providing contract training, i.e. classes ofl'ered to employees of a business, industrv’, labour union, or public agency, often at a site designated by the contracting agency. The focus of the contract training is on teaching job-specilie skills needed to perlbrm a job, to improve current
169
pertbniiance, or to prepare for advancement, (ii) Providing contract courses in basic reading, writing, or maths skills.
Available empirical evidence for USA suggest that community colleges increase aggregate educational attainment, and are asst:>ciated with higher wages, even for those not completing degrees.
6.3.2.2. Lessons for Karnataka State
First, as outlined under section 3.4.1.3.1. in Chapter 3, the Directorate of Vocational Education (DVE) imparts training in various vocational courses for students passing out of secondary education. These courses are college- based, (i.e. in junior colleges) and non-terminal (since students with vocational education certificates can enter degree courses). Thus, the current vocational education, imparted by the DVE in the State, is comparable with some of the functions of the communiK colleaes in the USA.
The experience of USA in community' colleges (e.g. contract training programmes) clearly implies that colleges go to the students, rather than students come to the colleges as in the case of Karnataka state. This is an important lesson for diversifying the activities and approaches to vocational education by the DVE in the State, such as, contract-training programmes for small-scale industries in local areas.
Thus, DVE seems to have the potential to provide education services under the new concept of community colleges. This potential may be utilised by giving further encouragement and support to the DVE by the State Government. In addition, the lessons from the experience of USA aDove mav be considered as useful guidelines in realising this potential of DVE.
170
CHAPTER?
Summary, conclusions and policy recommendations
This study has made an in-depth analysis of the structure, organisation, supply of and demand for, quality and relevance, public financing, management and co-ordination of collegiate education in Karnataka State during 1990’s. The analysis has been carried out, subject to the availability of primary and secondarv' data, at the State level, university level, district level and college level. Thus, the study's results have important implications for goals and strategies for collegiate education at different levels of planning, policy formulation and ^x)licy implementation m the State, both at present and in future.
7.1 .Summary and main conclusions
The main conclusions from within the analysis of this report are summarised below. The conclusions are presented by chapters, but sequentially numbered.
Chapter 1
7.1.1. The structure of collegiate education in the Karnataka State comprises regular and distance education. The regular collegiate education includes affiliated university colleges (UCs), Government colleges (GCs) and private colleges. The private colleges include private aided colleges (PACs) and private unaided colleges (PUACs). Both PACs and PUACs are broadly divided under three types of management, viz,. Minority colleges. SC/ST colleges and General colleges. These management essentially differs in the nature and composition of management, and rules in regard to recruitment of staff. The distance education is imparted by correspondence courses (CC), external examination system (ES) and open university system (OUS) by the universities within the State. At present. Bangalore University conducts CC and OUS, and Kamatak University conducts ES, in undergraduate and post-graduate courses. In addition, Karnataka State Open University has been established as a separate university for distance education in the State. In general, subjects in the distance education belong
ITl
to social sciences and humanities, and non-experimental science subjects (e.g. mathematics). Thus, distance education adds to the supply of collegiate education only in limited subjects or courses. However, admission to distance education is not limited to students within the university or the State.
7.1,2. Regular education and distance education is not directly comparable in terms of admission requirements, enrolment of students, learning performance of students and cost of education. In view of these differences, analysis of regular education needs to be treated separate from the regular collegiate education.. Thus, all analysis is separated in this report between regular and distance education in the State.
7.1.3 Secondary databases on the collegiate education are many and diversified in the State. The databases include the published, unpublished but processed, and unpublished and unprocessed data in the Department of Collegiate Education (DCE), Department of Finance, Universities (e.g. Annual Report, Convocation data, announced examination result Statistical Cells), and Reports and Committees on education and human development in the State. In general, the nature of data collected is comparable between the DCE and the universities. However, while the Department collects and maintains Ae data on GCs and PACs, the universities collect and maintain data on all their affiliated colleges. And, both the Department and universities do not collect information on the finances of the colleges, except by Mangalore University and University of Mysore in a limited way. In addition, data collected by the Department suffers from missing information due to non-reporting of data by many of the GCs and PACs. The presence of missing information makes the data on collegiate education incomplete for research and policy purposes.
7.1.4. The gaps in secondary databases have necessitated the collection of primary data in this report from 20 sample colleges and from their principals and 248 students during 1991-92, 1995-96 and 1999-00. The new design of sample survey and collection of sample data through structured questionnaire from the records of the colleges, college principals and college students is of useful frameworks for undertaking large-scale sample survey of colleges in the State in ftiture years.
172
Chapter 2
7.1.5. The major agents in regular collegiate education (or collegiate education, in brieC throughout below) arc those who contribute to the functioning and management of the colleges. These agents include the university. State Government University Grants Commission (UGC), college management, teaching and non-teaching staff and students enrolled in various courses with specific functions and roles. For instance, universities have important roles in affiliation, curriculum and examination matters. The State Government has the vast powers in effecting the establishment, organisation, management, promotion, regulation and financing of collegiate education. Thus, State Government policies and programmes are of critical importance in explaining past and current development and in influencing/determining future developments in collegiate education in the State
7.1.6. The district-wise and university-wise, growth and distribution of number of colleges during 1990’s show (a) slow growth of GCs, (b) stagnation in growth of PACs and UCs and (c) phenomenal growth of PUACs. For instance, the total number of GCs has increased from 99 during 1990-91, 138 during 1993-94, 148 during 19%-97 and to 151 in 2000-01. The total number of PACs (UCs) has remained the same at 290 (8) during 1992-93 to 1998-99. And, the total number of PUACs colleges has increased from 41 during 1990-91 to 93 during 1991-92, and from 150 during 1992- 93 to 259 during 1994-95 and to 473 during 2000-01. Thus, of the 924 degree colleges during 2000-01, 16.34 percent is GCs, 31.6 percent is PACs, 512 percent is PUACs and 0.86 percent is UCs.
7.1.7. Colleges are marked by distinct general and course characteristics. For instance, during 1999-00, the number of Mens' (Womens’) colleges is relatively higher within the GCs (PUACs) than in PACs. Composite colleges (i.e. degree colleges with pre-university education) are highest in PACs. Over 97 percent of colleges are day colleges. Of the private colleges, the share of Minority colleges (SC/ST) colleges is relatively higher in PACs (PUACs) and the share of General colleges is highest in the total PACs and PUACs. About 75.49 percent of GCs, 81.16 percent of PACs and 74.21 percent of PUACs, or, 76.63 percent of all colleges are urban colleges. All the UCs are co-education colleges, located in urban areas and are day colleges except for one evening college. However, no UC is a composite college.
173
7.1.8. Courses offered in colleges during 1999-00 are many anddiversified. For instance, during 1999-00, the undergraduate courses include traditional courses (i.e. B.A., B.Sc., and B.Com.) and professional courses (i.e. BCA, BBM, BFA, BHM and BSW). The traditional or professional courses include vocational subjects (e.g. Industrial Chemistry, Industrial Microbiology, Foreign Trade and Practice and Functional English/Communicative English). The post-graduate courses include traditional courses (e.g. M.A., M.Sc., M.Com) and professional/management courses (e.g. MBA and MCA). In addition, composite colleges offer pre-university education along with degree courses.
7.1.9. The courses offered in colleges differ in their combinations. For instance, during 1999-00, the number of colleges offering traditional degree courses along with a professional course is highest among the PACs (42.12 percent) and is followed by GCs (17.22 percent) and PUACs (5.29 percent). The number of GCs and PACs offering only professional courses is less than one percent, as compared to 21.99 percent of total PUACs. The combination of B.A. and professional courses is observed to be most popular in case of GCs (23.84 percent) and PUACs (28.12 percent) as compared to the combination of B.Sc. or B.Com. and professional courses. In particular, B.A., B.Com. and professional courses are the most popular combination of courses in GCs (46.36 percent), PACs (3322 percent) and PUACs (19.66 percent) than the combination of either (a) B.A., B.Sc. and professional courses or (b) B.Sc., B.Com. and professional courses. The number of degree colleges which offers post-graduate courses is relatively more in private colleges (in particular, in PACs) than in GCs.
7.1.10. As in the case of regular education, various undergraduate, postgraduate, diploma and certificate courses arc offered by distance education mode. For instance. Bangalore University offers undergraduate courses in B.A., BBM., B.Com., B.Ed. and B.C.A. the Kamatak University offers undergraduate courses in B.A. and B.Com. The KSOU offers undergraduate degree courses in B.A. B.Com., B.Ed. and B.L.I.Sc. Thus, undergraduate courses in distance education belong to non-science degree courses, and non-cxperimental professional subjects.
7.1.11. The 20 sample colleges differ in their current characteristics. For instance, the year of establishment of colleges varies from the oldest college established in 1944 to the newest colleges established in 1991. The earliest
174
college that was brought under GIA was in 1949 and latest college is in 1987. Third, all the sample colleges are day colleges. Co-education colleges constitute 85 percent of the total colleges. Kannada (or English) is the sole medium of instruction in 10 (or 25) percent of a>lleges. Composite colleges constitute 40 of total colleges. Traditional courses are offered in 80 percent of colleges and BBM is the most popular non-traditional course.
Chapter 3
7.1.12. This study has analysed, in detail, the students’ demand for collegiate education in terms of total and annual growth of enrolment of student by sex (i.e. male and female students), by social categories (i.e. SC/ST and non-SC/ST), by courses (i.e. B.A., B.Sc., and B.Com.), by colleges (i.e. GCs, PACs, PUACs), by 6 universities and by 20 districts from 1990-91 through 1999-00. In addition, enrolment of male and female students by courses, colleges, universities and districts is separately highlighted for select years during 1990’s. Further, enrolment in UCs and distance education during 1999-00 is highlighted. The main conclusions of these analyses at the State level are as follows
7.1.12.1. Total enrolment in GCs has declined in all the courses since 1996-97. In particular, the largest decline is evident for B.Sc. course and is followed by B.Com. For instance, the share of B.Sc. (B.Com.) students in the total enrolment in all courses has declined from 15.79 (13.05) percent during 19%-97 to 10.73 (12.87) percent during 1999-00. The share of SC/ST students in the total enrohnent of all students shows an increase from 16.73 percent in 1991-92 to 17.81 percent in 1991-92.
7.1.12.2. As in the case of GCs, total enrolment in PACs has declined in all the courses since 1996-97. In particular, the largest decline is evident for B.A. course and is followed by B.Sc. course. For instance, the share of B.A. (B.Sc.) students in the total enrolment in all courses has dechned from 56.07 (20.21) percent during 1996-97 to 49.60 (18.66) percent during 1999-00. The share of SC/ST students in the total students enrolled in all degree colleges has fluctuated from 9.68 percent during 1994-95 to 10.63 percent during 1997-98.
7.1.12.3. In contrast with GCs and PACs, total enrolment in PUACs has increased in all the courses since 19%-97. In particular, the largest increase is evident for B.Com. course and is followed by B.Sc. course. For instance.
175
the share of B.Com. (B.Sc.) students in the total enrolment in all courses has increased from 25.41 (8.34) percent during 1996-97 to 28.84 (10.62) percent during 1999-00. The share of SC/ST students in all private unaided colleges has increased from 13.34 percent during 1994-95 to 11.62 percent dunng 1997-98.
7.1.12.4. During 1999-00, total enrolment of students in UCs is equal to * 608 students. Of this total enrolment, the share of University of Mysore is 51.46 percent, Mangalore University is 22.95 percent, Kuvempu University IS 19.36 percent and Kamatak University is 6.23 percent.
7 1.12.5. During 1999-00, the share of KSOU in the total enrolment of students in distance education is highest in the State, i.e. 53.79 percent in B.A. course and 66.72 percent in B.Com course.
7.1.12.6. Aggregate enrolment of students in collegiate education in the State is the sum of students in all colleges in regular education and in universities in distance education. During 1999-00, aggregate enrolment in collegiate education is equal to 306265 students. Of this total, the share of GCs is 18.68 percent, PACs is 56.44 percent PUACs is 16.52 percent, UCs 15 2.48 percent and distance education is 5.87 percent. Thus, regular education constitutes 94.13 percent of total enrolment in collegiate education m the State.
7 1.13. This study has identified and anaK sed the following factor for the decline in demand for collegiate education from outside and from within the 5>'stem of collegiate education in the State. From the outside the system, the important factors include (i) a rise in the enrolment of student in vocational education; (ii) a fall in pass percent of students in PUC courses; (iii) a rise m enrolment of non-general education, especially in technical education; (IV ) a rise in unemployment of college graduates in traditional courses with special reference to the problem of decline in organised public sector employment opportunities; and (v) demographic factors, especially a decline m population of the coliege-going age groups. From within the system, the important factors include (a) a rise in dropout of students in traditional courses; (b) a rise in demand for non-traditional courses (i.e. for professional and vocational courses and subjects) within collegiate education; and (c) lack of quality and relevance in collegiate education. Thus, a plausible explanation for the decline in enrolment in collegiate education shall have to be in a holistic way rather than using a single indicator approach.
176
7.1.14. The findings of this study caution that the impact of decliningdemand for collegiate education may have several implications, both at present (short run) and in future (long run). The short-term impact is on a decline in the number of students per college or per course. This raises a fundamental question on the viability of a college or course in terms of a desired number of students, or a minimum number of students to sustain a college or course, given the investment already made in the college/course. The long-term impact includes: (i) a decline in the demand for postgraduate general education in the universities, and its attendant impact on the reduction in the supply of post-graduates for teaching jobs and research in universities and colleges; (ii) a decline in the supply of graduates for general regional and national economic development; (iii) an adverse impact on the existing number and future quantitative expansion of collegiate education; and (iv) an adverse impact on studies and research in humanities and social sciences and, hence, on societal and cultural studies in fiiture. In a way, these long run impacts are contradictory to the objectives of higher education in general, and collegiate education in particular, in the State.
7.1.15. The trends in and patterns of enrolment of students in survey colleges show that, except for GCs, the sample results are not consistent with the analysis based on secondary data. This indicates that results from secondary data and primary data on colleges would lead to divergent conclusions on the trends and patterns of enrolment by courses and by colleges.
Chapter 4
7.1.16. This study has identified the quality of collegiate education, as it is related to students, teaching and non-teaching staff and physical infrastructure, which are conducive for curricular and extra-curricular development of students. Quality of students is measured by pass percent of students in final year examinations and the distribution of pass percent by I Class, II Class and Pass Class, and retention rate of students by courses, in different types of colleges. The quality of staff is measured by the qualified and trained number, growth and distribution of the stafC existence of filled up positions and extent of representation for SC/ST staf^ by courses and by colleges. Availability of adequate water for drinking and non-drinking purposes, electricity, sanitation, library, laboratory’, building, class room, playground and sport materials, class room furniture and teaching materials etc. are qualitatively measured by the opinion and perceptions of the
177
principals and students by courses in sample colleges of this study. The major findings from these analyses are as follows.
7.1.16.1. Pass percent of all and SC/ST students in GCs during 1990’s do not show any consistent trend in any of the traditional courses, but the pass percent of all students has been higher than the pass percent of SC/ST students. Thus, total pass percent of students would exaggerate the pass percent of SC/ST students in all courses, hi addition, pass percent of students including SC ST student is relatively higher in final year B.A. and in final B.Com than in other courses.
7.1.16.2. As in the case of GCs, changes in pass percent of students (total or SC/ST) during 1990’s do not show any consistent trend in any of the traditional courses in PACs. But unlike in GCs, the pass percent of students including for SC/ST students in PACs is not consistently higher or lower between courses in all the years. Further, as compared to GCs, pass percent in PACs is higher in all the courses and for most of the years during 1990's. This suggests that the quantity of outturn of graduates in PACs is higher than in GCs.
7.1.16.3. The sample survey results on distribution of number of passes and total pass percent of students by courses and colleges reveal many new insights. In general, total pass percent shows wide fluctuations fi*om 1991- 92 through 1999-00 in all courses and colleges. First, in regard to B.A. course, total pass percent shows marked improvement in all colleges, except for female students in GCs, during 1999-00 as compared to 1994-95. In the same way, the number of pass class students has come down in all colleges with an appreciable increase in I Class students during 1999-00. Second, in B.Sc. course, the highest total pass percent for male (or SC/ST male) students are evident in PACs (or GCs) during 1999-00. And, the highest total pass percent for SC ST and non-SC/ST temale students is evident in GCs. Further, the proportion of students who pass with a Pass (or First) Class is highest among SC ST male (or non-SC/ST female) students in PUACs (UCs). Moreover, total pass percent of students shows improvements among all students in all colleges except in case of all female students and SC/ST male smdents in GCs. Third, in regard to B.Com course, total pass percent shows marked improvement in all colleges, except for SC/ST female students in GCs and UCs and for SC/ST male students in PUACs, and the number of I class students has increased in all colleges, during 1999-00 as compared to 1994-95
178
7.1.16.4. During 1996-97 to 1999-00, the retention rates at the State level for GCs show an increase in B.A. and B.Coni courses, and a decline in B.Sc course, in case PACs and PUACs, the retention rates show a marked fluctuations between years for all the years and in all the traditional courses.A comparison of retention rates between GCs and PACs show that the retention rates are higher in (a) PACs for both male and female students in all courses and for all years and (b) PACs than in GCs for all districts. Further, a comparison of retention rates between GCs, PACs and PUACs, show that retention rates are (a) comparable between GCs and PUACs than between PACs and PUACs and (b) generally higher in PACs than in GCs and PUACs for both male and female students and in all districts.
7.1.16.5. Analysis of retention rates of sample survey data by courses and by colleges provides the supporting evidence for decline in enrolment in traditional courses, especially in B.Sc. courses, based on secondary data.
7.1.16.6. The annual growth of total teaching staff in GCs has been very \ow at less than less than 2 percent since 1992-93. As compared to the GCs, the number of teaching staff has been higher in PACs for all the years. However, the annual growth of the total staff in PACs has been lower than in GCs, especially since 1995-96. In addition, since 1995-%, the number of SC/ST staff has been higher in GCs than in PACs.
7.1.16.7. Using sample survey data, the quality of teaching staff is analysed by courses and colleges during 1999-00. First, the number of faculty members who have attended the refresher and/or orientation programmes as a percentage of total number of staff is lowest in PUACs compared to faculty in other colleges. While the faculty in science, commerce and other subjects of PACs have attended the highest number of programmes, the faculty of GCs have attended the highest number of programmes in arts subjects Second, the number of faculty members who have obtained or doing M.Phil or Ph.D degree as a percentage of total number of staff shows that, in general, the UCs are relatively better placed than other colleges. Third, in terms of attendance in and organisation of professional seminars, workshops and guest lectures in the colleges as a percentage of total number of faculty members, the PACs and PUACs perform relatively better than GCs and UCs. Since these professional arrangements are the opportunities for taculty’ and students to interact and access recent knowledge, these need to be strongly encouraged in GCs and
179
UCs. Thus, except for participation in refresher/orientation programmes, other qualit\ indicator of the staff are not in favour of GCs in the State.
7.1.16.8. The total number of non-teaching staff in the State in GCs (PACs) had varied from 2294 (6526) persons during 1990-91 to 1725 (5886) persons during 1995-% and to 1927 (5638) persons during 1999-00. Thus, the number of non-teaching staff in PACs has declined over the years.
7.1.16.9. The main reason for the slow growth of teaching staff and decline in number of non-teaching staff is the existence of vacant positions of teaching and non-teaching staff in both GCs and PACs under all the universities. This is evident from both sample data and secondary data. For instance, as on February 1, 2001, about 13 percent of sanctioned teaching posts and 22 percent of sanctioned non-teaching posts are vacant in PACs. This result implies that a ban on the recruitment of these vacant positions will have differential impact on the quality of collegiate education between GCs and PACs, or in colleges under different universities in the State. The main reason for the existence of the vacant posts in PACs is attributed to lack of permission from the State Government to fill up the posts.
7.1.16.10. For GCs, the student-teacher ratio (STR) has gradually increased from 1990-91 to 1995-96 and declined during 1995-96 to 1999- GO. In case of PACs, the STR has gradually increased since 1995-96. However, unlike in GCs, there are no remarkable differences in the STR between districts in different years and in general, the STR in PACs is relatively lower than in GCs. However, data from sample survey of colleges shows that STR has declined in all the courses in GCs, in B.A. and B.Com. courses in PACs, in all traditional courses in PUACs and in B.A. course in UCs. During 1999-00, STR is lowest in B.Sc. in GCs, PACs and UCs, and in other courses in PUACs. This result may be seen as a consequence of decline in enrolment of student in B.Sc. course in these colleges.
7.1.16.11. The infrastructure facilities, based on the responses of the principals of all the sample colleges in this study, reveal the following. First, about 37 percent of the sample colleges have problems in obtaining books for their libraries and all the problems are related to lack of money to buy the books. Surprisingly, except two colleges for lack of resources, there seem to be no problems in obtaining laborator> equipments and consumables. Second, about 95 percent of sample colleges have their own buildings. Over
180
colleges have adequate students' desk, blackboard, teachers' chairs and desks, regular maintenance of classroom walls and root adequate sanitation facilities including separate toilet for boys and girls and playground and sport facilities. Third, only about 37 percent of colleges have students’ hostel facilities and only about 11 percent of colleges have employment guidance/placement cell for students. In the same way, only about 37 percent of colleges have alumni association and local people are contributory for college development. However, only 3 (or 15.8 percent) of the sample colleges have NAAC's recognition. Fourth, regarding the stafif position especially in PACs, 4 (3) out of 6 sample colleges have reported the existence of vacant teaching (non-teaching) stafif in their colleges.
7.1.17. An important determinant of relevance of collegiate education is the prescription of curricula for courses. At present, the college curriculum is fixed by the affiliating-universities through their Board of Undergraduate Studies. Such curricula are uniformly implemented throughout the university. While such uniformity are justifiable for the purpose of holding common examination and uniform evaluation of all students in the universities, it lacks autonomy for the colleges to design their own curricula according to the particular needs of students and areas within the universities.
7.1.18. In the 1990’s two important steps have been taken to increase the relevance of collegiate education in the State. First, introduction of UGC-sponsored, vocational subjects in degree colleges. Second, introduction of various professional courses, including computer science and computer applications, in degree colleges. In addition Bangalore University has introduced computer applications as one of tiie compulsory subjects of study for all Master’s degree students in humanities and social science students. And, in Mangalore University, computer applications are introduced for all university students as a voluntary training programme, outside the outside the curricula of the university. At the college level, while college management (or universities) may taken initiatives to introducing new courses in their private colleges (or universities), the State Government has to take similar initiative to bring in relevant in courses ofifered in Government colleges.
7.1.19. The response of sample students on their motivation for study, socio-economic background, relevance of education, reading habits, expenditure on books, boarding and lodging, private tuition, arid knowledge
181
and awareness of vocational education revealed many insights. These responses are classified into three groups.
First, the response of sample students in all courses and colleges is as follows. Of the motivations for the study, over 64 (67) percents of students have responded to pursue higher education and only about 23 (23) percent to find a job at the time of joining (completing) the course. Thus, the purpose of their study is consistent and stable over the years. Over 93 percent of students have borrowed books from the college libraries, but at the same time about 81 percent have purchased the reference books. The amount of money spent on books during last 3 years shows wide variations. For instance, 38 percent of students have spent less than Rs.500 and about 24 percent of students have spent between Rs.510 and Rs.lOOO. Interestingly, about 18 percent of students have spent more than Rs.lOOl on purchase of books. And, availability of books in the college library is the most important reason for not buying books for about 15 percent of students. Private tuition seems to be less popular as only 22 percent of students are taking private tuition in the colleges. And, over 97 percent of students spend less than Rs.500 per year on private tuition. Of the total students, about 10.9 percent have spent less than Rs.500, about 9 percent have spent between Rs.501 and Rs.lOOO towards boarding and lodging expenses per month. Of the total sample students, only about 38 percent are aware of the vocational education in the State. Much less of them (about 21 percent), know about the courses offered under vocational education, although about 29 percent of students know the eligibility criteria for admission to vocational education. Unfortunately, only about 16 percent of students know the job prospects of joining the vocational courses in the State.
Second, the response of students by colleges in all courses reveal the following. The proportion of total students who belong to SC/ST is higher in UCs than in other colleges. Number of students, whose mother-tongue is Kannada, is highest in GCs. Number of students whose parents have monthly income of more than Rs.lOOO is higher in non-GCs than in GCs. Number of students having III class in I -Year and II Year course is higher in GCs. Pursuance of higher education rather than finding a job is the motivation for joining a degree course, both at the time of admission and completion of a course, for the highest number of students in all the colleges. Newspaper reading habits of students is 100 percent in all the colleges. Students’ dependence on college library for reference books is highest in GCs. Proportion of students who bought reference books is highest in GCs
182
with 68 percent of students spending less than or equal to Rs.lOOO on books. Proportion of students who go for private tuition is relatively less in PUACs. Proportion of students staying in hostels is highest in UCs and is lowest in PUACs. Proportion of students who spend between Rs.501 and Rs.lOOO per month on boarding and lodging is highest in UCs. About 80 percent of students travel less than 2 km to reach their GCs. This is in contrast with UCs where about 23 percent of students travel more than 9 km to reach their college. Knowledge and awareness of vocational education is widespread among the students in UCs than in other colleges. This is for the main reason that University Employment Bureau and Vocational Guidance is located, in general, within the campus of university colleges (e.g. within the campus of Maharaja's College in the University of Mysore).
Third, the response of students by courses in all colleges reveal the following insights. The proportion of total students who belong to SC/ST is higher in B.A. course than in other courses. Number of students, whose mother-tongue is Kannada, is highest in B.A. course. 14umber of students whose parents have monthly income of more than Rs.5000 is higher in B.Sc. course than in other courses. Number of students having III class in I Year and II Year course is higher in B.A. course. Pursuance of higher education rather than finding a job is the motivation for joining a degree course, both at the time of admission and completion of a course, for the highest number of students in all the courses. Newspaper reading habits of students is 100 percent in all the courses. Students’ dependence on college library for reference books is highest in BBM course and lowest in case of B.A. course. Proportion of students who bought reference books is also highest in B.Com. course with about 73 percent of students spending less than or equal to Rs.lOOO on books. Proportion of students who go for private tuition is more in non-B.A. courses, especially in B.Sc. course. Proportion of students staying in hostels is highest in other course and is lowest in B.A. course. Proportion of students who spend between Rs.501 and Rs.lOOO per month on boarding and lodging is highest in BBM course. Knowledge and awareness of vocational education is widespread among the students in B.Sc. course and is followed by B.Com. course, B.A. course and in other course.
Chapter 5
7.1.20. The nature of public financing of collegiate education is different between the Government colleges and private colleges. For instance, in case
183
of Government colleges, all expenditure (i.e. net of students fee to the State Government, however) are met by the State Government. In case of private colleges, the State Government provides with maintenance or teaching grants in the form of cent reimbursement of salary payments of working teaching and non-teaching stafif. These grants are called grants-in-aid (or GIA). The GIA policy is guided by the GIA Codes for collegiate education in the State.
7.1.21. In the State budget, expenditure on collegiate education is a part of university and higher education, which in turn is a part of general education under social services. The budgetary expenditure on collegiate education comprises plan and non-plan revenue expenditure, capital expenditure and loans and advances.
7.1.22. Unfortunately, sample college did not report data on all items expenditure and receipts. However, from the reported data, the following insights are obtained.
7.1.22.1. A description of expenditure allocation to (jovemment colleges and aided colleges by universities and districts shows existence of several uniformities in the spatial distribution of public expenditure on GCs. In particular, the uniformities are evident for the following variables, (a) UniformitN' in the share of eaeh district in the State's total expenditure for all the years, (b) Uniformity in the share of each university in the State's total, (c) Uniformity in the share of expenditure of each district in the total expenditure under each university. The presence of the above uniformities indicates a simple formula tor spatial allocation of expenditure for Government colleges. That is, a proportionate rise (in percent terms) in the total expenditure for all districts or universities in the State. Most surprisingly, as in the case of GCs, there exist same uniformities in the spatial distribution of GIA on PACs.
7.1.22.2. Total expenditure by colleges shows that salary for teaching and non-teaching staff constitutes the largest expenditure in all colleges except in PUACs. For instance, in GCs, salary expenditure has been over 96 percent of total expenditure in all the years. In case of PACs (or UCs), over 80 (or 90) percent of total expenditure was towards staff salary. However, in case of PUACs, salar>’ expenditure varies between years. It is about 33 percent during 1991-92, about 85 percent during 1995-96 and about 65 percent during 1999-00. Consequently, expenditure on non-salary items has been
184
negligible, especially on land and buildings. During 1999-00, expenditure on laboratory (or library) has been highest in PACs (PUACs).
7.1.22.3. Per student expenditure shows an increase in all colleges except PUACs. For instance, per student expenditure in GCs has increased from about Rs.713 during 1991-92 to about Rs.l 140 during 1995-96 and to about Rs3791 during 1999-00. However, of all the colleges, per student expenditure is the lowest in GCs and highest in case of PACs in the State.
7.1.22.4.. The composition of receipts shows that, for GCs, the State Government is the single most important source of total receipts. In addition, total receipts and total receipts per student have increased over the years. For instance, total receipts per student receipts have increased from about Rs.322 during 1991-92 to about Rs.392 during 1995-96 and to about Rs.l325 during 1999-00. On the other hand, for PACs, the State Government is one of the most important reported sources (i.e. about 86 percent) of total receipts. The other important sources include college management, tuition fee fix>m students and UGC. For PUACs, the college management is single most important reported source (i.e. more than 90 percent) of total receipts. The other important sources include other sources of receipts whose composition is not made explicit. For UCs, the affiliating university and the UGC are the major sources of receipts.
7.1.23. This study has developed a simple policy framework for estimation of composition and volume of subsidies to GCs and PACs. The estimations show that the total volume of subsidies (i.e. plan and non-plan subsidies) to all GCs has increased from RsJ845.49 lakh during 1990-91 to Rs.8439.34 lakh during 2000-01. In case of aided colleges, the total volume of subsidies has increased from Rs.5515.13 lakh during 1991-91 to Rs.43600 lakh during 2000-01. The rise in subsidies to PACs, especially non-plan subsidies, is mainly attributable for implementation of new UGC pay scales and for the payment of new UGC pay scale arrears. Further, the aggregate subsidies (i.e. subsidies to all Government colleges and aided colleges) have increased from Rs.7360.62 lakh during 1990-91 to Rs.52039.34 lakh during 2000-01. And, the aggregate subsidies as a percentage of total revenue deficit (revenue expenditure) was 9328 (1.85) percent during 1990-91 and 32.89 (3.03) during 2000-01.
7.1.24. At present, the State Government has three policy measures in affecting the finances of the colleges. First, changes in the nature and size
185
of subsidies. Second, changes in students’ fee. Third, encourage colleges to increase internal receipts or non-State Government sources of revenue.
For instance, over the years, the subsidies to aided colleges in collegiate general education have been reduced in various ways. First, all the private degree colleges established after June 1, 1987 have been started permanently on non-GIA basis. Second, since 1990-91, no new courses have been brought under GIA. Third, since 1993-94, there has been a ban on filling up vacant position of non-teaching staff. Fourth, a large number of teaching posts has remained vacant for several years and is being gradually converted into unaided posts. Fifth, in the budget for 2000-01, 15% cut in GIA to the colleges is announced. Sixth, since the private college management refused to bear the burden of the 15% cut or teaching and non-teaching staff did not want to get 15% less salary, the Government decided to freeze recruitment of about 1035 teaching staff positions and 724 non-teaching stafif positions, and reallocate the savings of about Rs.30 crore on this account towards the reduced GIA (hence, full salary payments for the staff for 2000-01). Seventh, bifiircation of pre-university education from the existing composite degree colleges which, in the long run, will reduce the salary expenditure for new teaching staff to be involved in pre-university education. Eighth, transfer of the aided staff from where the workload for the teaching stafif is not full (e.g. 16 hours of teaching for non-science teaching staff) to aided colleges where the workload exists.
Over the years, the .students’ fees have remained both low and constant For instance, in the recent past, the students’ fee was revised in 1993 and was implemented from 1993-94. For the current academic year, the fee structure was revised with a total fee payable by a degree college student at Rs.835 (tuition fee Rs.5(X) and laboratory fee Rs.l60), an increase of about 135 percent over the 1993-94 fees. Subsequently, this new fee structure was modified to be applicable only for the I year degree students during 2(KX)-01 along with reduction in the tuition fee and laboratory fee to Rs.400 and Rs.llO respectively. However, the fee structure in collegiate education is relatively lower and uniform between government and private colleges and between all courses [i.e. between professional courses (e.g. management related courses), vocational courses (e.g. Industrial Microbiology) and nonprofessional and non-vocational courses (e.g. traditional courses in B.A. B.A. and B.Com degree)]. Thus, there is a need for both increasing and diversifying the fee structure between government, aided and unaided colleges in the State
’.86
Measures to increase in internal receipts of the colleges include charging differential fee for unaided and professional courses, endowments, charity, philanthropy, and alumni association (i.e. donations after graduation) and consultancy. In the same way, cross-subsidisation of students between professional and non-professional courses, and between aided and un-aided courses may be considered. In addition, charity by the temples is an important source of funds for the development of colleges in the State. Unfortunately, in general, the details of otlier receipts of the colleges above are not published. This is mainly due to two reasons. First, these receipts go to the management account rather than for college accounts. Hence, college finances do not report these receipts. Second, additional resource mobilisation through donations, either during or after the admission to new professional courses, (e.g. in the form of building and library ftinds) are not disclosed, as they are prohibited under the provisions of the Karnataka Educational Institutions (Prohibition of Capitation Fees) Act, 1984.
Chapter 6
7.1.25. The most important policy frameworks for the management, regulation and co-ordination of affiliated colleges in the State are as follows.
First, the Karnataka State Universities Act 1976 (or, in brie£ the Act) under (a) section 20 through section 34A on Authorities of the University; (b) section 29 on Board of Studies; (c) section 53 through 56A on Affiliation of Colleges and Recognition of Institutions; (d) section 6IB on Karnataka State Inter University Board; and (e) section 66 on Relations of Affiliated Colleges with the University.
Second, State Government Orders relating to service conditions (e.g. salary, allowances, increment, promotion and transfer) of the staf! fixation of student fee (except those fees which are fixed by the universities) in degree colleges, grants-in-aid for private aided degree colleges, and reorganisation of collegiate education (e.g. bifurcation of ^re-university educafion from composite colleges).
Third, UGC regulations in specifying/providing the (a) qualification and experience for recruitment of teaching staff through direct recruitment and through internal promotion; (b) higher qualifications and training for teaching staff; (c) opportunity for pursuing research for college teachers
187
under the UGC Scheme of Teacher Fellowship for Professional Development; (d) new UGC pay scales for colleges teachers with effect from January 1, 1996 as a measure of attracting and encouraging the talented and competitive teachers in colleges; (e) financial assistance in the form of development grants for vocationalisation at the First Degree Level since 1994-95, and for autonomous colleges; and (f) in establising National Assessment and Accreditation Council (NAAC) in 1994 with the main objective of helping them to work continuously to improve the quality of education.
7.1.26. This study has examined in detail the recent regulatory mechanisms in establishment of a college, reorganising of collegiate education through bifurcation of composite colleges, fi*aming of curriculum, conducting examinations, and for co-ordination of different agents and institutions in higher education as it is related to collegiate education. It is found that the present system of affiliating colleges has many promoters and regulators with multiplicity of rules and regulations over every aspect of the working of colleges in the State. Thus, colleges lack autonomy in their functioning for achieving their academic goals. Over the years, lack of autonomy has resulted in colleges being less innovative and responsive to the changing needs of the society, polity and economy. Thus, there is a need for alternative systems of colleges to the existing type of affiliating colleges. These alternative systems are explore in respect of autonomous colleges and community colleges for the State.
7.1.27. Throughout, this study has identified the best practices within the State, in other States in India and elsewhere in the world to draw lessons or cautions for current and future policy making for collegiate education in the State. These practices include introduction of computer literacy programme for students in Government arts and sciencc colleges in Tamil Nadu; experience of computer training programme in Mangalore University and computer applications course in Bangalore University; experience of autonomous colleges in Tamil Nadu; policy of abolishing grants to private colleges in Madhya Pradesh; experience of credit-based semester system of examination from the University of Agricultural Sciences in Karnataka State; and experience of USA in communit)' colleges.
188
The major policy recommendations of this study are as follows.
7.2.1. For improving the database on collegiate education
7.2.1.1. Data on collegiate education can be made complete without incurring any additional cost. First, collection of all data on colleges should be left only to the universities, as they have already got the initial infi-astructure, manpower and experience. The data thus collected by the universities for their own purposes (e.g. for publication in their Annual Report) should be consolidated with the help 6 Regional Directorate of Collegiate Education and organised by the Department, especially. This has three positive implications. First, the duplication in cost of collection of data by the Department and universities is avoided. Second, the consolidated data will be broad-based as it would naturally include PUACs. Third, the consolidated data will go a long way in building a data bank on collegiate education by the Department.
To accomplish the task above, the Statistical Cell of the Department must be reorganised. First, the available records on colleges must be properly reorganised and systematically maintained by years. Second, the future data organisation and consolidation must be computerised. Otherwise, speedy processing, communication and sharing of data may not be possible. In this regard, the Statistical Cell of the universities may also initiate steps to computerise their data on affiliated colleges. In this regard, the State Government may help universities by way of specific financial assistance. Third, the Department must depute/appoint, a computer-literate person to head the Statistical Cell who shall not only electronically organise and consolidate the data from the universities but also train the persons to be deputed/appointed into the Cell in future.
7.2. ]J2. Annual Report of the State Universities should be made to include an exclusive report on the atlfiliated colleges. This has been regulariy practiced in universities, such as. University of Mysore, Mangalore University, Gulbarga University, and Karnatak University, irregularly practiced in Bangalore University and never practiced in Kuvempu University. In addition, basic data on affiliated colleges should be made common for all universities, such as, enrolment of students, strength of
12. Policy recommendations
189
teaching and non-teaching stafif and pass percent of students by courses, social categories and by sex.
7.2.2. On controlling the quantitative expansion o f colleges
7.2.2.1. The decline in enrolment of students in GCs and PACs is often attributed, among others, to rapid quantitative expansion of PUAC in the 1990’s. However, for this reason alone, the quantitative expansion of PUACs should not be contained, both at present and in future, especially given the fact that there has been a stagnation of growth of GCs, PACs and UCs in the recent past. In fact, PUACs should be encouraged as they aim at meeting the diversified (e.g. for professional courses) and competitive (e.g. for traditional courses) demand for collegiate education without burdening the public finances in the State, if the quality of education provided by them is comparable with GCs and PACs.
7.2.22. The future planning for the quantitative growth of collegiate education should not be based on mere permission to start a large number of PUACs. Rather, the planning may also aim at making all-out efforts by all stakeholders (i.e. the State Government, affiliating University, and college- management) for inter-institutional collaboration (e.g. between GCs and PACs, or between colleges and university, located within the same area) to avoid creating parallel facilities and, thereby, promoting net work of personnel and institutions for long run reduction in total social cost of providing collegiate education in an area. Thus, consolidation and cooperative sharing of facilities rather than a numerical expansion of colleges should guide the future quantitative expansion of collegiate education in the State. In essence, this strategy calls (a) for an area-based rather than college- specific planning and utilisation of resources in and (b) helps in assessing the unmet demand for collegiate education.
7.2.23. In future planning for regular collegiate education, the complementar>' role of distance education should be considered. In fact, only that unmet aggregate demand for the existing regular and distance education should form the ba.sis for future expansion of either regular or distance education in the State.
190
At present, quality of infrastructure in all types of colleges, payment of salary of staff and amount of fee charged to students in unaided colleges and in unaided courses of aided colleges, and quality of students admitted are questionable in many colleges. In fact, the persistence of these problems indicates the failure on the part of colleges to complying with the Government/university rules and guidelines. Thus, new ways to deal with the improvement and regulation of quality are essential.
7.2.3.1. For improving the quality o f student in-take
7.2.3.1.1. Select urban colleges have attempted to improve the quality of student in-take by admitting students with higher marks in the qualifying examination. In few professional courses, admission tests are introduced by colleges. In all these cases, there exists more number of applications than the student in-take capacity in colleges, and colleges get the merited students. Obviously, those who do not succeed in these competitive processes, seek admission in other colleges where such admissions tests are not practiced. Accordingly, colleges get students of different levels of quality. This problem is severe in rural colleges, especially in rural GCs, where a large number of student get admitted with a pass class in their qualifying examinations. Very often, these students are not sure of their objectives for and options in pursuing collegiate education. Thus, there is a strong need to counseling students on vocational education and distance education, before they start their collegiate education, and get only the most motivated and interested students to pursue collegiate education. This shall also go a long way in increasing retention rate or enrolment of students in colleges.
It is gratifying to note that the Department of Collegiate Education and NIMHANS in Bangalore have joined together in giving training to college teachers in student counseling. The services such trained teachers are most useful in offering student counseling in their respective and nearby colleges.
7.2.3.1.2. Medium of instruction in Kannada is often said to a major obstacle for occupational and spatial mobility of college graduates outside the State. To overcome this problem, Kannada medium students should be provided with a short-term training in communicative skills in English language. It should be acknowledged that Gulbarga University has such an
7.2.3. For improving the quality of education
191
innovative programme for rural and Kannada medium students who are admitted to post-graduate education in the University.
1 2 3 2 . For improving quality o f teachers
7.2.3.2.I. At present, college teachers do not require a formal teacher’s training certificate or degree to get a teaching job. However, quality of teaching depends not only on the substance but also on the method of teaching. Thus, a short term training is essential for all college teachers in the methods and art of teaching. To be professional, such a training programme should be organised and conducted by the Government teacher training colleges for all pre-job and on-job teachers. The programme should be intensive and for a duration of 4 weeks. Alternatively, the universities and institutes of higher learning may organise such training programme with inputs from relevant experts, either on self-financing basis or grants from the State Government. In the meanwhile, the contents of the UGC-sponsored Refresher Courses and Orientation Programmes may be redesigned to accommodate more lectures on the teaching methods in the respective subjects.
1 2 3 2 2 . In-class teaching performance of teachers should be periodically evaluated in all colleges, either by the college management or administration or by students. This shall go a long way in improving the monitoring the quality of class-room teaching and in recognising the good teachers for special incentive purposes on objective basis (e.g. for best Lecturer awards by the Government).
7.2.3.2.3. The qualification and experience for appointment of teachers in all colleges, either by direct recruitment or promotion, should strictly follow as per the guidelines of the UGC.
7.2.3.2.4. The revised UGC-pay scale for college teachers have been implemented in the State with effect from January 1, 19%. At present, as per the decision of the State Government the direct beneficiaries of this revised pay scale are the teachers in the GCs and in aided courses of the PACs. The unaided teachers in PACs and teachers in PUACs are often said to be the non-beneficiaries of the revised pay scale, especially for lack of resources with the college management. However, pay differentials for equal work within the same college is a source of discouragement and disincentive for qualified stafi resulting in high turnover and adverse impact on quality of
192
teaching. Thus, equal pay for equal work in all colleges should be implemented and monitored , either by the University or by the State Government.
1.2.32.5. The existence of retired college teachers constitutes a large pool of experienced teachers in the State. There is a suggestion that the services of such retired persons may be utilised for teaching purposes on part-time or temporary basis in both Government and private colleges. This suggestion should considered only as a special case but not as a general policy since it would further worsen the job prospects of young postgraduates.
7.2.3.2.6. In a globalising economy, the biggest beneficiaries are those whose skills are transformable and those who are mobile. Unfortunately, at present, the collegiate education in traditional courses is not transformed in tune with the requirements of digilitisation of the economy. Thus, introduction of digitilisation is most desired in the collegiate education. In this regard, the experience of Bangalore University-, Mangalore Universit>', and the Government of Tamil Nadu, in introducing and financing the computer training programme in colleges, especially in Government colleges, deserve special consideration by the Government.
7.2.3.2.7. In the process of providing computer-training facilities to students, colleges can also directly access the most update knowledge and information through Internet services for both teachers and students. The access to knowledge has die immediate impact on reducing physical investment (i.e. on building and printed books) on library in colleges. For instance, the literature on World Trade Organisation, WTO, ( c o n t i n u o u s l y
updated, however) is available on free website: www.wto.org. In the same way, innumerable fi*ee websites are now available for science and commerce subjects. Thus, the benefits of information technology should be utilitsed for improving the quality of teaching and learning in the colleges.
7.2.3.2.5. In many of the rural colleges, courses are taught in Kannada language. In addition, more than half of the instruction in English medium classes is said to be in Kannada language. However, there is a terrible dearth of standard textbooks in Kannada language in social sciences Consequently, the instructor has to prepare his/her own teaching materials by translating into Kannada fi-om the available textbooks in English language. For this reason, the quality and content of teaching in social science has been
193
heavily dependent upon the abilit\ of translation of teachers and availability of English language textbooks. Consequently, low ability of translation and non-availability of English language textbooks have become the major reasons for low quality of classroom teaching. In addition, books on computer education, and computer manuals, are not available in Kannada language or not translated into Kannada language. Thus, students are handicapped in self-learning computer applications in one’s own area of subject and beyond their basic training in computer literacy. To overcome this problem on long term basis, the State Government or the Universities should take early initiatives in commissioning the writing of text books in Kananda language in all major courses in collegiate education. For this purpose, the services of retired professors from university and collegiate education may be considered. The procurement of such books should be made mandatory in all college libraries.
7.2.3 .3. For improving college infrastructure
7.2.3.3.1. In recent years, salar>' expenditure on stafif comprises the entire maintenance expenditure and the largest component of total expenditure of all colleges. This pattern of expenditure leaves little resources for non-salary recurring expenditure and for investment on college buildings, student hostel, librarv' facilities, computer facilities and other infrastructure facilities. Thus, expenditure on non-salarv' items should be increased with immediate eftect.
7 2.3.3.2. National Assessment and Accreditation Council (NAAC) has the main objective of helping universities and colleges to work continuously to improve the quality of education. The NAAC approaches evaluation of colleges for purposes of accreditation and grading in the most professional manner and star-grade the institution from one star to 5 stars. The criteria for NAAC's assessment include curricular aspects; teaching-leaming and evaluation; research, consultancy and extension; infrastructure and learning resources; student support and progression; organisation and management; and heahhy practices. Up to the end of March 2001, only about 1.84 percent of total affiliated general degree colleges in the State is accredited by the NAAC. In the interest of overall improvement of quality of education in colleges. NAAC's accreditation should be made mandatory for all colleges in the State within a pcritxl of next 3 to 5 years. It might be noted here that
194
NAAC’s recognition is made mandatory for institutions in distance education in the country including the Karnataka State Open University, before December 2003.
7.2.4, For improving the relevance o f education through autonomotis colleges
An important determinant of relevance of collegiate education is the prescription of curricula for courses. At present, the universities fix the curriculum for their colleges. And, colleges lack autonomy in designing of their own curricula according to the particular needs of students and areas within the universities. To bring in innovations, dynamism, and for improving quality and relevance in collegiate education, autonomy to colleges is offered by the University of Mysore, among other Universities in the State. And, all aspects of proposed autonomy by the University of Mysore are related to academic matters within the purview of the University. However, in order to improve efficiency, quality and additional resource mobilisation within the framework of proposed autonomy to the colleges, there is a need to consider financial autonomy in fixation of college-specific student fee and in raising resources through non-fee sources. Nevertheless, autonomous colleges should be monitored in regard to payment of salary to and other service conditions of their staff by, and should be made accountable for all receipts and expenditure of their colleges to, the State Government.
It should be emphasised that improvement in the relevance of education along with quality of education is also the most important way of increasing the demand for collegiate education by halting the declining enrolment of students in the colleges.
7.2.5. For diversifying vocational education through conummity colleges
The experience of USA in community colleges (e.g. contract training programmes) clearly implies that colleges go to the students, rather than students come to the colleges as in the case of Karnataka state. This is an important lesson for diversifying the activities and approaches to vocational education in degree colleges and by the Directorate of Vocational Education (DVE) in the State, such as, contract-training programmes for small-scale industries in local areas. In particular, DVE seems to have the potential to provide education services under the new concept of community colleges.
195
This potential should be utilised by giving further encouragement and support to the DVE by the State Government. In addition, the lessons from the experience of USA may be considered as useful guidelines in realising this potential of DVE.
1.2.6. On post-graduate education through degree colleges
Post-graduate education through degree colleges is imparted in two ways. First, post-graduate centers of the universities located in degree colleges. Second, post-graduate courses run by degree colleges. For instance, during a field visit to a post-graduate centre of a university revealed that it is located in a Government degree college without adequate and experienced staflC classroom facilities, water and sanitation facilities, housing facilities for stafl library facilities for staff and students etc. The situation is more deplorable in case of a science faculty by the absence of laboratory facilities. On the other hand, in a Government degree college with post-graduate courses, there exists no teaching staff who is appointed specially for postgraduate courses. In view of these problems, post-graduate education in degree colleges should not be encouraged in future. And, the continuation of post-graduate courses in the present degree colleges should be reconsidered at the earliest.
7.2.7. For improving the examination system
At present the annual examination system in affiliated colleges lacks specific mechanism for continuous monitoring of students’ learning performance, is heavily dependent on memorisation and involves examination-centred teaching-Ieaming process. Further, the nature and number of subjects of study in the present degree courses are decided (if only, there exists few combinations of subjects) at the beginning of the study. Sti^ents do not have options to choose subjects according their levels (i.e. from elementary to advanced levels through an intermediate level). Thus, there is a need to introduce a system wherein students have flexibility of choosing subjects and their levels in a degree course with scope for continuous monitoring of their learning performance. This need calls for a change in the e?camination from the present aimual examination system to a credit-based or marks-based semester scheme. Over the years, the University of Agricultural Sciences (UAS) in the State have been successfully practicing the credit-based, semester system in its undergraduate and postgraduate courses. In the 1980’s, the University of Mysore had introduced
196
marks-based semester scheme for post-graduate courses. Thus, the current experience of UAS and past experience of University of Mysore are of vital guidance for introducing credit-based, semester scheme in degree colleges in the State.
7.2.8. For reducing budgetary subsidies to collegiate education and improving self-finances o f colleges
7.2.8.1. There is a need for both increasing and diversifying the fee structure between courses and colleges within the collegiate education. At present, this can be done only by the State Government (or university in case of UCs), as colleges do not have powers to prescribe their own fee for students. However, the fee revisions should be periodic with built in safeguards for poor students in terms of providing education loan facilities and access to distance education. To start with, the recommendations of Punnayya committee, Pylee committee, Ananadakrishnan committee and Mahmood-ur Rahman committee may be considered as scientific guidelines for fee revisions.
7.2.8.2. At least, in the short run and other things'^ing the same, it is feared that a reduction in the volume of budgetary subsidies (or, subsidies, in brief) to collegiate education may lead to a reduction in provision of teaching and non-teaching staff' services of collegiate education. To avoid such a situation, a policy of reduction in subsidies may be announced well in advance (e.g. about 3 years in advance) such that the colleges may prepare themselves to cope with the new situation.
7.2.8.3. If select traditional courses is looked from the viewpoint of preserving and fostering the culture, encouraging learning, and teaching and researching in subjects of culture and civilisation of the society, one may get a broader perspective on a need for continuing subsidies to collegiate education. Such viewpoints are essential for prioritisation and targeting of reduction in subsidy is essential. Thus, subsidies should not be cut for courses, which have least or no market/employment orientation or which aim at preserving and fostering the culture, encouraging learning, and teaching and researching in subjects of culture and civilisation of the .society.
7.2.8.4. Given the diversities of collegiate education, a policy of reduction in subsidies may not be realistic if formulated and implemented uniformly across types of colleges and places in the State. This underlines a need for
197
evolving the management-specific and/or area-specific policies and instruments for reduction in subsidies to collegiate education. In the meanwhile, subsidies should not be cut to colleges, which are located in backward and rural areas and in which large number of students come from poor families.
7.2.8.5. There is a problem of lack of active involvement of local people, industry and old students in the development of the colleges. In fact, these are the potential sources for mobilising financial resources for future development of the colleges through endowments, philanthropy, and alumni association (i.e. donations after graduation). To tap these sources of resources, ^effective mechanism to participation of and co-ordination with industry, old students and local people must be developed by the colleges.
7.2.5.6. Role of charity from religious institutions (e.g. temples that under the Endowment Act) should be recognised. If permissible the limits to charity under the Endowment Act may be increased, subject to the condition that increased charity must be spent only on improving educational institutions, which are financially maintained or supported by the temples.
12.9. On bifurcation o f composite colleges
The Government Order on bifurcation of composite colleges is related only to the GCs and PACs. This is most surprising, if the objective of bifurcation is professional improvement of PU education by separating it from the degree or secondary education. Since professional improvement in collegiate education is accomplished through GCs, PACs and PUACs, the Government Order should be extended to all colleges (except UCs, as there are no composite UCs in the State).
7.2.10. On improving government colleges
There is a misconception that under the economic reforms in India, the role of the government is reduced including in collegiate education. However, the correct perception is that the role of the government is redefined in collegiate education. The redefined role is to (a) increase private finances in Government colleges and to reduce public finances to private colleges; and (b) improve the quality and relevance of education in Government colleges, as per the recommendations made for all colleges above. In addition. Government colleges are generally composed of students
198
(especially, SC/ST students) with low performance in qualifying examinations and poor economic background. Thus, over the years, students have benefited from various forms of fee concessions, scholarships and under Special Component Plan and Tribal Sub-plan. However, the real challenge for the Government colleges is to train their students such that they become competitive in University level. State level and national level selections (e.g. through Union Public Service Commission or Karnataka Public Service Commission), examinations (e.g. UGC’s NET or Government of Karnataka’s SLET, and admission to post-graduate courses) and in employment markets (i.e. number of placements in government and private sector jobs).
7.2.11. Other policy recommendations o f the study
7.2.11.1. This study has demonstrated that there exists wide disparities in all variables of growth and distribution of collegiate education by sex of students, by social categories of students, by types of colleges, by districts and by universities in the State. In particular, there exists considerable disparity in the growth and distribution of male and female students and staff in all colleges. Thus, the results of this report are useful for State policy makers in designing a scientific policy for achieving inter-regional balance in the growth of collegiate education in the State. In particular, the analyses in this report are useful for the on-going Highpower Committee for the Redressal of Regional Imbalances in Karnataka, constituted by tiie Government of Karnataka.
7.2.11.2. This report has demonstrated that collegiate education has close links with Pre-university education. Vocational education. Teachers’ education. Technical, Medical and Agricultural education and University education and research. These links should be considered for integrated planning and development of collegiate education.
7.2.11.3. There are several long run impact of recent decline in demand for collegiate education on (a) demand for post-graduate general education in the universities, and its attendant impact on the reduction in the supply of post-graduates for teaching jobs and research in universities and colleges; (b) current and future number and investment in collegiate education; and (c) supply of teachers for school education in the State. A systematic analysis of these impacts is an area of future policy study on collegiate education in the State.
199
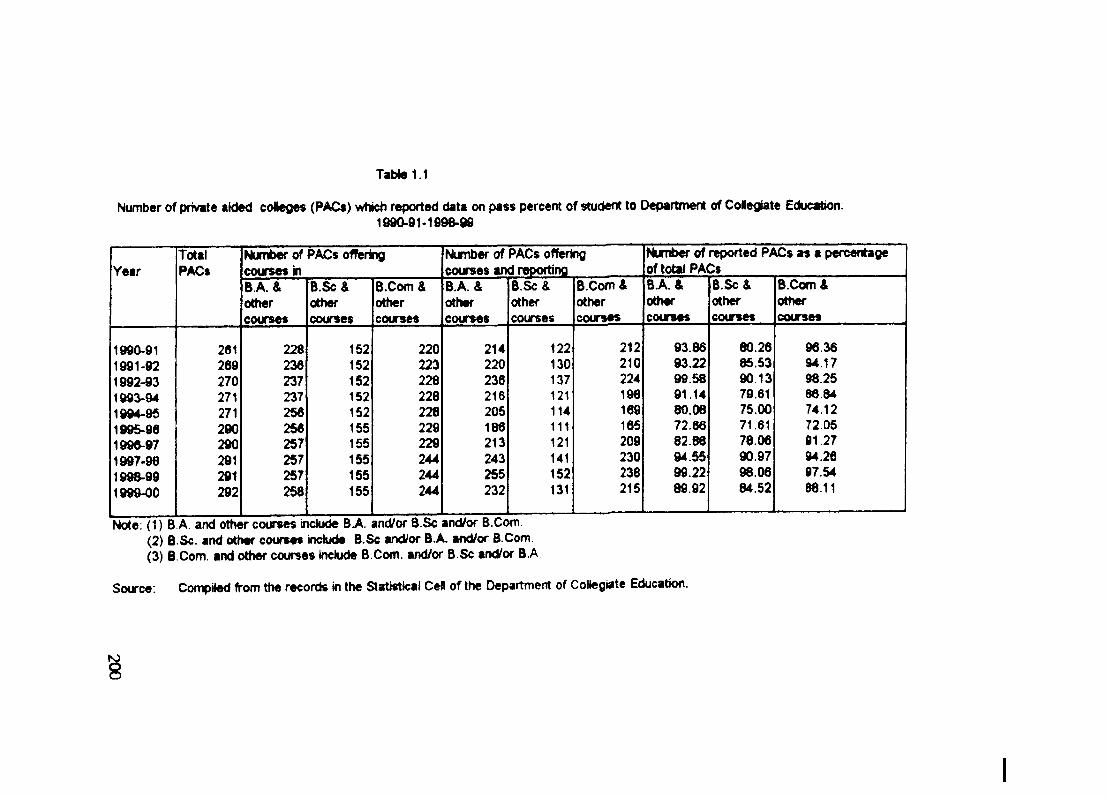
TaWel.1
Number of privite tided coNeges (PACt) which reported data on pass percent of student to Department of Collegiate Education;1090-9M 998-0e
YearTotalPACs
Number of PACs offering courses in
Number of PACs offering courses and reporting
Number of reported PACs as a percentage of total PACs
B.A.&othercourses
B.SC&othercourses
B.Com &othercourses
B A &othercourses
B.SC&othercourses
B.Com &othercourses
B A &othercourses
B.SC&othercourses
B.Com &othercourses
1990-91 261 228 152 220 214 122 212 93.86 80.26 96.361991-92 269 236 152 223 220 130 210 93.22 85.53 94.171992-93 270 237 152 228 236 137 224 99.58 90.13 98.251993-94 271 237 152 228 216 121 198 91.14 79.61 86 841994-95 271 256 152 228 205 114 169 80.06 75.00 74.121995-96 290 266 155 229 186 111 165 72.66 71.61 72.051996-97 290 257 155 229 213 121 209 82 88 78.06 91.271997-96 291 257 155 244 243 141 230 94.55 90.97 94.261998-99 291 257 155 244 255 152 238 99.22 98.06 97.541999-00 292 258 155 244 232 131 215 89.92 84.52 88.11
(2) B.Sc. and other cou tm s include B.Sc and/or B.A. and/or B.Com.(3) B.Com. and other courses Include B.Com. and/or B.Sc and/or B.A
Source; Compiled from the records in the Statistical Cell of the Department of Collegiate Education.
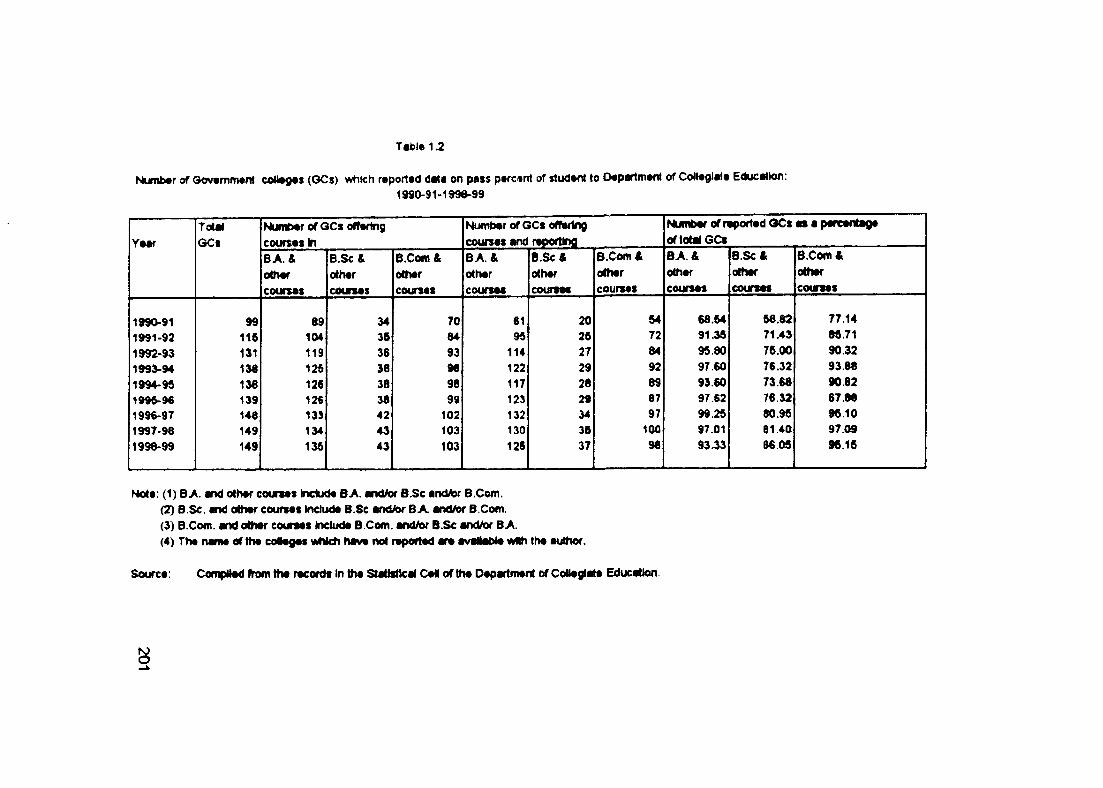
Number of Government colleges (G Cs) which reported date on pass percent of student to Department of Collegiate Education:1 9 i0 -9 1 -1 9 9 a -9 9
Table 1.2
Year
1990-911991-921992-931993-941994-95 1996-961996-971997-981998-99
TotalGCs
99116131136136139146149149
Num ber of G Cs ofTerfrig
courses InB A &othercoursas
69104119126126126135134135
B .SC &Othercourses
3436363638364243
43
B.Cotn &othercourses
7064
93969699
102103103
Num twr of G Cs offering
coursas and reporting
B A &othercoursM
6195
114122117123132130126
6 .S C &othercoursas
202627
2928
29 343637
B.Com 4
othercourses
54728492896797
10096
Numbar of reported O C s as a percentage
orto tH GCs
B A .&othercoursas
66.6491^95.8097.60
93.60
97.62
99.25
97.01
9 3 4 3
B .S c l.
courses
68 .82 71.43
76.00
76.32
73.68
76 32
60.95
81.40
86.05
B.Com Aothercourses
77.14 86.71
90.32
93.86
90.82 67 86
96.10
97.09
96.16
Note; (1) B A and other courses indude B A . and/or B .Sc and/or B.Com.(2) B.Sc. and other courses Include B.Sc and/or B A and/or B.Com.
(3) B.Com. and other courses Include B.Com. and/or B.Sc and/or B A .(4) The name of the collegas Mhlch have not reported are avaHabie with the euthor.
Source; CompNad ftom the records in the Statistical Can o f the Departm ent CoHeglate Education.
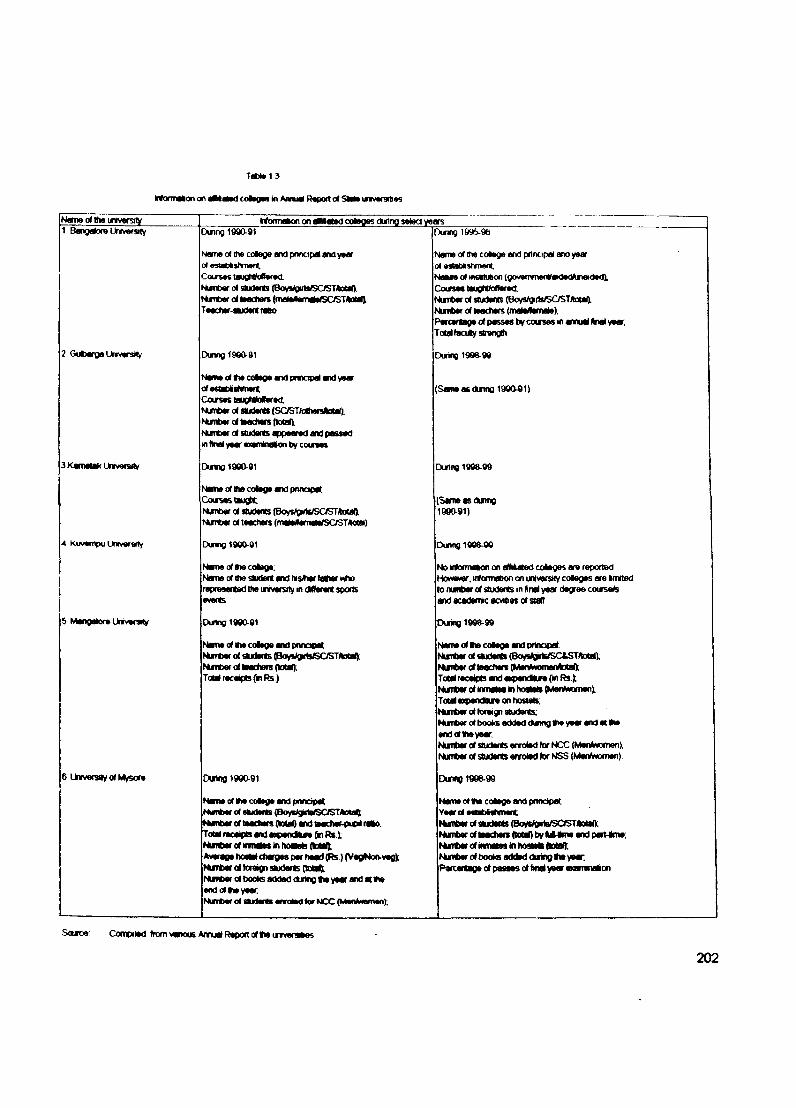
Tobto13
Womnson on eenaled col»g«s in Annual P«po(t of SM» unvarstties
Name of the univwsi^ Momwlon on flMated coleges during select years1 Bangaiore UniversJty Dunng 1980-91 1Dunng 1995-96
Name o( tfw colege and pnnctpd and yearof •stabkshment.Com et taugftfoRerad.
d sludM«s (Boys^guls/SaSTAotat NtfT MT of Metiers (maMemeWSC/STAoMlK Teadwr-tfudent raso
Name of itie colege and principal and year of establishment.Nottfe of HKlitueon (govemnrwnteKledAjnaielad). Cnisea taughtfoffered:Nuntier of students (Boys/girts/SC/STAotaa Number of teachers {meMtmg/ml Percentage of passes t>y courses m annualllnal yaar Total taculy strength
2 GObergaUtwyeraty Dunng 1990-91 Duri«v 1996-99
t ame of ttte colege and pnnapal and yearof ecoMflfimattCourses laugt«k)#ere<tNunnber of studerts (SC/ST/oltMnlloM).KUnber of iMctMrs (totatXNtmber of sludwts appeared and passedm Unal year eMmnoion by courses
(Same as dunng 1990-91)
3Kamalak Uhiversity Ounno 1990-91 Durii« 1998-99
Name of me colege and pnnopal; C o u ^ tau g dNumber of students (Boys jHlB/saSTAofaqi Number of tMctiers (mateHomaH/SC/ST^oMl)
(Same as dunng 1990-91)
4 Kui/enipu Umversrty Dunng 1990-91 During 1998^
Nameoftwcolege.Nome of student and t« s ^ fadter wfw represetted the univarsity m dMerert sports encerts
No irtormaion on afMated coleges are reported Honwawer. informalton on univ«rsi(y coleges are Imlted to number of students in final year degree course^ and academic acviDes of staff
Dumg 1990-91 During 1998-99
Name of tie cdege and pnncipat Nun«er of studmlsCBavslgKH/SC/STAotal) NunberoflMKharsdotiQ ToM receipts On Rs )
Name of tie colege and pnnctpal.Number of studeits (Boys«giriB/5CI.STAotal).
Total receipts and aiqMndMirie On Rs .]c NiffrtMr of innvlaa in hosMs (MenAwornen):Total et endtture on hostels.Number of foreign students;Ntfrber of boota added during tie year ertd at the end of tie year.Number of studerts enroled for NCC (MenAnnmen). f urnber of students enroled tor KISS (MenAwoiTien)
6 Umversay of Mysore Durtno 1990-91 Dunno 1996-99
Name of tie coaege and pmcipat Number of studertB (Boys girtsfSC/STAotaqr Martter of tMdwrs (lotaQ and teachef-pupil rMo.Total receipts and a i^ w n d ^ On R t ).NuntMT of mmles in hoMsfs (loMQiAwsrage hoaM chvges per head (Rs) (VeglNon-yeg):MfrtMT of teraiff) skiderts ()Dlri)iNumber of books added during tw year and at tieend of tte year.NtMitw of BkidMts enrotedfor NCC {iKtenMMmn):
Name of t« cotoge and ptmctpar.Yearof eetabiehmenl;Number of siideols (Boys/girta/SOSTtetan: Number of laadtais (total) by MUime and patMime: Nsnbar of iiwneies in hosHH (toteft Nun*er of bools added during f«e yaar PerceiVage of passes of Imal year eKammalion
S<urc9 Compiled from venous Annual Report of l»urivwa»es
202
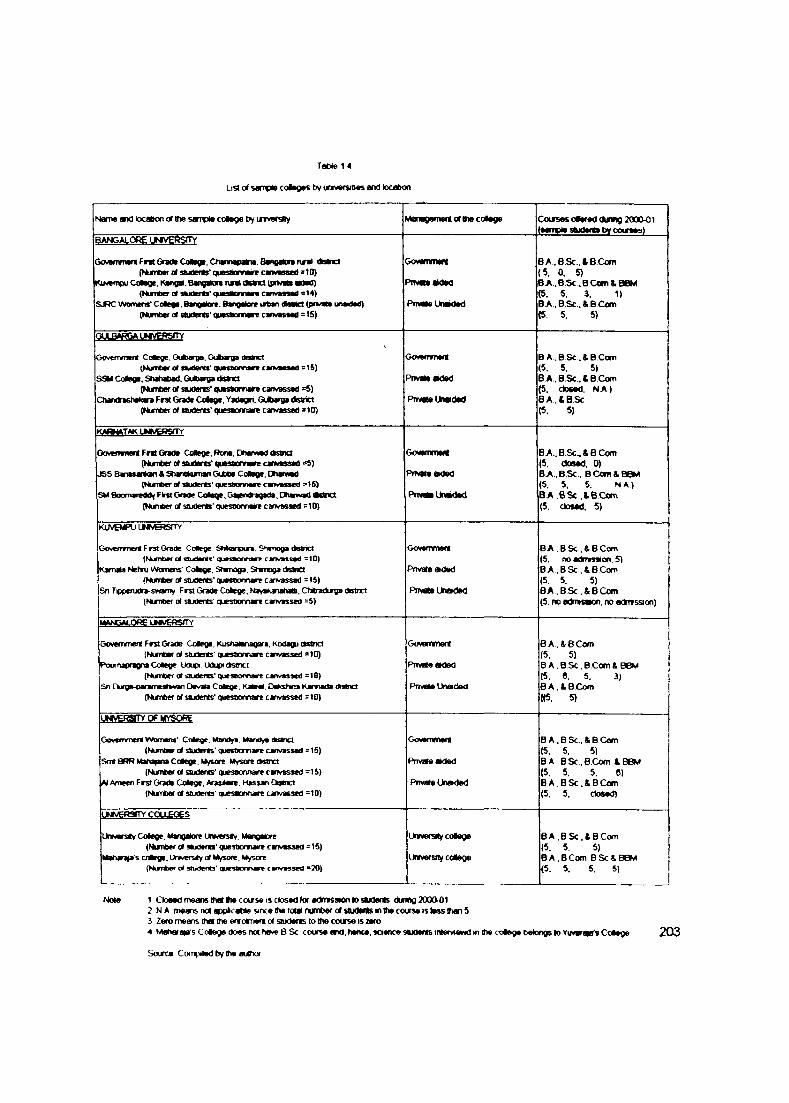
List of sarrpte coleges by uraversifies and locabon
Tat)te14
Name and locaBon of ffw sampi* coMge by urevwsliy
BANGALORE UMVEPSfTY
Management or 0w cot*9e Courses offered dtfing 2000-01 (aawipte sfcKtentt by courees)
GoivrTWTMrt first Grade Colagi. Ownapaw. Btngatare rurai dtetict (Numtief or studef«8‘questawire canvassed =10)
tCiMCfPpu Cdege. » ang«. Bangrtora n n l dm ci (prwaa adad)(Number oT studcrts' quaaHonnaire c w saad =14)
SJRC Womens' Catena, Bangakire. Rangetare tatoan d M d (pm/ale unaidad) (Number or sfeiderts' questannan canvasaed =15)
Go¥Bmmer«
Pnv«eaMed PfM le Unaided
B A .B .S c.iB .C oo)(5 . 0. 5)B A .B S c .B C ^ n iB e M (5. 5. 3. 1)B >.B Sc..& B C «ro (5. 5. 5)
OiNemmert Coaege, OufcarBa, OObargs dnarxrt(Number at students' q jm tts m a n canMened =16)
SSM Colege. Shahatod. OtAarga d sm(Numter or sajdents* quesMnnare carcassed =5)
Chandreslwkara First Grade Colege. Yadagn. Gubarga iftstrict (Number oT students' questnnnan can< assed =10)
G<ivemmert
Pnvaleiided
Pnv«le Unaided
B A .B Sc.& B C om (5. 5. 5)BA.B.Sc..&BCom (5. doced. H A ) B A .& B Sc (5. 5)
(3oN«mnent First Grade Colege. Rone. OTtanwad dethct(Number oT students' guesbomare cafMassed ^ )
JSS Banesantorl & StonGtunan (3ut)be Colege. Dttaiwad(Ntfnber of students' queseonrtare can««ned ^16)
SM Boomared>*< First Grade Coleqe'Ga|en»agada.DtiatwaddMnct (Nurrter oT studerts' quesbonrtaee carcassed =10)
GoMnvnert
Prwateakled
PTMleUnaidKl
B A . B Sc, 4 B Com (5. dosed. 0)B A .B Sc . BCom&B8M (5. 5. 5. N A )B A .B S c.LB C om (5. dos«l. 5)
KUVBkFU UNtVB»fTY
Govemmert First Grade Coaege. SMcanptra. Stwnoga district (Number at students' questnnrare carvasscd =10)
Kamata Nehru Womerts' Colege. Stanoga. STwnoga (talna(Numlier oT students' quecoorvtare canvassed =15)
S<i Tipperudra-swamy Frst Grade Colege. Ns akanaTtatti. Clriradurga dBtnct (Number ot sajdents quesoonrtan carvassed =5)
Govamment
Pnvate aided
Pnvaie Unaided
BA , B.Sc . & B Com(5, noedmission.S)B A .B S c .iB C o m15, 5. 5)BA.B.Sc.&BCom(5. m admisaon. no adrression)
MftNGAt-OREUWERSfTYGovernment First Grade Colege. Kitsftatenagara. Kodagu dtstnct
(Nijnber ot students' quesbonnare canvassed *10) Poomapragna Colege Udupi. Udup* Ostnct
(Nianber of students' quesbomare canvassed =10)Sn Ckygs-parameshman Oes/ata Coiege. KatMl. Oalahna Kanrtada dRbict
(Number of studerts' quesbonrtare canvassed =10)
Govsmmenr
Prrvate aided
Pnvate Unaicled
B A . ABCom (5. 5)B A , B Sc , B Com & BBM (5. e, 5. 3)BA.&BCom «5. 5)
iMsEMrmeSQREGovernment Womerw' Coaege. i«landya. Iiland^ dstnct
(Number cT sluderts' quesbonnare canvassed =15) Smt BRR Mahaiana Colege. Mysore. lt*ysorc (telnet
(Number of students'questionnare cvTvassed =15) Ameen Ffst Grade Colege. Aras<«re. Hassan Dwnct
(Nimt>er of s&jdefts' questnnnan carvassed =10)
Goyamment
Pnvate aided
Pnvate UnaKJed
B A .B Sc.& B C om (5, 5. 5)B A .B Sc .B Com tB 8M (5. 5. 5. 6)B A .B Sc.& B C om (5. 5. dosed)
UMvEpartvccxJLEoesUtriMersty Colege. Mangalore (jraversty. Mangaiore
(Number of students' questnrvtave carrvessed =15) Maharata's colege. Um/ersty at Mywre. Mysore
(Number of students' quesnomare carrvassed ‘ 20)
Utaversty colege
IMverstty colege
BA.BSc.& B C om 15. 5. 5)BA.BCom BSC&B6M (5. 5. 5. 5)
Note 1 CloaednteansiM tw course IS closed for admisvonlosaiderts during 2000-012 NA means not appkcat>ies«nce the totai number ol students m the course IS less than 53 Zero mear>s mat me enroimeni of students to the course is zero4 Maifaraie's Coiege does rwt h*»ve B Sc course and. hence, ectence students intervieMd tn tfie cottege beiongs lo Yuveraia's Colege 203Source Compiled t)y the auttxx
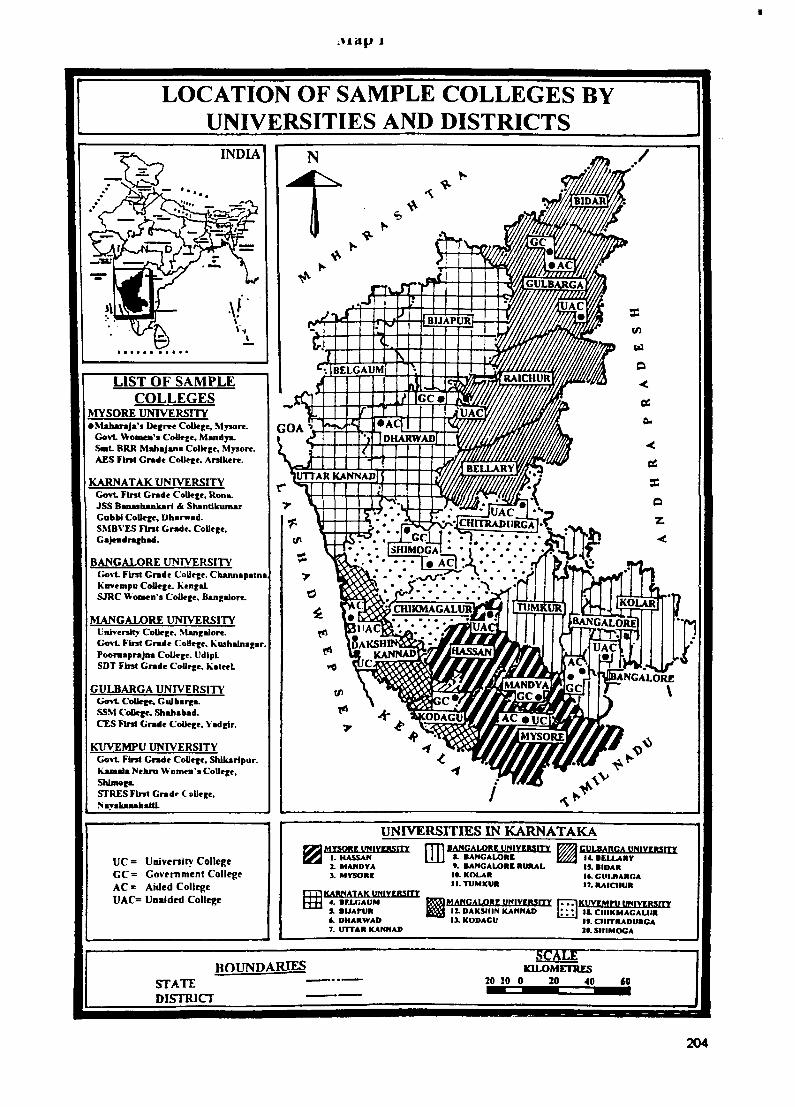
A i a p 1
L O C A T IO N O F S A M P L E C O L L E G E S B Y U N IV E R S IT IE S A N D D IS T R IC T S
LIST OF SAMPLE COLLEGES
MYSORE UNIVERSrrY • Maharaja’s Defrec CoUe|>e, Mysore.
Govt. Women’s CoUete, Mandya.Sait BRR Mahajana College, Mysore. AES First Grade CoUrce, Arslkerc.
KARN ATAK UNIVERSITY Govt. First Grade CoUete, Rona.JSS Banashankari & Shantikuniar Gobbi College, Dharwad.SMBVES First Grade, CoUe^e, Gaj«fidni{had.
BANGALORE UNIVERSITYGo\i. First Grade College, ChannapatnaKovempu College, ken|;aLSJRC Women’s College. Bangalore.
MANGALORE UNIVERSITYUniversity CoUe|;e, Mangalore.Govt. First Grade College. Kushalnagar. Poornaprajna College, UdlpL SDT Firat Grade College, KateeL
GULBARGA UNIVERSITY Govt. College, Gulbarga.SSM CoOege, Shahabad.CES First Grade College, Yadgir.
KUVEMPU UNIVERSITY Govt First Grade College, Shikaripur. kamala Nehrn Women’s College, Shimoga.STRES FlT3t Grade C sUege, NavakanabattL
u c = University CollegeGC = Governm ent CollegeAC = Aided CollegeUAC= Unaided College
UNIVERSITIES IN KARNATAKAMmHEWlYgRSmHASSAN1. MANDVA X MYSOREKA«f«ATAKWIYimmf4. arxnAUM
s. BUArUR<L OHARWAD 7. UTTAR KANNAO
BAWi?ALQBE VrtlYOmTY t. BANGAt>ORE9. BANGALORE RURAL10. KOLAR11.TUMKURiMAWCAWg^E VHIYERSITYI 12. DAKSIIIN KANNAO I3.KOOACU
CVLPARCA WIYtMITYI I4.BCLLARV IS. BIDAR I*. GUI JIARGA IT. RAICIlURKUVtMrU UNIVERSITYII. CIIIKMAGAUIR l>. OIITRADURGA 20. SHIMOGA
r o t j n d a r ie s
STATE
DISTRICT
KILOMETRES 20 !0 0 20 40 60
204
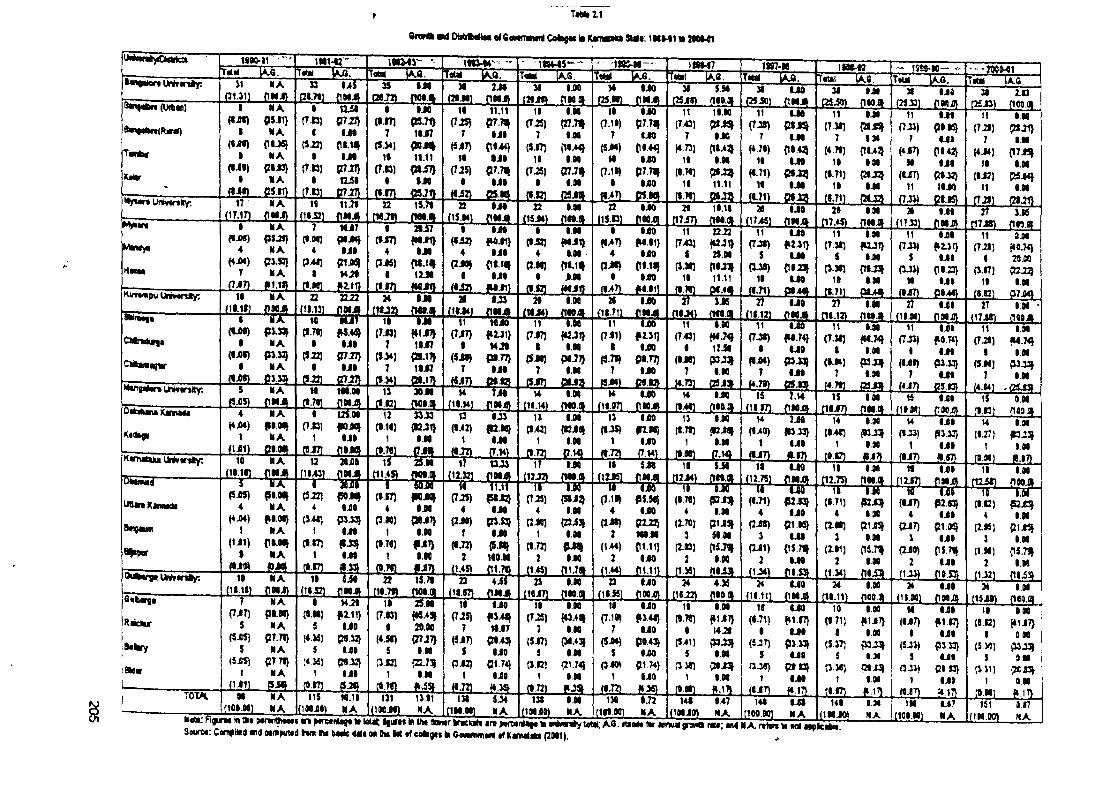
TcMiIl
Q r w t t m a O M r tM iM « f S o M fT M r t C t M f m k K v n t f k a S lU t : t H M t l i 2 I0 M 1
I W r m i y .
1S90-)1
M N A
t N A
( * jW ) p 5 . r )
• N A(«ilf) piJSJI N A
( • i t ) P I U )I N A
a I T T
m M j ' [T a « I A 8 .
3S f J ITom lA ft. I lA G .
31 IJO ( M J t ) { I M t l
T a r t 1 A 6 .
iW -M -
>«(2 5 .m
• J O
1 » M 7
T W lA f l .
31C«ig>
S.M
J ! ! t 2 .31
(25.5D1
T « > l IA S .
31
P 5 ^9 M
_ n w A
T im i A ^ . "
31 U d
-? Q C K 1t i S [a T
31 2 .0C25J3) fioo.at
I m t m
X««v
Unw«n«y.
M yim
Mm ^yk
Hm w
T T N A
I N A< f iW ) P S J I }
4 N A
( 4 ^ ) P3.S J}
7 N A
g j t n m . m
I Q jS I
r o ) P IT }I M l
(S-aj 0I.1IIt I jM
(^O ) P7JI)I G i l
(T.01 C T jnM 11JI
f u a i (1M j»
7 MJ7(».«J {MJK}
4 I J IP>MJ
t H 2 t
t«-wi ii2.tn
I IJ O
(1171
7 1 IJ 7
9 M ) { » J t
II 11.11(7 J 3 ) { 2 l i7 >
I IJ O
22 1 17 1
tK J t» fW .» • 2 S i7
c f iT ) m n4 I J I
PJSI {M .H I 1 2 J I
- 9 f n m j n
M 11.11a-25)
7 I J I
(5J7) p IM }n I J I
a^5 ) {27.7fI I J I
22 I J I
( i 5 . m f ^ ^ t J ^
I I I . M
(T J 5 ) {2 7 .7 f
7 IJ O
(S I75 { 1 l > ^
I I I . M
a J 5 j { 7 7 J ^I I . M
j L g - . j « ^ s
I I J I(IJ2)
4 I J I
P JI» C *M |I I J I
J § 1 3 ) m .f1 )
22 I . M
n>
I I(7.11)
7
(«JH)M
(7.11)I
J !4 2 L
I I . M( I J 2 ) (M J 1 >
4 I . M
P.H) ( « .1 fI I . M
S L S i - . M i n
n
i m
IJ O
{JT.7IJu o
p l . 4 ^
IJ O
C T .7 IJ
IJ O
j 5 j a .
11
(7.<3)7
K .73 )
I I
(1.711
I I
1 I .M
P J 3 »
IJ O
{1 1 .4 5
I . M
{ » ^II.11
I
( i ^ n4
( 3 i« )I
IJ O
J I E S L
( t . 7 n Q u a
IJ O
f i l l )
IJ O
IJ O
2«
I l Z i Z L11
(7431
i
[ i . y r i
I I
11.11
J 2! t a .
11( I - M ) P J S ^
7 M t
( ♦ J l ) {1 1 .4 ^I I U f t
d -7 1 ) p l J ^
I I I J I
p u a
22JE2{»2J1>
2S.M
{1 U 1 »
11.11
X I J O
11(7.311
7
(4.711
I I
(1 .71)
I I
J i m .
11
( 7 J I ) f J J t )
5 U l
(3 J « ) (1 I1 3 JI I C M
21
(17.4$)
I J I
{2 IJ 3 J
I M
{ 1 U 9
I M
{ 2 U 5I J I
11 (7 311
i
(3.31119
J t l l L
I M
11
(7 J 3 )
T
(4 J 7 )
M
(« J 7 )
11
J i a .
I .M
<WJ1>
I M
{5 1 - :^I M
m > 4 t
I M
21
(1713 )
I J I
P I I S }
U )
r » 4 2 }
I J I
P l.3 3 )
1 IJ 0
11(7 J 3 )
S
P J 3 )
I I
( I J 7 )
21
I J I
P M J )I J I
f2 .3 1 )I J I
r i - 2 3 }
I J I
P I4 4 V
I J I
11
( 7 J I )
7
(4 J 4 )
I I
{ • J 2 )11
( T H )
r
t1 7 J 8 )
I . M
c a -» >I . M
{17J5J
I . M
CM J4JI . M
g u n
11
( 7 J t )I
(3.97)
I I
3 .K
< i ia . g
IJ N {» 0 .K }
2 1 .»
{£ L 2 5
I .M
U n i» « n ty :
w n iM ta
I I N A
(11 .11) f lW J ^22 22:22
( i .T I ) fW .44}
I I J I
( * ^ P 7 1 7 }
I I J I
M G t l J \
24 I J I
( m M
21
( t i j t i n m j i21 I . M
iiU4LJ2M 11 i , i o
(7J71 f l2 J t>
I I N
(SJIJ PIJT}7 I . H
(SJ71 Q u a
21.
I l Z i l
IJ O
i l H f t s m .
27 U l
11 tM(7 -3 *) IH .7 4 }
I U l( I J 4 )
7 U l
(4 .7 t> t B M
27p m
27 I : m '
(1 7 J I1 ( 1 M J I
C l * M a q l r
n T
( U f ) PJ.S3J
I N A
( l i i i ) p y ^I N A
$
l i T i r(7 .13) f l l J ^
7 11.17
(J .34) p > . 1 ^
7 1 IJ 7
g > * i g - t n13 3 0 .M
( I . t 2 ) n C l. f l t
11 M J O
P J 7 ) f 2 4 1 }
I H J I
( 5 J I ) p i . 7 7 }
7 I J I
{ » . g
11
p i i )I
(a .7 i)7
W J 4 )
i j o
# 2 .3 1 )
IJ O
p i n }
IJ O
SISl
11(7 J 3 )
I 12.SI
( I .M 1 {J3 J3 J
7 I . M
i * ” l g S J 3 l
0 L 1 2 L11
„I M
(1 U « 111
TMJVU l
(7.M1 fW.7<J (7^) f l . 7 4 }1 I M 1 U l
( I . M ) ( U l ) P3.33}7
itZ!LI . M
0SJ3>7
JliZLU l
-215L
11(7211
I(5 .M )
7
I . M
!M .74J
I N
{U -3 3 }
I . M
U n iw n K y .
K « tM 4 a
N A
t lM J ^HI H I M
(1.71) {^ M J ^
I t5?M(7 .B ) { n j a (
1 I J I
9 . m { i m
14 Til(11.14) (IM Jt
14 la o
(11.14) (K O .O
M
(11.17)
U O
j m .
14j U 2 _
I . M
j m .
M 7 -U
(11171 f1 IC J >15
( 1 U T )
I M
j m ±
f i
1 1 1 « Lu( ! - » )
1
J ! £ L
I J I
U l
U l
9-ST^
(4 .14) . a m
IS I . M
U I . M
( I J 7 ) 9 a 2 ^
1 I M
( I . M ) H .I7>
I . M
fIC O J I
K « te 9 i
4 N A
(4 J 4 ) f t . M }
1 N A
12 n.33(1111 iK J l>
1 I . N
W L ( T J H
13 U 3
d .4 2 ) « e . i i }
1 U l
■ i t ^ - M
1) U l
d ^ i ( K J « i1 I . M
13
(1-55)
1
j ! j a .
u o
u o
JUiL
13
(1.71)
1
j ! j a .
I . M
i K J §
I . M
J L ^ S l
M 7 J I
(1 ^ 0 ) f » 3 3 )1 U l
14
( I 4 « l
1
( l - P l
I .M
{B J 3 »I .M
I U 7 )Kvrucakaunhmiy:c s s j s a
M « a K a n « i t
& t<9auii
l i m y u L
(5 J 5 ) {S I.M }
4 N A
(4 J 4 ) f l . M l
1 N A
( U l ) { 1 I .M }
I N A
g ^ O )
U
1 1 ! £ 1
IS
(11.45)i
(5 .2 1 [S0.MJ 4 U l
(3.411
1 U l
(1171 | U 3 |
1 U l
m .
2 S .H t 3 J 3
n a a .
( i . m i « J o i4 U l
( 3 M ) p u n1 I . M
(I .7 I1 f J 7 >
1 I . N
J I , ^ g J 7 }
C IJS )4
(2 iO )t
(• .7 2 )
2i l i a .
i m
{ S t J aU l
U l
{5 .H }
1 I0 .M
j m .
17
( « J 2 )I T
(T2514
(2J01
1
( i . n i
2
j m .
u o
J S 5 J .W
( « i aI . M
{ 2 3 i3 |
I . M
I . M
JlLZl
11
i mT T
(7 .H »4
(2 J « )2
( I M )
2(1-44)
f f M J t
wP 5 5 D
U O
P i B }
W I .M{11.11}U O
M i l
11
(1 2 J 4 )T T
(l.7 « )4
(2.701
3
(2.B12
S .H
JJJISL11 u o
T B r
t n J 3 »I . M
a i j s »
j l . M
{15JJII . H
(12.7;) f iM j»
- t 1 « )
1 1 — n r
(•-71) «S2J3}4 U l
(2J«) 9 1 .M}3 U l
(W1) {15.71J2 U l
11
(1 2 7 ^ )I I
(••71 )4
( 1 « 13
(2-Hl2
U l
J J iS J LT Mf a m
I .M
(21J ^
I M
(15 -T^I M
n
(12J71«
(U 7)4
(2 J 7 )
3
( 2 J I )
2
U l
f l M J }“ W -
P 2 . 0 }
U l
{21 .as}U l
0 5 7 1 1U l
I I
t n s s j
c i 5 * i24 I .M
(11.11) n o n
T T(i.C )
♦
(2.K)
3
( I .M )
2j m .
( l i J t )
I .M
I . M
{21J5JI .M
{15.711
I . M
( 1 l i3 ^I.M
{ i c a .gG tU r s a
R ik l tu r
8 « k r yI
i B k *
I I N A
(11.11) ( 1 M J )
7 N A
( 7 iT ) p i . H }
5 N A
(3 J S ) P 7 .7 I}
S N A
(5 J S ) {27 71}
1 N A
M
( I f l l . M )
II T ili i » ” i {1MJ}
I H .21
( • H ) f i l l )s u o
[4.3«) {21.32}
5 U l
;4 3 « ) {2112}1 U l
- g p ) g j l }
22 1S.7I
{ 1 l . 7 i ) ( 1 0 l . »
2S .MI I
(7 .« 1 I 2 0 .M
(4 .S I) P 7 J 7 }
5 I M
(3J21 {22.731
1 I . M
23
(11.871
I I
(7 J 5 )
7
(5 J 7 )
S
PJ2)1
J i n .
4 iS
J D M A
U l
11.17
PI43}U O
0 1 7 4 }
U l
J L S .
23 I . M
I I I . M
(7J25)
7 I . M
(5 J 7 ) {34.43J
5 I . M
(3 0 {21.74}
1 I . M
■ g g i . .
23
i mI I
(7.11)7
( 5 J l^5
P J O )
1(1.72)
U O
ffWJVU O
f 3 . 4 l }
U O
PO.43}
U O
P174}U O
J 1 5 « L
34
I i m .I I
(l.7«)I
(5.41)5
t3JD1
( I .M )
4 .)5
JilSLI . M
{ I I J 7 )
14.21
{33.33J
I . M
{ » J 3 » I M
- t l l L
24l l i l l L
u o( 1 M J )
I I U O
(1 .71 ) <41.17}
I U l
(5 J 7 ) P 3 .33}
5 U O
a j8 ) p t t3 )t U l
( U 7 ) » .1 7 )
I I(1 .71)
<(5.37)
S(3.3«1
t( l » 7 l
I.Mf»1J7>
I.M
IM(2U3)
IM# 1 ^
(ij3 ^ n m>4 U l
(1UI) TMiaM
( U 7 )
I
(5 J J )
5(3JJ)
1
J M UIM
(1 0 I.M )
U l#117}
U lP3.33)
U lC2IC}
U l- M L
U 7N A
I I( 8 . C )
I
($.>3)5
(331)1
JIB151
iL w jg i
I . M
{i1J7>I . M
{33.33»
I M
I.M#.17}U7HA
N A
N A115 W .1 I 131 1311 I 3 t 5 J T
1 1 M J I ) N A ( 1 M J * ) N A ( 1 I I . M ) N A
m » i p « n n l ^ f n teUC l | « t i in Um ik m ir V k i o I i i r i A O
SMITC4; C s T f ta l l a id M t a ^ d N f l i VM b « * M t M Dm M »f c o to g t i h G o w n m iw t v f K a n n ik a (2 M 1 )
131
(IMJI^I . M
NA131
t l U M )1.72
N A
141
(1 M J 0 1
1.47
NA141 U t
( I f lO .M l N A
141
(1 M J 0 »
I . M
NAftandt («r MiTMlgraMai r«u; i r l N A rtfm la M l ap p kM
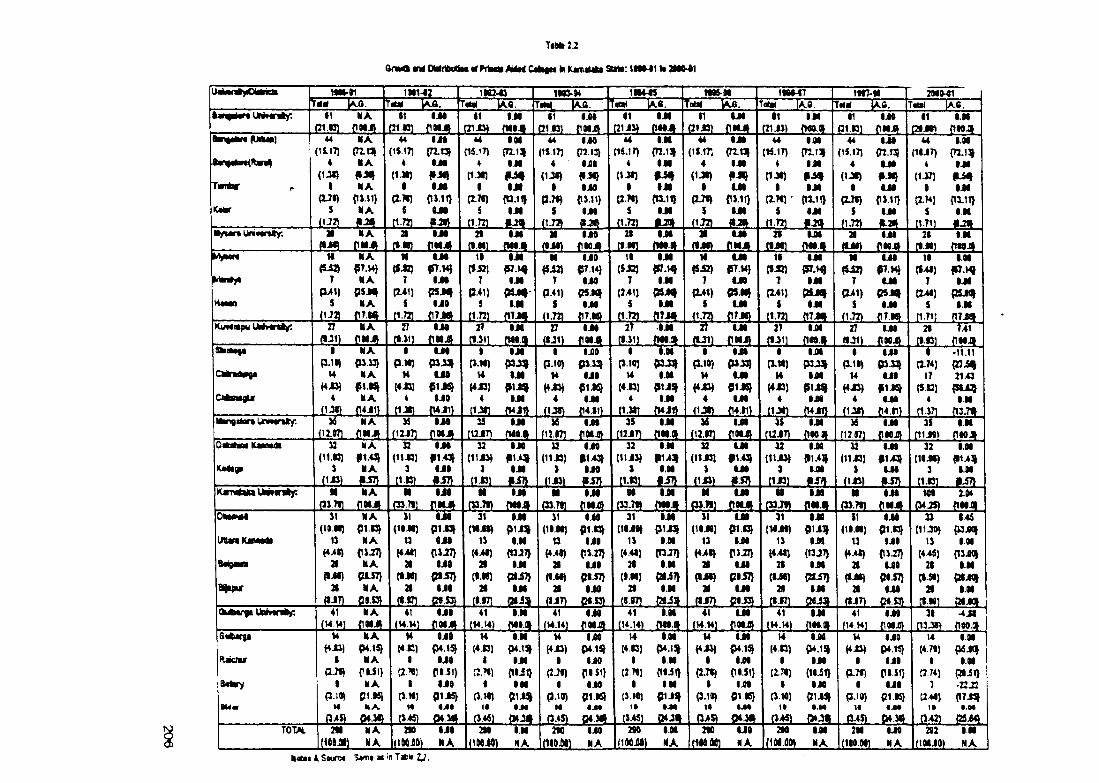
O nw am iO W rlM iM XhlHtt/M rtCalifM biKani^ Stttt: 1MM1 to 3MA41
Ttbte 2
UaUntyCMcHHiiari UW*Mntf. ‘TilH lA.0.'
f 1J21SL
NAj m
m i4 2(<K \M .
SI IjM 11J31 f1WJ»
T«« IA.8.41
C21i ^
\rn -n
tMm i t
IW-94
tBUSL
iMJIM .
1 IIM 5 ttrt ~ '1a.8.
1121
•J l
was-MiKH
nfiL H L
1I8M7T a il lA fl.
i i ! y L
HtT-M TotM lAC.
•121 J>) •J<j w a j .
IIf i lE L
liftfU M
~2I»(K1 T<trt IA.6.
I IC3»M)
I.M
tam iknM ta i)
Tsnlar
Ktltf
(1117)4
(1J«)I
(U Ds
I 122L
HAa2.o»
HA
NAPJ.11)
NAj y f t .
M l i t(1S17) cn-nj
4 IJ t
I IJ t(11.11}
8 «jM
u(15-'7)
4(1JI)
I(2.7I1
5m .
I.M{72.1^
IJ I
IJ I(0 ,1
IJ IJ t a .
44(tS l?)
4(IJ I)
IP.H)
5iL za .
IJO{72.13)
I jOI9 ^IJO
ps.11)IJ I
J L 2 L
44t15.1T)
4(IJ I)
I
siL 3 i_
IM(n .n
IJ I
•J lm -m
IJ IJ U S L
(U.1754
(IJ t)I
(2Jf)5
I ! ^
IJ I(72.0)
IJ I{IJI}U l
r v ioIJ I
- j a .
u(«.17)
4tty t)
I(2.W )'
5
IJ In-'Tt
IJ I
IJ I(n .11)
IJ Ij y 2_
44(15.17)
40 -* )
Ia-w)
s
IJ If.SI)U l
ps.11}U l
f■2l
44nuT)
4(1.»)
I{IM )
sn-711
I.M{T2.1i
i n|L54I.M
p il l }I.M
j y a _■ fM n Ui««rsty; a
i iJ f i .NA
J 1« A21 IJ I 21
2J5LIJ I
J S IS l
ai y f l .
IJO 21i t a .
IJ IJMA
ai l S . _ n m
21iLML
u cj w i
a 21(1-Ml
•.Mj m a .
H«na
I IPJ2)
TP >1)
S(1J2>
NAP7.M)
NA
NAj i L a
N %M(*•«) pr.M)
7 I J Iiw i) iaJ<»
9 IJO
I I(SJ2J
7P .*1)
i
IL 2 L
IJ I
IJ I
I.Hj c i a
M(5i2)
TP>1)
S(1.72)
IJO(57.14)
IJOP5»<^
IJOjc u a .
I I(5J2J
7(2.41J
Sm
IJ I
IJ IPSJ^
IJ Ij s L a
M(8i 2»
7(2>1)S
ILSL
P .M )u o
CSJIIuo
jfiLSL
11(S-B)
7(241)
S(1.72)
IJ I
IJ IP5J<I
IJ I{17 Jit
M
7(L41)
Si l 22L
U lfT.MJ
U l{».M|
IJOJ U S .
I I(l>4J)
7cwi)
sCl.71) (17 Jit
I.M<n.>^
M lPSJH
I.M
Kuwtapu V M nn ftf. 27J ! M .
NAJIMJL
27 IJO 27m
M lJ H U l
27j y i L
IJOJIM.
2TI ! i ! I
■MlJ!Stl
W uoJ ! M
27tu n
M l(no.ai
27j m .
2tJ1 « L
741Jl!tSL
CMradwga
IP.1D
u(4JS)
i l i a .
NApSJ3)
NA«S1.K)
NAJ l f J I l
I uoP.IO) p j j : }
H MO(*153 ffIJS}
4 IJO(IJT P4J1)
ItiM)
Ut*i3)
4
M l
M l91J9
M lj w i a
Ip.lO)
t4(4J1)
4J L » L
IJOPS.J3)
IJO91.K)
U lj i i ! i
I(S.IflJ
u(4UJ
4t1.Ml
I.M
I.M
I NJM J2L
I(S.1
wH iD
4
i i a .
uoplJ3)
U lflIJS}uo
J!i!!l
Ip.tt)
M(4A)
iL2!L
M l{«J1J
M l91J9
M lj m .
Ip-11)
M(4JS)
4
U lPS.S3)
U lf 1.l^uo
J!i!3i
I(174)
17($.*2)
4iliZL
-11.11p i ^2143
{5U5I.M
Jll-ZSLM v ^d o rt U rm nKy:
i m .NA
JIMM
112J7LIJO
JIM35
(13JT>M l
J!MS6
(1M71UO
JIM3S
(12J7)I.M
J!M7
H i mU l
JIM)S
m mM l
(lOOfll ilifZLuo
PWJD3S
(11J0>I.M
JIM .S2
(11U )s
il£L
NA#1.45)
NAJLSL
»(11J5J
3[1 B1
IJO{I1.43J
UOJtSL
32(11JS)
3JU5L
M l#1.4»
OJOJ m
u(11.«J
>JIM.
uo9142)
IJOJLSL
32(11J1)
9IL5L
I.M{H4]|
I.M- l a .
32(11JS)
ILfiL
U lf i .« )uo
JL£L
32(11JS)
9J1£L
M lfl1.4i
M lJ £ 1
12(11JS)
J L £ L
U lf143)
U lJB U L
32(llJ f)
3JL O L
I.M{lU lJ
I.MJfc2LKvTMlakaUMNniy: H
fiL 2 LNA
JIMM
i» J !LIJO
JIMM M l
J!MM M l
JIM01
(33.7HM l
J!MM
E L 2 L JIM18 M l
J!MU l
JIMw i
(S4Jg)Iftt
J I MOlHMl
IMm
Bc eauni
SI(10.M)13
(4>Da
( l i i )a
diT)
NAP IB )
NA{tJ.«}
NAP157)
NAs m
SI(1MI)
13(441)
a
aj L £ L
U lP1J3)
OJOP127)
OJO{»J7}
UO-21SL
31(HJO)
IS(4.41)
a(i.« )
aJ i m .
M l
IN(13J7>
M lptJ7>
I.MJ S i i
SI(1MI)
13
a(I.M)
a- M L
uop i.O
U lPS.27)
U lP «n j
IJOj g i a
31(lOJO)
IS(4.41)
21(9.N)
nJLEL
I.MP IJ^
1.0 1cnjT)
I.MpiiTJ
I.H
SI(1IJ 0)
12(<>«)
a(IJO)
a(IJ7>
p i *3} IJO
fJ i l }IJ I
CliJ}UO
M B .
31(MJO)
IS(4.4«)
2t(M l)
»tt.»7)
MOp u i j
M 9{ttJT}
M ltai7>
I.MJ S M
SI(IMO)
13(448)
a(IJC)
a.e iZ L
uoP1.0)
U l{>1-27)
UOPI.S7)
UOg«.S3)
3S (11 JO)
IS (446)
21 (0.50)
a
142(WJDl
IMP3J(|
I.MgtJNt
I.Mj t a .duteryt VMnnfty; 41
IU H LNA
JIM41
I M LU l
JIM41
IH J ILIN
JSM.41 uo
JIM41 I.M
J!M41
l!t!S LU l
JIM41
llt iS LM l
JIM .41
i l lJ lLu o
PM J)31
S i m .4J0
poo.atGiAarga
Rjictiur
3«i»y
14(4JJ)
IaJo)
Ip.io)
M(345)
NAP4.15)
NA01-51}
NAP IN )
H A ._ g n ft
H(4.B)
I(2.^:
I(3.10)
M(S.4g]
OJO(»15)
OJOPl.51)
UOP1J5)
• j(*
M(4.01
I
f(S.W)
ItJ11!L
IN(S4.11J
M lP l i l }
INP1J3J
•.M. a b a
14(4J3)
I(2J0)
IP.IO)
t«j i i a .
IJO P415}
UO p l$ 1 )
UO p i 05)
9MC4HI
14(4.KJ
I(2,71)
I(3W)i»
tv « i
IM
I.M
IMPIJSJ
4.Mj y a
w(4JJ)
I
I(3.10)
i«j m .
U lp4.W)
UOpl.51)
UOP IN )
J J O ft
14(4.13)
I(2.70)
I(S.W)
J14SL
M l{W.1SJ
IN{1IJ1}
M lp u a i
.54^
u(4JS)
IP-7«)
IP-1I»)
jS iS L
u oP4.W)
UOpis i}
U lpi .05)
P*30)
14(4.71)
1a.74j
7(241)
1*(S421
IMP6J0I
O.M PIJI} -22 J2 P7J^
».Mj s m .
Tom 2«(UMD
NANA
ao UONA
2N(1MJ0)
I.MMA
200t1IO.M)
UONA
200(IMjflO)
I.MMA
200 UONA
200m m
OJONA
2M(IflO.MI
UONA
»2(1MJ0)
INMA
Notet & SoMfw 3*<n# at in Tafcl* 2 j .
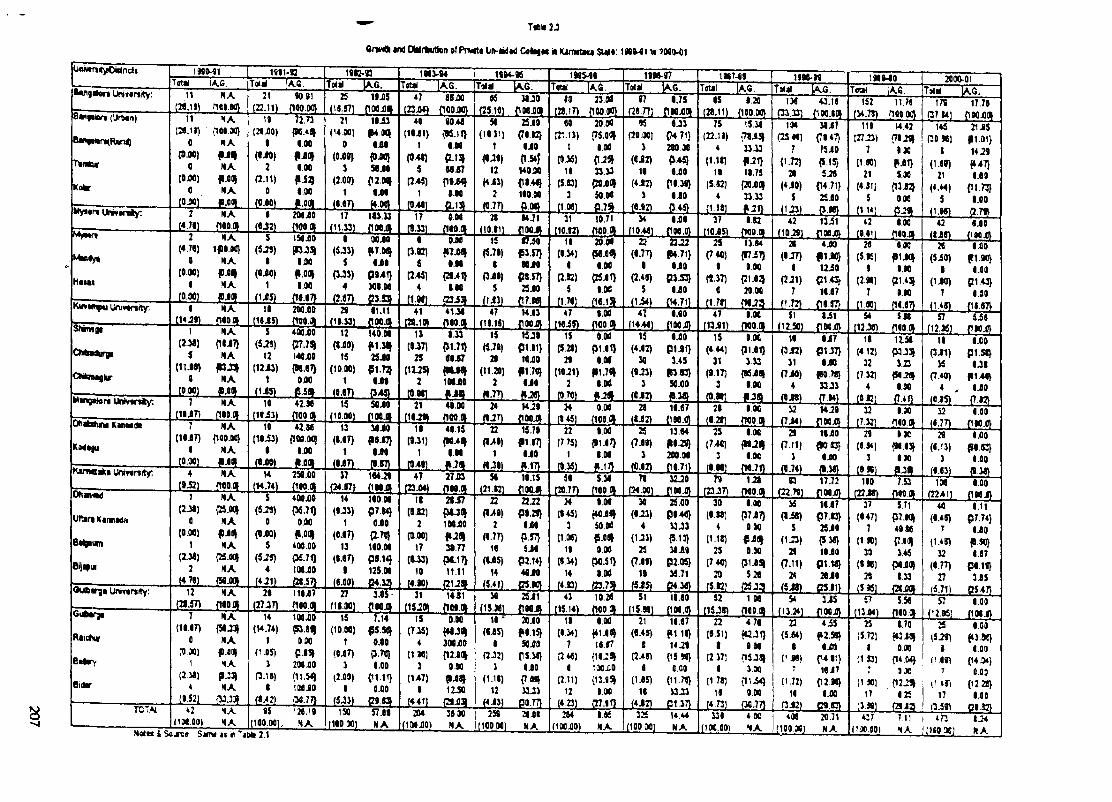
Triiti 2J
CrwO ind OMrHMtkn of PrKwtt Un-iidN C«Ii | k in K im ttau SUI*; IM M I t« lOOMl
t«m»CVsOidncli
•w gH on Uni»<rsfty: 11 NA;a .n ) n«».w
m i • cK 6 . To4^
21
1 2 J 1 I
MJ1OOO.PQ
19IM3
2S(H.871
1fi)Sr M i n
1HVS4T«t*l
♦7J A ^
asjMnoo.flcy
Tol|i_ «S
19M-K
UJO (25.10 PM-flfll
TottI A .6 .<0
I M L
23.0«noo.jo}
ltM-37Tom \K Q .
87
m u1.75
rw >cn
in7-«8ToUl Ia . ^
«5 1.20(28.11) {lOO.W
i t « - nfa i^ K G .
13< i3.18
1« M 0TctX IA.6.'
152TaiH [A.G.
11.7« 179 q 7 t* ]
145 CO *1
I(1.6»)21(4.44)
5
17.78
e«ifUort
Ban«Mir^Rttrd)
Tm * v
Kalv
11 1A(2«.tl) ' {108.30}
0 H A(aj»)
0(OUfl)
0
j m .
9 J l^N A
f-flOlN A
19(2IJ)0)
8(«J0)
2(2.11)0
J M _
71 T3
8.M8.M
H.598.M».0H
21(H .«J
0(OJlff)
3(2.00)1
(0.87)
18.53
8X8{DiW}S8X8
{12.MJ8X8
j m .
40(18J1)
1(0>«)
5(244)
1
J 2 4 !L
9048 {K.1T} 8i8 {2.13J 88 J7
{18X4} 0.80 (2.13>
SO(18J1)
1
12(4J3)
2
J IZ Z L
25X0 (7812)
8X0 (1.54f 140 X8 {18.48 180.08
80t2^.1J)
I(8J6)
18(5.S3)
3
20.0C{75XH8.0033.33
{20XI|50.»0
«f20.W)
3(« i2)
18(4X2)
3
8J3{J4 71} 280.38
8X0{18.3S}
8X0
75(22.11)
t(1.18)
18(5.82)
4
15.38<78X1|33.33 f-21} 18.75
{20X(933.33
104 (25 48)
7(1-72)
28(4X0)
5(108) 0.75^ tf«2) (3.44)
38J7 {78 47} 75i0 {5.15} 5 ^
04.71} 25X0
111(27.23)
7(1.80)21(4,»1)
J
W.42{71.291
f X l )5.90
{13X5o.oc
P90xa» 21X5
p i 31} 14.21 f»47} 8X0
{11.71} 8X0
H«iim
2 NA(4.78) f180.1>
2 HA (4.78) 1{D8.)0}
(8J2)
C(0.00)8
i i « L
N A§ J t^
H Aj w a .
5(5-25)
8(0X0)
1(t.85)
208 X0(ico n1S0X0?3J3»8.00m8.00
i ! t « 2 L
17(11.33)
8
183.33
m s L
(5-33)5
(3J3)4
j m .
MXOfT O q
8X8p941}3Q8.M
17
8(5-K)
5(245)
4
i ! i ! L
0.00J ! ! 2 A
0X0fl7X«l1.88{28^1}
8.80(23i3>
28
i i m .15
(5.79)8
(3X9)5
(tJ3)
84J1flOOX)87X0
153.57}88X0
(28.57}25X0
J l l i l
31
i i m .18
10.71(1C0.DI20.08
34I l iS f iL
(I.M)8
(2.82)5
P8X ^ 8.00(25X1) 8.00
ft .78) fH . l3>
22(8.77)
8(2.48)
5(1 i4)
8X8POO.CD22
P4.71}8X0
P1.S3}8X0
- C t z i
37(10X5)
25(740)
8(4.37)
8
812(TOO.fll13.84
{87i7)0.00{21X520.00
42jia -a a
28(8J7)
8(2^1)
7
13i1ro ox)
4X3f1.iO}t t iO
9 1 4 ^18X7
42(9,811
28(5.15)
I(2.«)
7
8.00j a m .8.00{81X0J8.00{21.43J
».S0
42(1X8)
28(5i(T)
9(1X0)
7
8X0
8X0 p i .90}
8X0 p i .43}
8X0
8 NA (14J8) f180J>
18(18X5)
200X0(100.0 29
Sim.12(8X0)
15(10.00)J i5 Z L
81.11
J I M .41
J25J2L13
(SJ7)25
(12J5)2
(0.88)
41.38(100.H
8.33{J U t}<8X7
108X0
j y a .
47
Sim.UX3
J I O ^ 15.38
p i l l } 18X0
f t 70} 8X0
47
i m15
(Si8)28
m \ )2
J0 7 5 L
8.00(10011>
47
I ! iS 5 L8X0
J I M .
47(13X1)
8.00jw o jL
51(12.50)
8i1ro ox)
54(12.38)
IS(4.12)
32(7.32)
4
588
J S M .11.50
P3J3J3.23
{58-2818.90
57(l2.ttS)
18(3X1)
35(7.40)
4
5X8 P90X)
8X0 p i . 58}
8J8|B1>40}
8X0P.K!)
1 NA(2.3i) {18X7}
5 NA(11.90) {n j3»
0(0-W)
NA
j y a .
5(5J8)
12(12X3)
1(1 i5)
400X0
144X0{•8X7}0.00
- f c ^ L
140.08
25X0P1T3J
8X8
- M L
15(5-M)
29(11.20)2
(t-77)
0.00{M.81}8.01(81.70} 8.00 I l i8 t
15(4.82)
30(« 3 )
3
8X0p u n
3.45fB3.S3}50X0
(CJ82) ».3g
15(4.44)
31(»12)
3(0.8«)
0.00{31X1}
3.33{KXfll8.00
18(3-82)
31(7X0)
4
8X7 p i -37}
8X0 fW.78} 33J3
O tiM uM Km m iM
7 NA (18X7) (180.01
10
S i m .42.H (100 ()> 15
ilOXOi.50X0
J I M .
211112a.
40.00(lOOfll
24(1^7)
22(1^9)
1«J8)
HJ9
J I M .15.79
{11.87}8X0
ff.17}
34
J l i ! L
0.00(lOO.fll
28
iL 5 2 L
18X7{108.0}
28(8.28)
8.00(woai
32(7 i4)
H J9{IOOjO
32(7.32]
800 {180 01
j m .12
iL Z Z L
8X0
N A(18X7) {100.00}
8 NA(OM) <8XB>
10(18X3)
8(8X0)
42.80{100.00}8.00j y i
13(8.87)
1
J S i lL
38X0(18.87}
8X0
j m
18(M l)
1
J 2 i ! L
48.15{80>l|
8.80
J L 2 1 .
22(7.75)
1
8.00 {>1.87} 8.01
(8.M) #.17}
25(7X9)
3
13.64 I88.29} 200 08
(0.82) P8.71)
25(740)
3(8.M1
8.00{88J^8.00
s m .
28(7.11)
3
18X0 {80 83}
8X0
29(**♦)
3
1.90 <W.83}
8.90
29(«.1J)
3
8X0{18.53}
8X04 N A
(9.52) noo.»H
(H.74)250 X0
J180J_37
J215ZL
1M.28
J I M
47 2Ti»3t iw < l
58(21.82)
18.15
J I M
58(20.77)
5.34(100.H 78(24.00)
32J0f190
79 \ 2 tnoo.fli
n(22.79)
17.72ro ox)
180(22X8)
7.53{180
108
i2241L40
(8.48)7
(1.45)32
(«.77)27
8X0
J I M .8.11P7.74}
8X0f8.«}8X7
P8.18}3X5
tiitan Kaiwate
Bllnur
1 N A(2.38) {25.001
0 NA(0.M) {DXI|
1 NA(2.38) (H.OO}
2 NA(4 78) (58.00t
5(5-28)
0(8X0)
5(5.25)
4
j m .
40CX0{36.71}0.00400 X0 P«.7f} 108X0
14(9J3)
1(0X7)
13(8X7)
9
J IS 2 L
180.08P7.I4}
0X0
180.08p s .t^125.08P4.3a
18(t.C)
2(0.M)
17(»J3)
10(4.90)
21J7 {M-31100X0
30.77{3«.17}11.11
22(t^9)
2(8.77)
18(8X5)
14
j m .
n i lP9.29}
8X0{3.57}5X8
P2.14}4«X0
J S J S L
24(8 45)
3(1.«)
18(8.14)
14
8.08{M X ^50.00 P.0810.00{50.51}8.00
30(8J3)
4(1J3)
25(7.89)
19
25X0P84<}33J3{5.13}38X9
P2.K}34.71
(23.7^ g J5 ) P4.30
30(8.88)4
(1.18)25
(7.40)20
(5.82)
8.00{37X7}0.00p x fli0.00
{31XSI528
34(8 i#)
5(1-»)
29(7.11)
24(5X8)
18X7P7.S3} 25X0 {5.38} 18X0
p i .18} 28X0
C5X1)
37(«47)
7(1 « )
30(8.18)
29
5.71P7.80}49.H{7XUJ345
{38X0}1.33
12 NA (28.57) n80J>
28 118X7
J I M .
27
Sim.3X5
J ! M
31(15-20)
14X1
J I M .
38
I l i « L
25X1r w x }
43 10.28(15.14) (100.H
51i l i W ] {108.0}
18X0108.
52
i i m .
1 Mfioo.ot (13.24)
3X5fioox}
4 i5f2.S8}
8X004 81} 18X7
0218} 8X0
57(13.04)
ss«f180.1|
57(12.M]
25(5-2?)
i0.89)
Tr * j)
17
8X9
J I M .8X9
{»39f} 8X0
(14.0*) 0X9
{12 28} 8X0
Rjictwr
Bi «vy
Bidv
N A(18.87) {58J3»
0
1(238)
4(9.521
NA{D.OQINA
NAi33.33
14(14.74)
1(^X5)
3P-15)
8J L l l L
100X0{53X^0.00P85}200 X0 {11.54} 100X0 {30.77} '28.19 MA
15(10.08)
1(0X7)
3t2X0)
8
7.14P5«J
0X0P70)8X0{1111}0X0
. £ i a57X9NA
15(7.35)
4(1 » ]
3(147)
8
j m .
0.003 M j0 0
{12XH0.009X1}12X0
j a x i
18'(8X5)
8(2J2)
3(1.18)
12(4X3)
20X0 f8l5} S8X0
0538} 8X0
{7 08} 33X3
PQ.77)
18(8.34)
7(2 48)
8(2.11)
12 (4 23)
8.00{♦1.8^18.87
{18.28}190X0{13X^
0.90(27X1}
21(8.45)
t(2.45)
8(1X5)
18(4.82) Cl 37)
18X7 11118} 14.29
{15 59}0.0001.78}33J3
22(8.51)
8(2 371
8(1.78)
18
478{M-3H
9.M {15J8}
390 {11 i< } 0.00
23(5X4)
8( i.« )
(1.72)18
25(5.72)
I(1 O)
(ISO)17
(4.721 {30.77}
t70{43X8}
0.90{14.04}
I X(12-23}
825
TOlAi,
Motts i. Sojrc# Sarw n r TjMi 2.1
*2dOO.OOt
NANA
95(100.00). ISO (180 »1
204(1D8X0)
38 00N A
259(100.00) 28X8NA
284(100X0)
l.iSNA
325 (100 00) 14.44NA
338(190-00)
400•<A
i08 (10 0 90)
20.71NA
437(liX.tOt
7.11NA
ra.59) p l.g )I *73i noo.M)
IJ 4NA
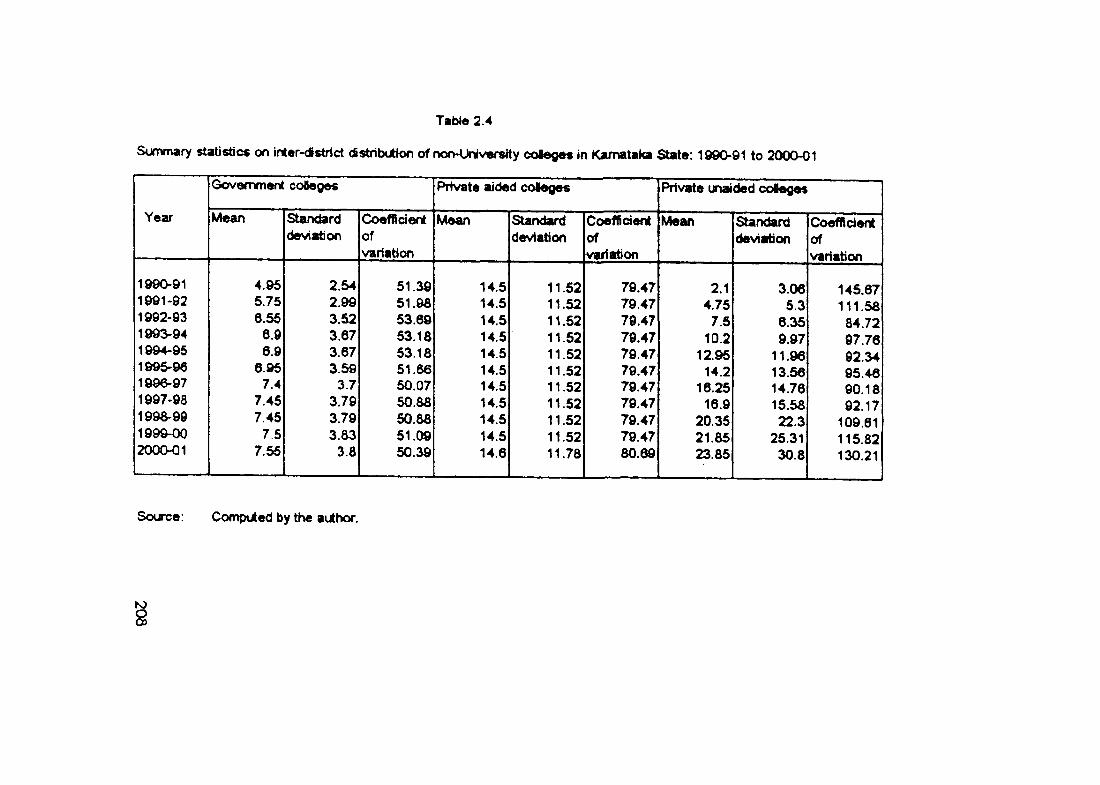
Table 2.4
Summary statistics on Inter-district (istribubon of nofvUnlversrty colegM in Karr^taka State: 199091 to 2000-01
Year
Government coBeges
Mean Standarddeviation
Coefficientofvariation
Private aided coleges
Mean Standarddeviation
Coefficientofvariation
Private iraded coSeges
Mean Standarddeviation
Coefficientofvariation
1990-911991-921992-931993-941994-951995-961996-971997-98 199S-991999-002000-01
4.95 5.75 6.55
6.96.9
6.957.4
7.457.45
7.5 7.65
2.542.993.523.673.67 3.59
3.73.793.79 3.83
3.8
51.39 51.98 53.6953.1853.18 51.66 50.0750.8850.88 51.0950.39
14.514.514.514.514.514.514.514.514.514.514.6
11.5211.5211.5211.5211.5211.5211.5211.5211.5211.52 11.78
79.4779.4779.4779.4779.4779.4779.4779.4779.4779.47 80.69
2.14.75
7.510.2
12.9514.2
16.2516.9
20.3521.8523.85
3.065.3
6.359.97
11.9613.5614.7615.5822.3
25.3130.8
145,67111.58
84.7297.7692.3495.4690.1892.17
109.61115.82130.21
Source: Computed by the author.
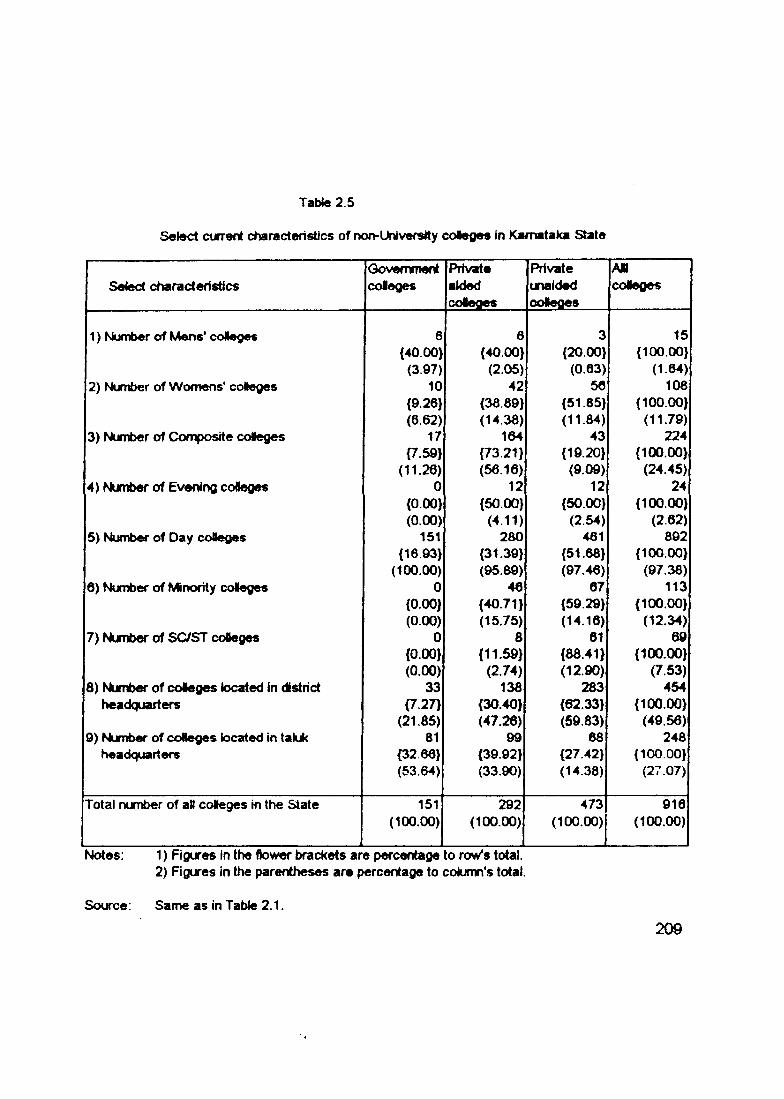
Table 2.5
Select current characteristics of non-LWversity coleges In Karnataka State
Select characteristicsGovernmentcoleges
Privateaidedcoleges
Privateunaidedcoleges
AMcoleges
1) Nimit>er of Mens* colleges 6 6 3 15{40.00) {40.00} {20.00} {100.00}
(3.97) (2.05) (0.63) (1.64)2) Number of Womens' colleges 10 42 56 108
{9.26} {38.89} {51.85} {100.00}(6.62) (14.38) (11.84) (11.79)
3) Number of Composite colleges 17 164 43 224{7.59} {73.21} {19.20} {100.00}
(11.26) (56.16) (9.09) (24.45)4) Number of Evening colleges 0 12 12 24
{0.00} {50.00} {50.00} {100.00}(0.00) (4.11) (2.54) (2.62)
5) Number of Day coOeges 151 280 461 892{16.93} {31.39} {51.68} {100.00}
(100.00) (95.89) (97.46) (97.38)6) Number of Minority colleges 0 46 67 113
{0.00} {40.71} {59.29} {100.00}(0.00) (15.75) (14.16) (12.34)
7) Number of SC/ST coBeges 0 8 61 69{0.00} {11.59} {88.41} {100.00}(0.00) (2.74) (12.90) (7.53)
8) Number of coleges k)cateci In district 33 138 283 454headquarters {7.27} {30.40} {62.33} {100.00}
(21.85) (47.26) (59.83) (49.56)9) Numt>er of coReges located in takjk 81 99 68 248
headquartcKS {32 66} {39.92} {27.42} {100.00}(53.64) (33.90) (14.38) (27.07)
Total number of all colleges in the State 151 292 473 916(100.00) (100.00) (100.00) (100.00)
Notes: 1) Figures In the ftower brackets are percentage to row's total.2) Figures in the parentheses are percentage to cokjmn's total.
Source: Same as in Table 2.1.
209
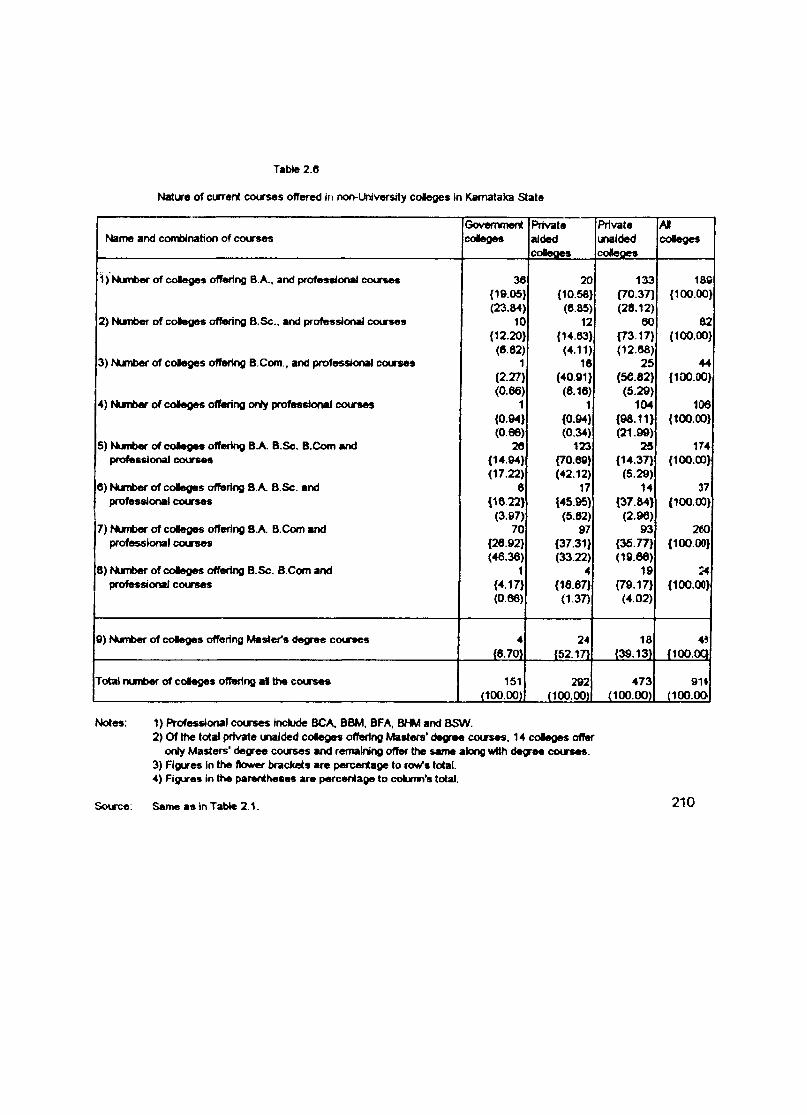
Table 2.0
Nature of current courses offered in non-University coleges in Karnataka State
Name and comt)lnation of coursesGovernmentcoleges
Privateaidedcoleges
Privateunaidedcoleges
Alcoleges
1) Number of coleges offering B.A., and professional courses 38 20 133 188{19.05} (10.58) (70.37) (100.00)(23.84) (8.85) (28.12)
2) Numt>er of coleges offering B.Sc., and professional courses 10 12 60 82(12.20) (14.83) (73.17) (100.00)
(8.82) (4.11) (12.68)3) Number of coleges offering B.Com., and professional courses 1 18 25 44
{2.27) (40.91) (56.82) (100.00)(0.66) (8.16) (5.29)
4) Number of coleges offering only professlonai courses 1 1 104 106{0.94} {0.94} (98.11) (100.00)(0.86) (0.34) (21.99)
5) Number of coleges offering B^. B.Sc. B.Com and 28 123 25 174professior»l courses (14.94) (70.89) (14.37) (100.00)
(17.22) (42.12) (5.29)0) Number of coleges offering B.A. B.Sc. arxJ 8 17 14 37
professional courses \16.22) 145.95) {37.84) (100.00)(3.97) (5.82) (2.96)
7) Number of coMeges offering BA B.Com and 70 97 93 260professior>al courses (26.92) (37.31) (36.77) (100.00)
(46.36) (33.22) (19.66)8) Number of coleges offering B.Sc. B.Com and 1 4 19 24
professional courses {4.17} (16.67) {79.17} (100.00)(0.86) (1.37) (4.02)
9) Numt>er of coleges offering Master's degree courses 4 24 18 45{8.70} (52.17) (39.13) (100.0Q
Total number of coleges offering al the courses 151 292 473 91»(100.00) (100.00) (100.00) (100.00
Notes: 1) Professional courses indude BCA, BBM. BFA, BHM and BSW.2) Of the total private unaided cotoges offering Masters' degree courses. 14 coleges offer
only Masters' degree courses and remaining offer the same along with degree courses.3) Figures in the t>racfcets are percentage to ro^s total.4) Figures in the parentheses are percentage to column’s total.
Source; Same as inJat>te 2.1. 210
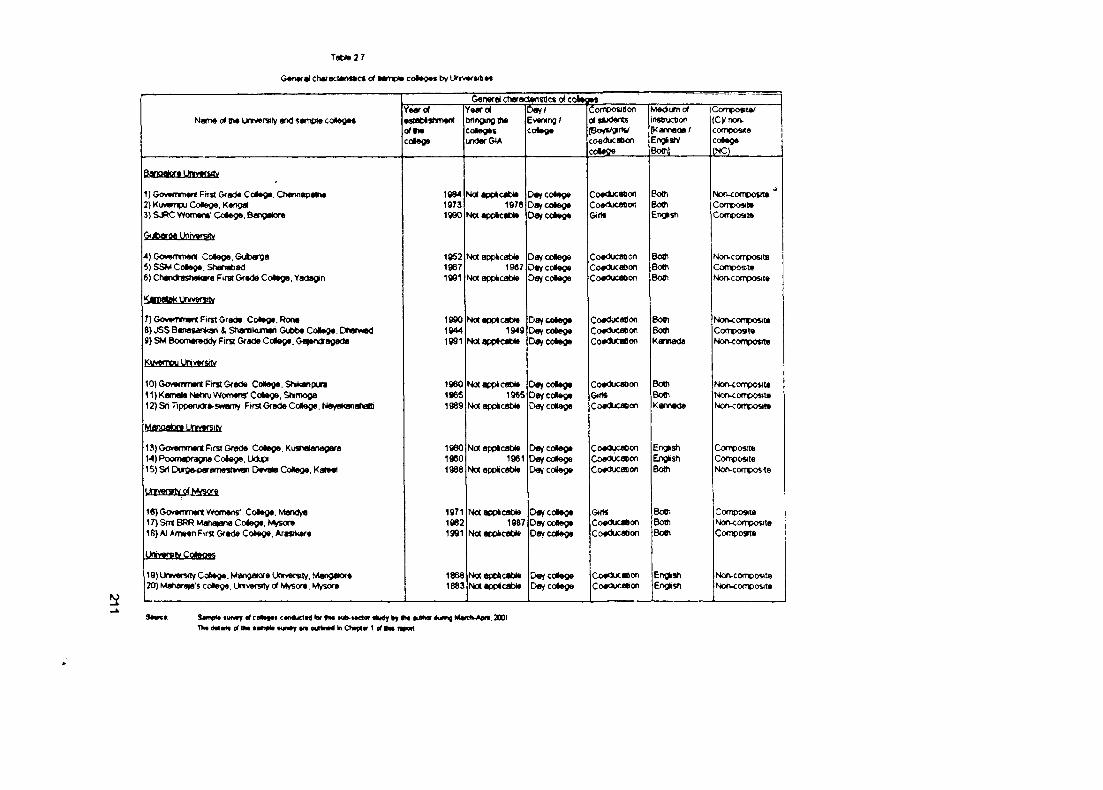
Tab»*27
0«rm9t c h a r s c te n t tc s o f M m p l * cot*9»* l>y U n v w -w b M
Narrw of tfw Unrversity and sampte co««o«s
General charactanstlcs ot coWoesYear of estaMstment oftw cdlege
Year of C>rirtgmgthe coleges under GU
0«y/Evening/colege
Cornpo«Bon of s»>dents [B c » A ^ n s /
coeducabon coMge
Med«un>otinstnjction[Kannada/EngisryBotni
Composte/ (Cy non- composite cotoge(NC)
Banoolort UnwmiN
1} Gov»mm«nl Pirst Grade Cotog*. ChannapatM 1984 Notappkcable Daycolege Coaducaoon Bo ^ Non<omposite2) Kuvwnpu Co»*ege. Kangal 1973 1978 college Coeducation Both Composite3) SJRC Vyor>*n«' CoJtega. Bangator* 1990 Not applicabte Dai cdege Girt* English Compost*
4) Gowwnmant Colega. Gubarga 1952 Not appkcatiie Daycotege Coeducation Bom Norwcomposite5) SSW Colaga. Shahabad 1967 1967 Daycolege Coaducation Both Composite6) Chendrashakara Fif« Gr*d« Col»ge. Yadagin 1901 Not app« cable Deycoiege Coaducaoon Bom Norvcorrposite
K«MtokUrmrsifc
1980 Not applicable Daycolage Coaducaeon Bom Norxomposite8) JSS Banatankari & Shartkumari Gubba Co*ag«, DTiarvad 1944 1949 Day college Coaducation Bom Compositefl) SM Bootnawddy First Grade Cdega. G«|ef>dragada 1991
<1 raOA
Notapplcabte D^colege CoaducaBon Kannada Non-compo$>te
Not flppiCdOw Oey colage Coe^xaoon D O O NorKompowte11) Kamala Nehru Womans' Cdtege. Shmoge 1*65 1965 Der/college G*rH Bom t '» o n < o rT p o s it*
12]ShTippenjdra-swamy First Grade Colega. NayekanahaKi 1989 Not app* cable Day college Coeducation Kannada Non-composite
13) Gowmwnt First Grade Colaga, Kushafariagare 1980 NotappCctiMe Day college Coeducation English Composfte14) Poomapragna Colage. Udupi 1960 1961 Day college Coeducation Engish Composite15) Sri Durgfrjjarameshwah Devala Co«ege. Ka»#l 1988 Not app* cable Day college Coeducation Bom Noo-composit©
16)GovemmertWofnans‘ Colege, Mand)« 1971 Not appl cable Daycdege GirH Bom Composite17) Srrt BRR Mahajana Cotoge. Mysore 1982 1987 DaycoOege Coeducaeon Bom Norv<omposite18) A1 Ameen First Grade CoHege. Arasikere 1991 Not applicabte Day college Coeducation Bom Composite
19) Unwersity Cottege. MangaKxe University. Mangalore 1868 Not npplt cable Da^colege CoaducaBon English Norvcorrposite20) Maharaja's c o B e g e , Ur»v»r5rty of Mysore, Mysore ------------------------------------------------------------------------------------ -----
1883 Not applicable Day co*ege Coaducanon English Non<ompositB
Smic«: Sanv** tuiwy of co>»|«« eanduct«4 tor IN* t<ib-i*etor thitfr by !>• iMaH of ttM •am ^ wjrwy *n euHlntd tn Owplw 1 cfttM t
lh« Kitttor *«ing MwdvA«nl. 2001
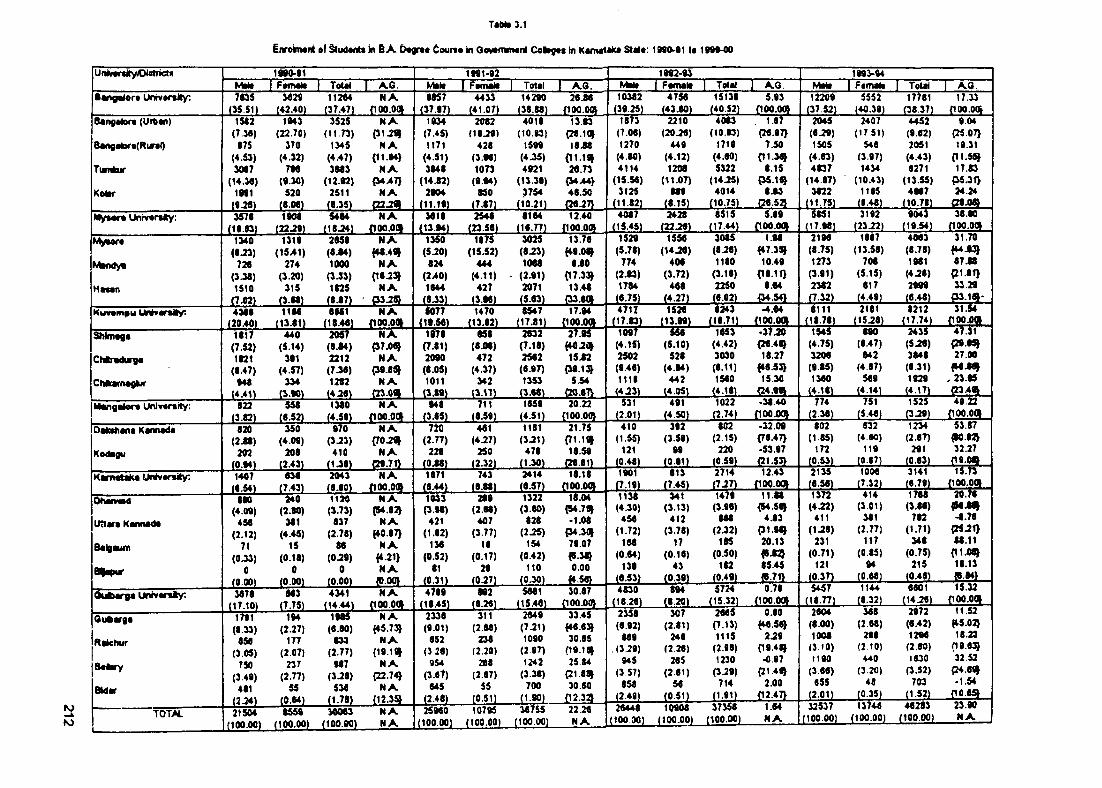
T«M» 3.1
Enrokfntni of § tu d M tt in 6 A D *g r« t C oun * in Qovtmm«nl Col»g«t in Kam«t«iu Slat*: 1990>91 to 19M-00
UniMrutyXXatnctu 1990-91I P w te I Tom I A.G. Mil*
1991-92 I FwiMrio TofI I
1992*9)Mite I Fomoli I To<«r A.Q.
1 W S - 9 4
Mite I Ftmite | ToUi | A.Q.■angiyoro Univortity: 7835
(35.51)M29
(♦2.40)112«4
(37.47)N A
flOO.OOt9857 4433
(41.07)14290
(38.88)28 J 6{100.00t
10382 4758 15138m s L
5.93(100.00» 12209 5552(40.39)
17781_Q137]_
17.33flOQ.OOt
B«ngak>r« (Urtoan)
B«ngfllor«(RunO
Tumkur
Kotor
Mysori Univ«rtify:Myter*
M M t t f y i
Hatan
1582 (7.38)
875 (4.53) 3087
(14.38) 1991
JL25L3578
iiteL
1943(22.70)
370(4.32)
798(9.30)
520(8.08)
1340(8J3)
728(3J8)1510
(740)
1908(22.29)
3525(tl.73)
1345(4.47)3883
(12.92)2511
JL35L
1319(15^1)
274(3.20)
315(3.88)
5484(18J4)
N AP1J9»
N A{11.9^
N A{34^7}
N A
2859(8J4)1000
(3J3)1825
(8J7)
N Afl 00.001
1934(7.45)1171
(4.51)3848
(14.82)2904
N A{48.491
N A(18.2^
N A<33J8>
3818(13.94)
2082(19.29)
428(3.98)1073(9.94)
850JLflL
4018(10.93)
1599(4.35)4921
(13.39)3754
(10.21)
1350(5J0)
824(240)1844
2548(23.58)
1875(15.52)
444(4.11)
427(3.98)
8184
13.93{28.10118J8{11.1JI28.73
0 4 ^48.50
08.27>
1873(7.08)1270
(4.80)4114
(15.58)3125
(11.82)
3025(8.23)1088
(2.91)2071(5.83)
12.40 4087(15.45)
2210 (20 J«)
449 (4.12) 1208
(11.07) 889
(8.15)
13.78H9.04
8J 0{17.33J13.48
^3.801
1529(5.78)
774(2.93)1784
i f i iS i .
2428(22.28)
4083(10.93)
1719(4.80)5322
(14.25)4014
(10.75)
1558(14J8)
408(3-72)
488
8515(17.44)
T 8 7(28.97)
7.50(11.38J
8.15(35.1^
8.93
5.89f100.00>
2045(8J9)1505
(4.83)4 0 7
(14.87)3822
2407(1751)
548(3.97)1434
(10.43)1185
(8-48)
3085(8J8)1180
(3.18)2250
JLQ2L
1.98{♦7.3^10.49
{18.11}8.04
5 ^(17.98)
3192(23.22)
4452(9.82)2051
(4.43)8271
(13.55)4987
ilL2!L
2198(8.75)1273
(3*1)2382
i m
1887(13.58)
708(5.15)
817(4.49)
9043(19.54)
4083(8.78)1981
(4.28)2999
9.04{25.07}19.31
(11.5^17.83
P5J1)24.24
38.80 fl 00.001
31.70 (44 87 J 8
{21J1}33.29
- f i L i a i31.S4Kuvimpu UNv«r«lty:
SMmogi
Chlradiirga
CMkamagkir
Mangator* Univ«r«ity;
OaksAana Kannada
Kodagu
Karnataka Untvartily:
4M8(20.40)
1817a.52)1821
(«-47)948
(4.41)
1188(».81)
822i l M .
440(5.14)
391(4.57)
334(3.90)
89C1
20S7(8.84)2212(7.38)1282
(4.28)
N Afl 00.001
820(2.88)202(0 >»)
558(8.52)
1407J i i l L
350(4.09)
208-12J2L
1380J4J9J^
N AP7.0^
N A
N A
1077
838(7.43)
970(3-21)410
( 0 8 )
N A
1978(7.81)2090(8.05)1011
jy891_
1470(13.82)
2043(8J0)
N A{70JII
N Ag J J L
948i3J5 i_
858(8.08)472
(4.37)342
(3.17)
8S47i lL U J
17.94 4717 1528 8243 •4.84 8111 2101 8212
N Af l00.0fl>
720(2.77)
228J 0J 2L
1871
711(8.59)
2832(7.18)2582(8.97)1353
1859(4.51)
271
15J2{38.1^
5.54Q0.87V
(17.83) (13.99) (18.71) f 100.00 (1i.78) (15.28) (I7.74i _ {1004>»1097 i58 1853 •37.20 1545 890 2435 47.31
(4.15) (5.10) (4.42) {28.4% (4.75) (8.47) (5.28) {29.8%2502 528 3030 18.27 3208 842 3848 27.00(9.48) (4.84) (8.11) {48.5% (9.85) (4.87) (8.31) {WJ%1118 442 1580 15.30 1340 589 1929 .23.85
(423) -Wi . (4.18) i4.1«i _ (4.141 (4.17) {234%
441(4.27)
250(2.32)
743(8.88)
1181(3.21)
478
20.22{100.00V531 491 1022 -38.40 774
(2.38)751
(5.48) (3.29) flOQ.OOt
2414iS iZ i .
21.75(71.1%18.59
18.18f100.0»
410 392 802 •32.09 802 532 1234 53.87(1.55) (3.59) (2.15) {78.47} (1.85) (4.80) (2.87) {80.92}
121 99 220 •53.97 172 119 291 32.27(0.48) (0.91) (0.59) {21.5% (0.53) (0.87) (0.83) (19.0%1901 813 2714 12.43 2135 1004 3141 15.73
.17.191. iZiSL341
j s m .1479
(3.98)888(2.32)
185 (0.50)
182 ■ (O.tgL
f100.00»11.88 i l H I1372
i L H L414
(3.01)381
(2.77)117
(0.«5)94(0.88)
J iJ S L1788
(3.88)792
(1.71)348
(0.75)215
(0481
f100.001
^ J 8|-8.78
{M-21}88.11{11.08J18.13
JSL2SL
haiMad Utlara Kannada
Balgaunt
890(4.09)
458(2.12)71
(0J3)0
240(2.80)
381(4.45)
15(0.18)
0J0_00)
1120(3.73)
837(2.78)88(0.29)0(0.00)
K A{54.82}
N A{40.97}
N A{*.21}N Ag..ML
1033P.98)421
(1.82)138
(0.52)81
J L 3 1 I
289(2.88)407
(3.77)18
(0.17)29
J0L22L
1322(3.80)
828(2-25)
154(0.42)110(0.30)
18.(M{54.78}•1.08
(34.30179.07{8.3^0.00
1138 (4 JO)
458 (1.72)
188 (0.84)
139 iS i3J_
(3.13) 412
(3.78) 17
(0.18) 43
(0 39)
{54.50}4J3
{31.98}20.13
85.45 ff-71} 0.78
fl 00.00} 0.80
{48.58} 2 2 t
09.48} •0.97
{21.4% 2.00
£■2.47}
(4 i2 )411
(1.2®)231
(0.71)121(0.37)5457 15.32
fl 00.00} 11.52
OutMrga Univanty: 3878(17.10)
883J L I5 L
4341 N Afl 00.00}
4789(18.45)
892(8.28)
5881l^S.48)
30.87{100.00}4830
(18.28)8«4
J i m .5724
(1832)2885(7.13)1115
(2.98)1230
(3.29)714
(1.91)
(18.n)2804
1144(8.32)
388(2.88)288(2.10)440
(3.20)48
(0.35)
8801(14.28)
2972(8.42)1298
(2.80)1830
(3.52) 703
(1.52)N)-Xto
OiAarga
Rakhur
Balvy
BMar
T O m
1791(••33)
858(3.05)
750(3.49)
481iL24i.21504
(100.00)
194(2.27)
177(2.07)
237(2.H)
55
8559(100.00)
1985(8.80)
833(2.77)
987(3J8)
538(1.78)30083(100.00)
N A{45.7^
H A{19.1%
N A{22.74}
N A{1?:35L
N AN A
2338(9.01)
852(3^8)
954(3.67)
845(2.48)25940
(100.00)
311(2.88)238(2.20)288
(2.87)55
(0.51)10795
2049(7.21)1090
(2.97)1242
(3.38)700
A i m .387S5
33.45 {48.83} 30.85
{19.1% 25 84 {21.8% 30.80
Jdlli
2358(8.92)
889(3.29)
045(3.57)
858■ 12,:4»J
(100.00) (100.00)22.24N A
20448(100.00)
307 (2.81)
248 (2.28)
285 (2.81)
58 _10.51)10908(100.00)
37358(100.00)1.84N A
(8.00)1008
(3.10)1190
(3.88)855(2.01)
32537(100.00)13748(100.00)
48283(100.00)
{45.02}18.23
(19.8^32.52
(24.8%-1.54
no.8^23.90N A
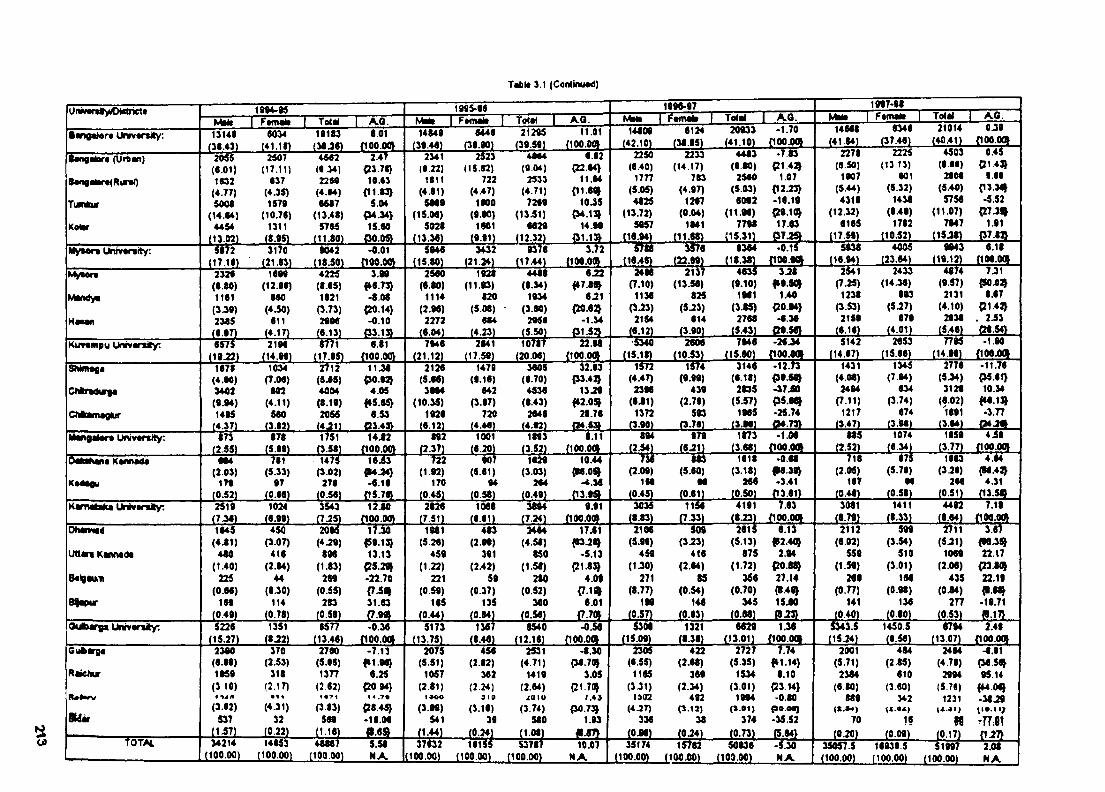
Tat)t« 3.1 (ConliiMMd)
Urwvniy^DMhdt
lanQaler« Univ«rsity: 13148(3<.i3)
1994-95 1 Famate
6034(41.It )
1 Toiiy 19183
(39J6)
1 A.O. 8.01
flOO.OOV
Mali14849
(39.46)
1995-96Ftmalt
6446(39.90)
Total 1 21295
(39.59)
A.O.11.01
(100.00}
Mate14809
(42.10)
1996-97 1 Famaii I
6124(30.85)
1 Total 20933
(41.10L
I A O :.•1.70
{100.00}
Mala14668
(41.84)
1997-98 1 FtfiMii 1
6346(37.46)
1 Total 21014
(40.41)
1 AO. 0J9
C M ^oa.
Bangalor* (Urtan) 209S 2607 45«2 2.47 2341 2523 4964 6.62 2250 2233 4463 -7.83 2278 2225 4503 0.45
(601) (17.11) (9.34) ^3 78} (6.22) (15.62) (9.04) {22.64} (6.40) (14.17) (8.80) C2149 (8.50J (13.13) (8.66) (21 49
BangaiBrt< Rtr*0 102 637 22M 10.63 1811 722 2533 11.64 1777 763 2560 1.07 1907 901 2806 9.69
(4.77) (4.35) (4.64) {11.83} (4.81) (4.47) (4.71) {11.891 (5.05) (4.97) (5.03) {12.29 (5.44) (5.32) (5.40) {13.39TtfMoir SOM 1579 6567 5.04 5669 1600 7269 10.35 4825 1267 6092 •16.19 4318 1438 5756 -5.52
(U.»4) (10.76) (13.48) {34J4> (15.06) (9.90) (13.51) {34.13J (13.72) (0.04) (11.M) C29.1flJ (12.32) (8.49) (11.07) {27 J 9KetM’ 44S4 1311 5765 15.60 5028 1601 6629 14.99 5957 1841 7798 17.63 6165 1782 7947 1.91
(13.02) (8.95) (11.80) 00.05) (13.36) (9.91) (12.32) 0 1 .1^ _ (1 6 ^ ) (11.68) (15.31) (17.59) (10.52) (15J8) P7.89Mysor* Univ«r«ity: 5 1 7 2^ 3170 9042 •0.01 5 M 3432 93)8 3.72 ^88 3i76 9364 •0.15 5938 4005 9043 6.18
(17.16) (21.63) (18.50) (100.00V (15.80) (21.24) (17.44) {100.00} (16.48) (22.69) (18.38) C9®r«L_ (16.94) (23.64) t u i i i . {106.001My««r« 2 i2 t 1699 4225 3.99 2560 1928 4468 6.22 2498 2137 4635 3J8 2541 2433 4974 7J1
( 9M) (12.96) (8.65) {16.73} (6.80) (11.93) (8.34) (47.86J (7.10) (13.56) (9.10) f9 .S 9 (7.25) (14 J 6) (9.57) (S0i )9MMtdyv 1161 660 1821 -8.08 1114 820 1934 9J1 1136 825 1961 1A0 1238 893 2131 8.67
(4.50) (3.73) {20.14} (2.96) (5.06) (3.60) {20.69 (3J13) (5J3) (3.85) {20.94} P 53) (5.27) (4.10) {21.49Hm m 2US 611 2996 -0.10 2272 664 2956 -1.34 2154 614 2768 -6.36 2159 679 2838 . 2.53
(6.97) (4.17) (6.13) (33.13} (6.04) (4.23) (5.50) P 1 ^ 9 _ (6.12) (3.90) .2 « « L _ (6.16) (4.01) (5.46) P8.5^Kuv«mpu University: 6S75 2196 8771 6.81 7946 2841 10787 22.98 2606 7946 •26.34 5142 2653 H95 •1.90
(1« ^ ) (14.99) (17.95) {100.00} (21.12) (17.59) (20.06) {100.001 (15.18) (10.53) IL5op i_ .fOO.ML_ (15.66) Ui»?l1671 1034 2712 11J 8 2126 1479 3605 32.93 1572 1574 3146 • i 2.h 1431 1345 2776 •11.76
(4.t0) (7.06) (SJ5) (5.66) (9.16) (6.70) (33.49 (4.47) (9.99) (6.18) (4.08) (7.94) (5M) {35.61}CMradtrta 3402 602 40(M 4.05 3994 642 4536 13J9 2396 439 2835 •37.50 2494 634 3129 10.34
(9.S4) (4.11) (8.19) |I5 .6 ^ (10.35) (3.97) (8.43) (42.0^ (6J1) (2.79) (5.57) P5.69 (7.11) (3.74) (6.02) fW.19ChkanMgiur 1465 560 2055 6.53 1926 720 2646 28.76 1372 593 1965 •25.74 1217 674 1891 -3 .n
f4.37) (3J2) (4J1) C3.43} (6 .12) (4.46) (4.92) (24.5^ (3.90) (3.76) . . . .11II2L ___ L i m . (3.iM)Mangator* University; •73 878 1751 14J2 892 1001 1893 8.11 894 979 1873 •1.06 885 1074 1959 4 i9
(2.55) (5.99) (3.58) {100.00} (2.37) (6.20) (3.52) {100.001 (2.54) (6J 1) (3.68) {100.001 , i«_34)_, (3.77) {100.09daiaMna Kannada ••4 n i l 14t^ 16 i3 722 907 1629 10.44 >35 883 1618 •0.68 718 975 1693 4.64
(2.03) (5.33) (3.02) fWJ4} (1.92) (5.61) (3.03) (M.OS) (2.09) (5.60) (3.18) (16.39} (2.05) (5.76) (3J6) (M .49K *« « u iT t 97 276 -6.16 170 94 2«4 -4.36 166 66 266 •3.41 167 M 266 4.31
(0.52) (0.66) (0.56) {15.76} (0.45) (0.58) (0.49) {I3.9a» (0.45) (0.61) (0.50) (13.61} (0.48) (0.58) (0.51) {13.59KarTMMu Untvarsty: 2519 1024 3543 12J 0 2826 1068 3894 9.91 3036 1156 4191 >.63 3081 1411 4492 7.18
( 7 ^ ) (6.99) (7J5) (100.00} (7.51) (6.61) (7.24) {100.001 (0.83) (7.33) (8.23) {100.00} (8.79) (8.33) (0.64) {100.WdhaiHatf 1645 450 2095 i i M 1981 483 3464 17.61 2106 509 2615 6.13 2112 599 2711 3.6)
(4J1) P.07) (4.29) {59.13} (5.26) (2.99) (4.58) (5.99) (3.23) (5.13) #2.4(1} (6.02) (3.54) (5J1) {80J9Utlan Kanna da 4«0 416 896 13.13 459 391 S50 -5.13 459 416 875 2.94 559 510 1069 22.17
(1.40) (2.84) (1.83) {25.29} (122) (2.42) (1.58) (21.89 (1J 0) (2.64) (1.72) {20.89 (1.59) (3.01) (2.06) (23.89BalBMMi Z25 44 269 •22.70 221 59 280 4.09 271 85 356 27.14 269 166 435 22.11
(0.66) (0.30) (0.55) {7.581 (0.59) (0.37) (0.52) {7.1SJ (0.77) (0.54) (0.70) (8 4 9 (0.77) (0.98) (0.84) fl.6 9B«apir 169 114 283 31.63 165 135 300 6.01 199 146 345 15UM 141 136 277 •19.71
(0.49) (0.78) (0.58) {7.9SJ (0.44) (0.»4) (0.56} {7.701 (0.57) (0.93) (0.68) (8.29 (0.40) (0.80) (0.53) ff.17}Oufearga Univarsfty: 5226 1351 65n -0.36 5173 1307 6540 -0.56 5308 1321 6629 1.36 ^ 3 .5 1450.5 6794 2.49
(15.27) C8.22) (13.46) {100.00} (13.75) (8.46) (12.16) {100.00) (15.09) (0.38) 03.01) {100.001 (15J4) (8.56) (13.07) {100.001GiAarga 2390 370 2760 -7.13 2075 456 2531 -8.30 2305 422 2727 7.74 2001 484 2484 -8.91
(6.99) (2.53) (5.6S) f»1.96} (5.51) (2.82) (4.71) (36.701 (6.55) (2.68) (5.35) fH .U } (5.71) (2.85) (4.78) {36.59Raichur 1959 318 13H 6.25 1057 362 1419 3.05 1165 369 1534 8.10 2384 610 2994 95.14
(3 10) (2.17) (2.62) {20 94} (2.81) (2.24) (2.64) {21.70} (3.31) (2.34) (3.01) (23 14} (6 80) (3 80) (5.7«) {44.09(U*«iv 4X4fi 1 14. 1900 319 ^UIU A.45 Id02 492 1994 -0.80 889 342 1231 •38 J9
(3.62) (4.31) (3.83) {28.45} (3.99) (3.16) (3.74) (30.79 (4J7) (3.13) <a.oi) (X .94) <*-•*)B U ir 537 32 569 •19.06 541 39 580 1.93 336 38 374 -35.52 70 1? M
(1.57) (0.22) (1.16) 9.69 (1.44) (0.24) (1.08) (0J 6) (0J4) (0.73) (5.64} (0.20) (0.09) (0.17) {1J7}TOTAL 34214 14653 48867 5.58 37632 16155 S3787 10.07 35(74 15^82 50936 -5.30 35057.5 16939.5 51997 2.6?
(100.00) (100.00) (100.00) N A (100.00) (100.00) (100.00) N A (100.00) (100i)0) (100.00) N A (100.00) (100.00) (100.00) N A
ti
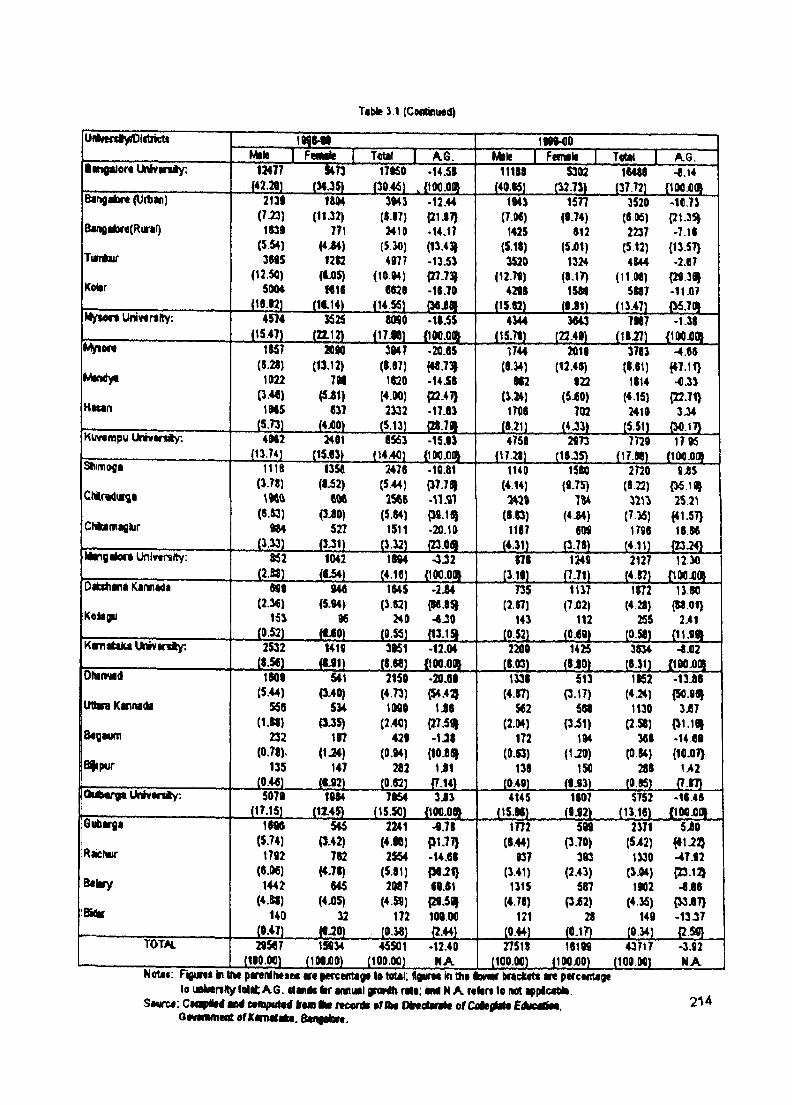
Tfbte 3.1 (CoMtiniMd)
UiriveriiylDiitriGtiMile
m m ________I Fwwii I Total | A.G.
1W»00 Mile I Fwtnii I ToM A.G.
lK i0«jort IM v inA y: 12477 S473 17K0 •14.58 11188 S302 16488 -8.14(42-20) (54-31) (30.45) .{lOO.Otft (40.85) (32.71) (37.72) {100X9
Ban(iiQf« (Uitan) 2139 f<04 3M3 -12,44 1043 1577 3520 -10.73( 7 ^ ) (1U 2) (S.07) {21J7) (7.08) (9-74) (8.05) {21.35^
B«nga*)r«(Rur«r) m s 771 2410 -14.17 1425 812 2237 -7.18(SM) (4J4) (5.30) (13-43J (5.18) (5j01) (512) {13.57)
Tumfcur 3MS 1212 407? -13.53 3S20 1324 4844 -2.87(12.50) (MS) (10.04) (27.73J (12.79) (8-17) (11.08) (29.39
Koltr 5004 m e 6820 -18.70 4298 1586 5887 -11X?(18.WJ (1C14) (14.55) O flja i (15.82) (9J1) (13.47) (3«.79
Mysort University; 4574 K25 8(M0 •18.55 4344 3643 7187 -1.38(15.47) ( a i 2) (17.W) m m (15.79) (22.40) ( I8 i7 ) {100X9
Myieri 1S57 X90 3M7 -20.85 1744 2019 3783 •4.88I9.2t) (13.12) (8.87) H8.73I (8.34) (12.48) (8.81) {47.11)
Mindy« 1W2 7M 1820 •14.58 M2 922 1814 -0.33(5J1) (4.00) (22.41) (3.24) (5^0) (4.15) {22-71}
Httan IMS «37 2332 •17.83 1708 702 H 10 3-34, (5.T3) (4X0) (5.13) (28.7fl| (8.21) (4J3) (5.51) (30.17)
Kuvompu Uhrvinty: 4M2 2401 8553 -15.93 4758 2973 7720 1705(13.74) (15.83) (14.40) {lOO.OQ (17.21) (18.35) (17.88) {100X9
SItimofa 111S t3S8 2478 -10.81 1140 1580 2720 9 iS(3.71) (1^ 2) (5.44) (37.7fl> (4.14) (9.75) (8 22) {35.19
CM ndw^t \ m tw 15«S 7M% 7W 32U 25.21(5.01 (3J0) (5.84) {3J.HJ (8.53) (4.84) (7.36) {41.57}
Chfeamaglur 527 1511 •20.10 1187 6U 1798 18.86(3J1) (3 32) (23.09 (4.31) (3.78) (4.11) (23.24)
M n g ilo rt Univtrfilty: ftS2 1042 1»4 -3J2 878 1249 2127 12.30. . R t t ) (•*54) (4.18) {100.09 (3.19) (7.71) (4.87) {100X9
D A itia rt Kanntdi 699 940 1845 -2.84 735 1137 1872 13.80(2.3«) (5-W) (3.82) (M .89 (2.87) (7X2) (4.28) (88X1)
Koli||u 153 06 240 -4^0 143 112 255 2,41(0.52) (MO) (0.55) f13.1» (0.52) (0-60) (0.58) (11.99
Kim iteJu C N v in ty : 2512 H19 3K1 -12.04 2200 1425 3834 •8X2(8.56) ( M l) (8.88) {100.09 (8.03) (8 JO) (8.31) {100X9
Ohimad 1M9 541 2150 •2S.69 1338 513 1152 -13X8(5.44) (3^0) (4.73) (».4aj (4.87) (3.17) (4.24) {50.99
Uttva Kannada S58 534 10S0 1J8 562 588 1130 3X7( l . t t ) (3J5) (2.40) (27.59 (2.04) (3-51) (2.58) {31.19
Baigauni 232 117 421 - U 8 172 104 368 -14 60(o .m (1J4) (0.04) (10^9 (8.83) (UO) (0.84) {10X7}
Bfipur 135 147 282 i i i 138 ISO 288 U 2(0.4<) (M 2) (0.82) (7.14) (0.49) (9J3) (0.85) (7.87)
Oi^arga VWvartity: 5070 1994 7K4 3J3 4145 1807 5752 -1848, (IM S ) (1145) (15.50) {100.09 (15.M) (9-92) (13.18) {100X9
Gubarsa ) m 545 2241 ^.78 1H 2 5 « 2371 5 i0(5.74) (5.42) (4.W) {31.77} (8.44) (3.70) (542) f» U 2)
Ractwr 17«2 782 2554 •14.68 137 303 1330 -47.92(9M) (4.7J) (5.81) (3<^1> (3.41) (2.43) (3.04) {23.12}
Salary 1442 645 2087 60.81 1315 587 1002 -8X8(4.58) (4j05) ( ♦ » ) (29.59 (4.78) P j62) (4.36) {33X7}
:Bktf 140 32 172 100.00 121 28 140 -13.37_._.(0.47) fIJO) (0.38) (2.44) (0.44) (0.17) (0.34) (2.SS)
total 295«7 19Q34 45S01 •12.40 27518 18109 43717 -3.92(100.00) (lOljOO) (100.00) N A (100.00) (100X0) (100.00) N A
lo w tervtty IqM; A.6 . tfands fH* aniiuil groNh rMt; «mi N A r t Itr t lo not a^plcaMi. Smtm : CMpMfd m4 eonvwM te n Im rtconk »f llw Oiwclorate o f C ol»tM t £Juet6m,
Qmtmment »f KanMfaln.2 1 4
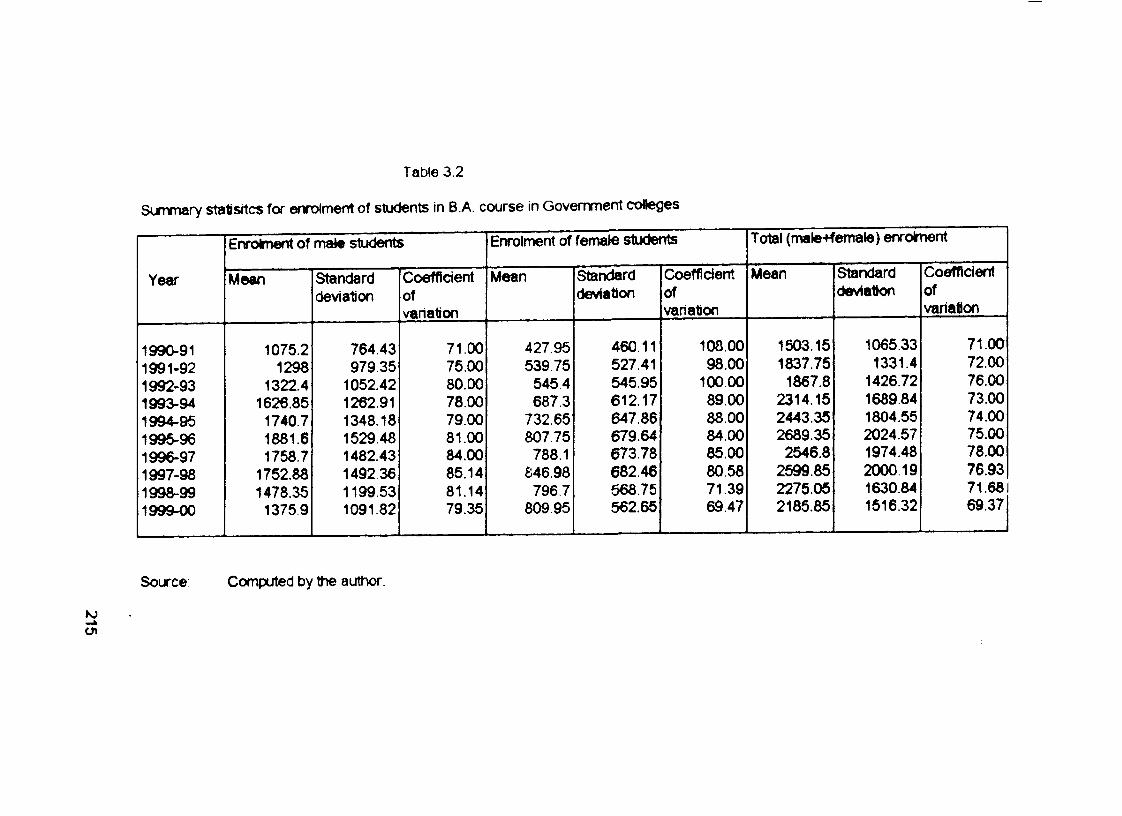
Table 3.2
Summary stattsitcs for enrolment of students in B.A. course in Government colleges
Enrolment of male students Enrolment of female students Total (male+female) enrolment
Year Mean Standarddeviation
Coefficientofvariation
Mean Standarddeviation
Coeffidentofvariation
Mean Standarddev1atk>n
Coefficientofvariation
1990-911991-921992-931993-941994-96 1996-961996-971997-981998-991999-00
1075.21298
1322.41626.85
1740.7 1881.61758.7
1752.88 1478.35
13759
764.43979.35
1052.42 1262.91 1348.18 1529.481482.43 1492.36 1199.53 1091.82
71.0075.0080.0078.0079.0081.00 84.0085.1481.14 79.35
427.95539.75
5454 687.3
732.65807.75
788.1846.98
7967 809 95
460.11527.41545.95612.17647.86679.64 673.78 682.46 568.75562.65
108.0098.00
100.0089.0088.0084.0085.00 80.58 71.39 69.47
1503.15 1837.75
1867.82314.152443.352689.35
2546.82599.85 2275.052185.85
1065.331331.4
1426.721689.84 1804.55 2024.57 1974.48 2000.191630.84 1516.32
71.0072.0076.0073.0074.0075.0078.00 76.93 71.68 69.37
Source: Computed by tfie author.
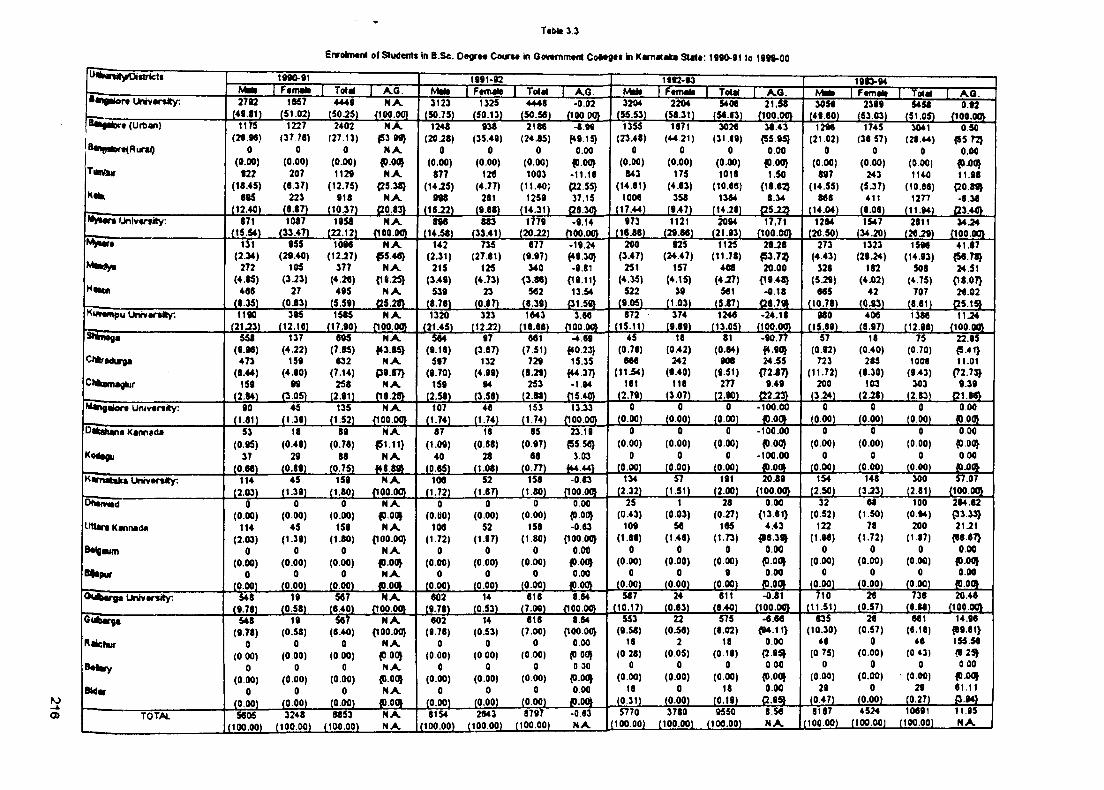
TaWt 3.3
Enrolm«nl of ShKtent* in B.Sc. Daqtm Coutm in Govtmmtfrt C o M g tt in KamXaka 1990-91 to 1999-00
U«lMnilyfartrtet« ••ip itor* Univ«r*lty:
1990-91 I FtfTMto I Total A.6 .
1991-92M iii I FtmaiB I ToOi A.G.
1•82-93Mate I Ftflwte I Totoi | A.Q,
1993-94Mali I Ftffiait I Tot^ | A.Q
2792 1567(51.02)
4449 N X 3123 1325 4448 • 0.02 3204 2204 5408 2T:58 3059 2399 ?45r 0.92
HOgaioi t (Urban) 1175 1227 2402 N X 1248 938 2188 -8 99 1355 1871 302< 3843 1298 1745 3041 0 50(29.98) (37 78) (27.13) {53 99 (20 J 8) (3549) (24.85) f»9 15} (2348) (44.21) (31.M) {55 95} (21.02) (38 57) (28.44) {55 72}
B«nBator#(Rur»0 0 0 0 N X 0 0 0 0.00 0 0 0 0.00 0 0 0 0.00(0.00) (0.00) (0.00) {0.00} (0.00) (0.00) (0.00) {D.OO} (0.00) (0.00) (0.00) (0.00} (0.00) (0.00) (0.00) (0J}(9
TiamSff 922 207 1129 N X 877 128 1003 -11.18 843 175 1018 1.50 897 243 1140 11.98(18.45) (8.37) (12.75) <25.3^ (14 J5) (4.77) (11.40) {22.55} (14.81) (4.83) (10.66) {18.8? (14.55) (5J7) (10.08) {20 89}
K«( 895 223 918 N X 998 281 1259 37.15 1006 358 1384 8.34 888 411 12H -8.38_ (12.40) (8.87) (10.37) C0.83> (1 5 ^ ) (9.88) (14J1) {28.30} (17.44) (947) (14 J 8) {25.22} (14.04) (9.08) (11.94) {23.40}
fjnivarsity: 871 1087 1958 N X 898 883 1779 -9.14 973 1121 2094 17.71 1284 1547 2811 34.24(15.54) (33.47) (22.12) flOO.OQ (14.58) (3341) (20.22) {100.00} (18J8) (29.88) (21.93) {100.00} (20.50) (34.20) (28.29) {100.00}
131 955 1098 N X U 2 735 877 -19.24 200 " 925 1125 28.28 273 1323 1598 41.87(2.34) (29.40) (12J7) {55.48} (2.31) (27.81) (9.97) (49.30} (347) (2447) (11.78) {53.73) (4.43) (29 J4) (14.93) ( S 9 m
272 105 377 N X 215 125 340 -9.81 251 157 408 20.00 328 182 508 24.51(♦.«5) (3.23) (4.28) {11.25} (3.49) (4.73) 13.88) {19.11} (4.35) (4.15) (4J7) {19.48} (5.29) (4.02) (4.75) {18.07}
Ha«ttt 488 27 495 N X 539 23 582 13.54 522 39 581 •0.18 885 42 707 28.02(8.35) (0.83) (5.59) «25.2«} (8.78) (0.87) (8.39) 01.58} (9.05) (1.03) (5.87) {28.79} (10.78) (OM) (8.81) {25.15}
Huvampu Univ«r«ity: 1190 395 1585 N X 1320 323 1843 3.88 872 374 1248 •24.18 980 408 1388 11J4(21J3) (12.18) (17.90) noo.oo} (21.45) (12^ ) (18.88) {100.00} (15.11) (9.89) (13.05) (100.00} (15.89) (8.97) (12.98) {100.00}
s»4i»oja 137 895 N X 584 97 881 -4.89 45 18 81 -9o.n 57 18 75 22.95(9.98) (4.22) (7.85) <43.8^ (9.18) (3.87) (7.51) {♦0.23} (0.78) (042) (0.84) {♦.90} (0.92) (040) (0.70) {541}
CtAradurga 473 159 832 N X 597 132 729 15.35 M 8 242 908 24.55 723 285 1008 11.01(8.44) (4.90) (7.14) P9.87} (9.70) (4.99) (8.29) {♦4.37} (11.54) («.40) (9.51) {72.«7> (11.72) (8.30) (943) T2.7^
Chkamaghir 159 99 258 N X 159 94 253 -1.94 181 118 277 949 200 103 303 9.39(2.84) (3.05) (2.91) fl8.28> (2.58) (3.58) (2.88) {15.40} (2.79) (3.07) (2.90) {22.23} (3.24) (2.28) (2.83) {21.88}
Mangalor* Univ«r*ity: 90 45 135 N X 107 48 153 13.33 0 0 0 - 100.00 0 0 0 0.00(1.81) (1.39) (1.52) {100.00} (1.74) (1.74) (1.74) {100.00} (0.00) (0.00) (0.00) ID.00I (0.00) (0.00) (0.00) 5) 00}
i tkaltana Karmada 53 18 89 N X 87 18 85 23.19 0 0 0 • 100.00 0 0 0 0 00(0.95) (0.49) (0.78) P 1.11} (1.09) (0.88) (0.97) {55.58} (0.00) (0.00) (0.00) (0.00} (0.00) (0.00) (0.00) (0.0(9
KO4.0U 37 29 88 N X 40 28 88 3.03 0 0 0 - 100.00 0 0 0 000(0.88) (0.89) (0.75) {♦8.89} (0.85) (1.08) (0.77) fU.44} (0.00) (0.00) (0.00) (D.Ofl| (0.00) (0.00) (0.00) (DJMi
^WTMtaka Univ«r»fty: 114 45 159 N X 108 52 158 -0.83 134 57 191 20.89 154 148 300 57.07(2.03) (1.39) (1.80) (100.00} (1.72) (1.87) (1.80) {100.00} (2.32) (1.51) (2.00) {100.00} (2.50) (3J3) (2.81] {100.00}
Dlinpwd 0 0 0 N X 0 0 0 0.00 25 1 28 0.00 32 88 100 284.82(0.00) (0.00) (0.00) 10.001 (o.eo) (0.00) (0.00) (3.00} (043) (0.03) (0.27) {13.81} (0.52) (1.50) (0.94) {33 33}
l'*ttara Kannada 114 45 159 N X 108 52 158 •0.83 109 5« 185 443 122 78 200 21-21(2.03) (1.39) (1.80) {100.00} (1-72) (1.97) (1.80) {100.0(9 (1.««) (1.48) (1.73) {88.39^ (1 M) (1.72) (1 17) (88.87}
B«4gaum 0 0 0 N X 0 0 0 0.00 0 0 0 0.00 0 0 0 O.M(0.00) (0.00) (0.00) fJ.OOJ (0.00) (0.00) (0.00) «D.OO} (0.00) (0.00) (0.00) f).00} (0.00) (0.00) (0.00) {0i)0|
Blapur 0 0 0 N X 0 0 0 0.00 0 0 9 0.00 0 0 0 0.00(0.00) (0.00) (0.00) 40.001 (0.00) (0.00) (0.00) 10.00} (0.00) (0.00) (0.00) (D.OOJ (0.00) (0.00) (0.00) {0.00}
OuMrga Univarsity: S48 19 587 N X 802 14 818 8.84 587 24 811 -0.81 710 28 738 2048(9.78) (0.58) (8.40) {100.00} (9.78) (0.53) (7.00) {100.00} (10.17) (0.83) (840) {100.00} (11.51) (0.57) W.-M) {100.00}
548 19 587 N X 802 14 818 8.84 553 22 575 -8.08 835 28 881 14.98(9.78) (0.58) (8.40) {100.00} (9.78) (0.53) (7.00) {100.00} (8.58) (0.58) (8.02) {94.11} (10.30) (0.57) («.18) (89.81}
R*tehur 0 0 0 N X 0 0 0 0.00 18 2 18 0.00 48 0 48 158.58(0 00) (0 .00) (0.00) {D00» (0 00) (0 00) (0 00) (P 00} (0 28) (0.05) (0.19) {2.95} (0 75) (0.00) (0 43) {8 2^
B««wy 0 0 0 N X 0 0 0 0 30 0 0 0 0 00 0 0 0 0 00(0.00) (0.00) (0.00) {0.00} (0.00) (0.00) (0.00) {D.0(^ (0.00) (0.00) (0.00) {0.00} (0.00) (0.00) ' (0.00)
Mar 0 0 0 N X 0 0 0 0.00 18 0 18 0.00 29 0 29 81.11
(0.00) (0.00) (0.00) {0.00} (0.00) (0.00) (0.00) fO.OOi (0.31) (0.00) (0.19) {2.95} (047) (0.00) (0.27)
TOTAi 5805 3248 8853 N X 8154 2043 8797 -0.83 5770 3780 9550 8.58 8187 4524 10891 11.95
(100.00) (100.00) (100.00) N X (100.00) (100.00) (100.00) N X (100.00) (100.00) (100.00) N X ( 100.00) (100.00) (100.00) N X
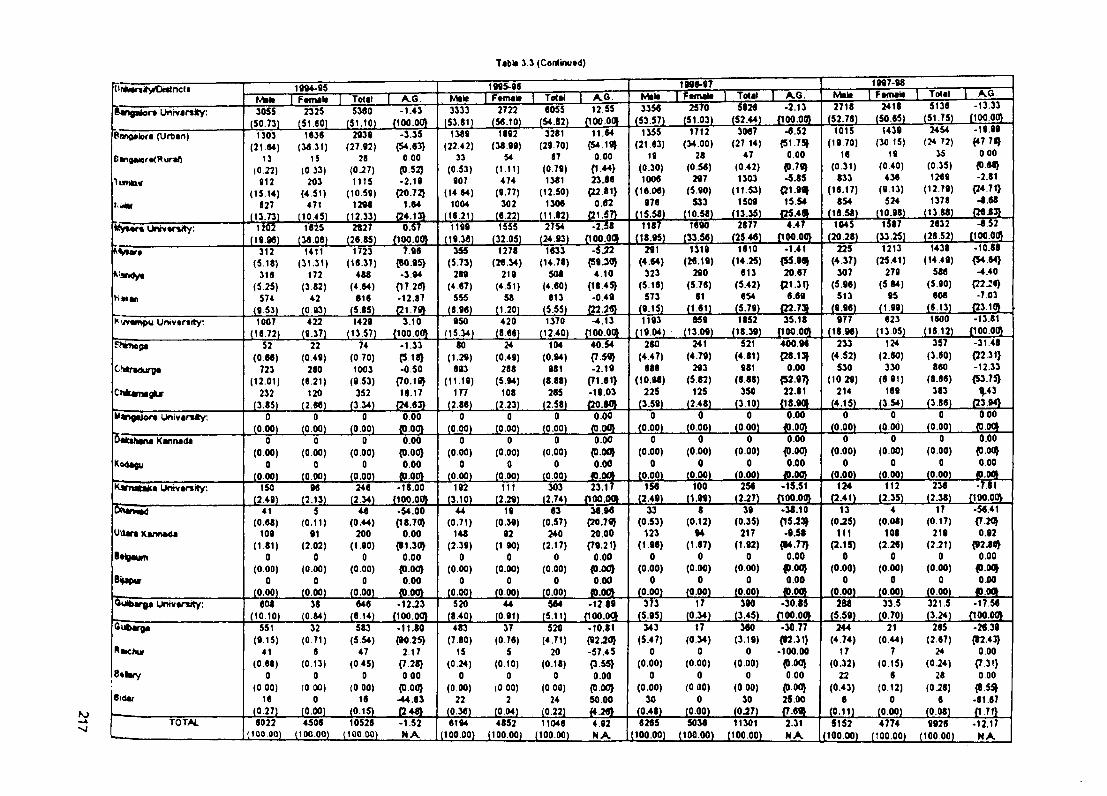
Tabit 3.3 (Cominued)
(ifiM n iry iO itir ic It 10M-Q5Malt I Ftnvalt | Total I A.g7
IMS-96Mate Ftmatt Total I A.G.
1995-97Mala Famala Total
S92<A.G.-2.13
1997-98I Famata Total
5136A.G
-13.33ftangalor* Univanky:
PaAgalora (Urttan)
(*arigaior*(R ur«0
lumlatr
I Him
3055(50.73)
1303(21.64)
13(0.22)812
(15.14)827
mm.
2325(51.60)
1636(36.31)
t$(0 13)
203 (4.51)
471 (10.45)
5380(51.10)
2939(27.92)
28(0.27)1115
(10.59)1298
-1.43{100.00
3333(53.81)
3.35 {54.63}
0 00 {0.52} -2.19
(20.72} 1.64
(12.33) g i . i n
1389(22.42)
33(0.53)
907(14.64)
1004111211
2722tso-101
1892(38.99)
54(1.11)474
(9.77)302(6.22)
6055(S4«)
3281 (29.70)
87 (0 79) 1381
(12.50) 1306
2754
12.55QOOM,
11.64{54.19}
0.000**}23.8602.81}
0.02,£L|ZL-2.M
3358(53.57)
1355(21.63)
19(0.30)1006
(16.06)976
(15.58)
2570(51.03)
1712(34.00)
28(0.56)
297(5.90)
533(10.58)
(52.44) 000.00}2718
(52.76)3087
(27 14) 47
(0.42) 1303
(11.53) 1509
-U125L
-8.52{51.75}
0.00f9.7«}-5.85
{21.99}15.54
4.47
1015 (19 70)
16 (0.31)
833 (16.17)
854
1045
2418(50.65) (51.75) (100.00}
1439(30 15)
19 (040)
436 (9.13)
524 (10.98)
1587
2454(24 T2)
15 (0.35) 1269
(12.79) 1378
(13.88) 2632
-19.99{47.78}
0 00 (0 68} -2.81
{24.71} • 8.68
-8.52Univarvty; 1202 1625 “27 W 1199 1555 1187 1690 2877(19.96) (38.06) (26.85) 1100.00} (19.38) (32.05) (24.93) {100.00} (18.95) (33.56) (25.48) {100.00} (20.28) (33.25) (26.52) {100.00}
^Vwr# 312 1411 1723 7.96 355 1278 1633 -5J2 291 1319 1610 -1.41 225 1213 1438 -10.88(5.18) (31.31) (16.37) {60.95} (5.73) (28.34) (14.78) {5«.30} (4.64) (28.19) (14.25) (55.98} (4.37) (25.41) (14.49) {54.84}
316 172 488 -3.94 289 219 508 4.10 323 290 613 20.67 307 279 586 -4.40(5 25) (3 82) (4.64) {17.26} (4.67) (4.51) (4.60) {18.45} (5.16) (5.76) (5.42) (21.31} (5.96) (5 84) (5.90) {22J!6}
VSMan 574 42 816 -12.87 555 58 013 -0.49 573 81 654 6.69 513 95 608 -7.03(9 53) (0.93) (5.85) {21.79} (8.96) (1.20) (5.55) {22.2flJ _ (9.15) (1.61) (5.79) {22.73} (9.96) (1.99) . {23.10}
>'!ivainpu Un*v#r»ity; 1007 422 1429 3.10 950 420 1370 -4.13 1193 659 1852 35.18 977 623 1600 -13.81(16.72) (9.37) (13.57) {100.00} (15.34) (8.66) (12.40) {100.00} (19.04) (13.09) (18.39) {100.00} (18.98) (13.05) (16.12) {100.00}
??»T»ojia 52 22 74 -1.33 80 24 104 40.54 280 241 521 400.98 233 124 357 -31.48(0.86) (0.49) (0.70) {5.18} (1.29) (0.49) (0.94) {7.5«} (4.47) (4.79) (4.81) {28.13} (4.52) (2.60) (3.60) (22.31}
t*iitra<lufya 723 280 1003 -0.50 693 288 981 -2.19 688 293 981 0.00 530 330 860 -12.33(12.01) (6.21) (9.53) {70.1flJ (11.19) (5.94) (8.88) {71.81} (10.98) (5.82) (8.88) {52.97} (10.29) (6.91) (8.66) {53.75}
Chkamagitf' 232 120 352 16.17 i n 108 285 -19.03 225 125 350 22.81 214 169 383 g.43(3.85) (2.8«) (3.34) {24.63} (2.86) (2.23) (2.58) {30.80} (3.59) (2.48) (3.10) {1«.9(» (4.15) (3.54) (3.86) 9 m ,
Mangaiora Univar»*y. 0 0 0 0.00 0 0 0 0.00 0 0 0 0.00 0 0 0 0 00(0.00) (0.00) (0 .00) 10.00} (0.00) (0.00) (0.00) {0.00} (0.00) (0.00) (0.00) fOOO} (0.00) (o.od) (0.00)
Oakshana Kannada 0 0 0 0.00 0 0 0 0.00 0 0 0 0.00 0 0 0 0.00(0.00) (0.00) (0.00) {D.OO} (0.00) (0.00) (0.00) {D.Ofl} (0.00) (0.00) (0.00) {0.00} (0 .00) (0.00) (0.00) fO.OO}
Kftdaju 0 0 0 0.00 0 0 0 0.00 0 0 0 0.00 0 0 0 0.00(0.00) (0.00) (0.00) ( a m (0.00) (0.00) (0.00) «D.OO} (0.00) tO.OO) (0.00) f l .00} (0.00) (0.00) (0.00)
Kamatoka Univartity: 150 96 246 • 18.00 192 111 303 23.17 158 100 258 -li.51 124 112 238 -7.81(2.49) (2.13) (2.34) {100.00} (3.10) (2.29) (2.74) {100.001 (2.49) (1.99) (2.27) {100.00} (2.41) (2.35) (2.38) {100.00}
iWviad 41 5 48 •54.00 44 19 63 38.98 33 8 39 •38.10 13 4 17 -58.41(0.68) (0.11) (0.44) (18.70} (0.71) (0.39) (0.57) {W.7fi» (0.53) (0.12) (0.35) (15J3J (0J5) (0.08) (0.17) {7.20}
Utlara Kann*da 109 91 200 0.00 148 92 240 20.00 123 94 217 -8.58 111 108 219 0.92(1 81) (2.02) (1.90) {81.30} (2.39) (1.90) (2.17) {?«.21} (1.98) (1.87) (1.92) (84.77} (2.15) (2.28) (2.21) {92J0}
0 0 0 0.00 0 0 0 0.00 0 0 0 0.00 0 0 0 0.00(0.00) (0.00) (0.00) {0.00} (0.00) (0.00) (0.00) {0.00} (0.00) (0.00) (0.00) p.OO} (0.00) (0.00) (0.00) {0.00}
BiMpur 0 0 0 0.00 0 0 0 0.00 0 0 0 0.00 0 0 0 0.00(0.00) (0.00) (0.00) {0 .00} (0.00) (0.00) (0.00) (p.0<5 (0.00) (0.00) (0.00) 9.0Oi (0 .00) (0.00) (0.00) f ) .« l
Oulbarga Univanity; 608 38 646 •12J3 520 44 584 -12.89 373 17 390 -30.85 388 33.5 321.5 -17.58(10.10) (0.84) (6.14) {100.00} (8.40) (0.91) (5.11) {100.001 (5.95) (0.34) (3.45) {100.00} (5.59) (0.70) (3.24) {100.00}
Qubarga 551 32 583 -11.80 483 37 520 -10.81 343 17 380 -30.77 244 21 265 •26.39(« 15) (0 71) (5.54) {90.25} (7.80) (0.76) (4.71) {92 JO} (5.47) (0.34) (3.19) {92.31} (4.74) (0.44) (2.67) (8243}
Raichur 41 6 47 2.17 15 5 20 -57.45 0 0 0 - 100.00 17 7 24 0.00(0.68) (0.13) (0.45) {7,28} (0-24) (0.10) (0.18) (3.55} (0.00) (0 00) (0.00) {0.00} (0.32) (0.15) (0J4) {7.31}
8*lary 0 0 0 0 00 0 0 0 0.00 0 0 0 0.00 22 6 28 0.00(0 00) (0 00) (0 00) {0 0(9 (0.00) (0 00) (0 00) {OOCf} (0.00) (0 00) (0 00) {0.00} (0.43) (0.12) (0J 8) (8.55}
Stdar 16 0 16 -44.83 22 2 24 50.00 30 0 30 25.00 8 0 6 -81.87(0.27) (0.00) (0.15) 0.48} (0.36) (0.04) (0.22) f».28> (0.48) (0.00) (0J7) {7.69} (0.11) (0.00) (0.08) {1.71}
TOTAl. 6022 4506 10528 -1.52 6194 4852 11046 4.92 6265 5038 11301 2.31 5152 4774 9926 -12.17(100.00) (100.00) (100.00) N A . (100.00) (100.00) (100.00) N A (100.00) (100.00) (100.00) N A (100.00) (100.00) (100.00) N A
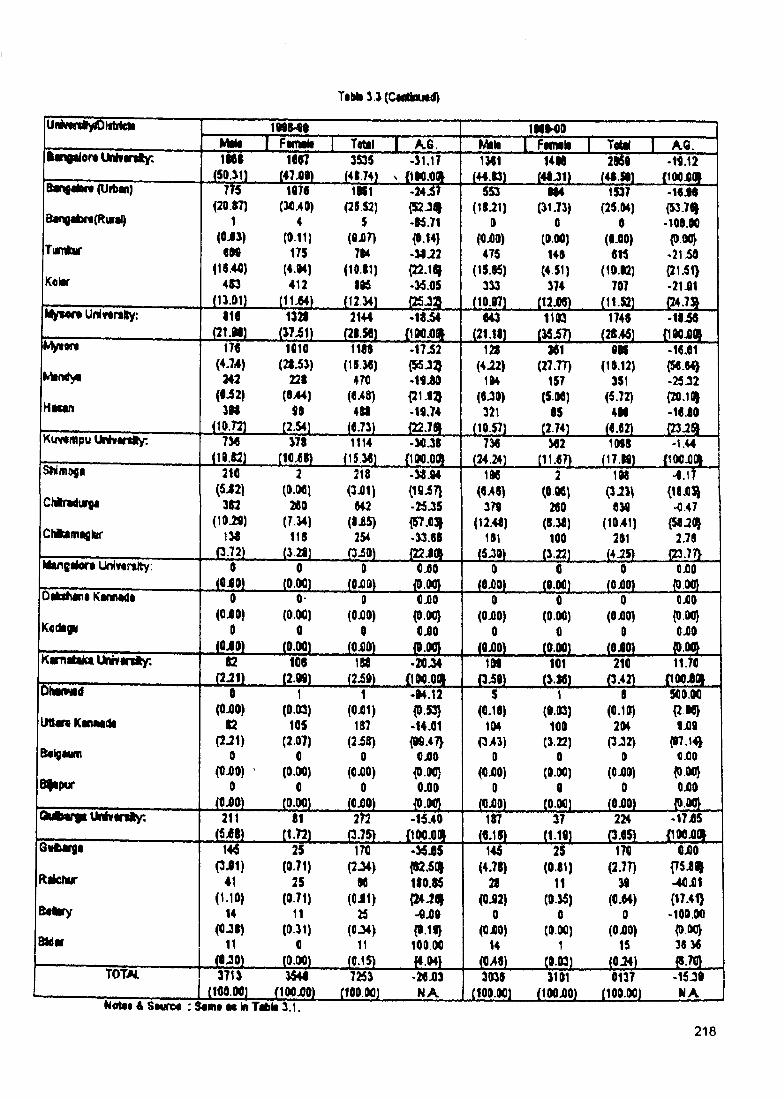
TiMia.}(CMliPLit(f)
1MS40Wm i fm m k I T rtil | A.G.
IM M OM iii I F tm ili I T o y i A.Q.
iv iQ iio r t U M v v ity : 1MI(5Q.^n
1«97
J i m .3S35
JliZil-J U T m i i4 « jR S
(44 D ) ( a . « ) (IQOjOOIB in g iiM (U itw )
Tum br
K e ir
1h(20.87)
1(OJJ)
(15.4<J)4t3
( iv o n
1076(U j40)
4(0.11)
17$(4.W)412
S i m .
1K1(25.$2)
5(OjOT)
714(19.11)
mi i m .
-M.71{•.14}•M J 2(22.1^-34.05
J 3 ^
553(1U1)
0(QjQO)
475
(15.K)353
0tm
140(4.51)
J74
1537(25.04)
0(«.Q0)
«I5(Itt.W)
707
•16J6{53.7«|
- 10 0 .0 0{0.00}-2150{21.51).2ljQ1
(10.07) i n s m (1 1 0 ) (24.7»MyMTt U nivtrtlty: t1«
snm132t 2144
j a i S L
•K.S4{100.0(1
643
. e u i i
1103(3Sj57)
1740(2846)
•1Sj5«{ ioojoo>
My«»r«
M ind>i
Htcan
Kuvimpu U M v in ty :
170 (4.74)
342 («i2)
3H
M m .7M
i L l B l .
1 Q 10
221(044)
90
371(10^0)
1180(15.M)
470(MS)
4 tt
j m .1114
(15.M)
-17.52
-1«.80{21.I3J-10.74
-3C.3S
m m
12t(4Ji2)
104(fl-30)
321
i i m .
M l(27.77)
157(5.00)
85
J H I L
OK( 10.12)
351(5-72)
4iM
j y a .
-1OJ01{5«.e^-25.32{20.11^-1 6 i0
m S L730 M2 1MB -1.44
(24.24) (11.07) (17.W) {1Q0i)(»S tiim oji
CMlraduirsi
Chitaniaglur
210(S i2 )
302( 1 0 ^ )
130
JIZIL
2(0.00)
280(7.14)110
s m .
218(3J)1)
042(B i5 )
254
-31.94(1Qi7)-25.35{57.031-33.08
q iO ) {22iO»
1M
370(12.48)
101J 5 ^
2(0.00)200
(0.38)100
108
m(1041)
201
TiT(18J1SI
-0.47{58J0J
2.70
i m _____ i!L l^_____ 1 2 2 2 LM tn e iio rt Univtrtfty; 0
(0j80)0
m i0
(OjOO)0^0
JL2SL (0.00)0
J M L
0
(0.00)OjOO
{0.00}D A i fM i Kam w li
K odig i
0 0 - 0 (0j60) (O.M) (0X0)
0 0 0(OJO) (0.00) (0X0)
0X0{0.00}0X0
jysL
(0X0)0
0(0X0)
0(0X0) (0.00) (0X0)
8X0{0.00}0X0
j y s LK w nite fc i IM v in t y :
b in m id
U d m KanMidi
B«iga«(n
B fip u r
02s m .
10$J [ 2 a i J i a .
-2«w34i lS o x o L
108 101J L M L
210j m .
11.70{1Q0Xfl>
0
(0X0)02
(2.21)0
(0X0)0
jo x o L
(0.03)105
(2.07)0
(0.W)0
j m .
1(0X1)
187( 2 i » )
0(0X0)
0(0X0)
•04.12{0.53}-14.01{09.47}
0X0{0.00}0X0
JSL2SL
(0.18)1(M
(3>»3)0
(0X0)0
J0X21
1(0.03)100
(J.22)0
(9.M)0
8(0.10)
204(3J2)
0(0X0)
0(0.00) (0X0)
500.00{2.00}8X0
{07.14}0X0{0.00}0X0
O u b v y tU M v in iy : 211JgJO L
81i i a
272
J3JS L
-15.40J lO O X l
187(8.18)
37
i U i L
224
j m .
-17X5{iQoxm
G v U ro t
Raidiur
S r tv y
B id ir
14<5(3X1)
41
(1.1D)14
(0-38)11
(8-30)
25(0.71)
25(0.71)
11(0.31)
0J 2 M
170(2.34)
80(O il)
25(0.34)
11J L IS L
-34X5{02.5()(180.05{24J8I•0X0{0.18}
100.00JttiiL
145«.78)
28(0J82)
0(0X0)
14
j m .
25
(0-81)11
(9.M)0
(8W)1
i t w i
170(2.77)
30(0.04)
0(0X0)
15(8.24)
0X0f r s x ^-40X1 {17.41}
• 100.00 {0.00} 38 30
T o m 3713(100.00)
3540flOOjQO)
7253ftOO.OO)
•20X3N A
3038(100.00)
3101(100X0)
0137(10 0 .00)
-15J0N A
Notes A S m tm : Sam* m In TM iii 3.1
2 1 8
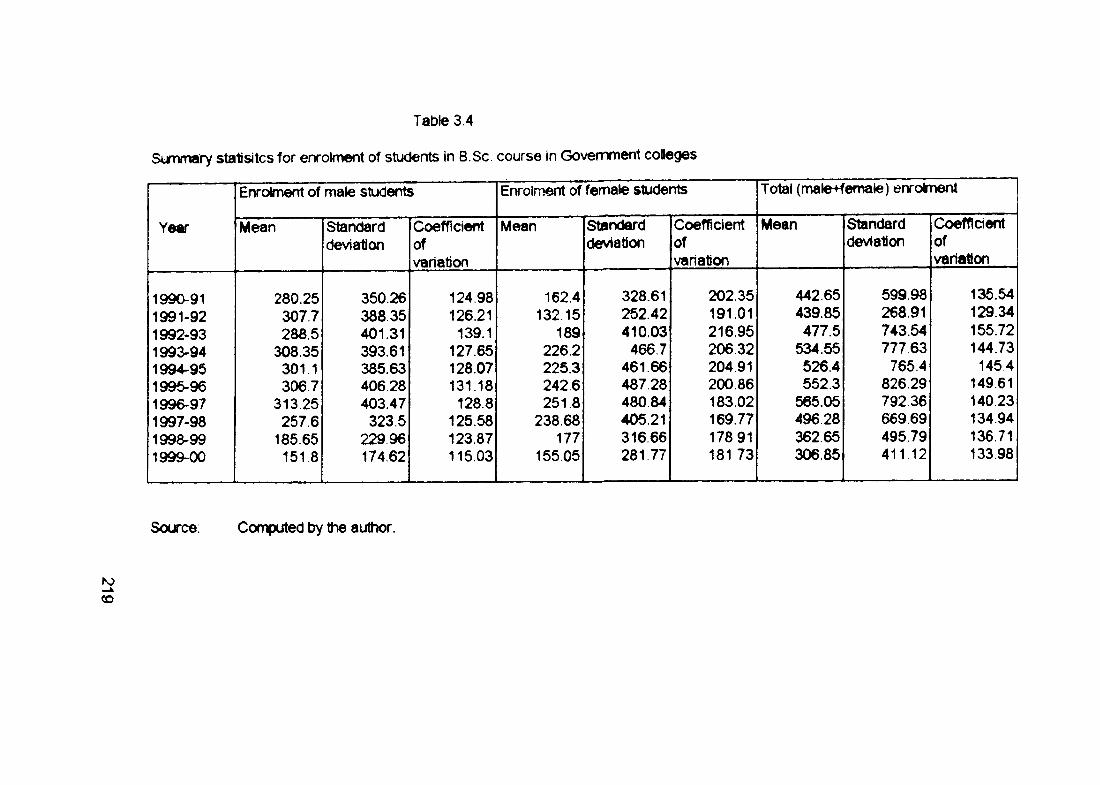
Table 3.4
Summary statsitcs for enrolmcMit of students in B.Sc. course In Government colleges
Year
1990-911991-921992-931993-941994-95 1996-961996-971997-981998-991999-00
Enrolment of mate students
Mean
280.25307.7288.5
308.35301.1306.7
313.25257.6
185.65151.8
Standarddeviation
350.26 388 35 401.31393.61 385.63 406 28 403.47
323.5 229 96174.62
Coefficientofvariation
124.98126.21
139.1127.65128.07131.18
128.8125.58123.87115.03
Enrolment of female students
Mean
162.4132.15
189226.2225.3242.6251.8
238.68177
155.05
Standarddeviation
328.61252.4241003
466.7461.66 487.28 480.84 405.21316.66 281 77
Coefficientofvariation
202.35191.01 216.95 206 32 204.91 200 86183.02 169.77 17891 181 73
Total (male+female) enrolment
Mean
442.65439.85 477.5
534.55 526.4 552.3
565.05 496 28362.65306.85
Standarddeviation
599.98 268.91 743.54 777,63
765.4 826.29 792.36 669.69 495.79 411 12
Coefficientofvariation
135.54129.34155.72144.73
1454149.61140.23134.94136.71133.98
Source; Computed by the author.
QD
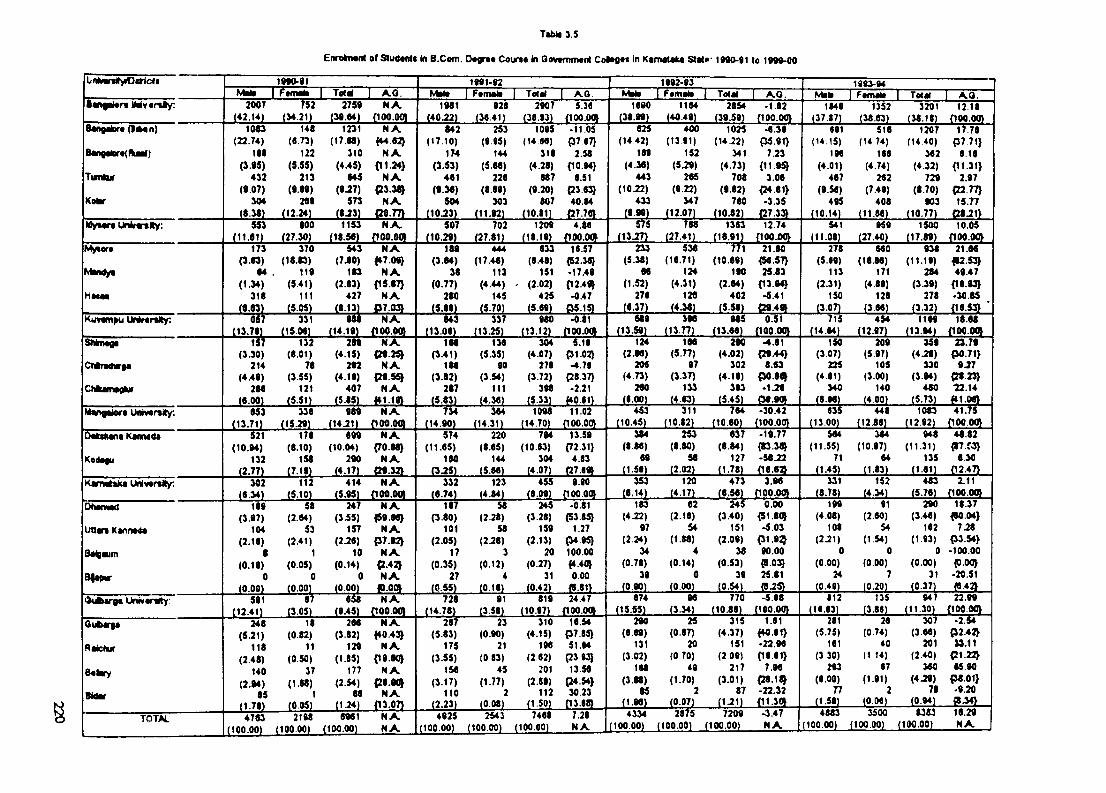
T a tli 3.5
UniwstyiasMciiMv«r«iy:
EnrokTMnt o f S tudw itt in B.Com. 0 « g r it C o u n t in Oovvmment C o lo fltt in Kam«t«U Stal»- 1 MO-91 to 19M-00
iee y_ I •fiMla2007 l52 I To<H I
2759 N A
1991-92M>l* [ Ftin«>t I Tolol I A.G.1M1 928 2907 5.30
Bangalor* ( l*« n ) 1083 148 1231 N A 842 253 1095 -11.05 625 400 1025 -6.39 «91 516 1207 1776(22.74) (8.73) (17.88) (44 62} (17.10) (9 95) 114,66) P7 67} (14.42) (1391) (14-22) {35.91} (14.15) (14 74) (14.40) P771)
B«tgaior«<nuiir) 188 122 310 N A 174 144 318 2.58 189 152 341 7.23 196 166 362 6.16(3.95) (5.55) (4.45) (11.24) (3.53) (5.66) (4.28) {10.94} (4.36) (5.29) (4.73) {11.9^ (4.01) (4.74) (4J2) {11.31}
Tumlur 432 213 645 N A 461 226 687 6.51 443 265 708 3.06 467 262 729 2.97(9.07) (9.69) (9J7) <23.3^ (9.36) (8.89) (9.20) {23.63} (10.22) (9.22) (9.82) {24.81} (9.56) (7.49) (8.70) {22.77}
Koiw 304 269 573 N A 504 303 807 40.84 433 347 780 -3.35 495 408 903 15.77(8.38) (12.24) (IJ3 ) {20.77} (10J3) (11.92) (10.81! (27.76) (9.99) (12.07) (10.82) {27.33} (10.14) ( 11.66) (10.77) {28J1}
MyMTO Uniir«-tKy: 553 800 1153 N A 507 702 1209 4.86 575 788 1363 12.74 S41 959 1500 10.05( 11.01) (27.30) (18.56) f100.00) (10.29) (27.81) (18.19) n 00.00) (13J7) (27,41) . (16.91) (lOOJK)} (11.08) (27.40) (17.89) {100.00}
Myiort 173 370 543 N A 189 444 633 16.57 233 538 771 21.80 278 660 938 21.66P.83) (18.83) (7 JO) (47.09) (3.84) (17.46) (6.48) {52.36} (5.38) (16.71) (10.69) {56.57} (5.69) (18.86) (11.19) 162.53}
MMtfyv •4 119 183 N A 38 113 151 -17.49 66 124 190 25.83 113 171 284 49.47(1.J4) (5.41) (2.83) {15.87} (0.77) (4.44) - (2.02) {12.49} (1.52) (4.31) (2.64) {13.94} (2.31) (4.89) (3J9) {18.93}
Hm m 318 111 427 N A 280 145 425 -0.47 276 126 402 -5.41 150 128 278 -30.85(6.83) (5.05) (8.13) P7.03} (5.69) (5.70) (5.69) 05.15) (6.37) (4.38) (5.58) {29.491 (3.07) (3.66) (3.32) {16.53} ‘
Kuv«npu Uniirortlty; 067 331 98i N A 643 337 980 -0.81 589 396 985 0.51 715 454 1169 18.6803.79) (15.06) (14.19) (100.00) (13.06) (13.25) (13.12) n 00.00) (13.59) (i3 .n ) (13.66) (100.00} (14.64) (12J7) (13.94) {100.00}
SMtnogt 132 289 N A 168 136 304 5.19 124 166 290 •4.61 150 209 359 23.79(3.30) (8.01) (4.15) {29.25} (3.41) (5.35) (4.07) {31.02} (2.86) (5.H) (4.02) {29.44} (3.07) (5.97) (4.28) (30.71)
Chlradiri* 214 78 292 N A 188 90 278 -4.79 205 97 302 8.63 225 105 330 9J7(4.49) (3.55) (4.19) P9.55) (3.82) (3.54) (3.72) P8.37} (4.73) (3.37) (4.19) {30.6fl» (4.61) (3.00) (3.94) {28.23}
Chfcarwglur 288 121 407 N A 287 111 398 -2.21 260 133 393 •1.26 340 140 480 ■22.14(6.001 (5.51) (5.85) f41.19} (5.83) (4.36) (5.331 f40.61) (6.00) (4.63) (5.45) {39.901 (6.96) (4.00) (5.73) ^1.06}
FNngtiers Univortily: 653 336 989 N A 734 364 1098 11.02 453 311 764 -30.42 635 448 1083 41.>5(13.71) (15.29) (14 J1) (100.00) (14.90) (14.311 (14.70) f100.00} (10.45) (10.82) (10.60) (100.00) (13.00) (12J6) (12.92) {100.00}
bakilMna Kannada ‘ 521 178 699 N A 574 220 794 13.59 384 253 637 -19.77 564 384 948 48.82(10.94) (8.10) (10.04) {70.68) (11.65) (8.65) (10.63) {72.31} (8.86) (8.80) (8.84) {83.3^ (11.55) (10.97) (11.31) (87 fO)
Koteffu 132 158 290 N A 160 144 304 4.83 69 58 127 -58.22 71 64 135 6.30(2.77) (7.19) (4.17) {29.32} (3J5) (5.66) (4.07) (27.esi (1.59) (2.02) (1.78) {16.62} (1.45) (1.83) (1.61) {12.47}
Karnataka UniMrsky: 302 112 414 N A 332 123 455 9.90 353 120 473 3.9« 331 152 483 2.11(6.34) (5.10) (5.95) (100.00) (6.74) (4.84) (6.09) f100.0(9 (6.14) (4.17) (6.56) (100.00} (8.78) (4>t) (5.76) {100.0(1}
OhanMd 189 58 247 N A 187 58 245 -0.81 183 62 245 0.00 199 91 290 18.37(3.97) (2.64) (3.55) (59.66) p.80) (2.28) (3.28) {53.85} (4.22) (2.16) (3.40) {51.80} (4.08) (2.60) (3.46) fM.04)
Uttara Kannada 104 53 157 N A 101 58 159 1.27 97 54 151 -5.03 108 54 162 7^8(2.18) (2.41) (2.26) P7.92} (2.05) (2J 8) (2.13) P4.95} (2.24) (1.88) (2.09) {31.9:j (2J 1) (1.54) (1-93) {33.54}
Baigaum 8 1 10 N A 17 3 20 100.00 34 4 38 90.00 0 0 0 - 100.00(0.19) (0.05) (0.14) {2.42} (0.35) (0.12) (0.27) (♦.40) (0.78) (0.14) (0.53) {8.03} (0.00) (0.00) (0.00) f).00)
B|apv 0 0 0 N A 27 4 31 0.00 39 0 39 25.81 24 7 31 -20.51(0.00) (0.001 (0.001 ff.OO} (0.55) (0.16) (0.42) 16.81} (0.90) (0.00) (0.54) (8.25} (0.49) (0.20) (0.37) ff.42}
duibarga Unwanity: 591 67 658 N A 728 91 819 24.47 674 96 770 -5.98 • 12 135 947 22.99
1992-93TotH A.O.
1690 1104 28S4 -1.82
1983-94Mili Ftmati Total AQ .1849 1352 3201 12.18
OutMrg*
Raiehur
8«lwy
Bi4w
TOTAL
(12.411 (3.05) (9.451 (lOO.OOt248
(5.21)118
(2.48)140
(2.94)85
(1.78)4783
( 100.00)
18 (0.82) 11(0.501
37(1.M)IP^-
2198 ( 100.001
208(3.82)
129(1.85)
177(2.54)86ililL
6961( 100.001
N AiQAZiN A
{19.80^N A
(28.*N A
_D107L
(14.78) (3.581 (10.971 (100.00)
N AN A
287 (5.83)
175 (3-55)
156 (3.17) 110 (2.23)
23 (0.90) 21 (0 83)
45 (1.77) 2(0.08)
4925( 100.00)
2543( 100.00)
310(4.15)
196(2.62)201(2.89)112
AIM.7468
( 100 .00 )
16.54P7.85}51.94
{23.93}13.56
P4.54)30.23
f13.68)
(15.551 (3.341 (10.881 (lOQ.OO)
7.28N A
290 25 315 1.61(6.69) (0.87) (4.37) (40.91)
131 20 151 -22.96(3.02) (0 70) (2 09) 09.61}
168 49 217 7.96(3.88) (1.70) (3.01) (28.1^
85 2 87 -22.32(1.96) (0.07) (1J 1) 01.30}4334 2875 7209 -3.47
00.00) (100.00) (100.00) N A
iie .63j__ (3.86) 0 00 .00}281 26 307 •2.54
(5.75) (0.74) (3.66) P2.42}161 40 201 33.11
(3 30) (1 14) (2.40) {2122}293 67 360 65.90
(6.00) (1-91) (4.29) (38.01)77 2 79 •9.20
(1.58) {0.06) (0.94) (834}4883
( 100.00 )
3500 ( 100.00)
8383 ( 100.00 )
16.2flNA
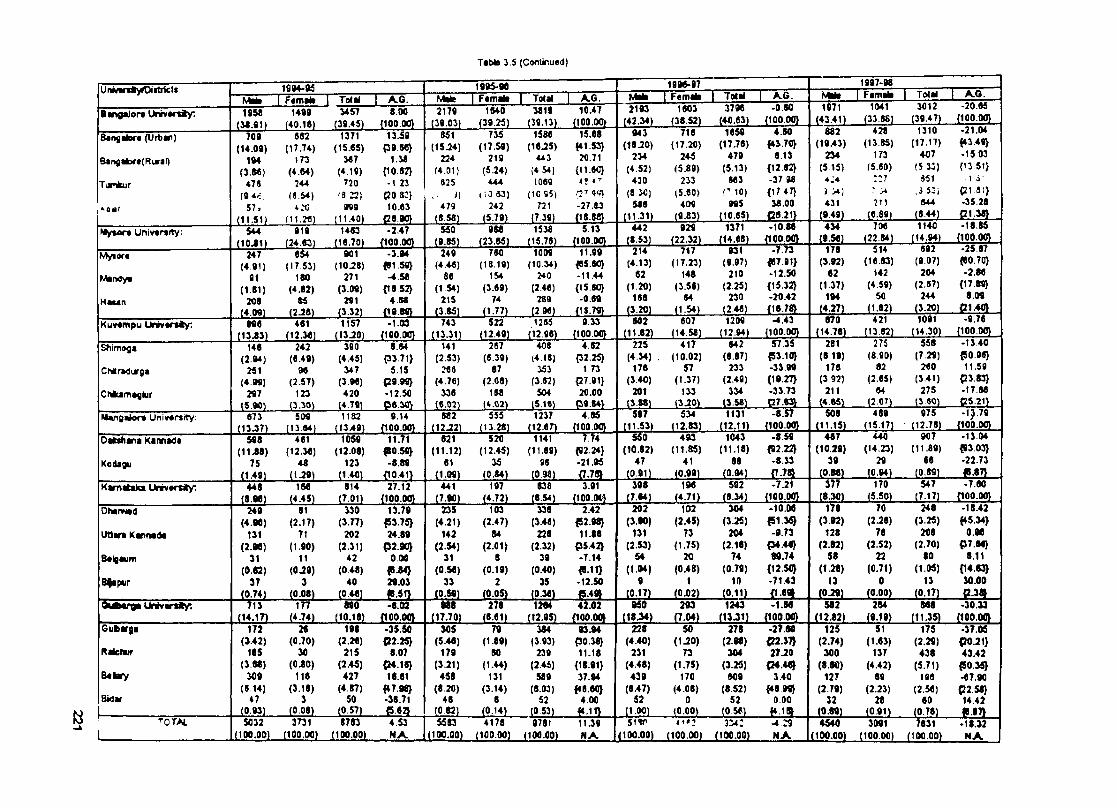
T«bte 3.5 (Cortkiu«d)
UnivwrstyDiitricts
BangaJert U n iv trs ty :fvWt I Ftm tk I Total I A.G.1S58 14fl9
(40.18)1457
(38-45)8.00{100.00}
1995-MMrte I F«mate I Tolal 1 A.G.2179
(39.03)1940
(39.25)3819
m?±10.47{100.00
19M-97Mite 1 F<m«ie I Toltl XG.2193
(42.34)1M3
(38.52)3 7 «
(40.C3)•0.80
{100.00
KM*1997-M
I F«mate1971
(43.41)1041
(33.88)428
(13.85)173
(5.60)
3012 (39.47)
1310 (17.17)
407 (5 32) 351 ,3 53)
»44 (8.44)
A.G.-20.85{100.00}-21.04(43.49}-1503{1351}1 4(21 51} -35 28
Bangatorc (Urtar)
B«njaiort(Rura[)
Tunkur
709(14.09)m(3.8«)
47 «(9*':. 57,
111.51)
682(17.74)
173(4.84)
244(fl.54) iX
(11 2<)
1371 (15.65)
367 (♦.19)
720 '3 22)
« 9
Alim.
130 P9.86}
1.38 {10.82} -1 23{20 s:}10.63
<28.00}
851(15-24)
224(4.01)
525 ,■ i)
479 (8.58)
735(17.59)
219(5.24)
444r.0.53)
242(S.79)
1586(16J5)
443(4 54)t069
(1C 95) 721 t7 39).
15.68 {41.53} 20.71
{11.60} 4* < '
q<»>-27.83
043(18J0)
234(4.52)
430(830)
588(11-31)
716(17.20)
245(5.89)
233(5.60)
409(9.83)
1659(17.78)
479(5.13)
663no)895
(10.65)1371
4.80{♦3.70} 8.13
{12.82} -37 98 {17 47} 38.00
-10.8<
882 (19.43)
234 (5 15)
*2 4
431(9.49)434
r215
(C-89>706M yto r* Univ«rsrty; 544 919 1483 -2.47 550 988 1538 5.13 442 929 1140 •18.85
NV*Of* 247 6S4 901 •3.04 249 780 1009 11.99 214 717 931 •7.73 178 514 692 -2587
(4.91) (17.53) (10.28) <51.59} (4.46) (18.19) (10.34) {65.80 (4.13) (17.23) (9.97) (87.91} (3.92) (16,83) (9.07) <50.70
Mandyi 91 180 271 -4.58 86 154 2*0 -11.44 62 148 210 • 12.50 62 142 204 -2.88
(1.81) (4.82) (3.09) {18 52} (1.54) (3.69) (2.46) {15.80 (1.20) (3.56) (2.25) {15.32} (1.37) (4.59) (2.67) {17.80
HMan 208 85 291 4.88 215 74 288 -0.89 168 84 230 -20.42 m 50 244 8.09
(4.09} (2.28) (3.52) {18.88} (3.85) (1.77) (2.96) (18.70 (3.20) (1.54) (2.46) {18.70 (4.27) (1.82) (3.20)
Kuv4mpu CMvartiy: 896 481 1157 • 1.03 743 522 1265 9.33 802 607 1.209 -4,43 870 421 1091 -9.76
(13.83) (12.3«) (13J0) {100.00} (13.31) (12.49) (12.98) {100.00 (11.82) (14.58) (12.94) {100.00 (14.78) (13.82) (14.30) {100.00^
SMmoga 148 242 3S0 8.84 141 287 408 4 82 225 417 842 57.35 281 275 558 -13.40(2.94) («-49) (♦ .« ) {33 71} (2.53) (6.39) (4.18) {32.25} (4.34) , (10.02) (8.87) {53.10 (8,19) (8.90) (7.29) {50,90
Chir«jjrga 251 M 347 5.15 268 87 353 1 73 178 57 233 -33.99 178 82 260 11.59(4.99) (2.57) (3.96) {29.99} (4.76) (2.08) (3.82) {27.91} (3.40) (1.37) (2.49) {19.27} (3 92) (2.65) (3.41) P3 83}
Chkamaglur 297 123 420 -12.50 338 188 504 20.00 201 133 334 -33.73 211 84 275 •17,88(S.M) (3.30) (4.79) (38.30 (6.02) (4.02) 15.U) {39.84> (1.8«) <3J20) (3.58) 0 7 .8^ (2.0T) 55,21} .
Mangatora Uniw«rtity: 673 509 1182 9.14 882 555 1237 4.85 597 534 1131 -8.57 508 489 975 •9,79(13J7) (13.84) (13.49) {100.00 (12J2) (13.28) (12.67) {100.00 (11.53) (12.83) (12.11) {100.00 (11.15) (15,17) (12.78) {100.00
Oaiealiana Kannada 598 461 1059 11.71 821 520 1141 7.74 550 493 1043 ■8.59 487 440 907 •13,04(11J8) (12.38) (12.08) 180.59} (11-12) (12.45) (11.69) {92.24} (10.62) (11.85) (11.18) (92.22} (1029) (14.23) (11.89) (83.03}
Kodagu 75 48 123 -8.89 61 35 88 -21.95 47 41 88 -8.33 39 29 68 -22.73(1.491 (1.29) (1.40) {10.41} (1.09) (0.84) (0.98) {7.78J (0.91) (0.99) (0.94) {7.719 (0.86) (0.94) H-87}
Kam«t*ka IMvarsity: ^ 448 188 814 27.12 441 197 838 3.91 398 196 502 -7.21 377 170 547 -7,80(8.M) (4.45) (7.01) {100.00 (7.90) (4.72) (8.54) {100.00 (7.84) (4.71) (8.34) {100.00 .. (5.50) (7.17) {100.00
OhanNad 249 81 330 13.79 235 103 338 2.42 202 102 304 -10.08 1>8 70 248 -18.42
(♦•M) (2.17) (3.n ) {53.75} (4.21) (2.47) (3.46) {52.98} (3.W) (2.45) (3.25) (5130 (3.92) (2.28) (3.25) {45.34)IMara Kannada 131 71 202 24.89 142 84 226 11.88 131 73 204 -0.73 128 78 208 O.M
(2.M) (1.90) (2.31) P2.W} (2.54) (2.01) (2.32) P5.42} (2.53) (1.75) (2.18) P4.40 (2.82) (2.52) (2.70) P7.80Balgaum 31 11 42 0.00 31 8 39 -7.14 54 20 74 89.74 58 22 80 8.11
(0.82) (0J9) (0.48) f!J4} (0.58) (0.19) (0.40) (8.11} (1.04) (0.48) (0.7«) {12.50 (1.28) (0.71) (1.05) {14.83}Bfapur 37 3 40 29.03 33 2 35 •12.50 9 1 10 -71.43 13 0 13 30.00
(0.74) (0.08) {0.4<) |B.51> (0.59) (0.05) (0.38) (5.481 (0.17) (0.02) (0.11) {1.691 (0.29) (0.00) (0.17) (2.381^ i * v a a umvars«y. t u 177 890 •8.02 m 278 1284 42.02 050 203 1243 -1.8« 582 284 848 -30.33
(14.17) (4.74) (10.18) {100.00 (17.70) (8.61) (12.95) (100.00 (18J4) (7.04) (13.31) {100.00 (12.82) (9.19) (11-35) {100.00Gufcarga 172 26 198 •35.50 305 79 384 93.94 228 50 278 -27.80 125 51 175 -37.05
(3.42) (0.70) (2.M) (2225} (5.48) (1.89) (3,93) {30.38} (4.40) (1-20) (2.oa) (22.37} (2.74) (1-63) (2.29) (20.21}Raictiur 185 30 215 8.07 179 80 239 11.18 231 73 304 27.20 300 137 438 43.42
(3.88) (0.80) (2.45) (24.18} (3.21) (1.44) (2.45) {18.91} (4.48) (1.75) (3.25) (24.«^ (8.60) (4.42) (5.71) (50.35}Batary 309 118 427 18.61 458 131 589 37.94 439 170 809 3,40 127 89 196 -87.90
(8.14) (3.18) (♦.87) {47.88} (8.20) (3.14) (8.03) {46.80 (8.47) (4.08) (8.52) {48 90 (2.79) (2.23) (2.5«) (22,50Bidar 47 3 50 -38.71 48 8 52 4.00 52 0 52 0.00 32 28 60 14.42
(0.93) (0.08) (0.57) (5 62} (0.82) (0.14) (0.53) {4.11) (i.QO) (0.00) (0 56) (0.89) (0.91) (0.78) (8.87>T O W 5032 3731 S783 453 5583 4178 9781 11.39 5l5r j u : -4.29 4640 3091 7831 •18.32
1 (100.00) (100.00) (100.00) NA. (100.00) (100.00) (100.00) N A n 00.00) (100.00) (100.00) M A (100.00) (100.00) (100.00) N A
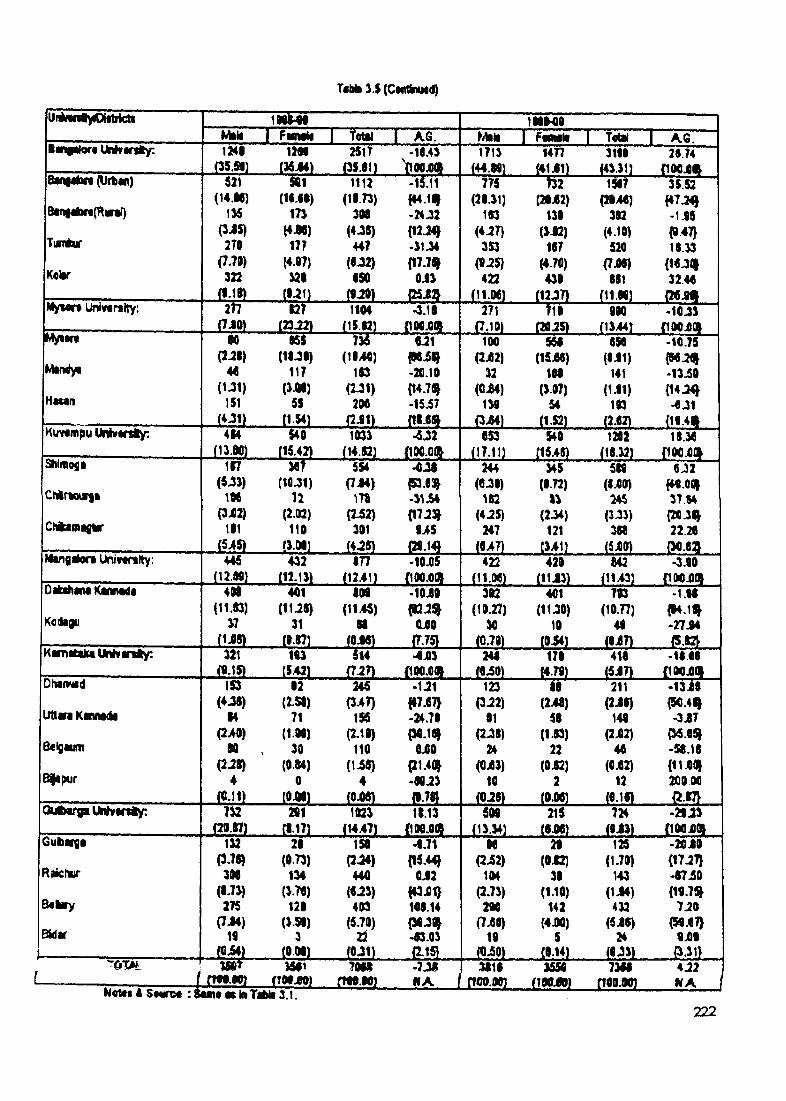
Tfbli %.S (ConttmMd)
U iiM iiy lD iftrtc ti
lanfiiorf UHvtnfty:M i H
1241
1W^I Fimlf Total
251TA.G.
<ie.4)
» 1 te lI " ?.'/,
1112 -15.11 775 h 2 1547( i w j w
35.52(1«.«t) (11.73) f « - 1 (21.31) (2*J62) (2044) f * 7 J ^
Ban|#)r«(RureO 136 173 308 -24 J2 183 130 302 •1.95(3 i5 ) (4J8) {12J ^ (4J7) (^.•2) (4.10) {0.47}
Tumhif 270 177 447 -31.34 353 167 524 18.33(7.7#) (4.87) («J2) fl7 .7 ^ («-25) (4.74) (7J08) {1« J fl|
Kciir 322 321 ISO 0J3 422 438 881 32.440 .1B) _ ( W 1) ( « 0) ( 11.« ) (12J7) (11.« ) (24.991
M yiort U nivtrtity : 2t7 127 1104 •3.18 271 t io 900 -14J3(7J0) (23.22) (15.82) (104J09 (7.1 OJ (20:25) (1344) {104j4(»
M KS 73^ 6J 1 104 558 656 -14.75(2 J I) (1W I ) (1044) (2jB2) (15j68) ( I J 1) (M .2^
MirWy« 44 117 183 -20.10 32 101 141 •13.50(1-31) (J.M) (2.31) {14.7AJ (0^ ) (3.07) (1J 1) {14
H m n 1S1 5S 206 -15v57 134 54 103 -4J31(i-31) _ L1.54) (2J 1) f« - 68| (3jW) (152) (2.62) (19.4»
Kuv«mpu IM v ir t iy : 414 S40 1033 ^ J 2 653 540 1242 18.34(U .M ) (15.42) (1 4 .0 {10G.0« (17.11) (1548) (18.32) f104i)l»
Shimoji 117 347 5S4 •4J8 244 34S 519 6J 2(5J1) (1U 1) (7J4) (53.6^ (flJO) (•72) ( m (49.011
C M n m iy t m 72 -31.54 182 13 24S 37 84P jf l2) (2.02) (2J52) (I7J2^ (4^5) (2.34) (3.31) {24.3^
Cliicamtfllw’ 111 110 301 247 121 386 2224(5^5) ?3.M) (4^8) (2S.14J (6>^7) (341) (5JOO) (34.623
M angilod U n iw ilty : 446 432 i n •10X5 422 420 842 •3.90(1M 3) (12/41) {104.0fl( (11.06) (1U 3 ) (1143) f104 iia |
Oafcdim Kmn«ta 4M 441 to i • 10J 0 312 441 703 -1.98( 11.0 ) (1 U 5 ) (1146) (KJI3J (10.27) (1U 0) (10.H ) (M .1^
K01M9U 37 31 81 OjOO 34 10 44 -27 J4i m (••W) (4J«) (7.75) (0.70) (054) (4j6T) (5.82)
K w D M a lM v in t y : 321 1(3 514 •4jQ3 244 170 414 -1448(«.15) (5A2) (7 JIT) (100.Q9 <9jS0) (4.74) (5 i7 ) f104jQQ|
OlMfVtfd 1S3 12 246 - U 1 123 18 211 -1 3 i8(4J«) (2.51) (3^7) H7.67) (3.22) (244) (2 i5 ) {54.4JI
unvaKanM da 14 71 1SS -24.78 81 58 144 -3J7
(1 W) (2-10) (34.161 (2-38) (1.« ) (2J02) {36.6^Bclgaum n 30 114 4J0 24 22 46 -54.18
(2J I ) (0.W) (1-58) (Oj63) (0.52) W { l l ^ f l leytpur 4 Cl 4 -64J3 14 2 12 2)00 04
(C-11) (0.M) (Ci)«) 9 .m (4J28) (04)6) (4.18) {2.07)Q u k v g tU M v tn iy ; 732 2S1 1023 11.13 5 U 215 724 -2 iJ 3
(20.17) («.17) (H 4 7 ) (100.0« (13.34) (9M) (9 i3 ) {104JOOIG ulta igt 132 28 1S4 •4.71 16 20 12s -20 J O
(3.78) (0.73) (2^ ) {!5,44» (2j52) (012) (1.70) (17 J7}Rakfiur 306 134 444 4J2 1IH 30 143 -87 iO
( i.7 i) 0 -W) («^5) ft t jO l) (2.73) (11C) (1J4) {19.751B«lwy 275 121 403 148.14 200 142 432 7 J0
(7J4) (> •») (5.70) P4JflJ a j60) (4.04) (6J5) (59.47>BSdar IS 3 22 -83.03 19 5 24 9jOI
(C-W) (O.M) (6J 1) a i5 ) (Q.50) (0.14) (4-33) (3.31)"O X a i IS fii 36ft 70«l • I M 3t18 3654 7311 4 J2
A ^ m I i r n a « ^ ---------( T O 8 j0 O » m . w i N A f rWD.04) ( T O e J D ) H40.04} f / A
1715
iWMa I Fiiwit
1477T<t»l I A.3110 28 74
222
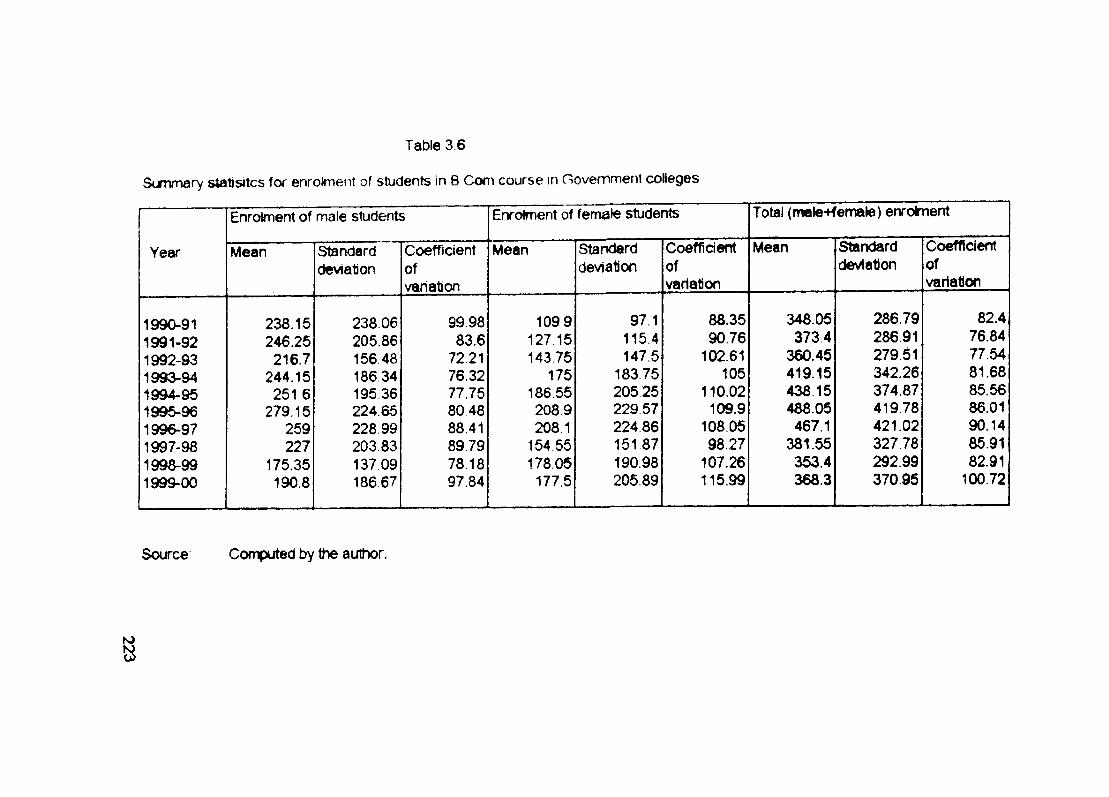
Table 3 6
Summary stalisitcs for enrolment of students in B Com course in Government colleges
Year
1990-911991-921992-931993-941994-95 1996-961996-971997-981998-991999-00
Enrolment of male students
Mean
238.15 246.25216.7
244.15 251 6
279.15 259 227
175.35190.8
Standarddeviation
238.06 205.86 156.48 186 34 195.36 224.65 228.99 203.83 137.09 186.67
Coefficientofvariation
99.9883.6
72.2176.3277.7580.4888.4189.7978.1897.84
Enrolment of female students
Mean
1099127.15143.75
175186.55 208.9 208.1
154.55 178.05177,5
Standarddeviation
97.1115.4147.5
183.75 205 25 229.57224.86151.87 190.98 205.89
Coefficientofvariation
88.3590.76
102.61105
110.02109.9
108.0598.27
107.26115.99
Total (mele-Kemale) enrolment
Mean
348.05373.4
360.45419.15438.15488.05 467.1
381.55353.4 368.3
Standarddeviation
28679286.91279.51342.26374.87419.78 421.02327.78 292.99 37095
Coefficientofvariation
82.476.8477.5481.6885.5686.0190.1485.9182.91
100.72
Source Computed by the author.
?s)a
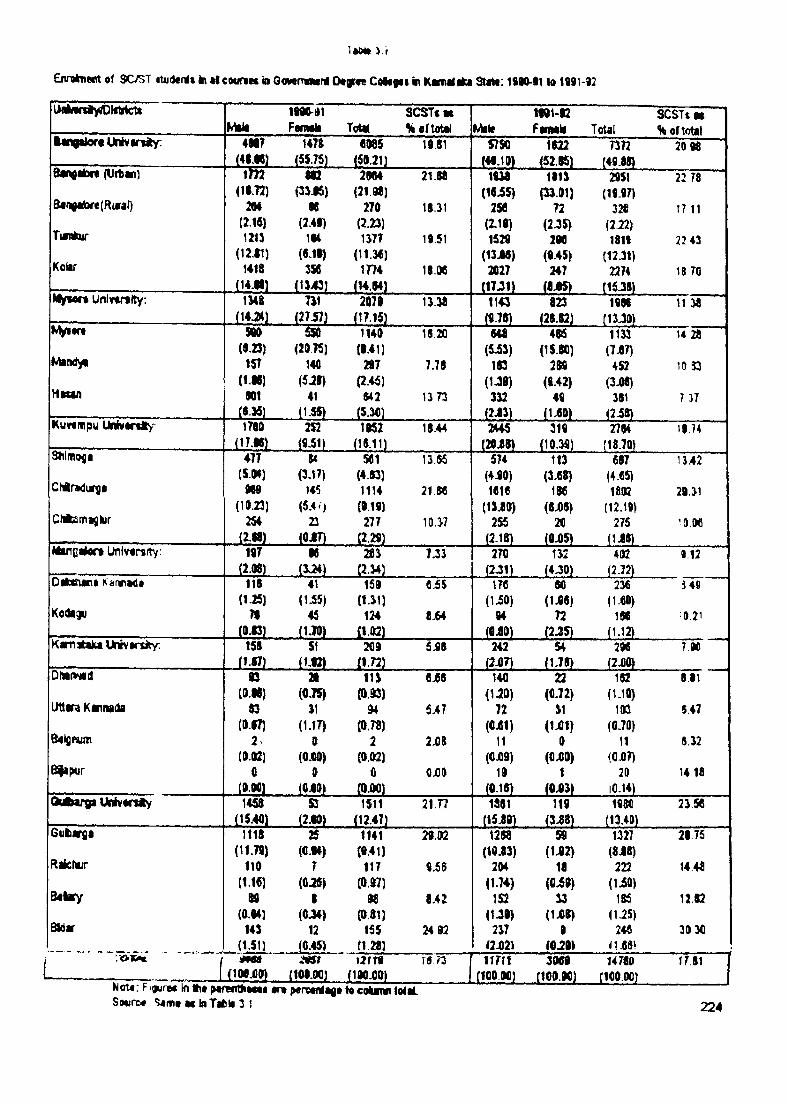
itEnT9liie«it 9l 3CVST itud«nl« in «lco«inec in 0«(Mn«Mnl O t0 r«e C o ltfii in Kamalifca to 1991-J2
Miit FsfTMla ToMSCSTtM%«rtotei Miie
IfOI-CFmntf Total
SCSTs M % of total
•m gaio ri U n iv in iy : 4N7 147» 608S It.SI S7SQ 1$22 20(U itanl 1 ^ 812 2W4 21 88
1 wr1538 1813
1 9 .«9f2951 22 78
(11T2) 01J5) (21 M ) (16 i5) (»-D1) (19.97)B«rtgiA)r«(Airaf) 88 270 18.31 258 72 328 t? 11
(2.15) (2-41) (2.23) (2-18) (2.35) (2J2)Tm la ir t i n l l i 1377 18.51 152S 298 181t 22 43
(12.11) («.18» (11.«) (13J88) (045) (12-31)Kolir 1418 3S6 i m 18.08 2027 247 2274 IB 70
(14.M1 _ (H .W ) (1TJ1) (8j85) (15-38)MyMTt Univ«nity; m s T il 2078 13.38 1143 823 1998 11 »
(1 4 ^ ) _ (27.57) (17.15) (5-T8) (28.82) (13 JO)M y itr t » 0 590 1140 18.20 848 4»5 1133 14 28
(123) (20.T5) (8.41) (5 i3 ) (15.80) (7X7)M indyi 1ST 140 287 7.78 183 289 452 10 O
( t .« ) (5J8) (2.45) (U 9 ) (0.42) (3X8)H ta n 8Q1 41 842 1373 332 49 381 7 17
(1-55) J 5 .M ) (2J3) (1^0) (2ii8)Kuv«mpu Univirtiv '^ 1780 252 1K2 18.44 2H5 319 2784 19.74
(9,51) (18.11) (28iS) (10.39) (18.70)Sliimogi 47T U 5«1 13.55 574 113 687 11.42
(5.0*) a i7 ) (4.83) (4J90) (3^5) (4-85)C hlr« ]ursi m 145 1114 21.88 1818 186 1802 29.31
(1l».23) (5.40 (9.10) (13J0) (8X8) (12.19)Chlcsmaglur 2S4 22 277 10.37 255 20 275 '0.06
(2.«) _ (0J7) (2.25) (2-18) (0X5) (1X8)Mtn(iaAort Univtrstty; 1«7 18 283 7.33 270 132 402 9 12
(2.(») (3J4) (2.34) (2J1) (4.30) (2.72)Oaftxsiari Kanradt 118 41 158 fl iS 17C 80 236 J4fi
(1.25) (1.55) (1.31) ( l iO ) (1X8) (1X0)Koiti^u 71 45 124 t M 84 72 198 •‘0.21
i m (1.W) il.02) (OiO) (2J5) (1-12)K im itaKa UnivtrsitY: 1S8 51 209 5.88 242 54 298 7.9C
(1.W) ( m n.72) (2X7) (1-78) (2X0)Otnmidl » 21 113 8.68 140 22 182 8.81
(D.«) (0.75) (0 .« ) (U O ) (0.72) (1-10)U tlva Kanittda 83 )1 5.47 72 31 103 547
(O.W) (1-17) (0.78) (0J61) (1X1) (0.70)d«lgnifr 2> 0 2 2.08 11 0 11 8.32
(D.»2) (Q.QO) (0.02) (CJQ9) (QXO) (0X7)Bfapur 0 0 0 OjOO 19 1 20 14 18
_ IM O j m ) (0-18) (0X3) 10-14)C M ir g t I M v t n t y 1458 S3 1511 21.77 1881 119 198Q 23.56
_L15.401 {2 m (12.47) ( I5 i» ) (3X8) (13.40)Gufcarsa 1118 25 1141 29.02 1288 59 1327 28 75
(11.75) (0-84) (0.41) (W J3) (1X2) (8X8)Raichur 110 7 117 9 i6 204 18 222 14 48
(1.16) (0^5) (0.87) (1.74) (0X9) (liO )B aivy » 8 n 8.42 152 33 ISS 12.S2
(0 .«) (0J4) (0.81) (U O ) (1X8) (U 5 )BUar 143 12 15$ 24.92 237 9 24« 30 30
(1.51) (0.45) n.28) #2412) fOJO) n x 8 ‘
j ' ^ 1 M M m i i2 r r t f 5 .7 3 ^ 11711 3089 14780 T781L . (10«il0) {108.00] (18Qi)0) (100.00} (100.00) (100.00)
Sourc* M in l i l i i f 3 1• r t penccnlAg* t« co lim lolaL
224
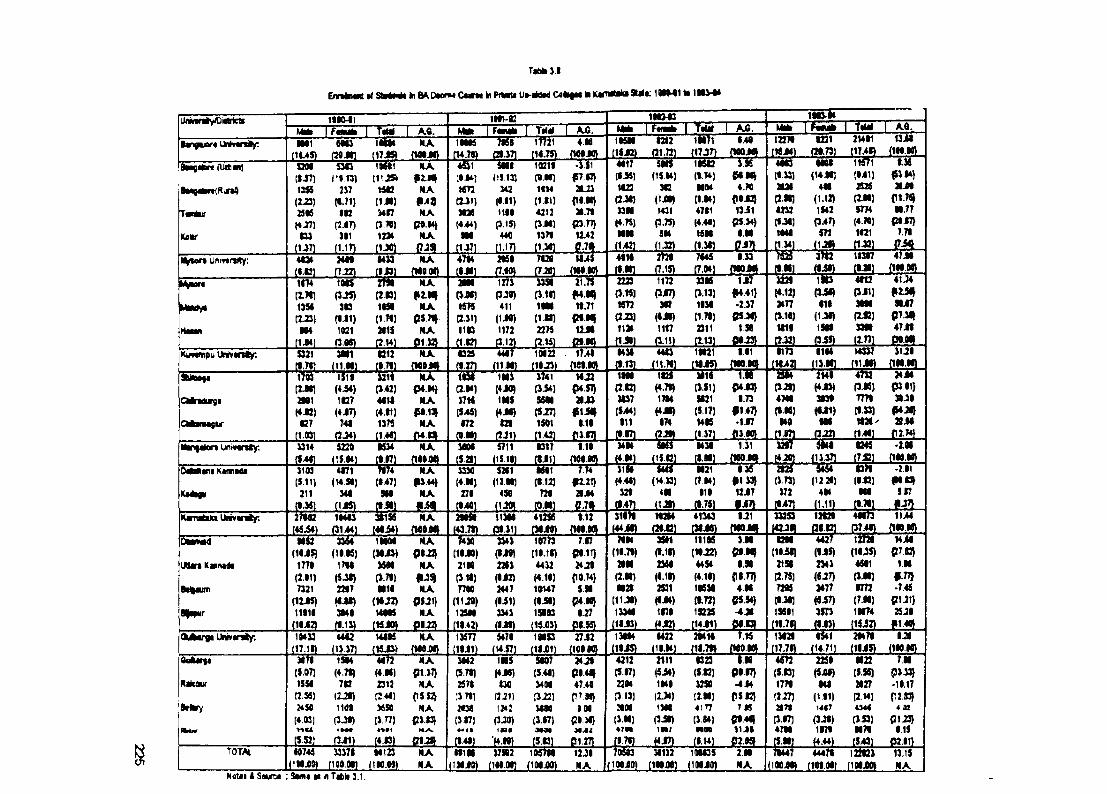
Tabki.t
EniilMK»fSb«ii*heADeor»«C«E*lnPf1wtiU»-*l»dCeli9*iiK«rw<sklSlile: 1WM1 <•IMwiiyDirtrtcl* n n - n
T S T M . MMt \fmrn I T i lH A .G .1 N } «
175 I T r iHm r r
■ i m
AjS.i w - i T
T 7 S S " 1 5 5 "2UH U i lNrltlw* IMvtniy; M l t m 1MM N A
[ I M S ) < M J H ( I 7 y ( W J I >INtS M b 17721 Tm ~
f14.7<) gt->7l {H.75) tMtJg1KM
(« J2)t2l2
J2LSL
t M 12271(WjM)
1231(21.73) tl7.at {1W.W
mTi{I4U8 29(2.M)S774(4.»)1121
J L S l
Bngitor* (Uit«]
SMg«lHt(Rtn4
1'ankur
K«lir
S2M 530 T5RT »A(tJ7) i * in ) [11 prM |13$S 2» 1M2 NA(L23) (1-71) (1J«)29ts i n 34(7 NAKJ7) (2JT) (J.W) P0.l*}KU 311 NA
[U71 (1.17> (IJfll (7J3I
J m(U.13J
343 (1.11) M il
(3.15) 440
o - 'n
«72031)MOB(444)M
10211
1114(1.11)421J
1371t1.30
-J 5 1P U }2U3
r i.M }2I.7I
P3.77}12^2
- m .
M S(JJ«JS3M(4.75)MM
w(1514)
3C2{ ] j m1431
(3.75)5M
(1.32)
i B c(1-745MM(1.14)4711(4.44)MM(131)
396
4.W
1 3 i 1CS34)
I.M
JU H L
ms( • » )2U I(2.11)4232(fJt)1«M
JliiL
(H U )4M
(1.H>1S42
(3.47)172
( 1 ^
1.36<»J4)2IjOI
C1.75JM.77
( M J 7 }7.71
J [ i S _
Unt<r«rvty: 4434 24MiL 2 L
14)3(tJP l
NAfMO.W)
4714j m
2KI(7.iO)
7I3«JL2L
ia>s 4IMJtfiL
m iiL lS -
7MS
JL2U.I.S3 7S2S
J I MW(tJW
11317J t 2 L
47JI {M>.W 41J4
9li7P7.3IJ47Jt
gy w ..
Iiy m ITM i# « XW NA( in ) p j5 ) (2.«) n m13S6 3«3 MSI NAC2J3) (IJ1) (1.71) P5.71JH4 1031 2115 NA
j m ___ Q if l___ 2 J i L - e i ^
1275 (3-3«) 411
(1J9) 1172
t l O (3.12)
MTS(2.31)l i e
(i.m1«M{1.ID2275
J2J£L
21.75f4.M)11.71
Pf.H}12jN.^ tS L
2223t».W)M72(2-23)11)1
J i a
1172PJ7)ya
(•i«)11170.11)
»is(3.13)1131
( 1 7 1 )2311
j m .
1J7iW,41}-2.37
PS.31}i.sa
3221(4.12)J477(3.1«)MM
J2J0L
( mt i l
(ij»»isn
4t12(3J1)3tM( la )
Kimmpu U iwanty:
QdrMurgt
CMtnMQkr
S321(t.7t)I m(2JI)2M1(412)•27
3M1(11.W1
1511(4i4)1C7
(4J7)741
C12tl.7 l)w(3.42)4«M(4.11)1375
NAjM iS L
NAP4.I4)
NA|».t3»
NA
02Stt.r )IB T( ii* )37M(S4S)f72
4417(11.M)1M3
(4iO)IMS
(4JM)129
10922(MJ3)3741
17>M(1C9.90)
j m ___ !2>U___
(334) S589(«J7) 1501
J I B ___ m ___
MJ2P4.57}29J3
«1.SS}9.M
-C H L
94Uj i a
19M(J.C)3137(S^)911
(f.9D
4413i i u t l
IBS
1794(4J9)974
JE2L
19921J 1 9 ^
MM(3.11)5921(517)U K
SL SL
9.91JMOM
T mP4.I3J
9.73f147)-1.97
M S L
9173
i ma i r(3J9)47M(9.96)949
m .
9194
i m2 u r(4JS)3«39(U1)9M
(3J5)7779(9.»)M29^
J M J L
31J9(199.99)
24JM P3 91} 39J9
2ZJ9f12.74)
3314 S229(H.94)
BST
(9/47)S9t
NA 3909J i m .
5711i l i l l L
9317
(i.12)729
J0J9L
9.19(109.90)
■ n r i rP2.21) 29 jM
j E a _
M94
j t a .
w
(14.33)4M
(t.a)
9431m .
1.31fM0.90)
w
(3.73)372
(9471
9949(13.37)
I M(7.B)
>299f ly jg -
6M«<a KaraiMt 3100(5.11)211
4971(14.*)
349(9.M1 (1JS) (9.W1
N A#3.44)
N A
j y i .
3330(4.M)279
5211(13.M)
450
31ST(4.49)329
M21 (7 94) 919
j m .
936#133)12J71 jS7>
5464(12 29)
494(1.11)
071(9.92)999
9 .m
-2.91{NS3|s r
jta .KvnattJa Unvanif. 2799S 19493-fililL
3tlS5 NA IWmMm 113Mj a i i L
41296 9.12
10773(19.19) 4432(4.19) 10147 (9J9) 15IB3
J2i«L
J im7.97
P9.11} 24 J9
ro.74) 5.99
(U.9Q 9.27
JBtSL
3MI9
7994(19.79)2999(199)9929
(11J9)13344
s m .
M294(29J2)
41343 9J1 332S3 12129
442t(9JJ)2343(6JT)3477<«i7)3sn
J m .
49973(37.49)
DMMd
IMirs Ksinida
Bt|ann
MS3(MJ?)
1779(2.91)7321
(12j95)1MM
(19J92)
3364(19.95)
1719(5JI)2297(4JI)3M9f9.13)
II (MJ3) 36M (3.79) MM
( « ^ V44tS
(16 JO)
NAP9J2)
NA
NAPSJI)
NAj B t a .
i i r(19J0)21 n(319)n9o
(iiJ«)12549
I2 t« L
3343(ii9 )2293(9J2)2447(9i1)3343
j u m
3SI1(9.19)2369(•-11)2S1(9JI)1979
iLSL
1111 (19 J2) 44S4 (4.19) 196M(9.W)1SB26
C14J1)
3.99p iis j
9.S0p in }4.99
«*»♦} •4J9
j s i a .T M
■ o y wi.99
P I 17} •4 94
{I5 92J TK
C»4<} 11J9
J21S -
9299(M il) 21S9 (2.75) 7295 (9.34) 1S691
i m«4T
J l i l lL
12729(MJS)4691(3.99)9772(7.M)19974
(I6i2)
MJ9P7C}
INf.77>-7.45
p u i}25 J9
-filiS LQUtargi U nvm iy; 19433
(S.37)1559(2.S5)2450(4.»3)
4442(13.37)
14495(16 J3) 4472(4.M)2312(2.44)MSO
(3.H)
NAfMOJO)
136H(MJ1)
5479i i t S L
199S3J i m .
ZJM(109.90)
139Mi i m .
4422j m .
294Mi m
13429i m
21479J 2 t!a .
9.2S(190.90)
6«te|a
Kiktmr
Bikry
1S94(4.79)792
(2-29)1109
PJ9)
NAPUT}
NAP5S2)
NAP3.B)
3442(5.79)2579:37t)2(34(3.r)
IMS(4J4)130
(2J1) 12*2 (3 JO)
S907(5.49)34U(1-22)34M
(3.97)
I IS ]___ (3J1) (4.(3) C9JI^ (9.44) -f4.99)105)99
(IOOjQO)
24 J9 P9 44}47.49P7«)
iMP9J4}
0127)
4212(5.97)2294(313)3909(3.M)«7M(!J!L
2111(6i4)1949
(2J4)13(9
(3i9)m r
J4J7L
9323(5.12)32S0(2.M)4 in(3.94)MM
J U IL
4672(5.13)1779:2.27)2IT«
(3.97)4790
H)
2259
944(111)1447(3J9)1979
4 u n
M22(S.S5)2927(2.14)4344(3.S3)M7«
l a E )
799P3.33} •19.17 V20}
4 at P1J3)
915
Tom 10746(1MX0)
" W i(100.04)
94123(190.00)
NANA
<91M(IMJO)
37992 12J9NA jlOOiO)
39132 (199 JO)
109435(109J0)
2.HNA (100X9) (M9 04) (199J0)
13.HNA
N«t«i 4 Smin* : S»m$ ■ « Tifcli 3.1.
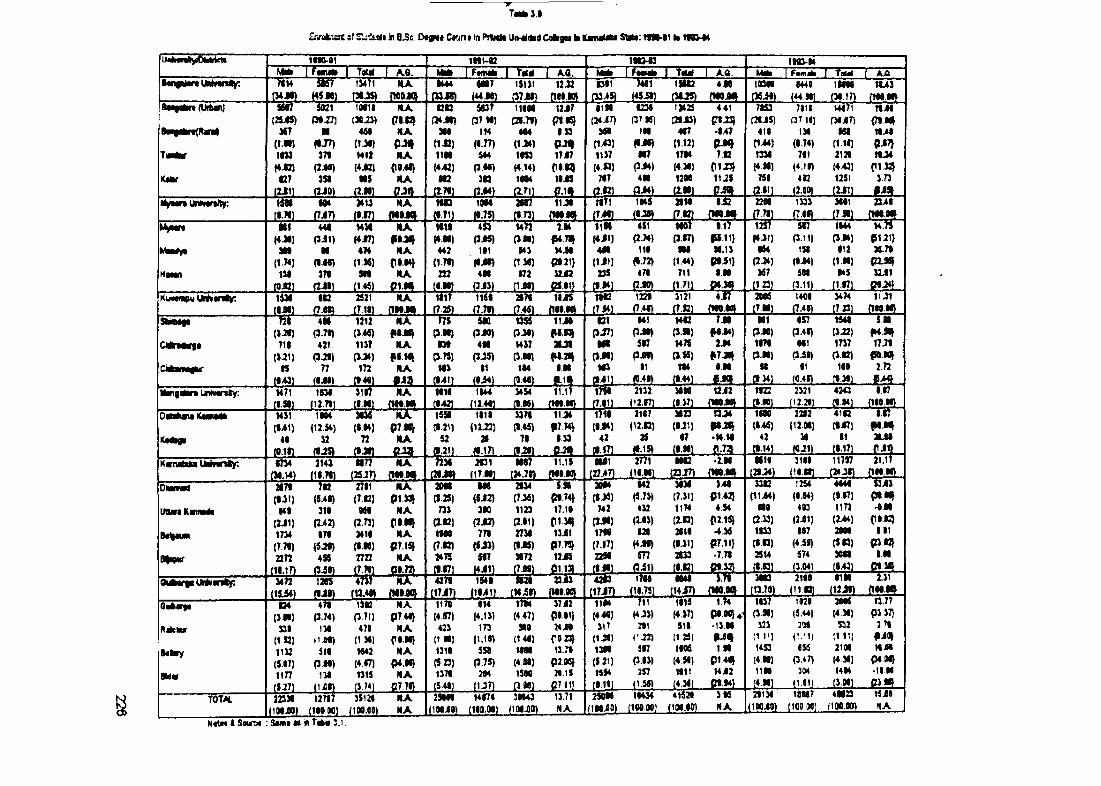
Tahnyi
MwiiySSSctrZ.'inA.'.ait it SLi&ait ^ B^e. Ot^v* C n n t In PrlMt UiMidid CokgM li Kmnittta StM: !• m ^ H
1HO-01fjssr^ s rHiMi
I T a w I km I Ftm aii I T t l^ A.G.HO-C
I Pfiiiisr n e1Slt2
ja*2LA.a.
1M3-MF«fiiab fatoi ( a S *iMwliy: JtU 15471 N A 17 151J1 12 J2 OH 4M IBM 8449 lira tU}
SM7 5021 10011 NA 020 407 11000 12J7 0110 1230 12425 4.41 7053 7911 m7i 10 JOPf-27) (30 J3) {7I.BJ f»JO) (37 M) C2I.7») (71*? (2ii7) (3TJ5) (20 J3) {7113} (20J5) (3TU) (30 JT) {7* JO}
Batgikn(Rin(| >57 H 400 NA 3H IM 404 I» 360 100 407 .147 411 1)0 SOO 104In m (1.30) p j f (1*2) (0.77) (114) P-M» (1/0) (OJO) (112) p jq f144) (0.74) (110) PJOT}
Twftur 11)3 371 1412 NA 1100 544 10S3 17J7 1137 M7 1704 70 1330 701 2120 1U4(4JJ) P-M) C04I} (442) P.0«) (414) {ion} (4.53) PJ4) (4.30) 0113} (4.M) (4.10) (443) flS2}
tUfer 127 351 005 NA 002 30 10M IOjH 707 410 1200 1U5 750 40 1251 3.7312J1) CJO) (2J01 fljn p.71) (2.04) R71) {7.m ( ip 0J4) (1001 QJ«k {2.01) (2.00) _ (2J1) 9J9
MyMr» UniMnity; Mi 2413 NA 100 1004 2W7 11J0 10 1 1045 20M 112 2201 1333 3001 2341(1.711 (7J7) (0.17) {NOJQ (071) (0.75) (0.73) m n (•-»> 000 J i| (7.00) (7 SI)Ml 441 H3I NA Mil 4 3 U72 lU 11^ 451 100> • 17 llh 507 1044 h .H
^yt) P il) (417) fOJOJ (4 00) Pi«) (iM) (S4 7I) (4J1) (2.74) P.07) Pi.1l) (4J1) P.11) p.o«l p u i)MmM M M 474 NA 442 101 043 14 JO 4#0 110 no M.13 064 150 012 1S.7I
(1») (•-«) (ts«) {10.04} (171) (Oil) H30) P».21) (1i») -72) (144) P»J1} (JJ*1 (0J4) (100) P2.50}hmm 131 371 soo NA 222 4M 072 32J2 235 470 711 1.00 367 SOI 045 32J1
fOJI] (2JI) (1.4«1 C1.00J (0.00) (3J3) {\m CS.01} (0.041 (2J0) (1,71) P4.» (1.23) (3.11) (1171 C014}Kuvmr u IMvmly: iSai lO 2S21 NA 1117 1150 a n IIjOS n o 1220 3121 4i7 20A5 14C0 3474 im
(iJi) o m (7.111 {100J4 (7.25) (7.70) (7.45) (100.00) {7.>4) (7.41) (7.12] m .m (7M) (7.40) (7 23) m mStaMft ■fill 4K 1212 NA 500 W 11J0 o i 041 HO tM 111 057 1544 in
IJJi) (3.7t) (3.4«) fOJO» POOJ PJO) (3 JO) f**3» p.17) (3J0) P.«) PJO) P.iO) (312)711 421 1137 NA 130 400 U37 2UI 000 507 1479 2J4 1070 001 1737 17 JO
[iin Q-m (3J») (3.W) (3J5) (3.00) fo a i (3J0) pJOO) P.«) P7J0} p.00) PJO) PO) {50.00}ryN w ^r n 77 172 NA M3 11 104 000 M3 11 m 0.00 00 01 100 2.72
(0431 (WO) (0.401 f i3 (•411 (0441 (0.40) i-11 (0.40) (0.44) p jq tO.34) (0.30)Mngrtan UnhMnty; M71 104 3117 NA 1010 1IU 3454 11.17 17io 2132 3000 12J2 1022 2321 4243 117
(•.«] (12.711 (I.MI flOO.09 (0421 (12.40) (t.061 m m (7.01) (12.07) (0.00) 1'2.20)_. (««1 (100 00)OMUMKMMit M)1 1004 3036 NA ISM 1111 3371 11J4 ilio 21C7 3023 n j4 1000 2202 410 1.17
(Ml) (12.54) (0.04) P7.00} (•■21) (1122) (1.43) P7M} (0.14) (12.0) (0J1) POJO} (04«) (12.00) (•«) po.00}41 U 72 NA 52 20 70 1.33 42 25 07 •H.M 42 30 11 20JO
(0.11) (IJS) (0J« (••211 (0.17) JO JO) 0 2 t tO.lT) (0.15 (0.M1 {1.7 {•.14J (€11) (0.171K«TMtikiUMf«niy: 1734 2143 Il7i NA w 201 m i 11.15 0001 2H1 ooo •2.00 K10 3101 117J7 21.17
m.i4> (11.71) (2SJ7) (100.M (20 JO) (17 00) (34.70) {HO.IO [VAT) (10.00) (23J7) {m .^ (20Ji4) (10.00) O il)DUMfMd M7f tu 2711 NA 2000 IM 2134 5.50 20#4 042 3030 3.40 330 1254 4«44 fiJ3
(•J1) (5 0) (7.12) PI.33J (1.25) (5i2) (7J6) P074} (*.3«) (3-73) (7.31) pi 42} (11J4) (0.04) (0.071 poo^iraan Kwmii Ml 310 ISO NA 733 3IQ 1123 17.10 742 432 1174 454 000 40 1173 •OM
(2J1) (2j<2) (2.73) ro.i4 (IB) (2J2) (2.11) ri3 ^ (2.ii) P-03) (2.0) p2.1^ (2.33) (2J1) (2441 {100}1734 171 3410 NA 10« 771 2730 13J1 17f0 120 3110 4J6 1033 107 2001 1.11(7.71) (5J0) (0.00) P7.14J (7 0) (0J3) (0J5) P7 73} (7.17) (4 JO) (0.31) P7.11} (0.0) (4.51) (SO) P3.0}2272 49S TtZt NA I4W 517 3072 12JS 2240 577 2133 •7.71 25U 574 3000 I.H
»i.m (3J0) (7.701 00.72) (•.ri (4J1) (7J0) eii3) l»?) m m P !g l (0.01 (3.04) .J lg L .»A *siU *r*y; 3472 120S ' 4f3» NA 42^ 1S4I 23 J3 42b i)oo •041 3.h 300 2100 01M 2.31
(ISii) (Ut> (tt,4H (Mijm (17J7) (1041) (Hil) (MO.H) (17J7) (10.75) l *42L. (13.70) (11 O), (12JD6i*«^ 04 471 1302 NA 1170 014 17W 37 J2 11»» 711 1015 1. 4 1037 1021 20« 13.77
(3.M) P.74) (3.71) P7.40J (4.07) (4.13) (447) pool} (4.40) (4J3) (4.37) PO.OO}*; P«) (5.44) (4 301 P3 37}Kiielnr 331 130 471 NA 423 m 510 24 JO 31T 2*1 511 •13.00 323 200 S32 271
(1 S3) • lilO) (1 301 fOOD (1 00) (1.10) (1 40) f#23) (1J01 • 1J2) t1 251 !1 I'l 0-M) ;i 11) PifllB«tinr 1132 ill 1042 NA 1310 550 tooo 13.70 1300 517 1006 100 1453 «S5 2100 MJO
(5.07) PJO) (4.07) P4 0« (5 23) P.75) (4.00) P2.IK) (5.21) P.03) (4.501 pi 40} (4.00) P.47> (4 301 P4M}au« iin 13t 131S NA 137« 204 15M 20.15 1554 257 1011 MJ2 1100 3M 14M >1I.M
(5J7) (IXt) (3.U) 07.70) (540) (1J7) (3 00) CT11} (O il) |1.5«) (4.301 P0.»4J (4M) tu i | (3.001 C3.0DT o m 22331 12717 35120 NA 25000 M074 30143 13.71 250M 10434 41520 3K 20130 18007 4H23 14 JO
(10li») (100.001 (100.00) NA (100J0) (100.001 (100X0) NA (IMJOO) [100.00] (100.00) NA (10QJ0) [100 Ml (100.00) I4A
N«tM i S tu n * : 3m<» m i i Ttfilt M
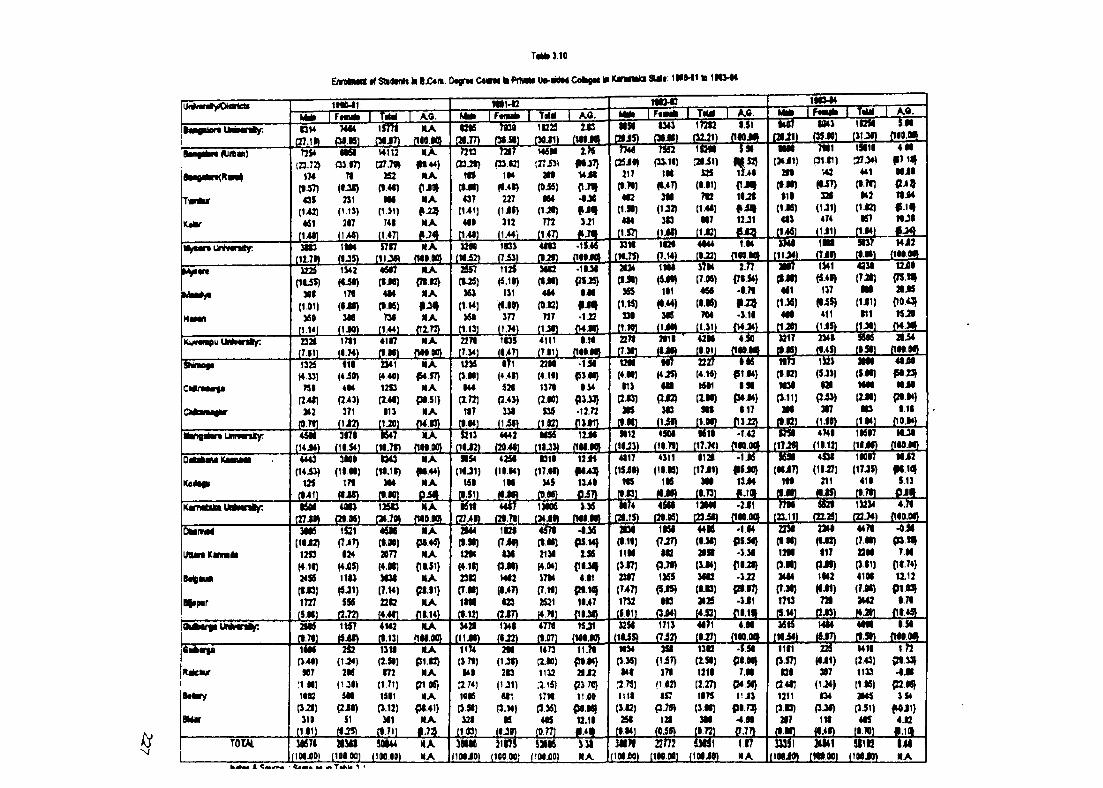
T«Ml ).10
EnrolMnt k 8jC4fi. D^jfw Cwn* h U o - a M Cok«M \0 (UnrtHa SUli: l» M i te
Fm u r f a r T X o rmi-t2
M l I F««airi Taw A .O .m a-c
M * I F t* * TM HT 5 c "
KQ.IS 1
\ n y uIF m i* “T5T
its s iA.a.
T mUmgburtyjmtn tf.
(U ftM l
Imtur
tUtM-
CMJ2LJL
7444(M « )
T55*
m(•■571
43S( 1> « )
«S1tlvOI
Wm.iT)
71(•Jl)»1
(1.1S)217
( 1 ^
is n rj j y Z L
w t«
2S2{«.«)•M
(1.51)741
NA(W .W
NA #•44}
NA( l i t NA
f-2^ NA
(1471 ».74|
C t s 7«3Q 1> 2 a S B ”M .7 7 ) f f t a ! Q f l J I ) ( W . WW
(23t<9
(•Jl)«37
( M l )
(1«1
I n f(33U)
m
227(1J»)
312(1.44t
t4j|M(27ii)
M(®J5)m
(iJi)772
(1471
2.78 #•^7}
14 J t{1.Tf•ije
JJ1
M M
w(J5J«>
217(•.W)m
(i.» )4 M
(1571
tU l
j m7 g r
m(•.47)
3M(1J2)
3 0J2i!L
(MJ1)io «(2IJI)
X2S(••1)
7t2(1.4*)
• 1 7JLSL
“ K flTfaJD
IM3.fiiSSL
ii>«C J9iiJ t
12J1± S L
0»^i|m
(•••)• I t
(1J8)413
(1^)
7101p i r )
V43tU7)»
(U1)474
J142L
M1«
441(•TfJ
•42(1 « )
•S7
.g-gj-
4*1
M ia(2^9fiJMf . l ttfJ t
Mywn UntwHly:
tAftm
y m(117H ff.35)
S 7I7(11J>»
NAm m
I S iJ42 44iJ NAc it iS ) f « i t ) ( • j e ) { 7 * B }
M 17« 414 NA(1.91) (iJ I) (•.15) f J f»» 3M 731 NA
(114) (1J0) (1.44) (lIT g
urn(H i2)w(•-25)
36)(1.U)
36*
1S33OSi)1125
<5.1 )131
(•-••)377
(113 ) (1.?4)
4I«3(•2»3 « 2(•J«)414
(t>.»2)727
•IS.4jw M a .
n iliiiZSL
i«2i(7.14)
PIJS} • ••
•1 i2
-CiSL
2U4(M O )355
(1.M)33t
JIM.
1M«
1 1<a.u)3«
(iJ it
(•J2)w iT
(7.J5)4 »
(•■•5)7«4
(1.31)
T np«.54j•1.71
-3 .11J204L
W 1MfiJO
W
(iJiJ451
4Mt1 .»
m i(5.4*)
137(•-S5)
411JtL«L
J ! £ I4231|7Ji)M
(1J1)•11
J 1 2 L
MJ2{10.IW
tui^(TS.m
21J 5{10.43J 15 JO
Ku««nipu U n M n t ir : 2321(7.11)
1711J£2!L
4ir7(«.w)
NAfwaoy
227«(7.34)
1«35(iv«7)
4111j m .
• Njw M a.
2271J1»L
2t 1tJ»|SL
h T(4J5>•••
PJ2)313
( liO
42te(•■•I)r f -(4M)15*1(!••)m
s m
4.S0 3217 234tJ!:15L
55«( • J l )
2 l i 4nw.w
CMrtdwya
1325(433)
751(2>4D342
( • 7 1 )
f ll(4iB>414
(2 3)371
(112)
2341(4.40)12S3a.m113IJ8)
NA<S4f7}
NA{31.51}
NAi l i f iL
1136(3.M)
• a(2-72)
117(•■•*]
171(4.41)S2«
(2.43)331
(1^
22M (4 1«) 13TI(2.«n
S35(1 ft21
•15 1P3JI}
• 34 P3J3J -12.72
J L ilL
t2t i(4M)
H3(2^ )as
Jt«L
IM9114}
I N{34 »4}
117fi3 q
w T(snjW3I(3.11)m
(•■Ci
1323(5J3)«2I
P i»317
ilSSLt m 4 W
3 M (5 i n NM(2JI)m
j m .
4 lilS
Mia(»•»}
• I IJ llE .
O i
iC e itp
45«
4443(t4 i3 )
135
3I7I(11.54)
"B 4 7( 1 I .7 D
3^a»( I I .H )
171
043(11. 11)
3i4
N A( 1 H .M )
N A(M.44}
N A
o i Tn i J 2 )
4442f204<)
m ____m ____m ____ s i i
»S4(1U1)
16a(••51)
42SI( i r i 4 )
i t iW J O
a«96(1U3)•311
( 1 7 .« )34$
(H.Ml
12jN( 1 M W
M12i m
12J4f l 4 3 }
134^
4117( I 5 i » )
tasJIS L
4SU
i m4311
( 1 I « )116
» J 5 )
•Sir(17.X)•121
( 1 7 i l )3M
J tS L
-1 4 2
MMJ U i .
(17 J « )T S i( H i 7 )
1 M
i m
i m
(1U7)2\\
J t S L
lisa?( t i J Dnon
(17 J5 )411
JL 2L
M J a
M i 2f l 1 < l
513
JE4!LK ir r a M m U B iM n ly ;
O M M id
J t t M K m a d i
2H S.3MS
(1IJ02)1253
(4 11)2495(•••3)I7 2 t
(5 .H )
4M 3
1S21( 7 ^ 7 )
124(4-05)1113
( 5 J 1 )5S5
(2.72)
12 5 0( y .7 g )
4<M(•■•I)2on
{4.H 13«3I
(7.W )2212
N A •511(27>m
N A{».4 6 }
N Ar « .5 i}
N AC a .l i )
N A(4.41) fft .1 4 )
2M4(••51)tm
(4.11)Z3 D
(7 .H )i<ai
(•■12)
J S U il1 C I
( 7 i » )131
( J i$ )m i
(1.47)<23
(2 J 7 )
13M6J 2 4 i J L
4571(•■•I)211«
f4.tt4) 37»4
(7.11) 2S21
(4 7<)
3Jm s L
{35 U ) L56
P I J I » 4.11
P I I Q 1 1 ^ 7
jc m .
H 7 4
2131( • « )It ^ l
(3.17)2317
(74 7)1732
( S it)
4 5 « r(3^^M)
IlSf( 7 J 7 )
U 2(3.7^)1365
113(3j04)
1 » 4 tJ 3 ^
4416(••31)2IS I
(3.14)3W2
( • .B ))I2 S
( 4 . 0
•2J1(1t8 .M )
•1.14PSSO}
•3.31P l ^
•3 JQ
• 3 J 1ilia.
2 2 M( t H )12M
( J « )M 4
(T.3«)1713
J 5 J 4 L
"m
iS it(W i4 )
tu t(M 2 )
117P J I )1142
d - i i )m
jm .
13234J S 2 S i .
4471(7.^^) 22M
(3.11) 41 • ! ( 7 J I ) 2M3
j t m .
4.; (H B .D O
• O S Ip m
7 .MP l.7 4 }12.12
p i n }• 71
J ! i 3 LQ U b t f p M H n i y ; 2U6
J 1 2 L1H7
f 6 j|A
(1J4)2tS
5M( 2 i l )
51(1.25)
4U2J t H L
N AfiM .ao}
3421(11JD
1341( I J 2 )
4771(•■g7)
15 J1JS!«L
1 1 . W (»»4}
21J 2p3Tfl}
I t i O
12.1 • - f c i S L
3251( H i 5 )
1713(7i2)
4 i n(•■27)
4 .M
p ro Q } 7.ao
C34 50} 1 1 J 3
P 1 7 3 } - 4 .n
J L Z l.
V4t4(•■51)
•.S<gy»-.gL
T nP«.33}
• mP 2 « }
3S4f O J i }
4.12- J i ! L
6 d b « y c
Kiicaur
t e lif y
T O l A l
lO M(341)
•07:i II) 1 I U
( 3 ^ ) 311
(111)
30671( im io t
1311(2.50)
172(1.71)1611
(3.12)311
J t l l L
N Apl.12}
N AP1J5}
N Apl.41}
N AJL23L
W(3.71)140
3^74)ua6
(3.51)321
m
2ta( I J I )
213(1J1)
611p.M)
K
1473(2.I0)1112
.1.15)17M
P.36)405
(0.77)
M34(3.36)Ml
3.75)t i l l
(3.12)251
m .
351( 1 i 7 )
370(1.12)W
p .75 )121
(OSg)
1312(2.sa)1211
(2.27)1176
(3 .«l)3ai
J ? J jL
(lo o io )
1111P .5 7)C l
(2.4111211
(3 .B )217
22S(Oil)
387( 1 J 4 )134
P J I )111
jm .
1411(2.43)1133
(115)2B46
( 3 ii )415
JSJSLn u t
[100 00)S0M4
(lOO.OO)NAMA
mm<100 JO)
5 1 W (10 0 00)
SXIS(100X0)
V3INA
3 H 7 1(100X0)
am (10 0 00)
1 1 7NA
IT( lO iiO )
M 4 1(m.oo)
SI1B(100 JO)
144NA
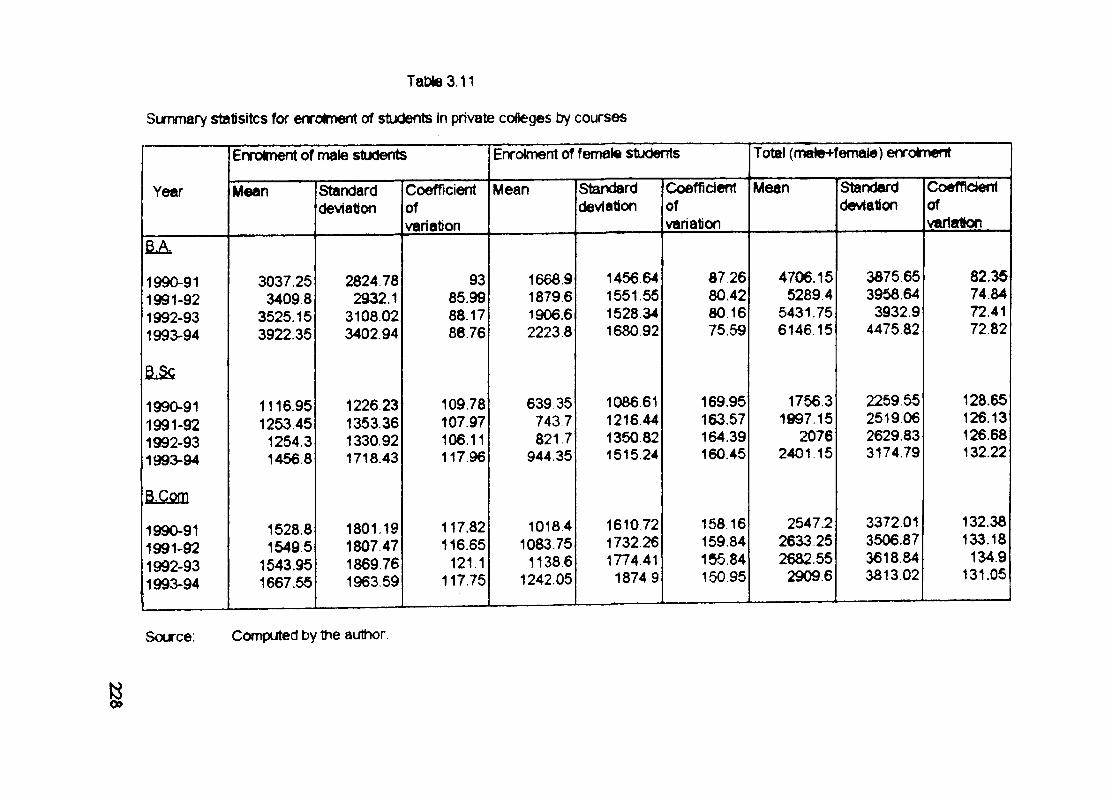
Table 3.11
Summary statisitcs for enrolment of students In private cofleges by courses
Enrolment of male students Enrolment of female students Total (male+female) enrolment
Year Mean Standarddeviation
Coefficientofvariation
Mean Standarddeviation
Coefficientofvariation
Mean Standarddeviation
Coefficientofvariation
£ A
1990-911991-921992-931993-94
3037.253409.8
3525.163922.35
2824782932.1
3108.02340294
9385.9988.1786.76
1668.91879.61906.6 2223.8
1456.641551.55 1528.34 1680 92
87.26 80.42 80 1675.59
4706.15 52894
5431.756146.15
3875.653958.643932.9
4475,82
82.3574.8472.4172.82
1990-911991-921992-931993-94
1116.95 1253.45
1254.3 1456 8
1226.231353.361330.921718.43
109.78107.97106.11117.96
639 35 7437 821 7
944.35
1086 61 1216,44 1350 82 1515,24
169.95163.57164.39160.45
1756.31997.15
20762401.15
2259 55 2519.06 2629.83 3174.79
128.65126.13126.68132.22
&Qssn
1990-911991-921992-931993-94
1528.81549.5
1543.951667.55
1801.191807,471869.761963.59
117.82116.65
121.1117.75
1018.41083.75
1138.61242.05
1610721732,261774.4118749
158.16159.84155.84150.95
2547.22633.252682.55
2909.6
3372.01 3506.87 3618.843813.02
132.38133.18134.9
131.05
Source: Computed by the author
o>
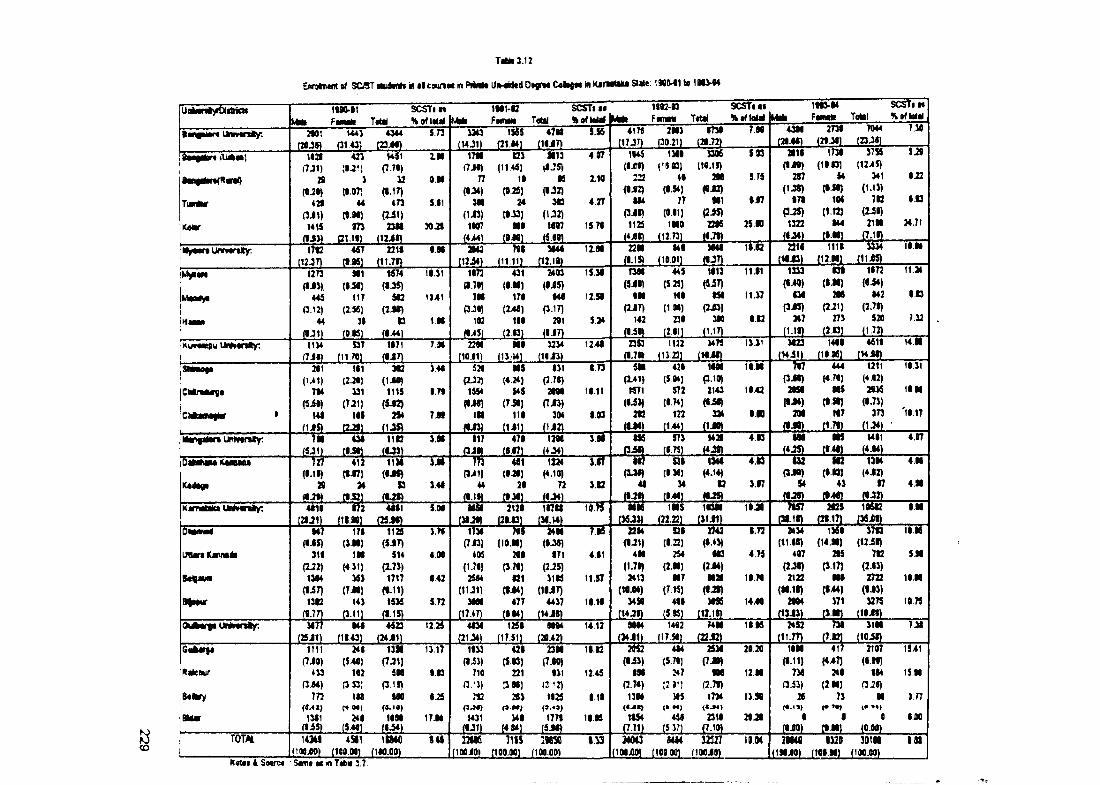
Ti m 3.12
EnntiMrt 9t StyST rtuiiM* m ilco iin M in P iM t U fr^ d O ig rM C oI^m in K jfw U te Sme: 1WM1 to 1H M 4
SCStiM
TM
UaiwniyiDiaict*F« T t M
SCSTin S of M il
IM I-CFniMlt Totll
SCSTiatHoftoUi
1StM3Ftntli Tftai
SCStiaiH ifM ai
-------TW
in3>MFwHti
2T3ITcMI
T044•w g ile n UHw<fi>y: m j 0 1 m
$73
■ g j a .3M3
(W.31)1S6S 47U
J M LT b 417«
(17JT)2M3 tm»
a»M) (2fJii
Ti»«Mr
K44V
i ( a(7J1)
28
421(3J1)U1S
J1«L
« 1
)
u(0.M)
mQ llt l
MSI(7.7I)U
(•.17)4T3
( 2 J 1 )2311
I M
1 8 *
5.11
30.21
17«(7 jm
77(IJ4)
3M( l i J )1W7
(4 i4 )
m(11.4«1
I IC0.25J
34tl-MJ
M l_a*L
M13VIJS)
m( • J 2 )
3«(1^ 2 )\«91
( ie » )
4.07
2.10
4.27
1S.7<
1145 1310 3306 SS3 2111 1731 37»(till) (’ ! « ) (11.11) ( IjM) (1 l« ) (1245)
222 41 2M 5 75 2f7 54 341(IJ2) (1.54) (IJ2) (1J«) (0.M) (1.13)
IM 77 Ml 1.17 I7t 104 7C(3JI) (0.11) (2J5) P-25) (112) t2 il)1125 1M0 2216 2sn 1322 M4 21M
(4JD (12.T31 _ m . . . (IM ] a m
SJS
1.22
i n
24.71
MyMn UnMrtJtyi 17C 467(tJSj
2211(11.71)
I M 2 M( I 2 i4 )
7«l(11.111
3«44
S im .1 I H 22M
JT15LMl
(lO.II)11.0 2211
jm .. (12H1 (11J8S)1I.M
1273 Ml(IJJ), (IJ Il
445 117P.12) (2.5fi)
44 31j m ____ \m .
1574(*-35)
m(u« )
13J!ilL
11.31
1041
1 M
1173 431 2403d.7D (IM ) (IJ5)
7M 171 M lPJI) (241) (3.17)
102 111 291(I4$| {2«1 |I.I7)
1530
l i s a
534
IM(JjID
IM(2>IT)
142(l^l>
445(5.25)
H I(IM )
231(2.11)
1113(3i7)
IM(2J3)
3MiU T L
11.f1 1333 O l 1172 11.24(140) (IM ) {*M)
11.37 134 2M U2 IC3PJ5) (2.21) (2.71)
I C 347 273 520 1.32(1-H) (2.«) 11.72)
Ku«MRpu Un^tnty. 1134 537
CMIndwss
ChtaMiiH'
Urt»tr»*y:
211 111(U l) (2JI)
714 331(« • ) (Til)
141 USJIB__S3L
1171J!4ZL
7.M
i Mj« J ! i
431j m .
3ft2(1J0)
1 1 1 S(112)
2S4iL25L
34«
1.71
7JI
22Mi « i ! L
t i ej m .
3.M
S2I(U2)1»4
(IJ«)1H
J&&L
M l
117(3il>
MS(4.24)
S4S(T«)
111
i J i l L
3234 12.41
471JifiL
441(l-M)
21j m .
131(2.71)2IM
(7J»)304
J l i l L
~ T f i
11.11
1.03
23S3JlZfi.
12MJOiL
T f f
T i f
5M(2>1)«71
( l i l )212
(M4)
1122
<13 a i
IS6
421($«)
572(1.74)
122ililL
3475i i l H L
13.J1
573j m .
II(3.1(1)2143
334( IjW)
1I.M
11.43
i.n
1421
(4.H)12
413
T S
3«23
(3jM)2«M
(IJ4)201
j y S L
1441M B .
4611(M it)
IM
(3JS)S4
(4 71) MS
(t.M)NT
J L 2 LMS
1211(4J2)2134
(1,73)373
-1L21L1411
J tS lLm 13I4
(IBJ (♦.12)43 17
J P LI M G
(3 l.1 t) (2 1171 I3gj)t)
14M
11.31
II.M
'11.17
497
Ol
lUiigM
127 412(1.11) (IJ7)
29 349 ^ ^ 9S li
1131(IJS)
S3
j y i L
T M
3.41
i r(341)
44
j s a .
i »(4.11)
72J«1L
3.S2(13I)41(I-2D
S3I(136)
34J!4!L
3.17
4.M
4M
KtfmMaUnMnfty. 4111 ml a j U - J L l W
4111JM JfL
S.M MMJBM2L
1 31(7J3)
4K(1.71)2S«
(11J1)MM
(17.47)
2121J m .
m uJ 2 t ilL
T 5 U ' MM IMS 1UM(36J3) (22.22)
22M S2I(1-21) (122) (1.43)
4M 254 M3(1.71) (2.M) (2J4)2413 M7 M2I
(10J4) (715)34H 411 3M5
(14 JD (5.M) (12.11)
1IJI
T n
I.M
'S5E555Jtlan KwuwM
147(IJS)
311(2J2)1394
(liT )1312
J U
171(3.M)
IM(4,31)
3«3(TJI)
143(3.11)
112S(SiT)
514(2.73)1717(1.11)M36
(I.1S)
T N
4.M
142
5.72
i i r(13.M)
211(3.71)
121(»••*)
477(IM )
24M(IJ»)
171 (2J5) 3115
(IliT ) 4437
(14 JD
- n r
4.11
11.57
1 1 .1 1
4.75
ll.7«
I44€
3434 1361 37t3 II.M(11.W) (14.M) (12il)
407 2IS m 5.M(2J«) (317) (2.13)2122 MO 2722 II.M
(M.1I) (144) (1.03)2IM 371 3275 11.75
(13J3) ( l l i l )24S2 h i 31M 7.31OUbwsB univwily; 4523 4131
(21^)1251 1412
(M.42)MI4
J2U1L1412
(17.51)74M
(22 J2)1I.H
(11.77) (712) (lOJt)41>6ufe«ta
KatcBur
B«lvy
m m
1111 241 13M(7 JO) (540) (7J1)
433 112 5MPJ4) f3S3) a i l )
772 IM IM(4.42) («-'•)1311 241 IIM
rtJ5) (541) (1-5*)14M 4SI1 \ t m
IHJO) (100 M) (IM.CO)
1317
i n
125
17.M
1133 421 23M 11.12 2M2 444 2534(Ii3) (5B) (7.10) (ti3) (5.71) (7 JO)
711 221 131 12.44 IM 247 mQ.'J) aM ) (3.'2) (2.74) :2 9') (2.7»)
?C 263 1125 111 13M MS 1704fjj* ) (*»*) (»•♦») 1* M,M31 341 1771 11.05 1IS4 456 2311
fIJI) {414) |5J«) (7.71) (5 37) {7.10)
20.2(1
12.M
13.M
21 J«
IIM(1.11)
731(3i3|
21
Ij m .
(447)241
(2M)73
IJTML
2107 1541( l i t )
U 4 t5 .M(3 J6 )
M • 7 7<•
0 1.00(0.00)
TOTJ SM » 8 6 Il ls(100.M)
133 31013(IM iW
8 4M
(100 M)32327
(lOCJDII.M 7MU
(IMilO)lUO
(H IM )301M
(1 M .0 0 )
i n
N«tii 4 So«n:« Smi* m lO Tifew 3.7.
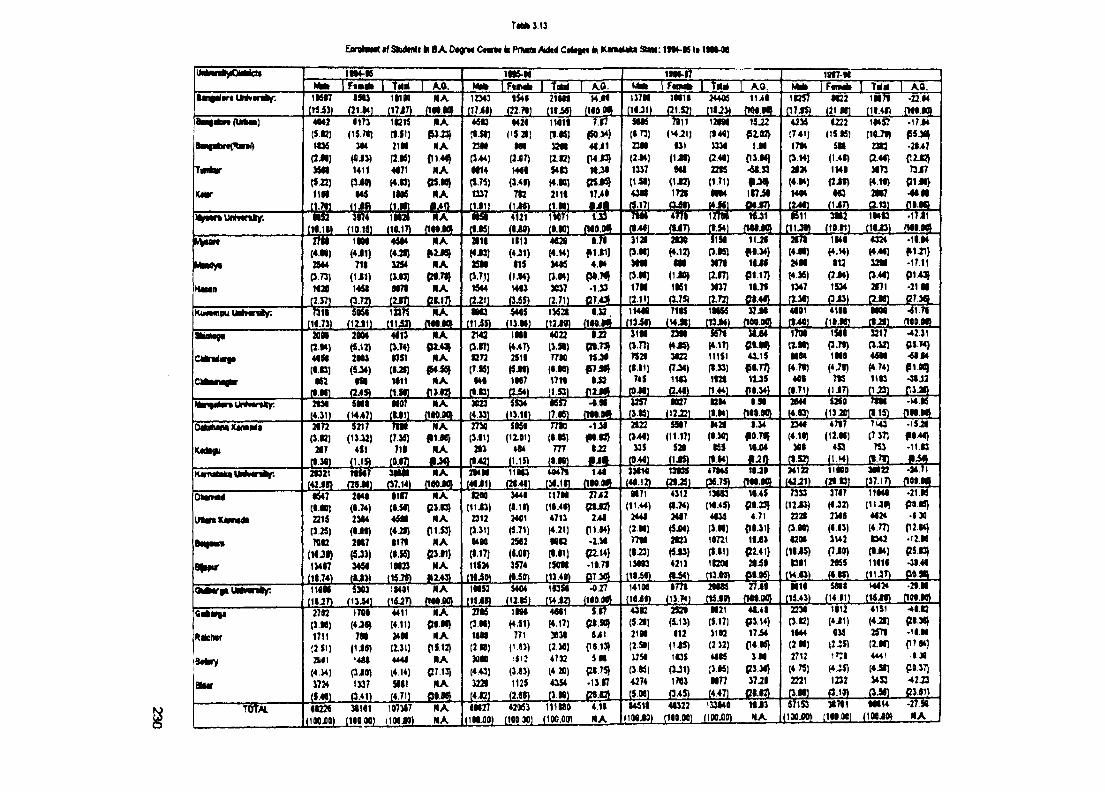
TaMi ).13
EarstaMt »f ShtfMi k BA OtgrM C om k PriMti M t i Ci/ktn ki HaMMfet a m ; IIM -K I* im -M
IWwwiylD^aictt 1M*>KTisriTMsrTiihr M .
im-17IS * I F«omIi I T M M . M i FtiMii I Tam A .O .•aigaJar* iHvaniy; 1»Sf7
a m .IS I3
a i » iHIM
(17i7)NA
{tw .w1ZM3
(32. Wl31IM
(It iOMjN
(W MT f T
ISO >4} 4ljl1
{MJ3J
C5JS}17>»l
U7M(H.31)
l i f i i(31 .Cl
H40Sj m
1 U Im s L
1057C17JS)
M22 i M i r •22MJW tfiL
t a | i l g r « ( l M M )
t a i i v
K m
4M2(sejm i(2M)M«f(f2Dim
JL
1173(15.71)
3M
1411(3i«»•45
(1JW(1111) (10.151
11215(I.SI)7 1 M(2.«)4471H.OJtl06
(1.W1
» A
MAri4 « j
NA
NA-1 > 1 L
46t)
23M(344)M 1 4
t*-75)037ti.y i
4426('5 2*1
M (2-07) W«l
{3.41) 7S2
.J U S .
I M il (•■KJ 3M 12.K) 54t3
2111j t i a
seas(•.T3)23M(2.»*)1337(ist)439$
« ■ft>«l
n u(V*J1)
131(1JI)
H i
0J2)1?2I
A W
12«M(*4fl)034(2.4«)22tS(1.71)
W(M7)
15J2{52.98}
1JIP3.I4}■6t.S3
f J Hi i7 i i04.f7t
4235CT41JITWp.MJ2f»;4,I4)
•5TTi m
1222(t5»5)
59$(1 .41)m i(2ii)K3
( u n
1M S 7C1C-71)23C(2.4*)3173ti.W)2M7
•17J*{55J^•2147C 2 ^7317
QIM}•M Uffl.W
H|fMr«VMNniy. 1H2IM U l
NA T B TJUSL
4121j m .
i w r(l-IOl
1] (l.>41 S1SI(5.K)3171
(2.17)
3<37
j m .
JSSIBLm l •17J1
H«aii
m(4 .N )
2544
P .7 3 )
1C20
IHM(4J1)711(1J1)
1451
C2.37) (3 .72)
4 5 K
(4JI)USi(i.n)M7I
j m .
NA»2J5}
NA
NAM U L
2111{4 J 3 )
25M
(i-7 1 )
1544
j m .
1113(4J1)t15
(1^ )14«3
(3.55)
4<28I4.M)3495
3037j m .
T f ff u i )
4.14
•1.33C 7 .4 3 I
3121
(3.«)3m(3-W)17Mt2.11)
2 0 9
(4.12)
H I(liO)1151
JL75L
11JIl U f
P 1 1 7 }
11.71.f iM fL
2171(4.99)»9$
(4.35)
1347(130
1141
(4 .H )112(2 J 4 )
1S34
Oi3)
4324(♦4033M0.49}2T1
J2J5L
•1IJ4#1-21} •17.11 P143J •21 M
J U S -KMMipU tjKtttn i f. n i l
i 2 im5M«
J i m .1Z375
.LVA2LNA i m
tlliS )54«5
(13.M 1
13521
J12J«L1.32
m M . a m .71IS
(14JI11M55
5571t4.17)11151(tJ3)H2if1441
37 J l(100.W
4181J3M.
4111i l t fS L 4 ^3217
{3.3:)40$(4 74)
i i n(1.23)
-5 1 T I
(W9.W)
CMriiavsa
20N(2M)49S9(1.13]•S3
2M4(S.12)2M3(5.34)l »
J !J L ___ 2 > a
4113
(3.74)•7S1
(Ml)1411
t1.SD
NAQ2.«i
NAtS4.55
NA_C iE L
2142(3.17)SIT3(1.55)Ml
J iS L
t n i(4.47)2511(«« )1N7
.&5SL
4C22
(3.51)n wli.ie)1711
JLS L
1.22 C*.7^ 15 J l
PTM^ 9S3
C 2 M .
31M0.77)7sa
( M l )745
j m .
099(4JSt3922(7J4)11S3
3 1 ^CI.WJ43.15
<51.77}1L35
M ? a
wa « )MS*(4.71)4«l
J !D I
1511
p . 7 1 ) IMS
(471)7*5
i i i n55# f m
(13-2D) CI.15)
42.31 PS74) •51J4 fllM } •3IJ2
M S -U i * i w s * y ; 2I3I
t4.y)5MI
i mw
(7.34)711
J IC L
NA(HO.W
3C23
J im .5534
i l i lS LKS7
J1«L•I.M 3257
(3.15)
tt27J i m .
CI4J1!!L
i.»(W.IXD
2M4(4P)
•14.15
(1M.WOMiaMKMMt w r
(3.C)217
5217(13.32)
451j t is i___m
NA{I1.N}
NA
273C(3.11)213
( t^ )
5»SI(12.01)494
(1.15)
7710(I.K)777
(I.W)
•131#012}1.22
_ £ !5 -
2122(3 4 4 )
335j m .
5SI7(11.17)
521q js t
1421( l .3 « )
955(1.14)
1.34i0.7911X4
J i l L
2344(411)
301(9-S2J
4717(12.M)4S3
(1.H)
7w43 (7 3?)
753J13L
•15JI§ 9 4 9 }
•11.13J U fL
Ktm
DktiHH
inurtK am *
8|i#ur
21321i « i ! L
•547(••«)2215(3.25)7012
(1l-3t)13417
(11.74)
n il?f i iS L2»4I(1.74)23«4( l i l )2 I7
(5 J 3 )
34M(U3)
(37.14)im(1.504501(4.21)1171(l.«)1M23
(15.71)
NA
NAC 3 .I3 )
NAC1.53}
NA{23.11}
NAB JSL
29*9$m mD90( 1 1 i3 )2312(3.31)I4M(1.17)11534(IliO)
11113J2!4!L
3441( M l )
24«1(5-71)2542(<.0I)3574(l-SO)
4Mn(S4.1t)
141nio.on
33IM(44.12)
I17M(11.41)4713(4.21)N C(I.H)iSOtl
t13.4i)
2742 CtJ2}
241 pi 94} •2.34
{22.14) •10.71 P7 3<ft
•171(11.44)2444(2.11)7711(IJ3)134«3
(1I-5D
130S. f i ! : * !
47145(35.75)
4312d.K)3447(5X4)2t23(5J3)4213
j m .
139S3(14.45)4«35(3.»l)11721(1.11)11201(13.10)
1IJ»J M J S i
11.45f.23 }
4.71ri.3 i)1|J|3C2.41}29^9
P«»^
3 4 1 S
i « i ! LH M D(210
7333
(1 2 4 3 )
2229(3.M)COD
( 1 IJ 5 )
n il( H J 3 )
3717 ($^2) 2348 (1.13) 3142 (7 JO) 2«S5 ( I I I )
3M22J2L12L
•34 (10I.I0)
11144(1UI)4424(4.77)•342( IJ 4 1m il
(1U7>
•21 »S P«>5) • IX
r2.«4)• a nP5.B}•3144
_ e i» LQutarfiUMiMniy: H I M
11122L1503(13.54)
IMOt(15J7)
NA(f .OO)
10«52
s m .5404
(12.B)1C54
(1 4 J 2 )
-0 1 7 14101( i m
itTl(13.74)
2IISS(15.10)
27 J l ft4l.0fl}
M i l 5 « l(14.11)
m24(15JD
4151
•2IM(10>.>ft4I.I26i*«sa
Rrictar
8Mvy
"rffR T
2702 (3.H) 1711 !2 51) 2S«t (4.J4) 3724 (S.4Q6(226
(100X0)
I7«l(4J5)?••
(1JD1441
piO)1337
J i i l L34161
(110.01)
4411(4.11)34M(131)
4Ul14.14)Mil
Jim.107317
(lOflJO)
NAP4«}
NApS.12}
NA(27.13)
NAj s m .
NANA
'S k(3M) IM (2 n) » «(4.43)3221
J iS L6M 27
IlMJO)
im(4.51)
771(1.«)H>2
(3.ai)1125(2.W)42M3
[110.001
4M1(4.17)»3«(2)4)47J214.20)4354
Jimm no
(100.00)
T i TP.5t»
141p n3)
saiPI.75J•13.17
. e t f iL411NA
4312(5 21)2m(2.SI)M5«P«14274
J iM .14511
(101X0)
2S2I
(4-13)112
(1i5)tC5
PJI)1703
j i i a .44322(110.001
M21(5.17)3113
(2.32)
4415:j *5)M n(4.47)133140
(100X0)
41.41P3.14} 17X4
C49S} 39$
93.34} 37 J l
j m .11X3NA
2234P*2)1644(2M) 2712 (4 73) 2221
J2J5L57153
(100X0)
1112(4J1)135
{:zs)it; i
(4J5)1232
J2J2L34711
(110.08)
(4JI)2571
(2.H)4441(4JI)J4S5
J U S im u
(100X0)
PI34}•ll.M{17*4}• X P#37} 42J3
_ei5]L-27.54
N A
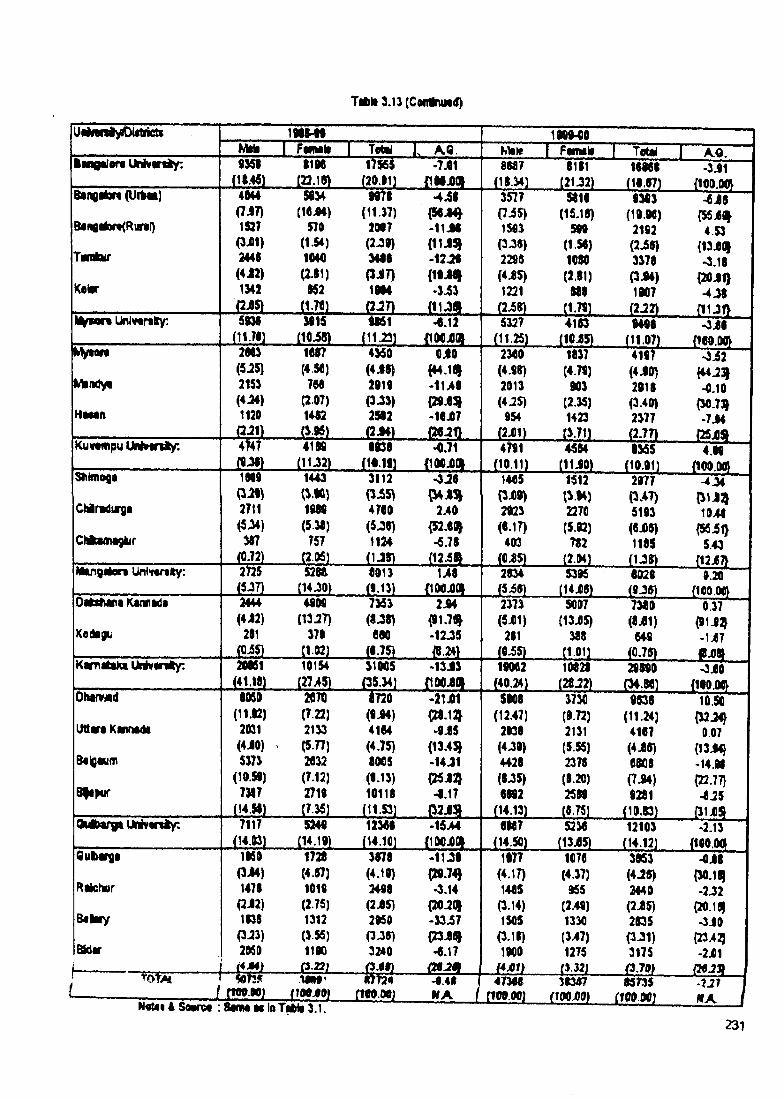
T tf) li3 .U (C o fiftu N d )
M ill i Fm w lt I Tetti K " T q !1MMI0
K)i>e I I Tqtai I KQ.ImOiiori UMvmly: 9361
il!i5LI1M
JSJ5L17KS
(20.11)•7JQ1
s u m .8S87 S i l l
(18.M) (21J2)16 i6 t
m m .-3J1
BtRQArt (UM)
dtnoitor«<Rural)
TinAoyr
Kt\m-
4M 4 M 7 I 4 J S I( 7 i7 ) (11.37) { M J ^1527 57» 2 0 f7 - t lJ M
(3j01) (1.54) (2 J 0 ) { 1 1 J ^
244$ 1040 3418 .12JW(4 J 2 ) (2.81) (3 JIT) {191342 M 2 1994 >3^3
j y s _______ (t.79 ) (211) ( i u e »
3577 »1 6 9M3 -6 J F(7 i5 ) (15.15) (19.M) {5 5 jg |1M3 599 2192 4.S3
(3J5) (1.56) (2^5) {13j8(|2296 1080 3378 -3.18{iJiS) (2.81) P J 4 ) (2flJ1>1221 88$ 1H7 -4J8
(2^8) (1.79) (2 ^2 t H U I }l% « n Univvrtfty: 5913$
i i m3915 9M1
(1Qi8) (11.23)•0.12
m m5327
i i m4183
(10JS)9498
i i m
•OJS(100.00)
i y m t
M indyv
H M n
2883(5J5)2153( 4 ^ )1120
j m .
1087(4.50)
798(2.07)1482
i i M L
4360(4J8)2919(3.33)2S92
OJO(44.181-1 U 9(?9.0^-10J07
. £ « ! L
2300(4.98)2013(4J5)
954
j m .
1037(4.79)
903(2.35)1423
j m .
4197 (4 JO) 2918
(3-40)2377(2.77)
-3 i2
•0.10{30.7^-7J4
m s LKuvtifipu U M v in iy : 4747
j m .41 n 9938
m m .«0.71
(lOOjQd4791 4584 9355
(10.11) (11J90) (10.91)4.
(100.00)SItifnoga
C M ndyrg t
Chiam«9lur
1819 1443 3 i l2 -3J$(3J») ^i.90) (3j55)2711 19M 4700 2>I0( 5 ^ ) (5.30) (5J5) {52.001
387 757 1124 ^ .78(0.72) C2.0S) (1J8> (12.58^
1405(3X9)2923
(0.17)403
(0.05)
1512
\ y ^ )2270
(5.92)702
j m .
2977
5193(5J08)1105
j m
- 4 ^
1041{55 it>
543
MtnQi*or« Unl*f«r«ty; 2725
s m .528ft 0013 U 8
|100j0(»2834(5.58)
5395(1 4 j08)
0029
j m .9.20
{100.00OUBDana runnidi
Kcdiiiu
2444(4 i2 )
281(OiS)
4909m r )
379
J L « L
7363( « 8 )
oao
JS2SL
2J94{91.7^-12J5
2373(5X1)
281
j m .
5007(13j(I5)
308
7300(0X1)
049(1.01) (0.78)
037
-1j67
J L £ 1 .K an n tak tU riv in ty : 28981
J4U 01.10154
s m .31005
0720(9J4)4104(4.75)0005
(8-13)10118
i l L S L
•13J3(lOOXg
19082 10820(40.2») (20.22)
29890
£ t 2 L
-3X0{190.00
Oliamid
iravaKimidi
0050(11.82)
2031(4X0)5373
(10.59)7307
i m
2070(7.22)2133(5.H)2032(7.12)2719
j m .
-21X1{?0.12J^ X 5
{13.4^-14J1{K x a j4.17
. £ 2 ^ .
5908(12.47)
2938(4-30)4428(8J5)0892
m m .
3730(9.72)2131(5.55)2378(8.20)2589
s m .
9538(11.24)
4107(4X5)0808
o m9201
(10.D)
10.50
007{13J^-14.91{22.77}■0J5
{31XS^OiAMTga IMviniy: 7117 5249
(14.03) (14.19)12308
m m .- 1 5 ^
m m0807
i l i a5230
(13X5)12103
j m m .-2.13
{lOOOOfQulb«<gt
Rlicrwr
L’ •0T «
N «tti A Sovrot
1M0(3 i4 )1478(2X2)1838
(3 i3 )2050
J i mW i t
1720(4.87)1019(2.75)1312(V55)1190
J g -g j-
3878(4.19)2498(2X5)2K0
P.38)3 » 0
-1 U 9
{ » .7 ^•3.14
{20-201-33X7{ P X ^•0.17
M iS L
1977(♦.17)1405
P.14)1505
(3.18)1900
1070(4.37)
» 5(2.49)1330
(347)1275
•9.48M A
i * j n ......47308
I cm.ooj38357
(TWXO)
3563(4JI8)2440(2X5)2535
(3-31)3175
.fi:Z3!L55735
flOO.OOl
-0X8{M.1B}-2J2
{20.181-3X0
{234?-2X1
-2J?I f A
231
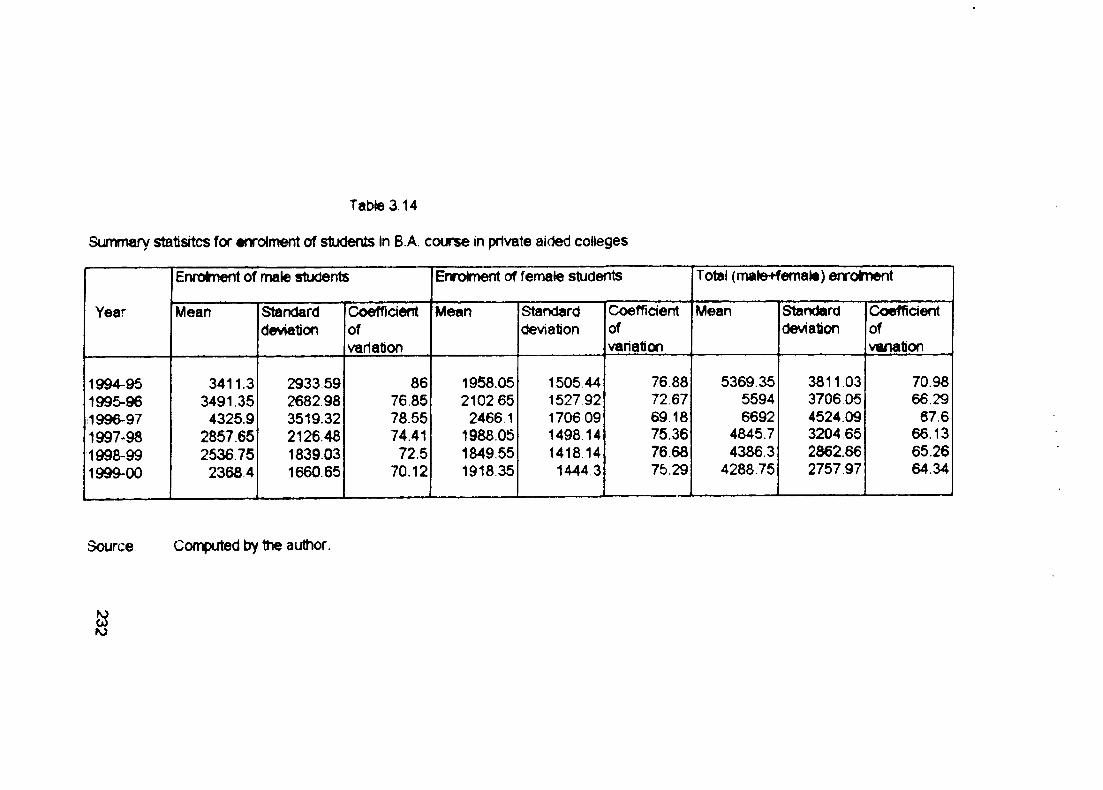
Table 3.14
Summary statisitcs for •nrolment of students In B.A. course in private aided colleges
Year
Enrolment of male students Enrolment of female students Total (male+femate) enrolment
Mean Standarddeviation
Coefficientofvariation
Mean Standarddeviation
Coefficientofvariation
Mean Standarddeviation
Coefficientofvariation
1994-951995-96 .1996-971997-981998-991999-00
3411.33491.354325.9
2857.652536.75
23684
2933 59 2682 98 3519.32 2126 48 1839.03 1660.65
8676.8578.5574.41
72.570.12
1958.05 2102 65
2466 11988.06 1849.55 1918.35
1505 44 1527 92 1706 091498.141418.14 1444,3
76.8872.67 69 18 75.3676.68 75.29
5369.3555946692
4845.74386.3
4288.75
3811.03 3706 05 4524.09 3204 65 2862.66 2757.97
70.9866,29
67.666.1365.2664.34
Source Computed by the author.
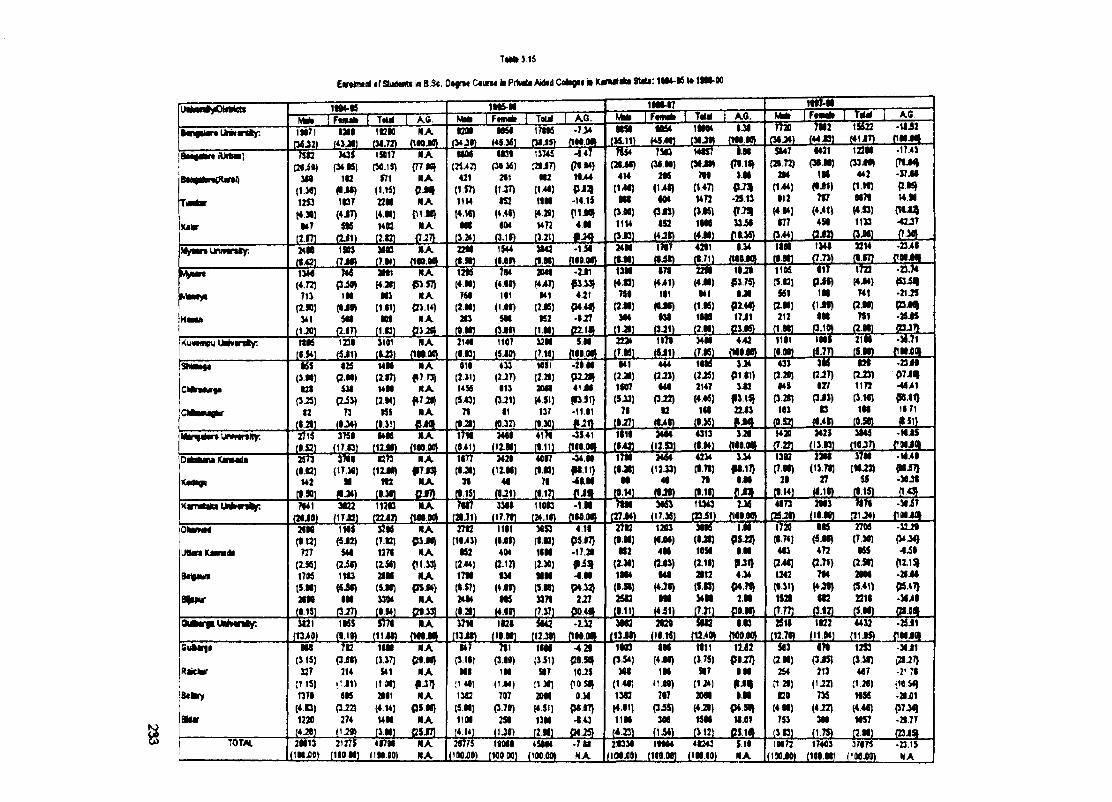
T«Ml) 15
IM oniyCM eti
Iw f ilo r t U>w»n*y.
8w ^ *n (U b e)
augAraUUnO
TiOTtar
K«IV
Evokm iri «r 9u d ««t* in B.Sc. 0 »«rM C « in 4 ki PiIm U M »i C ^ t k im -K to l l » 9 0
FMHiii I TMH A.C.1M71
[MJ2)W
C2flia»SM
(1J€11253f4.»)M7
f2J7l
! » •(O-MiWP*K )
1C<tiC)1t37
(4J7)SK
QJ1)
tCHW.72)1SB17
$71(l.M)22H
UOQJISL
NA( t e a j w
NA{77
NA
NAr i« ^
NAJL22L
1MS>MFtifiite I Tam I AQ.
I21M
MM(K>*2)
431{1.57)im(♦.M)
MS0.2*1
MSI
<t»
»1(1JT)n i
•Mq i» )
17MS
D74ScaiT)
M2|1«)tIM(♦H)M72
J V 2 1 1 .
• 7 >JMiOfi.
^ i f{»»♦)1fl>4
•U H
4M
_E2L
1IM-I7M ^i I I T im A O .M SI
U i l l LII
7HT
414(141)
H I
11140-Pl
1*54C3IJt»
0 1 M)3t6
(U l)M i
<3J»)tS2
j i i a
Vll$7(MJSt
7M(147)147J(J.K)1«MItSL
%2t
I.M(iiiiy
).M
-2S.13
J11«L
i m whM t I F « M kn a )m 2
fM J4) (4 4 mSS47
(21.72)2*4
(1>44)•12177
0441
1421(3I.H)
1!M(IJ1)717
(4.41)4SI
J 2 i } L
l i f e "t*tJ7>122M
03jM»442
( imM7«(♦m1133
j y S LU14
- 2 ^ir a
A.6•UJ2
f1M.Mtt i r i r{7«jH•37 J l RI5J 14.M
{«U4-4137
•2341MyBtn Uniwsty; 2iMS ! £ L a j t
3I«3JTJIL
NA(1M.M^
22M(t.Ml
1S44(IXD
3M2JtM L
-1.51 24M(t-Ml
1117j y n
171<441)111(IJ i)131
4211(t.7ll
1.34(1M.W
liH(i.« l
1341ff.73>
^ a i rt o i t•21JS
•2SJS
•36.71a m .
Hana
1344(4.72J713
(2.«J3*1
SIM.
us(3j59
IM(IJI>5«
j m .
3M1HJI)M3
(111)Ml
J L B .
NA|53.$7)
NACVU)
NAJ2L5L
12M(4.M)751
(2.M)213
J!L!!L
Ti*(4.W)111(U l)5M
(3.ID
3M(447)141
(J.»5)K2
(1.M)
-2J14.21
P4.4IJ•117
_ E J |L
13M(4.0)791
(1.M)344
(1-211
22M(4JI)Ml
(IK)I IK(2.M1
1 I J I
PJ75)I M
P 2 .4 I)
17J1
JIUSL
i m(SO)
9 6 1
(in)212(I.M)
117
PiS)IN
( l i l )IM
Jil2L
(4J4)741
(2.M1711
q.M)Kuvtflopu IMvanty: tits 1231 3101
J ! £ LNA
(IM.M)2141(l.« l
1107
( 5 J I )
32MiL!2L
SMJ a m .
223*J i m .
imjS i lL
34MMS)
442m m
1111j m .
IMS(1 7 7 )3 ir
(2J7)127
P J 3 )
13J t i a .
21M(S.M)
SMM«a T s r(3 .M )
U l(3 J 5 )
12(1.211
I2jP.M)
U l(2J3)
73(IJ*)
MM(2.17)
14M(2.M)1 S S
J ! i iL
NAf 7 ? 3 }
NA
NA
111(2.31)I4S6
(S.43)71
j m .
433(2JT)113
(3-21)II
j m .
list(221)3 U t
K.51)137
m
•2IM
41jMf iS I )-11.11
j y i L
Ml(2-M)1S97
(5J2)71
(117)
(2 .23)
M lPJJ)
12
II(2J5)2147(♦.«)IM
0 .3 6 )
3 J 4
p i l l )3 J 2
fJU J2 2 J 3
- U l .
433 (2.20) •41
(3 2«) 113
J 2 5 L
w(2J3)1172
( 3 1 « i1 1 1
J i S Lm s
•23MP 7 J f•4941f f s i n1171
•M-ISTMJOI
UMifiimjniMrsity; r n r 3751 MM NA 17H 24«l 4171 •3S.41 1111 3M4 4313 IJ i 142Q 2429
OiMImm Kmala 25T3 3711 1273 NA 1IT7 3421 4017 •34.M 17M 2464 4234 3.34 13K 2 » l 37M •11.41( I f i ) (17.31) (12M) #7.KJ (IJI) (12.M) (l.«) #1.11) (•JU (12.33) (I.W) #1.17} (7.M) (13.71) (H.22) (Mi7>
K$mgu U2 M m NA 31 M 71 41M M M ?• •M 21 27 59 •30 J l(•.«) ♦IJ4) (I.3D o s n (•IS) (1.21) (1.17) ( I J t (1J« (•.11) {»i3» (•14) (1.11) m . ._ D i2
K»THiakalM»«n%; 7141 3122 11213 NA >117 3311 11013 •1.M Hm 3K3 11343 136 4173 2M3 7171 -Jli7(2IJ0) f17«l (2242) flMM ) (21.71) (17.71) (34.1D (110.01) (17.35) (23-51) m m (25 J l) (IIM ] , ,2 'J4 j (IMJOI
CSliamMi 2IM 11IS 37K NA 2712 1111 3IS3 411 2712 1203 3tK t.M 1720 IK 27U •312*(1.12) (5-12) (7.K) P3M) (W43) (M l) (l.«) pSfT} (•.H) ( IjM) (1-21) PS.22} (•.74) (5Jf) (7.30) (34 J4)
J ttn K jm M 727 S4I 1271 NA K2 404 1IM -17.» K2 4M 1091 • M 413 472 K$ 4 i l(2.«) (2JD (2.51) pl.33) (244) (2-12) (130) (2.31) (2JH) (2.11) jijn (241) (2-71) (2.M) {111JJ
BtigaMi 17M 1113 2IH NA 17M 131 MM •I.H 1M4 t a 2t12 4J4 1142 714 2IM •21 jM(5.M) (SJI) (S.M) PS.14} (l.$7) (♦19) ($.M) P 4 ^ (»M) (4.71) (1.0) P4.71) (111) <4Jt) (5.41)MM IM 33M NA 3414 •K 3371 2J7 2SI2 IM 34M 2.M 1521 i n 2211 •3141(I.ISI (3J7) (I.M) C l» } (I.2IJ (4.M) (7.37) PO.4# ( • l l j (4i1) ( p i Pl.M) (T;^3 PJ2) (5.M)
ft— fytUnmnty: 3121 IKS 5)71 NA 37M 1121 SM2 •2.12 3M2 2t2^ iu2 1.83 2 11 1C2 4432 •25J1(1349) (».1D (IIM ) m m (1».«) (12JD (IH.M) («-••) (H.M) (12.401 (100.00) (1271) (IIM ) _(11.l^ rM jfli
Suteii M 712 1IM NA 147 ?I1 IIM 421 1083 IM t i l l 1112 SI3 171 12S3 ■3li1(5 IS) P.l»» (3.37) P IM ) (311) (3.W) (151) f»m PJ4) (4-M) (J.TS) P IIT ) (2.M) (3J$1 (1.3H Ca-2T>
RacJur 327 214 $41 NA Ml IM $17 10J5 3«l IM 117 I.M 2S4 213 417 -2’ 711 (1 IS) f J I ) (IM ) fiJT} :i4i) (144) :i3«i CO SI) (141) nxo) ( 1 » ri2i) (1J2) (121) iKS4)Balinr 1371 IK 2111 NA 13G 707 20M o n 13<2 707 20M I.M CO 735 1195 •2ii)1
(4.13) (3J2) (4.14) P$«J (5.M) (3.71) 14.51) P»I7i (4.11) P-55) (4JI) P4M) (4.M) (4-22) (4.41) P7.34J1220 274 14M NA I1H 2M 13M 443 11M 3M ISM lli l l 753 3M 14S7 -21.77(4JI) (3.M) C5J71 [4.I4J ..J2.M] 04,25} (4.0) (1i4) (V121 c s m (3.0) (1.7^ C2.M) {23J5J
TOm 2M13 2127$ 4I7M NA 21775 1I0II 4SM4 •7U 2«3 I IMM 41343 $11 IM72 17403 37173 -23.1$(1MX0) [110 Ml (iM.eo) NA (100X0) (100.00) (100.00) NA ( IM jOO) (100.001 (1H.00) NA (100 JO) (100.M1 (IOOjOO) NA
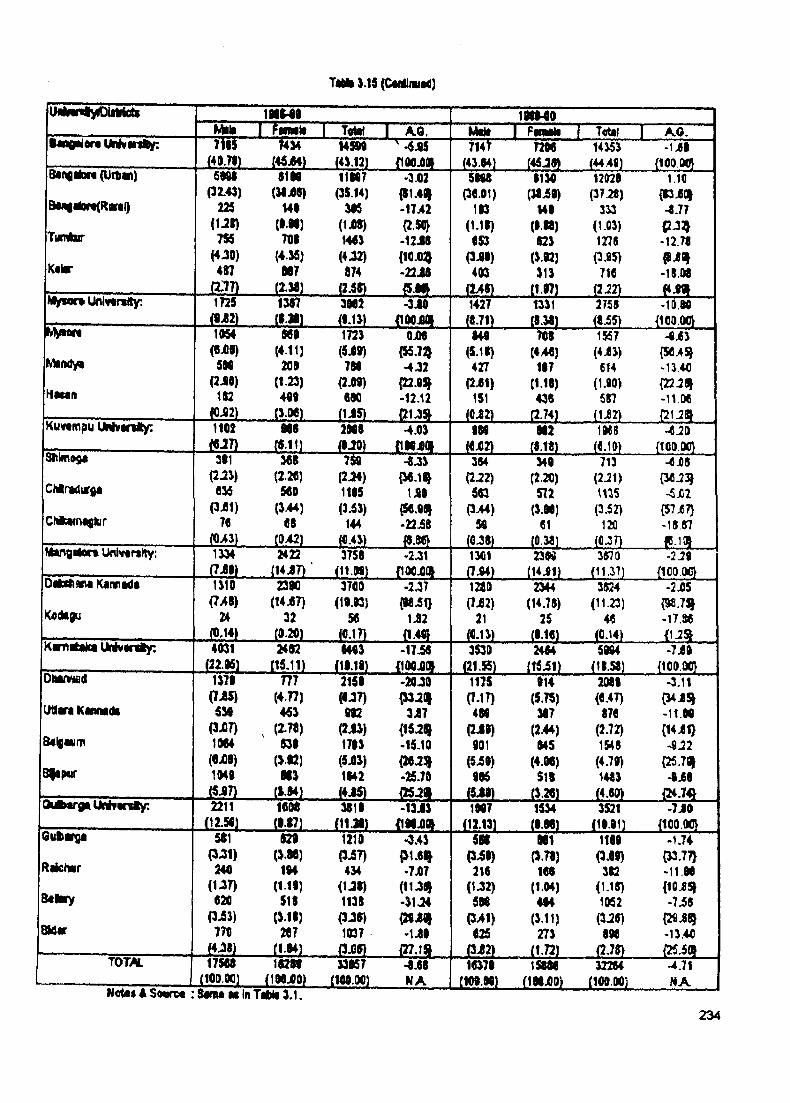
TaMiyid(CMlinui4)
M iH" I WM S I
i M M i I iiwti T«tK
IH M OFotmIi Tow i
t«o*lorf Univinfey: l i 5 r
J ! 5 M .
USBO(4V121
• JQS{lOCjOd
l u T 72 « UJ5J -1j8 I(43.<4) (4SJ»> (44 /it) (lOQ.W^
BanflMxf (liitw)
9tH|*rt(RBrai)
Tumliir
Kftar
S M I(32.43)
225
(U J )755
(4J0)487
-2 2 IL
S IM(M jW)
U l(I.M )
701(4.56)
M 7
J t H L
11H7P IM )
(1jO»)H«5
(♦-32)874
(2.5»
-3.02 {81.48^ -17j42 {2.50} - t2 J 8 {10.0:^ •22 J8
J5JBL
5M8(36.01)
113
(1.1»)«S3
(3J«)403
I I M( M i l )
Ul( • « )123
(3.82J313
12121(3 7 ^ )
333(1.03)1275
(3 i5 )71«
(141) (t.l7 ) (2.22)
l i e{C iO J■4.77C127^-12.719 J S |-1 I.U
Myfor» Univtrsity: 1725
j m .1317
jB L a i
3M2
j m .-3jI0
(lOOJlfll1427
(1.71)1331
J t H I
2758
j y a .M yton
H ttan
1054(QjQI)
5M(2JW)
182
J S M .
M l(4.11)201
(1.23)401
iL S S L
1723
(5.^9)7M
(2jW)6N
JUS.
OjDI
•4J2
(22.1^-12.12
J 2 U i
141(5.11)427
(2^1)151
708(4/M)
117(1.18)438
(CJ2) t2.74)
1557(4 i3 )
614(1.90)
587
(1J2)
.4j63
-U.4C{22J20J-n .oe(2i:2B>
Kuvtmpu U M v ir ity : 1102j m .
M l
J t l l l
2M8( l iO )
-4.03
iL M J g .
IMJ 0 2 L
M2J M 2 L
1MB« .1 I)
-«J20{100.00}Stiiin»9«
Chlradurga
CMkwntgiur
311(2.23)
63^(3j81)
76
368(2.2C)
561(344)68
(042)
7M( 2 ^ )1115(3.53)
144(6.43)
-6.33{36.18^
tJ i l{56.MJ•22M
JL»L
314(2.22)
5C3P 44)
SO
341(2.20)
572(3.M)61
(0.38) (Q.36)
713(2J1)U3S
(3 i2 )12fl
(0.37)
-6j08
-5X2{57i7>-18,57
JLL3LMangcAort Unhr«rtlty: 1334
( 7 i l )2422
s u m .3758
i i m-2J1
m m1301
O M )23$d
( U J l)3870
(1t.37)-2_29
{100.00}1310
(748)24
23MiUAT)
32(0.14) (0.20)
3700(11.13)
56J o ^ iZ L
-2.37{ M i l }
1J2
i l i s .
1260(7 i2 )
21
2344(U.78)
25
3824(11.23)
46(0.13) (1.16) (0.14)
-2X5{98.7^-17.M
J L ^K«niteka IMviniy: 4131
£ m .2482
J i L U I1413
m m-17-58 3S30
J i m .2414
j a m .5M4
i l L » L
- 7 i l{100.00}
Ohimad
l i t tv a K in n id i
Bflgwin
1371(7i5)530
(3J07)1(M4
(OjDI)m i
m(4.77)4^3
(2.T6)831
(».I2)M 3
J iW L
2151( « 7 )
M2(2-13)1713
(5il3)1142
i y a .
-20^0^ .2 ( »
3 i7{15JJJ-15.10
(2«J3|-25.71
1175(I.1T)
4M(2 J I)
901( 5 i l )
995
114(5.W)
317(244)
145(4.06)518
t326)
2(tt9(6.47)
876(2.72)m 8
(4.79)1463
(4.60)
-3.11{34J5J-11.M( U i l )-9J2
{25.79^-9j68
m s LOitf^irspi I M f t n t y : 2211
i i m1606
JBIZL3811
i i i a L
-1 3 i3( IM jOO
1M7il2J3]
1534
J M S L
3521
I M I
-7 iO{100.00}
6ufein)i
RikhirBcliiry
B U ir
Tom
511(3-31)
240(1.37)
620P i3 )770
JO!L17568(100.M)
821(3.W)194
(119)511
(319)267
(1.14)icn
( IM jOO)
1210PiT)434
(tJD1138
(3-31)1W7
m i33157
(160.00)
• 43(31.6-7J07
(luai-3li4
- U l
J L ! i•6.61NA
5M(3-51)
216(1-32)
5M(341)
625(3>82)16371
(10I.M)
M l(3.76)161
(1.04)m
(3.11)273
IL2L1MM
( IM jOO)
1161(3.61)
382(1.18)11K2
(3.28)8M
(2.78)32264
(100.003
-1.74{33.77}-11.M{10 9-7 i8
{29i-13.40
4.71N AHotel A SovTM : 3tm* it in TiMi 3.1.
234
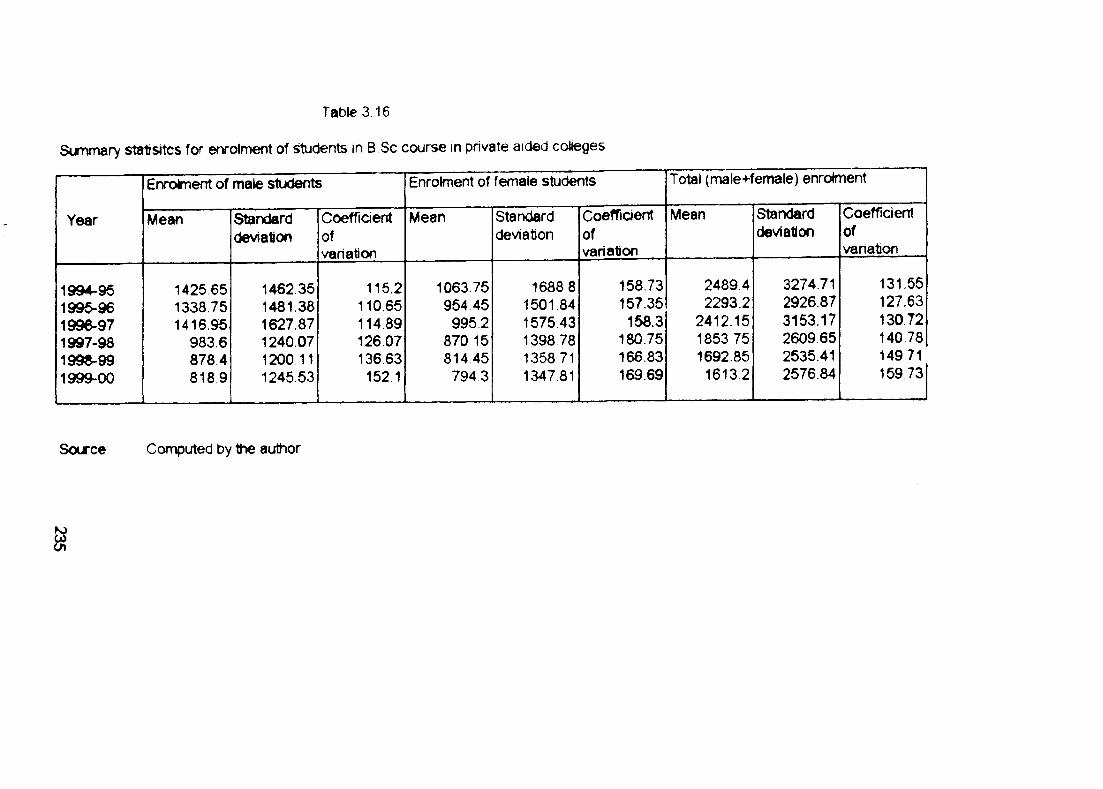
Table 3 16
Summary statisitcs for enrolment of ^dents in B.Sc course in private aided colleges
Enrolment of male students Enrolment of female students Total (male+female) enrolment
Year
1994-95 1996-961996-971997-981995-99 1999-00
Mean
1426.651338.751416.95
983.687848189
Standarddeviation
1462.351481.381627,871240.071200.111245.53
Coefficientofvariation
Mean
116.2 110.65 114 89 126.07 136.63
152.1
1063.75 954 45995.2
870.15 814.45794.3
Standarddeviation
1688 8 1501.84 1575.43 1398 78 135871 1347 81
Coefficientofvariation
Mean
158.73157.35
158.3180.75166.83169.69
2489,42293.2
2412.15 1853 75 1692,85
1613.2
Standarddeviation
3274,71 2926.87 3163.17 2609 65 2635.41 2576.84
Coefficientofvariation
131.65127.63130.72 140.78 149.71159.73
Source: Computed by the author
8?
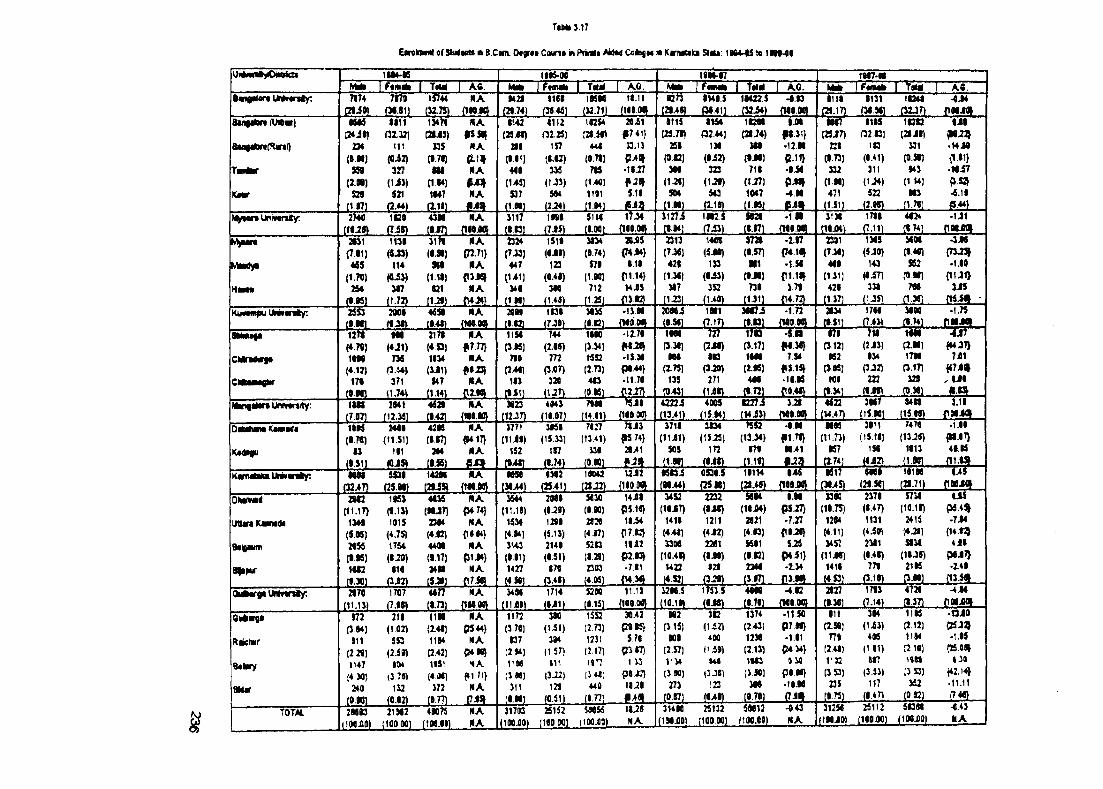
EorokMdl«(ShiiMts in B.Com. Otflri* Coun* h PmHi AmM C«Ib(m in KjnMtaka SlUt: 1BSMS t« 1 Nt4l9
liirinn ly lbM ric tsMill iFtiiiili I TiM A6. H»5-W
I f w mtW7-
t m I Fwiwfc I V iK A .8 .•aigiiort UMv«nty: 7IT4
Si2L7r# 15744 NA
(1W.W1421
i mnet
j mt»5M
(M.7T)U.1I
m s LB373
ia>a.IM IS0141)
•onfM8.aoy n i l
aiZL1131
fM.M]ttlS
f32.«]in
(1.41)311
<1-M)52
-d-ffl
lOilm u
■iMIBS3L
BtniilDn OMoi)
T i
•MSC2*i»)
2M(I.M)S »
(2.«)sn
(1.l7i
1111(32.33)111(Ci2)327(liJ)S21
Q.44)
1M71
C2U3)S3S
(•.71)
H i(IW)1147
J3L1!L
HA
«ACLJ»N AfJ3)« A
Ji3L
1142{25 J f) ai(1.11)
449(145)S37
m
1112ni2S)
15710.12)(1-W)544
j m .
1S2S4;2i.5«)
U4II.W)m
(1.40)1111J W
2Qi1f 7 4t)n.i)«2>«»-11.27#-2<l511
gig
1114{2S.7I)
251(9 1 2 )
3 M
(1-21)504
(1W1
ttM(32.44)
1M(•i2 )323
(1-29)543
a i»
1t2«C2IJ4)
m(tJi)711
(tJT )1047(t.iS)
•.M9m•12.Hp.n}•tMPJU|-4MgiU
m7(2JJ7)
S B
(••73)S32
(1M)471(1S1)
1I2C(2IJI)U1 (t).5l) •t) (1 W) •13 tVW)
IJII•MJO{1.11}•1«i7POJ•5.11
Mysan UnivtnKy: 2744 1S2 43M MA J117 1191 SIM 17.34
Jam.J l2 7 i
im.IK .S sea
jm .•in
JM15L)i»
sm.1711
(7.11)4434 •1J1
TiaiJWtMyMrt 2131 1131 3171 NA 2324 1519 3134 30JB5 2313 14CS 3720 -2.97 2301 1345 3«06 -3X6
(7.I1) 0J3) (•.St) {n.7i} (7.33) (6X9) (9.74) {WJ4} (73«) (5J0) (9.S7) {7410f (7 34) (5 JO) (9.40) {73231MHdy« 4S5 114 N9 NA 447 123 S79 9.11 421 133 M l •l.S I 409 143 952 •1.99
(1-TO) (Ci3> (1.11) p3J5} (141) (0.49) (1.90) P114} (13«l (•■53) (».N) {11.11} (U1) (OiT) (0.99) (1121)Hm m 2M 3«7 121 NA 341 3oe 712 H iS 317 3S2 739 J.79 421 330 709 3X5
(••5 ) (1.72) (1J«) IT4J4} ( in ) (1.44) (1.25). (13»2J (123) (UO) (1.31) r4.72) (137) ( IJ fl nJO) {1 5 ^ •Kuvmipu UMvmfty: 25S3 2ooe «5SI NA 2I« IS39 3036 -13.01 2 0 « i 1091 3M 7i -1.72 2134 1799 3990 •1.75
(•.M l (iJ f» (•.41} {100.90) (I.O) (7J9> (9.121 fie p J *. (9.S0] (7^71 (•.P I mm (M ’ l (7-4>l (9 74) mM8itim |a 12TI NO 21+1 NA use 744 1900 -12.71 19M )27 1713 • in i7 i ) l l MM
(4.7«) <4J1) (4.S3) #7.77} (3.»5) (2.19) (334) fl-M } (3.31) (2X0) (3.17) H M } (312) (2X3) (IM ) (»427>CmridMrfa 1«M 736 1134 NA 719 772 t5S2 -IS.M 099 913 1609 7.S4 052 934 1799 7X1
(4.12) (3.44) (3J1) f i i j } (24€) (3.0T) (2.73) p0 44} (175) P-20) (2.95) fS15} (3.05) PX2) a i7 ) t*7xq|CMMMQfeir m 371 547 NA 113 320 413 -11.70 139 271 m •19.05 101 22 328 . 9J9
(•.M) (1.74) (1.W1 (12.10) (U 7) (9 05) (1227) p43| (VXt) m C94I) i».34] (9X9) CO.M) m . . .M H i9 *n Uniwsity; i t n 2941 4421 NA 3C23 4043 7«9I W il 4222.5 400S I227i 329 4522 3997 9499 3.11
(7.97) (12.351 (•.421 (ie9.io) (t2-37) (19.97) (14.11) {119.00) (13.41) (1S.04) (« i3 ) (109.00) (W.47) (15.90) (15.99) P 99X010*HMM tUOMMla 1l»5 24e0 43 6 NA J771 3*59 7927 T I il 3711 3S34 ^S2 •9 09 M05 3911 7470 -1X9
(l.7«) (11.51) (1.17) {M.17} ( l l i l ) (15.13) (13.41) {M74} ( l l i l ) (1$25) (13J4) {1171} (11-73) (15.11) (13J9) (WXT>
K«d>9U 13 111 2*4 NA 152 197 139 20>i1 SOS in 979 0I>1 057 150 1013 49.95
(•.31) (QJ5» (•.55) M (•/« ) (0.74) (9.90) (1.00) (OXt) (1.«) •-23 (0X2) (1« ) O I-M L.,K a n iM i IM v in ty ; 9 M 5 » l 1420I NA •050 «3«2 19043 UJ2 05C3.5 0S30.S 19m 945 • il) 0019 191H ui
(32^7) (2S.M) (2 li5 ) (1H.90) (30^) (25.41) (»J2) mm (M>4) p5.ie) (2I.49) (100JO) (3945) (29.S0) (21.71) (190X(»
OlMWKl 2SC2 1iS3 4135 NA 3644 2M9 S630 14X1 34S2 2232 S0I4 9M 339Q 2371 5714 US(11,17) (1.13) (MJ7) P4 74} (11.11) (1-2*) (9.90) P5.10} (10J7) ( li« ) (10J04) pSi7} (19.75) (1.47) (10.19) P6.4%
UlUraKamM 134« 191S Z304 NA 1534 1299 2120 1 li4 1419 1211 2021 -7J7 12W 1131 2415 -7X4(S.K) (4.7S) (4.12) {1§«} (4.94) (5.13) (4.97) r742} (4/41) (4X2) (4.93) p9J0} (4.11) (4.50) (420) {14.9^
atlpain 2«»5 1754 4491 NA 3143 2149 S2S3 1«i2 3300 2201 S591 5J15 3457 2311 5434 4X9(•.M) (1.29) (l.»7) p1.W) (•.11) (1-51) tl.2S) P2.»3} (10.41) (IX f) (9.12) P4.S1} (iixor) (1.49) (19-39) P0X7>
B | i ^ ies2 lie 34tl NA 1427 171 2303 -7,11 U22 121 2340 -2.34 1419 779 2105 •149
(1.301 (3J2) (SJ«) (17.51) f4.$0) (3.49) (4.05) (H 30 (4.52) PJO) (3.17) (4.S3) (3.19) (3.M) {13.5«Q i^w yiU M m iiy : 2I7« 1707 4477 NA 3490 1714 5300 11.11 3290.5 1753 5 4«« <4.12 2177 1713 4729 -4X4
(11.13) (7.W (1.73) {1I9.M) (11X9) (9J1) [9.151 {109.0Q (10.19) (1X9) (1.701 mm (•.30) (7.14) (1.37) roo xd
QuftvSl 172 211 11M NA 1172 3« 1552 30.42 902 312 1374 -11.50 911 394 1105 •13X0
(3.W) (1.02) (141) C$44} (3.70) ( l i l ) 12.73) t2*K } (3.15) (1i2) (2.43) P7.09} (151) ( l i l ) (212) (2524
Raclwr S11 5S3 1194 NA 137 3M 1211 $70 901 iOO 12M •1 91 n i 405 1194 •1.9S
(2.2S) (2.59) (2.42) P4W) (2.W) (1.57) (2.17) (2317} 12.57) ( 'i9 ) (2.13) P4 34} !2.4I) (1 «1) !210) {25.0IJ
1'47 IM ItSI HA 1 '« 111 1*^ 1 13 I ’ M U t 1U3 910 132 897
'4 30) »3.75) (4M) HI Tl} (1 M] <3J2) (144) p itC ) [IW ) (3J9) (VJO) P9.99} (3 53) (3.31) ; i S3) <42.14J
BMW 240 112 J72 NA 311 121 449 K J I 273 123 M6 -19.M 235 117 362 • 11.11
(•■•0) (0.12) {9.77) (9.M) (0.51) [»^1 .. (0.97) iUt) m (975) (9.471 (0.92) {7,40
Torn 39e>3ooexD)
21 M2 (10Q.M)49075
flW.00)NAN A
31703(loejo)25152
[HOW) (1Q0.C0) N A (iMilO) (100.M1 (1W.0J) NA (1MJ0) [100.M) (1WJQ) MA
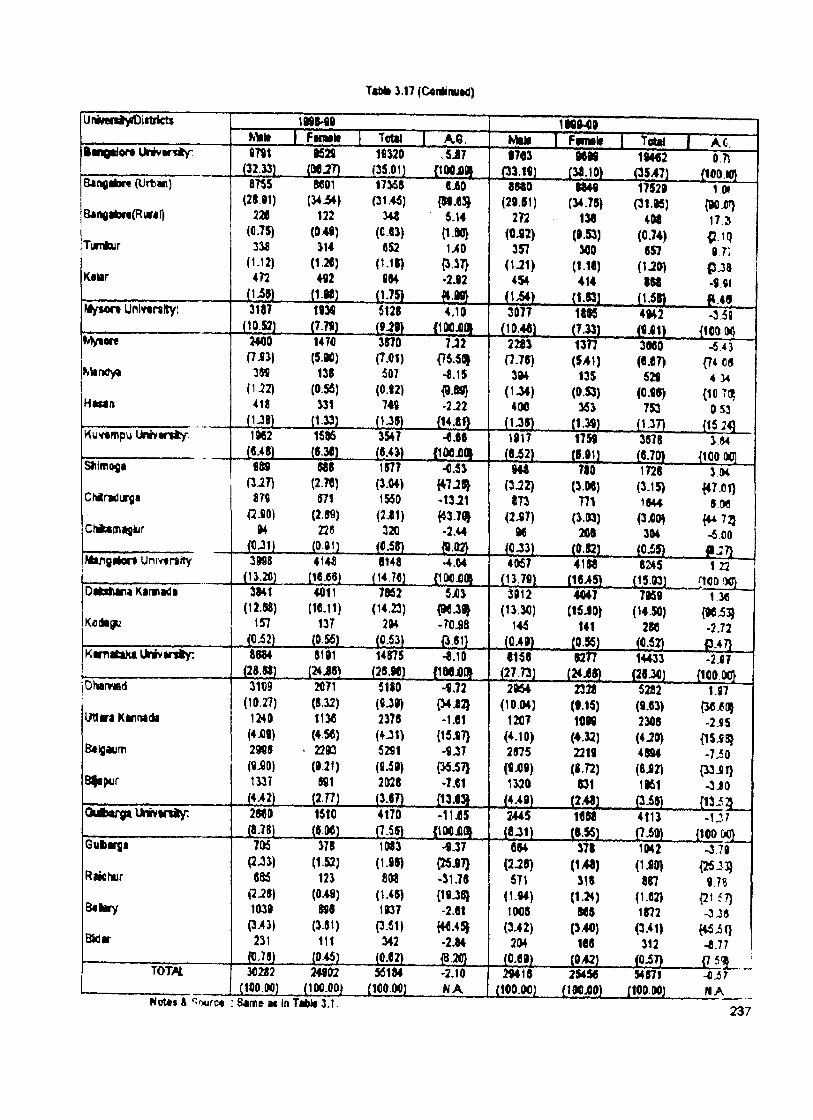
TaMi }.17
UninniysDittrtcts 1NM 9 1M M 9f M k 1 FaiMla Total 1 A.e. Mtla 1 Fimalf 1 Total 1 AC
d m g tip r i U v v irs tY ' m \ K29 19320 s5 i7 9703 9699 19402 0.7J i m . (MJT) .. R5:?1J {100J04 (33.19) (38.10) (3547) (100.10)B«ngiior« (Uitan) 8T55 17358 «j60 0880 8849 17529 1 m
(2S.91) (W ^ ) (31.45) {W-«^ (29.51) (14.75) (31.95) (90S«n8ilDrf(Ruv«l) 2 » 122 341 5.14 272 138 4(k8 17 a
<0.75) (0 « ) (C.«3) {1.M} (0J2) (9.53) (0.74) {2.1()Ttmiur 314 es2 MO 357 300 657 9 n
(1-12) (1-26) (i.i») P.37) (U 1 ) (1.18) (UO) {3JSK«kir 472 4«2 984 -2.92 4S4 414 858 -9.9!
m . (1.M) ..... ( 1 ^ ) ( i .n i (1.55) fl.49Myton University; 3WT 19M 5128 4.10 3077 1855 4942 • Z M
(10.52) i m x m {IOOjOOI (10.40) (T.33) (9X1) (100 00My«oc« 24€0 1470 3870 7J2 2283 13H 3560 -5.43
(7i3) (5.«) (7.01) (75.501 (7.75) ($41) (6.6T) (74 C53 « 138 507 -0.15 3M 135 529 4 M
(1^2) (0.55) (0.92) {8.W) (1-M) (0-53) (0.95) (1C 705Hftflin 331 749 -2.22 400 353 7S3 0.S3
(t.M) _ {14.01} (1.35) (1.39J (1-3T) (15 J4)Ku<r«mpu Unntriicy- 1M2 1695 3547 •0.88 1917 1759 3878 3iH
(fl.48) . m . (8^2) (5.911 (6.70) (100 001Stiimos* m 888 1877 -0.53 948 780 1728 3.04
{ ^ 2 7 ) (2.W) (3.04) (3J2) (3.06) (3.15) (47X1)CMndurga i n 571 1K0 -13.21 873 m 1544 5.M
( I M ) (2.8fl) (2i1) f^3.7flj (2^7) (3.03) (3X0) (44 725Chiam»9iur u 226 320 -2.44 96 208 Z U -5X0
. . . . m (0-33) (0.82) (0i5) p . : 7}hbngiiPrt Uniy«r*}ty 3M8 414£ 6148 •4.04 4057 4188 8:&45 1 22
(1«.W) (14.7«) {IOOjOO} (13.791 (16^5) (15.031 {100 M}DUsMna Karwadi 3»41 4Q11 7M2 Sj03 3912 4047 7959 1 30
(12.W) (1C.11) (14.23) {«.3flJ (13.3C) (15J0) (14.50) (9 6 i5Kodagu 157 137 294 - r o is 145 141 280 -2.72
m . . . _^.8i} (0.49) (0.55) (0-52) <3.47)K a n a tak ilM v in iy : 8884 8191 14575 -0.10 8158 52T7 14433 -2X7
(2B.8S) (28.M) {KMjOO _ (27,73) (24J65) (28.30J (100.00DlwfVifid 31C9 2071 5110 -9.72 2954 2328 5282 1 97
(10.27) (8.32) («J9) { J4 i5 (10.04) (9.15) (5.«3) (3«iajUtfara Karnada 1240 113« 2378 -1.01 1207 1099 2308 -2X5
(4jG9) (♦ « ) (4.31) {15.97} (♦.10) (4.32) (4 JO) (15X8}Baigaum 2 « 8 • 2293 52S1 -S.37 2575 2219 4894 -7 i0
(9-21) (9.59) {35.57} (9X9) («.72) (8i2) (33X1)B|apiir 1»7 891 2028 -7.01 1W0 531 1961 -3X0
(2.H) _(3-«T) {13.«^ (4.49) (2.481 (3i5) (1 3 i3Q iA v jft IM vaniy: 28«0 1510 4170 -lljfiS 2445 1658 4113 -1J7
m . j m i (7-58) {10€j0(« (0-31) (8.55) (7j50) {100 00)Gufcarga 7M m 1083 -9.37 654 378 1M2 -3.79
(2J3) (152) (1-S5) {25.97} (2.25) (148) (2 5 J^Raichur m 123 m -i1-78 5T1 318 887 9.TB
(2J8) (0.49) (1.45) {10-38} (1.94) (1.24) (1.82) {21 f7)Bahry 1039 898 1937 '2.61 10C5 M5 1872 -3J5
(3>»3) (3.81) (3.51) (3.42) (340) (3-41) (45 it)Bidar 2ii 111 342 -2.84 204 108 312 -8.77
A m , , (0.02) . M (0-69) (042) (OiT) (7 5 ^roTK 30282 24802 55154 -2.10 29415 25456 54871 -Oi7
ClfiO.OC) (100.00) (100.00) N A (100.00) (100X0) (100 00) N ASame M In Tililt 3.1 237
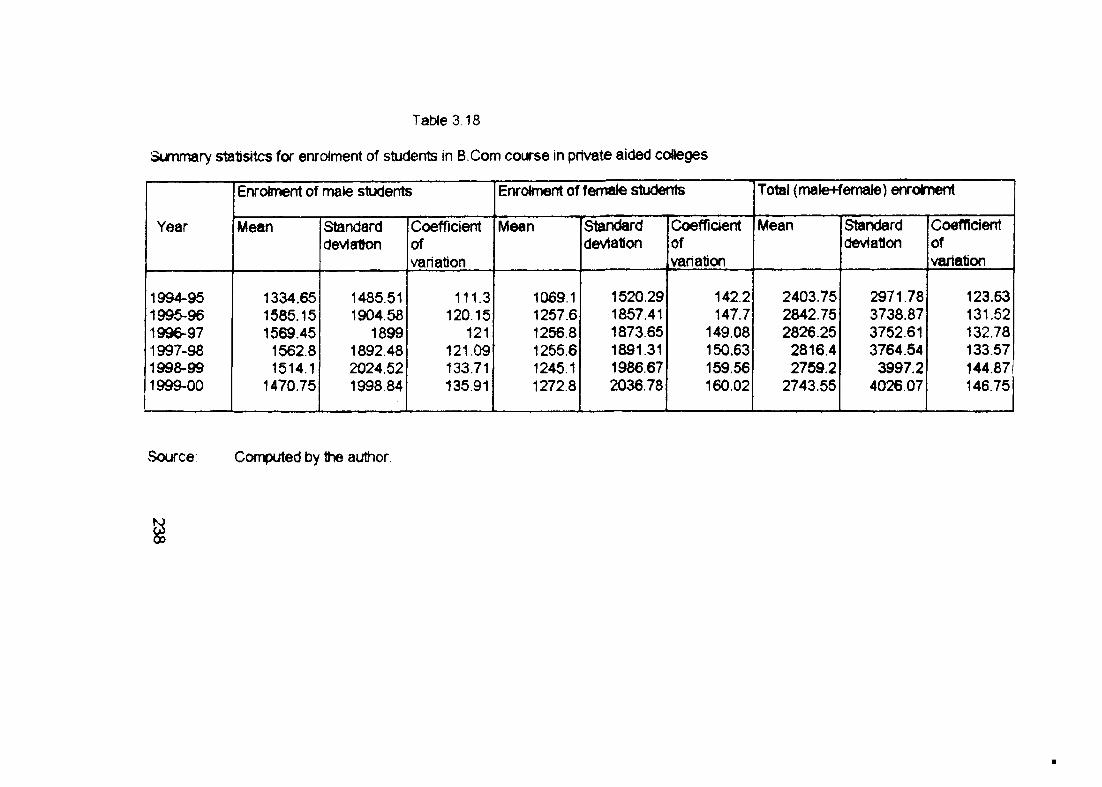
Table 3 18
Summary stalisitcs for enrolment of students In B.Com course in private aided coHeges
Year
Enrolment of male students
Mean Standarddevlalton
Coefficientofvariation
EnrolmerTt of female students
Mean Standarddeviation
Coefficientofvariation
Total (male+female) enrolment
Mean Standarddeviation
Coeffldentofvariation
1994-951995-961996-971997-981998-991999-00
1334.651686.151569.45
1562.81514.1
1470.75
1485.51 1904.58
18991892.482024.52 1998.84
111.3120.15
121121.09133.71135.91
1069.11257.61256.81255.61245.11272.8
1520.291857.411873.651891.311986.67203678
142.2147.7
149.08150.63159.56160.02
2403.752842.75 2826.25
2816.42759.2
2743.55
2971.783738.873752.613764.543997.2
4026.07
123.63131.52132.78133.57144.87146.75
vSource: Computed by the author
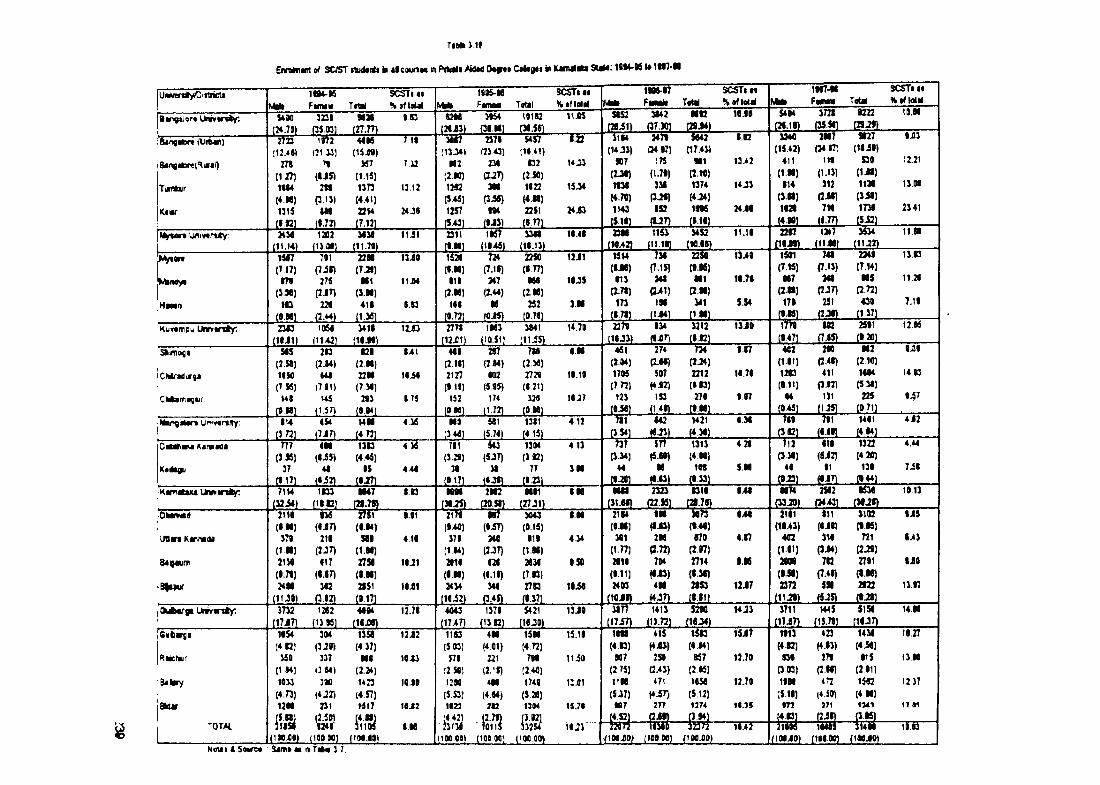
T<bk yif
Enn>*ii«it of 3C«T itu ik flli hi <1 couriw in FHMt Ai<M 0«fr«» Zo»tg»t in MnMlrita SUM: « » ^ K I* 1W -M
UiwertiyjDittncts im -KFkm m
SCSTi m
S490 3St MMt27.77)
».C
19»^MFmimM TottI
SCSTiai
CM »SiO iw i C3i.5»)
ItJOS
iiM -n Fi Total
SCCSTiatnofM ii
StS2t a i l )
m ij m .
MUta .w
IflJS
1N7-MFh m H T«tal
SCSTi I I
SiMP«.1SfU44
(13.«)411
(1.M) 114
(S«)I t s
J iS L
3T2IJ35i!L
2M7
C23
■■gj!LSR7
(U i»)S30
(1JI)11Mt l5 l}1731
10.M
B«ng«brt tXlitvi)
a*nQA>r«(l%waf)
T irta jr
<4 tv
m(127lOM(4.«)t 3 t j
J i m
Tmn iiJ ]
>1(eJ5):n
p.u)
«.72)
4415
W7(115)13T3(4.41)a u(7.121
n «
T12
13.12
24 its
M«7(13^1
M2(2.M)I2S2(543)1257(S/43)
w(2343)
234(2J7)
3M(3i«)
t94
JI42L
5457:i4.*i)
C2(2.5C)1422(4.H)Z251
J!J2L
T a "
15J4
J4j63
3144(WJJ)
» 7(2J4)1134H.Tfl)1143(511)
jJ n M420417)
ITS0.7i)334
PJ«)tS3
- M L
(17.4«M l
(2.W)1374(4J»)IfK
JtlS L
I C
13>2
14 J3
24iS
(14171HI
312(2JD714
J 1 2 D .1M7
f l lM l
«il3
12.21
13.H
23.41
Mywrt UriMrtily 2434(11.14)
1202 3434(11-70)
n i l 2311(IM i
1M7(1»4ii
33M(14.13)
14.4S QMi1143_
1153 3452(10.44)
11.14 Sf7il lW L
3634(11.22>
11.H
l<Vtar«
••liiM y*
Hann
1347(7.17)174
( V « )143
(» .«)
701(7i»)275
(2J7)224
n »(7-21)Ml
(1.M)411
J 1 « L
13i0
11JI4
I.S3
1S T(S .M )
l i t(2.M)
144J0721_
724(7.15)347
(2.44)M
j m .
7290(4.77)M4
(2-M)2S2
J0741_
12J1
14J5
3M
1314(••« )413
(2.71)173
(1-71)
734 23S0 1340 i5(n 741 2344(7.15) (4.K) (7.15) (7.13) (T.14)344 Ml 14.74 M7 344 M5
P41) (2.M) (2.M) (2J7) (2.73)IM 341 S.54 171 251 430
(1J4) (l.Ml (4.15) (3J4) (137)
13.B3
11 24
7.11
|Ku<r«inpu Unrvaniy:
Sliinio(a
CHirMlifta
Chtarraglur
uniftrtity;
23S31HJ1)
1K4(11^)
3411(14.M)
12^ 2771[12J01)
543 (2.54) 1«54
(7 K ) US
J im .114
j m .
2*3(3J4)
44417 ii)
U3p in
m(3.S5)
37(4171
654(747)
C t(2.M)SM
(7 34) 213
j m .
1/41
14i4
475
1M3(10.51)
3441[11i5)
14.70 D74 134 3312(1.121
13J0
448 2S7 744 4M(214) (2.44) (2.M)2127 102 2724 11.10(111) (345) (421)
152 174 32S 1437|0 40J (1.72)
IMI4i5)
44(4i2)
UMJ ilZ L
436
1313(4.44)
15(4J71
T W
444
MO(^44)
541 1381
J i« L412
711 543 1304(3.24) (3J7) (312)
30 38 77(017) 14 J4 ) (0.231
4 13
3M
461 (2.04) 1705
(7 72) 123
(0 54)n i lj m .
274p-44)
507<442)
153( 1 « »
734(2.24)2212(413)274
( 4 . M )
1.17
14.74
447
1774J112L
737(3.J4)
UJL»L
442<4J?3)
ifimM
<4.43)
U21
j m .434
4«2(1.41)12C3(411)
Uj m .
102i l i a .
1313(4M)
144(0 33)
424
5M
I W
140(3 42) 712
(334) 44
(0-23)
2MP.4»)411
<3 42) 131
(125)
2541 (4 20)
701
M2(2.1011444
(5 341 S5
(0.7111441(4.44)
114(3i2)
ItJ4J7L
1323 {4 20) 134
(044)w(M.24)
12.45
l iS
14 43
442
4.44
7 i l
Kim«atu ikwirrity: tuT(32^)
1433Jim.
47 143(30.25)
2042J ^
M41J27J11
IM 2S23(22.M) 4314-SLZfi-
M74 35120443)
10.13
OkanNid
Iran Karm^
B « Io « u it
Bliptir
2114(t.M)370
(IM )2134{t.n]24M
(1U0)
136( « i7 )
214(2J7)
«17(i-3T)342
0-12)
nsT(4.44)
544
(1.M)2754
( I .M )
2151
Ji!2L
1.01
414
1CJ1
t U I
2174(140)
371(1.44)2014(S.M)2434
i m
447(«-57)344
(2J7)i 2 t
341(3.45)
3043(0.13)111
(1.M)2834
(7.43)Z7I3(i.371
S M
434
1.50
1 4 i4
2184(0 .M )
341(IH )2414(1.11)2409
(WJ»>
I M
(4J1)2M
P .7 2 )
704
4MJ 0 2 L
3473(O .M )
470(2.47)2714
(».M)2453(t.lD
444
4.47
I.K
1 2 J 7
2141(1i>l)
402(1.41)2004
( • * )2373
(11.29)
111(4.10)
314
pJ4)712
(7.41)SM
(3J5)
3182(4.M)731
(2JS)2741(«.M)2122
j m .
I i 5
3.43
l i O
13.R
O 1A V 9 1 U n iv a r t t y ; 3732jlTJTL
1212
i l l S l4444
J14J5L12.71 4043
(1747)1371
(13.42)5421
I ’ijg L13i0 3177
i m1411
i l i aS2M
(H.34)H 2i 3711
i22iZL1445
(i5.y«)SI 54
J 2 m .14.M
SMfearga
Raktwr
Balav
Blear
'OT^
1454(412)360
(144)1033(4.73)12M
ilWXB)
304(334) 337
i3 44) 300
1432) 231
(100 ao)
1354(4.37)M4
(2.24)U23
(4.57)MI7
a(104.00)
1 2 i2
1043
tCJO
KJ2
IM
1143(5.1*3]578
!2»)12M
(5.S3)1023
(1M.09)
4M(4.01)231 (2.’4)4M
(4.44)
- O fi(108 ao) (tao.fl(»
15M(4.72)794
!2.^11744(5.24)niM
13.18
l l iO
i: iii
15.71
l i lJ *
14«(4.43)M7
(2.75)ItM
($37)M7.52:
415♦443)
2S0(2.43)
471
(4i7)277i t )
'm f i s 8 - - s y
16B3(4.44) 857
(2.45) 1454
(5.12)1374(3 44
jimxo} (ICO DC)5 ^
(lac.oo)
1 5 J 7
12.70
12.70
KJS
l u r
423 (4.13)
271 (2.«8)
472 (♦.SO)
371
m -
1413 (412) 434
(3 03) 10M (514) tTJ
(104J0)lias
(104.00)
1434(4.54)415
(2.91)15*2
( 4 M )4M13.t5)14M
(lOOilO)
18.27
13.M
12 37
ITM
10.13
N o U i 4 S M i m : S a n a a t m Tafeia 3 7
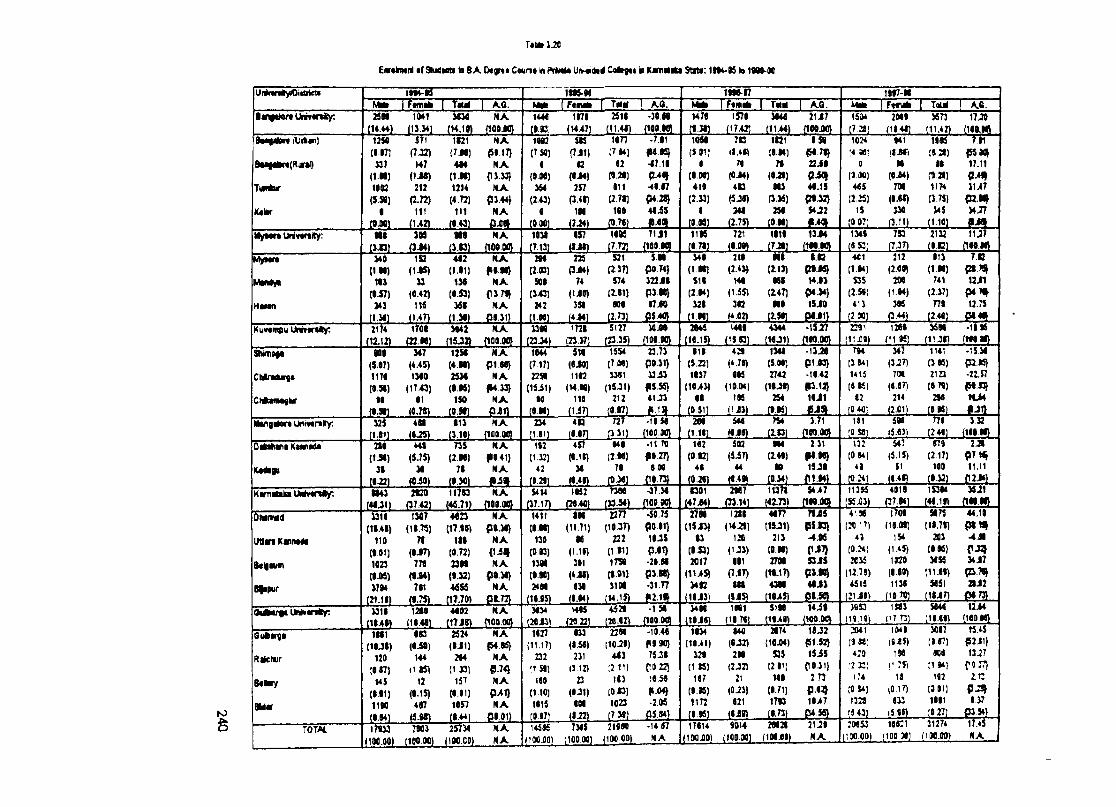
TaMi
Uni»«niy«Dittrict(
Eflr«kTH(M «rShitfMts in B A C o u n t in PrtMte U iv«ili4 C o l t j t i ip K amtfika S t t t t : I M t 'K to ISM-OQ
tIM-M"5fi» 1 faniaii I TaM M . F«imH I THK Kd. M * [FtOili I TMri A.O.
1197-MFtffuk r ToUi M t.
s ntU-44)
liMI
illHLMU NA
f1flO.W1444[i.c :!
1179
illiZL2S1«
(11.45)-30.n
(10Q.WMTe
j m .
1579 3444JllMl
21{IflOJXft
tSiMq a i
2MI(11441 «73(t1.42)
17J«(1M.W7 T
17.11
JM7
MJ7J L f t -
OJitv)
TuH but
K«lr
i:s4(1.17]
U 7( 1 . « J1003(5.«)
•
J125L
J71(7J2)
H7OM)
212(2.72)
111
JLi2L
1121(7J4)
444(1.M)1214
(4.72)111
j m .
NAP 9 I7 }
NA{1133}
NXp j.44}
NAox<t
1IW 2 (7 SO)
I{»•«)364
(2.43)0
m i
us(7J1)
<2(• i* )257
(3.41)1M
(2JH}
1477 ;7 44)
«2
S11I2.rt}109
J2J2L
-7.il {94 «S} -17.11 { lA ^ •49.47
4 liS
1044{4 911
I{ • » )
4t9(2.M)
I[D.Ml
7*3 It >4)
74iCM)4D
(5J«)344
(2.75)
1421!9.9»)
74(9.24)913
(J.3«)2S4
(0.W1
9 »
a J iQJUi44.IS
S4J2
J i S L
1024;< w ’
0(O.M)44S
(2.25)15
iliZi
Ml•tJ f)
n(0-44)704
(9.61)330
(3.11)
194$(9.24)
14 (0 21) im(375)345
J IM .MyMn Unit«nity; 414
JLS L3M
jS i ! L944
(3.P1NA
(MO.W1039(7.13)
457(tJ4)
14dSM M .
71J1 (109.90
1115(4 74)
721(«.0»
1414(7J4)
1344 1348(«C)
70(7JT)
2132(9.t2)
1U7(140.94)
My* on 340(1.40)143
(4.57)H i
(1.34j
152(1J5)
U(0.42)
115
U04js m .
442( i. i i)134
(4.53)361
(1.34)
N Afl4.4f)
N Ar» 7 ^
NA
244(2.93)909
(343)242
JIB.
22SPJ4)
74(1J9)354
(4i4)
521P.37)
574(2.01)404
f2.73)
519PO.74} 322 J4 P3 44) 97 JO
05.40)
344(1.44) $11
(2.44) 324
i l i S l
214(2.43)
>44(1.S5)342
(4.02)
M4(2.13)m
(147)494
(2.54)
4.C
W iJ
15J0
-fiS iJL
401(1*4)S3S
(2.58)41J
f2.«)
2 1 2(2.09)
200(1.44)3«
C M )
913(1.90)
741(2.37)noJ244L
7.93P.73Jt t jn
U.75P444»
KuMiRpu LMvtnAy: 2174(1112)
3442( i ^ a
N A(109.1)0)
3349IS J IL
1721(23.37)
5127 U j04{104.90
2444 1404 4344(10.31)
•1517(140.90)
2291(11X9>
1264(11 »S)
3649(104)
.1496 (149 99)
SNilioiaChirtdwaa
CMkanwgkr
404(5.97)1174(9.90)
94(4.99)
347(4.45)1340
(17,43)41
(0.74)
1254(4.44)2534(t.46)150
(9.M)
NAP1«J
N A194.33)
N AP in
1044(717)22S9
(13il|90
(9.W)
510(6J0)1102
(14.90)110
(1.37)
1554(7.M)3341
(15J1)212
(0.«7)
23.73 PO.31) 12 i3
P555) 4U3
419 424 1344 •I3 i« 744 347 1141 •1534(5.22) (4.79) (5.M) p i .*3} (3 9*) (3J7) C3 4S) P2»5)1437 045 2742 -14.42 1415 7M 2123 •21S7
(10>3) (19.04) (14J4) m.12} (8*5) 16.07) (074) <541^44 145 254 14J1 82 214 240 1U4
(951) (1i3) («5) [9 40; (2.01) (9.9S1204 644 754 371 t i l 5« H9 332Mangalen Univaralty; 325
i l i l l444
(4J5)413
(3.10)NA
(lOQ.OO)234
(1911443
(0.07)727
C 31)•19.50
{lOO.JO tno) (0J4) (lO ) 000.00) :0 M) (5.C3> (2.40) (109 94)OM)ana KannaiUi 244 449 T35 N A 182 457 •44 •11 70 102 S«2 M4 231 547 97) 2J9
tU4agu(1J4)
34(422)
(5-75)34
(OiO)
(2.46)74
(4.30)
(1941)N A
(1.32)42
(9.24)
(6.19)30
(0.49)
(2.46)74
(0.34J
119 27} 9.00
{19.75
(0.42)49
(0.20)
(5iT)44
(0.44)
(140)40
(9.34)
94.44}15J4
(11441
(0 94) 41
(0 24)
(5.15)$1
(6.49)
(2.17)100
(932)
P7M^11.11
r.2.9*}Kam ataJnU tivaniy: 1443 2t20 117*3 N A H U 1152 7306 -37 34 1391 2907 11371 54>7 11395 4919 15344 MJ1
(44 J1 ) (37.42) (45.71) (100.00) (37.17) (2440) (33.54) (100.90) (47 J4) P3.14) (4173) {140JJ0} (55X3) (37.44) (46.19)
OlMmad 3316 1307 4423 N A 1411 146 2277 -50.75 2740 1284 44H 7fj05 4106 1704 5475 44.19
(14.44) (14.75) (17.14) p4.3«) ( i « ) (11.71) (10JT) PO.91) (15J3) (14 J9) (13.31) P5.C} t2C.’7) (19.09) (11.71) p s m
IM m Kainadi 110 7« 114 N A 139 46 222 19J5 43 120 213 •4.05 4) 154 203 A M
(9.91) (4J7) (9.72) { 1 J^ (0.43) (1.l») (1 91) P.01) (9.53) (1J3) (9.44) {1J7} ( 9 ^ ) (1.45) (9.K) r - J 9
Balgauin 1023 770 2340 N A 1309 391 17S9 •29.94 2017 041 2704 S3JS 2035 1929 M9S 34 J7
(4.05) (4M ) (9.32) pO.34) (9.90) (♦i») (4.01) P3.B8} (1U 5) (7.«T) (14-17) PJ.4C9 112.78) (0.60) (11.64)
B^ipur 3744 741 4 iis N A 2490 636 3100 -31.n 3442 944 4344 44J3 4515 1139 5651 29J2
(21.14) (4.75) (17.70) P172) (16J5) (1.44) (14.15). f i m (10J3I 1IJ5) (10^5) 01.50) (21 i9) (19 70) (IliT) 0 4 73)
dUbargaUM vaniy: 3314 1244 4402 N A 3434 1445 4529 -1 54 3440 1001 5140 14 i4 1»3 5446 12i4
(14A4> (14.441 (17J8) (100.00) (2 0 ii) (20.22) {28.62) (100.00 (14J9) (1970) (100.00) (IT H) 111.61) (10090}
OuAarga 1441 043 2524 N A 1627 633 2300 -19.46 1434 >40 2474 16J2 3)41 1049(«i5)
3097(9.97)
15.45P2J1}(10J4) (4iO) (9.91) <54.95} (11.17) ( li« ) (10J9) f 9 90} (10.41) (0J2) (10j04) p i . 52} !9W)
Riknur 120 144 244 NA 232 231 403 75.34 329 209 535 l5 iS 429 IH 900 13J7
(9.97) 11 iS) (1 331 P-74J : i SO) (3.12) ;2 i i i CO 22} (1 45) (2J2) (2 91) C931} :2 k : (• 75) ;i w] fIJT }
B«9iiy H5 12 157 NA 169 23 163 16 i« 167 21 119 273 174 U 182 I C
(9.41) (4.15) (9.91) P>1> (1.10) (6J1) (0.«) (9.95) (0J3) (9.71) p.69 (0 94) (0.17) [3.91) p ja j
BUar 1190(4.44)
497 1057 NA 1015 604 1023 -2.95 1172 621 1743 10>7 1324 833 1091 9 57
(6.4S) (4.44) P4.91) (9.97) (Ii2 ) (7M) (9.45) (6J0) (4.73) p * ,* a fiJ.43) 15.85) !9.27)
TOTAi 17433(100.00)
7403[100.90)
25736(190.00)
NANA
14595jlOOilO)
7305[100.00)
21890(100.00)
-14 57 NA
17614(100 i)0)
9014(100.30)
29629(196.09)
21.29NA
:0653(1».00)
10C1 [109 JO)
31274(100.00)
17.45NA
to
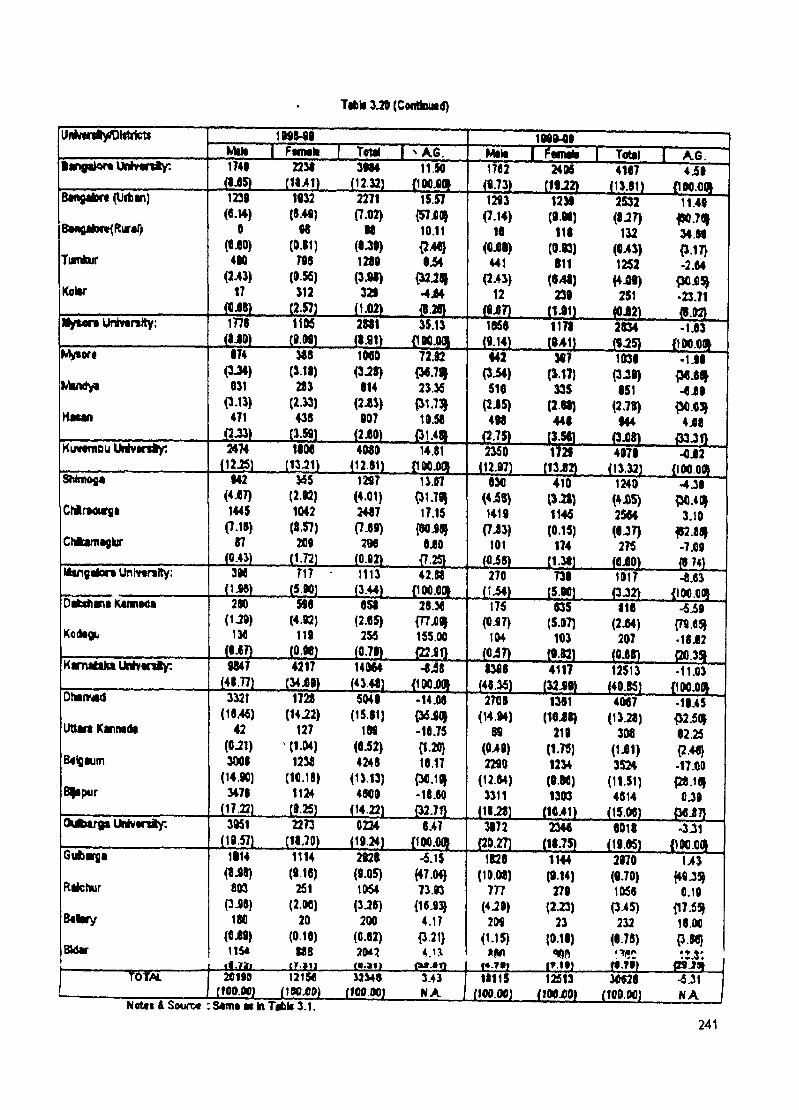
Tifcli 3^ (CefltkuMif)
U nkenfty^ittric ts 1 U M 9KkH174$
r FwMte I TctU i n A.G. Tcttl I a T "iangal n VMmiiy:j y j L
225t 3 IM(12.M)
11.50{iao.c(i
m if<-73)
2406
S i m .4167
i l M l I
4 i l(lPO.Ofl|BmgilDct (Uftan)
BMOi*>rt{Rur«l)
TumlDur
Kolir
M yM n Unhrtrsity:
1239(6.14)
0(6X0)
490(2.43)
17J O ^
1778
J M o l074
(3-M)031
0 - n )471
. M L
1032
( 8 ^ )oe
(0.11)796
(0.56)312
J iH L11(k6
2271(7.02)
tt(0^0)1209
( 3 ^321
i L s a .2N1(8.01)
1S.57{57jOOJ10.11{240}0 i4
•4.04
JL2L35.13
(lOOilOt
1293(7.14)
10(0X8)
441
(2^1)12
J M H1050
iiiiL
1230(0.00)
110(0 .» )
o i l(040)230
i m1170
i t H L
2S32(«J7)
132( « ^ i)1252
(4JOO)251
j m .2034
j y a
1140
34.09{3.17}•2.04
•23.71
JLEL•1.03
{100.0H^ ^ o r«
Hacin
300
( M « )203
(2.33)430
i i a i
1000
(3^1)014
(2X3)907
J2X0L
72.02{30.71123.36
(31.7^10.50
- f i l iS L
042(3 i4 )
510(2 i5 )
408
307(3.17)
335(2.00)440
1030(3^9)
051(2.70)
044
•1J0p o .o i|•o io
PC.03>4j60
L3.50) (3X0) 0 3 J nKuvtmou U n iv irs ty :
SMmogt
ChitiKiuroa
CMkamaolur
2474
042
1000m h .
(M 7 )1445
(7-18)07
365(2.02)1042
(0.57)209
4000
i i m
-(^-*3) (1.72)
1207(4.01)2407(7X9)
290(0X2)
14.81{100.00^
13.07(3t.7l|17.15
{WX8J0X0
J L a .
2350(12.87)
03C
1419(7 i3 )
101
JSi!L
1720j i 3 x a
410(3.21)1146(0.15)
174
4070lt.3-32j
1240(4X5)2504(0J7)
276
-0X2(I00XI»
•4 JO P0.4(|
3.10 fK x a i-7X9
t1.30) (0X0)Mbmgilort Unhrtnlty; 3H 717
(5.00)1113
j m .42.88
{100.001270
(1.54)730
s m .1017
J&32L-0X3
(100X01Olfcstiina Ktnnada
Kote0u
200(1J9)
130
j m .
508(4.02)
119
JOJSL
8S0(2X5)
256
i £ J ! L
28.30fn x 9 |165.00
176 S35 010 -5 i9(0.87) (5.07) (2X4) (TOXj^
104 103 207 .18X2(0X7) (0.02) (OXO> 00.35^
K v m O a k t lM v m iy : 0047J l t i z i
4217(34X9)
14064 •0X8{100X01
0308J 4 ^
4117(32J0)
12513(40.86)
•11.03(100X01OhtrvMd
UtUra Kafimdi
Belgium
B^ipur
3321(18.46)
42(0.21)3008
(14.«)3478
i m
1720 (U.22)
127 ' (1.W)
1230 (10.18)
1124
j m .
6049(15.81)
100
(0.52)4248
(13.13)4800
i m
-14X8{36X01-10.75{1.20}18.17
{30.HI-10.00
J3221L
2708(H.84)
(049)2200
(12.04)3311
S i m .
1301(10^8)
219(1.75)1234(0.80)1303
4007(13.20)
300(1X1)3534
(11.51)4814
10.45P2.50^02.26{2.40}-17.00{20.181
0J9(1041) (15.08) (30X7)
0dbar9a IM v tn iy : 3051(H.57)
2273
I H I 2 L
0234(H 2 4 )
047 (180.00
3072(20.27)
2340J1075L
0018(19.K)
-3J1(100.001
Gufcvoa
Raktwr
B « lvy
BMv
1814(0X8)
003P-88)
180(0X9)1154
o U iL
1114
(*1«)261
(2.00)20
(0.10)tOB
JJLiU .
2928
i m10S4
(3J8)200
(0X2)20A2
JJLiLL
-6.15{♦7.0^73.93
4.1T{3.21}4 .U
-g £ ^ a .
1820(10.00)
777(4J9)
200(1-15)
f* -y »
1144(9.14)
279(2.23)
23(0.10)
mJ Z i l L
2970(0.70)1060
P 4 5 )232
(0.78)‘
143{40J^
0.19{17.5^18.00{3.80}: : x :
T o f s : 20190flOO.00)
12150(100X0)
32340im .oo)
343W A
11115flOO.OO)
12513(100X0)
30028rioo.oo) N A
NotfiASouTM iS a m tM in T ifc lt 3.1.
241
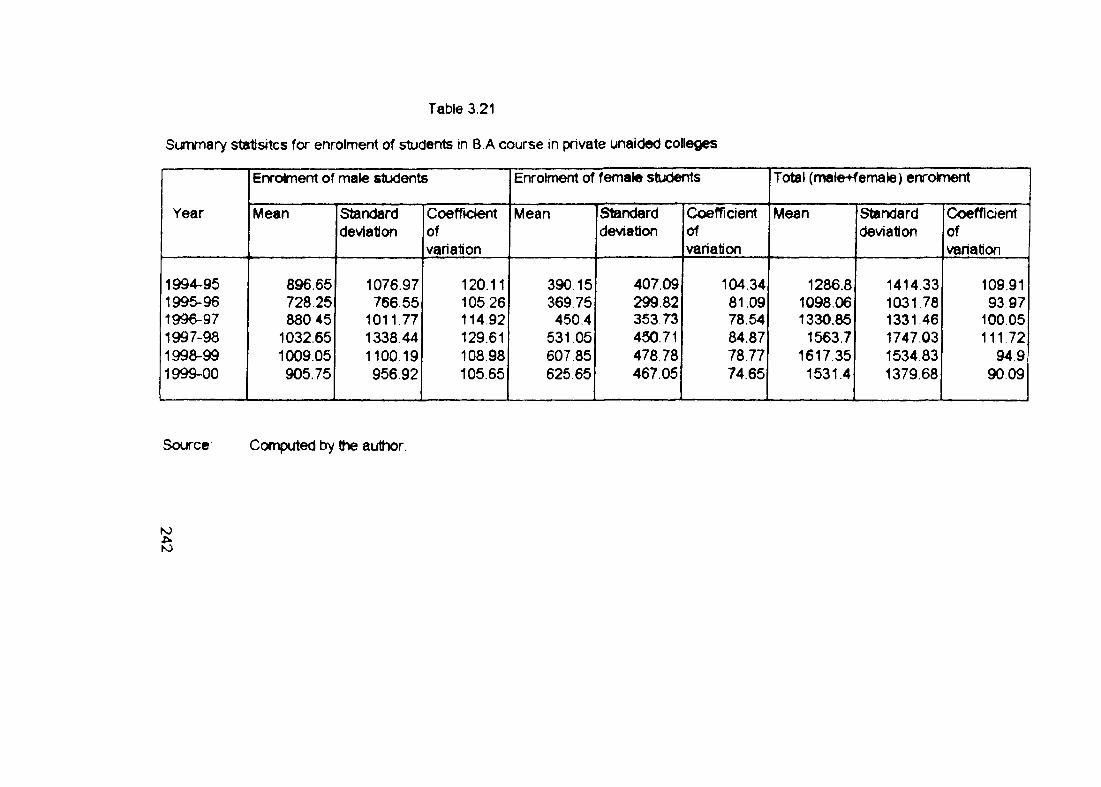
Table 3.21
Summary statisitcs for enrolment of students in B.A course in private unaided colleges
Year
Enrolment of male students
Mean Standarddeviation
Coefficientofvariation
Enrolment of femate students
Mean Standarddeviation
Coefficientofvariation
Total (male^emale) enrolment
Mean Standarddeviation
Coefficientofvariation
1994-951995-961996-971997-981998-991999-00
896.65 728.26 880 45
1032.65 1009.05 905.75
1076.97 766.65
1011.77 1338.44 1100.19 956 92
120.11 105 26 114.92 129.61 108.98 105.65
390.15 369 75 450.4
531 05 607.85 625.65
407.09 299.82 353 73 450.71 478 78 467.06
104.3481.0978.64 84.87 78.7774.65
1286.81098.061330.86
1563.71617.351531.4
1414.331031.781331.461747.031534.831379.68
109.919397
100.05111.72
94990.09
Source Computed by the author.
NJ
ro
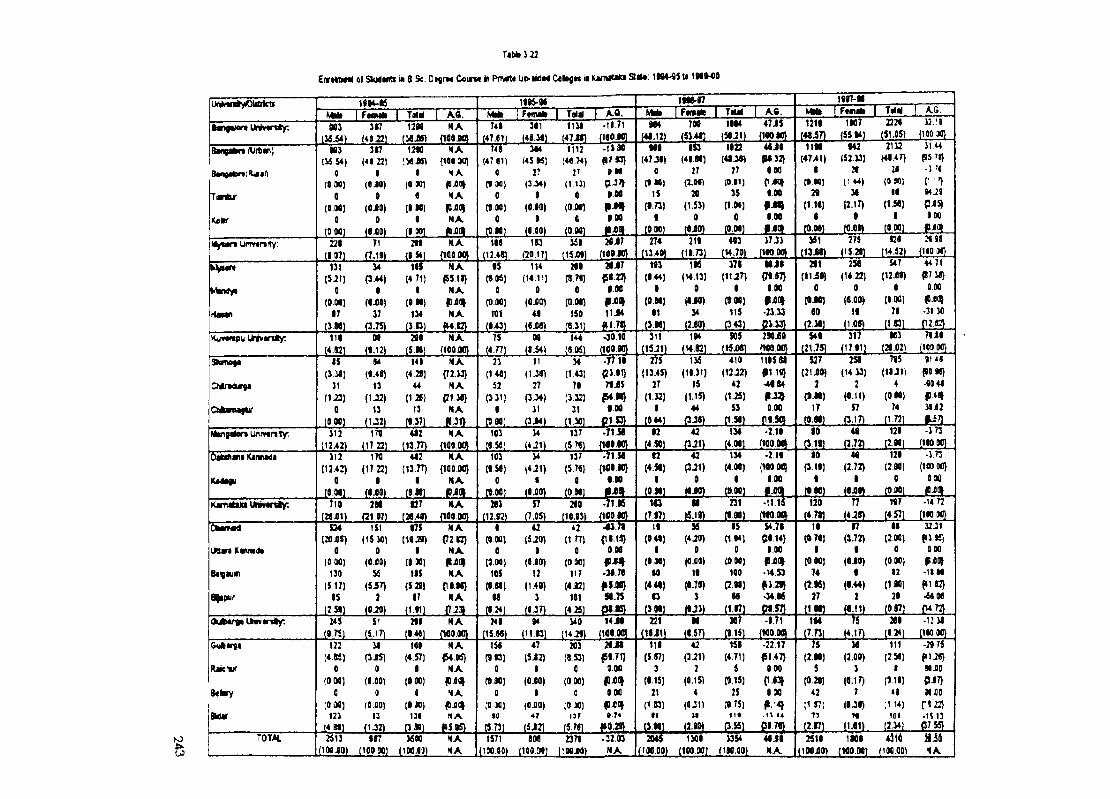
Tabte 1.22
LMwiiyOiiiricti
Eflr#to«( of Skjdwt* in 8.Sc. 0*or*« Ca itm iti Prh«t« IJMfcltd h Kj^mtUo S ii« : 1WW5U IWMO
Tam A.©. F m u k I T M [ A.O.tw>-r7
I F w iite i TbuT K<6.M t l - U
I U r n m I T x T /LG. 12.'9l « ) 0iior« Utw«n<y: M l 3V7
J 1 £ S .
12M NAHOOjW
T4t 391 t i l l
J1L 5 !L
-tl.T lflflP.W
864
(49.12)
706
(5 1 44 )
1984
(S 0 J1 )
47X 5
{190.80}
1219
(4 6 4 7 )
1907
(5 5 8 4 )
2329
(51X5)
999 9S3 1922 4 < J 9 1186 942 2112(47 J 9 ) (49.89) (49 P » S 2 } (47>41) (52.13) (49.47)
0 27 27 9 0 0 9 39 U
(0 99) (1.0«) [tt.91) p X O | { • ■ 0 ) VM) ( 9 « 1
IS 29 35 9.00 29 19 19
(8.73) (1.53) (1 .IH ) P j86» (1 1 6 ) (2.17) (1.56)
9 0 0 8.00 6 8 9
(0.00) (9 X 0) (0.09) 1 X 9 (0.00) «IX9) (0 00)
(100 M} II .M
{9S 78}-1{• 7)
PJ5J000
. m . .
Bm gibn (U it« i)
BMOi*>r«(Rui«0
tM rtur
lU Ir
Unt<r«r«ity:
H I(ViS4>
0(O.MJ
0(DM)
0j m .
221(i07l
W { *9 22]
•(OJO)
9(0X0)
f)(flilQ)
: y j5 )•
(0 90) <
(9«1«
(»«n71
g .n >
N X(100 30}
H A {Diia( N A
fix a iN A
2t1(t» l
N A
7«»
(47 61)«
(OM)0(0.00)Q
_C L «L1«6
(12.48)
<45 «J27
(3>»)•(0.10)0
i n(20171
1 1 1 2(4«.74)
V(VI3J
Q(0J»)
dto 00)
l£ t
j m
.IV M{87*3}
9 MPJT}• 00
f - f l l • 00
j m .K J7
no i.iW274
(13>0>211
f1».73)4«3
i!l2 ® L J!?£L9L tn J t> (1S.2I)2««S
fU.52) (ICO 00} S47
(12-Ot)0
(9. « )79
(1i31
^Vmt«
Haon
13t(5-21)
0(0.00)
97tJ.« l
M(3.U)
9
17
J U S L
1«S(4.71)
I{9.09)
134 J IO )
NAp s if}
NAfx a iNA
j±a_
95(0.05)
0(0.00)to i
(943)
114(14.11)
0(OJO)
49(g-Qg)
299(8.79)
0(0.M3
150(B.H)
3IJ7p ia j
1.00f jo t l11J4
i m .
m(9.44)
9(9.MJ
91(VWl
19S(14.13)
0(9 JO)
14(2.M)
179(11-2T)
9(9. « )115
P.43)SOS
j m
99J8{79 57}
9.00 PXO) -21.i3
jE ia .
291( l l i l )
0(OJO)
«0
jy S L
2se(14.H)
0(0X0)
19
J l l
44 71(87 M}
aoQ
•31 M
J l lM .Kut«««ipu U rtv tn ty ; 119
j m
MJ 1 I2 L
209
i l B
NA{100.K5
75
J i l l L
Mj y i L
144 ^010(100.90
311(15-21)
194(H.P)
299iBnco.oo)
S49(21.75)
527(21X0)
2(ft.99)
17O M )
317<17.91)
981(29X2)
7fi9(100 PC}
Q)ir»dwta
iimgalen Untvtnlty:
IS(1.19)
31(123)
Q( O M )
1 1 2(12.42)
94(9.48)
13(1J2)
13(1.32)
179 (17 2 )
141(4 28)
U (1.28)
11 (9.37)
NA{72.13}
NAp in }
NA
21(149)
52(3.11)
9(OM)
II(M 5)
27(3M)
1 1(3X4)
14(143)
79( i . r j
31(t.M l
412(13.77)
NA(100.00) 101
j m .14
(4.21)137
-7719 {21.91} T IiS
P4J9} • 00
J i X B .•71.56
275(13.45)
27(1.12)9
J1 4 4 L
116(19.11)
15(1.15)
44(3^9)
410(12 J2)
42 (1J5)
53 (159)
1195U9119}4914
0.00P9.50)
2SI(1413)
2(0.11)
57q i7 )
92JISO L
42
j m .134
(4.09)•2.19
{100 00}to 49
(2-72)
715(1IJ1)
4(OM)
74(1.72)
129
j m
II iS pOM} -90 44 p.4^ U i2
- M L-173
{190 00}O iW iaia KtiwMa 1 1 2
(12.42)0
J1 2 S L
170(1722)
9i m .
442(13.77)
9
NA{100.00}
NAf iO
10 1(9.5«)
0(O.M)
14
(4J1)9
137(5.7«)
0(Q .M )
T O T{M9.30}
•-00
92(4.S9)
9J 1 » L
42(3J1)
0(9-90)
134(4.09)
9(O.Ml
•219 {100 00} 9.00
J L S l-
90(319)
9j m .
4 t(2.72)
0« x »
129(2.M)
C(0.00)
•1T3 {100 00} 090
I M .K im itaM Univaniy: 719
(29X1)209
(2107)U7
(2<.4g)N A(100.00 2 tl
(12.92)57
(7X5)290
dCO.W4 3 ll{19.15}
0.00pXSI.39.79PS.09}SI.7S
_ B « L
1Q(7.W)
M(3.1»
231(«.M)
•1115fWOM}
120(4.7t)
n(4-29)
197(4.S7)
-14 72 {190 00}
OwMad
JBan Kauwli
Baigauin
B^pur
534(MX5)
0(0 00)
130 ($17)
95
j m .
151 (15 M)
0(0X0)
S5(547)
2
(0 ^ )
(19J9)9
(9.«)IIS
($.29)97
NA{7210}
NAp xo iNA
r9 .i9 }NA
9(0.00)0(0.00)
105(9.99)
98
iL H L
42(5-20)
0(0X0)
12(1.4»)
1
jy z L
42(1 77)
0(O.OC)
117 (4.42)
101 (4 25)
19(0.41)
9(9.09)
90(4.49)
93
J 1 « L
S5(4 i0 )
0(0X0)
19(8.78)
3(9.21)
95(1.94)
0(0.09)
too(2.«)
99(1.87)
m T
JL»5L
54.78 5814}
0.00 pXQI -14.S3 fJ M } 44 86 gt.57}-8.71
{WO.Ofl}
19(0 79)
8(0.00)74
(2.15)27
J L H L
87(3.72)
9(0X0)
9(9.44)
2« . 11)
l iJ 1 1 !L
49(2.00)0(0.00)
12(1.90)
29(8 fi)
12J1fl4 5 }
oooPXOJ-ItMf 'C }•59 06
j m .245
I L I 5 I
51 291
J i i l L
NA{100.00}
249115X5L
94(H 83)
140 14 J9f1<9.00}
221(16i1)
89(9.5T)
194(7.731
75(2.89)
5(0.20)
42; i *7)
j m -2510
(100X0)
289
j m .1214
G tiftirfa
Rjknur
3<l»y
Odar
122(4.55)
0(OOO)
0;oiX )
121j i a L
14PXS)
0(6.00)9
(0X0)13
fU 2)
191(4.S7)
9(9 « )
I(9 JO)
J L * I
NA{$405}
NAP X (|NA
PX(»HA.
j t m .
154(9«3)
0(8.M1
0.‘OX)
•0J573JL
47(5X2)
0(0X0)
9|0X0)
47
j m .
203 (8 S3)
0(0 00)
a;o x )
I3T
(5.76)
29X8(5971}
0.00|DXI|
0 0 0
».74
M S L
119($87)
3(8.15)
21(in)
t i'.891
(106X0)
42(3.21)
2(0.15)
4(6J1)
J 2 ^
158(4.71)
5(«.I5)
25.-OTS)Its
(3.S5)
•22.17 p i 47}
9.00 {1X3J 930
-IX u
J 2 i!S L
16(2X0)
1(fl-lT)
T(8J8)
nj m .
I l l(2.59)
4(0.19)
41 :i 14)
101 (2.141
-29 75 fl-M }MXOPX7)MXO
-IS 13 07 55}
(O r o ^ K 2513(100X0)
997(100 30)
3690(100.IQ)
NAMA
1571(100.00) 408(10S.M)
2371IlMXO)
• 32.03 MA
1309(100.00)13S4
(196.00)40X8NA
1808(100.00)
4 j1 i(100.00) Hi51A
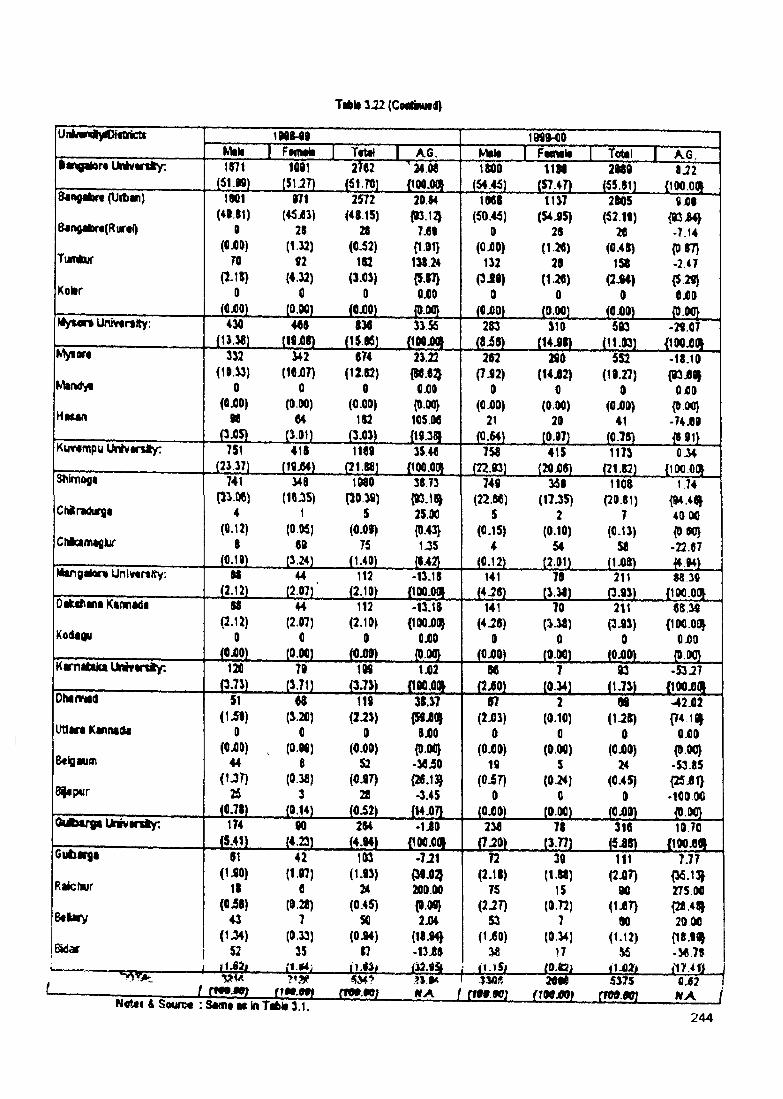
Tiftli 3 ^ (CooliMMd)
UiyMn«v4}«f&nctsMtk
1MM9I fntttk Tftal
2hi(S17t)]
I I M1MM0
Mule Fm m Ii Total KQ.l« > 9<lor« IM v m iy : 1871
J51^m \
(S1-3T)24.M
{100.00IttlO
i § * M11M
(57.4T>2 m aj2
{100.01»B«ngaiN« (IJ it in )
B«ng«br«(Rurf{)
Tumftur
Kolir
Myt«r« U nhririlly :
1M1(♦••81)
D(OjOO)
7C
0ffljQQ)434
871(4 5 i l)
2S
(112)92
(4.M)C
jyojLMS
2572(i815)
2t(C.52)1S2
(3.0»0
(OjOO)8M
20.S4{K.12J
7^9{1.01}131.24{5.87}QjOO
J 2 M .33 55
IM S<50.45)
0(OjOO)
132(3 J i)
0(OjOO)
2S3
1137 (54 J5)
2S
(1 M )20
I1 .« )0
j m .310
2M5(52.19)
7t(0.40)
159(2J4)
0(CJO)
503
9j09
(03 i4 } 7.14
{O.ST} -247 {5.29} 9j00
JiSL-29.07
(13.38) (19jOO) (15.05) w m (8 i0 ) (14X0) (11.03) {100X01332 342 874 23.22 202 290 552 -18.10
Kte(Wv«(1J.33) (IOjOT) (12.02) (M .89 (7^2) (14X2) (1027) {03X91
0 0 0 OjOO 0 0 0 0X0
H»un(0X0) (0.00) (0.00) {0.00} (0X0) (0.00) (0X0) {0.00}
08 84 102 105 08 21 20 41 -74X9PX5) (1.01) (3.03) {19-381 (0.W) (0.97) (0-70) {891}
Kutrimpu IM v in t y : I 751 41S 1180 35.48 758 415 1173(23.37) _ (H-W ) (2188) {100.005 (22.03) (20X0) (21.82) {10C.OOI
3Mmo(i 741 348 1080 38.73 749 359 1100 1.74
C hlrtdurstPVOC) (18J35) PO.39) {03.1^ (22.86) (17.35) (20.81) {04.48^
4 1 5 25.00 5 2 7 40 00
Chicann«slur(fi.12) (0,05) (0.09) {0.43} (0.15) (0.10) (0.13) {0 8C}
8 89 75 U 5 4 54 58 -22X7(0.19) _ t l » ) (1.40) (0.42) (0.12) (2.01) (1X0) H.04}
M angiion Unlv«r«lty; 08 44 112 -13.18 141 70 211 88 39(2.12) (2.07)’ (2.10) {100.00} (4JS) (3.38) (3.93) {100.001
OtU tim a Kannidi 08 44 112 -13.18 141 70 211 88.39
Kodladu(2.12) (2.97) (2.10) {IOQjOO (4 JO) (1.M) (3X3) {100.00^
0 0 0 0X0 0 0 0 0X0(OjOO) (0.001 (0X0) (0.00) (0X0) (0.00) (0X0) (0.00)
K im a fta Jc tlM v trtty : 120 79 109 1X2 08 7 03 -53J7p.73| . _ (1.T1J (3.73) {190.001 (2X0) (0.34) (1-73) {lOOXd
Oharv«d 51 6S 119 38.37 07 2 09 -42X2
Utlara Kannali(1 i» ) (3.20) (2J3) {59X0J (2X3) (0.10) (U O ) f?4.1i^
0 0 0 8X0 0 0 0 0X0
Bcigaum(OjOD) , (O.M) (0.00) {0.00} (0X0) (0.00) (0X0) {0.00}
44 8 S2 -3 8 i0 19 5 24 -53 85
Bfapur(U T ) (0.38) (0.97) (O iT) (0.24) (0-45) {25X1}
25 3 28 -3.45 0 Q 0 •100.00(0.78) (0.14) (0.52) (14X71 (0X0) (0.00) (0X0) (0.00}
0Ubar9a Ik v v in ty : 1T4 90 204 •1X0 2M 78 ) ie 10.70(5.41) . (4.23) (4.94) (100.001 (7J») (3.T7) {100X81
G u lifl^a 01 42 103 -7J1 72 30 111 7.77
Raichur(1^0) (1.07) (1 .« ) {M.02J (2.18) (1.88) (2X?) {36.13J
18 0 24 200.00 75 15 00 275.00
B « l«y(OiS) (0.28) (0-45) {9.08} (2J2T) (0.T2) (1XT) {28.481
43 7 50 2X4 S3 7 OQ 20.00
BMar( 1 ^ ) (0.13) (0J4) (1X0) (0.34) (1-12) {18.99J
52 35 87 -13 i0 38 17 55 -36.78it.94i IJ.8S; i (».J5/ ro.ftsj 117.40 i
t rw 9 mN o tti A SauTM ! SAfit* M ii
c w .mi
f f 99.00)■ ■ W
( m m5575
(m .9o j0X2 I W A 1
244
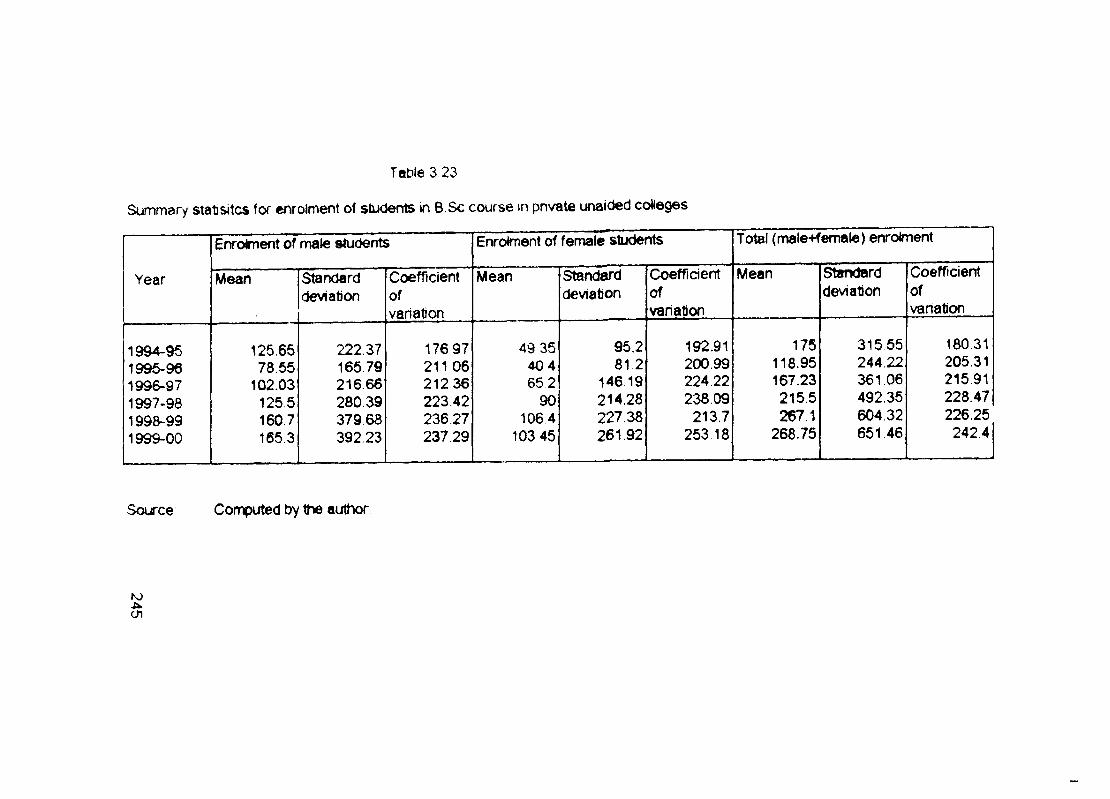
Table 3 23
Summary statsitcs for ftnrolrnent of students in B.Sc course in pnvate unaided colleges
Enrolment of male students Enrolment of female students Total (male+female) enrolment
Year Mean Standard CoefTicient Mean Standard Coefficient Mean Standard Coefficientdevtation of deviation of deviation of
variation variation variation
1994-95 125.66 222.37 17697 49 35 95.2 192.91 175 31555 180,311995-96 78.65 165 79 211 06 404 81,2 200.99 118.95 244.22 205.311996-97 102.03 216.66 212 36 652 146 19 224.22 167.23 361 06 215.911997-98 126,5 280.39 223.42 90 214.28 238 09 215.5 492.35 228.471998-99 160.7 379.68 236 27 106.4 227,38 213.7 267 1 604.32 226.251999-00 165.3 392 23 237.29 103 45 261.92 253 18 268.75 651 46 2424
Source Computed by the author
fOcn
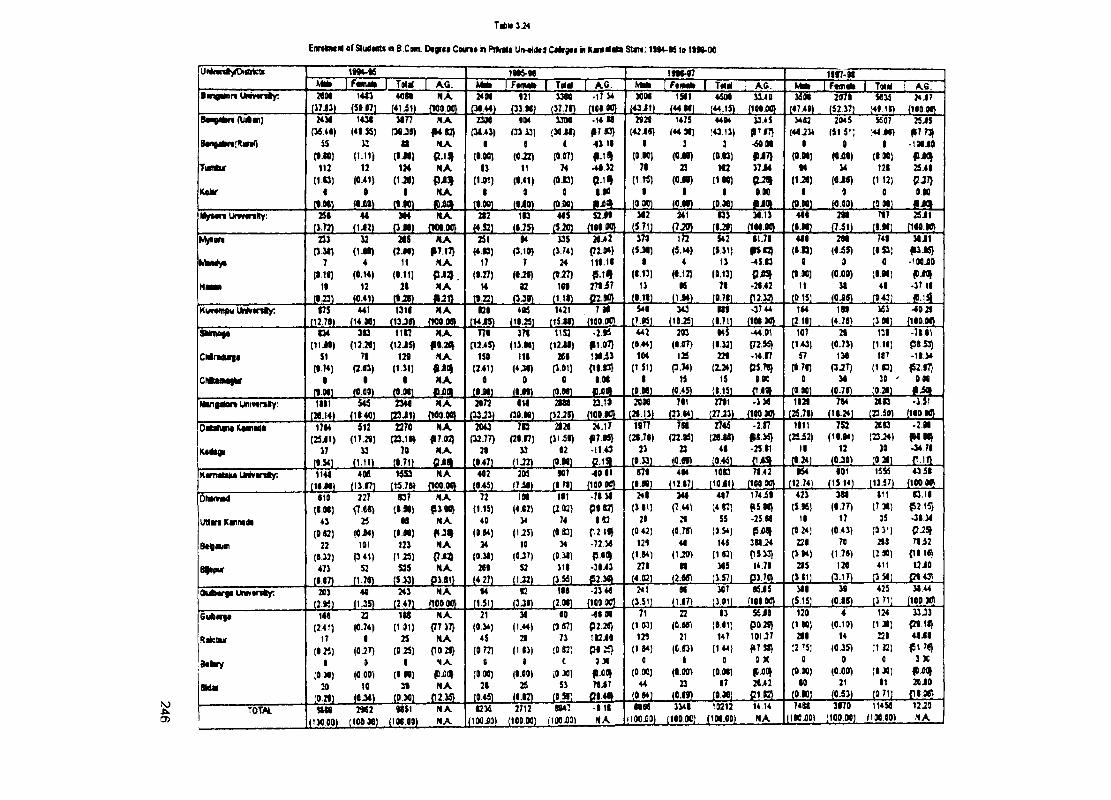
Emkncm « (Sludtnts in B.Com. 0«9r«t Cotn* h P iM t Un-tldii] C M tj*! in K an iliia Su m : 19M-K to It9»-0C
Tibli 3J4
t«M-KMite I Fwiifc I Tam I
im-wFm m* I Tolif AG.
im47T P m w H I THH AG. M<i I Ptmm I TmK l~A6?
I«i0iior« U m in iy : MM 1411 4Qn NA 24M «21 3« •ir>4 M M 1SI1 4<S0I 14M 2971 2*j;tiwH tttn (liHw) 24M 143t 3 in NA 23M 104 3300 .14 88 2S28 1475 4404 33.45 3482 2045 K97 25 J 5
(36.4«) (48 S5) (3«J9) # 4 82} (3843) (33 33) {MJ8) {17 0} I42J9) (44 38) !43.13) {|Tf7\ (44J2M (51 51; I'M 99) (87 73}Bm gjiHf'ltm fi a 33 8t HA. I 5 « -83 18 8 J 3 -59M 8 9 8 •IM iO
(9 « J (1.11) (» .« l (2.1JJ (9.00) (0J2) (0.07) (0.90) (0J8) (0.93) f J 7 ) (0.08) (OjOO) (800) {BJOITianlu’ 112 12 124 N A 13 11 74 4 8 32 78 23 m 37i4 94 34 128 2548
(1.0) (041) (1J6) P j03| (1JM) (841) (0.C) (1W) (0.89) (1M) (1-26) (0-89) (1 12) PJ7>Kolv 1 9 8 N A 8 0 0 8.90 8 8 8 9.00 8 0 0 9.80
9 M ) m o n (9.00) (8J0) to.oo) (0 00) (0.89) (0.M) M ... (0.80) (0.00) (OM) #-801MyMn U rm nlty; 2S« 41 3«4 N A 282 183 405 S2J9 312 Ml 833 30.13 488 298 717 25i1
(JT3) (1^2) (VI81 {WO.OO) {4.52) (8.75) (5.20) (109.00) (571) (7 JO) ( iJ f ) m m . . (8.M] . j m 1160.80}Myion 233 32 28S N A 251 •4 335 20>2 370 172 S42 91.78 488 298 748 38J1
(3.M) (1.M) (2.M) §7.17} (4.93) (3.10) (3.74) {710»} (5J0) (5.V4) (5.31) f$83} (6 0 ) (6-55) (8 53) #3*5}M«Wy« 7 4 11 N A 17 T 24 118.18 8 4 13 -4513 0 9 0 .IOC JO
l»l«) (0.14) (1.11) P i 3 . (8.27) (0J9) (tt-27) {5.1# (813) (0.12) (0.13) PJOSJ (0.00) (OJO) (8.M) #iO JHanii 19 12 28 N A 14 82 109 278i7 13 95 78 •2842 11 18 48 .37 18
\92Z) (0.41) t»J«) (0.22) (1.18) (9.18) (1.1*) tO.78) r2.32} (0.15) (0-89) (0.431 #.13}Ku««(npu UWvMity; f15 441 1316 N A 828 4K 1421 788 549 343 889 -37 44 144 198 363 -40 JS
(12.79) (I4.M) (13J9) flOO.OO) (14 J5) (18.25) (l5 J f) {109.00} (7.95) (10J5) (8.71) (108 00) (2.18) (4.78) (3M) {18000}SMmofa SM 383 1187 N A T79 371 1152 -2»5 442 203 945 -44.01 107 28 138 •78.81
(11J8) (12.20) (12J5) f0.20} (124$) (1180) (12-88) f i i im (9.44) (8.07) (8.32) {72.55} (143) (0.71) (118) P8S3}CMndwga 51 71 129 N A 159 118 208 lM i3 104 125 229 - i 4 . r 57 130 187 .18.14
(9.T4) (2.03) (1.31) (241) (4-38) (3.81) T8 83} (1.51) (3.74) (2J4) P5.70} (9.76) (3.27) (183) #2.87}1 9 8 N A 0 0 0 8.M 8 15 15 0.90 0 34 39 ' 9.80
(9.M] (0.00) (9.M) fDXOt (9.M) (8J0) (0.M) fiJ09_ (9.M) (0.45) (815) p .81 (0.00) (0.78) (0.28)Ntangilort UnivtrsSy; tta i 545 2340 N A 2072 110 2188 23.10 20M 781 2791 •3 34 1828 784 2883 • i .i i
(26.14) (18 40) (23J1) (100 90) (33 J3) (30.80) (32-28) (109 90} (28.131 (23 94) (27 J3) {100 00} (25.78) t18.24) (23.59) {190.80}
OMM na KMnadt 1794 512 2270 N A 2M3 7 0 2126 24.17 H77 788 2745 -2.57 1811 752 2883 •2M
(25J1) (IT.20) (2J-18) {17.82} (32.77) (28.87) (3148) {«7.a5} (28.78) (22.95) (26-88) (25i2) (18.94) (23 J4) # 8 98}
37 33 70 N A 29 33 62 -1143 23 a 48 •25 81 18 12 30 0 4 78
(9.S4) ( i . i n (8.71) O i « (9.47) (1J2) (0.«) P - 1 « _ (0.33) (0.09) (0.44) ... (0.24) (0-39) (0 28) -.11,n .Hvnataka Unteanty; 1141 406 15S3 N A 402 2K 907 4981 979 494 1083 78.42 954 801 I55S 43 i8
(l«M ) (1397) (15.79) (100 00) (943) (7i9) (8 71) {109 0 ^ (9 90) (12.87) (lO il) {100 00} (12.74) (13.57) {100 00}
DiMmtd 910 227 S37 NA 72 IM 181 -78 31 248 340 487 I74i8 423 3S8 111 13.18
|IM ) (7.08) ( l .« ) 93.90} (115) (4j02) (2.02) P8821 (3 81) (7.44) (417) f 5 88} (5K ) (8.7T) (7 38) P215}inian Kaimili 43 23 08 NA 40 14 74 8 D 29 21 55 -25 88 18 17 35 •3814
(912) (0-M) (9.«) (0.94) (1-25) (O.K) p itf l} (9 42) (0.7f) (9.54) (0.24) (0.43) (JJ1) Q JSi
22 101 123 N A 34 10 34 -72 30 125 44 148 3 8 8 ^ 238 70 288 71i2
(9.32) (3.41) (1.25) p i ? (0 38) (0-37) {0.31) p .« n (184) (1J0) (183) 0513} (104) (1.78) (2 SO) T8 14}
Bfipur 473 S2 S25 N A 269 S2 318 •3843 Z78 88 345 14.78 285 126 411 12-49
(•17) (1.78) (5.33) 0381} (4 27) (1J2) (3.56) P 2 3 0 L (4.K) (2.09) (157) (1.81) f3.lT) (3 58) £ 1 B .OUbargi U m tn ty : 203 40 243 NA 94 83 189 -2140 241 91 307 85J5 188 18 425 18 44
(2.9S) (1.35) (2.47) flOOOO} (1.51) (3J9) (2.M) (100 901 (3.51) (1.87) (3.91) (109 00} (5.15) (0.88) [3 71] {100.90}
6dbars« 149 22 188 N A 21 34 eo •08 n 71 22 81 56J0 120 4 124 33J3
(241) (0.74) (1.91) (77 37} (0.34) (1.44) (0.97) P2.20} (1 03) (0.99) (9.81) P02S} (180) (0.19) (138) P9.18}
R A tu r 17 8 2S N A 45 28 73 182 ilO 125 21 147 101-37 288 14 239 4 8 i8
(9 « ) (0-2T) (0 25) ro 2 f} (0 H) (183) !0 K) P8 25} (1 84) (0.81) (144) f7J8} .’275] (0J5) :u 2 ) #176}
B«kfy 1 } 1 HA, 0 1 0 930 0 1 0 9X 0 9 0 3 X
;o « ) (0.00) (* « ) fijoa^ (0 00) (8.00) i030) fXO) (0 90) (0.00) (O.M) (0 00) (OilO) (8.30) #iW |
9 im 20 10 30 N A 28 25 51 7«i7 a 23 87 2«>2 80 21 11 20i0
t0.2<] (0J4) (0.30) fl2.35} (0 45) (8.82) (0.58) C8.40} _ (0 94) (0.69) (O.M) C1.S2} (0.90) (0.53) [971) T8.06}
TOTAi M99 2 « 2 «51 N A 83» 2712 »47 -818 n s o 3148 10212 14.14 74SS 3970 1U56 12J29
(1M.00) tIOO.M) (1M.00) NA (lOOiOl (100.00) (tOOXO) NA flOO-OO) (100 00) (1M.00) NA (180X0) (100.00) (136.00) NAO)
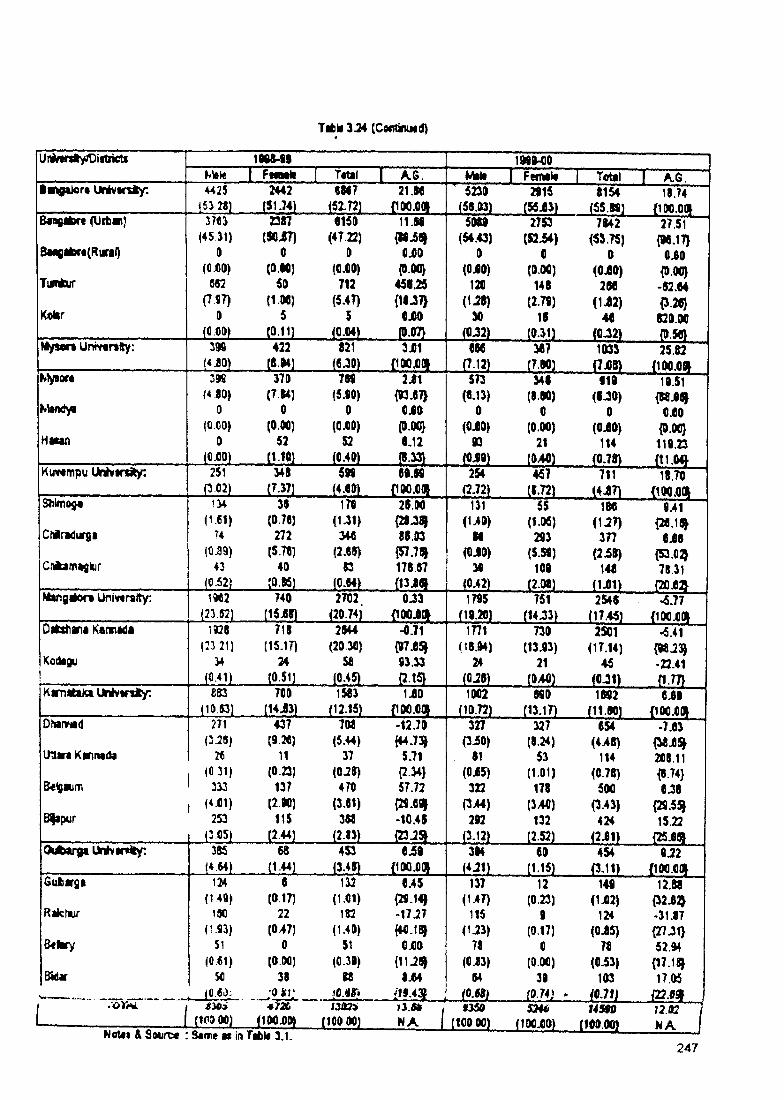
Tifcli 3 ^ (C«fitiUNd)
Jninnty/Diitricts 1 j6 M S _ 1 F tw rti T t i l I A.6'“
1UM0^ I FwTWk I Total I A.G.
l« « 9»)or« iM v a rs iy : ♦425 2U2 tU 7 21.18 ' 5230 2915 1164 18.74(51.74) (52.72) {100.001 (58.03) (S5X3) (S5.B9) {lOOXd
B«n6«tor« (U itv i) 3T«J 23S7 6150 11.58 5(M9 2753 7842 27.51(4531) ( » iT ) (47.22) { H i8 | (54.43) (52X4) (53.75) (W.1T)
BMSil»r«(Rtfal) 0 0 0 OjOO 0 0 0 0X0(0X0) [OM) (0.00) {0.00} (0X0) (0.00) (0X0) {0.00}
Tumkur 652 50 712 458J» 120 148 258 -52.04(7 57) (1.M) (5.4T) (U 8 ) (2.79) (1 i2 ) P.26}
K«lir 0 5 5 OjOO 30 15 40 820.00(COO) {0.07} (0J2) A m (0J2) {0.50}
M ysm Uniy«r«)ty; 39S 422 321 3j01 856 367 1033 25.82(6^0) {100XI(» (7.12) _ {7.WJ (7X8) {100.001
NV^ort 2M 370 799 2 i1 573 348 119 19.51(4.80) (7.14) (5-W) {»3.87> (8.13) (8W ) (8-30) {S8X8J
K W y« 0 0 0 0X0 0 0 0 0X0(0.00) (0.00) (OjOO) {0.00} (0X0) (0.(») (0X0) {0.00}
Hann 0 52 S2 8.12 n 21 114 119.23(OilO) f«.M} _ (0J9) i m (0.78) {11.04J
Kuvtmpu IM vm tlty : 251 » 8 5M 80.59 254 467 711 18.70(3.02) J T i? i [ 4 M _{!00.0H (2.72) _ CI.T2) (4X7) {100.0(1
S}iiino9« tM 35 170 25.00 131 55 180 U i(161) (0.7«) (U 1 ) {28J8I (MO) (1.05) (1-27) {28.18J
C h ir td ir fli 74 272 340 85.03 U 293 377 8X5{0 i9 ) (5.7«) (2.05) {57.781 (OJO) (5.59) (2X8) {53X ^
Chicjm»slur 43 40 83 178.57 34 109 148 78.31(0.52) (O.W) {13X« (0.42) _ _ (2.081 (1X1) {20X2}
fto n g iio n Unlvtrelty: 1M2 740 2702 0^3 1795 751 2S^5 -6.77(23 52) (15 i8) (20.74) {lOOXd (19.20) _ {14-33} (1T45) {100X01
D lis^v la Kaimada 1928 718 2544 -0.71 1771 730 2S01 -5.41C5 21) («.17) (20.30) {07X5J (18.04) (13X3) (1T.14) {WJ3J
KotU^u M 24 58 93.33 21 21 45 -22.41.....m i i m . . {2.1^ i m (0J1) fl.TT}
Kam iteKt U M v m ty : 8S3 700 1583 1X0 1002 n o 1592 8X9(10.53) (14 i3) . (1115) {100.001 (10.72) ....(13.17) (11.W) {100X01
O him id 271 437 708 -12.70 327 327 -7X3(3J28) i m (5.44) {♦4.7:^ (3 i0 ) (8.24) (4^8) {38X5}
lit lira Kannicb 2€ 11 37 5.71 51 53 114 208.11I (C31) (0.23) (0J8) {2.34} (0X5) (1-01) (0-78) {8.74}1 333 137 470 57.72 322 178 500 8J81 (4 i) l) (2.90) (3.81) {29X01 P>44) (3/40) (3.43) {29.5^
a jipu r 253 11$ 3 « -10.45 292 132 424 15.22(305) .... i m . . _ (3.12) (2.52^ (2X1) {25X9
OUtarga lM va r« ty : 385 68 4S3 8j59 314 60 4S4 0J2(4.64) (3.48) {100X01 14J11 (1.15} (3.11) {100.001
Guliarsa 124 8 132 8.45 137 12 149 12.88(149) (0.17) (1.01) {29.1^ (1,47) (0.23) (1J02) {32X3J
Riichur 190 22 182 -17 J7 115 9 124 -31.87(1-«) (047) (1-40) {« .1 9 (U 3 ) (0.17) (0X5) {27.31}
B«krv 51 0 51 0X0 78 0 78 52.M(061) (0.00) (0.39) {11-2^ (0J3) (0.00) (0X3) {17.1^
Bidv 50 38 88 1X4 54 39 103 17.1K. (0.6^: :o.iv fO.«ri >. . - j L y i .
(IC3 00) (1M J0) ftOOQO) ft A f109W) (100X0)14590
rtoQ.PO)12.02NANoUi & Swn:« : Same at in Titiif 3.1
247
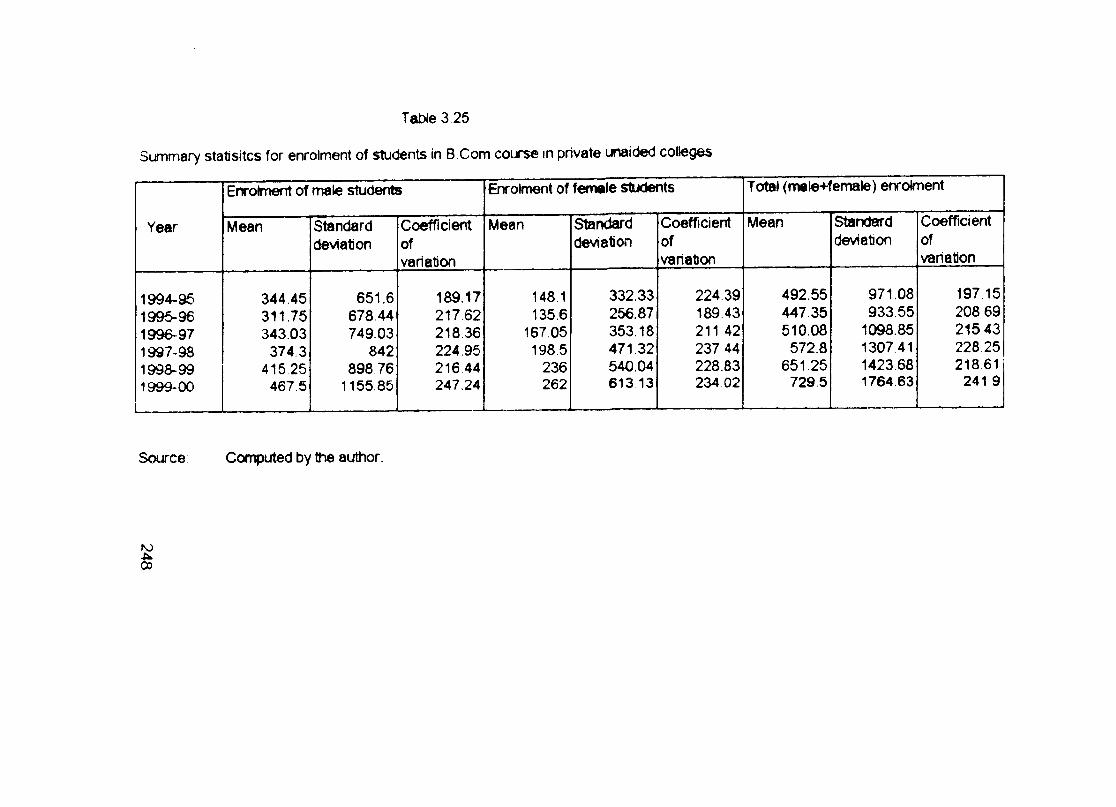
Table 3.25
Summary statisitcs for enrolment of students in B Com course in private unaided colleges
Year
1994-951996-961996-971997-981998-991999-00
Enrolment of male students
Mean
344.45311.75343.03
374341525
467.5
Standarddeviation
651.6 678.44 749.03
842 898 76
1155.85
Coefficientofvariation
189.17 217.62 218.36 224.95 216 44 247.24
Enrolment of female students
Mean
148 1135.6
167.05198.5
236262
Standarddeviation
332.33 256.87 353.18 471 32 540.04 613 13
Coefficientofvariation
224.39 189.43 211 42 237 44 228.83 234.02
Total (male+female) enrolment
Mean
492.55447.35510.08
572.8651.25
729.5
Standarddeviation
971.08933.55
1098.851307.411423681764.63
Coefficientofvariation
197.15 208 69 215.43 228 25 218.61 241 9
Source: Computed by the author.
NJ
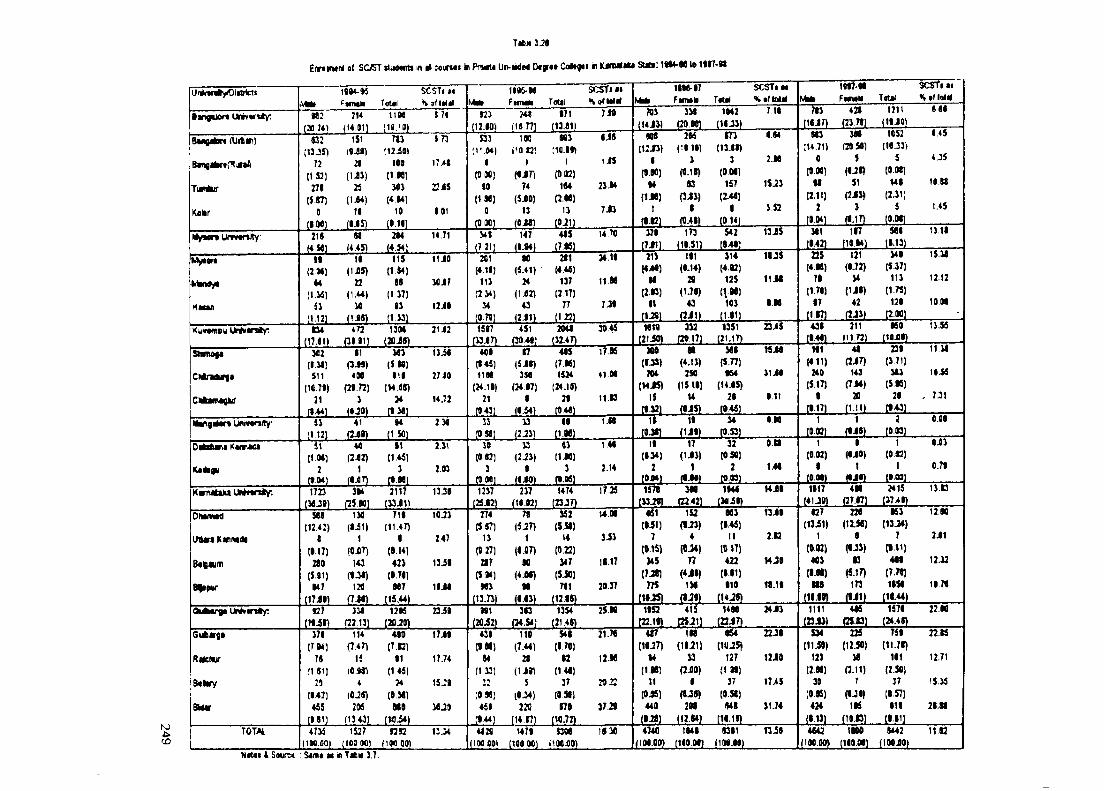
J i t k 3.29
Ew«ir»#f«l of SG5T students in d to u w i in Pnvrtt Un-Mded C o ltfti m Hmtnttka S ttti; 1«W-M lo 1W -W
UnMntyOittrtcUfvMi
1«M-MFtmtia ToUl
SCSTi •( S 9f l«4l<
190S-96FtnMit ToUl
SCSTi« of M il NMi
1996-97Fh m Ii T«tal
SCSTi t i S sflaK I
1W/-9IFm m M Total
;iC 4ii II %trio4ii
langaiort Univ«n<y: M3(20.74)
2U<14.91)
IIM(19.10)
S7« m(12.90)
249( i o n )
971(13.811
7J9 703 (14 J3)
331(20.90)
1042(16J3)
719 793(16X7)
42t(23 791
1111(19X0)
6 69
SMOilBrt
TumlBir
K«ltr
G2;13JS)
72(tSJ)
271($.871
0[9.00)
1S1(« ia )
21( l i l )
25(1J4)
19(9-9S)
Tt3;i2 i0 )
109(1 .« )
343[*U )
10(9.191
*73
i:> «
22i5
901
533;i'.04)
I(0 00)
(0 (199)
0(0 00)
190 1*0 93;
1(6JT)
74(5X0)
13(flJS)
983:1C.99)
1(0.02)
164(2.M)
13(0J1)
6J9
iX5
23 94
7J3
909(12i3)
9(9.90)
94(tJ* )
1(•■•21
296 (19 19)
1(9.19)
S3p J l )
9(0^9)
973(13X9)
3(DM)
157(^46)
9(014)
9.94
2,96
15J3
3S2
993;14.71)
0(0.00)
99(2.11)
2(0.04)
399(20 50)
J(«J«)
51(2X1)
3(i.17)
1052(16J3)
5(0.06)
149(2.11)
5|0.M)
6.45
4 J5
10.98
1.45
M^Mn Uravtnity: 219K M l
89(4.45)
294(4.54)
14.71 341(721)
147(9.94)
495(7.K)
14.70 379(7J1)
173(10.511
542t»49)
13X5 391(9.42)
117(10.14)
59919.13)
13 18
Mytart 19 19 115 11J0 201 90 291 24 19 211 191 114 m i 225 121 149 15.38
(Z.M) (1X5) (1.14) (4 19) (5.41) (4.4«) (449) (6.14) (4.82) (4.95) (6.72) (5.37)
IklMitfya 64 23 89 30J7 113 24 137 11.96 9t 29 125 11X1 79 14 113 12.12
(l.iS) (1.44) (1 37) (2.J4) (1^2) (2.17) (2.90) (1.79) ( l « ) (170) (1X9) (175)
H w u » 39 93 I2 i9 34 43 77 7J9 61 43 103 • •6 97 42 129 10.06
[I 13} (1J«) (1.33) (0.70) (2J1) (122) (1J8) (2J1) (1.91) ( i . r ) (2J1) (2.001 *
Ku<rtmpu iH v tn iy : tM ♦ 72 13M 21J2 1597 451 2041 30 45 1619 312 1351 H AS 439 211 960 13,55
(17.61) (39.91) (20i5> (13X7) (30.49) (12.47) (21 iO) (2017) (21.17) (9.46) (1172)
M2 91 W 13i9 4C9 17 495 17.K 3«0 99 M9 15X9 191 41 239 11 38
(1.31] P-M) (5.9«) (145) (5J9) (7.»5) (6.M) (4.13) (5.77) (4,11) (2 i7) (171)
CMnriiVfli S11 4U 919 27 iO 1199 356 1524 4109 704 250 964 31X9 MO 143 193 19.SS
(W-71) (29.72) (M.fl5) (24.19) (34.17) (24.19) (M i5) (15.19) (14X5) (5.17) (7X4) (5.K)
cmaiMgiur 21 3 24 U.72 21 9 29 11.93 IS M 29 911 9 20 29 , 7J1
[944] (9J0) (9 39) (0 43) (9.54) (0.46) [9 32] (9J5) (045) (917) (1.11)
Mtfigilar* Unmrtity: S3 41 94 239 33 33 69 tJ 9 19 19 34 9,96 1 1 3 0X9
(1 12J 0 9 9 ) (1.50) (0 « ) (2J3) (1.«) (»•») (1J9) (0.53) (0.82) m . {0.M)
OiM kira K«nMM 44 11 231 39 33 <3 1.69 19 17 32 0.99 1 9 1 0X3
(1.M3 (2-«2> 11*5) (0 92) (3J3) (1.00) (9.34) (1X3) (0.50) (0.02) (6X0) 10,02)
lUteON 2 1 3 2.03 3 9 3 2.14 2 1 2 141 9 1 1 0.79
(».9*) (9JT) ( t .« ) (0.06) (9J0) {•.Ml. (0.94) (9X9) fO.83) (0.09) <9Xt)
K im ib Ja U M nnty ; 1723 3M 2117 13J9 1237 237 1474 1TJ3 1579 3«9 1944 HX9 1917 499 2415 13.93
{25.90) (33J1) (25.62) (10.92) (23-37) fl3J®) (22,42) (KIX9) (41 JO) (27.97) (17>9)
DMmtd SM 13d 719 10J3 274 79 352 14.09 461 152 M3 13X9 927 22« •S3 12.90
(12.42) (« i1 ) (11.*7) (5 97) (5-37) (5.59) (•-51) (9JJ) (9.45) (13X1) (12.56) (13-24)
IJttM KWMdl 8 1 9 247 13 1 14 3 i3 7 4 11 2.12 1 9 7 2X1
[•17] (0X7) (9.14) (0 27) |6-fi7) (t>.22) l®.«) (« i4 ) w (®.K) (•-11) (111)210 143 423 13i9 217 90 347 1117 34S 77 422 14 JO 491 13 499 12.12
($.91) (9J9) (•76) (5 94) (4X«) (S.SOJ { m (4X9) (9.91) (I.M) (5.17) (7.70)B%pur 947 120 M7 19j99 963 99 791 20.37 775 I3« 910 19.19 999 173 1959 19.76
(17iU 0 J » ) (15.M) (13.7J| (6.13) (12.19) (16JS) (IJ5 ) (14J9) (19.9«| (IX1| (11441OUfccrgi UW«*n*y: 927 339 12»S 23i9 991 393 1354 2S.90 19S2 415 14M 24X3 1111 495 1576 22.90
(M iJ) (2213) (2flJ0) (2fli2} f24.54) (21.49) ( r . i J | (25J1) (22X7) |23X1| (25.0) (24.49)G iA v ft 379 114 490 17X9 439 110 549 21 76 467 199 954 22J9 S34 225 759 22,95
(TW) (7.4T) (7.C) (9 « ) (7.44) (9.70) (16J7) ( U i l ) (1U 5) (lliO ) (12.50) (11.71)Rikhur 79 15 91 17.74 64 29 92 12.96 94 13 127 12X0 121 19 161 12,71
:i 51) (0.9«) (1*5) (1 13] (1 i» ) (1 « ) (1M) (2X0) (199) (2.«) a i l ) (2.50)|s* iiry : i 4 24 15^9 $ 37 W22 11 9 37 1745 30 r 37 15,35
(942) (0J5) (O.M) (0 96) (6-34) (0.S9) (0J5) (9-39) (0,59) (0.K) (I-36I (•57)BMr 455 2K MO 3«J0 4^9 220 979 37.29 440 29« 949 11.74 424 195 919 29.99
(*.®1) ( 1 J « ) (10.54) (9.44) (14.97) (10.72) (IJ«) (12.94) (16.16) (9.131 (10.C) (•.91)TOTAi 4734 1S27 92 S2 12.34 462fi 1479 9309 1S30 4740 1949 9391 13i9 4942 1900 9442 1113
I1M.00) (100 90) (10«.00) (lOOXOk (100 W) (100X0) (109.0(n [160.0C] (109X0) (100.00) (160.09) (109X0)CDN«Ui 4 Saurr* ; S«m* m In Tifctt 3.7.
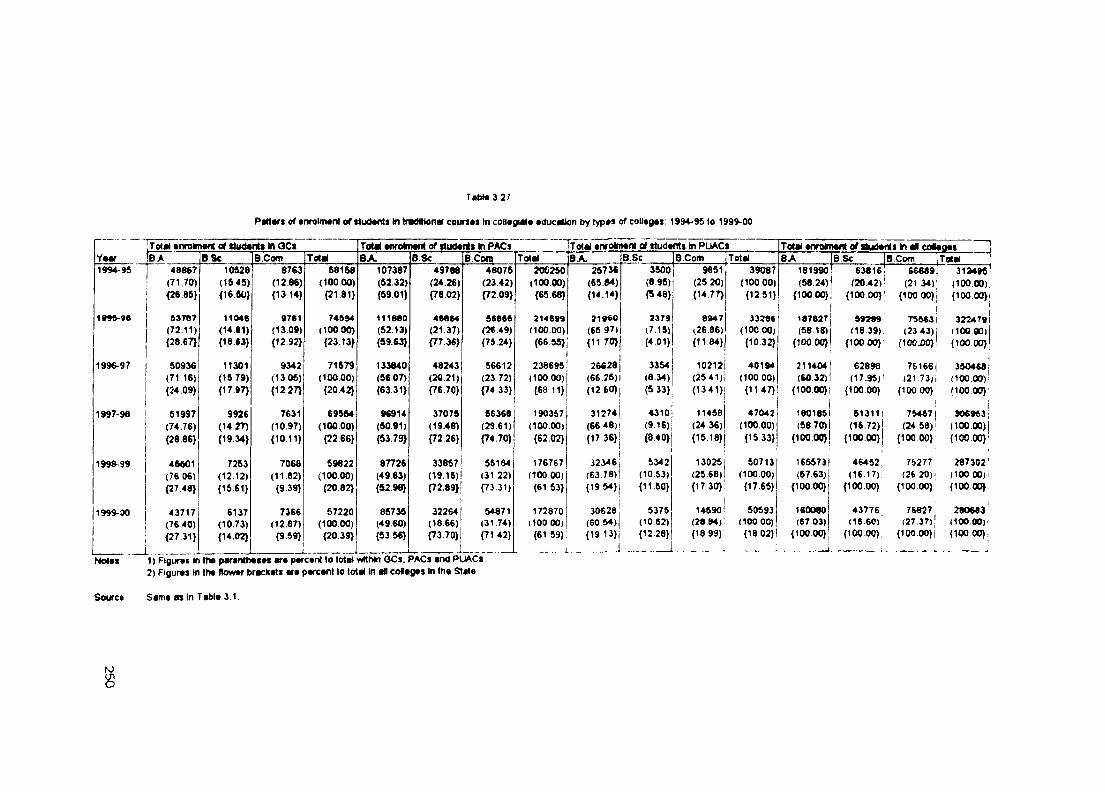
Tab»«3.2/
Pattfs of •nro lm *nl of ttud«nts m traditional courses In coll«glat« •ducM on by typ*s of coll«g«s: 1994-95 to 1999-00
Itoiai enrolmani of ttudanit In GCs Total anrolmfnl of students In PACs Total enrotmeni of students m PUACs Total enroimeni of Pudfta in ooiegas 1Year !b a B.Sc B.Com Total BA B.Sc B.Com Total BA B.Sc B Com Total BA B.Sc B.Cofn Total1994-95 I 48867
1 (7170) 1 {26 06}i
10928(16.48){16.60}
8763(12.86){13.14}
68168(100 00) {21.81}
107387(52.32){59.01}
49788(24.26){78.02}
48076(23.42){72.09}
20S260(100.00){65.68}
25736(65.54){14.14}
3500 (8.96) {5 48}
9851 (25,20) {14 77}
39087 (100 00) {12.51)
181990 (58.24)
{100 00}
63816 (20.42)!
1 {100,00}!:
66689(21 34)
{100 00)
3m «8|(100.M) (100 00}
199fr-a6 83787(72.11){28.67}
11046 (14.81) {18 63}
9761 (13.09) {12 92}
745^4(100.00){2313}
111860(52.13){59.63}
46664(21.37) {77 36}
56666(26.49){75.24}
214699(100.00){66.55}
21960 (66 97) {11 70}
2379(7.16){4.01}
8947(26,86){1184}
33286 (100 00) {1032}
187627(58.18)
{10000}
1 1 j 99289
(18,39) {100 00}
76663(23 43)
{100 iW)
3224T9 I(100.00){100,00}
1996-97 50936 (71 16) {24.09}
11301(16.79){17.97}
9342(13.06){12.27}
71679(100.00){2042}
133840(66.07){63.31}
48243(26.21){76.70}
56612 (23.72) {74 33}
1
238695 (100 00) {68 11}
26628 (66.25)1 (12 60}|
3354 1 (8.34)
{5 33}
10212 (25 41) (1341}
40194(100 00)
{1147}i
211404(60.32)
{100.00)1j
1 62898I (17.95)! 1 (100 00)i
75166(21 73)
(100 00}
350468(100 00) {100.00}
1997-98 61997 (74.76) {28 86}
9926 (14.27) {19 34}
7631(10.97){10.11}
69564(100.00) {22 68}
96914(60.91){53.79}
37075 (19.481 {72 26}
56366(29.61){74.70}
190367 (100.00) {62 02}
31274 (66 48)! {17 36}|
4310(9.16)(8.40}
i
11458 (24 36) {15,18}
47042 (100.00) {15 33}
11801861 (58 70)1
{100.00}
1t 613111
(16.72)1 {100.00}|
75467 (24 58)
(100.00)
i306963;
(100.00){100.00}'
199^ 99 46601(76.06){27.48}
7283(12.12){15.61}
7066(11.82) {9 39}
59822 (100.00) {20 82}
87726(4963){52.90}
33857(19.16){72.89}
56184 (31 22) {73 31}
176767 (100.00) {61 53}
32346(63.78){1954}j
5342(10.53){11.60}
13025 (25.68) {17 30}
50713 (100 00) {17.65}
165573 (67.63)
{100 00}
46452i (16.17):
{100.00}
76277 (26 20)1
(100.00)
287302' (100 00)1 (100,0(^1
1999-00
i !1___ i
43717 (76.40) {27 31}
6137(10.73){14.02}
7366 (12.87) {9 59}
57220(100.00){20.39}
86736(49.60){5356}
32264 (18.66) {73 70}
54871(31.74){7142}
172870 (100 00) {61 59}
— .... i
30628 (6054) {19 13}i____ 1
5376 (10 62) {12.28}
14690 (28.84; {18 99}
50593 (100 00)! (18 02)1
160080 (67 03)
{100.00}
43776;(16.60)'
{100.00}]
76827:(27.37)!
(100.00)1
280663! (lOOOO)j (100 00}i
No(«s 1) Flj|ijr»i m th» par«nlh*»** sr* p«rc*nl lo total >MtNn GCs. PACs and PUACs2) Figures In tha Itowaf brackets are percent to total In aA coSeges In the State
Source Same as In Table 3.1,
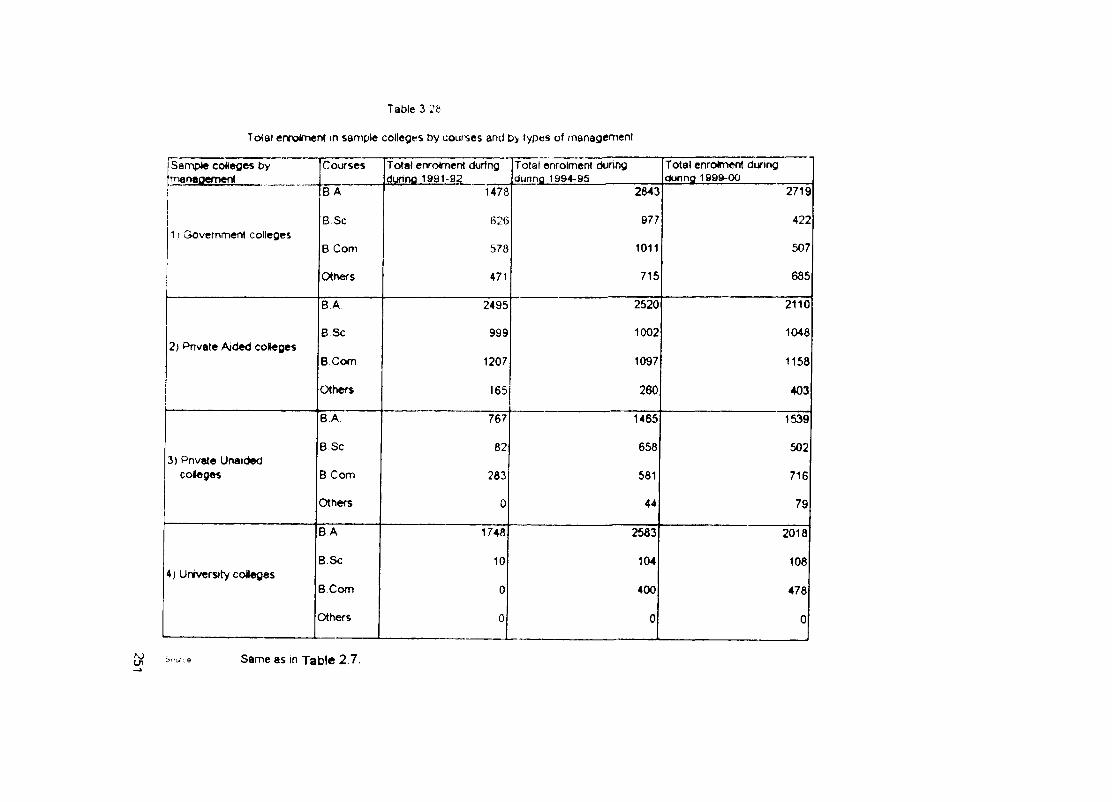
Total enroJmenl in sample colleges by courses and D> types of rnanagcnTent
Table 3 2t
Sample coUeges by manaoenrwnt
Courses Total enrolment during duhnfl 1991-92
Total enrolment during dunna 1994-95
Total enrolment during dunna 199&-00
i B A 1478 2843 2719
B Sc B26 977 42211 Government colleges
B Com 578 1011 507
Others 471 715 685
B A 2495 2520 2110
B Sc 999 1002 10462) Pnvate Aided colleges
B.Com 1207 1097 1158
Others 165 260 403
B.A. 767 1465 1539
B Sc 82 658 5023) Pnvate Unaided
coleges B Com 283 581 716
Others 0 44 79
B.A. 1748 2583 2018
B.Sc 10 104 1084) Unh/ersity coWeges
B.Com 0 400 478
Others 0 0 0
cn Same as in T able 2.7.
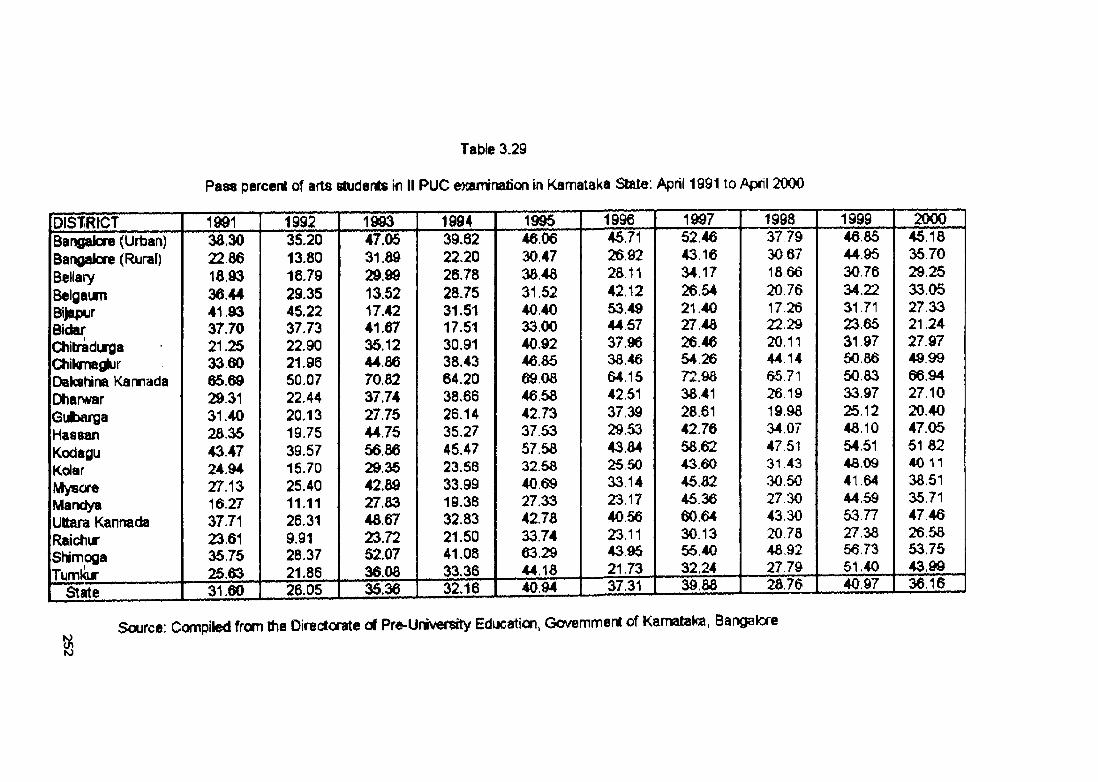
Table 3.29
Pass percent of arts students In II PUC exarrination in Karnataka Stale: April 1991 to April 2000
DISTRICT 1»91 1992 1993 1994 1995 1996 1997 1998 1999 2000Bangalore (Urban)Bangalore (Ruraf)BellaryBelgaumBi|apiirBidarCtiitradurgaCtiikmafl rDaksNna KannadaOliarwarGubaiigaMasaanKodaguKolarMysoreMandyaUttara KannadaRaictiurShinnogaTumliur
за.30 22 8618.93зб.4441.9337.70 21.25 33 60 65.69 29.31 31.40 28.35 43.4724.94 27.13 16.2737.71 23.61 3575 25.63
35.2013.80167929.3545.2237.7322.9021.96S0.0722.4420.13197539.5715.7025.4011.1126.319.9128.3721.86
47.0531.89 29.99 13.52 17.4241.67 36.1244.8670.8237.7427.7544.7556.86 29.3542.8927.8348.67 23.7252.0736.08
39.6222.2026,7828.7531.5117.51 30.91 38.43 64.20 38.66 26.14 35.27 45.47 23.56 33.99 19.38 32.83 21.50 41,08 33.36
46.0630.4738.4831.52 40.40 33.00 40.92 46.85 69.0846.5842.7337.5357.5832.58 40 69 27.33 42.7833.74 63.29 44.18
45.71 26 92 28.11 4212 53.49 44.57 37.96 38 46 64.15 42.51 37.39 29.53 43.84 25 50 33.14 23.17 40.56 23.11 43.95 21.73
52.46 43 16 34,17 26.5421.40 27.4826.46 54.26 72.98 3841 28.61 42.76 58.62 43.60 45.82 45.36 60.64 30.1355.40 32.24
37 79 30 67 1866 20 76 17,26 22 29 20.11 44.14 65.71 26,19 19,98 34.07 47.51 31.43 30.50 27 30 43 3020.78 48.9227.79 28,76
46,85 44 9530 76 34.22 3171 236531.97 50 86 50 8333.97 25.12 48.10 54.51 48 09 41 64 44,59 53.77 27 38 56.73 51.4040.97
45.18 35 70 29.25 33 05 27 33 21.24 27.97 49 99 66.94 27 10 20.40 47.05 51 82 40.11 38,51 35 71 47.46 26 58 53.75 43.99 3616State 31.60 26.05 35.36 32.16 40 94 37.31 39 88
to
Source: Compiled from the Directorate of Pre-Univefsity Edixation, Govemnnent of Karnataka, Bangakxe
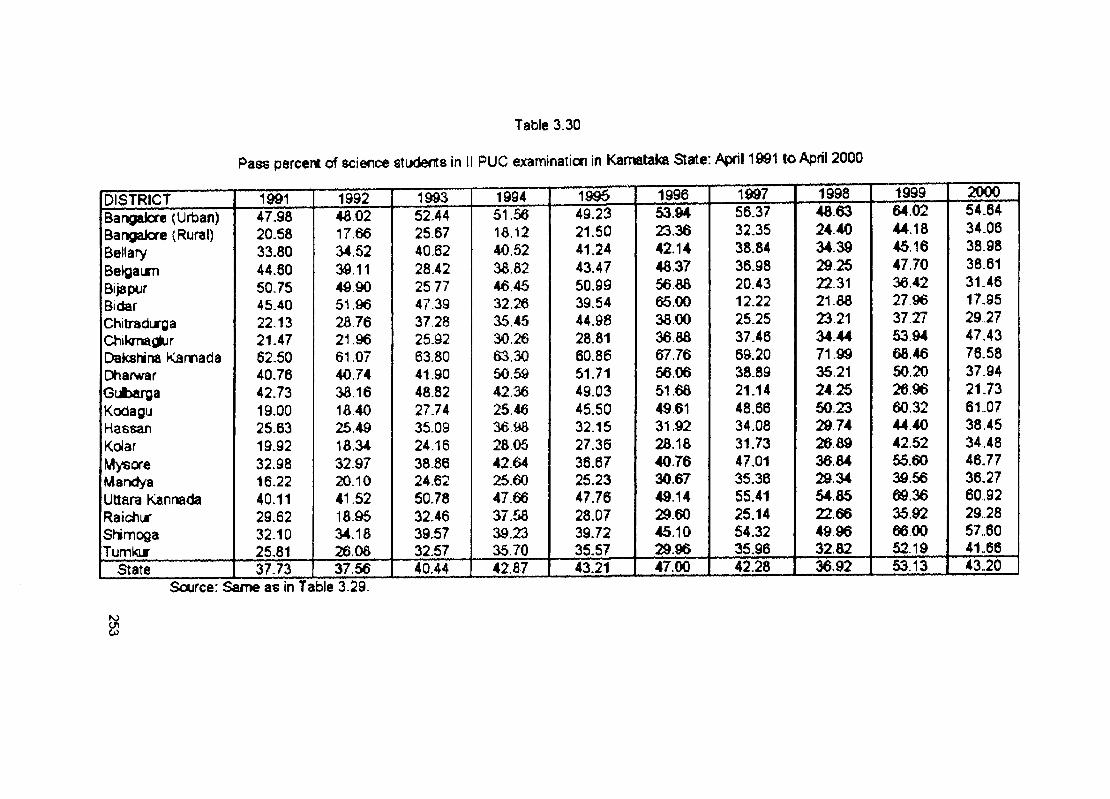
Table 3.30
Pass percent of science stixterts in 1! PUC examination in Kamalaka State: Apnl 1d91 lo April 2000
DISTRICT 1991 1992 1993 1994 1995 1996 1997 1998 1999 64 02
2 0 0 0
Bangaicre (Urban)Bangakxe (Rural)BellaryBelgaumBijspurBidarChitradLrgaChikmaglurDakshina KamadaDharwarGubargaKodaguHassanKoJar!y8ore
MandyaUttara KannadaRaic iurShimogaTumkLT
47.98 20,5833.80 44.60 50-75 45-40 22.13 21.47 62.50 40.76 42.73 19-00 25-63 19-9232.98 16.22 40.11 29.62 32.1025.81
46.02 1766 34.52 39.11 49 90 51 96 2B7621.9661.07 40.74 38.16 1840 25.49 18.3432.97 20.10 41 52 18.95 34.1826.08
52.4425.6740.62 28.42 2577 47.39 37.28 25,92 63.80 41.90 48.82 2774 35.09 24.16 38.8624.62 50.78 32.4639.5732.57
51.5618.1240.5238 82 46 4532.2635 4530.26 63.3050.59 42.36 25.4636 98 28 05 426425.60 47.66 37.5839 23 35,70
49.2321.5041.24 43.47 50.99 39.54 44.98 28.81 60.8651.71 49.0345.50 32.16 27.36 36.67 25.23 47.76 28.0739.72 35.57
53.9423.3642.1448 37 56.88 65.00 38 00 36 8867.76 56 06 51.6849 61 31 92 28.1840.76 30.6749.14 29.60 45.10 29.96
56.3732.35 38.84 36.98 20.43 12.22 25.25 37.46 69.20 38.8921.14 48.66 34.08 31.73 47.0135.36 55.4125.14 54.32 35.96
48 63 24.40 34 39 29 25 22 31 21.8823.21 34.44 71.9935.21 2425 50 23 29 74 26 89 36 84 29.34 54.85 22.6649 96 32.82
44.18 45.16 47.7036 42 27 9637 27 53.94 68.46 50.20 26 96 60.32 44 40 42.52 55.60 39.56 69.36 35.92 66 0052.19
54.6434..06 38.98 38.61 31 46 17.9529.27 47.43 76„58 37.94 21.73 61.07 38.45 34.48 46.7736.27 60.92 29 2867..60 41.66
State 37-73 37.56 40,44 42.87 43.21 47.00 42.28 36.92 53.13 43.20Source: Same as in Table 3.29.
cnCO
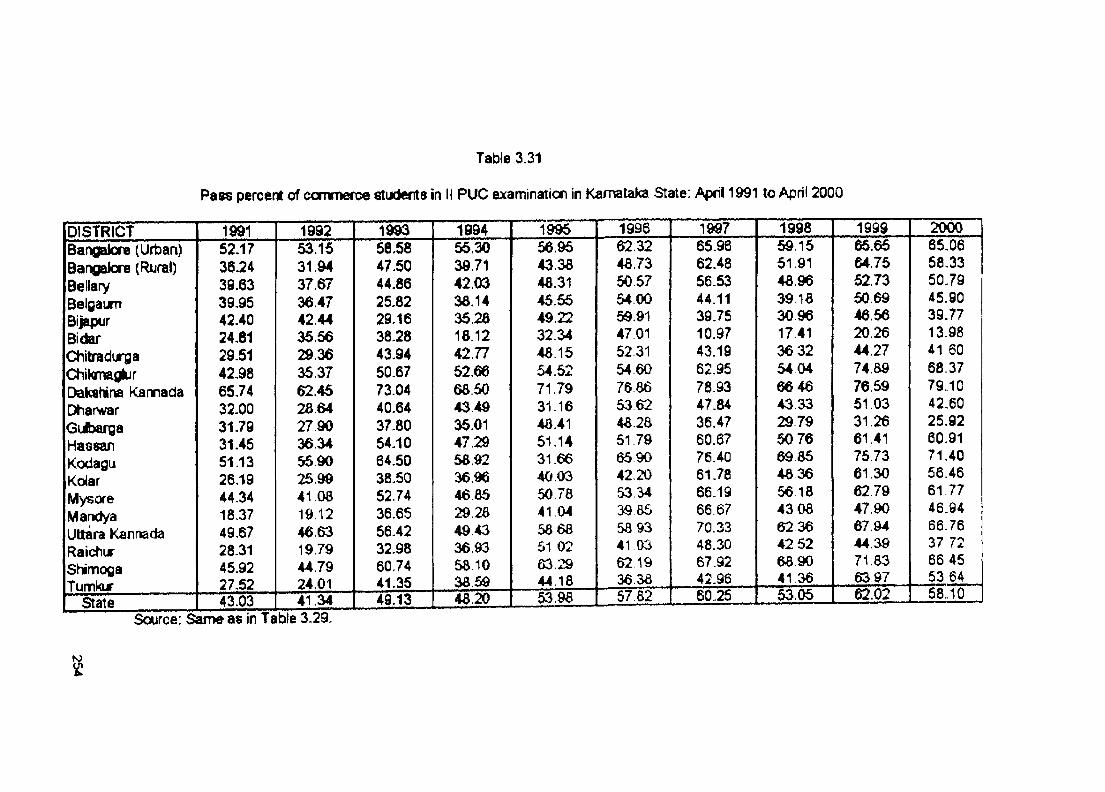
Table 3.31
Pass percent of commerce studefits in II PUC examination in Karnataka State: 1991 to April 2000
DISTRICT 1991 1992 1993 1994 1995 1996 1997 1998 1999 2 0 0 0
Bar galore (Urban)Bangakxe (RuraOBellaryBelgaumBijapurBidarOiilradu*gaChikmaglurDakahina KarradaDharwarGiJbargaHaasanKodaguKolarMysoreMarxJya Ultara Kannada Raidiur SNmoga Tumkur ___
52,1736,2439.6339.9542.4024,8129.51 42,98 65,74 32.00 31.79 31.45 51.13 26.1944-34 18 37 49.67 28.3145-9227.52
53.1631.9437.6736.47424435.5629.3635.37 62.45 28 64 27.90 36 34 55 90 25.99 41.06 19,12 46 6319.7944.79 24.01
58,5847.50 44.86 25.82 29.16 38.28 43.94 50.67 73.0440.64 37.80 54.1064.5038.5052.7436.65 56.42 32.9860.74 41.35
55.3039.7142.0336.1435.28 18.12 42.77 52.66 68.50 43 49 35.0147.29 58 92 36.96 46 85 29.28 49 43 36.93 58.10 38.59
56.9543.3848.3145.5549.2232.3448.15 54.52 71.7931.16 48.41 51.14 31.66 40 0350 78 41.04 58 6851 02 63.29 44.18
62.3248.7350.5754.00 59.9147.01 52.31 54 60 7686 53 62 48.28 51.79 65.90 42.20 53 34 39 85 58 93 41 03 62.19 36.38
65-9662.4856.5344.1139-7510-9743-1962.95 78.93 47-84 36.4760.67 76.40 61-78 66.1966.67 70-33 48.30 67.9242.96
59.15 51.91 48 96 39 18 30 96 17,41 36 32 54 04 66 46 43 33 29 79 50 76 69 85 48 36 56 18 43 08 62 36 4252 68 90 41 36
State 43.03 41.34 49.13 48.20 53.98 57 82 60.25 53.05
65.6564.7552.73 50,69 46.56 20.26 44.2774.89 76.59 51.03 31,26 61.4175.73 61.30 62.7947.90 67,94 44.39 71,83 63,9762.02
65.0658-3350.7945.90 39.77 13.9841.60 68.3779..1042.60 25.9260.91 71.4056..46 61 77 46.94 66-76
66 45 53.64 58.10
Source: Same as In Table 3.29.
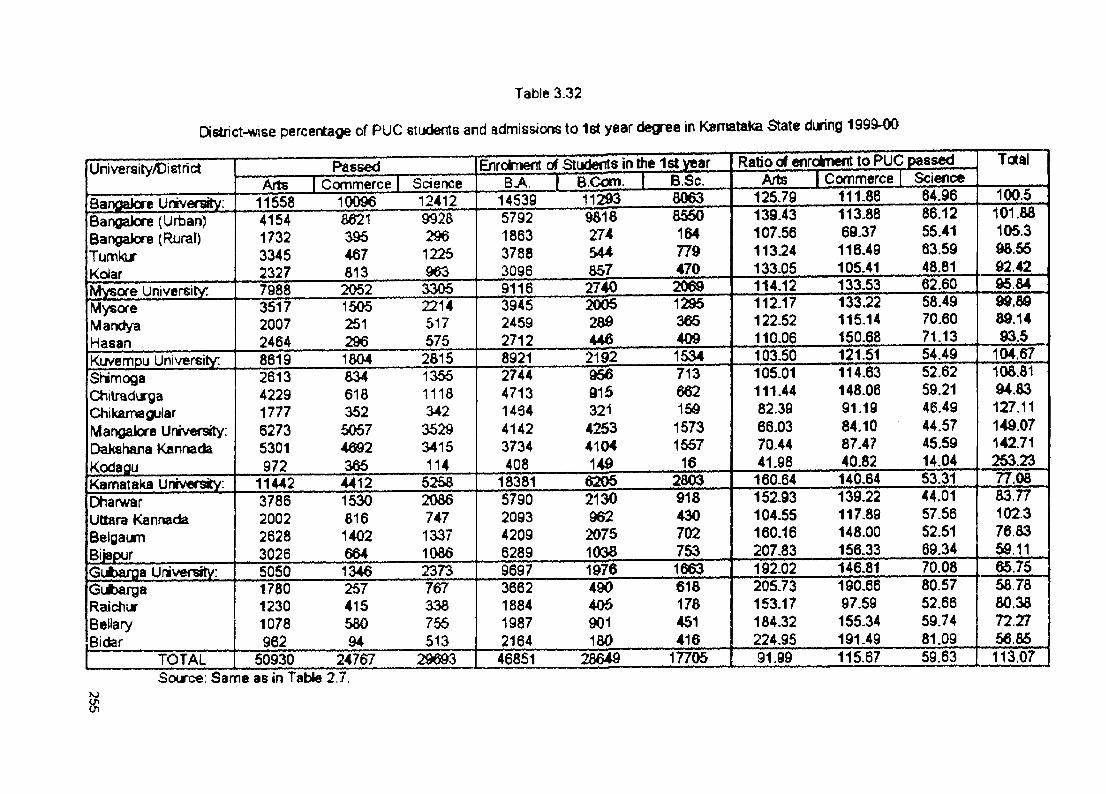
Table 3.32
District-wse percertage of PUC students and admissioos to 1st year degree in Karnataka State during 1999-00
University/District Passed Enrolment of Students in the 1st year Ratio of enroirnent to PUC passed TotalArts 1 Cofnmerce [ Science BA I B.Com. I B.Sc. Arts 1 Connmerce Science
Bangakxe University; 11558 10096 12412 14539 112^3 8063 125.79 111.86 64.96 100.5
Bangaiore (Urban) 4164 8621 9928 5792 9818 8560 139.43 113.88 86.12 101.88Bangalore (Ruraf) 1732 396 296 1863 274 164 107.56 69.37 55.41 105.3Tumkir 3345 467 1225 3788 S44 779 113.24 116.49 63.59 98.66Kdar 2327 ei3 963 3096 857 470 133.05 105.41 48.81 92.42Mysore University: 7988 2052 3305 9116 2740 2069 114.12 133.53 62.60 95.84Mysore 3517 1505 2214 3945 2005 1296 112.17 133,22 58.49 99.89Manctya 2007 251 517 2459 289 365 122.52 115.14 70.60 89.14Hasan 2464 296 575 2712 446 409 110.06 150.68 71.13 93.5Kiivempu University: 8619 1804 2815 8921 2192 1534 103.50 121.51 54.49 104.67SNmoga 2613 834 1356 2744 956 713 105.01 114.63 52.62 108.81Chilradurga 4229 618 1118 4713 915 662 111.44 148.06 59.21 94.83Chikamagular 1777 352 342 1434 321 159 82.39 91.19 46.49 127.11Mangalore Unrversity; 6273 5057 3529 4142 4263 1573 66.03 84.10 44.57 149.07Dakshana Kanrtada 5301 4692 3416 3734 4104 1667 70.44 87.47 45.59 142.71Kodagii 972 365 114 408 149 16 41.98 40.82 14.04 263.23Karnataka University: 11442 4412 5258 18381 6206 2803 160.64 140.64 53.31 77.08Dtiarwar 3786 1530 2086 5790 2130 918 152.93 139.22 44.01 83.77Uttara Kannada 2002 816 747 2093 962 430 104.55 117.89 57.56 102.3Beigaum 2628 1402 1337 4209 2075 702 160.16 148.00 52.51 76 83Bijaptir 3026 664 1086 6289 1038 753 207.83 156.33 69.34 59.11Gubarga University: 5050 1346 2373 9697 1976 1663 192.02 146.81 70.08 65.76GiA>arga 1780 257 767 3662 490 618 205.73 190.66 80.57 68.78Raichur 1230 415 338 1884 406 178 153.17 97.59 52.66 80.38Bellary 1078 580 755 1987 901 461 184.32 155.34 59.74 72.27Bidar 962 94 513 2164 180 416 224.95 191.49 81.09 56.86
TOTAL 50930 24767 29693 46851 28649 17705 91.99 115.67 59.63 113.07 1Source: Same as in TaWe 2.7.
fO
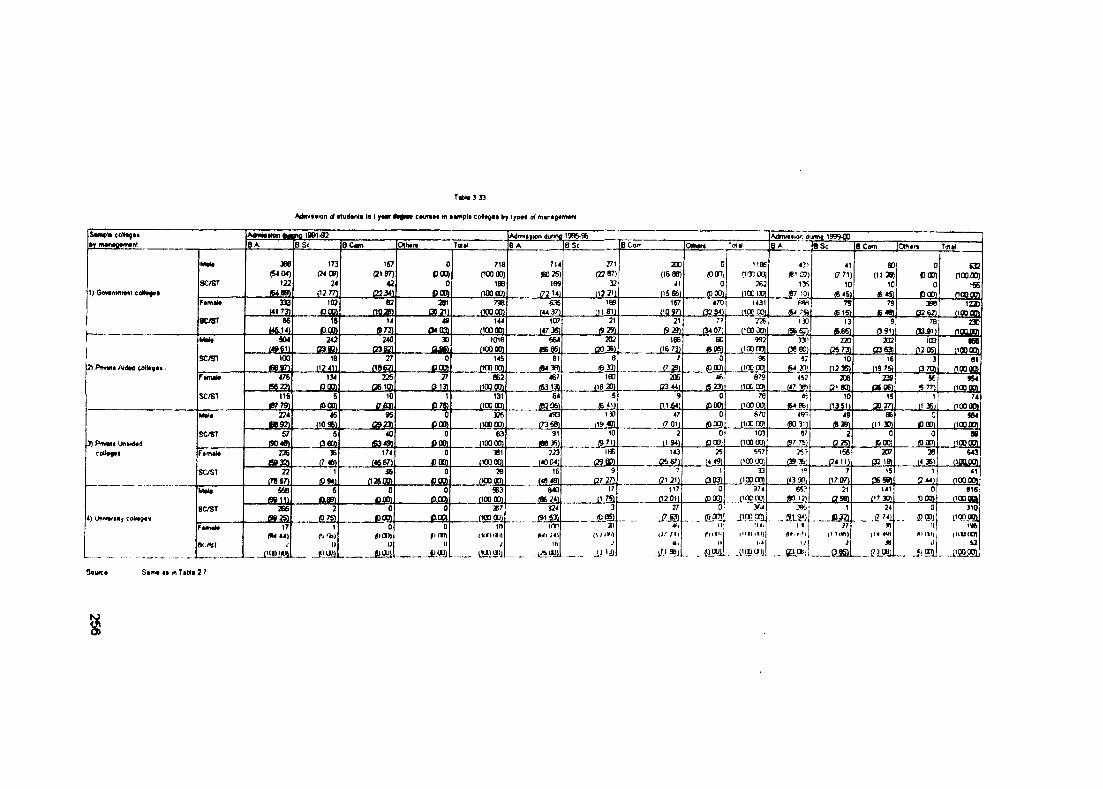
Tib«*3 33
Admittion of ttudtnti Ig I jvm ceurtM m t*mpl* col)*4«i by lypvt of
by m*nw«m*ntA4mw*ton«yinnfl 1961-93 AdrrMttion dunna 1985-96 Adr*u»»ior. flurttio 199M0BA BSc e.C«n Olhcr* Total 8 A 8 5c B Com OiNr* Totrf BSc e C»m Ottitrt Totrt
M«<« 388 173 157 0 710 714 271 200 0 nas 431 41 60 0 S32(54.04) (24(B) (2187) POO) f100(B) «B0 2S) (22 87) (16 88) (OOO) (lOCOtfl (B102) (7 71) (1) 28) POO) (100.00)
SC/ST 122 24 42 0 180 189 32 41 0 362 135 10 10 0 1551) Oowtnwn«itl ca**o»i . _S i?a (1277) C22341 _ .. .. .fioqi noooo) (72 14) (1 2 ^ l'5 65j ... (PWl (i(rno) |P7 101 (6 45) (6*5)| COO) flOOOO)
Ftmal* 333 1(0 82 736 635 1E9 1S7 470 1431 6W 75 791 396 120(41 731 (Dom (105®. 06211 noocDi (44 37) (11.811 (10 97) _. a s M i dODOO] (64 7« (616) fi40t (32 62) (100 07)
8C«T 66 le 14 49 144 107 21 21 77 226 i r 13 9 78 230(46..U) fi.QO) (872) £3403) (100(0) (47 36) 19 29) (9 29) . (34 07) flOOOOl {5b S2) 6.66) (3 91) (30 J1) rtOBon
Mtli S04 243 2« 30 1016 564 302 166 SO 992 SX! 220 20^ 103 666{49in (23 « ) £23S1j 0861 (100 001 IG6a5] (20361 _ . . (16 73) (100 00) (38 80) (25 73) S3 63) (12 061 (100 00)
9C/ST too 18 T V 0 145 ei 3 1 0 96 K 10 161 3 812) PnvMt A IM coHagti (B6 8n (12411 ne«2i COOl ntnooi (84 30) 6 33J . _ _ ...... (7 29J (DO)) (11X005 (64 X ) (12 3S) (19 75) (3 7® noo.ocfi
F u n » t* 476 134 225 27 0B2 467 100 206 48 679 442 2t38 239| 56 96486.221 (DCD) . C26lffl 013) (100 001 (5313) (la m C23 44J S23II (100 00) (47 3er) Q10O1 0106) (6 77) (tOO(X)
SC/ST ns 5 ID 1 131 64 5 9 0 78 «3 10 IS 1 74m r s i (000) (7j63) 076) (100 00) (8206) (6 *\1 (1.1-64) OOO) (100 001 (64 06) (13511 00 27)1 (1 36) (100 on
IM« 224 46 95 0 326 493 130 47 0 670 49 06 0 S84« 9 2 ) (10 96) (2973) COO) (10000) (7368) 119 «1 . . (7 01J (000) (100 ap (80 31) . (8.39) (11 30) POP) (100.00)
SC/ST 57 5 40 0 63 91 10 2 0 103 87 2 0 0 803) PnvMt (90 46) peo) 6349) OOO) (100 00) (88 36) _J97H L\ 94i (OWj (100 OO) (97 C2 25) pooil OOO) (100 OOl
coUvgti Fimal* Z3E 36 174 0 381 223 106 143 25 ?53 156 » 643S 32 ) (7 46) (4667) (DOO) (looqo) (40 04) C»67) (4 49i (100 001 (39 3S) £24 11) C32 19) (4 36) (lOOOOl
SC/ST 22 1 % 0 26 16 9 7 1 33 19 7 15 1 41(7B57) (0 941 (12600 POO) (KJO.OO) (46 401 0 7 m _______ e ’,.?u . _ Q o a (10000) (43 90) _. .a.7 07) (36 SB) £2 44) (100 OO)
MM 666 6 0 0 5B3 840 17 117 0 974 65? 21 141 0 916196111 CLflBl OOOl 0.00) (100 001 (86 24) (1 7S . . . (12 01) (oaa (100 00) (BO 12) (258) (17 301 (0 00) (100 oa
SC/ST 266 2 0 0 267 324 3 27 0 364 1 241 0 3104) UnnnHMf coUtgtt «9P2S) (0 75) COO) OOO) (100 OO) (91 sa J . S 1 ___ ___ f i M _____(? ^4^ P 00) (100 am
F tm tt* 17 1 0 0 in inn M, II ’’ lU, 11I ?f f) i»(»4 44) <•.»».) (Tlffl)) #ino) (11(1 III) M l ;4i <V.’ /11 ffimi llllMII) f * . t./i (1 iiift) (IV 4U| |HU (I})
m ./Hi ‘ 1) II (i t Ih 4ti II 1,' 1 JH u ■u___ . ............. _______ fe-Sffi ______ ____ J.1 IJ) . ..one*?'] . . . e » ; . . . ...086}. $L ____0°ai5 i
Some* S*m* a« in T*b<« 27
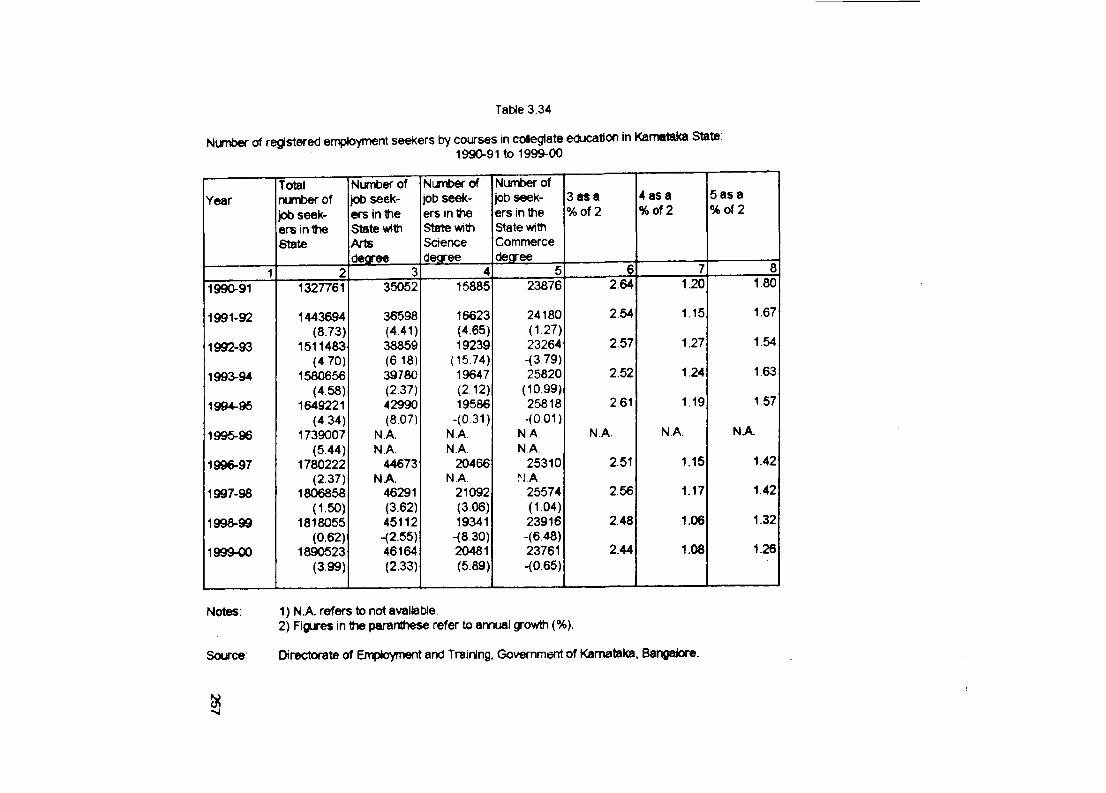
Number of registered employment seekers by courses in collegiate education In Kamataka State:1990-91 to 1999-00
Table 3.34
YearTotalnumber of job seekers in the State
Number of job seekers in the State with Arts dearee
Number of job seekers In the Stale with Science degree
Number of job seekers in the State with Commerce dearee
3asa%of2
4 as a%of2
5 as a%of2
1 2 3 4 5 6 7 81990-91 132776? 35052 15885 23876 2.64 1.20 1.80
1991-92 1443694 36598 16623 24180 2.54 1.15 1.67(8.73) (4.41) (4.65) (1.27)
1992-93 1511483 38859 19239 23264 2.57 1.27 1.54(4.70) (6.18) (15.74) -(379)
1993-94 1580656 39780 19647 25820 2.52 1.24 1.63(4.58) (2.37) (2.12) (10.99)
1994-95 1649221 42990 19586 25818 261 1.19 1.57(4.34) (8.07) -(0.31) -(0.01)
1996-96 1739007 N.A. N.A. N A N.A. N.A. NA(5.44) N.A. N.A. N.A.
1996-97 1780222 44673 20466 25310 2.51 1.15 1.42(2.37) NA N.A. N.A.
1997-98 1806858 46291 21092 25574 2.56 1.17 1.42(1.50) (3.62) (3.06) (1.04)
1998-99 1818055 45112 19341 23916 2.48 1.06 1.32(0.62) -(2.55) -(8.30) -(6.48)
1999-00 1890523 46164 20481 23761 2.44 1.08 1.26(3.99) (2.33) (5.89) -(0.65)
Notes; 1) N.A. refa to not available.2) Figures in the paranthese refer to annual growth (%).
Source; Directorate of Emptoyment and Training, Government of Kamataka, Bangatore.
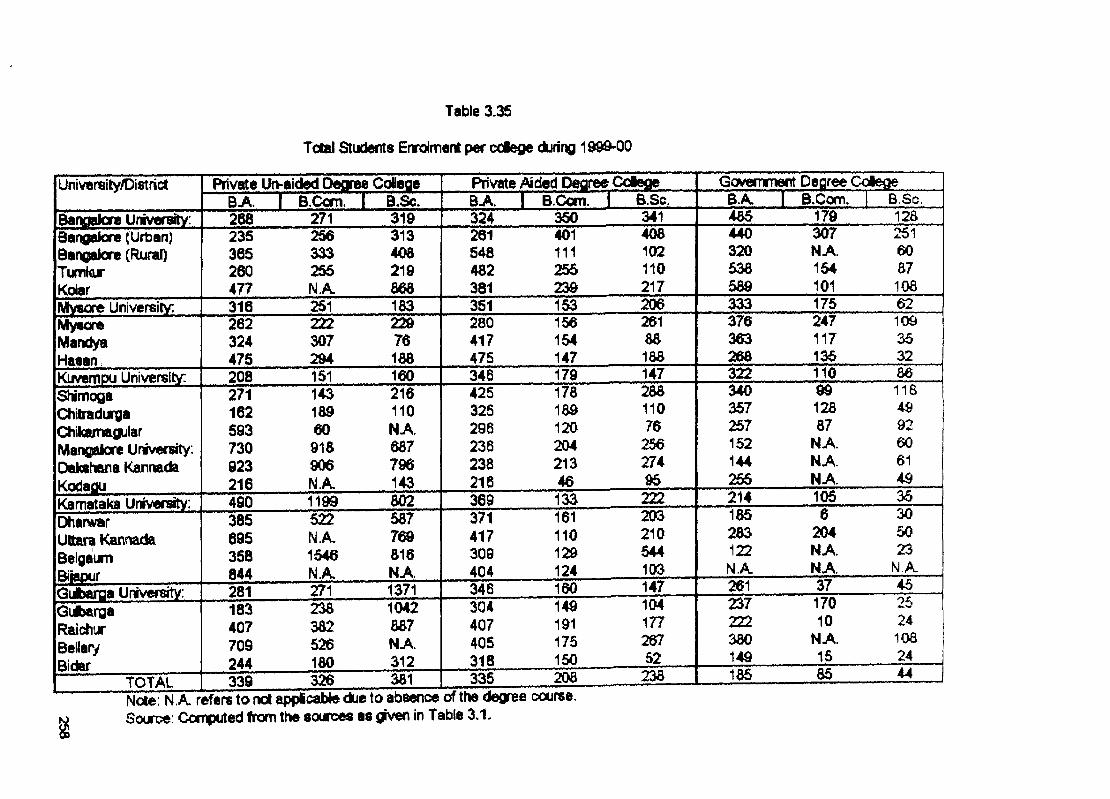
Table 3.35
TdBl Students Enrdmert per cdege during 1999-00
University/District Private Urvaided Degree Coiiege Private Aided Degree Cdege GG^wwnert Degree CclegeB A 1 B.Com. 1 B.Sc. B A 1 B.Com. 1 B.Sc. BA. 1 B.Com. BSc.
Bangalore University; 268 271 319 324 350 341 485 179 128Bangalore (Urban) 235 256 313 261 401 408 440 307 251Bangalore (Rural) 365 333 408 548 111 102 320 N A 60Tumkur 260 256 219 482 255 110 538 154 87Kolar 477 N A 868 381 239 217 589 101 108Mysore Universlry: 316 251 183 351 153 206 333 175 62Mysore 262 222 229 280 156 261 376 247 109Mandya 324 307 76 417 154 88 363 117 35Hasan 475 294 188 476 147 188 268 135 32Kiwempu University: 208 151 160 346 179 147 322 110 86Shimoga 271 143 216 425 178 288 340 99 118Chitradurga 162 189 110 326 189 110 357 128 49Chilcamaigular 593 eo N A 296 120 76 257 87 92Mangalore University; 730 918 687 236 204 256 152 N A 60Dekshana Kannada 923 906 796 238 213 274 144 N A 61Kodagu 216 N A 143 216 46 95 265 N A 49Kannataka University; 490 1199 802 369 133 222 214 105 35
Oharwar 385 522 587 371 161 203 185 6 30
Uttara Kannada 695 N A 769 417 110 210 283 204 50
Belgaum 358 1546 816 309 129 544 122 N A 23
Bijapiir____________ 844 N A N A 404 124 103 N A N A N AGiiMUiQa UnK ersfty; 281 271 1371 346 160 147 261 37 45
Gufcarga 183 238 1042 304 149 104 237 170 25
Raich jr 407 382 887 407 191 177 222 10 24
Bellary 709 526 N A 405 175 267 380 N A 108
Bidsr 244 180 312 318 150 52 149 15 24
TOTAL 339 326 381 335 208 238 185 85 44cojrse.
Sounje: C o rd e d from the sourtJM as given in Table 3.1.
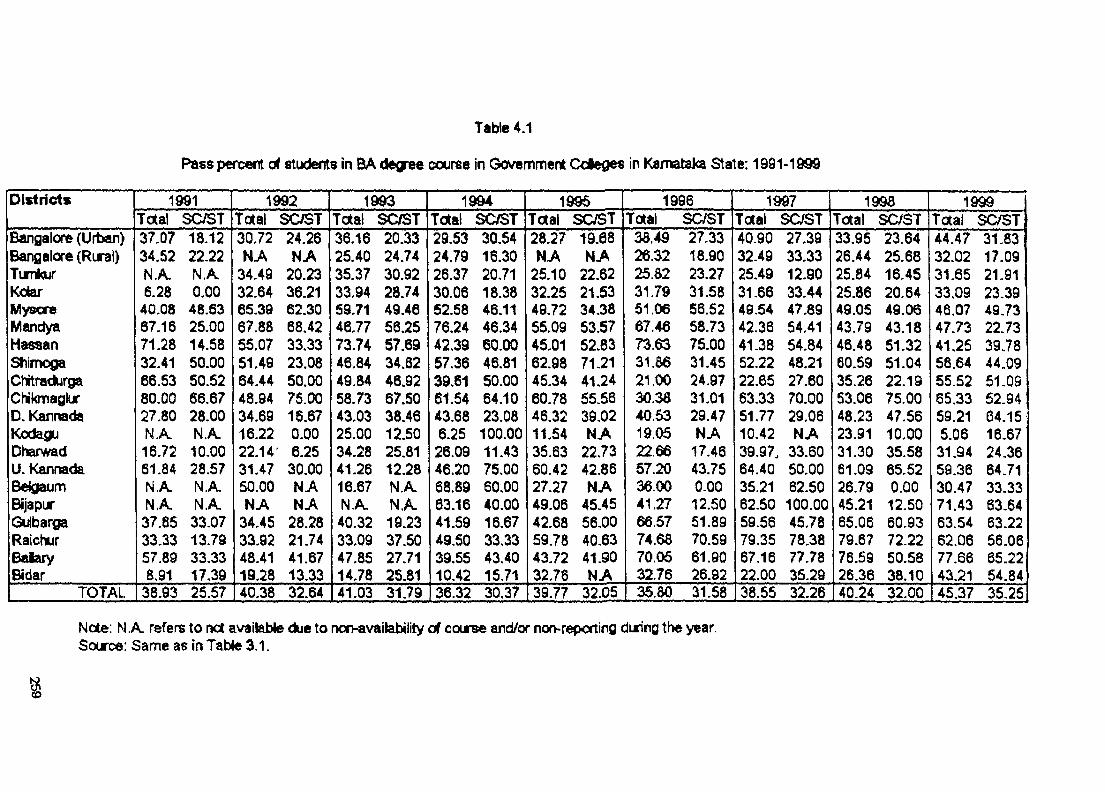
Table 4.1
Pass percent of students in BA degree course In Government Cdeges in Kamalaka State: 1991*1999
Districts 1991Total SC/ST
1992Total SC/ST
1993Total SOST
1994Total SC/ST
1995Total SCyST
1996Total SC/ST
1997Total SC/ST
1998Total SC/ST
1999Total SC/5T
Bangalore (Urt>ar)Bangalore (Rural)TtmkurKdarMysoreMandyaHassanShimogaCtitradurgaCNkmaglurD. KannadaKodaguDharwadU. KannadaBeigaunnBijapurGulbargaRaichurSalaryBidar
37.0734.52 NA 6.2840.08 67.16 71.28 32.4166.53 80.00 27.80 NA 16.7261.84 NA NA37.85 33.33 57.89 8.91
18.1222.22N A0.0048.6325.00 14.5850.00 50.52 66.6728.00 N A
10.00 28,57 NA N A 33.07 13.79 33.33 17.39
30.72NA
34.49 32.64 65.39 67.88 55.0751.4964.44 48.94 34.69 16.22 22.14 31.47 50.00 NA
34.45 33.92 48.41 19.28
24.26NA
20.2336.2162.3068.4233.33 23.0850.0075.0016.67 0.00 6.2530.00 N-A NA
28.28 21.7441.6713.33
36.1625.4035.3733.9459.7146.77 73.7446.8449.84 58.73 43.03 25.00 34.28 41.26 16.67 NA 40.32 33.0947.8514.78
20.3324.7430.9228.7449.46 56.25 57.69 34.6246.9267.5038.4612.5025.81 12.28 NA N A 19.2337.50 27.7125.81
29.53 24.79 26.37 30.0652.68 76.24 42.39 57.36 39.6161.5443.68 6.25 26.09 46.20 68.89 63.16 41.59 49.5039.55 10.42
30.5416.3020.71 18.38 46.11 46.34 60.00 46.8150.00 64.10 23.08100.00 11.4375.0060.00 40.00 16.67 33.33 43.4015.71
28.27 NA
25.10 32.2549.72 55.09 45.01 62.98 45.3460.78 46.32 11.54 35.63 60.4227.27 49.06 42.6859.7843.72 32.76
19.68NA
22.6221.5334,3853.5752.8371.2141.2455.5639.02NA
22.7342.86NA
45.4556-0040.6341.90NA
38.4926.3225.8231.7951.0667.4673.6331.8621.0030.3840.5319.05 22.66 57.20 36.00 41.27 66.57 74.6870.05 32.76
27.3318.9023.2731.58 56.52 58.7375.0031.45 24.9731.01 29.47 NA
17.46 43.75 0.00 12.5051.8970.5961.90 26.92
40.9032.4925.49 31.66 49.54 42,36 41.38 52.22 22.65 63.33 51.77 10.42 39.97. 64.40 35.2162.50 59.56 79.35 67.16 22.00
27.3933.3312.9033.4447.8954.4154.8448.2127.6070.00 29.06 NA
33.6050.00 62.50100.0045.78 78.3877.78 35.29
33.9526.4425.8425.8649.0543.79 46.4860.59 35.2653.06 48.23 23.91 31.30 61.0926.79 45.2165.06 79.6776.59 26.36
23.64 25.68 16.4520.64 49.0643.18 51.32 51.0422.1975.00 47.5610.0035.58 65.52 0.00 12.50 60.93 72.2250.58 38.10
44.47 32.0231.65 33.09 46.07 47.73 41,25 56.64 55.52 65.3359.215.06 31.94 59.3630.47 71.43 63.5462.0677.6643.21
31.8317.09 21.91 23.39 49.73 2273 397844.0951.09 52.94 64.15 16.67 24.36 6471 33.33 63.6463.22 56.0665.2254.84
TOTAL 38.93 25.57 40.38 32.64 41.03 31.79 36.32 30.37 139.77 32,05 35.80 31.58 38.55 32.26 40.24 32.00 45.37 35.25
Note; N A refers to not availaUe due to non-avaitability of course and/or norv-repcrting during the year. Source: Same as in TaWe 3.1.
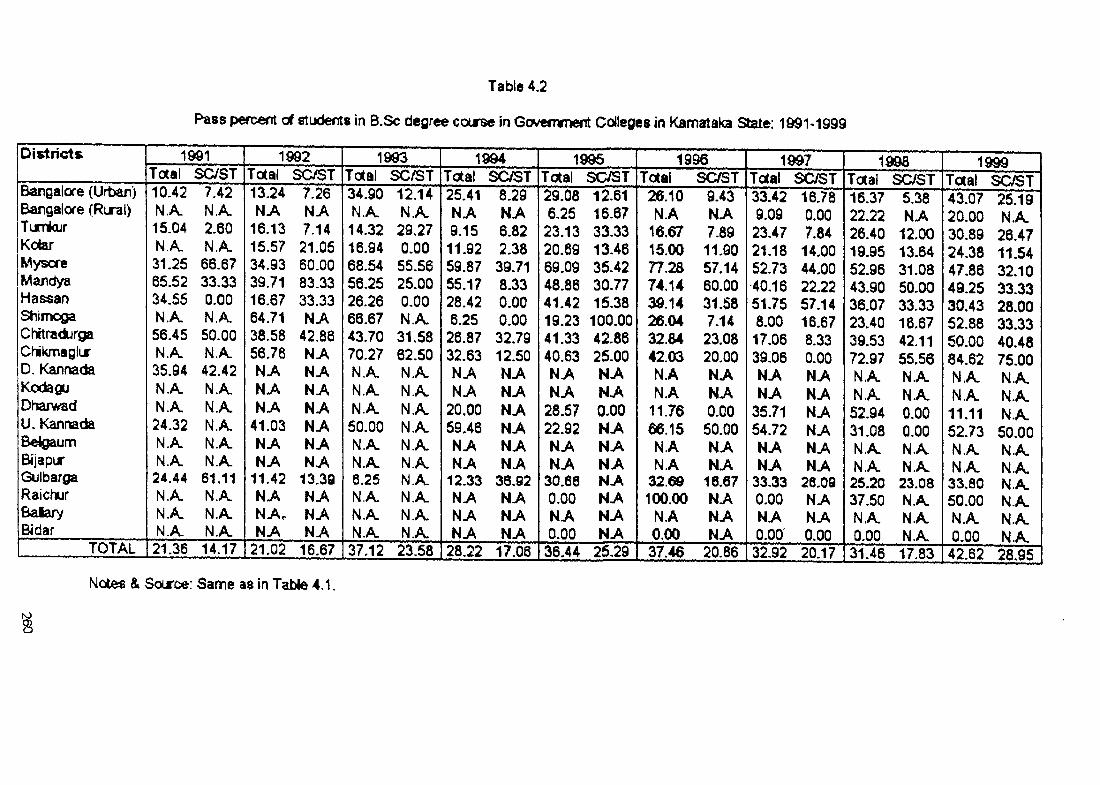
Table 4.2
Pass percent erf stixtents in B.Sc degree course in Govefnment Colleges in Karnataka State: 1991-1999
Districts
Bangalore (Urban)Bangalore (Rixal)Turr*urKoterMysoreMandyaHassanSJiimogaChitradurgaChikmaglurD. KannadaKodaguDharwadU. KannadaBekQaumBijapurGulbargaRaichurBaiaryBjdar
1d91 Total SC/ST10.42NA15.04NA31.2565.5234.55NA56.45NA35.94NANA24.32NANA24.44NANANA
7.42 NA 2.60 NA 66.67 33.33 0.00 NA 50.00 N A42.42 NA NA N A N A N A
61,11 N A N A NA
1992Total SC/ST13-24NA
16.1315.57 34.9339.71 16.6764.7138.58 56.76 NA NA NA
41.03 NA HA
11.42 NA HAr HA
7.26N ^7.1421.0560.0083.3333.33 N ^
42.86 HA HA HA HA HA HA HA
13.39 N ^ N ^ N.A
1993Total SC/ST34.90N A14.3216.9468.5456.2526.26 66.67 43.70 70.27 N A N A NA
50.00 NA NA 6.25 NA NA N A
12.14N A29.270.0055.5625.000.00NA31.5862.50NANANANANANANANANANA
1994Total SC/ST25.41 HA 9.15 11.9259.87 55.1728.42 6.25
26.87 32.63 N ^ N^
20.00 59.46 HA HA
12.33 N ^ HA HA
8.29N.A6.822.3839718.330.000.0032.7912.50HAHAHAHAHAHA
36.92N-AN.AHA
1995Total SC/ST29.08 6,25
23.13 20.6969.09 48.86 41.42 19.23 41.33 40.63 HA HA
28.57 22.92 NA HA
30.66 0.00 N-A 0.00
12-6116.6733-3313.4636-4230.7716-38100.0042.8626.00NA
0.00NAHAHAHAHAHAHA
1996Total SC/ST
26.10N.A
16.6715.00 77.2874.1439.14 26.04 32.W 42.03N.AN.A
11.7666.15 N.A N.A
32.69100.00
N.A 0.00
9.43HA7.8911.9057.14 60.00 31.587.14 23.08 20.00 N.A N ^ 0.00 50.00 HA HA
16.67 N.A NA HA
1997Total SOST33.429.0923-4721.1852.7340-1651-758.0017.0639-06HAHA
35.7154.72 HA HA
33-33 0.00 NA 0 . 00'
16.780.007.8414.0044.00 22.22 57.14 16.67 8.33 0.00 HA HA HA HA HA NA
26.09 N.A NA 0.00
1998Total SC/ST16.3722.2226.4019.9552.96 43.9036.0723.40 39.5372.97 N.A. N.A. 52.9431.08 N.A N.A. 25.20 37.50 N.A 0.00
5,38NA
12.0013.6431.08 50.00 33.33 16.67 42.11 55.56 N.A N.A 0.00 0.00 N.A N.A23.08 N.A, N.A. HA
1999Total SC/ST43.0720.0030.8924.3847.8649.2530.4352.8850.00 84.62 N.A HA 11.11 52.73 N.A. N.A
33.8050.00 N.A 0.00
25.19N.A26.47 11.54 32.1033.33 28.0033.3340.4875.00 N.A N.A N.A50.00 N.A N.A N.A N.A N.A N.A
TOTAL 21.36 14.17 21.02 16.67 37.12 23.58 28.22 17.06 36.44 26,29 37.46 20.86 32-92 20.17 31.46 17.83 42.62 28.95
Note® & Socrce: Same as in TaWe 4.1.
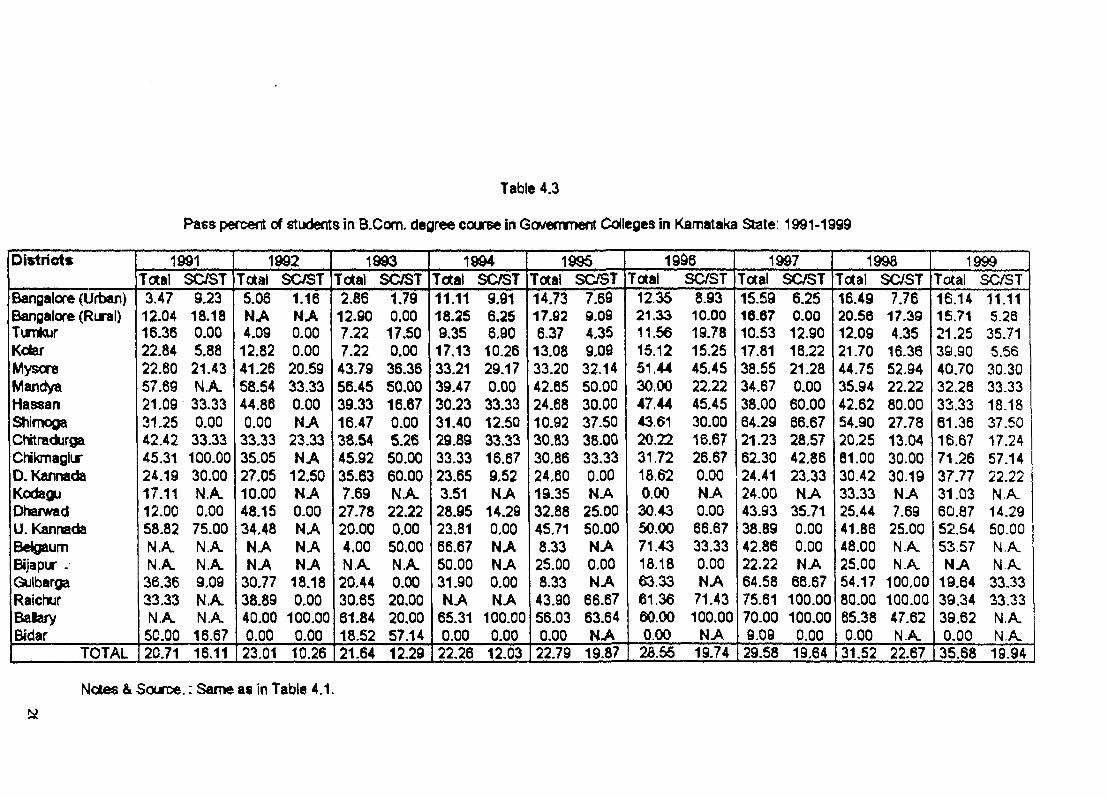
Table 4.3
Pass percent of students in B.Com. degree course in Gavernment Cdlefles in Karnataka Slate: 1991-1999
Districts 1991Total SC/ST
1992Total SC/ST
1993Total SC/ST
1994Total SC/ST
1995Total SC/ST
1996Total SC/ST
1997Total SC/ST
1998Total SC/ST
1999Total SaSJ
Bangalore (Urban)Bangalore (Rural)TimkurKdarMyscreMandyaHassanStiimogaChitradursaChikmaglurD. KannadaKodaguDhafwadU. KannadaBeigaumBijapur .QuibargaRalchufBalaryBidar
3-4712.0416.36 22.84 22.60 57.69 21.09 31.25 42.42 45.31 24.19 17.11 12.00 58.82 NA N A
36.36 33.33 NA
50.00
9.2318.180.005.8821.43N A33.33 0.0033.33 100.0030.00 NA 0.0075.00 NA NA 9.09 N A NA 16.67
5.06NA4.0912.8241.2658.5444.860.00
33.3335.0527.05 10.00 48.15 34.48 NA NA
30.77 38.89 40.00 0.00
1.16HA0.000.0020.5933.33 0.00 NA
23.33 NA
12.50 NA 0.00 UA NA NA
18.18 0.00
100.000.00
2.8612.907.227.22 43.79 56.45 39.33 16.47 38.54 45.92 35.63 7.69 27.78 20.00 4.00 NA 20.44 30.65 61.84 18.52
1.790.00
17.500.0036,3650.00 16.67 0.00 5.2650.0060.00 NA 22.22 0.0050.00 NA 0.00
20.00 20.00 57.14
11.1118.259.3517.1333.2139.4730.2331.4029.89 33.33 23.65 3.51 28.95 23.81 66.67 50.0031.90 HA
65.31 0.00
9.916.256.9010.2629.170.0033.33 12.5033.33 16.67 9.52 HA
14.29 0.00 HA HA 0.00 HA
100.000.00
14.7317.02 6.37 13.08 33.20 42.65 24.68 10.92 30.83 30.86 24.60 19.35 32.88 45.718.33 25.008.33
43.9056.03 0.00
7.699.09 4,359.09 32.1450.0030.00 37.5038.00 33.33 0.00 NA
25-00 50-00 NA 0.00 NA
66.67 63.64 NA
12.3521.33 11.56 15.1251.4430.0047.4443.61 20.22 31.7218.62 0.0030.4350.0071.43 18.1863.3361.3660.00 0.00
8.9310.0019.7815.2545.45 22.2245.4530.0016.6726.67 0.00 NA 0.0066.67 33.33 0-00 NA
71.43100.00
NA
15.5916.67 10.53 17.81 38-5534.6738.0064.29 21.2362.30 24.4124.00 43.93 38.89 42.86 22.22 64.58 75.6170.00 9.09
6.250.0012.9016.2221.280.0060.0066.67 28.57 42.86 23.33 NA
35.71 0.00 0.00 NA
66.67 100.00 100.00
0.00
16.4920.5612.0921.7044.7535.9442.6254.9020.2561.0030.4233.3325.4441.8648.0025.00 54.1780.00 65.38 0.00
7.7617.394.3516.3652.9422.2280.0027.7813.0430.00 30.19 HA 7.6925.00 NA NA
100.00 100.00 47.62 N.A
16.1415.7121.25 39.90 40.7032.2633.33 61.36 16.6771.26 37.77 31.03 60,87 52.54 53.57 NA
19.6439.34 39.62 0-00
11.115.2635.715.5630.3033.33 18.18 37.50 17.24 57.14 22.22 N A 14.29 50.00 N A N A33.3333.33 N A N A
TOTAL 20.71 16.11 23.01 10.26 21.64 12.29 22.26 12,03 22.79 19.87 28.55 19.74 29.58 19.64 31.52 22.67 35.68 19.94
Note6 & Socnoe.; San>e as in Table 4.1.
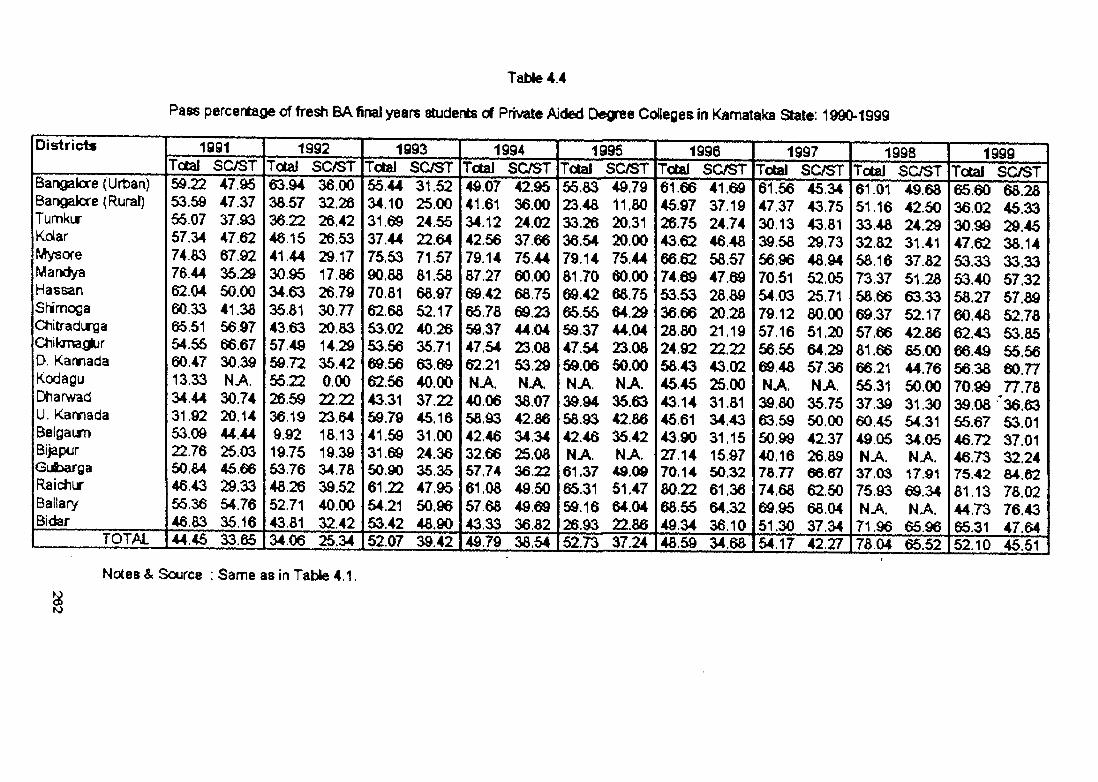
TaWe 4.4
Pass percentage of f^es BA final years sajdente of Private Ai(ted Degree CoHeges in Karnataka Stale; 1990-1999
Districts 1991 ToCaJ SC/ST
1992local SC/ST
1993Total SC/ST
1994Total SC/ST
1995Total SC/ST
1996Total SC/ST
1997Total SCj
1998Total SC/ST
1999Total S aST
Bangakxe (Urban)Bangakxe (Rural)TumkurKdarMysoreWlandyaHassanShimogaCtiitradurgaCtiikrna rD. KarradaKodaguDtiarwadU. KarradaBelgaumBijaptirGubargaRaictiurBallaryBidar
59.2253.5955.0757.3474.8376.44 62.0460.33 65.51 54.55 60.4713.3334.44 31.92 53.09 22.7650.84 46.43 55.36 46.83
47.9547.3737.9347.6267.9235.2950.0041.3656.9766.6730.39N A30.7420.1444.4425.0345.6629.3354.7635.16
63.94 38.5736.22 46.15 41.4430.9534.6335.8143.63 57.49 59.7255.22 26.59 36.19 9.9219.7553.76 48.26 52.7143.81
36.00 32.2626.42 26.53 29.17 17.86 26.7930.77 20.83 14.2935.42 0.00 22.22 23.64 18.13 19.3934.78 39.5240.0032.42
55.44 34.1031.6937.44 75.53 90.88 70.81 62.68 53.0253.5669.5662.56 43.31 59.79 41.5931.69 50.90 61.22 54.21 53.42
31.5225.00 24.55 22.6471.5781.58 68.97 52.17 40.26 35.71 63.6940.00 37.22 45.1631.00 24.36 35.3547.9550.96 48.90
49.07 41.61 34.12 42.56 79.14 87.27 69.42 65.78 59.37 47.54 62.21 N A 40.06 58.93 42.46 32.66 57.7461.08 57.68 43.33
42.9536.00 24.02 37.66 75.4460.00 68.75 69.23 44.04 23.08 53.29 N A38.07 42.86 34.3425.08 36.22 49.50 49.69 36.82
55.8323.4833.2636.54 79.14 81.70 69.4265.5559.37 47.54 59.06 N A 39.9458.93 42.46 N A61.37 65.31 59.1626.93
49.7911.80 20.31 20.00 75.44 60.00 68.75 64.2944.0423.08 50.00 NA. 35.6342.86 35.42 N A49.09 51.4764.0422.86
61.6645.9726.7543.6266.62 74.69 53.53 36.66 28.80 24.92 58.43 45.4543.14 45.61 43.9027.1470.14 80.22 68.55 49.34
41.6937.19 24.74 46.48 58.5747.69 28.89 20.2821.19 22.22 43.02 25.00 31.81 34.43 31.15 15.9750.32 61.3664.32 36.10
61.5647.3730.1339.58 56.96 70.51 54.03 79.1257.16 56.55 69.48 NA. 39.8063.59 50.9940.16 78.77 74.68 69.95 51.30
45.3443.75 43.81 29.73 48.94 52.05 25.71 80.00 51.20 64.2957.36 N A
35.75 50.0042.37 26.89 66.67 62.50 68.0437.34
61.0151.16 33.48 32.8258.1673.3758.6669.3757.6681.66 66.21 55.31 37.39 60.45 49.05 NA. 37.03 75.93 NA. 71.96
49.6842.5024.29 31.41 37.82 51.2863.33 52.17 42.8685.00 44.7650.0031.3054.31 34.05 N A 17.9169.34 NA. 65.96
65.6036.0230.99 47.62 53.33 53.40 58.2760.48 62.4366.49 56.3870.99 39.08 55.6746.7246.73 75.42 81.1344.73 65.31
68.2845.33 29.45 38.1433.33 57.32 57.89 52.78 53.85 55.5660.7777.78 '36.6353.0137.01 32.24 84.6278.02 76.43 47.64
TOTAL 44.45 33.65 34.06 25.34 52.07 39.42 49.79 38.54 52.73 37.24 48.59 34.68 54.17 42.27 78.04 65.52 52.10 45.51
Notes & Sotirce : Same as in TaWe 4.1.
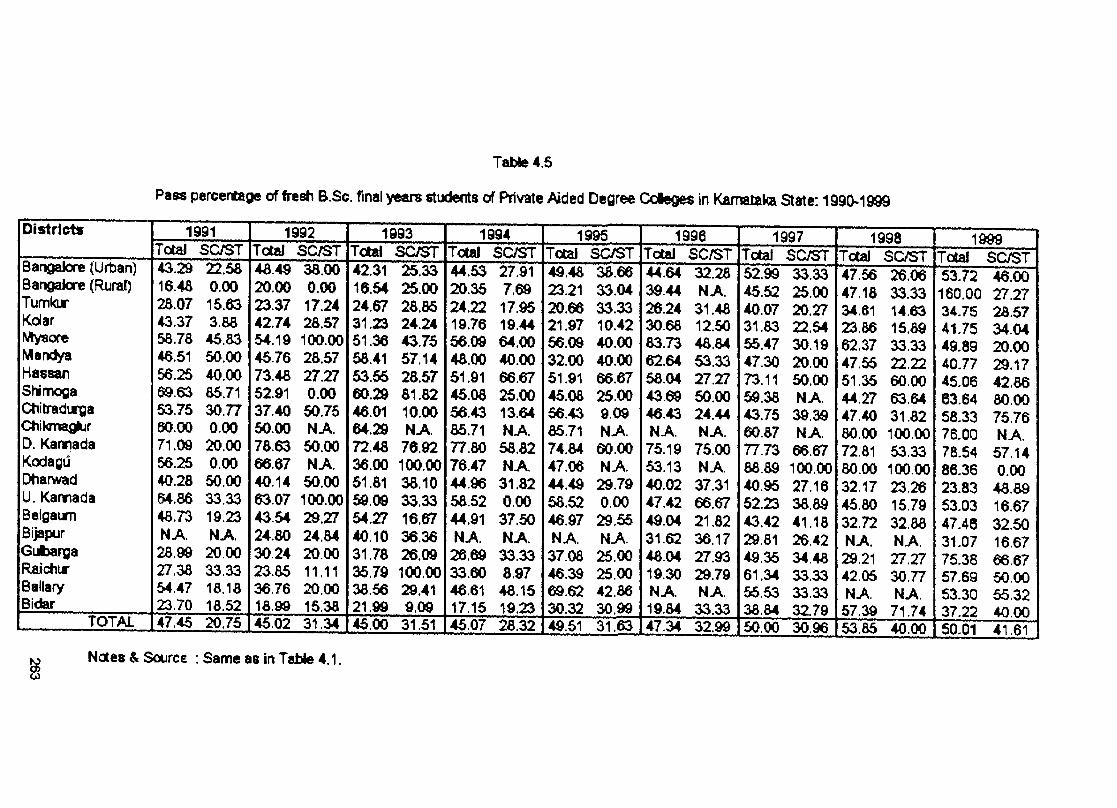
Table 4.5
Pass percentape of fresti B.Sc. final years students of Private Aided Degree Ccleoes in Karnataka State: 1990-1999
Districts 1991 Total SC/ST
1992Totel4B.49
SC/ST1993
Total SC/ST1994
Total SC/ST1995
Total SaST1996
Total SC/ST1997
Total SO/S T1998
Total SC/ST1999
Total SC/STBangalore (Urtan)Bangalore (Rural)TumkirKdarMysoreMandyaMassanShimogaCtiitradurgaCtiikmaglurD. KarradaKodaguiDtiarwadU. KaimadaBeigaumBijaptirGuibarigaRaichurBallaryBidar
43.2916.4fi28.0743.37 58.78 46.5156.25 69.63 53.75 60.00 71.0956.25 40.28 64.86 48.73 N A 28.9927.38 54.47 23.70 47.45
22.580.0015.633.8845.8350.0040.00 85.71 30.77 0.0020.00 0.0050.0033.33 19.23 N A20.0033.33 18.18 18.52
20.0023.3742.7454.1945.76 73.48 52.91 37.40 50.00 78.63 66.67 40.14 63.07 43.54 24.80 30.24 23.8536.76 18.99
38.00 0.00 17.2428.57100.0028.5727.27 0.00 50.75 N A50.00 N A50.00100.0029.27 24.84 20.00 11.11 20.00 15.38
42.3116.54 24.67 31.23 51.36 58.4153.5560.29 46.0164.29 72.48 36.00 51.8159.09 54.2740.1031.7835.7938.56 21.9<9
25.3325.00 28.85 24.24 43.75 57.14 28.57 81.8210.00 N A 76.92 100.00 38.1033.33 16.67 36.3626.09 100.00 29.419.09
44.5320.3524.2219.7656.0948.0051.91 45.08 56.43 85.71 77.80 76.47 44.96 58.5244.91 N A
26.6933.6046.61 17.15
27.917.6917.9519.4464.0040.00 66.6725.00 13.64 NA.58.82 N A31.82 0.00 37.50 NA. 33.33 8.97 48.15 19.23
49.48 23.21 20.6621.97 56.09 32.00 51.9145.08 56.43 85.71 74.84 47.0644.49 58.5246.97 NA.37.08 46.39 69.62 30.32
38.66 33.04 33.33 10.4240.0040.0066.6725.00 9.09 N A
60.00 N A 29.79 0.00
29,55 N A25.0025.00 42.86 30.99
44.6439.4426.2430.68 83.7362.6458.0443.69 46.43 N A
75.19 53.13 40.02 47.4249.04 31.6248.04 19.30 N A 19.84
32.28N A
31.4812.5048.8453.33 27.2750.00 24.44 N A
75.00 N A 37.31 66.67 21.82 36.17 27.93 29.79 NA.
33.33
52.9945.52 40.0731.83 55.47 47.30 73.11 59.38 43.75 60.87 77.73 88.89 40.95 52.23 43.42 29.81 49.36 61.3455.5338.84
33.3325.00 20.27 22.54 30.1920.0050.00 NA. 39.30 NA. 66.67100.00 27.16 38.89 41.18 26.42 34.4833.3333.33 32.79
47.5647.1834.6123.8662.3747.5551.3544.2747.4080.0072.8180.0032.1745.8032.72N A29.2142.05N A57.39
26.0633.33 14 63 15.8933.33 22.22 60.00 63.64 31.82 100.0053.33 100.0023.26 15.79 32.88 NA.27.27 30.77 N A 71.74
53.72160.0034.7541.75 49.89 40.7745.06 63.64 58.33 76.00 78.54 86.36 23.83 53.03 47.4631.07 75.38 57.69 53.30 37.22
46.00 27.27 28.57 34.0420.00 29.17 42.86 80.00 75.76 NA. 57.14 0.00 48.8916.67 32.5016.6766.6750.00 55.3240.00TOTAL 20.75 45.02 31.34 45.00 31.51 45.07 28.32 49.51 31.63 47.34 32.99 50.00 30.96 53.85 40.00 50.01 41.61
Notes & Source ; Same as in TaWe 4.1.
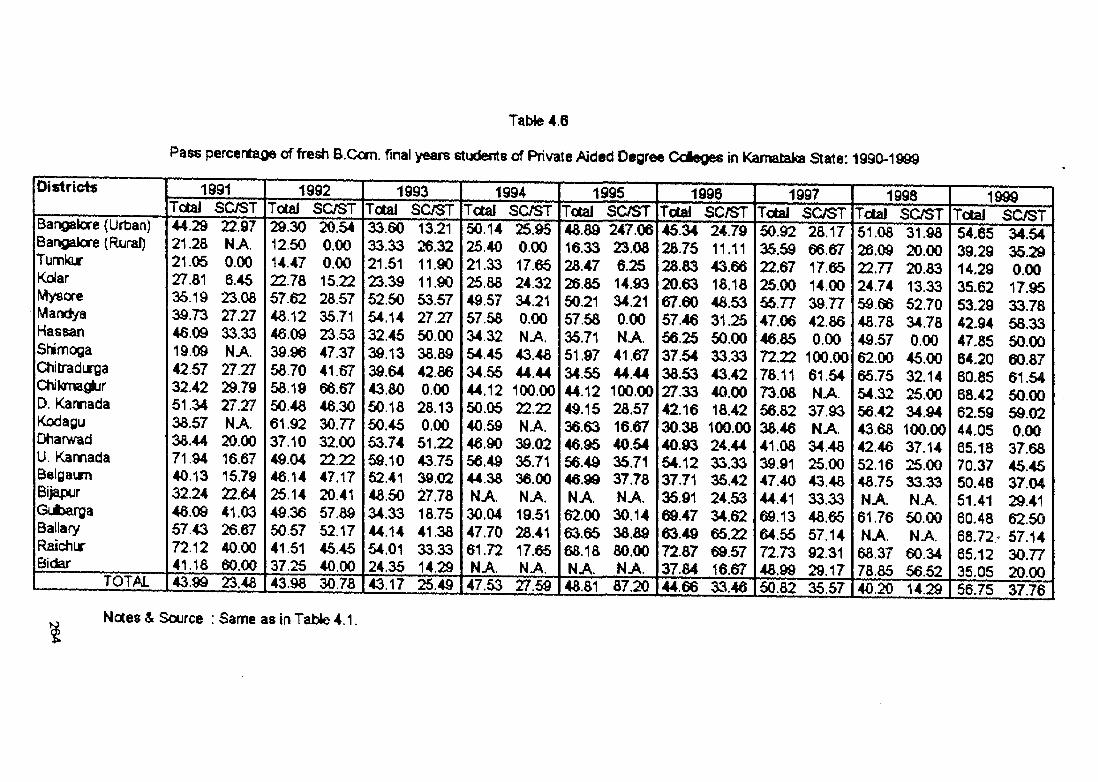
Table 4.6
Pass percertage of fresh B.Com. final years students of Private Aided Degree Coleges in Karnataka State: 1990-1999
Districts 1991 TctaJ SC/ST
1992 Total SCyST
1993Total SC/ST
1994Total SO/ST
1995Total S C i^
1996Total SC/ST
1997Total SC/ST
1998Total SaST
1999Total SC/STBangalore (Urban)
Bangalore (Rural)TumkurKdarMysoreMandyaHassanShimogaChitradjrgaCtiikmaglurD. KanradaKodaguOharwadU. KannadaBelgaumBijapcirGubargaBallaryRaichirBidlar
44.2921.2821.0527.8135.1939.7346.0919.09 425732.42 51.34 38.57 38.44 71.94 40.13 32.2446.0957.43 72.12 41.18 43.99
22.97N A0.006.4523.0827.27 33.33 N A27.2729.7927.27 N A 20.0016.6715.79 22.64 41.0326.6740.0060.00 23.48
29.3012.5014.47 22.78 57.62 48.1246.09 39.96 58.70 58.1950.48 61.9237.10 49.0446.1425.14 49.36 50.5741.51 37.25
20.540.000.0015.22 28.57 35.71 23.53 47.3741.6766.67 46.30 30.7732.0022.2247.17 20.41 57.8952.17 45.4540.00
33.6033.33 21.51 23.3952.50 54.1432.4539.13 39.64 43.80 50.1850.45 53.74 59.10 52.4148.5034.3344.14 54.01 24.35
13.2126.3211.9011.90 53.57 27.27 50.00 38.89 42.86 0.00
28.13 0.00
51.2243.75 39.02 27.7818.75 41.3833.33 14.29
50.1425.4021.3325.8849.5757.58 34 32 54.45 34.55 44.12 50.0540.59 46.90 56.49 44.38 N A 30.04 47.70 61.72 N A
25.950.0017.65 24.3234.21 0.00 NA.
43.48 44.44 100.0022.22 NA.
39.02 36.71 36.00 NA. 19.51 28.4117.65 NA.
48.8916.3328.4726.8550.2157.5835.7151.9734.5544.1249.1536.6346.9556.4946.99NA.62.0063.6568.18NA.
247.0623.086.2514.9334.210.00NA.41.67 44.44 100.00 28.5716.67 40.54 35.71 37.78 N A 30.14 38.89 80.00 N A
45.3428.7528.83 20.63 67.6057.46 56.25 37.54 38.53 27.33 42.16 30.38 40.93 54.12 37.71 35.9169.47 63.49 72.8737.84
24.7911.1143.66 18.1848.53 31.2550.0033.3343.4240.0018.42100.00 24.4433.3335.4224.53 34.62 65.22 69.5716.67
50.9235.5922.6725.0055.7747.0646.8572.2278.1173.08 56.82 38.4641.08 39.9147.4044.41 69.13 64.55 72.73 48.99
28.17 66.6717.6514.00 39.77 42.86 0.00
100.00 61.54 N A
37.93 NA.34.48 25.0043.48 33.3348.65 57.14 92.3129.17
51.0826.0922.7724.74 59.6648.78 49.57 62.0065.75 54.32 56.42 43.68 42.46 52.1648.75 N A61.76 NA.
68.37 78.85
31.9820.0020.8313.33 52.70 34.78 0.0045.0032.1425.00 34.94100.0037.1425.0033.33 NA.50.00 NA.60.34 56.52
54.6539.2914.29 35.6253.29 42.9447.85 64.2060.85 68.42 62.5944.05 65.18 70.37 50.46 51.41 60.48 68.72, 65.1235.05
34.54 35.29 0.00 17.95 33.78 58.3350.00 60.8761.5450.00 59.02 0.00
37.68 45.45 37.04 29.41 62.50 57.14 30.7720.00TOTAL 43.98 30.78 43.17 25.49 47.53 27.59 48.81 87.20 44.66 33.46 50.82 35.57 40.20 14.29 56.75 37.76
Notes & Source : Same as in Table 4.1.
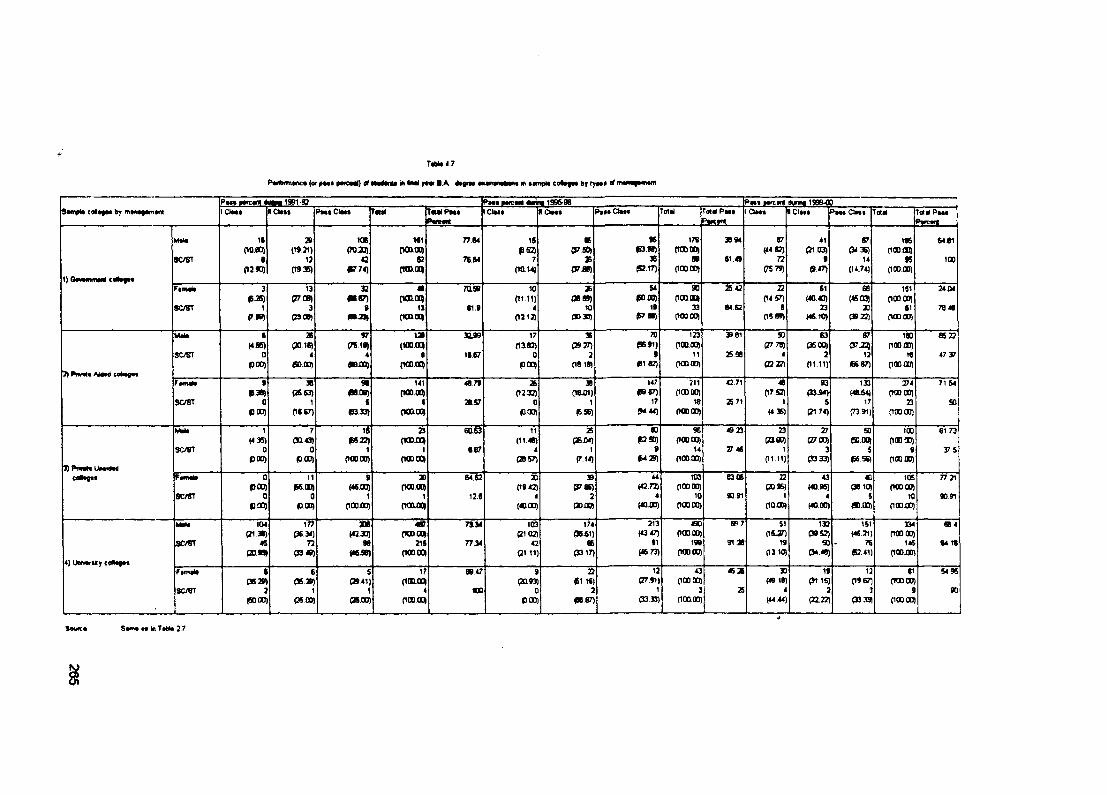
Tibt«47
P«i*nmtnc* (or pM t (MiCMt) of in <Ml ftm B A <»grM •Mm I m •■mpt* cotofM by typt* ^
Panaarcani 4IMM 1991-92 Paaa paicaM * m 1986^96 Paat aarcanl *jnn«199M0ICiMa ICtoat P»a« Claaa Tatii TaulPMa
PwcaKtC iM t DOaaa PataCtaa* Total TMii Paat I Om « 1 Clata Paaa Clat* Total Total Paaa
Mala 16 2B ICE M l 77.84 15 8E 96 I7B 38 94 97 41 67 196 64.81ooeo) (19 21) (7035 noooq PS2) P7J0) P»98) (10000) (44 82) (21 0 ^ (34.36) (lODXiq
8C/8T • 13 43 82 76A4 7 X 36 89 51.49 72 9 14 95 1000 2 « ) (19 36) 15774) (KB.OCI (10.14) (37JB) P3.T7) (100 OO) (75.79) (9 47) (14.74) 000.00)
Ftmala 3 13 33 41 7U.S9 10 3E 54 90 is 43 22 61 68 1S1 2404IB 25) C77(B) •167) (icaoq (11.11) (29 89) (BO 00) (100 0E| 04 57) (40 40) (45.03) (100 00)
8C/ST 1 3 9 IS 81.9 4 10 19 33 84 62 8 23 X 51 78 48(7W) (23 09) (WOODJ 0212) 00 30) (S7 88) (100 OO) 0SB9) (4610) C»22) (100 00)
Mata 6 2B 97 139 33J9 17 36 70 123 3B81 90 S3 67 180 65 23(4.85) (2018) (7519) (100.005 03.82) (29 27) P6 91) (loaoo) (27 78) P600) C37.2? (1000D)
SC/BT 0 4 4 e 18.67 0 2 9 11 25 as 4 2 12 18 47 3?(000) PO.OD) •oxn ) (HD.0C9 POO) (18 18) p i 82) (KB 00) (22 27) 01 11) » 6 7 ) (100 00)
7) ^iwMa AMad catiagai9 3B 98 141 48.79 26 38 147 211 42.71 46 93 133 374 7164
<5 3 ^ (2SS3) (BB.(38) Cioooq 02^32) (la o i) P9 6 ^ OODOO) 07.S2) (33.94) (48.fi4i (WOOD)SC/ST 0 1 S 1 28.57 0 1 17 18 2S71 1 5 17 23 SO
HOD) 0*67) (B333) (ioaoo» POO) (6J6) P4 44) (WOOD) (4 36) (2174) (73.91) (100 00)
Mala 1 7 18 2J eas3 11 2S 80 96 49 23 23 27 SO 100 61 73(4 3S) (Sa43) (B8 2J) (WDJH (1148) (B2 5D) (10000) (ZLQO) (27 00) «soon 000 00)
SC/BT 0 0 1 1 887 4 1 9 14 27 46 1 3 s 9 375POCJ) (000) (100.00) (WO OH C2B57) (7.14) P4 29) 000.00) 01 11) (S3 33) PSSB) (100 OO)
3) Ptwm U»»i<adC0H««at Pamata 0 11 9 X 64 52 X 39 44 103 8 3 a 22 43 40 105 77 21
pOO) (S&OO) (46IU) (KD.OO) (19 42) P 7 « ) (<2.72) (10000) P0 96) (40 96) (39.10) (WOOD)WVST 0 0 1 1 125 4 2 4 10 90 91 1 4 5 10 90 91
*JOD) POD) (lOOiS) (10D.0CI (40.00) (20 a s (40i)0) (10000) OOXD) (40,00) eo.oo) (100AI)
Mata 104 177 208 487 71)4 103 174 213 490 6P7 SI 132 151 334 SB4(21 » ) P6.34) (*2J0) (100 0D» (2103) P 6 il) (43 47) (100 OO) 0&J7) P9 52) (46.21) (100 00)
sa sr 46 72 96 21S 7734 42 86 t1 199 9128 19 50 76 1*6 64 18(2ata» 03 49) (46JB) (100 QQ (2111) (3317) («73) (10000) 03105 (34 48) P241) 000.00)
4) UoNwWy coHavMFimala 8 6 5 17 89 47 9 22 12 43 4636 30 19 12 61 54 96
(35 28) (36 29) C2941) (loaoo) (2093) p i 16) (27 91) (1COOO) (49 18) (3116) (19 67) (WO 00)SC/BT 3 1 1 4 WO 0 2 1 3 35 4 3 3 9 90
(SOOD) C6 0 fl CHjOO) (100.00) pOO) (8857) (33 33) (100.00) (44 >44) (22.22) CD 33) (im oo)
S«wc* Sam* n In TaWa 37
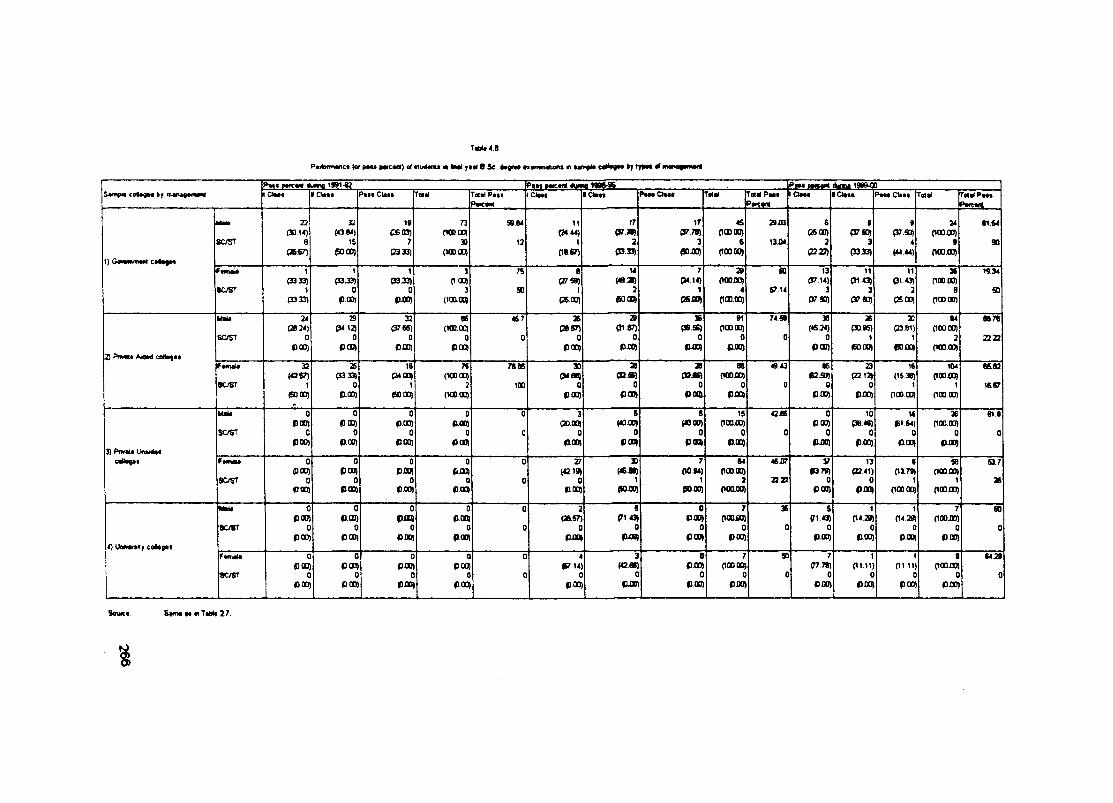
TibU4B
Paitormanc* (or pMt parcani) al Mu««nU ■ iMl j*m B Sc tsQTM «iananat»n« m H«n kf tr»M •( tS««npt* cot*9M by m«nig«r—■«
parcM 4unno 1991-W Paat MfcaM Am *a 1986-96 PcM aa«ant * « m 19»<3I?C3aat IIClM* Past Clata Total Total P a ti
Ptrc*miCta** 1 C1aa« PaaaCtaa* Taial T« il Paat
Paream1 Oaa* lOaaa Paa« 0*«» Total jlTotal Pat*
Parcani
M M 22 32 19 73 SB 84 11 17 17 45 39 xn 6 9 9 24 81.64(30.1<) (43 B4) (2603) POD 00) C24.44) (J7.?^ (37 78) OOOOO) (2500) (37 50) P7.S0) 000.00)
8C/ST e 15 7 X 12 1 2 3 6 13iM 2 3 4 9 90f» « 7 ) PO.OD) (2333) (100 00) n«-6n e033t POJO) nooocQ ( 2 ^ P3.33) (44 44) 000.00)
1 1 1 3 75 8 U 7 29 SO 13 11 11 38 1934(3333) (33.33) (3333) (100) C27SB) mTSi (2*14) (lOOOQ (J714) (31.43) C3143) OQOOO)
»<VST 1 0 0 3 SO 1 2 1 4 67.14 3 3 2 e SO(33 33) PCD) a m (loaoQ (26 00) (SOOJ?) (sm OOO.OIQ (37 SO) P7fiO) C»00) OOOOO)
MaU 34 29 33 as 467 26 29 36 91 74 S9 38 26 20 84 987BPB24) ( « 1 2 5 (37fiS) (100.00) C»S7) 0187) (»56) 000 00) (45 J4) (30.95) C23B1) OOOOO)
SC/ST 0 0 0 0 0 0 0 0 0 0 0 1 1 2 2222(DOOj POO) PXS) pOO) POD) POO) fm P-OP) POO) (6000) POOD) OOOOO)
2 Ptn«« Aio*4 calto|MF*mal« 33 25 ie n TBaS 30 X 28 88 49 43 86 23 16 104 8583
(0 *7 ) P3 3;» Q*oat (VXtCO) CM8B) (QJE) (BJE) (100 iP ) W2SJi (221^ 05.38) 000OQ•cysT 1 0 1 2 100 0 0 0 0 0 0 0 1 1 1&87
(50 QD)1*
P-OD) (SO 00) (100 019 POD) p a j) POQ POCQ POO) POO) 000 QO) OOOOO)
Mai* 0 0 0 0 0 3 8 e 15 42 J6 0 10 tf 36 61.9COO) (BCD) p.OO) fLOO) aaxxjt («0D) («.00) 000.00) POO) PB4S) P«54) OOOOO)
SC/ST 0 0 0 0 0 0 0 0 0 0 0 0 0 0 0®0O) POO) PflO) p a ® POtfl POO) POQ) p.00) fm POO) POO) a m3) PiwM*
F«maw 0 0 0 0 0 27 30 7 64 46 07 V 13 a 50 S17JlOO) PCD) pxm IU30) t«ai9) 00.94) OOO.OCQ #3 79) (2341) 0179) 000.00)8C/8T 0 0 0 0 0 0 1 1 3 2322 0 0 1 1 3S
(000) POO) pOO) POO) POO) «Kun) po.00) ooaoo) POO) poo» 000 ocq 000.00)Mala 0 0 0 0 0 3 s 0 7 36 s 1 1 7 SO
POD) P.CD) pm poo» (JB.57) (^143) pal) OOOQO) (T143) 0429) 0429) ooom )8C/ST 0 0 0 0 0 0 0 0 0 0 0 0 0 0 0
pOO) POO) pOO) pOO) PJJ« p O ) POO) POO) p.00) POO) P iM POO)4) UoMtrMjf cotogat
Ftmala 0 0 0 0 0 4 3 0 7 90 7 1 1 9 64 39OOO) POD) POO) POO) IS714) (<2«) p a j) 000 00) (77 78) 0111) 01 11) OOOiSD8C/ST 0 0 0 0 0 0 0 0 0 0 0 0 0 0 0(OOO) POD) p m POD) POO) PJBJ POO) PJO) p a j) p in ) pOO) P a j)
Souic* S«m« M « TtM« 2.7.
%
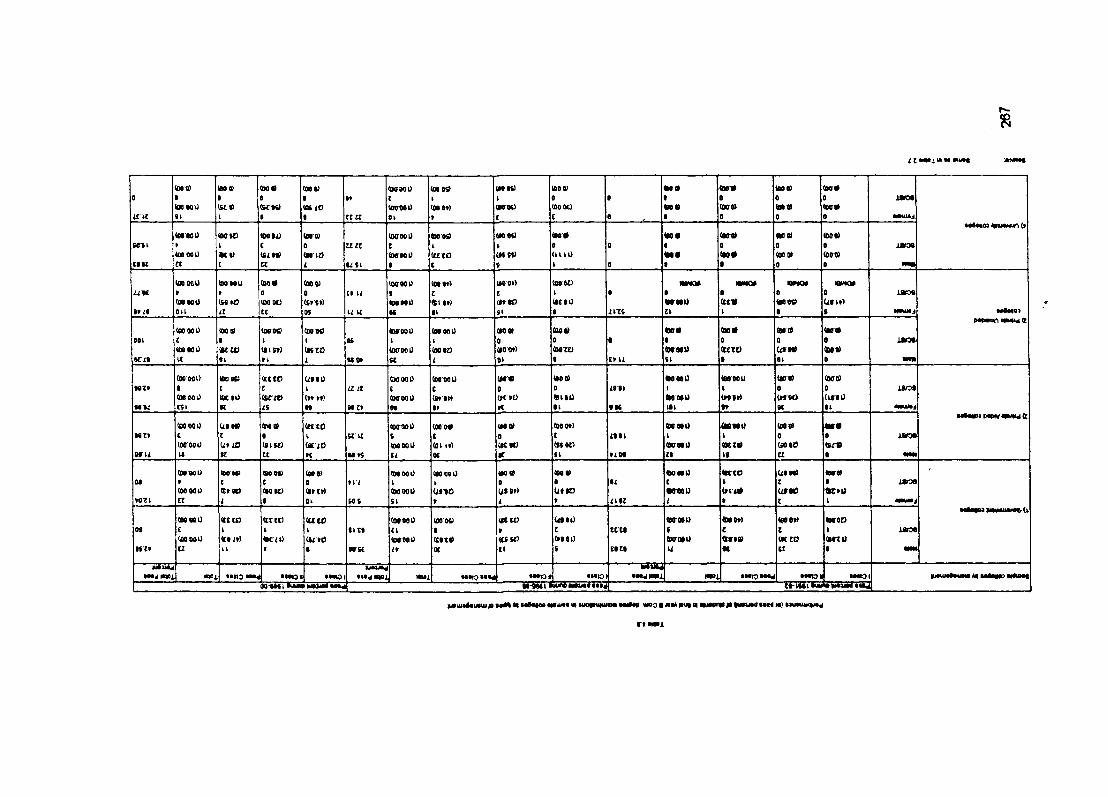
i C imi U) M »M>Mf
<oeo) Ifi0« (D0« (001> (oaooo (osva MOOS) (00 0) (B0« (aoo) (Off*0 t a 0 ■ 1* t \ 0 t 0 0 0 i»KM
(OOMO (U« (sew) US 10 (OOOOO (00 or) «wou <00 oe) («rtt «oott (Dff«XClt 91 1 ( 1 11 a 01 » t 0 t 0 0 0 muui
••••iieilesjeNufXfIMWO (DOK) (Offt (00 0) (o<rooO (00 os) (MOt) M * (OOD «oo) (OffO
M il » I c 0 t in c I I 0 t 0 0 0 iaro«(DOOOO (Kl) (StH) (WkS (Off MU (ttto (KS0 lUO (Off* (goo) (bffo)
uw a C U I liSl e e » 0 t • 0 0 •mt
unoQU (aowo (OT« (00 0) ISO 000 (o»»rt «00«> (OOftO NMQ* mtot lOMO* OMQ*a w » » 0 0 c» u f I I 0 • 0 0 0 xaros
(00 WU (BStO u»ao (S»S») (oatQO (ttWD (•CIO «rwt) (ce« <•0^ Uffi»)ou it cc ot UM K li ixzt tl I • » •puiij **«»lt>
»«WMin aiMw (t(00 000 (00 It (00 oc (00 00 ttwooo (Off 00 0 (Mtt (Ml) ttff« (nr* (OffHI
001 1 I I K I 0 f t 0 0 0 lao*(00 00l> (Ktt) (•tST) (MXO (DffOOO w o (foot) (oeco «)r«u (eeto QtfO)
*ct» u ♦ V t UO* K I OV e»ii « Sk 0 mm
<00 001) «»se> (Ecte) at to (Da 000 (Off 000 (Mff» (00 0) MrooO (ooooo (000) (OffO)wt» * c I a i t ( c 0 Xfftl t \ 0 0 laos
(aeooo ICC to (sr» (»♦>♦) (Off 00 0 (8tl« (»C »t) ttriU (MOOO 09V»> (HOC) (IfftoUK C$l K IS N ni* M K • I OK »» K •i ««niWi
*»0>WPiPWKHMMC(00 000 UtH> (MO) (nto (offooo (00 0# (MO) (BOO*) (DOOOI) (00« $mn
MX» c t 0 1 K K s t 0 l%%\ » \ 0 0 ian*(OO'MO U*iO (BiW (aciO (Off 00 0 (Oi t») (K«) (»0t) QKroiU <ucz* (SOK) (sr«
sru M n tt K M?« tl ot •C tl {• » a • mm
(oatMO <oe«« «0 0« (00 0> (MOOO (00 CIO i*0 0» (00 0) 4MiaO (Kte UfM) (Off»u f c t 0 *il V i 0 %L t ( t • laos
(00 000 t tiC tHK) (•»XH MOOO U tw US9») (itlO wrnei) UffK) •r»owz» a I • 01 H9 SI t I ivn i r t 1 •PUMi
(OOOOO (CtCO (ft to (ctto (Off 00 0 (00 00 tttct) Itftt) OO-QOU tt)oe» (00 0*) «HT0On € I I I i l t t • » eeci t c I 1 ian»
(00 000 «K- 0 (u »o (Off 000 (Clt« (ttSO (»teo ttKTOei) ttffttt (•etc) (kfftoKt* Cl u f • ITK It oc tt ertt u •c tt •
mei •«aoi Maiai t>* aioi m»x •••to *••4 •••loa •••101 •Mdmi •*«0»M^ •••to* •MIOI00-«M 1 BUU» MUiM M-96e I BwunO a«M« ttt^ tl-lWlluti
H»urai«u»uj * m M Me««o» M um* IK) nt M*(«e uloo a ink nm n mtmm m •««< j»
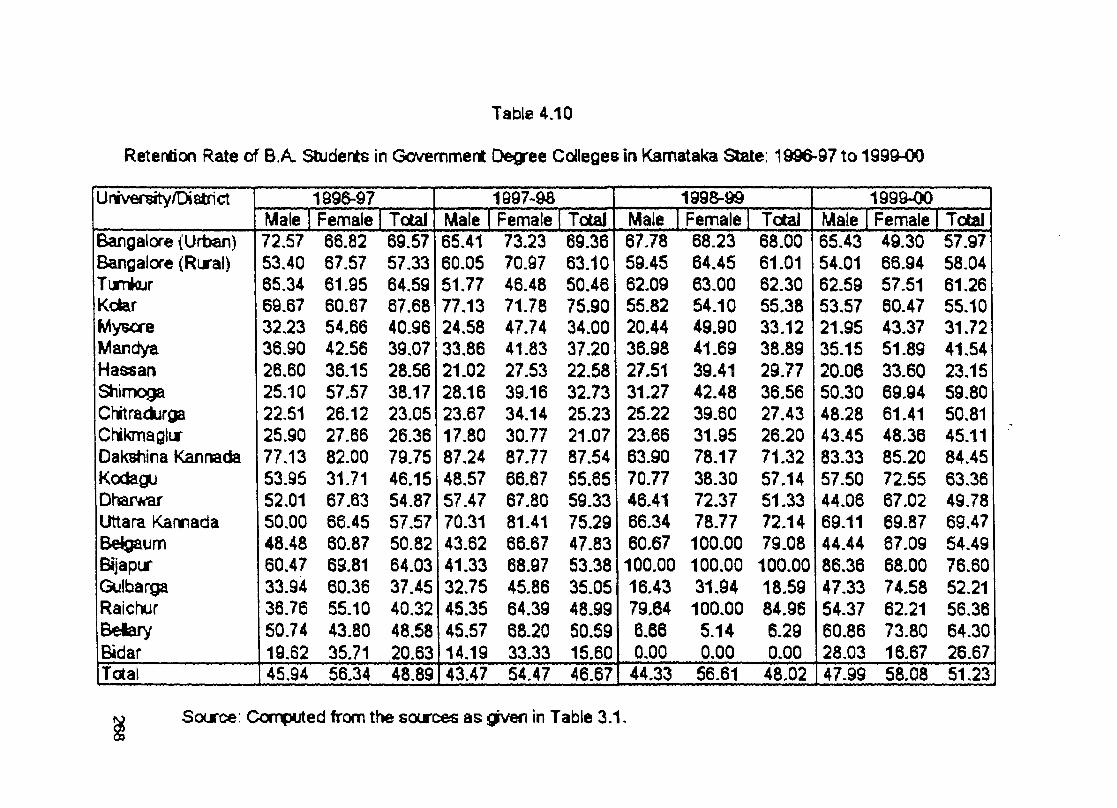
Table 4.10
Retention Rate of B A Students in GovemnnenI Degree CoHeges in Karnataka State: 1996-97 to 1 9 9 9 ^
Univefsity/Diatrict 1896-97Male Fennale Total
1997-93Male Fennale Total
1998-99Male Female Total
1 9 9 9 ^Male Female Total
Bangalore (Urban)Bangaiae (Rural)TurrtojrKoterMysoreMandyaHassanShimogaChitradurgaCNkmaglurOakstiina KannadaKodaguDharwarUttara KannadaBeigaumBtjapurGulbargaRaicliurBelaryBidar
72.5753.4065.3469.8732.2336.90 26.60 25.10 22.5125.90 77.13 53.95 52.01 50.00 48.48 60.47 33.94 36.76 50.74 19.62
66.8267.5761.9560.6754.6642.56 36.1557.57 26.1227.66 82.0031.71 67.83 68.45 60.87 69.81 60.36 55.10 43.8035.71
69.5757.3364.5967.6840.9639.0728.56 38.17 23.05 26.36 79.75 46.15 54.8757.57 50.82 64.03 37.45 40.3248.58 20.63
65.4160.0551.7777.1324.5833.8621.0228.1623.6717.8087.2448.57 57.47 70.31 43.62 41.33 32.75 45.3545.57 14.19
73.2370.97 46.48 71.78 47.74 41.83 27.53 39.16 34.1430.7787.7766.67 67.80 81.4166.6768.97 45.86 64.39 68.20 33.33
69.3663.1050.4675.9034.0037.2022.58 32.73 25.23 21.07 87.54 55.65 59.33 75.29 47.83 53.38 35.05 48.9950.5915.60
67.7859.4562.0955.8220.4436.9827.5131.2725.2223.66 63.90 70.77 46.41 66.3460.67 100.00 16.43 79.64 6.66 0.00
68.2364.4563.00 64.10 49.90 41.69 39.41 42.48 39.60 31.95 78.17 38.30 72.37 78.77100.00 100.00 31.94 100.005.140.00
68.0061.0162.3055.3833.1238.8929.7736.5627.4326.2071.3257.1451.3372.14 79.08 100.00 18.59 84.96 6.29 0.00
65.43 54.01 62.59 53.57 21.95 35.15 20.06 50.30 48.28 43.4583.33 57.50 44.06 69.1144.4486.3647.3354.37 60.86 28.03
49.3066.94 57.51 60.47 43.37 51.89 33.6069.94 61.41 48.3685.20 72.55 67.02 69.87 67.09 68.00 74.5862.21 73.80 16.67
57.9758.0461.2655.10 31.72 41.54 23.1559.8050.8145.11 84.4563.36 49.78 69.47 54.49 76.60 52.2156.36 64.30 26.67
Total 45.94 56.34 48.89 43.47 54.47 46.67 44.33 56.61 48.02 47.99 58.08 51.23
Source: Corrected from tlie sources as (^ven in Table 3.1.
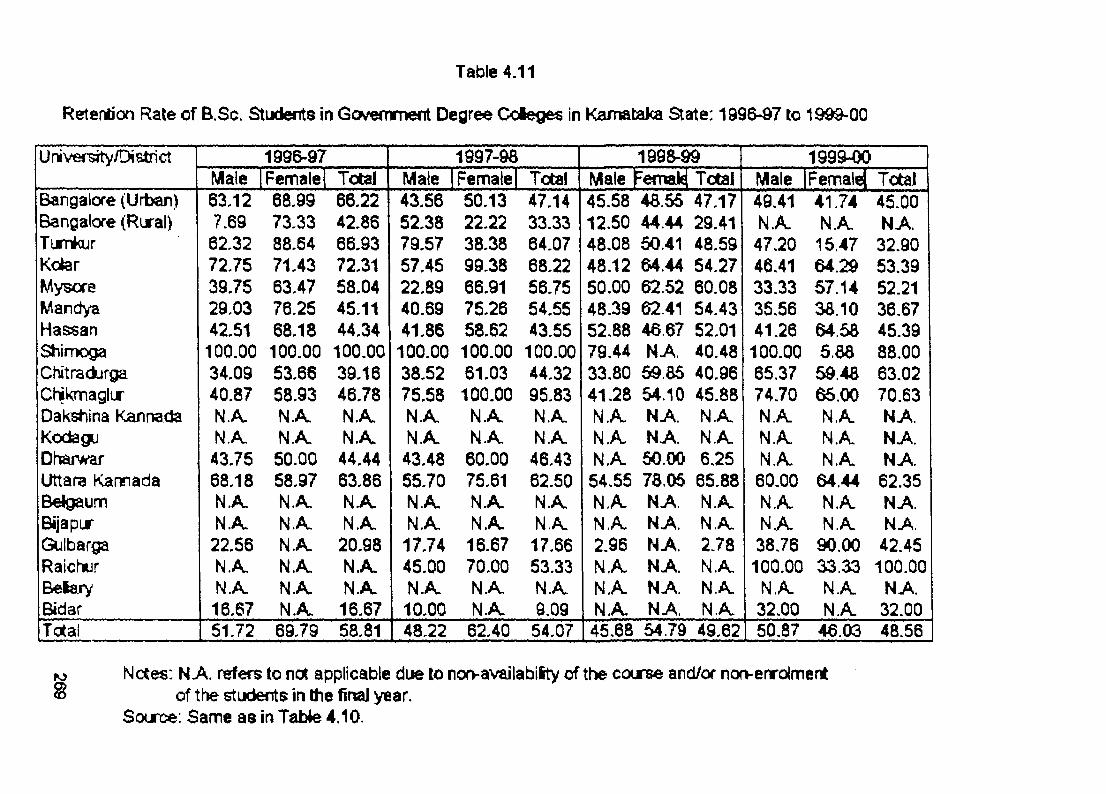
Table 4.11
Retention Rate of B.Sc. Students in Gavemmert Degree Cdeges in Karnataka State: 1996-97 to 1999-00
Universjty/Disirict 1996-97Male Female Total
1997-98Male iFemalel Total
1998-99Male Femald TotaJ
1999WMale IFennaM Total
Bangalore (Urban)Bangalore (Riral)TumkurKc*arMysoreMandyaHassanShinxjgaChitradurgaChjkmaglurDakstiina KannadaKodaguDhar#arUttara KamadaBelgaumBijapirGolbargaRaichurBeiaryBidar
63.127.6962.3272.7539.75 29.03 42.51 100.00 34.09 40.87 NA N.A.43.75 68.18 NA N A 22.56 N A N A 16.67
68.9973.3388.6471.4363.4776.2568.18100.0053.6658.93N AN A50.0058.97N AN AN AN AN AN A
66.2242.86 66.93 72.31 58.04 45.11 44.34 100.00 39.16 46.78 N A N A 44.4463.86 N A N A 20.98 N A N A 16.67
43.56 52.3879.57 57.45 22.8940.69 41.86
100.00 38.5275.58 N A N A 43.4855.70 N A N A 17.7445.00 N.A10.00
50.1322.2238.3899.38 66.91 75.26 58.62 100.00 61.03 100.00N AN A60.0075.61N AN A16.6770.00N.AN A
47.1433.3364.0768.2256.7554.5543.55 100.0044.32 95.83 N A N A 46.43 62.50 N A N A 17.6653.33 N A 9.09
45.5812.50
48.55U.44
48.08 50.41 48.12 64.44 50.00 62.52 48.39 62.41 52.88 46.67 79.44 N A 33.80 59.85 41.28 54.10N.A.N./LN.A.
N AN A50.00
54.55 78.05 N.A. N AN./Sw2.96N.A.N.A.N A
N AN AN AN AN A
47.1729.4148.5954.2760.0854.4352.0140.4840.9645.88N.AuN.A6.2565.88 N.A N.A 2.78 N.AN./iuN.Au
49.41 N.A. 47.2046.41 33.33 35.56 41.26 100.00 65.37 74.70 N.A. N./s N.A. 60.00 N.A. N.A 38.76
100.00N.A.32.00
41.74N.Au15.47 64.29 57.14 38.10 64.58 5.8859.4865.00 N.Au N.Au N.A.
64.44 N.A. N.A.
90.00 33.33 N.A. N.A.
45.00 NA. 32.9053.39 52.21 36.6745.3988.00 63.02 70.63 N A NJk,. N A 62.35 N A N A 42.45
100.00N A32.00
Total 51.72 69.79 8.81 48.22 62.40 54.07 45-68 54.79 49.62 50.87 46.03 48.56
Nctee: N A. refers to not applicable due to non-availabiity of the course and/or non-enrolment of the students in ttie finaJ year.
Source: Same as in Tabte 4.10.
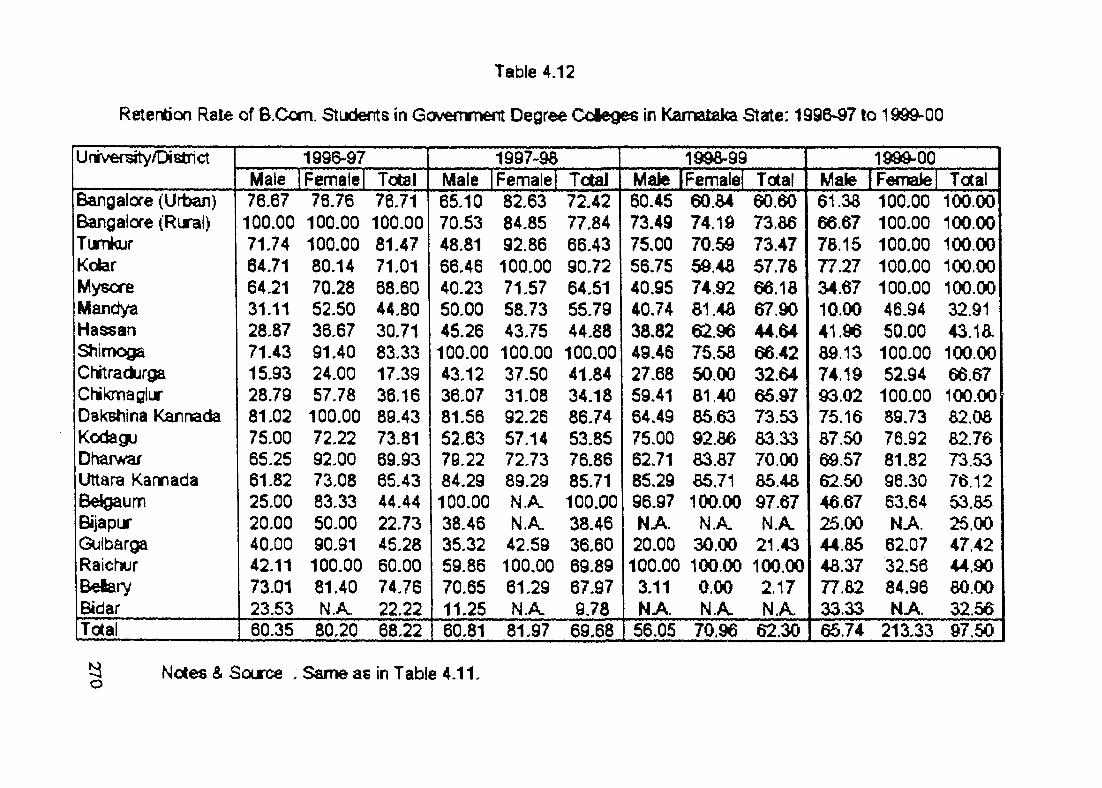
Table 4.12
Retention Rate of B.Com. Students in Gchi«mmert Degree Coleges in Karnataka State: 1996-97 to 193&-00
Unrveraity/Dialrct 1996-97Male Female Total
1997-98Male Female Total
1996^99Male I Female! Total
1999-00Male iFematel Total
Bangalore (Urtsin)Bangalore (Rural)TumkurKobrMysoreMandyaHassanShlnKtgaChitradurgaChikmaglurDakBhlna KanrtadaKodaguD^^rwarUttara KannadaBeigaumBijapurGulbargaRalchurBelarvBidar
76.67100.0071.7464.7164.2131.11 28.87 71.43 15.93 28.79 81.0275.00 65.25 61.8225.0020.0040.0042.1173.01 23.53
76.76100.00100.0080.1470.2852.5036.6791.4024.00 57.78
100.00 72.2292.00 73.08 83.3350.00 90.91100.0081.40N.Au
76.71 100.00 81.47 71.01 68.6044.8030.71 83.33 17.39 36.1689.4373.81 69.9385.4344.44 22.73 45.28 60.00 74.76 22.22
65.1070.5348.8166.46 40.2350.00 45.26100.00 43.12 36.07 81.56 52.63 79.22 84.29 100.0038.46 35.32 59.86 70.65 11.25
82.6384.8592.86 100.00 71.5758.73 43.75 100.00 37.50 31.08 92.26 57.1472.7389.29 N A N A 42.59 100.0061.29 N A
72.4277.8466.43 90.72 64.51 55.7944.88 100.0041.84 34.18 86.7453.8576.86 85.71 100.00 38.46 36,6069.89 67.97 9.78
60.4573.4975.00 56.75 40.95 40.74 38.8249.46 27.68 59.4164.4975.00 62.71 85.29 96.97 N A20.00
100.003.11N A
60.8474.1870.5950.48 74.9281.48 62.96 75.5850.00 81.40 85.6392.8683.87 85.71100.00
N.A.30.00100.00 0,00 N.A.
60.6073.8673.47 57.78 66.18 67.9044.6466.4232.64 65.97 73.53 83.3370.0085.48 97.67 N.A.
21.43100.00 2.17 N.A.
61.3866.6778.15 77.2734.67 10.00 41.96 89.13 74.19 93.0275.1687.50 69.5762.5046.67 25.00 44.85 48.37 77.82 33.33
100.00100.00100.00100.00100.0046.9450.00100.0052.94
100.00 89.73 76.92 81.82 96.30 63.64 NJi . 62.07 32.56 84.96 N A
100.00100.00100,00100.00100,0032,9143.18.100,0066,67100,0082,0882,7673.5376,1253,8525.00 47,42 44,9080.00 32,56
Total 60.35 80.20 68.22 60.81 81.97 69,68 56.05 70.96 62.30 65,74 213,33 97,50
o Notes & Source , Same as in Table 4.11
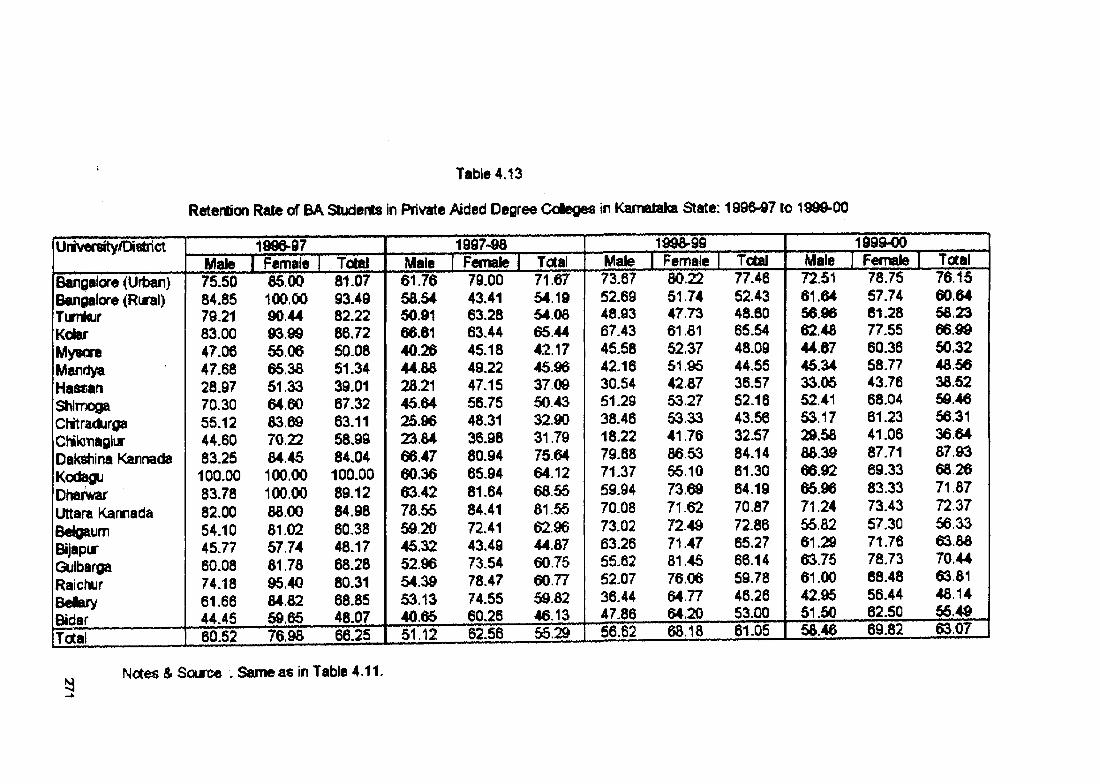
Table 4.13
Retention Rale of BA Students in Private Aided Degree Colegec in Karnataka State: 199M 7 to 1999-00
Uraveroty/Dietrict 1996-97Mate I Female I Totei
1997-9aMale I Femate I Totaf
1996^99Mate I Fennaie I TdST Male
1999^T Femaie f Total
BanQalore (Urban)Bangalore (Rural)TiMnfcurKoterMywreMandyaHassanShimogaChftradurgaChikiTiaglurDakshina KannadaK od^DharwarUttara KarnadaBeloaunnBijapurGulbargaRaicfiurBelaiyBidar
75.5084.8579,2183.00 47.06 47.68 28.97 70.30 56.12 44.60 83.25100.00 83.78 82.00 54.10 45.77 60.08 74.18 61.66 44.45
85.00100.0090.44 93.99 55.06 65.38 51.33 64.60 63.69 70.2264.45 100.00 100.00 86.00 61.02 57.74 61.76 d5.40 64.62 59.65
81.07 93.49 82.22 86.7250.08 51.34 39.01 67.3263.11 58.99 84.04
100.0089.12 84.98 60,38 48.17 68.28 80.31 68.85 48.07
61.7656.54 50.91 66.61 40.26 44.66 28.2145.6425.9623.64 66.47 60.36 63.4276.55 59.20 45.3252.96 54.39 53.1340.65
79.0043.41 63.28 63.44 45.18 49.22 47.15 56.75 48,31 36.9880.9465.94 81,6484.4172.41 43,4973.54 78,4774.55 60,26
71.67 54.19 54 06 65.44 42.1745.96 37 09 50.43 32.90 31.79 75.6464.1268.5561.5562.9644.67 60.75 60.77 59.6246.13
73.67 52.6948.9367.43 45.58 42.16 30.54 61.29 38.46 18.2279.68 71.3769.94 70.08 73.02 63.26 65.62 52.0736.44 47.86
80.22 51.74 47.73 61.61 52.37 51 95 42.67 53.27 53.3341.76 86 53 5510 73 69 71.62 7249 71.47 81.45 760664.77 64.20
77.4652.4348.6065.54 48.0944.55 36.57 52,1643.5632.5784.14 61.30 64-19 70,87 72.86 65.2766.14 59.78 46.26 53.00
72.5161.6456.9662.46 44.67 45.34 33.05 52.41 53.17 29.58 66.39 66.9265.96 71.24 55.62 61.29 63.75 61.00 42.95 51.5056.46
78.75 57.74 61.28 77.55 60.36 58.7743.76 68.04 61.23 41.06 87.7169.3383.3373.43 57.3071.76 78.73 68.4856.44 62.50 69.82
761560.64 58.23 66.99 50.32 46 56 36.52 59.46 56.3136.64 67.93 68.26 71 67 72.37 56 33 63.66 70.44 63.61 46.14 56.49 63.07Total 60.52 76.98 66.25 51.12 62.56 55.29 56.62 66.18 61.05
Notes 4 Source . Same as in Table 4,11
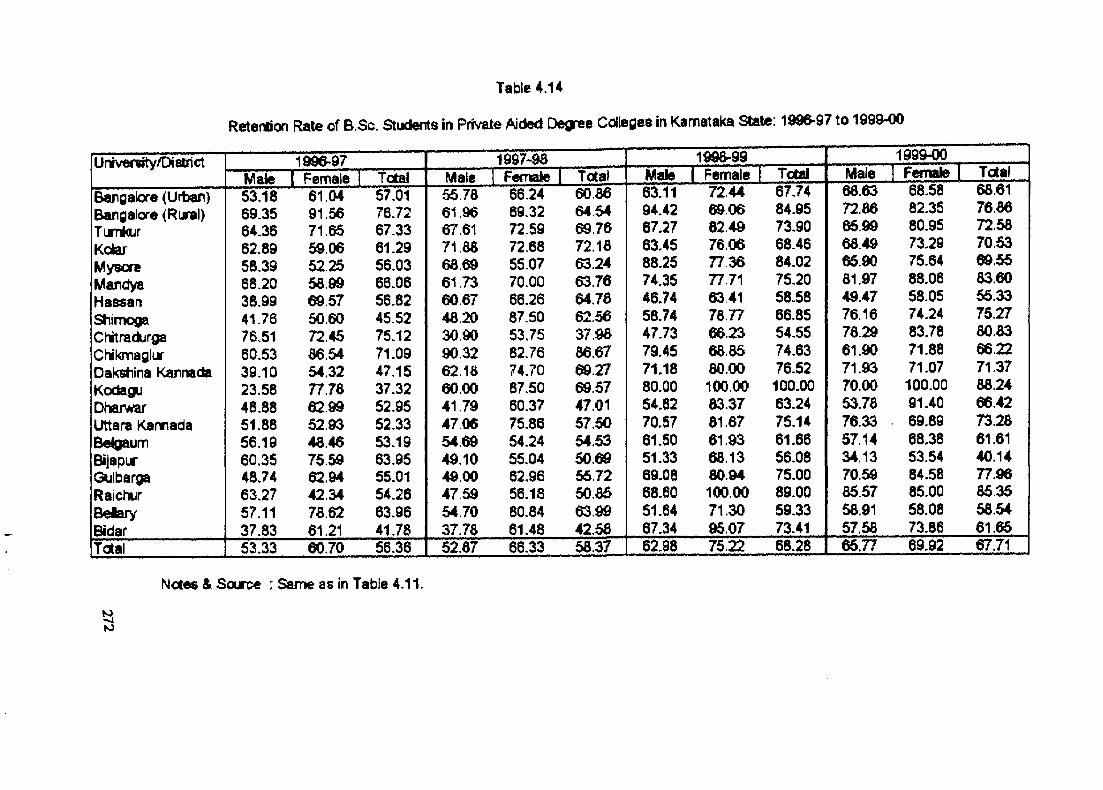
Table 4.14
Retettion Rate of B.Sc, Students in Private Aided Degree Cdlegee in Karnataka Slate: 1996-97 to 1999-00
Univeraty/Di8lnctMate I Female 1 Total Male 1 Female 1 TotaF Male Tctal Male
1d96-97 1096-99 I Female
1999-00[Female Total
66.61Bangalore (Urfoer)Bangalore (Rural)TumkurKolarMysoreMandyaHassanShimogaChitradurgaChikmaglurDakshina KannadaKodaguDliarwarUttara KanradaBelgaumBijapurGiilbargaRaic lurBefaryBidar
53.1869.3564.36 62.89 58.39 68.20 38.99 4178 76.51 60.5339.10 23.5848.8851.8856.19 60.35 4874 63.2757.11 37.83
61.0491.56 71 65 69.06 52 25 56.9969.57 50.6072.45 66.54 54.32 77.76 62 9952.9346.46 755962.94 42.34 76.62 61.21
57.01 76.72 67.33 61.29 56.03 66.06 56.82 45.52 75.12 71.09 47.1537.3252.9552.33 53.1963.9555.01 54.2663.96 4178
5576 61.96 67.61 71.66 66 69 61.73 60 6746 20 30.90 90 32 6216 60.00 41 7947 0654.69 49.10 49 00 47 5954.70 37.76
66.24 69.32 72.59 72.68 55.07 70.00 66.2687.5053.7582.76 74.7087.50 60.37 75.8654.24 55.04 62.96 56.18 80.84 61.48
60 66 64 5469.76 72.16 63.2463.76 64.7862.5637.98 66.67 69.2769.57 47.01 57.50 54.53 50.69 55.72 50.6663.9942.58
63.1194.4267.2763.45 88.25 74.3546.7458.74 47.7379.45 71.18 80.00 54.82 70.57 61.5051.33 69.08 68.60 51.8467.34
7244690662.4976.06 77 36 7771 63 41 76 77 66.23 6665 60.00 100.00 83.37 61.6761.93 66.1360.94 100.00 71.3095.07
67.7484.9573.9068.4684.0275.2058.5866.8554,5574.6376.52100.0063.2475.1461.6656.0875.0089.00 59.33 73.41
66.6372.66659966.4965.90 61.97 49.47 7616 76.2961.90 71.93 70.00 53.76 76.33 57.14 34.13 70.59 65.5756.91 57.56
68.58 82.35 80.95 73.29 75.64 88.08 58.05 74-24 83.7871.8871.07
100-00 91.4069.89 68.38 53.5484.58 85.0058.08 73.88
76.6672.5870.53 69.5563.60 55.3375.27 60.63 66.22 71.37 66.24 66.4273.2861.61 40.14 77.96 653556.54 61.65
Total 53.33 60.70 56.36 52.67 66.33 56.37 62.98 75.22 68.28 65.77 69.92 6771
Notes & Sourc e : Same as in Table 4.11
»o
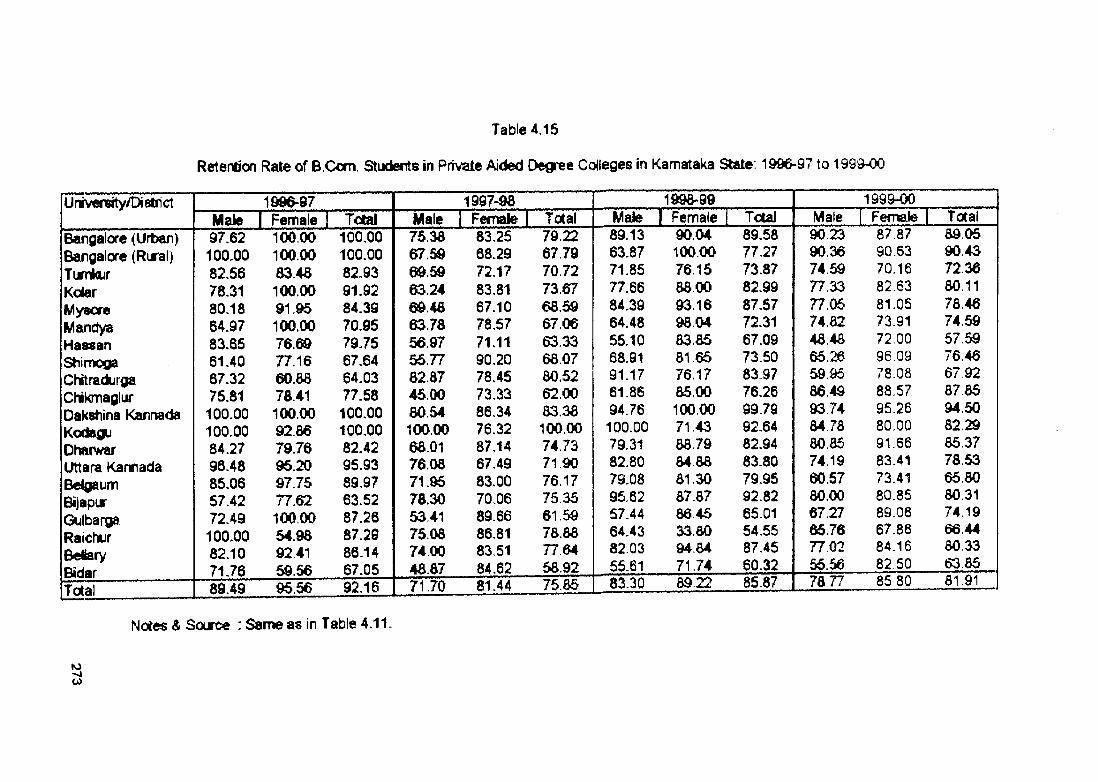
Table 4.16
Retertion Rale of B.Ccm. Students in Prtvate Aided Degree Colleges in Karnataka Slate; 1996-97 to 199&-00
University/Dielrjct 1d96>97Male I Female I Tctef
1997-98Male I Fernale I Total
199&-99Maie I Female Toiai
1999-00Male Female | Total
Bangalae (Urban)Bangalore (Rural)TumkurKoiarMydoreManctyaHassanStiinxsgaChitradurgaChikmaglijrDakshina KanrradaKoOagLiDNirwarUttara KanradaBeigaumBijapurGiilbargd.RaichurBeftaryBidar
97.62100,0082.5678.31 80.18 64.97 83.66 61.4067.32 75.81 100,00 100.00 84.2796.48 85.06 57.4272.49 100.00 82.10 71.76
100.00 100.00 83 46 100.00 91 95 100.00 76.69 7716 60.88 78.41 100.00 92.86 79.76 95.20 97 75 77.62 100.00 54.98 9241 59.56
10 0 .0 0100.0082.9391.92 84.39 70.95 7975 67.64 64.03 77.58 100.00 100.00 82.4295.93 89.97 63.52 87.26 87.29 86.14 67.05
75.3867.5969.59 63 24 69.48 63.78 56.97 56.7782.8746.00 80.54100.00 68.01 7608 71.95 78.30 53.41 75.08 74.0048.87
83.2568.2972.1783.8167.10 78.5771.11 90.20 78.4573.3386.34 76.32 87.14 67.49 83.00 70.06 89.6686.81 8351 84.62
7922 67 79 7072 73 6768.5967 06 63.3368 07 80.52 62 00 83.38 100.00 7473 71.90 76,17 753561.59 78.88 77,64 58 92
89.1363.8771.85 77.66 84.39 64.48 55.10 68.91 91.1761.86 94.76 100.00 79.31 82.80 79.08 95.62 57.44 64.43 82.03 55.61
90 04 100 00 7615 88 0093.16 98 04 83.85 81 6576.1785.00100.00 71.4388.79 84 88 81.30 87,87 86 4533.80 94 84 71.74 89 22
89.5877-2773.87 82.99 87,5772.31 67-09 73.50 83-97 76.26 99-79 92-6482.94 83.8079.95 92-82 65-01 54.55 87.4560.3285.87
90 23 90 36 7459 77.33 77.05 7482 48 48 65 26 59,95 86.49 93 74 8478 80 85 74.19 60.57 80.00 67.2765.76 77 02 55.5678.77
87 8790.6370.1682.6381.05 73.9172.00 96.09 78.08 88.57 95.2680.00 91.6683.4173.41 80.8689.06 67.8684.16 82 50 85.80
89 0590 4372.36 80.11 78.46 7459 57 59 7646 67 92 87 85 94.50 82 2985.37 7853 65,80 80 31 74.19 66.44 80 33 63 85 81.91
Total 89.49 95,56 92.16 71.70 81.44 75,85 83.30
Notes 8. Source : Same as in Table 4.11.
toO)
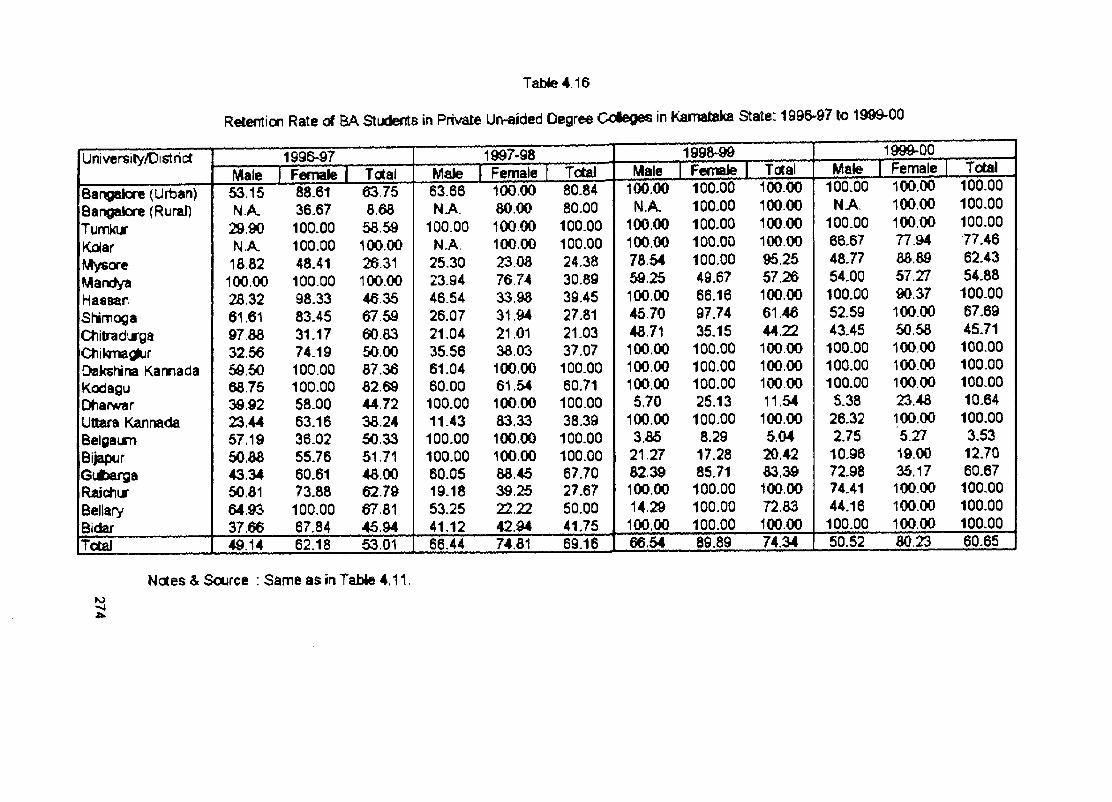
Table 4 16
ReCertion Rate of BA Studerts in Private Un-aided Degree Coiegec in Karnataka State: 1996-97 to 1989-00
Universily/District
Bangalore (Urban)Bangalore (Rural)TumkurKolarMysoreMantiyaHassarSNmogaOiitradLrgaCtiiKmag rDakshina KannadaKodaguOtiarwarUttara KannadaBelgaumBijapurGiAergaRaicfiurBellaryBidarTctaJ
1995-97Male I Feniale I TotaT53.15 N A
29.90 N.Ac 18.82 100.00 28.32 61.61 97 88 32.56 59.50 68.7539.92 23.44 57.19 50.88 43.34 50.8164.93 37.66
88.6136.67100.00100.0048.41
10 0 .0 098.3383.4531-1774.19100.00100.0058.00 63.16 36.02 55.76 60.61 73.88100.00 67.84
63 75 868
58 59 100.00 26.31 100.00 46 35 67.59 60 83 50 00 87.36 8269 44 72 38.24 50.33 51.71 48.00 62.79 67.81 45.94
49.14 62.18 53.01
1997-98Male I Female I Total63.66HA
100.00HA25,3023.9446.5426.0721.04 35.5661.04 60.00 100.00 11.43 100.00 100.0060.05 19.18 53-25 41.12
100.00 80.00 100.00 100.00 23 08 76.74 33.9831.94 21.01 38.03 100.00 61.54 100 00 83.33 100.00 100.00 88.45 39.25 22.2242.94
80.8480.00
100.00100.0024.38 30.89 39.45 27.81 21.03 37.07 100.00 60.71 100-0038.39
100.00 100.00 67.70 27.67 50.00 41.75
66-44 74.81 69.16
1998^99Male I Female I Trtaf
100.00 N.A.
100.00 100.00 78.54 59.25 100.00 45 70 48.71 100.00 100.00 100.00 5.70
100.00 3.86 21.27 82.39 100.00 14.29 100.00
100.00100.00100.00100.00100.0049.6766.1697.7435.15
100.00100.00100.0025.13
100.008.2917.2885.71
100.00100.00100.00
100 00 100 00 100 00 1000095.2557.26 100.00 61 46 44.22 100 00 100.00 100 00 11.54 100.005.04 20.42 83.39 100 00 72.83 100.00
66.54 89.89 74.34
Male1999-00
J_ Female100.00HA
100.0066.6748.7754.00
100.00 52.59 43.45
100.00 100.00 100.005.38
26.322.7510.9672.9874.4144.16
100.00
100.00100001000077.9488.8957.27 90.37 100.00 50.58 100 00 100.00 100 00 23.48 100.005.2719.00 35.17100.00 100.00 100.00
Total100.00100.00100.0077.4662.4354.88
100.0067.69 45.71 100.00 100.00 100.00 10.64 100.003.5312.70 60.67
100-00 100.00 100.00
50.52 80.23 60.65
Notes & Source : Same as in TalDte 4.11.
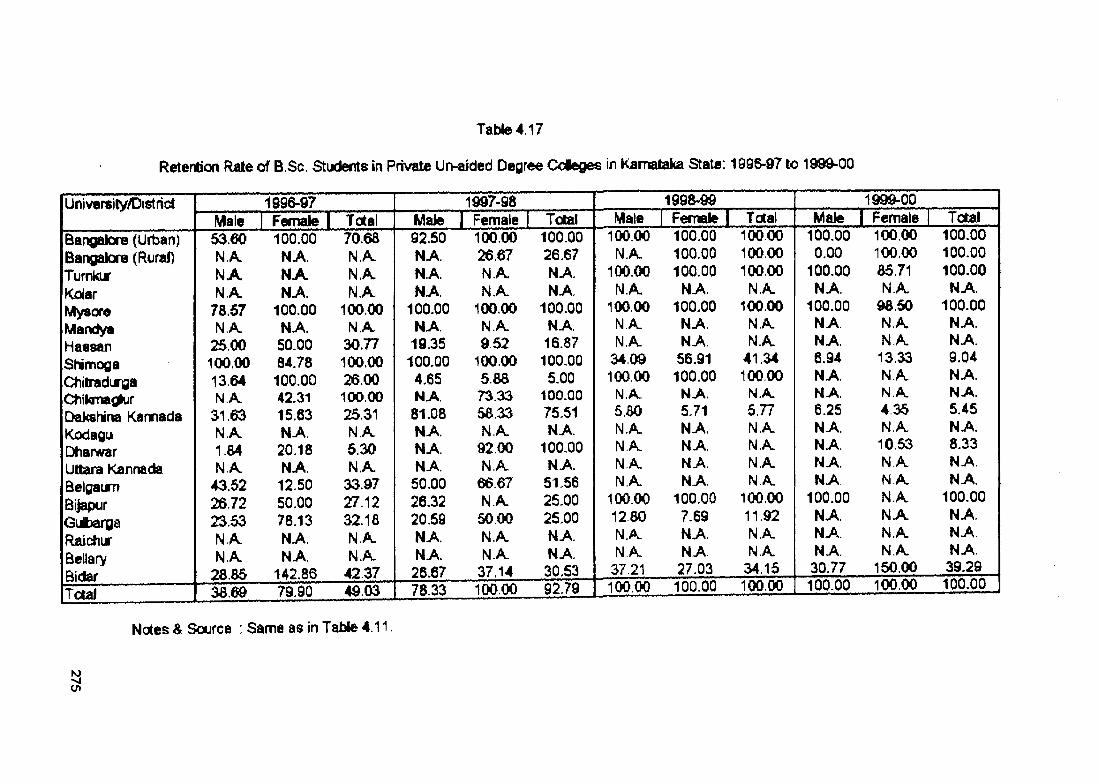
Table 4.17
Retention Rate of B.Sc. Studefite in Private Ui>ajded Degree Cdeges in Karrtataka State; 1996-97 to 1999-00
University/District
Bangalore (Urban)Bangalorie (Rural)TurnkurKoiarMysoreMandyaHaasanShimogaOiitradurgaCtiikmafi rDakahina KarradaKodaguDliarwarUttara KannadaBelgaumBijapurGidbargaRaicJiurBeilaryBidar
1996-97Male I Female I TotaT53.e0 NA NA N A
78.57 NA
2500 100.00 13 64 N A
31.63 NA 1.W NA
43.52 26.7223.53 N A N.A.
28.66
100.00N AN ANA.
10 0 .0 0NA.50.00 84.78
100.00 42.31 15.63 NA 20.18 N A 12.50 50.00 78.13 N A N A
142,86
70.68N.AN.AN.A
100.00N.A
30.77100.0026.00100.0025.31N.A5.30N.A
33.9727.1232.18N.AN.A
42.37
1997-98Male I Female I Totel92.50N AN AN A
100.00UA19-35
100.004.65N A81.08N AN AN A
50.0026.3220.59N AN A26.67
100.0026.67 N.A. N.A
100.00N.A.952
100.0058673.3358.33 N.A
92,00 N.Au
66.67 N.A.
50 00 N.A. N.A.
37.14
100.0026.67NA.N A
100.00N A
16.87100.005.00
100.00 75.51 N A
100.00N A
51,5625.0025.00 N A N A 30.53
Male1998-99 Female I Total
100.00N.A
100.00N.A.
100.00N AN.A.
34.09100.00N A5.80N.A.NAN.AN.A
100.001280N AN A
37.21
100.00100.00100.00
NA.100.00NA.N A
56.91100.00NA.571NA.NAN ANA.
100.007.69N ANA27.03
10000 100 00 10000 N.Au
100 00 N.A. N.A.
41.34 10000 N.A. 5.77 N.A N.A N.A N.A
100.00 11.92 N.A. N.A.
34.15 100 00
Male100.000.00
100.00NA.
100.00N AN A6.94N ANA.6.25NA.N ANA.N-A
100.00NA.NA.NA30.77100.00
1999-00 I Female
100.00100.0085.71N.A.
98.50N ANA13.33N AN A435
1053N AN AN.AuN AN.AN.A.
150.00100.00
Total100.00100,00100.00NA
100,00N AN A9.04N ANA.5.45N A8.33N AN A
10 0 .0 0N ANA,N A39.29100.00
Total 38.69 79.90 49.03 78.33 100.00 92.79 100.00 100.00
Notes & Source : Same as in TaWe 4.11
oi
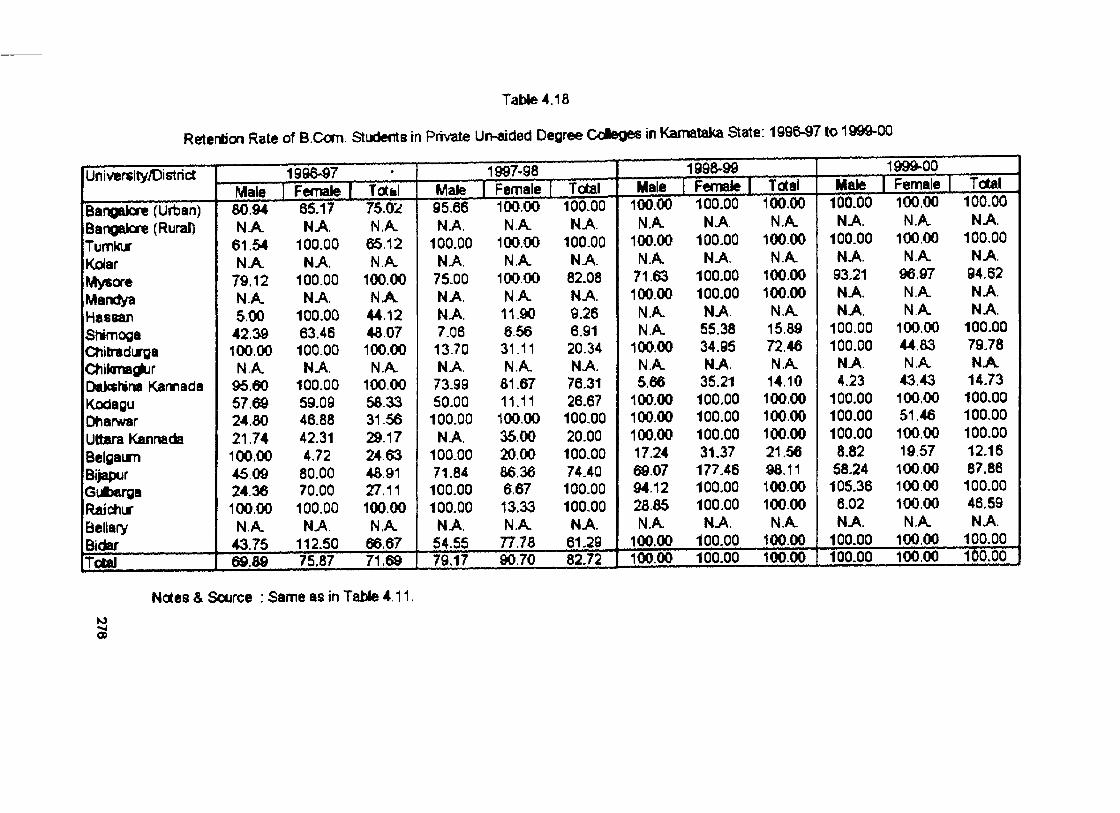
Table 4.18
Retenbon Rale of B.Ccm. Students in Pris/ate Un-aided Degree Cdteges in Karnataka State: 199M 7 to 1999-00
University/District 1995-97Male I Femaie I ToST
1997-98Male I Female I Total Male
199&-99 I Femaie I Total
100.00Male
100.00
199^00Femaie Total
100.00Bangalore (Urban)Bangalore (Rural)TumkurKolarMysoreMandyaHaaaarSNmogaCtiitradurgaC ikmag rDakshina KanradaKodaguOtiarwarUttara KannadaBelgaumBiiapcjrGiibergaRaictiu*BellaryBidar
80.94N A
61.54N A
79.12N.A.5.00
42.39 100.00N A
95.00 57.69 24.8021.74100.00 45 09 24.36 100.00N A
43.75
85.17N A
100.00NA.
100.00NA.
100.0063.46
10 0 .0 0UA
100 .0059.0946.8842.314.7280.0070.00
100.00 N^
112.50
75.02N.A
65.12 N.A
100.00NA
44.12 4807 100.00N.A
100.00 58 33 31 56 29.17 24 63 48.91 27.11 100.00 N.A
66.67
96.66UA.
100.00N A75.00 N A N A 7.06 13.70 N A 73.9950.00
100.00 N A
100.0071.84
100.00100.00N A
64.55
100.00 N.A
100.00 N.A
100 00 N.A 11.90 65631.11 N.A
81.6711.11 100.00 35.00 20 00 86 36 667 13.33 N.A
77.78ToiaJ 69.89 75.87 71.69
100.00HA
100-00N A82.08N A9.266.9120.34N A76.3126.67100.0020.00100.0074.40100.00100,00N A
61.2979.17 90.70 82.72
100.00N.A.
100.00N.A.
71.63100.00N.A.N.A.
100.00N.A.5.66
100.00100.00100.0017.2469.07941228.85N A
100.00
100.00NA
100.00N A
100.00100-00NA.56.3834.95NA.35.21100.00100.00100.0031.37
177.46100.00100-00N A
100.00
N.A.10000
N.A.100.00100.00
N.A.15.8972.46N.A.14.10 100.00 100.00 100.00 21.5698.11 100.00 100.00N.A.
100.00
NA.100.00NA93.21NA.N A
100.00100.00NA4.23
100.00100.00100.008.82
58.24106.36
6.02N A
100.00
100.00 N.Al
100.00 N.A.
96.97 hiA N.A
100.00 44 83 H.A
43.43 100.00 51.46 100.00 19 57 100.00 100.00 100.00 N.A
100.00100.00 100.00 100.00 100.00 100.00
N A100.00NA
94.62NAN A
100.0079-78N A14.73100.00100.00100.0012.1687.86100.0046-59NA.
100.00160.00
Notes & Source ; Same as in Table 4.11
a>
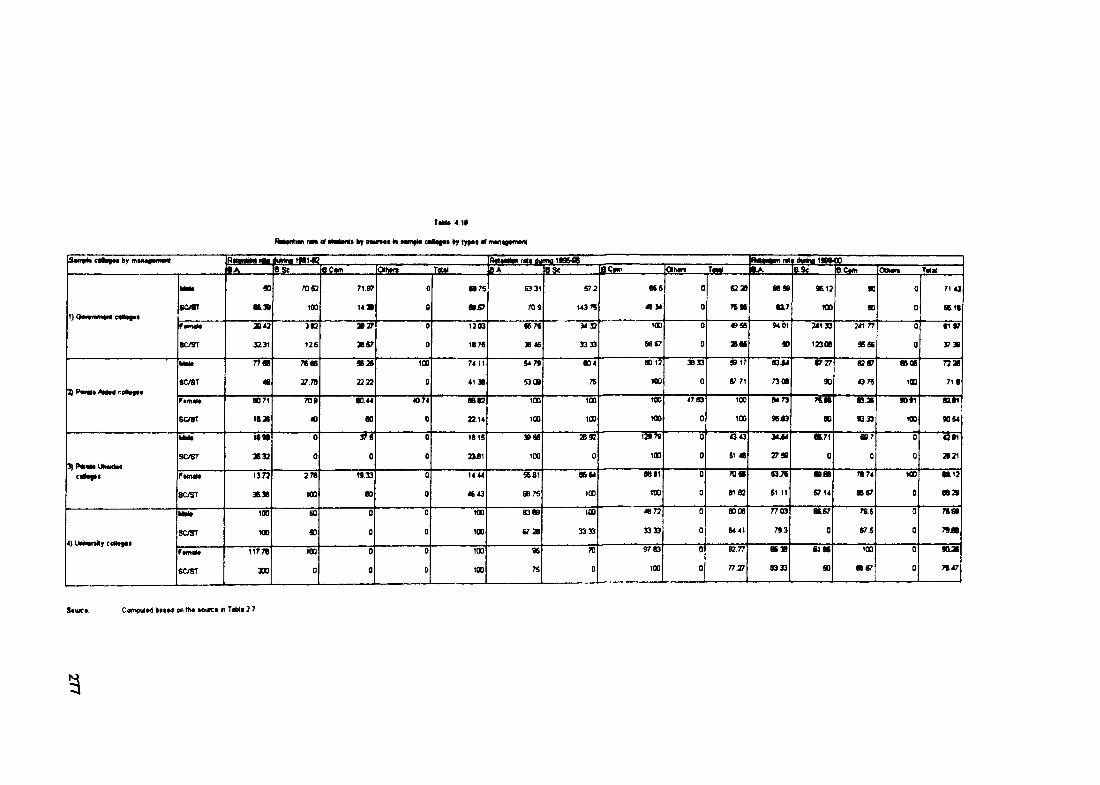
Heentien nt* gTaMMt by ewmt— in t twyt* c«a*|«« br of iMntgaimnt
TiW* 4.1»
S«uie* Compui*<S Nt*d on th* totic* « Tibl* 2 7
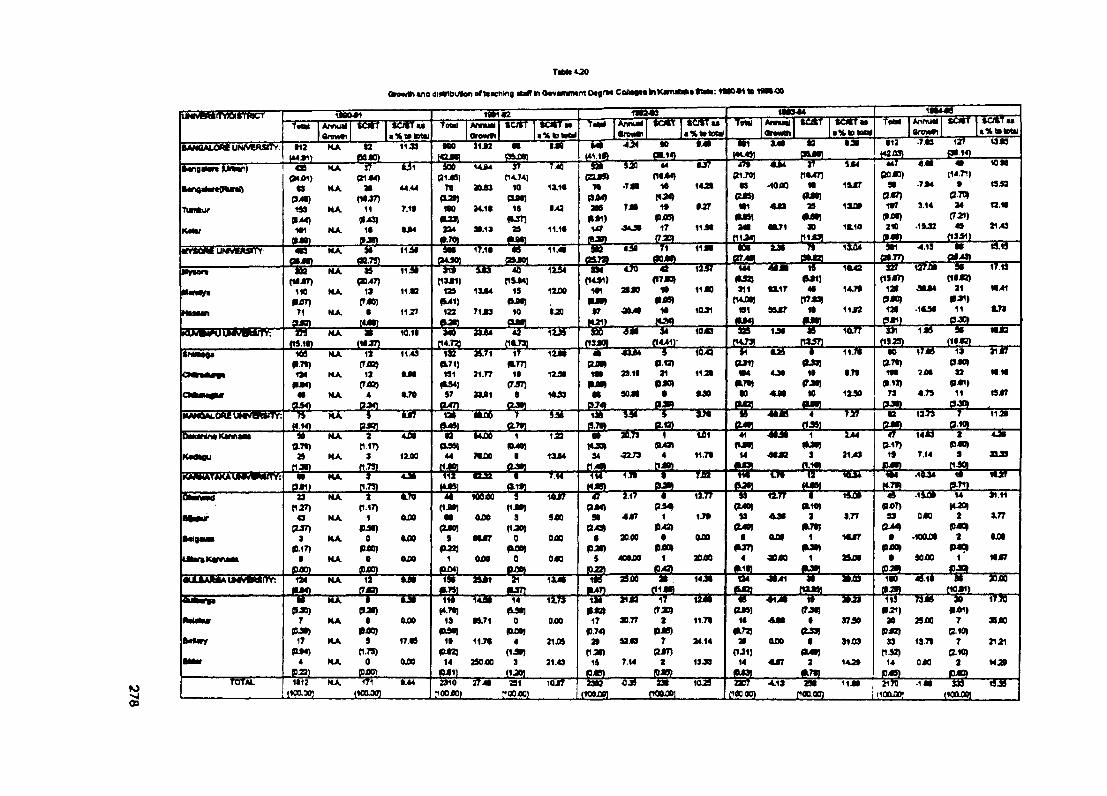
TiUiOOQiow«t «no iili*lbuttoo olfcaching « m (Wvwwmrtt Ot«rw CoU«at» ht K«mi«ifc» t M : 1«0-*1 to 19M-Q0
U M ^ rfv S b iiV fiic r ' ’l i m
1MCAnfHMlOrBwrtn
iS K s a * Y u•% w to tu
Yotali» i
A m « lOrowflt
«2«CI«T ia tV iT T«tirf
i mh iw *MSrewei
M9io iV ‘ Tow
1008<04M w s jr iz s fOtm M il
1804A nn u maroM4h
58ode? O O ttM
t% totoM I
BANOMjOAi UMVCRSnrV: t12 HA. f i 1 1 * " » ■ i l i 2 « iJB •40 00 •40 ■ *81 9u«0 88 8J0 •13 •7.09 127 13 09
(9a«o) (42JD P8.14) i?U >l J M . (3814)
fU ngM n o i HA - ^ T T - U A A S2i i x 44 t j f 47* 0J4 2^ 9A4 447 4.08 40 1008
(MXH) 91M ) p 1 « l p4w741 OU0) nojM) P1.70J nou«7) CO JO) (14.71)
•w « tf« ra9 toa l) «3 HA. « 44.44 7B ao jo 10 1X1* 7* > im 10 1420 a •1000 M 14J7 90 .704 0 i9 ia
P>*«) («J7) P » ) PjM) m o » j C2J7) p.7T^
TUmfeur -na NA 11 7.1» n o 34.1t 18 142 206 7JB 10 •JT « i ««9 29 19U00 19T 3.14 24 12.18
9>a) 4US> 1M7) P»1) P iB ) # » ) OJ80) PJJ) C731)
M«V 1*1 HA i« M 4 » 4 31119 29 11.1* 147 .90 8 17 11J8 MO 08L71 90 1X10 210 .19l32 40 21.43
0MB) dJR) •.701 ».3« p iJ4 ) n 1.091 , ? f f l - P?I3L.MV«6M'UNIV^^y«9yY:" ’ ' HA M iij M “ f i r V ” ii.4 i « a 4^0 71 11J0 n i » I M >0 1X04 4.13 80 19.19
a t m 08.75) e»*3oi (2M01 P17a_ p o jaMysan ■ ^ T n HA
-x _ jy .r„' i i3 T " ' 91t i b 40 i i i 4 i k CTO lilV M4 M m i j 10142 I2 7 i» 90 I r t t
(M jtT) 0047) n w i) P9iB4J 0451) (17 JO) <U2) P J i) tl9J7) (10 J3)M K y IW HA 19 1143 12» 19UI4 19 12IX> 1«1 a*JO « 1140 >11 •9L17 40 14w70 120 48L04 21 M.41
9 f fT ) C»«) fM IJ fr#*J M 0 | Pj08) (UJQO) P7J9J PJO) p.»1)
H u u n 71 HA t 113T 122 7 ijn 10 •23 f7 ■ » jm 10 10.91 99U87 18 11J2 128 .IOlM 11 X73CSJ8) [4JD ^ J m o m (01>_ p*1J P ^ „
ia J W U U iM B r f i’: ’ HA. 10.11 - i 5 ' “ 23JB4 - « ■ 1U 9 4 m 94 10J83 IJO lOiTt 9>1 1J^ 90 MJat14.723 f1C731 P 3J0L f1XS7) (192S)
tNMoga HA i i 1149 iH ii.71 i t 1ZM • 4 X M i i 642 i i t.2 i I 11.7* 00 17 j A 13 i i j fP.T«) t t a x f fr71J p.77) P.«2) 091) 039) 078) PJO)
a m n m a m 1M HA ia • jM 191 21.77 11 1Z9f ^ m 23.11 21 11» • 4 4.30 18 8.70 100 34M 32 M10PJN) (T ffl) #34) (757) w m P « ) 070) (T M l 912) P J I)
C r n m t ^ m « HA 4 • J O 47 a jt i a 10lS9 M 90 J i • •L90 00 « « to 1X90 79 0.79 11 1SJ7tw o 9 M ) 047) o a t) PJ4) o n fUO) (9J8) P f t
M M ^ b U iiiiv iK H T V ;^ HA i t J t f ik rio 1 » i M 5. ^
" U M ' 4 02 12>i i 11 ioW14) P « ) a 7 *j P .^ 0.U ) <139)
batoHnaKannM HA 2 4j60 C3 U o 6 1 122 1 i i i 41 1 ^44 i4 ^ i 2 4 i i9 - n t MIT) 0J») tC9B) P43> (108) o » i 017) PJO)
M d w 25 HA 9 uo o 44 7 9 J » 8 19US4 94 .32.79 4 11.78 14 40 J2 9 2143 19 7.14 9 3L3Sd J t) M.7S) ttJO l a m f148l t \ m fljJO) ... ^ (OJO)
i^W A T 3 K £ U m 8 n V ? | - R Z ‘ ' o r - N iV “T E E T.je ja ,.
■" ».T4'H m 9 i j s i V f T IM ' i O S ' i t ' i4 'if0 -tl) f1.79) a ^ 9 i P f f tT J
p.71I6iw ftw a
- r ^ ,HA ■‘ 5 ' k f o 1^4X1 i i4 iif y i i } 4 i l f f i i li.7 7 i •19u0* 14 i i. «
P IT) P IT) (1J*J (1JB»1 PJM) P >0 O40J O10) P4>7) (C39<9 HA 1 «uOO « OJOO 3 9«0 98 4 M t 1 i j * 99 «30 2 9.77 99 OJO 2 X77
PJT) (TW) (1.3#! {a -o P42) 040) 070) 044) PJO)M a w n 9 HA 0 OuOO 9 m j t t 0 OjOO 9 2DM O OlOO • OdOO 1 IftOT • .ioojoo 2 AOO
ja.1T) P i» ) P 2 H 0UOO) p m PAD o m 038) P4X»U BnKaonadt 0 HA 0 OjOO 1 OuOO 0 oxn s 40000 1 2040 4 40410 1 29uOO • 904» 1 MJ7
JWB) OBjOO) •UJ4) W Ol P22) . R42) O iq...
P-»» P i?iO jU M A T A iM ta n V :^ ■ HA i i M i lie s a i ' ■ 19L40 lid 2i9oo M . i4 J fi f U ^ i l 100 4^.1* i i £ i)0
tr« ) •J71 P47> 0u82] (1X09)f t — r» i HA • ' 1 3 f i i i i4 i» 14 liW l IX i i i i iT liJ k 80 ’^ '4 ft 1* ■ 5 * i9 "" 11i h M ' io iV h
ffJO) 9 3 tH <4.7^ flJ iJ p « n t7J0) 0 » ) (7J0J p a l) p j i )M d M 7 HA 0 OjW 19 •171 0 OM 17 90.77 2 11.78 18 «40 8 a rjo 20 294)0 7 9900
P « ) A9«l pJOtli P.74) PJB) 0723 0 3 9 1 PJ8) O»0)ft«Mry 17 HA 9 17.® 11 11J» 4 21D9 2 i 9 2 « 7 24.14 28 OuOO 8 31J» 39 13.70 7 21^1
P*«) C1.7S) W (1J0J na«) QMT) (1J1) 040) fi3a) O10)•H v 4 HA 0 QuOO 14 2904X1 3 21.49 14 7.14 2 19.39 14 ««7 2 1420 14 0410 2 M2*
V 3 2 ) PjOO) fU l] (1.201 B « ) 0 7 ^ (OJS) PJO)total i« i: HA i7 l i4 4 2910 i f m 231 lO jt 23b9 298 1029 2 » r •4.19 290 11J0 21 >0 •108 SS ” a r5§ --
(10030! (10000) rio o « ) riooxtt) (10000} (m oo l nOO.OO) (100.00) 11i IOOlOO) (IOOlOO)§
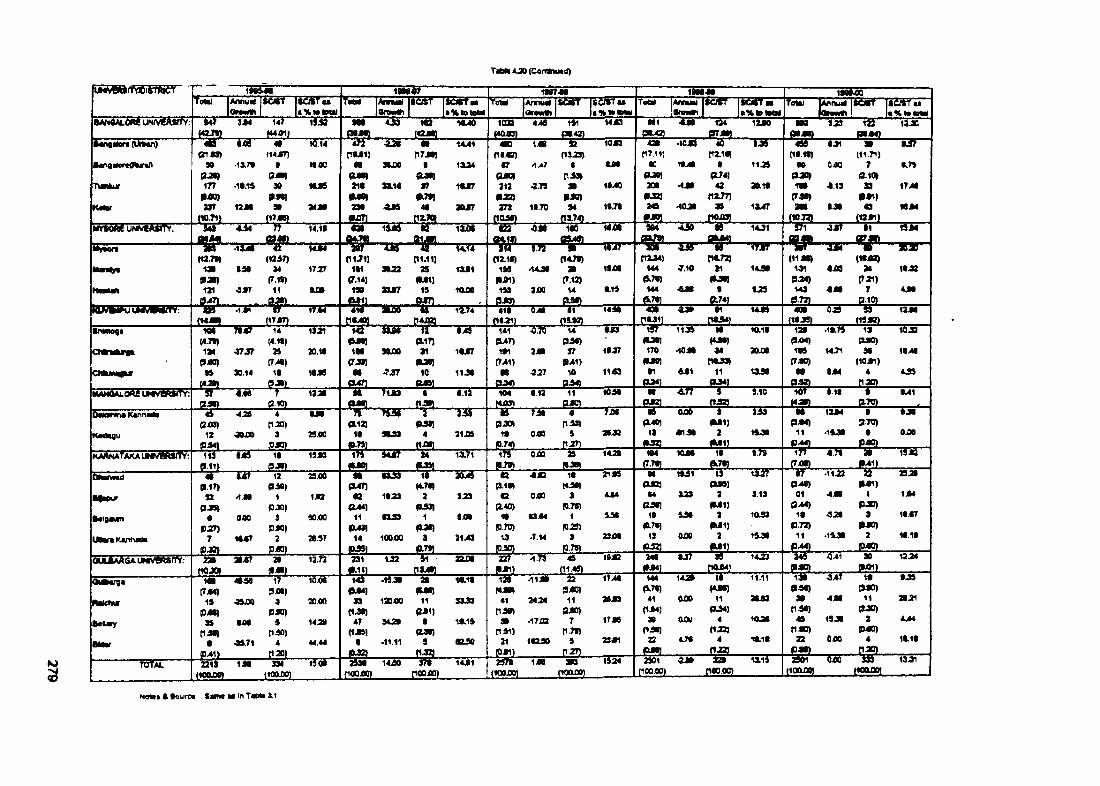
T iM iO O (C o nttM d)
C w flS a iftB iiT iS c f"
5 5 w 5 0 S r ijw ^ R 5 iy
TS5T 1MM6
n c r -JSSL
AonuK 15rrSM
- s rei«9)
90asm1T»
PAD277
J1SI2L
14>
i « 5 ! I
to s fw
T 5 S -
T s r
0 9
■07i s s r
OiJM)HMtJ
m
2 ltM012M
JfifZL
M2j s a .
i s s r s -• %totoWToST1032
JSSSL
twr-w "Annuif
4>ia i5i
(1333)
91IB-R)94
J«JiL
sSffl1443
l i o r r
M lP M g
i o a “
•4M
•MUR
134
j m .
l o i r s '
1180
w
To«U1MM0
M8£ s m
"RrnujTJSSSL
9J9
I S i T
I S_gM 2_
psfnrla jo
••n flilo r* (Lktan)
Sarmi«er«0tean
'n«*ur
12 J8
<14-*T)
a m»
f M )
10.14
MiK
MJ6
24 J0
•U i
XiX
3X14
mp r m
•a mV
14^1
1X24
1«J7
aomr
COO)
j ! » a .
mnicT)
•7PJH)212
IU 3 )279
1j«
«1>»7
•a.73
It.TO
1043
1I4Q
19.7«
nriijac
PJOJ201
(U2]2 «
£ S L9M
4(rnxi«i
•(174)
42P2J7J
S9sm .
11520i1«19147
■ar(H«)MPJtJ)1«lt74i)
“n r
oin<•19
tJI
(1171)70-10)99
P » 1 )<9
(0 4 1 )
TSTcr»17>M
«1MMYKME U N M ^tn V : w 43T 14.10 -i5H-Myiion
(ia.7»)19192ifia i
.19j«
•M47
W D e eP u C B ^ B D w r “TiT■w
<MA7)34tr.i9)11
..gglL,
Tijr1727
tuC»TTB"
Pl.71)Ml(7.UJ190
n r9022
3UT
19U»
Tsnrni.ii)29Mil19
&SL
19UI1
lOuOO
4i T " " am 6"— ‘ g
(1X1«)I9flPJ»1>14a
C349)
•040
TTTm
- S a - m r - - S f f i
V14J0
2i»1574
J2im. UH2LM2
1W(7«J<1171>11M0]10
JSSL
411g!??J
"53T
(14.70)2 i
C7.12)14
a »
urn
I T j
1SXN
0.15
<490
’ I W
1491
m / r
j i T
1 W
•1
T T(19Jg)
i 4 3 r
P124J144
(S.70J«44
J&2L
7.10
i3 T ^< « )170
MOJ•1
j a i L
TTS"
nc72j21
M•
-fc lf l.L29
•1£ •^ 1
1445
(11«) 191
0.M ) 149
-£ 2 2 L
443
•040
W
( « « )24
t7 ^ )7
- m .
m s L'I t J T
1471
144
-glSL19
C340)90
(1041)4
Cl 30)
1344
T r a r
1042
1240
iM m ogir
CM u m ^
H 5 5 i5 E o S Iu N R B S ^
101(«.71»1M
CJ*D19
J £ S -
4747
X.14
T f -040
14(4.10)
29tT40)
10
1921
30.10
1040
ssr90X» 1«47
11J0
12JP.W)
f&47]
JSSSLl i M T i T
141P47)
1 * 1t741>00
P .90
240
■237
4
j m .
104
P40)14
1.12
14P90)
37P41)10
J 2 ^
049
1047
1143
•1040
^ 1
11OJO)
1040
-T o T
“J D T
i r
94n*J9i
11-flgSL.
IOlIO
20J00
1190
120esxx)100
C740)
£SLT T io
J 4 »Tir X
J2;ZSL
1042
1040
A M
041
■ ns^bvtonina Kannadi
K«d>au
KA^NAf AKA UMVB^tS/tV:
(243)12
P34)
42S
gOJM
•ciga
lU nni
Q U A aAGA UM VSttrtY:
119
0.17)92
PJB)•
P27)7
j a
T 0 "
“l i T
4(120)
9cojo)
2940
10
- £ » L1943
T ffAL12J
10
W 3 T
9049
2 ^
21J09
7J0
040
^40
040
1047
a o * ~ a i'4?' (10.30)
12P90)
10340)
90340)
2P.eo)
■SoS”
142
90.00
20.97
iH usr
20
Oi<«)12.72
P47]02
«U4]11
(Ol4*)14
£SSL
"S 3 3 T
1929
03J»
10040
u
J S L
I S W
291 1JS
101470J
2(Bt93>
1» 2 n
3ftT ti
T S Z "
923
040
21^49
iT T
J&23L
040
0n-93)
5fl27)
2043
j muST■ s s r
02p.10)02
f340)10
P.70)19
j s a .
442
040
0344
.7.14
(091)^.73
(440)9
(0.70)1
(029)9
P.78)
1429
'F S T
I T040)
13i b a .
OuOO
9140
104j t j s l
I S F
T<M1)
2
J ia
1440
9l90
2340
1943
M092]
04(240)
19(OlTO)
13£ 3 _
^ *9 1
929
440
(tJOO
10<V79)
U T
P9«)11
1244
•1490
JCiiSL #94)T s r
19099)
2(DUSI)
2<M1)
2JE£!L
i n r
3.19
10lS9
19J0
noj>4)1423
ly r
P40)01
C244)10
P72)11
4.70
•1122
9070)
0.a S L
440
•920
•1440
I T
11094 )
4(1223
4
j m .
24T££L
190
«41
H91)1
J340)9
P90)2
_S£L•3.47
440
1940
040
90g ^ )
19090)
110 90 )
2P90)
J12L
040
1992
" s y
144
10.07
10.10
1324
Okttwya
M alctu
BaUay
la f A L
i s r(744)
14p m
99H90)
9C041)a i f
(lOOuDO)
T R T
•3440
040
•9171
" i S “
17o m
3P90)
4 (190)
4(120)3M
(10040)
1040
20.00
1420
44.44
I S W
OuW)39
(190)47
(194)0
-1^90
12040
9420
-11.11
(040)11
091)0
090)9
19.19
3399
10l14
0240
1440P0040)
■ W -(10040)
120(440)
41(190)
90(191)
2 1
•1140
3424
/I742
10340
1441
a040)11
090)7
(170)4
(127)
1740
3S93
1799
2391
'1924
fr70)41
094)30
(190)22
(10040) (10040)a o T
P0040)
1420
OUOO
04J
470
~3TflOO.OO)
11.11
3099
1020
10L10
H i T
090 )90
p m44
P90)22
(lOOuOO)040 933
(lOOiOOl
999
3021
AjU
10.10
1991
NoMaOOouret Oana a> In T a M 11
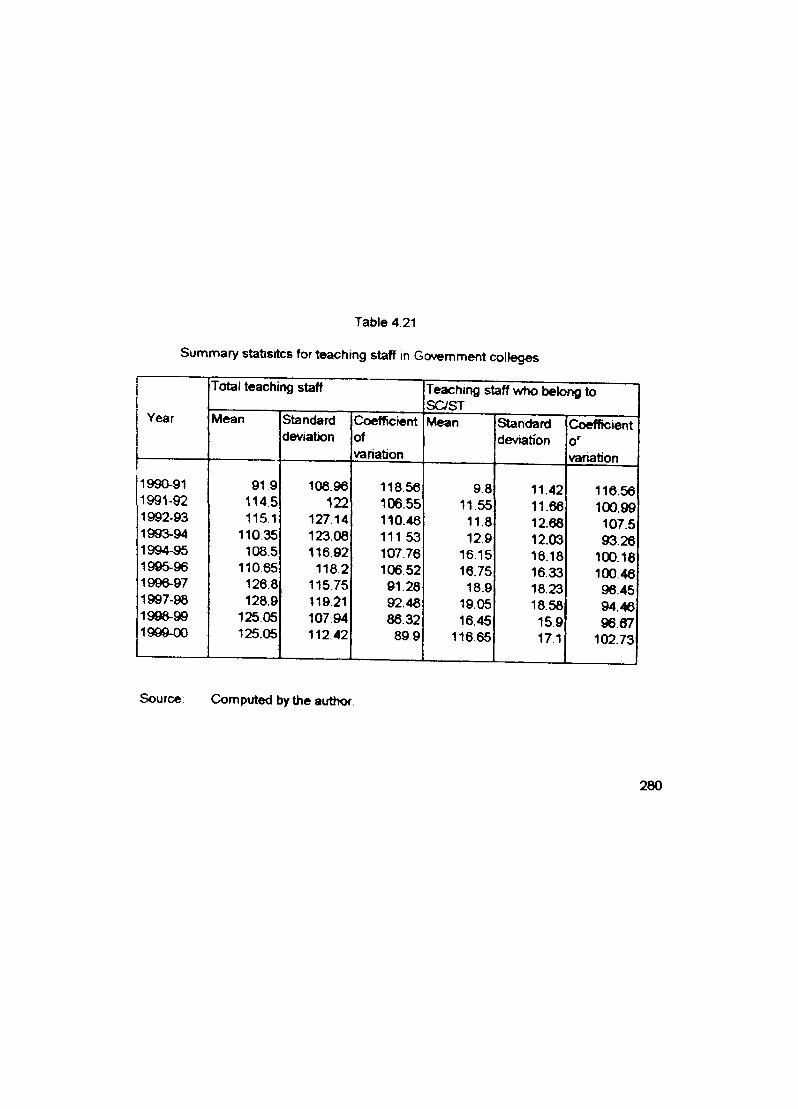
Table 4.21
Summary statisitcs for teaching staff in Govemment colleges
Year
1990-911991-921992-931993-941994-951995-961996-971997-98 199&-99 1999-00
Total teaching staff
Mean
91 9114.5 1151
11035108.5
110.65126 8 128.9
125 05 125.05
Standarddeviation
108.96 122
127.14 123.08 116.92
118.2 115.75 119.21 107.94 112 42
Coefficientofvariation
118.56 106.55 110.46 111 53 107.76 106.52 91.28 92.48 86.32
899
Teachirig staff who belong toSC/STMean
9.811.5511.812.9
16.15 16.7518.9
19.05 16.45
11665
Standarddeviation
11.4211.6612.6812.0316.1816.3318.2318.58159171
Coefficiento'variation
116.56 100.99 107.5 93.26
100.18 100 4696.4594.46 96.87
102.73
Source; Computed by the author
280
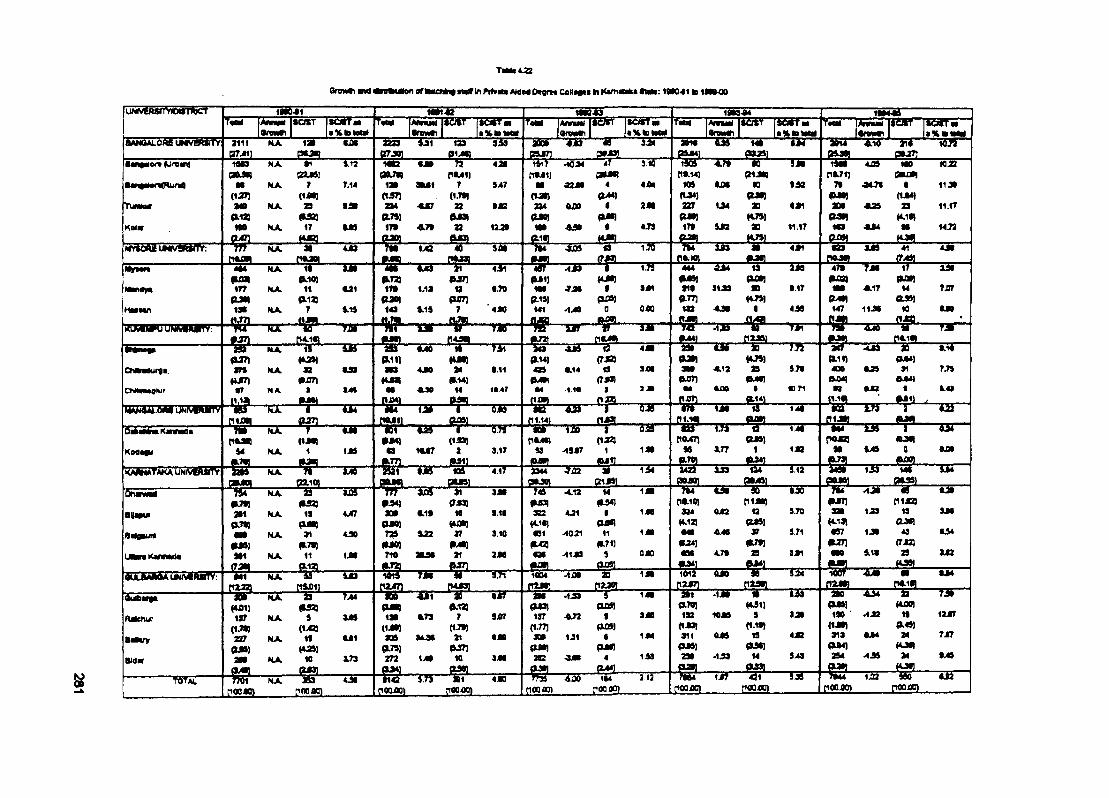
T lM t4 2
aretMh m a « n M o n of 1 h c M « iM T In M t i O tgrM Con«9t> ki K v n ttk a S M i: 19K141 to 1H »00
uRR®5reB5Ricr "i553T
aANQALOReiMVBRtnV■aiTT
0OJSIMM
OroMhiS sT s S iT ir - ts r
" W
0QiniiM(WT)294o»i17*(UO]
T5Ti s e r s -
1W343
SmMT)“IB"
isir-1T“
479M«J
4(M4J
IfllMJ
¥6*Y«”5S“
lan-M AM liWTO' * ~w6
CMJij ti» n
omU 4 X
«o»l9J9 SJS2L
i6*f»Tsr
is ir SCKTai
"~55jr-NA laijEsa.
«jOC m
T(1.W1s
M3)22JSfiL
"nrsssr
PMI)M(m224w
2»K
n*.wjio»ftS4J2Z7
17»
7*4JIljSL
-n rtaa
11.17
TFT "5i5T7S-
-Tisr-BHZLMO
•(tJ»4 1
23(4.1»|M
JjgL
Bm^Hori (Un«4
•an««en(Run4
TUnMM
Ko««
NA
NX
NX
NX
wrioSIuieTSgRfrr NX
TDT
#17(1M)
29(uq
17
1127.14
t.9iU)
8M14U0TAn
SA7
•J3
12
•10 J4
OUOO44«2M4.79
4j O i>e Tsr
11J112J
(4«•JtJTJ
ae»
Ta *1PJ71
t.ia 12am)
*114 7I.7W
nf»4JSL
AM 19
am0HypBL
T?TTJT
iM 4 J HJRSL
i3srP*.711
7»<DJH|30$(unm*23
47»PO)04DM7
M .
-M 7 I
TS" 41(7vyi
"ic2"11 Ji 1 1 .1 7
UJ7
Ntontfy*
imnFinmfliiFfr
■sirfUXDmi9i
W -
9JCT\jratr
-i;a-
NX
NX
CI14i15
Tor Tar
wfr72]m»30|149
■»■PL11)m<4«t
TJT•70
'4 JO
T*" TB-
4 8 T(U1)m
0-13J14 1
JtM•1>«
9«1040
cfa.Iff— n r
P.14J 4250-Wl
" n r
0 -7 7 1132
- S f f -
414 Waxm
atiB 2D H7»J
4M •
Sia
• 17
4M
«.17
1 1 ^
( 7 J 2 JIS
(7J»)I
f iM
■ W
T3TT 5 T
TJT9.7^
« n
*ii« l409
IM4J
n « « jM
P « )9S»
<4.1^«S7
<U7)
“3jB"«a»
•m
ITPUQ
14099)
10
5 TPUB41>1
6 jM)I
££2L
x 3 f
7J0 7
W
CNMurqa.
ChMwuffKjr
VKccsvTJKimrfV
N X
NX
NA
OSiM wKirawoi
Kodaau
KAitmTAKA UN(Vf/Ulfy
V
M1 7 1
T a r
N X
NX
T
T B "
•Lsa
S4S
TIT
rt
7(1 *11
fIM Il
4M 24H14J •030 14
“TJT•.11l« 4 l
“SB"014
-I.1#
4M
im
IM
Oumrnml
BHmM
atlgmjm
UUniKanmda
dULfc4iWK’uNi ffaT9F
OJtt2B1
M lj s m -
R X ^ca.i<>»
IJS
T f f -
NX
NX
NX
NX
T i i NX
"S'fMBJ
19(S«>*1
17»J11q i2 i
u s
447
4JM
^SSSSm
fUteiw
Btauy
mam
roas)x g a .
fO ll197
(1.7U227
o » i
iMnajQi]
NX
NX
NX
NX
to ta l"POOOQ
“B "fu a j
9(1 «
19(4»110
N X Wpooao)
T S T
uts
« ji
X73
T5"
• M l
pBiM}
# 3 4 190*
o m"na
(MO]710
02471
T H — T TOJOSl
4 a
" S ir
1«47(15S>2WJ11
TFT
3.17
S i m .■ o r
oaq
t mM
4.12HJ»129
•uoo • a i4 i
I f f — iiS — i t
•Jd iS *
(7«5 0 1 i 18
t*i» l 9i22 17
2L9C 21«U71
4JT
■ s ir
(104093
IJQO
wI947
9.ia
9.10
346
190
905a75i272
073
114P0040)
I S -(VU3)
^ 10.121
7(1J»1 2110
TFT
3B44 5jS "
4M3)922
(4.10J«ei
|M23434
^12
4J1
-1051
^103
JO fL .
PJSQ
- 4 ^ -
g tja i
W
1J0no47i
90
" i3 r
o » i177 1
j m .
T5TT3T1J2
T H -
M S
T i T
9j07
•4 *
3J I
1004P W ,■So003)197
(1.77]309
a m2B2
•1JOO
“T a
14
I#001I I
# 71]
p s a .
10010B10BOOO
T S T
(10.10)324
H.12)040#3*J090
J S S L
IS" t3T 2 £ L
TiT
10990fi£SL
A.72
1J1•aoo
- m - 400
r#09)
9#091
#00]4
.g f lL
1003 0 B
1 J 4
1 3 3
s m .
•Oo" " ‘ I T(1130) 002 1290S)
A.40 07#l7f]
4.70 29J&**L
•JO
9.70
9.71
301
~XST
iJ3
130
SlIO
■Si#.70)192
(1-OJ)Oil
#05)
sx—^ p m
is r
(1132319
030)49
(732129
JS22L
rOOiM) noo.an104
pooooL3 13
rs s s L
.lio U"<431)
10.0S 9d-10)
ojos a#30]
•133 MJBM .TIT—ar poo 00)
T5T320
4 0 3
943
T5T
W#o»i190 '
C1301 9 13
# 3 4 1 254
pOOJQ
tK.101
<13S
a(4JOO)
19#t«»)24
fCSO)24
<4301IJQ2 900
P O O 00 )
T i r
7.79
«l4I
o a
W
•uoo
TsrOS
XM
0S4302
■jsrT s r
1237
707
0 4 9
1 ® “
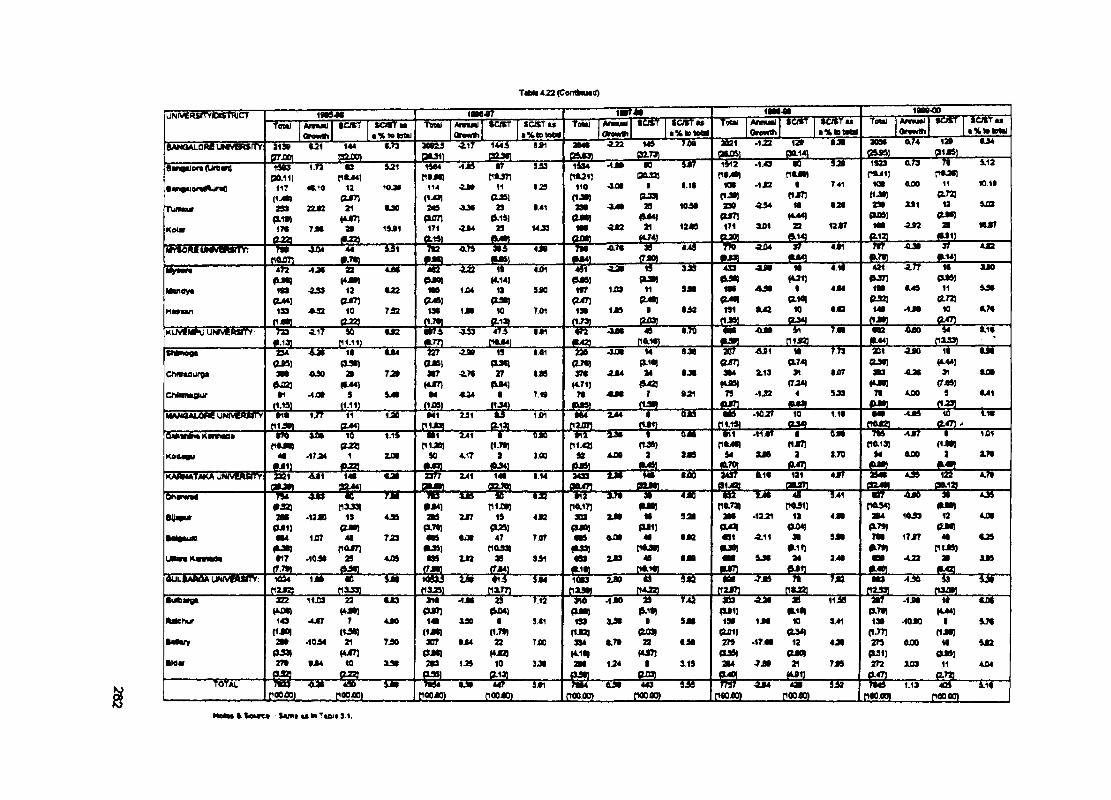
TM4J3(ConttaMd)
uNfvERSfrVormiCT
6AMQAL0AiUNrV«RSttY
t w a - a tTotaJ M m ai I S C fff t> m m
• %tototai313*
gran«21 144
tsuxqtJ 5 -
1.72p t ^ l
921
41.10 12OJS71
lO Jt
22J2 21HJITI
9 M
7M aa#22]
19J1
issssrTotti Amwkl iO S T SCiSTu f A ~ AfMMl
Onwrt) OtmtVi9oeu WiZiT «>ic o a tj
-1J9p * jn
9 ^
•2jm 110J51
tJS
•3M 23Pil9J
a.4i
■2M 29(M t)
14 JS
T B tS -
aoM •222J£2L
s c n r M
" T o T
T s r AimMl jkd*TOrowtfi-1J2 12t
tOStuaJB
i a w < »
ao9s
.e s L
AmMU-iosT"Or«wtti
129
g y i71
«0«T «s
CM
B a n Q ilo rt (U rovd
•«i«ueriAuriQ
Tunuuv
K0(«
ily*6MiWgiM5T9r
iS Seaft.li)
i^ r
2S3(X1*lIT t
poon4JM T S T
1M4(ItJS )
114
( 1 ^2«&
piXJT]1?1
j a . J M fi.3 T 4J0
i5TC1M1)
1i«
7»o mm
O flBW — 3 H
a.
• iJ i KOOLfi]
<sxa I a o i
A M 29
<U2 21
T iTt . i i
lo ja
12JS
4 :«
im(iJ iJ230
o « i171
U 0 ]_
•1 ^n » j» ).1J2 •(1J»D
.234 I t
a j)i
^ a S 15
1JB3 11
1J» •axoi
y j9j t a .
39
~Tsr7.41
12JT7
1S33r * ^ ij
lO i( iJ ijzm
Q J»)
OlOO
U 1
4S7
-5 3 5 — T f JE2fi
4J»1
n *j« )11
e-73j13
0 * J31
j T»141
Si12
n i t
&JQ2
W «7
4J3
Mantfy*
H a tn n
(M « li n
pJ44]1S3
J i a .
T s r
.2JS9
at * * l
12OMT)10q g j
C22
7S2
m0JO)m
cu»)19t
^ IS K14J
1J34 13
asmIJ i M
- e a .
4J01
9 «
7j01
45?
i t r04TJIM
ff-731
iW
9M
a j3
4S9
1 «a-*oi191
J t f iL
.3L« I t« o ij
a i« itue 10
T T
4«4
6jt3
431
l i t092]14t
JUSL
" 3 T T
^ J t
I tP « )11e.72j
w
i4
u o
9L9t
«.7«
Kuvfi#u UNTt«Asrry: T35 TA 2 2 L
"Siy 56' J i m
tJ 2 tW5
O ts ia r
k jtj
-133 475CKU4]
19
27(ScB4]
t
l»1 w *
0.7«)97t
(4.71J7t
W •a t 4 J *
a « n314
M S )T5
? rn i jg
TS"
u r
ta r
9J9
tS2♦L
a.i«
Oxtodurga
ChUoM igtur
234W3B*
(U 2)»1
490
•UOt
ia09« )
3t<M4]
9 iM
<2.7t
4J4
l. t l
• «
7.19
.4J3t 14ft1«J
M|M3J
7
"53T
a jt
921
•0J1
2.13
-1JS
ia0174J91
(72*14
301o a tia n
M tJn
.290
A2»
AM
It
91(TJ89J
S
tM
C«1d.i9) (1.11) (1J09J ta*9) n jf l ...f iS L ..• I t
f11J«i.f f 11
CM*)120 •41
CII Bf251 t f
(2.1311D1 M4
( 1 ^244 a
PJIJ0«9 m .1027 10 i.ia .4J9 10 i.i«
O A M m kw tafla '"^ 1 5 “, r ^ „
'■ i.i5 " " H B i 241 t oio i l i l3 t 4 ""■aa •11 .115* a 0«t 7i» ^57 i 151pom 0223 C1120J (1.791 c ii^ fi«4ti (1J7) tia i3) dMi
Koaagu 4t .1724 1 2JQt 90 4wl7 3 3.00 98 AJQO 3 3«a 94 3JB 3 8.7B 94 OlOO 3 170(M il 0.233 fW41 M , . - W *l„ „
MANATMCA UNIviAsiW 2331 4J1 14t «2 t 2377 241 14t 1.14 3433 iM I4 t •in 343f Ol19 131 45 ^ 4 i9 ii2 4.>90»2n 3244J B2701 cMun a i ^ Mjm C9ai33
Dhawat " W " ■ JXT" ■ ' I W - iM ■ iiS " t53 iW 4io •si ' ’h f f~ 9.41 9 ! 4ao s 4 ^PIXS3) P1X») tlflllT ) PM ) n M i) t«5») i tm
BlJiVur 2 tt .13J0 19 459 3M 297 19 4J3 303 299 « 92t s tt -1221 13 4J9 3B4 1«53 13 4J3$qmi] 0 * ? P 7«l (3291 (3J0J (341) (3U04J <179) OM)
Mtaum t»4 1JI7 4t 723 «ts t i» 47 TOT ••9 0J3t 4t a j8 •91 .2.11 3t 9M im 17J7 4C t09n<u7j «M»J tifljs i (U 3) t1«»> #391 •-K ) P^Ttl n u 9 )
unraKwrada •17 .lQ9t 29 4J» •99 3J2 3S 951 183 2J3 40 tJ t • • • 95S 24 3/4* tB9 -0 2 la 359_ W 2 L . ^40]
d U L iA M A U M vfA fil^ ; Kid4 «d 9J t lO tti ia t i«4 i t e 250 4§ !isi ta t > j i r >a 7J3 993 .150 i3 l3 9tl2921 C1«3) P129J C1X771 { 1 ^ (13Jff] tiaj09)
Sulbaga 3S2 11JO 23 •J3 21« .4Jt 23 *12 ilO .IJO T J i 303 4 i t M 11 is iatf .1J9 I t •59n m (U I7 ) P « I ( U 1 ) P iiil Pl7*| (M4)
M e h u r 1<9 • u t r 7 4JM 14t 350 a 9.41 133 3J» a 3M 19t 1M 10 941 199 ■1050 a 17«(1J01 (13 «) (ijtq (1.7») (1233 pjcag OaiJ 034) (1.77) (159)
Batary 2M .1054 21 750 307 •54 23 703 394 t.79 33 279 .i7.^a 13 45a 3M ouoo It 152(1S3) ( * j t n « » * ) (4J2) (4.1tJ (U ») (»»> QMI *191) (359)27* 9J4 10 35t 3U 129 10 35a 3M 1J4 a 9.19 » 4 21 759 277 203 11 454
0233 0.1? fW tl p fflj f t ? ' (4J11 (2.721f o t A t « i t 490 9Jlt • i t 44^ S«1 ^ 5 ? O jt 443 iM .2J4 439 iia W 1.13 40i i i«
roQx») riooix)) C10QA0) nooiao) nooAj) noo.flo) nooiD) poo 40) POO.OO) rioo.oo)
Motea » :Uflit«i»iT«fiieS.1.
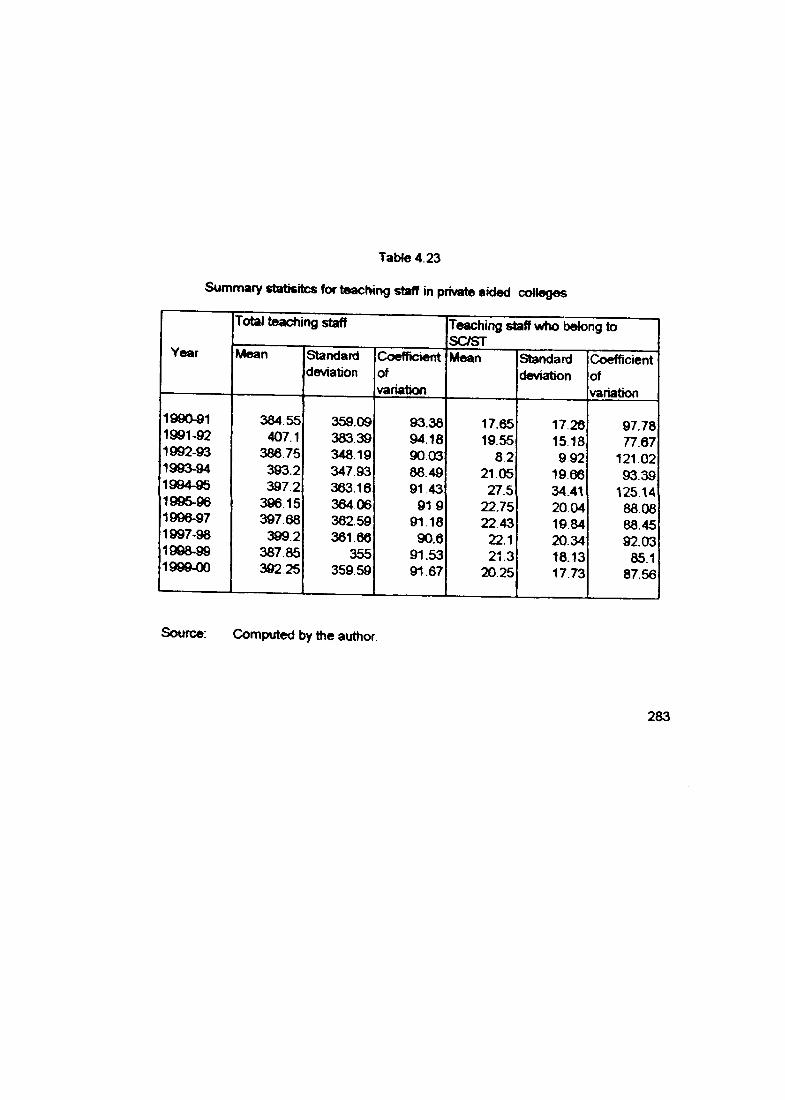
Table 4.23
Summary stabsrtics for teaching staff In private aideci coileges
Year
Total teaching staff Teaching staff who belong to sasT
Mean Standarddeviation
Coefficientofvariation
Mean standarddeviation
Coefficientofvariation
1990^1 384.55 359.09 93.38 17.65 17.26 97.781991-92 407.1 383 39 94.18 19.55 1518 77.671992-93 386.75 348.19 90 03 82 992 121.021993-94 393.2 347.93 88.49 21 05 19.66 93.391994-95 397.2 363.16 91 43 27.5 34.41 125.141995-96 396 15 364 06 91 9 22.75 20.04 88.081996-97 397 68 362.59 91 18 22 43 1984 88.451997-98 399 2 361.66 90.6 22.1 20.34 92.031 9 9 8 ^ 387.85 355 91.53 21.3 18.13 85.11 9 9 9 ^ 392 25 359.59 91.67 20.25 17.73 87.56
Source: Computed by the author
283
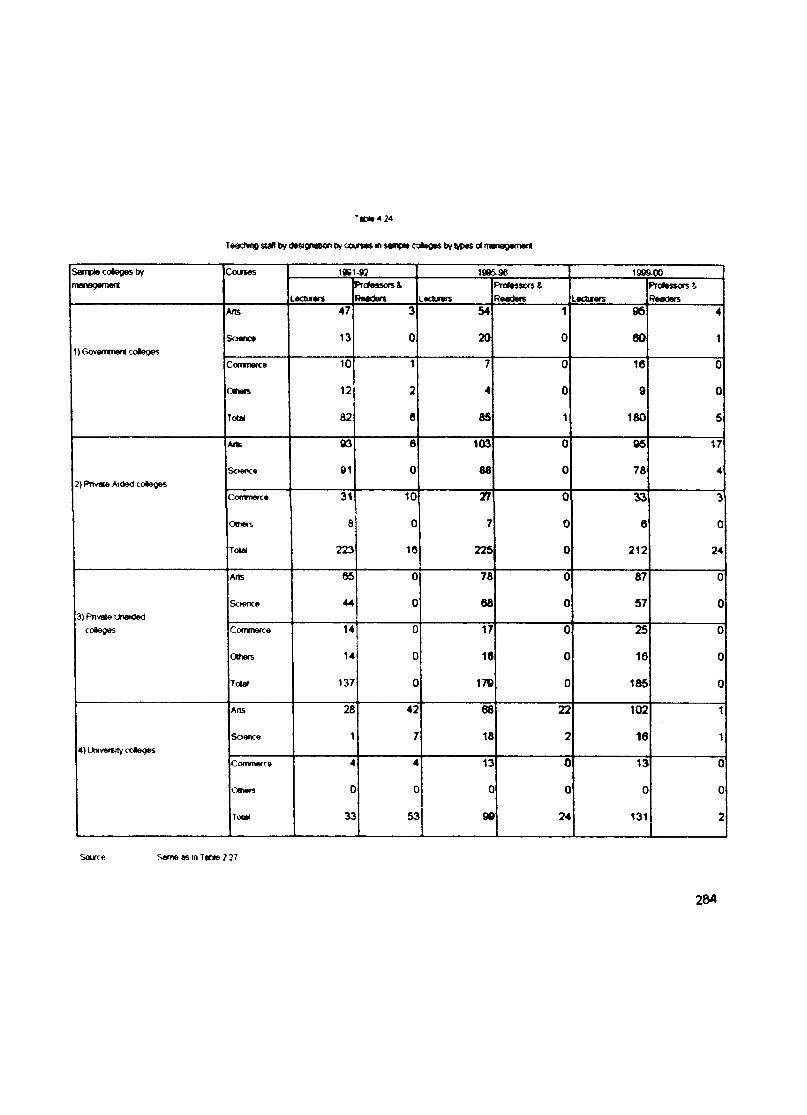
(4 24
Teectvng suA by (tosignaocn by cotfs»s m sawvite cotogvs ty M>«s ol rrwn8S)emenl
Sampte corteges by Couses 1961-92 19d5-96 199W»managwnent
LecturwsPTOtessors&Readers Lecturers
Prolessors & Readers Lecturers
ProtossorsiReaders
Arts 47 3 54 1 96 4
1) Govefnment colegesSo«K« 13 0 20 0 60 1
Comnwrce 10 1 7 0 16 0
Ottwrs 12 2 4 0 9 0
Total 82 6 85 1 180 5
AllE 03 6 103 0 05 17
2) Pnvfltft Aided cotogesScwoc* 91 0 88 0 78 4
Commerce 31 10 2V 0 33 2
0(hef5 8 0 7 0 6 0
Total 223 16 225 0 212 24
Arts 66 0 78 0 87 0
3) Pnvaie iJnaiOedSaence 44 0 98 0 57 0
coleg«s Commerce 14 0 17 0 25 0
Otfiers 14 0 16 0 16 0
Total 137 0 17e 0 185 0
Arts 28 42 68 22 102 1
4) Untvefsity colegesSaence 1 7 18 2 16 1
Commerce 4 4 13 0 13 0
Others 0 0 0 0 0 0
Tot# 33 53 90 24 131 2
Source SameasinTat)te227
28A
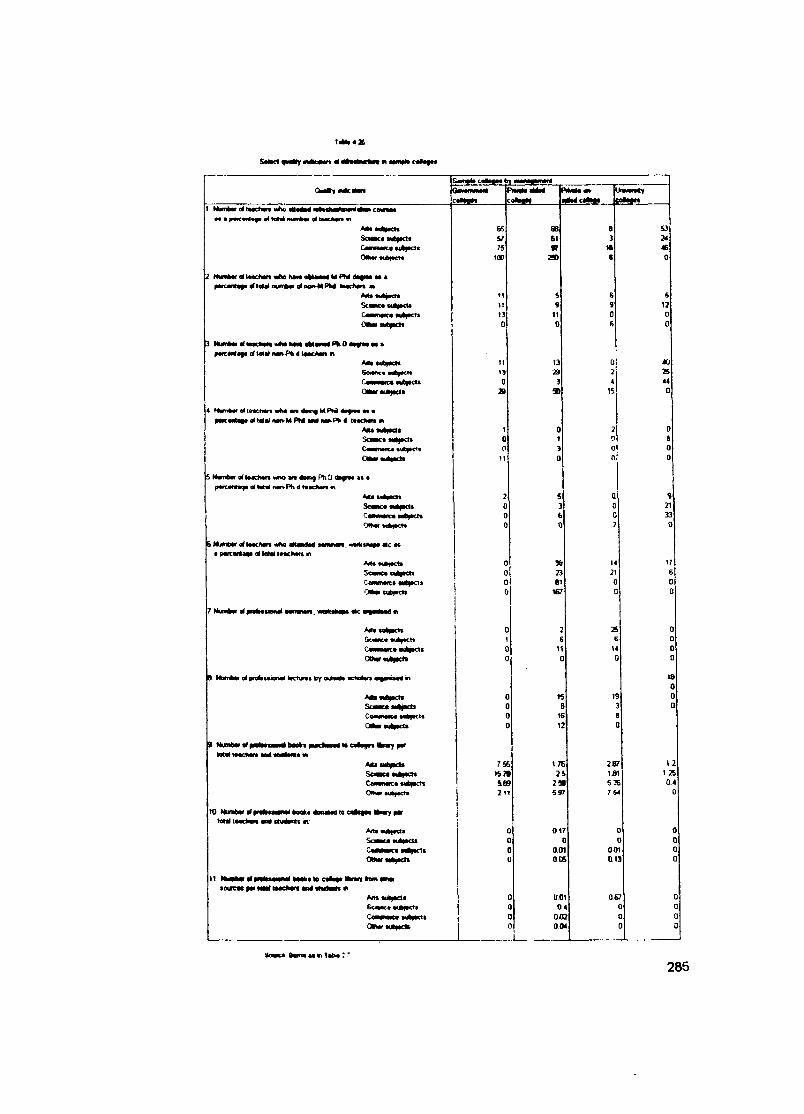
T « lb 4 Z
S«lKt qw*y w«M«*n «l IWMlwtl
Qw»Y«i*ciles
I •< tgM numb« «4 iMctwra •A4« MfeHCl* SCIMK*Cwnomc« «aA|Kl« OawcMbfKH
2 Nun*«( ol tMctMn wtw IMM oMm M M PM 4*flN* M • ptnOTMtarflotalnumbHofnoivMPM iMdMrt at
MswtfKHSciwiwCl»WW IM>|ICl$CHhw «ita|Kft
3 NumtattdractMwtwtMMtMMtfPkOittrMMaH<c«Ma9( ofMtl d iMdtOT fi
A<(t«4*)actt ScNnc* latii ef CowMic* ««b|*cU Otkm ■ut)>c»
4 Nvn6«r at tmclMr* an 4«n9 M.PM 4>fra« M •^wc«nla«t g(M«l (wn-MPM Mid Mik.pt> 4 ■••dMi* ««
ScMKaaAftm C»—w«n< tubftct* OMwi Ii*nrt«
S Nun*« iM dM n wfto art tfsmg PhD d ifrM n •p*rc<n>«<|« at loM noo-Pti 4 n.
Seme* w*|MMCaMMicaOawMkiaa*
6Numbar«(Maci«an «fM alWMlad i a parcanmi d toM laachan n
>aic ac
A<(«Mb|WtsSoaneaCamnafc* anfeiacts <ytm sutfacts
7 Numkat of fodtaaanal aanvnan. «okil«»« fk aifMlaad m
A«te riit^irK Soane* aukf*ct« Ca—narea «uh|K«t OOMtaukiKta
B Ntanbar ol preiitaional lactura* by ouMa tdwtan aifawiaid m
MaaHtjad* S aanu Mkiacts
CMMiaiAiacU
NumtMf a« pNltaMHd baokt puKkand ta cataga* ttrary par
ta Numbw total taachan and
af»N
bMka mrfanli in:
Scwci *ui)irt« Commaica aiAfacts OM«ar
A<taauk)«ct«SoamauktacU
tourew par tml laacOaakaaka to ca*a«t mnri I
andat«teMa<A#Hei*|Bds 6oanc* aub^rti
756tS78189211
OMar aukfactt
17625
2 *697
a o i0.06
001 0 4 002 C M
2JV1.81626754
00
001013
121250.4
0
9omt» 9m * aa h Tam* : '
285
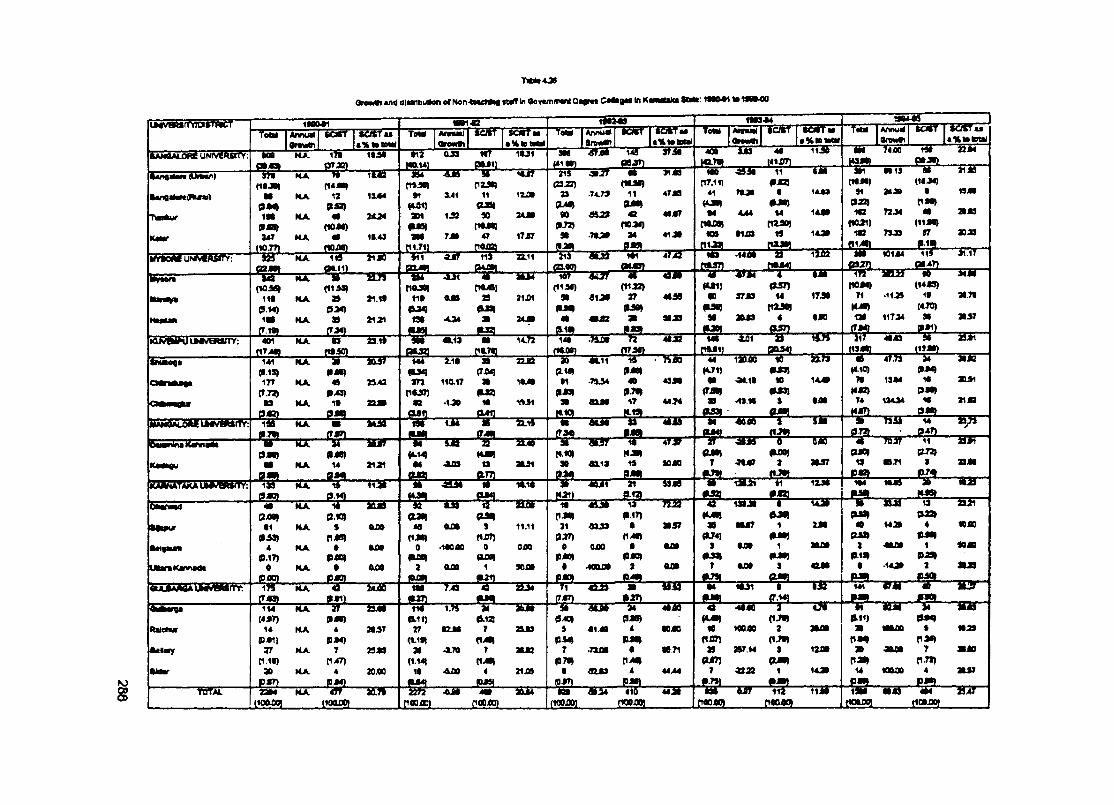
TM I4J6
Orowttt *nd an*lbuSon of N o n -e *d *e I" 9e wwiwunt OagNt C t fc gM In K a M ta k t I M i : « » # 1 U 1M M Q
lOs
U M n/^rtV jo iin rw cfY «
1M0Annual
♦1■®S«f ToM
i6 w '« ’ " " 'A nnn lj S O if Orawtil
s o c tn -T 5 5 - AnnuJtImw®'
MO- u r n T Z J lfS "
•%1»tDMl" 7 5 - ”
tM9Amualonwo«
144T d S T
m i1 Annuii |oraM4h
taU f]1 O O tTu |«%lDlDrtat
ftANOMjOM UMVCasnV; - la H HA. 1«“ 1 IM •12 aja " h T ' 1tJ1 3 tt ■SYjtt 149 3f7it 400 9uB3 4t 1140 tM 7400 2344
P iiO ) 07 JO) M0.141 PM11 (*V t^ J ? n . . (4940)kanflHwt M Mn) PLA. ~ S M - TJT itul7 219 J t i f ” t t 91 ta m « 3 t 11 to t in MIS at 2149
(14M) CT»Jil n z « i (2323) (IM i) C17.111 (1t4t) t«44)
•MngHoft twaO m MA 12 11M »i X41 11 I20 t 23 .74.79 11 47 ja 41 T tJt t 14J9 91 24 J i t 19400 M ) 03a> HOI) 0391 0 ^ 0 « ) (O t) m m 042) (140)
I t t HA 4f 24.24 am 1J3: ao 24Jt to 42 4t47 •4 4j44 14 14Jt 102 7244 4t 949
9 A ) (10M) #091 n««9 0.72) («a«) f1W») C1240I (*oai) (114 t)
Ktur 347 HA m 11.49 m 7M 47 17 J7 9t •T9C»f 34 4141 400 tl.09 19 lo t 103 7949 97 2049
(10.77) ttOJlMi 01.711 fItiXB pa») P f f n iJ9 i tia 4 ti «1>«)lif r io M u r ^ f iS f r r HA i t i MJO 911 " i s r i i i 22.11 319 M j f 1*1 474 i m •14ibt 23 liM M i 119 41.17
e 2 m 0*11) earn CMOtl c a m w „ r !M . J 25jf !LU»«ar> ~ » o r
j f j p -~ H 3 T " n s r - " - ja i? " ] i4 f 'M 3 T 4 l 4 l l l ” “ 41 Zfl4 4 t4 t 173 30222 •0 4440
(lo ia ) (11 01M) (U1] 0J57) (10A4) (144S)Mandy* I t t HA » * i.« l i t OJS 39 21.01 9t « iJ t 27 4t48 to 97J9 U 17J0 71 .1149 I t ai.Tt
P.M) m m n m 0 i« t tz m HJt) 14.70)H uun im HA » » i i i t9 t -0 4 a 34JM 4t 4tJB2 at 9449 9t a043 4 140 120 11744 90 2157
t rw) C7J4) (USI p itf 049) »40| C7W) ■ F ff . . .IMVBtSmr; 401 HA “ o ' “ T a i r - w 4tl13 • i4 .h 14t .H jot f2 4 i4 li M t 4 o i i i7 i 317 4049 9t 29.01
(17>I«) (1 t« caua C1t.7«J (M.0t) 074*) (1&41] 0034]Snuaoga 141 HA "S S T ” 144 T i t as ZLti 'a o U.U 14 • >i40 44 ii6 io i6 ix fa 4y.7i 34 a tis
Oi19) |U«) (T04J pM ) 0Jtt) (4J1J m m 14.10) 0-*«)CMraAaoK 1T7 HA 4» 23.42 a n 110.17 a 11 •1%34 4ft 494t t t .M.1t 10 144t 70 19A4 10 ao5i
(7.73) 9>a) n « n (tXQ 0 « ) 0.Jt» irm m m H48) 04 t)CMhb iv n HA I f 23Ji «B •1J3t I t t<»3l at 9XM 17 4474 at ^a.M a too 74 13444 K 2143
0 « ) o a ti (141] (».«) (t13) m m M , P fiLMMMALOAi UM</B«ITY: " W " k x m MJ9i ” W ■ li4
r g i, ....t i i i ■" '4 w r “ « a s it i i h i* 14
e im iTMn m m (rm p m 072) P in ,bewhln* Ksrwadi -T ii» "T E JT “ T H T ” ■T* “S J5 " U ib M M J? I t ” '47 J T " V ^ 4 8 d 41 7047 11 29>1
PJQ 040) (*•1^ (4.10) n m m m (ftOO) 040) 072)Kedeeu m HA. U * ia i t4 4JD3 n aausi 90 «.13 14 SOjtO r ■nj$r 2 atJ97 14 00.71 a 3340
o n - M - . . m (IJOJ .J P « -Iu UI^Ta^ uiJJWsrfr: h ' i i iU iA l i i l ak 4 0 il 21 t t 41 124t M49 at
P<0) O .M ) pa<l Hai) p.12fO t V O M d HA
_ r ^ r .aad !ld US 12 iib t 1t 14 " K S " 4 i iHM 1 U 3 9t bJO 1 4 i i i h
C 2 M ) 0.«9 03tl nm 0*7) M il 0JOI mm 022)■lipcr • 1 HA s 48 tuOt 9 1 1 .1 1 21 • S J J J t 3047 ao tu rr 1 2Jt 40 1420 4 «40
03ai P « B ) am ( 1 J T J p:»7) ri4 t) P I M J mm 042) P 4t|f t* ( fa u n i 4 HA • 0 •ItO ilO 0 O A l t ooo t tbOt 9 t J O t 1 atiot 2 •0000 1 9040
P . t T ) m m O O B I p t o ) p j tO ) #144) mm P.19» P49|UtaraKamaaa 0 HA • A flft 9 ant^ 1 XJB$ t -lO O JQ t 2 AOt 7 tuot 9 e o t t ■ 1 4 J t 3 a u 8
( D O ) ) PAD lO LO ^ • i t j p * » |D >«^ P f » lO U J K A M A U M P ^ r T Y ; HA 24J00 7 ^ 42 a s * " " r -T i m i at ” 1 1 ^ 04 1041 * ' " iS 14 1 ” W M ’ 4 0 M3r
t7 « l « « 1 ) msn mm ( r j D »4« m ork M « a 1 « 4 J7 b i i IK 1.7$ i t X M ' f t M W U 4 A M 4 i 4t«0 r « i i M iiM 44 “S IT
(<*7) 0 « ) fWIJ 0 L12J 0 ^ 048) f C 4 t ) ClJ»J H I) mmRaMwr 1 4 HA 4 3157 2T I2JM 7 2&J9 5 « 1 . 4 t 4 toto 10 1 0 0 4 0 2 a tu o t at itooo * Mia
( P J t l ) ( 1 .1 t | fim PAO P4t) (tjm no#B««aiy ar HA T 3 9 J 9 at 0 .7 0 7 aun 7 . 7 U t t t S .7 1 39 2 9 7 .1 4 a 1 2 0 0 30 4000 7 ao4o
Cl 1 « ) Cl >*7) (1 .1 4 J f im p.7t» <U«) naD HTS)UdM- ao HA 4 30.00 I t 4 JD 0 4 2 1 i » t 4 u a 4 4 4 4 4 7 .2 2 2 3 1 1 4 J t 1 4 10 0 0 0 4 3 0 5 7
P « 7 ) pm PJ^ P29rcrfAL w HA 4 5 7 ^ " T £ T r “ S w ■ o i i m a d i 4 1 s t « i 4 4 10 4 4 :3 1 ■ “A i f ' i i i ■ i i i * " ^ 4 3 4 ^ " “ H37™
(tO O D O l (lOQuOOl nooiD) rioooo) dOOjQO] dOOiW M0040) (10000) tlOMO) tlOOIM)
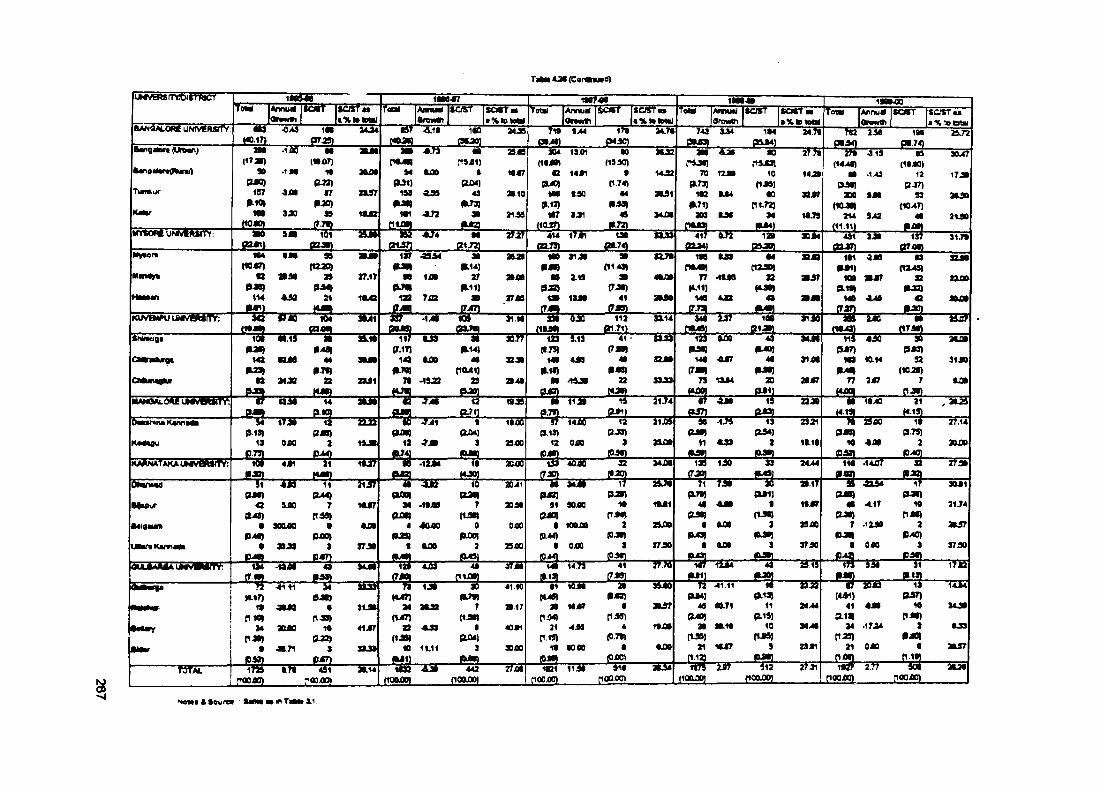
T M iO «(C on aM d )
uKrvBRSfmoim^icT
fraMOALOM UNtVCRSrTV
t o w |Annui«'H Z m "
l o i r •ssrs1 8 M -0 7
Aimuil COST s 6 * t » Yotal A n n u r i i S C f S T i o S T i 1 S T AnrnmiSrm aO i
$CWT i o i Ta % l o t D M
T o m lA n n u rf|or»wff>
8 0 8 T i s c f r r H
m i «g^38)
U 3 7KOJg
1«0 M J9 Tl* %MQi>W)
f J fP«-ao)
» o » 74 3
J!SL334 tM
■ g ^ l"5*7b t t t 23*
P»AO19S
P > 7 023.72
• a n g i t o r t (U tta n )
T W r A o r
K m r
WYioSruiAiRBTr
i i7 a i)90
0JO)1 5 7
►W>
J U S -
•1M
•SiM
3 J 0
( • X > 7 )10
PJ9)3 7
PJO)3 »
J L 5 L
90UM
a s 7
1M 2
' ~ T W
M tuOO (U1)
14 8
1 « 1 -3172
n * ^ i)•
OJQ4143
<M3)3 i
- g f i ,
2 9 4 9
1C ^
2i.10
21JS
5 0 4 1 3 5 1(1«J0)
C 14 ;» 1(3>I0)
«M IS ) !».«)
« I 7 3 ^( ig g )
•0(1950)
•Cl .74)
44
49- g .
JO B
M J2
3 U 1
MJM
TOP l73J
1«2P 1 7 1 J
209J2££5 l
4 j T
n j o
•lM
W
t of n j s j
10
n « j«
P1.72JM
“T O
1 4 J i
3aj7
1 t .7 5
2 7 * <319
m ^^A3
TOO »M (10Ji»
2 1 4 SJ3
B9(1«* )
12P J 7 )
S3(10 -4 7)
4 t
S U B L .
~ S m
i7 J i
a u o
21J0
»*y*ort- g y j
<«*7)n
0-38)m
• M
a a «
4 ^
T5iS S L
-H B I ■3JTg u n
99
»
a i
ar.iT
1 * 4 2
i557Bffin5K®BDy7r "1TB"
44PTD
22
■ T O
1 3 7 <39;94m m
m i j o * <u<oi
laa 7J92am
M■£1^
w
3i•L14)
2 7i n I)
J [ £ L
Taat
n »
2 7 « S
4 1 4 l f j * 1ggJ9)
1 »J S S l
i n s
m r tM 9 m
» 2 .19(9J2)
m 1 3 J NI S L
"5351 4 1 7gU41
" s r w
ni43»3 i
4 1
JZSL
S 3 :7 «
4«M
l a a .112
JEI11,
i tePM#J
7 7 <4.11J
14S_ £ a .
U 9
• 1 I J 8
*J2
12 9■ g ^ a .
* 1 4
9 4 ij m f i L
■ D T
• 4c « a o )
22M ® )
4 S
4 31 3 J >
2 1 5 7
1 t 1 <aj0 ► • 1 )
10 A 2 i « 7 P . 1 t |
1 «. 2 2 2 .
I F S - J Z g . T * "
(«>«a)S2
« M 2 )
JE3SL
92( l o a m
7
. P ,- W „
l u i
3ftJOO
-S!3F
thMtagt - W i f
B 5 5 K 3 « r a R e ® T F
14 2
c
■ e a .
M j a
"53T 1 4
" H i i f
3 M »
2 U 1
ISM
i i r * i S r( 7 .1 7 J
1 4 2 * n
7 1 -1 & 2 3
a m2
"53T" T 4 T
9 m 1 2 - 7 J i
Wi741
M 4 J4a
t10L41J29
- f i y ;
T B T f
S J i
2 9 4 3
123H .7 9 )
149H I * )
T i r
4 J S
^ i 9 J i
<2
O i M ]3
1 9 J 9
T io ff
i i i r
1425"
4 1( t m
m9 m
22
i £ l .
s a jn
T D 7
U S
29J30
12 39 m
(T m7 9
OUOO
•0l« 7
13UB4
“S T
43<MOJ
4 «
20
i n s
2 B jf7
m 4 io “ ( 5 ^
M 3 W .1 4
' u r
« 3 3
22J9
7 7 2 J 7
J!£SL• 0 18-40
9 m10 4i»
21
3 1 J 0
" 5 S
O a to M n a K a n n a d a
KadaguK A A N A T A K A U M V a t S n V :
T Tp .1 3 )
1 3
T r y
Oi»
4 J lJSiSL
"HZ ia
■ ii3F
294)0
« .12M O J 2 I
o mM . I B jOS
0 » )4 40 JQ 0
9 mI OuOO
M TJ 2 t 2 t 3 3
(t471 2 2 4 193
( 1 «« 1W1
j m
19 2QO)
(3.13)12
IOjW)OjOO
193JLSL
T525"
12PJB)
3
JE32.2 4 J0 t
" 2 3 5
10J1
2 » M
9 7 JM
Im
9 m11
p i» j40
CUQI
(OuO)
T5o“
(234J2
J&SL
a 3 i
11.19
T3T4 j i
OUOO
1t t m
2
■4-
2C44
■ 5 1 T
111 . i 4 a f '
s s r
am49 4.17
C 2J9)7 .1X90
OOjq 0 040
■ ^4
2774
a&oo
Ohanwad
a«Bpur
•« ta M a
U B a r a K a n n a « i
wasjsnssmDrfr
T i(UO )
420>«a)
•P40>
" T H -
9 «
900jOO
33
-a r
11a ^
7r^ f l)
•9 m
3HM D
l i 3 f
14UI7
OuOO
37 JO
■ w
(2 J «7
0p m
2
J & S L
20-41
2090
ooo
2 9 X »
J * - * 7 )1#
n « i24
- e a -
40J 1 1 2 L
■j W
91am
0p.44)
0p.
M M
90j00
100JQO
O i»
T S H T
P .2 0 )10
2
3_ £ 5 a _
l o j r
2 9 4 0
3T790
(4-40)29
{1i4) 31
Cl rt) 10
9 m
41
J!*Ln s r ■ H i f
l a
a u r
i t i »
•JOO
ISS2444
M 4 0
2 3 ^
I F F
13T
» a o )10
n * )2
P 40)3
j s a .31
T S aP IIS-
3 0 J 1
2 1 7 4
2037
J 7 3 0
ITS
T 2 f T S r i i •<00 JO)
-«1,11
« J S
aojoo
J8.T1
“ T T T
I TP.3B)
9n -« )
10a m
3
a rroo-oq
3 « J »
4 l J t 7
S3J>
2 1 1 4 n e o T sffOOuOO)
30PJ*J
7(1 3 0 )
•(204]
3J 0 J 5 L
T r i o
2 0 .1 7
4 0 * 1
3000
442flOOJOO)
2 fm m inoo.00)
’i B H '
1 0 4 7
A M
00.00
l T 3 r
219 m
0
4(0 .7 f)
0
noo-oci
49am
20(y » )
21
20J94
.11,11
00 .71
30.10
K J 7
i s r(lOIUXW
10O -iaj
11P .1 4 J
10n J 9 j
- 4flOOjQOl
(4 3 1 )4 1
a m24
n 2 9 )2 1 0 4 0
4 J 0
.M iA
pooxg)T T 7
0 * 7 )10
t140)2
9 m
- 4 -P O O J O )
2 4 J 0
U S
2 0 5 7
2 U 6
f> M t ia 4 S o u r e » t a n a aa m T M t t X V
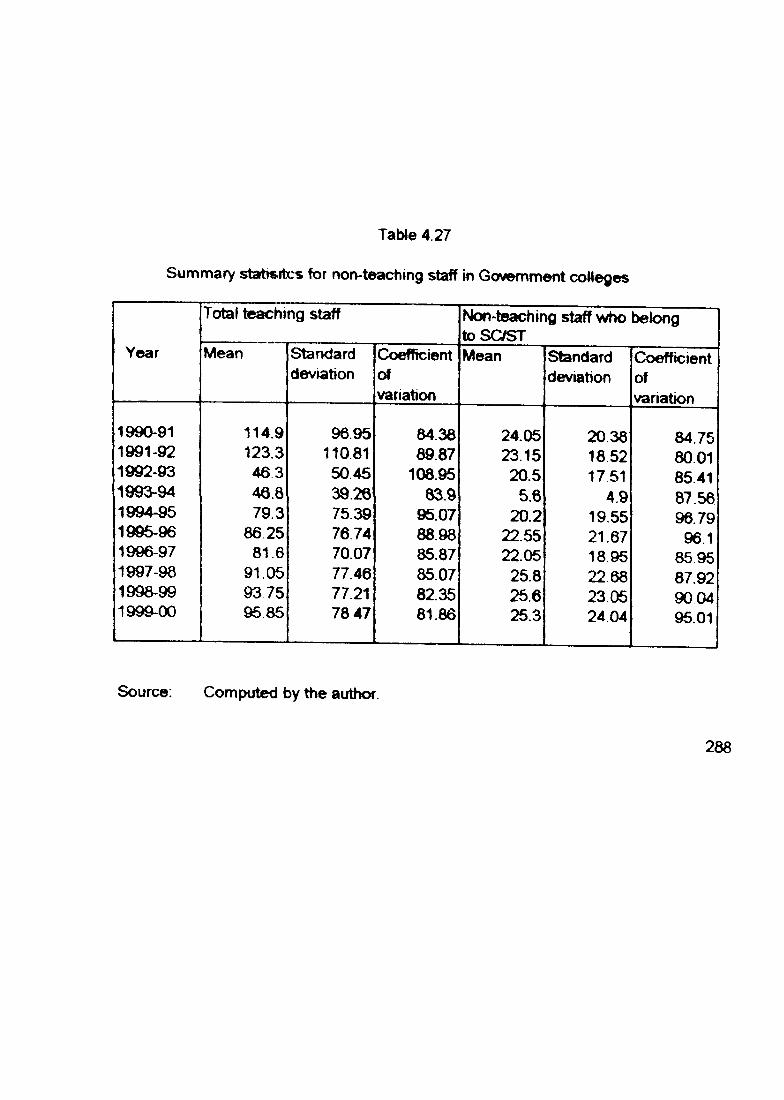
Table 4.27
Summary stabsrirs for norvteaching staff in Government coMeges
Total teaching staff Non-teaching staff who belong toSC/ST
Year Mean Standarddevotion
Coefficientofvariation
Mean Standarddeviation
Coefficientofvariation
1990-91 114.9 96.95 84.38 24.05 20.38 84.751991-92 123.3 110.81 89.87 23.15 18 52 80 011992-93 463 50 45 108.95 20.5 1751 85 411993-94 46.8 39 26 83.9 5.6 4.9 87.561994-95 79.3 7539 95.07 20.2 19.55 96.791996-96 86.25 76 74 88.98 22.55 21.67 96.11996-97 81.6 70.07 85.87 22.05 1895 85 951997-98 91.05 77.46 85.07 25.8 22.68 87.921998-99 93 75 77.21 82.35 25.6 23 05 90 041999-00 95 85 7847 81.86 25.3 24.04 95.01
Source: Computed by the author.
288
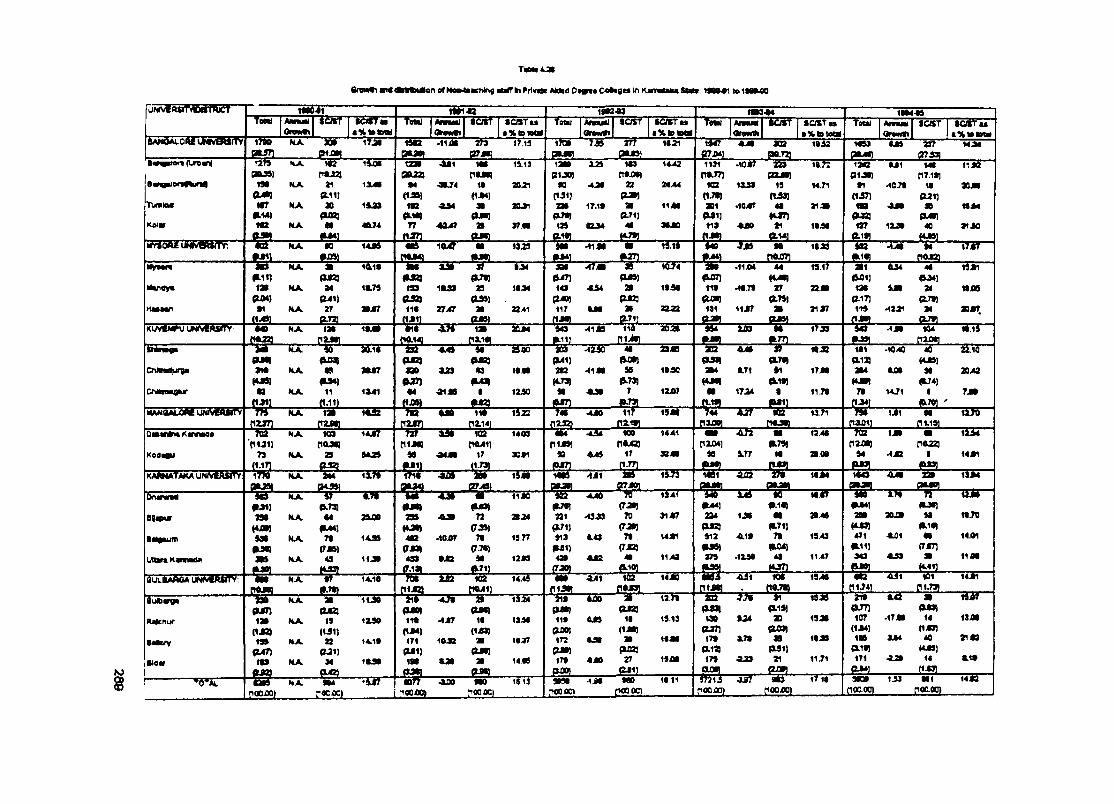
Qnmrth GfNon4tKhlng tu rb i^ r lva tt AMid 0«grctCo*tgM in KmcwwSaatt: H W »#lto l— 00
K)
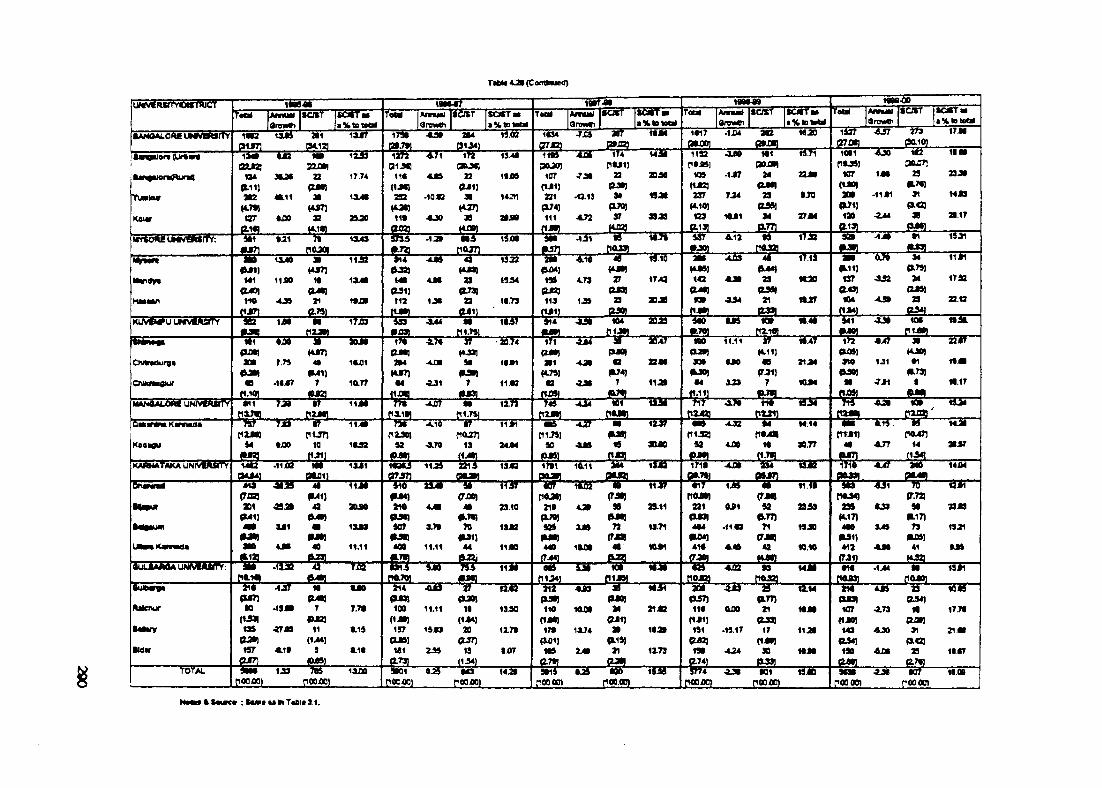
T M <2$ (Contfewd)
uN<v#Rsih««rmicT
[oiBTwKBSrrr!
T555TA m i M tflrew*ila B "
tSST S O C T m
ail2& ia .
133F
T S C i r
■ WB iJ l
M m i a lOro w tfi
ia S T S O S T ha^loM ri
2B4 19.03
T w T ^Tom Ammt ScST
1CMg r ^
I B »Tj a a
s s s r s "a % l D t e « n
ItM
TOM A n « « larewCh
1*1 r -1X14
io s T s c S f S ”
1 1 3 2
2 8 2a»sm
1«.20
1 9 M -0 0
i » raroKi
Arawm8rw(»1h
A57
' i C J S T
t np g i o i
to r r a i • %tototn
1 7 J i
•ai^uort (U«wt
kan«uer«<RuriO
T U n i i M
Kour
ICftOREUMVeMnV:
a u zm
a maei09 lXZT
a mT i lJI£L
"'4 g r w Tism
9 U I 22o m a
»j y S -
7 1
«L11
•uM
-iSS-
17.74
13 L 4 t
2U0
i3 nQ1J«]
1i«(1 ^
232(OC]11»
” i 7 r
.1042
-C30
M l 1 X 0 •10»
wOftJil
22OiiJM
(«71asJ*55L
"iSST
1>jO0
14-31
n »
JGS2LO fi)
1 4 t031J112
J H 9 .
M5nftzn
ISjM
l i a r90JO)
10 7
231P J 4 J111
JiJSL
432L
T 3 — i r rnM ij
•7.x 22OS]
^ X 1 3 3 «pJOJ
4 l7 2 »
j m -
" u W
aojfl
is j i
i n r
nt.asi105
<1-KJ237
(4.10)123
-£ 2 2 .
•1J7
7 0 4
1«j»1
27
23
. j m
« 7. m .
4l12
M l
24OM|
29wu
j a s L
- i3 T r
22Ji•JO
2 7 j M
I T S -
1«S1P*J»1
10 7(tJW)»
OTtJ120
JE22L
AJO
iM
-11*1
4U4
1t290XT:
29a7<(i>1
(X<2)39
qw i
I I M
Z S J i
14 J 3
2 B .1 7
29099(21
■CT,.
S2ij c a .
"olJo"
•9J2
#1JEH.
1351
n i l
1732
22.0
Mantfyt
H a s M n
*msp j i j
M lQMi110
SSB.
1X40
11JM- 0 5
<*J»3II
0 « )21
.£ 5 L
Ti3a"1 X 4 0
i« i»
"3H "
1JS
“3"(4m
29a73«22
-2!2L
132
19;S4
1 I .7 1
(W4J19S
(2J2}113
JJiJL
4i1«
4 .7 3
1 J »
" B I T
1 7 4 3
S J B
■ W
(4AS)1 4 2
0 « )tm
j m
■iM
T T T T
M 3 0
M je ?
5o 03"
a » )
" S ir
f r U J1 3 7
0 4 3 )104
tn 33T
O jU I
»
340 .7 * 1
MO 0 » i
230341
-53T12q n s
p i X I
e.aoi|«(1.101
u
1 3 T
M
- C ^
H J f T l
I M 1 17
irxa
" S o a r
T o
a « i2»4
(4JT7)• 4
• X 4 4
T T T
1 1 3 7
T 5 7 T
1 1 4
i7iO J O J2i1
(* .7 4 )02
4 3 T 164t i l J O )
T T(M O J
« 21 1 7 4 )
7
j f i a .
T83T2 2 M
lo t
♦ I H J«
( 7 ^ 1 )7
T i i r
2 1 ; m
M M
T s r
1J1
• 7 J 1
101P i r n ~ssr
M .1 7
~ n r
CNVadur a
CNtOMgkir
M A N b M j 6 M U N M P U r y '
7.74
.1IJS7
1C01
i a r 7
• 1 1 13"
p u w j
0 7
> 7C 1 1 J 7 J
10P-»?3
T i 3 r y f t
32
- 2 J 1
"33T
1 1 * 1
1 1 J Sa j o j
1 1 .1 1
« J 0
X 2 3
■ n W
n < u 7 i13
[<>
j S rS2SL
I3 i ie r
T 3 f •• P 3 3 I
«
J 1 £ L
" 3 3 r
T33T3 0 4 0
i m
r u a i32
j m
~SJi iii P l a n
" a s r - 2 3 "
* 4 J B |• 1
m mI
JfiSL■ O T -
T i 3 "
4 L T 7
cm:M i i
S 5 7
5 * 5 5 * 7
K o d a o u
T a
• jo o
11^40
1 U 2
4.10
K A i M A t M O k u N N t i u r r v
4 l70
^ iT3 ^f5 iSE
i i» i
24.04
miC11J3)
90
m .•9M
-*J24JOO
aua-®Sr-IJ H "
•4n«4D
MIHSL
M :1 4
3 0 7 7tn 4 i)
iT it 7 S a4 T IE -JKEL
iT ioCMlM
233( * .1 7 )4M
0311♦ It
ffJ Il
"23T
•TCWuO)
14(13*1
(T.72J30
a i7 )T3
• 0 3 )41
(023
Tssssr14C
(7XB]X I
<*-•13
•11 O S
sns"i s i r
<29^
3 4 1
•uLAAiWuuMviiury:n a y■ s r0 4 7 )
30(1J33Jm
157
poo 40)
-ms-msr
- 2 ^( M 1 J
43pmm9m
40ftg )
11J4
aoiso
1 X U
11.11
-fiiSL■ w
i<B T jn
OM)»10
pM )3 0 79m
400
•S fJG&22L
" 3 3 “
X 7 »
11.11
(TJOO)40
70•J I]
■ w
23.10
1 3 4 2
1 1 4 0
iT ir
P0J4J2ltg.j9i
993P4«
i i i i i
"iSH"
1444
4 J 4
T s r T i iT
(31301II
( 1 4 4 )»
OS7)13
(1-3*1
(7 4 4 )6bJ
P 1.3*1
(rm90
343 72
1040 *■
TTSr
2 9 .1 1
13 .T 1
1 0 4 1
2 m .
T3T lor TO T
P044)221
0 « 3 I444
004)414
iM
0J1
•«1.«3
«.4ft
T s a(3 40 )
10UOO M0 4 1 )
1X74 2B013)
241 21
T 3 190fiOQ.O O)
0 5 7 )110
( 1 4 1 )13 1
0 4 2 )190
S W
v m33
o n j7 1
(7 4 4 )43
J iS S ,
" iT i r
2359
1 3 4 0
1Q.M
"33T433
X4>
A 4 S
T33T2 3 4 3
I 9 i 1
4 4 3
J i m
0 7 7 121
033)1 7
(144)30
_E 2L
M *
" a i r # ■0 4 3 )
« 2 7C»40)
14 30 3 4 )
190
poo OCT
.1>I4
■*BT
“?3ir-CSSLOiiibar9t
KUchur
4 « 4 v y
BIdar
•1 3 4 0
•2748
•Hit
Mam
7(M2)
11(1.4 4 )
9
J & .
w
7 . 7 *
X 1 3
X 1 4
ii4043)100
(1 4 4 )1 9 7
0 4 3 )U1
. m
“5H"
11.11
1343
U3
TSB"
1 3 4 0
1 1 7 1
• 4 7
SElI22E5SL
l i TOJiJ110
H40)1 7 4(W1)143
£ZSL
H 3 T
2 1 4 3
1 » 4
1 1 7 3
“i3 3 r
OuOO
.1 9 .1 7
424
M 4 4
11 :■ M 4 4
"HB*
•2.73
AJO
4jn
a0 3 4 )
MOi»}»1
0 4 2 )29
0701
-lo B '
1 7 7 1
2 1 .4 1
1 1 .0 7
total 1.33 1 X 0 0POCOC)
9 ^ 4 0 “___ roc 40)14 .2 4
rooo m7 7 4
poo 00)•uo •01
P O O O C )4LSI 1 0 7
r o o o o11.00
M o m 4 t « * » c r : t w n a u a« T a b ia 3 1 .
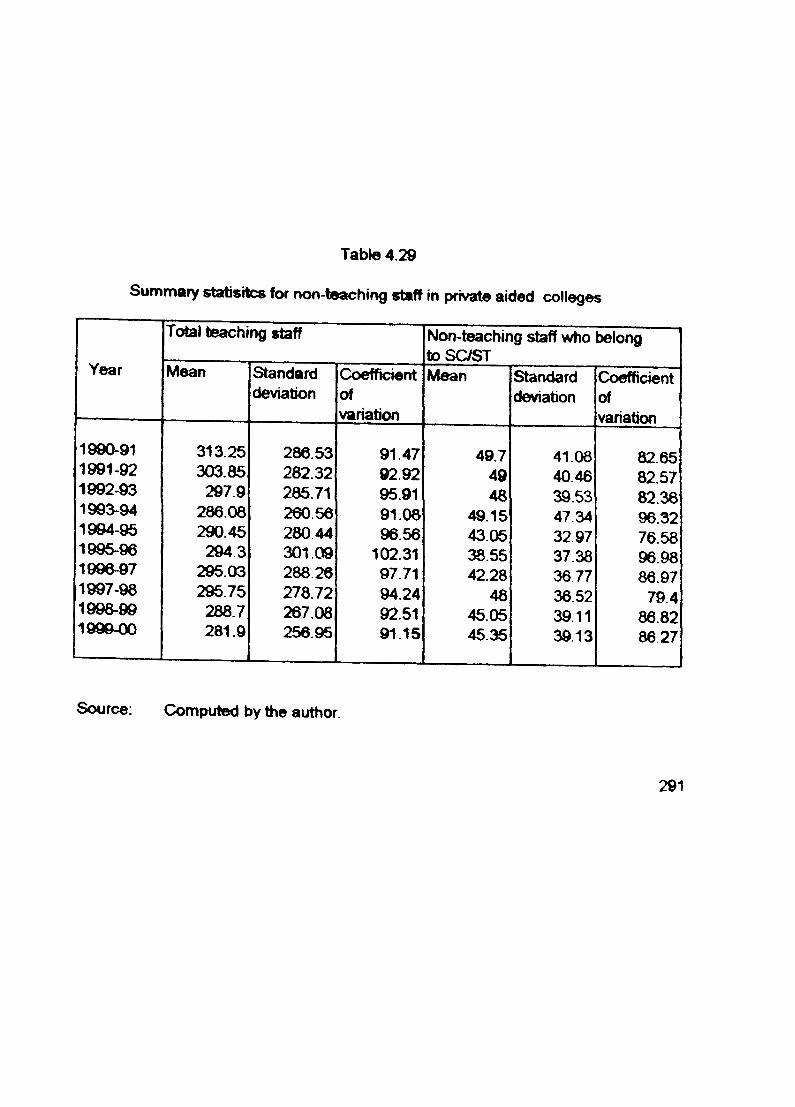
Tabte 4.29
Summary statisrtcs for non-teaching staff in private aided colleges
Year
Total teaching staff Non-teaching staff who belong to SC/ST
Mean Standarddeviation
Coefficientofvariation
Mean Standarddeviation
Coefficientofvariation
1990-91 313.25 286.53 91.47 49.7 41.08 82.651991-92 303.85 282.32 92.92 49 40.46 82.571992-93 297.9 285.71 95.91 48 39.53 82.361993-94 286.08 260 56 91.08 49.15 47.34 96.321994-95 290.45 280 44 96.56 43 05 32.97 76.581995-96 294 3 301.09 102.31 38.55 37.38 96.981996-97 295.03 288 26 97.71 42.28 36 77 86.971997-98 295.75 278.72 94.24 48 36.52 79.41998-99 288,7 267.08 92.51 45.05 39.11 86.821999-00 281.9 256.95 91.15 45.35 3913 86 27
Source: Computed by the author.
291
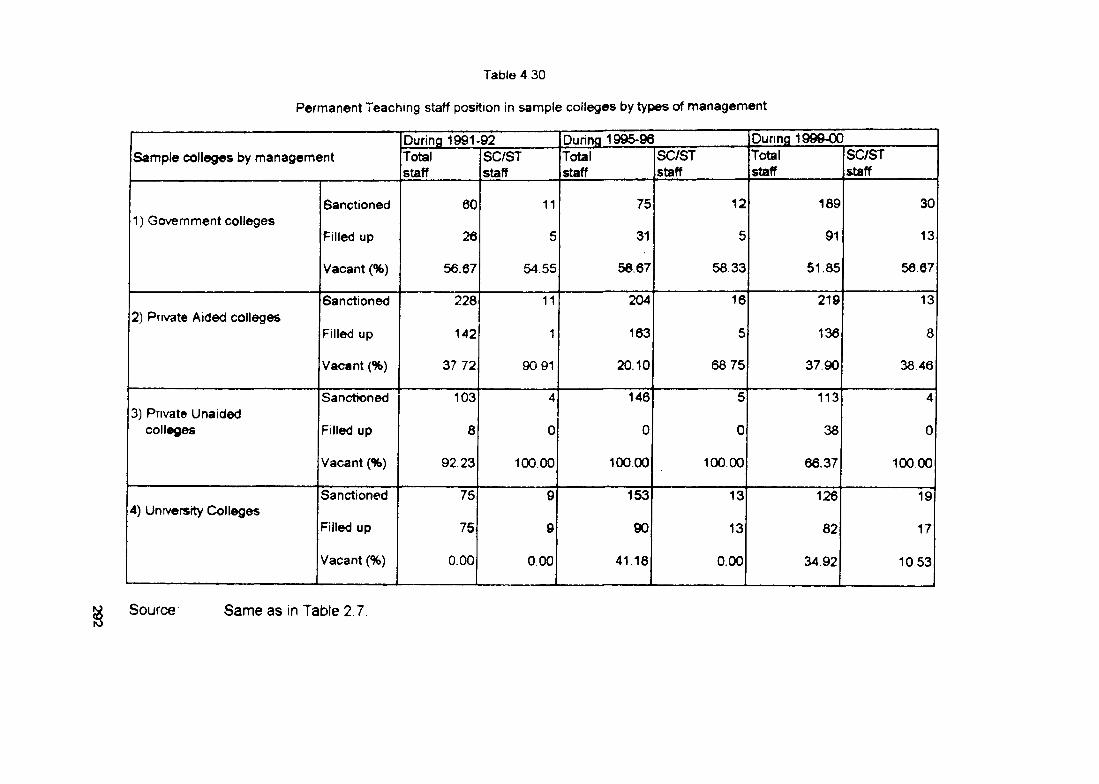
Table 4 30
Permanent Teaching staff position in sample colleges by types of management
Sample colleges by managementDuring 1991-■92 Durina 1995-96 During 1999-00Totalstaff
SC/STstaff
Totalstaff
SC/STstaff
Totalstaff
SC/STstaff
Sanctioned 60 11 75 12 189 301) Government colleges
Filled up 26 5 31 5 91 13
Vacant (%) 56.67 54.55 58.67 58.33 51.85 56.67
Sanctioned 228 11 204 16 219 132) Private Aided colleges
Filled up 142 1 163 5 136 8
Vacant (%) 37 72 9091 20.10 68 75 37 90 38 46
Sanctioned 103 4 146 5 113 43) Private Unaided
colleges Filled up 8 0 0 0 38 0
Vacant (%) 92 23 100.00 100.00 100.00 66.37 100 00
Sanctioned 75 9 153 13 126 194) Universrty Colleges
Filled up 75 9 90 13 82 17
Vacant (%) 0.00 0.00 41.18 0.00 34.92 10 53
Source Same as in Table 2.7.
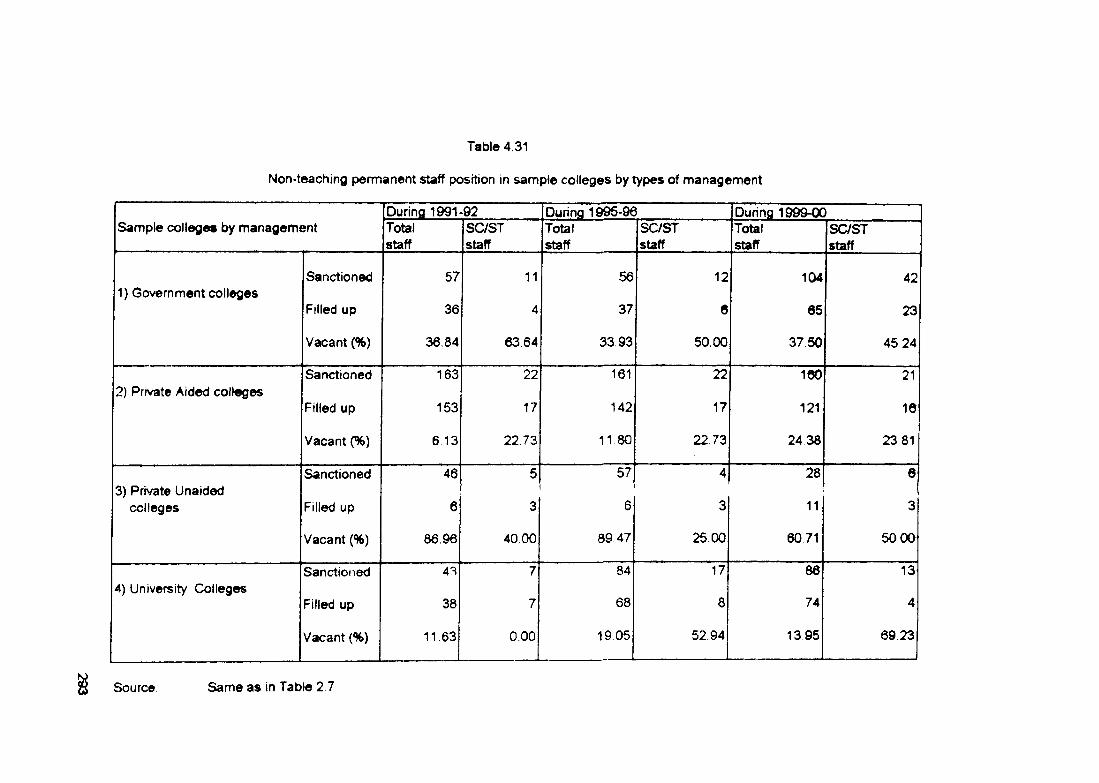
Table 4.31
Non-teaching permanent staff posrtion in sannple colleges by types of management
Sample colleges by managementDuring 1991 ■92 During 1996-96 During 1999-00Totalstaff
SC/STstaff
Totalstaff
SC/STstaff
Totalstaff
SC/STstaff
Sanctioned 57 11 56 12 104 421) Government colleges
Filled up 36 4 37 6 65 23
Vacant (%) 36.84 63.64 33.93 50.00 37 50 45 24
SarKtioned 163 22 161 22 160 212) Private Aided colleges
Filled up 153 17 142 17 121 10
Vacant (%) 6,13 22.73 11 80 22 73 24.38 23.81
Sanctioned 46 5 57 4 28 63) Private Unaided 1
colleges Filled up 6 3 6 3 11 3
Vacant (%) 86.96 40 00 89 47 25.00 6071 50 00
Sanctioned 43 7 84 17 86 134) University Colleges
Filled up 38 7 68 8 74 4
Vacant (%) 11.63 0.00 19 05 52 94 13 95 69 23
Source Same as in Table 2.7
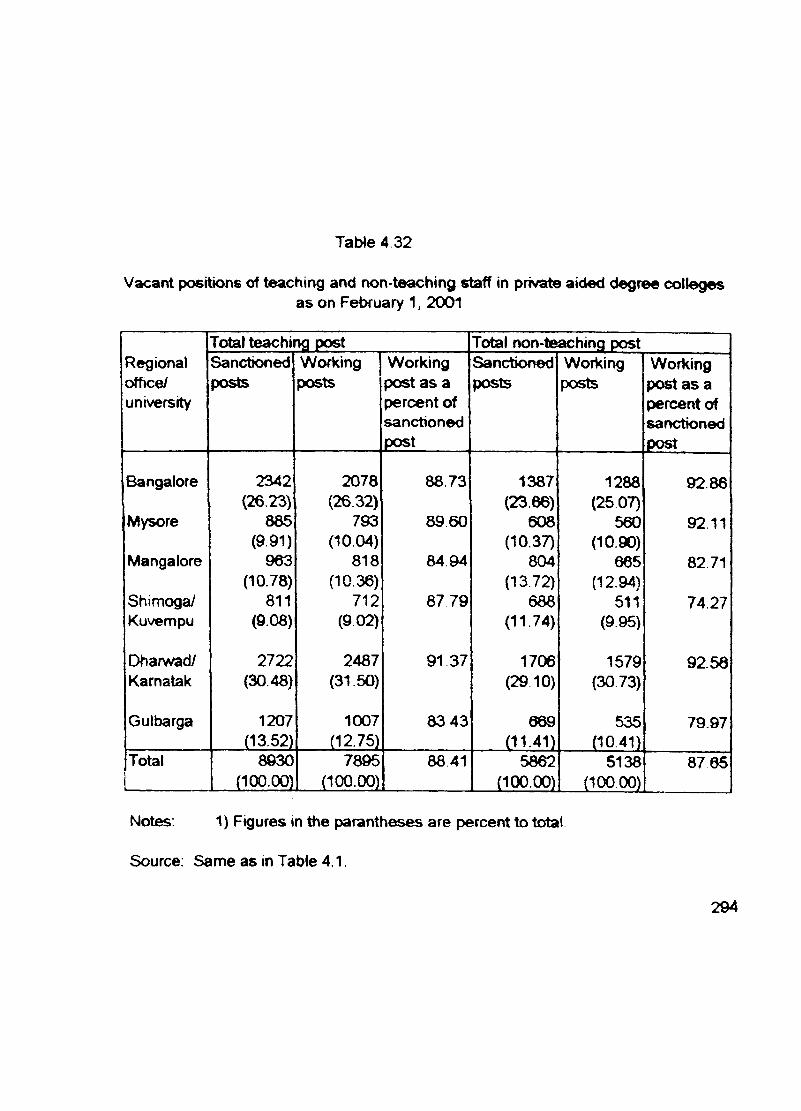
Vacant positions of teaching and non-teaching staff in private aided degree collegesas on FetHuary 1, 2001
Table 4.32
Total teachir>g post Total non-teaching postRegional Sanctioned Working Working Sanctioned Working Workingoffice/ posts posts post as a posts posts post as auniversity percent of percent of
sanctioned sar>ctk>nedpost post
Bangalore 2342 2078 88.73 1387 1288 92 86(26.23) (26.32) (23.66) (2507)
Mysore 885 793 89 60 608 560 92.11(9.91) (10.04) (10.37) (10.90)
Mangalore 963 818 84 94 804 665 82.71(10.78) (10.36) (13.72) (12.94)
Shimoga/ 811 712 87 79 688 511 74.27Kuvenr>pu (9.08) (9.02) (11.74) (9.95)
Dharwad/ 2722 2487 91.37 1706 1579 92.56Karnatak (30.48) (31 50) (29 10) (30.73)
Gulbarga 1207 1007 83 43 669 535 79.97(13.52) _...^12.751 . C11-41) (10.41)
Total 8930 7895 8841 5862 5138 87 65(100.00) (100.00) (100.00) (100.00)
Notes: 1) Figures in the parantheses are percent to total
Source; Same as in Table 4.1.
294
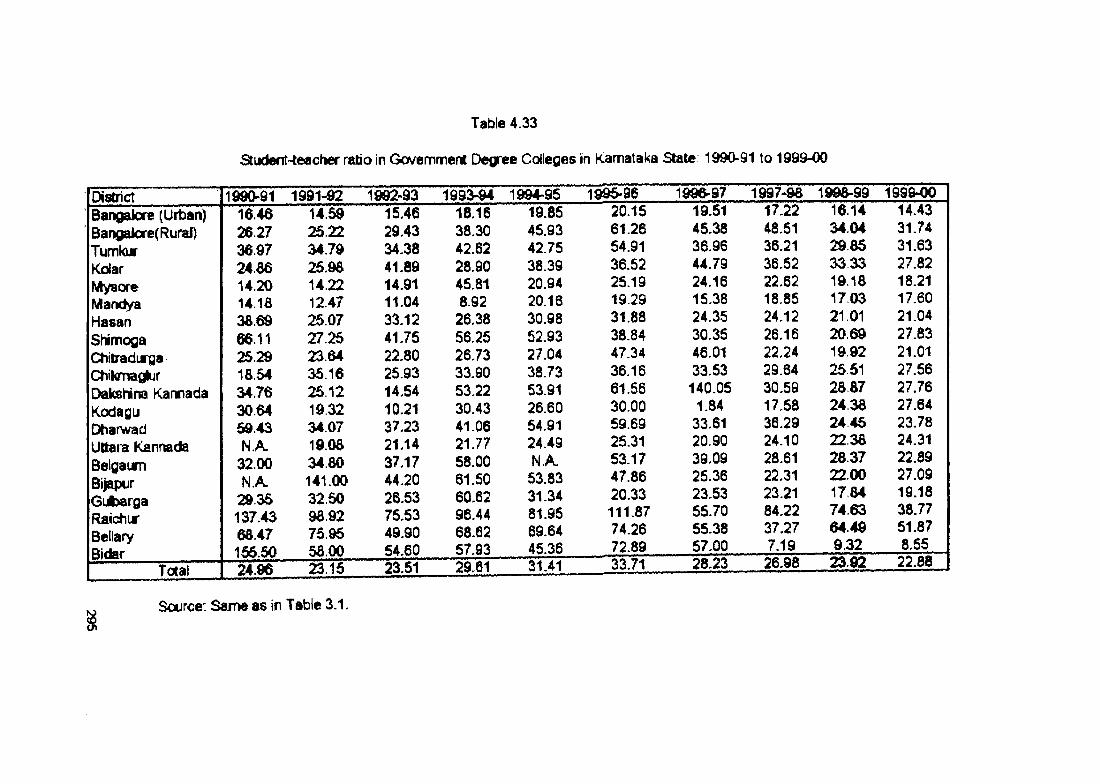
Table 4.33
StlJ(leflt-te«c lef ratio in Gcvemment Degree CoHeges h Karnataka Slate. 1990-91 to 1 9 9 9 ^
District 199(^91 1991-92 1902-93 1993-94 1994-95 1995»96 1996>97 1997>96 199^99 1999-00Bangalore (Urban)Bangalae(RuraDTumkurKdarMysoreManchaHasanShimogaCMtradurgaChikmagkjrDakshlna KanradaKodagijDharwadUttara KanruidaBelgaunBijapurGui>argaRaichirBeliaryBidar ___ _
16.46 26.27 36.97 24.86 14.20 14.18 38.69 66.11 25.29 18.54 S4.76 30.6469.43 N.A.
32.00 N.A.
2936137.4368.47 156.50
14.5925.2234.79 25.9814.22 12.47 25 07 27 25 23 64 35.16 25.12 193234.0719.0834.80141.00 32.50 98.92 75.9558.00
15.4629.4334.3841.89 14.91 11.04 33.12 41-75 22.80 25.93 14.54 10.21 37.23 21.14 37.17 44.2026.5375.5349.90 54.60
18.1638.3042.6228.90 45.81 8.92
26.38 56.25 26.7333.90 53.2230.43 41.06 21.77 58.00 61.5060.6296.44 68.62 57.93
19.8545.93 42.75 38.3920.94 20.16 30.98 52.93 27.04 38.7353.91 26.6054.91 24.49 N.A. 53.83 31.3481.95 69.64 45.36
20.15 61.26 54.91 36.52 25.19 19.2931.88 38.84 47.3436.16 61.56 30.00 59.69 25.3153.17 47.86 20.33 111.87 74.2672.89 33.71
19.5145.38 36.96 44.79 24.1615.3824.3530.35 46.0133.53 140.05
1.8433.6120.9039.0925.3623.53 55.7055.38 57.00 28.23
17.2248.5136.2136.52 22.62 18.85 24.12 26.16 22.24 29.64 30.59 17.58 36.29 24.10 28.61 22.3123.2184.22 37.27 7.19 26.98
16.14 34.04 29 85 33 33 19.18 1703 21.01 20 69 1992 25.51 2887 2438 24 45 22.38 28.37 22.00 17,84 74.63 64.49 9.32
2392
14.4331.7431.6327.82 18.21 17.60 21.0427.83 21.01 27.5627.7627.64 23.78 24.31 22.89 27.09 19.1838.7751.87 8.55
22.88Total 24.96 23.15 23.51 29.61 31.41
Source: Same as in Table 3.1.
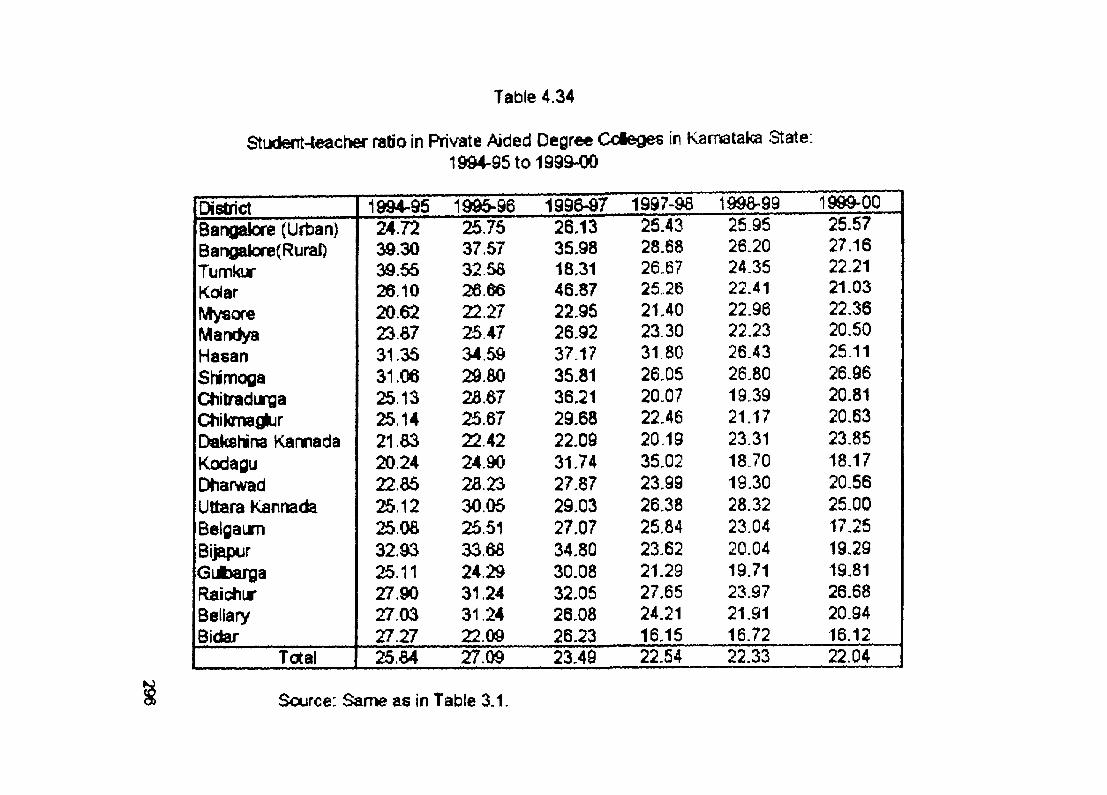
Table 4 .34
Student-teactier ratio in Private Aided Degree C d e g e s in Karnataka Starte:1994-95 to 1999-00
District 1994-95 199&-96 1996-97 1997-96 199&-99 1999-00Bangalore (Urban)Bangalore(RuraDTunrikurKdarMysoreMandyaMaeanShimogaCtiitradunsaCtiihrmglurDakehirta KamadaKodaguD^arwadUltara KannadaBelgaimBijapurGutbargaRaichirBellaryBidar
24.72 30.30 39.55 26.10 20.62 23 87 31.35 31.0625.1325.14 21.83 20.24 22.85 25.12 25.08 32.93 25.11 27.90 27,03 27.27
25.75 37.57 3258 26.66 22.27 2547 34 59 29.8028.6725.67 22.42 24.9028.23 30.06 25.5133.68 24.2931.2431.24 22.09
26.1335.9818.3146.87 22.96 26.92 37.17 35.81 36.21 29.68 22.09 31.7427.87 29.0327.07 34.8030.08 32.0526.08 26.23
25.43 28.68 26.67 25.26 21.40 23,30 31 80 26.05 20.07 22.46 20.19 35.02 23.99 26.38 25.84 23.62 21.29 27.65 24.21 16.15
25.95 26.20 24.35 22.4122.96 22.23 26.43 26.80 19.39 21.1723.3118.70 19.3028.3223.0420.0419.7123.97 21.9116.72
25.5727.16 2 2 .2 1
21.03 22.36 20.50 25 11 26.96 20.81 20.63 23.8518.17 20.56 25.00 17.25 19.29 19.81 26.68 20.94 16.12
Total 25 .84 27.09 23.49 22.54 22.33 22.04
Scurce: Same as in Table 3.1
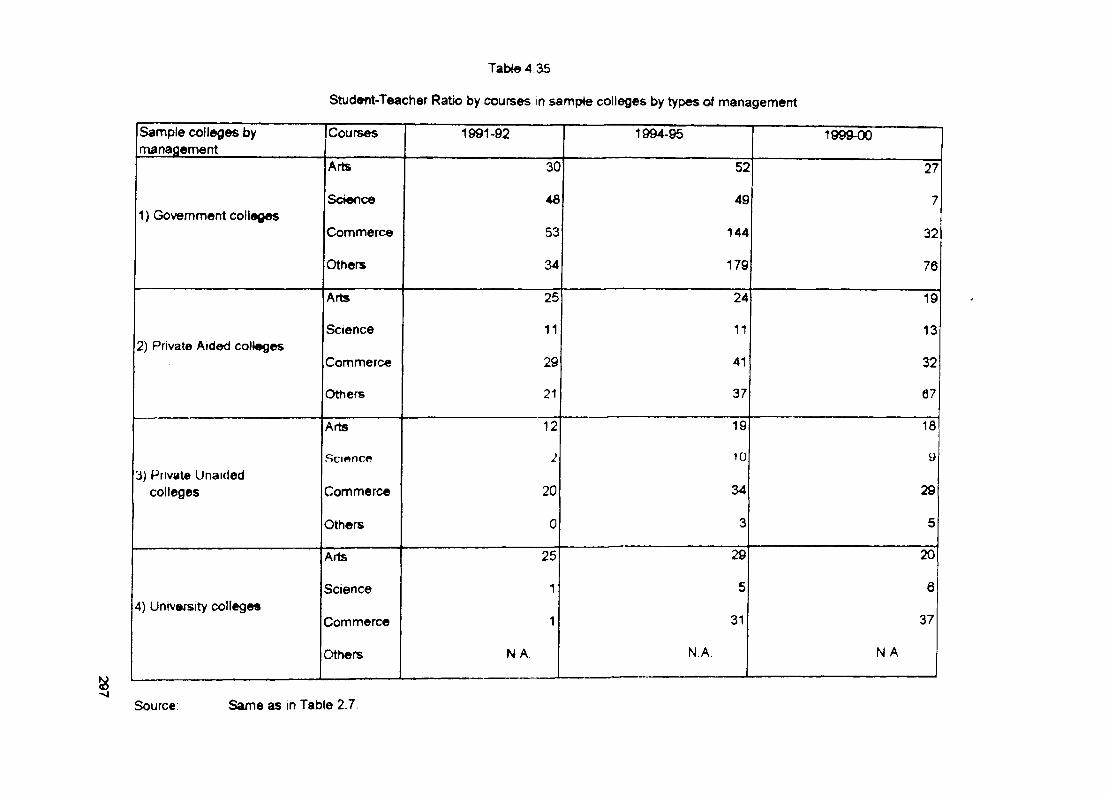
Tabte4 35
Student-Teacher Ratio by courses in sampte colleges by types of management
Sample colleges by management
Courses 1991-92 1994-95 1999-00
Arts 30 52 27
Science 48 49 71) Government colleges
Commerce 53 144 32
Others 34 179 76
Arts 25 24 19
Science 11 11 132) Private Aided colleges
Commerce 29 41 32
Others 21 37 67
Arts 12 19 18
Science 2 10 93) Private Unaided
colleges Commerce 20 34 29
Others 0 3 5
Arts 26 29 20
Science 1 5 64) Untversity colleges
Commerce 1 31 37
Others NA. N.A. N A
Source: Same as in Table 2.7.
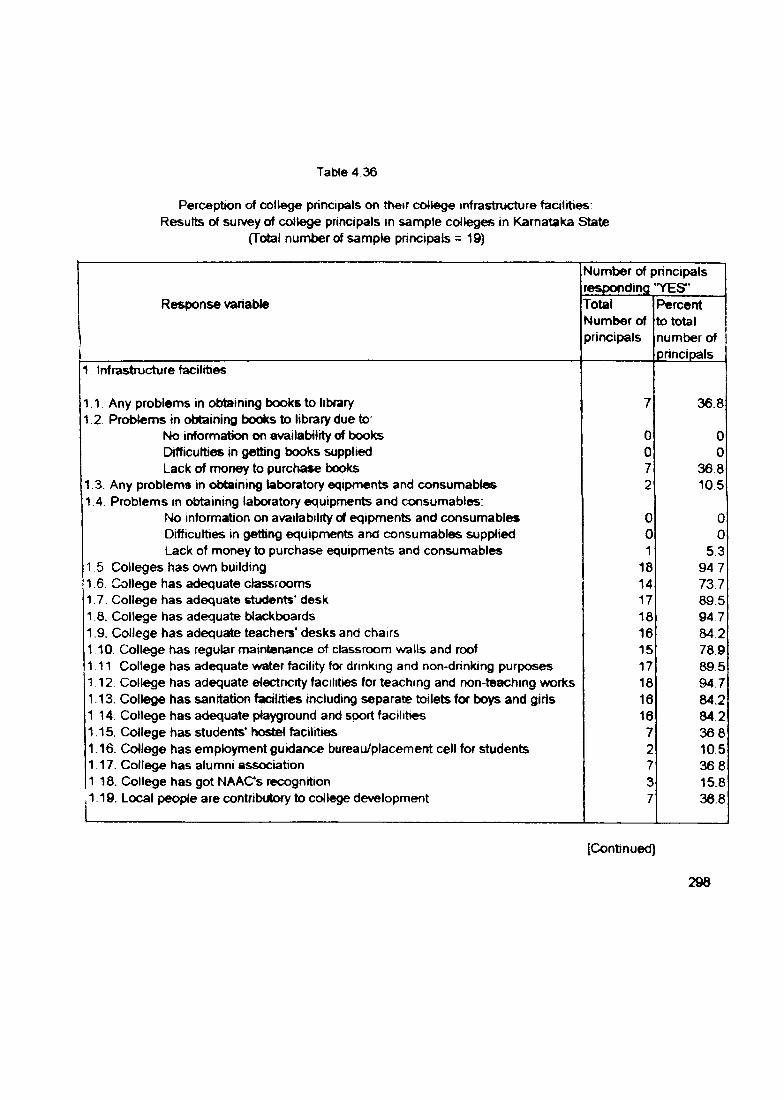
Perception of college principals on their college infrastructure facilities; Results of survey of college principals In sample colleges in Karnataka State
(Total nuniber of sample principals =19)
Table 4 36
Number of principals responding ‘YES’
Response variable TotalNumber of principals
Percent to total number of principals
1 Infrastructure facilities
1.1 Any problenr s in obtainirtg tx»ks to library 7 36.81 2 Problems in obtainino books to library due to:
No information on availat>ility of books 0 0Difficulties in getting books supplied 0 0Lack of money to purchase books 7 36.8
1 3. Any problems in obtainir>g laboratory eqipnr ents and consumables 2 10.51 4 Problems in obtaining latxxatory equipments and consumables:
No information on availability of eqipments and consumables 0 0Difficulties in getting equipments and consumables supplied 0 0Lack of money to purchase equipments and consumables 1 53
1.5 Colleges has own building 18 94.71.6 College has adequate classrooms 14 73.71.7. College has adequate students' desk 17 89.51.8. College has adequate blackt»ards 18 94 71.9. College has adequate teachers’ desks and chairs 16 84.2110 College has regular nrtaintenance of classroom walls and roof 15 78.9111. College has adequate water facility for dnnking and non-drinking purposes 17 89.5112. College has adequate electricity facilities for teaching and non-teaching works 18 94.71.13. College has sanitation facilities Including separate toilets for boys and girls 16 84.2114. College has adequate playground and sport facilities 16 84.21.15. College has students* hostel facilities 7 3681.16. College has employment guklance bureau/placement cell for students 2 105117. College has alumni association 7 368118. College has got NAACs recognition 3 15.8
i 1.19. Local people are contributory to college development 7 36.8
[Continued]
298
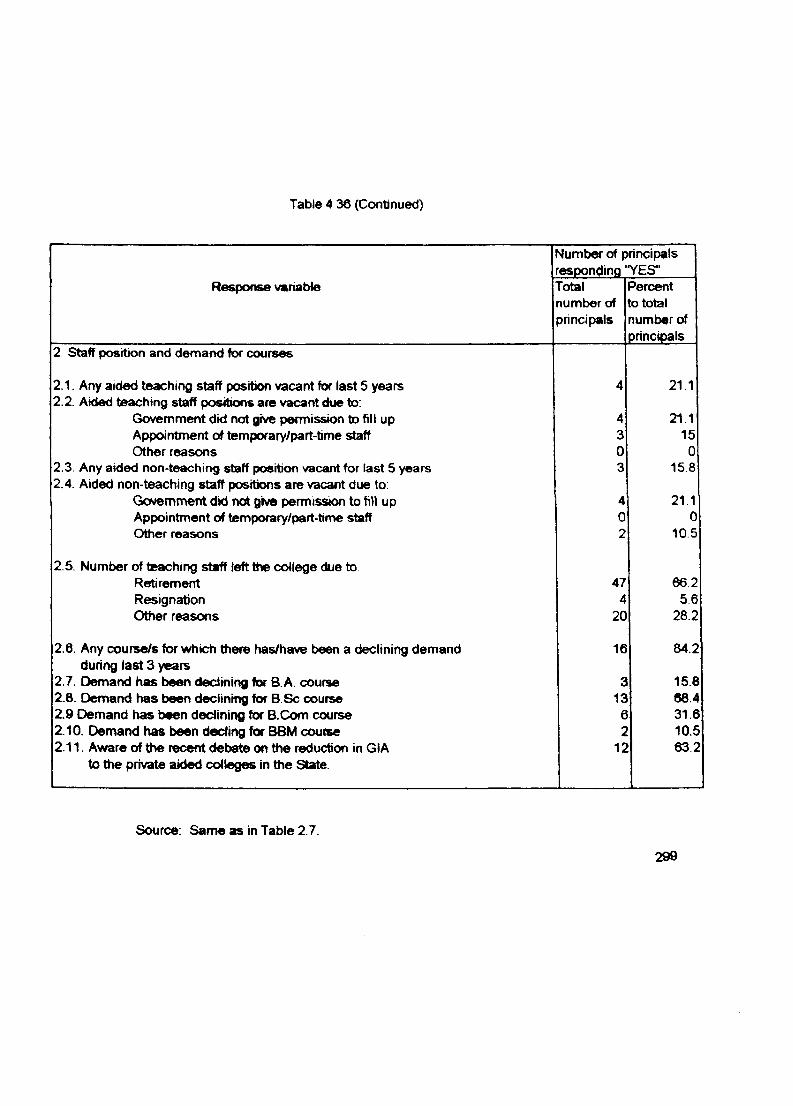
Table 4 36 (Continued)
Numl)er of principals responding 'YES*'
Response variable Totalnumber of principals
Percent to total number of principals
2. Staff position and dennand for courses
2.1. Any aided teaching staff position vacant for last 5 years 4 21 12.2. Aided teaching staff positions are vacant due to:
Government did not give permission to fill up 4 21.1Appointn>ent of temporary/part-time staff 3 15Other reasons 0 0
2.3. Any aided non-teachir>g staff position vacant for last 5 years 3 15.82.4. Aided non-teaching staff positions are vacant due to:
Govemn^nt did not giv® permission to fiU up 4 21 1Appointment of temporary/part-time staff 0 0Other reasons 2 10.5
2.5. Number of teaching staff left tf» college due toRetirement 47 662Resignation I 5.6Other reasons 20 28.2
2.6. Any course/s for which there has/have been a declining demand 16 84.2during last 3 years
2.7. Demand has been declining for B.A. course 3 15.82.8. Demand has l>een declinir^ for B.Sc course 13 68.42.9 Demand has b^en declining for 8.Com course 6 31.62.10. Demand has been deding for B6M course 2 10.52.11. Aware of the recent debate on the reduction in GIA 12 63.2
to the private aided colleges In the State
Source: Same as in Table 2.7.
299
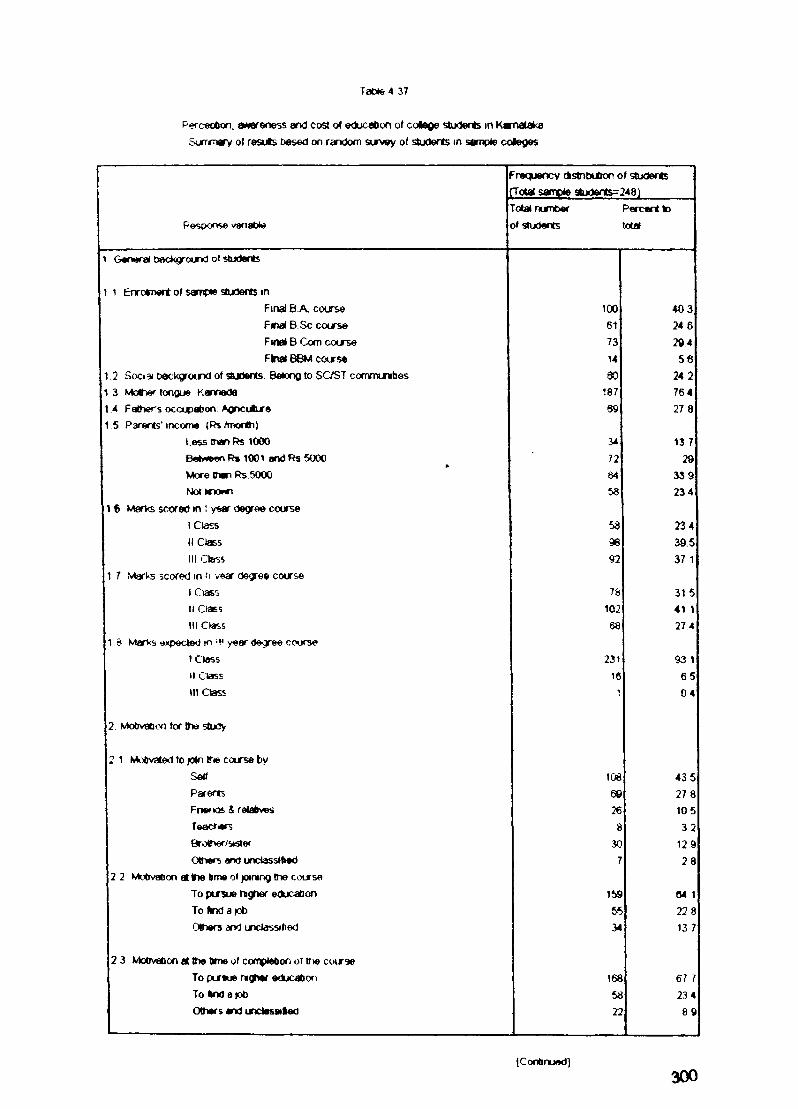
Perc«o6on. aMeneness and cost educabon of ccHtege students in Karnataka
Sijnrmtfv ot resuts l:>esed on random survey of students in sample coieges
T a w e 4 37
FrequerK;v dstntxjtior of students Total sample students-248)
Response vartshk*Total number of students
Perceri k>total
1 G«nera< backgrounc) d shjderls
I t Enrolment oT sample students in.Final B A course 100 40 3Final B Sc course 61 24 6Fmal B Com cotrse 73 2«4Flrwl B8M cours® 14 5 8
12 Soaa background of stiKterts Belong to SC/ST commLrwties 80 24 21 3 MoTief tongue Kamada 187 76 41 4 Father's occupatjon. Agnciritre 69 27 815 Parents’ income (Ps .'month)
Less man Rs 1000 M 13 7Between R» 1001 and Rs 5000 72 29More ttwi Rs 5000 84 339Not 58 23 4
1 6 MarVs scored in ! year degree course1 Class 5S 234II Class 96 39.5III <Oiess 92 37 1
1 7 Marks scored in 'i vear degree course1 Oass 7S 31 5II Class 102 41 1ill Class 68 27 4
1 6 MarVb expected m year degree course1 Class 231 93 1(1 Class 16 6 5III Class 1 04
2 Mobvaboo for the study
2 1 Motivated to jotn course bySetf 108 43 5Parents 69 27 8Fnerxis & relabves 26 10 5Toacr^rs 8 320rofr>er/s»5ter 30 12 90ttier5 and unciassifted 7 28
2 2 Motjvabon at the t>me ot joining the courseTo pursue higher education 159 64 1To Undajob 55 22 8'Dthers and urKlassified 34 13 7
2 3 Motivation at the time of completion of the coiraeTo ptraue highar education 168 67 7To (md ajo6 58 23 4Others tnd undassiled 22 8 9
(ContinLKKj]300
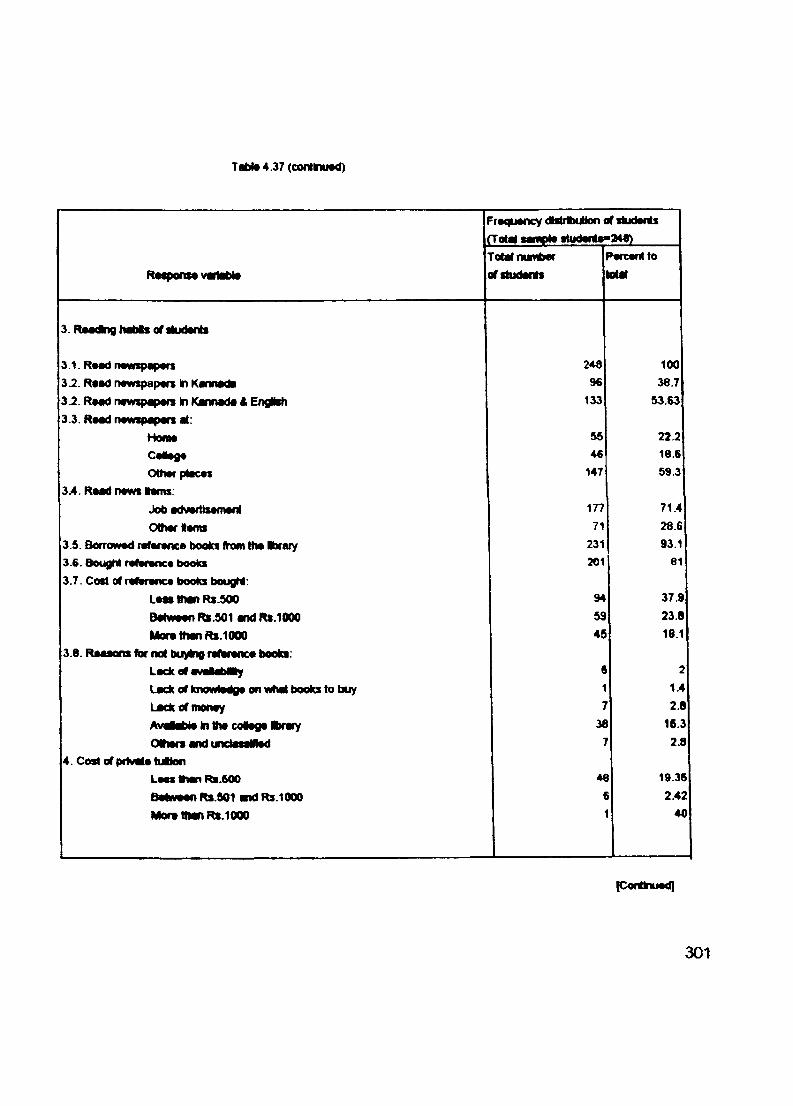
Tabto 4.37 (continued)
1frequency dtatftMilkNi of students
[Totel semple stydente«M «)
R M p o n s t v w lib lt
Totelnum lM r 1
Df students 1
to
M e l
3. R e w in g h eb ls of liudenls
3 .1. R«ad n«w spip#rs 2 4 9 100
3 ^ . R ta d newspapers in K enned i 96 38.7
3 ^ . Reed newspepers In Kennede A EngHth 133 53.63
3.3 . R eed newspepers el:« »------I 90IM 55 22.2
Cett«9e 46 18.6
Other pieces 147 59.3
3>l. R ead news terns;
Job edvertisemeni 177 71.4
Other Hems 71 28.6
3.5. Borrowed reference books from the Ibrary 231 93.1
3.6 . Bought reference books 201 81
3.7 . Cost of rtftre n c e books bought:
L e s t then R s.500 94 37.9
Between R i.9 0 1 end Rs.1000 59 23.8
M ore then Rs.1000 45 18.1
3 .8 . Reesons for not buying rtftre n c e books:
L e c k o fe v a le b M y S 2
Lack of knowledge on wfiel t)ooks to tMjy 1 1.4
Lack o f money 7 2.8
A ve iab le in the college ftre ry 36 16.3
O tie ra end undasellled 7 2.8
4 .C o s to fp r tv ile tu t to n
Lees then R s.600 4€1 19.36
Between Rs.901 end Rs.1000 6i 2 .42
M ore then Rs.1000 11 40
■ i--------- --
fCondnuMf]
301
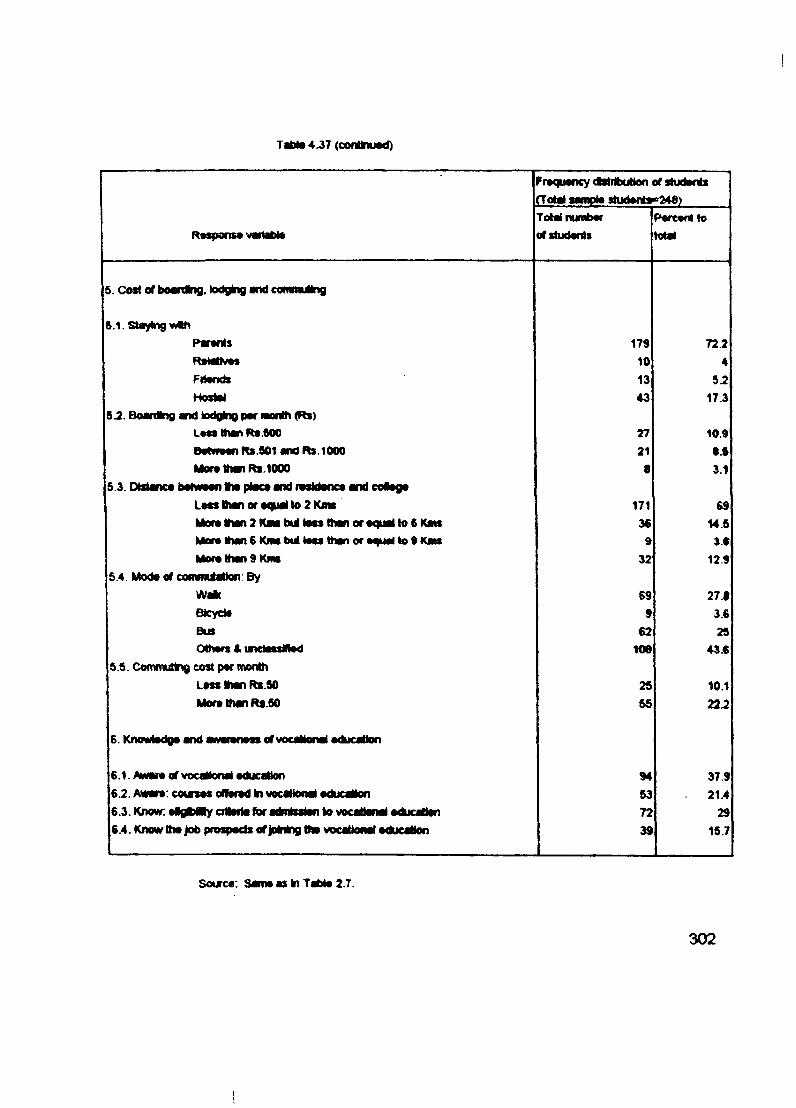
Tabto4^7(cominMd)
FraqMancy cBttrtbuHon of studonts (Total aampla s tu d a n la -^ )
Rospons* vahitotoTotai numbar
oTstudantsParcam to
td ai
5. Cost or boarding, lodging and commuting
ft .l. StayingParonls 173 722
10 4Filands 13 5.21 ir u la lrWSW 43 17.3
5 J . Boanflng and lodgino par laonlh <Rs)Lm s than Rs.600 27 10.9P a tiw n Rs.901 and Rs.1000 21 t.ftMora than Rb.1000 • 3.1
5 3 Dtitanca balMMan lha olaca and rasldanea and colaoa
Lots than or a q M to 2 Kms 171 69Mora than 2 Kaa bullats than or aqual to 6 Kan 36 U .5Mora lhan 6 Kiat but lass thon or a ^ to 9 Kaw 9 3.6MorathandKms 32 129
5.4. Mods of cocnmutaltan: ByW ak 69 27JBlcyds 9 3.6Bus 62 25Othars 4 undassllad loe 43.6
5.5. Commuttig coit par monthLass than Rs.90 25 10.1Mora than Ra.50 65 222
6.1. AMara or vocaHonal aducaHon 94 37.96.2. Awaro: co tfias oflarad m vocalkMMi aducatlon 53 21.46.3. Know: a lg M ly allM ia for admlssian to vocational aducallan 72 296.4. Know tha job proipads or Joining th i vocatkNMl aducaHon 39 15.7
Sourcc: Sanw as In 2.7.
302
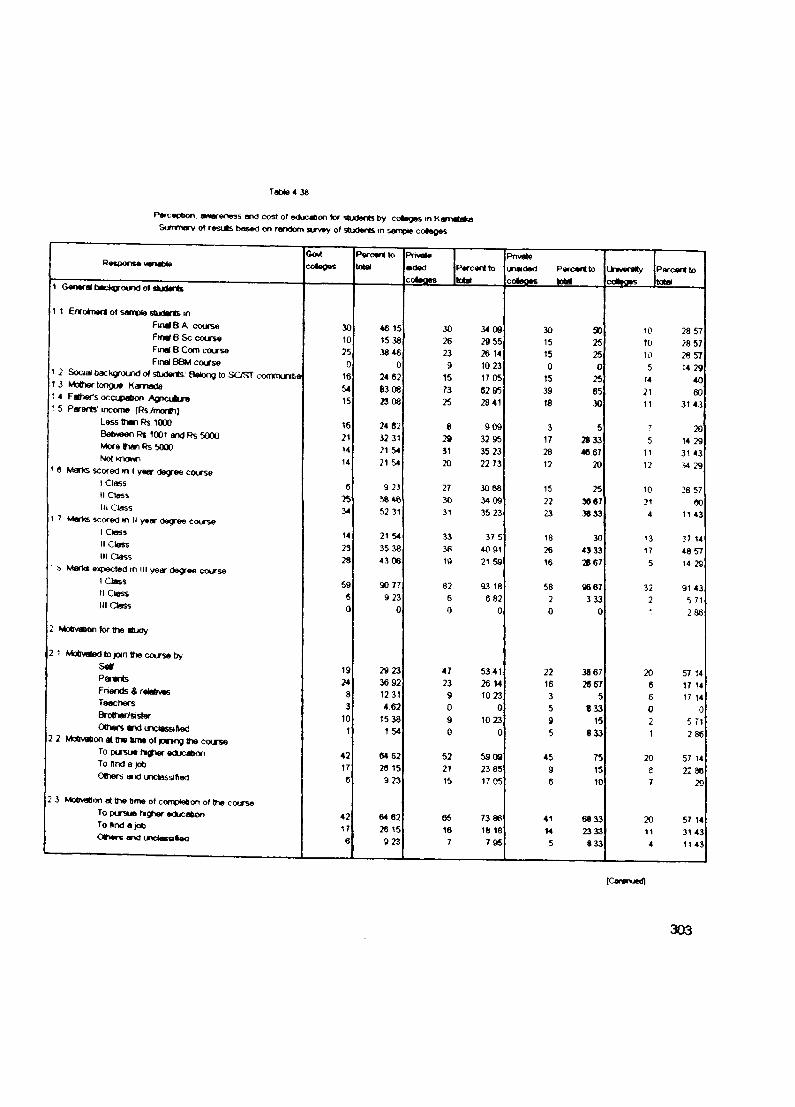
Tatite4 38
Perception wnreness and cost of »duc«bon tor students by co4eg»s m Kamat«««) SufTwnarv of restits b«s«0 on ran<Jom survey of students in sanpie coieges
Pespons* wanebtoGoMtcolag«s
Peroenltototal
Pnv<afeaidedcoleoes
PercerttoPnvateuneidedcoteoes
Percertto Uhnwraity Peroertto
30 50 10 28 5715 25 10 28 5715 25 10 28 570 0 5 14 29
15 25 14 4039 65 21 6018 30 11 31 43
3 5 7 2017 28 33 5 14 2928 46 67 11 31 4312 20 12 34 29
15 25 10 28 5722 3® 67 21 6023 38 S3 4 11 43
18 30 13 37 1426 43 33 17 48 5716 28 67 5 U 29
58 9667 32 91 432 333 2 5710 0 286
22 38 67 20 57 1416 26 67 6 17 143 5 6 17 145 833 0 09 15 2 5 715 833 1 286
45 75 20 57 149 15 8 22 866 10 7 20
41 68 33 20 57 1414 23 33 11 31 435 8 33 4 11 43
ICononucd]
1 General background of students
1 1 Enrdmert of sarnpte stuHrts inFm dB A course Final 8 Sc course Final B Co*n course Final B8M course
1 2 Social background of studwts; Belong to SC/ST commumti® 1 3 Mother tongue Kannada ' 4 Father's occupation Agncubre ' 5 Parerts' income (RsTmorth)
Less than Rs 1000Befe^een Rs 1001 and Rs 5000 More lhan Rs 5000 Not wx»vn
’ e Marks scored tn I year degree courseI ClassII ClassIII Class
1 7 Mert<& scored m II year degree courseI ClassII ClassIII Oass
' b Marl<s expected inI ClassII ClassIII Class
2 Motivabon for the rtuoy
2 1 Motivated to join the course t)y SaK ParentsFnends & reMrwts Teachers Brother/sistar Others « x l uiclasafvecl
2 2 Motivation at the fcme of joining (he courseTo pursue education To nnd a Jot)Others arxi unclassified
2 3 Motivatjon at the bme of completion of the course To ptrsue higher educakon To a jot)Others and unctaecited
I year degree course
46 1515 38 38 46
024 62 83 0823 08
24 62 32 31 21 54 21 54
9 23
52 31
21 54 35 38 43 06
90 77 9 23
0
2S23 36 92 12 31 462
15 38 1 54
64 6226 15923
64 62 26 15 923
30 34 0926 29 5523 26 149 10 23
)5 17 0573 62 9525 2841
8 9092a 32 9531 35 2320 22 73
27 30 6830 34 0931 35 23
33 37 536 40 9119 21 59
82 93 186 6 820 0
47 53.4123 26 149 10 230 09 10 230 0
52 59 0921 23 8515 17 05
65 73 8616 18 187 795
303
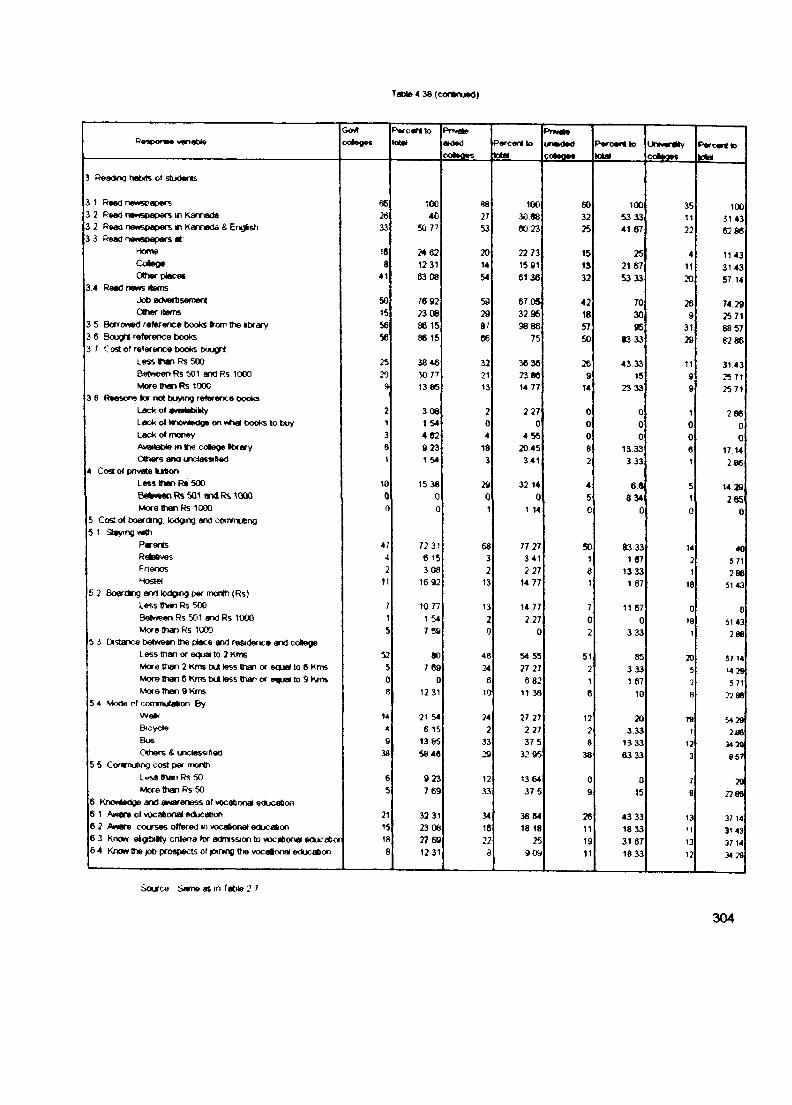
Tabte4 38 (cor»nued)
Poapon»» vonobteGo*AOOtoQM
P w cefttotoM
PrrvoiePercertiototal
♦^wateunaKledtoieoee
UnMwHtycoiwes
w wco*»<ies lota<
Percerttototal
3 nabfts of students
3 1 Rmc> netvspapers 06 100 88 100 60 100 35 1003 2 Rm O rwMsoapars m Karriacte 26 40 27 30 re 32 53 33 11 31 433 2 Pftad neMsparmrs m Karmada & Eng^sh 33 50 71 53 90 23 25 41 67 22 62 863 3 Rasd rw«spapers at:
Homa 16 24 62 20 T i n 15 25 4 1143Cotoge 8 12 31 14 15 91 15 21 67 11 3143Othar places 41 63 08 54 6136 32 53 33 20 57 14
3 4 Reed navys Items.Jot) 8(>«rtsament 50 76 92 59 67 05 42 70 26 74 290(her Items 15 23 08 29 32.96 18 30 9 25 71
3 5 Borrowed reference books from the iilyary 56 8615 87 98 86 57 95 31 88 573 6 Bought reference books 56 86 15 66 75 50 63 33 29 82 863 7 Cost of reference tx»ks bougtt
Less than Rs 500 25 38 46 32 36 36 26 43 33 11 31 43Bet»»een Rs 501 and Rs 1000 20 ?0 77 21 23 86 9 15 9 25 71More than Rs 1000 9 13 85 13 14 77 14 23 33 9 25 71
3 8 f^easons lor not txjying reference twoksLack of avaitabiUy 2 308 2 2 27 0 0 1 286Lack of Mno¥4e<l9e on vtlxtf t>ook5 to txiy 1 1 54 0 0 0 0 0 0Lack of money 3 4 62 4 455 0 0 0 0Awartable m tfte colege Kxary 8 923 18 2045 8 13.33 6 17.14Others artd urtciassified 1 1 54 3 341 2 3 33 1 286
4 Cost of prwate turiionLess than R» 500 10 15 38 29 32 14 4 6 ft 5 14 39B«kN8«nRs501 anSRs ^OOQ Q 0 0 0 5 834 1 285More than Rs 1000 0 0 1 1 14 0 0 0 0
5 Cost of txwrdirig, lodging and commuting 5 1 Staying v«<h
Parerts 47 72 31 68 77 27 50 83 33 14 40Relabves 4 6 15 3 341 1 167 2 5 71Fnends 2 308 2 2 27 8 1333 1 2B6Moste) t1 16 92 13 14 77 1 167 18 5143
5 2 Soardng and lodging per morth (Rs)Less than Rs 500 7 10 77 13 14 77 7 11 67 0 0Between Rs 501 and Rs 1000 1 1 54 2 227 0 0 18 5143More than Rs 1000 5 7 69 0 0 2 333 1 206
5 3 Distance between the ptoce and residerKa and coAegeLess than or nqiiai to 2 Kms V 80 48 54 55 51 85 20 57 14More than 2 Kms but less ttian or equal to 6 kms 5 7 69 24 27 27 2 333 5 14 29More thm 16 Kms txjt less than or equal to 9 h im 0 0 6 6 82 1 1 67 2 5 71More than 9 Kms 8 12 31 10 11 36 6 10 e 72 86
5 4 Mode of commutation ByWalk U 21 54 24 27 27 12 20 T9 54 20Btcycte 4 6 15 2 2 27 2 3 33 1 2 MBus 9 13 85 33 37 5 8 1333 12 3 4 MOthers & unctessitiea 38 58 46 29 32 95 38 63 33 3 0 57
5 5 ConmuUng cost pet monthLess than Rs 50 6 923 12 13 64 0 0 7 20More than Rs 50 5 769 33 37 5 9 15 B 72 86
6 Krw*4eb9earKl awareness of vocational editcjtfion6 1 of vocabonal education 21 32 31 34 38 64 26 43 33 13 37 146.2 AMare courses offered m vocattonat edncabon 15 23 08 16 18 18 11 18 33 M 31 436 3 Know eigrbillv cntena for admission to vocaborwri eduratior 18 27 69 22 25 19 31 67 13 37 146 4 Know the |ob prospects or joining the vocaional educaliori 8 12 31 d 9.09 11 1833 12 34 29
Sotrc« Sam® as in Tabte 2 7
304
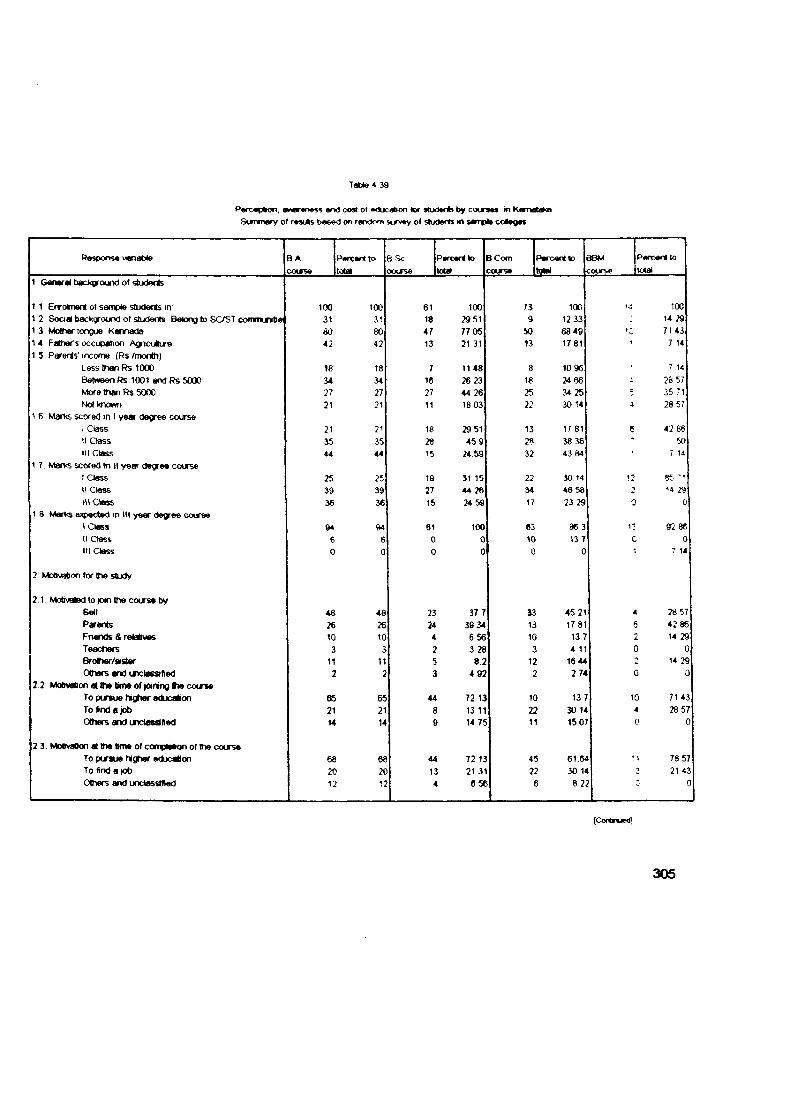
Table 4 39
P«rc«(Aon. aMar«n««4 and coat ot oducobon tor stud«r(s by coutms in KofnataM Summary of rMdte based of> random vurv*y o< studefts m sampto colegas
Paspons* vanabto B Ac o u rs e
Parcanttototal
BScoourse
Parcarl to total
BComcoursa
Parcantio
‘2S!____B8Mcourse
Parcart to total
I G a n a ra l b a c k g ro u n d o f s tix le n ts
I I E n ro tm an t of s a m p le s tu d e n ts in
1 2 S o o a l b a c k g ro u n d o f s tu d e n ts B e io n g to S C /S T co m m u w tiei 1 3 M other t o n ^ K a n n a d a
1 4 F a th e r 's o c c u p a tio n A g n c t tu r e
1 5 P a re n ts ' in co m e (R s /m ontfi)
L e s s th a n R s 100 0
B e tw e e n R s . 1001 a n d R s 500 0
M ore th a n R s 5 0 0 0
N o tl« x * w i
1 6 M a rte s c o re d in t y e a r d e g re e c o u rs e I C la s s
U C la s s III C la s s
1 7 M art® s c o re d In II y e a r d » g re « c o u r s e
I C la s s
II ClassmOess
1 8 M arVs e x p e c te d in III y e a r c te g re e c o u r s a I C la s s l l O a s s
III C la s s
2 M otivalior fo r th e s tu d y
2 1 M (« v a ted to jo in th e c o u r s a b y
8 e(f
P a r e r t s
Fnends & relaiivas Teachers Brother/sister Others and unclasafied
2 2 Motwation at the time of janifig t » course To pursue hn her education To find a job Others and unclassified
2 3 . MottvaOon a t th e ttm e o f c o m p M k m o f c o u r s e
To p i r m ie h ig h e r e d u c a tio n To find a job
O th e rs a n d u n d a s s t l ie d
100318042
18342721
2135 44
253936
946
0
4826103
112
962114
68201 2
100318042
18342721
2135 44
253936
94
61184713
71627 11
1828 15
192715
6100
2324425 3
44
44134
100 29 51 77 05 21 31
1148 26 23 44 2618 03
2951 45 9
24 59
31 15 44 2624 59
10000
37 7 39 34 656 3 28 8 2
492
72 1313 1114 75
72 13 21 31 656
739
5013
182522
132832
223417
63100
J313103
122
102211
4522
100 1233 68 49 1781
10 96 24 66 34 25 30 14
17 81 38 36 43 84
30 14 48 58 23 29
363 13 7
0
4521 17 81 137 4 11
16 44 2 74
13 7 30 1415 07
61 6430 14 8 22
12
C
104n
100 14 2971 43
7 14
7 1426 57 35 28 57
42 86 50
7 U
14 290
92 860
7 14
28 57 42 86 14 29
014 29
0
71 43 28 57
0
78 57 21 43
0
(ConOnued]
306
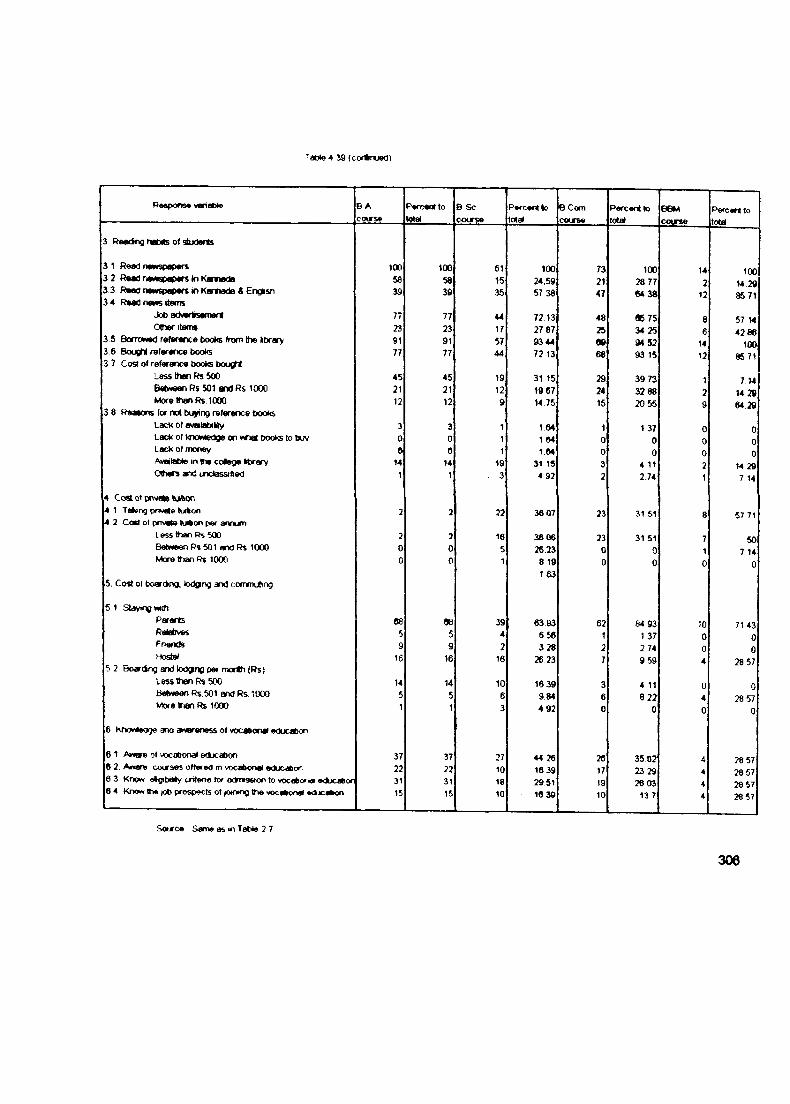
’ at5»e4 39 (confcnued)
R«6pons« vahabte B Acourse
f=Vceattot9«al .
B Sc course
Percent lo total
B Com course
Percent to total
BBMcourse
Percertto
3 Rawing naMs of students
3 1 Read newspflpers 3 2 Raad newspapers in Karmada
10058
10058
6115
10024.59
7321
100 28 77
142
100 14 29
3 3 Raad nevvspapars in Kannada & Engnsn 3d 39 35 57 38 47 64 38 12 85 713 4 Read news Items
Job ad««rtsament 77 77 44 72 13 48 95 75 8 57 14Other itsmt 23 23 17 27 87 25 34 25 6 4286
3 5 Borrowed reference books from ttie library 91 91 57 93 44 90 94 S2 14 1003 6 Bougn reterance boote 77 77 44 72 13 68 93 15 12 85713 7 Cost of reference boote bought
Less than Rs 500 45 45 19 31 15 29 39.73 1 7 14Beb^een Rs 501 end Rs 1000 21 21 12 19 87 24 32 88 2 14 29IA)re »un Rs 1000 12 12 9 14 75 15 20 55 9 64 28
3 8 Reaions for not buying reference booksLack of a^katnlty 3 3 1 1 64 1 1 37 0 0LacK of kTXMiedge on what books to buy 0 0 1 1 64 0 0 0 0Lack of money 6 0 1 1 64 0 0 0 0Available in the cotege tbrary U 14 19 31 15 3 4 11 2 14 29Others and urtdassined 1 1 , 3 4 92 2 274 1 7 14
4 Cost otpn>«te tuition4 1 Tatong povate tirtoo 2 2 32 36 07 23 31 51 8 57 714 2 Cost of pnyeto iuMon p«r annum
Less than Rs SOO 2 2 16 38 06 23 31 51 7 50Between Rs 501 andRs 1000 0 0 5 26 23 0 0 1 7 14More than Rs 1000 0 0 1 8 19
1 630 0 0 0
5. Cost of boarding, lodging and commuting
5 1 Staying vwihParents 08 as 39 63 93 62 84 93 10 71 43Reiatrves 5 5 4 656 1 1 37 0 0Fnends 9 9 2 328 2 2 74 0 0Hostel 16 16 16 26 23 7 9 59 4 28 57
b 2 Soaring end Io d in e per morih (Rs)Less tfwn Rs 500 14 14 10 16 39 3 4 11 0 0Between Rs 501 oxJ Rs 1000 5 5 6 9 84 6 8 22 4 28 57More irian Rs 1000
6 KrwwtAeoge and awareness of vocabona* ernrrVior
1 1 3 4 92 0 0 0 0
6 1 Aware of vocational educabon 37 37 27 44 26 26 35 82 4 28 576 2. Awars courses offered in vocaiKJoai rxMic-dbor. 22 22 10 16 39 17 23 29 4 28 576 3 Know elgtbiMy chtena tor adnmsstoo to vocabor^ educatior 31 31 18 2951 19 26 03 4 28 576 4 Knw<* the )0b prospects of >ow»ng the vocafco^^^dLicalwi 15 15 10 16 3© 10 13 7 4 28 57
Sourc« San* as in Tabte 2 7
306
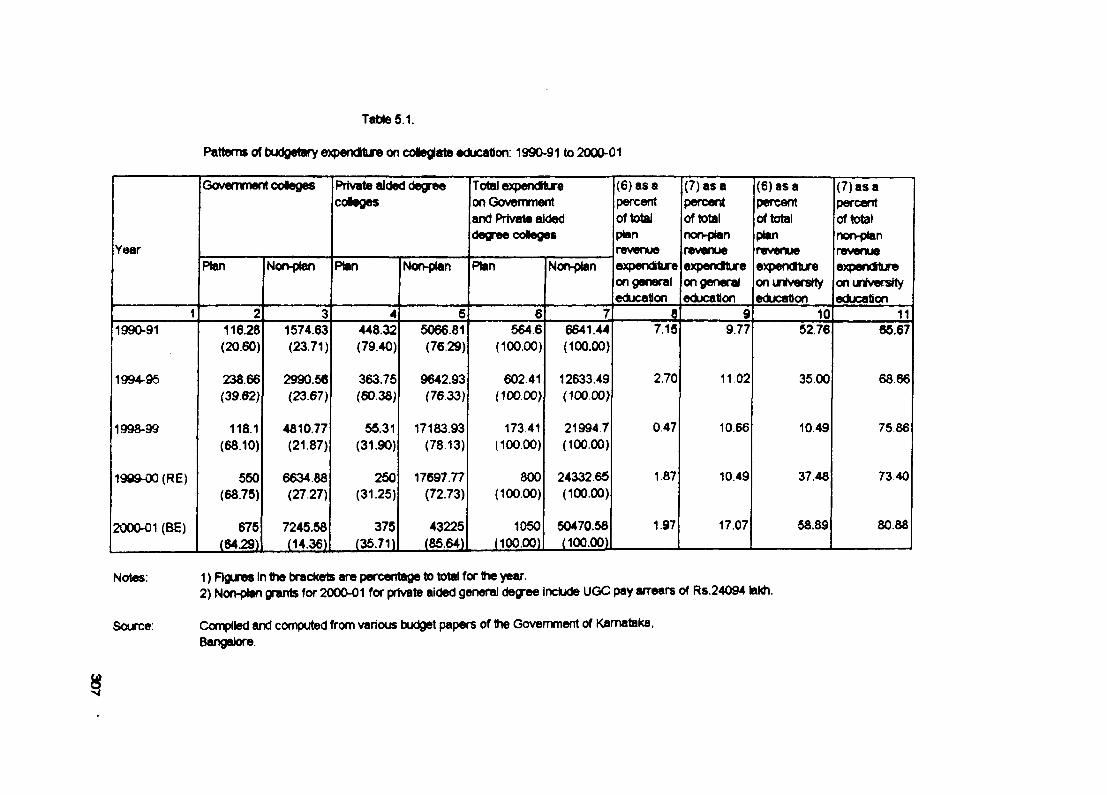
Table 5.1.
Patterns of budgetMY o)qpenditure on coieglata •ducaHon; 1990-91 to 2000-01
Year
Government coleges Private aided degree coleges
Total expendltLTe on Government and Private aided degree coNeges
(6) as a percent of total planrevenue
(7) as a percent of total non>pian revenue
(6) as a percent of total planrevenue
(7) as a percent of total non-plan revenue
Plan Nofvplan Plan Non-pian Plan Norvptan expenditure on general education
expendKure on general education
experxfture on university education
expendnure on university education
1 2 3 4 5 6 7 8 9 10 111990-91 116.28
(20.60)1574.63(23.71)
448.32(79.40)
5066.81(76.29)
564.6(100.00)
6641.44(100.00)
7.15 9.77 52.76 65.67
1994-95 238.66(39.62)
2990.56(23.67)
363.75(60.38)
9642.93(76.33)
602.41(100.00)
12633.49(100.00)
2.70 11 02 35.00 68 66
1998-99 118.1(68.10)
481077(21.87)
56.31(31.90)
17183.93(78.13)
173.41(100.00)
21994 7 (100.00)
0.47 10.66 10.49 7586
1989-00 (RE) 550(68.75)
6634.88(27.27)
250(31.25)
17697.77(72.73)
800(100.00)
24332.65(100.00)
1.87 1049 37.48 7340
2000-01 (BE) 675(6 4 .^
7245.58(14.36)
375(35.711
43225(85.64)
1050(100.00)
50470.58(100.00)
1.97 17.07 58.89 80.88
Notes; 1) Rgures in the brackets are percentage to total for the year.2) Non-plan grants for 2000-01 for private aided general degree Include UGC pay arrears of Rs.24094 lakh.
Source: Compiled and computed from various budget papers of the Government of Karnataka.Bangak)re.
§
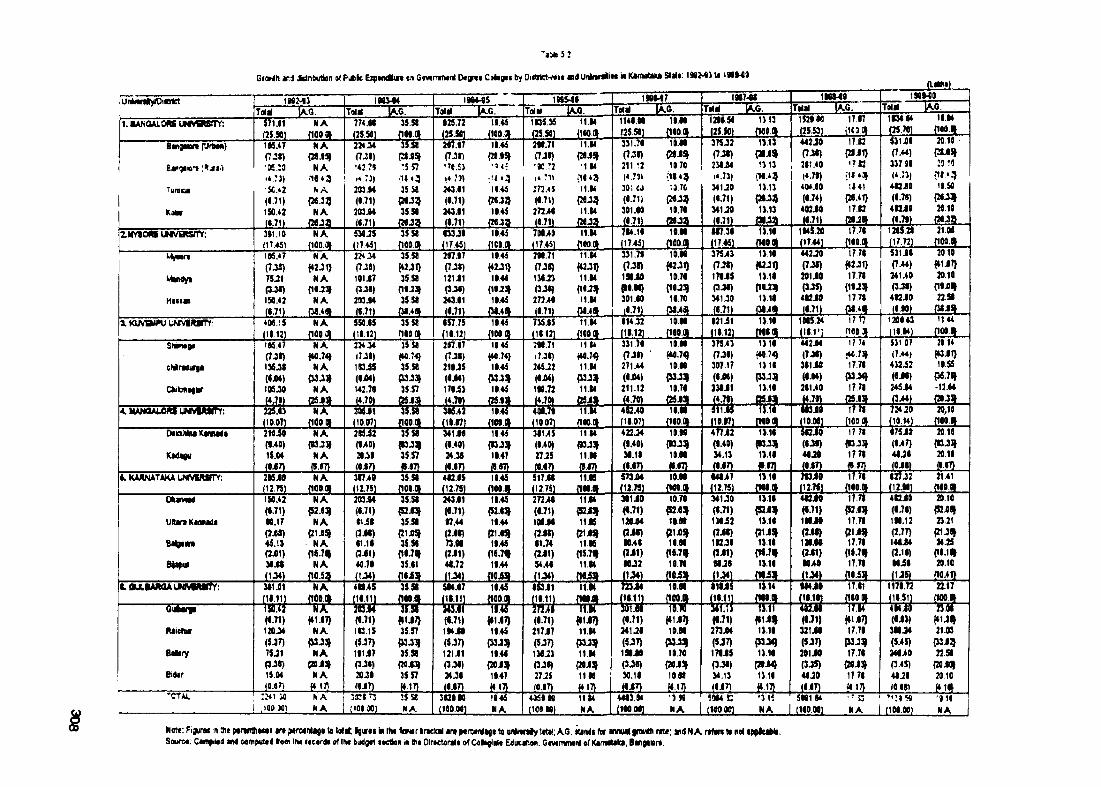
Tat»te 5,2
U(*eniy60ii6fict
GroMh vd Jdribirtkin #fPu6k Eipmdhr* on GcvtmiTnnl D tjrt* Cahjti by OiitiietHiiu aid unlrti^it* inK*n»itato Slilt; 1982-tJte 19JM9
1»243TolK Tairi
I86ys Tot198M7
ToiH Tam1W74»
Tow BT Toiri1MM0
M1. tANOALom uMVBesrrr: 571.81 NA V i M 35S8 925.72 19.45 1035.35 11.84 1148.96 19.88 1288.56 1)13 1529 M 17.97 1834.04 18.94
{3$.901 (lOO.fll (25.50) (160.(1 (25.50) {100.01 (25.50) {1«0d (25.50) d60.<|._ (25.50) . . . I l M J L - (25.53) {103.4 . P5„?«L_Bangaieni (UrMn) 1»5.47 NA 224.54 35.56 287.17 19.45 296.71 11.84 331.78 10.86 375 J2 1)13 442J0 17.82 531J8 20.10
(7-SS) PO.ISJ (7J8) {aj95j (7J5) {2a.9S» (7J8) {28JSJ (7.38) {»J5J (7.5*) {38JS» a-36) {28J1) (7.44) {28J^
1 Bap^aiort iRja^t •9£:a NA '42.71 *5 57 'Tfl.SJ •»4: ’K 72 •184 211.12 1070 236 J4 t) l3 281.40 ’712 337 SS 2J 10
.4 ?Jk .i« *5 t* ; j | |4 .18*:} (4 7H {18 49 .4.73) {16.49 »*.78) •;it 4 4 (*.:j)Tumcv 5C>2 hA. 2n.M 35M 243.81 11.45 272.4J 11.14 30i.tJ ;3.70 341 JO 13.13 494.80 ’ll41 482J0 19.50
<«.71) {26.:^ (1.71) {26J9 (8.71) {2«J3> (6.71) (26-39 (8.71) C26J9 (8.71) {26J9 (6.74) (26.41) (6.78) {26J9Kotar 1S0.42 NA 2UJB4 35 S6 343.81 19.45 272.48 11.84 301.60 10.76 341J0 13.13 402J0 17.82 482J9 20.16
«.71) («.71) {26J3 (8.71) {26J» (6.71) {26Ja (8.71) (26.3» 16.71) (38JS «-791 {28J»
2. t r r s o « uM«<i»saY: 391.10 NA 5U:Z5 35 56 833J9 19.45 im < i 11.84 784.18 10.86 M7.38 13.18 194i20 17.78 1265.21 21.06
(17.451 {100.4 (17.45) {100 0) (17.45) {lOOH (17.45) {100® (1745) (100.11 (17.84) (100.01 . U l f U - {18001 (17.72) {•«?».M ^ n 1«.47 NA 224.J4 3556 287.97 19.45 298.71 11.94 331.78 10.00 375;»3 1318 442J0 17.78 531J8 2010
(7J8) <42J1} (7J8) {«J1} (7-38) {♦2J1} (7J8) f « J t) (7.38) f»2J1} 0 ^ <tt-31) (7J8) {42-30 ( 7 ^ ) {41J7)
MMdyt 75J1 NA 101J7 3S.S6 121 i1 19.46 136J3 11.84 198-80 10.76 176J5 13.18 201 JO 17.78 34U0 20.10
P-M) (i«j :» (3J«) {1IJ3I (3-38) (3J8) {18J^ (I9.M) (19J!J (3-38) m n (3-35) (19J3J (3-38) {19J#
Haiian 150.42 NA 2in j4 35 56 243.81 19.44 272>8 11.94 301.60 18.70 34U0 13.18 402JO 17.78 492J0 22.56
(6.71) {M.481 a m (36.4« («.71) {36.4« (6.71) {36.481 (8.71) { « > « ( « J 1 i_ {364f (•.71) (38.481 (8J0) (36JS)
X w m n n j uNtvf urTY: 4M.15 NA 550.65 35 S« 8S7.75 19.45 7J5J5 1184 814.32 10.08 921 i1 1318 1005.24 1777 120843 11U
(11.131 {100.4 (H.12) n o o d (18.121 {100 0) (18.12) {icon (11.12) (160.11 (18.«) (N8 0I (181'] /100 4 (100 9)
Srwwfi t«.47 NA 224 .M 35 56 287.17 1945 J98.71 11S4 331 78 1008 375 43 1318 442J4 17 74 53107 2014
(7J«) <40.74J (7J») {M.7^ (7J8) {4«,74> a j8 ) {40.74J (7J8) (40.74J (7.38) {40.74J (7.38) •44.7]) (7.44J {43Jf)cM ndtfta 1XJS NA iSSiS 35 56 219J5 19.45 245J2 1184 271.U 10.88 307.17 1318 381J0 17.78 4)2i2 19.55
(••M) {«J3» (iJM) {J3J3J («J68) (6X*) (33J3» (M-3? (6J0*) {33.331 (••♦) 03J4J (6 JO) {36.78JOukmaikir IDS JO NA 142.7$ 35 57 1794J 19.45 190.72 1184 211.12 10.76 236J1 13.18 281.40 17.78 245 J4 •12J4
(4.70) O SJS (4.70t Q5J3» (4.7W (25.93) (4.70) (2SM (4.70) ( » J t (4.70) (3SJ3I (4.70) {25.93} ( iM)4.MAN(Ui«Ri LMivlfb/rr; iX M NA 3 ^ J 1 35 56 38^.42 19.4? 408.f9 11.14 4^2.40 18.88 il lJ U 1)18 t e j o i f h 734 JO 20 10
(10.071 flOO.H (10.0T7) fl00.fl| (I8.fl7) (lOO.fll (10.07) {160» (18.07) {1609 (1^071 {w on (10i») {100 01 (10.14) {100.dDanMuKMwda 210.50 NA 205i2 35 S8 341 j98 19.45 38U5 1184 422.24 10.08 4t7J2 1)18 582J0 17 78 875 J2 2010
(«.W) (BJ3J m ) H SJ9 (8.48) {93J3J (9.40) {93J3I (•.♦0) {W-33J (9.40) (8.38) {83.33) (8>7) {9SJ3JKaOou 15.04 NA 20.)» 35.57 24.38 19.47 27 J5 11.88 3I.18 10.08 34.13 1)18 40.20 17.78 46J8 2016
(OiT) ff.OT) (0J7) ff.87} (6.8T) {8.87} (6.67) {8.87) (6.67) {0.87} ( 6 jn #87} (6J7) {8.57} (0J8) {8.87)L KAANATAKA UWVWiry; 215 JO NA 3 n> o 35 56 482JS 19.45 517 J8 11.88 S13J04 10.08 04147 1)16 W JO 17.78 827J2 2141
(12.75) f1flO.(* (12.751 noo.fli (12.75) {100.* (12.75) (i6i.ai (U-TSJ (100.01 (12.75) {108.H (127«J {16011 (12.86) {i«o»Ottamad im :42 NA 203:94 35 56 243.81 19.45 272>8 11.94 301 JO 10.70 34U0 1)18 4O2J0 17.78 482J0 20.10
(••71) {S2.03J (6.71) (52J3J (6.71) {52.83J (6.71) (52J3» (6.71) P 2 J ^ (1.71) ( B J ^ (•71) {K.83J (•-78) {52J8IURar» Kaanada 00.17 NA 81 iS 35 S6 97.44 19.44 106J8 11.85 12«J4 19.08 13fi2 1)18 108J0 17,78 188.12 23.21
(3X0) (21.0SI ( iM) {21J03I (2.68) {21.8JJ (2JI) (J1J5I (2J8) d i j a j (2J«) PIJS I (2.61) (2.77) {21J8JBalaam 45.1) NA 81.18 35 56 73.86 19.45 81.74 11.85 90.48 18.06 102J18 1)18 120.00 17.78 140J4 34.25
(2J)1) (15.7f (2i1) {18.7% (2J1) (15.7f (2J1) {15.7# (2J1) {W.7t (2J1) {W.7f (2J1) (H.7* (2.18) {I8.1ta|af)tf M.Ot NA 40.79 35.81 41.72 19.44 54.48 1184 •0.32 10.76 88J8 1)16 00 40 17.78 08i8 20.10
(1J4> flO.53 i \M ) fl6i3» (1.38) {10i» (1-34) 06i3> ( 1 ^ ) (1.34) i \M ) {1«-5« (U 5)lOULIAMAUNIVmiffY; 311.01 NA 48I.4S 35 S6 SM.87 19.45 8S3J1 11.M ^ J 4 10.06 i16J5 1).U 104 JO 17.81 1178.72 2117
M OH (16.111 (18.11) {W .«- M -
{18001 . C M . . .Outergi RIA 283jM i r r W T O i r i r r 3&1 JO (V<r to J O 17.14 4 i4 i5 11.M
(•■71) HI.67} («.I1) {I1J7} (•.71) H1.67) (6.71) HUT) (6.71) f»lJ7} f«.71) fl1J9 | (•71) (11.87} (6J3) {41J9Raidw 120J4 NA 1C.15 35.57 194J9 19.45 217J7 11.84 241.28 10.08 273 J4 1)18 321J0 17.78 388J4 21.03
(5JT) {MJ3J (5J7) {J3J3I (5J7) {J3JS» (5.37) i m {M-331 (5J7) (5-JT) (»-33» (5>5) {33J9Balary 75J1 NA 191J7 35.56 121J1 19.46 136.23 11.14 198 JO 10.70 170J5 1318 201JO 17.78 34640 22.98
P J5 ) {20J3» P J« ) {20J2» (3-38) {20J3J (3.38) (28J3I (3-38) fWJJJ (3-38) {20J4J (3J5) {20J3» (3.45) {2OJ0JBidar 15.04 NA 2«.39 35 57 34.38 19.47 27.25 1198 30.18 10.08 34.13 1)18 40 JO 1778 48J8 20.10
(0J7) {♦17) («.87) (0.87) f*l7) . (6JT) {♦17} (6J7) .. f*17} (««T) (4 17) (0 881 1416)•CTAt 1 : j4i m N A !5S8 3829 80 1945 4(kS9M 1184 4483 84 !M 4 i: '31* 59918* .? £3 .
i .100X1 NA v'lflOiX) NA (100.06) NA [100 M) NA (160 08) NA 1 (100.00) NA 1 (160.00) NA 1 (100.00] NA
§ Note FigurM n »e pcrwttitMi i n ^rc«nlAge to loiiC fgm i \n Ihi taNirftnckil art ptrMtKattte uninniy total; A.O. iundi 1tar a n n u a l r a t e ; » « NA r th n ta nol appleaMa. Squtm; CanfiHd and MfiiptiUd IfM r«e«rik of IIm tudgct iKtfen In OlrKt«ral» of Col^lait Cducalion. G«v«mnMnl of KarnaUka, Bangaton.
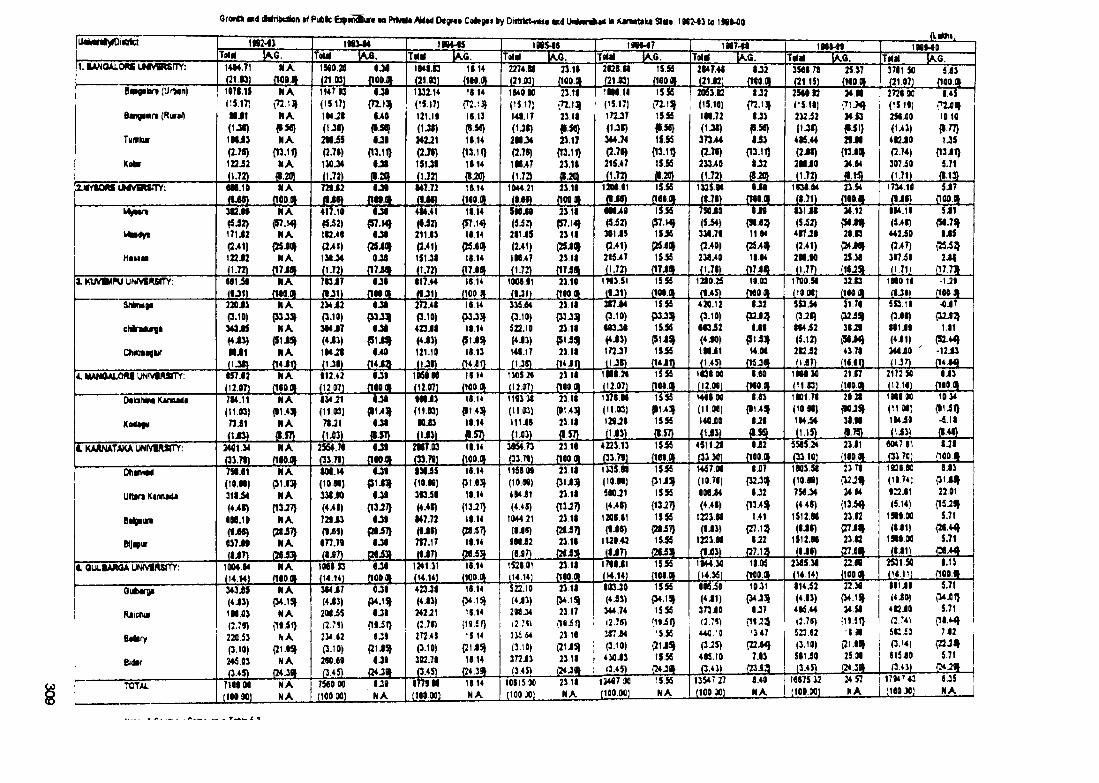
Qrorth wd (M ritatfon #f Pubic E ifM ia in an P iM * m tA 0«gr«» C olcfci ty O itttkt-M ia m i UniMnii«< in Kjn»«tiloi SMt: 11824) t« 1 n»40
limaniyfOiitrtd 1HM) latvM 1984 5 108548 100M7 1007-08 1M84I 1008-00Toiri 1^0. T«M IM JA.C. Tolg lAG. T«*H JAG. Totri lAG. Tit^ lAG. JM lAO.
1. lANQAlOWi IMVVRSrTY: 14M.7t NA 1580.20 o ji 1048.C 18.14 2274H 2318 2t2B.$8 15.55 2S47.48 ti2 3508.78 25 37 3781.50 5 il(21 U l fICOdI (2183) {100.01 (21*31 {loo.m (21JB) (100 0) (2i.oai (100.01 (21 i8) (100 0) (2115) (100 01 (21.07) (100.01
B«i«iloni (UrMn) im.i5 NA 1147*3 fJ I 1J3114 18 14 1840.80 23.1t 180110 15S5 21»S3.I2 Ii2 2500 12 34 88 2720 00 8.45CS.IT) {72.t3J (1517) {7J.13» (15171 r2.13» (1517) {72.13) (15.17) (n.^^ I (15.10) (T2.1D C518) •71-X) (IS 191 <72-09
BangtMr* (R«a<) M il NA 1MJI U i 121.18 18.13 148.17 2318 I72i7 1555 110.72 t i l 212i2 34 S3 250i0 10 10(1J«) e»M) <IJ«) (1.50) ( lit ) {»•«} ( lit ) #.56} ( l i t ) #■«} ( l it ) {8.50} ( l it ) (8.51) (U3) {•77)
Tumkur iM i) NA 2MiS i j i 142J1 1814 2Mi4 23.17 344.74 1S.»S m u t i l 4IS.44 2«it 4*2i0 li5(2.M) (13.11) (2.78) {13.11} (2.71) {13-11} (2.78) {13.11} P.7t) {13-11} (2.7t) {13.11} (2it) {13iO) a-74) {13i1}
Koto 122i2 NA \ytM OJt 15UI 1814 180 7 23.11 215.47 1555 233>i0 ti2 2MiO 34.84 307 i0 5.71<1.72) 9-m (1.72| 9.3H (*.20) (1.72) (1.72) (I.2B) (1.72) 920t (1.72) (1.71) (1.13)
ivyaoM UMvfitsrTY: NA 728i2 oi« 847.72 18.14 1044.21 23.18 120t.t1 15.S5 1325.00 tiO 1838.04 23 54 1734 10 5i7flM d WiO) dWH (fi») (100.0( (tit) (lOOO) f l it ) dtt.fl| (1-78) {won (t.7l) {1t*.t ( l it ) (100.0)
Mywn 312 J« NA 4li.10 f i t 4M.41 18.14 StOiO 2311 tat^o li.S5 75QiO t i t 131 i t 3412 884.18 Sil<4i2) (57.141 (5i2) {57.14J («iJ) (57.14} (3i2) (57.141 (3i2) (57.14) (5i4) (S8i5 (5i2) (50i9) (5>t) (50.75)
htatfyt 171i2 NA 1C2.48 Oil 211.83 1814 281 iS 23lt 301 iS 155S 330.70 11.84 4t7it 28*3 U2i0 8i5(2^1) (25-M» a>i) (2Si(| (2.41) {25-011} (2.41) (25i(» (2.41) {25i<» (2.40) (25 0) (2.41) OiO) (2.47) {25i3
H«u« tZ2i2 NA 130^ OiS 151 i t 1814 180.47 2311 215 7 15.S5 23«>0 18.84 2H.I0 25 30 307 i0 2 it(1.W) (I7i8» (1.72) (I7 i« (1.72) (17i«» (1.72) {17i9) (1.72) { I7 if (1-7t) {17i19 (1.7T) {1tJ3) (1.71| {17.79
1. KUVBHPU UNMRSrV: e«ii« NA 7l3i7 0J8 817.44 1814 1008.81 23.10 1143 51 15.55 12t0.25 10.03 1700.50 32*3 1000 10 -liO(«Ji) OOOfll fl-31) 000 01 (Oil) (100 01 (t il) (100 0) (Oil) (108.11 (0.45) noooi (>0 00) (100 0) (Oi») (100 (*
Snintft 2 » i) NA 234 i2 OJI 2h.4l 18.14 335.04 2318 M M 15.55 4».12 ti2 553.54 31 to 553.18 -Oi7P.1») (MJ3» (3.10) {J3J3I (3.10) {Mi3» aio) (33i3) (3.10) {J3i3) (3-10) (32i9 (3it) fl2iS) (3it) {12i9
cMndtfiga 343 jIS NA 384i7 Oil 4Z3it 18.14 522.10 2310 003i8 15.55 6t3i2 t i t t«4i2 38.21 tt1i8 1.81(4JJ) (S1iS» (4i3) ffliSJ (4i3) {51 i^ (4i3) PliS) (4i3) (5li3) (4i0) (51 i3) (5.12) {50i4) (4i1) (52-44)
Ctiikmagbr MJ1 NA 104 jn 0.40 121.10 18.13 148.17 2311 I72i7 iSiS lOtil H.OO 2l2i2 4170 340X0 ' -12ilfi4Jn (ij«) fl4 i3 (lit ) (14.01) (lit) (14JI} ( l it ) {14J1} (1.45) (15i« (liT) (lOOQ (tin
4. MAMOAi^ UNIVlMrrr; 857.12 NA 812.42 OJI 106800 1814 1MSM 23 18 1M0 20 15SS 113800 too 1M8 30 21*7 2172)0 8 il|12.#71 {100.0I (12.071 noooi (12.071 (100 0I (12.071 {100 0) (12.07) (100.(1 (12.081 <11*3) (100.0) |1M0) (1009
Otiarana iCtnnada 7M.11 NA 814.21 I08i3 1814 1103 30 2318 1371 M 15 55 H0800 8.03 1001.70 28 21 1988 00 101401.B) (11.431 (tlW) (11 iO) (81.43) (II.W) (81.4i (11.83) {8U« (11.00) {•M3) (loot) iWiS) (MOO) {•lil}n i t NA 7IJ1 0J8 80i3 1814 n ii8 2318 128J8 15H 14«i0 t i t 104 i4 38H 184i0 4.18
d.fn (Ij03) (Ii3 | (8.57) (1i3) 9 M . m (1.57) (liJ) . . m (1.15) ( l i l ) m . . . .1 KARNATAKA UNMKSTV; 3M1.M NA 2S64.70 o ji 2M7.03 18.14 3«54.73 2310 4223 13 1555 451 l i t 8i2 SS85i4 21i1 0047 81 t i t
(33.71) (1«0.« (33.71) flOOfll (31.71J (100.0) (33.711 (100.0) (33.71) (3330) (100.0) (3310) (100.0) qiTfl) {1009Dt\aviad 7M.fl1 NA tO«.14 ■ "" ia f- I3ti5 18.14 1158 09 23.18 1335.88 15.55 V457.00 8i7 1803.50 2178 1928.80 Oil
(19.8I) (31.031 (10.98) P1i3j (10.88) (31.03) (10.«) (31 i3) (10.08) (31 i3) (10.70) (12iO) (10.80) m n (10.74) (11 i 9Ultara K«m«ia 3lli4 NA 3)8i0 OJi 3«3i8 18.14 484 i t 2318 5MJ1 15 H OOOit 8i2 750 i4 34 84 92i1 22.01
(4^t) (13J7} (♦^«) {13-21} (♦.♦I) (13i7) (4.4J) (13J7) (4-4») {13i1} (4.48) (13>5) (4.4t) {13^ (5.14) {15-29Baliaum 8H.10 NA 728i3 Oil •47.72 18.14 1044.21 231t 1208.81 15.S5 1223.81 1.41 I5l2.tt 23.12 151100 5.71
(li<) (3li7> (8iS) {20iT} (tit) {20.57} (0i8) C28i7) ( l it ) {2ti7} (1i3) (27.13 (tit) {27ii» (t il) (20.44)Bi)#ur 637 Jf NA on.79 oio 717.17 18.14 980i2 23.18 1121.42 15.K 1S3.08 8i2 1512.00 2312 1508.00 5.71
( t in (26i3» (liT) (20i9 (ti7) (20.53) (OiT) (20i3) (ti7) CM-SS., (1i3) (tit) 0 7 i* (t il) ..1 OULIAMA UNM KSfTY; 1004.t4 NA 1008.53 OiO 124131 18.14 1S28.01 2318 iT ftil 15.S5 1M4.34 10.05 210510 22.81 2531.50 8.13
(14.H) (lOO.ft (14.141 nooo» (14.141 (1000) <14.14] (100H (H.14) (100.01 (14.36) noo.o) (14141 i1M .ll.. (14.11)O ulM rai 343iS NA 384i7 0i8 423it 18.14 522.10 2318 8(QiO 15.55 OtSiO 10.11 814.52 22 3« 881 iO 5.71
(4i3) (J4.15J (4i3) (J4.15J (4i3) (34.15) (4iJ) (34.15) (4i3) (34.1 (4i1) P4i3) (4il) 0-15) (4i0) {14i1}
Raictuf 1M.fl3 NA 200 iS oio 242i1 1814 200 J4 2317 344.74 15 55 373i0 8i7 405.U 34 51 482i0 5.71
C ? * ) {18.51} (2 75) (18it) (2.7S) !U * f } nsil) (2.75) '19it) (2.7S) {11.23 (2.75) .11 51} (2.:4k {18.44)
BaHry 220.23 HA. 234 (2 o.:» 272.41 't 14 :^64 23 10 :87i4 MQ '9 •147 523.12 ' IK 5Ci0 7i2
p. 10) (21.89 (3.10) {21 i3) 0.10) P1.8S) (3.10) (21i5) (3.10) {21J5) (3-25) {22-M) (3.10) {21.89 (3.'4) (22J9
BIdar 342.03 NA 2n.<9 oio 302.78 1814 3Hi3 2318 43«i3 1555 405.10 7.83 581 iO 25 90 eisio 5.71
(3.45) (24.391 (3.45) (24i« (3.45) (24.39) (3.45) {2 * it_ <3.45> (3.411 (23i3 13.451 (3.41) (24 i 9
T0T>JL 7108 08 NA 7560 M 0.39 tnsM 1814 1081$» 2318 13407 90 15H 13547 17 0.40 K87512 34 57 179* 43 6i5
1 [100 00) NA (100.00) NA (100.00) NA (100 X] NA (100.00) NA (100 00) NA (100.00) NA [100)0] NA
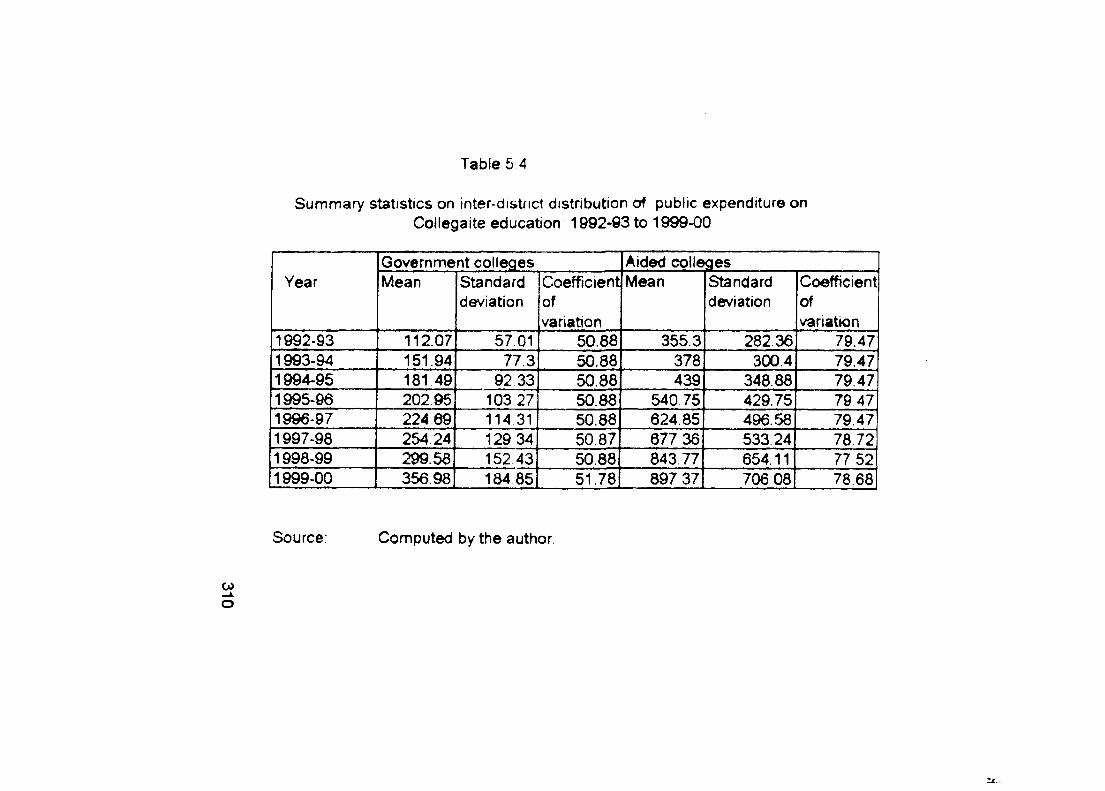
05-a.O
Summary statistics on inter-distnct distribution of public expenditure on Collegaite education 1992*03 to 1999-00
Table 5 4
YearGovernment colleges Aided collegesMean Standard
deviationCoefficientofvariation
Mean Standarddeviation
CoefficientofvariatK)n
1992-93 112.07 57.01 50.8'^ 355.3 282.36 79.471993-94 151.94 77.3 50.88 378 300.4 79.471994-95 181 49 92 33 50.88 439 348.88 79.471995-96 202 96 103 27 50.88 540.75 429.75 79471996-97 22489 114 31 50.88 624 85 496.58 79.471997-98 254 24 129 34 50.87 677 36 533 24 78.721998-99 299.58 152.43 50.88 843 77 654.11 77 521999-00 356.98 184 85 51.78 897 37 706 08 78.68
Source: Computed by the author
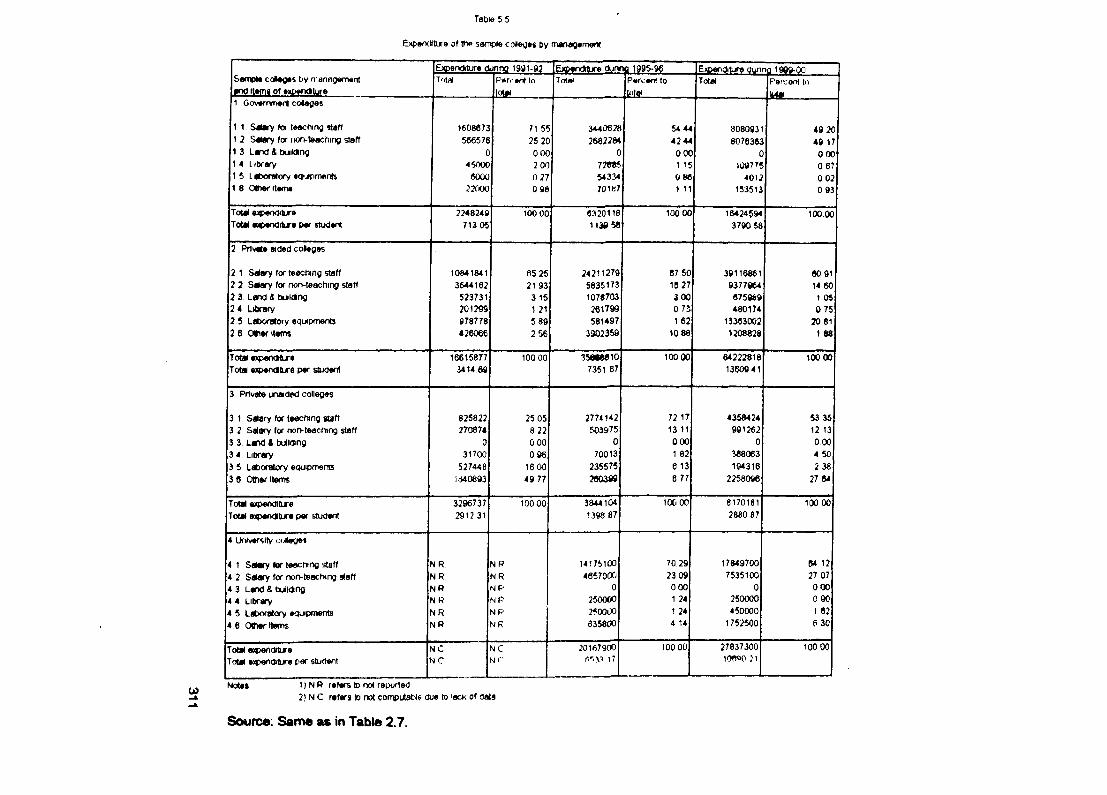
Table 5 5
Expendtijre of the sewnpte c ol«g*6 by fnanag«m«nt
&«np<e coHeges Oy manngement «nd!lefniofe)«)»n<Hure
Expenditure durina l9fl1-92 Ej©enditure c^jni10 199S-96 Expenditure duniIQ 19W-00Totfll P^n- »nt to
IPWTefal Percent to
Mu)Total Pervont tn
l44ai1 GoverntrienI cdeges
1 1 SM ry fO( teaching ^ f f 1608673 71 55 3440628 54 44 8080931 49 201 2 Salary tor fujn-teacning staff 566576 25 20 2682284 4244 8076363 49 171 3 Land & building 0 000 0 000 0 0001 4 Library 45000 2 00 77«5 1 15 109775 0 671 5 Laboratory •qutpments 6000 0 27 54 334 086 4012 0 021 8 Other iterm 22000 0 96 70187 1 11 153513 0 93
Total «)9>enditLre 2248249 100 00 8320118 100 00 16424594 100.00Total aotpenditure per student 713 05 1136 58 3790 58
2 Private aided colleges
2 1 Salary for teactiing staff 10841841 65 25 24211279 67 50 39116861 60 912 2 Salary fa non-teaching staff 3644162 21 93 5835173 1627 9377964 14 602 3. Land & building 523731 3 15 107C703 300 675989 1 052 4 Library 201299 1 21 261799 073 480174 0 752 5 Laboratory equipments 978778 5 89 581497 1 62 13363002 20 812 6 oner items 426066 256 3902369 10 88 1208828 1 88
Total expenditure 16615877 100 00 35606010 100.00 64222818 100 00Total e j^ d ltu re per student 3414 69 7351 67 13609 41
3 Private tnaded coileges
3 1 Salary for teaching staff 625822 25 05 2774142 72 17 4358424 53 353 2 Salary for norvteaching staff 270874 8 22 503975 13 11 991262 12 133 3 Land & bmiong 0 0 00 0 OOO 0 0003 4 Library 31700 096 70013 1 82 368063 4 503 5 Laboratory equipments 527448 1600 235575 6 13 194316 2383 6 Otner Items 1640893 49 77 280389 6 77 2258096 27 64
Total expenditure 3296737 100 00 3844104 100 00 8170161 100 00Total eiQpendltLre per biudent 291231 1398 87 2880 87
4 University cr)llege*
4 1 Satary tor teaching staff NR NP 14175100 7029 17849700 64 124 2 Salary for non-teaching staff NR NR 4657000 2309 7535100 27 074 3 Lar>d S building NR NP 0 000 0 0004 4 Library NR NR 250000 1 24 250000 0 904 5 Laboratory equipments NR NP 250000 1 24 450000 1 624 6 Ottiarltwns NR NR 835800 4 14 1752500 6 30
Total eoqMndlture NC NC 20167900 lOOOO 27837300 100 00Total e)^>endilure per student NC
. . . .Ni"' i7 icm o 7 1
U> Notes )) N R r*f*rs to not reported2) N C refers to not computaW^i due to lack of data
Sourca: Same as in Table 2.7.
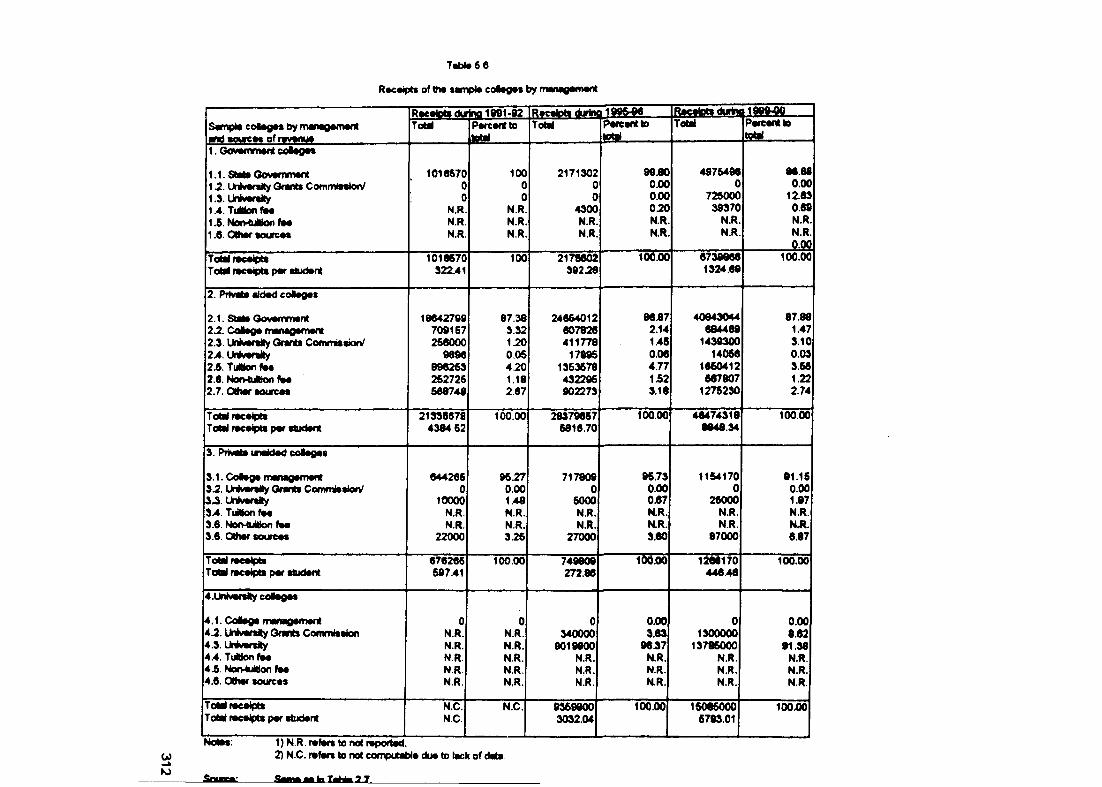
Tab(»6 6
R»c«iptB of th« sanripl* col«g«« by marwgMfwnt
Sampla coMagas by managamant «td aourcM of ravanua
RacalDtsduiTotiri Parcantto
total
Racaipts duriraT 6 M
L 1 9 ^ _ . Parcantto total
B fta te fiE JytiTotal Parcantto
1. GoMammant colagat
1.1. Stata Oovammant 12 . LHvartily Orants Com m Mon/
10166700
1000 2171302099.800.00
4976496086.680.00
1.3.Untvar«ity 0 0 0 0.00 725000 12.63lA Tuittonfaa N.R. N.R. 4300 020 39370 0.601.5. Nor>4ui6on faa N.R. N.R. N.R. N.R. N.R. N.R.1.6. Olhar tourcat N.R. N.R. N.R. N.R. N.R. N.R.
Total racaipttTotii racaipta par aludant
1016670322.41
100 217S602392.28
100.00 67398661324.69
100.00
2. Privata aidad eolaoat
2 .1. State OovarTYnant 1B642799 87.38 24664012 86J7 40843044 87.882 2 . Col<ga managamant 709167 3.32 607826 2.14 684468 1.472.3. Uniwaraity Qranti CommisaioiV 266000 1.20 411778 145 1439300 3.102 A . Un^araity 9896 0.06 17895 0.06 14066 0.032 A . TuNion faa 896263 4.20 1353678 4 7 7 1660412 3562.6. Non-tuKon faa 262726 1.18 432295 152 667807 1.222.7. Oihar tourcaa 668748 2.67 902273 3.18 1276230 2.74
Tolai racaiptaTotal racaipta par atudant
213966784384.62
100.00 283796676816.70
100.00 464743188048.34
100.00
3. PriMato unaidad coMagas
3.1. Colaga managamant 644266 96.27 717809 96.73 1154170 81.163^ . UnKvraiy Orants Commiasion/ 0 0.00 0 0.00 0 0.003ALMvar«lty 10000 1.48 6000 0.67 26000 1.873 A TuHkm fM N.R. N.R. N.R. KR . N.R. N.R.3.6. NorvtuWon fM N.R. N.R. N.R. N.R. N.R. NJt.3.6. Olhar courcaa 22000 3.26 27000 3.60 87000 6.87
Total racaiptaTotal racaipts par atudar«
676266697.41
100.00 749809272.86
100.00 126617044646
100.00
4.UniMartfty colagat
4.1. Colaga managamart 0 0 0 O j O O 0 0.004 2 . Un^artfty O rats Commiaaion 4.3. UnivaraJty
N.R.N.R.
N.R.N.R.
3400009019800
3 j 6 3
96.371300000
137860008.62
81.384.4. Tuition faa N.R. N.R. N.R. N.R. N.R. N.R.4.5. N o n ^ o n faa N.R. N.R. N.R. N.R. N.R. N.R.4.6. Othar sourcas N.R. N.R. N.R. N.R. N.R. N.R.
ToM racaiptaTotal racaipta par atudant
N.C.N.C.
N.C. 93688003032.04
1 0 0 M 150850005793.01
100X»
O)K>
2) N.C. r«tare to not coinputabi* du* to lack of data
teT 2.7
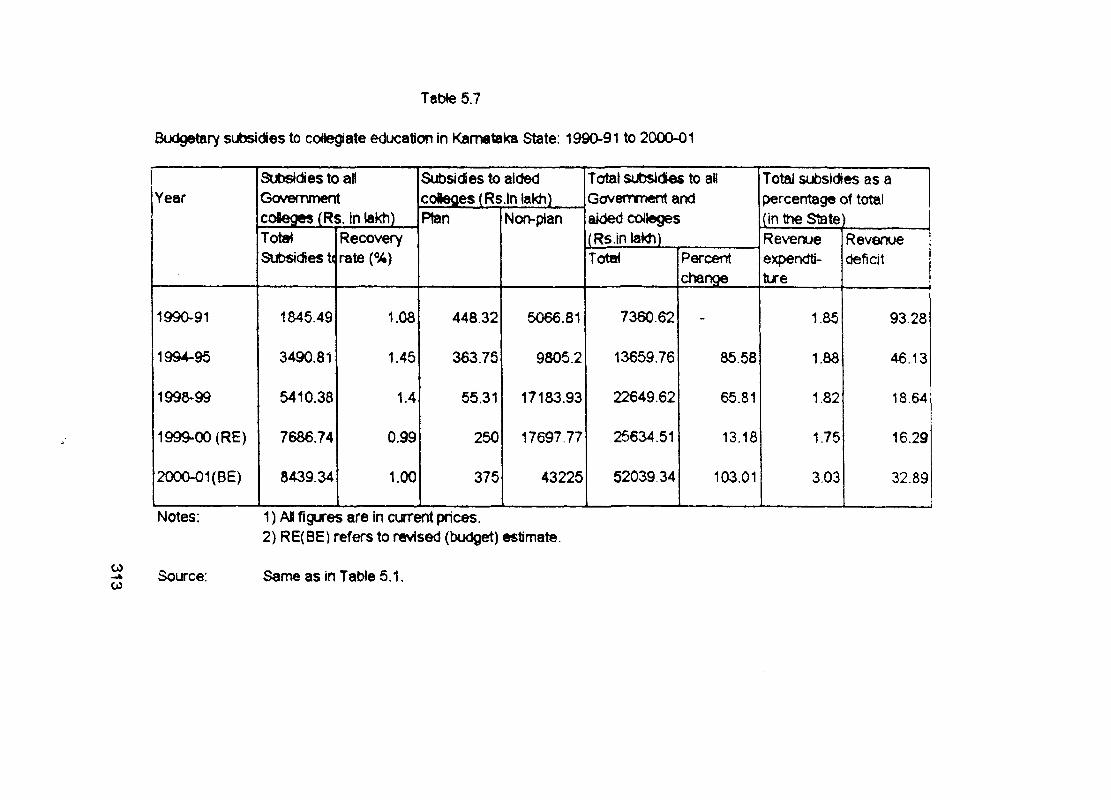
Table 5.7
Budgetary subsidies to collegiate education In Karnataka State: 1990-91 to 2000-01
YearSubsidies to all Government co«eges (Rs. In lakh)
Subsidies to aided colleges (Rs.ln lakh)
Total sutisidies to aH Government and akjed colleges (Rs.in lakh)
Total subsidies as a percentage of total
Ran Non-plan (in the StateTotalSubsidies t(
Recovery rate (%)
Revenueexpendti-ture
RevenuedeficitTotal Percent
change
1990-91 1845.49 1.08 448.32 5066.81 7360.62 - 1.85 93.28
1994-95 3490.81 1.45 363.75 9805.2 13659.76 85.58 1.88 46.13
1998-99 541038 1.4 55.31 17183.93 22649.62 65.81 1.82 18.64
1999-00 (RE) 7686.74 0.99 250 17697.77 25634.51 13.18 1.75 16.29
2000-01(BE) 8439.34 1.00 375 43225 52039.34 103.01 3.03 32.891
Notes;
Source:COC O
1) All figures are in current prices.2) RE(BE) refers to revised (budget) estimate.
Same as In Table 5.1.
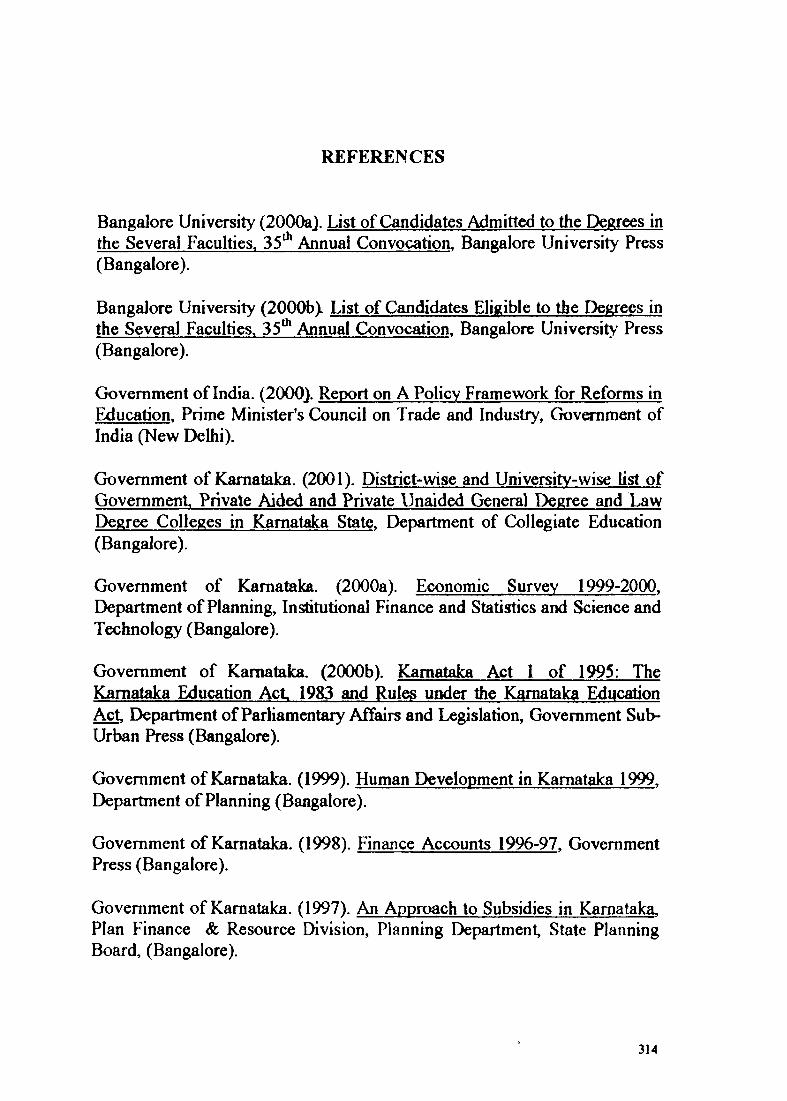
REFERENCES
Bangalore University (2000aJ. List of Candidates Admitted to the Degrees in the Several Faculties, 35^ Annual Convocation, Bangalore University Press (Bangalore).
Bangalore University (2000b)i List of Candidates Eligible to the Degrees in the Several Faculties, 35^ Annual Convocation, Bangalore University Press (Bangalore).
Government of India. (2000). Report on A Policy Framework for Reforms in Education, Prime Minister's Council on Trade and Industry, Government of India (New Delhi).
Government of Karnataka. (2001). District-wise and University-wise list of Government Private Aided and Private \3naided General Degree and Law Degree Colleges in Karnataka State, Department of Collegiate Education (Bangalore).
Government of Karnataka. (2000a). Economic Survey 1999-2000, Department of Planning, Institutional Finance and Statistics and Science and Technology (Bangalore).
Government of Karnataka. (2000b). Karnataka Act 1 of 1995: The Karnataka Education Act 1983 and Rules under the Karnataka Education Act Department of Parliamentary Affairs and Legislation, Government Sub- Urban Press (Bangalore).
Government of Karnataka. (1999). Human Development in Karnataka 1999, Department of Planning (Bangalore).
Government of Karnataka. (1998). Finance Accounts 1996-97, Government Press (Bangalore).
Government of Karnataka. (1997). An Approach to Subsidies in Karnataka, Plan Finance & Resource Division, Planning Department, State Planning Board, (Bangalore).
314
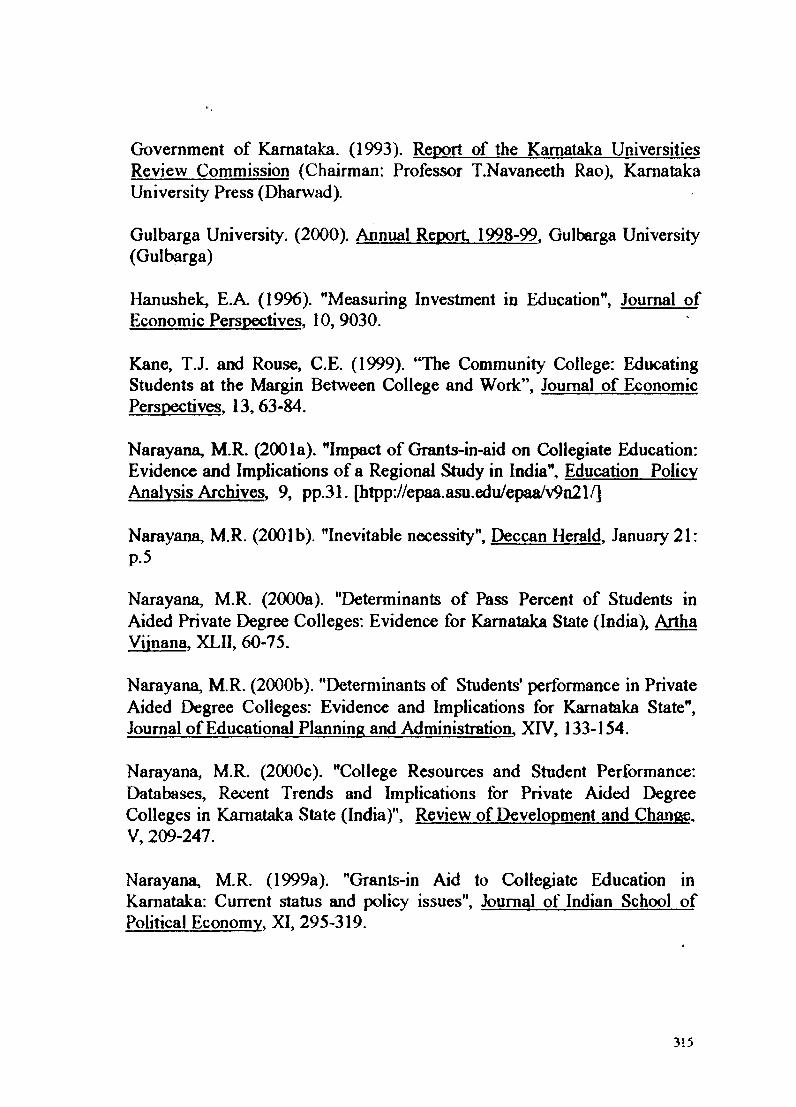
Government of Karnataka. (1993). Report of the Karnataka Universities Review Commission (Chairman: Professor T.Navaneeth Rao), Karnataka University Press (Dharwad).
Gulbarga University. (2000). Annual Report 1998-99. Gulbarga University (Gulbarga)
Hanushek, E.A. (1996). "Measuring Investment in Education", Journal of Economic Perspectives, 10, 9030.
Kane, T.J. and Rouse, C.E. (1999). “The Community (Allege: Educating Students at the Margin Between College and Work”, Journal of Economic Perspectives. 13,63-84.
Narayana, M.R. (2(X)la). ^Impact of Grants-in-aid on Collegiate Education; Evidence and Implications of a Regional Study in India", Education Policy Analysis Archives, 9, pp.31. [htpp://epaa.asu.edu/epaa/v9n21/]
Narayana, M.R. (2001b). "Inevitable necessity", Deccan Herald, January 21: p.5
Narayana, M.R. (2(X)0a). "Determinants of Pass Percent of Students in Aided Private Degree Colleges: Evidence for Karnataka State (India), Artha Viinana, XLII, 60-75.
Narayana, M.R. (2(X)0b). "Determinants of Students’ performance in Private Aided Degree Colleges: Evidence and Implications for Karnataka State", Journal of Educational Planning and Administration, XIV, 133-154.
Narayana, M.R. (2(X)0c). "College Resources and Student Performance: Databases, Recent Trends and Implications tor Private Aided Degree Colleges in Karnataka State (India)", Review of Development and Changs. V, 209-247.
Narayana, M.R. (1999a). "Grants-in Aid to Collegiate Education in Karnataka: Current status and policy issues”. Journal of Indian School of Political Economy, XI, 295-319.
315
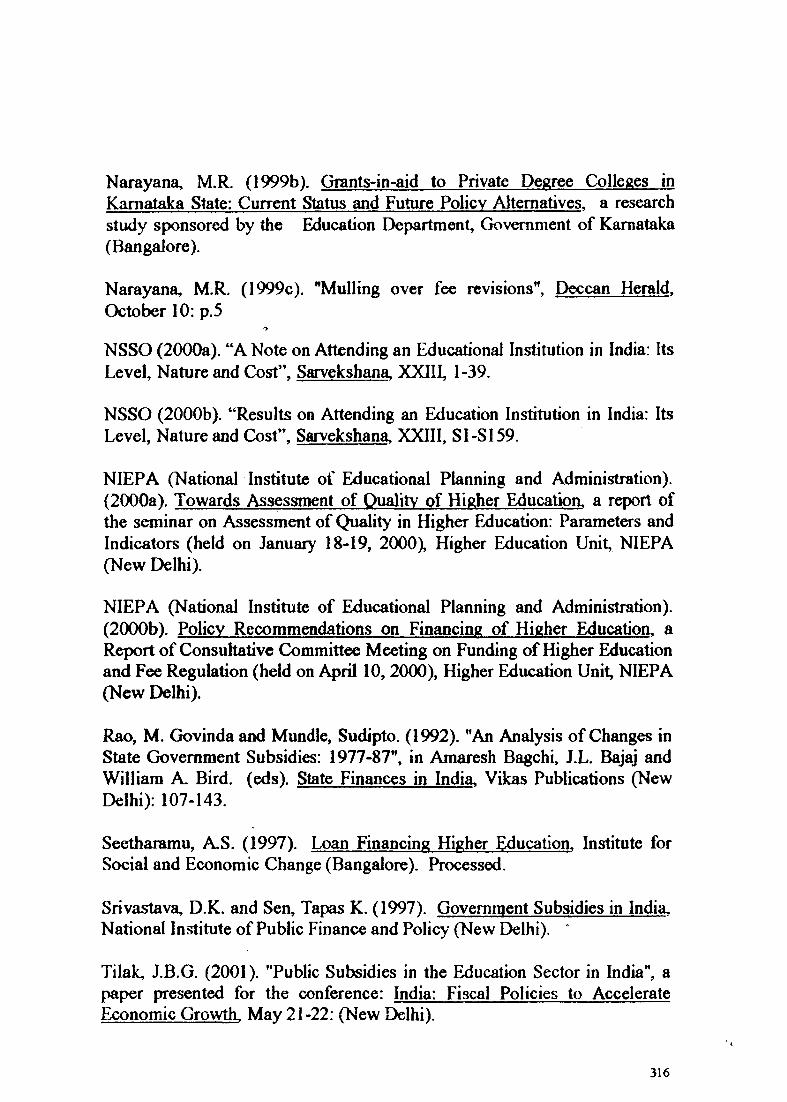
Narayana, M.R. (1999b). Grants-in-aid to Private Degree Colleges in Karnataka State: Current Status and Future Policy Alternatives, a research study sponsored by the Education Department, Government of Karnataka (Bangalore).
Narayana, M R. (1999c). "Mulling over fee revisions”, Deccan Herald, October 10: p.5
NSSO (2000a). “A Note on Attending an Educational Institution in India: Its Level, Nature and Cost”, Sarvekshana, XXIII, 1-39.
NSSO (2000b). “Results on Attending an Education Institution in India: Its Level, Nature and Cost”, Sarvekshana, XXIII, SI-SI 59.
NIEPA (National Institute of Educational Planning and Administration). (2000a). Towards Assessment of Quality of Higher Education, a report of the seminar on Assessment of (Quality in Higher Education: Parameters and Indicators (held on January 18-19, 2000X Higher Education Unit, NIEPA (New Delhi).
NIEPA (National Institute of Educational Planning and Administration). (2000b). Policy Recommendations on Financing of Higher Education, a Report of Consultative Committee Meeting on Funding of Higher Education and Fee Regulation (held on April 10, 2000), Higher Education Unit, NIEPA (New Delhi).
Rao, M. Govinda and Mundle, Sudipto. (1992). ”An Analysis of Changes in State Government Subsidies: 1977-87”, in Amaresh Bagchi, J.L. Bajaj and William A. Bird. (eds). State Finances in India, Vikas Publications (New Delhi): 107-143.
Seetharamu, A.S. (1997). Loan Financing Higher Education, Institute for Social and Economic Change (Bangalore). Processed.
Srivastava, D.K. and Sen, Tapas K. (1997). Government Subsidies in India, National Institute of Public Finance and Policy (New Delhi). ”
Tilak, J.B.G. (2001). "Public Subsidies in the Education Sector in India”, a paper presented for the conference: India: Fiscal Policies to Accelerate Economic Growth. May 21-22: (New Delhi).
316
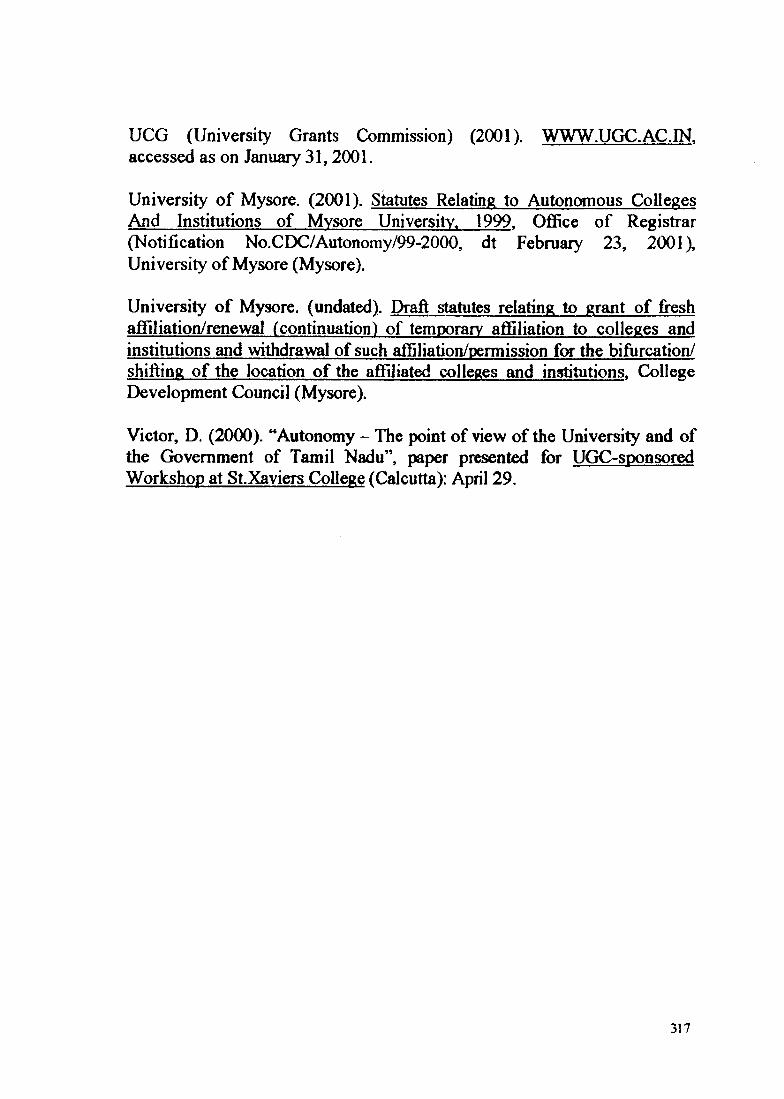
UCG (University Grants Commission) (2001). WWW.UGC.AC.IN. accessed as on January 31,2(X)1.
University of Mysore. (2001). Statutes Relating to Autonomous Colleges And Institutions of Mysore University. 1999. Office of Registrar (Notification No.CDC/Autonomy/99-2000, dt February 23, 2001),University of Mysore (Mysore).
University of Mysore, (undated). E>raft statutes relating to grant of fresh affiliation/renewal (continuation) of temporary affiliation to colleges and institutions and withdrawal of such affiliation/permission for the bifurcation/ shifting of the location of the affiliated colleges and institutions. College Development Council (Mysore).
Victor, D. (2000). “Autonomy - The point of view of the University and of the Government of Tamil Nadu”, paper presented for UGC-stx)nsored Workshop at St.Xaviers College (Calcutta): April 29.
317
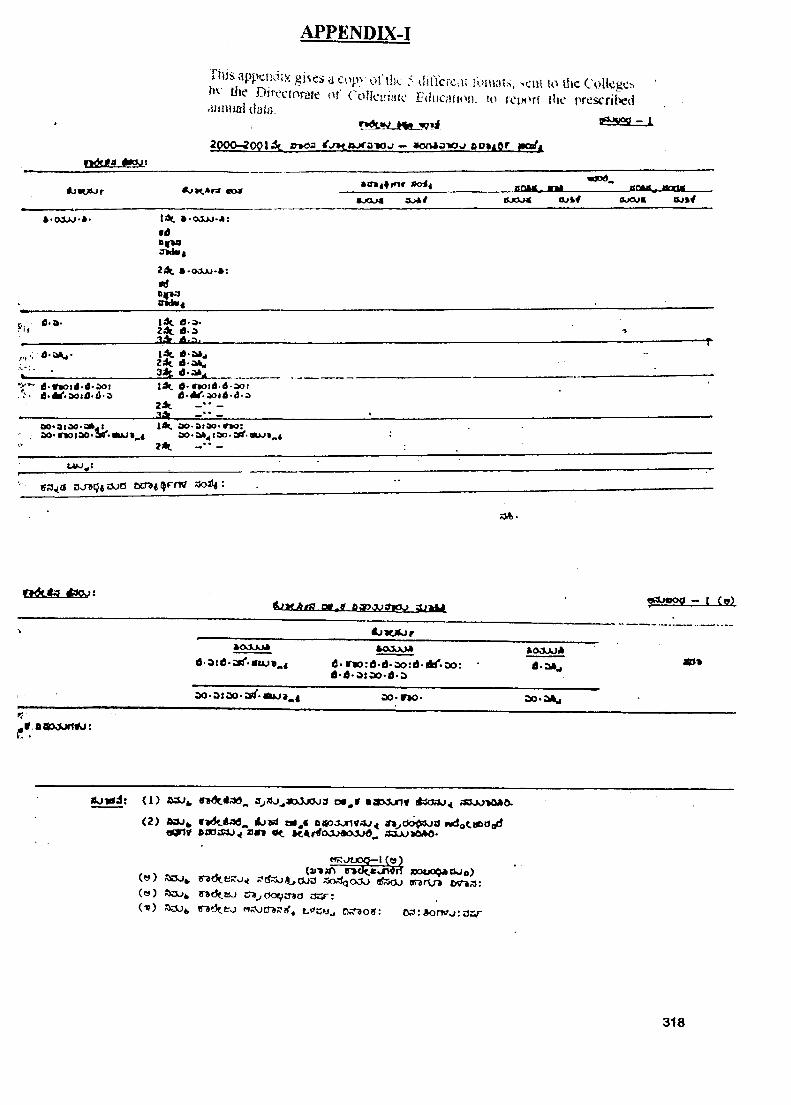
APPENDIX-I
ihjs appcikiix ojvcs a copy ol the : diricrcai ionivils, >cnt to the CollegerJc jtecforjfe ol ( olJei iiuo LduoHKj). !<> reix rt {he presented iiiinimi dai;3.
* J M W - I
2900- ^ 09 1 i t «r»oa ^o><.ivxa-Kiu — « o fU sw u D o t io r imbTi
tfUvtAJr <0K.*r5* 0o« »(Ta4fm « Soil BAK r anftSj. anritfSJOK 3 ^ / s.jcv>« ojW &xv;« djft^
A'OXM-** 1 ^ * -o jj j- J l : «daywi3»I«4
2i3 • -o ju tj-* : »doav)
e «.a- l4 t a o - 2A d o
• 3Jt d -a * j ■----------------T*" d*#*oi<-tf*aoi l i t « -rK>:a '4oot
2Jt3 ^ - • • -
aooiaO’ SAji l4 t ao>atao*r»o;, ao*«votao>M'*auj«.4 ao*;i*4tao.ar^*auj«^«
2)*t - • • -
ss^a av/9tj<3JC3 ocr»^<}rrw ;^3J«: -
a * .
4,LtLAtf}.at^9 D«?>x;?KO' - 1 iv )
.-...- ... .
»<xxuyi 4<XXOAd- rK >:d-d-ao:d-d ij'-D o: d *d o :a o *d *a
ftOJJOAd-a«4 «3«
ao • a : ao • «u^ 9^1 ao*r»o* a o * a ^
,gf f ia x o n ^ j :
( 1 ) ftSJfc, w V .i;3 t5^ 3^» j ^»oJ jOo 3 o* ^ » »9 x k jr i«
(2) aaj 4jvi n Oop a wdotneUocJ
^ r»cJ^t:a^rf x»t>oQAOJo)\.ff j nOu^ S^o^t;»vv)^ J ? rfi3 j^ 0 j3 SjCw^ocJo a5i5oo ®^rv/^(e>) ?T»d<.cjvJ cra_yOo^:rto( t») TT»?3tt;Nj «;?jcr8?!f^ l i s u ^ o t o s £«?: A o ntfo :oar
318
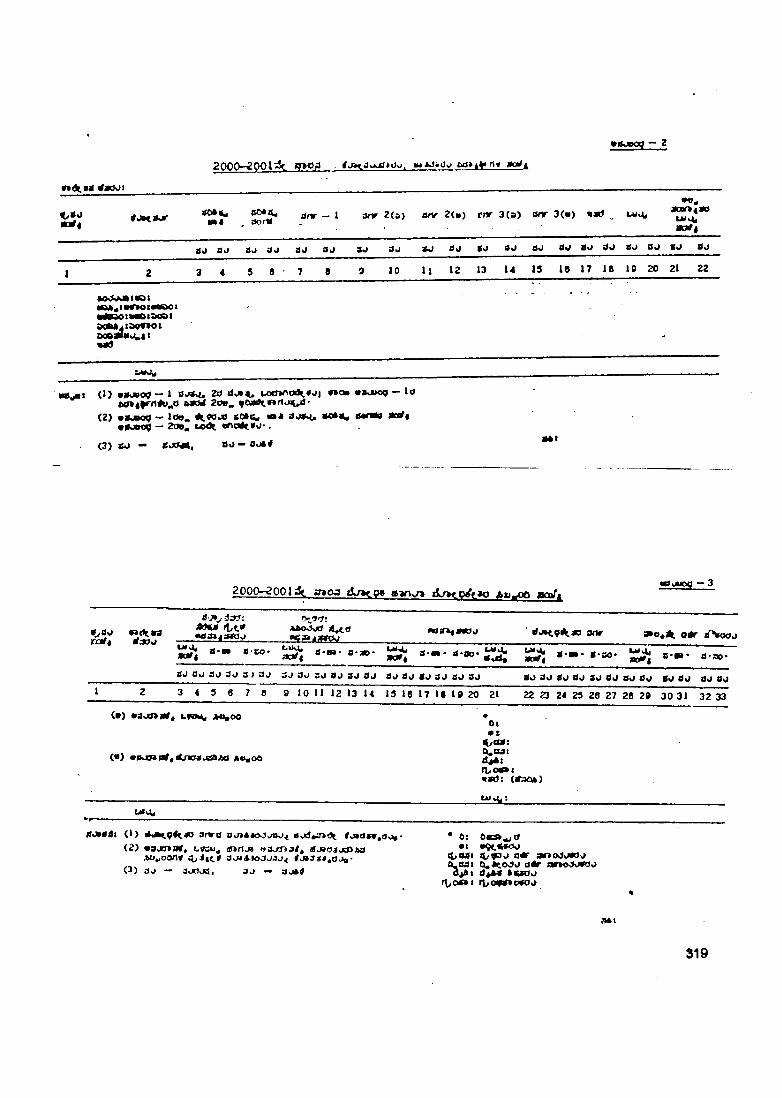
— 22000-iQQl ui*iJi>0j t^t¥ri ita t
«»dr Ml 4»>jt
l>tfO a<0*^Oorlt anr — 1 a rr 2 (a ) anr 2 (a ) rnr 3 0 ) dnr 3 (« ) Uiwg
• « -Soor*4S0U I4 ,
ao so i o ao s j a j 30 d j SO a j «o so so SO so do 80 do SO do
1 2 3 4 5 9 7 8 9 10 U 12 13 U 15 le 17 IB IB 20 21 22
«o^«M»taotIA*4ia«K>IMK>OI
>!MOiaOOId o M jta o o o l
9ta
0) 90*JOO — 1 0*rtvi. 2d da»», wxJ»A0rt5.««J| •»v»o9 —2 0 0 . f04dtWrtv>^«J'
<2) «Mo9 - lo«« *o t ■»« ao$*t. «•«*» *irf#m0joo — 200, uodt, .
au - do«f
2 0 0 0 -2 0 0 l;S t J»oa ®VKr» d /> fD ^ f» o A u -o ft am f.«KliJtX>Q '- 3
S^SO S>(A(.liS Z ^ 4 rfdOO
a >mMt(3a4;»«0o S j» 4 lW V , , . .
MSS^JMOO < f^ 9 ^ s a snr odr jfVooo
5 ^ ; . . « • s . » - s . - s . s o . S ." : • — d'rJP*
SO SO so do 3 ; ao wJ So so so so do so so so so so do so do so do so do so do so do do so1 2 3 4 3 0 7 8 9 10 11 12 13 u 15 1 6 1 7 1 8 1 9 20 21 22 23 24 23 28 27 28 29 30 31 32 33
( • } •a a » s# « CVM« AO«O0 •Ot
( • ) »M*f>t4^JTaiJgsafti A«aOO
9 t^ joa:(^OStd ^ :0 ,o«>i ntxS: (d;30i»}
UlvU
( > ) a rtrd o ^ * » o j , / a o ^ i » o d * a i d t(2 ) •s o n s tf, t-ysu^ o^nj* uSs/na/* rfj»ojjcOAo
AOnOOrti 3j*A.k)Ja4v»<( 3 ) a j — ayXJjii, a o •• au b tf
* 0: Oasn tf•» *9<.*«oost>04i a **iLaai o 9f.ojj d** dpt *Mdu
r\yoO i rt>oftf«o«oa
;««i
319
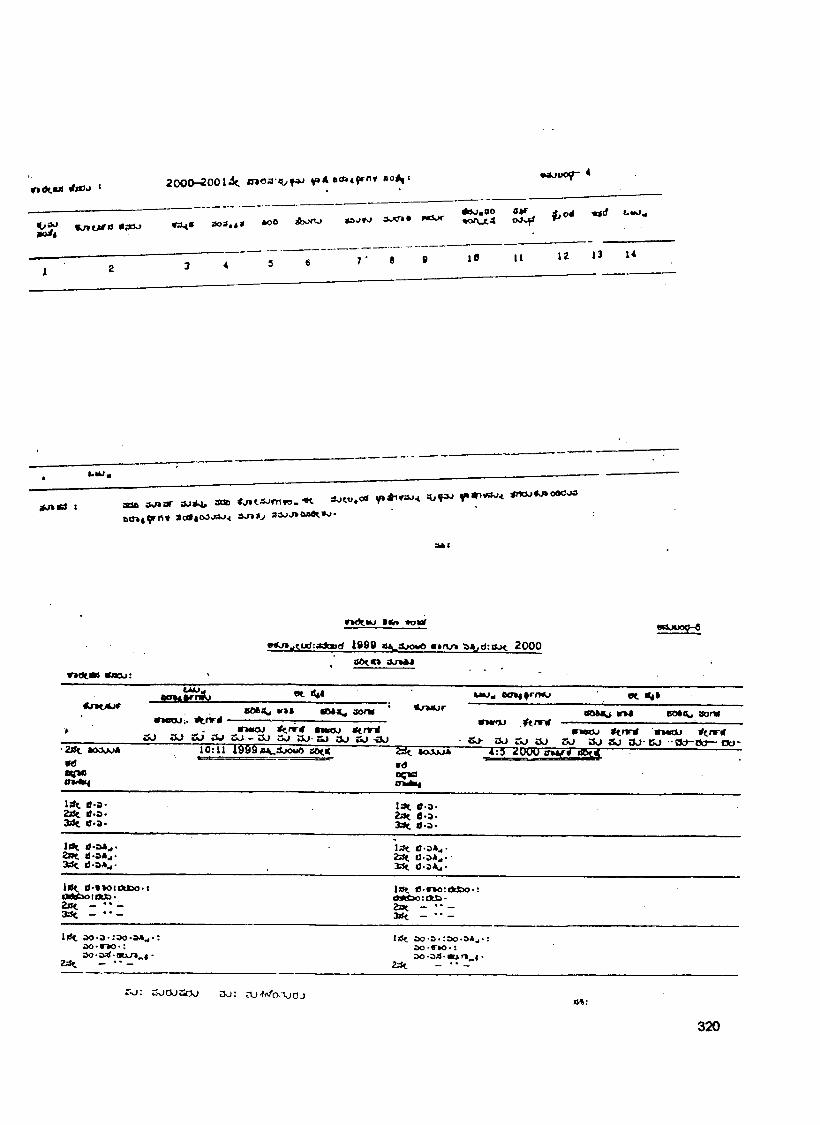
2 0 0 0 - 5 0 0 1
soa«4<9oi«*o O A o n j 3 .x r » * f « u r » o f \ j t 4 o 3 o ^
7 • e 10 u IZ 13 u
bMJ,
] 3oa d ^ a r aae -wt ^ « .u *o a ^ * iv j» u < ^ r * x j ^ o a c o a
& tn « ^ n « sccf^ocJjoo^ 3%njiv
aAt
rK)c.iM •*« vcnoT W 3jtX>^
*dOk>:i t o ^ n
t J H J t j rM io^ e o » lfr rH U
V ie o j. , ^ r i r t f ■a o * ^ « • « 0 4 ^ a o m ^ • r t n j r so»«a ir*« co«<y ifons
>ZkJ Z J s J S J
#crv-tf m tm o jSo - o j s o a o s j a j
< tn n fCO -{30
•>••30 . ^ t n n f
« 0 - 3 0 SOt n t n x j # t rm r «MaXi # tn m
S o SO SO SO 60 -O c r -O c r-o t> ->2tfC AOOJkjA 10:11 1 9 9 9 » v ,d J o u o so(« a<xXK>A 4 :5 2D 0U ir i.«dMpiS0» f* t|
vdt t p at n ^
1 0>9* 2» c d«a> M t n o .
l;» t 0O - 2 tS t 0>3« 3 0 k. t f o *
«»•»*-• ZrH . il-sA rf- 3SJt O O A j-
D o * ^ - 2 0 f. U » * ^ . 3sJ«. COJlu-
lltff 0*t>O llM DO M i i a o t t k X i - 2» t - • '“ - a s t - • • -
• 1 l» f. 0-rK>:ikSy>>: iMt<3o:dt£>'2a t - • • -3jtft - • • -
l l ^ SOO'IOO'SA^0 0 *r» 0 ‘ ; so*s4-atx/i_ i
2;*t!»>«. ao s*tDO'SJtj-
o o - r » o - : D o -o ^ - « jL r » _ « ■
2sSf. - •• -
r-o: oOcUufjj EJo: cUf o-xiOj
320
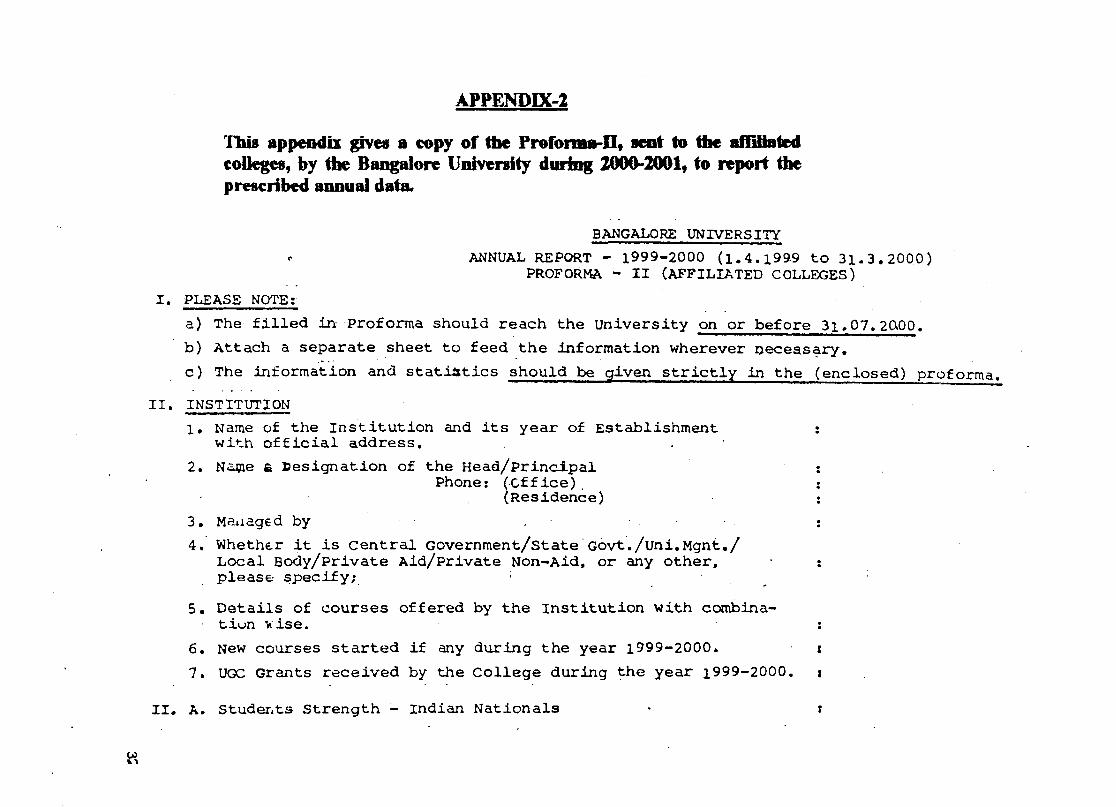
This appendix gives a copy of the Profona»-ll« went to the afliliafed colleges, by the Bangalore University during 2000-200iy to report tiie prescribed annual data.
BANGALORE UNIVERSITYANNUAL REPORT - 1999-2000 (1.4.1999 to 31-3,2000)
PROFORMA - II (AFFILIATED COLLEGES)I. PLEASE NOTE;
a) The filled in Proforma should reach the University on or before 3i>07.20>00.b) Attach a separate sheet to feed the information wherever necessary,c) The information and statistics should be given strictly in the (enclosed) proforma,
II. INSTITUTION1 , Name of the Institution and its year of Establishment :
with official address.2, Na^ie fi designation of the Head/principal ;
Phone; Tcffice). :(Residence) :
3, Maxiaged by •4, Whether it is central Government/state Govt./uni,Mgnt,/
Local Body/private Aid/private Non-Aid, or any other, ;please specify; i
5, Details of courses offered by the Institution with combina-• tiun vise. ;
6, New courses started if any during the year 1999-2000. i
7, UGC Grants received by the College during the year 1999-2000, i
II. A. StudeTits Strength - Indian Nationals • ;
APPENDlX-2
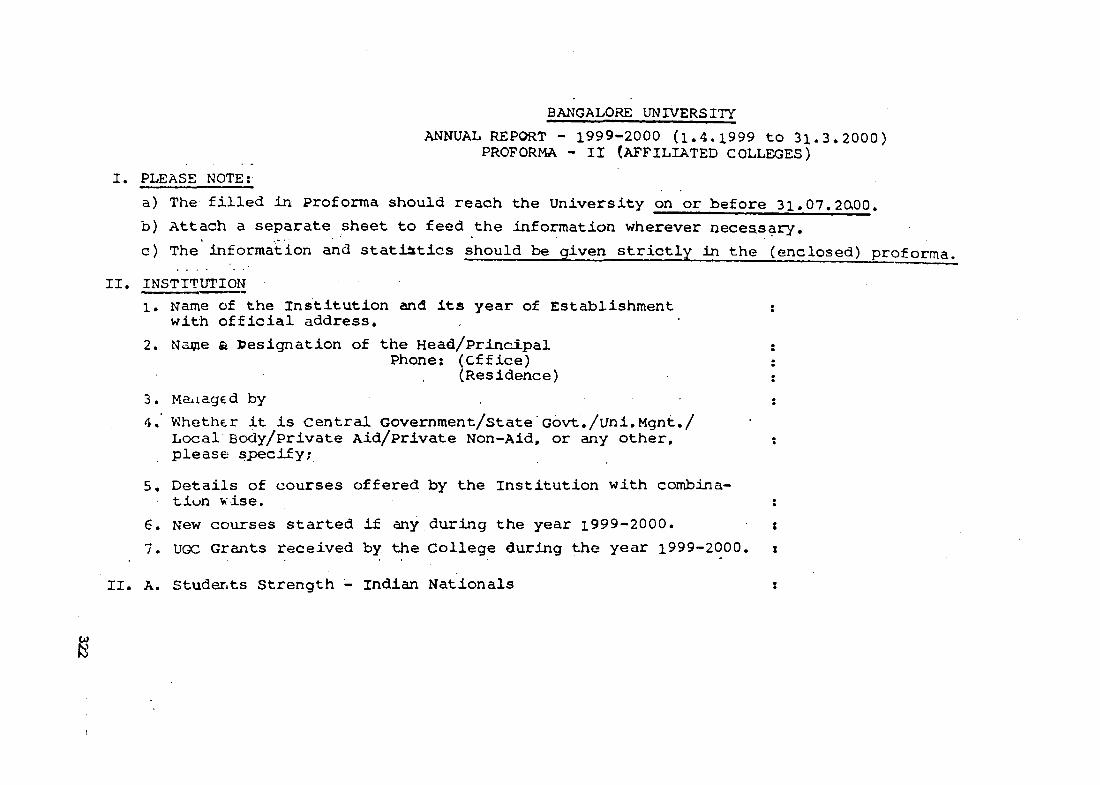
BANGALORE UNIVERSITYANNUAL REPORT - 1999-2000 (1.4.1999 to 31.3.2000)
PROFORMA - II (AFFILIATED COLLEGES)I . PLEASE NOTE;
a) The filled in Proforma should reach the University on or before 3i.07.20>00.b) Attach a separate sheet to feed the information wherever necessary.c) The information and statistics should be given strictly in the (enclosed) proforma
II. INSTITUTION1. Name of the institution and its year of Establishment ;
with official address,2. Naflie a designation of the Head/Princ±pal :
Phone; Tcffice) :(Residence) :
3. M a i ia g e d by :4 . Whether it is Central Government/state'Govt./uni.Mgnt,/
Local Body/private Aid/Private Non-Aid, or any other, ;please, specify;
5. Details of courses offered by the Institution with combination vise. ;
6. New courses started if any during the year 1999-2000. t
7. UGC Grants received by the College during the year 1999-2000. i
II. A. Studerits Strength - Indian Nationals ;
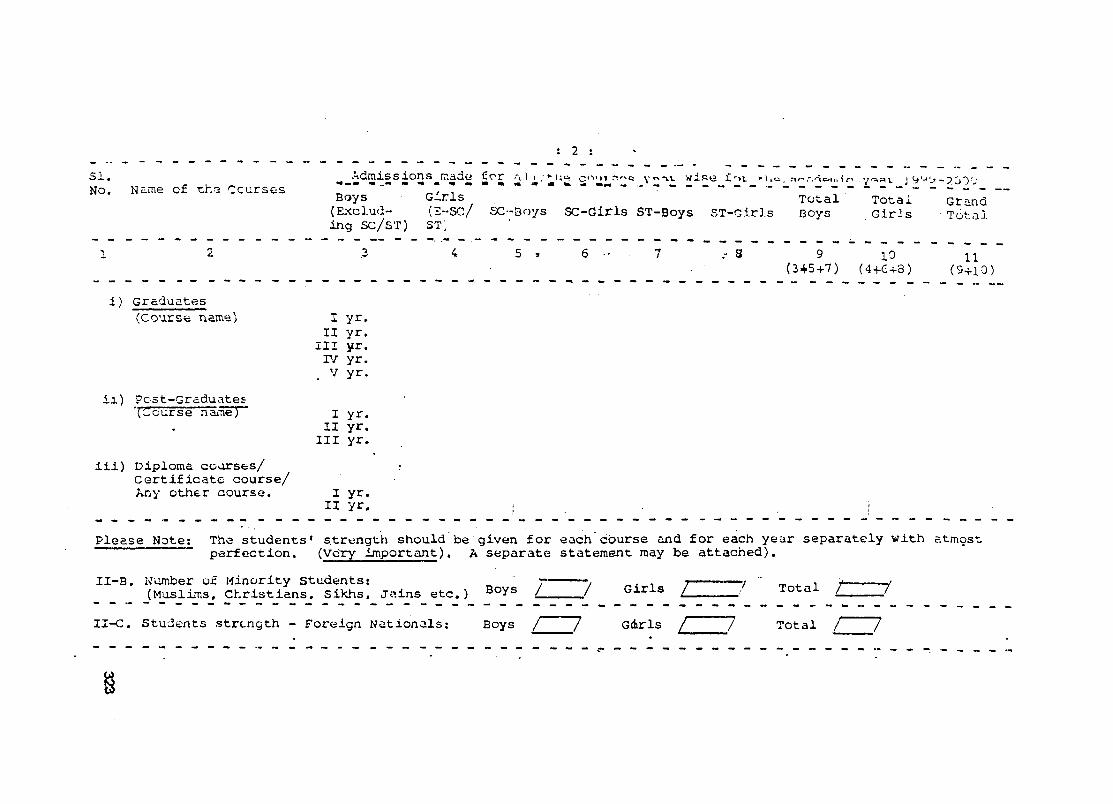
Si.No, Nome of T:.hf2 Ccurses
: 2 :
^ ^ A d m is s io n s ^ r r .a d e y ' ' * ' ’'*- i ' > i ' - \ i o . r^or.^c^ui-i/-- j 9 ‘-''j>~?.OO'J
Boys Girls -1 ^ . .Total(Exclud- (S-SC/ SC-Boys SC-Girls ST-Boys ST-Girls Doy ing SC/ST) ST;
TotalGirls
GrandTotal
. - 8 9 10(3+5+7 ) (4+6+8 ) 11(3+1 0)
i ) Graduates(Course name)
ii) Post-Grdduates ' (C o u r s e n arrie ]T
lii) Diploma coorses/Certificate course/ Any other course.
I y r .II yr.
Ill yr, r/ yr. V yr.
I yr. II yr,
III yr.
I yr.II yr.
Please Note: The students* strength should be given for each course and for each year separately with atmost"* perfection. (Very important), A separate statement may be attached).
II-B, Number of Minority Students:(Muslims, Christians, Sikhs, jains etc.) Boys /_____ / Girls ^ Total /
II-C. Students strength - Foreign Nationals: Boys / ~] Gdrls / / Total j 7
%
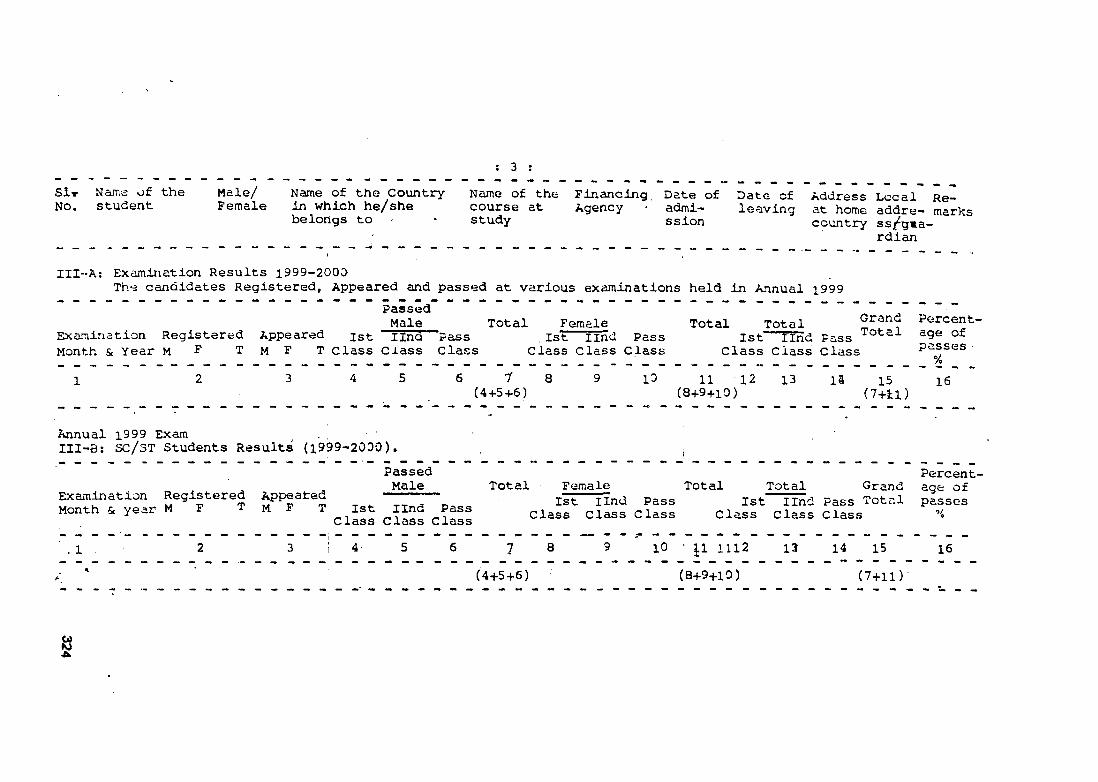
Six Name of the Male/ Name of the Country Name of the Financing Date of Date cf Address Local Re-No. student Female in which he/she course at Agency • admi- leaving at home addre- marks
belongs to - • study ssion country ss/gma-; rdian
III-A; Excimination Results 1999-2000-Th*3 candidates Registered, Appeared and passed at various examinations held in Annual i999
PassedMale Total Female Total Total Percent-
Examination Registered Appeared ist Ilnd Pass .1st find Pass 1st TTnd Pass ^9® ofMonth Sc Year M F T m F T Class Class Class Class class Class Class Class Class passes
__ ____ __________________________ ________ ___________ - ___________1 2 3 4 5 6 7' 8 9 10 11 12 13 la 15 16
(4+5+6) (8+9+10) (7+il)
Annual i999 Exam . . ■III-B: SC/ST Students Results (l9p9-2000). ^
Passed Percent-Male Total Female Total Total Grand aqe of
^ a m ^ a t i o n R e g i s t e r e d A p p e a t e d l i T - n n d P a s s I s t " - i l H d P a s s T o t a l p a s s e sM o n t h s y e a r - M F T „ P c l S s c ! S s C l a s s C l a s s C l a s s C l a s s c l a s s
■ .1 . 2 3 i 4 5 6 7 8 5 10 : 1112 13 14 15 16/ ' (4+5+6) (8+9+10) (7+11)
: 3 :
§
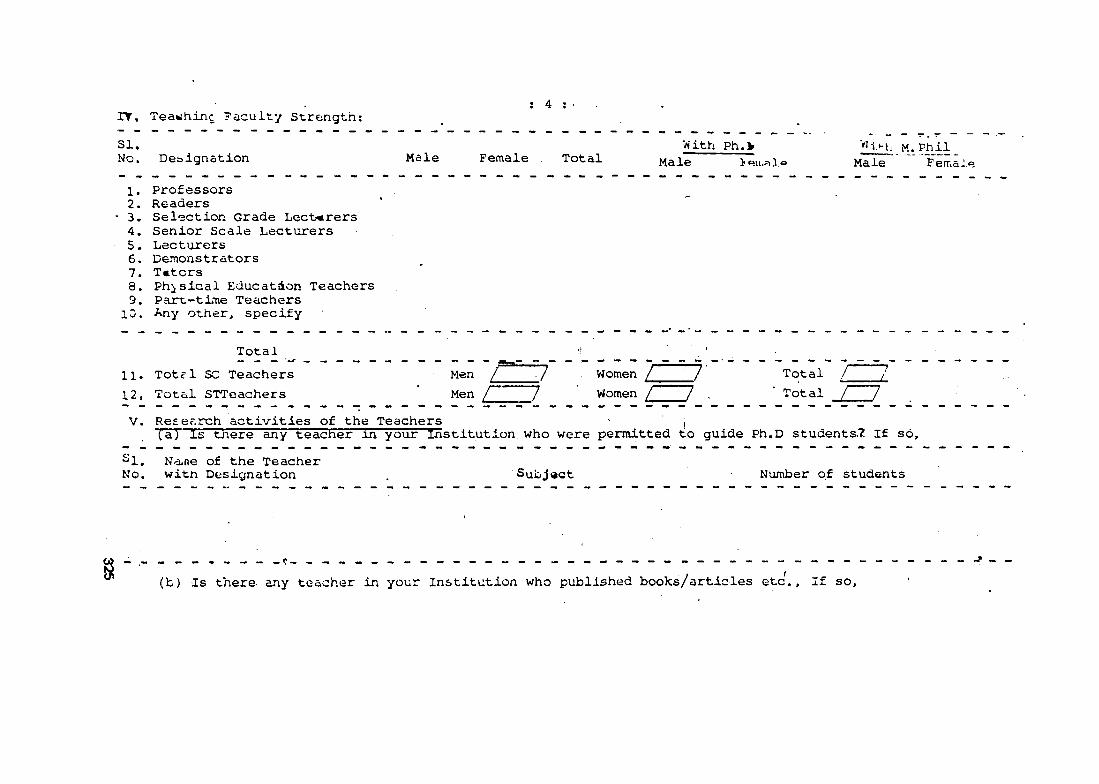
IT . Teawhinc Faculty Strength:: 4 : •
SI.No. Deblgnation Male Female
With Ph.kTotal Male
_ M. Ph_il _ Male Fenvalo
1 . Professors2. Readers
• 3. Selection Grade Lecturers4. Senior Scale Lecturers5. Lecturers6. Demonstrators7. Tutors8. Phisical Educatdon Teachers9. Part-time Teachers
1 0 , Any other, specify
Total11. Totcl SC Teachers12, Total STTeachers
Men / ■ /Men j 7
Women / /Women / /
TotalTotal £ U
V. Reser.rch activities of the Teachers i('a) Is there any teacher in your Institution who were permitted to guide Ph.D students.? If so.
^1, Ndine of the Teacher No, witn Designation Subject Number of students
(b) Is there- any teacher in your Institution who published books/articles etc.. If so.
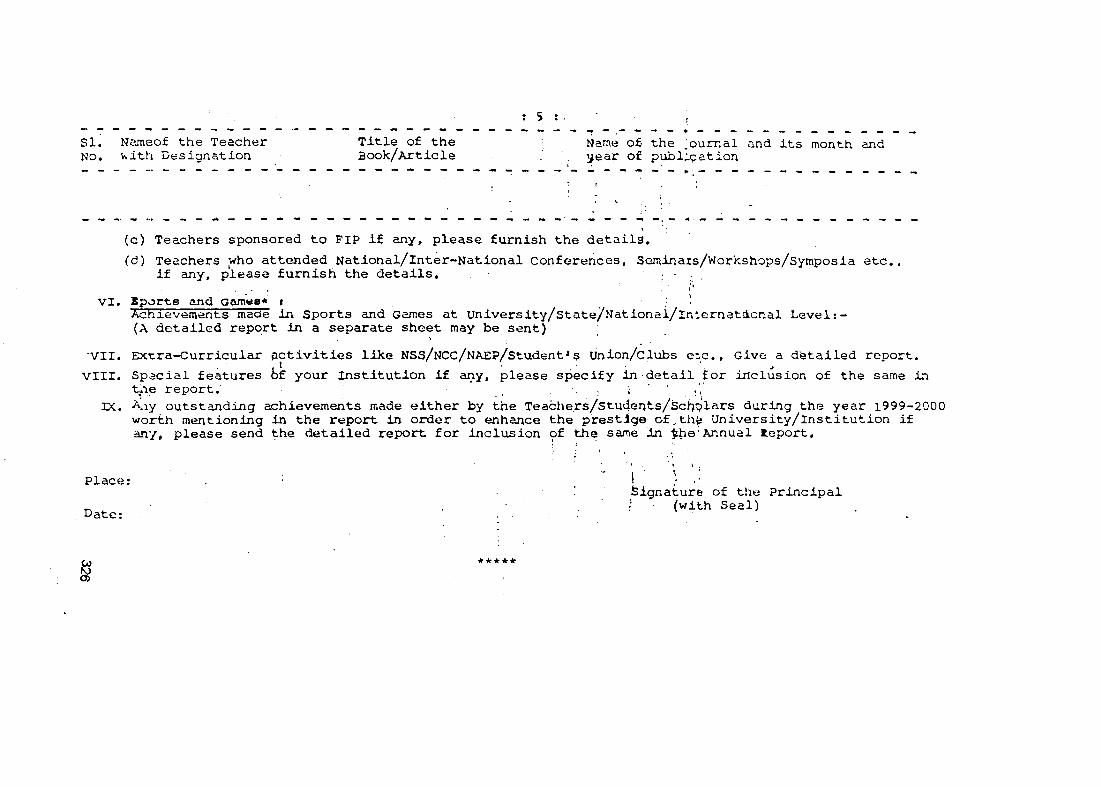
si. Nameof the Teacher No. vsith Designation
Title of the Book/Article
Name of.- the journal and its month and year of publ;.(pation
(c) Teachers sponsored to FIP if any, please furnish the details, .(d) Teachers who attended National/lnter-National Conferences, SGminars/Workshops/symposia etc.,
if any, please furnish the details,.................................. ; I *
V I , g p o r t - s and o a m c i g * i . ; •Achievements made in Sports and Games at University/state/Nationai/lnternatdonal Level (A detailed report in a separate sheet may be sent)
'VII. Extra-Curricular yictivities like NSS/NCC/NAEP/student^ s Union/clubs etc.. Give a detailed report.VIII. Spacial features b f your Institution if any, please specify in detail for inclusion of the same in
t-ie report.' ,IX. Aay outstanding achievements made either by the Teache.rs/Students/Schplars during the year 1999-2000
worth mentioning in the report in order to enhance the prestige of,th^ University/institution if any, please send the detailed report for inclusion of the same ^ e ‘Annual Report.
Place:
Date;
! ) ..Signature of the Principal ; (with Seal)
a>
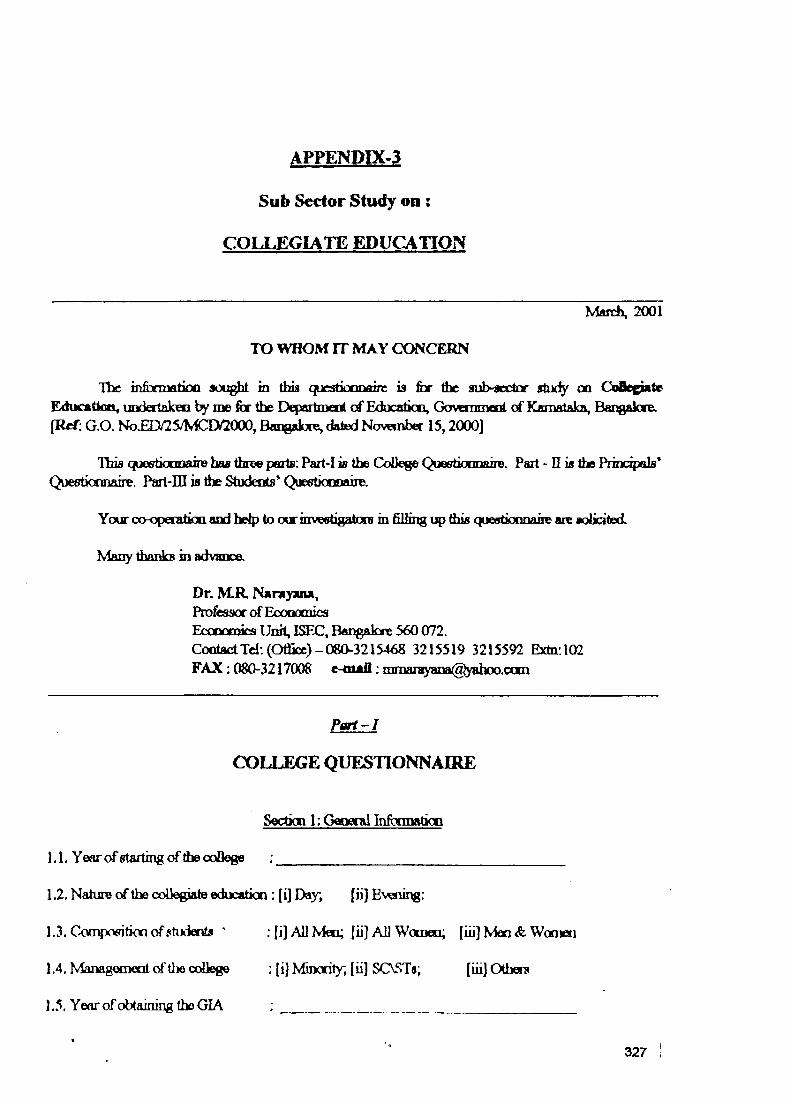
APPENPIX-3
Sub Sector Study oa :
COLLEGUTE EDUCATION
March, 2001
TO WHOM IT MAY CCHVCERN
The infcanfttkio sougjjt in this qucstioonaire is for the sub-aector study oo CofiegiBite Eduaiticn, unckrlakm by me for the Departnacnl of Edocatkxi, Govemmcfri of Kamalaka, Bangalore (Ref; G.O. Nfo.ED/25/MCiy2000, Bar^alore, dated NovOTbcr 15,2000J
Uns qi3G6tkxmajre has three parts: Part-I is the Colkge QuestioiiQaire. Pait - II is tije Princqpals’ Questioonaire. Part-Ill is the Studeats’ QueeticiiDaire.
Your CQ-operatiaa and help to our inv eetigatoiB in filling this queetkxmaire are solicited.
Many thaidcB in advance.
Dr M.R N*rnym»Professor of EoooocnicsEconmmics Unh, ISEC, Bangalore 560 072.CooiactTd: (Office)-080-3215468 3215519 3215592 Extn;l02 FAX : 080-3217008 e-m ail; [email protected]
P a i - I
COLLEGE QUESTIONNAIRE
Secticii l. GeDgrallnfonnatioD
1.1. Year of starting of the oaDege :_____________________________________
1.2. Nature of the ct^iegiate educatioQ: [i] Day, [ii] E\«iing:
1.3. Coopofdtion of students ” : [i] All Men; [ii] All Women; [iii] Meo <fe Womeu
1.4. Maaagemeot of tlie coUeg© : [i] Minority, [ii] SOSTs; [iiij Others
1.5. Year of obtaining the GIA ; _______________________________________
327 I
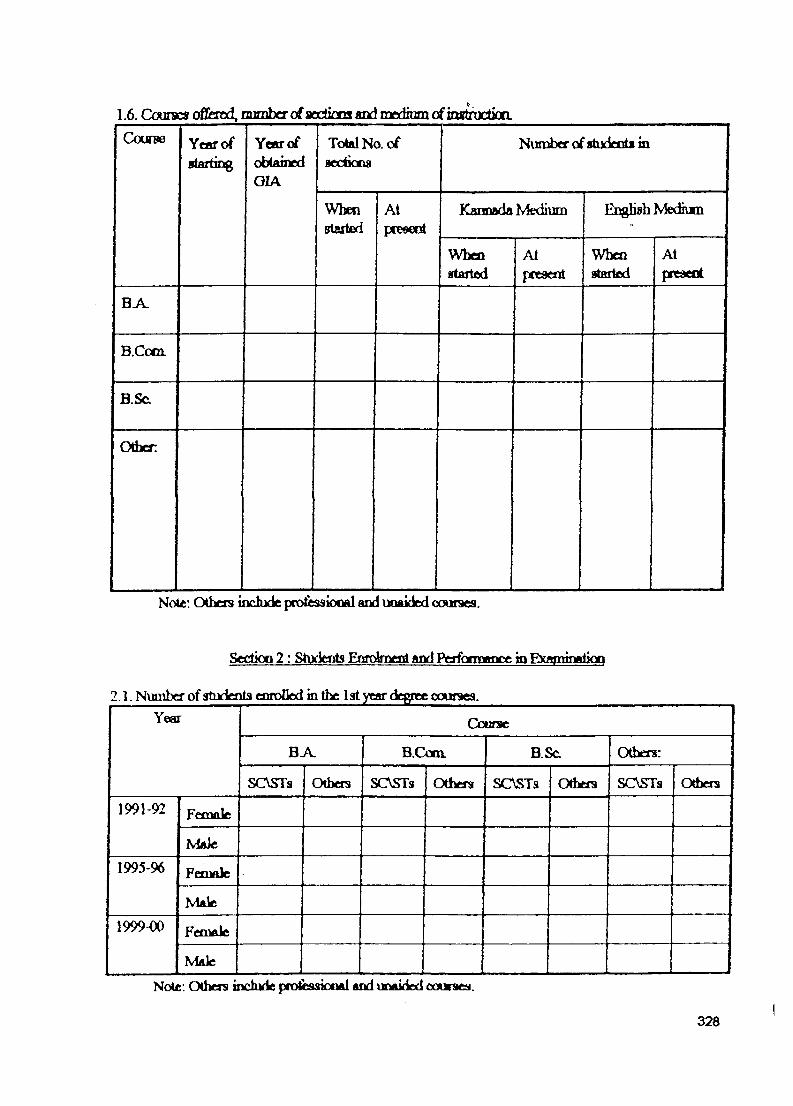
1A Courses Gffocd, m m bcr o f sectioca ax)d m ed h ^
Couree Year of starfm g
YoffofobtainedOIA
Total No. of aecdoQg
Number of stixkiiii m
Whenstarted
Atpreeeut
Kaunada Medium EngbBh Medhm
Whenstarted
Atpreacflt
Whenstaiied
At
BA.
B.Ccfn
BSc.
Other
Note: Others mchxle profi»isiooal and uoakled coufses.
Scctioo 2 : Stiykirfs EmtApgit and Pcjfomxmcf; m ExamiiMdioo
2 .1. Number ofatiideola cim)lledtn the 1 at year degree couraea.Year Course
BA. B.Com B.Sc. Others:
SC\STs Others SCVSTs Others SCNSTs Others SC\STs Others
1991-92 Female
Male1995-96 Female
Male1999-00 Female
MaleNote: O tlvn tnctude pn>fessionAl aod unftided couraea.
328
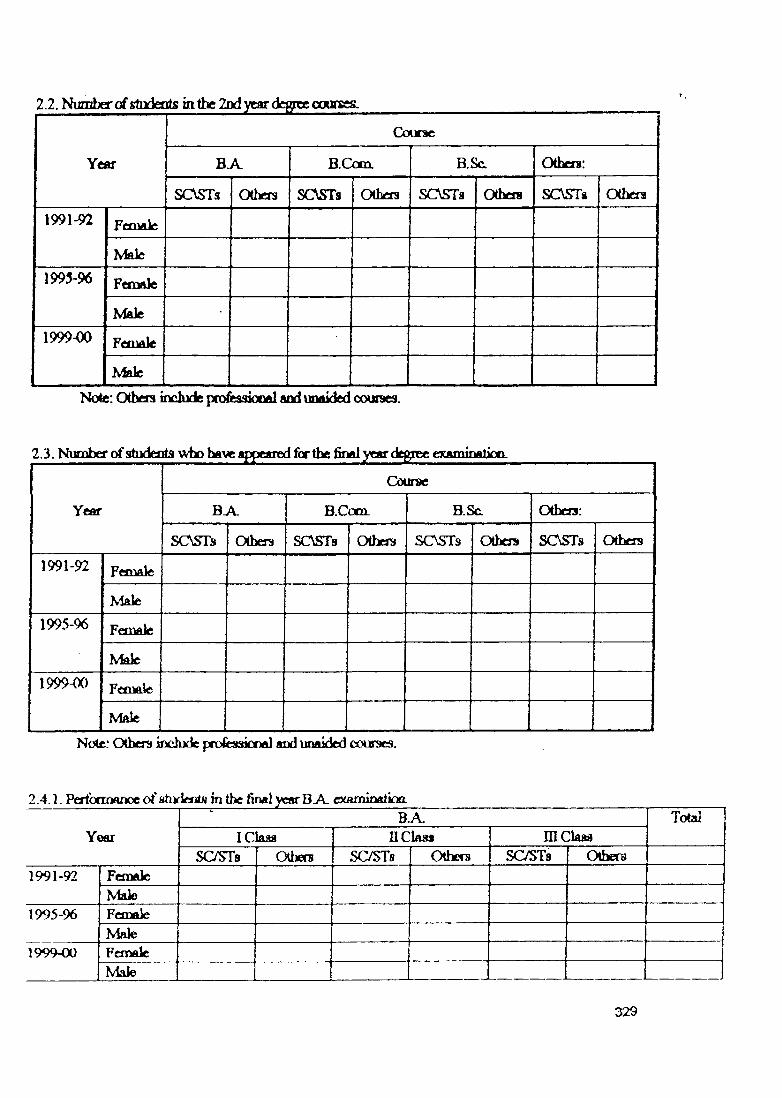
2.2. >himber of ttodente in the 2nd year degree oouree^
Ycatr
Course
Bj V B-Com. B.Sc Otbe«:
SOSTs Others SCNSTa Othas SC\STa Otberi SOSTi Othcra
1991-92 Female
}M t1995-96 Female
Male1999-00 F e o ^
MakNote: Othera include profieasdoml and u o A i d e d couraes.
2J.Num bef ofstiKfeotswtio have appeared for the final year degree exiimintttiniL
Year
Course
B ^ B.Com. B.Sc. Othen:
SC\STa Others SC\STs Others SC\STs Othe« SC\STs Others
1991-92 Fen'wle
Male1995-96 Female
Male1999-00 Female
Male
Note! Others include pnofeasicfiAl and unaided courses.
2.4. ]. Perionmnoe of atudftnto in the final year BJl exftminflJioaB.A Totai
Year IC aita nClaas inClaaaSOSTs Othere SC/STs OtheTB SC/STs Others
1991-92 FemaleMale
1995-96 FanakMale
199SMX) FemaleMale
329
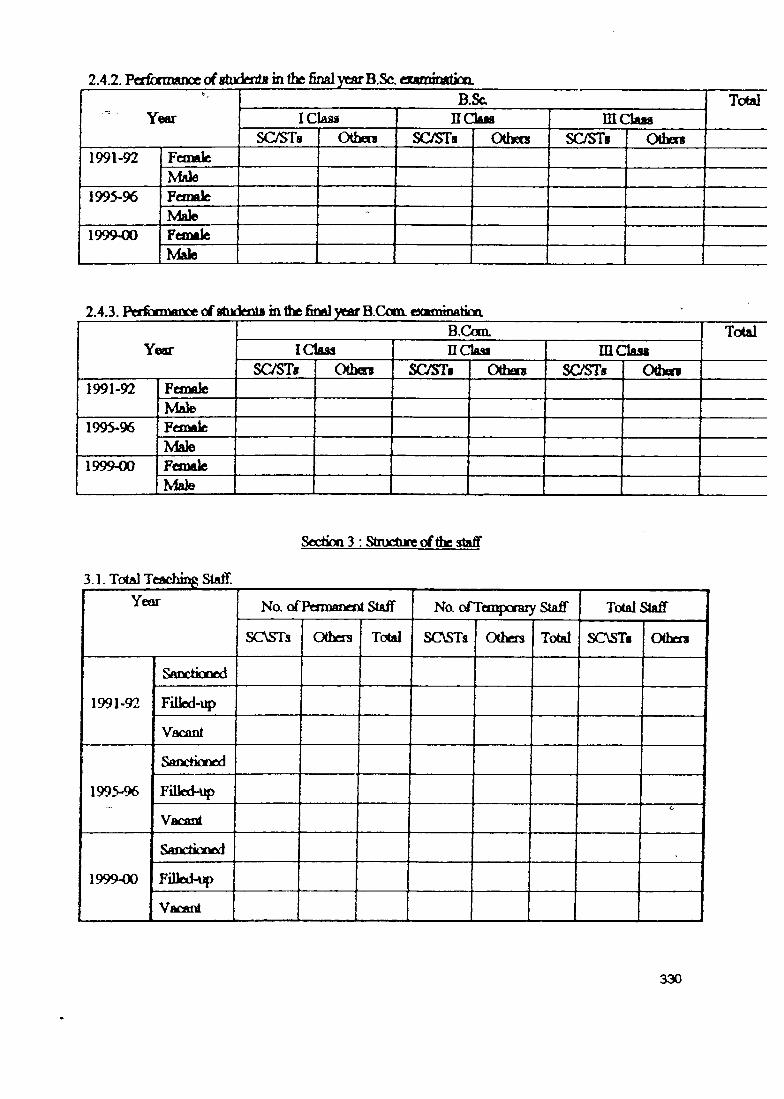
2.4.2. Pcffofmana of studestem the fiiMl year B.Sc. ccammatioa.
YearB.St Total
IC aaa nCkaa mClaaaSC/STs Others SC/STs OthecB SC/STi Others
1991-92 FemaleMale
1995-96 FemaleMale "
1 9 9 9 ^ FesMleMale
2.4.3. Pgffi3m3<g»e of gtiKimtg in find year B.ConL cxaminAtinn
YearB.Com. Tc3*ai
IClaaa nclass mClasflSC/STs Othen SC/STi Otbare SOST® Odien
1991-92 FeiiMileMale
1995-96 FeoMleMale
1999-00 FemaleMale
SedioQ 3 : Stiudure of staff
3.1. Total Tfcflching Staff.Year No. of Pomantfit Staff N a ofTen^xarar Staff Total Staff
SOSTs Othfs s Total SC\STa Others Total SOSTs Others
1991-92
Sancticneid
Filkd-i4>
Vacant
1995-96
Sanctioocd
FiUed-up
Vacantc
1999-00
SAncticined
Filled-up
Vacant
330
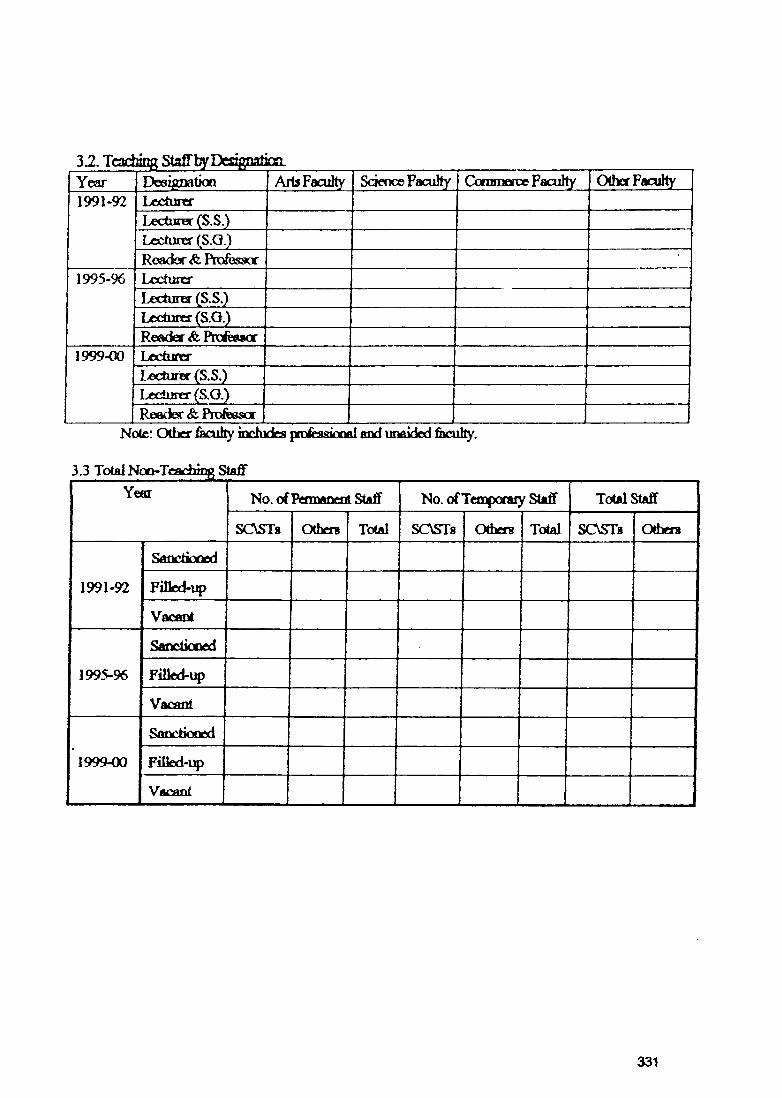
Year Desigaatkn Alts Faculty SdcnceFacuhy Commerce Faculty Ohor Faculty1991-92 Lcctunef
I^ecturer (S,S.)Lecturer (S.Q.)Reader & Professor
1995-96 LcctuirrLecturer (S.S.)Lecturer (S.O.)Reader & Professor
1999-00 Lcctuferl^ectxm (S.S.)Lecturer (S.O.)Reader & Professor
Note: Other &cully inchiffes pfofesdooal aod unaided &cuhy.
Year No. of PemMment Staff No. of TeiDponuy SUff Total Staff
SCVSTg Others Total SC\STs Others Total SC\STs Others
SftnctkYied
1991-92 Fillcd-up
Vacfioi
1995-96 Filkd-up
Vacant
SoDctiooed
\999-00 Filled-i^)
Vacant..
331
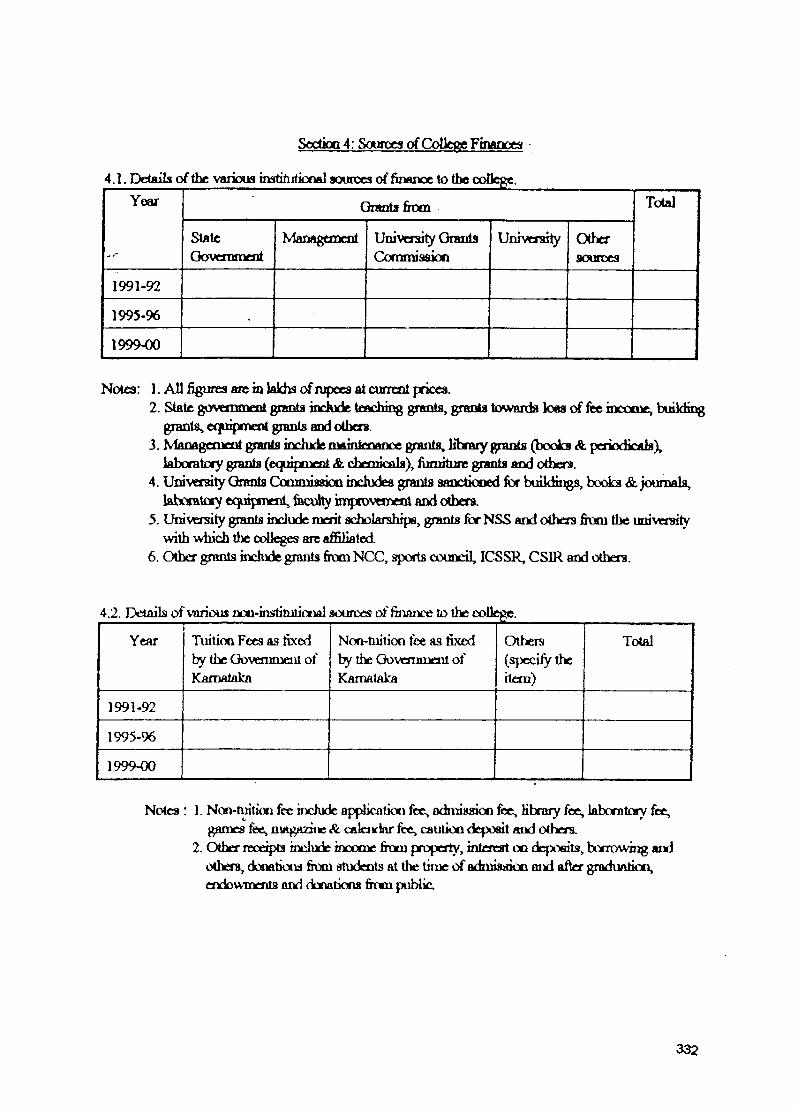
Sedioo 4: Souroca of CoUecg FinftPocs
Year Grants from Total
StateOovemment
Management Univeraity Grants Cocnmisakn
Univcrstily Otherflouroes
1991-92
1995-96
199900
Noiea: l.AU figures are in kkhs cyf rupees at cucnesi prices.2. State govemmeoi grants indude teaching grants, grants towanls k«s of fee buikiing
grants, equipfDent grants and ott^os.3. Managgn^it grants include OMtntenanoe grants, libmiy grants (boofcg & pqiodkals),
laboratory grants (equipment & chemicals), furniture grants and others.4. Univenity Grants CommissioQ includes grants sanctiooed for buildings, b o (^ & journals,
laboratay cqojpnoeDt, &cuhy iiiigprovem eal aiid others.5. University grants include merit scholarships, grants for NSS and others fiom the u n i v c r s i t Y
with which the colleges are affiliated6. Other grants iiiclude grajits fiom NCC, sports council, ICSSR, CSIR and others.
4.2. Details of various noc-inestitutionfll soun^es of &:>ance to the college.
Year Tuition Fees as fixed by the Oo\«iimeiil of Karnataka
Non-tuition tee as fixed by the Oovwnment of Kamalalra
Others (specily the item)
Total
1991-92
1995-96
1999-00„ .......................
Notes : I. Non-tuition fee include applicatioji fee, admission fee, Hhrary fee, laboratory fee, games fee, magaziiic &, calendar fee, caution deposit and others.
2. Other receipts include income from property, interest on depoeits, booowi;^ and others, donations 6om students at the time of adniisaioo aiid af\er graduation, endowments and donations from public.
332
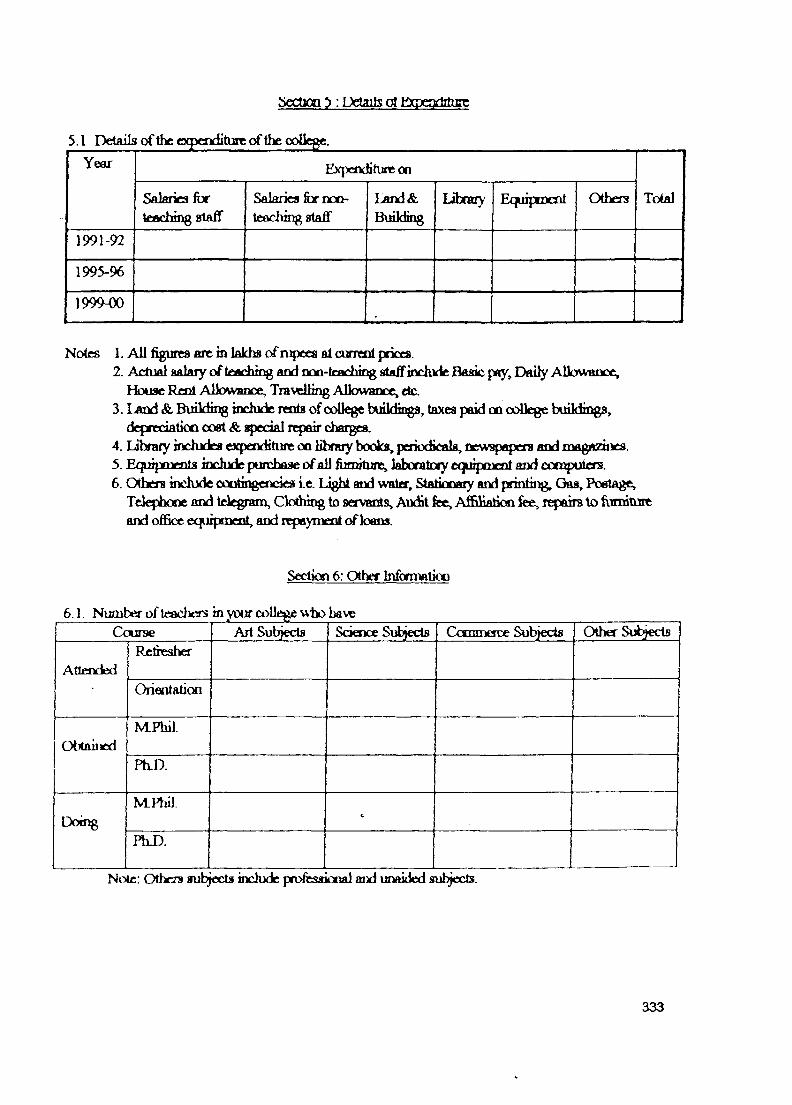
Section^ : DetailsotKxpegdrttge
Year Expenditure on
TotalSalaries fo r
teaching stafifSalaries fiy non- teiiching staff
T,and&Building
Lilraiy Equipment Others
1991-92
1995-96
1 9 9 9 ^
Notes 1. All fig U T M a re in la k lM of n^»esfllairi«iil prices.2. Actual aakiy of teaching and noo-tcaching gtaffiiKrlude Basic pay. Doily Allovvance*
Pfomc Rent Allowance, Travelling Allowance, etc.3. Land & Building include rents of college buildinga, taxes paid oo ccJlege buildings,
depredatioQ cost & special repair chargiea.4. libraiy includes expenditure on Hbmy books, periodicals, newspapers and m agazii^.5. Equipiucnts include purchase of all jiimiture, laboratDiy equipQient and coQ^xjins.6. Others include contingencies le. Light and water, Stationaiy and printing, Oas, Postage,
Telephone and tekgram, C b to tg to servants, Au(^t fee. Affiliation fee, repairs to ixmiturt and office equipment, and repayment of loans.
Section 6: Other Infoni^tion
6.1 ■ Number of teacl)e« in youf college who haveCourse Alt Subjects Science Subjects Cccimerce Subjects Other S\A9€cts
Atlei¥iedRefresher
Orientation
ObtainedMPhil.
PkD.
DoingMPhiJ.
c
PhD.
N i^: Othfrrs subjects inchide professiooal and unaided subjects.
333
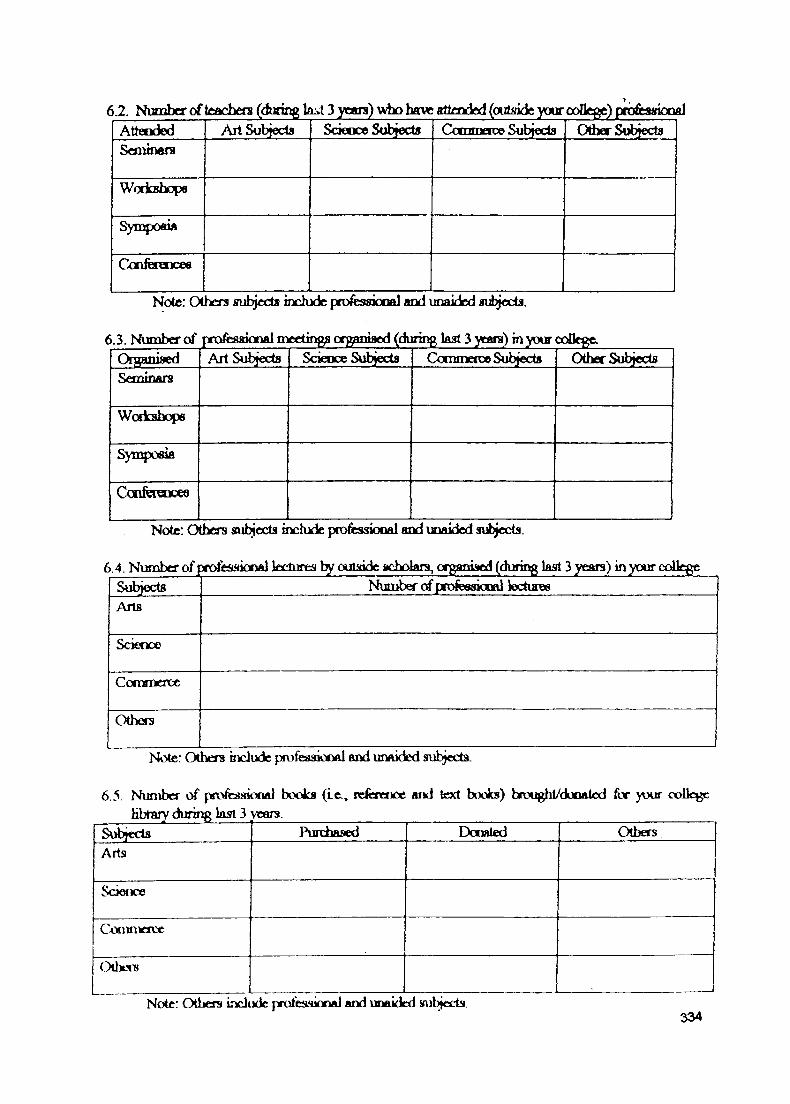
6.2. >hgpbcf ofteacbtfs (during 3 yeCT)\vfao have atl£ndfid(outifideyoMrooflcgc)pfDfbi^^Attended Art Subjects Scieoce Subjects Cofnmeroe Subjects Other SubjectsSeimDftn
WodcBhop6
SyiT4X)«ift
Conferaices
Note: Others srufcjcds inchide pmfessinnfl] /md imaidrd jnihjeds.
Orinanwed Art Subjects Sdenoe Subjects Corameroe Subjects Other SubjectsSeminATS
Wodahope
Sympofim
Ccnfereoce«
Note; Others subjcds inchxie pmfessioQal and UDaided subjects.
Subjects Number d'profe8sional lectiawArts
Science
Commeaxie
Others
Note: Olhera inchide pn>fessiooftl and unaided subjects.
6.5. Nimiber of ptv>feaoonAl books (Le., referaice aiid text bodes) brought/dooAled for jrxir coUcgc
Subjects PHjrchased Donated OthersArts
Sciecice
CoiiMncnjc
OtljLTH
Note: Others incliMlc pmfesaional and unaided334
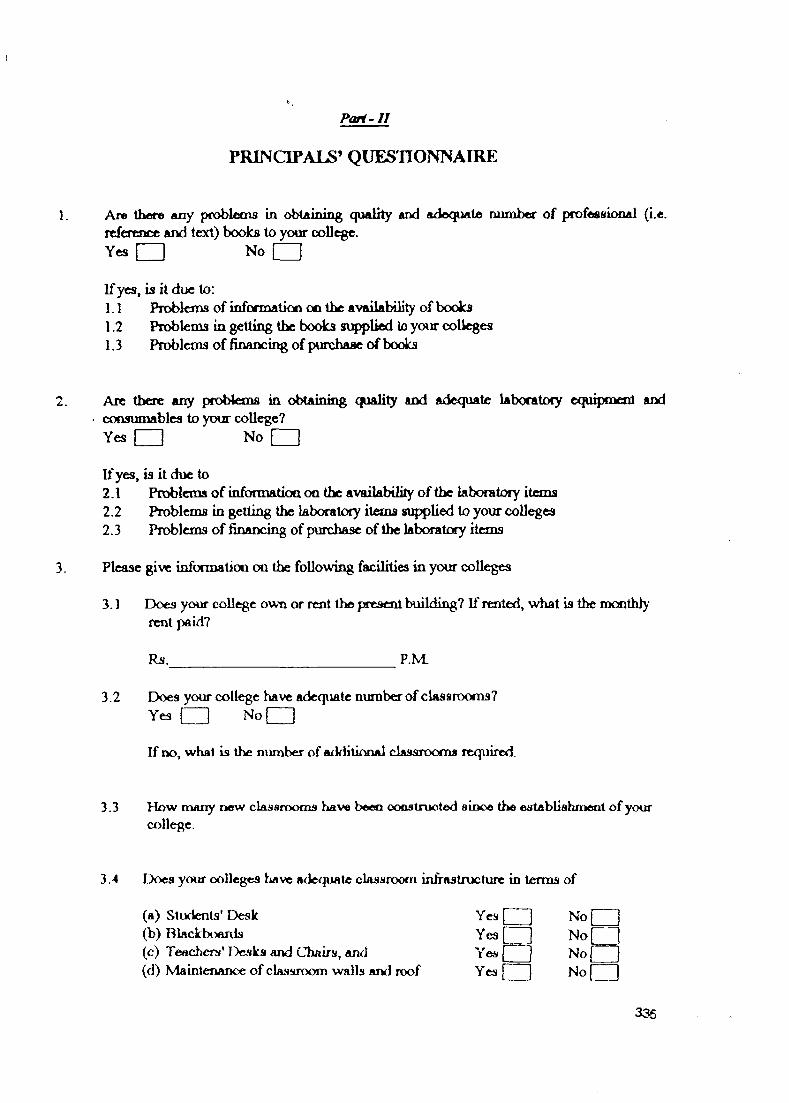
P<ui~I1
PRBSOPAUS’ QUESTIONNAIRE
1. Ar« there any probtana in obtaining quality and adequate number of professional (i.e. reference and text) books to your coUegc.Yes No
If yes, is it due to:1.1 Problems of informatioo oo the availability of books1.2 Problems in getting the books s\4)plied lo your colleges1.3 P^roblcms of financing of purchase of bodes
Are there any pft>blems in obtaining quality and adequate labonitocy equipment and consumables to your college?
NoYes
If yes, is it due to2.1 Problems of infbrmatioa on the availability of the laboratory items2.2 Problems in getting the laboratoiy items suj;^lied to your colleges2.3 Problems of financing of purchase of the laboratofy items
Please give informatioo on the following facilities in your colleges
3.1 E>oes your college own or rent the present building? If rented, what is the monthly’ rent paid?
Rs. P.M.
3 .2 Does ycHir college have adequate number of classrooms?NoYes
If no, what is the number of additional classrooms required.
3.3 How many new claaarooms have been ooastruoted ainoe the establiahment of your college.
3.4 Does your colleges liave adequate classroom infrastructure in terms of
(a) Students' Desk Yes(b) Blackboards Yes(c) Teachers' I>esks and Chairs, anti Yes(d) Maintenance of classroom walls awl roof Yes
1 1 NoNo|Noj 1
_ J N o ___1
336
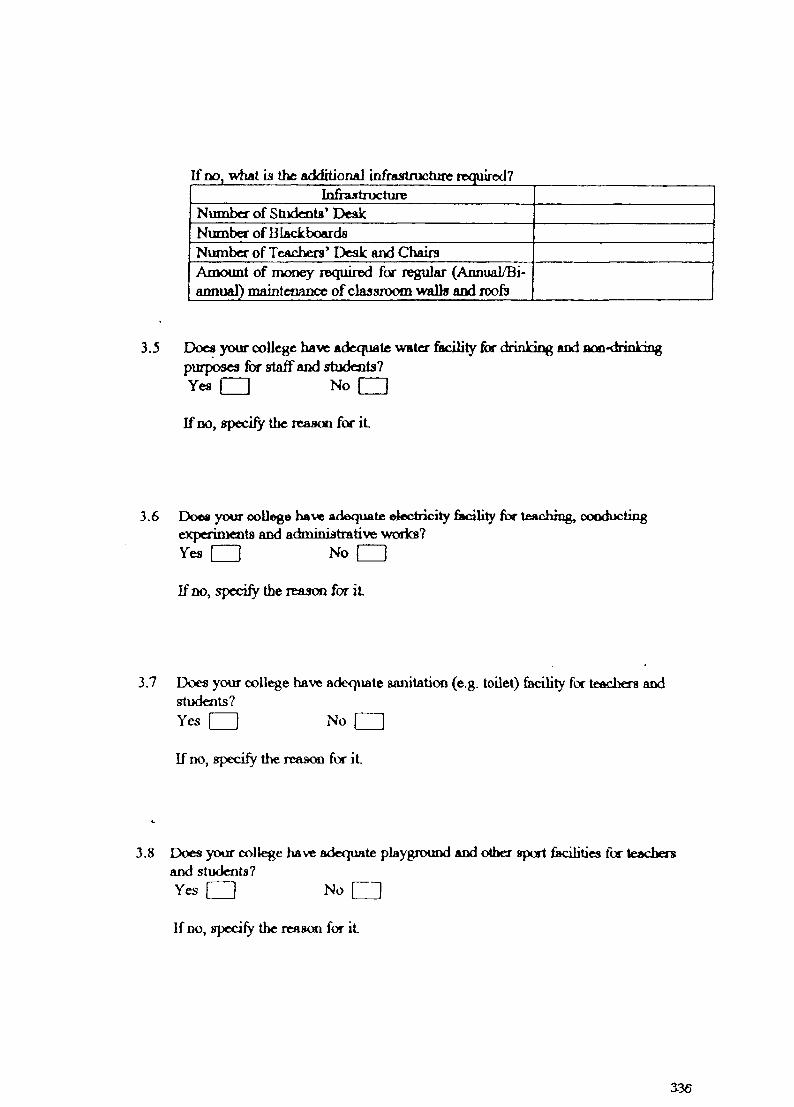
If no, wiiat is the addhJoriAl injraistmcture required?Infrastructure
Number of Students’ DeskNumber of BlackboardsNumber of Teachers’ Desk and ChairsAmount of money required for regular (Annual/Biannual) maintenance of classroom walls and roofij
3.5 Docs your colJegc have adequate water facility for drinking And noo-drinking purposes for staif and students?
NoYes
If no, specify the reason for it
3.6 Does your ooUege have adequate electricity fiK^ty for teaching, oooducting experiments and administrative wodcs?Yes No
If DO, specify the reason for it
3.7 Does your college have adequate sanitation (e.g. toilet) facility for teachers and students?Yes I I No r~
If no, specify the reason for i t
3.8 Does your college have adequate playground and other sport fiacilitics fbi teachevs and students?Yes I No
If no, specify the reason for it
336
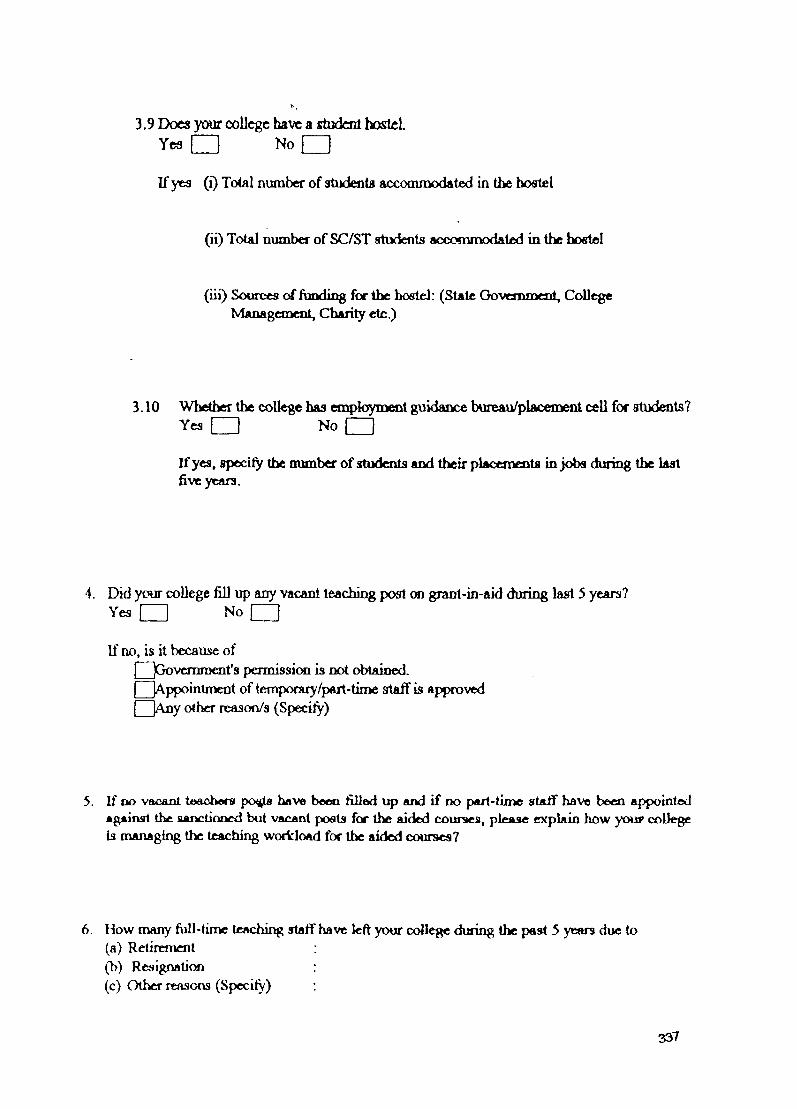
3.9 Docs your coDcgc have a student hostel. NoYc3
If yfc3 (i) To<al number of students accommodated in the hostel
(ii) Total number of SC/ST students accommodated in the ho«tei
(iii) Sources of funding for the hostel: (State Oovemment, CoUege Management, Charity etc.)
3.10 Whether the college has employment guidance bureau/placement cell for students? Yes No
If yea. speciiy the numt)er of students and their placemeDts in jobs during the last five years.
4. Did your college fill up any vacant teaching post on grant-in-aid during last 5 years? NoYes
If no, is it because ofGovernment's pennission is not obtained. Appointment of temporary/part-tinrie staff is approved Any other reason/s (Specify)
5. If DO vacant teachers p o^ have beAQ fiUed up and if no part-time srtaif have been appointed agjiinst the aanciiooed but vacant posts for the aided courses, please explain how youp college Is managing the teaching woricload for the aided courses?
6. How niany full-time teaching staff have left your college during the past 5 years due to(a) Retirenicnt(b) Resignation(c) Other reasons (Specity)
337
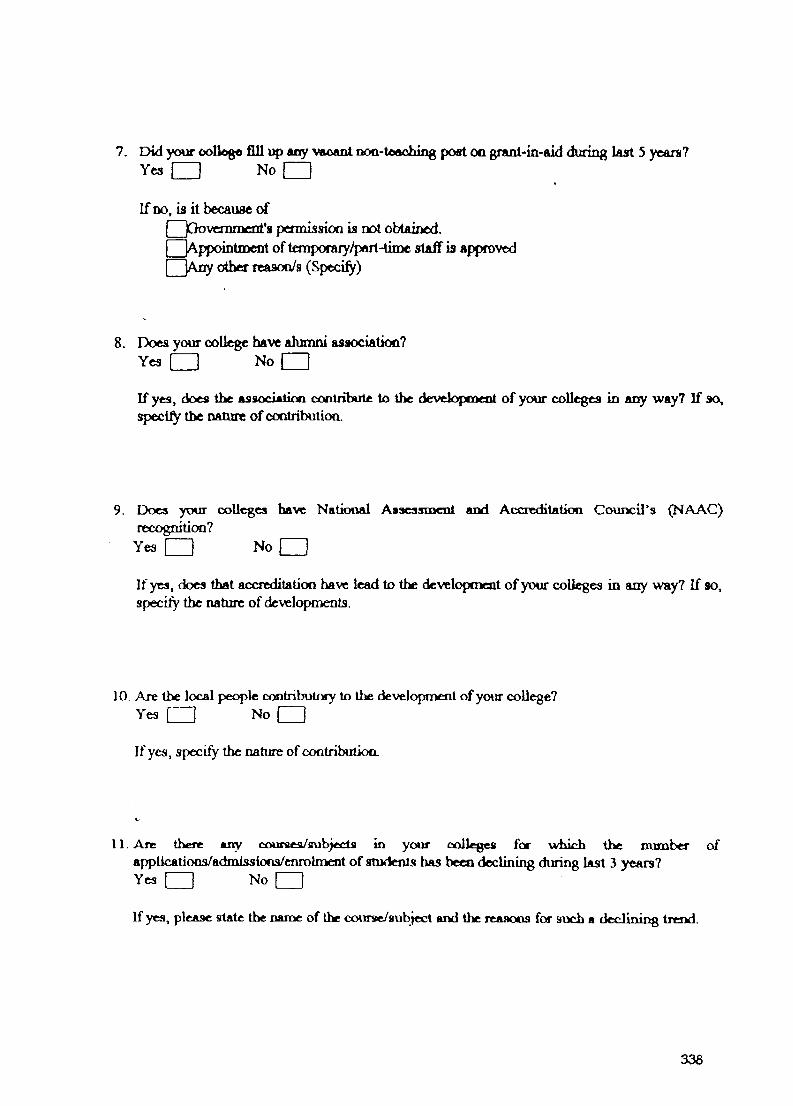
7. Did your ootl6g« fill any vaoanl DOQ-i6ftching po«t oo grant-in-aid during last 5 years? Yes No
If no, is it because ofJOovcmmcnt's pcnnission is not obtained. ^Appointment of temporaiy/part-time staff is approved jAny other reasoo/s (Specify)
8. Does your college have alumni association?No rYes
If yes, does the assoclAtioo conlribute to the developcoex^ of your colleges in any way? If so, specify the nature of contribution.
9. Does yuur collegea have National Asscasmcnt and Accreditatioo Council’s (NAAC) recognition?
Yes No
If yes, does that accreditation have lead to the development of your colleges in any way? If so, specify the nature of developments.
10. Are the local people contributory to the development of your college? Yes No
If yes, specify the nature of contributioa
11. Ane there any couraefL/subjeds in your colleges for which the number of applications/admissiona/cnrolment of students has been declining during last 3 years?Yes No
If yes, please state the name of the course/srubject and tlie reaaons for snch a declining trend.
338
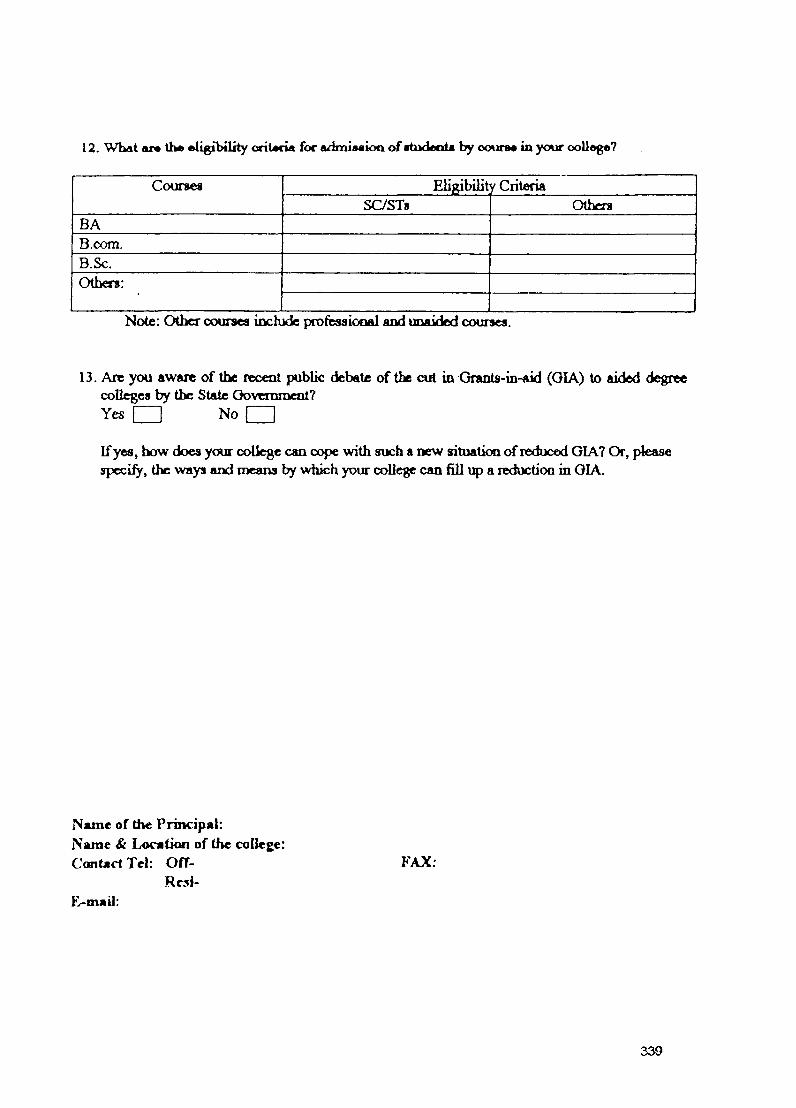
12. What ar* t h e eligibility ortiMia for adbniMioa of v tu d M iia by o o u t m in your ooll«g«7
Courses Eligibility CriteriaSC/STb Others
BAB.com.B.Sc.Others:
Note: Other courses iDchide professiooal aiKi unaided courses.
13. Are you aware of the recent public debate of the o it in O rants-m -^ (OIA) to aided degree collegea by the State Oovammcnt?Yes No
If yes, how does your college can cope with such a new situatioQ of reduced GIA7 Or, please specify, the ways and means by which your college can fill up a reduction in OIA.
Name of the Principal:Name & Location of the collegc: Contact Tel: Off-
Rc3i-E mail:
FAX:
330
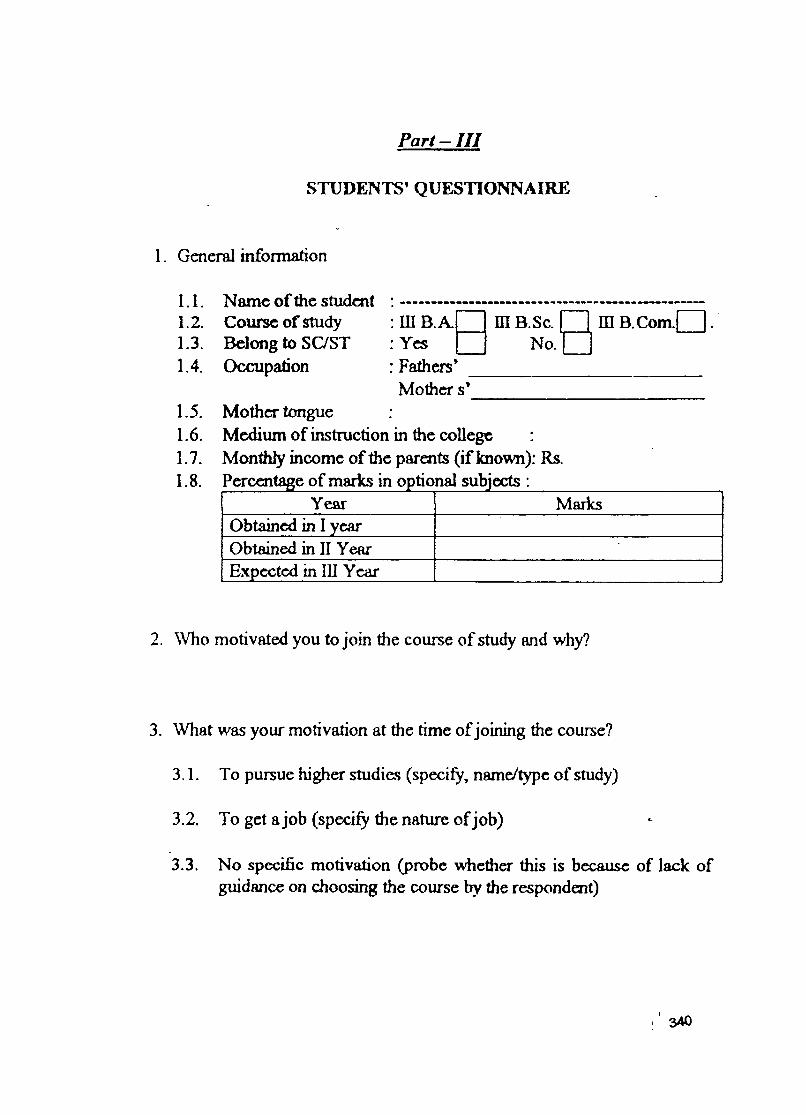
P a r t - I I I
STUDENTS’ QUESTIONNAIRE
1. General information
1.1. Name of the student
1.4. Occupation Fathers’ Mother s’
1.5. Mother tongue1.6 . Medium of instruction in the coUegc1.7. Monthly income of the parents (if known): Rs.
1 .2 . Course of smdy :inB.A ffl B.Sc. in B.Com.1.3. Belong to SaST : Yes No.
Year MfliksObtained in I yearObtained in II YearExpected in III Year
2. Who motivated you to join the course of study and why?
3. What was your motivation at the time of joining the course?
3.1. To pursue higher studies (specify, name/type of study)
3.2. To get a job (specify the nature of job)
3.3. No specific motivation (probe whether this is because of lack of guidance on choosing the course by the respondent)
340
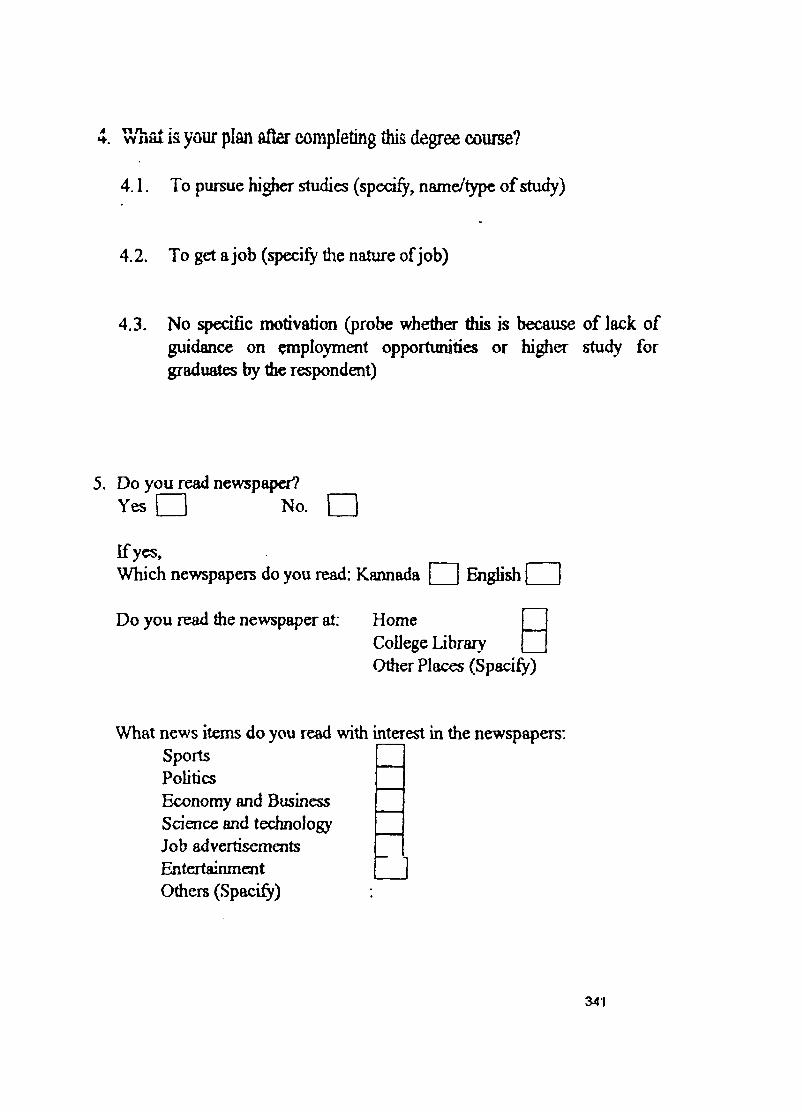
4 wTiat is your plan afler completing this degree course?
4.1. To pursue hi^icr studies (specify, namc/typc of stucfy)
4.2. To get a job (specify the nature of job)
4.3. No specific motivation (probe whether this is because of lack of guidance on employment opportunities or higher study for graduates by the respondent)
5. Do you read newspapei7 Yes No.
If yes,Whidi newspapers do you read: Kannada [ Engiish
Do you read the newspaper at: HomeCollege Library Other Places (Spacify)
What news items do you read with interest in the newspapers: SportsPoliticsEconomy and Business Science and technology Job advertisements Entertainment Others (Spacify)
341
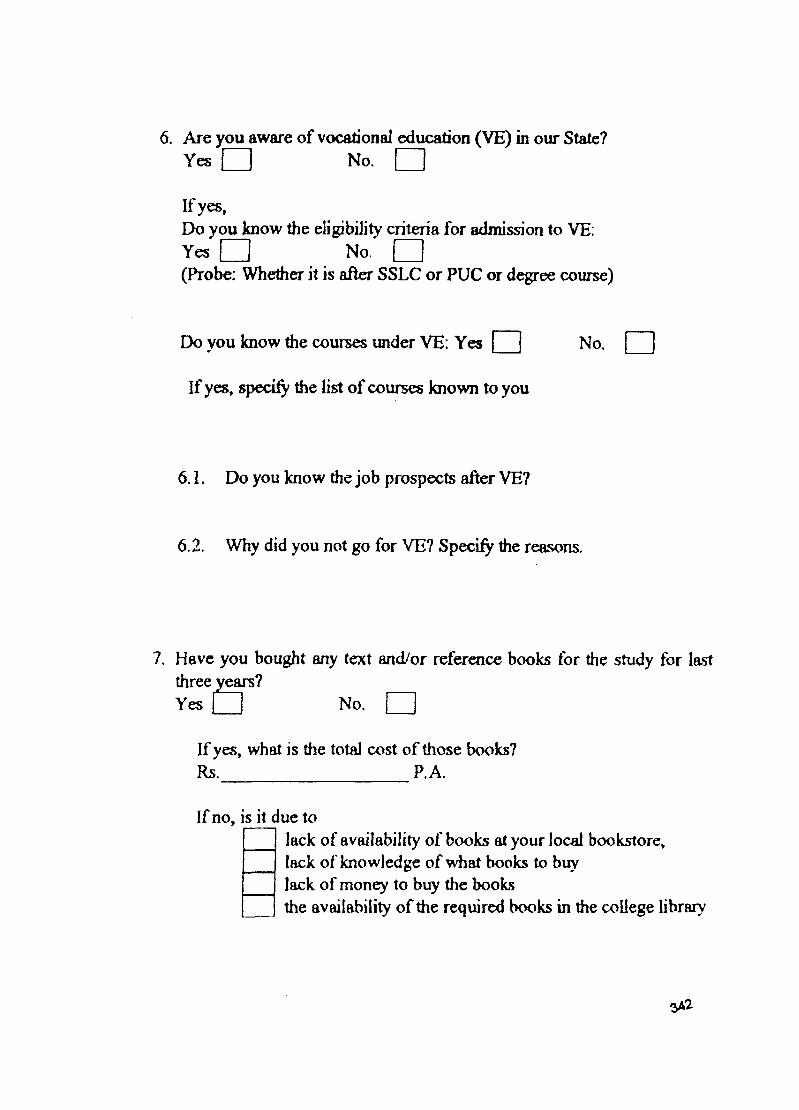
6 . Are you aware of vocadonaJ cducadon (VE) in our State? Yes No.
If yes.Do you know the eligibility criteria for admission to VE; Yes No.(Probe: Whether it is after SSLC or PUC or degree course)
Do you know the courees under VE: Yes No.
If yes, specify the list of courses known to you
6 .1. Do you know the job prospects after VE?
6.2. Why did you not go for VE? Specify the reasons.
7. Have you bought any text and/or reference books for the study for last three years?Yes r ~ l No.
If yes, what is the total cost of those books? Rs. P.A.
If no, is it due tolack of availability of books at your local bookstore, lack of knowledge of what books to buy lack of money to buy the booksthe availability of the required books in the college library
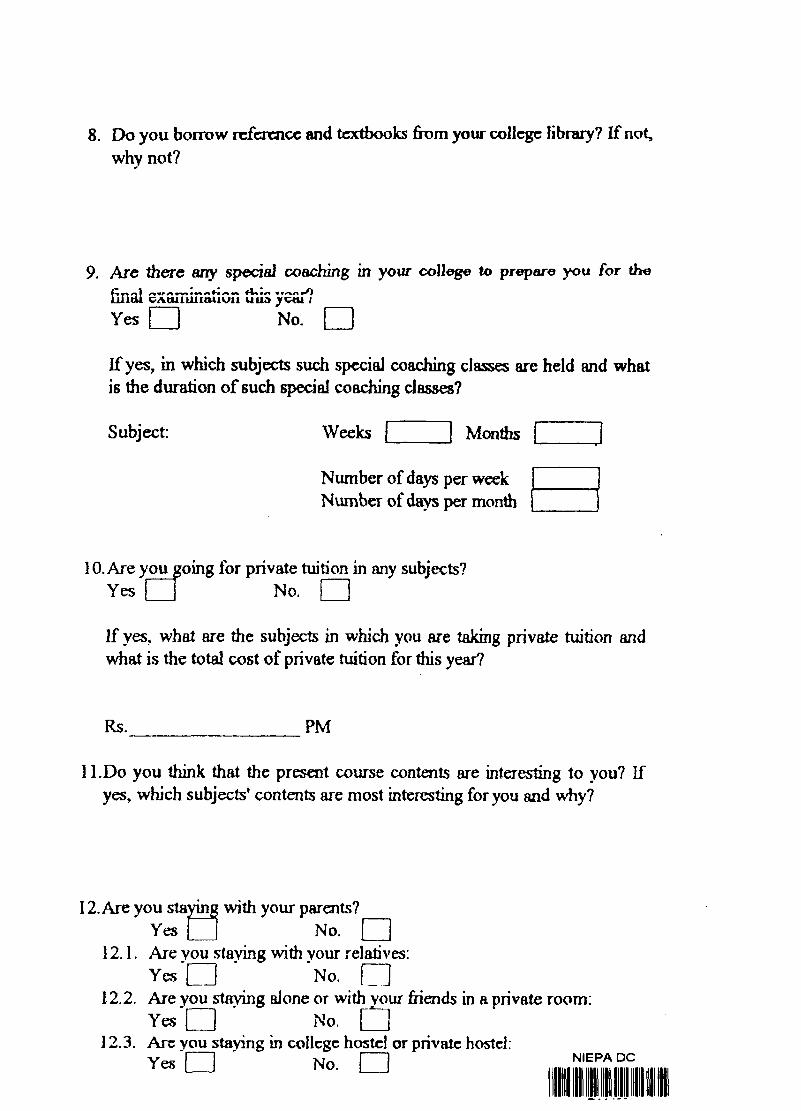
8 . Do you borrow rcfcrcncc and textbooks fix)ni your collcgc library? If not, why not?
9. Are there any specie] c o a c h in g in y o u r c o l l e g e to p r e p a r e y o u f o r t h e
finalYes
---4Uw^imituivii uad tNo.
If yes, in which subjects such special coaching classes are held and what is the duration of such special coaching classes?
Subject: Weeks Months
Number of days per week Number of days per month
10. Are you going for private tuition in any subjects? Yes I No.
If yes, what are the subjects in which you are taking private tuition and what is ^ e total cost of private tuition for s year?
Rs. PM
11.Do you think that the present course contents are interesting to you? If yes, which subjects' contents are most interesting for you and why?
12. Are you staying with your parents?Yes No.
12.1. Are you staying with your relatives: Yes' No.
12.2. Are you staying alone or with your friends in a private room:Yes No.
12.3. Arc you staying in collcgc hostel or private hostel: Yes No. NIEPA DC
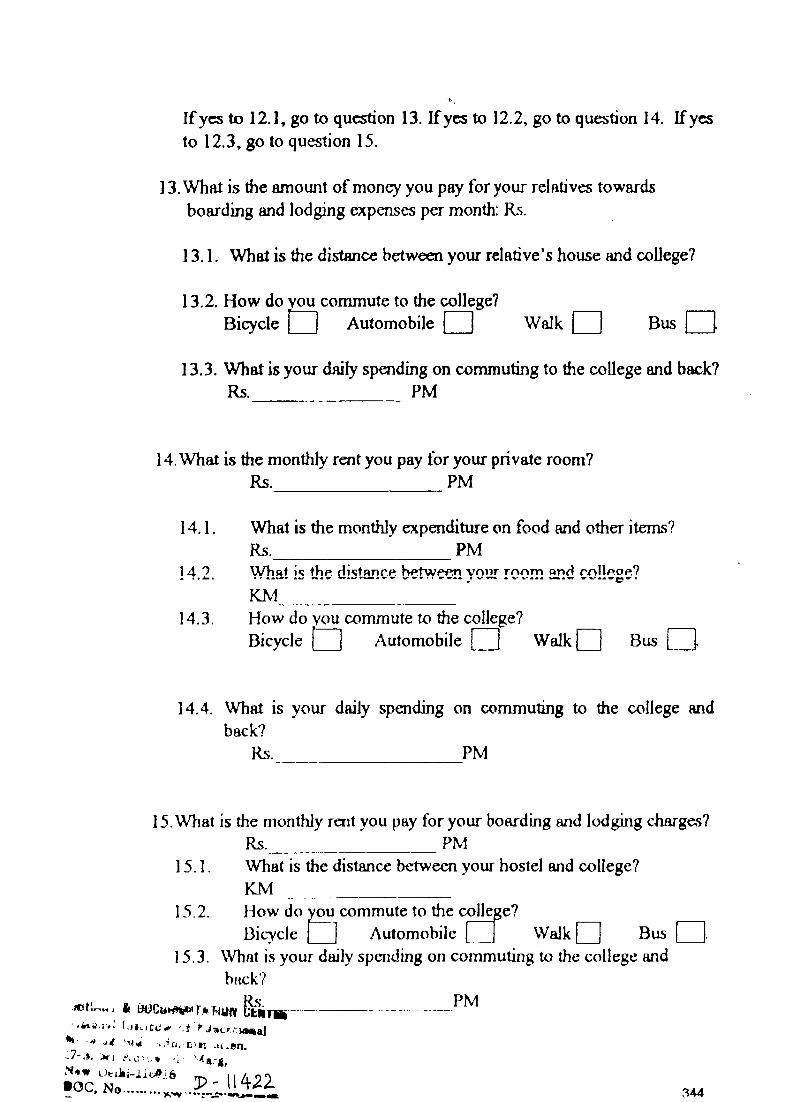
If yes to 12.1, go to question 13. If yes to 12.2, go to question 14. If yes to 12.3, go to question 15.
13. What is the amount of money you pay for your relatives towards boarding and lodging expenses per month: Rs.
13.1. What is the distance betwcCTi your relative’s house and college?
13.2. How do you commute to the college?Bicycle Automobile Walk Bus
13.3. What is your daily spending on commuting to the college and back? Rs. PM
14. What is the monthly rent you pay for your private room? Rs. PM
14.1. What isRs.
14.2. What isKM
14.3. How doBicycle
PMWhat is the distance between your room and coilc^c?
Automobile Walk Bus
14.4. What is your daily spending on commuting to the college and back?
Rs. PM
15. What is the monthly rent you pay for your boarding and lodging charges? Rs. PM
15.1.
15.2.
What is the distance between your hostel and college?KM___________________How do you commute to the college?
AutomobileBic-ycle Walk Bus15.3. What is your daily spending on commuting to the college and
h(ick?PMRs.. Ii tH3Cu»^r^^. RUHI UfcNTHS
j j f ‘-'na lU i. ij'r .:.■J-'A. /*. 0'':.» -i'
» O C . N o ............ 344