cmp resiliency plan april 12 2019 (w7220731).docx
TRANSCRIPT
Central Maine Power
Company
2019-2020
Resiliency Plan
April 12, 2019
Docket No. 2018-194
Exhibit OAR-REB-3Docket No. 2018-00194
Page 1 of 125REDACTED
12 / April / 2019
CMP Resiliency Plan
Central Maine Power Company Page i of 38
Table of Contents
Executive Summary ................................................................................................ 1
1 Introduction ..................................................................................................... 6
2 Reliability and Resiliency ................................................................................... 8
3 CMP Programs to Enhance Resiliency ................................................................. 13
4 CMP’s 2019-2020 Resiliency Plan ....................................................................... 22
5 Benefit Cost Analysis ....................................................................................... 31
6 Conclusion ...................................................................................................... 38
Appendix A: AVANGRID Distribution Resiliency Guide
Appendix B: 2019-2020 CMP Circuit Resiliency Plans
Appendix C: Benefit-Cost Analysis of Central Maine Power’s 2019-2020 Resiliency Plan
Exhibit OAR-REB-3Docket No. 2018-00194
Page 2 of 125
12 / April / 2019
CMP Resiliency Plan
Central Maine Power Company Page 1 of 38
Executive Summary
Central Maine Power (CMP) has prepared this Resiliency Plan to reduce the number of
customers that experience outages and to restore power more quickly when outages do
occur.1 The plan will be implemented on a circuit-by-circuit basis over the next decade, with
a priority given to CMP’s worst-performing circuits. The Resiliency Plan responds to the
number of storms of all types and severity that CMP has experienced over the past decade
and an emerging consensus that CMP should enhance the resiliency of its electric
distribution system in order to reduce the costs imposed on customers by long outages and
expensive restoration efforts. As businesses and residences rely more on electric vehicles
and other electric end-uses, CMP expects that the tolerance for extended outages will
continue to diminish.
Most outages are caused by tree contact, including contact by “hazard” trees from outside
CMP’s Right-of-Way that fall on electric equipment and cause serious damage. The
Resiliency Plan is comprised of three types of actions. The first two, enhanced vegetation
management and hardening of the existing infrastructure, increase the ability of the
distribution system to withstand intense storms or contact with electric equipment by
outside forces and thereby reduce the number of outages. The third category enables CMP
to restore power more quickly by making changes to the configuration of CMP’s distribution
network along with automation investments that isolate outages within smaller segments.
The first program, enhanced vegetation management, involves “ground-to-sky” tree
trimming and more aggressive targeting and removal of hazard trees. The remaining two
programs are capital investments in infrastructure that enhance the resiliency of the
distribution system:
Hardening of infrastructure (e.g., poles, crossarms, wires, etc.) by using more
robust construction practices and materials in compliance with AVANGRID’s
Distribution Resiliency Guide (Appendix A). This guide also specifies requirements
for application of tree wire that replaces bare primary conductors with covered
conductors capable of withstanding temporary contact with tree branches. These
1 The Resiliency Plan is designed to address all outages including non-storm events and storm of all types
and magnitude, from major regional storms that create headlines and cause widespread outages in CMP’s service territory (“Tier 3” storms), storms that are less severe but still cause significant outages (“Tiers 1 and 2”), and smaller, localized storms that are not rated but that are equally disruptive to the customers that lose power.
Exhibit OAR-REB-3 Docket No. 2018-00194
Page 3 of 125
12 / April / 2019
CMP Resiliency Plan
Central Maine Power Company Page 2 of 38
updated requirements are applicable to all construction activities in CMP’s service
territory.
Changes to the topology of circuits by designing and implementing a circuit-specific
combination of actions including upgrading lines, increasing feeder ties and
switching capabilities (with automation). These actions work together to enable
further segmentation of circuits during outages and limit the number of customers
that are impacted by a particular outage. The investments that support these
strategies include upgrading and adding more circuits and lines, increasing ties
between circuits, upgrading or adding substations, and accelerating automation
investments. Automation includes the installation of additional SCADA-enabled line
switches, tie switches, and reclosers to segment long circuits into multiple sections
that can be isolated automatically in order to limit the number of customers that
lose power, and also increase the speed of restoring power.
CMP’s distribution planning function has developed an initial plan for each of the 101 worst
performing circuits. The plan takes a holistic approach that considers vegetation
management, hardening, and accelerated automation along with the changes in topology.
The 2019-2020 Resiliency Plan addresses twelve of CMP’s worst performing circuits and
incorporates all three programs in a holistic plan.
CMP is requesting a increase in the 2020 operations and maintenance budget
to perform enhanced vegetation management on the initial twelve circuits. Once the initial
ground-to-sky clearing and more aggressive hazard tree removal has occurred on each
circuit, the vegetation management spend for subsequent five-year cycle trims will revert
to historical levels. This reduced level of funding is expected to be sufficient to maintain the
enhanced clearing levels and continue to realize the benefits from the resiliency plan.
CMP will also invest $25.7 million ($8.2 million in 2019; $17.5 million in 2020) in hardening,
automation, and topology for the initial twelve circuits. The initial circuit plans will be
updated based on field assessments before final engineering is performed. The final step
will be project plans that are sufficiently detailed to procure construction materials and enter
into agreements with contractors. These detailed project plans are the culmination of a
process that is designed to maximize the value per dollar of investment on each circuit.
CMP will separately record and track the costs associated with its Resiliency Plan.2
2 Accounts have been established to track resiliency expenditures.
Exhibit OAR-REB-3Docket No. 2018-00194
Page 4 of 125
12 / April / 2019
CMP Resiliency Plan
Central Maine Power Company Page 3 of 38
CMP has also preliminarily identified investments for the 101 worst-performing circuits for
the 2021-2028 period and will update its Resiliency Plan every year as part of CMP’s annual
capital planning process. The Resiliency Plan will be provided to the Commission, Staff, and
other stakeholders whenever CMP makes a rate filing. These updates will provide CMP with
the flexibility required to adjust the Resiliency Plan in response to changing circumstances
and incorporate lessons learned from CMP’s experience, the experience of its utility affiliates
throughout AVANGRID and Iberdrola, and industry insights. CMP collects outage
information each year that will form the basis for forensic analysis of each resiliency
program, and the collection of all resiliency programs on the circuits that have been
addressed to date. For example, data on outages caused by hazard trees outside of the
right-of-way will help CMP refine the anticipated benefits from hazard tree removal.
CMP retained Nexant to perform a Benefit-Cost Analysis (BCA) of the 2019-2020 Resiliency
Plan. The BCA is a forward-looking analysis that typically compares the up-front costs of a
discretionary investment with the net present value (NPV) of benefits that accrue over
multiple years.3 Nexant applied a “societal” perspective including the value to customers
from fewer and shorter outages (“avoided interruption costs”) and CMP’s avoided
restoration, avoided vegetation management, and avoided pole replacement costs. The
results of this analysis are summarized in Figure 1 on the following page.
3 The BCA is an important consideration when evaluating a resiliency program. A resiliency program differs
in important ways from a program that is optional and not required to provide safe, reliable service (e.g. a
new Energy Efficiency program) or an investment that performs an existing function in a new way (e.g., a Smart Meter investment). The decision to invest in resiliency is more akin to replacing aging infrastructure and involves a broader consideration of the public interest, with the BCA serving as one of many decision factors.
Exhibit OAR-REB-3 Docket No. 2018-00194
Page 5 of 125
12 / April / 2019
CMP Resiliency Plan
Central Maine Power Company Page 4 of 38
Figure 1. Net Present Value of 2019-2020 Resiliency Costs and Benefits
As shown above, the NPV of benefits ($84.6 million over the 30-year period ending 2049)
exceed the NPV of costs ($30.3 million) by $54.3 million for a BCA ratio of 2.8. Avoided
interruption costs ($78.6 million) account for the overwhelming majority of NPV benefits.
Enhanced vegetation management is estimated to produce $49.5 million of avoided
interruption costs; the combination of topology changes and enhanced automation that will
reduce restoration times on the twelve circuits is estimated to contribute $27.9 million to
avoided interruption costs.
CMP’s Resiliency Plan will improve the resiliency of CMP’s distribution network, reducing the
number of outages from any cause, including storms of all types and sizes. Our plan will
enable CMP to restore power more quickly when there are outages. The number of storms
and other outages over the past decade support the conclusion that has been reached by
Exhibit OAR-REB-3Docket No. 2018-00194
Page 6 of 125
12 / April / 2019
CMP Resiliency Plan
Central Maine Power Company Page 5 of 38
CMP’s customers and public officials: there is a lot of work to be done to improve the
resiliency of the distribution system and it should begin now. CMP has already taken steps
to enhance resiliency by adopting hardening guidelines that will increase the ability of the
network to withstand storms. CMP is prepared to implement more aggressive trimming
practices and change the configuration of the network. We plan to phase these efforts in
over a decade or longer in order to balance any increase in costs with increased benefits to
customers.
Exhibit OAR-REB-3Docket No. 2018-00194
Page 7 of 125
12 / April / 2019
CMP Resiliency Plan
Central Maine Power Company Page 6 of 38
Introduction
On October 15, 2018, CMP submitted Operations and Capital Investment testimony in its
2018 rate case (Docket No. 2018-00194), along with Exhibit CAP-3 which presented CMP’s
Capital Resiliency Plan. CMP has been working over the past nine months to develop a more
rigorous, circuit-specific analysis that is documented in this updated plan. This report
documents specific resiliency actions to be undertaken in 2019 and 2020 and includes a
Benefit-Cost Analysis (BCA).4
The Resiliency Plan responds to the number of storms of all types and severity that CMP
has experienced over the past decade. There is also an emerging point of view among
customers, legislators, and the Commission that CMP should enhance the resiliency of our
electric distribution system in response to this experience and to prepare for the potential
that Maine will experience more intense and more frequent storms. In response to the
October 30, 2017 wind and rain storm, the Legislature directed the Commission to prepare
a report addressing two issues that relate directly to resiliency:
1) whether investor-owned T&D utilities are doing enough to strengthen their systems
given what appears to be an increase in high-intensity storm events; and
2) whether it is in the ratepayers’ interest to require T&D utilities to strengthen and
protect their systems.5
The Commission filed its report on February 1, 2019, noting that it would not be appropriate
to comment on these issues because they are being addressed in the current rate case
docket.6 Indeed, these two issues are addressed in this Resiliency Plan. CMP is elevating
the priority given to resiliency as part of its distribution planning process and annual capital
budgeting decisions.
The Resiliency Plan proposes a set of targeted investments to supplement historical efforts
to address resiliency along with other distribution system planning goals. We start the
discussion of resiliency in Section 2 by defining “resiliency” and how it differs from
4 The Plan is responsive to the August 8, 2019 Procedural Order requests in Docket 2017-00324 and to inquiries that have been made by Staff and interveners during the rate case discovery phase and the December 7, 2018 technical conference. Reference: Docket No. 2018-00194, Data Requests EXM-002-050, EXM-002-051, and EXM-002-069 dated November 26, 2018.
5 An Act to Restore Confidence in Utility Billing Systems, P.L. 2017, c. 448 (Act), Section 4. 6 Maine Public Utilities Commission, “Report Related to Public Law 2017, Chapter 448”, presented to the Joint
Standing Committee on Energy, Utilities, and Technology, February 1, 2019, at p. 6.
Exhibit OAR-REB-3Docket No. 2018-00194
Page 8 of 125
12 / April / 2019
CMP Resiliency Plan
Central Maine Power Company Page 7 of 38
“reliability”. Section 3 describes many actions that CMP plans to take to enhance resiliency
and how each action either helps to reduce the number of outages during major storms or
helps to restore power more quickly to customers that are impacted. CMP groups these
actions into three categories or “programs”. The first two categories, enhanced vegetation
management and hardening of the existing infrastructure, increase the ability of the system
to withstand intense storms and thereby reduce the number of outages. The third category,
changes to the configuration of CMP’s distribution network or “topology” along with
investments in automation, enable CMP to isolate some outages to smaller areas and to
restore power more quickly.
Section 4 presents CMP’s ten-year (2019-2028) Resiliency Plan beginning with an
explanation of how CMP applied recent performance data to identify CMP’s 101 worst
performing circuits and then selected twelve of these circuits to address in 2019 and 2020.
CMP presents a detailed proposal for each of these twelve circuits comprised of a collection
of actions in the three categories: enhanced vegetation management, infrastructure
hardening, and changes in topology with automation investments.
Section 5 summarizes the BCA prepared by Nexant. CMP’s conclusions and
recommendations are presented in Section 6.
Exhibit OAR-REB-3 Docket No. 2018-00194
Page 9 of 125
12 / April / 2019
CMP Resiliency Plan
Central Maine Power Company Page 8 of 38
Reliability and Resiliency
It is important to distinguish between the related goals of “reliability” and “resiliency” before
addressing utility actions to improve resiliency.
“Reliability” refers to the ability of an electric distribution utility to deliver the desired
quantity of quality power to all customers when needed. Reliability is typically measured
and reported for a specified period using a set of widely-accepted industry metrics. These
metrics include the average duration of experienced power interruptions (“CAIDI”), the
average number of interruptions per customer (“SAIFI”), and the average duration of
interruptions per customer in a year (“SAIDI”). The Companies measure CAIDI and SAIFI
both with and without storms.
While certain outages are caused by events beyond the control of the utility, e.g., vehicles
striking a utility pole, there are many actions that a utility can take to improve reliability,
reducing the probability that outages will occur under normal “blue-sky” weather conditions
and minor storms. CMP maintains a database that identifies the root causes for as many
outages as possible, including outages that occur during major storms. The Companies
utilize this data to identify actions that will improve reliability. These actions include
replacing equipment that has failed or is nearing the end of its useful life, trimming trees
around wires to prevent outages that occur by contact during strong winds, and protecting
facilities from intrusions by animals such as squirrels. CMP and other utilities also address
reliability by applying industry standards when designing and constructing new system
infrastructure. Actions that improve reliability may also contribute to improvements in
resiliency.
“Resiliency” focuses on (1) preventing and limiting the scope and impact of outages when
they occur, and (2) the ability to expediently restore power after a significant outage. Thus,
resiliency is both the ability of a system to withstand forces that could potentially cause
damage, as well as, the ability to limit the impact of and restore service when damage is
experienced. Resiliency pertains to all outages, including major storms.
Major storms often cause extended outages to large numbers of residential and business
customers, with consequent impacts on safety and welfare of communities and their
citizens. They may have large economic consequences as utilities work to repair and replace
damaged infrastructure in an effort to restore power to all customers as expediently as
Exhibit OAR-REB-3 Docket No. 2018-00194
Page 10 of 125
12 / April / 2019
CMP Resiliency Plan
Central Maine Power Company Page 9 of 38
possible.7 The increased attention on resiliency is attributable to the view that storms are
increasing in both intensity and frequency in recent years and that this trend will continue.
Storms vary significantly in terms of the nature and extent of damage, and geographic
dispersion. CMP has experienced 48 “major storms” over the past decade.8 These include
ice storms, blizzards, heavy wet snow, lightning, heavy winds, heavy winds accompanied
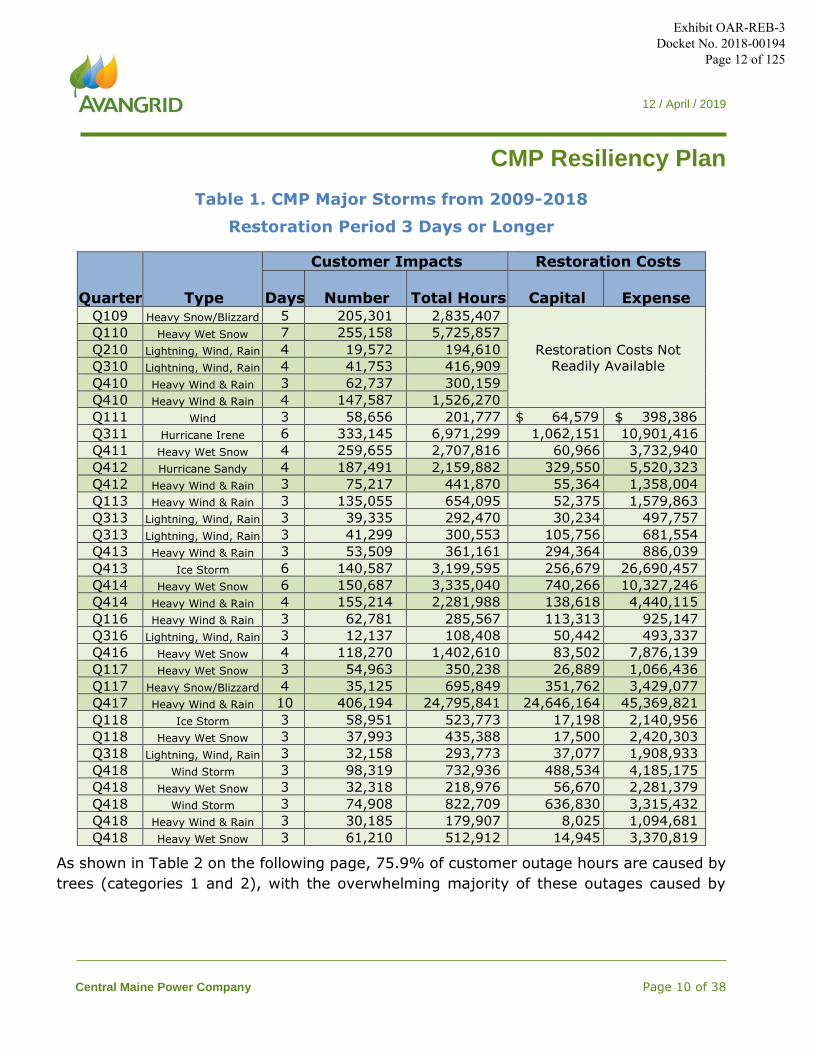
by rain, and hurricanes. As shown in Table 1 on the following page, 32 of these “major”
storms experienced restoration periods that lasted at least 3 days, with eight of these
storms occurring in 2018.
There were 16 other storms over this same period that were significant enough to be
categorized as major storms, contributing to an average of nearly 5 major storms per year.
Every one of these 48 storms took at least two days to restore power to every customer
causing, on average, over 88,000 customers to lose power. CMP’s Resiliency Plan also
targets improvements to reduce the damage and shorten the outage time required to
restore power after less severe storms. CMP has averaged 54 “minor storms”9 per year over
this same period, affecting an average of nearly 4,000 customers.
Each type of storm presents unique challenges to the resilience of the electric system. For
example, ice storms cover nearby tree limbs as well as wires and other electric
infrastructure with a coating of ice that can vary from one-quarter inch to over an inch.
Wires may be designed to withstand significant levels of ice accretion, but they remain
exposed to nearby ice-laden tree limbs falling across wires causing lines and connected
poles to snap. Heavy wet snow presents similar challenges but causes the most damage if
the storm hits during the late fall or early spring when trees are heavily foliated. Ice, heavy
snow and rain cause significantly more damage to electric infrastructure when accompanied
by sustained high winds and/or strong gusts.
7 The October 30, 2017 wind and rain storm caused outages to over 400,000 CMP customers, with power
restored to the last customer on November 7th. 8 Major storms are identified and qualified according to IEEE Standard 1366 (updated 2003) for reliability
reporting purposes. For financial tracking, CMP categorizes storms as Tier 3, 2 and 1 to establish the method of cost recovery under its storm cost recovery tariff mechanism. A Tier 3 storm results in incremental
recovery costs of at least $15 million; a Tier 2 storm results in incremental recovery costs of between $3.5 million and $15 million. As discussed in CMP’s October 15, 2018 Operations and Capital Investment testimony, CMP is proposing to redefine Tier 2 by reducing the lower bound to $1.5 million.
9 “Minor storms” are identified by CMP on an operating division basis when 4% or more of the customers are interrupted and the number of daily interruptions is 2x more than the average day. These impacts need to be caused from weather related interruptions.
Exhibit OAR-REB-3 Docket No. 2018-00194
Page 11 of 125
12 / April / 2019
CMP Resiliency Plan
Central Maine Power Company Page 10 of 38
Table 1. CMP Major Storms from 2009-2018
Restoration Period 3 Days or Longer
Quarter Type
Customer Impacts Restoration Costs
Days Number Total Hours Capital Expense Q109 Heavy Snow/Blizzard 5 205,301 2,835,407
Restoration Costs Not
Readily Available
Q110 Heavy Wet Snow 7 255,158 5,725,857
Q210 Lightning, Wind, Rain 4 19,572 194,610
Q310 Lightning, Wind, Rain 4 41,753 416,909
Q410 Heavy Wind & Rain 3 62,737 300,159
Q410 Heavy Wind & Rain 4 147,587 1,526,270
Q111 Wind 3 58,656 201,777 $ 64,579 $ 398,386
Q311 Hurricane Irene 6 333,145 6,971,299 1,062,151 10,901,416
Q411 Heavy Wet Snow 4 259,655 2,707,816 60,966 3,732,940
Q412 Hurricane Sandy 4 187,491 2,159,882 329,550 5,520,323
Q412 Heavy Wind & Rain 3 75,217 441,870 55,364 1,358,004
Q113 Heavy Wind & Rain 3 135,055 654,095 52,375 1,579,863
Q313 Lightning, Wind, Rain 3 39,335 292,470 30,234 497,757
Q313 Lightning, Wind, Rain 3 41,299 300,553 105,756 681,554
Q413 Heavy Wind & Rain 3 53,509 361,161 294,364 886,039
Q413 Ice Storm 6 140,587 3,199,595 256,679 26,690,457
Q414 Heavy Wet Snow 6 150,687 3,335,040 740,266 10,327,246
Q414 Heavy Wind & Rain 4 155,214 2,281,988 138,618 4,440,115
Q116 Heavy Wind & Rain 3 62,781 285,567 113,313 925,147
Q316 Lightning, Wind, Rain 3 12,137 108,408 50,442 493,337
Q416 Heavy Wet Snow 4 118,270 1,402,610 83,502 7,876,139
Q117 Heavy Wet Snow 3 54,963 350,238 26,889 1,066,436
Q117 Heavy Snow/Blizzard 4 35,125 695,849 351,762 3,429,077
Q417 Heavy Wind & Rain 10 406,194 24,795,841 24,646,164 45,369,821
Q118 Ice Storm 3 58,951 523,773 17,198 2,140,956
Q118 Heavy Wet Snow 3 37,993 435,388 17,500 2,420,303
Q318 Lightning, Wind, Rain 3 32,158 293,773 37,077 1,908,933
Q418 Wind Storm 3 98,319 732,936 488,534 4,185,175
Q418 Heavy Wet Snow 3 32,318 218,976 56,670 2,281,379
Q418 Wind Storm 3 74,908 822,709 636,830 3,315,432
Q418 Heavy Wind & Rain 3 30,185 179,907 8,025 1,094,681
Q418 Heavy Wet Snow 3 61,210 512,912 14,945 3,370,819
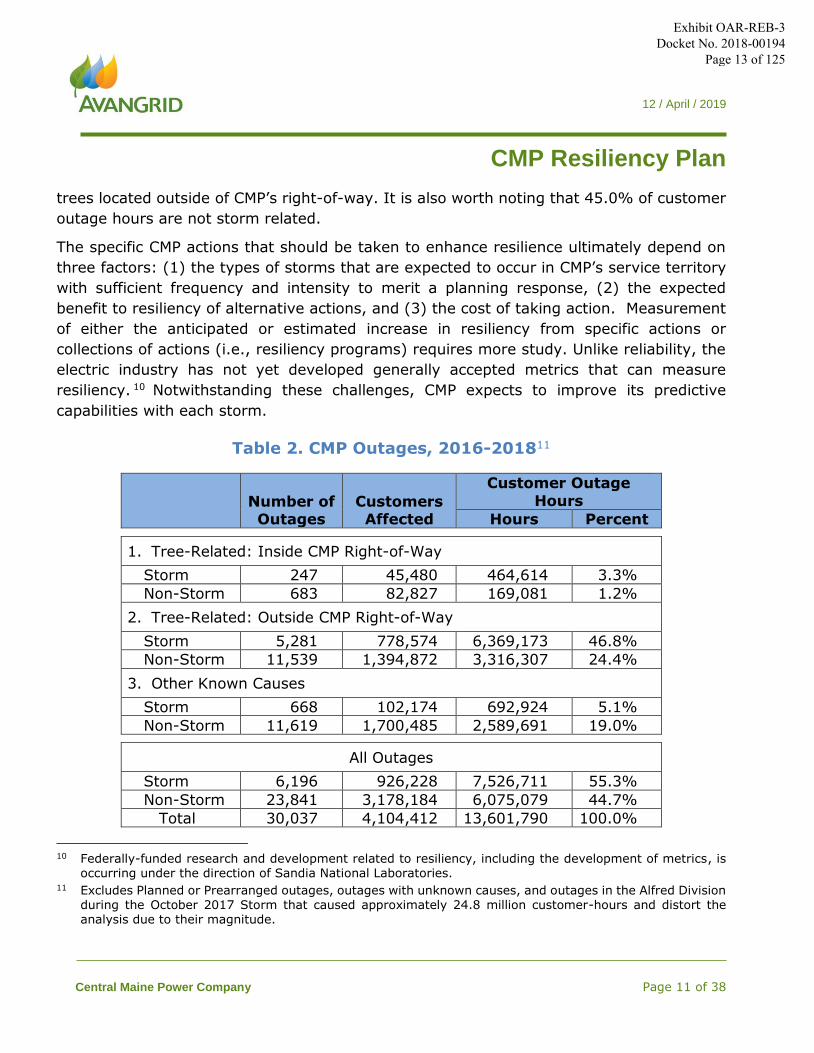
As shown in Table 2 on the following page, 75.9% of customer outage hours are caused by
trees (categories 1 and 2), with the overwhelming majority of these outages caused by
Exhibit OAR-REB-3Docket No. 2018-00194
Page 12 of 125
12 / April / 2019
CMP Resiliency Plan
Central Maine Power Company Page 11 of 38
trees located outside of CMP’s right-of-way. It is also worth noting that 45.0% of customer
outage hours are not storm related.
The specific CMP actions that should be taken to enhance resilience ultimately depend on
three factors: (1) the types of storms that are expected to occur in CMP’s service territory
with sufficient frequency and intensity to merit a planning response, (2) the expected
benefit to resiliency of alternative actions, and (3) the cost of taking action. Measurement
of either the anticipated or estimated increase in resiliency from specific actions or
collections of actions (i.e., resiliency programs) requires more study. Unlike reliability, the
electric industry has not yet developed generally accepted metrics that can measure
resiliency. 10 Notwithstanding these challenges, CMP expects to improve its predictive
capabilities with each storm.
Table 2. CMP Outages, 2016-201811
Number of Outages
Customers Affected
Customer Outage
Hours
Hours Percent
1. Tree-Related: Inside CMP Right-of-Way
Storm 247 45,480 464,614 3.3%
Non-Storm 683 82,827 169,081 1.2%
2. Tree-Related: Outside CMP Right-of-Way
Storm 5,281 778,574 6,369,173 46.8%
Non-Storm 11,539 1,394,872 3,316,307 24.4%
3. Other Known Causes
Storm 668 102,174 692,924 5.1%
Non-Storm 11,619 1,700,485 2,589,691 19.0%
All Outages
Storm 6,196 926,228 7,526,711 55.3%
Non-Storm 23,841 3,178,184 6,075,079 44.7%
Total 30,037 4,104,412 13,601,790 100.0%
10 Federally-funded research and development related to resiliency, including the development of metrics, is
occurring under the direction of Sandia National Laboratories. 11 Excludes Planned or Prearranged outages, outages with unknown causes, and outages in the Alfred Division
during the October 2017 Storm that caused approximately 24.8 million customer-hours and distort the analysis due to their magnitude.
Exhibit OAR-REB-3 Docket No. 2018-00194
Page 13 of 125
12 / April / 2019
CMP Resiliency Plan
Central Maine Power Company Page 12 of 38
Significant progress has been made regarding the actions that a utility can take to enhance
resiliency. As discussed in Section 3, these include enhanced vegetation management that
focuses on more aggressive clearances, decreasing the likelihood that large limbs and entire
trees will fall on wires or take down poles. They also include increasing industry standards
to harden infrastructure and changing the design of the distribution system to provide
alternative power paths by adding ties between circuits.
There is evidence that customer expectations with respect to both reliability and resiliency
are increasing.12 CMP expects that as the Maine economy becomes increasingly dependent
on electricity from transportation to end-user devices, outage duration and the effectiveness
of the utility’s response will be barometers for customer satisfaction.
The impact on the total cost of electricity will also impact how much is spent on resiliency
in the aggregate and how those expenditures are prioritized and spread out over time.
Customers implicitly weigh the value of enhanced resiliency against the cost of electricity.
12 August 8, 2019 Procedural Order requests in Docket 2017-00324.
Exhibit OAR-REB-3Docket No. 2018-00194
Page 14 of 125
12 / April / 2019
CMP Resiliency Plan
Central Maine Power Company Page 13 of 38
CMP Programs to Enhance Resiliency
This section describes CMP’s three programs to enhance resiliency:
Enhanced Vegetation Management;
Hardening; and
Topology, with Automation on prioritized circuits.
A. Enhanced Vegetation Management
Tree contact with electrical conductors and other facilities is the most common cause of
service interruptions in the United States. Maine, at 89%, has the highest percentage of
forest coverage of any state in the country.13 Although this is a statewide statistic, CMP is
certainly among the most forested electric service areas in the country, with over 22,000
miles of overhead primary lines in tree-covered areas. During the 2016-2018 period, 75.9%
of CMP classified outages were caused by trees or branches contacting electric
infrastructure.
CMP’s current tree-trimming program consists of the following elements:
- A five-year tree trimming cycle that includes vegetation pruning and tree removals,
including limited removal of trees outside of CMP’s right-of-way;
- Supplemental “hot-spot” pruning of faster growing vegetation species that would
otherwise encroach upon electric facilities if pruned on the five-year cycle; and
- Removal of hazard trees located outside of CMP’s right-of-way.14
As shown in Figure 2, the current clearance requirements are:
- Minimum of eight (8) feet of side clearance from the outside conductors;
- Minimum of fifteen (15) feet of overhead clearance from the highest electrical conductor; and
13 https://en.wikipedia.org/wiki/Forest_cover_by_state_and_territory_in_the_United_States 14 Hazard trees are dead, declining, weak, uprooted, storm damaged, diseased trees, or tree species known
to have a high failure rate that are located such that there is a high probability of the tree contacting the electrical conductors if the tree were to fall. CMP increased funding for hazard tree removal was approved in CMP’s last rate case (Docket No. 2013-00168).
Exhibit OAR-REB-3 Docket No. 2018-00194
Page 15 of 125

12 / April / 2019
CMP Resiliency Plan
Central Maine Power Company Page 14 of 38
- Minimum of ten (10) feet of clearance will be provided from the lowest
electrical conductor to any vegetation, when ground clearing is not permitted.
Figure 2. Current Tree-Trimming Clearances
While these clearance requirements have proven to be effective for reducing interruptions
within the clearance zone, an overwhelming percentage (94.6% from 2016-2018) of tree-
related interruptions have been caused by tree branches falling from above or outside of
the clearance zone. CMP arborists believe that many branches that do not fall during high
winds or a storm are sufficiently weakened such that they fall during subsequent milder
conditions.
The current tree removal policy states that:
All non-compatible tree species are removed within a minimum of 8 feet from
outside conductors15;
15 “Non-compatible” or “incompatible” tree species, as addressed in standards established by the Tree Care
Industry Association (A300, Part 7), are defined as trees with characteristics (e.g., species, growth rates, density, current height, location, and condition) that conflict with the intended use of the site (in this case, reliable electric distribution). This same source defines a hazard tree as, “A structurally unsound tree that could strike a target when it fails. As used here, the target of concern is electrical supply lines.”
Exhibit OAR-REB-3Docket No. 2018-00194
Page 16 of 125
12 / April / 2019
CMP Resiliency Plan
Central Maine Power Company Page 15 of 38
Large sturdy trees that do not pose a hazard to conductors can remain within the
right-of-way if side and overhead limbs have been removed, but removal of as
many trees as possible within the right-of-way is preferred; and
Trees that are beyond the road limits or outside the easement require landowner
permission to remove.
Unfortunately, as hazard trees are removed, existing healthy trees are reclassified as hazard
trees due to storm damage or natural tree decline. The recent appearance of the emerald
ash borer insect in York, Maine is killing ash trees within two or three years of infestation.
CMP’s proposed enhanced Vegetation Management Program has two components:
enhanced clearances and more aggressive tree removal.
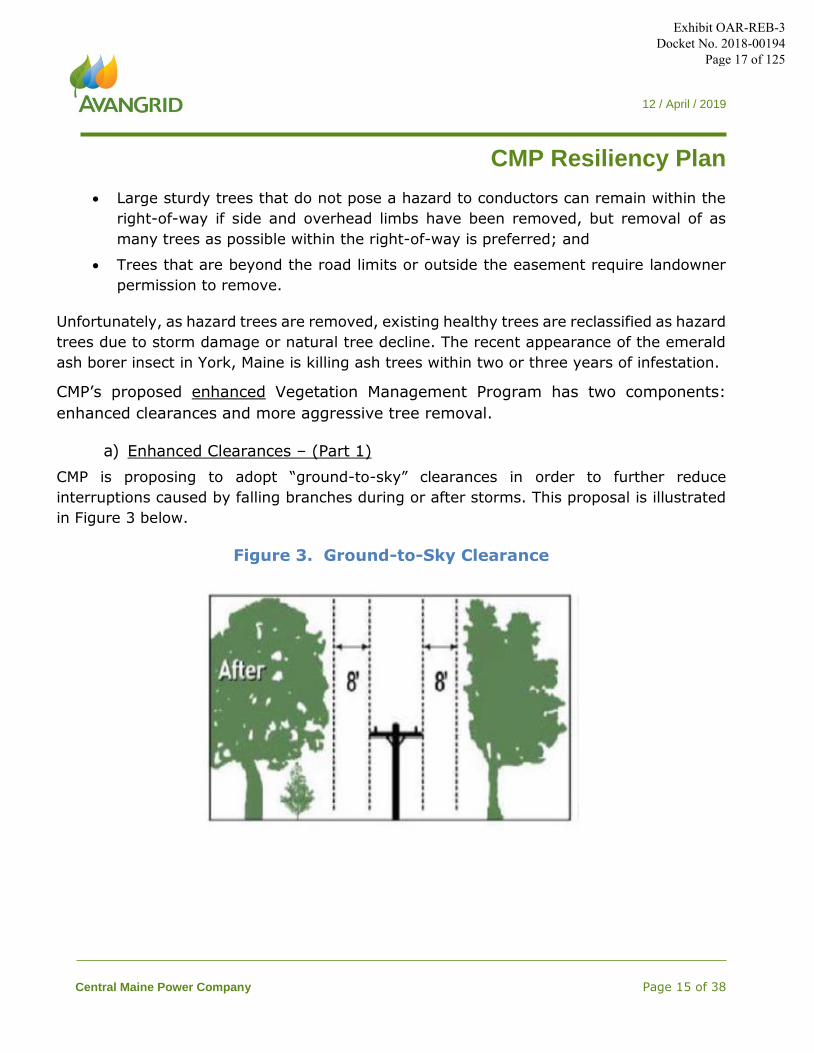
a) Enhanced Clearances – (Part 1)
CMP is proposing to adopt “ground-to-sky” clearances in order to further reduce
interruptions caused by falling branches during or after storms. This proposal is illustrated
in Figure 3 below.
Figure 3. Ground-to-Sky Clearance
Exhibit OAR-REB-3 Docket No. 2018-00194
Page 17 of 125
12 / April / 2019
CMP Resiliency Plan
Central Maine Power Company Page 16 of 38
b) Enhanced Tree Removal – (Part 2)
Despite an increase in funding for hazard tree removal in 2014, CMP is not able to keep
pace with the increasing number of hazard trees. In 2010, a CMP study indicated that there
were over 69,000 hazard trees on its system.
As an integral part of its Enhanced Vegetation
Management program, CMP proposes to increase the
2020 tree-trimming budget by to fund the
Enhanced Vegetation Management program with an
increased proportion of this funding applied to the
removal of hazard trees.
Increased spending on vegetation management will
improve reliability performance under blue-sky conditions and minor weather events, as
well as improving resiliency during major storms.
CMP will collect outage information each year that will form the basis for forensic analysis
of each resiliency program on the circuits that have been addressed to date. For example,
data on outages caused by hazard trees outside of the right-of-way will help CMP refine the
anticipated benefits from hazard tree removal.
B. Infrastructure Hardening
Hardening of existing system infrastructure will also reduce the number of outages. As
expressed by the Department of Energy:
Hardening refers to physically changing the infrastructure to make it less susceptible
to damage from extreme wind, flooding, or flying debris. Hardening improves the
durability and stability of energy infrastructure, making it better able to withstand
the impacts of hurricanes and weather events without sustaining major damage.16
Hardening of existing electric system infrastructure will reduce the number of outages. CMP
is addressing the hardening of infrastructure (e.g., poles, crossarms, wires, etc.) by
requiring the use of more robust construction practices and materials in compliance with
AVANGRID’s Distribution Resiliency Guide, attached as Appendix A. This guide also specifies
16 “Hardening and Resiliency: U.S. Energy Industry Response to Recent Hurricane Seasons”, Infrastructure
Security and Energy Restoration Office of Electricity Delivery and Energy Reliability U.S. Department of Energy, August 2010, p. v.
Proven Results
More aggressive tree-trimming
procedures have proven to yield
results. The adoption of a five-year
cycle in 2009 has resulted in a 17%
decline in SAIFI from 2004-2008 to
the most recent five-year period for
which data is available (2013-2017).
Exhibit OAR-REB-3 Docket No. 2018-00194
Page 18 of 125
12 / April / 2019
CMP Resiliency Plan
Central Maine Power Company Page 17 of 38
requirements for application of tree wire that replaces bare primary conductors with covered
conductors capable of withstanding temporary contact with tree branches. These updated
requirements are applicable to all construction activities in CMP’s service territory and not
only to the action being taken as part of CMP’s enhanced Resiliency Plan. All requirements
are compliant with the 2017 National Electrical Safety Code (NESC). These guidelines are
being implemented during 2019 as procurement contracts are revised to correspond to the
new requirements.
CMP will apply these requirements to all construction activities, including as an integrated
component of the holistic planning applied to the twelve circuits that comprise the 2019-
2020 Resiliency Plan. Hardening activities that are either accelerated (i.e., identified when
finalizing the project plan for a targeted circuit) or are identified for the first time as part of
a topology plan (e.g., new poles to reduce the distance between existing poles) are included
in the 2019-2020 Resiliency Plan; other hardening actions are included in CMP’s baseline
capital budget.
a) Pole Replacement
As specified in the Distribution Resiliency Guide, CMP replaces target poles that meet either
of the following two criteria:
Poles that have been in service for at least 75 years; and/or
Poles that fail inspections performed in accordance with CMP’s Distribution Line
Inspection (DLI) program.
Although there is a strong correlation between pole age and condition, the DLI program
supplements the 75-year criterion by identifying target poles that may be 40 or 50 years
old but have deficiencies that make them prone to failure. The DLI program is a thorough,
condition-based, inspection of all distribution equipment on each overhead structure. Any
equipment identified for repair or replacement is prioritized by criticality of failure and
subsequently remedied by the Company. Common issues include defective cross arms,
poles, cutouts, transformers, and insulators.
As an increased measure of efficiency, CMP’s DLI program is coordinated with the vegetation
management program. DLI inspections are conducted within a year of circuit tree trimming
and includes a quality check to ensure that tree trimming was performed in accordance with
contractual specifications. Any equipment, including target poles, that is identified for repair
or replacement is prioritized by criticality of failure and subsequently remedied by the
Company. Pole replacements are performed in compliance with the standards identified in
Exhibit OAR-REB-3 Docket No. 2018-00194
Page 19 of 125
12 / April / 2019
CMP Resiliency Plan
Central Maine Power Company Page 18 of 38
AVANGRID’s Distribution Resiliency Guide. CMP estimates that the annual increase in pole
replacement costs attributable to the stricter pole standards for new construction activities
is $370,000 for the entire service territory.
Pole replacements will be included as part of CMP’s 2019-2020 Resiliency Plan if they are
incremental to business-as-usual replacements. They will be identified during the detailed
engineering and project planning phase of the holistic plan for each of the twelve circuits or
if they are on the DLI list of target poles but have not yet been replaced.17 New poles may
be needed as part of a detailed circuit plan to accommodate guying wire, conductors, and
automation devices. All new poles will comply with the requirements in AVANGRID’s
Distribution Resiliency Guide.
b) Tree Wire
The application of tree wire will be required for all new construction projects under
AVANGRID’s Distribution Resiliency Guide. Tree wire will only be installed on a targeted
basis as part of CMP’s 2019-2020 Resiliency Plan and only if identified during the detailed
engineering and project planning phase as a prudent addition to the circuit-specific
resiliency plan. Thus, tree wire will be applied based on observed field conditions.
c) Selective Undergrounding
Undergrounding is the replacement of overhead primary electric wires with underground
cables. From a resiliency perspective, undergrounding makes the power lines less
susceptible to outages during high winds, thunderstorms, heavy snow, or ice storms. Many
communities express an interest in undergrounding because of the aesthetic benefits.
However, undergrounding of wire and associated infrastructure is often an expensive option
to construct. Undergrounding may be a viable option where common facilities support
multiple overhead circuits such as at substation gateways.
CMP has not included any undergrounding projects in its 2019-2020 Resiliency Plan,
although undergrounding will be considered as an option as the 2021-2028 plans are further
refined.
17 An initial estimate of poles that will need to be replaced for each circuit has been included in the BCA.
Exhibit OAR-REB-3 Docket No. 2018-00194
Page 20 of 125
12 / April / 2019
CMP Resiliency Plan
Central Maine Power Company Page 19 of 38
C. Changes in System and Circuit Topology, with Automation
A distribution system topology describes the configuration of infrastructure that comprises
the distribution system. CMP has a predominantly radial structure, characterized by a
design in which power is received at a substation from the transmission system and
distributed via three-phase or single-phase radial circuits to homes and businesses. The
challenge from a resiliency perspective is that CMP’s radial network is dominated by
relatively long circuits serving multiple communities. Given the miles of circuit exposure,
these circuits are prone to localized damages that impact many customers. This
circumstance is exacerbated during major storms when there are multiple damage sites
along a circuit.
CMP can enhance resiliency, including both the ability to limit the number of outages and
improve the speed of recovery by changing the topology through multiple strategies
including upgrading lines and enabling segmentation of circuits during outages to limit the
number of customers that are impacted by a particular outage. Segmentation is achieved
by adding and automating feeder ties that allow CMP to switch power flows around specific
outages and thereby reduce the number of “downstream” customers on a radial circuit that
would otherwise be impacted by an event. The investments that support these strategies
include upgrading and adding more circuits and lines, upgrading or adding substations, and
other investments that support desired outcomes. Providing alternative sources of power
by adding connected circuits also helps minimize outages.
As discussed in the next Section, CMP’s Resiliency Plan considers all of these options,
including their respective benefits and costs, and proposes the combination of options for
each circuit that is the most cost-effective solution while complying with distribution system
planning criteria. Topology changes work in concert with automated switches to facilitate
customer segmentation (fewer outages) and faster restoration by restoring power to as
many customers as possible before repairing the damage to the grid.
All topology related construction will be performed in accordance with the AVANGRID
Distribution Resiliency Guide and will comply with the material standards reported in the
Guide.
a) Upgraded and New Lines, Voltage Conversions, and Step Transformers
Upgrading existing lines to 3-phase or upgrading existing conductors enables CMP to
enhance feeder switching and to support the establishment of a new circuit. New lines,
combined with circuit breakers, allow CMP to establish a new circuit. They may increase tie
Exhibit OAR-REB-3 Docket No. 2018-00194
Page 21 of 125
12 / April / 2019
CMP Resiliency Plan
Central Maine Power Company Page 20 of 38
capabilities by connecting radial feeders. New lines may also enable CMP to transfer loads
or create a new tie point to an adjacent circuit. Voltage conversions enable power flows
between circuits as well as load transfers. Step transformers enable the connection of two
circuits with different voltages by either “stepping up” or “stepping down” the voltage. An
overriding objective of these investments is to strategically place additional circuit ties
between adjacent substations and circuits to add backup capacity and improve network
connectivity. This will be particularly effective at outlying locations that do not currently
have distribution ties to adjacent circuits. By adding circuit ties, alternate sources of supply
can be selected to restore customers that would otherwise be isolated.
b) Upgraded and New Substations
Upgraded and new substations, along with sub-transmission lines and circuit breakers,
enable to CMP to create new circuits reducing the outage exposure to customers located on
long circuits. They may also provide a second transmission feed into a substation to protect
against the loss of its single source of power.
c) Other Investments
When considering changes to the design of the network, distribution planners must assess
the performance of reconfigured network and make investments that support desired
outcomes or continue to meet planning standards. Load transfers provide a low-cost
alternative by allowing CMP to switch a load from one circuit to another. Diesel generators
may also provide a local source of controllable generation when it is not cost-effective or
feasible to arrange a backup supply through other changes in topology.
d) Automation
Distribution and substation automation are an integral part of CMP’s Smart Grid initiative
and are integrated with the modified topology to enhance resiliency. Automation allows CMP
to measure and control power flows on distribution circuits. It is enabled by switches and
distribution reclosers, supported by telecommunications capabilities including remote
terminal unit (RTU) communications that connect these devices to CMP‘s control center,
and network infrastructure that CMP has classified as “topology” for purposes of the
Resiliency Plan including circuit breakers, voltage regulators, and capacitor banks.
CMP’s Resiliency Plan includes the accelerated deployment of two types of devices to enable
automation functions on circuits: distribution reclosers and SCADA switches. When
combined with changes to topology that enable circuit segmentation, this will allow CMP to
Exhibit OAR-REB-3Docket No. 2018-00194
Page 22 of 125

12 / April / 2019
CMP Resiliency Plan
Central Maine Power Company Page 21 of 38
deliver more granular fault isolation and alternate circuit feeds so that outages can be
constrained to smaller circuit segments (limiting the impact of an outage) and power
restored more quickly. This is consistent with CMP’s long-term automation goal to increase
the number of automated devices to support sectionalizing of customers along a circuit.
1. Distribution Reclosers
Automated reclosers, along with circuit breakers, are located on distribution poles that trip
to isolate a section of a feeder under fault conditions and thereby minimize the number of
customers without service. Since they act as smart circuit breakers, they have the capability
to restore power automatically in temporary fault situations. They also help protect utility
and customer equipment from damage. Automation of existing reclosers and the
accelerated addition of new reclosers will help reduce fault location time and reduce
restoration time after the damage has been repaired.
2. SCADA Switches with Fault Detectors
Along with reclosers, automated switches help operators further isolate an outage by
opening and closing switches to serve an undamaged section with unaffected adjacent
feeders and continue to serve these customers.
The automation and topology investments result in smaller customer sections along the
circuits and in the case of the ties, fewer sections subject to outages along the circuit
affected by a line fault. These changes result in fewer customers being impacted by the
outages created by line faults. As a result, customer outage hours per year decline.
Exhibit OAR-REB-3Docket No. 2018-00194
Page 23 of 125
12 / April / 2019
CMP Resiliency Plan
Central Maine Power Company Page 22 of 38
CMP’s 2019-2020 Resiliency Plan
This section presents CMP’s plan to apply the three resiliency programs in a holistic manner
to twelve of CMP’s worst performing circuits.
CMP’s 2019-2020 Resiliency Plan reflects a balance between the desire of our customers
for increased resiliency and the need to maintain affordable rates for electric distribution
service. It is an “enhanced” resiliency plan because it identifies incremental actions that can
be taken by CMP to improve resiliency.18 Thus, the vegetation management activities and
investments in hardening, topology, and automation are incremental to actions that are
already reflected in CMP’s existing vegetation management program and in the capital
budgeting process.
Approach
Step 1: Identify and Rank the Worst Performing Circuits
CMP determined that it was appropriate to focus on its worst performing circuits19, as
measured by weighted SAIFI, calculated to include performance during major storms.20
After ranking all 475 distribution circuits, CMP eliminated circuits with an individual SAIFI
below 1.80 in blue sky conditions and below 2.0 under Major Storm conditions, leaving 101
“worst performing circuits”. These 101 circuits are responsible for approximately 55% of
the SAIFI under Major Storm conditions, representing 47% of SAIFI for the system. As part
of this exercise, CMP compiled data on the number and causes of outages and total outage
hours experienced by customers on each circuit to inform the development of a circuit-
specific plan.
Step 2: Determining a Cost-Effective Plan for each Circuit
CMP established a cost-effective plan for each of the 101 circuits that reflects a combination
of actions in the three categories: vegetation management, hardening, and topology, with
automation. The cost-effective plan starts with an understanding of existing circuit topology
and facilities. CMP’s distribution planners and field personnel are aware of past performance
18 CMP will separately track investments associated with this enhanced Resiliency Plan. 19 CMP has 475 distribution circuits. 20 SAIFI by circuit was calculated for a three-year period, 2015-2017, excluding the October 30, 2017 storm.
Exhibit OAR-REB-3Docket No. 2018-00194
Page 24 of 125

12 / April / 2019
CMP Resiliency Plan
Central Maine Power Company Page 23 of 38
issues on each circuit and these insights along with outage data informed their decisions as
to the holistic plan and specific investments for each circuit.
There are several steps to this process, but all circuit plans include enhanced vegetation
management as described in Section 3. CMP will allocate funding to perform enhanced
vegetation management activities on 3-phase facilities that are selected for resiliency
projects in each year. Any surplus funds will be directed to other circuits based on the circuit
reliability performance over the preceding three years.
In general, CMP examined topology and automation together, exploring opportunities to
install reclosers and SCADA switches as a first step. This is a relatively (compared to new
lines and substations) low-cost way to segment the circuit, creating the ability to
automatically isolate an outage that would otherwise impact large numbers of customers.21
Tree wire is planned for new construction activities where there is a high degree of likelihood
of tree contact.
New lines, substations, and selective undergrounding are the final options considered and
require longer planning lead times and have higher costs. It will be necessary to revisit
SCADA switches and recloser investments when evaluating these options.
Step 3: Identifying Circuits to be Addressed in 2019 and 2020
Mindful of potential rate impacts and recognizing the value of gaining initial experience as
part of a ramping up of resiliency investments, CMP determined that capital spending during
the initial two years of the Plan should be capped at $25.7 million in total: $8.2 million in
2019 and $17.5 million in 2020. Twelve circuits were selected to begin implementation
during the first two years. This decision was based on feasibility, cost, and value. For
example, it is not feasible to perform an upgrade to a substation or build a new substation
within the first two years because of the long lead time required to plan, design, and execute
these large, complex projects. Siting and building a new line is also challenging, depending
on the length of the line and location.
CMP developed cost estimates for each and every action and grouped them into circuit-
specific projects to capture management and construction efficiencies. Finally, the value of
a project can be estimated by applying assumptions as to how specific actions may improve
21 SCADA switches and reclosers cost between $50,000 and $75,000 per device, including a new pole.
Exhibit OAR-REB-3Docket No. 2018-00194
Page 25 of 125
12 / April / 2019
CMP Resiliency Plan
Central Maine Power Company Page 24 of 38
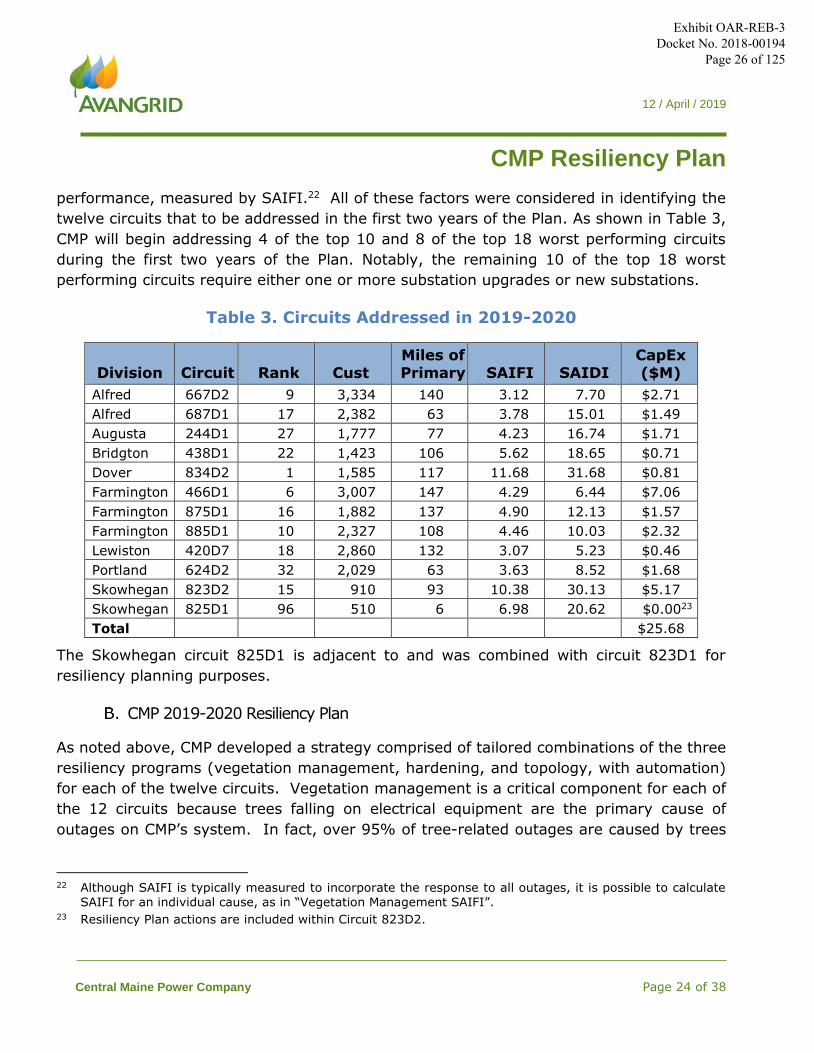
performance, measured by SAIFI.22 All of these factors were considered in identifying the
twelve circuits that to be addressed in the first two years of the Plan. As shown in Table 3,
CMP will begin addressing 4 of the top 10 and 8 of the top 18 worst performing circuits
during the first two years of the Plan. Notably, the remaining 10 of the top 18 worst
performing circuits require either one or more substation upgrades or new substations.
Table 3. Circuits Addressed in 2019-2020
Division Circuit Rank Cust Miles of Primary SAIFI SAIDI
CapEx ($M)
Alfred 667D2 9 3,334 140 3.12 7.70 $2.71
Alfred 687D1 17 2,382 63 3.78 15.01 $1.49
Augusta 244D1 27 1,777 77 4.23 16.74 $1.71
Bridgton 438D1 22 1,423 106 5.62 18.65 $0.71
Dover 834D2 1 1,585 117 11.68 31.68 $0.81
Farmington 466D1 6 3,007 147 4.29 6.44 $7.06
Farmington 875D1 16 1,882 137 4.90 12.13 $1.57
Farmington 885D1 10 2,327 108 4.46 10.03 $2.32
Lewiston 420D7 18 2,860 132 3.07 5.23 $0.46
Portland 624D2 32 2,029 63 3.63 8.52 $1.68
Skowhegan 823D2 15 910 93 10.38 30.13 $5.17
Skowhegan 825D1 96 510 6 6.98 20.62 $0.0023
Total $25.68
The Skowhegan circuit 825D1 is adjacent to and was combined with circuit 823D1 for
resiliency planning purposes.
CMP 2019-2020 Resiliency Plan
As noted above, CMP developed a strategy comprised of tailored combinations of the three
resiliency programs (vegetation management, hardening, and topology, with automation)
for each of the twelve circuits. Vegetation management is a critical component for each of
the 12 circuits because trees falling on electrical equipment are the primary cause of
outages on CMP’s system. In fact, over 95% of tree-related outages are caused by trees
22 Although SAIFI is typically measured to incorporate the response to all outages, it is possible to calculate SAIFI for an individual cause, as in “Vegetation Management SAIFI”.
23 Resiliency Plan actions are included within Circuit 823D2.
Exhibit OAR-REB-3Docket No. 2018-00194
Page 26 of 125
12 / April / 2019
CMP Resiliency Plan
Central Maine Power Company Page 25 of 38
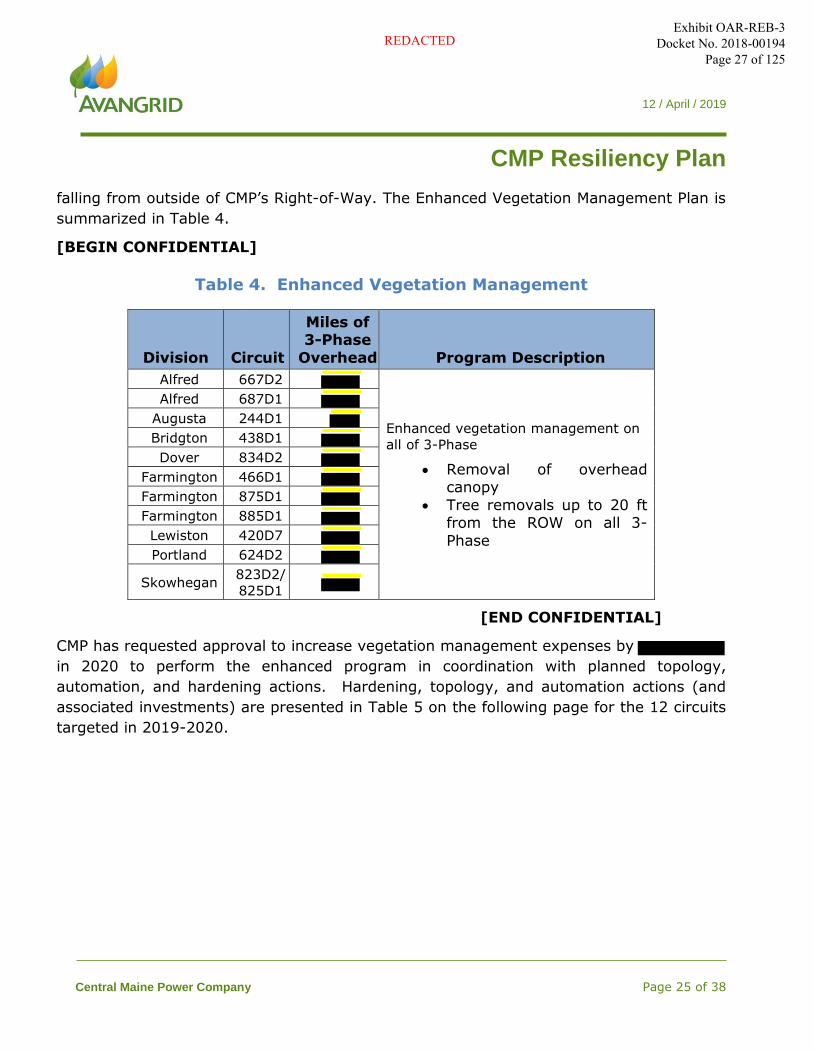
falling from outside of CMP’s Right-of-Way. The Enhanced Vegetation Management Plan is
summarized in Table 4.
[BEGIN CONFIDENTIAL]
Table 4. Enhanced Vegetation Management
Division Circuit
Miles of 3-Phase
Overhead Program Description
Alfred 667D2
Enhanced vegetation management on
all of 3-Phase
Removal of overhead canopy
Tree removals up to 20 ftfrom the ROW on all 3-
Phase
Alfred 687D1
Augusta 244D1
Bridgton 438D1
Dover 834D2
Farmington 466D1
Farmington 875D1
Farmington 885D1
Lewiston 420D7
Portland 624D2
Skowhegan 823D2/
825D1
[END CONFIDENTIAL]
CMP has requested approval to increase vegetation management expenses by
in 2020 to perform the enhanced program in coordination with planned topology,
automation, and hardening actions. Hardening, topology, and automation actions (and
associated investments) are presented in Table 5 on the following page for the 12 circuits
targeted in 2019-2020.
Exhibit OAR-REB-3Docket No. 2018-00194
Page 27 of 125REDACTED
12 / April / 2019
CMP Resiliency Plan
Central Maine Power Company Page 26 of 38
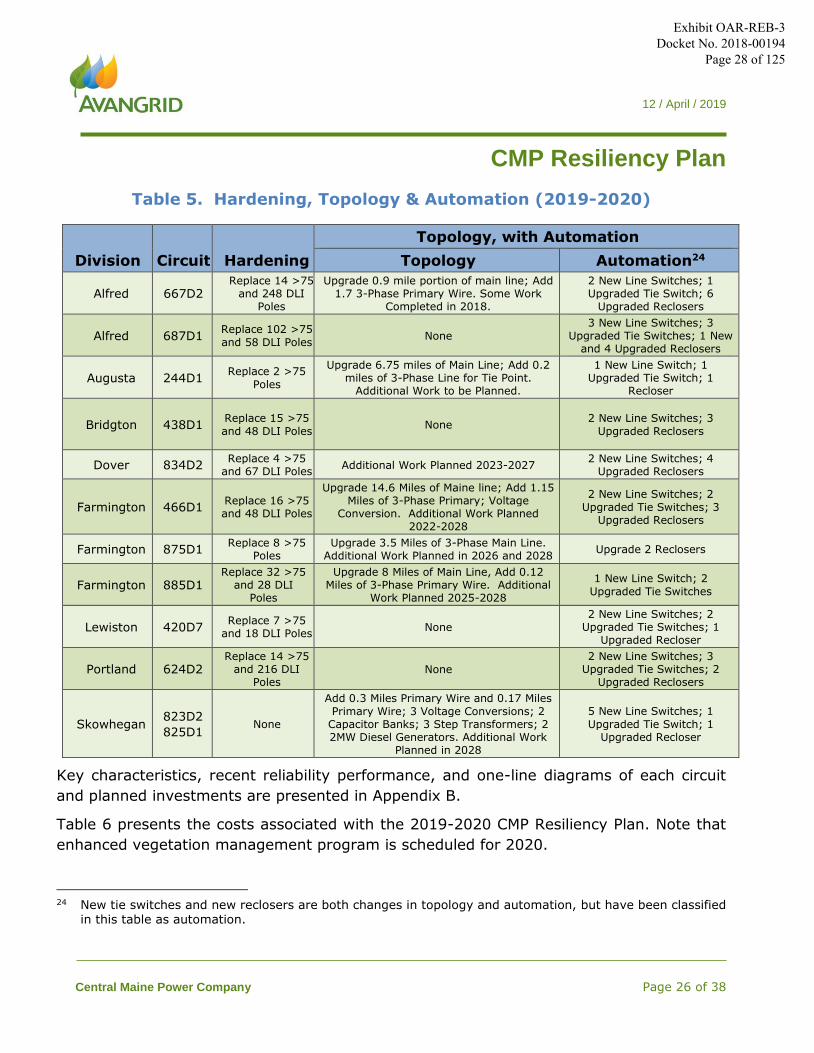
Table 5. Hardening, Topology & Automation (2019-2020)
Division Circuit Hardening
Topology, with Automation
Topology Automation24
Alfred 667D2 Replace 14 >75
and 248 DLI Poles
Upgrade 0.9 mile portion of main line; Add 1.7 3-Phase Primary Wire. Some Work
Completed in 2018.
2 New Line Switches; 1 Upgraded Tie Switch; 6
Upgraded Reclosers
Alfred 687D1 Replace 102 >75
and 58 DLI Poles None
3 New Line Switches; 3 Upgraded Tie Switches; 1 New
and 4 Upgraded Reclosers
Augusta 244D1 Replace 2 >75
Poles
Upgrade 6.75 miles of Main Line; Add 0.2 miles of 3-Phase Line for Tie Point.
Additional Work to be Planned.
1 New Line Switch; 1 Upgraded Tie Switch; 1
Recloser
Bridgton 438D1 Replace 15 >75
and 48 DLI Poles None
2 New Line Switches; 3
Upgraded Reclosers
Dover 834D2 Replace 4 >75
and 67 DLI Poles Additional Work Planned 2023-2027
2 New Line Switches; 4 Upgraded Reclosers
Farmington 466D1 Replace 16 >75 and 48 DLI Poles
Upgrade 14.6 Miles of Maine line; Add 1.15 Miles of 3-Phase Primary; Voltage
Conversion. Additional Work Planned 2022-2028
2 New Line Switches; 2
Upgraded Tie Switches; 3 Upgraded Reclosers
Farmington 875D1 Replace 8 >75
Poles Upgrade 3.5 Miles of 3-Phase Main Line.
Additional Work Planned in 2026 and 2028 Upgrade 2 Reclosers
Farmington 885D1 Replace 32 >75
and 28 DLI Poles
Upgrade 8 Miles of Main Line, Add 0.12 Miles of 3-Phase Primary Wire. Additional
Work Planned 2025-2028
1 New Line Switch; 2
Upgraded Tie Switches
Lewiston 420D7 Replace 7 >75
and 18 DLI Poles None
2 New Line Switches; 2 Upgraded Tie Switches; 1
Upgraded Recloser
Portland 624D2 Replace 14 >75
and 216 DLI Poles
None
2 New Line Switches; 3 Upgraded Tie Switches; 2
Upgraded Reclosers
Skowhegan 823D2
825D1 None
Add 0.3 Miles Primary Wire and 0.17 Miles
Primary Wire; 3 Voltage Conversions; 2 Capacitor Banks; 3 Step Transformers; 2 2MW Diesel Generators. Additional Work
Planned in 2028
5 New Line Switches; 1
Upgraded Tie Switch; 1 Upgraded Recloser
Key characteristics, recent reliability performance, and one-line diagrams of each circuit
and planned investments are presented in Appendix B.
Table 6 presents the costs associated with the 2019-2020 CMP Resiliency Plan. Note that
enhanced vegetation management program is scheduled for 2020.
24 New tie switches and new reclosers are both changes in topology and automation, but have been classified in this table as automation.
Exhibit OAR-REB-3Docket No. 2018-00194
Page 28 of 125
12 / April / 2019
CMP Resiliency Plan
Central Maine Power Company Page 27 of 38
Table 6. Expected Hardening, Topology & Automation Capital Costs ($M)
CMP 2021-2028 Resiliency Plan
Preliminary 2021-2028 plans for all 101 worst-performing circuits have been developed and
provide the current perspective as to CMP’s intentions with respect to the particular circuits
that will be addressed. Table 5 on the previous page indicates that additional work is
planned during this period for 7 of the initial twelve circuits. Substation investments will
begin planning and detailed engineering approximately 2 (substation upgrades) or 4 (new
substations) years before the planned in-service dates. All planned work for 2021-2022 will
be refined and included in our next two-year plan.
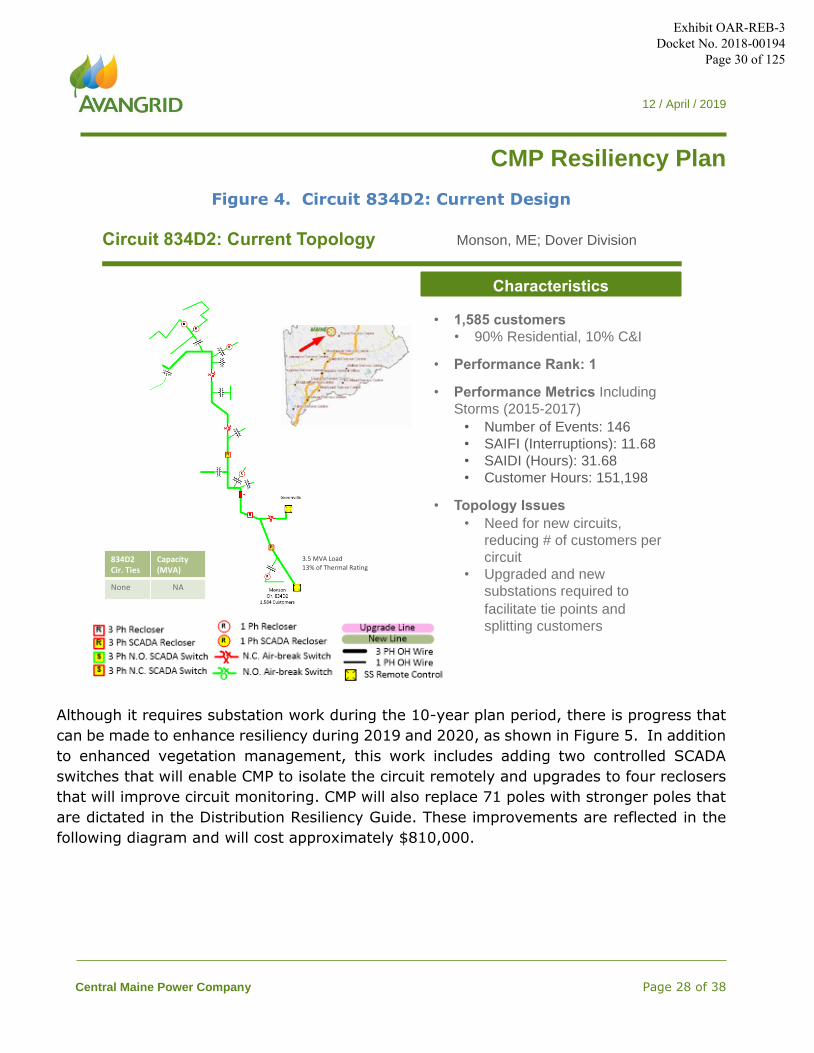
Circuit Plan Example: Circuit 834D2
As identified in the Figure 4 on the following page, Circuit 834D2 is CMP’s worst performing
circuit (Priority 1 out of 101) located in the northwest section of CMP’s service territory. The
average number of customer outage hours is 95 hours or approximately 30 hours a year.
The circuit needs investments in substations and new wires in order to create several
smaller circuit segments and thus reduce the number of customers affected by an outage
incident.
Exhibit OAR-REB-3Docket No. 2018-00194
Page 29 of 125
12 / April / 2019
CMP Resiliency Plan
Central Maine Power Company Page 28 of 38
Figure 4. Circuit 834D2: Current Design
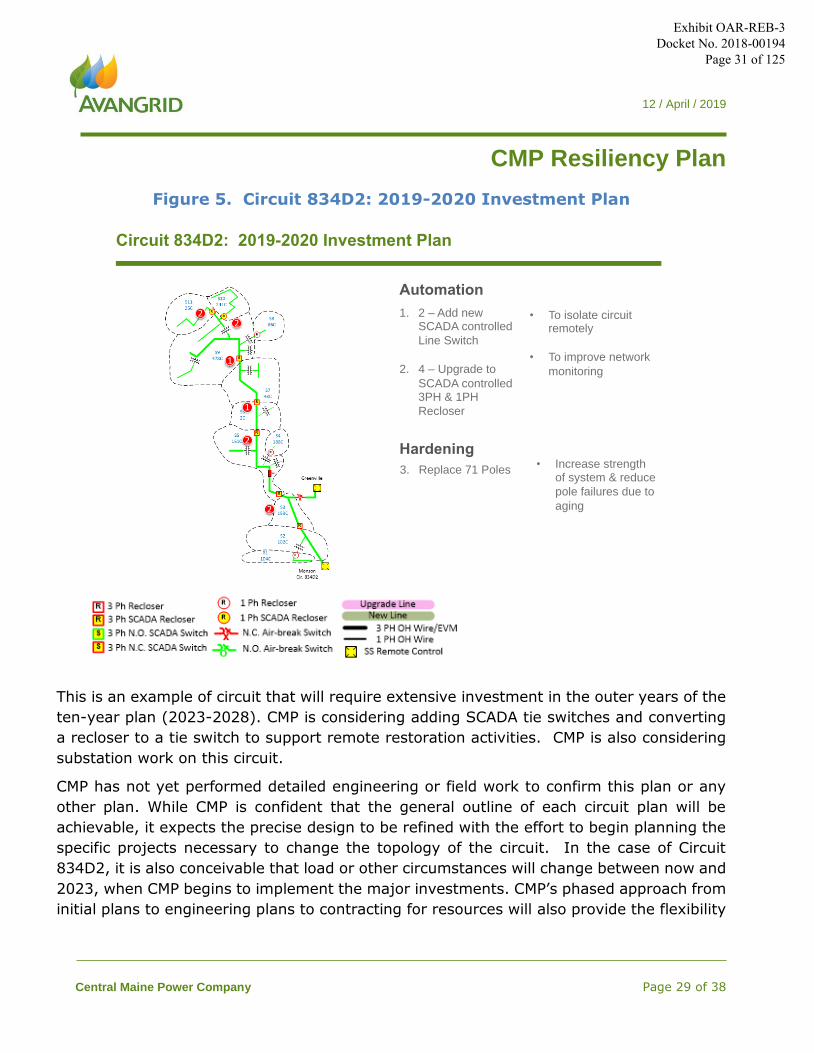
Although it requires substation work during the 10-year plan period, there is progress that
can be made to enhance resiliency during 2019 and 2020, as shown in Figure 5. In addition
to enhanced vegetation management, this work includes adding two controlled SCADA
switches that will enable CMP to isolate the circuit remotely and upgrades to four reclosers
that will improve circuit monitoring. CMP will also replace 71 poles with stronger poles that
are dictated in the Distribution Resiliency Guide. These improvements are reflected in the
following diagram and will cost approximately $810,000.
Circuit 834D2: Current Topology
834D2Cir. Ties
Capacity (MVA)
None NA
3.5 MVA Load
13% of Thermal Rating
Characteristics
• 1,585 customers
• 90% Residential, 10% C&I
• Performance Rank: 1
• Performance Metrics Including
Storms (2015-2017)
• Number of Events: 146
• SAIFI (Interruptions): 11.68
• SAIDI (Hours): 31.68
• Customer Hours: 151,198
• Topology Issues
• Need for new circuits,
reducing # of customers per
circuit
• Upgraded and new
substations required to
facilitate tie points and
splitting customers
Monson, ME; Dover Division
Exhibit OAR-REB-3Docket No. 2018-00194
Page 30 of 125
12 / April / 2019
CMP Resiliency Plan
Central Maine Power Company Page 29 of 38
Figure 5. Circuit 834D2: 2019-2020 Investment Plan
This is an example of circuit that will require extensive investment in the outer years of the
ten-year plan (2023-2028). CMP is considering adding SCADA tie switches and converting
a recloser to a tie switch to support remote restoration activities. CMP is also considering
substation work on this circuit.
CMP has not yet performed detailed engineering or field work to confirm this plan or any
other plan. While CMP is confident that the general outline of each circuit plan will be
achievable, it expects the precise design to be refined with the effort to begin planning the
specific projects necessary to change the topology of the circuit. In the case of Circuit
834D2, it is also conceivable that load or other circumstances will change between now and
2023, when CMP begins to implement the major investments. CMP’s phased approach from
initial plans to engineering plans to contracting for resources will also provide the flexibility
Circuit 834D2: 2019-2020 Investment Plan
Automation
1. 2 – Add newSCADA controlled
Line Switch
2. 4 – Upgrade to
SCADA controlled3PH & 1PH
Recloser
• To isolate circuitremotely
• To improve network
monitoring
Hardening
3. Replace 71 Poles• Increase strength
of system & reduce
pole failures due to
aging
1
2
1
22
2
Exhibit OAR-REB-3Docket No. 2018-00194
Page 31 of 125
12 / April / 2019
CMP Resiliency Plan
Central Maine Power Company Page 30 of 38
needed to confirm the most optimal solutions and achieve engineering and construction
efficiencies.
Exhibit OAR-REB-3Docket No. 2018-00194
Page 32 of 125
12 / April / 2019
CMP Resiliency Plan
Central Maine Power Company Page 31 of 38
Benefit Cost Analysis
The BCA is a forward-looking analysis that typically compares the costs of an up-front
investment with the NPV of benefits that accrue over multiple years. Regulators are often
interested in a BCA when evaluating the costs of a new program (e.g. an energy efficiency
program or portfolio of programs), or a significant investment that provides new
functionality (e.g., a Smart Grid proposal). The Resiliency Plan represents incremental
upfront investments that improve CMP’s ability to deliver distribution service by focusing
directly on an attribute (resiliency) that is increasing in importance to customers and the
State of Maine.
The first decision in performing a BCA is to specify a perspective, which will then determine
the costs and benefits to be considered. For example, some BCAs focus narrowly on the
costs and benefits that accrue to the utility. As described in Appendix C, the BCA Report,
Nexant applies a broader “societal” perspective to CMP’s Resiliency Plan in order to capture
the external benefits that accrue to customers from fewer outages and faster restoration
times. The cost side of the equation is relatively straightforward and represented by the
increase in O&M costs attributable to the enhanced vegetation management program plus
up-front investment costs attributable to hardening, topology, and automation activities.
The total 2019-2020 investments by circuit are presented in Table 7 on the following page.
Benefits are attributable to three sources and accrue over the remainder of the 30-year
BCA period of analysis (2020-2049):
Avoided interruption costs represent the largest benefit stream. When
customers experience interruptions, they bear economic costs.25 The Resiliency
Plan investments are designed to reduce the frequency and duration of
interruptions and thus deliver an economic benefit to customers. To estimate the
value of the reduction in customer interruption costs associated with reductions in
outage frequency and duration, Nexant used the Interruption Cost Estimation (ICE)
Model that they developed in partnership with Lawrence Berkeley National
Laboratory (LBNL), for the U.S. Department of Energy (DOE).26
25 Note that the terms “outage” and “interruption” are used interchangeably in this report. 26 https://icecalculator.com/documentation
Exhibit OAR-REB-3Docket No. 2018-00194
Page 33 of 125

12 / April / 2019
CMP Resiliency Plan
Central Maine Power Company Page 32 of 38
Table 7. 2019-2020 Costs By Circuit
Avoided restoration costs are benefits from CMP restoring power to customers
less frequently due to fewer outages in future years. Restoration costs consist of
capital and O&M.
Avoided vegetation management costs are those which would be spent in the
absence of the Resiliency Plan on “standard,” non-enhanced vegetation
management (in the base case). The difference between the total proposed
investment expenditure and the base case costs is the incremental cost of the
resiliency investment.
Avoided pole replacement costs are those which would be spent on replacing
poles in the absence of the Resiliency Plan. The per-pole replacement costs are
$6,000, but the replacements are accelerated under the Plan.
In order to estimate benefits, it is necessary to define a base or reference case that
represents expected outcomes without the increase in vegetation management expenses
and hardening, topology, and enhanced automation capital investments attributable to the
Resiliency Plan. Nexant assumed that CMP’s outage experience during the most recent 3-
year period (2016-2018) would serve as the base case. CMP maintains an outage database
that tracks every outage by location, identifying the cause of the outage for as many
Exhibit OAR-REB-3Docket No. 2018-00194
Page 34 of 125
12 / April / 2019
CMP Resiliency Plan
Central Maine Power Company Page 33 of 38
outages as possible. Nexant collaborated with AVANGRID experts to estimate the
improvement in outage performance that can be expected for each circuit based on the
circuit-specific plans as described in Section 4 (with reference to Appendix B).
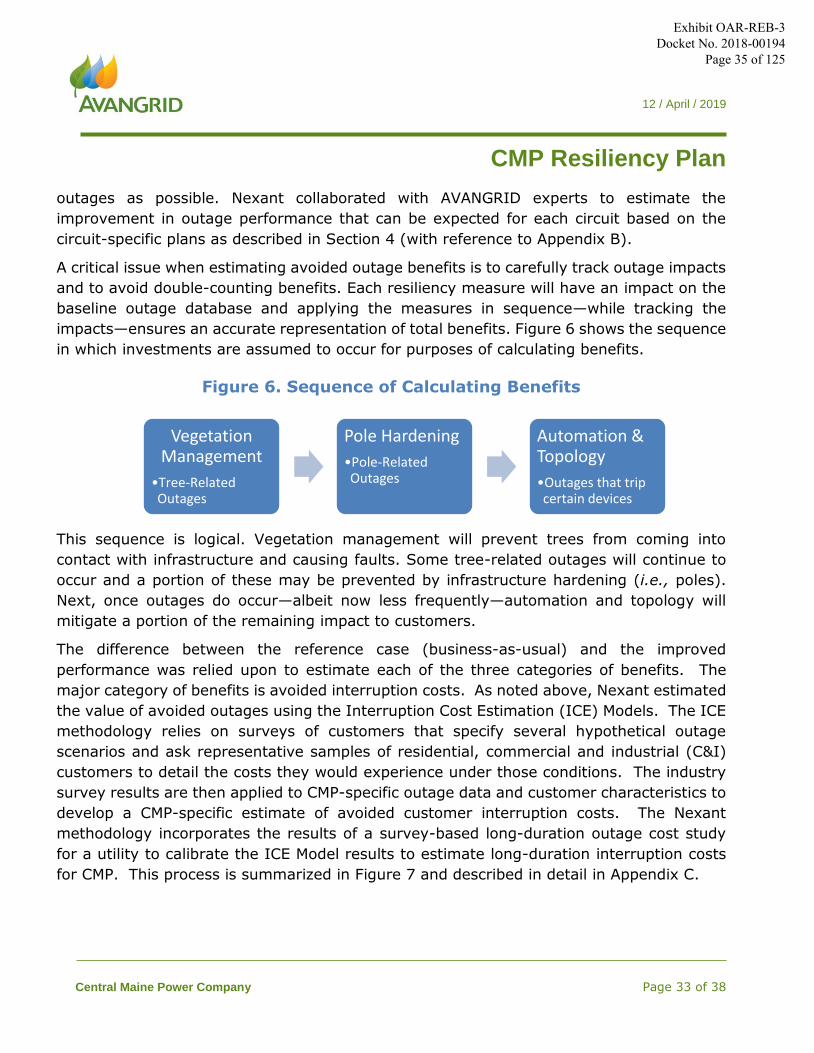
A critical issue when estimating avoided outage benefits is to carefully track outage impacts
and to avoid double-counting benefits. Each resiliency measure will have an impact on the
baseline outage database and applying the measures in sequence—while tracking the
impacts—ensures an accurate representation of total benefits. Figure 6 shows the sequence
in which investments are assumed to occur for purposes of calculating benefits.
Figure 6. Sequence of Calculating Benefits
This sequence is logical. Vegetation management will prevent trees from coming into
contact with infrastructure and causing faults. Some tree-related outages will continue to
occur and a portion of these may be prevented by infrastructure hardening (i.e., poles).
Next, once outages do occur—albeit now less frequently—automation and topology will
mitigate a portion of the remaining impact to customers.
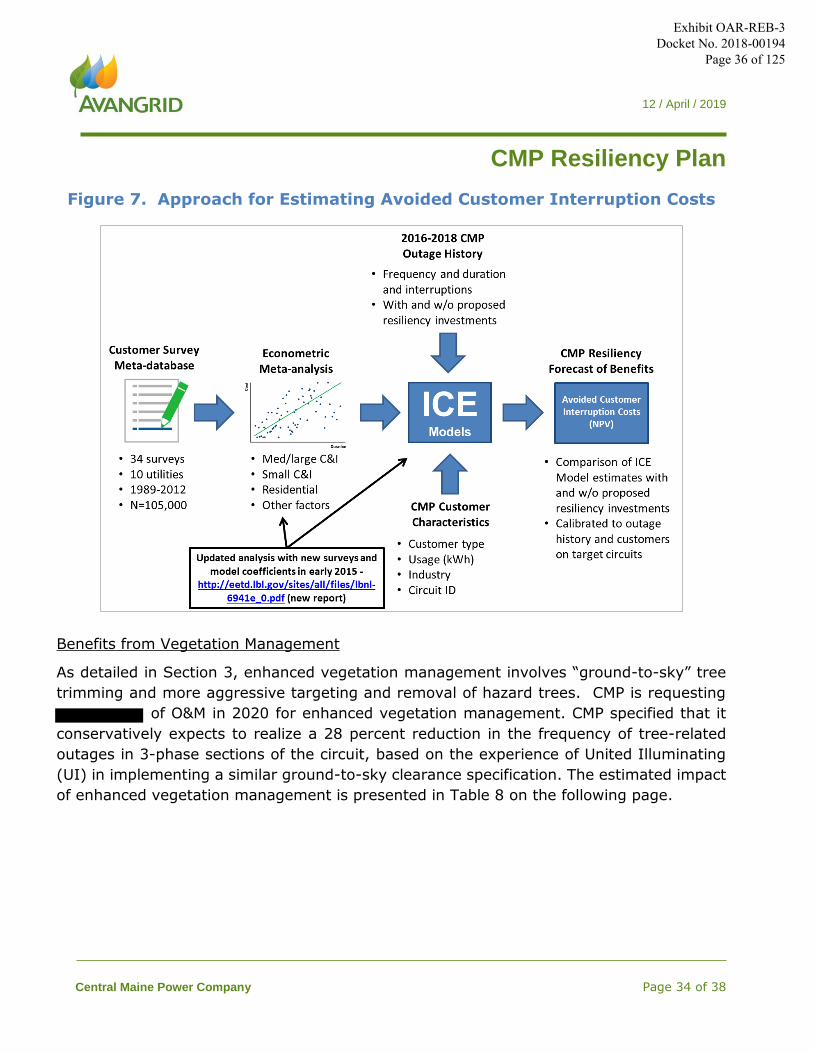
The difference between the reference case (business-as-usual) and the improved
performance was relied upon to estimate each of the three categories of benefits. The
major category of benefits is avoided interruption costs. As noted above, Nexant estimated
the value of avoided outages using the Interruption Cost Estimation (ICE) Models. The ICE
methodology relies on surveys of customers that specify several hypothetical outage
scenarios and ask representative samples of residential, commercial and industrial (C&I)
customers to detail the costs they would experience under those conditions. The industry
survey results are then applied to CMP-specific outage data and customer characteristics to
develop a CMP-specific estimate of avoided customer interruption costs. The Nexant
methodology incorporates the results of a survey-based long-duration outage cost study
for a utility to calibrate the ICE Model results to estimate long-duration interruption costs
for CMP. This process is summarized in Figure 7 and described in detail in Appendix C.
Vegetation Management
•Tree-RelatedOutages
Pole Hardening
•Pole-RelatedOutages
Automation & Topology
•Outages that tripcertain devices
Exhibit OAR-REB-3Docket No. 2018-00194
Page 35 of 125
12 / April / 2019
CMP Resiliency Plan
Central Maine Power Company Page 34 of 38
Figure 7. Approach for Estimating Avoided Customer Interruption Costs
Benefits from Vegetation Management
As detailed in Section 3, enhanced vegetation management involves “ground-to-sky” tree
trimming and more aggressive targeting and removal of hazard trees. CMP is requesting
of O&M in 2020 for enhanced vegetation management. CMP specified that it
conservatively expects to realize a 28 percent reduction in the frequency of tree-related
outages in 3-phase sections of the circuit, based on the experience of United Illuminating
(UI) in implementing a similar ground-to-sky clearance specification. The estimated impact
of enhanced vegetation management is presented in Table 8 on the following page.
Exhibit OAR-REB-3Docket No. 2018-00194
Page 36 of 125
12 / April / 2019
CMP Resiliency Plan
Central Maine Power Company Page 35 of 38
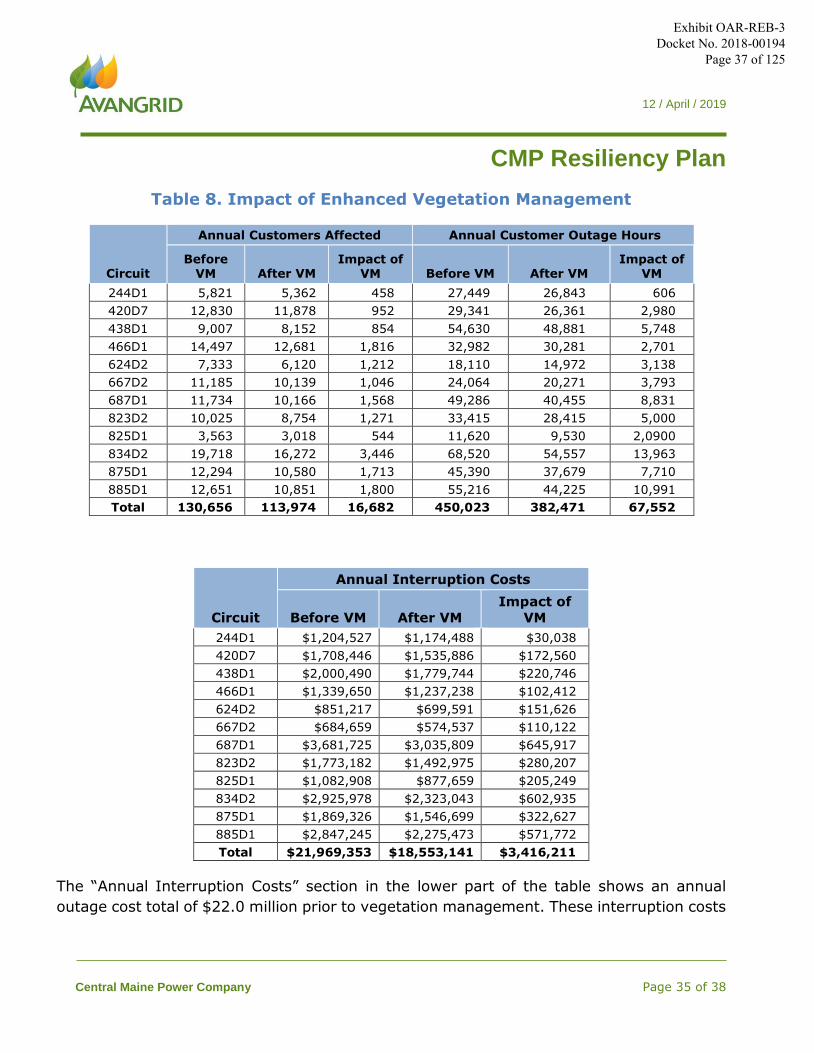
Table 8. Impact of Enhanced Vegetation Management
Circuit
Annual Customers Affected Annual Customer Outage Hours
Before VM After VM
Impact of VM Before VM After VM
Impact of VM
244D1 5,821 5,362 458 27,449 26,843 606
420D7 12,830 11,878 952 29,341 26,361 2,980
438D1 9,007 8,152 854 54,630 48,881 5,748
466D1 14,497 12,681 1,816 32,982 30,281 2,701
624D2 7,333 6,120 1,212 18,110 14,972 3,138
667D2 11,185 10,139 1,046 24,064 20,271 3,793
687D1 11,734 10,166 1,568 49,286 40,455 8,831
823D2 10,025 8,754 1,271 33,415 28,415 5,000
825D1 3,563 3,018 544 11,620 9,530 2,0900
834D2 19,718 16,272 3,446 68,520 54,557 13,963
875D1 12,294 10,580 1,713 45,390 37,679 7,710
885D1 12,651 10,851 1,800 55,216 44,225 10,991
Total 130,656 113,974 16,682 450,023 382,471 67,552
Circuit
Annual Interruption Costs
Before VM After VM
Impact of
VM
244D1 $1,204,527 $1,174,488 $30,038
420D7 $1,708,446 $1,535,886 $172,560
438D1 $2,000,490 $1,779,744 $220,746
466D1 $1,339,650 $1,237,238 $102,412
624D2 $851,217 $699,591 $151,626
667D2 $684,659 $574,537 $110,122
687D1 $3,681,725 $3,035,809 $645,917
823D2 $1,773,182 $1,492,975 $280,207
825D1 $1,082,908 $877,659 $205,249
834D2 $2,925,978 $2,323,043 $602,935
875D1 $1,869,326 $1,546,699 $322,627
885D1 $2,847,245 $2,275,473 $571,772
Total $21,969,353 $18,553,141 $3,416,211
The “Annual Interruption Costs” section in the lower part of the table shows an annual
outage cost total of $22.0 million prior to vegetation management. These interruption costs
Exhibit OAR-REB-3Docket No. 2018-00194
Page 37 of 125
12 / April / 2019
CMP Resiliency Plan
Central Maine Power Company Page 36 of 38
decrease to $18.6 million after vegetation management, reflecting a $3.4 million annual
unadjusted benefit from enhanced vegetation management. Vegetation management also
contributes to an annual savings in avoided restoration costs of approximately $59,300.
Benefits from Hardening
The BCA also estimates the avoided interruption costs, restoration, and replacement costs
for hardening, after consideration of enhanced vegetation management. These annual
savings are estimated to be approximately $96,000.
Benefits from Automation and Topology
Finally, the BCA estimates the avoided interruption costs of $2,343,800 after consideration
of enhanced vegetation management. Automation and Topology investments do not impact
restoration or replacement costs because they accelerate the time of restoration but do not
reduce the amount of damage that is caused by a storm or other event.
Net Present Value of Costs and Benefits
The final step in the BCA is to discount all costs and benefits that occur in future years,
using CMP’s weighted average cost of capital of 7.06%.
The results of the BCA analysis are summarized in Figure 8 on the next page.
Exhibit OAR-REB-3Docket No. 2018-00194
Page 38 of 125
12 / April / 2019
CMP Resiliency Plan
Central Maine Power Company Page 37 of 38
Figure 8. Net Present Value of 2019-2020 Resiliency Costs and Benefits
As shown above, the NPV of benefits ($84.6 million over the 30-year period ending 2049)
exceed the NPV of costs ($30.3 million) by $54.3 million for a BCA ratio of 2.8. Avoided
interruption costs ($78.6 million) account for the overwhelming majority of NPV benefits.
Enhanced vegetation management is estimated to produce $49.5 million of avoided
interruption costs; the combination of topology changes and enhanced automation that will
reduce restoration times on the twelve circuits is estimated to contribute $27.9 million to
avoided interruption costs.
Exhibit OAR-REB-3Docket No. 2018-00194
Page 39 of 125
12 / April / 2019
CMP Resiliency Plan
Central Maine Power Company Page 38 of 38
Conclusion
CMP’s Resiliency Plan will improve the resiliency of CMP’s distribution network, reducing the
number of outages from any cause, including storms of all types and sizes. Our plan will
enable CMP to restore power more quickly when there are outages. The number of storms
and other outages over the past decade support the conclusion that has been reached by
CMP’s customers and public officials: there is a lot of work to be done to improve the
resiliency of the distribution system and it should begin now. CMP has already taken steps
to enhance resiliency by adopting hardening guidelines that will increase the ability of the
network to withstand storms. CMP is prepared to implement more aggressive trimming
practices and change the configuration of the network. We plan to phase these efforts in
over a decade or longer in order to balance any increase in costs with increased benefits to
customers.
Exhibit OAR-REB-3Docket No. 2018-00194
Page 40 of 125

Distribution
Resiliency
Guide
Up to 35 kV
Revision 0
Prepared by AVANGRID Distribution Standards
AVANGRID ENGINEERING
DISTRIBUTION CONSTRUCTION STANDARDS
AVANGRID Distribution Resiliency Guide Up to 35 kV
DSN: HL DR: HL Page 1 of 13
CK. MZ MACRO:
UPDATES TO STANDARD DRAWING AND MACROS APP. WHR NO. REV.
0 REV. DATE BY DESCRIPTION APP. DATE 03/07/19
Appendix A Exhibit OAR-REB-3
Docket No. 2018-00194Page 41 of 125
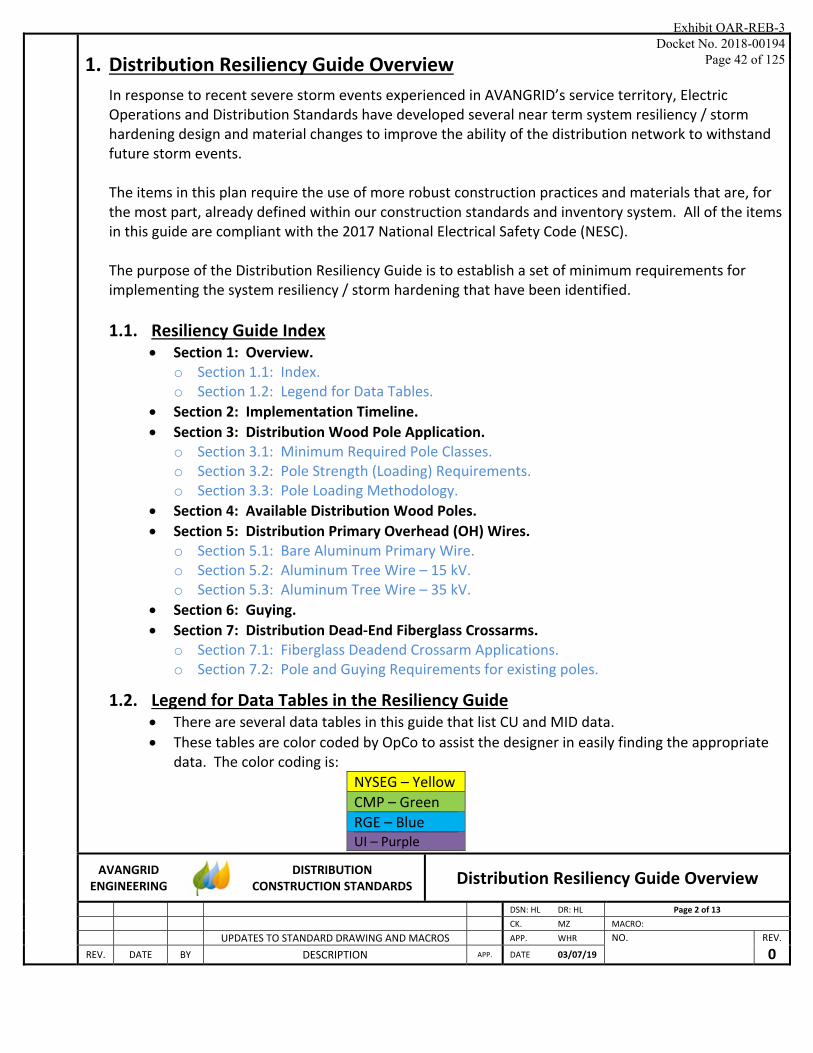
1. Distribution Resiliency Guide Overview
In response to recent severe storm events experienced in AVANGRID’s service territory, Electric Operations and Distribution Standards have developed several near term system resiliency / storm hardening design and material changes to improve the ability of the distribution network to withstand future storm events.
The items in this plan require the use of more robust construction practices and materials that are, for the most part, already defined within our construction standards and inventory system. All of the items in this guide are compliant with the 2017 National Electrical Safety Code (NESC).
The purpose of the Distribution Resiliency Guide is to establish a set of minimum requirements for implementing the system resiliency / storm hardening that have been identified.
1.1. Resiliency Guide Index Section 1: Overview.
o Section 1.1: Index.o Section 1.2: Legend for Data Tables.
Section 2: Implementation Timeline.
Section 3: Distribution Wood Pole Application.o Section 3.1: Minimum Required Pole Classes.o Section 3.2: Pole Strength (Loading) Requirements.o Section 3.3: Pole Loading Methodology.
Section 4: Available Distribution Wood Poles.
Section 5: Distribution Primary Overhead (OH) Wires.o Section 5.1: Bare Aluminum Primary Wire.o Section 5.2: Aluminum Tree Wire – 15 kV.o Section 5.3: Aluminum Tree Wire – 35 kV.
Section 6: Guying.
Section 7: Distribution Dead‐End Fiberglass Crossarms.o Section 7.1: Fiberglass Deadend Crossarm Applications.o Section 7.2: Pole and Guying Requirements for existing poles.
1.2. Legend for Data Tables in the Resiliency Guide There are several data tables in this guide that list CU and MID data.
These tables are color coded by OpCo to assist the designer in easily finding the appropriatedata. The color coding is:
NYSEG – Yellow
CMP – Green
RGE – Blue UI – Purple
AVANGRID ENGINEERING
DISTRIBUTION CONSTRUCTION STANDARDS Distribution Resiliency Guide Overview
DSN: HL DR: HL Page 2 of 13
CK. MZ MACRO:
UPDATES TO STANDARD DRAWING AND MACROS APP. WHR NO. REV.
0 REV. DATE BY DESCRIPTION APP. DATE 03/07/19
Exhibit OAR-REB-3Docket No. 2018-00194
Page 42 of 125
2. Distribution Resiliency Guide Implementation Timeline
Although the items in the Resiliency Guide typically utilize construction practices and materials that are already in use by AVANGRID, there will be a transition period including a number of steps that must be completed before the Resiliency Guide can be fully implemented.
These steps include:
Creating new Material IDs (MIDs) and Compatible Units (CUs) for certain tree wire and guyingmaterials.
Creating new or modified construction standards.
Reviewing the impact on existing Framework Agreements and adjusting accordingly.
Depleting existing inventory of materials being phased out.
Additionally, time will be required for suppliers and AVANGRID Logistics to adjust their inventories to support the items in the Resiliency Guide.
Work has already begun to complete the steps listed above.
In the interim, existing MIDs, CUs and construction standards will continue to be used in accordance with the resiliency criteria established in this guide.
Communications will be issued to all stakeholders whenever one of the prerequisite steps has been completed.
AVANGRID ENGINEERING
DISTRIBUTION CONSTRUCTION STANDARDS Resiliency Guide Implementation Timeline
DSN: HL DR: HL Page 3 of 13
CK. MZ MACRO:
UPDATES TO STANDARD DRAWING AND MACROS APP. WHR NO. REV.
0 REV. DATE BY DESCRIPTION APP. DATE 03/07/19
Exhibit OAR-REB-3Docket No. 2018-00194
Page 43 of 125
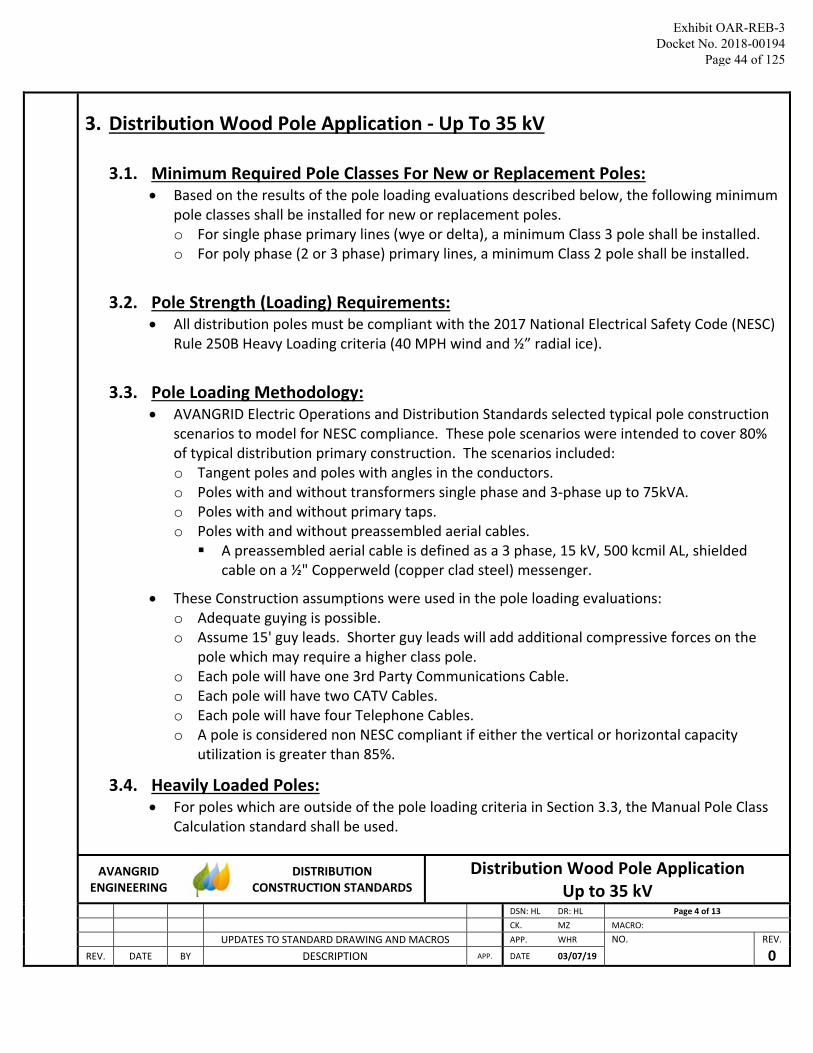
3. Distribution Wood Pole Application ‐ Up To 35 kV
3.1. Minimum Required Pole Classes For New or Replacement Poles: Based on the results of the pole loading evaluations described below, the following minimum
pole classes shall be installed for new or replacement poles. o For single phase primary lines (wye or delta), a minimum Class 3 pole shall be installed. o For poly phase (2 or 3 phase) primary lines, a minimum Class 2 pole shall be installed.
3.2. Pole Strength (Loading) Requirements: All distribution poles must be compliant with the 2017 National Electrical Safety Code (NESC)
Rule 250B Heavy Loading criteria (40 MPH wind and ½” radial ice).
3.3. Pole Loading Methodology: AVANGRID Electric Operations and Distribution Standards selected typical pole construction
scenarios to model for NESC compliance. These pole scenarios were intended to cover 80% of typical distribution primary construction. The scenarios included: o Tangent poles and poles with angles in the conductors. o Poles with and without transformers single phase and 3‐phase up to 75kVA. o Poles with and without primary taps. o Poles with and without preassembled aerial cables. A preassembled aerial cable is defined as a 3 phase, 15 kV, 500 kcmil AL, shielded
cable on a ½" Copperweld (copper clad steel) messenger.
These Construction assumptions were used in the pole loading evaluations: o Adequate guying is possible. o Assume 15' guy leads. Shorter guy leads will add additional compressive forces on the
pole which may require a higher class pole. o Each pole will have one 3rd Party Communications Cable. o Each pole will have two CATV Cables. o Each pole will have four Telephone Cables. o A pole is considered non NESC compliant if either the vertical or horizontal capacity
utilization is greater than 85%.
3.4. Heavily Loaded Poles: For poles which are outside of the pole loading criteria in Section 3.3, the Manual Pole Class
Calculation standard shall be used.
AVANGRID
ENGINEERING
DISTRIBUTION CONSTRUCTION STANDARDS
Distribution Wood Pole Application Up to 35 kV
DSN: HL DR: HL Page 4 of 13
CK. MZ MACRO:
UPDATES TO STANDARD DRAWING AND MACROS APP. WHR NO.
REV.
0 REV. DATE BY DESCRIPTION APP. DATE 03/07/19
Exhibit OAR-REB-3 Docket No. 2018-00194
Page 44 of 125
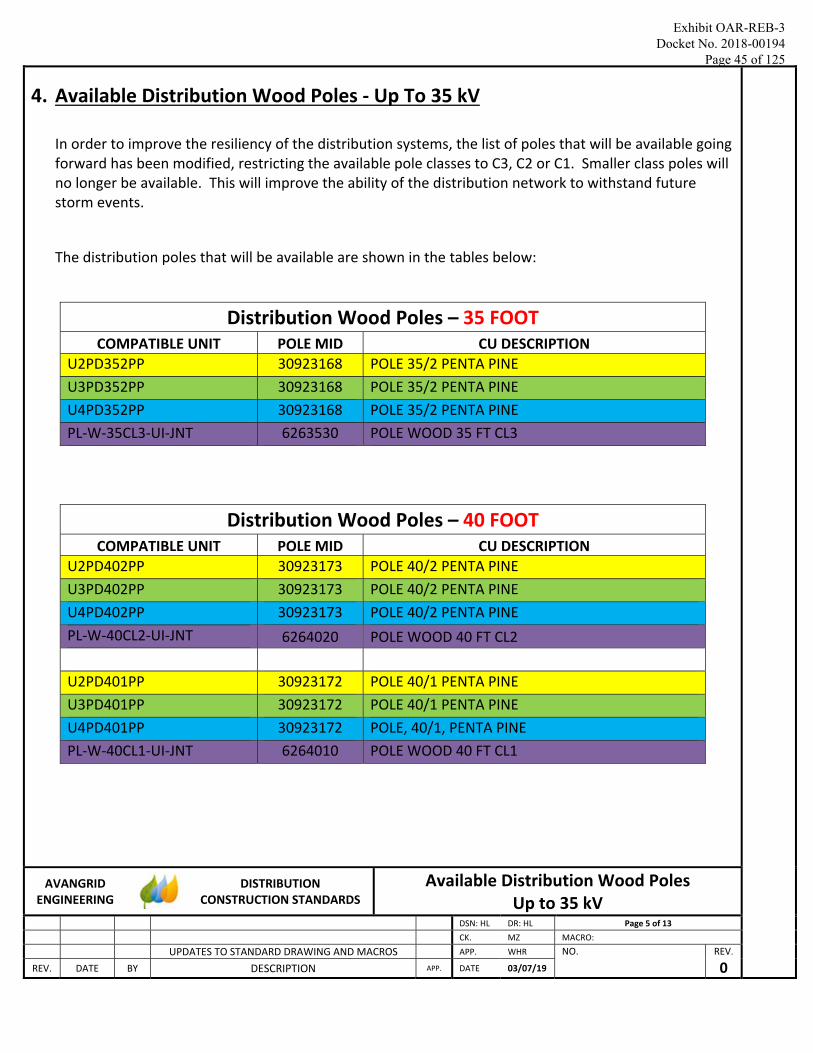
4. Available Distribution Wood Poles ‐ Up To 35 kV
In order to improve the resiliency of the distribution systems, the list of poles that will be available going forward has been modified, restricting the available pole classes to C3, C2 or C1. Smaller class poles will no longer be available. This will improve the ability of the distribution network to withstand future storm events.
The distribution poles that will be available are shown in the tables below:
Distribution Wood Poles – 35 FOOT COMPATIBLE UNIT POLE MID CU DESCRIPTION
U2PD352PP 30923168 POLE 35/2 PENTA PINE
U3PD352PP 30923168 POLE 35/2 PENTA PINE
U4PD352PP 30923168 POLE 35/2 PENTA PINE
PL‐W‐35CL3‐UI‐JNT 6263530 POLE WOOD 35 FT CL3
Distribution Wood Poles – 40 FOOT COMPATIBLE UNIT POLE MID CU DESCRIPTION
U2PD402PP 30923173 POLE 40/2 PENTA PINE
U3PD402PP 30923173 POLE 40/2 PENTA PINE
U4PD402PP 30923173 POLE 40/2 PENTA PINE
PL‐W‐40CL2‐UI‐JNT 6264020 POLE WOOD 40 FT CL2
U2PD401PP 30923172 POLE 40/1 PENTA PINE
U3PD401PP 30923172 POLE 40/1 PENTA PINE
U4PD401PP 30923172 POLE, 40/1, PENTA PINE
PL‐W‐40CL1‐UI‐JNT 6264010 POLE WOOD 40 FT CL1
AVANGRID ENGINEERING
DISTRIBUTION CONSTRUCTION STANDARDS
Available Distribution Wood Poles Up to 35 kV
DSN: HL DR: HL Page 5 of 13
CK. MZ MACRO:
UPDATES TO STANDARD DRAWING AND MACROS APP. WHR NO.
REV.
0 REV. DATE BY DESCRIPTION APP. DATE 03/07/19
Exhibit OAR-REB-3 Docket No. 2018-00194
Page 45 of 125

4. Available Distribution Wood Poles ‐ Up To 35 kV
Distribution Wood Poles – 45 FOOT COMPATIBLE UNIT POLE MID CU DESCRIPTION
U22PD453PP 30923179 POLE WOOD 45FT CL3 PENTA PINE
U3PD453PP 30923179 POLE, 45/3, PENTA PINE
U42PD453PP 30923179 POLE WOOD 45FT CL3 PENTA PINE
N/A N/A N/A
U22PD452PP 30923178 POLE WOOD 45FT CL2 PENTA PINE
U3PD452PP 30923178 POLE, 45/2, PENTA PINE
U42PD452PP 30923178 POLE WOOD 45FT CL2 PENTA PINE
PL‐W‐45CL2‐UI‐JNT 6264520 POLE WOOD 45 FT CL2
U2PD451PP 30923177 POLE 45/1 PENTA PINE
U3PD451PP 30923177 POLE 45/1 PENTA PINE
U4PD451PP 30923177 POLE 45/1 PENTA PINE
PL‐W‐45CL1‐UI‐JNT 6264510 POLE WOOD 45 FT CL1
Distribution Wood Poles – 50 FOOT COMPATIBLE UNIT POLE MID CU DESCRIPTION
U22PD502PP 30923125 POLE WOOD 50FT CL2 PENTA PINE
U3PD502PP 30923125 POLE 50/2 PENTA PINE (PRE DRILLED)
U42PD502PP 30923125 POLE WOOD 50FT CL2 PENTA PINE
N/A N/A N/A
U22PD501PP 30923182 POLE WOOD 50FT CL1 PENTA PINE
U3PD501PP 30923182 POLE, 50/1, PENTA PINE
U42PD501PP 30923182 POLE WOOD 50FT CL1 PENTA PINE
PL‐W‐50CL1‐UI‐JNT 6265010 POLE WOOD 50 FT CL1
AVANGRID
ENGINEERING
DISTRIBUTION CONSTRUCTION STANDARDS
Available Distribution Wood Poles Up to 35 kV
DSN: HL DR: HL Page 6 of 13
CK. MZ MACRO:
UPDATES TO STANDARD DRAWING AND MACROS APP. WHR NO.
REV.
0
REV. DATE BY DESCRIPTION APP. DATE 03/07/19
Exhibit OAR-REB-3 Docket No. 2018-00194
Page 46 of 125
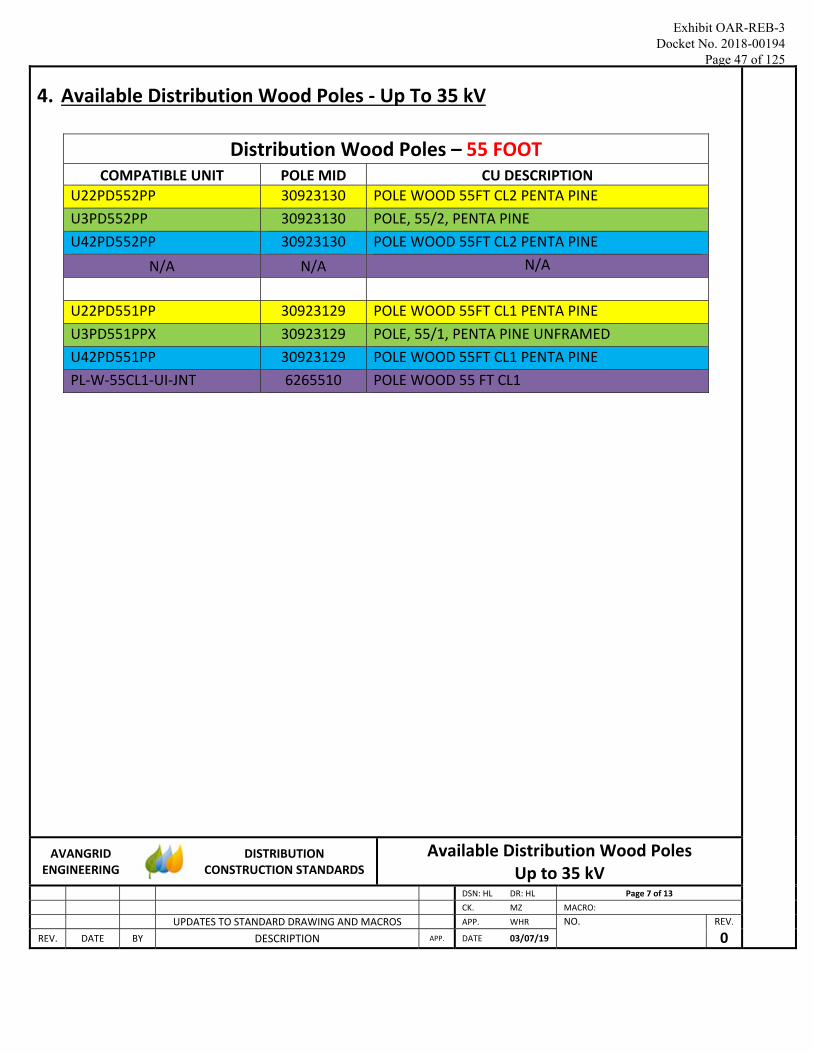
4. Available Distribution Wood Poles ‐ Up To 35 kV
Distribution Wood Poles – 55 FOOT COMPATIBLE UNIT POLE MID CU DESCRIPTION
U22PD552PP 30923130 POLE WOOD 55FT CL2 PENTA PINE
U3PD552PP 30923130 POLE, 55/2, PENTA PINE
U42PD552PP 30923130 POLE WOOD 55FT CL2 PENTA PINE
N/A N/A N/A
U22PD551PP 30923129 POLE WOOD 55FT CL1 PENTA PINE
U3PD551PPX 30923129 POLE, 55/1, PENTA PINE UNFRAMED
U42PD551PP 30923129 POLE WOOD 55FT CL1 PENTA PINE
PL‐W‐55CL1‐UI‐JNT 6265510 POLE WOOD 55 FT CL1
AVANGRID ENGINEERING
DISTRIBUTION CONSTRUCTION STANDARDS
Available Distribution Wood Poles Up to 35 kV
DSN: HL DR: HL Page 7 of 13
CK. MZ MACRO:
UPDATES TO STANDARD DRAWING AND MACROS APP. WHR NO.
REV.
0 REV. DATE BY DESCRIPTION APP. DATE 03/07/19
Exhibit OAR-REB-3 Docket No. 2018-00194
Page 47 of 125
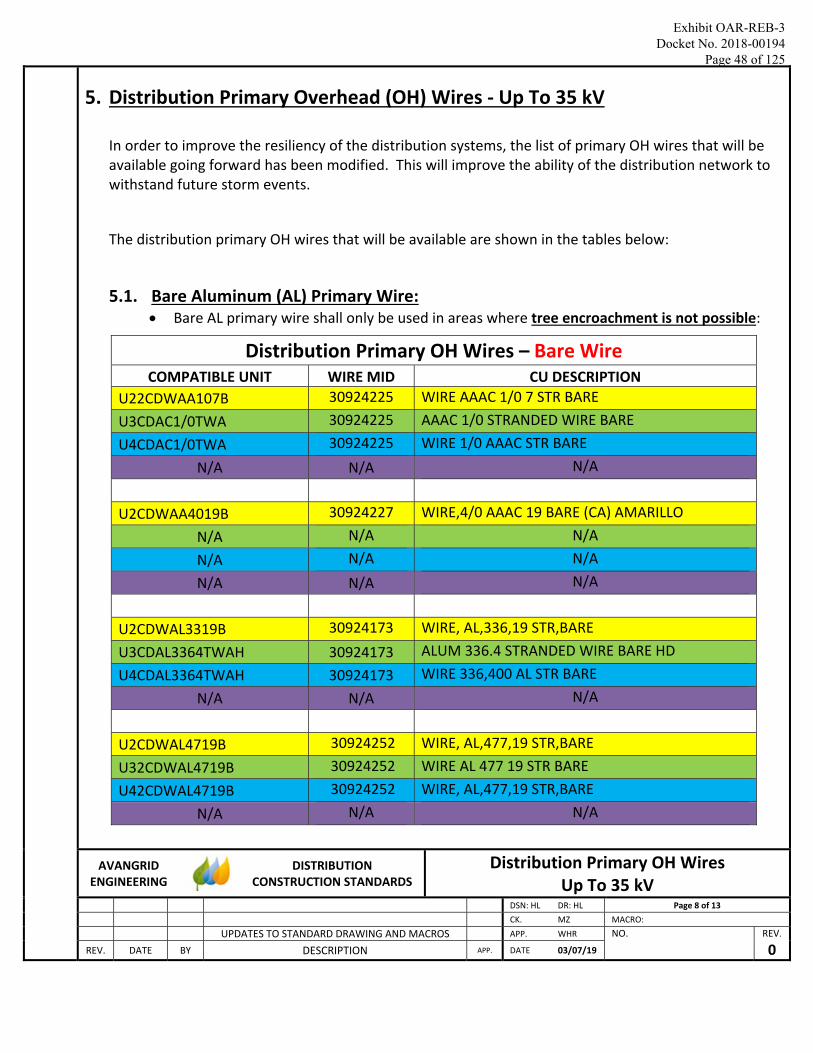
5. Distribution Primary Overhead (OH) Wires ‐ Up To 35 kV
In order to improve the resiliency of the distribution systems, the list of primary OH wires that will be available going forward has been modified. This will improve the ability of the distribution network to withstand future storm events.
The distribution primary OH wires that will be available are shown in the tables below:
5.1. Bare Aluminum (AL) Primary Wire: Bare AL primary wire shall only be used in areas where tree encroachment is not possible:
Distribution Primary OH Wires – Bare Wire COMPATIBLE UNIT WIRE MID CU DESCRIPTION
U22CDWAA107B 30924225 WIRE AAAC 1/0 7 STR BARE
U3CDAC1/0TWA 30924225 AAAC 1/0 STRANDED WIRE BARE
U4CDAC1/0TWA 30924225 WIRE 1/0 AAAC STR BARE
N/A N/A N/A
U2CDWAA4019B 30924227 WIRE,4/0 AAAC 19 BARE (CA) AMARILLO
N/A N/A N/A
N/A N/A N/A
N/A N/A N/A
U2CDWAL3319B 30924173 WIRE, AL,336,19 STR,BARE
U3CDAL3364TWAH 30924173 ALUM 336.4 STRANDED WIRE BARE HD
U4CDAL3364TWAH 30924173 WIRE 336,400 AL STR BARE
N/A N/A N/A
U2CDWAL4719B 30924252 WIRE, AL,477,19 STR,BARE
U32CDWAL4719B 30924252 WIRE AL 477 19 STR BARE
U42CDWAL4719B 30924252 WIRE, AL,477,19 STR,BARE
N/A N/A N/A
AVANGRID
ENGINEERING
DISTRIBUTION CONSTRUCTION STANDARDS
Distribution Primary OH Wires Up To 35 kV
DSN: HL DR: HL Page 8 of 13
CK. MZ MACRO:
UPDATES TO STANDARD DRAWING AND MACROS APP. WHR NO.
REV.
0 REV. DATE BY DESCRIPTION APP. DATE 03/07/19
Exhibit OAR-REB-3 Docket No. 2018-00194
Page 48 of 125
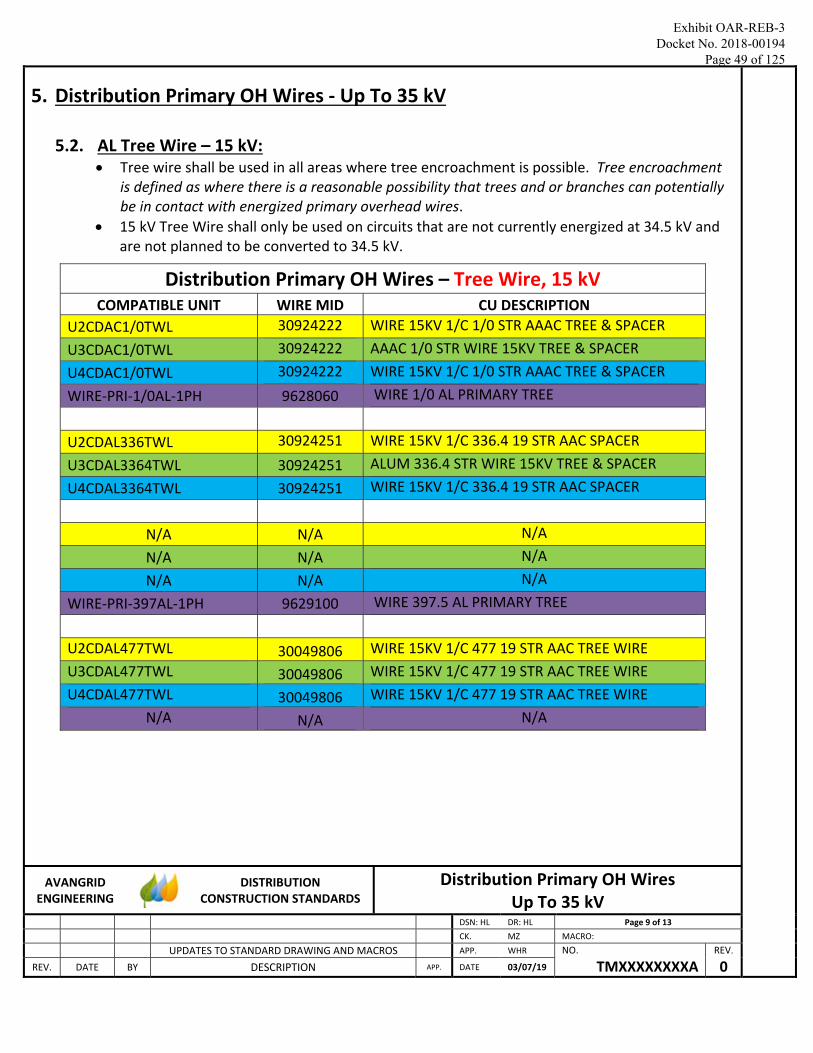
5. Distribution Primary OH Wires ‐ Up To 35 kV
5.2. AL Tree Wire – 15 kV: Tree wire shall be used in all areas where tree encroachment is possible. Tree encroachment
is defined as where there is a reasonable possibility that trees and or branches can potentially be in contact with energized primary overhead wires.
15 kV Tree Wire shall only be used on circuits that are not currently energized at 34.5 kV and are not planned to be converted to 34.5 kV.
Distribution Primary OH Wires – Tree Wire, 15 kV COMPATIBLE UNIT WIRE MID CU DESCRIPTION
U2CDAC1/0TWL 30924222 WIRE 15KV 1/C 1/0 STR AAAC TREE & SPACER
U3CDAC1/0TWL 30924222 AAAC 1/0 STR WIRE 15KV TREE & SPACER
U4CDAC1/0TWL 30924222 WIRE 15KV 1/C 1/0 STR AAAC TREE & SPACER
WIRE‐PRI‐1/0AL‐1PH 9628060 WIRE 1/0 AL PRIMARY TREE
U2CDAL336TWL 30924251 WIRE 15KV 1/C 336.4 19 STR AAC SPACER
U3CDAL3364TWL 30924251 ALUM 336.4 STR WIRE 15KV TREE & SPACER
U4CDAL3364TWL 30924251 WIRE 15KV 1/C 336.4 19 STR AAC SPACER
N/A N/A N/A
N/A N/A N/A
N/A N/A N/A
WIRE‐PRI‐397AL‐1PH 9629100 WIRE 397.5 AL PRIMARY TREE
U2CDAL477TWL 30049806 WIRE 15KV 1/C 477 19 STR AAC TREE WIRE
U3CDAL477TWL 30049806 WIRE 15KV 1/C 477 19 STR AAC TREE WIRE
U4CDAL477TWL 30049806 WIRE 15KV 1/C 477 19 STR AAC TREE WIRE
N/A N/A N/A
AVANGRID ENGINEERING
DISTRIBUTION CONSTRUCTION STANDARDS
Distribution Primary OH Wires Up To 35 kV
DSN: HL DR: HL Page 9 of 13
CK. MZ MACRO:
UPDATES TO STANDARD DRAWING AND MACROS APP. WHR NO.
TMXXXXXXXXA
REV.
0 REV. DATE BY DESCRIPTION APP. DATE 03/07/19
Exhibit OAR-REB-3 Docket No. 2018-00194
Page 49 of 125
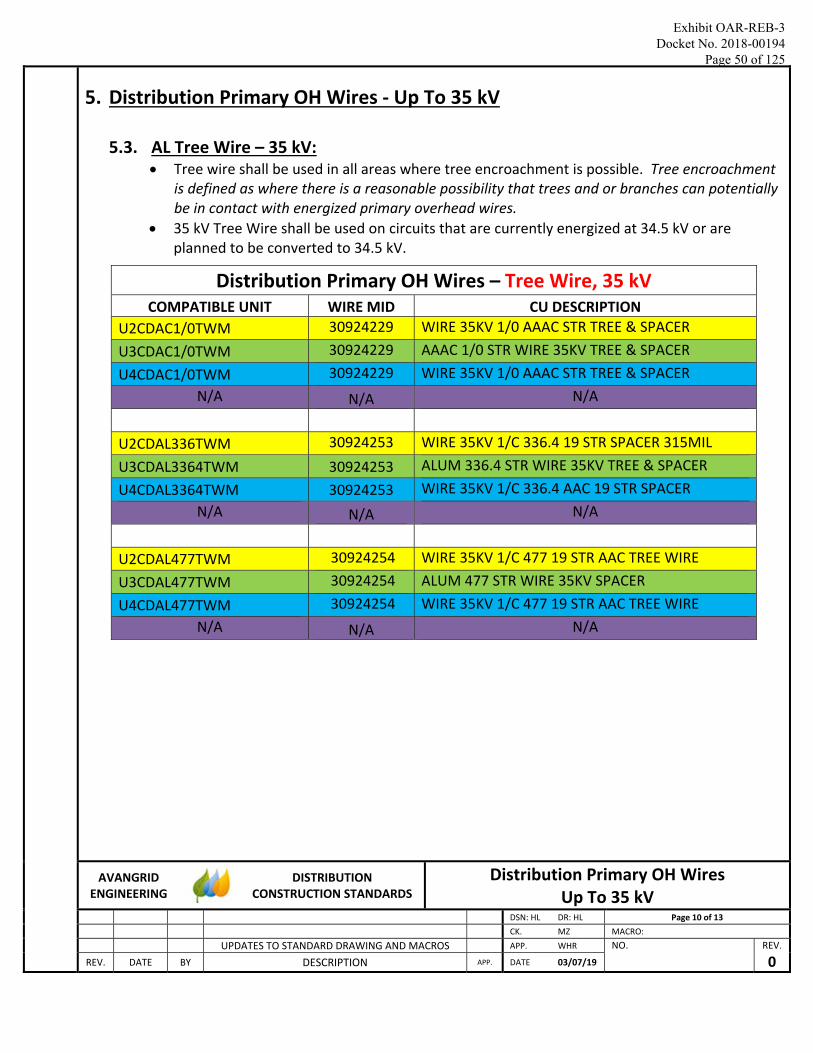
5. Distribution Primary OH Wires ‐ Up To 35 kV
5.3. AL Tree Wire – 35 kV: Tree wire shall be used in all areas where tree encroachment is possible. Tree encroachment
is defined as where there is a reasonable possibility that trees and or branches can potentially be in contact with energized primary overhead wires.
35 kV Tree Wire shall be used on circuits that are currently energized at 34.5 kV or are planned to be converted to 34.5 kV.
Distribution Primary OH Wires – Tree Wire, 35 kV COMPATIBLE UNIT WIRE MID CU DESCRIPTION
U2CDAC1/0TWM 30924229 WIRE 35KV 1/0 AAAC STR TREE & SPACER
U3CDAC1/0TWM 30924229 AAAC 1/0 STR WIRE 35KV TREE & SPACER
U4CDAC1/0TWM 30924229 WIRE 35KV 1/0 AAAC STR TREE & SPACER
N/A N/A N/A
U2CDAL336TWM 30924253 WIRE 35KV 1/C 336.4 19 STR SPACER 315MIL
U3CDAL3364TWM 30924253 ALUM 336.4 STR WIRE 35KV TREE & SPACER
U4CDAL3364TWM 30924253 WIRE 35KV 1/C 336.4 AAC 19 STR SPACER
N/A N/A N/A
U2CDAL477TWM 30924254 WIRE 35KV 1/C 477 19 STR AAC TREE WIRE
U3CDAL477TWM 30924254 ALUM 477 STR WIRE 35KV SPACER
U4CDAL477TWM 30924254 WIRE 35KV 1/C 477 19 STR AAC TREE WIRE
N/A N/A N/A
AVANGRID
ENGINEERING
DISTRIBUTION CONSTRUCTION STANDARDS
Distribution Primary OH Wires Up To 35 kV
DSN: HL DR: HL Page 10 of 13
CK. MZ MACRO:
UPDATES TO STANDARD DRAWING AND MACROS APP. WHR NO.
REV.
0 REV. DATE BY DESCRIPTION APP. DATE 03/07/19
Exhibit OAR-REB-3 Docket No. 2018-00194
Page 50 of 125

6. Distribution Guying
In order to improve the resiliency of the distribution systems, the guy wires that will be available going forward have been modified. To improve the ability of the distribution network to withstand future storm events, the 5/16” guy wire will be eliminated.
Currently, the AVANGRID operating companies use different construction standards and different materials for installing guying. As a result, the existing guying CUs varying significantly between the operating companies.
Due to the variations in guying construction between the operating companies, the existing CUs will not be listed in the Distribution Resiliency Guide at this time. Distribution Standards is in the process of creating AVANGRID guying construction standards and CUs that will be consistent across all operating companies. These uniform AVANGRID guying CUs will be published in a future version of the Distribution Resiliency Guide.
As previously mentioned, existing guying MIDs, CUs and construction standards will continue to be used in accordance with the resiliency criteria established in this guide.
Communications will be issued to all stakeholders when the new guying construction standards and CUs are available.
Going forward, the available AVANGRID guy wires will be:
Guy Wire Description ME and NY
MID CT MID Rated Breaking Strength (Pounds)
3/8” Extra High Strength 30924290 5895120 15,400
7/16” Utility Grade 30924296 5895130 18,000
All guys shall be designed to be within the strength criteria of these guy wires.
AVANGRID ENGINEERING
DISTRIBUTION CONSTRUCTION STANDARDS Distribution Guying
DSN: HL DR: HL Page 11 of 13
CK. MZ MACRO:
UPDATES TO STANDARD DRAWING AND MACROS APP. WHR NO.
REV.
0 REV. DATE BY DESCRIPTION APP. DATE 03/07/19
Exhibit OAR-REB-3 Docket No. 2018-00194
Page 51 of 125
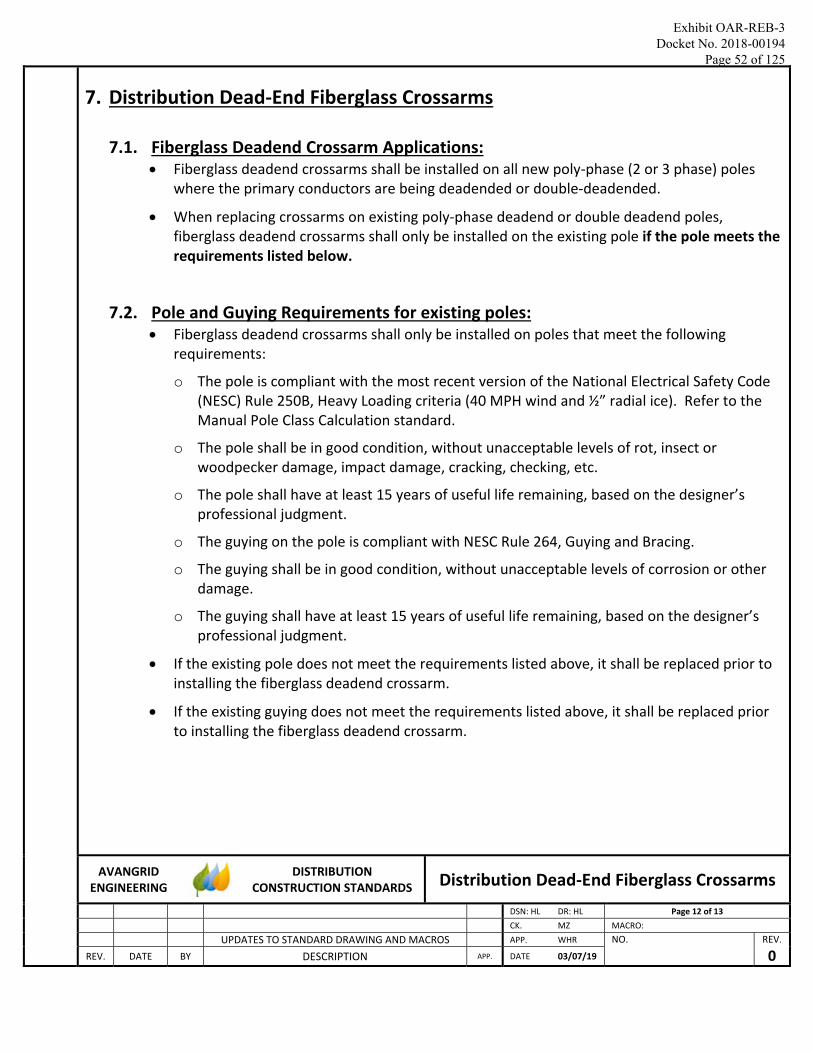
7. Distribution Dead‐End Fiberglass Crossarms
7.1. Fiberglass Deadend Crossarm Applications: Fiberglass deadend crossarms shall be installed on all new poly‐phase (2 or 3 phase) poles
where the primary conductors are being deadended or double‐deadended.
When replacing crossarms on existing poly‐phase deadend or double deadend poles, fiberglass deadend crossarms shall only be installed on the existing pole if the pole meets the requirements listed below.
7.2. Pole and Guying Requirements for existing poles: Fiberglass deadend crossarms shall only be installed on poles that meet the following
requirements:
o The pole is compliant with the most recent version of the National Electrical Safety Code (NESC) Rule 250B, Heavy Loading criteria (40 MPH wind and ½” radial ice). Refer to the Manual Pole Class Calculation standard.
o The pole shall be in good condition, without unacceptable levels of rot, insect or woodpecker damage, impact damage, cracking, checking, etc.
o The pole shall have at least 15 years of useful life remaining, based on the designer’s professional judgment.
o The guying on the pole is compliant with NESC Rule 264, Guying and Bracing.
o The guying shall be in good condition, without unacceptable levels of corrosion or other damage.
o The guying shall have at least 15 years of useful life remaining, based on the designer’s professional judgment.
If the existing pole does not meet the requirements listed above, it shall be replaced prior to installing the fiberglass deadend crossarm.
If the existing guying does not meet the requirements listed above, it shall be replaced prior to installing the fiberglass deadend crossarm.
AVANGRID
ENGINEERING
DISTRIBUTION CONSTRUCTION STANDARDS Distribution Dead‐End Fiberglass Crossarms
DSN: HL DR: HL Page 12 of 13
CK. MZ MACRO:
UPDATES TO STANDARD DRAWING AND MACROS APP. WHR NO.
REV.
0 REV. DATE BY DESCRIPTION APP. DATE 03/07/19
Exhibit OAR-REB-3 Docket No. 2018-00194
Page 52 of 125
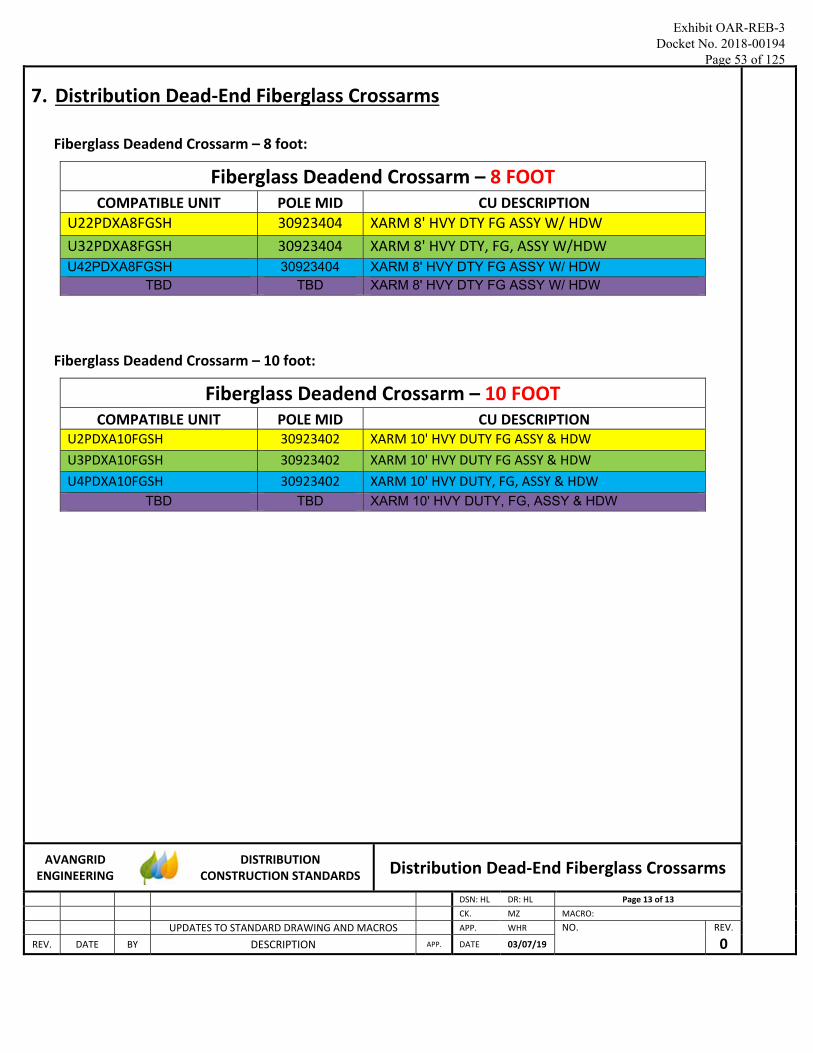
7. Distribution Dead‐End Fiberglass Crossarms
Fiberglass Deadend Crossarm – 8 foot:
Fiberglass Deadend Crossarm – 8 FOOT COMPATIBLE UNIT POLE MID CU DESCRIPTION
U22PDXA8FGSH 30923404 XARM 8' HVY DTY FG ASSY W/ HDW
U32PDXA8FGSH 30923404 XARM 8' HVY DTY, FG, ASSY W/HDW
U42PDXA8FGSH 30923404 XARM 8' HVY DTY FG ASSY W/ HDW TBD TBD XARM 8' HVY DTY FG ASSY W/ HDW
Fiberglass Deadend Crossarm – 10 foot:
Fiberglass Deadend Crossarm – 10 FOOT COMPATIBLE UNIT POLE MID CU DESCRIPTION
U2PDXA10FGSH 30923402 XARM 10' HVY DUTY FG ASSY & HDW
U3PDXA10FGSH 30923402 XARM 10' HVY DUTY FG ASSY & HDW
U4PDXA10FGSH 30923402 XARM 10' HVY DUTY, FG, ASSY & HDW TBD TBD XARM 10' HVY DUTY, FG, ASSY & HDW
AVANGRID ENGINEERING
DISTRIBUTION CONSTRUCTION STANDARDS Distribution Dead‐End Fiberglass Crossarms
DSN: HL DR: HL Page 13 of 13
CK. MZ MACRO:
UPDATES TO STANDARD DRAWING AND MACROS APP. WHR NO.
REV.
0 REV. DATE BY DESCRIPTION APP. DATE 03/07/19
Exhibit OAR-REB-3 Docket No. 2018-00194
Page 53 of 125
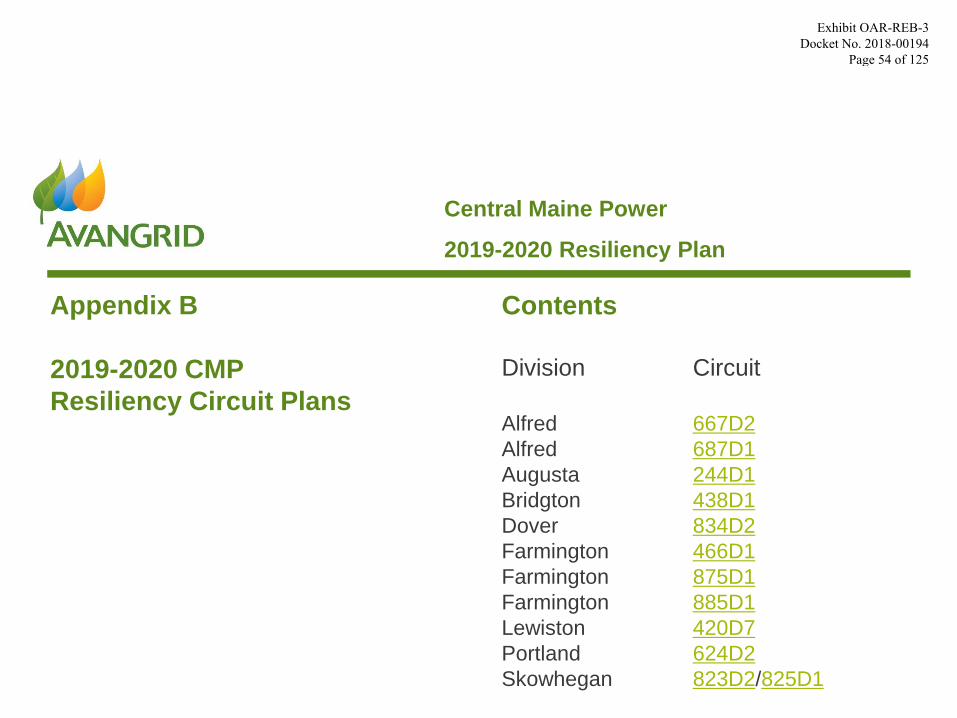
www.avangrid.com Appendix B Page 1
Central Maine Power
Contents
Division Circuit
Alfred 667D2
Alfred 687D1
Augusta 244D1
Bridgton 438D1
Dover 834D2
Farmington 466D1
Farmington 875D1
Farmington 885D1
Lewiston 420D7
Portland 624D2
Skowhegan 823D2/825D1
2019-2020 Resiliency Plan
Appendix B
2019-2020 CMP
Resiliency Circuit Plans
Exhibit OAR-REB-3 Docket No. 2018-00194
Page 54 of 125
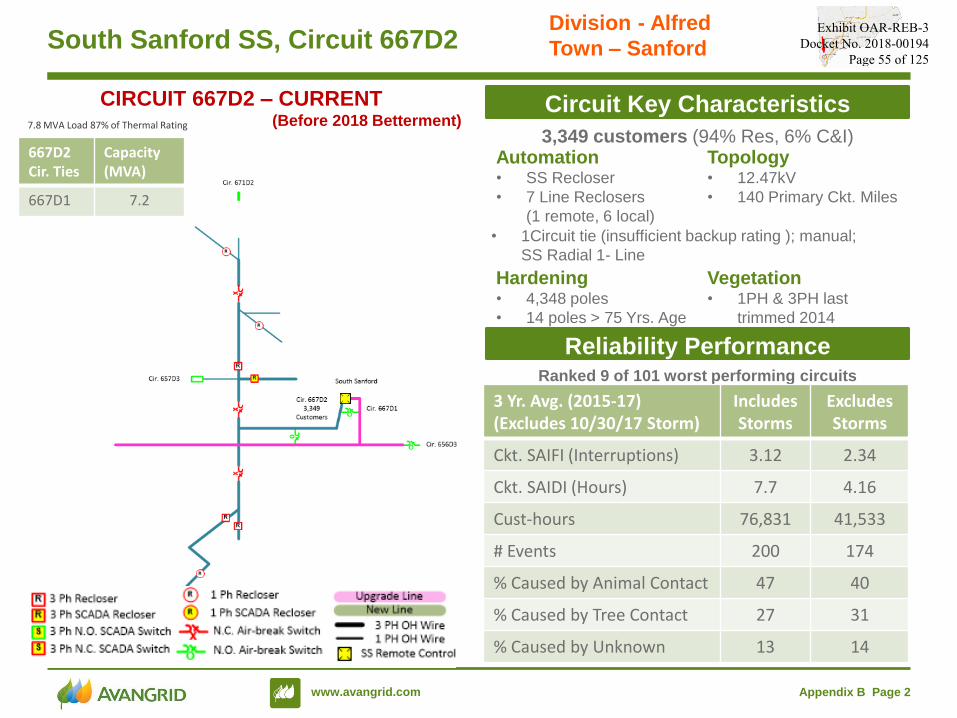
www.avangrid.com Appendix B Page 2
South Sanford SS, Circuit 667D2
Circuit Key Characteristics
3,349 customers (94% Res, 6% C&I)
Hardening Vegetation• 4,348 poles
• 14 poles > 75 Yrs. Age
• 1PH & 3PH last
trimmed 2014
Automation Topology• SS Recloser
• 7 Line Reclosers
(1 remote, 6 local)
• 12.47kV
• 140 Primary Ckt. Miles
• 1Circuit tie (insufficient backup rating ); manual;
SS Radial 1- Line
Reliability PerformanceRanked 9 of 101 worst performing circuits
3 Yr. Avg. (2015-17) (Excludes 10/30/17 Storm)
Includes Storms
ExcludesStorms
Ckt. SAIFI (Interruptions) 3.12 2.34
Ckt. SAIDI (Hours) 7.7 4.16
Cust-hours 76,831 41,533
# Events 200 174
% Caused by Animal Contact 47 40
% Caused by Tree Contact 27 31
% Caused by Unknown 13 14
CIRCUIT 667D2 – CURRENT (Before 2018 Betterment)
Division - Alfred
Town – Sanford
667D2Cir. Ties
Capacity (MVA)
667D1 7.2
7.8 MVA Load 87% of Thermal Rating
Exhibit OAR-REB-3 Docket No. 2018-00194
Page 55 of 125
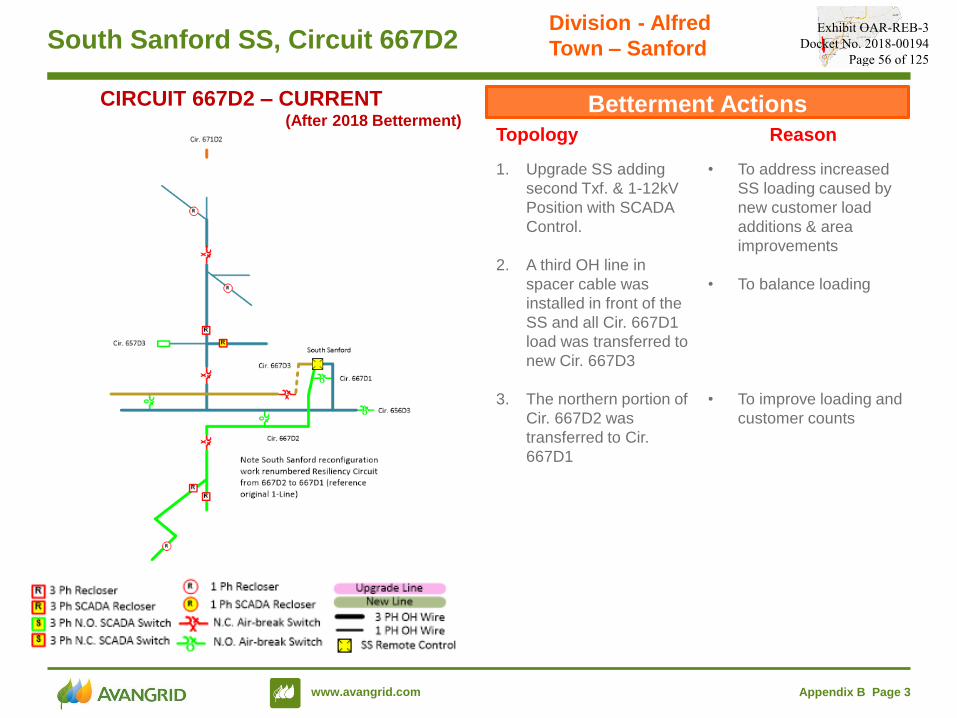
www.avangrid.com Appendix B Page 3
South Sanford SS, Circuit 667D2
Betterment Actions
Topology Reason
1. Upgrade SS adding
second Txf. & 1-12kV
Position with SCADA
Control.
2. A third OH line in
spacer cable was
installed in front of the
SS and all Cir. 667D1
load was transferred to
new Cir. 667D3
3. The northern portion of
Cir. 667D2 was
transferred to Cir.
667D1
• To address increased
SS loading caused by
new customer load
additions & area
improvements
• To balance loading
• To improve loading and
customer counts
Division - Alfred
Town – Sanford
CIRCUIT 667D2 – CURRENT (After 2018 Betterment)
Exhibit OAR-REB-3 Docket No. 2018-00194
Page 56 of 125
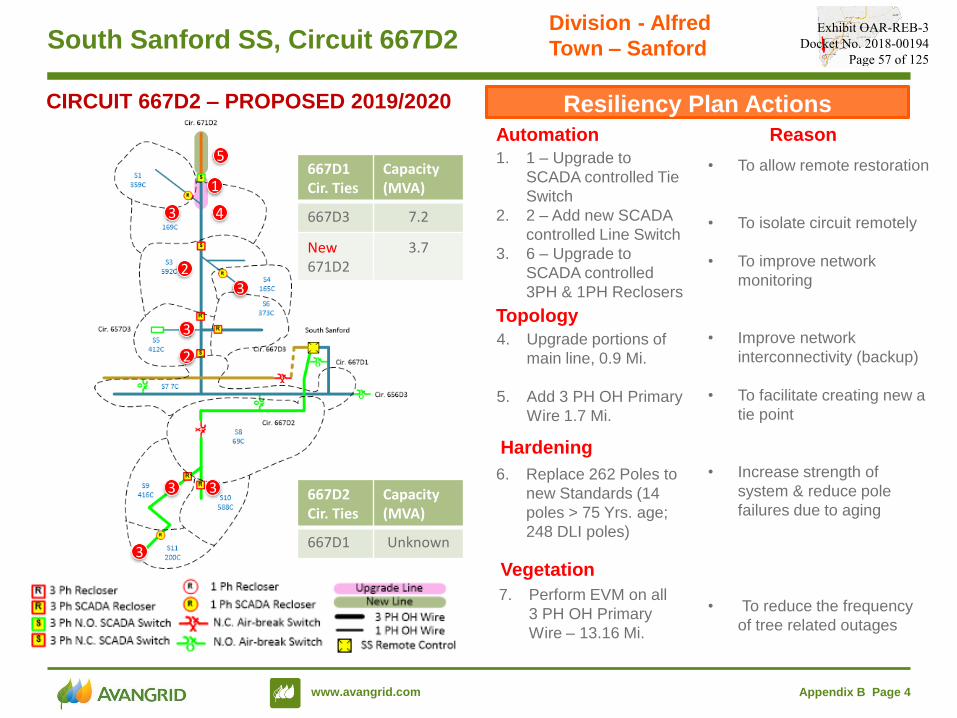
www.avangrid.com Appendix B Page 4
South Sanford SS, Circuit 667D2
Resiliency Plan Actions
Automation Reason
1. 1 – Upgrade to
SCADA controlled Tie
Switch
2. 2 – Add new SCADA
controlled Line Switch
3. 6 – Upgrade to
SCADA controlled
3PH & 1PH Reclosers
Topology
4. Upgrade portions of
main line, 0.9 Mi.
5. Add 3 PH OH Primary
Wire 1.7 Mi.
1
Division - Alfred
Town – Sanford
CIRCUIT 667D2 – PROPOSED 2019/2020
Hardening
6. Replace 262 Poles to
new Standards (14
poles > 75 Yrs. age;
248 DLI poles)
• To allow remote restoration
• To isolate circuit remotely
• To improve network
monitoring
• Improve network
interconnectivity (backup)
• To facilitate creating new a
tie point
• Increase strength of
system & reduce pole
failures due to aging
• To reduce the frequency
of tree related outages
2
2
3
3
3
3 3
3
667D2Cir. Ties
Capacity (MVA)
667D1 Unknown
667D1Cir. Ties
Capacity (MVA)
667D3 7.2
New671D2
3.7
5
4
Vegetation
7. Perform EVM on all
3 PH OH Primary
Wire – 13.16 Mi.
Exhibit OAR-REB-3 Docket No. 2018-00194
Page 57 of 125
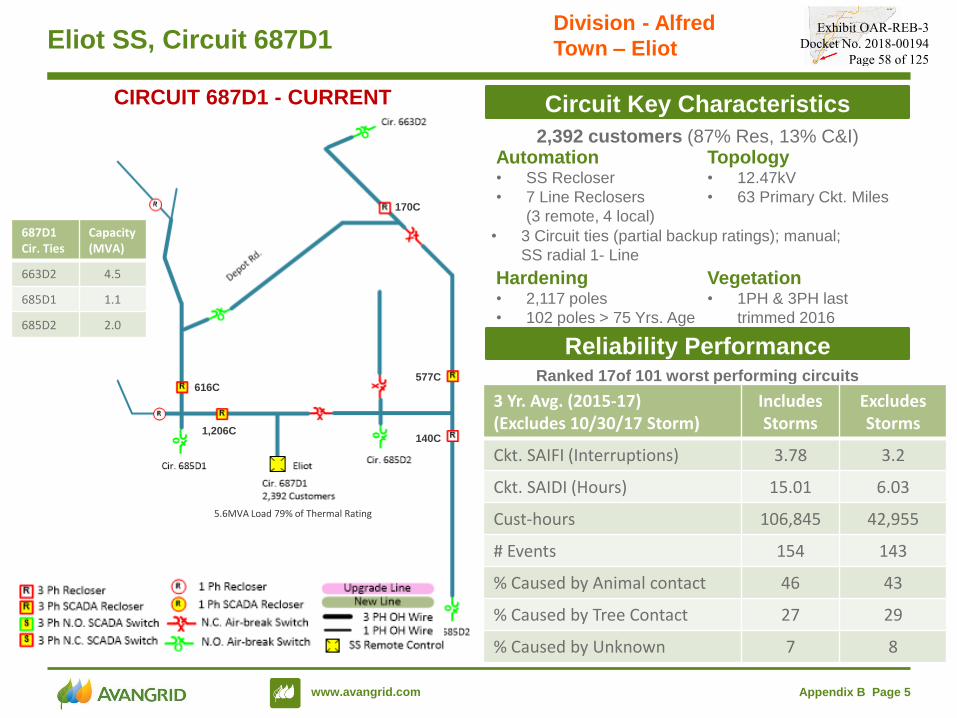
www.avangrid.com Appendix B Page 5
Eliot SS, Circuit 687D1
Circuit Key Characteristics
2,392 customers (87% Res, 13% C&I)
Hardening Vegetation• 2,117 poles
• 102 poles > 75 Yrs. Age
• 1PH & 3PH last
trimmed 2016
Automation Topology• SS Recloser
• 7 Line Reclosers
(3 remote, 4 local)
• 12.47kV
• 63 Primary Ckt. Miles
• 3 Circuit ties (partial backup ratings); manual;
SS radial 1- Line
Reliability PerformanceRanked 17of 101 worst performing circuits
1,206C
577C
3 Yr. Avg. (2015-17)(Excludes 10/30/17 Storm)
Includes Storms
ExcludesStorms
Ckt. SAIFI (Interruptions) 3.78 3.2
Ckt. SAIDI (Hours) 15.01 6.03
Cust-hours 106,845 42,955
# Events 154 143
% Caused by Animal contact 46 43
% Caused by Tree Contact 27 29
% Caused by Unknown 7 8
CIRCUIT 687D1 - CURRENT
Division - Alfred
Town – Eliot
687D1Cir. Ties
Capacity (MVA)
663D2 4.5
685D1 1.1
685D2 2.0
5.6MVA Load 79% of Thermal Rating
616C
140C
170C
Exhibit OAR-REB-3 Docket No. 2018-00194
Page 58 of 125

www.avangrid.com Appendix B Page 6
Eliot SS, Circuit 687D1
Resiliency Plan Actions
Automation Reason
1. 3 – Upgrade to
SCADA controlled Tie
Switch
2. 3 – Add new SCADA
controlled Line Switch
3. 4 – Upgrade to
SCADA controlled
3PH &1PH Reclosers
4. 1- Add SCADA
controlled 3PH
Recloser
• To allow remote
restoration
• To isolate circuit
remotely
• To improve network
monitoring
• To reduce mainline
exposure
CIRCUIT 687D1 – PROPOSED 2019/2020
Hardening
5. Replace 160 Poles to
new Standards (102
poles > 75 Yrs. age;
58 DLI poles)
• Increase strength of
system & reduce pole
failures due to aging
• To reduce the
frequency of tree
related outages
3
Division - Alfred
Town – Eliot
1
1
1
2
2
2
3
3
34
Vegetation
6. Perform EVM on all
3 PH OH Primary
Wire – 20.48 Mi.
Exhibit OAR-REB-3 Docket No. 2018-00194
Page 59 of 125
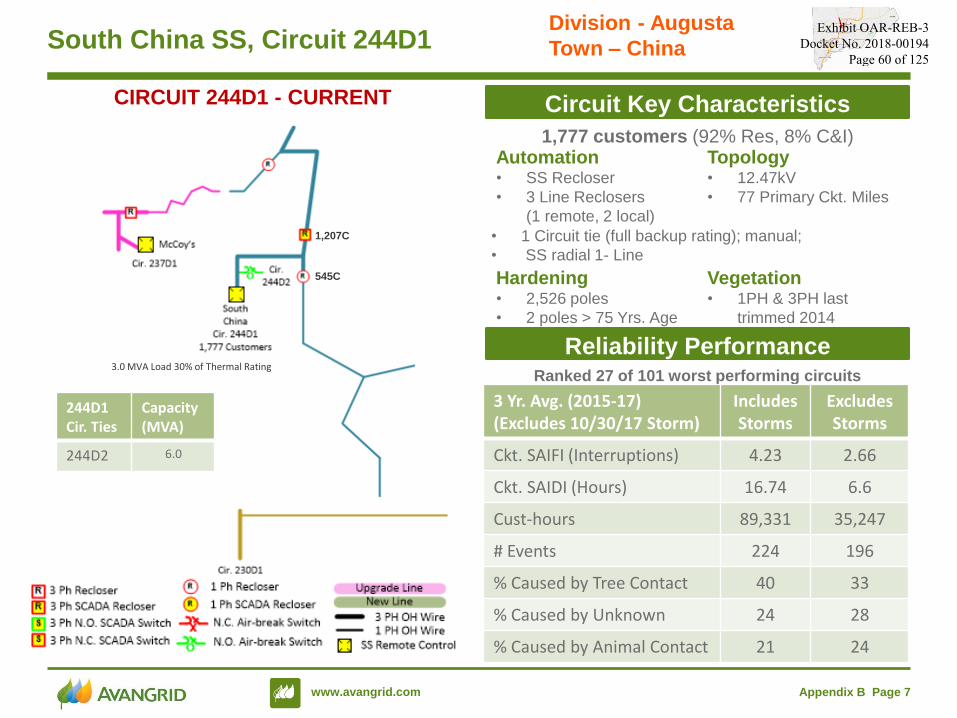
www.avangrid.com Appendix B Page 7
South China SS, Circuit 244D1
Circuit Key Characteristics
1,777 customers (92% Res, 8% C&I)
Hardening Vegetation• 2,526 poles
• 2 poles > 75 Yrs. Age
• 1PH & 3PH last
trimmed 2014
Automation Topology• SS Recloser
• 3 Line Reclosers
(1 remote, 2 local)
• 12.47kV
• 77 Primary Ckt. Miles
• 1 Circuit tie (full backup rating); manual;
• SS radial 1- Line
Reliability PerformanceRanked 27 of 101 worst performing circuits
1,207C
545C
3 Yr. Avg. (2015-17) (Excludes 10/30/17 Storm)
Includes Storms
ExcludesStorms
Ckt. SAIFI (Interruptions) 4.23 2.66
Ckt. SAIDI (Hours) 16.74 6.6
Cust-hours 89,331 35,247
# Events 224 196
% Caused by Tree Contact 40 33
% Caused by Unknown 24 28
% Caused by Animal Contact 21 24
CIRCUIT 244D1 - CURRENT
Division - Augusta
Town – China
244D1Cir. Ties
Capacity (MVA)
244D2 6.0
3.0 MVA Load 30% of Thermal Rating
Exhibit OAR-REB-3 Docket No. 2018-00194
Page 60 of 125
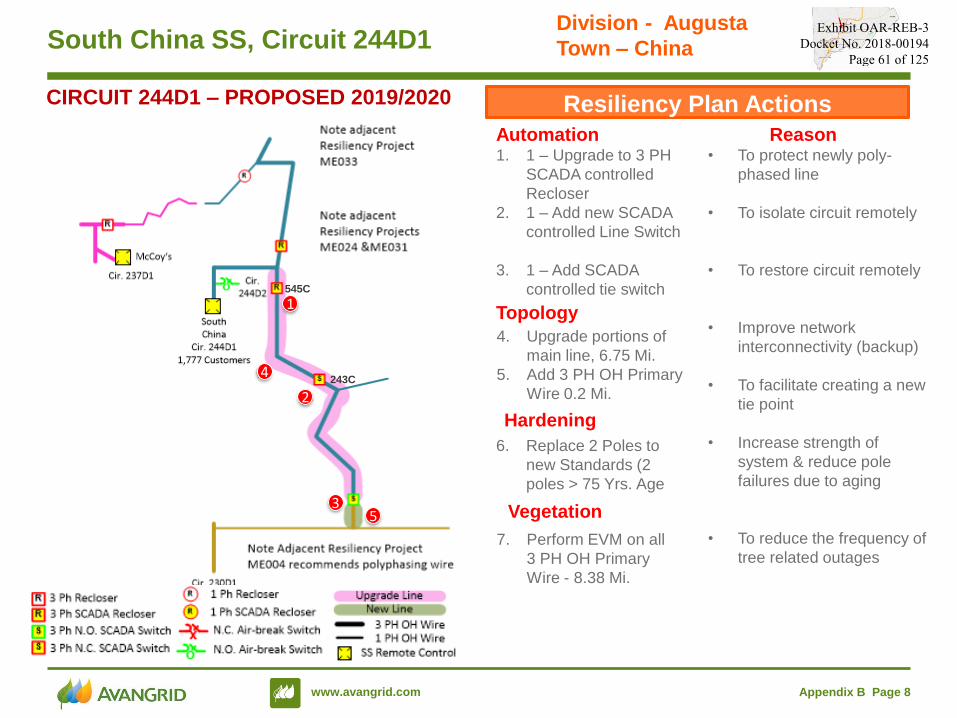
www.avangrid.com Appendix B Page 8
South China SS, Circuit 244D1
Resiliency Plan Actions
Automation Reason1. 1 – Upgrade to 3 PH
SCADA controlled
Recloser
2. 1 – Add new SCADA
controlled Line Switch
3. 1 – Add SCADA
controlled tie switch
• To protect newly poly-
phased line
• To isolate circuit remotely
• To restore circuit remotely
• Improve network
interconnectivity (backup)
• To facilitate creating a new
tie point
• Increase strength of
system & reduce pole
failures due to aging
• To reduce the frequency of
tree related outages
CIRCUIT 244D1 – PROPOSED 2019/2020
Topology
4. Upgrade portions of
main line, 6.75 Mi.
5. Add 3 PH OH Primary
Wire 0.2 Mi.
Hardening
Division - Augusta
Town – China
3
1
6. Replace 2 Poles to
new Standards (2
poles > 75 Yrs. Age
2
4
5
545C
243C
Vegetation
7. Perform EVM on all
3 PH OH Primary
Wire - 8.38 Mi.
Exhibit OAR-REB-3 Docket No. 2018-00194
Page 61 of 125
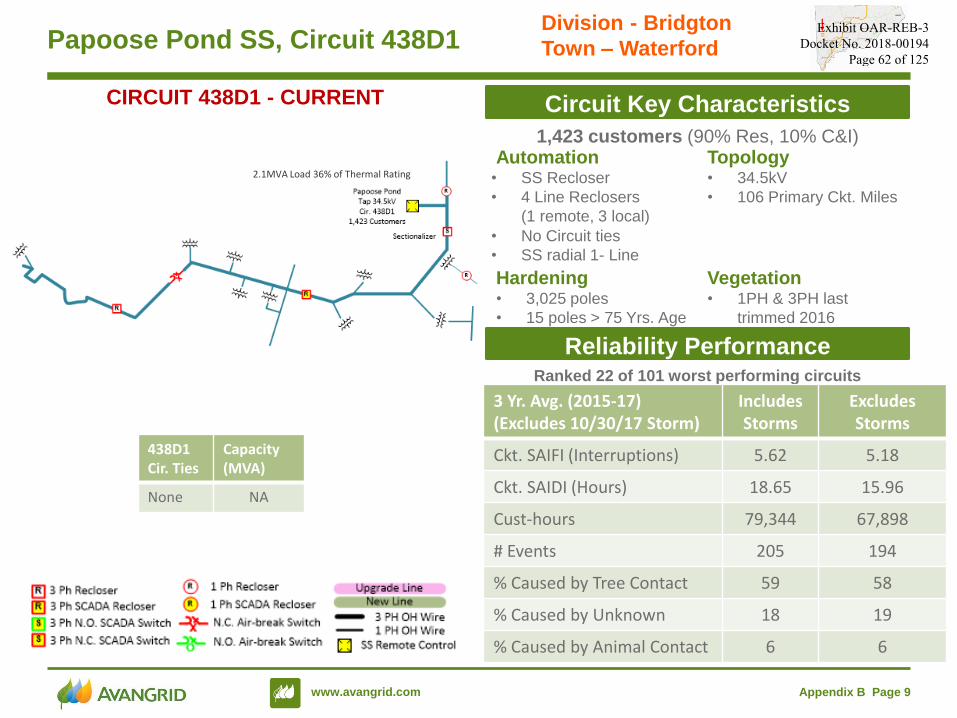
www.avangrid.com Appendix B Page 9
Papoose Pond SS, Circuit 438D1
Circuit Key Characteristics
1,423 customers (90% Res, 10% C&I)
Hardening Vegetation• 3,025 poles
• 15 poles > 75 Yrs. Age
• 1PH & 3PH last
trimmed 2016
Automation Topology• SS Recloser
• 4 Line Reclosers
(1 remote, 3 local)
• 34.5kV
• 106 Primary Ckt. Miles
• No Circuit ties
• SS radial 1- Line
Reliability PerformanceRanked 22 of 101 worst performing circuits
3 Yr. Avg. (2015-17) (Excludes 10/30/17 Storm)
Includes Storms
ExcludesStorms
Ckt. SAIFI (Interruptions) 5.62 5.18
Ckt. SAIDI (Hours) 18.65 15.96
Cust-hours 79,344 67,898
# Events 205 194
% Caused by Tree Contact 59 58
% Caused by Unknown 18 19
% Caused by Animal Contact 6 6
CIRCUIT 438D1 - CURRENT
Division - Bridgton
Town – Waterford
438D1Cir. Ties
Capacity (MVA)
None NA
2.1MVA Load 36% of Thermal Rating
Exhibit OAR-REB-3 Docket No. 2018-00194
Page 62 of 125
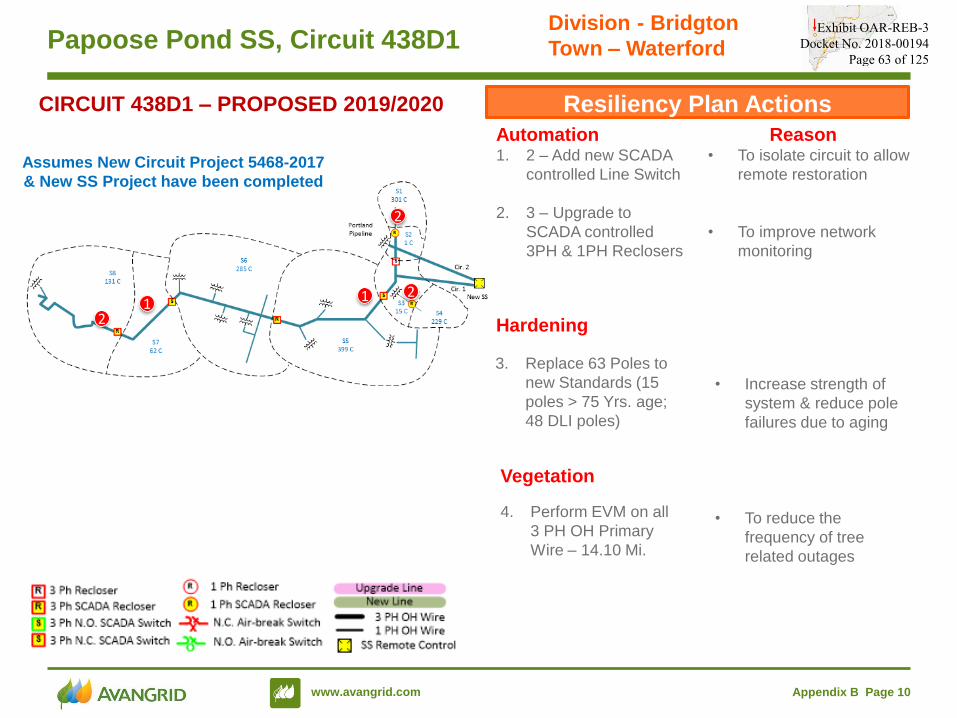
www.avangrid.com Appendix B Page 10
Papoose Pond SS, Circuit 438D1
Resiliency Plan Actions
Automation Reason1. 2 – Add new SCADA
controlled Line Switch
2. 3 – Upgrade to
SCADA controlled
3PH & 1PH Reclosers
• To isolate circuit to allow
remote restoration
• To improve network
monitoring
CIRCUIT 438D1 – PROPOSED 2019/2020
Hardening
3. Replace 63 Poles to
new Standards (15
poles > 75 Yrs. age;
48 DLI poles)
• Increase strength of
system & reduce pole
failures due to aging
• To reduce the
frequency of tree
related outages
Division - Bridgton
Town – Waterford
1
2
12
2
Assumes New Circuit Project 5468-2017
& New SS Project have been completed
Vegetation
4. Perform EVM on all
3 PH OH Primary
Wire – 14.10 Mi.
Exhibit OAR-REB-3 Docket No. 2018-00194
Page 63 of 125

www.avangrid.com Appendix B Page 11
Monson SS, Circuit 834D2
Circuit Key Characteristics
1,585 customers (90% Res, 10% C&I)
Hardening Vegetation• 3,023 poles
• 4 Poles > 75 Yrs. Age
• 1PH & 3PH last
trimmed 2016
Automation Topology• SS Recloser
• 8 Line Reclosers
(2 remote, 5 local)
• 34.5kV
• 117 Primary Ckt. Miles
• No Circuit ties
• SS radial 1- Line
Reliability PerformanceRanked 1 of 101 worst performing circuits
3 Yr. Avg. (2015-17) (Excludes 10/30/17 Storm)
Includes Storms
ExcludesStorms
Ckt. SAIFI (Interruptions) 11.68 10.49
Ckt. SAIDI (Hours) 31.68 24.12
Cust-hours 151,198 115,132
# Events 146 138
% Caused by Tree Contact 61 59
% Caused by Unknown 10 10
% Caused by Animal Contact 3 4
CIRCUIT 834D2 - CURRENT
Division - Dover
Town – Monson
834D2Cir. Ties
Capacity (MVA)
None NA
3.5 MVA Load 13% of Thermal Rating
Exhibit OAR-REB-3 Docket No. 2018-00194
Page 64 of 125
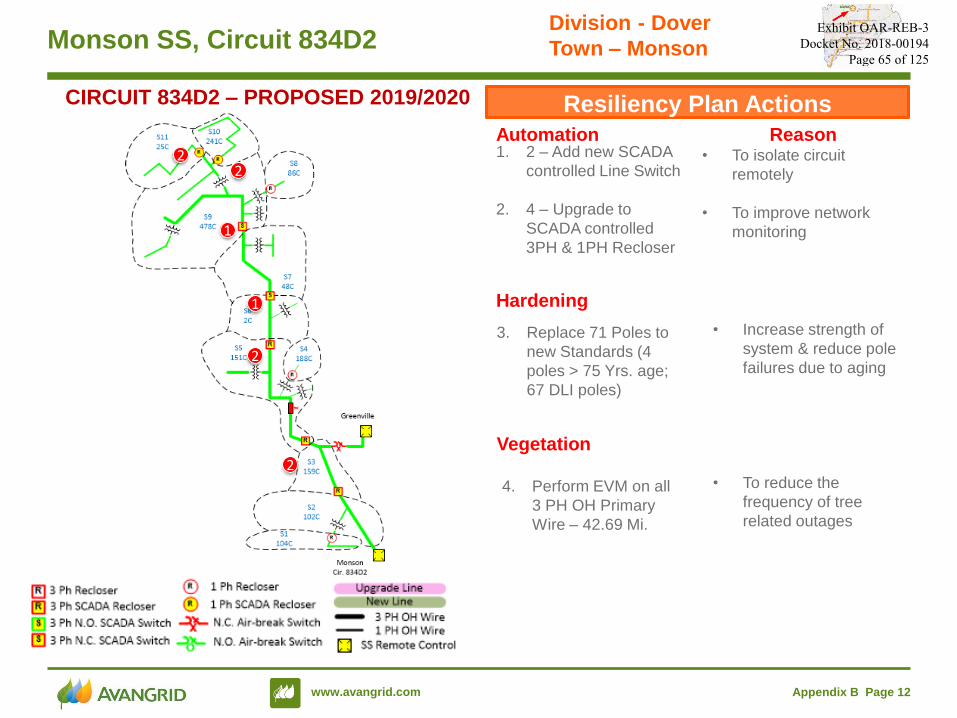
www.avangrid.com Appendix B Page 12
Monson SS, Circuit 834D2
Resiliency Plan Actions
Automation Reason1. 2 – Add new SCADA
controlled Line Switch
2. 4 – Upgrade to
SCADA controlled
3PH & 1PH Recloser
• To isolate circuit
remotely
• To improve network
monitoring
CIRCUIT 834D2 – PROPOSED 2019/2020
Hardening
3. Replace 71 Poles to
new Standards (4
poles > 75 Yrs. age;
67 DLI poles)
• Increase strength of
system & reduce pole
failures due to aging
• To reduce the
frequency of tree
related outages
Vegetation
1
2
Division - Dover
Town – Monson
1
22
2
4. Perform EVM on all
3 PH OH Primary
Wire – 42.69 Mi.
Exhibit OAR-REB-3 Docket No. 2018-00194
Page 65 of 125
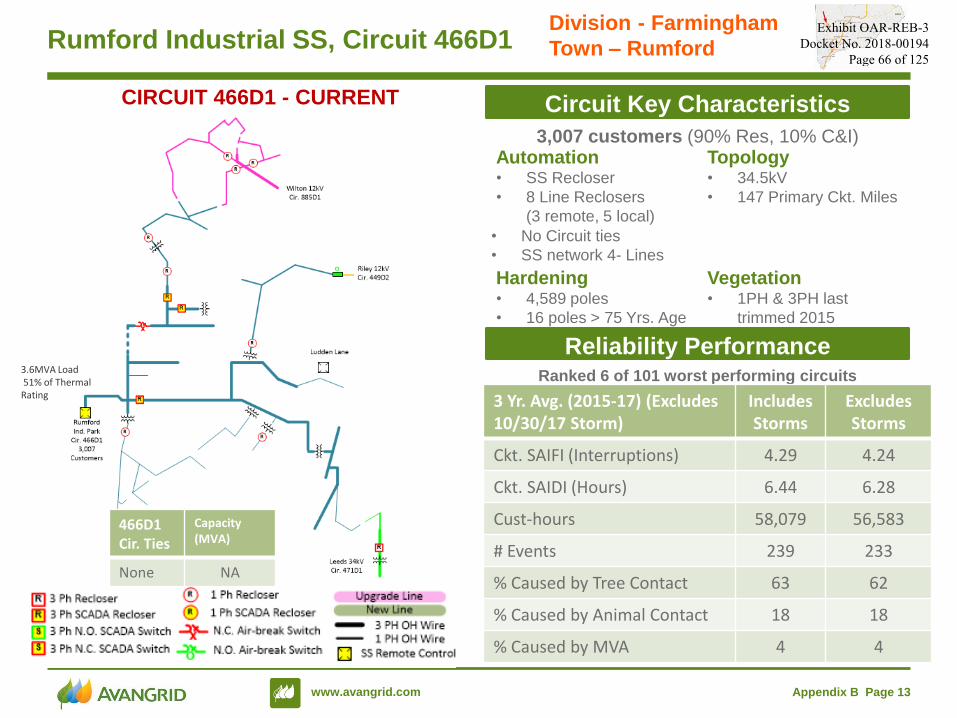
www.avangrid.com Appendix B Page 13
Rumford Industrial SS, Circuit 466D1
Circuit Key Characteristics
3,007 customers (90% Res, 10% C&I)
Hardening Vegetation• 4,589 poles
• 16 poles > 75 Yrs. Age
• 1PH & 3PH last
trimmed 2015
Automation Topology• SS Recloser
• 8 Line Reclosers
(3 remote, 5 local)
• 34.5kV
• 147 Primary Ckt. Miles
• No Circuit ties
• SS network 4- Lines
Reliability PerformanceRanked 6 of 101 worst performing circuits
3 Yr. Avg. (2015-17) (Excludes 10/30/17 Storm)
Includes Storms
ExcludesStorms
Ckt. SAIFI (Interruptions) 4.29 4.24
Ckt. SAIDI (Hours) 6.44 6.28
Cust-hours 58,079 56,583
# Events 239 233
% Caused by Tree Contact 63 62
% Caused by Animal Contact 18 18
% Caused by MVA 4 4
CIRCUIT 466D1 - CURRENT
Division - Farmingham
Town – Rumford
466D1Cir. Ties
Capacity (MVA)
None NA
3.6MVA Load51% of Thermal Rating
Exhibit OAR-REB-3 Docket No. 2018-00194
Page 66 of 125
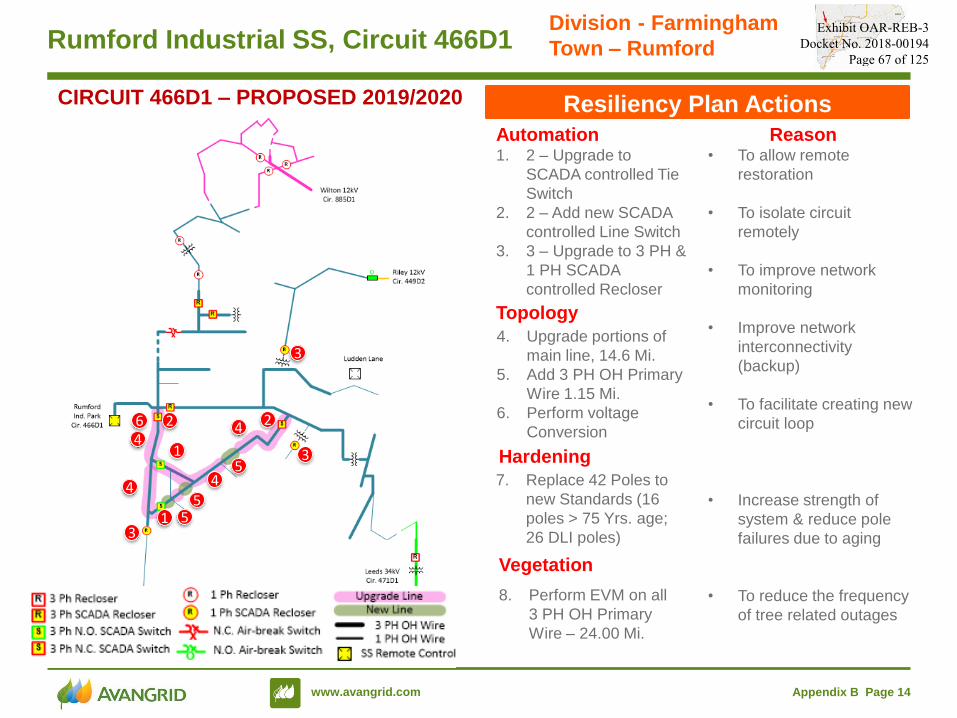
www.avangrid.com Appendix B Page 14
Rumford Industrial SS, Circuit 466D1
Resiliency Plan Actions
Automation Reason1. 2 – Upgrade to
SCADA controlled Tie
Switch
2. 2 – Add new SCADA
controlled Line Switch
3. 3 – Upgrade to 3 PH &
1 PH SCADA
controlled Recloser
• To allow remote
restoration
• To isolate circuit
remotely
• To improve network
monitoring
• Improve network
interconnectivity
(backup)
• To facilitate creating new
circuit loop
• Increase strength of
system & reduce pole
failures due to aging
• To reduce the frequency
of tree related outages
CIRCUIT 466D1 – PROPOSED 2019/2020
Topology
1
2
3
4
Division - Farmingham
Town – Rumford
1
2 44
4
4. Upgrade portions of
main line, 14.6 Mi.
5. Add 3 PH OH Primary
Wire 1.15 Mi.
6. Perform voltage
Conversion
Hardening
7. Replace 42 Poles to
new Standards (16
poles > 75 Yrs. age;
26 DLI poles)
55
5
6
3
3
Vegetation
8. Perform EVM on all
3 PH OH Primary
Wire – 24.00 Mi.
Exhibit OAR-REB-3 Docket No. 2018-00194
Page 67 of 125
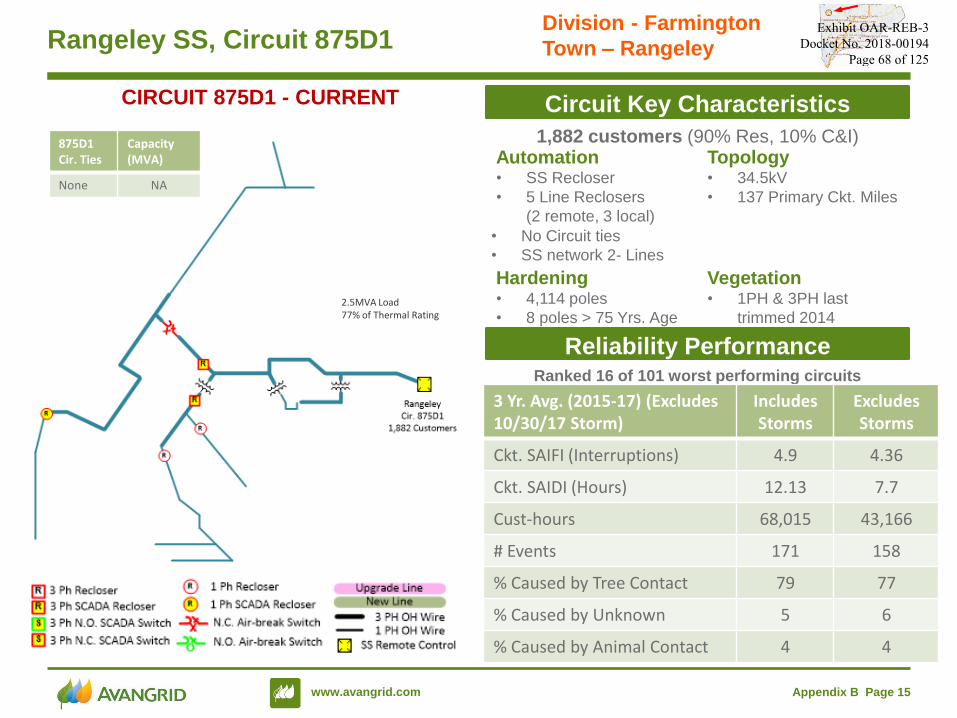
www.avangrid.com Appendix B Page 15
Rangeley SS, Circuit 875D1
Circuit Key Characteristics
1,882 customers (90% Res, 10% C&I)
Hardening Vegetation• 4,114 poles
• 8 poles > 75 Yrs. Age
• 1PH & 3PH last
trimmed 2014
Automation Topology• SS Recloser
• 5 Line Reclosers
(2 remote, 3 local)
• 34.5kV
• 137 Primary Ckt. Miles
• No Circuit ties
• SS network 2- Lines
Reliability PerformanceRanked 16 of 101 worst performing circuits
3 Yr. Avg. (2015-17) (Excludes 10/30/17 Storm)
Includes Storms
ExcludesStorms
Ckt. SAIFI (Interruptions) 4.9 4.36
Ckt. SAIDI (Hours) 12.13 7.7
Cust-hours 68,015 43,166
# Events 171 158
% Caused by Tree Contact 79 77
% Caused by Unknown 5 6
% Caused by Animal Contact 4 4
CIRCUIT 875D1 - CURRENT
Division - Farmington
Town – Rangeley
875D1Cir. Ties
Capacity (MVA)
None NA
2.5MVA Load77% of Thermal Rating
Exhibit OAR-REB-3 Docket No. 2018-00194
Page 68 of 125
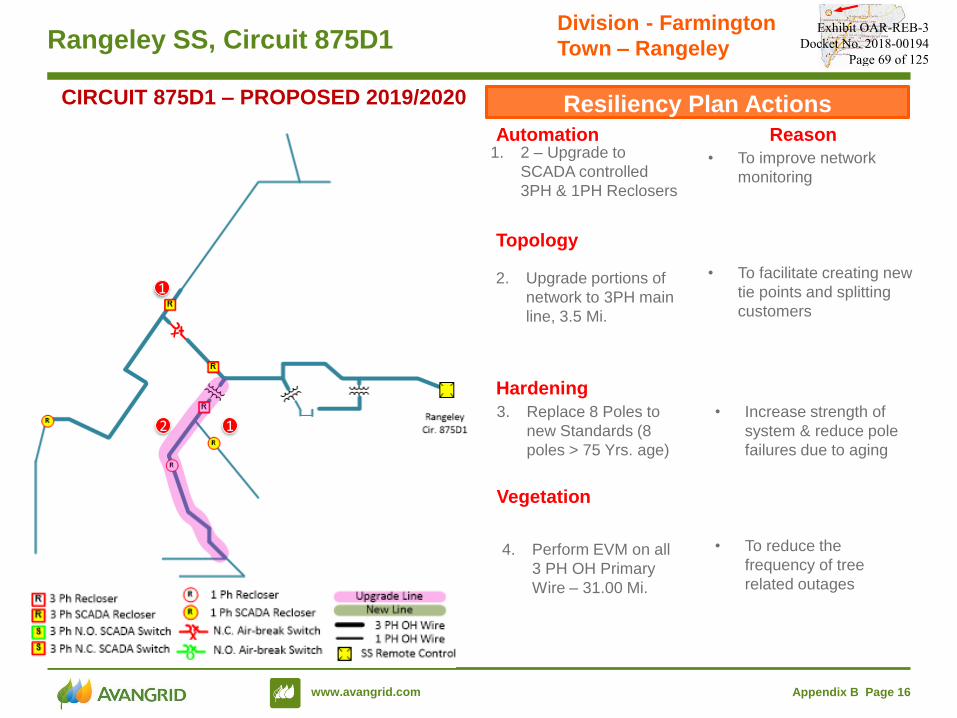
www.avangrid.com Appendix B Page 16
Rangeley SS, Circuit 875D1
Resiliency Plan Actions
Automation Reason1. 2 – Upgrade to
SCADA controlled
3PH & 1PH Reclosers
• To improve network
monitoring
• To facilitate creating new
tie points and splitting
customers
CIRCUIT 875D1 – PROPOSED 2019/2020
Hardening
3. Replace 8 Poles to
new Standards (8
poles > 75 Yrs. age)
• Increase strength of
system & reduce pole
failures due to aging
• To reduce the
frequency of tree
related outages
Vegetation
Division - Farmington
Town – Rangeley
1
1
Topology
2. Upgrade portions of
network to 3PH main
line, 3.5 Mi.
2
4. Perform EVM on all
3 PH OH Primary
Wire – 31.00 Mi.
Exhibit OAR-REB-3 Docket No. 2018-00194
Page 69 of 125
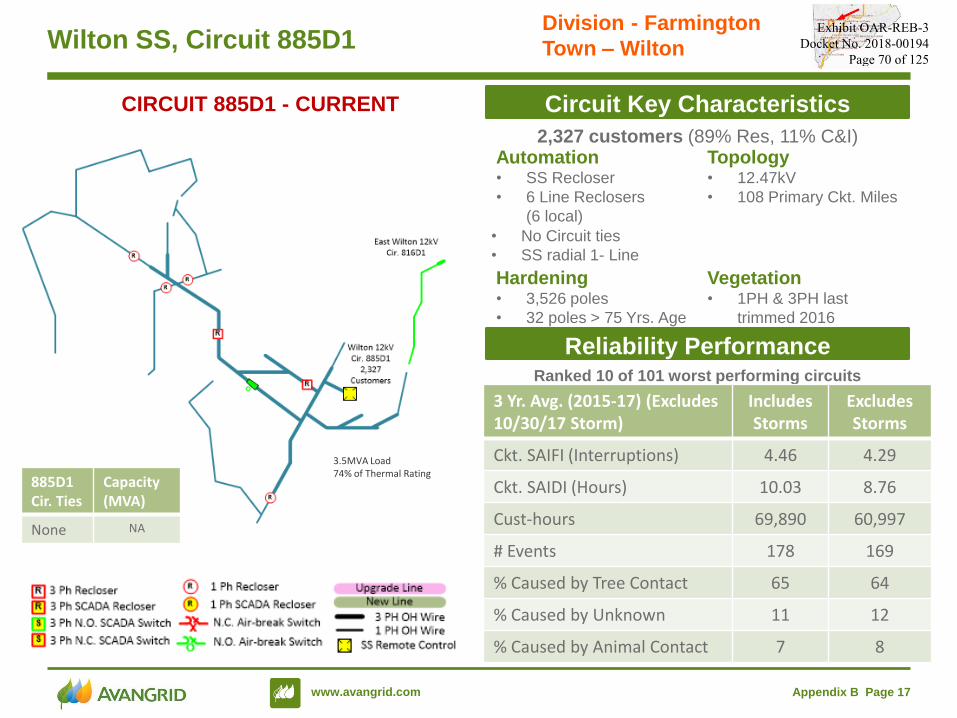
www.avangrid.com Appendix B Page 17
Wilton SS, Circuit 885D1
Circuit Key Characteristics
2,327 customers (89% Res, 11% C&I)
Hardening Vegetation• 3,526 poles
• 32 poles > 75 Yrs. Age
• 1PH & 3PH last
trimmed 2016
Automation Topology• SS Recloser
• 6 Line Reclosers
(6 local)
• 12.47kV
• 108 Primary Ckt. Miles
• No Circuit ties
• SS radial 1- Line
Reliability PerformanceRanked 10 of 101 worst performing circuits
3 Yr. Avg. (2015-17) (Excludes 10/30/17 Storm)
Includes Storms
ExcludesStorms
Ckt. SAIFI (Interruptions) 4.46 4.29
Ckt. SAIDI (Hours) 10.03 8.76
Cust-hours 69,890 60,997
# Events 178 169
% Caused by Tree Contact 65 64
% Caused by Unknown 11 12
% Caused by Animal Contact 7 8
CIRCUIT 885D1 - CURRENT
885D1Cir. Ties
Capacity (MVA)
None NA
3.5MVA Load74% of Thermal Rating
Division - Farmington
Town – WiltonExhibit OAR-REB-3
Docket No. 2018-00194 Page 70 of 125
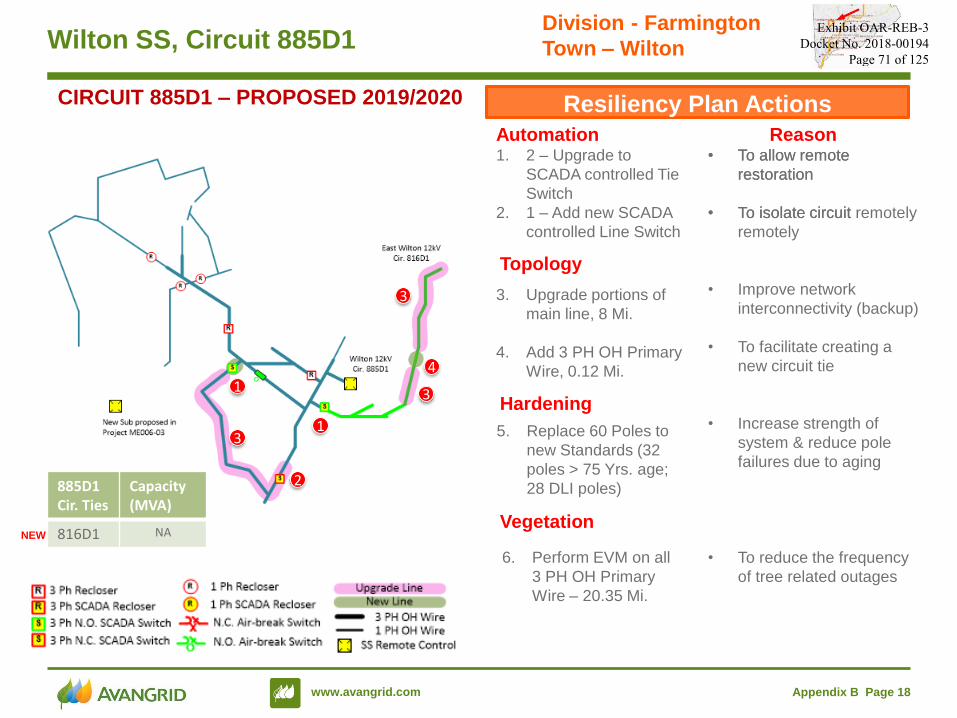
www.avangrid.com Appendix B Page 18
Wilton SS, Circuit 885D1
Resiliency Plan Actions
Automation Reason1. 2 – Upgrade to
SCADA controlled Tie
Switch
2. 1 – Add new SCADA
controlled Line Switch
• To allow remote
restoration
• To isolate circuit
remotely
CIRCUIT 885D1 – PROPOSED 2019/2020
Division - Farmington
Town – Wilton
• To allow remote
restoration
• To isolate circuit remotely
• Improve network
interconnectivity (backup)
• To facilitate creating a
new circuit tie
• Increase strength of
system & reduce pole
failures due to aging
• To reduce the frequency
of tree related outages
Topology
3. Upgrade portions of
main line, 8 Mi.
4. Add 3 PH OH Primary
Wire, 0.12 Mi.
Hardening
5. Replace 60 Poles to
new Standards (32
poles > 75 Yrs. age;
28 DLI poles)
1
1
2
3
3
3
4
885D1Cir. Ties
Capacity (MVA)
816D1 NANEWVegetation
6. Perform EVM on all
3 PH OH Primary
Wire – 20.35 Mi.
Exhibit OAR-REB-3 Docket No. 2018-00194
Page 71 of 125
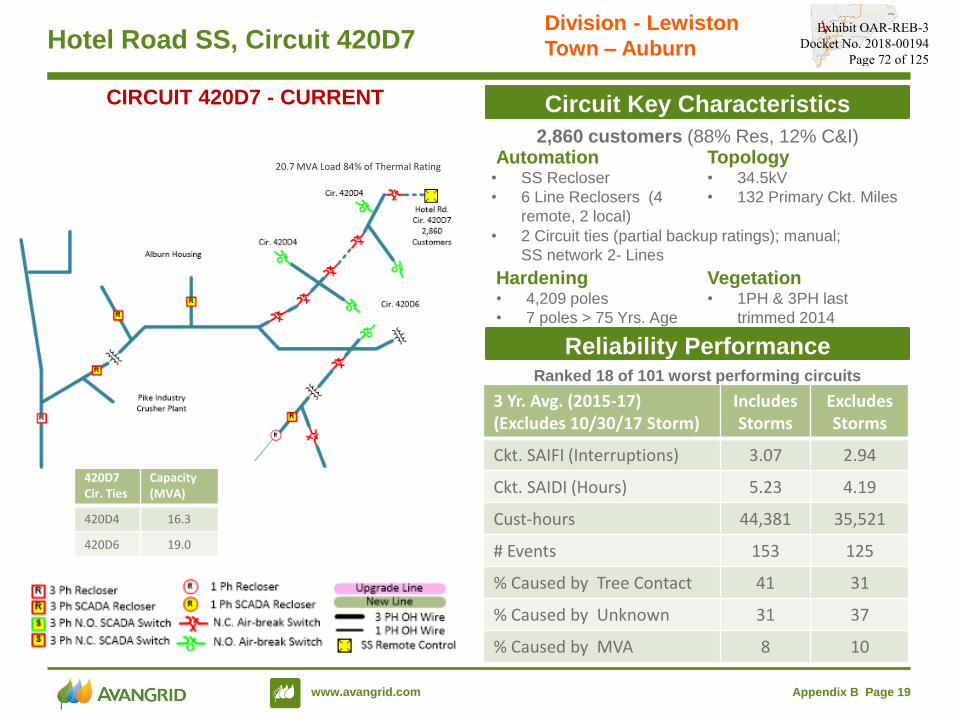
www.avangrid.com Appendix B Page 19
Hotel Road SS, Circuit 420D7
Circuit Key Characteristics
2,860 customers (88% Res, 12% C&I)
Hardening Vegetation• 4,209 poles
• 7 poles > 75 Yrs. Age
• 1PH & 3PH last
trimmed 2014
Automation Topology• SS Recloser
• 6 Line Reclosers (4
remote, 2 local)
• 34.5kV
• 132 Primary Ckt. Miles
• 2 Circuit ties (partial backup ratings); manual;
SS network 2- Lines
Reliability PerformanceRanked 18 of 101 worst performing circuits
3 Yr. Avg. (2015-17) (Excludes 10/30/17 Storm)
Includes Storms
ExcludesStorms
Ckt. SAIFI (Interruptions) 3.07 2.94
Ckt. SAIDI (Hours) 5.23 4.19
Cust-hours 44,381 35,521
# Events 153 125
% Caused by Tree Contact 41 31
% Caused by Unknown 31 37
% Caused by MVA 8 10
CIRCUIT 420D7 - CURRENT
Division - Lewiston
Town – Auburn
420D7Cir. Ties
Capacity (MVA)
420D4 16.3
420D6 19.0
20.7 MVA Load 84% of Thermal Rating
Exhibit OAR-REB-3 Docket No. 2018-00194
Page 72 of 125
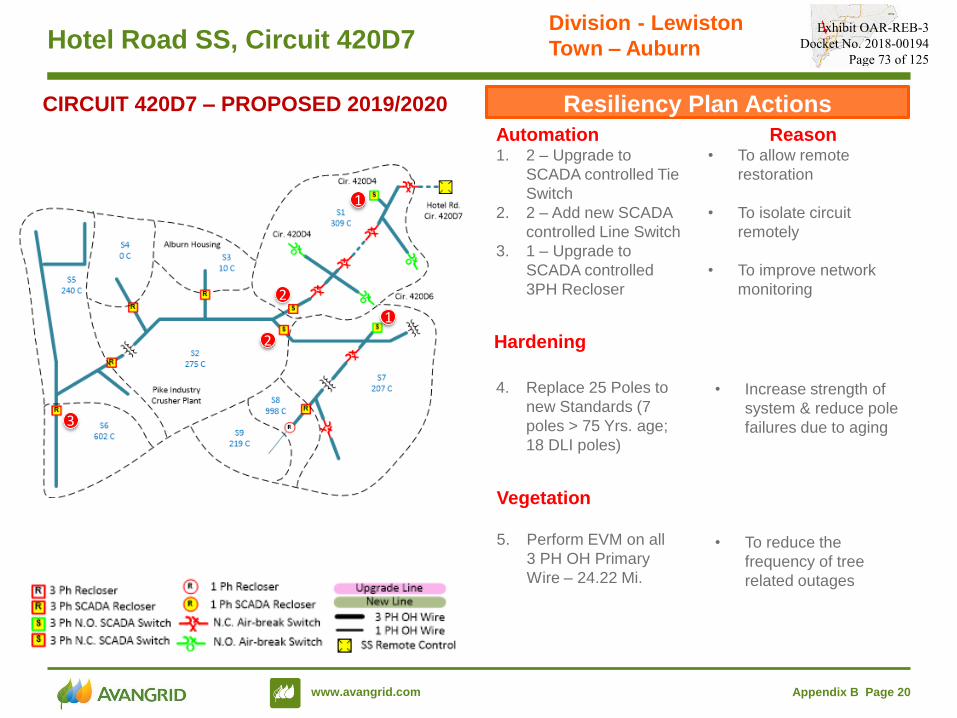
www.avangrid.com Appendix B Page 20
Hotel Road SS, Circuit 420D7
Resiliency Plan Actions
Automation Reason1. 2 – Upgrade to
SCADA controlled Tie
Switch
2. 2 – Add new SCADA
controlled Line Switch
3. 1 – Upgrade to
SCADA controlled
3PH Recloser
• To allow remote
restoration
• To isolate circuit
remotely
• To improve network
monitoring
CIRCUIT 420D7 – PROPOSED 2019/2020
Hardening
4. Replace 25 Poles to
new Standards (7
poles > 75 Yrs. age;
18 DLI poles)
• Increase strength of
system & reduce pole
failures due to aging
• To reduce the
frequency of tree
related outages
Division - Lewiston
Town – Auburn
1
2
1
2
3
Vegetation
5. Perform EVM on all
3 PH OH Primary
Wire – 24.22 Mi.
Exhibit OAR-REB-3 Docket No. 2018-00194
Page 73 of 125
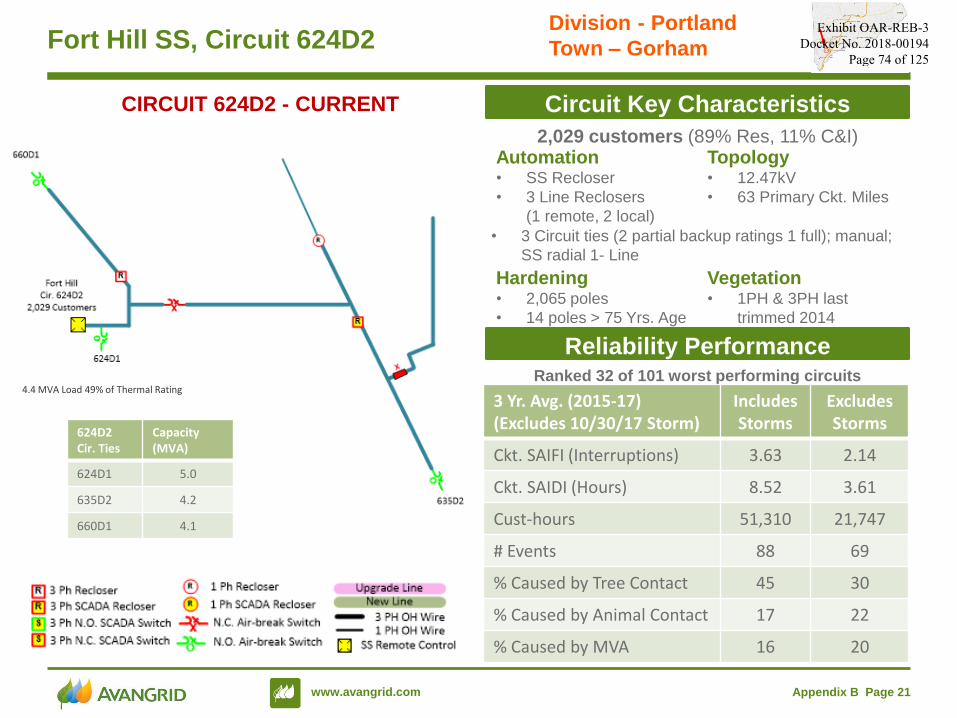
www.avangrid.com Appendix B Page 21
Fort Hill SS, Circuit 624D2
Circuit Key Characteristics
2,029 customers (89% Res, 11% C&I)
Hardening Vegetation• 2,065 poles
• 14 poles > 75 Yrs. Age
• 1PH & 3PH last
trimmed 2014
Automation Topology• SS Recloser
• 3 Line Reclosers
(1 remote, 2 local)
• 12.47kV
• 63 Primary Ckt. Miles
• 3 Circuit ties (2 partial backup ratings 1 full); manual;
SS radial 1- Line
Reliability PerformanceRanked 32 of 101 worst performing circuits
3 Yr. Avg. (2015-17) (Excludes 10/30/17 Storm)
Includes Storms
ExcludesStorms
Ckt. SAIFI (Interruptions) 3.63 2.14
Ckt. SAIDI (Hours) 8.52 3.61
Cust-hours 51,310 21,747
# Events 88 69
% Caused by Tree Contact 45 30
% Caused by Animal Contact 17 22
% Caused by MVA 16 20
CIRCUIT 624D2 - CURRENT
Division - Portland
Town – Gorham
624D2Cir. Ties
Capacity (MVA)
624D1 5.0
635D2 4.2
660D1 4.1
4.4 MVA Load 49% of Thermal Rating
Exhibit OAR-REB-3 Docket No. 2018-00194
Page 74 of 125
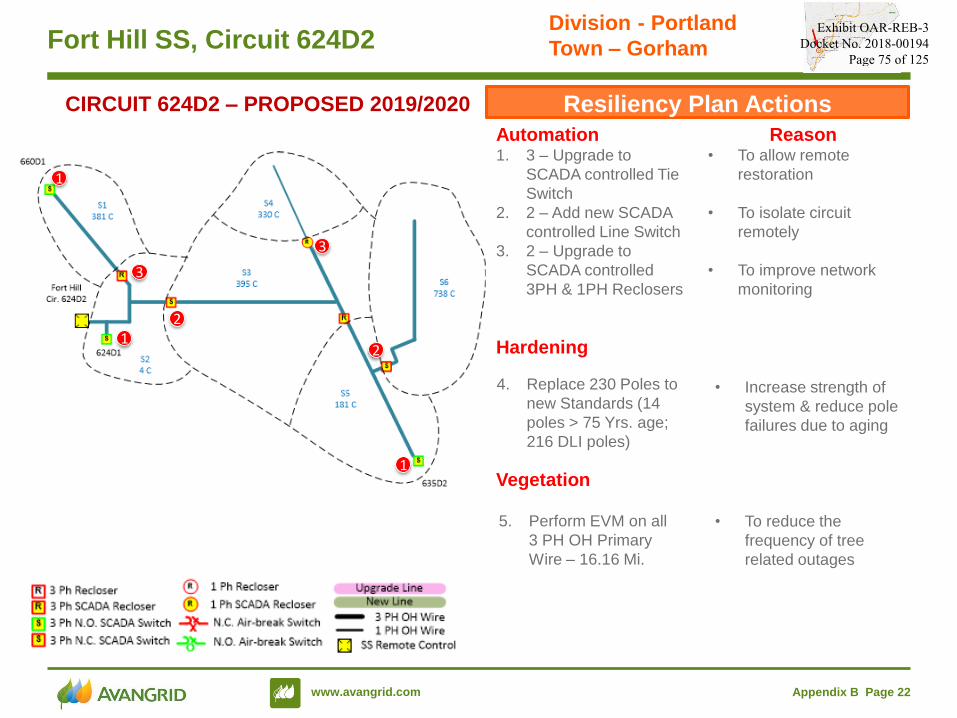
www.avangrid.com Appendix B Page 22
Fort Hill SS, Circuit 624D2
Resiliency Plan Actions
Automation Reason1. 3 – Upgrade to
SCADA controlled Tie
Switch
2. 2 – Add new SCADA
controlled Line Switch
3. 2 – Upgrade to
SCADA controlled
3PH & 1PH Reclosers
• To allow remote
restoration
• To isolate circuit
remotely
• To improve network
monitoring
CIRCUIT 624D2 – PROPOSED 2019/2020
Hardening
4. Replace 230 Poles to
new Standards (14
poles > 75 Yrs. age;
216 DLI poles)
• Increase strength of
system & reduce pole
failures due to aging
• To reduce the
frequency of tree
related outages
Vegetation1
2
3
Division - Portland
Town – Gorham
1
12
3
5. Perform EVM on all
3 PH OH Primary
Wire – 16.16 Mi.
Exhibit OAR-REB-3 Docket No. 2018-00194
Page 75 of 125
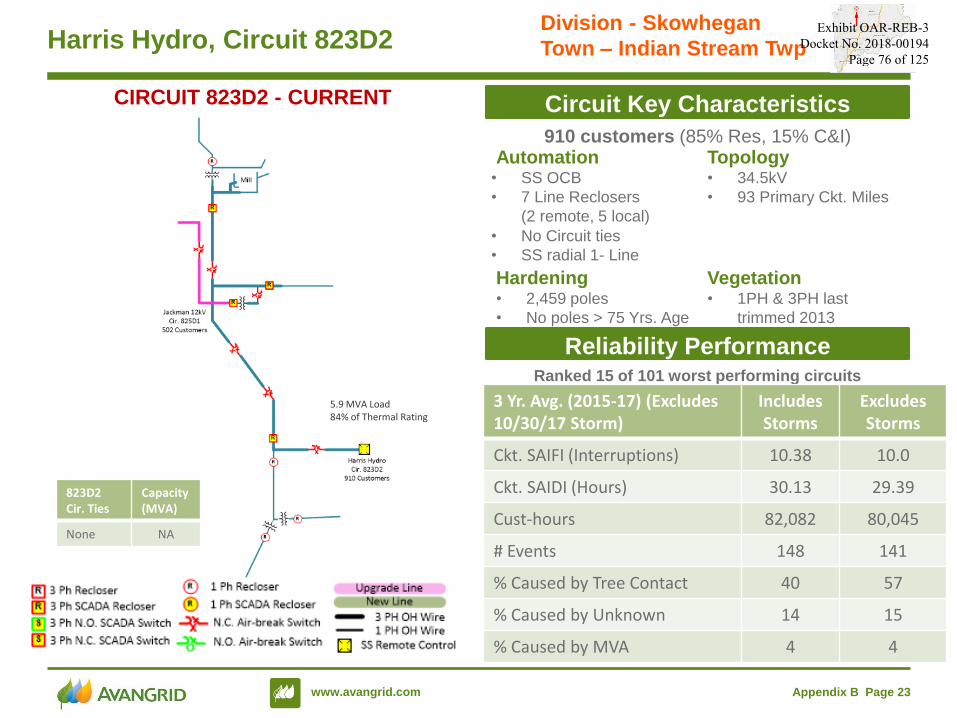
www.avangrid.com Appendix B Page 23
Harris Hydro, Circuit 823D2
Circuit Key Characteristics
910 customers (85% Res, 15% C&I)
Hardening Vegetation• 2,459 poles
• No poles > 75 Yrs. Age
• 1PH & 3PH last
trimmed 2013
Automation Topology• SS OCB
• 7 Line Reclosers
(2 remote, 5 local)
• 34.5kV
• 93 Primary Ckt. Miles
• No Circuit ties
• SS radial 1- Line
Reliability PerformanceRanked 15 of 101 worst performing circuits
3 Yr. Avg. (2015-17) (Excludes 10/30/17 Storm)
Includes Storms
ExcludesStorms
Ckt. SAIFI (Interruptions) 10.38 10.0
Ckt. SAIDI (Hours) 30.13 29.39
Cust-hours 82,082 80,045
# Events 148 141
% Caused by Tree Contact 40 57
% Caused by Unknown 14 15
% Caused by MVA 4 4
CIRCUIT 823D2 - CURRENT
Division - Skowhegan
Town – Indian Stream Twp
823D2Cir. Ties
Capacity (MVA)
None NA
5.9 MVA Load 84% of Thermal Rating
Exhibit OAR-REB-3 Docket No. 2018-00194
Page 76 of 125
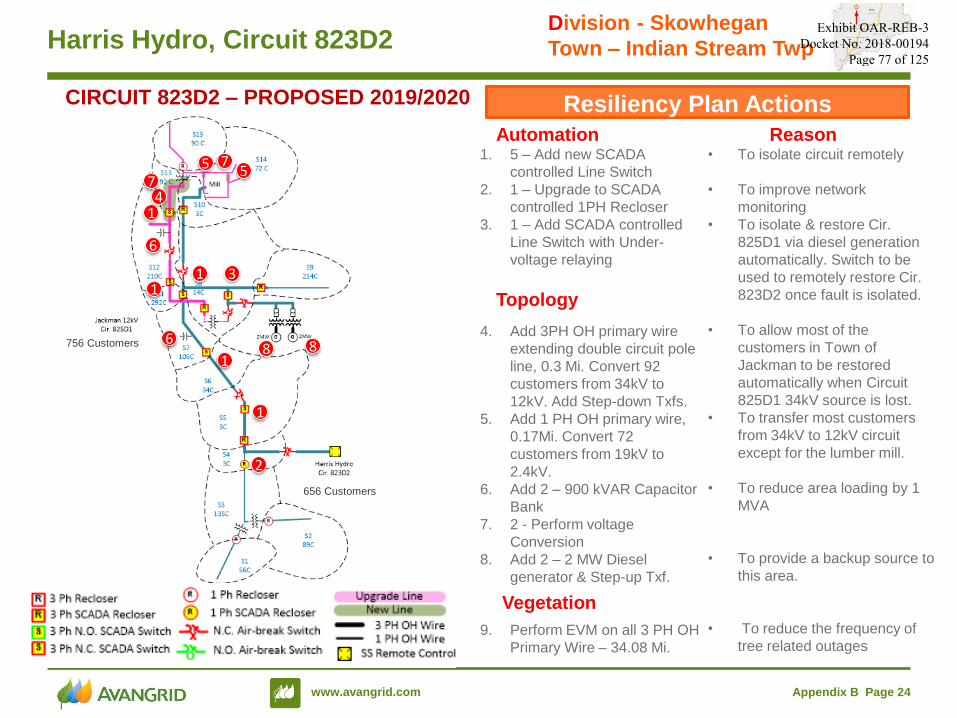
www.avangrid.com Appendix B Page 24
Harris Hydro, Circuit 823D2
Resiliency Plan Actions
Automation Reason• To isolate circuit remotely
• To improve network
monitoring
• To isolate & restore Cir.
825D1 via diesel generation
automatically. Switch to be
used to remotely restore Cir.
823D2 once fault is isolated.
• To allow most of the
customers in Town of
Jackman to be restored
automatically when Circuit
825D1 34kV source is lost.
• To transfer most customers
from 34kV to 12kV circuit
except for the lumber mill.
• To reduce area loading by 1
MVA
• To provide a backup source to
this area.
• To reduce the frequency of
tree related outages
CIRCUIT 823D2 – PROPOSED 2019/2020
1
2
3
Division - Skowhegan
Town – Indian Stream Twp
756 Customers
656 Customers
11
1
1
4
5 5
6
6
7
7
8 8
Vegetation
9. Perform EVM on all 3 PH OH
Primary Wire – 34.08 Mi.
1. 5 – Add new SCADA
controlled Line Switch
2. 1 – Upgrade to SCADA
controlled 1PH Recloser
3. 1 – Add SCADA controlled
Line Switch with Under-
voltage relaying
Topology
4. Add 3PH OH primary wire
extending double circuit pole
line, 0.3 Mi. Convert 92
customers from 34kV to
12kV. Add Step-down Txfs.
5. Add 1 PH OH primary wire,
0.17Mi. Convert 72
customers from 19kV to
2.4kV.
6. Add 2 – 900 kVAR Capacitor
Bank
7. 2 - Perform voltage
Conversion
8. Add 2 – 2 MW Diesel
generator & Step-up Txf.
Exhibit OAR-REB-3 Docket No. 2018-00194
Page 77 of 125
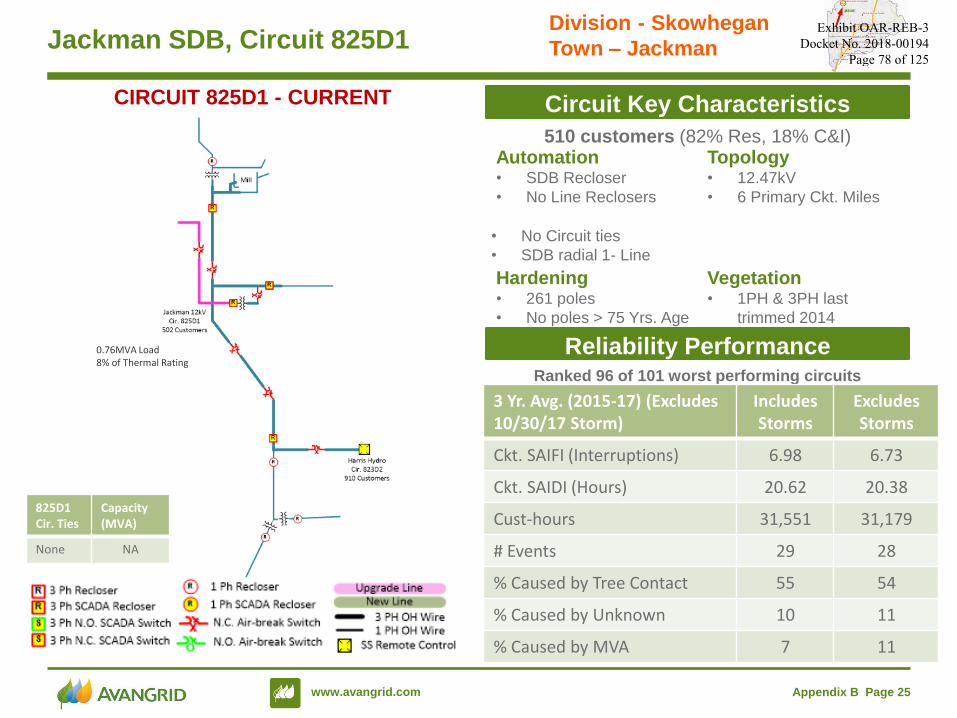
www.avangrid.com Appendix B Page 25
Jackman SDB, Circuit 825D1
Circuit Key Characteristics
510 customers (82% Res, 18% C&I)
Hardening Vegetation• 261 poles
• No poles > 75 Yrs. Age
• 1PH & 3PH last
trimmed 2014
Automation Topology• SDB Recloser
• No Line Reclosers
• 12.47kV
• 6 Primary Ckt. Miles
• No Circuit ties
• SDB radial 1- Line
Reliability PerformanceRanked 96 of 101 worst performing circuits
3 Yr. Avg. (2015-17) (Excludes 10/30/17 Storm)
Includes Storms
ExcludesStorms
Ckt. SAIFI (Interruptions) 6.98 6.73
Ckt. SAIDI (Hours) 20.62 20.38
Cust-hours 31,551 31,179
# Events 29 28
% Caused by Tree Contact 55 54
% Caused by Unknown 10 11
% Caused by MVA 7 11
CIRCUIT 825D1 - CURRENT
Division - Skowhegan
Town – Jackman
825D1Cir. Ties
Capacity (MVA)
None NA
0.76MVA Load 8% of Thermal Rating
Exhibit OAR-REB-3 Docket No. 2018-00194
Page 78 of 125
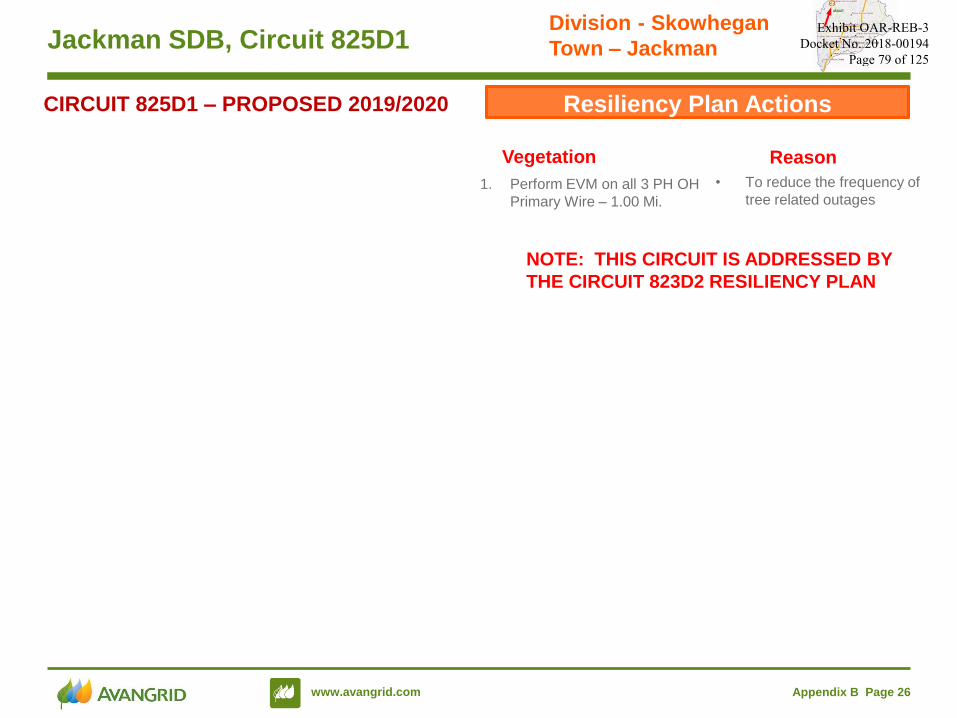
www.avangrid.com Appendix B Page 26
Jackman SDB, Circuit 825D1
Resiliency Plan ActionsCIRCUIT 825D1 – PROPOSED 2019/2020
Division - Skowhegan
Town – Jackman
• To reduce the frequency of
tree related outages
Vegetation
1. Perform EVM on all 3 PH OH
Primary Wire – 1.00 Mi.
Reason
NOTE: THIS CIRCUIT IS ADDRESSED BY
THE CIRCUIT 823D2 RESILIENCY PLAN
Exhibit OAR-REB-3 Docket No. 2018-00194
Page 79 of 125
REPORT
Appendix C Benefit-Cost Analysis of Central Maine Power’s 2019-2020 Resiliency Plan
Submitted to Central Maine Power
April 5, 2019
Principal authors:
Myles Collins, Josh Schellenberg, Stephen George, Robert Gottlieb,
Ty Lehman – Nexant, Inc.
Gary Fauth – Erbridge, Inc.
Exhibit OAR-REB-3 Docket No. 2018-00194
Page 80 of 125

Appendix C Benefit-Cost Analysis of Central Maine Power’s 2019-2020
Resiliency Plan i
Contents
1 Executive Summary ............................................................................. 4
2 Introduction .......................................................................................... 9
3 Background .......................................................................................... 9
3.1 Enhanced Vegetation Management ........................................................ 10
3.1.1 Enhanced Clearances – Part 1 ........................................................ 11
3.1.2 Enhanced Tree Removal – Part 2 .................................................... 12
3.2 Infrastructure Hardening ......................................................................... 12
3.2.1 Pole Replacement ........................................................................... 12
3.2.2 Tree Wire ......................................................................................... 13
3.2.3 Selective Undergrounding ................................................................ 13
3.3 Changes in System and Circuit Topology, with Automation ................ 14
3.3.1 Upgraded and New Lines, Voltage Conversions, and Step
Transformers ................................................................................... 14
3.3.2 Upgraded and New Substations ...................................................... 15
3.3.3 Other Investments ........................................................................... 15
3.3.4 Automation ....................................................................................... 15
3.3.4.1 Distribution Reclosers ........................................................... 15
3.3.4.2 SCADA Switches with Fault Detectors .................................. 15
4 Methodology ....................................................................................... 16
4.1 Approach Overview .................................................................................. 16
4.1.1 General BCA Approach ................................................................... 16
4.1.2 Quantifying Benefits ......................................................................... 16
4.2 Interruption Cost Estimation ................................................................... 18
4.2.1 Source of Interruption Cost Estimates ............................................. 18
4.2.2 Overview of Approach for Estimating Avoided Customer Interuption
Costs ............................................................................................... 19
4.2.3 Generating Predictor Variables for ICE Models ............................... 20
Exhibit OAR-REB-3 Docket No. 2018-00194
Page 81 of 125

Appendix C Benefit-Cost Analysis of Central Maine Power’s 2019-2020
Resiliency Plan ii
4.2.4 Accounting for Regional Variation for Medium & Large C&I
Customers ....................................................................................... 21
4.2.5 Estimating Long Duration Interruption Costs ................................... 22
5 Results ................................................................................................ 24
5.1 Costs ......................................................................................................... 24
5.2 Benefits ..................................................................................................... 25
5.2.1 Overview of Historical Interruptions ................................................. 28
5.2.2 Vegetation Management .................................................................. 29
5.2.2.1 Relevant Outage Types and Modeling Assumptions ............ 30
5.2.2.2 Avoided Interruption Costs .................................................... 31
5.2.2.3 Avoided Restoration Costs .................................................... 31
5.2.2.4 Avoided Vegetation Management Costs ............................... 32
5.2.3 Pole Replacement/Hardening .......................................................... 33
5.2.3.1 Relevant Outage Types and Modeling Assumptions ............ 33
5.2.3.2 Avoided Interruption Costs .................................................... 35
5.2.3.3 Avoided Restoration Costs .................................................... 35
5.2.3.4 Avoided Pole Replacement Costs ......................................... 35
5.2.4 Automation and Topology ................................................................ 36
5.2.4.1 Relevant Outage Types and Modeling Assumptions ............ 36
5.2.4.2 Avoided Interruption Costs .................................................... 39
5.3 Net Present Value of Costs and Benefits ............................................... 40
6 Appendix A: ICE Model Coefficients ................................................. 43
Exhibit OAR-REB-3 Docket No. 2018-00194
Page 82 of 125
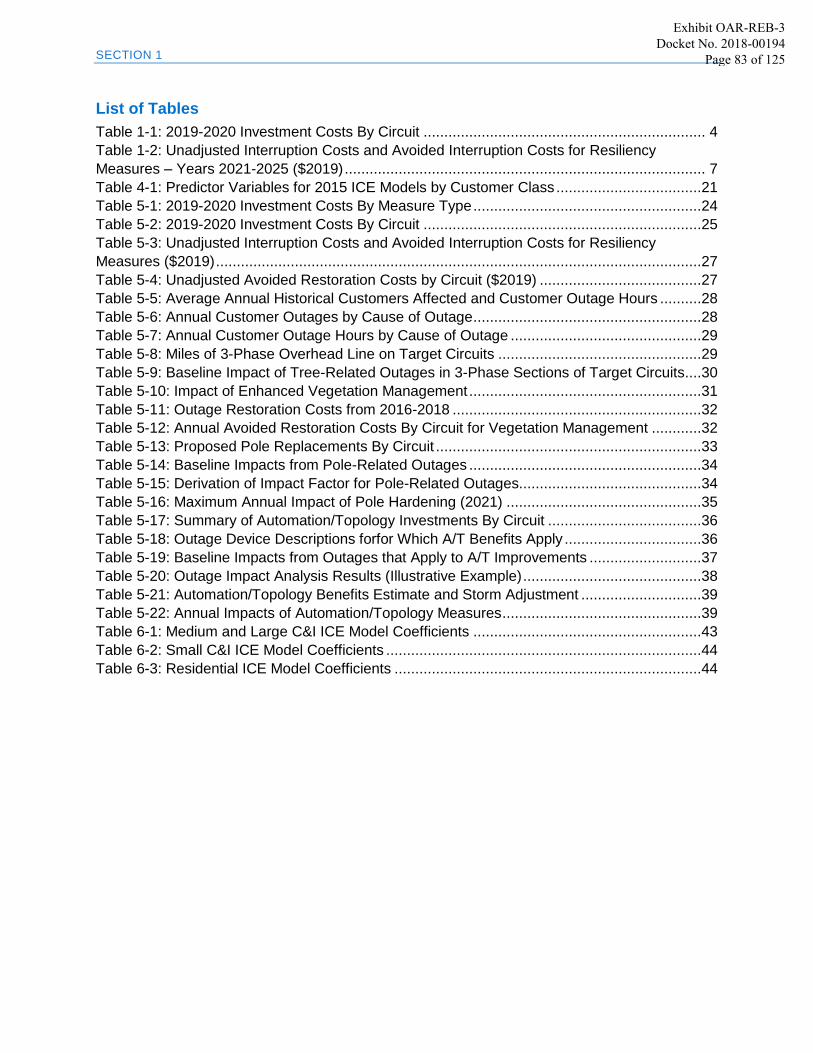
SECTION 1
List of Tables
Table 1-1: 2019-2020 Investment Costs By Circuit .................................................................... 4
Table 1-2: Unadjusted Interruption Costs and Avoided Interruption Costs for Resiliency
Measures – Years 2021-2025 ($2019) ....................................................................................... 7
Table 4-1: Predictor Variables for 2015 ICE Models by Customer Class ...................................21
Table 5-1: 2019-2020 Investment Costs By Measure Type .......................................................24
Table 5-2: 2019-2020 Investment Costs By Circuit ...................................................................25
Table 5-3: Unadjusted Interruption Costs and Avoided Interruption Costs for Resiliency
Measures ($2019) .....................................................................................................................27
Table 5-4: Unadjusted Avoided Restoration Costs by Circuit ($2019) .......................................27
Table 5-5: Average Annual Historical Customers Affected and Customer Outage Hours ..........28
Table 5-6: Annual Customer Outages by Cause of Outage .......................................................28
Table 5-7: Annual Customer Outage Hours by Cause of Outage ..............................................29
Table 5-8: Miles of 3-Phase Overhead Line on Target Circuits .................................................29
Table 5-9: Baseline Impact of Tree-Related Outages in 3-Phase Sections of Target Circuits ....30
Table 5-10: Impact of Enhanced Vegetation Management ........................................................31
Table 5-11: Outage Restoration Costs from 2016-2018 ............................................................32 Table 5-12: Annual Avoided Restoration Costs By Circuit for Vegetation Management ............32
Table 5-13: Proposed Pole Replacements By Circuit ................................................................33
Table 5-14: Baseline Impacts from Pole-Related Outages ........................................................34
Table 5-15: Derivation of Impact Factor for Pole-Related Outages............................................34
Table 5-16: Maximum Annual Impact of Pole Hardening (2021) ...............................................35
Table 5-17: Summary of Automation/Topology Investments By Circuit .....................................36
Table 5-18: Outage Device Descriptions forfor Which A/T Benefits Apply .................................36
Table 5-19: Baseline Impacts from Outages that Apply to A/T Improvements ...........................37
Table 5-20: Outage Impact Analysis Results (Illustrative Example) ...........................................38
Table 5-21: Automation/Topology Benefits Estimate and Storm Adjustment .............................39
Table 5-22: Annual Impacts of Automation/Topology Measures ................................................39
Table 6-1: Medium and Large C&I ICE Model Coefficients .......................................................43
Table 6-2: Small C&I ICE Model Coefficients ............................................................................44
Table 6-3: Residential ICE Model Coefficients ..........................................................................44
Exhibit OAR-REB-3 Docket No. 2018-00194
Page 83 of 125
SECTION 1
Appendix C Benefit-Cost Analysis of Central Maine Power’s 2019-2020
Resiliency Plan 3
List of Figures
Figure 1-1: Sequence of Calculating Benefits ............................................................................ 6
Figure 1-2: Timing of Benefits Realization .................................................................................. 6
Figure 1-3: Net Present Value of 2019-2020 Resiliency Costs and Benefits .............................. 8
Figure 3-1: Current Tree-Trimming Clearances .........................................................................11
Figure 3-2: Ground-to-Sky Clearance .......................................................................................12
Figure 4-1: Sequence of Calculating Benefits ...........................................................................18
Figure 4-2: Overview of Approach for Estimating Avoided Customer Interuption Costs .............20
Figure 4-3: Comparison of Methods for Estimating Long Duration Interruption Costs ................23
Figure 5-1: Timing of Benefits Realization .................................................................................26
Figure 5-2: Illustrative Circuit Diagram to Explain Outage Impact Methodology.........................38
Figure 5-3: Net Present Value of 2019-2020 Resiliency Costs and Benefits .............................41
Figure 5-4: Summary of NPV Calculation Model .......................................................................42
Exhibit OAR-REB-3 Docket No. 2018-00194
Page 84 of 125
SECTION 1 EXECUTIVE SUMMARY
Appendix C Benefit-Cost Analysis of Central Maine Power’s 2019-2020
Resiliency Plan 4
1 Executive Summary
This report presents a benefit-cost analysis (BCA) of Central Maine Power’s (CMP) Resiliency
Plan for investments planned for 2019 and 2020. A BCA compares the costs of an investment
with the benefits it produces. It is applied on a forward looking basis to investments that typically
have large upfront costs but have benefits that accrue over multiple years. A BCA requires a
pre-specified perspective, as two different parties can view the same outcome differently. While
policies and programs can lead to winners and losers, cost-effectiveness analysis focuses on
the broader question of whether the overall 2019-2020 Resiliency Plan is beneficial.
This BCA has been developed based on the societal perspective, which evaluates the question
of whether the benefits, including externalities, exceed the costs. The societal test not only
counts operational benefits to a utility, but it also includes benefits experienced by customers,
such as reduced outage costs. It does not treat transfers between parties as costs.
Table 1-1 summarizes the 2019-2020 costs by circuit. Circuit 825D1 only has $26,000 of
enhanced vegetation management proposed for 2019-2020, but will realize benefits from
automation and topology improvements to circuit 823D2. Circuit-level costs for the other eleven
circuits range from $1.1 million on circuit 438D1 to $7.7 million on circuit 466D1.
Table 1-1: 2019-2020 Investment Costs By Circuit
Exhibit OAR-REB-3 Docket No. 2018-00194
Page 85 of 125
SECTION 1 EXECUTIVE SUMMARY
Appendix C Benefit-Cost Analysis of Central Maine Power’s 2019-2020
Resiliency Plan 5
The Resiliency Plan yields four major categories of benefits.
Avoided interruption costs represent the largest benefit stream. When customers
experience interruptions, they bear economic costs.1 The Resiliency Plan investments
are designed to reduce the frequency and duration of interruptions and thus deliver an
economic benefit to customers. To estimate the value of reductions in customer outage
costs associated with reductions in outage frequency and duration, this analysis used
the Interruption Cost Estimation (ICE) Model developed by Nexant, in partnership with
LBNL, for the U.S. Department of Energy.2 This model is detailed in Section 4.2.
Avoided restoration costs are benefits from CMP restoring power to customers less
frequently due to fewer outages in future years. Restoration costs consist of capital and
O&M.
Avoided vegetation management costs are those which would be spent in the
absence of the Resiliency Plan on “standard,” non-enhanced vegetation management (in
the base case). The difference between the total proposed investment expenditure and
the base case costs is the incremental cost of the resiliency investment.
Avoided pole replacement costs are those which would be spent on replacing poles in
the absence of the Resiliency Plan. The per-pole replacement costs are $6,000, but the
replacements are accelerated under the Plan.
Quantifying the impact of investments for a BCA involves first defining a base case, which
represents a projection of the future in the absence of the investment. Benefits are measured as
the difference between the future state with the investment and the base case. For this analysis,
Nexant used a database of historical outages from 2016-2018 to represent the base case future
scenario. This period was selected because it covers multiple years and is recent enough that
the outages should reasonably reflect the performance of current grid infrastructure under
current conditions (i.e. the further back in time the baseline period stretches, the less reflective
the outages will be of current conditions). Nexant worked with subject matter experts at
AVANGRID to assess the impacts of the various resiliency measures on the existing database
of outages to determine how the investments would impact this baseline set of outages.
A critical issue when estimating avoided outage benefits is to carefully track outage impacts and
to avoid double-counting benefits. Each resiliency measure will have an impact on the baseline
outage database and applying the measures in sequence—while tracking the impacts—ensures
an accurate representation of total benefits. Figure 1-1 shows the sequence in which
investments are assumed to occur for purposes of calculating benefits. Enhanced vegetation
management reduces the frequency of tree-related outages, while pole hardening reduces the
frequency of pole-related outages. However, some outages are classified as both tree-related
and pole-related. Similarly, the outages mitigated by automation and topology (A/T) could be
tree-related or pole-related.
1 Note that the terms “outage” and “interruption” are used interchangeably in this report.
2 https://icecalculator.com/documentation
Exhibit OAR-REB-3 Docket No. 2018-00194
Page 86 of 125

SECTION 1 EXECUTIVE SUMMARY
Appendix C Benefit-Cost Analysis of Central Maine Power’s 2019-2020
Resiliency Plan 6
Figure 1-1: Sequence of Calculating Benefits
Given the importance of avoiding double-counting benefits, the order of applying benefits should
follow a logical process. The benefits hierarchy shown in Figure 1-1 reflects the process of
moving from measures to address the cause of the outage to the response. Vegetation
management will prevent trees from coming into contact with infrastructure and causing faults.
Some tree-related outages will continue to occur and a portion of these may be prevented by
infrastructure hardening. Next, once outages do occur—albeit now less frequently—automation
and topology will mitigate a portion of the remaining impact to customers.
Figure 1-2 shows the timing of the benefits realization. The first year of benefits realization is
2021 and includes benefits from enhanced vegetation management, accelerated pole
hardening, and A/T. Enhanced vegetation management benefits are realized across target
circuits through an expenditure in 2020 that is incremental to base case levels of vegetation
management. This benefit stream continues indefinitely with regular maintenance expenses
which are the same amount as base case vegetation management expenses (i.e. no
incremental vegetation management costs after 2020). Accelerated pole hardening has benefits
in 2021 that represent an accelerated replacement of all open DLI poles and poles older than 75
years. Approximately 75 percent of these benefits expire in 2022, as the base case assumes
the open DLI poles would have all been replaced by the end of 2021. For the remaining poles,
which do not have an open DLI status, the analysis assumes they would have been replaced
over the next 15 years in the base case. These benefits therefore steadily decline until 2036,
when the poles that were replaced as part of the 2019-2020 Resiliency Plan would have all
been replaced by hardened poles in the base case.
Figure 1-2: Timing of Benefits Realization
Avoided interruption costs make up the vast majority of the benefits from the resiliency
measures. Table 1-2 shows the components of the avoided interruption cost annual benefit
stream. These annual benefit figures are unadjusted, in that they represent $2019, but an
Vegetation Management
•Tree-RelatedOutages
Pole Hardening
•Pole-RelatedOutages
Automation & Topology
•Outages that tripcertain devices
2020 2025 2030 2035 2040 2045 2050
Enhanced Vegetation Management Benefits continue with regular maintenance
Accelerated Pole Hardening Benefits decrease over 15 years, when old
poles would have been replaced in base case
DLI Poles Replaced
Automation/Topology Benefits continue to end of useful life
Exhibit OAR-REB-3Docket No. 2018-00194
Page 87 of 125

SECTION 1 EXECUTIVE SUMMARY
Appendix C Benefit-Cost Analysis of Central Maine Power’s 2019-2020
Resiliency Plan 7
escalation rate of 2.0 percent and a discount rate of 7.06 percent3 would be applied to them to
reflect the first year of realization in 2021 (and beyond). Enhanced vegetation management
makes up the largest portion, with $3.4 million across all targeted circuits. These benefits are
maintained throughout the analysis timeframe (through 2049), as outages will continue to be
avoided with regular trimming that does not exceed the cost of base case maintenance.
Avoided interruption costs from automation/topology have an annual unadjusted total of $2.3
million and a useful life of 20 years. Pole hardening benefits—which come from accelerating
pole replacements—have a maximum annual benefit in 2021 of $96,000 from avoided
interruption costs. Prior to implementing resiliency measures, total interruption costs across all
circuits are nearly $22.0 million annually. After applying the measures, interruption costs
decrease by over 25 percent to $16.1 million annually.
Table 1-2: Unadjusted Interruption Costs and Avoided Interruption Costs for Resiliency Measures – Years 2021-2025 ($2019)
Circuit
Annual Baseline
Interruption Costs ($)
Avoided Interruption Costs ($) Interruption Costs with Resiliency
Investments ($)
Vegetation Management
Pole Replacement/
Hardening Automation/
Topology
244D1 $1,204,527 $30,038 $380 $10,368 $1,163,741
420D7 $1,708,446 $172,560 $3,176 $170,364 $1,362,346
438D1 $2,000,490 $220,746 $6,547 $151,681 $1,621,516
466D1 $1,339,650 $102,412 $806 $53,393 $1,183,039
624D2 $851,217 $151,626 $23,023 $180,802 $495,766
667D2 $684,659 $110,122 $6,087 $23,446 $545,004
687D1 $3,681,725 $645,917 $38,546 $942,286 $2,054,976
823D2 $1,773,182 $280,207 $0 $321,233 $1,171,742
825D1 $1,082,908 $205,249 $0 $255,908 $621,751
834D2 $2,925,978 $602,935 $7,248 $105,487 $2,210,308
875D1 $1,869,326 $322,627 $287 $4,761 $1,541,651
885D1 $2,847,245 $571,772 $9,632 $123,071 $2,142,770
Total $21,969,353 $3,416,211 $95,732 $2,342,800 $16,114,610
Enhanced vegetation management also yields benefits in the form of avoided outage restoration
costs, which include both capital and O&M. These benefits are relatively small, totaling $59,000
annually (unadjusted) across the 12 target circuits.
The 2019-2020 CMP Resiliency Investments have a positive NPV of $54.3 million and a
benefit/cost ratio of 2.8. The NPV of costs is $30.3 million, due to a portion of the investment
being made in 2020, to which the discount factor is applied. The NPV of benefits is $84.6
million. Avoided interruption costs from enhanced vegetation management have an NPV of
$49.5 million. The NPV of A/T benefits is $27.9 million. Figure 1-3 shows the NPV of each
category of costs and benefits.
3 The discount rate, which is used to calculate the present value of costs and benefits over the life of the investments, is equal to
CMP’s after tax weighted average cost of capital (WACC).
Exhibit OAR-REB-3 Docket No. 2018-00194
Page 88 of 125
SECTION 1 EXECUTIVE SUMMARY
Appendix C Benefit-Cost Analysis of Central Maine Power’s 2019-2020
Resiliency Plan 8
Figure 1-3: Net Present Value of 2019-2020 Resiliency Costs and Benefits
Exhibit OAR-REB-3 Docket No. 2018-00194
Page 89 of 125
SECTION 2 INTRODUCTION
Appendix C Benefit-Cost Analysis of Central Maine Power’s 2019-2020
Resiliency Plan 9
2 Introduction
This report presents a benefit-cost analysis (BCA) of Central Maine Power’s (CMP) Resiliency
Plan for investments planned for 2019 and 2020. Nexant conducted the BCA, working closely
with AVANGRID subject matter experts to understand each component of the plan and its
expected impact to the CMP grid. Most of the Resiliency Plan’s benefits come from reducing the
economic impacts of power outages to CMP customers, and Nexant has particular expertise in
estimating these avoided customer interruption costs.4 This report presents the results of the
BCA and explains in detail the assumptions used for determining the costs and the expected
benefits. The sections of this report are as follows:
Section 3 – Background: Reviews the details of the CMP Resiliency Plan and the types
of measures to be implemented in 2019 and 2020.
Section 4 – Methodology: Gives an overview of benefit-cost analysis and describes the
methodology for determining the benefits of the investments. This section provides
details of the data and underlying econometric models used to estimate customer
interruption costs.
Section 5 – Results: Details the results of the analysis, covering the costs, benefits, and
conversion of future benefit streams to net present value (NPV). This section outlines the
assumptions used for estimating the impact of the resiliency measures on the frequency
and duration of power outages and provides the monetized benefits of the investments
by circuit.
3 Background
CMP has developed three programs to enhance resiliency:
Enhanced Vegetation Management;
Hardening; and
Topology, with Automation on prioritized circuits.
CMP’s Resiliency Plan is a holistic plan to enhance the resiliency of twelve of CMP’s worst
performing circuits. The individual circuit plans combine CMP’s enhanced vegetation
management proposal, application of recently adopted hardening guidelines, and changes to
the topology of these circuits, with automation devices, resulting in a holistic approach to
resiliency planning for each circuit. This section provides an overview of the investments in each
of these three categories included in CMP’s Resiliency Plan for 2019 and 2020.
4 See Section 4.2 for more detail.
Exhibit OAR-REB-3 Docket No. 2018-00194
Page 90 of 125
SECTION 3 BACKGROUND
Appendix C Benefit-Cost Analysis of Central Maine Power’s 2019-2020
Resiliency Plan 10
3.1 Enhanced Vegetation Management Tree contact with electrical conductors and other facilities is the most common cause of service
interruptions in the United States. Maine, at 89%, has the highest percentage of forest
coverage of any state in the country. Although this is a statewide statistic, CMP is certainly
among the most forested electric service areas in the country, with over 22,000 miles of
overhead primary lines in tree-covered areas. During the 2016-2018 period, 46.9 percent of
CMP outages were caused by trees or branches contacting electric infrastructure.
CMP’s current tree-trimming program consists of the following elements:
A five-year tree trimming cycle that includes vegetation pruning and tree removals,
including limited removal of trees outside of CMP’s right-of-way;
Supplemental “hot-spot” pruning of faster growing vegetation species that would
otherwise encroach upon electric facilities if pruned on the five-year cycle; and
Removal of hazard trees located outside of CMP’s right-of-way.5
As shown in Figure 2, the current clearance requirements are:
Minimum of eight (8) feet of side clearance from the outside conductors;
Minimum of fifteen (15) feet of overhead clearance from the highest electrical conductor;
and
Minimum of ten (10) feet of clearance will be provided from the lowest electrical
conductor to any vegetation, when ground clearing is not permitted.
5 Hazard trees are dead, declining, weak, uprooted, storm damaged, diseased trees, or tree species known to have a high failure
rate that are located such that there is a high probability of the tree contacting the electrical conductors if the tree were to fall. CMP increased funding for hazard tree removal was approved in CMP’s last rate case (Docket No. 2013-00168).
Exhibit OAR-REB-3Docket No. 2018-00194
Page 91 of 125
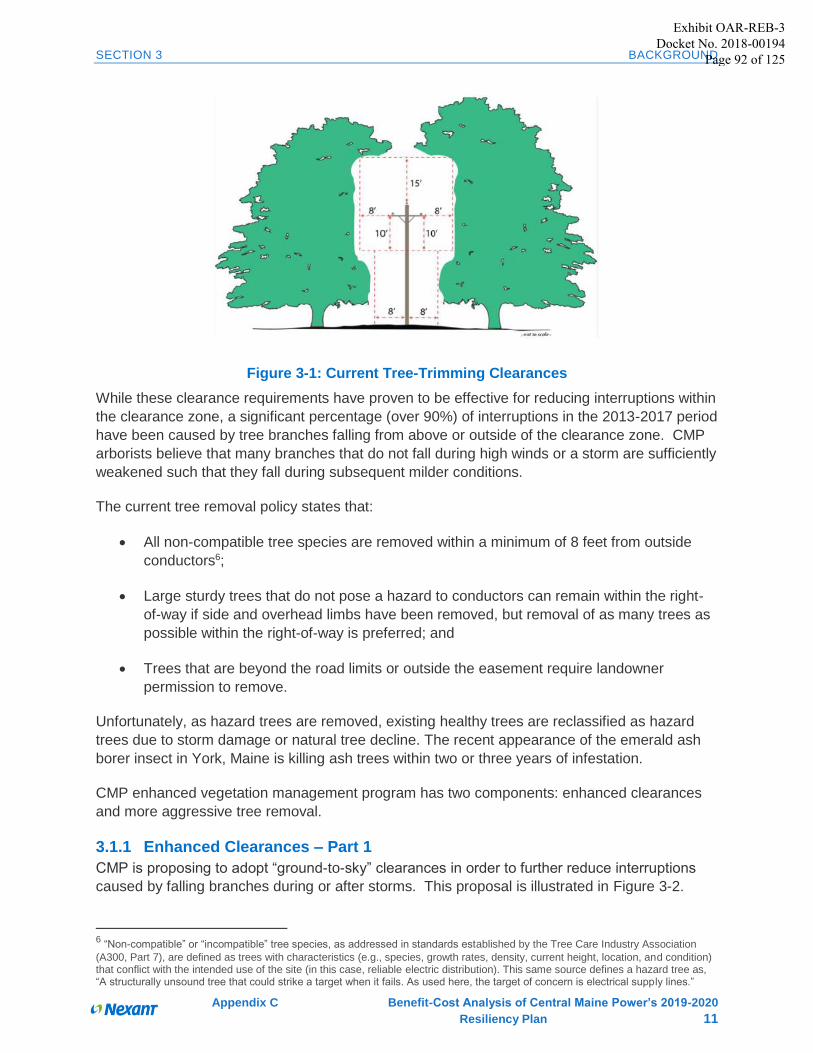
SECTION 3 BACKGROUND
Appendix C Benefit-Cost Analysis of Central Maine Power’s 2019-2020
Resiliency Plan 11
Figure 3-1: Current Tree-Trimming Clearances
While these clearance requirements have proven to be effective for reducing interruptions within
the clearance zone, a significant percentage (over 90%) of interruptions in the 2013-2017 period
have been caused by tree branches falling from above or outside of the clearance zone. CMP
arborists believe that many branches that do not fall during high winds or a storm are sufficiently
weakened such that they fall during subsequent milder conditions.
The current tree removal policy states that:
All non-compatible tree species are removed within a minimum of 8 feet from outside
conductors6;
Large sturdy trees that do not pose a hazard to conductors can remain within the right-
of-way if side and overhead limbs have been removed, but removal of as many trees as
possible within the right-of-way is preferred; and
Trees that are beyond the road limits or outside the easement require landowner
permission to remove.
Unfortunately, as hazard trees are removed, existing healthy trees are reclassified as hazard
trees due to storm damage or natural tree decline. The recent appearance of the emerald ash
borer insect in York, Maine is killing ash trees within two or three years of infestation.
CMP enhanced vegetation management program has two components: enhanced clearances
and more aggressive tree removal.
3.1.1 Enhanced Clearances – Part 1
CMP is proposing to adopt “ground-to-sky” clearances in order to further reduce interruptions
caused by falling branches during or after storms. This proposal is illustrated in Figure 3-2.
6 “Non-compatible” or “incompatible” tree species, as addressed in standards established by the Tree Care Industry Association
(A300, Part 7), are defined as trees with characteristics (e.g., species, growth rates, density, current height, location, and condition) that conflict with the intended use of the site (in this case, reliable electric distribution). This same source defines a hazard tree as, “A structurally unsound tree that could strike a target when it fails. As used here, the target of concern is electrical supply lines.”
Exhibit OAR-REB-3 Docket No. 2018-00194
Page 92 of 125
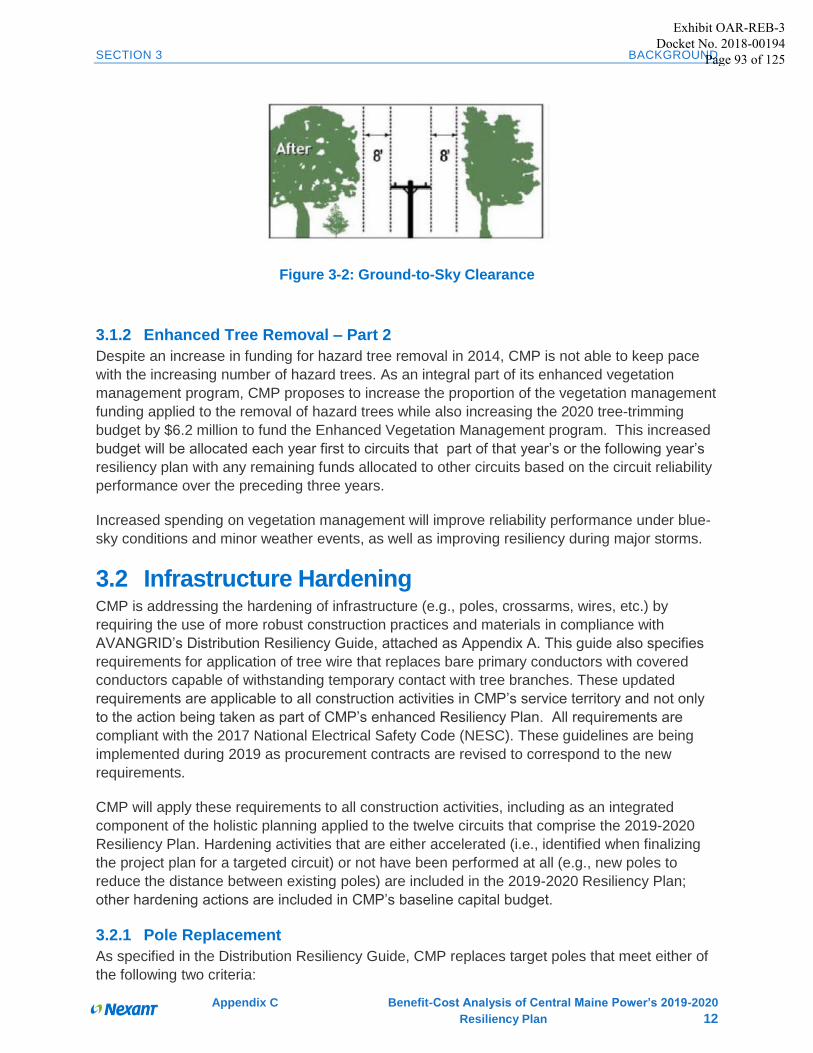
SECTION 3 BACKGROUND
Appendix C Benefit-Cost Analysis of Central Maine Power’s 2019-2020
Resiliency Plan 12
Figure 3-2: Ground-to-Sky Clearance
3.1.2 Enhanced Tree Removal – Part 2
Despite an increase in funding for hazard tree removal in 2014, CMP is not able to keep pace
with the increasing number of hazard trees. As an integral part of its enhanced vegetation
management program, CMP proposes to increase the proportion of the vegetation management
funding applied to the removal of hazard trees while also increasing the 2020 tree-trimming
budget by $6.2 million to fund the Enhanced Vegetation Management program. This increased
budget will be allocated each year first to circuits that part of that year’s or the following year’s
resiliency plan with any remaining funds allocated to other circuits based on the circuit reliability
performance over the preceding three years.
Increased spending on vegetation management will improve reliability performance under blue-
sky conditions and minor weather events, as well as improving resiliency during major storms.
3.2 Infrastructure Hardening CMP is addressing the hardening of infrastructure (e.g., poles, crossarms, wires, etc.) by
requiring the use of more robust construction practices and materials in compliance with
AVANGRID’s Distribution Resiliency Guide, attached as Appendix A. This guide also specifies
requirements for application of tree wire that replaces bare primary conductors with covered
conductors capable of withstanding temporary contact with tree branches. These updated
requirements are applicable to all construction activities in CMP’s service territory and not only
to the action being taken as part of CMP’s enhanced Resiliency Plan. All requirements are
compliant with the 2017 National Electrical Safety Code (NESC). These guidelines are being
implemented during 2019 as procurement contracts are revised to correspond to the new
requirements.
CMP will apply these requirements to all construction activities, including as an integrated
component of the holistic planning applied to the twelve circuits that comprise the 2019-2020
Resiliency Plan. Hardening activities that are either accelerated (i.e., identified when finalizing
the project plan for a targeted circuit) or not have been performed at all (e.g., new poles to
reduce the distance between existing poles) are included in the 2019-2020 Resiliency Plan;
other hardening actions are included in CMP’s baseline capital budget.
3.2.1 Pole Replacement
As specified in the Distribution Resiliency Guide, CMP replaces target poles that meet either of
the following two criteria:
Exhibit OAR-REB-3 Docket No. 2018-00194
Page 93 of 125

SECTION 3 BACKGROUND
Appendix C Benefit-Cost Analysis of Central Maine Power’s 2019-2020
Resiliency Plan 13
Poles that have been in service for at least 75 years; and
Poles that fail inspections performed in accordance with CMP’s Distribution Line
Inspection (DLI) program.
Although there is a strong correlation between pole age and condition, the DLI program
supplements the 75-year criterion by identifying target poles that that may be 40 or 50 years old
but have deficiencies that make them prone to failure. The DLI program is a thorough, condition-
based, inspection of all distribution equipment on each overhead structure. Any equipment
identified for repair or replacement is prioritized by criticality of failure and subsequently
remedied by the Company. Common issues include defective cross arms, poles, cutouts,
transformers, and insulators.
As an increased measure of efficiency, CMP’s DLI program is coordinated with the vegetation
management program. DLI inspections are conducted within a year of circuit tree trimming and
includes a quality check to ensure that tree trimming was performed in accordance with
contractual specifications. Any equipment, including target poles, that is identified for repair or
replacement is prioritized by criticality of failure and subsequently remedied by the Company.
Pole replacements are performed in compliance with the standards identified in AVANGRID’s
Distribution Resiliency Guide. CMP estimates that the annual increase in pole replacement
costs attributable to the stricter pole standards for new construction activities is $370,000 for the
entire service territory.
Pole replacements will be included as part of CMP’s 2019-2020 Resiliency Plan if they are
incremental to business-as-usual replacements. They will be identified during the detailed
engineering and project planning phase of the holistic plan for each of the twelve circuits or if
they are on the DLI list of target poles but have not yet been replaced. New poles may be
needed as part of a detailed circuit plan to accommodate guying wire, conductors, and
automation devices. All new poles will comply with the requirements in AVANGRID’s
Distribution Resiliency Guide.
3.2.2 Tree Wire
The application of tree wire will be required for all new construction projects under AVANGRID’s
Distribution Resiliency Guide. Tree wire will only be installed on a targeted basis as part of
CMP’s 2019-2020 Resiliency Plan and only if identified during the detailed engineering and
project planning phase as a prudent addition to the circuit-specific resiliency plan. Thus, tree
wire will be applied based on observed field conditions.
3.2.3 Selective Undergrounding
Undergrounding is the replacement of overhead primary electric wires with underground cables.
From a resiliency perspective, undergrounding makes the power lines less susceptible to
outages during high winds, thunderstorms, heavy snow or ice storms. Many communities
express an interest in undergrounding because of the aesthetic benefits. However,
undergrounding of wire and associated infrastructure is often an expensive option to construct.
Undergrounding may be a viable option where common facilities support multiple overhead
circuits such as at substation gateways.
CMP has not included any undergrounding projects in its 2019-2020 Resiliency Plan, although
undergrounding will be considered as an option as the 2021-2028 plans are further refined.
Exhibit OAR-REB-3 Docket No. 2018-00194
Page 94 of 125
SECTION 3 BACKGROUND
Appendix C Benefit-Cost Analysis of Central Maine Power’s 2019-2020
Resiliency Plan 14
3.3 Changes in System and Circuit Topology, with
Automation A distribution system topology describes the configuration of infrastructure that comprises the
distribution system. CMP has a predominantly radial structure, characterized by a design in
which power is received at a substation from the transmission system and distributed via three-
phase or single-phase radial circuits to homes and businesses. The challenge from a resiliency
perspective is that CMP’s radial network is dominated by relatively long circuits serving multiple
communities. Given the miles of circuit exposure, these circuits are prone to localized damages
that impact many customers. This circumstance is exacerbated during major storms when there
are multiple damage sites along a circuit.
CMP can enhance resiliency, including both the ability to limit the number of outages and
improve the speed of recovery by changing the topology through multiple strategies including
upgrading lines, and enabling segmentation of circuits during outages to limit the number of
customers that are impacted by a particular outage. Segmentation is achieved by adding and
automating feeder ties that allow CMP to switch power flows around specific outages and
thereby reduce the number of “downstream” customers on a radial circuit that would otherwise
be impacted by an event. The investments that support these strategies include upgrading and
adding more circuits and lines, upgrading or adding substations, and other investments that
support desired outcomes. Providing alternative sources of power by adding connected circuits
also helps minimize outages.
As discussed in the next Section, CMP’s Resiliency Plan considers all of these options,
including their respective benefits and costs, and proposes the combination of options for each
circuit that is the most cost-effective solution while complying with distribution system planning
criteria. Topology changes work in concert with automated switches to facilitate customer
segmentation (fewer outages) and faster restoration by restoring power to as many customers
as possible before repairing the damage to the grid.
All topology related construction is performed in accordance with the AVANGRID Distribution
Resiliency Guide and will comply with the material standards reported in the Guide.
3.3.1 Upgraded and New Lines, Voltage Conversions, and Step Transformers
Upgrading existing lines to 3-phase or upgrading existing conductors enables CMP to enhance
feeder switching and to support the establishment of a new circuit. New lines, combined with
circuit breakers, allow CMP to establish a new circuit. They may increase tie capabilities by
connecting radial feeders. New lines may also enable CMP to transfer loads or create a new tie
point to an adjacent circuit. Voltage conversions enable power flows between circuits as well as
load transfers. Step transformers enable the connection of two circuits with different voltages by
either “stepping up” or “stepping down” the voltage. An overriding objective of these
investments is to strategically place additional circuit ties between adjacent substations and
circuits to add backup capacity and improve network connectivity. This will be particularly
effective at outlying locations that do not currently have distribution ties to adjacent circuits. By
adding circuit ties, alternate sources of supply can be selected to restore customers that would
otherwise be isolated.
Exhibit OAR-REB-3Docket No. 2018-00194
Page 95 of 125
SECTION 3 BACKGROUND
Appendix C Benefit-Cost Analysis of Central Maine Power’s 2019-2020
Resiliency Plan 15
3.3.2 Upgraded and New Substations
Upgraded and new substations, along with sub-transmission lines and circuit breakers, enable
to CMP to create new circuits reducing the outage exposure to customers located on long
circuits. They may also provide a second transmission feed into a substation to protect against
the loss of its single source of power.
3.3.3 Other Investments
When considering changes to the design of the network, distribution planners must assess the
performance of reconfigured network and make investments that support desired outcomes or
continue to meet planning standards. Load transfers provide a low-cost alternative by allowing
CMP to switch a load from one circuit to another. Generators (e.g. diesel) may also provide a
local source of controllable generation when it is not cost-effective or feasible to arrange a
backup supply through other changes in topology.
3.3.4 Automation
Distribution and substation automation are an integral part of CMP’s Smart Grid initiative and
are integrated with the modified topology to enhance resiliency. Automation allows CMP to
measure and control power flows on distribution circuits. It is enabled by switches and
distribution reclosers, supported by telecommunications capabilities including remote terminal
unit (RTU) communications that connect these devices to CMP‘s control center, and network
infrastructure that CMP has classified as “topology” for purposes of the Resiliency Plan
including circuit breakers, switches, voltage regulators, and capacitor banks.
CMP’s Resiliency Plan includes the accelerated deployment of two types of devices to enable
automation functions on circuits: distribution reclosers and SCADA switches. When combined
with changes to topology that enable circuit segmentation, this will allow CMP to deliver more
granular fault isolation and alternate circuit feeds so that outages can be constrained to smaller
circuit segments (limiting the impact of an outage) and power restored more quickly. This is
consistent with CMP’s long-term automation goal to increase the number of automated devices
to support sectionalizing of customers along a circuit.
3.3.4.1 Distribution Reclosers
Automated reclosers, along with circuit breakers, are located on distribution poles that trip to
isolate a section of a feeder under fault conditions and thereby minimize the number of
customers without service. Since they act as smart circuit breakers, they have the capability to
restore power automatically in temporary fault situations. They also help protect utility and
customer equipment from damage. Automation of existing reclosers and the accelerated
addition of new reclosers will help reduce fault location time and reduce restoration time after
the damage has been repaired.
3.3.4.2 SCADA Switches with Fault Detectors
Along with reclosers, automated switches help operators further isolate an outage by opening
and closing switches to serve an undamaged section with unaffected adjacent feeders and
continue to serve these customers.
The automation and topology investments result in smaller customer sections along the circuits
and in the case of the ties, fewer sections subject to outages along the circuit affected by a line
Exhibit OAR-REB-3 Docket No. 2018-00194
Page 96 of 125
SECTION 4 METHODOLOGY
Appendix C Benefit-Cost Analysis of Central Maine Power’s 2019-2020
Resiliency Plan 16
fault. These changes result in fewer customers being impacted by the outages created by line
faults. As a result, customer outage hours per year decline.
4 Methodology
Benefit-cost analysis compares the benefits and costs of long term investments by estimating
present value of benefits and costs for each year over the life of the investments. The results of
a BCA can be a useful factor in the process for determining whether to undertake an
investment. This section summarizes the overall BCA methodology used to examine the 2019-
2020 Resiliency Plan and provides detail on the models used to estimate the economic impacts
of power interruptions to customers.
4.1 Approach Overview
4.1.1 General BCA Approach
As summarized above, BCA compares the costs of an investment with the benefits it produces.
BCA is applied on a forward looking basis to investments that typically have large upfront costs
but have benefits that accrue over multiple years. BCA requires a pre-specified perspective, as
two different parties can view the same outcome differently. While policies and programs can
lead to winners and losers, cost-effectiveness analysis focuses on the broader question of
whether the overall 2019-2020 Resiliency investments are beneficial.
Benefit-cost analyses can take a number of different perspectives. This BCA has been
developed based on the societal perspective, which evaluates the question of whether the
benefits, including externalities, exceed the costs. The societal test not only counts operational
benefits to a utility, but it also includes benefits experienced by customers, such as reduced
outage costs. It does not treat transfers between parties as costs.
4.1.2 Quantifying Benefits
The Plan yields four major categories of benefits.
Avoided interruption costs represent the largest benefit stream. When customers
experience interruptions, they bear economic costs. 7 The Resiliency Plan investments
are designed to reduce the frequency and duration of interruptions and thus deliver an
economic benefit to customers. To estimate the value of reduction in customer outage
costs associated with reductions in outage frequency and duration, we used the
Interruption Cost Estimation (ICE) Model developed by Nexant, in partnership with
LBNL, for the U.S. Department of Energy.8 This model is detailed in Section 4.2.
Avoided restoration costs are benefits from CMP restoring power to customers less
frequently due to fewer outages in future years. Restoration costs consist of capital and
O&M.
7 Note that the terms “outage” and “interruption” are used interchangeably in this report.
8 https://icecalculator.com/documentation
Exhibit OAR-REB-3 Docket No. 2018-00194
Page 97 of 125
SECTION 4 METHODOLOGY
Appendix C Benefit-Cost Analysis of Central Maine Power’s 2019-2020
Resiliency Plan 17
Avoided vegetation management costs are those which would be spent in the
absence of the Resiliency Plan on “standard,” non-enhanced vegetation management (in
the base case). The difference between the total proposed investment expenditure and
the base case costs is the incremental cost of the resiliency investment.
Avoided pole replacement costs are those which would be spent on replacing poles in
the absence of the Resiliency Plan. The per-pole replacement costs are $6,000, but the
replacements are accelerated under the Plan.
Quantifying the impact of investments for a BCA involves first defining a base case, which
represents a projection of the future in the absence of the investment. Benefits are measured as
the difference between the future state with the investment and the base case. For this analysis,
Nexant used a database of historical outages from 2016-2018 to represent the base case future
scenario. This period was selected because it covers multiple years and is recent enough that
the outages should reasonably reflect the performance of current grid infrastructure under
current conditions (i.e. the further back in time the baseline period stretches, the less reflective
the outages will be of current conditions). Nexant worked with subject matter experts at
AVANGRID to assess the impacts of the various resiliency measures on the existing database
of outages to determine how the investments would impact this baseline set of outages.
A critical issue when estimating avoided outage benefits is to carefully track outage impacts and
to avoid double-counting benefits. Each resiliency measure will have an impact on the baseline
outage database and applying the measures in sequence—while tracking the impacts—ensures
an accurate representation of total benefits. Figure 4-1 shows the sequence in which
investments are assumed to occur for purposes of calculating benefits. Vegetation management
reduces the frequency of tree-related outages, while pole hardening reduces the frequency of
pole-related outages. However, some outages are classified as both tree-related and pole-
related. Similarly, the outages mitigated by automation and topology could be tree-related or
pole-related. It is important to track the impacts of each measure in the outage dataset to
ensure that impacts from the subsequent measure are applied to the set of outages post-
vegetation management.
Given the importance of avoiding double-counting benefits, the order of applying benefits should
follow a logical process. The benefits hierarchy shown in Figure 4-1 reflects the process of
moving from measures to address the cause of the outage to the response. Vegetation
management will prevent trees from coming into contact with infrastructure and causing faults.
Some tree-related outages will continue to occur and a portion of these may be prevented by
infrastructure hardening. Next, once outages do occur—albeit now less frequently—automation
and topology will mitigate the impact to customers. This analysis assumes that the benefits from
accelerated pole hardening covered by the 2020 costs will expire after 15 years, when the target
poles would have all been replaced under the base case.
Exhibit OAR-REB-3 Docket No. 2018-00194
Page 98 of 125
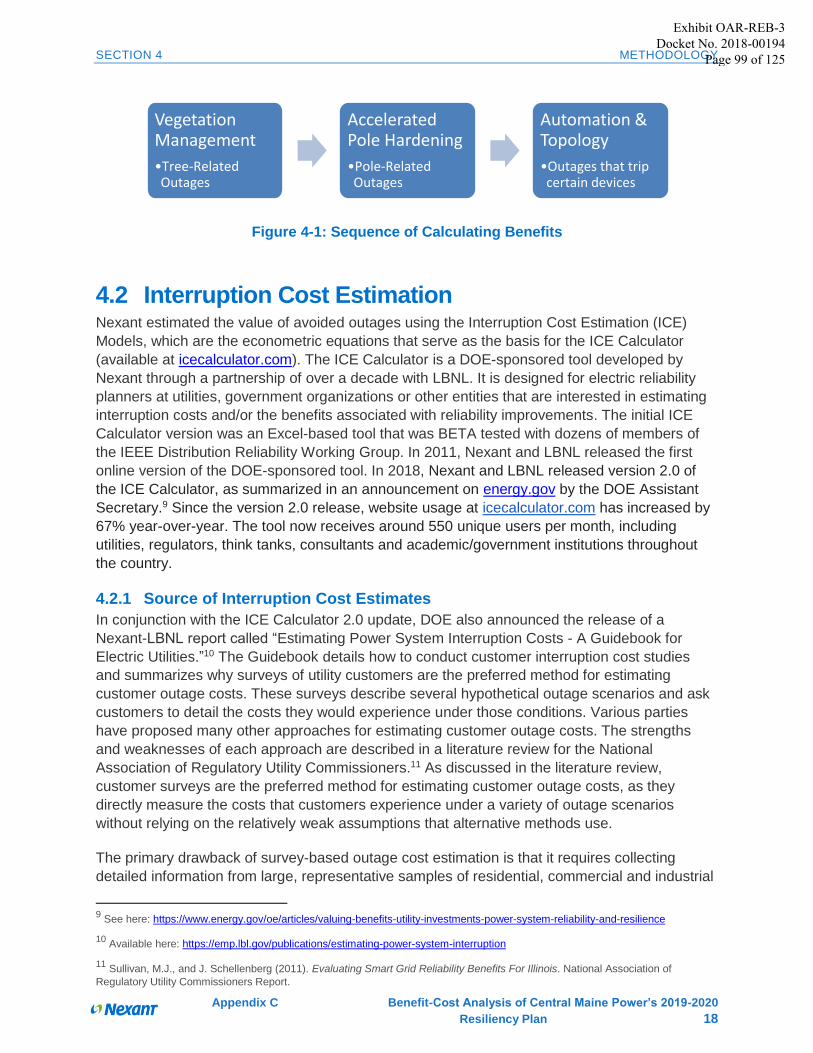
SECTION 4 METHODOLOGY
Appendix C Benefit-Cost Analysis of Central Maine Power’s 2019-2020
Resiliency Plan 18
Figure 4-1: Sequence of Calculating Benefits
4.2 Interruption Cost Estimation Nexant estimated the value of avoided outages using the Interruption Cost Estimation (ICE)
Models, which are the econometric equations that serve as the basis for the ICE Calculator
(available at icecalculator.com). The ICE Calculator is a DOE-sponsored tool developed by
Nexant through a partnership of over a decade with LBNL. It is designed for electric reliability
planners at utilities, government organizations or other entities that are interested in estimating
interruption costs and/or the benefits associated with reliability improvements. The initial ICE
Calculator version was an Excel-based tool that was BETA tested with dozens of members of
the IEEE Distribution Reliability Working Group. In 2011, Nexant and LBNL released the first
online version of the DOE-sponsored tool. In 2018, Nexant and LBNL released version 2.0 of
the ICE Calculator, as summarized in an announcement on energy.gov by the DOE Assistant
Secretary.9 Since the version 2.0 release, website usage at icecalculator.com has increased by
67% year-over-year. The tool now receives around 550 unique users per month, including
utilities, regulators, think tanks, consultants and academic/government institutions throughout
the country.
4.2.1 Source of Interruption Cost Estimates
In conjunction with the ICE Calculator 2.0 update, DOE also announced the release of a
Nexant-LBNL report called “Estimating Power System Interruption Costs - A Guidebook for
Electric Utilities.”10 The Guidebook details how to conduct customer interruption cost studies
and summarizes why surveys of utility customers are the preferred method for estimating
customer outage costs. These surveys describe several hypothetical outage scenarios and ask
customers to detail the costs they would experience under those conditions. Various parties
have proposed many other approaches for estimating customer outage costs. The strengths
and weaknesses of each approach are described in a literature review for the National
Association of Regulatory Utility Commissioners.11 As discussed in the literature review,
customer surveys are the preferred method for estimating customer outage costs, as they
directly measure the costs that customers experience under a variety of outage scenarios
without relying on the relatively weak assumptions that alternative methods use.
The primary drawback of survey-based outage cost estimation is that it requires collecting
detailed information from large, representative samples of residential, commercial and industrial
9 See here: https://www.energy.gov/oe/articles/valuing-benefits-utility-investments-power-system-reliability-and-resilience
10 Available here: https://emp.lbl.gov/publications/estimating-power-system-interruption
11 Sullivan, M.J., and J. Schellenberg (2011). Evaluating Smart Grid Reliability Benefits For Illinois. National Association of
Regulatory Utility Commissioners Report.
Vegetation Management
•Tree-Related Outages
Accelerated Pole Hardening
•Pole-Related Outages
Automation & Topology
•Outages that trip certain devices
Exhibit OAR-REB-3 Docket No. 2018-00194
Page 99 of 125
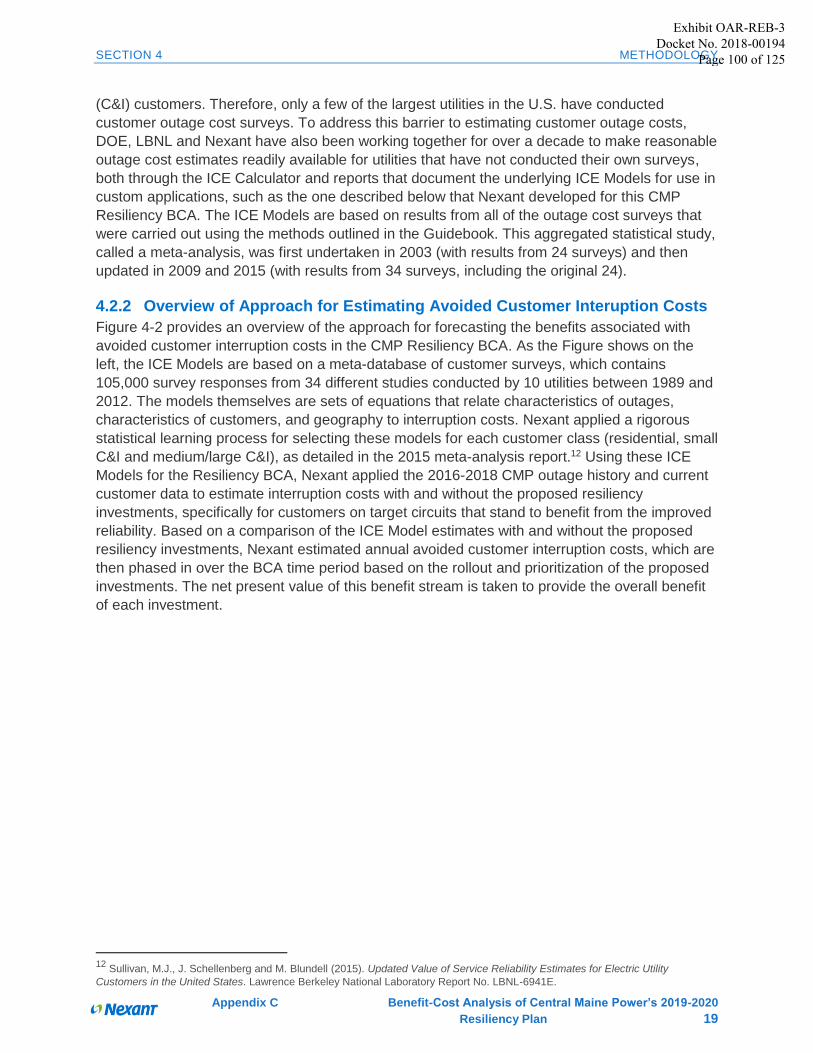
SECTION 4 METHODOLOGY
Appendix C Benefit-Cost Analysis of Central Maine Power’s 2019-2020
Resiliency Plan 19
(C&I) customers. Therefore, only a few of the largest utilities in the U.S. have conducted
customer outage cost surveys. To address this barrier to estimating customer outage costs,
DOE, LBNL and Nexant have also been working together for over a decade to make reasonable
outage cost estimates readily available for utilities that have not conducted their own surveys,
both through the ICE Calculator and reports that document the underlying ICE Models for use in
custom applications, such as the one described below that Nexant developed for this CMP
Resiliency BCA. The ICE Models are based on results from all of the outage cost surveys that
were carried out using the methods outlined in the Guidebook. This aggregated statistical study,
called a meta-analysis, was first undertaken in 2003 (with results from 24 surveys) and then
updated in 2009 and 2015 (with results from 34 surveys, including the original 24).
4.2.2 Overview of Approach for Estimating Avoided Customer Interuption Costs
Figure 4-2 provides an overview of the approach for forecasting the benefits associated with
avoided customer interruption costs in the CMP Resiliency BCA. As the Figure shows on the
left, the ICE Models are based on a meta-database of customer surveys, which contains
105,000 survey responses from 34 different studies conducted by 10 utilities between 1989 and
2012. The models themselves are sets of equations that relate characteristics of outages,
characteristics of customers, and geography to interruption costs. Nexant applied a rigorous
statistical learning process for selecting these models for each customer class (residential, small
C&I and medium/large C&I), as detailed in the 2015 meta-analysis report.12 Using these ICE
Models for the Resiliency BCA, Nexant applied the 2016-2018 CMP outage history and current
customer data to estimate interruption costs with and without the proposed resiliency
investments, specifically for customers on target circuits that stand to benefit from the improved
reliability. Based on a comparison of the ICE Model estimates with and without the proposed
resiliency investments, Nexant estimated annual avoided customer interruption costs, which are
then phased in over the BCA time period based on the rollout and prioritization of the proposed
investments. The net present value of this benefit stream is taken to provide the overall benefit
of each investment.
12
Sullivan, M.J., J. Schellenberg and M. Blundell (2015). Updated Value of Service Reliability Estimates for Electric Utility
Customers in the United States. Lawrence Berkeley National Laboratory Report No. LBNL-6941E.
Exhibit OAR-REB-3 Docket No. 2018-00194
Page 100 of 125
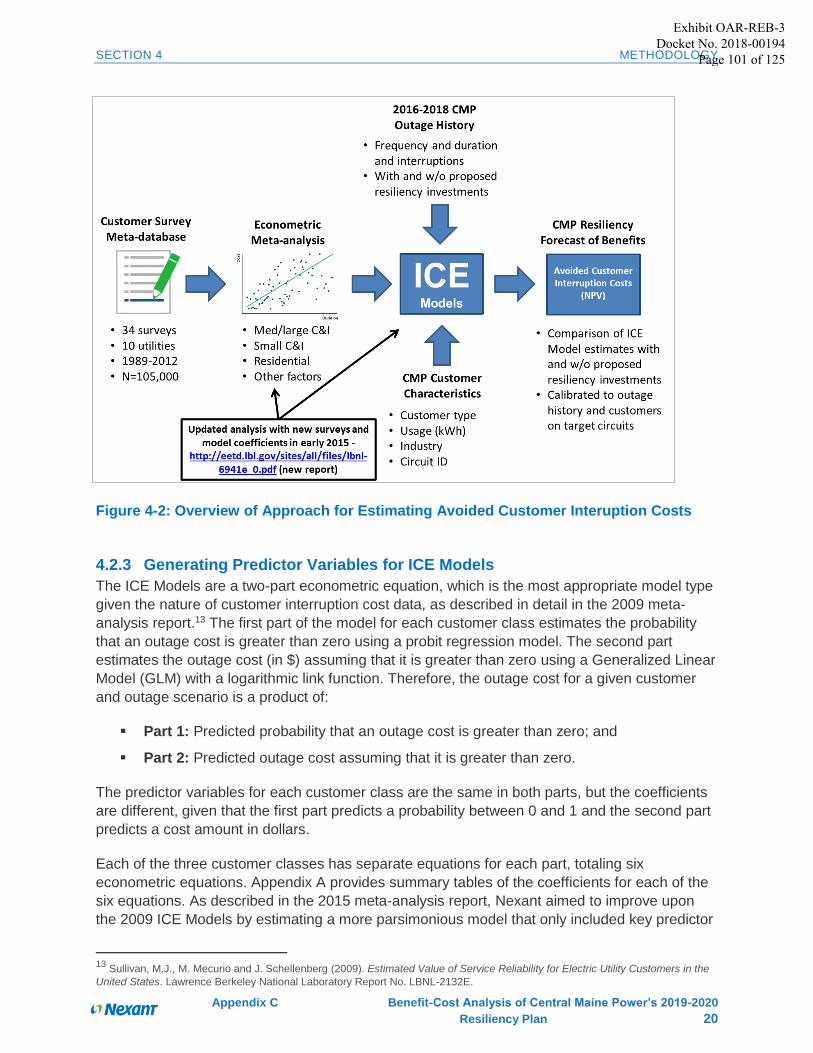
SECTION 4 METHODOLOGY
Appendix C Benefit-Cost Analysis of Central Maine Power’s 2019-2020
Resiliency Plan 20
Figure 4-2: Overview of Approach for Estimating Avoided Customer Interuption Costs
4.2.3 Generating Predictor Variables for ICE Models
The ICE Models are a two-part econometric equation, which is the most appropriate model type
given the nature of customer interruption cost data, as described in detail in the 2009 meta-
analysis report.13 The first part of the model for each customer class estimates the probability
that an outage cost is greater than zero using a probit regression model. The second part
estimates the outage cost (in $) assuming that it is greater than zero using a Generalized Linear
Model (GLM) with a logarithmic link function. Therefore, the outage cost for a given customer
and outage scenario is a product of:
Part 1: Predicted probability that an outage cost is greater than zero; and
Part 2: Predicted outage cost assuming that it is greater than zero.
The predictor variables for each customer class are the same in both parts, but the coefficients
are different, given that the first part predicts a probability between 0 and 1 and the second part
predicts a cost amount in dollars.
Each of the three customer classes has separate equations for each part, totaling six
econometric equations. Appendix A provides summary tables of the coefficients for each of the
six equations. As described in the 2015 meta-analysis report, Nexant aimed to improve upon
the 2009 ICE Models by estimating a more parsimonious model that only included key predictor
13
Sullivan, M.J., M. Mecurio and J. Schellenberg (2009). Estimated Value of Service Reliability for Electric Utility Customers in the
United States. Lawrence Berkeley National Laboratory Report No. LBNL-2132E.
Exhibit OAR-REB-3 Docket No. 2018-00194
Page 101 of 125
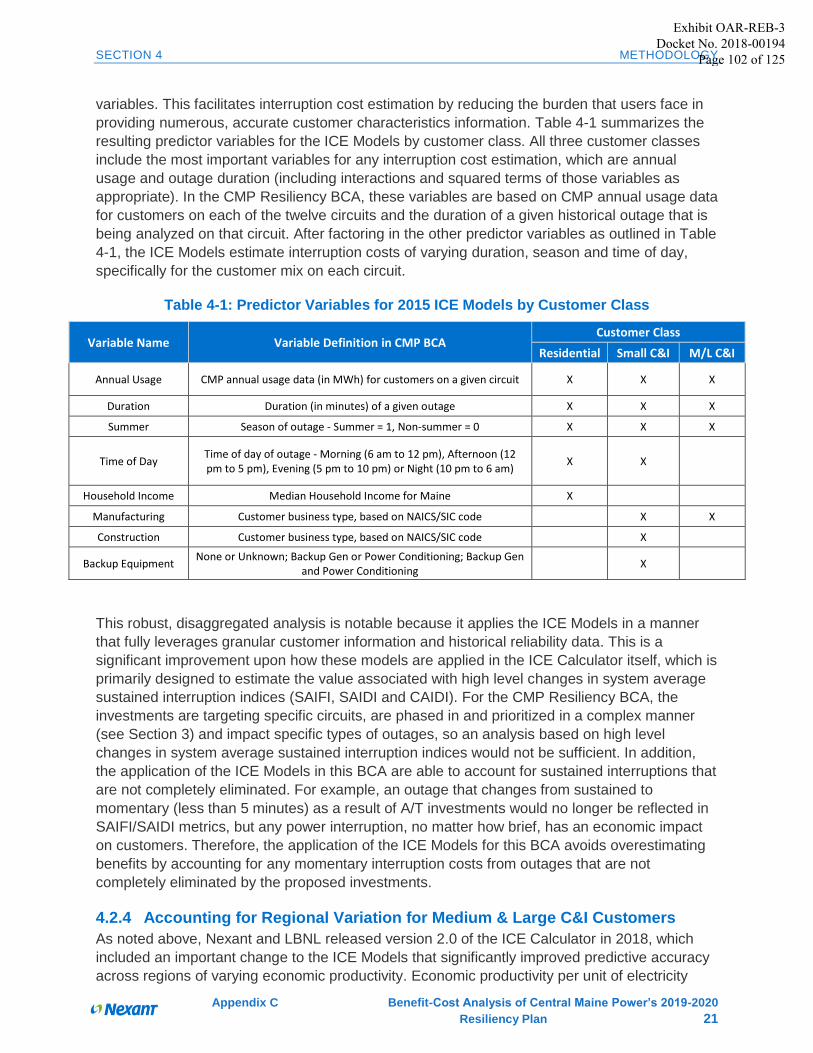
SECTION 4 METHODOLOGY
Appendix C Benefit-Cost Analysis of Central Maine Power’s 2019-2020
Resiliency Plan 21
variables. This facilitates interruption cost estimation by reducing the burden that users face in
providing numerous, accurate customer characteristics information. Table 4-1 summarizes the
resulting predictor variables for the ICE Models by customer class. All three customer classes
include the most important variables for any interruption cost estimation, which are annual
usage and outage duration (including interactions and squared terms of those variables as
appropriate). In the CMP Resiliency BCA, these variables are based on CMP annual usage data
for customers on each of the twelve circuits and the duration of a given historical outage that is
being analyzed on that circuit. After factoring in the other predictor variables as outlined in Table
4-1, the ICE Models estimate interruption costs of varying duration, season and time of day,
specifically for the customer mix on each circuit.
Table 4-1: Predictor Variables for 2015 ICE Models by Customer Class
Variable Name Variable Definition in CMP BCA Customer Class
Residential Small C&I M/L C&I
Annual Usage CMP annual usage data (in MWh) for customers on a given circuit X X X
Duration Duration (in minutes) of a given outage X X X
Summer Season of outage - Summer = 1, Non-summer = 0 X X X
Time of Day Time of day of outage - Morning (6 am to 12 pm), Afternoon (12 pm to 5 pm), Evening (5 pm to 10 pm) or Night (10 pm to 6 am)
X X
Household Income Median Household Income for Maine X
Manufacturing Customer business type, based on NAICS/SIC code X X
Construction Customer business type, based on NAICS/SIC code X
Backup Equipment None or Unknown; Backup Gen or Power Conditioning; Backup Gen
and Power Conditioning X
This robust, disaggregated analysis is notable because it applies the ICE Models in a manner
that fully leverages granular customer information and historical reliability data. This is a
significant improvement upon how these models are applied in the ICE Calculator itself, which is
primarily designed to estimate the value associated with high level changes in system average
sustained interruption indices (SAIFI, SAIDI and CAIDI). For the CMP Resiliency BCA, the
investments are targeting specific circuits, are phased in and prioritized in a complex manner
(see Section 3) and impact specific types of outages, so an analysis based on high level
changes in system average sustained interruption indices would not be sufficient. In addition,
the application of the ICE Models in this BCA are able to account for sustained interruptions that
are not completely eliminated. For example, an outage that changes from sustained to
momentary (less than 5 minutes) as a result of A/T investments would no longer be reflected in
SAIFI/SAIDI metrics, but any power interruption, no matter how brief, has an economic impact
on customers. Therefore, the application of the ICE Models for this BCA avoids overestimating
benefits by accounting for any momentary interruption costs from outages that are not
completely eliminated by the proposed investments.
4.2.4 Accounting for Regional Variation for Medium & Large C&I Customers
As noted above, Nexant and LBNL released version 2.0 of the ICE Calculator in 2018, which
included an important change to the ICE Models that significantly improved predictive accuracy
across regions of varying economic productivity. Economic productivity per unit of electricity
Exhibit OAR-REB-3 Docket No. 2018-00194
Page 102 of 125
SECTION 4 METHODOLOGY
Appendix C Benefit-Cost Analysis of Central Maine Power’s 2019-2020
Resiliency Plan 22
usage varies widely throughout the country, as measured by 2016 state-level data on Gross
Domestic Product (GDP) from the U.S. Bureau of Economic Analysis (BEA) and non-residential
electricity usage (kWh) from the U.S. Energy Information Administration (EIA). Based on these
data sources, GDP/kWh varies from $2.8/kWh in Wyoming to $16/kWh in Connecticut.
Significantly larger states such as Mississippi ($3.5/kWh), Alabama ($3.7/kWh), New York
($15.5/kWh) and California ($15.6/kWh) are also near the minimum and maximum values,
indicating that this wide range of economic productivity per unit of electricity usage is not driven
by a couple of small outlier states.
The 2015 ICE Models account for some regional variation in non-residential interruption costs
with variables on customer size and industry, as summarized in Table 4-1 above. However,
these few variables may not account for a substantial portion of the regional variation in
interruption costs for C&I customers. Therefore, as part of the version 2.0 update of the ICE
Calculator, Nexant re-ran the meta-analysis for the two C&I segments with GDP/kWh included
as a predictor variable, based on the year of each survey response and location (state) of the
respondent. This analysis found that the GDP/kWh variable significantly improved the predictive
accuracy of the ICE Models across states for the medium and large C&I segment. As a result,
Nexant and LBNL incorporated this improvement into the medium and large C&I model for the
ICE Calculator. The small C&I segment did not show a similar improvement in predictive
accuracy with the GDP/kWh variable included, so those econometric models remained the
same as in 2015.
Given that this BCA applied the improved ICE Model for medium and large C&I customers,
Nexant developed an estimate of GDP per kWh for Maine using 2017 state-level data on GDP
from BEA and non-residential kWh from EIA. Maine GDP in 2017, current dollars, was $61,703
million. Using the GDP Deflator (also from BEA), Nexant converted 2017 Maine GDP to $2013
to be consistent with the ICE Model predictor variable, resulting in a GDP of $58,161 million.
Based on EIA data,14 Maine had 6,575 GWh of non-residential electricity usage in 2017. This
resulted in a GDP/kWh value of $8.85 in $2013, which was used in this BCA. Relative to other
states, this value is in the middle of the range of GDP/kWh across all states and is lower than
the values for New Hampshire ($12.13) and Vermont ($9.02).
4.2.5 Estimating Long Duration Interruption Costs
A limitation of the ICE Models is that they cannot reliability estimate interruption costs for long
duration interruptions at this point, given the lack of survey data on outages longer than one
day. However, the proposed resiliency investments are designed to address storms that cause
long duration power interruptions. The 2016-2018 CMP outage history data has outages going
up to multiple days, though ones that long are relatively rare. Therefore, this BCA required a
reasonable solution for estimating the costs of long duration interruptions. To identify this
solution, Nexant tested a few methods with the ICE Calculator and compared results to
determine a reasonable, scalable approach for estimating long duration interruption costs for the
CMP Resiliency BCA.
Figure 4-3 shows the results of a comparison of methods using the default ICE Calculator inputs
for Maine. The "SF" estimates are based on the only survey-based long duration interruption
cost study for a utility, which Nexant conducted in San Francisco for Pacific Gas & Electric
14 Retrieved here: https://www.eia.gov/electricity/monthly/xls/table_5_04_b.xlsx
Exhibit OAR-REB-3Docket No. 2018-00194
Page 103 of 125
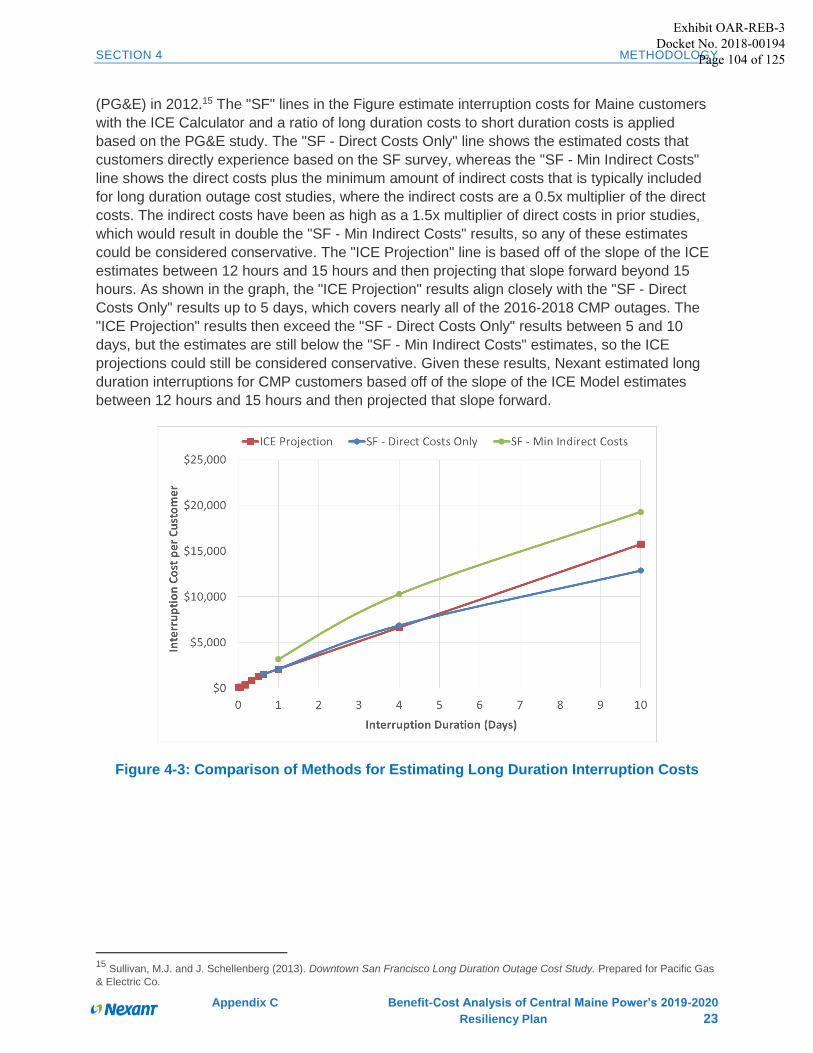
SECTION 4 METHODOLOGY
Appendix C Benefit-Cost Analysis of Central Maine Power’s 2019-2020
Resiliency Plan 23
(PG&E) in 2012.15 The "SF" lines in the Figure estimate interruption costs for Maine customers
with the ICE Calculator and a ratio of long duration costs to short duration costs is applied
based on the PG&E study. The "SF - Direct Costs Only" line shows the estimated costs that
customers directly experience based on the SF survey, whereas the "SF - Min Indirect Costs"
line shows the direct costs plus the minimum amount of indirect costs that is typically included
for long duration outage cost studies, where the indirect costs are a 0.5x multiplier of the direct
costs. The indirect costs have been as high as a 1.5x multiplier of direct costs in prior studies,
which would result in double the "SF - Min Indirect Costs" results, so any of these estimates
could be considered conservative. The "ICE Projection" line is based off of the slope of the ICE
estimates between 12 hours and 15 hours and then projecting that slope forward beyond 15
hours. As shown in the graph, the "ICE Projection" results align closely with the "SF - Direct
Costs Only" results up to 5 days, which covers nearly all of the 2016-2018 CMP outages. The
"ICE Projection" results then exceed the "SF - Direct Costs Only" results between 5 and 10
days, but the estimates are still below the "SF - Min Indirect Costs" estimates, so the ICE
projections could still be considered conservative. Given these results, Nexant estimated long
duration interruptions for CMP customers based off of the slope of the ICE Model estimates
between 12 hours and 15 hours and then projected that slope forward.
Figure 4-3: Comparison of Methods for Estimating Long Duration Interruption Costs
15 Sullivan, M.J. and J. Schellenberg (2013). Downtown San Francisco Long Duration Outage Cost Study. Prepared for Pacific Gas
& Electric Co.
Exhibit OAR-REB-3Docket No. 2018-00194
Page 104 of 125
SECTION 5 RESULTS
Appendix C Benefit-Cost Analysis of Central Maine Power’s 2019-2020
Resiliency Plan 24
5 Results
This section details the results of the analysis. Section 5.1 covers the costs of the investments.
Section 5.2 presents the benefits and explains how they were derived. Section 5.3 details the
NPV of the costs and benefits over the life of the investments.
Exhibit OAR-REB-3Docket No. 2018-00194
Page 105 of 125
SECTION 5 RESULTS
Appendix C Benefit-Cost Analysis of Central Maine Power’s 2019-2020
Resiliency Plan 25
5.2 Benefits CMP is proposing to invest in the 2019-2020 Resiliency Plan measures to reduce the frequency
and duration of power interruptions. This analysis uses an average year of outages from years
2016-2018 as the baseline.16 This section details the process of estimating the resiliency
measure impacts on the baseline level of outages. It presents the monetized results of the
avoided interruption costs—calculated using the ICE Model—as well as the avoided restoration
costs.
Figure 5-1 shows the timing of the benefits realization. The first year of benefits realization is
2021 and includes benefits from enhanced vegetation management, accelerated pole
hardening, and automation/topology. Enhanced vegetation management benefits are realized
across target circuits through an expenditure in 2020 that is incremental to base case levels of
vegetation management. This benefit stream continues indefinitely with regular maintenance
expenses which are the same amount as base case vegetation management expenses (i.e. no
incremental vegetation management costs after 2020). Accelerated pole hardening has benefits
in 2021 that represent an accelerated replacement of all open DLI poles and poles older than 75
years. Approximately 75 percent of these benefits expire in 2022, as the base case assumes
the open DLI poles would have all been replaced by the end of 2021. For the remaining poles,
16 This does not include the October 2017 storm, as the outages for that storm were not recorded in the database on the circuits of
interest.
Exhibit OAR-REB-3Docket No. 2018-00194
Page 106 of 125
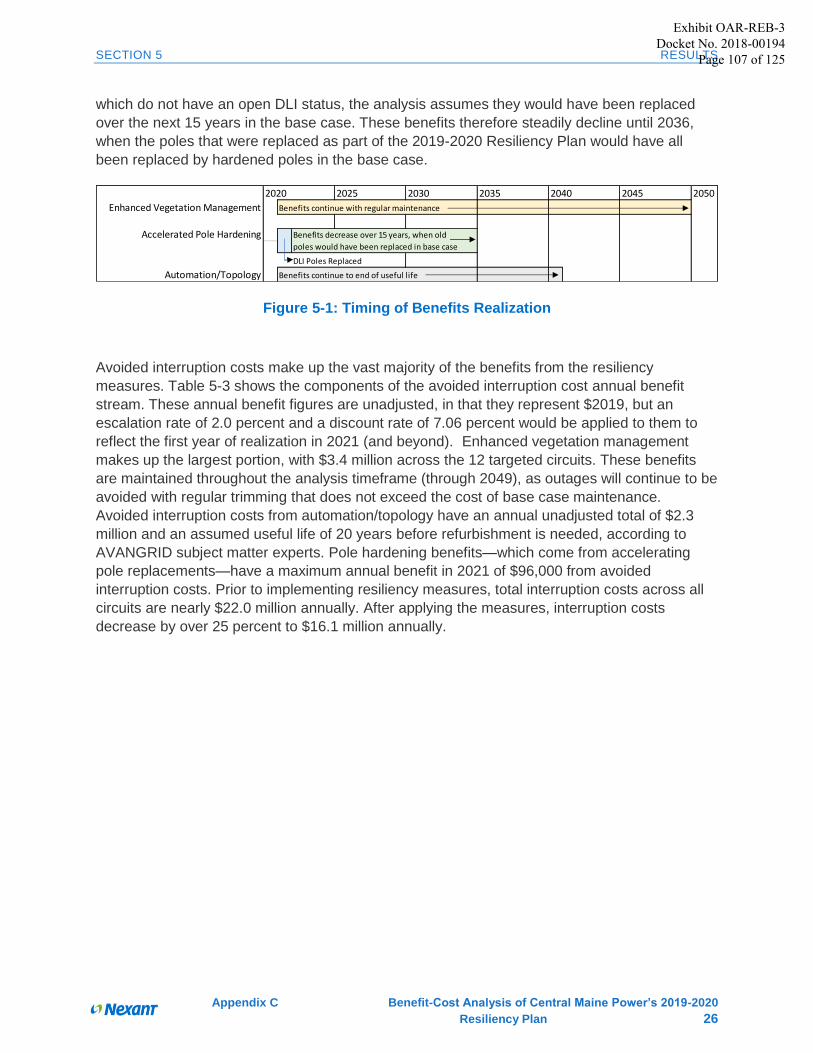
SECTION 5 RESULTS
Appendix C Benefit-Cost Analysis of Central Maine Power’s 2019-2020
Resiliency Plan 26
which do not have an open DLI status, the analysis assumes they would have been replaced
over the next 15 years in the base case. These benefits therefore steadily decline until 2036,
when the poles that were replaced as part of the 2019-2020 Resiliency Plan would have all
been replaced by hardened poles in the base case.
Figure 5-1: Timing of Benefits Realization
Avoided interruption costs make up the vast majority of the benefits from the resiliency
measures. Table 5-3 shows the components of the avoided interruption cost annual benefit
stream. These annual benefit figures are unadjusted, in that they represent $2019, but an
escalation rate of 2.0 percent and a discount rate of 7.06 percent would be applied to them to
reflect the first year of realization in 2021 (and beyond). Enhanced vegetation management
makes up the largest portion, with $3.4 million across the 12 targeted circuits. These benefits
are maintained throughout the analysis timeframe (through 2049), as outages will continue to be
avoided with regular trimming that does not exceed the cost of base case maintenance.
Avoided interruption costs from automation/topology have an annual unadjusted total of $2.3
million and an assumed useful life of 20 years before refurbishment is needed, according to
AVANGRID subject matter experts. Pole hardening benefits—which come from accelerating
pole replacements—have a maximum annual benefit in 2021 of $96,000 from avoided
interruption costs. Prior to implementing resiliency measures, total interruption costs across all
circuits are nearly $22.0 million annually. After applying the measures, interruption costs
decrease by over 25 percent to $16.1 million annually.
2020 2025 2030 2035 2040 2045 2050
Enhanced Vegetation Management Benefits continue with regular maintenance
Accelerated Pole Hardening Benefits decrease over 15 years, when old
poles would have been replaced in base case
DLI Poles Replaced
Automation/Topology Benefits continue to end of useful life
Exhibit OAR-REB-3Docket No. 2018-00194
Page 107 of 125
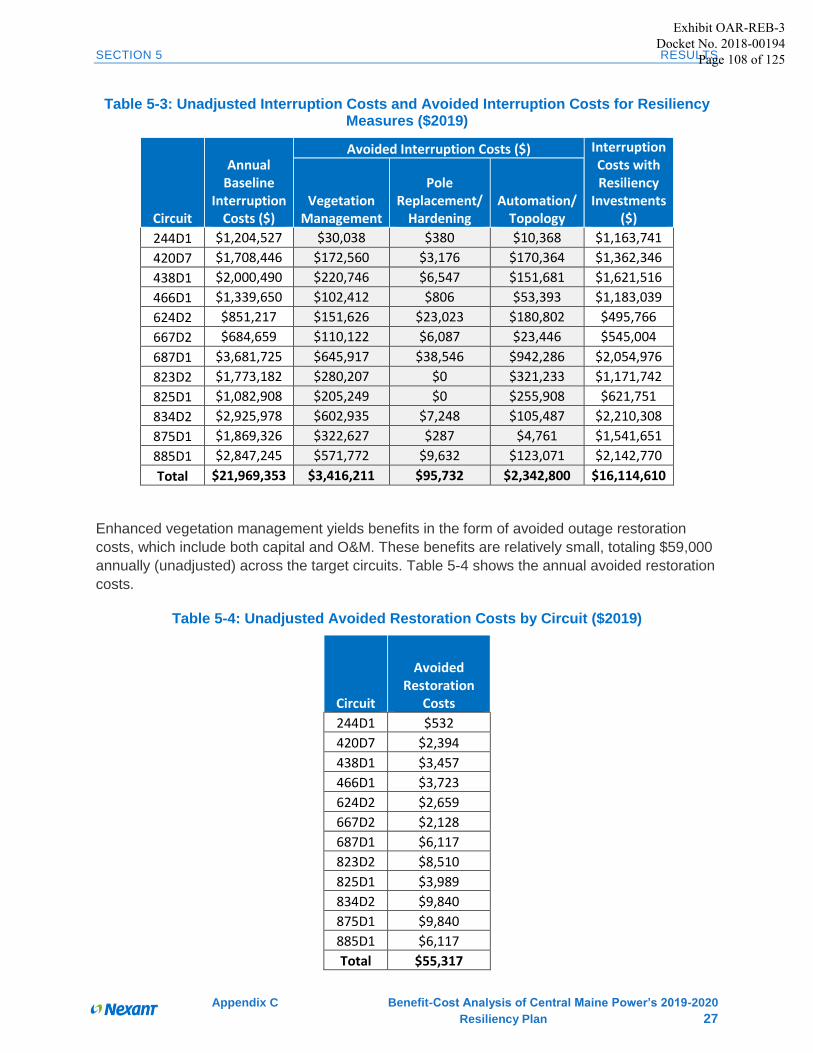
SECTION 5 RESULTS
Appendix C Benefit-Cost Analysis of Central Maine Power’s 2019-2020
Resiliency Plan 27
Table 5-3: Unadjusted Interruption Costs and Avoided Interruption Costs for Resiliency Measures ($2019)
Circuit
Annual Baseline
Interruption Costs ($)
Avoided Interruption Costs ($) Interruption Costs with Resiliency
Investments ($)
Vegetation Management
Pole Replacement/
Hardening Automation/
Topology
244D1 $1,204,527 $30,038 $380 $10,368 $1,163,741
420D7 $1,708,446 $172,560 $3,176 $170,364 $1,362,346
438D1 $2,000,490 $220,746 $6,547 $151,681 $1,621,516
466D1 $1,339,650 $102,412 $806 $53,393 $1,183,039
624D2 $851,217 $151,626 $23,023 $180,802 $495,766
667D2 $684,659 $110,122 $6,087 $23,446 $545,004
687D1 $3,681,725 $645,917 $38,546 $942,286 $2,054,976
823D2 $1,773,182 $280,207 $0 $321,233 $1,171,742
825D1 $1,082,908 $205,249 $0 $255,908 $621,751
834D2 $2,925,978 $602,935 $7,248 $105,487 $2,210,308
875D1 $1,869,326 $322,627 $287 $4,761 $1,541,651
885D1 $2,847,245 $571,772 $9,632 $123,071 $2,142,770
Total $21,969,353 $3,416,211 $95,732 $2,342,800 $16,114,610
Enhanced vegetation management yields benefits in the form of avoided outage restoration
costs, which include both capital and O&M. These benefits are relatively small, totaling $59,000
annually (unadjusted) across the target circuits. Table 5-4 shows the annual avoided restoration
costs.
Table 5-4: Unadjusted Avoided Restoration Costs by Circuit ($2019)
Circuit
Avoided Restoration
Costs
244D1 $532
420D7 $2,394
438D1 $3,457
466D1 $3,723
624D2 $2,659
667D2 $2,128
687D1 $6,117
823D2 $8,510
825D1 $3,989
834D2 $9,840
875D1 $9,840
885D1 $6,117
Total $55,317
Exhibit OAR-REB-3Docket No. 2018-00194
Page 108 of 125
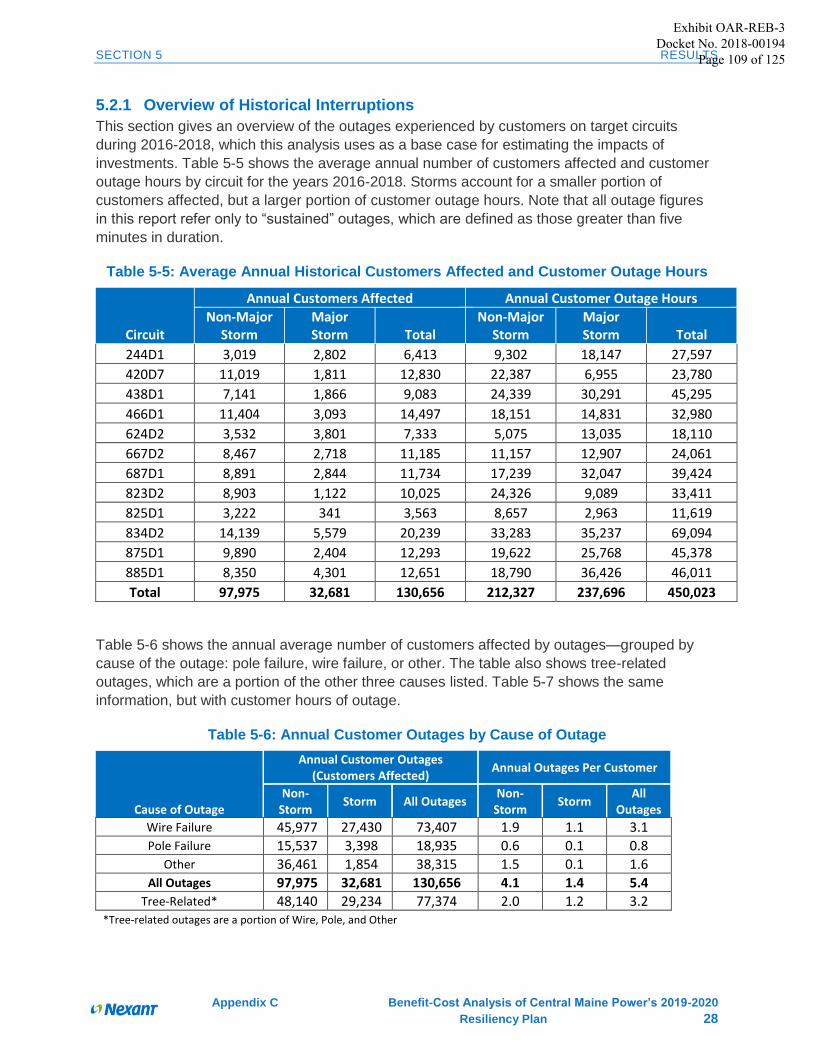
SECTION 5 RESULTS
Appendix C Benefit-Cost Analysis of Central Maine Power’s 2019-2020
Resiliency Plan 28
5.2.1 Overview of Historical Interruptions
This section gives an overview of the outages experienced by customers on target circuits
during 2016-2018, which this analysis uses as a base case for estimating the impacts of
investments. Table 5-5 shows the average annual number of customers affected and customer
outage hours by circuit for the years 2016-2018. Storms account for a smaller portion of
customers affected, but a larger portion of customer outage hours. Note that all outage figures
in this report refer only to “sustained” outages, which are defined as those greater than five
minutes in duration.
Table 5-5: Average Annual Historical Customers Affected and Customer Outage Hours
Circuit
Annual Customers Affected Annual Customer Outage Hours
Non-Major Storm
Major Storm Total
Non-Major Storm
Major Storm Total
244D1 3,019 2,802 6,413 9,302 18,147 27,597
420D7 11,019 1,811 12,830 22,387 6,955 23,780
438D1 7,141 1,866 9,083 24,339 30,291 45,295
466D1 11,404 3,093 14,497 18,151 14,831 32,980
624D2 3,532 3,801 7,333 5,075 13,035 18,110
667D2 8,467 2,718 11,185 11,157 12,907 24,061
687D1 8,891 2,844 11,734 17,239 32,047 39,424
823D2 8,903 1,122 10,025 24,326 9,089 33,411
825D1 3,222 341 3,563 8,657 2,963 11,619
834D2 14,139 5,579 20,239 33,283 35,237 69,094
875D1 9,890 2,404 12,293 19,622 25,768 45,378
885D1 8,350 4,301 12,651 18,790 36,426 46,011
Total 97,975 32,681 130,656 212,327 237,696 450,023
Table 5-6 shows the annual average number of customers affected by outages—grouped by
cause of the outage: pole failure, wire failure, or other. The table also shows tree-related
outages, which are a portion of the other three causes listed. Table 5-7 shows the same
information, but with customer hours of outage.
Table 5-6: Annual Customer Outages by Cause of Outage
Cause of Outage
Annual Customer Outages (Customers Affected)
Annual Outages Per Customer
Non- Storm
Storm All Outages Non-
Storm Storm
All Outages
Wire Failure 45,977 27,430 73,407 1.9 1.1 3.1 Pole Failure 15,537 3,398 18,935 0.6 0.1 0.8
Other 36,461 1,854 38,315 1.5 0.1 1.6 All Outages 97,975 32,681 130,656 4.1 1.4 5.4
Tree-Related* 48,140 29,234 77,374 2.0 1.2 3.2 *Tree-related outages are a portion of Wire, Pole, and Other
Exhibit OAR-REB-3Docket No. 2018-00194
Page 109 of 125
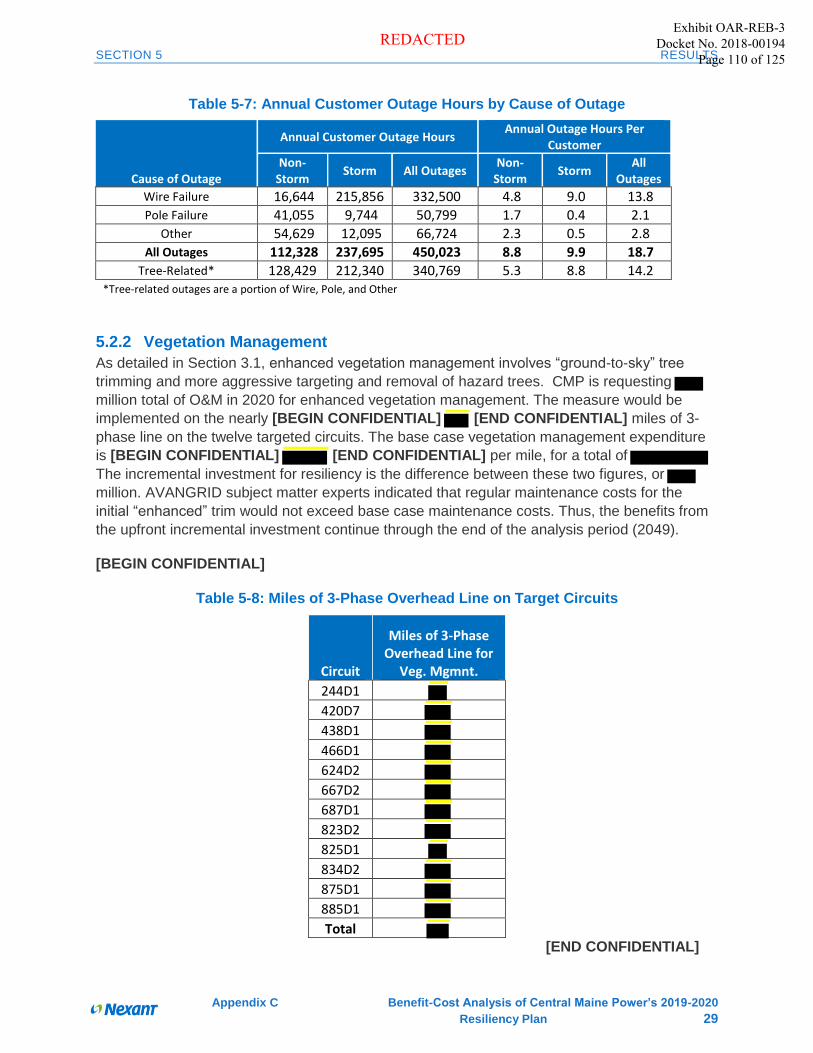
SECTION 5 RESULTS
Appendix C Benefit-Cost Analysis of Central Maine Power’s 2019-2020
Resiliency Plan 29
Table 5-7: Annual Customer Outage Hours by Cause of Outage
Cause of Outage
Annual Customer Outage Hours Annual Outage Hours Per
Customer
Non- Storm
Storm All Outages Non-
Storm Storm
All Outages
Wire Failure 16,644 215,856 332,500 4.8 9.0 13.8 Pole Failure 41,055 9,744 50,799 1.7 0.4 2.1
Other 54,629 12,095 66,724 2.3 0.5 2.8 All Outages 112,328 237,695 450,023 8.8 9.9 18.7
Tree-Related* 128,429 212,340 340,769 5.3 8.8 14.2 *Tree-related outages are a portion of Wire, Pole, and Other
5.2.2 Vegetation Management
As detailed in Section 3.1, enhanced vegetation management involves “ground-to-sky” tree
trimming and more aggressive targeting and removal of hazard trees. CMP is requesting
million total of O&M in 2020 for enhanced vegetation management. The measure would be
implemented on the nearly [BEGIN CONFIDENTIAL] [END CONFIDENTIAL] miles of 3-
phase line on the twelve targeted circuits. The base case vegetation management expenditure
is [BEGIN CONFIDENTIAL] [END CONFIDENTIAL] per mile, for a total of
The incremental investment for resiliency is the difference between these two figures, or
million. AVANGRID subject matter experts indicated that regular maintenance costs for the
initial “enhanced” trim would not exceed base case maintenance costs. Thus, the benefits from
the upfront incremental investment continue through the end of the analysis period (2049).
[BEGIN CONFIDENTIAL]
Table 5-8: Miles of 3-Phase Overhead Line on Target Circuits
Circuit
Miles of 3-Phase Overhead Line for
Veg. Mgmnt.
244D1
420D7
438D1
466D1
624D2
667D2
687D1
823D2
825D1
834D2
875D1
885D1
Total [END CONFIDENTIAL]
Exhibit OAR-REB-3Docket No. 2018-00194
Page 110 of 125REDACTED
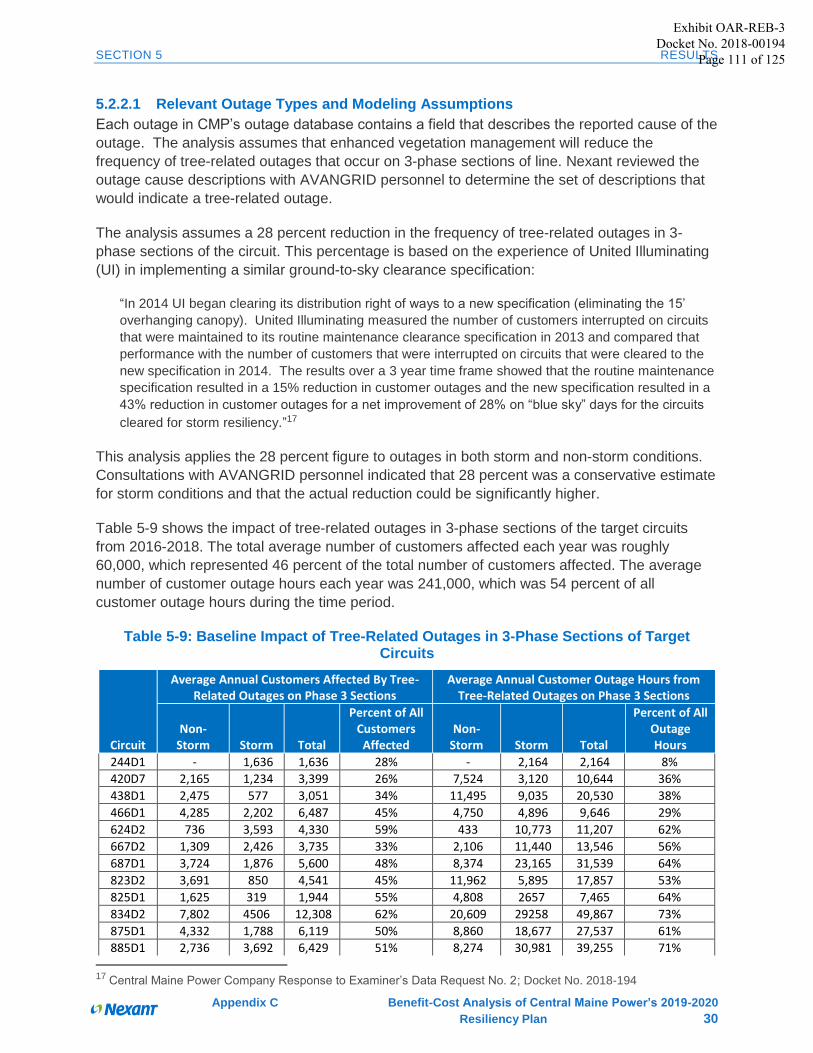
SECTION 5 RESULTS
Appendix C Benefit-Cost Analysis of Central Maine Power’s 2019-2020
Resiliency Plan 30
5.2.2.1 Relevant Outage Types and Modeling Assumptions
Each outage in CMP’s outage database contains a field that describes the reported cause of the
outage. The analysis assumes that enhanced vegetation management will reduce the
frequency of tree-related outages that occur on 3-phase sections of line. Nexant reviewed the
outage cause descriptions with AVANGRID personnel to determine the set of descriptions that
would indicate a tree-related outage.
The analysis assumes a 28 percent reduction in the frequency of tree-related outages in 3-
phase sections of the circuit. This percentage is based on the experience of United Illuminating
(UI) in implementing a similar ground-to-sky clearance specification:
“In 2014 UI began clearing its distribution right of ways to a new specification (eliminating the 15’
overhanging canopy). United Illuminating measured the number of customers interrupted on circuits
that were maintained to its routine maintenance clearance specification in 2013 and compared that
performance with the number of customers that were interrupted on circuits that were cleared to the
new specification in 2014. The results over a 3 year time frame showed that the routine maintenance
specification resulted in a 15% reduction in customer outages and the new specification resulted in a
43% reduction in customer outages for a net improvement of 28% on “blue sky” days for the circuits
cleared for storm resiliency.”17
This analysis applies the 28 percent figure to outages in both storm and non-storm conditions.
Consultations with AVANGRID personnel indicated that 28 percent was a conservative estimate
for storm conditions and that the actual reduction could be significantly higher.
Table 5-9 shows the impact of tree-related outages in 3-phase sections of the target circuits
from 2016-2018. The total average number of customers affected each year was roughly
60,000, which represented 46 percent of the total number of customers affected. The average
number of customer outage hours each year was 241,000, which was 54 percent of all
customer outage hours during the time period.
Table 5-9: Baseline Impact of Tree-Related Outages in 3-Phase Sections of Target Circuits
Circuit
Average Annual Customers Affected By Tree-Related Outages on Phase 3 Sections
Average Annual Customer Outage Hours from Tree-Related Outages on Phase 3 Sections
Non-Storm Storm Total
Percent of All Customers Affected
Non-Storm Storm Total
Percent of All Outage Hours
244D1 - 1,636 1,636 28% - 2,164 2,164 8%
420D7 2,165 1,234 3,399 26% 7,524 3,120 10,644 36%
438D1 2,475 577 3,051 34% 11,495 9,035 20,530 38%
466D1 4,285 2,202 6,487 45% 4,750 4,896 9,646 29%
624D2 736 3,593 4,330 59% 433 10,773 11,207 62%
667D2 1,309 2,426 3,735 33% 2,106 11,440 13,546 56%
687D1 3,724 1,876 5,600 48% 8,374 23,165 31,539 64%
823D2 3,691 850 4,541 45% 11,962 5,895 17,857 53%
825D1 1,625 319 1,944 55% 4,808 2657 7,465 64%
834D2 7,802 4506 12,308 62% 20,609 29258 49,867 73%
875D1 4,332 1,788 6,119 50% 8,860 18,677 27,537 61%
885D1 2,736 3,692 6,429 51% 8,274 30,981 39,255 71%
17 Central Maine Power Company Response to Examiner’s Data Request No. 2; Docket No. 2018-194
Exhibit OAR-REB-3Docket No. 2018-00194
Page 111 of 125
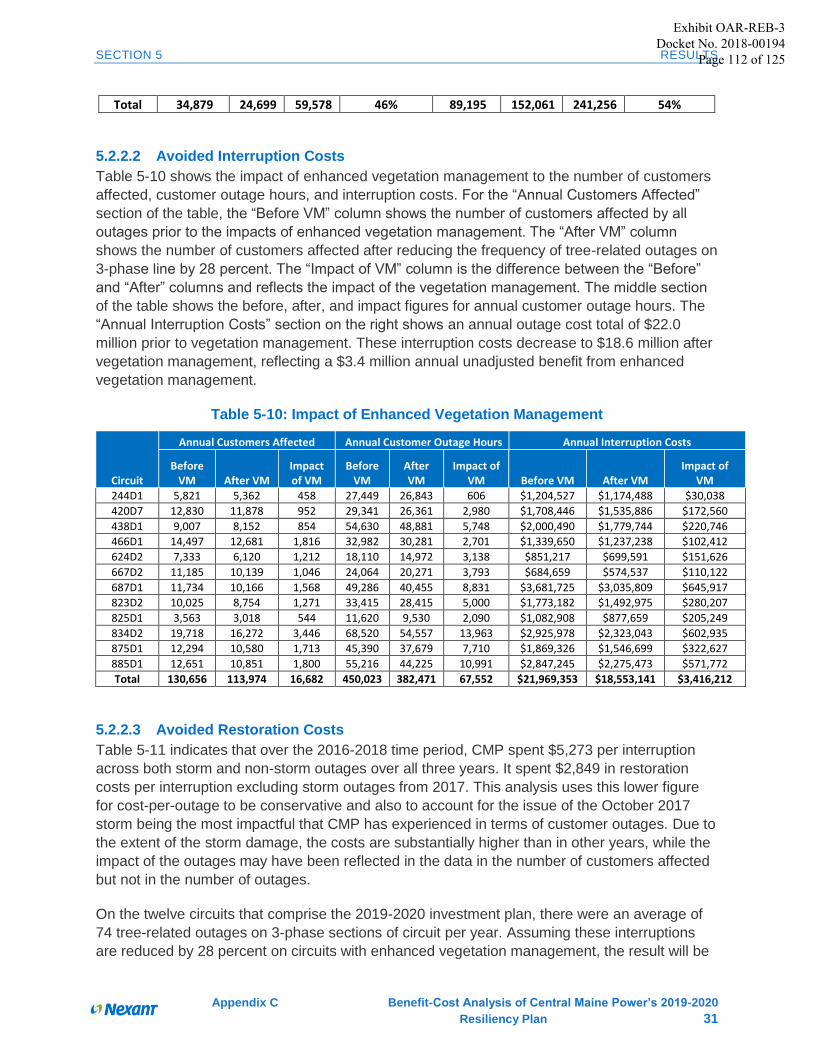
SECTION 5 RESULTS
Appendix C Benefit-Cost Analysis of Central Maine Power’s 2019-2020
Resiliency Plan 31
Total 34,879 24,699 59,578 46% 89,195 152,061 241,256 54%
5.2.2.2 Avoided Interruption Costs
Table 5-10 shows the impact of enhanced vegetation management to the number of customers
affected, customer outage hours, and interruption costs. For the “Annual Customers Affected”
section of the table, the “Before VM” column shows the number of customers affected by all
outages prior to the impacts of enhanced vegetation management. The “After VM” column
shows the number of customers affected after reducing the frequency of tree-related outages on
3-phase line by 28 percent. The “Impact of VM” column is the difference between the “Before”
and “After” columns and reflects the impact of the vegetation management. The middle section
of the table shows the before, after, and impact figures for annual customer outage hours. The
“Annual Interruption Costs” section on the right shows an annual outage cost total of $22.0
million prior to vegetation management. These interruption costs decrease to $18.6 million after
vegetation management, reflecting a $3.4 million annual unadjusted benefit from enhanced
vegetation management.
Table 5-10: Impact of Enhanced Vegetation Management
Circuit
Annual Customers Affected Annual Customer Outage Hours Annual Interruption Costs
Before VM After VM
Impact of VM
Before VM
After VM
Impact of VM Before VM After VM
Impact of VM
244D1 5,821 5,362 458 27,449 26,843 606 $1,204,527 $1,174,488 $30,038
420D7 12,830 11,878 952 29,341 26,361 2,980 $1,708,446 $1,535,886 $172,560
438D1 9,007 8,152 854 54,630 48,881 5,748 $2,000,490 $1,779,744 $220,746
466D1 14,497 12,681 1,816 32,982 30,281 2,701 $1,339,650 $1,237,238 $102,412
624D2 7,333 6,120 1,212 18,110 14,972 3,138 $851,217 $699,591 $151,626
667D2 11,185 10,139 1,046 24,064 20,271 3,793 $684,659 $574,537 $110,122
687D1 11,734 10,166 1,568 49,286 40,455 8,831 $3,681,725 $3,035,809 $645,917
823D2 10,025 8,754 1,271 33,415 28,415 5,000 $1,773,182 $1,492,975 $280,207
825D1 3,563 3,018 544 11,620 9,530 2,090 $1,082,908 $877,659 $205,249
834D2 19,718 16,272 3,446 68,520 54,557 13,963 $2,925,978 $2,323,043 $602,935
875D1 12,294 10,580 1,713 45,390 37,679 7,710 $1,869,326 $1,546,699 $322,627
885D1 12,651 10,851 1,800 55,216 44,225 10,991 $2,847,245 $2,275,473 $571,772
Total 130,656 113,974 16,682 450,023 382,471 67,552 $21,969,353 $18,553,141 $3,416,212
5.2.2.3 Avoided Restoration Costs
Table 5-11 indicates that over the 2016-2018 time period, CMP spent $5,273 per interruption
across both storm and non-storm outages over all three years. It spent $2,849 in restoration
costs per interruption excluding storm outages from 2017. This analysis uses this lower figure
for cost-per-outage to be conservative and also to account for the issue of the October 2017
storm being the most impactful that CMP has experienced in terms of customer outages. Due to
the extent of the storm damage, the costs are substantially higher than in other years, while the
impact of the outages may have been reflected in the data in the number of customers affected
but not in the number of outages.
On the twelve circuits that comprise the 2019-2020 investment plan, there were an average of
74 tree-related outages on 3-phase sections of circuit per year. Assuming these interruptions
are reduced by 28 percent on circuits with enhanced vegetation management, the result will be
Exhibit OAR-REB-3Docket No. 2018-00194
Page 112 of 125
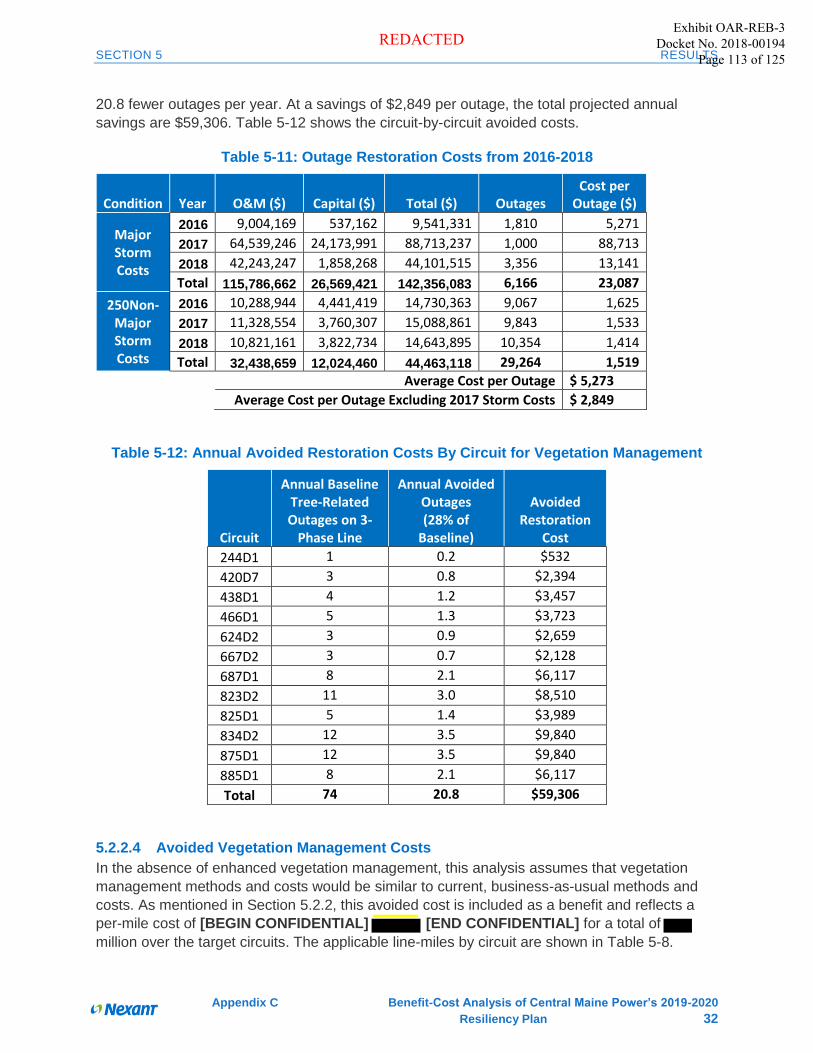
SECTION 5 RESULTS
Appendix C Benefit-Cost Analysis of Central Maine Power’s 2019-2020
Resiliency Plan 32
20.8 fewer outages per year. At a savings of $2,849 per outage, the total projected annual
savings are $59,306. Table 5-12 shows the circuit-by-circuit avoided costs.
Table 5-11: Outage Restoration Costs from 2016-2018
Condition Year O&M ($) Capital ($) Total ($) Outages Cost per
Outage ($)
Major Storm Costs
2016 9,004,169 537,162 9,541,331 1,810 5,271
2017 64,539,246 24,173,991 88,713,237 1,000 88,713
2018 42,243,247 1,858,268 44,101,515 3,356 13,141
Total 115,786,662 26,569,421 142,356,083 6,166 23,087
250Non-Major Storm Costs
2016 10,288,944 4,441,419 14,730,363 9,067 1,625
2017 11,328,554 3,760,307 15,088,861 9,843 1,533
2018 10,821,161 3,822,734 14,643,895 10,354 1,414
Total 32,438,659 12,024,460 44,463,118 29,264 1,519
Average Cost per Outage $ 5,273
Average Cost per Outage Excluding 2017 Storm Costs $ 2,849
Table 5-12: Annual Avoided Restoration Costs By Circuit for Vegetation Management
Circuit
Annual Baseline Tree-Related Outages on 3-
Phase Line
Annual Avoided Outages (28% of
Baseline)
Avoided Restoration
Cost
244D1 1 0.2 $532
420D7 3 0.8 $2,394
438D1 4 1.2 $3,457
466D1 5 1.3 $3,723
624D2 3 0.9 $2,659
667D2 3 0.7 $2,128
687D1 8 2.1 $6,117
823D2 11 3.0 $8,510
825D1 5 1.4 $3,989
834D2 12 3.5 $9,840
875D1 12 3.5 $9,840
885D1 8 2.1 $6,117
Total 74 20.8 $59,306
5.2.2.4 Avoided Vegetation Management Costs
In the absence of enhanced vegetation management, this analysis assumes that vegetation
management methods and costs would be similar to current, business-as-usual methods and
costs. As mentioned in Section 5.2.2, this avoided cost is included as a benefit and reflects a
per-mile cost of [BEGIN CONFIDENTIAL] [END CONFIDENTIAL] for a total of
million over the target circuits. The applicable line-miles by circuit are shown in Table 5-8.
Exhibit OAR-REB-3Docket No. 2018-00194
Page 113 of 125REDACTED
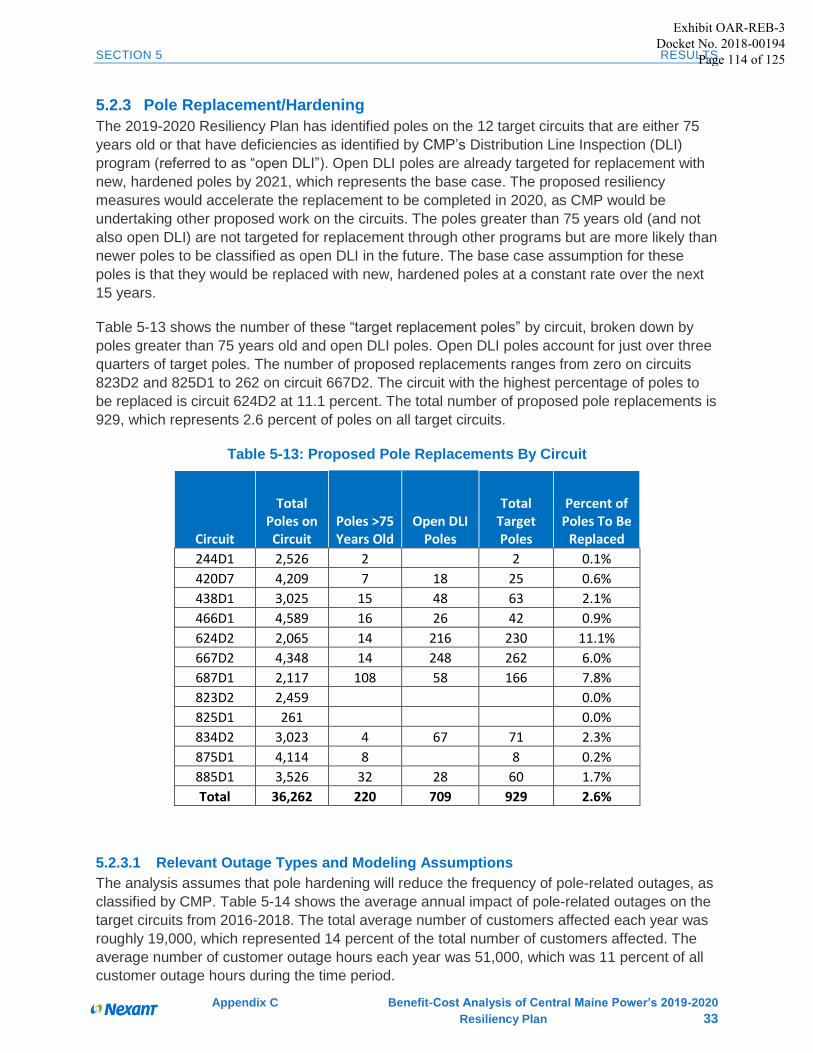
SECTION 5 RESULTS
Appendix C Benefit-Cost Analysis of Central Maine Power’s 2019-2020
Resiliency Plan 33
5.2.3 Pole Replacement/Hardening
The 2019-2020 Resiliency Plan has identified poles on the 12 target circuits that are either 75
years old or that have deficiencies as identified by CMP’s Distribution Line Inspection (DLI)
program (referred to as “open DLI”). Open DLI poles are already targeted for replacement with
new, hardened poles by 2021, which represents the base case. The proposed resiliency
measures would accelerate the replacement to be completed in 2020, as CMP would be
undertaking other proposed work on the circuits. The poles greater than 75 years old (and not
also open DLI) are not targeted for replacement through other programs but are more likely than
newer poles to be classified as open DLI in the future. The base case assumption for these
poles is that they would be replaced with new, hardened poles at a constant rate over the next
15 years.
Table 5-13 shows the number of these “target replacement poles” by circuit, broken down by
poles greater than 75 years old and open DLI poles. Open DLI poles account for just over three
quarters of target poles. The number of proposed replacements ranges from zero on circuits
823D2 and 825D1 to 262 on circuit 667D2. The circuit with the highest percentage of poles to
be replaced is circuit 624D2 at 11.1 percent. The total number of proposed pole replacements is
929, which represents 2.6 percent of poles on all target circuits.
Table 5-13: Proposed Pole Replacements By Circuit
Circuit
Total Poles on Circuit
Poles >75 Years Old
Open DLI Poles
Total Target Poles
Percent of Poles To Be
Replaced
244D1 2,526 2 2 0.1%
420D7 4,209 7 18 25 0.6%
438D1 3,025 15 48 63 2.1%
466D1 4,589 16 26 42 0.9%
624D2 2,065 14 216 230 11.1%
667D2 4,348 14 248 262 6.0%
687D1 2,117 108 58 166 7.8%
823D2 2,459 0.0%
825D1 261 0.0%
834D2 3,023 4 67 71 2.3%
875D1 4,114 8 8 0.2%
885D1 3,526 32 28 60 1.7%
Total 36,262 220 709 929 2.6%
5.2.3.1 Relevant Outage Types and Modeling Assumptions
The analysis assumes that pole hardening will reduce the frequency of pole-related outages, as
classified by CMP. Table 5-14 shows the average annual impact of pole-related outages on the
target circuits from 2016-2018. The total average number of customers affected each year was
roughly 19,000, which represented 14 percent of the total number of customers affected. The
average number of customer outage hours each year was 51,000, which was 11 percent of all
customer outage hours during the time period.
Exhibit OAR-REB-3 Docket No. 2018-00194
Page 114 of 125
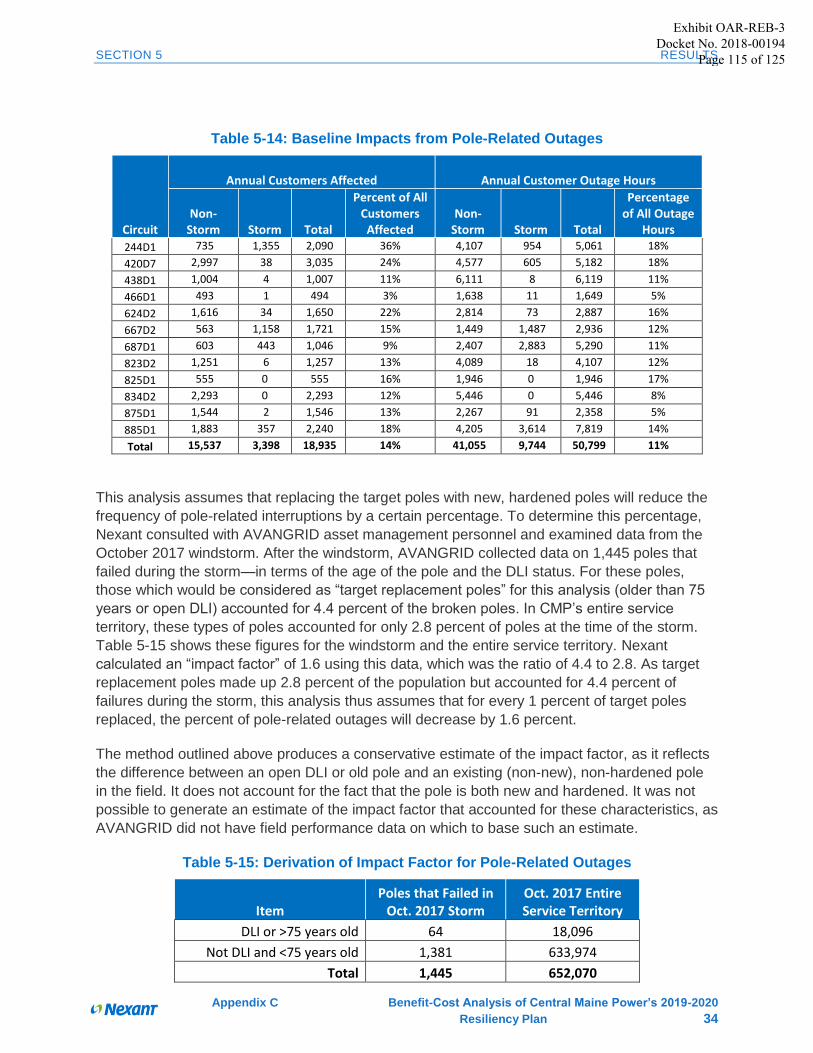
SECTION 5 RESULTS
Appendix C Benefit-Cost Analysis of Central Maine Power’s 2019-2020
Resiliency Plan 34
Table 5-14: Baseline Impacts from Pole-Related Outages
Circuit
Annual Customers Affected Annual Customer Outage Hours
Non-Storm Storm Total
Percent of All Customers Affected
Non-Storm Storm Total
Percentage of All Outage
Hours
244D1 735 1,355 2,090 36% 4,107 954 5,061 18%
420D7 2,997 38 3,035 24% 4,577 605 5,182 18%
438D1 1,004 4 1,007 11% 6,111 8 6,119 11%
466D1 493 1 494 3% 1,638 11 1,649 5%
624D2 1,616 34 1,650 22% 2,814 73 2,887 16%
667D2 563 1,158 1,721 15% 1,449 1,487 2,936 12%
687D1 603 443 1,046 9% 2,407 2,883 5,290 11%
823D2 1,251 6 1,257 13% 4,089 18 4,107 12%
825D1 555 0 555 16% 1,946 0 1,946 17%
834D2 2,293 0 2,293 12% 5,446 0 5,446 8%
875D1 1,544 2 1,546 13% 2,267 91 2,358 5%
885D1 1,883 357 2,240 18% 4,205 3,614 7,819 14%
Total 15,537 3,398 18,935 14% 41,055 9,744 50,799 11%
This analysis assumes that replacing the target poles with new, hardened poles will reduce the
frequency of pole-related interruptions by a certain percentage. To determine this percentage,
Nexant consulted with AVANGRID asset management personnel and examined data from the
October 2017 windstorm. After the windstorm, AVANGRID collected data on 1,445 poles that
failed during the storm—in terms of the age of the pole and the DLI status. For these poles,
those which would be considered as “target replacement poles” for this analysis (older than 75
years or open DLI) accounted for 4.4 percent of the broken poles. In CMP’s entire service
territory, these types of poles accounted for only 2.8 percent of poles at the time of the storm.
Table 5-15 shows these figures for the windstorm and the entire service territory. Nexant
calculated an “impact factor” of 1.6 using this data, which was the ratio of 4.4 to 2.8. As target
replacement poles made up 2.8 percent of the population but accounted for 4.4 percent of
failures during the storm, this analysis thus assumes that for every 1 percent of target poles
replaced, the percent of pole-related outages will decrease by 1.6 percent.
The method outlined above produces a conservative estimate of the impact factor, as it reflects
the difference between an open DLI or old pole and an existing (non-new), non-hardened pole
in the field. It does not account for the fact that the pole is both new and hardened. It was not
possible to generate an estimate of the impact factor that accounted for these characteristics, as
AVANGRID did not have field performance data on which to base such an estimate.
Table 5-15: Derivation of Impact Factor for Pole-Related Outages
Item Poles that Failed in
Oct. 2017 Storm Oct. 2017 Entire Service Territory
DLI or >75 years old 64 18,096
Not DLI and <75 years old 1,381 633,974
Total 1,445 652,070
Exhibit OAR-REB-3 Docket No. 2018-00194
Page 115 of 125
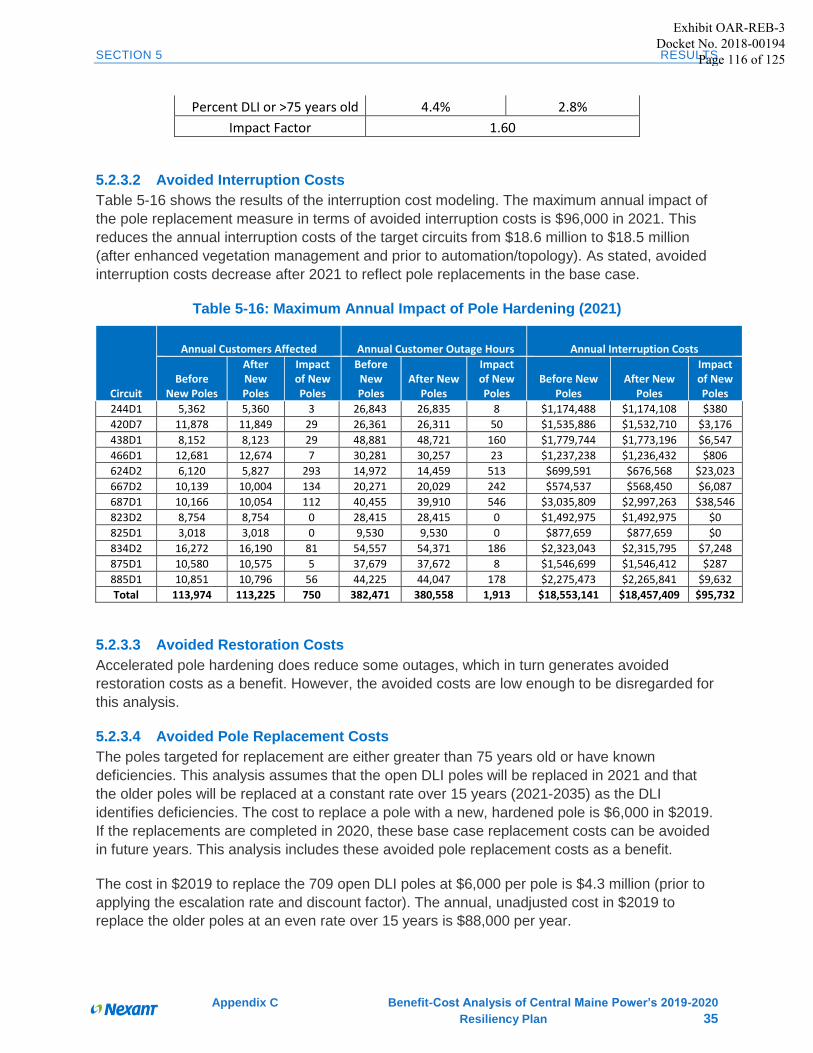
SECTION 5 RESULTS
Appendix C Benefit-Cost Analysis of Central Maine Power’s 2019-2020
Resiliency Plan 35
Percent DLI or >75 years old 4.4% 2.8%
Impact Factor 1.60
5.2.3.2 Avoided Interruption Costs
Table 5-16 shows the results of the interruption cost modeling. The maximum annual impact of
the pole replacement measure in terms of avoided interruption costs is $96,000 in 2021. This
reduces the annual interruption costs of the target circuits from $18.6 million to $18.5 million
(after enhanced vegetation management and prior to automation/topology). As stated, avoided
interruption costs decrease after 2021 to reflect pole replacements in the base case.
Table 5-16: Maximum Annual Impact of Pole Hardening (2021)
Circuit
Annual Customers Affected Annual Customer Outage Hours Annual Interruption Costs
Before New Poles
After New Poles
Impact of New Poles
Before New Poles
After New Poles
Impact of New Poles
Before New Poles
After New Poles
Impact of New Poles
244D1 5,362 5,360 3 26,843 26,835 8 $1,174,488 $1,174,108 $380
420D7 11,878 11,849 29 26,361 26,311 50 $1,535,886 $1,532,710 $3,176
438D1 8,152 8,123 29 48,881 48,721 160 $1,779,744 $1,773,196 $6,547
466D1 12,681 12,674 7 30,281 30,257 23 $1,237,238 $1,236,432 $806
624D2 6,120 5,827 293 14,972 14,459 513 $699,591 $676,568 $23,023
667D2 10,139 10,004 134 20,271 20,029 242 $574,537 $568,450 $6,087
687D1 10,166 10,054 112 40,455 39,910 546 $3,035,809 $2,997,263 $38,546
823D2 8,754 8,754 0 28,415 28,415 0 $1,492,975 $1,492,975 $0
825D1 3,018 3,018 0 9,530 9,530 0 $877,659 $877,659 $0
834D2 16,272 16,190 81 54,557 54,371 186 $2,323,043 $2,315,795 $7,248
875D1 10,580 10,575 5 37,679 37,672 8 $1,546,699 $1,546,412 $287
885D1 10,851 10,796 56 44,225 44,047 178 $2,275,473 $2,265,841 $9,632
Total 113,974 113,225 750 382,471 380,558 1,913 $18,553,141 $18,457,409 $95,732
5.2.3.3 Avoided Restoration Costs
Accelerated pole hardening does reduce some outages, which in turn generates avoided
restoration costs as a benefit. However, the avoided costs are low enough to be disregarded for
this analysis.
5.2.3.4 Avoided Pole Replacement Costs
The poles targeted for replacement are either greater than 75 years old or have known
deficiencies. This analysis assumes that the open DLI poles will be replaced in 2021 and that
the older poles will be replaced at a constant rate over 15 years (2021-2035) as the DLI
identifies deficiencies. The cost to replace a pole with a new, hardened pole is $6,000 in $2019.
If the replacements are completed in 2020, these base case replacement costs can be avoided
in future years. This analysis includes these avoided pole replacement costs as a benefit.
The cost in $2019 to replace the 709 open DLI poles at $6,000 per pole is $4.3 million (prior to
applying the escalation rate and discount factor). The annual, unadjusted cost in $2019 to
replace the older poles at an even rate over 15 years is $88,000 per year.
Exhibit OAR-REB-3 Docket No. 2018-00194
Page 116 of 125
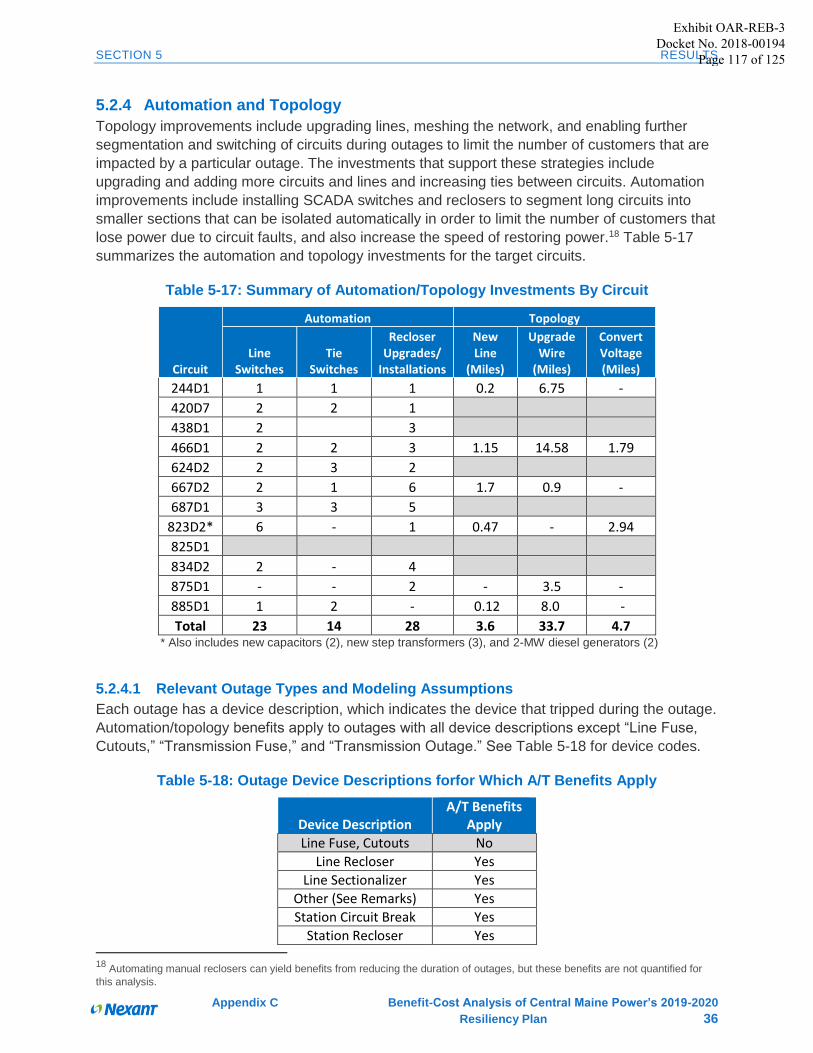
SECTION 5 RESULTS
Appendix C Benefit-Cost Analysis of Central Maine Power’s 2019-2020
Resiliency Plan 36
5.2.4 Automation and Topology
Topology improvements include upgrading lines, meshing the network, and enabling further
segmentation and switching of circuits during outages to limit the number of customers that are
impacted by a particular outage. The investments that support these strategies include
upgrading and adding more circuits and lines and increasing ties between circuits. Automation
improvements include installing SCADA switches and reclosers to segment long circuits into
smaller sections that can be isolated automatically in order to limit the number of customers that
lose power due to circuit faults, and also increase the speed of restoring power.18 Table 5-17
summarizes the automation and topology investments for the target circuits.
Table 5-17: Summary of Automation/Topology Investments By Circuit
Circuit
Automation Topology
Line Switches
Tie Switches
Recloser Upgrades/
Installations
New Line
(Miles)
Upgrade Wire
(Miles)
Convert Voltage (Miles)
244D1 1 1 1 0.2 6.75 -
420D7 2 2 1
438D1 2 3
466D1 2 2 3 1.15 14.58 1.79
624D2 2 3 2
667D2 2 1 6 1.7 0.9 -
687D1 3 3 5
823D2* 6 - 1 0.47 - 2.94
825D1
834D2 2 - 4
875D1 - - 2 - 3.5 -
885D1 1 2 - 0.12 8.0 -
Total 23 14 28 3.6 33.7 4.7 * Also includes new capacitors (2), new step transformers (3), and 2-MW diesel generators (2)
5.2.4.1 Relevant Outage Types and Modeling Assumptions
Each outage has a device description, which indicates the device that tripped during the outage.
Automation/topology benefits apply to outages with all device descriptions except “Line Fuse,
Cutouts,” “Transmission Fuse,” and “Transmission Outage.” See Table 5-18 for device codes.
Table 5-18: Outage Device Descriptions forfor Which A/T Benefits Apply
Device Description A/T Benefits
Apply
Line Fuse, Cutouts No
Line Recloser Yes
Line Sectionalizer Yes
Other (See Remarks) Yes
Station Circuit Break Yes
Station Recloser Yes 18
Automating manual reclosers can yield benefits from reducing the duration of outages, but these benefits are not quantified for
this analysis.
Exhibit OAR-REB-3 Docket No. 2018-00194
Page 117 of 125
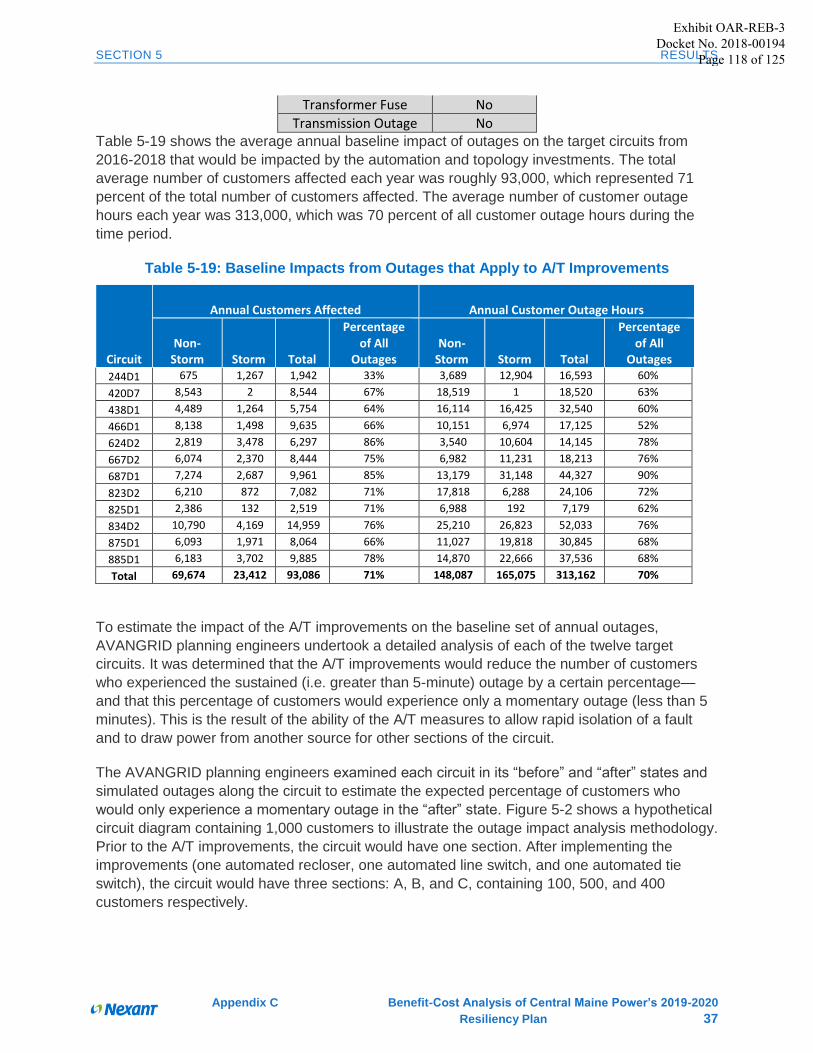
SECTION 5 RESULTS
Appendix C Benefit-Cost Analysis of Central Maine Power’s 2019-2020
Resiliency Plan 37
Transformer Fuse No
Transmission Outage No Table 5-19 shows the average annual baseline impact of outages on the target circuits from
2016-2018 that would be impacted by the automation and topology investments. The total
average number of customers affected each year was roughly 93,000, which represented 71
percent of the total number of customers affected. The average number of customer outage
hours each year was 313,000, which was 70 percent of all customer outage hours during the
time period.
Table 5-19: Baseline Impacts from Outages that Apply to A/T Improvements
Circuit
Annual Customers Affected Annual Customer Outage Hours
Non-Storm Storm Total
Percentage of All
Outages Non-
Storm Storm Total
Percentage of All
Outages
244D1 675 1,267 1,942 33% 3,689 12,904 16,593 60%
420D7 8,543 2 8,544 67% 18,519 1 18,520 63%
438D1 4,489 1,264 5,754 64% 16,114 16,425 32,540 60%
466D1 8,138 1,498 9,635 66% 10,151 6,974 17,125 52%
624D2 2,819 3,478 6,297 86% 3,540 10,604 14,145 78%
667D2 6,074 2,370 8,444 75% 6,982 11,231 18,213 76%
687D1 7,274 2,687 9,961 85% 13,179 31,148 44,327 90%
823D2 6,210 872 7,082 71% 17,818 6,288 24,106 72%
825D1 2,386 132 2,519 71% 6,988 192 7,179 62%
834D2 10,790 4,169 14,959 76% 25,210 26,823 52,033 76%
875D1 6,093 1,971 8,064 66% 11,027 19,818 30,845 68%
885D1 6,183 3,702 9,885 78% 14,870 22,666 37,536 68%
Total 69,674 23,412 93,086 71% 148,087 165,075 313,162 70%
To estimate the impact of the A/T improvements on the baseline set of annual outages,
AVANGRID planning engineers undertook a detailed analysis of each of the twelve target
circuits. It was determined that the A/T improvements would reduce the number of customers
who experienced the sustained (i.e. greater than 5-minute) outage by a certain percentage—
and that this percentage of customers would experience only a momentary outage (less than 5
minutes). This is the result of the ability of the A/T measures to allow rapid isolation of a fault
and to draw power from another source for other sections of the circuit.
The AVANGRID planning engineers examined each circuit in its “before” and “after” states and
simulated outages along the circuit to estimate the expected percentage of customers who
would only experience a momentary outage in the “after” state. Figure 5-2 shows a hypothetical
circuit diagram containing 1,000 customers to illustrate the outage impact analysis methodology.
Prior to the A/T improvements, the circuit would have one section. After implementing the
improvements (one automated recloser, one automated line switch, and one automated tie
switch), the circuit would have three sections: A, B, and C, containing 100, 500, and 400
customers respectively.
Exhibit OAR-REB-3 Docket No. 2018-00194
Page 118 of 125
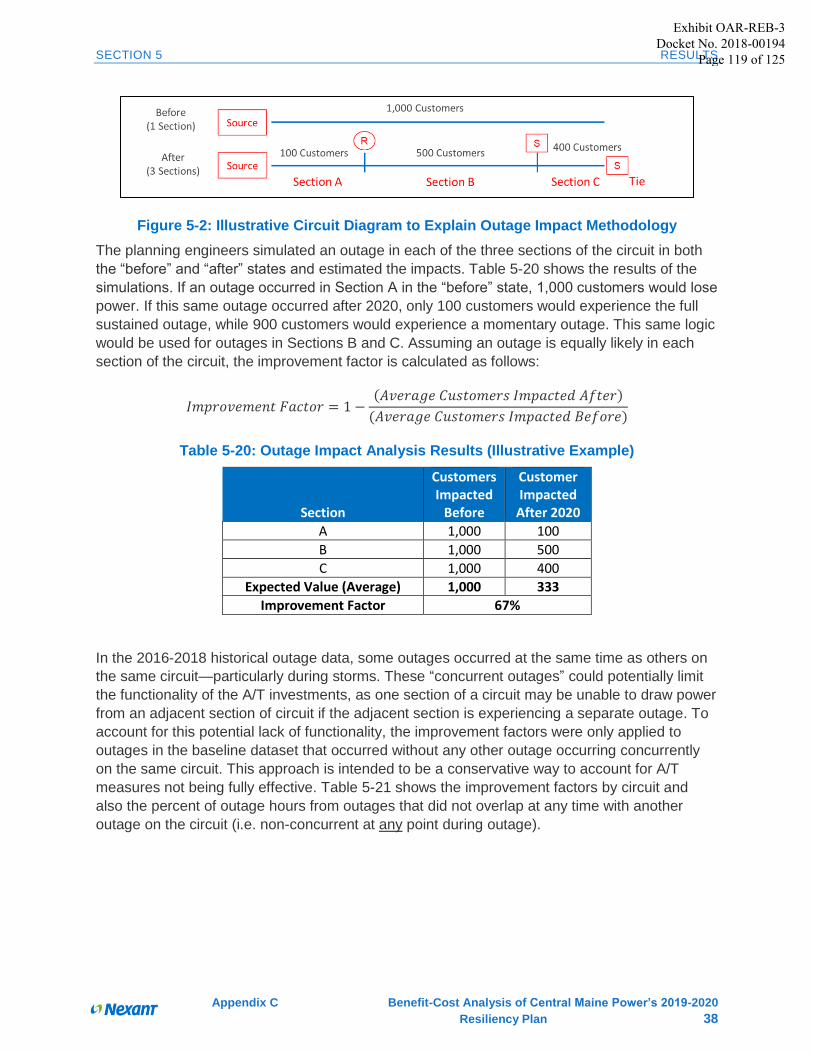
SECTION 5 RESULTS
Appendix C Benefit-Cost Analysis of Central Maine Power’s 2019-2020
Resiliency Plan 38
Figure 5-2: Illustrative Circuit Diagram to Explain Outage Impact Methodology
The planning engineers simulated an outage in each of the three sections of the circuit in both
the “before” and “after” states and estimated the impacts. Table 5-20 shows the results of the
simulations. If an outage occurred in Section A in the “before” state, 1,000 customers would lose
power. If this same outage occurred after 2020, only 100 customers would experience the full
sustained outage, while 900 customers would experience a momentary outage. This same logic
would be used for outages in Sections B and C. Assuming an outage is equally likely in each
section of the circuit, the improvement factor is calculated as follows:
𝐼𝑚𝑝𝑟𝑜𝑣𝑒𝑚𝑒𝑛𝑡 𝐹𝑎𝑐𝑡𝑜𝑟 = 1 −(𝐴𝑣𝑒𝑟𝑎𝑔𝑒 𝐶𝑢𝑠𝑡𝑜𝑚𝑒𝑟𝑠 𝐼𝑚𝑝𝑎𝑐𝑡𝑒𝑑 𝐴𝑓𝑡𝑒𝑟)
(𝐴𝑣𝑒𝑟𝑎𝑔𝑒 𝐶𝑢𝑠𝑡𝑜𝑚𝑒𝑟𝑠 𝐼𝑚𝑝𝑎𝑐𝑡𝑒𝑑 𝐵𝑒𝑓𝑜𝑟𝑒)
Table 5-20: Outage Impact Analysis Results (Illustrative Example)
Section
Customers Impacted
Before
Customer Impacted
After 2020
A 1,000 100
B 1,000 500
C 1,000 400
Expected Value (Average) 1,000 333
Improvement Factor 67%
In the 2016-2018 historical outage data, some outages occurred at the same time as others on
the same circuit—particularly during storms. These “concurrent outages” could potentially limit
the functionality of the A/T investments, as one section of a circuit may be unable to draw power
from an adjacent section of circuit if the adjacent section is experiencing a separate outage. To
account for this potential lack of functionality, the improvement factors were only applied to
outages in the baseline dataset that occurred without any other outage occurring concurrently
on the same circuit. This approach is intended to be a conservative way to account for A/T
measures not being fully effective. Table 5-21 shows the improvement factors by circuit and
also the percent of outage hours from outages that did not overlap at any time with another
outage on the circuit (i.e. non-concurrent at any point during outage).
Exhibit OAR-REB-3 Docket No. 2018-00194
Page 119 of 125

SECTION 5 RESULTS
Appendix C Benefit-Cost Analysis of Central Maine Power’s 2019-2020
Resiliency Plan 39
Table 5-21: Automation/Topology Benefits Estimate and Storm Adjustment
Circuit
Percent Reduction in Customers Who Experience Full
Sustained Outage (Improvement Factor)
Percent of Outage Hours
from Non-Overlapping
Outages
244D1 5% 34%
420D7 45% 54%
438D1 32% 48%
466D1 25% 53%
624D2 53% 88%
667D2 31% 50%
687D1 69% 68%
823D2 65% 65%
825D1 65% 95%
834D2 13% 66%
875D1 2% 41%
885D1 15% 51%
5.2.4.2 Avoided Interruption Costs
Table 5-22 shows the results of the interruption cost modeling. The annual impact of A/T in
terms of avoided interruption costs is $2.3 million. This reduces the annual interruption costs of
the target circuits from $18.5 million to $16.1 million after applying enhanced vegetation
management and pole hardening.
Table 5-22: Annual Impacts of Automation/Topology Measures
Circuit
Annual Customers Affected
Annual Customer Outage Hours Annual Interruption Costs
Before A/T
After A/T
Impact of A/T
Before A/T
After A/T
Impact of A/T Before A/T After A/T
Impact of A/T
244D1 5,360 5,312 47 26,835 26,566 269 $1,174,108 $1,163,740 $10,368
420D7 11,849 8,625 3,224 26,311 21,109 5,202 $1,532,710 $1,362,346 $170,364
438D1 8,123 6,690 1,433 48,721 43,363 5,358 $1,773,196 $1,621,515 $151,681
466D1 12,674 11,007 1,667 30,257 27,722 2,535 $1,236,432 $1,183,039 $53,393
624D2 5,827 3,327 2,500 14,459 8,884 5,575 $676,568 $495,765 $180,802
667D2 10,004 8,116 1,888 20,029 18,058 1,971 $568,450 $545,004 $23,446
687D1 10,054 5,510 4,544 39,910 24,282 15,628 $2,997,263 $2,054,977 $942,286
823D2 8,754 5,708 3,045 28,415 20,088 8,327 $1,492,975 $1,171,743 $321,233
825D1 3,018 1,678 1,341 9,530 5,743 3,787 $877,659 $621,750 $255,908
834D2 16,190 14,852 1,338 54,371 50,795 3,576 $2,315,795 $2,210,308 $105,487
875D1 10,575 10,461 114 37,672 37,468 204 $1,546,412 $1,541,651 $4,761
885D1 10,796 9,938 857 44,047 41,026 3,021 $2,265,841 $2,142,770 $123,071
Total 113,225 91,225 22,000 380,558 325,104 55,454 $18,457,409 $16,114,608 $2,342,801
Exhibit OAR-REB-3 Docket No. 2018-00194
Page 120 of 125
SECTION 5 RESULTS
Appendix C Benefit-Cost Analysis of Central Maine Power’s 2019-2020
Resiliency Plan 40
5.3 Net Present Value of Costs and Benefits The 2019-2020 CMP Resiliency Investments have a positive NPV of $54.3 million and a
benefit/cost ratio of 2.8 over 30 years. Figure 5-3 shows the NPV of each category of costs and
benefits. The NPV of costs is $30.3 million, due to a portion of the investment being made in
2020, to which the discount factor is applied. The NPV of benefits is $84.6 million. Avoided
interruption costs account for the vast majority of benefits. Avoided interruption costs from
enhanced vegetation management total $49.5 million. Those from A/T total $27.9 million.
Figure 5-4 shows a snapshot of the NPV calculation model. As the figure shows, the
investments are made in 2019 and 2020, which are years 0 and 1 of the project. The benefits
begin to be realized in year 2 (2021). Avoided interruption, restoration, and base case pole
replacement costs are all escalated at a rate of 2 percent per year. Future cost and benefit
streams are discounted at a rate of 7.06 percent per year. The discount rate, which is used to
calculate the present value of costs and benefits over the life of the investments, is equal to
CMP’s after tax weighted average cost of capital (WACC).
The authors believe the estimated net benefit of $54.3 million is a conservative estimate. Where
assumptions were made throughout the analysis, the conservative options were taken.
Incorporating A/T refurbishment costs and continuing A/T benefits from years 20 through 30
could yield an additional net benefit.
Exhibit OAR-REB-3 Docket No. 2018-00194
Page 121 of 125

SECTION 5 RESULTS
Appendix C Benefit-Cost Analysis of Central Maine Power’s 2019-2020
Resiliency Plan 41
Exhibit OAR-REB-3 Docket No. 2018-00194
Page 122 of 125
SECTION 5 RESULTS
Appendix C Benefit-Cost Analysis of Central Maine Power’s 2019-2020
Resiliency Plan 42
Exhibit OAR-REB-3 Docket No. 2018-00194
Page 123 of 125
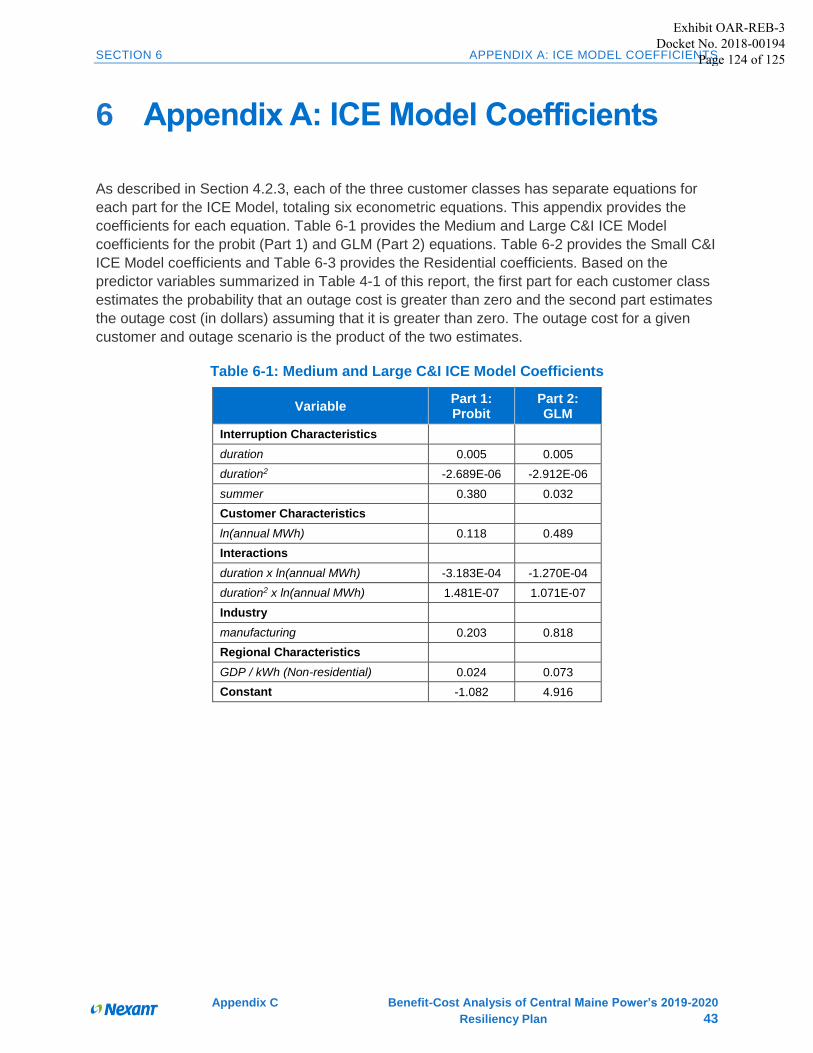
SECTION 6 APPENDIX A: ICE MODEL COEFFICIENTS
Appendix C Benefit-Cost Analysis of Central Maine Power’s 2019-2020
Resiliency Plan 43
6 Appendix A: ICE Model Coefficients
As described in Section 4.2.3, each of the three customer classes has separate equations for
each part for the ICE Model, totaling six econometric equations. This appendix provides the
coefficients for each equation. Table 6-1 provides the Medium and Large C&I ICE Model
coefficients for the probit (Part 1) and GLM (Part 2) equations. Table 6-2 provides the Small C&I
ICE Model coefficients and Table 6-3 provides the Residential coefficients. Based on the
predictor variables summarized in Table 4-1 of this report, the first part for each customer class
estimates the probability that an outage cost is greater than zero and the second part estimates
the outage cost (in dollars) assuming that it is greater than zero. The outage cost for a given
customer and outage scenario is the product of the two estimates.
Table 6-1: Medium and Large C&I ICE Model Coefficients
Variable Part 1: Probit
Part 2: GLM
Interruption Characteristics
duration 0.005 0.005
duration2 -2.689E-06 -2.912E-06
summer 0.380 0.032
Customer Characteristics
ln(annual MWh) 0.118 0.489
Interactions
duration x ln(annual MWh) -3.183E-04 -1.270E-04
duration2 x ln(annual MWh) 1.481E-07 1.071E-07
Industry
manufacturing 0.203 0.818
Regional Characteristics
GDP / kWh (Non-residential) 0.024 0.073
Constant -1.082 4.916
Exhibit OAR-REB-3 Docket No. 2018-00194
Page 124 of 125
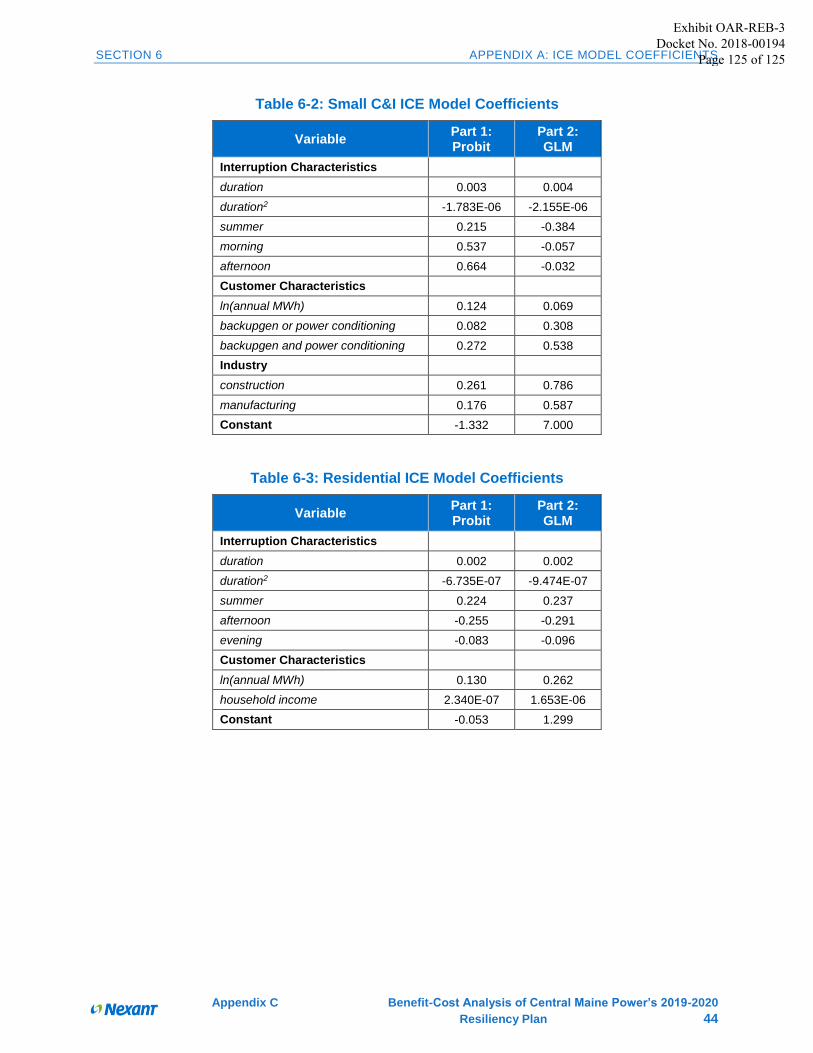
SECTION 6 APPENDIX A: ICE MODEL COEFFICIENTS
Appendix C Benefit-Cost Analysis of Central Maine Power’s 2019-2020
Resiliency Plan 44
Table 6-2: Small C&I ICE Model Coefficients
Variable Part 1: Probit
Part 2: GLM
Interruption Characteristics
duration 0.003 0.004
duration2 -1.783E-06 -2.155E-06
summer 0.215 -0.384
morning 0.537 -0.057
afternoon 0.664 -0.032
Customer Characteristics
ln(annual MWh) 0.124 0.069
backupgen or power conditioning 0.082 0.308
backupgen and power conditioning 0.272 0.538
Industry
construction 0.261 0.786
manufacturing 0.176 0.587
Constant -1.332 7.000
Table 6-3: Residential ICE Model Coefficients
Variable Part 1: Probit
Part 2: GLM
Interruption Characteristics
duration 0.002 0.002
duration2 -6.735E-07 -9.474E-07
summer 0.224 0.237
afternoon -0.255 -0.291
evening -0.083 -0.096
Customer Characteristics
ln(annual MWh) 0.130 0.262
household income 2.340E-07 1.653E-06
Constant -0.053 1.299
Exhibit OAR-REB-3 Docket No. 2018-00194
Page 125 of 125