characterization of the street networks in the traditional turkish urban form
TRANSCRIPT
1 IntroductionTraditional Turkish street networks are said to possess certain features discerniblefrom cities in other cultural backgrounds. Typical features include an abundant amountof `organic' networks consisting of closed-end edges, winding and narrow roads (ofhuman scale), and a general absence of main streets. Several cities, such as Venice andSienna, which are outside of the Ottoman ^Turkish influence, however, also have suchfeatures. Then, what is the `true' nature of traditional Turkish street networks? Moti-vated by this question, in this paper we quantitatively seek indices or a combination ofindices to measure traditional characteristics revealed by the street network patterns.
To this end, several cities in Turkey possessing traditional Turkish characteristicsare selected for case-study purposes. Some cities in Turkey, which do not possess theso-called traditional characteristics, are also selected for comparison purposes. Afurther selection of world cities previously studied by Asami et al (1999) is selectedas a second comparison group. All are listed in section 2.
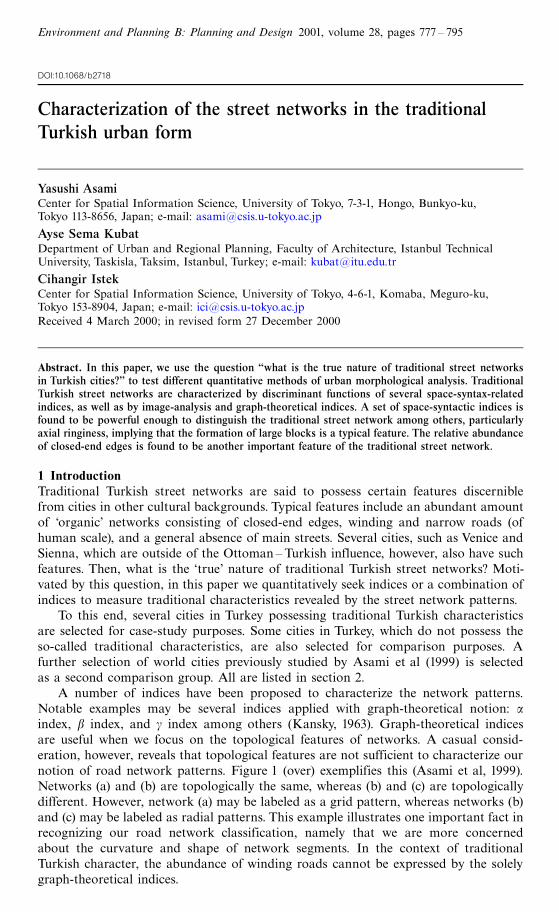
A number of indices have been proposed to characterize the network patterns.Notable examples may be several indices applied with graph-theoretical notion: aindex, b index, and g index among others (Kansky, 1963). Graph-theoretical indicesare useful when we focus on the topological features of networks. A casual consid-eration, however, reveals that topological features are not sufficient to characterize ournotion of road network patterns. Figure 1 (over) exemplifies this (Asami et al, 1999).Networks (a) and (b) are topologically the same, whereas (b) and (c) are topologicallydifferent. However, network (a) may be labeled as a grid pattern, whereas networks (b)and (c) may be labeled as radial patterns. This example illustrates one important fact inrecognizing our road network classification, namely that we are more concernedabout the curvature and shape of network segments. In the context of traditionalTurkish character, the abundance of winding roads cannot be expressed by the solelygraph-theoretical indices.
Characterization of the street networks in the traditionalTurkish urban form
Yasushi AsamiCenter for Spatial Information Science, University of Tokyo, 7-3-1, Hongo, Bunkyo-ku,Tokyo 113-8656, Japan; e-mail: [email protected]
Ayse Sema KubatDepartment of Urban and Regional Planning, Faculty of Architecture, Istanbul TechnicalUniversity, Taskisla, Taksim, Istanbul, Turkey; e-mail: [email protected]
Cihangir IstekCenter for Spatial Information Science, University of Tokyo, 4-6-1, Komaba, Meguro-ku,Tokyo 153-8904, Japan; e-mail: [email protected] 4 March 2000; in revised form 27 December 2000
Environment and Planning B: Planning and Design 2001, volume 28, pages 777 ^ 795
Abstract. In this paper, we use the question ``what is the true nature of traditional street networksin Turkish cities?'' to test different quantitative methods of urban morphological analysis. TraditionalTurkish street networks are characterized by discriminant functions of several space-syntax-relatedindices, as well as by image-analysis and graph-theoretical indices. A set of space-syntactic indices isfound to be powerful enough to distinguish the traditional street network among others, particularlyaxial ringiness, implying that the formation of large blocks is a typical feature. The relative abundanceof closed-end edges is found to be another important feature of the traditional street network.
DOI:10.1068/b2718
To overcome the limitation of graph-theoretical indices, we can introduce someconcepts developed in image analysis. Network patterns can be represented as imagesby coloring street networks in black and all other parts in white. In such a black andwhite image, street networks are not lines in a mathematical sense, but an imagerepresented by black pixels. Streets are typically shown as a thick black area. To obtaina `skeleton' of the streets, in other words, centerlines, a thinning operation is often usedin image analysis. Such a thinning operation peels off boundaries of networks gradu-ally, so that the streets are connected by pixels, to a point where no further peeling offis possible. The resulting image shows the thinnest network, which is topologically thesame as the original network. In this operation, we can count the number of `peelingoff' operations necessary for each edge, yielding the width of each edge. By using suchan operation, we can measure the average width of streets, and the ratio of distancealong an edge to the distance between two end nodes.
Another important group of indices has been developed with the concept of `spacesyntax'. The framework of this methodology is based on two basic tools called convexand axial maps to model and capture several syntactic properties of street networksquantitatively (Hillier, 1996; Hillier and Hanson, 1984). The indices based on graph theoryand image analysis are described in detail in section 3. Those based on space syntax aredescribed in section 4 together with the exposition of the methodology of space syntax.
With such indices at hand, in this paper we seek efficient discriminant functions. Adiscriminant function is a function of indices, which most differentiates the traditionalcities from other cities. A typical function is a linear function of indices with propercoefficients. Typically, a discriminant function for traditional Turkish character willhave the largest (positive) value for the most `traditional' city judged by the indices ofstreet networks, and the smallest (negative) value for the least traditional city. Ideally,since functional value is greater than a certain threshold value for all traditional cities,and is less than the threshold value for all nontraditional cities, such a discriminantfunction might completely distinguish the traditional cities.
Given this framework, several interesting questions arise here. What is themost important feature for traditional Turkish street networks? Which city containsthe most traditional character? Which indices are the most powerful in discerning thetraditional character? Are space-syntax-related indices effective in discerning the tradi-tional character? In section 5 we report the results of the discriminant functionanalysis, and answer these questions. A summary of results as well as concludingremarks are stated in the last section.
2 Traditional Turkish cities and nontraditional citiesWhat are the characteristics of traditional Turkish city form? Traditional Turkish streetpatterns show similar characteristics to street patterns in Islamic cities which could beattributed to certain religious factors and climatic conditions. For example, Morris
(a) (b) (c)
Figure 1. Three road networks: (a) grid; (b) radial and homeomorphic to (a); (c) radial and nothomeomorphic to (a).
778 Y Asami, A S Kubat, C Istek
(1994) describes street patterns in Islamic cities as follows:`̀ the road system in the Islamic city was the result of the patterning of buildings, nota determinant as in most modern planning. Individual houses were groupedtogether around cul-de-sac lanes, entered off the city's main public right-of-waythoroughfares and which serve to provide access only to that cluster of houses.The cul-de-sac is owned in common by the houses it serves and comprises a basicunit in the self policing nature of the city'' (page 389).
Aru (1997), a leading Turkish scholar on Turkish cities, describes similar features intraditional Turkish cities:
`̀The old Turkish city, which has free and organic fabric, has a rhythmic geometry.The basic forms of these cities have evolved out of the needs of their inhabitants.Climate also plays an important role in determining the urban fabric. The Turks,while building their own cities in Anatolia, did not simply take the Hellenistic andByzantine urban fabrics for granted as their predecessors did. In their cities, somefactors like the introvert lifestyle and the naturally or self-organized topography arerepeated perpetually. The closed-end street patterns are very common as well''(page 396).(1)
As emphasized above, cul-de-sac type of access is not public but derives from a patternof coownership to adjacent or bordering residents. Opening of doors into a cul-de-sacis also a typical characteristic of the traditional street pattern of Turkish cities. Thesecharacteristics of organic networks, abundance of culs-de-sac, and winding of narrowroads are generally accepted as features found in traditional Turkish cities.
To construct the discriminant functions, we need to analyze cities of both tradi-tional Turkish and nontraditional characters. For effective analysis, street patterns ofthe study areas need to have almost the same precision.(2) All the street networks aretherefore c̀ut out' by a square of 1:25 km by 1:25 km. Although the cutting outoperation might weaken the significance of global indices in space syntax, this oper-ation is judged necessary for the purpose of this research. The reason is that thetraditional urban form is found only partly in many cities. If all city areas are included,then the abundant inclusion of modern planned form is unavoidable, which conse-quently lessens the significance of the selection of traditional areas. To define the studyareas, a careful selection is made among the old cores where the traditional streetpatterns still exist. In order to discuss the true traditional feature of Turkish streetnetworks, the cut-out size and the selection of areas are optimized.
In his seminal work on `̀ Turkish cities'' Aru (1998) presents a comprehensivecollection of street networks for Turkish cities, from which we have selected thefollowing cities for our analysis: (3)
Adana, Adiyaman, Diyarbakir, Erzurum, Eskisehir, Izmir, Iznik, Kayseri, Konya,Kutahya, Manisa, Sivas, Tokat, and Urfa.
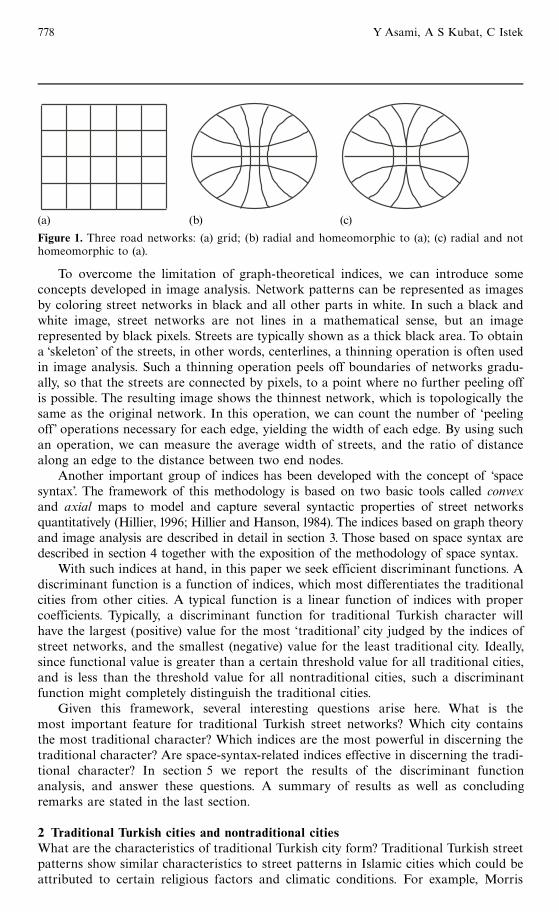
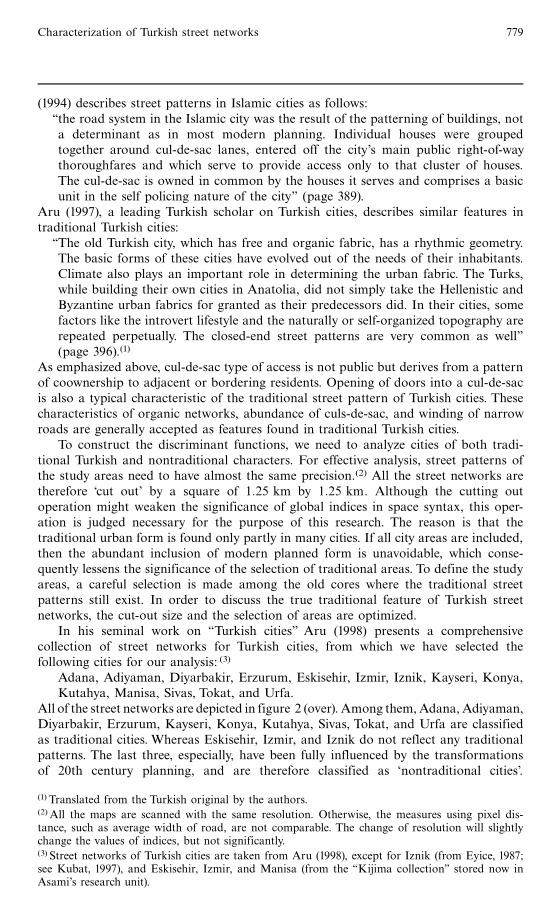
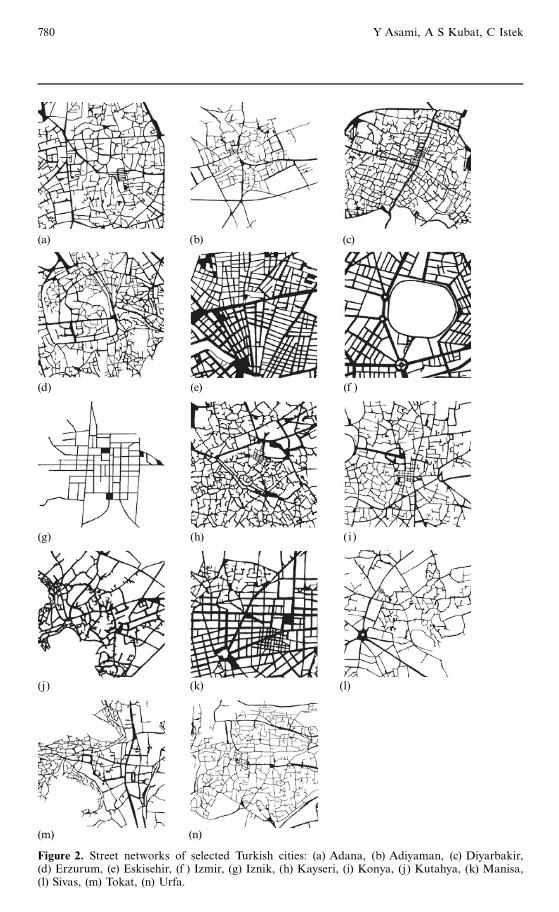
All of the street networks are depicted in figure 2 (over). Among them,Adana, Adiyaman,Diyarbakir, Erzurum, Kayseri, Konya, Kutahya, Sivas, Tokat, and Urfa are classifiedas traditional cities. Whereas Eskisehir, Izmir, and Iznik do not reflect any traditionalpatterns. The last three, especially, have been fully influenced by the transformationsof 20th century planning, and are therefore classified as `nontraditional cities'.
(1) Translated from the Turkish original by the authors.(2) All the maps are scanned with the same resolution. Otherwise, the measures using pixel dis-tance, such as average width of road, are not comparable. The change of resolution will slightlychange the values of indices, but not significantly.(3) Street networks of Turkish cities are taken from Aru (1998), except for Iznik (from Eyice, 1987;see Kubat, 1997), and Eskisehir, Izmir, and Manisa (from the `̀ Kijima collection'' stored now inAsami's research unit).
Characterization of Turkish street networks 779
(a) (b) (c)
(d) (e) (f )
(g) (h) (i)
(j) (k) (l)
(m) (n)
Figure 2. Street networks of selected Turkish cities: (a) Adana, (b) Adiyaman, (c) Diyarbakir,(d) Erzurum, (e) Eskisehir, (f ) Izmir, (g) Iznik, (h) Kayseri, (i) Konya, (j) Kutahya, (k) Manisa,(l) Sivas, (m) Tokat, (n) Urfa.
780 Y Asami, A S Kubat, C Istek
(a) (b) (c)
(d) (e) (f )
(g) (h) (i)
(j) (k) (l)
(m) (n) (o)
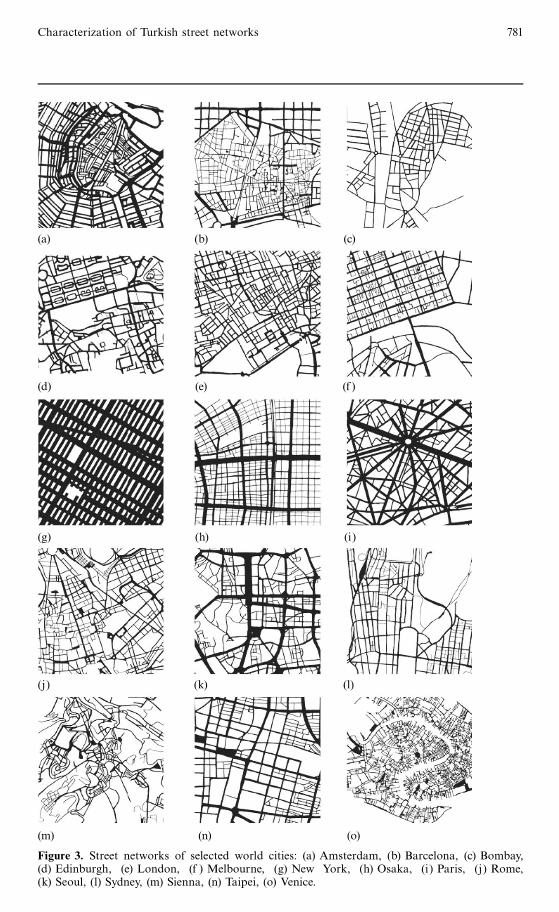
Figure 3. Street networks of selected world cities: (a) Amsterdam, (b) Barcelona, (c) Bombay,(d) Edinburgh, (e) London, (f ) Melbourne, (g) New York, (h) Osaka, (i) Paris, (j) Rome,(k) Seoul, (l) Sydney, (m) Sienna, (n) Taipei, (o) Venice.
Characterization of Turkish street networks 781
Finally, Manisa cannot be classified into either of the two categories, and is left as`nonclassified', eventually being classified by the resulting discriminant functions.
For comparison purposes, cities outside of Turkey are also included. For this wehave utilized the street networks of the following cities from a study by Asami et al(1999): (4)
Amsterdam, Barcelona, Bombay, Edinburgh, London, Melbourne, New York,Osaka, Paris, Rome, Seoul, Sienna, Sydney, Taipei, and Venice.
These street networks are depicted in figure 3. All cities in this category are classifiedas `nontraditional cities'. For the purpose of this paper, `traditional' will refer to `tradi-tional Turkish', and hence a traditional city outside of Turkey will be classified as a`nontraditional city'.
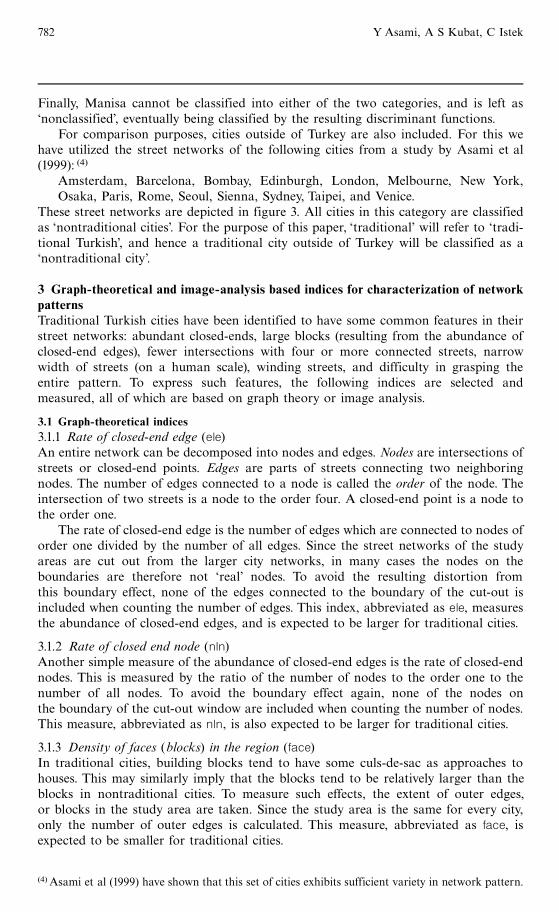
3 Graph-theoretical and image-analysis based indices for characterization of networkpatternsTraditional Turkish cities have been identified to have some common features in theirstreet networks: abundant closed-ends, large blocks (resulting from the abundance ofclosed-end edges), fewer intersections with four or more connected streets, narrowwidth of streets (on a human scale), winding streets, and difficulty in grasping theentire pattern. To express such features, the following indices are selected andmeasured, all of which are based on graph theory or image analysis.
3.1 Graph-theoretical indices3.1.1 Rate of closed-end edge (ele)An entire network can be decomposed into nodes and edges. Nodes are intersections ofstreets or closed-end points. Edges are parts of streets connecting two neighboringnodes. The number of edges connected to a node is called the order of the node. Theintersection of two streets is a node to the order four. A closed-end point is a node tothe order one.
The rate of closed-end edge is the number of edges which are connected to nodes oforder one divided by the number of all edges. Since the street networks of the studyareas are cut out from the larger city networks, in many cases the nodes on theboundaries are therefore not `real' nodes. To avoid the resulting distortion fromthis boundary effect, none of the edges connected to the boundary of the cut-out isincluded when counting the number of edges. This index, abbreviated as ele, measuresthe abundance of closed-end edges, and is expected to be larger for traditional cities.
3.1.2 Rate of closed end node (nln)Another simple measure of the abundance of closed-end edges is the rate of closed-endnodes. This is measured by the ratio of the number of nodes to the order one to thenumber of all nodes. To avoid the boundary effect again, none of the nodes onthe boundary of the cut-out window are included when counting the number of nodes.This measure, abbreviated as nln, is also expected to be larger for traditional cities.
3.1.3 Density of faces (blocks) in the region (face)In traditional cities, building blocks tend to have some culs-de-sac as approaches tohouses. This may similarly imply that the blocks tend to be relatively larger than theblocks in nontraditional cities. To measure such effects, the extent of outer edges,or blocks in the study area are taken. Since the study area is the same for every city,only the number of outer edges is calculated. This measure, abbreviated as face, isexpected to be smaller for traditional cities.
(4) Asami et al (1999) have shown that this set of cities exhibits sufficient variety in network pattern.
782 Y Asami, A S Kubat, C Istek
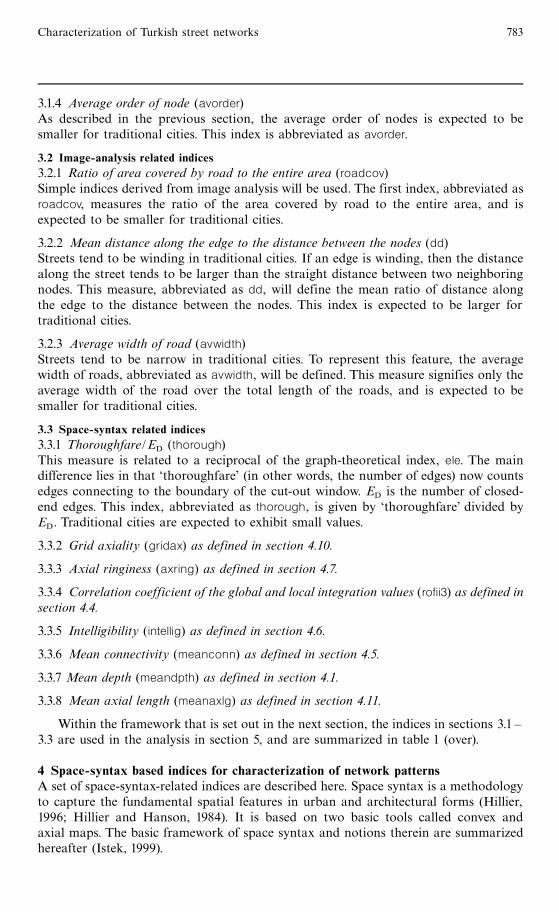
3.1.4 Average order of node (avorder)As described in the previous section, the average order of nodes is expected to besmaller for traditional cities. This index is abbreviated as avorder.
3.2 Image-analysis related indices3.2.1 Ratio of area covered by road to the entire area (roadcov)Simple indices derived from image analysis will be used. The first index, abbreviated asroadcov, measures the ratio of the area covered by road to the entire area, and isexpected to be smaller for traditional cities.
3.2.2 Mean distance along the edge to the distance between the nodes (dd)Streets tend to be winding in traditional cities. If an edge is winding, then the distancealong the street tends to be larger than the straight distance between two neighboringnodes. This measure, abbreviated as dd, will define the mean ratio of distance alongthe edge to the distance between the nodes. This index is expected to be larger fortraditional cities.
3.2.3 Average width of road (avwidth)Streets tend to be narrow in traditional cities. To represent this feature, the averagewidth of roads, abbreviated as avwidth, will be defined. This measure signifies only theaverage width of the road over the total length of the roads, and is expected to besmaller for traditional cities.
3.3 Space-syntax related indices3.3.1 Thoroughfare/ED (thorough)This measure is related to a reciprocal of the graph-theoretical index, ele. The maindifference lies in that `thoroughfare' (in other words, the number of edges) now countsedges connecting to the boundary of the cut-out window. ED is the number of closed-end edges. This index, abbreviated as thorough, is given by `thoroughfare' divided byED. Traditional cities are expected to exhibit small values.
3.3.2 Grid axiality (gridax) as defined in section 4.10.
3.3.3 Axial ringiness (axring) as defined in section 4.7.
3.3.4 Correlation coefficient of the global and local integration values (rofii3) as defined insection 4.4.
3.3.5 Intelligibility (intellig) as defined in section 4.6.
3.3.6 Mean connectivity (meanconn) as defined in section 4.5.
3.3.7 Mean depth (meandpth) as defined in section 4.1.
3.3.8 Mean axial length (meanaxlg) as defined in section 4.11.
Within the framework that is set out in the next section, the indices in sections 3.1 ^3.3 are used in the analysis in section 5, and are summarized in table 1 (over).
4 Space-syntax based indices for characterization of network patternsA set of space-syntax-related indices are described here. Space syntax is a methodologyto capture the fundamental spatial features in urban and architectural forms (Hillier,1996; Hillier and Hanson, 1984). It is based on two basic tools called convex andaxial maps. The basic framework of space syntax and notions therein are summarizedhereafter (Istek, 1999).
Characterization of Turkish street networks 783
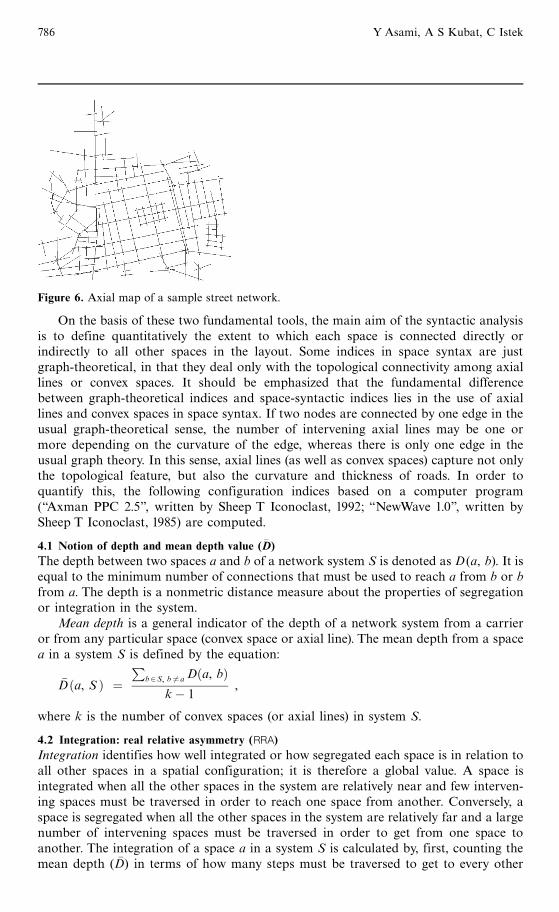
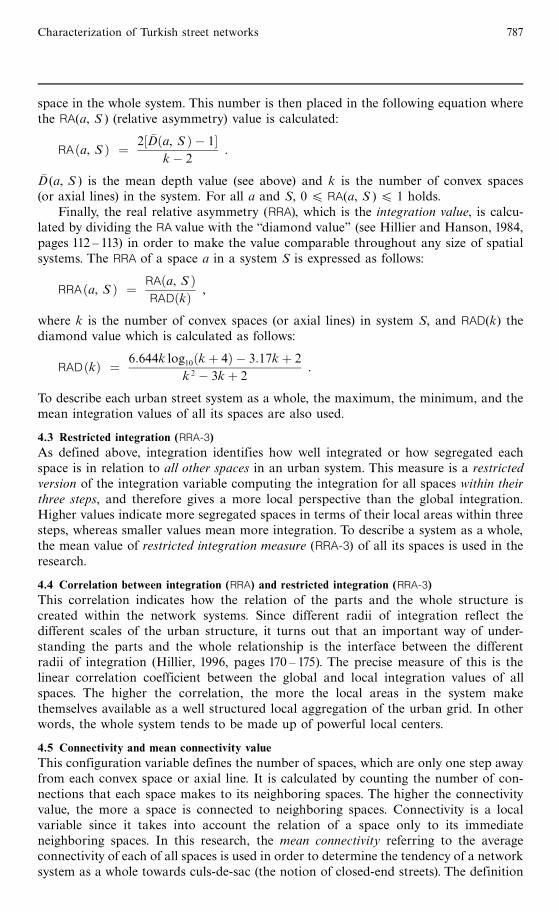
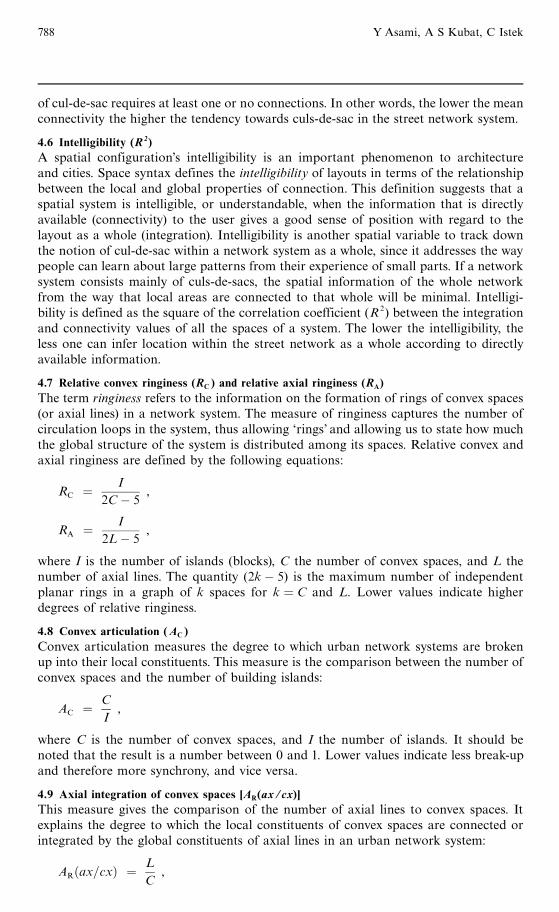
The convex and axial maps are nonoverlapping descriptions of space. Figure 4illustrates the open space structure of a sample street network. On the basis of figure 4,the convex map breaks up the open space structure into two-dimensional extensions ofspaces called convex spaces (figure 5). By definition, the convex spaces identify thelargest and fewest possible segments that can be fully perceived at one time within thelayout of urban street networks. The convex map reveals the `local constituents' sinceeach convex segment has a boundary of its own, and it is defined by every point thathas direct accessibility to every other point in that segment. On the other hand, theaxial map deals with the linear extension of the longest and fewest possible straightlines that cover all the available connections between the convex spaces (figure 5).The axial map (figure 6, over) tries to capture the overall sense of connections that isavailable to a potential observer or passerby who is moving about the street networks,and therefore represents the `global constituents' of the layouts.
As a direct implication of these two analytic modeling tools, the spatial layoutscan be seen in their sense of operating at two different scales at once. Whenever onemoves in the street networks through the convex spaces, the local organization of thespace the person is in is perceived. But, at the same time, the global organization ofthe space is also perceived through the axial lines of longest sight and access.
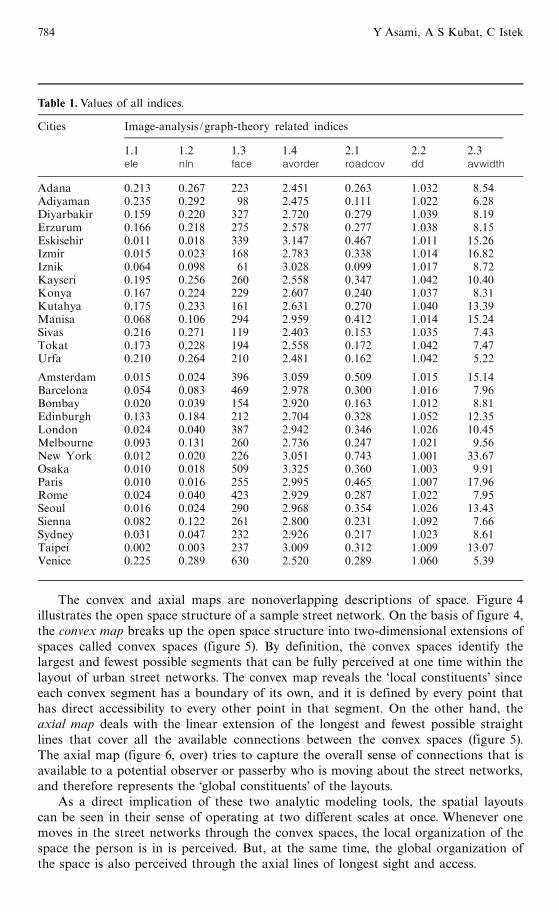
Table 1.Values of all indices.
Cities Image-analysis/graph-theory related indices
1.1 1.2 1.3 1.4 2.1 2.2 2.3ele nln face avorder roadcov dd avwidth
Adana 0.213 0.267 223 2.451 0.263 1.032 8.54Adiyaman 0.235 0.292 98 2.475 0.111 1.022 6.28Diyarbakir 0.159 0.220 327 2.720 0.279 1.039 8.19Erzurum 0.166 0.218 275 2.578 0.277 1.038 8.15Eskisehir 0.011 0.018 339 3.147 0.467 1.011 15.26Izmir 0.015 0.023 168 2.783 0.338 1.014 16.82Iznik 0.064 0.098 61 3.028 0.099 1.017 8.72Kayseri 0.195 0.256 260 2.558 0.347 1.042 10.40Konya 0.167 0.224 229 2.607 0.240 1.037 8.31Kutahya 0.175 0.233 161 2.631 0.270 1.040 13.39Manisa 0.068 0.106 294 2.959 0.412 1.014 15.24Sivas 0.216 0.271 119 2.403 0.153 1.035 7.43Tokat 0.173 0.228 194 2.558 0.172 1.042 7.47Urfa 0.210 0.264 210 2.481 0.162 1.042 5.22
Amsterdam 0.015 0.024 396 3.059 0.509 1.015 15.14Barcelona 0.054 0.083 469 2.978 0.300 1.016 7.96Bombay 0.020 0.039 154 2.920 0.163 1.012 8.81Edinburgh 0.133 0.184 212 2.704 0.328 1.052 12.35London 0.024 0.040 387 2.942 0.346 1.026 10.45Melbourne 0.093 0.131 260 2.736 0.247 1.021 9.56New York 0.012 0.020 226 3.051 0.743 1.001 33.67Osaka 0.010 0.018 509 3.325 0.360 1.003 9.91Paris 0.010 0.016 255 2.995 0.465 1.007 17.96Rome 0.024 0.040 423 2.929 0.287 1.022 7.95Seoul 0.016 0.024 290 2.968 0.354 1.026 13.43Sienna 0.082 0.122 261 2.800 0.231 1.092 7.66Sydney 0.031 0.047 232 2.926 0.217 1.023 8.61Taipei 0.002 0.003 237 3.009 0.312 1.009 13.07Venice 0.225 0.289 630 2.520 0.289 1.060 5.39
784 Y Asami, A S Kubat, C Istek
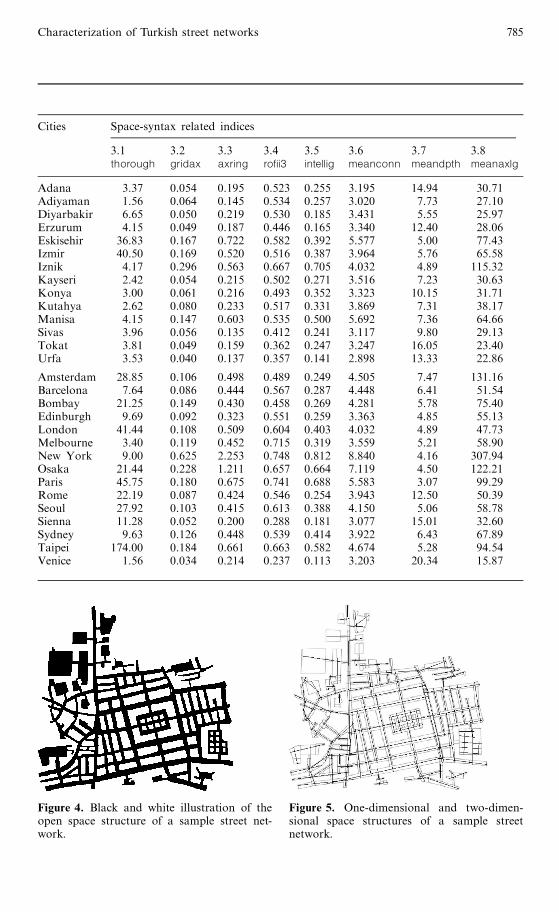
Cities Space-syntax related indices
3.1 3.2 3.3 3.4 3.5 3.6 3.7 3.8thorough gridax axring rofii3 intellig meanconn meandpth meanaxlg
Adana 3.37 0.054 0.195 0.523 0.255 3.195 14.94 30.71Adiyaman 1.56 0.064 0.145 0.534 0.257 3.020 7.73 27.10Diyarbakir 6.65 0.050 0.219 0.530 0.185 3.431 5.55 25.97Erzurum 4.15 0.049 0.187 0.446 0.165 3.340 12.40 28.06Eskisehir 36.83 0.167 0.722 0.582 0.392 5.577 5.00 77.43Izmir 40.50 0.169 0.520 0.516 0.387 3.964 5.76 65.58Iznik 4.17 0.296 0.563 0.667 0.705 4.032 4.89 115.32Kayseri 2.42 0.054 0.215 0.502 0.271 3.516 7.23 30.63Konya 3.00 0.061 0.216 0.493 0.352 3.323 10.15 31.71Kutahya 2.62 0.080 0.233 0.517 0.331 3.869 7.31 38.17Manisa 4.15 0.147 0.603 0.535 0.500 5.692 7.36 64.66Sivas 3.96 0.056 0.135 0.412 0.241 3.117 9.80 29.13Tokat 3.81 0.049 0.159 0.362 0.247 3.247 16.05 23.40Urfa 3.53 0.040 0.137 0.357 0.141 2.898 13.33 22.86
Amsterdam 28.85 0.106 0.498 0.489 0.249 4.505 7.47 131.16Barcelona 7.64 0.086 0.444 0.567 0.287 4.448 6.41 51.54Bombay 21.25 0.149 0.430 0.458 0.269 4.281 5.78 75.40Edinburgh 9.69 0.092 0.323 0.551 0.259 3.363 4.85 55.13London 41.44 0.108 0.509 0.604 0.403 4.032 4.89 47.73Melbourne 3.40 0.119 0.452 0.715 0.319 3.559 5.21 58.90New York 9.00 0.625 2.253 0.748 0.812 8.840 4.16 307.94Osaka 21.44 0.228 1.211 0.657 0.664 7.119 4.50 122.21Paris 45.75 0.180 0.675 0.741 0.688 5.583 3.07 99.29Rome 22.19 0.087 0.424 0.546 0.254 3.943 12.50 50.39Seoul 27.92 0.103 0.415 0.613 0.388 4.150 5.06 58.78Sienna 11.28 0.052 0.200 0.288 0.181 3.077 15.01 32.60Sydney 9.63 0.126 0.448 0.539 0.414 3.922 6.43 67.89Taipei 174.00 0.184 0.661 0.663 0.582 4.674 5.28 94.54Venice 1.56 0.034 0.214 0.237 0.113 3.203 20.34 15.87
Figure 4. Black and white illustration of theopen space structure of a sample street net-work.
Figure 5. One-dimensional and two-dimen-sional space structures of a sample streetnetwork.
Characterization of Turkish street networks 785
On the basis of these two fundamental tools, the main aim of the syntactic analysisis to define quantitatively the extent to which each space is connected directly orindirectly to all other spaces in the layout. Some indices in space syntax are justgraph-theoretical, in that they deal only with the topological connectivity among axiallines or convex spaces. It should be emphasized that the fundamental differencebetween graph-theoretical indices and space-syntactic indices lies in the use of axiallines and convex spaces in space syntax. If two nodes are connected by one edge in theusual graph-theoretical sense, the number of intervening axial lines may be one ormore depending on the curvature of the edge, whereas there is only one edge in theusual graph theory. In this sense, axial lines (as well as convex spaces) capture not onlythe topological feature, but also the curvature and thickness of roads. In order toquantify this, the following configuration indices based on a computer program(`̀Axman PPC 2.5'', written by Sheep T Iconoclast, 1992; `̀ NewWave 1.0'', written bySheep T Iconoclast, 1985) are computed.
4.1 Notion of depth and mean depth value ( �D)The depth between two spaces a and b of a network system S is denoted as D(a, b). It isequal to the minimum number of connections that must be used to reach a from b or bfrom a. The depth is a nonmetric distance measure about the properties of segregationor integration in the system.
Mean depth is a general indicator of the depth of a network system from a carrieror from any particular space (convex space or axial line). The mean depth from a spacea in a system S is defined by the equation:
�D�a, S � �P
b2S b 6� a D�a, b�kÿ 1
,
where k is the number of convex spaces (or axial lines) in system S.
4.2 Integration: real relative asymmetry (RRA)Integration identifies how well integrated or how segregated each space is in relation toall other spaces in a spatial configuration; it is therefore a global value. A space isintegrated when all the other spaces in the system are relatively near and few interven-ing spaces must be traversed in order to reach one space from another. Conversely, aspace is segregated when all the other spaces in the system are relatively far and a largenumber of intervening spaces must be traversed in order to get from one space toanother. The integration of a space a in a system S is calculated by, first, counting themean depth ( �D) in terms of how many steps must be traversed to get to every other
,
Figure 6. Axial map of a sample street network.
786 Y Asami, A S Kubat, C Istek
space in the whole system. This number is then placed in the following equation wherethe RA(a, S ) (relative asymmetry) value is calculated:
RA�a, S � � 2� �D�a, S � ÿ 1�kÿ 2
.
�D(a, S ) is the mean depth value (see above) and k is the number of convex spaces(or axial lines) in the system. For all a and S, 0 4 RA(a, S ) 4 1 holds.
Finally, the real relative asymmetry (RRA), which is the integration value, is calcu-lated by dividing the RA value with the ``diamond value'' (see Hillier and Hanson, 1984,pages 112 ^ 113) in order to make the value comparable throughout any size of spatialsystems. The RRA of a space a in a system S is expressed as follows:
RRA�a, S � � RA�a, S �RAD�k� ,
where k is the number of convex spaces (or axial lines) in system S, and RAD(k) thediamond value which is calculated as follows:
RAD�k� � 6:644k log10�k� 4� ÿ 3:17k� 2
k 2 ÿ 3k� 2.
To describe each urban street system as a whole, the maximum, the minimum, and themean integration values of all its spaces are also used.
4.3 Restricted integration (RRA-3)As defined above, integration identifies how well integrated or how segregated eachspace is in relation to all other spaces in an urban system. This measure is a restrictedversion of the integration variable computing the integration for all spaces within theirthree steps, and therefore gives a more local perspective than the global integration.Higher values indicate more segregated spaces in terms of their local areas within threesteps, whereas smaller values mean more integration. To describe a system as a whole,the mean value of restricted integration measure (RRA-3) of all its spaces is used in theresearch.
4.4 Correlation between integration (RRA) and restricted integration (RRA-3)This correlation indicates how the relation of the parts and the whole structure iscreated within the network systems. Since different radii of integration reflect thedifferent scales of the urban structure, it turns out that an important way of under-standing the parts and the whole relationship is the interface between the differentradii of integration (Hillier, 1996, pages 170 ^ 175). The precise measure of this is thelinear correlation coefficient between the global and local integration values of allspaces. The higher the correlation, the more the local areas in the system makethemselves available as a well structured local aggregation of the urban grid. In otherwords, the whole system tends to be made up of powerful local centers.
4.5 Connectivity and mean connectivity valueThis configuration variable defines the number of spaces, which are only one step awayfrom each convex space or axial line. It is calculated by counting the number of con-nections that each space makes to its neighboring spaces. The higher the connectivityvalue, the more a space is connected to neighboring spaces. Connectivity is a localvariable since it takes into account the relation of a space only to its immediateneighboring spaces. In this research, the mean connectivity referring to the averageconnectivity of each of all spaces is used in order to determine the tendency of a networksystem as a whole towards culs-de-sac (the notion of closed-end streets). The definition
Characterization of Turkish street networks 787
of cul-de-sac requires at least one or no connections. In other words, the lower the meanconnectivity the higher the tendency towards culs-de-sac in the street network system.
4.6 Intelligibility (R2)A spatial configuration's intelligibility is an important phenomenon to architectureand cities. Space syntax defines the intelligibility of layouts in terms of the relationshipbetween the local and global properties of connection. This definition suggests that aspatial system is intelligible, or understandable, when the information that is directlyavailable (connectivity) to the user gives a good sense of position with regard to thelayout as a whole (integration). Intelligibility is another spatial variable to track downthe notion of cul-de-sac within a network system as a whole, since it addresses the waypeople can learn about large patterns from their experience of small parts. If a networksystem consists mainly of culs-de-sacs, the spatial information of the whole networkfrom the way that local areas are connected to that whole will be minimal. Intelligi-bility is defined as the square of the correlation coefficient (R 2) between the integrationand connectivity values of all the spaces of a system. The lower the intelligibility, theless one can infer location within the street network as a whole according to directlyavailable information.
4.7 Relative convex ringiness (RC ) and relative axial ringiness (RA)The term ringiness refers to the information on the formation of rings of convex spaces(or axial lines) in a network system. The measure of ringiness captures the number ofcirculation loops in the system, thus allowing `rings' and allowing us to state how muchthe global structure of the system is distributed among its spaces. Relative convex andaxial ringiness are defined by the following equations:
RC �I
2Cÿ 5,
RA �I
2Lÿ 5,
where I is the number of islands (blocks), C the number of convex spaces, and L thenumber of axial lines. The quantity (2kÿ 5) is the maximum number of independentplanar rings in a graph of k spaces for k � C and L. Lower values indicate higherdegrees of relative ringiness.
4.8 Convex articulation (AC )Convex articulation measures the degree to which urban network systems are brokenup into their local constituents. This measure is the comparison between the number ofconvex spaces and the number of building islands:
AC �C
I,
where C is the number of convex spaces, and I the number of islands. It should benoted that the result is a number between 0 and 1. Lower values indicate less break-upand therefore more synchrony, and vice versa.
4.9 Axial integration of convex spaces [AR(ax /cx)]This measure gives the comparison of the number of axial lines to convex spaces. Itexplains the degree to which the local constituents of convex spaces are connected orintegrated by the global constituents of axial lines in an urban network system:
AR�ax=cx� �L
C,
788 Y Asami, A S Kubat, C Istek
where C is the number of convex spaces, and L the number of axial lines crossing allconvex spaces. Lower values indicate a high degree of axial integration of convexspaces. It should be noted that the result is a number between 0 and 1.
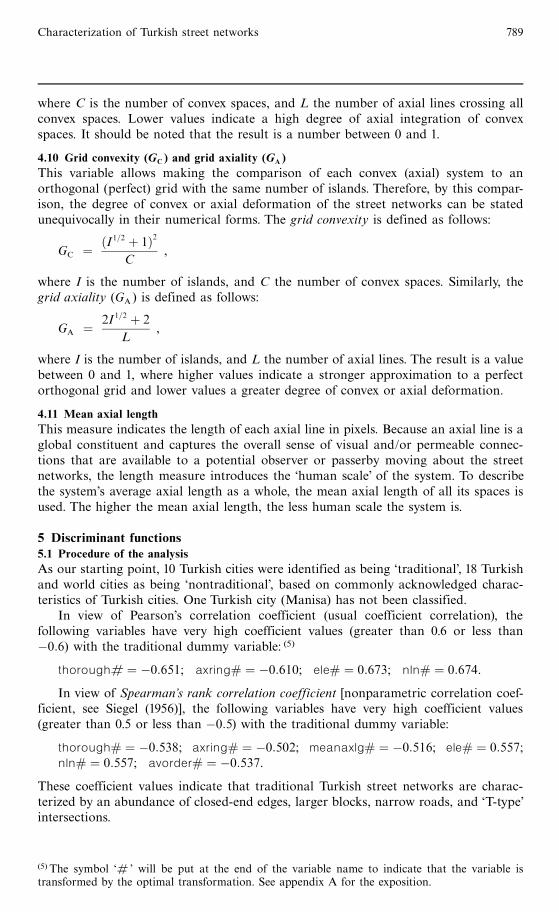
4.10 Grid convexity (GC ) and grid axiality (GA )This variable allows making the comparison of each convex (axial) system to anorthogonal (perfect) grid with the same number of islands. Therefore, by this compar-ison, the degree of convex or axial deformation of the street networks can be statedunequivocally in their numerical forms. The grid convexity is defined as follows:
GC ��I 1=2 � 1�2
C,
where I is the number of islands, and C the number of convex spaces. Similarly, thegrid axiality (GA ) is defined as follows:
GA �2I 1=2 � 2
L,
where I is the number of islands, and L the number of axial lines. The result is a valuebetween 0 and 1, where higher values indicate a stronger approximation to a perfectorthogonal grid and lower values a greater degree of convex or axial deformation.
4.11 Mean axial lengthThis measure indicates the length of each axial line in pixels. Because an axial line is aglobal constituent and captures the overall sense of visual and/or permeable connec-tions that are available to a potential observer or passerby moving about the streetnetworks, the length measure introduces the `human scale' of the system. To describethe system's average axial length as a whole, the mean axial length of all its spaces isused. The higher the mean axial length, the less human scale the system is.
5 Discriminant functions5.1 Procedure of the analysisAs our starting point, 10 Turkish cities were identified as being `traditional', 18 Turkishand world cities as being `nontraditional', based on commonly acknowledged charac-teristics of Turkish cities. One Turkish city (Manisa) has not been classified.
In view of Pearson's correlation coefficient (usual coefficient correlation), thefollowing variables have very high coefficient values (greater than 0.6 or less thanÿ0:6) with the traditional dummy variable: (5)
thorough# � ÿ0:651; axring# � ÿ0:610; ele# � 0:673; nln# � 0:674.
In view of Spearman's rank correlation coefficient [nonparametric correlation coef-ficient, see Siegel (1956)], the following variables have very high coefficient values(greater than 0.5 or less than ÿ0:5) with the traditional dummy variable:
thorough# � ÿ0:538; axring# � ÿ0:502; meanaxlg# � ÿ0:516; ele# � 0:557;nln# � 0:557; avorder# � ÿ0:537.
These coefficient values indicate that traditional Turkish street networks are charac-terized by an abundance of closed-end edges, larger blocks, narrow roads, and `T-type'intersections.
(5) The symbol `# ' will be put at the end of the variable name to indicate that the variable istransformed by the optimal transformation. See appendix A for the exposition.
Characterization of Turkish street networks 789
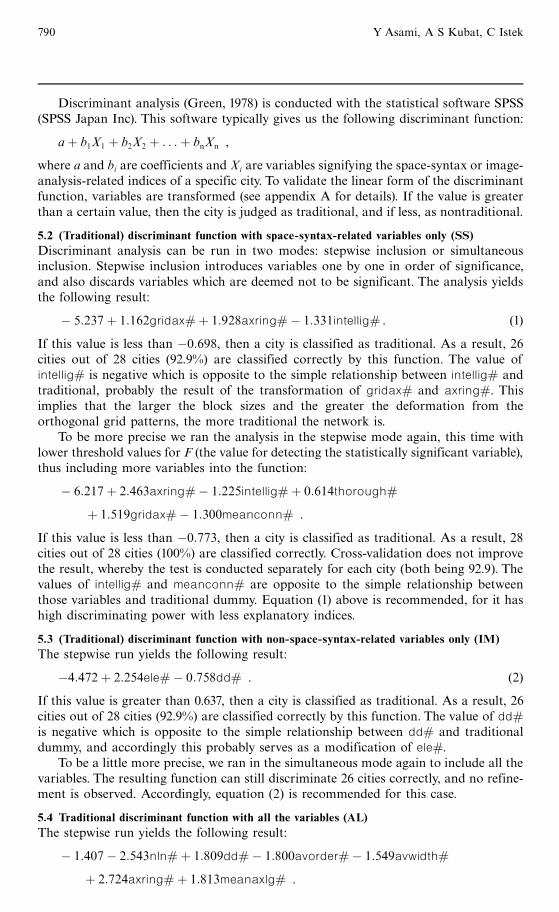
Discriminant analysis (Green, 1978) is conducted with the statistical software SPSS(SPSS Japan Inc). This software typically gives us the following discriminant function:
a� b1X1 � b2X2 � . . .� bnXn ,
where a and bi are coefficients and Xi are variables signifying the space-syntax or image-analysis-related indices of a specific city. To validate the linear form of the discriminantfunction, variables are transformed (see appendix A for details). If the value is greaterthan a certain value, then the city is judged as traditional, and if less, as nontraditional.
5.2 (Traditional) discriminant function with space-syntax-related variables only (SS)Discriminant analysis can be run in two modes: stepwise inclusion or simultaneousinclusion. Stepwise inclusion introduces variables one by one in order of significance,and also discards variables which are deemed not to be significant. The analysis yieldsthe following result:
ÿ 5:237� 1:162gridax#� 1:928axring#ÿ 1:331intellig# . (1)
If this value is less than ÿ0:698, then a city is classified as traditional. As a result, 26cities out of 28 cities (92.9%) are classified correctly by this function. The value ofintellig# is negative which is opposite to the simple relationship between intellig# andtraditional, probably the result of the transformation of gridax# and axring#. Thisimplies that the larger the block sizes and the greater the deformation from theorthogonal grid patterns, the more traditional the network is.
To be more precise we ran the analysis in the stepwise mode again, this time withlower threshold values for F (the value for detecting the statistically significant variable),thus including more variables into the function:
ÿ 6:217� 2:463axring#ÿ 1:225intellig#� 0:614thorough#
� 1:519gridax#ÿ 1:300meanconn# .
If this value is less than ÿ0:773, then a city is classified as traditional. As a result, 28cities out of 28 cities (100%) are classified correctly. Cross-validation does not improvethe result, whereby the test is conducted separately for each city (both being 92.9). Thevalues of intellig# and meanconn# are opposite to the simple relationship betweenthose variables and traditional dummy. Equation (1) above is recommended, for it hashigh discriminating power with less explanatory indices.
5.3 (Traditional) discriminant function with non-space-syntax-related variables only (IM)The stepwise run yields the following result:
ÿ4:472� 2:254ele#ÿ 0:758dd# . (2)
If this value is greater than 0.637, then a city is classified as traditional. As a result, 26cities out of 28 cities (92.9%) are classified correctly by this function. The value of dd#is negative which is opposite to the simple relationship between dd# and traditionaldummy, and accordingly this probably serves as a modification of ele#.
To be a little more precise, we ran in the simultaneous mode again to include all thevariables. The resulting function can still discriminate 26 cities correctly, and no refine-ment is observed. Accordingly, equation (2) is recommended for this case.
5.4 Traditional discriminant function with all the variables (AL)The stepwise run yields the following result:
ÿ 1:407ÿ 2:543nln#� 1:809dd#ÿ 1:800avorder#ÿ 1:549avwidth#
� 2:724axring#� 1:813meanaxlg# .
790 Y Asami, A S Kubat, C Istek
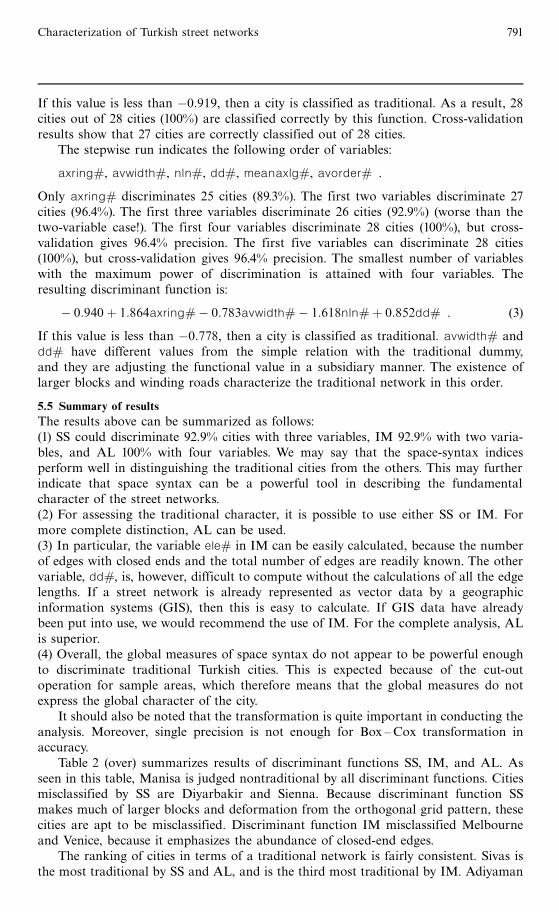
If this value is less than ÿ0:919, then a city is classified as traditional. As a result, 28cities out of 28 cities (100%) are classified correctly by this function. Cross-validationresults show that 27 cities are correctly classified out of 28 cities.
The stepwise run indicates the following order of variables:
axring#, avwidth#, nln#, dd#, meanaxlg#, avorder# .
Only axring# discriminates 25 cities (89.3%). The first two variables discriminate 27cities (96.4%). The first three variables discriminate 26 cities (92.9%) (worse than thetwo-variable case!). The first four variables discriminate 28 cities (100%), but cross-validation gives 96.4% precision. The first five variables can discriminate 28 cities(100%), but cross-validation gives 96.4% precision. The smallest number of variableswith the maximum power of discrimination is attained with four variables. Theresulting discriminant function is:
ÿ 0:940� 1:864axring#ÿ 0:783avwidth#ÿ 1:618nln#� 0:852dd# . (3)
If this value is less than ÿ0:778, then a city is classified as traditional. avwidth# anddd# have different values from the simple relation with the traditional dummy,and they are adjusting the functional value in a subsidiary manner. The existence oflarger blocks and winding roads characterize the traditional network in this order.
5.5 Summary of resultsThe results above can be summarized as follows:(1) SS could discriminate 92.9% cities with three variables, IM 92.9% with two varia-bles, and AL 100% with four variables. We may say that the space-syntax indicesperform well in distinguishing the traditional cities from the others. This may furtherindicate that space syntax can be a powerful tool in describing the fundamentalcharacter of the street networks.(2) For assessing the traditional character, it is possible to use either SS or IM. Formore complete distinction, AL can be used.(3) In particular, the variable ele# in IM can be easily calculated, because the numberof edges with closed ends and the total number of edges are readily known. The othervariable, dd#, is, however, difficult to compute without the calculations of all the edgelengths. If a street network is already represented as vector data by a geographicinformation systems (GIS), then this is easy to calculate. If GIS data have alreadybeen put into use, we would recommend the use of IM. For the complete analysis, ALis superior.(4) Overall, the global measures of space syntax do not appear to be powerful enoughto discriminate traditional Turkish cities. This is expected because of the cut-outoperation for sample areas, which therefore means that the global measures do notexpress the global character of the city.
It should also be noted that the transformation is quite important in conducting theanalysis. Moreover, single precision is not enough for Box ^Cox transformation inaccuracy.
Table 2 (over) summarizes results of discriminant functions SS, IM, and AL. Asseen in this table, Manisa is judged nontraditional by all discriminant functions. Citiesmisclassified by SS are Diyarbakir and Sienna. Because discriminant function SSmakes much of larger blocks and deformation from the orthogonal grid pattern, thesecities are apt to be misclassified. Discriminant function IM misclassified Melbourneand Venice, because it emphasizes the abundance of closed-end edges.
The ranking of cities in terms of a traditional network is fairly consistent. Sivas isthe most traditional by SS and AL, and is the third most traditional by IM. Adiyaman
Characterization of Turkish street networks 791
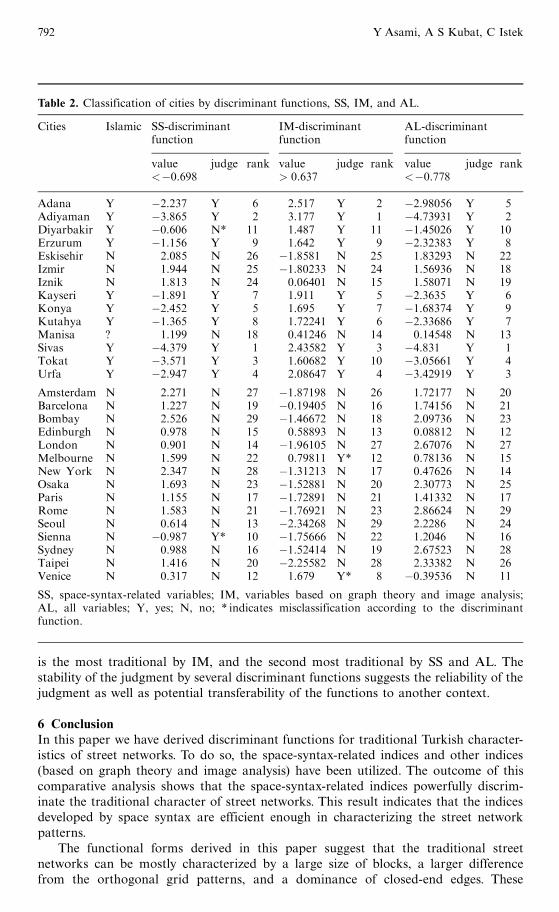
is the most traditional by IM, and the second most traditional by SS and AL. Thestability of the judgment by several discriminant functions suggests the reliability of thejudgment as well as potential transferability of the functions to another context.
6 ConclusionIn this paper we have derived discriminant functions for traditional Turkish character-istics of street networks. To do so, the space-syntax-related indices and other indices(based on graph theory and image analysis) have been utilized. The outcome of thiscomparative analysis shows that the space-syntax-related indices powerfully discrim-inate the traditional character of street networks. This result indicates that the indicesdeveloped by space syntax are efficient enough in characterizing the street networkpatterns.
The functional forms derived in this paper suggest that the traditional streetnetworks can be mostly characterized by a large size of blocks, a larger differencefrom the orthogonal grid patterns, and a dominance of closed-end edges. These
Table 2. Classification of cities by discriminant functions, SS, IM, and AL.
Cities Islamic SS-discriminant IM-discriminant AL-discriminantfunction function function
value judge rank value judge rank value judge rank<ÿ0.698 > 0.637 <ÿ0.778
Adana Y ÿ2.237 Y 6 2.517 Y 2 ÿ2.98056 Y 5Adiyaman Y ÿ3.865 Y 2 3.177 Y 1 ÿ4.73931 Y 2Diyarbakir Y ÿ0.606 N* 11 1.487 Y 11 ÿ1.45026 Y 10Erzurum Y ÿ1.156 Y 9 1.642 Y 9 ÿ2.32383 Y 8Eskisehir N 2.085 N 26 ÿ1.8581 N 25 1.83293 N 22Izmir N 1.944 N 25 ÿ1.80233 N 24 1.56936 N 18Iznik N 1.813 N 24 0.06401 N 15 1.58071 N 19Kayseri Y ÿ1.891 Y 7 1.911 Y 5 ÿ2.3635 Y 6Konya Y ÿ2.452 Y 5 1.695 Y 7 ÿ1.68374 Y 9Kutahya Y ÿ1.365 Y 8 1.72241 Y 6 ÿ2.33686 Y 7Manisa ? 1.199 N 18 0.41246 N 14 0.14548 N 13Sivas Y ÿ4.379 Y 1 2.43582 Y 3 ÿ4.831 Y 1Tokat Y ÿ3.571 Y 3 1.60682 Y 10 ÿ3.05661 Y 4Urfa Y ÿ2.947 Y 4 2.08647 Y 4 ÿ3.42919 Y 3
Amsterdam N 2.271 N 27 ÿ1.87198 N 26 1.72177 N 20Barcelona N 1.227 N 19 ÿ0.19405 N 16 1.74156 N 21Bombay N 2.526 N 29 ÿ1.46672 N 18 2.09736 N 23Edinburgh N 0.978 N 15 0.58893 N 13 0.08812 N 12London N 0.901 N 14 ÿ1.96105 N 27 2.67076 N 27Melbourne N 1.599 N 22 0.79811 Y* 12 0.78136 N 15New York N 2.347 N 28 ÿ1.31213 N 17 0.47626 N 14Osaka N 1.693 N 23 ÿ1.52881 N 20 2.30773 N 25Paris N 1.155 N 17 ÿ1.72891 N 21 1.41332 N 17Rome N 1.583 N 21 ÿ1.76921 N 23 2.86624 N 29Seoul N 0.614 N 13 ÿ2.34268 N 29 2.2286 N 24Sienna N ÿ0.987 Y* 10 ÿ1.75666 N 22 1.2046 N 16Sydney N 0.988 N 16 ÿ1.52414 N 19 2.67523 N 28Taipei N 1.416 N 20 ÿ2.25582 N 28 2.33382 N 26Venice N 0.317 N 12 1.679 Y* 8 ÿ0.39536 N 11
SS, space-syntax-related variables; IM, variables based on graph theory and image analysis;AL, all variables; Y, yes; N, no; * indicates misclassification according to the discriminantfunction.
792 Y Asami, A S Kubat, C Istek
features are frequently referred to in specific studies on Turkish and Islamic urbanform. The significance of this study is not only the quantitative confirmation ofwell-acknowledged features, but also their ordering through discriminant functions.
The transferability of these results should be tested against a broader set of net-works by applying the discriminant functions. Moreover, the indices calculated hererelate only to the two-dimensional characteristics, and an extension of indices to thethree-dimensional features is seen as necessary. This presents a number of futureresearch directions.
Acknowledgements. Comments by Yuji Arai, Naoko Fukami, Masashi Haneda, Eugenia Kermeli,Nilufer Narli, Kiyoaki Oikawa, Aylin Orbasli, Hidehiko Sazanami, and anonymous referees werevery helpful for refining the paper. This research has been supported by ``Grant-In-Aid'' from theMinistry of Education, Culture, Science and Sports of the Japanese Government, which is grate-fully acknowledged. An earlier version of this paper was presented at the International Conferenceof the Islamic Area Studies Project `̀ Beyond the Border'', 8 ^ 10 October 1999 in Kyoto, Japan.
ReferencesAru K A, 1997, `̀ Conceptions on the general characteristics of Ottoman Turkish cities''Housing
and Settlement in Anatolia (Prime Ministry Housing Development, Administration,Republic of Turkey)
Aru K A, 1998 Turk Kenti: Turk Kent Dokularinin Incelenmesine ve Bugunku Kossullar IcindeDegerlendirilmesine IliskinYontem Arastirmasi [Turkish cities: research on the methodologyand contemporary evaluations of Turkish urban patterns] (Yapi Endustri Merkezi Yayinlari,Istanbul)
Asami Y, Kamiya H, Shimazu T, 1999, `̀ The perceptive similarity of urban road networks''Comprehensive Urban Studies 69 187 ^ 199
Box G E P, Cox D R, 1964, `̀An analysis of transformations'' Journal of Royal Statistical SocietyB 26 211 ^ 252
Eyice S, 1987, `̀ Iznik'' Sanat Arastirmalari Dergisi 1(1) 95 (Istanbul, Turkey)Goodman A C, 1978, `̀ Hedonic prices, price indices and housing market'' Journal of Urban
Economics 5 471 ^ 484Green P E, 1978 Analyzing Multivariate Data (Dryden Press, Hinsdale, IL)Hillier B, 1996 Space is the Machine (Cambridge University Press, Cambridge)Hiller B, Hanson J, 1984 The Social Logic of Space (Cambridge University Press, Cambridge)Istek I C, 1999, `̀ Spatial dynamics of market places'', DP 20, Center for Spatial Information
Science, University of Tokyo, TokyoKansky K J, 1963, `̀ Structure of transportation networks'', research paper 84, Department of
Geography (University of Chicago Press, Chicago, IL)Kubat A S, 1997, ``The morphological characteristics of Anatolian fortified towns'' Environment
and Planning B: Planning and Design 24 95 ^ 123Linneman P, 1981, `̀ The demand for residential site characteristics'' Journal of Urban Economics
9 129 ^ 148Morris A E J, 1994 History of Urban Form: Before the Industrial Revolutions (Longman, Harlow,
Essex)Siegel S, 1956 Nonparametric Statistics for the Behavioral Sciences (McGraw-Hill, NewYork)
Characterization of Turkish street networks 793
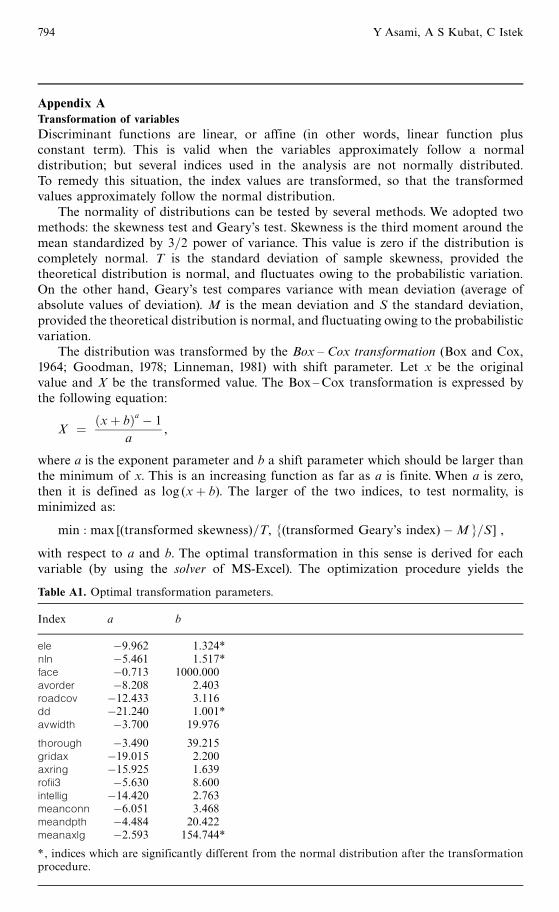
Appendix ATransformation of variablesDiscriminant functions are linear, or affine (in other words, linear function plusconstant term). This is valid when the variables approximately follow a normaldistribution; but several indices used in the analysis are not normally distributed.To remedy this situation, the index values are transformed, so that the transformedvalues approximately follow the normal distribution.
The normality of distributions can be tested by several methods. We adopted twomethods: the skewness test and Geary's test. Skewness is the third moment around themean standardized by 3=2 power of variance. This value is zero if the distribution iscompletely normal. T is the standard deviation of sample skewness, provided thetheoretical distribution is normal, and fluctuates owing to the probabilistic variation.On the other hand, Geary's test compares variance with mean deviation (average ofabsolute values of deviation). M is the mean deviation and S the standard deviation,provided the theoretical distribution is normal, and fluctuating owing to the probabilisticvariation.
The distribution was transformed by the Box ^ Cox transformation (Box and Cox,1964; Goodman, 1978; Linneman, 1981) with shift parameter. Let x be the originalvalue and X be the transformed value. The Box ^Cox transformation is expressed bythe following equation:
X � �x� b�a ÿ 1
a,
where a is the exponent parameter and b a shift parameter which should be larger thanthe minimum of x. This is an increasing function as far as a is finite. When a is zero,then it is defined as log (x� b). The larger of the two indices, to test normality, isminimized as:
min : max [(transformed skewness)=T, {(transformed Geary's index)ÿM }=S ] ,
with respect to a and b. The optimal transformation in this sense is derived for eachvariable (by using the solver of MS-Excel). The optimization procedure yields the
Table A1. Optimal transformation parameters.
Index a b
ele ÿ9.962 1.324*nln ÿ5.461 1.517*face ÿ0.713 1000.000avorder ÿ8.208 2.403roadcov ÿ12.433 3.116dd ÿ21.240 1.001*avwidth ÿ3.700 19.976
thorough ÿ3.490 39.215gridax ÿ19.015 2.200axring ÿ15.925 1.639rofii3 ÿ5.630 8.600intellig ÿ14.420 2.763meanconn ÿ6.051 3.468meandpth ÿ4.484 20.422meanaxlg ÿ2.593 154.744*
*, indices which are significantly different from the normal distribution after the transformationprocedure.
794 Y Asami, A S Kubat, C Istek
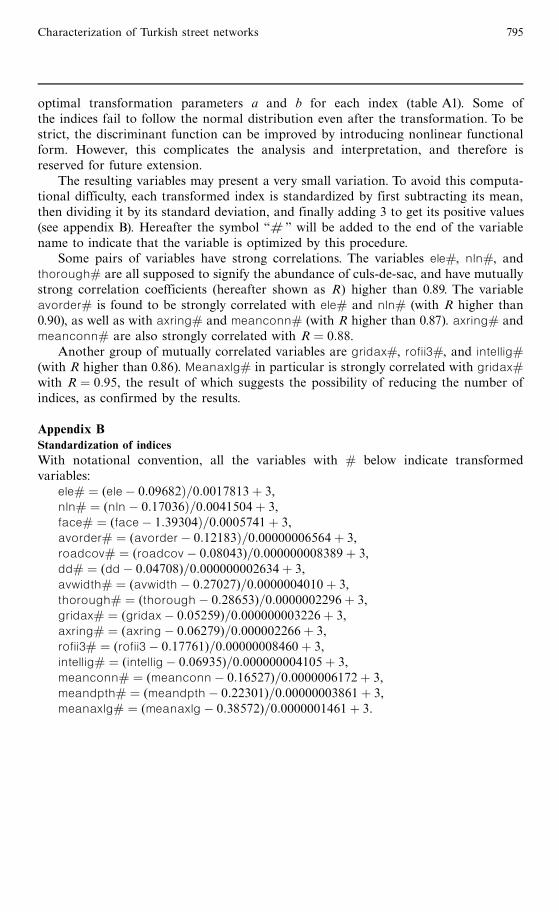
optimal transformation parameters a and b for each index (table A1). Some ofthe indices fail to follow the normal distribution even after the transformation. To bestrict, the discriminant function can be improved by introducing nonlinear functionalform. However, this complicates the analysis and interpretation, and therefore isreserved for future extension.
The resulting variables may present a very small variation. To avoid this computa-tional difficulty, each transformed index is standardized by first subtracting its mean,then dividing it by its standard deviation, and finally adding 3 to get its positive values(see appendix B). Hereafter the symbol `̀ # '' will be added to the end of the variablename to indicate that the variable is optimized by this procedure.
Some pairs of variables have strong correlations. The variables ele#, nln#, andthorough# are all supposed to signify the abundance of culs-de-sac, and have mutuallystrong correlation coefficients (hereafter shown as R) higher than 0.89. The variableavorder# is found to be strongly correlated with ele# and nln# (with R higher than0.90), as well as with axring# and meanconn# (with R higher than 0.87). axring# andmeanconn# are also strongly correlated with R � 0:88.
Another group of mutually correlated variables are gridax#, rofii3#, and intellig#(with R higher than 0.86). Meanaxlg# in particular is strongly correlated with gridax#with R � 0:95, the result of which suggests the possibility of reducing the number ofindices, as confirmed by the results.
Appendix BStandardization of indicesWith notational convention, all the variables with # below indicate transformedvariables:
ele# � (eleÿ 0:09682�=0:0017813� 3,nln# � (nlnÿ 0:17036�=0:0041504� 3,face# � (faceÿ 1:39304�=0:0005741� 3,avorder# � (avorderÿ 0:12183�=0:00000006564� 3,roadcov# � (roadcovÿ 0:08043)=0:000000008389� 3,dd# � (ddÿ 0:04708)=0:000000002634� 3,avwidth# � (avwidthÿ 0:27027)=0:0000004010� 3,thorough# � (thoroughÿ 0:28653)=0:0000002296� 3,gridax# � (gridaxÿ 0:05259)=0:000000003226� 3,axring# � (axringÿ 0:06279)=0:000002266� 3,rofii3# � (rofii3ÿ 0:17761)=0:00000008460� 3,intellig# � (intelligÿ 0:06935)=0:000000004105� 3,meanconn# � (meanconnÿ 0:16527)=0:0000006172� 3,meandpth# � (meandpthÿ 0:22301)=0:00000003861� 3,meanaxlg# � (meanaxlgÿ 0:38572)=0:0000001461� 3.
Characterization of Turkish street networks 795

ß 2001 a Pion publication printed in Great Britain