characteristics of airborne ultrafine and coarse particles during the australian dust storm of 23...
TRANSCRIPT
lable at ScienceDirect
Atmospheric Environment 45 (2011) 3996e4001
Contents lists avai
Atmospheric Environment
journal homepage: www.elsevier .com/locate/atmosenv
Characteristics of airborne ultrafine and coarse particles duringthe Australian dust storm of 23 September 2009
E.R. Jayaratne, G.R. Johnson, P. McGarry, H.C. Cheung, L. Morawska*
International Laboratory for Air Quality and Health, Queensland University of Technology, GPO Box 2434, Brisbane, QLD 4001, Australia
a r t i c l e i n f o
Article history:Received 2 March 2011Received in revised form20 April 2011Accepted 21 April 2011
Keywords:Dust stormParticle concentrationParticle sizeVisibilityAir pollution
* Corresponding author. Tel.: þ61 7 3138 2616; faxE-mail address: [email protected] (L. Moraw
1352-2310/$ e see front matter � 2011 Elsevier Ltd.doi:10.1016/j.atmosenv.2011.04.059
a b s t r a c t
Particle number concentrations and size distributions, visibility and particulate mass concentrations andweather parameters were monitored in Brisbane, Australia, on 23 September 2009, during the passage ofa dust storm that originated 1400 km away in the dry continental interior. The dust concentration peakedat about mid-day when the hourly average PM2.5 and PM10 values reached 814 and 6460 mg m�3,respectively, with a sharp drop in atmospheric visibility. A linear regression analysis showed a goodcorrelation between the coefficient of light scattering by particles (Bsp) and both PM10 and PM2.5. Theparticle number in the size range 0.5e20 mm exhibited a lognormal size distribution with modal andgeometrical mean diameters of 1.6 and 1.9 mm, respectively. The modal mass was around 10 mmwith lessthan 10% of the mass carried by particles smaller than 2.5 mm. The PM10 fraction accounted for about 68%of the total mass. By mid-day, as the dust began to increase sharply, the ultrafine particle numberconcentration fell from about 6 � 103 cm�3 to 3 � 103 cm�3 and then continued to decrease to less than1 � 103 cm�3 by 14 h, showing a power-law decrease with Bsp with an R2 value of 0.77 (p < 0.01).Ultrafine particle size distributions also showed a significant decrease in number during the dust storm.This is the first scientific study of particle size distributions in an Australian dust storm.
� 2011 Elsevier Ltd. All rights reserved.
1. Introduction
Dust storms occur when high winds caused by pressure gradi-ents whip up loose soil over a large area and transport it across theland. When the wind speed reaches a threshold value, sand anddust particles on the surface of the ground begin to vibrate and areejected into the air e a process known as ‘saltation’. The impact ofthese windborne particles on the surface ejects yet more particlesand causes a chain reaction. Ejected sands and dust can be trans-ported by wind to great distances and, in addition to reducedvisibility that affects air and road transport, dust storms cause soilerosion and loss of organic matter and nutrients from the soil(Wang et al., 2006).
From the point of view of human health, people with breathing-related problems, such as asthma and emphysema, have beenknown to experience difficulties during severe dust storms. Leiet al. (2004) demonstrated that particulate matter in an Asiandust storm increased lung inflammation and injury in pulmonaryhypertensive rats. However, other studies have shown that humanmortality rates were not elevated during dust storm days and
: þ61 7 3138 9079.ska).
All rights reserved.
attributed this to the absence of toxicity in crustal particles (Hefflinet al., 1994; Schwartz et al., 1999).
Fine particles in the air are scavenged by larger particles. Thisprocess of coagulation can lead to a shift of average particle size tolarger values, especially when the number concentration of parti-cles is high (Matsoukas and Friedlander,1991). Urban environmentsare dominated by particles from motor vehicle exhaust, with thelarge majority of them being in the ultrafine size range, that issmaller than 0.1 mm (Shi et al., 1999). A detailed account of thecharacteristics of ultrafine particles in urban environments may befound in the two recent reviews by Morawska et al. (2008) andKumar et al. (2010). Thus, the passage of a dust storm across amajorcity offers an ideal opportunity to investigate the coagulationprocess between two distinctly different particle size groups in theoutdoor environment.
Air quality monitoring stations routinely measure particulatemass in accordancewith the respective national ambient air qualitystandard requirements and normally record this quantity as PM10or PM2.5 e the mass concentration of particles smaller than 10 mmor 2.5 mm, respectively. This has enabled a considerable amount ofresearch addressing particle mass concentrations during thepassage of dust storms. For example, Zhang et al. (2006) monitoredparticles in the 20 March 2002 dust storm in Beijing, China, andshowed that the peak total suspended particle concentration

E.R. Jayaratne et al. / Atmospheric Environment 45 (2011) 3996e4001 3997
reached 12,000 mg m�3 while the mass concentrations of coarseparticles accounted for 91% of the total, compared to 61% on non-dust storm days. Choi and Choi (2008) measured particulate massconcentrations at the ground during a dust storm in Kangnung,Korea on 8 March 2004 and showed that PM10 concentrationsreached 340 mgm�3. They also found thatmost of the particles werein the range between PM2.5 and PM10. Several other studies haveconfirmed that the average particle size in a dust storm occur in thesize range 2e6 mm (Abdulla et al., 1988; Mikami et al., 2005;Kobayashi et al., 2007). Wang et al. (2008) used aircraft measure-ments during the 2006 dust storms over the coastal areas inNorthern China and reported that number concentrations ofultrafine particles exceeded 105 cm�3. While, data on particlenumber distributions in dust storms is sparse, measurements ofultrafine particles during dust storm episodes are highly limited.
The continental interior of Australia is a major global sourceregion for atmospheric dust. However, unlike dust and sand stormsthat occur regularly in many parts of the world such as in NorthernChina and the Sahara, Australian dust storms require a specificsequence of environmental conditions. During heavy rain episodes,flood waters from Queensland flow south and deposit large quan-tities of fluvial sediments over a large area of the continentalinterior in and around the Lake Eyre Basin (see map in Fig. 1). Suchintense flood events followed by prolonged drought conditions canthen lead to a significant erosion of alluvial dust with the onset ofstrong winds that generally occur around SeptembereNovember(Mitchell et al., 2010). In contrast to the composition of dust inother parts of the world, Australian desert dust is particularly richin iron which gives it its typical reddish hue, while halites from drysalt lakes comprise about 0.5% by mass (Radhi et al., 2010).
2. Methods
2.1. Overview and aims
On the 22nd and 23rd September 2009, a large amount of dustwas swept up in strong winds caused by an intense low-pressurezone near Lake Eyre and was very quickly carried eastwards andnorthwards (Fig.1). The ensuing dust stormwas estimated to be theworst in 70 years (AGBM, 2010). At its peak, the dust plume wasmore than 3400 km long and stretched from southern New South
Fig. 1. Map of Australia, showing the source and dispersion of dust. All sampling wascarried out in Brisbane.
Wales to far north Queensland. Airborne particle concentrations ofover 15,000 mgm�3 were recorded at many locations. It is estimatedthat 1.6 � 109 kg of dust was removed from the continental interiorwhich at one time was losing 7.5 � 107 kg h�1 of dust off its easterncoastline (Leys et al., 2009). The region affected by the dustincluded the state capitals of Sydney and Brisbane. The dustreached Brisbane at a distance of about 1400 km from its source ataround 11 am on the 23rd and by 12 noon, resulted in a drop invisibility to a few metres. Dust in the air gave the environment aneerie redeorange colour and the air temperature dropped byseveral degrees.
The International Laboratory for Air Quality and Health (ILAQH)at the Queensland University of Technology was carrying outmeasurements of airborne particles at the top of two buildings inthe Central Business District of Brisbane when the dust stormpassed over the city. The aim of this paper is to use the resultsobtained to investigate the physical characteristics of the dustparticles as well as to assess the impact of the dust on the regularultrafine particle number and mass concentrations in an urbanenvironment.
2.2. Monitoring sites
As this was not a planned experiment, not all instruments wereoperative right through the dust storm and not all at the samelocation. Themeasurements were carried out at two locations, to bedenoted Site A and Site B, being two buildings in the BrisbaneCentral Business District (CBD), separated by a distance of about0.5 km. Site Awas located in a six-floor building within the GardensPoint campus of the Queensland University of Technology,approximately 100 m away and midway between a busy freewayand the City Botanical Gardens. The air was sampled from outsidea 6th floor window. This site also included an air monitoring stationoperated by the Queensland Department of the Environment andResource Management (DERM). Site B was located in a five-floorbuilding situated next to a city street with the air sampled fromoutside the 5th floor. Therefore, both monitoring sites could beregarded as urban environments, normally dominated by vehicularemissions.
2.3. Instrumentation
The following particle measuring instruments were used in thisstudy:
The TSI 3320 Aerodynamic Particle Sizer (APS) is an opticaltime-of-flight spectrometer that provides real time high-resolutionparticle sizing from 0.5 to 20 mm. A complete size distribution, in 52size bins within the detection range, was obtained every 1 min.
The TSI 3782 water-based Condensation Particle Counter (CPC)measures ultrafine particle number concentration down to a size of10 nm at concentrations up to 5 � 104 cm�3. Readings were takenevery 1 s and the software was programmed to log average valuesat intervals of 5 s.
The TSI 8520 DustTrak Aerosol Monitor is a portable laserphotometer that measures and records airborne dust concentrationfrom 1 to 105 mg m�3. The DustTrak is calibrated against a gravi-metric reference using the respirable fraction of standard ISO Ari-zona test dust which has a wide size distribution covering theentire size range of the DustTrak and is representative of a widevariety of ambient aerosols (TSI, 1997). An inlet impactor was usedto restrict the sampled particle mass to an upper size of 2.5 mm(PM2.5). Readings were taken every 1 s and the instrument was setto log average values at intervals of 30 s.
Using PM2.5 data obtained during the dust storm, the DustTrakwas calibrated against a tapered element oscillating microbalance

Fig. 2. Light scattering coefficient of particles (Bsp) as a function of time (Site A).
E.R. Jayaratne et al. / Atmospheric Environment 45 (2011) 3996e40013998
(TEOM) located at Site A. The TEOM is an instrument that is certi-fied by the US-EPA for gravimetric measurements of particulatematter in ambient air.
A TSI 3936 Scanning Mobility Particle Sizer (SMPS) comprisinga 3080 electrostatic classifier and a 3010 CPC was used to obtainparticle size distributions in the size range 4e100 nm in 91 sizebins. A complete scan was derived every 10 min in real time.
Table 1 shows the location and times of operation of the variousinstruments. While the APS and SMPS were located at Site A, theCPC and DustTrak were located at Site B. These locations were notselected but, with the exception of the APS, the instrumentshappened to be operating there on other projects as the dust stormapproached. It is unfortunate that the APS was not switched onuntil 16 h. Meteorological, visibility and PM10 concentrations weremonitored at the roof level of the building at the DERM air moni-toring station at Site A. The meteorological parameters included airtemperature, relative humidity, wind speed and direction. Visibilitywas monitored with an integrating nephelometer that measuredthe atmospheric light scattering coefficient of particles (Bsp) andexpressed it in Mm�1. Particulate matter concentration in the formof PM10 was recorded with a TEOM at Site A. Hourly average data ofthe meteorological conditions, visibility and PM10 values were alsoobtained from several ground-level DERM monitoring stationsaround the city of Brisbane.
2.4. Data analysis
The data on the CPC, APS and DustTrak were logged in real timeat 1 s intervals. The DERM data were available as 30 min averages.Linear regression analysis was used to determine the correlationcoefficients between half-hourly PM10 and PM2.5 values and thecorresponding Bsp values. The SMPS and APS data were processedand analysed using Aerosol Instrumentation Manager Softwarefrom TSI.
3. Results and discussion
3.1. Overview of the dust episode
The morning of the 23rd September 2009 was a typical finespring day in Brisbane. At 8 am, the air temperature was 23 �C andthe relative humidity just over 60%. A steady gentle breeze of0.4 m s�1 blew in from the west. Ambient particle concentrationwas normal with a PM10 level of 21 mgm�3 and a Bsp of 22 Mm�1 atSite A. However, by about 10 am, with dust being transported in bythe westerly winds, the PM10 had exceeded 100 mg m�3, while thevisibility had deteriorated, almost doubling the Bsp to 41 Mm�1.The Australian ambient air quality standard for PM10 averaged over24 h is 50 mg m�3. By 11 am, the effects of the dust storm wereclearly visible. Conditions continued to deteriorate rapidly in thenext hour. Maximum dust levels were observed near mid-day withthe Bsp exceeding 1000 Mm�1. Thereafter, the visibility continued
Table 1The instruments, their locations and times of operation.
Instrument Site Period operatedon 23/09/2009
APS A 16 he24 hSMPS A All dayCPC B 0 he15 hDustTrak B All dayTEOM A All dayNephelometer A All dayMet parameters A All day
to improve steadily with the Bsp dropping sharply until 17 h and ata slower rate thereafter. By midnight, there was still a considerableamount of dust in the air, as evidenced by the Bsp value of 83Mm�1.The real time variation of Bsp in Fig. 2 shows the passage of the duststorm over Brisbane. It is instructive to note that the Bsp in Brisbaneon a normal day is 10e30 Mm�1.
3.2. DustTrak accuracy
Fig. 3 shows the half-hourly averaged PM2.5 data from theDustTrak at Site B and the TEOM at Site A, obtained between12:30 h and 15:30 h which corresponds to the time period whenthe dust was most concentrated on the day of the dust storm. Thetwo parameters are plotted against each other. Despite the sepa-ration of about 0.5 km between the two sites, the slope of the bestline is very close to 1 (0.99 with R2 ¼ 0.99) showing excellentagreement between the two parameters. This result indicates thatthe material of the dust was very similar to the Arizona Dust that isused to calibrate the DustTrak (TSI, 1997) and provides confidencethat the DustTrak data may be used as a reasonably accuratemeasure of the PM2.5 particulate matter concentration in the duststorm.
3.3. Particulate mass concentrations
Fig. 4 shows the hourly average particulate mass concentrationsbetween 10 h and 16 h. The time axis shows the end-hour of each
Fig. 3. Half-hourly averaged PM2.5 data from the DustTrak and the TEOM during thedust storm, plotted against each other.

Fig. 4. Hourly average PM10 and PM2.5 concentrations as a function of time (Site A).
E.R. Jayaratne et al. / Atmospheric Environment 45 (2011) 3996e4001 3999
data bin. Thus, for example, the maximum average PM2.5 and PM10values of 814 and 6460 mg m�3, respectively, were observed duringthe hour between 12 h and 13 h. It is clear that most of theparticulate mass in the size range below 10 mm lay between 2.5 mmand 10 mm.
3.4. Larger particles
Fig. 5(a) shows the particle number size distribution asmeasuredwith the APS at 16 h. Note that particles smaller than 0.5 mm are notincluded in this figure. The total APS particle number concentrationwas 17.3 cm�3 and exhibited a near-lognormal size distributionwith modal and geometrical mean diameters of 1.6 and 1.9 mm,respectively. The particle volume size distribution (Fig. 5(b)) showsthat most of the particle volume and, hence, mass was contributedby particles larger than 2.5 mm. The modal mass was around 10 mm.
a
b
Fig. 5. Particle number (a) and volume (b) size distributionsmeasured by theAPS (Site A).
A cumulative analysis showed that less than 10% of the mass wascarried by particles smaller than 2.5 mm, while the PM10 fractionaccounted for about 68% of the total mass. However, thesecomparisons should be treated with caution, as the APS softwarecalculates the volume from the size assuming that the particles arespherical.
3.5. Ultrafine particle number concentration
Next, we look at the impact of the dust on the ultrafine particlenumber concentrations. It has been shown that the large majorityof ultrafine particles in urban settings are combustion aerosolsfromvehicle emissions (Shi et al., 1999;Wåhlin et al., 2001). Most ofthese particles are smaller than 200 nm, which is less than one-tenth the size of particles in the dust storm. This gives rise toa process of polydisperse coagulation whereby smaller particlesdiffuse to the surface of larger particles. A tenfold difference inparticle size produces a threefold increase in coagulation (Hinds,1982). Coagulation generally leads to a reduction in small particlenumber with no change to the particle mass concentration.
On dust-free days, prior to the event day, the ultrafine particlenumber concentrations at bothmeasurement sites were typically ofthe order of 1 � 104 cm�3. Average values peaked between 1 � 104
and 3 � 104 cm�3 during the peak traffic hours and dropped toabout 5 � 103 cm�3 in the early hours of the morning. The meandaytime concentration on the day immediately prior to the duststorm, 22nd September, was 1.2 � 104 cm�3. On the 23rd, aftera normal peak number concentration of about 1.5 � 104 cm�3
during the morning traffic peak, the concentration as measured bythe CPC at Site B stabilised at around 6� 103 cm�3 bymid-morning.Fig. 6 shows the ultrafine particle number concentration togetherwith the PM2.5 measured at the same location between 10 h and15 h. The PM2.5 curve clearly shows the arrival and passage of thedust. At 11 h, as the PM2.5 value began to increase sharply, theparticle number concentration showed the expected decrease.Particle number concentration values fell from about 5 � 103 cm�3
at 11 h to less than 3 � 103 cm�3 by 12 h at the peak of the storm.This initial sharp decrease in ultrafine concentration coincidedwiththe arrival of the main dust storm peak. However the ultrafineparticle number concentration then continued to decrease ata slower rate even after the dust concentration had begun todecline. These observations suggest that coagulation scavenging ofthe ultrafine particles was accompanied by a second unidentifiedprocess, and that both acted simultaneously to reduce the ultrafineparticle number concentration. Right through the time perioddepicted in Fig. 6, the wind remained WSW (250�TN � 15�) ata fairly steady 4.5 � 0.5 m s�1. Air temperature was 26� � 1� whilethe relative humidity dropped steadily from about 50% at 10 h to
Fig. 6. Ultrafine particle number concentration together with the PM2.5 measured atSite B.

Fig. 7. Hourly average ultrafine particle number concentrations as a function of thePM10 concentration.
a
b
Fig. 8. Hourly average (a) particulate matter and (b) ultrafine particle numberconcentrations shown as a function of the light scattering coefficient of particles, Bsp.
Fig. 9. Particle number concentration and geometrical mean diameter as measured bythe APS.
E.R. Jayaratne et al. / Atmospheric Environment 45 (2011) 3996e40014000
about 16% at 15 h. Thus, it is unlikely that any change in particlenumber concentration or particle size was due to a changing airmass other than for the dust from the south-west. In support of themodelling studies that have shown that fine mode particles arescavenged by larger particles in the environment (Ackermann et al.,1998; Jung et al., 2002), the present study demonstrates that theeffect can be very effective in a real life dust storm situation.
Next, we investigate the effect of PM10 on the ultrafine particlenumber concentration. Fig. 7 shows the hourly average ultrafineparticle number concentration against the corresponding PM10concentration between 7 h and 16 h on the 23rd September. Thegraph shows a sharp decrease in ultrafine particle numberconcentration as the PM10 concentration increased. The ultrafineparticle number concentration showed a power-law decrease withPM10 with an R2 value of 0.73 (p < 0.01).
3.5.1. Bsp and PM correlationsIn Fig. 8, we look at correlations between the light scattering
coefficient of particles (Bsp) and the particulate matter concentra-tions, PM10 and PM2.5. Fig. 8(a) shows the hourly particulate matterconcentrations against Bsp, between 7 h and 16 h on the 23rdSeptember. A linear regression analysis showed a good correlationbetween Bsp and both PM10 and PM2.5, with an R2 value of 0.98(p < 0.01) for each. Fine particles in the size range 0.4e0.7 mm thatcorresponds to the visible spectral wavelength are more efficient atscattering light than other sizes. As this range falls within the sizeranges of both PM10 and PM2.5, it is not surprising that they bothcorrelate well with Bsp.
Fig. 8(b) shows the corresponding hourly average ultrafineparticle number concentration measured by the CPC as a functionof Bsp. In accordance with Fig. 4, this graph showed a sharpdecrease in particle number concentration as the dust arrived andthe Bsp increased. The particle number concentration showeda power-law decrease with Bsp with an R2 value of 0.77 (p < 0.01).
As stated, the APS was switched on soon after 16 h andcontinued to sample until 10 h on the next day. Fig. 9 shows theparticle number concentration and geometrical mean diameter asmeasured between 16 h and 24 h. If we disregard the peak ataround 18 h, which was no doubt associated with increased roaddust from vehicular traffic in the evening rush hour, we see that thenumber concentration dropped steadily from about 16 cm�3 toabout 5 cm�3 during this period. Over the same period, the hourlyaverage Bsp and PM10 dropped from about 280 Mm�1 to 85 Mm�1
and from 1300 mg m�3 to 400 mg m�3, respectively (Figs. 2 and 4). Itis interesting to note that, from 16 h to 24 h, all three parameters
decreased by the same factor of just over 3. This was only possible ifthe particle size did not show a significant difference in time andthis is substantiated by the time series graph of the particlediameter in Fig. 9. There are twelve outlier points seen in the graphclose to 20:30 h and 23:00 h, which are clearly due to spuriouseffects as they fall well above the expected variation of the longterm readings. Excluding these twelve points, the APS particlegeometrical mean diameter over this period was 1.9 � 0.1 mm,where the uncertainty is the standard deviation. Thus, we see that
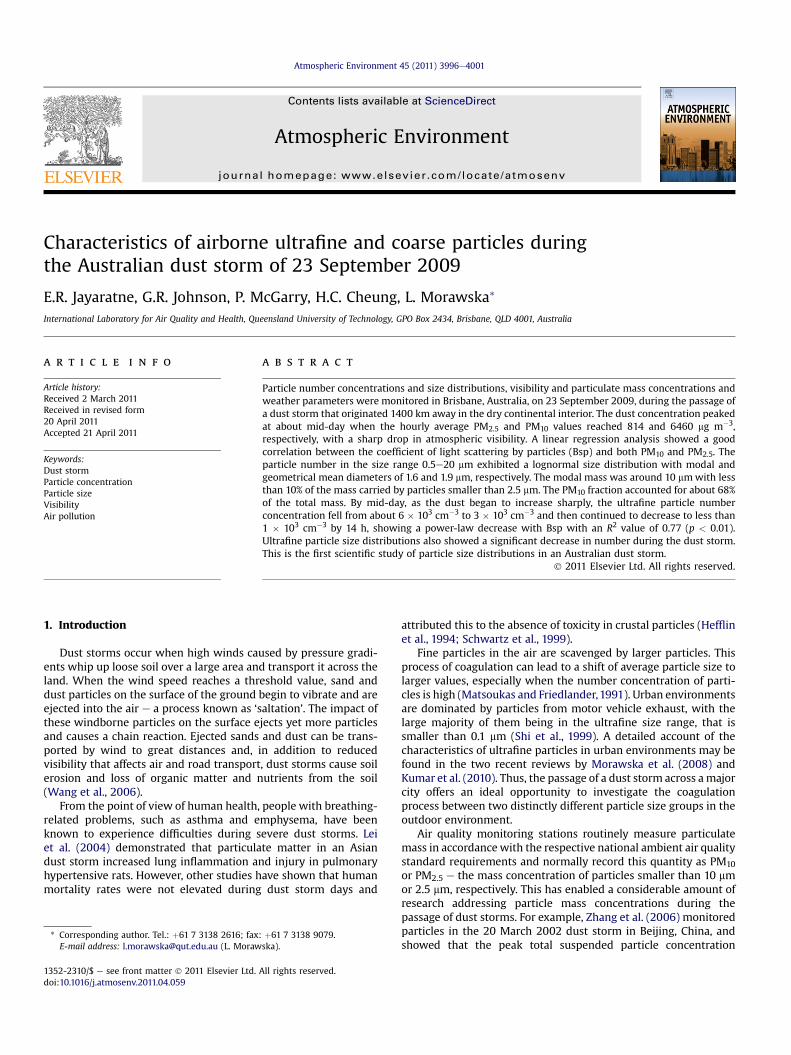
Fig. 10. Ultrafine particle size distributions before and during the dust storm.
E.R. Jayaratne et al. / Atmospheric Environment 45 (2011) 3996e4001 4001
the variation of the particle diameter about its mean value was nomore than about 5%. The slight increase at night-time was probablycaused by hygroscopic growth and/or particle coagulation, bothphenomena that have been observed in the environment. Rightthrough the time period depicted in Fig. 9, the wind remainedWSW (255�TN � 10�) at a fairly steady 4.5 � 1.0 m s�1.
3.6. Ultrafine particle size distribution
Fig. 10 shows the ultrafine particle size distributions before andduring the dust storm as measured by the SMPS. Each curve is theaverage of 12 scans over a full two-hour period. The upper curvereflects the size distribution prior to the arrival of the dust between8 and 10 am. During this time, the particle mass concentrationvalues were as on any other day, indicating no excess dust in theatmosphere. As the dust arrived, the ultrafine particle numbersdecreased. This reduction was very pronounced for ultrafineparticles in the size range close to 100 nm but decreased at smallersizes, with no significant drop in number being detected forparticles smaller than 20 nm. This latter range is generally occupiedby nanoparticles produced by nucleation of the gaseous products ofmotor vehicle emissions (Kittelson et al., 2004). Given the urbanlocation of the measurement site, it is probable that local trafficemissions were responsible for maintaining concentrations in thissize range and that those emissions had been produced too recentlyto have been significantly affected by the surrounding dustparticles.
4. Conclusions
At the peak dust time, the hourly-averaged PM2.5 and PM10values were 814 and 6460 mg m�3, respectively, with the lightscattering coefficient of particles, Bsp, exceeding 1000 Mm�1. Alinear regression analysis showed a good correlation between Bspand both PM10 and PM2.5. The PM10 fraction accounted for about68% of the total mass. The particle number concentration measuredby the APS exhibited a lognormal size distribution with modal andgeometrical mean diameters of 1.6 and 1.9 mm, respectively. Themodal mass was around 10 mm with less than 10% of the masscarried by particles smaller than 2.5 mm. The ultrafine particlenumber concentrations fell sharply as the dust storm passed overefrom about 6 � 103 cm�3 to about 3 � 103 cm�3 as the dust peakedand then continued to decrease to less than 1 � 103 cm�3 over thenext 2 h. Through our observations, we have also shown that thenumber concentration of ultrafine particles in the environment is
significantly suppressed due to scavenging by larger particlesduring a dust storm. The ultrafine particle number concentrationshowed a power-law decrease with PM10 with an R2 value of 0.73(p < 0.01). We believe that this is the first report of the particle sizedistribution in an Australian dust storm.
Acknowledgements
We would like to thank the Queensland Department of theEnvironment and Resource Management (DERM) for providingthe hourly average PM andmeteorological data for the period of thedust storm.
References
Abdulla, S.A., Al-Rizzo, H.M., Cyril, M.M., 1988. Particle size distribution of Iraqi sandand dust storms and their influence on microwave communication systems.IEEE Trans. Antennas Propag. 36, 114e126.
Ackermann, I.J., Hass, H., Memmesheimer, M., Ebel, A., Binkowski, F.S., Shankar, U.,1998. Modal aerosol dynamics model for Europe: development and firstapplications. Atmos. Environ. 17, 2981e2999.
AGBM, 2010. Annual Australian Climate Statement, 2009. Australian GovernmentBureau of Meteorology. Issued 5 Jan 2010.
Choi, H., Choi, D.S., 2008. Concentrations of PM10, PM2.5 and PM1 influenced byatmospheric circulation and atmospheric boundary layer in the Koreanmountainous coast during a duststorm. Atmos. Res. 89, 330e337.
Hefflin, B.J., Jalaludin, B., McClure, E., Cobb, N., Johnson, C.A., Jecha, L., Etzel, R.A.,1994. Surveillance for dust storms and respiratory diseases in WashingtonState, 1991. Arch. Environ. Health 49, 170e174.
Hinds, W.C., 1982. Aerosol Technology. John Wiley, New York.Jung, C.H., Kim, Y.P., Lee, K.W., 2002. Simulation of the influence of coarse mode
particles on the properties of fine mode particles. J. Aerosol Sci. 33, 1201e1216.Kittelson, D.B., Watts, W.F., Johnson, J.P., 2004. Nanoparticle emissions on Minne-
sota highways. Atmos. Environ. 38, 9e19.Kobayashi, H., Arao, K., Murayama, T., Iokibe, K., Koga, R., Shiobara, M., 2007. High
resolution measurement of size distributions of Asian dust using a Coultermultisizer. J. Atmos. Oceanic Technol. 24, 194e205.
Kumar, P., Robins, A., Vardoulakis, S., Britter, R., 2010. A review of the characteristicsof nanoparticles in the urban atmosphere and the prospects for developingregulatory control. Atmos. Environ. 44, 5035e5052.
Lei, Y.C., Chan, C.C., Wang, P.Y., Lee, C.T., Cheng, T.J., 2004. Effects of Asian dust eventparticles on inflammation markers in peripheral blood and bronchoalveolarlavage in pulmonary hypertensive rats. Environ. Res. 95, 71e76.
Leys, J., Heidenreich, S., Case, M., 2009. DustWatch Interim Report 22e23rdSeptember. DustWatch, Department of Environment and Climate Change, NSWand Griffith University, Queensland, Australia.
Matsoukas, T., Friedlander, S.K., 1991. Dynamics of aerosol agglomerate formation.J. Colloid Interface Sci. 146, 495e506.
Mikami, M., Aoki, T., Ishizuka, M., Yabum, S., Yamada, Y., Gao, W., Zeng, F., 2005.Observation of number concentration of desert aerosols in the South of theTaklimakan Desert, China. J. Meteorol. Soc. Jpn. 83A, 31e43.
Mitchell, R.M., Campbell, S.K., Qin, Y., 2010. Recent increase in aerosol loading overthe Australian arid zone. Atmos. Chem. Phys. 10, 1689e1699.
Morawska, L., Ristovski, Z., Jayaratne, E.R., Keogh, D.U., Ling, X., 2008. Ambient nanoand ultrafine particles from motor vehicle emissions: characteristics, ambientprocessing and implications on human exposure. Atmos. Environ. 42,8113e8138.
Radhi, M., Box, M.A., Box, G.P., Mitchell, R.M., Cohen, D.D., Stelcer, E., Keywood, M.D.,2010. Size-resolvedmass and chemical properties of dust aerosols fromAustralia’sLake Eyre Basin. Atmos. Environ. 44, 3519e3528.
Schwartz, J., Norris, G., Larson, T., Sheppard, L., Claiborne, C., Koenig, J., 1999.Episodes of high coarse particle concentrations are not associated withincreased mortality. Environ. Health Perspect. 107, 339e342.
Shi, J.P., Khan, A.A., Harrison, R.M., 1999. Measurements of ultrafine particleconcentrations and size distribution in the urban atmosphere. Sci. TotalEnviron. 235, 51e64.
TSI, 1997. DustTrak Aerosol Monitor, Theory of Operation. Health and SafetyApplication Note ITI-036. Revised 11/14/97. TSI Incorporated, St Paul MN, USA.
Wåhlin, P., Palmgren, F., Van Dingenen, R., 2001. Experimental studies of ultrafineparticles in streets and the relationship to traffic. Atmos. Environ. 35, S63eS69.
Wang, X., Oenema, O., Hoogmoed, W.B., Perdok, U.D., Cai, D., 2006. Dust stormerosion and its impact on soil carbon and nitrogen losses in northern China.Catena 66, 221e227.
Wang, W., Ma, J., Hatakeyama, S., Liu, X., Chen, Y., Takami, A., Ren, L., Geng, C., 2008.Aircraft measurements of vertical ultrafine particles over Northern Chinacoastal areas during dust storms in 2006. Atmos. Environ. 42, 5715e5720.
Zhang, R., Wang, Z., Shen, Z., Yabuki, S., Kanai, Y., 2006. Physicochemical charac-terization and origin of the 20 March 2002 heavy dust storm in Beijing. AerosolAir Qual. Res. 6, 268e280.