chapter sr (source rocks) - usgs publications repository
TRANSCRIPT
SR-1
Chapter SR (Source Rocks)
PETROLEUM SOURCE ROCK EVALUATIONBASED ON SONIC AND RESISTIVITY LOGS
by Margaret A. Keller1, Kenneth J. Bird1, and Kevin R. Evans1
in The Oil and Gas Resource Potential of the 1002 Area, Arctic NationalWildlife Refuge, Alaska, by ANWR Assessment Team, U.S. GeologicalSurvey Open-File Report 98-34.
1999
1 U.S. Geological Survey, Menlo Park, California
This report is preliminary and has not been reviewed for conformity with U. S. Geological Survey editorial standards (orwith the North American Stratigraphic Code). Use of trade, product, or firm names is for descriptive purposes only anddoes not imply endorsement by the U. S. Geological Survey.

SR-2
TABLE OF CONTENTS
AbstractIntroductionAcknowledgmentsMethods and Data Sets
The ∆LogR Method and Other TOC DataDetermination of Net Richness and Source Potential
Results of ∆LogR AnalysesHue Shale Including the Gamma-Ray ZonePebble Shale UnitKingak ShaleMikkelsen Tongue of the Canning FormationDiscussion
Richness and Source Potential InterpretationHue Shale Including the Gamma-Ray ZonePebble Shale UnitKingak ShaleMikkelsen Tongue of the Canning Formation
Richness of the Shublik FormationThe Aurora 1 Well
Hue Shale and Pebble Shale UnitMikkelsen Tongue of the Canning Formation
Conclusions
FIGURESSR1. Index Map of the study area, northeastern Alaska.SR2. Stratigraphic chart highlighting petroleum source rocks.SR3. Location map of wells evaluated near the 1002 area of the ANWR.SR4. Gamma-ray profile, age, and lithology of the "Emerald Island" section, Canning
River.SR5. Total organic carbon of the Hue Shale and pebble shale unit equivalents in the
Aurora 1 well.
TABLESSR1. Richness and source potential for the Hue Shale exclusive of the gamma-ray
zone.SR2. Richness and source potential for the gamma-ray zone of the Hue Shale.SR3. Richness and source potential for the pebble shale unit.SR4. Richness and source potential for the complete Hue Shale and the Hue Shale
plus pebble shale unit.SR5. Richness and source potential for the Kingak Shale .

SR-3
SR6. Richness and source potential for the Mikkelsen Tongue of the CanningFormation.
SR7. Total organic carbon data for the Shublik Formation.
PLATESSR1. The Hue Shale and pebble shale unit in the Mikkelsen Bay 1 well.SR2. The Hue Shale and pebble shale unit in the Point Thomson 2 well.SR3. The Hue Shale and pebble shale unit in the West Staines 2 well.SR4. The Hue Shale and pebble shale unit in the Leffingwell 1 well.SR5. The Hue Shale, pebble shale unit, and Kingak Shale in the Beli 1 well.SR6. The Hue Shale, pebble shale unit, and Kingak Shale in the Canning River B-1
well.SR7. The Hue Shale, pebble shale unit, and Kingak Shale in the Canning River A-1
well.SR8. The Hue Shale, pebble shale unit, and Kingak Shale in the Kavik 1 well.SR9. The Mikkelsen Tongue of the Canning Formation in the Mikkelsen Bay 1 well.SR10. The Mikkelsen Tongue of the Canning Formation in the Point Thomson 2
well.SR11. The Mikkelsen Tongue of the Canning Formation in the West Staines 2 well.SR12. The Mikkelsen Tongue of the Canning Formation in the Alaska State C-1 well.SR13. Summary correlation chart for the Hue Shale, pebble shale unit, and Kingak
Shale.SR14. Summary correlation chart for the Mikkelsen Tongue of the Canning
Formation.SR15. Biostratigraphy and lithology report for the Hue Shale and pebble shale unit
equivalents in the Aurora 1 well.
SR-4
ABSTRACT
Mesozoic and Cenozoic marine siliciclastic sedimentary rocks ofnortheastern Alaska include important sections of organic-rich mudstone andshale. In this report, organic-rich subsurface sections of Jurassic,Cretaceous, and Paleogene age are evaluated for organic richness andpetroleum source potential using the ∆logR method of Passey and others(1990) and source potential indices (SPI) of Dembicki and Pirkle (1985).Total organic carbon (TOC) content is determined by the ∆logR methodapplied to porosity and resistivity borehole geophysical logs with thermalmaturity data from vitrinite reflectance. The SPI for oil and gas arecalculated from thermal maturity and net richness values, net richness beingthe thickness of effective or net source rock times the average TOC for thatinterval. In net richness and SPI calculations, TOCs ≥2 wt % are used formarine source rocks, and ≥1 wt % for deltaic source rocks.
Profiles of TOC determined by the ∆logR method are reported for ten wells,nine along the west side and southwest corner of the 1002 area of the ArcticNational Wildlife Refuge plus the Aurora 1 well, to the northeast andoffshore from the 1002 area. In some parts of these wells, the ∆logR TOCprofiles compare well with laboratory measured TOC results from priorstudies on borehole cuttings and core, and also to the gamma-ray log, whoseresponse in many other studies correlates positively with TOC. In otherboreholes or parts of boreholes, however, the ∆logR TOC profiles showsignificant departures from TOC profiles determined from cuttings, and donot show a positive correlation with gamma-ray log response. Where TOCsdetermined by the ∆logR method show significant difference from TOCsdetermined from cuttings, the accuracy of the cuttings data is consideredquestionable when we can document sloughing; and the ∆logR TOCs areconsidered the more representative of average TOC values, except in caseswhere we can document anomalous porosity or resistivity log response, orwhere we believe we have set the baseline incorrectly.
For the Hue Shale, including the gamma-ray zone (GRZ) on the west side ofthe 1002 area, TOCs determined using the ∆logR method and TOCmeasurements from cuttings samples both indicate high net organic richness,particularly in the basal several hundred feet. Interval average TOCs fromboth methods are predominantly between 2-5 wt %, ranging up to 10 wt %.Net richness values range from 560 to 1,611. The SPI for oil generationfrom the Hue Shale, which has thermal maturities ranging from 0.6-1.0 %Rois also high (392-1,611), but in areas where the Hue has been uplifted andcooled since maximum burial, the SPI does not represent present-day

SR-5
potential. In the Aurora 1 well, approximately 440 ft of an age-equivalentsection of the Hue Shale are present at the top of the Mesozoic section.With ∆logR-calculated TOCs that average a minimum of 1.5 wt % andvitrinite reflectance values of approximately 1.3-1.5 % Ro, this "Hue Shale"section has a minimum net richness of approximately 600 and correspondingSPI of 180 for oil and 600 for gas.
Both TOCs measured on cuttings and TOCs calculated by the ∆logR methodfor the Lower Cretaceous pebble shale unit are variable, predominantlybetween 1 and 3 wt %, ranging mainly up to 5 wt %. The pebble shale unitalso has highly variable overall thickness (<20 to >200 ft), net richness (11-338), and SPI (11-338). Except for 2 wells near the southwest corner of the1002 area, net organic richness is low because the pebble shale unit is thin,or in the Aurora 1 well because it is organically lean.
For the Kingak Shale, TOCs from both methods indicate uniformly lowvalues of approximately 1-2 wt % in the 2 southernmost wells and generallyhigher values up to approximately 3.5 wt % in the Beli 1 and Canning RiverB1 wells, particularly in the upper and middle parts of the Kingak Shale.Our ∆logR-calculated TOCs also indicate that the upper and middle parts ofthe Kingak are richer, and in the Canning River B1 well up to 7.5 wt %TOC. These determinations (Table SR5) suggest that the Kingak Shale hashigh net richness and SPI in three of the four wells if we average TOCvalues ≥1 wt % as the cut-off for an effective Kingak, and in two of the fourwells using a 2 wt % cut-off.
The Mikkelsen Tongue of the Canning Formation is a very thick unit withmostly low TOCs between 1 and 2 wt %, but also one or more intervals ofhigher TOCs between approximately 2 and 4 wt %, suggested by both TOCsfrom cuttings and TOCs from the ∆logR method. Net organic richness(1,336-3,393) and SPI for oil (401-1,018) are high if we assume that a thicksuccession with mostly low TOCs between 1 and 2 wt % is a viablepetroleum source rock. Near the 1002 area, the Mikkelsen Tongue is notmature, however, we think that the lateral, age-equivalent lithofacies of theMikkelsen Tongue, if present to the north and offshore the 1002 area, wouldbe buried more deeply and may be a richer, or at least equally viable sourceof hydrocarbons.
For the Shublik Formation, low transit times on the sonic log indicate it isout of the range of calibration of the ∆logR method, so we evaluatedrichness using other TOC data. TOCs measured on outcrop, cuttings, andcore samples indicate that the Shublik is quite rich in some intervals, but

SR-6
their proportion of the total section is presently unknown. TOC values rangefrom approximately 1-7 wt % in samples from wells and outcrop near the1002 area, and up to 10 wt % in core samples from much farther west andnorth where it is also very heterogeneous in stratigraphic profile on a scaleas small as 0.1 ft. Near the 1002 area, the data suggest that the averageorganic richness of the Shublik Formation is in the range between 1.5-4.0 wt% TOC, and probably closer to 1.5 wt %.
INTRODUCTION
Mesozoic and Cenozoic marine carbonate and siliciclastic sedimentary rocksof northeastern Alaska include substantial sections of organic-rich mudstoneand shale which are considered to be the sources of petroleum in the oil andgas fields of that region (Craig and others, 1985; Bird and Molenaar, 1987;Magoon and others, 1987; Magoon and others, Chap. PS). Thesemudstone/shale successions include the Triassic Shublik Formation, theJurassic and Lower Cretaceous Kingak Shale, the Lower Cretaceous pebbleshale unit, the Cretaceous Hue Shale including the gamma-ray zone (GRZ),and the Tertiary Canning Formation--principally the Eocene MikkelsenTongue of Molenaar and others (1987). They have been described and theirpetroleum source parameters characterized from several outcrops in andadjacent to the 1002 area of the Arctic National Wildlife Refuge (ANWR)and/or from borehole cuttings and some core in oil and gas wells to thesouthwest, west, northwest, and offshore of the 1002 area (Figs. SR1, SR2)(Craig and others, 1985; Bird and Molenaar, 1987; Magoon and others,1987; Banet, 1992; 1993; Flett and Paul, 1994; Paul, 1994; Bergman andothers, 1995; written communication, 1998; Lillis and others, Chap. OA;Magoon and others, Chap. PS).
The existing outcrop and well core TOC data for the these organic-richmudstones and shales are mainly spatially scattered samples (Magoon andothers, 1987) that are not readily quantifiable in terms of stratigraphicvariation in richness and thickness. Also, in most of the wells near the 1002area, the cuttings samples are spaced at ≥50 ft intervals (Magoon and others,1987; Nelson and others, Chap. WL). Several wells near the 1002 areawere sampled approximately every 30 ft for TOC analyses from cuttings(Magoon and others, 1987), and these few wells have, so far, provided themost complete data on the stratigraphic variation in organic-richness of thesepotential petroleum source rocks. However, a relatively new wireline logtechnique, the ∆logR method of Passey and others (1990), uses porosity andresistivity logs to produce profiles of TOC variation at a scale ofapproximately 3 ft or one m, the resolution of the logging tools. Thus, for

SR-7
the petroleum assessment of the 1002 area, we applied this method to nearbywells in order to provide a better understanding of the stratigraphic variationin organic richness and its proportions in potential source rock intervals.
In this report we evaluate siliciclastic organic-rich mudstone sections ofJurassic, Cretaceous, and Eocene age in 10 wells adjacent to the 1002 area(Fig. SR3) using the D logR method of Passey and others (1990). We alsoqualitatively compare TOCs determined from the D logR method to TOCsmeasured on borehole cuttings and core samples. Total organic carbonprofiles produced by the D logR method provide a powerful tool forevaluating source rock richness and its stratigraphic variation and have notpreviously been reported for the wells of this area. Creaney and Passey(1993) show several D logR calculated TOC profiles for the CretaceousTorok Formation from wells much farther west on the North Slope. TheD logR TOCs are then used with vitrinite reflectance data reported in Birdand others (Chap. VR) to calculate the petroleum source potential, which isexpressed as source potential indices (SPI) (Dembicki and Pirkle, 1985).
The Triassic Shublik Formation has many calcareous organic-rich mudstoneintervals with low transit times for which the D logR method is notcalibrated, therefore its organic richness in the 1002 area and vicinity isevaluated from several other sources of TOC data. TOC data are evaluatedfrom analyses on cores published since the 1987 assessment (Kupecz, 1995;Robison and others, 1996), previously unpublished outcrop TOC data (J.T.Parrish, written communication, 3/97), and reported TOC analyses fromborehole cuttings (Magoon and others (1987, Chap. PS).
ACKNOWLEDGMENTS
We are very grateful to the oil companies who provided log and TOC datafor this study. We especially thank John Decker, Steve Bergman, and othersat ARCO for allowing us to use and reprint their data from the "EmeraldIsland" section of the Canning River, and Judy Parrish for her Shublikoutcrop data at Fire Creek, Kavik River, and Last Creek. We also thankQuinn Passey, Steve Bergman, Michael Mickey, Joe Macquaker, KevinTaylor, Kevin Bohacs, and the U. S. Geological Survey's ANWRAssessment team members for stimulating and helpful discussions. Weappreciate the suggestions of reviewers Bob Burruss and Les Magoon andeditor Phil Nelson.
SR-8
METHODS AND DATA SETS
The ∆logR Method And Other TOC Data
The ∆logR methodology of Passey and others (1990) determines totalorganic carbon (TOC) from the separation apparent when a properly scaledporosity log and resistivity log are overlain and a maturity factor applied. Inwater-saturated, organic-lean rocks the two curves parallel each otherbecause both respond to variations in formation porosity. In bothhydrocarbon reservoirs and organic-rich non-reservoir rocks a separationbetween the curves, termed ∆logR, is present. Reservoir rocks areeliminated from the analysis by their gamma-ray response and by other welldata such as the lithology from mudlog and well samples, where available.
The TOC of the source rock intervals is then calculated based on the ∆logRseparation measured in logarithmic resistivity cycles and thermal maturityexpressed as LOM (level of organic metamorphism) using the followingempirical relationships discussed fully in Passey and others (1990):
(1) ∆logR = log10(R/Rbaseline) + 0.02 x (∆t - ∆tbaseline)
(2) TOC = (∆logR) x 10(2.297 - 0.1688 x LOM)
R is the resistivity measured in ohm-m by the logging tool; ∆t is themeasured transit time in µsec/ft; Rbaseline is the resistivity corresponding tothe ∆tbaseline value when the curves are baselined in non-source, clay-richrocks; and 0.02 is based on the ratio of -50µsec/ft per one resistivity cycle.
In immature rocks the ∆logR separation is due primarily to the response ofthe porosity log, e.g., the longer transit time of the sonic or acoustic logresponding to the lower density organic matter. In thermally mature rocksthe separation is also caused by longer transit times, but additionally byhigher resistivity due to the presence of generated unexpelled hydrocarbons.We applied the method using the differential transit time log (DT), alsoknown as the sonic or acoustic log, and the deep induction log (ILD) asrecommended by Passey and others (1990). We used thermal maturity datafrom vitrinite reflectance measurements (Bird and others, Chap. VR)converted to LOM using the relationship in Figure VR1.
The first step in applying the method is to properly scale the porosity (DT)and resistivity (ILD) log profiles such that their relative scaling is -50 µsec/ft

SR-9
per one logarithmic resistivity cycle (see left column of Plates SR1-SR12).The profiles are then overlain and baselined in a fine-grained, non-sourcerock as shown in Plates SR1-SR12. Since this process counts the "non-source" shale as zero TOC, an estimate or measure of its TOC needs to beadded back after the calculation of equation #2 above. We use the samevalue as Passey and others (1990), which is 0.8 wt % TOC, because it is inthe mid-range of average TOC for shales worldwide. A baseline conditionexists where the two profiles track or directly overlie each other over asignificant depth range. For example, see Plate SR9 from 6,050-6,150 ft andPlate SR12 from 7,750-7,900 ft. Organic-rich intervals are then recognizedby separation and non-parallelism of the two profiles, and a TOC profile iscalculated using the same intervals as the digital data, in this case at 0.5 orone-foot intervals.
Establishing the baseline in a non-source shale seemed at first to be verysubjective in the absence of an independent measure of TOC and especiallyfor intervals that we thought were quite rich overall. However, in thepractice of applying the method to an increasing number of wells, we thinkwe gained the experience to apply the method consistently to get goodresults, although this becomes more difficult when the resistivity responseincreases due to the presence of hydrocarbons in rocks that have reached thethermal maturity to begin generation (0.6% Ro) (see Plates SR1 and SR6).The combined resolution of the porosity/resistivity overlay is approximatelyone m, thus the method does not accurately quantify the organic content ofsource intervals significantly thinner than one m, however, intervals as thinas 0.33 m are readily identified (Passey and others, 1990). We used wirelinedata digitized at either 0.5 or one-foot intervals.
TOC results from the ∆logR method, particularly apparent anomalies, aremore reliably interpreted if a suite of good wireline logs are available and ifother sources of TOC data are available for comparison. So far, we havequalitatively compared our TOC results from the ∆logR method with a largeset of oil industry TOC data measured on borehole cuttings (Magoon andothers, 1987; Nelson and others, Chap. WL). The complete set of wirelinelogs and other data for wells used in this study can be viewed in Nelson andothers ( Chap. WL).
TOC analyses on borehole cuttings are the best means to check the TOCsdetermined by ∆logR calculations because they both represent an intervalaverage -- even though the interval of the cuttings is usually greater than theapproximate one meter resolution of the ∆logR values. Therefore, inheterogeneous sections cuttings are better for comparison or validation than

SR-10
TOC data from a point source, such as a core sample. However, the qualityand representativeness of cuttings samples are more sensitive than core tofactors in the well such as the mud program, casing points, and sloughing.Because we did not collect the samples or do the TOC analyses, we knowlittle about the data set of TOCs measured on cuttings, except for the sampling interval, therefore we cautiously compared the measured TOCs toour D logR-calculated TOCs.
Determination of Net Richness and Source Potential
The source potential of our sections was determined by calculating a netorganic-richness based on the D logR TOC profiles and then using maturityscaling factors applied to present-day thermal maturity from vitrinitereflectance using the methods of Dembicki and Pirkle (1985). Dembicki andPirkle (1985) use "richness" to mean the thickness of an effective sourcerock times the average TOC for that "effective" interval. We use "netrichness" in the same way they used "richness" to distinguish it fromrichness as organic carbon concentration. We define net or effective sourcerock as the thickness of rock with ³ 2 wt % TOC for rocks withpredominantly marine organic matter and ³ 1 wt % TOC for rocks withpredominantly terrigenous organic matter.
The source potental indices (SPI) are calculated from the net richness valueand a thermal maturity scaling factor which becomes one when the rock is atpeak generation (defined as 0.8-1.0% Ro). For example, a predominantlymarine source rock that is 100 net ft thick with an average TOC of 3.5 wt %would have a net richness of 350 (100 x 3.5) and an SPI for oil of 350 (350 x1) where vitrinite reflectance values are between 0.8-1.0 % Ro. However,for the same source interval where vitrinite reflectance is between 0.6-0.8 %Ro and a scaling factor of 0.7 is applied, the SPI would drop to 245 (350 x0.7). Dembicki and Pirkle (1985) describe values of SPI greater than 300 as"high richness." Similarly, in evaluating potential for gas generation, asource rock with a net richness of 350 would also have an SPI of 350 wherevitrinite reflectance values are between 1.2-1.5% Ro, and an SPI of 245where vitrinite reflectance values are between 1.0-1.2 % Ro. Note that arelatively organically lean (1-2 wt %) deltaic source interval such as theMikkelsen Tongue can have high net richness and thus high SPI values dueto high net thickness of source rock with ³ 1 wt % TOC.
SR-11
RESULTS OF ∆logR ANALYSES
Profiles of TOC produced from ∆logR calculations are presented for theKingak Shale, pebble shale unit, Hue Shale including the gamma-ray zone,and the Mikkelsen Tongue of the Canning Formation in Plates SR1-SR12.These 12 plates also show the borehole logs used, other TOC data whereavailable from borehole cuttings or core, and the tabulations of net richnessand source potential. Summary plates present both the TOCs from ∆logRcalculations and the TOC data from cuttings and core, and show itscorrelation with gamma-ray log response in two cross sections; Plate SR13shows the Hue Shale -- including the gamma-ray zone (GRZ), the pebbleshale unit, and the Kingak Shale, and Plate SR14 shows the MikkelsenTongue. Richness and source potential for these formations are discussed inthe next section of this report.
In some boreholes or parts of boreholes analyzed in this study, TOCscomputed from ∆logR compare well with TOCs measured on cuttings,which is the expected result for very representative cuttings from a boreholewith little or no sloughing such as the West Staines 2 well in the Hue Shaleand older units (Plate SR3). However, in other boreholes or parts ofboreholes, such as part of the Mikkelsen Tongue interval in the West Staines2 well (Plate SR11), the ∆logR TOC profiles do not compare well withcuttings data. Therefore, because we know little about the cuttings dataother than the sampling interval, where the results from the two methods donot agree, the accuracy of the cuttings data is considered questionable whenwe can document sloughing from an enlarged borehole indicated by thecaliper log, and the ∆logR-derived TOCs are considered the morerepresentative of average interval TOC values except in cases where we candocument anomalous sonic or resistivity log response. A comparison of theTOC data sets and other observations and information about the log data andthe well are also included on Plates SR1-SR12. Results are summarized foreach of the formations in the following sections.
Hue Shale Including the Gamma-Ray Zone
The Cretaceous Hue Shale is evaluated by the ∆logR method in nine wellsadjacent to the 1002 area of the ANWR (Fig. SR3). Eight of these wells,including Mikkelsen Bay 1, West Staines 2, Point Thomson 2, Leffingwell1, Beli 1, Canning River A-1 and B-1, and Kavik 1, comprise the correlationsection shown in Plate SR13. The data sets for each well are displayed inPlates SR1-SR8, including net richness and source potential results that arealso summarized in Tables SR1, SR2, and SR4. The most marked features

SR-12
of the ∆logR TOC profiles for the Hue Shale in the eight wells on PlateSR13 are the differences in thickness of the formation; the striking verticalvariation in organic carbon content, also indicated by the TOC profiles fromcuttings and gamma-ray response; and the similarity in that vertical TOCdistribution from one well to the next. The ninth well, Aurora 1, is locatedoffshore and northeast of the 1002 area, and is discussed in a separatesection.
Including the gamma-ray zone (GRZ), which is the lower part of the HueShale that has very high gamma-ray response, the thickness of the Hueranges from 519 ft in the Point Thomson 2 well to 1,085 ft in the WestStaines 2 well (Table SR1 and SR2). Correlation of the TOC profiles withgamma-ray response (Plate SR13) indicates that the upper part of the HueShale that is characterized by fairly low TOCs between 1-3 wt % andgenerally lower gamma-ray response in the West Staines 2 and Leffingwell1 wells has been eroded in the Point Thomson 2 and Mikkelsen Bay 1 wellson the coastal plain. This upper part of the Hue Shale is also absent in theCanning River A-1 and B-1 wells and the Beli 1 well, and appears to bethinner in the Kavik 1 well.
Vertical variation in the TOC profile for the Hue Shale is striking. Belowthe thick, relatively organic-lean upper part of the Hue, the lowest part of theHue, called the GRZ, was analyzed separately as well as together with therest of the overlying Hue Shale because it is a very distinctive stratigraphicinterval that has been studied extensively in outcrop and probably also in thesubsurface. At the Hue Shale type locality in Ignek Valley, approximately400 ft in the lower part of the Hue, including the GRZ and more than 200 ftabove it, are very rich with TOCs generally ranging from greater than 2 wt% to approximately 6 wt % (Bird and Molenaar, 1987, p. 56). Our resultsalso show that the lower several hundred feet of the Hue Shale, including theGRZ and strata above it, are the richest; they have calculated ∆logR TOCsup to 9 wt %, with about the same range for TOC values measured oncuttings, except for the Hue in the Kavik 1 well which has high ∆logR-calculated TOC values up to almost 10 wt %, but low values from cuttings.In this well the highest ∆logR TOC values are probably erroneous due toapparent sonic log cycle-skipping (Rider, 1991, p. 81).
The very distinctive ∆logR-calculated TOC profile for the GRZ alsocorrelates with gamma-ray log response that uniformly shows a lower partwith relatively lower API values than the very high response of the section atthe top of the GRZ. The high response in the upper part is also a result of

SR-13
high gamma-ray signal contribution by tuff and bentonite in the section (Fig.SR4) (Bergman, 1995; Bergman and others, written communication 3/98).
Within the lower part of the Hue Shale are the most obvious apparentanomalies in the ∆logR-calculated TOC profile, and they contribute to thevertical variation as well. These are the thin intervals of very low or"negative" calculated TOCs which correlate to relatively low resistivity, andalso correspond to relatively high gamma-ray response. These intervals arepresent in the GRZ in all the wells and may be tuff or bentonite as describedin the well history and in outcrop (Fig. SR4) (Bird and Molenaar, 1987;Bergman and others, 1995). Creaney and Passey (1993) also note that a highgamma-ray, low TOC unit is possibly a bentonite layer within the HRZ (thehighly radioactive zone), which is a condensed facies of early Cretaceousage in the Torok Shale to the west of the 1002 area (Molenaar, 1988). Notehowever, that in some wells the TOCs measured on cuttings through theseintervals do not commonly indicate low values, e.g. the Canning River wells,whereas in other wells such as the West Staines 2, the TOC values incuttings are lower and appear to be more in agreement with the TOCsdetermined by the ∆logR method. It seems reasonable to conclude that thesetuffaceous or bentonitic parts of the lower Hue Shale would have lowerinterval average ∆logR-calculated TOCs than the mudstone sections, but notnegative values. However, the very low resistivity of these zones reducesthe ∆logR-calculated TOC profile to erroneously low or negative values insome places.
Pebble Shale Unit
As for the Hue Shale, the Lower Cretaceous pebble shale unit is evaluatedby the ∆logR method in nine wells adjacent to the 1002 area of the ANWR(Fig. SR3). The Mikkelsen Bay 1, West Staines 2, Point Thomson 2,Leffingwell 1, Beli 1, Canning River A-1 and B-1, and the Kavik 1 wellscomprise the correlation section from the west and southwest shown in PlateSR13. The data sets for each well are displayed in Plates SR1-SR8,including richness and source potential results that are also summarized inTables SR3 and SR4 where the pebble shale is added in with the Hue. TheAurora 1 well, located offshore and near the northeast corner of the 1002area, is discussed in a separate section. The most important features of the∆logR TOC profiles for the pebble shale unit in the eight wells of PlateSR13 are the differences in thickness of the formation; the vertical variationin organic carbon content; and the apparent lack of similarity in verticalTOC distribution among the wells.
SR-14
The thickness of the pebble shale unit is very different in each well. Definedby the gamma-ray response of the overlying GRZ, the thickness of thepebble shale unit ranges from 16 ft in the Mikkelsen Bay 1 well to more than200 ft in two wells to the southwest, in one or both of which the section ispossibly thickened structurally. It forms the basal part of a thick marineCretaceous, mostly mudstone, succession that also includes the Hue Shale.
TOC from both sets of data is highly variable for the pebble shale unit. Insome wells the ∆logR-calculated TOCs are as low as approximately 1-2 wt% and in others as high as 4-5 wt % or more for interval averages. TOCsmeasured on cuttings are higher than ∆logR-calculated TOCs in the 4southern wells where most values are between 2-4 wt % and they range ashigh as 4.5 wt %. The ∆logR-calculated TOCs are generally higher thanmeasured TOCs in the 4 northern wells where most values are between 3-4wt % and range as high as about 5.5 wt %. In Ignek Valley, the pebble shaleunit in outcrop has TOCs up to approximately 6 wt % (Bird and Molenaar,1987), and equally high values occur along the Canning River (Bergman,1998--oral communication). The gamma-ray log response seems moreconsistent among the wells than TOC, with relatively higher values at thetop and lower values at the base, except for the Canning River A-1 andKavik 1 wells which have relatively high gamma-ray response also, or only,at the base of the pebble shale unit.
Kingak Shale
The Jurassic and Lower Cretaceous Kingak Shale is evaluated by the ∆logRmethod in four wells adjacent to the southwest corner of the 1002 area of theANWR (Fig. SR3). The Beli 1, Canning River A-1 and B-1, and the Kavik1 wells are shown on the correlation section of Plate SR13. The data sets foreach well are displayed in Plates SR5-SR8, including richness and sourcepotential results that are also summarized in Table SR5. The Kingak in theAurora 1 well, located offshore and northeast of the 1002 area, is discussedin a separate section.
The most notable features of the ∆logR TOC profiles for the Kingak Shale inthe four wells analyzed on the southwest side of the 1002 area are thedifferences in thickness of the formation; the vertical variation in organiccarbon content -- or uniformity shown for the Kavik 1 well; and the apparentdifference in vertical TOC distribution among the wells. The gamma-raylog response is relatively flat through the formation in all the wells exceptthe Canning River B-1, where it has relatively lower values through aninterval with the only high TOC values, ranging from approximately 3-7 wt

SR-15
% for ∆logR TOCs and 2-3.5 wt % for measured TOCs on cuttings.Thickness of the Kingak in these wells ranges from 295 ft in the Beli 1 wellto almost 1,000 ft in the Canning River A-1 well, where it is very likelythickened structurally (Plate GG3).
TOC is relatively low through most of the Kingak interval in all except theCanning River B-1 well. For the most part the Kingak ranges fromapproximately 1-2 wt % for both ∆logR TOCs and measured TOCs oncuttings, and is slightly higher than this in the Beli 1 well in the upper 100 ft.However, approximately 100 ft of the upper 150 ft of the Kingak in theCanning River B-1 well have much higher TOC values, ranging fromapproximately 3-7 wt % for ∆logR TOCs and 2-3.5 wt % for TOCsmeasured on cuttings.
Mikkelsen Tongue of the Canning Formation
The Eocene Mikkelsen Tongue of the Canning Formation is evaluated by the∆logR method in four wells along the coast northwest of the 1002 area (Fig.SR3). The Mikkelsen Bay 1, the West Staines 2, the Point Thomson 2, andthe Alaska State C 1 wells comprise the correlation section shown in PlateSR14. The data sets used for each well are displayed in Plates SR9-SR12,and the richness and source potential are summarized in Table SR6.
The ∆logR TOC profiles for these wells indicate that most of the MikkelsenTongue has fairly low TOC concentrations that range from just under 1 wt %to less than 2 wt %. However, the upper part of the Mikkelsen Tongue in allfour well profiles shows an interval up to several hundred ft thick withgreater TOC values, most approximately 2 wt % but some as high as 4 wt %,and even higher in the Mikkelsen Bay 1 well where the values areerroneously high due to very high transit times that are probably erroneous--possibly due to sonic log cycle-skipping (Rider, 1991). TOC data fromcuttings in 2 of the 4 wells (Plate SR14) do not demonstrate unequivocallythe presence of this higher TOC interval in the upper part of the MikkelsenTongue; one well doesn't show a marked increase and the other does.However, other wells nearby show higher measured and/or calculated TOCfor the upper part of the Mikkelsen Tongue.
The extensive cuttings set for the Mikkelsen Tongue in the West Staines 2well shows only very rare increases above the predominant 1 wt % TOC forthe whole interval, but these slight increases generally correspond tointervals of higher calculated TOC. In the Point Thomson 2 well, the fewTOC measurements in the upper part of the Mikkelsen Tongue show
SR-16
increased richness in the upper several hundred feet, suggested by twovalues of greater than 1.5 wt % and then a third of just over 4 wt % TOC.Moreover, the gamma-ray and sonic log response for some wells in thevicinity, e.g. Alpenglow 1, Badami 1 and 2, and East Mikkelsen 1 (see welldata in Nelson and others, Chap. WL), may also indicate the presence of aslightly higher TOC interval in the upper part of the Mikkelsen Tongue.
Similar but thinner intervals of higher calculated TOC are also present in thelower part of the Mikkelsen Tongue. These intervals are indicated in somewells by higher cuttings TOC values and in other wells by gamma-ray andsonic log response, e.g. the Mikkelsen Bay 1, West Staines 2, Alaska Island1, Alaska State D-1, Alaska State F-1, and Alaska State J-1 wells (see welldata in Nelson and others, Chap. WL).
The overall gamma-ray response for the Mikkelsen Tongue is consistentlyhigher than for the Sagavanirktok Formation above and below, butcommonly it is also relatively flat--not showing excursions to highergamma-ray response that parallel the higher TOCs indicated, except in a fewwells, e.g. the Mikkelsen Bay 1, East Mikkelsen 1, and several others nearbywells. These wells are also similar to the Mikkelsen Bay 1 well in havinglonger transit times and relatively higher TOCs from cuttings for severalhundred feet of the upper part of the Mikkelsen Tongue. The gamma-raylog response for this upper, potentially richer interval of the MikkelsenTongue is not consistently higher in all the wells examined; however, lowgamma-ray response is also noted for a known source rock interval in theParis basin by Creaney and Passey (1993).
Discussion
Qualitative comparison of ∆logR TOC values with laboratory measuredTOC values from cuttings or core indicate good agreement for some sourcerock formations or parts of a formation in some wells, and lack of agreementfor other source rock formations or parts of a formation. The Hue Shaleabove the gamma-ray zone (GRZ), the Kingak Shale, and the MikkelsenTongue show the best agreement between TOC values from cuttingscompared to TOCs determined by the ∆logR method (e.g., the West Staines2 well for the Hue Shale above the GRZ and the Mikkelsen Tongue --excluding the part from ≈ 6,150-6,650 ft, and the Canning River A-1 and B-1 and Kavik 1 wells for most of the Kingak Shale succession) (Plates SR13and SR14). The pebble shale unit and the GRZ show the least agreementbetween the TOC values from cuttings compared to TOCs determined by the

SR-17
∆logR method (e.g., the West Staines 2 and Canning River A-1 and B-1wells) (Plate SR13).
Our data illustrate at least 4 factors contributing to the discrepancy betweenTOC determined by the ∆logR method and TOC measured on cuttings: (1)borehole sloughing; (2) unknown collection , sampling, and analyticalmethods/strategy for cuttings analyses; (3) anomalous sonic or resistivity logresponse; and (4) choice of baseline and/or maturity parameters. TOCanalyses on borehole cuttings are potentially the best means to check theTOCs determined by ∆logR calculations because they both represent aninterval average -- even though the interval of the cuttings is usually greaterthan the approximate one meter resolution of the ∆logR values. Thus, inheterogeneous sections the cuttings are better for comparison or validationthan TOC data from a point source, such as core.
In our data set, however, the caliper log and mudlog indicate sloughing andpossible contamination of borehole cuttings for parts of many wells.Therefore, because we know little about the cuttings data other than thesampling interval, where the results from the two methods do not agree, theaccuracy of the cuttings data is considered questionable when we candocument sloughing, and the ∆logR TOCs the more representative ofaverage interval TOC values except in cases where we can documentanomalous sonic or resistivity log response, or where we can see that thebaseline is probably off.
For those zones where erroneously calculated TOCs are produced by verylow resistivity response in tuff and bentonite, note that the cutting's TOCs insome wells do not commonly indicate low values over these zones, e.g. theCanning River wells, whereas in other wells such as the West Staines 2, thecuttings values seem to be lower and more in agreement with the TOCsproduced by the ∆logR method. It seems reasonable to conclude that thesetuffaceous or bentonitic parts of the lower Hue Shale would have lowerinterval average TOC than a mudstone part of the section, but not negativevalues. The very low resistivities of these zones have the effect of drawingdown the ∆logR TOC profile to erroneously low or negative values, therebyunderestimating the average TOC for that zone, which should only go as lowas zero for intervals of contiguous volcanics thicker than approximately onemeter. If this is an accurate appraisal of how the ∆logR method has depictedthe average TOC of these intervals, then our richness and SPI estimates arelow for these zones. If one can identify an interval of tuff (100%), then thatinterval, no matter what is calculated, should be disregarded. It should betreated the same way as a sandstone or any other non-source rock.

SR-18
Another place that some of our ∆logR calculations may be underestimatingthe average TOC is in wells where we are unable to set the baseline in a non-source shale, but instead have set it in a rock that probably has a higher TOCthan the 0.8 wt % that we add back in during the final calculation of TOCfrom the ∆logR separation. This would give us lower interval average TOCvalues for that part of the well where we were using that baseline.
RICHNESS AND SOURCE POTENTIAL INTERPRETATION
In this section our interpretation of net richness and source potential isdiscussed and summarized in Tables SR1-SR6 for the Kingak Shale, pebbleshale unit, Hue Shale including the gamma-ray zone, the combined HueShale and pebble shale unit, and the Mikkelsen Tongue of the CanningFormation. Net richness, as described in the section on methods, iscalculated with TOCs determined by ∆logR calculations, and used incombination with thermal maturity data from vitrinite reflectance (Bird andothers, Chap. VR) to calculate oil and/or gas source rock potential using themethods of Dembicki and Pirkle (1985) (Tables SR1-SR6). The Shublik'srichness, which was evaluated using a different approach, is presented in aseparate section and Table SR7.
Hue Shale Including the Gamma-Ray Zone
In the eight wells evaluated to the west of the Canning River and the 1002area, the Hue Shale including the GRZ is a very rich source rock withpredominantly marine organic matter (Magoon and others, Chap. PS).Interval average TOCs from ∆logR calculations range from low values up toalmost 10 wt % for both the GRZ and the upper part of the Hue Shaleexclusive of the GRZ (Tables SR1, SR2, and SR4). While the lower severalhundred feet of the Hue Shale, including all the GRZ, are the richest strata,the upper part is thicker and fairly organic-lean and has the lowest gamma-ray response. TOC values from both cuttings and the ∆logR method rangefrom approximately 1-2 wt %, but most are close to 1 wt % in the uppermostpart of the Hue Shale where it is preserved. In the middle part of the HueShale, such as from 12,400-12,750 in the West Staines 2 well (Plates SR3,SR13), the TOCs from both methods are mostly between 2-3 wt %.
The Hue Shale exclusive of the GRZ has very high net richness values from439-1,258 in seven of eight wells evaluated; only in the Point Thomson 2well is it less than 300, which is used by Dembicki and Pirkle (1985) as thelower limit of their high richness category. The GRZ of the Hue also has

SR-19
high net richness values that range from 311-670 in six of eight wells, onlyin the Point Thomson 2 and Leffingwell 1 wells are the net richness valuesless than 300. However, the TOC values in both these wells, and thereforealso the net richness, would be higher were it not for the anomalous ∆logRresults discussed previously and on Plates SR2 and SR4. Richness and netrichness would also be higher in these wells if we adjusted the baselinevalues, which seems reasonable due to the many negative TOC valuesproduced using the present baselines.
The Hue Shale is buried deeply enough to be currently generatinghydrocarbons, though just barely in the West Staines 2, Point Thomson 2,and Leffingwell 1 wells where it also has SPI for oil greater than 300 exceptin the Point Thomson 2 well. The Beli 1 well and the other four wellsevaluated near the southwest corner of the 1002 area achieved theirmaximum burial heating during Eocene time. Since then, they have beenuplifted and cooled to varying degrees. These wells have high SPI valuesfrom 524-1,611 for the complete Hue Shale. Where the complete Hue Shaleincluding the GRZ is evaluated (Table SR4), all wells have high net richnessand high SPI for oil.
Pebble Shale Unit
The Lower Cretaceous pebble shale unit is defined here as themudstone/shale succession stratigraphically below the high gamma-rayinterval (GRZ) at the base of the Hue Shale and above the Thomson sand,Kemik Sandstone, or Lower Cretaceous unconformity. Among the wells weevaluated, the pebble shale unit is highly variable. It is < 20 to > 200 ftthick, and in most wells too thin to have high net richness or SPI, except fortwo wells in the southwest corner where it is thicker and more mature (SPIvalues there are 312 and 338), and in the West Staines 2 well which has thehighest average TOC for the pebble shale unit (Table SR3). Our TOCs fromboth methods are extremely variable for the pebble shale unit, in some casesas low as approximately 1-2 wt % and in others as high as 3-4 wt % forinterval averages. This variation is exemplified by net richness values thatrange from 11-338.
It seems reasonable that the pebble shale unit might have highly variableTOC concentration as the basal part of a transgressive marine mudstonesuccession that may be quite variable due to differences in depositional anddiagenetic settings encountered as the basin subsided. Since it is contiguouswith the Hue Shale in some places such as the Canning River, and basal Hueis distinguished mainly by the beginning of volcanic ash deposition in the

SR-20
basin, it also seems reasonable to consider it in combination with the HueShale as shown in Table SR4. Data in Magoon and others (1987) indicatethat the pebble shale unit from outcrops near the northeast part of the 1002area is gas prone.
Kingak Shale
In the four wells southwest of the 1002 area where we evaluated the Jurassicand Lower Cretaceous Kingak Shale, results from both methods show thatTOC is generally low, 1-2 wt %, throughout most of the Kingak interval inall except parts of the section in the Canning River B-1 and Beli 1 wellswhere higher values up to approximately 3.5 wt % are present, particularlyin the upper and middle parts of the Kingak Shale (Plates SR5-SR8 andSR13). Additionally, ∆logR TOCs indicate that the upper and middle partsof the Kingak are richer (up to 7.5 wt % TOC) in the Canning River B-1well. Nevertheless, the Kingak Shale is thick enough in all the wells so thatresulting net richnesses using a 1 wt % cut-off are all above 300 and the SPIfor oil and also gas are close to or greater than 300 except in the Beli 1 well(Table SR5). Using a 2 wt % cut-off, only the two Canning River wellshave richness and SPI for oil greater than 300. Previous work on outcropsamples indicates that the Kingak Shale is gas prone in the northeast part ofthe 1002 area (Magoon and others, 1987).
Mikkelsen Tongue of the Canning Formation
In the 4 wells where ∆logR TOC profiles are calculated, as well as thenearby wells discussed in this chapter, the data show that the MikkelsenTongue of the Canning Formation has high net organic richness if weassume that a very thick succession with fairly low TOCs between 1 and 2wt % , is a viable petroleum source rock (Table SR6). Even without thatassumption, the ∆logR TOC profiles (Plate SR14) indicate the presence ofone or more intervals of higher TOCs between approximately 2 and 4 wt %in the Mikkelsen Tongue, and this is corroborated by cuttings TOCs andgamma-ray log response in several wells. In the West Staines 2 and thePoint Thomson 2 and 3 wells, Craig and others (1985) also describe a partof the Canning Formation equivalent to the Mikkelsen Tongue which hasone or more rich intervals with source potential for generating oil orcondensate.
In the near vicinity of the 1002 area, however, the Mikkelsen Tongue of theCanning Formation is immature with vitrinite reflectance values ofapproximately 0.5 % Ro. Therefore, the transgressive sediments of this part

SR-21
of the Canning Formation haven't been buried deeply enough to enter thegenerative window for conventional hydrocarbons, and their richness ismore relevant to modeling the depositional system farther offshore and northof the 1002 area where it is projected to be buried deeply enough to be in thedepth and temperature range for generating hydrocarbons (Craig and others,1985). From the model proposed by Creaney and Passey (1993) to explainpatterns of TOC distribution in many basins worldwide, it seems reasonableto propose that the lateral, age-equivalent lithofacies of the MikkelsenTongue to the north and offshore the 1002 area would be a richer, or at leastequally viable source of hydrocarbons. Deposited farther offshore duringthe Eocene, these sediments are more likely to be finer-grained or moreclayey, and more enriched in marine organic matter from deposition in adeeper marine slope or basinal setting where the organic matter would beless likely to be diluted by influx of terrigenous clastic material and couldpotentially accumulate a more continuous and overall richer succession ofmudstone in some places, perhaps similar to parts of the Hue Shale.
Richness of the Shublik Formation
The Middle and Late Triassic Shublik Formation consists primarily offossiliferous limestone and calcareous shale. Because of this compositionand the abundance of well cemented zones that have sonic log transit timesapproximately less than 70 µsec/ft, for which the ∆logR method is notcalibrated (Passey and others, 1990), we did not apply this method todetermining the organic richness of the Shublik in the subsurface near the1002 area. Instead we examined and evaluated total organic carbon (TOC)data from several different studies done since USGS Bulletin 1778 (1987),as well as data included in that volume (Magoon and others, 1987) and fromDetterman (1970). These results are summarized in Table SR7. We alsoanalyzed the relationship between organic richness and total gamma-rayintensity in two Shublik subsurface sections on the North Slope in order tosee if this relation could be used to evaluate the distribution of organiccarbon in subsurface Shublik sections near the 1002 area.
Two important recent studies include detailed analysis of the verticalvariation of total organic carbon in the Shublik Formation using coresamples from wells to the west of the 1002 area (Table SR7). Kupecz(1995) analyzed 63 samples through approximately 120 ft of Shublik fromthe Sohio Term Well B in the Prudhoe Bay area (Fig. SR1). The averageTOC for these samples, which were collected approximately every 2 ft, is1.8 wt % (range, less than 1 wt % to approximately 6.4 wt %; median 1.4 wt%). Robison and others (1996) report 70 TOC analyses on core samples
SR-22
through 284 ft of Shublik from the Tenneco Phoenix 1 well, which is fartherto the northwest and offshore (Fig. SR1). Their samples are randomlyspaced from 0.1-10 ft; the initial 10 ft sampling interval was modified to bemore closely spaced in certain parts of the core. TOC for all their samplesaverages 3.9 wt % (range 0.4-10.2 wt %; median 3.1 wt %).
The data published for these two wells probably give us the best informationon the variation in total organic carbon within the Shublik Formation west ofthe 1002 area, although Detterman's (1970) study of 88 outcrop samples(collected every 1 ft and composited every 5 ft) at Fire Creek just south ofthe 1002 area (Fig. SR1) is important (more discussion below). All thesedata indicate that TOC distribution in the Shublik is heterogeneous and hasvery broad vertical variation. Variation from Kupecz's data (1995) is on atleast as small a scale as 2 ft, from Robison and other's data (1996)approximately 0.1 ft, and in some parts of the Shublik it is more likely on amillimeter scale where that is the smallest scale of lamination or beddingpresent.
We have not determined, however, if the organic facies patterns exhibited inthe areas of the Phoenix 1 and Term Well B wells are the same as in theShublik of the 1002 area. Those facies first need to be described, includingthe variation in their organic richness, before we can understand how theycompare to the Shublik facies from other locations. With the exception ofDetterman's (1970) generalized lithostratigraphy and very systematicallycollected samples from Fire Creek, what we have that suggests a measure ofthe heterogeneity of the Shublik near the 1002 area are some data from wellcuttings and some data from outcrops for which the sampling strategy isunknown. We also know that the Shublik has variable thickness near the1002 area (Plate PS2), from a low of approximately 130 ft in wells to thesouthwest to a high of 500 ft or more to the south and southeast.
Of the ten wells that penetrate the Shublik to the west of the 1002 area,seven have one or more TOC measurements on cuttings samples, includingthe Beli 1, the Canning River A-1 and B-1, the Kemik 1 and 2, the FinCreek 1, the Kavik 1, and the West Kavik 1 (Fig. SR 3). These well data aredisplayed in Nelson and others (Chap. WL) and summarized in Table SR7.The TOC values from these well cuttings are most likely eitherrepresentative of average interval values or of individual rock chips.Therefore, it is unknown how representative these values are for the wholeShublik. We know little about the cuttings data other than the samplinginterval, but much can be deduced about the possibility of contamination of

SR-23
the cuttings in these wells from the caliper log and placement of casingwhile the well was being drilled (see data in Nelson and others, Chap. WL).
With the exception of the Beli 1 and Kemik 2 wells, the caliper logs indicatesloughing from rock units overlying the Shublik with no casing in positionto prevent contamination of the cuttings. Among the wells we report(Nelson and others, Chap. WL), the Beli 1 and Kemik 2 wells are the onlyones where casing was installed just above, or within the upper part of theShublik -- thereby preventing contamination from the sloughing of overlyingKingak and other relatively organic lean units into the Shublik cuttings (seediscussion of the Kingak Shale in previous section). Possibly because of thisprotection, these two wells also have the highest TOC values of the sevenwells. In the Beli 1 well (Plate WL12), seven TOC analyses average 1.74 wt%; the range is 0.49 wt % to 5.44 wt %. The Beli data suggestapproximately the same range in TOC variation as the Term Well B;however, these samples fail to adequately represent the Shublik section. Sixsamples were analyzed at approximately 10 ft intervals in the upper 50 ft ofthe Shublik and the seventh sample is from close to the middle of the lower104 ft. In the Kemik 2 well (Plate WL27), the four samples are more evenlyspaced; the average TOC is 1.68 wt %, ranging from 0.65-3.99 wt %.
Outcrop TOC data included in Table SR7 are from one very systematicallycollected set of 88 samples from Fire Creek (Detterman, 1970) and othersample sets without published stratigraphic information. The latter samplesinclude unpublished data for Fire Creek, Last Creek, and Kavik River fromParrish (written communication, 3/97) and also from Fire Creek, Last Creek,and Ignek Valley summarized in Magoon and others (1987), and available indigital form by Magoon and others (Chap. PS, data file “PS1778.xls”).Except for the study of Detterman (1970), whose TOC values may bequestionable because of the analytical methods used at that time, the outcropdata generally consist of results from both fewer and more randomlydistributed samples, nevertheless, probably representing the approximaterange in TOCs present, but not telling us the proportion of the Shublik thatthese values represent.
For the Fire Creek Shublik section, Detterman's (1970) data indicate a TOCrange from 0.08-2.59 wt %, with an average of 1.2 wt %; however, thisrepresents the total 475 ft of the Shublik. His results for the upper 230 ft ofthe Shublik at Fire Creek are higher, averaging 1.6 wt % TOC, which issomewhat closer to the 2.0 and 2.2 averages of the other Fire Creek datasets. Probably because of compositing his samples, but maybe for otherreasons as well, Detterman's (1970) highest TOC values are lower than in

SR-24
both other sample groups from Fire Creek (Table SR7). At Last Creek,Magoon and others (1987) report 8 TOC analyses for which the average andmaximum values are inexplicably only approximately half the amount ofParrish's values for a total of 7 samples (Table SR7). Possibly the set withlower values was also composite samples such as Detterman's (1970)because the average and maximum values are almost identical to his.Parrish (Table SR7) also analyzed 13 samples from Kavik River whichindicate a range from 0.74-5.46 wt % TOC, and an average TOC of 2.6 wt%, and Magoon and others (1987) report 11 samples from Ignek Valley thataverage 2.7 wt % TOC with a range of 0.31-7.01 wt % TOC. Outcrop datafrom several other areas are also included in Magoon and others (1987) andin this volume (Magoon and others, Chap PS, data are available in digitalform as data file “PS1778.xls”); TOCs for these few samples fit the rangefor other outcrop data reported in Table SR7. Overall, the outcrop data areconsistent with the well data except for the highest TOC values in thePhoenix 1 well -- to 10.2 wt % -- which is the farthest from the 1002 area.These values are higher than any outcrop samples or any other well samplesthat we know of (Table SR7), perhaps due to the presence of a richer faciesin the vicinity of the Phoenix-1 well.
To summarize, from the studies described above, Shublik TOC variation isroughly comparable for both the surface and subsurface. Most of the TOCvalues in Table SR7 range from less than 1 wt % to 6 or 7 wt % TOC, exceptfor a dozen samples in the Phoenix-1 well that range higher, to 10.2 wt %TOC. The highest values from outcrop are somewhat less than the highestsubsurface values, and may be weathered. The highest TOC values fromcuttings are also somewhat lower than the highest core values and mayrepresent a mixing value of chips with higher values plus chips with lowervalues, as would Detterman's (1970) results (Table SR7).
In order to determine the distribution and proportion of organic facies in theShublik, we evaluated the relationship between organic richness and totalgamma-ray intensity proposed for Devonian shales in the Appalachians bySchmoker (1981) to determine the distribution of organic carbon insubsurface Shublik sections near the 1002 area of the ANWR. However,similar to the findings of Schmoker (1981) that the total gamma-ray methodsignificantly underestimates organic matter in some intervals and thatquantitative interpretation of the gamma-ray log in terms of organic matter isimpossible accross large regions of the Appalachian basin, we also found thecorrelation between TOC and gamma-ray intensity to be inconsistent for theShublik in the Term Well B and the Phoenix 1 Well. In the Phoenix 1 well,the gamma-ray intensity (total U counts from spectral gamma-ray log)

SR-25
correlates fairly well with TOC in much of the Shublik (Robison, 1996, p.265). However, several zones exist where the gamma-ray intensity eitherunder- or overestimates TOC in the well. Similarly, in the Term Well B,TOC analyses of the Shublik Formation (Kupecz, 1995) fail to showconsistent correlation with gamma-ray log response. A major considerationin applying this relation to the Shublik Formation is that phosphatic zones inthe Shublik exhibit high gamma-ray intensity interpreted as the result of Uincorporation by phosphate (Kupecz, 1995), however, they may also havelow TOC as shown by Robison and others (1996).
In conclusion, it is apparent from Table SR7 and the prior discussion that theShublik Formation near the 1002 area, as well as to the west and northwesthas broad vertical variation in organic richness. Clearly the Shublik also hasrich, very good petroleum source rock intervals within it whose proportionof the total section is presently unknown. In comparison to existing wirelinelog techniques for evaluating richness and its distribution, such as gamma-ray intensity and the ∆logR method, it seems that the best method for theShublik is systematic sampling of cuttings, outcrop, or core on as fine a scaleas possible because of the Shublik's variable composition and physicalproperties, and the great vertical variation in TOC. Lacking systematicallycollected core samples, we evaluated existing TOC data, both from Magoonand others (1987) and from other sources given in Table SR7. Based on thatevaluation, we suggest that a reasonable estimate of the average organicrichness of the Shublik Formation of the 1002 area is somewhere in therange between 1.5 and 4 wt %, and probably closer to 1.5 wt %. A moreaccurate estimate can be made by analyzing many more samples from wellsor outcrop near the 1002 area of the ANWR.
THE AURORA 1 WELL
Located offshore and near the northeast corner of the 1002 area, the Aurora1 well is important because it is the only subsurface information for theeastern part of the 1002 area (Fig. SR3). The log response, lithology,stratigraphy, and organic geochemistry of this well, which was completed in1988, have been described and interpreted by Banet (1992; 1993), Flett andPaul (1994) and Paul (1994). However, Banet's work was done withoutbiostratigrapic interpretation. Therefore, some of his interpretations of thestratigraphy and conclusions are different from ours, which were made usingbiostratigraphy in conjunction with other well data. Our interpretation of thelithostratigraphy, formation designations, and biostratigraphy for the Aurora1 well is more similar to Paul's (1994) and Turner's (1994) interpretations,and is shown in the three lefthand columns of Plate WL8 with the

SR-26
lithostratigraphic interpretation of Banet (1992) summarized in column 4 ofPlate WL8.
Two intervals in the Aurora 1 well are the primary focus of the followingdiscussion of results from our evaluation of organic richness using data fromthe Geochemical Report of the Tenneco Oil Company (1988, publicallyavailable as of 1991) and the ∆logR method. Note, however, that the twointervals (4,600-7,600 ft and 15,500-16,446 ft) we evaluated using the∆logR method straddle the oil window in the well (Fig. VR12), thus pushingthis method to the limits of rigorous calibration (Passey and others, 1990).Nevertheless, the method still yields a qualitative result indicating intervalswith ∆logR separation that may be potential source rocks, as well as aprofile of relative TOC for the interval evaluated.
In the lower part of the well we evaluated the interval from approximately15,500-16,446 ft, comprising a fine-grained siliciclastic succession of EarlyCretaceous age with notably high TOC values measured on sidewall cores inthe Lower Cretaceous section from approximately 15,500-15,937 ft (PlateWL8). In the upper part of the well, we analyzed the section from 4,600-7,600 ft, which is lithologically comparable and age equivalent to all, or onlypart, of the Eocene Mikkelsen Tongue of the Canning Formation, dependingon your interpretation of biostratigraphy in this well (see Plate WL8). Wealso evaluated existing data and interpretations regarding the richness of theJurassic fine-grained, siliciclastic section in the well from 16,620 to totaldepth, and we generally agree with the conclusions in the GeochemicalReport of the Tenneco Oil Company (1988). That report stated that the unitwas inadequately evaluated in the Aurora 1 well because of its high thermalmaturity and additives to the drilling muds.
Hue Shale and Pebble Shale Unit
In the lower part of the Aurora 1 well we evaluated the section fromapproximately 15,500-16,446 ft using the ∆logR method. Approximately440 ft of that succession from 15,500-15,940 ft, is of greater interest becauseof much higher TOCs measured on sidewall cores as compared to the wellcuttings (Geochemical Report of the Tenneco Oil Company, 1988) (PlateWL8). The high TOCs from sidewall cores are noted by Banet (1992; 1993)who placed this interval at the base of the Tertiary and his unit 4,interpreting it as the basal part of the Brookian section. Flett and Paul(1994) also note the high SWC TOCs and place the interval from 15,480-15,930 ft in the basal Brookian, but assigning it an age of Early Cretaceous.

SR-27
At first, we considered this unit to be either a locally richer facies of thelower part of the Canning Formation or the upper part of the pebble shaleunit. However, further analysis of the biostratigraphic and lithologicdescriptions and interpretations by M.B. Mickey (1988; reprinted herein asPlate SR15) for sidewall cores compared to cuttings indicated that this unitis lithologically more similar to, as well as age equivalent to, at least part ofthe Hue Shale.
Sloughing was apparently a problem in certain intervals in the well(Choromanski, 1994; Paul, 1994; Turner; 1994) resulting in contaminationof cuttings and therefore erroneous lithologic, age, and geochemicalinterpretations if based solely on cuttings. Plate SR15, a segment of theforaminiferal plot sheet from Micropaleo Consultants, Inc., highlights thesidewall core (SWC) data in gray so that differences between the sidewalland cuttings samples are more obvious. Different foraminiferal faunas arepresent in the SWC as compared to the cuttings. We interpret this toindicate that the cuttings samples are contaminated or mixed with rock chipssloughing from overlying units, and conclude that any geochemical or otheranalyses on these cuttings are erroneous for that interval.
On Plate SR15, "paper shale" is noted in 7 SWC samples (15,514, 15,550,15,569, 15,594, 15,747, 15,780, and 15,856) but not in any of the cuttingssamples for this interval; only a few SWC in this interval lack paper shale.The paper shale lithology is typical of the Hue Shale, but not typical of theCanning Formation. A puzzling consideration is that bentonite, which is acommon lithology in the Hue Shale, is noted in many of the cuttings andSWC samples from 15,950-16,270 ft in the Aurora 1 well, i.e. in the pebbleshale unit below the Hue Shale (Mickey, 1988, and Plate SR15). Also, at15,740 ft the Geochemical Report of the Tenneco Oil Company (1988) notesan abrupt organic facies change to a more promising interval down to 16,950ft, characterized by very high concentrations of TOC and amorphouskerogen.
TOC analyses for the interval 15,500-15,940 range from 2.5-6.0 wt % onsidewall cores (n=5) and 1.3-3.0 wt % TOC on cuttings (Fig. SR5). Notethat sidewall core TOCs are much lower in both the overlying andunderlying units (Plate WL8). Preliminary TOCs determined by the ∆logRmethod using "adjusted" thermal maturity values average about 1.5 wt % forthe total interval from 15,500-15,940. However, since the method is notrigorously calibrated in this thermal maturity range, and because of howmaturity is factored into the calculations, we believe that 1.5 wt % is aminimum value for the average TOC of this unit. A more important result is

SR-28
that the ∆logR TOC profile for this unit fails to correlate well with the TOCprofile plotted from cuttings values (Fig. SR5). This is another line ofevidence suggesting that the cuttings are contaminated by material sloughedfrom above, i.e. that the lower TOC values from cuttings in the upper part ofthis interval are due to contamination by organically leaner material cavingin from the borehole above (Plate WL8).
In summary, we correlate the fine-grained, Lower Cretaceous siliciclasticsuccession from approximately 15,500-15,940 ft in the Aurora 1 well to atleast part of the Hue Shale based on lithology and age. This unit wasunrecognized as equivalent to the Hue Shale in previous reports. Banet(1992; 1993) placed it in the lower Tertiary succession; and Paul (1994)designates it an unnamed Lower Cretaceous shale. We think that Banet's(1993, p. 16) overview for this part of the sequence,"these higher-potentialsamples are generally few and widely separated"; and Flett and Paul's (1994)conclusion that "contamination by drilling fluids probably caused the fewhigh TOC values between 15,656 and 15,940 ft", are not the only, or mostlikely, explanations of these data. We think that the five high TOC valuesfrom sidewall cores ranging from 2.5-6.0 wt % (four are greater than 4 wt %TOC) in the approximately 440 ft succession from 15,500-15,940 ft suggestthe likelihood that this Lower Cretaceous succession is organic rich.
The interval from 15,940-16,446 ft is placed in the pebble shale unit basedon age, overall lithology, and stratigraphic position. However, bentonite orbentonitic material, which is commonly noted from 15,950-16,270 ft (PlateSR15), is unknown to be common in the pebble shale unit. Paul (1994) alsotentatively correlates this interval to the pebble shale unit, but says that thelithology doesn't accurately fit the pebble shale unit, noting that none of thekey markers are present. This interval has casing above it beginning at15,941; however, the timing of installation of this casing is an importantpoint because the liner/casing was installed after the well had been drilled to16,950 ft. Therefore, the hole was open and sloughing, as indicated by thewell report (Choromanski, 1994) and the caliper log, during the drilling to16,950 ft (Plate WL8). This is probably the reason for the lack of closeagreement in the TOC analyses for this interval, as for the overlying interval.SWC analyses (n=6) range from 0.9-1.2 wt % TOC, but cuttings values arehigher, ranging from 1.9-3.0 wt % TOC. Preliminary calculated TOCsbased on the ∆logR method and "adjusted" maturity values average about1.0 wt % over the whole interval, however, since this method is notrigorously calibrated for this high level of thermal maturity, the SWC areconsidered a more reliable indicator of TOC, and we suggest that thecuttings are indicating higher values than seen in any of the SWC because of
SR-29
sloughing from overlying organic rich strata. As discussed previously, theoverall low organic richness that we interpret for this unit is uncommon forthe pebble shale unit.
Mikkelsen Tongue of the Canning Formation
The mostly shale and claystone section from 4,600-7,600 ft in the Aurora 1well is lithologically comparable to the Mikkelsen Tongue of the CanningFormation and is temporally equivalent to early and middle Eocene age asinterpreted by Poag (Chap. BI, see also Plate WL8). Note that a differentage interpretation by M. B. Mickey (1997, written communication, and PlateWL8) based on analysis of additional samples compared to his original studyin 1988, extends the lower Eocene in this well from 10,490 to 13,720 ft andthe middle Eocene from 4,640-10,490 ft.
With respect to whether the interval we evaluated is relatively moreterrigenous or more marine in character, as might be expected for theMikkelsen Tongue, the evidence is somewhat equivocal, but mainly suggeststhat it is not notably more marine. In the interval we evaluated from 4,600-7,600 ft, the SWC samples at 4,962 and 5,464 ft (but not 4,097 or 6,161 ft)show gas chromatograms of C15+ saturated hydrocarbons indicating aslightly more marine character as suggested by less than C25 saturates inrelatively greater abundance. However, the Geochemical Report of theTenneco Oil Company (1988) gives the two samples at 4,860 and 5,464 ft asexamples of significant extract values (in excess of 100 ppm) that oftenreflect migrated hydrocarbons because their gas chromatograms are "oillike" in character and therefore contrast with the neighboring immaturebitumens. They further state that "the chromatograms from 1,440-6,480 ftrepresent waxy, immature terrestrial bitumens with minor contributions, insome instances, of algal or bacterial source material" and that "the waxynature of these extracts persists in the deeper samples,...".
The TOC data suggest that much of about the upper 1,700 ft of this intervalis closer to 1.4 wt % TOC than to 1 wt % TOC. The range is 1.2-1.8 wt %TOC for cuttings, and approximately 1.0-1.6 wt % TOC for SWC samples(Plate WL8). TOC values determined by the ∆logR method give basicallythe same results, however, the section is immature and, therefore, out of thematurity range of rigorous calibration of the method. Also, because thesonic and resistivity logs track very well through most of this interval withonly minor separation, the TOCs calculated by the ∆logR method can varydepending on the choices made for baseline sonic and resistivity values andthe value for the baseline shale that is added back into the calculation. TOC
SR-30
values drop to about 1 wt % by about 7,100 ft and between 7,100-8,500 ftare close to 1 wt % or slightly more (Range: 1.0-1.2 wt % TOC cuttings,0.8-1.2 wt % TOC SWC). The Mikkelsen Tongue is immature in theAurora-1 well with respect to petroleum generation, however, as weconcluded for the Mikkelsen Tongue in the other wells where we evaluatedit, this unit has high net organic richness and potential as a petroleum source(where thermally mature) if we assume that a very thick succession withfairly low TOCs between 1 and 2 wt % can be a viable source rock.
CONCLUSIONS
Validation of the ∆logR method and discussion of problematic or anomalousresults have been reported by Passey and others (1990) and Creaney andPassey (1993; 1997) in many hundreds of boreholes worldwide. In ourinterpretation we point out the parts of our analysis where measured TOCdata lack agreement with TOC determined by the ∆logR method, and wherewe believe either of the results is anomalous. In our experience the methodworked better and was easier to apply in rocks with maturity less thanapproximately LOM 10 (≈ 0.85 % Ro) because baseline values weredifficult to establish as maturity increased in parts of the section which seemto lack non-source shales.
Considering the challenges of our borehole data set, we think the methodworked very well overall. The correlation of calculated and measured TOCprofiles with gamma-ray response for the wells we analyzed adjacent to the1002 area of the ANWR illustrates the reliability of the ∆logR method fordetermining net organic carbon richness and variability in source rockintervals, even where measured TOCs are unavailable. Also, the method canbe applied if the only data available are wireline logs, and it is less expensivethan extensive measurements on cuttings or core.
For the eight wells we analyzed to the west and southwest of the 1002 areaof the ANWR, our profiles of total organic carbon determined using the∆logR method indicate that the Hue Shale including the GRZ is a veryorganic-rich petroleum source rock, particularly in the basal several hundredfeet, with very high calculated richness that ranges from 560 to 1,611. Thepresent-day potential for oil generation from the Hue Shale, which hasmaturities ranging from 0.6-1.0 Ro is also high.
In the Aurora 1 well at the northeast corner of the 1002 area, we havedetermined that approximately 440 ft of an age-equivalent section of the HueShale are present at the top of the Mesozoic section. With ∆logR-calculated

SR-31
TOCs that average 1.5 wt % (as a minimum value) and vitrinite reflectancevalues of approximately 1.3-1.5 % Ro, this "Hue Shale" section has aminimum richness of approximately 600 and corresponding SPIs of 180 foroil and 600 for gas. It also has TOCs measured on six sidewall core samplesthat range from 2.5-6.0 wt %, and "paper shale" noted in the biostratigraphyreport--but only from sidewall core samples, which may indicate that theoverall unit is richer than the ∆logR average of 1.5 wt % TOC.
In most of the wells we evaluated, and using our gamma-ray log-baseddefinition, the Lower Cretaceous pebble shale unit by itself is too thin tohave high net richness or high calculated SPI except for 2 wells near thesouthwest corner of the 1002 area. Our TOCs from both methods areextremely variable for this unit, in some places as low as approximately 1-2wt % and in others as high as 3-4 wt % for interval averages, and it hassimilarly variable richness and SPI. Since it is contiguous with the HueShale, it seems reasonable to count the pebble shale unit with the Hue asshown in Table SR4.
For the Kingak Shale, TOCs measured on cuttings indicate uniformly lowvalues of approximately 1-2 wt % in the two southernmost wells andgenerally higher values up to approximately 3.5 wt % in the Beli 1 andCanning River B1 wells, particularly in the upper and middle parts of theKingak Shale. Our ∆logR-calculated TOCs also indicate that the upper andmiddle parts of the Kingak are richer, and in the Canning River B1 well upto 7.5 wt % TOC. These determinations (Table SR5) suggest that theKingak Shale has high richness and source potential in half the wells using a2 wt % cut-off for an effective source and in three of the four wells using a 1wt % cut-off.
The Mikkelsen Tongue of the Canning Formation is a very thick unit withmostly low TOCs between 1 and 2 wt %, and cumulative high organicrichness if we assume that it is a viable petroleum source rock (Table SR6).The ∆logR TOC profiles (Plate SR14) also indicate the presence of one ormore intervals of higher TOCs between approximately 2 and 4 wt %, andthis is corroborated by cuttings TOCs or gamma-ray and sonic log response.In the wells where we studied the Mikkelsen Tongue to the west of the 1002area, it is immature. However, it seems reasonable to propose that thelateral, age-equivalent lithofacies of the Mikkelsen Tongue to the north andoffshore the 1002 area would be buried more deeply and may be a richer, orat least equally viable source of hydrocarbons.

SR-32
The Shublik Formation near the 1002 area of the ANWR, as well as to thewest and northwest has broad vertical variation in organic richness. Clearlythe Shublik also has rich, very good petroleum source rock intervals within itwhose proportion of the total section is presently unknown. Our evaluationis based on existing cuttings, core, and outcrop TOC data. These datasuggest that a reasonable estimate of the average organic richness of theShublik Formation of the 1002 area is somewhere in the range between 1.5and 4 wt % TOC, and probably closer to 1.5 wt %. In comparison toexisting wireline log techniques for evaluating richness and its distribution,such as gamma-ray intensity and the ∆logR method, it seems that the bestmethod for the Shublik is systematic sampling of cuttings, outcrop, or coreon as fine a scale as possible. This method holds promise for future studiesthat can more accurately determine organic richness and its distribution inthe Shublik Formation.

SR-33
REFERENCES CITED
Banet, A.C., Jr., 1992, Log analysis of Aurora #1, OCS-Y-0943 well,offshore of the Arctic National Wildlife Refuge 1002 area, northeast Alaska:Anchorage, Alaska: USDOI, Bureau of Land Management-Alaska TechnicalReport No. 15, p. 37.
Banet, A.C., Jr., 1993, A geochemical profile and burial history of Aurora890 #1, OCS Y-0943 well, offshore of the ANWR 1002 area, northeastAlaska: Anchorage, Alaska: USDOI, Bureau of Land Management-AlaskaTechnical Report 16, p. 51.
Bergman, S.C., Decker, J., and Talbot, J., 1995, Upper Cretaceous tephradeposits, Canning River area, north Alaska [abs.]: Geological Society ofAmerica, Cordilleran Section Meeting, May 24-26, 1995, Abstracts withProgram, v. 27, no. 5, p. 5.
Bird, K.J., and Molenaar, C.M., 1987, Stratigraphy, in Bird, K.J., andMagoon, L.B., eds., Petroleum geology of the northern part of the ArcticNational Wildlife Refuge, northeastern Alaska, U.S. Geological SurveyBulletin 1778, p. 37–59.
Choromanski, Douglas, 1994, Operational summary and drilling program, inPaul, L.E, ed., Geological, geochemical, and operational summary, Aurorawell, OCS Y-0943-1, Beaufort Sea, Alaska: Minerals Management ServiceOCS Report MMS 94-0001, p. 4-14.
Craig, J.D., Sherwood, K.W., and Johnson, P.P., 1985, Geologic report forthe Beaufort Sea planning area, Alaska—Regional geology, petroleumgeology, environmental geology: Minerals Management Service MMS 85-0111.
Creaney, S., and Passey, Q.R., 1993, Recurring patterns of total organiccarbon and source rock quality within a sequence stratigraphic framework:American Association of Petroleum Geologists Bulletin, v. 77, no. 3, p. 386-401.
Creaney, S., and Passey, Q.R., 1997, Well log evaluation of source rocks —15 years and 3000+ wells later [abs.]: 1997 American Association ofPetroleum Geologists Annual Convention, Program with Abstracts, Dallas,Texas, v. 6, p. A23.
SR-34
Dembicki, H., Jr., and Pirkle, F. L., 1985, Regional source rock mappingusing a source potential rating index: American Association of PetroleumGeologists Bulletin, v. 69, no. 4, p. 567-581.
Flett, T.O., and Paul, L.E., 1994, Organic geochemistry, in Paul, L.E, ed.,Geological, geochemical, and operational summary, Aurora well, OCS Y-0943-1, Beaufort Sea, Alaska: Minerals Management Service OCS ReportMMS 94-0001, p. 38-54.
Kupecz, J.A., 1995, Depositional setting, sequence stratigraphy, diagenesis,and reservoir potential of a mixed-lithology, upwelling deposit: UpperTriassic Shublik Formation, Prudhoe Bay, Alaska: American Association ofPetroleum Geologists Bulletin, v. 79, no. 9, p. 1301-1319.
Magoon, L.B., Woodward, P.V., Banet, A.C., Jr., Griscom, A.B., and Daws,T.A., 1987, Thermal maturity, richness, and type of organic matter of sourcerock units, in Bird, K.J., and Magoon, L.B., eds., Petroleum geology of thenorthern part of the Arctic National Wildlife Refuge, northeastern Alaska,U.S. Geological Survey Bulletin 1778, p. 127–179.
Molenaar, C.M., 1988, Depositional history and seismic stratigraphy ofLower Cretaceous rocks in the National Petroleum Reserve in Alaska andadjacent areas, in Gryc, G., ed., Geology and exploration of the NationalPetroleum Reserve in Alaska, 1974 to 1982, U.S. Geological SurveyProfessional Paper 1399, p. 593–621.
Molenaar, C.M., Bird, K.J., and Kirk, A.R., 1987, Cretaceous and Tertiarystratigraphy of northeastern Alaska, in Tailleur, I., and Weimer, P., eds.,Alaskan North Slope Geology: Bakersfield, California, Pacific Section,Society of Economic Paleontologists and Mineralogists and AlaskaGeological Society, p. 513–528.
Passey, Q.R., Creaney, S., Kulla, J.B., Moretti, F.J., and Stroud, J.D., 1990,A practical model for organic richness from porosity and resistivity logs:American Association of Petroleum Geologists Bulletin, v. 74, no. 12, p.1777-1794.
Paul, L.E., 1994, Well log interpretation and lithology, in Paul, L.E, ed.,Geological, geochemical, and operational summary, Aurora well, OCS Y-0943-1, Beaufort Sea, Alaska: Minerals Management Service OCS ReportMMS 94-0001, p. 26-33.
SR-35
Rider, M. H., 1991, The geological interpretation of well logs: Caithness,Whittles Publishing, 175 p.
Robison, V.D., Liro, L.M., Robison, C.R., Dawson, W.C., and Russo, J.W.,1996, Integrated geochemistry, organic petrology, and sequence stratigraphyof the Triassic Shublik Formation, Tenneco Phoenix #1 well, North Slope,Alaska, U.S.A.: Organic Geochemistry, v. 24, no. 2, p. 257-272.
Turner, R.F., 1994, Biostratigraphy, in Paul, L.E, ed., Geological,geochemical, and operational summary, Aurora well, OCS Y-0943-1,Beaufort Sea, Alaska: Minerals Management Service OCS Report MMS 94-0001, p. 15-25.
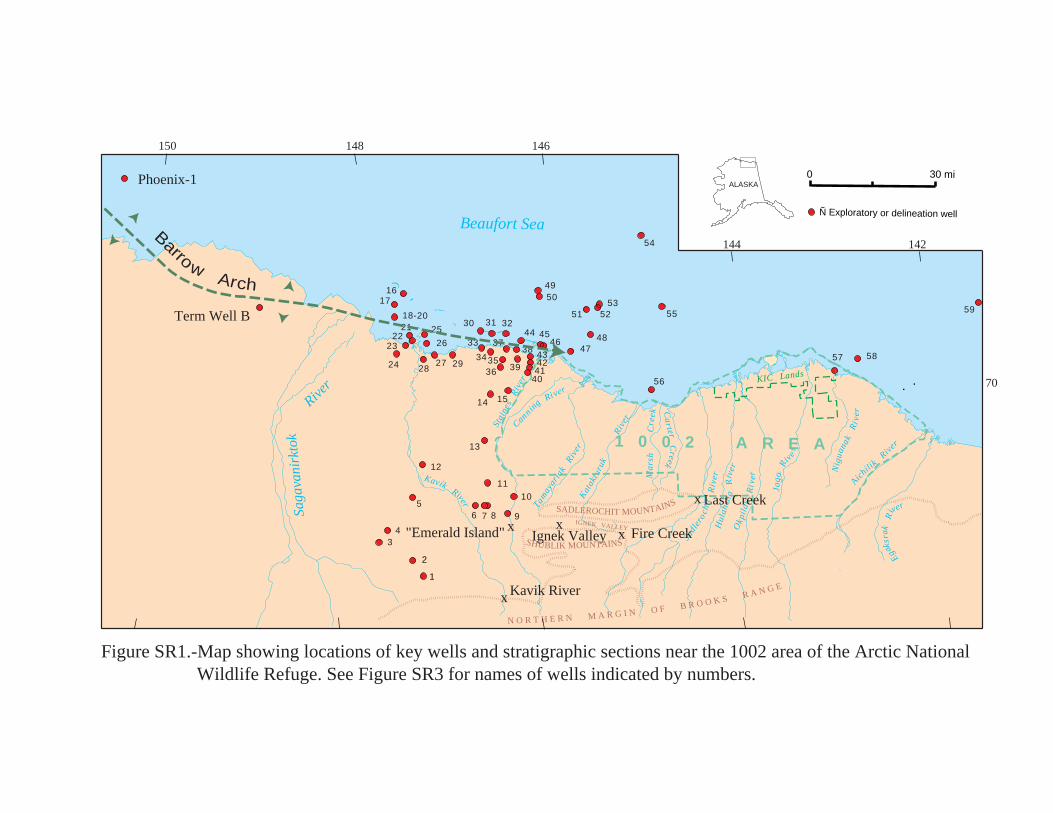
KavikRiver
Stai
nes
Riv
erCannin
g
River
Tamay
aria
kR
iver
Kat
aktu
ruk
Riv
er
Mar
shC
r eek
Sadl
ero
chit
Riv
erH
ulah
ula
Riv
erO
kpil
akR
iver
Car ter
Creek
Jago
R ive
r
Nig
uana
kR
i ver
Aich
ilik
River
Egaks
rak
River
KIC Lands
1 0 0 2 A R E A
IGNEK VALLEY
2
1
56 7 8 9
10
11
12
13
14 15
1617
2122
23
24 28
25
26
27 29
30 31 32
33
3435
3738
44 4546
4748
4950
51 5253
54
56
55
57 58
59
36 39404142
18-20
3 4
Beaufort Sea
N O R T H E R N M A R G I N O F B R O O K S R A N G E
SADLEROCHIT MOUNTAINS
SHUBLIK MOUNTAINS
43
150 148 146
70
Saga
vani
rkto
k
R
iver
x
x
x
Last Creek
Fire Creekx
Ignek Valleyx"Emerald Island"
Kavik River
0 30 mi
Ñ Exploratory or delineation well
144 142
ALASKAPhoenix-1
Term Well B
Barrow Arch
Figure SR1.-Map showing locations of key wells and stratigraphic sections near the 1002 area of the Arctic National Wildlife Refuge. See Figure SR3 for names of wells indicated by numbers.
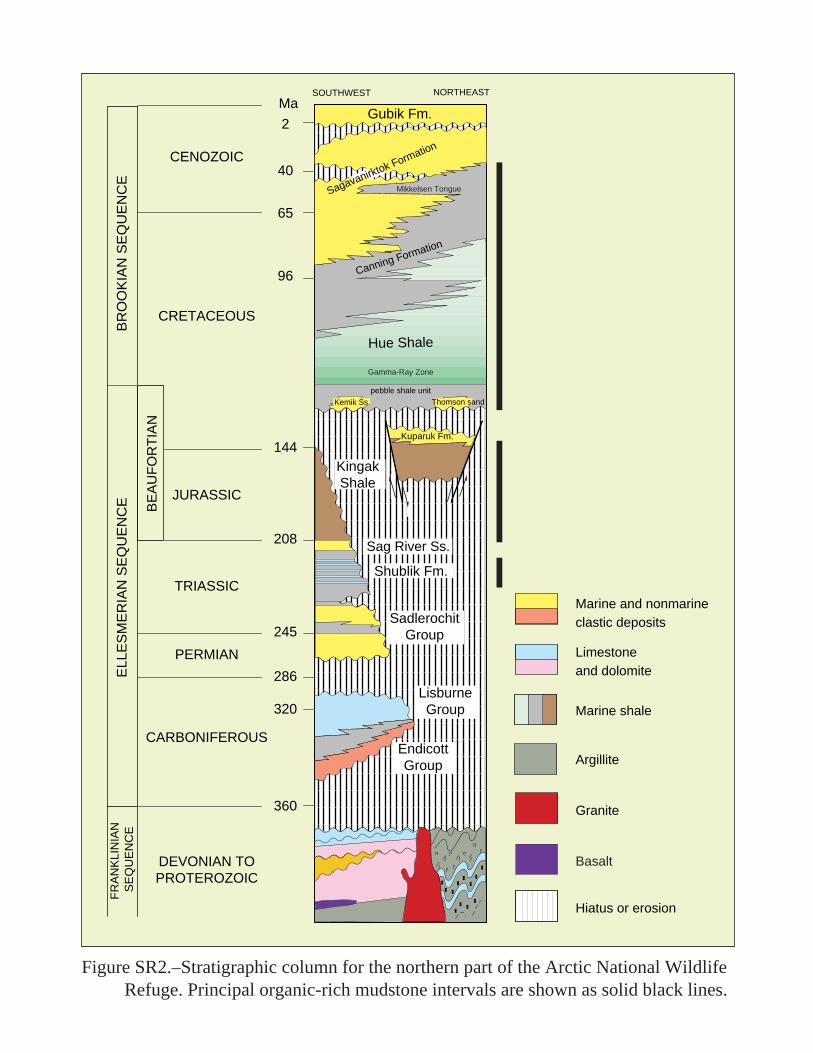
Figure SR2.–Stratigraphic column for the northern part of the Arctic National Wildlife Refuge. Principal organic-rich mudstone intervals are shown as solid black lines.
... ... .... .. . ..
Marine and nonmarineclastic deposits
Limestoneand dolomite
pebble shale unit
SOUTHWEST NORTHEAST
Gubik Fm.Ma
2
40
65
96
144
208
245
286
320
360
DEVONIAN TOPROTEROZOIC
CARBONIFEROUS
PERMIAN
TRIASSIC
JURASSIC
CRETACEOUS
CENOZOIC
BR
OO
KIA
N S
EQ
UE
NC
EE
LLE
SM
ER
IAN
SE
QU
EN
CE
FR
AN
KLI
NIA
N
SE
QU
EN
CE
Kuparuk Fm.
Hue Shale
Canning Formation
BE
AU
FO
RT
IAN
R
Argillite
Granite
Basalt
EndicottGroup
LisburneGroup
SadlerochitGroup
Shublik Fm.
Sag River Ss.
KingakShale
Hiatus or erosion
Kemik Ss.
Mikkelsen TongueStaines Tongue
Thomson sand
Marine shale
Gamma-Ray Zone
Sagavanirktok Formation

Shav
iovi
k
Riv
er
KavikRiver
Stai
nes
Riv
erCannin
gRiver
Tamay
aria
kR
iver
Kat
aktu
ruk
Riv
er
Mar
shC
r eek
Sadl
ero
chit
Riv
erH
ulah
ula
Riv
erO
kpil
akR
iver
Car ter
Creek
Jago
R ive
r
Nig
uana
kR
i ver
Aich
ilik
River
Egaksr
akR
iver
KIC Lands
1 0 0 2 A R E A
3-mile State-Federal boundary
IGNEK VALLEY
0 30 mi
2
1
Exploratory or delineation well Well used for D LogR calculations
56 7 8 9
1011
12
13
14 15
1617
2122
23
24 28
25
26
27 29
30 31 32
33
34
3738
44 4546
4748
4950
51 5253
54
56
55
57 58
59
3639
404142
18-20
3 4
Figure SR3. Location map of wells near the 1002 area of the Arctic National Wildlife Refuge.
Beaufort Sea
N O R T H E R N M A R G I N O F B R O O K S R A N G E
SADLEROCHIT MOUNTAINS
SHUBLIK MOUNTAINS
43
1. Kemik-22. Kemik-13. Fin Creek-14. Shaviovik-15. Gyr-16. Kavik-27. Kavik-18. Kavik-39. Canning River A110. Canning River B111. Beli-112. West Kavik-113. Alaska State J114. Leffingwell-115. Yukon Gold-116. Jeanette Island-117. Karluk-118. Tern-119. Tern-220. Tern-3
21. West Mikkelsen-422. West Mikkelsen-323. West Mikkelsen-124. Alpenglow-125. West Mikkelsen-226. Badami-227. Badami-128. Mikkelsen Bay-129. East Mikkelsen-130. Challenge Island-131. Alaska Island-132. Alaska State F133. Point Thomson-434. Point Thomson-235. West Staines-136. West Staines-237. Point Thomson-138. Point Thomson-339. Alaska State C140. Sourdough-2
41.Sourdough-342. Staines River State-143. North Staines River-144. Alaska State D145. Alaska State A146. Alaska State G247. Stinson-148. Wild Weasel-149. Hammerhead-250. Hammerhead-151. Kuvlum-252. Kuvlum-153. Kuvlum-354. Galahad-155. Corona-156. Warthog-157. KIC Jago River-158. Aurora-159. Belcher-1
35

EMERALD ISLAND SECTION
Gamma-Ray (counts/sec)
0 100 200 300
120 Ma (40Ar/39Ar age)
88-90 Ma (40Ar/39Ar age)
800
700
600
500
400
300
200
100
0
Mea
sure
d th
ickn
ess
in fe
et
mudstone, shale, and tuff
siltstone
sandstone
prismatic calcite-Inoceramus prism horizon
silicifiedInterval
V
V
V
V V
V V
V
V V
V V
V V
V V
V V
V V
V V V
V V
Gamma-Ray Zone ofHue Shale
pebble shale
Kemik Sandstone
Hue Shale
Canning Formation
Figure SR4.–Stratigraphic column, gamma-ray profile, and radiometric age data for the "Emerald Island" section of Kemik Sandstone, pebble shale unit, and Hue Shale along the Canning River (from Bergman and others, 1995, and written communi- cation, March, 1998).
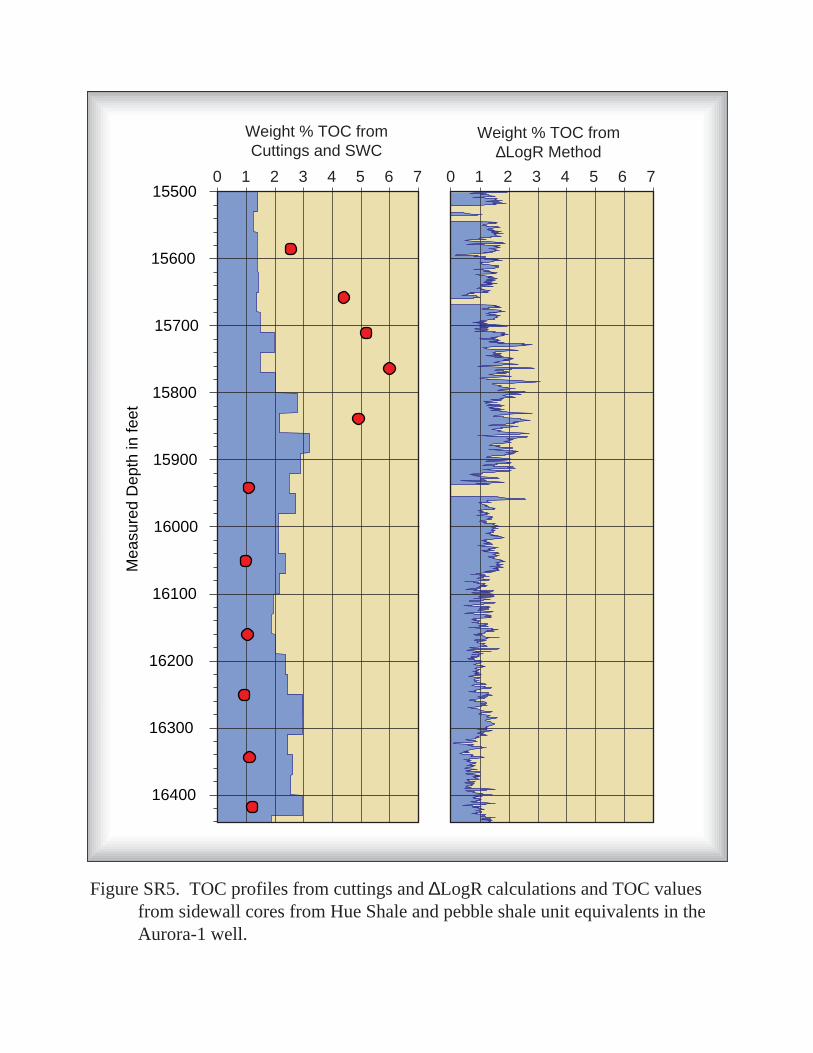
15500
15600
15700
15800
15900
16000
16100
16200
16300
16400
Mea
sure
d D
epth
in fe
et
Figure SR5. TOC profiles from cuttings and D LogR calculations and TOC values from sidewall cores from Hue Shale and pebble shale unit equivalents in the Aurora-1 well.
Weight % TOC fromD LogR Method
Weight % TOC fromCuttings and SWC
0 1 2 3 4 5 6 7 0 1 2 3 4 5 6 7

Table SR1. Richness and source potential for the Hue Shale exclusive of the gamma-ray zone.
Well Name MikkelsonBay 1
PointThomson
2
WestStaines 2
Leffingwell 1
Beli 1 CanningRiver B-1
CanningRiver A-
1
Kavik 1
Gross thickness (feet) 372 382 928 927 545 355 440 735
Average TOC (wt %) 1.97 1.58 1.47 1.35 1.81 2.25 2.55 2.37
Net thickness (feet)(TOC>2 wt %)
169 74 161 163 171 186 344 418
Average TOC (wt %)(TOC>2 wt %)
3.41 3.63 3.72 2.83 2.57 2.91 2.81 3.01
Maximum TOC (wt%) 7.7 6.7 8.7 6.5 4.6 7.6 7 9.9
Net Richness 576 269 599 461 439 541 967 1258
Vitrinite Reflectance (% Ro) 0.9 0.6 0.6 0.6 0.6 0.95 0.9 1
Maturity factor if oil prone 1 0.7 0.7 0.7 0.7 1 1 1
Source Potential Index Oil 576 188 419 323 308 541 967 1258
Maturity factor if gas prone 0.4 0.2 0.2 0.2 0.2 0.4 0.4 0.4
Source Potential Index Gas 230 14 20 92 88 216 387 503
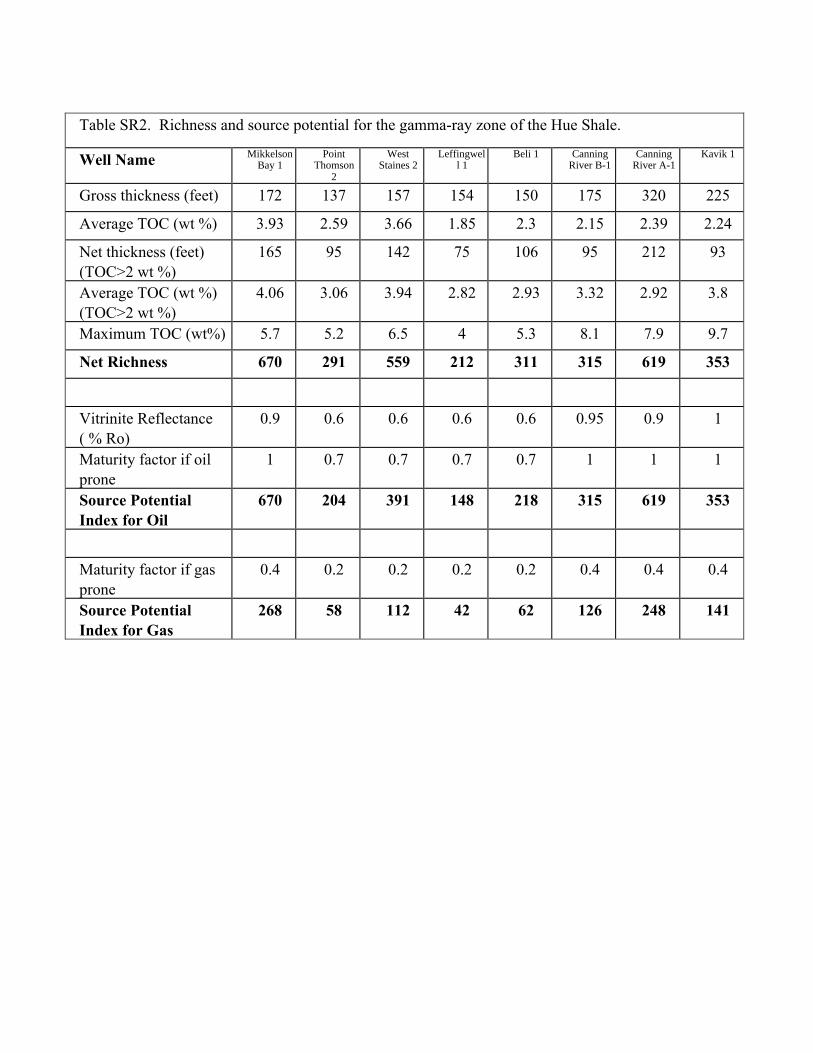
Table SR2. Richness and source potential for the gamma-ray zone of the Hue Shale.
Well Name MikkelsonBay 1
PointThomson
2
WestStaines 2
Leffingwell 1
Beli 1 CanningRiver B-1
CanningRiver A-1
Kavik 1
Gross thickness (feet) 172 137 157 154 150 175 320 225
Average TOC (wt %) 3.93 2.59 3.66 1.85 2.3 2.15 2.39 2.24
Net thickness (feet)(TOC>2 wt %)
165 95 142 75 106 95 212 93
Average TOC (wt %)(TOC>2 wt %)
4.06 3.06 3.94 2.82 2.93 3.32 2.92 3.8
Maximum TOC (wt%) 5.7 5.2 6.5 4 5.3 8.1 7.9 9.7
Net Richness 670 291 559 212 311 315 619 353
Vitrinite Reflectance( % Ro)
0.9 0.6 0.6 0.6 0.6 0.95 0.9 1
Maturity factor if oilprone
1 0.7 0.7 0.7 0.7 1 1 1
Source PotentialIndex for Oil
670 204 391 148 218 315 619 353
Maturity factor if gasprone
0.4 0.2 0.2 0.2 0.2 0.4 0.4 0.4
Source PotentialIndex for Gas
268 58 112 42 62 126 248 141

Table SR3. Richness and source potential for the pebble shale unit.
Well Name MikkelsonBay 1
PointThomson
2
WestStaines 2
Leffingwell 1
Beli 1 CanningRiver B-1
CanningRiver A-1
Kavik 1
Gross thickness (feet) 16 31 85 17 55 55 245 210
Average TOC (wt %) 3.73 1.9 3.77 2.72 1.68 1.47 2.01 2.42
Net thickness (feet)(TOC>2 wt %)
16 11 84 16 18 5 135 90
Average TOC (wt %)(TOC>2 wt %)
3.73 2.66 3.8 2.77 2.67 2.27 2.31 3.76
Maximum TOC (wt%) 4.2 3.2 5.4 3.5 3.8 2.8 3.3 9.5
Net Richness 60 29 319 44 48 11 312 338
Vitrinite Reflectance(%Ro)
0.9 0.6 0.6 0.6 0.6 0.95 0.9 1
Maturity factor if oilprone
1 0.7 0.7 0.7 0.7 1 1 1
Source PotentialIndex for Oil
60 20 223 31 34 11 312 338
Maturity factor if gasprone
0.4 0.2 0.2 0.2 0.2 0.4 0.4 0.4
Source PotentialIndex for Gas
24 6 64 9 10 4 125 135

Table SR4. Richness and source potential for the Hue Shale plus pebble shale unit, with separatecomputation of richness for the entire Hue Shale (including the gamma-ray zone (GRZ)).Well Name Mikkelson
Bay 1Point
Thomson2
WestStaines 2
Leffingwell 1
Beli 1 CanningRiver B-1
CanningRiver A-1
Kavik 1
Gross thickness (feet) 560 550 1170 1098 750 585 1005 1170
Average TOC (wt %) 2.56 1.39 1.92 1.45 1.9 2.15 2.37 2.35
Net thickness (feet)(TOC>2 wt %)
351 180 383 255 295 285 691 603
Average TOC (wt %)(TOC>2 wt %)
3.73 3.27 3.82 2.82 2.7 3.04 2.75 3.24
Maximum TOC (wt %) 7.7 6.7 8.7 6.5 5.4 8.1 7.9 9.9
Net Richness (HueShale + pebble shaleunit)
1309 589 1463 719 797 866 1900 1954
Vitrinite Reflectance (%Ro)
0.9 0.6 0.6 0.6 0.6 0.95 0.9 1
Maturity factor if oilprone
1 0.7 0.7 0.7 0.7 1 1 1
Source Potential Indexfor Oil
1309 412 1024 503 557 866 1900 1954
Maturity factor if gasprone
0.4 0.2 0.2 0.2 0.2 0.4 0.4 0.4
Source Potential Indexfor Gas
524 82 204 101 111 346 760 782
Net Richness (Hueincluding GRZ)
1249 560 1144 675 749 855 1588 1611

Table SR5. Richness and source potential for the Kingak Shale.
Well Name Beli 1 CanningRiver B-1
CanningRiver A-1
Kavik 1
Gross thickness (feet) 295 335 960 740
Average TOC (wt %) 1.38 2.17 1.5 1.02
Net thickness (feet)(TOC>2 wt %)
77 143 144 13
Average TOC (wt %)(TOC>2 wt %)
2.59 3.4 2.39 3.14
Maximum TOC (wt %) 3.5 7.7 4 4.2
Net Richness 199 486 344 41
Vitrinite Reflectance(% Ro)
0.6 0.95 0.9 1.1
Maturity factor if oilprone
0.7 1 1 0.7
Source PotentialIndex for Oil
140 486 344 29
Maturity factor if gasprone
0.2 0.4 0.4 0.7
Source PotentialIndex for Gas
40 194 138 29
Using 1 wt % TOC cutoff:
Net thickness (feet)(TOC>1 wt %)
180 283 813 357
Average TOC (wt %)(TOC>1 wt %)
1.92 2.46 1.61 1.3
Net Richness 346 696 1309 464
Vitrinite Reflectance(% Ro)
0.6 0.95 0.9 1.1
Maturity factor if oilprone
0.7 1 1 0.7
Source PotentialIndex Oil
243 696 1309 325
Maturity factor if gasprone
0.2 0.4 0.4 0.7
Source PotentialIndex Gas
69 278 523 325
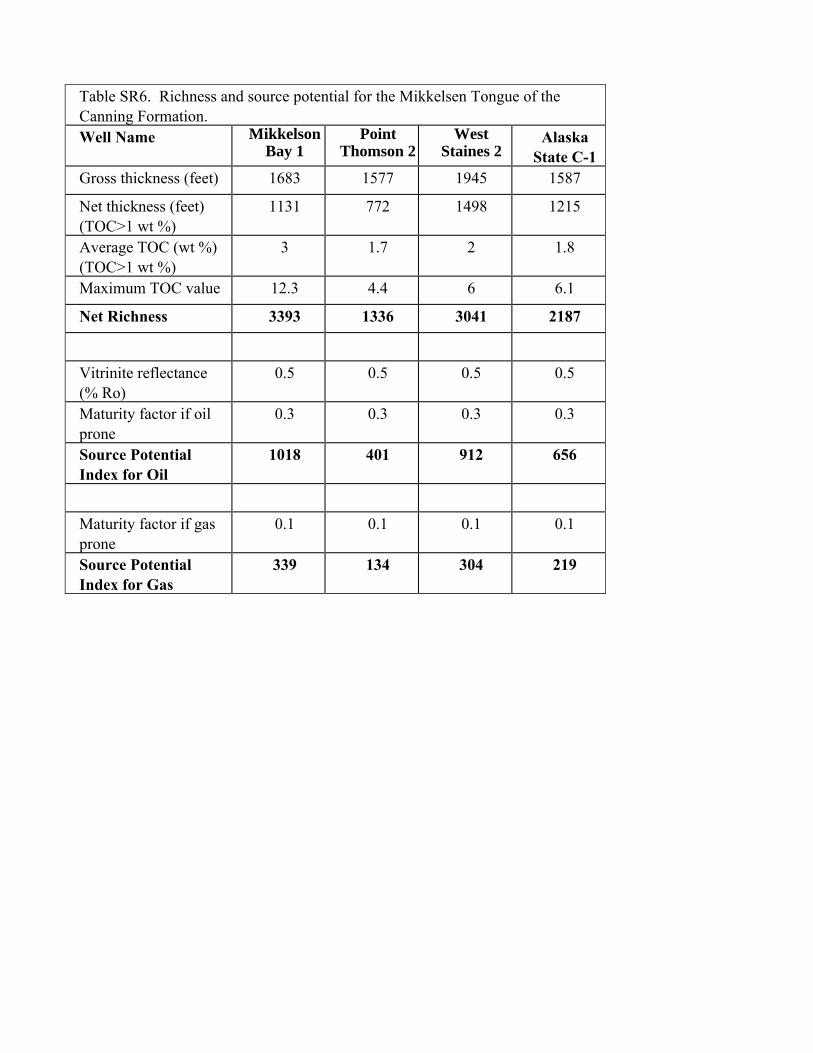
Table SR6. Richness and source potential for the Mikkelsen Tongue of theCanning Formation.Well Name Mikkelson
Bay 1Point
Thomson 2West
Staines 2Alaska
State C-1Gross thickness (feet) 1683 1577 1945 1587
Net thickness (feet)(TOC>1 wt %)
1131 772 1498 1215
Average TOC (wt %)(TOC>1 wt %)
3 1.7 2 1.8
Maximum TOC value 12.3 4.4 6 6.1
Net Richness 3393 1336 3041 2187
Vitrinite reflectance(% Ro)
0.5 0.5 0.5 0.5
Maturity factor if oilprone
0.3 0.3 0.3 0.3
Source PotentialIndex for Oil
1018 401 912 656
Maturity factor if gasprone
0.1 0.1 0.1 0.1
Source PotentialIndex for Gas
339 134 304 219

Table SR7. Total organic carbon (TOC) data for the Shublik Formation.
Sample Location and Reference Average TOCin weight %
Numberof
samples
Range ofTOCvalues
MedianValue
Well Cores
Phoenix-1 (Robison and others,1996)
3.9 70 0.44-10.2 3.1
Term Well B (Kupecz, 1995) 1.8 63 <1 to≈6.4
1.4
Well Cuttings
Beli-1 (Plate WL12; Magoon andothers, 1987)
1.7 7 0.49-5.44
Kemik-2 (Plate WL27; Magoon andothers, 1987)
1.7 4 0.65-3.99
Outcrop Samples
Fire Creek-Upper 230 ft only(Detterman, 1970)
1.6 42 0.20-2.59
Fire Creek-complete Shublik(Detterman, 1970)
1.2 88 0.08-2.59
Fire Creek (Parrish, unpublisheddata, 1997)
2.2 13 0.45-4.87 1.76
Fire Creek (Magoon, AppendixTable 2)
2.0 13 0.85-4.55 1.63
Kavik River (Parrish, unpublisheddata, 1997)
2.6 13 0.74-5.46 2.4
Last Creek (Parrish, unpublisheddata, 1997)
2.4 7 0.64-5.27 2.15
Last Creek (Magoon, AppendixTable 2)
1.2 8 0.42-2.33 1.08
Ignek Valley (Magoon, AppendixTable 2)
2.7 11 0.31-7.01 2.44
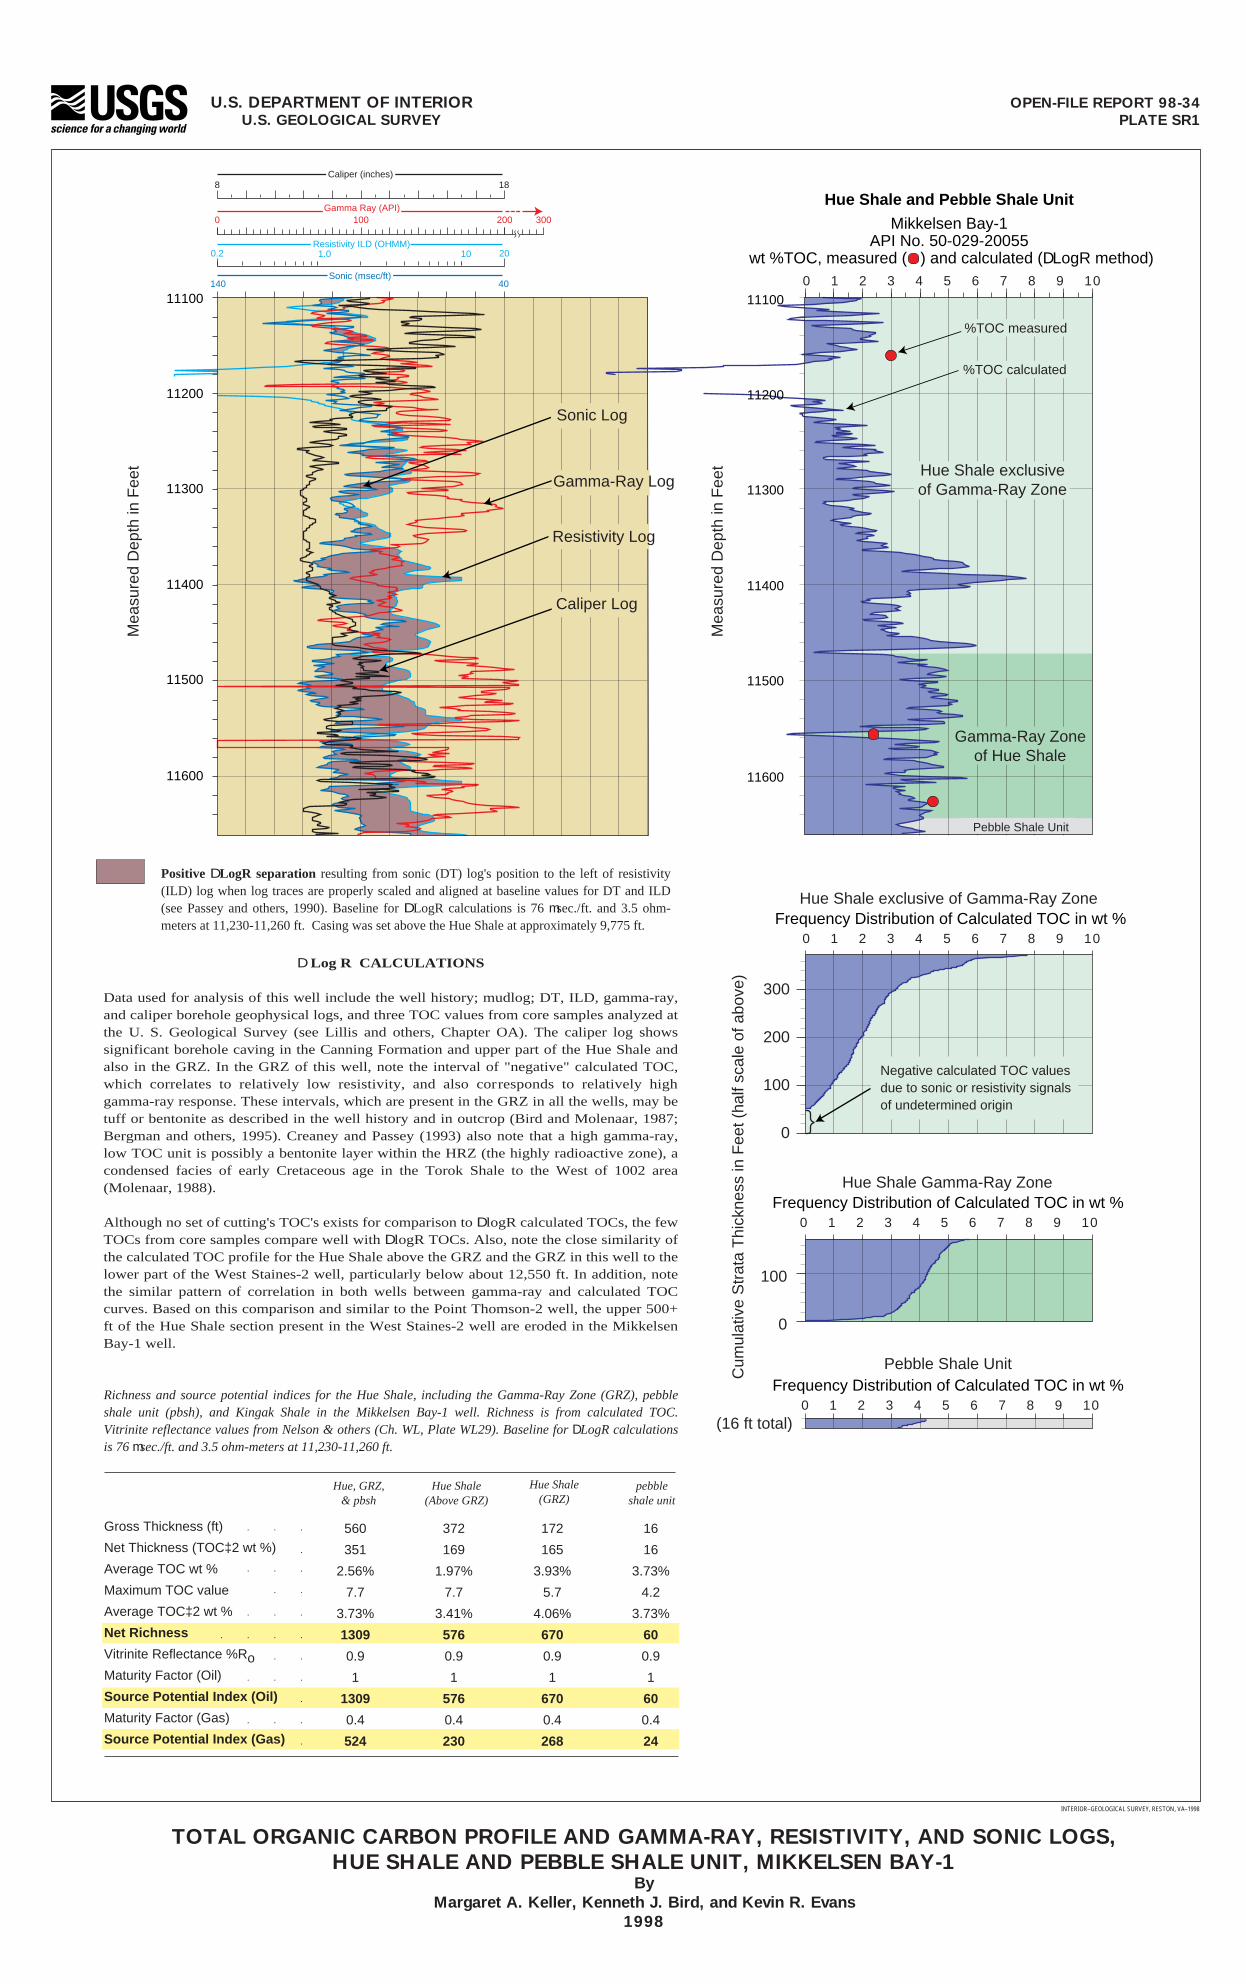
Pebble Shale UnitFrequency Distribution of Calculated TOC in wt %
0 1 2 3 4 5 6 7 8 9 10 (16 ft total)
Mea
sure
d D
epth
in F
eet
11100
11200
11300
11400
11500
11600
Gamma Ray (API)0 200 300100
Caliper (inches)8 18
Sonic (m sec/ft)140 40
Resistivity ILD (OHMM)0.2 20
Hue Shale exclusive of Gamma-Ray Zone
Hue Shale Gamma-Ray Zone
Frequency Distribution of Calculated TOC in wt %0 1 2 3 4 5 6 7 8 9 10
Frequency Distribution of Calculated TOC in wt %0 1 2 3 4 5 6 7 8 9 10
Cum
ulat
ive
Str
ata
Thi
ckne
ss in
Fee
t (ha
lf sc
ale
of a
bove
)
300
200
100
0
100
0
Negative calculated TOC valuesdue to sonic or resistivity signalsof undetermined origin
101.0
0 1 2 3 4 5 6 7 8 9 10
Hue Shale and Pebble Shale Unit
Mikkelsen Bay-1API No. 50-029-20055
wt %TOC, measured ( ) and calculated (D LogR method)
Gamma-Ray Zoneof Hue Shale
Hue Shale exclusiveof Gamma-Ray Zone
11100
11200
11300
11400
11500
11600
Mea
sure
d D
epth
in F
eet
Pebble Shale Unit
OPEN-FILE REPORT 98-34PLATE SR1
U.S. DEPARTMENT OF INTERIORU.S. GEOLOGICAL SURVEY
TOTAL ORGANIC CARBON PROFILE AND GAMMA-RAY, RESISTIVITY, AND SONIC LOGS,HUE SHALE AND PEBBLE SHALE UNIT, MIKKELSEN BAY-1
ByMargaret A. Keller, Kenneth J. Bird, and Kevin R. Evans
1998
INTERIOR–GEOLOGICAL SURVEY, RESTON, VA–1998
Positive D LogR separation resulting from sonic (DT) log's position to the left of resistivity (ILD) log when log traces are properly scaled and aligned at baseline values for DT and ILD (see Passey and others, 1990). Baseline for D LogR calculations is 76 m sec./ft. and 3.5 ohm-meters at 11,230-11,260 ft. Casing was set above the Hue Shale at approximately 9,775 ft.
Richness and source potential indices for the Hue Shale, including the Gamma-Ray Zone (GRZ), pebble shale unit (pbsh), and Kingak Shale in the Mikkelsen Bay-1 well. Richness is from calculated TOC. Vitrinite reflectance values from Nelson & others (Ch. WL, Plate WL29). Baseline for D LogR calculations is 76 m sec./ft. and 3.5 ohm-meters at 11,230-11,260 ft.
D Log R CALCULATIONS
Data used for analysis of this well include the well history; mudlog; DT, ILD, gamma-ray, and caliper borehole geophysical logs, and three TOC values from core samples analyzed at the U. S. Geological Survey (see Lillis and others, Chapter OA). The caliper log shows significant borehole caving in the Canning Formation and upper part of the Hue Shale and also in the GRZ. In the GRZ of this well, note the interval of "negative" calculated TOC, which correlates to relatively low resistivity, and also corresponds to relatively high gamma-ray response. These intervals, which are present in the GRZ in all the wells, may be tuff or bentonite as described in the well history and in outcrop (Bird and Molenaar, 1987; Bergman and others, 1995). Creaney and Passey (1993) also note that a high gamma-ray, low TOC unit is possibly a bentonite layer within the HRZ (the highly radioactive zone), a condensed facies of early Cretaceous age in the Torok Shale to the West of 1002 area (Molenaar, 1988).
Although no set of cutting's TOC's exists for comparison to D logR calculated TOCs, the few TOCs from core samples compare well with D logR TOCs. Also, note the close similarity of the calculated TOC profile for the Hue Shale above the GRZ and the GRZ in this well to the lower part of the West Staines-2 well, particularly below about 12,550 ft. In addition, note the similar pattern of correlation in both wells between gamma-ray and calculated TOC curves. Based on this comparison and similar to the Point Thomson-2 well, the upper 500+ ft of the Hue Shale section present in the West Staines-2 well are eroded in the Mikkelsen Bay-1 well.
Gross Thickness (ft)
Net Thickness (TOC³ 2 wt %)
Average TOC wt %
Maximum TOC value
Average TOC³ 2 wt %
Net Richness
Vitrinite Reflectance %RoMaturity Factor (Oil)
Source Potential Index (Oil)
Maturity Factor (Gas)
Source Potential Index (Gas)
Hue Shale(GRZ)
172
165
3.93%
5.7
4.06%
670
0.9
1
670
0.4
268
pebbleshale unit
16
16
3.73%
4.2
3.73%
60
0.9
1
60
0.4
24
Hue Shale(Above GRZ)
372
169
1.97%
7.7
3.41%
576
0.9
1
576
0.4
230
Hue, GRZ,& pbsh
560
351
2.56%
7.7
3.73%
1309
0.9
1
1309
0.4
524
%TOC calculated
%TOC measured
Resistivity Log
Gamma-Ray Log
Sonic Log
Caliper Log

Mea
sure
d D
epth
in F
eet
12500
12600
12700
12800
12900
0 1 2 3 4 5 6 7 8 9 10
Mea
sure
d D
epth
in F
eet
Hue Shale and Pebble Shale Unit
Point Thomson-2API No. 50-089-20006
wt %TOC, measured ( ) and calculated (D Log R method)
12700
12800
12900 Gamma-Ray Zoneof Hue Shale
Hue Shale exclusiveof Gamma-Ray Zone
Pebble Shale Unit
Gamma Ray (API)0 200 300100
Caliper (inches)8 18
Sonic (m sec/ft)120 20
Resistivity ILD (OHMM)0.7 70
Hue Shale exclusive of Gamma-Ray Zone
Hue Shale Gamma-Ray Zone
Pebble Shale Unit
Frequency Distribution of Calculated TOC in wt %0 1 2 3 4 5 6 7 8 9 10
Frequency Distribution of Calculated TOC in wt %0 1 2 3 4 5 6 7 8 9 10
Frequency Distribution of Calculated TOC in wt %0 1 2 3 4 5 6 7 8 9 10
Cum
ulat
ive
Str
ata
Thi
ckne
ss in
Fee
t (ha
lf sc
ale
of a
bove
)
300
200
100
0
100
0
Negative calculated TOC valuesdue to sonic or resistivity signalsof undetermined origin
(31 ft total)
101.0
12500
12600
OPEN-FILE REPORT 98-34PLATE SR2
U.S. DEPARTMENT OF INTERIORU.S. GEOLOGICAL SURVEY
TOTAL ORGANIC CARBON PROFILE AND GAMMA-RAY, RESISTIVITY, AND SONIC LOGS,HUE SHALE AND PEBBLE SHALE UNIT, POINT THOMSON-2
ByMargaret A. Keller, Kenneth J. Bird, and Kevin R. Evans
1998
INTERIOR–GEOLOGICAL SURVEY, RESTON, VA–1998
Positive D LogR separation resulting from sonic (DT) log's position to the left of resistivity (ILD) log when log traces are properly scaled and aligned at baseline values for DT and ILD (see Passey and others, 1990). Baseline for D LogR calculation is 75 m sec./ft. and 6.2 ohm-meters at 12,400-12,440 ft. Casing was set above the Hue Shale at approximately 10,100 ft.
Richness and source potential indices for the Hue Shale, including the Gamma-Ray Zone (GRZ), pebble shale unit (pbsh), and Kingak Shale in the Point Thomson-2 well. Richness is from calculated TOC. Vitrinite reflectance values from Nelson & others (Ch. WL, Plate WL34). Baseline for D LogR calculations is 75 m sec./ft. and 6.2 ohm-meters at 12,400-12,440 ft.
D LogR CALCULATIONS
Data used for analysis of this well include the well history; mudlog; DT, ILD, gamma-ray, and caliper borehole geophysical logs; and reported TOC values measured on cuttings. No additional information is available about the TOC values from cuttings, such as whether the samples were composited or from selected individual rock chips. However, the caliper log shows severe caving in the Canning Formation overlying the Hue and also in the lower part of the GRZ and the pebble shale.
The TOCs measured on borehole cuttings from this well do not compare well with calculated D logR TOC values. This may be due to the extensive caving in this borehole and resulting sample contamination of the cuttings. Furthermore, the close similarity of the calculated TOC profile in this well to that in the nearby West Staines-2 well beginning at approximately 12,540 ft, in addition to the similar pattern of correlation in both wells between gamma-ray and calculated TOC curves, suggests that the calculated TOC values may be more reliable for this well. The correlation also shows that the upper 500+ ft of the Hue Shale section in the West Staines-2 well are eroded in the Point Thomson-2 well.
The numerous "negative" values for calculated TOC due to very low resistivities in this well may indicate that the baseline needs to be adjusted. This would uniformly add ª 1-1.5 wt % TOC to the curve, not changing its shape, but bringing many of the values closer to values in correlative intervals of the West Staines-2 well, and would also increase the richness and source potential indices in the table below. In the GRZ of this well, note the intervals of very low or "negative" calculated TOCs which are due to high conductivity or low resistivity, and also correspond to relatively higher gamma-ray response. These intervals, which are present in the GRZ in all the wells, may be tuff or bentonite as described in the well history and in outcrop (Bird and Molenaar, 1987; Bergman and others, 1995).
Gross Thickness (ft)
Net Thickness (TOC³ 2 wt %)
Average TOC wt %
Maximum TOC value
Average TOC³ 2 wt %
Net Richness
Vitrinite Reflectance %RoMaturity Factor (Oil)
Source Potential Index (Oil)
Maturity Factor (Gas)
Source Potential Index (Gas)
Hue Shale(GRZ)
137
95
2.59%
5.2
3.06%
291
0.6
0.7
204
0.2
58
pebbleshale unit
31
11
1.9%
3.2
2.66%
29
0.6
0.7
20
0.2
6
Hue Shale(Above GRZ)
382
74
1.58%
6.7
3.63%
269
0.6
0.7
188
0.2
14
Hue, GRZ,& pbsh
550
180
1.39%
6.7
3.27%
589
0.6
0.7
412
0.2
82
%TOC measured
%TOC calculated
Sonic Log
Resistivity Log
Gamma-Ray Log
Caliper Log

Pebble Shale UnitFrequency Distribution of Calculated TOC in wt %
0 1 2 3 4 5 6 7 8 9 10 80
0
0 1 2 3 4 5 6 7 8 9 10
Hue Shale and Pebble Shale Unit
West Staines-2API No. 50-089-20004
wt %TOC, measured ( ) and calculated (D Log R method)
Gamma Ray (API)0 200 300100
Caliper (inches)8 18
Sonic (m sec/ft)
Resistivity ILD (OHMM)1 10 100
110 10
Gamma-Ray Zoneof Hue Shale
Hue Shale exclusiveof Gamma-Ray Zone
Pebble Shale Unit
Mea
sure
d D
epth
in F
eet
Mea
sure
d D
epth
in F
eet
12000
12100
12200
12300
12400
12500
12600
12700
12800
12900
13000
13100
12000
12100
12200
12300
12400
12500
12600
12700
12800
12900
13000
13100
Negative calculated TOC valuesdue to sonic or resistivity signalsof undetermined origin
Hue Shale exclusive of Gamma-Ray ZoneFrequency Distribution of Calculated TOC in wt %
0 1 2 3 4 5 6 7 8 9 10
Cum
ulat
ive
Str
ata
Thi
ckne
ss in
Fee
t (ha
lf sc
ale
of a
bove
)
900
800
700
600
500
400
300
200
100
0
Hue Shale Gamma-Ray ZoneFrequency Distribution of Calculated TOC in wt %
0 1 2 3 4 5 6 7 8 9 10
100
0
OPEN-FILE REPORT 98-34PLATE SR3
U.S. DEPARTMENT OF INTERIORU.S. GEOLOGICAL SURVEY
TOTAL ORGANIC CARBON PROFILE AND GAMMA-RAY, RESISTIVITY, AND SONIC LOGS,HUE SHALE AND PEBBLE SHALE UNIT, WEST STAINES-2
ByMargaret A. Keller, Kenneth J. Bird, and Kevin R. Evans
1998
INTERIOR–GEOLOGICAL SURVEY, RESTON, VA–1998
Positive D LogR separation resulting from sonic (DT) log's position to the left of resistivity (ILD) log when log traces are properly scaled and aligned at baseline values for DT and ILD (see Passey and others, 1990). Baseline for D LogR calculation is 91 m sec./ft. and 2.05 ohm-meters at 12,200-12,320 ft. Casing was set above the Hue Shale at approximately 11,250 ft.
Richness and source potential indices for the Hue Shale, including the Gamma-Ray Zone (GRZ), pebble shale unit (pbsh), and Kingak Shale in the West Staines-2 well. Richness is from calculated TOC. Vitrinite reflectance values from Nelson & others (Ch. WL, Plate WL37). Baseline for D LogR calculations is 91 m sec./ft. and 2.05 ohm-meters at 12,200-12,320 ft.
D LogR CALCULATIONS
Data used for analysis of this well include the well history; mudlog; DT, ILD, gamma-ray, and caliper borehole geophysical logs; and reported TOC values measured on cuttings. No additional information is available about the TOC values from cuttings, such as whether the samples were composited or from selected individual rock chips. The caliper log indicates that only minor caving occurred in the borehole; much of this is in the upper Hue Shale and in the overlying Canning Formation.
Good agreement exists between calculated TOC values and most measured TOC values, or they differ in a reasonable manner in that they represent interval averages of different intervals. The exceptions are intervals where the calculated TOC values are higher than measured TOCs, such as the basal part of the pebble shale, and intervals where calculated TOCs are lower than measured values, such as the upper part of the GRZ. Note in the GRZ the intervals of very low or "negative" calculated TOCs whic h are due to high conductivity/low resistivity, and also correspond to relatively higher gamma-ray response. These intervals, which are present in the GRZ in all the wells, may be tuff or bentonite as described in the well history and in outcrop (Bird and Molenaar, 1987; Bergman and others, 1995).
Gross Thickness (ft)
Net Thickness (TOC³ 2 wt %)
Average TOC wt %
Maximum TOC value
Average TOC³ 2 wt %
Net Richness
Vitrinite Reflectance %RoMaturity Factor (Oil)
Source Potential Index (Oil)
Maturity Factor (Gas)
Source Potential Index (Gas)
Hue Shale(GRZ)
157
142
3.66%
6.5
3.94%
559
0.6
0.7
391
0.2
112
pebbleshale unit
85
84
3.77%
5.4
3.8%
319
0.6
0.7
223
0.2
64
Hue Shale(Above GRZ)
928
161
1.47%
8.7
3.72%
599
0.6
0.7
419
0.2
20
Hue, GRZ,& pbsh
1170
383
1.92%
8.7
3.82%
1463
0.6
0.7
1024
0.2
204
%TOC calculated
%TOC measured
Resistivity Log
Gamma-Ray Log
Sonic Log
Caliper Log

Cum
ulat
ive
Str
ata
Thi
ckne
ss in
Fee
t (ha
lf sc
ale
of a
bove
)
Mea
sure
d D
epth
in F
eet
Mea
sure
d D
epth
in F
eet
13200
13300
13400
13500
12900
13000
13100
12700
12800
12900
13000
13100
12700
12800
13600
13700
13800
0 1 2 3 4 5 6 7 8 9 10
Hue Shale and Pebble Shale Unit
Leffingwell-1API No. 50-089-20021
wt % TOC, calculated (D LogR method)
Gamma Ray (API)0 200 300100
Sonic (m sec/ft)
Resistivity ILD (OHMM)1 10 600.6
120 20
(17 ft total)
13200
13300
13400
13500
13600
13700
13800
Gamma-Ray Zoneof Hue Shale
Hue Shale exclusiveof Gamma-Ray Zone
Pebble Shale Unit
Hue Shale Gamma-Ray ZoneFrequency Distribution of Calculated TOC in wt %
0 1 2 3 4 5 6 7 8 9 10
Hue Shale exclusive of Gamma-Ray ZoneFrequency Distribution of Calculated TOC in wt %
0 1 2 3 4 5 6 7 8 9 10
Pebble Shale UnitFrequency Distribution of Calculated TOC in wt %
0 1 2 3 4 5 6 7 8 9 10
100
0
900
800
700
600
500
400
300
200
100
0
Negative calculated TOC values
Negative calculated TOC valuesdue to sonic or resistivity signalsof undetermined origin
Sonic Log
Gamma-Ray Log
Resistivity Log
OPEN-FILE REPORT 98-34PLATE SR4
U.S. DEPARTMENT OF INTERIORU.S. GEOLOGICAL SURVEY
TOTAL ORGANIC CARBON PROFILE AND GAMMA-RAY, RESISTIVITY, AND SONIC LOGS,HUE SHALE AND PEBBLE SHALE UNIT, LEFFINGWELL-1
ByMargaret A. Keller, Kenneth J. Bird, and Kevin R. Evans
1998
INTERIOR–GEOLOGICAL SURVEY, RESTON, VA–1998
Positive D LogR separation resulting from sonic (DT) log's position to the left of resistivity (ILD) log when log traces are properly scaled and aligned at baseline values for DT and ILD (see Passey and others, 1990). Baseline for D LogR calculation is 89 m sec./ft. and 2.2 ohm-meters at 13,000-13,100 ft. Casing was set above the Hue Shale at approximately 12,300 ft.
Richness and source potential indices for the Hue Shale, including the Gamma-Ray Zone (GRZ), pebble shale unit (pbsh), and Kingak Shale in the Leffingwell-1 well. Richness is from calculated TOC. Vitrinite reflectance values from Nelson & others (Ch. WL, Plate WL28). Baseline for D LogR calculations is 89 m sec./ft. and 2.2 ohm-meters at 13,000-13,100 ft.
D LogR CALCULATIONS
Data used for analysis of this well include the well history; mudlog; and the DT, ILD, and gamma-ray borehole logs. The caliper log, which does not extend down to the Hue and Pebble shale, indicates caving in the Canning Formation overlying the Hue. Note in the GRZ of this well the intervals of low or "negative" calculated TOC's which are due to high conductivity/low resistivity, and also correspond to relatively higher gamma-ray response. These intervals, which are present in the GRZ in all the wells, may be tuff or bentonite as described in the well history and in outcrop (Bird and Molenaar, 1987; Bergman and others, 1995). Creaney and Passey (1993) also note that a high gamma-ray, low TOC unit is possibly a bentonite layer within the HRZ (the highly radioactive zone), a condensed facies of early Cretaceous age in the Torok Shale to the West of the 1002 area (Molenaar, 1988).
Although no measured TOCs on well samples have been reported to compare to calculated D logR TOC values, note the close similarity of the calculated TOC profile in this well to that in the nearby West Staines-2 well, in addition to the similar pattern of correlation in both wells between gamma-ray and calculated TOC curves.
Gross Thickness (ft)
Net Thickness (TOC³ 2 wt %)
Average TOC wt %
Maximum TOC value
Average TOC³ 2 wt %
Net Richness
Vitrinite Reflectance %RoMaturity Factor (Oil)
Source Potential Index (Oil)
Maturity Factor (Gas)
Source Potential Index (Gas)
Hue Shale(GRZ)
154
75
1.85%
4.0
2.82%
212
0.6
0.7
148
0.2
42
pebbleshale unit
17
16
2.72%
3.5
2.77%
44
0.6
0.7
31
0.2
9
Hue Shale(Above GRZ)
927
163
1.35%
6.5
2.83%
461
0.6
0.7
323
0.2
92
Hue, GRZ,& pbsh
1098
255
1.45%
6.5
2.82%
719
0.6
0.7
503
0.2
101
%TOC calculated

0 1 2 3 4 5 6 7 8 9 10
Hue Shale, Pebble Shale Unit, and Kingak Shale
Beli -1API No. 50-179-20002
wt % TOC, measured ( ) and calculated (D Log R method)
Gamma-Ray Zoneof Hue Shale
Hue Shale exclusiveof Gamma-Ray Zone
Pebble Shale Unit
Kemik Sandstone
Kingak Shale
Mea
sure
d D
epth
in F
eet
Mea
sure
d D
epth
in F
eet
Cum
ulat
ive
Str
ata
Thi
ckne
ss in
Fee
t (ha
lf sc
ale
of a
bove
)
Pebble Shale UnitFrequency Distribution of Calculated TOC in wt %
0 1 2 3 4 5 6 7 8 9 10
Hue Shale exclusive of Gamma-Ray ZoneFrequency Distribution of Calculated TOC in wt %
0 1 2 3 4 5 6 7 8 9 10
Hue Shale Gamma-Ray ZoneFrequency Distribution of Calculated TOC in wt %
0 1 2 3 4 5 6 7 8 9 10
Kingak ShaleFrequency Distribution of Calculated TOC in wt %
300
200
100
0
500
400
300
200
100
0
100
0
0 1 2 3 4 5 6 7 8 9 10
400
Gamma Ray (API)0 200 300100
Caliper (inches)8 18
Sonic (m sec/ft)
Resistivity ILD (OHMM)1.0 10 100
120 20
10100
10200
10300
10400
10500
10600
10700
10800
10900
11000
11100
10100
10200
10300
10400
10500
10600
10700
10800
10900
11000
11100
Positive D LogR separation resulting from sonic (DT) log's position to the left of resistivity (ILD) log when log traces are properly scaled and aligned at baseline values for DT and ILD (see Passey and others, 1990). Baselines for D LogR calculations are 78 m sec./ft. and 5.4 ohm-meters at 10,200-10,250 ft and 70 m sec./ft. and 7 ohm-meters for the Kingak Shale at 11,050-11,120 ft. Casing was set above the Hue Shale at approximately 2,680 ft.
Richness and source potential indices for the Hue Shale, including the Gamma-Ray Zone (GRZ), pebble shale unit (pbsh), and Kingak Shale in the Beli-1 well. Richness is from calculated TOC. Vitrinite reflectance values from Nelson & others (Ch. WL, Plate WL12). Baselines for D LogR calculations are 78 m sec./ft. and 5.4 ohm-meters at 10,200-10,250 ft and 70 m sec./ft. and 7 ohm-meters at 11,050-11,120 ft.
D LogR CALCULATIONS
Data used for analysis of this well include the well history; mudlog; DT, ILD, gamma-ray, and caliper borehole geophysical logs; and reported TOC values measured on cuttings. No additional information is available about the TOC values from cuttings, such as whether the samples were composited or from selected individual rock chips. The caliper log indicates that caving occurred in the borehole, including the Kingak, pebble shale unit, GRZ, Hue Shale above the GRZ, and in the overlying Canning Formation. Thus, both the quality of the borehole logs, principally the sonic DT log, and the representativeness of the measured values of TOC (from borehole cuttings) are somewhat questionable. However, in general the calculated TOC values agree fairly well with measured values, or seem to differ in a reasonable manner in that they represent interval averages of different intervals.
The exceptions are several intervals where the calculated TOC values are higher than measured TOCs, such as the upper part of the Hue Shale, and several intervals where the calculated TOCs are lower than measured values, such as the lower parts of the GRZ and Kingak Shale. Contamination by cuttings from overlying units with lower TOC may explain the first case, but does not seem to be the only explanation in the second case (e.g., the lower part of the GRZ at ª 10,710 ft and the middle part of the Kingak at ª 10,960 ft) where calculated TOCs are lower than measured values, and where these measured values are also higher than measured values in the adjacent overlying section. Also note in the GRZ the two intervals of "negative" calculated TOCs which ar e due to high conductivity/low resistivity, and also correspond to relatively higher gamma-ray response. These intervals, which are present in the GRZ in all the wells, may be tuff or bentonite as described in the well history and in outcrop (Bird and Molenaar, 1987; Bergman and others, 1995).
OPEN-FILE REPORT 98-34PLATE SR5
U.S. DEPARTMENT OF INTERIORU.S. GEOLOGICAL SURVEY
TOTAL ORGANIC CARBON PROFILE AND CALIPER, GAMMA-RAY, RESISTIVITY, AND SONIC LOGS,HUE SHALE, PEBBLE SHALE UNIT, AND KINGAK SHALE, BELI-1
ByMargaret A. Keller, Kenneth J. Bird, and Kevin R. Evans
1998
INTERIOR–GEOLOGICAL SURVEY, RESTON, VA–1998
Gross Thickness (ft)
Net Thickness (TOC³ 2 wt %)
Average TOC wt %
Maximum TOC value
Average TOC³ 2 wt %
Net Richness
Vitrinite Reflectance %RoMaturity Factor (Oil)
Source Potential Index (Oil)
Maturity Factor (Gas)
Source Potential Index (Gas)
Hue Shale(Above GRZ)
Hue Shale(GRZ)
pebbleshale unit
KingakShale
150
106
2.3%
5.3
2.93%
311
0.6
0.7
218
0.2
62
55
18
1.68%
3.8
2.67%
48
0.6
0.7
34
0.2
10
295
77
1.38%
3.5
2.59%
199
0.6
0.7
140
0.2
40
KingakShale*
295
180
1.38%
3.5
1.92%
346
0.6
0.7
243
0.2
69
545
171
1.81%
4.6
2.57%
439
0.6
0.7
308
0.2
88
Hue, GRZ,& pbsh
750
295
1.9%
5.4
2.7%
797
0.6
0.7
557
0.2
111
*Tabulations using ³ 1 wt % TOC.
Gamma-Ray Log
Caliper Log
Resistivity LogSonic Log
%TOC measured
%TOC calculated

0 1 2 3 4 5 6 7 8 9 10
Hue Shale, Pebble Shale Unit, and Kingak Shale
Canning River B-1API No. 50-179-20006
wt %TOC, measured ( ) and calculated (D Log R method)
Gamma Ray (API)0 200 300100
Caliper (inches)8 18
Sonic (m sec/ft)
Resistivity ILD (OHMM)0.1 10 100
130 30
7500
7600
7700
7800
8000
8100
8200
8300
7500
7600
7700
7900
8000
8100
8200
8300
Gamma-Ray Zoneof Hue Shale
Hue Shale exclusiveof Gamma-Ray Zone
Pebble Shale Unit
Kemik Sandstone
Kingak Shale
Mea
sure
d D
epth
in F
eet
Cum
ulat
ive
Str
ata
Thi
ckne
ss in
Fee
t (ha
lf sc
ale
of a
bove
)
Pebble Shale UnitFrequency Distribution of Calculated TOC in wt %
0 1 2 3 4 5 6 7 8 9 10
Hue Shale exclusive of Gamma-Ray ZoneFrequency Distribution of Calculated TOC in wt %
0 1 2 3 4 5 6 7 8 9 10
Hue Shale Gamma-Ray ZoneFrequency Distribution of Calculated TOC in wt %
0 1 2 3 4 5 6 7 8 9 10
Kingak ShaleFrequency Distribution of Calculated TOC in wt %
600
500
400
300
200
100
0
300
200
100
0
100
0
0 1 2 3 4 5 6 7 8 9 10
400
7900
Mea
sure
d D
epth
in F
eet
7800
Gross Thickness (ft)
Net Thickness (TOC³ 2 wt %)
Average TOC wt %
Maximum TOC value
Average TOC³ 2 wt %
Net Richness
Vitrinite Reflectance %RoMaturity Factor (Oil)
Source Potential Index (Oil)
Maturity Factor (Gas)
Source Potential Index (Gas)
Hue Shale(Above GRZ)
Hue Shale(GRZ)
pebbleshale unit
KingakShale
Positive D LogR separation resulting from sonic (DT) log's position to the left of resistivity (ILD) log when log traces are properly scaled and aligned at baseline values for DT and ILD (see Passey and others, 1990). Baseline for D LogR calculations is 76 m sec./ft. and 10.2 ohm-meters at 7,560-7,580 ft. Casing was set above the Hue Shale at approximately 2,500 ft.
D LogR CALCULATIONS
Data used for analysis of this well include the well history; mudlog; DT, ILD, gamma-ray, and caliper borehole geophysical logs; and reported TOC values measured on cuttings. No additional information is available about the TOC values from cuttings, such as whether the samples were composited or from selected individual rock chips. The caliper log indicates that caving occurred in many parts of the borehole, and severely in the Kingak, pebble shale unit, lower part of the GRZ, and in the Canning Formation overlying the Hue Shale. Therefore, both the quality of the borehole logs, principally the sonic DT log, and the representativeness of the measured values of TOC (from borehole cuttings) are somewhat questionable. However, in general the calculated TOC values agree very well with measured values, or seem to differ in a reasonable manner in that they represent interval averages of different intervals, with the exception of two anomalous TOC peaks at ª 7,805 ft and 7,840 ft. These peaks correlate to relatively high measured TOC values between 5 and 6 wt %, but have "negative" calculated TOCs due to very low resistivity or high conductivity, and are present in the GRZ in all the wells. They also commonly correspond to relatively higher gamma-ray response, and may be tuff or bentonite as noted in the mudlog and in outcrop for the GRZ (Bird and Molenaar, 1987; Bergman and others, 1995).
Some intervals where the calculated TOC values are much higher than measured TOCs, such as the upper part of the Hue Shale, may indicate contamination by cuttings from overlying units with lower TOC. The other explanation for most of the intervals in which the travel times exceed 150 µsec/ft (e.g. ª 7,890-7,910 ft and 8,110-8,180 ft) and where the calculated TOCs are also much higher than measured TOC values is cycle skipping, as described for the Canning River A-1 well.
Richness and source potential indices for the Hue Shale, including the Gamma-Ray Zone (GRZ), pebble shale unit (pbsh), and Kingak Shale in the Canning River B-1 well. Richness is from calculated TOC. Vitrinite reflectance values from Nelson & others (Ch. WL, Plate WL14). Baseline for D LogR calculations is 76 m sec./ft. and 10.2 ohm-meters at 7,560-7,580 ft.
175
95
2.15%
8.1
3.32%
315
0.95
1
315
0.4
126
55
5
1.47%
2.8
2.27%
11
0.95
1
11
0.4
4
335
143
2.17%
7.7
3.4%
486
0.95
1
486
0.4
194
KingakShale*
335
283
2.17%
7.7
2.46%
696
0.95
1
696
0.4
278
355
186
2.25%
7.6
2.91%
541
0.95
1
541
0.4
216
Hue, GRZ,& pbsh
585
285
2.15%
8.1
3.04%
866
0.95
1
866
0.4
346
*Tabulations using ³ 1 wt % TOC.
OPEN-FILE REPORT 98-34PLATE SR6
U.S. DEPARTMENT OF INTERIORU.S. GEOLOGICAL SURVEY
TOTAL ORGANIC CARBON PROFILE AND CALIPER, GAMMA-RAY, RESISTIVITY, AND SONIC LOGS,HUE SHALE, PEBBLE SHALE UNIT, AND KINGAK SHALE, CANNING RIVER B-1
ByMargaret A. Keller, Kenneth J. Bird, and Kevin R. Evans
1998
INTERIOR–GEOLOGICAL SURVEY, RESTON, VA–1998
Gamma-Ray Log
Caliper LogResistivity Log
Sonic Log
%TOC calculated
%TOC measured
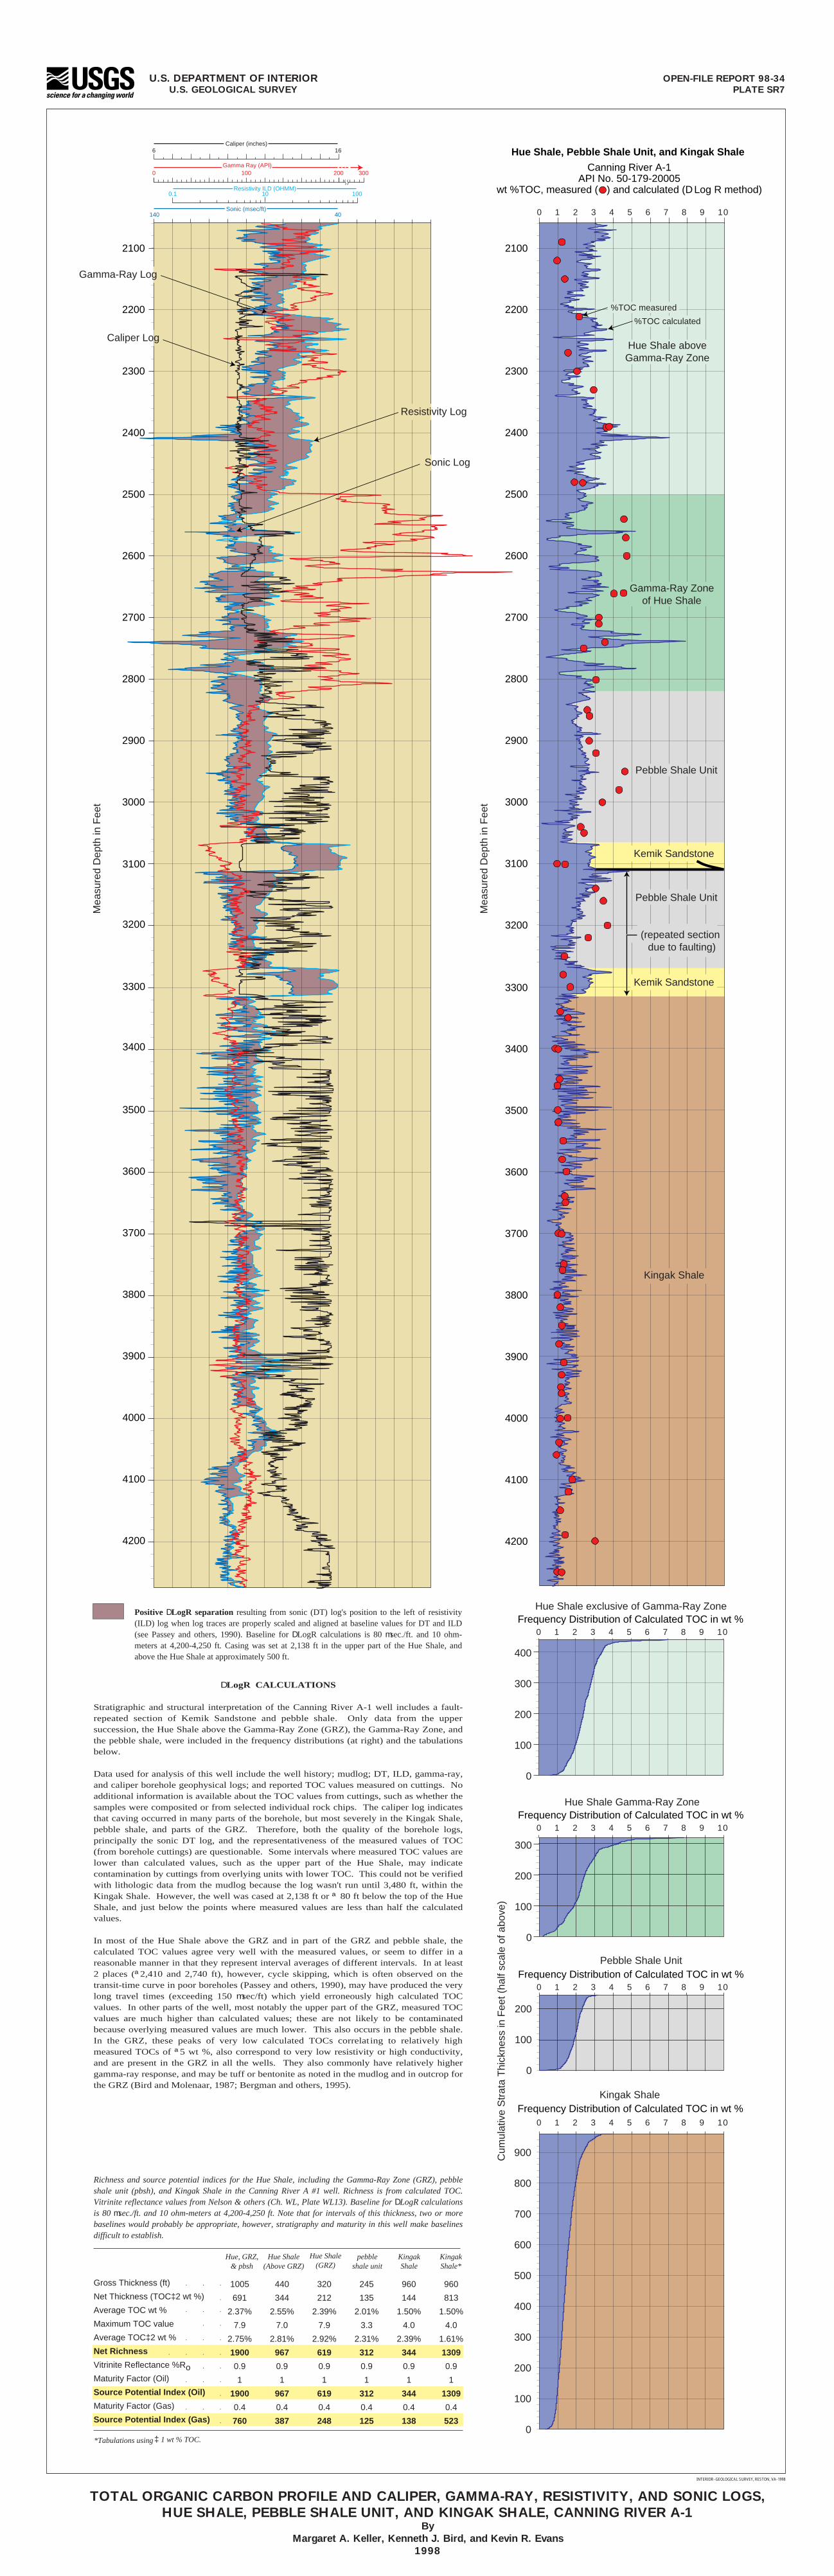
3500
3400
3300
3200
3100
3600
3700
3800
3900
4000
4100
4200
0 1 2 3 4 5 6 7 8 9 10
Hue Shale, Pebble Shale Unit, and Kingak Shale
Canning River A-1API No. 50-179-20005
wt %TOC, measured ( ) and calculated (D Log R method)
Gamma Ray (API)0 200 300100
Caliper (inches)6 16
Sonic (m sec/ft)
Resistivity ILD (OHMM)0.1 10 100
140 40
Gross Thickness (ft)
Net Thickness (TOC³ 2 wt %)
Average TOC wt %
Maximum TOC value
Average TOC³ 2 wt %
Net Richness
Vitrinite Reflectance %RoMaturity Factor (Oil)
Source Potential Index (Oil)
Maturity Factor (Gas)
Source Potential Index (Gas)
Gamma-Ray Zoneof Hue Shale
Hue Shale aboveGamma-Ray Zone
Pebble Shale Unit
Pebble Shale Unit
(repeated section due to faulting)
Kemik Sandstone
Kemik Sandstone
Mea
sure
d D
epth
in F
eet
Pebble Shale UnitFrequency Distribution of Calculated TOC in wt %
Kingak ShaleFrequency Distribution of Calculated TOC in wt %
0 1 2 3 4 5 6 7 8 9 10
Cum
ulat
ive
Str
ata
Thi
ckne
ss in
Fee
t (ha
lf sc
ale
of a
bove
)
900
800
700
600
500
400
300
200
100
0
Hue Shale Gamma-Ray ZoneFrequency Distribution of Calculated TOC in wt %
0 1 2 3 4 5 6 7 8 9 10
300
200
100
0
200
100
0
2200
2100
2300
2400
2500
2600
2700
2800
2900
3000
2200
2100
2300
2400
2500
2600
2700
2800
2900
3000
3100
3200
3400
3300
3500
3600
3700
3800
3900
4000
4100
4200
Hue Shale exclusive of Gamma-Ray ZoneFrequency Distribution of Calculated TOC in wt %
0 1 2 3 4 5 6 7 8 9 10
400
300
200
100
0
0 1 2 3 4 5 6 7 8 9 10
Kingak Shale
Mea
sure
d D
epth
in F
eet
Hue Shale(Above GRZ)
Hue Shale(GRZ)
pebbleshale unit
KingakShale
Positive D LogR separation resulting from sonic (DT) log's position to the left of resistivity (ILD) log when log traces are properly scaled and aligned at baseline values for DT and ILD (see Passey and others, 1990). Baseline for D LogR calculations is 80 m sec./ft. and 10 ohm-meters at 4,200-4,250 ft. Casing was set at 2,138 ft in the upper part of the Hue Shale, and above the Hue Shale at approximately 500 ft.
D LogR CALCULATIONS
Stratigraphic and structural interpretation of the Canning River A-1 well includes a fault-repeated section of Kemik Sandstone and pebble shale. Only data from the upper succession, the Hue Shale above the Gamma-Ray Zone (GRZ), the Gamma-Ray Zone, and the pebble shale, were included in the frequency distributions (at right) and the tabulations below.
Data used for analysis of this well include the well history; mudlog; DT, ILD, gamma-ray, and caliper borehole geophysical logs; and reported TOC values measured on cuttings. No additional information is available about the TOC values from cuttings, such as whether the samples were composited or from selected individual rock chips. The caliper log indicates that caving occurred in many parts of the borehole, but most severely in the Kingak Shale, pebble shale, and parts of the GRZ. Therefore, both the quality of the borehole logs, principally the sonic DT log, and the representativeness of the measured values of TOC (from borehole cuttings) are questionable. Some intervals where measured TOC values are lower than calculated values, such as the upper part of the Hue Shale, may indicate contamination by cuttings from overlying units with lower TOC. This could not be verified with lithologic data from the mudlog because the log wasn't run until 3,480 ft, within the Kingak Shale. However, the well was cased at 2,138 ft or ª 80 ft below the top of the Hue Shale, and just below the points where measured values are less than half the calculated values.
In most of the Hue Shale above the GRZ and in part of the GRZ and pebble shale, the calculated TOC values agree very well with the measured values, or seem to differ in a reasonable manner in that they represent interval averages of different intervals. In at least 2 places (ª 2,410 and 2,740 ft), however, cycle skipping, which is often observed on the transit-time curve in poor boreholes (Passey and others, 1990), may have produced the very long travel times (exceeding 150 m sec/ft) which yield erroneously high calculated TOC values. In other parts of the well, most notably the upper part of the GRZ, measured TOC values are much higher than calculated values; these are not likely to be contaminated because overlying measured values are much lower. This also occurs in the pebble shale. In the GRZ, these peaks of very low calculated TOCs correlat ing to relatively high measured TOCs of ª 5 wt %, also correspond to very low resistivity or high conductivity, and are present in the GRZ in all the wells. They also commonly have relatively higher gamma-ray response, and may be tuff or bentonite as noted in the mudlog and in outcrop for the GRZ (Bird and Molenaar, 1987; Bergman and others, 1995).
Richness and source potential indices for the Hue Shale, including the Gamma-Ray Zone (GRZ), pebble shale unit (pbsh), and Kingak Shale in the Canning River A #1 well. Richness is from calculated TOC. Vitrinite reflectance values from Nelson & others (Ch. WL, Plate WL13). Baseline for D LogR calculations is 80 m sec./ft. and 10 ohm-meters at 4,200-4,250 ft. Note that for intervals of this thickness, two or more baselines would probably be appropriate, however, stratigraphy and maturity in this well make baselines difficult to establish.
320
212
2.39%
7.9
2.92%
619
0.9
1
619
0.4
248
245
135
2.01%
3.3
2.31%
312
0.9
1
312
0.4
125
960
144
1.50%
4.0
2.39%
344
0.9
1
344
0.4
138
KingakShale*
960
813
1.50%
4.0
1.61%
1309
0.9
1
1309
0.4
523
440
344
2.55%
7.0
2.81%
967
0.9
1
967
0.4
387
Hue, GRZ,& pbsh
1005
691
2.37%
7.9
2.75%
1900
0.9
1
1900
0.4
760
*Tabulations using ³ 1 wt % TOC.
Gamma-Ray Log
Caliper Log
Sonic Log
%TOC calculated
%TOC measured
Resistivity Log
OPEN-FILE REPORT 98-34PLATE SR7
U.S. DEPARTMENT OF INTERIORU.S. GEOLOGICAL SURVEY
TOTAL ORGANIC CARBON PROFILE AND CALIPER, GAMMA-RAY, RESISTIVITY, AND SONIC LOGS,HUE SHALE, PEBBLE SHALE UNIT, AND KINGAK SHALE, CANNING RIVER A-1
ByMargaret A. Keller, Kenneth J. Bird, and Kevin R. Evans
1998
INTERIOR–GEOLOGICAL SURVEY, RESTON, VA–1998
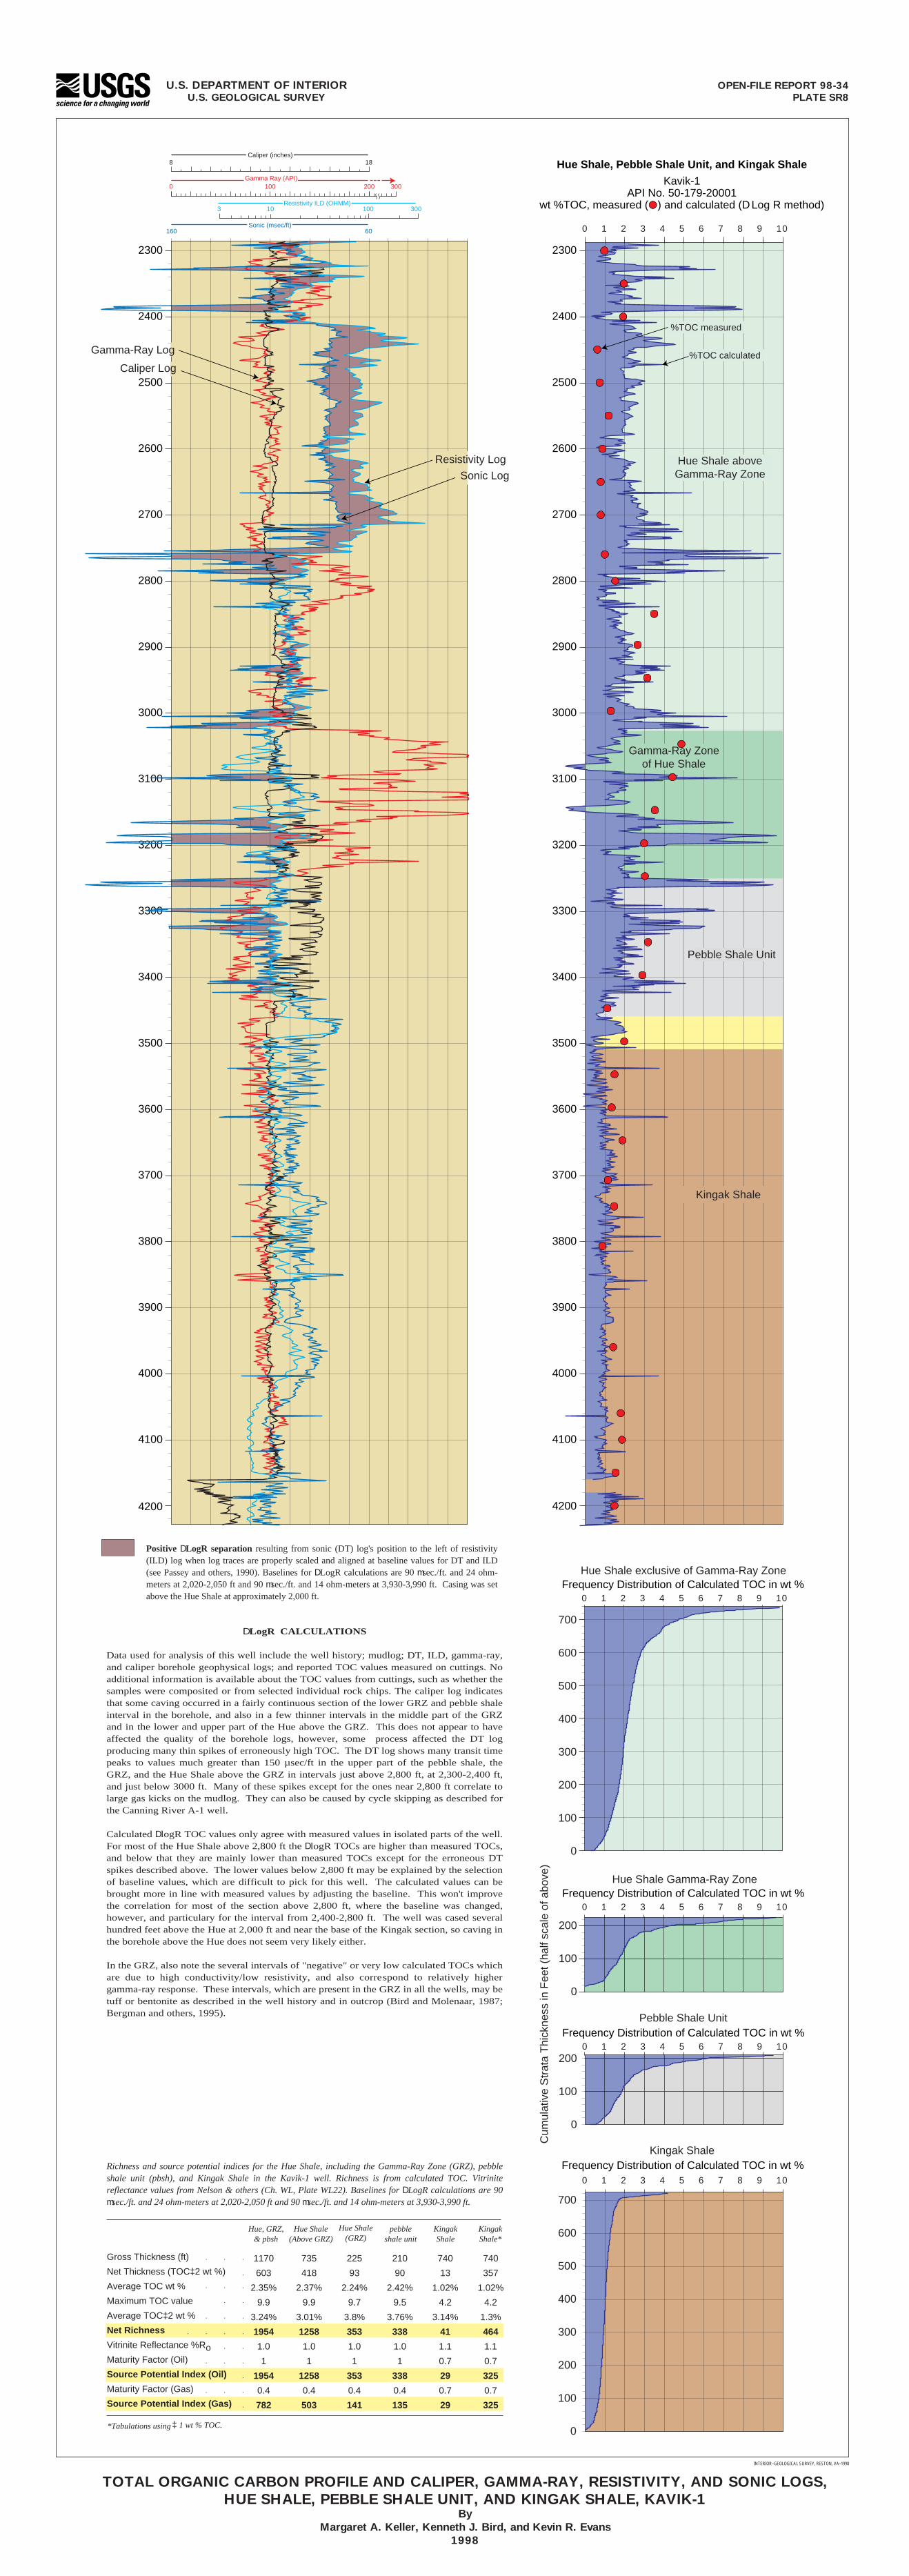
2300
2400
2500
2600
2700
2800
2900
3000
3100
3200
3300
3400
3500
3600
3700
3800
3900
4000
4100
4200
2300
2400
2500
2600
2700
2800
2900
3000
3100
3200
3300
3400
3500
3600
3700
3800
3900
4000
4100
4200
0 1 2 3 4 5 6 7 8 9 10
Hue Shale, Pebble Shale Unit, and Kingak Shale
Kavik-1API No. 50-179-20001
wt %TOC, measured ( ) and calculated (D Log R method)
Gamma Ray (API)0 200 300100
Caliper (inches)8 18
Sonic (m sec/ft)
Resistivity ILD (OHMM)3 10 300100
160 60
Positive D LogR separation resulting from sonic (DT) log's position to the left of resistivity (ILD) log when log traces are properly scaled and aligned at baseline values for DT and ILD (see Passey and others, 1990). Baselines for D LogR calculations are 90 m sec./ft. and 24 ohm-meters at 2,020-2,050 ft and 90 m sec./ft. and 14 ohm-meters at 3,930-3,990 ft. Casing was set above the Hue Shale at approximately 2,000 ft.
Pebble Shale UnitFrequency Distribution of Calculated TOC in wt %
Kingak ShaleFrequency Distribution of Calculated TOC in wt %
0 1 2 3 4 5 6 7 8 9 10
Cum
ulat
ive
Str
ata
Thi
ckne
ss in
Fee
t (ha
lf sc
ale
of a
bove
)
700
600
500
400
300
200
100
0
Hue Shale Gamma-Ray ZoneFrequency Distribution of Calculated TOC in wt %
0 1 2 3 4 5 6 7 8 9 10
200
100
0
200
100
0
Hue Shale exclusive of Gamma-Ray ZoneFrequency Distribution of Calculated TOC in wt %
0 1 2 3 4 5 6 7 8 9 10
700
600
500
400
300
200
100
0
0 1 2 3 4 5 6 7 8 9 10
Richness and source potential indices for the Hue Shale, including the Gamma-Ray Zone (GRZ), pebble shale unit (pbsh), and Kingak Shale in the Kavik-1 well. Richness is from calculated TOC. Vitrinite reflectance values from Nelson & others (Ch. WL, Plate WL22). Baselines for D LogR calculations are 90 m sec./ft. and 24 ohm-meters at 2,020-2,050 ft and 90 m sec./ft. and 14 ohm-meters at 3,930-3,990 ft.
D LogR CALCULATIONS
Data used for analysis of this well include the well history; mudlog; DT, ILD, gamma-ray, and caliper borehole geophysical logs; and reported TOC values measured on cuttings. No additional information is available about the TOC values from cuttings, such as whether the samples were composited or from selected individual rock chips. The caliper log indicates that some caving occurred in a fairly continuous section of the lower GRZ and pebble shale interval in the borehole, and also in a few thinner intervals in the middle part of the GRZ and in the lower and upper part of the Hue above the GRZ. This does not appear to have affected the quality of the borehole logs, however, some process affected the DT log producing many thin spikes of erroneously high TOC. The DT log shows many transit time peaks to values much greater than 150 µsec/ft in the upper part of the pebble shale, the GRZ, and the Hue Shale above the GRZ in intervals just above 2,800 ft, at 2,300-2,400 ft, and just below 3000 ft. Many of these spikes except for the ones near 2,800 ft correlate to large gas kicks on the mudlog. They can also be caused by cycle skipping as described for the Canning River A-1 well.
Calculated D logR TOC values only agree with measured values in isolated parts of the well. For most of the Hue Shale above 2,800 ft the D logR TOCs are higher than measured TOCs, and below that they are mainly lower than measured TOCs except for the erroneous DT spikes described above. The lower values below 2,800 ft may be explained by the selection of baseline values, which are difficult to pick for this well. The calculated values can be brought more in line with measured values by adjusting the baseline. This won't improve the correlation for most of the section above 2,800 ft, where the baseline was changed, however, and particulary for the interval from 2,400-2,800 ft. The well was cased several hundred feet above the Hue at 2,000 ft and near the base of the Kingak section, so caving in the borehole above the Hue does not seem very likely either.
In the GRZ, also note the several intervals of "negative" or very low calculated TOCs which are due to high conductivity/low resistivity, and also correspond to relatively higher gamma-ray response. These intervals, which are present in the GRZ in all the wells, may be tuff or bentonite as described in the well history and in outcrop (Bird and Molenaar, 1987; Bergman and others, 1995).
OPEN-FILE REPORT 98-34PLATE SR8
U.S. DEPARTMENT OF INTERIORU.S. GEOLOGICAL SURVEY
TOTAL ORGANIC CARBON PROFILE AND CALIPER, GAMMA-RAY, RESISTIVITY, AND SONIC LOGS,HUE SHALE, PEBBLE SHALE UNIT, AND KINGAK SHALE, KAVIK-1
ByMargaret A. Keller, Kenneth J. Bird, and Kevin R. Evans
1998
INTERIOR–GEOLOGICAL SURVEY, RESTON, VA–1998
Gamma-Ray Log
Caliper Log%TOC calculated
%TOC measured
Gross Thickness (ft)
Net Thickness (TOC³ 2 wt %)
Average TOC wt %
Maximum TOC value
Average TOC³ 2 wt %
Net Richness
Vitrinite Reflectance %RoMaturity Factor (Oil)
Source Potential Index (Oil)
Maturity Factor (Gas)
Source Potential Index (Gas)
Hue Shale(Above GRZ)
Hue Shale(GRZ)
pebbleshale unit
KingakShale
225
93
2.24%
9.7
3.8%
353
1.0
1
353
0.4
141
210
90
2.42%
9.5
3.76%
338
1.0
1
338
0.4
135
740
13
1.02%
4.2
3.14%
41
1.1
0.7
29
0.7
29
KingakShale*
740
357
1.02%
4.2
1.3%
464
1.1
0.7
325
0.7
325
735
418
2.37%
9.9
3.01%
1258
1.0
1
1258
0.4
503
Hue, GRZ,& pbsh
1170
603
2.35%
9.9
3.24%
1954
1.0
1
1954
0.4
782
*Tabulations using ³ 1 wt % TOC.
Gamma-Ray Zoneof Hue Shale
Hue Shale aboveGamma-Ray Zone
Pebble Shale Unit
Kingak Shale
Resistivity Log
Sonic Log
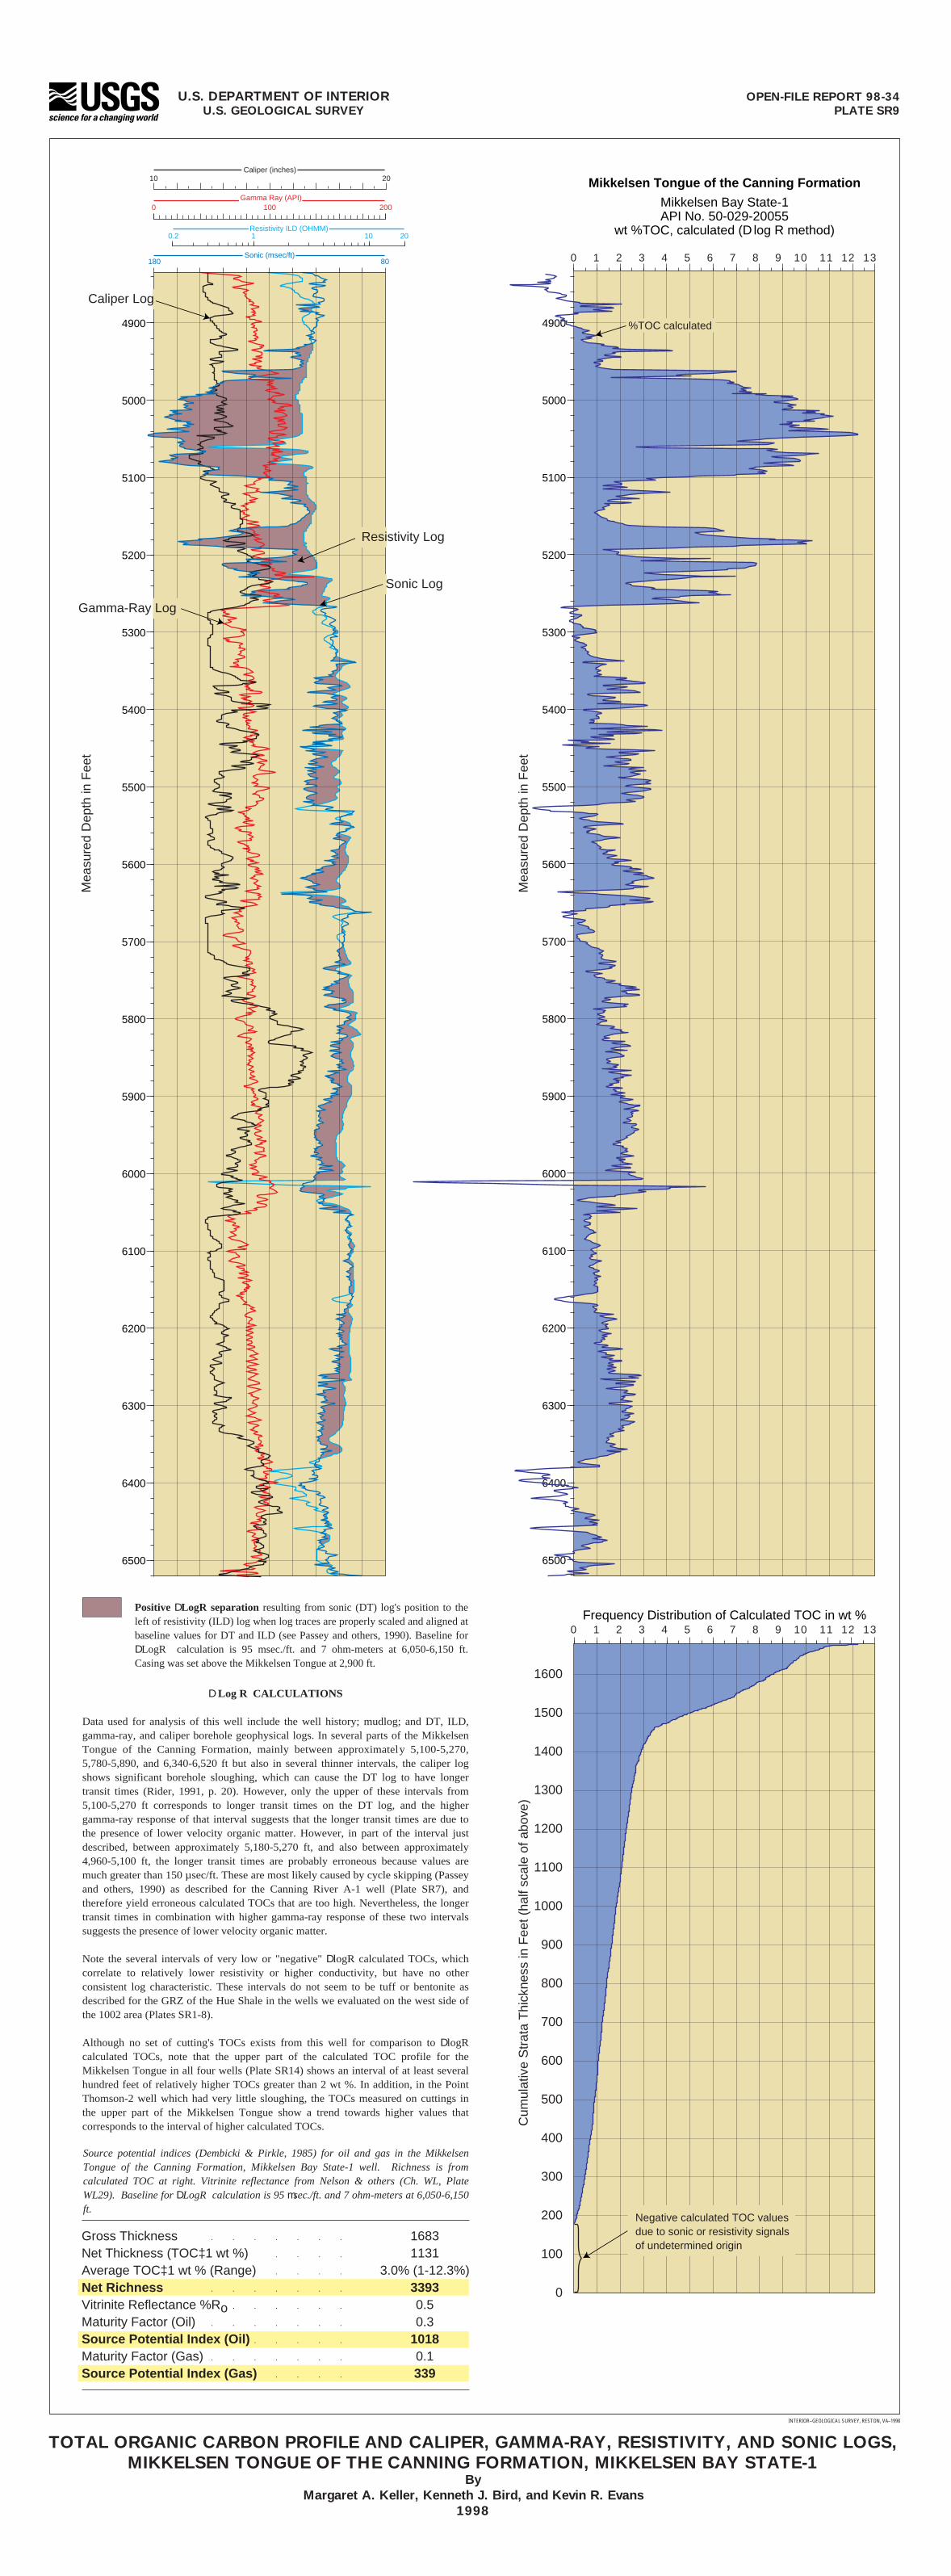
4900
5000
5100
5200
5300
5400
5500
5600
5700
5800
5900
6000
6100
6200
6300
6400
6500
1600
1500
1400
1300
1200
1100
1000
900
800
700
600
500
400
300
200
100
0
Negative calculated TOC valuesdue to sonic or resistivity signalsof undetermined origin
Gross ThicknessNet Thickness (TOC³ 1 wt %)Average TOC³ 1 wt % (Range)Net RichnessVitrinite Reflectance %RoMaturity Factor (Oil)Source Potential Index (Oil)Maturity Factor (Gas)Source Potential Index (Gas)
16831131
3.0% (1-12.3%)33930.50.3
10180.1339
Resistivity ILD (OHMM)0.2 1 2010
Gamma Ray (API)0 200100
Caliper (inches)10 20
Sonic (m sec/ft)180 80
Mea
sure
d D
epth
in F
eet
Cum
ulat
ive
Str
ata
Thi
ckne
ss in
Fee
t (ha
lf sc
ale
of a
bove
)
%TOC calculated4900
5000
5100
5200
5300
5400
5500
5600
5700
5800
5900
6000
6100
6200
6300
6400
6500
0 1 2 3 4 5 6 7 8 9 10 11 12 13
0 1 2 3 4 5 6 7 8 9 10 11 12 13
Mea
sure
d D
epth
in F
eet
Mikkelsen Tongue of the Canning Formation
Mikkelsen Bay State-1API No. 50-029-20055
wt %TOC, calculated (D log R method)
Frequency Distribution of Calculated TOC in wt %Positive D LogR separation resulting from sonic (DT) log's position to the left of resistivity (ILD) log when log traces are properly scaled and aligned at baseline values for DT and ILD (see Passey and others, 1990). Baseline for D LogR calculation is 95 msec./ft. and 7 ohm-meters at 6,050-6,150 ft. Casing was set above the Mikkelsen Tongue at 2,900 ft.
Caliper Log
Sonic Log
Resistivity Log
Gamma-Ray Log
OPEN-FILE REPORT 98-34PLATE SR9
U.S. DEPARTMENT OF INTERIORU.S. GEOLOGICAL SURVEY
TOTAL ORGANIC CARBON PROFILE AND CALIPER, GAMMA-RAY, RESISTIVITY, AND SONIC LOGS,MIKKELSEN TONGUE OF THE CANNING FORMATION, MIKKELSEN BAY STATE-1
ByMargaret A. Keller, Kenneth J. Bird, and Kevin R. Evans
1998
INTERIOR–GEOLOGICAL SURVEY, RESTON, VA–1998
D Log R CALCULATIONS
Data used for analysis of this well include the well history; mudlog; and DT, ILD, gamma-ray, and caliper borehole geophysical logs. In several parts of the Mikkelsen Tongue of the Canning Formation, mainly between approximately 5,100-5,270, 5,780-5,890, and 6,340-6,520 ft but also in several thinner intervals, the caliper log shows significant borehole sloughing, which can cause the DT log to have longer transit times (Rider, 1991, p. 20). However, only the upper of these intervals from 5,100-5,270 ft corresponds to longer transit times on the DT log, and the higher gamma-ray response of that interval suggests that the longer transit times are due to the presence of lower velocity organic matter. However, in part of the interval just described, between approximately 5,180-5,270 ft, and also between approximately 4,960-5,100 ft, the longer transit times are probably erroneous because values are much greater than 150 µsec/ft. These are most likely caused by cycle skipping (Passey and others, 1990) as described for the Canning River A-1 well (Plate SR7), and therefore yield erroneous calculated TOCs that are too high. Nevertheless, the longer transit times in combination with higher gamma-ray response of these two intervals suggests the presence of lower velocity organic matter.
Note the several intervals of very low or "negative" D logR calculated TOCs, which correlate to relatively lower resistivity or higher conductivity, but have no other consistent log characteristic. These intervals do not seem to be tuff or bentonite as described for the GRZ of the Hue Shale in the wells we evaluated on the west side of the 1002 area (Plates SR1-8).
Although no set of cutting's TOCs exists from this well for comparison to D logR calculated TOCs, note that the upper part of the calculated TOC profile for the Mikkelsen Tongue in all four wells (Plate SR14) shows an interval of at least several hundred feet of relatively higher TOCs greater than 2 wt %. In addition, in the Point Thomson-2 well which had very little sloughing, the TOCs measured on cuttings in the upper part of the Mikkelsen Tongue show a trend towards higher values that corresponds to the interval of higher calculated TOCs.
Source potential indices (Dembicki & Pirkle, 1985) for oil and gas in the Mikkelsen Tongue of the Canning Formation, Mikkelsen Bay State-1 well. Richness is from calculated TOC at right. Vitrinite reflectance from Nelson & others (Ch. WL, Plate WL29). Baseline for D LogR calculation is 95 m sec./ft. and 7 ohm-meters at 6,050-6,150 ft.
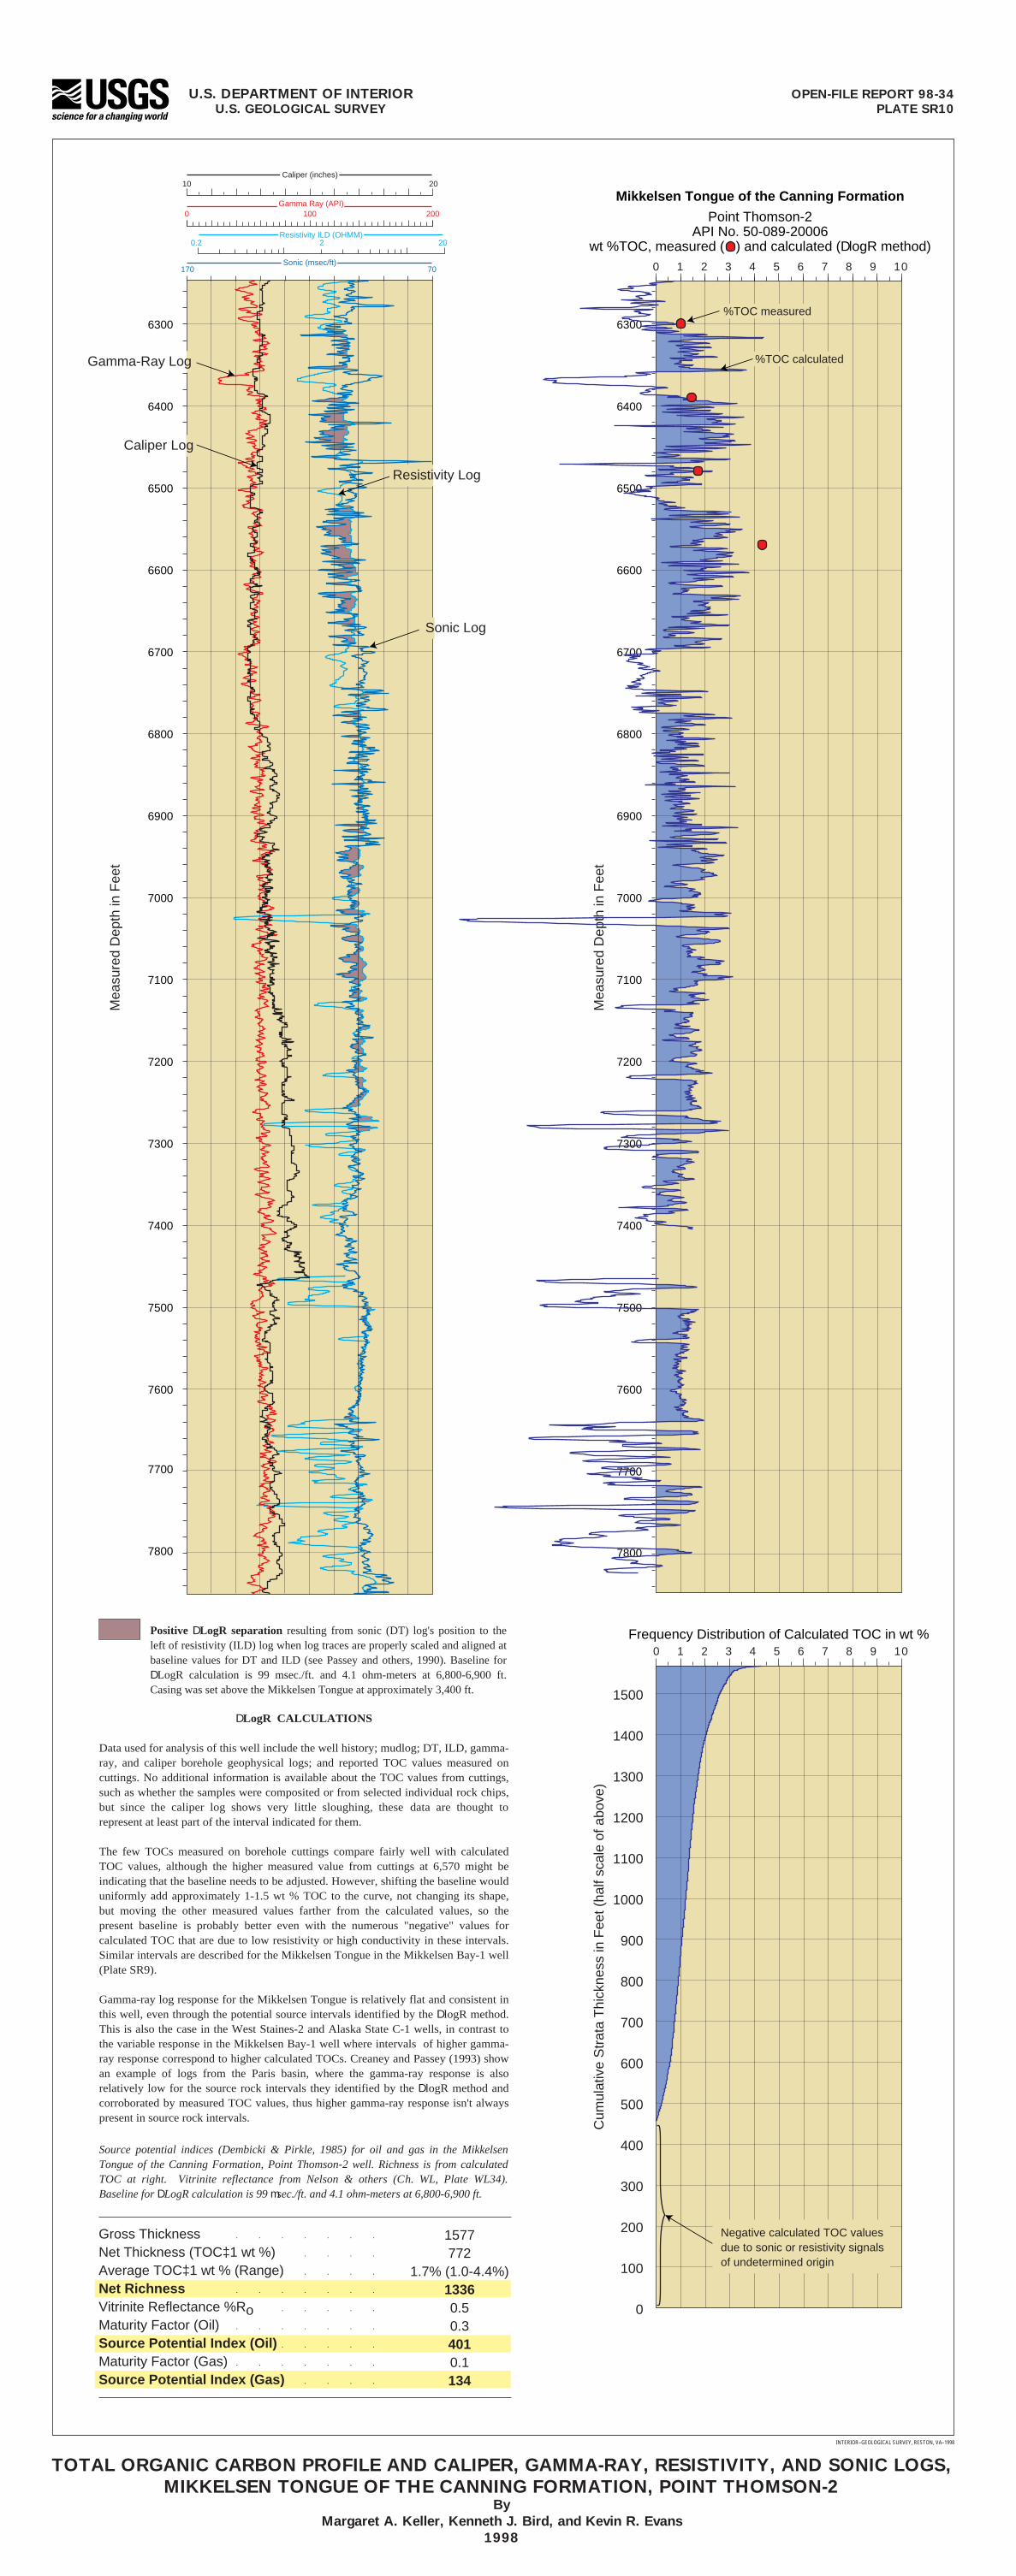
Positive D LogR separation resulting from sonic (DT) log's position to the left of resistivity (ILD) log when log traces are properly scaled and aligned at baseline values for DT and ILD (see Passey and others, 1990). Baseline for D LogR calculation is 99 msec./ft. and 4.1 ohm-meters at 6,800-6,900 ft. Casing was set above the Mikkelsen Tongue at approximately 3,400 ft.
D LogR CALCULATIONS
Data used for analysis of this well include the well history; mudlog; DT, ILD, gamma-ray, and caliper borehole geophysical logs; and reported TOC values measured on cuttings. No additional information is available about the TOC values from cuttings, such as whether the samples were composited or from selected individual rock chips, but since the caliper log shows very little sloughing, these data are thought to represent at least part of the interval indicated for them.
The few TOCs measured on borehole cuttings compare fairly well with calculated TOC values, although the higher measured value from cuttings at 6,570 might be indicating that the baseline needs to be adjusted. However, shifting the baseline would uniformly add approximately 1-1.5 wt % TOC to the curve, not changing its shape, but moving the other measured values farther from the calculated values, so the present baseline is probably better even with the numerous "negative" values for calculated TOC that are due to low resistivity or high conductivity in these intervals. Similar intervals are described for the Mikkelsen Tongue in the Mikkelsen Bay-1 well (Plate SR9).
Gamma-ray log response for the Mikkelsen Tongue is relatively flat and consistent in this well, even through the potential source intervals identified by the D logR method. This is also the case in the West Staines-2 and Alaska State C-1 wells, in contrast to the variable response in the Mikkelsen Bay-1 well where intervals of higher gamma-ray response correspond to higher calculated TOCs. Creaney and Passey (1993) show an example of logs from the Paris basin, where the gamma-ray response is also relatively low for the source rock intervals they identified by the D logR method and corroborated by measured TOC values, thus higher gamma-ray response isn't always present in source rock intervals.
Source potential indices (Dembicki & Pirkle, 1985) for oil and gas in the Mikkelsen Tongue of the Canning Formation, Point Thomson-2 well. Richness is from calculated TOC at right. Vitrinite reflectance from Nelson & others (Ch. WL, Plate WL34). Baseline for D LogR calculation is 99 m sec./ft. and 4.1 ohm-meters at 6,800-6,900 ft.
Frequency Distribution of Calculated TOC in wt %
Gross ThicknessNet Thickness (TOC³ 1 wt %)Average TOC³ 1 wt % (Range)Net RichnessVitrinite Reflectance %RoMaturity Factor (Oil)Source Potential Index (Oil)Maturity Factor (Gas)Source Potential Index (Gas)
Resistivity ILD (OHMM)0.2 202
Gamma Ray (API)0 200100
Caliper (inches)10 20
Sonic (m sec/ft)170 70
6300
6400
6500
6600
6700
6800
6900
7000
7100
7200
7300
7400
7500
7600
7700
Mea
sure
d D
epth
in F
eet
Cum
ulat
ive
Str
ata
Thi
ckne
ss in
Fee
t (ha
lf sc
ale
of a
bove
)
0 1 2 3 4 5 6 7 8 9 10
1500
1400
1300
1200
1100
1000
900
800
700
600
500
400
300
200
100
0
Negative calculated TOC valuesdue to sonic or resistivity signalsof undetermined origin
7800
1577772
1.7% (1.0-4.4%)13360.50.34010.1134
Gamma-Ray Log
Caliper Log
Sonic Log
0 1 2 3 4 5 6 7 8 9 10
6300
6400
6500
6600
6700
6800
6900
7000
7100
7200
7300
7400
7500
7600
7700
7800
Mea
sure
d D
epth
in F
eet
Mikkelsen Tongue of the Canning Formation
Point Thomson-2API No. 50-089-20006
wt %TOC, measured ( ) and calculated (D logR method)
%TOC calculated
%TOC measured
Resistivity Log
OPEN-FILE REPORT 98-34PLATE SR10
U.S. DEPARTMENT OF INTERIORU.S. GEOLOGICAL SURVEY
TOTAL ORGANIC CARBON PROFILE AND CALIPER, GAMMA-RAY, RESISTIVITY, AND SONIC LOGS,MIKKELSEN TONGUE OF THE CANNING FORMATION, POINT THOMSON-2
ByMargaret A. Keller, Kenneth J. Bird, and Kevin R. Evans
1998
INTERIOR–GEOLOGICAL SURVEY, RESTON, VA–1998

1900
1800
1700
1600
1500
1400
1300
1200
1100
1000
900
800
700
600
500
400
300
200
100
0
Negative calculated TOC valuesdue to sonic or resistivity signalsof undetermined origin
Gross ThicknessNet Thickness (TOC³ 1 wt %)Average TOC³ 1 wt % (Range)Net RichnessVitrinite Reflectance %Ro Maturity Factor (Oil)Source Potential Index (Oil)Maturity Factor (Gas)Source Potential Index (Gas)
1945'1498'
2.03% (1.0-6.0%)30410.50.39120.1304
Resistivity ILD (OHMM)0.1 1 10
Gamma Ray (API)0 200100
Caliper (inches)10 20
Sonic (m sec/ft)170 70
Caliper Log
Sonic Log
7650
5850
5950
6050
6150
6250
6350
6450
6550
6650
6750
6850
6950
7050
7150
7250
7350
7450
7550
7750
Mea
sure
d D
epth
in F
eet
Cum
ulat
ive
Str
ata
Thi
ckne
ss in
Fee
t (ha
lf sc
ale
of a
bove
)
%TOC measured
%TOC calculated
AtypicalSonic Log
AtypicalResistivityIntervals
5850
5950
6050
6150
6250
6350
6450
6550
6650
6750
6850
6950
7050
7150
7250
7350
7450
7550
7650
7750
0 1 2 3 4 5 6 7 8 9 10
Mea
sure
d D
epth
in F
eet
Mikkelsen Tongue of the Canning Formation
West Staines-2API No. 50-089-20004
wt %TOC, measured ( ) and calculated (D log R method)
Frequency Distribution of Calculated TOC in wt %0 1 2 3 4 5 6 7 8 9 10
Resistivity LogGamma-Ray Log
Positive D LogR separation resulting from sonic (DT) log's position to the left of resistivity (ILD) log when log traces are properly scaled and aligned at baseline values for DT and ILD (see Passey and others, 1990). Note that two baselines were used to calculate D LogR values in this well. The curves are scaled to the upper baseline at 105 m sec and 2.2 ohm-meters at 5,870-5,930 ft. The lower baseline is 94 m sec and 4.1 ohm-meters at 6,900-7,000 ft. Casing was set above the Mikkelsen Tongue at 2,280 ft.
OPEN-FILE REPORT 98-34PLATE SR11
U.S. DEPARTMENT OF INTERIORU.S. GEOLOGICAL SURVEY
TOTAL ORGANIC CARBON PROFILE AND CALIPER, GAMMA-RAY, RESISTIVITY, AND SONIC LOGS,MIKKELSEN TONGUE OF THE CANNING FORMATION, WEST STAINES-2
ByMargaret A. Keller, Kenneth J. Bird, and Kevin R. Evans
1998
INTERIOR–GEOLOGICAL SURVEY, RESTON, VA–1998
D LogR CALCULATIONS
Data used for analysis of this well include the well history; mudlog; DT, ILD, gamma-ray, and caliper borehole geophysical logs; and reported TOC values measured on cuttings. No additional information is available about the TOC values from cuttings, such as whether the samples were composited or from selected individual rock chips.
The caliper log indicates that major sloughing occurred in the borehole between approximately 6,150-6,350 ft and 6,950-7,200 ft. Contamination of cuttings due to sloughing may explain the lack of agreement between D logR calculated TOC values and TOC values measured on cuttings between approximately 6,300-6,600 ft.
Note the several intervals of very low or "negative" D logR calculated TOCs which correspond to relatively lower resistivity or higher conductivity, but have no other consistent log characteristic. These intervals do not seem to be tuff or bentonite as described for similar log response in the GRZ of the Hue Shale in wells on the west side of the 1002 area (Plates SR1-8).
Gamma-ray log response for the Mikkelsen Tongue is relatively flat and consistent in this well, even through the main potential source interval identified by the D logR method between 6,250-6,500 ft. This is also the case in the Point Thomson-2 and Alaska State C-1 wells, in contrast to the variable response in the Mikkelsen Bay-1 well where intervals of higher gamma-ray response correspond to higher calculated TOCs (see discussion of gamma-ray response on Plate SR10).
Source potential indices (Dembicki & Pirkle, 1985) for oil and gas in the Mikkelsen Tongue of the Canning Formation, West Staines-2 well. Net richness is from calculated TOC at right. Vitrinite reflectance from Nelson & others (Ch. WL, Plate WL37). Two baselines were used for D LogR calculation: 1) for the interval 5,000-6,500 ft., 105 m sec./ft. and 2.2 ohm-meters at 5,870-5,930 ft.; and 2) for the interval 6,500-8,000 ft., 94 m sec./ft. and 4.1 ohm-meters at 6,900-7,000 ft.

Frequency Distribution of Calculated TOC in wt %
Resistivity ILD (OHMM)0.1 1.0 10
Gamma Ray (API)0 200100
Caliper (inches)10 20
Sonic (m sec/ft)170 70
6400
6500
6600
6700
6800
6900
7000
7100
7200
7300
7400
7500
7600
7700
7800
7900
Tru
e V
ertic
al D
epth
Sub
-Sea
(T
VD
SS
) in
Fee
t
Cum
ulat
ive
Str
ata
Thi
ckne
ss in
Fee
t (ha
lf sc
ale
of a
bove
)
Sonic Log
0 1 2 3 4 5 6 7 8 9 10
1600
1500
1400
1300
1200
1100
1000
900
800
700
600
500
400
300
200
100
0
0 1 2 3 4 5 6 7 8 9 10
6400
6500
6600
6700
6800
6900
7000
7100
7200
7300
7400
7500
7600
7700
7800
7900
Tru
e V
ertic
al D
epth
Sub
-Sea
(T
VD
SS
) in
Fee
t
Mikkelsen Tongue of the Canning Formation
Alaska State C-1API No. 50-089-20011
wt %TOC, calculated (D log R method)
Negative calculated TOC valuesdue to sonic or resistivity signalsof undetermined origin
Gross ThicknessNet Thickness (TOC³ 1%)Average TOC³ 1 wt % (Range)Net RichnessVitrinite Reflectance % Ro Maturity Factor (Oil)Source Potential Index (Oil)Maturity Factor (Gas)Source Potential Index (Gas)
1587*1215*
1.8% (1.0-6.1%)21870.50.36560.1219
*Calculated using TVDSS.
%TOC calculated
Positive D LogR separation resulting from sonic (DT) log's position to the left of resistivity (ILD) log when log traces are properly scaled and aligned at baseline values for DT and ILD (see Passey and others, 1990). Baseline for D LogR calculation is 88 msec./ft. and 5.0 ohm-meters at 7,750-7,900 ft. Casing was set above the Mikkelsen Tongue at approximately 3,950 ft (TVDSS).
OPEN-FILE REPORT 98-34PLATE SR12
U.S. DEPARTMENT OF INTERIORU.S. GEOLOGICAL SURVEY
TOTAL ORGANIC CARBON PROFILE AND CALIPER, GAMMA-RAY, RESISTIVITY, AND SONIC LOGS,MIKKELSEN TONGUE OF THE CANNING FORMATION, ALASKA STATE C-1
ByMargaret A. Keller, Kenneth J. Bird, and Kevin R. Evans
1998
INTERIOR–GEOLOGICAL SURVEY, RESTON, VA–1998
D LogR CALCULATIONS
Data used for analysis of this well include the well history; mudlog; and DT, ILD, gamma-ray, and caliper borehole geophysical logs. Throughout most of the Mikkelsen Tongue of the Canning Formation in this well, the caliper log shows significant borehole sloughing, which can cause the DT log response to exhibit longer transit times (Rider, 1991, p. 20). That may be the cause of the longer transit times on the DT log for much of this well, however, no other well data exists to corroborate that, and in most of the section below 7,300 ft where the borehole is also sloughing, the transit times are relatively shorter. Therefore, the longer transit times could also be due to the presence of low velocity organic matter.
Gamma-ray log response for the Mikkelsen Tongue in this well is relatively flat and consistent even through the possible source interval between approximately 6450-7,300 ft identified by D logR calculated TOCs greater than 2%. This flat gamma-ray log pattern is also exhibited in the West Staines-2 and Point Thomson-2 wells, in contrast to the variable response in the Mikkelsen Bay-1 well, where intervals of higher gamma-ray response correspond to higher calculated TOCs (see discussion of gamma-ray response on Plate SR10).
Resistivity Log
Gamma-Ray Log
Caliper Log
Source potential indices (Dembicki & Pirkle, 1985) for oil and gas in the Mikkelsen Tongue of the Canning Formation, Alaska State C-1 well. Net richness is from calculated TOC at right. Vitrinite reflectance from Nelson & others (Ch. WL, Plate WL4). Baseline for D LogR calculation is 88 m sec./ft. and 5.0 ohm-meters at 7,750-7,900 ft.; note caving in borehole through most of the Mikkelsen Tongue.

0 1 2 3 4 5 6 7 8 9 10
12000
12100
12200
12300
12400
12500
12600
12700
12800
12900
13000
13100
12700
12800
12900
13000
13100
0 1 2 3 4 5 6 7 8 9 10
0 1 2 3 4 5 6 7 8 9 10
13200
13300
13400
13500
13600
13700
13800
0 1 2 3 4 5 6 7 8 9 10
7500
7600
7700
7900
8000
8200
8300
0 1 2 3 4 5 6 7 8 9 10
0 1 2 3 4 5 6 7 8 9 10
2200
2100
2300
2400
2500
2600
2700
2800
2900
3000
3100
3200
3400
3300
3500
3600
3700
3800
3900
4000
4100
4200
0 1 2 3 4 5 6 7 8 9 10
10100
10200
10300
10400
10500
10600
10700
10800
10900
11000
11100
CORRELATION OF TOTAL ORGANIC CARBON PROFILES AND GAMMA-RAY LOGS,CRETACEOUS AND JURASSIC SOURCE ROCKS
ByMargaret A. Keller, Kenneth J. Bird, and Kevin R. Evans
1998
U.S. DEPARTMENT OF INTERIORU.S. GEOLOGICAL SURVEY
OPEN-FILE REPORT 98-34PLATE SR13
INTERIOR–GEOLOGICAL SURVEY, RESTON, VA–1998
DATUMBase of Gamma-RayZone in Hue Shale
LCU(Lower Cretaceousunconformity)
12500
12600
12700
12800
12900
SOUTH NORTH
West Staines-2API No. 50-089-20004
%TOC, measured and calculated (D logR method)
Point Thomson-2API No. 50-089-20006
%TOC, calculated (D logR method)
Leffingwell-1API No. 50-089-20021
%TOC, calculated (D logR method)
Canning River B-1API No. 50-179-20006
%TOC, measured and calculated (D logR method)
Canning River A-1API No. 50-179-20005
%TOC, measured and calculated (D logR method)
Kavik-1API No. 50-179-20001
%TOC, measured and calculated (D logR method)
Beli-1API No. 50-179-20002
%TOC, measured and calculated (D logR method)
Shav
iovi
k
Riv
er
KavikRiver
Stai
nes
Riv
erCannin
g
River
Tamay
aria
kR
iver
Kat
aktu
ruk
Riv
er
Mar
shC
r eek
Sadl
ero
chit
Riv
erH
ulah
ula
Riv
erO
kpil
akR
iver
Car ter
Creek
Jago
R ive
r
Nig
uana
kR
i ver
Aich
ilik
River
Egaksr
akR
iver
KIC Lands
1 0 0 2 A R E A
3-mile State-Federal boundary
Beaufort Sea
N O R T H E R N M A R G I N O F B R O O K SR A N G E
SADLEROCHIT MOUNTAINS
SHUBLIK MOUNTAINS
0 30 mi
Locations of wells in cross-section. Note distances in cross-section not to scale.
Point Thomson #2W. Staines #2
Leffingwell #1
Beli #1
Kavik #1 Canning River A-1
Canning River B-1
8 miles 5 miles8 miles 24 miles 18 miles5 miles6 miles
Gamma-Ray Zoneof Hue Shale
Hue Shale exclusiveof Gamma-Ray Zone
Pebble shale
Gamma-Ray Zoneof Hue Shale
Hue Shale exclusiveof Gamma-Ray Zone
Gamma-Ray Zoneof Hue Shale
Hue Shale exclusiveof Gamma-Ray Zone
Kemik Sandstone Thomson sands
Pebble shale
Kingak Shale
Paleozoic and Older Rocks
Gamma-Ray Zoneof Hue Shale
Hue Shale aboveGamma-Ray Zone
Kingak Shale
Kemik Sandstone
Pebble shale
(repeated section due to faulting)
Kemik Sandstone
Pebble shale
7800
8100
CA
MP
AN
IAN
-M
AA
ST
RIC
HT
IAN
CA
MP
AN
IAN
-M
AA
ST
RIC
HT
IAN
TU
RO
NIA
N-
SA
NT
ON
IAN
ALB
IAN
-C
EN
OM
AN
IAN
HA
UT
ER
IVIA
N-
BA
RR
EM
IAN
AGE
UNCERTAIN
CE
NO
MA
NIA
N-
SA
NT
ON
IAN
ALB
IAN
EA
RLY
CR
ET
. UN
DIF
F.
Gamma-Ray Log(scale x30)
E X P L A N A T I O N
Hue Shale, above Gamma-Ray Zone
Hue Shale Gamma-Ray Zone (GRZ)
Pebble shale unit
Kemik Sandstone and Thomson sand
Kingak Shale
Paleozoic and older rocks
Total Organic Carbon (TOC) in weight percent, calculated using DT and ILD logs and D LogR
Gamma-Ray Log traces, measured in API units, equivalent to log scale x30
Total Organic Carbon (TOC) in weight percent, from borehole cuttings and core
Lower Cretaceous unconformity (LCU)
Fault, direction of relative displacement indicated
method of Passey & others (1990)
0 1 2 3 4 5 6 7 8 9 10
Mikkelsen Bay-1API No. 50-089-20006
%TOC, calculated (D logR method)
11100
11300
11400
11500
11600
11200
Mikkelsen Bay #1
2300
2400
2500
2600
2700
2800
2900
3000
3100
3200
3300
3400
3500
3600
3700
3800
3900
4000
4100
4200
Correlations are based on log response and may not correspond to lithologic or time-stratigraphicboundaries.

CORRELATION OF TOTAL ORGANIC CARBON PROFILES AND GAMMA-RAY LOGS,MIKKELSEN TONGUE OF THE CANNING FORMATION
ByMargaret A. Keller, Kenneth J. Bird, and Kevin R. Evans
1998
U.S. DEPARTMENT OF INTERIORU.S. GEOLOGICAL SURVEY
OPEN-FILE REPORT 98-34PLATE SR14
INTERIOR–GEOLOGICAL SURVEY, RESTON, VA–1998
WEST EAST
Shav
iovi
k
Riv
er
KavikRiver
Stai
nes
Riv
erCannin
g
River
Tamay
aria
kR
iver
Kat
aktu
ruk
Riv
er
Mar
shC
r eek
Sadl
ero
chit
Riv
erH
ulah
ula
Riv
erO
kpil
akR
iver
Car ter
Creek
Jago
R ive
r
Nig
uana
kR
i ver
Aich
ilik
River
Egaksr
akR
iver
KIC Lands
1 0 0 2 A R E A
3-mile State-Federal boundary
Beaufort Sea
N O R T H E R N M A R G I N O F B R O O K SR A N G E
SADLEROCHIT MOUNTAINS
SHUBLIK MOUNTAINS
0 30 mi
Locations of wells in cross-section. Note distances in cross-section not to scale.
Point Thomson #2
Alaska State C#1
5 miles5 miles18 miles
E X P L A N A T I O N
Total Organic Carbon (TOC) in weight percent, calculated using DT and ILD logs and D LogR
Gamma-Ray Log traces, measured in API units, equivalent to log scale x20
Total Organic Carbon (TOC) in weight percent, from borehole cuttings and core
method of Passey & others (1990)
MikkelsenBay #1
4900
5000
5100
5200
5300
5400
5500
5600
5700
5800
5900
6000
6100
6200
6300
6400
6500
0 1 2 3 4 5 6 7 8 9 10 11 12 13
Mikkelsen Bay State-1API No. 50-029-20055
%TOC, calculated
0 1 2 3 4 5 6 7 8 9 10
6300
6400
6500
6600
6700
6800
6900
7000
7100
7200
7300
7400
7500
7600
7700
7800
Point Thomson-2API No. 50-089-20006
%TOC, measured and calculated
5850
5950
6050
6150
6250
6350
6450
6550
6650
6750
6850
6950
7050
7150
7250
7350
7450
7550
7650
7750
0 1 2 3 4 5 6 7 8 9 10
West Staines State-2API No. 50-089-20004
%TOC, measured and calculated
0 1 2 3 4 5 6 7 8 9 10
6400
6500
6600
6700
6800
6900
7000
7100
7200
7300
7400
7500
7600
7700
7800
7900
Alaska State C-1API No. 50-089-20011
%TOC, calculated
Correlations are based on log response and may not correspond to lithologic or time-stratigraphicboundaries.
W. Staines #2

Side-wall Core Sample Interval
MICROPALEO CONSULTANTS INC. BIOSTRATIGRAPHY AND LITHOLOGY REPORT FOR THE CRETACEOUS HUE AND PEBBLE SHALE EQUIVALENTS IN THE AURORA-1 WELL
ByMargaret A. Keller, Kenneth J. Bird, and Kevin R. Evans
1998
U.S. DEPARTMENT OF INTERIORU.S. GEOLOGICAL SURVEY
OPEN-FILE REPORT 98-34PLATE SR15