chapter six
TRANSCRIPT
CHAPTER SIX: FIELD STUDY IN NORTH-WESTERN UTTAR PRADESH, INDIA
Introduction
In this last empirical chapter, I tighten my lens of observation
even further and examine the impact of aid on food security using
personally collected household and individual data. I conducted the
field research in north-western India, close to the Nepali border.
The choice of the place was driven partly by my desire to elucidate
the ‘South Asian’ enigma in which India’s food insecurity levels
have remained at record heights despite rapid economic growth in the
past few decades and partly by personal reasons (family
connections). Since small-scale field research is generally not good
at providing answers to broad social science questions, I still use
this study to test the hypotheses which I have either confirmed or
modified in the previous chapters but its primary purpose is to
offer deeper insight into the processes and mechanisms underlying
the influence of aid on recipients’ food security. With this
consideration in mind, I use quantitative analysis on the basis of
survey-gathered data but heavily supplement it with qualitative
analysis of information collected in longer interviews.
This chapter proceeds as follows. I first briefly re-state those
of my hypotheses which can be plausibly tested in this study and
remind the reader of the key literature pertinent to the
relationships considered. Second, I talk more about the chapter’s
empirical approach including the development projects examined and
the methods of data collection and of data analysis utilized. After
that, I present the results of my data analysis, discuss their
significance, and finish the chapter with a few concluding remarks
and observations.
Recap of relevant literature and hypotheses
Chapter six: Field study in India
The relationships considered
In the same vein as the previous chapters, this one also examines
whether aid strengthens food security, whether governance conditions
this relationship and whether the impact differs based on the
specific type of aid provided. Similar to the previous chapter and
unlike the first two empirical ones, I rely here on micro-level data
and hence consider as my main dependent variable household and
individual-level food security and as my main independent variable
development assistance as received and reported by individual
families.
The development project1 which I chose to examine consists of four
different parts – agricultural help, livestock help, credit
assistance, and water sanitation and hygiene (WASH) assistance -
provided sometimes separately and other times in compound to
different recipients. The financing provided by the NGO to each
component has been approximately equal. This set-up enables me to
compare the effectiveness of the different project components in
strengthening food security (related to where aid goes), reminiscent
of a natural experiment. Given that one of the project parts
consists of credit provision, I can also compare the credit portion
of the aid provided with the non-credit portion (related to how aid
is provided).
During the data collection I found that the people under study
have not benefitted from almost any other external assistance, with
the main exception being the national government-run Public
Distribution System (PDS). Through this scheme, more than half of my
survey respondents have acquired ration cards that enable them to
purchase basic cereals at reduced prices. A few people have also
1 For privacy purposes, I have agreed not to disclose the name of the organizationimplementing the project. From here onwards, I hence refer to the project examined simply as‘project’ and to the implementing organization as ‘NGO’.
2
Chapter six: Field study in India
received free laptops through the state government’s laptop-
distribution programme. Thus, aside from considering the effect of
the project on beneficiaries’ food security, I also examine the
effect of the government programmes and compare the NGO and
governmental interventions to see how the aid provided by the
government compares to the NGO-implemented aid (related to who
provides/implements aid). Of course, given that the type of
governmental aid considered here (direct transfer aid) in no way
overlaps with the NGO aid, one has to be careful about drawing any
firm conclusions with regard to the greater effectiveness of one
implementer over the other. The differential impact of aid provided
as budget support versus as project aid, as food aid versus non-food
aid, and as long-term versus short-term and emergency aid cannot be
investigated here due to the lack of relevant data. Aid volatility
and its impact, on the other hand, can be assessed using information
obtained through personal interviews (also related to how aid is
given).
Third, as in the previous chapters, I am also interested in
finding out whether the quality of governance affects in any way the
aid-food security relationship. While I am sure that national and
district-level quality of governance might play a larger role here,
I cannot examine such impact directly as all the people considered
in this study live in a cluster of villages located next to each
other and thus there is no variation in their measures. Instead, I
use a measure of village-level governance quality. I explain in
greater detail how it was obtained in the data section.
Hypotheses re-stated, with references to key existing literature
First, I examine whether the aid provided has had a positive
impact on the food security of its recipients and whether this
impact has been conditioned on the quality of local governance (H1).
3
Chapter six: Field study in India
The existing literature and findings from the previous levels of my
study indicate that generally aid does have some even if only small
positive effect in this regard (Berti et al., 2004; Bhutta et al., 2004;
Hoque et al., 1996; IYCN, 2011). Vis-à-vis the conditioning role of
local governance, the few works that address this question (e.g.
Blair, 2000; Rajkumar and Swaroop, 2002) along with my own
conclusions from the previous chapter also point in the direction of
a positive relationship.
Then I consider the different types of the aid provided and
whether they affect the impact of aid on food security. Regarding
the question of who provides/implements the assistance under study,
I can compare here the NGO-implemented development project with the
governmental PDS scheme of ration cards (and perhaps also the
government-run programme of laptop distribution). My initial
hypothesis vis-à-vis this relationship (H2.2), formulated with a
view to existing literature (e.g. Hulme and Edwards, 1997; Lewis and
Opoku-Mensah, 2006) was that aid projects implemented by NGOs were
more effective than the ones implemented by government-related
organizations due to their greater flexibility and fewer
bureaucratic restrictions. The findings in the previous chapter lent
some support to this hypothesis.
Turning attention to the way how aid is disbursed, this study
allows me to once again examine whether credit aid is less effective
and more conditioned on governance than non-credit aid (H3.2) and
whether aid volatility has a negative effect on recipients’ food
security (H6). Both existing literature (on credit versus non-credit
aid e.g. Khandker, 1998, 2001; Mosley and Hulme, 1998; Wright, 2000,
Diagne, 1998; Morduch, 1998; Schrieder and Pfaff, 1997 and on aid
volatility e.g. Bulíř and Hamann, 2008; Lensink and Morrissey, 2000;
Rodrik, 1990) and my results from the previous chapters have
confirmed these hypotheses.
4
Chapter six: Field study in India
Finally, I am going to compare the effectiveness of agricultural
and livestock interventions as opposed to credit assistance, social
infrastructure (WASH) help, and the direct transfer aid provided by
the government. My initial hypothesis in this regard, formulated
with a view to existing findings (e.g. Berti et al., 2004; IYCN, 2011,
Bhutta et al. 2008, Hoque et al. 1996), was that agricultural aid would
be the most impactful. In the course of the previous three studies,
I modified the hypothesis to expect to find also social
infrastructural aid to be very beneficial in its effects on food
security (H8a). Unlike in the previous chapters, I also look at the
compound effects of different aid initiatives. Authors including
Oxenham (2002), Walingo (2006), and Wenhold et al. (2007) indicated
that multi-component projects were in general more successful at
strengthening food security and reducing poverty than projects
focused on one activity only and I expect to discover something
similar.
Methodology
This section first briefly discusses the current state of food
insecurity in India in general and in Uttar Pradesh specifically.
Then it describes the project in Maharajganj, on the basis of which
the empirical analysis is conducted, and discusses in detail each of
its four main components. A description on the Public Distribution
System and ration cards follows. Proceeding, I talk about the
quantitative and qualitative data collection. Finally, the last part
of the section explains the most appropriate methods for analysis of
the data collected.
The state of food insecurity in India in general and in Uttar Pradesh specifically
In the two preceding chapters, I have described the serious
situation of food insecurity in India, which has improved slightly
5
Chapter six: Field study in India
in the last few decades but not nearly as much as one would have
expected on the basis of India’s recent high economic growth. Some
researchers have dubbed this phenomenon the ‘South Asian enigma’ and
fierce debates continue vis-à-vis its main cause. As a reminder, the
most recent figures available from the WHO indicate that about 18.5
per cent of the Indian population is undernourished (lacks access to
sufficient daily calories), 43 per cent of children under five are
underweight, and 48 per cent of children are stunted (WHO). India’s
National Family Health Survey (International Institute for
Population Sciences [IIPS] and Macro International, 2007) helps to
complete the picture of India’s food insecurity state, suggesting
that one third of all children in India are born with low weight
(under 2500 kg), one third of all adult women are undernourished
(BMI below 18.5), and 56 per cent of adult women and 71 per cent of
children under five are anaemic2 (iron-deficient).
The situation in Uttar Pradesh is in many respects even worse than
in India in general. While ‘only’ 42 per cent of children under five
in Uttar Pradesh as opposed to 43 nationally are underweight, a
whopping 57 per cent are stunted (48 nationally). 15 per cent of
children are wasted (low weight for height) and 74 per cent are
anaemic. Only one in ten children between one and three years of age
have received vitamin A supplementation – significantly less than
the 25 per cent on the national level – and only one third of
children eat iodized salt, which is essential to proper functioning
of the thyroid gland. More than one third of all adults are
considered too thin according to their BMI scores and out of those,
more than half are severely thin (BMI less than 17.0).
Multi-component project in north-western Uttar Pradesh
2 Anaemia leads to increased morbidity from infectious diseases and in children also toimpaired cognitive performance, motor development, and lower scholastic achievement (WHO).
6
Chapter six: Field study in India
The project examined is being implemented among poor and
marginalized households in 20 villages in north-western Uttar
Pradesh, situated in four districts - Siddharthnagar, Maharajganj,
Gorakhpur, and Sant Kabir Nagar. All the communities lie in the
basin of the Rapti river, a tributary of the Ghanghra, and are
subject to major close-to-annual flooding. Land-based livelihoods -
agriculture and animal husbandry - have traditionally been the main
source of livelihoods among the poor people here. However, due to
heavy and ever-increasing population pressure, the average size of
landholdings is consistently on the decline, to the extent that for
some farmers, agriculture has purportedly become economically
unviable. This perspective fits well with the opinion of some
development scholars that small-scale agriculture in today’s world
constitutes for many an unsustainable way of life (Collier, 2008;
Seavoy, 2000). Consequently, there is an emergent crisis of
livelihoods along with serious and rising food insecurity in the
area.
The situation is further aggravated by a poor quality of
governance and deeply entrenched class and gender inequalities.
Corruption and discrimination against women, evident from birth, and
against scheduled classes and castes have hindered the potential
impact of state interventions aimed at reducing poverty and
strengthening food security. Another serious problem in the area is
an extremely poor level of sanitation and hygiene among the poor.
The NGO implementing the project under study has tried to address
these issues through a four-component development project consisting
of agricultural, livestock, economic, and sanitation/hygiene
interventions3.
Agricultural intervention
3 This information was obtained from the implementing NGO.
7
Chapter six: Field study in India
The main focus of this component of the development project has
been on strengthening the agricultural production and productivity
of small and marginalized farmers through introducing new crops,
techniques, practices, and technologies. As the Maharajganj area is
very flood-prone, one of the main activities has been the
distribution of ‘pre-flood’ rice cultivation packages that allow
farmers to harvest crop before the onset of floods. Similarly, the
project workers tried to introduce farmers to more flood-tolerant
rice varieties and less expensive practices of vegetable
cultivation. In flood-less years, they encourage farmers to produce
three crops in two seasons. They have also supported the farmers in
setting up small vegetable gardens for their own consumption and in
growing new types of vegetables.
Livestock intervention
The aim of the livestock project component is to contribute to
improving livestock breed, health, and overall productivity. The
main activity within the intervention has been training a troupe of
local veterinarians (‘para-vets’), who then provide basic healthcare
to domestic animals as well as artificial insemination services for
breed improvement. Between 2012 and 2014, this project component
managed to establish 16 ‘para-vet’ centres in the Maharajganj area,
which artificially inseminated close to 2000 cows and buffaloes,
vaccinated over 9000 animals, and provided de-worming medication to
850 animals.
8
Chapter six: Field study in India
Credit intervention
Within this component, the development project has encouraged the
establishment of self-help groups for micro-finance. Unlike many
other organizations, this NGO has not created a microfinance
institution itself but has rather tried to promote and capacitate
the Maharajganj community to manage their own saving and lending
operations. The available credit is then sometimes used to set up
micro-enterprises, including tea stalls, grocery shops, and shops
with building materials. However, thus far the credit has been used
most frequently to cover emergency expenses and other consumption
costs.
Water sanitation and hygiene (WASH) intervention
The objective of this project component has been to improve
hygiene and sanitation practices and conditions among the
Maharajganj communities. The main activities within this initiative
involve the construction of toilets in household premises and
awareness-raising among participating households about the dangers
of open defecation as well as about safe water drinking, sanitary
handling of sewage, and safe and sustainable waste disposal
management. The NGO has also provided some new technology related to
sanitary waste management to participating households and
communities.
Government schemes
Public Distribution System (PDS) and ration cards
The Public Distribution System is India’s largest national
programme aimed at improving food security. It dates back to the
1960s and has been managed jointly by the national and state
governments. Its basic premise is to allow people to purchase basic
9
Chapter six: Field study in India
commodities such as wheat and rice but also sugar and kerosene at
subsidized prices. Since 1992, it has been trying to target
primarily the poor.
Three different types of ration cards are available. The first is
the Antyodaya Anna Yojana (AAY) card, which should be in theory
provided to the 25 million poorest people across India, with the
discretion to whom to allocate them precisely left to local
authorities. The Below Poverty Line (BPL) card is in theory
available to all the people living below the official poverty line
(currently set at 27 Indian rupees a day for rural areas and 33 in
urban areas) and the Above Poverty Line (APL) card to everyone else
interested. In 2013, Antyodaya card holders were entitled to
purchase wheat for 2 IRS4 per kg and rice for 3 IRS per kg, BPL
holders wheat for 4.15 and rice for 5.65 IRS per kg, and APL holders
wheat for 6.10 and rice for 8.30 IRS per kg, with the maximum
purchase allowed usually set at 35 kgs per month per household
(DFPD, 2014).
Free laptop distribution
The other type of governmental assistance affecting the lives of
the people surveyed in my study has been a free-laptop distribution
scheme, initiated by the Samajwadi Party governing Uttar Pradesh
between 2012 and 2017. Only qualitative data on this scheme are
available as the people in my study received their first laptops
only after the quantitative surveys were collected – in the spring
of 2013.
According to the official rules of the scheme, secondary students
with good academic progress were eligible to receive a free notebook
computer each, in order to level the academic playing field between
the rich and the poor. The scheme has served, however, also as a
4 IRS to USD exchange rate as of July 2014: 0.017:1
10
Chapter six: Field study in India
massive propagation tool for the Samajwadi party as each computer
comes with a pre-programmed Samajwadi start-up screen and screen
saver. Recipients were warned not to attempt to change these default
settings as such attempts would lead to a crashing of the primary
software. After frequent news that the computers could later be
found offered by their owners for sale in various places, the
government of Uttar Pradesh decided to make the formerly publicly
available data about the programme private5.
Data collection
Both quantitative and qualitative data on the project were
collected. The quantitative data were gathered using brief household
surveys administered to 146 households that have benefitted from at
least one of the project’s components and to 23 households in
villages that did not participate in the project at all (control
group). First, eight villages from the project-participating ones
and three from the non-participating ones in close geographical
proximity were selected at random to be examined. Second, from each
village five to 15 households (depending on the size of the
community) were randomly selected and surveyed. The survey data were
collected in December 2012.
The surveys distributed, available in full in the appendix,
contained five main sections. The first one collected information
about different project components - if any - that the households
have benefitted from and about the households’ location. The second
section gathered data on all the households’ members, their age,
education levels, and religious affiliation. The third part
attempted to gauge the households’ wealth, based on both external
observations about their dwelling and information about their income
5 http://timesofindia.indiatimes.com/india/Beneficiaries-selling-Samajwadi-Party-laptops-for-Rs-4000/articleshow/25908761.cms
11
Chapter six: Field study in India
and asset ownership. The fourth section inquired whether the
families under study were recipients of any other external
assistance, whether governmental or private, and finally the fifth
one asked about their food security levels.
Qualitative data on the project were gathered in December 2013 -
January 2014, through a series of longer interviews with household
members from a few of the project-participating and non-
participating villages. The main objectives underlying this second
round of data collection were to validate the preliminary results
obtained through quantitative analysis and to uncover details about
the project’s impacts that could not be obtained or understood by
simply looking at numbers. The households to be interviewed were
selected also randomly and in total, ten people from project
participants and five from non-participants were interviewed. The
interviews were conducted using a series of open-ended questions
(full text is also included in the appendix), which attempted to
elucidate the processes underlying the impacts of the various
interventions.
Analytical methods
Methods for analyzing quantitative data
The first approach that I use to establish the effect of the
project and its various components on recipients’ food security is
Propensity Score Matching (PSM), which allows for impact evaluation
even in the absence of panel data. Already described in the previous
chapter, this quasi-experimental approach is based on the
construction of a suitable control group to the treated one (those
households that received some help from the project), whose output
indicators are then subtracted from the treatment groups’ to
12
Chapter six: Field study in India
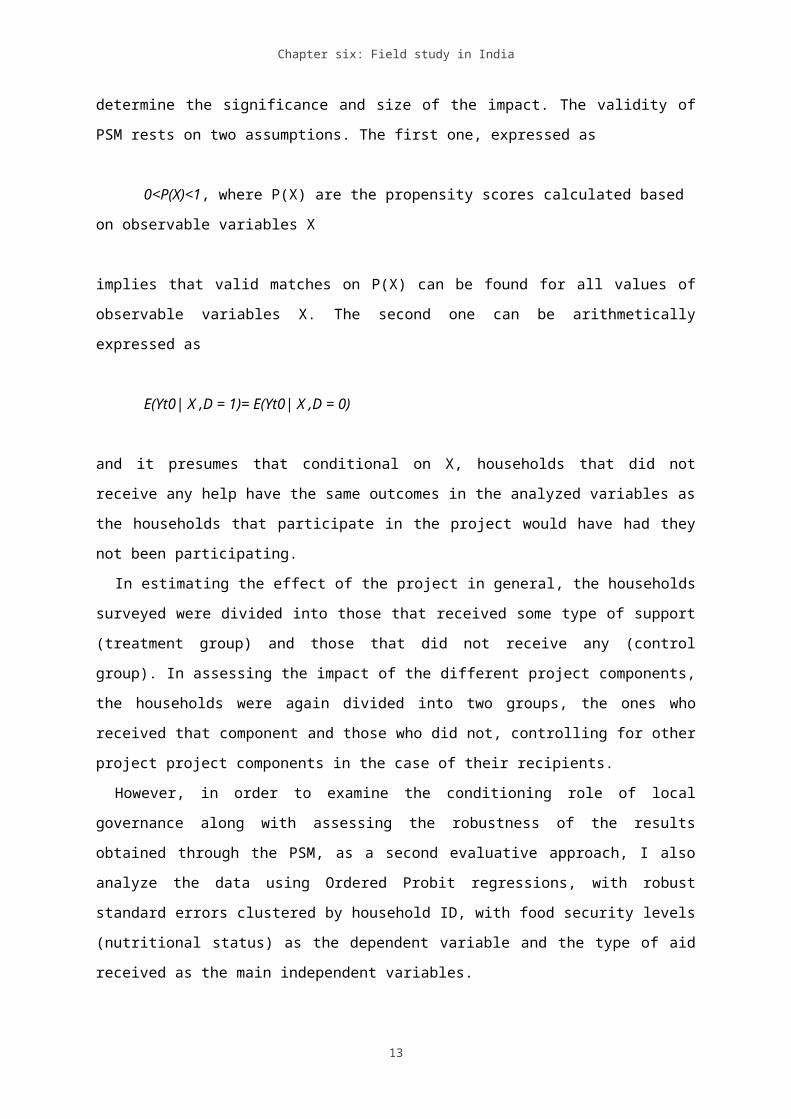
determine the significance and size of the impact. The validity of
PSM rests on two assumptions. The first one, expressed as
0<P(X)<1, where P(X) are the propensity scores calculated based
on observable variables X
implies that valid matches on P(X) can be found for all values of
observable variables X. The second one can be arithmetically
expressed as
E(Yt0| X ,D = 1)= E(Yt0| X ,D = 0)
and it presumes that conditional on X, households that did not
receive any help have the same outcomes in the analyzed variables as
the households that participate in the project would have had they
not been participating.
In estimating the effect of the project in general, the households
surveyed were divided into those that received some type of support
(treatment group) and those that did not receive any (control
group). In assessing the impact of the different project components,
the households were again divided into two groups, the ones who
received that component and those who did not, controlling for other
project project components in the case of their recipients.
However, in order to examine the conditioning role of local
governance along with assessing the robustness of the results
obtained through the PSM, as a second evaluative approach, I also
analyze the data using Ordered Probit regressions, with robust
standard errors clustered by household ID, with food security levels
(nutritional status) as the dependent variable and the type of aid
received as the main independent variables.
13
Chapter six: Field study in India
Methods for analyzing qualitative data
As a primary method here I use simple content analysis. I read
each of the interview transcripts carefully and identified a series
of unifying themes and topics. I cross-checked these with the
results obtained via quantitative methods and used the qualitative
data to provide depth and explanatory power to my overall
conclusions.
Data and descriptive statistics
Food insecurity measures
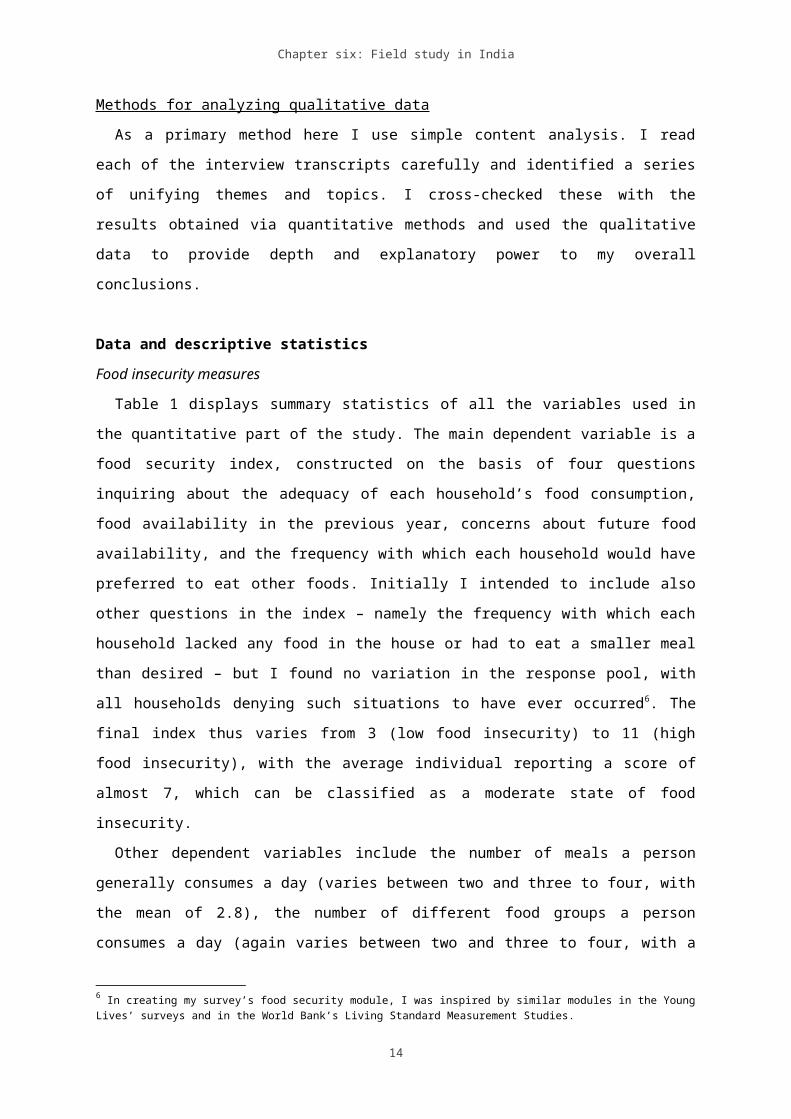
Table 1 displays summary statistics of all the variables used in
the quantitative part of the study. The main dependent variable is a
food security index, constructed on the basis of four questions
inquiring about the adequacy of each household’s food consumption,
food availability in the previous year, concerns about future food
availability, and the frequency with which each household would have
preferred to eat other foods. Initially I intended to include also
other questions in the index – namely the frequency with which each
household lacked any food in the house or had to eat a smaller meal
than desired – but I found no variation in the response pool, with
all households denying such situations to have ever occurred6. The
final index thus varies from 3 (low food insecurity) to 11 (high
food insecurity), with the average individual reporting a score of
almost 7, which can be classified as a moderate state of food
insecurity.
Other dependent variables include the number of meals a person
generally consumes a day (varies between two and three to four, with
the mean of 2.8), the number of different food groups a person
consumes a day (again varies between two and three to four, with a
6 In creating my survey’s food security module, I was inspired by similar modules in the YoungLives’ surveys and in the World Bank’s Living Standard Measurement Studies.
14
Chapter six: Field study in India
mean of 2.53), the number of times a person suffered from a bout of
diarrhoea in the past month (on average between two and three
times), and the number of times a person was ill in the past six
months (approximately three times on average).
Table 1. Descriptive statistics of all variables usedM ean Std. Dev. M in M ax
Dependent variablesFood insecurity 6.91 1.90 3 11 Food consum ption 2.11 0.48 1 3 Future concern 2.20 0.74 1 4 W ould prefer other foods 0.79 0.60 0 2 Food availability 1.21 0.41 1 2No. of m eals per day 2.80 0.28 2 3.5No. of foods per day 2.53 0.19 2 3.5Diarrhoea 2.69 1.35 0 7.5Ilness 3.05 0.92 1.5 7.5Financial concern 2.37 0.77 1 4Project and governance variablesProject 0.88 0.32 0 1 Agricultural com ponent 0.81 0.39 0 1 Livestock com ponent 0.46 0.50 0 1 Credit com ponent 0.69 0.46 0 1 W ash com ponent 0.25 0.43 0 1Ration card 0.62 0.49 0 1 AAY card 0.28 0.45 0 1 BPL card 0.31 0.46 0 1 APL card 0.03 0.18 0 1Local governance quality 6.59 1.62 4 9Control variablesM ale 0.54 0.50 0 1Age 26.24 19.22 0 90Education (age>22y) 3.44 4.54 0 18HH size 9.56 4.88 1 24Fem ale headed hh 0.13 0.34 0 1M uslim 0.03 0.18 0 1Pucca' house 0.64 0.48 0 1W ealth index 0.02 2.02 -4.01 14.69Incom e per capita (USD) 86.74 45.95 26.20 392.93N 1257
Source: author’s own calculations
15
Chapter six: Field study in India
The final dependent variable used, financial situation, has less to do
with food security and more to do with a subjective measure of well
being as it enquired of surveyed households whether they were
concerned about their financial situation in the coming year. The
resultant values vary from 1 (little concern) to 4 (high concern),
with the average falling at 2.37.
Overall, the dependent variables paint a picture of moderate food
insecurity in the villages surveyed, with people somewhat but not
overly worried about their future prospects. However, as the
previous chapter insinuated, households in India might have the
tendency to downplay the gravity of their food security situations
and the qualitative data gathered suggest that it is the case also
here.
Assistance and governance variables
The first relevant variable here, project, inquired whether a
respondent has been a beneficiary of any of the project components.
Out of the 1257 people surveyed, 1110 (89 per cent) received at
least one of the components while 147 did not. The following four
variables provide the same information vis-à-vis the four separate
components – agricultural, livestock, credit, and WASH. The results
in Table 1 show that 81 per cent of respondents have benefitted from
the agricultural project elements, 69 per cent have received credit
support, 46 per cent livestock help, and 25 per cent support from
WASH.
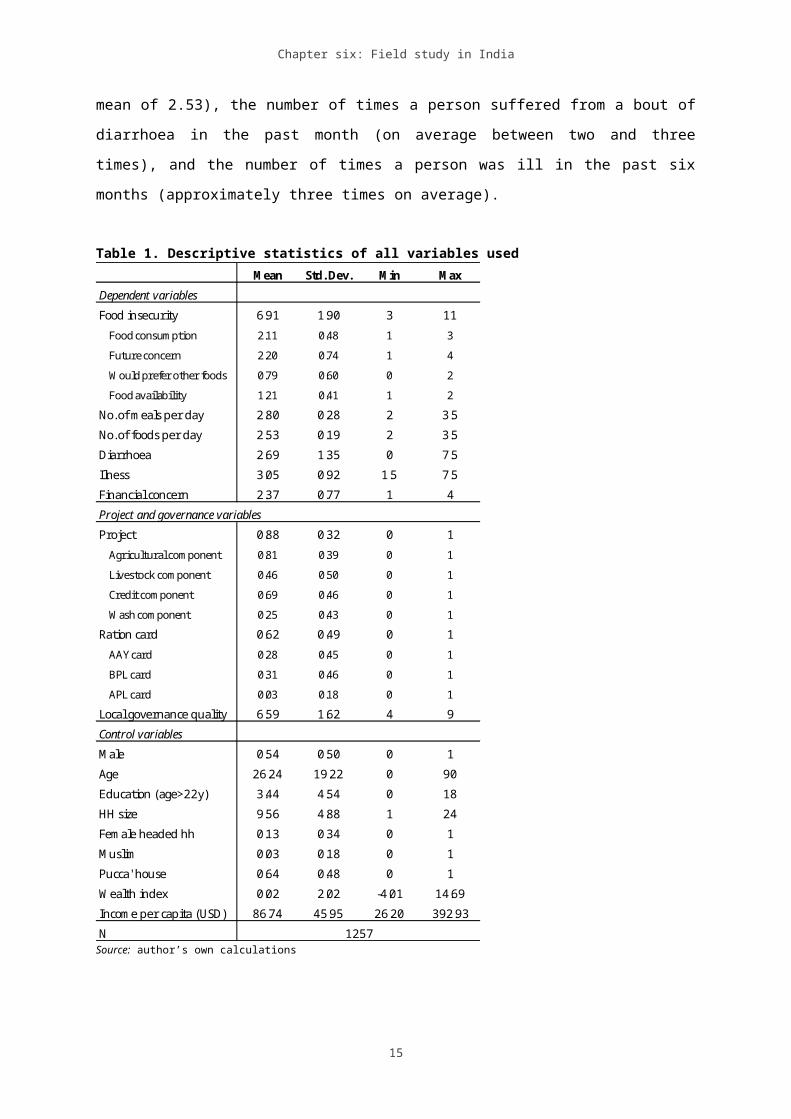
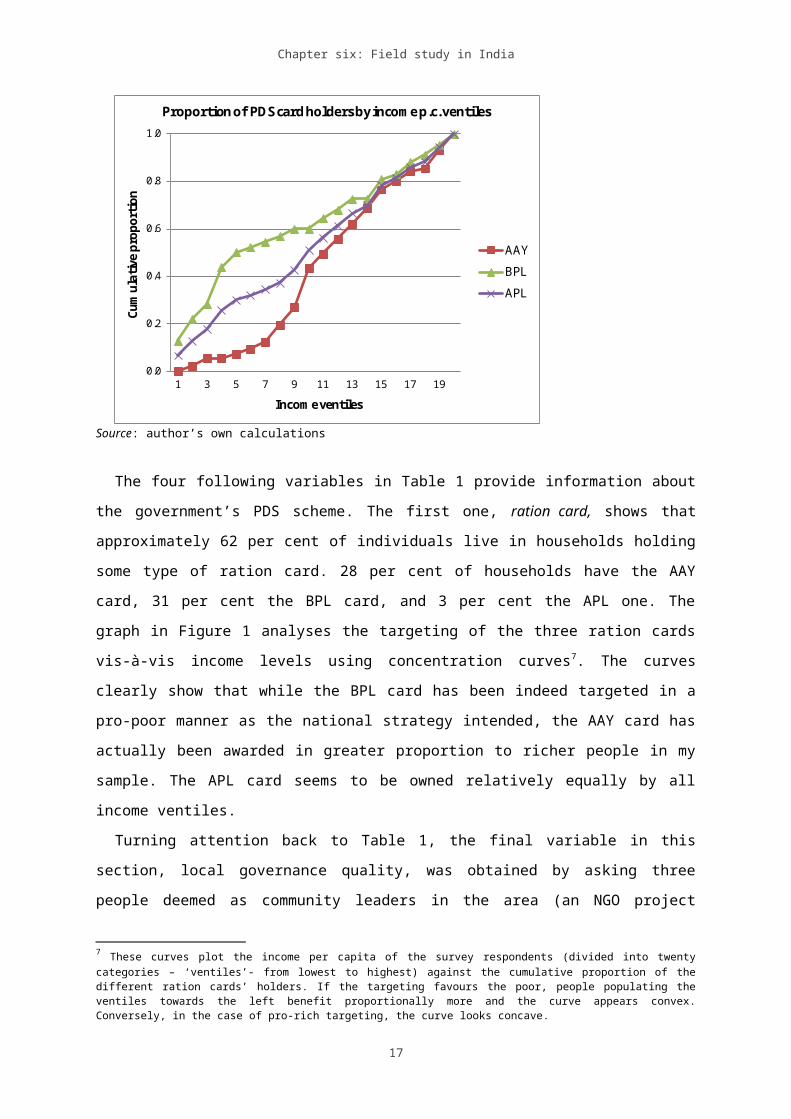
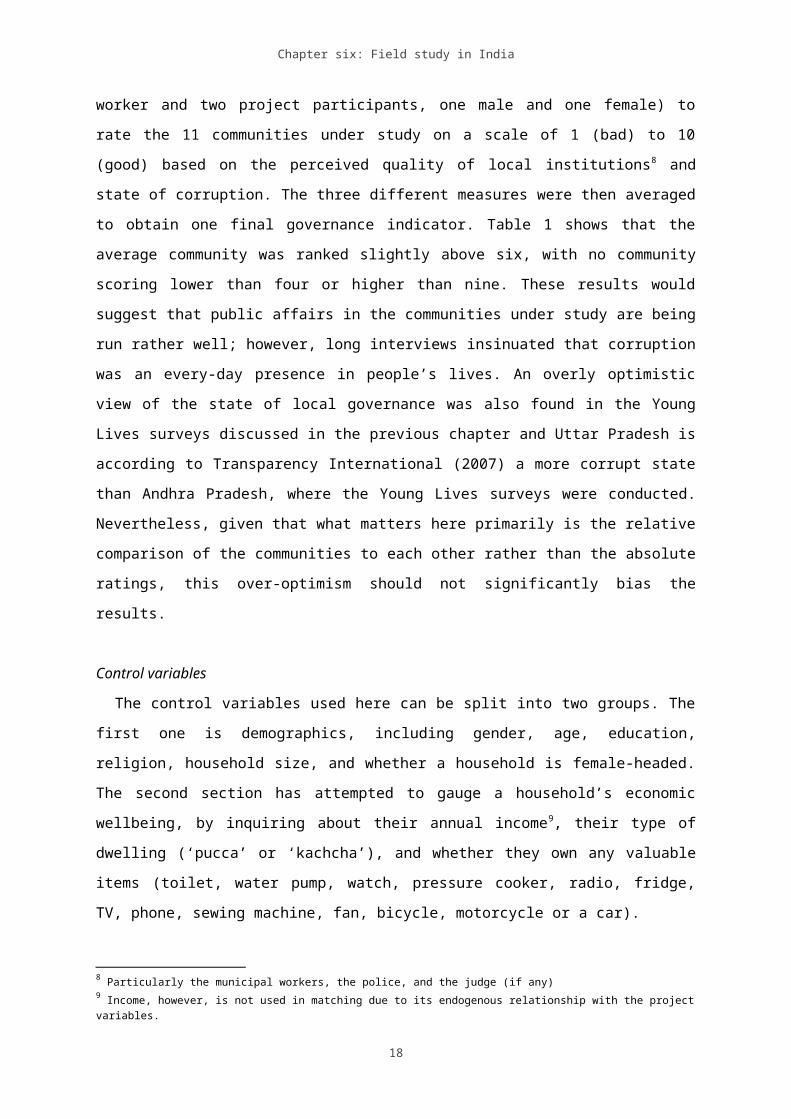
Figure 1. Relationship between PDS participation and income per capita
16
Chapter six: Field study in India
0.0
0.2
0.4
0.6
0.8
1.0
1 3 5 7 9 11 13 15 17 19
Cumulative
proportio
n
Incom e ventiles
Proportion of PDS card holders by incom e p.c. ventiles
AAYBPLAPL
Source: author’s own calculations
The four following variables in Table 1 provide information about
the government’s PDS scheme. The first one, ration card, shows that
approximately 62 per cent of individuals live in households holding
some type of ration card. 28 per cent of households have the AAY
card, 31 per cent the BPL card, and 3 per cent the APL one. The
graph in Figure 1 analyses the targeting of the three ration cards
vis-à-vis income levels using concentration curves7. The curves
clearly show that while the BPL card has been indeed targeted in a
pro-poor manner as the national strategy intended, the AAY card has
actually been awarded in greater proportion to richer people in my
sample. The APL card seems to be owned relatively equally by all
income ventiles.
Turning attention back to Table 1, the final variable in this
section, local governance quality, was obtained by asking three
people deemed as community leaders in the area (an NGO project
7 These curves plot the income per capita of the survey respondents (divided into twentycategories – ‘ventiles’- from lowest to highest) against the cumulative proportion of thedifferent ration cards’ holders. If the targeting favours the poor, people populating theventiles towards the left benefit proportionally more and the curve appears convex.Conversely, in the case of pro-rich targeting, the curve looks concave.
17
Chapter six: Field study in India
worker and two project participants, one male and one female) to
rate the 11 communities under study on a scale of 1 (bad) to 10
(good) based on the perceived quality of local institutions8 and
state of corruption. The three different measures were then averaged
to obtain one final governance indicator. Table 1 shows that the
average community was ranked slightly above six, with no community
scoring lower than four or higher than nine. These results would
suggest that public affairs in the communities under study are being
run rather well; however, long interviews insinuated that corruption
was an every-day presence in people’s lives. An overly optimistic
view of the state of local governance was also found in the Young
Lives surveys discussed in the previous chapter and Uttar Pradesh is
according to Transparency International (2007) a more corrupt state
than Andhra Pradesh, where the Young Lives surveys were conducted.
Nevertheless, given that what matters here primarily is the relative
comparison of the communities to each other rather than the absolute
ratings, this over-optimism should not significantly bias the
results.
Control variables
The control variables used here can be split into two groups. The
first one is demographics, including gender, age, education,
religion, household size, and whether a household is female-headed.
The second section has attempted to gauge a household’s economic
wellbeing, by inquiring about their annual income9, their type of
dwelling (‘pucca’ or ‘kachcha’), and whether they own any valuable
items (toilet, water pump, watch, pressure cooker, radio, fridge,
TV, phone, sewing machine, fan, bicycle, motorcycle or a car).
8 Particularly the municipal workers, the police, and the judge (if any)9 Income, however, is not used in matching due to its endogenous relationship with the projectvariables.
18
Chapter six: Field study in India
Looking first at the demographics, 54 per cent of the sample is
male, with the average age slightly above 26 years. The average
education level of all adult persons older than 22 years surveyed is
3.44, with a large range from no education to 18 years of schooling.
13 per cent of respondents live in female-headed households and only
three per cent are Muslim. The average household size is close to
ten, indicating the co-habitation of several generations of
families.
Turning attention to the indicators of economic well-being, 64 per
cent of respondents live in so-called ‘pucca’ houses with the rest
in ‘kachchas’. ‘Pucca’ houses refer to buildings constructed using
firm materials such as clay, bricks, tiles, or even metal, whereas
‘kachcha’ houses are made of temporary materials, primarily mud and
other organic matter. Data on the valuable items owned were used to
create a wealth index, using principal component analysis, with the
resulting average somewhere around zero on a scale from -4 to more
than 14. Finally, the average per capita income in my sample is
extremely low, less than 85 USD annually, which is deeply below the
international poverty line of 1.25 USD per person per day.
Nevertheless, these numbers cannot be taken at a face value from
this point of view as all the households surveyed are agricultural
and most of them are subsistence farmers, who consume primarily
home-cultivated food (which they do not report as part of their
income).
Qualitative data
While the long interviews were conducted using a series of open-
ended questions, a few statistics were also collected on the
respondents in order to compare them with the survey respondent
group. Due to the fact that men in this part of India are generally
seen as more competent at talking with strangers, 73 per cent (11
19
Chapter six: Field study in India
out of 15) of my sample were constituted by males. Unsurprisingly
then, the 15 interviewed people had also a higher average level of
finished education, 4.3 years of schooling10 as opposed to the 3.4
years in the whole sample. The mean age of the interviewees is also
higher than in the quantitative study, 42 as opposed to 26, due to
older people seen by members of the communities as more fit to
participate in interviews. The average household size and income per
capita were similar, however, at nine members and 89 USD annually.
Interviewed persons were also asked to rate their household
financial situation on a scale of 1 (poor) to 3(well-off) and their
food security situation on a scale of one (bad) to three (good). An
absolute majority of respondents replied two to both questions,
suggesting living in a state of moderate food insecurity and mild
poverty. Nevertheless, further questions indicated that most
respondents’ families were actually very poor, confirming yet again
the suspicion about the tendency of poor families in India (and
perhaps elsewhere as well) to downplay the true scale of their
destitution.
Data and study limitations
Due to the nature of the data collected and the intrinsic
difficulties of establishing attribution in impact evaluations, this
study suffers from several limitations. First, I compare recipients
of certain types of assistance to non-recipients but the reasons
underlying the differentiation are not always clear. In the case of
the NGO project, the non-recipients are primarily people who could
not receive the project/specific project component due to
geographical causes – because the NGO either does not work in their
community at all or because it does not implement the specific
10 The average level for adults over 22 who are male in the whole sample is 5.1.
20
Chapter six: Field study in India
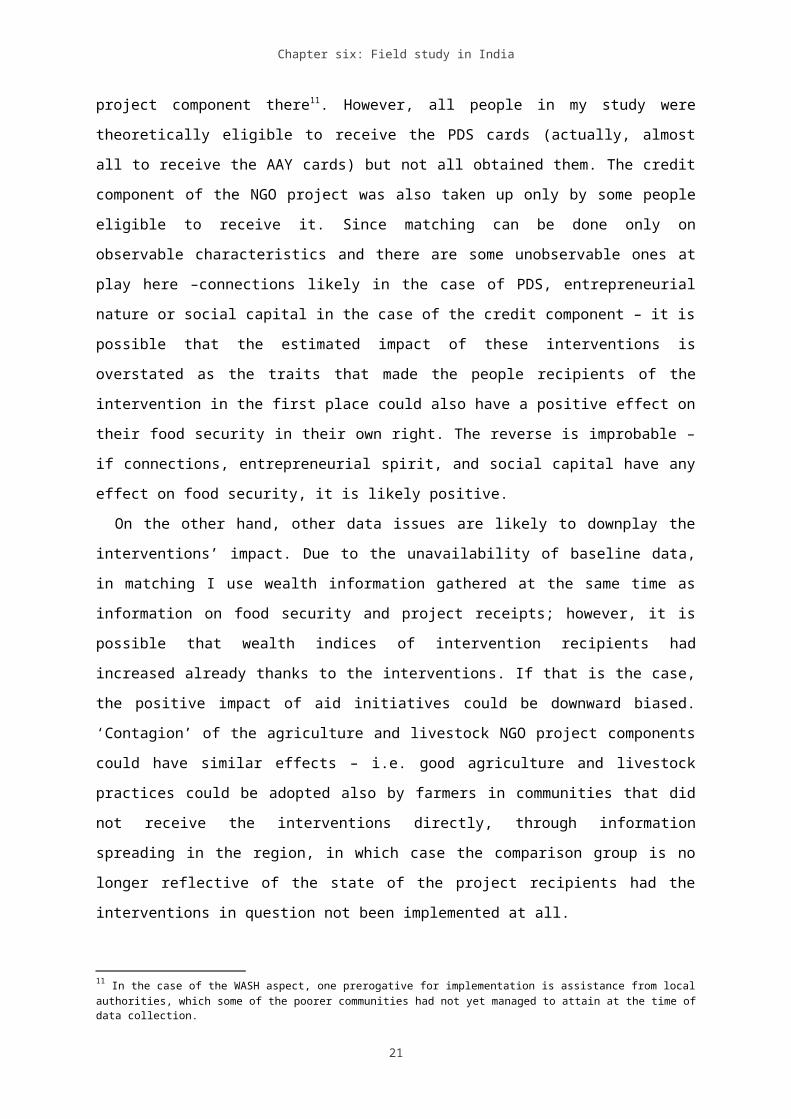
project component there11. However, all people in my study were
theoretically eligible to receive the PDS cards (actually, almost
all to receive the AAY cards) but not all obtained them. The credit
component of the NGO project was also taken up only by some people
eligible to receive it. Since matching can be done only on
observable characteristics and there are some unobservable ones at
play here –connections likely in the case of PDS, entrepreneurial
nature or social capital in the case of the credit component – it is
possible that the estimated impact of these interventions is
overstated as the traits that made the people recipients of the
intervention in the first place could also have a positive effect on
their food security in their own right. The reverse is improbable –
if connections, entrepreneurial spirit, and social capital have any
effect on food security, it is likely positive.
On the other hand, other data issues are likely to downplay the
interventions’ impact. Due to the unavailability of baseline data,
in matching I use wealth information gathered at the same time as
information on food security and project receipts; however, it is
possible that wealth indices of intervention recipients had
increased already thanks to the interventions. If that is the case,
the positive impact of aid initiatives could be downward biased.
‘Contagion’ of the agriculture and livestock NGO project components
could have similar effects – i.e. good agriculture and livestock
practices could be adopted also by farmers in communities that did
not receive the interventions directly, through information
spreading in the region, in which case the comparison group is no
longer reflective of the state of the project recipients had the
interventions in question not been implemented at all.
11 In the case of the WASH aspect, one prerogative for implementation is assistance from localauthorities, which some of the poorer communities had not yet managed to attain at the time ofdata collection.
21
Chapter six: Field study in India
My hope with regard to these limitations is that the two opposing
forces on my estimates of impact mostly cancel each other out.
Moreover, in relation with the unavailability of baseline data, I
also perform matching on demographic variables only (leaving out
wealth) to check for robustness of results. Finally, the qualitative
data gathered through long interviews should serve as a check on the
numerical results and in case of agreement should strengthen their
validity.
The impact of aid in general
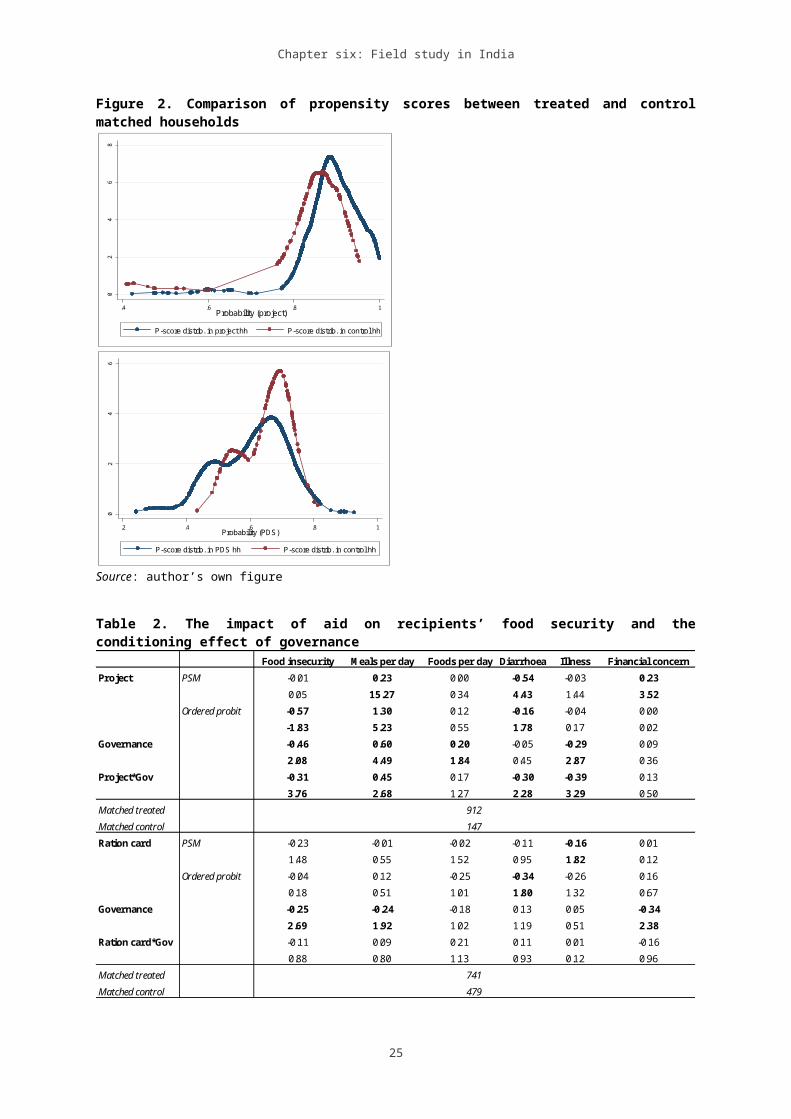
The first part of Table 2 shows the impact of the NGO project on
recipients’ food security as measured by the food insecurity index,
the number of meals consumed per day and of foods consumed per meal,
the frequency of diarrhoea and illness, and financial concern.
Overall, the impact appears to be positive, with the most robust
results found on increasing the number of meals consumed per day and
reducing the frequency of diarrhoea in the past month. A less robust
but still positive result was found with regard to the project’s
impact on recipients’ food insecurity index. Paradoxically, it also
seems that the project might have increased people’s concern about
future financial security but that could be attributed to the
inherently uncertain nature of project assistance. Even though
project recipients are better off today than they would have been
had they not received any help, their worry that things will
deteriorate significantly if/when the project leaves might have
heightened. The quality of local governance strengthens the positive
effect of the project, particularly in reducing the food insecurity
index and the frequency of diarrhoea and illnesses and in increasing
the number of food groups consumed12. 12 From the un-displayed control variables, the most significant were the ones capturinghousehold wealth, namely the wealth index and whether a household lives in a permanent ‘pucca’house. As expected, the better-off households suffered from less food insecurity in general.Female-headed households also appear to be more vulnerable to food insecurity than male-headed
22
Chapter six: Field study in India
Information gathered through interviews generally confirmed these
findings. All the persons interviewed that were active beneficiaries
of the project expressed a notion that the assistance provided by
the NGO contributed to improving their food security. When asked
about the intervening effects of governance, most respondents opined
that although the local authorities did not interfere much with the
NGO’s work, in some instances the positive impacts of the project
were to some extent dependent on the quality of the local
bureaucracy, particularly on their willingness to cooperate and
their likelihood to require bribes in exchange.
The PDS ration card scheme appears much less effective than the
project in the quantitative results. It might have slightly lowered
the frequency with which survey respondents suffer with illnesses
and diarrhoea but otherwise has had no impact on their food
security. Its effect has also been in no way conditioned on good
local governance, a result that seems a little surprising in view of
the information gathered from interviews, which suggested that some
PDS shopkeepers were significantly more demanding of bribes in
exchange for selling the subsidized rations than others. However,
the ratings of local governance were not based primarily on the
quality of the PDS shops; i.e. there might be a low level of
correlation between ‘good’ local governance as measured in this
study and the level of corruption among PDS administrators. On the
benefits of owning the cards, people in interviews reported that
particularly possession of the AAY cards was useful but at the same
time expressed a wish that the cards covered more goods than just
wheat, rice, sugar, and kerosene13.
ones, again an expected result given that usually households are female-headed because nofather/husband is present and hence there are fewer adults to provide financially for thehousehold dependents.13 The PSM models were also run without the wealth index, as a robustness tests, and theresults obtained varied slightly in the size of coefficients but generally not insignificance.
23

Chapter six: Field study in India
24
Chapter six: Field study in India
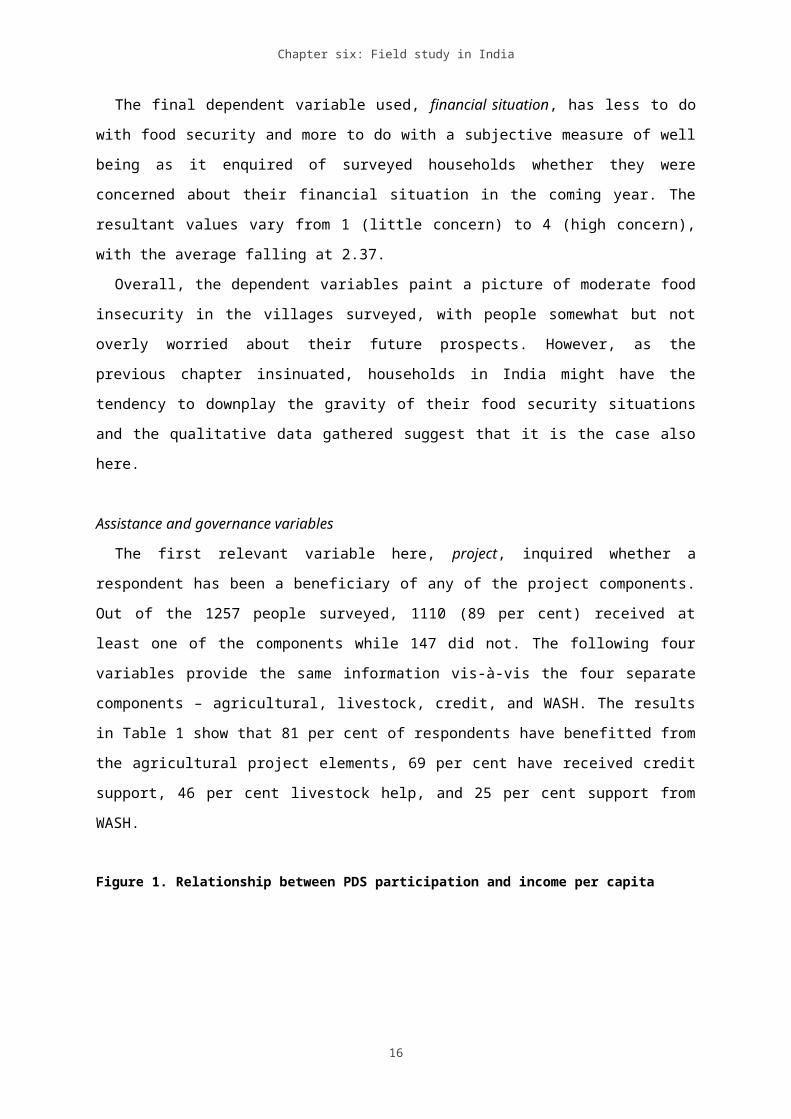
Figure 2. Comparison of propensity scores between treated and controlmatched households
02
46
8
.4 .6 .8 1Probability (project)
P-score distrib. in project hh P-score distrib. in control hh
02
46
.2 .4 .6 .8 1Probability (PDS)
P-score distrib. in PDS hh P-score distrib. in control hh
Source: author’s own figure
Table 2. The impact of aid on recipients’ food security and theconditioning effect of governance
Food insecurity M eals per day Foods per day Diarrhoea Illness Financial concernProject PSM -0.01 0.23 0.00 -0.54 -0.03 0.23
0.05 15.27 0.34 4.43 1.44 3.52Ordered probit -0.57 1.30 0.12 -0.16 -0.04 0.00
-1.83 5.23 0.55 1.78 0.17 0.02Governance -0.46 0.60 0.20 -0.05 -0.29 0.09
2.08 4.49 1.84 0.45 2.87 0.36Project*Gov -0.31 0.45 0.17 -0.30 -0.39 0.13
3.76 2.68 1.27 2.28 3.29 0.50Matched treatedMatched controlRation card PSM -0.23 -0.01 -0.02 -0.11 -0.16 0.01
1.48 0.55 1.52 0.95 1.82 0.12Ordered probit -0.04 0.12 -0.25 -0.34 -0.26 0.16
0.18 0.51 1.01 1.80 1.32 0.67Governance -0.25 -0.24 -0.18 0.13 0.05 -0.34
2.69 1.92 1.02 1.19 0.51 2.38Ration card*Gov -0.11 0.09 0.21 0.11 0.01 -0.16
0.88 0.80 1.13 0.93 0.12 0.96Matched treatedMatched control 479
741
912147
25
Chapter six: Field study in India
The number next to each variable is the Average Treatment Effect on the Treated (ATT) in caseof PSM regressions and a coefficient in case of the ordered probit regressions, the numberbelow is the corresponding Z score. Results significant at least as the 90% level are in bold.
Only three interview respondents mentioned to have benefitted
from the laptop-distribution scheme but all of those who did
obtained more than one laptop even though they did not have more
than one child of the appropriate age to be eligible to receive more
than one. One person had two in their household, one three, and one
six. When asked how that came about, the interviewees were rather
evasive and said that distant family members (cousins etc.) donated
them as they had already owned computers themselves. However, none
of the laptops mentioned by the interviewees were in active use due
to a) insufficient electricity, only 5 hours a day, b) no internet
connection in the communities, and c) computer illiteracy among most
household members. All three laptop-holding interviewees expressed
their desire to sell them. Since the main objective of the laptop
initiative is to level the playing field between rich and poor
students, not to address food insecurity, it would be unfair to
judge it from the same perspective; however, even the limited
information collected insinuates that the scheme might not be
effective 14.
The heterogeneous impact of aid
First, looking at the aid implemented by the NGO versus the
government schemes, both the quantitative and qualitative data
presented above suggest that the NGO aid has been significantly more
effective at bolstering recipients’ food security. When asked about
this specifically, interviewees also pointed to the greater
effectiveness of the NGO aid, citing much faster delivery times,
less bureaucracy, and no corruption as the main underlying reasons.14 The Times of India also share this view:http://timesofindia.indiatimes.com/india/Beneficiaries-selling-Samajwadi-Party-laptops-for-Rs-4000/articleshow/25908761.cms
26
Chapter six: Field study in India
This finding appears to validate my initially hypothesis (H2.2) on
NGO versus government-implemented aid even more so than the findings
in the previous chapter. However, the types of assistance provided
here by the NGO differ completely in kind from those provided by the
government, and hence it is not clear whether an agricultural
extension service or micro-finance provision run by the government
would also be less successful than the NGO ones examined here. What
certainly seems quite inefficient is the distribution of laptops to
families that still lack reliable access not only to electricity and
internet connections but also to safe drinking water and toilets.
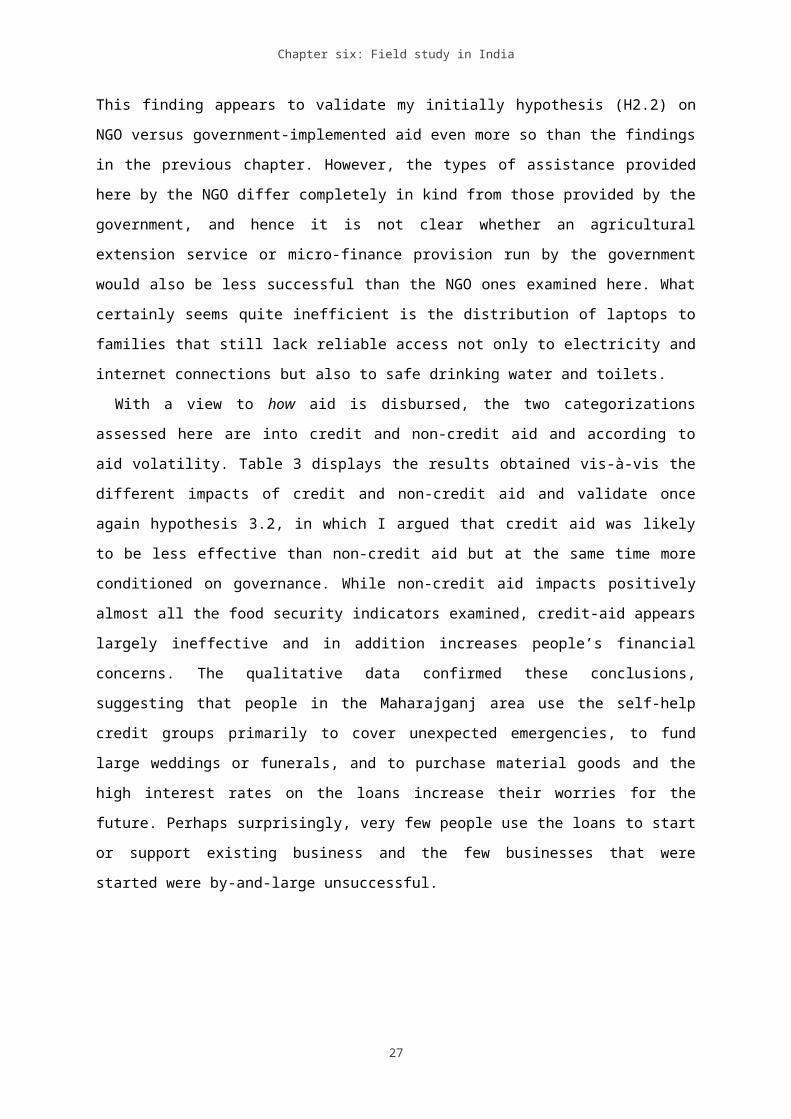
With a view to how aid is disbursed, the two categorizations
assessed here are into credit and non-credit aid and according to
aid volatility. Table 3 displays the results obtained vis-à-vis the
different impacts of credit and non-credit aid and validate once
again hypothesis 3.2, in which I argued that credit aid was likely
to be less effective than non-credit aid but at the same time more
conditioned on governance. While non-credit aid impacts positively
almost all the food security indicators examined, credit-aid appears
largely ineffective and in addition increases people’s financial
concerns. The qualitative data confirmed these conclusions,
suggesting that people in the Maharajganj area use the self-help
credit groups primarily to cover unexpected emergencies, to fund
large weddings or funerals, and to purchase material goods and the
high interest rates on the loans increase their worries for the
future. Perhaps surprisingly, very few people use the loans to start
or support existing business and the few businesses that were
started were by-and-large unsuccessful.
27
Chapter six: Field study in India
Table 3. The impact of credit versus non-credit aid on recipients’ foodsecurity
Food insecurity M eals per day Foods per day Diarrhoea Illness Financial concernCredit PSM 0.25 0.00 -0.01 0.00 -0.64 0.37
1.26 0.17 0.26 0.01 7.28 1.45Ordered probit 0.32 0.27 -0.42 -0.20 -0.31 0.51
0.19 0.97 1.35 0.65 1.32 1.89Non-credit PSM -1.39 0.22 0.00 -0.45 -0.13 -0.02
1.72 13.03 0.41 3.56 1.57 0.43Ordered probit -3.08 3.43 3.03 -1.28 -1.49 -2.35
1.81 2.15 1.64 2.13 0.93 1.90Governance Ordered probit -0.48 0.07 -0.15 0.03 -0.26 0.04
2.44 1.22 1.28 0.18 2.20 0.16Credit*gov Ordered probit -0.27 0.11 0.92 0.05 0.23 -0.21
2.13 0.52 2.88 0.29 1.08 1.97Non-credit*gov Ordered probit -0.38 0.25 -0.05 0.28 0.24 0.34
1.64 1.12 0.89 1.13 1.00 0.96The number next to each variable is the Average Treatment Effect on the Treated (ATT) in caseof PSM regressions and a coefficient in case of the ordered probit regressions, the numberbelow is the corresponding Z score. Results significant at least as the 90% level are in bold.
Regarding aid volatility, no relevant quantitative data were
collected but in the interviews, people did not appear to be
seriously harmed by it from the side of the NGO project as it has
provided assistance continuously for several years with no plans of
disbanding thus far. Nevertheless, some people did express a mild
worry that things would deteriorate again once the NGO left the area
(no one seems to have illusions that this will never happen).
Looking to the PDS scheme, while the households that have a ration
card generally have it for life, the availability of the subsidized
grain for purchase does vary over time and hence food-insecure
families cannot fully rely on the cards. Particularly in times of
droughts or floods when the harvest is bad and people are in most
need of free/cheap food, the ration-card stores tend to run out of
stock. Moreover, since 2012 there has been a push in Uttar Pradesh
to replace all the existing plastic ration cards with digitized
ones, in an effort to curb corruption. As of 2014, this process has
not been completed yet and it has added an extra element of
insecurity into the scheme. Overall, the data clearly provide
support to my original sixth hypothesis (H6).
28
Chapter six: Field study in India
Finally, we can use the data available to examine the
heterogeneous impact of aid on food security on the basis of where
the aid specifically goes. Looking at the different effects of the
four project components, displayed in Table 4, agricultural help
appears to have bolstered most robustly the number of meals a person
consumes per day along with the number of different food groups
consumed. This result, the interviewees explained, arose thanks to
the project workers introducing them to new types of crops as well
as to the use of chemical fertilizers and drip irrigation. For
several farmers the intervention backfired, however, as one season
they grew only the new crops and proceeded to lose their whole
harvest in a flood. Other, less robust, positive effects of the
agricultural project component have been to decrease the
participants’ perception of food insecurity along with the frequency
with which they suffer from diarrhoea and other illnesses. In
interviews, beneficiaries have described this effect as a result of
consuming food of better quality and variety, which has contributed
to an overall feeling of better food security.
Table 4. The heterogeneous impact of the various Project components on foodsecurity
29
Chapter six: Field study in India
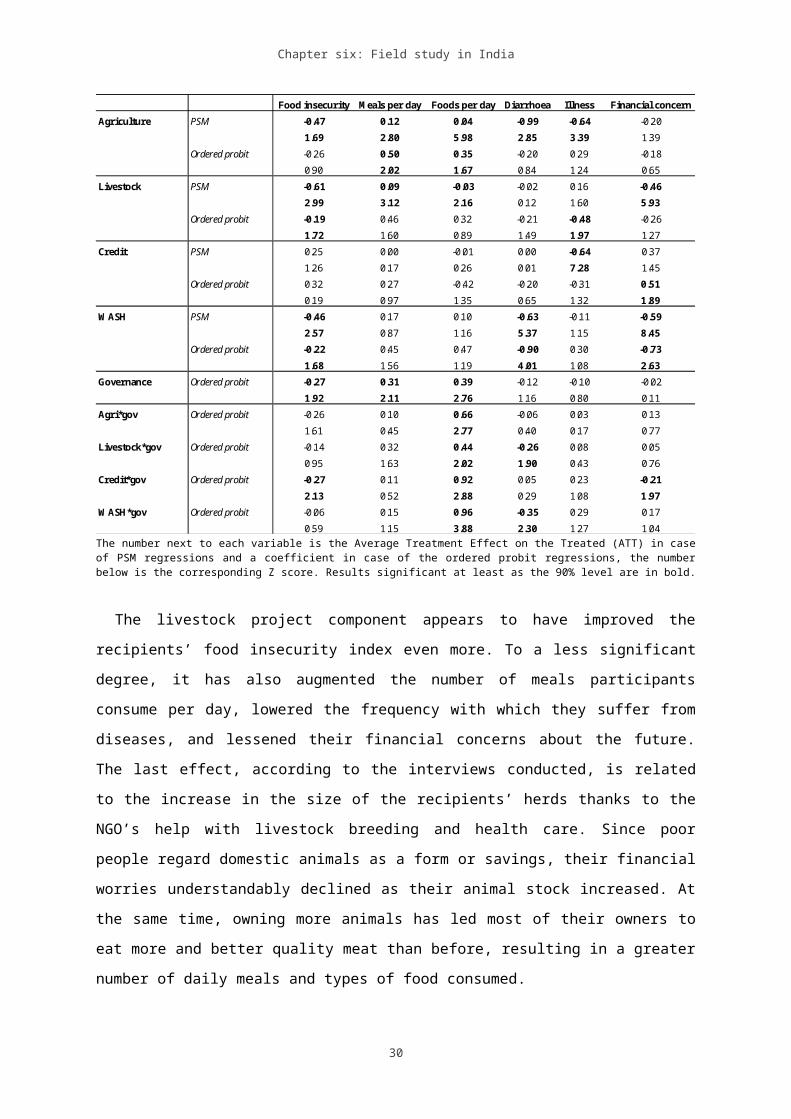
Food insecurity M eals per day Foods per day Diarrhoea Illness Financial concernAgriculture PSM -0.47 0.12 0.04 -0.99 -0.64 -0.20
1.69 2.80 5.98 2.85 3.39 1.39Ordered probit -0.26 0.50 0.35 -0.20 0.29 -0.18
0.90 2.02 1.67 0.84 1.24 0.65Livestock PSM -0.61 0.09 -0.03 -0.02 0.16 -0.46
2.99 3.12 2.16 0.12 1.60 5.93Ordered probit -0.19 0.46 0.32 -0.21 -0.48 -0.26
1.72 1.60 0.89 1.49 1.97 1.27Credit PSM 0.25 0.00 -0.01 0.00 -0.64 0.37
1.26 0.17 0.26 0.01 7.28 1.45Ordered probit 0.32 0.27 -0.42 -0.20 -0.31 0.51
0.19 0.97 1.35 0.65 1.32 1.89W ASH PSM -0.46 0.17 0.10 -0.63 -0.11 -0.59
2.57 0.87 1.16 5.37 1.15 8.45Ordered probit -0.22 0.45 0.47 -0.90 0.30 -0.73
1.68 1.56 1.19 4.01 1.08 2.63Governance Ordered probit -0.27 0.31 0.39 -0.12 -0.10 -0.02
1.92 2.11 2.76 1.16 0.80 0.11Agri*gov Ordered probit -0.26 0.10 0.66 -0.06 0.03 0.13
1.61 0.45 2.77 0.40 0.17 0.77Livestock*gov Ordered probit -0.14 0.32 0.44 -0.26 0.08 0.05
0.95 1.63 2.02 1.90 0.43 0.76Credit*gov Ordered probit -0.27 0.11 0.92 0.05 0.23 -0.21
2.13 0.52 2.88 0.29 1.08 1.97W ASH*gov Ordered probit -0.06 0.15 0.96 -0.35 0.29 0.17
0.59 1.15 3.88 2.30 1.27 1.04The number next to each variable is the Average Treatment Effect on the Treated (ATT) in caseof PSM regressions and a coefficient in case of the ordered probit regressions, the numberbelow is the corresponding Z score. Results significant at least as the 90% level are in bold.
The livestock project component appears to have improved the
recipients’ food insecurity index even more. To a less significant
degree, it has also augmented the number of meals participants
consume per day, lowered the frequency with which they suffer from
diseases, and lessened their financial concerns about the future.
The last effect, according to the interviews conducted, is related
to the increase in the size of the recipients’ herds thanks to the
NGO’s help with livestock breeding and health care. Since poor
people regard domestic animals as a form or savings, their financial
worries understandably declined as their animal stock increased. At
the same time, owning more animals has led most of their owners to
eat more and better quality meat than before, resulting in a greater
number of daily meals and types of food consumed.
30
Chapter six: Field study in India
The credit part of the project performed the worst from the
viewpoint of the recipients’ food security. As Table 4 reveals, its
effect on most outcome variables has been insignificant. One PSM
regression suggests that those with access to microcredit suffer
less often from illnesses. On the other hand, an Ordered Probit
result insinuates that the microloans heightened people’s financial
concerns. This finding can logically be attributed to people’s fears
that they will be unable to repay the loans. The four interviewed
women who borrowed from the NGO-supported self-help groups all used
the money to cover consumption rather than production costs
(weddings etc.) and the repayment of the loans has strained their
already-tight household budgets.
The WASH project component has had a robust positive effect on
people’s food insecurity index, comparable in size and consistency
to the positive effect of the livestock component. It has also
significantly reduced the frequency of recipients’ diarrhoea. This
finding, as explained in interviews, is mainly thanks to the WASH
beneficiaries gaining access to in-household toilets and to more
knowledge about the importance of hand washing and safe water and
food-handling practices, which all contribute to lowering the
occurrence of digestive and other health problems. Interestingly,
the recipients’ financial concerns also decreased, perhaps thanks to
the realization that observing sanitary standards would likely
render household members healthier and hence less needy of emergency
credit assistance to cover health costs.
The quality of local governance reinforced the positive effects of
all four project components. This conditioning effect has been the
strongest in the case of the credit component. Interviewed credit
recipients suggested that the conditioning role might lie in the
fact that the communities with better local authorities (less
corruption, more efficient) provided some support to those organized
31
Chapter six: Field study in India
in microfinance self-help groups, ranging from arranging additional
business training courses to providing locations where the groups
could meet. Interviewees also highlighted the importance of
governance in strengthening the impact of the WASH component, as the
physical toilets themselves were supposed to be provided through the
government (with the NGO assuring their proper installation) and in
some communities, their delivery was much more efficient than in
others.
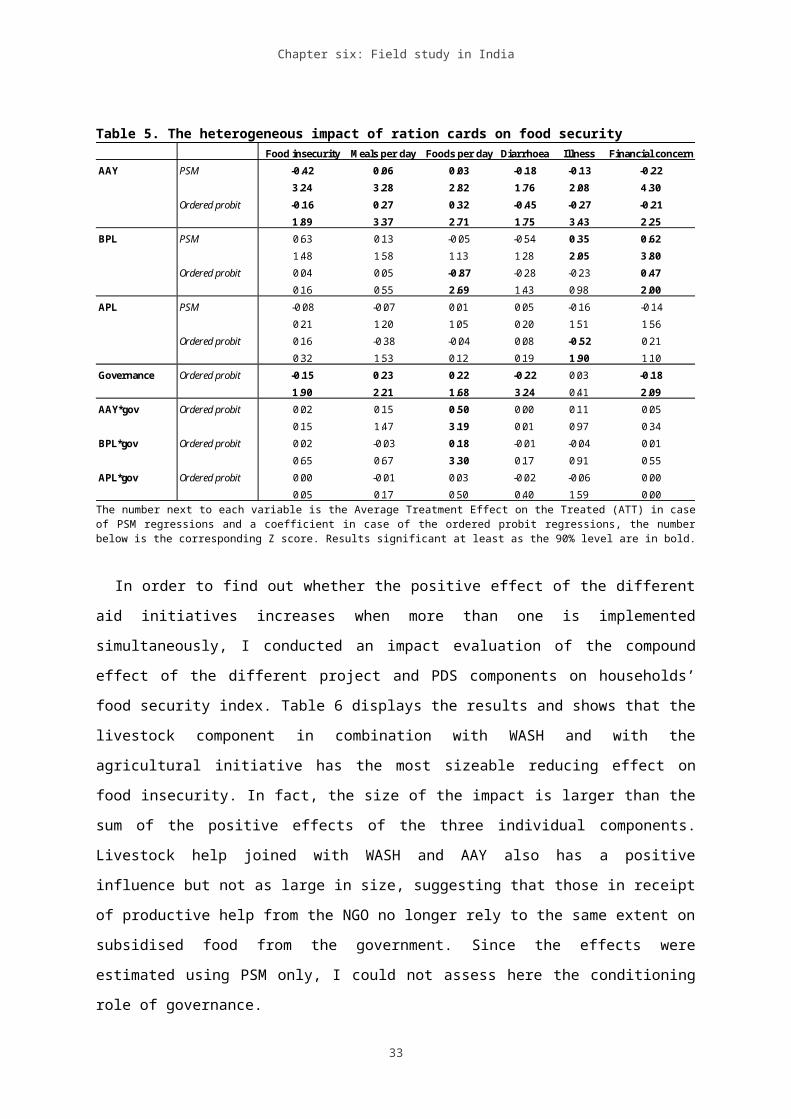
Out of interest, I also compare the effectiveness of the three
different PDS ration cards (Table 5), even though they all
constitute a form of ‘direct-transfer’ aid and hence their
comparison cannot add much to the assessment of my hypotheses. The
results show that while holding an AAY card unequivocally helps
people improve their food security, it is not so in the case of the
other two cards, with the BPL card actually appearing harmful in its
effect on several of the food-insecurity indicators examined. The
interviewees elucidated this finding, explaining that when stocks of
ration food were low, only AAY card holders were allowed purchasing.
The BPL and APL cards are hence considered to be a far-inferior
possession to the AAY cards, which then explains why particularly
the distribution of AAY cards is so income-regressive (Figure 1).
Since the AAY cards render much more significant positive effects,
richer people with more money for bribes and better connections are
more interested in obtaining them, leaving the most destitute with
the ineffective BPL cards. Unlike in Table 2, however, governance
quality here appears to condition positively the impact of AAY and
BPL cards on the number of food groups recipients consume per day.
Information from interviews indicated that in the ‘better governed’
communities, ration shops ran out of supplies less frequently and
hence also BPL cards might have had some positive impact on
recipients’ food security.
32
Chapter six: Field study in India
Table 5. The heterogeneous impact of ration cards on food securityFood insecurity M eals per day Foods per day Diarrhoea Illness Financial concern
AAY PSM -0.42 0.06 0.03 -0.18 -0.13 -0.223.24 3.28 2.82 1.76 2.08 4.30
Ordered probit -0.16 0.27 0.32 -0.45 -0.27 -0.211.89 3.37 2.71 1.75 3.43 2.25
BPL PSM 0.63 0.13 -0.05 -0.54 0.35 0.621.48 1.58 1.13 1.28 2.05 3.80
Ordered probit 0.04 0.05 -0.87 -0.28 -0.23 0.470.16 0.55 2.69 1.43 0.98 2.00
APL PSM -0.08 -0.07 0.01 0.05 -0.16 -0.140.21 1.20 1.05 0.20 1.51 1.56
Ordered probit 0.16 -0.38 -0.04 0.08 -0.52 0.210.32 1.53 0.12 0.19 1.90 1.10
Governance Ordered probit -0.15 0.23 0.22 -0.22 0.03 -0.181.90 2.21 1.68 3.24 0.41 2.09
AAY*gov Ordered probit 0.02 0.15 0.50 0.00 0.11 0.050.15 1.47 3.19 0.01 0.97 0.34
BPL*gov Ordered probit 0.02 -0.03 0.18 -0.01 -0.04 0.010.65 0.67 3.30 0.17 0.91 0.55
APL*gov Ordered probit 0.00 -0.01 0.03 -0.02 -0.06 0.000.05 0.17 0.50 0.40 1.59 0.00
The number next to each variable is the Average Treatment Effect on the Treated (ATT) in caseof PSM regressions and a coefficient in case of the ordered probit regressions, the numberbelow is the corresponding Z score. Results significant at least as the 90% level are in bold.
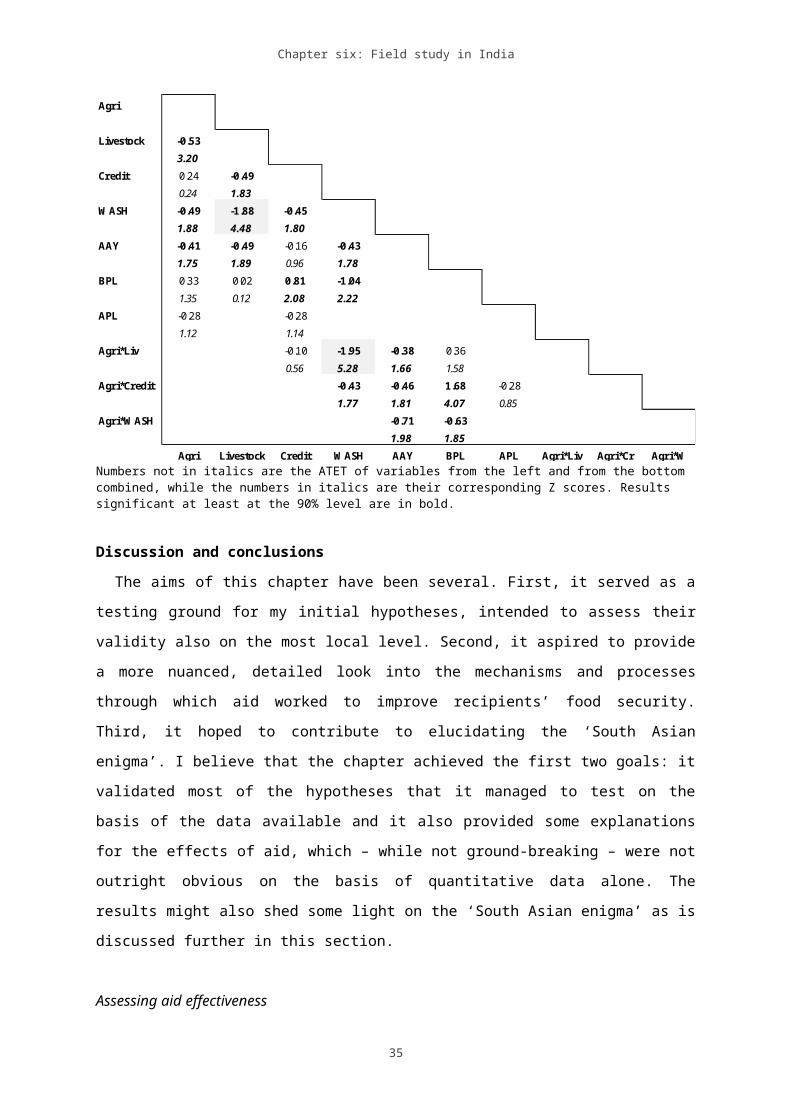
In order to find out whether the positive effect of the different
aid initiatives increases when more than one is implemented
simultaneously, I conducted an impact evaluation of the compound
effect of the different project and PDS components on households’
food security index. Table 6 displays the results and shows that the
livestock component in combination with WASH and with the
agricultural initiative has the most sizeable reducing effect on
food insecurity. In fact, the size of the impact is larger than the
sum of the positive effects of the three individual components.
Livestock help joined with WASH and AAY also has a positive
influence but not as large in size, suggesting that those in receipt
of productive help from the NGO no longer rely to the same extent on
subsidised food from the government. Since the effects were
estimated using PSM only, I could not assess here the conditioning
role of governance.
33
Chapter six: Field study in India
Overall, the results on the heterogeneous impact of aid on food
security based on the specific aid activity involved imply that
agricultural and livestock aid along with social infrastructure aid
are more helpful to food security than economic (credit) and direct-
transfer aid. In addition, the analysis of compound impact of the
different aid initiatives suggested that households receiving all
three beneficial project components (agricultural, livestock, and
WASH) benefit significantly more than households receiving only one
component, confirming the conjecture that bolstering more than one
food security aspect at a time can strengthen food security to a
greater extent.
The results also indicate that one type of the direct-transfer aid
examined here (the AAY card) is very effective at bolstering
recipients’ food security. However, there are several concerns about
the long-term effects of direct transfer programmes, primarily that
they are unsustainable and that they instil in their recipients a
passive, aid-reliant mentality. The first worry is not particularly
relevant here as the PDS is a long-standing government scheme,
unlikely to be disbanded any time in the near future. The second
worry might be more applicable but the data collected do not allow
me to delve deeper into its exploration. However, the main problem
with the direct-transfer programme here is its dismal targeting of
the poor, as a result of which the transfers cannot help the most
food insecure households.
Table 6. The Impact of Two/Three Aid Initiatives Combined on Recipients’ Food Security
34
Chapter six: Field study in India
Agri
Livestock -0.533.20
Credit 0.24 -0.490.24 1.83
W ASH -0.49 -1.88 -0.451.88 4.48 1.80
AAY -0.41 -0.49 -0.16 -0.431.75 1.89 0.96 1.78
BPL 0.33 0.02 0.81 -1.041.35 0.12 2.08 2.22
APL -0.28 -0.281.12 1.14
Agri*Liv -0.10 -1.95 -0.38 0.360.56 5.28 1.66 1.58
Agri*Credit -0.43 -0.46 1.68 -0.281.77 1.81 4.07 0.85
Agri*W ASH -0.71 -0.631.98 1.85
Agri Livestock Credit W ASH AAY BPL APL Agri*Liv Agri*Cr Agri*WNumbers not in italics are the ATET of variables from the left and from the bottom combined, while the numbers in italics are their corresponding Z scores. Results significant at least at the 90% level are in bold.
Discussion and conclusions
The aims of this chapter have been several. First, it served as a
testing ground for my initial hypotheses, intended to assess their
validity also on the most local level. Second, it aspired to provide
a more nuanced, detailed look into the mechanisms and processes
through which aid worked to improve recipients’ food security.
Third, it hoped to contribute to elucidating the ‘South Asian
enigma’. I believe that the chapter achieved the first two goals: it
validated most of the hypotheses that it managed to test on the
basis of the data available and it also provided some explanations
for the effects of aid, which – while not ground-breaking – were not
outright obvious on the basis of quantitative data alone. The
results might also shed some light on the ‘South Asian enigma’ as is
discussed further in this section.
Assessing aid effectiveness
35
Chapter six: Field study in India
This study, just like the preceding ones, found that aid can have
a small but significant positive impact on recipients’ food
security, which is at least to some extent positively conditioned on
the quality of governance, in this case of the local kind. This
finding not only validated my first hypothesis (H1) once again but
in combination with results from the previous chapter interestingly
suggested that not only the quality of governance at the national
level but also at the more local levels matters in ensuring aid
effectiveness. Accordingly, local authorities also possess the
ability to either enhance or hinder the impact of aid projects
implemented within their jurisdictions.
With regard to the different types of aid, this study confirmed
once more a few others of my initial hypotheses. As in the previous
chapter, non-governmental aid was found here to be significantly
more effective than governmental aid, thanks to being faster, less
bureaucratic, and burdened with less corruption (H2.2). Credit aid
was significantly less effective than non-credit aid and effective
at all only in communities deemed to be well-governed locally
(confirming H3.2). Credit recipients elucidated the lack of
effectiveness by pointing out that most people took out loans to
cover consumption rather than production expenses and found it very
hard to subsequently repay them. They also pointed out that many
people obtained loans from the self-help groups to repay other
loans, from banks, microfinance institutions, and money lenders,
which often led them to a vicious cycle of over-indebtedness and
great financial concern. The inconsistency in the availability of
subsidized food rations (aka, aid volatility) was reported as one of
the crucial problems undermining the effectiveness of the PDS (H6).
Vis-à-vis the effectiveness of different aid activities,
agricultural aid – particularly its livestock element – and even
more consistently social infrastructure aid (specifically,
36
Chapter six: Field study in India
sanitation, hygiene, and water focused activities) appeared to be
the most effective at boosting recipients food security, validating
hypothesis eight (H8) both in its original and in its amended form.
Moreover, the analysis of compound impact suggested that actually
receiving both agricultural (livestock) and social infrastructure
aid at the same time have the most positive impact. The positive
effect of the aid activities revolving around crops and livestock
appears to come from the greater amount and variety of foods
produced as a result. Some beneficiaries were also able to sell part
of their food production, improving their financial situation and in
turn also their ability to purchase more/different types of food if
needed. The sanitation and hygiene project component, on the other
hand, appears to have bolstered recipients’ food security primarily
via the food utilization route, by improving the sanitary handling
of food and water and in that way reducing the frequency of
digestive and other illnesses.
The direct-transfer aid supplied by the national government did
not have a significantly positive impact overall but one of its
three types, the AAY ration card, was found to be on its own highly
effective at reducing food insecurity. The data available, however,
did not allow me to examine whether this positive impact would hold
also in the long run and more importantly, the targeting of the
initiative to the richer people in the communities surveyed
suggested that the most food insecure people were often left out of
the initiative. On a different note, while the distribution of free
laptops organised by the UP government was not intended to
specifically bolster food security, from any developmental point of
view it appears to constitute a waste of resources, which in a
country with child undernourishment rates as high as in India could
surely be used more productively.
37
Chapter six: Field study in India
The ‘South Asian’ enigma
The point made above with regard to the laptop scheme brings me
back to the topic of the ‘South Asian enigma’, which my study
certainly did not resolve but might have contributed to its greater
understanding. The term, coined by Ramalingaswami et al. (1997),
refers to the fact that the rate of South Asian (and particularly
Indian) child malnutrition is disproportionately high in view of the
region’s level of economic development. Panagariya (2013) argued
that the rates of child undernourishment were not in fact so much
higher in India than elsewhere, with the explanation that the
international reference standards used were simply inapplicable to
India – that Indian children were genetically shorter and lighter
than children elsewhere. Nevertheless, a multi-reference growth
study by the WHO (2009) showed that children living in affluent
Indian neighbourhoods in Delhi were not significantly different in
their height or weight from their peers in the US or Norway.
Alternative explanations for the enigma have focused on
discrimination against girls and higher-order children within Indian
households, with parents providing relatively more resources to boys
and first-born children (Jayachandran and Pande, 2012), and on the
negative effects of low hygiene, which might instigate
undernourishment even among economically better-off households
(Spears, 2013).
In my study, I did not collect specific nutritional data and hence
could not examine child undernourishment precisely. What I did learn
from the surveys and interviews carried out was that parents in
general desired male offspring more than female and consequently
invested less in girls, also in terms of their feeding. When asked
who went hungry first within the household in the case of food
scarcity, all survey respondents without exception responded that it
was women and girls. Interviewees confirmed this view, admitting
38
Chapter six: Field study in India
that men and boys were always fed first, with girls and women eating
only what remained. These findings hence provide some support to the
hypothesis that the high rates of child undernourishment in India
might be at least partially driven by the intra-familiar
discrimination of girls.
Even more of a contributing factor in my study, however, seems to
be the lack of good hygiene and sanitary practices. Out of the 1257
survey respondents, only 31 per cent had access to a toilet within
household premises and out of the remaining 69 per cent, most
practiced open defecation. The results of both my quantitative and
qualitative data analysis suggest that the WASH project component,
focused primarily on the installation of in-household toilets,
significantly contributed to better food security among recipients
and that this relationship was further strengthened by the presence
of ‘good’ local governance. Hence, my case study supports the
conclusions by Spears (2013) and Haddad et al. (2014) that one of the
best ways to tackle food insecurity and child undernourishment in
India is by increasing investment in sanitation and hygiene
programmes and raising awareness about the issues to achieve a
greater involvement of both national and local governments15.
Moreover, it shows that even small-scale initiatives can have a
meaningful positive effect on strengthening food security, implying
that more well-designed pro-poor social and economic initiatives
would likely reduce undernourishment and poverty faster than a
higher but less socially-aware economic growth (as argued by Drèze
and Sen, 2013 as opposed to Bhagwati and Panagariya, 2013).
Concluding remarks
15 These initiatives are much easier to carry out than to successfully ensure that Indiangirls – and high-order children –receive an equal amount of resources as male and first-bornchildren. Many Indian states including Andhra Pradesh, Karnataka, and Himachal Pradesh haveput some programmes aimed at addressing also this issue in place but their effectiveness hasbeen challenged (UNFPA, 2010).
39
Chapter six: Field study in India
This chapter concludes the empirical part of my thesis. It has
shown that many of the hypotheses that were found to hold true in
the macro levels of analysis are relevant also at the micro level.
In addition, by analysing more detailed, in-depth data collected
through long interviews it was able to provide more of an insight
into the effectiveness and ineffectiveness of different aid types in
their impact on food security. In the next chapter, I summarize,
analyse, and discuss the findings from all four empirical chapters
together, in an attempt to draw more definite and generalize-able
conclusions. Furthermore, I point out the gaps and limitations of my
research and briefly address issues that are highly relevant to aid
and/or to food security but were not touched upon here. Finally, I
formulate some relevant policy recommendations.
40