changes in propeller shaft behavior by fluctuating ... - mdpi
TRANSCRIPT

Citation: Lee, J.-W.; Vuong, Q.D.;
Jeong, B.; Lee, J.-u. Changes in
Propeller Shaft Behavior by
Fluctuating Propeller Forces during
Ship Turning. Appl. Sci. 2022, 12,
5041. https://doi.org/10.3390/
app12105041
Academic Editor: Roberto Camussi
Received: 5 April 2022
Accepted: 14 May 2022
Published: 17 May 2022
Publisher’s Note: MDPI stays neutral
with regard to jurisdictional claims in
published maps and institutional affil-
iations.
Copyright: © 2022 by the authors.
Licensee MDPI, Basel, Switzerland.
This article is an open access article
distributed under the terms and
conditions of the Creative Commons
Attribution (CC BY) license (https://
creativecommons.org/licenses/by/
4.0/).
applied sciences
Article
Changes in Propeller Shaft Behavior by Fluctuating PropellerForces during Ship TurningJi-Woong Lee 1 , Quang Dao Vuong 1 , Byongug Jeong 2 and Jae-ung Lee 1,*
1 Division of Marine System Engineering, Korea Maritime and Ocean University, Busan 49112, Korea;[email protected] (J.-W.L.); [email protected] (Q.D.V.)
2 Department of Naval Architecture, Ocean and Marine Engineering, University of Strathclyde,100 Montrose Street, Glasgow G4 0LZ, UK; [email protected]
* Correspondence: [email protected]; Tel.: +82-(0)51-410-4662
Abstract: It is known that a ship’s shafting system can be adversely affected by hull deformation,variations in the engine power, the propeller load, and eccentric propeller thrusts, thereby increasinglyaffecting the behavior of the shaft’s movement. A deformed shafting system may also lead to apotential risk of bearing damage by causing a change in the local load of the rear part of the after-sterntube bearing of the propeller shaft. With this concern, a series of previous studies were focused onoptimizing the effects of hull deformation by securing a proper level of propulsion shaft stabilityand optimizing the relative inclination angle and oil film retention based on a quasi-static state, thatis, Rules for the Classification of Steel Ships and experiences of shipyards. However, despite ourefforts to resolve this issue, marine accidents involving stern tube bearing damage have continuedto occur under relatively unattended ship motions in a transient state, that is, a quasi-static statethat can possibly cause sudden stern flow field changes. Therefore, to improve the stability of thepropulsion shaft, it is necessary to understand ship motions and the conditions of shafting systemsin a dynamic state and a transient state when the system is designed. From this point of view, thisstudy investigated the effect of changes in eccentric propeller forces on the motion of the propellershaft in a representative transient state of a 50,000 deadweight tonnage tanker by means of the straingauge method and a displacement sensor. The research findings demonstrate that propeller thrustfluctuations have a direct effect on the shaft stability by significant changes in the shaft motion thatcan lead to unbalanced supporting loads on the stern tube bearing. These results clearly reproducethe cause of damage to the ship in which the accident occurred at a reliable level and will be areference for establishing pragmatic guidelines for preventing damage to similar ships in the future.
Keywords: shaft movement; propeller forces; shafting system; strain gauge; displacement sensor
1. Introduction
The first studies related to securing the stability of ships’ shafting systems began inthe United States Navy in the late 1950s and progressed in various ways throughout the1970s [1]. In the 1960s, when shaft alignment was performed according to the conventionalstraight alignment theory, it was found that the shaft system could be damaged by theuneven distribution of the bearing load [2]. With the introduction of the fair curve alignmenttheory, which can guarantee the proper spacing and height adjustment between the shaftsupport bearings, the support bearings could be made to effectively share the loads of thepropulsion shafts, leading to a significant reduction in the bearing damage caused by poorlydistributed loads on the bearings [3–5]. In addition, a series of shaft optimization studiesconducted in the late 1970s, along with the development of shaft alignment computationprograms, played an important role in establishing the shaft alignment theory that is stillused to this day [6–9].
Meanwhile, the application of high-tensile steel plates in shipbuilding in the 1990soffered a great deal of flexibility to the hulls of large ships. This trend resulted in a higher
Appl. Sci. 2022, 12, 5041. https://doi.org/10.3390/app12105041 https://www.mdpi.com/journal/applsci

Appl. Sci. 2022, 12, 5041 2 of 20
degree of deformation of ship hulls, whereas the strength of the propulsion shaft tended toincrease to cover larger engines with high power. In other words, the engine compartmentlocated in a double-bottom hull has become thinner and is easier to deform as a consequenceof hull optimization; the opposite trend occurred with propulsion shafts [10]. Similarly tothe target ship of this study, the oil tanker is a linear type of ship that exhibits the greatesthull deformation due to draught changes due to the characteristics of transporting oil cargo.As a result of such hull deformation, the offset of the propulsion shaft support bearingwill change and the reaction force of the support bearing will also significantly change ina chain, resulting in damage to the shaft bearing. There are two parts that would sufferbearing damage in the propulsion system due to offset changes.
Firstly, in the case of main engine bearing damage, damage to the aftmost bearing in thevicinity of the turning wheel occurs as a wiping phenomenon due to overloading, whereascrank throw end bearing (the aftmost crank throw bearing) damage occurs as a hammeringphenomenon due to unloading. These types of damage have as their main cause the ship’sdeformation due to a change in the ship’s draught. These types of damage can be reducedsignificantly in collaboration with main engine manufacturers who could recognize andaddress the load sharing problem in the crankshaft bearing [11,12]. Meanwhile, the secondissue, damage involved in the second after-stern tube bearing, remains serious. The majorcauses of such damage to the after-stern tube bearing are primarily the misalignment andexcessive local load at the end of the after-stern tube bearing due to hull deformation [13,14].Therefore, in consideration of the major damage issues mentioned above, shafting systemdesign has been carried out focusing on alleviating the local load of the rear end [15]and maintaining the minimum oil film thickness of the after-stern tube bearing [16–18]in accordance with the Rules for the Classification of Steel Ships and the guidelines ofthe shipyard.
However, despite such design considerations in the rules and guidelines, if eccentricpropeller thrust force fluctuations frequently occur in a dynamic or transient state, theafter-stern tube bearing is highly likely to be damaged, regardless of how much the bearinglocal load fluctuation is predicted and prepared for by means of sophisticating machiningwith single-sloped or double-sloped processing. Another notable recent shaft system designperspective is to apply an ultra-long stroke engine to increase the ship’s operating efficiency.The ship’s operating efficiency can be improved through the application of an ultra-longstroke engine, while the shaft rotation speed can be lowered, resulting in a slight decreasein the ship’s speed. Therefore, to compensate for this, the propeller’s diameter can beslightly increased compared with the previous design [19]. The increase in the propeller’sdiameter leads to an increase in the propeller’s mass, and the bearing load and pressure ofthe after-stern tube bearing (ASTB) are also increased. Therefore, to cope with the above-mentioned issue, the length of the ASTB of the vessel is increased in order to compensatefor the increased load and pressure compared with the previous medium-range (MR) classvessel. However, the bearing load will be closer to the manufacturer’s maximum allowablebearing load compared with the previous design.
Considering the current trend, this situation leads to higher loads on the after-sterntube bearing. These load distribution conditions bring about a high probability of bearingdamage. In these circumstances, the stability of the shaft system cannot be ensured bystandardized quasi-static methods. ‘Quasi-static’ analysis means that the calculationsare performed in a static state, but the eccentric propeller thrust values generated at thevessel’s maximum design speed are reflected in the static state in the form of a bendingmoment. The quasi-static method has the advantage of being able to save time and reducecosts because the calculation is relatively simple, and it is easy to estimate the amount ofdeformation of the propulsion shaft. However, this method has fundamental limitationsthat make it difficult to identify potential hazards that may arise under real dynamicconditions. Saitoh [20] found that when the shaft system is designed in such a way thatonly the existing quasi-static conditions are considered, the force generated by the propellercauses serious damage to the stern tube bearing and the stern tube seal ring when the ship
Appl. Sci. 2022, 12, 5041 3 of 20
is in a dynamic state. This has created a strong demand for securing the shaft’s stabilityunder various propeller loads continuously in dynamic ship states, such as when the shipgoes straight ahead or turns [21–34].
In order to ensure the stability of the ship’s propulsion shaft, it is important to performextensive statistical analyses to obtain reliable data to further develop rules and standardsapplicable to all types of ships. Therefore, in this study, the effect of eccentric propellerthrust on the propeller shaft behavior during turning, which is a typical transient operatingstate of a ship, was investigated using a strain gauge and a displacement sensor fora medium-range tanker, which has not been covered in past studies that rely on theconventional methods.
2. Approaches Adopted
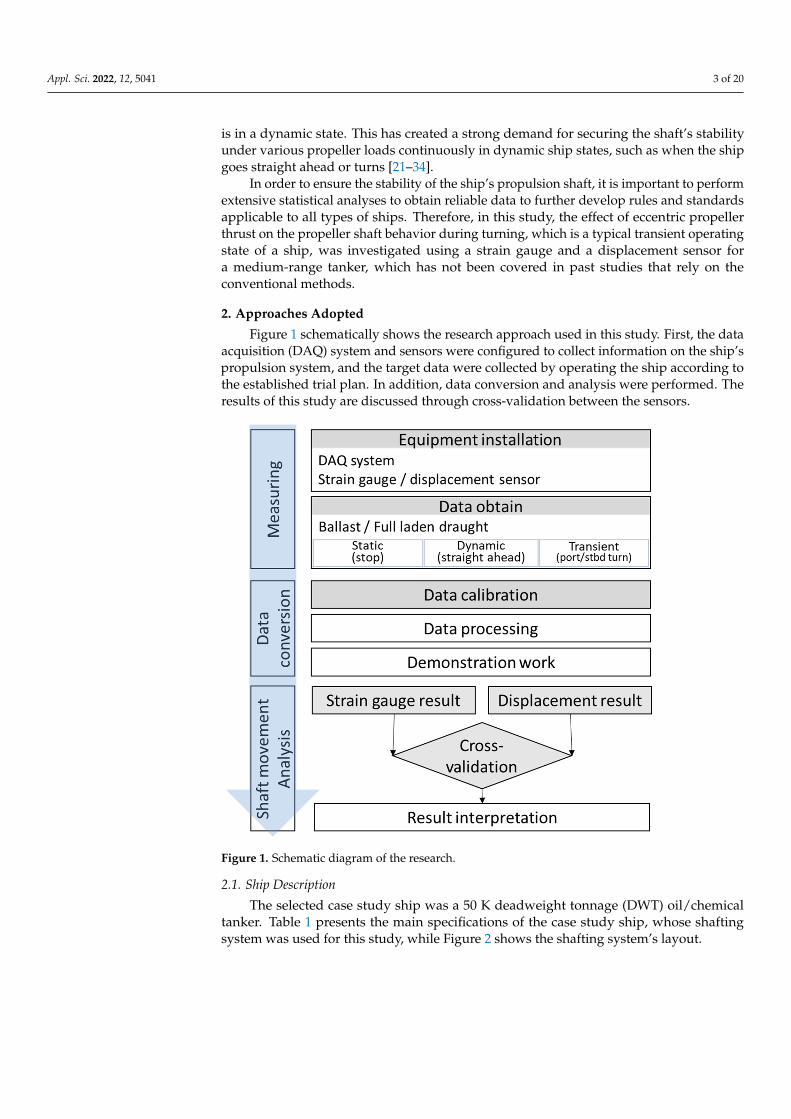
Figure 1 schematically shows the research approach used in this study. First, the dataacquisition (DAQ) system and sensors were configured to collect information on the ship’spropulsion system, and the target data were collected by operating the ship according tothe established trial plan. In addition, data conversion and analysis were performed. Theresults of this study are discussed through cross-validation between the sensors.
Appl. Sci. 2022, 12, x FOR PEER REVIEW 3 of 21
the existing quasi-static conditions are considered, the force generated by the propeller causes serious damage to the stern tube bearing and the stern tube seal ring when the ship is in a dynamic state. This has created a strong demand for securing the shaft’s stability under various propeller loads continuously in dynamic ship states, such as when the ship goes straight ahead or turns [21–34].
In order to ensure the stability of the ship’s propulsion shaft, it is important to per-form extensive statistical analyses to obtain reliable data to further develop rules and standards applicable to all types of ships. Therefore, in this study, the effect of eccentric propeller thrust on the propeller shaft behavior during turning, which is a typical transi-ent operating state of a ship, was investigated using a strain gauge and a displacement sensor for a medium-range tanker, which has not been covered in past studies that rely on the conventional methods.
2. Approaches Adopted Figure 1 schematically shows the research approach used in this study. First, the data
acquisition (DAQ) system and sensors were configured to collect information on the ship’s propulsion system, and the target data were collected by operating the ship according to the established trial plan. In addition, data conversion and analysis were performed. The results of this study are discussed through cross-validation between the sensors.
Figure 1. Schematic diagram of the research.
2.1. Ship Description The selected case study ship was a 50 K deadweight tonnage (DWT) oil/chemical
tanker. Table 1 presents the main specifications of the case study ship, whose shafting system was used for this study, while Figure 2 shows the shafting system’s layout.
Figure 1. Schematic diagram of the research.
2.1. Ship Description
The selected case study ship was a 50 K deadweight tonnage (DWT) oil/chemicaltanker. Table 1 presents the main specifications of the case study ship, whose shaftingsystem was used for this study, while Figure 2 shows the shafting system’s layout.
Appl. Sci. 2022, 12, 5041 4 of 20
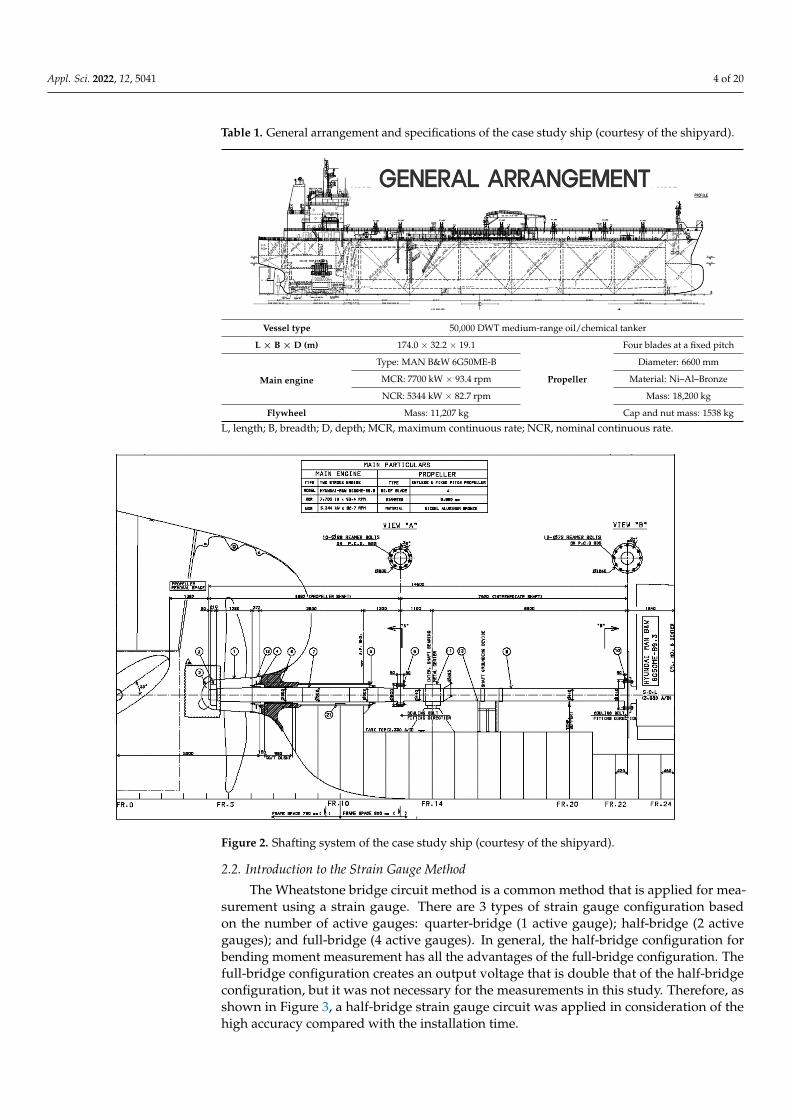
Table 1. General arrangement and specifications of the case study ship (courtesy of the shipyard).
Appl. Sci. 2022, 12, x FOR PEER REVIEW 4 of 21
Table 1. General arrangement and specifications of the case study ship (courtesy of the shipyard).
Vessel type 50,000 DWT medium-range oil/chemical tanker L × B × D (m) 174.0 × 32.2 × 19.1
Propeller
Four blades at a fixed pitch
Main engine Type: MAN B&W 6G50ME-B Diameter: 6600 mm
MCR: 7700 kW × 93.4 rpm Material: Ni–Al–Bronze NCR: 5344 kW × 82.7 rpm Mass: 18,200 kg
Flywheel Mass: 11,207 kg Cap and nut mass: 1538 kg L, length; B, breadth; D, depth; MCR, maximum continuous rate; NCR, nominal continuous rate.
Figure 2. Shafting system of the case study ship (courtesy of the shipyard).
2.2. Introduction to the Strain Gauge Method The Wheatstone bridge circuit method is a common method that is applied for meas-
urement using a strain gauge. There are 3 types of strain gauge configuration based on the number of active gauges: quarter-bridge (1 active gauge); half-bridge (2 active gauges); and full-bridge (4 active gauges). In general, the half-bridge configuration for bending moment measurement has all the advantages of the full-bridge configuration. The full-bridge configuration creates an output voltage that is double that of the half-bridge con-figuration, but it was not necessary for the measurements in this study. Therefore, as
Vessel type 50,000 DWT medium-range oil/chemical tanker
L × B × D (m) 174.0 × 32.2 × 19.1
Propeller
Four blades at a fixed pitch
Main engine
Type: MAN B&W 6G50ME-B Diameter: 6600 mm
MCR: 7700 kW × 93.4 rpm Material: Ni–Al–Bronze
NCR: 5344 kW × 82.7 rpm Mass: 18,200 kg
Flywheel Mass: 11,207 kg Cap and nut mass: 1538 kg
L, length; B, breadth; D, depth; MCR, maximum continuous rate; NCR, nominal continuous rate.
Appl. Sci. 2022, 12, x FOR PEER REVIEW 4 of 21
Table 1. General arrangement and specifications of the case study ship (courtesy of the shipyard).
Vessel type 50,000 DWT medium-range oil/chemical tanker L × B × D (m) 174.0 × 32.2 × 19.1
Propeller
Four blades at a fixed pitch
Main engine Type: MAN B&W 6G50ME-B Diameter: 6600 mm
MCR: 7700 kW × 93.4 rpm Material: Ni–Al–Bronze NCR: 5344 kW × 82.7 rpm Mass: 18,200 kg
Flywheel Mass: 11,207 kg Cap and nut mass: 1538 kg L, length; B, breadth; D, depth; MCR, maximum continuous rate; NCR, nominal continuous rate.
Figure 2. Shafting system of the case study ship (courtesy of the shipyard).
2.2. Introduction to the Strain Gauge Method The Wheatstone bridge circuit method is a common method that is applied for meas-
urement using a strain gauge. There are 3 types of strain gauge configuration based on the number of active gauges: quarter-bridge (1 active gauge); half-bridge (2 active gauges); and full-bridge (4 active gauges). In general, the half-bridge configuration for bending moment measurement has all the advantages of the full-bridge configuration. The full-bridge configuration creates an output voltage that is double that of the half-bridge con-figuration, but it was not necessary for the measurements in this study. Therefore, as
Figure 2. Shafting system of the case study ship (courtesy of the shipyard).
2.2. Introduction to the Strain Gauge Method
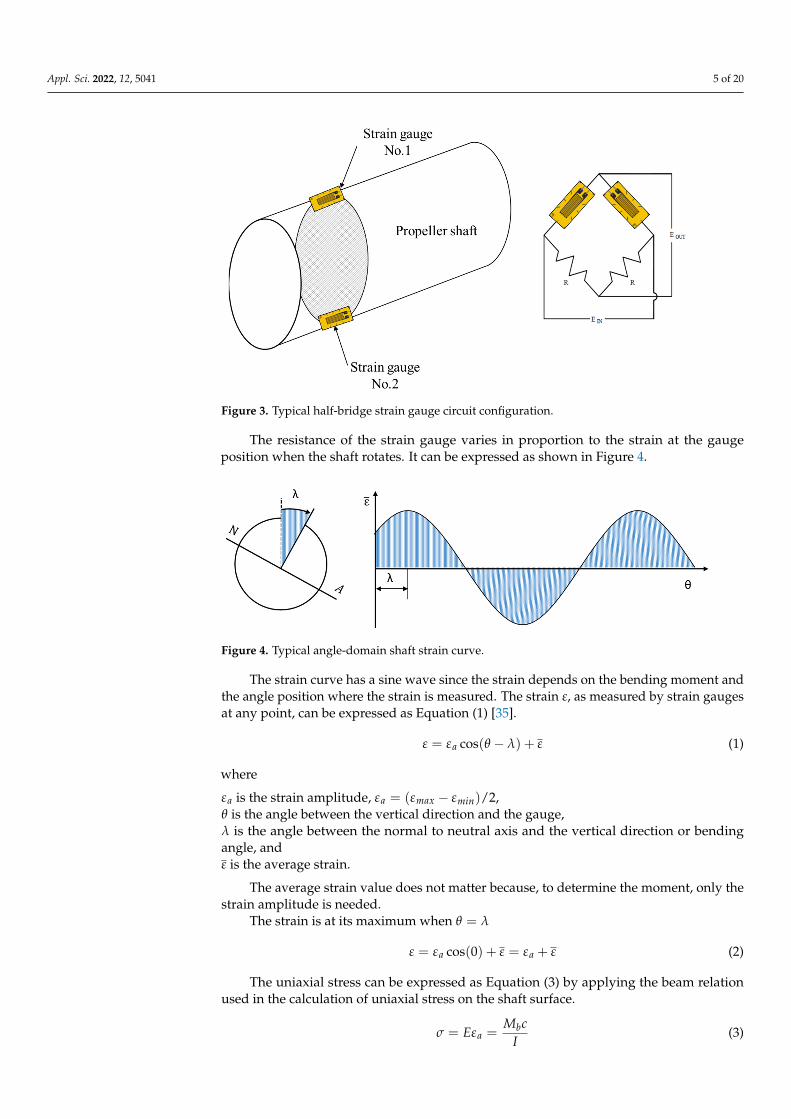
The Wheatstone bridge circuit method is a common method that is applied for mea-surement using a strain gauge. There are 3 types of strain gauge configuration basedon the number of active gauges: quarter-bridge (1 active gauge); half-bridge (2 activegauges); and full-bridge (4 active gauges). In general, the half-bridge configuration forbending moment measurement has all the advantages of the full-bridge configuration. Thefull-bridge configuration creates an output voltage that is double that of the half-bridgeconfiguration, but it was not necessary for the measurements in this study. Therefore, asshown in Figure 3, a half-bridge strain gauge circuit was applied in consideration of thehigh accuracy compared with the installation time.
Appl. Sci. 2022, 12, 5041 5 of 20
Appl. Sci. 2022, 12, x FOR PEER REVIEW 5 of 21
shown in Figure 3, a half-bridge strain gauge circuit was applied in consideration of the high accuracy compared with the installation time.
Figure 3. Typical half-bridge strain gauge circuit configuration.
The resistance of the strain gauge varies in proportion to the strain at the gauge po-sition when the shaft rotates. It can be expressed as shown in Figure 4.
Figure 4. Typical angle-domain shaft strain curve.
The strain curve has a sine wave since the strain depends on the bending moment and the angle position where the strain is measured. The strain ε, as measured by strain gauges at any point, can be expressed as Equation (1) [35]. 𝜀 = 𝜀 cos(𝜃 − 𝜆) 𝜀 ̅ (1)
where 𝜀 is the strain amplitude, 𝜀 = (𝜀 − 𝜀 )/2, 𝜃 is the angle between the vertical direction and the gauge, 𝜆 is the angle between the normal to neutral axis and the vertical direction or bending angle, and 𝜀 ̅is the average strain. The average strain value does not matter because, to determine the moment, only the
strain amplitude is needed. The strain is at its maximum when 𝜃 = 𝜆 𝜀 = 𝜀 cos(0) 𝜀̅ = 𝜀 𝜀 ̅ (2)
The uniaxial stress can be expressed as Equation (3) by applying the beam relation used in the calculation of uniaxial stress on the shaft surface.
Figure 3. Typical half-bridge strain gauge circuit configuration.
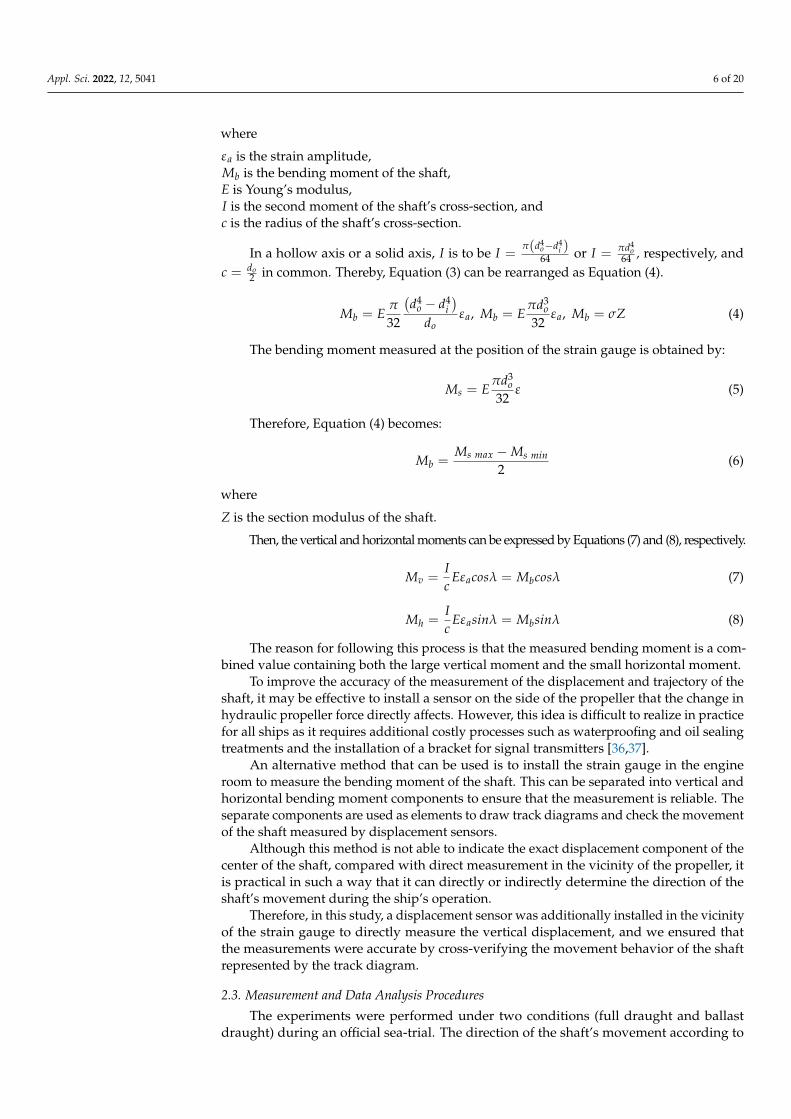
The resistance of the strain gauge varies in proportion to the strain at the gaugeposition when the shaft rotates. It can be expressed as shown in Figure 4.
Appl. Sci. 2022, 12, x FOR PEER REVIEW 5 of 21
shown in Figure 3, a half-bridge strain gauge circuit was applied in consideration of the high accuracy compared with the installation time.
Figure 3. Typical half-bridge strain gauge circuit configuration.
The resistance of the strain gauge varies in proportion to the strain at the gauge po-sition when the shaft rotates. It can be expressed as shown in Figure 4.
Figure 4. Typical angle-domain shaft strain curve.
The strain curve has a sine wave since the strain depends on the bending moment and the angle position where the strain is measured. The strain ε, as measured by strain gauges at any point, can be expressed as Equation (1) [35]. 𝜀 = 𝜀 cos(𝜃 − 𝜆) 𝜀 ̅ (1)
where 𝜀 is the strain amplitude, 𝜀 = (𝜀 − 𝜀 )/2, 𝜃 is the angle between the vertical direction and the gauge, 𝜆 is the angle between the normal to neutral axis and the vertical direction or bending angle, and 𝜀 ̅is the average strain. The average strain value does not matter because, to determine the moment, only the
strain amplitude is needed. The strain is at its maximum when 𝜃 = 𝜆 𝜀 = 𝜀 cos(0) 𝜀̅ = 𝜀 𝜀 ̅ (2)
The uniaxial stress can be expressed as Equation (3) by applying the beam relation used in the calculation of uniaxial stress on the shaft surface.
Figure 4. Typical angle-domain shaft strain curve.
The strain curve has a sine wave since the strain depends on the bending moment andthe angle position where the strain is measured. The strain ε, as measured by strain gaugesat any point, can be expressed as Equation (1) [35].
ε = εa cos(θ − λ) + ε (1)
where
εa is the strain amplitude, εa = (εmax − εmin)/2,θ is the angle between the vertical direction and the gauge,λ is the angle between the normal to neutral axis and the vertical direction or bendingangle, andε is the average strain.
The average strain value does not matter because, to determine the moment, only thestrain amplitude is needed.
The strain is at its maximum when θ = λ
ε = εa cos(0) + ε = εa + ε (2)
The uniaxial stress can be expressed as Equation (3) by applying the beam relationused in the calculation of uniaxial stress on the shaft surface.
σ = Eεa =Mbc
I(3)
Appl. Sci. 2022, 12, 5041 6 of 20
where
εa is the strain amplitude,Mb is the bending moment of the shaft,E is Young’s modulus,I is the second moment of the shaft’s cross-section, andc is the radius of the shaft’s cross-section.
In a hollow axis or a solid axis, I is to be I =π(d4
o−d4i )
64 or I = πd4o
64 , respectively, andc = do
2 in common. Thereby, Equation (3) can be rearranged as Equation (4).
Mb = Eπ
32
(d4
o − d4i)
doεa, Mb = E
πd3o
32εa, Mb = σZ (4)
The bending moment measured at the position of the strain gauge is obtained by:
Ms = Eπd3
o32
ε (5)
Therefore, Equation (4) becomes:
Mb =Ms max − Ms min
2(6)
where
Z is the section modulus of the shaft.
Then, the vertical and horizontal moments can be expressed by Equations (7) and (8), respectively.
Mv =Ic
Eεacosλ = Mbcosλ (7)
Mh =Ic
Eεasinλ = Mbsinλ (8)
The reason for following this process is that the measured bending moment is a com-bined value containing both the large vertical moment and the small horizontal moment.
To improve the accuracy of the measurement of the displacement and trajectory of theshaft, it may be effective to install a sensor on the side of the propeller that the change inhydraulic propeller force directly affects. However, this idea is difficult to realize in practicefor all ships as it requires additional costly processes such as waterproofing and oil sealingtreatments and the installation of a bracket for signal transmitters [36,37].
An alternative method that can be used is to install the strain gauge in the engineroom to measure the bending moment of the shaft. This can be separated into vertical andhorizontal bending moment components to ensure that the measurement is reliable. Theseparate components are used as elements to draw track diagrams and check the movementof the shaft measured by displacement sensors.
Although this method is not able to indicate the exact displacement component of thecenter of the shaft, compared with direct measurement in the vicinity of the propeller, itis practical in such a way that it can directly or indirectly determine the direction of theshaft’s movement during the ship’s operation.
Therefore, in this study, a displacement sensor was additionally installed in the vicinityof the strain gauge to directly measure the vertical displacement, and we ensured thatthe measurements were accurate by cross-verifying the movement behavior of the shaftrepresented by the track diagram.
2.3. Measurement and Data Analysis Procedures
The experiments were performed under two conditions (full draught and ballastdraught) during an official sea-trial. The direction of the shaft’s movement according to
Appl. Sci. 2022, 12, 5041 7 of 20
rapid turning while the ship went straight ahead under the normal continuous rate (NCR)condition was mainly observed.
2.3.1. Configuration
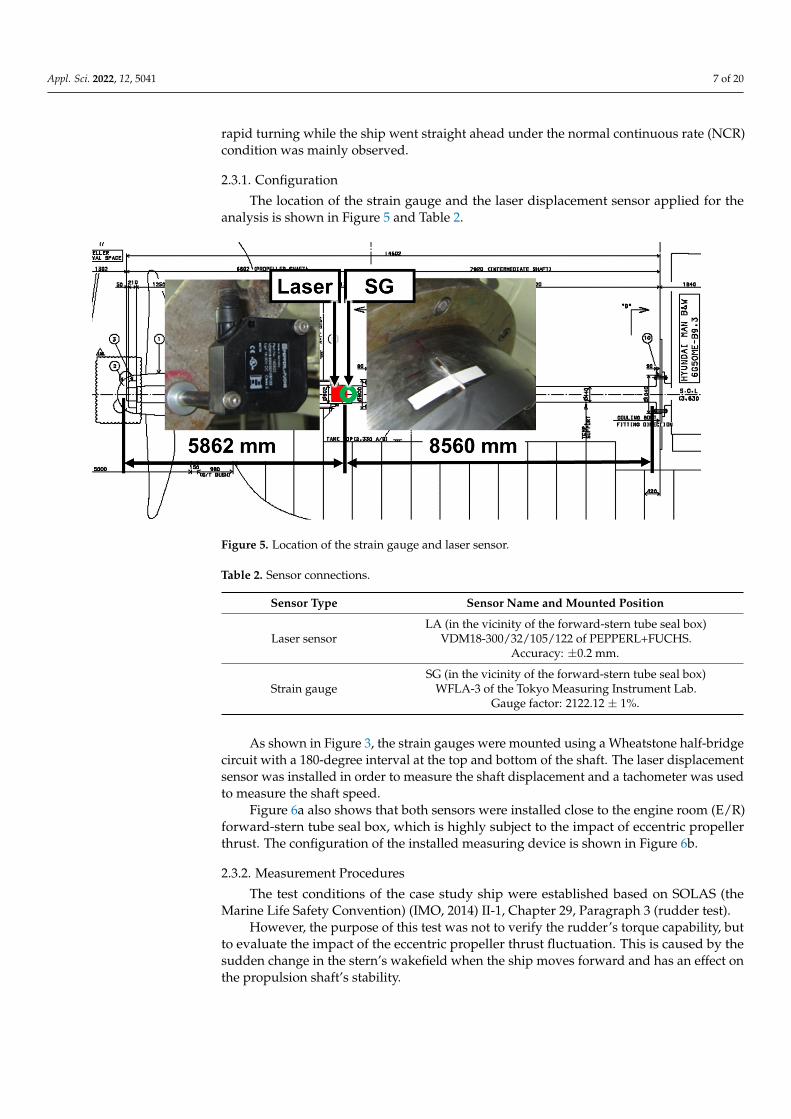
The location of the strain gauge and the laser displacement sensor applied for theanalysis is shown in Figure 5 and Table 2.
Appl. Sci. 2022, 12, x FOR PEER REVIEW 7 of 21
2.3. Measurement and Data Analysis Procedures The experiments were performed under two conditions (full draught and ballast
draught) during an official sea-trial. The direction of the shaft’s movement according to rapid turning while the ship went straight ahead under the normal continuous rate (NCR) condition was mainly observed.
2.3.1. Configuration The location of the strain gauge and the laser displacement sensor applied for the
analysis is shown in Figure 5 and Table 2.
Figure 5. Location of the strain gauge and laser sensor.
Table 2. Sensor connections.
Sensor Type Sensor Name and Mounted Position
Laser sensor LA (in the vicinity of the forward-stern tube seal box)
VDM18-300/32/105/122 of PEPPERL+FUCHS. Accuracy: ±0.2 mm.
Strain gauge SG (in the vicinity of the forward-stern tube seal box)
WFLA-3 of the Tokyo Measuring Instrument Lab. Gauge factor: 2122.12 ± 1%.
As shown in Figure 3, the strain gauges were mounted using a Wheatstone half-bridge circuit with a 180-degree interval at the top and bottom of the shaft. The laser dis-placement sensor was installed in order to measure the shaft displacement and a tachom-eter was used to measure the shaft speed.
Figure 6a also shows that both sensors were installed close to the engine room (E/R) forward-stern tube seal box, which is highly subject to the impact of eccentric propeller thrust. The configuration of the installed measuring device is shown in Figure 6b.
Figure 5. Location of the strain gauge and laser sensor.
Table 2. Sensor connections.
Sensor Type Sensor Name and Mounted Position
Laser sensorLA (in the vicinity of the forward-stern tube seal box)
VDM18-300/32/105/122 of PEPPERL+FUCHS.Accuracy: ±0.2 mm.
Strain gaugeSG (in the vicinity of the forward-stern tube seal box)
WFLA-3 of the Tokyo Measuring Instrument Lab.Gauge factor: 2122.12 ± 1%.
As shown in Figure 3, the strain gauges were mounted using a Wheatstone half-bridgecircuit with a 180-degree interval at the top and bottom of the shaft. The laser displacementsensor was installed in order to measure the shaft displacement and a tachometer was usedto measure the shaft speed.
Figure 6a also shows that both sensors were installed close to the engine room (E/R)forward-stern tube seal box, which is highly subject to the impact of eccentric propellerthrust. The configuration of the installed measuring device is shown in Figure 6b.
2.3.2. Measurement Procedures
The test conditions of the case study ship were established based on SOLAS (theMarine Life Safety Convention) (IMO, 2014) II-1, Chapter 29, Paragraph 3 (rudder test).
However, the purpose of this test was not to verify the rudder’s torque capability, butto evaluate the impact of the eccentric propeller thrust fluctuation. This is caused by thesudden change in the stern’s wakefield when the ship moves forward and has an effect onthe propulsion shaft’s stability.

Appl. Sci. 2022, 12, 5041 8 of 20Appl. Sci. 2022, 12, x FOR PEER REVIEW 8 of 21
(a) (b)
Figure 6. Installation of the sensors and the telemetry system in the engine room. (a): Laser dis-placement sensor and strain gauge installation. (b): Strain gauge telemetry transmitter installation.
2.3.2. Measurement Procedures The test conditions of the case study ship were established based on SOLAS (the Ma-
rine Life Safety Convention) (IMO, 2014) II-1, Chapter 29, Paragraph 3 (rudder test). However, the purpose of this test was not to verify the rudder’s torque capability,
but to evaluate the impact of the eccentric propeller thrust fluctuation. This is caused by the sudden change in the stern’s wakefield when the ship moves forward and has an effect on the propulsion shaft’s stability.
Therefore, as given in Table 3 and Figure 7, the measurement was made by going straight ahead (at a 0° rudder angle) and then turning rapidly (at a 12° rudder angle) until the head of the ship changed by 90°, and then the ship went back to going straight ahead (at a 0° rudder angle).
In addition, the ship’s speed was limited to the NCR in consideration of the ship’s operational conditions, the sea states, and the ship’s seaworthiness.
Table 3. Test conditions of the case study ship.
Test No. Condition Load
Rpm (Approxi-mately)
1 Static 0 0 2 Steady state 25% 57.3 3 Steady state NCR 78.3 4 Steady state 85% 90.3 5 Steady state MCR 95 6 Straight ahead (Midship 0°) NCR 83.7 7 Command rudder angle port 12° NCR 84.9 8 Ship turning (Rudder angle port 12° steady) NCR 84.9 9 Ship’s heading 90° (Then midship 0°) NCR 84.9
10 Straight ahead (Midship 0°) NCR 84.9 11 Command rudder angle starboard 12° NCR 84.9 12 Ship turning (Rudder angle starboard 12° steady) NCR 84.9 13 Ship’s heading 90° (Then midship 0°) NCR 84.9
Figure 6. Installation of the sensors and the telemetry system in the engine room. (a): Laserdisplacement sensor and strain gauge installation. (b): Strain gauge telemetry transmitter installation.
Therefore, as given in Table 3 and Figure 7, the measurement was made by goingstraight ahead (at a 0◦ rudder angle) and then turning rapidly (at a 12◦ rudder angle) untilthe head of the ship changed by 90◦, and then the ship went back to going straight ahead(at a 0◦ rudder angle).
Table 3. Test conditions of the case study ship.
Test No. Condition Load Rpm(Approximately)
1 Static 0 02 Steady state 25% 57.33 Steady state NCR 78.34 Steady state 85% 90.35 Steady state MCR 956 Straight ahead (Midship 0◦) NCR 83.77 Command rudder angle port 12◦ NCR 84.98 Ship turning (Rudder angle port 12◦ steady) NCR 84.99 Ship’s heading 90◦ (Then midship 0◦) NCR 84.9
10 Straight ahead (Midship 0◦) NCR 84.911 Command rudder angle starboard 12◦ NCR 84.912 Ship turning (Rudder angle starboard 12◦ steady) NCR 84.913 Ship’s heading 90◦ (Then midship 0◦) NCR 84.9
Appl. Sci. 2022, 12, x FOR PEER REVIEW 9 of 21
Figure 7. Sea-trial procedure for the case study ship.
2.3.3. Processing of Raw Signals The measurement data received from the strain gauge were used as basic information
to obtain the amplitude and direction (bending angle) of bending moments that were sub-jected to the engine loads in the shaft cross-section where the gauges were installed. The bending moments at the position of the strain gauge were obtained by using the measured strain (ε) as described in Figure 8.
Figure 8. Example of a measured bending moment at the position of the strain gauge and the ver-tical displacement before processing at the NCR going straight ahead.
In Figure 8, the signal received from the displacement sensor includes the tacho-com-ponent for detecting the rotating angle as well as the rotating speed of the shaft. The laser maker is located at 40° before the position of the strain gauge. As a result, the extracted signal was required to undergo a smoothing process to acquire proper displacement val-ues as shown in Figure 9.
Figure 7. Sea-trial procedure for the case study ship.
Appl. Sci. 2022, 12, 5041 9 of 20
In addition, the ship’s speed was limited to the NCR in consideration of the ship’soperational conditions, the sea states, and the ship’s seaworthiness.
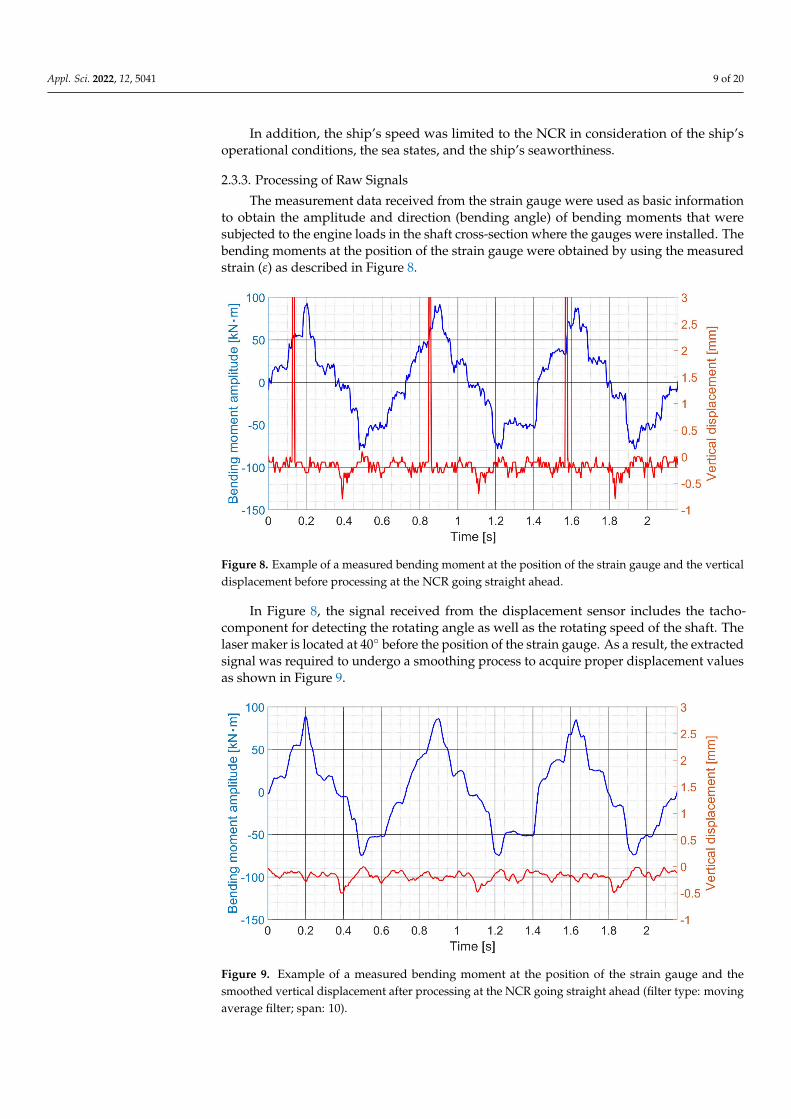
2.3.3. Processing of Raw Signals
The measurement data received from the strain gauge were used as basic informationto obtain the amplitude and direction (bending angle) of bending moments that weresubjected to the engine loads in the shaft cross-section where the gauges were installed. Thebending moments at the position of the strain gauge were obtained by using the measuredstrain (ε) as described in Figure 8.
Appl. Sci. 2022, 12, x FOR PEER REVIEW 9 of 21
Figure 7. Sea-trial procedure for the case study ship.
2.3.3. Processing of Raw Signals The measurement data received from the strain gauge were used as basic information
to obtain the amplitude and direction (bending angle) of bending moments that were sub-jected to the engine loads in the shaft cross-section where the gauges were installed. The bending moments at the position of the strain gauge were obtained by using the measured strain (ε) as described in Figure 8.
Figure 8. Example of a measured bending moment at the position of the strain gauge and the ver-tical displacement before processing at the NCR going straight ahead.
In Figure 8, the signal received from the displacement sensor includes the tacho-com-ponent for detecting the rotating angle as well as the rotating speed of the shaft. The laser maker is located at 40° before the position of the strain gauge. As a result, the extracted signal was required to undergo a smoothing process to acquire proper displacement val-ues as shown in Figure 9.
Figure 8. Example of a measured bending moment at the position of the strain gauge and the verticaldisplacement before processing at the NCR going straight ahead.
In Figure 8, the signal received from the displacement sensor includes the tacho-component for detecting the rotating angle as well as the rotating speed of the shaft. Thelaser maker is located at 40◦ before the position of the strain gauge. As a result, the extractedsignal was required to undergo a smoothing process to acquire proper displacement valuesas shown in Figure 9.
Appl. Sci. 2022, 12, x FOR PEER REVIEW 10 of 21
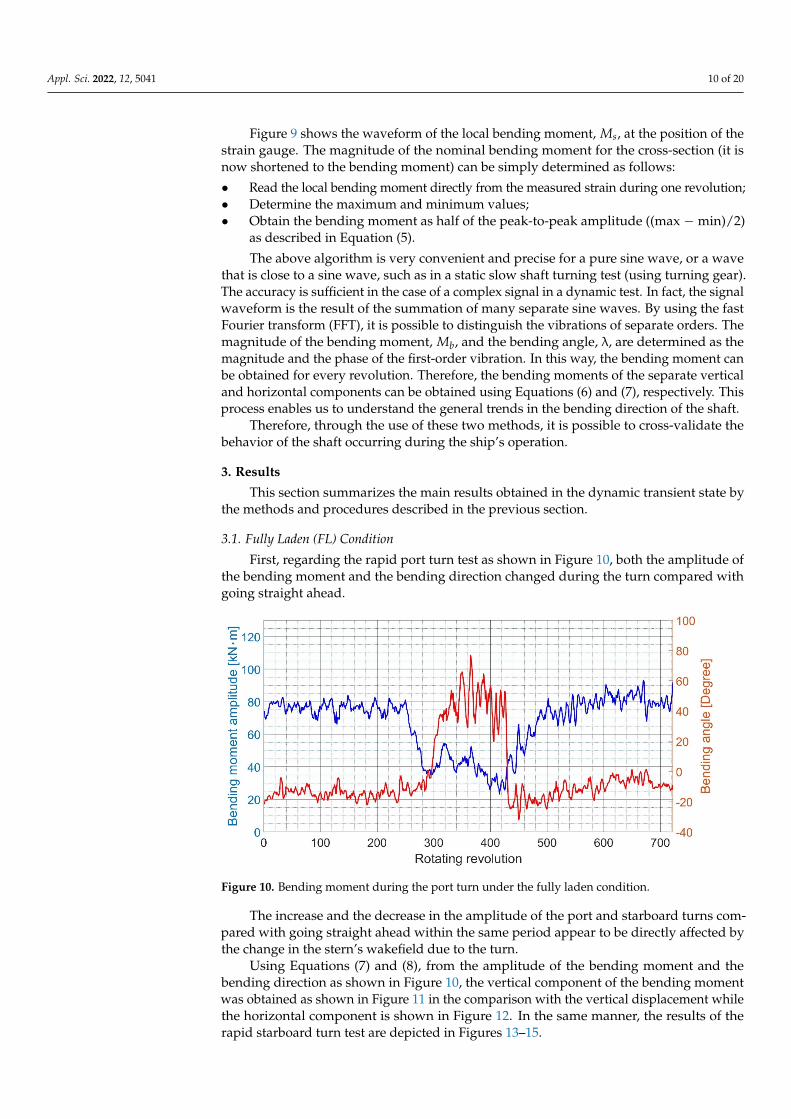
Figure 9. Example of a measured bending moment at the position of the strain gauge and the smoothed vertical displacement after processing at the NCR going straight ahead (filter type: mov-ing average filter; span: 10).
Figure 9 shows the waveform of the local bending moment, 𝑀 , at the position of the strain gauge. The magnitude of the nominal bending moment for the cross-section (it is now shortened to the bending moment) can be simply determined as follows: • Read the local bending moment directly from the measured strain during one revo-
lution; • Determine the maximum and minimum values; • Obtain the bending moment as half of the peak-to-peak amplitude ((max − min)/2) as
described in Equation (5). The above algorithm is very convenient and precise for a pure sine wave, or a wave
that is close to a sine wave, such as in a static slow shaft turning test (using turning gear). The accuracy is sufficient in the case of a complex signal in a dynamic test. In fact, the signal waveform is the result of the summation of many separate sine waves. By using the fast Fourier transform (FFT), it is possible to distinguish the vibrations of separate orders. The magnitude of the bending moment, 𝑀 , and the bending angle, λ, are determined as the magnitude and the phase of the first-order vibration. In this way, the bending moment can be obtained for every revolution. Therefore, the bending moments of the separate ver-tical and horizontal components can be obtained using Equations (6) and (7), respectively. This process enables us to understand the general trends in the bending direction of the shaft.
Therefore, through the use of these two methods, it is possible to cross-validate the behavior of the shaft occurring during the ship’s operation.
3. Results This section summarizes the main results obtained in the dynamic transient state by
the methods and procedures described in the previous section.
3.1. Fully Laden (FL) Condition First, regarding the rapid port turn test as shown in Figure 10, both the amplitude of
the bending moment and the bending direction changed during the turn compared with going straight ahead.
The increase and the decrease in the amplitude of the port and starboard turns com-pared with going straight ahead within the same period appear to be directly affected by the change in the stern’s wakefield due to the turn.
Figure 9. Example of a measured bending moment at the position of the strain gauge and thesmoothed vertical displacement after processing at the NCR going straight ahead (filter type: movingaverage filter; span: 10).
Appl. Sci. 2022, 12, 5041 10 of 20
Figure 9 shows the waveform of the local bending moment, Ms, at the position of thestrain gauge. The magnitude of the nominal bending moment for the cross-section (it isnow shortened to the bending moment) can be simply determined as follows:
• Read the local bending moment directly from the measured strain during one revolution;• Determine the maximum and minimum values;• Obtain the bending moment as half of the peak-to-peak amplitude ((max − min)/2)
as described in Equation (5).
The above algorithm is very convenient and precise for a pure sine wave, or a wavethat is close to a sine wave, such as in a static slow shaft turning test (using turning gear).The accuracy is sufficient in the case of a complex signal in a dynamic test. In fact, the signalwaveform is the result of the summation of many separate sine waves. By using the fastFourier transform (FFT), it is possible to distinguish the vibrations of separate orders. Themagnitude of the bending moment, Mb, and the bending angle, λ, are determined as themagnitude and the phase of the first-order vibration. In this way, the bending moment canbe obtained for every revolution. Therefore, the bending moments of the separate verticaland horizontal components can be obtained using Equations (6) and (7), respectively. Thisprocess enables us to understand the general trends in the bending direction of the shaft.
Therefore, through the use of these two methods, it is possible to cross-validate thebehavior of the shaft occurring during the ship’s operation.
3. Results
This section summarizes the main results obtained in the dynamic transient state bythe methods and procedures described in the previous section.
3.1. Fully Laden (FL) Condition
First, regarding the rapid port turn test as shown in Figure 10, both the amplitude ofthe bending moment and the bending direction changed during the turn compared withgoing straight ahead.
Appl. Sci. 2022, 12, x FOR PEER REVIEW 11 of 21
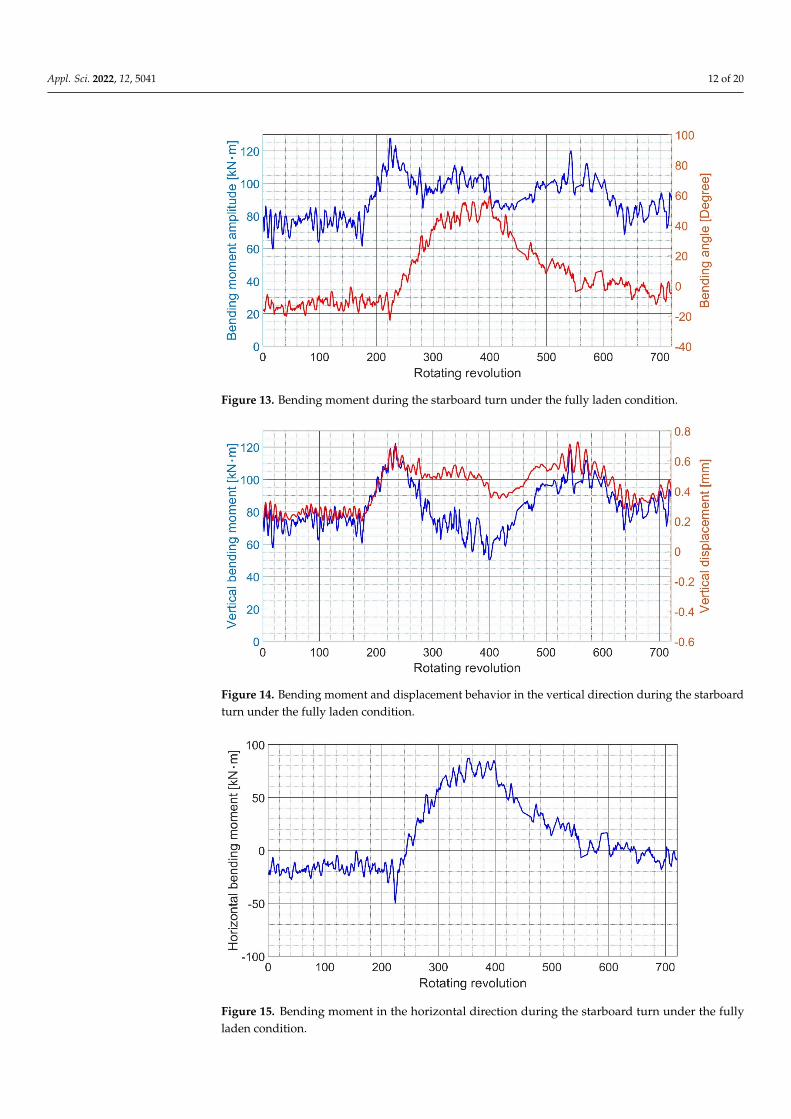
Using Equations (7) and (8), from the amplitude of the bending moment and the bending direction as shown in Figure 10, the vertical component of the bending moment was obtained as shown in Figure 11 in the comparison with the vertical displacement while the horizontal component is shown in Figure 12. In the same manner, the results of the rapid starboard turn test are depicted in Figures 13–15.
Figure 10. Bending moment during the port turn under the fully laden condition.
Figure 11. Bending moment and displacement behavior in the vertical direction during the port turn under the fully laden condition.
Figure 10. Bending moment during the port turn under the fully laden condition.
The increase and the decrease in the amplitude of the port and starboard turns com-pared with going straight ahead within the same period appear to be directly affected bythe change in the stern’s wakefield due to the turn.
Using Equations (7) and (8), from the amplitude of the bending moment and thebending direction as shown in Figure 10, the vertical component of the bending momentwas obtained as shown in Figure 11 in the comparison with the vertical displacement whilethe horizontal component is shown in Figure 12. In the same manner, the results of therapid starboard turn test are depicted in Figures 13–15.

Appl. Sci. 2022, 12, 5041 11 of 20
Appl. Sci. 2022, 12, x FOR PEER REVIEW 11 of 21
Using Equations (7) and (8), from the amplitude of the bending moment and the bending direction as shown in Figure 10, the vertical component of the bending moment was obtained as shown in Figure 11 in the comparison with the vertical displacement while the horizontal component is shown in Figure 12. In the same manner, the results of the rapid starboard turn test are depicted in Figures 13–15.
Figure 10. Bending moment during the port turn under the fully laden condition.
Figure 11. Bending moment and displacement behavior in the vertical direction during the port turn under the fully laden condition. Figure 11. Bending moment and displacement behavior in the vertical direction during the port turnunder the fully laden condition.
Appl. Sci. 2022, 12, x FOR PEER REVIEW 12 of 21
Figure 12. Bending moment in the horizontal direction during the port turn under the fully laden condition.
Figure 13. Bending moment during the starboard turn under the fully laden condition.
Figure 14. Bending moment and displacement behavior in the vertical direction during the star-board turn under the fully laden condition.
Figure 12. Bending moment in the horizontal direction during the port turn under the fullyladen condition.
Next, using the horizontal and vertical components shown in Figures 11 and 12and Figures 14 and 15 as the x-axis and y-axis, respectively, the average value trajecto-ries of the straight/port and straight/starboard turns were obtained and are shown inFigures 16 and 17, respectively.
As presented in Figures 16 and 17, the trajectory plot obtained from Figures 11, 12, 14 and 15provides another perspective to help us understand the actual shaft movement.
It can be clearly seen how the fluctuating propeller forces directly have an effect onthe shaft’s movement while the ship is turning, and it is easy to compare it with the NCRgoing straight ahead case or the rapid port turn case or vice versa.
It is worth noting that the moment behavior of the shaft shifts downward (counter-clockwise) during the port turn compared with going straight ahead, while it shifts upward(clockwise) during the starboard turn, and the opposite trend can be seen.
Appl. Sci. 2022, 12, 5041 12 of 20
Appl. Sci. 2022, 12, x FOR PEER REVIEW 12 of 21
Figure 12. Bending moment in the horizontal direction during the port turn under the fully laden condition.
Figure 13. Bending moment during the starboard turn under the fully laden condition.
Figure 14. Bending moment and displacement behavior in the vertical direction during the star-board turn under the fully laden condition.
Figure 13. Bending moment during the starboard turn under the fully laden condition.
Appl. Sci. 2022, 12, x FOR PEER REVIEW 12 of 21
Figure 12. Bending moment in the horizontal direction during the port turn under the fully laden condition.
Figure 13. Bending moment during the starboard turn under the fully laden condition.
Figure 14. Bending moment and displacement behavior in the vertical direction during the star-board turn under the fully laden condition. Figure 14. Bending moment and displacement behavior in the vertical direction during the starboardturn under the fully laden condition.
Appl. Sci. 2022, 12, x FOR PEER REVIEW 13 of 21
Figure 15. Bending moment in the horizontal direction during the starboard turn under the fully laden condition.
Next, using the horizontal and vertical components shown in Figures 11, 12 and Fig-ures 14, 15 as the x-axis and y-axis, respectively, the average value trajectories of the straight/port and straight/starboard turns were obtained and are shown in Figures 16 and 17, respectively.
As presented in Figures 16 and 17, the trajectory plot obtained from Figures 11, 12, 14 and 15 provides another perspective to help us understand the actual shaft movement.
It can be clearly seen how the fluctuating propeller forces directly have an effect on the shaft’s movement while the ship is turning, and it is easy to compare it with the NCR going straight ahead case or the rapid port turn case or vice versa.
Figure 16. Plot of trajectories obtained during the port turn under the fully laden condition. Stage (a): Rudder angle 0-degree: NCR straight going (begin). Stage (b): Rudder angle changes from 0 to 12-degree (port). Stage (c): Rudder angle 12-degree: ship’s heading is gradually changing. Stage (d): Rudder angle 0-degree: NCR straight going (end).
Figure 15. Bending moment in the horizontal direction during the starboard turn under the fullyladen condition.
Appl. Sci. 2022, 12, 5041 13 of 20
Appl. Sci. 2022, 12, x FOR PEER REVIEW 13 of 21
Figure 15. Bending moment in the horizontal direction during the starboard turn under the fully laden condition.
Next, using the horizontal and vertical components shown in Figures 11, 12 and Fig-ures 14, 15 as the x-axis and y-axis, respectively, the average value trajectories of the straight/port and straight/starboard turns were obtained and are shown in Figures 16 and 17, respectively.
As presented in Figures 16 and 17, the trajectory plot obtained from Figures 11, 12, 14 and 15 provides another perspective to help us understand the actual shaft movement.
It can be clearly seen how the fluctuating propeller forces directly have an effect on the shaft’s movement while the ship is turning, and it is easy to compare it with the NCR going straight ahead case or the rapid port turn case or vice versa.
Figure 16. Plot of trajectories obtained during the port turn under the fully laden condition. Stage (a): Rudder angle 0-degree: NCR straight going (begin). Stage (b): Rudder angle changes from 0 to 12-degree (port). Stage (c): Rudder angle 12-degree: ship’s heading is gradually changing. Stage (d): Rudder angle 0-degree: NCR straight going (end).
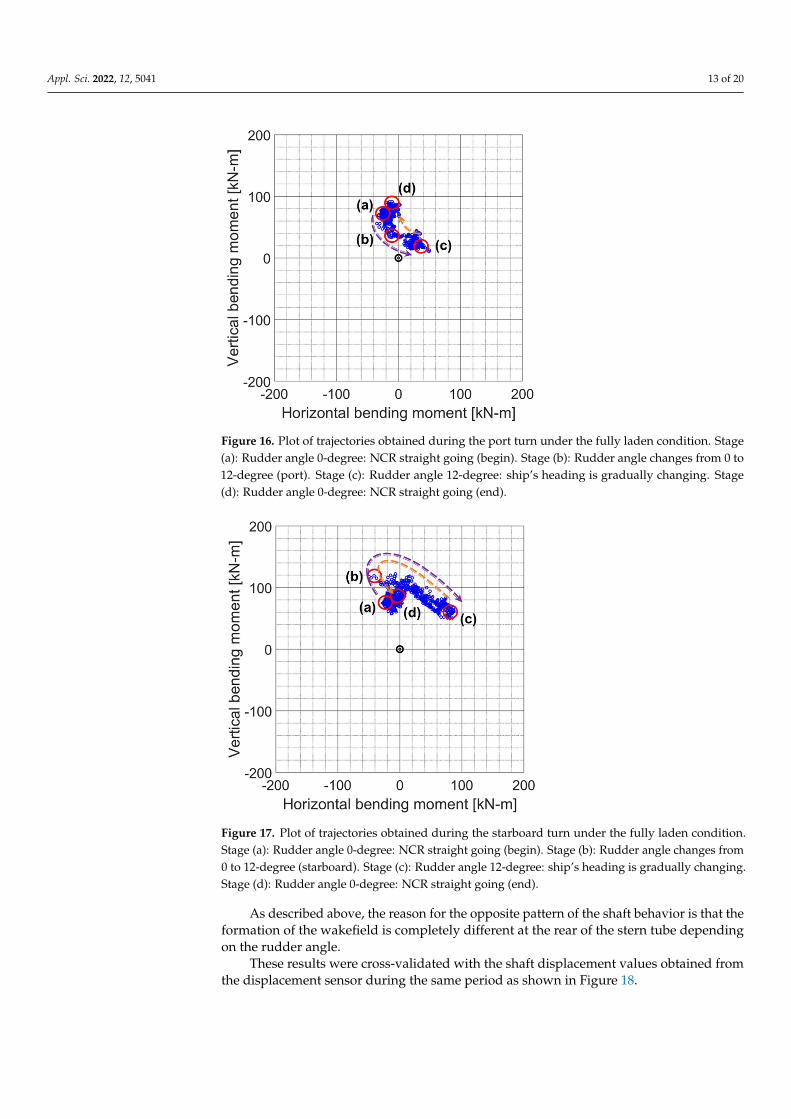
Figure 16. Plot of trajectories obtained during the port turn under the fully laden condition. Stage(a): Rudder angle 0-degree: NCR straight going (begin). Stage (b): Rudder angle changes from 0 to12-degree (port). Stage (c): Rudder angle 12-degree: ship’s heading is gradually changing. Stage(d): Rudder angle 0-degree: NCR straight going (end).
Appl. Sci. 2022, 12, x FOR PEER REVIEW 14 of 21
Figure 17. Plot of trajectories obtained during the starboard turn under the fully laden condition. Stage (a): Rudder angle 0-degree: NCR straight going (begin). Stage (b): Rudder angle changes from 0 to 12-degree (starboard). Stage (c): Rudder angle 12-degree: ship’s heading is gradually changing. Stage (d): Rudder angle 0-degree: NCR straight going (end).
It is worth noting that the moment behavior of the shaft shifts downward (counter-clockwise) during the port turn compared with going straight ahead, while it shifts up-ward (clockwise) during the starboard turn, and the opposite trend can be seen.
As described above, the reason for the opposite pattern of the shaft behavior is that the formation of the wakefield is completely different at the rear of the stern tube depend-ing on the rudder angle.
These results were cross-validated with the shaft displacement values obtained from the displacement sensor during the same period as shown in Figure 18.
Figure 18. Comparison of behaviors between the port turn and the starboard turn under the fully laden condition. Stage (a): Rudder angle 0-degree: NCR straight going (begin). Stage (b): Rudder angle changes from 0 to 12-degree (port, starboard). Stage (c): Rudder angle 12-degree: ship’s head-ing is gradually changing. Stage (d): Rudder angle 0-degree: NCR straight going (end).
Through this, it can clearly be seen that the shaft behavior compared with going straight ahead shows a high degree of consistency in both the direction of the bending
Figure 17. Plot of trajectories obtained during the starboard turn under the fully laden condition.Stage (a): Rudder angle 0-degree: NCR straight going (begin). Stage (b): Rudder angle changes from0 to 12-degree (starboard). Stage (c): Rudder angle 12-degree: ship’s heading is gradually changing.Stage (d): Rudder angle 0-degree: NCR straight going (end).
As described above, the reason for the opposite pattern of the shaft behavior is that theformation of the wakefield is completely different at the rear of the stern tube dependingon the rudder angle.
These results were cross-validated with the shaft displacement values obtained fromthe displacement sensor during the same period as shown in Figure 18.
Appl. Sci. 2022, 12, 5041 14 of 20
Appl. Sci. 2022, 12, x FOR PEER REVIEW 14 of 21
Figure 17. Plot of trajectories obtained during the starboard turn under the fully laden condition. Stage (a): Rudder angle 0-degree: NCR straight going (begin). Stage (b): Rudder angle changes from 0 to 12-degree (starboard). Stage (c): Rudder angle 12-degree: ship’s heading is gradually changing. Stage (d): Rudder angle 0-degree: NCR straight going (end).
It is worth noting that the moment behavior of the shaft shifts downward (counter-clockwise) during the port turn compared with going straight ahead, while it shifts up-ward (clockwise) during the starboard turn, and the opposite trend can be seen.
As described above, the reason for the opposite pattern of the shaft behavior is that the formation of the wakefield is completely different at the rear of the stern tube depend-ing on the rudder angle.
These results were cross-validated with the shaft displacement values obtained from the displacement sensor during the same period as shown in Figure 18.
Figure 18. Comparison of behaviors between the port turn and the starboard turn under the fully laden condition. Stage (a): Rudder angle 0-degree: NCR straight going (begin). Stage (b): Rudder angle changes from 0 to 12-degree (port, starboard). Stage (c): Rudder angle 12-degree: ship’s head-ing is gradually changing. Stage (d): Rudder angle 0-degree: NCR straight going (end).
Through this, it can clearly be seen that the shaft behavior compared with going straight ahead shows a high degree of consistency in both the direction of the bending
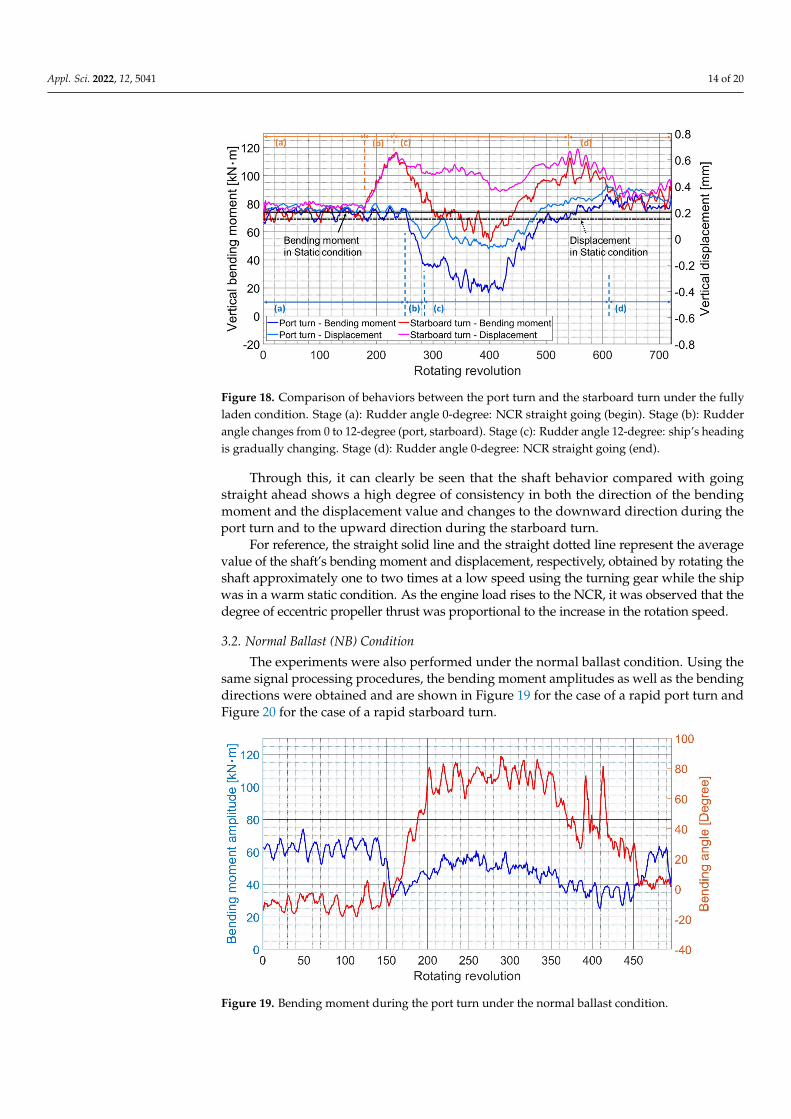
Figure 18. Comparison of behaviors between the port turn and the starboard turn under the fullyladen condition. Stage (a): Rudder angle 0-degree: NCR straight going (begin). Stage (b): Rudderangle changes from 0 to 12-degree (port, starboard). Stage (c): Rudder angle 12-degree: ship’s headingis gradually changing. Stage (d): Rudder angle 0-degree: NCR straight going (end).
Through this, it can clearly be seen that the shaft behavior compared with goingstraight ahead shows a high degree of consistency in both the direction of the bendingmoment and the displacement value and changes to the downward direction during theport turn and to the upward direction during the starboard turn.
For reference, the straight solid line and the straight dotted line represent the averagevalue of the shaft’s bending moment and displacement, respectively, obtained by rotating theshaft approximately one to two times at a low speed using the turning gear while the shipwas in a warm static condition. As the engine load rises to the NCR, it was observed that thedegree of eccentric propeller thrust was proportional to the increase in the rotation speed.
3.2. Normal Ballast (NB) Condition
The experiments were also performed under the normal ballast condition. Using thesame signal processing procedures, the bending moment amplitudes as well as the bendingdirections were obtained and are shown in Figure 19 for the case of a rapid port turn andFigure 20 for the case of a rapid starboard turn.
Appl. Sci. 2022, 12, x FOR PEER REVIEW 15 of 21
moment and the displacement value and changes to the downward direction during the port turn and to the upward direction during the starboard turn.
For reference, the straight solid line and the straight dotted line represent the average value of the shaft’s bending moment and displacement, respectively, obtained by rotating the shaft approximately one to two times at a low speed using the turning gear while the ship was in a warm static condition. As the engine load rises to the NCR, it was observed that the degree of eccentric propeller thrust was proportional to the increase in the rotation speed.
3.2. Normal Ballast (NB) Condition The experiments were also performed under the normal ballast condition. Using the
same signal processing procedures, the bending moment amplitudes as well as the bend-ing directions were obtained and are shown in Figure 19 for the case of a rapid port turn and Figure 20 for the case of a rapid starboard turn.
Figure 19. Bending moment during the port turn under the normal ballast condition.
Figure 20. Bending moment during the starboard turn under the normal ballast condition.
The average values of the trajectories for the going straight ahead, port turn, and starboard turn cases are shown in Figures 21 and 22.
Figure 19. Bending moment during the port turn under the normal ballast condition.
Appl. Sci. 2022, 12, 5041 15 of 20
Appl. Sci. 2022, 12, x FOR PEER REVIEW 15 of 21
moment and the displacement value and changes to the downward direction during the port turn and to the upward direction during the starboard turn.
For reference, the straight solid line and the straight dotted line represent the average value of the shaft’s bending moment and displacement, respectively, obtained by rotating the shaft approximately one to two times at a low speed using the turning gear while the ship was in a warm static condition. As the engine load rises to the NCR, it was observed that the degree of eccentric propeller thrust was proportional to the increase in the rotation speed.
3.2. Normal Ballast (NB) Condition The experiments were also performed under the normal ballast condition. Using the
same signal processing procedures, the bending moment amplitudes as well as the bend-ing directions were obtained and are shown in Figure 19 for the case of a rapid port turn and Figure 20 for the case of a rapid starboard turn.
Figure 19. Bending moment during the port turn under the normal ballast condition.
Figure 20. Bending moment during the starboard turn under the normal ballast condition.
The average values of the trajectories for the going straight ahead, port turn, and starboard turn cases are shown in Figures 21 and 22.
Figure 20. Bending moment during the starboard turn under the normal ballast condition.
The average values of the trajectories for the going straight ahead, port turn, andstarboard turn cases are shown in Figures 21 and 22.
Appl. Sci. 2022, 12, x FOR PEER REVIEW 16 of 21
Figure 21. Plot of trajectories obtained during the port turn under the normal ballast condition. Stage (a): Rudder angle 0-degree: NCR straight going (begin). Stage (b): Rudder angle changes from 0 to 12-degree (port). Stage (c): Rudder angle 12-degree: ship’s heading is gradually changing. Stage (d): Rudder angle 0-degree: NCR straight going (end).
Figure 22. Plot of trajectories obtained during the starboard turn under the normal ballast condition. Stage (a): Rudder angle 0-degree: NCR straight going (begin). Stage (b): Rudder angle changes from 0 to 12-degree (starboard). Stage (c): Rudder angle 12-degree: ship’s heading is gradually changing. Stage (d): Rudder angle 0-degree: NCR straight going (end).
In addition, as described in Section 3.1, the axis shows a similar tendency to move downward during the port turn and upward the during starboard turn. This trend was cross-validated using the shaft’s vertical displacement as shown in Figure 23.
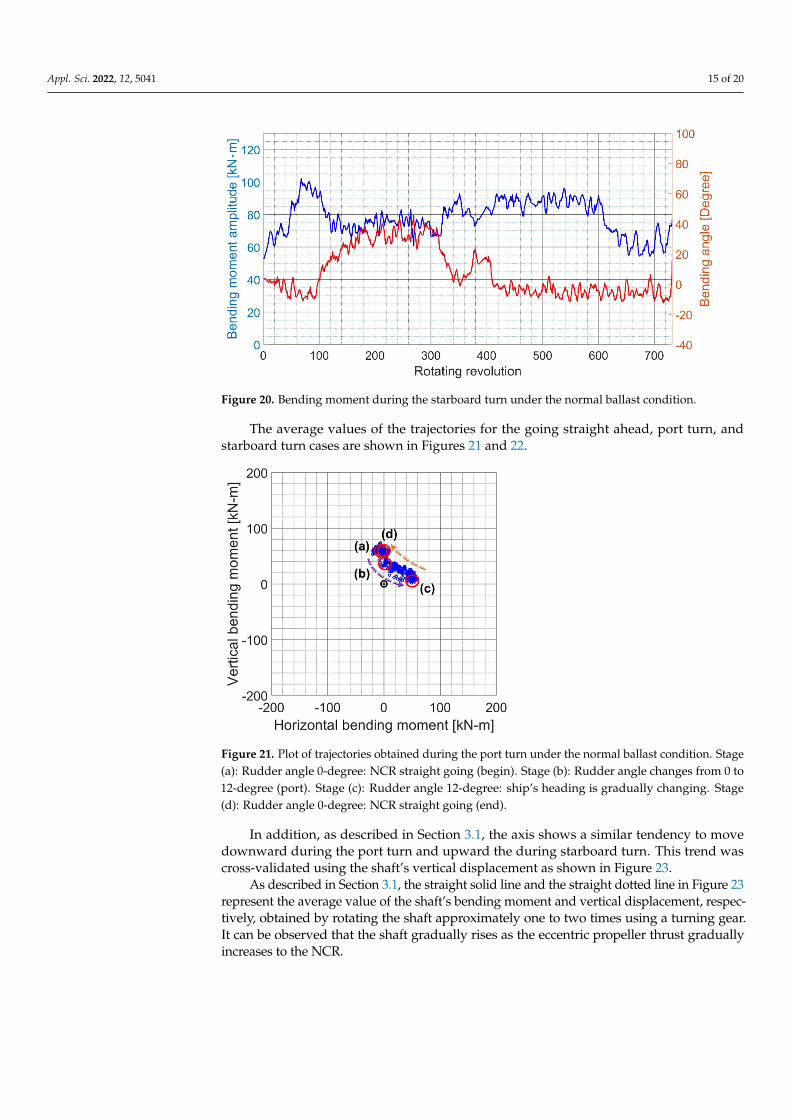
Figure 21. Plot of trajectories obtained during the port turn under the normal ballast condition. Stage(a): Rudder angle 0-degree: NCR straight going (begin). Stage (b): Rudder angle changes from 0 to12-degree (port). Stage (c): Rudder angle 12-degree: ship’s heading is gradually changing. Stage(d): Rudder angle 0-degree: NCR straight going (end).
In addition, as described in Section 3.1, the axis shows a similar tendency to movedownward during the port turn and upward the during starboard turn. This trend wascross-validated using the shaft’s vertical displacement as shown in Figure 23.
As described in Section 3.1, the straight solid line and the straight dotted line in Figure 23represent the average value of the shaft’s bending moment and vertical displacement, respec-tively, obtained by rotating the shaft approximately one to two times using a turning gear.It can be observed that the shaft gradually rises as the eccentric propeller thrust graduallyincreases to the NCR.

Appl. Sci. 2022, 12, 5041 16 of 20
Appl. Sci. 2022, 12, x FOR PEER REVIEW 16 of 21
Figure 21. Plot of trajectories obtained during the port turn under the normal ballast condition. Stage (a): Rudder angle 0-degree: NCR straight going (begin). Stage (b): Rudder angle changes from 0 to 12-degree (port). Stage (c): Rudder angle 12-degree: ship’s heading is gradually changing. Stage (d): Rudder angle 0-degree: NCR straight going (end).
Figure 22. Plot of trajectories obtained during the starboard turn under the normal ballast condition. Stage (a): Rudder angle 0-degree: NCR straight going (begin). Stage (b): Rudder angle changes from 0 to 12-degree (starboard). Stage (c): Rudder angle 12-degree: ship’s heading is gradually changing. Stage (d): Rudder angle 0-degree: NCR straight going (end).
In addition, as described in Section 3.1, the axis shows a similar tendency to move downward during the port turn and upward the during starboard turn. This trend was cross-validated using the shaft’s vertical displacement as shown in Figure 23.
Figure 22. Plot of trajectories obtained during the starboard turn under the normal ballast condition.Stage (a): Rudder angle 0-degree: NCR straight going (begin). Stage (b): Rudder angle changes from0 to 12-degree (starboard). Stage (c): Rudder angle 12-degree: ship’s heading is gradually changing.Stage (d): Rudder angle 0-degree: NCR straight going (end).
Appl. Sci. 2022, 12, x FOR PEER REVIEW 17 of 21
Figure 23. Comparison of behaviors between the port turn and the starboard turn under the normal ballast condition. Stage (a): Rudder angle 0-degree: going straight ahead at the NCR (begin). Stage (b): The rudder angle changes from 0 to 12-degree (port, starboard). Stage (c): Rudder angle 12-degree: the ship’s heading is gradually changing. Stage (d): Rudder angle 0-degree: going straight ahead at the NCR (end).
As described in Section 3.1, the straight solid line and the straight dotted line in Fig-ure 23 represent the average value of the shaft’s bending moment and vertical displace-ment, respectively, obtained by rotating the shaft approximately one to two times using a turning gear. It can be observed that the shaft gradually rises as the eccentric propeller thrust gradually increases to the NCR.
In addition, compared with Figure 18, it can be observed that the average values of the static bending stress (80 kN∙m under the FL condition to 60 kN∙m under the NB con-dition) and the shaft’s vertical displacement (0.17 mm under the FL condition to −0.2 mm under the NB condition) were changed. This is due to the effect of hull deformation ac-cording to the change in the draught, and it is the result of the deformation of the shaft line depending on it [38–41].
Moreover, when taking the results together, one can observe that the shaft’s vertical bending moment and displacement values show an increase during the starboard turn under both draught conditions.
Additionally, when comparing stage (c) in Figure 18, one can also observe that the shaft continuously moves upward for a longer time under the normal ballast condition than under the fully laden condition during the starboard turn.
This means that eccentric propeller thrust fluctuations directly affect the amplitude and magnitude of the vertical load applied by the vertical component to the after-stern tube bearing that supports the shaft as discussed in Section 4. Accordingly, this acts as an important observation in terms of developing safety guidelines for ship operation.
4. Discussion The factors that have an effect on the test results can be summarized as follows.
4.1. Eccentric Propeller Thrust Fluctuations Eccentric propeller thrust fluctuations due to abrupt non-uniformities in the stern’s
flow field under transient conditions during the vessel’s operation cause fluctuations in the bearing force.
The bearing force causes a change in the behavior of the rotating shaft in the form of displacements and bending moments.
Figure 23. Comparison of behaviors between the port turn and the starboard turn under the normalballast condition. Stage (a): Rudder angle 0-degree: going straight ahead at the NCR (begin). Stage(b): The rudder angle changes from 0 to 12-degree (port, starboard). Stage (c): Rudder angle 12-degree:the ship’s heading is gradually changing. Stage (d): Rudder angle 0-degree: going straight ahead atthe NCR (end).
In addition, compared with Figure 18, it can be observed that the average values of thestatic bending stress (80 kN·m under the FL condition to 60 kN·m under the NB condition)and the shaft’s vertical displacement (0.17 mm under the FL condition to −0.2 mm underthe NB condition) were changed. This is due to the effect of hull deformation according tothe change in the draught, and it is the result of the deformation of the shaft line dependingon it [38–41].
Moreover, when taking the results together, one can observe that the shaft’s verticalbending moment and displacement values show an increase during the starboard turnunder both draught conditions.
Appl. Sci. 2022, 12, 5041 17 of 20
Additionally, when comparing stage (c) in Figure 18, one can also observe that theshaft continuously moves upward for a longer time under the normal ballast conditionthan under the fully laden condition during the starboard turn.
This means that eccentric propeller thrust fluctuations directly affect the amplitudeand magnitude of the vertical load applied by the vertical component to the after-sterntube bearing that supports the shaft as discussed in Section 4. Accordingly, this acts as animportant observation in terms of developing safety guidelines for ship operation.
4. Discussion
The factors that have an effect on the test results can be summarized as follows.
4.1. Eccentric Propeller Thrust Fluctuations
Eccentric propeller thrust fluctuations due to abrupt non-uniformities in the stern’sflow field under transient conditions during the vessel’s operation cause fluctuations in thebearing force.
The bearing force causes a change in the behavior of the rotating shaft in the form ofdisplacements and bending moments.
This may act temporarily or continuously on the stern tube rear bearing with loadsthat may exceed the allowable values, causing fatigue and thermal damage such as wipingof the stern tube bearings.
As reviewed in previous studies [38,42,43], based on the fact that the shaft systemunder hull deformation satisfies the allowable values and there is no singularity in theanalysis of the lateral vibration caused by the bearing force, such a transient state did notnegatively affect the shaft system during a short period of time.
However, from a long-term perspective, we recommend that the research on theaccurate evaluation of the effect of the bearing force on the propulsion system due to anon-uniform wake distribution be further extended.
4.2. Correlation between Sensor Position and Propeller Thrust Force Generating Position
Figure 24 briefly shows the change in the displacement of the propeller shaft relativeto the stern tube bearing. This describes the correlation between the shaft displacement atthe forward-stern tube seal box in the engine room where the laser displacement sensorwas installed and the propeller thrust force generating position.
Appl. Sci. 2022, 12, x FOR PEER REVIEW 18 of 21
This may act temporarily or continuously on the stern tube rear bearing with loads that may exceed the allowable values, causing fatigue and thermal damage such as wiping of the stern tube bearings.
As reviewed in previous studies [38,42,43], based on the fact that the shaft system under hull deformation satisfies the allowable values and there is no singularity in the analysis of the lateral vibration caused by the bearing force, such a transient state did not negatively affect the shaft system during a short period of time.
However, from a long-term perspective, we recommend that the research on the ac-curate evaluation of the effect of the bearing force on the propulsion system due to a non-uniform wake distribution be further extended.
4.2. Correlation between Sensor Position and Propeller Thrust Force Generating Position Figure 24 briefly shows the change in the displacement of the propeller shaft relative
to the stern tube bearing. This describes the correlation between the shaft displacement at the forward-stern tube seal box in the engine room where the laser displacement sensor was installed and the propeller thrust force generating position.
Figure 24. Rigid beam assumptions.
If it is assumed that the propeller shaft is a rigid beam without deformation, the movement of the propeller’s position (the eccentric thrust force generating position) can be deductively inferred to lie in the opposite direction to the sensor position.
Therefore, while turning to the port side, the shaft of the measurement position moves downward. So, this force is transmitted as a force applied to the propeller shaft to the upward direction, which temporally relieves the stern tube bearing of the supporting loads.
On the other hand, during a starboard turn, it can be seen that the force is applied in the opposite way such that it increases the supporting load of the stern tube bearing by acting as a force that pushes down at the propeller position.
The validity of this inference regarding the shaft behavior was confirmed by its sim-ilarity to the result of the calculation of a bending moment near an actual propeller per-formed by Vartdal [24].
In summary, it can be observed that the reaction force state of the stern tube bearing is relieved during a port turn and deteriorates during a starboard turn when compared with going straight ahead.
Additionally, it can be seen that the after-stern tube bearing reaction force continu-ously increases for a longer period of time under the normal ballast condition compared with the fully laden draught condition.
Therefore, we recommend that ships avoid making a rapid starboard turn under nor-mal ballast draught conditions.
The shaft’s moment behavior was determined to fluctuate in the clockwise and coun-terclockwise directions; however, the measurement of only the vertical displacement of the shaft can be seen as a limitation of this study from the point of view of complete cross-validation. This limitation needs to be supplemented through additional studies.
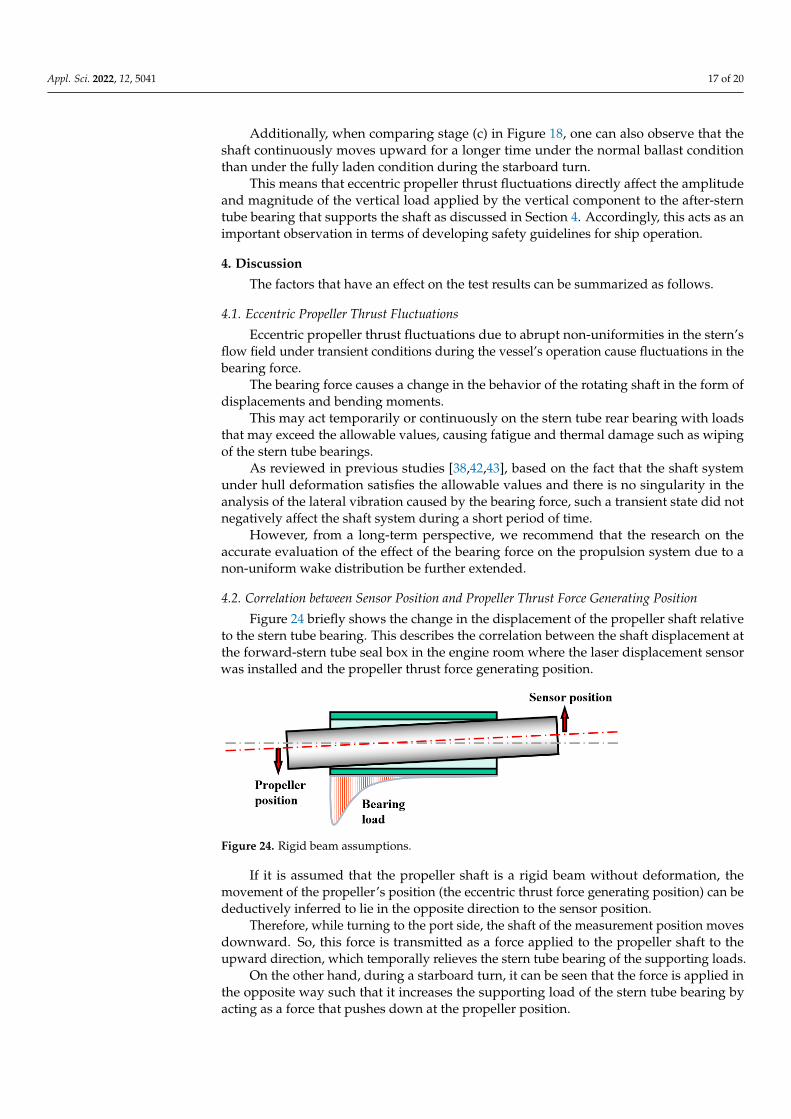
Figure 24. Rigid beam assumptions.
If it is assumed that the propeller shaft is a rigid beam without deformation, themovement of the propeller’s position (the eccentric thrust force generating position) can bedeductively inferred to lie in the opposite direction to the sensor position.
Therefore, while turning to the port side, the shaft of the measurement position movesdownward. So, this force is transmitted as a force applied to the propeller shaft to theupward direction, which temporally relieves the stern tube bearing of the supporting loads.
On the other hand, during a starboard turn, it can be seen that the force is applied inthe opposite way such that it increases the supporting load of the stern tube bearing byacting as a force that pushes down at the propeller position.
Appl. Sci. 2022, 12, 5041 18 of 20
The validity of this inference regarding the shaft behavior was confirmed by itssimilarity to the result of the calculation of a bending moment near an actual propellerperformed by Vartdal [24].
In summary, it can be observed that the reaction force state of the stern tube bearing isrelieved during a port turn and deteriorates during a starboard turn when compared withgoing straight ahead.
Additionally, it can be seen that the after-stern tube bearing reaction force continuouslyincreases for a longer period of time under the normal ballast condition compared with thefully laden draught condition.
Therefore, we recommend that ships avoid making a rapid starboard turn undernormal ballast draught conditions.
The shaft’s moment behavior was determined to fluctuate in the clockwise and coun-terclockwise directions; however, the measurement of only the vertical displacement ofthe shaft can be seen as a limitation of this study from the point of view of completecross-validation. This limitation needs to be supplemented through additional studies.
The key finding of this study is that, even with the same starboard turn, a greater loadis applied to the stern tube bearing under ballast conditions compared with fully ladenconditions. In addition, the correlation between bending moment and displacement wasdetermined (Figure 23) under the normal ballast condition and was found to be much moreconsistent than in the Figure 18 case of the fully laden condition. The reason for this isprobably the eccentric propeller thrust fluctuation. This could be a significant contributionto the literature, as the conventional quasi-static analysis methods cannot yield these results.
Despite its limitations, this study is meaningful. Through our experiments, we foundthat, at present, the key reasons for bearing damage are not sufficiently considered duringpropulsion shaft system engineering in a transient state. We also discovered that, evenwith the same starboard turn, a greater load is applied to the stern tube bearing under theballast condition compared with the fully laden condition. We believe that this could be asignificant contribution to the literature, as the conventional quasi-static analysis methodscannot yield these results.
In particular, this study offers an insight into the overload of the bearing support loadas it reproduced the same situation at the time of the accident with an identical ship, whichmay help with the development of guidelines for increasing the stability of the shaftingsystem for similar vessels in the future.
5. Conclusions
This study successfully cross-validated the effect of eccentric propeller thrust fluctu-ations on the shaft behavior in the case of excessive dynamic conditions through straingauges and displacement sensors.
The shaft measurement was performed under two conditions (FL and NB), and thefollowing results were obtained regarding the effects of the hydrodynamic force of thepropeller that was generated during port and starboard turns on the behavior of theshaft system.
(1) The moment behavior of the shaft shifted downward in the counterclockwise directionduring the port turn compared with going straight ahead, while it shifted upwardin the clockwise direction during the starboard turn, and the opposite trend couldbe observed.
The reason why the shaft behavior patterns were contrary to each other is that theformation of the wake field at the rear of the stern tube would be completely differentdepending on the rudder angle.This was cross-validated using the shaft’s vertical displacement value obtained fromthe displacement sensor. However, we were unable to measure the vertical displace-ment due to the limited number of sensor applications. Given that the shaft’s momentbehavior varies in the clockwise and anticlockwise directions, further studies withenhanced sensing applications should be performed to improve the accuracy.

Appl. Sci. 2022, 12, 5041 19 of 20
(2) The shaft continuously moved upward for a longer period of time under the normalballast condition compared with the fully laden condition during starboard turns.
Therefore, we recommend that ships avoid rapid starboard turns under ballastdraught conditions in terms of securing the stability of the shafting system.Moreover, from a long-term perspective, we recommend that the research on evaluat-ing the effect of the bearing force on the shafting system due to a non-uniform wakedistribution be further extended.
(3) The key finding of this study is that, even with the same starboard turn, a greaterload is applied to the stern tube bearing under ballast conditions compared with fullyladen conditions. This could be a significant contribution to the literature, as theconventional quasi-static analysis methods cannot yield these results.
In particular, this study offers a meaningful insight into the causes of the overloadof bearing loads in the transient operating state as it reproduced the same situation atthe time of the accident with the same type of vessel. Furthermore, we expect that theresults of this study will be used in the development of the health monitoring algorithmsrequired for autonomous ships in the future, and they may also help with the developmentof guidelines for improving the stability of systems in related industries.
Author Contributions: J.-W.L. and J.-u.L. contributed equally to this work. Conceptualization, J.-W.L.and J.-u.L.; methodology, J.-u.L. and Q.D.V.; software, Q.D.V.; validation, J.-W.L. and J.-u.L.; formalanalysis, J.-W.L. and J.-u.L.; investigation, J.-W.L. and Q.D.V.; resources, J.-u.L.; data curation, Q.D.V.;writing—original draft preparation, J.-W.L., Q.D.V. and J.-u.L.; writing—review and editing, B.J.and J.-u.L.; visualization, Q.D.V. and J.-W.L.; supervision, B.J. and J.-u.L.; project administration,J.-u.L.; funding acquisition, J.-u.L. All authors have read and agreed to the published version ofthe manuscript.
Funding: This work was supported by a National Research Foundation of Korea (NRF) grant fundedby the Korean government (MSIT) (No. NRF-2021R1F1A1047115). This research was supported bythe ‘Development of Autonomous Ship Technology (20200615)’ project funded by the Ministry ofOceans and Fisheries (MOF, Korea).
Institutional Review Board Statement: Not applicable.
Informed Consent Statement: Not applicable.
Data Availability Statement: Not applicable.
Acknowledgments: This research was supported by the BB21plus project funded by Busan Metropoli-tan City and the Busan Institute for Talent and Lifelong Education (BIT).
Conflicts of Interest: The authors declare no conflict of interest.
References1. Michel, R. A quarter century of propulsion shafting design practice and operating experience in the US navy. J. Am. Soc. Nav. Eng.
1959, 71, 153–164. [CrossRef]2. Lehr, W.; Parker, E. Considerations in the design of marine propulsion shaft systems. Soc. Nav. Archit. Mar. Eng. 1961, 67, 555.3. Mann, G. Design of propulsion shaft systems using fair curve alignment theory. Nav. Eng. J. 1964, 76, 851–862.4. Mann, G. Analysis of shafting problems using fair curve alignment theory. Nav. Eng. J. 1965, 77, 117–133. [CrossRef]5. Mann, G. Shipyard alignment of propulsion shafting using fair curve alignment theory. Nav. Eng. J. 1965, 77, 651–659. [CrossRef]6. Jeon, H.-J.; Park, J.-G.; Choi, J.-S. Optimum alignment of marine engine shaftings by the finite element method. J. Korean Soc. Mar.
Eng. 1978, 2, 3–14.7. Moon, D.; Jeon, H. A study on the propulsion shaft alignment calculation by the matrix method of three-moment theory. J. Korean
Soc. Mar. Eng. 1981, 5, 20–27.8. Park, T.-I.; Lee, H.-Y. Alignment Calculation of Marine Engine Shafting System by Quadruple Integration Method. J. Korean Soc.
Mar. Eng. 1979, 3, 32–39.9. Larsen, O. Some considerations of marine shafting design. Ind. Lubr. Tribol. 1981, 33, 164–171. [CrossRef]10. Class NK. Guidelines on Shafting Alignmen; Class NK: Tokyo, Japan, 2006.11. MAN Energy Solutions. Final Alignment of Engine on Board; MAN Energy Solutions: Augsburg, Germany, 2014; p. 5.12. MAN Energy Solutions. Bearing Load Measurement by Jacking Up; MAN Energy Solutions: Augsburg, Germany, 2012; p. 23.

Appl. Sci. 2022, 12, 5041 20 of 20
13. Shin, S.; Choe, I. Pressure Distribution Analysis for After Bush Bearing of Ship Propulsion Shaft. J. Soc. Nav. Archit. Korea 2004, 41,35–40.
14. Choung, J.-M.; Choe, I.-H. Development of elastic shaft alignment design program. J. Soc. Nav. Archit. Korea 2006, 43, 512–520.15. Kozousek, V.; Davies, P. Analysis and Survey Procedures of Propulsion Systems: Shaft Alignment; Lloyd’s Register’s Technical
Association: London, UK, 2000; p. 5.16. DNV. DNVGL-RU-SHIP Pt. 4, Ch. 2, Sec. 4, 2.1.6 Aft Most Bearing Lubrication Criteria; DNV: Greater Oslo, Norway, 2021; pp. 36–40.17. Sun, J.-S.; Kim, Y.-G.; Kim, U.-K. Study on shaft alignment of propulsion shafting system depending on single reaction force
supporting position of aft stern tube bearing. J. Mar. Sci. Technol. 2021, 26, 1340–1357. [CrossRef]18. Bureau Veritas. Elastic Shaft Alignment(ESA). In Sec 2. 5. Running Calculations; Bureau Veritas: Neuilly sur Seine, France, 2015;
Volume NR 592, pp. 13–18.19. Park, G.; Koh, C.; Chung, J.; Nam, G.; Chae, J. A Study on the Stern Bearing Damage and Shaft Alignment for 37K DWT
Product/Chemical Tanker. J. Soc. Nav. Archit. Korea 2021, 58, 97–104. [CrossRef]20. Saitoh, T. Dynamic alignment taking account of propeller forces and stern tube bearing performances. J. MESJ 1983, 18, 142–153.
[CrossRef]21. Kuroiwa, R.; Oshima, A.; Nishioka, T.; Tateishi, T.; Ohyama, K.; Ishijima, T. Reliability improvement of stern tube bearing
considering propeller shaft forces during ship turning. Mitshbishi Heavy Ind. Ltd. Tech. Rev. 2007, 44, 1–3.22. Sugimoto, I.; Baba, S.; Yatsuo, M.; Tanaka, H. Development of the criteria for crankshaft alignment in large 2-stroke marine diesel
engines. In Proceedings of the Conference Publication of 23rd CIMAC World Congress on Combustion Engine Technology forShip Propulsion, Power Generation, Rail Traction, Hamburg, Germany, 7–10 May 2001.
23. Ortolani, F. Dubbioso, G. Experimental investigation of blade and propeller loads: Steady turning motion. Appl. Ocean. Res. 2019,91, 101874. [CrossRef]
24. Vartdal, B.J.; Gjestland, T.; Arvidsen, T.I. Lateral propeller forces and their effects on shaft bearings. In Proceedings of the FirstInternational Symposium on Marine Propulsors, Trondheim, Norway, 22–24 June 2009; pp. 475–481.
25. Dubbioso, G.; Muscari, R.; Ortolani, F.; Di Mascio, A. Analysis of propeller bearing loads by CFD. Part I: Straight ahead andsteady turning maneuvers. Ocean. Eng. 2017, 130, 241–259. [CrossRef]
26. Muscari, R.; Dubbioso, G.; Ortolani, F.; Di Mascio, A. Analysis of propeller bearing loads by CFD. Part II: Transient maneuvers.Ocean. Eng. 2017, 146, 217–233. [CrossRef]
27. Shin, S.-H. Effects of Propeller Forces on the Propeller Shaft Bearing during Going Straight and Turning of Ship. J. Soc. Nav.Archit. Korea 2015, 52, 61–69. [CrossRef]
28. Lee, J.-U. Application of strain gauge method for investigating influence of ship shaft movement by hydrodynamic propellerforces on shaft alignment. Measurement 2018, 121, 261–275. [CrossRef]
29. Choi, S.-P.; Lee, J.-U.; Park, J.-B. Application of Deep Reinforcement Learning to Predict Shaft Deformation Considering HullDeformation of Medium-Sized Oil/Chemical Tanker. J. Mar. Sci. Eng. 2021, 9, 767. [CrossRef]
30. Takahashi, S.; Matsumoto, S.; Tateishi, T.; Ohyama, K.; Kuroiwa, R.; Morohoshi, S. Study on oil film analysis of the stern tubebearing under the conditions of dynamic propeller shaft forces. Jpn. Soc. Mech. Eng. Trans. C 2009, 75, 3054–3061. [CrossRef]
31. Song, G.; Park, H.; Lee, T. The Effect of Rudder Existence on Propeller Eccentric Force. J. Mar. Sci. Eng. 2019, 7, 455. [CrossRef]32. Lin, J.-F.; Zhao, D.-G.; Guo, C.-Y.; Su, Y.-M.; Zhong, X.-H. Comprehensive test system for ship-model resistance and propulsion
performance in actual seas. Ocean. Eng. 2020, 197, 106915. [CrossRef]33. Wontka, L. In Service Diagnosing of a Marine Diesel Engine usion Mean Indicated Pressure. Sci. J. Gdyn. Marit. Univ. 2018, 108,
153–167. [CrossRef]34. Wróblewski, P.; Iskra, A. Problems of Reducing Friction Losses of a Piston-Ring-Cylinder Configuration in a combustion
Piston Engine with an Increased Isochoric Pressure Gain. In SAE Technical Paper 2020-01-2227; 2020; Available online: https://saemobilus.sae.org/content/2020-01-2227/ (accessed on 9 May 2022).
35. Forrest, A.W., Jr.; Labasky, R.F. Shaft Alignment Using Strain Gages. Mar. Technol. 1981, 18, 276–284. [CrossRef]36. ABS. Guide for Enhanced Shaft Alignment; American Bureau of Shipping: Houston, TX, USA, 2018; pp. 6–12.37. ABS. Guidance Notes on Propulsion Shafting Alignment; American Bureau of Shipping: Housto, TX, USA, 2019; pp. 107–110.38. Lee, J.-U. A study of the analysis of shaft alignment considering hull deflections for 50,000 DWT oil/chemical tankers. J. Korean
Soc. Mar. Eng. 2016, 40, 191–197.39. Seo, C.-O.; Jeong, B.; Kim, J.-R.; Song, M.; Noh, J.-H.; Lee, J.-U. Determining the influence of ship hull deformations caused by
draught change on shaft alignment application using FE analysis. Ocean. Eng. 2020, 210, 107488. [CrossRef]40. Shi, L.; Xue, D.; Song, X. Research on shafting alignment considering ship hull deformations. Mar. Struct. 2010, 23, 103–114.
[CrossRef]41. Avgouleas, K.; Sarris, E.; Gougoulidis, G. Practical Aspects of Propulsion Shaft Alignment. In Proceedings of the SNAME 7th
International Symposium on Ship Operations, Management and Economics, Athens, Greece, 2–3 April 2021.42. Lee, J.-U. A study on the analysis of bearing reaction forces and hull deflections affecting shaft alignment using strain gauges for
a 50,000 DWT oil/chemical tanker. J. Korean Soc. Mar. Eng. 2016, 40, 288–294. [CrossRef]43. Lee, J.-U. Theoretical and experimental analysis of the lateral vibration of shafting system using strain gauges in 50,000-DWT
oil/chemical tankers. J. Korean Soc. Mar. Eng. 2016, 40, 301–306.