cfd study of coal direct chemical looping combustion
TRANSCRIPT
“CFD study of a coal direct chemical looping pilot plant”
A DISSERTATION
Submitted in the partial fulfillment of the
requirements for the award of the degree
of
INTEGRATED DUAL DEGREE
(Bachelor of Technology and Master of Technology)
in
CHEMICAL ENGINEERING
(With specialization in Hydrocarbon Engineering)
By
RAHUL WADHWANI
DEPARTMENT OF CHEMICAL ENGINEERING
INDIAN INSTITUTE OF TECHNOLOGY, ROORKEE
ROORKEE-247667 (INDIA)
June, 2014
CANDIDATE’S DECLARATION
I hereby declare that the work, which is being presented in this dissertation, entitled “CFD study
of a coal direct chemical looping pilot plant” submitted in partial fulfillment of the
requirements for the award of Integrated Dual Degree (Bachelor of Technology and Master of
Technology) in Chemical Engineering with specialization in Hydrocarbon Engineering, is an
authentic record of my own work carried out during the period from May 2013 to June 2014,
under the supervision of Dr. Bikash Mohanty, Professor, Department of Chemical Engineering,
Indian Institute of Technology Roorkee.
Date: June 1st, 2014 Place: Roorkee (RAHUL WADHWANI)
CERTIFICATE
This is to certify that the above statement made by the candidate is correct to the best of my
knowledge.
Dr. Bikash Mohanty
Professor Department of Chemical Engineering
Indian Institute of Technology Roorkee
ACKNOWLEDGEMENT
I wish to express my deep sense of gratitude and sincere indebtedness to my supervisor Dr.
Bikash Mohanty, Professor, Department of Chemical Engineering, Indian Institute of
Technology, Roorkee; for his kind cooperation and encouragement that he provides me for
developing new ideas and tackle the various situations which come across while doing the
dissertation work. His undying determination to get the best out of his students served as
inspiration for completion of this report.
I wish to express my profound gratitude to Dr. V. K. Agrawal, Professor and Head, Department
of Chemical Engineering, Indian Institute of Technology Roorkee for providing all the facilities
which have made it possible for me to complete this work. I am also indebted to the faculty
members of Department of Chemical Engineering, who have taught me during last five years.
In addition to it, I am also thankful of Department of Chemical Engineering, IIT Roorkee
administration whose help and resources I have used from time to time, I thank the brains behind
the scientific publications, chemical engineering books and research papers whose guidance I
have drawn on to make this report.
I am thankful to Mr. Amit Rai, Mr. Gajendra K. Gaurav, and Mr. Tejbir Singh, for support
and help during different stages of my dissertation work.
Lastly, I will be always grateful to God and my parents whose blessings are always with me and
acts as a beacon in finding the right path.
i
Carbon emission from fossil fuel, estimated by IPCC has thrown considerable challenge for
researchers and scientists in the past decade. For obvious reasons, the applications of clean
technologies such as chemical looping combustion, oxy-fuel combustion, fuel cells and similar
technologies are becoming an attractive proposition in foreseeable future. Traditional
technologies that generate electricity from fossil fuel via combustion or gasification process
generate flue gas from which separation of carbon dioxide is costly and technically cumbersome.
However, the chemical looping technology, in which carbonaceous materials such as coal can be
oxidize as fuel to generate pure sequestration ready carbon dioxide and heat to generate
electricity appears to be a befitting solution to carbon emission problem.
Abstract
Various studies on gas based fuel for chemical looping combustion have been the major focus in
the past decade while, solid based fuel for chemical looping combustion is relatively a new
concept and very little research efforts have been directed towards this field more specifically
towards CFD simulation of the complete system. The present work entitled as “CFD study of a
coal direct chemical looping pilot plant” is related to the modeling of the pilot plant developed
by Ohio State University, USA for coal direct chemical looping process using Iron (III) oxide on
alumina support as an oxygen carrier for which experimental data are available. For this purpose,
a two dimensional model of two interacting reactors (moving bed reactor and fluidized bed
reactor) is developed using quadrilateral cell on Fluent 6.3.26 and Gambit 2.3.16. The present
models uses Species Transport model and assumes fluid system to study volumetric reactions
between gases and solids. The model takes in to account eighteen homogeneous reactions (coal
Devolatilization, char gasification, oxygen carrier reductions and oxidations, char combustion)
taking place inside two reactors and their inter-connecting parts. The results are verified with the
published pilot plant results. Further, the verified model is used to study the suitability of Indian
coal for coal direct chemical looping process and to identify the possible bottlenecks.
The model predictions of the present work are in good agreement with that of the pilot plant data.
The results of fuel conversion (based on dry ash free coal) of present model for sub-bituminous
coal and metallurgical coke are 91.52% and 85.12% respectively, whereas, respective fuel
conversion for pilot plant are in the range of 97-99% and 70-99%. Thus, the predicted fuel
conversion results have a maximum error of 7.55% and 14.02%. Furthermore, the purity of CO2
ii
(on dry and free nitrogen basis) in reducer exhaust stream is 89.62% and 93.56% for sub-
bituminous coal and metallurgical coke respectively, while, the pilot plant result shows purity
levels of CO2
Further, the developed model is used for studying the suitability of four different grades of coals
found in the region of Asia-Pacific and Australia having considerable amount of ash and are
denoted as “A”, “B”, “C” and “D”. The conversion (based on dry ash free coal) for coal “A” is
65.27% , for coal “B” is 87.82%, for coal “C” is 93.8%, and for “D” is 87.79% while purity of
CO
(on dry and free nitrogen basis) in reducer exhaust stream to be 99% and 99.9%
respectively.
2
From the simulation study it has been identified that for coal with high ash content the
consumption of coal is about 2-4.5 times than that of metallurgical coke. Further, it has been
seen that the reactor bed temperature falls appreciably (5% to 40%) when high ash content coal
is used. For some coals the reactor bed temperature also quenches to a limit that makes process
inoperable. It has been observed that for high ash coals the exhaust CO
(on dry and nitrogen free basis) in reducer exhaust is 70.27%, 80.27%, 89.2% and 90.72%
respectively for coals “A”, “B”, “C” and “D”.
2 gas from fuel reactor
contains small amount (3-7%) of silica which may cause problem in CO2
In addition to it, it has been found that the pressure of the chemical looping combustion process
has considerable effect on fuel conversion and CO
separation.
2
purity. It is thus recommended that chemical
looping combustion should be operated at about 10-15 atmosphere. However, the exact pressure
will be based on economic evaluation of the process.
iii
Abstract
Content of Thesis
i
Contents of Thesis iii
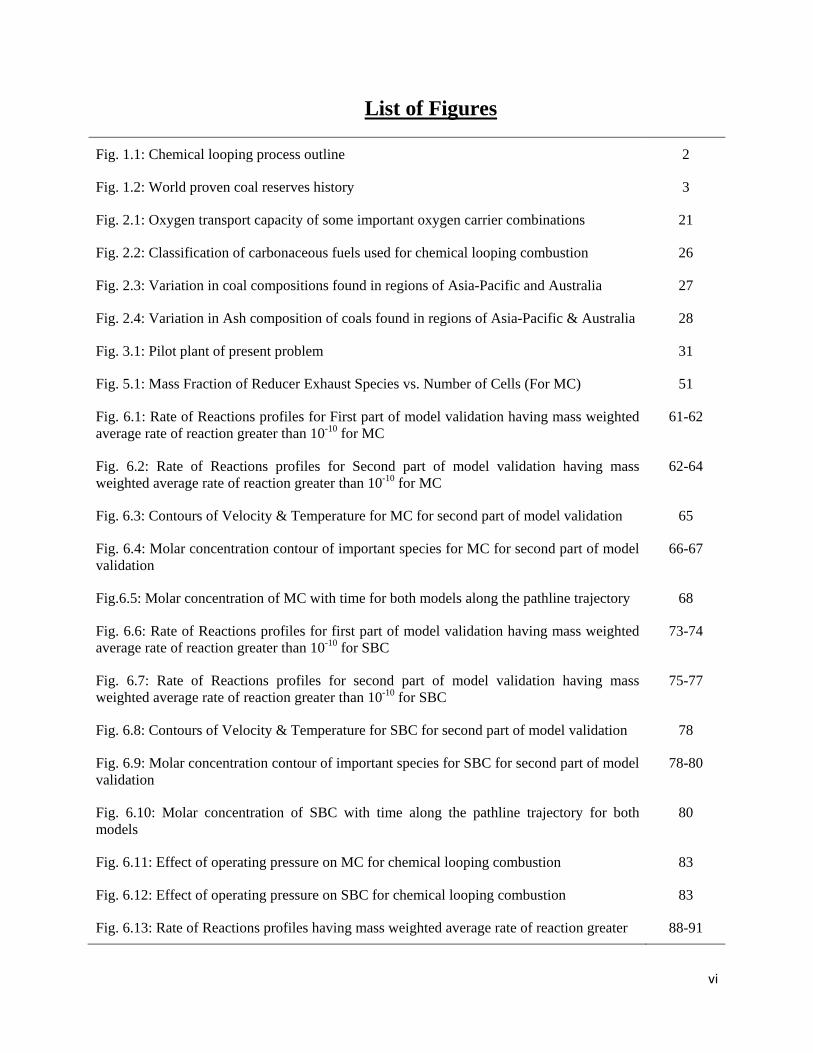
List of Figures vi
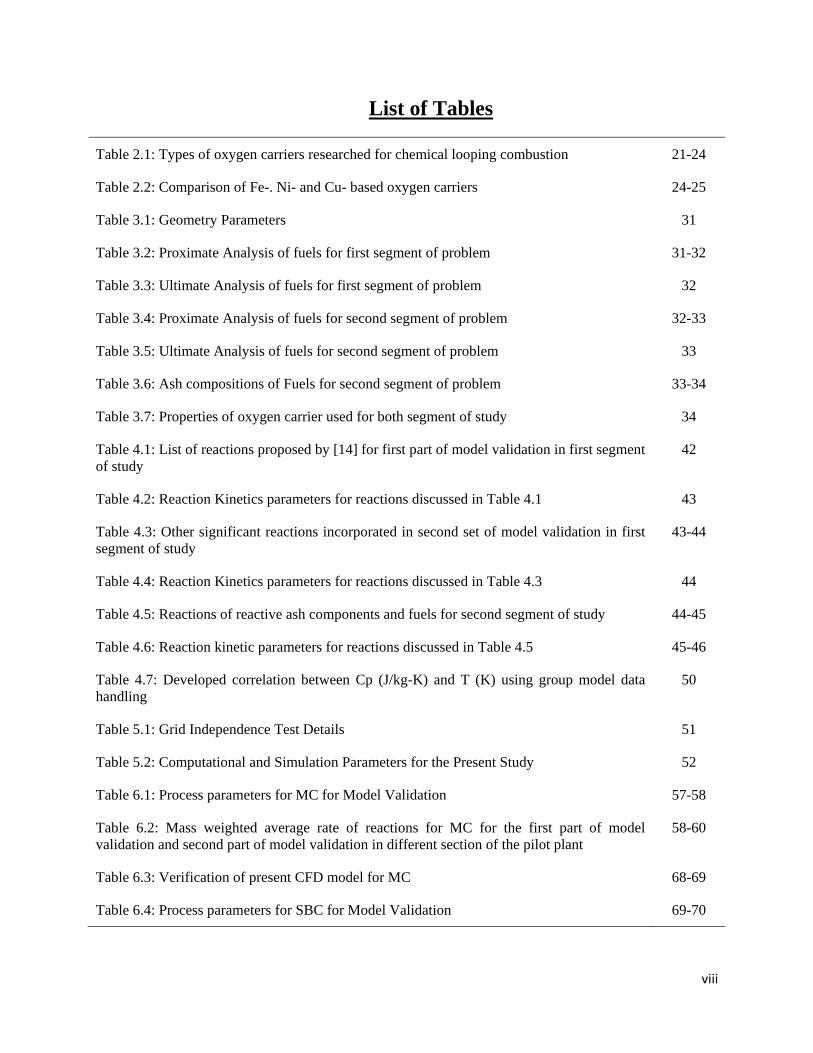
List of Tables viii
Chapter 1 Introduction 1
Objective 4
Chapter 2 Literature Review 5
2.1 Experimental Approach 5
2.2 Computational Approach 13
2.3 Oxygen Carriers 19
2.4 Carbonaceous Fuels 26
2.5 Properties Estimation by Neural Network 28
Chapter 3 Problem Description 30
Geometry Parameters 31
Fuel Properties 31
Oxygen Carrier Properties 34
Chapter 4 Model Development 35
Model Assumptions 35
4.1 Mass Conservation Equations 36
4.2 Momentum Conservation Equations 36
4.3 Energy Conservation Equations 37
4.4 Species Transport Equations 38
4.5 Laminar Finite Rate Model 38
iv
4.6 Reaction Kinetics 41
4.7 Effect of Pressure 46
4.8 Standard k-ε model 47
4.9 Group Method of Data Handling (GMDH) model 48
Chapter 5 Solution Techniques 51
Grid Independence Test 51
Computational & Simulation Parameters of study 52
Discretization 53
5.1 Finite Volume Method 53
5.2 Spatial Discretization Method 53
5.3 Temporal Discretization 54
Algorithm of Present study 56
Chapter 6 Results & Discussion 57
6.1 Results of First Segments (Model Validation) 57
6.1.1 Comparison of Simulation Results of the present model and that of pilot plant when Metallurgical coke (MC) is used
57
6.1.2 Comparison of Simulation Results of the present model and that of pilot plant when Sub-bituminous coal (SBC) is used
69
6.1.3 Effect of operating pressure 82
6.2 Results of Second Segments 83
6.2.1 Simulation Results of the present model when Coal “A” is used 84
6.2.2 Simulation Results of the present model when Coal “B” is used 95
6.2.3 Simulation Results of the present model when Coal “C” is used 105
6.2.4 Simulation Results of the present model when Coal “D” is used 116
6.2.5 Comparison between coals 126
6.2.6 Effect of operating pressure 129
v
Chapter 7 Conclusion & Recommendations 132
Conclusion from First Segment of study 132
Conclusion from Second Segment of study 133
Recommendations 133
List of Publications 135
References 136
vi
Fig. 1.1: Chemical looping process outline
List of Figures
2
Fig. 1.2: World proven coal reserves history 3
Fig. 2.1: Oxygen transport capacity of some important oxygen carrier combinations 21
Fig. 2.2: Classification of carbonaceous fuels used for chemical looping combustion 26
Fig. 2.3: Variation in coal compositions found in regions of Asia-Pacific and Australia 27
Fig. 2.4: Variation in Ash composition of coals found in regions of Asia-Pacific & Australia 28
Fig. 3.1: Pilot plant of present problem 31
Fig. 5.1: Mass Fraction of Reducer Exhaust Species vs. Number of Cells (For MC) 51
Fig. 6.1: Rate of Reactions profiles for First part of model validation having mass weighted average rate of reaction greater than 10-10
61-62 for MC
Fig. 6.2: Rate of Reactions profiles for Second part of model validation having mass weighted average rate of reaction greater than 10-10
62-64 for MC
Fig. 6.3: Contours of Velocity & Temperature for MC for second part of model validation 65
Fig. 6.4: Molar concentration contour of important species for MC for second part of model validation
66-67
Fig.6.5: Molar concentration of MC with time for both models along the pathline trajectory 68
Fig. 6.6: Rate of Reactions profiles for first part of model validation having mass weighted average rate of reaction greater than 10-10
73-74 for SBC
Fig. 6.7: Rate of Reactions profiles for second part of model validation having mass weighted average rate of reaction greater than 10-10
75-77 for SBC
Fig. 6.8: Contours of Velocity & Temperature for SBC for second part of model validation 78
Fig. 6.9: Molar concentration contour of important species for SBC for second part of model validation
78-80
Fig. 6.10: Molar concentration of SBC with time along the pathline trajectory for both models
80
Fig. 6.11: Effect of operating pressure on MC for chemical looping combustion 83
Fig. 6.12: Effect of operating pressure on SBC for chemical looping combustion 83
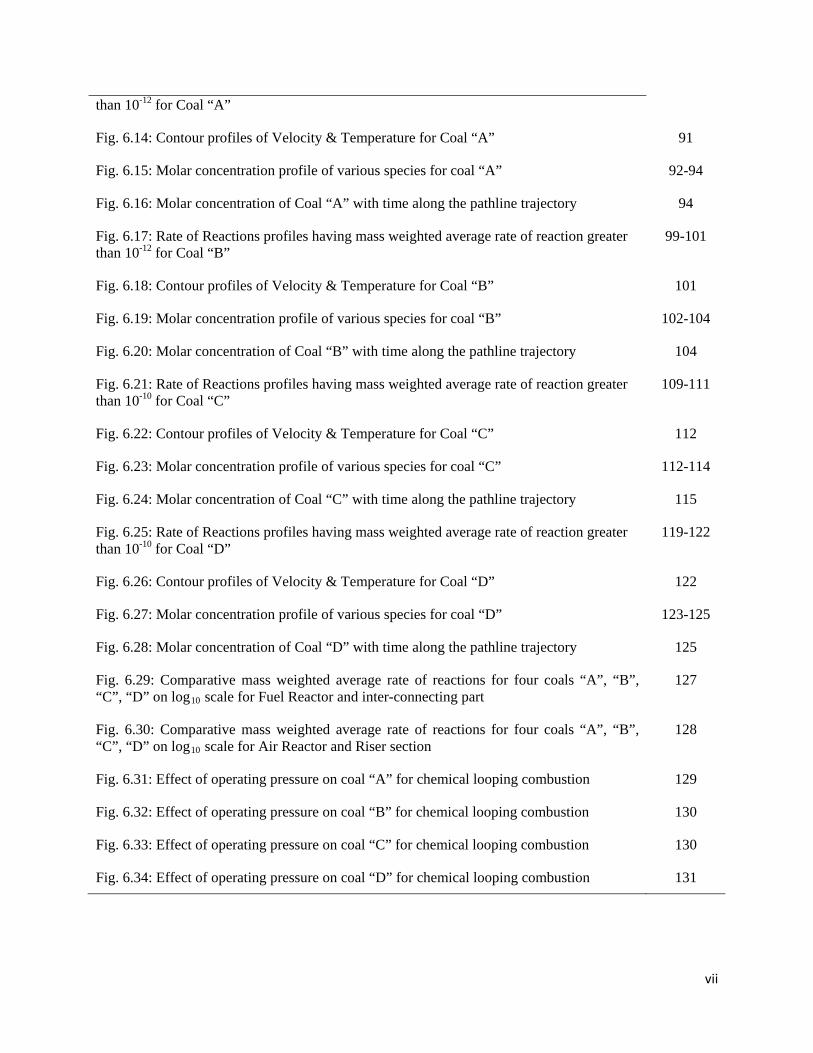
Fig. 6.13: Rate of Reactions profiles having mass weighted average rate of reaction greater 88-91
vii
than 10-12 for Coal “A”
Fig. 6.14: Contour profiles of Velocity & Temperature for Coal “A” 91
Fig. 6.15: Molar concentration profile of various species for coal “A” 92-94
Fig. 6.16: Molar concentration of Coal “A” with time along the pathline trajectory 94
Fig. 6.17: Rate of Reactions profiles having mass weighted average rate of reaction greater than 10-12
99-101 for Coal “B”
Fig. 6.18: Contour profiles of Velocity & Temperature for Coal “B” 101
Fig. 6.19: Molar concentration profile of various species for coal “B” 102-104
Fig. 6.20: Molar concentration of Coal “B” with time along the pathline trajectory 104
Fig. 6.21: Rate of Reactions profiles having mass weighted average rate of reaction greater than 10-10
109-111 for Coal “C”
Fig. 6.22: Contour profiles of Velocity & Temperature for Coal “C” 112
Fig. 6.23: Molar concentration profile of various species for coal “C” 112-114
Fig. 6.24: Molar concentration of Coal “C” with time along the pathline trajectory 115
Fig. 6.25: Rate of Reactions profiles having mass weighted average rate of reaction greater than 10-10
119-122 for Coal “D”
Fig. 6.26: Contour profiles of Velocity & Temperature for Coal “D” 122
Fig. 6.27: Molar concentration profile of various species for coal “D” 123-125
Fig. 6.28: Molar concentration of Coal “D” with time along the pathline trajectory 125
Fig. 6.29: Comparative mass weighted average rate of reactions for four coals “A”, “B”, “C”, “D” on log10
127 scale for Fuel Reactor and inter-connecting part
Fig. 6.30: Comparative mass weighted average rate of reactions for four coals “A”, “B”, “C”, “D” on log10
128 scale for Air Reactor and Riser section
Fig. 6.31: Effect of operating pressure on coal “A” for chemical looping combustion 129
Fig. 6.32: Effect of operating pressure on coal “B” for chemical looping combustion 130
Fig. 6.33: Effect of operating pressure on coal “C” for chemical looping combustion 130
Fig. 6.34: Effect of operating pressure on coal “D” for chemical looping combustion 131
viii
Table 2.1: Types of oxygen carriers researched for chemical looping combustion
List of Tables
21-24
Table 2.2: Comparison of Fe-. Ni- and Cu- based oxygen carriers 24-25
Table 3.1: Geometry Parameters 31
Table 3.2: Proximate Analysis of fuels for first segment of problem 31-32
Table 3.3: Ultimate Analysis of fuels for first segment of problem 32
Table 3.4: Proximate Analysis of fuels for second segment of problem 32-33
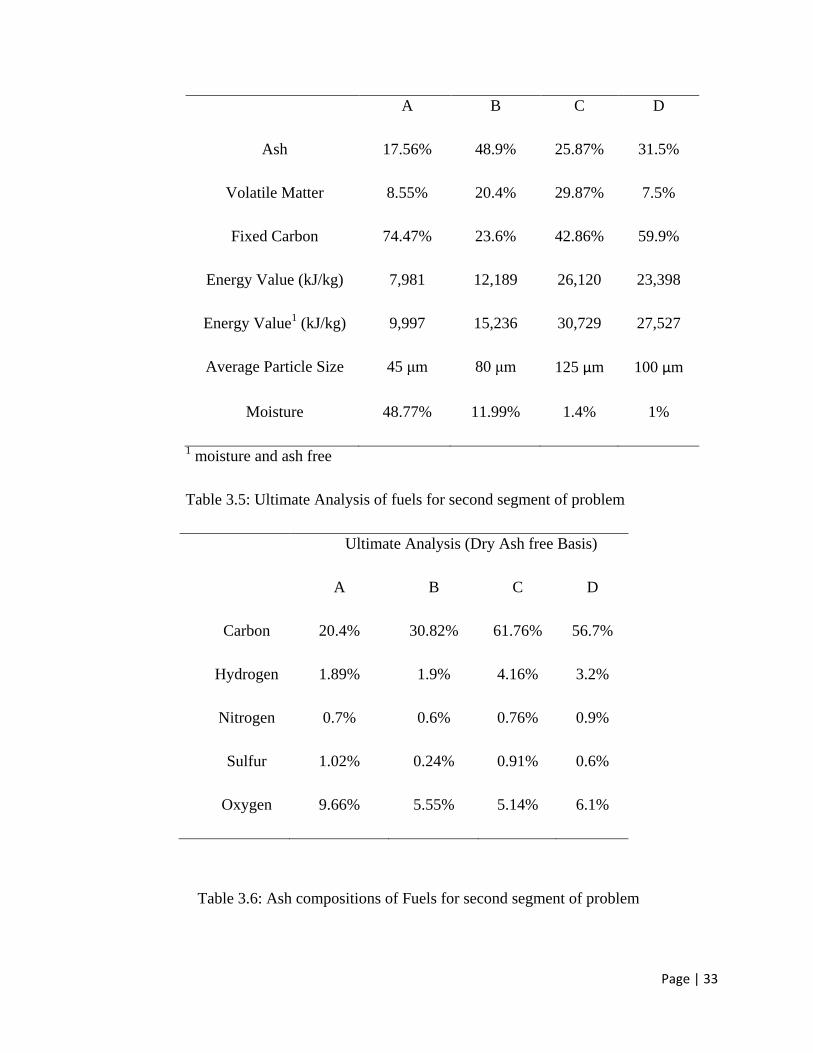
Table 3.5: Ultimate Analysis of fuels for second segment of problem 33
Table 3.6: Ash compositions of Fuels for second segment of problem 33-34
Table 3.7: Properties of oxygen carrier used for both segment of study 34
Table 4.1: List of reactions proposed by [14] for first part of model validation in first segment of study
42
Table 4.2: Reaction Kinetics parameters for reactions discussed in Table 4.1 43
Table 4.3: Other significant reactions incorporated in second set of model validation in first segment of study
43-44
Table 4.4: Reaction Kinetics parameters for reactions discussed in Table 4.3 44
Table 4.5: Reactions of reactive ash components and fuels for second segment of study 44-45
Table 4.6: Reaction kinetic parameters for reactions discussed in Table 4.5 45-46
Table 4.7: Developed correlation between Cp (J/kg-K) and T (K) using group model data handling
50
Table 5.1: Grid Independence Test Details 51
Table 5.2: Computational and Simulation Parameters for the Present Study 52
Table 6.1: Process parameters for MC for Model Validation 57-58
Table 6.2: Mass weighted average rate of reactions for MC for the first part of model validation and second part of model validation in different section of the pilot plant
58-60
Table 6.3: Verification of present CFD model for MC 68-69
Table 6.4: Process parameters for SBC for Model Validation 69-70
ix
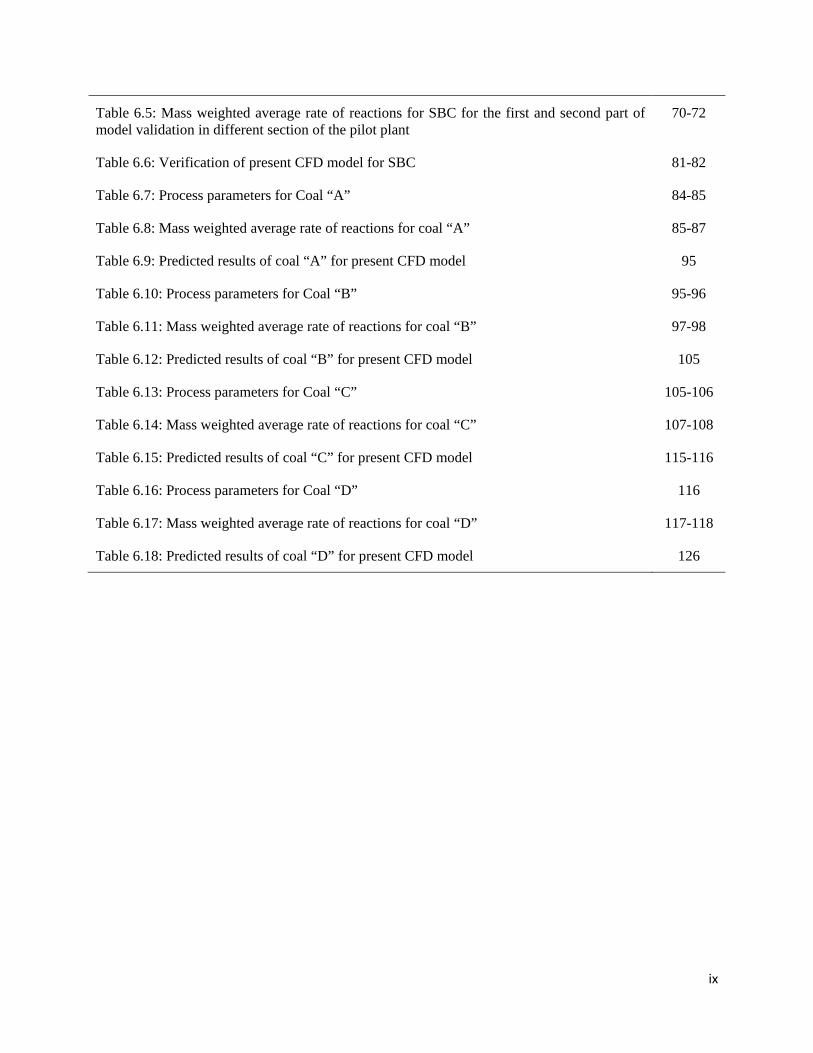
Table 6.5: Mass weighted average rate of reactions for SBC for the first and second part of model validation in different section of the pilot plant
70-72
Table 6.6: Verification of present CFD model for SBC 81-82
Table 6.7: Process parameters for Coal “A” 84-85
Table 6.8: Mass weighted average rate of reactions for coal “A” 85-87
Table 6.9: Predicted results of coal “A” for present CFD model 95
Table 6.10: Process parameters for Coal “B” 95-96
Table 6.11: Mass weighted average rate of reactions for coal “B” 97-98
Table 6.12: Predicted results of coal “B” for present CFD model 105
Table 6.13: Process parameters for Coal “C” 105-106
Table 6.14: Mass weighted average rate of reactions for coal “C” 107-108
Table 6.15: Predicted results of coal “C” for present CFD model 115-116
Table 6.16: Process parameters for Coal “D” 116
Table 6.17: Mass weighted average rate of reactions for coal “D” 117-118
Table 6.18: Predicted results of coal “D” for present CFD model 126
Page | 1
Chapter 1 INTRODUCTION
Energy and global warming are two intertwined planetary issues of significant
magnitude in the current era. Oil price crossing $110/barrel mark and atmospheric
CO2 level recently reaching to 400 ppm [1] level mark it has become imperative to
develop clean and cost effective energy conversion processes. Renewable energy like
hydro, solar, biomass and wind are unlikely to meet the energy demand in foreseeable
future. Nuclear energy due to its constraint on its spent fuel management and
susceptibility to catastrophic hazards makes it implausible to play a vital role in
meeting future energy demand. Despite, current developments in the fields of
renewable energy, nuclear power and other sources, fossil based fuels provide around
85% of world’s energy demand. This makes the fossil fuels as the most imminent
source of energy in near future. [2]- [3]
The carbon emission from fossil fuel estimated by IPCC [4] has posed
considerable challenge for researchers and scientists in the past decade. For obvious
reasons, the applications of clean technologies such as chemical looping combustion,
oxy-fuel combustion, fuel cells and similar technologies are becoming an attractive
proposition in foreseeable future. Researches [5-6] in these fields are gaining
momentum to tackle above stated planetary issues and to provide clean and efficient
technologies to meet the present and future energy demands. Most of the
conventional oil and gas fields have already been exploited and rate of crude oil
production worldwide peak around 2004 which was roughly 72 million barrels per
day. However, the demand for energy is continuously increasing especially in
developing countries like China and India [2]. Therefore, the availability of abundant
reserves of coal to provide energy for 200+ years is to be utilized properly which are
abundant in countries like India and China. In addition to it, cost of coal is much
cheaper in comparison to other fossil fuels, and its pricing is also regionally
controlled which act as one of its economic drivers.
Page | 2
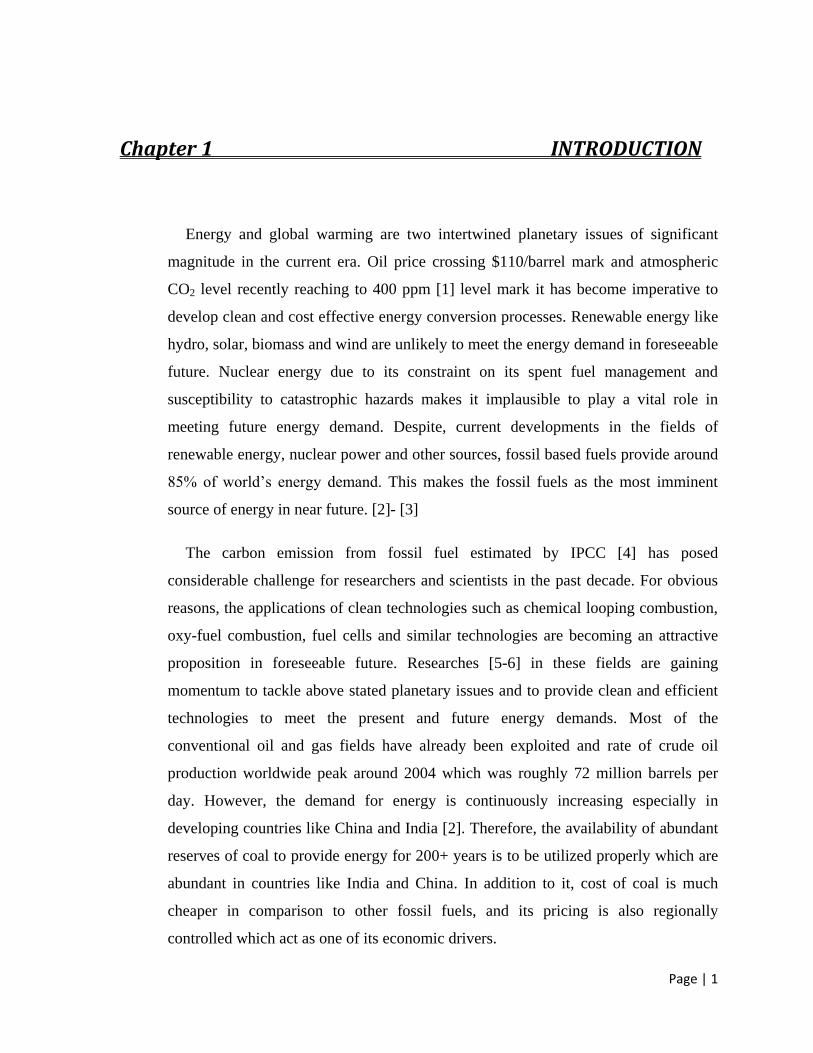
Traditional technologies that generate electricity from fossil fuel via combustion or
gasification process generate flue gas from which separation of carbon dioxide is
costly and technically cumbersome. In the chemical looping technology, carbon
dioxide is available as a directly sequestration ready stream, and thus significantly
increases its cost effectiveness. The history of chemical looping process dates back to
1951 when Lewis and Gilliland [7] proposed a patented process in which
carbonaceous materials can be oxidize as fuel to generate pure carbon dioxide. In the
chemical looping combustion process, carbonaceous fuel, such as coal; first reacts in
a fuel reactor with a metal oxide which acts as an oxygen carrier and subsequently
gets reduced to metal. The above reaction yields carbon dioxide and steam as
products from which carbon dioxide is readily separable by condensing steam. The
reduced metal in the fuel reactor is oxidized again by air in air reactor for its
regeneration to metal oxide. The metal oxide is then recycled back to the fuel reactor
for reuse. The cyclic process is shown in Fig. 1.1.
Fig. 1.1: Chemical looping process outline
In early years, the adoption of a chemical looping strategy was ineffective as
commercial process lacked effective chemical conversion and the absence of cost
Fuel
Reactor
Air
Reactor
Depleted
O2 air
Atmospheric
air
Fuel
Injection
Regenerated
oxygen carrier
Reduced oxygen
carrier
Page | 3
effective separation techniques compounded the problem. In the last decade, chemical
looping process has gained momentum and has been targeted mainly towards
efficient carbon capturing, hydrogen and power generation, etc. Researchers [8] have
worked with different segments of this process. They have adopted experimental as
well as simulation based approaches to study this process with a variety of gaseous
and solid fuels and nearly more than 700 different type of oxygen carrier have been
tested so far.
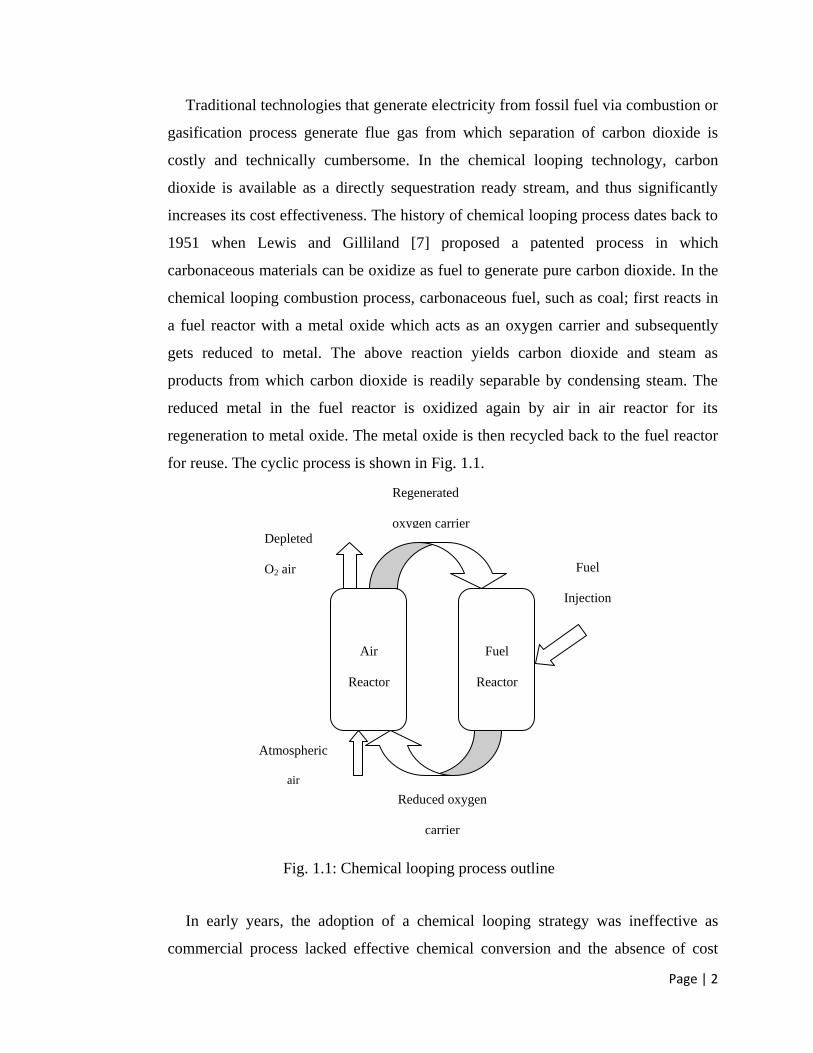
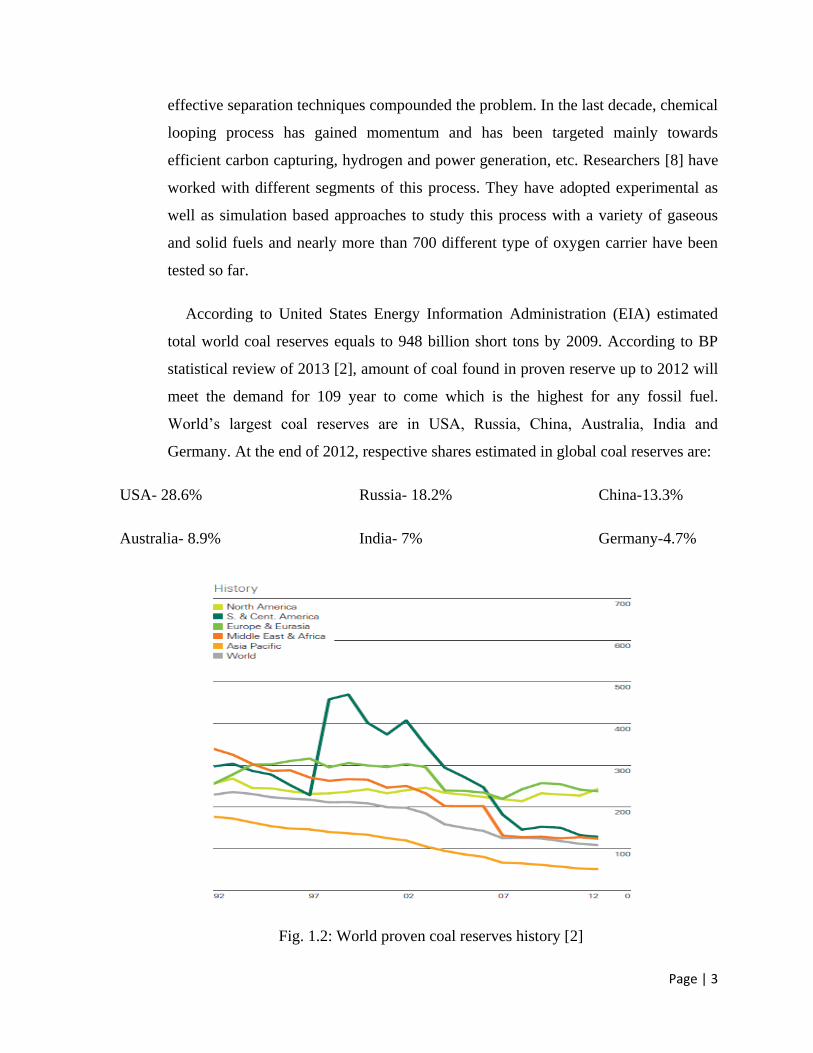
According to United States Energy Information Administration (EIA) estimated
total world coal reserves equals to 948 billion short tons by 2009. According to BP
statistical review of 2013 [2], amount of coal found in proven reserve up to 2012 will
meet the demand for 109 year to come which is the highest for any fossil fuel.
World’s largest coal reserves are in USA, Russia, China, Australia, India and
Germany. At the end of 2012, respective shares estimated in global coal reserves are:
USA- 28.6% Russia- 18.2% China-13.3%
Australia- 8.9% India- 7% Germany-4.7%
Fig. 1.2: World proven coal reserves history [2]
Page | 4
India has the fourth largest coal reserve in the world and is the fourth largest
producer of coal. Coal is one of the primary sources of energy, accounting for nearly
65% of total energy consumption in the county. Coal deposits in India occur mostly
in thick seams and at shallow depths. However, Indian coals have high ash content
(15-45%) and low calorific value. With the present Reserve to production (R/P) ratio
of 100, estimated coal reserves in India will last nearly for 100 years. The energy
derived from coal (~65%) in India is more than twice of world’s energy derived from
coal (~30%).
Recent rapid development of chemical looping combustion to seek for an
alternative process for efficient and clean technology for carbon capture is the major
driver of the present study. Various studies on gas based fuel for chemical looping
combustion have been the major focus in the past decade while, solid based fuel for
chemical looping combustion is relatively a new concept and very little research
efforts have been directed towards this field more specifically towards CFD
simulation of complete system.
Under the backdrop of the above facts, the present work has been formulated with
following objectives:
To develop CFD simulation of complete coal direct chemical looping plant
including fuel and air reactors and their interconnecting parts.
Development of simulation model for coals having high ash content to study the
effect of ash in feed with respect to operating parameters, fuel conversion and
purity of CO2 in fuel reactor exhaust.
To study the effect of variation in operating pressure of the system.
Page | 5
Chapter 2 LITERATURE REVIEW
The objective of the present work is detailed in Chapter-1. Based on the above
objective a detailed literature review on different aspects of chemical looping
combustion has been conducted and subsequently reported in this Chapter. Although,
the technology has been proposed by Lewis and Gilliland [7] back in 1950 for
beverage industry to produce pure carbon dioxide using ferric oxide as an oxygen
carrier and methane as a fuel but the most significant development of this technology
took place in the last decade. During this period various aspects of chemical looping
combustion have been investigated such as design and layout of chemical looping
system, fuel and air reactors, oxygen carriers, carbonaceous fuels, optimal operating
parameters like bed height, feed rate, pressure, etc. As the present work is on
computational fluid dynamics (CFD) study, this Chapter also includes detailed
literature review on the CFD study of chemical looping process carried out for
gaseous and solid fuels as well. Further, as it deals with the validation of simulation
results with pilot plant data and then extension of the CFD model for coal with high
ash content (such as Asia Pacific coal and Australian coal) a literature review in this
regard has also been conducted. In addition to it, as the present work requires
properties of oxygen carrier and ash components such as heat capacity which are
dependent on temperature, a literature review to this effect has also be carried out.
Further, the literature review Chapter has been segmented into following sections:
experimental based study, computational based study, types of oxygen carriers, types
of fuel for chemical looping combustion, effect of ash, properties estimation via
neural network, etc.
2.1. Experimental approach:
The experimental studies has played an important role in the development of
chemical looping combustion through pilot plant study, lab scale study, TGA
Page | 6
analysis, XRD analysis, etc. to determine the dependence of various parameters and
suitable operating conditions for chemical looping combustion for carbonaceous
fuels. Various such studies for chemical looping combustion have been outlined and
discussed by Wadhwani and Mohanty (2013) [6], Moghatedri (2012) [5], Adanez
(2012) [9] and Lyngfelt (2014) [10].
For experimental studies, various pilot plants have been developed at different
locations across the globe like at Chalmers 10 kW & 100 kW (Lyngfelt (2014) [10],
Lyngfelt (2011) [8]), Nanjing 1 kW & 10 kW (Wu et al. (2010) [11], Wu et al. (2009)
[12]), Ohio 2.5kW & 25kW (Fan & Li (2010) [13], Kim et al. (2013) [14]) and
Hamburg (Thon et al. (2012) [15]), etc. The pilot plant studies have been reported in
various literatures to impart knowledge about the design criteria of the reactors, study
on reactor kinetics, and optimal operating parameters of the system.
Abad et al. (2006) [16] published results pertaining to continuous operation of a
chemical looping combustion (CLC) unit for Natural gas/syngas as fuel and Mn3O4 as
an oxygen carrier of 300W and also tested the feasibility of manganese based oxygen
carrier. In their study they found that higher temperature and lower fuel flow,
enhances fuel combustion efficiency which varied from 0.88 to 0.99. Lyngfelt (2011)
[8] discusses the operational experience of chemical looping combustion processes
developed at various locations so far. Further, Lyngfelt (2014) [10] discussed the
status of development of chemical looping combustion for solid fuels from the
experiences gained and performance observed from the pilot plants developed till
date. Gu et al. (2011) [17] have carried out experimental study on a 1 kWth
continuous chemical looping reactor using biomass/coal as fuel and Australian iron
ore as oxygen carrier. However, they investigated the effect of temperature on gas
composition of fuel and air reactors, carbon capturing efficiency, etc.
Kim et al. (2013) [14] have reported the design criteria and operating conditions of
a 25 kWth coal direct chemical looping sub pilot plant developed at Ohio State
University for two coals (metallurgical coke & sub-bituminous coal) as fuel & Fe2O3
as oxygen carrier. Their study showed 81% and 97% conversion of fuels i.e.
metallurgical coke and sub-bituminous coal respectively. For both type of coal, purity
Page | 7
of CO2 in output stream was more than 99%. Leion et al. (2009) [18] have carried out
batch chemical looping combustion with iron ore and scales of iron oxide as oxygen
carriers with solid fuels such as Petroleum coke, charcoal, lignite and two bituminous
coals. The experiments were run at cyclically operated lab based fluidized bed reactor
with alternating oxidation and reduction phases. Their results showed that both
oxygen carriers passed their suitability as oxygen carrier and also their reactivity
increased with time.
Kolbitsch et al. (2009) have investigated the performance of 120 kW dual
circulating fluidized bed chemical looping combustor. They used a very simple
structure of circulating fluidized bed to develop the model in which the reacting gas is
only in contact with a defined fraction of well mixed solid particles. Thus, different
parameters that characterized gas-solid interaction are merged into a single parameter
i.e. the fraction of solid exposed to gas passing in plug flow. The 120 kW pilot plant
used Ni based oxygen carrier and natural gas as fuel. Further, they concluded that
oxygen carrier is fully oxidized in air reactor when the air reactor solid inventory is
much larger than fuel reactor or when both reactors are very large. Pröll et al. (2011)
[20] carried out experimental study using methane as fuel and NiO as oxygen carrier
for a 120 kW pilot plant. The system consists of two inter-connected circulating
fluidized bed reactors. They observed that fuel conversion for methane has been in
the range of 99.8% while carbon dioxide yield is 92%.
Xiao et al. (2010) [21] have investigated the pressurized CLC by using Chinese
bituminous coal in a medium-pressure, high temperature fixed bed reactor & with
iron (Companhia Valedo Rio Doce iron ore) ore as oxygen carrier. They also
estimated the effect of operating pressure and concluded that pressurized condition
suppresses the initial reaction of coal pyrolysis while it enhances the coal char
gasification and reduction of iron ore in steam. Hence, limited pressurized chemical
looping combustion shows a promising process. Scott et al. (2006) [22] have carried
out experimental study on chemical looping combustion using solid coal as fuel to
test the suitability of using solid coal as carbonaceous fuel for chemical looping
combustion. Their study concluded that the in-situ gasification of solid fuel in
chemical looping combustion is feasible provided the gasification agent like CO2 is
Page | 8
fed to the reactor which converts coal to CO which is then oxidized by oxygen
carrier. Bayham et al. (2013) [23] have discussed the 25 kWth coal direct chemical
looping pilot plant developed at Ohio State University which used two solid fuels
sub-bituminous coal and lignite. Their test showed more than 90% coal conversion
with 99.5% carbon dioxide purity from reducer exhaust for both fuels.
Arias et al. (2013) [24] discussed the results of calcium looping 1.7 MWth plant for
circulating fluidized bed combustors and demonstrated the concept of MWth scale
plant to facilitate the scale-up methods. Azis et al. (2013) [25] have experimentally
studied the effect of bituminous and lignite ash on the performance of chemical
looping combustion where in ilmenite as oxygen carrier is used. They concluded that
addition of ash has decreased fuel conversion while it doesn’t show any negative
effect on fluidizability of the bed material. Bao et al. (2014) [26] studied
experimentally the interaction between iron-based oxygen carried and four different
types of coal ash in a lab-scale fluidized bed reactor. They concluded that few
components of ash such as CaSO4 and Fe2O3 helped in the reduction of reaction time
by acting as an extended oxygen carrier while other components hindered the
reduction rate. Thus, the existence of ash with solid fuels such as coal for chemical
looping combustion have considerable impact on oxygen carrier reactivity while it
also hindered the solid fluidization.
Källén et al. (2014) [27] carried out experimental study using Fe0.66Mn1.33SiO3 and
FeMnSiO3 as oxygen carrier in fluidized bed reactor system designed for a 300W
thermal power. Their study used natural gas as fuel with Fe0.66Mn1.33SiO3 as oxygen
carrier and showed that a conversion reaching up to 100% around 950⁰C is
achievable. Mendiara et al. (2014) [28] focused their study on in-situ gasification in
chemical looping combustion using high reactive iron ore as oxygen carrier for
various coals for a 500Wth chemical looping combustion unit. Velazquez-Vargas et
al. (2012) [29] discussed the fundamental concept of coal direct chemical looping
process using pulverized coal as fuel and ferric oxide as oxygen carrier and published
their latest experimental data generated from a 25 kWth pilot facility. Abandes et al.
(2004) [30] carried out experimental study on pilot scale fluidized bed reactor to
investigate the carbonation reaction of CaO to capture carbon dioxide from flue gases
Page | 9
at high temperature. Their result show that the extent of carbon dioxide capturing
efficiency to be very high while the same reduces with number of carbonation-
calcination cycles.
Xiao et al. (2010) [31] studied the performance of a pressurized chemical looping
combustion combine cycle system for solid fuel coal and Companhia Valedo Rio
Doce iron ore on a lab scale fixed bed reactor. Their study showed that pressurized
chemical looping combustion of coal is feasible and a low-cost oxygen carrier adds to
its suitability. Siriwardane et al. (2009) [32] carried out their investigation on
combustion and re-oxidation properties of direct coal based chemical looping
combustion on CuO, NiO, Fe2O3 and Mn2O3 as oxygen carrier using thermo-
gravimetric analysis on bench scale fixed bed flow reactor. Their study concluded
that CuO showed best reaction properties among other carriers. Song et al. (2008)
[33] have proposed the concept of CLC using CaSO4 based oxygen carrier. Further,
they have also performed reduction tests of CaSO4 with simulated coal gas on lab
scale fluidized bed reactor at 890-950⁰C and studied its kinetics using shrinking core
model.
Berguerand and Lyngfelt (2008) [34] have carried out their study on petroleum-
coke based 10 kWth chemical looping combustor using ilmentie, and iron titanium
oxide as oxygen carriers. The fuel reactor has been fluidized by steam. They studied
the effects of particle circulation and carbon stripper operation on petroleum coke,
conversion of gas from the reducer reactor and CO2 capture. Kronberger et al. (2004)
[35] discussed and outlined the conceptual design of large scale (200MW) chemical
looping combustion system which uses refinery gases as a source of fuel carried out
experimental study on small scale model.
Apart from pilot plant and lab-scale studies various investigators have assessed the
effect of various operation parameters of chemical looping combustion. Adanez et al.
(2012) [9] have undertaken a comprehensive study on chemical looping combustion
and chemical looping reforming and discussed significant advances in these
technologies till 2010 which comprises experimental experiences, computational
models, pilot plant developments, etc.
Page | 10
Liu et al. (2004) [36] studied the effect of inorganic materials present in coal on
reactivity and kinetics of coal pyrolysis using TGA. Keller et al. (2013) [37] studied
the interaction between mineral materials common in coal with oxygen carrier by
experimental and thermodynamic equilibrium calculations. Their study concluded
that the CuO/MgAl2O4 and Mn3O4/ZrO2 have quite a tendency to react with mineral
materials while ilmenite has been found to be the most robust oxygen carrier. In
addition to it, sulfur can clearly deactivate Ni-, Cu-, and Mn- based oxygen carriers.
Kang et al. (2014) [38] carried out experimental study using thermo-gravimetric
analyzer for reactions between Fe2O3/ZrO2 and methane, hydrogen, carbon monoxide,
steam and oxygen was studied. Through their study they determined kinetic
parameters for each reduction and oxidation reactions.
Coppola et al. (2014) [39] have conducted experimental investigation to study the
effect in hydration induced reactivation of spent sorbent for a calcium looping
process. They studied the changes in sorbent properties due to induced by hydration,
regeneration of CO2 capture capacity and attrition tendency of the material on looping
cycles. Abad et al. (2011) [40] determined the kinetics of redox reactions of ilmenite
for chemical looping combustion. They carried out their study on pre-oxidized
ilmenite and activated ilmenite as oxygen carrier for the chemical looping system.
They carried out TGA analysis to deduce kinetics for reducing gases such as
hydrogen, methane and carbon monoxide as well as oxygen for oxidation step. The
system used natural gas, syngas and coal as fuel.
Yu et al. (2012) [41] have studied the effects of C/Fe2O3 molar ratio and
impregnated oxygen carrier with alkali carbonates on reduction rate of coal char. In
addition to it, they also studied the feasibility of using coal char for direct chemical
looping combustion with alkali carbonated impregnated oxygen carrier using TGA,
XRD, SEM, and similar techniques. They concluded that impregnated alkali
carbonate increases the reduction rate in the following order K2CO3>Na2CO3>
Li2CO3. Yu et al. (2013) [42] have examined the effect of CO2 atmosphere and
K2CO3 addition (as the reaction between char and ferric oxide is slow which is
enhanced by impregnation of alkali carbonates) on the reduction rate of char for
Page | 11
chemical looping process using ferric oxide as an oxygen carrier. Yang et al. (2008)
[43] have carried out experimental study the feasibility of three processes using
fluidized bed reactor- these are: direct reduction of iron oxide by char, hydrogen gas
production from steam-iron process and oxidation of reduced oxygen carrier to
generate Fe2O3. The fuel for combustion was Chinese lignite coal and the oxygen
carrier was doped with K2CO3.
Cao et al. (2006) [44] have evaluated the reduction of CuO-Cu as an oxygen
carrier with solid fuels such as coal for chemical looping combustion for circulating
fluidized bed fuel reactor. They carried out test on the reduction of CuO by
differential scanning calorimetry and thermo-gravimetric analysis. Further, they
carrier mass spectrometer analysis for evolved gas analysis and X-ray diffraction and
scanning electron microscope for characterization of solid residues. Shen et al. (2007)
[45] have carried out thermodynamic analysis for chemical looping combustion using
coal as fuel in inter-connected fluidized beds with inherent carbon dioxide separation.
Their study indicates that NiO/Ni oxygen carrier showed the optimal results out of
various oxygen carriers such as Co3O4/CoO, CuO/Cu2O, Cu2O/Cu, Fe3O4/FeO,
Fe2O3/Fe3O4, Mn2O3/Mn3O4, etc.
Xiao and Song (2011) [46] have proposed the concept of using CaSO4 based
oxygen carrier for CLC. Further, they have performed tests such as X- ray diffraction
(XRD), scanning electron microscopy with energy dispersive X-ray (SEM-EDX) and
N2 adsorption-desorption techniques to study the kinetics modeling and physical-
chemical characterization analysis for CaSO4. Their experimental study results were
theorized by using gas-solid shrinking un-reacted core model in which both chemical
reaction control and product layer diffusion were considered.
Siriwardane et al. (2010) [47] have worked on the reaction mechanism of chemical
looping combustion between coal & CuO. They demonstrated that the solid/ solid
reactions can be completed at a much lower temperature with rates that are
technically adequate for reaction between fuel & metal oxide. They also studied
potential interaction between the two solids through various techniques like TGA,
Page | 12
XPS, XRD, etc. Gnanapragasm et al. (2009) [48] have utilized operating conditions
for coal direct chemical looping (CDCL) and syngas chemical looping (SCL) to
produce hydrogen directly from coal. Their study showed that CDCL process has
higher H2/CO2 ratio than SCL process and thus proved to be advantageous.
Additionally, CDCL process required fewer resources (steam & air) & generates few
intermediates in process.
Jheng et al. (2010) [49] discussed the thermodynamic and kinetics aspect of CaSO4
as an oxygen carrier for coal based chemical looping combustion. They conducted
experiments on chemical looping process for CaSO4 as oxygen carrier and coal
syngas as fuel were carried out in fluidized bed reactor at different reaction
temperature resulting different intermediates. The products were further analyzed and
characterized by gas chromatograph, gas analyzers and scanning electron microscope.
Luo et al. (2013) [50] have investigated direct chemical looping combustion using
Yimin coal and biomasses using CuO as oxygen carrier. In addition to it, they also
conducted thermo-gravimetric analysis to simulate direct chemical looping
combustion using solid fuels and their co-combustion. Their result proved the
suitability of CuO as oxygen carrier for CLC of solid fuels.
Shen et al. (2009) [51] carried out experimental investigations to analyze gas
compositions of fuel and air reactors, carbon conversion efficiency, carbon dioxide
capturing efficiency and carbon of fly ash in fuel reactor for inter-connected fluidized
bed reactors which consists of high velocity fluidized bed as air reactor, and spout-
fluidized bed as fuel reactor. The two reactors are connected to each other via cyclone
separator. Orr (2012) [52] carried out experimental study to measure the solid
circulation rate in the two inter-connecting reactors developed at Ohio State
University (OSU). He studied iso-kinetic to measure the circulation by determining
the effect of angle of entry of fuels in fuel reactor. He found that all angles that have
been tested showed direct proportionality between the velocity in the iso-kinetic
device and the reactor column.
Page | 13
Zhao et al. (2008) [53] have experimentally observed the direct reduction reaction
of NiO/NiAl2O4 oxygen carriers by coal char. They prepared NiO/NiAl2O4 particles
by sol-gel method rather than dissolution method. TGA was used to evaluate the
reduction reaction through analyzing the weight of mixture as a function of time &
temperature; XRD, SEM & N2 adsorption–desorption methods were utilized to
characterize the solid residues. Jin and Ishida (2004) [54] have experimentally
examined coal gas and natural gas fueled chemical looping combustion and found
that coal gas based chemical looping combustor shows a better reactivity than natural
gas based combustor when NiO is used as oxygen carrier. Labino et al. (2006) [55]
have analyzed the effects of reactor parameters on Cu, Fe, and Ni based oxygen
carrier in syngas fueled chemical looping combustion and concluded that the
dependence of reaction rates on temperature has been low while total pressure has a
negative effect on oxygen carrier reactions.
Saha and Bhattacharya (2011) [56] carried out their experiments using thermo-
gravimetric analyzer for NiO and CuO as oxygen carriers using Victorian brown coal
for five alternative cycles of reduction and oxidation. They concluded a weight loss of
4.4-7.5% for NiO as oxygen carrier while for CuO as an oxygen carrier there was no
such weight loss. Moreover, the percentage combustion of coal using NiO and CuO
as oxygen carriers is 96% and 67% respectively. Further, Saha et al. (2011) [57] have
discussed the same work of Saha and Bhattacharya (2011) [56] for NiO as oxygen
carrier. Hamers et al. (2014) [58] carried out their study on the performance of
oxygen carrier (13 wt. % CuO/Al2O3) in a packed bed reactor with periodic switching
between oxidizing and reducing conditions for syngas as fuel. The experimental
results were well described by a 1D reactor model. Wang et al. (2014) [59] studied
the effect of HCl on cyclic calcium based sorbent in calcium looping process. The
effect of presence of HCl in carbonation atmosphere, carbonation temperature,
calcinations temperature, HCl concentration and particle size on chemical looping
combustion using dual fixed bed reactor was thus investigated.
2.2. Computational approach:
Page | 14
In the development of chemical looping combustion various researchers opted for
computational and numerical approach to study the behavior of chemical looping
combustion and to study the role of various parameters in the operation of chemical
looping process. Various investigation carried out in this field have been outlined and
discussed in detail by Singh et al. (2013) [60], Wadhwani and Mohanty (2013) [6],
Lyngfelt (2014) [10] and Adanez (2012) [9].
The computational approach have mainly targeted through CFD based simulation,
numerical simulation, thermodynamic computation, ASPEN Plus based simulation,
etc. to model the process and to study the behavior of variation of design & operating
parameters. Singh et al. (2013) [60] have reviewed the use of CFD modeling
technique to study combustion and gasification in fluidized beds and discusses the
fundamental equations used in the development of the CFD models. Anheden and
Svedberg (1998) [61] carried exergy analysis on two different chemical combustion
gas turbine systems. The first system utilized methane as fuel and NiO as oxygen
carrier while in the second system utilized a fuel gas mixture primarily composed of
CO and H2 with NiO and Fe2O3 as oxygen carriers. They concluded that the two
systems are comparable in their conventional combustion. The exergy analysis shows
that irreversibility generated during combustion of fuel can be minimized. The net
power efficiency of the chemical looping-gas turbine system is almost similar or
higher than their corresponding gas turbine system with conventional combustion.
Shuai et al. (2011) [62] developed a 2D CFD model for chemical looping combustion
using inter-connected fluidized beds. They used Eulerian continuum two fluid models
for both gas phase and solid phase. Using their model they; successfully described the
hydrodynamics of gas and solid particles in chemical looping combustion process.
Wang et al. (2011 a&b) [63-64] developed a 3-D numerical model to simulate the
chemical looping combustion process of the fuel reactor. They used a bubbling
fluidized bed fuel reactor, with 14 wt% of CuO on Al2O3 as oxygen carrier and coal
gas as fuel which comprises of 55 vol. % CO, 30 vol. % of H2 and 15 vol. % of CO2.
They studied the flow patterns, distribution of gaseous component and profiles of
bubbles, conversion of fuel, effect of particle diameter and superficial gas velocity of
Page | 15
the oxygen carrier particle. They concluded that the fuel conversion will increase if
the gas residence time and surface to volume ratio of particles are increased. Peng et
al. (2013) [65] carried out a numerical study to investigate the mixing and segregation
behavior of binary mixtures of particles in bubbling fluidized bed of a 10 kWth
chemical looping combustor. They used discrete element model to track the motion of
particles and gas flow was modeled by CFD. Gas-particle interactions were
considered by a two-way coupling method.
Abad et al. (2013) [66] developed a mathematical model for the fuel reactor to
assess the key parameters such as reactor temperature, solids circulation rate and solid
inventory on the efficiency of carbon dioxide capture. They validated their simulated
results against a 100 kWth chemical looping combustion unit. Their result showed
carbon dioxide capture efficiency as 98.5% when operating temperature of fuel
reactor was 1000⁰C. Jafarian et al. (2014) [67] carried out a thermal analysis for a
hybrid solar chemical looping combustion to identify energetic performance of
various combinations of oxygen carriers and fuels. Their study showed that the
highest system Carnot efficiency was with using Co- as an oxygen carrier which was
followed by Ni- and Fe- as an oxygen carrier, while the highest solar share was
achieved with Fe- as an oxygen carrier.
Medrano et al. (2014) [68] proposed a novel hybrid reactor that utilized chemical
looping reforming technology and membrane reactor system. The thermodynamic
studies of the above new reactor are carried out to determine the hydrogen recovery,
methane conversion, etc. Schwebel et al. (2014) [69] carried out experimental study
to obtain apparent reaction kinetics of Norway ilmenite as an oxygen carrier with CO,
H2 and CH4 as fuel gases. Their obtained results were modeled to analyze the effect
of different parameters and reported that reaction order with respect to gas is close to
the reported values in the literature.
Deng et al. (2009) [70] developed a multi-phase CFD model in FLUENT to model
chemical lopping combustion using CaSO4 as oxygen carrier and H2 as fuel. They
concluded that the conversion of hydrogen was about 34% and was a probably due
Page | 16
large bubble rising rapidly throughout the reactor, low reactor bed temperature and
large diameter of oxygen carrier particles. Further, Deng et al. (2008) [71] developed
a multiphase CFD model for bubbling fluidized fuel reactor of chemical looping
combustion. Their CFD model incorporated the complex gas-solid hydrodynamics
and chemical reaction for CaSO4 as oxygen carrier and hydrogen as fuel. Wang et al.
(2013) [72] developed a 3D numerical model for a pressurized circulating fluidized
bed fuel reactor for coal fired chemical looping combustion using ilmenite as oxygen
carrier. Their model predicted the complex gas-solid flow behavior in terms of
velocity and voidage contour profiles and also incorporated the reactions between
steam gasification of coal and reduction of oxygen carrier.
Schöny et al. (2011) [73] have discussed a 3-D model for the fuel reactor of a large
scale chemical looping combustion unit. Their model was based on the validated
model available in literature i.e. Thunman et al. (2004) [74] for large scale fluidized
beds along with kinetic data obtained from chemical looping experiments at lab-scale.
Their model was used to evaluate the performance of large scale fuel reactor
including the effect of variation in different inputs, operation strategies such as
feeding point for oxygen carriers and fuels, physical properties of oxygen carriers and
fuel, and operating condition such as fluidization velocity and pressure drop.
Sharma et al. (2011) [75] have demonstrated possible configuration of a 200 MW
CLC system with methane as fuel & iron oxide as an oxygen carrier. They analyzed
various parameters for the design of the process such as mass of the reactor bed,
pressure drop, solid mass flow rate, residence time, etc. Marx et al. (2012) [76]
evaluated the fluidized bed dimensions for a dual circulating fluidized bed system for
a 10 MW fuel power system incorporating heat integration setup and scaling law.
Kronberger et al. (2003) [77] developed a mathematical model for a chemical
looping combustion system with integrated mass and energy balance. They evaluated
effect of number of design and operating parameter i.e. fuel gas composition a reactor
cooling arrangement. Mahalatkar et al. (2011) [78] have developed a computational
fluid dynamics based model for chemical looping combustion fuel reactor for gaseous
Page | 17
fuel and analyzed two experimental cases of literature. They used methane as fuel and
ferric oxide as oxygen carrier.
Kruggel-Emden et al. (2010) [79] have studied an interconnected multiphase CFD
model which was capable of describing the transient response of coupled CLC using
methane as fuel & Mn3O4 supported on Mg-ZrO2 as oxygen carrier. In this case, fuel
reactor was a bubbling fluidized whereas, air reactor was a high velocity riser.
Further, Kruggel-Emden et al. (2011 a) [80] have also carried out CFD based
investigation for three different oxygen carrier materials (CaSO4, NiO and Mn3O4)
with the gaseous fuels (methane) in batch type reaction vessel. They used four
reaction models on case by case basis namely, linear shrinking core, spherical core,
Avarami-Erofeev, and multi-parameter model. Additionally, Kruggel-Emden et al.
(2011 b) [81] have advanced their earlier work by carrying out CFD based
investigation for four different oxygen carrier materials (CaSO4, CuO, NiO and
Mn3O4) for methane by taking above described four reaction models and compared
the results with published data.
Jin et al. (2009) [82] developed CFD model for chemical looping combustion
using hydrogen as fuel and CaSO4 as an oxygen carrier incorporating reaction kinetic
model. They studied the effects of partial pressure of hydrogen on the system
performance and concluded that higher partial pressure accelerated the reaction rate.
Lygfelt et al. (2001) [83] discussed the design of a boiler with chemical looping
combustion process with Fe2O3 and NiO as oxygen carriers. Their system comprises
two inter-connected fluidized bed reactors (one high velocity riser while the other is
low velocity bed).
Brahimi et al. (2012) [84] simulated chemical looping combustion for pure
methane as fuel and NiO as an oxygen carrier under various operating conditions.
Their mathematical model was based on the reaction kinetics and population balance
of oxygen carrier in each air and fuel reactor and derived proper operating condition
for complete utilization of fuel. Anthony (2008) [85] has examined the potential of
Page | 18
chemical looping combustion and lime-based carbon dioxide looping cycles in which
calcined limestone is used to capture in-situ carbon dioxide.
Han et al. (2013) [86] carried out their investigation using heterogeneous modeling
to study the intra-particle diffusion, temperature fluctuation and dispersion on fixed
bed reactor for chemical looping combustion. Their results were validated with the
Zhou et al. (2013) literature for methane as fuel and NiO as oxygen carrier. Though
in their study, they concluded that for an optimal particle size there is an enhancement
to overall reaction rate and reactor temperature. Wadhwani and Mohanty (2014) [87]
developed an approximate 2-D CFD model for a complete coal direct chemical
looping process for a 25 kWth pilot plant for sub-bituminous coal as fuel and ferric
oxide as oxygen carrier. Their study assumed gaseous flow of particles using
volumetric reaction in FLUENT. Their study verified the pilot plant data found in
Kim et al. (2013) [14] literature and estimated fuel conversion and carbon dioxide
purity in fuel reactor exhaust to be 89.81% and 88.98% respectively while in the
published literature the corresponding values were 97% and 99.6% respectively.
Li and Fan (2008) [88] discussed the background of the historical utilization of
coal as a source of energy and documented the progress and challenges of clean
conversion processes. They also discussed & illustrated the technology with ASPEN
Plus simulation data. Sarofim et al. (2011) [89] have carried out their ASPEN based
simulation study of chemical looping system for CuO and Fe2O3 as oxygen carriers
and optimized design considerations and also develop economic model. Xiang et al.
(2010) [90] analyzed a novel process comprising three reactors to generate hydrogen
and electricity from coal, based on chemical looping combustion. They carried out
ASPEN Plus based simulation using Fe2O3/FeAl2O4 as oxygen carrier and showed
carbon capture efficiency of 89.62% with CO2 emission of ~239 g/kWh.
Zhou et al. (2014) [91] carried out ASPEN Plus based analysis for chemical
looping combustion comprising entire process. The model showed that large amount
of energy is liberated in fuel reactor while there is a need to supply energy in air
reactor and thus evaluated the performance and efficiency of the modeled chemical
Page | 19
looping system. Gopaul (2014) [92] has carried out ASPEN Plus based study for the
chemical looping gasificaion of biomasss for syngas production and utilization of it in
solid-oxide fuel cell system. Their work was divided into three sections, the first
section of the process uses chemical looping gasification of biomass using CaO as an
oxygen carrier for carbon dioxide capturing and generation of lower yields of high
purity syngas, in the second section of the process, their work which used iron-based
oxygen carrier to produce higher yield of syngas with low purity did not involve
carbon dioxide capture.
Zeng et al. (2012) [93] have carried out ASPEN Plus reactor simulation model
based on kinetic and thermodynamic equilibrium limitations to analyze individual
reactors of coal direct chemical looping reactors. They estimated the performance of
coal direct chemical looping process under various mass and energy management
schemes. Guo et al. (2012) [94] have analyzed the behavior of CaSO4 as an oxygen
carrier for chemical looping combustion with gaseous fuel (i.e. CO, H2 and CH4) and
solid fuel (i.e. coal and biomass). Further, they carried out ASPEN Plus based
simulation study for a chemical looping process using CaSO4 as an oxygen carrier.
Li et al. (2010) [95] have carried out ASPEN Plus based study of biomass direct
chemical looping (BDCL) process based on solid biomass as fuel and Fe2O3 as an
oxygen carrier to generate hydrogen and electricity with high efficiency. In addition
to it, the facility for total capture of CO2 produced made it a carbon negative process.
Kobayashi and Fan (2011) [96] provided a perspective for the use of biomass as a
fuel in a similar technology to chemical looping combustion known as biomass direct
chemical looping. They discussed about the preliminary design of the process and its
potential problems and carried out feasibility assessment using ASPEN Plus.
2.3. Oxygen Carriers:
Since the proposal of chemical looping combustion was put forward by Lewis and
Gilliland for production of carbon dioxide in 1950 and by Richter and Knoche in
1983 for enhancement of power station efficiency, the major drawback identified for
the process is the slow reaction kinetics of metal oxide and carbonaceous fuel which
Page | 20
affects the performance of fuel reactor and ultimately the whole process. Oxygen
carriers during its evolution have passed through stages, in the first stage transition
metal oxides were used while, in the second stage of it development their oxygen
carrying capacity is significantly enhanced by doping with different compounds
forming doped oxygen carriers and bi-metallic oxygen carriers. The aboveefforts
have been discussed by Liu (2013) [97], Fan and Siriwardane (2014) [98],
Moghatedri (2012) [5], Cormos (2010) [99], Ciferno et al. (2009) [100], Hossain and
Lasa (2008) [101] and Rezvani et al. (2009) [102]. One of the most important
characteristics of a suitable oxygen carrier for chemical looping combustion is its
reactivity in both fuel and air reactor where both reduction and oxidation cycle take
place. Further, its ability to combust a carbonaceous fuel is an additional selection
criterion along with the following characteristics that are required for an effective
oxygen carrier:
High oxygen carrying capacity
Stable under repeated reduction and oxidation cycles at high temperature
Low attrition rate and Good mechanical strength
Eco-friendly and cost effective
High heat capacity and melting point
Fluidizable and resistant to agglomeration
There are several methods to produce oxygen carriers, out of these spray drying,
impregnation and granulation are the most popular approaches. The synthetic oxygen
carrier prepared from this approach are generally costly than the natural oxygen
carrier such as ilmenite which is cheap in comparison to synthetic oxygen carrier. The
synthetic oxygen carriers are provided with inert binding support such as alumina
(Al2O3), silica (SiO2), Yttria stabilized Zirconia (YSZ), Zirconia (ZrO2), etc. which
enhances the surface area of oxygen carriers.
One key parameter for oxygen carrier suitability is oxygen transport capacity, R0,
which is defined as the mass fraction of usable oxygen in oxygen carrier between air
reactor and fuel reactor:
Page | 21
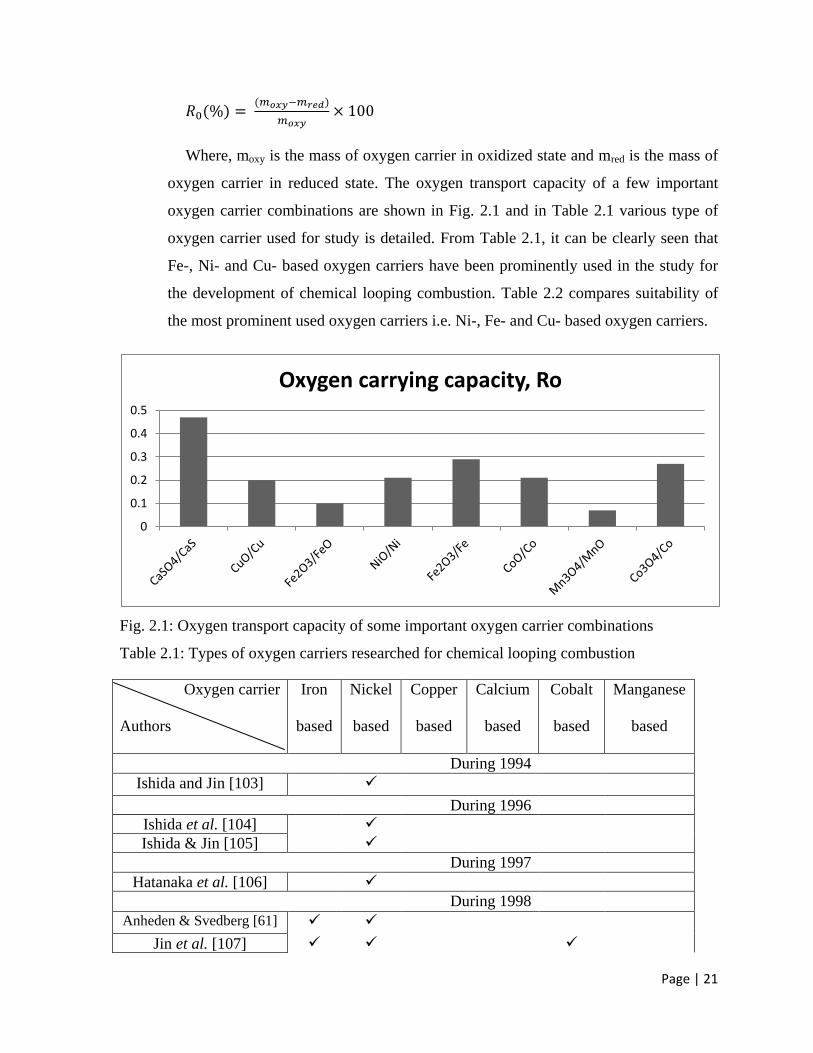
Where, moxy is the mass of oxygen carrier in oxidized state and mred is the mass of
oxygen carrier in reduced state. The oxygen transport capacity of a few important
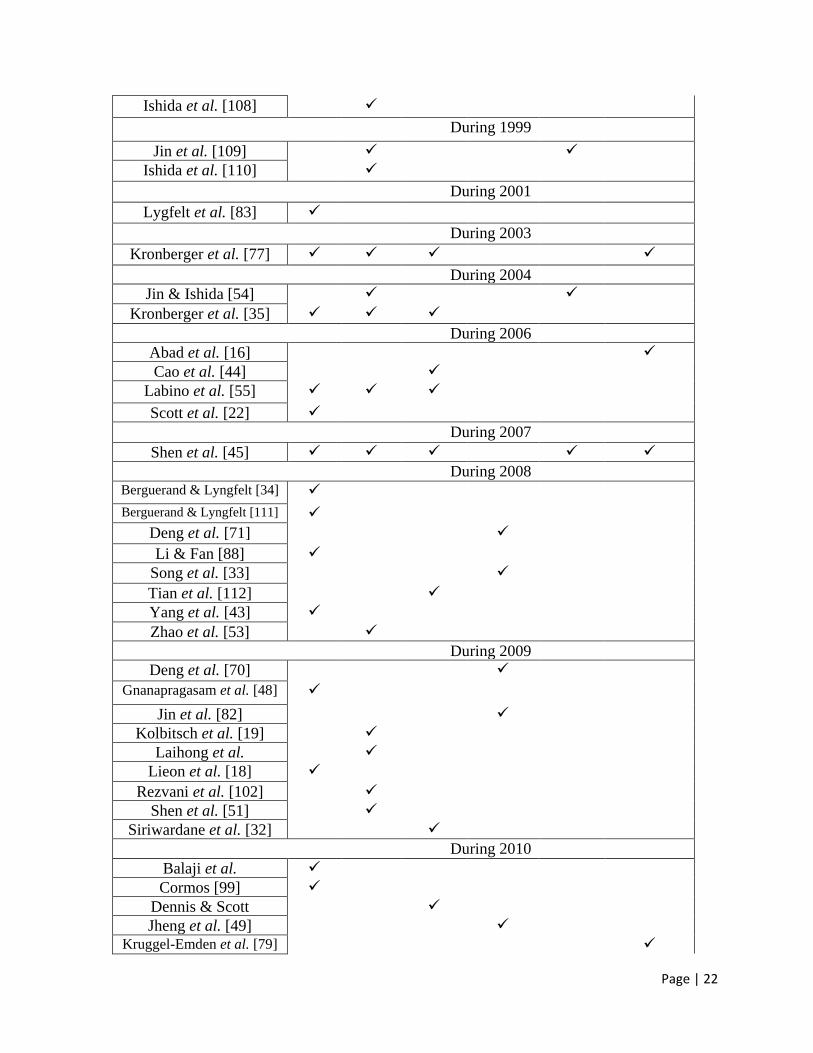
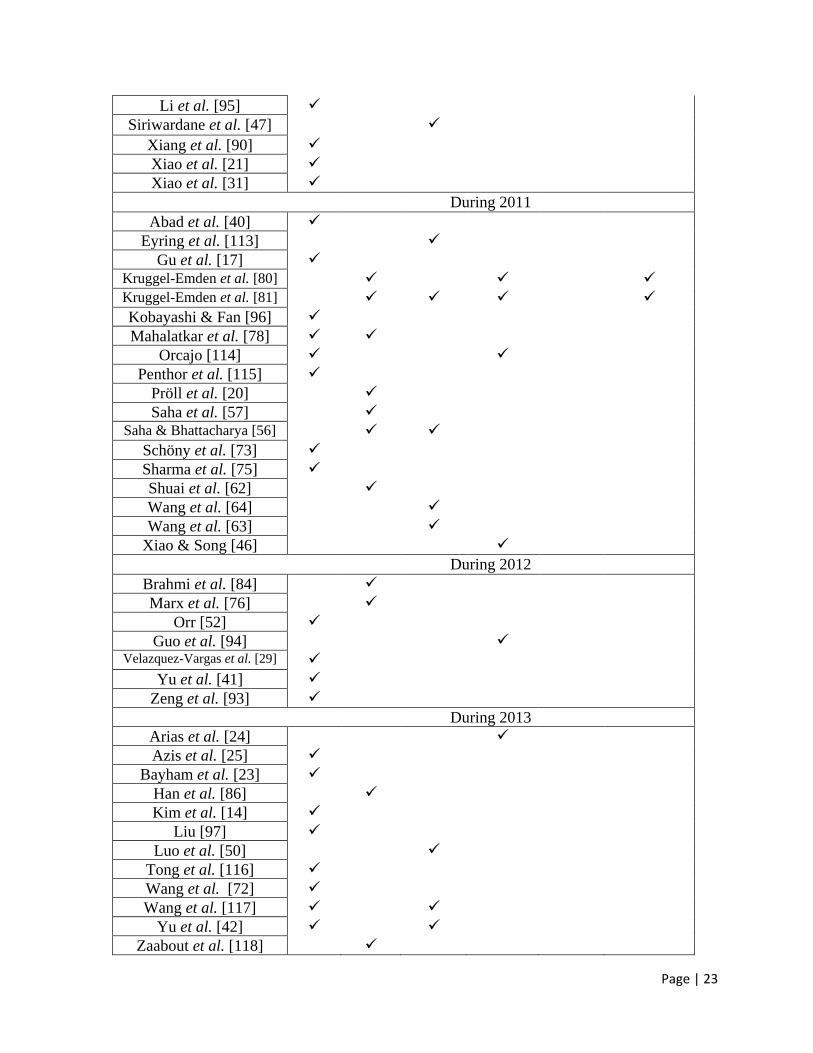
oxygen carrier combinations are shown in Fig. 2.1 and in Table 2.1 various type of
oxygen carrier used for study is detailed. From Table 2.1, it can be clearly seen that
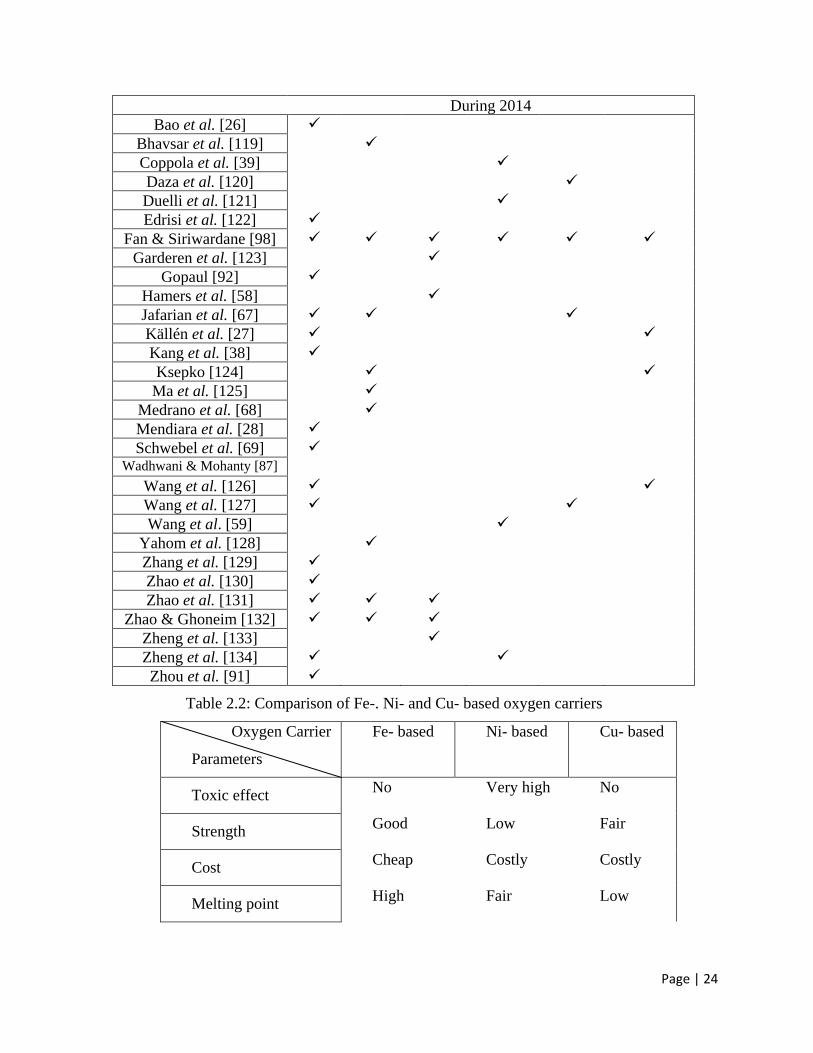
Fe-, Ni- and Cu- based oxygen carriers have been prominently used in the study for
the development of chemical looping combustion. Table 2.2 compares suitability of
the most prominent used oxygen carriers i.e. Ni-, Fe- and Cu- based oxygen carriers.
Fig. 2.1: Oxygen transport capacity of some important oxygen carrier combinations
Table 2.1: Types of oxygen carriers researched for chemical looping combustion
Oxygen carrier
Authors
Iron
based
Nickel
based
Copper
based
Calcium
based
Cobalt
based
Manganese
based
During 1994
Ishida and Jin [103]
During 1996
Ishida et al. [104]
Ishida & Jin [105]
During 1997
Hatanaka et al. [106]
During 1998
Anheden & Svedberg [61]
Jin et al. [107]
0
0.1
0.2
0.3
0.4
0.5
Oxygen carrying capacity, Ro
Page | 22
Ishida et al. [108]
During 1999
Jin et al. [109]
Ishida et al. [110]
During 2001
Lygfelt et al. [83]
During 2003
Kronberger et al. [77]
During 2004
Jin & Ishida [54]
Kronberger et al. [35]
During 2006
Abad et al. [16]
Cao et al. [44]
Labino et al. [55]
Scott et al. [22]
During 2007
Shen et al. [45]
During 2008 Berguerand & Lyngfelt [34]
Berguerand & Lyngfelt [111]
Deng et al. [71]
Li & Fan [88]
Song et al. [33]
Tian et al. [112]
Yang et al. [43]
Zhao et al. [53]
During 2009
Deng et al. [70]
Gnanapragasam et al. [48]
Jin et al. [82]
Kolbitsch et al. [19]
Laihong et al.
Lieon et al. [18]
Rezvani et al. [102]
Shen et al. [51]
Siriwardane et al. [32]
During 2010
Balaji et al.
Cormos [99]
Dennis & Scott
Jheng et al. [49] Kruggel-Emden et al. [79]
Page | 23
Li et al. [95]
Siriwardane et al. [47]
Xiang et al. [90]
Xiao et al. [21]
Xiao et al. [31]
During 2011
Abad et al. [40]
Eyring et al. [113]
Gu et al. [17] Kruggel-Emden et al. [80]
Kruggel-Emden et al. [81]
Kobayashi & Fan [96]
Mahalatkar et al. [78]
Orcajo [114]
Penthor et al. [115]
Pröll et al. [20]
Saha et al. [57] Saha & Bhattacharya [56]
Schöny et al. [73]
Sharma et al. [75]
Shuai et al. [62]
Wang et al. [64]
Wang et al. [63]
Xiao & Song [46]
During 2012
Brahmi et al. [84]
Marx et al. [76]
Orr [52]
Guo et al. [94] Velazquez-Vargas et al. [29]
Yu et al. [41]
Zeng et al. [93]
During 2013
Arias et al. [24]
Azis et al. [25]
Bayham et al. [23]
Han et al. [86]
Kim et al. [14]
Liu [97]
Luo et al. [50]
Tong et al. [116]
Wang et al. [72]
Wang et al. [117]
Yu et al. [42]
Zaabout et al. [118]
Page | 24
During 2014
Bao et al. [26]
Bhavsar et al. [119]
Coppola et al. [39]
Daza et al. [120]
Duelli et al. [121]
Edrisi et al. [122]
Fan & Siriwardane [98]
Garderen et al. [123]
Gopaul [92]
Hamers et al. [58]
Jafarian et al. [67]
Källén et al. [27]
Kang et al. [38]
Ksepko [124]
Ma et al. [125]
Medrano et al. [68]
Mendiara et al. [28]
Schwebel et al. [69] Wadhwani & Mohanty [87]
Wang et al. [126]
Wang et al. [127]
Wang et al. [59]
Yahom et al. [128]
Zhang et al. [129]
Zhao et al. [130]
Zhao et al. [131]
Zhao & Ghoneim [132]
Zheng et al. [133]
Zheng et al. [134]
Zhou et al. [91]
Table 2.2: Comparison of Fe-. Ni- and Cu- based oxygen carriers
Oxygen Carrier
Parameters
Fe- based Ni- based Cu- based
Toxic effect No Very high No
Strength Good Low Fair
Cost Cheap Costly Costly
Melting point High Fair Low
Page | 25
Attrition rate Moderate Low High
Reactivity Slow Fast Fast
Further, Zhao et al. (2008) [53] have experimentally observed the direct reduction
reaction of NiO/NiAl2O4 oxygen carriers by coal char. They prepared NiO/NiAl2O4
particles by sol-gel method rather than dissolution method. TGA was used to evaluate
the reduction reaction through analyzing the weight of mixture as a function of time
& temperature; XRD, SEM & N2 adsorption–desorption methods were used to
characterize the solid residues. Tian et al. (2008) [112] have studied CuO/bentonite &
CuO-BHA nanocomposites as oxygen carrier using coal derived syngas for CLC and
found that reduction reactions were always faster than the oxidation reactions. They
observed excellent reaction performance and thermal stability for both Cu-based
oxygen carriers for chemical looping combustion at 700-900⁰C.
Ishida and Jin (1996) [105] have reported the results of a novel combustor by
kinetics and crystallographic study. They concluded that NiO as oxygen carrier mixed
with Yttria Stabilized Zirconia (YSZ) shown promising results as oxygen carrier with
respect to its reaction rate, conversion and physical strength. Daza et al. (2014) [120]
synthesized a new type of oxygen carrier for water-gas shift chemical looping using
Pechini method and examined it with XRD. They developed five different strontium-
doped lanthanum cobaltites, La1-xSrxCoO3-δ (0≤x≤1 in steps of 0.25). Their result
indicated that the suitability of perovskite-type of oxygen carrier for reverse water gas
shift chemical looping process.
Liu (2013) [97] has studied the doping of CeO2 in ferric oxide oxygen carrier for
chemical looping combustion. The reactivity of oxygen carriers was studied using
TGA-MS on a bench scale chemical looping combustion setup. The oxygen carriers
were analyzed by using XRD and Raman spectroscopy to model the promoting role
of CeO2 in ferric oxide reactivity for chemical looping combustion. The reaction
kinetics of oxygen carrier was studied using shrinking core model. Tong et al. (2013)
[116] have discussed the properties of oxygen carrier, reactor design and modeling,
Page | 26
results of bench scale model, and integrated energy optimization of the pilot plant
developed at Ohio State University. Fan and Siriwardane (2014) [98] carried out their
study to analyze several bimetallic oxygen carriers, such as- CoFe2O4, NiFe2O4,
CuFe2O4, MgFe2O4, CaFe2O4, SrFe2O4, BaFe2O4, and MnFeO3 using thermo-
gravimetric analysis. Their study concluded that all bimetallic ferrites have better
reduction rate than Fe2O3 while Group 2 elements ferrites showed better reduction
and oxidation rates than the transition-metal ferrites. In Group 2 element ferrites,
BaFe2O4 has highest reduction and oxidation rate which is comparable to CuO at
higher reaction temperatures.
2.4. Carbonaceous fuels:
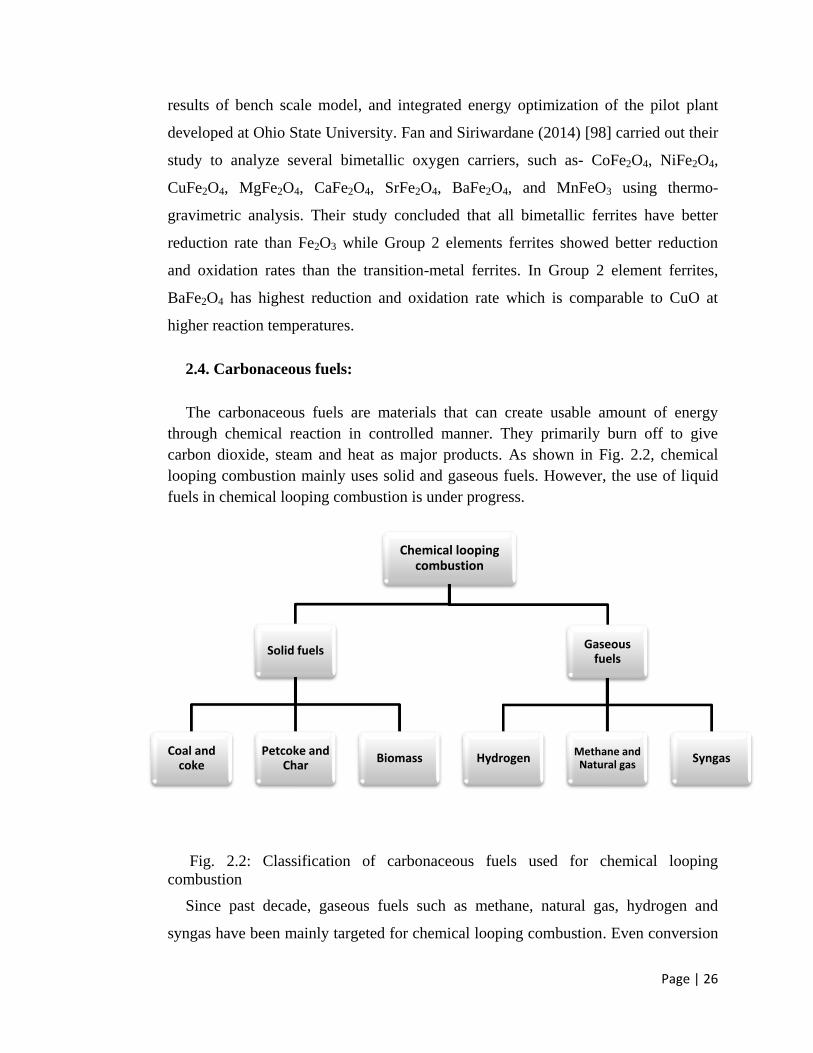
The carbonaceous fuels are materials that can create usable amount of energy
through chemical reaction in controlled manner. They primarily burn off to give
carbon dioxide, steam and heat as major products. As shown in Fig. 2.2, chemical
looping combustion mainly uses solid and gaseous fuels. However, the use of liquid
fuels in chemical looping combustion is under progress.
Fig. 2.2: Classification of carbonaceous fuels used for chemical looping
combustion
Since past decade, gaseous fuels such as methane, natural gas, hydrogen and
syngas have been mainly targeted for chemical looping combustion. Even conversion
Chemical looping combustion
Solid fuels
Coal and coke
Petcoke and Char
Biomass
Gaseous fuels
Hydrogen Methane and Natural gas
Syngas
Page | 27
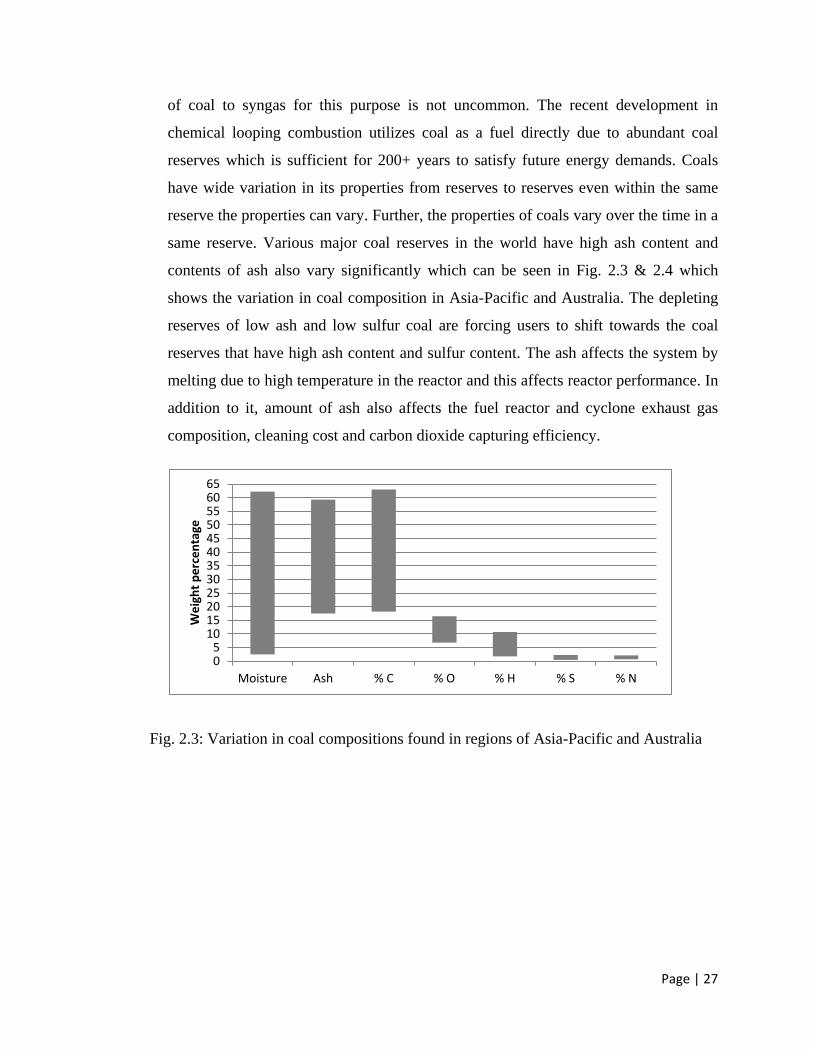
of coal to syngas for this purpose is not uncommon. The recent development in
chemical looping combustion utilizes coal as a fuel directly due to abundant coal
reserves which is sufficient for 200+ years to satisfy future energy demands. Coals
have wide variation in its properties from reserves to reserves even within the same
reserve the properties can vary. Further, the properties of coals vary over the time in a
same reserve. Various major coal reserves in the world have high ash content and
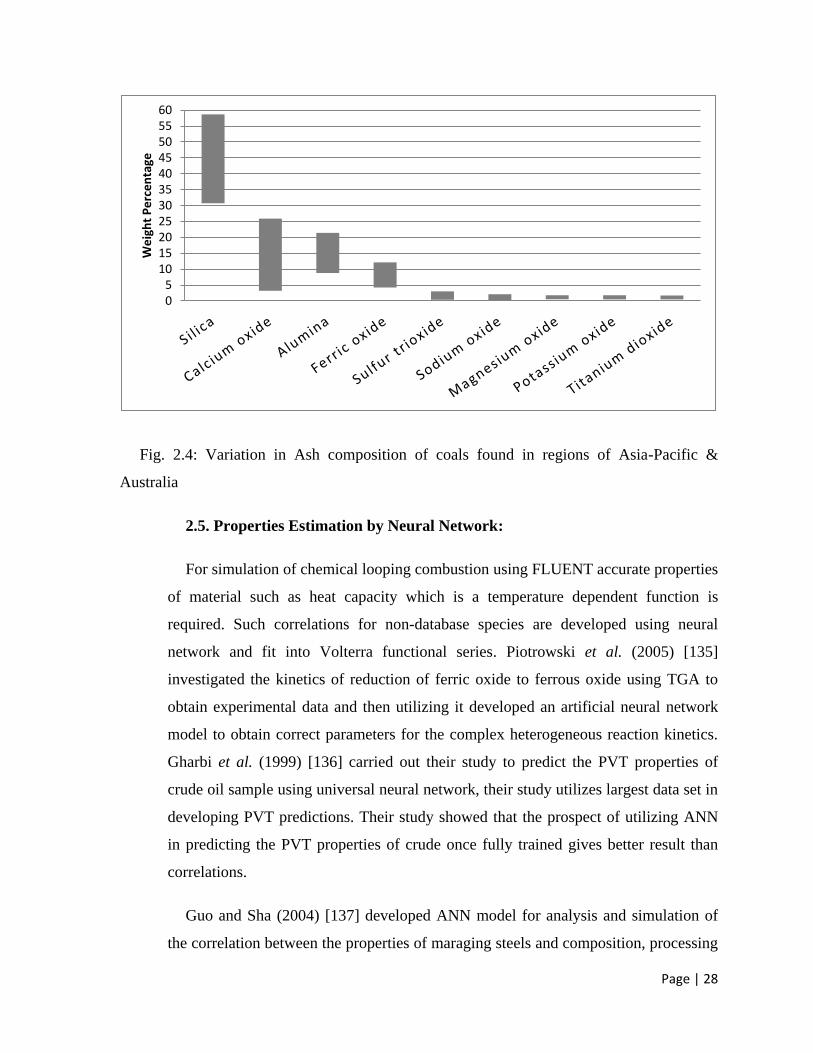
contents of ash also vary significantly which can be seen in Fig. 2.3 & 2.4 which
shows the variation in coal composition in Asia-Pacific and Australia. The depleting
reserves of low ash and low sulfur coal are forcing users to shift towards the coal
reserves that have high ash content and sulfur content. The ash affects the system by
melting due to high temperature in the reactor and this affects reactor performance. In
addition to it, amount of ash also affects the fuel reactor and cyclone exhaust gas
composition, cleaning cost and carbon dioxide capturing efficiency.
Fig. 2.3: Variation in coal compositions found in regions of Asia-Pacific and Australia
0 5
10 15 20 25 30 35 40 45 50 55 60 65
Moisture Ash % C % O % H % S % N
We
igh
t p
erc
en
tage
Page | 28
Fig. 2.4: Variation in Ash composition of coals found in regions of Asia-Pacific &
Australia
2.5. Properties Estimation by Neural Network:
For simulation of chemical looping combustion using FLUENT accurate properties
of material such as heat capacity which is a temperature dependent function is
required. Such correlations for non-database species are developed using neural
network and fit into Volterra functional series. Piotrowski et al. (2005) [135]
investigated the kinetics of reduction of ferric oxide to ferrous oxide using TGA to
obtain experimental data and then utilizing it developed an artificial neural network
model to obtain correct parameters for the complex heterogeneous reaction kinetics.
Gharbi et al. (1999) [136] carried out their study to predict the PVT properties of
crude oil sample using universal neural network, their study utilizes largest data set in
developing PVT predictions. Their study showed that the prospect of utilizing ANN
in predicting the PVT properties of crude once fully trained gives better result than
correlations.
Guo and Sha (2004) [137] developed ANN model for analysis and simulation of
the correlation between the properties of maraging steels and composition, processing
0 5
10 15 20 25 30 35 40 45 50 55 60
We
igh
t P
erc
en
tage
Page | 29
and working conditions. Their results were in agreement with the experimental data.
Malinov and Sha (2001) [138] have developed a model for the analysis and prediction
of correlation between heat treatment parameters and mechanical properties in
titanium alloys using artificial neural network technique. The model they used was
multilayer feed-forward neural network which was trained using comprehensive data
collected from literatures. Their model used to predict properties of titanium alloy at
different temperature as function of heat treatment and processing parameters.
Page | 30
CHAPTER 3 PROBLEM DESCRIPTION
The present study is divided into two segment, in the first segment CFD model
development is carried out using commercial software FLUENT 6.3.2 and mesh
generation using GAMBIT 2.3.26 for validation of the pilot plant data while in the
second segment the verified CFD model is utilized to model and study the behavior of
coals of Asia-Pacific and Australian origin. Further, the first segment of the study is
further sub-divided by using two parts consisting of two different set of reactions; the
first part of model validation utilizes eleven set of reactions as proposed by [14] while
the second part of model validation incorporates seven other significant reaction in
addition to those proposed by [14].
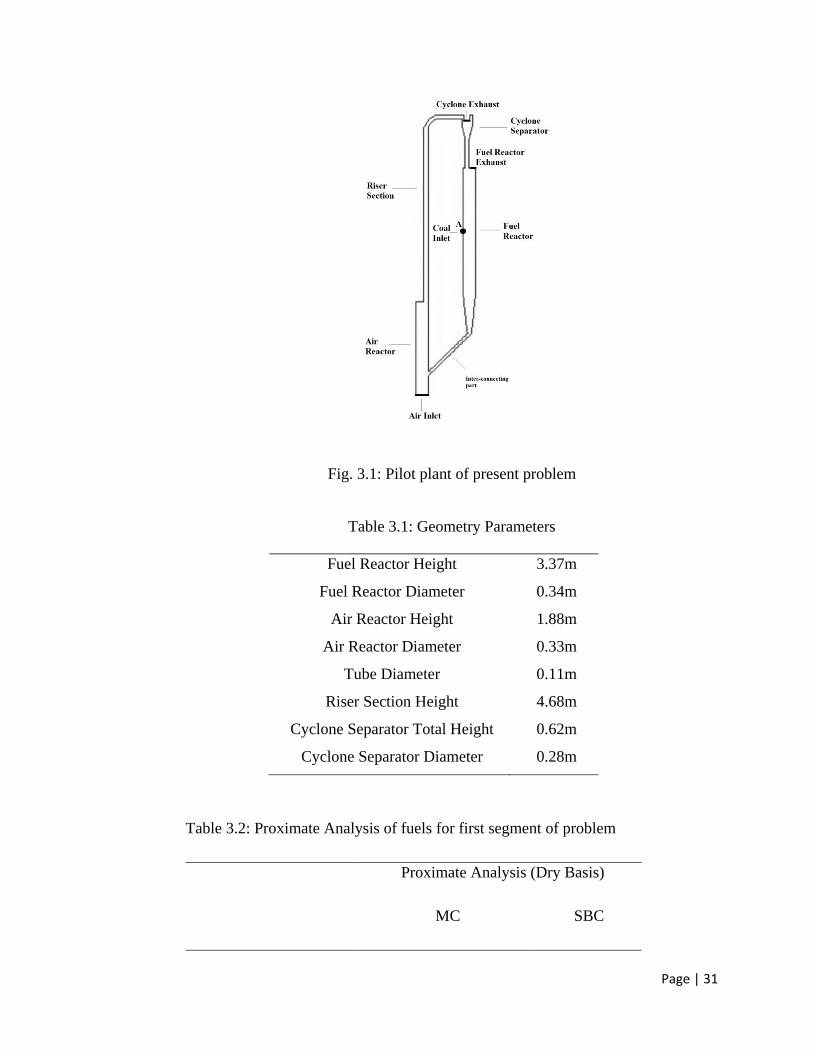
The geometrical as well as operating parameters of the 25 kWth pilot plant
developed by Ohio State University, USA and described by [14] has been considered
for the present CFD simulation. The pilot plant parameters and its geometry are
shown in Fig. 3.1 with dimension of different section in Table 3.1. For first segment
of the study has been used for model validation purpose, two fuels namely sub-
bituminous coal (SBC) and metallurgical coke (MC), whose properties are given in
Table 3.2 & 3.3, are used one at a time in the pilot plant along with ferric oxide as an
oxygen carrier whose properties are given Table 3.7. For second segment of the
study, four different coals, labeled as “A”, “B”, “C” and “D” and whose properties
are given in Table 3.4 & 3.5, of Asia-Pacific and Australia origin are used one at a
time with the same ferric oxide as an oxygen carrier. In Table 3.6 ash composition of
different coals labeled as “A”, “B”, “C” and “D” are given.
Page | 31
Fig. 3.1: Pilot plant of present problem
Table 3.1: Geometry Parameters
Fuel Reactor Height 3.37m
Fuel Reactor Diameter 0.34m
Air Reactor Height 1.88m
Air Reactor Diameter 0.33m
Tube Diameter 0.11m
Riser Section Height 4.68m
Cyclone Separator Total Height 0.62m
Cyclone Separator Diameter 0.28m
Table 3.2: Proximate Analysis of fuels for first segment of problem
Proximate Analysis (Dry Basis)
MC SBC
Page | 32
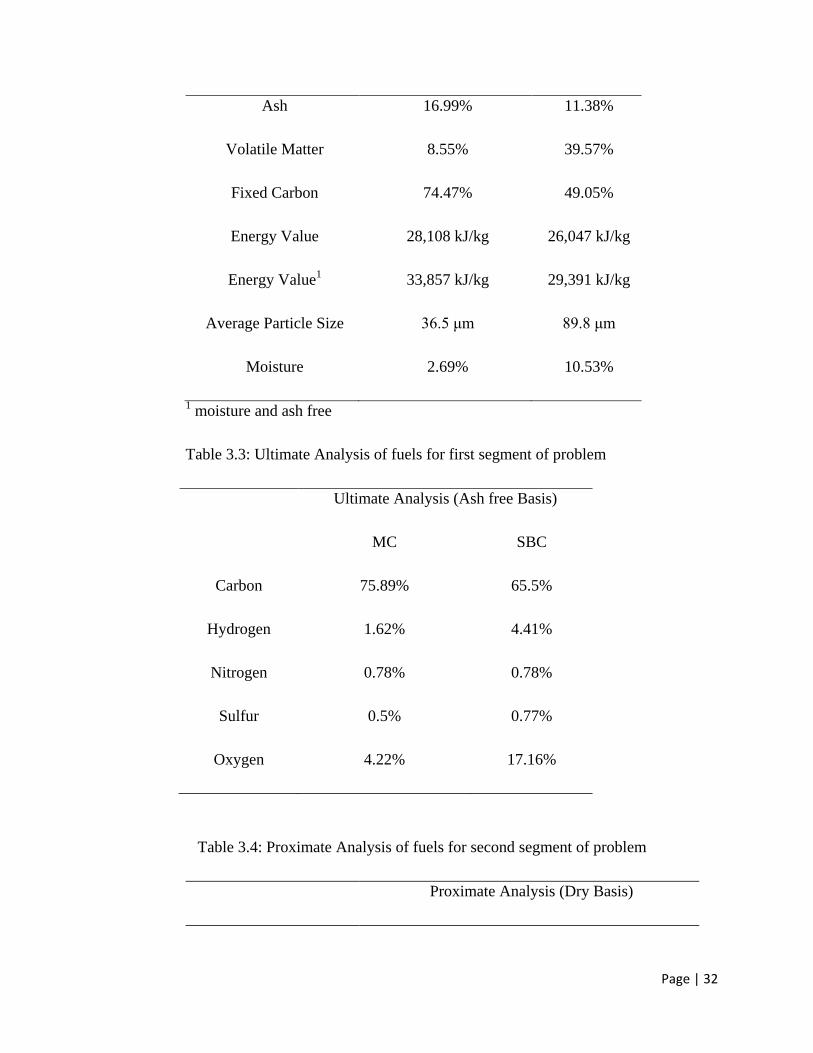
Ash 16.99% 11.38%
Volatile Matter 8.55% 39.57%
Fixed Carbon 74.47% 49.05%
Energy Value 28,108 kJ/kg 26,047 kJ/kg
Energy Value1 33,857 kJ/kg 29,391 kJ/kg
Average Particle Size 36.5 μm 89.8 μm
Moisture 2.69% 10.53%
1 moisture and ash free
Table 3.3: Ultimate Analysis of fuels for first segment of problem
Ultimate Analysis (Ash free Basis)
MC SBC
Carbon 75.89% 65.5%
Hydrogen 1.62% 4.41%
Nitrogen 0.78% 0.78%
Sulfur 0.5% 0.77%
Oxygen 4.22% 17.16%
Table 3.4: Proximate Analysis of fuels for second segment of problem
Proximate Analysis (Dry Basis)
Page | 33
A B C D
Ash 17.56% 48.9% 25.87% 31.5%
Volatile Matter 8.55% 20.4% 29.87% 7.5%
Fixed Carbon 74.47% 23.6% 42.86% 59.9%
Energy Value (kJ/kg) 7,981 12,189 26,120 23,398
Energy Value1 (kJ/kg) 9,997 15,236 30,729 27,527
Average Particle Size 45 μm 80 μm 125 μm 100 μm
Moisture 48.77% 11.99% 1.4% 1%
1 moisture and ash free
Table 3.5: Ultimate Analysis of fuels for second segment of problem
Ultimate Analysis (Dry Ash free Basis)
A B C D
Carbon 20.4% 30.82% 61.76% 56.7%
Hydrogen 1.89% 1.9% 4.16% 3.2%
Nitrogen 0.7% 0.6% 0.76% 0.9%
Sulfur 1.02% 0.24% 0.91% 0.6%
Oxygen 9.66% 5.55% 5.14% 6.1%
Table 3.6: Ash compositions of Fuels for second segment of problem
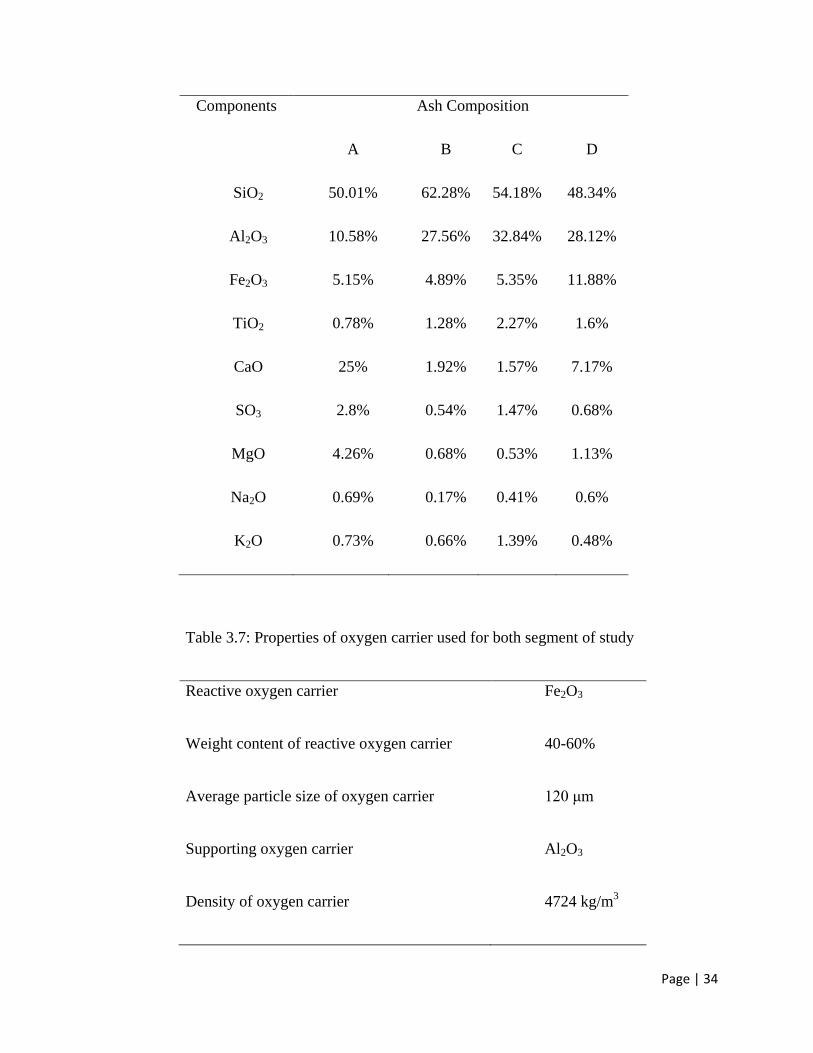
Page | 34
Components Ash Composition
A B C D
SiO2 50.01% 62.28% 54.18% 48.34%
Al2O3 10.58% 27.56% 32.84% 28.12%
Fe2O3 5.15% 4.89% 5.35% 11.88%
TiO2 0.78% 1.28% 2.27% 1.6%
CaO 25% 1.92% 1.57% 7.17%
SO3 2.8% 0.54% 1.47% 0.68%
MgO 4.26% 0.68% 0.53% 1.13%
Na2O 0.69% 0.17% 0.41% 0.6%
K2O 0.73% 0.66% 1.39% 0.48%
Table 3.7: Properties of oxygen carrier used for both segment of study
Reactive oxygen carrier Fe2O3
Weight content of reactive oxygen carrier 40-60%
Average particle size of oxygen carrier 120 μm
Supporting oxygen carrier Al2O3
Density of oxygen carrier 4724 kg/m3
Page | 35
CHAPTER 4 MODEL DEVELOPMENT
A 2-D CFD model for inter-connected fuel and air reactor is developed using
commercial computational software Fluent 6.3.2 and mesh for above assembly has
been developed using GAMBIT 2.3.16. The mixture (fuel and oxygen carrier)
containing solid particles in the range of 36-120 μm along with amount of gases
injected in the system as well as created from the reaction which amounts to about
75% by volume are assumed to flow as a fluid inside both the reactors and their inter-
connecting parts.
This assumption has been used for the development of an approximate CFD
model. The present study is carried out in two segments, while the first segment of
the study is divided using two parts consisting of two different set of reactions for
validation. In first segment of study, the first part of model validation is carried out by
considering first set of reactions which consists eleven reactions, as given in Table
4.1 and reported by [14], which occur inside the reactors and inter-connecting parts
and results thus obtained are subsequently used for first part of model validation. The
second part of model validation which is carried out using second set of reactions
which comprises above stated eleven reactions added with seven more significant
reactions (which are not considered by [14]), as given in Table 4.2. The second part
of model validation offered better agreement of pilot plant data than the first part of
model validation in the first segment of study. Before a complicated two phase CFD
model is selected for the analysis for the present problem, it is thought logical to use
the least complicated model, the Species-Transport model with volumetric reaction
for the present study and to find out the extent of agreement it offers to the pilot plant
data.
Once the CFD model is validated, in the first segment of study it is used in second
segment of study to investigate the effects of ash content in different coals
(designated as A, B, C and D). For this purpose eighteen reactions as used in second
part of model validation in the first segment of study, five more reactions of ash
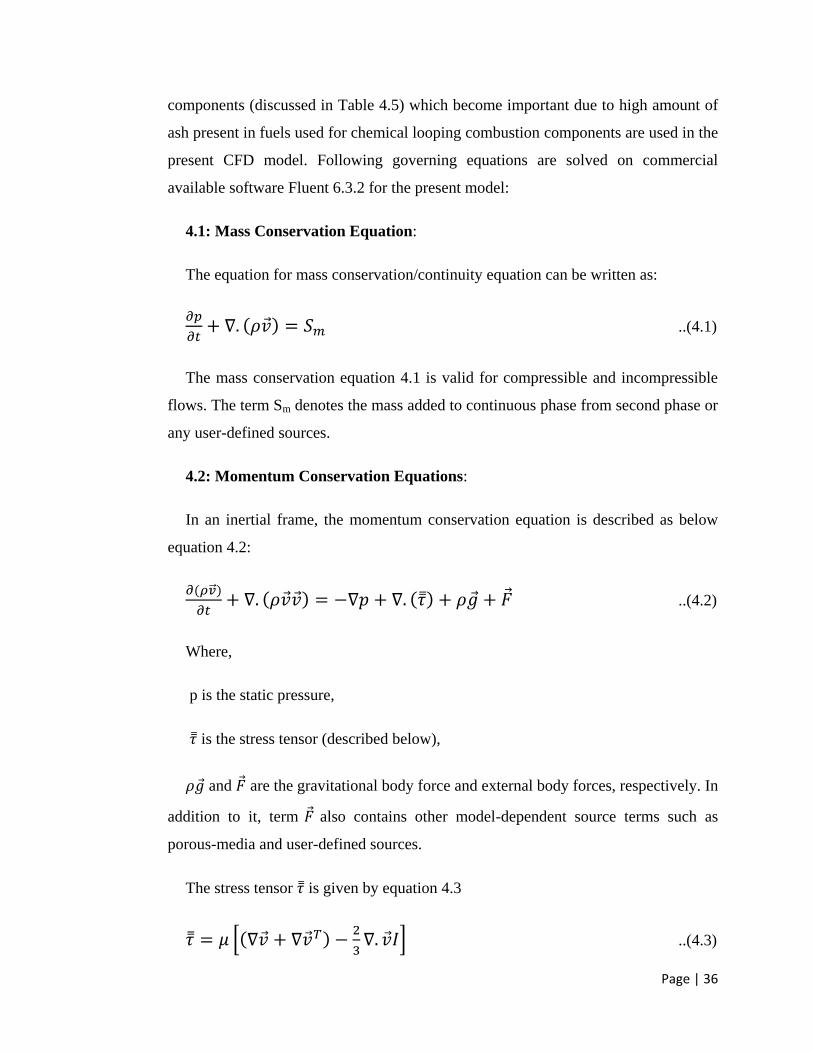
Page | 36
components (discussed in Table 4.5) which become important due to high amount of
ash present in fuels used for chemical looping combustion components are used in the
present CFD model. Following governing equations are solved on commercial
available software Fluent 6.3.2 for the present model:
4.1: Mass Conservation Equation:
The equation for mass conservation/continuity equation can be written as:
..(4.1)
The mass conservation equation 4.1 is valid for compressible and incompressible
flows. The term Sm denotes the mass added to continuous phase from second phase or
any user-defined sources.
4.2: Momentum Conservation Equations:
In an inertial frame, the momentum conservation equation is described as below
equation 4.2:
..(4.2)
Where,
p is the static pressure,
is the stress tensor (described below),
and are the gravitational body force and external body forces, respectively. In
addition to it, term also contains other model-dependent source terms such as
porous-media and user-defined sources.
The stress tensor is given by equation 4.3
..(4.3)
Page | 37
Where, μ is the molecular viscosity, I is the unit tensor, and the second term on the
right hand side of equation 4.3 is the effect of volume dilation.
4.3: Energy Conservation Equation:
The conservation of Energy is defined by the following equation 4.4:
..(4.4)
Where,
keff is the effective conductive (k+kt , where kt is the turbule thermal conductivity,
defined according to the turbulence model being used),
is the diffusion flux of species j.
Sh is the heat of chemical reaction and any other volumetric source by used defined
function
In Equation 4.4,
..(4.5)
The sensible enthalpy is defined as:
For ideal gases as:
..(4.6)
and, for incompressible flows as:
..(4.7)
In equations (4.6) and (4.7), Yj is the mass fraction of species j and is hj at Tref =
298.15K is defined as:
Page | 38
..(4.8)
4.4: Species Transport Equations:
The local mass fraction of each species, Yi, through the solution of a convection-
diffusion equation for the ith
species is solved. It takes the following general form:
..(4.9)
Where,
Ri = net rate of production of species i by chemical reaction
Si = rate of creation by addition from dispersed phase plus any user defined
sources
Mass Diffusion in Laminar Flows:
In the above equation, 4.9, the term is the diffusion flux of the ith
species, which
arises due to concentration gradients. In the present model, dilute approximation is
assumed, under which it is defined as follows:
..(4.10)
Where, Di,m is defined as diffusion coefficient for the ith
species in the mixture
4.5: Laminar Finite-Rate Model:
The net source of chemical species ith
due to reaction is computed as the sum of the
Arrhenius reaction sources over the NR reactions that the species participate in:
..(4.11)
Where, Mw,i is the molecular weight of ith
species, is the Arrhenius molar rate
of creation/destruction of species ith
in reaction r.
Page | 39
Consider the rth
reaction written in general form as follows in equation 4.12 which
is valid for both reversible and non reversible reactions. For non-reversible reactions
the backward rate constant is omitted.
..(4.12)
where,
N = number of chemical species in the system
v’i,r = stoichiometric coefficient for reactant i in reaction r
v”i,r = stoichiometric coefficient for product i in reaction r
Mi = symbol denoting species i
kf,r = forward rate constant for reaction r
kb,r = backward rate constant for reaction r
The summations in Equation 4.12 are for all chemical species in the system, but
only species that appear as reactants or products will have non-zero stoichiometric
coefficients. Hence, species that are not involved will drop out of the equation.
For a non-reversible reaction, the molar rate of creation/destruction of species i in
reaction r is given by
.. (4.13)
where,
Cj,r = molar concentration of species j in reaction r (kmol/m3)
η'j,r = rate exponent for reactant species j in reaction r
η”j,r = rate exponent for product species j in reaction r
Page | 40
For a reversible reaction, the molar rate of creation/destruction of species i in
reaction r, is given by
..(4.14)
The rate exponent for the reverse reaction part in equation 4.14 is always the
product species stoichiometric coefficient (v”j,r).
Γ represents the net effect of third bodies on the reaction rate. This term is given by
..(4.15)
Where, γj,r is the third-body efficiency of the jth
species in the rth
The forward rate constant for reaction r, kf,r is computed using the Arrhenius
expression
..(4.16)
Where,
Ar = pre-exponential factor
Βr = temperature exponent
ER = activation energy for the reaction
R= universal gas constant
Values of v’i,r , v”i,r , η’j,r ,η”j,r , βr ,Ar and ER are provided to solve equation 4.13
For reversible reactions, the backward rate constant for reaction r, kb,r , is
computed from the forward rate constant using the following relation:
..(4.17)
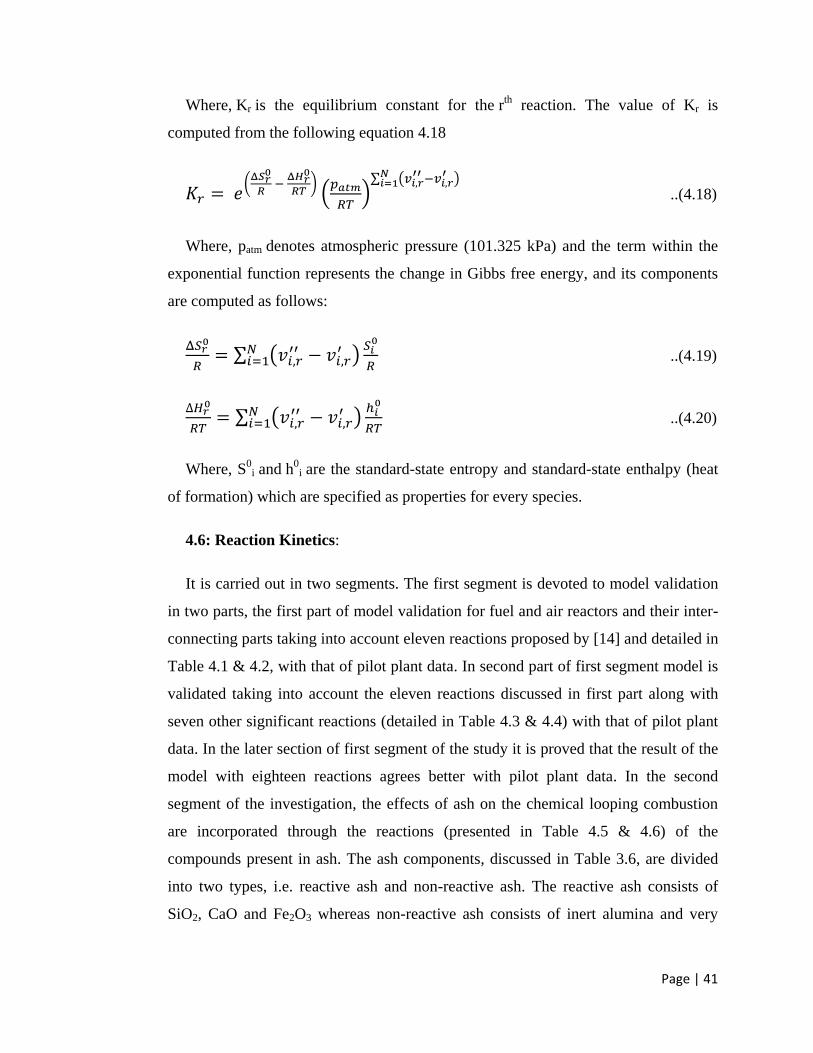
Page | 41
Where, Kr is the equilibrium constant for the rth
reaction. The value of Kr is
computed from the following equation 4.18
..(4.18)
Where, patm denotes atmospheric pressure (101.325 kPa) and the term within the
exponential function represents the change in Gibbs free energy, and its components
are computed as follows:
..(4.19)
..(4.20)
Where, S0
i and h0
i are the standard-state entropy and standard-state enthalpy (heat
of formation) which are specified as properties for every species.
4.6: Reaction Kinetics:
It is carried out in two segments. The first segment is devoted to model validation
in two parts, the first part of model validation for fuel and air reactors and their inter-
connecting parts taking into account eleven reactions proposed by [14] and detailed in
Table 4.1 & 4.2, with that of pilot plant data. In second part of first segment model is
validated taking into account the eleven reactions discussed in first part along with
seven other significant reactions (detailed in Table 4.3 & 4.4) with that of pilot plant
data. In the later section of first segment of the study it is proved that the result of the
model with eighteen reactions agrees better with pilot plant data. In the second
segment of the investigation, the effects of ash on the chemical looping combustion
are incorporated through the reactions (presented in Table 4.5 & 4.6) of the
compounds present in ash. The ash components, discussed in Table 3.6, are divided
into two types, i.e. reactive ash and non-reactive ash. The reactive ash consists of
SiO2, CaO and Fe2O3 whereas non-reactive ash consists of inert alumina and very
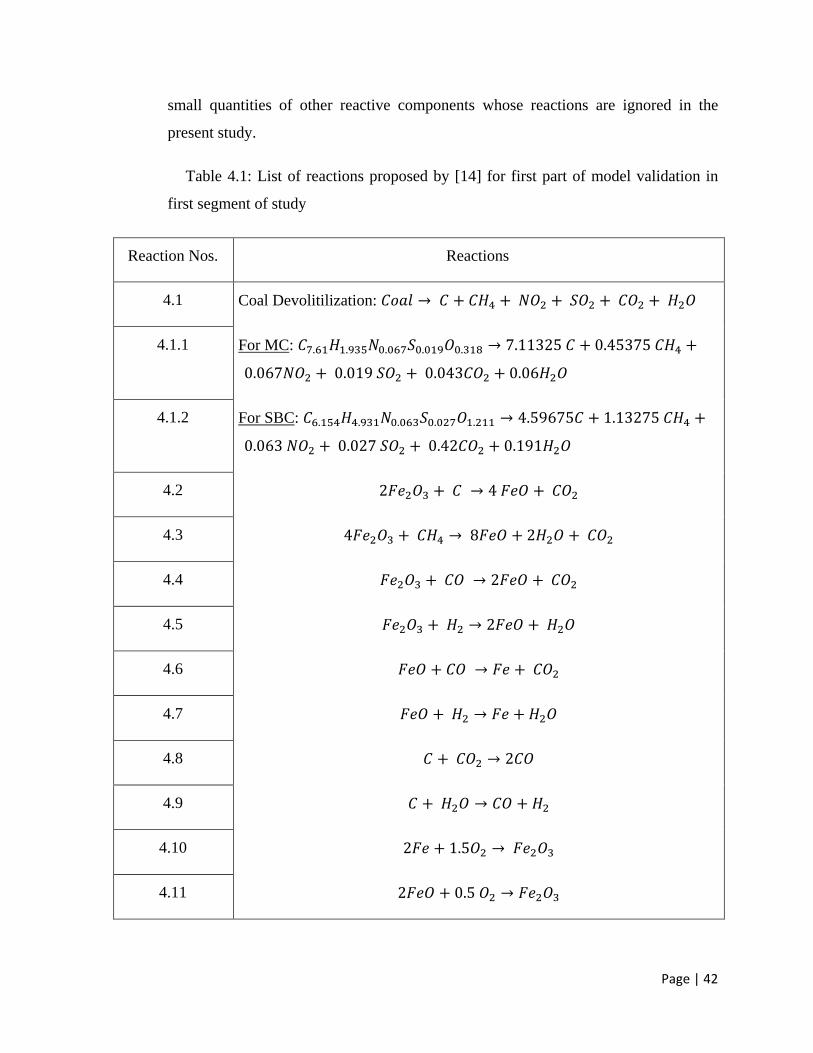
Page | 42
small quantities of other reactive components whose reactions are ignored in the
present study.
Table 4.1: List of reactions proposed by [14] for first part of model validation in
first segment of study
Reaction Nos. Reactions
4.1 Coal Devolitilization:
4.1.1 For MC:
4.1.2 For SBC:
4.2
4.3
4.4
4.5
4.6
4.7
4.8
4.9
4.10
4.11
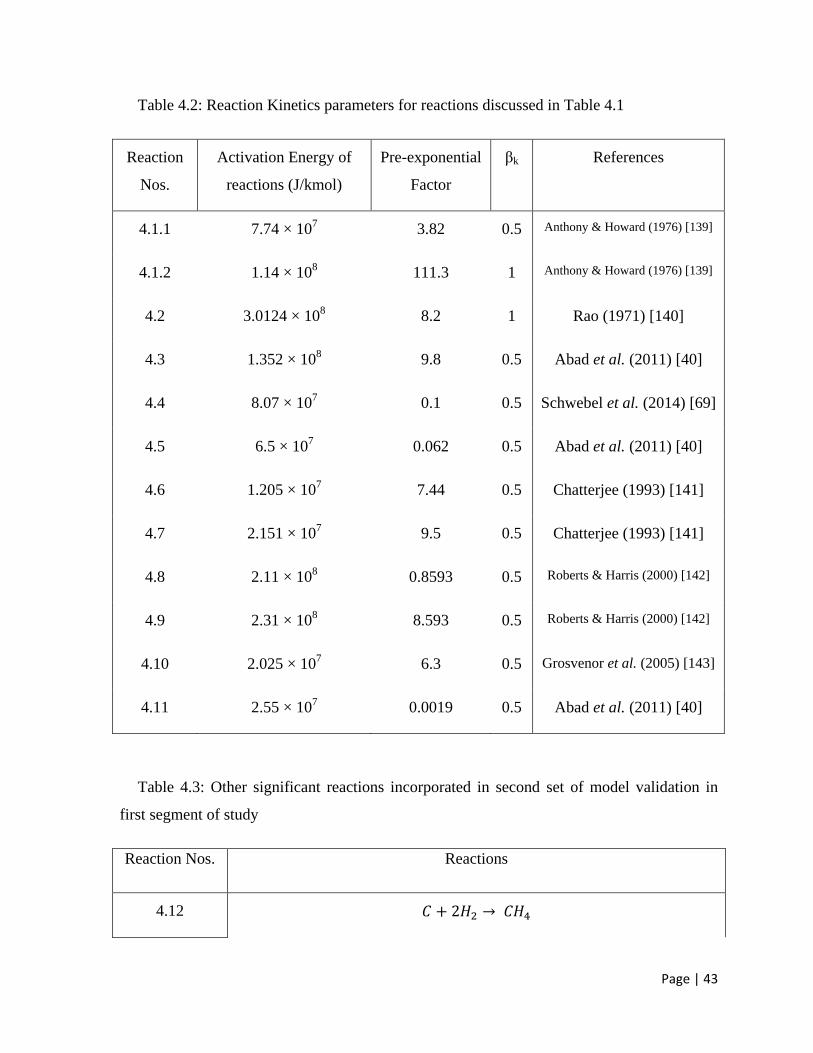
Page | 43
Table 4.2: Reaction Kinetics parameters for reactions discussed in Table 4.1
Reaction
Nos.
Activation Energy of
reactions (J/kmol)
Pre-exponential
Factor
βk References
4.1.1 7.74 × 10⁷ 3.82 0.5 Anthony & Howard (1976) [139]
4.1.2 1.14 × 10⁸ 111.3 1 Anthony & Howard (1976) [139]
4.2 3.0124 × 10⁸ 8.2 1 Rao (1971) [140]
4.3 1.352 × 10⁸ 9.8 0.5 Abad et al. (2011) [40]
4.4 8.07 × 10⁷ 0.1 0.5 Schwebel et al. (2014) [69]
4.5 6.5 × 10⁷ 0.062 0.5 Abad et al. (2011) [40]
4.6 1.205 × 10⁷ 7.44 0.5 Chatterjee (1993) [141]
4.7 2.151 × 10⁷ 9.5 0.5 Chatterjee (1993) [141]
4.8 2.11 × 10⁸ 0.8593 0.5 Roberts & Harris (2000) [142]
4.9 2.31 × 10⁸ 8.593 0.5 Roberts & Harris (2000) [142]
4.10 2.025 × 10⁷ 6.3 0.5 Grosvenor et al. (2005) [143]
4.11 2.55 × 10⁷ 0.0019 0.5 Abad et al. (2011) [40]
Table 4.3: Other significant reactions incorporated in second set of model validation in
first segment of study
Reaction Nos. Reactions
4.12
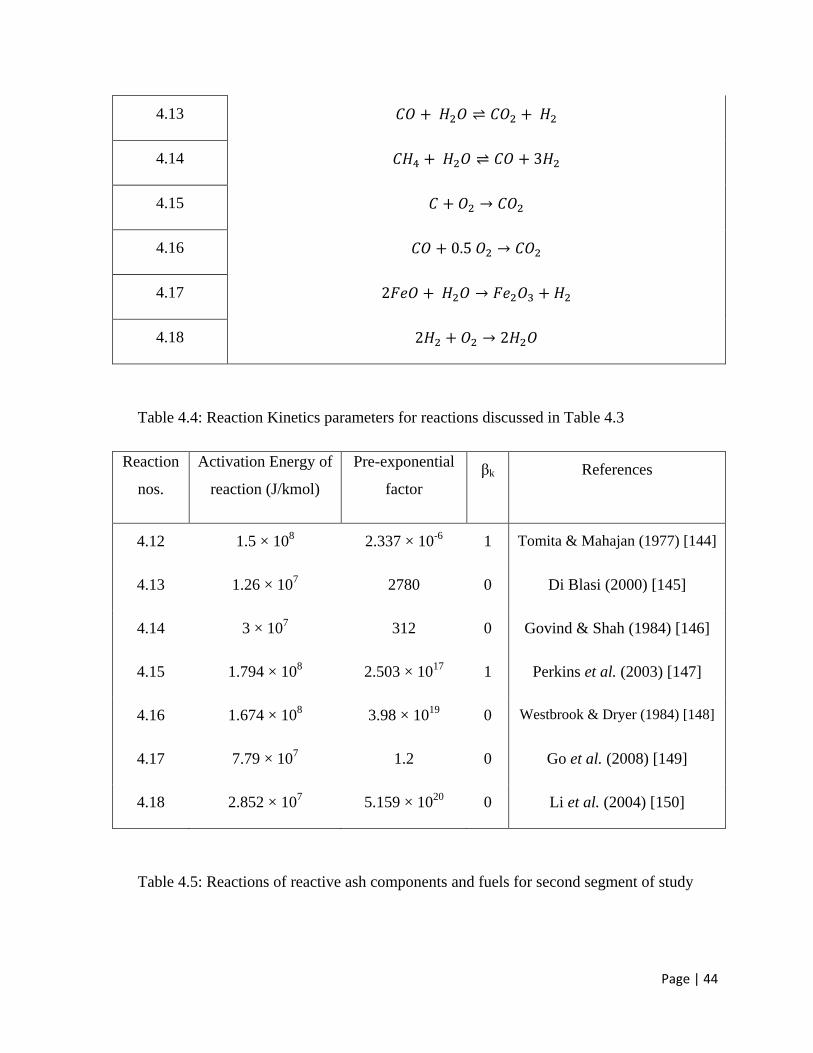
Page | 44
4.13
4.14
4.15
4.16
4.17
4.18
Table 4.4: Reaction Kinetics parameters for reactions discussed in Table 4.3
Reaction
nos.
Activation Energy of
reaction (J/kmol)
Pre-exponential
factor
βk References
4.12 1.5 × 10⁸ 2.337 × 10
-6 1 Tomita & Mahajan (1977) [144]
4.13 1.26 × 10⁷ 2780 0 Di Blasi (2000) [145]
4.14 3 × 10⁷ 312 0 Govind & Shah (1984) [146]
4.15 1.794 × 10⁸ 2.503 × 10
17 1 Perkins et al. (2003) [147]
4.16 1.674 × 10⁸ 3.98 × 10
19 0 Westbrook & Dryer (1984) [148]
4.17 7.79 × 10⁷
1.2 0 Go et al. (2008) [149]
4.18 2.852 × 10⁷
5.159 × 10²⁰
0 Li et al. (2004) [150]
Table 4.5: Reactions of reactive ash components and fuels for second segment of study
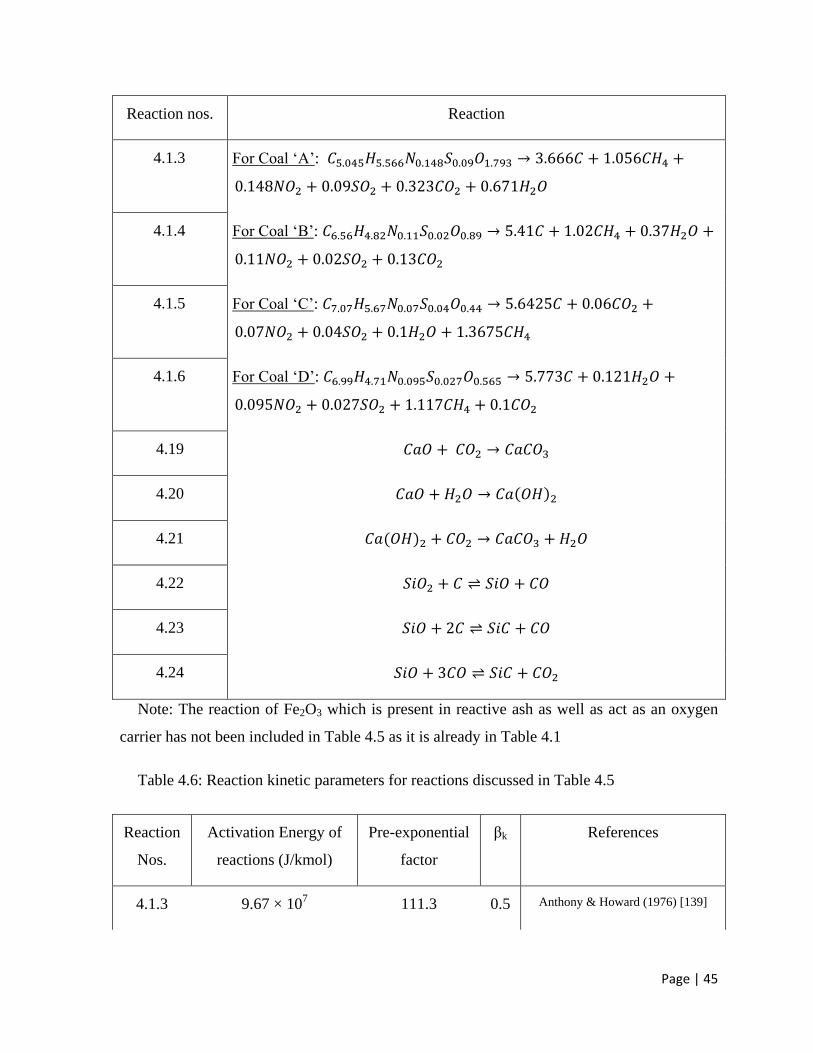
Page | 45
Reaction nos. Reaction
4.1.3 For Coal ‘A’:
4.1.4 For Coal ‘B’:
4.1.5 For Coal ‘C’:
4.1.6 For Coal ‘D’:
4.19
4.20
4.21
4.22
4.23
4.24
Note: The reaction of Fe2O3 which is present in reactive ash as well as act as an oxygen
carrier has not been included in Table 4.5 as it is already in Table 4.1
Table 4.6: Reaction kinetic parameters for reactions discussed in Table 4.5
Reaction
Nos.
Activation Energy of
reactions (J/kmol)
Pre-exponential
factor
βk References
4.1.3 9.67 × 10⁷
111.3 0.5 Anthony & Howard (1976) [139]
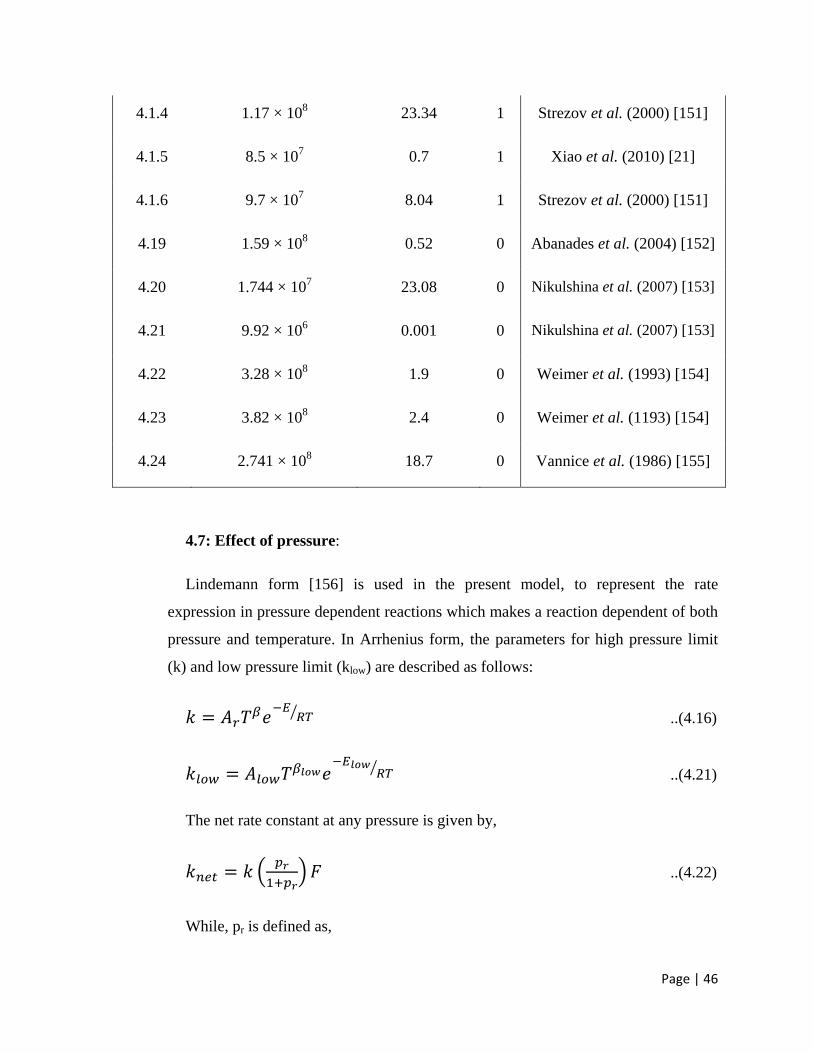
Page | 46
4.1.4 1.17 × 10⁸ 23.34 1 Strezov et al. (2000) [151]
4.1.5 8.5 × 10⁷
0.7 1 Xiao et al. (2010) [21]
4.1.6 9.7 × 10⁷
8.04 1 Strezov et al. (2000) [151]
4.19 1.59 × 10⁸
0.52 0 Abanades et al. (2004) [152]
4.20 1.744 × 10⁷
23.08 0 Nikulshina et al. (2007) [153]
4.21 9.92 × 10⁶ 0.001 0 Nikulshina et al. (2007) [153]
4.22 3.28 × 10⁸ 1.9 0 Weimer et al. (1993) [154]
4.23 3.82 × 10⁸
2.4 0 Weimer et al. (1193) [154]
4.24 2.741 × 10⁸
18.7 0 Vannice et al. (1986) [155]
4.7: Effect of pressure:
Lindemann form [156] is used in the present model, to represent the rate
expression in pressure dependent reactions which makes a reaction dependent of both
pressure and temperature. In Arrhenius form, the parameters for high pressure limit
(k) and low pressure limit (klow) are described as follows:
..(4.16)
..(4.21)
The net rate constant at any pressure is given by,
..(4.22)
While, pr is defined as,
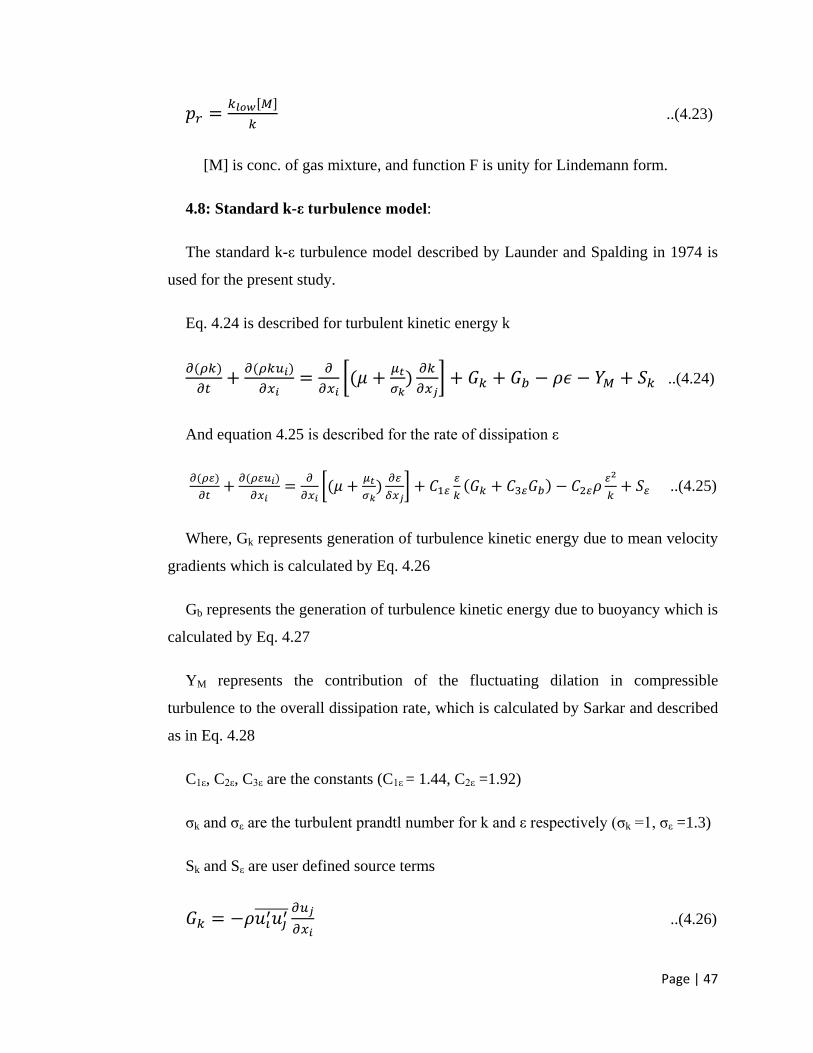
Page | 47
..(4.23)
[M] is conc. of gas mixture, and function F is unity for Lindemann form.
4.8: Standard k-ε turbulence model:
The standard k-ε turbulence model described by Launder and Spalding in 1974 is
used for the present study.
Eq. 4.24 is described for turbulent kinetic energy k
..(4.24)
And equation 4.25 is described for the rate of dissipation ε
..(4.25)
Where, Gk represents generation of turbulence kinetic energy due to mean velocity
gradients which is calculated by Eq. 4.26
Gb represents the generation of turbulence kinetic energy due to buoyancy which is
calculated by Eq. 4.27
YM represents the contribution of the fluctuating dilation in compressible
turbulence to the overall dissipation rate, which is calculated by Sarkar and described
as in Eq. 4.28
C1ε, C2ε, C3ε are the constants (C1ε = 1.44, C2ε =1.92)
σk and σε are the turbulent prandtl number for k and ε respectively (σk =1, σε =1.3)
Sk and Sε are user defined source terms
..(4.26)
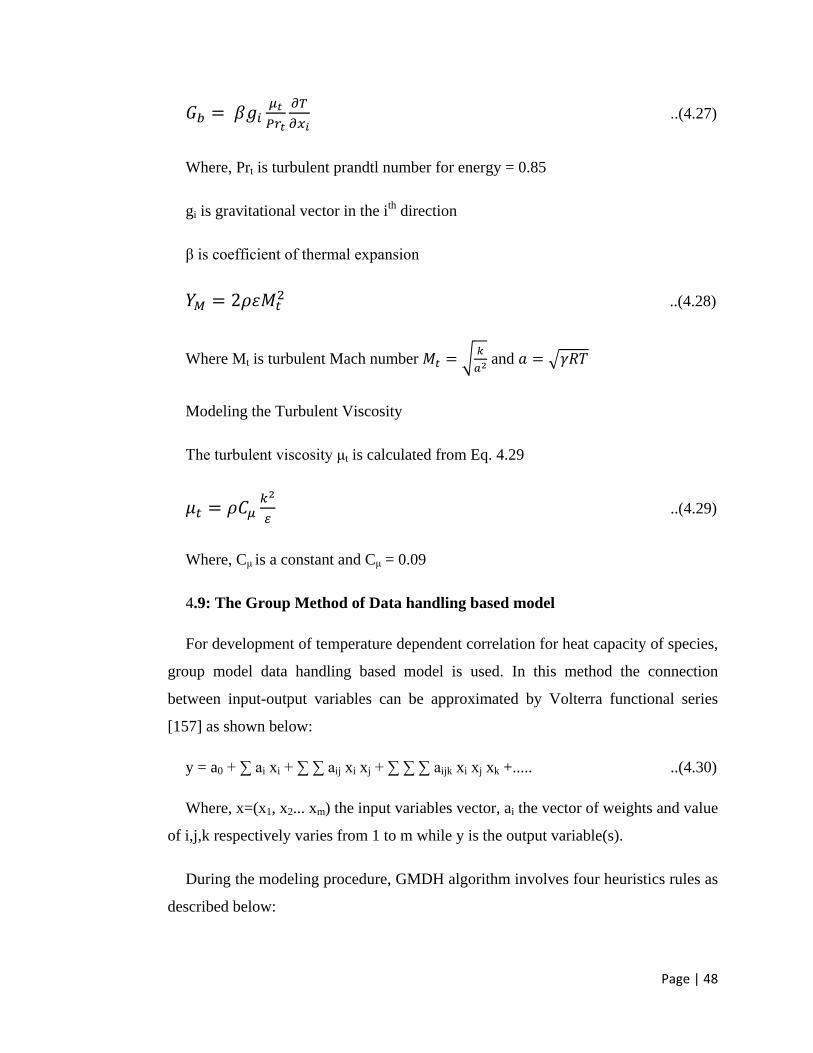
Page | 48
..(4.27)
Where, Prt is turbulent prandtl number for energy = 0.85
gi is gravitational vector in the ith
direction
β is coefficient of thermal expansion
..(4.28)
Where Mt is turbulent Mach number
and
Modeling the Turbulent Viscosity
The turbulent viscosity μt is calculated from Eq. 4.29
..(4.29)
Where, Cμ is a constant and Cμ = 0.09
4.9: The Group Method of Data handling based model
For development of temperature dependent correlation for heat capacity of species,
group model data handling based model is used. In this method the connection
between input-output variables can be approximated by Volterra functional series
[157] as shown below:
y = a0 + ∑ ai xi + ∑ ∑ aij xi xj + ∑ ∑ ∑ aijk xi xj xk +..... ..(4.30)
Where, x=(x1, x2... xm) the input variables vector, ai the vector of weights and value
of i,j,k respectively varies from 1 to m while y is the output variable(s).
During the modeling procedure, GMDH algorithm involves four heuristics rules as
described below:
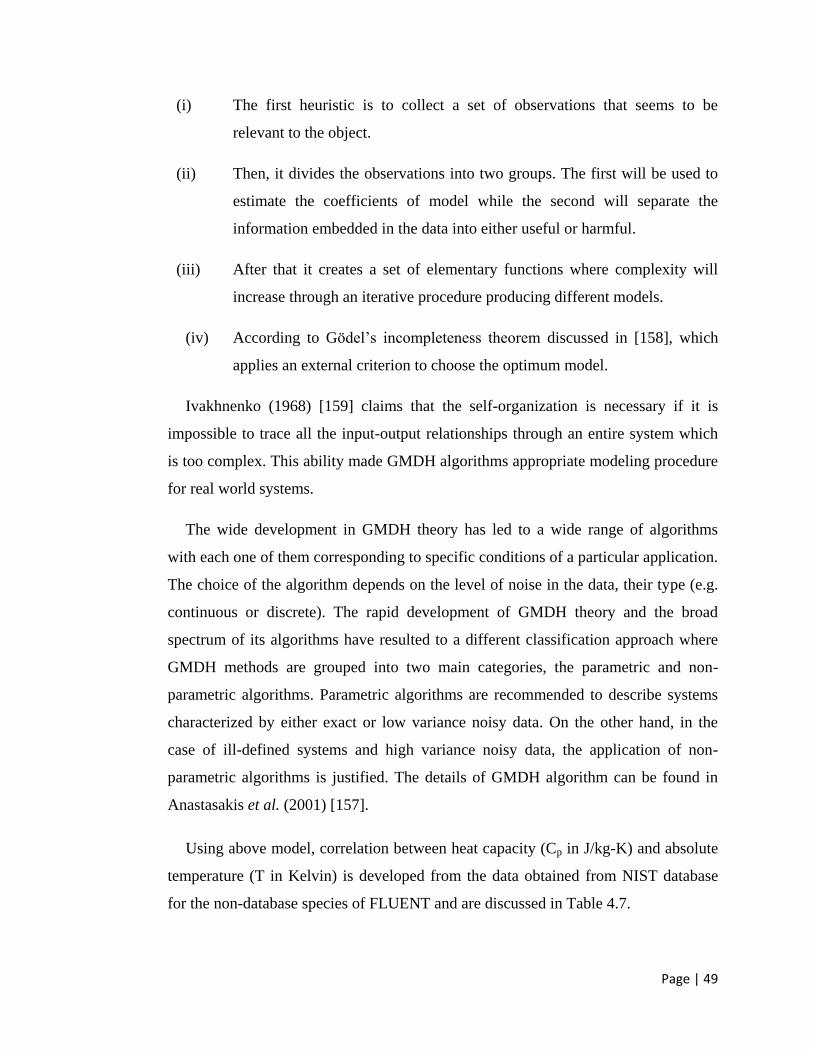
Page | 49
(i) The first heuristic is to collect a set of observations that seems to be
relevant to the object.
(ii) Then, it divides the observations into two groups. The first will be used to
estimate the coefficients of model while the second will separate the
information embedded in the data into either useful or harmful.
(iii) After that it creates a set of elementary functions where complexity will
increase through an iterative procedure producing different models.
(iv) According to Gödel’s incompleteness theorem discussed in [158], which
applies an external criterion to choose the optimum model.
Ivakhnenko (1968) [159] claims that the self-organization is necessary if it is
impossible to trace all the input-output relationships through an entire system which
is too complex. This ability made GMDH algorithms appropriate modeling procedure
for real world systems.
The wide development in GMDH theory has led to a wide range of algorithms
with each one of them corresponding to specific conditions of a particular application.
The choice of the algorithm depends on the level of noise in the data, their type (e.g.
continuous or discrete). The rapid development of GMDH theory and the broad
spectrum of its algorithms have resulted to a different classification approach where
GMDH methods are grouped into two main categories, the parametric and non-
parametric algorithms. Parametric algorithms are recommended to describe systems
characterized by either exact or low variance noisy data. On the other hand, in the
case of ill-defined systems and high variance noisy data, the application of non-
parametric algorithms is justified. The details of GMDH algorithm can be found in
Anastasakis et al. (2001) [157].
Using above model, correlation between heat capacity (Cp in J/kg-K) and absolute
temperature (T in Kelvin) is developed from the data obtained from NIST database
for the non-database species of FLUENT and are discussed in Table 4.7.
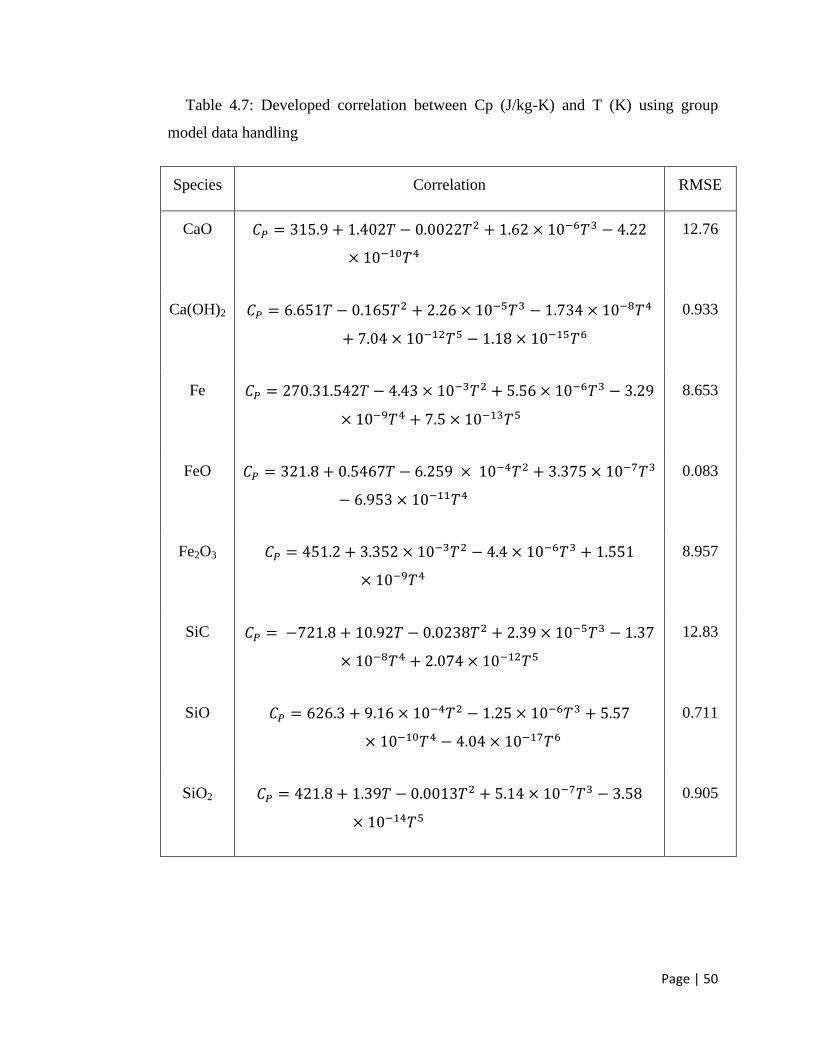
Page | 50
Table 4.7: Developed correlation between Cp (J/kg-K) and T (K) using group
model data handling
Species Correlation RMSE
CaO
12.76
Ca(OH)2
0.933
Fe
8.653
FeO
0.083
Fe2O3
8.957
SiC
12.83
SiO
0.711
SiO2
0.905
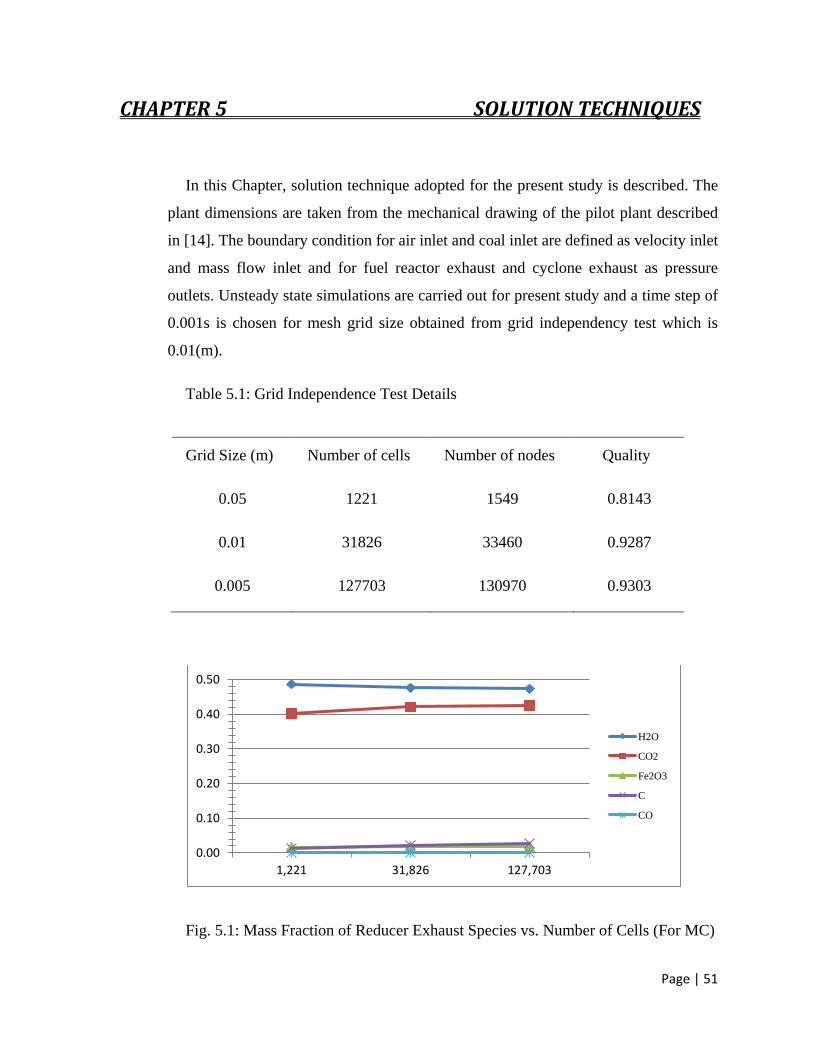
Page | 51
CHAPTER 5 SOLUTION TECHNIQUES
In this Chapter, solution technique adopted for the present study is described. The
plant dimensions are taken from the mechanical drawing of the pilot plant described
in [14]. The boundary condition for air inlet and coal inlet are defined as velocity inlet
and mass flow inlet and for fuel reactor exhaust and cyclone exhaust as pressure
outlets. Unsteady state simulations are carried out for present study and a time step of
0.001s is chosen for mesh grid size obtained from grid independency test which is
0.01(m).
Table 5.1: Grid Independence Test Details
Grid Size (m) Number of cells Number of nodes Quality
0.05 1221 1549 0.8143
0.01 31826 33460 0.9287
0.005 127703 130970 0.9303
Fig. 5.1: Mass Fraction of Reducer Exhaust Species vs. Number of Cells (For MC)
0.00
0.10
0.20
0.30
0.40
0.50
1,221 31,826 127,703
H2O
CO2
Fe2O3
C
CO
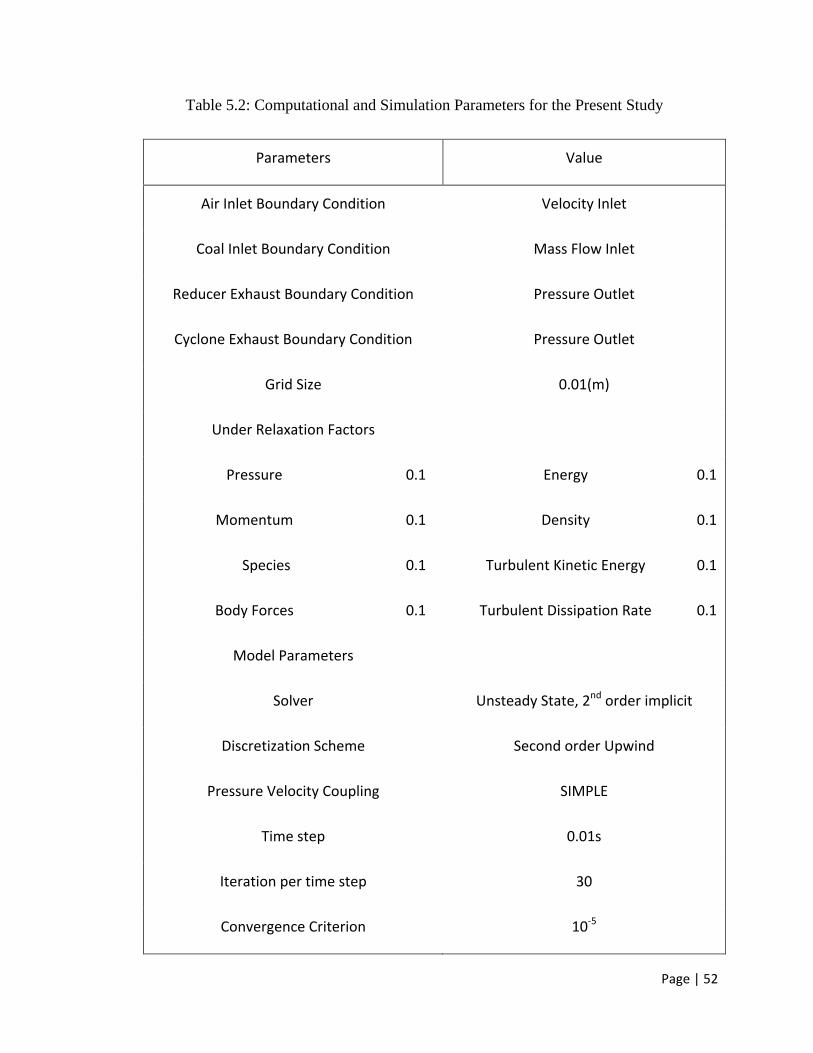
Page | 52
Table 5.2: Computational and Simulation Parameters for the Present Study
Parameters Value
Air Inlet Boundary Condition Velocity Inlet
Coal Inlet Boundary Condition Mass Flow Inlet
Reducer Exhaust Boundary Condition Pressure Outlet
Cyclone Exhaust Boundary Condition Pressure Outlet
Grid Size 0.01(m)
Under Relaxation Factors
Pressure 0.1 Energy 0.1
Momentum 0.1 Density 0.1
Species 0.1 Turbulent Kinetic Energy 0.1
Body Forces 0.1 Turbulent Dissipation Rate 0.1
Model Parameters
Solver Unsteady State, 2nd order implicit
Discretization Scheme Second order Upwind
Pressure Velocity Coupling SIMPLE
Time step 0.01s
Iteration per time step 30
Convergence Criterion 10-5
Page | 53
Discretization
In computational mathematics, discretization means the process of transferring
continuous model and equations into discrete counterparts. This process is usually
carried out as a first step toward making them suitable for numerical evaluation and
implementation on computers. In present study, following discretization methods are
being used:
5.1Finite Volume method
Finite volume method (FVM) is one of the standard approach used often in
commercial software such as ANSYS Fluent, OpenFOAM, etc. and research codes.
The governing equations are solved on discrete control volumes which refer to the
small volume surrounding each node point on a mesh. In this method, partial
differential equations (PDEs) of Navier-Strokes equations are recasts into
conservation equations and then these equations are discretized.
In this method, volume integrals in a PDE that contains a divergence term are
converted to surface integrals using divergence theorem. These terms are evaluated as
fluxes at the surface of each finite volume, as entering flux in a finite volume is equal
to leaving flux of the adjacent finite volume.
The advantage of using this method is that it is easily formulated to allow for
unstructured meshes which guarantee the conservation of fluxes through a particular
control volume. Though the overall solution will be conservative in nature there is no
guarantee that it is the actual solution. Moreover, FVM is sensitive to distorted
elements which can prevent convergence if such elements are in critical flow regions.
Where, Q is the vector of conserved variables, F is the vector of fluxes, V is
volume of finite element and A is the surface area of finite volume
5.2 Spatial Discretization
Page | 54
In default situation, ANSYS FLUENT stores discrete values of the scalar φ at the
cell centers. However, face values φf, are also required for the convection terms and
must be interpolated from the cell center values (φ). This is accomplished using an
upwind scheme, in which the face values φf, are derived from quantities in the cell
upstream or “upwind”, relative to the direction of the normal velocity un. FLUENT
have several upwind schemes: first-order upwind, second-upwind, QUICK, and
power-law. In the present study, second-order upwind is utilized for determination of
face values of the cells.
Second order upwind
When second-order accuracy is desired, quantities at cell faces are computed using
a multidimensional linear reconstruction approach. In this approach, higher-order
accuracy is achieved at cell faces through a Taylor series expansion of the cell-
centered solution about the cell centroid. Thus, when second-order upwind is
selected, the face value φf is computed using following equation:
Where, ϕ and ϕ are the cell-centered value and its gradient in the upstream cell,
and is the displacement vector from the upstream cell centroid to the face centroid.
5.3 Temporal Discretization
For transient simulation study, the governing equations must be discretized into
both space and time. The spatial discretization for time dependent equations is similar
to steady state case. In this discretization method, involves the discretization of every
term in differential equation over a time step of Δt which is described by following
equation:
Where, the function “F” incorporates spatial discretization
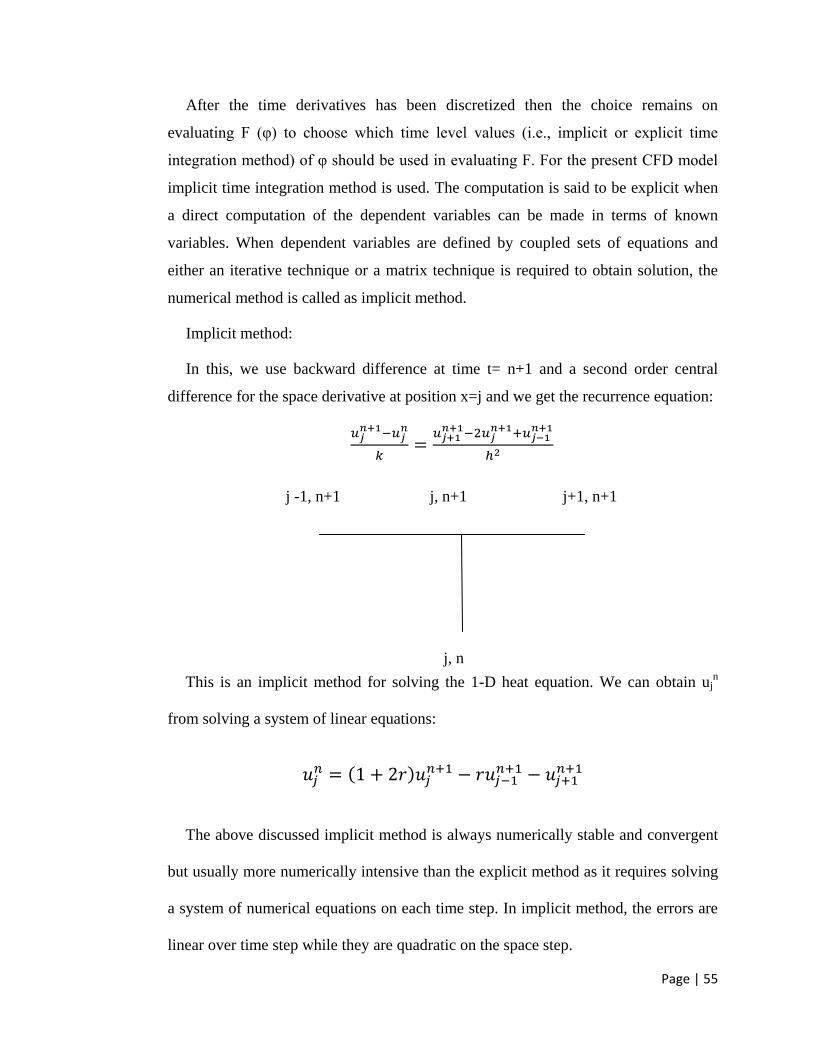
Page | 55
After the time derivatives has been discretized then the choice remains on
evaluating F (φ) to choose which time level values (i.e., implicit or explicit time
integration method) of φ should be used in evaluating F. For the present CFD model
implicit time integration method is used. The computation is said to be explicit when
a direct computation of the dependent variables can be made in terms of known
variables. When dependent variables are defined by coupled sets of equations and
either an iterative technique or a matrix technique is required to obtain solution, the
numerical method is called as implicit method.
Implicit method:
In this, we use backward difference at time t= n+1 and a second order central
difference for the space derivative at position x=j and we get the recurrence equation:
This is an implicit method for solving the 1-D heat equation. We can obtain ujn
from solving a system of linear equations:
The above discussed implicit method is always numerically stable and convergent
but usually more numerically intensive than the explicit method as it requires solving
a system of numerical equations on each time step. In implicit method, the errors are
linear over time step while they are quadratic on the space step.
j -1, n+1 j, n+1 j+1, n+1
j, n
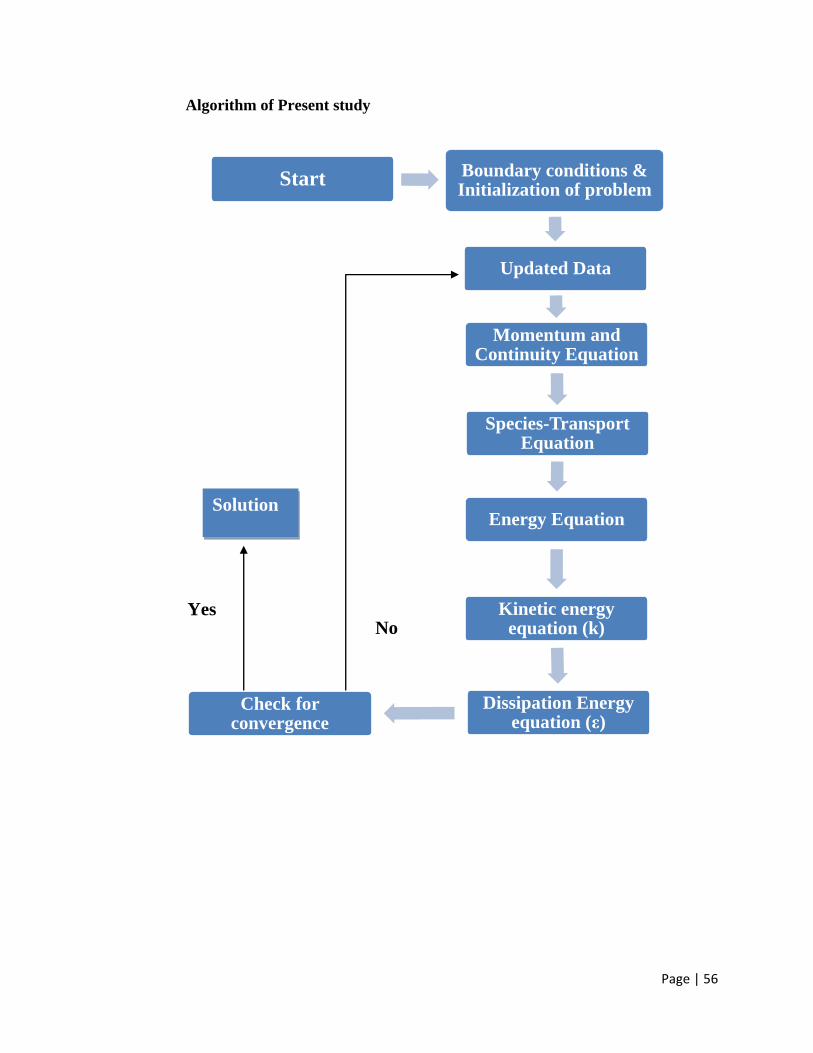
Page | 56
Algorithm of Present study
Start Boundary conditions & Initialization of problem
Updated Data
Momentum and Continuity Equation
Species-Transport Equation
Energy Equation
Kinetic energy equation (k)
Dissipation Energy equation (ε)
Check for convergence
Solution
Yes No
Page | 57
CHAPTER 6 RESULTS & DISCUSSION
In this Chapter, results of CFD model developed in present investigation is
presented and discussed. In the present work 2D CFD simulation for a coal direct
chemical looping process based on the geometrical and operating parameters of a
25kWth pilot plant described by [14] has been carried out in two segments, first part
of the first segment is devoted to validation of data of a chemical looping pilot plant
with its published data with present CFD model and the second segment of the
investigation is an extension of present CFD model to study the effect of ash on
chemical looping combustion. The first segment of study for model validation is sub-
divided into two parts; In the first part the CFD model is validated using eleven
reactions as proposed by [14] while in the second part, model is validated using
eighteen reactions (eleven reactions proposed by [14] and seven other reactions). The
physical dimension of the pilot plant is given in Tables 3.1. The present CFD model
is described in Chapter 4 and it solution procedure is given Chapter 5.
6.1: Results of First Segment (Model Validation)
In this section the present CFD model is validated for two fuels namely MC and
SBC which are used in the pilot plant [14] and are discussed in Table 3.2 & 3.3.
6.1.1: Comparison of Simulation Results of the present model and that of pilot
plant when Metallurgical coke (MC) is used:-
The process parameters used in the present study for MC are discussed in Table
6.1.
Table 6.1: Process parameters for MC for Model Validation
Fuel flow rate 1.18 kg/hr
Carrier CO2 gas flow rate 10 LPM
Air flow rate 0.0005m/s
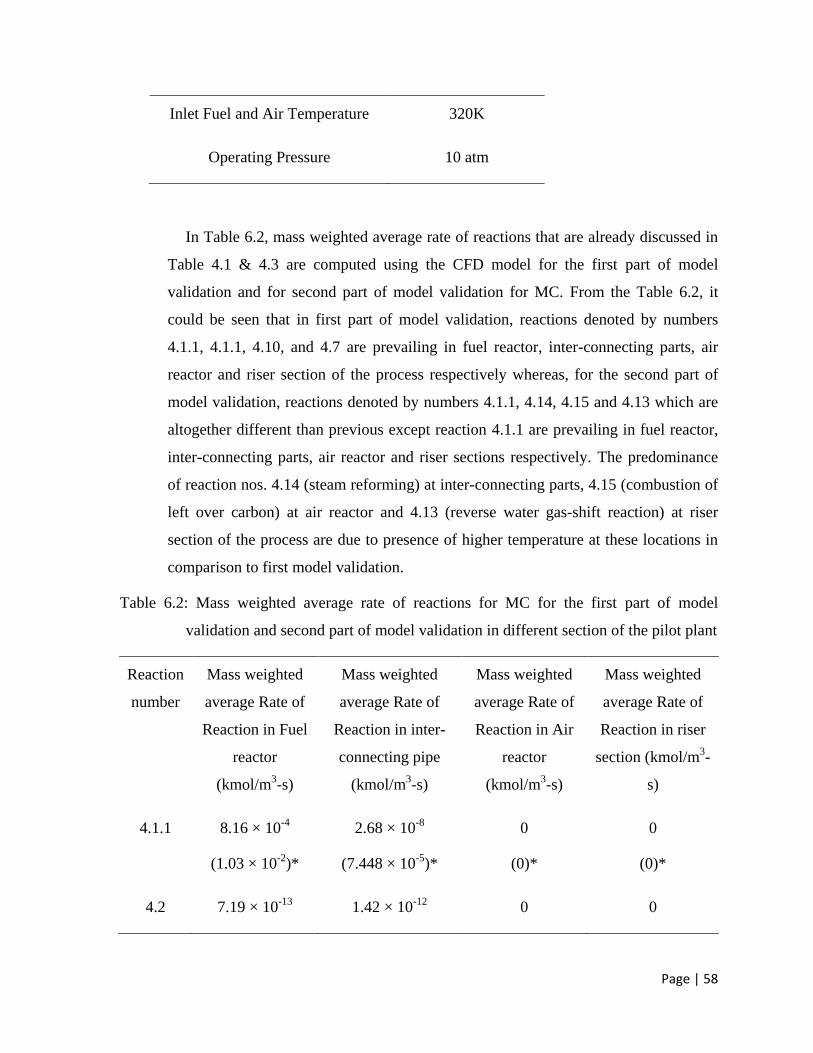
Page | 58
Inlet Fuel and Air Temperature 320K
Operating Pressure 10 atm
In Table 6.2, mass weighted average rate of reactions that are already discussed in
Table 4.1 & 4.3 are computed using the CFD model for the first part of model
validation and for second part of model validation for MC. From the Table 6.2, it
could be seen that in first part of model validation, reactions denoted by numbers
4.1.1, 4.1.1, 4.10, and 4.7 are prevailing in fuel reactor, inter-connecting parts, air
reactor and riser section of the process respectively whereas, for the second part of
model validation, reactions denoted by numbers 4.1.1, 4.14, 4.15 and 4.13 which are
altogether different than previous except reaction 4.1.1 are prevailing in fuel reactor,
inter-connecting parts, air reactor and riser sections respectively. The predominance
of reaction nos. 4.14 (steam reforming) at inter-connecting parts, 4.15 (combustion of
left over carbon) at air reactor and 4.13 (reverse water gas-shift reaction) at riser
section of the process are due to presence of higher temperature at these locations in
comparison to first model validation.
Table 6.2: Mass weighted average rate of reactions for MC for the first part of model
validation and second part of model validation in different section of the pilot plant
Reaction
number
Mass weighted
average Rate of
Reaction in Fuel
reactor
(kmol/m3-s)
Mass weighted
average Rate of
Reaction in inter-
connecting pipe
(kmol/m3-s)
Mass weighted
average Rate of
Reaction in Air
reactor
(kmol/m3-s)
Mass weighted
average Rate of
Reaction in riser
section (kmol/m3-
s)
4.1.1 8.16 × 10⁻⁴
(1.03 × 10⁻²
)*
2.68 × 10⁻⁸
(7.448 × 10⁻⁵
)*
0
(0)*
0
(0)*
4.2 7.19 × 10⁻¹³
1.42 × 10⁻¹²
0 0
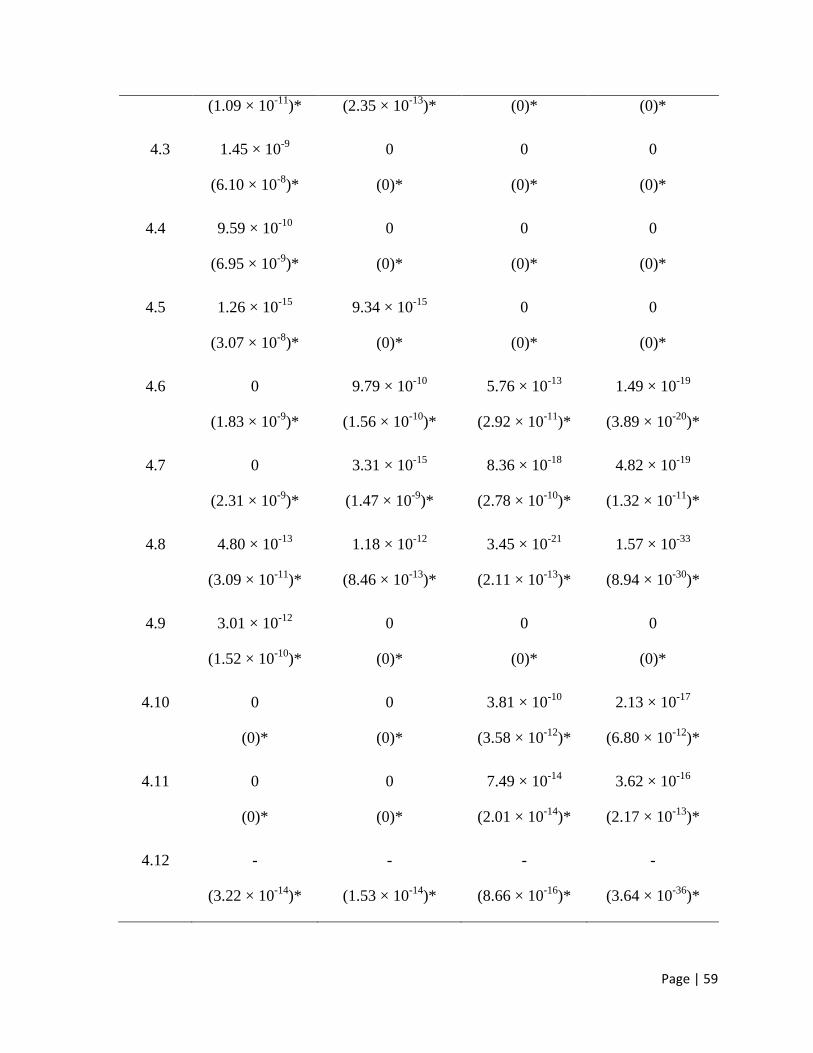
Page | 59
(1.09 × 10⁻¹¹
)* (2.35 × 10⁻¹³
)* (0)* (0)*
4.3 1.45 × 10⁻⁹
(6.10 × 10⁻⁸
)*
0
(0)*
0
(0)*
0
(0)*
4.4 9.59 × 10⁻¹⁰
(6.95 × 10⁻⁹
)*
0
(0)*
0
(0)*
0
(0)*
4.5 1.26 × 10⁻¹⁵
(3.07 × 10⁻⁸
)*
9.34 × 10⁻¹⁵
(0)*
0
(0)*
0
(0)*
4.6 0
(1.83 × 10⁻⁹
)*
9.79 × 10⁻¹⁰
(1.56 × 10⁻¹⁰
)*
5.76 × 10⁻¹³
(2.92 × 10⁻¹¹
)*
1.49 × 10⁻¹⁹
(3.89 × 10⁻²⁰
)*
4.7 0
(2.31 × 10⁻⁹
)*
3.31 × 10⁻¹⁵
(1.47 × 10⁻⁹
)*
8.36 × 10⁻¹⁸
(2.78 × 10⁻¹⁰
)*
4.82 × 10⁻¹⁹
(1.32 × 10⁻¹¹
)*
4.8 4.80 × 10⁻¹³
(3.09 × 10⁻¹¹
)*
1.18 × 10⁻¹²
(8.46 × 10⁻¹³
)*
3.45 × 10⁻²¹
(2.11 × 10⁻¹³
)*
1.57 × 10⁻³³
(8.94 × 10⁻³⁰
)*
4.9 3.01 × 10⁻¹²
(1.52 × 10⁻¹⁰
)*
0
(0)*
0
(0)*
0
(0)*
4.10 0
(0)*
0
(0)*
3.81 × 10-10
(3.58 × 10⁻¹²
)*
2.13 × 10⁻¹⁷
(6.80 × 10⁻¹²
)*
4.11 0
(0)*
0
(0)*
7.49 × 10-14
(2.01 × 10⁻¹⁴
)*
3.62 × 10⁻¹⁶
(2.17 × 10⁻¹³
)*
4.12 -
(3.22 × 10⁻¹⁴
)*
-
(1.53 × 10⁻¹⁴
)*
-
(8.66 × 10⁻¹⁶
)*
-
(3.64 × 10-36
)*
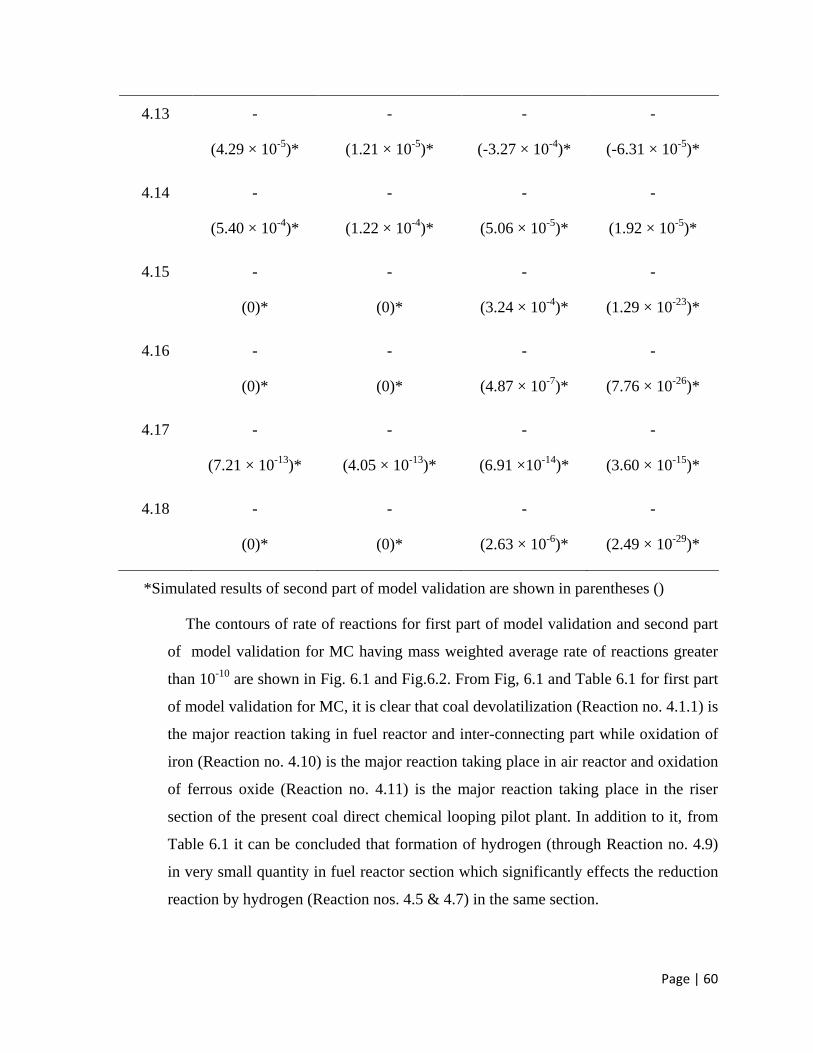
Page | 60
4.13 -
(4.29 × 10⁻⁵
)*
-
(1.21 × 10⁻⁵
)*
-
(-3.27 × 10⁻⁴
)*
-
(-6.31 × 10⁻⁵
)*
4.14 -
(5.40 × 10⁻⁴
)*
-
(1.22 × 10⁻⁴
)*
-
(5.06 × 10⁻⁵
)*
-
(1.92 × 10⁻⁵
)*
4.15 -
(0)*
-
(0)*
-
(3.24 × 10⁻⁴
)*
-
(1.29 × 10⁻²³
)*
4.16 -
(0)*
-
(0)*
-
(4.87 × 10⁻⁷
)*
-
(7.76 × 10⁻²⁶
)*
4.17 -
(7.21 × 10⁻¹³
)*
-
(4.05 × 10⁻¹³
)*
-
(6.91 ×10⁻¹⁴
)*
-
(3.60 × 10⁻¹⁵
)*
4.18 -
(0)*
-
(0)*
-
(2.63 × 10⁻⁶
)*
-
(2.49 × 10⁻²⁹
)*
*Simulated results of second part of model validation are shown in parentheses ()
The contours of rate of reactions for first part of model validation and second part
of model validation for MC having mass weighted average rate of reactions greater
than 10-10
are shown in Fig. 6.1 and Fig.6.2. From Fig, 6.1 and Table 6.1 for first part
of model validation for MC, it is clear that coal devolatilization (Reaction no. 4.1.1) is
the major reaction taking in fuel reactor and inter-connecting part while oxidation of
iron (Reaction no. 4.10) is the major reaction taking place in air reactor and oxidation
of ferrous oxide (Reaction no. 4.11) is the major reaction taking place in the riser
section of the present coal direct chemical looping pilot plant. In addition to it, from
Table 6.1 it can be concluded that formation of hydrogen (through Reaction no. 4.9)
in very small quantity in fuel reactor section which significantly effects the reduction
reaction by hydrogen (Reaction nos. 4.5 & 4.7) in the same section.
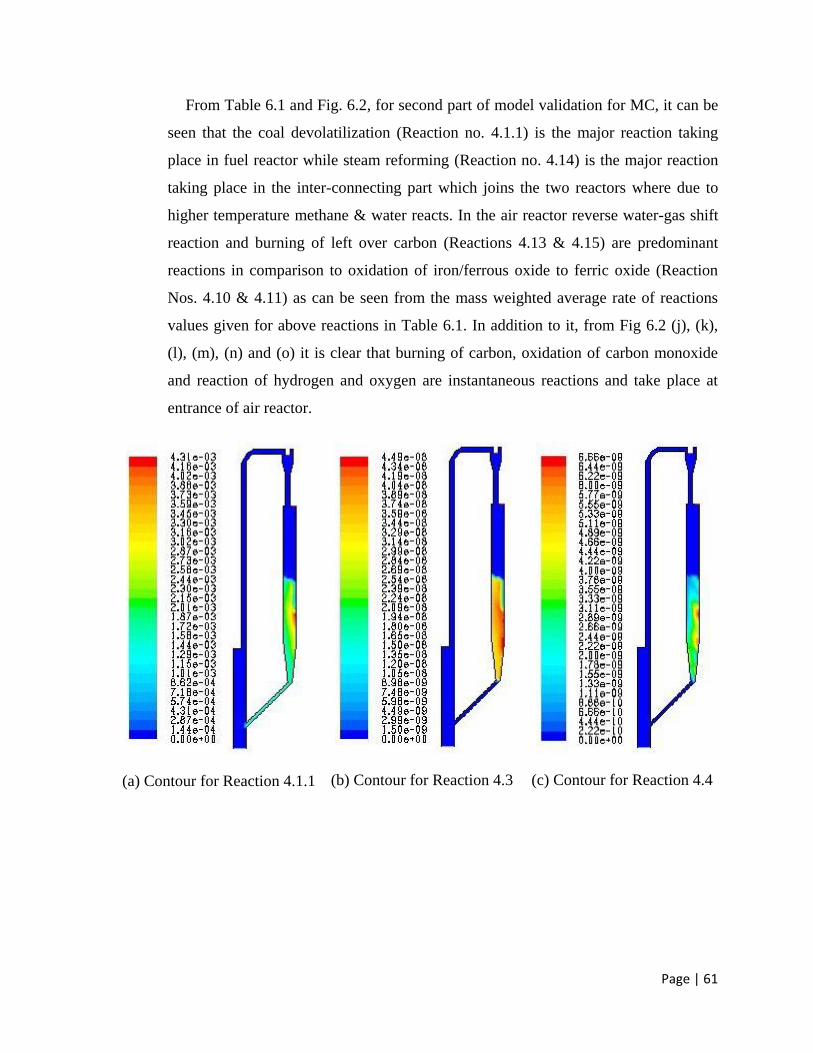
Page | 61
From Table 6.1 and Fig. 6.2, for second part of model validation for MC, it can be
seen that the coal devolatilization (Reaction no. 4.1.1) is the major reaction taking
place in fuel reactor while steam reforming (Reaction no. 4.14) is the major reaction
taking place in the inter-connecting part which joins the two reactors where due to
higher temperature methane & water reacts. In the air reactor reverse water-gas shift
reaction and burning of left over carbon (Reactions 4.13 & 4.15) are predominant
reactions in comparison to oxidation of iron/ferrous oxide to ferric oxide (Reaction
Nos. 4.10 & 4.11) as can be seen from the mass weighted average rate of reactions
values given for above reactions in Table 6.1. In addition to it, from Fig 6.2 (j), (k),
(l), (m), (n) and (o) it is clear that burning of carbon, oxidation of carbon monoxide
and reaction of hydrogen and oxygen are instantaneous reactions and take place at
entrance of air reactor.
(a) Contour for Reaction 4.1.1
(b) Contour for Reaction 4.3
(c) Contour for Reaction 4.4
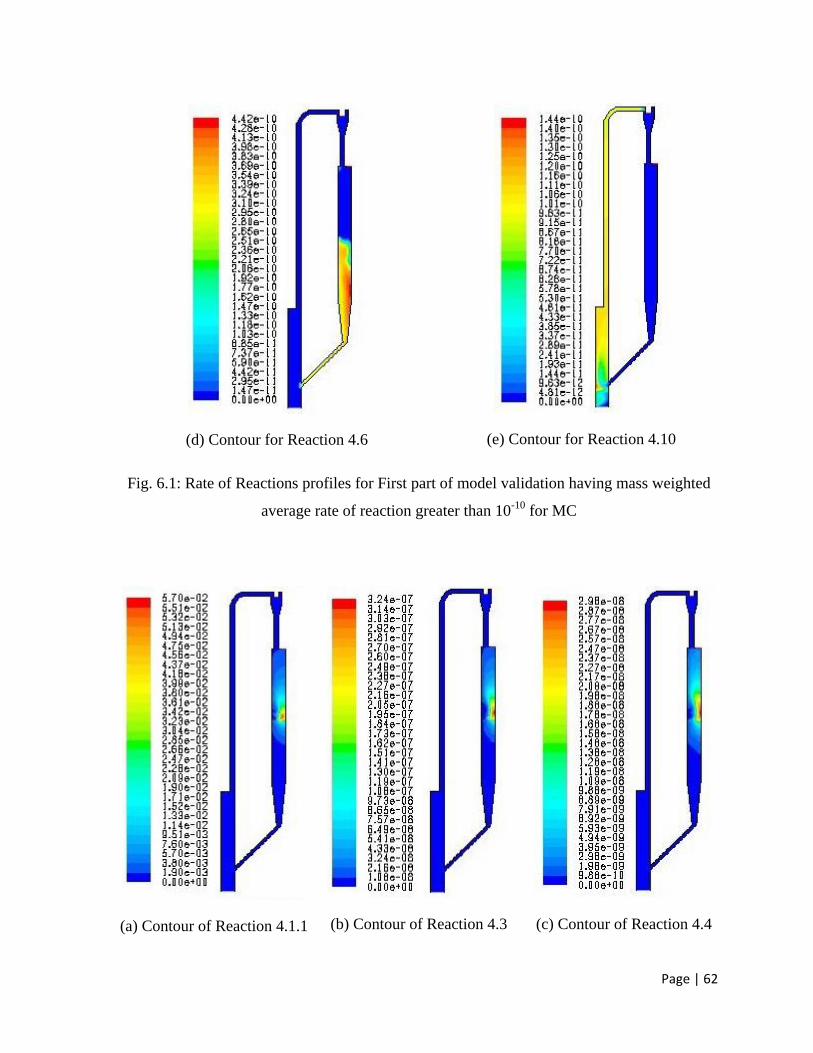
Page | 62
(d) Contour for Reaction 4.6
(e) Contour for Reaction 4.10
Fig. 6.1: Rate of Reactions profiles for First part of model validation having mass weighted
average rate of reaction greater than 10-10
for MC
(a) Contour of Reaction 4.1.1
(b) Contour of Reaction 4.3
(c) Contour of Reaction 4.4
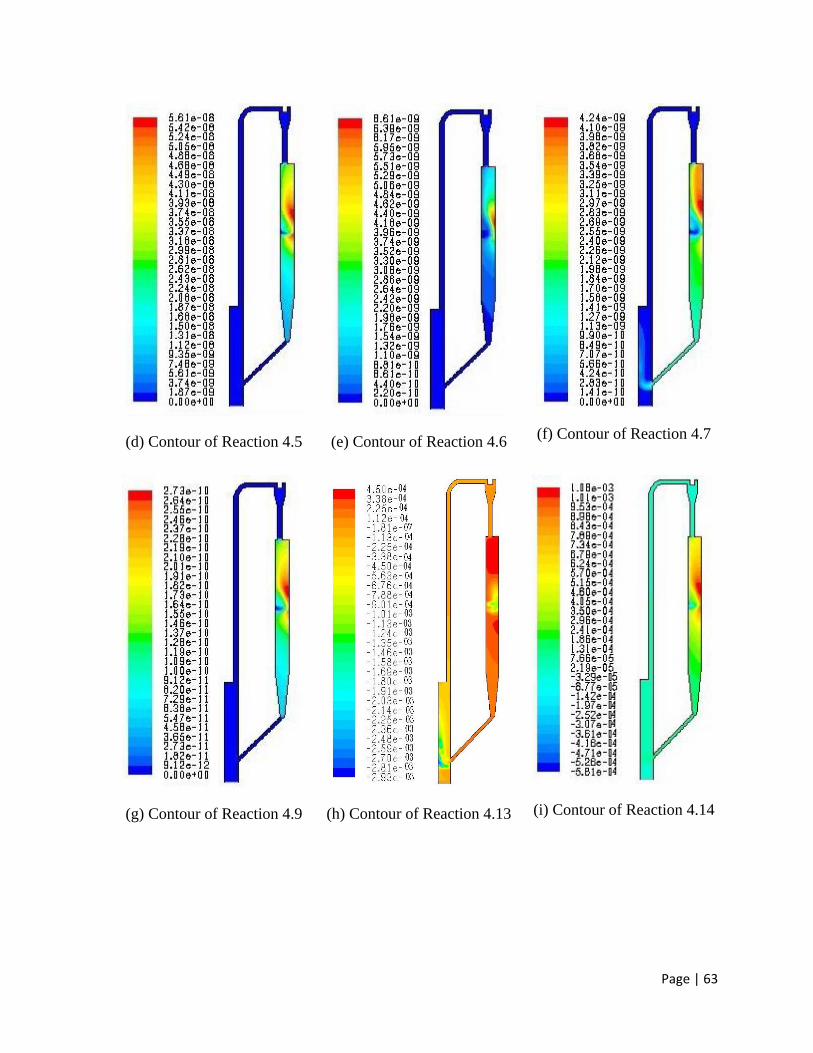
Page | 63
(d) Contour of Reaction 4.5
(e) Contour of Reaction 4.6
(f) Contour of Reaction 4.7
(g) Contour of Reaction 4.9
(h) Contour of Reaction 4.13
(i) Contour of Reaction 4.14
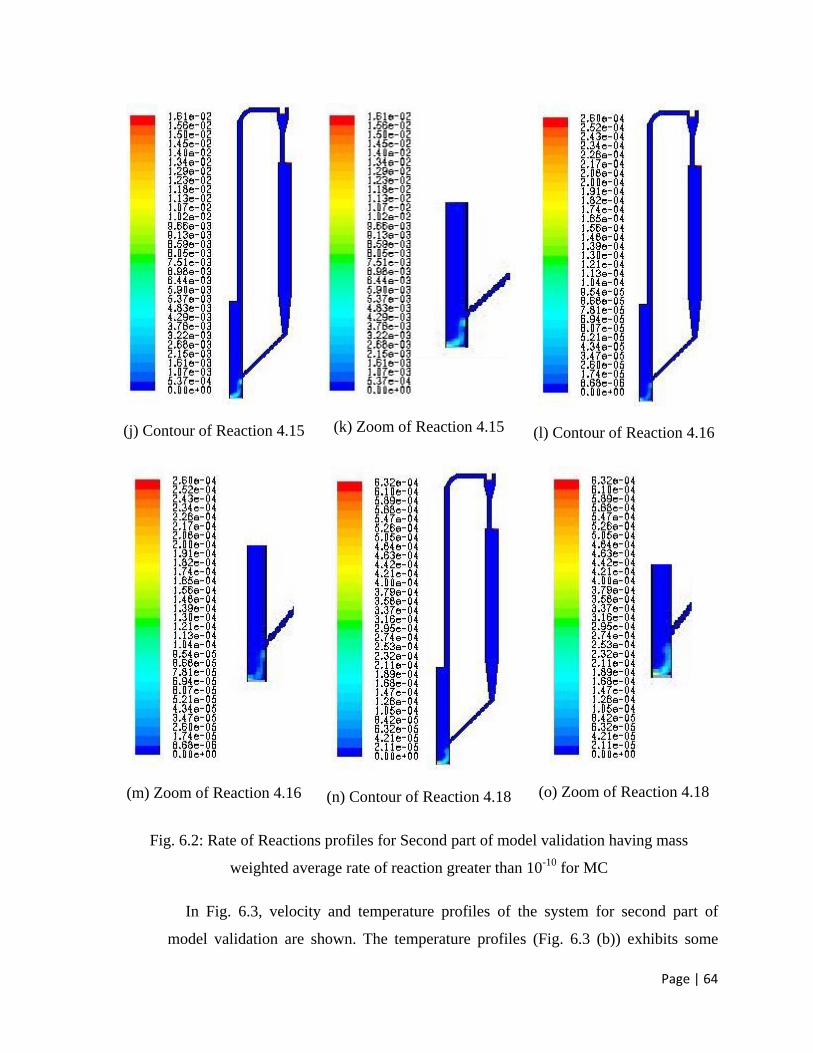
Page | 64
(j) Contour of Reaction 4.15
(k) Zoom of Reaction 4.15
(l) Contour of Reaction 4.16
(m) Zoom of Reaction 4.16
(n) Contour of Reaction 4.18
(o) Zoom of Reaction 4.18
Fig. 6.2: Rate of Reactions profiles for Second part of model validation having mass
weighted average rate of reaction greater than 10-10
for MC
In Fig. 6.3, velocity and temperature profiles of the system for second part of
model validation are shown. The temperature profiles (Fig. 6.3 (b)) exhibits some
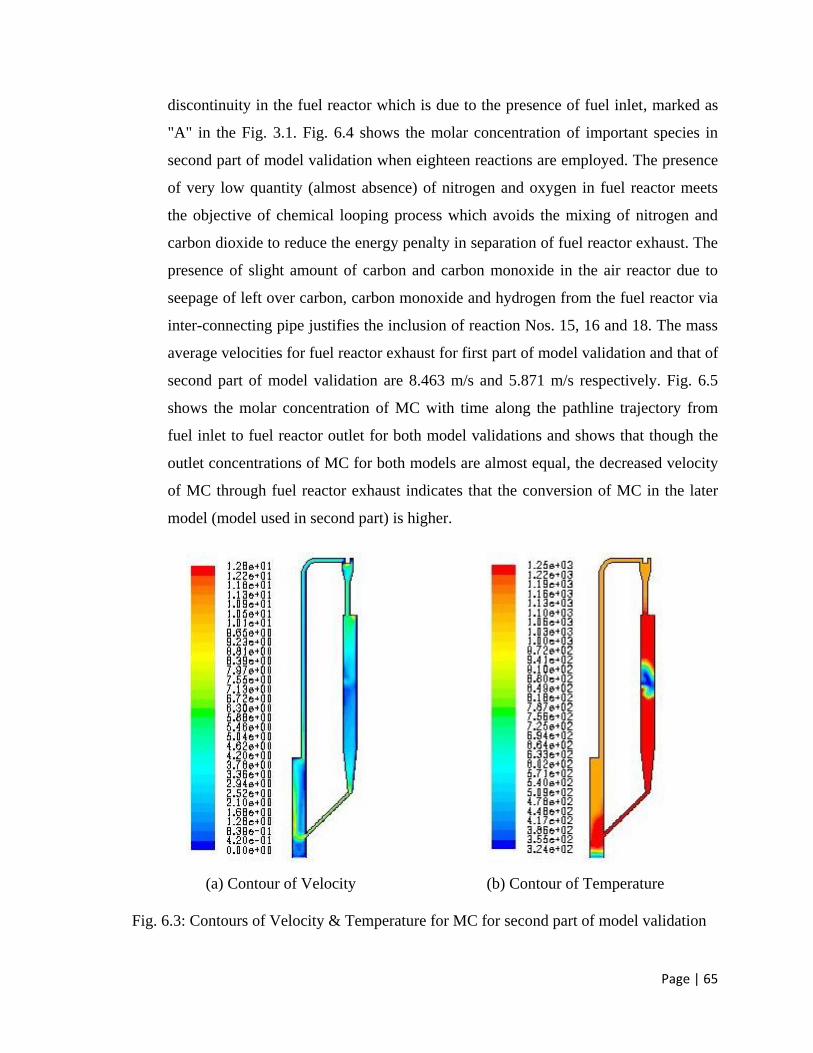
Page | 65
discontinuity in the fuel reactor which is due to the presence of fuel inlet, marked as
"A" in the Fig. 3.1. Fig. 6.4 shows the molar concentration of important species in
second part of model validation when eighteen reactions are employed. The presence
of very low quantity (almost absence) of nitrogen and oxygen in fuel reactor meets
the objective of chemical looping process which avoids the mixing of nitrogen and
carbon dioxide to reduce the energy penalty in separation of fuel reactor exhaust. The
presence of slight amount of carbon and carbon monoxide in the air reactor due to
seepage of left over carbon, carbon monoxide and hydrogen from the fuel reactor via
inter-connecting pipe justifies the inclusion of reaction Nos. 15, 16 and 18. The mass
average velocities for fuel reactor exhaust for first part of model validation and that of
second part of model validation are 8.463 m/s and 5.871 m/s respectively. Fig. 6.5
shows the molar concentration of MC with time along the pathline trajectory from
fuel inlet to fuel reactor outlet for both model validations and shows that though the
outlet concentrations of MC for both models are almost equal, the decreased velocity
of MC through fuel reactor exhaust indicates that the conversion of MC in the later
model (model used in second part) is higher.
(a) Contour of Velocity
(b) Contour of Temperature
Fig. 6.3: Contours of Velocity & Temperature for MC for second part of model validation
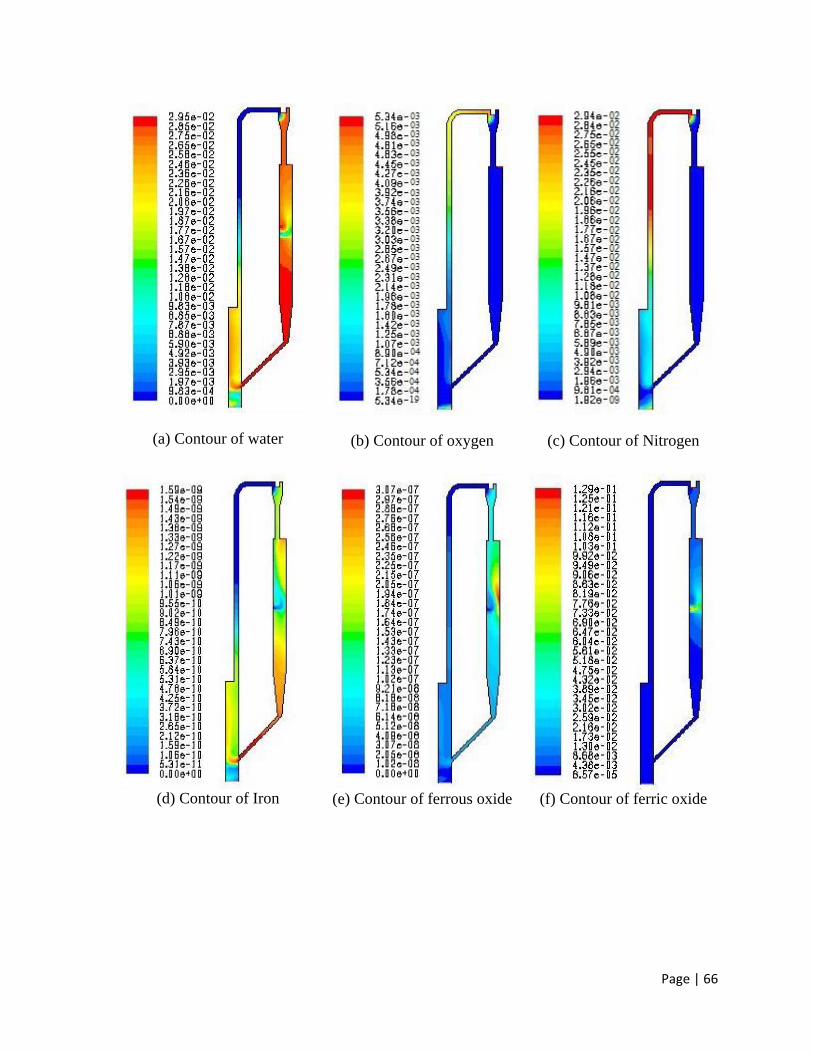
Page | 66
(a) Contour of water
(b) Contour of oxygen
(c) Contour of Nitrogen
(d) Contour of Iron (e) Contour of ferrous oxide (f) Contour of ferric oxide
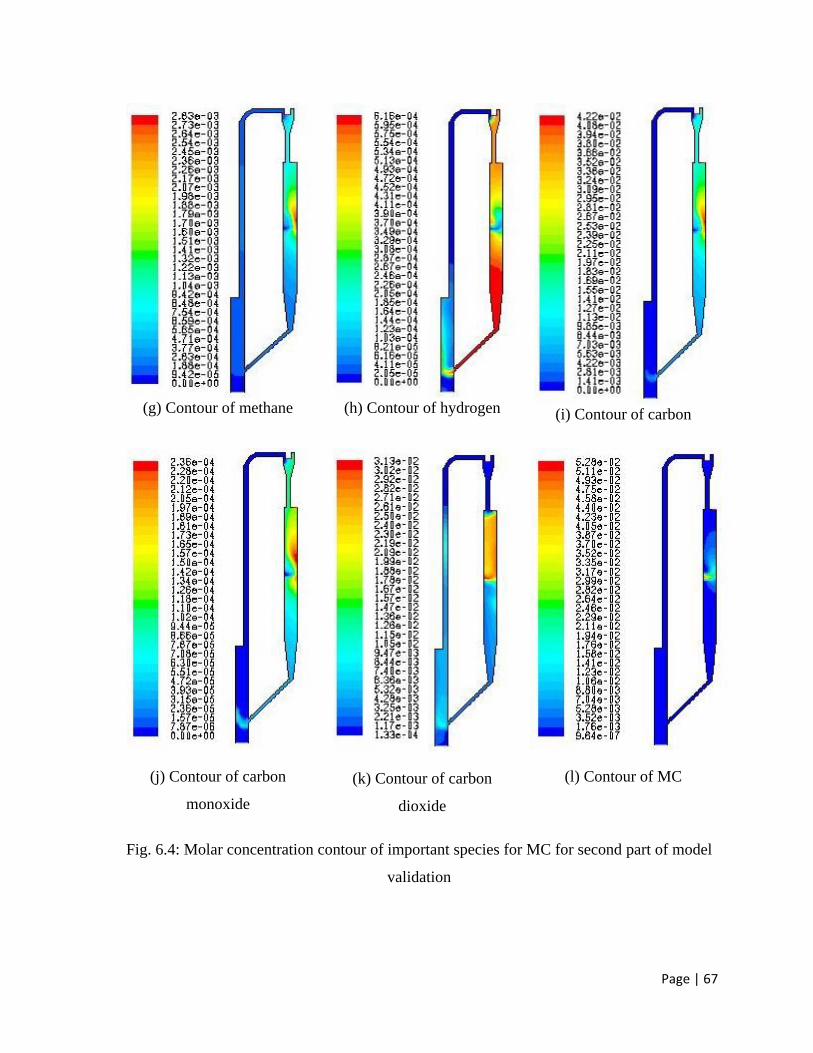
Page | 67
(g) Contour of methane (h) Contour of hydrogen (i) Contour of carbon
(j) Contour of carbon
monoxide
(k) Contour of carbon
dioxide
(l) Contour of MC
Fig. 6.4: Molar concentration contour of important species for MC for second part of model
validation
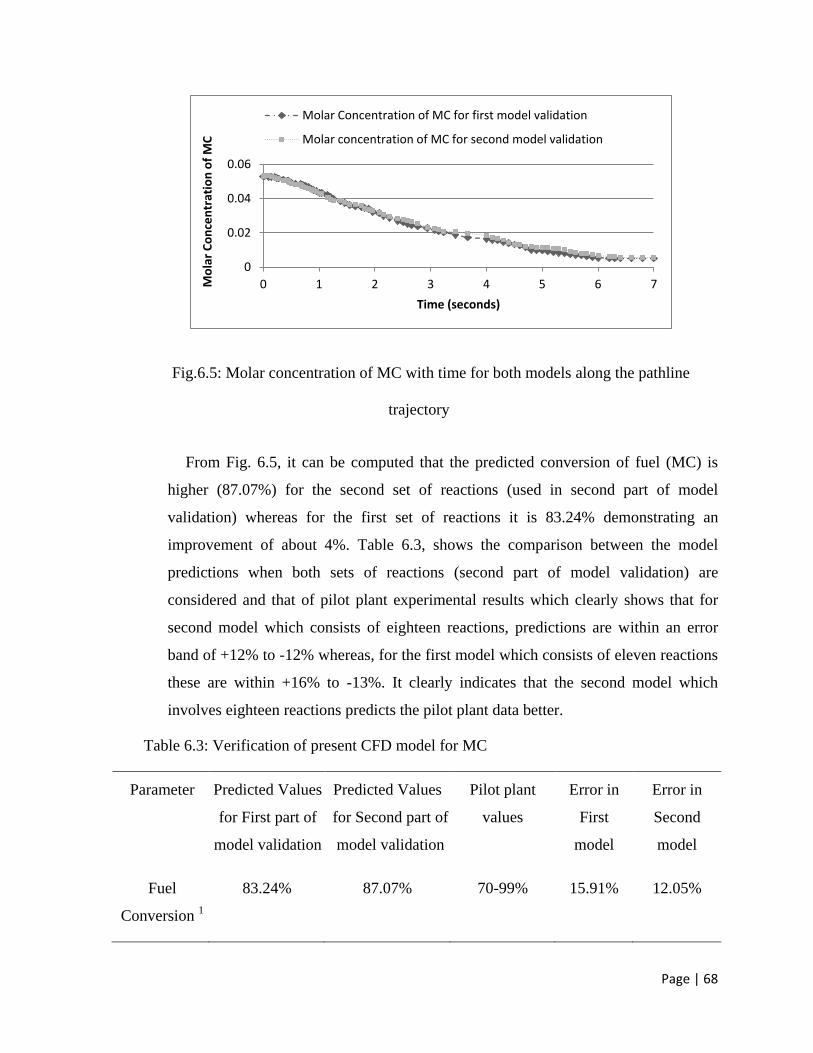
Page | 68
Fig.6.5: Molar concentration of MC with time for both models along the pathline
trajectory
From Fig. 6.5, it can be computed that the predicted conversion of fuel (MC) is
higher (87.07%) for the second set of reactions (used in second part of model
validation) whereas for the first set of reactions it is 83.24% demonstrating an
improvement of about 4%. Table 6.3, shows the comparison between the model
predictions when both sets of reactions (second part of model validation) are
considered and that of pilot plant experimental results which clearly shows that for
second model which consists of eighteen reactions, predictions are within an error
band of +12% to -12% whereas, for the first model which consists of eleven reactions
these are within +16% to -13%. It clearly indicates that the second model which
involves eighteen reactions predicts the pilot plant data better.
Table 6.3: Verification of present CFD model for MC
Parameter Predicted Values
for First part of
model validation
Predicted Values
for Second part of
model validation
Pilot plant
values
Error in
First
model
Error in
Second
model
Fuel
Conversion 1
83.24% 87.07% 70-99% 15.91% 12.05%
0
0.02
0.04
0.06
0 1 2 3 4 5 6 7 Mo
lar
Co
nce
ntr
atio
n o
f M
C
Time (seconds)
Molar Concentration of MC for first model validation
Molar concentration of MC for second model validation
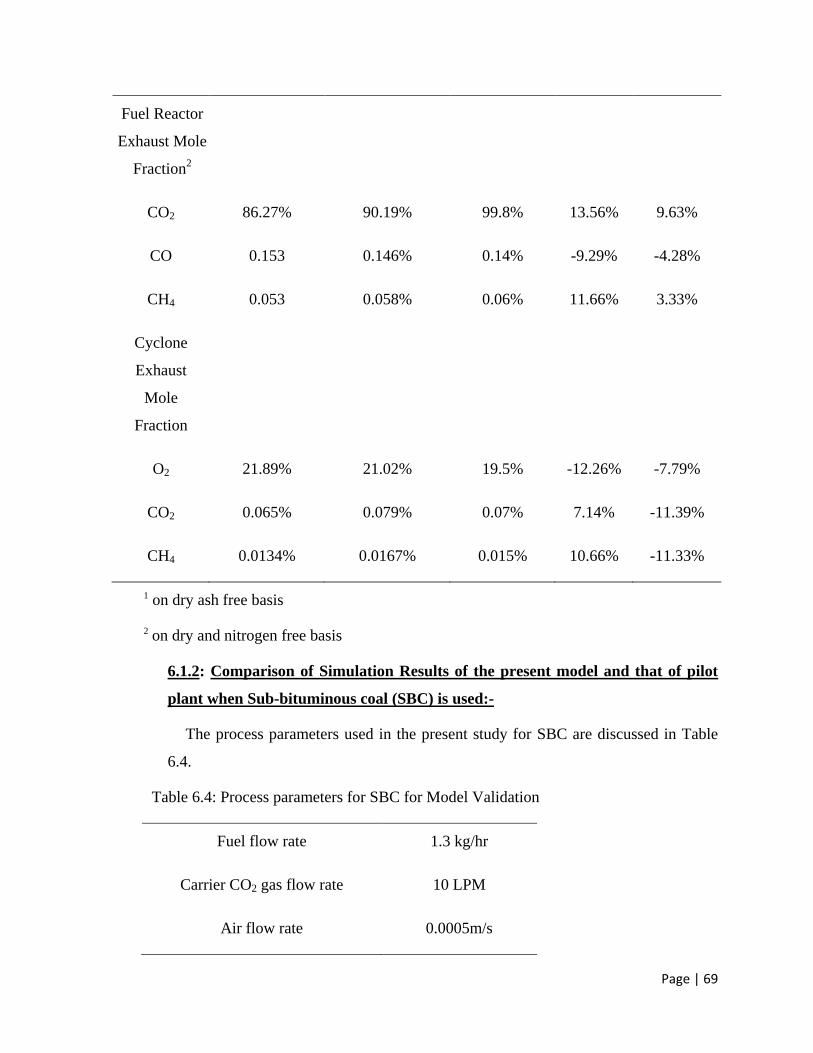
Page | 69
Fuel Reactor
Exhaust Mole
Fraction2
CO2 86.27% 90.19% 99.8% 13.56% 9.63%
CO 0.153 0.146% 0.14% -9.29% -4.28%
CH4
0.053 0.058% 0.06% 11.66% 3.33%
Cyclone
Exhaust
Mole
Fraction
O2 21.89% 21.02% 19.5% -12.26% -7.79%
CO2 0.065% 0.079% 0.07% 7.14% -11.39%
CH4 0.0134% 0.0167% 0.015% 10.66% -11.33%
1 on dry ash free basis
2 on dry and nitrogen free basis
6.1.2: Comparison of Simulation Results of the present model and that of pilot
plant when Sub-bituminous coal (SBC) is used:-
The process parameters used in the present study for SBC are discussed in Table
6.4.
Table 6.4: Process parameters for SBC for Model Validation
Fuel flow rate 1.3 kg/hr
Carrier CO2 gas flow rate 10 LPM
Air flow rate 0.0005m/s
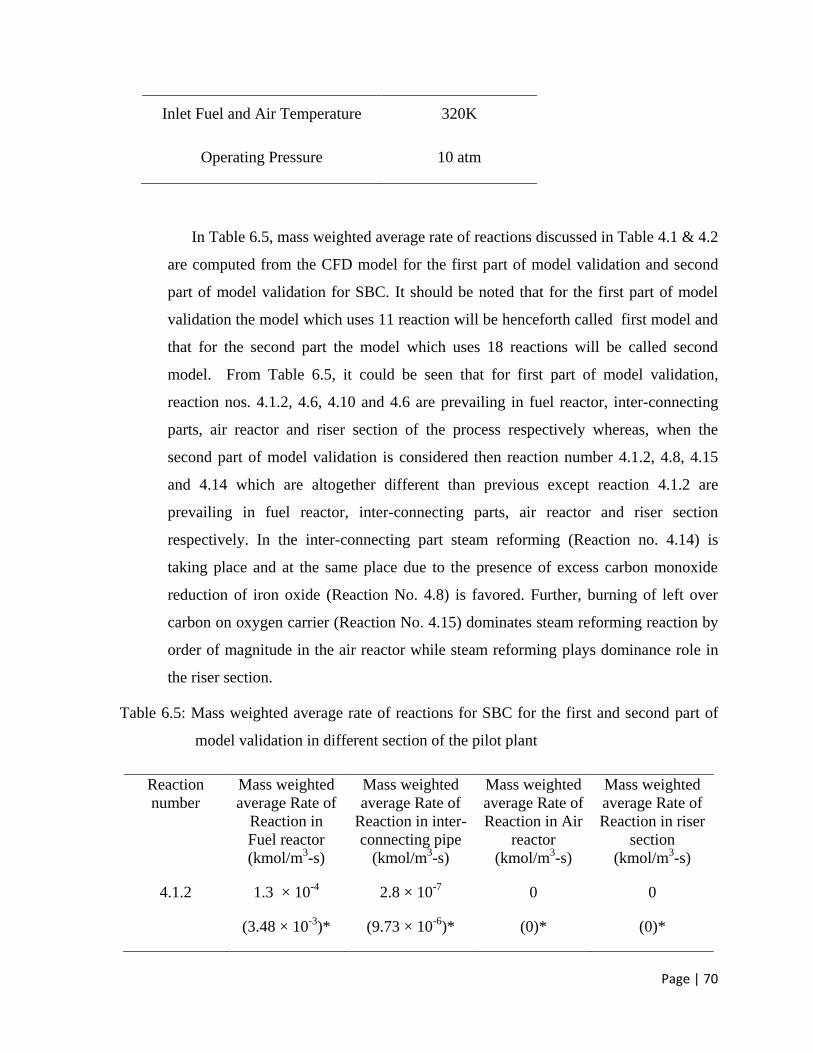
Page | 70
Inlet Fuel and Air Temperature 320K
Operating Pressure 10 atm
In Table 6.5, mass weighted average rate of reactions discussed in Table 4.1 & 4.2
are computed from the CFD model for the first part of model validation and second
part of model validation for SBC. It should be noted that for the first part of model
validation the model which uses 11 reaction will be henceforth called first model and
that for the second part the model which uses 18 reactions will be called second
model. From Table 6.5, it could be seen that for first part of model validation,
reaction nos. 4.1.2, 4.6, 4.10 and 4.6 are prevailing in fuel reactor, inter-connecting
parts, air reactor and riser section of the process respectively whereas, when the
second part of model validation is considered then reaction number 4.1.2, 4.8, 4.15
and 4.14 which are altogether different than previous except reaction 4.1.2 are
prevailing in fuel reactor, inter-connecting parts, air reactor and riser section
respectively. In the inter-connecting part steam reforming (Reaction no. 4.14) is
taking place and at the same place due to the presence of excess carbon monoxide
reduction of iron oxide (Reaction No. 4.8) is favored. Further, burning of left over
carbon on oxygen carrier (Reaction No. 4.15) dominates steam reforming reaction by
order of magnitude in the air reactor while steam reforming plays dominance role in
the riser section.
Table 6.5: Mass weighted average rate of reactions for SBC for the first and second part of
model validation in different section of the pilot plant
Reaction
number
Mass weighted
average Rate of
Reaction in
Fuel reactor
(kmol/m3-s)
Mass weighted
average Rate of
Reaction in inter-
connecting pipe
(kmol/m3-s)
Mass weighted
average Rate of
Reaction in Air
reactor
(kmol/m3-s)
Mass weighted
average Rate of
Reaction in riser
section
(kmol/m3-s)
4.1.2 1.3 × 10⁻⁴
(3.48 × 10⁻³
)*
2.8 × 10⁻⁷
(9.73 × 10⁻⁶
)*
0
(0)*
0
(0)*
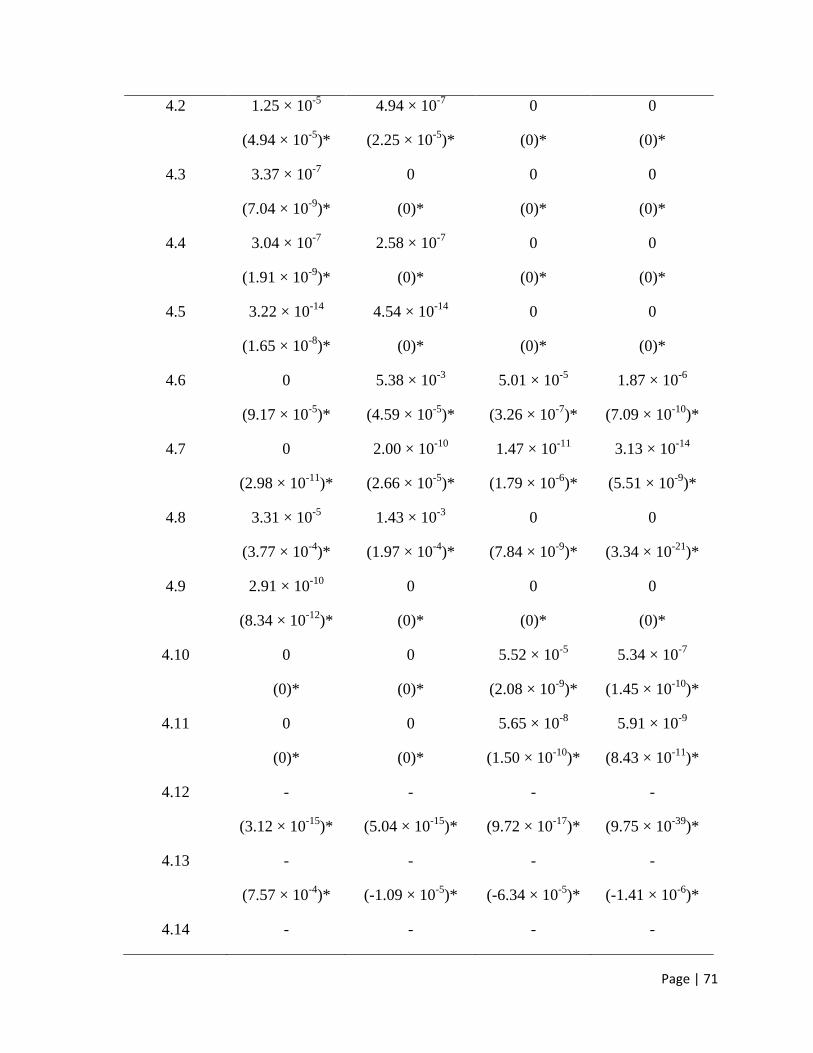
Page | 71
4.2 1.25 × 10⁻⁵
(4.94 × 10⁻⁵
)*
4.94 × 10⁻⁷
(2.25 × 10⁻⁵
)*
0
(0)*
0
(0)*
4.3 3.37 × 10⁻⁷
(7.04 × 10⁻⁹
)*
0
(0)*
0
(0)*
0
(0)*
4.4 3.04 × 10⁻⁷
(1.91 × 10⁻⁹
)*
2.58 × 10⁻⁷
(0)*
0
(0)*
0
(0)*
4.5 3.22 × 10⁻¹⁴
(1.65 × 10⁻⁸
)*
4.54 × 10⁻¹⁴
(0)*
0
(0)*
0
(0)*
4.6 0
(9.17 × 10⁻⁵
)*
5.38 × 10⁻³
(4.59 × 10⁻⁵
)*
5.01 × 10⁻⁵
(3.26 × 10⁻⁷
)*
1.87 × 10⁻⁶
(7.09 × 10⁻¹⁰
)*
4.7 0
(2.98 × 10⁻¹¹
)*
2.00 × 10⁻¹⁰
(2.66 × 10⁻⁵
)*
1.47 × 10⁻¹¹
(1.79 × 10⁻⁶
)*
3.13 × 10⁻¹⁴
(5.51 × 10⁻⁹
)*
4.8 3.31 × 10⁻⁵
(3.77 × 10⁻⁴
)*
1.43 × 10⁻³
(1.97 × 10⁻⁴
)*
0
(7.84 × 10⁻⁹
)*
0
(3.34 × 10⁻²¹
)*
4.9 2.91 × 10⁻¹⁰
(8.34 × 10⁻¹²
)*
0
(0)*
0
(0)*
0
(0)*
4.10 0
(0)*
0
(0)*
5.52 × 10-5
(2.08 × 10⁻⁹
)*
5.34 × 10⁻⁷
(1.45 × 10⁻¹⁰
)*
4.11 0
(0)*
0
(0)*
5.65 × 10-8
(1.50 × 10⁻¹⁰
)*
5.91 × 10⁻⁹
(8.43 × 10⁻¹¹
)*
4.12 -
(3.12 × 10⁻¹⁵
)*
-
(5.04 × 10⁻¹⁵
)*
-
(9.72 × 10⁻¹⁷
)*
-
(9.75 × 10-39
)*
4.13 -
(7.57 × 10⁻⁴
)*
-
(-1.09 × 10⁻⁵
)*
-
(-6.34 × 10⁻⁵
)*
-
(-1.41 × 10⁻⁶
)*
4.14 - - - -
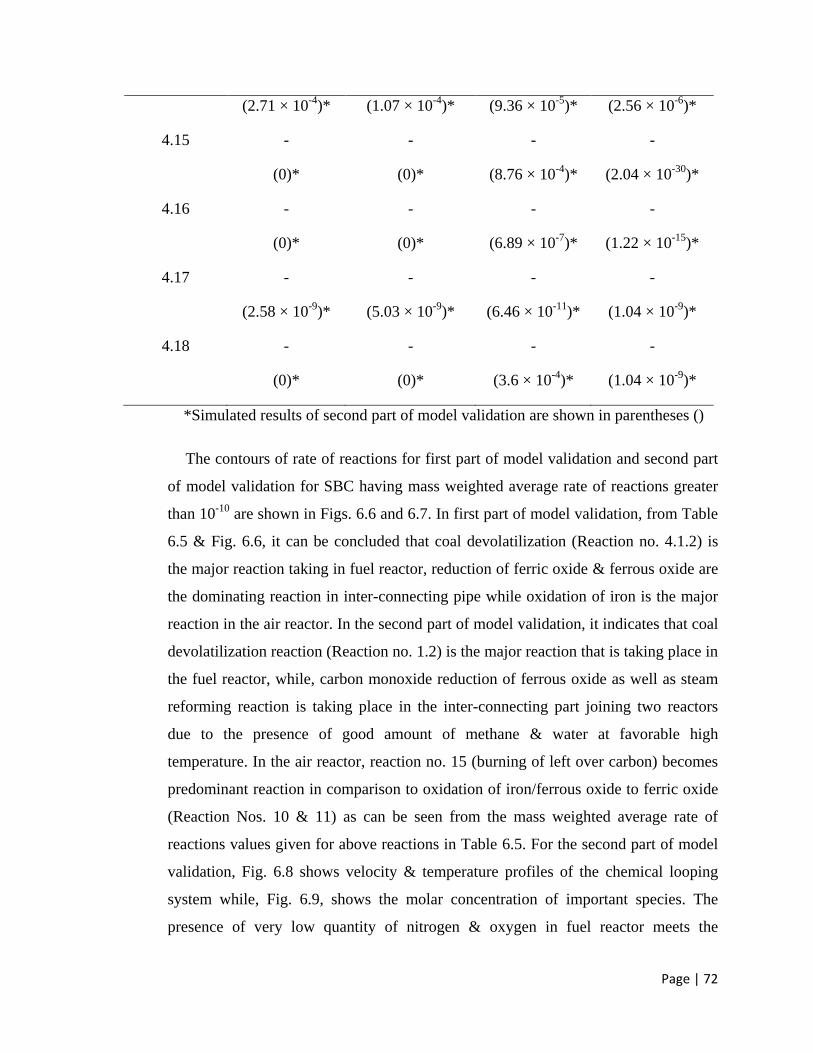
Page | 72
(2.71 × 10⁻⁴
)* (1.07 × 10⁻⁴
)* (9.36 × 10⁻⁵
)* (2.56 × 10⁻⁶
)*
4.15 -
(0)*
-
(0)*
-
(8.76 × 10⁻⁴
)*
-
(2.04 × 10⁻³⁰
)*
4.16 -
(0)*
-
(0)*
-
(6.89 × 10⁻⁷
)*
-
(1.22 × 10⁻¹⁵
)*
4.17 -
(2.58 × 10⁻⁹
)*
-
(5.03 × 10⁻⁹
)*
-
(6.46 × 10⁻¹¹
)*
-
(1.04 × 10⁻⁹
)*
4.18 -
(0)*
-
(0)*
-
(3.6 × 10⁻⁴
)*
-
(1.04 × 10⁻⁹
)*
*Simulated results of second part of model validation are shown in parentheses ()
The contours of rate of reactions for first part of model validation and second part
of model validation for SBC having mass weighted average rate of reactions greater
than 10-10
are shown in Figs. 6.6 and 6.7. In first part of model validation, from Table
6.5 & Fig. 6.6, it can be concluded that coal devolatilization (Reaction no. 4.1.2) is
the major reaction taking in fuel reactor, reduction of ferric oxide & ferrous oxide are
the dominating reaction in inter-connecting pipe while oxidation of iron is the major
reaction in the air reactor. In the second part of model validation, it indicates that coal
devolatilization reaction (Reaction no. 1.2) is the major reaction that is taking place in
the fuel reactor, while, carbon monoxide reduction of ferrous oxide as well as steam
reforming reaction is taking place in the inter-connecting part joining two reactors
due to the presence of good amount of methane & water at favorable high
temperature. In the air reactor, reaction no. 15 (burning of left over carbon) becomes
predominant reaction in comparison to oxidation of iron/ferrous oxide to ferric oxide
(Reaction Nos. 10 & 11) as can be seen from the mass weighted average rate of
reactions values given for above reactions in Table 6.5. For the second part of model
validation, Fig. 6.8 shows velocity & temperature profiles of the chemical looping
system while, Fig. 6.9, shows the molar concentration of important species. The
presence of very low quantity of nitrogen & oxygen in fuel reactor meets the
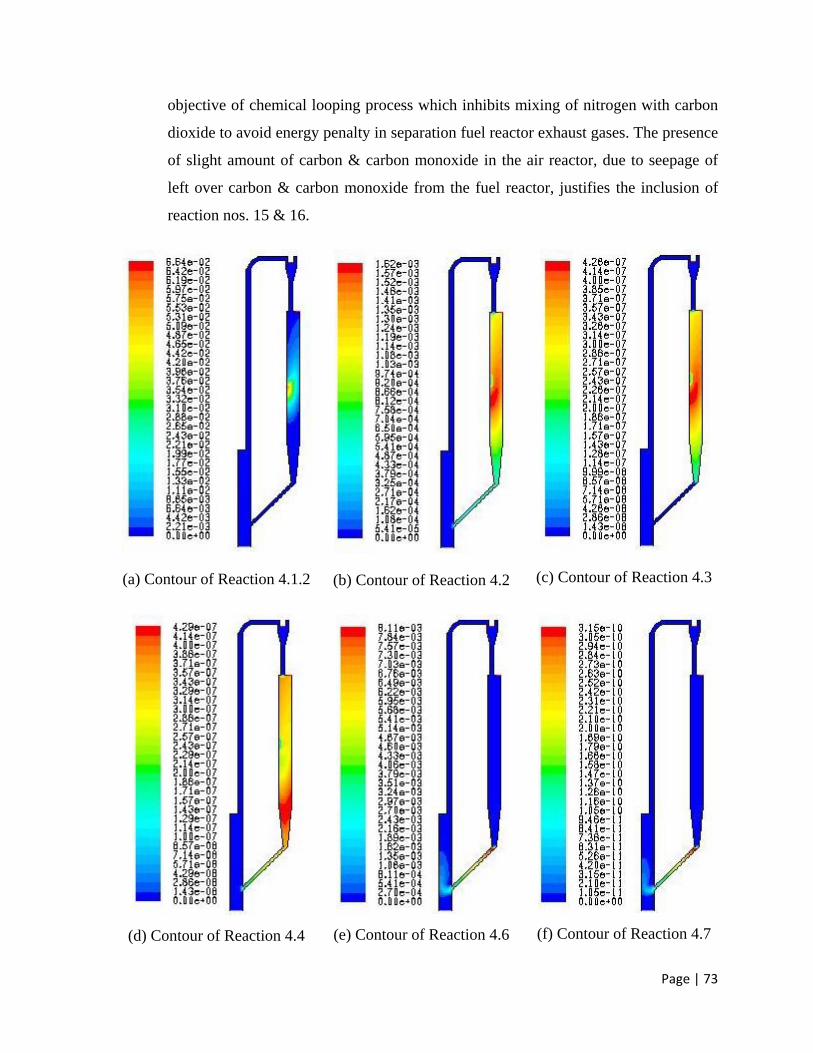
Page | 73
objective of chemical looping process which inhibits mixing of nitrogen with carbon
dioxide to avoid energy penalty in separation fuel reactor exhaust gases. The presence
of slight amount of carbon & carbon monoxide in the air reactor, due to seepage of
left over carbon & carbon monoxide from the fuel reactor, justifies the inclusion of
reaction nos. 15 & 16.
(a) Contour of Reaction 4.1.2
(b) Contour of Reaction 4.2
(c) Contour of Reaction 4.3
(d) Contour of Reaction 4.4
(e) Contour of Reaction 4.6
(f) Contour of Reaction 4.7
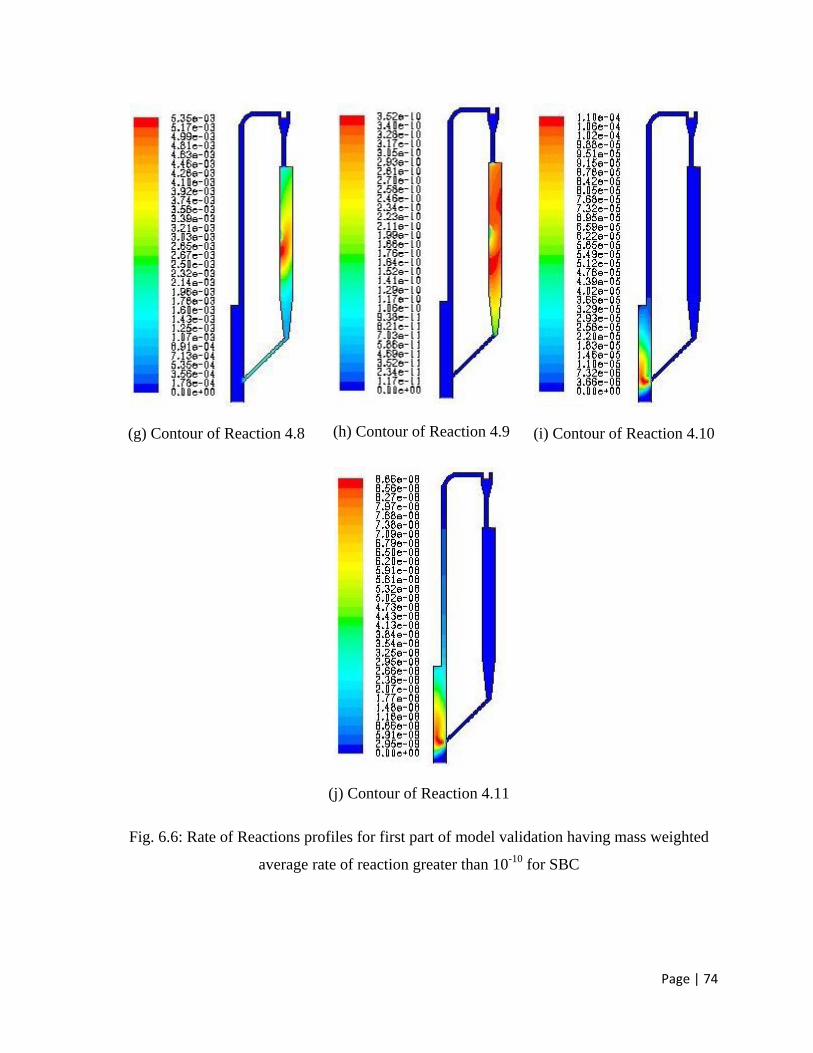
Page | 74
(g) Contour of Reaction 4.8
(h) Contour of Reaction 4.9
(i) Contour of Reaction 4.10
(j) Contour of Reaction 4.11
Fig. 6.6: Rate of Reactions profiles for first part of model validation having mass weighted
average rate of reaction greater than 10-10
for SBC
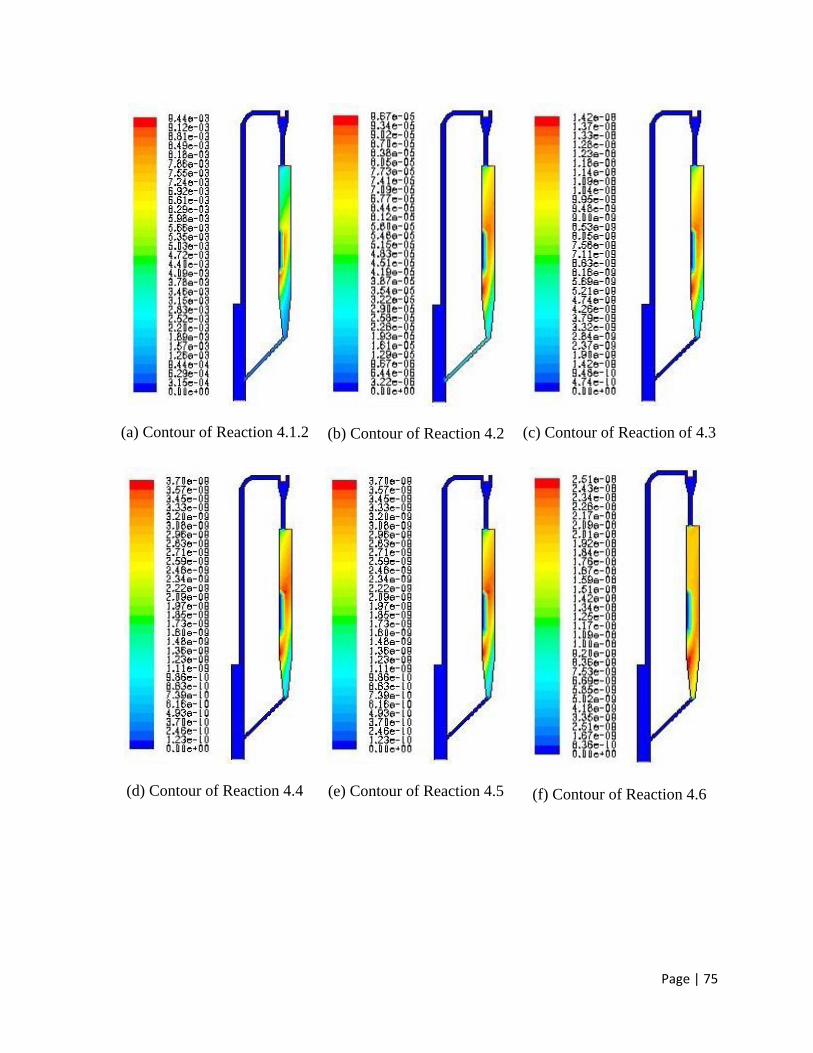
Page | 75
(a) Contour of Reaction 4.1.2
(b) Contour of Reaction 4.2
(c) Contour of Reaction of 4.3
(d) Contour of Reaction 4.4
(e) Contour of Reaction 4.5
(f) Contour of Reaction 4.6
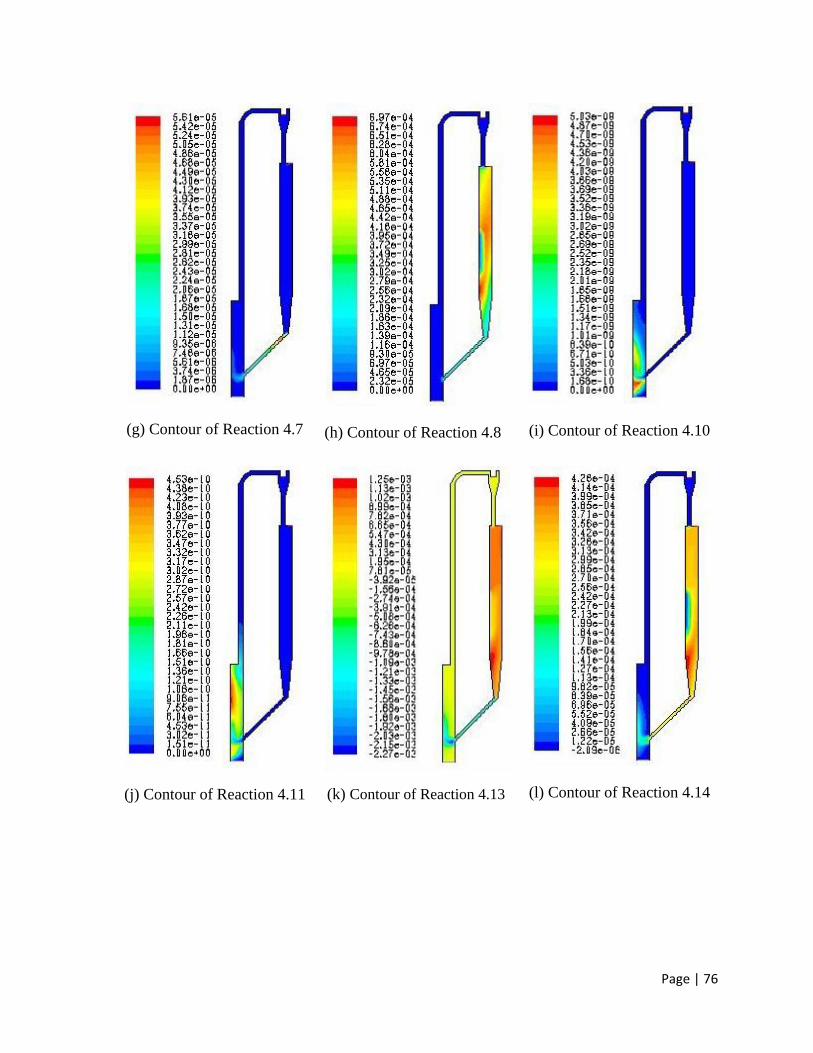
Page | 76
(g) Contour of Reaction 4.7
(h) Contour of Reaction 4.8
(i) Contour of Reaction 4.10
(j) Contour of Reaction 4.11
(k) Contour of Reaction 4.13
(l) Contour of Reaction 4.14
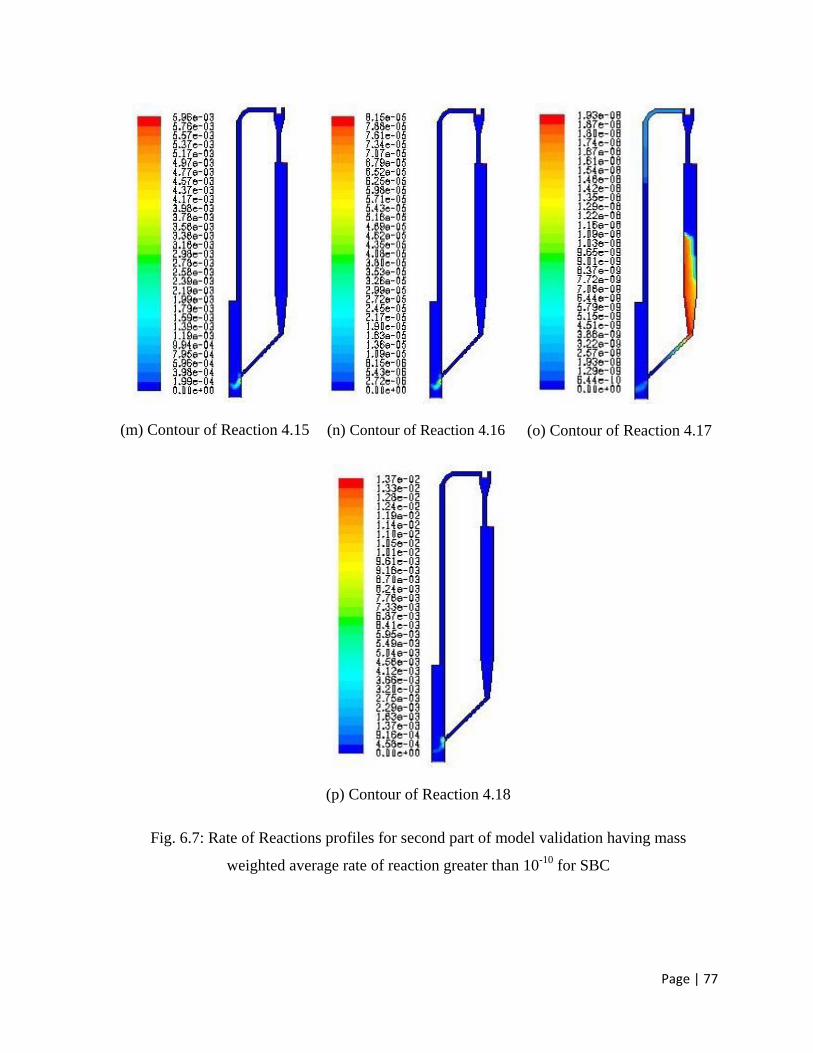
Page | 77
(m) Contour of Reaction 4.15
(n) Contour of Reaction 4.16
(o) Contour of Reaction 4.17
(p) Contour of Reaction 4.18
Fig. 6.7: Rate of Reactions profiles for second part of model validation having mass
weighted average rate of reaction greater than 10-10
for SBC
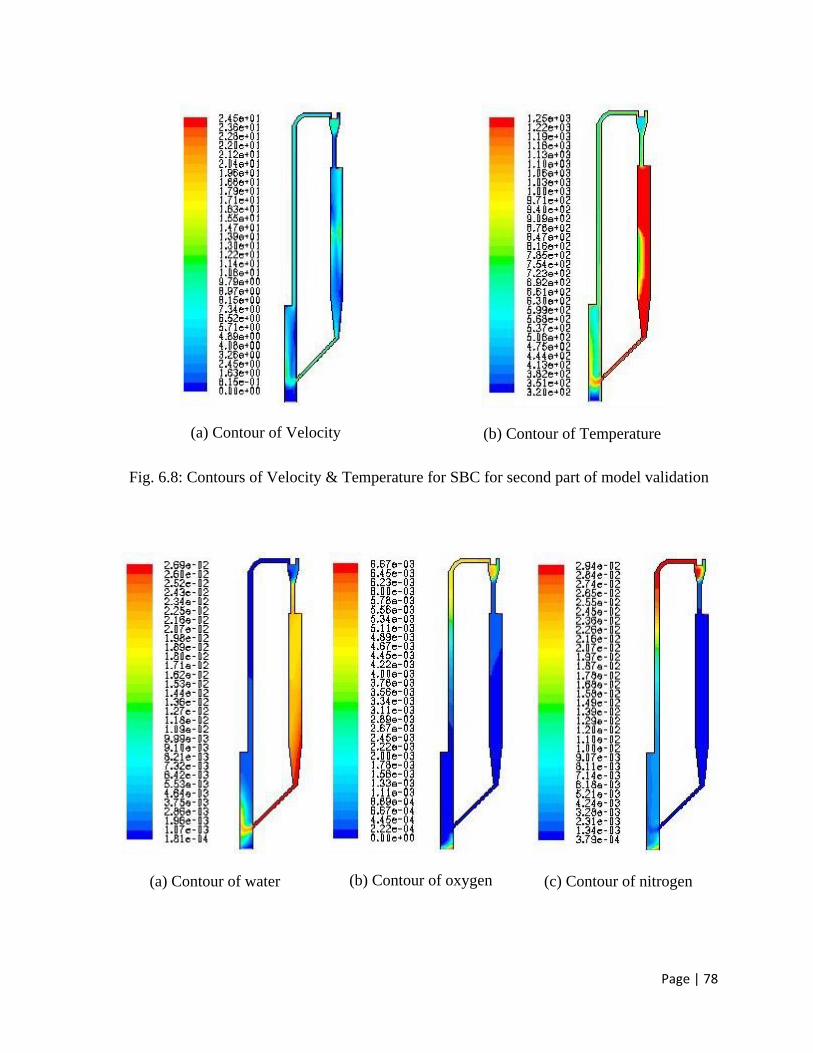
Page | 78
(a) Contour of Velocity
(b) Contour of Temperature
Fig. 6.8: Contours of Velocity & Temperature for SBC for second part of model validation
(a) Contour of water
(b) Contour of oxygen
(c) Contour of nitrogen
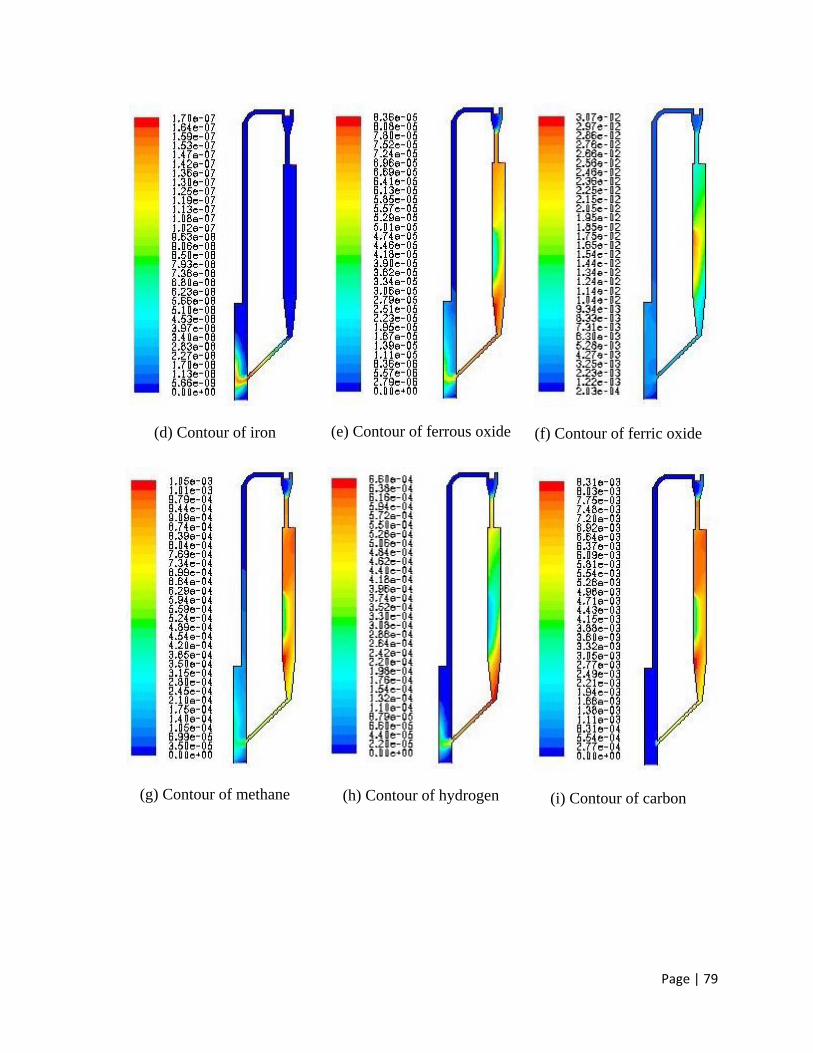
Page | 79
(d) Contour of iron
(e) Contour of ferrous oxide
(f) Contour of ferric oxide
(g) Contour of methane
(h) Contour of hydrogen
(i) Contour of carbon
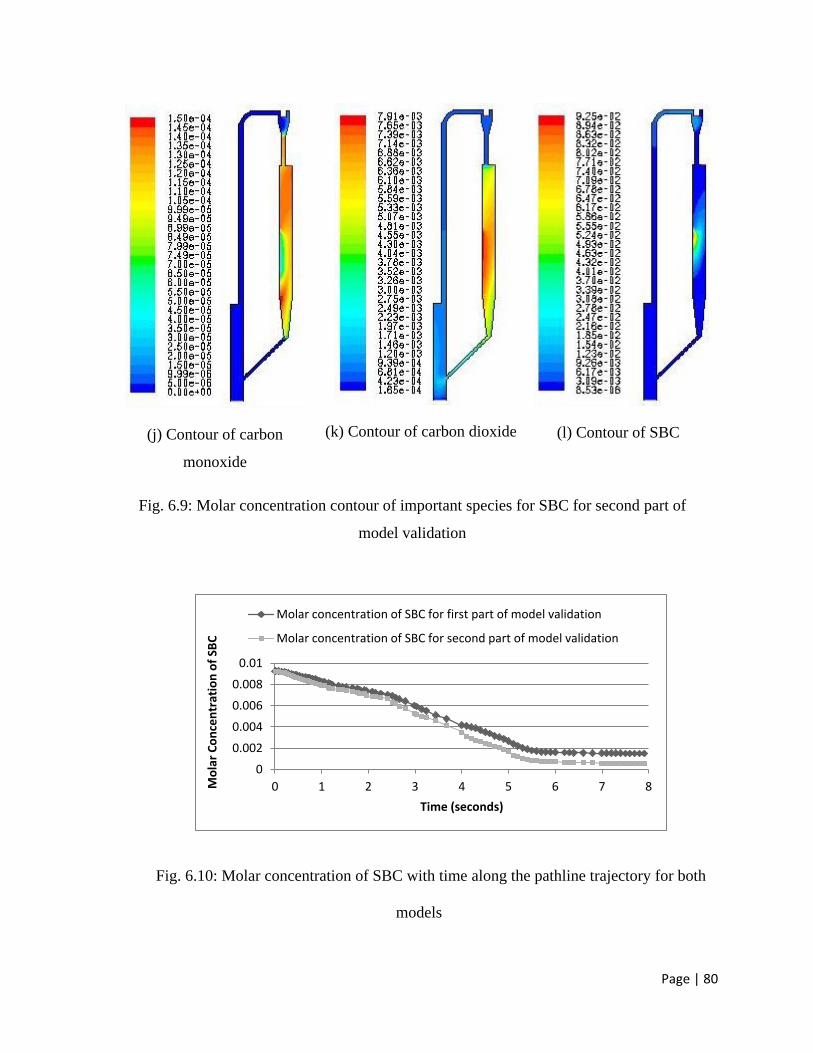
Page | 80
(j) Contour of carbon
monoxide
(k) Contour of carbon dioxide
(l) Contour of SBC
Fig. 6.9: Molar concentration contour of important species for SBC for second part of
model validation
Fig. 6.10: Molar concentration of SBC with time along the pathline trajectory for both
models
0
0.002
0.004
0.006
0.008
0.01
0 1 2 3 4 5 6 7 8 Mo
lar
Co
nce
ntr
atio
n o
f SB
C
Time (seconds)
Molar concentration of SBC for first part of model validation
Molar concentration of SBC for second part of model validation
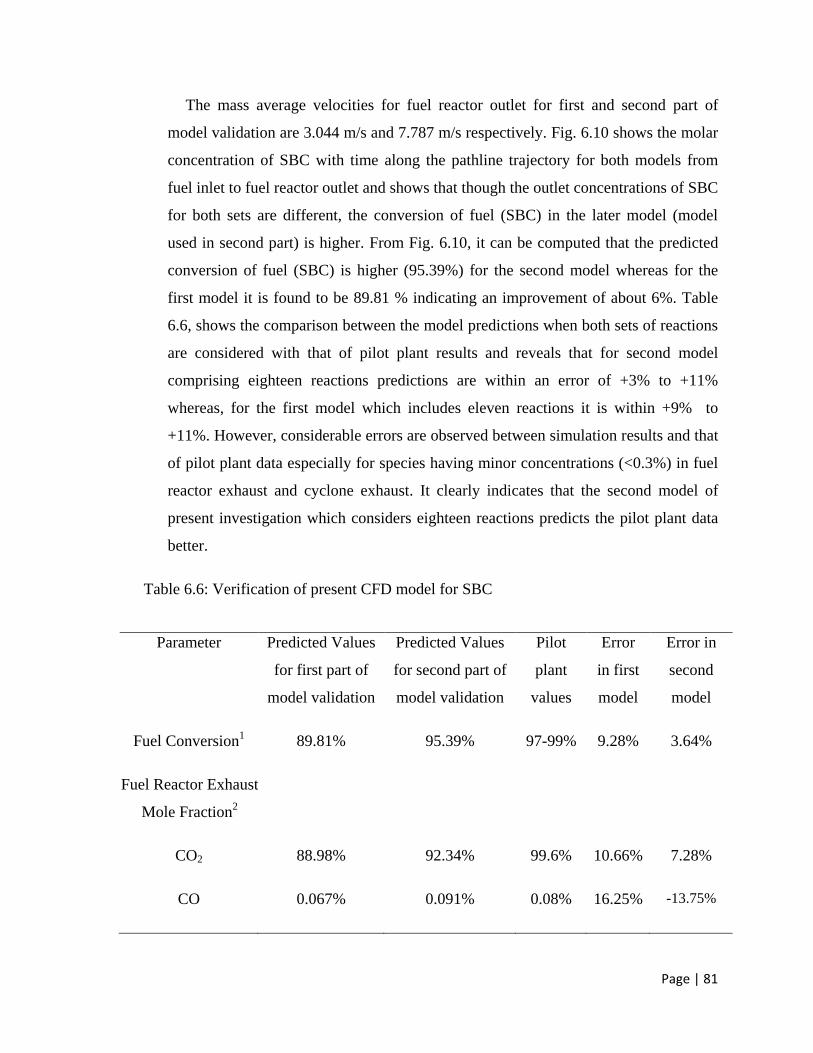
Page | 81
The mass average velocities for fuel reactor outlet for first and second part of
model validation are 3.044 m/s and 7.787 m/s respectively. Fig. 6.10 shows the molar
concentration of SBC with time along the pathline trajectory for both models from
fuel inlet to fuel reactor outlet and shows that though the outlet concentrations of SBC
for both sets are different, the conversion of fuel (SBC) in the later model (model
used in second part) is higher. From Fig. 6.10, it can be computed that the predicted
conversion of fuel (SBC) is higher (95.39%) for the second model whereas for the
first model it is found to be 89.81 % indicating an improvement of about 6%. Table
6.6, shows the comparison between the model predictions when both sets of reactions
are considered with that of pilot plant results and reveals that for second model
comprising eighteen reactions predictions are within an error of +3% to +11%
whereas, for the first model which includes eleven reactions it is within +9% to
+11%. However, considerable errors are observed between simulation results and that
of pilot plant data especially for species having minor concentrations (<0.3%) in fuel
reactor exhaust and cyclone exhaust. It clearly indicates that the second model of
present investigation which considers eighteen reactions predicts the pilot plant data
better.
Table 6.6: Verification of present CFD model for SBC
Parameter Predicted Values
for first part of
model validation
Predicted Values
for second part of
model validation
Pilot
plant
values
Error
in first
model
Error in
second
model
Fuel Conversion1 89.81% 95.39% 97-99% 9.28% 3.64%
Fuel Reactor Exhaust
Mole Fraction2
CO2 88.98% 92.34% 99.6% 10.66% 7.28%
CO 0.067% 0.091% 0.08% 16.25% -13.75%
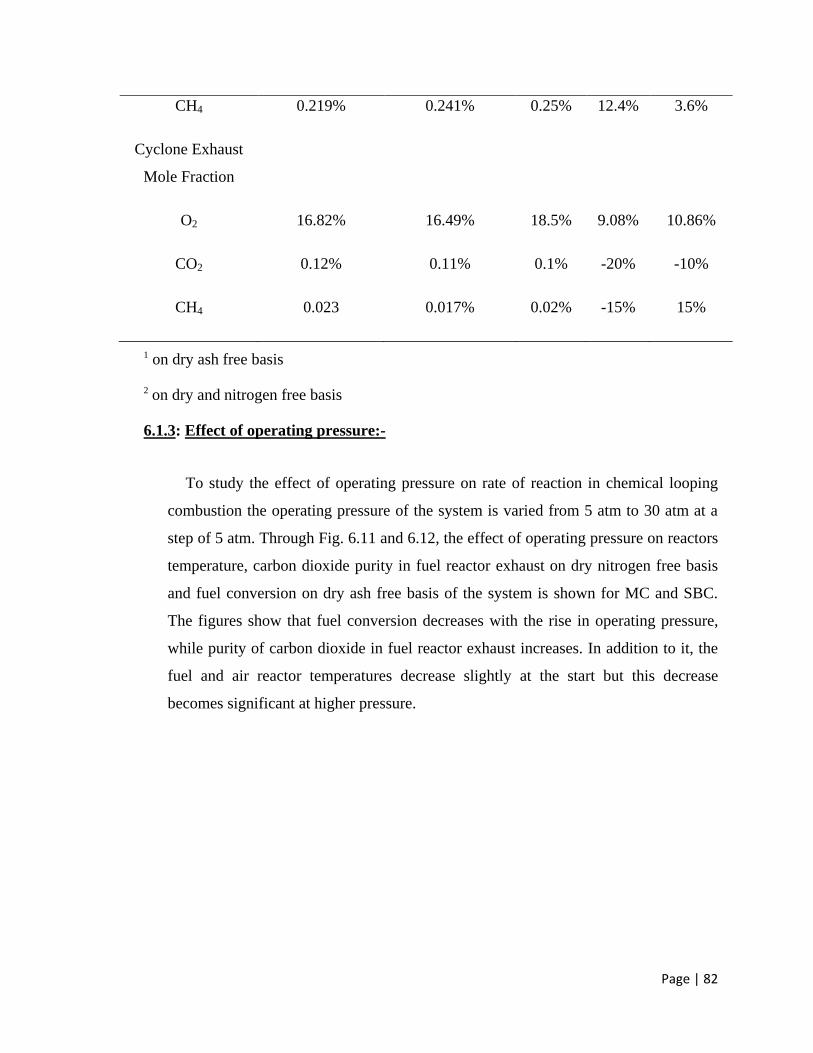
Page | 82
CH4
0.219% 0.241% 0.25% 12.4% 3.6%
Cyclone Exhaust
Mole Fraction
O2 16.82% 16.49% 18.5% 9.08% 10.86%
CO2 0.12% 0.11% 0.1% -20% -10%
CH4 0.023 0.017% 0.02% -15% 15%
1 on dry ash free basis
2 on dry and nitrogen free basis
6.1.3: Effect of operating pressure:-
To study the effect of operating pressure on rate of reaction in chemical looping
combustion the operating pressure of the system is varied from 5 atm to 30 atm at a
step of 5 atm. Through Fig. 6.11 and 6.12, the effect of operating pressure on reactors
temperature, carbon dioxide purity in fuel reactor exhaust on dry nitrogen free basis
and fuel conversion on dry ash free basis of the system is shown for MC and SBC.
The figures show that fuel conversion decreases with the rise in operating pressure,
while purity of carbon dioxide in fuel reactor exhaust increases. In addition to it, the
fuel and air reactor temperatures decrease slightly at the start but this decrease
becomes significant at higher pressure.
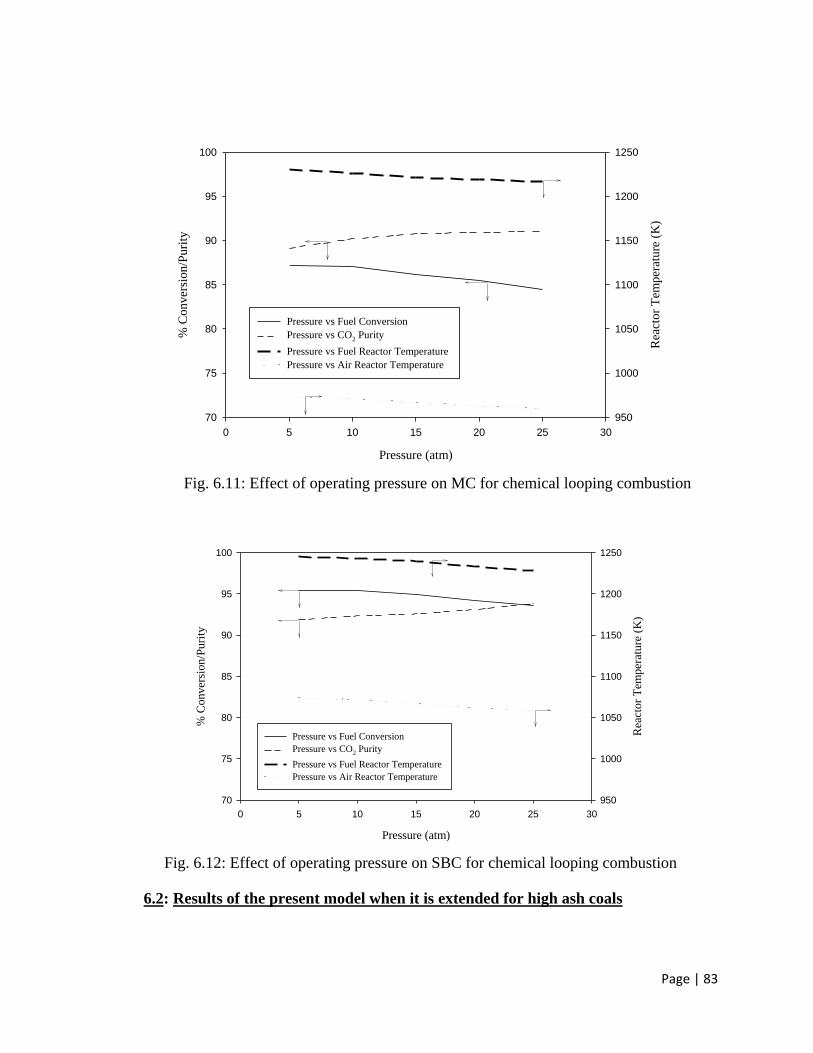
Page | 83
Pressure (atm)
0 5 10 15 20 25 30
% C
onver
sion/P
uri
ty
70
75
80
85
90
95
100
Rea
ctor
Tem
per
ature
(K
)
950
1000
1050
1100
1150
1200
1250
Pressure vs Fuel Conversion
Pressure vs CO2 Purity
Pressure vs Fuel Reactor Temperature
Pressure vs Air Reactor Temperature
Fig. 6.11: Effect of operating pressure on MC for chemical looping combustion
Pressure (atm)
0 5 10 15 20 25 30
% C
onver
sion/P
uri
ty
70
75
80
85
90
95
100
Rea
cto
r T
emper
ature
(K
)
950
1000
1050
1100
1150
1200
1250
Pressure vs Fuel Conversion
Pressure vs CO2 Purity
Pressure vs Fuel Reactor Temperature
Pressure vs Air Reactor Temperature
Fig. 6.12: Effect of operating pressure on SBC for chemical looping combustion
6.2: Results of the present model when it is extended for high ash coals
Page | 84
In this segment, the developed 2-D CFD model in the First segment of Chapter 6 is
extended to study the effect of ash components in coal which is used as a fuel in coal
direct chemical looping process. The previously developed model incorporating
eighteen reactions for MC and SBC showed a better agreement with the pilot plant
data. For the present study, four different types of coals found in the regions of Asia-
Pacific and Australia and designated as “A”, “B”, “C” and “D” are used. Properties of
these coals are discussed in Table 3.4 and 3.5, while ash compositions are described
in Table 3.6. In present study only reaction kinetic aspect of ash is studied, the
melting of ash and its associated effects, oxygen carrier activity deactivation due to
presence of ash, etc. are not incorporated. In the present CFD model for “A”, “B”,
“C” and “D”, six more reactions of reactive ash components are incorporated over
and above eighteen reactions discussed in previous segment. While the present model
is extended for different types of ash bearing coals, the original dimensions of the
pilot plant is not modified according to the coal type. This has presented some
constraints for the study as far as the variation of the operating parameters are
concerned and thus considered as the limitations of the study. In fact the limiting
operating parameters like pressure drop, reactor bed temperature of the pilot plant
have been kept in the limits fixed for the pilot plant [14].
6.2.1: Simulation Results of the present model when Coal “A” is used:-
The process parameters used in the present study for coal “A” are discussed in
Table 6.7.
Table 6.7: Process parameters for Coal “A”
Fuel flow rate 4.5 kg/hr
Carrier CO2 gas flow rate 10 LPM
Air flow rate 0.001m/s
Inlet Fuel and Air Temperature 320K
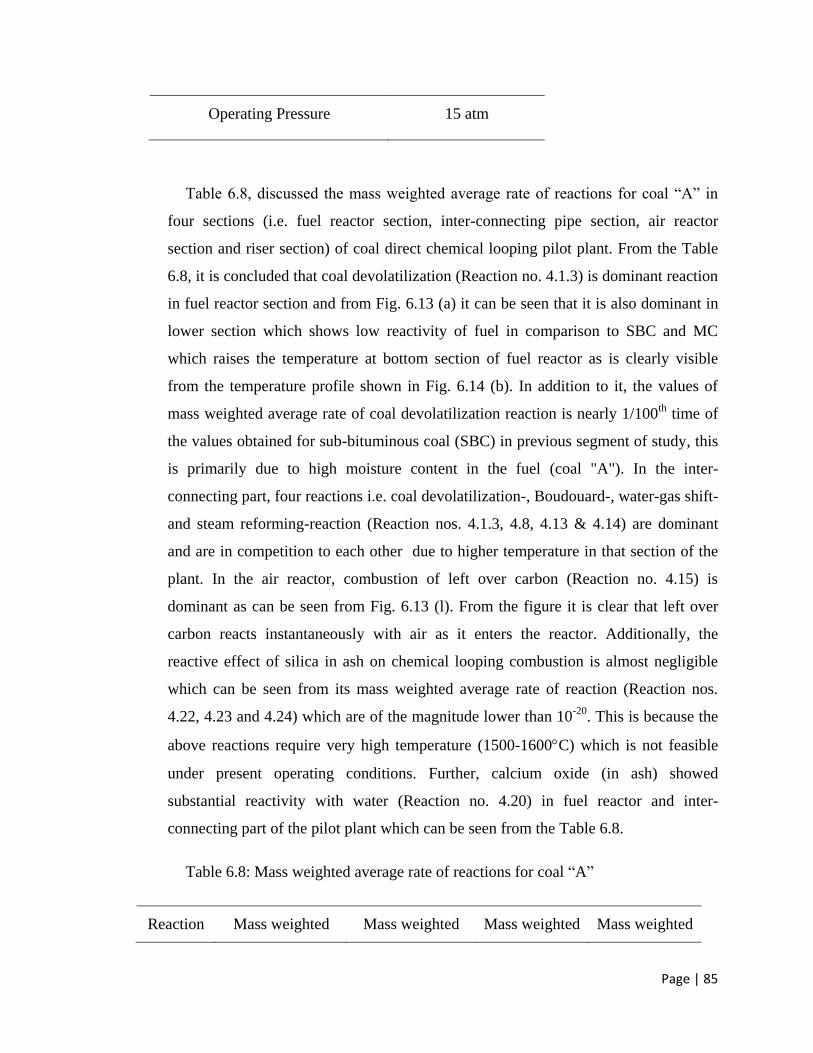
Page | 85
Operating Pressure 15 atm
Table 6.8, discussed the mass weighted average rate of reactions for coal “A” in
four sections (i.e. fuel reactor section, inter-connecting pipe section, air reactor
section and riser section) of coal direct chemical looping pilot plant. From the Table
6.8, it is concluded that coal devolatilization (Reaction no. 4.1.3) is dominant reaction
in fuel reactor section and from Fig. 6.13 (a) it can be seen that it is also dominant in
lower section which shows low reactivity of fuel in comparison to SBC and MC
which raises the temperature at bottom section of fuel reactor as is clearly visible
from the temperature profile shown in Fig. 6.14 (b). In addition to it, the values of
mass weighted average rate of coal devolatilization reaction is nearly 1/100th
time of
the values obtained for sub-bituminous coal (SBC) in previous segment of study, this
is primarily due to high moisture content in the fuel (coal "A"). In the inter-
connecting part, four reactions i.e. coal devolatilization-, Boudouard-, water-gas shift-
and steam reforming-reaction (Reaction nos. 4.1.3, 4.8, 4.13 & 4.14) are dominant
and are in competition to each other due to higher temperature in that section of the
plant. In the air reactor, combustion of left over carbon (Reaction no. 4.15) is
dominant as can be seen from Fig. 6.13 (l). From the figure it is clear that left over
carbon reacts instantaneously with air as it enters the reactor. Additionally, the
reactive effect of silica in ash on chemical looping combustion is almost negligible
which can be seen from its mass weighted average rate of reaction (Reaction nos.
4.22, 4.23 and 4.24) which are of the magnitude lower than 10-20
. This is because the
above reactions require very high temperature (1500-1600C) which is not feasible
under present operating conditions. Further, calcium oxide (in ash) showed
substantial reactivity with water (Reaction no. 4.20) in fuel reactor and inter-
connecting part of the pilot plant which can be seen from the Table 6.8.
Table 6.8: Mass weighted average rate of reactions for coal “A”
Reaction Mass weighted Mass weighted Mass weighted Mass weighted
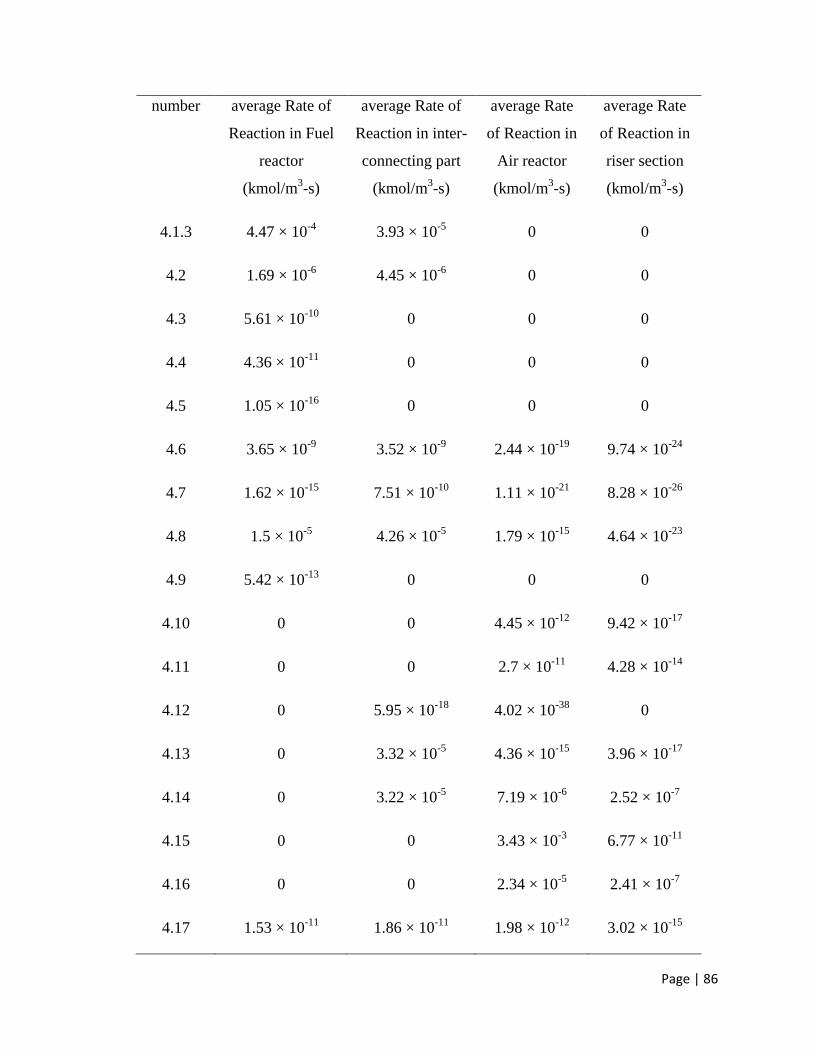
Page | 86
number average Rate of
Reaction in Fuel
reactor
(kmol/m3-s)
average Rate of
Reaction in inter-
connecting part
(kmol/m3-s)
average Rate
of Reaction in
Air reactor
(kmol/m3-s)
average Rate
of Reaction in
riser section
(kmol/m3-s)
4.1.3 4.47 × 10⁻⁴
3.93 × 10⁻⁵
0 0
4.2 1.69 × 10⁻⁶
4.45 × 10⁻⁶
0 0
4.3 5.61 × 10⁻¹⁰
0 0 0
4.4 4.36 × 10⁻¹¹
0 0 0
4.5 1.05 × 10⁻¹⁶
0 0 0
4.6 3.65 × 10⁻⁹
3.52 × 10⁻⁹
2.44 × 10⁻¹⁹
9.74 × 10⁻²⁴
4.7 1.62 × 10⁻¹⁵
7.51 × 10⁻¹⁰
1.11 × 10⁻²¹
8.28 × 10⁻²⁶
4.8 1.5 × 10⁻⁵
4.26 × 10⁻⁵
1.79 × 10⁻¹⁵
4.64 × 10⁻²³
4.9 5.42 × 10⁻¹³
0 0 0
4.10 0 0 4.45 × 10⁻¹²
9.42 × 10⁻¹⁷
4.11 0 0 2.7 × 10⁻¹¹
4.28 × 10⁻¹⁴
4.12 0 5.95 × 10⁻¹⁸
4.02 × 10-38
0
4.13 0 3.32 × 10⁻⁵
4.36 × 10⁻¹⁵
3.96 × 10⁻¹⁷
4.14 0 3.22 × 10⁻⁵
7.19 × 10⁻⁶
2.52 × 10⁻⁷
4.15 0 0 3.43 × 10⁻³
6.77 × 10⁻¹¹
4.16 0 0 2.34 × 10⁻⁵
2.41 × 10⁻⁷
4.17 1.53 × 10⁻¹¹
1.86 × 10⁻¹¹
1.98 × 10⁻¹²
3.02 × 10⁻¹⁵
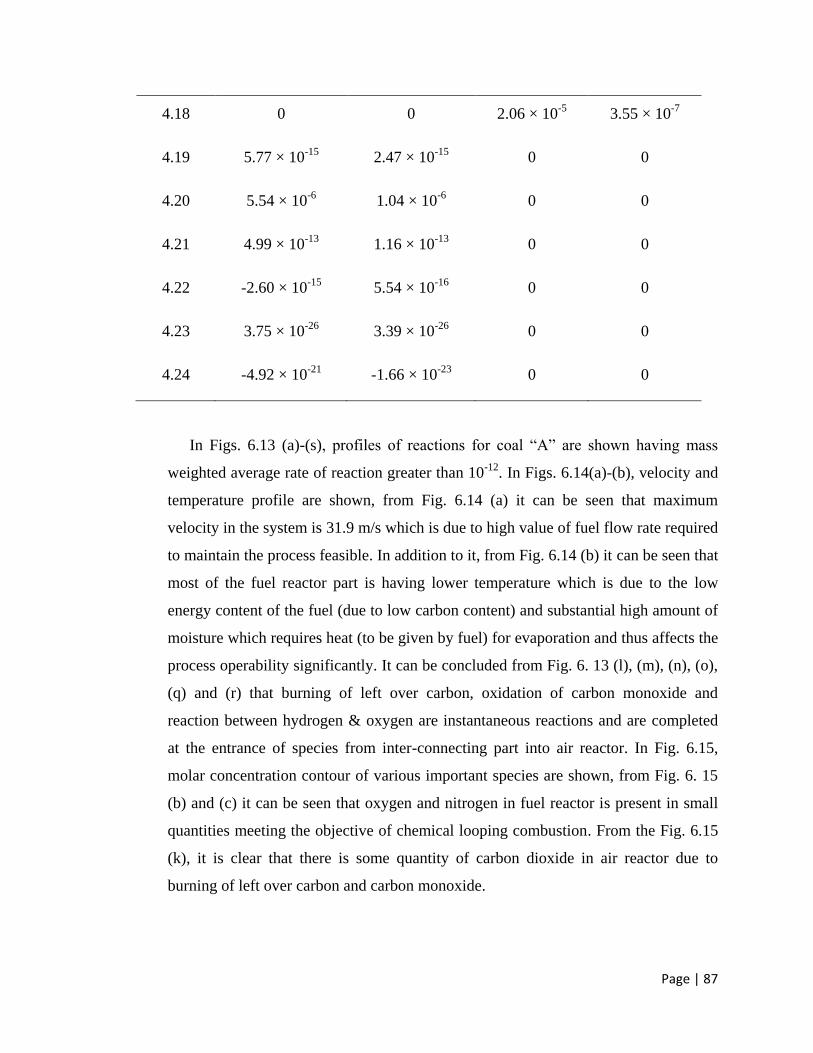
Page | 87
4.18 0 0 2.06 × 10⁻⁵
3.55 × 10⁻⁷
4.19 5.77 × 10⁻¹⁵
2.47 × 10⁻¹⁵
0 0
4.20 5.54 × 10⁻⁶
1.04 × 10⁻⁶
0 0
4.21 4.99 × 10⁻¹³
1.16 × 10⁻¹³
0 0
4.22 -2.60 × 10⁻¹⁵
5.54 × 10⁻¹⁶
0 0
4.23 3.75 × 10⁻²⁶
3.39 × 10⁻²⁶
0 0
4.24 -4.92 × 10⁻²¹
-1.66 × 10⁻²³
0 0
In Figs. 6.13 (a)-(s), profiles of reactions for coal “A” are shown having mass
weighted average rate of reaction greater than 10-12
. In Figs. 6.14(a)-(b), velocity and
temperature profile are shown, from Fig. 6.14 (a) it can be seen that maximum
velocity in the system is 31.9 m/s which is due to high value of fuel flow rate required
to maintain the process feasible. In addition to it, from Fig. 6.14 (b) it can be seen that
most of the fuel reactor part is having lower temperature which is due to the low
energy content of the fuel (due to low carbon content) and substantial high amount of
moisture which requires heat (to be given by fuel) for evaporation and thus affects the
process operability significantly. It can be concluded from Fig. 6. 13 (l), (m), (n), (o),
(q) and (r) that burning of left over carbon, oxidation of carbon monoxide and
reaction between hydrogen & oxygen are instantaneous reactions and are completed
at the entrance of species from inter-connecting part into air reactor. In Fig. 6.15,
molar concentration contour of various important species are shown, from Fig. 6. 15
(b) and (c) it can be seen that oxygen and nitrogen in fuel reactor is present in small
quantities meeting the objective of chemical looping combustion. From the Fig. 6.15
(k), it is clear that there is some quantity of carbon dioxide in air reactor due to
burning of left over carbon and carbon monoxide.
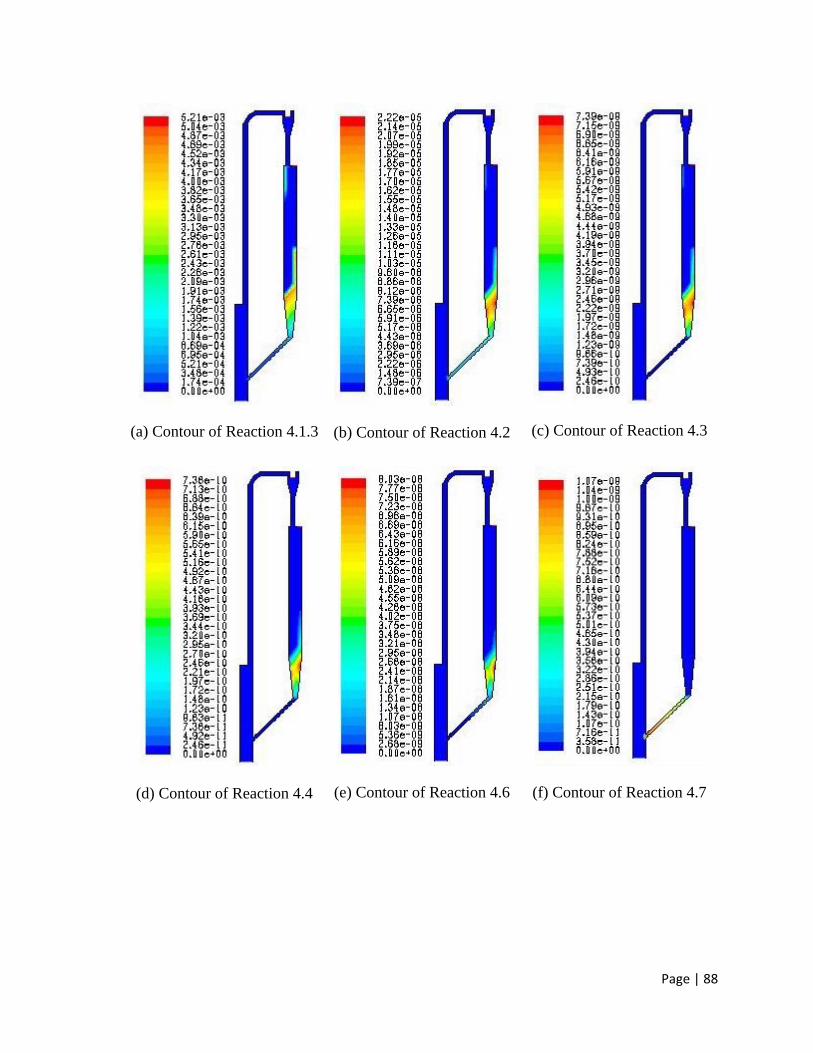
Page | 88
(a) Contour of Reaction 4.1.3
(b) Contour of Reaction 4.2
(c) Contour of Reaction 4.3
(d) Contour of Reaction 4.4
(e) Contour of Reaction 4.6
(f) Contour of Reaction 4.7
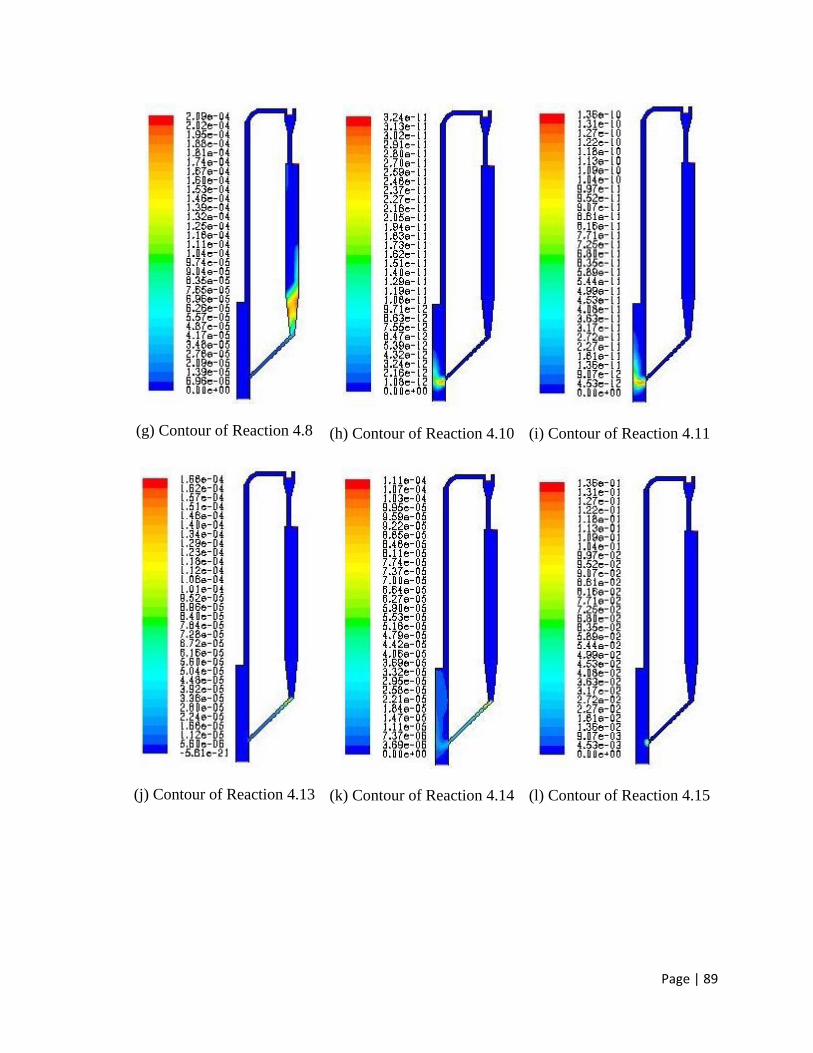
Page | 89
(g) Contour of Reaction 4.8
(h) Contour of Reaction 4.10
(i) Contour of Reaction 4.11
(j) Contour of Reaction 4.13
(k) Contour of Reaction 4.14
(l) Contour of Reaction 4.15
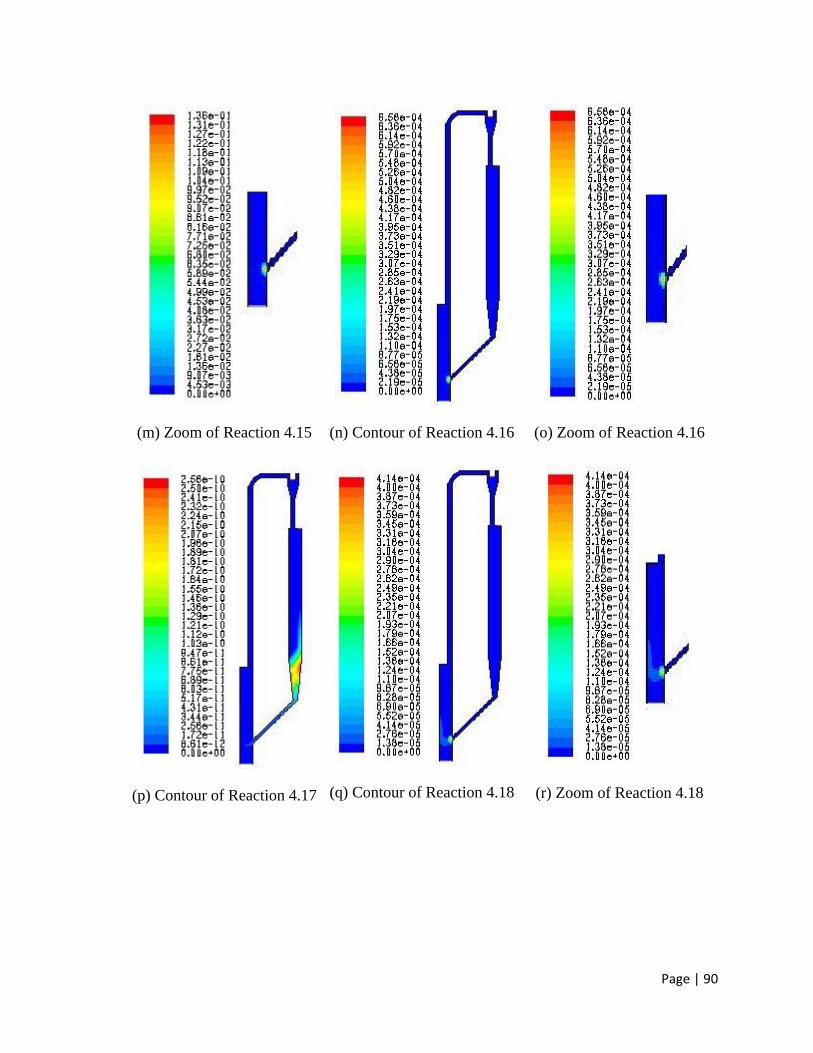
Page | 90
(m) Zoom of Reaction 4.15
(n) Contour of Reaction 4.16
(o) Zoom of Reaction 4.16
(p) Contour of Reaction 4.17
(q) Contour of Reaction 4.18
(r) Zoom of Reaction 4.18
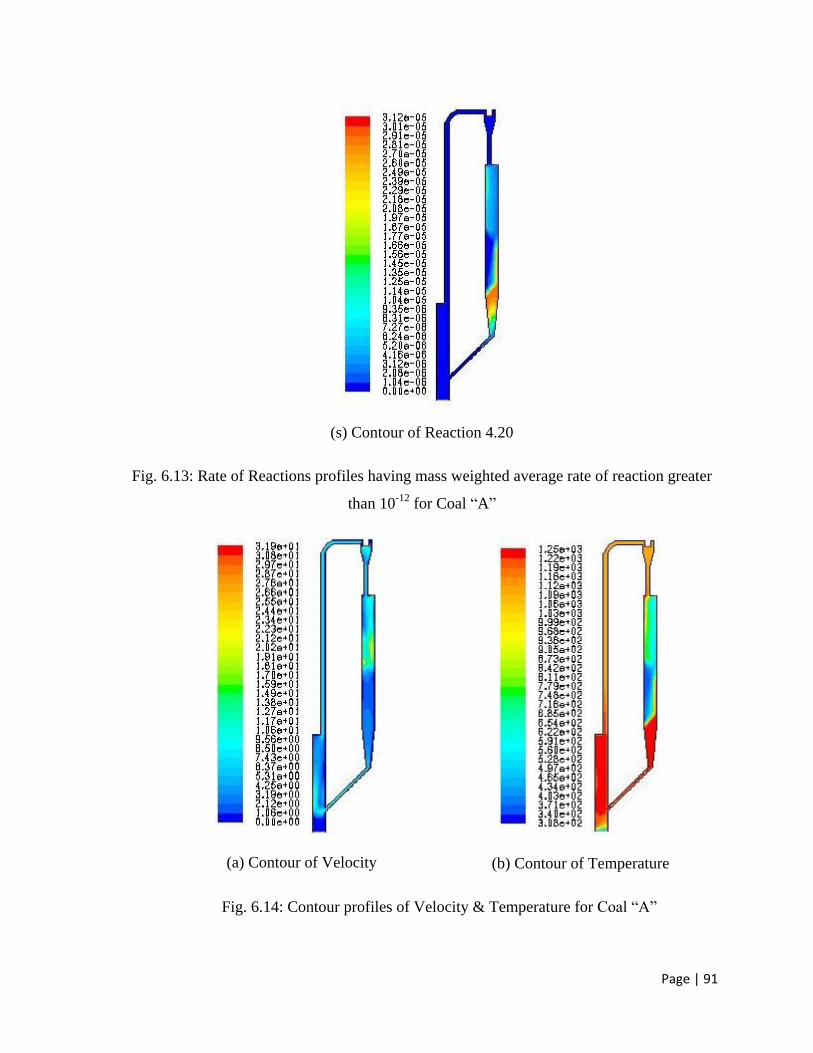
Page | 91
(s) Contour of Reaction 4.20
Fig. 6.13: Rate of Reactions profiles having mass weighted average rate of reaction greater
than 10-12
for Coal “A”
(a) Contour of Velocity
(b) Contour of Temperature
Fig. 6.14: Contour profiles of Velocity & Temperature for Coal “A”
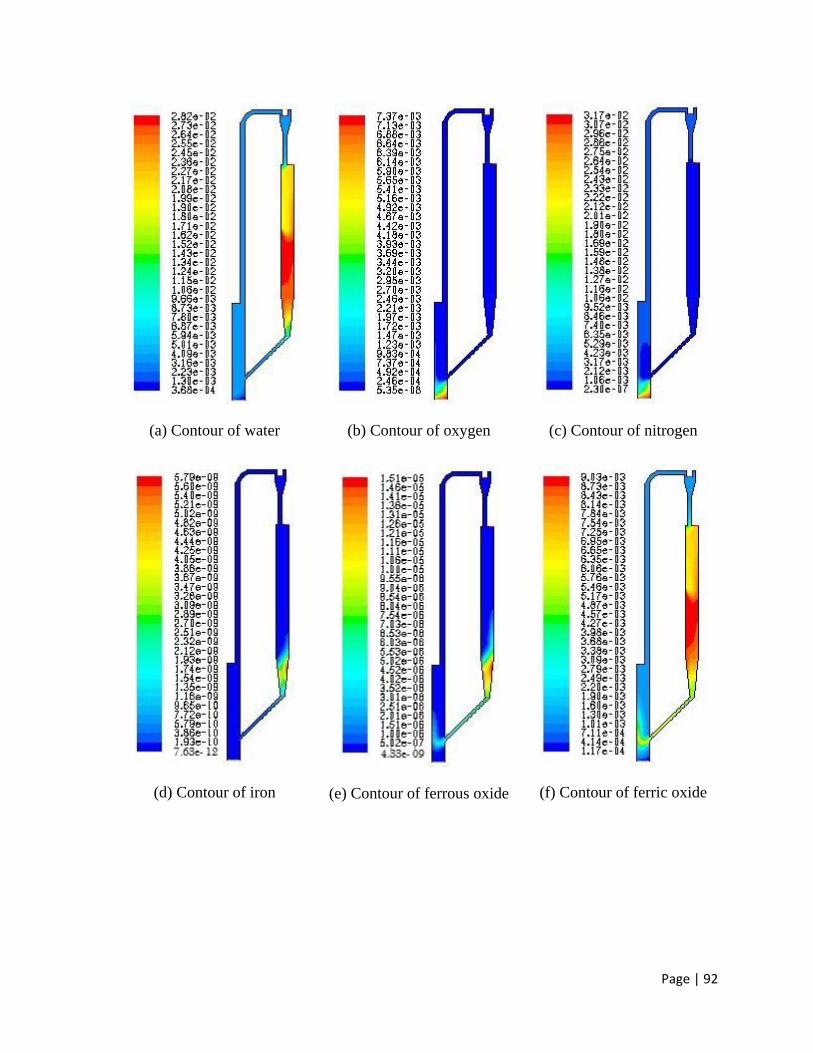
Page | 92
(a) Contour of water
(b) Contour of oxygen
(c) Contour of nitrogen
(d) Contour of iron
(e) Contour of ferrous oxide
(f) Contour of ferric oxide
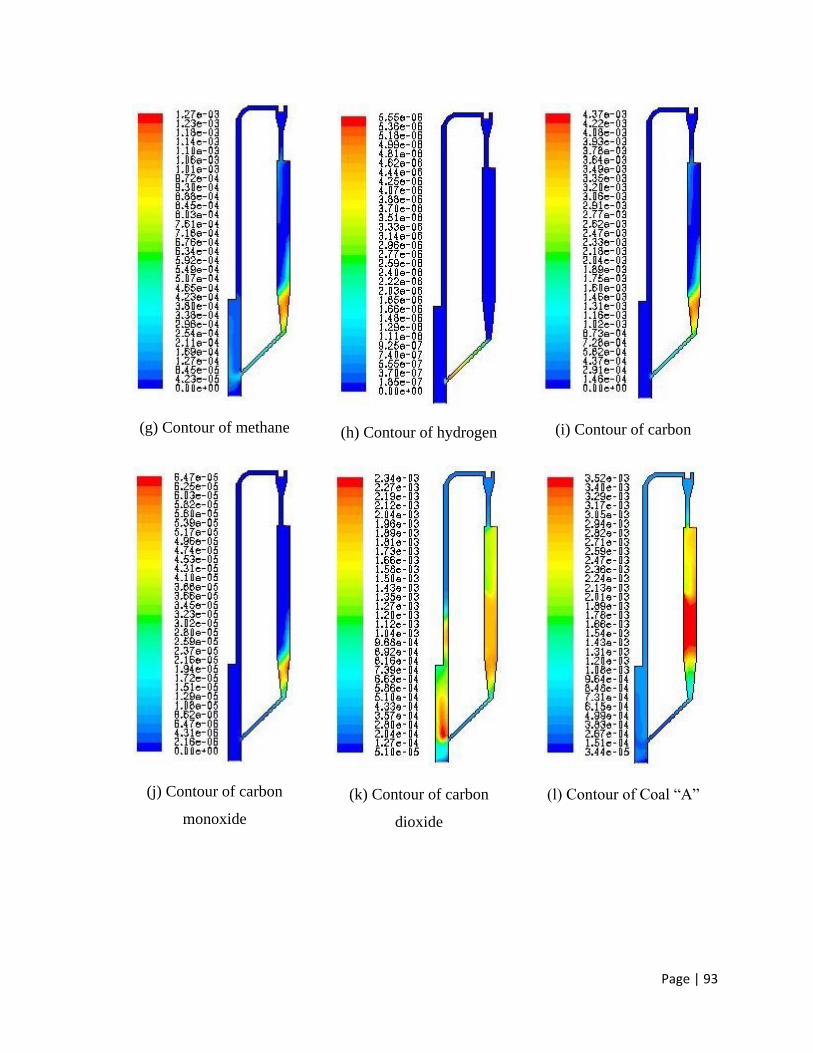
Page | 93
(g) Contour of methane
(h) Contour of hydrogen
(i) Contour of carbon
(j) Contour of carbon
monoxide
(k) Contour of carbon
dioxide
(l) Contour of Coal “A”
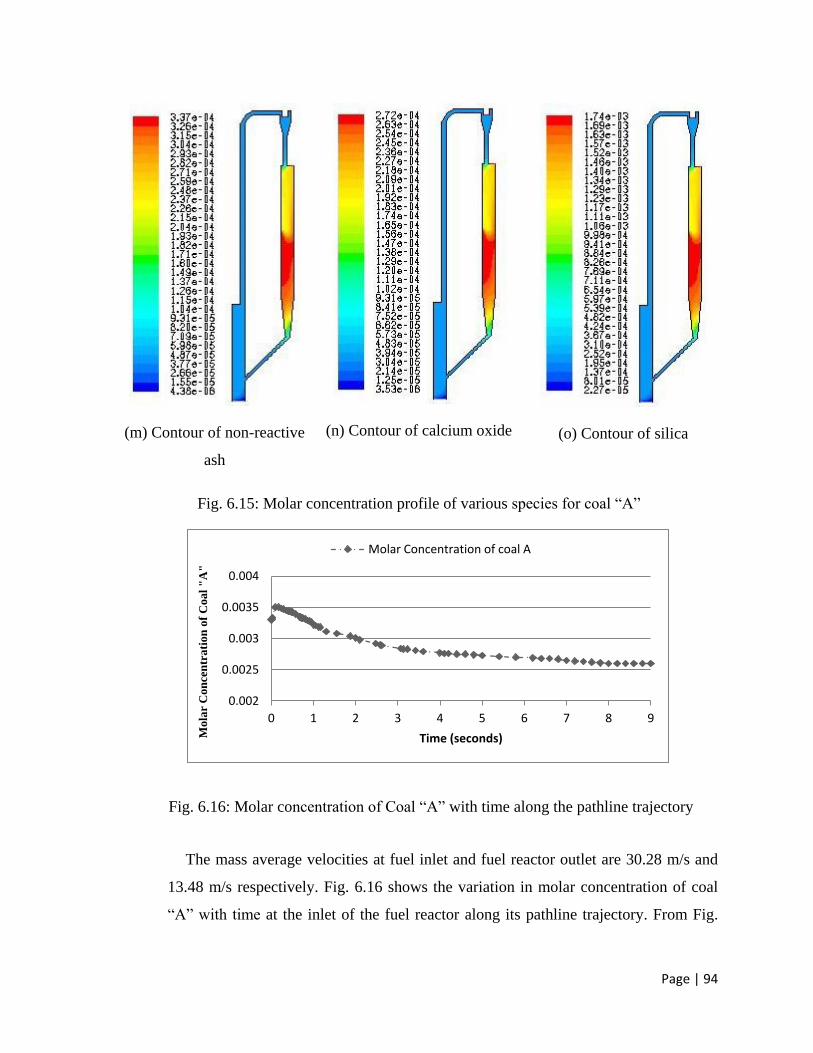
Page | 94
(m) Contour of non-reactive
ash
(n) Contour of calcium oxide
(o) Contour of silica
Fig. 6.15: Molar concentration profile of various species for coal “A”
Fig. 6.16: Molar concentration of Coal “A” with time along the pathline trajectory
The mass average velocities at fuel inlet and fuel reactor outlet are 30.28 m/s and
13.48 m/s respectively. Fig. 6.16 shows the variation in molar concentration of coal
“A” with time at the inlet of the fuel reactor along its pathline trajectory. From Fig.
0.002
0.0025
0.003
0.0035
0.004
0 1 2 3 4 5 6 7 8 9
Mola
r C
on
cen
trati
on
of
Coal
"A
"
Time (seconds)
Molar Concentration of coal A
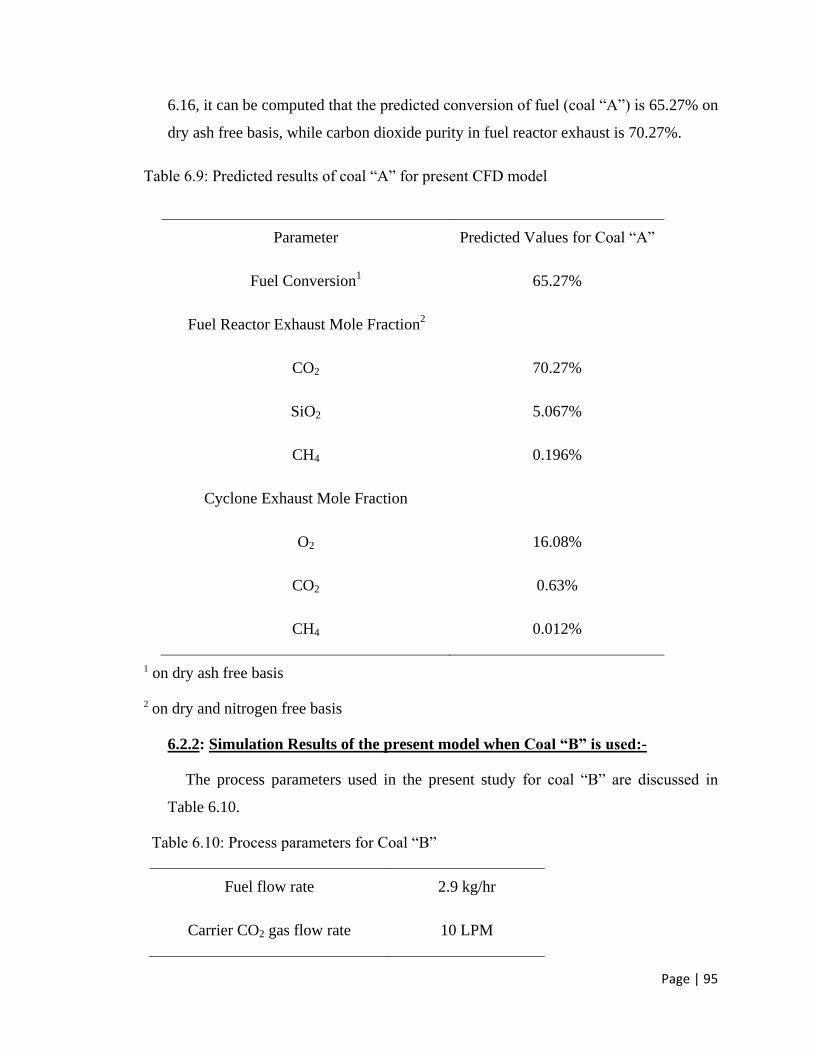
Page | 95
6.16, it can be computed that the predicted conversion of fuel (coal “A”) is 65.27% on
dry ash free basis, while carbon dioxide purity in fuel reactor exhaust is 70.27%.
Table 6.9: Predicted results of coal “A” for present CFD model
Parameter Predicted Values for Coal “A”
Fuel Conversion1 65.27%
Fuel Reactor Exhaust Mole Fraction2
CO2 70.27%
SiO2 5.067%
CH4
0.196%
Cyclone Exhaust Mole Fraction
O2 16.08%
CO2 0.63%
CH4 0.012%
1 on dry ash free basis
2 on dry and nitrogen free basis
6.2.2: Simulation Results of the present model when Coal “B” is used:-
The process parameters used in the present study for coal “B” are discussed in
Table 6.10.
Table 6.10: Process parameters for Coal “B”
Fuel flow rate 2.9 kg/hr
Carrier CO2 gas flow rate 10 LPM
Page | 96
Air flow rate 0.001m/s
Inlet Fuel and Air Temperature 320K
Operating Pressure 10 atm
Table 6.11, discussed the mass weighted average rate of reactions for coal “B” in
four sections (i.e. fuel reactor section, inter-connecting pipe section, air reactor
section and riser section) of coal direct chemical looping pilot plant. From the Table
6.11, it is concluded that coal devolatilization (Reaction no. 4.1.4) is dominant
reaction in fuel reactor section and from Fig. 6.17 (a) it can be seen that it is mainly
dominant in lower section of the fuel reactor where the temperature at the bottom
section of fuel reactor is at higher side as is clearly visible from the temperature
profile shown in Fig. 6.18 (b). In addition to it, the value of mass weighted average
rate of coal devolatilization reaction is nearly 1/1000th
time of the values obtained for
metallurgical coke (MC) in previous segment of study; this is primarily due to the
high amount of ash in the fuel (coal “B”) and low calorific value. In the inter-
connecting part, two reactions i.e., coal devolatilization, reduction of ferrous oxide by
carbon monoxide (Reaction nos. 4.1.4, & 4.6) are dominant and are in competition to
each other due to higher temperature in that section of the plant. In the air reactor,
combustion of left over carbon and reaction between hydrogen & oxygen (Reaction
nos. 4.15 & 4.18) are dominant as can be seen from Fig. 6.17 (j) and (n). From the
figure it is clear that left over carbon and hydrogen entering in air reactor reacts
instantaneously as it enters the reactor with air. Additionally, the reactive effect of
silica (present in ash) on chemical looping combustion is almost negligible which can
be seen from its mass weighted average rate of reaction (Reaction nos. 4.22, 4.23 and
4.24) which are of the magnitude lower than 10-20
. This is because the above reactions
of silica requires very high temperature in the range of 1500-1600⁰C which is not
feasible in the present operation condition. Further, calcium oxide present in ash
shows a significant reactivity with water (Reaction no. 4.20) in fuel reactor & inter-
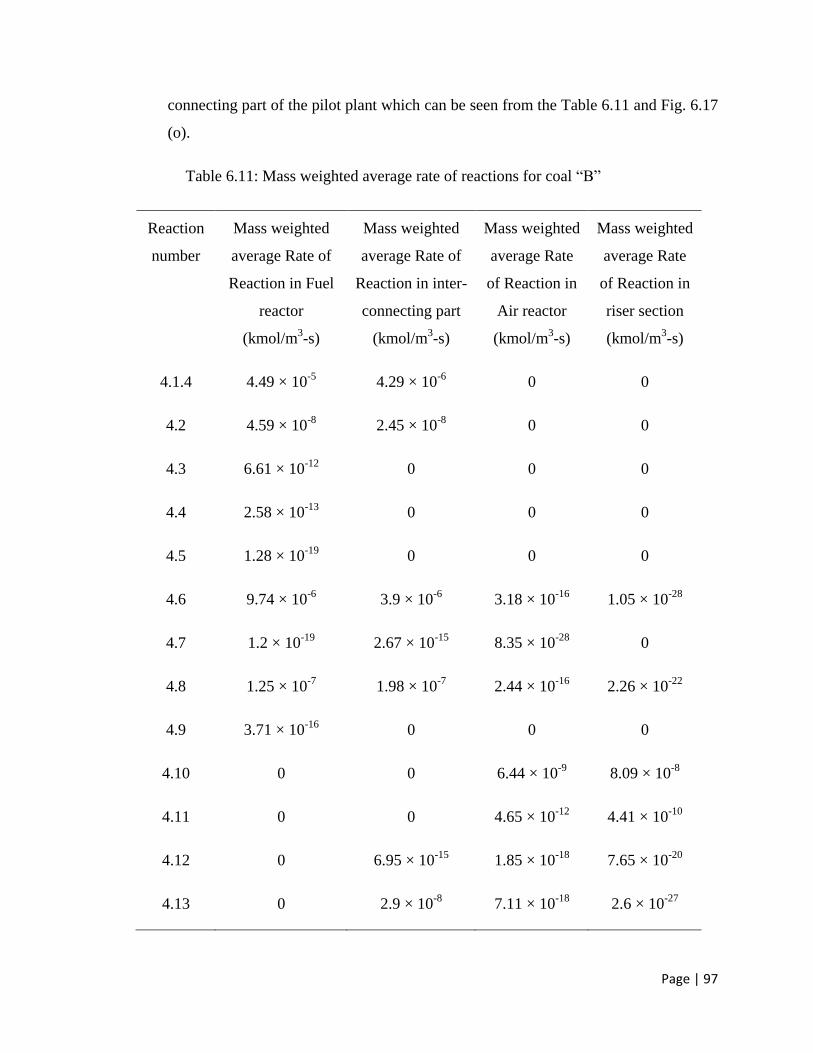
Page | 97
connecting part of the pilot plant which can be seen from the Table 6.11 and Fig. 6.17
(o).
Table 6.11: Mass weighted average rate of reactions for coal “B”
Reaction
number
Mass weighted
average Rate of
Reaction in Fuel
reactor
(kmol/m3-s)
Mass weighted
average Rate of
Reaction in inter-
connecting part
(kmol/m3-s)
Mass weighted
average Rate
of Reaction in
Air reactor
(kmol/m3-s)
Mass weighted
average Rate
of Reaction in
riser section
(kmol/m3-s)
4.1.4 4.49 × 10⁻⁵
4.29 × 10⁻⁶
0 0
4.2 4.59 × 10⁻⁸
2.45 × 10⁻⁸
0 0
4.3 6.61 × 10⁻¹²
0 0 0
4.4 2.58 × 10⁻¹³
0 0 0
4.5 1.28 × 10⁻¹⁹
0 0 0
4.6 9.74 × 10⁻⁶
3.9 × 10⁻⁶
3.18 × 10⁻¹⁶
1.05 × 10⁻²⁸
4.7 1.2 × 10⁻¹⁹
2.67 × 10⁻¹⁵
8.35 × 10⁻²⁸
0
4.8 1.25 × 10⁻⁷
1.98 × 10⁻⁷
2.44 × 10⁻¹⁶
2.26 × 10⁻²²
4.9 3.71 × 10⁻¹⁶
0 0 0
4.10 0 0 6.44 × 10⁻⁹
8.09 × 10⁻⁸
4.11 0 0 4.65 × 10⁻¹²
4.41 × 10⁻¹⁰
4.12 0 6.95 × 10⁻¹⁵
1.85 × 10⁻¹⁸
7.65 × 10⁻²⁰
4.13 0 2.9 × 10⁻⁸
7.11 × 10⁻¹⁸
2.6 × 10⁻²⁷
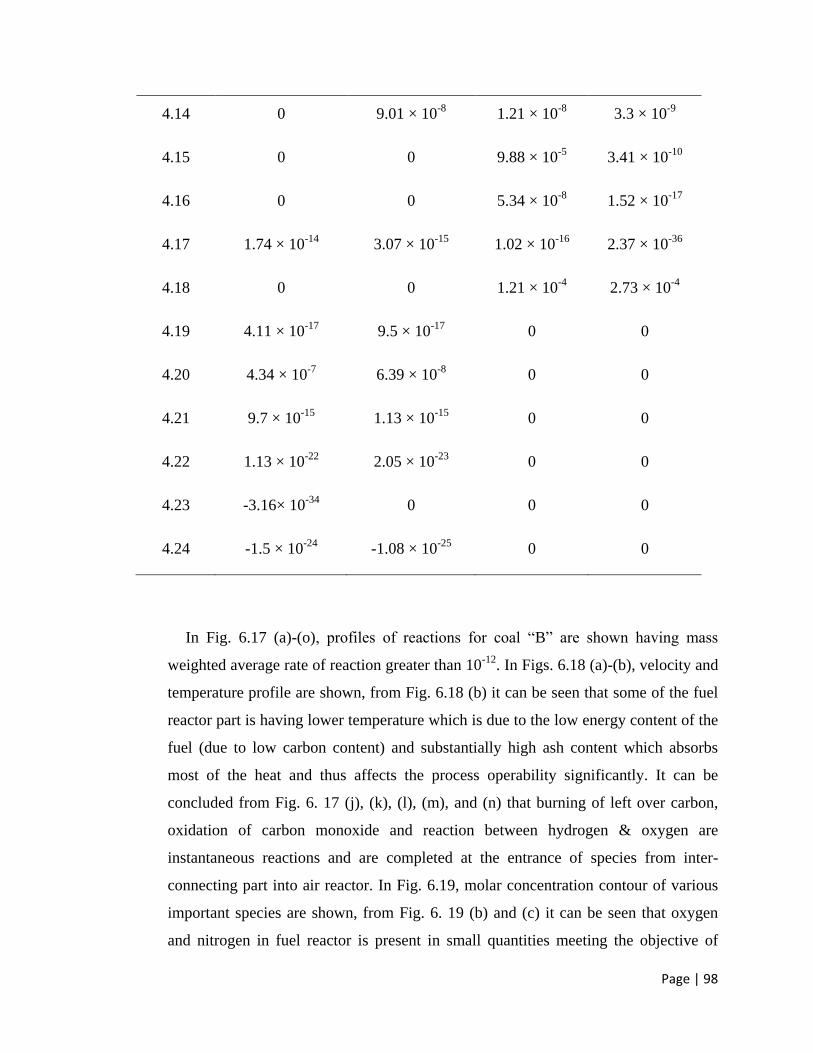
Page | 98
4.14 0 9.01 × 10⁻⁸
1.21 × 10⁻⁸
3.3 × 10⁻⁹
4.15 0 0 9.88 × 10⁻⁵
3.41 × 10⁻¹⁰
4.16 0 0 5.34 × 10⁻⁸
1.52 × 10⁻¹⁷
4.17 1.74 × 10⁻¹⁴
3.07 × 10⁻¹⁵
1.02 × 10⁻¹⁶
2.37 × 10-36
4.18 0 0 1.21 × 10⁻⁴
2.73 × 10⁻⁴
4.19 4.11 × 10⁻¹⁷
9.5 × 10⁻¹⁷
0 0
4.20 4.34 × 10⁻⁷
6.39 × 10⁻⁸
0 0
4.21 9.7 × 10⁻¹⁵
1.13 × 10⁻¹⁵
0 0
4.22 1.13 × 10⁻²²
2.05 × 10⁻²³
0 0
4.23 -3.16× 10⁻³⁴
0
0 0
4.24 -1.5 × 10⁻²⁴
-1.08 × 10⁻²⁵
0 0
In Fig. 6.17 (a)-(o), profiles of reactions for coal “B” are shown having mass
weighted average rate of reaction greater than 10-12
. In Figs. 6.18 (a)-(b), velocity and
temperature profile are shown, from Fig. 6.18 (b) it can be seen that some of the fuel
reactor part is having lower temperature which is due to the low energy content of the
fuel (due to low carbon content) and substantially high ash content which absorbs
most of the heat and thus affects the process operability significantly. It can be
concluded from Fig. 6. 17 (j), (k), (l), (m), and (n) that burning of left over carbon,
oxidation of carbon monoxide and reaction between hydrogen & oxygen are
instantaneous reactions and are completed at the entrance of species from inter-
connecting part into air reactor. In Fig. 6.19, molar concentration contour of various
important species are shown, from Fig. 6. 19 (b) and (c) it can be seen that oxygen
and nitrogen in fuel reactor is present in small quantities meeting the objective of
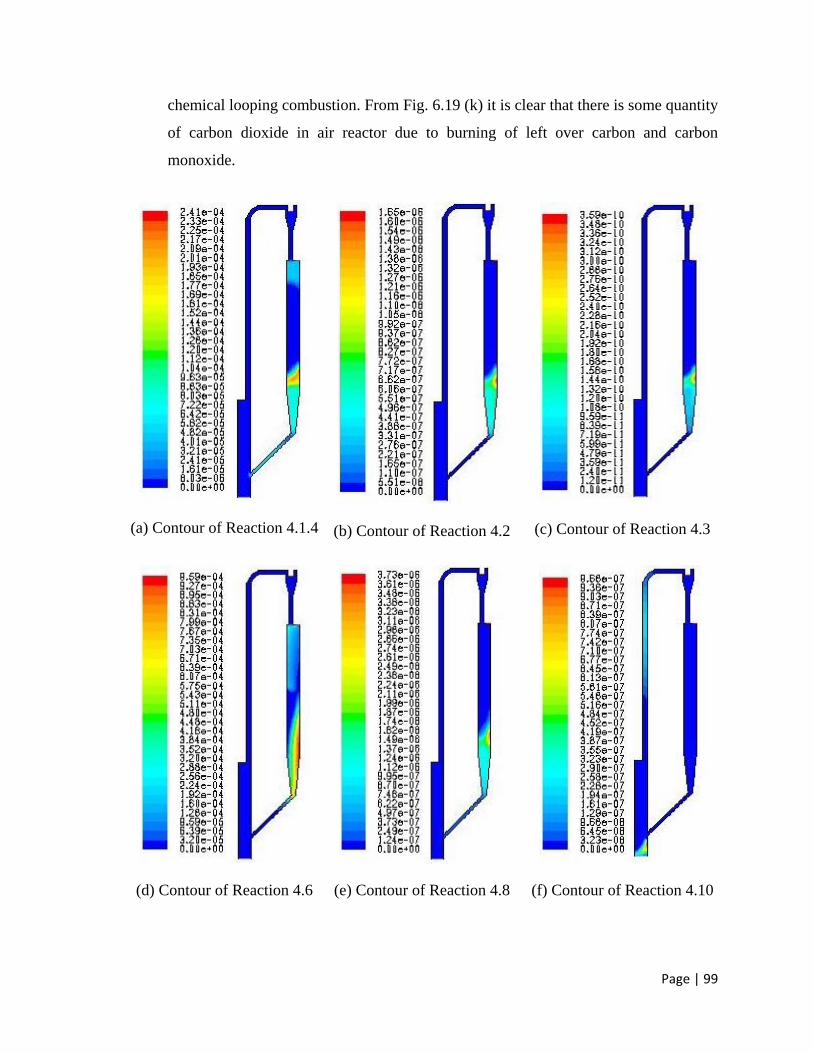
Page | 99
chemical looping combustion. From Fig. 6.19 (k) it is clear that there is some quantity
of carbon dioxide in air reactor due to burning of left over carbon and carbon
monoxide.
(a) Contour of Reaction 4.1.4
(b) Contour of Reaction 4.2
(c) Contour of Reaction 4.3
(d) Contour of Reaction 4.6
(e) Contour of Reaction 4.8
(f) Contour of Reaction 4.10
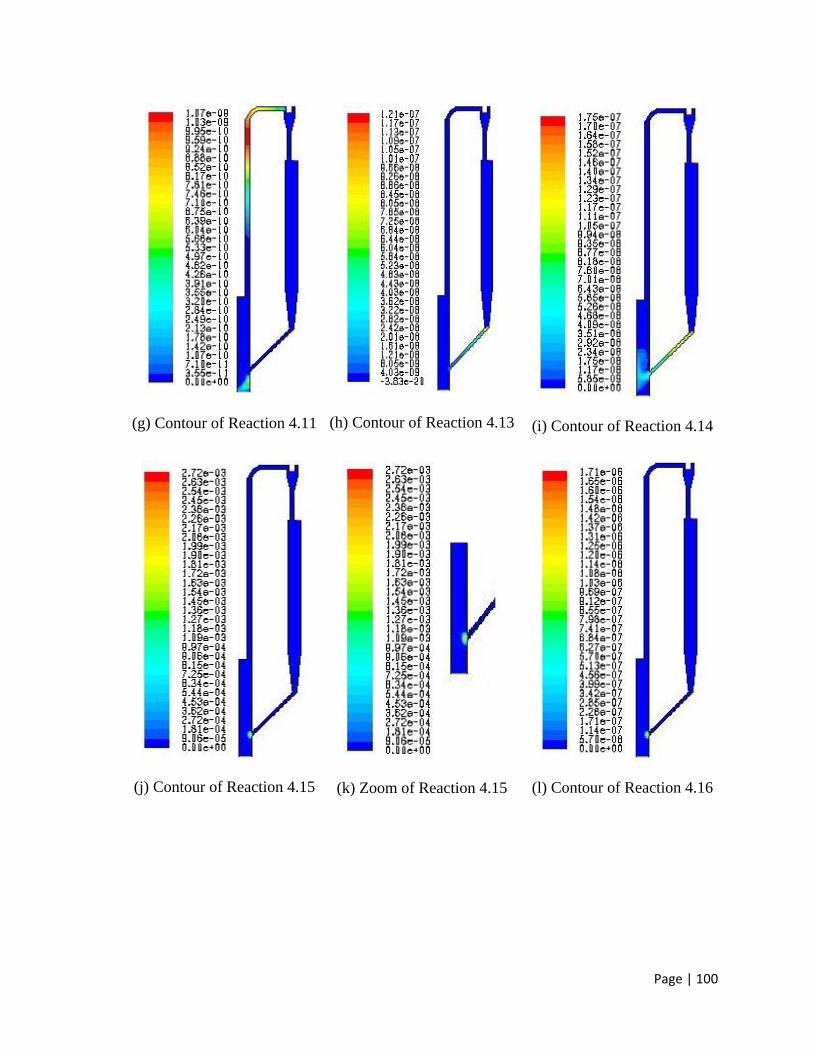
Page | 100
(g) Contour of Reaction 4.11
(h) Contour of Reaction 4.13
(i) Contour of Reaction 4.14
(j) Contour of Reaction 4.15
(k) Zoom of Reaction 4.15
(l) Contour of Reaction 4.16
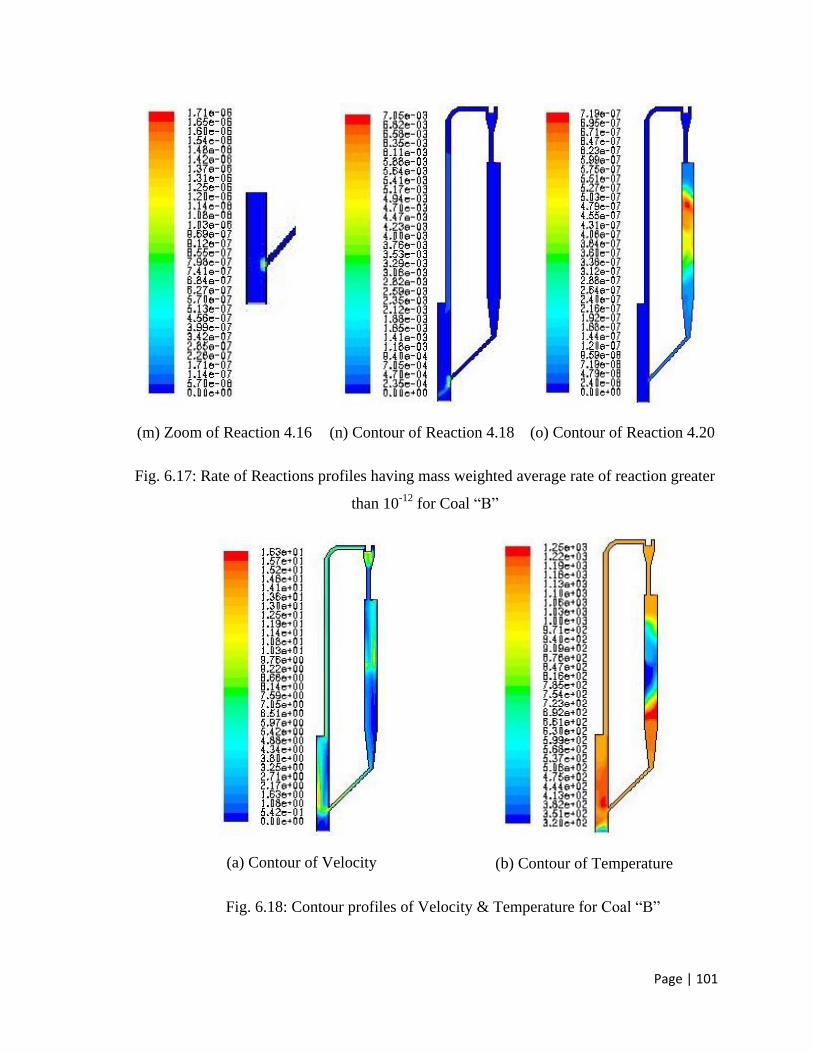
Page | 101
(m) Zoom of Reaction 4.16
(n) Contour of Reaction 4.18
(o) Contour of Reaction 4.20
Fig. 6.17: Rate of Reactions profiles having mass weighted average rate of reaction greater
than 10-12
for Coal “B”
(a) Contour of Velocity
(b) Contour of Temperature
Fig. 6.18: Contour profiles of Velocity & Temperature for Coal “B”
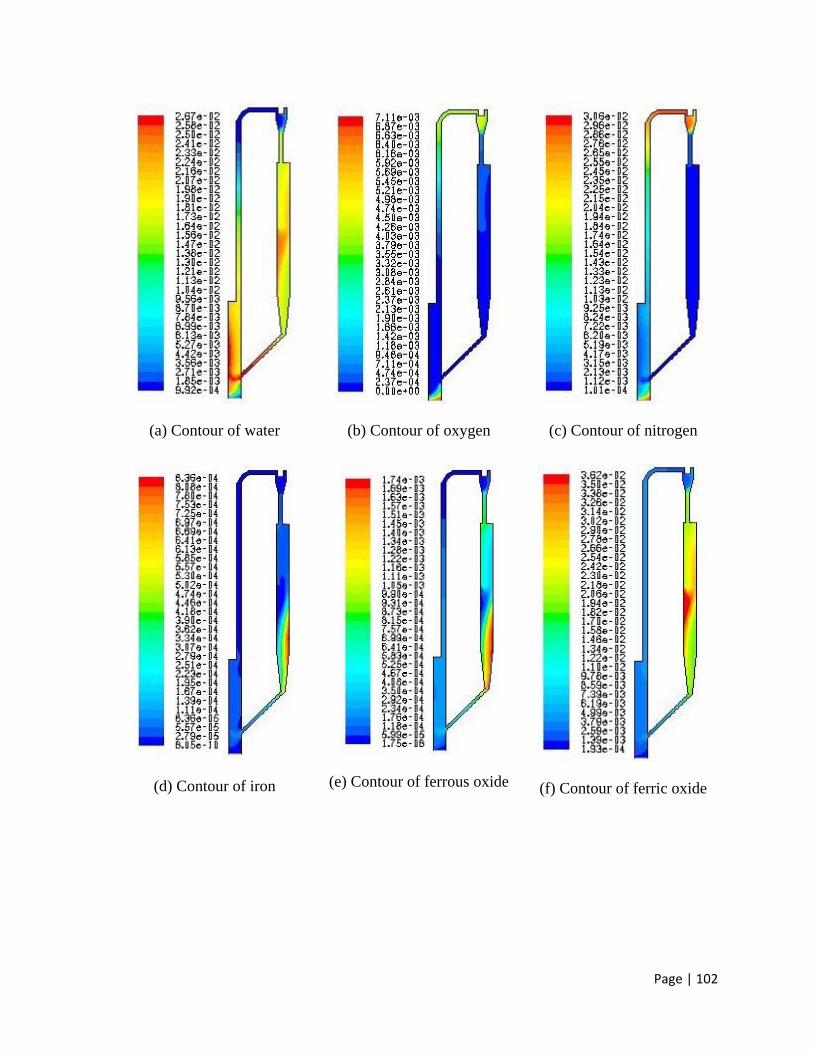
Page | 102
(a) Contour of water
(b) Contour of oxygen
(c) Contour of nitrogen
(d) Contour of iron
(e) Contour of ferrous oxide
(f) Contour of ferric oxide
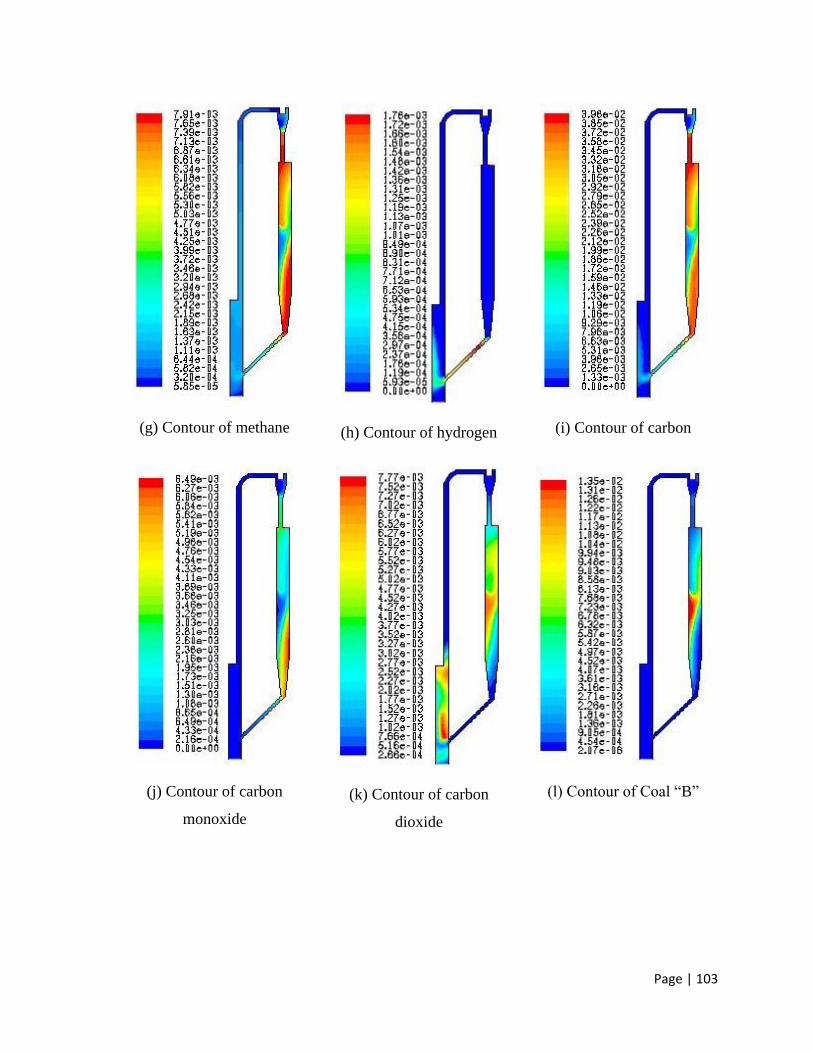
Page | 103
(g) Contour of methane
(h) Contour of hydrogen
(i) Contour of carbon
(j) Contour of carbon
monoxide
(k) Contour of carbon
dioxide
(l) Contour of Coal “B”
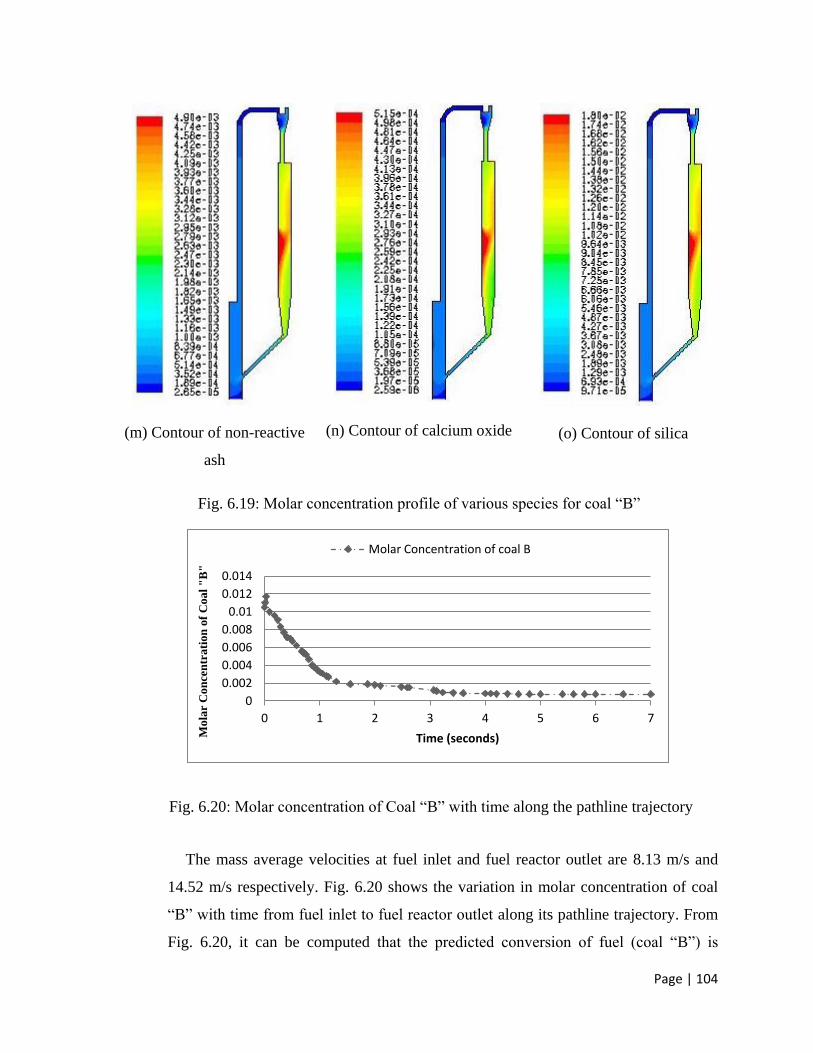
Page | 104
(m) Contour of non-reactive
ash
(n) Contour of calcium oxide
(o) Contour of silica
Fig. 6.19: Molar concentration profile of various species for coal “B”
Fig. 6.20: Molar concentration of Coal “B” with time along the pathline trajectory
The mass average velocities at fuel inlet and fuel reactor outlet are 8.13 m/s and
14.52 m/s respectively. Fig. 6.20 shows the variation in molar concentration of coal
“B” with time from fuel inlet to fuel reactor outlet along its pathline trajectory. From
Fig. 6.20, it can be computed that the predicted conversion of fuel (coal “B”) is
0
0.002
0.004
0.006
0.008
0.01
0.012
0.014
0 1 2 3 4 5 6 7
Mola
r C
on
cen
trati
on
of
Coal
"B
"
Time (seconds)
Molar Concentration of coal B
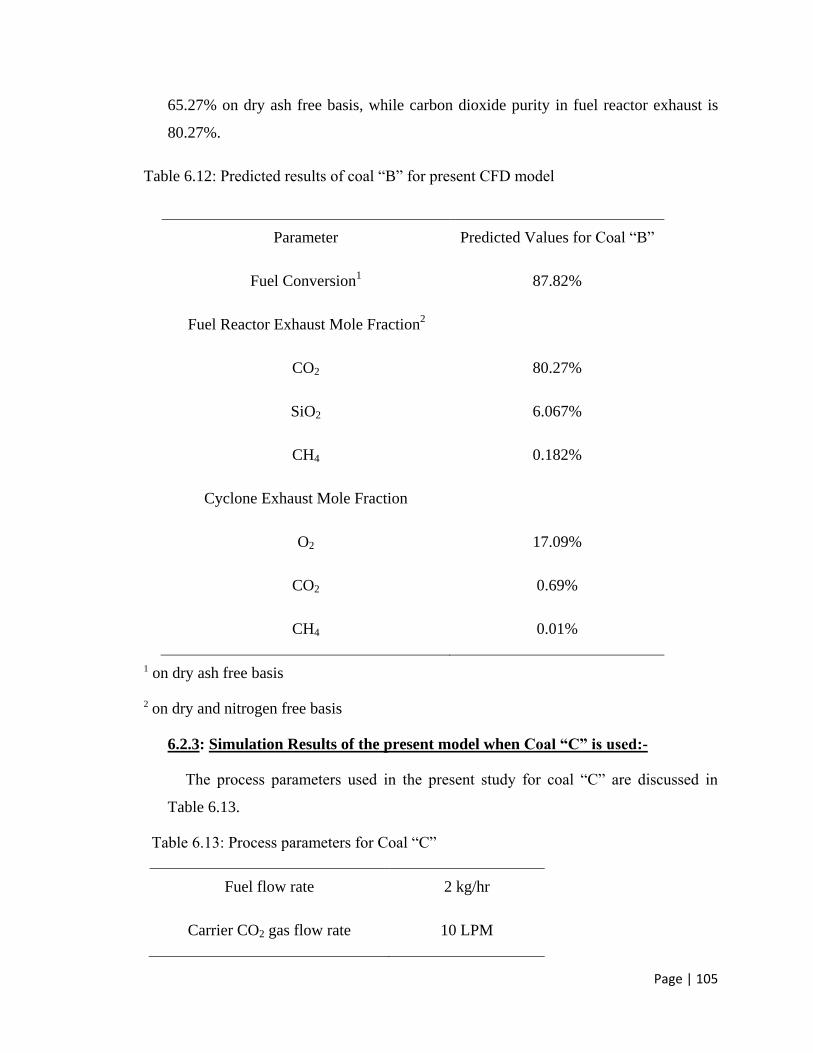
Page | 105
65.27% on dry ash free basis, while carbon dioxide purity in fuel reactor exhaust is
80.27%.
Table 6.12: Predicted results of coal “B” for present CFD model
Parameter Predicted Values for Coal “B”
Fuel Conversion1 87.82%
Fuel Reactor Exhaust Mole Fraction2
CO2 80.27%
SiO2 6.067%
CH4
0.182%
Cyclone Exhaust Mole Fraction
O2 17.09%
CO2 0.69%
CH4 0.01%
1 on dry ash free basis
2 on dry and nitrogen free basis
6.2.3: Simulation Results of the present model when Coal “C” is used:-
The process parameters used in the present study for coal “C” are discussed in
Table 6.13.
Table 6.13: Process parameters for Coal “C”
Fuel flow rate 2 kg/hr
Carrier CO2 gas flow rate 10 LPM
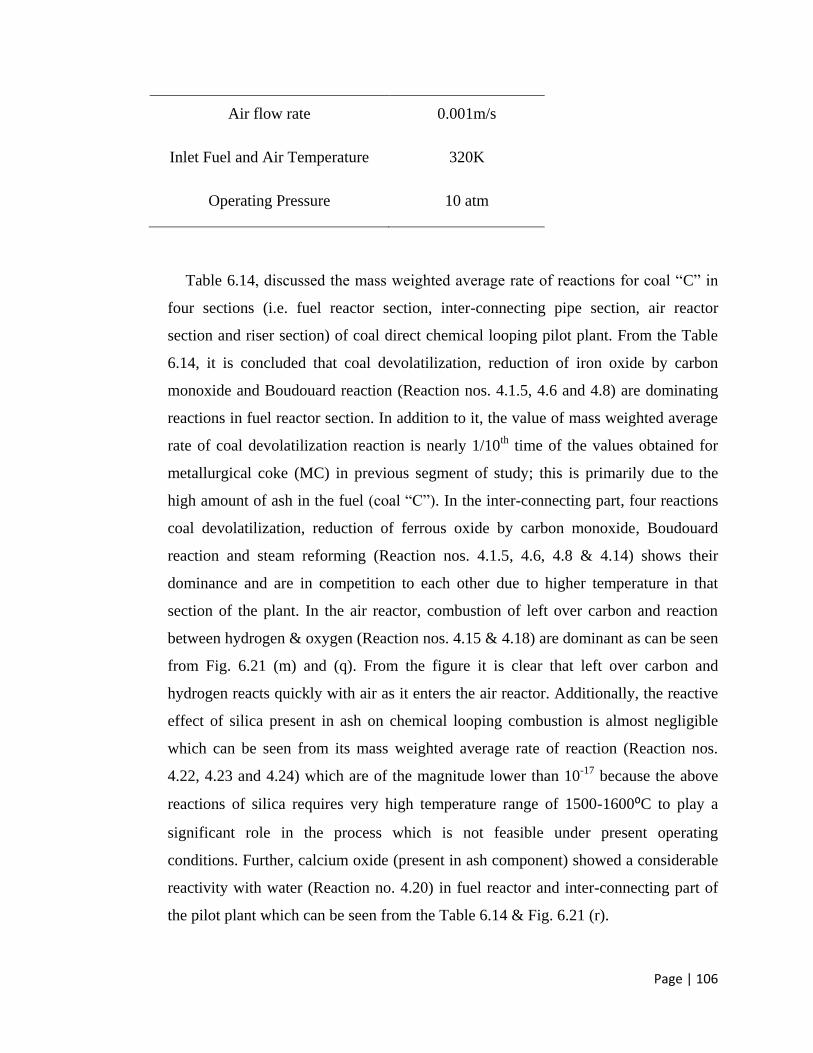
Page | 106
Air flow rate 0.001m/s
Inlet Fuel and Air Temperature 320K
Operating Pressure 10 atm
Table 6.14, discussed the mass weighted average rate of reactions for coal “C” in
four sections (i.e. fuel reactor section, inter-connecting pipe section, air reactor
section and riser section) of coal direct chemical looping pilot plant. From the Table
6.14, it is concluded that coal devolatilization, reduction of iron oxide by carbon
monoxide and Boudouard reaction (Reaction nos. 4.1.5, 4.6 and 4.8) are dominating
reactions in fuel reactor section. In addition to it, the value of mass weighted average
rate of coal devolatilization reaction is nearly 1/10th
time of the values obtained for
metallurgical coke (MC) in previous segment of study; this is primarily due to the
high amount of ash in the fuel (coal “C”). In the inter-connecting part, four reactions
coal devolatilization, reduction of ferrous oxide by carbon monoxide, Boudouard
reaction and steam reforming (Reaction nos. 4.1.5, 4.6, 4.8 & 4.14) shows their
dominance and are in competition to each other due to higher temperature in that
section of the plant. In the air reactor, combustion of left over carbon and reaction
between hydrogen & oxygen (Reaction nos. 4.15 & 4.18) are dominant as can be seen
from Fig. 6.21 (m) and (q). From the figure it is clear that left over carbon and
hydrogen reacts quickly with air as it enters the air reactor. Additionally, the reactive
effect of silica present in ash on chemical looping combustion is almost negligible
which can be seen from its mass weighted average rate of reaction (Reaction nos.
4.22, 4.23 and 4.24) which are of the magnitude lower than 10-17
because the above
reactions of silica requires very high temperature range of 1500-1600⁰C to play a
significant role in the process which is not feasible under present operating
conditions. Further, calcium oxide (present in ash component) showed a considerable
reactivity with water (Reaction no. 4.20) in fuel reactor and inter-connecting part of
the pilot plant which can be seen from the Table 6.14 & Fig. 6.21 (r).
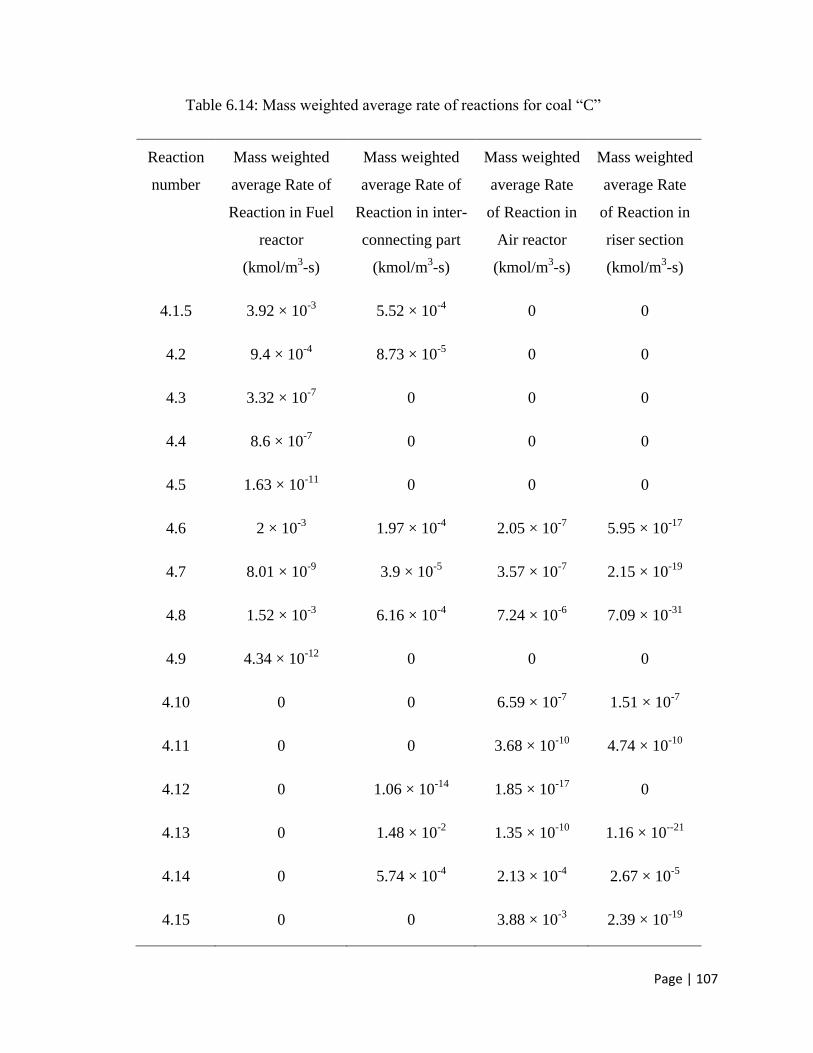
Page | 107
Table 6.14: Mass weighted average rate of reactions for coal “C”
Reaction
number
Mass weighted
average Rate of
Reaction in Fuel
reactor
(kmol/m3-s)
Mass weighted
average Rate of
Reaction in inter-
connecting part
(kmol/m3-s)
Mass weighted
average Rate
of Reaction in
Air reactor
(kmol/m3-s)
Mass weighted
average Rate
of Reaction in
riser section
(kmol/m3-s)
4.1.5 3.92 × 10⁻³
5.52 × 10⁻⁴
0 0
4.2 9.4 × 10⁻⁴
8.73 × 10⁻⁵
0 0
4.3 3.32 × 10⁻⁷
0 0 0
4.4 8.6 × 10⁻⁷
0 0 0
4.5 1.63 × 10⁻¹¹
0 0 0
4.6 2 × 10⁻³
1.97 × 10⁻⁴
2.05 × 10⁻⁷
5.95 × 10⁻¹⁷
4.7 8.01 × 10⁻⁹
3.9 × 10⁻⁵
3.57 × 10⁻⁷
2.15 × 10⁻¹⁹
4.8 1.52 × 10⁻³
6.16 × 10⁻⁴
7.24 × 10⁻⁶
7.09 × 10⁻³¹
4.9 4.34 × 10⁻¹²
0 0 0
4.10 0 0 6.59 × 10⁻⁷
1.51 × 10⁻⁷
4.11 0 0 3.68 × 10⁻¹⁰
4.74 × 10⁻¹⁰
4.12 0 1.06 × 10⁻¹⁴
1.85 × 10⁻¹⁷
0
4.13 0 1.48 × 10⁻²
1.35 × 10⁻¹⁰
1.16 × 10--21
4.14 0 5.74 × 10⁻⁴
2.13 × 10⁻⁴
2.67 × 10⁻⁵
4.15 0 0 3.88 × 10⁻³
2.39 × 10⁻¹⁹
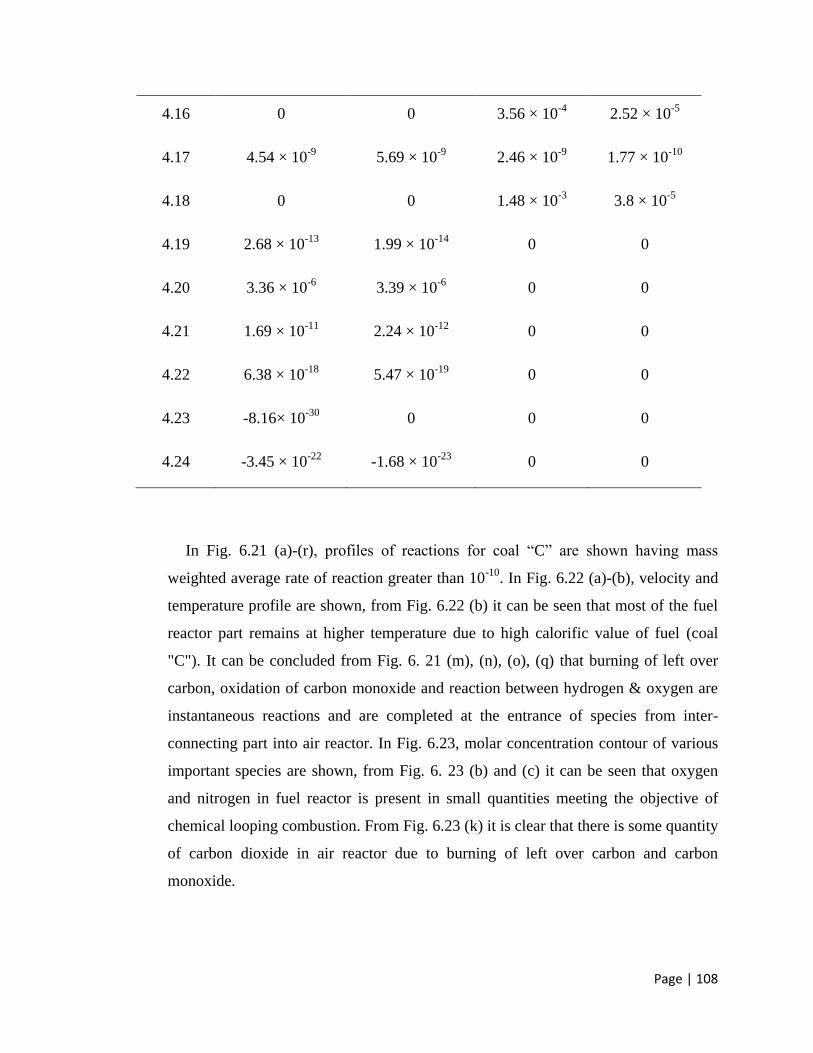
Page | 108
4.16 0 0 3.56 × 10⁻⁴
2.52 × 10⁻⁵
4.17 4.54 × 10⁻⁹
5.69 × 10⁻⁹
2.46 × 10⁻⁹
1.77 × 10⁻¹⁰
4.18 0 0 1.48 × 10⁻³
3.8 × 10⁻⁵
4.19 2.68 × 10⁻¹³
1.99 × 10⁻¹⁴
0 0
4.20 3.36 × 10⁻⁶
3.39 × 10⁻⁶
0 0
4.21 1.69 × 10⁻¹¹
2.24 × 10⁻¹²
0 0
4.22 6.38 × 10⁻¹⁸
5.47 × 10⁻¹⁹
0 0
4.23 -8.16× 10⁻³⁰
0
0 0
4.24 -3.45 × 10⁻²²
-1.68 × 10⁻²³
0 0
In Fig. 6.21 (a)-(r), profiles of reactions for coal “C” are shown having mass
weighted average rate of reaction greater than 10-10
. In Fig. 6.22 (a)-(b), velocity and
temperature profile are shown, from Fig. 6.22 (b) it can be seen that most of the fuel
reactor part remains at higher temperature due to high calorific value of fuel (coal
"C"). It can be concluded from Fig. 6. 21 (m), (n), (o), (q) that burning of left over
carbon, oxidation of carbon monoxide and reaction between hydrogen & oxygen are
instantaneous reactions and are completed at the entrance of species from inter-
connecting part into air reactor. In Fig. 6.23, molar concentration contour of various
important species are shown, from Fig. 6. 23 (b) and (c) it can be seen that oxygen
and nitrogen in fuel reactor is present in small quantities meeting the objective of
chemical looping combustion. From Fig. 6.23 (k) it is clear that there is some quantity
of carbon dioxide in air reactor due to burning of left over carbon and carbon
monoxide.
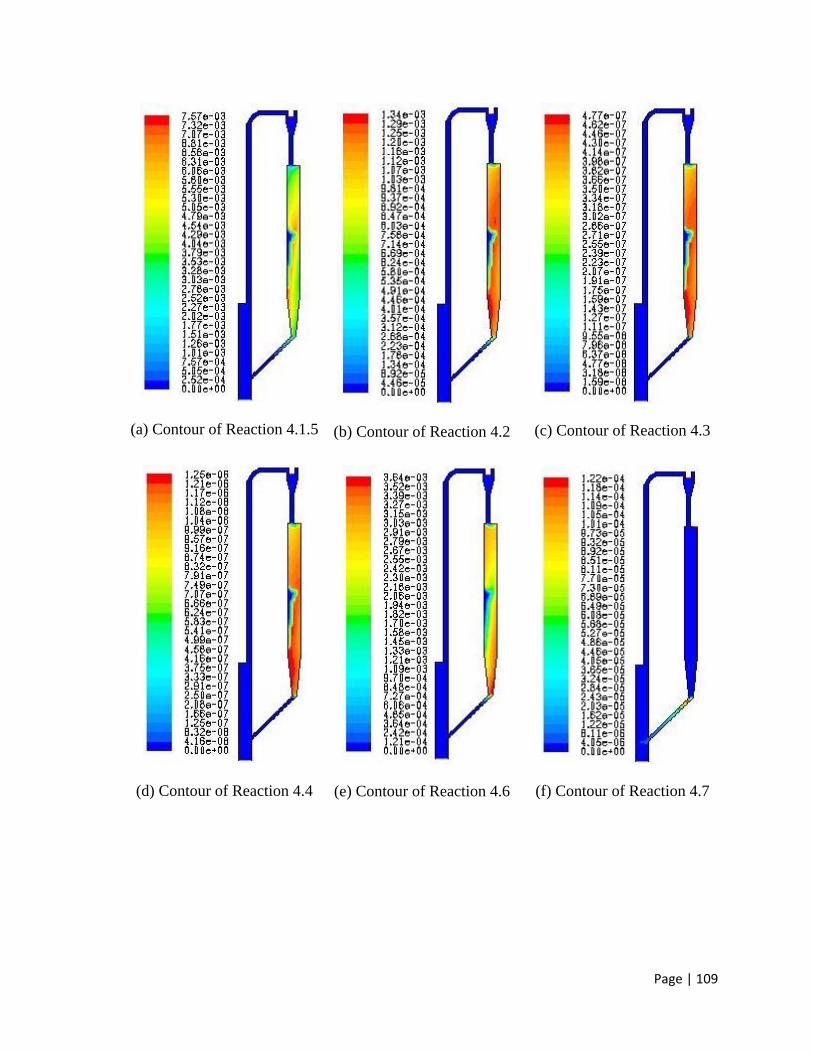
Page | 109
(a) Contour of Reaction 4.1.5
(b) Contour of Reaction 4.2
(c) Contour of Reaction 4.3
(d) Contour of Reaction 4.4
(e) Contour of Reaction 4.6
(f) Contour of Reaction 4.7
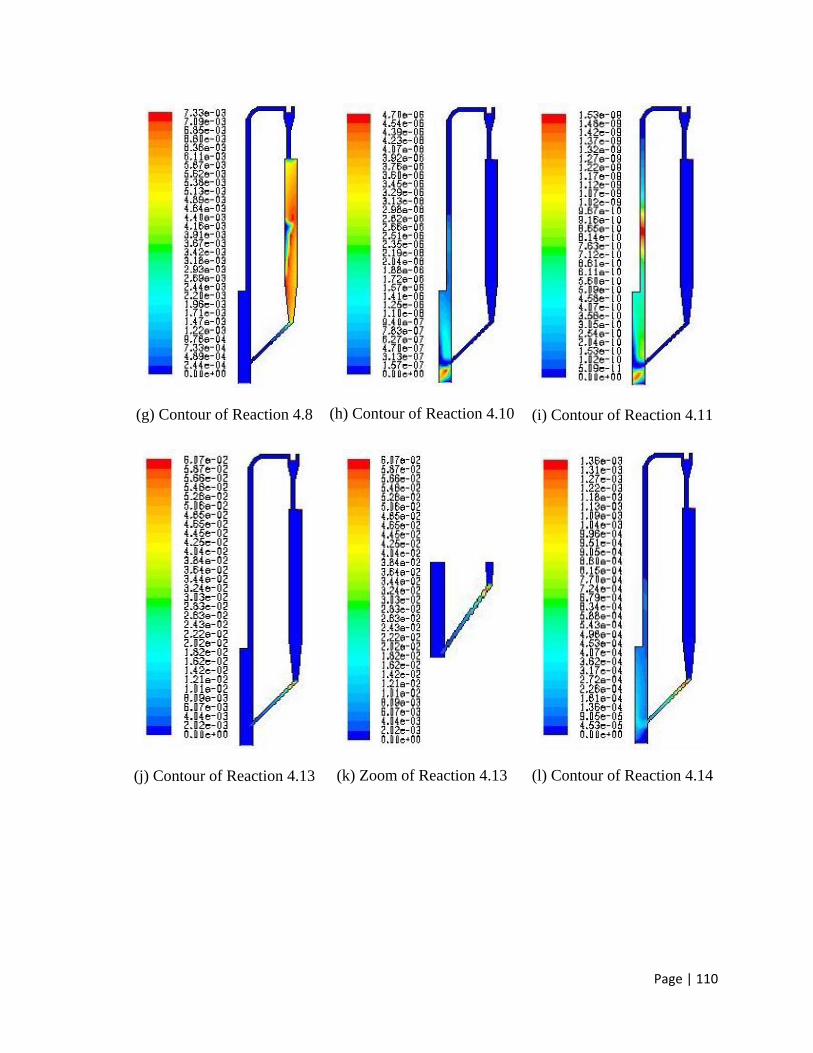
Page | 110
(g) Contour of Reaction 4.8
(h) Contour of Reaction 4.10
(i) Contour of Reaction 4.11
(j) Contour of Reaction 4.13
(k) Zoom of Reaction 4.13
(l) Contour of Reaction 4.14
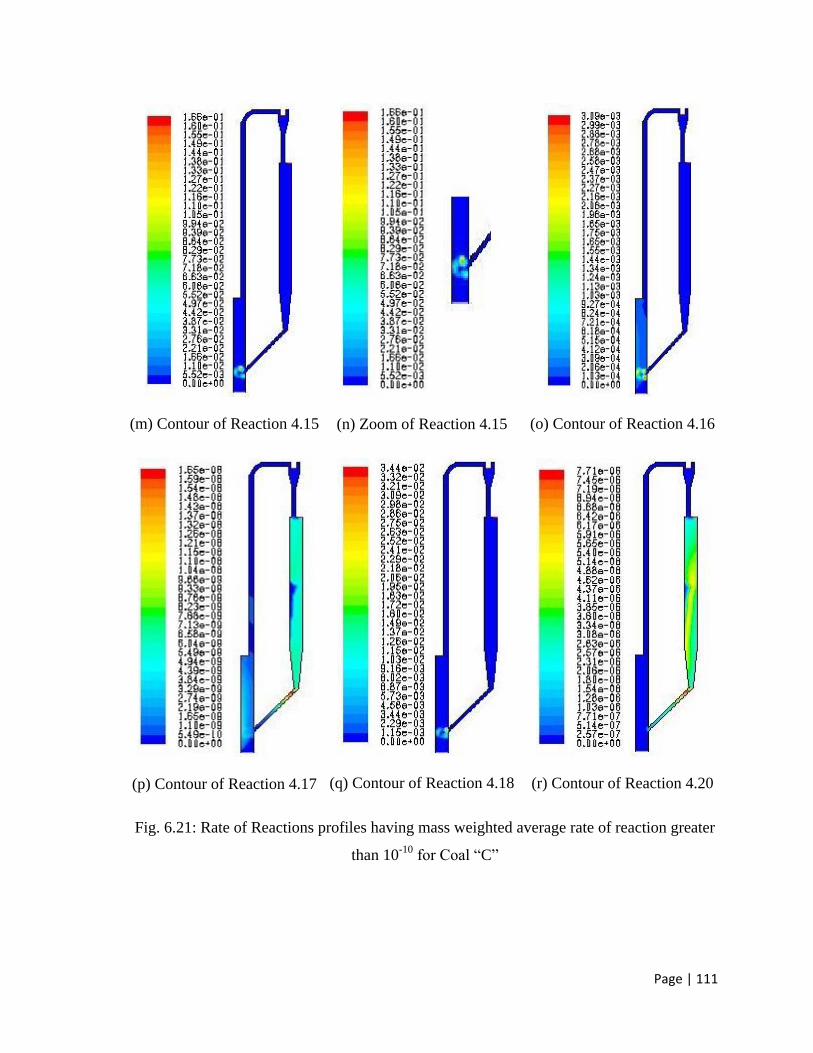
Page | 111
(m) Contour of Reaction 4.15
(n) Zoom of Reaction 4.15
(o) Contour of Reaction 4.16
(p) Contour of Reaction 4.17
(q) Contour of Reaction 4.18
(r) Contour of Reaction 4.20
Fig. 6.21: Rate of Reactions profiles having mass weighted average rate of reaction greater
than 10-10
for Coal “C”
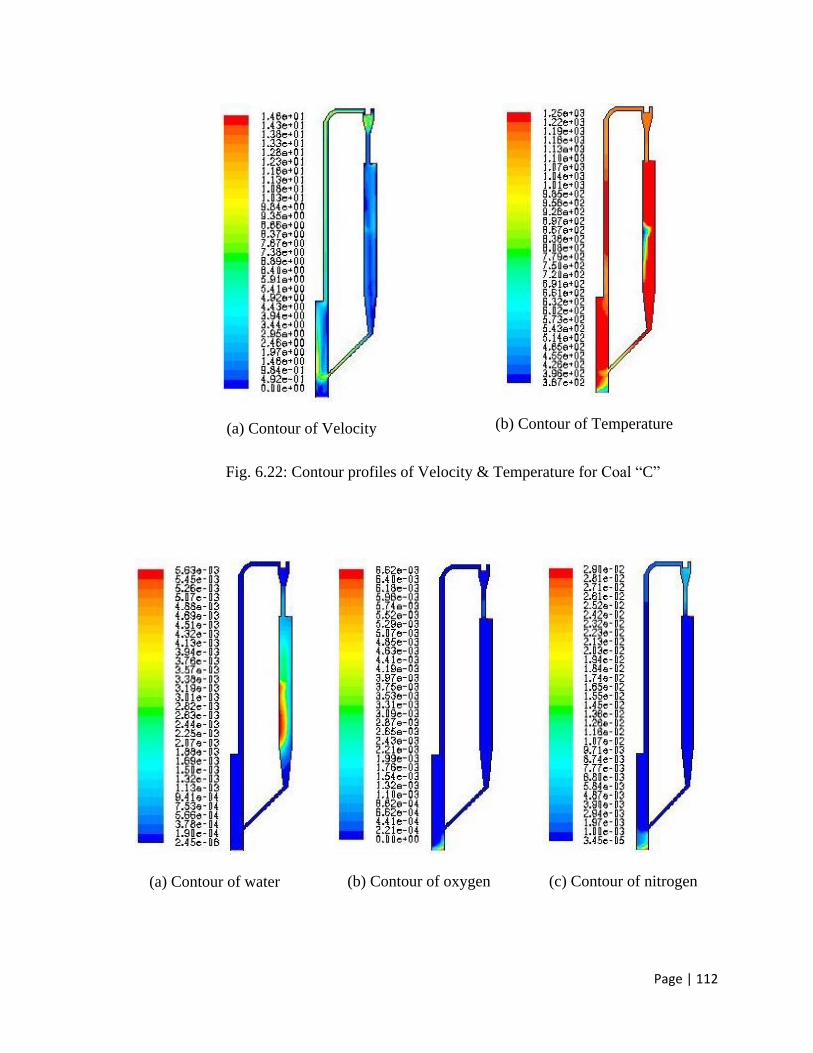
Page | 112
(a) Contour of Velocity
(b) Contour of Temperature
Fig. 6.22: Contour profiles of Velocity & Temperature for Coal “C”
(a) Contour of water
(b) Contour of oxygen
(c) Contour of nitrogen
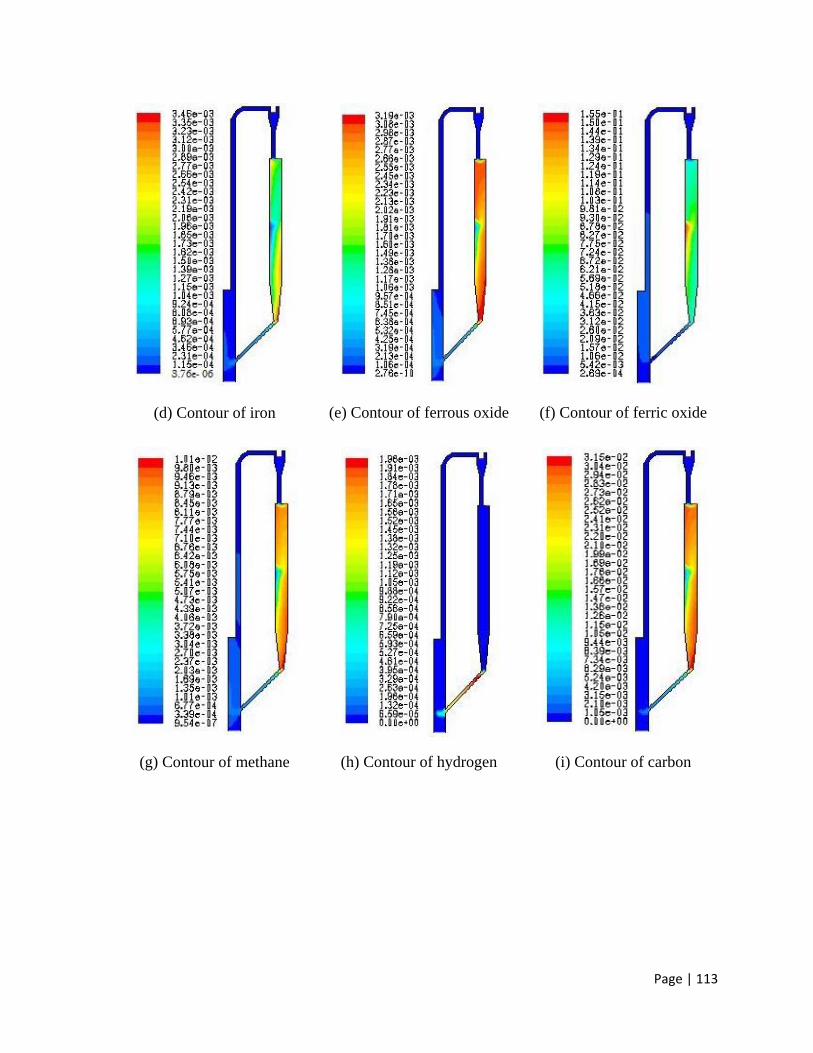
Page | 113
(d) Contour of iron
(e) Contour of ferrous oxide
(f) Contour of ferric oxide
(g) Contour of methane
(h) Contour of hydrogen
(i) Contour of carbon
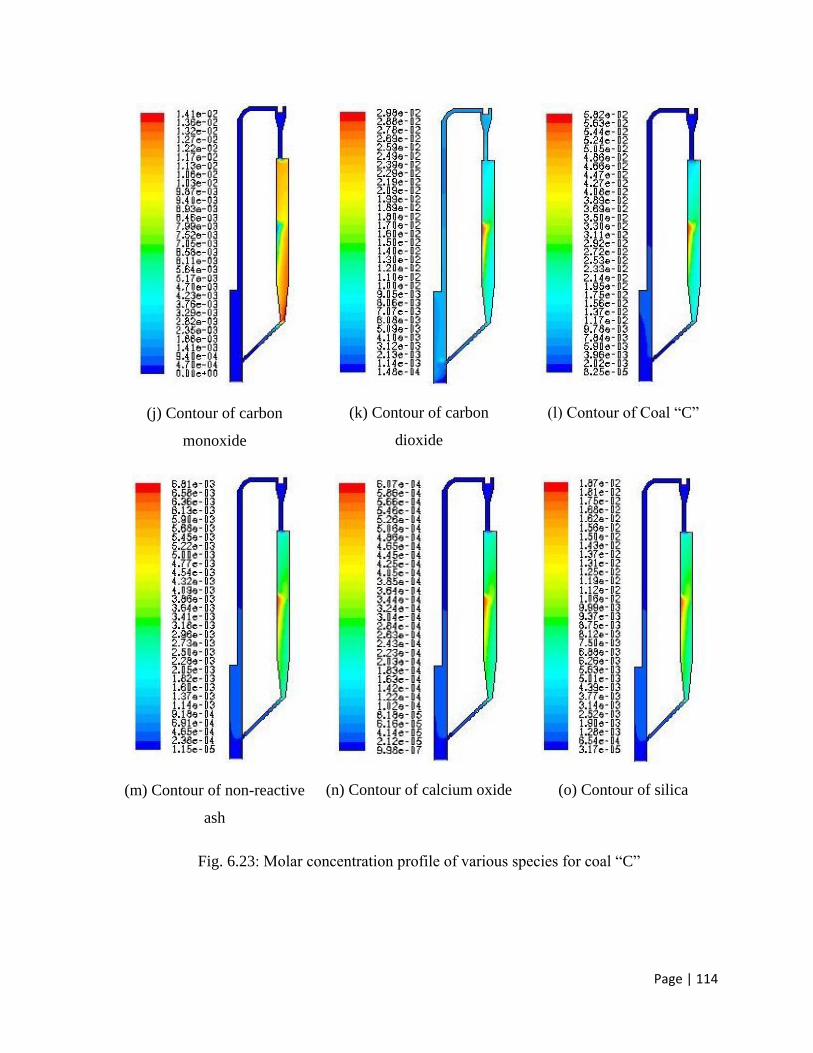
Page | 114
(j) Contour of carbon
monoxide
(k) Contour of carbon
dioxide
(l) Contour of Coal “C”
(m) Contour of non-reactive
ash
(n) Contour of calcium oxide
(o) Contour of silica
Fig. 6.23: Molar concentration profile of various species for coal “C”
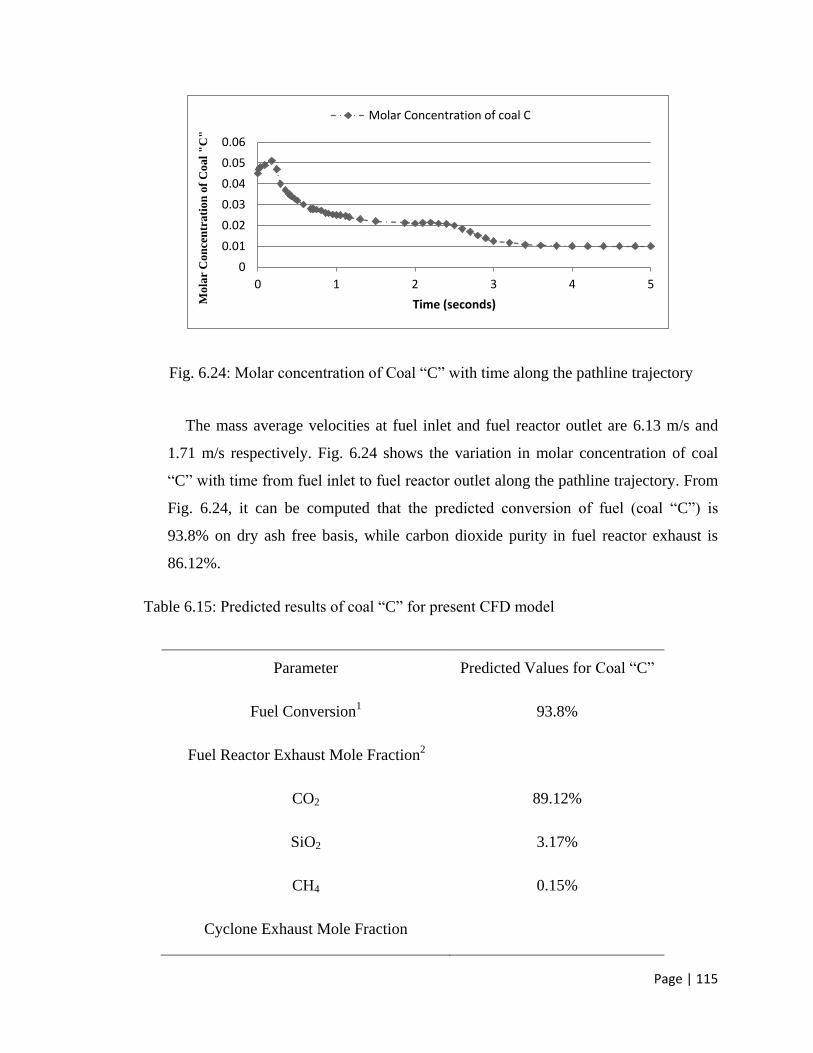
Page | 115
Fig. 6.24: Molar concentration of Coal “C” with time along the pathline trajectory
The mass average velocities at fuel inlet and fuel reactor outlet are 6.13 m/s and
1.71 m/s respectively. Fig. 6.24 shows the variation in molar concentration of coal
“C” with time from fuel inlet to fuel reactor outlet along the pathline trajectory. From
Fig. 6.24, it can be computed that the predicted conversion of fuel (coal “C”) is
93.8% on dry ash free basis, while carbon dioxide purity in fuel reactor exhaust is
86.12%.
Table 6.15: Predicted results of coal “C” for present CFD model
Parameter Predicted Values for Coal “C”
Fuel Conversion1 93.8%
Fuel Reactor Exhaust Mole Fraction2
CO2 89.12%
SiO2 3.17%
CH4
0.15%
Cyclone Exhaust Mole Fraction
0
0.01
0.02
0.03
0.04
0.05
0.06
0 1 2 3 4 5
Mola
r C
on
cen
trati
on
of
Coal
"C
"
Time (seconds)
Molar Concentration of coal C
Page | 116
O2 12.09%
CO2 0.79%
CH4 0.008%
1 on dry ash free basis
2 on dry and nitrogen free basis
6.2.4: Simulation Results of the present model when Coal “D” is used:-
The process parameters used in the present study for coal “D” are discussed in
Table 6.16.
Table 6.16: Process parameters for Coal “D”
Fuel flow rate 2.25 kg/hr
Carrier CO2 gas flow rate 10 LPM
Air flow rate 0.001m/s
Inlet Fuel and Air Temperature 320K
Operating Pressure 10 atm
Table 6.17, discussed the mass weighted average rate of reactions for coal “D” in
four sections (i.e. fuel reactor section, inter-connecting pipe section, air reactor
section and riser section) of coal direct chemical looping pilot plant. From the Table
6.17, it is concluded that coal devolatilization, and Boudouard reaction (Reaction nos.
4.1.5, and 4.8) are dominating reactions in fuel reactor section. In addition to it, the
value of mass weighted average rate of coal devolatilization reaction is nearly 1/10th
time of the values obtained for sub-bituminous coal (SBC) in previous segment of
study which is due to the high amount of ash in the fuel and high calorific value of
fuel (coal “D”). In the inter-connecting part, water-gas shift reaction (Reaction no.
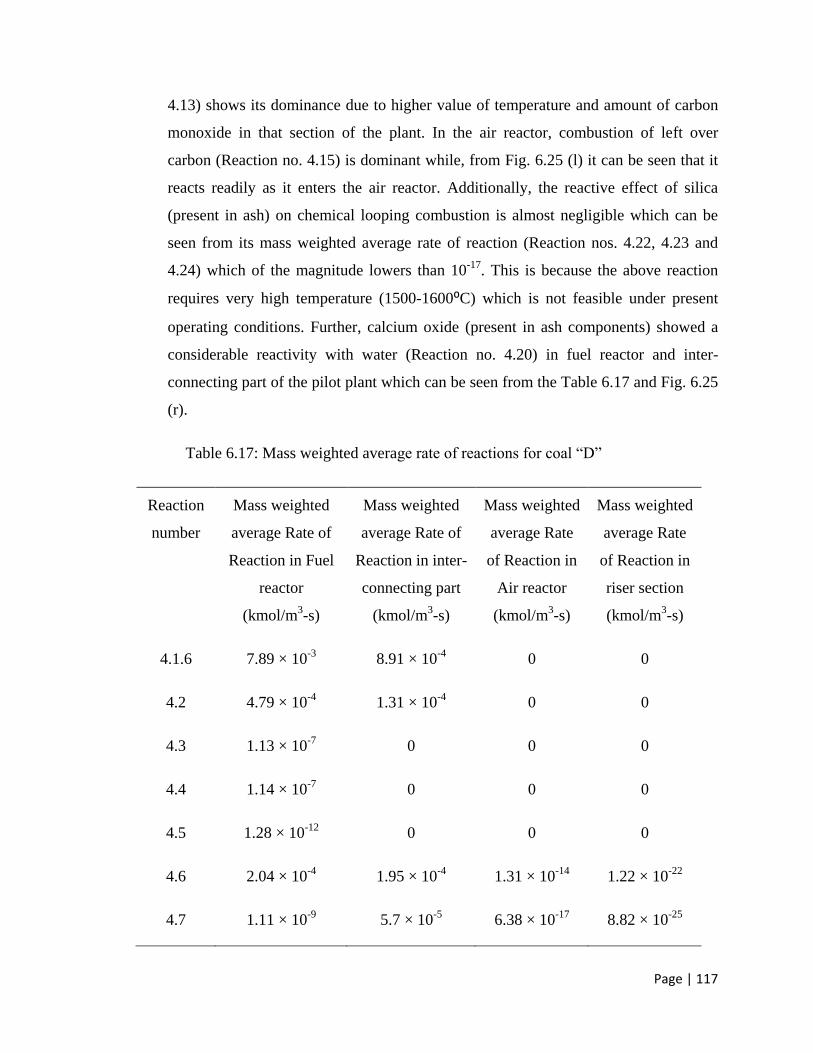
Page | 117
4.13) shows its dominance due to higher value of temperature and amount of carbon
monoxide in that section of the plant. In the air reactor, combustion of left over
carbon (Reaction no. 4.15) is dominant while, from Fig. 6.25 (l) it can be seen that it
reacts readily as it enters the air reactor. Additionally, the reactive effect of silica
(present in ash) on chemical looping combustion is almost negligible which can be
seen from its mass weighted average rate of reaction (Reaction nos. 4.22, 4.23 and
4.24) which of the magnitude lowers than 10-17
. This is because the above reaction
requires very high temperature (1500-1600⁰C) which is not feasible under present
operating conditions. Further, calcium oxide (present in ash components) showed a
considerable reactivity with water (Reaction no. 4.20) in fuel reactor and inter-
connecting part of the pilot plant which can be seen from the Table 6.17 and Fig. 6.25
(r).
Table 6.17: Mass weighted average rate of reactions for coal “D”
Reaction
number
Mass weighted
average Rate of
Reaction in Fuel
reactor
(kmol/m3-s)
Mass weighted
average Rate of
Reaction in inter-
connecting part
(kmol/m3-s)
Mass weighted
average Rate
of Reaction in
Air reactor
(kmol/m3-s)
Mass weighted
average Rate
of Reaction in
riser section
(kmol/m3-s)
4.1.6 7.89 × 10⁻³
8.91 × 10⁻⁴
0 0
4.2 4.79 × 10⁻⁴
1.31 × 10⁻⁴
0 0
4.3 1.13 × 10⁻⁷
0 0 0
4.4 1.14 × 10⁻⁷
0 0 0
4.5 1.28 × 10⁻¹²
0 0 0
4.6 2.04 × 10⁻⁴
1.95 × 10⁻⁴
1.31 × 10⁻¹⁴
1.22 × 10⁻²²
4.7 1.11 × 10⁻⁹
5.7 × 10⁻⁵
6.38 × 10⁻¹⁷
8.82 × 10⁻²⁵
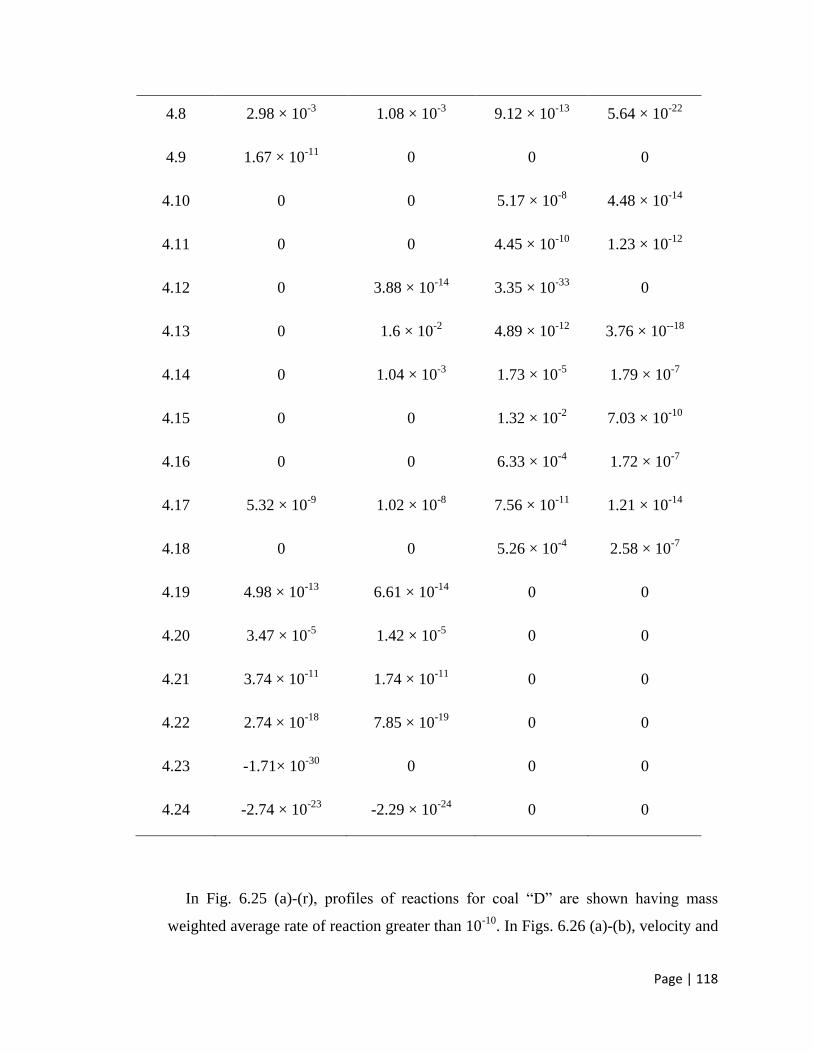
Page | 118
4.8 2.98 × 10⁻³
1.08 × 10⁻³
9.12 × 10⁻¹³
5.64 × 10⁻²²
4.9 1.67 × 10⁻¹¹
0 0 0
4.10 0 0 5.17 × 10⁻⁸
4.48 × 10⁻¹⁴
4.11 0 0 4.45 × 10⁻¹⁰
1.23 × 10⁻¹²
4.12 0 3.88 × 10⁻¹⁴
3.35 × 10⁻³³
0
4.13 0 1.6 × 10⁻²
4.89 × 10⁻¹²
3.76 × 10--18
4.14 0 1.04 × 10⁻³
1.73 × 10⁻⁵
1.79 × 10⁻⁷
4.15 0 0 1.32 × 10⁻²
7.03 × 10⁻¹⁰
4.16 0 0 6.33 × 10⁻⁴
1.72 × 10⁻⁷
4.17 5.32 × 10⁻⁹
1.02 × 10⁻⁸
7.56 × 10⁻¹¹
1.21 × 10⁻¹⁴
4.18 0 0 5.26 × 10⁻⁴
2.58 × 10⁻⁷
4.19 4.98 × 10⁻¹³
6.61 × 10⁻¹⁴
0 0
4.20 3.47 × 10⁻⁵
1.42 × 10⁻⁵
0 0
4.21 3.74 × 10⁻¹¹
1.74 × 10⁻¹¹
0 0
4.22 2.74 × 10⁻¹⁸
7.85 × 10⁻¹⁹
0 0
4.23 -1.71× 10⁻³⁰
0
0 0
4.24 -2.74 × 10⁻²³
-2.29 × 10⁻²⁴
0 0
In Fig. 6.25 (a)-(r), profiles of reactions for coal “D” are shown having mass
weighted average rate of reaction greater than 10-10
. In Figs. 6.26 (a)-(b), velocity and
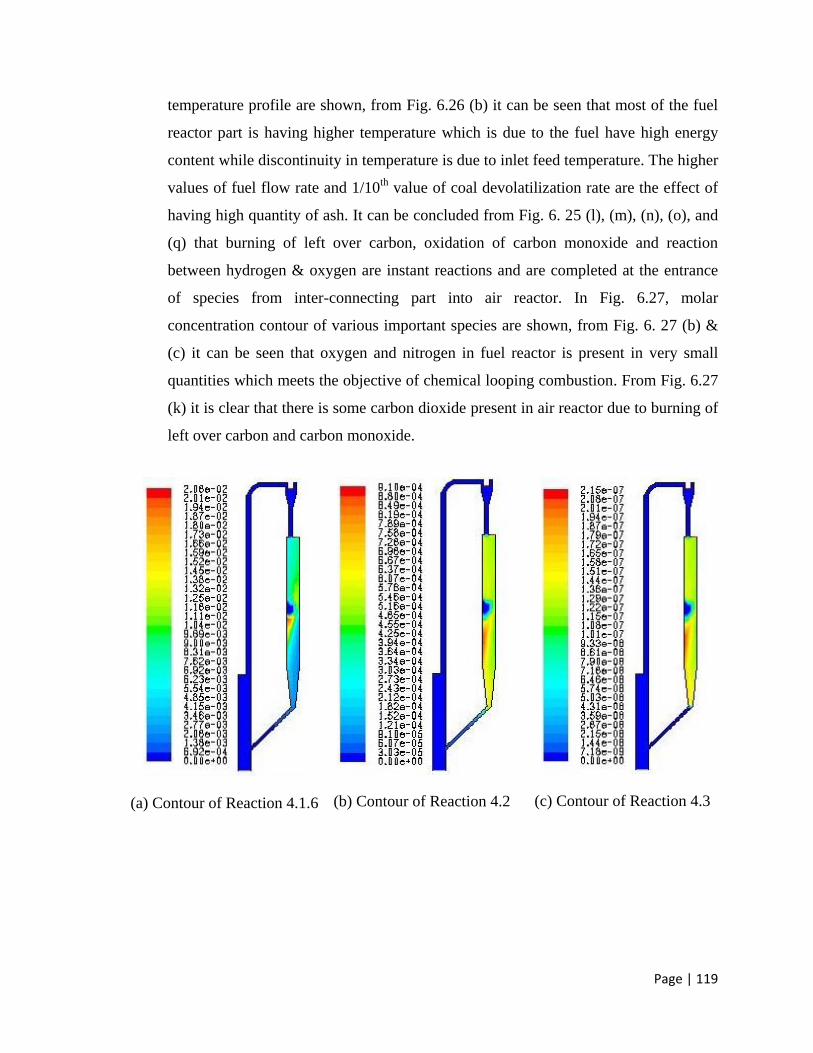
Page | 119
temperature profile are shown, from Fig. 6.26 (b) it can be seen that most of the fuel
reactor part is having higher temperature which is due to the fuel have high energy
content while discontinuity in temperature is due to inlet feed temperature. The higher
values of fuel flow rate and 1/10th
value of coal devolatilization rate are the effect of
having high quantity of ash. It can be concluded from Fig. 6. 25 (l), (m), (n), (o), and
(q) that burning of left over carbon, oxidation of carbon monoxide and reaction
between hydrogen & oxygen are instant reactions and are completed at the entrance
of species from inter-connecting part into air reactor. In Fig. 6.27, molar
concentration contour of various important species are shown, from Fig. 6. 27 (b) &
(c) it can be seen that oxygen and nitrogen in fuel reactor is present in very small
quantities which meets the objective of chemical looping combustion. From Fig. 6.27
(k) it is clear that there is some carbon dioxide present in air reactor due to burning of
left over carbon and carbon monoxide.
(a) Contour of Reaction 4.1.6
(b) Contour of Reaction 4.2
(c) Contour of Reaction 4.3
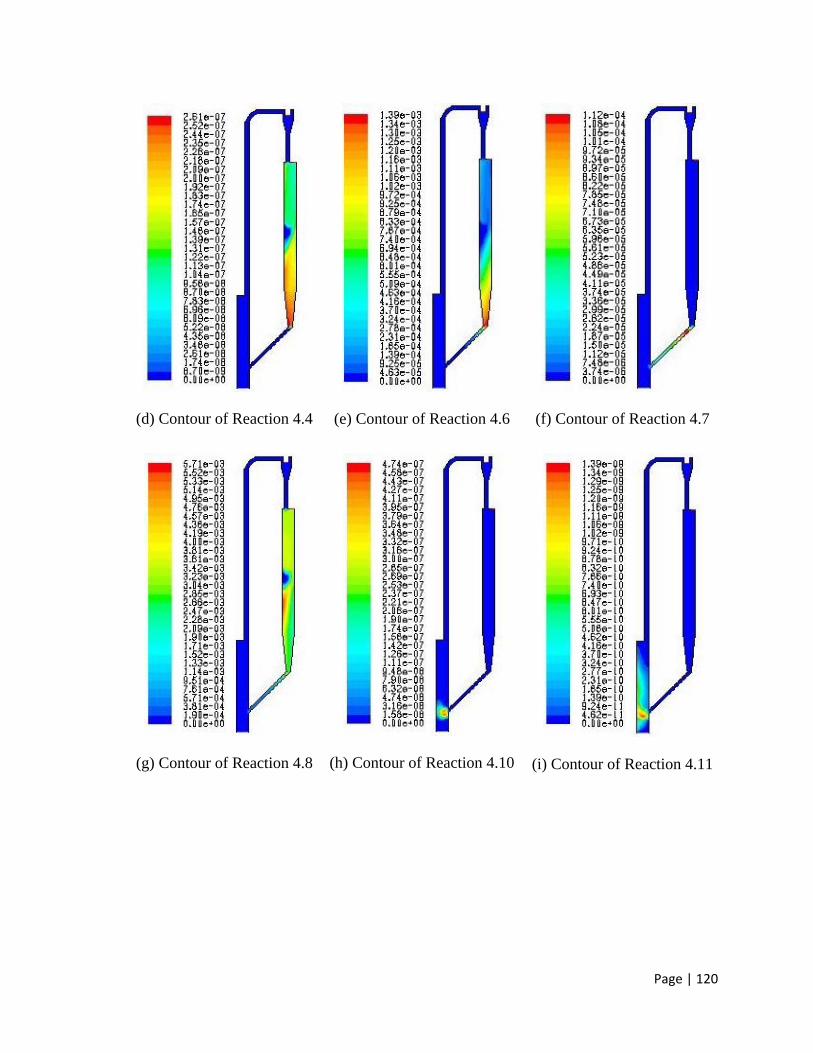
Page | 120
(d) Contour of Reaction 4.4
(e) Contour of Reaction 4.6
(f) Contour of Reaction 4.7
(g) Contour of Reaction 4.8
(h) Contour of Reaction 4.10
(i) Contour of Reaction 4.11
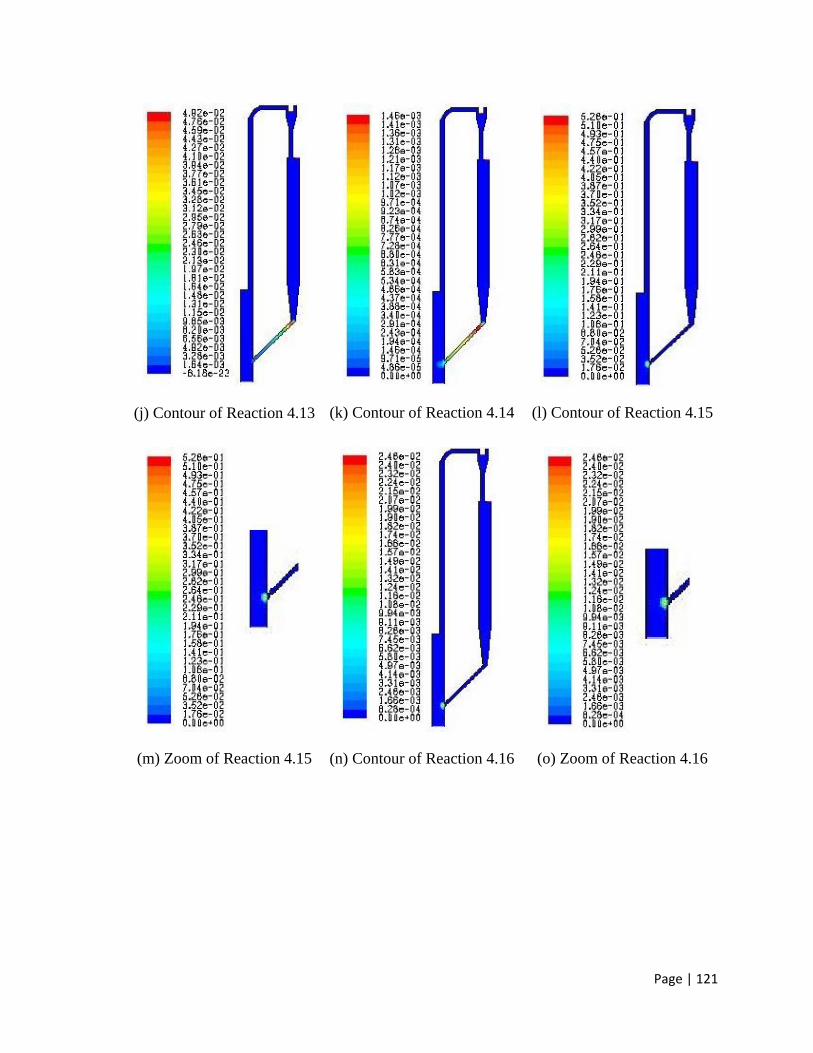
Page | 121
(j) Contour of Reaction 4.13
(k) Contour of Reaction 4.14
(l) Contour of Reaction 4.15
(m) Zoom of Reaction 4.15
(n) Contour of Reaction 4.16
(o) Zoom of Reaction 4.16
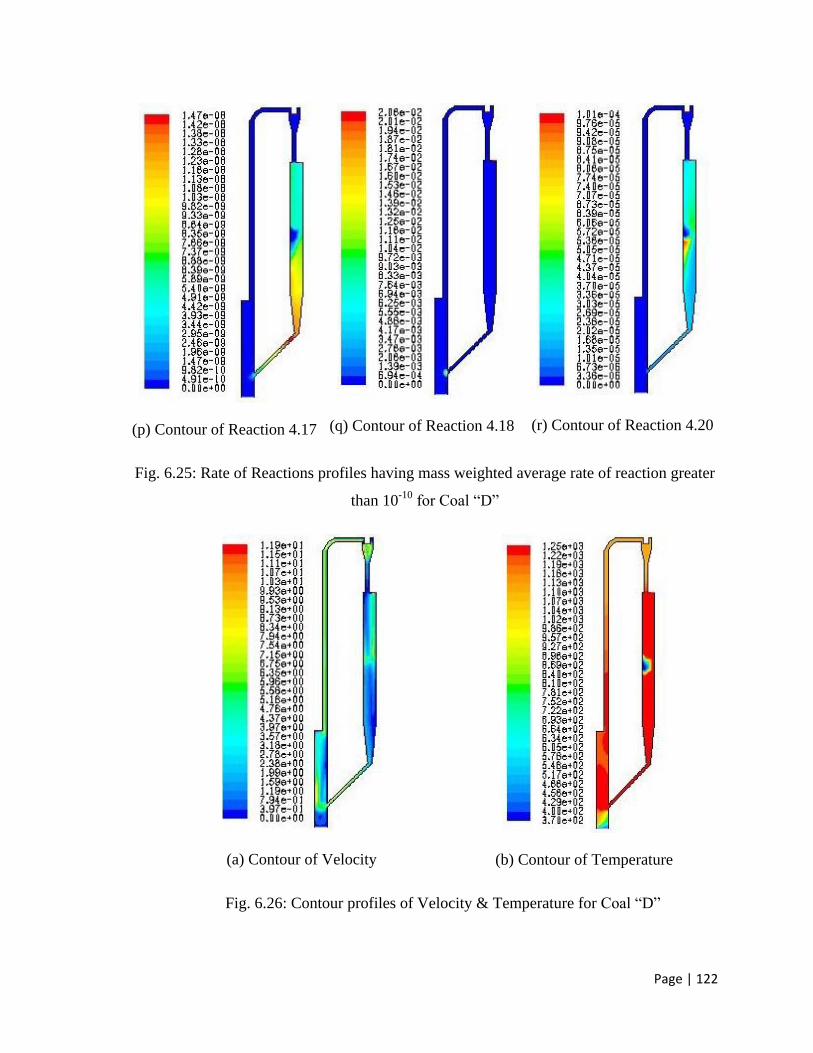
Page | 122
(p) Contour of Reaction 4.17
(q) Contour of Reaction 4.18
(r) Contour of Reaction 4.20
Fig. 6.25: Rate of Reactions profiles having mass weighted average rate of reaction greater
than 10-10
for Coal “D”
(a) Contour of Velocity
(b) Contour of Temperature
Fig. 6.26: Contour profiles of Velocity & Temperature for Coal “D”
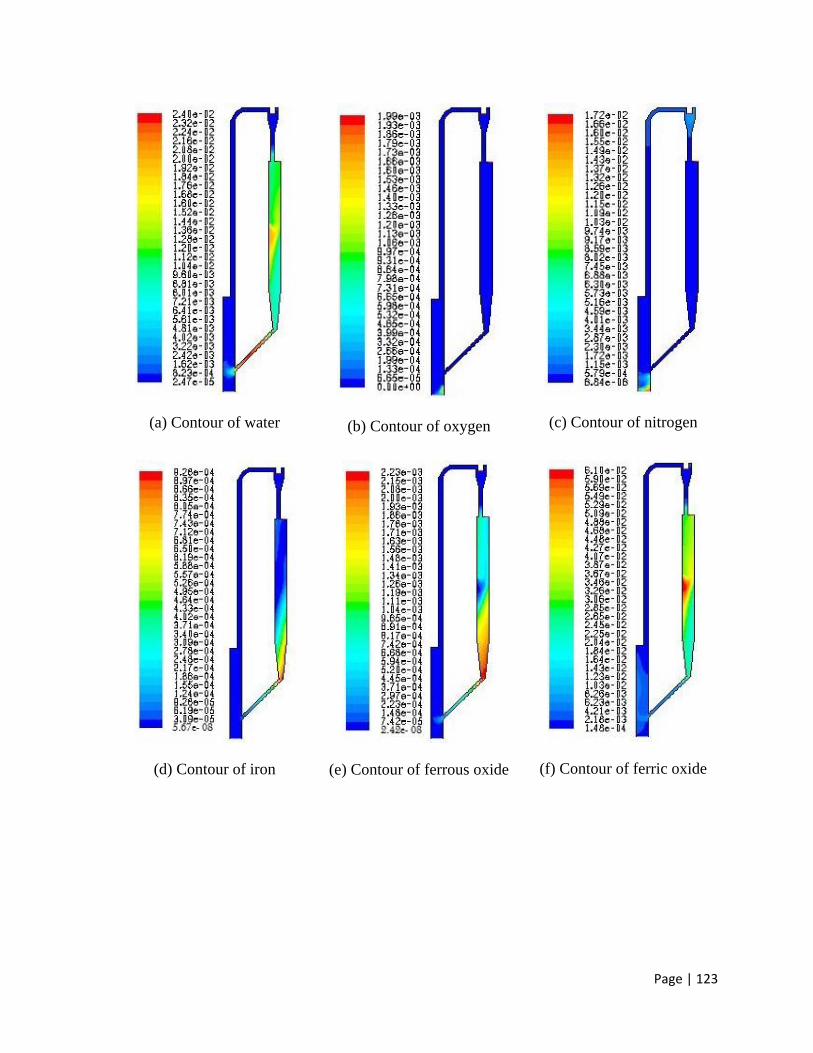
Page | 123
(a) Contour of water
(b) Contour of oxygen
(c) Contour of nitrogen
(d) Contour of iron
(e) Contour of ferrous oxide
(f) Contour of ferric oxide
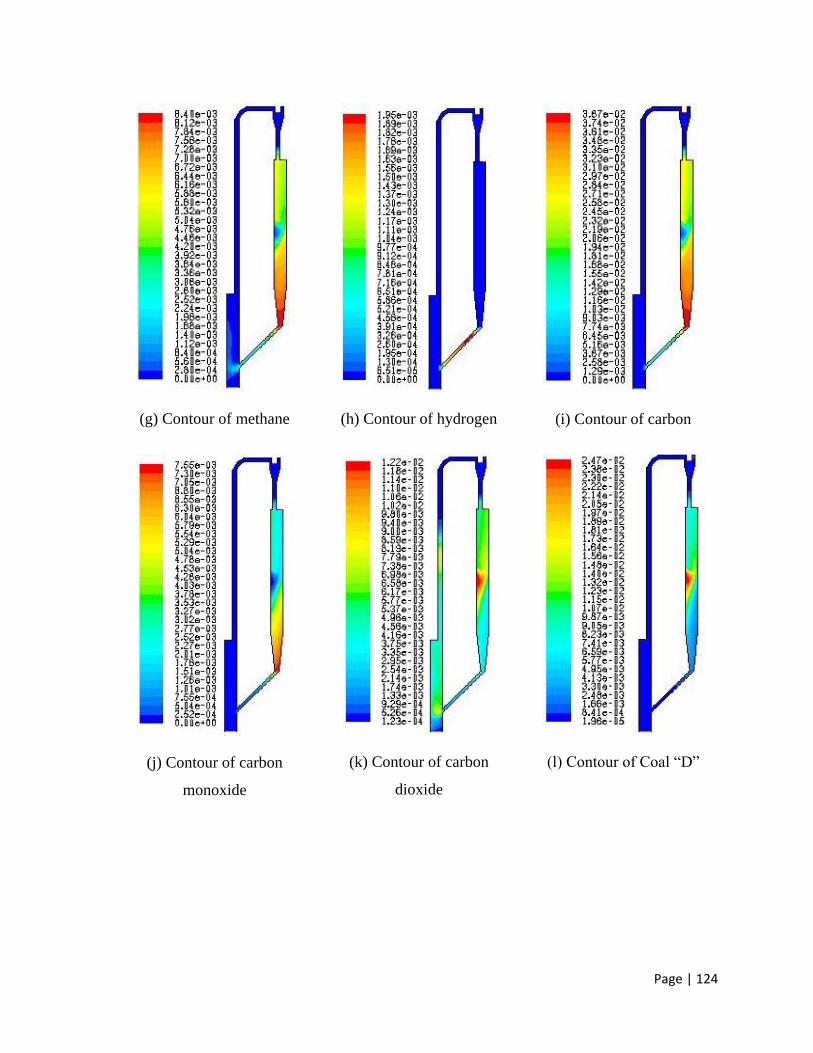
Page | 124
(g) Contour of methane
(h) Contour of hydrogen
(i) Contour of carbon
(j) Contour of carbon
monoxide
(k) Contour of carbon
dioxide
(l) Contour of Coal “D”
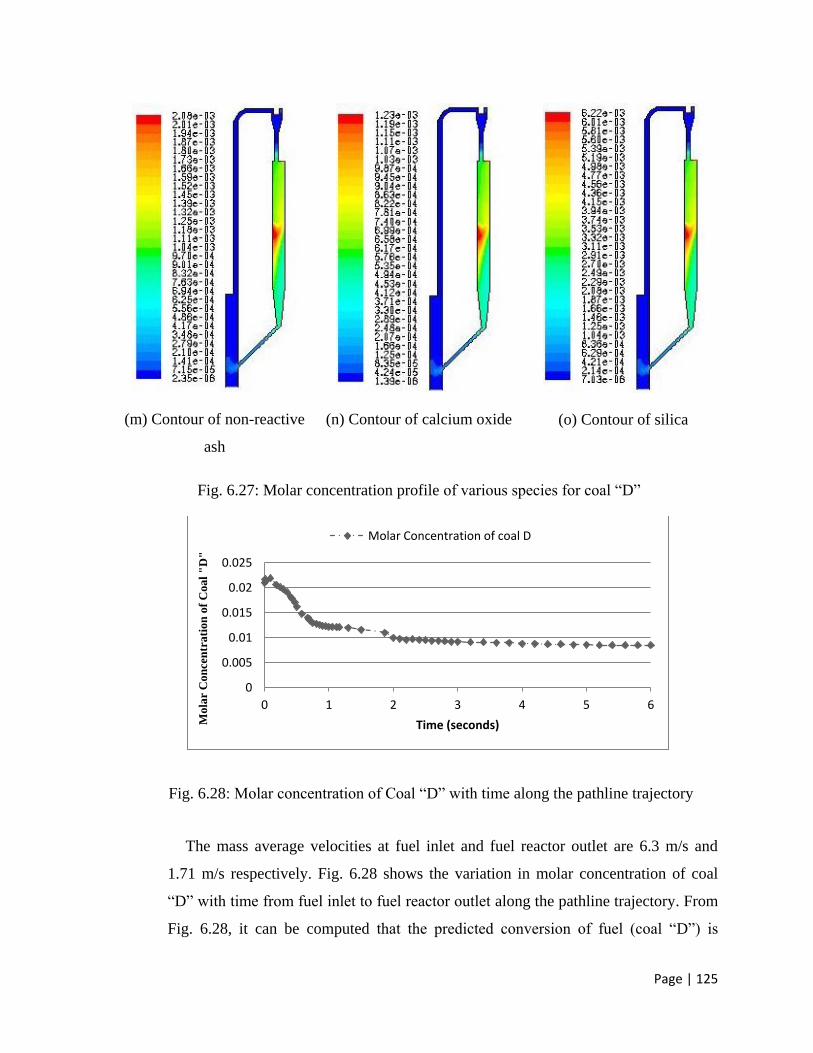
Page | 125
(m) Contour of non-reactive
ash
(n) Contour of calcium oxide
(o) Contour of silica
Fig. 6.27: Molar concentration profile of various species for coal “D”
Fig. 6.28: Molar concentration of Coal “D” with time along the pathline trajectory
The mass average velocities at fuel inlet and fuel reactor outlet are 6.3 m/s and
1.71 m/s respectively. Fig. 6.28 shows the variation in molar concentration of coal
“D” with time from fuel inlet to fuel reactor outlet along the pathline trajectory. From
Fig. 6.28, it can be computed that the predicted conversion of fuel (coal “D”) is
0
0.005
0.01
0.015
0.02
0.025
0 1 2 3 4 5 6
Mola
r C
on
cen
trati
on
of
Coal
"D
"
Time (seconds)
Molar Concentration of coal D
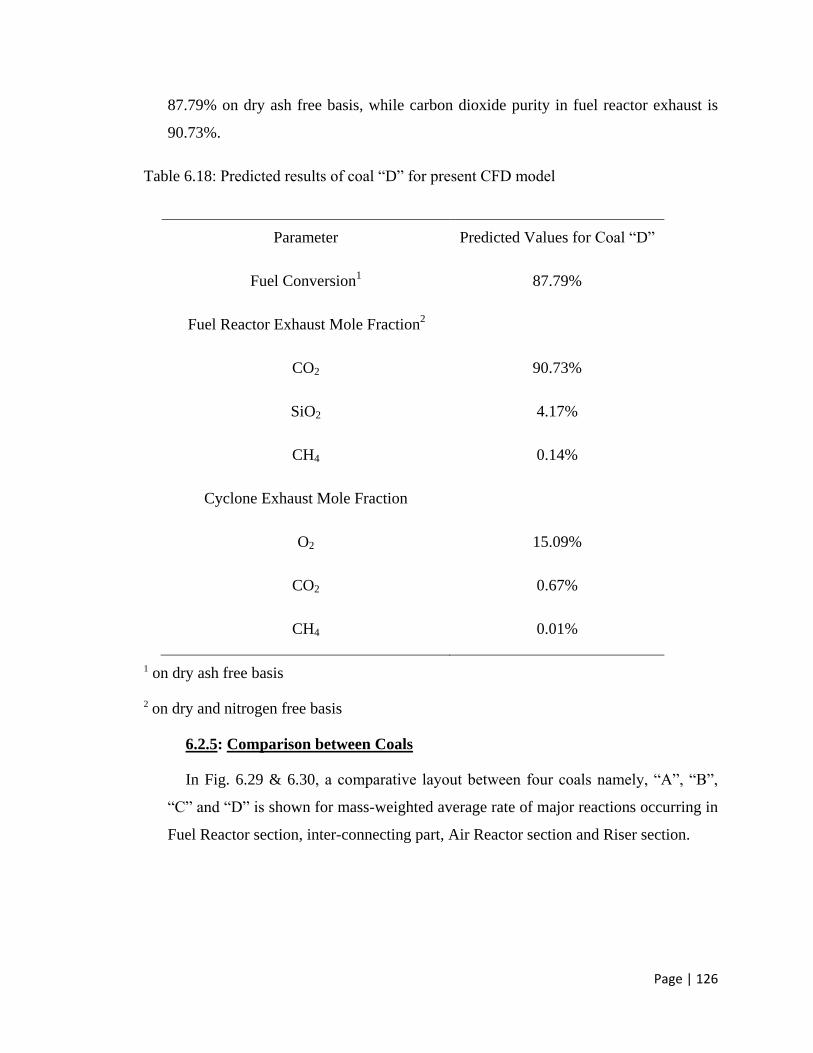
Page | 126
87.79% on dry ash free basis, while carbon dioxide purity in fuel reactor exhaust is
90.73%.
Table 6.18: Predicted results of coal “D” for present CFD model
Parameter Predicted Values for Coal “D”
Fuel Conversion1 87.79%
Fuel Reactor Exhaust Mole Fraction2
CO2 90.73%
SiO2 4.17%
CH4
0.14%
Cyclone Exhaust Mole Fraction
O2 15.09%
CO2 0.67%
CH4 0.01%
1 on dry ash free basis
2 on dry and nitrogen free basis
6.2.5: Comparison between Coals
In Fig. 6.29 & 6.30, a comparative layout between four coals namely, “A”, “B”,
“C” and “D” is shown for mass-weighted average rate of major reactions occurring in
Fuel Reactor section, inter-connecting part, Air Reactor section and Riser section.
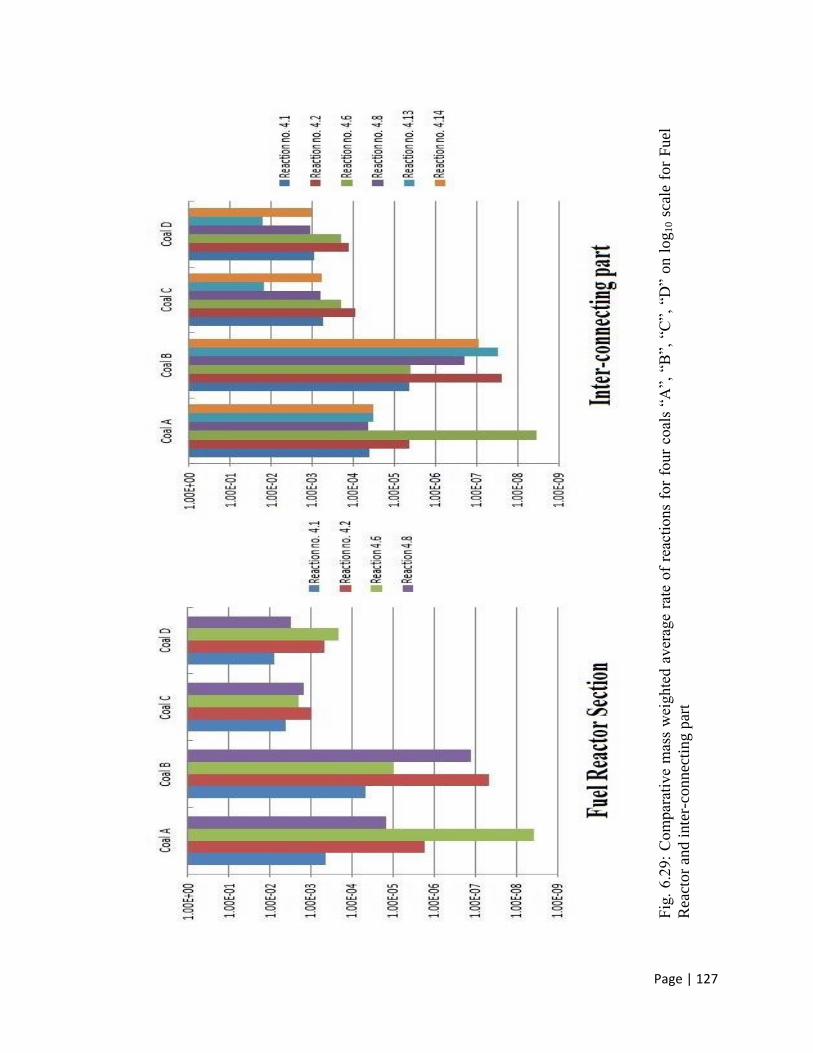
Page | 127
Fig
. 6.2
9:
Com
par
ativ
e m
ass
wei
ghte
d a
ver
age
rate
of
reac
tions
for
four
coal
s “A
”, “
B”,
“C
”, “
D” o
n l
og
10 s
cale
for
Fuel
Rea
ctor
and i
nte
r-co
nnec
ting p
art
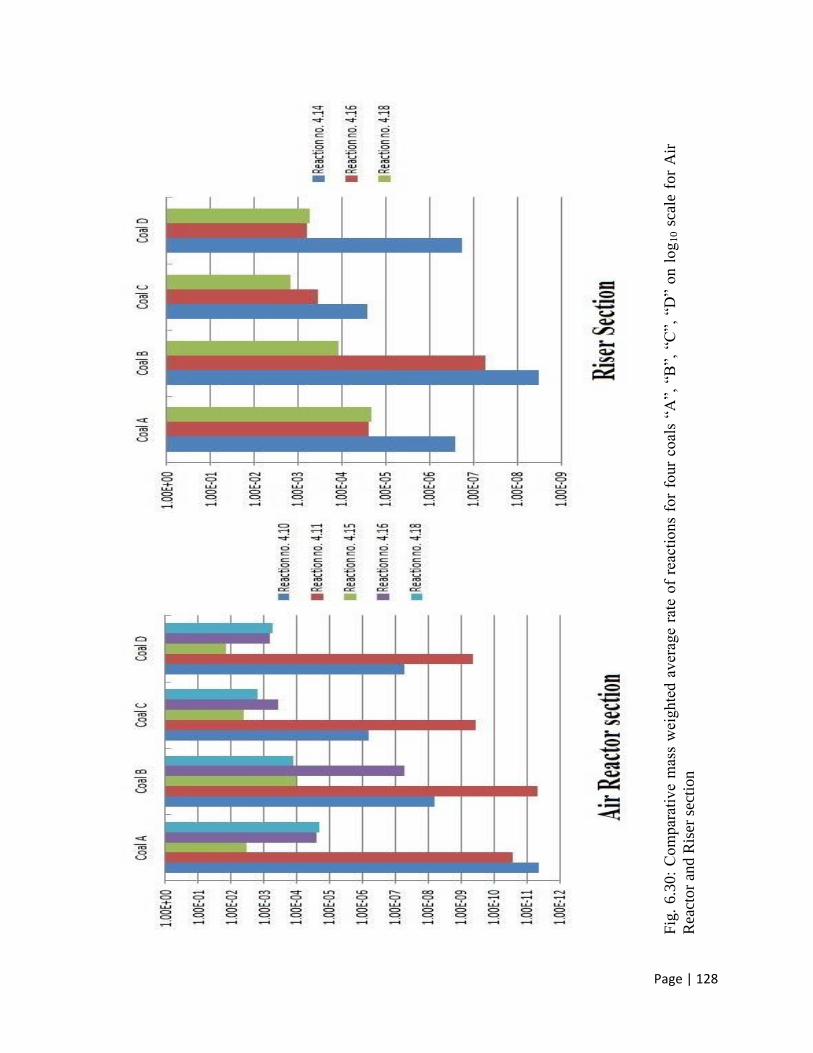
Page | 128
Fig
. 6.3
0:
Com
par
ativ
e m
ass
wei
ghte
d a
ver
age
rate
of
reac
tions
for
four
coal
s “A
”, “
B”,
“C
”, “
D”
on l
og
10 s
cale
for
Air
Rea
ctor
and R
iser
sec
tion
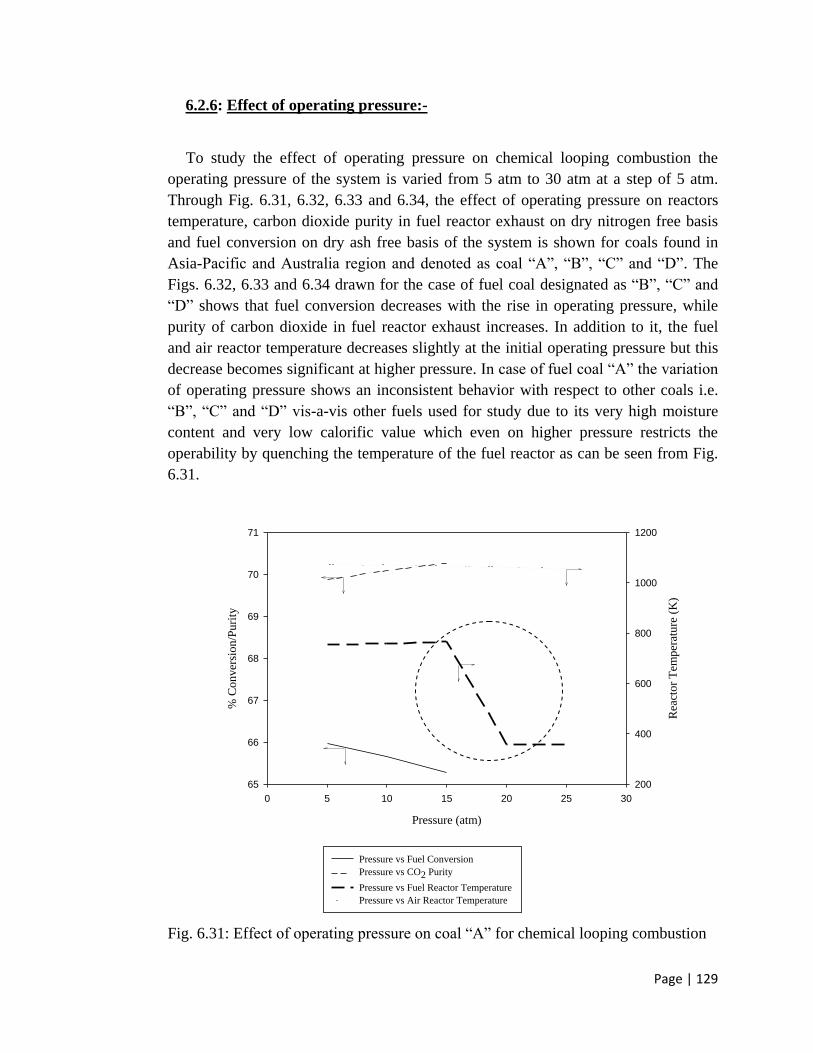
Page | 129
6.2.6: Effect of operating pressure:-
To study the effect of operating pressure on chemical looping combustion the
operating pressure of the system is varied from 5 atm to 30 atm at a step of 5 atm.
Through Fig. 6.31, 6.32, 6.33 and 6.34, the effect of operating pressure on reactors
temperature, carbon dioxide purity in fuel reactor exhaust on dry nitrogen free basis
and fuel conversion on dry ash free basis of the system is shown for coals found in
Asia-Pacific and Australia region and denoted as coal “A”, “B”, “C” and “D”. The
Figs. 6.32, 6.33 and 6.34 drawn for the case of fuel coal designated as “B”, “C” and
“D” shows that fuel conversion decreases with the rise in operating pressure, while
purity of carbon dioxide in fuel reactor exhaust increases. In addition to it, the fuel
and air reactor temperature decreases slightly at the initial operating pressure but this
decrease becomes significant at higher pressure. In case of fuel coal “A” the variation
of operating pressure shows an inconsistent behavior with respect to other coals i.e.
“B”, “C” and “D” vis-a-vis other fuels used for study due to its very high moisture
content and very low calorific value which even on higher pressure restricts the
operability by quenching the temperature of the fuel reactor as can be seen from Fig.
6.31.
Pressure (atm)
0 5 10 15 20 25 30
% C
onver
sion/P
uri
ty
65
66
67
68
69
70
71
Rea
ctor
Tem
per
ature
(K
)
200
400
600
800
1000
1200
Pressure vs Fuel Conversion
Pressure vs CO2 Purity
Pressure vs Fuel Reactor Temperature
Pressure vs Air Reactor Temperature
Fig. 6.31: Effect of operating pressure on coal “A” for chemical looping combustion
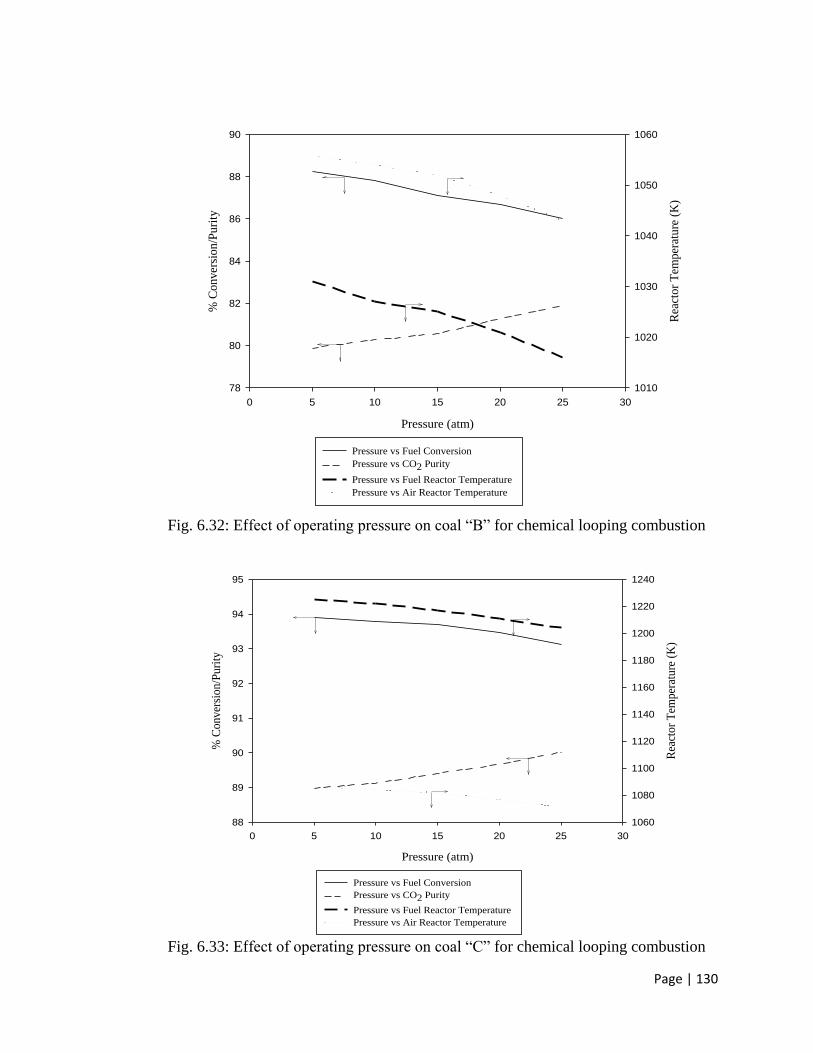
Page | 130
Pressure (atm)
0 5 10 15 20 25 30
% C
onver
sion/P
uri
ty
78
80
82
84
86
88
90
Rea
ctor
Tem
per
ature
(K
)
1010
1020
1030
1040
1050
1060
Pressure vs Fuel Conversion
Pressure vs CO2 Purity
Pressure vs Fuel Reactor Temperature
Pressure vs Air Reactor Temperature
Fig. 6.32: Effect of operating pressure on coal “B” for chemical looping combustion
Pressure (atm)
0 5 10 15 20 25 30
% C
onver
sio
n/P
uri
ty
88
89
90
91
92
93
94
95
Rea
cto
r T
emper
atu
re (
K)
1060
1080
1100
1120
1140
1160
1180
1200
1220
1240
Pressure vs Fuel Conversion
Pressure vs CO2 Purity
Pressure vs Fuel Reactor Temperature
Pressure vs Air Reactor Temperature
Fig. 6.33: Effect of operating pressure on coal “C” for chemical looping combustion
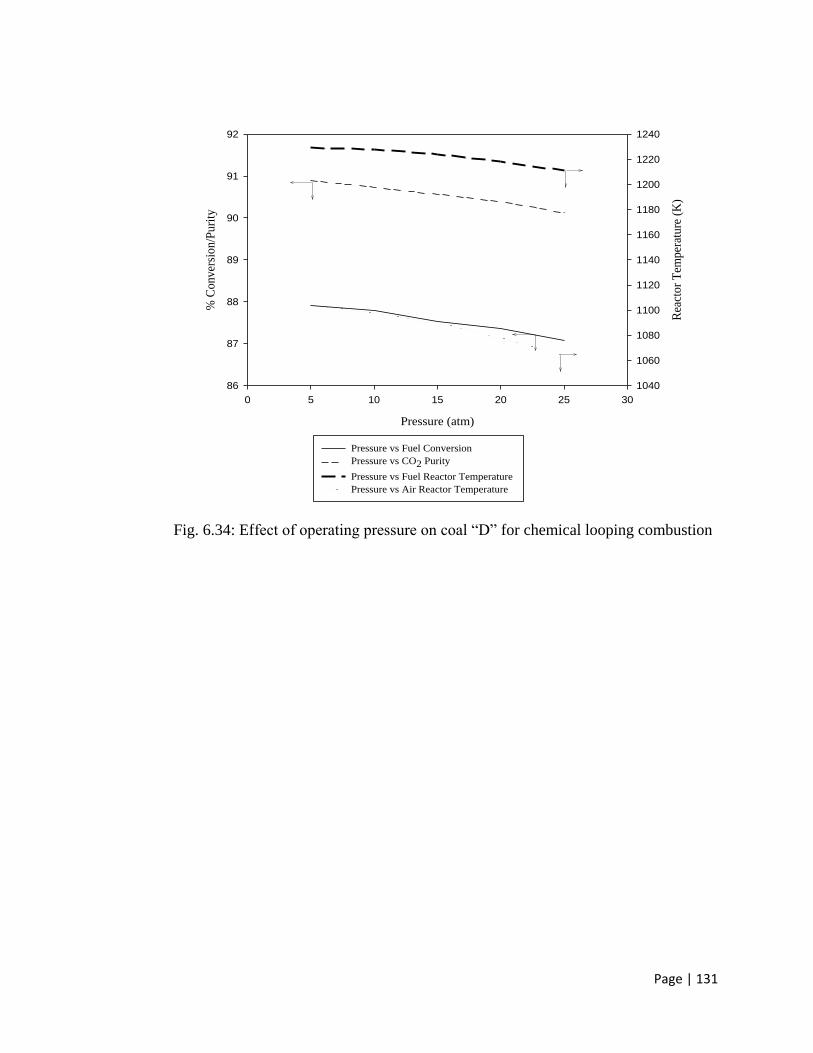
Page | 131
Pressure (atm)
0 5 10 15 20 25 30
% C
onver
sion/P
uri
ty
86
87
88
89
90
91
92
Rea
ctor
Tem
per
ature
(K
)
1040
1060
1080
1100
1120
1140
1160
1180
1200
1220
1240
Pressure vs Fuel Conversion
Pressure vs CO2 Purity
Pressure vs Fuel Reactor Temperature
Pressure vs Air Reactor Temperature
Fig. 6.34: Effect of operating pressure on coal “D” for chemical looping combustion
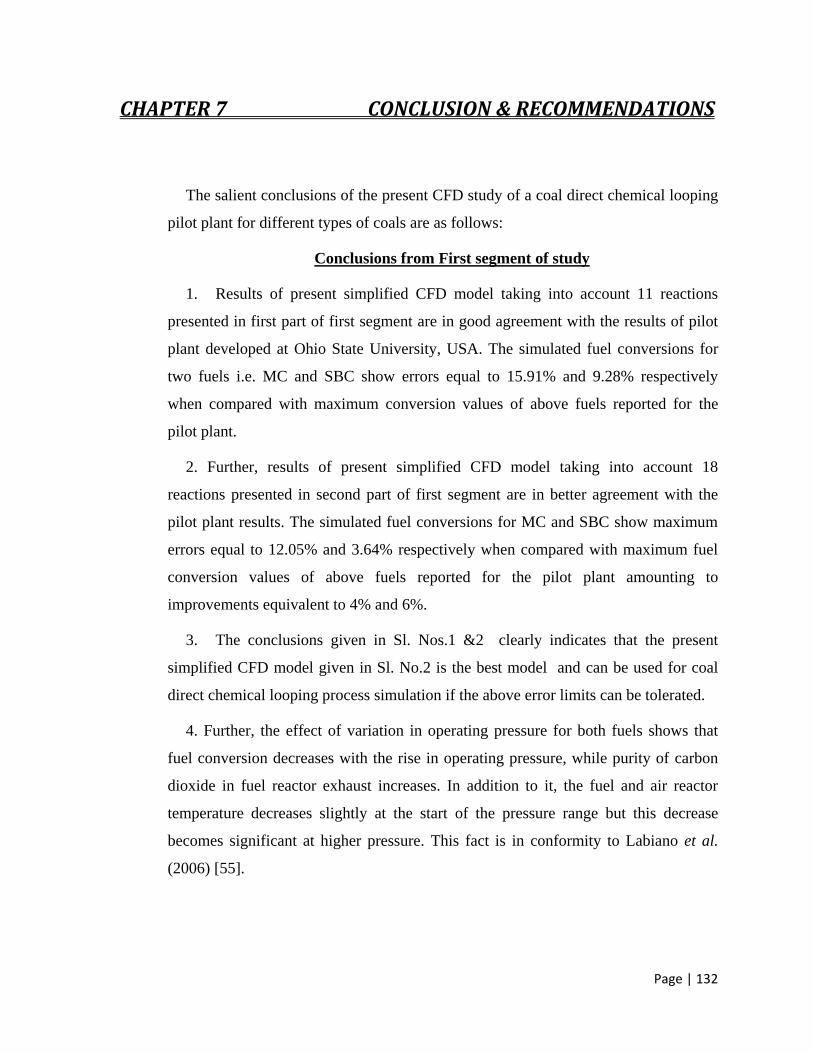
Page | 132
CHAPTER 7 CONCLUSION & RECOMMENDATIONS
The salient conclusions of the present CFD study of a coal direct chemical looping
pilot plant for different types of coals are as follows:
Conclusions from First segment of study
1. Results of present simplified CFD model taking into account 11 reactions
presented in first part of first segment are in good agreement with the results of pilot
plant developed at Ohio State University, USA. The simulated fuel conversions for
two fuels i.e. MC and SBC show errors equal to 15.91% and 9.28% respectively
when compared with maximum conversion values of above fuels reported for the
pilot plant.
2. Further, results of present simplified CFD model taking into account 18
reactions presented in second part of first segment are in better agreement with the
pilot plant results. The simulated fuel conversions for MC and SBC show maximum
errors equal to 12.05% and 3.64% respectively when compared with maximum fuel
conversion values of above fuels reported for the pilot plant amounting to
improvements equivalent to 4% and 6%.
3. The conclusions given in Sl. Nos.1 &2 clearly indicates that the present
simplified CFD model given in Sl. No.2 is the best model and can be used for coal
direct chemical looping process simulation if the above error limits can be tolerated.
4. Further, the effect of variation in operating pressure for both fuels shows that
fuel conversion decreases with the rise in operating pressure, while purity of carbon
dioxide in fuel reactor exhaust increases. In addition to it, the fuel and air reactor
temperature decreases slightly at the start of the pressure range but this decrease
becomes significant at higher pressure. This fact is in conformity to Labiano et al.
(2006) [55].
Page | 133
5. Carbon dioxide purity in fuel reactor exhaust increases with rise in fuel reactor
temperature for MC as well as SBC. This fact is in conformity to the observations of
Abad et al. (2013) [66].
Conclusions from Second segment of study
The best CFD model developed, incorporating eighteen reactions as proposed in
the second part of the First Segment and six more reactions of reactive ash
components, which has been validated with the pilot plant data is used to study the
effect of four different coals (denoted as “A”, “B”, “C” and “D”) having considerable
amount of ash and moisture on chemical looping combustion. The salient conclusions
of this study are listed below:
1. Fuel conversion on dry ash free basis for fuel coals “A”, “B”, “C” and “D” are
65.27%, 87.82%, 93.8% and 90.73% respectively 2. CaO and Fe2O3 as a part of
reactive ash component shows reactivity under the process condition while SiO2
shows mass weighted average rate of reactions are lesser than 10-20
kmol/m3-s which
are almost negligible.
3. The amount of ash present in fuel coal increases the fuel flow rate
proportionately to produce required feasible process conditions for chemical looping
combustion. The carbon capturing efficiency decreases as fuel flow rate is increased
which has also been observed by Abad et al. (2013) [66]. Further, it can be seen that
overall fuel conversion decreases as amount of non-carbonaceous species increases
such as moisture and ash in the fuel coal as also been identified by Azis et al. (2013)
[25]
4. The carbon dioxide purity in fuel reactor exhaust increases with the rise in fuel
reactor temperature for the four fuels used in the present study. This fact is in tune
with the observations of Abad et al. (2013) [66].
Recommendations:
Further, in development of CFD based model for coal direct chemical looping
technology research on following topics is recommended:
Page | 134
1. Fuel (Coal) specific process design should be developed so as to provide process
residence time for it reactions to achieve better conversion and ash handling.
2. A 3-D based CFD model should be developed and validated with the pilot plant
results to observe the effectiveness of 2D vis-a-vis 3D model predictions.
3. Attempt should be made to incorporate complex CFD model like Euler-Euler
Granular flow model, CFD- DEM method for accurate prediction of hydrodynamics
of the system and associated reactions.
4. Other newly developed metal oxides which are doped with compounds and bi-
metallic oxygen carriers should be tested through modeling for better conversion.
Page | 135
List of Publications:
R. Wadhwani, B. Mohanty, “A Review on clean & efficient technology to
generate electricity from coal”, in Proceedings of the IICBE CAMS-2013, Kuala
Lumpur, Malaysia, pp. 4-8, 2013
R. Wadhwani, B. Mohanty, “Computational study on coal direct chemical looping
combustion”, International Journal of Latest Trends in Engineering and
Technology, Vol. 4, Issue 1, Article 25, 2014
R.Wadhwani, B. Mohanty “CFD study on a complete coal direct chemical
looping pilot plant”, (Submitted in Energy Technology, April 2014)
R. Wadhwani, B. Mohanty, “Effect of ash on coal direct chemical looping
combustion”, (In Preparation)
Page | 136
References:
[1] Concentration of CO2 in Earth’s atmosphere, Scripps Institution of Oceanography,
University of California-San Diego, USA
[2] British Petroleum Co. (2013) BP Statistical Review of World Energy, British
Petroleum Co., London
[3] Energy Information Administration (2006) International Energy Outlook 2006, U.S.
Department of Energy, Washington DC
[4] National Council for Science and the Environment (2006) Energy for a Sustainable
and Secure Future: A Report of the Sixth National Conference on Science, Policy and the
Environment, Washington DC
[5] B. Moghtaderi, “Review of the recent chemical looping process developments for
novel energy and fuel applications”, Energy &Fuels, 2012, Vol. 26, pp. 15-40.
[6] R. Wadhwani, B. Mohanty, “A Review on clean & efficient technology to generate
electricity from coal”, in Proceedings of the 2013IICBE CAMS, Malaysia, pp. 4-8, 2013
[7] L.S. Fan, Chemical looping systems for fossil energy conversion, A John Wiley &
sons Inc., publication, 2010
[8] A. Lyngfelt, “Oxygen carriers of chemical looping combustion – 4000h of
experience”, Oil & Gas Science and Technology, Vol. 66, 2011, pp. 161-172
[9] J. Adanez, A. Abad, F. G. Labiano, P. Gayan, L. F. de Diego, “Progress in Chemical-
looping combustion and reforming technologies”, Progress in Energy and Combustion
Science, Vol. 38, 2012, pp. 215-282
[10] A. Lyngfelt, “Chemical-looping combustion of solid fuels- Status of development”,
Applied Energy, Vol. 113, 2014, pp. 1869-1873
Page | 137
[11] J. Wu et al., “Chemical looping combustion of coal in a 1kWth reactor”, in
Proceedings of 1st International conference on chemical looping, Lyon, 2010
[12] J. Wu et al., “Chemical looping combustion of sawdust in a 10 kWth inter-connected
fluidized bed, Huagong Xuebao/CISEC Journal, Vol. 60, 2009, pp. 2080-2088
[13] L. S. Fan and F. Li, “Chemical looping technology and its fossil energy conversion
applications”, Industrial Engineering Chemical Research, Vol. 49, 2010, pp. 10200-10211
[14] H. R. Kim, D. Wang, L. Zeng, S. Bayham, A. Tong, E. Chung, M. V. Kathe, S. Luo,
O. McGiveron, A. Wang, Z. Sun, D. Chen, L. S. Fan, “Coal direct chemical looping
combustion process: Design and operation of a 25-kWth sub-pilot unit”, Fuel, Vol. 108, 2013,
pp. 370-384
[15] A. Thon et al., “Operational experience with a coupled fluidized bed system for
chemical looping combustion of solid fuels”, in Proceeding of 2nd
International conference
on chemical looping, Darmstadt, 2012
[16] A. Abad, T. Mattisson, A. Lygfelt, M. Rydén, “ Chemical looping combustion in a
300W continuously operating reactor system using a manganese-based oxygen carrier”, Fuel,
Vol. 85, 2006, pp. 1174-1185
[17] H. Gu, L. shen, J. Xiao, S. Zhang, T. Song, “Chemical looping combustion of
biomass/coal with natural iron ore as oxygen carrier in a continuous reactor”, Energy and
Fuels, Vol. 25, 2011, pp. 446-455
[18] H. Leion, E. Jerndal, B. M. Steenari, S. Hermansson, M. Israelsson, E. Jansson, M.
Johnsson, R. Thunberg, A. Vadenbo, T. Mattisson, A. Lyngfelt, “Solid fuels in chemical-
looping combustion using oxide scale and unprocessed iron ore as oxygen carriers”, Fuels,
Vol. 88, 2009, pp. 1945-1954
[19] P. Kolbitsch, T. Pröll, H. Hofbauer, “Modeling of a 120 kW chemical looping
combustion reactor using a Ni-based oxygen carrier”, Chemical Engineering Science, Vol.
64, 2009, pp. 99-108
Page | 138
[20] T. Pröll, P. Kolbitsch, J. B. Nordenkampf, H. Hofbauer, “Chemical looping pilot
plant results using a Nickel-based oxygen carrier”, Oil & Gas Science and Technology, Vol.
66, 2011, pp. 173-180
[21] R. Xiao, Q. Song, M. Song, Z. Lu, S. Zhang, L. Shen, “Pressurized chemical-looping
combustion of coal with an iron ore-based oxygen carrier”, Combustion and Flame, Vol. 157,
2010, pp. 1140-1153
[22] S. A. Scott, J. S. Dennis, A. N. Hayhurst, T. Brown, “In-situ Gasification of a solid
fuel and CO2 separation using chemical looping”, Environmental and Energy Engineering,
Vol. 52, September 2006, pp. 3325-3328
[23] S. C. Bayham, H. R. Kim, D. Wang, A. Tong, L. Zeng, O. McGiveron, M.V. Kathe,
E. Chung, W. Wang, A. Wang, A. Majumder, L. S. Fan, “Iron based coal direct chemical
looping combustion process: 200 h continuous operation of a 25 kWth sub-pilot unit”, Energy
and Fuels, Vol. 27, 2013, pp. 1347-1356
[24] B. Arias, M.E. Diego, J.C. Abanades, M. Lorenzo, L. Diaz, D. Martinez, J. Alvarez,
A. S. Biezma, “Demonstration of steady state CO2 capture in a 1.7 MWth calcium looping
pilot”, International Journal of Greenhouse Gas Control, Vol. 18, 2013, pp. 237-245
[25] M. M. Azis, H. Leion, E. Jerndal, B. M. Steenari, T. Mattison, A. Lyngfelt, “The
effect of bituminous and lignite ash on the performance of ilmenite as oxygen carrier in
chemical looping combustion”, Chemical Engineering Technology, Vol. 36, 2013, pp. 1460-
1468
[26] J. Bao, Z. Li, N. Cai, “ Interaction between iron-based oxygen carrier and four coal
ashes during chemical looping combustion”, Applied Energy, Vol. 115, 2014, pp. 549-558
[27] M. Källén, P. Hallberg, M. Rydén, T. Mattisson, A. Lyngfelt, “Combined oxides of
iron, manganese and silica as oxygen carriers for chemical looping combustion”, Fuel
Processing Technology, Vol. 124, 2014, pp. 87-96
Page | 139
[28] T. Mendiara, L. F. de Diego, F. G. Labiano, P. Gayán, A. Abad, J. Adánez, “On the
use of a highly reactive iron ore in chemical looping combustion of different coals”, Fuel,
Vol. 126, 2014, pp. 239-249
[29] L. G. Velazquez-Vargas et al., “Atmospheric iron-based coal direct chemical
looping process for power generation”, Presented at Power-Gen International, Florida, USA,
Dec. 11-13, 2012
[30] J. C. Abandes, E. J. Anthony, D. Y. Lu, C. Salvador, D. Alvarez, “Capture of CO2
from combustion gases in a fluidized bed of CaO”, Environmental and Energy Engineering,
Vol. 50, 2004, pp. 1614-1622
[31] R. Xiao, Q. Song, S. Zhang, W. Zheng, Y. Yang, “Pressurized chemical looping
combustion of Chinese bituminous coal: cyclic performance and characterization of iron ore-
based oxygen carrier”, Energy and Fuels, Vol. 24, 2010, pp. 1449-1463
[32] R. Siriwardane, H. Tian, G. Richards, T. Simonyi, J. Poston, “Chemical looping
combustion of coal with metal oxide oxygen carriers”, Energy and Fuels, Vol. 23, 2009,
3885-3892
[33] Q. Song, R. Xiao, Z. Deng, L. Shen, J. Xiao, M. Zhang, “Effect of Temperature on
Reduction of CaSO4 Oxygen Carrier in Chemical-Looping Combustion of Simulated Coal
Gas in a Fluidized Bed Reactor”, Industrial Engineering Chemical Research, Vol. 47, 2008,
pp. 8148-8159
[34] N. Berguerand, A. Lyngfelt, “The use of petroleum coke as fuel in a 10 kWth
chemical-looping combustor”, International Journal of Greenhouse gas control, Vol. 2, 2008,
pp. 169-179
[35] B. Kronberger, C. Beal, J.X. Morin, H. Hofbauer, “Design, hydrodynamic testing
and scale up recommendations of a conceptual large scale chemical looping combustion
power plant”, In Proceedings of 3rd
Conference on carbon Sequestration, Alexandria, USA,
2004
Page | 140
[36] Q. Liu, H. Hu, Q. Zhou, S. Zhu, G. Chen, “Effect of inorganic matter on reactivity
and kinetics of coal pyrolysis”, Fuel, Vol. 83, 2004, pp. 713-718
[37] M. Keller, M. Arjmand, H. Leion, T. Mattisson, “Interaction of mineral matter of
coal with oxygen carriers in chemical looping combustion”, Chemical Engineering Research
and Design, 2014, http://dx.doi.org/10.1016/j.cherd.2013.12.006
[38] K. S. Kang, C. H. Kim, K.K. Bae, W.C. Cho, S.U. Jeong, Y.J. Lee, C.S. Park,
“Reduction and oxidation properties of Fe2O3/ZrO2 oxygen carrier for hydrogen production”,
Chemical Engineering Research and Design, 2014,
http://dx.doi.org/10.106/j.cherd.2014.04.001
[39] A. Coppola, P. Salatino, F. Montagnaro, F. Scala, “Hydration-induced reactivation
of spent sorbents for fluidized bed calcium looping (double looping)”, Fuel Processing
Technology, Vol. 120, 2014, pp. 71-78
[40] A. Abad, J. Adánez, A. Cuadrat, F. G. Labiano, P. Gayán, L. F. de Diego, “Kinetics
of redox reactions of ilmenite for chemical looping combustion”, Chemical Engineering
Science, Vol. 66, 2011, pp. 689-702
[41] Z. Yu, C. Li, J. Huang, Z. Wang, “Reduction Rate enhancements for coal direct
chemical looping combustion with an iron oxide oxygen carrier”, Energy and Fuels, Vol. 26,
2012, pp. 2505-2511
[42] Z. Yu, C. Li, X. Jing, Q. Zhang, Y. Fang, J. Zhao, J. Huang, “Effects of CO2
atmosphere and K2CO3 addition on the reduction reactivity, oxygen transport capacity, and
sintering of CuO and Fe2O3 oxygen carriers in coal direct chemical looping combustion”,
Energy and Fuels, Vol. 27, 2013, pp. 2703-2711
[43] J. B. Yang, N. S. Cai, Z. S. Li, “Hydrogen production from the steam-iron process
with direct reduction of iron oxide by chemical looping combustion of coal char”, Energy
and Fuels, Vol. 22, 2008, pp. 2570-2579
[44] Y. Cao, B. Casenas, W. P. Pan, “Investigation of chemical looping combustion by
solid fuels. 2. Redox reaction kinetics and product characterization with coal, biomass and
Page | 141
solid waste as solid fuels and CuO as an oxygen carrier”, Energy and Fuels, Vol. 20, 2006,
pp. 1845- 1854
[45] L. H. Shen, M. Zheng, J. Xiao, H. Zhang, R. Xiao, “Chemical looping combustion of
coal in interconnected fluidized beds”, Science in China Series E: Technological Sciences,
Vol. 50, 2007, pp. 230-240
[46] R. Xiao, Q. Song, “Characterization and kinetics of reduction of CaSO4 with carbon
monoxide for chemical looping combustion”, Combustion and Flame, Vol. 158, 2011, pp.
2524- 2539
[47] R. Siriwardane, H. Tian, D. Miller, G. Richards, T. Simonyi, J. Poston, “Evaluation
of reaction mechanism of coal-metal oxide interactions in chemical- looping combustion”,
Combustion and Flame, Vol. 157, 2010, pp. 2198-2208
[48] N. V. Gnanapragasam, B.V. Reddy, M.A. Rosen, “Hydrogen production from coal
using coal direct chemical looping and syngas chemical looping combustion systems:
Assessment of system operation and resource requirements”, International Journal of
Hydrogen Energy, Vol. 34, 2009, pp. 2606-2615
[49] M. Jheng, L. Shen, J. Xiao, “Reduction of CaSO4 oxygen carrier with coal in
chemical looping combustion: Effects of temperature and gasification intermediate”,
International Journal of Greenhouse Gas Control, Vol. 4, 2010, pp. 716-728
[50] M. Luo, S. Wang, L. Wang, M. Lv, L. Qian, H. Fu, “ Experimental investigation of
co-combustion of coal and biomass using chemical looping technology”, Fuel Processing
Technology, Vol. 110, 2013, pp. 258-267
[51] L. Shen, J. Wu, J. Xiao, “Experiments on chemical looping combustion of coal with
a NiO based oxygen carrier”, Combustion and Flame, Vol. 156, 2009, pp. 721-728
[52] J. Orr, “Angulated studies of the iso-kinetic device for use in the measurement of
solids circulation rate”, Senior Thesis 2012, The Ohio State University, USA
Page | 142
[53] H. Zhao, L. Liu, B. Wang, D. Xu, L. Jiang, C. Zheng, “Sol-gel derived NiO/NiAl2O4
oxygen carriers for chemical looping combustion by coal char”, Energy and Fuels, Vol. 22,
2008, pp. 898-905
[54] H. Jin, M. Ishida, “A new type of coal gas fueled chemical looping combustion”,
Fuel, Vol. 83, 2004, pp. 2411-2417
[55] F. G. Labiano, J. Adánez, L. F. de Diego, P. Gayán, A. Abad, “Effect of pressure on
the behavior of copper-, iron-, and nickel- based oxygen carriers for chemical looping
combustion”, Energy and Fuels, Vol. 20, 2006, pp. 26-33
[56] C. Saha, S. Bhattacharya, “Comparison of CuO and NiO as oxygen carrier in
chemical looping combustion of a Victorian brown coal”, International Journal of Hydrogen
Energy, Vol. 36, 2011, pp. 12048-12057
[57] C. Saha, B. Roy, S. Bhattacharya, “ Chemical looping combustion of Victorian
brown coal using NiO oxygen carrier”, International Journal of Hydrogen Energy, Vol. 36,
2011, pp. 3253-3259
[58] H. P. Hamers, F. Gallucci, P. D. Cobden, E. Kimball, M. van Sint Annaland, “CLC
in packed beds using syngas and CuO/Al2O3: Model description and experimental
validation”, Applied Energy, Vol. 119, 2014, pp. 163-172
[59] W. Wang, Y. Li, X. Xie, R. Sun, “Effect of the presence of HCl on cyclic CO2
capture of calcium-based sorbent in calcium looping process”, Applied Energy, Vol. 125,
2014, pp. 246-253
[60] R. I. Singh, A. Brink, M. Hupa, “CFD modeling to study fluidized bed combustion
and gasification”, Applied Thermal Engineering, Vol. 52, 2013, pp. 585-614
[61] M. Anheden, G. Svedberg, “Exergy analysis of chemical looping combustion
systems”, Energy Conversion and Management, Vol. 39, 1998, pp. 1967-1980
Page | 143
[62] W. Shuai, L. Guodong, L. Huilin, C. Juhui, H. Yurong, W. Jiaxing, “Fluid dynamic
simulation in a chemical looping combustion with two interconnected fluidized beds”, Fuel
Processing Technology, Vol. 92, 2011, pp. 385-393
[63] X. Wang, B. Jin, W. Zhong, Y. Zhang, M. Song, “Three- dimensional simulation of
a coal gas fueled chemical looping combustion”, International Journal of Greenhouse Gas
Control, Vol. 5, 2011a, pp. 1498-1506
[64] X. Wang, B. Jin, Y. Zhang, W. Zhong, S. Yin, “Multiphase computational fluid
dynamics (CFD) modeling of chemical looping combustion using a CuO/Al2O3 oxygen
carrier: effect of operating conditions on coal gas combustion”, Energy and Fuels, Vol. 25,
2011b, pp. 3815-3824
[65] Z. Peng, E. Doroodchi, Y. Alghamdi, B. Moghtaderi, “Mixing and segregation of
solid mixtures in bubbling fluidized beds under conditions pertinent to the fuel reactor of a
chemical looping system”, Powder Technology, Vol. 235, 2013, pp. 823-837
[66] A. Abad, J. Adánez, L. F. de Deigo, P. Gayán, F. G. Labiano, A. Lyngfelt, “Fuel
reactor model validation: Assessment of the key parameters affecting the chemical looping
combustion of coal”, International Journal of Greenhouse Gas Control, Vol. 19, 2013, pp.
541- 551
[67] M. Jafarian, M. Arjomandi, G. J. Nathan, “Influence of the type of oxygen carriers
on the performance of a hybrid solar chemical looping combustion system”, 2014,
http://dx.doi.org/10.1021/ef402542b
[68] J. A. Medrano, V. Spallina, M. van Sint Annaland, F. Gallucci, “Thermodynamic
analysis of a membrane-assisted chemical looping reforming reactor concept for combined
H2 production and CO2 capture”, International Journal of Hydrogen Energy, Vol. 39, 2014,
pp. 4725-4738
[69] G. L. Schwebel, S. Sundqvist, W. Krumm, H. Leion, “Apparent Kinetics derived
from fluidized bed experiments for Norwegian ilmenite as oxygen carrier”, Journal of
Environmental Chemical Engineering, 2014, http://dx.doi.org/10.1016/j.jece.2014.04.013
Page | 144
[70] Z. Deng, R. Xiao, B. Jin, Q. Song, “Numerical simulation of chemical looping
combustion process with CaSO4 oxygen carrier”, International Journal of Greenhouse Gas
Control, Vol. 3, 2009, pp. 368-375
[71] Z. Deng, R. Xiao, B. Jin, Q. Song, H. Huang, “Multiphase CFD modeling for a
chemical looping combustion process (Fuel Reactor)”, Chemical Engineering Technology,
Vol. 31, 2008, pp. 1754- 1766
[72] X. Wang, B. Jin, Y. Zhang, Y. Zhang, X. Liu, “Three dimensional modeling of a
coal fired chemical looping combustion process in the circulating fluidized bed fuel reactor”,
Energy and Fuels, Vol. 27, 2013, pp. 2173-2184
[73] G. Schöny D. Pallarès, H. Leion, J. Wolf, “Assessment of the scale-up and
operational design of the fuel reactor in chemical looping combustion”, In Proceeding of 36th
International Technical Conference on Clean Coal & Fuel Systems, Florida, USA, June 5-9,
2011
[74] H. Thunman, K. Davidsson, B. Leckner, “Separation of drying and devolatilization
during conversion of solid fuels”, Combustion and Flame, Vol. 137, 2004, pp. 242-250
[75] R. Sharma, M. K. Chandel, A. Delebarre, B. Alappat, “200-MW chemical looping
combustion based thermal power plant for clean power generation”, International Journal of
Energy Research, 2011, pp. 49-58
[76] K. Marx, T. Pröll, H. Hofbauer, “Next scale chemical looping combustion: fluidized
bed system design for demonstration unit”, In Proceedings of 21st International Conference
on Fluidized bed combustion, June 3-6, 2012, Naples, Italy, pp. 269-279 ISBN 978-88-
89677-83-4
[77] B. Kronberger, G. Löffler, H. Hofbauer, “Simulation of mass and energy balance of
a chemical looping combustion system”, In Proceeding of International Conference in
Energy for a Clean Environment, Lisbon, Portugal, 2003
Page | 145
[78] K. Mahalatkar, J. Kuhlman, E. D. Huckaby, T. O’Brien, “Computational fluid
dynamic simulations of chemical looping fuel reactors utilizing gaseous fuels”, Chemical
Engineering Sciences, Vol. 66, 2011, pp. 469-479
[79] H. Kruggel-Emden, S. Rickelt, F. Stepanek, A. Munjiza, “Development and testing
of an interconnected multiphase CFD-model for chemical looping combustion”, Chemical
Engineering Sciences, Vol. 65, 2010, pp. 4732-4745
[80] H. Kruggel-Emden, F. Stepandek, A. Munija, “A study on the role of reaction
modeling in multi-phase CFD based simulations of chemical looping combustion”, Oil &
Gas Science and Technology, Vol. 66, 2011a, pp. 313-331
[81] H. Kruggel-Emden, F. Stepandek, A. Munija, “A comparative study of reaction
models applied for chemical looping combustion”, Chemical Engineering Research and
Design, Vol. 89, 2011b, pp. 2714-2727
[82] B. Jin, R. Xiao, Z. Deng, Q. Song, “Computational fluid dynamics modeling of
chemical looping combustion process with calcium sulphate oxygen carrier”, International
Journal of Chemical Reactor Engineering, Vol. 7, 2009, Article 19
[83] A. Lyngfelt, B. Leckner, T. Mattisson, “A fluidized bed combustion process with
inherent CO2 separation; application of chemical looping combustion”, Chemical
Engineering Science, Vol. 56, 2001, pp. 3101-3113
[84] D. Brahimi, J. H. Choi, P. S. Youn, Y. W. Jeon, S. D. Kim, H. J. Ryu, “Simulation
on operating conditions of chemical looping combuston of methane in a continuous bubbling
fluidized bed process”, Energy and Fuels, Vol. 26, 2012, pp. 1441-1448
[85] E. J. Anthony, “Solid looping cycles: A new technology for coal conversion”,
Industrial Engineering Chemical Research, Vol. 47, 2008, pp. 1747-1754
[86] L. Han, Z. Zhou, G. M. Bollas, “Heterogeneous modeling of chemical looping
combustion. Part-1: Reactor model”, Chemical Engineering Science, Vol. 104, 2013, pp.
233-249
Page | 146
[87] R. Wadhwani, B. Mohanty, “Computational study on coal direct chemical looping
combustion”, International Journal of Latest Trends in Engineering and Technology, Vol. 4,
Issue 1, Article 25, 2014
[88] F. Li, L. S. Fan, “Clean coal conversion processes – progress and challenges”,
Energy and Environmental Science, Vol. 1, 2008, pp. 248-267
[89] A. F. Sarofim, J. S. Lighty, P. J. Smit, K. J. Whitty, E. Eyring, A. Sahir, M. Alvarez,
M. Hradisky, C. Clayton, G. Konya, R. Baracki, K. Kelly, “Chemical looping combustion
reactions and systems”, Tropical Report, Utah Clean Coal Program, 2011
[90] W. Xiang, S. Chen, Z. Xue, X. Sun, “Investigation of coal gasification hydrogen and
electricity co-production plant with three-reactors chemical looping process”, International
Journal of Hydrogen Energy, Vol. 35, 2010, pp. 8580-8591
[91] L. Zhou, Z. Zhang, R. K. Agarwal, “Simulation and validation of chemical looping
combustion using ASPEN plus”, International Journal of Energy and Environment, Vol. 5,
2014, pp. 53-58
[92] S. G. Gopaul, “The chemical looping gasification of biomass for syngas utilization
in a solid oxide fuel cell system simulated in ASPEN Plus”, Master of Applied Science
Thesis, University of Guelph, Canada, 2014
[93] L. Zeng, F. He, F. Li, L. S. Fan, “Coal direct chemical looping gasification for
hydrogen production: reactor modeling and process simulation”, Energy and Fuels, Vol. 26,
2012, pp. 3680-3690
[94] Q. Guo, J. Zhang, H. Tian, “Recent advances in CaSO4 oxygen carrier for chemical
looping combustion process”, Chemical Engineering Communications, Vol. 199, 2012, pp.
1463-1491
[95] F. Li, L. Zeng, L. S. Fan, “Biomass direct chemical looping process: Process
simulation”, Fuel, Vol. 89, 2010, pp. 3773, 3784
Page | 147
[96] N. Kobayashi, L. S. Fan, “Biomass direct chemical looping process: A perspective”,
Biomass and Bioenergy, Vol. 35, 2011, pp. 1252-1262
[97] F. Liu, “Cerium oxide promoted oxygen carrier development and scale modeling
study for chemical looping combustion”, Thesis and Dissertation-Mechanical Engineering,
Paper-31, University of Kentucky, 2013
[98] Y. Fan, R. Siriwardane, “Novel new oxygen carriers for chemical looping
combustion of solid fuels”, Energy and Fuels, Vol. 28, 2014, pp. 2248-2257
[99] C. C. Cormos, “Evaluation of iron based chemical looping for hydrogen and
electricity co-production by gasification process with carbon capture and storage”,
International Journal of Hydrogen Energy, Vol. 35, 2010, pp. 2278-2289
[100] J. P. Ciferno, T. E. Fout, A. P. Jones, J. T. Murphy, “Capturing carbon from
existing coal fired power plants”, Chemical Engineering Progress, April 2009, pp. 33-41
[101] M. M. Hossain, H. I. de Lasa, “Chemical looping combustion (CLC) for inherent
CO2 separations – a review”, Chemical Engineering Science, Vol. 63, 2008, pp. 4433-4451
[102] S. Rezvani, Y. Huang, D. M. Wright, N. Hewitt, J. D. Mondol, “Comparative
assessment of coal fired IGCC systems with CO2 capture using physical adsorption,
membrane reactors and chemical looping”, Fuel, Vol. 88, 2009, pp. 2463-2472
[103] M. Ishida, H. Jin, “A novel chemical looping combustor and its reaction kinetics”,
Journal of Chemical Engineering of Japan, Vol. 27, 1994, pp. 296-301
[104] M. Ishida, H. Jin, T. Okamato, “A fundamental study of a new kind of medium
material for chemical looping combustion”, Energy and Fuels, Vol. 10, 1996, pp. 958-963
[105] M. Ishida, H. Jin, “Novel chemical looping combustor without NOx formation”,
Industrial and Engineering Chemistry, Vol. 35, 1996, pp. 2469-2472
Page | 148
[106] T. Hatanaka, S. Matsuda, H. Hatano, “A new concept gas-solid combustion system
“MERIT” for high combustion efficiency and low emissions”, In Proceedings of Intersociety
energy conversion engineering conference”, Vol. 30, 1997, pp. 944-948
[107] H. Jin, T. Okamoto, M. Ishida, “Development of a novel chemical looping
combustion: synthesis of a looping material with double metal oxide of CoO – NiO”, Energy
and Fuels, Vol. 12, 1998, pp. 1272-1277
[108] M. Ishida, T. Okamoto, H. Jin, “Kinetic behavior of solid particle in chemical
looping combustion: Suppressing carbon deposition in reduction, Energy and Fuels, Vol. 12,
1998, pp. 223- 229
[109] H. Jin, T. Okamoto, M. Ishida, “Development of a novel chemical looping
combustion: synthesis of a solid looping material of NiO/NiAl2O4”, Industrial and
Engineering Chemistry Research, Vol. 38, 1999, pp. 126-132
[110] M. Ishida, M. Yamamoto, Y. Saito, “Experimental works on innovative chemical
looping combustor”, In Proceeding of ECOS’99, International Conference on efficiency,
costs, optimization, simulation and environmental aspects of energy systems, Tokyo, Japan,
June 8-10, 1999, pp. 306-310
[111] N. Berguerand. A. Lyngfelt, “Design and operation of a 10kWth chemical looping
combustor for solid fuels- Testing with South African coal”, Fuel, Vol. 87, 2008, pp. 2713-
2726
[112] H. Tian, K. Chaudhari, T. Simonyi, J. Poston, T. Liu, T. Sanders, G. Veser, R.
Siriwardane, “Chemical looping combustion of coal derived synthesis gas over copper oxide
oxygen carriers”, Energy and Fuels, Vol. 22, 2008, pp. 3744-3755
[113] E. Eyring, G. Konya, J. S. Lighty, A. H. Sahir, A. F. Sarofim, K. Whitty,
“Chemical looping with Copper oxide as carrier and coal as fuel”, Oil & Gas Science and
Technology, Vol. 66, 2011, pp. 209-221
Page | 149
[114] M. Z. Orcajo, “Process simulation and comparison of CO2 separation through
chemical looping”, 2011, Department of Energy systems of Technical University of Munich
& Universidad Pontificia de Comillas, Madrid
[115] S. Penthor, T. Pröll, H. Hofbauer, “Chemical looping combustion using biomass as
fuel”, In Proceeding of 2nd
Oxyfuel Combustion Conference
[116] A. Tong, S. Bayham, M. V. Kathe, L. Zeng, S. Luo, L. S. Fan, “Iron based syngas
chemical looping process and coal direct chemical looping process development at Ohio
State University”, Applied Energy, 2013, http://dx.doi.org.10.1016/j.apenergy.2013.05.024
[117] X. Wang, B. Jin, X. Liu, Y. Zhang, H. Liu, “Experimental investigation on flow
behaviors in a novel in-situ gasification chemical looping combustion apparatus”, Industrial
and Engineering Chemistry Research, Vol. 52, 2013, pp. 14208-14218
[118] A. Zaabout, S. Cloete, S. T. Johansen, M. van Sint Annaland, F. Gallucci, S.
Amini, “Experimental demonstration of a novel gas switching combustion reactor for power
production with integrated CO2 capture”, Industrial and Engineering Chemistry Research,
Vol. 52, 2013, pp. 14241-14250
[119] S. Bhavsar, M. Najera, R. Solunke, G. Veser, “Chemical looping: to combustion
and beyond”, Catalysis Today, Vol. 228, 2014, pp. 96-105
[120] Y. A. Daza, R. A. Kent, M. M. Yung, J. N. Kuhn, “Carbon dioxide conversion by
reverse water-gas shift chemical looping on Perovskite- type oxides”, Industrial &
Engineering Chemistry Research, Vol. 53, 2014, pp. 5828-5837
[121] G. Duelli, A. R. Bidwe, I. Papandreou, H. Dieter, G. Scheffknecht,
“Characterization of the oxy-fired regenerator at a 10 kWth dual fluidized bed calcium
looping facility”, Applied Thermal Engineering, 2014,
http://dx.doi.org/10.106/j.applthermaleng.2014.03.042
[122] A. Edrisi, Z. Mansoori, B. Dabir, “Using three chemical looping reactors in
ammonia production process- a novel plant configuration for a green production”,
Page | 150
International Journal of Hydrogen Energy, 2014,
http://dx.doi.org10.1016/j.ijhydene.2014.03.119
[123] N. van Garderen, F. J. Clemens, T. Graule, “Development of copper impregnated
porous granulates for chemical looping combustion”, Fuel, 119, 2014, pp. 323-327
[124] E. Ksepko, “Perovskite-type Sr(Mn1-xNix)O3 materials and their chemical looping
oxygen transfer properties”, International Journal of Hydrogen Energy, 2014,
http://dx.doi.org/10.1016/j.ijhydene.2014.03.093
[125] Z. Ma, S. P. Zhang, D. Y. Xie, Y. J. Yan, “A novel integrated process for hydrogen
production from biomass”, International Journal of Hydrogen Energy, Vol. 39, 2014, pp.
1274- 1279
[126] B. Wang, C. Gao, W. Wang, H. Zhao, C. Zheng, “Sulfur evolution in chemical
looping combustion of coal with MnFe2O4 oxygen carrier”, Journal of Environmental
Sciences, Vol. 26, 2014, pp. 1062-1070
[127] B. Wang, C. Gao, W. Wang, F. Kong, C. Zeng, “TGA-FTIR investigation of
chemical looping combustion by coal with CoFe2O4 combined oxygen carrier”, Journal of
Analytical and Applied Pyrolysis, Vol. 105, 2014, pp. 369-378
[128] A. Yahom, J. Powell, V. Pavarajarn, P. Onbhuddha, S. Charojrochkul, S.
Assabumrungrat, “Simulation and thermodynamic analysis of chemical looping reforming
and CO2 enhanced chemical looping reforming”, Chemical Engineering Research and
Design, 2014, http://dx.doi.org/10.106/j.cherd.2014.04.002
[129] X. Zhang, S. Li, H. Hong, H. Jin, “A hydrogen and oxygen combined cycle with
chemical looping combustion”, Energy Conversion and Management, 2014,
http://dx.doi.org/10.106/j.enconman.2014.03.013
[130] K. Zhao, F. He, Z. Huang, A. Zheng, H. Li, Z. Zhao, “Three-dimensionally ordered
macroporous LaFeO3 perovskites for chemical looping steam reforming of methane”,
International Journal of Hydrogen Energy, Vol. 39, 2014, pp. 3243-3252
Page | 151
[131] Z. Zhao, C. O. Iloeje, T. Chen, A. F. Ghoniem, “Design of a rotary reactor for
chemical looping combustion. Part-1: Fundamentals and design methodology”, Fuel, Vol.
121, 2014, pp. 327- 343
[132] Z. Zhao, A. F. Ghoniem, “Design of a rotary reactor for chemical looping
combustion. Part-2: Comparison of copper-, nickel- and iron- based oxygen carriers”, Fuel,
Vol. 121, 2014, pp. 344-360
[133] X. Zheng, Q. Su, W. Mi, P. Zhang, “Effect of steam reforming on methane fueled
chemical looping combustion with Cu-based oxygen carrier”, International Journal of
Hydrogen Energy, 2014, http://dx.doi.org/10.106/j.ijhydene.2014.03.245
[134] M. Zheng, L. Shen, X. Fang, “In situ gasification chemical looping combustion of a
coal using the binary oxygen carrier natural anhydrite ore and natural iron ore”, Energy
Conversion and Management, Vol. 83, 2014, pp. 270-283
[135] K. Piotrowski, T. Wiltowski, K. Mondol. L. Stonawski, T. Szmanski, D. Dasgupta,
“Simultaneous influence of gas mixture composition and process temperature on Fe2O3
FeO reduction kinetics- Neural network modeling”, Brazilian Journal of Chemical
Engineering, Vol. 22, 2005, pp. 419-432
[136] R. B. C. Gharbi, A. M. Elsharkawy, “Neural network model for estimating the PVT
properties of Middle East crude oils”, Society of Petroleum Engineers, Vol. 2, 1999, pp. 255-
265
[137] Z. Guo, W. Sha, “Modelling the correlation between processing parameters and
properties of magaging steels using artificial neural network”, Computational Materials
Science, Vol. 29, 2004, pp. 12-28
[138] S. Malinov, W. Sha, “Modelling the correlation between processing parameters and
properties in titanium alloys using artificial neural network”, Computational Materials
Science, Vol. 21, 2001, pp. 375-394
[139] D. B. Anthony, J. B. Howard, “Coal devolatilization and hydrogasification”,
AIChE Journal, Vol. 22, 1976, pp. 625-656
Page | 152
[140] Y. K. Rao, “The kinetics of reduction of hematite by carbon”, Metallurgical
Transactions, Vol. 2, 1971, pp. 1439-1447
[141] A. Chatterjee, “Beyond the Blast Furnace”, CRC Press, 1993
[142] D. G. Roberts, D. J. Harris, “Char gasification with O2, CO2, and H2O: Effects of
pressure on intrinsic reaction kinetics”, Energy and Fuels, Vol. 14, 2000, pp. 483-489
[143] A. P. Grosvenor, B. A. Kobe, N. S. Mclntyre, “Activation energies for the
oxidation of iron by oxygen gas and water vapour”, Surface Science, Vol. 574, 2005, pp.
317-321
[144] A. Tomita, O.P. Mahajan, “Reactivity of heat treated coals in hydrogen”, Fuel, Vol.
56, 1977, pp. 137-144
[145] C. Di Blasi, “Dynamic behavior of stratified downdraft gasifiers”, Chemical
Engineering Science, Vol. 55, 2000, pp. 2931-2944
[146] R. Govind, J. Shah, “Modeling and simulation of an entrained flow coal gasifier,
AIChE Journal, Vol. 30, 1984, pp. 79-91
[147] G. Perkins, A. Saghafi, V. Sahajwalla, “Numerical modeling of Underground coal
gasification and its application to Australian coal seam conditions”, School of Material
Science and Engineering, University of New South Wales, Sydney, Australia
[148] C. Westbrook, F. L. Dryer, “Chemical kinetic modeling of hydrocarbon
combustion”, Progress in Energy and Combustion Science, Vol. 10, 1984, pp. 1-57
[149] K. S. Go, S. R. Ron, S. D. Kim, “Reaction kinetics of reduction and oxidation of
metal oxides for hydrogen production”, International Journal of Hydrogen Energy, Vol. 33,
2008, pp. 5986- 5995
[150] J. Li, Z. Zhao, A. Kazakov, F. L. Dryer, “An updated comprehensive kinetic model
of hydrogen combustion”, International Journal of Chemical Kinetics, Vol. 36, 2004, pp.
566-575

Page | 153
[151] V. Strezov, J. A. Lucas, L. Strezov, “Quantifying the heats of coal
devolatilization”, Metallurgical and Materials Transactions B, Vol. 31B, 2000, pp. 1125-
1131
[152] J. C. Abanades, E. J. Anthony, D. Y. Lu, C. Salvador, D. Alvarez, “Capture of CO2
from combustion gases in a fluidized bed of CaO”, Environmental and Energy Engineering,
Vol. 50, 2004, pp. 1614-1622
[153] V. Kilusinha, M. E. Galvez, A. Steinfeld, “Kinetic analysis of the carbonation
reactions for the capture of CO2 from air via the Ca(OH)2–CaCO3–CaO solar thermo-
chemical cycle”, Chemical Engineering Journal, Vol. 129, 2007, pp. 75-83
[154] A. W. Weimer, K. J. Nilsen, G. A. Cochran, R. P. Roach, “Kinetics of
carbothermal reduction synthesis of beta silicon carbide”, Reactors, Kinetics and Catalysis,
Vol. 39, 1993, pp. 493-503
[155] M. A. Vannice, Y. Lin. Chao, R. M. Friedman, “The preparation and use of high
surface area silicon carbide catalyst supports”, Applied Catalysis, Vol. 20, 1986, pp. 91-107
[156] ANSYS Fluent 12.0 Theory Guide, April 2009
[157] L. Anastasakis, N. Mort, “The development of self-organization techniques in
modeling: a review of the group method of data handling (GMDH)”, Research Report no.
813, Department of Automatic Control & systems engineering, University of Sheffield, 2001
[158] Kozen, C. Dexter, “Gödel’s Incompleteness Theorem, Automata and
Computability”, Springer New York, 1997, pp. 282-286
[159] A.G. Ivakhnenko, “The group method of data handling – a rival of the method of
stochastic approximation”, Soviet Automatic Control c/c of Avtomatika, Vol. 1, Issue 3,
1968, pp. 43-55