certificate - charusat
TRANSCRIPT
CHAROTAR UNIVERSITY OF SCIENCE AND TECHNOLOGY Faculty of Technology and Engineering
Manubhai Shivabhai Patel Department of Civil Engineering
4
CERTIFICATE
This is to certify that Mr./ Ms. _________________________________ Of
Division__________, Branch_______________, Batch__________ Roll
No.____________, has satisfactorily completed his / her term work in the
subject MECHANICS OF SOLIDS (CL243)for the term ending in
_________________20___ / 20___.
Date:
Sign of the Faculty Head of the Department

CHAROTAR UNIVERSITY OF SCIENCE AND TECHNOLOGY Faculty of Technology and Engineering
Manubhai Shivabhai Patel Department of Civil Engineering
5
INDEX
Sr.
No.
Title Page
No.
Date Grade Signature
1. Izod Impact Test
2. Rockwell Hardness Test
3. Transverse Test on Timber
4. Compression Test on Bricks &
Blocks
5. Tension Test on Various
Materials
6 Tutorial:1 Simple Stresses and
Strains
7 Tutorial:2 Shear Force and
Bending Moment
8 Tutorial:3 Moment of Inertia
9 Tutorial:4 Principal Stresses
and Strains
10 Tutorial:5 Bending and Shear
Stresses in Homogeneous and
Composite Beam Sections
11 Tutorial:6 Strain Energy
CHAROTAR UNIVERSITY OF SCIENCE AND TECHNOLOGY Faculty of Technology and Engineering
Manubhai Shivabhai Patel Department of Civil Engineering
6
Date:
Experiment No. 1
IZOD IMPACT TEST
OBJECTIVE:
To study the behavior of metals under impact load.
EQUIPMENT:
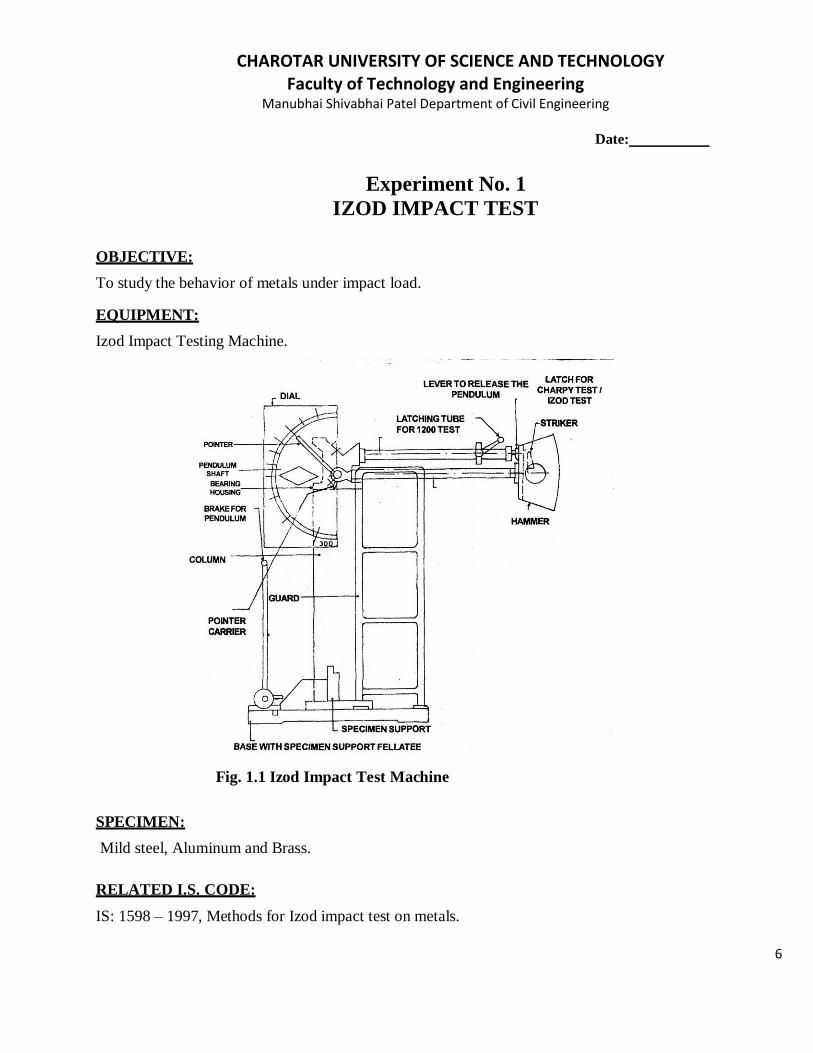
Izod Impact Testing Machine.
Fig. 1.1 Izod Impact Test Machine
SPECIMEN:
Mild steel, Aluminum and Brass.
RELATED I.S. CODE:
IS: 1598 – 1997, Methods for Izod impact test on metals.
CHAROTAR UNIVERSITY OF SCIENCE AND TECHNOLOGY Faculty of Technology and Engineering
Manubhai Shivabhai Patel Department of Civil Engineering
7
Mechanics of solids (CL 243)
THEORETICAL BACKGROUND:
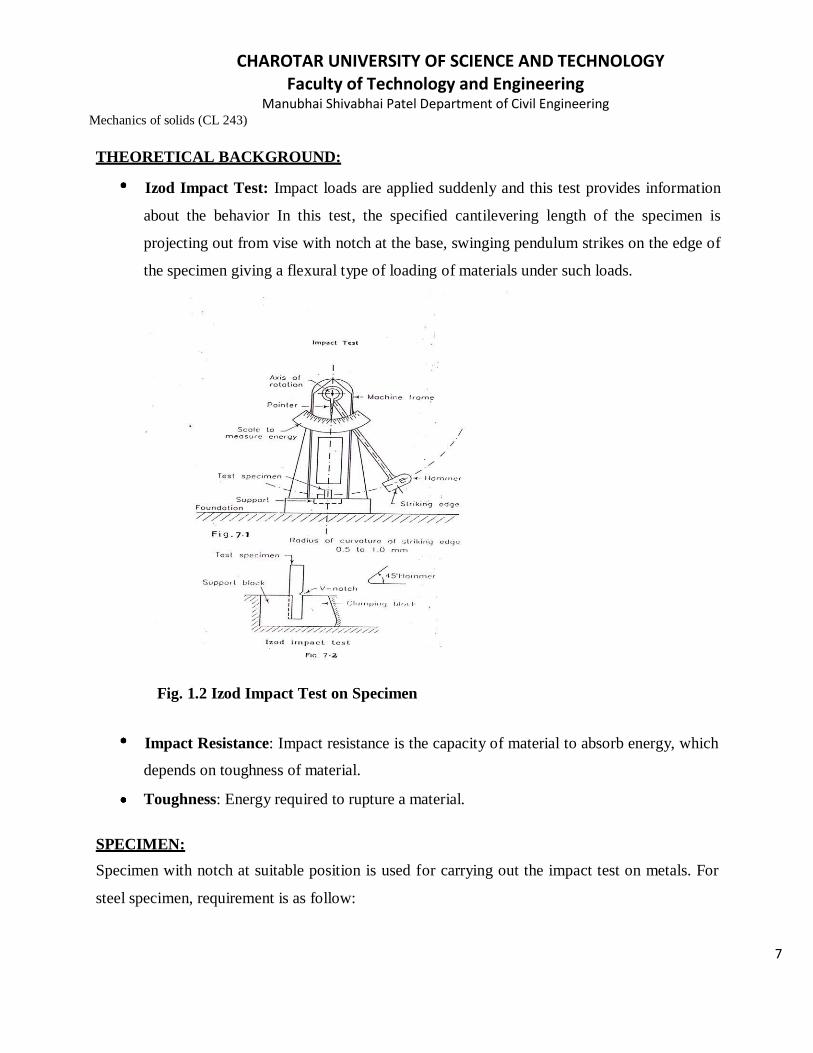
Izod Impact Test: Impact loads are applied suddenly and this test provides information
about the behavior In this test, the specified cantilevering length of the specimen is
projecting out from vise with notch at the base, swinging pendulum strikes on the edge of
the specimen giving a flexural type of loading of materials under such loads.
Fig. 1.2 Izod Impact Test on Specimen
Impact Resistance: Impact resistance is the capacity of material to absorb energy, which
depends on toughness of material.
Toughness: Energy required to rupture a material.
SPECIMEN:
Specimen with notch at suitable position is used for carrying out the impact test on metals. For
steel specimen, requirement is as follow:

CHAROTAR UNIVERSITY OF SCIENCE AND TECHNOLOGY Faculty of Technology and Engineering
Manubhai Shivabhai Patel Department of Civil Engineering
8
Shape of The
Specimen
Type Type of Notch Reference
Square or Round Cantilever beam fixed at notch V notch at base Fig. 1.3
Fig. 1.3 Single Notch Square Specimen for Izod Impact Test Confirming
to I.S. 1958 – 1960
PROCEDURE:
1. Check the specimen, measure its dimensions and ascertain the IS requirements are
satisfied.
2. Lift the hammer in position. Put the stop bar and set the indicator on the scale.
3. Fix the specimen between the jaws properly such that the notch is in level with the anvil
and faces the hammer side and the level of the specimen is in line with the striking edge of
the hammer.
4. Release the pendulum and allow it to strike the test specimen.
5. Note the reading on the scale indicate by the pointer after the specimen is fractured, which
gives impact value. 6. Study the type of fracture and co-relate it with fracture of specimens of different material.
CHAROTAR UNIVERSITY OF SCIENCE AND TECHNOLOGY Faculty of Technology and Engineering
Manubhai Shivabhai Patel Department of Civil Engineering
9
PRECAUTIONS:
1. It is not advisable to stand near or in front of the machine when the pendulum is to
released.
2. Notch should be exactly in the line of action of the pendulum.
3. When specimen is being fitted, care should be taken that pendulum dose not get released.

CHAROTAR UNIVERSITY OF SCIENCE AND TECHNOLOGY Faculty of Technology and Engineering
Manubhai Shivabhai Patel Department of Civil Engineering
10
APPLICATIONS:
1. This test is basically designed so as to check the suitability of materials
subjected to dynamic loads, e.g., vehicles traveling over bridges, hull of
sheep subjected to waves or hammer falling on nail.
2. The ductile material like steel has more impact value and therefore has wide
acceptability in structural and other mechanical application.
OBSERVATION TABLE:
Sr.
No.
Material Energy Losses
(J)
Impact Value
(N m)
Mode of Failure
1. Mild Steel
2. Aluminum
3. Brass
OR
Sr. Material Gross Energy Energy Losses Impact Value Mode of Failure
No. (J) (J) (N m)
1. Mild Steel
2. Aluminum
3. Brass
CONCLUSIONS:
Grade Obtained: Signature of Faculty: Date:
CHAROTAR UNIVERSITY OF SCIENCE AND TECHNOLOGY Faculty of Technology and Engineering
Manubhai Shivabhai Patel Department of Civil Engineering
11
Date:
EXPERIMENT NO. 2
ROCKWELL HARDNESS TEST
OBJECTIVE:
To determine the hardness number of given specimens by Rockwell hardness test.
EQUIPMENT:
Rockwell Hardness Testing machine with a direct reading dial.
APPARATUS:
Microscope.
MATERIALS:
Mild steel, Brass and Aluminium.
RELATED I.S. CODE:
IS: 1586 – 1986: Method of Rockwell hardness test for metallic materials.
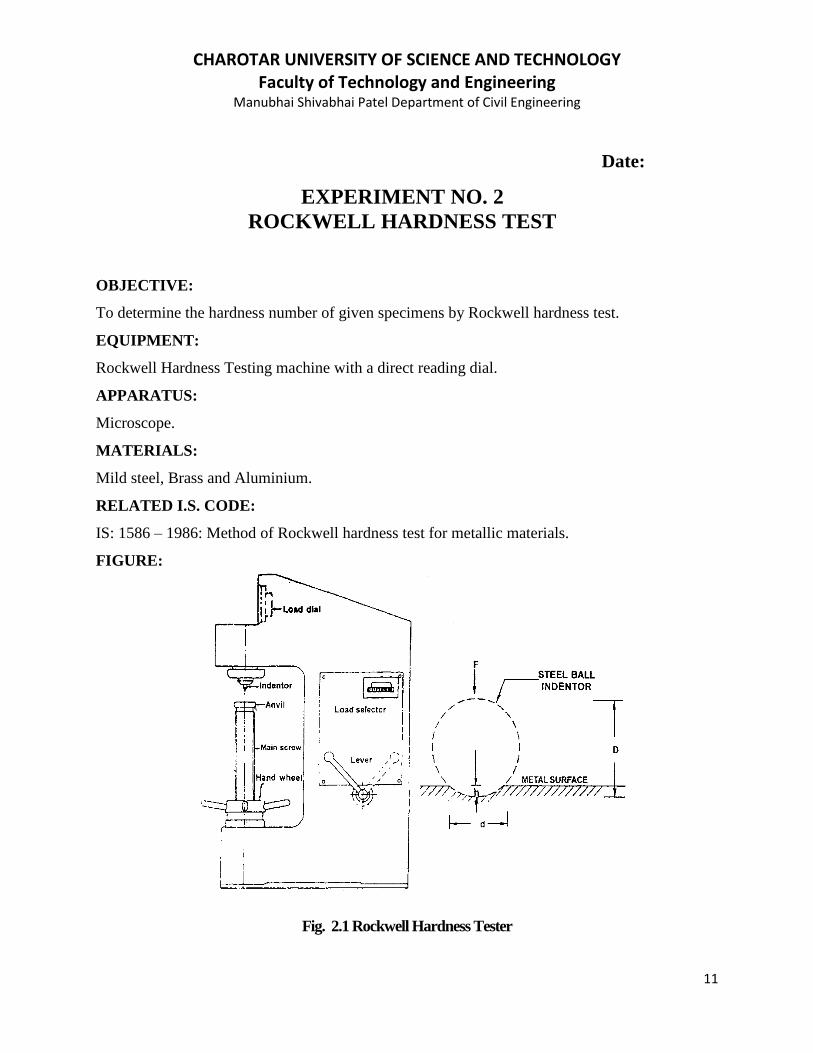
FIGURE:
Fig. 2.1 Rockwell Hardness Tester
CHAROTAR UNIVERSITY OF SCIENCE AND TECHNOLOGY Faculty of Technology and Engineering
Manubhai Shivabhai Patel Department of Civil Engineering
12
THEORETICAL BACKGROUND:
Hardness is an important property of metals. It is defined as a resistance given by the metals
specimen to scratching, abrasion or indentation on its surface.
This experiment performs to indentation hardness under a given static load. Standard value of the
indenting force is applied on the specimen and impression formed on the surface of the specimen
is measured is assigned. The prefix HR with dial reading is used to designate the Rockwell
hardness number. The line diagram of the machine is shown in the Fig. 2.1.
Rockwell number is directly read from dial having B& C scales. B-scales are meant for materials
with of medium hardness whereas C-scale is used for harder than HRB 100. The C-scale should
not be used for range below HRC20.
This test differs from the Brinell test in the sense that the penetration and the applied loads are
smaller, and hence the resulting indentation is shallower, so it is applicable to the testing of
materials having hardness beyond the scope of the Brinell test. Rockwell hardness number is
inversely proportional to the depth of the indentation. Fig. 2.1 shows the indentation caused by
steel ball and the indentation caused by diamond cone on the metal surfaces. A minor load of 10
kg is applied first for proper fixing of specimen, which causes initial indentation and sets the
indenter on the specimen. This is followed by the application of major load, which leaves an
indentation on the surfaces of the specimen. The depth of the indentation (h) is derived from the
dimension of the indentation.
Rockwell B number (HRB) = 130 - depth of penetration h in mm / 0.002
Rockwell C number (HRC) = 100 - depth of penetration h in mm / 0.002
CHAROTAR UNIVERSITY OF SCIENCE AND TECHNOLOGY Faculty of Technology and Engineering
Manubhai Shivabhai Patel Department of Civil Engineering
13
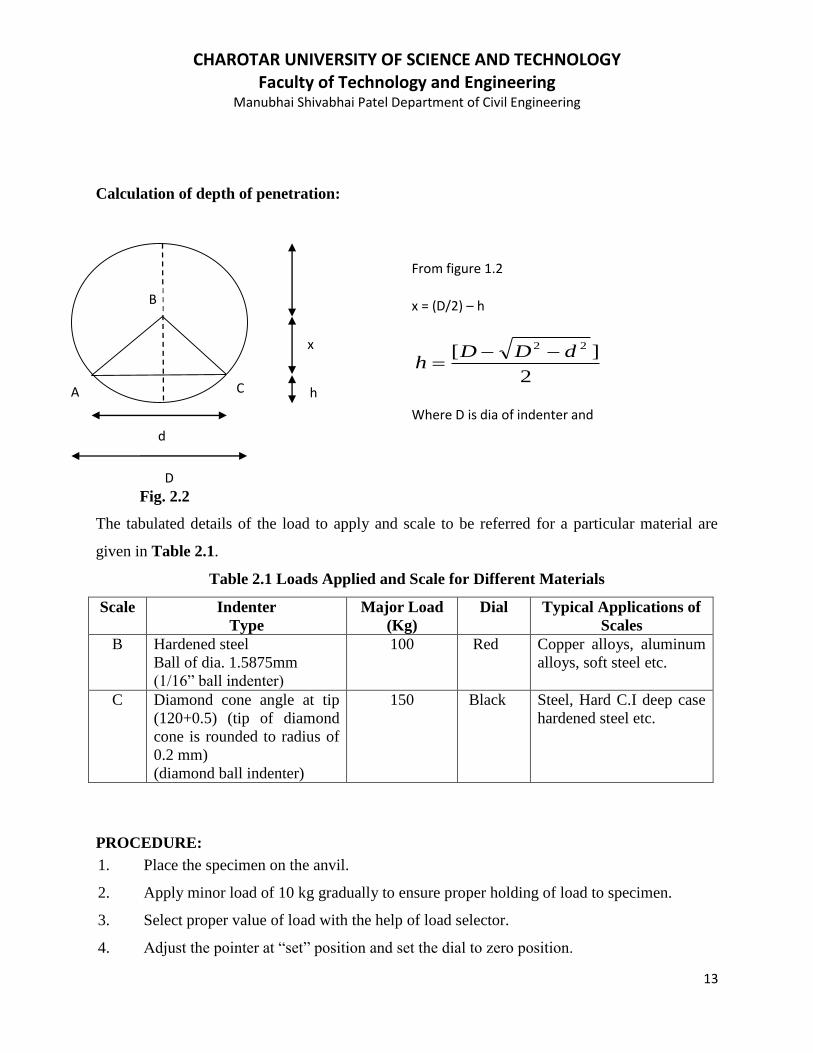
Calculation of depth of penetration:
Fig. 2.2
The tabulated details of the load to apply and scale to be referred for a particular material are
given in Table 2.1.
Table 2.1 Loads Applied and Scale for Different Materials
Scale Indenter
Type
Major Load
(Kg)
Dial Typical Applications of
Scales
B Hardened steel
Ball of dia. 1.5875mm
(1/16” ball indenter)
100 Red Copper alloys, aluminum
alloys, soft steel etc.
C Diamond cone angle at tip
(120+0.5) (tip of diamond
cone is rounded to radius of
0.2 mm)
(diamond ball indenter)
150 Black Steel, Hard C.I deep case
hardened steel etc.
PROCEDURE:
1. Place the specimen on the anvil.
2. Apply minor load of 10 kg gradually to ensure proper holding of load to specimen.
3. Select proper value of load with the help of load selector.
4. Adjust the pointer at “set” position and set the dial to zero position.
h
x
d
C
B
A
D
From figure 1.2
x = (D/2) – h
2
][ 22 dDDh
Where D is dia of indenter and
d is dia of indentation.
CHAROTAR UNIVERSITY OF SCIENCE AND TECHNOLOGY Faculty of Technology and Engineering
Manubhai Shivabhai Patel Department of Civil Engineering
14
5. Apply major load gradually by operating handle without any interference.
6. Bring the lever back to its catch position to take off the load from the specimen.
7. Read position of the pointer on appropriate dial that gives Rockwell hardness number.
8. Measure the diameter of the impression with the help of microscope and determine the
depth of the indentation using simple geometry.
PRECAUTIONS:
The minimum distance between two indentations should be at least 2d and the distance of the
indentation from edge of the specimen should be at least 3d, where d is the diameter of the
indentation.
APPLICATIONS:
On the basis of hardness, materials are graded for their commercial use. The quality of materials
and its products is maintained or controlled by hardness test. Also the strength of the job like
forging, alloying case hardening etc is determined with the help of this test.
Some correlation of hardness with other parameters like tensile strength is established which is
useful in determining the tensile strength of the material.
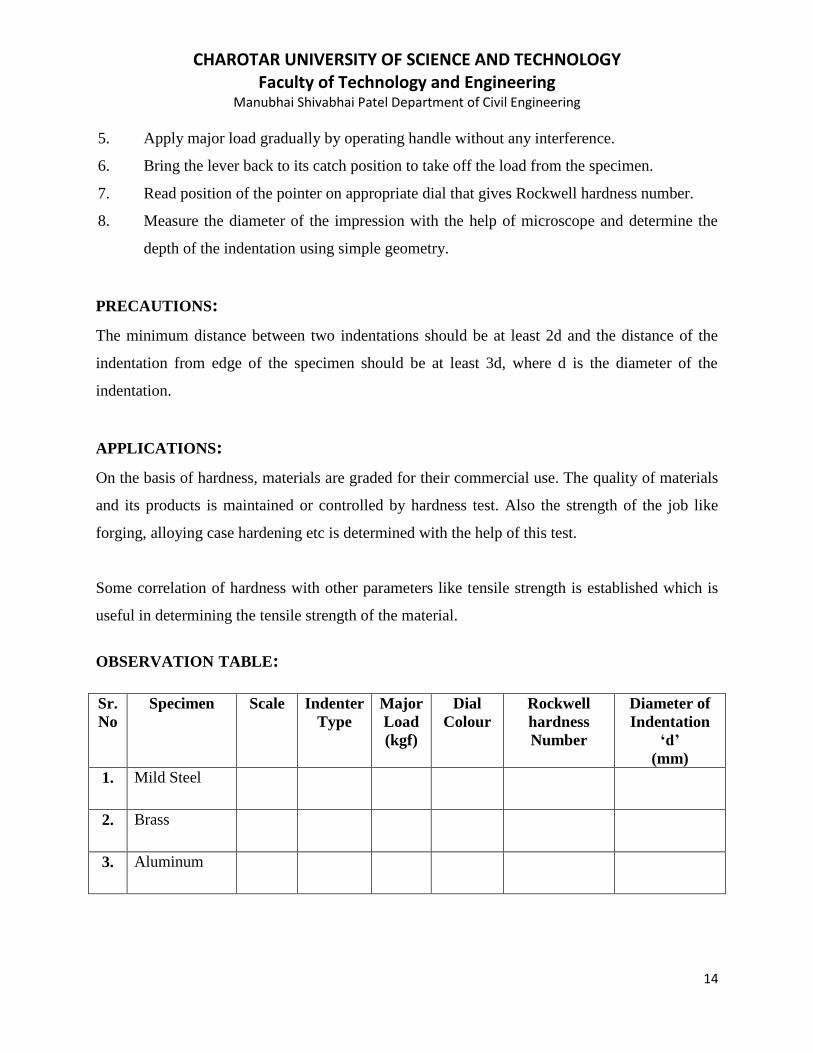
OBSERVATION TABLE:
Sr.
No
Specimen Scale Indenter
Type
Major
Load
(kgf)
Dial
Colour
Rockwell
hardness
Number
Diameter of
Indentation
‘d’
(mm)
1. Mild Steel
2. Brass
3. Aluminum

CHAROTAR UNIVERSITY OF SCIENCE AND TECHNOLOGY Faculty of Technology and Engineering
Manubhai Shivabhai Patel Department of Civil Engineering
15
CALCULATIONS:
CHAROTAR UNIVERSITY OF SCIENCE AND TECHNOLOGY Faculty of Technology and Engineering
Manubhai Shivabhai Patel Department of Civil Engineering
16
RESULT TABLE:
Sr.
No.
Specimen Hardness Number Remarks
Experimental Analytical
1. Mild steel
2. Aluminium
3. Brass
CONCLUSION:
Grade Obtained: Signature of Faculty: Date:
CHAROTAR UNIVERSITY OF SCIENCE AND TECHNOLOGY Faculty of Technology and Engineering
Manubhai Shivabhai Patel Department of Civil Engineering
17
OBJECTIVE:
To study the behavior of a timber specimen under transverse or flexural loading and determine
the bending properties such as Bending stress, Young’s modulus of elasticity and Modulus of
rupture.
EQUIPMENT:
Universal Testing Machine.
APPARATUS:
Vernier-calliper.
MATERIAL:
Timber.
RELATED I.S. CODE:
IS: 1708 – 1986 ( Part 8 & 9 ): Methods of testing of small clear specimens of timber.
FIGURE:
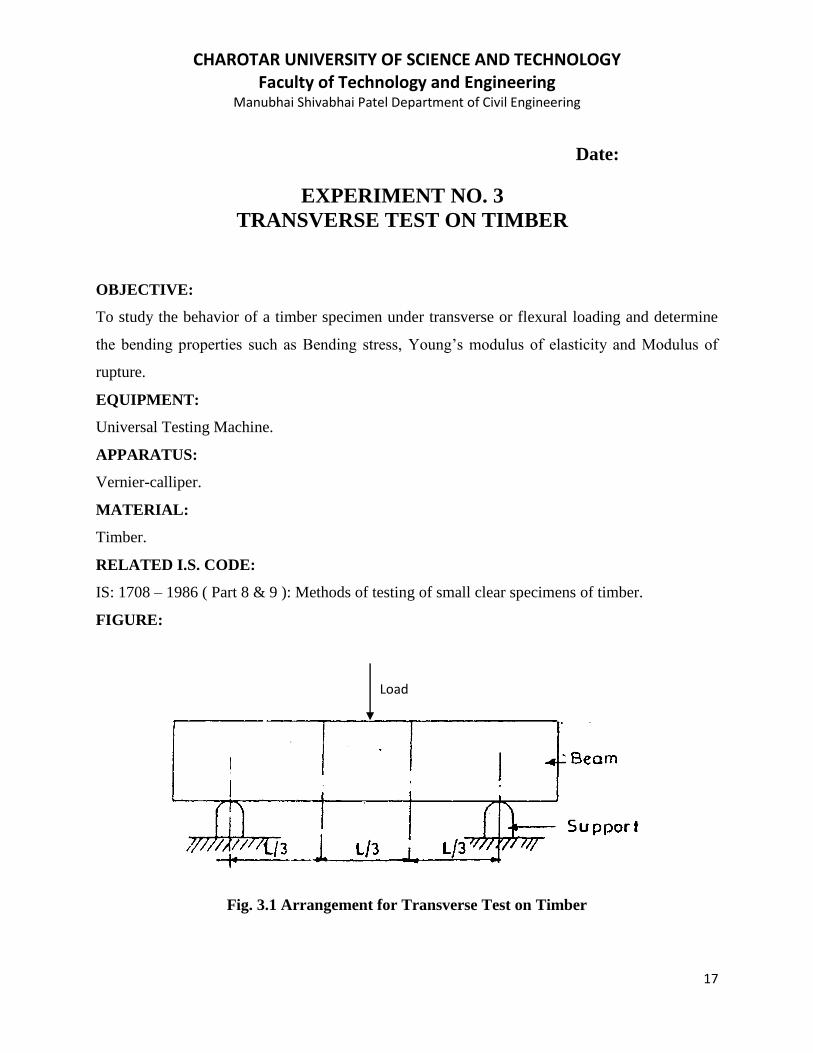
Fig. 3.1 Arrangement for Transverse Test on Timber
Date:
EXPERIMENT NO. 3
TRANSVERSE TEST ON TIMBER
Load
CHAROTAR UNIVERSITY OF SCIENCE AND TECHNOLOGY Faculty of Technology and Engineering
Manubhai Shivabhai Patel Department of Civil Engineering
18
R
THEORETICAL BACKGROUND:
If force act on a piece of material in such a way that they tend to induce compressive stress over
one part of cross-section and tensile stresses over the remaining part, the piece is said to be in
bending. The common illustration of bending action is a beam acted upon by transverse loads.
The bending effect at any section is expressed as bending moment (M) which is the sum of the
moment of all forces to the left (or to the right) of the section. The stresses induced by a bending
moment may be termed as bending stress. For equilibrium, the resultant of the tensile forces (T)
must always be equal to the resultant of compressive forces (C).The resultant of bending stress at
any section from a couple that is equal in magnitude to the bending moment. The resultant of
bending stresses at any section forms a couple that is equal in magnitude to the externally applied
bending moment. The transverse shear (V) which is computed as the algebraic sum of all
transverse forces to the left (or to the right) of section. Bending action in beams is often referred
to as flexure.
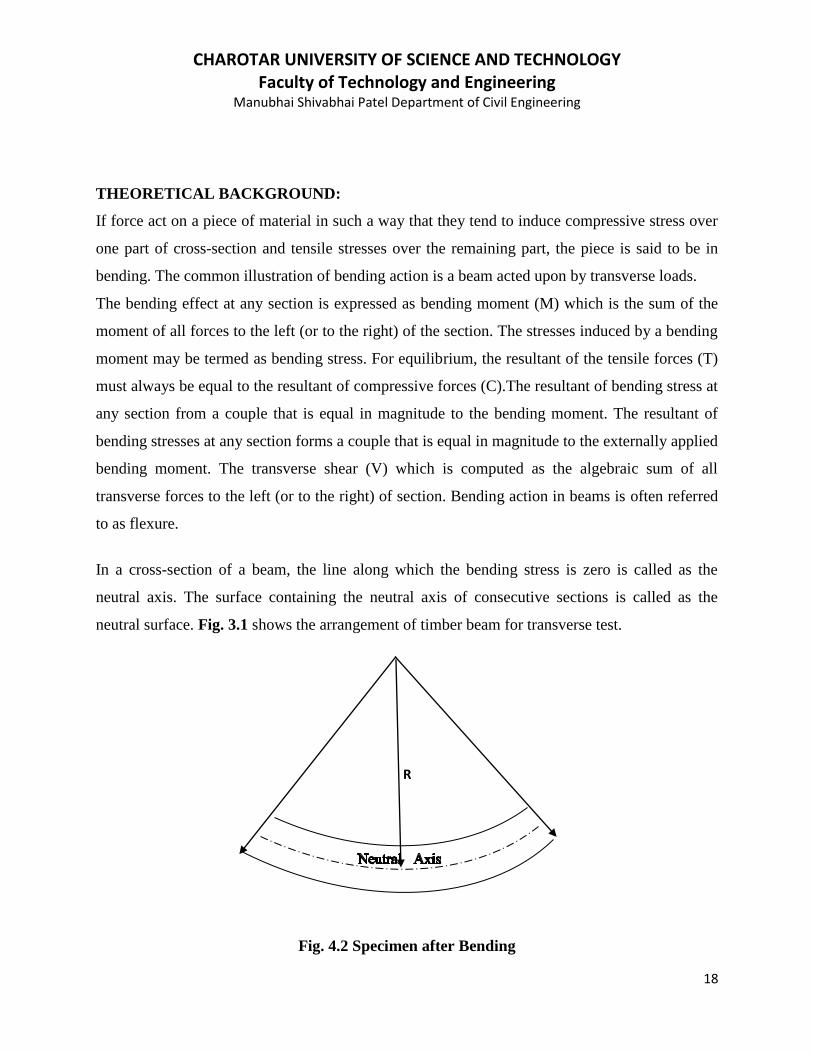
In a cross-section of a beam, the line along which the bending stress is zero is called as the
neutral axis. The surface containing the neutral axis of consecutive sections is called as the
neutral surface. Fig. 3.1 shows the arrangement of timber beam for transverse test.
Fig. 4.2 Specimen after Bending

CHAROTAR UNIVERSITY OF SCIENCE AND TECHNOLOGY Faculty of Technology and Engineering
Manubhai Shivabhai Patel Department of Civil Engineering
19
CHAROTAR UNIVERSITY OF SCIENCE AND TECHNOLOGY Faculty of Technology and Engineering
Manubhai Shivabhai Patel Department of Civil Engineering
20
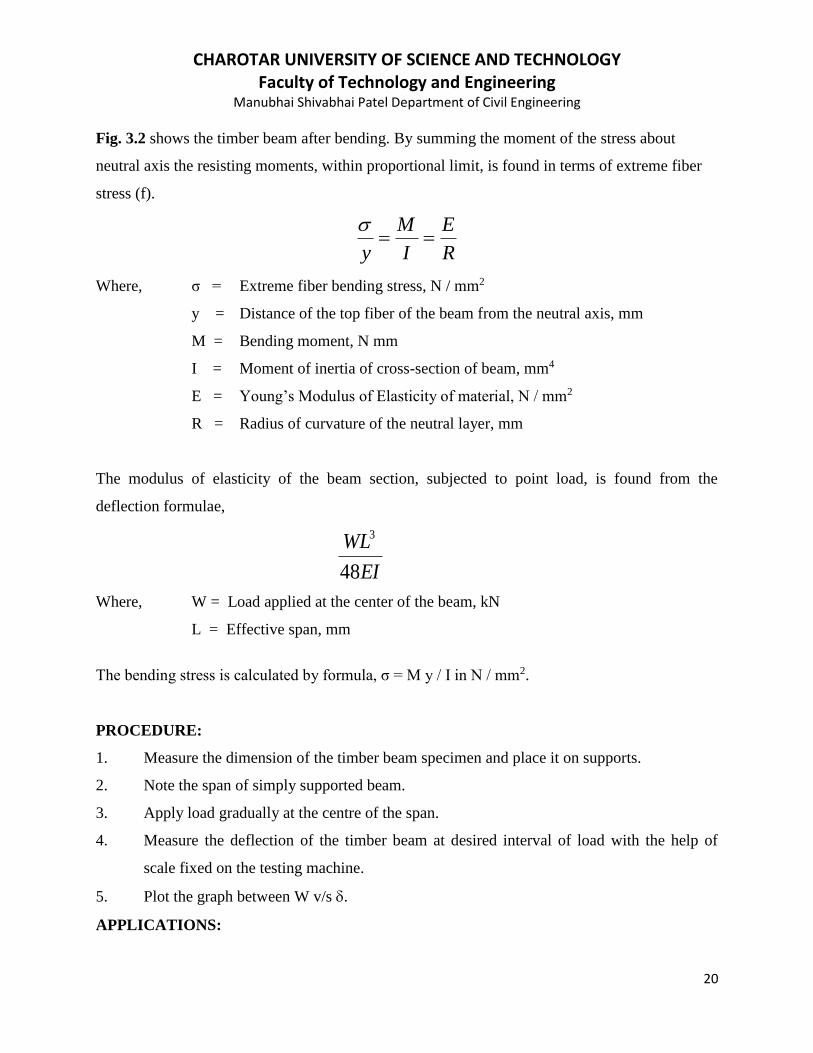
Fig. 3.2 shows the timber beam after bending. By summing the moment of the stress about
neutral axis the resisting moments, within proportional limit, is found in terms of extreme fiber
stress (f).
R
E
I
M
y
Where, σ = Extreme fiber bending stress, N / mm2
y = Distance of the top fiber of the beam from the neutral axis, mm
M = Bending moment, N mm
I = Moment of inertia of cross-section of beam, mm4
E = Young’s Modulus of Elasticity of material, N / mm2
R = Radius of curvature of the neutral layer, mm
The modulus of elasticity of the beam section, subjected to point load, is found from the
deflection formulae,
EI
WL
48
3
Where, W = Load applied at the center of the beam, kN
L = Effective span, mm
The bending stress is calculated by formula, σ = M y / I in N / mm2.
PROCEDURE:
1. Measure the dimension of the timber beam specimen and place it on supports.
2. Note the span of simply supported beam.
3. Apply load gradually at the centre of the span.
4. Measure the deflection of the timber beam at desired interval of load with the help of
scale fixed on the testing machine.
5. Plot the graph between W v/s .
APPLICATIONS:

CHAROTAR UNIVERSITY OF SCIENCE AND TECHNOLOGY Faculty of Technology and Engineering
Manubhai Shivabhai Patel Department of Civil Engineering
21
1. The bending test serves as a direct means of evaluating behavior under transverse loads,
particularly for determining the limits of structural usefulness of beam of various shapes
and sizes.
2. Flexural tests on beams are usually made to determine strength and stiffness in bending.
Beam tests also offer a means of determining the resilience and toughness of materials in
bending. The properties evaluated in the test can be used for design of beams and for
selection of proper materials.
OBSERVATIONS:
Least Count of the Vernier caliper = _________________
Sr.
No.
Parameters
Specimen -1 Specimen -2
1. Width of the beam
(b), mm
2. Depth of the beam (d), mm
3. Effective span (L), mm
4. Distance of the top fiber of the beam
from the neutral axis (y) = d / 2, mm
5. Ultimate Load Wmax , N
6. Deflection at Ultimate load: δmax, mm

CHAROTAR UNIVERSITY OF SCIENCE AND TECHNOLOGY Faculty of Technology and Engineering
Manubhai Shivabhai Patel Department of Civil Engineering
22
CALCULATIONS:
Calculate Moment of inertia (I) and Modulus of Rupture (Stress at Failure) (σ)
1. Moment of Inertia is I = b*d3 /12
2. Maximum Bending Moment is Mmax = Wmax*L /4
3. Modulus of Rupture is σmax = Mmax * y /I
4. Young’s Modulus, E1 = [Slope * L3] / [48* I]
5. Average Young’s Modulus, Eavg =

CHAROTAR UNIVERSITY OF SCIENCE AND TECHNOLOGY Faculty of Technology and Engineering
Manubhai Shivabhai Patel Department of Civil Engineering
23
CONCLUSIONS:
Grade Obtained: Signature of Faculty: Date:

CHAROTAR UNIVERSITY OF SCIENCE AND TECHNOLOGY Faculty of Technology and Engineering
Manubhai Shivabhai Patel Department of Civil Engineering
24
OBJECTIVE:
To determine the compressive strength and to study the behavior of specimens of bricks and
blocks when subjected to compressive load upto failure.
EQUIPMENT:
Universal Testing Machine.
APPARATUS:
Scale, Vernier caliper.
MATERIAL:
Brick & Cement Block
FIGURE:
Fig. 4.1 Universal Testing Machine
Date:
EXPERIMENT NO. 4
COMPRESSION TEST ON BRICKS & BLOCKS

CHAROTAR UNIVERSITY OF SCIENCE AND TECHNOLOGY Faculty of Technology and Engineering
Manubhai Shivabhai Patel Department of Civil Engineering
25
THEORETICAL BACKGROUND:
There are several materials used in engineering practice that are primarily meant to carry
compressive load. Such material in compression member relevant mechanical properties is
determined and load applied on a specimen up to failure or a predetermined load. Fig. 4.1 shows
the diagrams of the machine.
When a specimen is subjected to an axial load on end surfaces produces a crushing action. An
internal resistance is setup against chastening of its length. This resistance is called compressive
resistance. The compressive resistance is turned as compressive stress. Thus compressive stress
is a ratio of compressive load (P) to the cross sectional area (A) resisting it.
PROCEDURE:
1. Place the specimen in position between the compression pads.
2. Switch on UTM.
3. Apply the load gradually and increase it steadily so as to avoid sudden shocks.
4. Note the ultimate load and breaking load.
5. Observe the failure of the specimen.
PRECAUTIONS:
1. Place the specimen at centre of compression pads.
2. The specimen should be free from defects.
3. Stop the UTM as soon as specimen fails.
LIMITATIONS:
1. It is difficult to ensure that the load applied on the specimen is truly concentric and axial.
2. There is always a tendency for bending stress to be set up, which may result into slipping
of the specimen as the load increases.
3. Friction between the heads of the testing machine and the end surfaces of the specimen
due to lateral expansion of the specimen may alter result considerably in compression to
those obtained in absence of such lateral restraint.

CHAROTAR UNIVERSITY OF SCIENCE AND TECHNOLOGY Faculty of Technology and Engineering
Manubhai Shivabhai Patel Department of Civil Engineering
26
4. The relatively larger cross sectional areas of the specimen is required to obtain a proper
degree of stability of the specimen.
APPLICATIONS:
1. The mechanical properties such as yield strength, modulus of toughness are determined
by studying the behavior of specimen under load.
2. By experiment the strength of brick and cement block can be found and compare.
3. The Compressive strength can be found out.
OBSERVATIONS:
Specimen – 1: Brick
(i) Size of Ordinary Brick = _____________________
(ii) Size of Fly Ash Brick = _____________________
Specimen – 2: Cement Block
(i) Size of Cement Block = _____________________
OBSERVATION TABLE:
Sr.
No.
Observations Specimen – 1 Specimen – 2 Specimen – 3 Specimen – 4
1. Cross-sectional
area (A), mm2
2. Load at failure, N
3. Compressive
strength, N/mm2
4. Average
Compressive
strength, N/mm2

CHAROTAR UNIVERSITY OF SCIENCE AND TECHNOLOGY Faculty of Technology and Engineering
Manubhai Shivabhai Patel Department of Civil Engineering
27
CALCULATIONS:
CHAROTAR UNIVERSITY OF SCIENCE AND TECHNOLOGY Faculty of Technology and Engineering
Manubhai Shivabhai Patel Department of Civil Engineering
28
CONCLUSIONS:
Comment on nature of fracture and the strength of the specimens.
Grade Obtained: Signature of Faculty: Date:

CHAROTAR UNIVERSITY OF SCIENCE AND TECHNOLOGY Faculty of Technology and Engineering
Manubhai Shivabhai Patel Department of Civil Engineering
29
Date:
EXPERIMENT NO. 5
TENSION TEST ON VARIOUS MATERIALS OBJECTIVE:
To study the behavior of Steel under tensile load with the help of stress-strain curve on Universal
Testing Machine.
EQUIPMENT:
Universal Testing Machine.
APPARATUS:
Vernier – Calliper and scale.
MATERIALS:
Mild steel and Cast iron.
RELATED I.S. CODES:
IS: 1608 – 1995: Mechanical testing of metals – Tensile strength.
IS: 1916 – 1979: Methods of tensile test for light metals and their alloys.
FIGURE:
Fig. 5.1 Universal Testing Machine

CHAROTAR UNIVERSITY OF SCIENCE AND TECHNOLOGY Faculty of Technology and Engineering
Manubhai Shivabhai Patel Department of Civil Engineering
30
THEORETICAL BACKGROUND:
Tensile test is carried on Universal Testing Machine as shown in Fig.5.1. This machine is also
used for testing materials subjected to compression, bending and shear tests.
The test consists of straining a test piece by tensile force, generally to fracture for the purpose of
determining one or more mechanical properties viz. percentage elongation, percentage reduction
in area, modulus of elasticity, yield stress, ultimate stress and breaking stress.
Specimen
The specimen is specially prepared as per prescribed standard guidelines, which are so framed as
to induce failure within the length earmarked for observation – called the gauge length.
Test piece, the original gauge length of which is related to the original cross-sectional area (Ao)
by the equation Lo = 5.65(√Ao) is called proportional test piece. The portion in which the
specimen is gripped is also highly stressed but the dimensions are so adjusted that these stresses
do not affect failure within the gauge length. Fig. 5.2 shows a typical specimen used for testing
under tension.
Section X–X
Fig. 2.2 Typical Specimen for Tensile Test
Metals used in engineering structures are mostly ductile, e.g. steel, aluminum, brass, copper etc,
but some like cast iron are brittle. When specimens are tested under tensile (axial) load, both
these types behave differently.
CHAROTAR UNIVERSITY OF SCIENCE AND TECHNOLOGY Faculty of Technology and Engineering
Manubhai Shivabhai Patel Department of Civil Engineering
31
Ductile metals undergo comparatively large elongations, along the directions of loading,
accompanied necessarily, of course, with contraction in the transverse direction. At a certain
stress level, the specimen ceases to take any additional load but the elongation continues to a
certain level where after additional load is required to increase the elongation. At fracture,
ultimately, the specimen breaks at or very near the narrowest section. The fracture is not along a
plane right angle to cross-section; it is along an inclined plane and has appearance of a cup and
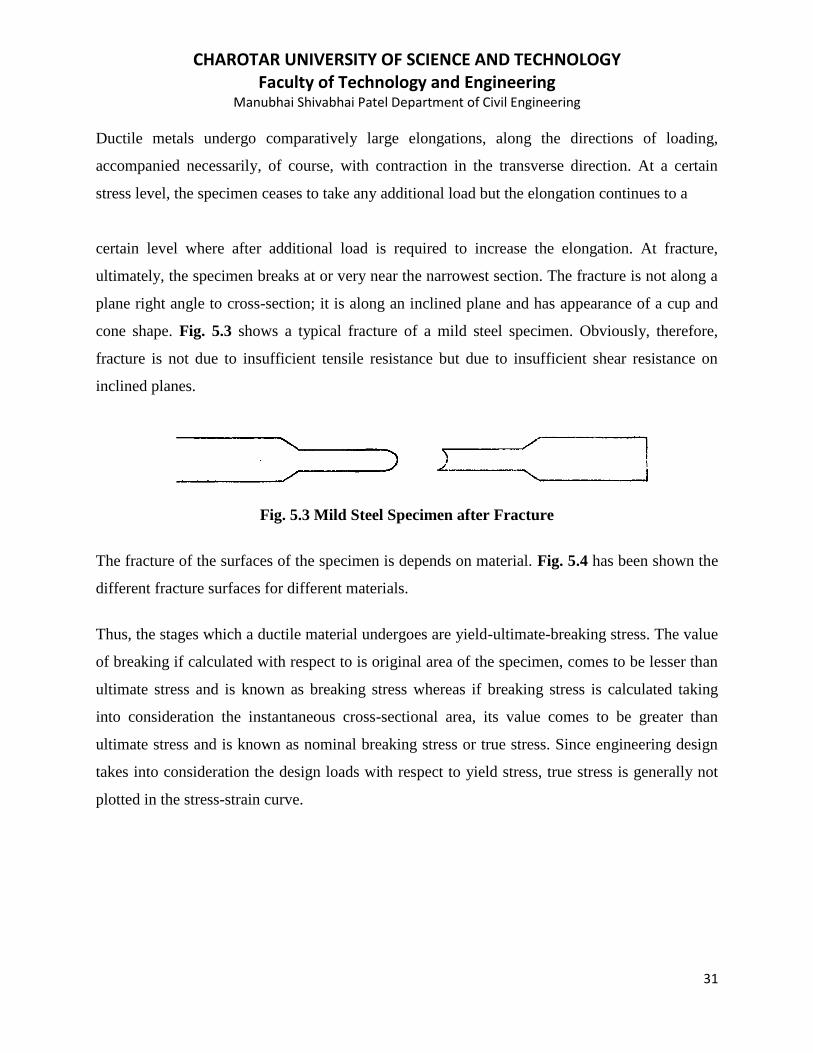
cone shape. Fig. 5.3 shows a typical fracture of a mild steel specimen. Obviously, therefore,
fracture is not due to insufficient tensile resistance but due to insufficient shear resistance on
inclined planes.
Fig. 5.3 Mild Steel Specimen after Fracture
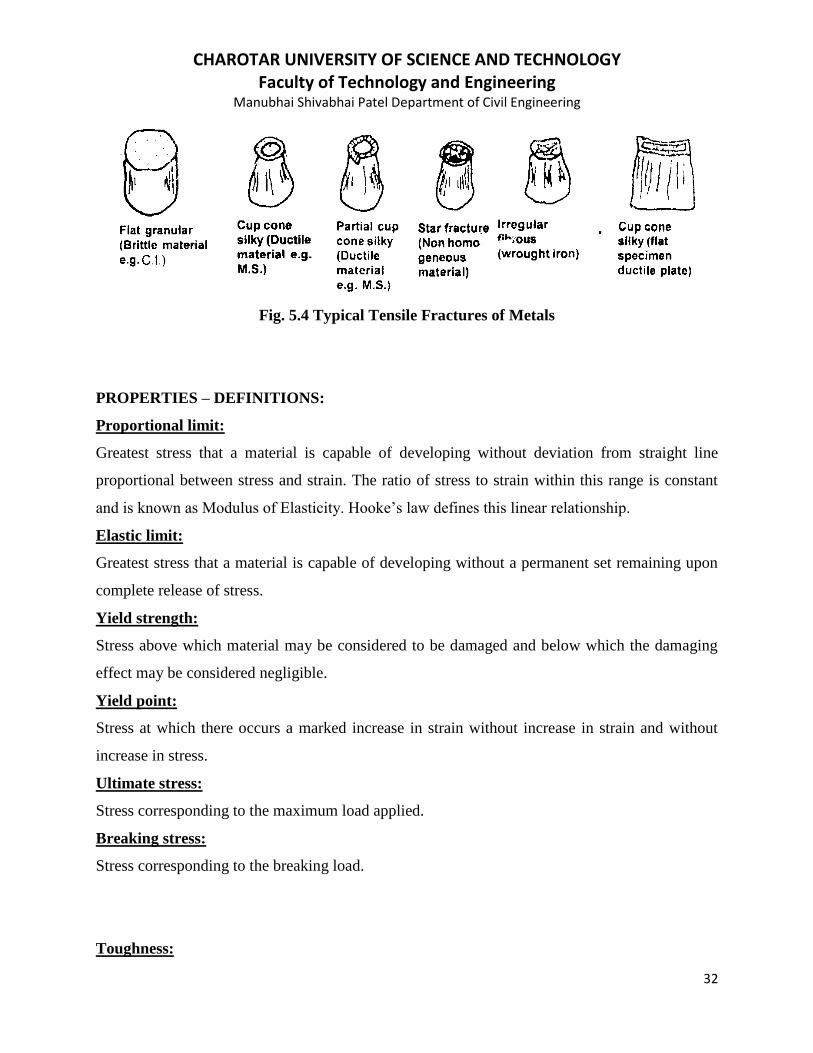
The fracture of the surfaces of the specimen is depends on material. Fig. 5.4 has been shown the
different fracture surfaces for different materials.
Thus, the stages which a ductile material undergoes are yield-ultimate-breaking stress. The value
of breaking if calculated with respect to is original area of the specimen, comes to be lesser than
ultimate stress and is known as breaking stress whereas if breaking stress is calculated taking
into consideration the instantaneous cross-sectional area, its value comes to be greater than
ultimate stress and is known as nominal breaking stress or true stress. Since engineering design
takes into consideration the design loads with respect to yield stress, true stress is generally not
plotted in the stress-strain curve.
CHAROTAR UNIVERSITY OF SCIENCE AND TECHNOLOGY Faculty of Technology and Engineering
Manubhai Shivabhai Patel Department of Civil Engineering
32
Fig. 5.4 Typical Tensile Fractures of Metals
PROPERTIES – DEFINITIONS:
Proportional limit:
Greatest stress that a material is capable of developing without deviation from straight line
proportional between stress and strain. The ratio of stress to strain within this range is constant
and is known as Modulus of Elasticity. Hooke’s law defines this linear relationship.
Elastic limit:
Greatest stress that a material is capable of developing without a permanent set remaining upon
complete release of stress.
Yield strength:
Stress above which material may be considered to be damaged and below which the damaging
effect may be considered negligible.
Yield point:
Stress at which there occurs a marked increase in strain without increase in strain and without
increase in stress.
Ultimate stress:
Stress corresponding to the maximum load applied.
Breaking stress:
Stress corresponding to the breaking load.
Toughness:
CHAROTAR UNIVERSITY OF SCIENCE AND TECHNOLOGY Faculty of Technology and Engineering
Manubhai Shivabhai Patel Department of Civil Engineering
33
Ability of the metal specimen to absorb energy during elastic and plastic deformation. The
modulus of toughness is measured as area under the entire stress-strain curve and is the
energy absorbed by the material of the specimen per unit volume up to fracture.
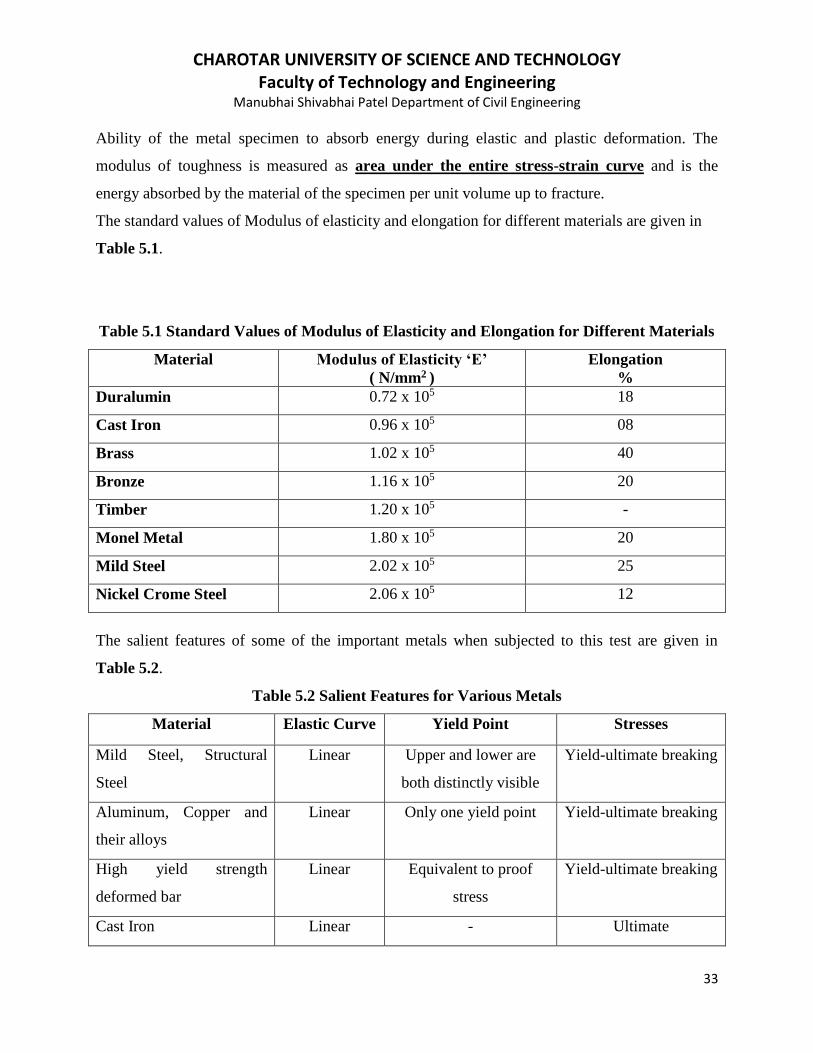
The standard values of Modulus of elasticity and elongation for different materials are given in
Table 5.1.
Table 5.1 Standard Values of Modulus of Elasticity and Elongation for Different Materials
Material Modulus of Elasticity ‘E’
( N/mm2 )
Elongation
%
Duralumin 0.72 x 10⁵ 18
Cast Iron 0.96 x 10⁵ 08
Brass 1.02 x 10⁵ 40
Bronze 1.16 x 10⁵ 20
Timber 1.20 x 10⁵ -
Monel Metal 1.80 x 10⁵ 20
Mild Steel 2.02 x 10⁵ 25
Nickel Crome Steel 2.06 x 10⁵ 12
The salient features of some of the important metals when subjected to this test are given in
Table 5.2.
Table 5.2 Salient Features for Various Metals
Material Elastic Curve Yield Point Stresses
Mild Steel, Structural
Steel
Linear Upper and lower are
both distinctly visible
Yield-ultimate breaking
Aluminum, Copper and
their alloys
Linear Only one yield point Yield-ultimate breaking
High yield strength
deformed bar
Linear Equivalent to proof
stress
Yield-ultimate breaking
Cast Iron Linear - Ultimate
CHAROTAR UNIVERSITY OF SCIENCE AND TECHNOLOGY Faculty of Technology and Engineering
Manubhai Shivabhai Patel Department of Civil Engineering
34
Concrete Non-linear - Ultimate
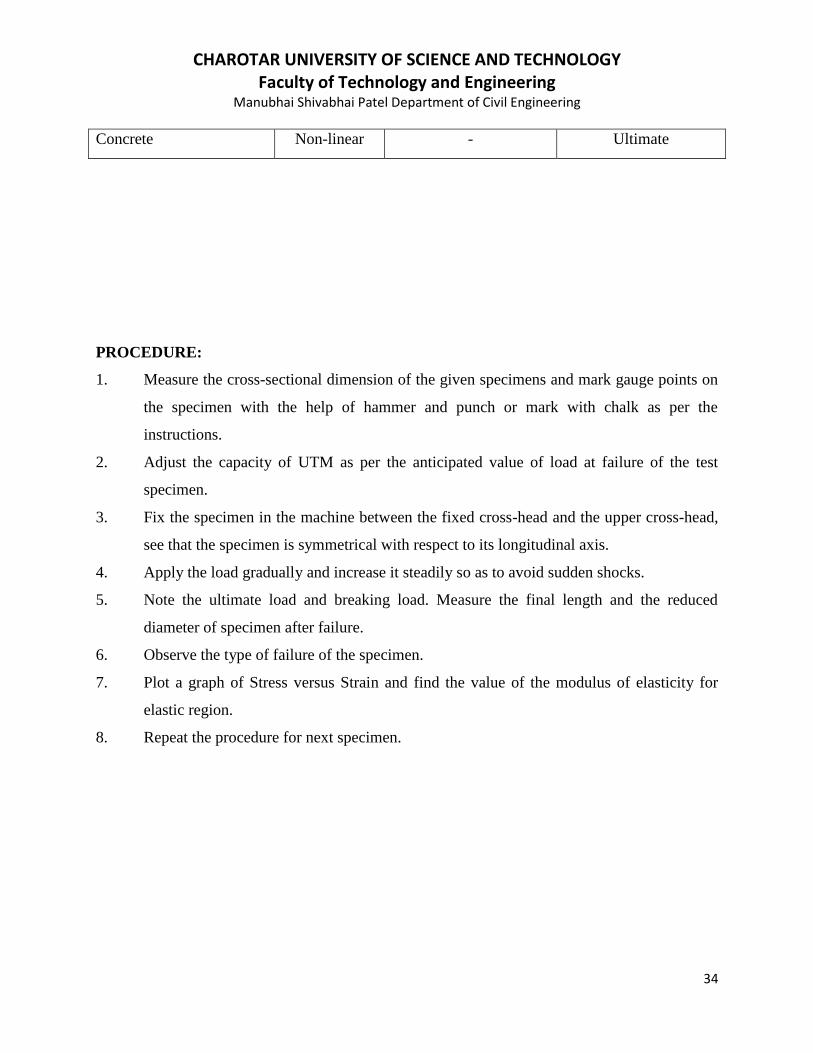
PROCEDURE:
1. Measure the cross-sectional dimension of the given specimens and mark gauge points on
the specimen with the help of hammer and punch or mark with chalk as per the
instructions.
2. Adjust the capacity of UTM as per the anticipated value of load at failure of the test
specimen.
3. Fix the specimen in the machine between the fixed cross-head and the upper cross-head,
see that the specimen is symmetrical with respect to its longitudinal axis.
4. Apply the load gradually and increase it steadily so as to avoid sudden shocks.
5. Note the ultimate load and breaking load. Measure the final length and the reduced
diameter of specimen after failure.
6. Observe the type of failure of the specimen.
7. Plot a graph of Stress versus Strain and find the value of the modulus of elasticity for
elastic region.
8. Repeat the procedure for next specimen.
CHAROTAR UNIVERSITY OF SCIENCE AND TECHNOLOGY Faculty of Technology and Engineering
Manubhai Shivabhai Patel Department of Civil Engineering
35
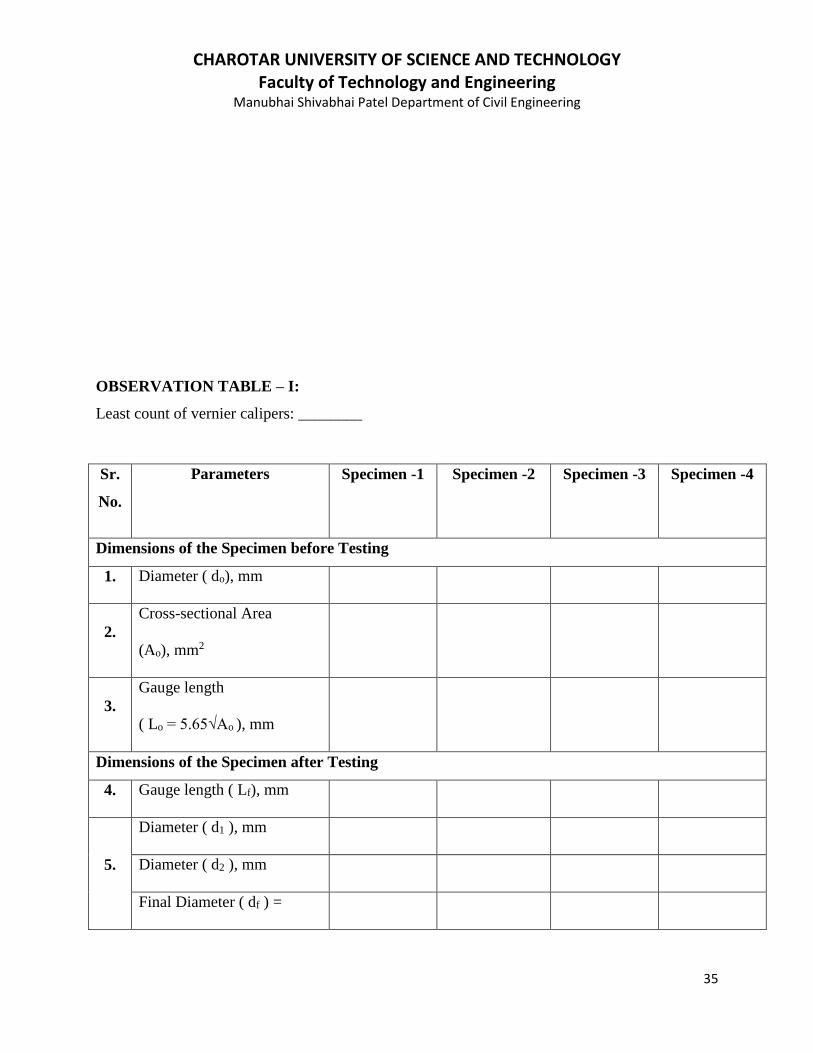
OBSERVATION TABLE – I:
Least count of vernier calipers: ________
Sr.
No.
Parameters
Specimen -1 Specimen -2 Specimen -3 Specimen -4
Dimensions of the Specimen before Testing
1. Diameter ( do), mm
2.
Cross-sectional Area
(Ao), mm2
3.
Gauge length
( Lo = 5.65√Ao ), mm
Dimensions of the Specimen after Testing
4. Gauge length ( Lf), mm
5.
Diameter ( d1 ), mm
Diameter ( d2 ), mm
Final Diameter ( df ) =
CHAROTAR UNIVERSITY OF SCIENCE AND TECHNOLOGY Faculty of Technology and Engineering
Manubhai Shivabhai Patel Department of Civil Engineering
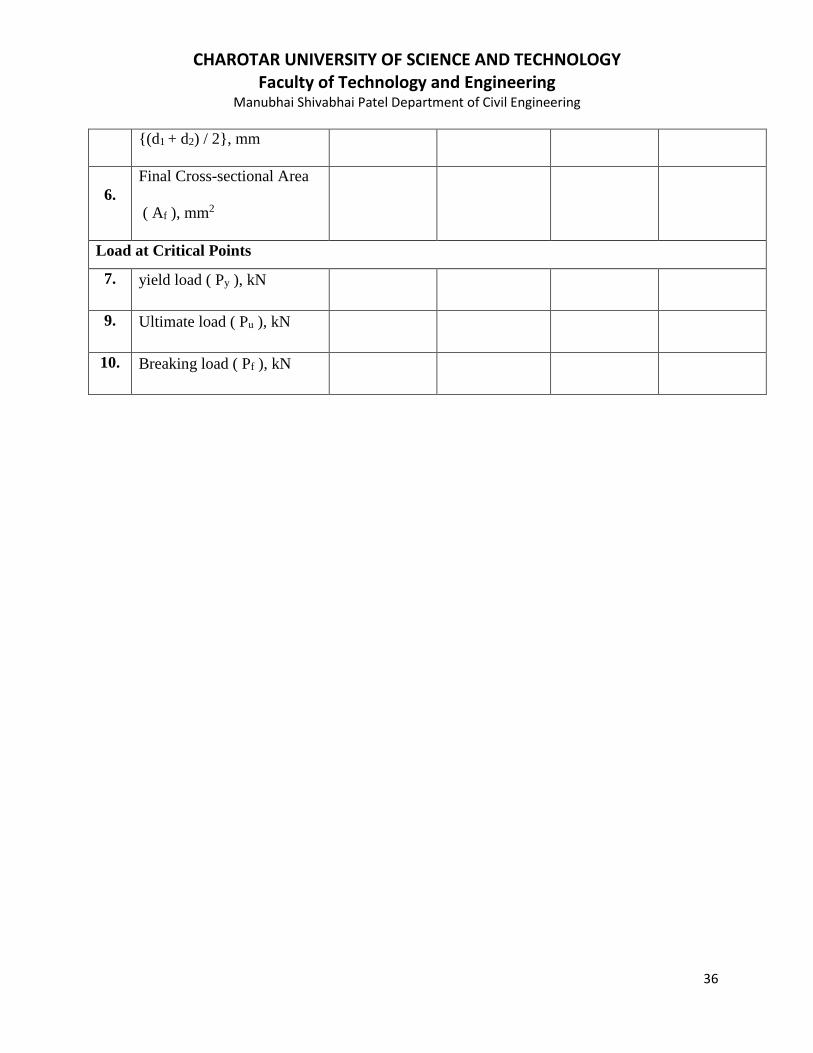
36
{(d1 + d2) / 2}, mm
6.
Final Cross-sectional Area
( Af ), mm2
Load at Critical Points
7. yield load ( Py ), kN
9. Ultimate load ( Pu ), kN
10. Breaking load ( Pf ), kN

CHAROTAR UNIVERSITY OF SCIENCE AND TECHNOLOGY Faculty of Technology and Engineering
Manubhai Shivabhai Patel Department of Civil Engineering
37
CALCULATIONS:

CHAROTAR UNIVERSITY OF SCIENCE AND TECHNOLOGY Faculty of Technology and Engineering
Manubhai Shivabhai Patel Department of Civil Engineering
38
CHAROTAR UNIVERSITY OF SCIENCE AND TECHNOLOGY Faculty of Technology and Engineering
Manubhai Shivabhai Patel Department of Civil Engineering
39
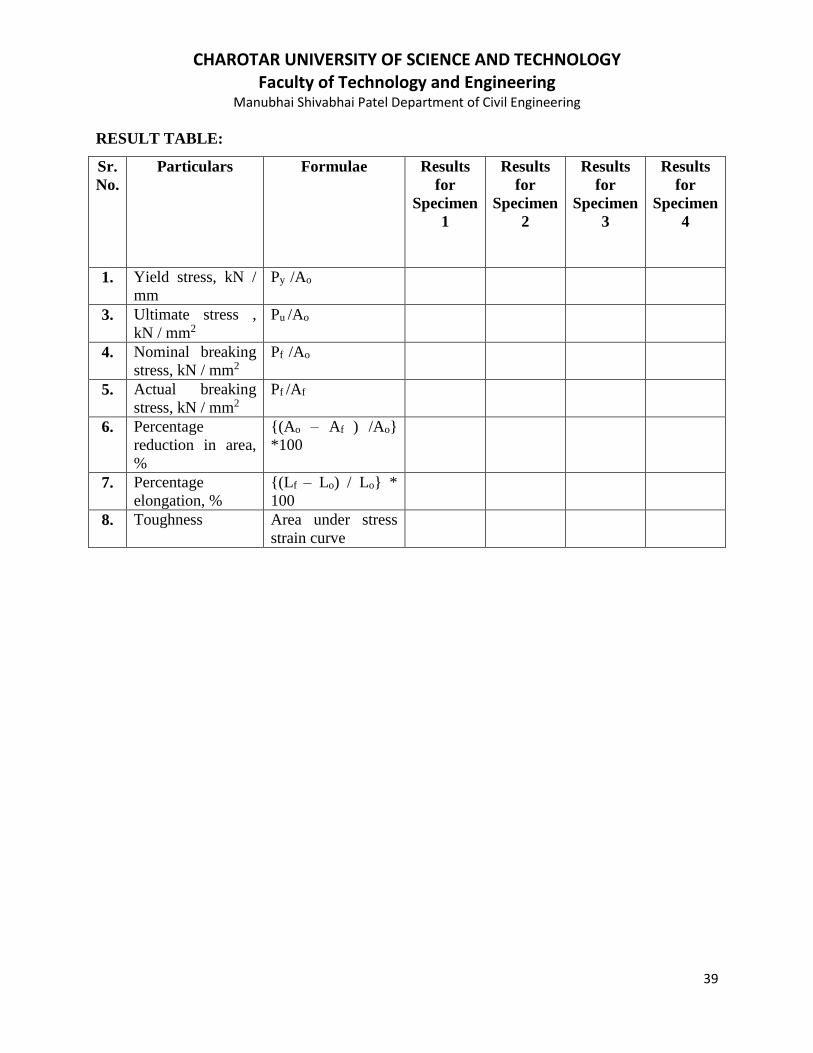
RESULT TABLE:
Sr.
No.
Particulars Formulae Results
for
Specimen
1
Results
for
Specimen
2
Results
for
Specimen
3
Results
for
Specimen
4
1. Yield stress, kN /
mm
Py /Ao
3. Ultimate stress ,
kN / mm2
Pu /Ao
4. Nominal breaking
stress, kN / mm2
Pf /Ao
5. Actual breaking
stress, kN / mm2
Pf /Af
6. Percentage
reduction in area,
%
{(Ao – Af ) /Ao}
*100
7. Percentage
elongation, %
{(Lf – Lo) / Lo} *
100
8. Toughness Area under stress
strain curve
CHAROTAR UNIVERSITY OF SCIENCE AND TECHNOLOGY Faculty of Technology and Engineering
Manubhai Shivabhai Patel Department of Civil Engineering
40
CONCLUSIONS:
Grade Obtained: Signature of Faculty: Date:

CHAROTAR UNIVERSITY OF SCIENCE AND TECHNOLOGY Faculty of Technology and Engineering
Manubhai Shivabhai Patel Department of Civil Engineering
41