cement hydration rate of ordinarily and internally cured
TRANSCRIPT
Cement Hydration Rate of Ordinarily and Internally Cured ConcretesJiahe Wang, Jun Zhang and Jiajia ZhangJournal of Advanced Concrete Technology , volume16 (2018), pp. 306-316
Influence of Curing Conditions on Properties of Normal and High Strength Concrete with and without Pre-Wetted Lightweight Aggregates Licheng Wang, Jiuwen Bao and Baojuan ChengJournal of Advanced Concrete Technology, volume 15 (2017), pp. 300-313
Cracking and Chemical Composition of Cement Paste Subjected to Heating and Water Re-Curing Michael Henry, Katsufumi Hashimoto, Ivan Sandi Darma and Takafumi Sugiyama Journal of Advanced Concrete Technology, volume 14 (2016), pp. 134-143
Cement Reaction and Resultant Physical Properties of Cement Paste Ippei Maruyama and Go IgarashiJournal of Advanced Concrete Technology, volume 12 (2014), pp. 200-213
Enhanced Model and Simulation of Hydration Process of Blast Furnace Slag in Blended Cement Yao Luan, Tetsuya Ishida, Toyoharu Nawa and Takahiro SagawaJournal of Advanced Concrete Technology, volume 10 (2012), pp. 1-13
Journal of Advanced Concrete Technology Vol. 16, 306-316, July 2018 / Copyright © 2018 Japan Concrete Institute 306
Scientific paper
Cement Hydration Rate of Ordinarily and Internally Cured Concretes Jiahe Wang1, Jun Zhang2* and Jiajia Zhang3
Received 28 February 2018, accepted 15 July 2018 doi:10.3151/jact.16.306
Abstract In the present paper, adiabatic temperature rise test was used to evaluate the effect of internal curing on cement hydration rate and final degree of hydration in normal and high strength concretes. In the experiments, emphases were placed on the impacts of internal curing and water to cementitious material ratio on the adiabatic temperature rise characteristics. Two kinds of concrete, ordinarily cured concrete and internally cured concrete were used in the experiments. In each kind, four concrete mixtures with water to cementitious material ratios of 0.20, 0.30, 0.43 and 0.62 were used. The test results show that internal curing with PSLWA increases temperature rise of concrete, whatever the concrete strength is low or high. Internal curing can not only increase the ultimate temperature rise, but also increase the rate of temperature rise. Internal curing can obviously improve the cement hydration behavior compared with the concrete without internal curing. The improvements on cement hydration may present in two. One is the hydration rate in the second stage is increased; another is the final cement hydration degree is increased. For internally cured concrete, the water used to calculate the water to binder ratio can be simply summing the mixing water and internal curing water together when calculate the final cement hydration degree. The proposed cement hydration rate model can well predict developing of cement hydration degree for both ordinarily and internally cured concretes.
1. Introduction
Shrinkage and thermal deformation occurred in concrete are thought to be the major sources of the formation of cracks in concrete. Cracks allow water and chemical agents, such as deicing salt, to go into concrete and contact with the reinforcement, leading to reinforcement corrosion and rupture in steel reinforced concrete. The progress of shrinkage since set of concrete is normally derived by chemical shrinkage of cement paste in the first short beginning stage with moisture saturation, dis-played as internal relative humidity close to 100%, and capillary force developed in the capillary pores due to forming empty curved capillary pores in the following stage of relative humidity decreasing. Therefore, to fill the empty capillary pores in time should reduce the cap-illary force, which in turn decreases shrinkage of con-crete. This is the basic principle of internal curing using pre-wetted lightweight aggregates or super absorbing polymers for shrinkage reduction. Number of existing tests shows positive affects of internal curing with lightweight aggregates or super absorbing polymers on shrinkage decrease not only for high strength concrete, but also for normal strength concrete (Zhang et al. 2016). This technique may allow high strength concrete to be
used in more fields, including those structures more sensitive to shrinkage cracking, such as bridge decks, industrial floor, subway segments. However, most of the existing studies on internally cured concrete are focused on shrinkage performance. The following properties of internally cured concrete, including mechanical proper-ties, permeability and long term durability are critically needed to be investigated as well apart from shrinkage performance, due to the inclusion of porous materials in concrete.
To well understand the effect of internal curing on mechanical and durability properties of concrete, possi-ble impact of internal curing water on cement hydration rate during hardening of concrete has to be learnt first. Concrete is a multiphase system where the voids of the skeleton formed by aggregates and cement powders are filled with hydration products of cement, liquid water and partly with a gas mixture composed of air and water vapor. After mixing with water, the volume of hydration products gradually increases with time and the total volume of pores is gradually decreased. Developing concrete strength and other mechanical properties is principally influenced by the degree of reaction between cement and water, which in turn is controlled by water to cement ratio and temperature in place. Therefore, it is reasonable to expect the extra water released from LWA or SAP should take part in cement hydration and enhance mechanical or durability properties of the internally cured concrete. This positive effect may be partly com-posite the negative effect of porous particles on the me-chanical or durability properties of the concrete. About the determination cement hydration degree of concrete, several methods have been developed in the past. The direct determination of the degree of cement hydration
1PhD Candidate, Key Laboratory of Safety and Dura-bility of Civil Engineering, China Education Ministry, China. 2Professor, Department of Civil Engineering, Tsinghua University, Beijing, China. *Corresponding author, E-mail: [email protected] 3Master Student, Department of Civil Engineering, Tsinghua University, Beijing, China.
J. Wang, J. Zhang and J. Zhang / Journal of Advanced Concrete Technology Vol. 16, 306-316, 2018 307
may be performed by measuring the unreacted clinker fraction in the paste by means of optical microscopy or quantitative X-ray diffraction analysis. Normally, the samples for above tests should be well prepared. In ad-dition, X-ray defection analysis can relative precisely determine the content of calcium hydroxide. For CSH gel, it is almost impossible to obtain the accurate content. For concrete with addition of silica fume, slag or fly ash, the single measurement on content of calcium hydroxide may not well reflect the actual cement hydration degree due to pozzolanic reaction. Further, for continuously monitoring cement hydration degree, especially for concrete at very early age, and/or under varied tem-perature history, the optical microscopy or quantitative X-ray diffraction analysis may not be convenient. The indirect determination of degree of cement hydration may be carried out by measuring some properties of hardening concrete, for example the compressive strength, the amount of non-evaporable water, and the heat release of hydration (Parrotta et al. 1990). For in-place monitoring of cement hydration status, most of the above methods are not applicable because it cannot determine the content of specific material continuously. In such case, the indirect method, adiabatic temperature test, which has been utilized to investigate the heat gen-eration in massive concrete (RILEM Recommendation TCE1 1997; ASTM C1702-09a 2009) and to indirectly estimate the degree of cement hydration by measuring the temperature rise, may be suitable. In present work, cement hydration rate in two kinds of concrete, normally cured concrete and internally cured concrete was evalu-ated by adiabatic temperature rise tests. In each kind of concrete, four concrete mixtures with water to cementi-tious material ratios (w/b) of 0.20, 0.30, 0.43 and 0.62 were designed, which represents low, middle, high and extra high strength concretes in practice, respectively. The effects of water to binder ratio, and internal curing, on temperature rise and cement hydration rate were ana-lyzed.
2. Experimental programs
To study the effects of internal curing and water to binder ratio on cement hydration rate of concrete, first, four basic concrete mixtures with water to cementitious ma-terials ratio (w/b) of 0.62, 0.43, 0.30 and 0.20 are de-signed to form four concretes with compressive strength at 28 days around 30 MPa, 50 MPa, 80 MPa and 100 MPa respectively, labeled as C30-OC, C50-OC, C80-OC and C100-OC, representing normal cured low, middle, high and extra high strength concretes in practice. Based on above four basic mixtures, another four mixtures were designed with some of normal aggregates replaced by PSLWA to form four additional corresponding con-cretes with internal curing, labeled as C30-IC, C50-IC, C80-IC and C100-IC respectively. The mixture of con-crete containing lightweight aggregate is designed ac-cording to the amount of internal curing water needed
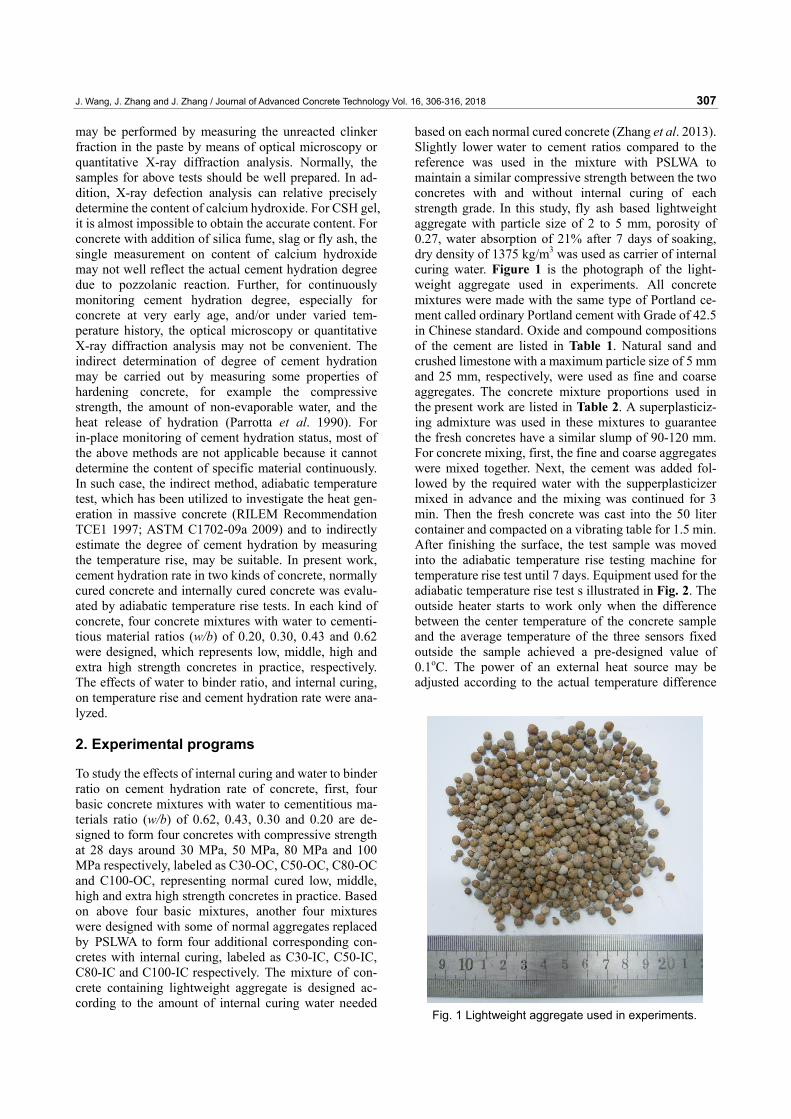
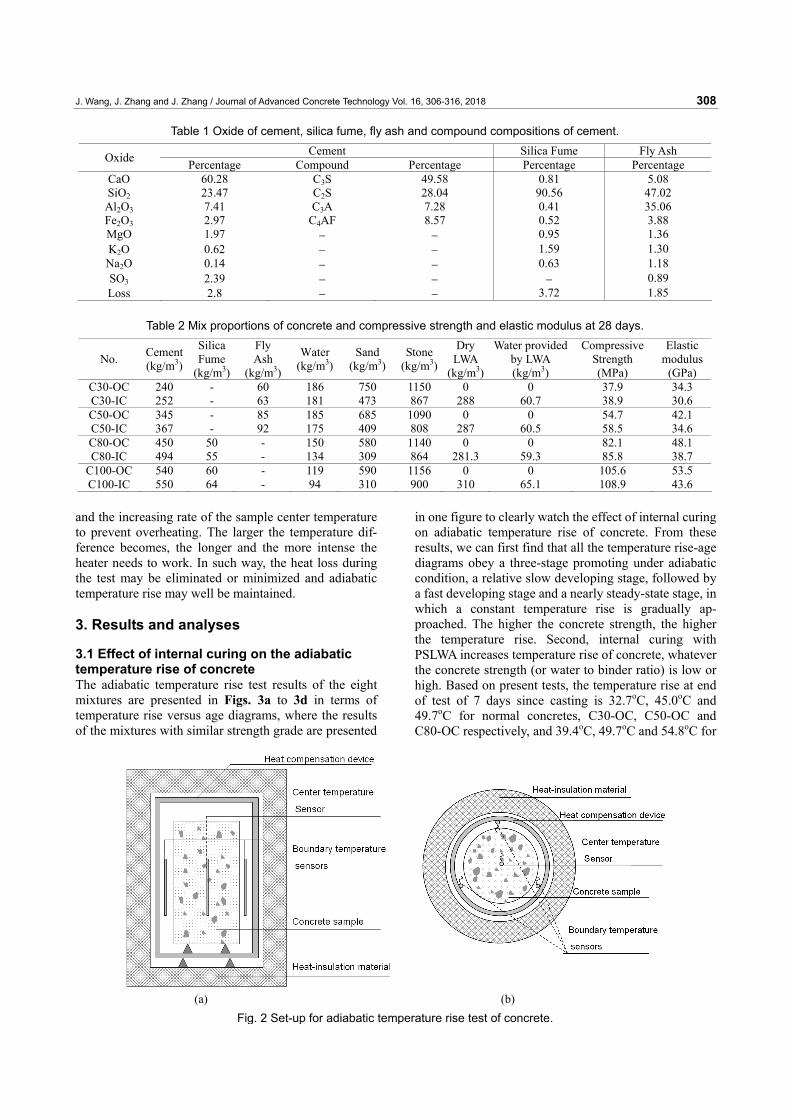
based on each normal cured concrete (Zhang et al. 2013). Slightly lower water to cement ratios compared to the reference was used in the mixture with PSLWA to maintain a similar compressive strength between the two concretes with and without internal curing of each strength grade. In this study, fly ash based lightweight aggregate with particle size of 2 to 5 mm, porosity of 0.27, water absorption of 21% after 7 days of soaking, dry density of 1375 kg/m3 was used as carrier of internal curing water. Figure 1 is the photograph of the light-weight aggregate used in experiments. All concrete mixtures were made with the same type of Portland ce-ment called ordinary Portland cement with Grade of 42.5 in Chinese standard. Oxide and compound compositions of the cement are listed in Table 1. Natural sand and crushed limestone with a maximum particle size of 5 mm and 25 mm, respectively, were used as fine and coarse aggregates. The concrete mixture proportions used in the present work are listed in Table 2. A superplasticiz-ing admixture was used in these mixtures to guarantee the fresh concretes have a similar slump of 90-120 mm. For concrete mixing, first, the fine and coarse aggregates were mixed together. Next, the cement was added fol-lowed by the required water with the supperplasticizer mixed in advance and the mixing was continued for 3 min. Then the fresh concrete was cast into the 50 liter container and compacted on a vibrating table for 1.5 min. After finishing the surface, the test sample was moved into the adiabatic temperature rise testing machine for temperature rise test until 7 days. Equipment used for the adiabatic temperature rise test s illustrated in Fig. 2. The outside heater starts to work only when the difference between the center temperature of the concrete sample and the average temperature of the three sensors fixed outside the sample achieved a pre-designed value of 0.1oC. The power of an external heat source may be adjusted according to the actual temperature difference
Fig. 1 Lightweight aggregate used in experiments.
J. Wang, J. Zhang and J. Zhang / Journal of Advanced Concrete Technology Vol. 16, 306-316, 2018 308
and the increasing rate of the sample center temperature to prevent overheating. The larger the temperature dif-ference becomes, the longer and the more intense the heater needs to work. In such way, the heat loss during the test may be eliminated or minimized and adiabatic temperature rise may well be maintained. 3. Results and analyses
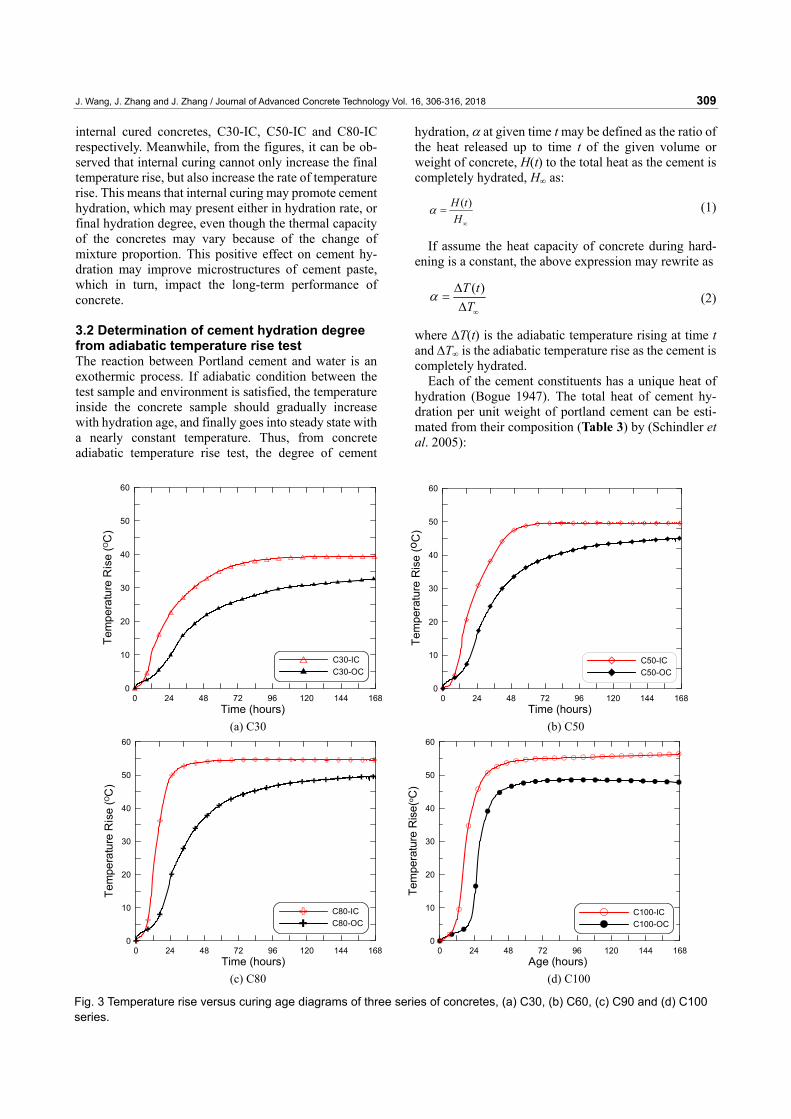
3.1 Effect of internal curing on the adiabatic temperature rise of concrete The adiabatic temperature rise test results of the eight mixtures are presented in Figs. 3a to 3d in terms of temperature rise versus age diagrams, where the results of the mixtures with similar strength grade are presented
in one figure to clearly watch the effect of internal curing on adiabatic temperature rise of concrete. From these results, we can first find that all the temperature rise-age diagrams obey a three-stage promoting under adiabatic condition, a relative slow developing stage, followed by a fast developing stage and a nearly steady-state stage, in which a constant temperature rise is gradually ap-proached. The higher the concrete strength, the higher the temperature rise. Second, internal curing with PSLWA increases temperature rise of concrete, whatever the concrete strength (or water to binder ratio) is low or high. Based on present tests, the temperature rise at end of test of 7 days since casting is 32.7oC, 45.0oC and 49.7oC for normal concretes, C30-OC, C50-OC and C80-OC respectively, and 39.4oC, 49.7oC and 54.8oC for
(a) (b) Fig. 2 Set-up for adiabatic temperature rise test of concrete.
Table 1 Oxide of cement, silica fume, fly ash and compound compositions of cement. Cement Silica Fume Fly Ash Oxide Percentage Compound Percentage Percentage Percentage
CaO 60.28 C3S 49.58 0.81 5.08 SiO2 23.47 C2S 28.04 90.56 47.02 Al2O3 7.41 C3A 7.28 0.41 35.06 Fe2O3 2.97 C4AF 8.57 0.52 3.88 MgO 1.97 − − 0.95 1.36 K2O 0.62 − − 1.59 1.30 Na2O 0.14 − − 0.63 1.18 SO3 2.39 − − − 0.89 Loss 2.8 − − 3.72 1.85
Table 2 Mix proportions of concrete and compressive strength and elastic modulus at 28 days.
No. Cement (kg/m3)
Silica Fume
(kg/m3)
Fly Ash
(kg/m3)
Water(kg/m3)
Sand (kg/m3)
Stone(kg/m3)
Dry LWA
(kg/m3)
Water provided by LWA (kg/m3)
Compressive Strength (MPa)
Elastic modulus
(GPa) C30-OC 240 - 60 186 750 1150 0 0 37.9 34.3 C30-IC 252 - 63 181 473 867 288 60.7 38.9 30.6 C50-OC 345 - 85 185 685 1090 0 0 54.7 42.1 C50-IC 367 - 92 175 409 808 287 60.5 58.5 34.6 C80-OC 450 50 - 150 580 1140 0 0 82.1 48.1 C80-IC 494 55 - 134 309 864 281.3 59.3 85.8 38.7
C100-OC 540 60 - 119 590 1156 0 0 105.6 53.5 C100-IC 550 64 - 94 310 900 310 65.1 108.9 43.6
J. Wang, J. Zhang and J. Zhang / Journal of Advanced Concrete Technology Vol. 16, 306-316, 2018 309
internal cured concretes, C30-IC, C50-IC and C80-IC respectively. Meanwhile, from the figures, it can be ob-served that internal curing cannot only increase the final temperature rise, but also increase the rate of temperature rise. This means that internal curing may promote cement hydration, which may present either in hydration rate, or final hydration degree, even though the thermal capacity of the concretes may vary because of the change of mixture proportion. This positive effect on cement hy-dration may improve microstructures of cement paste, which in turn, impact the long-term performance of concrete. 3.2 Determination of cement hydration degree from adiabatic temperature rise test The reaction between Portland cement and water is an exothermic process. If adiabatic condition between the test sample and environment is satisfied, the temperature inside the concrete sample should gradually increase with hydration age, and finally goes into steady state with a nearly constant temperature. Thus, from concrete adiabatic temperature rise test, the degree of cement
hydration, α at given time t may be defined as the ratio of the heat released up to time t of the given volume or weight of concrete, H(t) to the total heat as the cement is completely hydrated, H∞ as:
( )H tH
α∞
= (1)
If assume the heat capacity of concrete during hard-ening is a constant, the above expression may rewrite as
( )T tT
α∞
Δ=
Δ (2)
where ΔT(t) is the adiabatic temperature rising at time t and ΔT∞ is the adiabatic temperature rise as the cement is completely hydrated.
Each of the cement constituents has a unique heat of hydration (Bogue 1947). The total heat of cement hy-dration per unit weight of portland cement can be esti-mated from their composition (Table 3) by (Schindler et al. 2005):
0 24 48 72 96 120 144 168Time (hours)
0
10
20
30
40
50
60
Tem
pera
ture
Ris
e (O
C)
C30-ICC30-OC
0 24 48 72 96 120 144 168
Time (hours)
0
10
20
30
40
50
60
Tem
pera
ture
Ris
e (o
C)
C50-ICC50-OC
(a) C30 (b) C50
0 24 48 72 96 120 144 168Time (hours)
0
10
20
30
40
50
60
Tem
pera
ture
Ris
e (O
C)
C80-ICC80-OC
0 24 48 72 96 120 144 168
Age (hours)
0
10
20
30
40
50
60
Tem
pera
ture
Ris
e(o C
)
C100-ICC100-OC
(c) C80 (d) C100
Fig. 3 Temperature rise versus curing age diagrams of three series of concretes, (a) C30, (b) C60, (c) C90 and (d) C100 series.
J. Wang, J. Zhang and J. Zhang / Journal of Advanced Concrete Technology Vol. 16, 306-316, 2018 310
3 2 3 4
3
0 500 260 866 420
624 1186 850C S C S C A C AF
SO FreeCaO MgO
H p p p p
p p p
= + + +
+ + + (3)
where H0 is total heat of hydration of per unit weight of cement in kJ/kg. Pi is the weight ratio of each contrib-uting component to cement hydration heat. Constant behind each constituent in equation (3) is the hydration heat per unit weight of the constituent that was deter-mined directly with pure material (Bogue 1947). For concrete with additional cementitious materials used, the total hydration heat of cement may differ from (3). Ex-isting studies show that the use of silica fume (SF) and fly ash (FA) will influence the total hydration heat of cement (Kishi and Maekawa 1995; Schindler et al. 2005; Maekawa et al. 2009; Wang et al. 2012). Based on the results of the contribution of fly ash and silica fume to the total hydration heat of cement presented by Kishi and Maekawa (1995) and Maekawa et al. (2009), for con-crete with fly ash and silica fume used respectively, equation (3) is revised as (4) to take the effect of the additional cementitious materials on cement hydration heat into account in the present study.
3 2 3 4
3
0 500 260 866 420
624 1186 850C S C S C A C AF
SO FreeCaO MgO
H p p p p
p p p
= + + +
+ + + (4)
It should be noted that the value of 209 kJ/kg for con-tribution of fly ash was recommended by Kishi and Maekawa (1995). The sum of calcium oxide and silica is 56.9% and 54.1% respectively for the fly ash used in the reference and in the present work. The difference is small and the possible errors induced by such difference may be acceptable. Further, the constants used in equations (3) and (4) are also indirectly verified with isothermal calorimetric test data in the following section of the present paper. Regarding the contribution of silica fume to the complete hydration heat of cement, recommended value of 565 kJ/kg by Maekawa et al. (2009) is used in the present calculation for C80 and C100 concrete. Silica fume may be more comparable between different pro-ducers. Normally, less difference either on chemical composition or fineness can be observed. Above value should be reasonable for the calculation. Thus, for given concrete either in volume or in weight, the total heat of hydration of the cement at complete hydration, H∞ can be obtained by:
0cH M H∞ = (5)
where Mc is the mass of cement used in the concrete sample. From (3) and (4), the complete hydration heat per kilogram of cement in C30, C50 (cement and fly ash system) and C80, C100 (cement and silica fume system) used in present work is estimated as 400.8 kJ/kg and 450.0 kJ/kg respectively. For pure cement, without any extra cementitious materials, the value is 448.7 kJ/kg.
Considering the disputation on the slight variation of the heat capacity of concrete during the hydration proc-ess (De Schutter et al. 1995, 1996; Van Breugel 1991; Larrard 1999), present work assumes the heat capacity of concrete is only a function of the initial constituents and is estimated as:
/ /
1.05()
w w c c s s a a
FA SF FA SF LWA LWA
c p c p c p c p cp c p c
= + + +
+ + (6)
where c is the specific heat capacity of concrete in kJ/(kg°C). cc, cw, cs, ca, cFA/SF and cLWA are the specific heat capacity of cement, water, sand, stone, fly ash or silica fume and lightweight aggregate respectively, they are equal to 0.86, 4.19, 0.82, 0.82, 0.86 and 0.86 kJ/(kg°C) respectively. pc, pw, ps, pa, pFA/SF and pLWA are the mass fraction of cement, water, sand, stone, fly ash or silica fume and lightweight aggregate respectively in concrete. Thus, the total temperature rise expected in the adiabatic temperature rise test as cement is completely hydrated, ΔT∞, can be calculated by:
0c
t
W HT
W c∞Δ = (7)
where Wc is the mass of cement (kg) in the concrete sample used in the adiabatic temperature rise test. Wt is the concrete mass in the temperature rise test (kg). The specific heat capacity, expected total temperature rise of all concretes used in the present test program is listed in Table 4. Using the temperature measured in the adiabatic temperature rise test in equation (2), cement hydration degree at a given age can be obtained.
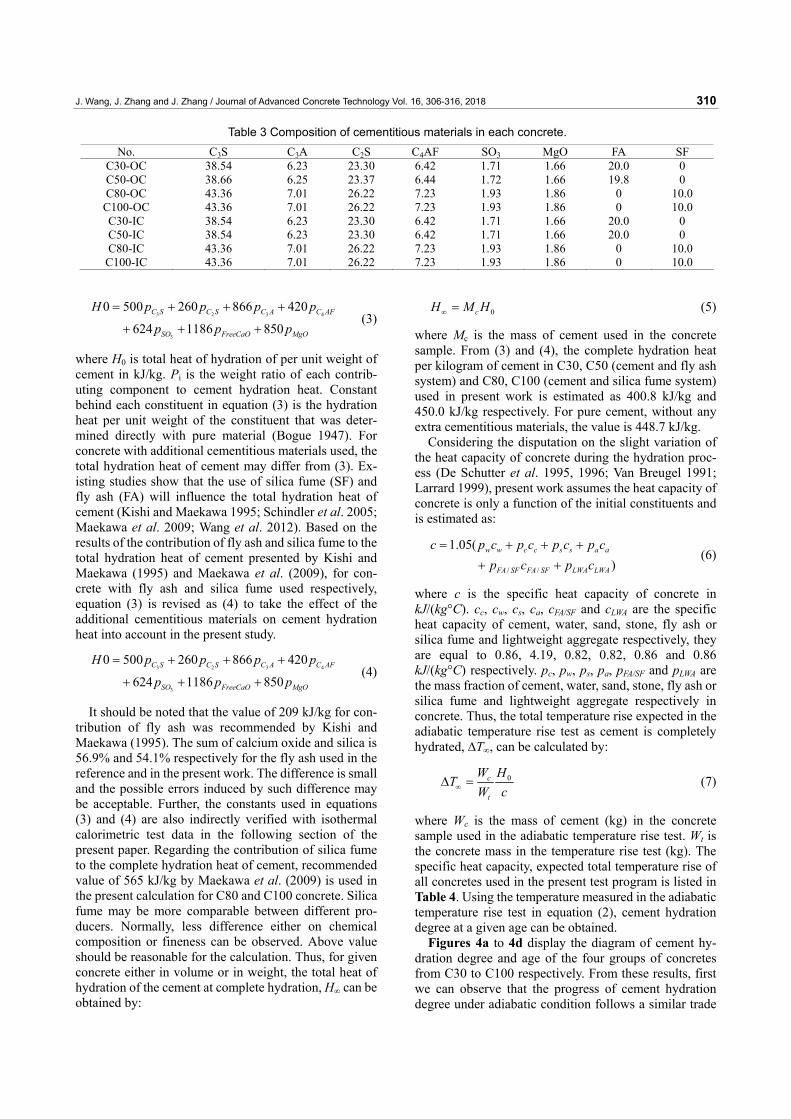
Figures 4a to 4d display the diagram of cement hy-dration degree and age of the four groups of concretes from C30 to C100 respectively. From these results, first we can observe that the progress of cement hydration degree under adiabatic condition follows a similar trade
Table 3 Composition of cementitious materials in each concrete. No. C3S C3A C2S C4AF SO3 MgO FA SF
C30-OC 38.54 6.23 23.30 6.42 1.71 1.66 20.0 0 C50-OC 38.66 6.25 23.37 6.44 1.72 1.66 19.8 0 C80-OC 43.36 7.01 26.22 7.23 1.93 1.86 0 10.0
C100-OC 43.36 7.01 26.22 7.23 1.93 1.86 0 10.0 C30-IC 38.54 6.23 23.30 6.42 1.71 1.66 20.0 0 C50-IC 38.54 6.23 23.30 6.42 1.71 1.66 20.0 0 C80-IC 43.36 7.01 26.22 7.23 1.93 1.86 0 10.0
C100-IC 43.36 7.01 26.22 7.23 1.93 1.86 0 10.0
J. Wang, J. Zhang and J. Zhang / Journal of Advanced Concrete Technology Vol. 16, 306-316, 2018 311
as the temperature rise does, which includes a first rela-tive slow stage, then a fast developing stage and next a nearly steady-state stage, in which a constant cement hydration degree is almost approached finally. Second, the effects of concrete strength or water to binder ratio, on cement hydration, either in cement hydration rate or in final hydration degree, are significant. With increase of concrete strength or decrease of water to binder ratio, cement hydration rate in the highly developing stage is gradually increased. The higher the concrete strength or the lower the water to binder ratio, the lower the final cement hydration degree that is approached at the end of
the adiabatic temperature rise test. From the present study, the final cement hydration degree at the end of the test is 0.89, 0.81, 0.60 and 0.48 respectively for C30, C50, C80 and C100. This is coincident with existing results about the effect of water to cement ratio on cement hydration degree (Zhang et al. 2014). Third, as internal curing with pre-wetted lightweight aggregate is used in concrete, cement hydration behavior is obviously enhanced com-pared to the corresponding concrete without internal curing. These enhancements on cement hydration may present in two aspects. One is the hydration rate in the second stage is raised. Another is the time used to
0 24 48 72 96 120 144 168 192 216 240Age (hours)
0.00
0.20
0.40
0.60
0.80
1.00
Deg
ree
of H
ydra
tion
C30-OCC30-IC
0 24 48 72 96 120 144 168 192 216 240
Age (hours)
0.00
0.20
0.40
0.60
0.80
1.00
Deg
ree
of H
ydra
tion
C50-OCC50-IC
(a) (b)
0 24 48 72 96 120 144 168 192 216 240Age (hours)
0.00
0.20
0.40
0.60
0.80
1.00
Deg
ree
of H
ydra
tion
C80-OCC80-IC
0 24 48 72 96 120 144 168 192 216 240
Age (hours)
0.00
0.20
0.40
0.60
0.80
1.00
Deg
ree
of H
ydra
tion
C100-OCC100-IC
(c) (d)
Fig. 4 Cement hydration degree versus age diagrams of four concretes.
Table 4 Calculation result of total temperature rise of all concretes.
No. c (kJ/kgoC)
H∞
(kJ/kg) ΔT∞ (oC) αu
ΔTmax (oC)
C30-OC 1.0877 400.819 44.86 0.8853 39.71 C50-OC 1.0881 401.377 61.94 0.8106 50.21 C80-OC 1.0417 460.397 89.26 0.6014 53.69 C100-OC 0.9702 460.397 116.31 0.4394 51.10 C30-IC 1.1911 400.819 46.26 0.9222 42.66 C50-IC 1.1715 400.819 62.21 0.8412 52.33 C80-IC 1.1053 460.397 91.28 0.6299 57.50 C100-IC 1.0379 460.395 113.27 0.5210 59.02
J. Wang, J. Zhang and J. Zhang / Journal of Advanced Concrete Technology Vol. 16, 306-316, 2018 312
achieve the final steady-state is reduced. And, the third is the final cement hydration degree is increased. Based on the present study, the final cement hydration degree at the end the test is 0.92, 0.84, 0.63 and 0.52 respectively for C30-IC, C50-IC, C80-IC and C100-IC. Clearly, the extra water provided by the pre-wetted lightweight aggregate can not only reduce the shrinkage that is the normally purpose of internal curing (Han et al. 2014), but also can improve cement hydration performance, which may enhance the mechanical properties of concrete as well.
3.3 Simulation of cement hydration rate in in-ternally cured concrete The above degree of cement hydration, and its variation trade with age is obtained based on a specific tempera-ture developing history. To know the degree of cement hydration under different temperature histories, such as different construction seasons or curing conditions, the effect of temperature on cement hydration must be taken into account. Therefore, a concept called equivalent age was introduced (Kjellsen et al. 1993). The equivalent age concept assumed that samples of a concrete mixture of the same equivalent age will have the same mechanical properties or degree of cement hydration, regardless of the temperature history. Based on the above definition, the equivalent age teq can be expressed as
0
( )( )
t
eqref
K Tt dtK T
= ∫ (8)
where teq is the equivalent age at the reference tempera-ture Tref. K(Tref) and K(T) are the rate constants of cement hydration at reference temperature Tref and the actual temperature T. According to the Arrhenius law, the rate constant can be expressed as
(273 )( )aTU
R TK T Ae−
+= (9)
where UaT is the apparent activation energy (J/mol). R is the universal gas constant, 8.314 J/molk and A is a con-stant. T is temperature in Celsius (oC). Replacing K(T) and K(Tref) with (9) in (8) yields
1 ( )293 273
0
ar aTU UtR T
eqT e dt−
+= ∫ (10)
where Tref = 20oC is assumed. Regarding apparent acti-vation energy, a number of researchers have concluded that it could not be considered as a constant independent of time except during the beginning of cement hydration (Kjellsen et al. 1993; Kim 2001). Based on these studies, the apparent activation energy of cement is expressed as a function of temperature and curing time as (Pane and Hansen 2002):
tT
a eTU )00017.0()4342830( −−= (11)
where T is curing temperature (oC) and t is curing time in days. Due to the varying curing temperature T inside of concrete, it is convenient to solve teq in the matrix form instead of integrating. If the curing time is divided into n sections and the temperature in each time interval is assumed to be a constant, then we have
( )1 ( )
293 2731
1
aTar i
i
UUnR T
eq i ii
t e t t−
+−
=
= −∑ (12)
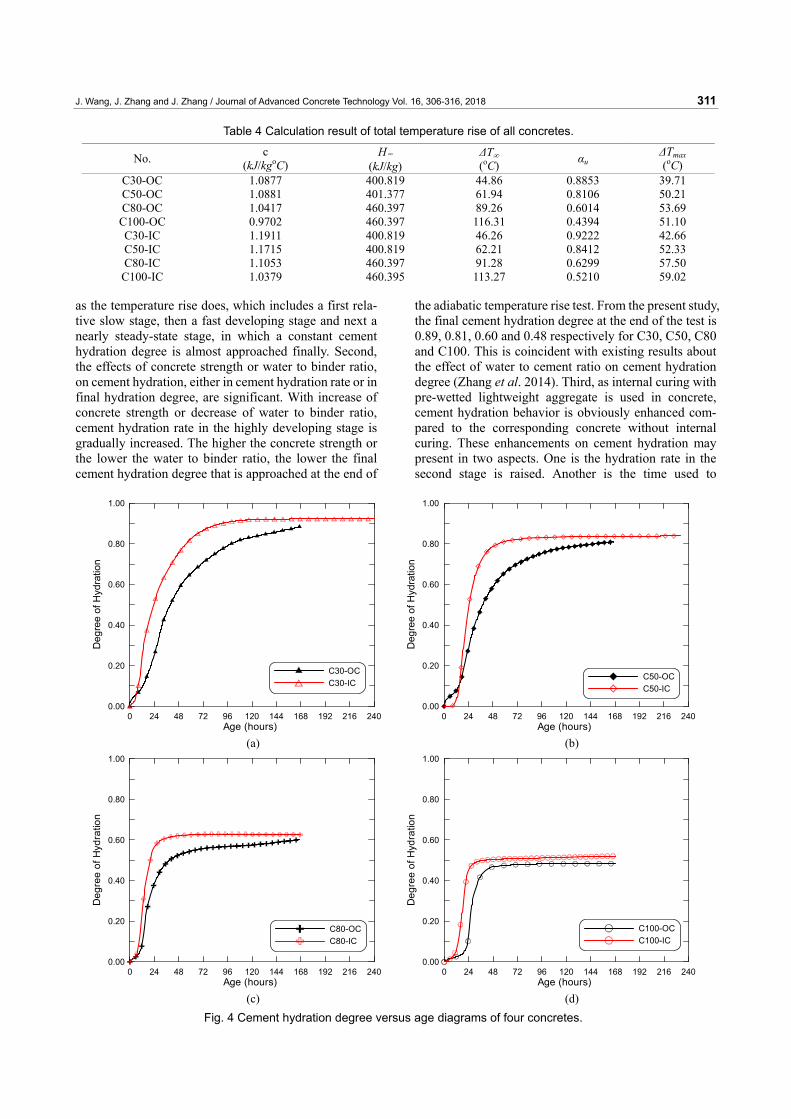
The section number n may depend on the required accuracy. Thus, the relationship between degree of ce-ment hydration and equivalent age can then be obtained from the test results of adiabatic temperature rise test and which may serve as a standard curve for solving the cement hydration status of concrete under different cur-ing conditions and at any curing age as well. Figures 5a and 5b present the relationship of cement hydration de-gree and equivalent age of normal concretes and internal
0 500 1000 1500 2000 2500 3000Equivalent Age (hours)
0.00
0.20
0.40
0.60
0.80
1.00
Deg
ree
of H
ydra
tion
C30C50C80C100
0 500 1000 1500 2000 2500 3000
Equivalent Age (hours)
0.00
0.20
0.40
0.60
0.80
1.00
Deg
ree
of H
ydra
tion
C30-ICC50-ICC80-ICC100-IC
(a) (b) Fig. 5 Cement hydration degree versus equivalent age diagrams of four concretes, (a) normal curing and (b) internal curing.
J. Wang, J. Zhang and J. Zhang / Journal of Advanced Concrete Technology Vol. 16, 306-316, 2018 313
cured concrete respectively. After taken the effect of temperature into account, the shape of the curve changes from a three-stage mode into a simply two-stage manner, which means the first slowly progressing stage is just due to the low temperature of the fresh concrete.
From above test results of cement hydration degree in different concretes ring from compressive strength at 28 days of 30 MPa to 100 MPa, we may be obviously noted that the final cement hydration degree is less than 1, and is dependent on concrete strength or water to cement ratio, which was found by Mills (1966) with pure cement paste and Schindler et al. (2005) and Luzio et al. (2009) with additional cementitious materials apart from cement used. Mills (1966) measured the degree of cement hy-dration in cement paste of different water to cement ratios (w/c) by weighting the nonevaporable water and found that most cement paste stops hydrating before the cement are completely consumed. To characterize the ultimate state of the hydration reaction of cement in different concretes, a parameter called ultimate degree of hydration, αu was introduced. Existing studies show that αu is mainly controlled by water to cement ratio and the relationship between αu and water to cement ratio are investigated. Mills (1966) proposed a relationship be-tween αu and water to cement ratio (w/c) for pure Port-land cement concrete as:
1.031( / )0.194 ( / )u
w cw c
α =+
(13)
In the view of micro mechanisms, above relationship means that the final cement hydration degree in concrete is principally controlled by the amount of water by that each cement particle is surrounded. For concrete with fly ash addition, such as C30 and C50 concrete used in the present work, above equation is revised as (Schindler and Folliard 2005):
u1.031 /( ) 0.50 /( ) 1.0
0.194 /( )w c f f c f
w c fα +
= + + ≤+ +
(14)
For concrete with silica fume, such as C80 and C100 concrete used in the present paper, αu can be expressed as (Luzio and Cusatis 2009):
1.031 /( )0.194 /( )u
w c sw c s
α +=
+ + (15)
where w, c, f and s are mass content of water, cement, fly ash and silica fume in concrete. Above revising takes the effect of the addition of additional cementitious materials reducing the water surrounding cement particles, and the effect of activity of fly ash into account.
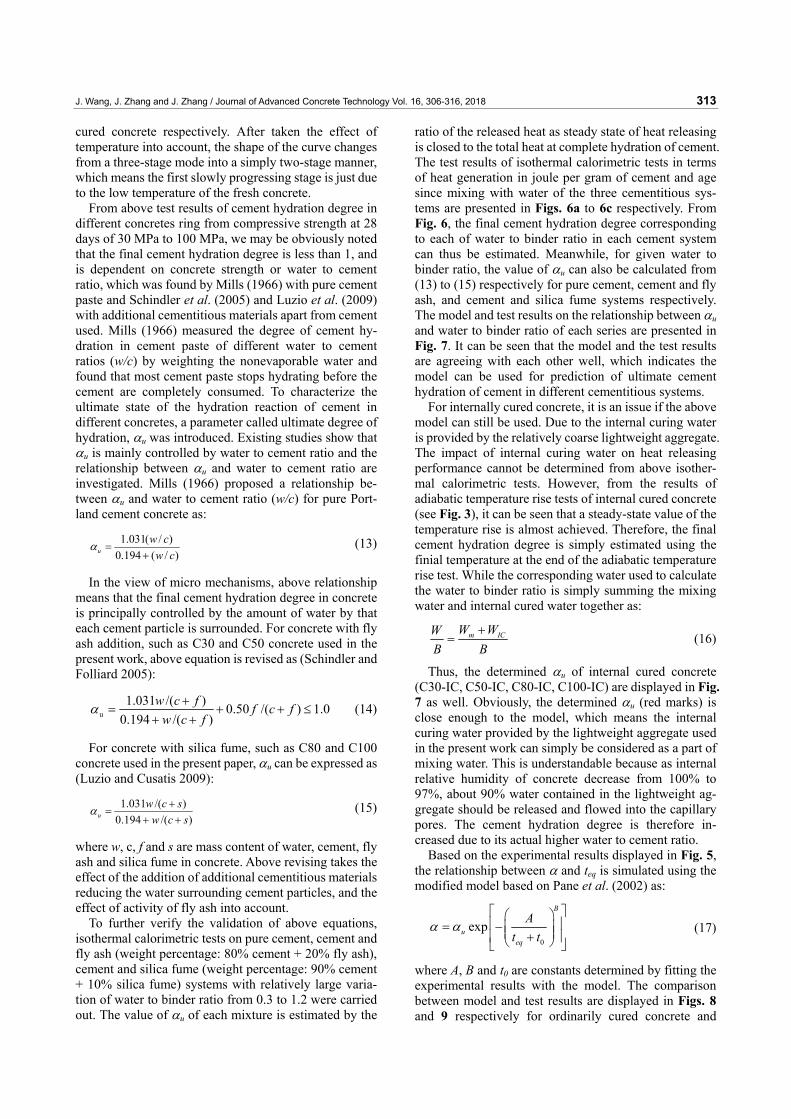
To further verify the validation of above equations, isothermal calorimetric tests on pure cement, cement and fly ash (weight percentage: 80% cement + 20% fly ash), cement and silica fume (weight percentage: 90% cement + 10% silica fume) systems with relatively large varia-tion of water to binder ratio from 0.3 to 1.2 were carried out. The value of αu of each mixture is estimated by the
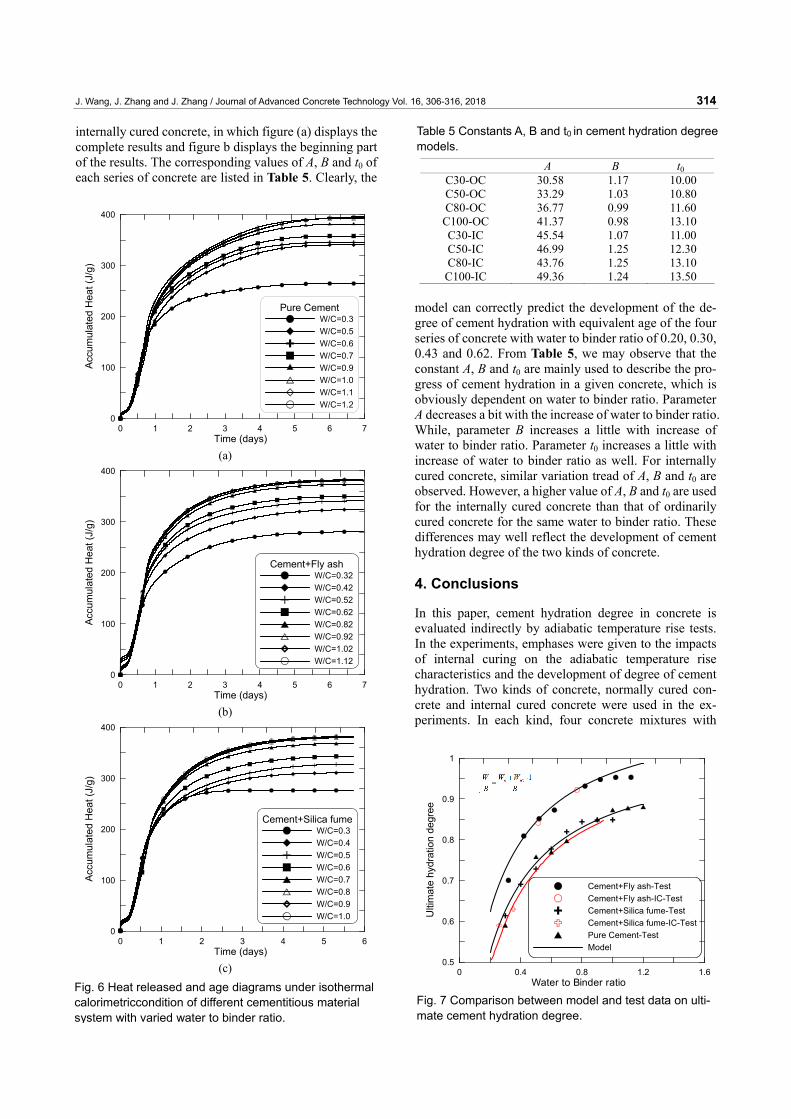
ratio of the released heat as steady state of heat releasing is closed to the total heat at complete hydration of cement. The test results of isothermal calorimetric tests in terms of heat generation in joule per gram of cement and age since mixing with water of the three cementitious sys-tems are presented in Figs. 6a to 6c respectively. From Fig. 6, the final cement hydration degree corresponding to each of water to binder ratio in each cement system can thus be estimated. Meanwhile, for given water to binder ratio, the value of αu can also be calculated from (13) to (15) respectively for pure cement, cement and fly ash, and cement and silica fume systems respectively. The model and test results on the relationship between αu and water to binder ratio of each series are presented in Fig. 7. It can be seen that the model and the test results are agreeing with each other well, which indicates the model can be used for prediction of ultimate cement hydration of cement in different cementitious systems.
For internally cured concrete, it is an issue if the above model can still be used. Due to the internal curing water is provided by the relatively coarse lightweight aggregate. The impact of internal curing water on heat releasing performance cannot be determined from above isother-mal calorimetric tests. However, from the results of adiabatic temperature rise tests of internal cured concrete (see Fig. 3), it can be seen that a steady-state value of the temperature rise is almost achieved. Therefore, the final cement hydration degree is simply estimated using the finial temperature at the end of the adiabatic temperature rise test. While the corresponding water used to calculate the water to binder ratio is simply summing the mixing water and internal cured water together as:
m ICW WWB B
+= (16)
Thus, the determined αu of internal cured concrete (C30-IC, C50-IC, C80-IC, C100-IC) are displayed in Fig. 7 as well. Obviously, the determined αu (red marks) is close enough to the model, which means the internal curing water provided by the lightweight aggregate used in the present work can simply be considered as a part of mixing water. This is understandable because as internal relative humidity of concrete decrease from 100% to 97%, about 90% water contained in the lightweight ag-gregate should be released and flowed into the capillary pores. The cement hydration degree is therefore in-creased due to its actual higher water to cement ratio.
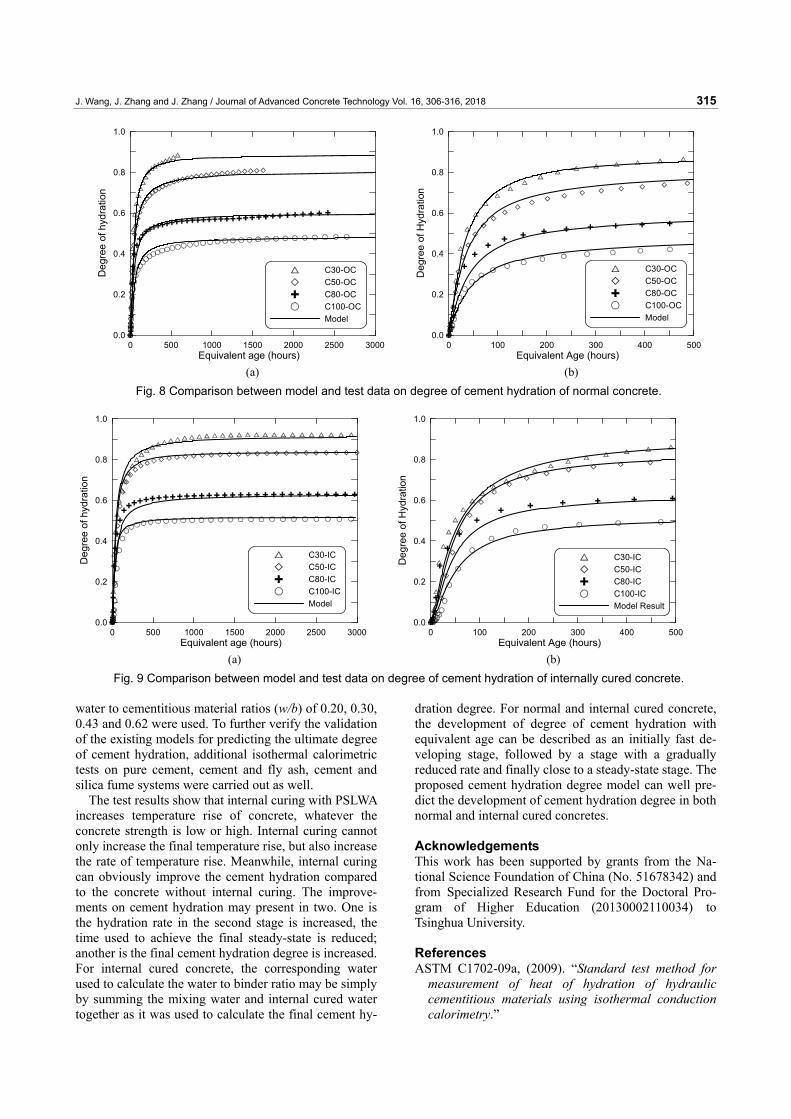
Based on the experimental results displayed in Fig. 5, the relationship between α and teq is simulated using the modified model based on Pane et al. (2002) as:
0
expB
ueq
At t
α α⎡ ⎤⎛ ⎞⎢ ⎥= −⎜ ⎟⎜ ⎟+⎢ ⎥⎝ ⎠⎣ ⎦
(17)
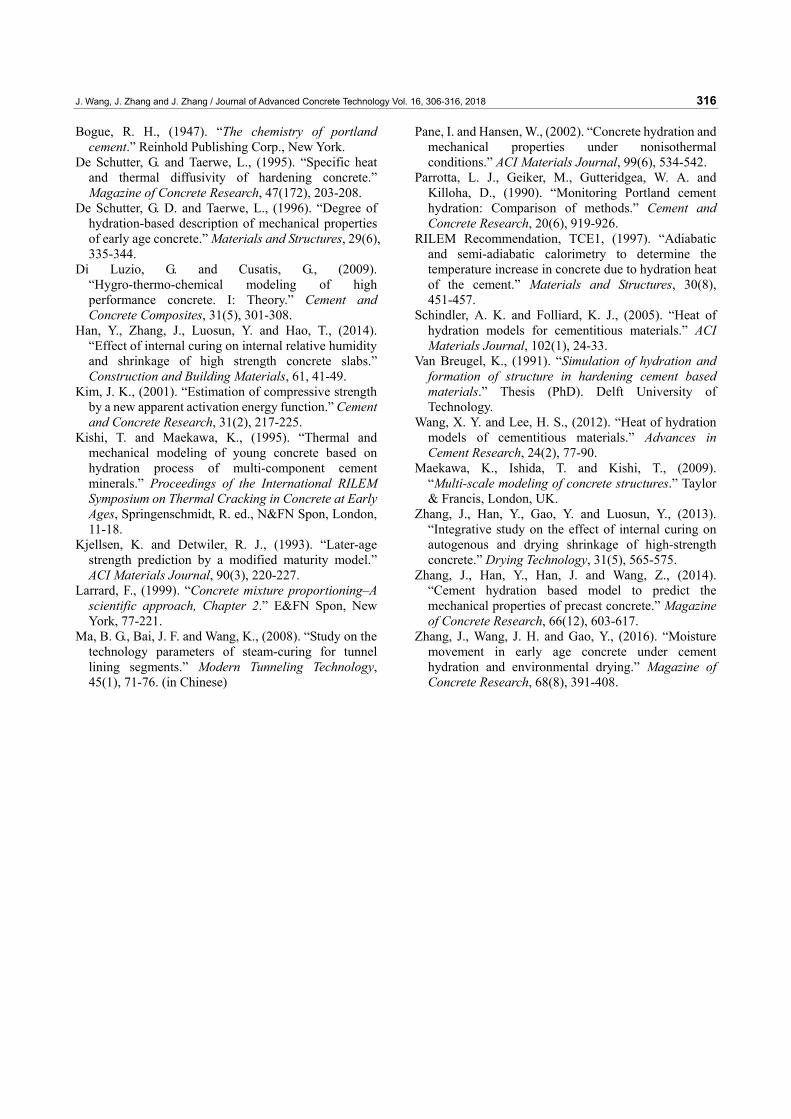
where A, B and t0 are constants determined by fitting the experimental results with the model. The comparison between model and test results are displayed in Figs. 8 and 9 respectively for ordinarily cured concrete and
J. Wang, J. Zhang and J. Zhang / Journal of Advanced Concrete Technology Vol. 16, 306-316, 2018 314
internally cured concrete, in which figure (a) displays the complete results and figure b displays the beginning part of the results. The corresponding values of A, B and t0 of each series of concrete are listed in Table 5. Clearly, the
model can correctly predict the development of the de-gree of cement hydration with equivalent age of the four series of concrete with water to binder ratio of 0.20, 0.30, 0.43 and 0.62. From Table 5, we may observe that the constant A, B and t0 are mainly used to describe the pro-gress of cement hydration in a given concrete, which is obviously dependent on water to binder ratio. Parameter A decreases a bit with the increase of water to binder ratio. While, parameter B increases a little with increase of water to binder ratio. Parameter t0 increases a little with increase of water to binder ratio as well. For internally cured concrete, similar variation tread of A, B and t0 are observed. However, a higher value of A, B and t0 are used for the internally cured concrete than that of ordinarily cured concrete for the same water to binder ratio. These differences may well reflect the development of cement hydration degree of the two kinds of concrete. 4. Conclusions
In this paper, cement hydration degree in concrete is evaluated indirectly by adiabatic temperature rise tests. In the experiments, emphases were given to the impacts of internal curing on the adiabatic temperature rise characteristics and the development of degree of cement hydration. Two kinds of concrete, normally cured con-crete and internal cured concrete were used in the ex-periments. In each kind, four concrete mixtures with
0 1 2 3 4 5 6 7Time (days)
0
100
200
300
400
Acc
umul
ated
Hea
t (J/
g)
Pure CementW/C=0.3W/C=0.5W/C=0.6W/C=0.7W/C=0.9W/C=1.0W/C=1.1W/C=1.2
(a)
0 1 2 3 4 5 6 7Time (days)
0
100
200
300
400
Acc
umul
ated
Hea
t (J/
g)
Cement+Fly ashW/C=0.32W/C=0.42W/C=0.52W/C=0.62W/C=0.82W/C=0.92W/C=1.02W/C=1.12
(b)
0 1 2 3 4 5 6Time (days)
0
100
200
300
400
Acc
umul
ated
Hea
t (J/
g)
Cement+Silica fumeW/C=0.3W/C=0.4W/C=0.5W/C=0.6W/C=0.7W/C=0.8W/C=0.9W/C=1.0
(c) Fig. 6 Heat released and age diagrams under isothermal calorimetriccondition of different cementitious material system with varied water to binder ratio.
Table 5 Constants A, B and t0 in cement hydration degree models.
A B t0 C30-OC 30.58 1.17 10.00 C50-OC 33.29 1.03 10.80 C80-OC 36.77 0.99 11.60 C100-OC 41.37 0.98 13.10 C30-IC 45.54 1.07 11.00 C50-IC 46.99 1.25 12.30 C80-IC 43.76 1.25 13.10 C100-IC 49.36 1.24 13.50
0 0.4 0.8 1.2 1.6Water to Binder ratio
0.5
0.6
0.7
0.8
0.9
1
Ulti
mat
e hy
drat
ion
degr
ee
Cement+Fly ash-TestCement+Fly ash-IC-TestCement+Silica fume-TestCement+Silica fume-IC-TestPure Cement-TestModel
Fig. 7 Comparison between model and test data on ulti-mate cement hydration degree.
J. Wang, J. Zhang and J. Zhang / Journal of Advanced Concrete Technology Vol. 16, 306-316, 2018 315
water to cementitious material ratios (w/b) of 0.20, 0.30, 0.43 and 0.62 were used. To further verify the validation of the existing models for predicting the ultimate degree of cement hydration, additional isothermal calorimetric tests on pure cement, cement and fly ash, cement and silica fume systems were carried out as well.
The test results show that internal curing with PSLWA increases temperature rise of concrete, whatever the concrete strength is low or high. Internal curing cannot only increase the final temperature rise, but also increase the rate of temperature rise. Meanwhile, internal curing can obviously improve the cement hydration compared to the concrete without internal curing. The improve-ments on cement hydration may present in two. One is the hydration rate in the second stage is increased, the time used to achieve the final steady-state is reduced; another is the final cement hydration degree is increased. For internal cured concrete, the corresponding water used to calculate the water to binder ratio may be simply by summing the mixing water and internal cured water together as it was used to calculate the final cement hy-
dration degree. For normal and internal cured concrete, the development of degree of cement hydration with equivalent age can be described as an initially fast de-veloping stage, followed by a stage with a gradually reduced rate and finally close to a steady-state stage. The proposed cement hydration degree model can well pre-dict the development of cement hydration degree in both normal and internal cured concretes.
Acknowledgements This work has been supported by grants from the Na-tional Science Foundation of China (No. 51678342) and from Specialized Research Fund for the Doctoral Pro-gram of Higher Education (20130002110034) to Tsinghua University. References ASTM C1702-09a, (2009). “Standard test method for
measurement of heat of hydration of hydraulic cementitious materials using isothermal conduction calorimetry.”
0 500 1000 1500 2000 2500 3000Equivalent age (hours)
0.0
0.2
0.4
0.6
0.8
1.0
Deg
ree
of h
ydra
tion
C30-OCC50-OCC80-OCC100-OCModel
0 100 200 300 400 500
Equivalent Age (hours)
0.0
0.2
0.4
0.6
0.8
1.0
Deg
ree
of H
ydra
tion
C30-OCC50-OCC80-OCC100-OCModel
(a) (b)
Fig. 8 Comparison between model and test data on degree of cement hydration of normal concrete.
0 500 1000 1500 2000 2500 3000Equivalent age (hours)
0.0
0.2
0.4
0.6
0.8
1.0
Deg
ree
of h
ydra
tion
C30-ICC50-ICC80-ICC100-ICModel
0 100 200 300 400 500
Equivalent Age (hours)
0.0
0.2
0.4
0.6
0.8
1.0
Deg
ree
of H
ydra
tion
C30-ICC50-ICC80-ICC100-ICModel Result
(a) (b)
Fig. 9 Comparison between model and test data on degree of cement hydration of internally cured concrete.
J. Wang, J. Zhang and J. Zhang / Journal of Advanced Concrete Technology Vol. 16, 306-316, 2018 316
Bogue, R. H., (1947). “The chemistry of portland cement.” Reinhold Publishing Corp., New York.
De Schutter, G. and Taerwe, L., (1995). “Specific heat and thermal diffusivity of hardening concrete.” Magazine of Concrete Research, 47(172), 203-208.
De Schutter, G. D. and Taerwe, L., (1996). “Degree of hydration-based description of mechanical properties of early age concrete.” Materials and Structures, 29(6), 335-344.
Di Luzio, G. and Cusatis, G., (2009). “Hygro-thermo-chemical modeling of high performance concrete. I: Theory.” Cement and Concrete Composites, 31(5), 301-308.
Han, Y., Zhang, J., Luosun, Y. and Hao, T., (2014). “Effect of internal curing on internal relative humidity and shrinkage of high strength concrete slabs.” Construction and Building Materials, 61, 41-49.
Kim, J. K., (2001). “Estimation of compressive strength by a new apparent activation energy function.” Cement and Concrete Research, 31(2), 217-225.
Kishi, T. and Maekawa, K., (1995). “Thermal and mechanical modeling of young concrete based on hydration process of multi-component cement minerals.” Proceedings of the International RILEM Symposium on Thermal Cracking in Concrete at Early Ages, Springenschmidt, R. ed., N&FN Spon, London, 11-18.
Kjellsen, K. and Detwiler, R. J., (1993). “Later-age strength prediction by a modified maturity model.” ACI Materials Journal, 90(3), 220-227.
Larrard, F., (1999). “Concrete mixture proportioning–A scientific approach, Chapter 2.” E&FN Spon, New York, 77-221.
Ma, B. G., Bai, J. F. and Wang, K., (2008). “Study on the technology parameters of steam-curing for tunnel lining segments.” Modern Tunneling Technology, 45(1), 71-76. (in Chinese)
Pane, I. and Hansen, W., (2002). “Concrete hydration and mechanical properties under nonisothermal conditions.” ACI Materials Journal, 99(6), 534-542.
Parrotta, L. J., Geiker, M., Gutteridgea, W. A. and Killoha, D., (1990). “Monitoring Portland cement hydration: Comparison of methods.” Cement and Concrete Research, 20(6), 919-926.
RILEM Recommendation, TCE1, (1997). “Adiabatic and semi-adiabatic calorimetry to determine the temperature increase in concrete due to hydration heat of the cement.” Materials and Structures, 30(8), 451-457.
Schindler, A. K. and Folliard, K. J., (2005). “Heat of hydration models for cementitious materials.” ACI Materials Journal, 102(1), 24-33.
Van Breugel, K., (1991). “Simulation of hydration and formation of structure in hardening cement based materials.” Thesis (PhD). Delft University of Technology.
Wang, X. Y. and Lee, H. S., (2012). “Heat of hydration models of cementitious materials.” Advances in Cement Research, 24(2), 77-90.
Maekawa, K., Ishida, T. and Kishi, T., (2009). “Multi-scale modeling of concrete structures.” Taylor & Francis, London, UK.
Zhang, J., Han, Y., Gao, Y. and Luosun, Y., (2013). “Integrative study on the effect of internal curing on autogenous and drying shrinkage of high-strength concrete.” Drying Technology, 31(5), 565-575.
Zhang, J., Han, Y., Han, J. and Wang, Z., (2014). “Cement hydration based model to predict the mechanical properties of precast concrete.” Magazine of Concrete Research, 66(12), 603-617.
Zhang, J., Wang, J. H. and Gao, Y., (2016). “Moisture movement in early age concrete under cement hydration and environmental drying.” Magazine of Concrete Research, 68(8), 391-408.