micro-reactors to study alite hydration
TRANSCRIPT
Micro-Reactors to Study Alite Hydration
Prannoy Suraneni and Robert J. Flatt†2
Department of Civil, Environmental, and Geomatic Engineering, ETH Z€urich, Z€urich 8093, Switzerland3
A new approach to study the early hydration reaction of aliteis presented. It relies on milling micron-sized gaps into alitegrains using a Focused Ion Beam. This provides for a “micro-reactor” in which hydration in confined conditions can befollowed after introducing aqueous solutions of any desiredcomposition. Hydration is followed by stopping the reaction atdesired ages using solvent exchange and imaging the gaps usinga Scanning Electron Microscope. These microreactors offerseveral advantages over conventional methods to monitor alitehydration. In particular, we can study the time evolution of dis-solution in a reproducible manner using a setup that mimicsparticles in close contact. This paper presents this new method-ology and applies it to studying the effects of solution composi-tion and selected chemical admixtures on the dissolution ofalite. New insights into the role of these factors are obtainedand discussed.
I. Introduction
A LITE, an impure, defected form of tricalcium silicate(3CaO�SiO2) with small amounts of impurities is the
major volumetric phase of ordinary portland cement (OPC).1
Studying the hydration of alite is quite complex, but is thefirst step toward understanding the more complex hydrationof OPC. For alite, there is an initial period of high reactionrate, immediately after the addition of water, which slowsdown very rapidly, leading to the so-called induction period,which is a period where the rate is very low and roughly con-stant.1 At the end of the induction period, the reaction accel-erates, continues at an increasing rate for about 12 h andthen decelerates, later reaching very low values. Although theoverall kinetics are reasonably clear, the reasons behind thesedifferent stages of reaction are not well understood and thereare several competing theories to explain them.2,3 The highearly rate of reaction is commonly agreed to be due to rapiddissolution, although the reason for which it slows downremains debated.2,3 Recent studies by Juilland et al.,4 pro-pose that with water, the dissolution is rapid and proceedsby formation of etch pits and vacancy islands, whereas indissolution with solutions having calcium concentrations, thedriving force for dissolution is lower, and dissolution pro-ceeds via step retreat from pre-existing etch pits. Therefore,according to this theory, undersaturation plays a critical rolenot only in determining the driving force for dissolution, butpossibly also in changing its dominant mechanism. Otherrecent studies by Nicoleau et al.5,6 also show very significantsupport for dissolution depending strongly on solution un-dersaturation. The dissolution via etch pits and undersatura-tion-dependent dissolution mechanisms are well known ingeochemistry as shown in numerous studies by Lasaga et al.,Arvidson et al. and others.7,8 There are, however, still several
unanswered questions with respect to alite2,3—for example,discrepancies in solution concentration data, the importanceof defects and perhaps most importantly, why the inductionperiod ends. An increasing amount of studies are devoted tothese questions,9 some of which incorporate geochemicaltechniques such as Vertical Scanning Interferometry, whichare rather new in the cement field.10
The acceleration period seems to be controlled by growthprocesses,2,3 with initial nucleation occurring very early intime (first few minutes after mixing), and growth continuingfrom these initial nuclei at later times.11–13 The exact growthmechanisms of C–S–H are however debated. One mechanismstates that initial nucleation occurs on the alite surface, andsubsequent growth of these initial nuclei occurs both paralleland perpendicular to the grain, with different growth rates.Growth continues in both directions until complete coverageof the alite surface, and then proceeds only perpendicular tothe grain surface.14,15 Another conceptual view states thatthe initial growth is that of a loose C–S–H, which later densi-fies and impinges, causing the reaction to decelerate. Theexact nature of this densification is still unclear, though somestudies do provide support for densifying C–S–H.16,17 It isdifficult to study the morphology of C–S–H as almost allobservation methods involve drying of the sample, leading toirreversible shrinkage of the C–S–H on a nanoscale, thereforemodifying its nano- and perhaps, microstructure, even if thehydration is very carefully stopped.18 The best ways toobserve C–S–H without damaging it significantly appear tobe High-resolution environmental scanning electron micros-copy (HRESEM), Focused ion beam used in cryogenicconditions tomography,19 and X-ray nano CT (computedtomography).20 A study done with HRESEM concluded pes-simistically that “the morphology of C–S–H cannot yet beimaged in its natural state.”21 In terms of morphology, sev-eral different types C–S–H are described in the literature:“fibrous particles seen as partly-rolled sheets,” “reticular net-work or interlocking structure,” “relatively nondescript orconsisting of an equant grain morphology,” etc., though itmust be remembered that these may be modified morphologi-es because of the rather harsh sample preparation process.21
Several chemical admixtures have long been used to mod-ify concrete properties, including superplasticizers, accelera-tors, and retarders. These have rather complex effects oncement hydration that are not completely understood yet.Superplasticizers are known to retard cement hydration, withthe proposed mechanisms being retardation of dissolution,retardation of nucleation and growth, deactivation of activesites, and complex formation with calcium modifying diffu-sion.22,23 Retarders, which can slowdown various processesof the hydration reaction, have been proposed to work insimilar ways by poisoning of hydrates, retardation of dissolu-tion, etc.24,25 Several accelerators have been used, which canmodify different stages of the setting and hardening pro-cesses. Some new admixtures use seeds of C–S–H as an accel-erator, and these work by providing additional surface onwhich more C–S–H can nucleate and grow. Using largeenough amounts of such admixtures can significantly increasethe heat of hydration at about 1 d, eliminate the inductionperiod, etc.26,27
G. Scherer—contributing editor
Manuscript No. 35925. Received November 15, 2014; approved December 22, 2014.†Author to whom correspondence should be addressed. e-mail: [email protected]
1
2
3
4
5
6
7
8
9
10
11
12
13
14
15
16
17
18
19
20
21
22
23
24
25
26
27
28
29
30
31
32
33
34
35
36
37
38
39
40
41
42
43
44
45
46
47
48
49
50
51
52
53
54
55
56
57
58
59
60
61
62
63
64
65
66
67
68
69
70
71
72 1
J. Am. Ceram. Soc., 1–7 (2015)
DOI: 10.1111/jace.13472
© 2015 The American Ceramic Society
JA
CE
13472
Dispa
tch:
8.1.15
CE:M
uthu
malliga
JournalCode
ManuscriptNo.
No.
ofpa
ges:
7PE:Rag
hu
Journal

In this study, we present a new approach to study thehydration reaction of alite.28 The approach uses a FocusedIon Beam to mill micron-sized gaps into alite grains to mimichydration between grains in close contact. These gaps areimaged at various ages after hydration is stopped to gaininsights into aspects of dissolution and how solutioncomposition and chemical admixtures affect these. Althoughsome studies have used Focused Ion Beams in concrete sci-ence,29–31 very few have used it to study hydration19,32 andthe effect of admixtures.19 This paper represents the firststudy on dissolution that the authors are aware of.
II. Materials and Methods
(1) MaterialsAlite was produced by adapting protocols developed byCostoya.33 In brief, SiO2, CaCO3, Al2O3, and MgO (>99%pure; Sigma-Aldrich CO, St. Louis, MO) in the molar ratioof 1: 2.967: 0.016: 0.068 were mixed and homogenized in aturbula (Turbula� T2F; Glen Mills, Clifton, NJ) for 24 h.The mixed powder was then pressed into pellets 3 cm indiameter and weighing 10 g using a manual press (VLP-Ser-ies; Enerpac, Menomonee Falls, WI). These pellets were thenheated from 25°C to 1600°C for 5 h, then held at 1600°C for8 h in a furnace (Nabertherm LHT 08/16; NaberthermGmbH, Lilienthal, Germany) and then rapidly cooled byquenching with compressed air on a cold steel plate. Theproduced alite was then ground, pressed, and sintered a sec-ond time following the same heating and quenching proce-dures. Using XRD and Rietveld refinement (D8 ADVANCE;Bruker CO, Billerica, MA), the alite was identified as poly-morph MIII, with less than 1% impurities. Silica sand andcalcium carbonate (>96% pure from Merck, Whitehouse Sta-tion, NJ) were used to prepare reference and inert microreac-tors. Solutions were prepared on a mass basis. They wereprepared and stored 30 min—1 d prior to use, after all solidshad dissolved, noted from clear appearance of the solution.Stirring was used in cases when solubility was low. The effectof solution composition was studied with DI water [ultrapureMillipore water with resistivity >18 MΩ cm at 25°C (Milli-Q;Millipore, Billerica, MA)] and calcium hydroxide (>96%pure, with less than 2% of calcium carbonate; Merck, White-house Station, NJ) at concentrations of 2 and 20 mM.
The effect of chemical admixtures on the hydration processwas also studied. A commercial superplasticizer (ACE 30;BASF SE, Ludwigshafen, Germany) and two synthesizedpure comb-type polycarboxylate superplasticizers were used.Both pure superplasticizers were synthetized by copolymeri-zation of methoxy polyethylene glycol methacrylates andmethacrylic acid (Sigma-Aldrich CO, St. Louis, MO). Theywere then ultrafiltrated (Labscale TFF System; EMD Milli-pore CO, Billerica, MA) to remove residual monomers andsalts. The molecular weight was determined by size-exclusionchromatography (Agilent 1260 Infinity; Agilent Tech, SantaClara, CA) by standard calibration with PEO/PEG stan-dards. Data analysis was performed by using WinGPC soft-ware (PSS Polymer Standard Service GmBH, Mainz,Germany). The characteristics of the synthesized superplasti-cizers are summarized in Table I.
A commercial accelerator was used to test its effect on thehydration (X-Seed� 100; BASF SE). Sucrose (>99% pure,Thermo Fisher Scientific, Waltham, MA) and citric acid(>99% pure, Merck, Whitehouse Station, NJ) were used as
retarders. Potassium hydroxide (>95% pure, Riedel-de HaenGmbH, Seelze, Germany) at a concentration of 150 mM wasused to increase the pH of the retarder solutions to about 13.
(2) Preparation of the GapsAlite pellets were lightly ground using a mortar and pestlefor 10 min to give grains about 100 lm in size (mostly poly-crystalline in nature, with individual grains ranging fromabout 10 to 50 lm in size). For each sample prepared, threegrains were then placed on a flat rubber surface and a dropof liquid epoxy (EPO-TEK 301, Epoxy Technology, Inc.,Billerica, MA) was placed on them. The epoxy was left toharden overnight, which resulted in the grains being firmlyembedded in the epoxy. The side of the sample close to thegrains was then polished using 2500X and 4000X SiC grind-ing paper (Buehler CO, Lake Bluff, IL) for about two min-utes with each paper manually to expose a flat surface of thealite. The polished sample was sputter coated with a goldlayer 20 nm thick using a current of 25 mA (MED010; Oerli-kon Balzers, Balzers, Liechtenstein). The sample was thenplaced in a dual beam SEM-FIB (Quanta 200 3D; FEI CO,Eindhoven, Netherlands), and gaps 5 lm long, 1 lm wide,and 1 lm deep were milled in the alite grains with theGa-FIB using a current of 50 pA and a voltage of 30 kV.This proved to be a good compromise between milling timeand roughness created (higher currents lead to rougher sur-face, lower ones require excessively long milling time). Thewidth of the gaps was chosen as 1 lm, that we take as anupper bound for the contact distance between hydratingcement grains.19 Gaps of other shapes and sizes were alsotested, but no qualitative changes in the nature of the resultswere seen for the conditions presented in this paper. In addi-tion to alite, some samples were prepared using silica sandand calcium carbonate to obtain inert references.
(3) Hydration Initiation, Stoppage, and ImagingThe samples prepared as defined above were then taken outof the microscope, and immersed in either pure water or cal-cium hydroxide solutions, prepared as explained earlier. Thevolume of solution used was 1 � 0.2 mL. The volume of thegap is 17 lm3; this means that the gaps are essentially underconditions of infinite dilution. The solutions did not impreg-nate the gaps easily at normal pressure, possibly because ofthe difficulty of removing air in such a small gap, therefore aslight low vacuum (150 mbar) was applied for about a min-ute after the samples were immersed in solution to removethe air and introduce the solution in the gaps.1
The samples were then stored, fully submerged, sealed,and allowed to hydrate for the required reaction time. Thissystem of the gaps hydrating in solution is what we termmicroreactors. When the hydration had to be stopped, thesamples were immersed in reagent-grade isopropanol for 2 hat �18°C, and then dried at 60°C for 2 h. Although this isgenerally accepted as being one of the best ways to stophydration for microscopy,18 it may still somewhat modify theC–S–H on a nanoscale.
The samples were then sputter coated with a gold layerabout 5 nm thick (SCD050; Oerlikon Balzers, Balzers, Liech-tenstein). The dissolution and growth in the gaps were thenimaged using a high-resolution SEM (Leo 1530 Gemini; CarlZeiss AG, Oberkochen, Germany) using an in-lens second-ary electron detector. Images were collected at a voltage of5 kV and magnifications between 40 0009–50 0009, unless
Table I. Characteristics of Synthesized Superplasticizers
Polymer
Molecular
weight
Molecular weight
of the side chains
Grafting
density
2.5PMA1000 36 000 1000 2.674PMA1000 24 000 1000 4.54
1Without the application of vacuum the solution did not always impregnate thegap, and hydration was not seen at all in some cases, even though it was expected. Thisis believed to be because of the presence of air bubbles in the gap that may prevent theingress of solution into the gap. The application of vacuum ensured hydration in allcases and an increase in the reproducibility. Although vacuum would usually be appliedbefore the solution is added, we believe that in this case, as the porosity is not veryhigh, application of vacuum after solution is added is sufficient.
2 Journal of the American Ceramic Society—Suraneni and Flatt
1
2
3
4
5
6
7
8
9
10
11
12
13
14
15
16
17
18
19
20
21
22
23
24
25
26
27
28
29
30
31
32
33
34
35
36
37
38
39
40
41
42
43
44
45
46
47
48
49
50
51
52
53
54
55
56
57
58
59
60
61
62
63
64
65
66
67
68
69
70
71
72

otherwise noted. For each gap presented here graphically,at least 2–3 gaps were imaged. Quantitative calculations ofdissolution are presented; in that case, data are averagedover 6–9 gaps.
III. Results
(1) Creation of the GapFigure 1 shows a gap before the sample is immersed in solu-tion. The gap is 5 lm long and 1 lm wide and 1 lm deep.Unless otherwise specified, all gaps presented here have thesame dimensions. The low FIB current used results in thegap having very smooth surfaces. It is well-known that usinga FIB can cause damage to the sample, including some sur-face amorphization and Gallium implantation.34,35 Addition-ally, material, which has been removed from the millingprocess, can be re-deposited on the sides of the milled gap. Itcannot be excluded that a certain thickness of the alite,roughly estimated to be about 50 nm is modified by theFIB.36 However, tests performed on polished samples withneighboring milled and nonmilled zones did not reveal anyclear differences in dissolution or growth regardless of thehydration times considered (2 min, 30 min, and 2 d). Themicroreactors offer an important advantage over the polishedsurfaces. Indeed, although useful results can be obtained withpolished surfaces, they are qualitative at best, and informa-tion about the dissolution extent is almost impossible toquantify. Additionally, the surface characteristics of the mic-roreactors are much better controlled than polished surfaces.In the following sections, we focus mostly on the dissolutionprocess that can be observed with the microreactors ratherthan on the nature of the hydrates, since the latter is difficultto quantify using the microreactors.
(2) Hydration with DI WaterWith DI water, hydration times of 2 min, 30 min, 4 h, and2 d were examined. The behavior of different samplesshowed a good qualitative agreement. In all cases, the goldcoating on the top of the samples proved to be a good pro-tection against water ingress, hindering hydration.
For samples in which the hydration was stopped after2 min, the walls of the gap already cave in, indicating disso-lution (Fig. S1, in supplementary material). Additionally,some hydrates are also observed at the base of the gap.Although there is some variability, these results show thatdissolution and nucleation processes have begun after 2 minin DI water.
Typical results later in time (30 min and 2 d) are illus-trated in Fig. 2. At 30 min, the extent of dissolution isalready rather large—the walls and the bottom of the gaps
have caved in, and the gap is measurably larger than it wasbefore the experiment. The dissolution continues further at4 h and at 2 d.
The dissolution is clearly three-dimensional and does notfollow a clear front: in the image at 2 d, areas at the base ofthe gap are completely dark, indicating that they lie at a dif-ferent focal plane (in this case, lower), than the rest of thematerial. These results show that dissolution in alite can bevery localized; areas, which are a few hundred nm away fromeach other, can show very different dissolution behavior (atleast with DI water).
(3) Effect of Concentrated Calcium Hydroxide SolutionsThe samples immersed in 20 mM CH solutions were also leftto hydrate for periods for 2 min, 30 min, 4 h, and 2 d.
At 2 min, there is virtually no dissolution. The walls ofthe gap are smooth and bright as they were before immersionin solution. The base of the gap shows some hydrates, insome cases.
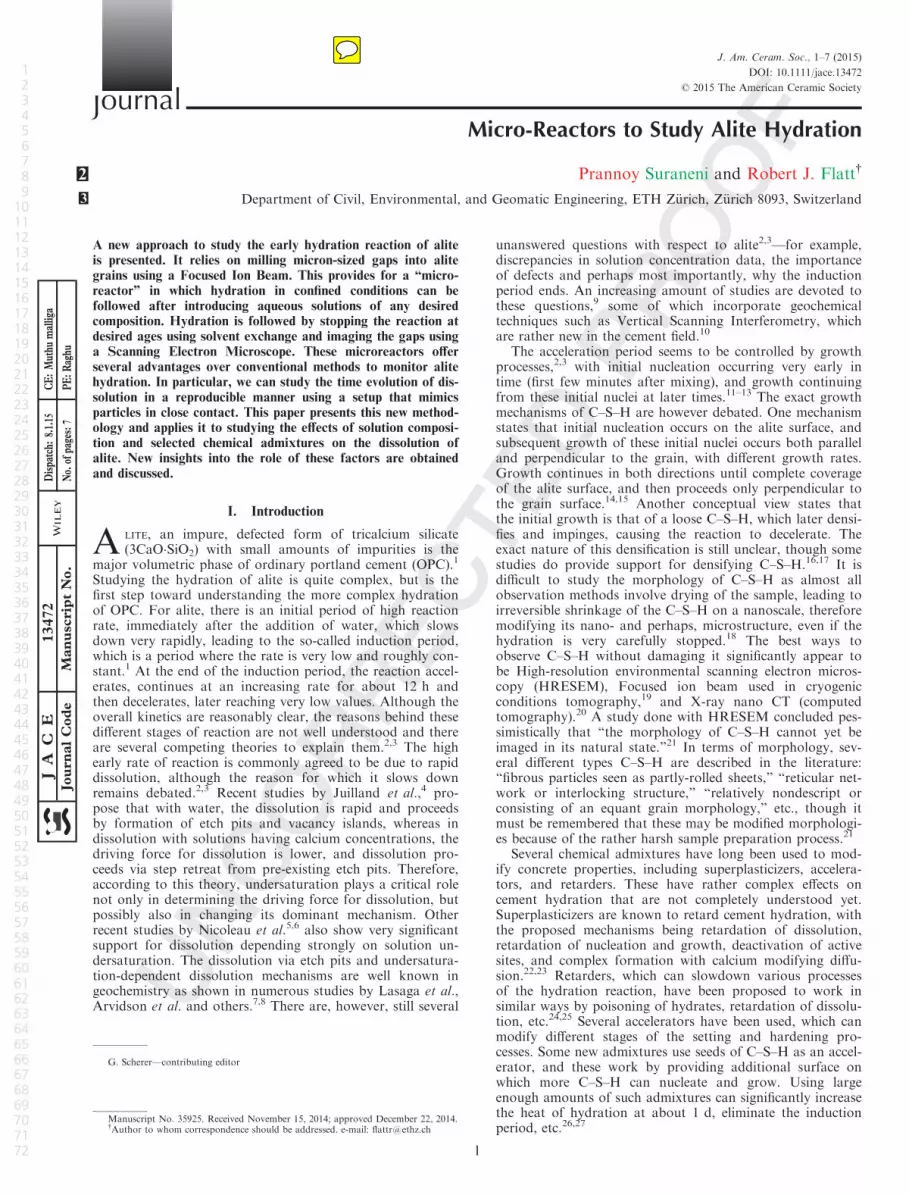
Representative images of the samples of which the hydra-tion was stopped at 30 min and 2 d times are shown inFig. 3. At 30 min. the walls of the gap are still quite smoothand bright and the extent of dissolution appears to be low.Hydrates are seen at the base of the gap. The extent of disso-lution varies between small and no observable dissolution,and in all cases, however, this extent was immensely smallerthan in the pure water.
At 4 h and 2 d (Fig. 3), the surface of the gap is com-pletely covered with hydration products, with significantporosity between them—they are not space filling in the mic-roreactor gap. From 4 h to 2 d, for all samples there appearsto be no significant difference in the extent of coverage orthe nature of the product.
(4) Effect of Dilute Calcium Hydroxide ConcentrationsA dilute solution of CH was used with a concentration of2 mM. As before the hydration times examined were 2 min,
Fig. 1. Gap shown before hydration, 5 lm 9 1 lm 9 1 lm indimension. The walls and base of the gap are smooth and flat. For adistance of about 0.2–0.5 lm around the gaps, the gold layer isremoved; however, this does not affect subsequent dissolutionbehavior.
(a)
(b)
Fig. 2. Gaps after (a) 30 min and (b) 2 d after hydration with DIwater. Dissolution is already clear at 30 min, and the extent is verylarge at 2 d.
Alite Hydration 13
1
2
3
4
5
6
7
8
9
10
11
12
13
14
15
16
17
18
19
20
21
22
23
24
25
26
27
28
29
30
31
32
33
34
35
36
37
38
39
40
41
42
43
44
45
46
47
48
49
50
51
52
53
54
55
56
57
58
59
60
61
62
63
64
65
66
67
68
69
70
71
72
30 min, 4 h, and 2 d. Results with 30 min and 2 d are shownin fig. 5.
At 2 and 30 min, the behavior is very similar to the sam-ples with the 20 mM CH solution. There is little or no disso-lution, much lesser than with DI water, and hydrates are onthe microreactor base. A representative gap with the 2 mMCH solution at 2 min is shown in the supplementary mate-rial, in Fig. S2 (the gaps look almost the same with 20 mMCH solution also).
At 4 h, the gaps look much more similar to those withwater than those with 20 mM CH. There is significant disso-lution with a significant retreat of the sidewalls and the baseof the gaps which continues till 2 d (Fig. 4). There is alsoclear growth of hydration products, of a variable nature.
We only note here that the nature of the hydrates formeddepends on the calcium concentration in the solution, but adetailed discussion of the nature of the hydrates is out of thescope of the present work.
(5) Quantification of the Extent of DissolutionAlthough the above results provide a qualitative picture ofhydration in the microreactors, they do not quantify the dif-ferences caused by the solutions used. For this it is proposedto quantify the extent of dissolution by measuring the rela-tive change in area at the top of the microreactor. Thisparameter will be referred to as Relative Top Area Change(RTAC). Limitations of this approach are discussed inSection 4.
Relative Top Area Change results presented in fig. 7 showvery clear differences. At 2 d, the extent of dissolution forwater is about five times higher than that with the 20 mMCH solution and about double that with the 2 mM CH solu-tion. These values are obtained by averaging 6–9 gaps in atleast two different samples. As shown by the error bars onthe graphs, there is a substantial variance, but this does notchange the general trend in our observations. The same gen-eral trend was seen to hold at the other hydration times
considered: the extent of dissolution is highest with water,lowest for the 20 mM CH solution, and in between thesetwo for the 2 mM CH solution. It is also particularly inter-esting to note results when the solution composition wasswitched—samples left for 30 min in water and subsequentlyfor 2 d in 20 mM CH showed a large extent of dissolution,almost the same as with water (fig. 7).
(6) Effect of SuperplasticizersThe effect of superplasticizers was also studied using a com-mercial product and two pure comb-copolymers. It is difficultto correlate dosages used here to dosages in concentratedpastes, therefore tests were done using a range of superplasti-cizer dosages spanning two orders of magnitude. The rangewas chosen such that at the lowest end no effect wasobserved, while at the highest end, further increases did notchange the effect caused by the superplasticizer. The effectsof the superplasticizer were the same qualitatively for all thesuperplasticizers used, and representative results are pre-sented.
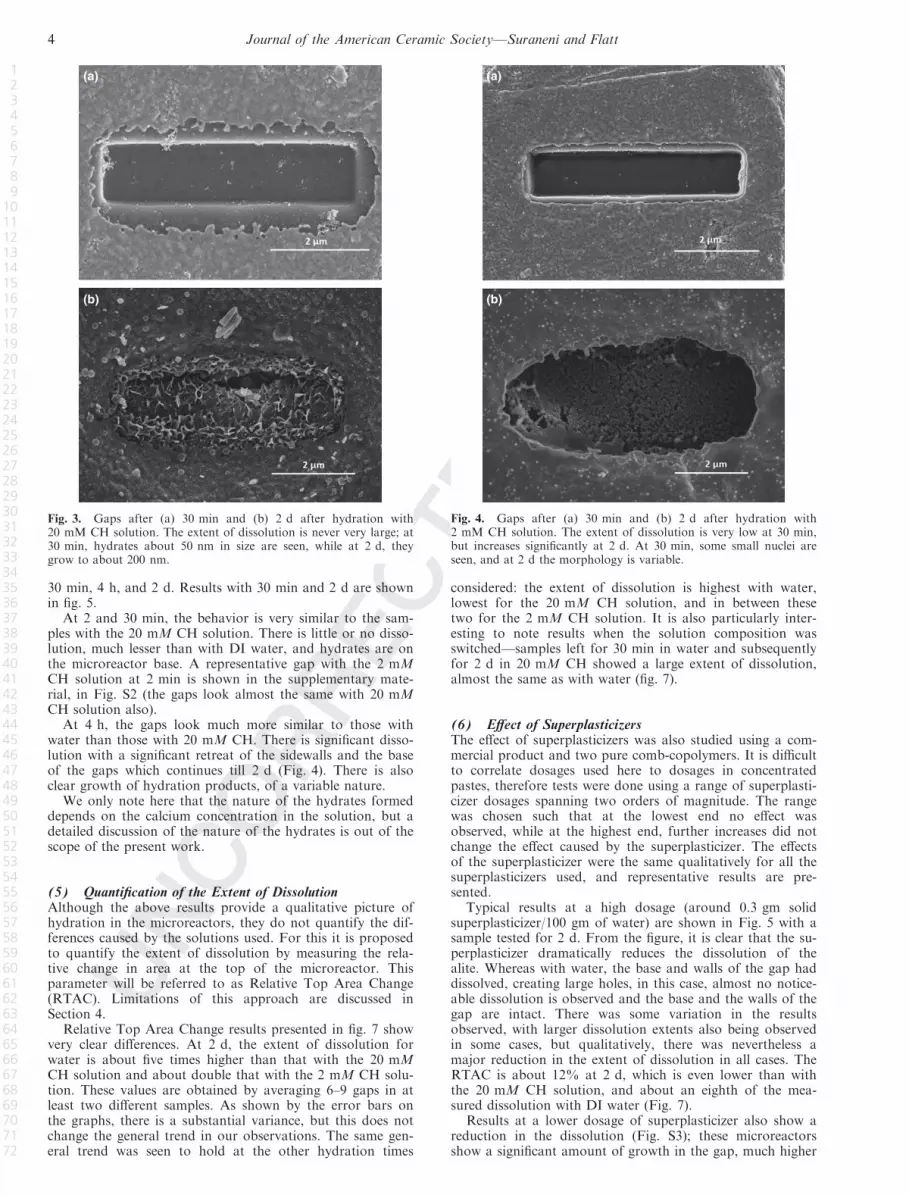
Typical results at a high dosage (around 0.3 gm solidsuperplasticizer/100 gm of water) are shown in Fig. 5 with asample tested for 2 d. From the figure, it is clear that the su-perplasticizer dramatically reduces the dissolution of thealite. Whereas with water, the base and walls of the gap haddissolved, creating large holes, in this case, almost no notice-able dissolution is observed and the base and the walls of thegap are intact. There was some variation in the resultsobserved, with larger dissolution extents also being observedin some cases, but qualitatively, there was nevertheless amajor reduction in the extent of dissolution in all cases. TheRTAC is about 12% at 2 d, which is even lower than withthe 20 mM CH solution, and about an eighth of the mea-sured dissolution with DI water (Fig. 7).
Results at a lower dosage of superplasticizer also show areduction in the dissolution (Fig. S3); these microreactorsshow a significant amount of growth in the gap, much higher
(a)
(b)
Fig. 4. Gaps after (a) 30 min and (b) 2 d after hydration with2 mM CH solution. The extent of dissolution is very low at 30 min,but increases significantly at 2 d. At 30 min, some small nuclei areseen, and at 2 d the morphology is variable.
(a)
(b)
Fig. 3. Gaps after (a) 30 min and (b) 2 d after hydration with20 mM CH solution. The extent of dissolution is never very large; at30 min, hydrates about 50 nm in size are seen, while at 2 d, theygrow to about 200 nm.
4 Journal of the American Ceramic Society—Suraneni and Flatt
1
2
3
4
5
6
7
8
9
10
11
12
13
14
15
16
17
18
19
20
21
22
23
24
25
26
27
28
29
30
31
32
33
34
35
36
37
38
39
40
41
42
43
44
45
46
47
48
49
50
51
52
53
54
55
56
57
58
59
60
61
62
63
64
65
66
67
68
69
70
71
72

than is normally seen; indicating that the superplasticizers donot inhibit nucleation and growth processes; thereby support-ing the hypothesis that the tested superplasticizers act on thedissolution directly. The interpretations for this effect mightbe complex and we are in the process of performing experi-ments with carefully selected combinations of admixtures toconfirm these preliminary results.
(7) Effect of RetardersTests were performed with citric acid and sucrose, known toact as retarders of cement hydration,24,25 at dosages of 10,30, and 50 mM in an aqueous solution for 2 d. In purewater, little or no effect was noted, however, when the pH ofthe solution was raised to about 13 by adding KOH intosolution, a reduction in the extent of dissolutionwas observed (Fig. S4). This pH-dependent effect on theactions of citric acid24 and sucrose25 has been noted earlierin literature. It has to do with the formation of complexeswith calcium. For sucrose, this requires pH above 11 for thefirst deprotonation to occur,37 which explains our choice ofraising pH to study these admixtures.
(8) Effect of C–S–H SeedsThe product X-Seed� 100 is a suspension of dispersed C–S–H nanoparticles, which is meant to increase the rate ofhydration by providing additional surface for growth (as pre-dicted by nucleation and growth models).26,27 Figure 6 showsheterogeneous nucleation with the admixture, with a largeamount of (presumably) C–S–H growth in a sample testedwith 0.5 gm X-Seed� 100/100 gm DI water at 2 d. The dos-ages used were determined in a similar manner as with thesuperplasticizer.
Additional tests with gaps in calcium carbonate and silicarevealed only slight agglomeration of seeds, but no massivegrowth as observed with alite. The accumulation of materialin the microreactor gap shown in Fig. 6 is therefore not asimple deposition of the nanoparticles, but true growth ofhydrates with ions provided by the dissolution of the mic-roreactor walls.
IV. Discussion
(1) Role of UndersaturationIt was recently proposed that the early period of hydrationof alite is dissolution controlled,4 and that the rate of disso-lution depends strongly on the undersaturation of the solu-tion both because of a change in the driving force andbecause of a mechanism change. In the first set of experi-ments presented, the undersaturation is changed by modify-ing the calcium hydroxide concentration and our resultsconfirm the important role of calcium hydroxide on dissolu-tion (Fig. 7).
In the microreactors, strong diffusion into the bulk alsoaids the dissolution as it allows ions to diffuse away from thedissolving surface. In our experiment, dissolution is highestwith water, lowest with 20 mM CH, and somewhere inbetween for the 2 mM CH. In the later case, we did howeverobserve a relatively high variability in the results. This isinterpreted as possibly coming from a variation in the natureof the mechanism controlling the rate of dissolution at thislow calcium concentration. More specifically, under suchconditions, either etch pit formation, vacancy island forma-tion, or step retreat may be rate limiting, additionallydepending on the crystallographic nature of the dissolvingsurface.
(2) Inferences About the Formation of Etch PitsThe experiments referred to above show a strong influence ofundersaturation on the dissolution rate. Additionally, theimportant differences between pure water, the 2 mM CH,and the 20 mM CH solutions suggest a possible change inthe nature of the rate-limiting mechanism. More convincingevidence about this is provided by the “solution switch”experiments. In that experiment water was first introducedinto the microreactors to activate etch pits and then rapidlyreplaced by the 20 mM CH solution (in the results shownhere, the samples were immersed in water for the first 30 minof the reaction; tests were also done with the initial immer-sion time in water being 5 or 10 min, with qualitatively simi-lar results). As shown in Fig. 8 this leads to a very extensive
Fig. 5. Representative results showing reduction in extent ofdissolution with addition of superplasticizer at 2 d. At high dosage,there is virtually zero dissolution.
Fig. 6. Increased growth of hydrates with addition of X-Seed� 100into DI water at 2 d; there is significantly higher growth than isobserved with only water.
Fig. 7. Variation in the average extent of dissolution with differentsolution compositions, all at 2 d. Six to nine measurements wereused to calculate the RTAC value for each solution, and standarddeviations indicated on the graph are on the average of eachmeasurement. The RTAC decreases dramatically as the calciumconcentration is solution increases. Additionally, addition ofsuperplasticizer reduces the RTAC very significantly. RTAC valuesin solution switch experiments show almost the same value as withwater.
Colouronline,B&W
inprint
Alite Hydration 15
1
2
3
4
5
6
7
8
9
10
11
12
13
14
15
16
17
18
19
20
21
22
23
24
25
26
27
28
29
30
31
32
33
34
35
36
37
38
39
40
41
42
43
44
45
46
47
48
49
50
51
52
53
54
55
56
57
58
59
60
61
62
63
64
65
66
67
68
69
70
71
72
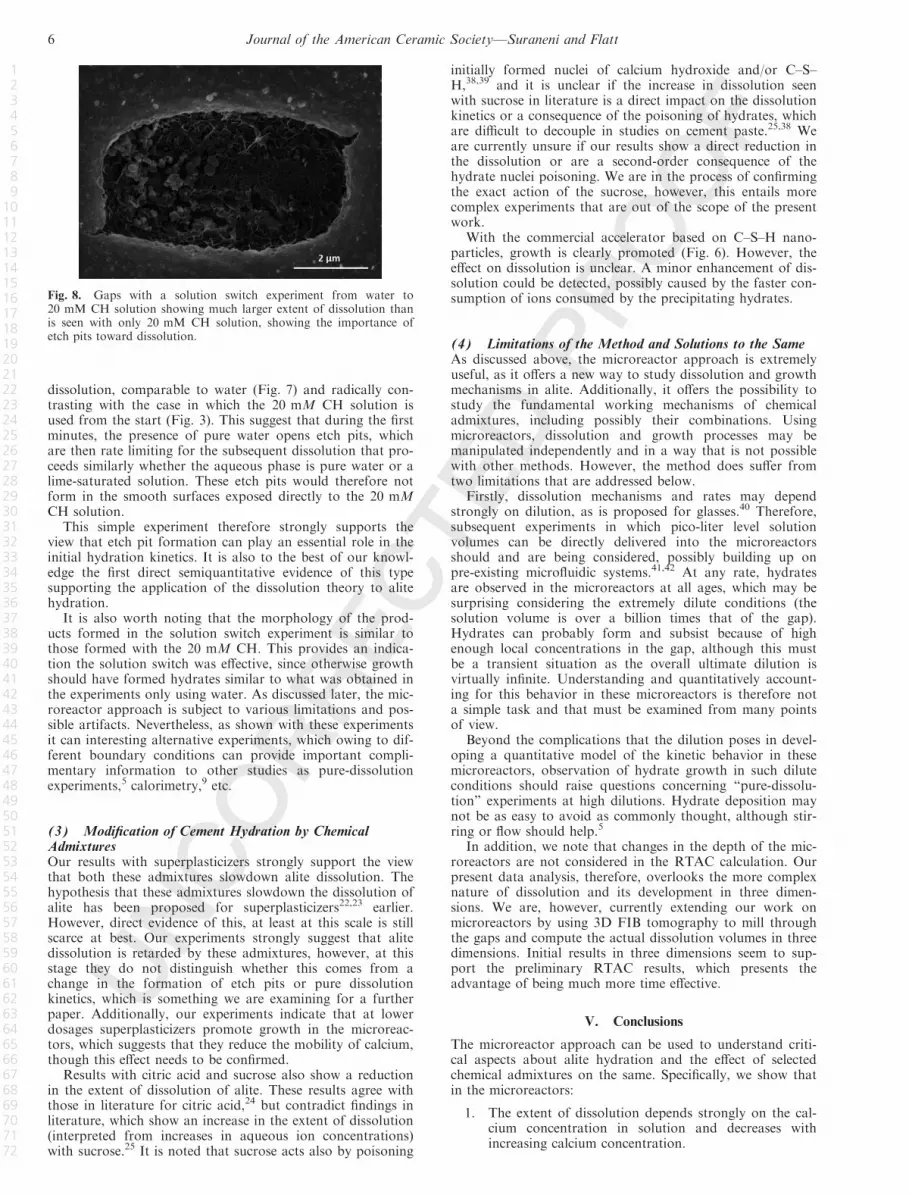
dissolution, comparable to water (Fig. 7) and radically con-trasting with the case in which the 20 mM CH solution isused from the start (Fig. 3). This suggest that during the firstminutes, the presence of pure water opens etch pits, whichare then rate limiting for the subsequent dissolution that pro-ceeds similarly whether the aqueous phase is pure water or alime-saturated solution. These etch pits would therefore notform in the smooth surfaces exposed directly to the 20 mMCH solution.
This simple experiment therefore strongly supports theview that etch pit formation can play an essential role in theinitial hydration kinetics. It is also to the best of our knowl-edge the first direct semiquantitative evidence of this typesupporting the application of the dissolution theory to alitehydration.
It is also worth noting that the morphology of the prod-ucts formed in the solution switch experiment is similar tothose formed with the 20 mM CH. This provides an indica-tion the solution switch was effective, since otherwise growthshould have formed hydrates similar to what was obtained inthe experiments only using water. As discussed later, the mic-roreactor approach is subject to various limitations and pos-sible artifacts. Nevertheless, as shown with these experimentsit can interesting alternative experiments, which owing to dif-ferent boundary conditions can provide important compli-mentary information to other studies as pure-dissolutionexperiments,5 calorimetry,9 etc.
(3) Modification of Cement Hydration by ChemicalAdmixturesOur results with superplasticizers strongly support the viewthat both these admixtures slowdown alite dissolution. Thehypothesis that these admixtures slowdown the dissolution ofalite has been proposed for superplasticizers22,23 earlier.However, direct evidence of this, at least at this scale is stillscarce at best. Our experiments strongly suggest that alitedissolution is retarded by these admixtures, however, at thisstage they do not distinguish whether this comes from achange in the formation of etch pits or pure dissolutionkinetics, which is something we are examining for a furtherpaper. Additionally, our experiments indicate that at lowerdosages superplasticizers promote growth in the microreac-tors, which suggests that they reduce the mobility of calcium,though this effect needs to be confirmed.
Results with citric acid and sucrose also show a reductionin the extent of dissolution of alite. These results agree withthose in literature for citric acid,24 but contradict findings inliterature, which show an increase in the extent of dissolution(interpreted from increases in aqueous ion concentrations)with sucrose.25 It is noted that sucrose acts also by poisoning
initially formed nuclei of calcium hydroxide and/or C–S–H,38,39 and it is unclear if the increase in dissolution seenwith sucrose in literature is a direct impact on the dissolutionkinetics or a consequence of the poisoning of hydrates, whichare difficult to decouple in studies on cement paste.25,38 Weare currently unsure if our results show a direct reduction inthe dissolution or are a second-order consequence of thehydrate nuclei poisoning. We are in the process of confirmingthe exact action of the sucrose, however, this entails morecomplex experiments that are out of the scope of the presentwork.
With the commercial accelerator based on C–S–H nano-particles, growth is clearly promoted (Fig. 6). However, theeffect on dissolution is unclear. A minor enhancement of dis-solution could be detected, possibly caused by the faster con-sumption of ions consumed by the precipitating hydrates.
(4) Limitations of the Method and Solutions to the SameAs discussed above, the microreactor approach is extremelyuseful, as it offers a new way to study dissolution and growthmechanisms in alite. Additionally, it offers the possibility tostudy the fundamental working mechanisms of chemicaladmixtures, including possibly their combinations. Usingmicroreactors, dissolution and growth processes may bemanipulated independently and in a way that is not possiblewith other methods. However, the method does suffer fromtwo limitations that are addressed below.
Firstly, dissolution mechanisms and rates may dependstrongly on dilution, as is proposed for glasses.40 Therefore,subsequent experiments in which pico-liter level solutionvolumes can be directly delivered into the microreactorsshould and are being considered, possibly building up onpre-existing microfluidic systems.41,42 At any rate, hydratesare observed in the microreactors at all ages, which may besurprising considering the extremely dilute conditions (thesolution volume is over a billion times that of the gap).Hydrates can probably form and subsist because of highenough local concentrations in the gap, although this mustbe a transient situation as the overall ultimate dilution isvirtually infinite. Understanding and quantitatively account-ing for this behavior in these microreactors is therefore nota simple task and that must be examined from many pointsof view.
Beyond the complications that the dilution poses in devel-oping a quantitative model of the kinetic behavior in thesemicroreactors, observation of hydrate growth in such diluteconditions should raise questions concerning “pure-dissolu-tion” experiments at high dilutions. Hydrate deposition maynot be as easy to avoid as commonly thought, although stir-ring or flow should help.5
In addition, we note that changes in the depth of the mic-roreactors are not considered in the RTAC calculation. Ourpresent data analysis, therefore, overlooks the more complexnature of dissolution and its development in three dimen-sions. We are, however, currently extending our work onmicroreactors by using 3D FIB tomography to mill throughthe gaps and compute the actual dissolution volumes in threedimensions. Initial results in three dimensions seem to sup-port the preliminary RTAC results, which presents theadvantage of being much more time effective.
V. Conclusions
The microreactor approach can be used to understand criti-cal aspects about alite hydration and the effect of selectedchemical admixtures on the same. Specifically, we show thatin the microreactors:
1. The extent of dissolution depends strongly on the cal-cium concentration in solution and decreases withincreasing calcium concentration.
Fig. 8. Gaps with a solution switch experiment from water to20 mM CH solution showing much larger extent of dissolution thanis seen with only 20 mM CH solution, showing the importance ofetch pits toward dissolution.
6 Journal of the American Ceramic Society—Suraneni and Flatt
1
2
3
4
5
6
7
8
9
10
11
12
13
14
15
16
17
18
19
20
21
22
23
24
25
26
27
28
29
30
31
32
33
34
35
36
37
38
39
40
41
42
43
44
45
46
47
48
49
50
51
52
53
54
55
56
57
58
59
60
61
62
63
64
65
66
67
68
69
70
71
72

2. Solution switch experiments from water to 20 mM CHsolutions show strong support for initial reaction beingdissolution controlled; with etch pits being formedwhen the undersaturation is large enough.
3. Selected superplasticizers slowdown the dissolution. Itremains to be determined whether their effect is on theformation of etch pits or on dissolution kinetics.
4. Citric acid and sucrose slowdown the dissolution; how-ever further tests are needed to confirm this effect.
5. Seeds of C–S–H enhance growth, but do not seem toenhance dissolution significantly.
Acknowledgments
The authors acknowledge the support of the Scientific Center for Optical andElectron Microscopy (ScopeM) at ETH Z€urich, and specifically of Dr. AnneGreet Bittermann at ScopeM for aid with the electron microscopy work. Del-phine Marchon from ETH Z€urich is thanked for providing alite and superp-lasticizers. Dr. Lorenz Holzer from ZHAW and Dr. Marta Palacios fromETH Z€urich are thanked for their helpful suggestions and ideas.
Supporting Information
Additional Supporting Information may be found in theonline version of this article:
Fig. S1. Representative results showing microreactors after2 min in water; the walls of the gap start dissolving andsome hydrates can be seen at the base of the gap.
Fig. S2. Representative results showing microreactors after2 min in CH solutions; no clear dissolution can be seenthough some hydrates are observed at the base of the gap.
Fig. S3. Representative results showing reduction in extentof dissolution with addition of low dosage of superplasticizerat 2 d. There is higher growth than is normally seen in thegaps (dosage around 0.06 gm solid superplasticizer/100 gmof water).
Fig. S4. Representative results showing reduction in extentof dissolution with addition of retarders at high pH; baseand walls of the gap are clearly visible with water at 2 d andthe extent of dissolution is low (shown with citric acid50 mM, pH adjusted to about 13 with 150 mM KOH).
References
1H. F. W. Taylor, Cement Chemistry, 2nd edition. Thomas Telford, Lon-don, 1997.
2J. W. Bullard, H. M. Jennings, R. A. Livingston, A. Nonat, G. W. Scherer,J. F. Schweitzer, K. L. Scrivener, and J. J. Thomas, “Mechanisms of CementHydration,” Cem. Concr. Res., 41 [12] 1208–23 (2011).
3K. L. Scrivener and A. Nonat, “Hydration of Cementitious Materials, Pres-ent and Future,” Cem. Concr. Res., 41 [7] 651–65 (2011).
4P. Juilland, E. Gallucci, R. J. Flatt, and K. L. Scrivener, “Dissolution The-ory Applied to the Induction Period in Alite Hydration,” Cem. Concr. Res., 40[6] 831–44 (2010).
5L. Nicoleau, A. Nonat, and D. Perrey, “The Di- and Tricalcium SilicateDissolutions,” Cem. Concr. Res., 47, 14–30 (2013).
6L. Nicoleau, E. Schreiner, and A. Nonat, “Ion-Specific Effects Influenc-ing the Dissolution of Tricalcium Silicate,” Cem. Concr. Res., 59, 118–38(2014).
7A. C. Lasaga and A. Luttge, “Variation of Crystal Dissolution Rate Basedon a Dissolution Stepwave Model,” Science, 291 [5512] 2400–4 (2001).
8R. S. Arvidson, I. E. Ertan, J. E. Amonette, and A. Luttge, “Variation inCalcite Dissolution Rates: A Fundamental Problem?” Geochim. Cosmochim.Acta, 67, 1623–34 (2003).
9A. Bazzoni, M. Cantoni, and K. L. Scrivener, “Impact of Annealing on theEarly Hydration of Tricalcium Silicate,” J. Am. Ceram. Soc., 97 [2] 584–91(2014).
10A. Kumar, J. Reed, and G. Sant, “Vertical Scanning Interferometry: ANew Method to Measure the Dissolution Dynamics of Cementitious Miner-als,” J. Am. Ceram. Soc., 96 [9] 2766–78 (2013).
11J. W. Bullard, “A Determination of Hydration Mechanisms for TricalciumSilicate Using a Kinetic Cellular Automaton Model,” J. Am. Ceram. Soc., 91[7] 2088–97 (2008).
12J. W. Bullard and R. J. Flatt, “New Insights into the Effect of CalciumHydroxide Precipitation on the Kinetics of Tricalcium Silicate Hydration,”J. Am. Ceram. Soc., 93 [7] 1894–903 (2010).
13G. W. Scherer, J. Zhang, and J. J. Thomas, “Nucleation and GrowthModels for Hydration of Cement,” Cem. Concr. Res., 42 [7] 982–93 (2012).
14S. Garrault and A. Nonat, “Hydrated Layer Formation on Tricalciumand Dicalcium Silicate Surfaces: Experimental Study and Numerical Simula-tions,” Langmuir, 17 [26] 8131–8 (2001).
15S. Garrault, T. Behr, and A. Nonat, “Formation of the C-S-H Layer Dur-ing Early Hydration of Tricalcium Silicate Grains with Different Sizes,”J. Phys. Chem. C, 110 [1] 270–5 (2006).
16S. Bishnoi and K. L. Scrivener, “Studying Nucleation and Growth Kinet-ics of Alite Hydration Using lic,” Cem. Concr. Res., 39 [10] 849–60 (2009).
17A. C. A. Muller, K. L. Scrivener, A. M. Gajewicz, and P. J. McDonald,“Densification of C-S-H Measured by H NMR Relaxometry,” J. Phys. Chem.C, 117 [1] 403–12 (2013).
18J. Zhang and G. W. Scherer, “Comparison of Methods for ArrestingHydration of Cement,” Cem. Concr. Res., 41, 1024–36 (2011).
19A. Zingg, L. Holzer, A. Kaech, F. Winnefeld, J. Pakusch, S. Becker, andL. Gauckler, “The Microstructure of Dispersed and Non-Dispersed FreshCement Pastes—New Insight by Cryo-Microscopy,” Cem. Concr. Res., 38 [4]522–9 (2008).
20S. R. Chae, J. Moon, S. Yoon, S. Bae, P. Levitz, R. Winarski, and P. J.M. Monteiro, “Advanced Nanoscale Characterization of Cement Based Mate-rials Using X-Ray Synchrotron Radiation: A Review,” Int. J. Conc. Struct.Mater., 7 [2] 95–110 (2013).
21P. C. Fonseca and H. M. Jennings, “The Effect of Drying on Early-AgeMorphology of C–S–H as Observed in Environmental SEM,” Cem. Concr.Res., 40 [12] 1673–80 (2010).
22M. Y. A. Mollah, W. J. Adams, R. Schennach, and D. L. Cocke, “AReview of Cement-Superplasticizer Interactions and Their Models,” Adv. Cem.Res., 12 [4] 153–61 (2000).
23S. Pourchet, C. Comparet, L. Nicoleau, and A. Nonat, “Influence of PCSuperplasticizers on Tricalcium Silicate Hydration”; Proceedings of the 12thICCC, July 8–13, Montreal, 2007.
24G. M€oschner, B. Lothenbach, R. Figi, and R. Kretzschmar, “Influence ofCitric Acid on the Hydration of Portland Cement,” Cem. Concr. Res., 39,279–82 (2009).
25N. L. Thomas and J. D. Birchall, “The Retarding Action of Sugars onCement Hydration,” Cem. Concr. Res., 13, 830–42 (1983).
26L. Nicoleau, “Accelerated Growth of Calcium Silicate Hydrates: Experi-ments and Simulations,” Cem. Concr. Res., 41, 1339–48 (2011).
27J. J. Thomas, H. M. Jennings, and J. J. Chen, “Influence of NucleationSeeding on the Hydration Mechanisms of Tricalcium Silicate and Cement,”J. Phys. Chem. C, 113 [11] 4327–34 (2009).
28P. Suraneni and R. J. Flatt, “Micro-Reactors for Studying Mineral Reac-tivity”; Proceedings of the 14th EMABM, June 10–14, Helsingør, 2013.
29L. Holzer, R. J. Flatt, S. T. Erdo�gan, J. W. Bullard, and E. J. Garboczi,“Shape Comparison Between 0.4–2.0 and 20–60 lm Cement Particles,” J. Am.Ceram. Soc., 93 [6] 1626–33 (2010).
30L. Holzer, B. M€unch, M. Wegmann, P. Gasser, and R. J. Flatt, “FIB-Na-notomography of Particulate Systems—Part I: Particle Shape and Topology ofInterfaces,” J. Am. Ceram. Soc., 89 [8] 2577–85 (2006).
31B. M€unch, P. Gasser, L. Holzer, and R. J. Flatt, “FIB-Nanotomographyof Particulate Systems—Part II: Particle Recognition and Effect of BoundaryTruncation,” J. Am. Ceram. Soc., 89 [8] 2586–95 (2006).
32P. Trtik, B. M€unch, P. Gasser, A. Leemann, R. Loser, R. Wepf, and P.Lura, “Focussed Ion Beam Nanotomography Reveals the 3D Morphology ofDifferent Solid Phases in Hardened Cement Pastes,” J. Microscopy, 241 [3]234–42 (2011).
33M. M. Costoya Fernandez, “Effect of Particle Size on the HydrationKinetics and Microstructural Development of Tricalcium Silicate”;PhD Thesis,�Ecole polytechnique f�ed�erale de Lausanne. 2008.
34B. I. Prenitzer, C. A. Urbanik-Shannon, L. A. Giannuzzi, S. R. Brown, R.B. Irwin, T. L. Shofner, and F. A. Stevie, “The Correlation Between IonBeam/Material Interactions and Practical FIB Specimen Preparation,” Mi-crosc. Microanal., 9, 216–36 (2003).
35P. M. Nellen, V. Callegari, and U. Sennhauser, “Preparative Methods forNanoanalysis of Materials with Focused Ion Beam Instruments,” Chimia, 60[11] 735–41 (2006).
36J. F. Zeigler, J. P. Biersack, and U. Littmark, The Stopping Range of Ionsin Solids. Pergamon Press, New York, NY, 1985.
37K. I. Popov, N. Sultanova, H. R€onkk€om€aki, M. Hannu-Kuure, J. Jalo-nen, L. H. J. Lajunen, I. F. Bugaenko, and V. I. Tuzhilkin, “13C NMR andElectrospray Ionization Mass Spectrometric Study of Sucrose Aqueous Solu-tions at High pH: NMR Measurement of Sucrose Dissociation Constant,”Food Chem., 96 [2] 248–53 (2006).
38M. C. G. Juenger and H. M. Jennings, “New Insights into the Effects ofSugar on the Hydration and Microstructure of Cement Pastes,” Cem. Concr.Res., 32 [3] 393–9 (2002).
39V. K. Peterson and M. C. G. Juenger, “Hydration of Tricalcium Silicate:Effects of CaCl2 and Sucrose on Reaction Kinetics and Product Formation,”Chem. Mater., 18 [24] 5798–804 (2006).
40S. Mercado-Depierre, F. Angeli, F. Frizon, and S. Gin, “AntagonistEffects of Calcium on Borosilicate Glass Alteration,” J. Nucl. Mater., 441 [1–3] 402–10 (2013).
41R. Grossier, Z. Hammadi, R. Morin, A. Magnaldo, and S. Veesler, “Gen-erating Nanoliter to Femtoliter Microdroplets with Ease,” Appl. Phys. Lett.,98 [9] 0919161–3 (2011).
42V. Neu, R. Steiner, S. M€uller, C. Fattinger, and R. Zenobi, “Developmentand Characterization of a Capillary Gap Sampler as New Microfluidic Devicefor Fast and Direct Analysis of Low Sample Amounts by ESI-MS,” Anal.Chem., 85 [9] 4628–35 (2013). h
Alite Hydration 17
1
2
3
4
5
6
7
8
9
10
11
12
13
14
15
16
17
18
19
20
21
22
23
24
25
26
27
28
29
30
31
32
33
34
35
36
37
38
39
40
41
42
43
44
45
46
47
48
49
50
51
52
53
54
55
56
57
58
59
60
61
62
63
64
65
66
67
68
69
70
71
72