cellular plasticity enables adaptation to unforeseen cell- cycle rewiring challenges
TRANSCRIPT
Cellular Plasticity Enables Adaptation to Unforeseen Cell-Cycle Rewiring ChallengesYair Katzir1, Elad Stolovicki2,3, Shay Stern4, Erez Braun2,3*
1 Faculty of Medicine, Technion, Haifa, Israel, 2Department of Physics, Technion, Haifa, Israel, 3 Laboratory of Network Biology, Technion, Haifa, Israel, 4Department of
Biological Chemistry, Weizmann Institute of Science, Rehovot, Israel
Abstract
The fundamental dynamics of the cell cycle, underlying cell growth and reproduction, were previously found to be robustunder a wide range of environmental and internal perturbations. This property was commonly attributed to its networkstructure, which enables the coordinated interactions among hundreds of proteins. Despite significant advances indeciphering the components and autonomous interactions of this network, understanding the interfaces of the cell cyclewith other major cellular processes is still lacking. To gain insight into these interfaces, we used the process of genome-rewiring in yeast by placing an essential metabolic gene HIS3 from the histidine biosynthesis pathway, under the exclusiveregulation of different cell-cycle promoters. In a medium lacking histidine and under partial inhibition of the HIS3p, therewired cells encountered an unforeseen multitasking challenge; the cell-cycle regulatory genes were required to regulatethe essential histidine-pathway gene in concert with the other metabolic demands, while simultaneously driving the cellcycle through its proper temporal phases. We show here that chemostat cell populations with rewired cell-cycle promotersadapted within a short time to accommodate the inhibition of HIS3p and stabilized a new phenotypic state. Furthermore,a significant fraction of the population was able to adapt and grow into mature colonies on plates under such inhibitingconditions. The adapted state was shown to be stably inherited across generations. These adaptation dynamics wereaccompanied by a non-specific and irreproducible genome-wide transcriptional response. Adaptation of the cell-cycleattests to its multitasking capabilities and flexible interface with cellular metabolic processes and requirements. Similaradaptation features were found in our previous work when rewiring HIS3 to the GAL system and switching cells fromgalactose to glucose. Thus, at the basis of cellular plasticity is the emergence of a yet-unknown general, non-specificmechanism allowing fast inherited adaptation to unforeseen challenges.
Citation: Katzir Y, Stolovicki E, Stern S, Braun E (2012) Cellular Plasticity Enables Adaptation to Unforeseen Cell-Cycle Rewiring Challenges. PLoS ONE 7(9): e45184.doi:10.1371/journal.pone.0045184
Editor: Ben Lehner, CRG, Spain
Received May 29, 2012; Accepted August 14, 2012; Published September 18, 2012
Copyright: � 2012 Katzir et al. This is an open-access article distributed under the terms of the Creative Commons Attribution License, which permitsunrestricted use, distribution, and reproduction in any medium, provided the original author and source are credited.
Funding: This work was supported in part by a United States-Israel Binational Science foundation grant and by the Israel Science Foundation (grant # 496/10).The funders had no role in study design, data collection and analysis, decision to publish, or preparation of the manuscript.
Competing Interests: The authors have declared that no competing interests exist.
* E-mail: [email protected]
Introduction
The living cell is a dynamical system demonstrating consider-
able organization manifested in its metabolism, morphology and
function. Cell cycle regulation, which is responsible for proper
cell growth and division, coordinates a temporal phenotypic
order that enables this dynamic behavior. Understanding the
internal regulation of the cell cycle as well as its interface with
numerous other cellular processes is therefore fundamental to
many fields of biological research, such as development and
cancer. The operational principles of the eukaryotic cell cycle
have been found to be universal across a wide range of
organisms, from yeast to mammals [1,2,3,4]. The common
picture emerging is of the cell cycle progression driven by a robust
machinery, presumably an outcome of a scrutinized evolutionary
natural selection process [5,6,7,8,9]. However, direct experimen-
tal evidences for the mechanisms underlying this robustness are
still lacking. Thus, despite the success in deciphering the cell
cycle circuitry and genomic makeup, two basic inter-related
issues beyond its autonomous normal operation remain largely
open: its flexibility to respond to environmental stresses and
accommodate internal perturbations [10], and its interface with
the other intracellular processes, in particular the metabolic
system [11,12,13].
The cell-cycle progression is regulated at two levels: via protein-
protein interactions, the main components of which are cyclins
(which bind to cyclin-dependent kinases (CDKs)) and their
degraders (e.g. anaphase promoting complex (APC)), and via
protein-DNA interactions (transcription factors (TFs)) [14]. Recent
studies have revealed that the major transitions between phases in
the cycle are transcriptionally regulated [15], but there are also
important check-points involving other mechanisms at various
phases of the cycle [16] along with an essential feedback
mechanism to ensure coherent entry into the cycle [17]. Evidently,
the cell-cycle network is not an autonomous isolated ‘‘oscillator’’,
but rather an integral part of the cellular complex web of
interactions. Indeed, it has been demonstrated that in the budding
yeast hundreds of genes (,800) that do not directly participate in
the cell cycle process exhibit temporal dynamics similar to the
genes that directly regulate the cell cycle progression, and are
synchronized with its dynamic phases [12,18]. However, the
functional significance of this temporal ordering remains elusive.
In this paper we use a genome-rewiring methodology to open
a window to these dynamical aspects of the cell cycle, in particular
PLOS ONE | www.plosone.org 1 September 2012 | Volume 7 | Issue 9 | e45184
the flexibility of its interface with the metabolic system. We focus
here on transcriptional regulation and introduce a direct regula-
tory perturbation by rewiring the genome; placing a foreign,
essential metabolic gene exclusively under one of the promoters of
the cell cycle in the budding yeast [19]. Such genome rewiring
events are not completely artificial, as they are thought to play an
important role in the emergence of novel phenotypes in the
evolution of developmental systems [20,21,22,23]. We have
recently shown in a separated experimental system, that rewiring
an essential metabolic gene to a foreign regulatory system and
creating an unforeseen challenge, is an effective way for perturbing
the cellular regulatory modes. The genome rewiring perturbation
exposes novel adaptive responses that are based on non-specific
cellular plasticity mechanisms [19,24,25]. Our approach of
genome rewiring has several advantages over the more commonly
used methodologies that rely on gene deletion, mutations in coding
regions or common environmental stresses. First, it does not
introduce new proteins or other intracellular components, nor
deletes existing ones. Rather, it re-shuffles existing cellular
interactions, forcing proteins to operate in novel contexts. Second,
it allows to study the response of cells to unforeseen challenges not
previously encountered in their evolutionary history. This is
significant since it has the potential to expose new cellular
dynamics and mechanisms that otherwise might be masked by the
operation of specific ‘‘hard-wired’’ functional modules that were
selected in evolution to respond in a direct way to familiar stresses.
In the case of the cell cycle, its promoters are ‘‘hard-wired’’ to
perform the routine task of cell cycle progression but their
potential ‘‘soft’’ interactions with other cellular processes and
regulators remain hidden until exposed by novel perturbations.
Harnessing cell-cycle regulators to directly control an essential
metabolic process increases the load on its regulatory network at
a specific phase of the cycle and demands re-distribution of its
resources. Such a perturbation introduces a complex challenge to
the cells by requiring the cell-cycle regulators to operate outside of
their natural context and in concert with arbitrarily chosen
metabolic demands.
We show here that yeast cell populations with rewired cell-cycle
promoters can rapidly adapt to grow at normal rates despite an
increased inhibition of the metabolic rewired gene. Moreover, the
new adapted phenotype is stably inherited across generations. A
significant fraction of the population has the potential to adapt to
the severe unforeseen genome-rewiring challenge. Thus, the ability
to adapt is not a special property of a rare subpopulation.
Furthermore, we show that underlying the adaptation process
there is a non-specific and irreproducible genome-wide transcrip-
tional response. The cell cycle system is regarded as a tightly
regulated network, ensuring its robust temporal ordered dynamics.
Our current experiments do not address a specific mechanism for
adaptation, but they show that the cell cycle system forms a flexible
and adaptive interface with the cellular metabolic processes. This
interface can support multitasking utility of the cell-cycle
promoters and enables concurrent regulation of their native
function and the control of a foreign essential metabolic gene
under inhibiting conditions. This adaptation, stimulated initially
by a local perturbation to the cell-cycle network, is eventually
manifested in a global re-organization of the cell’s regulatory
modes and metabolic fluxes. As discussed below, these results
prove the existence of a general and non-specific cellular
mechanism allowing adaptation to unforeseen challenges. Thus,
even the cell-cycle with its unique role, specific structure and tight
regulation is able to interface flexibly with the other cellular
processes. It suggests that robustness of temporal phenotypic order
is not an autonomous property of the cell-cycle network, but rather
is a property of the cellular system - the plasticity of the cellular
integrated web of interactions.
Results
Experiments were performed on the haploid budding yeast
Saccharomyces cerevisiae. The essential gene HIS3, from the histidine
biosynthesis pathway, was detached from its native regulatory
system and integrated into the genome under a particular
promoter of the cell cycle. We have shown before in detailed
experiments that HIS3 is not redundant and does not have an
alternative pathway in the budding yeast [19]. Moreover, under
genome-rewiring conditions in which HIS3 is rewired to be under
the exclusive control of a foreign regulatory promoter (pGAL1 in
our previous work), the cells could not produce an alternative
metabolic pathway or detour the challenge by other regulatory
pathways that do not involve the regulation of the rewired HIS3
[19,24,25]. Thus, it is expected that also in the case of the cell-
cycle promoters, cells will need to adapt the HIS3 expression
without detouring the regulatory challenge. We constructed a set
of strains, each with HIS3 rewired to be under the exclusive
control of a different single cell-cycle’s promoter, regulating the
genes SWI4, NDD1 or SWI5 (Fig. 1). Rewiring was carried out by
duplicating one of the native cell-cycle’s regulating promoter,
leaving the natural promoter intact, and integrating the HIS3’s
ORF under this promoter into the genome (see Methods). These
promoters were arbitrarily chosen, but they represent a set of
essential transcription factors; each of them is known to activate
a set of genes at different phases of the cycle. SWI4 was shown to
be part of the SBF regulatory complex activated during late G1
phase of the cycle to induce the expression of NDD1, which itself
participates in another gene complex activating the G2 to M phase
progression [15]. This latter complex activates SWI5 which in turn
is part of the process activating the genes responsible for the M to
G1 phase progression, thus closing the cycle (Fig. 1a). By rewiring
the promoter of each of these genes to regulate exclusively the
essential metabolic HIS3 gene, in parallel of its native regulation of
the cell cycle process (Figs. 1b-d), we were able to compare the
susceptibility of these essential nodes of the cell cycle network to
the rewiring perturbation. The rewired promoters are restricted to
operate by the cell-cycle’s limiting resources and only at short time
intervals during a specific phase of the cycle. These constraints
supposedly limit their ability to support the demands imposed by
the histidine pathway and other metabolic processes, enabling us
to present the cells with severe unforeseen challenges.
In a batch culture with medium lacking histidine, all the rewired
strains (with HIS3 linked to any one of the above-mentioned cell
cycle promoters) could grow with no apparent significant effect on
their growth rate or morphology compared to that in a medium
containing histidine (Table 1). To challenge the cells, we utilized 3-
amino-1,2,4-triazole (3AT), a specific competitive inhibitor of
HIS3p, to increase the load on the cell populations in a controlled
manner. 3AT is a known drug, demonstrated to have minimal side
effects on yeast beyond the specific inhibition of HIS3p
[19,25,26,27]. The growth rates of all the rewired strains in
a medium containing 4 mM of 3AT was much reduced compared
to that in the same medium lacking 3AT (Table 1). Similarly, the
growth of colonies on agar plates with media lacking histidine but
containing different concentrations of 3AT, showed a significant
delay in growth for all rewired cells; the first mature colonies
appeared on the plates only after more than 4 days compared to
the normal 2-days growth in a 3AT-free medium (Fig. S1). It is
clear that the presence of the HIS3p’s inhibiting drug in the
medium caused a substantial challenge to the cells. As shown
Cell-Cycle Plasticity Enables Cell Adaptation
PLOS ONE | www.plosone.org 2 September 2012 | Volume 7 | Issue 9 | e45184
below, we indeed observed a direct stress due to effects of the
challenge on the cell cycle, manifested by morphological changes
during growth in the 3AT environment. We have previously
demonstrated that even a partial inhibition of the activity of
HIS3p by 3AT is a challenge to the rewired cells having HIS3
under the exclusive regulation of a foreign promoter. Overcoming
it requires a significant adaptation that involves the emergence of
new regulatory modes [19,24,25].
We next study the population growth dynamics in the
challenging environment. Rewired cells were grown in a home-
made chemostat; a continuous culture technique allowing growth
of large cell populations over extended periods under constant
environmental conditions [19,28]. Our chemostat setup was
constructed to enable the measurements of the population’s
growth dynamics at high temporal resolution in conjunction with
gene expression and cell morphology (Methods). Figure 2a depicts
the results of repeated chemostat experiments, showing the growth
dynamics of cell populations, as measured by optical density (OD),
for strains with HIS3 placed exclusively under the pSwi4, pNdd1
or pSwi5 promoters. The chemostat medium was free of histidine
throughout the experiments. First, a steady state was established
for all the populations in a 3AT-free medium, followed by the
switch at t = 0 to the same medium supplemented with 4 mM
3AT. All populations exhibited a sharp exponential decline in cell
density immediately upon exposure to the HIS3p inhibitor,
proving again that the addition of the HIS3p inhibitor caused
a significant challenge to the cells. Note that the decline at the
onset of exposure to 3AT was insensitive to the particular strain
and was repeated with similar exponents in all experiments. The
exponential decline in cell density at this transient phase (with
mean exponential decay time ,1462 hr) was slower than the
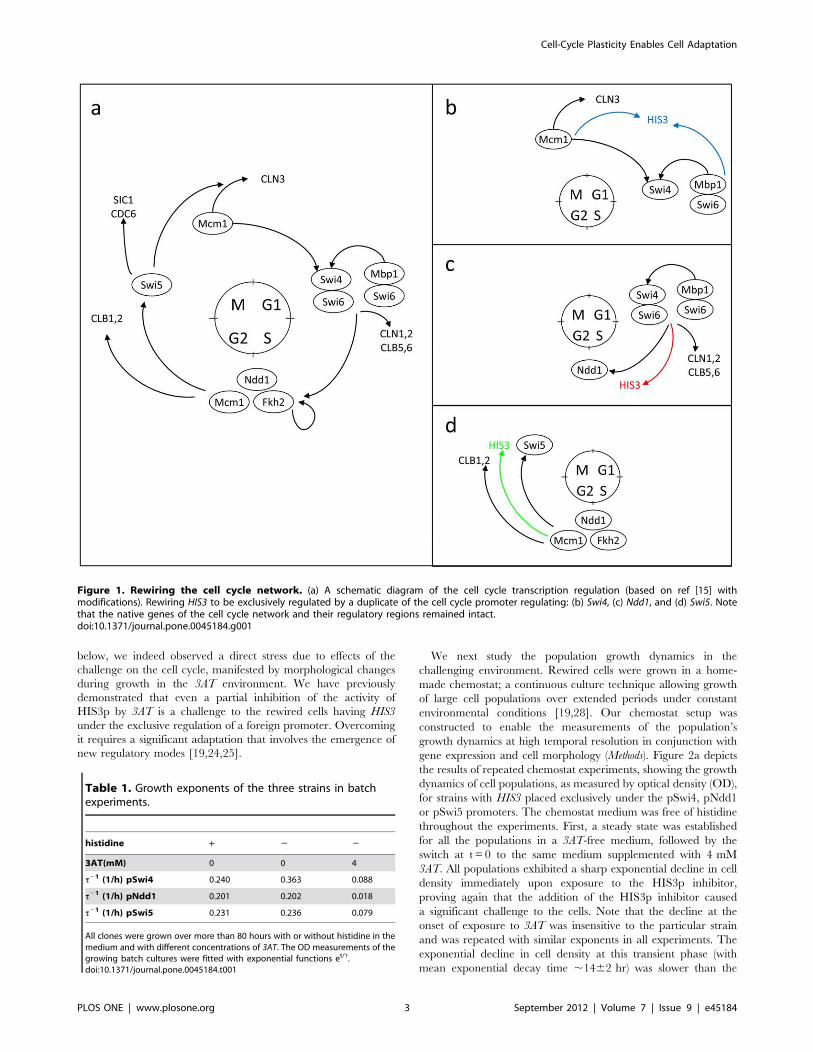
Figure 1. Rewiring the cell cycle network. (a) A schematic diagram of the cell cycle transcription regulation (based on ref [15] withmodifications). Rewiring HIS3 to be exclusively regulated by a duplicate of the cell cycle promoter regulating: (b) Swi4, (c) Ndd1, and (d) Swi5. Notethat the native genes of the cell cycle network and their regulatory regions remained intact.doi:10.1371/journal.pone.0045184.g001
Table 1. Growth exponents of the three strains in batchexperiments.
histidine + 2 2
3AT(mM) 0 0 4
t21 (1/h) pSwi4 0.240 0.363 0.088
t21 (1/h) pNdd1 0.201 0.202 0.018
t21 (1/h) pSwi5 0.231 0.236 0.079
All clones were grown over more than 80 hours with or without histidine in themedium and with different concentrations of 3AT. The OD measurements of thegrowing batch cultures were fitted with exponential functions et/t.doi:10.1371/journal.pone.0045184.t001
Cell-Cycle Plasticity Enables Cell Adaptation
PLOS ONE | www.plosone.org 3 September 2012 | Volume 7 | Issue 9 | e45184
chemostat dilution time (,7 hr), showing that there was a consid-
erable cell growth during this period, albeit at a rate lower than
that required to support steady growth under the chemostat
dilution. This observation is also supported by direct imaging of
the cells at this phase (see Fig. 3). We emphasize that the decline in
cell density during this phase mainly reflects a population-average
growth rate smaller than the chemostat’s dilution rate rather than
cell arrest or cell death. Note also that the response for the
application of 3AT to the chemostat’s medium is instantaneous.
The lack of delay in response suggests that there were no
significant HIS3’s mRNA or HIS3p storages that played significant
role at the onset of response to the inhibiting drug. The chemostat
cell density reflected the integrated metabolic processes contrib-
uting to cell growth and proliferation and thus was sensitive to the
overall metabolic state of the cells as well as to the functioning of
the cell cycle [29]. The limited-resource environment and the
dilution rate dictated by the chemostat, intensify the cell density as
a sensitive measure of the metabolic and cell cycle response of the
population. Thus, the decline of the cell density in the chemostat
in response to the addition of 3AT, reflected a stressful load on the
cells’ growth capabilities.
Interestingly, all populations accommodated to the challenging
environment within a variable time period spanning 10–40
chemostat-generation times, after which a stable steady state was
established at approximately the same OD level as the one prior to
the introduction of 3AT. This indicates an inherent robustness of
the cell-cycle regulatory system, allowing it to maintain homeo-
stasis by reaching a similar metabolic state (manifested by the
chemostat steady-state cell density) under different conditions –
with and without the HIS3p inhibition. Note that this was not
necessarily a direct response of the cell cycle system: rather it may
reflect the interface of the cell cycle with the cell’s metabolic
system. As shown below, the emergence of a new phenotypic state
under 3AT, represents true adaptation; it was stably inherited
along generations. The pSwi5-HIS3 strain (Fig. 2a green curves)
exhibited shorter adaptation time compared with the pSwi4-HIS3
(Fig. 2a blue curves) and pNdd1-HIS3 (Fig. 2a red curves) strains.
Note, however, that the same strain may show variable response in
repeated experiments, showing that there is a stochastic compo-
nent in the adaptation process.
On agar plates a large number of individual cells, representing
a sizeable fraction of the original population, adapted to grow into
mature colonies on media lacking histidine and containing 3AT
(see Fig. S1 for a quantitative analysis). Within a certain 3AT-
concentration range (4–20 mM), the adaptation time scale
depended on the amount of 3AT, with clear differences between
the different promoters. The variability in response of the different
promoters proves that the adaptation process was not a mere
metabolic response, but rather was sensitive to the regulatory
constraints set by the specific rewiring event. Evidently, the
presence of 3AT caused a delay in adaptation that was pro-
portional to the concentration of the inhibitor and consequently
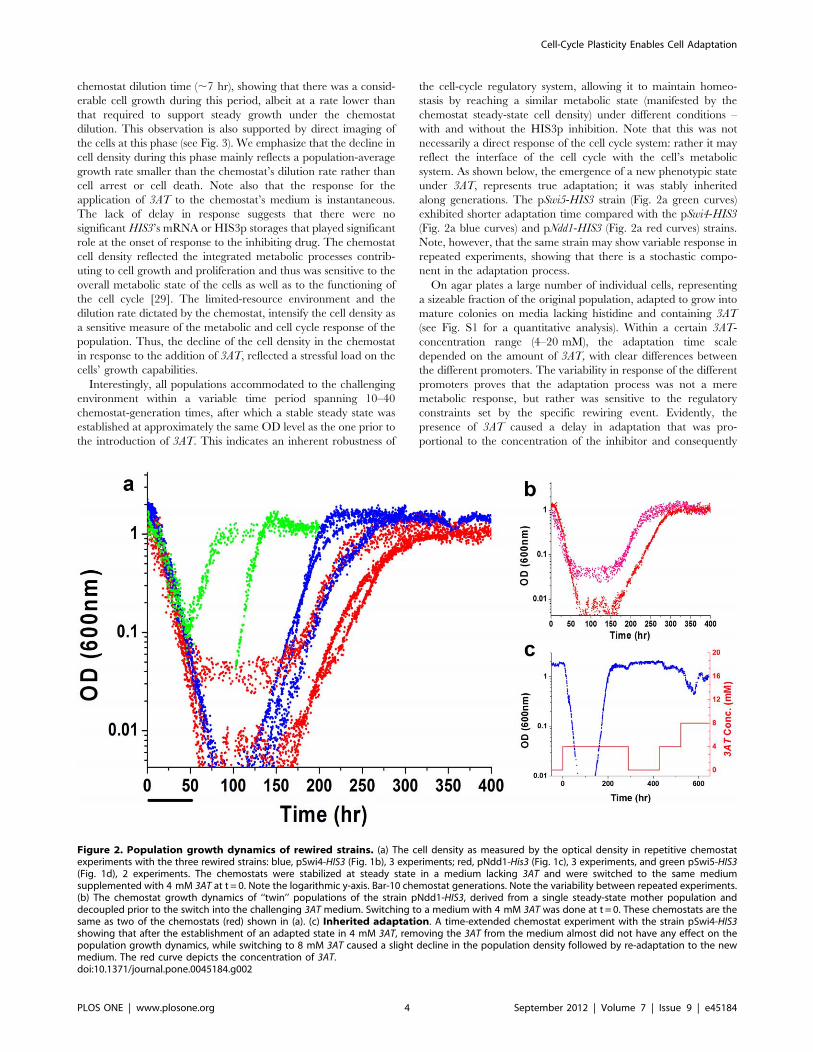
Figure 2. Population growth dynamics of rewired strains. (a) The cell density as measured by the optical density in repetitive chemostatexperiments with the three rewired strains: blue, pSwi4-HIS3 (Fig. 1b), 3 experiments; red, pNdd1-His3 (Fig. 1c), 3 experiments, and green pSwi5-HIS3(Fig. 1d), 2 experiments. The chemostats were stabilized at steady state in a medium lacking 3AT and were switched to the same mediumsupplemented with 4 mM 3AT at t = 0. Note the logarithmic y-axis. Bar-10 chemostat generations. Note the variability between repeated experiments.(b) The chemostat growth dynamics of ‘‘twin’’ populations of the strain pNdd1-HIS3, derived from a single steady-state mother population anddecoupled prior to the switch into the challenging 3AT medium. Switching to a medium with 4 mM 3AT was done at t = 0. These chemostats are thesame as two of the chemostats (red) shown in (a). (c) Inherited adaptation. A time-extended chemostat experiment with the strain pSwi4-HIS3showing that after the establishment of an adapted state in 4 mM 3AT, removing the 3AT from the medium almost did not have any effect on thepopulation growth dynamics, while switching to 8 mM 3AT caused a slight decline in the population density followed by re-adaptation to the newmedium. The red curve depicts the concentration of 3AT.doi:10.1371/journal.pone.0045184.g002
Cell-Cycle Plasticity Enables Cell Adaptation
PLOS ONE | www.plosone.org 4 September 2012 | Volume 7 | Issue 9 | e45184
also a severe proportional reduction in the final number of
adapted colonies above certain concentrations. Increasing
amounts of 3AT increased the inhibition of HIS3p and presumably
drained significant resources from the cell cycle network to
compensate the loss of active proteins by enhanced expression
levels, presenting the cell populations with a growing challenge
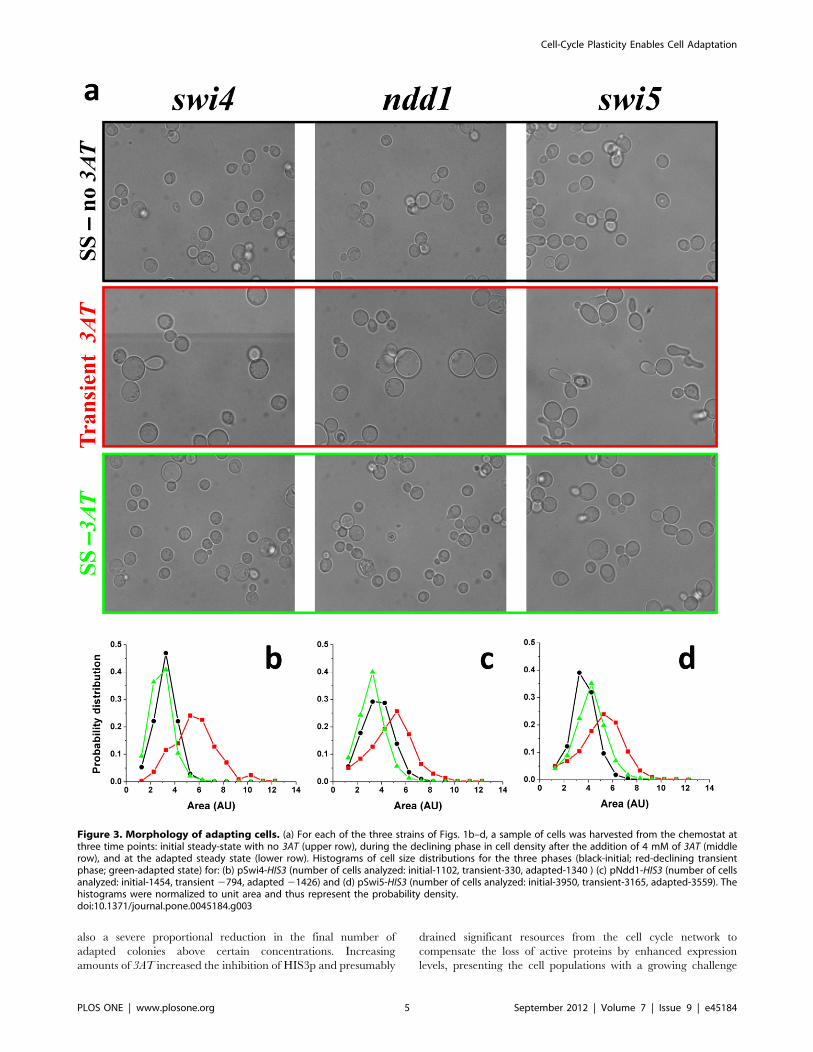
Figure 3. Morphology of adapting cells. (a) For each of the three strains of Figs. 1b–d, a sample of cells was harvested from the chemostat atthree time points: initial steady-state with no 3AT (upper row), during the declining phase in cell density after the addition of 4 mM of 3AT (middlerow), and at the adapted steady state (lower row). Histograms of cell size distributions for the three phases (black-initial; red-declining transientphase; green-adapted state) for: (b) pSwi4-HIS3 (number of cells analyzed: initial-1102, transient-330, adapted-1340 ) (c) pNdd1-HIS3 (number of cellsanalyzed: initial-1454, transient 2794, adapted 21426) and (d) pSwi5-HIS3 (number of cells analyzed: initial-3950, transient-3165, adapted-3559). Thehistograms were normalized to unit area and thus represent the probability density.doi:10.1371/journal.pone.0045184.g003
Cell-Cycle Plasticity Enables Cell Adaptation
PLOS ONE | www.plosone.org 5 September 2012 | Volume 7 | Issue 9 | e45184
that scales with the concentration of the inhibitor. For a given
number of plated cells, there was a clear upper limit to the
concentration of 3AT, depending on the specific rewired pro-
moter, above which no observable fraction of cells could adapt
(Figs. S1a, b for 20 mM 3AT). Nevertheless, the final number of
mature adapted colonies, within the range of 3AT allowing
adaptation, was significant and represented a sizable fraction of
the population. Adaptation evidently occurred simultaneously in
many cells in the population and was not due to selection of
a special rare subpopulation [24]. Note that higher 3AT
concentrations caused higher variability in colony sizes on plates,
indicating higher dispersion in adaptation dynamics and time
scales (Fig. S2). As a control, Fig. S3 shows that ‘‘wild-type’’ cells
(the same strain with HIS3 under its native promoter in its native
locus), were almost insensitive to the concentration of 3AT within
the range used in the above experiments for the rewired cells,
which by contrast showed great sensitivity to the amount of
HIS3p’s inhibition. Thus, the response of the cells to 3AT reflected
the challenge due to the cell-cycle’s promoter rewiring. The
rewired pSwi5-HIS3 strain proved to be markedly different from
the other strains; it could accommodate larger concentrations of
3AT (20 mM) and remarkably, it eventually grew more colonies on
agar plates with 8 mM than on 4 mM of the inhibiting drag, or
even more than on a substrate lacking 3AT (Fig. S1c). This latter
point indicates that adaptation to the inhibition of the rewired
metabolic protein might work, under certain circumstances, to
allow eventually a better tuned set-point of gene regulation in the
challenging environment [19].
In principle, the chemostat experiments could not exclude the
possibility that the source of the observed variable dynamics
between repeated experiments was due to clonal effects, i.e.
differences between the specific histories of each population prior
to the switch into the 3AT-containing medium. To test this
possibility, we studied the dynamics of ‘‘twin’’ chemostat
populations sharing identical histories [30]. Populations with
identical histories were created by using two identical chemostat
reactors, initiated from a single clone of pNdd1-HIS3 cells and
coupled via an external pump so that the cells and medium were
mixed at a rate much faster than the dilution rate (see Methods). A
steady state in a 3AT-free medium was first stabilized for these
coupled chemostats, after which the mixing of cells between them
was stopped, they were decoupled so that each one contained its
own isolated sub-population, and their common feeding medium
was supplemented with 4 mM of 3AT. Thus, after decoupling, the
initial single steady-state population was separated into two ‘‘twin’’
populations, allowing the comparison of their separate responses
to the environmental pressure. Figure 2b shows that despite
originating from a single steady-state mother population, these
‘‘twin’’ populations exhibited different dynamics: one adapted
faster than the other by ,10 generations. Thus, the different
growth curves for nominally identical repeated populations mainly
reflect intrinsic variability in their adaptation dynamics beyond
history-dependent and clonal effects.
Remarkably, the adapted phenotypic state in the 3AT
challenging environment was stably inherited over many genera-
tions, as demonstrated by the chemostat dynamics for a pSwi4-
HIS3 population in Fig. 2c. In this experiment, removing the 3AT
from the chemostat medium and introducing it back at a later
point in time, caused a negligible effect on the population growth
dynamics. However, increasing the 3AT concentration from
4 mM to 8 mM in the same experiment caused a weak declining
response in the population density followed by fast re-adaptation.
Similar inheritance characteristics were demonstrated for pSwi4-
HIS3 cells adapting on agar plates, as well as for the other two
strains, pNdd1-HIS3 and pSwi5-HIS3 (Figs. S4, S5, and S6) and
thus were not a particular feature of the chemostat nor of a specific
rewired node of the network. The plate experiments showed that
the exposure to a certain amount of 3AT stabilized a new
phenotypic state for the adapted cells, allowing them to
accommodate faster and in larger fractions to a growing
concentration of 3AT in the second round of plating (Figs. S4,
S5, and S6 b and c). Note again the sensitivity of the inherited
response to the concentration of 3AT in which the original
adaptation took place (compare Figs. S4, S5, and S6 b and c). Note
that the observed inheritance of the capacity of cells to grow in the
challenging 3AT environment proves that this phenomenon
represents a genuine adaptation process. It excludes transient
intracellular adjustments (e.g., the export of the toxic 3AT out of
the cell) or commonly observed stress responses (see the discussion
below in connection to the expression response). The inheritance
of the adapted state is particularly intriguing since, as was
discussed above, the adaptation of numerous individual cells into
mature colonies on agar plates testified that adaptation was not
due to selection of a rare, advantageous subpopulation [24].
The adaptation dynamics of all chemostat populations were
accompanied by clear morphological changes of their cells.
Figure 3a shows a sample of typical optical microscopy images
of cells harvested from the chemostats of the three strains of Fig. 2a,
at different phases of the dynamics: (i) the initial steady state before
the addition of 3AT (upper row), (ii) at the declining phase
following the 3AT supplement (middle row), and (iii) at the final
adapted steady state (lower row). Clearly, the cells of all three
strains were highly stressed during the declining phase of the
chemostat dynamics, as manifested in their change of morphology,
proving again that the populations faced a severe challenge due to
the inhibition of HIS3p (Fig. 3a middle row). Note the appearance
of large vacuoles during the transient phase, a clear indication of
stress [31]. Additionally, the pSwi5-HIS3 strain showed cells with
shmoo-like structures, reminding a response of yeast to the mating
pheromone [32]. Nevertheless, the recovery of the populations
after adaptation showed relaxed cells at the steady state phase of
the chemostats (Fig. 3a lower row), with similar morphologies to
the original steady-state populations (Fig. 3a upper row).
Histograms summarizing the cell-size distributions based on
analysis of such images are shown in Figs. 3b–d. All strains
exhibited a significant shift to a larger size distribution during the
transient phase and a shift back to smaller size distributions at the
final steady state compared to the ones before the addition of 3AT.
The only exception was the pSwi5-HIS3 strain which exhibited
a final size distribution shifted to larger values compared to the
initial steady state. But even for this strain, the transient response
to 3AT showed the largest cell sizes, indicating a recovery in cell
morphology upon adaptation. Significant modifications in cell size
are usually attributed to the functionality of the cell cycle and its
proper progression through the various growth phases [32]. Thus,
the morphological changes observed in the chemostat experiments
suggest that adaptation was also manifested in accommodation of
the cell cycle regulation and indicates that pSwi5 is a more plastic
node of the network compared with pSwi4 and pNdd1. The
greater plasticity of pSwi5 is consistent with its different adaptive
capabilities on agar plates discussed above (see Fig. S1).
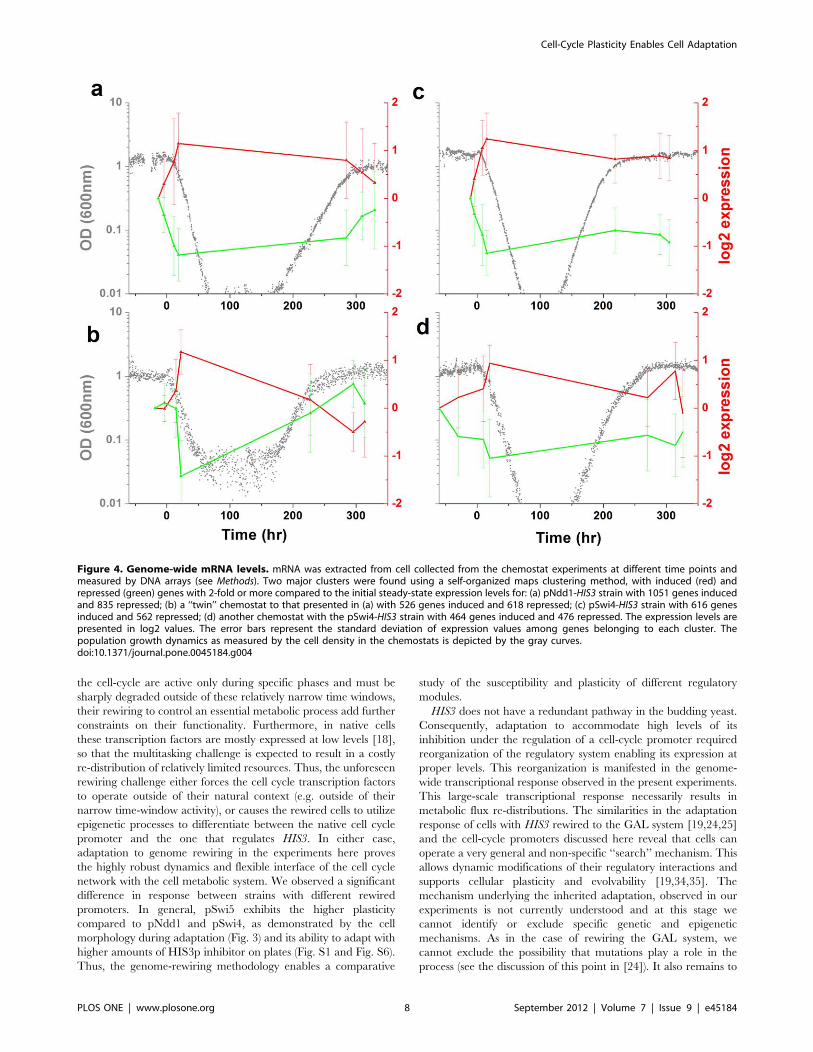
Next, we investigated the gene expression response underlying
the adaptation process. The genome-wide mRNA expression
levels of cells harvested from the chemostat at different time points,
for two strains with pNdd1-HIS3 (Figs. 4a,b) and pSwi4-HIS3
(Figs 4c,d), were measured using DNA arrays (Methods). These
measurements show that a genome-wide expression response
accompanied the adaptation process: a sizable fraction of the
Cell-Cycle Plasticity Enables Cell Adaptation
PLOS ONE | www.plosone.org 6 September 2012 | Volume 7 | Issue 9 | e45184
genes in the genome changed their expression levels by twofold or
more. Cluster analysis revealed two large gene groups responding
at the onset of exposure to the 3AT challenge, one induced and the
other, of approximately the same size, repressed (see also Fig. S7).
As mentioned above, 3AT by itself does not cause side effects
beyond the specific local inhibition of HIS3p [25,26,27] and thus
was not the direct cause of these gene expression responses
[19,25]. Comparing the gene expression measurements in re-
peated experiments showed that the gene content of the
responding gene clusters, as well as the number of responding
genes, were non-reproducible and varied between nominally
identical experiments (Figs. S8–S9). The Pearson correlation
coefficient between all the responding genes (.2 fold) in the
populations, for two repetitive experiments and even for ‘‘twin’’
populations having identical histories (Figs. 4a,b), showed
relatively low values, both during the steady state growth after
adaptation (Fig. S8) and during the transient dynamics (Fig. S9).
By contrast, each population exhibited significant correlations
between its responding genes at two separated time points, both
during steady (Fig. S8c) and transient (Figs. S9c,d) growth
conditions. The low correlations in transcriptional response
between repeated experiments indicate that indeed the patterns
of responding genes reflect a non-specific and irreproducible
global process [25,30]. Nevertheless, within a population, the
transcriptional pattern was stable and showed high coherency
between genes throughout the adaptation dynamics and along
steady growth in the adapted state. It indicates the possibility that
the underlying response of gene expression reflects collective
population dynamics [25,30]. Obviously, a direct, superficial
comparison between the clusters of responding genes for the
different strains did not reveal any systematic features that could
serve as signatures for an adaptation process that is specific to
a particular cell-cycle rewiring event. Tables S1–S2 provide the
gene content of the induced and repressed clusters of Fig. 4. This
analysis shows that, indeed, the gene content was not reproducible
over repeated experiments, except for a small percentage of genes
that did not match any particular functional group. The
annotation search also revealed that some of the clusters contained
significant GO groups, while others did not. The results here are
compatible with our previous experiments with HIS3 rewired to
the GAL system, that had also demonstrated that the gene
expression response does not overlap the common stress responses
in yeast (see Table S3 for detailed comparison) [25,33]. However,
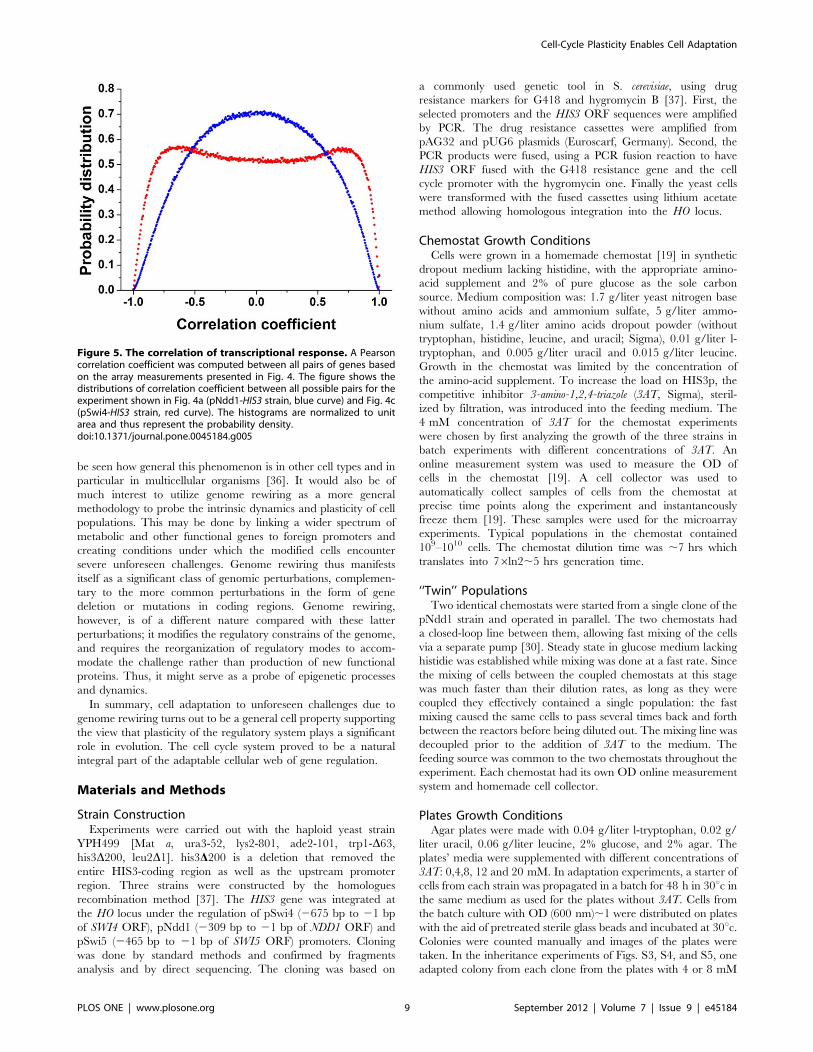
as shown in Fig. 5, the rewiring load on the different nodes of the
cell cycle network had a clear and distinctive influence on the
distribution of the genome-wide pair correlation coefficients,
estimated from the array data for the different strains. It revealed
that the pSwi4-HIS3 strain exhibited a unimodal distribution (with
mean value at zero; Fig. 5, blue), while the pNdd1-HIS3 strain
showed a bimodal distribution (Fig. 5, red curve. The latter
pattern is consistent with stronger correlations between activating
and repressing mechanisms compared with the former one. In
both cases, however, numerous gene pairs exhibited high
correlations, indicating again a global process across functional
modules [25].
The mRNA expression response of the different strains was
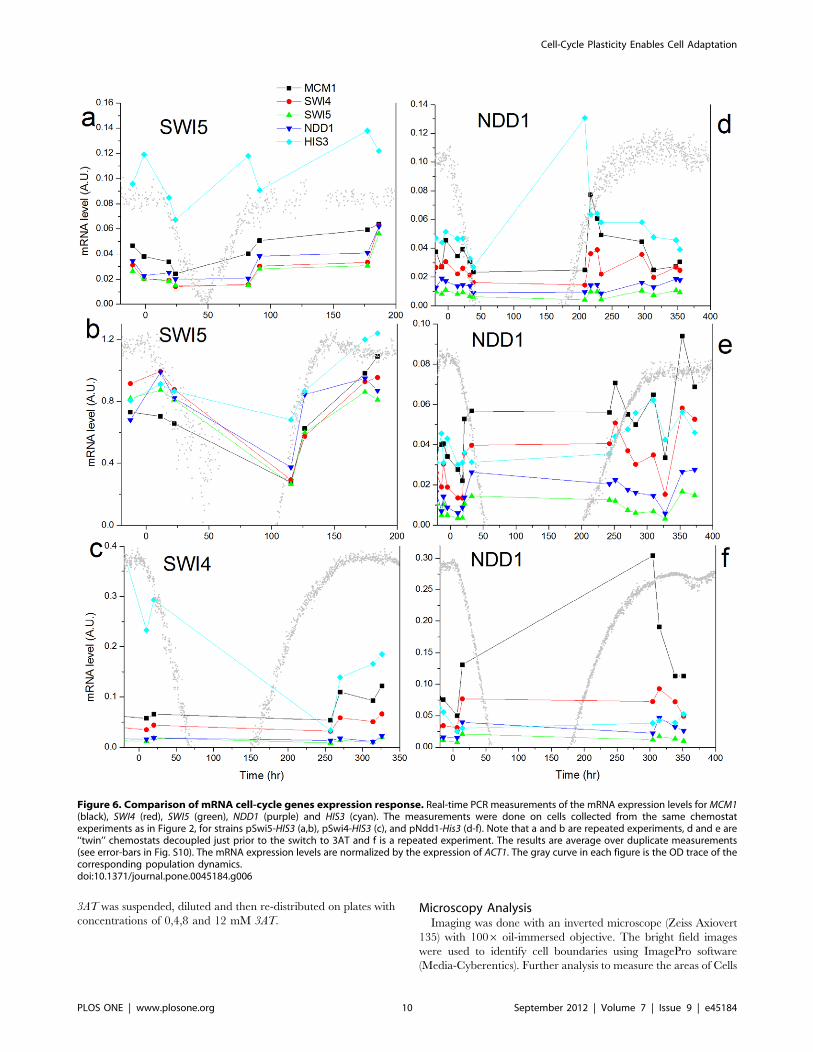
studied also at higher precision by real-time PCR. Figure 6 shows
the response of some cell cycle genes and HIS3 for the different
strains in six different chemostat experiments. Analysis of
additional genes belonging to the cell cycle, histidine and purine
pathways is shown in Fig. S10. Results of the real-time PCR on the
SWI4, SWI5 and NDD1 rewired strains demonstrated that they
did not respond in a significantly different manner. Thus, there
was no significant, direct, signature on the transcriptional response
of the cell cycle genes. These results are consistent with the
observation that adaptation involved a non-specific large-scale
transcriptional response. It shows that the robustness of the cell
cycle system is manifested through its capability to redistribute the
initially local perturbation into a global cellular response. Note
that the lack of reproducibility in response between repeated
experiments, even between ‘‘twin’’ chemostats (NDD1, Fig. 6d,e) is
consistent with the results of the array experiments shown in this
work, and with our previous work on the GAL system [25,30].
Discussion
We have demonstrated that cell populations with rewired
genomes, harnessing the cell cycle promoters to regulate an
essential metabolic gene, could accommodate a significant in-
hibition of this protein and rapidly adapted to stabilize a new
phenotypic state. Subsequently, this adapted state was stably
inherited over generations. A large fraction of the population was
shown to be able to adapt on plates and grew into mature colonies,
proving that adaptation was not a property of a special rare
subpopulation. The adaptation process was accompanied by a non-
specific genome-wide transcriptional response exhibiting high
correlations between hundreds of genes that reside across the
entire metabolic network. The dynamics and list of responding
genes were irreproducible over repeated experiments and even
between ‘‘twin’’ populations having identical histories. The
population adaption capabilities scaled with the 3AT concentra-
tion and different cell cycle promoters exhibited disperse
susceptibilities to the challenge, in sharp contrast to the in-
sensitivity of ‘‘wild-type" cells. Taken together, we conclude that
adaptation involved the emergence of novel regulatory feedbacks
between the metabolic system and the cell cycle network. This
regulatory plasticity enables the cells to control their growth and
reproduction by accommodating to the environmental pressure. It
shows that the cell cycle network, despite of being a well conserved
and tightly regulated module is an integral part of the cellular
plasticity allowing dynamic reorganization of its regulatory modes.
A rapid inherited adaptation of a sizeable fraction of the
population accompanied by non-specific and non-reproducible
genome-wide expression response also characterized the adapta-
tion of rewired cells with HIS3 exclusively regulated by the GAL
system upon a medium switch from galactose to glucose, from
inducing to repressing conditions of the GAL system
[19,24,25,30]. This shows that rewiring of an essential metabolic
gene to a foreign regulatory system and exposing the cells to an
unforeseen challenge stimulates the emergence of a general
cellular mechanism allowing a plastic cellular response and rapid
adaptation. The case of the cell cycle is different in certain
important aspects from that of the GAL system. While the GAL
system does not have any particular functional role in glucose and
is certainly not essential in this medium [19], the proper
functionality of the cell cycle is absolutely essential under all
environmental conditions. Thus, while the resources of the GAL
system could be fully harnessed to meet the metabolic require-
ments due to rewiring [19], this is not the case for the cell cycle
which must operate in a multi-tasking mode. Moreover, in the case
of the cell cycle, each rewired promoter binds a number of
transcription factors thus requiring combinatorial re-distribution
of resources. By contrast, the GAL system is regulated by
a promoter binding a single transcription factor (GAL4), the
activity of which is modified by interacting with other proteins
(e.g., GAL80). The cell-cycle rewiring experiments presented here
also add a temporal constraint to adaptation that does not exist in
the case of the GAL system. Since the transcription factors driving
Cell-Cycle Plasticity Enables Cell Adaptation
PLOS ONE | www.plosone.org 7 September 2012 | Volume 7 | Issue 9 | e45184
the cell-cycle are active only during specific phases and must be
sharply degraded outside of these relatively narrow time windows,
their rewiring to control an essential metabolic process add further
constraints on their functionality. Furthermore, in native cells
these transcription factors are mostly expressed at low levels [18],
so that the multitasking challenge is expected to result in a costly
re-distribution of relatively limited resources. Thus, the unforeseen
rewiring challenge either forces the cell cycle transcription factors
to operate outside of their natural context (e.g. outside of their
narrow time-window activity), or causes the rewired cells to utilize
epigenetic processes to differentiate between the native cell cycle
promoter and the one that regulates HIS3. In either case,
adaptation to genome rewiring in the experiments here proves
the highly robust dynamics and flexible interface of the cell cycle
network with the cell metabolic system. We observed a significant
difference in response between strains with different rewired
promoters. In general, pSwi5 exhibits the higher plasticity
compared to pNdd1 and pSwi4, as demonstrated by the cell
morphology during adaptation (Fig. 3) and its ability to adapt with
higher amounts of HIS3p inhibitor on plates (Fig. S1 and Fig. S6).
Thus, the genome-rewiring methodology enables a comparative
study of the susceptibility and plasticity of different regulatory
modules.
HIS3 does not have a redundant pathway in the budding yeast.
Consequently, adaptation to accommodate high levels of its
inhibition under the regulation of a cell-cycle promoter required
reorganization of the regulatory system enabling its expression at
proper levels. This reorganization is manifested in the genome-
wide transcriptional response observed in the present experiments.
This large-scale transcriptional response necessarily results in
metabolic flux re-distributions. The similarities in the adaptation
response of cells with HIS3 rewired to the GAL system [19,24,25]
and the cell-cycle promoters discussed here reveal that cells can
operate a very general and non-specific ‘‘search’’ mechanism. This
allows dynamic modifications of their regulatory interactions and
supports cellular plasticity and evolvability [19,34,35]. The
mechanism underlying the inherited adaptation, observed in our
experiments is not currently understood and at this stage we
cannot identify or exclude specific genetic and epigenetic
mechanisms. As in the case of rewiring the GAL system, we
cannot exclude the possibility that mutations play a role in the
process (see the discussion of this point in [24]). It also remains to
Figure 4. Genome-wide mRNA levels. mRNA was extracted from cell collected from the chemostat experiments at different time points andmeasured by DNA arrays (see Methods). Two major clusters were found using a self-organized maps clustering method, with induced (red) andrepressed (green) genes with 2-fold or more compared to the initial steady-state expression levels for: (a) pNdd1-HIS3 strain with 1051 genes inducedand 835 repressed; (b) a ‘‘twin’’ chemostat to that presented in (a) with 526 genes induced and 618 repressed; (c) pSwi4-HIS3 strain with 616 genesinduced and 562 repressed; (d) another chemostat with the pSwi4-HIS3 strain with 464 genes induced and 476 repressed. The expression levels arepresented in log2 values. The error bars represent the standard deviation of expression values among genes belonging to each cluster. Thepopulation growth dynamics as measured by the cell density in the chemostats is depicted by the gray curves.doi:10.1371/journal.pone.0045184.g004
Cell-Cycle Plasticity Enables Cell Adaptation
PLOS ONE | www.plosone.org 8 September 2012 | Volume 7 | Issue 9 | e45184
be seen how general this phenomenon is in other cell types and in
particular in multicellular organisms [36]. It would also be of
much interest to utilize genome rewiring as a more general
methodology to probe the intrinsic dynamics and plasticity of cell
populations. This may be done by linking a wider spectrum of
metabolic and other functional genes to foreign promoters and
creating conditions under which the modified cells encounter
severe unforeseen challenges. Genome rewiring thus manifests
itself as a significant class of genomic perturbations, complemen-
tary to the more common perturbations in the form of gene
deletion or mutations in coding regions. Genome rewiring,
however, is of a different nature compared with these latter
perturbations; it modifies the regulatory constrains of the genome,
and requires the reorganization of regulatory modes to accom-
modate the challenge rather than production of new functional
proteins. Thus, it might serve as a probe of epigenetic processes
and dynamics.
In summary, cell adaptation to unforeseen challenges due to
genome rewiring turns out to be a general cell property supporting
the view that plasticity of the regulatory system plays a significant
role in evolution. The cell cycle system proved to be a natural
integral part of the adaptable cellular web of gene regulation.
Materials and Methods
Strain ConstructionExperiments were carried out with the haploid yeast strain
YPH499 [Mat a, ura3-52, lys2-801, ade2-101, trp1-D63,his3D200, leu2D1]. his3D200 is a deletion that removed the
entire HIS3-coding region as well as the upstream promoter
region. Three strains were constructed by the homologues
recombination method [37]. The HIS3 gene was integrated at
the HO locus under the regulation of pSwi4 (2675 bp to 21 bp
of SWI4 ORF), pNdd1 (2309 bp to 21 bp of NDD1 ORF) and
pSwi5 (2465 bp to 21 bp of SWI5 ORF) promoters. Cloning
was done by standard methods and confirmed by fragments
analysis and by direct sequencing. The cloning was based on
a commonly used genetic tool in S. cerevisiae, using drug
resistance markers for G418 and hygromycin B [37]. First, the
selected promoters and the HIS3 ORF sequences were amplified
by PCR. The drug resistance cassettes were amplified from
pAG32 and pUG6 plasmids (Euroscarf, Germany). Second, the
PCR products were fused, using a PCR fusion reaction to have
HIS3 ORF fused with the G418 resistance gene and the cell
cycle promoter with the hygromycin one. Finally the yeast cells
were transformed with the fused cassettes using lithium acetate
method allowing homologous integration into the HO locus.
Chemostat Growth ConditionsCells were grown in a homemade chemostat [19] in synthetic
dropout medium lacking histidine, with the appropriate amino-
acid supplement and 2% of pure glucose as the sole carbon
source. Medium composition was: 1.7 g/liter yeast nitrogen base
without amino acids and ammonium sulfate, 5 g/liter ammo-
nium sulfate, 1.4 g/liter amino acids dropout powder (without
tryptophan, histidine, leucine, and uracil; Sigma), 0.01 g/liter l-
tryptophan, and 0.005 g/liter uracil and 0.015 g/liter leucine.
Growth in the chemostat was limited by the concentration of
the amino-acid supplement. To increase the load on HIS3p, the
competitive inhibitor 3-amino-1,2,4-triazole (3AT, Sigma), steril-
ized by filtration, was introduced into the feeding medium. The
4 mM concentration of 3AT for the chemostat experiments
were chosen by first analyzing the growth of the three strains in
batch experiments with different concentrations of 3AT. An
online measurement system was used to measure the OD of
cells in the chemostat [19]. A cell collector was used to
automatically collect samples of cells from the chemostat at
precise time points along the experiment and instantaneously
freeze them [19]. These samples were used for the microarray
experiments. Typical populations in the chemostat contained
109–1010 cells. The chemostat dilution time was ,7 hrs which
translates into 76ln2,5 hrs generation time.
‘‘Twin’’ PopulationsTwo identical chemostats were started from a single clone of the
pNdd1 strain and operated in parallel. The two chemostats had
a closed-loop line between them, allowing fast mixing of the cells
via a separate pump [30]. Steady state in glucose medium lacking
histidie was established while mixing was done at a fast rate. Since
the mixing of cells between the coupled chemostats at this stage
was much faster than their dilution rates, as long as they were
coupled they effectively contained a single population: the fast
mixing caused the same cells to pass several times back and forth
between the reactors before being diluted out. The mixing line was
decoupled prior to the addition of 3AT to the medium. The
feeding source was common to the two chemostats throughout the
experiment. Each chemostat had its own OD online measurement
system and homemade cell collector.
Plates Growth ConditionsAgar plates were made with 0.04 g/liter l-tryptophan, 0.02 g/
liter uracil, 0.06 g/liter leucine, 2% glucose, and 2% agar. The
plates’ media were supplemented with different concentrations of
3AT: 0,4,8, 12 and 20 mM. In adaptation experiments, a starter of
cells from each strain was propagated in a batch for 48 h in 30uc inthe same medium as used for the plates without 3AT. Cells from
the batch culture with OD (600 nm),1 were distributed on plates
with the aid of pretreated sterile glass beads and incubated at 30uc.Colonies were counted manually and images of the plates were
taken. In the inheritance experiments of Figs. S3, S4, and S5, one
adapted colony from each clone from the plates with 4 or 8 mM
Figure 5. The correlation of transcriptional response. A Pearsoncorrelation coefficient was computed between all pairs of genes basedon the array measurements presented in Fig. 4. The figure shows thedistributions of correlation coefficient between all possible pairs for theexperiment shown in Fig. 4a (pNdd1-HIS3 strain, blue curve) and Fig. 4c(pSwi4-HIS3 strain, red curve). The histograms are normalized to unitarea and thus represent the probability density.doi:10.1371/journal.pone.0045184.g005
Cell-Cycle Plasticity Enables Cell Adaptation
PLOS ONE | www.plosone.org 9 September 2012 | Volume 7 | Issue 9 | e45184
3AT was suspended, diluted and then re-distributed on plates with
concentrations of 0,4,8 and 12 mM 3AT.Microscopy AnalysisImaging was done with an inverted microscope (Zeiss Axiovert
135) with 1006 oil-immersed objective. The bright field images
were used to identify cell boundaries using ImagePro software
(Media-Cyberentics). Further analysis to measure the areas of Cells
Figure 6. Comparison of mRNA cell-cycle genes expression response. Real-time PCR measurements of the mRNA expression levels for MCM1(black), SWI4 (red), SWI5 (green), NDD1 (purple) and HIS3 (cyan). The measurements were done on cells collected from the same chemostatexperiments as in Figure 2, for strains pSwi5-HIS3 (a,b), pSwi4-HIS3 (c), and pNdd1-His3 (d-f). Note that a and b are repeated experiments, d and e are‘‘twin’’ chemostats decoupled just prior to the switch to 3AT and f is a repeated experiment. The results are average over duplicate measurements(see error-bars in Fig. S10). The mRNA expression levels are normalized by the expression of ACT1. The gray curve in each figure is the OD trace of thecorresponding population dynamics.doi:10.1371/journal.pone.0045184.g006
Cell-Cycle Plasticity Enables Cell Adaptation
PLOS ONE | www.plosone.org 10 September 2012 | Volume 7 | Issue 9 | e45184
was performed by homemade software written in Matlab.
Histograms were constructed from several hundred cells each,
and normalized for unit area.
Expression ArraysmRNA expression measurements followed the same procedures
as in ref [25]. They were done for two independent chemostat
experiments with the pSwi4-HIS3 strain, and for a pair of ‘‘twin’’
chemostats (see above) with the pNdd1-HIS3 strain. Samples of
cells were collected from the chemostats along each experiment at
7 different time points. From each sample, 15 mg of total RNA was
isolated using hot phenol extraction [25]. mRNA was reverse
transcribed (superscript II, Invitrogen) and labeled indirectly with
cy5/3 dyes (Amersham) using amino-allyl dUTP (Ambion). For
each time point, two cDNA microarrays (yeast 6.4 k, UHN
microarray center, www.microarrays.ca) containing all ,6400
yeast ORFs in duplicate (a total of four spots for each ORF) were
hybridized overnight (42uC) with the sample labeled with cy5 and
a reference sample labeled with cy3. Arrays were scanned using
a commercial scanner and software (GenePix 4000B, Axon
instruments). For each microarray, cy5/cy3 intensity ratios were
normalized using the Acuty software (Axon instruments), so the
ratio of medians was 1. log2(cy5/cy3) values of all spots for each
gene were averaged for each time point and only genes with at
least two high-quality spots in each time point and full dynamic
path along the experiments were subject for further analysis.
Duplicate arrays were checked to yield high correlated signal for
each gene (Fig. S8d) and the data from each array were compared
to real-time PCR measurements for various genes from each
sample. Between 3200 and 4200 genes passed all filters in the
experiments (two Swi4p and two Ndd1p chemostat experiments).
For all analyses the log2(cy5/cy3) values in each time point were
normalized to the first steady-state time point.
Clustering AnalysisClustering analysis followed the same procedures as in ref [25].
All genes with a two-fold change in at least one time point were
clustered using the EXPANDER software [38]. The self-organized
maps clustering method [38,39] was applied to the gene profiles,
with 16 clusters as a pre-defined parameter. Clusters that show the
same fundamental mean expression profile (Fig. S7) were joined
into two large clusters presented in Fig. 4. These results were not
sensitive to the self-organized maps clustering method and similar
results have been obtained with different methods (data not
shown). Enrichment of biological process was computed for
clusters of genes using the GO TermFinder (SGD, Tables S1-S2).
All P-values were computed using the hypergeometric distribution.
mRNA Measurements Using Real-time PCRTotal RNA was prepared from cells collected from the
chemostats at precise time points, by phenol extraction followed
by cDNA preparation (oligo-d(T)16; TAQMAN-Reverse Tran-
scription Kit, Applied Biosystems). Real-time PCR measurements
were performed with AB 7700 (SYBR master mix, AB). Measured
amounts of ACT1 prepared by PCR served as a ruler. All
measurements were normalized by the ACT1 transcription level
measured in each sample as the other genes. In all measurements
a non-template control for each of the primer pairs resulted in at
least two orders of magnitude lower signal. Some of the
measurements were performed in duplicates in two separate
PCR measurements. Typical measurement errors are shown in
Fig. S10. mRNA levels from 18 genes belonging to four different
functional groups were measured: cell-cycle: mcm1, swi4, swi5, clb2,
cln2, cln3, whi5, ndd1, sic1; Histidine pathway: His1, His3,His4,
His6,His7, His5; Purine pathway: ynd1, pnp1, imd4,.
Supporting Information
Figure S1 Adaptation on plates. Rewired cells were grown in
batch cultures in media lacking histidine and 3AT and dispersed
on plates (duplicates) with the same media and different 3AT
concentrations (see Methods). The number of mature visible
colonies were counted as a function of time (average over
duplicates) for 4 mM 3AT (black curves), 8 mM 3AT (blue curves)
and 20 mM 3AT (red curves). (a) pSwi4-HIS3 (maximal variability
between duplicates ,16%), (b) pNdd1-HIS3 (maximal variability
between duplicates ,9%), and (C) pSswi5-HIS3 (maximal
variability between duplicates ,30%). The lines are spline
extrapolations to guide the eye. The number of observed colonies
was normalized to the number observed on plates with 0 mM
3AT. Note that first colonies appeared after a period longer than
,4 days (for comparison, cells in a medium lacking histidine grow
into mature colonies after ,2 days).
(PDF)
Figure S2 Images of colonies on plates. Images of plates
after adaptation for: rich media (first column), 4 mM 3AT (second
column), 8 mM 3AT (third column), and 20 mM 3AT (fourth
column) for the different rewired strains as indicated. Samples
from batch cultures were plated as in Fig. S1. For each strain the
number of plated cells on all plates was identical.
(PDF)
Figure S3 The growth of ‘‘wild-type’’ cells under 3AT.(a) ‘‘Wild-type’’ cells with HIS3 under its native promoter. Left:
no 3AT; Right: 4 mM 3AT. The images were captured after
72 hrs. While there is a slight delay in the appearance of visible
colonies on 3AT plates, the overall growth was more or less similar
to that with no 3AT. The medium is similar to the one used in the
paper. (b) ‘‘wild-type’’ cells grown with different concentrations of
3AT (as marked) imaged after 4 days on plates. Note the lack of
sensitivity to the 3AT concentration. The table on the right
quantifies the number of visible colonies in duplicate plates after 4
days. While there are variations, within the experimental errors
there is clearly no sensitivity in the ability of cells to grow to
mature colonies to the 3AT concentration.
(PDF)
Figure S4 Inheritance of adapted phenotypes. Cells of thestrain pSwi4-HIS3 were grown in a batch culture with no 3AT and
then dispersed on plates with different concentrations of 3AT as in
Fig. S1 (results repeated in (a)). After adaptation, mature colonies
from plates with (b) 4 and (c) 8 mM 3AT were re-plated for
a second phase of growth on plates with 4 mM 3AT (black curve),
8 mM 3AT (blue curve) and 12 mM 3AT (red curve) and the
number of mature visible colonies were counted as a function of
time (average over duplicates).
(PDF)
Figure S5 Inheritance of adapted phenotypes. The same
as Fig. S4 for cells of the strain pNDD1-HIS3.
(PDF)
Figure S6 Inheritance of adapted phenotypes. The same
as Fig. S4 for cells of the strain pSwi5-HIS3.
(PDF)
Figure S7 Clustering analysis for DNA arrays. Only
active genes which exhibited at least a twofold change in at least
one time point along each of the experiments were subjected to
clustering (1645 and 1519 genes out of 3281 and 3446,
Cell-Cycle Plasticity Enables Cell Adaptation
PLOS ONE | www.plosone.org 11 September 2012 | Volume 7 | Issue 9 | e45184
respectively, for the pSwi4-HIS3 strain, 1656 and 2433 out of 3266
and 4252, respectively, for the pNdd1-HIS3 strain). The Self
Organizing Maps (SOM) clustering method [39] which is
implemented in the EXPANDER microarray analysis package
[38] was applied to these gene profiles, with 16 clusters as a pre-
defined parameter (the results are not sensitive to the predefined
number of clusters parameter implemented in the SOM
algorithm). The 16 clusters (overall average homogeneity: 0.72
and 0.76 for the pSwi4-HIS3 strain and 0.86 and 0.76 for the
pNdd1-HIS3 strain) show that 57–78% of the active genes in all
the experiments exhibited a mean expression pattern of significant
induction/repression after the addition of 3AT to the medium, and
then a relaxation on the time scale of cells adaptation. (a) pNdd1-
HIS3 strain with 1051 genes induced (assigned to 7 clusters) and
835 repressed (assigned to 5 clusters); (b) a ‘‘twin’’ chemostat to
that presented in (a) with 526 genes induced (assign to 4 clusters)
and 618 repressed (assigned to 6 clusters); (c) pSwi4-HIS3 strain
with 616 genes induced (assign to 5 clusters) and 562 repressed
(assigned to 5 clusters); (d) another chemostat with the pSwi4-HIS3
strain with 464 genes induced (assigned to 4 clusters) and 476
repressed (assigned to 5 clusters). The expression levels are
presented in log2 values. The error bars represent the standard
deviation of expression values among genes belonging to each
cluster. The population growth dynamics as measured by the cell
density in the chemostats is depicted by the gray curves.
(PDF)
Figure S8 Comparison between the expression levels atsteady states of two repeated experiments. The mRNA
levels as measured by the DNA arrays (see Methods) comparing the
adapted steady state for different chemostat populations for: (a)
pSwi4-HIS3 versus pNdd1-HIS3 strains; (b) two populations of the
pNdd1-HIS3 strain in ‘‘twin’’ chemostats; (c) two points in time
separated by 20 hrs within the steady state after adaptation for the
same pNdd1-HIS3 population; and (d) for comparison, typical
array duplicates at the same point reflecting the error in the array
experiments. The lines are linear fits to the data and the R values
are the Pearson correlation coefficients (linear regression) for each
plot. Note the significantly lower correlation for separate
experiments compared to time points within the same experiment.
(PDF)
Figure S9 Comparison between the expression levels inthe transient phase for two repeated experiments. ThemRNA levels as measured by the DNA arrays (see Methods) at
,16 hrs after the addition of 3AT to the chemostat medium
comparing two populations. (a) Comparison between two transient
points of pSwi4-HIS3 and pNdd1-HIS3 strains. (b) Comparison
between two transient points of a pair of ‘‘twin’’ pNdd1-HIS3
populations. (c) Comparison between two transient points
separated by 7 hrs of the same pNdd1-HIS3 strain population.
(d) Comparison between transient and steady state points within
the same pNdd1-HIS3 experiment, separated by 390 hrs. The
lines are linear fits to the data and the R values are the Pearson
correlation coefficients between the experiments on the two axes.
Note the negative correlations between two repeated experiments
compared to the relatively high positive correlations between two
time points within the same experiment.
(PDF)
Figure S10 mRNA expression response. Real-time PCR
measurements of the mRNA expression levels for genes belonging
to: the cell-cycle system (left), histidine pathway (middle), and the
purine pathway (right) for cells collected from the same chemostat
experiments as in Figure 2 main text. The results are for the
following strains: pSwi5-HIS3 (upper row), pSwi4-HIS3 (second
row) and pNdd1-His3 for two twin chemostats decoupled just prior
to the switch to 3AT (last two rows). The mRNA expression levels
are normalized by the expression of ACT1. The results shown are
the average over duplicate measurements and the error-bars are
the standard deviations. The gray curve in each figure is the OD
trace of the corresponding population dynamics.
(PDF)
Table S1 GO term groups for a pSwi4-HIS3 population.Gene content of the expression clusters, as well as the number of
responding genes, were non-reproducible and varied between
nominally identical experiments. There was 8% matching between
the genes in the repressed clusters of the pNdd1-HIS3 experiments
(the ‘‘twin chemostats’’), and 9% between the induced clusters. In
the pSwi4-HIS3 experiments there were 15% and 10% matching
between the genes in the repressed and induced clusters,
respectively. Enrichment of biological process was computed for
clusters of genes using the GO TermFinder [40,41]. The
annotation search revealed that some of the clusters contained
significant GO groups, while other did not. Table S1 depicts the
Go term groups in one pSwi4-HIS3 experiment (in the other
pSwi4-HIS3 experiment no GO groups were found).
(PDF)
Table S2 GO term groups, pNdd2 experiment. The same
as Table S1 for a pNDD1-HIS3 experiment (in the other pNDD1-
HIS3 experiment no GO groups were found).
(PDF)
Table S3 Comparison of the genome-wide mRNAexpression in our experimentsto genome-wide expres-sions in stress response and amino acid starvation. (a)
The fraction of genes in our experiments that showed at least 2
fold change (induced/repressed) of the expression after the
addition of 3AT (4th time point) relative to the initial steady-
state and were also induced or repressed in the environmental
stress response (ESR, Fig. 3 in [33]). It is clear that the overlap
between the expression patterns observed in our experiments and
that of the known stress response is insignificant. (b), (c) Amino
acid starvation expression data was derived from [42]. The gene
expression values that were induced/repressed significantly (at
least 2 fold change, p,0.05) in their dataset C (+/2100 mM 3AT)
have been compared to our expression data (same as in (a)). The
table presents the correlation coefficients between the two
experiments. It is clear that there is no correlation between the
pattern of expression observed in our experiments and the
response to amino acid starvation.
(PDF)
Acknowledgments
We thank L. Moore for helpful discussions and remarks on the manuscript,
L. David, N. Brenner, K. Keren and Y. Soen for helpful discussions related
to the work presented in this paper, T. Dror for technical help in producing
the rewired strains, and I. Ventura for help with measuring the cell-size
distributions.
Author Contributions
Conceived and designed the experiments: YK EB. Performed the
experiments: YK ES SS EB. Analyzed the data: YK ES SS EB. Wrote
the paper: YK EB.
Cell-Cycle Plasticity Enables Cell Adaptation
PLOS ONE | www.plosone.org 12 September 2012 | Volume 7 | Issue 9 | e45184
References
1. Hartwell LH (2002) Nobel Lecture. Yeast and cancer. Biosci Rep, Fred
Hutchinson Cancer Research Center, 1100 Fairview Avenue N, DI-060, Seattle,
WA 98109–1024, USA 22: 373–394.
2. Murray AW (2004) Recycling the cell cycle: cyclins revisited. Cell 116: 221–234.
3. Morgan DO (2006) The Cell Cycle: Principles of Control New Science Press.
4. Murray A, Hunt T (1993) The cell cycle: an introduction: Oxford UniversityPress.
5. Chen KC, Calzone L, Csikasz-Nagy A, Cross FR, Novak B, et al. (2004)Integrative analysis of cell cycle control in budding yeast. Molecular Biology of
the Cell 15: 3841–3862.
6. Cross FR, Archambault V, Miller M, Klovstad M (2002) Testing a MathematicalModel of the Yeast Cell Cycle. Molecular Biology of the Cell 13: 52–70.
7. Ingolia NT, Murray AW (2004) The Ups and Downs of Modeling the CellCycle. Current Biology 14: R771–R777.
8. Li F, Long T, Lu Y, Ouyang Q, Tang C (2004) The yeast cell-cycle network is
robustly designed. Proceedings of the National Academy of Sciences of the USA101: 4781.
9. Csikasz-Nagy A, Battogtokh D, Chen KC, Novak B, Tyson JJ (2006) Analysis ofa Generic Model of Eukaryotic Cell-Cycle Regulation. Biophysical Journal 90:
4361–4379.
10. West-Eberhard MJ (2003) Developmental plasticity and evolution. Oxford:Oxford University Press.
11. Jorgensen P, Tyers M (2004) How Cells Coordinate Growth and Division.Current Biology 14: R1014–R1027.
12. Kaizu K, Ghosh S, Matsuoka Y, Moriya H, Shimizu-Yoshida Y, et al. (2010) A
comprehensive molecular interaction map of the budding yeast cell cycle.Molecular Systems Biology 6: 415.
13. Lichtenberg Ud, Jensen LJ, Brunak S, Bork P (2005) Dynamic Complex
Formation During the Yeast Cell Cycle. Science 307: 724–727.
14. Orlando DA, Lin CY, Bernard A, Wang JY, Socolar JES, et al. (2008) Global
control of cell-cycle transcription by coupled CDK and network oscillators.Nature 453: 944–947.
15. Simon I, Barnett J, Hannett N, Harbison CT, Rinaldi NJ, et al. (2001) Serial
Regulation of Transcriptional Regulators in the Yeast Cell Cycle. Cell 106: 697–
708.
16. Khodjakov A, Rieder CL (2009) The nature of cell-cycle checkpoints: facts andfallacies. Journal of Biology 8: 88.
17. Skotheim JM, Talia SD, Siggia ED, Cross FR (2008) Positive feedback of G1
cyclins ensures coherent cell cycle entry. Nature 454: 291–297.
18. Spellman PT, Sherlock G, Zhang MQ, Iyer VR, Anders K, et al. (1998)
Comprehensive identification of cell cycle-regulated genes of the yeastSaccharomyces cerevisiae by microarray hybridization. Mol Biol Cell 9: 3273–3297.
19. Stolovicki E, Dror T, Brenner N, Braun E (2006) Synthetic gene recruitment
reveals adaptive reprogramming of gene regulation in yeast. Genetics 173: 75–
85.
20. Carroll SB (2005) Evolution at Two Levels: On Genes and Form. PLoS Biology3: 1159–1166.
21. Carroll SB, Grenier JK, Weatherbee SD (2001) From DNA to Diversity:
Molecular Genetics and the Evolution of Animal Design. Oxford: Blackwell
Science Inc.
22. Davidson EH (2006) The Regulatory Genome. Amsterdam: Elsevier.
23. Wilkins AS (2002) The Evolution of Developmental Pathways. Sunderland:
Sinauer Associates, Inc.24. David L, Stolovicki E, Haziz E, Braun E (2010) Inherited adaptation of genome-
rewired cells in response to a challenging environment. HFSP Journal 4: 131–141.
25. Stern S, Dror T, Stolovicki E, Brenner N, Braun E (2007) Genome-wide
transcriptional plasticity underlies cellular adaptation to novel challenge.Molecular Systems Biology 3: 106.
26. Horecka J, Sprague GF (2000) Use of Imidazoleglycerophosphate Dehydratase(His3) as a biological reporter in yeast. Methods in Enzymology 326: 107–119.
27. Marton MJ, DeRisi JL, Bennet HA, Iyer VR, Meyer MR, et al. (1998) Drug
target validation and identification of secondary drug target effects using DNAmicroarrays. Nature Medicine 4: 1293–1301.
28. Novick A, Szilard L (1950) Experiments with the chemostat on spontaneousmutations of bacteria. Proc Nat Acad Sci USA 36: 708.
29. Smith HL, Waltman P (1995) The theory of the chemostat: Dynamics ofmicrobial competition. New York: Cambridge University Press.
30. Stolovicki E, Braun E (2011) Collective dynamics of gene expression in cell
populations. Plos One 6: e20530.31. Li SC, Kane PM (2009) The yeast lysosome-like vacuole: Endpoint and
crossroads. Biochimica et Biophysica Acta 1793: 650–663.32. Goranov AI, Cook M, Ricicova M, Ben-Ari G, Gonzalez C, et al. (2009) The
rate of cell growth is governed by cell cycle stage. Genes & Development 23:
1408–1422.33. Gasch AP, Spellman PT, Kao CM, Carmel-Harel O, Eisen MB, et al. (2000)
Genomic expression programs in the response of yeast cells to environmentalchanges. Molecular Biology of the Cell 11: 4241–4257.
34. Gerhart J, Kirschner M (1997) Cells, embryos, and evolution: Blackwell ScienceInc.
35. Kirschner M, Gerhart J (1998) Evolvability. Proc Nat Acad Sci 95: 8420–8427.
36. Stern S, Fridmann-Sirkis Y, Braun E, Soen Y (2012) Epigenetically HeritableAlteration of Fly Development in Response to Toxic Challenge. Cell Reports 1:
528–542.37. Goldstein AL, Mccusker JH (1999) Three New Dominant Drug Resistance
Cassettes for Gene Disruption in Saccharomyces cerevisiae. Yeast 15: 1541–
1553.38. Shamir R, Maron-Katz A, Tanay A, Linhart C, Steinfeld I, et al. (2005)
EXPANDER – an integrative program suite for microarray data analysis. BMCBioinformatics 6: 232.
39. Tamayo P, Slonim D, Mesirov J, Zhu Q, Kitareewan S, et al. (1999) Interpretingpatterns of gene expression with self-organizing maps: Methods and application
to hematopoietic differentiation. Proc Nat Acad Sci USA 96: 2907–2912.
40. Saccharomyces Genome Database website. Available: www.yeastgenome.org.Accessed 2012 26 Aug.
41. Boyle EI, Weng S, Gollub J, Jin H, Botstein D, et al. (2004) TermFinder–opensource software for accessing Gene Ontology information and finding
significantly enriched Gene Ontology terms associated with a list of genes.
Bioinformatics 20: 3710–3715.42. Natarajan K, Meyer MR, Jackson BM, Slade D, Roberts C, et al. (2001)
Transcriptional profiling shows that Gcn4p is a master regulator of geneexpression during amino acid starvation in yeast. Mol and Cellular Biologyl 21:
4347–4368.
Cell-Cycle Plasticity Enables Cell Adaptation
PLOS ONE | www.plosone.org 13 September 2012 | Volume 7 | Issue 9 | e45184