metabolic rewiring by oncogenic braf v600e links ketogenesis pathway to braf-mek1 signaling
TRANSCRIPT

Article
Metabolic Rewiring by Onc
ogenic BRAF V600E LinksKetogenesis Pathway to BRAF-MEK1 SignalingGraphical Abstract
Highlights
d HMGCL is a synthetic lethal partner of BRAF V600E
d BRAF V600E upregulates HMGCL in human cancers
d HMGCL product acetoacetate selectively promotes BRAF
V600E-MEK1 binding
d Active BRAF upregulates HMGCL via Oct-1
Kang et al., 2015, Molecular Cell 59, 1–14August 6, 2015 ª2015 Elsevier Inc.http://dx.doi.org/10.1016/j.molcel.2015.05.037
Authors
Hee-Bum Kang, Jun Fan,
Ruiting Lin, ..., Chuan He, Sumin Kang,
Jing Chen
[email protected] (S.K.),[email protected] (J.C.)
In Brief
Many cancers share common metabolic
alterations, yet how such alterations
contribute to tumor development remains
unclear. Kang et al. demonstrate a
‘‘synthetic lethal’’ interaction between
oncogenic BRAF V600E and a ketogenic
enzyme 3-hydroxy-3-methylglutaryl-CoA
lyase (HMGCL) that promotes BRAF
V600E-dependent tumor development.
Please cite this article in press as: Kang et al., Metabolic Rewiring by Oncogenic BRAF V600E Links Ketogenesis Pathway to BRAF-MEK1 Signaling,Molecular Cell (2015), http://dx.doi.org/10.1016/j.molcel.2015.05.037
Molecular Cell
Article
Metabolic Rewiring by Oncogenic BRAF V600ELinks Ketogenesis Pathway to BRAF-MEK1 SignalingHee-Bum Kang,1,14 Jun Fan,1,14 Ruiting Lin,1,14 Shannon Elf,1 Quanjiang Ji,2 Liang Zhao,1 Lingtao Jin,1 Jae Ho Seo,1
Changliang Shan,1 Jack L. Arbiser,3,4 Cynthia Cohen,5 Daniel Brat,5 Henry M. Miziorko,6 Eunhee Kim,7
Omar Abdel-Wahab,7 Taha Merghoub,7 Stefan Frohling,8 Claudia Scholl,9 Pablo Tamayo,10 David A. Barbie,10 Lu Zhou,11
Brian P. Pollack,3,4 Kevin Fisher,5 Ragini R. Kudchadkar,1 David H. Lawson,1 Gabriel Sica,1 Michael Rossi,1 Sagar Lonial,1
Hanna J. Khoury,1 Fadlo R. Khuri,1 Benjamin H. Lee,12 Titus J. Boggon,13 Chuan He,2 Sumin Kang,1,* and Jing Chen1,*1Department of Hematology and Medical Oncology, Winship Cancer Institute of Emory, Emory University School of Medicine, Atlanta, GA
30322, USA2Department of Chemistry and Institute for Biophysical Dynamics, University of Chicago, Chicago, IL 60637, USA3Department of Dermatology, Emory University, Atlanta, GA 30322, USA4Atlanta Veterans Administration Medical Center, Atlanta, GA 30322, USA5Department of Pathology and Laboratory Medicine, Emory University, Atlanta, GA 30322, USA6Division of Molecular Biology and Biochemistry, University of Missouri, Kansas City, Kansas City, MO 64110, USA7Memorial Sloan-Kettering Cancer Center, New York, NY 10065, USA8Department of Translational Oncology, National Center for Tumor Diseases (NCT) Heidelberg and German Cancer Research Center (DKFZ),
Section for Personalized Oncology, Heidelberg University Hospital, German Cancer Consortium (DKTK), 69121 Heidelberg, Germany9Department of Translational Oncology, National Center for Tumor Diseases (NCT) Heidelberg, German Cancer Research Center (DKFZ),
69121 Heidelberg, Germany10Broad Institute of MIT and Harvard, Cambridge, MA 02142, USA11School of Pharmacy, Fudan University, Shanghai 201203, China12Novartis Institutes for BioMedical Research, Cambridge, MA 02139, USA13Department of Pharmacology, Yale University School of Medicine, New Haven, CT 06520, USA14Co-first author
*Correspondence: [email protected] (S.K.), [email protected] (J.C.)http://dx.doi.org/10.1016/j.molcel.2015.05.037
SUMMARY
Many human cancers share similar metabolic alter-ations, including the Warburg effect. However, it re-mains unclear whether oncogene-specific metabolicalterations are required for tumor development. Herewe demonstrate a ‘‘synthetic lethal’’ interactionbetween oncogenic BRAF V600E and a ketogenicenzyme 3-hydroxy-3-methylglutaryl-CoA lyase(HMGCL). HMGCL expression is upregulated inBRAF V600E-expressing human primary melanomaand hairy cell leukemia cells. Suppression of HMGCLspecifically attenuates proliferation and tumorgrowth potential of human melanoma cells express-ing BRAF V600E. Mechanistically, active BRAF upre-gulates HMGCL through an octamer transcriptionfactor Oct-1, leading to increased intracellular levelsof HMGCL product, acetoacetate, which selectivelyenhances binding of BRAF V600E but not BRAFwild-type to MEK1 in V600E-positive cancer cells topromote activation of MEK-ERK signaling. Thesefindings reveal a mutation-specific mechanism bywhich oncogenic BRAF V600E ‘‘rewires’’ metabolicand cell signaling networks and signals through theOct-1-HMGCL-acetoacetate axis to selectively pro-mote BRAF V600E-dependent tumor development.
INTRODUCTION
The importance of metabolic alterations in cancer has been
increasingly recognized over the past decade. Identification of
metabolic vulnerability of human cancers has informed develop-
ment of therapeutic strategies to treat cancer. However,
although increasing evidence emerges and suggests that
different human cancers may share common metabolic proper-
ties such as the Warburg effect, it remains unclear whether
distinct oncogenic backgrounds in different cancer types require
different metabolic properties for tumor development.
Melanoma is one of the most common human cancers, which,
according to American Cancer Society, accounts for >76,600
cases in US in 2013 with �9,000 death each year. More than
50% of melanomas express BRAF V600E mutant, which repre-
sents a therapeutic target due to its pathogenic role. However,
despite the success of BRAF mutant and MEK inhibitors in clin-
ical trials for BRAF V600E-positive melanoma patients, clinical
resistance invariably develops (Bollag et al., 2012; Gibney
et al., 2013; Johnson and Sosman, 2013). Thus, identification
of alternative ‘‘targets’’ in BRAF V600E-positive melanomas
may inform effective long-term treatment strategies.
Herein we approached this question by identifying ‘‘metabolic
vulnerabilities’’ specifically required by oncogenic BRAF V600E
mutant, but not other oncogenes such as NRas Q61R/K in hu-
man melanomas. We found that HMG-CoA lyase (HMGCL), a
key enzyme in ketogenesis producing ketone bodies, was
Molecular Cell 59, 1–14, August 6, 2015 ª2015 Elsevier Inc. 1
Please cite this article in press as: Kang et al., Metabolic Rewiring by Oncogenic BRAF V600E Links Ketogenesis Pathway to BRAF-MEK1 Signaling,Molecular Cell (2015), http://dx.doi.org/10.1016/j.molcel.2015.05.037
selectively essential in melanoma cells expressing BRAF V600E,
but not in control cells containing NRas mutants or wild-type
(WT) BRAF and NRas. Ketogenesis mainly occurs in the mito-
chondria of liver cells, which normally produces ketone bodies
as a result of fatty acid breakdown to generate energy when
glucose levels in the blood are low (Balasse and Fery, 1989;
McPherson and McEneny, 2012). b-oxidation breaks down fatty
acids to form acetyl-CoA, which, under normal conditions, is
further oxidized in the TCA cycle. However, if TCA cycle activity
is low, or the acetyl-CoA generation rate of b-oxidation exceeds
the capacity of the TCA cycle, ketogenesis will be activated to
convert acetyl-CoA to ketone bodies via HMG-CoA. HMGCL
converts HMG-CoA to acetyl-coA and a ketone body, acetoace-
tate (AA), which can be further converted to two other ketone
bodies, including D-b-hydroxybutyrate (3-HB) and acetone. Ke-
tone bodies can be transported from liver to other tissues, where
AA and 3-HB but not acetone will be further oxidized via the TCA
cycle to produce acetyl-CoA for energy production. Organs
including heart and brain can use AA and 3-HB for energy. AA,
if not used for energy, will be decarboxylated to acetone, which
is removed as waste (Cotter et al., 2013; Morris, 2005). However,
although the ketogenic diet (high fat, adequate protein, and low
carbohydrate) has been evaluated for cancer prevention and
treatment purposes with the hope of attenuating tumor develop-
ment by limiting carbohydrate supply, it is unknown whether and
how ketogenesis and/or ketone bodies may contribute to cancer
metabolism and tumor growth.
Here we report that active BRAF upregulates HMGCL via an
octamer transcription factor Oct-1. Consistently, BRAF V600E
expression results in increased HMGCL gene expression in
cancer cells. HMGCL, however, selectively promotes BRAF
V600E-dependent phosphorylation and activation of MEK1 by
controlling intracellular levels of its product AA, which specif-
ically promotes BRAF V600E (but not BRAF WT) binding to
MEK1 and subsequent MEK1 phosphorylation in cancer cells.
RESULTS
HMGCL Is a ‘‘Synthetic Lethal’’ Partner of BRAF V600Ein Human Melanoma CellsTo identify ‘‘metabolic vulnerabilities’’ specific to oncogenic
BRAF V600E mutant, but not other oncogenes such as NRas
Q61R/K in human melanomas, we designed and constructed a
shRNA library that targets 1,361 out of 1,417 genes encoding
known metabolism-related enzymes and protein factors in
the human genome (search at http://www.phosphosite.org/
psrSearchAction.do by selecting ‘‘containing ‘metabolism’ ’’ in
‘‘Protein type’’ section), which are available in thewhole-genome
shRNA library that we purchased from OpenBioSystems. The li-
brary contains 6,872 lentiviral-based shRNA constructs, where
each gene is individually targeted by 1-5 different shRNA con-
structs that target different regions of the target gene (Figure 1A;
Table S1). We performed a systematic RNAi screen in two BRAF
V600D/E mutant expressing melanoma cells lines including
WM2664 (V600D) and A375 (V600E), as well as control BRAF
WT-expressing melanoma cells including PMWK, CHL-1,
HMCB (NRas Q61K) and SK-MEL-2 (NRas Q61R) (Figure 1B;
Table S2). We then used two RIGER methods (RIGER_SB
2 Molecular Cell 59, 1–14, August 6, 2015 ª2015 Elsevier Inc.
and RIGER_KS) and overlapped these against another
method, Gene Set Analysis R package, to analyze the normal-
ized B scores for each cell line (Barbie et al., 2009; Gould
et al., 2006; Malo et al., 2006; Sims et al., 2011). The top-ranked
100 genes identified by each method were overlapped, and 36
genes were enriched as top candidate synthetic lethal partners
of BRAF V600E (Figure 1B; Tables S3, S4, S5, and S6). In a sec-
ondary screen, we validated the 36 candidates (186 shRNAs)
using additional BRAF V600E-expressing SK-MEL-5 and
A2058melanoma cells, compared to control BRAFWT-express-
ing PMWK and HMCB cells (Figure 1B). Results were analyzed
by RIGER_SB, RIGER_KS, and Gene Set Analysis R package,
and eight genes were enriched using the top 15 genes identified
in the primary screen (Figure 1B; Table S7).
Among these candidates, we validated the two key ketogenic
enzymes, HMG-CoA lyase (HMGCL) (Figures 1C, S1A, and
S1B) and HMG-CoA synthase 1 (HMGCS1) (Figure S1C) as
synthetic lethal partners of BRAF V600E, using an alternative
cell-number-based cell proliferation rate assay. Suppression
of HMGCL and HMGCS1 resulted in more attenuated cell pro-
liferation rates in BRAF V600E-expressing melanoma cells
compared to cells expressing BRAF WT, suggesting selective
importance of ketogenesis in BRAF V600E induced melanoma
transformation.
Expression of BRAF V600E Upregulates HMGCL in CellsKetogenesis mainly occurs in the mitochondria of liver cells,
which normally convert acetyl-CoA to ketone bodies via HMG-
CoA as a result of fatty acid breakdown to generate energy
when glucose levels in the blood are low. HMGCL converts
HMG-CoA to acetyl-coA and a ketone body, AA, which can be
further converted to two other ketone bodies, including 3-HB
and acetone (Balasse and Fery, 1989;McPherson andMcEneny,
2012). We found that HMGCL is upregulated in a group of BRAF
V600E-expressing humanmelanoma cell lines compared to cells
expressing BRAF WT (Figure 2A, left) and in the immortalized
melanocyte Mel-ST cells expressing BRAF V600E but not
BRAF WT (Figure 2A, right).
Consistent with these findings, HMGCL expression assessed
by immunohistochemistry (IHC) staining is significantly upregu-
lated in primary tumor samples of BRAF V600E-positive mela-
noma patients compared to control tumor tissue samples from
BRAF WT-expressing melanoma patients (Figure 2B). In addi-
tion, immunoblotting results confirmed upregulated HMGCL
protein andmRNA levels in primary human tumor tissue samples
from BRAF V600E-positive melanoma patients, which also
demonstrated enhanced phosphorylation and activation of
MEK1 and ERK, compared to primary melanoma sample from
one representative patient with BRAF WT (Figure 2C).
BRAF V600E mutation has been identified in other human ma-
lignancies such as colorectal cancer, multiple myeloma (Benl-
loch et al., 2006; Chapman et al., 2011), and hairy cell leukemia
(HCL). HCL is a chronic B cell lymphoproliferative disease, and
nearly 100% of classic HCL patients harbor somatic BRAF
V600E mutation (Arcaini et al., 2012; Golomb et al., 1982;
Schnittger et al., 2012; Tiacci et al., 2011). Consistently, protein
and mRNA levels of HMGCL and phosphorylation of MEK1 and
ERK were upregulated in primary human leukemia cells from
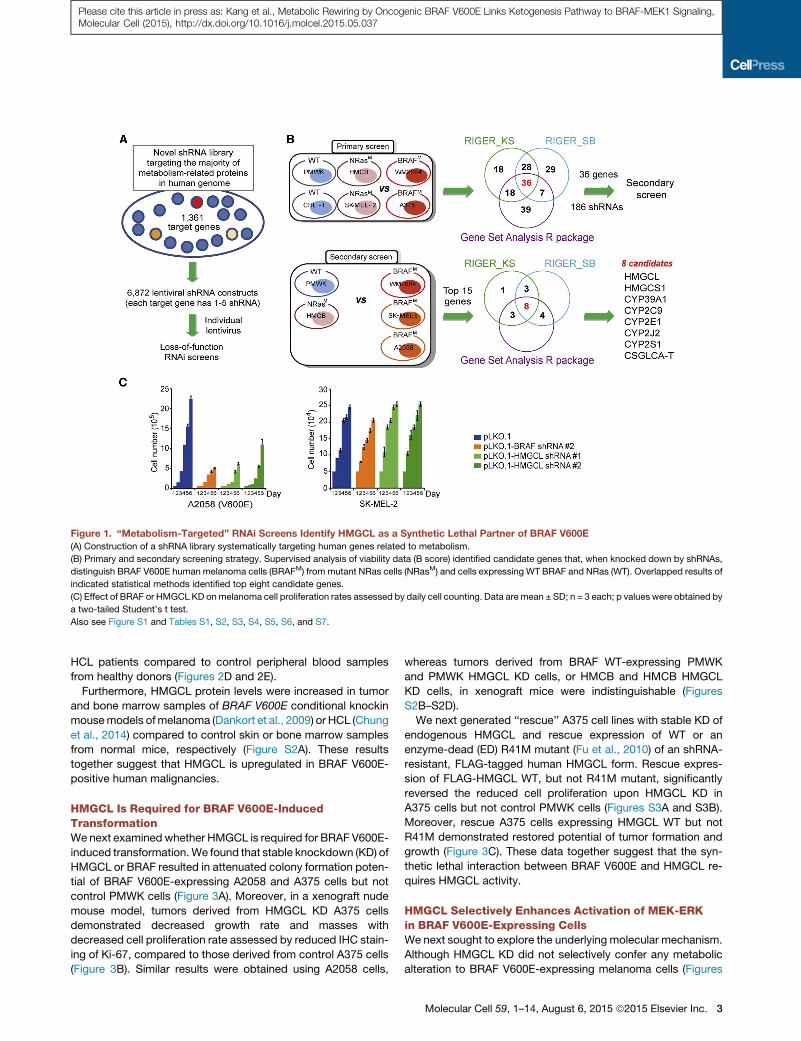
Figure 1. ‘‘Metabolism-Targeted’’ RNAi Screens Identify HMGCL as a Synthetic Lethal Partner of BRAF V600E
(A) Construction of a shRNA library systematically targeting human genes related to metabolism.
(B) Primary and secondary screening strategy. Supervised analysis of viability data (B score) identified candidate genes that, when knocked down by shRNAs,
distinguish BRAF V600E human melanoma cells (BRAFM) from mutant NRas cells (NRasM) and cells expressing WT BRAF and NRas (WT). Overlapped results of
indicated statistical methods identified top eight candidate genes.
(C) Effect of BRAF or HMGCL KD onmelanoma cell proliferation rates assessed by daily cell counting. Data are mean ± SD; n = 3 each; p values were obtained by
a two-tailed Student’s t test.
Also see Figure S1 and Tables S1, S2, S3, S4, S5, S6, and S7.
Please cite this article in press as: Kang et al., Metabolic Rewiring by Oncogenic BRAF V600E Links Ketogenesis Pathway to BRAF-MEK1 Signaling,Molecular Cell (2015), http://dx.doi.org/10.1016/j.molcel.2015.05.037
HCL patients compared to control peripheral blood samples
from healthy donors (Figures 2D and 2E).
Furthermore, HMGCL protein levels were increased in tumor
and bone marrow samples of BRAF V600E conditional knockin
mousemodels ofmelanoma (Dankort et al., 2009) or HCL (Chung
et al., 2014) compared to control skin or bone marrow samples
from normal mice, respectively (Figure S2A). These results
together suggest that HMGCL is upregulated in BRAF V600E-
positive human malignancies.
HMGCL Is Required for BRAF V600E-InducedTransformationWenext examined whether HMGCL is required for BRAF V600E-
induced transformation.We found that stable knockdown (KD) of
HMGCL or BRAF resulted in attenuated colony formation poten-
tial of BRAF V600E-expressing A2058 and A375 cells but not
control PMWK cells (Figure 3A). Moreover, in a xenograft nude
mouse model, tumors derived from HMGCL KD A375 cells
demonstrated decreased growth rate and masses with
decreased cell proliferation rate assessed by reduced IHC stain-
ing of Ki-67, compared to those derived from control A375 cells
(Figure 3B). Similar results were obtained using A2058 cells,
whereas tumors derived from BRAF WT-expressing PMWK
and PMWK HMGCL KD cells, or HMCB and HMCB HMGCL
KD cells, in xenograft mice were indistinguishable (Figures
S2B–S2D).
We next generated ‘‘rescue’’ A375 cell lines with stable KD of
endogenous HMGCL and rescue expression of WT or an
enzyme-dead (ED) R41M mutant (Fu et al., 2010) of an shRNA-
resistant, FLAG-tagged human HMGCL form. Rescue expres-
sion of FLAG-HMGCL WT, but not R41M mutant, significantly
reversed the reduced cell proliferation upon HMGCL KD in
A375 cells but not control PMWK cells (Figures S3A and S3B).
Moreover, rescue A375 cells expressing HMGCL WT but not
R41M demonstrated restored potential of tumor formation and
growth (Figure 3C). These data together suggest that the syn-
thetic lethal interaction between BRAF V600E and HMGCL re-
quires HMGCL activity.
HMGCL Selectively Enhances Activation of MEK-ERKin BRAF V600E-Expressing CellsWe next sought to explore the underlying molecular mechanism.
Although HMGCL KD did not selectively confer any metabolic
alteration to BRAF V600E-expressing melanoma cells (Figures
Molecular Cell 59, 1–14, August 6, 2015 ª2015 Elsevier Inc. 3
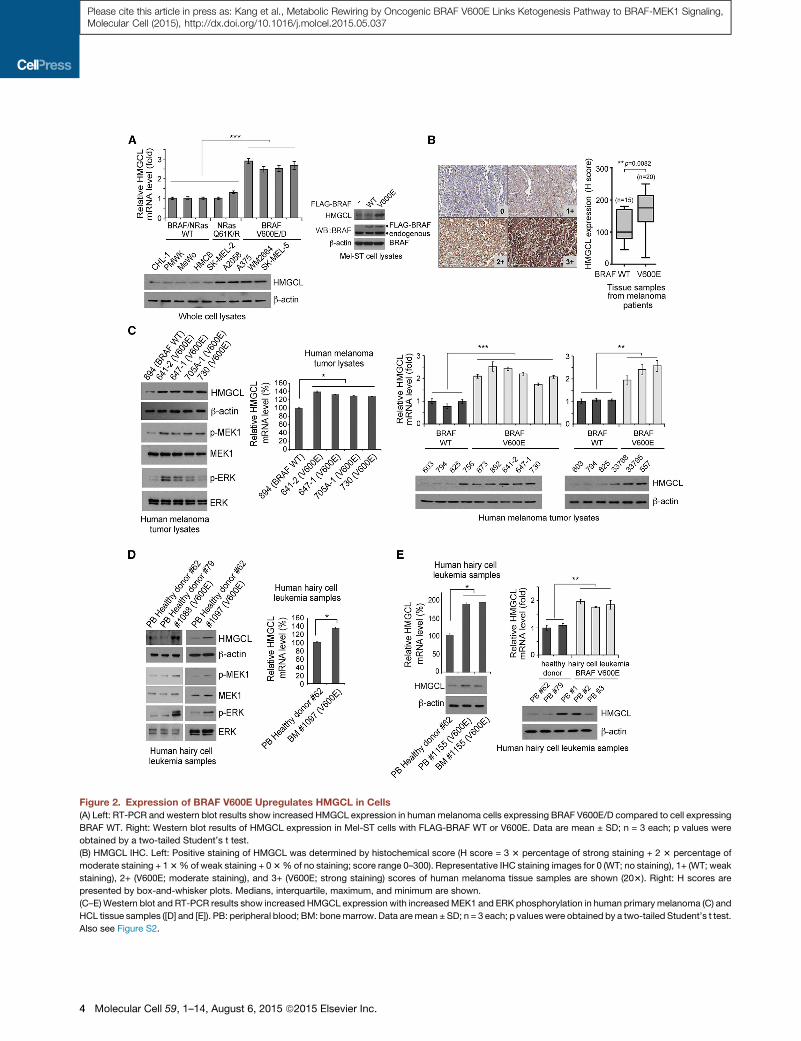
Figure 2. Expression of BRAF V600E Upregulates HMGCL in Cells
(A) Left: RT-PCR and western blot results show increased HMGCL expression in human melanoma cells expressing BRAF V600E/D compared to cell expressing
BRAF WT. Right: Western blot results of HMGCL expression in Mel-ST cells with FLAG-BRAF WT or V600E. Data are mean ± SD; n = 3 each; p values were
obtained by a two-tailed Student’s t test.
(B) HMGCL IHC. Left: Positive staining of HMGCL was determined by histochemical score (H score = 3 3 percentage of strong staining + 2 3 percentage of
moderate staining + 13%of weak staining + 03%of no staining; score range 0–300). Representative IHC staining images for 0 (WT; no staining), 1+ (WT; weak
staining), 2+ (V600E; moderate staining), and 3+ (V600E; strong staining) scores of human melanoma tissue samples are shown (203). Right: H scores are
presented by box-and-whisker plots. Medians, interquartile, maximum, and minimum are shown.
(C–E)Western blot and RT-PCR results show increased HMGCL expression with increasedMEK1 and ERK phosphorylation in human primary melanoma (C) and
HCL tissue samples ([D] and [E]). PB: peripheral blood; BM: bonemarrow. Data aremean ± SD; n = 3 each; p valueswere obtained by a two-tailed Student’s t test.
Also see Figure S2.
4 Molecular Cell 59, 1–14, August 6, 2015 ª2015 Elsevier Inc.
Please cite this article in press as: Kang et al., Metabolic Rewiring by Oncogenic BRAF V600E Links Ketogenesis Pathway to BRAF-MEK1 Signaling,Molecular Cell (2015), http://dx.doi.org/10.1016/j.molcel.2015.05.037

Figure 3. HMGCL Promotes MEK-ERK Activation and Is Specifically Required for Cell Proliferation and Tumor Growth Potential of BRAF
V600E-Expressing Melanoma Cells(A) Anchorage-independent growth of melanoma cells with or without stable KD of BRAF or HMGCL. Duplicate experiment; data are mean ± SEM; p values were
obtained by a two-tailed Student’s t test.
(B and C) Left two panels: Tumor growth and size of xenograft mice injected with parental or HMGCL KD BRAF V600E-positive A375 cells (B) or HMGCL KD cells
with rescue expression of FLAG-HMGCL WT or enzyme deficient R41M mutant (C). Middle panels show the dissected tumors in representative mice. Right
panels show representative images of IHC staining of Ki-67 of tumors (brown color). Data are mean ± SEM; p values were obtained by a paired two-tailed
Student’s t test.
(legend continued on next page)
Molecular Cell 59, 1–14, August 6, 2015 ª2015 Elsevier Inc. 5
Please cite this article in press as: Kang et al., Metabolic Rewiring by Oncogenic BRAF V600E Links Ketogenesis Pathway to BRAF-MEK1 Signaling,Molecular Cell (2015), http://dx.doi.org/10.1016/j.molcel.2015.05.037
Please cite this article in press as: Kang et al., Metabolic Rewiring by Oncogenic BRAF V600E Links Ketogenesis Pathway to BRAF-MEK1 Signaling,Molecular Cell (2015), http://dx.doi.org/10.1016/j.molcel.2015.05.037
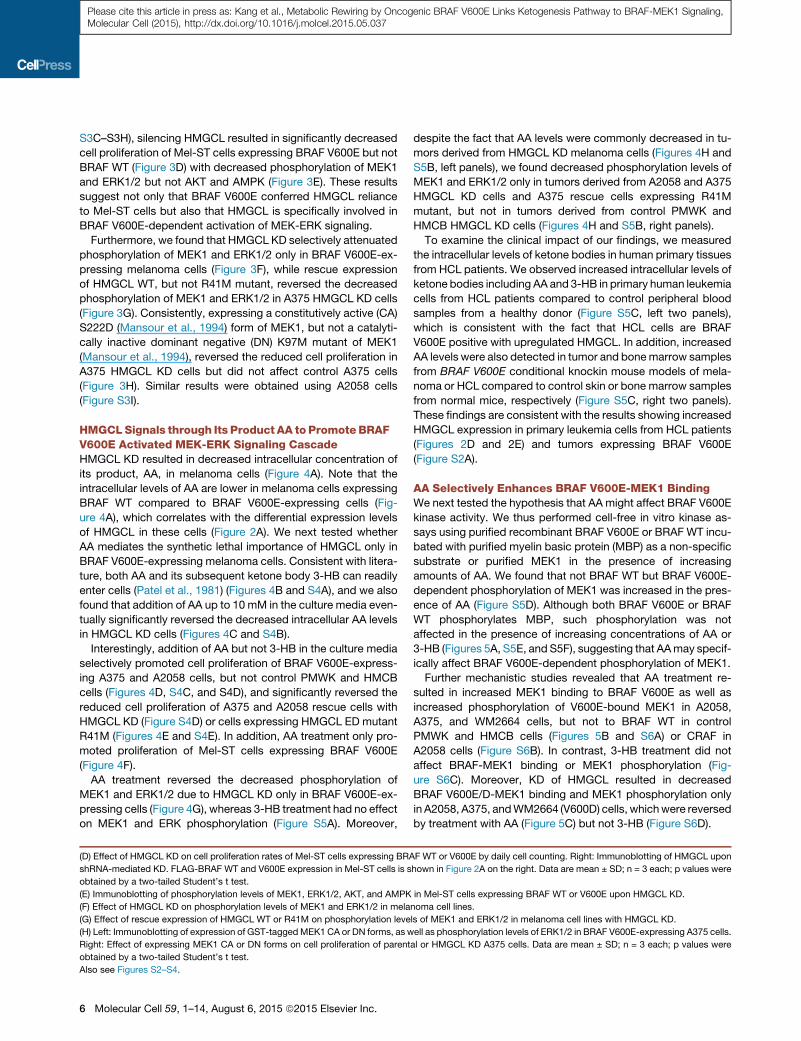
S3C–S3H), silencing HMGCL resulted in significantly decreased
cell proliferation of Mel-ST cells expressing BRAF V600E but not
BRAF WT (Figure 3D) with decreased phosphorylation of MEK1
and ERK1/2 but not AKT and AMPK (Figure 3E). These results
suggest not only that BRAF V600E conferred HMGCL reliance
to Mel-ST cells but also that HMGCL is specifically involved in
BRAF V600E-dependent activation of MEK-ERK signaling.
Furthermore, we found that HMGCL KD selectively attenuated
phosphorylation of MEK1 and ERK1/2 only in BRAF V600E-ex-
pressing melanoma cells (Figure 3F), while rescue expression
of HMGCL WT, but not R41M mutant, reversed the decreased
phosphorylation of MEK1 and ERK1/2 in A375 HMGCL KD cells
(Figure 3G). Consistently, expressing a constitutively active (CA)
S222D (Mansour et al., 1994) form of MEK1, but not a catalyti-
cally inactive dominant negative (DN) K97M mutant of MEK1
(Mansour et al., 1994), reversed the reduced cell proliferation in
A375 HMGCL KD cells but did not affect control A375 cells
(Figure 3H). Similar results were obtained using A2058 cells
(Figure S3I).
HMGCLSignals through Its Product AA toPromoteBRAFV600E Activated MEK-ERK Signaling CascadeHMGCL KD resulted in decreased intracellular concentration of
its product, AA, in melanoma cells (Figure 4A). Note that the
intracellular levels of AA are lower in melanoma cells expressing
BRAF WT compared to BRAF V600E-expressing cells (Fig-
ure 4A), which correlates with the differential expression levels
of HMGCL in these cells (Figure 2A). We next tested whether
AA mediates the synthetic lethal importance of HMGCL only in
BRAF V600E-expressing melanoma cells. Consistent with litera-
ture, both AA and its subsequent ketone body 3-HB can readily
enter cells (Patel et al., 1981) (Figures 4B and S4A), and we also
found that addition of AA up to 10 mM in the culture media even-
tually significantly reversed the decreased intracellular AA levels
in HMGCL KD cells (Figures 4C and S4B).
Interestingly, addition of AA but not 3-HB in the culture media
selectively promoted cell proliferation of BRAF V600E-express-
ing A375 and A2058 cells, but not control PMWK and HMCB
cells (Figures 4D, S4C, and S4D), and significantly reversed the
reduced cell proliferation of A375 and A2058 rescue cells with
HMGCL KD (Figure S4D) or cells expressing HMGCL ED mutant
R41M (Figures 4E and S4E). In addition, AA treatment only pro-
moted proliferation of Mel-ST cells expressing BRAF V600E
(Figure 4F).
AA treatment reversed the decreased phosphorylation of
MEK1 and ERK1/2 due to HMGCL KD only in BRAF V600E-ex-
pressing cells (Figure 4G), whereas 3-HB treatment had no effect
on MEK1 and ERK phosphorylation (Figure S5A). Moreover,
(D) Effect of HMGCL KD on cell proliferation rates of Mel-ST cells expressing BRA
shRNA-mediated KD. FLAG-BRAF WT and V600E expression in Mel-ST cells is s
obtained by a two-tailed Student’s t test.
(E) Immunoblotting of phosphorylation levels of MEK1, ERK1/2, AKT, and AMPK
(F) Effect of HMGCL KD on phosphorylation levels of MEK1 and ERK1/2 in mela
(G) Effect of rescue expression of HMGCL WT or R41M on phosphorylation leve
(H) Left: Immunoblotting of expression of GST-taggedMEK1 CA or DN forms, as w
Right: Effect of expressing MEK1 CA or DN forms on cell proliferation of parent
obtained by a two-tailed Student’s t test.
Also see Figures S2–S4.
6 Molecular Cell 59, 1–14, August 6, 2015 ª2015 Elsevier Inc.
despite the fact that AA levels were commonly decreased in tu-
mors derived from HMGCL KD melanoma cells (Figures 4H and
S5B, left panels), we found decreased phosphorylation levels of
MEK1 and ERK1/2 only in tumors derived from A2058 and A375
HMGCL KD cells and A375 rescue cells expressing R41M
mutant, but not in tumors derived from control PMWK and
HMCB HMGCL KD cells (Figures 4H and S5B, right panels).
To examine the clinical impact of our findings, we measured
the intracellular levels of ketone bodies in human primary tissues
from HCL patients. We observed increased intracellular levels of
ketone bodies including AA and 3-HB in primary human leukemia
cells from HCL patients compared to control peripheral blood
samples from a healthy donor (Figure S5C, left two panels),
which is consistent with the fact that HCL cells are BRAF
V600E positive with upregulated HMGCL. In addition, increased
AA levels were also detected in tumor and bonemarrow samples
from BRAF V600E conditional knockin mouse models of mela-
noma or HCL compared to control skin or bone marrow samples
from normal mice, respectively (Figure S5C, right two panels).
These findings are consistent with the results showing increased
HMGCL expression in primary leukemia cells from HCL patients
(Figures 2D and 2E) and tumors expressing BRAF V600E
(Figure S2A).
AA Selectively Enhances BRAF V600E-MEK1 BindingWe next tested the hypothesis that AA might affect BRAF V600E
kinase activity. We thus performed cell-free in vitro kinase as-
says using purified recombinant BRAF V600E or BRAF WT incu-
bated with purified myelin basic protein (MBP) as a non-specific
substrate or purified MEK1 in the presence of increasing
amounts of AA. We found that not BRAF WT but BRAF V600E-
dependent phosphorylation of MEK1 was increased in the pres-
ence of AA (Figure S5D). Although both BRAF V600E or BRAF
WT phosphorylates MBP, such phosphorylation was not
affected in the presence of increasing concentrations of AA or
3-HB (Figures 5A, S5E, and S5F), suggesting that AAmay specif-
ically affect BRAF V600E-dependent phosphorylation of MEK1.
Further mechanistic studies revealed that AA treatment re-
sulted in increased MEK1 binding to BRAF V600E as well as
increased phosphorylation of V600E-bound MEK1 in A2058,
A375, and WM2664 cells, but not to BRAF WT in control
PMWK and HMCB cells (Figures 5B and S6A) or CRAF in
A2058 cells (Figure S6B). In contrast, 3-HB treatment did not
affect BRAF-MEK1 binding or MEK1 phosphorylation (Fig-
ure S6C). Moreover, KD of HMGCL resulted in decreased
BRAF V600E/D-MEK1 binding and MEK1 phosphorylation only
in A2058, A375, andWM2664 (V600D) cells, whichwere reversed
by treatment with AA (Figure 5C) but not 3-HB (Figure S6D).
F WT or V600E by daily cell counting. Right: Immunoblotting of HMGCL upon
hown in Figure 2A on the right. Data are mean ± SD; n = 3 each; p values were
in Mel-ST cells expressing BRAF WT or V600E upon HMGCL KD.
noma cell lines.
ls of MEK1 and ERK1/2 in melanoma cell lines with HMGCL KD.
ell as phosphorylation levels of ERK1/2 in BRAF V600E-expressing A375 cells.
al or HMGCL KD A375 cells. Data are mean ± SD; n = 3 each; p values were

Figure 4. HMGCL’s Product AA Specifically Promotes MEK-ERK Activation in BRAF V600E-Expressing Cells
(A) Intracellular concentration of AA in melanoma cells with HMGCL KD.
(B) Cell permeability of AA (upper) or 3-HB (lower) was examined by increased scintillation counting of 14C in the cell lysates using humanmelanoma cells cultured
in the presence of 14C-labeled AA or 3-HB for 12 hr.
(legend continued on next page)
Molecular Cell 59, 1–14, August 6, 2015 ª2015 Elsevier Inc. 7
Please cite this article in press as: Kang et al., Metabolic Rewiring by Oncogenic BRAF V600E Links Ketogenesis Pathway to BRAF-MEK1 Signaling,Molecular Cell (2015), http://dx.doi.org/10.1016/j.molcel.2015.05.037

Please cite this article in press as: Kang et al., Metabolic Rewiring by Oncogenic BRAF V600E Links Ketogenesis Pathway to BRAF-MEK1 Signaling,Molecular Cell (2015), http://dx.doi.org/10.1016/j.molcel.2015.05.037
To determine whether AA directly or indirectly affects the
BRAF V600E-MEK1 complex, we performed cell-free in vitro
binding and kinase assays using purified recombinant BRAF
V600E or BRAF WT incubated with recombinant purified MEK1
as substrate, in the presence of increasing amounts of AA. We
found that AA treatment promoted MEK1 binding to BRAF
V600E and phosphorylation of V600E-bound MEK1 in a dose-
dependent manner, whereas such phenotypes were absent in
MEK1 incubated with BRAF WT (Figure 5D). Notably, increasing
AA concentrations from 200 mM to 300 mM caused a significant
increase in BRAF V600E-bound and phosphorylated MEK1 (Fig-
ure 5D), which were physiologically consistent with the AA levels
determined in HMGCL KD A375 and A2058 cells compared to
control cells (Figure 4A).
Moreover, we found that purified BRAF V600E pre-treated
with increasing concentrations of AA (Figure 5E, left) but not
3-HB (Figure S6E, left) showed increased binding ability to
MEK1, whereas neither AA (Figure 5E, right) nor 3-HB (Fig-
ure S6E, right) pre-treated MEK1 demonstrated increased
binding ability to BRAF V600E. These results are consistent
with our observation that AA might directly bind to BRAF
V600E but not BRAF WT in a thermal melt shift assay using
purified BRAF WT or V600E incubated with increasing concen-
trations of AA (Figure 5F). Furthermore, we performed a
radiometric metabolite-protein interaction analysis using 14C-
labeled AA incubated with purified BRAF variants. Labeled
AA specifically binds to BRAF V600E and a V600E mutant of
an active, truncated C-terminal domain of BRAF (tBRAF,
416–766 aa) (Brummer et al., 2006), but not to control proteins
including BRAF WT, tBRAF WT, or a N-terminal domain of
BRAF (BRAF-N, 1–415 aa), which further suggest the direct as-
sociation between AA and V600E mutant of BRAF (Figure 5G).
Consistently, treatment with 300 or 400 mM of AA resulted in
increased Vmax and slightly decreased Km of BRAF V600E us-
ing MEK1 as a substrate, whereas treatment with lower con-
centrations (0, 100, and 200 mM) of AA did not affect Vmax
or Km of V600E (Figure 5H, left panels). In contrast, treatment
with AA did not affect Vmax or Km of BRAF V600E using MBP
as a substrate (Figure 5H, right panels). Together, these data
suggest an important role of AA in BRAF V600E-dependent
transformation.
Active BRAF Signals through Oct-1 to UpregulateHMGCL and Its Product AA, which, however, SelectivelyEnhances BRAF V600E-Dependent Activation of MEK1We found that stable KD of BRAF V600E but not BRAF WT in
melanoma cells resulted in decreased HMGCL protein (Fig-
ure 6A, upper) and mRNA (Figure S7A, upper) levels. Similar
results were obtained using treatment with BRAF mutant small
(C) Effect of adding increasing concentrations of AA on A375 (upper) or HMCB (low
(D–F) Effect of adding AA or 3-HB in culture media on cell proliferation rates of m
expressing BRAF WT or V600E (F). Cell proliferation rates were determined by d
(G) Effect of adding AA in culture media on phosphorylation levels of MEK1 and
(H) Intracellular AA levels (left panels) and immunoblotting results detecting MEK1
and ERK1/2 (right panels) using tumor lysates are shown. The tumorswere from xe
Figure 4 are represented as mean ± SD; n = 3 each; p values were obtained by a
Also see Figures S4 and S5.
8 Molecular Cell 59, 1–14, August 6, 2015 ª2015 Elsevier Inc.
molecule inhibitor PLX-4032 (Figures 6A and S7A, lower
panels), whereas treatment with MEK1 inhibitors U0126
(Figure 6B), selumatinib, and trametinib (Figure S7B) did not
affect HMGCL mRNA levels in PMWK, A375, and A2058 cells.
These results suggest that active BRAF V600E but not its
downstream MEK1-ERK signaling is involved in HMGCL
upregulation.
To decipher how BRAF V600E upregulates HMGCL in cells in-
dependent of MEK1, using a series of luciferase reporter con-
structs, we identified �929 to �665 as the functional region of
HMGCLpromoter (Figure 6C). Sequence analysis by TFSEARCH
(https://archive.is/ANbf4) revealed seven potential transcription
factors that may bind directly to �929 to �665 and modulate
HMGCL promoter activity. Among these factors, ChIP assay
suggested that both Oct-1 and IKAROS could bind to HMGCL
promoter (Figure 6D). Further experiments revealed that KD of
BRAF V600E in A2058 cells resulted in decreased binding of
Oct-1 but not IKAROS to HMGCL �929 to �665 promoter re-
gion, whereas KD of BRAF WT in PMWK cells did not affect
either Oct-1 or IKAROS binding to this region (Figure 6E). Similar
results were obtained using A375 and HMCB cells with BRAF KD
(Figure S7C), or those cells treated with PLX-4032 (Figures 6F
and S7D).
Consistent with these findings, we found that Oct-1 KD re-
sulted in decreased HMGCL expression and intracellular AA
levels in BRAF V600E-expressing A2058 and A375 cells but
not in control PMWK and HMCB cells expressing BRAFWT (Fig-
ures 6G and S7E). Moreover, Oct-1 KD resulted in decreased
phosphorylation of MEK1 and ERK1/2 in A2058 and A375 cells
but not in control PMWK and HMCB cells (Figures 6H and
S7F), which was reversed by adding AA in culture media (Figures
6I and S7G). In addition, treatment with AA also reversed
reduced protein amount and phosphorylation of MEK1 bound
to BRAF V600E in A2058 and A375 cells with Oct-1 KD, but
not in control PMWK and HMCB cells (Figures 6J and S7H).
Consistently, AA treatment also partially reversed decreased
cell proliferation in A2058 and A375 cells with Oct-1 KD, but
not in control PMWK and HMCB cells (Figures 6K and S7I).
This suggests that Oct-1 plays an essential role in BRAF
V600E-dependent transformation, and HMGCL is one of the
important downstream effectors of Oct-1.
In order to determine whether active BRAF activates the Oct-
1-HMGCL-AA axis in cells, we included an active, N-terminally
truncated BRAF (tBRAF, 416–766 aa). We found that both
BRAF V600E and tBRAF demonstrated comparably increased
kinase activity in an in vitro kinase assay compared to BRAF
WT (Figure 7A). In addition, stable expression of BRAF V600E
and tBRAF in Mel-ST cells resulted in comparably enhanced
cell proliferation (Figure 7B), increased HMGCL expression
er) cells in culturemedia on reduced intracellular levels of AA upon HMGCLKD.
elanoma cell lines (D), HMGCL R41M rescue A375 cells (E), and Mel-ST cells
aily cell counting.
ERK1/2 in melanoma cell lines and cells with HMGCL KD.
, ERK1/2, and HMGCL protein levels as well as phosphorylation levels of MEK1
nograft nudemice presented in Figures 3B, 3C, and S2D. Datawith error bars in
two-tailed Student’s t test.

Figure 5. AA Selectively Enhances BRAF V600E-MEK1 Binding(A) Effect of AA on phosphorylation of MBP in an in vitro kinase assay using purified recombinant BRAF V600E or BRAF WT incubated with purified MBP as a
substrate.
(B andC) Effect of adding cell-permeable AA in culturemedia on BRAF-MEK1 binding andMEK1 phosphorylation inmelanoma cells (B) and cells with HMGCLKD
(C). IP: immunoprecipitates.
(D) Effect of AA on BRAF-MEK1 binding and MEK1 phosphorylation in cell-free in vitro assays using purified recombinant BRAF (rBRAF) and MEK1 (rMEK1).
(E) Effect of pre-treatment of rBRAF V600E (left) or rMEK1 (right) with increasing concentrations of AA on BRAF-MEK1 binding andMEK1 phosphorylation in cell-
free in vitro assays.
(F) Thermal melt shift assay was performed to examine the protein (BRAFWT or V600E) and ligand (AA) interaction. Change of melting temperature (Tm) in a dose-
dependentmanner at concentrations from 0 mM to 400 mMdemonstrates that AAmay directly bind to BRAF V600E but not BRAFWTprotein. Arrows in each panel
indicate melting temperatures at 0 mM (left) and 300 mM (right), since 300 mM represents the physiological AA level in BRAF V600E-expressing human melanoma
cells.
(G) Radiometric metabolite-protein interaction analysis using 14C-labeled AA incubated with purified BRAF variants. Data are mean ± SD; n = 3 each; p values
were obtained by a two-tailed Student’s t test.
(H) Vmax and Km of BRAF V600E were measured using purified BRAF V600E protein (100 ng) incubated with increasing concentrations of ATP in the presence
and absence of increasing concentration of AA, using excessive amount of purified MEK1 (left) or MBP (right) as substrates. Data are mean ± SD; n = 3 each;
p values were obtained by a two-tailed Student’s t test. Also see Figures S5 and S6.
Please cite this article in press as: Kang et al., Metabolic Rewiring by Oncogenic BRAF V600E Links Ketogenesis Pathway to BRAF-MEK1 Signaling,Molecular Cell (2015), http://dx.doi.org/10.1016/j.molcel.2015.05.037
(Figure 7C) along with increased Oct-1 binding to HMGCL pro-
moter region (Figure 7D), and elevated intracellular AA levels
(Figure 7E) compared to cells expressing control BRAF WT or
an ED (K482M) (Sievert et al., 2013) form of tBRAF.
However, only expression of BRAF V600E and tBRAF but not
the EDmutant of tBRAF resulted in increased phosphorylation of
MEK1 and ERK1/2 (Figure 7C). Moreover, treatment with AA
selectively promotes BRAF V600E but not tBRAF to bind and
Molecular Cell 59, 1–14, August 6, 2015 ª2015 Elsevier Inc. 9

Figure 6. BRAF V600E Upregulates HMGCL Expression through an Octamer Transcription Factor Oct-1
(A) Western blot to detect HMGCL protein levels in humanmelanoma cells with stable KD of BRAFWT or V600E/D mutant (upper) or treatment with BRAF V600E
inhibitor PLX-4032 (lower).
(B) RT-PCR to examine the effect of treatment with MEK1 inhibitor U0126 on HMGCL mRNA levels in PMWK (BRAF WT) and A2058 (V600E) melanoma cells.
(C) Luciferase reporter assay revealed a functional HMGCL promoter region (�929 to �665).
(legend continued on next page)
10 Molecular Cell 59, 1–14, August 6, 2015 ª2015 Elsevier Inc.
Please cite this article in press as: Kang et al., Metabolic Rewiring by Oncogenic BRAF V600E Links Ketogenesis Pathway to BRAF-MEK1 Signaling,Molecular Cell (2015), http://dx.doi.org/10.1016/j.molcel.2015.05.037

Please cite this article in press as: Kang et al., Metabolic Rewiring by Oncogenic BRAF V600E Links Ketogenesis Pathway to BRAF-MEK1 Signaling,Molecular Cell (2015), http://dx.doi.org/10.1016/j.molcel.2015.05.037
phosphorylate MEK1 (Figure 7F), leading to increased cell prolif-
eration in Mel-ST cells (Figure 7G). These results together sug-
gest that active BRAF commonly activates Oct-1, leading to
upregulated HMGCL and consequently intracellular AA levels,
whereas AA selectively promotes BRAF V600E-dependent acti-
vation of MEK-ERK signaling cascade.
DISCUSSION
Thecurrent understandingofmetabolic alterations in humancan-
cers is befuddling. We propose to distinguish metabolic ‘‘rewir-
ing’’ and ‘‘reprogramming’’ in cancer cells, wherein metabolic re-
programming describes ‘‘software’’ changes induced by growth
factors in normal proliferative cells that are ‘‘hijacked’’ by onco-
genic signals in cancer cells, while metabolic rewiring represents
‘‘hardware’’ changes that are ‘‘forged’’ due to ‘‘neo-function’’ of
oncogenic mutants, but are not found in normal cells. Our find-
ings suggest a ‘‘mutation-specific’’ function in which BRAF
V600E upregulates HMGCL, leading to increased intracellular
levels of AA that specifically promote BRAF V600E binding to
MEK1and subsequentMEK1phosphorylation (Figure 7H). These
results also support the emerging ‘‘metabolic rewiring’’ concept
describing metabolic alterations in cancer cells that are required
for a group of oncogenes but are not found in normal cells. In our
case, we demonstrated that oncogenic BRAF V600E links keto-
genesis to BRAF-MEK-ERK signaling cascade, representing a
‘‘wiring’’ between metabolic and cell signaling pathways. This
in part shares conceptual similarity with the mutations in isoci-
trate dehydrogenase (IDH) 1 and 2 identified in glioma and acute
myeloid leukemia, which enable the enzymes to produce onco-
metabolite 2-hydroxyglutamate (Dang et al., 2009; Mardis et al.,
2009; Parsons et al., 2008; Yan et al., 2009).
In addition, our findings provide evidence that supports a
concept suggesting that a group of oncogenes may require
different metabolic alterations for tumor growth. We found that
active BRAF commonly activates Oct-1 to promote HMGCL
gene expression, which in turn leads to increased intracellular
levels of AA in cells. However, it appears that only BRAF proteins
with substitution of V600 or mutations within the V600 flanking
region may benefit from the elevated levels of AA, which selec-
tively promotes MEK1 binding. Thus, although AA levels are
commonly elevated upon activation of BRAF, only cancer cells
expressing BRAF V600E/D mutant can benefit from increased
intracellular AA, where increased AA specifically promotes
V600E-MEK1 signaling, providing an ‘‘evolutionary advantage’’
that may explain why V600E is the predominant mutation of
BRAF identified in human malignancies. Further studies are war-
ranted to determine whether other cancer-associated active
BRAF mutants may similarly upregulate HMGCL expression
(D) ChIP results detecting binding ability of a group of transcription factors to the f
indicated with ‘‘+’’ in red color.
(E and F) ChIP results detecting binding ability of Oct-1 or IKAROS to HMGCL prom
inhibitor PLX-4032 (F).
(G and H) Effect of Oct-1 KD on HMGCL expression and intracellular AA levels (
(I–K) Effect of adding AA in culture on phosphorylation levels of MEK1 and ER
proliferation (K) inmelanoma cells with Oct-1 KD. Data with error bars in Figure 6 ar
Student’s t test.
Also see Figure S7.
and AA levels but cannot respond to AA in terms of MEK1 bind-
ing and phosphorylation.
In addition, future structural studies are also warranted to
explore the molecular basis underlying how AA specifically pro-
motes BRAF V600E-MEK1 binding and elucidate the molecular
mechanism by which active BRAF mutants, which, however,
may not be necessarily limited to BRAF V600E, upregulate
HMGCL gene expression in cancer cells. It will also be inter-
esting to explore the molecular mechanism by which active
BRAF activates Oct-1 in a MEK1-independent manner, which
may involve direct or indirect phosphorylation of Oct-1, since
BRAF kinase activity is important to promote Oct-1 binding to
HMGCL promoter. In addition, there may be additional Oct-1
transcription targets besides HMGCL that are important to
mediate BRAF V600E-dependent transformation in cancer cells,
which may explain why AA treatment only partially reversed the
decreased cell proliferation in BRAF V600E-positive melanoma
cells with Oct-1 KD (Figures 6K and S7I).
Our findings also link the ketogenic pathway to oncogenic
BRAF V600E-MEK-ERK signaling cascade, suggesting a
signaling function of AA that is independent of its role in cell meta-
bolism. These findings add to emerging evidence that supports a
concept suggesting that metabolites could function as signaling
molecules to allow crosstalk between metabolic pathways and
cell signaling networks. For example, we previously reported
that glycolytic intermediate 3-phosphoglycerate is a competitive
inhibitor of 6-phosphoglyconate dehydrogenase (6PGD) in the
oxidative pentose phosphate pathway (Hitosugi et al., 2012),
while others have found that AMP is an allosteric activator for
AMPK.On theother hand, there has beenaccumulating evidence
showing that post-translational modifications including tyrosine
phosphorylation (Fan et al., 2011; Hitosugi et al., 2011; Hitosugi
et al., 2009; Hitosugi et al., 2013) and lysine acetylation (Choudh-
aryet al., 2009; Fanet al., 2014;Kimet al., 2006;Wanget al., 2010;
Zhao et al., 2010) of metabolic enzymes are common and impor-
tant to link cell signaling pathways to metabolic pathways in can-
cer cells. These findings together represent a realm of crosstalk
with ‘‘back and forth’’ signal flows between metabolic and cell
signaling networks that ‘‘acutely’’ regulate cell metabolism and
proliferation,which, unfortunately, are ‘‘hijacked’’ bycancer cells.
Lastly, our results suggest that HMGCL inhibitor or non-
metabolizable AA derivatives that can compete with AA for
BRAF V600E binding may represent alternative therapies to treat
oncogenic BRAF V600E driven cancers. However, organs
including heart and brain can use ketone bodies including AA
and 3-HB for energy (Cotter et al., 2013; Morris, 2005). This war-
rants further detailed toxicity and pharmacokinetics studies to
evaluate the proposed anti-HMGCL or anti-AA therapies in can-
cer treatment.
unctional region of HMGCL promoter. Positive binding of Oct-1 and IKAROS is
oter region inmelanoma cells with BRAF KD (E) or treatment with BRAF V600E
G) and phosphorylation levels of MEK1 and ERK1/2 (H).
K1/2 (I), phosphorylation of MEK1 and BRAF-MEK1 association (J), and cell
e represented asmean ± SD; n = 3 each; p valueswere obtained by a two-tailed
Molecular Cell 59, 1–14, August 6, 2015 ª2015 Elsevier Inc. 11
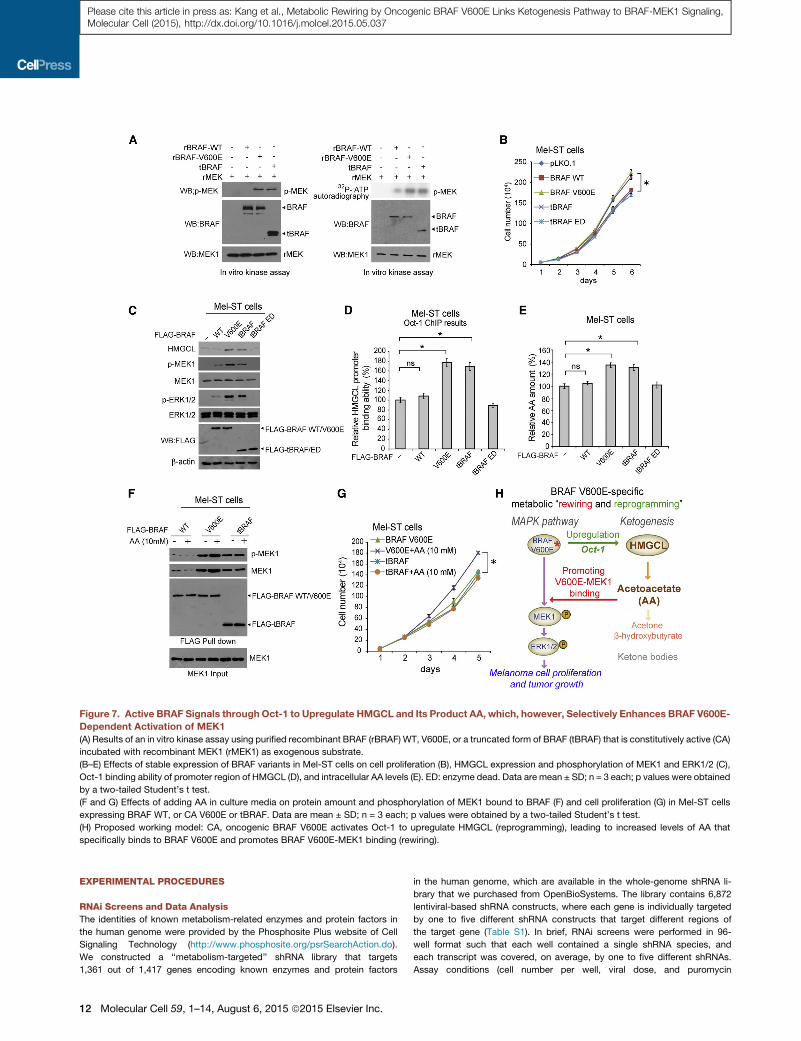
Figure 7. Active BRAF Signals throughOct-1 to Upregulate HMGCL and Its Product AA, which, however, Selectively Enhances BRAF V600E-
Dependent Activation of MEK1
(A) Results of an in vitro kinase assay using purified recombinant BRAF (rBRAF) WT, V600E, or a truncated form of BRAF (tBRAF) that is constitutively active (CA)
incubated with recombinant MEK1 (rMEK1) as exogenous substrate.
(B–E) Effects of stable expression of BRAF variants in Mel-ST cells on cell proliferation (B), HMGCL expression and phosphorylation of MEK1 and ERK1/2 (C),
Oct-1 binding ability of promoter region of HMGCL (D), and intracellular AA levels (E). ED: enzyme dead. Data are mean ± SD; n = 3 each; p values were obtained
by a two-tailed Student’s t test.
(F and G) Effects of adding AA in culture media on protein amount and phosphorylation of MEK1 bound to BRAF (F) and cell proliferation (G) in Mel-ST cells
expressing BRAF WT, or CA V600E or tBRAF. Data are mean ± SD; n = 3 each; p values were obtained by a two-tailed Student’s t test.
(H) Proposed working model: CA, oncogenic BRAF V600E activates Oct-1 to upregulate HMGCL (reprogramming), leading to increased levels of AA that
specifically binds to BRAF V600E and promotes BRAF V600E-MEK1 binding (rewiring).
Please cite this article in press as: Kang et al., Metabolic Rewiring by Oncogenic BRAF V600E Links Ketogenesis Pathway to BRAF-MEK1 Signaling,Molecular Cell (2015), http://dx.doi.org/10.1016/j.molcel.2015.05.037
EXPERIMENTAL PROCEDURES
RNAi Screens and Data Analysis
The identities of known metabolism-related enzymes and protein factors in
the human genome were provided by the Phosphosite Plus website of Cell
Signaling Technology (http://www.phosphosite.org/psrSearchAction.do).
We constructed a ‘‘metabolism-targeted’’ shRNA library that targets
1,361 out of 1,417 genes encoding known enzymes and protein factors
12 Molecular Cell 59, 1–14, August 6, 2015 ª2015 Elsevier Inc.
in the human genome, which are available in the whole-genome shRNA li-
brary that we purchased from OpenBioSystems. The library contains 6,872
lentiviral-based shRNA constructs, where each gene is individually targeted
by one to five different shRNA constructs that target different regions of
the target gene (Table S1). In brief, RNAi screens were performed in 96-
well format such that each well contained a single shRNA species, and
each transcript was covered, on average, by one to five different shRNAs.
Assay conditions (cell number per well, viral dose, and puromycin

Please cite this article in press as: Kang et al., Metabolic Rewiring by Oncogenic BRAF V600E Links Ketogenesis Pathway to BRAF-MEK1 Signaling,Molecular Cell (2015), http://dx.doi.org/10.1016/j.molcel.2015.05.037
concentration) were optimized for each cell line prior to screening. Cells
were seeded, incubated for 24 hr, infected with lentivirus, and incubated
for 5 days. All lentiviral infections were performed with two replicates
selected with puromycin during the final 5 days of incubation and the other
two replicates left untreated. Cell viability and proliferation were measured
5 days after lentiviral infection using a CyQUANT Direct Cell Proliferation
Assay kit (Invitrogen). For both primary and secondary screens, we used
two RIGER methods (RIGER_KS and RIGER_SB) and another method,
Gene Set Analysis R package (Barbie et al., 2009; Gould et al., 2006;
Malo et al., 2006; Sims et al., 2011), to analyze the normalized B scores
for each cell line.
Xenograft Studies and Primary Tissue Samples from Patients with
Melanoma or HCL and Healthy Donors
Approval of use of mice and designed experiments was given by the Insti-
tutional Animal Care and Use Committee of Emory University. Approval of
use of human specimens was given by the Institutional Review Board of
Emory University School of Medicine. All clinical samples were obtained
with informed consent with approval by the Emory University Institutional
Review Board. Clinical information for the patients was obtained from the
pathologic files at Emory University Hospital under the guidelines and
with approval from the Institutional Review Board of Emory University
School of Medicine and according to the Health Insurance Portability and
Accountability Act. Detailed experimental procedures using mice and hu-
man primary tissue samples are described in the Supplemental Experi-
mental Procedures.
SUPPLEMENTAL INFORMATION
Supplemental Information includes seven figures, seven tables, and Supple-
mental Experimental Procedures and can be found with this article online at
http://dx.doi.org/10.1016/j.molcel.2015.05.037.
AUTHOR CONTRIBUTIONS
H.-B.K., J.F., and R.L. contributed equally to this work. J.L.A., C.C., D.B.,
H.M.M., E.K., O.A.-W., T.M., B.P.P., K.F., R.R.K., D.H.L., G.S., M.R., S.L.,
H.J.K., and F.R.K. provided critical reagents. Q.J. and C.H. performed
biochemical analysis of purified proteins incubated with AA and analyzed
the data. T.J.B. performed structural analysis. B.H.L. performed the histopath-
ological analyses. S.F., C. Scholl, P.T., and D.A.B. contributed to experimental
design of screens and statistical analyses. H.-B.K., J.F., R.L., S.E., L.Z., L.J., C.
Shan, and J.H.S. performed all other experiments. H.-B.K., J.F., R.L., S.K., and
J.C. designed the study. S.K. and J.C. are senior authors and jointly managed
the project and wrote the paper.
ACKNOWLEDGMENTS
We thank Cancer Tissue and Pathology Core of Emory University for providing
primary cancer patient tissue samples. This work was supported in part by NIH
grants CA140515, CA183594, CA174786 (J.C.), CA175316 (S.K.), GM071440
(C.H.), and AR47901 (J.L.A.); the Pharmacological Sciences Training Grant
T32 GM008602 (S.E.); DoD grant W81XWH-12-1-0217 (J.C.); National Natural
Science Funds of China No.20902013 (L.Z.); the Jamie Rabinowitch Davis
Foundation (J.L.A.); the Charles Harris Run For Leukemia, Inc. (H.J.K.); and
the Hematology Tissue Bank of the Emory University School of Medicine
and the Georgia Cancer Coalition (H.J.K.). H.J.K., F.R.K., S.K., and J.C. are
Georgia Cancer Coalition Distinguished Cancer Scholars. S.K. and J.C. are
American Cancer Society Basic Research Scholars. J.C. is a Scholar of the
Leukemia and Lymphoma Society.
Received: February 13, 2015
Revised: April 17, 2015
Accepted: May 28, 2015
Published July 2, 2015
REFERENCES
Arcaini, L., Zibellini, S., Boveri, E., Riboni, R., Rattotti, S., Varettoni, M.,
Guerrera, M.L., Lucioni, M., Tenore, A., Merli, M., et al. (2012). The BRAF
V600E mutation in hairy cell leukemia and other mature B-cell neoplasms.
Blood 119, 188–191.
Balasse, E.O., and Fery, F. (1989). Ketone body production and disposal: ef-
fects of fasting, diabetes, and exercise. Diabetes Metab. Rev. 5, 247–270.
Barbie, D.A., Tamayo, P., Boehm, J.S., Kim, S.Y., Moody, S.E., Dunn, I.F.,
Schinzel, A.C., Sandy, P., Meylan, E., Scholl, C., et al. (2009). Systematic
RNA interference reveals that oncogenic KRAS-driven cancers require
TBK1. Nature 462, 108–112.
Benlloch, S., Paya, A., Alenda, C., Bessa, X., Andreu, M., Jover, R., Castells,
A., Llor, X., Aranda, F.I., and Massutı, B. (2006). Detection of BRAF V600E mu-
tation in colorectal cancer: comparison of automatic sequencing and real-time
chemistry methodology. J. Mol. Diagn. 8, 540–543.
Bollag, G., Tsai, J., Zhang, J., Zhang, C., Ibrahim, P., Nolop, K., and Hirth, P.
(2012). Vemurafenib: the first drug approved for BRAF-mutant cancer. Nat.
Rev. Drug Discov. 11, 873–886.
Brummer, T., Martin, P., Herzog, S., Misawa, Y., Daly, R.J., and Reth, M.
(2006). Functional analysis of the regulatory requirements of B-Raf and the
B-Raf(V600E) oncoprotein. Oncogene 25, 6262–6276.
Chapman, M.A., Lawrence, M.S., Keats, J.J., Cibulskis, K., Sougnez, C.,
Schinzel, A.C., Harview, C.L., Brunet, J.P., Ahmann, G.J., Adli, M., et al.
(2011). Initial genome sequencing and analysis of multiple myeloma. Nature
471, 467–472.
Choudhary, C., Kumar, C., Gnad, F., Nielsen, M.L., Rehman, M., Walther, T.C.,
Olsen, J.V., andMann,M. (2009). Lysine acetylation targets protein complexes
and co-regulates major cellular functions. Science 325, 834–840.
Chung, S., Kim, E., Park, J.H., Chung, Y.R., Lito, P., Feldstein, J., Hu, W.,
Beguilin, W., Monette, S., Duy, C., Rampal, R., Telis, L., Patel, M., Kim,
M.K., Melnick, A.M., Rosen, N., Tallman, M.S., Park, C.Y., and Abdel-
Wahab, O. (2014). Hematopoietic stem cell origin of BRAFV600E mutations
in hairy cell leukemia. Sci. Transl. Med. 6, http://dx.doi.org/10.1126/sci-
translmed.3008004.
Cotter, D.G., Schugar, R.C., and Crawford, P.A. (2013). Ketone body meta-
bolism and cardiovascular disease. Am. J. Physiol. Heart Circ. Physiol. 304,
H1060–H1076.
Dang, L., White, D.W., Gross, S., Bennett, B.D., Bittinger, M.A., Driggers, E.M.,
Fantin, V.R., Jang, H.G., Jin, S., Keenan,M.C., et al. (2009). Cancer-associated
IDH1 mutations produce 2-hydroxyglutarate. Nature 462, 739–744.
Dankort, D., Curley, D.P., Cartlidge, R.A., Nelson, B., Karnezis, A.N., Damsky,
W.E., Jr., You, M.J., DePinho, R.A., McMahon, M., and Bosenberg, M. (2009).
Braf(V600E) cooperates with Pten loss to induce metastatic melanoma. Nat.
Genet. 41, 544–552.
Fan, J., Hitosugi, T., Chung, T.W., Xie, J., Ge, Q., Gu, T.L., Polakiewicz, R.D.,
Chen, G.Z., Boggon, T.J., Lonial, S., et al. (2011). Tyrosine phosphorylation of
lactate dehydrogenase A is important for NADH/NAD(+) redox homeostasis in
cancer cells. Mol. Cell. Biol. 31, 4938–4950.
Fan, J., Shan, C., Kang, H.B., Elf, S., Xie, J., Tucker, M., Gu, T.L., Aguiar, M.,
Lonning, S., Chen, H., et al. (2014). Tyr phosphorylation of PDP1 toggles
recruitment between ACAT1 and SIRT3 to regulate the pyruvate dehydroge-
nase complex. Mol. Cell 53, 534–548.
Fu, Z., Runquist, J.A., Montgomery, C., Miziorko, H.M., and Kim, J.J. (2010).
Functional insights into human HMG-CoA lyase from structures of Acyl-
CoA-containing ternary complexes. J. Biol. Chem. 285, 26341–26349.
Gibney, G.T., Messina, J.L., Fedorenko, I.V., Sondak, V.K., and Smalley, K.S.
(2013). Paradoxical oncogenesis—the long-term effects of BRAF inhibition in
melanoma. Nat. Rev. Clin. Oncol. 10, 390–399.
Golomb, H.M., Davis, S., Wilson, C., and Vardiman, J. (1982). Surface immu-
noglobulins on hairy cells of 55 patients with hairy cell leukemia. Am. J.
Hematol. 12, 397–401.
Molecular Cell 59, 1–14, August 6, 2015 ª2015 Elsevier Inc. 13
Please cite this article in press as: Kang et al., Metabolic Rewiring by Oncogenic BRAF V600E Links Ketogenesis Pathway to BRAF-MEK1 Signaling,Molecular Cell (2015), http://dx.doi.org/10.1016/j.molcel.2015.05.037
Gould, J., Getz, G.,Monti, S., Reich, M., andMesirov, J.P. (2006). Comparative
gene marker selection suite. Bioinformatics 22, 1924–1925.
Hitosugi, T., Kang, S., Vander Heiden, M.G., Chung, T.W., Elf, S., Lythgoe, K.,
Dong, S., Lonial, S., Wang, X., Chen, G.Z., et al. (2009). Tyrosine phosphory-
lation inhibits PKM2 to promote the Warburg effect and tumor growth. Sci.
Signal. 2, ra73.
Hitosugi, T., Fan, J., Chung, T.W., Lythgoe, K., Wang, X., Xie, J., Ge, Q., Gu,
T.L., Polakiewicz, R.D., Roesel, J.L., et al. (2011). Tyrosine phosphorylation
of mitochondrial pyruvate dehydrogenase kinase 1 is important for cancer
metabolism. Mol. Cell 44, 864–877.
Hitosugi, T., Zhou, L., Elf, S., Fan, J., Kang, H.B., Seo, J.H., Shan, C., Dai, Q.,
Zhang, L., Xie, J., et al. (2012). Phosphoglycerate mutase 1 coordinates glycol-
ysis and biosynthesis to promote tumor growth. Cancer Cell 22, 585–600.
Hitosugi, T., Zhou, L., Fan, J., Elf, S., Zhang, L., Xie, J., Wang, Y., Gu, T.L.,
Ale�ckovi�c, M., LeRoy, G., et al. (2013). Tyr26 phosphorylation of PGAM1 pro-
vides ametabolic advantage to tumours by stabilizing the active conformation.
Nat. Commun. 4, 1790.
Johnson, D.B., and Sosman, J.A. (2013). Update on the targeted therapy of
melanoma. Curr. Treat. Options Oncol. 14, 280–292.
Kim, S.C., Sprung, R., Chen, Y., Xu, Y., Ball, H., Pei, J., Cheng, T., Kho, Y.,
Xiao, H., Xiao, L., et al. (2006). Substrate and functional diversity of lysine acet-
ylation revealed by a proteomics survey. Mol. Cell 23, 607–618.
Malo, N., Hanley, J.A., Cerquozzi, S., Pelletier, J., and Nadon, R. (2006).
Statistical practice in high-throughput screening data analysis. Nat.
Biotechnol. 24, 167–175.
Mansour, S.J., Matten, W.T., Hermann, A.S., Candia, J.M., Rong, S.,
Fukasawa, K., Vande Woude, G.F., and Ahn, N.G. (1994). Transformation of
mammalian cells by constitutively active MAP kinase kinase. Science 265,
966–970.
Mardis, E.R., Ding, L., Dooling, D.J., Larson, D.E., McLellan, M.D., Chen, K.,
Koboldt, D.C., Fulton, R.S., Delehaunty, K.D., McGrath, S.D., et al. (2009).
Recurringmutations found by sequencing an acutemyeloid leukemia genome.
N. Engl. J. Med. 361, 1058–1066.
14 Molecular Cell 59, 1–14, August 6, 2015 ª2015 Elsevier Inc.
McPherson, P.A., and McEneny, J. (2012). The biochemistry of ketogenesis
and its role in weight management, neurological disease and oxidative stress.
J. Physiol. Biochem. 68, 141–151.
Morris, A.A. (2005). Cerebral ketone body metabolism. J. Inherit. Metab. Dis.
28, 109–121.
Parsons, D.W., Jones, S., Zhang, X., Lin, J.C., Leary, R.J., Angenendt, P.,
Mankoo, P., Carter, H., Siu, I.M., Gallia, G.L., et al. (2008). An integrated
genomic analysis of human glioblastoma multiforme. Science 321, 1807–
1812.
Patel, M.S., Russell, J.J., and Gershman, H. (1981). Ketone-body metabolism
in glioma and neuroblastoma cells. Proc. Natl. Acad. Sci. USA 78, 7214–7218.
Schnittger, S., Bacher, U., Haferlach, T., Wendland, N., Ulke, M., Dicker, F.,
Grossmann, V., Haferlach, C., and Kern, W. (2012). Development and valida-
tion of a real-time quantification assay to detect and monitor BRAFV600E mu-
tations in hairy cell leukemia. Blood 119, 3151–3154.
Sievert, A.J., Lang, S.S., Boucher, K.L., Madsen, P.J., Slaunwhite, E.,
Choudhari, N., Kellet, M., Storm, P.B., and Resnick, A.C. (2013). Paradoxical
activation and RAF inhibitor resistance of BRAF protein kinase fusions charac-
terizing pediatric astrocytomas. Proc. Natl. Acad. Sci. USA 110, 5957–5962.
Sims, D., Mendes-Pereira, A.M., Frankum, J., Burgess, D., Cerone, M.A.,
Lombardelli, C., Mitsopoulos, C., Hakas, J., Murugaesu, N., Isacke, C.M.,
et al. (2011). High-throughput RNA interference screening using pooled
shRNA libraries and next generation sequencing. Genome Biol. 12, R104.
Tiacci, E., Trifonov, V., Schiavoni, G., Holmes, A., Kern, W., Martelli, M.P.,
Pucciarini, A., Bigerna, B., Pacini, R., Wells, V.A., et al. (2011). BRAFmutations
in hairy-cell leukemia. N. Engl. J. Med. 364, 2305–2315.
Wang, Q., Zhang, Y., Yang, C., Xiong, H., Lin, Y., Yao, J., Li, H., Xie, L., Zhao,
W., Yao, Y., et al. (2010). Acetylation ofmetabolic enzymes coordinates carbon
source utilization and metabolic flux. Science 327, 1004–1007.
Yan, H., Parsons, D.W., Jin, G., McLendon, R., Rasheed, B.A., Yuan, W., Kos,
I., Batinic-Haberle, I., Jones, S., Riggins, G.J., et al. (2009). IDH1 and IDH2mu-
tations in gliomas. N. Engl. J. Med. 360, 765–773.
Zhao, S., Xu, W., Jiang, W., Yu, W., Lin, Y., Zhang, T., Yao, J., Zhou, L., Zeng,
Y., Li, H., et al. (2010). Regulation of cellular metabolism by protein lysine acet-
ylation. Science 327, 1000–1004.