carta geologica d’italia
TRANSCRIPT
A P A TAgenzia per la protezione dell’ambiente e per i servizi tecniciDIPARTIMENTO DIFESA DEL SUOLOS e r v i z i o G e o l o g i c o d’I t a l i a
Organo Cartografico dello Stato (legge n°68 del 2.2.1960)
MEMORIEDESCRITTIVE DELLA
CARTA GEOLOGICA D’ITALIAVOLUME LXXIV
INTENSITY SCALE ESI 2007
La Scala di Intensità ESI 2007
Authors
A.M. MICHETTI, E. ESPOSITO, L. GUERRIERI, S. PORFIDO, L. SERVA, R. TATEVOSSIAN, E. VITTORI,F. AUDEMARD, T. AZUMA, J. CLAGUE, V. COMERCI, A. GÜRPINAR, J. MCCALPIN, B. MOHAMMADIOUN,
N.A. MÖRNER, Y. OTA, E. ROGHOZIN
Editors
GUERRIERI L., VITTORI E.
SYTEMCART - 2007

Direttore responsabile: Leonello SERVA
REDAZIONE a cura del Servizio Cartografico, coordinamento base dati e tavoli europeiDirigente: Norman ACCARDICapo Settore: Domenico TACCHIACoordinamento Editoriale, allestimento digitale dei testi: Maria Luisa VATOVEC
SYSTEMCART - 2007
Preface
The idea of an Intensity scale based on coseismic environmental effects started to ripe early in the '80sfollowing the macroseismic surveys of strong earthquakes, in particular, for Italy, those occurred in 1976(Friuli) and 1980 (Irpinia-Basilicata). In fact, during such surveys, it was often observed that intensitycould not be reliably evaluated only based on damage to artefacts. This was specially true for sparselypopulated areas and for the highest degrees, because it was extremely difficult to estimate damage abovedegree X. Environmental effects, although sometimes widespread, were generally overlooked even ifsome of them do not suffer of such limitations. Among them was particularly impressive the observationof jumping stones, which sometimes were found higher than their original position, clear evidence ofpeak acceleration exceeding gravity.It must be underlined that the compilers of the earlier macroseismic scales already at the end of XIX cen-tury judged useful to define the intensity degree based on effects not only on man and man-made struc-tures, but also on the environment.The intensity scale ESI 2007 (Environmental Seismic Intensity scale) results from a reviewing process ofprevious versions lasted for eight years and carried out also under the patronage of INQUA (InternationalUnion for Quaternary Research). To this revision have participated many qualified geologists, seismolo-gists and engineers from many countries, under the coordination of the Italian Geological Survey of theItalian Environmental Agency.The ESI scale does not substitute the traditional ones, but integrates them, allowing to define the ear-thquake intensity on the basis of the whole set of coseismic effects. It can be applied not only to futureearthquakes, but also to reassess historical events. Therefore, I believe that, if properly applied, the ESIscale will provide valuable information in many areas for a better assessment of seismic hazard.
PrefazioneL’idea di una scala di intensità basata sugli effetti cosismici sull’ambiente è iniziata a maturare a partire dagli anni '80 aseguito dei rilievi macrosismici di forti terremoti, in particolare per l’Italia quelli del 1976 (Friuli) e 1980 (Irpinia-Basilicata). Infatti, nel corso di tali rilievi si osservava spesso che l’intensità non poteva essere stimata in maniera affidabi-le sulla base dei soli danni sul costruito. Ciò valeva in particolare per le aree scarsamente abitate e per i terremoti più forti,in quanto risultava estremamente complesso stimare il danneggiamento sopra il decimo grado. Gli effetti ambientali, pur talo-ra numerosi e diffusi su tutto il territorio venivano invece trascurati sebbene alcuni di loro non soffrissero di simili limitazio-ni (tra essi, l’effetto che più mi colpiva erano le impronte sul terreno di sassi che si ritrovavano nelle immediate vicinanze,anche a monte, indicazione sicura di picchi di accelerazione superiori a quello di gravità). Va detto che gli Autori delle prime scale macrosismiche già alla fine del XIX secolo avevano ritenuto utile definire il gradod’intensità sulla base degli effetti non solo sull’uomo e sulle strutture antropiche, ma anche sull’ambiente naturale. La scala di intensità ESI 2007 (Environmental Seismic Intensity scale) è il risultato di un processo di revisione delle pre-cedenti versioni durato otto anni e realizzato anche nell’ambito delle attività dell’INQUA (International Union forQuaternary Research). A tale revisione hanno collaborato numerosi e qualificatissimi geologi, sismologi e ingegneri prove-nienti da varie parti del mondo coordinate dal Servizio Geologico d’Italia dell’APAT.La scala ESI 2007 non si sostituisce a quelle tradizionali ma le integra, consentendo di definire l'intensità sismica sullabase di tutti gli effetti a disposizione. Essa è potenzialmente utilizzabile non solo per terremoti futuri ma anche per la revi-sione di terremoti storici. Pertanto, sono convinto che, se adottata correttamente, la scala ESI 2007 potrà fornire in moltearee utili indicazioni anche per la rivalutazione della pericolosità sismica.
Il Direttore del Servizio Geologico d’Italia / Dipartimento Difesa del SuoloDr. Leonello SERVA
ABSTRACT - The Environmental Seismic Intensity scale (ESI2007) is a new earthquake intensity scale only based on theeffects triggered by the earthquake in the natural environ-ment. The coseismic effects considered more diagnostic forintensity evaluation are surface faulting and tectonicuplift/subsidence (primary effects), landslides, groundcracks, liquefactions, displaced boulders, tsunami andhydrological anomalies (secondary effects). The ESI 2007scale follows the same basic structure as any other XIIdegree scale, such as the MCS, MM, MSK and EMS scales.This type of intensity scale was proposed to the scientificcommunity since the beginning of '90s. The idea was defi-nitely accepted in 1999, when a first version of the scale wasdeveloped by a Working Group of geologists, seismologistsand engineers sponsored by the International Union forQuaternary Research (INQUA). In the following years, thisversion has been revised and updated.The ESI 2007 scale is the result of the revision of previousversions after its application to a large number of earthqua-kes worldwide. In the frame of INQUA SubCommissionon Paleoseismicity, this activity was conducted by academicand research institutes coordinated by the GeologicalSurvey of Italy - APAT (for further details,s e e h t t p : / / w w w . a p a t . g o v . i t / s i t e / e n -GB/Projects/INQUA_Scale/default.html).For intensity levels lower than IX, the main goal of this newscale is to bring the environmental effects in line with thedamage indicators. In this range, the ESI 2007 scale shouldbe used along with the other scales. In the range between Xand XII, the distribution and size of environmental effects,specially primary tectonic features, becomes the most dia-gnostic tool to assess the intensity level. Documentaryreport and/or field observations on fault rupture lengthand surface displacement should be consistently implemen-ted in the macroseismic study of past and future earthqua-kes. Therefore, the use of the ESI 2007 alone is recommen-
ded only when effects on humans and on manmade struc-tures i) are absent, or too scarce (i.e. in sparsely populatedor desert areas), and ii) saturate (i.e., for intensity X to XII)loosing their diagnostic value.After its official approval at the 17th INQUA Congress, theuse of the ESI 2007 scale will be proposed to national insti-tutions (geological surveys, academic and research institu-tes, departments for civil protection, environmental agen-cies, etc.), dealing in the field of earthquake intensity andseismic hazard.
RIASSUNTO - L’Environmental Seismic Intensity scale (ESI2007) è una nuova scala di intensità dei terremoti basataesclusivamente sugli effetti ambientali. Tra questi, quelliconsiderati diagnostici per la valutazione dell’intensità sonola fagliazione superficiale e i sollevamenti/abbassamenti tet-tonici (effetti primari), i fenomeni franosi, le fratture, leliquefazioni, gli tsunami, le variazione idrologiche (effettisecondari). La scala ESI 2007 è strutturata come le altrescale a XII gradi, quali le scale MCS, MM, MSK ed EMS.Già dagli anni '90 questo tipo di scala di intensità venivaproposta all’interno della comunità scientifica per esseresuccessivamente accolta e sviluppata in ambito internazio-nale, sotto l’egida dell’INQUA (International Union forQuaternary Research), da un Gruppo di Lavoro costituito dageologi, sismologi e ingegneri. Nel 1999 ne veniva redattauna prima versione, più volte aggiornata negli anni succes-sivi.La versione ESI 2007 è il risultato della revisione delle pre-cedenti sulla scorta delle informazioni ottenute attraversol’applicazione della scala a un gran numero di terremoti in tutto il mondo. Tale attività è stata condotta, nell’ambitodell’INQUA SubCommission on Paleoseismicity, daUniversità e Istituti di ricerca a livello internazionale coordinati dal Dipartimento Difesa del Suolo - ServizioGeologico d’Italia dell’APAT (per maggiori dettagli
Environmental Seismic Intensity scale - ESI 2007La scala di Intensità Sismica basata sugli effetti ambientali - ESI 2007
(1) Università dell’Insubria, Como, Italy.(2) Istituto per l’Ambiente Marino Costiero, CNR, Napoli, Italy.(3) Geological Survey of Italy, APAT, Roma, Italy.(4) Russian Academy of Sciences, Moscow, Russia.(5) FUNVISIS, Caracas, Venezuela.(6) National Institute of Advanced Industrial Science and Technology, Tokyo, Japan.(7) Department of Earth Sciences, Simon Fraser University, Burnaby, British Columbia, Canada.(8) IAEA, Vienna, Austria.(9) GEO-HAZ Consulting, Crestone, Colorado, USA.(10) Robinswood Consultant, Saint Martin de Nigelles, France.(11) Institute for Paleogeodynamics & Paleogeophysics, Stockolm , Sweden.(12) Emeritous of Yokohama National University, Japan.
MICHETTI A.M. (1), ESPOSITO E. (2), GUERRIERI L. (3), PORFIDO S. (2), SERVA L. (3),TATEVOSSIAN R. (4), VITTORI E. (3), AUDEMARD F. (5), AZUMA T. (6), CLAGUE J. (7),
COMERCI V. (3), GÜRPINAR A. (8), MC CALPIN J. (9), MOHAMMADIOUN B. (10),MÖRNER N.A. (11), OTA Y. (12), ROGHOZIN E. (4)
(1) The application of the INQUA scale to case studies was conducted within the INQUA Scale Project Working Group bythe Authors and by the following scientists:· R. AMIT - Geological Survey of Israel.· G. BESANA - Nagoya University, Furo-cho Chikusa-ku, Nagoya, Aichi, Japan.· K. CHUNGA - Università dell’Insubria, Como, Italy.· A. FOKAEFS - Institute of Geodynamics, National Observatory of Athens, Greece.· L.E. FRANCO - INGEOMINAS, Bogotà, Colombia.· C.P. LALINDE PULIDO - Universidad EAFIT, Departamiento de Ciencias de la Tierra, Medellin, Colombia.· E. KHAGAN - Geological Survey of Israel.· N. LIN YUNONG - National Taiwan University, Taiwan.· S. MARCO - Department of Geophysics and Planetary Sciences, Tel Aviv, Israel.· A. NELSON - US Geological Survey, Denver, USA.· I. PAPANIKOLAU - University College London, Department of Earth Sciences, BHRC, London, UK.· G. PAPATHANASSIOU - Aristotle University of Thessaloniki, Greece.· S. PAVLIDES - Aristotle University of Thessaloniki, Greece.· K. REICHERTER - Aachen University, Germany.· A. SALAMON - Geological Survey of Israel.· C. SPERNANZONI - University of Roma Tre, Italy.· P.G. SILVA - Departamento de Geología, Universidad de Salamanca Sapin.· J. ZAMUDIO - Istituto Geofisico del Perù, Lima.
h t t p : / / w w w . a p a t . g o v . i t / s i t e / e n -GB/Projects/INQUA_Scale/default.html).Per livelli di intensità inferiori a IX, lo scopo principale diquesta nuova scala è quello di considerare gli effetti ambien-tali alla stessa stregua degli indicatori di danneggiamento. Inquesto intervallo di intensità, la scala ESI 2007 deve essereutilizzata insieme alle altre scale d'intensità. Tra il X e il XIIgrado, la distribuzione e le dimensioni degli effetti tettoniciprimari costituiscono l’indicatore maggiormente diagnosti-ca per la valutazione dell’intensità. Le descrizioni delle carat-teristiche della fagliazione superficiale (lunghezza della rot-tura; massima dislocazione verticale) dovrebbe essere ripor-tata in maniera consistente negli studi macrosismici dei ter-remoti passati e futuri. L’utilizzo della scala ESI 2007 comeunico e indipendente strumento di valutazione deve essereutilizzata solamente quando gli effetti sull’uomo e sullestrutture antropiche i) sono assenti o troppo scarsi (es. areedeserte o scarsamente abitate) oppure ii) arrivano a satura-zione (per intensità comprese tra X e XII).Al fine di promuoverne un utilizzo più condiviso e ampiopossibile, la scala ESI 2007, che verrà ufficializzata duranteil 17th INQUA Congress, sarà proposta alle istituzioni (servi-zi geologici nazionali, istituti di ricerca in campo sismologi-co, dipartimenti di protezione civile, agenzie ambientali) chenei vari Paesi si occupano della valutazione dell’intensità deiterremoti e della pericolosità sismica.
1. - INTRODUCTION
In 1999, during the 15th INQUA (InternationalUnion for Quaternary Research) Congress inDurban, the Subcommission on Paleoseismicitypromoted the compilation of a new scale ofmacroseismic intensity based only on environ-mental effects. A Working Group including geo-logists, seismologists and engineers compiled afirst version of the scale, that was presented at the16th INQUA Congress in Reno (July 23 - 30,2003), and updated one year later at the 32nd
International Geological Congress in Florence(MICHETTI et alii, 2004). To this end, the INQUATERPRO (Commission on Terrestrial Processes)approved a specific project (INQUA ScaleProject, 2004 - 2007) with the aim of A) testing
the scale for a trial period of 4 years, coincidentwith the intercongress cycle, B) reviewing the firstversion through its application to case studies wor-ldwide(1) , and C) submitting the revised version soas to be ratified during the 17th INQUA Congressin Cairns (July 28 - August 3, 2007). The 2004 ver-sion of this scale was provisionally namedINQUA EEE scale, where EEE stands forEarthquake Environmental Effects.
This document describes the revised versionof the scale, which is formally named Enviro-nmental Seismic Intensity scale - ESI 2007. TheIES 2007 scale is composed by:
a) Definition of intensity degrees on the basisof Earthquake Environmental Effects, i.e. thescale itself, which follows the same basic structu-re of the widely used twelve degrees macrosei-smic scales (see MICHETTI et alii, 2004);
b) Guidelines, which aim at better clarifying i)the background of the scale and the scientificconcepts that support the introduction of such anew macroseismic scale; ii) the procedure to usethe scale alone or integrated with damage-based,traditional scales; iii) how the scale is organized;iv) the descriptions of diagnostic features requi-red for intensity assessment, and the meaning ofidioms, colors, and fonts.
A gallery of photographs kindly provided bynumerous scientists involved in the INQUA ScaleProject are reported in Appendix I.
The ESI 2007 Form (Appendix II) is an hel-pful tool for data collection of EarthquakeEnvironmental Effects. The Plate I (AppendixIII) reports the definition of intensity degrees ina synoptic table, classified by the category ofEarthquake Environmental Effect.
Both these latter documents have been desi-gned for the application of the ESI 2007 scaleduring field surveys immediately after the seismicevent.
MICHETTI A.M. ET ALII8
Definition of intensity degreesDefinizione dei gradi di intensità
From I to III: There are no environmental effects that can be used as diagnostic.
IV - LARGELY OBSERVED - First unequivocal effects in the environment
Primary effects are absent.Secondary effects:
a) Rare small variations of the water level in wells and/or of the flow-rate of springs are locally recorded,as well as extremely rare small variations of chemical-physical properties of water and turbidity in springs and wells, especially within large karstic spring systems, which appear to be most prone to thisphenomenon.
b) In closed basins (lakes, even seas) seiches with height not exceeding a few centimeters may develop,commonly observed only by tidal gauges, exceptionally even by naked eye, typically in the far field ofstrong earthquakes. Anomalous waves are perceived by all people on small boats, few people on largerboats, most people on the coast. Water in swimming pools swings and may sometimes overflows.
c) Hair-thin cracks (millimeter-wide) might be occasionally seen where lithology (e.g., loose alluvial depo-sits, saturated soils) and/or morphology (slopes or ridge crests) are most prone to this phenomenon.
d)Exceptionally, rocks may fall and small landslide may be (re)activated, along slopes where the equili-brium is already near the limit state, e.g. steep slopes and cuts, with loose and generally saturated soil.
e) Tree limbs shake feebly.
V - STRONG - Marginal effects in the environment
Primary effects are absent.
Secondary effects:
a) Rare variations of the water level in wells and/or of the flow-rate of springs are locally recorded, aswell as small variations of chemical-physical properties of water and turbidity in lakes, springs and wells.
b) In closed basins (lakes, even seas) seiches with height of decimeters may develop, sometimes noted alsoby naked eye, typically in the far field of strong earthquakes. Anomalous waves up to several tens of cmhigh are perceived by all people on boats and on the coast. Water in swimming pools overflows.
c) Thin cracks (millimeter-wide and several cms up to one meter long) are locally seen where lithology(e.g., loose alluvial deposits, saturated soils) and/or morphology (slopes or ridge crests) are most proneto this phenomenon.
d)Rare small rockfalls, rotational landslides and slump earth flows may take place, along often but notnecessarily steep slopes where equilibrium is near the limit state, mainly loose deposits and saturated soil. Underwater landslides may be triggered, which can induce small anomalous waves in coastal areasof sea and lakes.
e) Tree limbs and bushes shake slightly, very rare cases of fallen dead limbs and ripe fruit.f) Extremely rare cases are reported of liquefaction (sand boil), small in size and in areas most prone to
this phenomenon (highly susceptible, recent, alluvial and coastal deposits, near-surface water table).
VI - SLIGHTLY DAMAGING - Modest effects in the environment
Primary effects are absent.Secondary effects:
a) Significant variations of the water level in wells and/or of the flow-rate of springs are locally recor-ded, as well as small variations of chemical-physical properties of water and turbidity in lakes, springsand wells.
b) Anomalous waves up to many tens of cm high flood very limited areas nearshore. Water in swimmingpools and small ponds and basins overflows.
c) Occasionally, millimeter-centimeter wide and up to several meters long fractures are observed in loose alluvial depositsand/or saturated soils; along steep slopes or riverbanks they can be 1-2 cm wide. A few minor cracks develop in paved(either asphalt or stone) roads.
d) Rockfalls and landslides with volume reaching ca. 103 m3 can take place, especially where equilibriumis near the limit state, e.g. steep slopes and cuts, with loose saturated soil, or highly weathered / frac-tured rocks. Underwater landslides can be triggered, occasionally provoking small anomalous waves incoastal areas of sea and lakes, commonly seen by intrumental records.
e) Trees and bushes shake moderately to strongly; a very few tree tops and unstable-dead limbs may breakand fall, also depending on species, fruit load and state of health.
f) Rare cases are reported of liquefaction (sand boil), small in size and in areas most prone to this phenomenon (highlysusceptible, recent, alluvial and coastal deposits, near surface water table).
VII - DAMAGING - Appreciable effects in the environment
Primary effects: observed very rarely, and almost exclusively in volcanic areas. Limited surface fault rup-tures, tens to hundreds of meters long and with centimetric offset, may occur, essentially associated tovery shallow earthquakes.
Secondary effects: The total affected area is in the order of 10 km2.
a) Significant temporary variations of the water level in wells and/or of the flow-rate of springs arelocally recorded. Seldom, small springs may temporarily run dry or appear. Weak variations of chemi-cal-physical properties of water and turbidity in lakes, springs and wells are locally observed.
b) Anomalous waves even higher than a meter may flood limited nearshore areas and damage or washaway objects of variable size. Water overflows from small basins and watercourses.
c) Fractures up to 5-10 cm wide and up to hundred metres long are observed, commonly in loose alluvial deposits and/orsaturated soils; rarely, in dry sand, sand-clay, and clay soil fractures are also seen, up to 1 cm wide. Centimeter-widecracks are common in paved (asphalt or stone) roads.
d) Scattered landslides occur in prone areas, where equilibrium is unstable (steep slopes of loose / satu-rated soils), while modest rock falls are common on steep gorges, cliffs). Their size is sometimes signi-ficant (103 - 105 m3); in dry sand, sand-clay, and clay soil, the volumes are usually up to 100 m3.Ruptures, slides and falls may affect riverbanks and artificial embankments and excavations (e.g., roadcuts, quarries) in loose sediment or weathered / fractured rock. Significant underwater landslides canbe triggered, provoking anomalous waves in coastal areas of sea and lakes, directly felt by people onboats and ports.
e) Trees and bushes shake vigorously; especially in densely forested areas, many limbs and tops breakand fall.
f) Rare cases are reported of liquefaction, with sand boils up to 50 cm in diameter, in areas most prone to this phenome-non (highly susceptible, recent, alluvial and coastal deposits, near surface water table).
VIII - HEAVILY DAMAGING - Extensive effects in the environment
Primary effects: observed rarely.Ground ruptures (surface faulting) may develop, up to several hundred meters long, with offsets not exceeding a few cm, par-ticularly for very shallow focus earthquakes such as those common in volcanic areas. Tectonic subsidence or uplift of theground surface with maximum values on the order of a few centimeters may occur.
MICHETTI A.M. ET ALII10
Secondary effects: The total affected area is in the order of 100 km2.a) Springs may change, generally temporarily, their flow-rate and/or elevation of outcrop. Some small
springs may even run dry. Variations in water level are observed in wells. Weak variations of chemi-cal-physical properties of water, most commonly temperature, may be observed in springs and/orwells. Water turbidity may appear in closed basins, rivers, wells and springs. Gas emissions, often sul-phureous, are locally observed.
b) Anomalous waves up to 1-2 meters high flood nearshore areas and may damage or wash away objectsof variable size. Erosion and dumping of waste is observed along the beaches, where some bushesand even small weak-rooted trees can be eradicated and drifted away. Water violently overflows fromsmall basins and watercourses.
c) Fractures up to 50 cm wide and up to hundreds metres long, are commonly observed in loose alluvial deposits and/or saturated soils; in rare cases fractures up to 1 cm can be observed in competent dry rocks. Decimetric cracks arecommon in paved (asphalt or stone) roads, as well as small pressure undulations.
d) Small to moderate (103 - 105 m3) landslides are widespread in prone areas; rarely they can occur alsoon gentle slopes; where equilibrium is unstable (steep slopes of loose / saturated soils; rock falls onsteep gorges, coastal cliffs) their size is sometimes large (105 - 106 m3). Landslides can occasionally dam
narrow valleys causing temporary or even permanent lakes. Ruptures, slides and falls affect riverbanksand artificial embankments and excavations (e.g., road cuts, quarries) in loose sediment or weathered /fractured rock. Frequent is the occurrence of landslides under the sea level in coastal areas.e) Trees shake vigorously; branches may break and fall, trees may be uprooted , especially along steep slopes.f) Liquefaction may be frequent in the epicentral area, depending on local conditions; the most typicalò effects are: sand boils
up to ca. 1 m in diameter; apparent water fountains in still waters; localised lateral spreading and settlements (subsiden-ce up to ca. 30 cm), with fissuring parallel to waterfront areas (river banks, lakes, canals, seashores).
g) In dry areas, dust clouds may rise from the ground in the epicentral area.h) Stones and even small boulders and tree trunks may be thrown in the air, leaving typical imprints in soft
soil.
IX - DESTRUCTIVE - Effects in the environment are a widespread source of considerablehazard and become important for intensity assessment
Primary effects: observed commonly.Ground ruptures (surface faulting) develop, up to a few km long, with offsets generally in the order of several cm. Tectonicsubsidence or uplift of the ground surface with maximum values in the order of a few decimeters may occur.
Secondary effects: The total affected area is in the order of 1000 km2.a) Springs can change, generally temporarily, their flow-rate and/or location to a considerable extent. Some modest springs
may even run dry. Temporary variations of water level are commonly observed in wells. Variations of chemical-physical properties of water, most commonly temperature, are observed in springs and/or wells. Water turbidity is common in clo-sed basins, rivers, wells and springs. Gas emissions, often sulphureous, are observed, and bushes and grass near emissionzones may burn.
b) Meters high waves develop in still and running waters. In flood plains water streams may even change their course, also because of land subsidence. Small basins may appear or be emptied. Depending on shape of sea bottom and coastline, dangerous tsunamis may reach the shores with runups of up to several meters flooding wide areas. Widespread erosionand dumping of waste is observed along the beaches, where bushes and trees can be eradicated and drifted away.
c) Fractures up to 100 cm wide and up to hundreds metres long are commonly observed in loose alluvial deposits and/or saturated soils; in competent rocks they can reach up to 10 cm. Significant cracks are common in paved (asphalt or stone) roads, as well as small pressure undulations.
d) Landsliding is widespread in prone areas, also on gentle slopes; where equilibrium is unstable (steep slopes of loose / satu-rated soils; rock falls on steep gorges, coastal cliffs) their size is frequently large (105 m3), sometimes very large (106m3). Landslides can dam narrow valleys causing temporary or even permanent lakes. Riverbanks, artificial embankmentsand excavations (e.g., road cuts, quarries) frequently collapse. Frequent are large landslides under the sea level.
e) Trees shake vigorously; branches and thin tree trunks frequently break and fall. Some trees might beuprooted and fall, especially along steep slopes.
f) Liquefaction and water upsurge are frequent; the most typical effects are: sand boils up to 3 m in diameter; apparent waterfountains in still waters; frequent lateral spreading and settlements (subsidence of more than ca. 30 cm), with fissuring parallel to waterfront areas (river banks, lakes, canals, seashores).
INTENSITY SCALE ESI 200711
g) In dry areas, dust clouds may rise from the ground.h) Small boulders and tree trunks may be thrown in the air and move away from their site for meters, also depending onslope angle and roundness, leaving typical imprints in soft soil.
X - VERY DESTRUCTIVE - Effects on the environment become a leading source of hazard and are critical for intensity assessment
Primary effects become leading.Surface faulting can extend for few tens of km, with offsets from tens of cm up to a few meters. Gravity grabens and elon-gated depressions develop; for very shallow focus earthquakes in volcanic areas rupture lengths might be much lower. Tectonicsubsidence or uplift of the ground surface with maximum values in the order of few meters may occur.
Secondary effects. The total affected area is in the order of 5,000 km2.a) Many springs significantly change their flow-rate and/or elevation of outcrop. Some springs may run
temporarily or even permanently dry. Temporary variations of water level are commonly observed inwells. Even strong variations of chemical-physical properties of water, most commonly temperature,are observed in springs and/or wells. Often water becomes very muddy in even large basins, rivers,wells and springs. Gas emissions, often sulphureous, are observed, and bushes and grass near emissionzones may burn.
b) Meters high waves develop in even big lakes and rivers, which overflow from their beds. In flood plains rivers may chan-ge their course, temporary or even permanently, also because of widespread land subsidence. Basins may appear or beemptied. Depending on shape of sea bottom and coastline, tsunamis may reach the shores with runups exceeding 5 m floo-ding flat areas for thousands of meters inland. Small boulders can be dragged for many meters. Widespread deep erosionis observed along the shores, with noteworthy changes of the coastline profile. Trees nearshore are eradicated and driftedaway.
c) Open ground cracks up to more than 1 m wide and up to hundred metres long are frequent, mainly in loose alluvial depo-sits and/or saturated soils; in competent rocks opening reaches several decimeters. Wide cracks develop in paved (asphaltor stone) roads, as well as pressure undulations.
d) Large landslides and rock-falls (> 105 - 106 m3) are frequent, practically regardless of equilibrium state of slopes,causing temporary or permanent barrier lakes. River banks, artificial embankments, and sides of excavations typicallycollapse. Levees and earth dams may also incur serious damage. Frequent are large landslides under the sea level in coa-stal areas.
e) Trees shake vigorously; many branches and tree trunks break and fall. Some trees might be uprooted and fall.f) Liquefaction, with water upsurge and soil compaction, may change the aspect of wide zones; sand volcanoes even more
than 6 m in diameter; vertical subsidence even > 1m; large and long fissures due to lateral spreading are common. g) In dry areas, dust clouds commonly rise from the ground.h) Boulders (diameter in excess of 2-3 meters) can be thrown in the air and move away from their site for hundreds of meters
down even gentle slopes, leaving typical imprints in soil.
XI - DEVASTATING - Effects on the environment become decisive for intensity assessment,due to saturation of structural damage
Primary effects are dominant
Surface faulting extends from several tens of km up to more than one hundred km, accompanied by slips reaching severalmeters. Gravity graben, elongated depressions and pressure ridges develop. Drainage lines can be seriously offset. Tectonic sub-sidence or uplift of the ground surface with maximum values in the order of numerous meters may occur.
Secondary effects. The total affected area is in the order of 10,000 km2.a) Many springs significantly change their flow-rate and/or elevation of outcrop. Many springs may run
temporarily or even permanently dry. Temporary or permanent variations of water level are generallyobserved in wells. Even strong variations of chemical-physical properties of water, most commonlytemperature, are observed in springs and/or wells. Often water becomes very muddy in even largebasins, rivers, wells and springs. Gas emissions, often sulphureous, are observed, and bushes and grassnear emission zones may burn.
b) Large waves develop in big lakes and rivers, which overflow from their beds. In flood plains rivers can change their cour-
MICHETTI A.M. ET ALII12
se, temporary or even permanently, also because of widespread land subsidence and landsliding. Basins may appear or beemptied. Depending on shape of sea bottom and coastline, tsunamis may reach the shores with runups reaching 15 metersand more devastating flat areas for kilometers inland. Even meter-sized boulders can be dragged for long distances.Widespread deep erosion is observed along the shores, with noteworthy changes of the coastal morphology. Trees nearsho-re are eradicated and drifted away.
c) Open ground cracks up to several meters wide are very frequent, mainly in loose alluvial depositsand/or saturated soils. In competent rocks they can reach 1 m. Very wide cracks develop in paved(asphalt or stone) roads, as well as large pressure undulations.
d) Large landslides and rock-falls (> 105 - 106 m3) are frequent, practically regardless of equilibrium stateof slopes, causing many temporary or permanent barrier lakes. River banks, artificial embankments,and sides of excavations typically collapse. Levees and earth dams incur serious damage. Significant landslides can occur even at 200 - 300 km distance from the epicenter. Frequent are large landslidesunder the sea level in coastal areas.
e) Trees shake vigorously; many branches and tree trunks break and fall. Many trees are uprooted and fall.f) Liquefaction changes the aspect of extensive zones of lowland, determining vertical subsidence possi-
bly exceeding several meters; numerous large sand volcanoes, and severe lateral spreading can be observed.g) In dry areas dust clouds arise from the ground.h) Big boulders (diameter of several meters) can be thrown in the air and move away from their site for long distances down
even gentle slopes., leaving typical imprints in soil.
XII - COMPLETELY DEVASTATING - Effects in the environment are the only tool for intensity assessment
Primary effects are dominant.Surface faulting is at least few hundreds of km long, accompanied by offsets reaching several tens of meters. Gravity gra-ben, elongated depressions and pressure ridges develop. Drainage lines can be seriously offset. Landscape and geomorpholo-gical changes induced by primary effects can attain extraordinary extent and size (typical examples are the uplift or subsi-dence of coastlines by several meters, appearance or disappearance from sight of significant landscape elements, rivers chan-ging course, origination of waterfalls, formation or disappearance of lakes).Secondary effects. The total affected area is in the order of 50,000 km2 and more.a) Many springs significantly change their flow-rate and/or elevation of outcrop. Temporary or perma-
nent variations of water level are generally observed in wells. Many springs and wells may run tempo-rarily or even permanently dry. Strong variations of chemical-physical properties of water, most com-monly temperature, are observed in springs and/or wells. Water becomes very muddy in even largebasins, rivers, wells and springs. Gas emissions, often sulphureous, are observed, and bushes and grassnear emission zones may burn.
b) Giant waves develop in lakes and rivers, which overflow from their beds. In flood plains rivers change their course and even their flow direction, temporary or even permanently, also because of widespread land subsidence and landsliding. Large basins may appear or be emptied. Depending on shape of sea bottom and coastline, tsunamis may reach the sho-res with runups of several tens of meters devastating flat areas for many kilometers inland. Big boulders can be draggedfor long distances. Widespread deep erosion is observed along the shores, with outstanding changes of the coastal mor-phology. Many trees are eradicated and drifted away. All boats are tore from their moorings and swept away or carriedonshore even for long distances. All people outdoor are swept away.
c) Ground open cracks are very frequent, up to one meter or more wide in the bedrock, up to more than10 m wide in loose alluvial deposits and/or saturated soils. These may extend up to several kilometers.
d) Large landslides and rock-falls (> 105 - 106 m3) are frequent, practically regardless to equilibriumstate of the slopes, causing many temporary or permanent barrier lakes. River banks, artificial embankments,and sides of excavations typically collapse. Levees and earth dams incur serious damage. Significant landslides can occur at more than 200 - 300 km distance from the epicenter. Frequent are very large landslides under the sea level in coastal areas.
e) Trees shake vigorously; many branches and tree trunks break and fall. Many trees are uprooted and fall.f) Liquefaction occurs over large areas and changes the morphology of extensive flat zones, determining
vertical subsidence exceeding several meters, widespread large sand volcanoes, and extensive severelateral spreading can be observed.
g) In dry areas dust clouds arise from the ground.h) Also very big boulders can be thrown in the air and move for long distances even down very gentle slopes, leaving typical
imprints in soil.
INTENSITY SCALE ESI 200713
1. - BACKGROUND
1.1. - RATIONALE
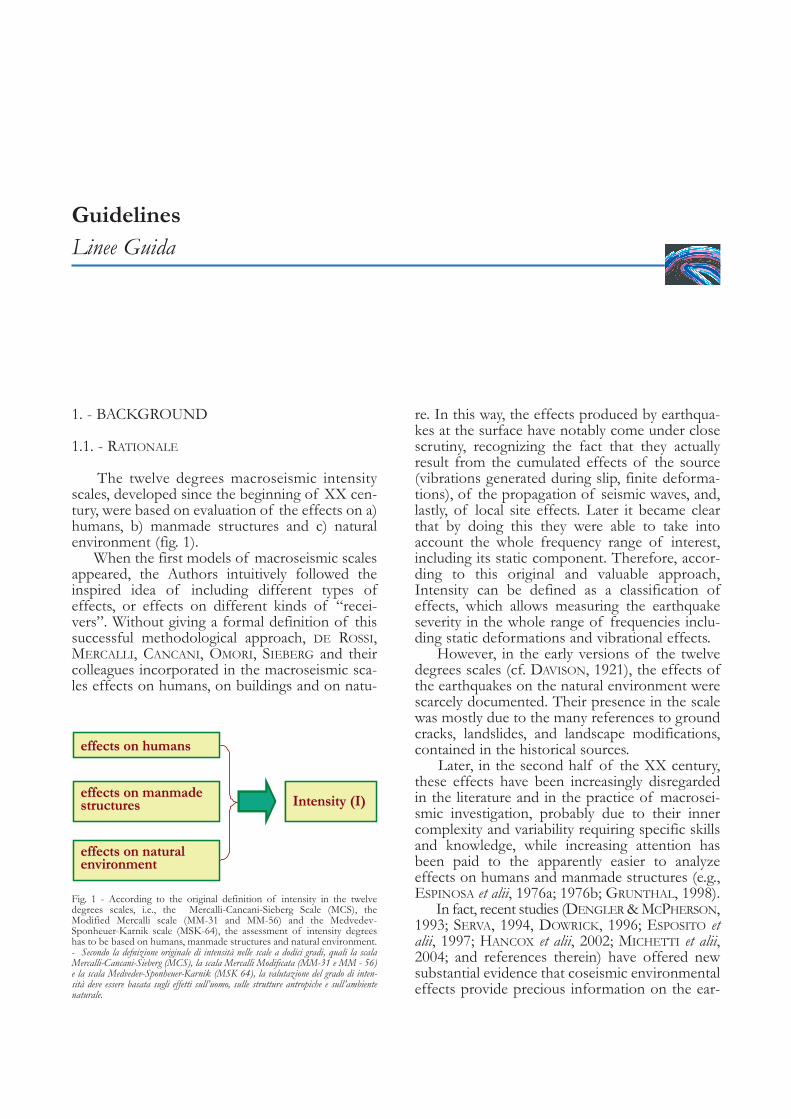
The twelve degrees macroseismic intensityscales, developed since the beginning of XX cen-tury, were based on evaluation of the effects on a)humans, b) manmade structures and c) naturalenvironment (fig. 1).
When the first models of macroseismic scalesappeared, the Authors intuitively followed theinspired idea of including different types ofeffects, or effects on different kinds of “recei-vers”. Without giving a formal definition of thissuccessful methodological approach, DE ROSSI,MERCALLI, CANCANI, OMORI, SIEBERG and theircolleagues incorporated in the macroseismic sca-les effects on humans, on buildings and on natu-
re. In this way, the effects produced by earthqua-kes at the surface have notably come under closescrutiny, recognizing the fact that they actuallyresult from the cumulated effects of the source(vibrations generated during slip, finite deforma-tions), of the propagation of seismic waves, and,lastly, of local site effects. Later it became clearthat by doing this they were able to take intoaccount the whole frequency range of interest,including its static component. Therefore, accor-ding to this original and valuable approach,Intensity can be defined as a classification ofeffects, which allows measuring the earthquakeseverity in the whole range of frequencies inclu-ding static deformations and vibrational effects.
However, in the early versions of the twelvedegrees scales (cf. DAVISON, 1921), the effects ofthe earthquakes on the natural environment werescarcely documented. Their presence in the scalewas mostly due to the many references to groundcracks, landslides, and landscape modifications,contained in the historical sources.
Later, in the second half of the XX century,these effects have been increasingly disregardedin the literature and in the practice of macrosei-smic investigation, probably due to their innercomplexity and variability requiring specific skillsand knowledge, while increasing attention hasbeen paid to the apparently easier to analyzeeffects on humans and manmade structures (e.g.,ESPINOSA et alii, 1976a; 1976b; GRUNTHAL, 1998).
In fact, recent studies (DENGLER & MCPHERSON,1993; SERVA, 1994, DOWRICK, 1996; ESPOSITO etalii, 1997; HANCOX et alii, 2002; MICHETTI et alii,2004; and references therein) have offered newsubstantial evidence that coseismic environmentaleffects provide precious information on the ear-
GuidelinesLinee Guida
Fig. 1 - According to the original definition of intensity in the twelvedegrees scales, i.e., the Mercalli-Cancani-Sieberg Scale (MCS), theModified Mercalli scale (MM-31 and MM-56) and the Medvedev-Sponheuer-Karnik scale (MSK-64), the assessment of intensity degreeshas to be based on humans, manmade structures and natural environment.- Secondo la defnizione originale di intensità nelle scale a dodici gradi, quali la scalaMercalli-Cancani-Sieberg (MCS), la scala Mercalli Modificata (MM-31 e MM - 56)e la scala Medvedev-Sponheuer-Karnik (MSK 64), la valutazione del grado di inten-sità deve essere basata sugli effetti sull’uomo, sulle strutture antropiche e sull’ambientenaturale.
eeffffeeccttss oonn hhuummaannss
eeffffeeccttss oonn mmaannmmaaddee ssttrruuccttuurreess
eeffffeeccttss oonn nnaattuurraall eennvviirroonnmmeenntt
IInntteennssiittyy ((II))
thquake size and its intensity field, complemen-ting, de facto, the traditional damage-based macro-seismic scales. As a matter of fact, with the out-standing growth of Paleoseismology as a newindependent discipline, nowadays the effects onthe environment can be described and quantifiedwith a remarkable detail compared with that avai-lable at the time of the earlier scales. Therefore,today the definition of the intensity degrees caneffectively take advantage of the diagnostic cha-racteristics of the effects on natural environment.
This is the goal of the ESI 2007 scale. Its use,alone or integrated with the other traditional sca-les (see chapter 2), affords a better picture of theearthquake scenario, because only environmentaleffects allow suitable comparison of the ear-thquake intensity both:
· in time: effects on the natural environmentare comparable for a time-window (recent, histo-ric and palaeo seismic events) much larger thanthe period of instrumental record (last century),and
· in different geographic areas: environmentaleffects do not depend on peculiar socio-econo-mic conditions or different building practices.
1.2. - PRIMARY AND SECONDARY EFFECTS
Earthquake Environmental Effects (EEEs) are any phenomena generated in the natural envi-ronment by a seismic event. They can be catego-rized in two main types:· primary effects, the surface expression ofthe seismogenic tectonic source (including surfa-ce faulting, surface uplift and subsidence), typical-ly observed for crustal earthquakes over a certainthreshold value of magnitude. Being directly lin-ked to the size, hence the energy of the earthqua-ke, these effects in principle do not suffer satura-tion, i.e., they saturate only for intensity XII, thisbeing an obvious inherent limit of all macrosei-smic scales.· secondary effects: phenomena generallyinduced by the ground shaking. Their occurrenceis commonly observed in a specific range ofintensities. For each type of secondary effect, theESI 2007 scale describes their characteristics andsize as a diagnostic feature in a range of intensitydegrees. Hence, in some cases it is only possibleto establish a minimum intensity value.Conversely, the total area of distribution ofsecondary effects does not saturate and thereforeit can be used as an independent tool for theassessment of the epicentral intensity Ι0 (par. 3.2).
1.3. - THRESHOLD FOR SURFACE FAULTING IN VOL-CANIC AREAS
The focal depth and the stress environment ofan earthquake obviously influence the occurrenceand the size of the observed effects. Two crustalearthquakes with the same energy but very diffe-rent focal depths and stress environment can pro-duce a very different field of environmentaleffects and therefore largely different local inten-sity values. This is particularly important in volca-nic areas, where tectonic earthquakes with lowmagnitude and very shallow focus (in the order of1-4 km) can generate primary effects (e.g.,AZZARO, 1999). To take this into account, thethreshold for surface faulting in volcanic areas hasbeen set at intensity VII, whereas for typical ear-thquakes (focal depth 5-15 km) primary effectsstart from intensity VIII.
2. - HOW TO USE THE ESI 2007 SCALE
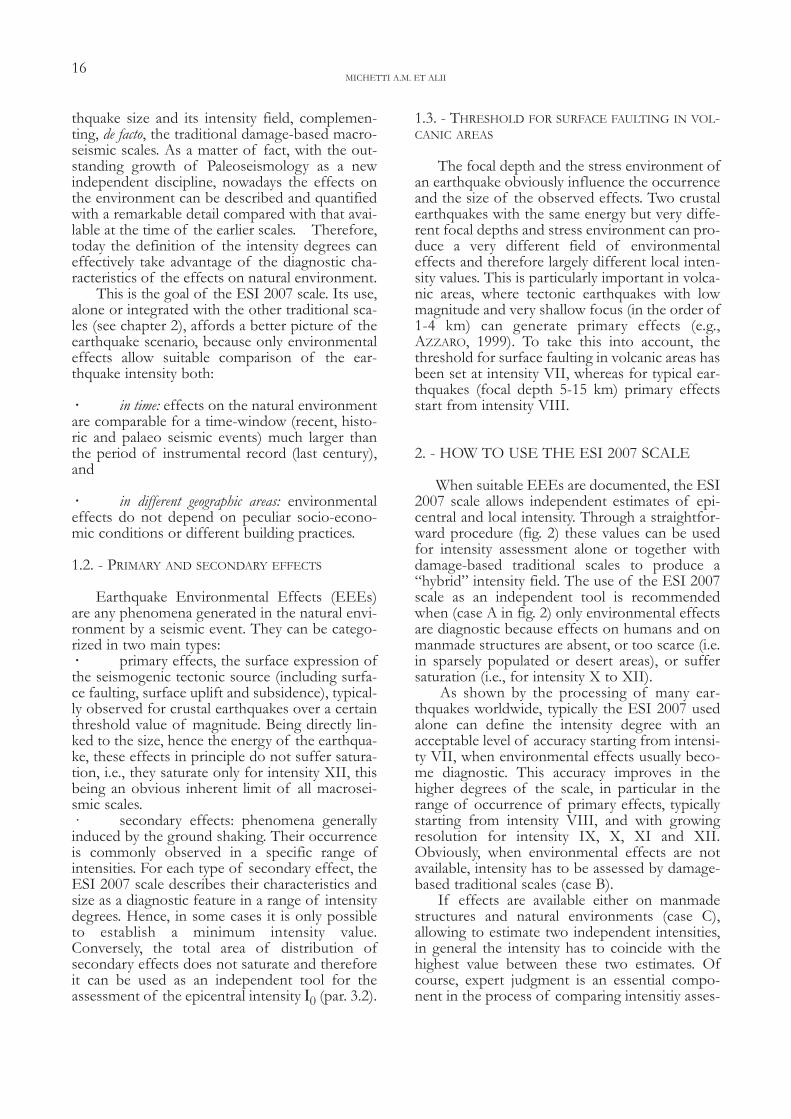
When suitable EEEs are documented, the ESI2007 scale allows independent estimates of epi-central and local intensity. Through a straightfor-ward procedure (fig. 2) these values can be usedfor intensity assessment alone or together withdamage-based traditional scales to produce a“hybrid” intensity field. The use of the ESI 2007scale as an independent tool is recommendedwhen (case A in fig. 2) only environmental effectsare diagnostic because effects on humans and onmanmade structures are absent, or too scarce (i.e.in sparsely populated or desert areas), or suffersaturation (i.e., for intensity X to XII).
As shown by the processing of many ear-thquakes worldwide, typically the ESI 2007 usedalone can define the intensity degree with anacceptable level of accuracy starting from intensi-ty VII, when environmental effects usually beco-me diagnostic. This accuracy improves in thehigher degrees of the scale, in particular in therange of occurrence of primary effects, typicallystarting from intensity VIII, and with growingresolution for intensity IX, X, XI and XII.Obviously, when environmental effects are notavailable, intensity has to be assessed by damage-based traditional scales (case B).
If effects are available either on manmadestructures and natural environments (case C),allowing to estimate two independent intensities,in general the intensity has to coincide with thehighest value between these two estimates. Ofcourse, expert judgment is an essential compo-nent in the process of comparing intensitiy asses-
MICHETTI A.M. ET ALII16
sed using different categories of “receivers”.This procedure allows generating a “hybrid
field” of local intensities, i.e., derived from theintegration of ESI 2007 and other intensity scales.This is deemed to be the best intensity scenariobecause 1) it takes into account all the effects trig-gered by the earthquake, 2) it is in agreement withthe original definition of intensity, and 3) it allowsthe comparison of earthquakes in time and inspace over the largest chronological and geogra-phic window.
2.1. - PROCEDURE TO USE THE ESI 2007 SCALE ASA SELF INSTRUMENT FOR INTENSITY ASSESSMENT
Evidently the ESI 2007 scale is a tool to assessboth epicentral and local intensities.
2.1.1. - Epicentral intensity (Ι0)
Epicentral intensity (I0) is defined as the inten-sity of shaking at epicenter, i.e. what intensity wewould get, if there were a locality that matches
the epicenter. Several techniques can be appliedto assess I0; for instance, POSTPISCHL (1985) defi-ne I0 as “the value of the closed isoseismal linehaving the highest degree and including at least 3different data points”.
Surface faulting parameters and total area ofdistribution of secondary effects (landslidesand/or liquefactions) are two independent toolsto assess I0 on the basis of environmental effects,starting from the intensity VII.
SURFACE FAULTING PARAMETERS: The rangesreported in Table 1 are based on the analysis ofsurface faulting parameters and intensity dataavailable for more than 400 shallow crustal ear-thquakes worldwide (SURFIN, SURFace faultingand INtensity database; INQUA scale Project,2007). The use of this simple table for I0 asses-sment requires particular attention when theamount of surface faulting is close to the boun-daries between two intensity degrees. In this caseit is recommended to choose the intensity valuebetter consistent with the characteristics anddistribution of secondary effects.
C
BB
AA
DDAATTAA CCOOLLLLEECCTTIIOONN
HHIISSTTOORRIICCAALL EEAARRTTHHQQUUAAKKEESS
RREECCEENNTT EEAARRTTHHQQUUAAKKEESS
Revision of effects from historical documents
Revision of effects from macroseismic and geological surveys
IINNTTEENNSSIITTYY AASSSSEESSSSMMEENNTT
FFUUTTUURREE EEAARRTTHHQQUUAAKKEESS
Ad hoc macroseismic and geological field surveys
AVAILABLE EFFECTS ON
HUMANS + MANMADE STRUCTURES
IIMMCCSS IIMMMM IIMMSSKK IIEEMMSS
IIJJMMAA
NNAATTUURRAALL EENNVVIIRROONNMMEENNTT IIEESSII
HHUUMMAANNSS ++ MMAANNMMAADDEE SSTTRRUUCCTTUURREESS AANNDD NNAATTUURRAALL EENNVVIIRROONNMMEENNTT IIEESSII
MMAAXXIIMMUUMM VVAALLUUEE
== IINNTTEENNSSIITTYY
IIMMCCSS IIMMMM IIMMSSKK IIEEMMSS
IIJJMMAA
Fig. 2 - Logical scheme for the use of ESI 2007 scale alone or together with damage-based traditional scales. We show only the most commonly used scales,however, any scale can be integrated with the ESI 2007 scale following the same methodological steps.
- Schema logico per l'utilizzo della scala ESI 2007 da sola o insieme con le scale tradizionali basate sui danni. Qui sono considerate solo le scale maggiormente usate, tuttavia qual-siasi scala può integrarsi con la scala ESI 2007 seguendo un approccio metodologico analogo.
INTENSITY SCALE ESI 200717

TOTAL AREA OF SECONDARY EFFECTS: Startingfrom intensity VII, the ESI 2007 scale considersthe total area of secondary effects as diagnosticelement for I0 assessment. Even in this case, foreach intensity degree table 1 only lists the order ofmagnitude of the total area, and the chosen valueof I0 has to be consistent with primary effects.
The definition of total area should not inclu-de the isolated effects occasionally located in thefar field. In fact, the occurrence of these effects ismost likely due to peculiar site conditions.Evidently, only a sound professional judgmentcan establish which effects should be inclu-ded/excluded in the definition of total area.
2.1.2 . - Local intensity (IL)
The local intensity is essentially assessedthrough the description of secondary effects.However, even the local expression of primaryeffects, in terms of maximum displacement of afault segment, may contribute to its evaluation.The evaluation of local intensity can be done intwo different ways:
LOCALITY - SITE: this approach is recommen-ded when the descriptions of environmentaleffects are not homogeneously surveyed over theterritory, which is common for historical ear-thquakes. The main advantage of this procedure isthat it allows the comparison with local intensitiesderiving from traditional macroseismic scales.
According to this approach, a Site can be defi-ned as any place where a single environmentaleffect has occurred. The description of one effecthas to be done at this level.
One Locality may include several sites and presents a level of generalization, to which inten-sity can be assigned. It can refer to any place,either inhabited or natural. It has to be smallenough to keep separated areas with significantlydifferent site intensities, but large enough toinclude several sites and consequently to be repre-sentative for intensity assessment. Therefore, thelocality has to be defined by expert judgment.
REGULAR GRID: in case a systematic field sur-vey of the affected area provides a homogeneousdistribution of environmental effects, which isstill uncommon for modern earthquakes buthighly advisable for future earthquakes, it isrecommended to divide the territory into a regu-lar grid with a cell size that depends on the scaleof the field survey. It should be possible to assigna local intensity to each cell. The resulting distri-bution of local intensities allows to define themap of isoseismals. However, with this approachthe comparison and integration with “standard”macroseismic intensity values may become quitedifficult.
2.2. - CORRELATION BETWEEN ESI 2007 ANDTRADITIONAL MACROSEISMIC SCALES
In principle, the correlations of intensity sca-les, degree by degree, should be never allowedbecause each scale classifies the effects in a diffe-rent way. Hence, for the comparison of two ear-thquakes it should be advisable to use the sameintensity scale, even if it is necessary to reclassifyall the effects. For instance, in the MSK64 scalethe concepts of “typical” damage and buildingtypes are used. As a result this is a scale of con-stant intervals. The MCS and Modified Mercalli sca-les, based on maximum effects, are scales of order.As a consequence intensity VIII is much easier toget in original Mercalli than applying MSK64.
Indeed, the “classic” twelve degrees scales,though they included environmental effects, werenot able to differentiate intensities above IX,because (a) they did not make difference betweenprimary and secondary effects, (b) they did notuse quantitative approach for the effects on natu-re. Therefore, it is expected that when we dealwith the strongest earthquakes the application ofthe ESI 2007 scale will yield an intensity valuethat is different, and more physically meaningful,from that obtained with the others scales. That isexactly the reason why it is necessary to developthis new intensity scale.
PPRRIIMMAARRYY EEFFFFEECCTTSS
SSEECCOONNDDAARRYY EEFFFFEECCTTSS
II00
IInntteennssiittyy SSUURRFFAACCEE RRUUPPTTUURREE LLEENNGGTTHH
MMAAXX SSUURRFFAACCEE DDIISSPPLLAACCEEMMEENNTT
// DDEEFFOORRMMAATTIIOONN
TTOOTTAALL AARREEAA
IV - - - V - - - VI - - VII (*) (*) 10 km2 VIII Several hundreds
meters Centimetric 100 km2
IX 1- 10 km 5 - 40 cm 1000 km2 X 10 - 60 km 40 - 300 cm 5000 km2 XI 60 – 150 km 300 –700 cm 10000 km2 XII > 150 km > 700 cm > 50000 km2
TAB. 1 - Ranges of surface faulting parameters (prima-ry effects) and typical extents of total area (secondaryeffects) for each intensity degree.- Valori di riferimento per ciascun grado di inten-sità relativo ai parametri di fagliazione superficia-le (effetti primari) e all’area totale degli effettisecondari.
(*) Limited surface fault ruptures, tens to hundreds meters long with cen-timetric offset may occur essentially associated to very shallow earthqua-kes in volcanic areas.
MICHETTI A.M. ET ALII18
As a matter of fact, in the practice of macro-seismic investigation, very often one is obliged tocompare earthquakes intensities classified withdifferent scales. This has promoted the use ofconversion tables, such as those proposed byKRINITZSKY & CHANG (1978), REITER (1990), andPANZA (2004). On the other hand, the applicationof such kind of tables has often caused the intro-duction of additional uncertainties, such as theuse of half-degrees or fractional degrees.
In order to avoid these inconveniences, thecorrelation among the most important intensityscales has to be simply based on one-to-one rela-tionships. As discussed in MICHETTI et alii, (2004),due to the level of uncertainty inherent in thestructure itself of the macroseismic scales, and incase a conversion between scales is a step thatcannot be absolutely avoided, the best we can dois to consider all the twelve degrees scales as equi-valent. This includes also the Chinese macrosei-smic intensity scale, which has been originallydesigned to be consistent with the MM scale (e.g.,XIE, 1957; WANG, 2004). Nevertheless, the corre-lation with the 7-degrees JMA intensity scale(KRINTIZSKY & CHANG, 1977; REITER, 1990;HANCOX et alii, 2002), and with other scales notbased on twelve degrees, inevitably requires grou-ping of some intensity degrees.
3. - STRUCTURE OF THE SCALE
The ESI 2007 scale has been developed to beconsistent with the Modified Mercalli macrosei-smic scale (MM-31, WOOD & NEUMANN, 1931;MM-56, RICHTER, 1958) and the MSK-64 (Medvedev-Sponheuer-Karnik scale), since theseare the most applied worldwide and includesmany explicit references to environmental effects.
More in general, the new scale was carefullydesigned in order to keep the internal consistencyof the original twelve degrees scale, as discussedin depth by MICHETTI et alii, (2004). A great dealof work in seismic hazard assessment is accompli-shed in the world, and intensity is a basic parame-ter in this. Any “new word” in this research fieldmust not result in dramatic changes. The membersof the WG are aware that, by definition, the twel-ve-degree macroseismic scales are based essential-ly on effects on humans in the range of intensityII to V, on damage in the range of intensity VI toIX, and on natural environment in the range of intensity X to XII. The ESI 2007 scale is therefo-re really useful only for the assessment of thehighest intensities. But, as mentioned above,to avoid any confusion, the classical numbering is kept.
3.1. - MAIN GROUPS OF INTENSITY DEGREES
The ESI 2007 scale starts where environmen-tal effects become regularly observed in favorableconditions, i.e. at intensity IV. The scale is linearand works well up to XII degree. In the first ver-sion of the scale, intensity I, II and III were alsodefined using environmental effects (MICHETTI etalii, 2004). It is important to remark that severaleffects on nature, especially concerning waterbodies and hydrogeological phenomena(MONTGOMERY & MANGA, 2003 and referencestherein), but also instrumentally-detected primarytectonic deformations (permanent fault offsetmeasured at the INFN Gran Sasso, Italy, strain-meter; cf., AMORUSO & CRESCENTINI, 1999), havebeen observed for very low intensity. Perhapsfuture investigation will allow a new revision ofthe scale in order to include environmental effectssuitable for intensity assessment in the rangefrom I to III. However, after 4 years of applica-tion at a global scale through the INQUA scaleproject, it was clear that with the knowledge avai-lable today, effects on natural environment in thisrange are not diagnostic.
Therefore, comparing the ESI 2007 with theother 12 degrees scales, we can identify threemain subset:I) From I to III: There are no environmen-tal effects that can be used as diagnostic.
II) From IV to IX: Environmental effects areeasily observable starting from intensity IV, andoften permanent and diagnostic especially star-ting from intensity VII. However, they are neces-sarily less suitable for intensity assessment thaneffects on humans and manmade structures.Their use is therefore recommended especially insparsely populated areas;
III) From X to XII: Effects on humans andmanmade structures saturate, while environmen-tal effects become dominant; in fact, several typesof environmental effects do not suffer saturationin this range. Thus, environmental effects are themost effective tool to evaluate the intensity.
3.2. - TITLE AND DESCRIPTION
The title reflects the corresponding force ofthe earthquake and the role of environmentaleffects.
In the description, the characteristics and sizeof primary effects associated to each degree arereported firstly. Then, secondary effects aredescribed i) in terms of total area of distributionfor the assessment of epicentral Intensity (star-
INTENSITY SCALE ESI 200719

ting from intensity VII); ii) grouped in severalcategories (see previous chapter and tab. 2), orde-red by the initial degree of occurrence.
Text in Italic has been used to highlightdescriptions regarded as diagnostic by itself for agiven degree.
3.3. - DESCRIPTION OF EARTHQUAKEENVIRONMENTAL EFFECTS
It is possible to collect the characteristics ofearthquake environmental effects in two differentways:
- the ESI 2007 Form, designed to be used duringthe emergency phase after an earthquake(Appendix II);
- the EEE Database, designed to be used for therevision of historical reports and for final archi-ving.Both these documents can be downloaded from h t t p : / / w w w. a p a t . g o v . i t / s i t e / e n -GB/Projects/INQUA_Scale/Documents/
The structure of the ESI 2007 Form and EEEDatabase is similar. Thus, it is possible to migratefrom the former to the latter without difficulties.
3.3.1. - Primary effects
The size of primary effects is typically expres-sed in terms of two parameters: i) Total SurfaceRupture Length (SRL) and ii) MaximumDisplacement (MD). Their occurrence is com-monly associated to a minimum intensity value(VIII), except in case of very shallow earthquakesin volcanic areas. Amount of tectonic surfacedeformation (uplift, subsidence) is also taken intoaccount.
3.3.2. - Secondary effects
Secondary effects can be classified into eightmain categories (tab. 2). While some descriptionsare considered diagnostic (in Italic), others aresusceptible to be changed after the implementa-tion of the database which correlates characteri-stic features of secondary effects and intensitydegrees.
Nevertheless, in order to provide a reasonablevalue for the total area of secondary effects, it isrecommended to describe and map the wholedistribution of secondary effects, including thosenot yet incorporated in the description of inten-sity degrees (e.g., karst collapses).
A - Hydrological anomaliesHydrological anomalies show up from inten-
sity III and saturate (i.e. their size does not increa-se) at intensity X.
They can be divided in two groups:· Surface water effects: 1) Overflow; 2)Discharge variation; 3) Turbidity of rivers;· Ground water effects: 1) Drying up of springs;2) Appearance of springs; 3) Temperature chan-ges; 4) Anomaly in chemical component; 5)Turbidity of springs.
Further useful information might be: theamount and rates of variation in temperature anddischarge, the presence of anomalous chemicalelement, the duration of the anomaly, and thetime delay.
B - Anomalous waves/tsunamisIn this category are included: seiches in closed
basins, outpouring of water from pools andbasins, and tsunami waves. In the case of tsuna-mis, more than the size of the tsunami wave itself,the effects on the shores (especially runup, beacherosion, change of coastal morphology), without
EEnnvviirroonnmmeennttaall eeffffeeccttss DDiiaaggnnoossttiicc rraannggee
ooff iinntteennssiittyy ddeeggrreeeess
SSUURRFFAACCEE FFAAUULLTTIINNGG
AANNDD DDEEFFOORRMMAATTIIOONN VIII (*) XII
A HHYYDDRROOLLOOGGIICCAALL AANNOOMMAALLIIEESS IV X
B AANNOOMMAALLOOUUSS WWAAVVEESS//TTSSUUNNAAMMIISS IV XII
C GGRROOUUNNDD CCRRAACCKKSS IV X
D SSLLOOPPEE MMOOVVEEMMEENNTTSS IV X
E TTRREEEE SSHHAAKKIINNGG IV XI
F LLIIQQUUEEFFAACCTTIIOONNSS V X
G DDUUSSTT CCLLOOUUDDSS VIII VIII
H JJUUMMPPIINNGG SSTTOONNEESS IX XII
(*) For intensity degree VII, limited surface fault ruptures, tens to hun-dreds meters long with centimetric offset may occur essentially associatedto very shallow earthquakes in volcanic areas.
TAB. 2 - Diagnostic range of intensity degrees for eachclass of environmental effects.
- Intervallo di gradi di intensità diagnostico perciascuna classe di effetti ambientali.
MICHETTI A.M. ET ALII20
neglecting those on humans and manmade struc-tures, are taken as diagnostic of the sufferedintensity.
Effects may already occur at intensity IV, butare more diagnostic from IX to XII. The defini-tion of intensity degrees has taken advantagefrom the tsunami intensity scale proposed byPAPADOPOULOS & IMAMURA (2001), and frommany descriptions of the aforementioned effectsworldwide (e.g., LANDER et alii, 2003).
C - Ground cracksGround cracks show up from intensity IV and
saturate (i.e. their size does not increase) at inten-sity X.Diagnostic parameters are lithology, strike anddip, maximum width, and area density.
D - Slope movementsSlope movements, including under water lan-
dslides, have been grouped in:1) Rock fall; 2) Debris fall; 3) Toppling; 4) Rock
slide; 5) Debris slide; 6) Avalanche; 7) Mudslide;8) Debris flow; 9) Earth flow; 10) Mud flow; 11)Slow slide; 12) Slow earth flow; 13) Slow mudflow; 14) Lateral spread; 15) Sackung; 16)Complex (two or more concurrent types).
They show up at intensity IV and saturate (i.e.their size does not increase) at intensity X.
The total volume is diagnostic for intensityassessment. It can be roughly estimated on thebasis of the landslide area when the depth of sli-ding mass can be reasonably estimated. Theuncertainties introduced with this procedure donot appear to significantly influence the intensityevaluation.
Further information: maximum dimension ofblocks, area density, amount of slip, humidity andtime delay.
E - Trees’ shakingTrees’ shaking is reported from a minimum
intensity IV. It is important to record the occur-rence of broken branches and the morphologiccharacteristics of the area (flat, slope). The defini-tion of intensity degrees basically follows theseprovided by DENGLER & MCPHERSON (1993).
F - LiquefactionsLiquefactions occur from intensity V. The dia-
gnostic features for liquefactions are the diameterof sand volcanoes and the lithology. Saturation(i.e. their size does not increase) occur at intensi-ty X. Other useful characteristics are shape, thetime delay, the depth of water table and theoccurrence of water and sand ejection.
G - Dust cloudsDust clouds are reported since intensity VIII,
typically in dry areas.
H - Jumping stonesJumping stones have been reported from mi-
nimum intensity IX. The size of stones and theirimprint in soft soil are considered as diagnosticparameters for intensity evaluation.
REFERENCES
AMORUSO A. & CRESCENTINI L. (1999) - Coseismic andaseismic strain offsets recorded by the Gran SassoStrainmeter. Phys.Chem. Earth (A), 24, 2, 101-104.
AZZARO R. (1999) - Earthquake surface faulting at MountEtna Volcano (Sicily) and implications for active tectonics.Journal of Geodynamics, 28 (2-3), 193 - 213.
DAVISON, C. (1921). On scales of seismic intensity and on the con-struction of isoseismal lines. Bull. Seis. Soc.Am., 11, 95-129.
DENGLER L. & MCPHERSON R. (1993) - The 17 August 1991 Honeydaw earthquake north coast California: a case for revisingthe Modified Mercalli Scale in sparsely populated areas. Bull.Seis. Soc. Am. 83, 4, 1081-1094.
DOWRICK D. J. (1996) - The Modified Mercalli earthquake inten-sity scale- Revisions arising from recent studies of New Zealand earthquakes. Bull. Of new Zeal. Nat. Soc. For earthqua- ke Engineering, 29, 2, 92-106.
ESPINOSA, A. F., R. HUSID, S. T. ALGERMISSEN, & J. DE LASCASAS (1976a) - TheLima earthquake of October 3, 1974, intensity distribution. Bulletin of the Seismological Societyof America, 67, 1429-1440.
ESPINOSA, A. F., R. HUSID, & A. QUESADA (1976b) -Intensitydistribution and source parameters from field observations of theFebruary 4, 1976, Guatemalan earthquake. In: “TheGuatemalan Earthquake of February 4, 1976, a Preliminary Report”, A. F. ESPINOSA, Eds., U.S. Geological Survey Professional Paper 1002, 52-66 .
ESPOSITO E., PORFIDO S., MASTROLORENZO G., NIKONOVA.A. & SERVA L., (1997) - Brief rewiew and preliminary pro-posal for the use of ground effects in the macroseismic intensity assesment. Proc. 30th International Geological Congress,Beijing, China, vol 5. Contemporary lithospheric motionseismic geology, the Netherlands, VSP ed., ISBN: 90- 6764-269-X, 233-243.
GRUNTHAL G. (1998) - European Macroseismic Scale 1998(EMS-98). European Seismological Commission,Subcommission on Engineering Seismology, WorkingGroup Macroseismic Scales. Conseil de l’Europe,Cahiers du Centre Européen de Géodynamique et deSéismologie, 15, Luxembourg, 99 pp.
HANCOX G.T., PERRIN N.D. & DELLOW G.D. (2002) -Recentstudies of historical earthquake-induced landsliding, grounddamage, and MM intensity in New Zealand. Bulletin of theNew Zealand Society for Earthquake Engineering, 35(2), 59-95, ISSN 1174-9857.
INQUA Scale Project (2007) - Available online at http://www.apat.gov.it/site/en-GB/Projects/INQUA_Scale
KRINITZSKY, E.L. & CHANG, F.K. (1988) - Intensity-related ear-thquake ground motions. Bulletin of the Association ofEngineering Geologists, 25, 425-435.
LANDER J.F., WHITESIDE L.S. & LOCKRIDGE P.A. (2003) -Two Decades of Global Tsunamis 1982-2002. TheInternational Journal of The Tsunami Society (21) 1,
INTENSITY SCALE ESI 200721
NOAA - NGDC, Boulder, Colorado USA, 73 pp.MICHETTI A.M., ESPOSITO E., GÜRPINAR J., MOHAMMADIOUN
B., MOHAMMADIOUN A., PORFIDO S., ROGOZHIN E.,SERVA L., TATEVOSSIAN R., VITTORI E., AUDEMARD F.,COMERCI V., MARCO S., MCCALPIN J. & MÖRNER N.A.(2004) - The INQUA Scale. An innovative approach for assessing earthquake intensities based on seismically-induced groundeffects- in natural environment. Special paper APAT, Mem.Descr. Carta geol. d’Italia, 68. (E. VITTORI & V.COMERCI Eds.), 115 pp.
MONTGOMERY D.R. & MANGA M. (2003) - Streamflow andWater Well Responses to Earthquakes. Science, 300, 27 June2003, 2047-2049.
PANZA G.F. (2004) - Correlation among intensity scales.Downloadable from http://www.apat.gov.it/ site/en-GB/Projects/INQUA_Scale/Documents/, 15 p., Trieste.
PAPADOPOULOS, G.A. & F. IMAMURA (2001) - Proposal for anew tsunami intensity scale. Proc. Internat. TsunamiConference, Seattle , 7 - 9 August 2001, 569 - 577.
POSTPISCHL D. (1985) - Catalogo dei terremoti italiani dall’anno1000 al 1980. CNR-PFG 114, 2B: 238 pp.
REITER L. (1990) - Earthquake Hazard Analysis. Issues andinsights. Columbia University Press, New York, 254 pp.
RICHTER C.F. (1958) - Elementary Seismology. W.H. FREEMAN& CO, San Francisco, 768 p.
SERVA L. (1994) - Ground effects in intensity scales. Terra Nova6, 414-416.
WANG J. (2004) - Historical earthquake investigation and researchin China. Annals of Geophysics, 47 (2/3), 831-838.
XIE Y. (1957) - A new scale of seismic intensity adapted to the con-ditions in Chinese territories. Acta Geophysica Sinica, 6-1,35-47, (in Chinese).
PUBLICATIONS WITHIN THE INQUA SCALEPROJECT
In the frame of the “INQUA Scale Project” activities,numerous papers, reports and abstracts have been publi-shed. In this section is reported a preliminary list.
PAPERS AND REPORTS (PUBLISHED OR IN PRESS).
FOKAEFS A. & PAPADOPOULOS G. (in press) - Testing thenew INQUA intensity scale in Greek earthquakes. QuaternaryInternational (2007), doi: 10.1016/j.quaint.2007.02.019.
GUERRIERI L., TATEVOSSIAN R., VITTORI E., COMERCIV., ESPOSITO E., MICHETTI A.M., PORFIDO S. & SERVA L.(2007) - Earthquake environmental effects (EEE) and intensityassessment: the INQUA scale project. Boll. Soc. Geol. It. (Ital. J.Geosci.), 126, No. 2, Roma.
GUERRIERI L., VITTORI E., ESPOSITO E., PORFIDO S.,TATEVOSSIAN R. & SERVA L. (2006) - The INQUA intensityscale. Brochure APAT, 4 pp., Roma.
LALINDE C. P. & SANCHEZ J.A. (2007) - Earthquake andenvironmental effects in Colombia in the last 35 years. INQUAScale Project. Bulletin of the Seismological Society ofAmerica, 97, (2), pp. 646-654.
MICHETTI A.M., AUDEMARD F.A.M. & MARCO S. (2005)- Future trends in paleoseismology: Integrated study of the seismic lan-dscape as a vital tool in seismic hazard analyses. Tectonophysics408 (2005) 3 -21.
MICHETTI A. M., ESPOSITO E., GÜRPINAR A.,MOHAMMADIOUN J., MOHAMMADIOUN B., PORFIDO S.,ROGOZHIN E., SERVA L., TATEVOSSIAN R., VITTORI E.,AUDEMARD F., COMERCI V., MARCO S., MCCALPIN J. &MÖRNER N.A. (2004) - The INQUA Scale. An innovativeapproach for assessing earthquake intensities based on seismically-induced ground effects in natural environment. Special paperAPAT, Mem. Descr. Carta Geol. d’Italia , 67. (E. VITTORI &
V. COMERCI Eds.), 115 pp., Roma.MICHETTI A.M., LIVIO F., CHINGA K. ESPOSITO E.,
FANETTI D., GAMBILLARA R., MARTIN S., PASQUARÈ F.,PORFIDO S., SILEO G. & VITTORI E. (2005) - Ground effects ofthe Ml 5.2, November 24, 2004, Salò earthquake, Northern Italy,and the seismic hazard of the western Southern Alps. Rend. Soc.Geol. It., 1 (2005), Nuova Serie, 134-135, 2 ff.
PAPATHANASSIOU G., VALKANIOTIS S. & PAVLIDES S.(2007) - Applying the INQUA Scale to the Sofaeds 1954, CentralGreece, earthquake.
PORFIDO S., ESPOSITO E., VITTORI E., TRANFAGLIA G.,GUERRIERI L. & PECE R. (2007) - Seismically induced groundeffects of the 1805, 1930 and 1980 earthquakes in the SouthernApennines (Italy). Boll.Soc.Geol.It. (Ital .J. Geosci.), 126, No.2, Roma.
SALAMON A. (2005) - Seismically induced ground effects of theFebruary 11, 2004, Ml=5.2 northeastern Dead Sea earthquake.Geological Survey of Israel, Report 30/04.
SERVA L., ESPOSITO E., GUERRIERI L., PORFIDO S.,VITTORI E. & COMERCI V. (in press) - Environmental Effectsfrom some historical earthquakes in Southern Apennines (Italy) andmacroseismic intensity asseessment. Contribution to INQUAEEE scale project. Quaternary International (2007),doi:10.1016/j.quaint.2007.03.015.
SILVA P.G. (2006) - La Escala de Intensidad Macrosísmica deINQUA (EEE Intensity Scale): Efectos Geológicos yGeomorfológicos de los terremotos. Journal of Quaternary andGeomorphology: Cuaternario y Geomorfología, 20 (1.2).
TATEVOSSIAN R.E. (in press) - The Verny, 1887, earthqua-ke in central Asia: Application of the INQUA scale based on cosei-smic environmental effects. Quaternary International (2007),accepted manuscript.
ABSTRACTS
32nd International Geological Congress - Florence, Italy,20-28 August 2004.
MOHAMMADIOUN B. - Interpretation of paleoseismic data usingan innovative macroseismicity scale.
SERVA L., ESPOSITO E., GURPINAR A., MARCO S., MCCALPIN J., MICHETTI A.M., MOHAMMADIOUN B., PORFIDOS., TATEVOSSIAN R. & VITTORI E. - The INQUA Scale: aninnovative approach for assessing earthquake base ond seismically-induced ground effects in natural environments.
International Symposium on Active Faulting - Hokudan,Japan, 17-22 January 2005
ESPOSITO E., PORFIDO S., LIVIO F., MARTIN S., MICHETTIA. M., CHUNGA K., FANETTI D., GAMBILLARA, R., SILEO G.& VITTORI E. - Ground effects of the Ml 5.2, November 24,2004, Salò earthquake, Northern Italy: a case study for the use of theINQUA scale.
GUERRIERI L., COMERCI V. & VITTORI E. - An earthquakesdatabase linking epicentral Intensity and surface faulting parameters.KINUGASA Y. - The INQUA Seismic Intensity Scale, its importan-ce and problems.
MICHETTI, A.M. - Paleoseismology, seismic hazard, and theINQUA Scale Project.
PORFIDO S. & ESPOSITO E. - The INQUA Scale Project:Analysis and distribution of ground effects by type for Italian ear-thquakes.
VITTORI E., GUERRIERI L. & COMERCI V. - Intensity - faultparameter relationships: implications for seismic hazard assessment.“Dark Nature - Rapid natural Change and HumanResponses”, Como, Italy, 3-7 September, 2005
CHUNGA K., LEÓN C., QUIÑÓNEZ M., STALÍN BENÍTEZ& MONTENEGRO G. - Seismic Hazard Assessment for GuayaquilCity (Ecuador): Insights from Quaternary Geological Data.
MICHETTI A.M. ET ALII22
CHUNGA K., ZAMUDIO Y., MARÍN G., EGRED J.,QUIÑÓNEZ M. & ITURRALDE D. - The 12 Dic, 1953,Earthquake, Ms 7.3, Ecuador-Peru border region: A Case Studyfor Applying the New INQUA Intensity Scale.
ESPOSITO E., PORFIDO S, GUERRIERI L, VITTORI E. &PENNETTA M. - INQUA intensity Scale Evaluation for the 1980Southern Italy “Historical” Earthquake.
FOKAEFS A., G.A. PAPADOPOULOS & PAVLIDES S. - Testi-ng the New INQUA Intensity Scale in Greek Earthquakes.
GUERRIERI L., TATEVOSSIAN R., VITTORI E., COMERCIV., ESPOSITO E., MICHETTI A.M., PORFIDO S. & SERVA L. -The Database of Coseismic Environmental Effects as a Tool forEarthquake Intensity Assessment within the INQUA EEE ScaleProject.
KAGAN E.J. , AGNON A., BAR-MATTHEWS M. & AVNERAYALON - Damaged Cave Deposits Record 200, 000 Years ofPaleoseismicity: Dead Sea Transform Region.
PAPATHANASSIOU G. & PAVLIDES S. - Using the INQUAScale for the Assessment of Intensity: Case Study of 14/08/2003Lefkada Earthquake, Greece.
TATEVOSSIAN R. - Study of the Verny, 1887, Earthquakein Central Asia: Using Environmental Effects to Scale the Intensity
ZAMUDIO DIAZ Y., MARIN RUIZ G. & VILCAPOMALAZARO L. - Applying the INQUA Scale to Some Historical andRecent Peruvian Earthquakes.
EGU General Assembly 2006, Vienna, Austria, 06 April2006, Session “3000 years of earthquake ground effectsreports in Europe: geological analysis of active faults andbenefits for hazard assessment”
AZUMA, T.& OTA, Y. - Comparison between seismic groundeffects and instrumental seismic intensity- an example from a study onthe 2004 Chuetsu earthquake in Central Japan.
GIARDINA, F.,CARCANO C., LIVIO F.. MICHETTI, A.M.,MUELLER, K., ROGLEDI S., SERVA L., SILEO G. & VITTORIE. - Active compressional tectonics and Quaternary capable faults inthe Western Southern Alps.
GUERRIERI L., ESPOSITO E., PORFIDO S. & VITTORI E.- The application of INQUA Scale to the 1805 Molise earthquake.MICHETTI A.M. - The INQUA Scale Project The INQUA ScaleProject: linking pre-historical and historical records of earthquakeground effects.
REICHERTER K.R., SILVA P.G., GOY J.L., SCHLEGEL U.,SCHÖNEICH S. & ZAZO C. - Active faults and paleostress historyof the Gibraltar Arc area (southern Spain) - first results.
PAPANIKOLAOU I.D., PAPANIKOLAOU D.I., LEKKAS E.L.- Epicentral-near field and far field effects from recent earthquakes inGreece. Implications for the recently introduced INQUAScale.
SILVA BARROSO P.G., REICHERTER K., BARDAJÍ T., LARIOJ., PELTZER M., GRÜTZNER C., BECKER-HEIDMANN P., GOYJ.L., ZAZO C. & BORJA F. - The Baelo Claudia earthquake pro-blem, Southern Spain.
SILVA P., G.REICHERTER K.R., BARDAJÍ T., LARIO J.,PELTZER M., GRÜTZNER CH., BECKER-HEIDMANN P., GOYJ.L., ZAZO C.& BORJA F. - Surface and subsurface paleoseismicrecord of the Baelo Claudia area (Gibraltar Arc area, southern
Spain) - first results.
ICTP IAEA Workshop on the Conduct of Seismic HazardAnalyses for Critical Facilities Trieste, Italy, 15-19 May 2006.
ABDEL AZIZ M. - INQUA intensity assessment for the 1995Aqaba earthquake.
AMIT R. - The use of paleoseismic data and ground effects(INQUA Scale) of strong earthquakes for seismic hazard evalua-tions of the Dead Sea Rift.
KINUGASA Y. - Use of geological data for seismic hazard asses-sment and siting of the nuclear facilities in Japan.
LALINDE PULIDO C. - Active tectonics and earthquake groundeffects in Colombia, with examples of applications of the INQUAScale.
MC CALPIN J. - Paleoseismology and Maximum Magnitude esti-mates in extensional terranes.
MICHETTI A.M. - Introduction of the INQUA Intensity Scale.MOHAMMADIOUN B. - The INQUA Scale Project: A better
link to dynamic source parameters and maximum magnitude determi-nation.
MUELLER K. - Assessing Mmax on Active Thrust Faults inNew Madrid (USA) and the Northern Po Basin (Italy).
NELSON A. - Earthquakes accompanied by tsunamis: theirpaleoseismic records and application to the INQUA intensity scale.
OTA Y., AZUMA T. & LIN N. - Paleoseismological study andseismic hazards resulting from major recent active faulting in Japanand Taiwan, and examples of INQUA scale intensity maps.
PAPATHANASIOU G. - Applications of the INQUA Scale inGreece.
PORFIDO S., ESPOSITO E., GUERRIERI L.& VITTORI E. -Application of the INQUA Scale to Italian earthquakes.
REICHERTER K. - Paleoseismology and the study of earthqua-ke ground effects in the Mediterranean Region.
SERVA L. - The concept of the Intensity parameter in the Intensityscales.
SILVA P.G. - Fault activity and earthquake ground effects inSpain: applications of the INQUA Scale in the Iberian Peninsula.
TATEVOSSIAN R. - Geological effects in the macroseismic inten-sity assessment, and the application of the INQUA Scale in formerUSSR.
VITTORI E. - Relationships among surface rupture parametersand intensity.
OTHER CONFERENCES
ASHOORI S., GHADYANI A., MEMARIAN H. & ZARÈ M. -Estimation of the Earthquake Intensities in Iran based on groundeffects (application of INQUA scale); two cases studies.
LALINDE C.P., ESTRADA R. B.E. & FARBIARZ J. F. -Preliminary application of the INQUA scale to the recentColombian earthquakes. X° Congreso Colombiano de Geologia,Bogotà, April 2005.
PAPATHANASSIOU G. & PAVLIDES S. - Lefkada. 14thMAEGS, Turin, September 2005.
VITTORI E. - The INQUA EEE scale. WS RegionalCooperation on natural hazards: tools for risk management,Yerevan, Armenia, October 26-28, 2005.
INTENSITY SCALE ESI 200723
APPENDIX IAPPENDIX I
EarEar thquakthquake Ene Envirvironmental Efonmental EfffectsectsPhoto gPhoto galleraller yy

January 3, 1911, Chon Kemin, Kirgyzstan earthquake(Ms=8.2).A fault slip of more than ten meters was produced by onesingle seismic event. In such a case, a paleoseismologicaltrench needs to be very deep to recognize past events (cen-tre of photo, man for scale).- Un rigetto di oltre 10 metri venne generato da un singolo eventosismico. In questi casi servono trincee paleosismiche molto estese perricostruire gli eventi precedenti (per confronto, si osservi l’uomo al cen-tro della foto).
Photo: E. Vittori
PRIMARPRIMARY EFFECTSY EFFECTS
December 4, 1957, Mogod, Gobi-Altay earthquake(Mw=8.1).Bogd Toromhon coseismic fault rupture: 6 m of leftlateral and 5 m (cfr. Shmulik Marco + KelvinBerryman + Thomas Rockwell) of vertical slip.- Fagliazione superficiale cosismica a Bogd Toromhon: lo sposta-mento cosismico è stato pari a circa 6 metri di movimento late-rale sinistro, e a circa 5 m (cfr. Shmulik Marco + KelvinBerryman + Thomas Rockwell) di dislocazione verticale.
Photo: R. Amit
March 27, 1964 Alaska earthquake (Mw=9.2).Hanning Bay fault scarp on Montague Island.Vertical displacement in the foreground, inrock, is about 3.6 m. The maximum measureddisplacement of 4.2 m is at the beach ridge nearthe trees in the background.- Scarpata di faglia di Hanning Bay, Montague Island.In primo piano, la dislocazione verticale è pari a 3,6 m.La massima dislocazione, pari a 4,2 m, è stata misu-rata vicino agli alberi sullo sfondo.
Source: U.S. Geological Survey PhotographicLibrary (http://libraryphoto.cr.usgs.gov) .Published on U.S. Geological SurveyProfessional paper 541.
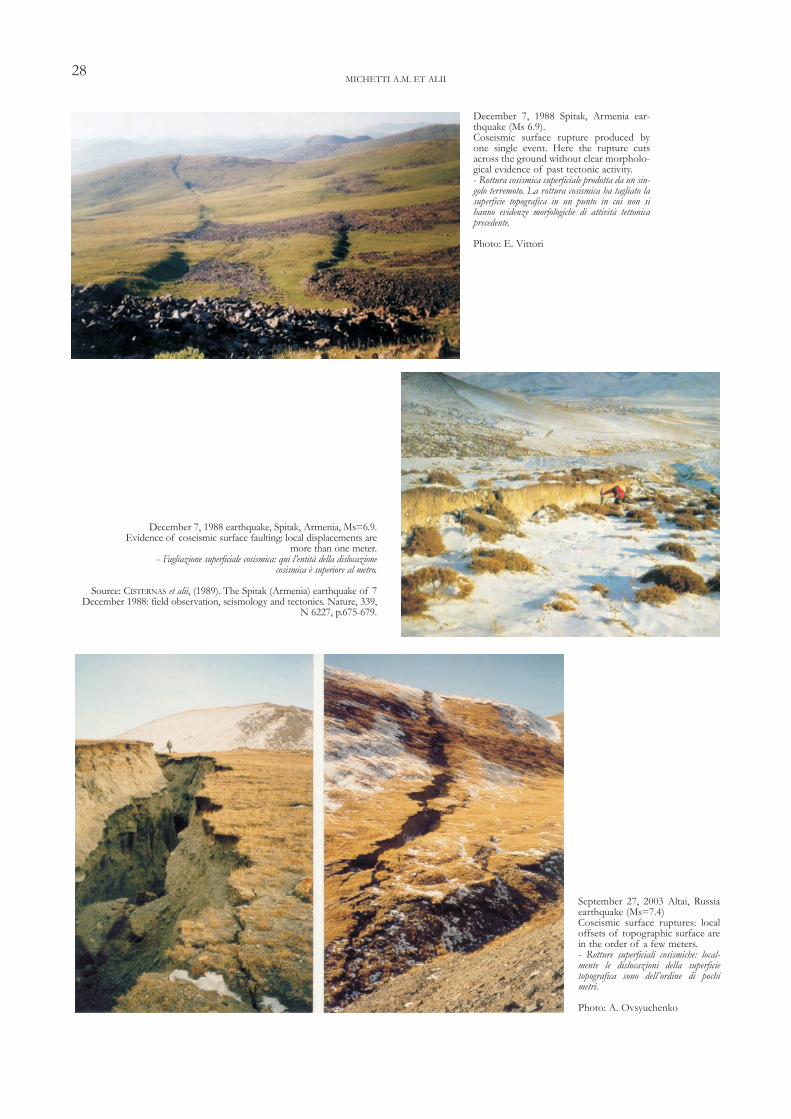
September 27, 2003 Altai, Russiaearthquake (Ms=7.4) Coseismic surface ruptures: localoffsets of topographic surface arein the order of a few meters.- Rotture superficiali cosismiche: local-mente le dislocazioni della superficietopografica sono dell’ordine di pochimetri.
Photo: A. Ovsyuchenko
December 7, 1988 Spitak, Armenia ear-thquake (Ms 6.9).Coseismic surface rupture produced byone single event. Here the rupture cutsacross the ground without clear morpholo-gical evidence of past tectonic activity.- Rottura cosismica superficiale prodotta da un sin-golo terremoto. La rottura cosismica ha tagliato lasuperficie topografica in un punto in cui non sihanno evidenze morfologiche di attività tettonicaprecedente.
Photo: E. Vittori
December 7, 1988 earthquake, Spitak, Armenia, Ms=6.9.Evidence of coseismic surface faulting: local displacements are
more than one meter.- Fagliazione superficiale cosismica: qui l’entità della dislocazione
cosismica è superiore al metro.
Source: CISTERNAS et alii, (1989). The Spitak (Armenia) earthquake of 7December 1988: field observation, seismology and tectonics. Nature, 339,
N 6227, p.675-679.
MICHETTI A.M. ET ALII28
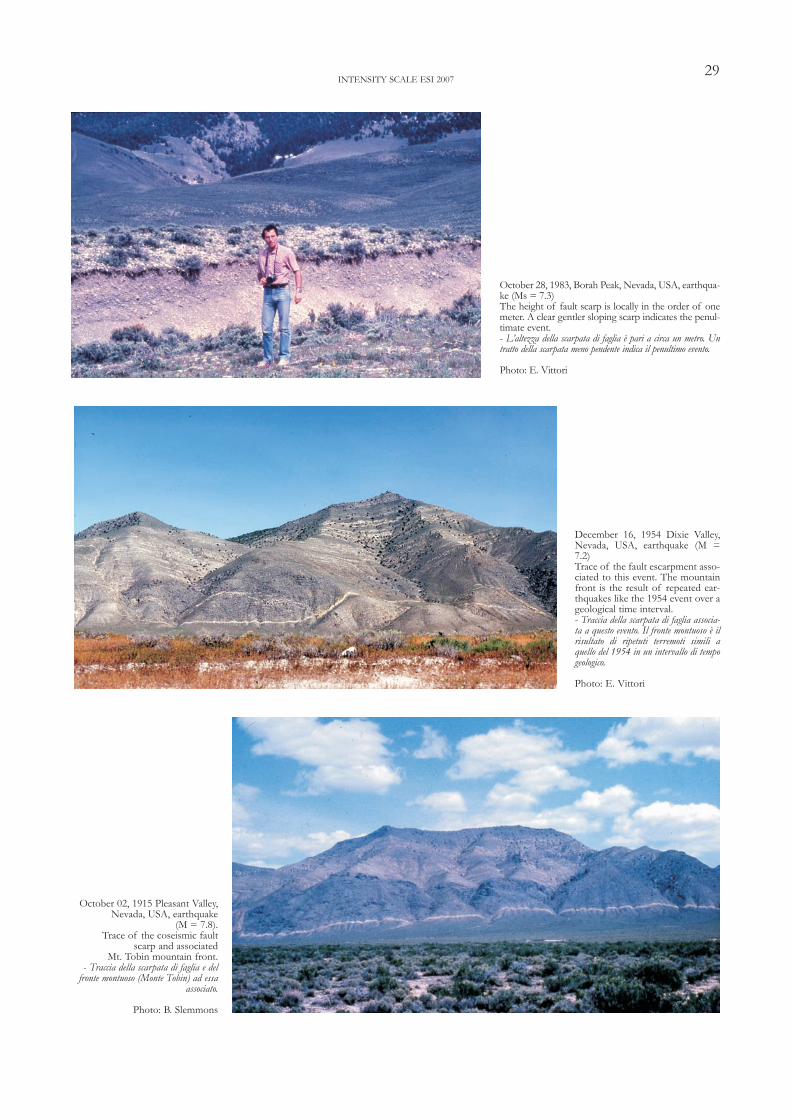
December 16, 1954 Dixie Valley,Nevada, USA, earthquake (M =7.2)Trace of the fault escarpment asso-ciated to this event. The mountainfront is the result of repeated ear-thquakes like the 1954 event over ageological time interval.- Traccia della scarpata di faglia associa-ta a questo evento. Il fronte montuoso è ilrisultato di ripetuti terremoti simili aquello del 1954 in un intervallo di tempogeologico.
Photo: E. Vittori
October 02, 1915 Pleasant Valley,Nevada, USA, earthquake
(M = 7.8).Trace of the coseismic fault
scarp and associated Mt. Tobin mountain front.
- Traccia della scarpata di faglia e delfronte montuoso (Monte Tobin) ad essa
associato.
Photo: B. Slemmons
INTENSITY SCALE ESI 2007
October 28, 1983, Borah Peak, Nevada, USA, earthqua-ke (Ms = 7.3)The height of fault scarp is locally in the order of onemeter. A clear gentler sloping scarp indicates the penul-timate event.- L’altezza della scarpata di faglia è pari a circa un metro. Untratto della scarpata meno pendente indica il penultimo evento.
Photo: E. Vittori
29
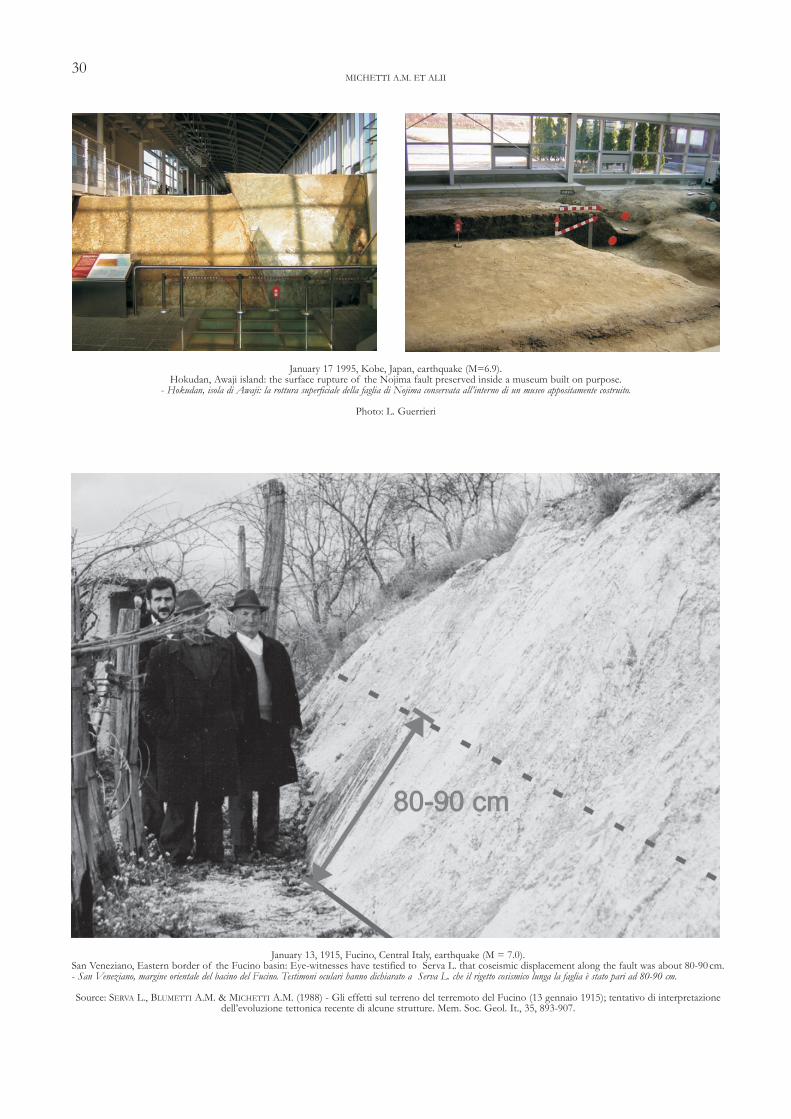
January 17 1995, Kobe, Japan, earthquake (M=6.9).Hokudan, Awaji island: the surface rupture of the Nojima fault preserved inside a museum built on purpose.
- Hokudan, isola di Awaji: la rottura superficiale della faglia di Nojima conservata all’interno di un museo appositamente costruito.
Photo: L. Guerrieri
MICHETTI A.M. ET ALII30
January 13, 1915, Fucino, Central Italy, earthquake (M = 7.0).San Veneziano, Eastern border of the Fucino basin: Eye-witnesses have testified to Serva L. that coseismic displacement along the fault was about 80-90 cm.- San Veneziano, margine orientale del bacino del Fucino. Testimoni oculari hanno dichiarato a Serva L. che il rigetto cosismico lunga la faglia è stato pari ad 80-90 cm.
Source: SERVA L., BLUMETTI A.M. & MICHETTI A.M. (1988) - Gli effetti sul terreno del terremoto del Fucino (13 gennaio 1915); tentativo di interpretazionedell’evoluzione tettonica recente di alcune strutture. Mem. Soc. Geol. It., 35, 893-907.
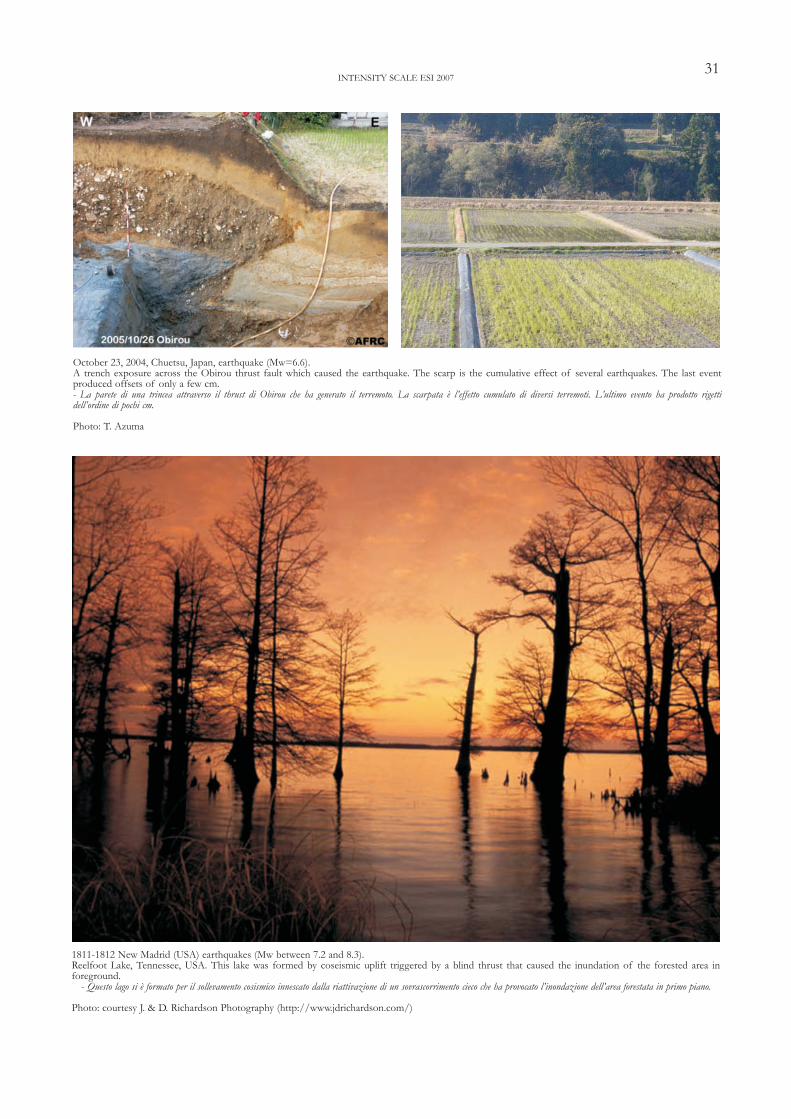
October 23, 2004, Chuetsu, Japan, earthquake (Mw=6.6).A trench exposure across the Obirou thrust fault which caused the earthquake. The scarp is the cumulative effect of several earthquakes. The last event produced offsets of only a few cm.- La parete di una trincea attraverso il thrust di Obirou che ha generato il terremoto. La scarpata è l’effetto cumulato di diversi terremoti. L’ultimo evento ha prodotto rigetti dell’ordine di pochi cm.
Photo: T. Azuma
1811-1812 New Madrid (USA) earthquakes (Mw between 7.2 and 8.3).Reelfoot Lake, Tennessee, USA. This lake was formed by coseismic uplift triggered by a blind thrust that caused the inundation of the forested area in foreground.
- Questo lago si è formato per il sollevamento cosismico innescato dalla riattivazione di un sovrascorrimento cieco che ha provocato l’inondazione dell’area forestata in primo piano.
Photo: courtesy J. & D. Richardson Photography (http://www.jdrichardson.com/)
INTENSITY SCALE ESI 200731

SECONDSECONDARARY EFFECTSY EFFECTS
February 5, 1783 Calabria ear-thquake (Mm=7.1).A seismically-induced landslidedammed the S. Cristina narrowvalley and formed a temporarylake.- Una frana sismoindotta sbarrò lastretta valle di S. Cristina e formòun lago temporaneo.
Source: Sarconi (1784) - Istoriade' fenomeni del Tremoto avvenutonelle Calabrie e nel Valdemone nel-l’anno 1783. Reale Accademiadelle Scienze, e delle BelleLettere di Napoli. Naples.
October 23, 2004 Chuetsu, Japan, earthquake(Mw=6.6).Seismically induced landslide in the hills ofYamakoshi.- Una frana sismoindotta sulle colline di Yamakoshi.
Photo: T. Azuma
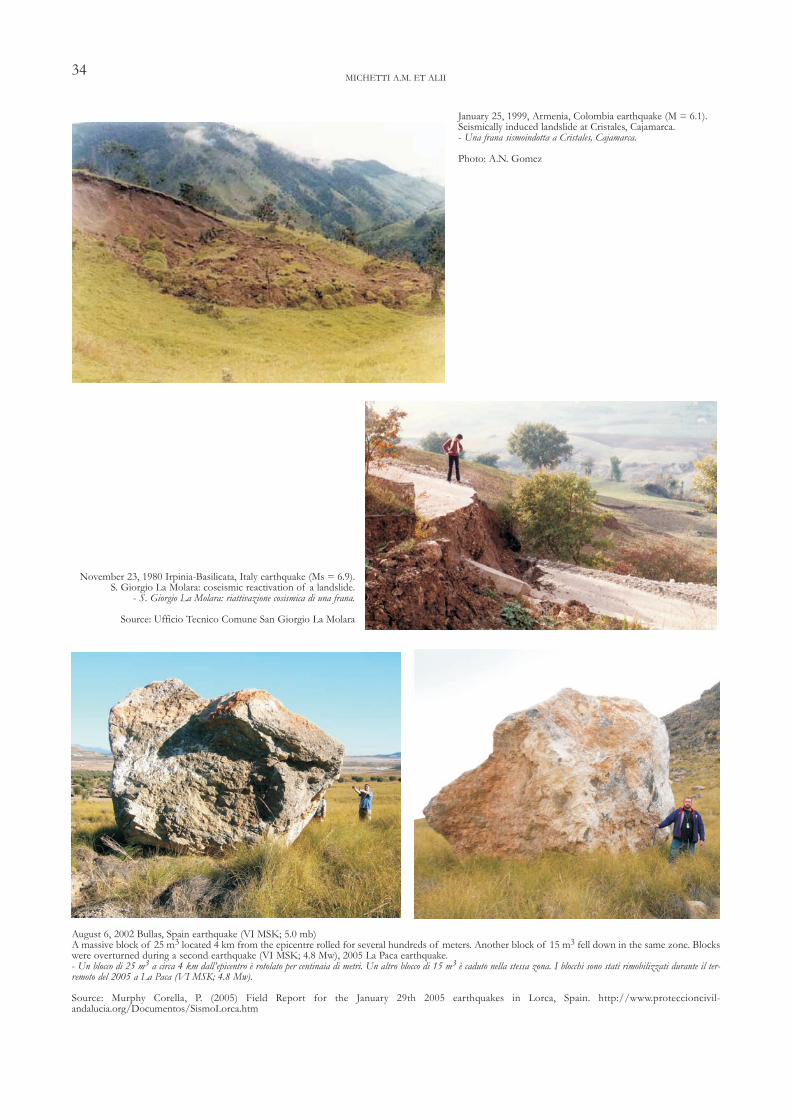
January 25, 1999, Armenia, Colombia earthquake (M = 6.1).Seismically induced landslide at Cristales, Cajamarca.- Una frana sismoindotta a Cristales, Cajamarca.
Photo: A.N. Gomez
November 23, 1980 Irpinia-Basilicata, Italy earthquake (Ms = 6.9).S. Giorgio La Molara: coseismic reactivation of a landslide.
- S. Giorgio La Molara: riattivazione cosismica di una frana.
Source: Ufficio Tecnico Comune San Giorgio La Molara
August 6, 2002 Bullas, Spain earthquake (VI MSK; 5.0 mb)A massive block of 25 m3 located 4 km from the epicentre rolled for several hundreds of meters. Another block of 15 m3 fell down in the same zone. Blockswere overturned during a second earthquake (VI MSK; 4.8 Mw), 2005 La Paca earthquake.- Un blocco di 25 m3 a circa 4 km dall’epicentro è rotolato per centinaia di metri. Un altro blocco di 15 m3 è caduto nella stessa zona. I blocchi sono stati rimobilizzati durante il ter-remoto del 2005 a La Paca (VI MSK; 4.8 Mw).
Source: Murphy Corella, P. (2005) Field Report for the January 29th 2005 earthquakes in Lorca, Spain. http://www.proteccioncivil-andalucia.org/Documentos/SismoLorca.htm
MICHETTI A.M. ET ALII34
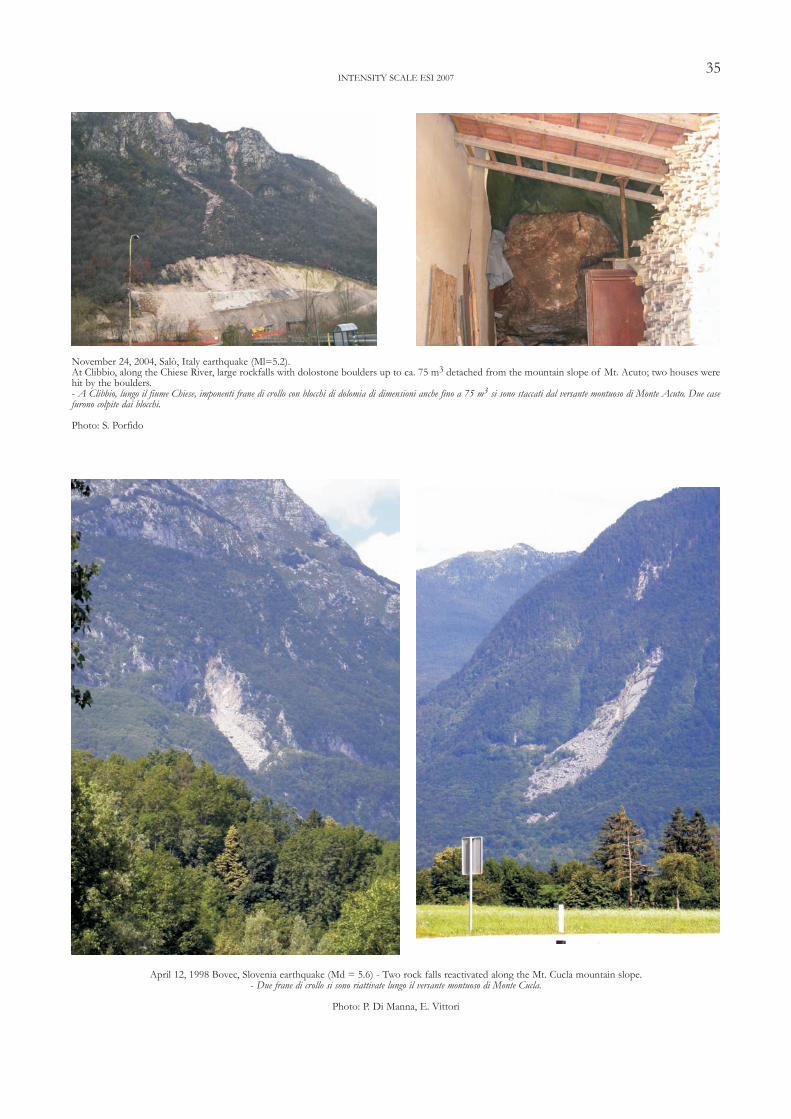
November 24, 2004, Salò, Italy earthquake (Ml=5.2).At Clibbio, along the Chiese River, large rockfalls with dolostone boulders up to ca. 75 m3 detached from the mountain slope of Mt. Acuto; two houses werehit by the boulders.- A Clibbio, lungo il fiume Chiese, imponenti frane di crollo con blocchi di dolomia di dimensioni anche fino a 75 m3 si sono staccati dal versante montuoso di Monte Acuto. Due casefurono colpite dai blocchi.
Photo: S. Porfido
April 12, 1998 Bovec, Slovenia earthquake (Md = 5.6) - Two rock falls reactivated along the Mt. Cucla mountain slope.- Due frane di crollo si sono riattivate lungo il versante montuoso di Monte Cucla.
Photo: P. Di Manna, E. Vittori
INTENSITY SCALE ESI 200735
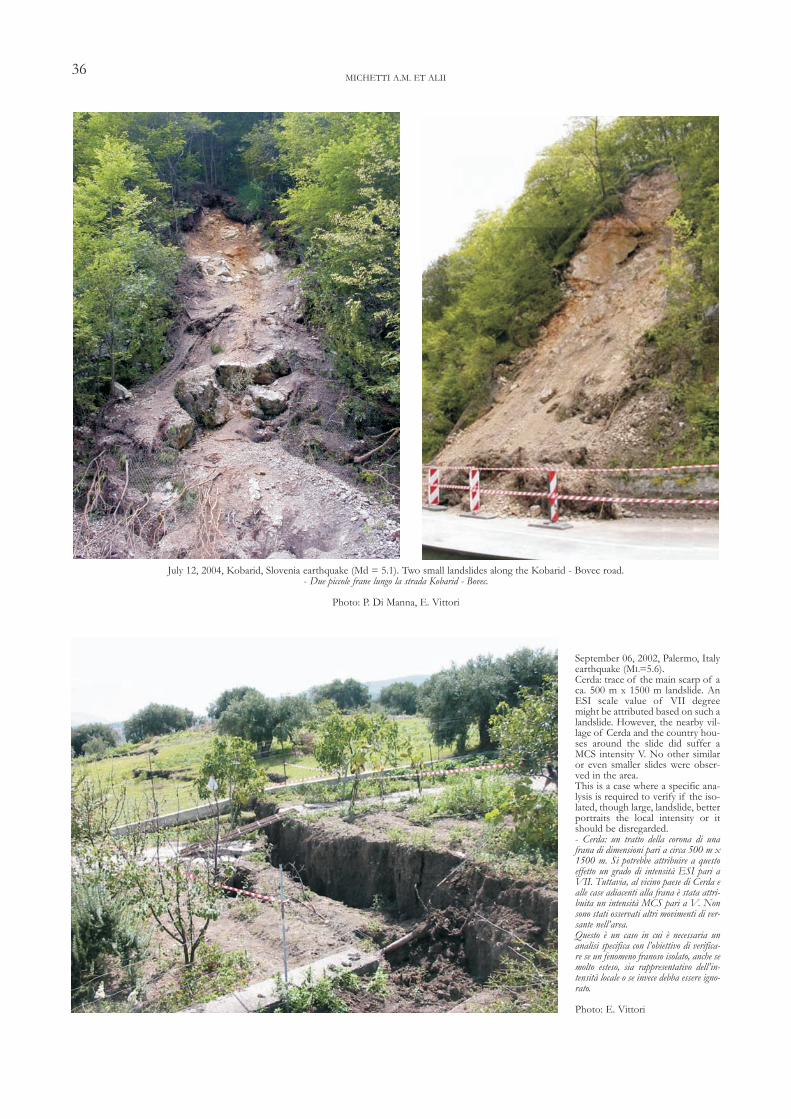
July 12, 2004, Kobarid, Slovenia earthquake (Md = 5.1). Two small landslides along the Kobarid - Bovec road.- Due piccole frane lungo la strada Kobarid - Bovec.
Photo: P. Di Manna, E. Vittori
September 06, 2002, Palermo, Italyearthquake (ML=5.6).Cerda: trace of the main scarp of aca. 500 m x 1500 m landslide. AnESI scale value of VII degreemight be attributed based on such alandslide. However, the nearby vil-lage of Cerda and the country hou-ses around the slide did suffer aMCS intensity V. No other similaror even smaller slides were obser-ved in the area.This is a case where a specific ana-lysis is required to verify if the iso-lated, though large, landslide, betterportraits the local intensity or itshould be disregarded.- Cerda: un tratto della corona di unafrana di dimensioni pari a circa 500 m x1500 m. Si potrebbe attribuire a questoeffetto un grado di intensità ESI pari aVII. Tuttavia, al vicino paese di Cerda ealle case adiacenti alla frana è stata attri-buita un intensità MCS pari a V. Nonsono stati osservati altri movimenti di ver-sante nell’area. Questo è un caso in cui è necessaria unanalisi specifica con l’obiettivo di verifica-re se un fenomeno franoso isolato, anche semolto esteso, sia rappresentativo dell’in-tensità locale o se invece debba essere igno-rato.
Photo: E. Vittori
MICHETTI A.M. ET ALII36
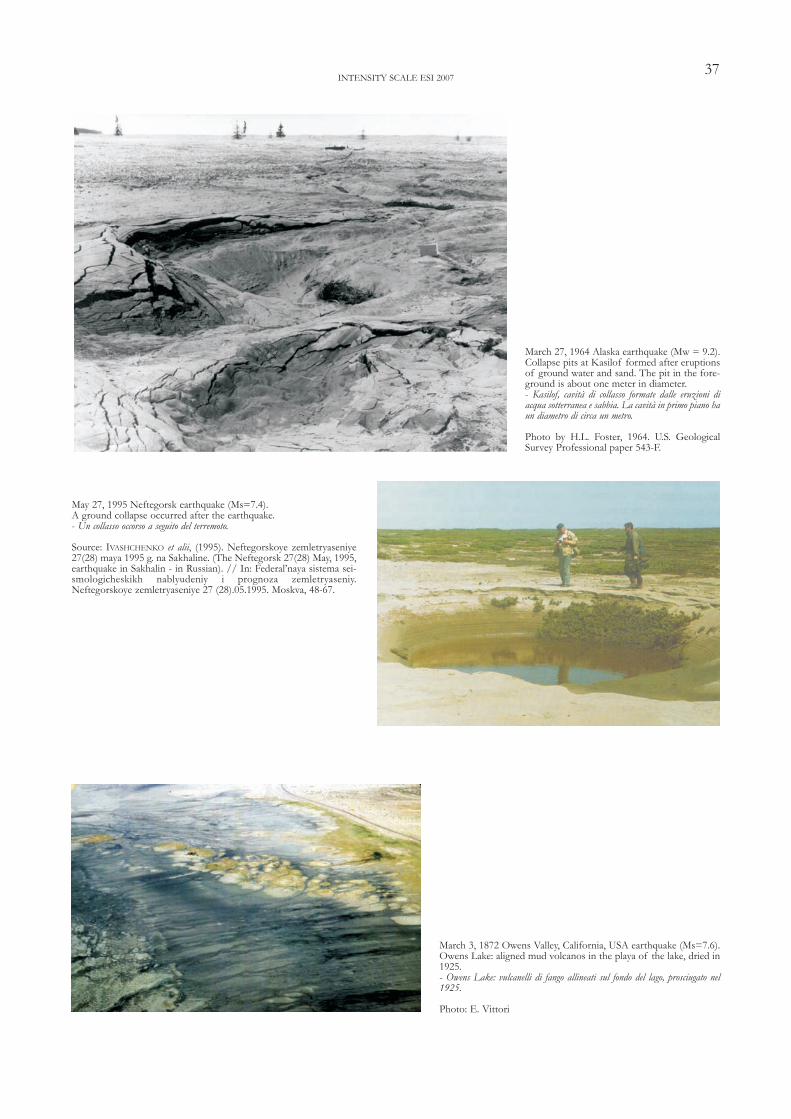
INTENSITY SCALE ESI 2007
May 27, 1995 Neftegorsk earthquake (Ms=7.4).A ground collapse occurred after the earthquake.- Un collasso occorso a seguito del terremoto.
Source: IVASHCHENKO et alii, (1995). Neftegorskoye zemletryaseniye27(28) maya 1995 g. na Sakhaline. (The Neftegorsk 27(28) May, 1995,earthquake in Sakhalin - in Russian). // In: Federal’naya sistema sei-smologicheskikh nablyudeniy i prognoza zemletryaseniy.Neftegorskoye zemletryaseniye 27 (28).05.1995. Moskva, 48-67.
March 3, 1872 Owens Valley, California, USA earthquake (Ms=7.6).Owens Lake: aligned mud volcanos in the playa of the lake, dried in1925.- Owens Lake: vulcanelli di fango allineati sul fondo del lago, prosciugato nel1925.
Photo: E. Vittori
March 27, 1964 Alaska earthquake (Mw = 9.2).Collapse pits at Kasilof formed after eruptionsof ground water and sand. The pit in the fore-ground is about one meter in diameter.- Kasilof, cavità di collasso formate dalle eruzioni diacqua sotterranea e sabbia. La cavità in primo piano haun diametro di circa un metro.
Photo by H.L. Foster, 1964. U.S. GeologicalSurvey Professional paper 543-F.
37
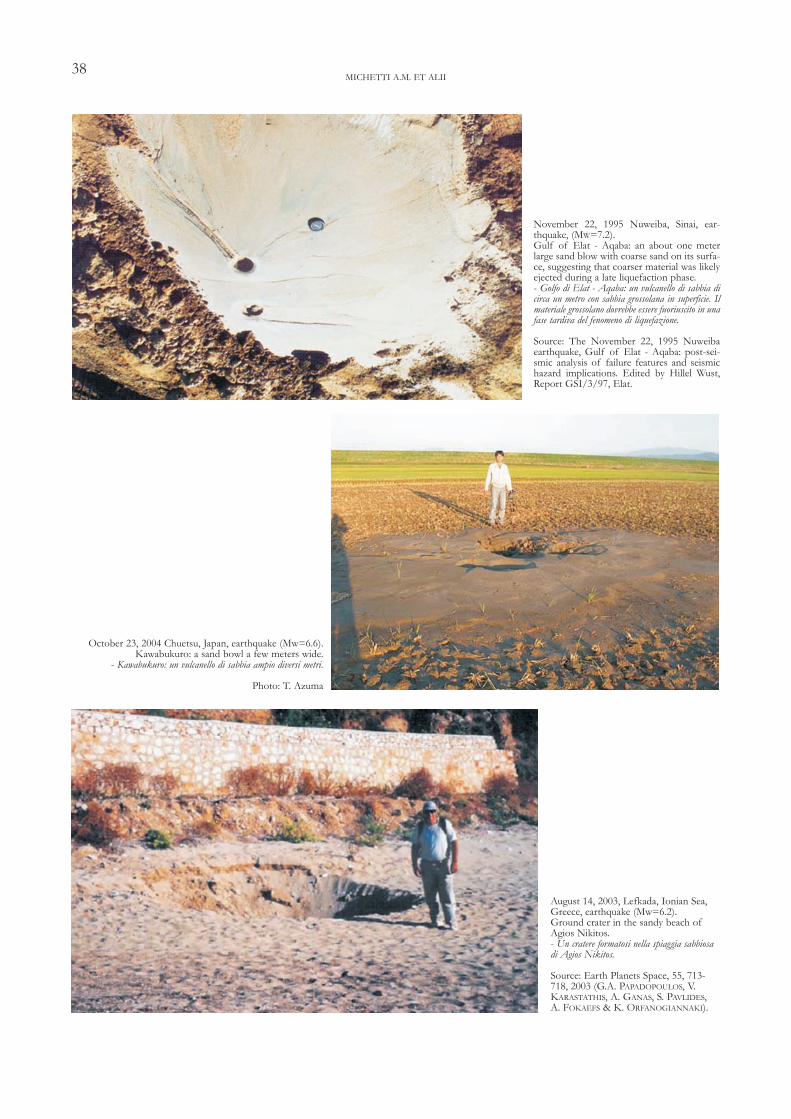
October 23, 2004 Chuetsu, Japan, earthquake (Mw=6.6).Kawabukuro: a sand bowl a few meters wide.
- Kawabukuro: un vulcanello di sabbia ampio diversi metri.
Photo: T. Azuma
November 22, 1995 Nuweiba, Sinai, ear-thquake, (MW=7.2).Gulf of Elat - Aqaba: an about one meterlarge sand blow with coarse sand on its surfa-ce, suggesting that coarser material was likelyejected during a late liquefaction phase.- Golfo di Elat - Aqaba: un vulcanello di sabbia dicirca un metro con sabbia grossolana in superficie. Ilmateriale grossolano dovrebbe essere fuoriuscito in unafase tardiva del fenomeno di liquefazione.
Source: The November 22, 1995 Nuweibaearthquake, Gulf of Elat - Aqaba: post-sei-smic analysis of failure features and seismichazard implications. Edited by Hillel Wust,Report GSI/3/97, Elat.
August 14, 2003, Lefkada, Ionian Sea,Greece, earthquake (Mw=6.2).Ground crater in the sandy beach ofAgios Nikitos.- Un cratere formatosi nella spiaggia sabbiosadi Agios Nikitos.
Source: Earth Planets Space, 55, 713-718, 2003 (G.A. PAPADOPOULOS, V.KARASTATHIS, A. GANAS, S. PAVLIDES,A. FOKAEFS & K. ORFANOGIANNAKI).
MICHETTI A.M. ET ALII38

INTENSITY SCALE ESI 2007
November 24, 2004, Salò, Italy, earthquake (Ml=5.2)Salò: in the harbor evidence of liquefaction and localized (over anarea of ca. 500 m2) lateral spreading was observed, with fissuringup to 30 cm wide parallel to the waterfront area.- Salò: nel porto sono state osservate evidenze di liquefazione ed espandimen-ti laterali localizzati in un area di circa 500 m2, con fessure ampie fino a 30cm parallele al fronte del porto.
Photo: E. Esposito
October 18, 1992, Murindo, Colombia earthquake (Mw=7.1)Murindo River basin, Colombia: The vegetation cover was heavily
damaged and trees collapsed even in flat areas.- Bacino del fiume Murindo, Colombia: La copertura vegetale venne profondamen-
te devastata e alberi caddero anche in aree pianeggianti.
Photo: E. Parra
October 18, 1992, Murindo,Colombia earthquake (Mw=7.1)Damaquiel Island (50m x150m) emerged in the Gulf ofUraba Colombia.- L’isola di Damaquiel (50 m x150 m) emerse nel Golfo di Uraba,Colombia.
Photo: E. Parra
39

October 18, 1992, Murindo, Colombiaearthquake (Mw=7.1)San Pedro de Uraba: the Cacahual mud-volcano erupted some minutes after theevent emitting gas that burnt for days.- San Pedro de Uraba: il mud-volcano diCacahual ha iniziato ad eruttare alcuni minutidopo l’evento con emissioni gassose che alimenta-rono incendi per diversi giorni.
Photo: E. Parra
March 27, 1964, Alaska earthquake (Mw=9.2).Shoup Bay: a boulder estimated to weigh almost 800 kg wasthrown 27 m above the shoreline.- Shoup Bay: un enorme blocco il cui peso è stato stimato pari a quasi800 kg è stato scagliato fino a 27 metri sopra la linea di costa.
Photo by G. Plafker, 1964. Figure 4, U.S. Geological SurveyProfessional paper 542-G.
MICHETTI A.M. ET ALII40

February 11, 2004, Northeastern Dead Seaearthquake (ML=5.2).Anomalous wave in the Dead Sea, half an hourafter the event.- Un onda anomala nel Mar Morto, mezz’ora dopol’evento.
Source: SALAMON, A., 2005. Natural seismoge-nic effects of the February 11, 2004, ML=5.2,Dead Sea earthquake, Israel Journal of EarthSciences, 54, 145-169).Photo taken by C. Barghoorn
February 11, 2004, DeadNortheastern Sea earthqua-ke (ML=5.2).Ponds along the Dargacoast, probably formed bythe run-up wave of a smalltsunami.- Pozze d’acqua lungo la costa diDarga, formate probabilmentedall’onda di run-up di un picco-lo tsunami.
Source: SALAMON, A., 2005.Natural seismogenic effectsof the February 11, 2004,ML=5.2, Dead Sea ear-thquake, Israel Journal ofEarth Sciences, 54, 145-169).Photo taken by G. Baer.
INTENSITY SCALE ESI 200741

APPENDIX IIAPPENDIX II
ESI 2007 FESI 2007 Foror mm

ESI 2007 Form This 2 pages - form has to be used for field surveys immediately after the earthquake and for the revision of environmental effects from historical sources. It is designed at the site level (one different form for each different site). Fields in Italic should be filled when required information is available. A complete Guide to Compilation is available at the end of this Form.
Authors & Institution
1. ____________________________________________________________________________________________________
2. ____________________________________________________________________________________________________
3._____________________________________________________________________________________________________
4._____________________________________________________________________________________________________
5._____________________________________________________________________________________________________
Earthquake
Earthquake Code __________________ Earthquake Region _____________________________________________
Year________ Month ______ Day_______ Greenwich Time______________Epicentral Intensity_______ Intensity type______
Magnitude_______________ Magnitude type________________ Focal Depth (km) _______ Depth accuracy_______
Latitude __________________ Longitude__________________________Earthquake References_________________________
Surface faulting (yes/not): _________________ Map of rupture zone (available /not available) _________________________
Maximum Displacement (cm) ______Total Rupture Length (km)______ Slip-sense ____________________________________
Surface faulting References_______________________________________________________________________________
Area of max secondary effects (kms) _________ Reference for secondary effects _______________________________________
ESI epicentral intensity assessment _______________
Locality
Locality Code______________________ EEE-Survey Date ______________ Surveyors _______________________________
Locality ______________________ Town/District______________ Locality length (m) _________ Locality width (m) ________
Latitude _________________ Longitude ____________________ Altitude (m) __________ Location accuracy ______________
Distance from epicentre (km) _________ Local PGA (g) ______ Geomorphological setting_______________________________
Local Macroseismic Intensity _____________ Intensity type______
EEE site EEE Code__________________ EEE type____________________ Site length (m) _________ Site width (m) _____________
Site position _____________________Latitude __________ Longitude ___________ Altitude (m) ______ Loc. accuracy _____
Description ________________________________________________________________________________________
Notes on the site ____________________________________________________________________________________
Bedrock lithology_______________________________________ Soft sediment lithology __________________________
Strength_____________________________________________ Structure______________________________________
EEE Site References __________________________________________________________________________________
Effects on man-made structures
Type of man-made structures _____________________________________________________________________________
Level of damage _________________________ Single/multiple _________________________________________________

Surface faulting
Strike (°) ______ Dip (°) _____ Slip vector (°) ______ Type of movement__________________________________________
Vertical Offset (cm) ___________ Horizontal Offset (cm) ______ Displaced features _________________________________
Length of fault segment (km) ________ Scarp ________ Associated features:________________________________________
Hydrologic anomalies
Surface water effects____________________________________ Ground water effects________________________________
Temperature Anomaly Temperature change (°C) ________ Discharge anomaly Discharge change (l/s)_________
Chemical anomaly Change chemical components________________ Gas emission Gas element _____________
Duration of anomaly (days) __________ Time delay (hrs) __________ Velocity_______________________________________
Anomalous waves/tsunami
Max wave height (m) _________ Width (m) ___________ Length of affected coast (km) ________ Time delay (min) _________
Description____________________________________________________________________________________________
Ground cracks
Origin________________________________ Strike (°) ______ Dip (°) _____ Areal density (Nr/m2) _________________
Shape___________________________ Max opening (cm) _______________ Length (m) ___________________________
Slope movements
Type_________________________________ Max dimension of blocks (m3) __________Total volume (m3)________________
Linear density (Nr/m) ____________ Areal density (Nr/m2) ____________________ Humidity__________________________
Time delay (hrs) _____________________ Width (m) _____________________ Slip amount (m) __________________
Liquefactions
Type____________________________________ Max diameter (m) _____________ Linear density (Nr/m) ________________
Areal densit y (Nr/m2) ________ Max lowering/uplift (m) _________ Shape _________________________________________
Humidity_________________________ Depth of water table (m) ___________ Water ejection Sand ejection
Velocity ____________________________________ Time delay/advance (hrs) _____________________________________
Other effects
Three shaking Dust clouds Jumping stones Other__________________________________
Description_____________________________________________________________________________________________
Sketch
ESI local intensity assessment _______________
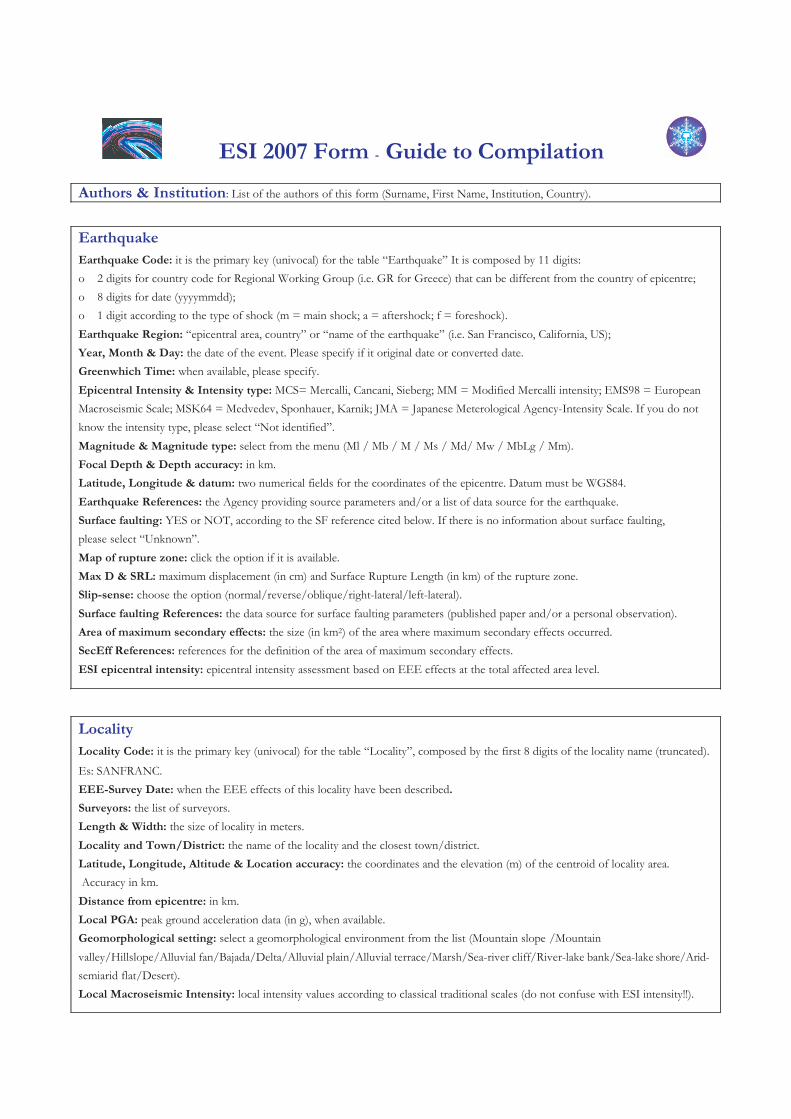
ESI 2007 Form - Guide to Compilation
Authors & Institution: List of the authors of this form (Surname, First Name, Institution, Country).
Earthquake Earthquake Code: it is the primary key (univocal) for the table “Earthquake” It is composed by 11 digits: o 2 digits for country code for Regional Working Group (i.e. GR for Greece) that can be different from the country of epicentre; o 8 digits for date (yyyymmdd); o 1 digit according to the type of shock (m = main shock; a = aftershock; f = foreshock). Earthquake Region: “epicentral area, country” or “name of the earthquake” (i.e. San Francisco, California, US); Year, Month & Day: the date of the event. Please specify if it original date or converted date. Greenwhich Time: when available, please specify. Epicentral Intensity & Intensity type: MCS= Mercalli, Cancani, Sieberg; MM = Modified Mercalli intensity; EMS98 = European Macroseismic Scale; MSK64 = Medvedev, Sponhauer, Karnik; JMA = Japanese Meterological Agency-Intensity Scale. If you do not know the intensity type, please select “Not identified”. Magnitude & Magnitude type: select from the menu (Ml / Mb / M / Ms / Md/ Mw / MbLg / Mm). Focal Depth & Depth accuracy: in km. Latitude, Longitude & datum: two numerical fields for the coordinates of the epicentre. Datum must be WGS84. Earthquake References: the Agency providing source parameters and/or a list of data source for the earthquake. Surface faulting: YES or NOT, according to the SF reference cited below. If there is no information about surface faulting, please select “Unknown”. Map of rupture zone: click the option if it is available. Max D & SRL: maximum displacement (in cm) and Surface Rupture Length (in km) of the rupture zone. Slip-sense: choose the option (normal/reverse/oblique/right-lateral/left-lateral). Surface faulting References: the data source for surface faulting parameters (published paper and/or a personal observation). Area of maximum secondary effects: the size (in km2) of the area where maximum secondary effects occurred. SecEff References: references for the definition of the area of maximum secondary effects. ESI epicentral intensity: epicentral intensity assessment based on EEE effects at the total affected area level.
Locality Locality Code: it is the primary key (univocal) for the table “Locality”, composed by the first 8 digits of the locality name (truncated).
Es: SANFRANC. EEE-Survey Date: when the EEE effects of this locality have been described.
Surveyors: the list of surveyors. Length & Width: the size of locality in meters. Locality and Town/District: the name of the locality and the closest town/district. Latitude, Longitude, Altitude & Location accuracy: the coordinates and the elevation (m) of the centroid of locality area. Accuracy in km. Distance from epicentre: in km. Local PGA: peak ground acceleration data (in g), when available. Geomorphological setting: select a geomorphological environment from the list (Mountain slope /Mountain valley/Hillslope/Alluvial fan/Bajada/Delta/Alluvial plain/Alluvial terrace/Marsh/Sea-river cliff/River-lake bank/Sea-lake shore/Arid-semiarid flat/Desert). Local Macroseismic Intensity: local intensity values according to classical traditional scales (do not confuse with ESI intensity!!).

EEE site EEE Code: it is the primary key (univocal) for the table “EEE Effects”, composed by 11 digits (8 digits of locality code + 1 + 2 digits for counter). Es: SANFRANC101. If another earthquake recorded in this database has hit the same locality you should insert 2 (instead of 1) between the 8 digits for locality code and the 2 digits for counter ). Es. SANFRANC201. Site position: describe the position of the site within the locality (50 digits). Length & Width: the size of site in meters. Latitude, Longitude, Altitude & Location accuracy: the coordinates and the elevation (m) of the EEE site. Accuracy in m. Description: a description of the effect as reported by the original observer (essential for historical earthquakes). In this field you should include description of the evolution in time of the effect. Notes: any additional information on the site. Bedrock lithology: select from the menu (Intrusive/Volcaniclava/Pyroclastic/Metamorphic/Shale/Sandstone/Conglomerate/Limestone/Salt). Soft sediment lithology: select from the menu (Soil/Clay/Silt/Sand/Gravel). Strength: select from the menu (hard/semi-coherent/soft). Structure: select from the menu (massive/stratified/densely cleaved). EEE Site References: cite the document supporting the EEE description. EEE type: select the dominant type of EEE effect in this site: Surface faulting - Slope movements - Ground cracks - Ground settlements - Hydrological anomaly – Tsunami - Not geological effects.
Effects on man-made structures Type of man-made structure: select from the menu (Buildings/Bridge/Viaduct/Railway/Tunnel/Paved road/Unimproved road/Highway). Level of damage: select from the menu (partially damaged/collapsed). Single/Multiple: choose the option.
Surface faulting Strike, Dip & Slip vector: in degrees. Slip sense: . it can be different from the general trend of movement. Select from the list (normal/reverse/oblique/strike-slip dextral/ strike-slip sinistral). Vertical Offset & Horizontal Offset: in cm. Displaced features: type the displaced features (i.e. alluvial fan deposits, limestone, erosional terrace, etc.); Length of fault segment: in km. Scarp: select single/multiple. Associated features: select from the menu (Gravity graben/Push-up/Pull-a-part/Mole track).
Hydrologic anomalies Surface water effects: select from the menu (Surface waters effects/Overflow/Waves/Water fountain/Discharge variation/ Turbidity of river/Seiches/Temporary sea-level change/Temporary lake-level change). Ground water effects: select from the menu (Drying up of springs/Appearance of springs/Temperature/Chemical component/ Turbidity of springs). Temperature Anomaly &Temperature change: in case, click the option and estimate the change in °C. Discharge anomaly & Discharge change: in case, click the option and estimate the change in l/s Chemical anomaly & Change chemical components: in case, click the option and record the anomalous chemical component. Gas emission & Gas element: in case, click the option and record the anomalous gas element. Duration of anomaly: in days. Time delay: in hours. Velocity: select from the menu (Extremely slow/Very slow/Slow/Moderately rapid/Rapid).
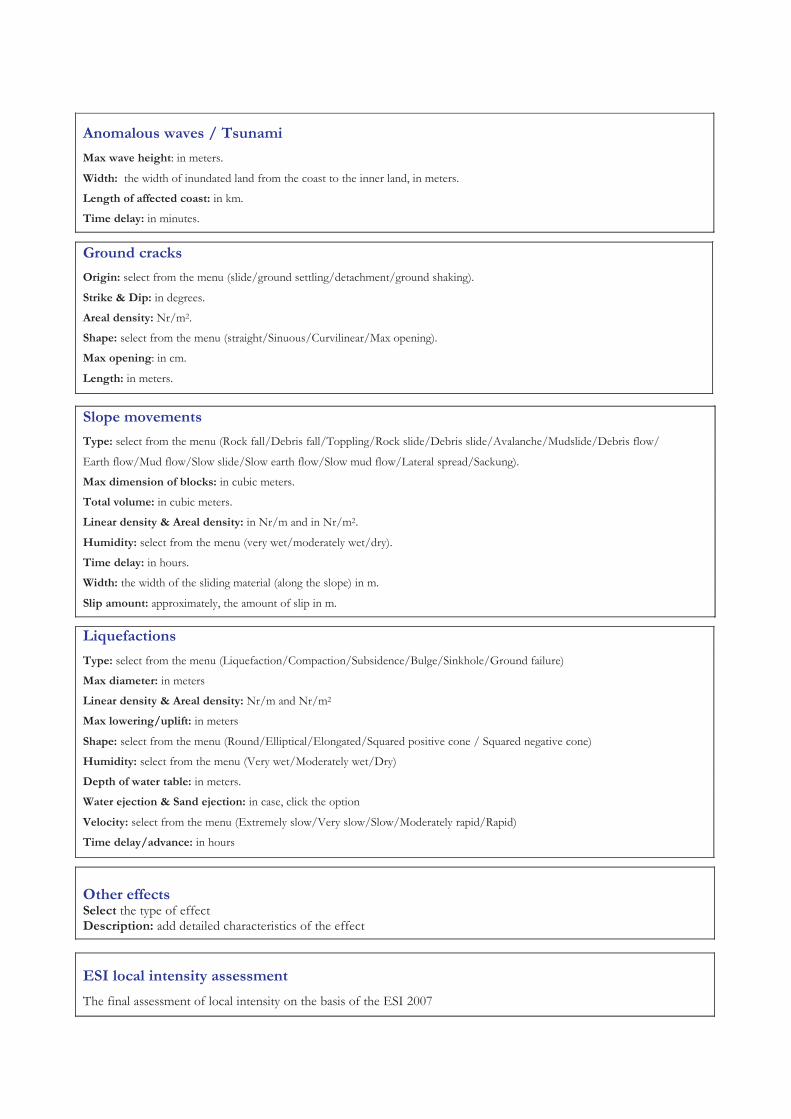
Anomalous waves / Tsunami
Max wave height: in meters.
Width: the width of inundated land from the coast to the inner land, in meters.
Length of affected coast: in km.
Time delay: in minutes.
Ground cracks
Origin: select from the menu (slide/ground settling/detachment/ground shaking).
Strike & Dip: in degrees.
Areal density: Nr/m2.
Shape: select from the menu (straight/Sinuous/Curvilinear/Max opening).
Max opening: in cm.
Length: in meters.
Slope movements
Type: select from the menu (Rock fall/Debris fall/Toppling/Rock slide/Debris slide/Avalanche/Mudslide/Debris flow/
Earth flow/Mud flow/Slow slide/Slow earth flow/Slow mud flow/Lateral spread/Sackung).
Max dimension of blocks: in cubic meters.
Total volume: in cubic meters.
Linear density & Areal density: in Nr/m and in Nr/m2.
Humidity: select from the menu (very wet/moderately wet/dry).
Time delay: in hours.
Width: the width of the sliding material (along the slope) in m.
Slip amount: approximately, the amount of slip in m.
Liquefactions
Type: select from the menu (Liquefaction/Compaction/Subsidence/Bulge/Sinkhole/Ground failure)
Max diameter: in meters
Linear density & Areal density: Nr/m and Nr/m2
Max lowering/uplift: in meters
Shape: select from the menu (Round/Elliptical/Elongated/Squared positive cone / Squared negative cone)
Humidity: select from the menu (Very wet/Moderately wet/Dry)
Depth of water table: in meters.
Water ejection & Sand ejection: in case, click the option
Velocity: select from the menu (Extremely slow/Very slow/Slow/Moderately rapid/Rapid)
Time delay/advance: in hours
Other effects Select the type of effect Description: add detailed characteristics of the effect
ESI local intensity assessment The final assessment of local intensity on the basis of the ESI 2007
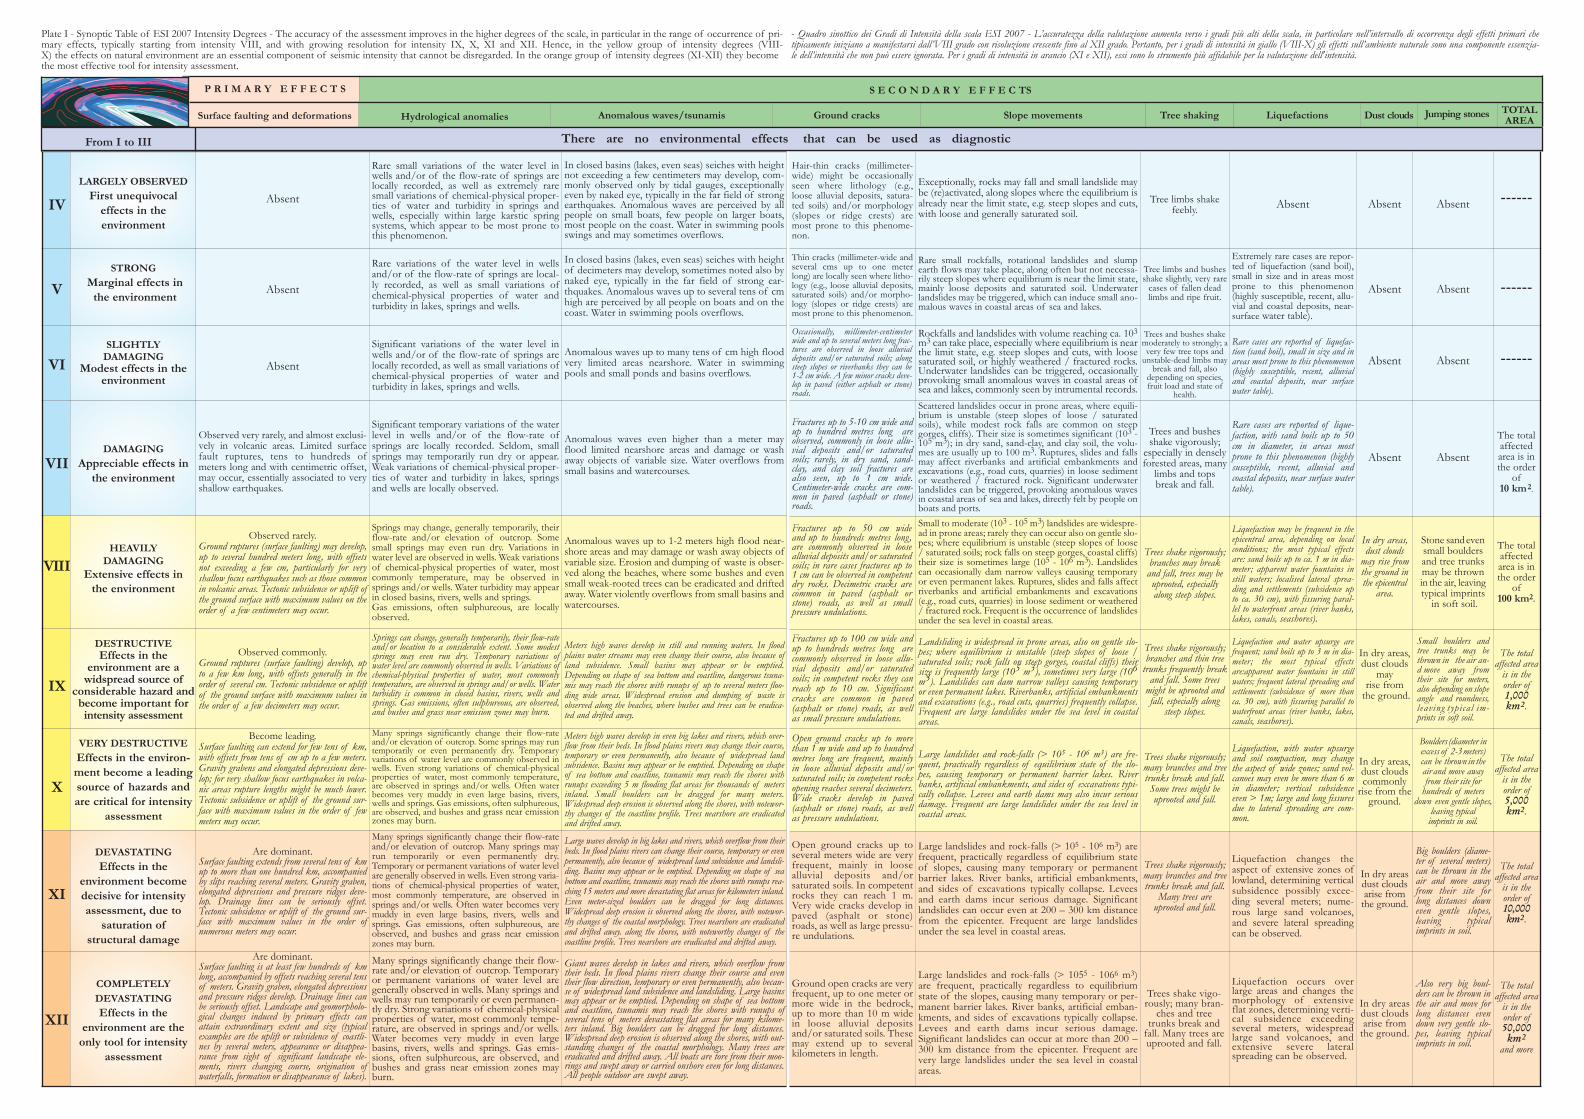
IV
LARGELY OBSERVED
First unequivocal effects in the environment
Absent
Rare small variations of the water level inwells and/or of the flow-rate of springs arelocally recorded, as well as extremely raresmall variations of chemical-physical proper-ties of water and turbidity in springs andwells, especially within large karstic springsystems, which appear to be most prone tothis phenomenon.
In closed basins (lakes, even seas) seiches with heightnot exceeding a few centimeters may develop, com-monly observed only by tidal gauges, exceptionallyeven by naked eye, typically in the far field of strongearthquakes. Anomalous waves are perceived by allpeople on small boats, few people on larger boats,most people on the coast. Water in swimming poolsswings and may sometimes overflows.
V
STRONG
Marginal effects inthe environment
Absent
Rare variations of the water level in wellsand/or of the flow-rate of springs are local-ly recorded, as well as small variations ofchemical-physical properties of water andturbidity in lakes, springs and wells.
In closed basins (lakes, even seas) seiches with heightof decimeters may develop, sometimes noted also bynaked eye, typically in the far field of strong ear-thquakes. Anomalous waves up to several tens of cmhigh are perceived by all people on boats and on thecoast. Water in swimming pools overflows.
VISLIGHTLY
DAMAGINGModest effects in the
environmentAbsent
Significant variations of the water level inwells and/or of the flow-rate of springs arelocally recorded, as well as small variations ofchemical-physical properties of water andturbidity in lakes, springs and wells.
Anomalous waves up to many tens of cm high floodvery limited areas nearshore. Water in swimmingpools and small ponds and basins overflows.
VIIDAMAGING
Appreciable effects inthe environment
Observed very rarely, and almost exclusi-vely in volcanic areas. Limited surfacefault ruptures, tens to hundreds ofmeters long and with centimetric offset,may occur, essentially associated to veryshallow earthquakes.
Significant temporary variations of the waterlevel in wells and/or of the flow-rate ofsprings are locally recorded. Seldom, smallsprings may temporarily run dry or appear.Weak variations of chemical-physical proper-ties of water and turbidity in lakes, springsand wells are locally observed.
Anomalous waves even higher than a meter mayflood limited nearshore areas and damage or washaway objects of variable size. Water overflows fromsmall basins and watercourses.
VIIIHEAVILY
DAMAGINGExtensive effects in
the environment
Observed rarely.Ground ruptures (surface faulting) may develop,up to several hundred meters long, with offsetsnot exceeding a few cm, particularly for veryshallow focus earthquakes such as those commonin volcanic areas. Tectonic subsidence or uplift ofthe ground surface with maximum values on theorder of a few centimeters may occur.
Springs may change, generally temporarily, theirflow-rate and/or elevation of outcrop. Somesmall springs may even run dry. Variations inwater level are observed in wells. Weak variationsof chemical-physical properties of water, mostcommonly temperature, may be observed insprings and/or wells. Water turbidity may appearin closed basins, rivers, wells and springs.Gas emissions, often sulphureous, are locallyobserved.
Anomalous waves up to 1-2 meters high flood near-shore areas and may damage or wash away objects ofvariable size. Erosion and dumping of waste is obser-ved along the beaches, where some bushes and evensmall weak-rooted trees can be eradicated and driftedaway. Water violently overflows from small basins andwatercourses.
IX
DESTRUCTIVEEffects in the
environment are a widspread source of
considerable hazard andbecome important forintensity assessment
Observed commonly.Ground ruptures (surface faulting) develop, upto a few km long, with offsets generally in theorder of several cm. Tectonic subsidence or upliftof the ground surface with maximum values inthe order of a few decimeters may occur.
Springs can change, generally temporarily, their flow-rateand/or location to a considerable extent. Some modestsprings may even run dry. Temporary variations ofwater level are commonly observed in wells. Variations ofchemical-physical properties of water, most commonlytemperature, are observed in springs and/or wells. Waterturbidity is common in closed basins, rivers, wells andsprings. Gas emissions, often sulphureous, are observed,and bushes and grass near emission zones may burn.
Meters high waves develop in still and running waters. In floodplains water streams may even change their course, also because ofland subsidence. Small basins may appear or be emptied.Depending on shape of sea bottom and coastline, dangerous tsuna-mis may reach the shores with runups of up to several meters floo-ding wide areas. Widespread erosion and dumping of waste isobserved along the beaches, where bushes and trees can be eradica-ted and drifted away.
X
VERY DESTRUCTIVE
Effects in the environ-ment become a leadingsource of hazards andare critical for intensity
assessment
Become leading.Surface faulting can extend for few tens of km,with offsets from tens of cm up to a few meters.Gravity grabens and elongated depressions deve-lop; for very shallow focus earthquakes in volca-nic areas rupture lengths might be much lower.Tectonic subsidence or uplift of the ground sur-face with maximum values in the order of fewmeters may occur.
Many springs significantly change their flow-rateand/or elevation of outcrop. Some springs may runtemporarily or even permanently dry. Temporaryvariations of water level are commonly observed inwells. Even strong variations of chemical-physicalproperties of water, most commonly temperature,are observed in springs and/or wells. Often waterbecomes very muddy in even large basins, rivers,wells and springs. Gas emissions, often sulphureous,are observed, and bushes and grass near emissionzones may burn.
Meters high waves develop in even big lakes and rivers, which over-flow from their beds. In flood plains rivers may change their course,temporary or even permanently, also because of widespread landsubsidence. Basins may appear or be emptied. Depending on shapeof sea bottom and coastline, tsunamis may reach the shores withrunups exceeding 5 m flooding flat areas for thousands of metersinland. Small boulders can be dragged for many meters.Widespread deep erosion is observed along the shores, with notewor-thy changes of the coastline profile. Trees nearshore are eradicatedand drifted away.
XI
DEVASTATING
Effects in the environment becomedecisive for intensityassessment, due to
saturation ofstructural damage
Are dominant.Surface faulting extends from several tens of kmup to more than one hundred km, accompaniedby slips reaching several meters. Gravity graben,elongated depressions and pressure ridges deve-lop. Drainage lines can be seriously offset.Tectonic subsidence or uplift of the ground sur-face with maximum values in the order ofnumerous meters may occur.
Many springs significantly change their flow-rateand/or elevation of outcrop. Many springs mayrun temporarily or even permanently dry.Temporary or permanent variations of water levelare generally observed in wells. Even strong varia-tions of chemical-physical properties of water,most commonly temperature, are observed insprings and/or wells. Often water becomes verymuddy in even large basins, rivers, wells andsprings. Gas emissions, often sulphureous, areobserved, and bushes and grass near emissionzones may burn.
Large waves develop in big lakes and rivers, which overflow from theirbeds. In flood plains rivers can change their course, temporary or evenpermanently, also because of widespread land subsidence and landsli-ding. Basins may appear or be emptied. Depending on shape of seabottom and coastline, tsunamis may reach the shores with runups rea-ching 15 meters and more devastating flat areas for kilometers inland.Even meter-sized boulders can be dragged for long distances.Widespread deep erosion is observed along the shores, with notewor-thy changes of the coastal morphology. Trees nearshore are eradicatedand drifted away. along the shores, with noteworthy changes of thecoastline profile. Trees nearshore are eradicated and drifted away.
XII
COMPLETELY
DEVASTATING
Effects in the environment are the
only tool for intensityassessment
Are dominant.Surface faulting is at least few hundreds of kmlong, accompanied by offsets reaching several tensof meters. Gravity graben, elongated depressionsand pressure ridges develop. Drainage lines canbe seriously offset. Landscape and geomorpholo-gical changes induced by primary effects canattain extraordinary extent and size (typicalexamples are the uplift or subsidence of coastli-nes by several meters, appearance or disappea-rance from sight of significant landscape ele-ments, rivers changing course, origination ofwaterfalls, formation or disappearance of lakes).
Many springs significantly change their flow-rate and/or elevation of outcrop. Temporaryor permanent variations of water level aregenerally observed in wells. Many springs andwells may run temporarily or even permanen-tly dry. Strong variations of chemical-physicalproperties of water, most commonly tempe-rature, are observed in springs and/or wells.Water becomes very muddy in even largebasins, rivers, wells and springs. Gas emis-sions, often sulphureous, are observed, andbushes and grass near emission zones mayburn.
Giant waves develop in lakes and rivers, which overflow fromtheir beds. In flood plains rivers change their course and eventheir flow direction, temporary or even permanently, also becau-se of widespread land subsidence and landsliding. Large basinsmay appear or be emptied. Depending on shape of sea bottomand coastline, tsunamis may reach the shores with runups ofseveral tens of meters devastating flat areas for many kilome-ters inland. Big boulders can be dragged for long distances.Widespread deep erosion is observed along the shores, with out-standing changes of the coastal morphology. Many trees areeradicated and drifted away. All boats are tore from their moo-rings and swept away or carried onshore even for long distances.All people outdoor are swept away.
Hair-thin cracks (millimeter-wide) might be occasionallyseen where lithology (e.g.,loose alluvial deposits, satura-ted soils) and/or morphology(slopes or ridge crests) aremost prone to this phenome-non.
Exceptionally, rocks may fall and small landslide maybe (re)activated, along slopes where the equilibrium isalready near the limit state, e.g. steep slopes and cuts,with loose and generally saturated soil.
Tree limbs shake feebly. Absent Absent Absent ------
Thin cracks (millimeter-wide andseveral cms up to one meterlong) are locally seen where litho-logy (e.g., loose alluvial deposits,saturated soils) and/or morpho-logy (slopes or ridge crests) aremost prone to this phenomenon.
Rare small rockfalls, rotational landslides and slumpearth flows may take place, along often but not necessa-rily steep slopes where equilibrium is near the limit state,mainly loose deposits and saturated soil. Underwaterlandslides may be triggered, which can induce small ano-malous waves in coastal areas of sea and lakes.
Tree limbs and bushesshake slightly, very rare
cases of fallen deadlimbs and ripe fruit.
Extremely rare cases are repor-ted of liquefaction (sand boil),small in size and in areas mostprone to this phenomenon(highly susceptible, recent, allu-vial and coastal deposits, near-surface water table).
Absent Absent ------
Occasionally, millimeter-centimeterwide and up to several meters long frac-tures are observed in loose alluvialdeposits and/or saturated soils; alongsteep slopes or riverbanks they can be1-2 cm wide. A few minor cracks deve-lop in paved (either asphalt or stone)roads.
Rockfalls and landslides with volume reaching ca. 103m3 can take place, especially where equilibrium is nearthe limit state, e.g. steep slopes and cuts, with loosesaturated soil, or highly weathered / fractured rocks.Underwater landslides can be triggered, occasionallyprovoking small anomalous waves in coastal areas ofsea and lakes, commonly seen by intrumental records.
Trees and bushes shakemoderately to strongly; avery few tree tops and
unstable-dead limbs maybreak and fall, also
depending on species,fruit load and state of
health.
Rare cases are reported of liquefac-tion (sand boil), small in size and inareas most prone to this phenomenon(highly susceptible, recent, alluvialand coastal deposits, near surfacewater table).
Absent Absent ------
Fractures up to 5-10 cm wide andup to hundred metres long areobserved, commonly in loose allu-vial deposits and/or saturatedsoils; rarely, in dry sand, sand-clay, and clay soil fractures arealso seen, up to 1 cm wide.Centimeter-wide cracks are com-mon in paved (asphalt or stone)roads.
Scattered landslides occur in prone areas, where equili-brium is unstable (steep slopes of loose / saturatedsoils), while modest rock falls are common on steepgorges, cliffs). Their size is sometimes significant (103 -105 m3); in dry sand, sand-clay, and clay soil, the volu-mes are usually up to 100 m3. Ruptures, slides and fallsmay affect riverbanks and artificial embankments andexcavations (e.g., road cuts, quarries) in loose sedimentor weathered / fractured rock. Significant underwaterlandslides can be triggered, provoking anomalous wavesin coastal areas of sea and lakes, directly felt by people on boats and ports.
Trees and bushesshake vigorously;
especially in denselyforested areas, many
limbs and tops break and fall.
Rare cases are reported of lique-faction, with sand boils up to 50cm in diameter, in areas mostprone to this phenomenon (highlysusceptible, recent, alluvial andcoastal deposits, near surface watertable).
Absent Absent
The total affectedarea is inthe order
of10 km2.
Fractures up to 50 cm wideand up to hundreds metres long,are commonly observed in loosealluvial deposits and/or saturatedsoils; in rare cases fractures up to1 cm can be observed in competentdry rocks. Decimetric cracks arecommon in paved (asphalt orstone) roads, as well as smallpressure undulations.
Small to moderate (103 - 105 m3) landslides are widespre-ad in prone areas; rarely they can occur also on gentle slo-pes; where equilibrium is unstable (steep slopes of loose/ saturated soils; rock falls on steep gorges, coastal cliffs)their size is sometimes large (105 - 106 m3). Landslidescan occasionally dam narrow valleys causing temporaryor even permanent lakes. Ruptures, slides and falls affectriverbanks and artificial embankments and excavations(e.g., road cuts, quarries) in loose sediment or weathered/ fractured rock. Frequent is the occurrence of landslidesunder the sea level in coastal areas.
Trees shake vigorously;branches may break and fall, trees may beuprooted, especially along steep slopes.
Liquefaction may be frequent in theepicentral area, depending on localconditions; the most typical effectsare: sand boils up to ca. 1 m in dia-meter; apparent water fountains instill waters; localised lateral sprea-ding and settlements (subsidence upto ca. 30 cm), with fissuring paral-lel to waterfront areas (river banks,lakes, canals, seashores).
In dry areas,dust clouds
may rise fromthe ground in the epicentral
area.
Stone sandevensmall bouldersand tree trunksmay be thrownin the air, leavingtypical imprints
in soft soil.
The totalaffectedarea is inthe order
of100 km2.
Fractures up to 100 cm wide andup to hundreds metres long arecommonly observed in loose allu-vial deposits and/or saturatedsoils; in competent rocks they canreach up to 10 cm. Significantcracks are common in paved(asphalt or stone) roads, as wellas small pressure undulations.
Landsliding is widespread in prone areas, also on gentle slo-pes; where equilibrium is unstable (steep slopes of loose /saturated soils; rock falls on steep gorges, coastal cliffs) theirsize is frequently large (105 m3), sometimes very large (106m3). Landslides can dam narrow valleys causing temporaryor even permanent lakes. Riverbanks, artificial embankmentsand excavations (e.g., road cuts, quarries) frequently collapse.Frequent are large landslides under the sea level in coastalareas.
Trees shake vigorously;branches and thin tree
trunks frequently breakand fall. Some trees
might be uprooted andfall, especially along
steep slopes.
Liquefaction and water upsurge arefrequent; sand boils up to 3 m in dia-meter ; the most typical effectsare:apparent water fountains in stillwaters; frequent lateral spreading andsettlements (subsidence of more thanca. 30 cm), with fissuring parallel towaterfront areas (river banks, lakes,canals, seashores).
In dry areas,dust clouds
may rise from
the ground.
Small boulders andtree trunks may bethrown in the air an-d move away fromtheir site for meters,also depending on slopeangle and roundness,l eaving typical im-prints in soft soil.
The totalaffected area
is in the order of1,000km2.
Open ground cracks up to morethan 1 m wide and up to hundredmetres long are frequent, mainlyin loose alluvial deposits and/orsaturated soils; in competent rocksopening reaches several decimeters.Wide cracks develop in paved(asphalt or stone) roads, as wellas pressure undulations.
Large landslides and rock-falls (> 105 - 106 m3) are fre-quent, practically regardless of equilibrium state of the slo-pes, causing temporary or permanent barrier lakes. Riverbanks, artificial embankments, and sides of excavations typi-cally collapse. Levees and earth dams may also incur seriousdamage. Frequent are large landslides under the sea level incoastal areas.
Trees shake vigorously;many branches and treetrunks break and fall.Some trees might beuprooted and fall.
Liquefaction, with water upsurgeand soil compaction, may changethe aspect of wide zones; sand vol-canoes may even be more than 6 min diameter; vertical subsidenceeven > 1m; large and long fissuresdue to lateral spreading are com-mon.
In dry areas,dust cloudscommonly
rise from theground.
Boulders (diameter inexcess of 2-3meters)can be thrown in theair and move away from their site for
hundreds of metersdown even gentle slopes,
leaving typicalimprints in soil.
The totalaffected area
is in theorder of5,000km2.
Open ground cracks up toseveral meters wide are veryfrequent, mainly in loosealluvial deposits and/orsaturated soils. In competentrocks they can reach 1 m.Very wide cracks develop inpaved (asphalt or stone)roads, as well as large pressu-re undulations.
Large landslides and rock-falls (> 105 - 106 m3) arefrequent, practically regardless of equilibrium stateof slopes, causing many temporary or permanentbarrier lakes. River banks, artificial embankments,and sides of excavations typically collapse. Leveesand earth dams incur serious damage. Significantlandslides can occur even at 200 – 300 km distancefrom the epicenter. Frequent are large landslidesunder the sea level in coastal areas.
Trees shake vigorously;many branches and treetrunks break and fall.
Many trees are uprooted and fall.
Liquefaction changes theaspect of extensive zones oflowland, determining verticalsubsidence possibly excee-ding several meters; nume-rous large sand volcanoes,and severe lateral spreadingcan be observed.
In dry areasdust cloudsarise from
the ground.
Big boulders (diame-ter of several meters)can be thrown in theair and move awayfrom their site forlong distances downeven gentle slopes,leaving typicalimprints in soil.
The totalaffected area
is in the order of10,000km2.
Ground open cracks are veryfrequent, up to one meter ormore wide in the bedrock,up to more than 10 m widein loose alluvial depositsand/or saturated soils. Thesemay extend up to severalkilometers in length.
Large landslides and rock-falls (> 1055 - 1066 m3)are frequent, practically regardless to equilibriumstate of the slopes, causing many temporary or per-manent barrier lakes. River banks, artificial emban-kments, and sides of excavations typically collapse.Levees and earth dams incur serious damage.Significant landslides can occur at more than 200 –300 km distance from the epicenter. Frequent arevery large landslides under the sea level in coastalareas.
Trees shake vigo-rously; many bran-
ches and treetrunks break and
fall. Many trees areuprooted and fall.
Liquefaction occurs overlarge areas and changes themorphology of extensiveflat zones, determining verti-cal subsidence exceedingseveral meters, widespreadlarge sand volcanoes, andextensive severe lateralspreading can be observed.
In dry areasdust cloudsarise from
the ground.
Also very big boul-ders can be thrown inthe air and move forlong distances evendown very gentle slo-pes, leaving typicalimprints in soil.
The totalaffected area
is in the order of50,000km2
and more
From I to III There are no environmental effects that can be used as diagnostic
Surface faulting and deformations Hydrological anomalies Anomalous waves/tsunamis Ground cracks Slope movements Tree shaking Liquefactions Dust clouds Jumping stones TOTALAREA
P R I M A R Y E F F E C T S S E C O N D A R Y E F F E C TS
Plate I - Synoptic Table of ESI 2007 Intensity Degrees - The accuracy of the assessment improves in the higher degrees of the scale, in particular in the range of occurrence of pri-mary effects, typically starting from intensity VIII, and with growing resolution for intensity IX, X, XI and XII. Hence, in the yellow group of intensity degrees (VIII-X) the effects on natural environment are an essential component of seismic intensity that cannot be disregarded. In the orange group of intensity degrees (XI-XII) they becomethe most effective tool for intensity assessment.
- Quadro sinottico dei Gradi di Intensità della scala ESI 2007 - L’accuratezza della valutazione aumenta verso i gradi più alti della scala, in particolare nell’intervallo di occorrenza degli effetti primari che tipicamente iniziano a manifestarsi dall’VIII grado con risoluzione crescente fino al XII grado. Pertanto, per i gradi di intensità in giallo (VIII-X) gli effetti sull’ambiente naturale sono una componente essenzia-le dell’intensità che non può essere ignorata. Per i gradi di intensità in arancio (XI e XII), essi sono lo strumento più affidabile per la valutazione dell'intensità.