capacities of dowel-type fastener joints in australian pine
TRANSCRIPT
Capacities of Dowel-Type Fastener Joints in Australian PineIan Smith, M.ASCE1; Greg Foliente, A.M.ASCE2; Minh Nguyen3; and Michael Syme4
Abstract: An experimental study is reported aimed at determining stiffness and strength of laterally loaded dowel-type fastener joints inAustralian grown pine. Emphasis is on joints in Radiata pine lumber or glued-laminated �glulam� timber, and Slash pine lumber.Information was collected in a manner that makes it useful for load and resistance factor design. It was found that characteristic“one-fastener” design capacities of joints are most reliably based on the yield load rather than the ultimate load, and that for practicalpurposes behaviors of joints in Radiata pine and Slash pine can be regarded as identical.
DOI: 10.1061/�ASCE�0899-1561�2005�17:6�664�
CE Database subject headings: Timber construction; Wood; Stiffness; Design; Dowels; Fasteners; Joints; Australia.
Introduction
In recent years, there has been a shift in some countries within theSouthern Hemisphere from construction with indigenous hard-wood species to use of pine species. Australia is typical in thatregard with Radiata pine �Pinus radiata� and Slash pine �Pinuselliottii� being the species of choice. About 80% of housing inAustralia is timber framed, with over 85% of the framing beingRadiata pine and Slash pine lumber. Chile, New Zealand, andSouth Africa also produce pine in significant volume, and thestage has been reached where Southern Hemisphere pine lumberproducts are traded internationally as commodities. Radiata pineis a major export product with the United States, Japan, and someEuropean countries being principal markets. To date, attention ofresearchers has focused on structural properties of lumber. Con-sequently, there has been deficient information on properties ofjoints in Southern Hemisphere pines, creating a major impedi-ment to efficient structural use of the material. Joints are often themost critical components within engineered systems and can gov-ern the overall strength, serviceability, durability, and fire-resistance of buildings �Foliente 1998�.
Most parts of the world have timber design codes predicatedon the load and resistance factor design �LRFD� approach, also
1Professor, Univ. of New Brunswick, P.O. Box 44555, FrederictonNB, Canada E3B 6C2; formerly, Visiting Scientist, CSIRO, P.O. Box 56,Highett, Victoria 3190, Australia. E-mail: [email protected]
2Team Leader and Principal Research Scientist, CSIROManufacturing and Infrastructure Technology, P.O. Box 56, Highett,Victoria 3190, Australia. E-mail: [email protected]
3Research Scientist, CSIRO Manufacturing and InfrastructureTechnology, P.O. Box 56, Highett, Victoria 3190, Australia. E-mail:[email protected]
4Senior Research Engineer, CSIRO Manufacturing and InfrastructureTechnology, P.O. Box 56, Highett, Victoria 3190, Australia. E-mail:[email protected]
Note. Associate Editor: Roberto Lopez-Anido. Discussion open untilMay 1, 2006. Separate discussions must be submitted for individual pa-pers. To extend the closing date by one month, a written request must befiled with the ASCE Managing Editor. The manuscript for this paper wassubmitted for review and possible publication on April 25, 2003; ap-proved on August 5, 2004. This paper is part of the Journal of Materialsin Civil Engineering, Vol. 17, No. 6, December 1, 2005. ©ASCE, ISSN
0899-1561/2005/6-664–675/$25.00.664 / JOURNAL OF MATERIALS IN CIVIL ENGINEERING © ASCE / NOVEM
known as partial coefficients limit states design �ASCE 1996;CEN 1995; CSA 2001; SAA 1997b�. Application of LRFD meth-ods depends upon availability of adequate information about me-chanical properties of all components, i.e., members and joints.
Dowel-type fasteners include plain dowels, bolts, lag screws�known as coach screws in some countries�, wood screws, nails,spikes, and timber rivets. Dowel fasteners are permitted in appli-cations where they resist loads by bending action. This is referredto as lateral loading because force from the members is appliedperpendicular �laterally� to the axis of the fastener. All types,other than drift pins, are permitted in applications where theyresist forces along the axis, referred to as axial loading, or with-drawal loading in the case of nails and screws. Axial force resis-tance capability of nails, wood screws, and lag-screws is rela-tively unreliable and is therefore only utilized for applicationssuch as resistance of wind suction on wood-based roof sheathing.The most common joints are those made using nail, bolt, andscrew dowel-fasteners, and specialty punched-metal-plate con-nectors, folded plate connectors, and hangers. Of these types, onlycapacities of those made with generic dowel-type fasteners aredealt with by design codes �Smith and Foliente 2002�.
LRFD codes for timber specify that joints be designed accord-ing to the generic “ultimate limit state” design equation
��Rj� � N* �1�
where
��Rj� = �k1 ¯ k1nfRk �2�
and Rj =resistance adjusted to account for all design specificconsiderations; �=resistance factor; ki=modification factor�i=1, . . . , I�; nf =number of fasteners; Rk=characteristic resistanceper fastener; and N*=factored design action effect. Rk values arenear minimum, usually fifth percentile, values determined at ref-erence conditions. Values of � are assigned based on past expe-rience to achieve “traditionally acceptable” solutions in terms ofthe number of fasteners required for various end-use applications�DeGrace 1986; McLain 1984�. Modification factors �ki values�account for deviations between design conditions and the refer-ence conditions for Rk, e.g., duration of loading, service environ-ment. Codes require that certain minimum requirements be metwith regard to the arrangement of fasteners in a joint, so as toreduce the possibility of premature brittle failure due to splitting
of members.BER/DECEMBER 2005
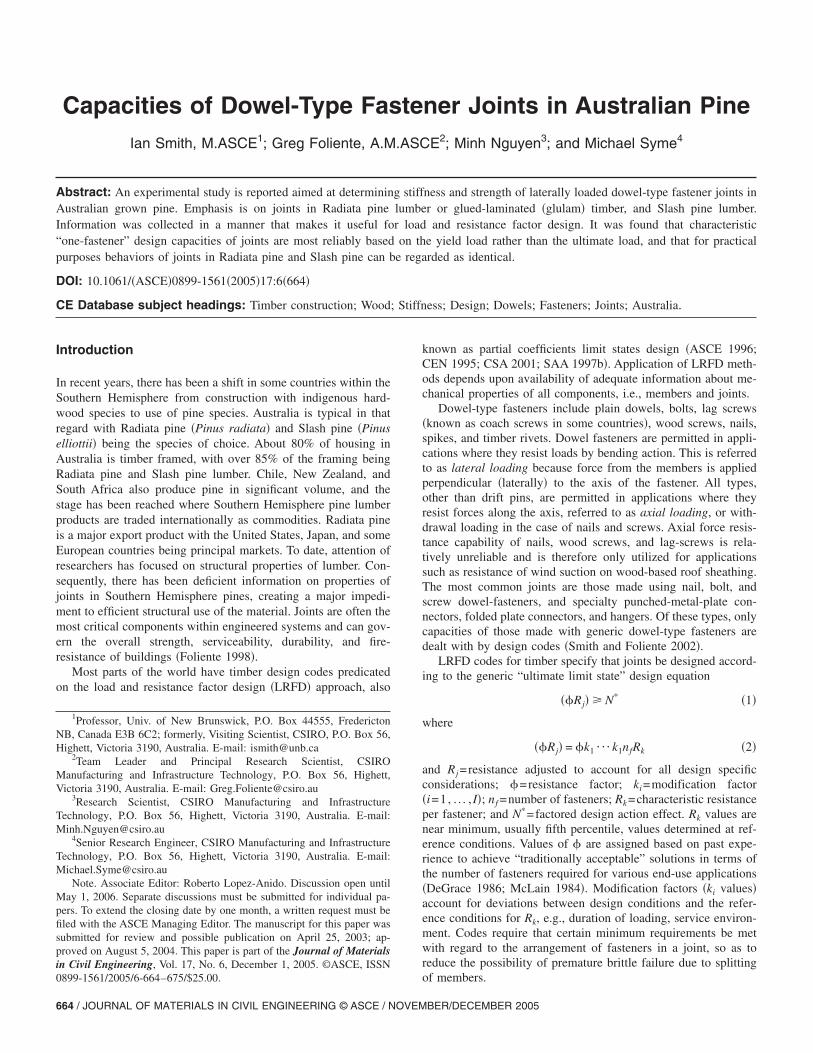
All countries use the strength of a joint with one fastener as thebasis for assigning characteristic properties that enter LRFDequations, but practice is not uniform regarding the point on aload–deformation/slip curve used to define Rk. For example, inCanada the intent is that the ultimate �peak� load capacity be used�Lepper and Smith 1995�, in Europe that the yield load be used�Ehlbeck and Larsen 1993�, and in the United States that a “5%diameter offset load” be used �McLain 1993�, Fig. 1. There areseveral ways in which the yield point can be estimated �Daneff1997�, but the most direct is that shown in Fig. 1. As demon-strated later in this paper, whether there is a substantial deviationbetween one of the points on the curve and the others dependsupon the type of joint. Although international consensus on thedefinition of Rk is desirable, lack of such agreement in itself is nogreat concern, because other parameters in the design equationare manipulated to insure that the number of fasteners required ina certain situation is acceptable �Smith and Foliente 2002�.
Experiments reported in this paper were undertaken to deter-mine strength and stiffness of laterally loaded dowel-type fastenerjoints in Australian grown pine. Emphasis is on joints in Radiatapine lumber or glued-laminated �glulam� timber, and Slash pinelumber.
Method
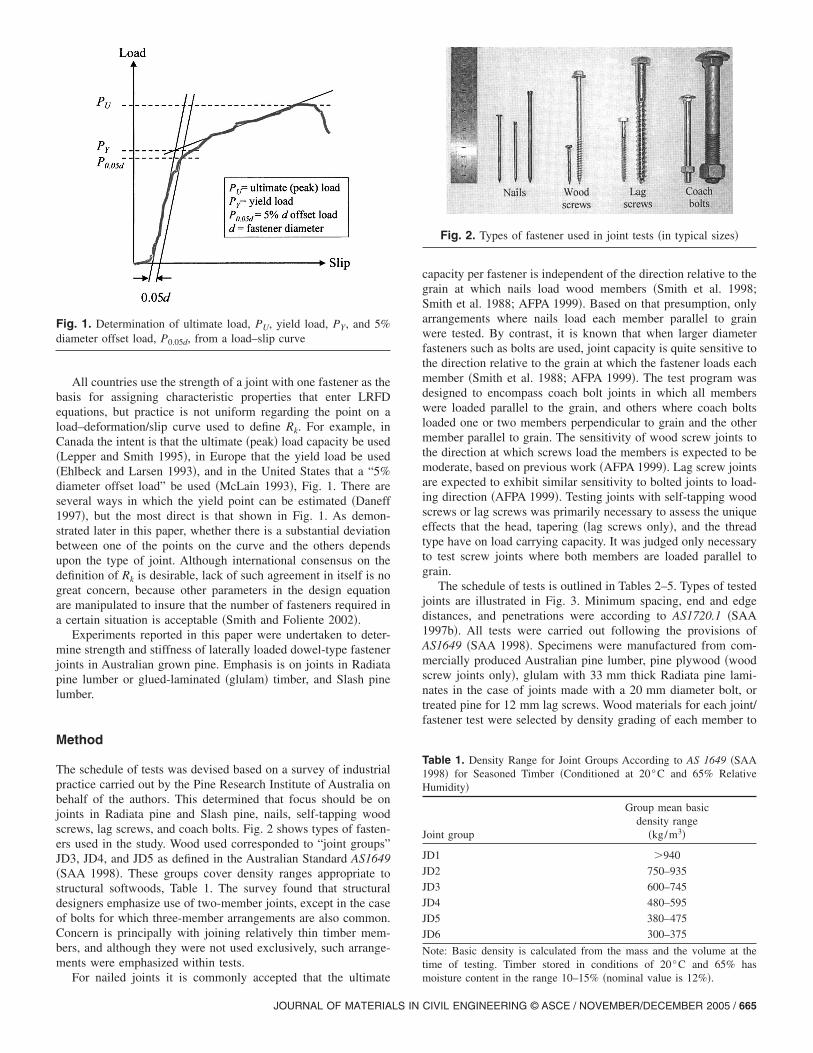
The schedule of tests was devised based on a survey of industrialpractice carried out by the Pine Research Institute of Australia onbehalf of the authors. This determined that focus should be onjoints in Radiata pine and Slash pine, nails, self-tapping woodscrews, lag screws, and coach bolts. Fig. 2 shows types of fasten-ers used in the study. Wood used corresponded to “joint groups”JD3, JD4, and JD5 as defined in the Australian Standard AS1649�SAA 1998�. These groups cover density ranges appropriate tostructural softwoods, Table 1. The survey found that structuraldesigners emphasize use of two-member joints, except in the caseof bolts for which three-member arrangements are also common.Concern is principally with joining relatively thin timber mem-bers, and although they were not used exclusively, such arrange-ments were emphasized within tests.
Fig. 1. Determination of ultimate load, PU, yield load, PY, and 5%diameter offset load, P0.05d, from a load–slip curve
For nailed joints it is commonly accepted that the ultimate
JOURNAL OF MATERIALS IN
capacity per fastener is independent of the direction relative to thegrain at which nails load wood members �Smith et al. 1998;Smith et al. 1988; AFPA 1999�. Based on that presumption, onlyarrangements where nails load each member parallel to grainwere tested. By contrast, it is known that when larger diameterfasteners such as bolts are used, joint capacity is quite sensitive tothe direction relative to the grain at which the fastener loads eachmember �Smith et al. 1988; AFPA 1999�. The test program wasdesigned to encompass coach bolt joints in which all memberswere loaded parallel to the grain, and others where coach boltsloaded one or two members perpendicular to grain and the othermember parallel to grain. The sensitivity of wood screw joints tothe direction at which screws load the members is expected to bemoderate, based on previous work �AFPA 1999�. Lag screw jointsare expected to exhibit similar sensitivity to bolted joints to load-ing direction �AFPA 1999�. Testing joints with self-tapping woodscrews or lag screws was primarily necessary to assess the uniqueeffects that the head, tapering �lag screws only�, and the threadtype have on load carrying capacity. It was judged only necessaryto test screw joints where both members are loaded parallel tograin.
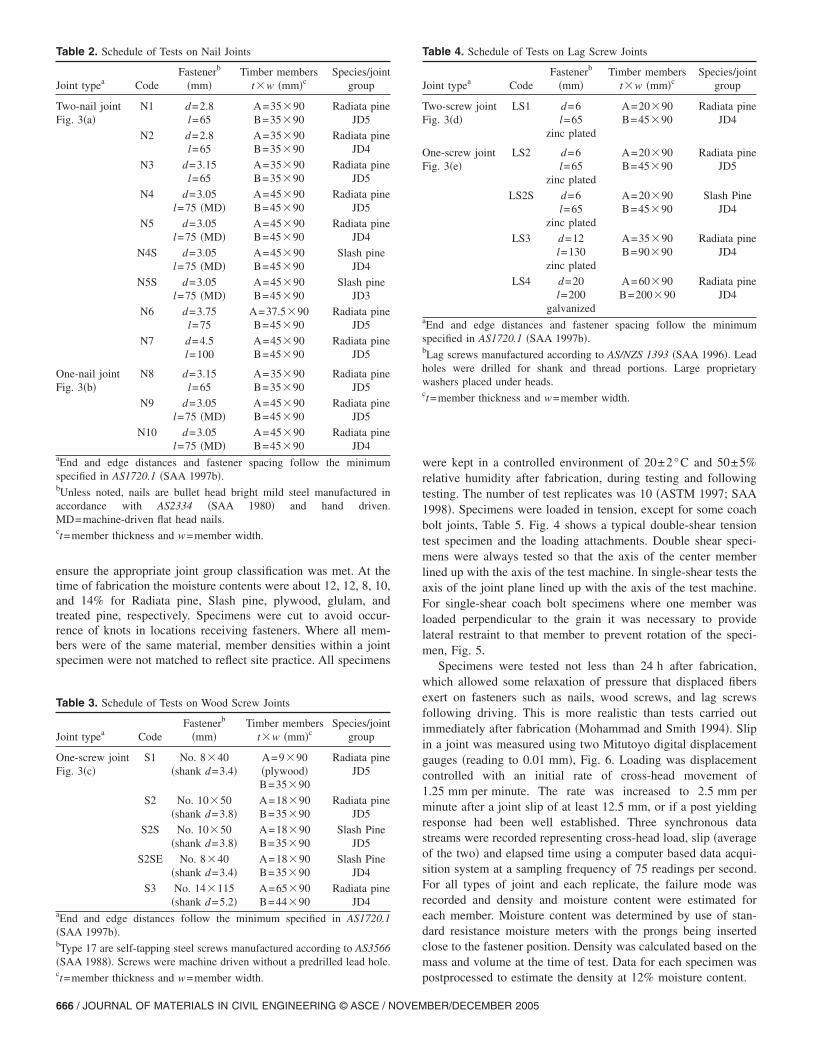
The schedule of tests is outlined in Tables 2–5. Types of testedjoints are illustrated in Fig. 3. Minimum spacing, end and edgedistances, and penetrations were according to AS1720.1 �SAA1997b�. All tests were carried out following the provisions ofAS1649 �SAA 1998�. Specimens were manufactured from com-mercially produced Australian pine lumber, pine plywood �woodscrew joints only�, glulam with 33 mm thick Radiata pine lami-nates in the case of joints made with a 20 mm diameter bolt, ortreated pine for 12 mm lag screws. Wood materials for each joint/fastener test were selected by density grading of each member to
Table 1. Density Range for Joint Groups According to AS 1649 �SAA1998� for Seasoned Timber �Conditioned at 20°C and 65% RelativeHumidity�
Joint group
Group mean basicdensity range
�kg/m3�
JD1 �940
JD2 750–935
JD3 600–745
JD4 480–595
JD5 380–475
JD6 300–375
Note: Basic density is calculated from the mass and the volume at thetime of testing. Timber stored in conditions of 20°C and 65% has
Fig. 2. Types of fastener used in joint tests �in typical sizes�
moisture content in the range 10–15% �nominal value is 12%�.
CIVIL ENGINEERING © ASCE / NOVEMBER/DECEMBER 2005 / 665
ensure the appropriate joint group classification was met. At thetime of fabrication the moisture contents were about 12, 12, 8, 10,and 14% for Radiata pine, Slash pine, plywood, glulam, andtreated pine, respectively. Specimens were cut to avoid occur-rence of knots in locations receiving fasteners. Where all mem-bers were of the same material, member densities within a jointspecimen were not matched to reflect site practice. All specimens
Table 2. Schedule of Tests on Nail Joints
Joint typea CodeFastenerb
�mm�Timber members
t�w �mm�cSpecies/joint
group
Two-nail jointFig. 3�a�
N1 d=2.8l=65
A=35�90B=35�90
Radiata pineJD5
N2 d=2.8l=65
A=35�90B=35�90
Radiata pineJD4
N3 d=3.15l=65
A=35�90B=35�90
Radiata pineJD5
N4 d=3.05l=75 �MD�
A=45�90B=45�90
Radiata pineJD5
N5 d=3.05l=75 �MD�
A=45�90B=45�90
Radiata pineJD4
N4S d=3.05l=75 �MD�
A=45�90B=45�90
Slash pineJD4
N5S d=3.05l=75 �MD�
A=45�90B=45�90
Slash pineJD3
N6 d=3.75l=75
A=37.5�90B=45�90
Radiata pineJD5
N7 d=4.5l=100
A=45�90B=45�90
Radiata pineJD5
One-nail jointFig. 3�b�
N8 d=3.15l=65
A=35�90B=35�90
Radiata pineJD5
N9 d=3.05l=75 �MD�
A=45�90B=45�90
Radiata pineJD5
N10 d=3.05l=75 �MD�
A=45�90B=45�90
Radiata pineJD4
aEnd and edge distances and fastener spacing follow the minimumspecified in AS1720.1 �SAA 1997b�.bUnless noted, nails are bullet head bright mild steel manufactured inaccordance with AS2334 �SAA 1980� and hand driven.MD=machine-driven flat head nails.ct=member thickness and w=member width.
Table 3. Schedule of Tests on Wood Screw Joints
Joint typea CodeFastenerb
�mm�Timber members
t�w �mm�cSpecies/joint
group
One-screw jointFig. 3�c�
S1 No. 8�40�shank d=3.4�
A=9�90�plywood�B=35�90
Radiata pineJD5
S2 No. 10�50�shank d=3.8�
A=18�90B=35�90
Radiata pineJD5
S2S No. 10�50�shank d=3.8�
A=18�90B=35�90
Slash PineJD5
S2SE No. 8�40�shank d=3.4�
A=18�90B=35�90
Slash PineJD4
S3 No. 14�115�shank d=5.2�
A=65�90B=44�90
Radiata pineJD4
aEnd and edge distances follow the minimum specified in AS1720.1�SAA 1997b�.bType 17 are self-tapping steel screws manufactured according to AS3566�SAA 1988�. Screws were machine driven without a predrilled lead hole.c
t=member thickness and w=member width.666 / JOURNAL OF MATERIALS IN CIVIL ENGINEERING © ASCE / NOVEM
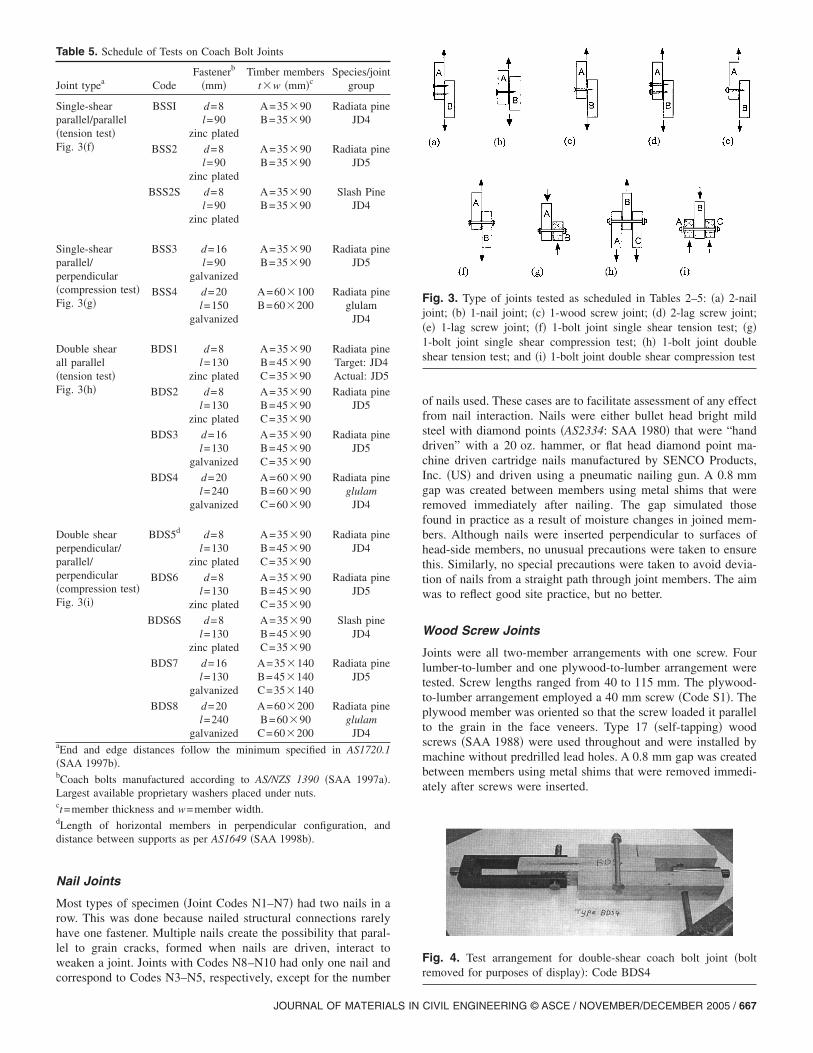
were kept in a controlled environment of 20±2°C and 50±5%relative humidity after fabrication, during testing and followingtesting. The number of test replicates was 10 �ASTM 1997; SAA1998�. Specimens were loaded in tension, except for some coachbolt joints, Table 5. Fig. 4 shows a typical double-shear tensiontest specimen and the loading attachments. Double shear speci-mens were always tested so that the axis of the center memberlined up with the axis of the test machine. In single-shear tests theaxis of the joint plane lined up with the axis of the test machine.For single-shear coach bolt specimens where one member wasloaded perpendicular to the grain it was necessary to providelateral restraint to that member to prevent rotation of the speci-men, Fig. 5.
Specimens were tested not less than 24 h after fabrication,which allowed some relaxation of pressure that displaced fibersexert on fasteners such as nails, wood screws, and lag screwsfollowing driving. This is more realistic than tests carried outimmediately after fabrication �Mohammad and Smith 1994�. Slipin a joint was measured using two Mitutoyo digital displacementgauges �reading to 0.01 mm�, Fig. 6. Loading was displacementcontrolled with an initial rate of cross-head movement of1.25 mm per minute. The rate was increased to 2.5 mm perminute after a joint slip of at least 12.5 mm, or if a post yieldingresponse had been well established. Three synchronous datastreams were recorded representing cross-head load, slip �averageof the two� and elapsed time using a computer based data acqui-sition system at a sampling frequency of 75 readings per second.For all types of joint and each replicate, the failure mode wasrecorded and density and moisture content were estimated foreach member. Moisture content was determined by use of stan-dard resistance moisture meters with the prongs being insertedclose to the fastener position. Density was calculated based on themass and volume at the time of test. Data for each specimen was
Table 4. Schedule of Tests on Lag Screw Joints
Joint typea CodeFastenerb
�mm�Timber members
t�w �mm�cSpecies/joint
group
Two-screw jointFig. 3�d�
LS1 d=6l=65
zinc plated
A=20�90B=45�90
Radiata pineJD4
One-screw jointFig. 3�e�
LS2 d=6l=65
zinc plated
A=20�90B=45�90
Radiata pineJD5
LS2S d=6l=65
zinc plated
A=20�90B=45�90
Slash PineJD4
LS3 d=12l=130
zinc plated
A=35�90B=90�90
Radiata pineJD4
LS4 d=20l=200
galvanized
A=60�90B=200�90
Radiata pineJD4
aEnd and edge distances and fastener spacing follow the minimumspecified in AS1720.1 �SAA 1997b�.bLag screws manufactured according to AS/NZS 1393 �SAA 1996�. Leadholes were drilled for shank and thread portions. Large proprietarywashers placed under heads.ct=member thickness and w=member width.
postprocessed to estimate the density at 12% moisture content.
BER/DECEMBER 2005
Nail Joints
Most types of specimen �Joint Codes N1–N7� had two nails in arow. This was done because nailed structural connections rarelyhave one fastener. Multiple nails create the possibility that paral-lel to grain cracks, formed when nails are driven, interact toweaken a joint. Joints with Codes N8–N10 had only one nail and
Table 5. Schedule of Tests on Coach Bolt Joints
Joint typea CodeFastenerb
�mm�Timber members
t�w �mm�cSpecies/joint
group
Single-shearparallel/parallel�tension test�Fig. 3�f�
BSSI d=8l=90
zinc plated
A=35�90B=35�90
Radiata pineJD4
BSS2 d=8l=90
zinc plated
A=35�90B=35�90
Radiata pineJD5
BSS2S d=8l=90
zinc plated
A=35�90B=35�90
Slash PineJD4
Single-shearparallel/perpendicular�compression test�Fig. 3�g�
BSS3 d=16l=90
galvanized
A=35�90B=35�90
Radiata pineJD5
BSS4 d=20l=150
galvanized
A=60�100B=60�200
Radiata pineglulam
JD4
Double shearall parallel�tension test�Fig. 3�h�
BDS1 d=8l=130
zinc plated
A=35�90B=45�90C=35�90
Radiata pineTarget: JD4Actual: JD5
BDS2 d=8l=130
zinc plated
A=35�90B=45�90C=35�90
Radiata pineJD5
BDS3 d=16l=130
galvanized
A=35�90B=45�90C=35�90
Radiata pineJD5
BDS4 d=20l=240
galvanized
A=60�90B=60�90C=60�90
Radiata pineglulam
JD4
Double shearperpendicular/parallel/perpendicular�compression test�Fig. 3�i�
BDS5d d=8l=130
zinc plated
A=35�90B=45�90C=35�90
Radiata pineJD4
BDS6 d=8l=130
zinc plated
A=35�90B=45�90C=35�90
Radiata pineJD5
BDS6S d=8l=130
zinc plated
A=35�90B=45�90C=35�90
Slash pineJD4
BDS7 d=16l=130
galvanized
A=35�140B=45�140C=35�140
Radiata pineJD5
BDS8 d=20l=240
galvanized
A=60�200B=60�90C=60�200
Radiata pineglulam
JD4aEnd and edge distances follow the minimum specified in AS1720.1�SAA 1997b�.bCoach bolts manufactured according to AS/NZS 1390 �SAA 1997a�.Largest available proprietary washers placed under nuts.ct=member thickness and w=member width.dLength of horizontal members in perpendicular configuration, anddistance between supports as per AS1649 �SAA 1998b�.
correspond to Codes N3–N5, respectively, except for the number
JOURNAL OF MATERIALS IN
of nails used. These cases are to facilitate assessment of any effectfrom nail interaction. Nails were either bullet head bright mildsteel with diamond points �AS2334: SAA 1980� that were “handdriven” with a 20 oz. hammer, or flat head diamond point ma-chine driven cartridge nails manufactured by SENCO Products,Inc. �US� and driven using a pneumatic nailing gun. A 0.8 mmgap was created between members using metal shims that wereremoved immediately after nailing. The gap simulated thosefound in practice as a result of moisture changes in joined mem-bers. Although nails were inserted perpendicular to surfaces ofhead-side members, no unusual precautions were taken to ensurethis. Similarly, no special precautions were taken to avoid devia-tion of nails from a straight path through joint members. The aimwas to reflect good site practice, but no better.
Wood Screw Joints
Joints were all two-member arrangements with one screw. Fourlumber-to-lumber and one plywood-to-lumber arrangement weretested. Screw lengths ranged from 40 to 115 mm. The plywood-to-lumber arrangement employed a 40 mm screw �Code S1�. Theplywood member was oriented so that the screw loaded it parallelto the grain in the face veneers. Type 17 �self-tapping� woodscrews �SAA 1988� were used throughout and were installed bymachine without predrilled lead holes. A 0.8 mm gap was createdbetween members using metal shims that were removed immedi-ately after screws were inserted.
Fig. 3. Type of joints tested as scheduled in Tables 2–5: �a� 2-nailjoint; �b� 1-nail joint; �c� 1-wood screw joint; �d� 2-lag screw joint;�e� 1-lag screw joint; �f� 1-bolt joint single shear tension test; �g�1-bolt joint single shear compression test; �h� 1-bolt joint doubleshear tension test; and �i� 1-bolt joint double shear compression test
Fig. 4. Test arrangement for double-shear coach bolt joint �boltremoved for purposes of display�: Code BDS4
CIVIL ENGINEERING © ASCE / NOVEMBER/DECEMBER 2005 / 667
Lag Screw Joints
Most specimens had one lag screw �Codes LS2–LS4�. Code LS1specimens had two lag screws in a row, but otherwise they werethe same as Code LS2 specimens. This allowed assessment of anynegative effects of fastener interaction. Lag screws were zincplated or galvanized steel and manufactured in accordance withAS/NZS 1393 �SAA 1996�, Table 4. They were inserted into pre-drilled lead holes. The diameter drilled for the threaded portiondid not exceed the root diameter of the screw �SAA 1997b�.“Plated flat round” steel washers were installed underneath theheads of lag screws. Corresponding fastener diameter and wash-ers dimensions are given in Table 6. Although washers did notmeet the requirements of AS1720.1 �SAA 1997b�, they were thelargest commercially available. All joints were “done up” tightlyand then slightly loosened to avoid pretension in the lag screw.
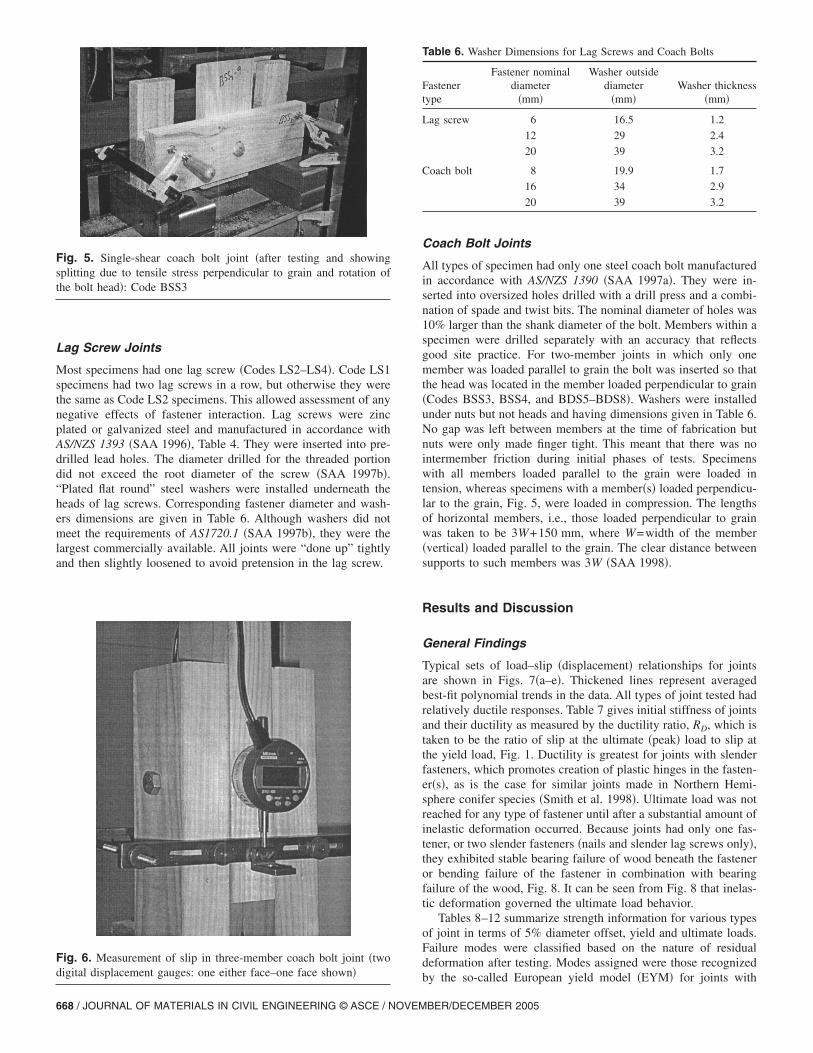
Fig. 5. Single-shear coach bolt joint �after testing and showingsplitting due to tensile stress perpendicular to grain and rotation ofthe bolt head�: Code BSS3
Fig. 6. Measurement of slip in three-member coach bolt joint �twodigital displacement gauges: one either face–one face shown�
668 / JOURNAL OF MATERIALS IN CIVIL ENGINEERING © ASCE / NOVEM
Coach Bolt Joints
All types of specimen had only one steel coach bolt manufacturedin accordance with AS/NZS 1390 �SAA 1997a�. They were in-serted into oversized holes drilled with a drill press and a combi-nation of spade and twist bits. The nominal diameter of holes was10% larger than the shank diameter of the bolt. Members within aspecimen were drilled separately with an accuracy that reflectsgood site practice. For two-member joints in which only onemember was loaded parallel to grain the bolt was inserted so thatthe head was located in the member loaded perpendicular to grain�Codes BSS3, BSS4, and BDS5–BDS8�. Washers were installedunder nuts but not heads and having dimensions given in Table 6.No gap was left between members at the time of fabrication butnuts were only made finger tight. This meant that there was nointermember friction during initial phases of tests. Specimenswith all members loaded parallel to the grain were loaded intension, whereas specimens with a member�s� loaded perpendicu-lar to the grain, Fig. 5, were loaded in compression. The lengthsof horizontal members, i.e., those loaded perpendicular to grainwas taken to be 3W+150 mm, where W=width of the member�vertical� loaded parallel to the grain. The clear distance betweensupports to such members was 3W �SAA 1998�.
Results and Discussion
General Findings
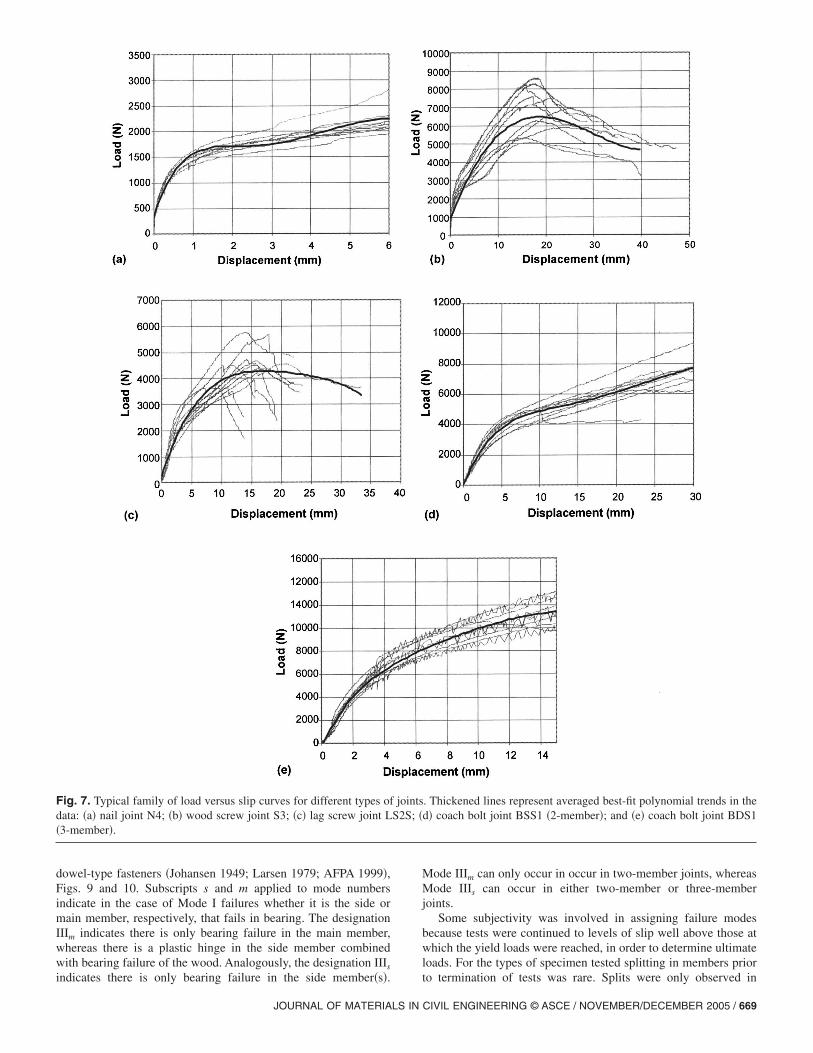
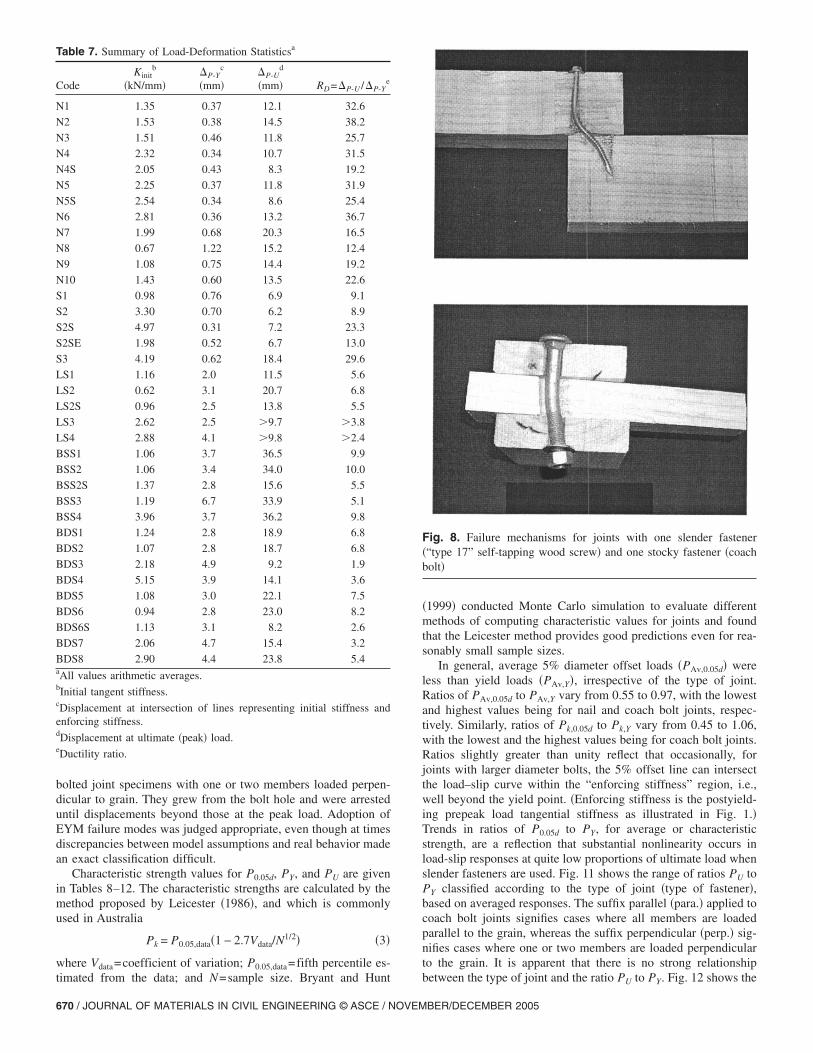
Typical sets of load–slip �displacement� relationships for jointsare shown in Figs. 7�a–e�. Thickened lines represent averagedbest-fit polynomial trends in the data. All types of joint tested hadrelatively ductile responses. Table 7 gives initial stiffness of jointsand their ductility as measured by the ductility ratio, RD, which istaken to be the ratio of slip at the ultimate �peak� load to slip atthe yield load, Fig. 1. Ductility is greatest for joints with slenderfasteners, which promotes creation of plastic hinges in the fasten-er�s�, as is the case for similar joints made in Northern Hemi-sphere conifer species �Smith et al. 1998�. Ultimate load was notreached for any type of fastener until after a substantial amount ofinelastic deformation occurred. Because joints had only one fas-tener, or two slender fasteners �nails and slender lag screws only�,they exhibited stable bearing failure of wood beneath the fasteneror bending failure of the fastener in combination with bearingfailure of the wood, Fig. 8. It can be seen from Fig. 8 that inelas-tic deformation governed the ultimate load behavior.
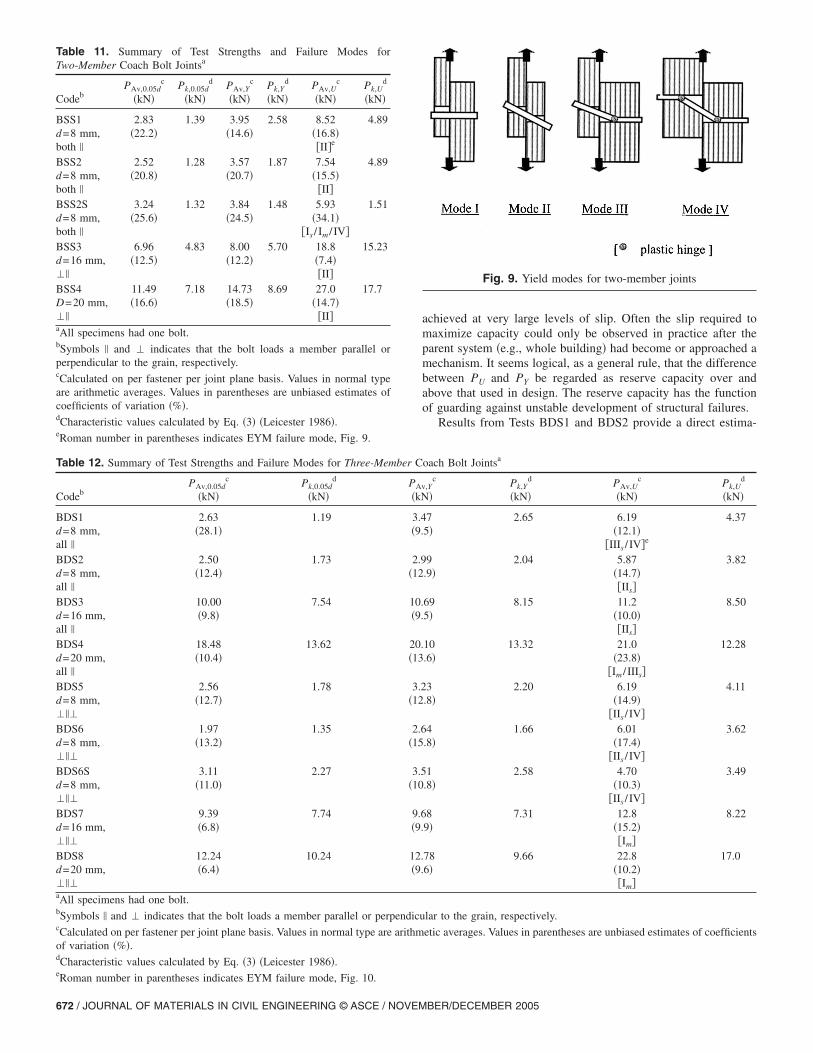
Tables 8–12 summarize strength information for various typesof joint in terms of 5% diameter offset, yield and ultimate loads.Failure modes were classified based on the nature of residualdeformation after testing. Modes assigned were those recognized
Table 6. Washer Dimensions for Lag Screws and Coach Bolts
Fastenertype
Fastener nominaldiameter
�mm�
Washer outsidediameter
�mm�Washer thickness
�mm�
Lag screw 6 16.5 1.2
12 29 2.4
20 39 3.2
Coach bolt 8 19.9 1.7
16 34 2.9
20 39 3.2
by the so-called European yield model �EYM� for joints with
BER/DECEMBER 2005
dowel-type fasteners �Johansen 1949; Larsen 1979; AFPA 1999�,Figs. 9 and 10. Subscripts s and m applied to mode numbersindicate in the case of Mode I failures whether it is the side ormain member, respectively, that fails in bearing. The designationIIIm indicates there is only bearing failure in the main member,whereas there is a plastic hinge in the side member combinedwith bearing failure of the wood. Analogously, the designation IIIs
Fig. 7. Typical family of load versus slip curves for different types ofdata: �a� nail joint N4; �b� wood screw joint S3; �c� lag screw joint L�3-member�.
indicates there is only bearing failure in the side member�s�.
JOURNAL OF MATERIALS IN
Mode IIIm can only occur in occur in two-member joints, whereasMode IIIs can occur in either two-member or three-memberjoints.
Some subjectivity was involved in assigning failure modesbecause tests were continued to levels of slip well above those atwhich the yield loads were reached, in order to determine ultimateloads. For the types of specimen tested splitting in members prior
. Thickened lines represent averaged best-fit polynomial trends in thed� coach bolt joint BSS1 �2-member�; and �e� coach bolt joint BDS1
jointsS2S; �
to termination of tests was rare. Splits were only observed in
CIVIL ENGINEERING © ASCE / NOVEMBER/DECEMBER 2005 / 669
bolted joint specimens with one or two members loaded perpen-dicular to grain. They grew from the bolt hole and were arresteduntil displacements beyond those at the peak load. Adoption ofEYM failure modes was judged appropriate, even though at timesdiscrepancies between model assumptions and real behavior madean exact classification difficult.
Characteristic strength values for P0.05d, PY, and PU are givenin Tables 8–12. The characteristic strengths are calculated by themethod proposed by Leicester �1986�, and which is commonlyused in Australia
Pk = P0.05,data�1 − 2.7Vdata/N1/2� �3�
where Vdata=coefficient of variation; P0.05,data=fifth percentile es-
Table 7. Summary of Load-Deformation Statisticsa
CodeKinit
b
�kN/mm��P-Y
c
�mm��P-U
d
�mm� RD=�P-U /�P-Ye
N1 1.35 0.37 12.1 32.6
N2 1.53 0.38 14.5 38.2
N3 1.51 0.46 11.8 25.7
N4 2.32 0.34 10.7 31.5
N4S 2.05 0.43 8.3 19.2
N5 2.25 0.37 11.8 31.9
N5S 2.54 0.34 8.6 25.4
N6 2.81 0.36 13.2 36.7
N7 1.99 0.68 20.3 16.5
N8 0.67 1.22 15.2 12.4
N9 1.08 0.75 14.4 19.2
N10 1.43 0.60 13.5 22.6
S1 0.98 0.76 6.9 9.1
S2 3.30 0.70 6.2 8.9
S2S 4.97 0.31 7.2 23.3
S2SE 1.98 0.52 6.7 13.0
S3 4.19 0.62 18.4 29.6
LS1 1.16 2.0 11.5 5.6
LS2 0.62 3.1 20.7 6.8
LS2S 0.96 2.5 13.8 5.5
LS3 2.62 2.5 �9.7 �3.8
LS4 2.88 4.1 �9.8 �2.4
BSS1 1.06 3.7 36.5 9.9
BSS2 1.06 3.4 34.0 10.0
BSS2S 1.37 2.8 15.6 5.5
BSS3 1.19 6.7 33.9 5.1
BSS4 3.96 3.7 36.2 9.8
BDS1 1.24 2.8 18.9 6.8
BDS2 1.07 2.8 18.7 6.8
BDS3 2.18 4.9 9.2 1.9
BDS4 5.15 3.9 14.1 3.6
BDS5 1.08 3.0 22.1 7.5
BDS6 0.94 2.8 23.0 8.2
BDS6S 1.13 3.1 8.2 2.6
BDS7 2.06 4.7 15.4 3.2
BDS8 2.90 4.4 23.8 5.4aAll values arithmetic averages.bInitial tangent stiffness.cDisplacement at intersection of lines representing initial stiffness andenforcing stiffness.dDisplacement at ultimate �peak� load.eDuctility ratio.
timated from the data; and N=sample size. Bryant and Hunt
670 / JOURNAL OF MATERIALS IN CIVIL ENGINEERING © ASCE / NOVEM
�1999� conducted Monte Carlo simulation to evaluate differentmethods of computing characteristic values for joints and foundthat the Leicester method provides good predictions even for rea-sonably small sample sizes.
In general, average 5% diameter offset loads �PAv,0.05d� wereless than yield loads �PAv,Y�, irrespective of the type of joint.Ratios of PAv,0.05d to PAv,Y vary from 0.55 to 0.97, with the lowestand highest values being for nail and coach bolt joints, respec-tively. Similarly, ratios of Pk,0.05d to Pk,Y vary from 0.45 to 1.06,with the lowest and the highest values being for coach bolt joints.Ratios slightly greater than unity reflect that occasionally, forjoints with larger diameter bolts, the 5% offset line can intersectthe load–slip curve within the “enforcing stiffness” region, i.e.,well beyond the yield point. �Enforcing stiffness is the postyield-ing prepeak load tangential stiffness as illustrated in Fig. 1.�Trends in ratios of P0.05d to PY, for average or characteristicstrength, are a reflection that substantial nonlinearity occurs inload-slip responses at quite low proportions of ultimate load whenslender fasteners are used. Fig. 11 shows the range of ratios PU toPY classified according to the type of joint �type of fastener�,based on averaged responses. The suffix parallel �para.� applied tocoach bolt joints signifies cases where all members are loadedparallel to the grain, whereas the suffix perpendicular �perp.� sig-nifies cases where one or two members are loaded perpendicularto the grain. It is apparent that there is no strong relationship
Fig. 8. Failure mechanisms for joints with one slender fastener�“type 17” self-tapping wood screw� and one stocky fastener �coachbolt�
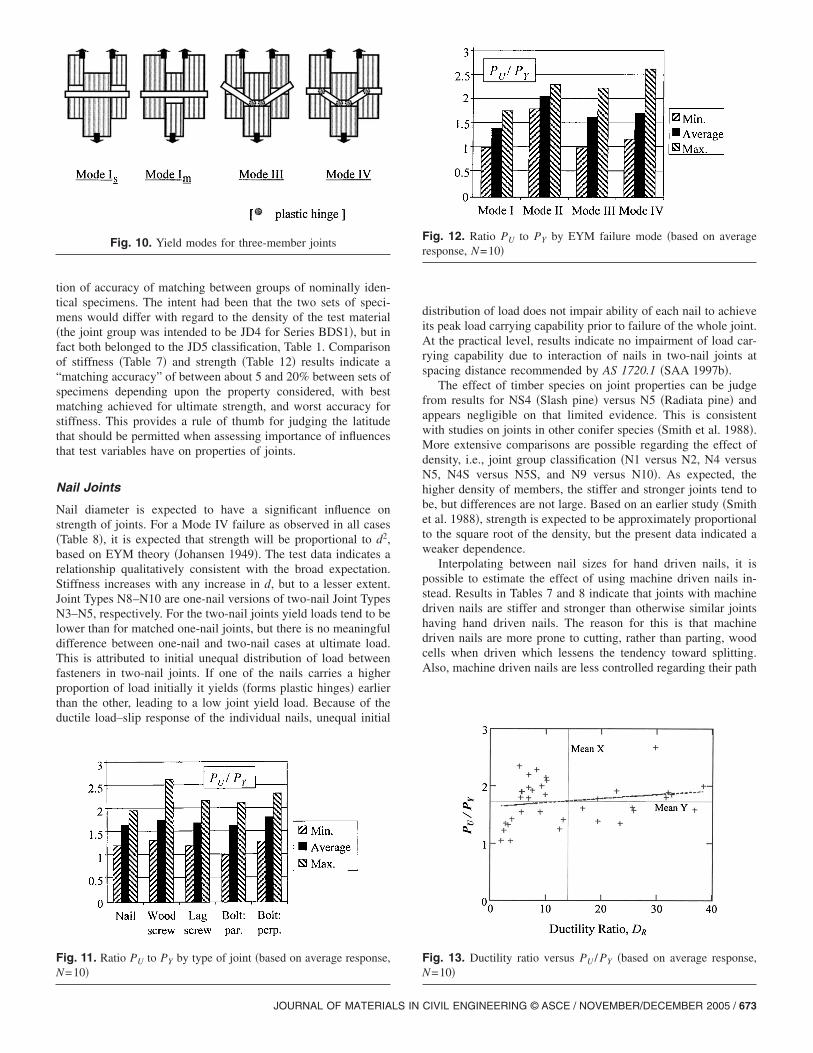
between the type of joint and the ratio PU to PY. Fig. 12 shows the
BER/DECEMBER 2005
range of ratios PU to PY classified by EYM failure mode, basedon averaged responses. In Figs. 9 and 10, it is apparent that ModeI failures depend only upon the bearing capabilities of the woodbeneath the fastener, so it is expected that ratios PU to PY tend tobe low in that case. Modes III and IV involve formation of at leastone plastic hinge in the fastener�s�. This allows significant ductil-ity, and thus large displacement effects that account for the rela-tively high ratios PU to PY. Mode II failures involve rigid bodytranslation and rotation of the fastener�s� and are only observedfor some two-member joints with coach bolts. The high ratios PU
to PY reflect that for this mode rotation of bolts leads to signifi-cant tensile force within them. Tension in bolts enhances lateralload capacity through both a string effect and development ofinter-member friction �coach bolt joints did not have an initial gapbetween members so friction developed quite early�. NeglectingMode II results for coach bolt joints, the EYM failure mode is a
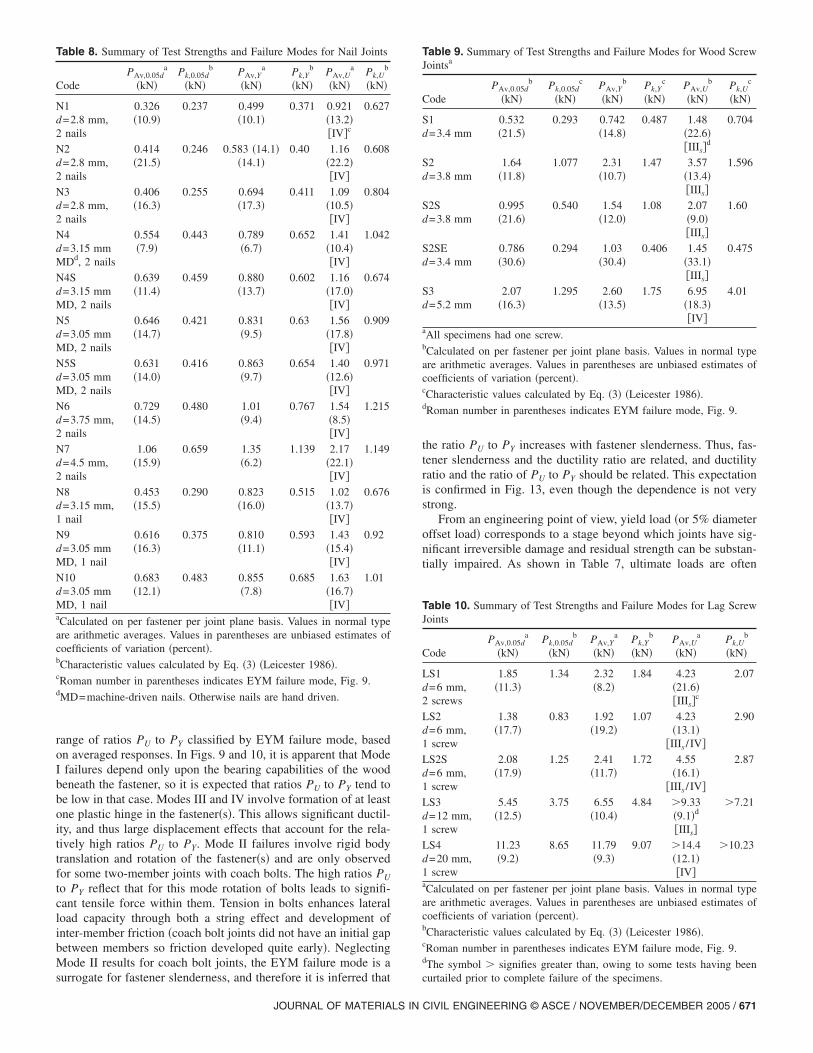
Table 8. Summary of Test Strengths and Failure Modes for Nail Joints
CodePAv,0.05d
a
�kN�Pk,0.05d
b
�kN�PAv,Y
a
�kN�Pk,Y
b
�kN�PAv,U
a
�kN�Pk,U
b
�kN�
N1d=2.8 mm,2 nails
0.326�10.9�
0.237 0.499�10.1�
0.371 0.921�13.2��IV�c
0.627
N2d=2.8 mm,2 nails
0.414�21.5�
0.246 0.583 �14.1��14.1�
0.40 1.16�22.2��IV�
0.608
N3d=2.8 mm,2 nails
0.406�16.3�
0.255 0.694�17.3�
0.411 1.09�10.5��IV�
0.804
N4d=3.15 mmMDd, 2 nails
0.554�7.9�
0.443 0.789�6.7�
0.652 1.41�10.4��IV�
1.042
N4Sd=3.15 mmMD, 2 nails
0.639�11.4�
0.459 0.880�13.7�
0.602 1.16�17.0��IV�
0.674
N5d=3.05 mmMD, 2 nails
0.646�14.7�
0.421 0.831�9.5�
0.63 1.56�17.8��IV�
0.909
N5Sd=3.05 mmMD, 2 nails
0.631�14.0�
0.416 0.863�9.7�
0.654 1.40�12.6��IV�
0.971
N6d=3.75 mm,2 nails
0.729�14.5�
0.480 1.01�9.4�
0.767 1.54�8.5��IV�
1.215
N7d=4.5 mm,2 nails
1.06�15.9�
0.659 1.35�6.2�
1.139 2.17�22.1��IV�
1.149
N8d=3.15 mm,1 nail
0.453�15.5�
0.290 0.823�16.0�
0.515 1.02�13.7��IV�
0.676
N9d=3.05 mmMD, 1 nail
0.616�16.3�
0.375 0.810�11.1�
0.593 1.43�15.4��IV�
0.92
N10d=3.05 mmMD, 1 nail
0.683�12.1�
0.483 0.855�7.8�
0.685 1.63�16.7��IV�
1.01
aCalculated on per fastener per joint plane basis. Values in normal typeare arithmetic averages. Values in parentheses are unbiased estimates ofcoefficients of variation �percent�.bCharacteristic values calculated by Eq. �3� �Leicester 1986�.cRoman number in parentheses indicates EYM failure mode, Fig. 9.dMD=machine-driven nails. Otherwise nails are hand driven.
surrogate for fastener slenderness, and therefore it is inferred that
JOURNAL OF MATERIALS IN
the ratio PU to PY increases with fastener slenderness. Thus, fas-tener slenderness and the ductility ratio are related, and ductilityratio and the ratio of PU to PY should be related. This expectationis confirmed in Fig. 13, even though the dependence is not verystrong.
From an engineering point of view, yield load �or 5% diameteroffset load� corresponds to a stage beyond which joints have sig-nificant irreversible damage and residual strength can be substan-tially impaired. As shown in Table 7, ultimate loads are often
Table 9. Summary of Test Strengths and Failure Modes for Wood ScrewJointsa
CodePAv,0.05d
b
�kN�Pk,0.05d
c
�kN�PAv,Y
b
�kN�Pk,Y
c
�kN�PAv,U
b
�kN�Pk,U
c
�kN�
S1d=3.4 mm
0.532�21.5�
0.293 0.742�14.8�
0.487 1.48�22.6��IIIs�
d
0.704
S2d=3.8 mm
1.64�11.8�
1.077 2.31�10.7�
1.47 3.57�13.4��IIIs�
1.596
S2Sd=3.8 mm
0.995�21.6�
0.540 1.54�12.0�
1.08 2.07�9.0��IIIs�
1.60
S2SEd=3.4 mm
0.786�30.6�
0.294 1.03�30.4�
0.406 1.45�33.1��IIIs�
0.475
S3d=5.2 mm
2.07�16.3�
1.295 2.60�13.5�
1.75 6.95�18.3��IV�
4.01
aAll specimens had one screw.bCalculated on per fastener per joint plane basis. Values in normal typeare arithmetic averages. Values in parentheses are unbiased estimates ofcoefficients of variation �percent�.cCharacteristic values calculated by Eq. �3� �Leicester 1986�.dRoman number in parentheses indicates EYM failure mode, Fig. 9.
Table 10. Summary of Test Strengths and Failure Modes for Lag ScrewJoints
CodePAv,0.05d
a
�kN�Pk,0.05d
b
�kN�PAv,Y
a
�kN�Pk,Y
b
�kN�PAv,U
a
�kN�Pk,U
b
�kN�
LS1d=6 mm,2 screws
1.85�11.3�
1.34 2.32�8.2�
1.84 4.23�21.6��IIIs�
c
2.07
LS2d=6 mm,1 screw
1.38�17.7�
0.83 1.92�19.2�
1.07 4.23�13.1�
�IIIs / IV�
2.90
LS2Sd=6 mm,1 screw
2.08�17.9�
1.25 2.41�11.7�
1.72 4.55�16.1�
�IIIs / IV�
2.87
LS3d=12 mm,1 screw
5.45�12.5�
3.75 6.55�10.4�
4.84 �9.33�9.1�d
�IIIs�
�7.21
LS4d=20 mm,1 screw
11.23�9.2�
8.65 11.79�9.3�
9.07 �14.4�12.1��IV�
�10.23
aCalculated on per fastener per joint plane basis. Values in normal typeare arithmetic averages. Values in parentheses are unbiased estimates ofcoefficients of variation �percent�.bCharacteristic values calculated by Eq. �3� �Leicester 1986�.cRoman number in parentheses indicates EYM failure mode, Fig. 9.dThe symbol � signifies greater than, owing to some tests having been
curtailed prior to complete failure of the specimens.CIVIL ENGINEERING © ASCE / NOVEMBER/DECEMBER 2005 / 671
Roman number in parentheses indicates EYM failure mode, Fig. 9.
Roman number in parentheses indicates EYM failure mode, Fig. 10.
672 / JOURNAL OF MATERIALS IN CIVIL ENGINEERING © ASCE / NOVEM
achieved at very large levels of slip. Often the slip required tomaximize capacity could only be observed in practice after theparent system �e.g., whole building� had become or approached amechanism. It seems logical, as a general rule, that the differencebetween PU and PY be regarded as reserve capacity over andabove that used in design. The reserve capacity has the functionof guarding against unstable development of structural failures.
Results from Tests BDS1 and BDS2 provide a direct estima-
oach Bolt Jointsa
,Yc
�Pk,Y
d
�kN�PAv,U
c
�kN�Pk,U
d
�kN�
75�
2.65 6.19�12.1�
�IIIs / IV�e
4.37
9.9�
2.04 5.87�14.7��IIs�
3.82
695�
8.15 11.2�10.0��IIs�
8.50
10.6�
13.32 21.0�23.8�
�Im / IIIs�
12.28
3.8�
2.20 6.19�14.9�
�IIs / IV�
4.11
4.8�
1.66 6.01�17.4�
�IIs / IV�
3.62
1.8�
2.58 4.70�10.3�
�IIs / IV�
3.49
89�
7.31 12.8�15.2��Im�
8.22
786�
9.66 22.8�10.2��Im�
17.0
lar to the grain, respectively.
etic averages. Values in parentheses are unbiased estimates of coefficients
Fig. 9. Yield modes for two-member joints
Table 11. Summary of Test Strengths and Failure Modes forTwo-Member Coach Bolt Jointsa
CodebPAv,0.05d
c
�kN�Pk,0.05d
d
�kN�PAv,Y
c
�kN�Pk,Y
d
�kN�PAv,U
c
�kN�Pk,U
d
�kN�
BSS1d=8 mm,both �
2.83�22.2�
1.39 3.95�14.6�
2.58 8.52�16.8��II�e
4.89
BSS2d=8 mm,both �
2.52�20.8�
1.28 3.57�20.7�
1.87 7.54�15.5��II�
4.89
BSS2Sd=8 mm,both �
3.24�25.6�
1.32 3.84�24.5�
1.48 5.93�34.1�
�Is / Im / IV�
1.51
BSS3d=16 mm,��
6.96�12.5�
4.83 8.00�12.2�
5.70 18.8�7.4��II�
15.23
BSS4D=20 mm,��
11.49�16.6�
7.18 14.73�18.5�
8.69 27.0�14.7��II�
17.7
aAll specimens had one bolt.bSymbols � and � indicates that the bolt loads a member parallel orperpendicular to the grain, respectively.cCalculated on per fastener per joint plane basis. Values in normal typeare arithmetic averages. Values in parentheses are unbiased estimates ofcoefficients of variation �%�.dCharacteristic values calculated by Eq. �3� �Leicester 1986�.e
Table 12. Summary of Test Strengths and Failure Modes for Three-Member C
CodebPAv,0.05d
c
�kN�Pk,0.05d
d
�kN�PAv
�kN
BDS1d=8 mm,all �
2.63�28.1�
1.19 3.4�9.
BDS2d=8 mm,all �
2.50�12.4�
1.73 2.9�12
BDS3d=16 mm,all �
10.00�9.8�
7.54 10.�9.
BDS4d=20 mm,all �
18.48�10.4�
13.62 20.�13
BDS5d=8 mm,���
2.56�12.7�
1.78 3.2�12
BDS6d=8 mm,���
1.97�13.2�
1.35 2.6�15
BDS6Sd=8 mm,���
3.11�11.0�
2.27 3.5�10
BDS7d=16 mm,���
9.39�6.8�
7.74 9.6�9.
BDS8d=20 mm,���
12.24�6.4�
10.24 12.�9.
aAll specimens had one bolt.bSymbols � and � indicates that the bolt loads a member parallel or perpendicucCalculated on per fastener per joint plane basis. Values in normal type are arithmof variation �%�.dCharacteristic values calculated by Eq. �3� �Leicester 1986�.e
BER/DECEMBER 2005
tion of accuracy of matching between groups of nominally iden-tical specimens. The intent had been that the two sets of speci-mens would differ with regard to the density of the test material�the joint group was intended to be JD4 for Series BDS1�, but infact both belonged to the JD5 classification, Table 1. Comparisonof stiffness �Table 7� and strength �Table 12� results indicate a“matching accuracy” of between about 5 and 20% between sets ofspecimens depending upon the property considered, with bestmatching achieved for ultimate strength, and worst accuracy forstiffness. This provides a rule of thumb for judging the latitudethat should be permitted when assessing importance of influencesthat test variables have on properties of joints.
Nail Joints
Nail diameter is expected to have a significant influence onstrength of joints. For a Mode IV failure as observed in all cases�Table 8�, it is expected that strength will be proportional to d2,based on EYM theory �Johansen 1949�. The test data indicates arelationship qualitatively consistent with the broad expectation.Stiffness increases with any increase in d, but to a lesser extent.Joint Types N8–N10 are one-nail versions of two-nail Joint TypesN3–N5, respectively. For the two-nail joints yield loads tend to belower than for matched one-nail joints, but there is no meaningfuldifference between one-nail and two-nail cases at ultimate load.This is attributed to initial unequal distribution of load betweenfasteners in two-nail joints. If one of the nails carries a higherproportion of load initially it yields �forms plastic hinges� earlierthan the other, leading to a low joint yield load. Because of theductile load–slip response of the individual nails, unequal initial
Fig. 10. Yield modes for three-member joints
Fig. 11. Ratio PU to PY by type of joint �based on average response,N=10�
JOURNAL OF MATERIALS IN
distribution of load does not impair ability of each nail to achieveits peak load carrying capability prior to failure of the whole joint.At the practical level, results indicate no impairment of load car-rying capability due to interaction of nails in two-nail joints atspacing distance recommended by AS 1720.1 �SAA 1997b�.
The effect of timber species on joint properties can be judgefrom results for NS4 �Slash pine� versus N5 �Radiata pine� andappears negligible on that limited evidence. This is consistentwith studies on joints in other conifer species �Smith et al. 1988�.More extensive comparisons are possible regarding the effect ofdensity, i.e., joint group classification �N1 versus N2, N4 versusN5, N4S versus N5S, and N9 versus N10�. As expected, thehigher density of members, the stiffer and stronger joints tend tobe, but differences are not large. Based on an earlier study �Smithet al. 1988�, strength is expected to be approximately proportionalto the square root of the density, but the present data indicated aweaker dependence.
Interpolating between nail sizes for hand driven nails, it ispossible to estimate the effect of using machine driven nails in-stead. Results in Tables 7 and 8 indicate that joints with machinedriven nails are stiffer and stronger than otherwise similar jointshaving hand driven nails. The reason for this is that machinedriven nails are more prone to cutting, rather than parting, woodcells when driven which lessens the tendency toward splitting.Also, machine driven nails are less controlled regarding their path
Fig. 12. Ratio PU to PY by EYM failure mode �based on averageresponse, N=10�
Fig. 13. Ductility ratio versus PU / PY �based on average response,N=10�
CIVIL ENGINEERING © ASCE / NOVEMBER/DECEMBER 2005 / 673
into and through timber members, which mobilizes some axialload carrying capability that is absent when nails are drivenperfectly.
Screw Joints
For the self-tapping type of wood screw used in this study, diam-eter and associated change in length has a strong influence onjoint strength and stiffness �as deduced from data in Tables 7 and9�. This reflected in part the change in the failure mode from IIIs
to IV as screw dimensions increased. An effect of timber speciesis apparent by comparing results for S2S �Slash pine� with thosefor S2 �Radiata pine�. Radiata pine members lead to a strongerand stiffer joint than do Slash pine members. Influence of jointgroup classification can only be assessed indirectly �S2SE versusS1� as the comparison includes the species effect as well. There isa strong positive influence of increased density on mechanicalproperties other than PU.
Diameter has a marked effect on stiffness and strength ofjoints made with lag screws �Tables 7 and 10�. As for the woodscrews this reflects change in both fastener dimensions and atransition in the failure mode. Results for LS1 �two lag screws,Radiata pine� versus LS2S �one lag screw, Slash pine� give anindication of the effect of interaction between fasteners on jointproperties. From this comparison, it appears that neither the num-ber of lag screws nor the timber species strongly influencesstrength or stiffness. In general, fastener and member characteris-tics have a much strong influence on mechanical properties ofscrew joints.
Coach Bolt Joints
Although the structure of the test schedule does not permit unam-biguous separation of cause and effect, it is clear overall that bothbolt diameter and joint group strongly influence stiffness andstrength, irrespective of the number of jointed members or thearrangement �directions to grain at which members are loaded�,Tables 7, 11, and 12. The effect of timber species is slight exceptfor PU that tends to be lower for Slash pine than for Radiata pine�BSS1 versus BSS2S and BDS5 versus BDS6S�.
Concluding Remarks
Major findings of the present study on dowel-type fastener jointsin Australian pine are:1. Characteristic one-fastener design capacities of joints are
most reliably based on the yield load or an approximation toit, rather than on ultimate load. This is because the yield loadcorresponds to a stage beyond which joints have significantirreversible damage and residual strength can be substantiallyimpaired.
2. Stiffness and strength properties of joints made with woodscrews, lag screws, or coach bolts are quite sensitive to fas-tener dimensions �mainly diameter�, and to the density ofjoined timber members. Mechanical properties of nailedjoints are comparatively less sensitive to fastener dimensionsor member density.
3. For practical purposes, behaviors of joints in Radiata pineand Slash pine can be regarded as identical. This conclusionapplies to stiffness and yield capacity and is reached despiteevidence that the ultimate capacity for joints in Slash pine
can be less than for comparable joints in Radiata pine. This is674 / JOURNAL OF MATERIALS IN CIVIL ENGINEERING © ASCE / NOVEM
predicated on the presumption that yield load is the logicalbasis for design.
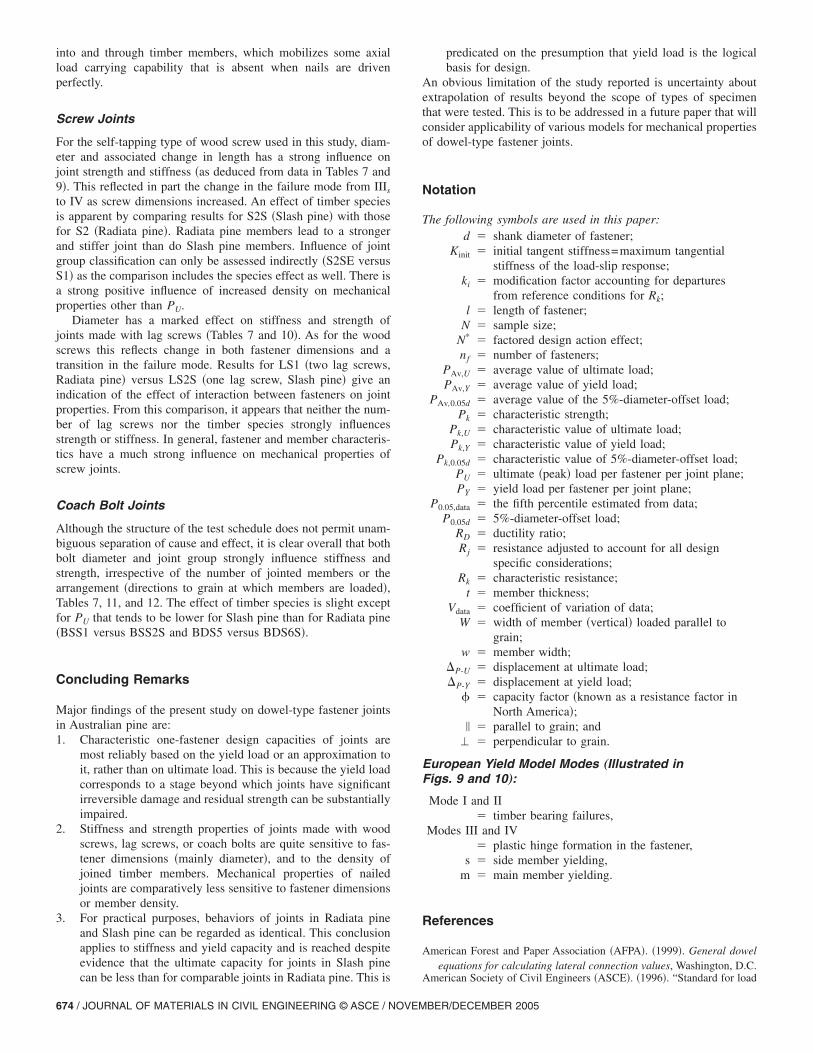
An obvious limitation of the study reported is uncertainty aboutextrapolation of results beyond the scope of types of specimenthat were tested. This is to be addressed in a future paper that willconsider applicability of various models for mechanical propertiesof dowel-type fastener joints.
Notation
The following symbols are used in this paper:d � shank diameter of fastener;
Kinit � initial tangent stiffness=maximum tangentialstiffness of the load-slip response;
ki � modification factor accounting for departuresfrom reference conditions for Rk;
l � length of fastener;N � sample size;
N* � factored design action effect;nf � number of fasteners;
PAv,U � average value of ultimate load;PAv,Y � average value of yield load;
PAv,0.05d � average value of the 5%-diameter-offset load;Pk � characteristic strength;
Pk,U � characteristic value of ultimate load;Pk,Y � characteristic value of yield load;
Pk,0.05d � characteristic value of 5%-diameter-offset load;PU � ultimate �peak� load per fastener per joint plane;PY � yield load per fastener per joint plane;
P0.05,data � the fifth percentile estimated from data;P0.05d � 5%-diameter-offset load;
RD � ductility ratio;Rj � resistance adjusted to account for all design
specific considerations;Rk � characteristic resistance;
t � member thickness;Vdata � coefficient of variation of data;
W � width of member �vertical� loaded parallel tograin;
w � member width;�P-U � displacement at ultimate load;�P-Y � displacement at yield load;
� � capacity factor �known as a resistance factor inNorth America�;
� � parallel to grain; and� � perpendicular to grain.
European Yield Model Modes „Illustrated inFigs. 9 and 10…:
Mode I and II� timber bearing failures,
Modes III and IV� plastic hinge formation in the fastener,
s � side member yielding,m � main member yielding.
References
American Forest and Paper Association �AFPA�. �1999�. General dowelequations for calculating lateral connection values, Washington, D.C.
American Society of Civil Engineers �ASCE�. �1996�. “Standard for load
BER/DECEMBER 2005
and resistance factor design for engineered wood construction.” ASCE16-95, New York.
American Society for Testing Materials �ASTM�. �1997�. “Standard testmethods for mechanical fasteners in wood.” ASTM D1761-1997, Vol.4.10 Wood, ASTM, Philadelphia.
Bryant, A. H., and Hunt, R. D. �1999�. “Estimates of joint strength fromexperimental tests.” Proc., Pacific Timber Engineering Conf.(PTEC’99), Forest Research Bulletin 212, Vol. 2, New Zealand ForestResearch Institute Ltd., Rotorua, New Zealand, 225–230.
Canadian Standards Association �CSA�. �2001�. “Engineering design inwood.” CSA Standard 086-01, Toronto.
Daneff, G. �1997�. “Response of bolted connections to pseudo-dynamic�cyclic� loading.” MScFE thesis, Univ. of New Brunswick, Frederic-ton N.B., Canada.
DeGrace, R. F. �1986�. “Commentary on CSA Standard 086.1-M84 En-gineering design in wood �limit states design�.” Special PublicationNo. 086.1.1-M1986, Canadian Standards Association, Toronto.
Ehlbeck, J., and Larsen, H. J. �1993�. “Eurocode 5—Design of timberstructures: joints.” Proc., 1992 Int. Workshop on Wood Connectors,Forest Products Society, Madison, Wis., 9–23.
European Committee for Standardization �CEN�. �1995�. “Design of tim-ber structures: General rules and rules for buildings.” Eurocode 5:Part 1.1, Brussels, Belgium.
Foliente, G. C. �1998�. “Design of timber structures subjected to extremeloads.” Prog. Struct. Eng. Mater., 1�3�, 236–244.
Johansen, K. W. �1949�. “Theory of timber connectors.” Publication No.9, Int. Association of Bridges and Structural Engineering, Bern, Swit-zerland, 249–262.
Larsen, H. J. �1979�. “Design of bolted joints.” Proc., Int. Council forBuilding Research Studies and Documentation: Working CommissionW18, Timber Structures, Bordeaux, France, International Council forResearch and Innovation in Building and Construction, Rotterdam,The Netherlands.
Leicester, R. H. �1986�. “Confidence in estimates of characteristic val-ues.” Proc., Int. Council for Building Research Studies and Documen-tation: Working Commission W18, Timber Structures, Firenze, Italy,Int. Council for Research and Innovation in Building and Construc-tion, Rotterdam, The Netherlands.
Lepper, M., and Smith, I. �1995�. “Fastenings �commentary on Chapter10 of CSA Standard 086.1-1994�.” Wood design manual 1995, Cana-dian Wood Council, Ottawa, 647–666.
McLain, T. E. �1993�. “Connector code development and application in
JOURNAL OF MATERIALS IN
the United States: Generic fasteners.” Proc., 1992 Int. Workshop onWood Connectors, Forest Products Society, Madison, Wis., 52–56.
McLain, T. E. �1984�. “Mechanical fastening of structural woodmembers—Design and research status.” Structural wood research:State-of-the-art and research needs, R. Itani and K. Faherty, eds.,ASCE, New York, 33–68.
Mohammad, M. A. H., and Smith, I. �1994�. “Stiffness of nailed OSB-to-lumber connections.” For. Prod. J., 44�11/12�, 37–44.
Smith, I. �1998�. “Joints in timber structures: State-of-the-art knowledgein North America.” Keynote address, Session 4, Proc., Int. Conf. onControl of the Semi-Rigid Behaviour of Civil Engineering StructuralConnections, Liege, European Commission, Luxembourg, 255–264.
Smith, I., Daneff, G., Ni, C., and Chui, Y. H. �1998�. “Performance ofbolted and nailed timber connections subjected to seismic loading.”Special Publication 7275, Forest Products Society, Madison, Wis.,6–17.
Smith, I., and Foliente, G. C. �2002�. “Load and resistance factor designof timber joints: International practice and future direction.” J. Struct.Eng., 128�1�, 48–59.
Smith, I., Whale, L. R. J., Anderson, C., Hilson, B. O., and Rodd, P. D.�1988�. “Design properties of laterally loaded nailed or bolted joints.”Can. J. Civ. Eng., 15�4�, 633–643.
Standards Association of Australia �SAA�. �1980�. “Steel nails—metricseries.” AS2334, The Crescent, Homebush, New South Wales,Australia.
Standards Association of Australia �SAA�. �1988�. “Screw—selfdrilling—for the building and construction industries.” AS3566, TheCrescent, Homebush, New South Wales, Australia.
Standards Association of Australia �SAA�. �1996�. “Coach screws—metric series with ISO hexagon heads.” AS/NZS 1393, The Crescent,Homebush, New South Wales, Australia.
Standards Association of Australia �SAA�. �1997a�. “Cup head bolts withISO metric course pitch threads.” AS/NZS 1390, The Crescent, Home-bush, New South Wales, Australia.
Standards Association of Australia �SAA�. �1997b�. “Timber structures,Part 1: Design methods.” AS 1720.1—1997, The Crescent, Homebush,New South Wales, Australia.
Standards Association of Australia �SAA�. �1998�. “Timber—methods oftest for mechanical fasteners and connectors—Basic working loadsand characteristic strengths.” AS 1649—1998, The Crescent, Home-bush, New South Wales, Australia.
CIVIL ENGINEERING © ASCE / NOVEMBER/DECEMBER 2005 / 675