potassium fixing capacities of some selected soils in south
TRANSCRIPT
Research ArticleVolume 2 Issue 1 - July 2016
Agri Res & Tech: Open Access JCopyright © All rights are reserved by Thomas EY
Potassium Fixing Capacities of Some Selected Soils in South Western Nigeria
Thomas EY, Omueti JAI* and Bandele BDepartment of Agronomy, University of Ibadan, Nigeria
Submission: June 13, 2016; Published: July 02, 2016*Corresponding author: Omueti JAI, Department of Agronomy, University of Ibadan, Nigeria, Tel: +2347031128303; Email:
Introduction
Potassium (K) is the third most essential nutrient element after nitrogen and phosphorus for plant nutrition. It is very instrumental in plant nutrition and physiology. Potassium has been found to activate over sixty (60) enzymes. It also promotes photosynthesis, controls stomata opening, improves the utilization of N, promotes the transport of assimilates and consequently increases crop yields. Also, K influences the microbial population in the rhizosphere and plays key roles in the nutrition and health of man and livestock [1,2]. Potassium exists in four forms in the soil. These include the solution, exchangeable, non-exchangeable or fixed and mineral or structural K forms [3-5]. Solution K constitutes about 2-5 mg/l except in recently K amended soils and is the form directly taken by plants and microbes and subject to leaching losses [5]. Exchangeable K is the form that is electrostatically bound to the outer surface of clay minerals and humic substances and which is readily exchangeable and available to plants. Non-exchangeable or fixed K represents the portion held between adjacent tetrahedral
layers of 2:1 clay minerals such as micas and vermiculites and which is sparingly available to plants [6,3,4] while mineral or structural K consist about 90-98% of total soil potassium and constitutes the portion that is bonded within crystal structures of soil mineral particles [7].
Equilibrium and kinetic reactions exist between potassium forms in the soils and this affects their solution concentration and availability to plants [8,9]. Thus as soil solution potassium concentration is depleted through leaching and plant uptake, it is immediately replenished by the other forms especially the exchangeable and non-exchangeable fractions [10]. Availability of potassium in soil solution could therefore be influenced by the solution-exchangeable K dynamics, rate of K exchange in soils, K fixation and release from soil minerals and leaching [7,5]. Many researchers have observed that at times, some soils that test high may respond to K application contrary to expectation. This is an indication that there are other forms of K other than the exchangeable K contributing to K needs of crops. Non-exchangeable K has been shown to also contribute significantly
Agri Res & Tech: Open Access J 2(1): ARTOAJ.MS.ID.555577 (2016) 007
Abstract
Potassium fixation is a widespread phenomenon in most soils and accounts significantly for the availability of applied K to plants. Although this phenomenon is a direct consequence of the presence of 2:1 clay minerals, recent studies have shown that this phenomenon also occurs in tropical soils with insignificant content of 2:1 silicate clays. Also, the knowledge of potassium status of soils provides useful information for rational K fertilizer management. Therefore this study investigated the potassium fixation capacities as well as the potassium status of some soils of southwestern Nigeria. Potassium fixation in the soils was conducted by evaluating the effect of applied K on the extractability of K with time. A series of five K sorption treatment solution (0.11, 0.22, 0.45, 0.90 and 1.80 cmol/kg) were prepared and applied as KCl replicated three times. The first set of soil samples were extracted with 1N NH4OAc extractant for K after the first day of incubation. The second and third sets were extracted with the same extractant after 10 and 42 days of incubation respectively to determine the amount of K fixed. Correlation between applied K and fixed K was carried out. Potassium status of the soils was evaluated. Fixation increased with increase in the concentration of added K. There was also a linear relationship between the proportion of K fixed and the amount added at higher incubation periods. It was concluded that the soils have the ability to fix potassium. Therefore, fertilizer recommendation should take in to account the amount that is initially fixed.
Keywords: Fixation; Potassium; Sorption; Incubation
Agricultural Research & Technology: Open Access JournalISSN: 2471-6774
How to cite this article: Thomas EY, Omueti J, Bandele B. Potassium Fixing Capacities of Some Selected Soils in South Western Nigeria. Agri Res & Tech: Open Access J. 2016; 2(1): 555577. DOI: 10.19080/ARTOAJ.2016.01.555577008
Agricultural Research & Technology: Open Access Journal
to plant uptake, this has often been ascribed to the fixed K; step K [11,12]. Potassium fixation is a direct consequence of the presence of 2:1 clay minerals. However some studies in West-Indices and in Nigeria [13-17,34] have shown that this phenomenon also occurs in tropical soils with insignificant content of 2:1 silicate clays. Therefore in assessing the K supplying capacity, the readily released K and the slow released K portions must be assessed because of the dynamics of water and gas in the soil-plant system and rhizosphere processes, Reports of K deficiency in southwest Nigerian soils have been reported by [14] while the exact levels of soil K at which the deficiencies occur cannot be predicted accurately. Hence, in order to improve the reliability of predicting soil K, indices of K availability should be considered. Potassium status of our soils should be well understood to help formulate the right fertilizer mixtures to boost crop production. The objectives of this study were therefore to determine the K fixation capacities of some selected soils of the southwestern Nigeria.
Materials and Methods
Description of study sites
Experimental soil samples were collected from 6 different locations in Ogun, Osun and Oyo states based on parent rock materials; sedimentary rocks and basement complex rocks respectively as shown in Table 1.
Table 1: Sampling location coordinates and land use of the studied soils.
S/N Sampling location Coordinates Land use
1 Parry road3˚ 27’ 10’’ N
3˚ 53 20’’ EUncultivated land
2 Technology road7˚ 26’ 24’’ N
3˚ 53’ 20’’ ELand sown to Cassava
3 Apomu7˚ 21’ 11’’ N
4˚ 10’ 58’’ EPlantain plantation
4 Ikoyi7˚ 21’ 0’’ N
4˚ 9’ 21’’ EForested land
5 Ilisan6˚ 53’ 11’’ N
3˚ 42’ 11’’ ELand sown to Cassava
6 Ikenne6˚ 53’ 0’’ N
3˚ 42’ 11’’ EUncultivated land
Sample collection and preparation
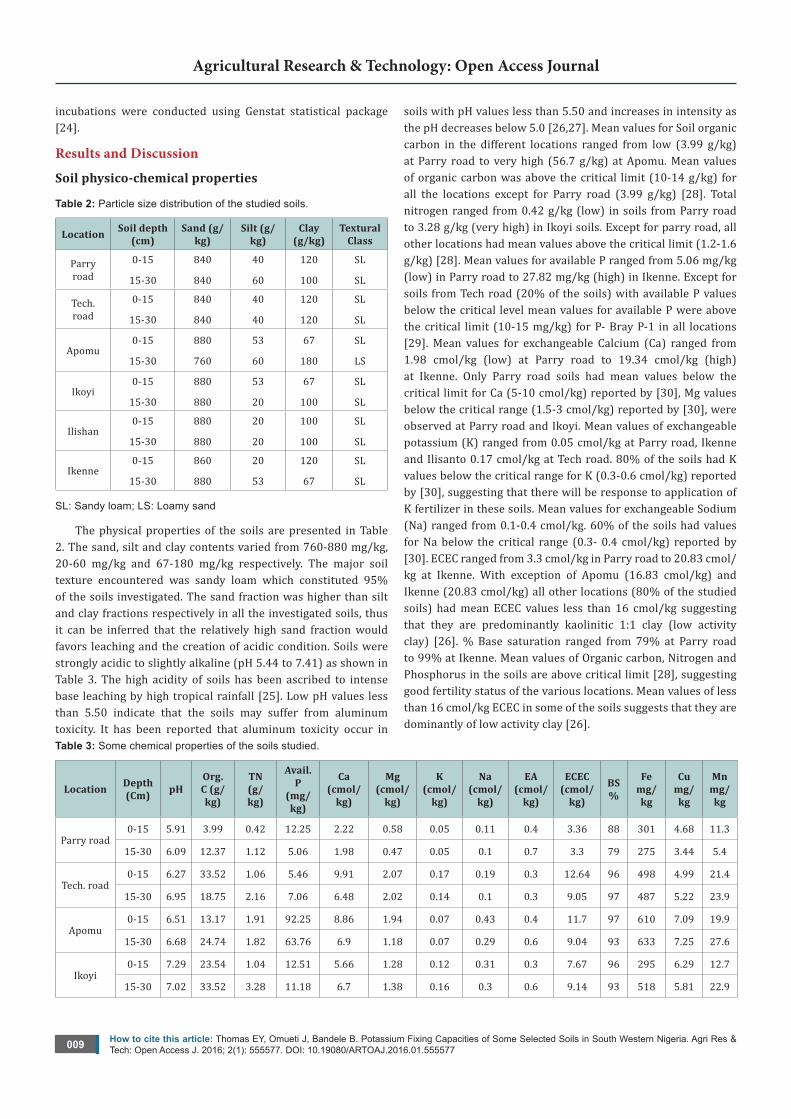
Soil samples were randomly collected at a point from two depths (0-15cm and 15-30cm) at 6 different locations across the south-western region of Nigeria, giving a total of 12 samples. The collected soil samples were air-dried, crushed and sieved through 2 mm and 0.5 mm sieve (depending on the analysis to be carried out on the soils) respectively and fine earth fractions stored ready for analysis (Figure 1).
Figure 1: Map showing locations of experimental soil samples.
Laboratory analysis
Soil pH was determined on a 1:10 (soil: water). Particle size was determined by hydrometer method [18]. Phosphorus was extracted with Bray P-1 solution and the P in the extract was determined by Molybdate blue colour method of [19] with Spectronic 20. Organic carbon was determined by the dichromate wet oxidation method as described by [20]. Exchangeable acidity was extracted with 1 N KCl and titrated against 0.01N NaOH. The effective cation exchange capacity (ECEC) was obtained by the sum of the total exchangeable bases (TEB) and total exchangeable acidity (TEA). Total Nitrogen was determined by Micro-Kjeldahl method as described by [21]. Micronutrient elements (Fe, Mn, Cu and Zn) were extracted with 0.1 N HCl and their concentrations read on the Atomic Absorption Spectrophotometer [20].
Potassium fixation
A stock solution was prepared by dissolving 1.91 g KCl in 200 ml distilled water and the volume made up to 1 litre solution with distilled water. This gave a concentration of 1 g K/l (2.56 cmol/kg). A series of five sorption treatment solutions viz: 0.11, 0.22, 0.45, 0.90 and 1.80 cmol/kg [22], were prepared by diluting 21.48, 43.00, 87.89, 175.78 and 351.56 ml respectively of the stock solution to 500 ml. 2.5 g each of the 20 soil samples was weighed into custom laboratory cups in tray racks. A 2.5 ml portion of each treatment solution was added, in three sets, to the 20 soil samples contained in the custom laboratory cups. A control experiment was also set up. They were then covered with clean polythene sheets following 1, 10 and 42 days of incubation. The samples were kept moist to about field capacity with deionized water throughout the incubation period. The first set of soil samples were extracted with 1N NH4OAc extractant for K after one day of incubation. The second and third sets were extracted with the same extractant for K after 10 and 42 days of incubation, respectively. The extract was read using a flame photometer.
Statistical analysis
Fixed K was calculated as follows:
(K added at rate R + K in control) – K recovered at rate R [23].
While Correlation between added K and different days of
How to cite this article: Thomas EY, Omueti J, Bandele B. Potassium Fixing Capacities of Some Selected Soils in South Western Nigeria. Agri Res & Tech: Open Access J. 2016; 2(1): 555577. DOI: 10.19080/ARTOAJ.2016.01.555577009
Agricultural Research & Technology: Open Access Journal
incubations were conducted using Genstat statistical package [24].
Results and Discussion
Soil physico-chemical properties
Table 2: Particle size distribution of the studied soils.
Location Soil depth (cm)
Sand (g/kg)
Silt (g/kg)
Clay (g/kg)
Textural Class
Parry road
0-15
15-30
840
840
40
60
120
100
SL
SL
Tech. road
0-15
15-30
840
840
40
40
120
120
SL
SL
Apomu0-15
15-30
880
760
53
60
67
180
SL
LS
Ikoyi0-15
15-30
880
880
53
20
67
100
SL
SL
Ilishan0-15
15-30
880
880
20
20
100
100
SL
SL
Ikenne0-15
15-30
860
880
20
53
120
67
SL
SL
SL: Sandy loam; LS: Loamy sand
The physical properties of the soils are presented in Table 2. The sand, silt and clay contents varied from 760-880 mg/kg, 20-60 mg/kg and 67-180 mg/kg respectively. The major soil texture encountered was sandy loam which constituted 95% of the soils investigated. The sand fraction was higher than silt and clay fractions respectively in all the investigated soils, thus it can be inferred that the relatively high sand fraction would favors leaching and the creation of acidic condition. Soils were strongly acidic to slightly alkaline (pH 5.44 to 7.41) as shown in Table 3. The high acidity of soils has been ascribed to intense base leaching by high tropical rainfall [25]. Low pH values less than 5.50 indicate that the soils may suffer from aluminum toxicity. It has been reported that aluminum toxicity occur in
soils with pH values less than 5.50 and increases in intensity as the pH decreases below 5.0 [26,27]. Mean values for Soil organic carbon in the different locations ranged from low (3.99 g/kg) at Parry road to very high (56.7 g/kg) at Apomu. Mean values of organic carbon was above the critical limit (10-14 g/kg) for all the locations except for Parry road (3.99 g/kg) [28]. Total nitrogen ranged from 0.42 g/kg (low) in soils from Parry road to 3.28 g/kg (very high) in Ikoyi soils. Except for parry road, all other locations had mean values above the critical limit (1.2-1.6 g/kg) [28]. Mean values for available P ranged from 5.06 mg/kg (low) in Parry road to 27.82 mg/kg (high) in Ikenne. Except for soils from Tech road (20% of the soils) with available P values below the critical level mean values for available P were above the critical limit (10-15 mg/kg) for P- Bray P-1 in all locations [29]. Mean values for exchangeable Calcium (Ca) ranged from 1.98 cmol/kg (low) at Parry road to 19.34 cmol/kg (high) at Ikenne. Only Parry road soils had mean values below the critical limit for Ca (5-10 cmol/kg) reported by [30], Mg values below the critical range (1.5-3 cmol/kg) reported by [30], were observed at Parry road and Ikoyi. Mean values of exchangeable potassium (K) ranged from 0.05 cmol/kg at Parry road, Ikenne and Ilisanto 0.17 cmol/kg at Tech road. 80% of the soils had K values below the critical range for K (0.3-0.6 cmol/kg) reported by [30], suggesting that there will be response to application of K fertilizer in these soils. Mean values for exchangeable Sodium (Na) ranged from 0.1-0.4 cmol/kg. 60% of the soils had values for Na below the critical range (0.3- 0.4 cmol/kg) reported by [30]. ECEC ranged from 3.3 cmol/kg in Parry road to 20.83 cmol/kg at Ikenne. With exception of Apomu (16.83 cmol/kg) and Ikenne (20.83 cmol/kg) all other locations (80% of the studied soils) had mean ECEC values less than 16 cmol/kg suggesting that they are predominantly kaolinitic 1:1 clay (low activity clay) [26]. % Base saturation ranged from 79% at Parry road to 99% at Ikenne. Mean values of Organic carbon, Nitrogen and Phosphorus in the soils are above critical limit [28], suggesting good fertility status of the various locations. Mean values of less than 16 cmol/kg ECEC in some of the soils suggests that they are dominantly of low activity clay [26].
Table 3: Some chemical properties of the soils studied.
Location Depth (Cm) pH
Org. C (g/kg)
TN (g/kg)
Avail. P
(mg/kg)
Ca (cmol/
kg)
Mg (cmol/
kg)
K (cmol/
kg)
Na (cmol/
kg)
EA (cmol/
kg)
ECEC (cmol/
kg)
BS %
Fe mg/kg
Cu mg/kg
Mn mg/kg
Parry road0-15 5.91 3.99 0.42 12.25 2.22 0.58 0.05 0.11 0.4 3.36 88 301 4.68 11.3
15-30 6.09 12.37 1.12 5.06 1.98 0.47 0.05 0.1 0.7 3.3 79 275 3.44 5.4
Tech. road0-15 6.27 33.52 1.06 5.46 9.91 2.07 0.17 0.19 0.3 12.64 96 498 4.99 21.4
15-30 6.95 18.75 2.16 7.06 6.48 2.02 0.14 0.1 0.3 9.05 97 487 5.22 23.9
Apomu0-15 6.51 13.17 1.91 92.25 8.86 1.94 0.07 0.43 0.4 11.7 97 610 7.09 19.9
15-30 6.68 24.74 1.82 63.76 6.9 1.18 0.07 0.29 0.6 9.04 93 633 7.25 27.6
Ikoyi0-15 7.29 23.54 1.04 12.51 5.66 1.28 0.12 0.31 0.3 7.67 96 295 6.29 12.7
15-30 7.02 33.52 3.28 11.18 6.7 1.38 0.16 0.3 0.6 9.14 93 518 5.81 22.9
How to cite this article: Thomas EY, Omueti J, Bandele B. Potassium Fixing Capacities of Some Selected Soils in South Western Nigeria. Agri Res & Tech: Open Access J. 2016; 2(1): 555577. DOI: 10.19080/ARTOAJ.2016.01.5555770010
Agricultural Research & Technology: Open Access Journal
Ilishan0-15 7.30 31.12 2.21 16.77 10.01 1.98 0.07 0.11 0.6 12.77 95 565 6.7 30.7
15-30 7.41 18 2.75 18.9 10.29 1.33 0.04 0.13 0.7 12.49 94 593 7.16 25.2
Ikenne0-15 6.50 5.59 1.46 13.84 5.56 3.99 0.06 0.15 0.7 10.46 93 563 6.98 19.2
15-30 5.44 25.14 1.79 27.82 19.34 0.81 0.11 0.27 0.3 20.83 99 702 6.44 21.6
Org.C: Organic carbon; TN: Total nitrogen; Avail. P: Available phosphorus; EA: Exchangeable acidity
Fixation capacity
Tables 4-9 show the proportion of K fixed in the different soils. Mean proportion of K fixed ranged from 0.02 cmol/kg in Ikoyi (15-30 cm) to I.72 cmol/kg in Apomu (0-15cm). Mean K fixation capacity ranged from 0.16-1.71, 0.03-1.63, 0.06-1.72, 0.09-1.28, 0.02-1.02 and 0.06-1.21 cmol/kg in Parry road, Tech. road, Apomu, Ikoyi, IIisan and Ikenne respectively. K fixation was best at 1.80 cmol/kg added K in all the soils and soils showed releasing properties at lower concentrations of added K. Variation in K fixation capacity has been reported to depend on the type of clay mineral and its charge density, degree of interlaying, moisture content, concentration of K ions as well
as concentration of competing cations and pH of the ambient solution bathing the clay or soil [3].
Parry road
Soils from Parry road (15-30 cm) showed releasing properties at 0.11, 0.22, 0.45 and 0.9 cmol/kg of added K. There was no fixation at 0.11, 0.22, and 0.45 cmol/kg application rates respectively. Mean K fixation varied as 0.41 and 1.33 cmol/kg at 0.9 and 1.8 cmol/kg respectively. Parry road (15-30 cm) soils showed releasing properties at 0.11 and 0.22 cmol/kg added K. Mean K fixation varied as 0.16, 0.28, 1.48, 1.00, and 1.71 cmol/kg at 0.11, 0.22, 0.45, 0.9 and 1.8 cmol/kg application rates respectively (Table 4).
Table 4: Amounts of potassium fixed by soils from Parry road following incubation for 1, 10 and 42 days of incubation.
K added (cmol/kg) Incubation time (Days)
(0 - 15 cm) K (15-30 cm) K
Recovered (cmol/kg) Fixed (cmol/kg) Recovered (cmol/kg) Fixed (cmol/kg)
0.00
1 0.08- 0.05-
10 0.14- 2.11 -
42 0.05- 0.02-
Mean 0.09 - 0.72 -
0.11
1 0.27 -0.08 0.24 -0.08
10 0.72 -0.47 1.65 0.57
42 1.00 -0.84 0.14 -0.01
Mean 0.66 - 0.68 0.16
0.22
1 0.46 -0.16 0.46 -0.19
10 1.00 -0.64 1.35 0.98
42 0.25 0.02 0.18 0.06
Mean 0.57 - 0.66 0.28
0.45
1 0.43 0.10 0.49 2.07
10 1.37 -0.78 0.48 2.08
42 0.21 0.29 0.17 0.30
Mean 0.67 - 0.38 1.48
0.90
1 0.46 0.52 0.61 0.34
10 1.06 -0.02 1.14 1.87
42 0.21 0.74 0.13 0.79
Mean 0.58 0.41 0.63 1.00
1.80
1 0.95 0.93 0.66 1.25
10 0.70 1.24 1.29 2.62
42 0.08 1.77 0.12 1.70
Mean 0.58 1.33 0.69 1.71
How to cite this article: Thomas EY, Omueti J, Bandele B. Potassium Fixing Capacities of Some Selected Soils in South Western Nigeria. Agri Res & Tech: Open Access J. 2016; 2(1): 555577. DOI: 10.19080/ARTOAJ.2016.01.5555770011
Agricultural Research & Technology: Open Access Journal
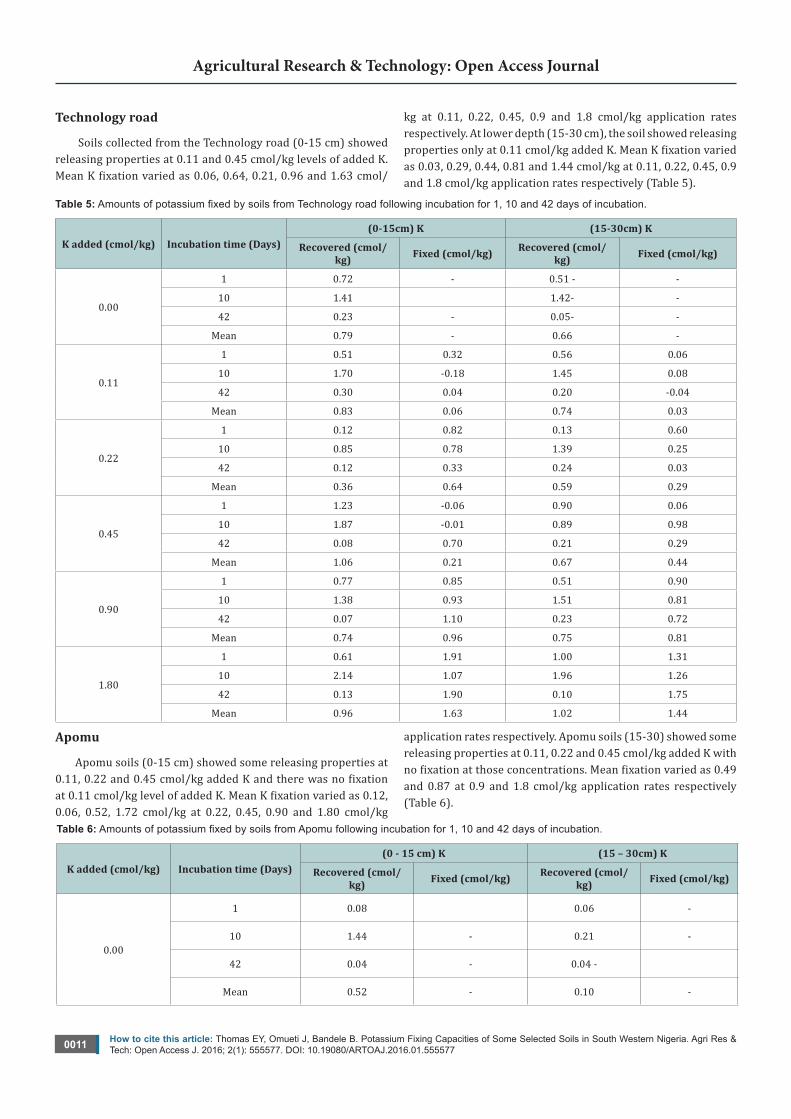
Technology road
Soils collected from the Technology road (0-15 cm) showed releasing properties at 0.11 and 0.45 cmol/kg levels of added K. Mean K fixation varied as 0.06, 0.64, 0.21, 0.96 and 1.63 cmol/
kg at 0.11, 0.22, 0.45, 0.9 and 1.8 cmol/kg application rates respectively. At lower depth (15-30 cm), the soil showed releasing properties only at 0.11 cmol/kg added K. Mean K fixation varied as 0.03, 0.29, 0.44, 0.81 and 1.44 cmol/kg at 0.11, 0.22, 0.45, 0.9 and 1.8 cmol/kg application rates respectively (Table 5).
Table 5: Amounts of potassium fixed by soils from Technology road following incubation for 1, 10 and 42 days of incubation.
K added (cmol/kg) Incubation time (Days)(0-15cm) K (15-30cm) K
Recovered (cmol/kg) Fixed (cmol/kg) Recovered (cmol/
kg) Fixed (cmol/kg)
0.00
1 0.72 - 0.51 - -
10 1.41 1.42- -
42 0.23 - 0.05- -
Mean 0.79 - 0.66 -
0.11
1 0.51 0.32 0.56 0.06
10 1.70 -0.18 1.45 0.08
42 0.30 0.04 0.20 -0.04
Mean 0.83 0.06 0.74 0.03
0.22
1 0.12 0.82 0.13 0.60
10 0.85 0.78 1.39 0.25
42 0.12 0.33 0.24 0.03
Mean 0.36 0.64 0.59 0.29
0.45
1 1.23 -0.06 0.90 0.06
10 1.87 -0.01 0.89 0.98
42 0.08 0.70 0.21 0.29
Mean 1.06 0.21 0.67 0.44
0.90
1 0.77 0.85 0.51 0.90
10 1.38 0.93 1.51 0.81
42 0.07 1.10 0.23 0.72
Mean 0.74 0.96 0.75 0.81
1.80
1 0.61 1.91 1.00 1.31
10 2.14 1.07 1.96 1.26
42 0.13 1.90 0.10 1.75
Mean 0.96 1.63 1.02 1.44
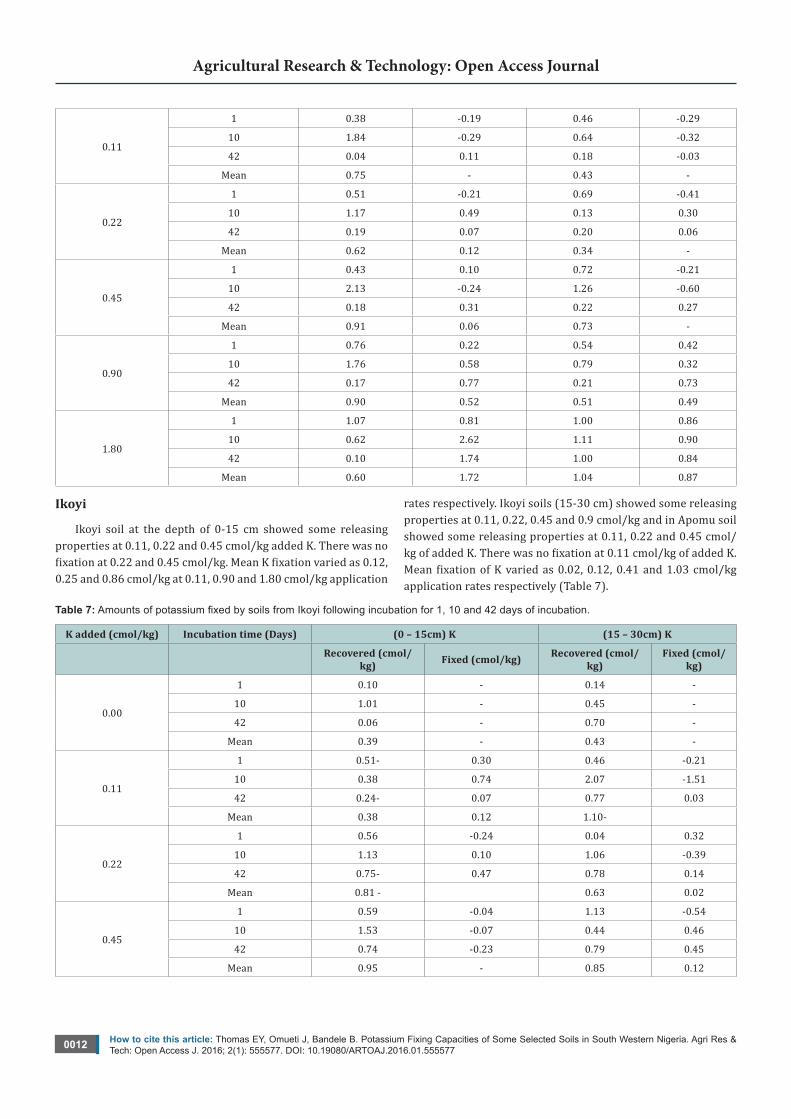
Apomu
Apomu soils (0-15 cm) showed some releasing properties at 0.11, 0.22 and 0.45 cmol/kg added K and there was no fixation at 0.11 cmol/kg level of added K. Mean K fixation varied as 0.12, 0.06, 0.52, 1.72 cmol/kg at 0.22, 0.45, 0.90 and 1.80 cmol/kg
application rates respectively. Apomu soils (15-30) showed some releasing properties at 0.11, 0.22 and 0.45 cmol/kg added K with no fixation at those concentrations. Mean fixation varied as 0.49 and 0.87 at 0.9 and 1.8 cmol/kg application rates respectively (Table 6).
Table 6: Amounts of potassium fixed by soils from Apomu following incubation for 1, 10 and 42 days of incubation.
K added (cmol/kg) Incubation time (Days)(0 - 15 cm) K (15 – 30cm) K
Recovered (cmol/kg) Fixed (cmol/kg) Recovered (cmol/
kg) Fixed (cmol/kg)
0.00
1 0.08 0.06 -
10 1.44 - 0.21 -
42 0.04 - 0.04 -
Mean 0.52 - 0.10 -
How to cite this article: Thomas EY, Omueti J, Bandele B. Potassium Fixing Capacities of Some Selected Soils in South Western Nigeria. Agri Res & Tech: Open Access J. 2016; 2(1): 555577. DOI: 10.19080/ARTOAJ.2016.01.5555770012
Agricultural Research & Technology: Open Access Journal
0.11
1 0.38 -0.19 0.46 -0.29
10 1.84 -0.29 0.64 -0.32
42 0.04 0.11 0.18 -0.03
Mean 0.75 - 0.43 -
0.22
1 0.51 -0.21 0.69 -0.41
10 1.17 0.49 0.13 0.30
42 0.19 0.07 0.20 0.06
Mean 0.62 0.12 0.34 -
0.45
1 0.43 0.10 0.72 -0.21
10 2.13 -0.24 1.26 -0.60
42 0.18 0.31 0.22 0.27
Mean 0.91 0.06 0.73 -
0.90
1 0.76 0.22 0.54 0.42
10 1.76 0.58 0.79 0.32
42 0.17 0.77 0.21 0.73
Mean 0.90 0.52 0.51 0.49
1.80
1 1.07 0.81 1.00 0.86
10 0.62 2.62 1.11 0.90
42 0.10 1.74 1.00 0.84
Mean 0.60 1.72 1.04 0.87
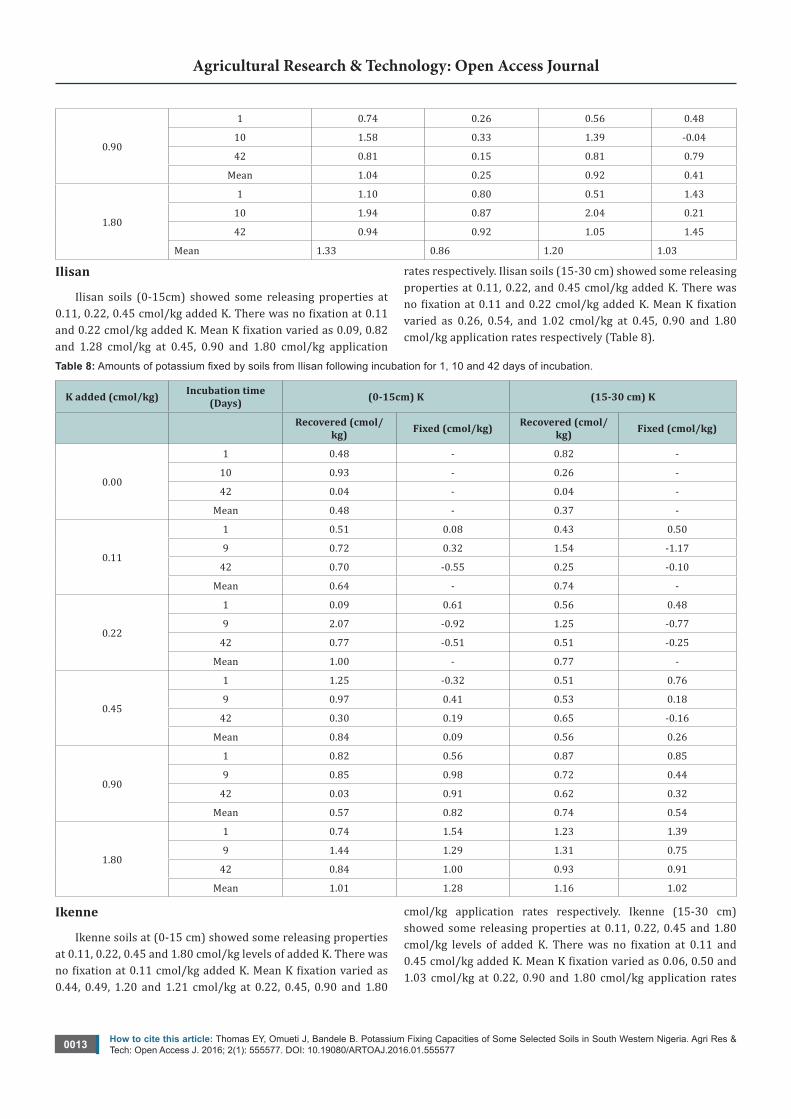
Ikoyi
Ikoyi soil at the depth of 0-15 cm showed some releasing properties at 0.11, 0.22 and 0.45 cmol/kg added K. There was no fixation at 0.22 and 0.45 cmol/kg. Mean K fixation varied as 0.12, 0.25 and 0.86 cmol/kg at 0.11, 0.90 and 1.80 cmol/kg application
rates respectively. Ikoyi soils (15-30 cm) showed some releasing properties at 0.11, 0.22, 0.45 and 0.9 cmol/kg and in Apomu soil showed some releasing properties at 0.11, 0.22 and 0.45 cmol/kg of added K. There was no fixation at 0.11 cmol/kg of added K. Mean fixation of K varied as 0.02, 0.12, 0.41 and 1.03 cmol/kg application rates respectively (Table 7).
Table 7: Amounts of potassium fixed by soils from Ikoyi following incubation for 1, 10 and 42 days of incubation.
K added (cmol/kg) Incubation time (Days) (0 – 15cm) K (15 – 30cm) K
Recovered (cmol/kg) Fixed (cmol/kg) Recovered (cmol/
kg)Fixed (cmol/
kg)
0.00
1 0.10 - 0.14 -
10 1.01 - 0.45 -
42 0.06 - 0.70 -
Mean 0.39 - 0.43 -
0.11
1 0.51- 0.30 0.46 -0.21
10 0.38 0.74 2.07 -1.51
42 0.24- 0.07 0.77 0.03
Mean 0.38 0.12 1.10-
0.22
1 0.56 -0.24 0.04 0.32
10 1.13 0.10 1.06 -0.39
42 0.75- 0.47 0.78 0.14
Mean 0.81 - 0.63 0.02
0.45
1 0.59 -0.04 1.13 -0.54
10 1.53 -0.07 0.44 0.46
42 0.74 -0.23 0.79 0.45
Mean 0.95 - 0.85 0.12
How to cite this article: Thomas EY, Omueti J, Bandele B. Potassium Fixing Capacities of Some Selected Soils in South Western Nigeria. Agri Res & Tech: Open Access J. 2016; 2(1): 555577. DOI: 10.19080/ARTOAJ.2016.01.5555770013
Agricultural Research & Technology: Open Access Journal
0.90
1 0.74 0.26 0.56 0.48
10 1.58 0.33 1.39 -0.04
42 0.81 0.15 0.81 0.79
Mean 1.04 0.25 0.92 0.41
1.80
1 1.10 0.80 0.51 1.43
10 1.94 0.87 2.04 0.21
42 0.94 0.92 1.05 1.45
Mean 1.33 0.86 1.20 1.03
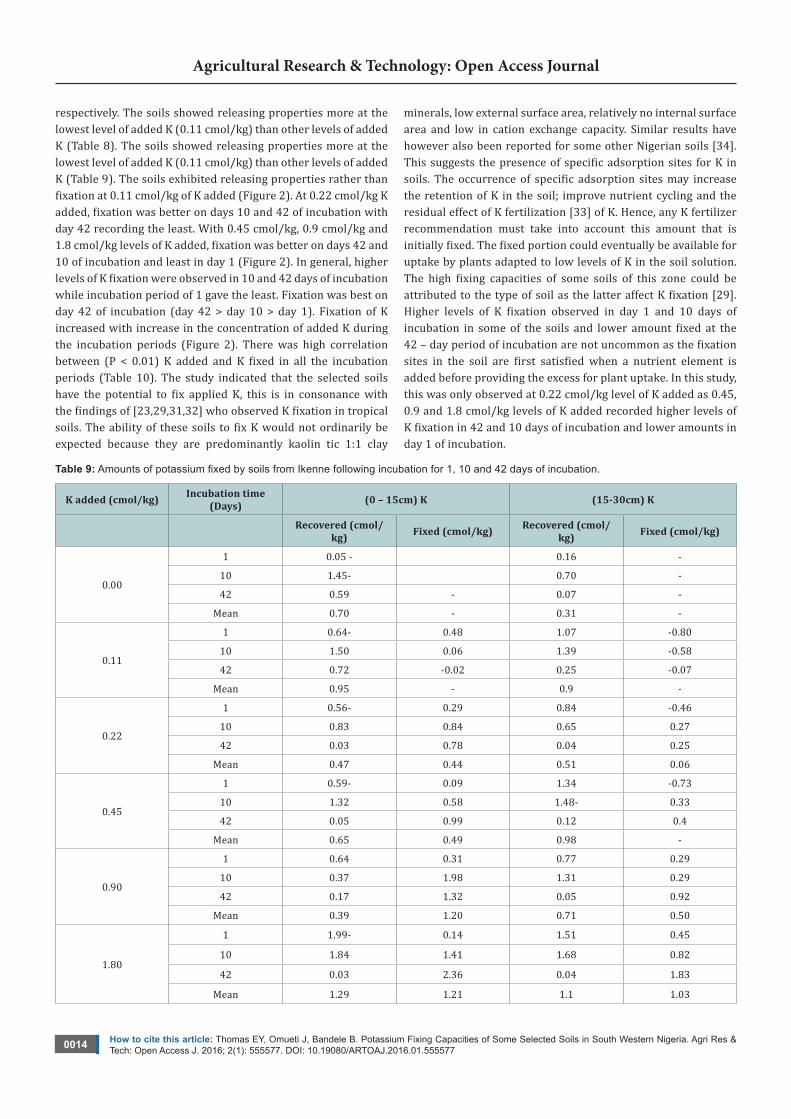
Ilisan
Ilisan soils (0-15cm) showed some releasing properties at 0.11, 0.22, 0.45 cmol/kg added K. There was no fixation at 0.11 and 0.22 cmol/kg added K. Mean K fixation varied as 0.09, 0.82 and 1.28 cmol/kg at 0.45, 0.90 and 1.80 cmol/kg application
rates respectively. Ilisan soils (15-30 cm) showed some releasing properties at 0.11, 0.22, and 0.45 cmol/kg added K. There was no fixation at 0.11 and 0.22 cmol/kg added K. Mean K fixation varied as 0.26, 0.54, and 1.02 cmol/kg at 0.45, 0.90 and 1.80 cmol/kg application rates respectively (Table 8).
Table 8: Amounts of potassium fixed by soils from Ilisan following incubation for 1, 10 and 42 days of incubation.
K added (cmol/kg) Incubation time (Days) (0-15cm) K (15-30 cm) K
Recovered (cmol/kg) Fixed (cmol/kg) Recovered (cmol/
kg) Fixed (cmol/kg)
0.00
1 0.48 - 0.82 -
10 0.93 - 0.26 -
42 0.04 - 0.04 -
Mean 0.48 - 0.37 -
0.11
1 0.51 0.08 0.43 0.50
9 0.72 0.32 1.54 -1.17
42 0.70 -0.55 0.25 -0.10
Mean 0.64 - 0.74 -
0.22
1 0.09 0.61 0.56 0.48
9 2.07 -0.92 1.25 -0.77
42 0.77 -0.51 0.51 -0.25
Mean 1.00 - 0.77 -
0.45
1 1.25 -0.32 0.51 0.76
9 0.97 0.41 0.53 0.18
42 0.30 0.19 0.65 -0.16
Mean 0.84 0.09 0.56 0.26
0.90
1 0.82 0.56 0.87 0.85
9 0.85 0.98 0.72 0.44
42 0.03 0.91 0.62 0.32
Mean 0.57 0.82 0.74 0.54
1.80
1 0.74 1.54 1.23 1.39
9 1.44 1.29 1.31 0.75
42 0.84 1.00 0.93 0.91
Mean 1.01 1.28 1.16 1.02
Ikenne
Ikenne soils at (0-15 cm) showed some releasing properties at 0.11, 0.22, 0.45 and 1.80 cmol/kg levels of added K. There was no fixation at 0.11 cmol/kg added K. Mean K fixation varied as 0.44, 0.49, 1.20 and 1.21 cmol/kg at 0.22, 0.45, 0.90 and 1.80
cmol/kg application rates respectively. Ikenne (15-30 cm) showed some releasing properties at 0.11, 0.22, 0.45 and 1.80 cmol/kg levels of added K. There was no fixation at 0.11 and 0.45 cmol/kg added K. Mean K fixation varied as 0.06, 0.50 and 1.03 cmol/kg at 0.22, 0.90 and 1.80 cmol/kg application rates
How to cite this article: Thomas EY, Omueti J, Bandele B. Potassium Fixing Capacities of Some Selected Soils in South Western Nigeria. Agri Res & Tech: Open Access J. 2016; 2(1): 555577. DOI: 10.19080/ARTOAJ.2016.01.5555770014
Agricultural Research & Technology: Open Access Journal
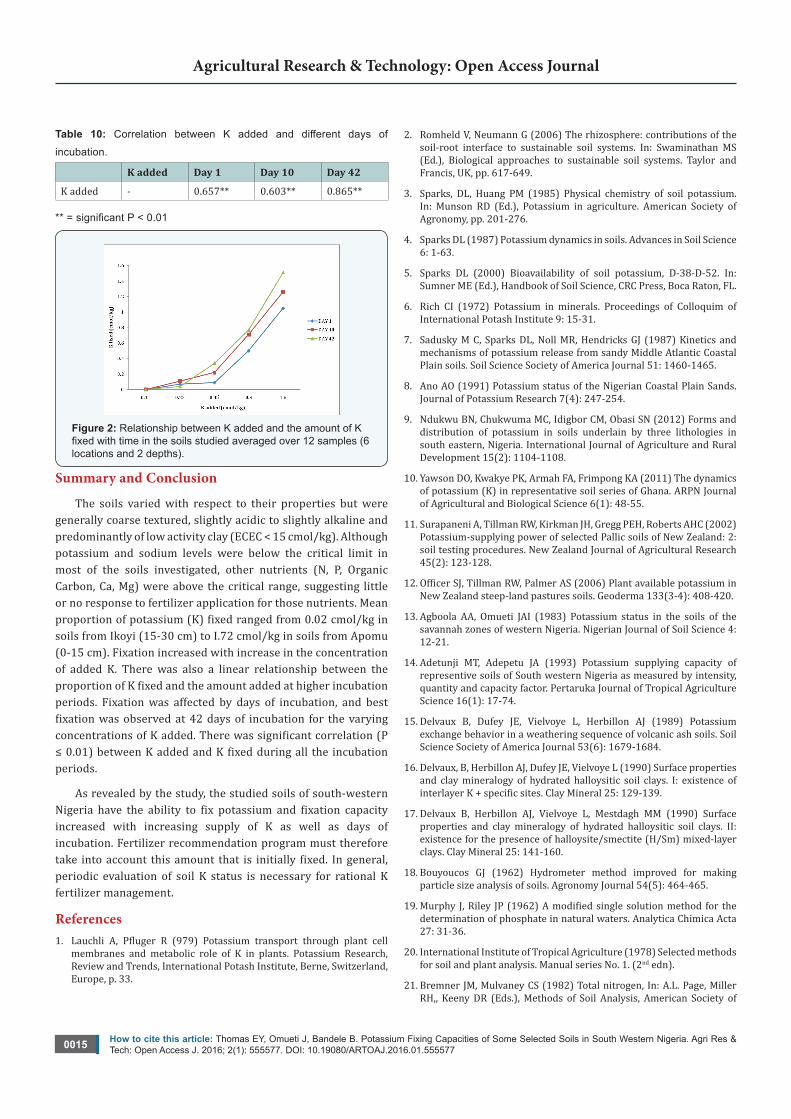
respectively. The soils showed releasing properties more at the lowest level of added K (0.11 cmol/kg) than other levels of added K (Table 8). The soils showed releasing properties more at the lowest level of added K (0.11 cmol/kg) than other levels of added K (Table 9). The soils exhibited releasing properties rather than fixation at 0.11 cmol/kg of K added (Figure 2). At 0.22 cmol/kg K added, fixation was better on days 10 and 42 of incubation with day 42 recording the least. With 0.45 cmol/kg, 0.9 cmol/kg and 1.8 cmol/kg levels of K added, fixation was better on days 42 and 10 of incubation and least in day 1 (Figure 2). In general, higher levels of K fixation were observed in 10 and 42 days of incubation while incubation period of 1 gave the least. Fixation was best on day 42 of incubation (day 42 > day 10 > day 1). Fixation of K increased with increase in the concentration of added K during the incubation periods (Figure 2). There was high correlation between (P < 0.01) K added and K fixed in all the incubation periods (Table 10). The study indicated that the selected soils have the potential to fix applied K, this is in consonance with the findings of [23,29,31,32] who observed K fixation in tropical soils. The ability of these soils to fix K would not ordinarily be expected because they are predominantly kaolin tic 1:1 clay
minerals, low external surface area, relatively no internal surface area and low in cation exchange capacity. Similar results have however also been reported for some other Nigerian soils [34]. This suggests the presence of specific adsorption sites for K in soils. The occurrence of specific adsorption sites may increase the retention of K in the soil; improve nutrient cycling and the residual effect of K fertilization [33] of K. Hence, any K fertilizer recommendation must take into account this amount that is initially fixed. The fixed portion could eventually be available for uptake by plants adapted to low levels of K in the soil solution. The high fixing capacities of some soils of this zone could be attributed to the type of soil as the latter affect K fixation [29]. Higher levels of K fixation observed in day 1 and 10 days of incubation in some of the soils and lower amount fixed at the 42 – day period of incubation are not uncommon as the fixation sites in the soil are first satisfied when a nutrient element is added before providing the excess for plant uptake. In this study, this was only observed at 0.22 cmol/kg level of K added as 0.45, 0.9 and 1.8 cmol/kg levels of K added recorded higher levels of K fixation in 42 and 10 days of incubation and lower amounts in day 1 of incubation.
Table 9: Amounts of potassium fixed by soils from Ikenne following incubation for 1, 10 and 42 days of incubation.
K added (cmol/kg) Incubation time (Days) (0 – 15cm) K (15-30cm) K
Recovered (cmol/kg) Fixed (cmol/kg) Recovered (cmol/
kg) Fixed (cmol/kg)
0.00
1 0.05 - 0.16 -
10 1.45- 0.70 -
42 0.59 - 0.07 -
Mean 0.70 - 0.31 -
0.11
1 0.64- 0.48 1.07 -0.80
10 1.50 0.06 1.39 -0.58
42 0.72 -0.02 0.25 -0.07
Mean 0.95 - 0.9 -
0.22
1 0.56- 0.29 0.84 -0.46
10 0.83 0.84 0.65 0.27
42 0.03 0.78 0.04 0.25
Mean 0.47 0.44 0.51 0.06
0.45
1 0.59- 0.09 1.34 -0.73
10 1.32 0.58 1.48- 0.33
42 0.05 0.99 0.12 0.4
Mean 0.65 0.49 0.98 -
0.90
1 0.64 0.31 0.77 0.29
10 0.37 1.98 1.31 0.29
42 0.17 1.32 0.05 0.92
Mean 0.39 1.20 0.71 0.50
1.80
1 1.99- 0.14 1.51 0.45
10 1.84 1.41 1.68 0.82
42 0.03 2.36 0.04 1.83
Mean 1.29 1.21 1.1 1.03
How to cite this article: Thomas EY, Omueti J, Bandele B. Potassium Fixing Capacities of Some Selected Soils in South Western Nigeria. Agri Res & Tech: Open Access J. 2016; 2(1): 555577. DOI: 10.19080/ARTOAJ.2016.01.5555770015
Agricultural Research & Technology: Open Access Journal
Table 10: Correlation between K added and different days of incubation.
K added Day 1 Day 10 Day 42
K added - 0.657** 0.603** 0.865**
** = significant P < 0.01
Figure 2: Relationship between K added and the amount of K fixed with time in the soils studied averaged over 12 samples (6 locations and 2 depths).
Summary and Conclusion
The soils varied with respect to their properties but were generally coarse textured, slightly acidic to slightly alkaline and predominantly of low activity clay (ECEC < 15 cmol/kg). Although potassium and sodium levels were below the critical limit in most of the soils investigated, other nutrients (N, P, Organic Carbon, Ca, Mg) were above the critical range, suggesting little or no response to fertilizer application for those nutrients. Mean proportion of potassium (K) fixed ranged from 0.02 cmol/kg in soils from Ikoyi (15-30 cm) to I.72 cmol/kg in soils from Apomu (0-15 cm). Fixation increased with increase in the concentration of added K. There was also a linear relationship between the proportion of K fixed and the amount added at higher incubation periods. Fixation was affected by days of incubation, and best fixation was observed at 42 days of incubation for the varying concentrations of K added. There was significant correlation (P ≤ 0.01) between K added and K fixed during all the incubation periods.
As revealed by the study, the studied soils of south-western Nigeria have the ability to fix potassium and fixation capacity increased with increasing supply of K as well as days of incubation. Fertilizer recommendation program must therefore take into account this amount that is initially fixed. In general, periodic evaluation of soil K status is necessary for rational K fertilizer management.
References1. Lauchli A, Pfluger R (979) Potassium transport through plant cell
membranes and metabolic role of K in plants. Potassium Research, Review and Trends, International Potash Institute, Berne, Switzerland, Europe, p. 33.
2. Romheld V, Neumann G (2006) The rhizosphere: contributions of the soil-root interface to sustainable soil systems. In: Swaminathan MS (Ed.), Biological approaches to sustainable soil systems. Taylor and Francis, UK, pp. 617-649.
3. Sparks, DL, Huang PM (1985) Physical chemistry of soil potassium. In: Munson RD (Ed.), Potassium in agriculture. American Society of Agronomy, pp. 201-276.
4. Sparks DL (1987) Potassium dynamics in soils. Advances in Soil Science 6: 1-63.
5. Sparks DL (2000) Bioavailability of soil potassium, D-38-D-52. In: Sumner ME (Ed.), Handbook of Soil Science, CRC Press, Boca Raton, FL.
6. Rich CI (1972) Potassium in minerals. Proceedings of Colloquim of International Potash Institute 9: 15-31.
7. Sadusky M C, Sparks DL, Noll MR, Hendricks GJ (1987) Kinetics and mechanisms of potassium release from sandy Middle Atlantic Coastal Plain soils. Soil Science Society of America Journal 51: 1460-1465.
8. Ano AO (1991) Potassium status of the Nigerian Coastal Plain Sands. Journal of Potassium Research 7(4): 247-254.
9. Ndukwu BN, Chukwuma MC, Idigbor CM, Obasi SN (2012) Forms and distribution of potassium in soils underlain by three lithologies in south eastern, Nigeria. International Journal of Agriculture and Rural Development 15(2): 1104-1108.
10. Yawson DO, Kwakye PK, Armah FA, Frimpong KA (2011) The dynamics of potassium (K) in representative soil series of Ghana. ARPN Journal of Agricultural and Biological Science 6(1): 48-55.
11. Surapaneni A, Tillman RW, Kirkman JH, Gregg PEH, Roberts AHC (2002) Potassium-supplying power of selected Pallic soils of New Zealand: 2: soil testing procedures. New Zealand Journal of Agricultural Research 45(2): 123-128.
12. Officer SJ, Tillman RW, Palmer AS (2006) Plant available potassium in New Zealand steep-land pastures soils. Geoderma 133(3-4): 408-420.
13. Agboola AA, Omueti JAI (1983) Potassium status in the soils of the savannah zones of western Nigeria. Nigerian Journal of Soil Science 4: 12-21.
14. Adetunji MT, Adepetu JA (1993) Potassium supplying capacity of representive soils of South western Nigeria as measured by intensity, quantity and capacity factor. Pertaruka Journal of Tropical Agriculture Science 16(1): 17-74.
15. Delvaux B, Dufey JE, Vielvoye L, Herbillon AJ (1989) Potassium exchange behavior in a weathering sequence of volcanic ash soils. Soil Science Society of America Journal 53(6): 1679-1684.
16. Delvaux, B, Herbillon AJ, Dufey JE, Vielvoye L (1990) Surface properties and clay mineralogy of hydrated halloysitic soil clays. I: existence of interlayer K + specific sites. Clay Mineral 25: 129-139.
17. Delvaux B, Herbillon AJ, Vielvoye L, Mestdagh MM (1990) Surface properties and clay mineralogy of hydrated halloysitic soil clays. II: existence for the presence of halloysite/smectite (H/Sm) mixed-layer clays. Clay Mineral 25: 141-160.
18. Bouyoucos GJ (1962) Hydrometer method improved for making particle size analysis of soils. Agronomy Journal 54(5): 464-465.
19. Murphy J, Riley JP (1962) A modified single solution method for the determination of phosphate in natural waters. Analytica Chimica Acta 27: 31-36.
20. International Institute of Tropical Agriculture (1978) Selected methods for soil and plant analysis. Manual series No. 1. (2nd edn).
21. Bremner JM, Mulvaney CS (1982) Total nitrogen, In: A.L. Page, Miller RH,, Keeny DR (Eds.), Methods of Soil Analysis, American Society of
How to cite this article: Thomas EY, Omueti J, Bandele B. Potassium Fixing Capacities of Some Selected Soils in South Western Nigeria. Agri Res & Tech: Open Access J. 2016; 2(1): 555577. DOI: 10.19080/ARTOAJ.2016.01.5555770016
Agricultural Research & Technology: Open Access Journal
Agronomy and Soil Science Society of America, Madison, pp. 1119-1123
22. Hunter AH (1975) Laboratory and greenhouse technique for nutrient survey to determine the soil amendments required for optimum plant growth. Soil fertility Evaluation Imp. Project N.C. State University Raleigh, N.C, USA.
23. Ayarza, MA (1988) Potassium dynamics in a humid tropical pasture in the Peruvian amazon. Ph. D Thesis, North Carolina State University, Raleigh, N.C, USA, pp. 156.
24. Buysse W, Stern R, Coe R, Crispin M (2004) Genstat Discovery Edition for everyday use. ICRAF Nairobi, Kenya, pp. 117.
25. Enwezor WO, Ohiri A C, Opowaribo EE, Udo EJ (1990) A review of soil fertilizer use for crops in South eastern Nigeria (in five volumes). Produced by the Federal Ministry of Agriculture and Natural Resources Lagos, Nigeria.
26. Opara-Nadi OA, Oranekwulu SC (1988) Liming and organic matter interactions in two Nigerian ultisols. 1. Effects on soil pH, organic carbon and early growth of maize (Zea mays L.). Proceedings of the 16th Annual Conf. of the Soil Science Society of Nigeria held in Minna. Pp. 177-198.
27. White J R, Bell MJ, Marzies NW (2006) Effect of sub-soil acidity treatments on the chemical properties of a ferrosol. Proceedings of Agronomic Conference of Australia, 10th -15th September, pp. 10-15
28. Federal Fertilizer Department (FFD) (2012) In: Chude VO, et al. (Eds.), Fertilizer use and management practices for crops in Nigeria (3rd ed), Federal ministry of Agriculture and rural development, Abuja, pp. 204.
29. Adeoye GO (1986) Comparative studies of ammonium difluoride chelate extractants and some conventional extractants for sedimentary soils of Southwestern Nigeria. Ph.D. Thesis of the University of Ibadan, Nigeria. pp. 245.
30. Obigbesan GO (1981) Nutrient requirement of yams (Dioscoreaspp). Faculty of Agriculture and Forestry, University of Ibadan, Nigeria. Agric Res Bull 2(1).
31. Malavolta E (1985) Potassium status of tropical and subtropical region soils.. In R.D. Munson (ed.) Potassium in agriculture. American Society of Agronomy, Madison, WI. pp. 163-200.
32. Sanz JI (1986) Native sources of soil potassium and use of feldspars as fertilizer in the Savanah of Colombia. Ph. D. Thesis, University of Reading, England, pp. 130.
33. Ritchey KD, Souza DMG, Lobato E, Correa O (1980) Calcium leaching to increase rooting depth in Brazillian Savanna Oxisol. Agronomy Journal 72(1): 40-44.
34. Tening AS, Omueti JAI, Tarawali G (1995) Fixation of Potassium in some soils of the sub humid zone of Nigeria. Comm Soil Sci Plant Analysis 26(7&8): 1169-1177.