fixing leaks and making tweaks: - emnrd
TRANSCRIPT
FIXING LEAKS AND MAKING TWEAKS: Conserving energy at home and school
Prepared by the Energy Conservation and Management Division of the New Mexico Energy Minerals and Natural Resources Department
A teacher’s guide to teaching middle-level students energy conservation and energy efficiency in New Mexico
2
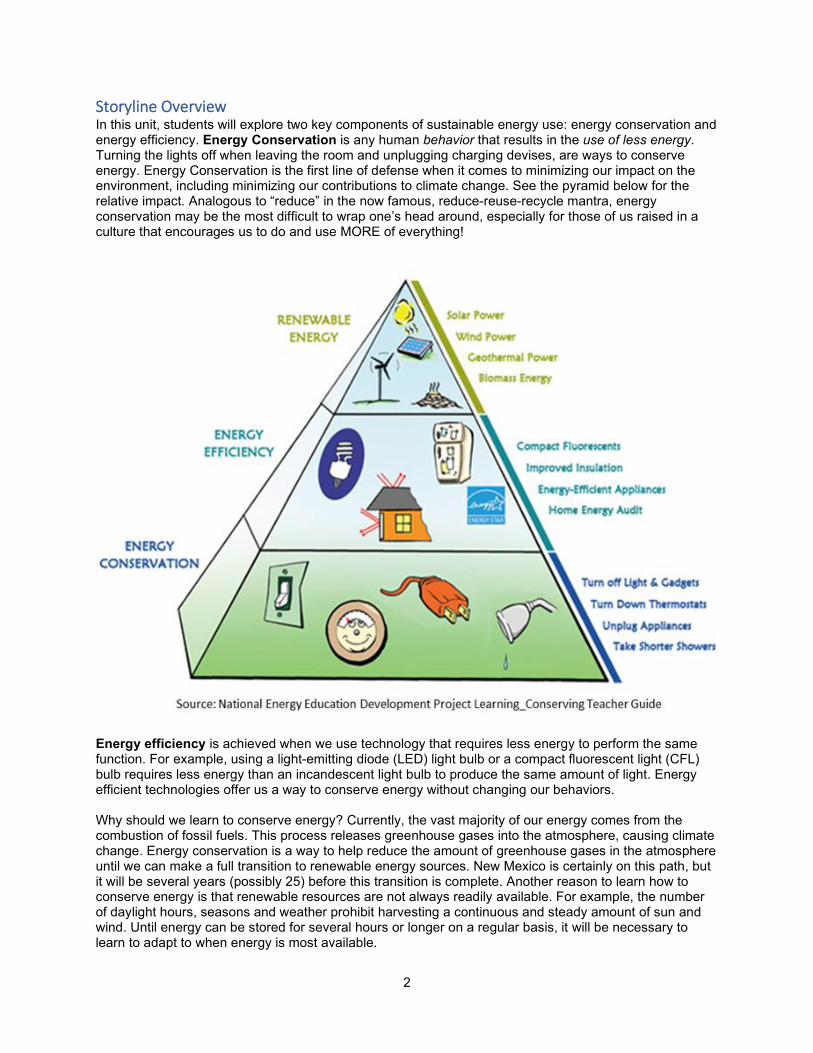
Storyline Overview In this unit, students will explore two key components of sustainable energy use: energy conservation and energy efficiency. Energy Conservation is any human behavior that results in the use of less energy. Turning the lights off when leaving the room and unplugging charging devises, are ways to conserve energy. Energy Conservation is the first line of defense when it comes to minimizing our impact on the environment, including minimizing our contributions to climate change. See the pyramid below for the relative impact. Analogous to “reduce” in the now famous, reduce-reuse-recycle mantra, energy conservation may be the most difficult to wrap one’s head around, especially for those of us raised in a culture that encourages us to do and use MORE of everything!
Energy efficiency is achieved when we use technology that requires less energy to perform the same function. For example, using a light-emitting diode (LED) light bulb or a compact fluorescent light (CFL) bulb requires less energy than an incandescent light bulb to produce the same amount of light. Energy efficient technologies offer us a way to conserve energy without changing our behaviors. Why should we learn to conserve energy? Currently, the vast majority of our energy comes from the combustion of fossil fuels. This process releases greenhouse gases into the atmosphere, causing climate change. Energy conservation is a way to help reduce the amount of greenhouse gases in the atmosphere until we can make a full transition to renewable energy sources. New Mexico is certainly on this path, but it will be several years (possibly 25) before this transition is complete. Another reason to learn how to conserve energy is that renewable resources are not always readily available. For example, the number of daylight hours, seasons and weather prohibit harvesting a continuous and steady amount of sun and wind. Until energy can be stored for several hours or longer on a regular basis, it will be necessary to learn to adapt to when energy is most available.
3
Energy conservation is a function of understanding both: 1) How much energy we use relative to what we actually need, and 2) How much energy is lost when we cannot contain it or capture it in a usable form. Of course, energy is never actually lost, but changes from one form to another. For example, a small percentage of energy emitted from an incandescent light bulb is in the form of visible light. The rest of the energy radiates from the bulb in the form of heat. Student Learning Goals This unit will empower students to conserve energy and encourage others to do the same by arming them with knowledge of their own habits and behaviors at home and at school, an understanding of how heat is transferred and contained, strategies for recognizing, fixing or mitigating building inefficiencies, and evidence of how climate change impacts energy use. Students will also learn about careers that are relevant to the activities in this unit. The theme of leaking, wasted, or unused energy is carried throughout the unit, with particular attention to how students can “see” invisible electrical and thermal energy using simple tools. Students will also learn when a behavioral change is necessary for reducing energy consumption and when it might be useful to employ an energy-saving technology. Learning Tasks Students will complete the following tasks:
• Measure, record, analyze, and observe evidence of wasted energy in homes or at school. • Distinguish between three methods of heat transfer in buildings and ways to mitigate each. • Define “variable” and identify different variables that affect energy consumption and conservation. • Use data to calculate costs associated with wasted energy (i.e., Home Energy Audit) • Develop methods of controlling variables to limit/save energy. • Conduct original research about climate change by interviewing an older family member. • Apply an understanding of wasted energy to the creation of a public service
announcement/slogan/message
Learning Standards Next Generation Science Standard MS-PS3-3. Apply scientific principles to design, construct, and test a device that either minimizes or maximizes thermal energy transfer. * [Clarification Statement: Examples of devices could include an insulated box, a solar cooker, and a Styrofoam cup.] Common Core State Standards: Mathematics, Grade 6: Ratios and Proportional Relationships: Understand ratio concepts and use ratio reasoning to solve problems. Expressions and Equations: Represent and analyze quantitative relationships between dependent and independent variables. Geometry: Solve real-world and mathematical problems involving area, surface area, and volume. National Geography Standard 4/Grade 8: The Physical and human characteristics of places. Explain how changes in climate may result in changes to places (e.g., warmer temperatures). National Geography Standard 10/Grade 8: The characteristics, distribution, and complexity of Earth’s cultural mosaics. Describe the architectural styles of residential structures in selected regions. Common Core State Standards: English/Language Arts: College and Career Readiness Anchor Standards for Reading: Integration of Knowledge and Ideas (7). Integrate and evaluate content presented in diverse formats and media, including visually and quantitatively, as well as in words.
4
Common Core State Standards: English/Language Arts: College and Career Readiness Anchor Standards for Writing: Production and Distribution of Writing (4). Produce clear and coherent writing in which the development, organization, and style are appropriate to task, purpose, and audience. Materials Preparation Teachers should double-check and view all linked sources to make sure they are accessible and familiar. Teachers may want to make copies of handouts if not delivered to students electronically. There are a few instances where students will need to build/assemble a tool for collecting data. Materials are listed in the At-a-Glance summaries. Students can be assigned to work in pairs or groups to conserve materials. In addition, students will need the following:
• A calculator and access to Microsoft Excel™ • A measuring tape or yard stick • A compass (or a smartphone with a compass)
Teachers might also want to have for demonstration:
• Weatherizing materials, such as weather stripping or caulk • Other home building materials
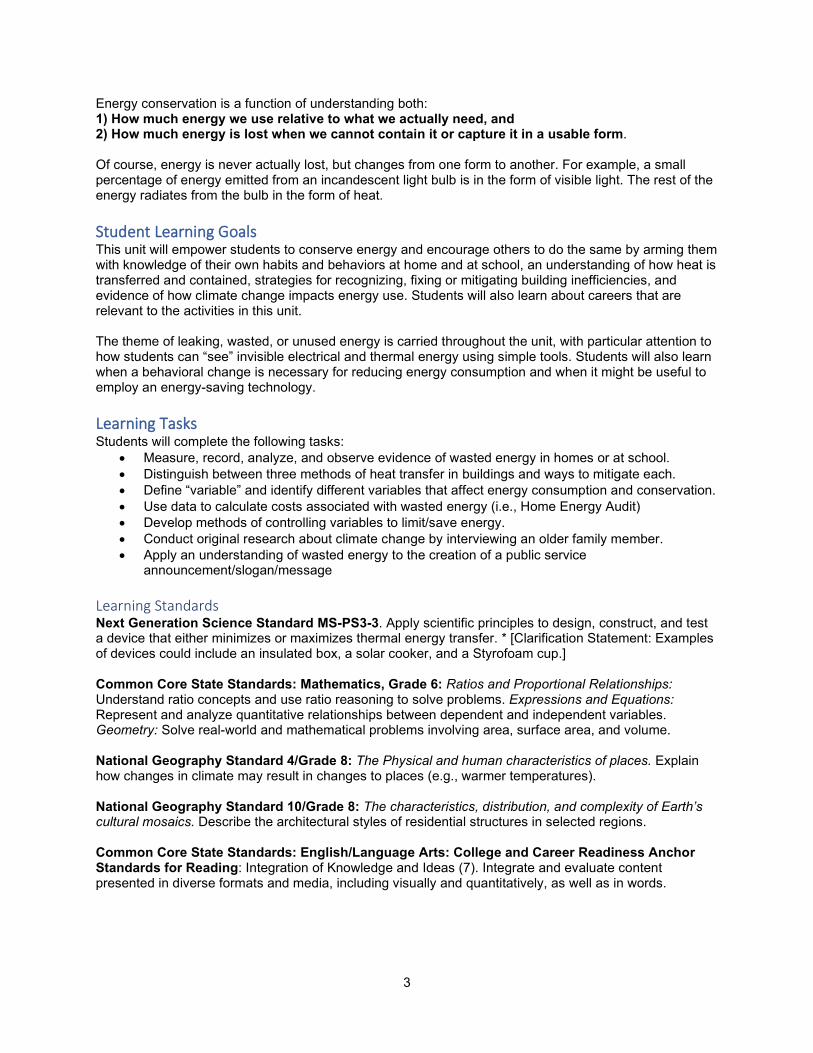
Teacher Background In part one of this unit, students will explore energy use in the form of electricity. The first lesson is intended to hook students into the Unit with an investigation of the differences in energy use pre-and during the COVID-19 outbreak. Students will be asked to look at a typical home and examine a made-up family’s energy use before turning toward their own energy consumption behaviors. In both the Home Energy Audit and School Energy Audit assignments, students will calculate both how much energy is actively used and how much “phantom” energy is wasted. That is, how many and which appliances are consuming electricity even when not on or in active use. Note: in situations where not all students have fully electrified homes, the School Energy Audit can serve as the class assignment for everyone. Part two of the is unit allows students to explore energy efficiency in buildings Students will develop an understanding of how heat is transferred and retained. In each (of #) lessons students experiment with a primary heat transfer mechanism and explore a mitigation solution. The three heat transfer mechanisms are: convection, conduction, and radiation.
1) Convection is the transfer of heat by way of a medium such as a liquid or gas (air). Warm liquid or gas will have a lower density and will rise above cooler or more dense liquid or gas.
2) Conduction of heat occurs when solid objects of different temperatures come in contact with
each other.
3) Radiation All objects radiate heat (and/or light) outward. Some objects will absorb, and therefor radiate, more heat than others.
In part three of this unit students will examine climate variation over space and change over time. Students will also examine how humans adapt to climate change. Adaptations can be behavioral or technological. In these lessons, students will be asked to conduct interviews of their family elders and apply what they learned in previous lessons to design energy efficient buildings for two different climate zones.
5
Finally, in part four of this unit, students will complete a summative assessment of their learning. This section also provides opportunities for students to extend their learning. Each of the lessons in this Unit require about 50 minutes to complete, unless a homework component is indicated, and has five parts: 1) a connection to the previous lesson and/or students’ background knowledge; 2) a preparation section which sets up the day’s investigation; 3) an investigation or experiment section; 4) a questions section that provides structure for thinking about and discussing the investigation; and 5) a summary section that also motivates the next lesson. Students should be encouraged to capture lesson summaries and vocabulary in their own words. All activity worksheets can be found at the end of this document unless otherwise noted as something students would create in their own notebooks. At-A-Glance Lesson 1.1. COVID-19 Impact on Electricity Use
Timing Activity Materials Needed 3 min. Connect to students’ prior knowledge. Note-taking guide or template 10 min. Hook 5 min Prepare to Investigate YouTube video segments, Washington Post
article or teacher-provided images 20 min Investigate electricity sales during
COVID-19 Graphs and tables of electricity sales by sector in New Mexico
5 min Questions and Discussion 5 min Summary
Lesson 1.2. Household Electricity Use
Timing Activity Materials Needed 2 min Link to previous class and set the stage 3 min Prepare to investigate Appliance tag 30 min Investigate the electricity use and
expenses of a family Household Energy Use worksheet/spreadsheet
10 min Questions and Discussion Household Energy Use worksheet/spreadsheet 5 min Summary
Lesson 1.3. Lightbulb Analysis
Lesson 1.4. Energy Audit
Timing Activity Materials Needed 3 min Link to previous class and set the stage 10 min Prepare to investigate by identifying
electricity-drawing devices and appliances
Appliance list or notebook page for identifying appliances/devices drawing electricity in the classroom
20 min Investigate classroom and/or home energy use
Energy Audit student worksheet Personal Energy Meter spreadsheet
Timing Activity Materials Needed 3 min Link to previous class and set the stage 10 min Prepare to Investigate bulb types A lamp with different bulbs would be helpful to
see any qualitative differences. 20 min Investigate lightbulb efficiencies and cost
savings Lightbulb Analysis worksheet
10 min Questions and Discussion Lightbulb Analysis worksheet 5 min Summary
6
10 min Questions and Discussion 5 min Summary
Lesson 2.1. Is this Room Drafty?
Timing Activity Materials Needed 3 min Link to previous class and set the stage 10 min Prepare to investigate: Discuss what it
means to be ‘drafty.’ Assemble draftometer.
Plastic wrap Tape Pencil or chopstick
20 min Investigate drafts Template/note-taking guide to record data 10 min Questions and Discussion Weather stripping, plastic window seal, caulk 5 min Summary
Lesson 2.2. Do we want more windows?
Timing Activity Materials Needed 3 min Link to previous class and set the stage 10 min Prepare to investigate the role of
windows and direction in heat and heat transfer
Handheld or smartphone compass NRP article about greenhouses
20 min Investigate the efficiency ratio of the room
tape measure notebook
10 min Questions and Discussion (shade, blind or curtain) 5 min Summary
Lesson 2.3. Let’s get some air in here!
Timing Activity Materials Needed 3 min Link to previous class and set the stage 10 min Prepare to investigate room
temperatures Room thermostat or handheld thermometer
20 min Investigate heating and cooling of rooms Cardboard box and flashlight 10 min Questions and Discussion 5 min Summary
Lesson 2.4. Color Matters
Activity Materials Needed 3 min Link to previous class and set the stage 10 min Prepare to investigate surfaces that feel
hot
20 min Investigate the connection between heat transfer and colors
colored construction paper scissors tape ice cubes
10 min Questions and Discussion 5 min Summary
Lesson 2.5. Building insulation
Timing Activity Materials Needed 3 min Link to previous class and set the stage 10 min Prepare to investigate building design Link to the YouTube video Sustainable
City/Fully Charged 20 min Investigate insulating properties of
different materials Electric hotplate Thermometer
7
single-pane glass 2x4 building wood 5/8” sheetrock/gypsum board 1/2” plywood 3” fiberglass insulation 4” concrete masonry unit Plastic window insulation treatment
10 min Questions and Discussion 5 min Summary
Lesson 3.1. Climate Zones
Timing Activity Materials Needed 3 min Link to previous class and set the stage Review notes 10 min Prepare to investigate variations in
climate across space Maps of New Mexico and U.S. climate zones
20 min Investigate relationship of climate to building specifications
Data table
10 min Questions and Discussion Blank/notebook paper and (colored) pencils 5 min Summary
Lesson 3.2. Adapting to a Changing Climate
Timing Activity Materials Needed 3 min Link to previous class and set the stage YouTube video from NASA on the Greenhouse
Effect 10 min Prepare to investigate variations in
climate across time Data graphs
20 min Investigate students’ family members experienced changes in climate over time
Interview Guide
10 min Questions and Discussion 5 min Summary
Lesson 4.1. Get the Word Out!
Timing Activity Materials Needed 3 min Link to previous class and set the stage 10 min Prepare to investigate notes from
previous lessons Notebook
20 min Investigate by thinking through key words and intended audience
Markers, paper and other materials for making signs
10 min Questions and Discussion 5 min Summary
8
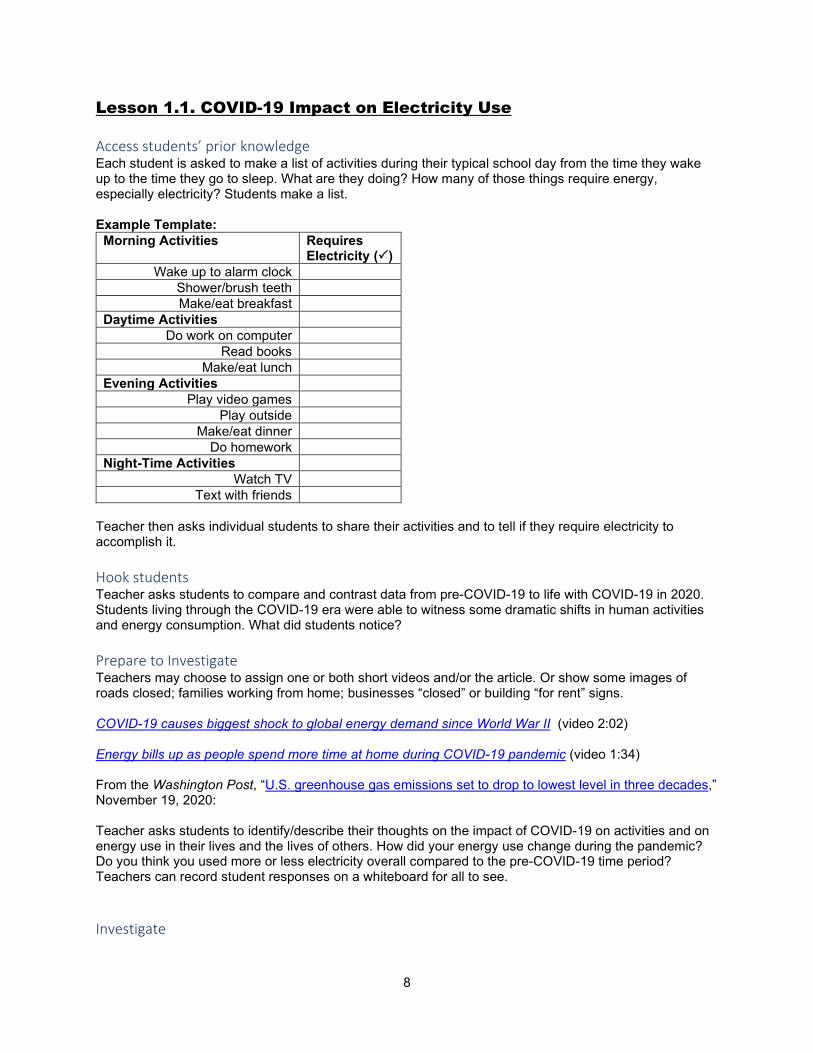
Lesson 1.1. COVID-19 Impact on Electricity Use Access students’ prior knowledge Each student is asked to make a list of activities during their typical school day from the time they wake up to the time they go to sleep. What are they doing? How many of those things require energy, especially electricity? Students make a list. Example Template:
Morning Activities Requires Electricity ()
Wake up to alarm clock Shower/brush teeth Make/eat breakfast
Daytime Activities Do work on computer
Read books Make/eat lunch
Evening Activities Play video games
Play outside Make/eat dinner
Do homework Night-Time Activities
Watch TV Text with friends
Teacher then asks individual students to share their activities and to tell if they require electricity to accomplish it. Hook students Teacher asks students to compare and contrast data from pre-COVID-19 to life with COVID-19 in 2020. Students living through the COVID-19 era were able to witness some dramatic shifts in human activities and energy consumption. What did students notice? Prepare to Investigate Teachers may choose to assign one or both short videos and/or the article. Or show some images of roads closed; families working from home; businesses “closed” or building “for rent” signs. COVID-19 causes biggest shock to global energy demand since World War II (video 2:02) Energy bills up as people spend more time at home during COVID-19 pandemic (video 1:34) From the Washington Post, “U.S. greenhouse gas emissions set to drop to lowest level in three decades,” November 19, 2020: Teacher asks students to identify/describe their thoughts on the impact of COVID-19 on activities and on energy use in their lives and the lives of others. How did your energy use change during the pandemic? Do you think you used more or less electricity overall compared to the pre-COVID-19 time period? Teachers can record student responses on a whiteboard for all to see. Investigate
9
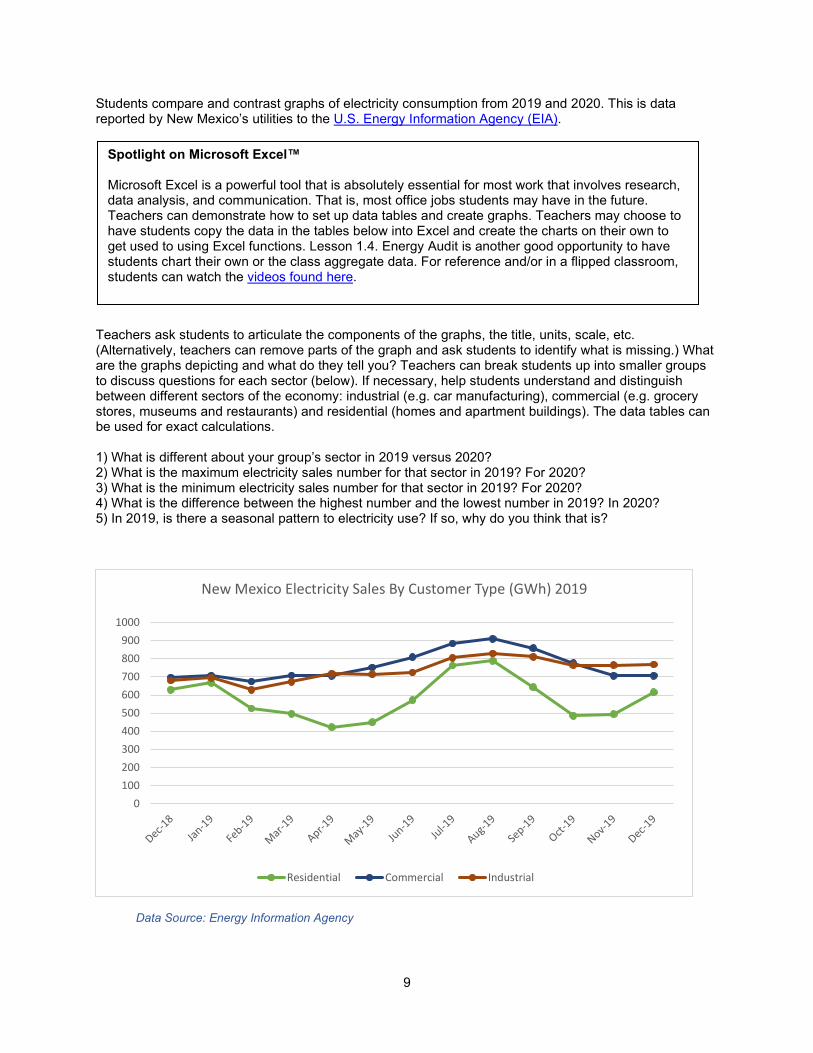
Students compare and contrast graphs of electricity consumption from 2019 and 2020. This is data reported by New Mexico’s utilities to the U.S. Energy Information Agency (EIA).
Teachers ask students to articulate the components of the graphs, the title, units, scale, etc. (Alternatively, teachers can remove parts of the graph and ask students to identify what is missing.) What are the graphs depicting and what do they tell you? Teachers can break students up into smaller groups to discuss questions for each sector (below). If necessary, help students understand and distinguish between different sectors of the economy: industrial (e.g. car manufacturing), commercial (e.g. grocery stores, museums and restaurants) and residential (homes and apartment buildings). The data tables can be used for exact calculations. 1) What is different about your group’s sector in 2019 versus 2020? 2) What is the maximum electricity sales number for that sector in 2019? For 2020? 3) What is the minimum electricity sales number for that sector in 2019? For 2020? 4) What is the difference between the highest number and the lowest number in 2019? In 2020? 5) In 2019, is there a seasonal pattern to electricity use? If so, why do you think that is?
Data Source: Energy Information Agency
0100200300400500600700800900
1000
New Mexico Electricity Sales By Customer Type (GWh) 2019
Residential Commercial Industrial
Spotlight on Microsoft Excel™ Microsoft Excel is a powerful tool that is absolutely essential for most work that involves research, data analysis, and communication. That is, most office jobs students may have in the future. Teachers can demonstrate how to set up data tables and create graphs. Teachers may choose to have students copy the data in the tables below into Excel and create the charts on their own to get used to using Excel functions. Lesson 1.4. Energy Audit is another good opportunity to have students chart their own or the class aggregate data. For reference and/or in a flipped classroom, students can watch the videos found here.
10
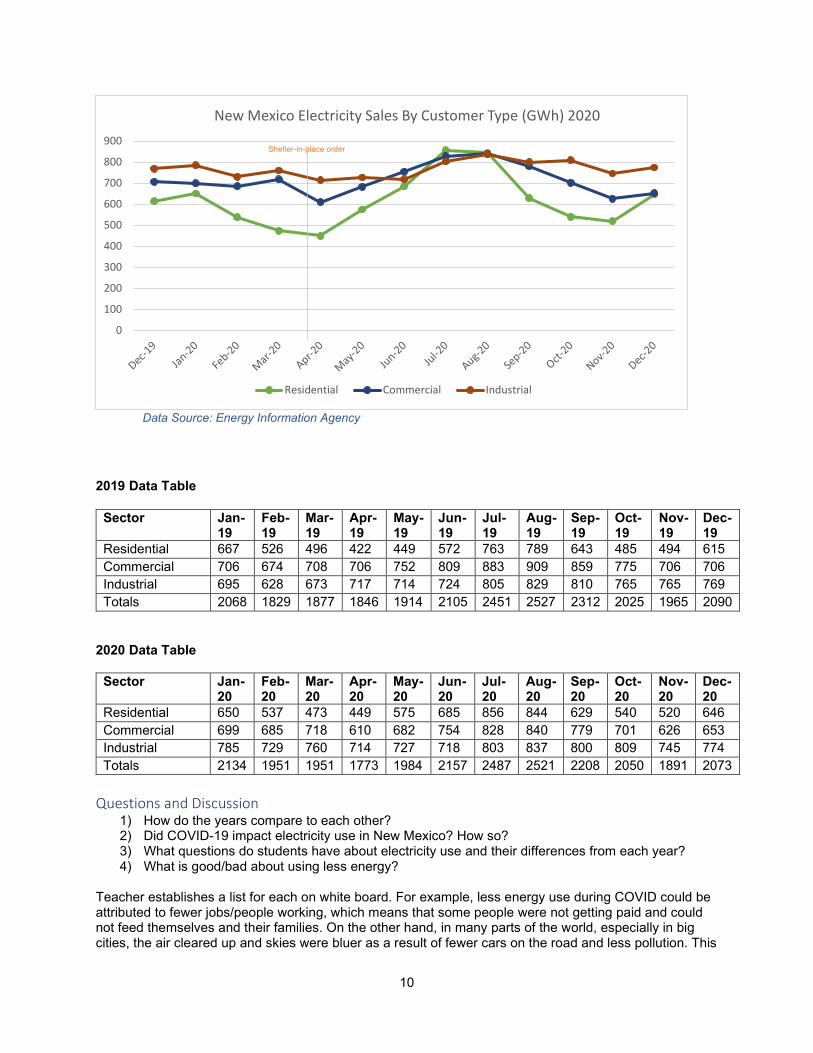
Data Source: Energy Information Agency
2019 Data Table
Sector Jan-19
Feb-19
Mar-19
Apr-19
May-19
Jun-19
Jul-19
Aug-19
Sep-19
Oct-19
Nov-19
Dec-19
Residential 667 526 496 422 449 572 763 789 643 485 494 615 Commercial 706 674 708 706 752 809 883 909 859 775 706 706 Industrial 695 628 673 717 714 724 805 829 810 765 765 769 Totals 2068 1829 1877 1846 1914 2105 2451 2527 2312 2025 1965 2090
2020 Data Table
Sector Jan-20
Feb-20
Mar-20
Apr-20
May-20
Jun-20
Jul-20
Aug-20
Sep-20
Oct-20
Nov-20
Dec-20
Residential 650 537 473 449 575 685 856 844 629 540 520 646 Commercial 699 685 718 610 682 754 828 840 779 701 626 653 Industrial 785 729 760 714 727 718 803 837 800 809 745 774 Totals 2134 1951 1951 1773 1984 2157 2487 2521 2208 2050 1891 2073
Questions and Discussion
1) How do the years compare to each other? 2) Did COVID-19 impact electricity use in New Mexico? How so? 3) What questions do students have about electricity use and their differences from each year? 4) What is good/bad about using less energy?
Teacher establishes a list for each on white board. For example, less energy use during COVID could be attributed to fewer jobs/people working, which means that some people were not getting paid and could not feed themselves and their families. On the other hand, in many parts of the world, especially in big cities, the air cleared up and skies were bluer as a result of fewer cars on the road and less pollution. This
0
100
200
300
400
500
600
700
800
900
New Mexico Electricity Sales By Customer Type (GWh) 2020
Residential Commercial Industrial
Shelter-in-place order
11
is good for people with health conditions like asthma, and for people who like to be outside in nature. It’s good for the animals too. Summary Energy conservation is defined as not using energy, especially when it is not needed. One form of energy is electricity. Different amounts of electricity are used depending on the activity. Factories use a lot of electricity. Business and office (and school) activities use less electricity, but there are more office buildings, retail stores and restaurants than industrial facilities in New Mexico. COVID-19 has had some impacts on electricity use, but not what we might have expected. Energy use can change based on outside factors beyond our control. For example, residential electricity consumption increased due to mandatory stay-at home- orders imposed on residents due to the virus.
12
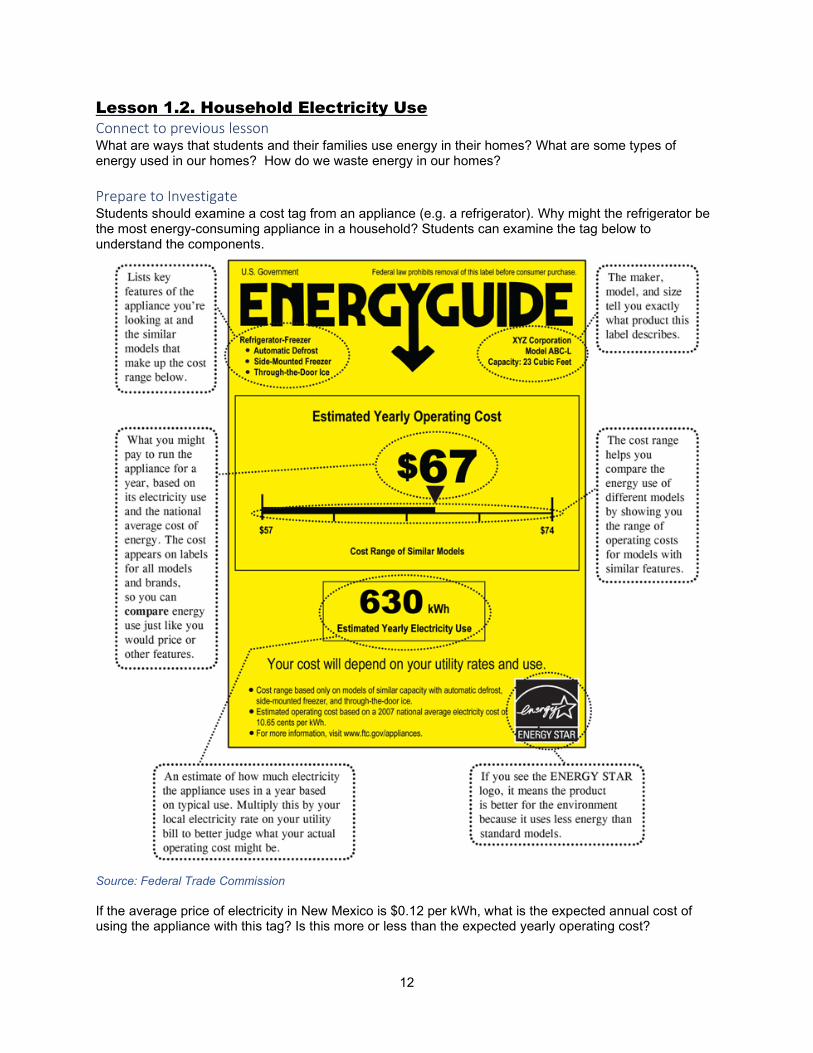
Lesson 1.2. Household Electricity Use Connect to previous lesson What are ways that students and their families use energy in their homes? What are some types of energy used in our homes? How do we waste energy in our homes? Prepare to Investigate Students should examine a cost tag from an appliance (e.g. a refrigerator). Why might the refrigerator be the most energy-consuming appliance in a household? Students can examine the tag below to understand the components.
Source: Federal Trade Commission If the average price of electricity in New Mexico is $0.12 per kWh, what is the expected annual cost of using the appliance with this tag? Is this more or less than the expected yearly operating cost?
13
Investigation Students look at overall electricity used and wasted by a hypothetical family based on average used for different devices (Household Electricity Use). The Household Electricity Use activity includes several questions students should answer based on the data provided. Students can work in small groups or work on questions for homework to maximize class time. Questions and Discussion
1) Based on the data, which three appliances consumed the most energy over this week (Wh)? 2) Based on the data, which appliance was the most expensive to operate over this week ($)? 3) Does an appliance with a high wattage always use the most energy (Wh)? Explain? 4) If the Martinez family were without electricity for a day, how could they replace the work of three
appliances or devices? 5) What could this family do to save money? Use calculations to show the savings. 6) Calculate the annual (watts/year) for the Martinez’s refrigerator. Is this a lot? 7) If the Martinez family has two phone chargers plugged in at all times and they are drawing 1.5
watts each, how much energy would be lost in a 12-hour period? What does that equal in $? [Hint: Divide your watts/hour figure by 1000 to get kWh and then multiply by $0.15.]
8) What other devices might be leaking energy? [Hint: Walk around your own home to find appliances with lights or digital clocks that are on all the time.]
Summary Energy (in the form of electricity) costs money. Some appliances use more electricity than others. There are some appliances that we use all the time and others that we might be able to turn off or unplug. Some appliances appear to be off but are actually leaking energy. Household energy use can be significantly impacted by lighting as well, depending on how long lights are on and which type of lightbulbs are used.
14
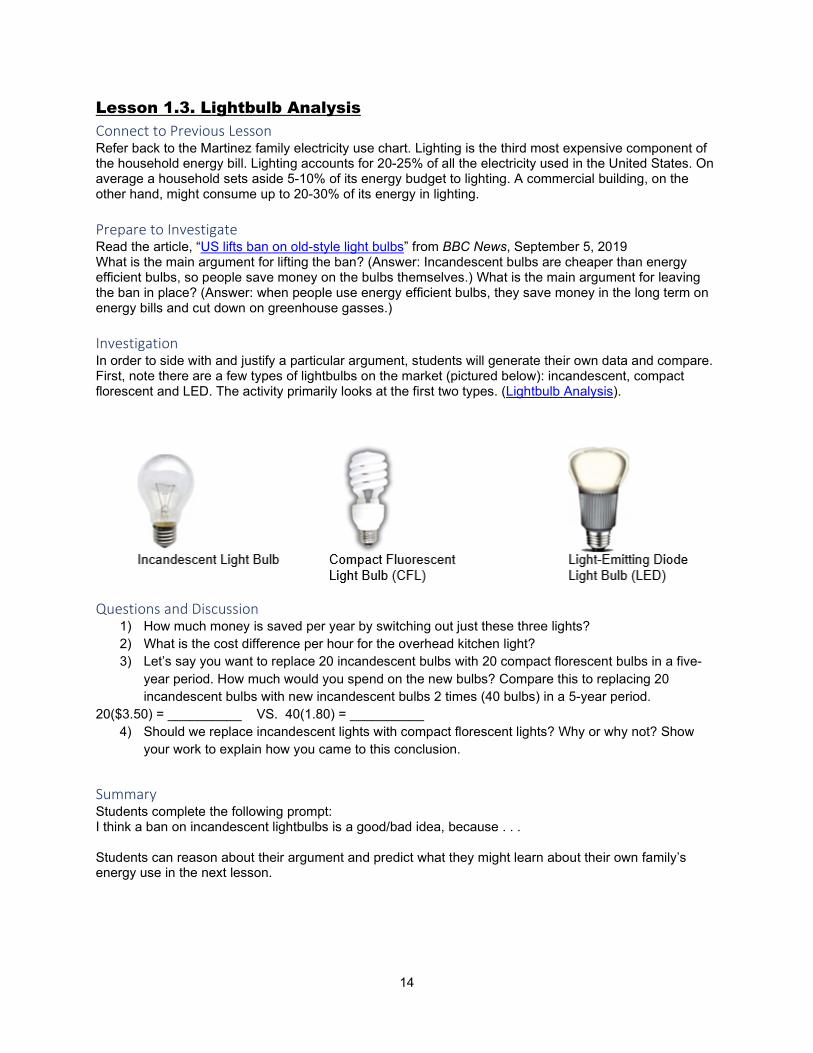
Lesson 1.3. Lightbulb Analysis Connect to Previous Lesson Refer back to the Martinez family electricity use chart. Lighting is the third most expensive component of the household energy bill. Lighting accounts for 20-25% of all the electricity used in the United States. On average a household sets aside 5-10% of its energy budget to lighting. A commercial building, on the other hand, might consume up to 20-30% of its energy in lighting. Prepare to Investigate Read the article, “US lifts ban on old-style light bulbs” from BBC News, September 5, 2019 What is the main argument for lifting the ban? (Answer: Incandescent bulbs are cheaper than energy efficient bulbs, so people save money on the bulbs themselves.) What is the main argument for leaving the ban in place? (Answer: when people use energy efficient bulbs, they save money in the long term on energy bills and cut down on greenhouse gasses.) Investigation In order to side with and justify a particular argument, students will generate their own data and compare. First, note there are a few types of lightbulbs on the market (pictured below): incandescent, compact florescent and LED. The activity primarily looks at the first two types. (Lightbulb Analysis).
Questions and Discussion
1) How much money is saved per year by switching out just these three lights? 2) What is the cost difference per hour for the overhead kitchen light? 3) Let’s say you want to replace 20 incandescent bulbs with 20 compact florescent bulbs in a five-
year period. How much would you spend on the new bulbs? Compare this to replacing 20 incandescent bulbs with new incandescent bulbs 2 times (40 bulbs) in a 5-year period.
20($3.50) = __________ VS. 40(1.80) = __________ 4) Should we replace incandescent lights with compact florescent lights? Why or why not? Show
your work to explain how you came to this conclusion.
Summary Students complete the following prompt: I think a ban on incandescent lightbulbs is a good/bad idea, because . . . Students can reason about their argument and predict what they might learn about their own family’s energy use in the next lesson.
15
Lesson 1.4. Home and/or School Energy Audit Connect to previous lesson This culminating lesson involves a take home assignment. Students will recall that many of our modern devices and appliances require electricity, and therefore have an energy cost. Specifically, students will examine their family’s own electricity use behaviors over the course of one week. Included in this investigation is a look at costs associated with appliances that draw electricity even when they appear to be off or are not in use. What are some clues to this ‘phantom’ energy? Prepare to Investigate In lieu of or before doing the home audit, students should apply the same tools and processes to the classroom. This will allow the teacher to conduct an informal assessment/evaluation of the students’ investigation skills. The teacher will be able to analyze if the students have grasped the material (e.g., calculating correcting) before moving on to home activities. Review the following investigation tips with your students.
1. Before students start, they should walk around their house/classroom with the printout of the assessment to make sure they do not overlook any major appliance. Students should be informed to not overlook clocks and aquariums and other appliances that run 24 hours a day. At home, particular attention should be given to their own bedroom – after all, that’s where students have the most control over energy use!
2. Students should be encouraged to engage family members to help with this assignment! Students can give other family members a copy of the printout and ask them to be responsible for different things in the house. For example, make one person responsible for tracking TV use, another washing machine use, and so on.
Investigate [See Energy Audit] Questions Students will answer questions in the Energy Audit and share with the full class. Together, they can create a table of each students’ energy use and projected “What If” energy use. Alternatively, teachers may want to opt to make the home audit data private or aggregate data across the whole class ahead of time. The class can estimate the total energy and dollars it could collectively save class could save if students implemented the identified changes. Summary Students should be asked to summarize their family’s energy use relative to the cost of electricity and identify areas where they may be able to conserve energy (change in behaviors) or, in the case of new lightbulbs or appliances, use energy more efficiently. What are some other ways that energy enters students’ homes and is used?
16
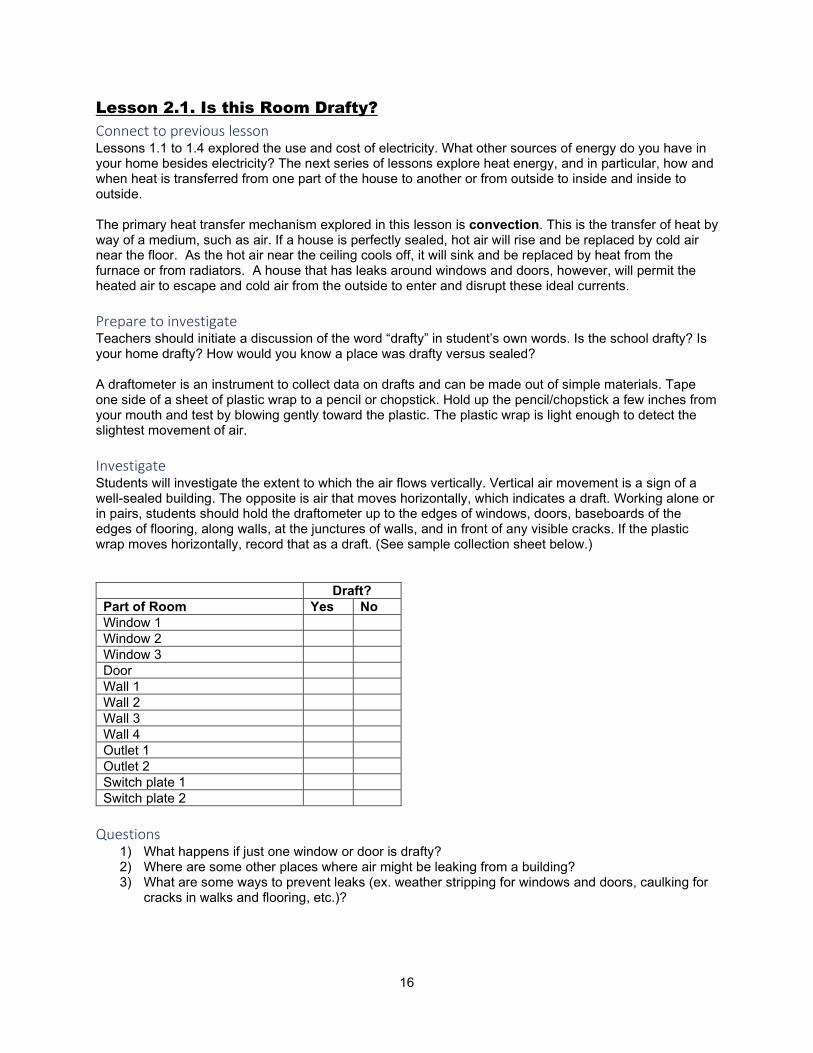
Lesson 2.1. Is this Room Drafty? Connect to previous lesson Lessons 1.1 to 1.4 explored the use and cost of electricity. What other sources of energy do you have in your home besides electricity? The next series of lessons explore heat energy, and in particular, how and when heat is transferred from one part of the house to another or from outside to inside and inside to outside. The primary heat transfer mechanism explored in this lesson is convection. This is the transfer of heat by way of a medium, such as air. If a house is perfectly sealed, hot air will rise and be replaced by cold air near the floor. As the hot air near the ceiling cools off, it will sink and be replaced by heat from the furnace or from radiators. A house that has leaks around windows and doors, however, will permit the heated air to escape and cold air from the outside to enter and disrupt these ideal currents. Prepare to investigate Teachers should initiate a discussion of the word “drafty” in student’s own words. Is the school drafty? Is your home drafty? How would you know a place was drafty versus sealed? A draftometer is an instrument to collect data on drafts and can be made out of simple materials. Tape one side of a sheet of plastic wrap to a pencil or chopstick. Hold up the pencil/chopstick a few inches from your mouth and test by blowing gently toward the plastic. The plastic wrap is light enough to detect the slightest movement of air. Investigate Students will investigate the extent to which the air flows vertically. Vertical air movement is a sign of a well-sealed building. The opposite is air that moves horizontally, which indicates a draft. Working alone or in pairs, students should hold the draftometer up to the edges of windows, doors, baseboards of the edges of flooring, along walls, at the junctures of walls, and in front of any visible cracks. If the plastic wrap moves horizontally, record that as a draft. (See sample collection sheet below.)
Draft? Part of Room Yes No Window 1 Window 2 Window 3 Door Wall 1 Wall 2 Wall 3 Wall 4 Outlet 1 Outlet 2 Switch plate 1 Switch plate 2
Questions
1) What happens if just one window or door is drafty? 2) Where are some other places where air might be leaking from a building? 3) What are some ways to prevent leaks (ex. weather stripping for windows and doors, caulking for
cracks in walks and flooring, etc.)?
17
Summary In a sealed building, hot air __________ and cool air __________ in a vertical fashion. In a drafty building, air moves horizontally in and out of small spaces, causing a building to be __________ in the winter and __________ in the summer. Cracks and spaces around doors and windows can be fixed with simple products sold at most ___________ stores.
hardwarerises sinkshotter colder
Spotlight on Energy Auditors and Weatherization Specialists This career path focuses entirely on how to make homes more energy efficient. These workers see buildings in their entirety and the small details. They use technologies to find leaks and may perform a variety of repairs. In fact, they apply most of the lessons learned in this unit to make their customers more comfortable and to help them save energy and money. This is a relatively new field with growing opportunities. For, example, see courses at Santa Fe Community College’s Energy Smart Academy. For a short video about this career, go to Career Onestop.
18
Lesson 2.2. Do we want more windows? Connect to previous lesson Teacher reiterates that air is constantly circulating around a room , ideally with warm air rising and cool air falling vertically. Sometimes, even in a sealed building, one room can feel warmer or colder than another. What role do windows play in this differentiation? Are windows good at preventing heat transfer? Prepare to Investigate The primary method of heat transfer in this lesson is radiation. This is the transfer of heat from an object to its immediate surroundings. Although windows can allow conduction (on a hot day, a window will feel hot to the touch and the air near it will be warm) and even convection (cold air falling near a single-pane window on a cold day can even feel drafty). The best example of the role of glass in allowing the penetration of solar radiation is a greenhouse. Students read this article and watch the video from NPR’s Series, “The Salt,” Vegetables Under Glass (December 8, 2015). Why are greenhouses made of glass? What does this tell you about windows? One way to measure the impact of windows on room temperature is to calculate the ratio between floorspace and window space. If the ratio is greater than 1:10 ft2, the building may be allowing too much solar radiation in. This could lead to using more energy for cooling in hotter months. (One thing to note is that not all windows are the same. This lesson assumes a single pane window with sealed edges and with no extra coating on the glass). Investigate Teachers ask students to investigate the classroom to determine if it is an energy saving room. To be considered efficient at preventing the transfer of heat, a room must not have more the 1 ft2 of window for every 10 ft2 of floorspace (greater than 10%). This investigation works best if students can compare two or more rooms.
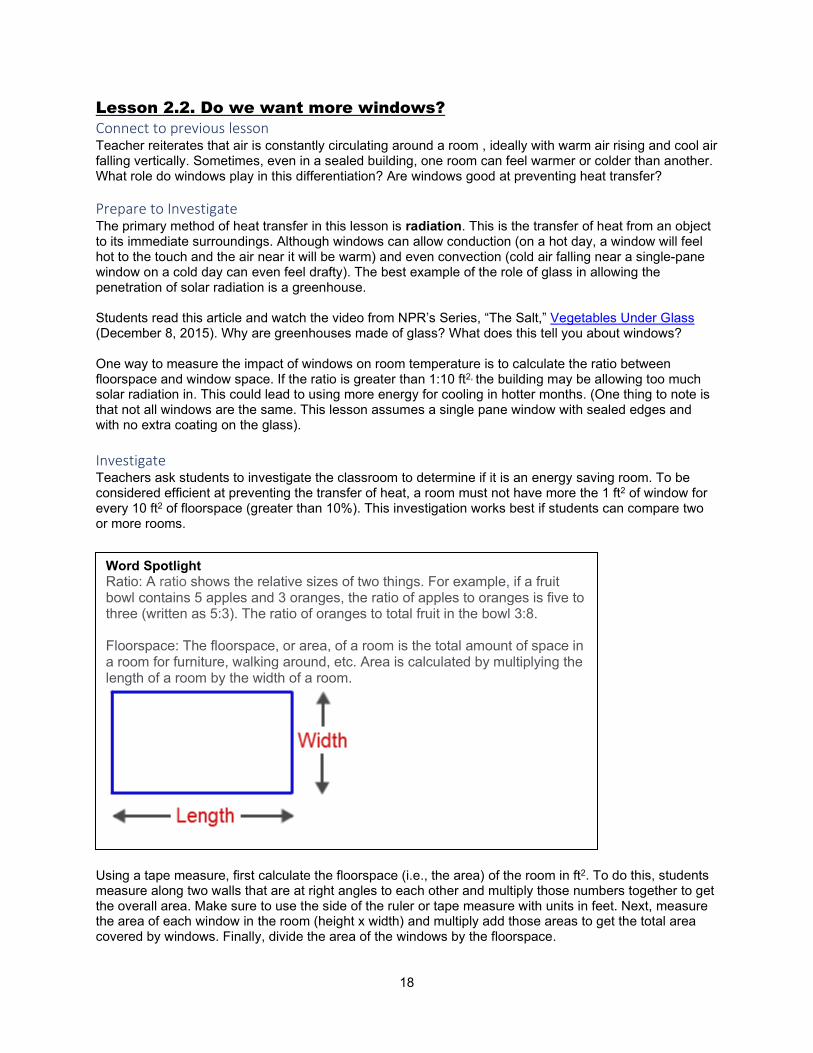
Using a tape measure, first calculate the floorspace (i.e., the area) of the room in ft2. To do this, students measure along two walls that are at right angles to each other and multiply those numbers together to get the overall area. Make sure to use the side of the ruler or tape measure with units in feet. Next, measure the area of each window in the room (height x width) and multiply add those areas to get the total area covered by windows. Finally, divide the area of the windows by the floorspace.
Word Spotlight Ratio: A ratio shows the relative sizes of two things. For example, if a fruit bowl contains 5 apples and 3 oranges, the ratio of apples to oranges is five to three (written as 5:3). The ratio of oranges to total fruit in the bowl 3:8. Floorspace: The floorspace, or area, of a room is the total amount of space in a room for furniture, walking around, etc. Area is calculated by multiplying the length of a room by the width of a room.
19
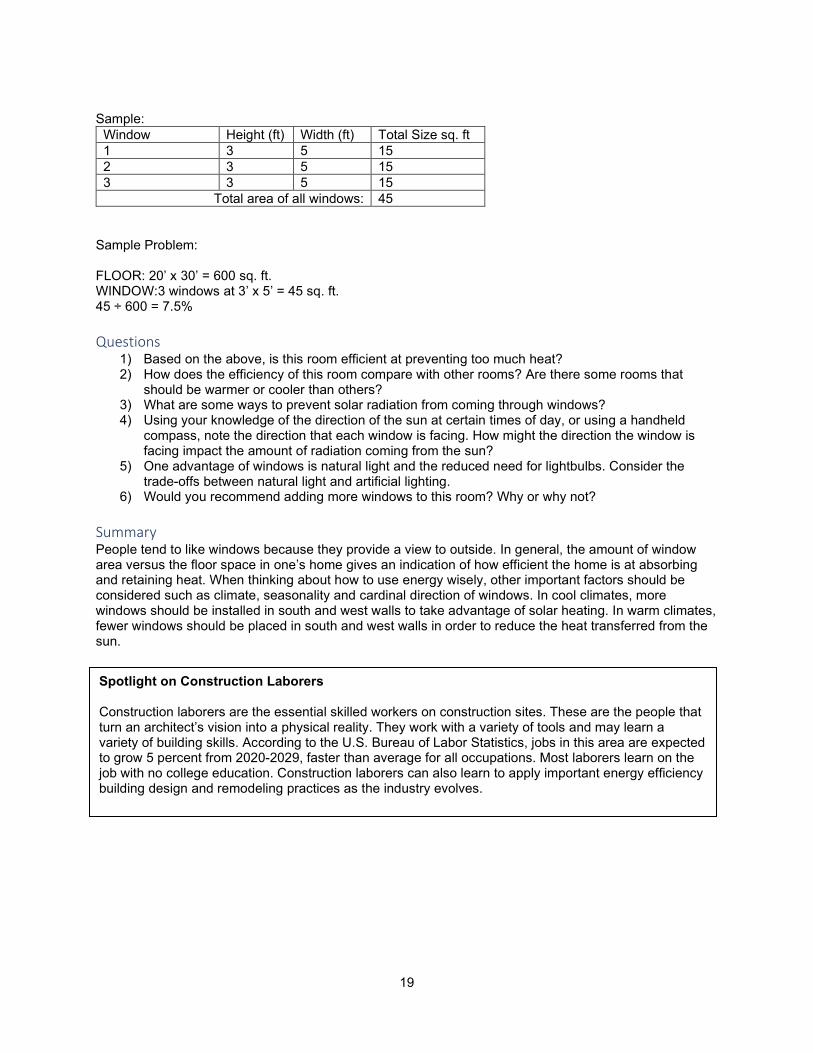
Sample:
Window Height (ft) Width (ft) Total Size sq. ft 1 3 5 15 2 3 5 15 3 3 5 15
Total area of all windows: 45 Sample Problem: FLOOR: 20’ x 30’ = 600 sq. ft. WINDOW:3 windows at 3’ x 5’ = 45 sq. ft. 45 ÷ 600 = 7.5% Questions
1) Based on the above, is this room efficient at preventing too much heat? 2) How does the efficiency of this room compare with other rooms? Are there some rooms that
should be warmer or cooler than others? 3) What are some ways to prevent solar radiation from coming through windows? 4) Using your knowledge of the direction of the sun at certain times of day, or using a handheld
compass, note the direction that each window is facing. How might the direction the window is facing impact the amount of radiation coming from the sun?
5) One advantage of windows is natural light and the reduced need for lightbulbs. Consider the trade-offs between natural light and artificial lighting.
6) Would you recommend adding more windows to this room? Why or why not?
Summary People tend to like windows because they provide a view to outside. In general, the amount of window area versus the floor space in one’s home gives an indication of how efficient the home is at absorbing and retaining heat. When thinking about how to use energy wisely, other important factors should be considered such as climate, seasonality and cardinal direction of windows. In cool climates, more windows should be installed in south and west walls to take advantage of solar heating. In warm climates, fewer windows should be placed in south and west walls in order to reduce the heat transferred from the sun.
Spotlight on Construction Laborers Construction laborers are the essential skilled workers on construction sites. These are the people that turn an architect’s vision into a physical reality. They work with a variety of tools and may learn a variety of building skills. According to the U.S. Bureau of Labor Statistics, jobs in this area are expected to grow 5 percent from 2020-2029, faster than average for all occupations. Most laborers learn on the job with no college education. Construction laborers can also learn to apply important energy efficiency building design and remodeling practices as the industry evolves.
20
Lesson 2.3. Let’s get some air in here! Connect to previous lessons As discussed in the previous lessons, a room can become overheated as solar radiation gets trapped as heat in a room. This lesson looks at the role of air flow, or ventilation, in cooling a building. This lesson returns to the idea of convection as the heat transfer mechanism. Recall that hot air will rise, and cool air will fall. Prepare to investigate Ask students to consider what is a comfortable air temperature? Look at a thermostat or handheld thermometer and record the temperature. Do students feel this is too warm, too cold, or just right? While not everyone will agree on the temperature, this lesson will use what students know about convectional heat transfer to make a hot room more comfortable. What are the variables that we could control? Have students make a list and start to put them in a ‘sentence.’ Then they can hypothesize which variables are likely to make the most impact.
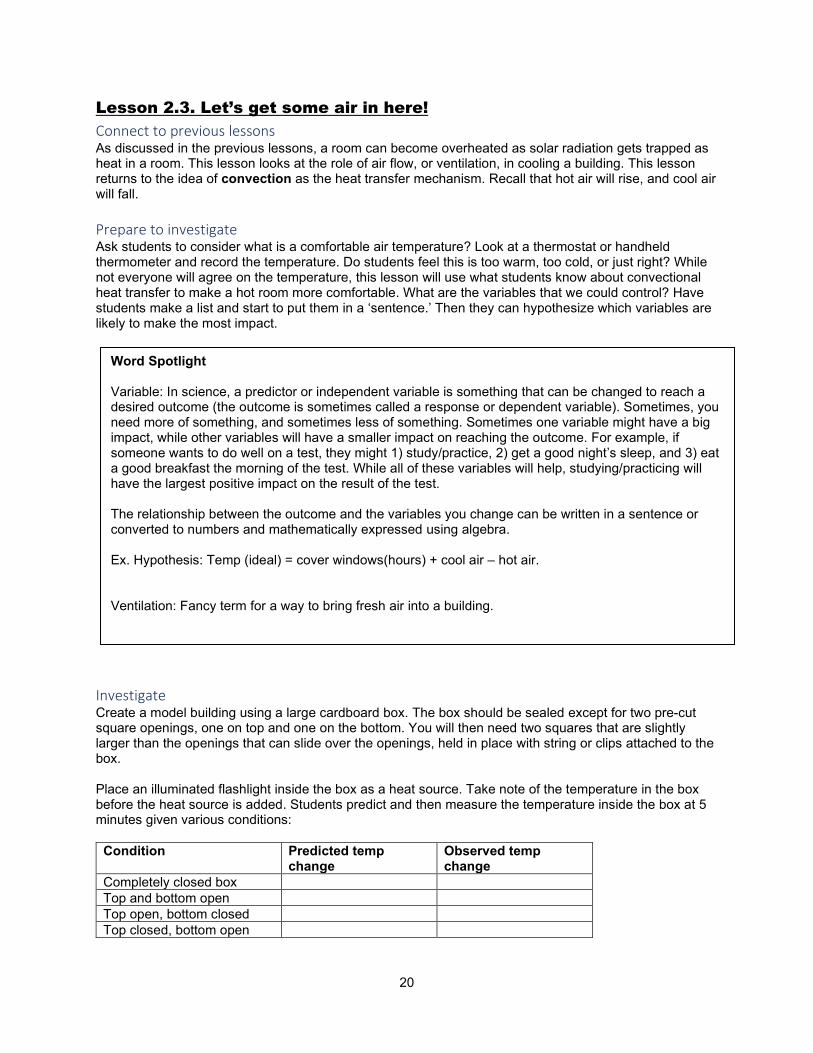
Investigate Create a model building using a large cardboard box. The box should be sealed except for two pre-cut square openings, one on top and one on the bottom. You will then need two squares that are slightly larger than the openings that can slide over the openings, held in place with string or clips attached to the box. Place an illuminated flashlight inside the box as a heat source. Take note of the temperature in the box before the heat source is added. Students predict and then measure the temperature inside the box at 5 minutes given various conditions:
Condition Predicted temp change
Observed temp change
Completely closed box Top and bottom open Top open, bottom closed Top closed, bottom open
Word Spotlight Variable: In science, a predictor or independent variable is something that can be changed to reach a desired outcome (the outcome is sometimes called a response or dependent variable). Sometimes, you need more of something, and sometimes less of something. Sometimes one variable might have a big impact, while other variables will have a smaller impact on reaching the outcome. For example, if someone wants to do well on a test, they might 1) study/practice, 2) get a good night’s sleep, and 3) eat a good breakfast the morning of the test. While all of these variables will help, studying/practicing will have the largest positive impact on the result of the test. The relationship between the outcome and the variables you change can be written in a sentence or converted to numbers and mathematically expressed using algebra. Ex. Hypothesis: Temp (ideal) = cover windows(hours) + cool air – hot air. Ventilation: Fancy term for a way to bring fresh air into a building.
21
Questions 1) Were your predictions correct? 2) What surprised you? 3) What is the best way to keep the box from increasing in temperature? Explain in terms of how
heat moves. 4) Instead of modifying the environment of a room, what else could we do to conserve energy in this
‘room? What behaviors might make us warmer in winter? Is it better to change our behaviors or change the environment?
5) Application to other environments - What consequences could there be if no ventilation is provided. Think of animals or people left in a car on a hot day.
Summary Rooms with no ventilation can heat up pretty quickly. In order to cool a room, cool air must replace an equal amount of hot air. The best way to remove hot air is through the roof and the best way to introduce cool air is from a low opening/window.
Spotlight on Heating, Air Conditioning and Refrigeration Professionals People in this profession are trained to keep indoor temperatures clean and comfortable all year round by controlling the flow of air. They perform hard work, sometimes under difficult conditions outdoors, but they are absolutely essential. They were especially important during the COVID outbreak as business owners, homeowners and school building managers had to figure out how to keep indoor areas safe for customers, residents and students and teachers. These professionals can be trained right out of high school and make on average $50,590/yr. For more information and a video, see the Career Onestop profile.
22
Lesson 2.4. Color Matters Connect to previous lessons As we have seen over the course of these lessons there are ways to conserve energy by adjusting variables such as understanding how to manage heat from the sun coming through windows, how to fix drafts, how to manipulate air flows within our homes and buildings and how ventilation works. There are still more ways to conserve the amount of energy we have to buy or use. Today’s lesson will explore the relationship between color, heat retention and radiation. Prepare to investigate Ask students to explain what it means to say, “You can fry an egg on that parking lot.” As students have likely observed, some surfaces seem to feel hotter than others. Black asphalt feels especially hot, as well as dark leather car seats and a metal (unpainted) playground slide. Students should list other items that we tend to avoid touching in the heat of the day. Students might also recall that if it snows in the winter, snow tends to not build up or last long on roads and parking lots in New Mexico. Why is that? Investigate Students will experiment with different colors to understand which colors absorb and reradiate the most heat from the sun.
1) First, prepare or have students in pairs build 4 small boxes out of colored construction paper, with one side open. Boxes can be any colors but should include one white box and one black box.
2) Place the boxes equidistant with openings facing outward on a surface, near a window and place an ice cube in each of the boxes. And ask students to guess which box will absorb the most heat. In which box will the ice cube melt first?
3) Students observe and note the order in which the cubes melt. *Note: this can be done outside in the sun, but other variables such as wind should be minimized if possible.
Questions and Discussion
1) What color(s) retain and radiate the most heat? 2) What color(s) retain and radiate less heat? 3) Is one color better for a roof? Why? 4) Does the location of a building in a certain climate influence your answers? Explain.
Summary Colors provide some benefits and drawbacks to energy use when it comes to absorbing and radiating heat from the sun. When might dark colors be beneficial? How about light colors? These can change based on where you are located and the time of year (season). What if the squares were made out of something other than paper? What materials might help keep the ice from melting?
23
Lesson 2.5. Building Insulation This lesson looks at yet another variable that factors into how much energy we conserve, use and potentially waste. In today’s lesson, students will experiment with heat conduction using a variety of different household building materials. Prepare to Investigate Students should describe the buildings they see in New Mexico. The Teacher can record these observations on a whiteboard. What are many buildings made out of? Also, are buildings generally tall (more than 1 story) or short (1 story)? What materials do you think are good at preventing the flow of heat, or insulating a home? Recall that transfer of heat from one solid object to another is called conduction. Students can review the video Sustainable City/Fully Charged, and write down everything they hear about orientation of buildings, color and materials. Investigate Insulation is material that provides a high resistance to heat flow, i.e., it helps to maintain a consistent inside temperature regardless of what is happening outside of a home or other building. In this example, the R-value is the amount of resistance to heat flow or transfer (the higher the number, the better at insulating).
1) Set a hotplate on a table and set it to a low temperature. 2) One at a time, place the materials on top of the hot plate and then a thermometer on top of the
material for a total of 5 minutes, recording the temperature every 30 seconds in your notebook. As a class, plot the change in temperature over the 5-minute period for each material. Compare the graphs to each other.
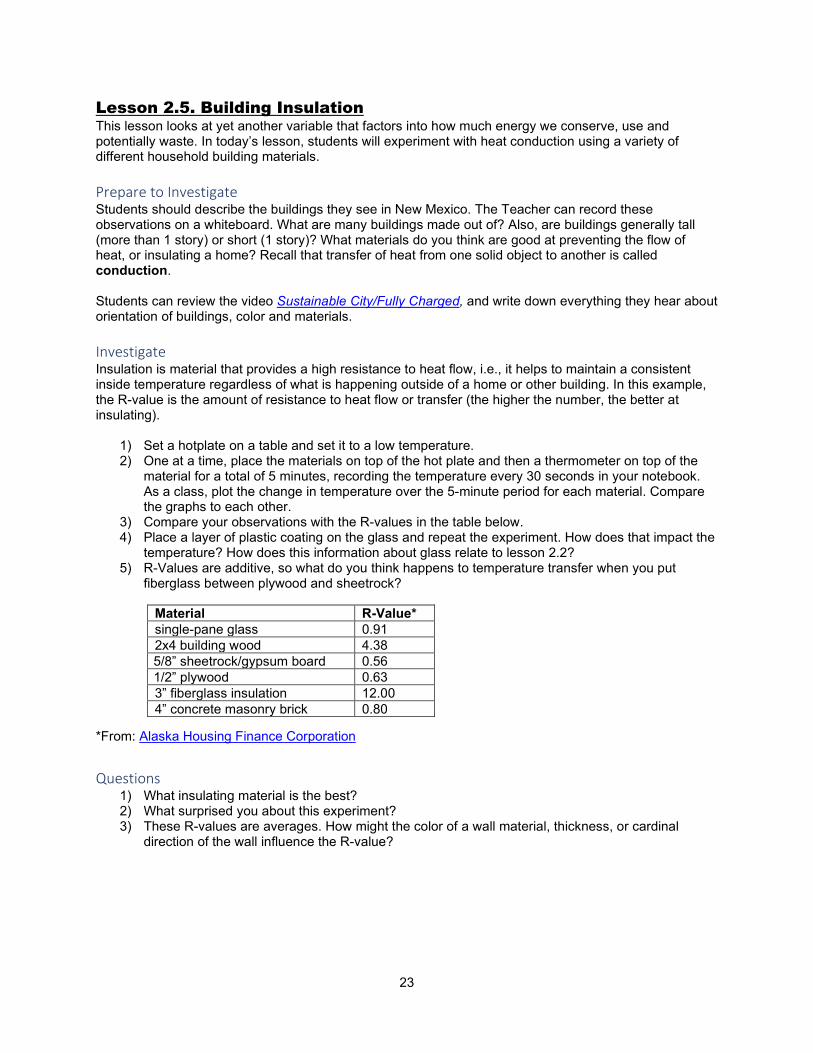
3) Compare your observations with the R-values in the table below. 4) Place a layer of plastic coating on the glass and repeat the experiment. How does that impact the
temperature? How does this information about glass relate to lesson 2.2? 5) R-Values are additive, so what do you think happens to temperature transfer when you put
fiberglass between plywood and sheetrock? *From: Alaska Housing Finance Corporation Questions
1) What insulating material is the best? 2) What surprised you about this experiment? 3) These R-values are averages. How might the color of a wall material, thickness, or cardinal
direction of the wall influence the R-value?
Material R-Value* single-pane glass 0.91 2x4 building wood 4.38 5/8” sheetrock/gypsum board 0.56 1/2” plywood 0.63 3” fiberglass insulation 12.00 4” concrete masonry brick 0.80
24
Summary Different materials retain heat, or insulate, better than others. While some materials are known for their strength and ability to withstand fire, etc., they actually are not the best materials for energy conservation. Many homes in New Mexico are built with a combination of these materials. How might climate impact the choice of materials?
Spotlight on Adobe Adobe structures and the adobe style of architecture have been around a very long time in New Mexico, with roots in Native American Pueblo culture. Many societies around the world, such as the vast majority of African cultures, still use adobe bricks because they can be made and used locally. Measuring the insulating value of adobe is complicated, however, because the bricks themselves have thermal mass. That is, they act more as energy storage devices than insulating material. The bricks will store heat up to a maximum point of saturation, and then radiate that heat. This is good in cooler and/or continental climates when walls can heat up during the day and then radiate heat at night when the temperatures drop. For more information, see this New Mexico Geology article.
Spotlight on Masons Masonry Workers or Masons work with a variety of building materials, such as concrete blocks, terra-cotta brick, stone, etc., to build structures that last. Their specialized skills combine stamina, materials science and artistry. Masons do not need a college degree and most learn on-the-job through an apprenticeship. The average salary in the U.S. is $46,000/yr. For more information see the Career Onestop profile. While the outlook may be low across the country overall, the competition is stiff for high-quality masonry work in New Mexico.
Spotlight on Insulator Workers Insulation workers install insulation in buildings and around mechanical equipment to balance temperatures and conserve energy. They must be good at math and be experts at measuring. People interested in this career get on-the-job training or complete an apprenticeship after high school. The average salary is $41,690/yr. For more information, see the Career Onestop profile.
25
Lesson 3.1. Climate Zones
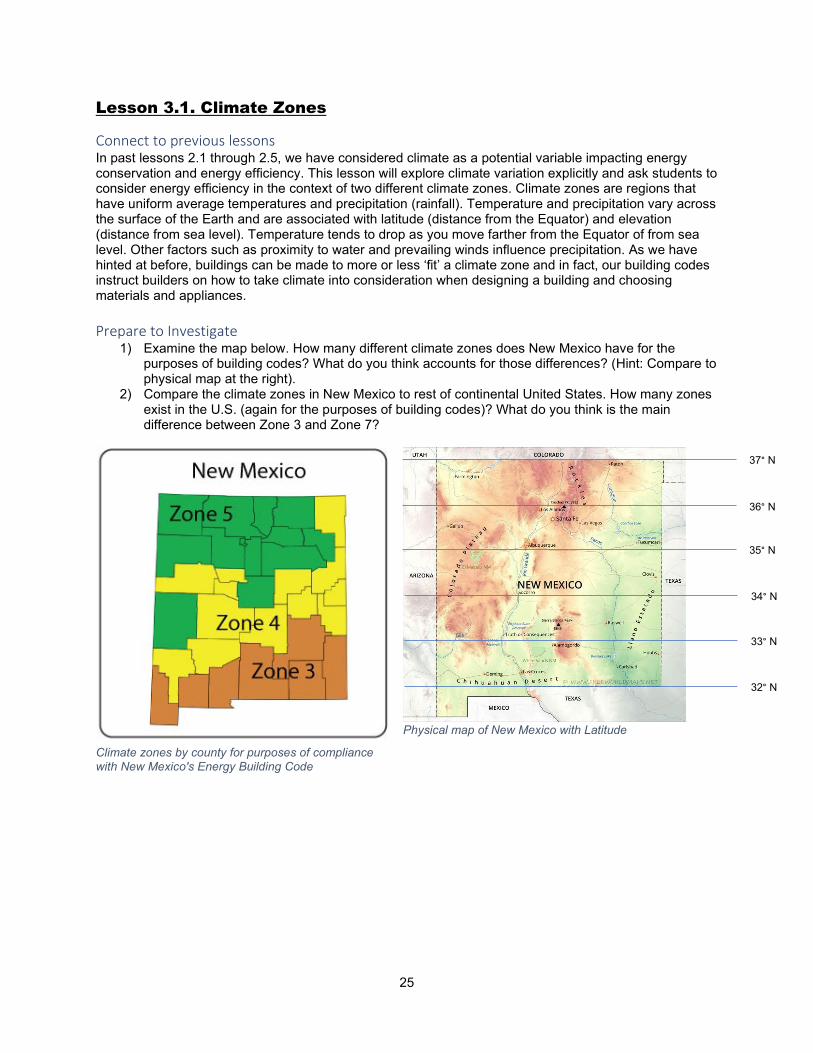
Connect to previous lessons In past lessons 2.1 through 2.5, we have considered climate as a potential variable impacting energy conservation and energy efficiency. This lesson will explore climate variation explicitly and ask students to consider energy efficiency in the context of two different climate zones. Climate zones are regions that have uniform average temperatures and precipitation (rainfall). Temperature and precipitation vary across the surface of the Earth and are associated with latitude (distance from the Equator) and elevation (distance from sea level). Temperature tends to drop as you move farther from the Equator of from sea level. Other factors such as proximity to water and prevailing winds influence precipitation. As we have hinted at before, buildings can be made to more or less ‘fit’ a climate zone and in fact, our building codes instruct builders on how to take climate into consideration when designing a building and choosing materials and appliances. Prepare to Investigate
1) Examine the map below. How many different climate zones does New Mexico have for the purposes of building codes? What do you think accounts for those differences? (Hint: Compare to physical map at the right).
2) Compare the climate zones in New Mexico to rest of continental United States. How many zones exist in the U.S. (again for the purposes of building codes)? What do you think is the main difference between Zone 3 and Zone 7?
Physical map of New Mexico with Latitude
32° N
33° N
34° N
35° N
36° N
37° N
Climate zones by county for purposes of compliance with New Mexico's Energy Building Code
26
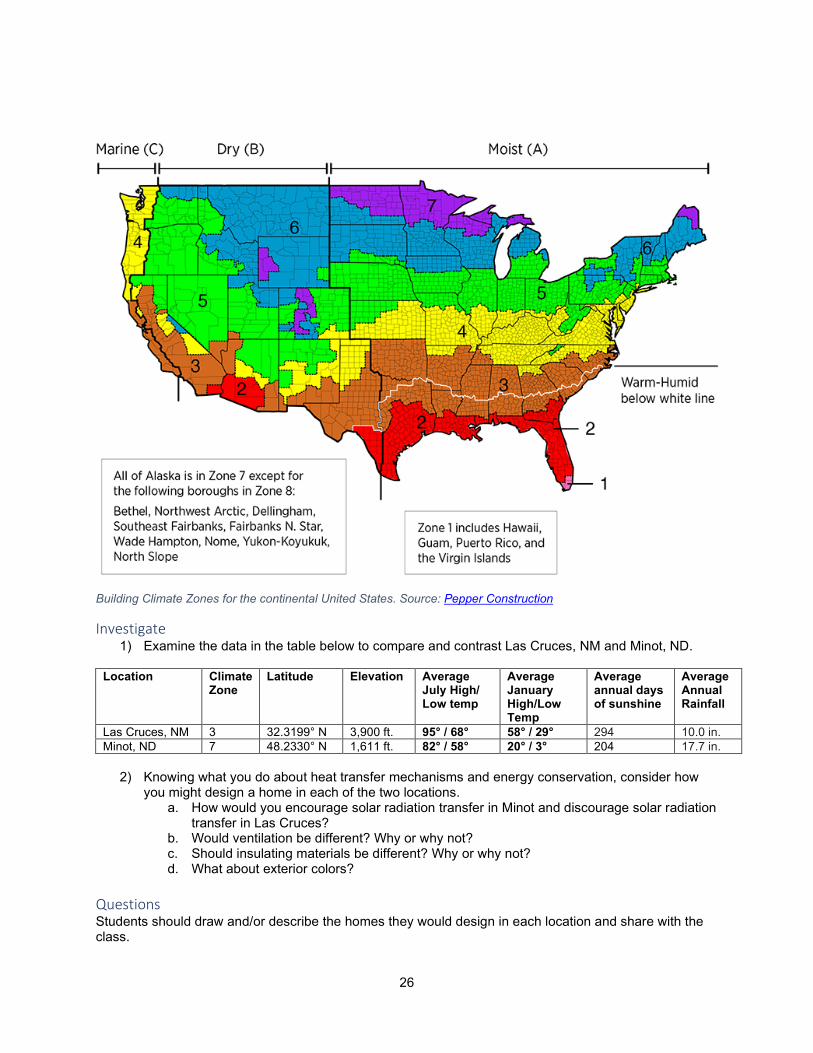
Building Climate Zones for the continental United States. Source: Pepper Construction
Investigate 1) Examine the data in the table below to compare and contrast Las Cruces, NM and Minot, ND.
Location Climate
Zone Latitude Elevation Average
July High/ Low temp
Average January High/Low Temp
Average annual days of sunshine
Average Annual Rainfall
Las Cruces, NM 3 32.3199° N 3,900 ft. 95° / 68° 58° / 29° 294 10.0 in. Minot, ND 7 48.2330° N 1,611 ft. 82° / 58° 20° / 3° 204 17.7 in.
2) Knowing what you do about heat transfer mechanisms and energy conservation, consider how
you might design a home in each of the two locations. a. How would you encourage solar radiation transfer in Minot and discourage solar radiation
transfer in Las Cruces? b. Would ventilation be different? Why or why not? c. Should insulating materials be different? Why or why not? d. What about exterior colors?
Questions Students should draw and/or describe the homes they would design in each location and share with the class.
27
Summary The United States has many climate zones. As seen in the maps and data, going further from the Equator (latitude) and higher from sea level (elevation) both have a similar cooling effect on climate. In a place like Las Cruces, where the warmer season is long, windows should face north, if possible, to discourage solar radiation from coming into the house. On the other hand, in Minot, windows should be south facing, if possible, to encourage more solar radiation during most of the year. Ventilation is the same as long as the homes are well-insulated. In Minot, it is more important most of the year to keep warm air inside the home (to save on heating energy) and therefore a need for more internal insulation such as fiberglass. To capture rising hot air in Minot, two-story homes with sleeping areas on the second story are more helpful in keeping people warm in winter. In Las Cruces, it is more important to keep warm air outside of the home (to save on cooling energy). Insulation in combination with light exterior reflective colors would be better in Las Cruces, whereas darker colors may help absorb more solar radiation in Minot.
Spotlight on Climate Scientists Part of a broader field of environmental scientists, climate scientists analyze how the changing environment impacts humans and ecosystems. Like other environmental scientists, they may do field work or work in labs. A bachelor’s degree is required for most jobs and many go on to get advanced degrees. These jobs will continue to be in high demand. For more information, see the Career Onestop profile.
Spotlight on Architects Architects design buildings to meet clients’ needs. They must be good designers and good communicators and listeners. Increasingly, architects are designing using computer software and tools. People desiring to be architects must complete 5 or more years of university education, complete a paid internship, and then pass an exam. Architects apply the building codes that govern buildings in their geographic area. The more architects can apply important lessons about climate and energy conserving design, the more likely our buildings will become part of the climate change solution. Some standards have been established by the U.S. Green Building Council, for example. For a short video on LEED® certification and education.
28
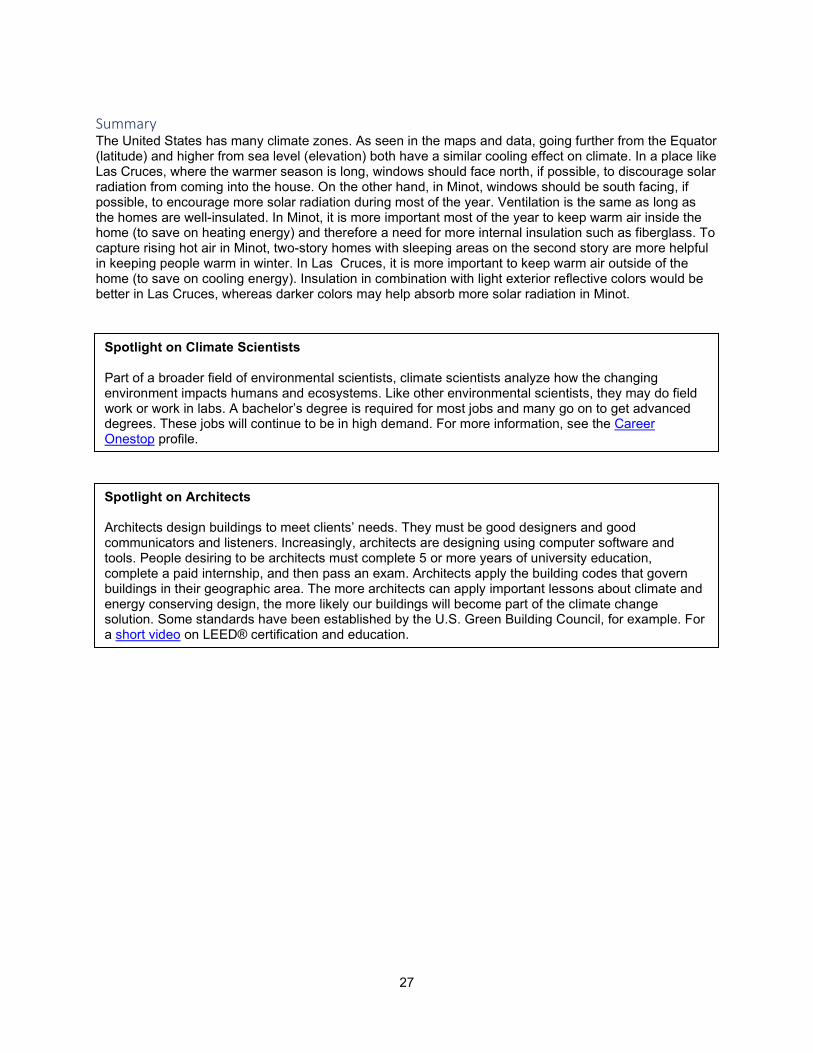
Lesson 3.2. Adapting to a changing climate Connect to previous lessons As we saw in the previous lesson, there is variation in climate zones, which leads to differentiation in energy conservation methods and practices between different locations (e.g. building codes). This lesson looks at changes in energy use over time as a result of global climate change. Recall from Lesson 2.2 that glass acts as a greenhouse. Similarly, the Earth’s atmosphere acts as a greenhouse by allowing in (short wave) solar radiation but trapping in heat (long wave radiation). The more greenhouse gasses (e.g. carbon dioxide and methane) in the atmosphere, the hotter the Earth becomes over time. See video from NASA (2:29). Prepare to investigate Examine the chart below. What does it clearly tell you? What can you infer? What does it not tell you? (Note: PPM is a measure of the concentration and stands for parts per million. That is, for every million units of air there are that many units of CO2 ).
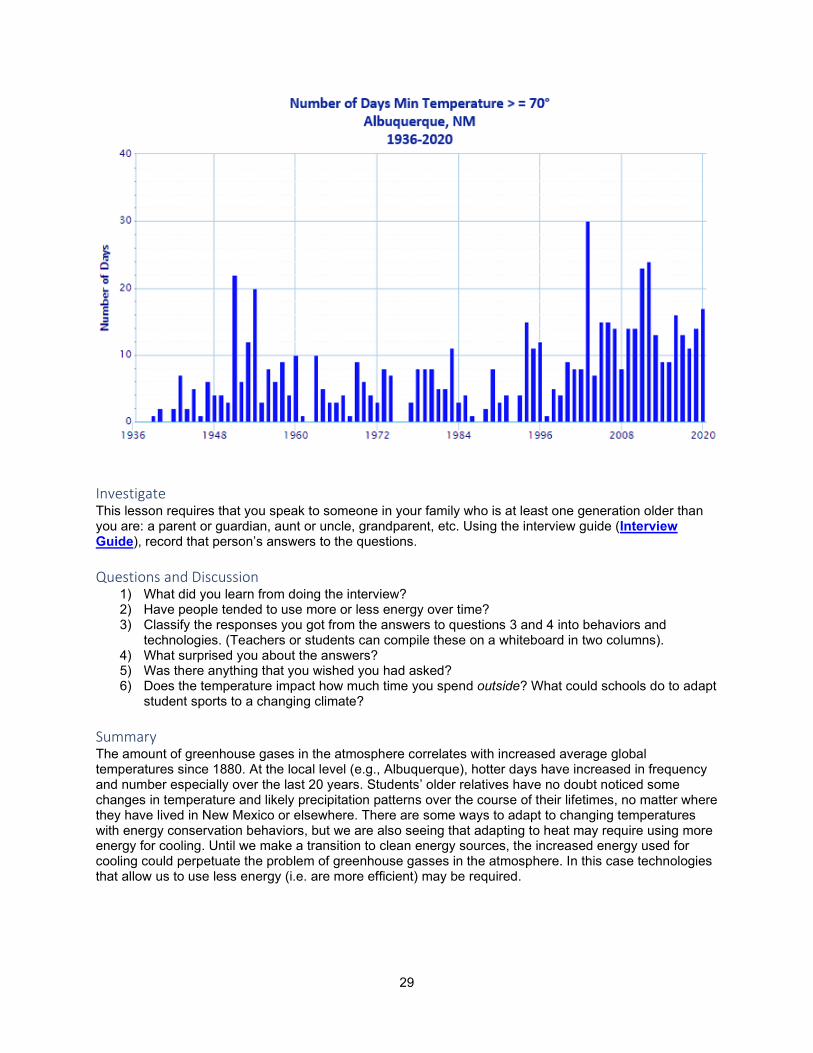
Now examine the temperature data for Albuquerque, New Mexico over the last 84 years. What is the graph telling you? How might have energy use changed over this period?1 Explain. (Note: “Min” stands for minimum).
1 Findings from an Energy Conservation and Management Division 2018 survey found that 40% of homeowning respondents still use swamp coolers. However, evidence suggests that swamp coolers are being replaced in southern New Mexico where already hot temperatures are increasing. Replacements include electrified air conditioning units and heat pumps.
29
Investigate This lesson requires that you speak to someone in your family who is at least one generation older than you are: a parent or guardian, aunt or uncle, grandparent, etc. Using the interview guide (Interview Guide), record that person’s answers to the questions. Questions and Discussion
1) What did you learn from doing the interview? 2) Have people tended to use more or less energy over time? 3) Classify the responses you got from the answers to questions 3 and 4 into behaviors and
technologies. (Teachers or students can compile these on a whiteboard in two columns). 4) What surprised you about the answers? 5) Was there anything that you wished you had asked? 6) Does the temperature impact how much time you spend outside? What could schools do to adapt
student sports to a changing climate? Summary The amount of greenhouse gases in the atmosphere correlates with increased average global temperatures since 1880. At the local level (e.g., Albuquerque), hotter days have increased in frequency and number especially over the last 20 years. Students’ older relatives have no doubt noticed some changes in temperature and likely precipitation patterns over the course of their lifetimes, no matter where they have lived in New Mexico or elsewhere. There are some ways to adapt to changing temperatures with energy conservation behaviors, but we are also seeing that adapting to heat may require using more energy for cooling. Until we make a transition to clean energy sources, the increased energy used for cooling could perpetuate the problem of greenhouse gasses in the atmosphere. In this case technologies that allow us to use less energy (i.e. are more efficient) may be required.
30
Lesson 4.1. Get the word out! Connect to previous lessons Students will pull their learning of this unit together by summarizing the knowledge and skills they acquired into an educational message to others. The theme will be “energy conservation.” Prepare to Investigate To prompt what students may want to say about conserving energy, teachers ask students to review their notes, investigations, observations and lessons learned over the course of this unit. Ask: What is important to communicate with others? Investigate and Act Students will construct a sign to put on their refrigerators to encourage themselves and their families to think about conserving energy. Teachers ask students to collectively identity action words that would be appropriate for the sign. The sign should have at least one action word from the list generated by the students. Students then take time to construct their signs. Multiple languages are encouraged if applicable to the student’s family. Questions, Discussion and Summary Teachers ask students to share their signs with each other and to ask each other questions. Students discuss how they will apply these lessons going forward. [Students can also report on any discussions they initiated at home with their signs.]
Extension Activity Methane Map Students examine an online map that shows “hotspots” of methane that is being vented from oil and gas wells in New Mexico. The map allows students to zoom in and out and to see more localized hotspots. Oil and gas drilling companies report the amount of methane that they are venting in thousands of cubic feet (mcf) to the Energy, Minerals and Natural Resources Department on a monthly basis. Without these reports or a special camera, we cannot see this methane leaking. It is invisible. See this video from the UN Environment Programme (0:42). After students watch the video, teacher asks them to answer the following questions:
1) What are the problems with methane leaks? 2) What is the estimated cost of these methane leaks? 3) How are scientists/people able to “see” this methane?
31
References Alaska Housing Finance Corporation. n.d. "Building Manual Appendix 1: R-Value of Buidling Materials."
Accessed October 2020. https://www.ahfc.us/iceimages/manuals/building_manual_ap_1.pdf. Austin, George S. 1984. "Adobe as a building material." New Mexico Geology, November .
https://geoinfo.nmt.edu/publications/periodicals/nmg/6/n4/nmg_v6_n4_p69.pdf. BBC News. 2019. "US lifts ban on old-style light bulbs." September 5.
https://www.eia.gov/electricity/data.php#sales. Career One Stop. n.d. Sponsored by U.S. Department of Labor. Accessed August 2021.
https://www.careeronestop.org/Videos/CareerVideos/career-videos.aspx?frd=true Charles, Dan. 2015. "Vegetables Under Glass Could Bring Us Better Winter Produce." The Salt,
December 8. https://www.npr.org/sections/thesalt/2015/12/08/458774088/veggies-under-glass-greenhouses-could-bring-us-better-winter-produce.
2020. COVID-19 causes biggest shock to global energy demand since WW II. Video. https://www.youtube.com/watch?v=NBgrsLZESmg.
Downs, Roger, and Susan Heffron, eds. 2012. National Standards for Geograhy Education, vol 2. Washington, DC: National Council for Geographic Education, 37& 58.
2020. Energy bills up as people spend more time at home during COVID-19 pandemic. Video. Produced by TVH11. https://www.youtube.com/watch?v=40P_tqiDkb4.
Heinking, Susan. 2019. The science of building codes and climate zones. August 15. Accessed December 2020. https://www.pepperconstruction.com/blog/science-building-codes-and-climate-zones.
2019. Invisible Emissions - High tech cameras reveal methan leaks. YouTube. Produced by UN Environment Programme. Accessed December 2020. https://www.youtube.com/watch?v=WsQmxnk3gps.
Mufson, Steven. 2020. "U.S. greenhouse gas emissions set to drop to lowest level in three decades." The Washington Post, November 19. https://www.washingtonpost.com/climate-environment/2020/11/19/us-emissions-climate-bloombergnef/.
National Weather Service. n.d. 100° Facts for Albuquerque and New Mexico. National Weather Service . Accessed December 2020. https://www.weather.gov/abq/clifeatures_100degrees.
NGA Center for Best Practices, and Council of Chief State School Officers. 2010. Common Core State Standards: English Language Arts. Washington, DC: National Governors Association Center for Best Practices, Council of Chief State School Officers. Accessed June 2021. http://www.corestandards.org/wp-content/uploads/ELA_Standards1.pdf.
NGA Center for Best Practices, and Council of Chief State School Officers. 2010. Common Core State Standards: Mathematics. Washington, DC: National Governors Association Center for Best Practices, Council of Chief State School Officers, 42. Accessed October 2020. http://www.corestandards.org/wp-content/uploads/Math_Standards1.pdf.
NGSS Lead States. 2013. Next Generation Science Standards: For States, By States. Washington, DC: The National Academies Press. Accessed 2020. https://www.nextgenscience.org/pe/ms-ps3-3-energy.
2017. Sustainable City/Fully Charged. Video. Accessed December 2020. https://youtu.be/WCKz8ykyI2E. U.S. Climate Assessment. 2014. "Temperature v. CO2, 1880-2013." U.S. Climate Assessment. Climate
Central. Accessed December 2020. U.S. Energy Information Agency. 2019, 2020. Retail Sales by Sector.
https://www.eia.gov/electricity/data.php#sales. 2020. What is the Greenhouse Affect. Video. Produced by NASA. Accessed December 2020.
https://www.youtube.com/watch?v=SN5-DnOHQmE.
Household Energy Use | 1
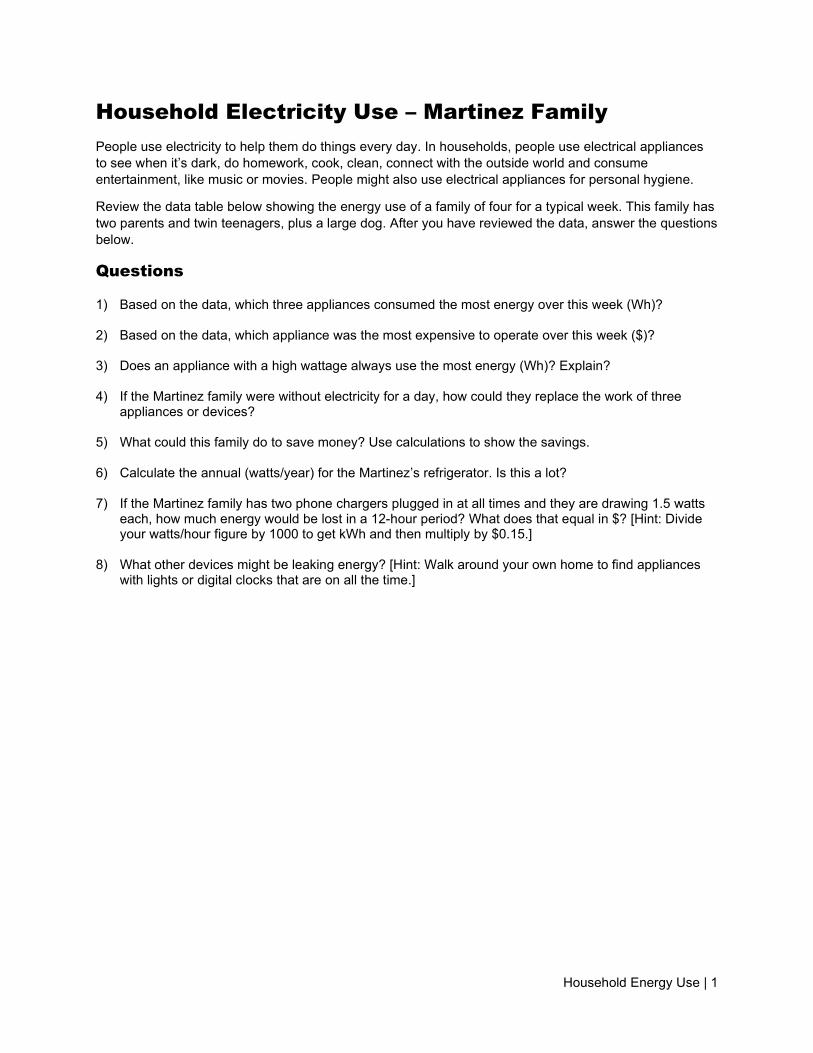
Household Electricity Use – Martinez Family People use electricity to help them do things every day. In households, people use electrical appliances to see when it’s dark, do homework, cook, clean, connect with the outside world and consume entertainment, like music or movies. People might also use electrical appliances for personal hygiene.
Review the data table below showing the energy use of a family of four for a typical week. This family has two parents and twin teenagers, plus a large dog. After you have reviewed the data, answer the questions below.
Questions 1) Based on the data, which three appliances consumed the most energy over this week (Wh)? 2) Based on the data, which appliance was the most expensive to operate over this week ($)?
3) Does an appliance with a high wattage always use the most energy (Wh)? Explain?
4) If the Martinez family were without electricity for a day, how could they replace the work of three
appliances or devices?
5) What could this family do to save money? Use calculations to show the savings.
6) Calculate the annual (watts/year) for the Martinez’s refrigerator. Is this a lot?
7) If the Martinez family has two phone chargers plugged in at all times and they are drawing 1.5 watts each, how much energy would be lost in a 12-hour period? What does that equal in $? [Hint: Divide your watts/hour figure by 1000 to get kWh and then multiply by $0.15.]
8) What other devices might be leaking energy? [Hint: Walk around your own home to find appliances
with lights or digital clocks that are on all the time.]
Household Energy Use | 2
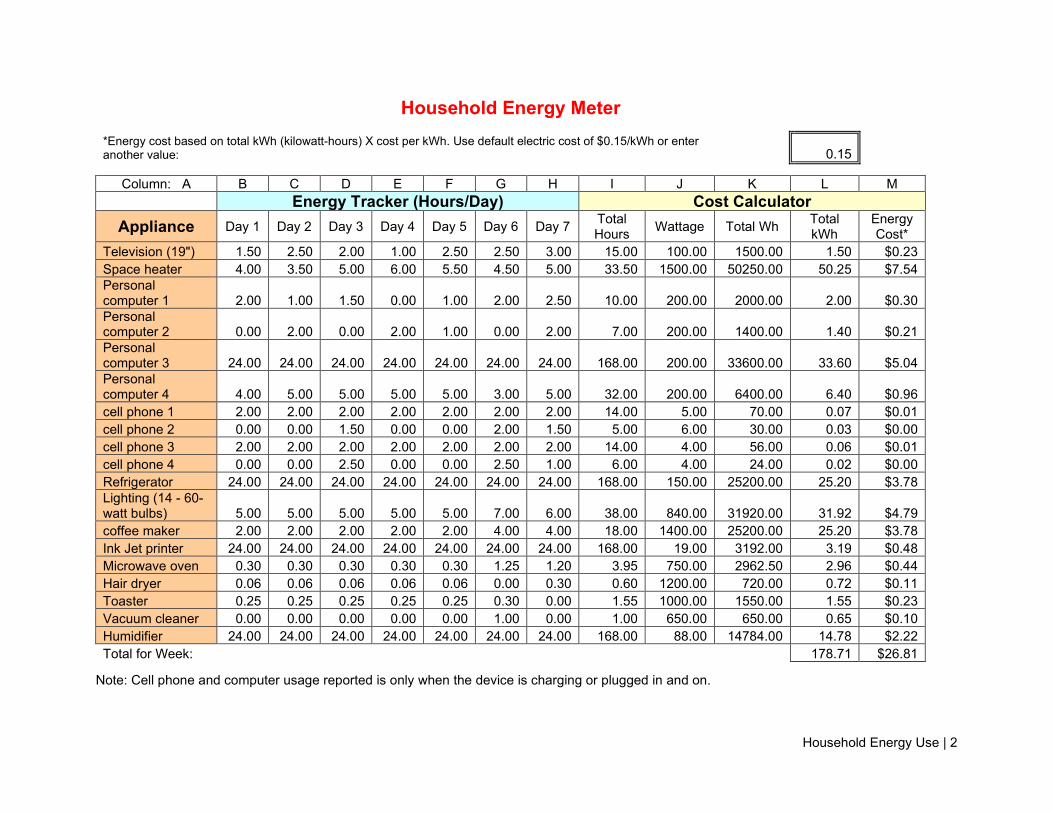
Household Energy Meter
*Energy cost based on total kWh (kilowatt-hours) X cost per kWh. Use default electric cost of $0.15/kWh or enter another value: 0.15
Column: A B C D E F G H I J K L M Energy Tracker (Hours/Day) Cost Calculator
Appliance Day 1 Day 2 Day 3 Day 4 Day 5 Day 6 Day 7 Total Hours Wattage Total Wh Total
kWh Energy Cost*
Television (19") 1.50 2.50 2.00 1.00 2.50 2.50 3.00 15.00 100.00 1500.00 1.50 $0.23 Space heater 4.00 3.50 5.00 6.00 5.50 4.50 5.00 33.50 1500.00 50250.00 50.25 $7.54 Personal computer 1 2.00 1.00 1.50 0.00 1.00 2.00 2.50 10.00 200.00 2000.00 2.00 $0.30 Personal computer 2 0.00 2.00 0.00 2.00 1.00 0.00 2.00 7.00 200.00 1400.00 1.40 $0.21 Personal computer 3 24.00 24.00 24.00 24.00 24.00 24.00 24.00 168.00 200.00 33600.00 33.60 $5.04 Personal computer 4 4.00 5.00 5.00 5.00 5.00 3.00 5.00 32.00 200.00 6400.00 6.40 $0.96 cell phone 1 2.00 2.00 2.00 2.00 2.00 2.00 2.00 14.00 5.00 70.00 0.07 $0.01 cell phone 2 0.00 0.00 1.50 0.00 0.00 2.00 1.50 5.00 6.00 30.00 0.03 $0.00 cell phone 3 2.00 2.00 2.00 2.00 2.00 2.00 2.00 14.00 4.00 56.00 0.06 $0.01 cell phone 4 0.00 0.00 2.50 0.00 0.00 2.50 1.00 6.00 4.00 24.00 0.02 $0.00 Refrigerator 24.00 24.00 24.00 24.00 24.00 24.00 24.00 168.00 150.00 25200.00 25.20 $3.78 Lighting (14 - 60-watt bulbs) 5.00 5.00 5.00 5.00 5.00 7.00 6.00 38.00 840.00 31920.00 31.92 $4.79 coffee maker 2.00 2.00 2.00 2.00 2.00 4.00 4.00 18.00 1400.00 25200.00 25.20 $3.78 Ink Jet printer 24.00 24.00 24.00 24.00 24.00 24.00 24.00 168.00 19.00 3192.00 3.19 $0.48 Microwave oven 0.30 0.30 0.30 0.30 0.30 1.25 1.20 3.95 750.00 2962.50 2.96 $0.44 Hair dryer 0.06 0.06 0.06 0.06 0.06 0.00 0.30 0.60 1200.00 720.00 0.72 $0.11 Toaster 0.25 0.25 0.25 0.25 0.25 0.30 0.00 1.55 1000.00 1550.00 1.55 $0.23 Vacuum cleaner 0.00 0.00 0.00 0.00 0.00 1.00 0.00 1.00 650.00 650.00 0.65 $0.10 Humidifier 24.00 24.00 24.00 24.00 24.00 24.00 24.00 168.00 88.00 14784.00 14.78 $2.22 Total for Week: 178.71 $26.81
Note: Cell phone and computer usage reported is only when the device is charging or plugged in and on.
Lightbulb Analysis | 1
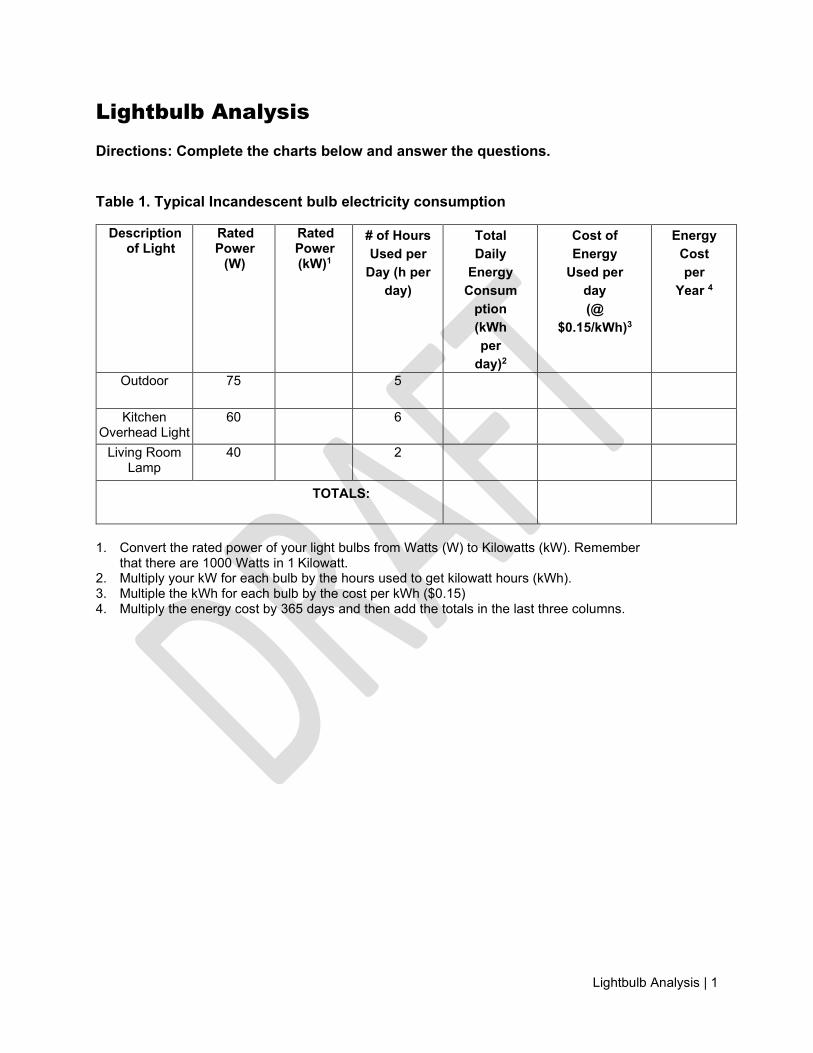
Lightbulb Analysis Directions: Complete the charts below and answer the questions. Table 1. Typical Incandescent bulb electricity consumption
1. Convert the rated power of your light bulbs from Watts (W) to Kilowatts (kW). Remember
that there are 1000 Watts in 1 Kilowatt. 2. Multiply your kW for each bulb by the hours used to get kilowatt hours (kWh). 3. Multiple the kWh for each bulb by the cost per kWh ($0.15) 4. Multiply the energy cost by 365 days and then add the totals in the last three columns.
Description of Light
Rated Power
(W)
Rated Power (kW)1
# of Hours Used per
Day (h per day)
Total Daily
Energy Consum
ption (kWh per
day)2
Cost of Energy
Used per day (@
$0.15/kWh)3
Energy Cost per
Year 4
Outdoor 75 5
Kitchen Overhead Light
60 6
Living Room Lamp
40 2
TOTALS:
Lightbulb Analysis | 2
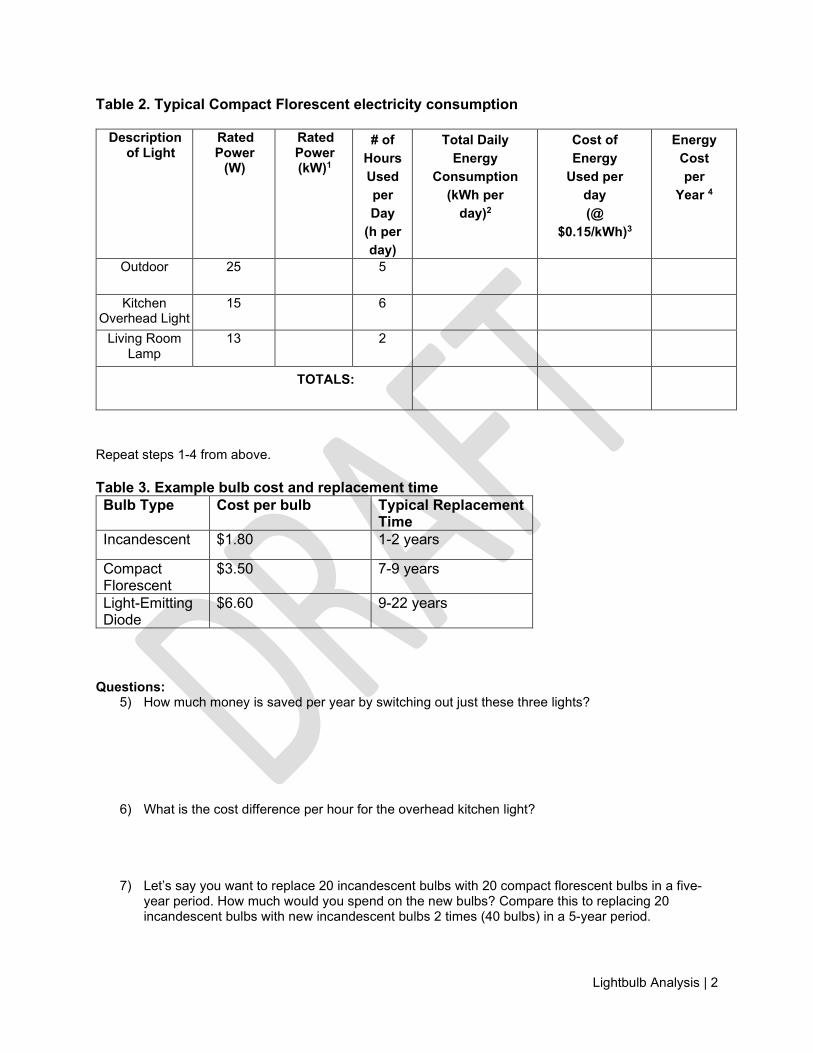
Table 2. Typical Compact Florescent electricity consumption
Repeat steps 1-4 from above. Table 3. Example bulb cost and replacement time Bulb Type Cost per bulb Typical Replacement
Time Incandescent $1.80 1-2 years
Compact Florescent
$3.50 7-9 years
Light-Emitting Diode
$6.60 9-22 years
Questions:
5) How much money is saved per year by switching out just these three lights?
6) What is the cost difference per hour for the overhead kitchen light?
7) Let’s say you want to replace 20 incandescent bulbs with 20 compact florescent bulbs in a five-year period. How much would you spend on the new bulbs? Compare this to replacing 20 incandescent bulbs with new incandescent bulbs 2 times (40 bulbs) in a 5-year period.
Description of Light
Rated Power
(W)
Rated Power (kW)1
# of Hours Used per Day
(h per day)
Total Daily Energy
Consumption (kWh per
day)2
Cost of Energy
Used per day (@
$0.15/kWh)3
Energy Cost per
Year 4
Outdoor 25 5
Kitchen Overhead Light
15 6
Living Room Lamp
13 2
TOTALS:

Lightbulb Analysis | 3
20($3.50) = __________ VS. 40(1.80) = __________
8) Should we replace incandescent lights with compact florescent lights? Why or why not? Show
your work to explain how you came to this conclusion.
Energy Audit | 1
Energy Audit
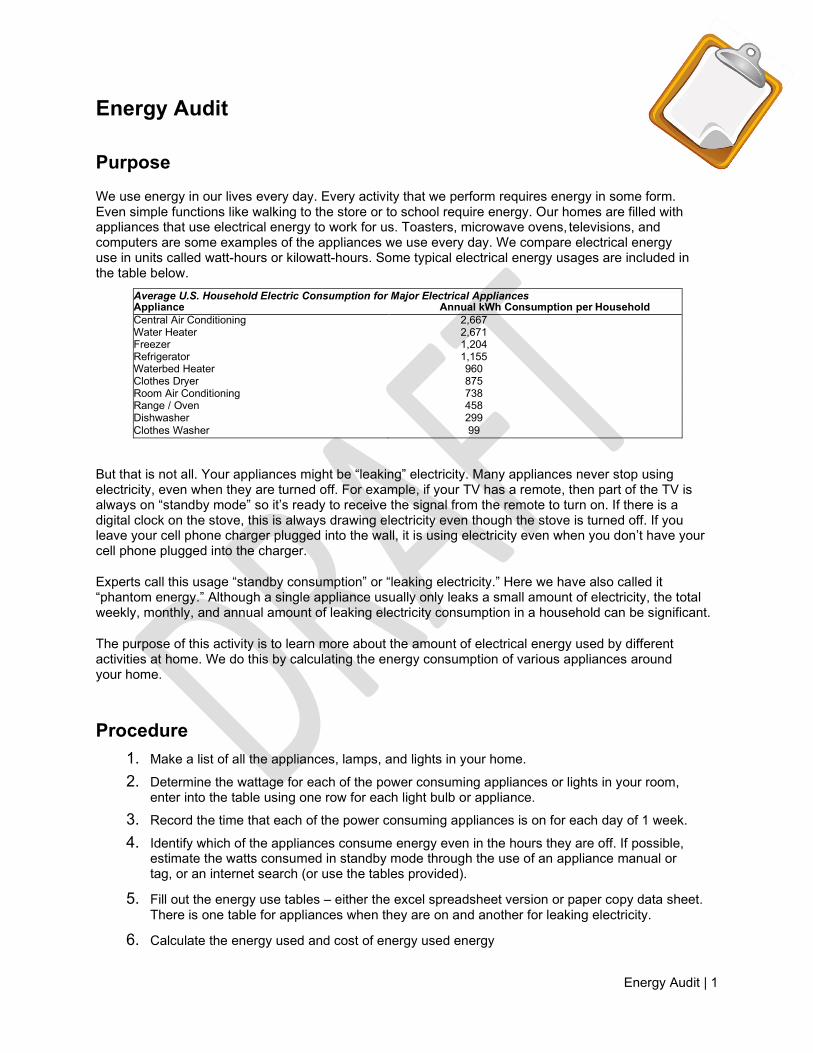
Purpose We use energy in our lives every day. Every activity that we perform requires energy in some form. Even simple functions like walking to the store or to school require energy. Our homes are filled with appliances that use electrical energy to work for us. Toasters, microwave ovens, televisions, and computers are some examples of the appliances we use every day. We compare electrical energy use in units called watt-hours or kilowatt-hours. Some typical electrical energy usages are included in the table below.
Average U.S. Household Electric Consumption for Major Electrical Appliances Appliance Annual kWh Consumption per Household Central Air Conditioning 2,667 Water Heater 2,671 Freezer 1,204 Refrigerator 1,155 Waterbed Heater 960 Clothes Dryer 875 Room Air Conditioning 738 Range / Oven 458 Dishwasher 299 Clothes Washer 99
But that is not all. Your appliances might be “leaking” electricity. Many appliances never stop using electricity, even when they are turned off. For example, if your TV has a remote, then part of the TV is always on “standby mode” so it’s ready to receive the signal from the remote to turn on. If there is a digital clock on the stove, this is always drawing electricity even though the stove is turned off. If you leave your cell phone charger plugged into the wall, it is using electricity even when you don’t have your cell phone plugged into the charger. Experts call this usage “standby consumption” or “leaking electricity.” Here we have also called it “phantom energy.” Although a single appliance usually only leaks a small amount of electricity, the total weekly, monthly, and annual amount of leaking electricity consumption in a household can be significant. The purpose of this activity is to learn more about the amount of electrical energy used by different activities at home. We do this by calculating the energy consumption of various appliances around your home.
Procedure
1. Make a list of all the appliances, lamps, and lights in your home.
2. Determine the wattage for each of the power consuming appliances or lights in your room, enter into the table using one row for each light bulb or appliance.
3. Record the time that each of the power consuming appliances is on for each day of 1 week. 4. Identify which of the appliances consume energy even in the hours they are off. If possible,
estimate the watts consumed in standby mode through the use of an appliance manual or tag, or an internet search (or use the tables provided).
5. Fill out the energy use tables – either the excel spreadsheet version or paper copy data sheet. There is one table for appliances when they are on and another for leaking electricity.
6. Calculate the energy used and cost of energy used energy
Energy Audit | 2
(kWh)= power(W)/1000 X time(h)
7. Answer the discussion questions
Discussion Questions
1. What three appliances in your home consume the most electrical energy at your house?
2. Does an appliance or device that has a high wattage always use the most energy over the week or month? Explain.
3. What do you think you could do to reduce the amount of energy used in your house? What could you do to conserve energy? What could help you use energy more efficiently?
Examples:
Efficiency measures Conservation measures o Replace appliance with an Energy
Star appliance (see www.energystar.gov )
o Replace light bulbs with CFLs o Replace Plasma TV with LED TV
o Watch TV less o Turn off lights o Turn off your computer at night o Don’t use your hair dryer (or other optional appliance) o Unplug appliances that have high stand by power
requirements when not in use
4. Electricity is one of the critical energy resources in our daily lives. Describe how you might replace the work of three of the appliances / devices if you did not have electricity.
5. How does the amount of leaking electricity consumption compare with the total amount of electricity used in your household? Can you think of ways to reduce the leaking (stand-by) electricity use?
Energy Audit | 3
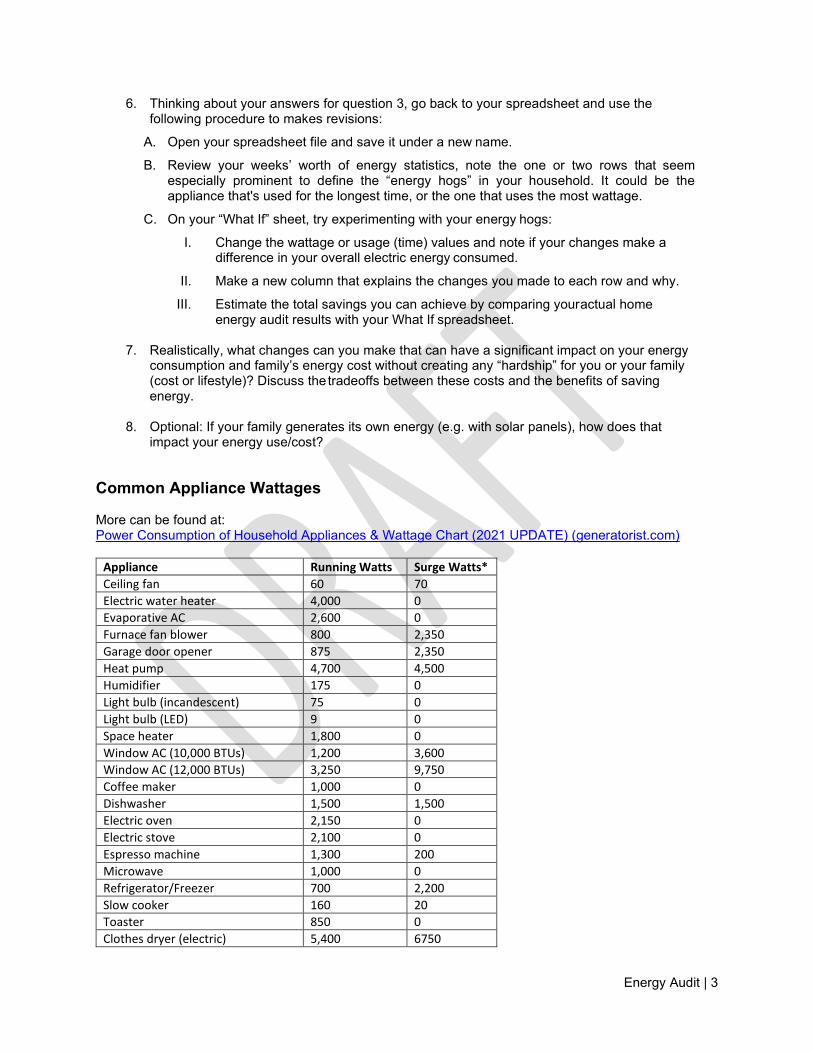
6. Thinking about your answers for question 3, go back to your spreadsheet and use the following procedure to makes revisions:
A. Open your spreadsheet file and save it under a new name.
B. Review your weeks’ worth of energy statistics, note the one or two rows that seem especially prominent to define the “energy hogs” in your household. It could be the appliance that's used for the longest time, or the one that uses the most wattage.
C. On your “What If” sheet, try experimenting with your energy hogs:
I. Change the wattage or usage (time) values and note if your changes make a difference in your overall electric energy consumed.
II. Make a new column that explains the changes you made to each row and why.
III. Estimate the total savings you can achieve by comparing your actual home energy audit results with your What If spreadsheet.
7. Realistically, what changes can you make that can have a significant impact on your energy
consumption and family’s energy cost without creating any “hardship” for you or your family (cost or lifestyle)? Discuss the tradeoffs between these costs and the benefits of saving energy.
8. Optional: If your family generates its own energy (e.g. with solar panels), how does that impact your energy use/cost?
Common Appliance Wattages More can be found at: Power Consumption of Household Appliances & Wattage Chart (2021 UPDATE) (generatorist.com)
Appliance Running Watts Surge Watts* Ceiling fan 60 70 Electric water heater 4,000 0 Evaporative AC 2,600 0 Furnace fan blower 800 2,350 Garage door opener 875 2,350 Heat pump 4,700 4,500 Humidifier 175 0 Light bulb (incandescent) 75 0 Light bulb (LED) 9 0 Space heater 1,800 0 Window AC (10,000 BTUs) 1,200 3,600 Window AC (12,000 BTUs) 3,250 9,750 Coffee maker 1,000 0 Dishwasher 1,500 1,500 Electric oven 2,150 0 Electric stove 2,100 0 Espresso machine 1,300 200 Microwave 1,000 0 Refrigerator/Freezer 700 2,200 Slow cooker 160 20 Toaster 850 0 Clothes dryer (electric) 5,400 6750
Energy Audit | 4
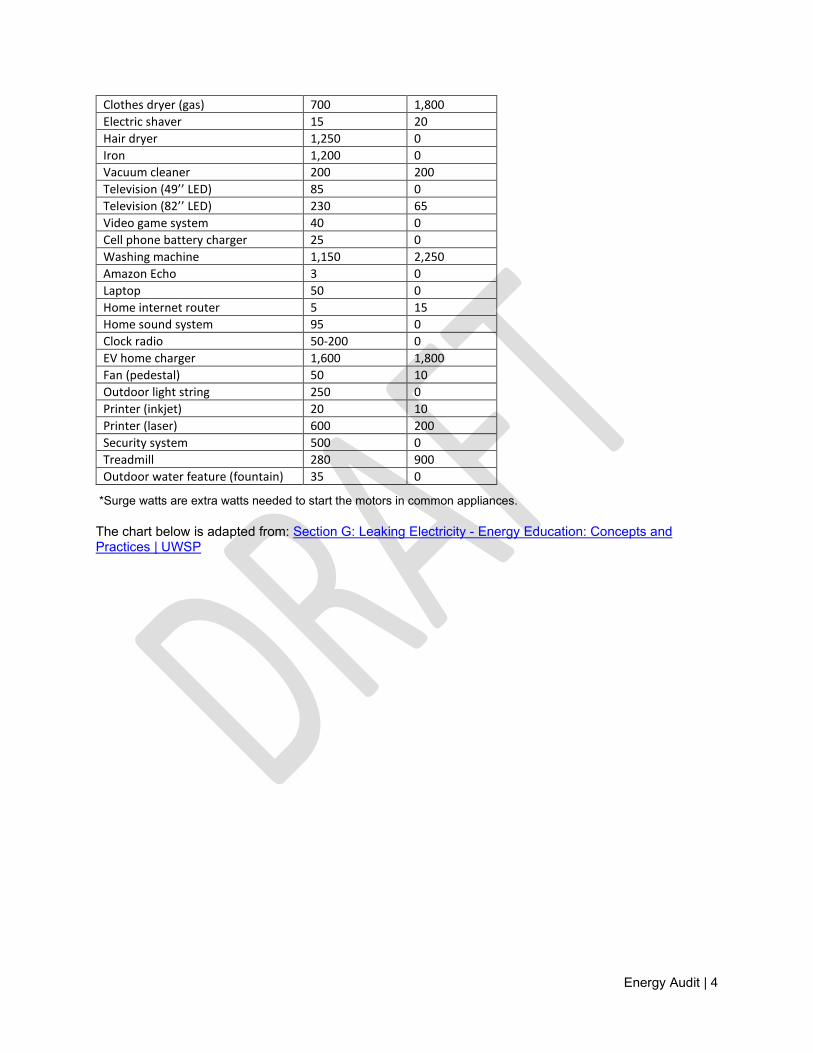
Clothes dryer (gas) 700 1,800 Electric shaver 15 20 Hair dryer 1,250 0 Iron 1,200 0 Vacuum cleaner 200 200 Television (49’’ LED) 85 0 Television (82’’ LED) 230 65 Video game system 40 0 Cell phone battery charger 25 0 Washing machine 1,150 2,250 Amazon Echo 3 0 Laptop 50 0 Home internet router 5 15 Home sound system 95 0 Clock radio 50-200 0 EV home charger 1,600 1,800 Fan (pedestal) 50 10 Outdoor light string 250 0 Printer (inkjet) 20 10 Printer (laser) 600 200 Security system 500 0 Treadmill 280 900 Outdoor water feature (fountain) 35 0
*Surge watts are extra watts needed to start the motors in common appliances. The chart below is adapted from: Section G: Leaking Electricity - Energy Education: Concepts and Practices | UWSP
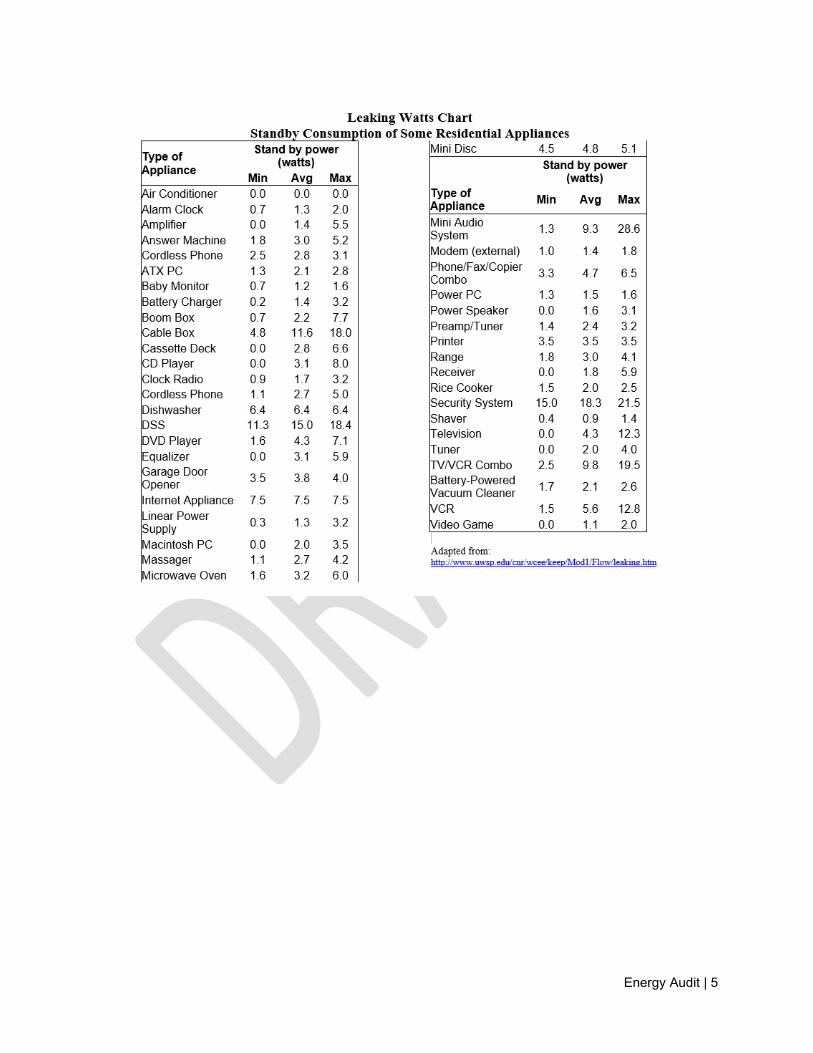
Energy Audit | 5
Energy Audit | 6
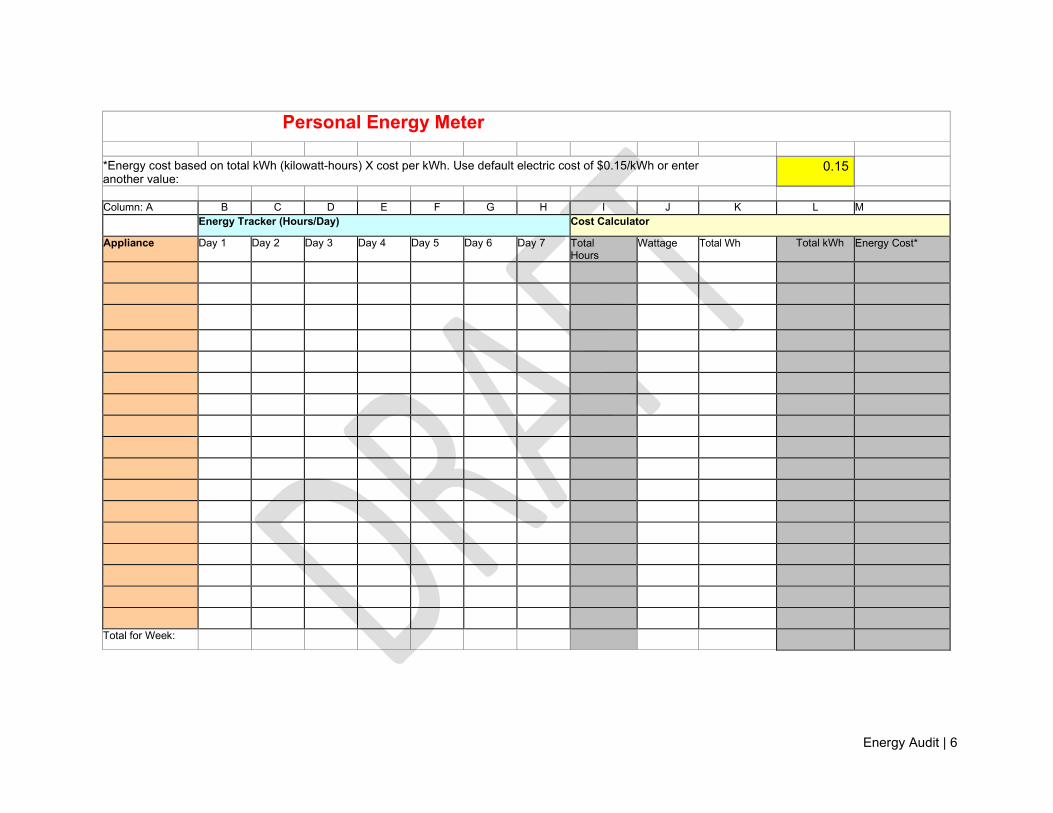
Personal Energy Meter
*Energy cost based on total kWh (kilowatt-hours) X cost per kWh. Use default electric cost of $0.15/kWh or enter another value:
0.15
Column: A B C D E F G H I J K L M Energy Tracker (Hours/Day) Cost Calculator
Appliance Day 1 Day 2 Day 3 Day 4 Day 5 Day 6 Day 7 Total Hours
Wattage Total Wh Total kWh Energy Cost*
Total for Week:
Energy Audit | 7
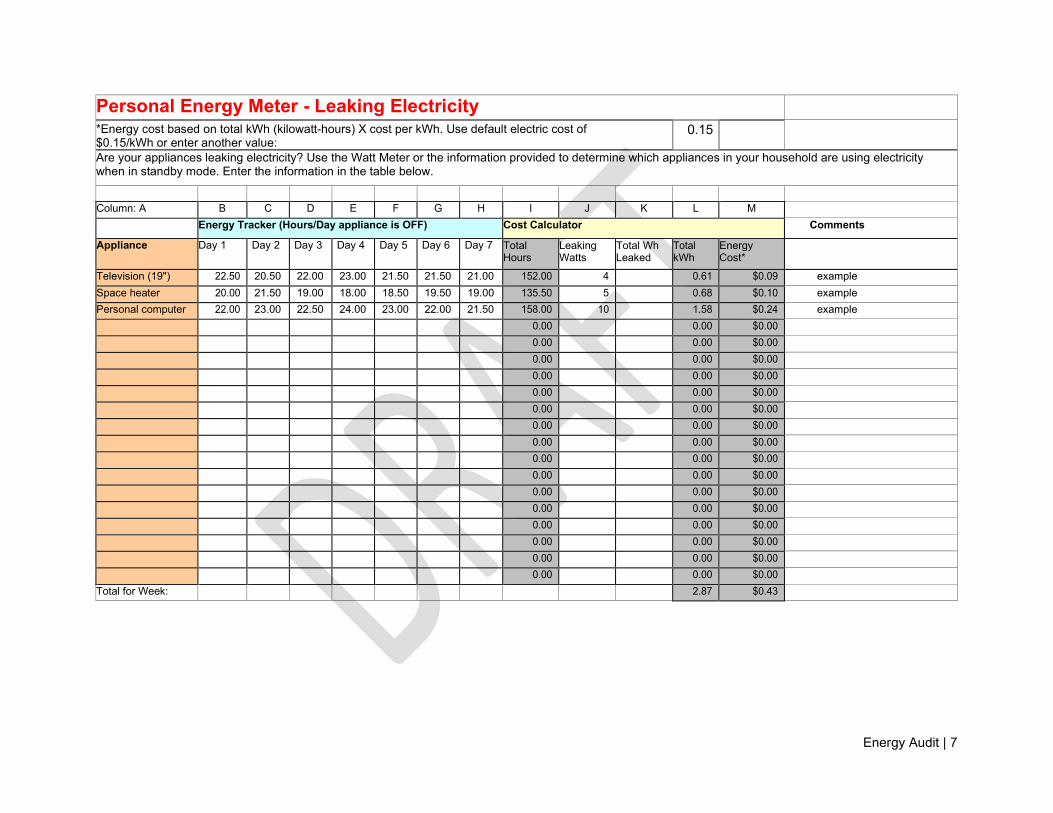
Personal Energy Meter - Leaking Electricity
*Energy cost based on total kWh (kilowatt-hours) X cost per kWh. Use default electric cost of $0.15/kWh or enter another value:
0.15
Are your appliances leaking electricity? Use the Watt Meter or the information provided to determine which appliances in your household are using electricity when in standby mode. Enter the information in the table below. Column: A B C D E F G H I J K L M Energy Tracker (Hours/Day appliance is OFF) Cost Calculator Comments
Appliance Day 1 Day 2 Day 3 Day 4 Day 5 Day 6 Day 7 Total Hours
Leaking Watts
Total Wh Leaked
Total kWh
Energy Cost*
Television (19") 22.50 20.50 22.00 23.00 21.50 21.50 21.00 152.00 4 0.61 $0.09 example Space heater 20.00 21.50 19.00 18.00 18.50 19.50 19.00 135.50 5 0.68 $0.10 example Personal computer 22.00 23.00 22.50 24.00 23.00 22.00 21.50 158.00 10 1.58 $0.24 example 0.00 0.00 $0.00 0.00 0.00 $0.00 0.00 0.00 $0.00 0.00 0.00 $0.00 0.00 0.00 $0.00 0.00 0.00 $0.00 0.00 0.00 $0.00 0.00 0.00 $0.00 0.00 0.00 $0.00 0.00 0.00 $0.00 0.00 0.00 $0.00 0.00 0.00 $0.00 0.00 0.00 $0.00 0.00 0.00 $0.00 0.00 0.00 $0.00 0.00 0.00 $0.00 Total for Week: 2.87 $0.43
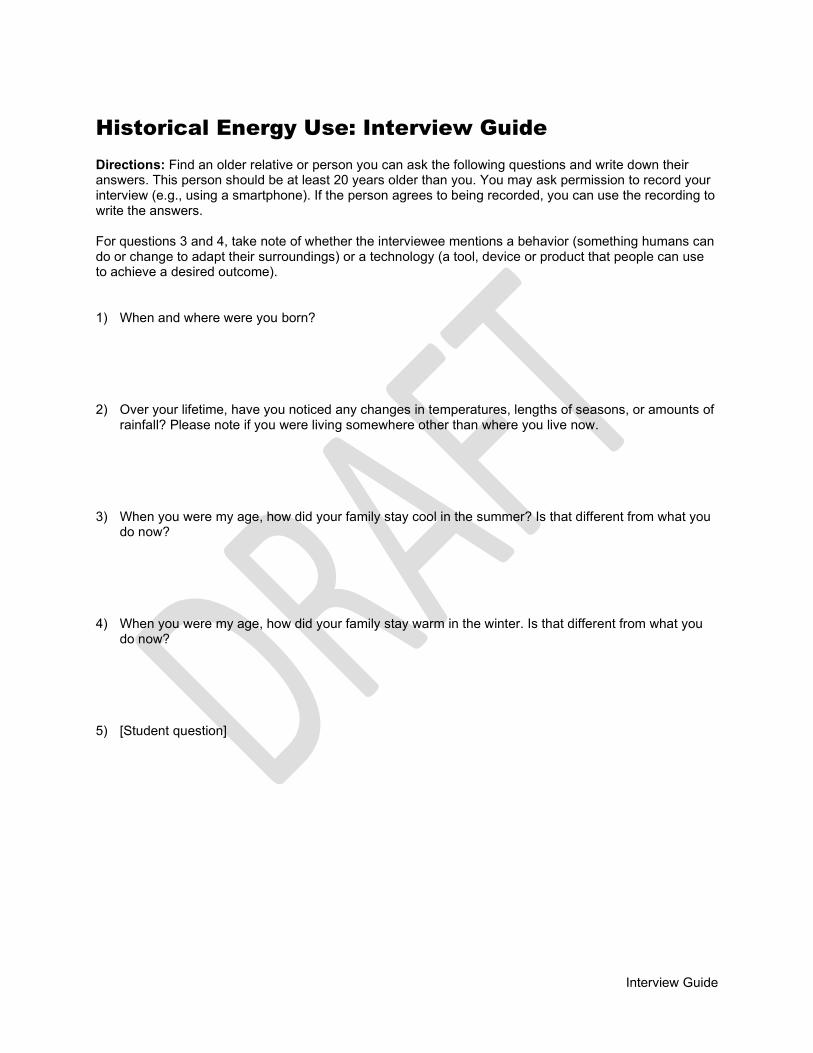
Interview Guide
Historical Energy Use: Interview Guide Directions: Find an older relative or person you can ask the following questions and write down their answers. This person should be at least 20 years older than you. You may ask permission to record your interview (e.g., using a smartphone). If the person agrees to being recorded, you can use the recording to write the answers. For questions 3 and 4, take note of whether the interviewee mentions a behavior (something humans can do or change to adapt their surroundings) or a technology (a tool, device or product that people can use to achieve a desired outcome). 1) When and where were you born?
2) Over your lifetime, have you noticed any changes in temperatures, lengths of seasons, or amounts of rainfall? Please note if you were living somewhere other than where you live now.
3) When you were my age, how did your family stay cool in the summer? Is that different from what you
do now? 4) When you were my age, how did your family stay warm in the winter. Is that different from what you
do now? 5) [Student question]